..t THE PHOENIX - BSE
67
November 12, 2020 BSE Limited Phiroze Jeejeebhoy Towers Dalal Street, Fort, Mumbai- 400 001 Security code: 503100 Dear Sir(s), t� THE PHOEN MILLS LIMIT�D Corp. Office : Shree Laxmi Woolen Mills Estate, 2nd Floor, R.R. Hosie, Off Dr. E. Moses Rd. Mahalaxmi, Mumbai - 400 011 Tel : (022) 3001 6600 Fax : (022) 3001 6601 CIN No.: L17100MH1905PLC000200 National Stock Exchange of India Limited Exchange Plaza, Bandra-Kurla Complex, Bandra East, Mumbai- 400051 Symbol: PHOENlXLTD S ub: I . vesto ' +r•�a,n n n Un tan a one and onsoHdated Unaudited Finanal Results r the second quarter and half year ended September 30,202: Pursuant to Regulation 30 and Para A of Part A of Schedule III of the SEBI (Listing Obligations and Disclosure Requirements) Regulations, 2015, we enclose herewith the presentation on Unaudted Standalone and Consolidated Financial Results of The Phoenix Mills Limited ('Company') r the second quarter and half year ended September 30, 2020, to be made to investors and analysts. The same is also being /w.thephoenixmills.com Regulations. uploaded on the Company's website at in compliance with regulation 46(2) of the Listing You are requested to take the aresaid inrmation on your record. Thanking you, Yours Faithlly, For The Phoenix Mills Limited Gajendra Mewara Company Secretary Encl:- As above Regd. Office: The Phoenix Mills Ltd., 462 Senapati Bapat Marg, Lower Parel, Mumbai 400 013. •Tel: (022) 2496 4307 / 8 / 9 • Fax": (022) 2493 838& E-mail : info@thephoenixmills.com • www.thephoenixmills.com
-
Upload
khangminh22 -
Category
Documents
-
view
0 -
download
0
Transcript of ..t THE PHOENIX - BSE

November 12, 2020
BSE Limited
Phiroze Jeejeebhoy Towers Dalal Street, Fort, Mumbai- 400 001
Security code: 503100
Dear Sir(s),
.. t� THE PHOENIX ,pr- MILLS LIMIT�D Corp. Office : Shree Laxmi Woolen Mills Estate, 2nd Floor,
R.R. Hosiery, Off Dr. E. Moses Rd. Mahalaxmi, Mumbai - 400 011
Tel : (022) 3001 6600 Fax : (022) 3001 6601
CIN No.: L 17100MH1905PLC000200
National Stock Exchange of India Limited
Exchange Plaza, Bandra-Kurla Complex, Bandra East, Mumbai- 400051
Symbol: PHOENlXL TD
Sub: I . vesto '
11r•�C!a,n n n Un tan a one and onsoHdated Unaudited
Financial Results for the second quarter and half year ended September 30,202:
Pursuant to Regulation 30 and Para A of Part A of Schedule III of the SEBI (Listing Obligations and Disclosure Requirements) Regulations, 2015, we enclose herewith the presentation on Unaudted Standalone and Consolidated Financial Results of The Phoenix Mills Limited ('Company') for the second quarter and half year ended September 30, 2020, to be made to investors and analysts.
The same is also being ht.tns.J/www.thephoenixmills.com Regulations.
uploaded on the Company's website at in compliance with regulation 46(2) of the Listing
You are requested to take the aforesaid information on your record.
Thanking you,
Yours Faithfully, For The Phoenix Mills Limited
Gajendra Mewara
Company Secretary
Encl:- As above
Regd. Office: The Phoenix Mills Ltd., 462 Senapati Bapat Marg, Lower Parel, Mumbai 400 013. •Tel: (022) 2496 4307 / 8 / 9 • Fax": (022) 2493 838& E-mail : [email protected] • www.thephoenixmills.com

1
The Phoenix Mills Ltd.Investor Presentation – Q2 & H1 FY21
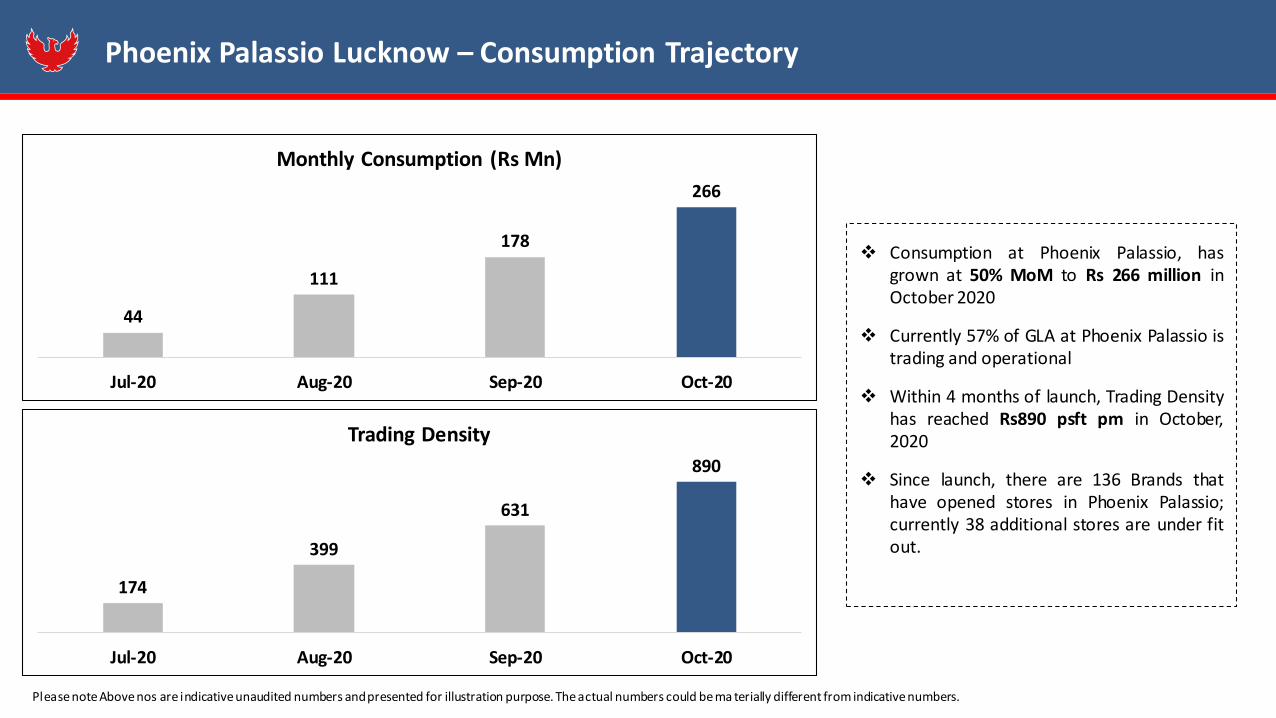
Phoenix Palassio, Lucknow

India's largest mall owner showing >13% rental CAGR FY13 through FY20
~7 msft
>100%
14%
~5 msft
~98%
15%
EBITDA margin in Retail Malls
Rental CAGRDuring FY13-FY20
Leased occupancyAcross HSP and
MarketCity malls
Consumption CAGRDuring FY13-FY20
Total of ~12 msft mall GLA expected to be operational by FY24
GLA across 9 operational
RETAIL malls in 6 cities
GLA of under-development &
under-planning RETAIL
Note: Under development and under planning assets are subject to change and carry risks of planning, approvals, execution and market conditions which may be beyond the control of the Company.GLA is an estimate based on current plans and market/company norms and is subject to change based on changes in development plans and tenant negotiations.Data as on 30 September 2020. Rental and Consumption CAGR adjusted for the for the period for which the mall was operational.EBITDA Margin > 100% is in most months on aggregate for the portfolio and is derived at the asset level before corporate costs and other non operating costs as on FY20
2

Dynamic and diverse leading developer of mixed-use projects
The St. Regis, Mumbai
Commercial Hospitality Residential
~1.3 msft
Operational Office Spaces GLA
Under-development & Under-planning
Offices GLA
~4.9 msft
588 keys
~300 keys
~4 msft
Total Saleable Area
Completed Area (OC Received)
~3 msft
Retail
~7 msft
OperationalRetail Spaces GLA
Under-development & Under-planning
Retail GLA
~5 msft
Under-planning Grand Hyatt, Bangalore
+ Courtyard by Marriott, Agra
Total ~12 msft
Total ~6.2 msft
Total ~888 keys
Total ~4 msft
Note: Under development and under planning assets are subject to change and carry risks of planning, approvals, execution and market conditions which may be beyond the control of the Company.GLA is an estimate based on current plans and market/company norms and is subject to change based on changes in development plans and tenant negotiations.Grand Hyatt term sheet executed, definitive documentation underway. Data as on 30 September 2020
3

Acquisitions carry substantial risk which can impact closing. # Includes sold areaUnder development and under planning assets are subject to change and carry risks of planning, approvals, execution and market conditions which may be beyond the control of the Company.GLA is an estimate based on current plans and market/company norms and is subject to change based on changes in development plans and tenant negotiations. Data as on 30 September 2020. 4
ChennaiMallPhoenix MarketCity– (~1 msft)Palladium – (~0.22 msft)
ResidentialThe Crest - A & B – (0.26 msft)The Crest - C – (0.28 msft)
CommercialPalladium Offices – (~0.42 msft)
Under-development / planning
Gross Leasable / Saleable Area
BengaluruMallPhoenix MarketCity– (~1 msft) + Expansion (~0.31 msft)Phoenix Mall of Asia – (~1.2 msft)ResidentialOne Bangalore West – (2.41 msft)Kessaku – (1.03 msft)
CommercialPhoenix MarketCIty– (~1 msft)Phoenix Mall of Asia – (~1.2 msft)
HospitalityGrand Hyatt – (~300 keys)
Lucknow
MallPhoenix United – (0.37 msft)Phoenix Palassio – (0.90 msft)
AgraHospitalityCourtyard by Marriott – (193 keys)
BareillyMallPhoenix United – (0.34 msft)
MumbaiMallHSP & Palladium – (0.77 msft)Phoenix MarketCity– (1.14 msft)HSP Densification Retail – (~0.5 msft)
CommercialPhoenix Paragon Plaza – (0.44 msft)#The Centrium – (~0.25 msft)#Art Guild House – (~0.80 msft)#Phoenix House – (~0.10 msft)HSP – (~1 msft)
HospitalityThe St. Regis – (395 keys)
PuneMallPhoenix MarketCity– (1.19 msft)Phoenix Millennium – (~1.1 msft)
CommercialEast Court – (~0.25 msft)#Fountainhead Tower 1 – (0.17 msft)Fountainhead Tower 2 & 3 – (~0.66 msft)Phoenix Millennium – (~0.60 msft)
Kolkata
Indore
MallPhoenix Citadel– (~1 msft)
Ahmedabad
MallPalladium– (~0.7 msft)
Acquisition underwayMallPhoenix Market City– (1.00 msft)
Office
- (0.60 msft)
Portfolio in India’s top cities

Business UpdateBusiness PerformanceFinancial ResultsAnnexure
Palladium, Mumbai

257
174 208
135 118 70
High Street Phoenix &Palladium
PMC Bangalore PMC Pune PMC Mumbai PMC & PalladiumChennai
Phoenix Palassio
NA
Consumption in 1st week of Nov 2020 at 85% of same period last year
Please note Above nos are indicative unaudited numbers and presented for illustration purpose. The actual numbers could be ma terially different from indicative numbers.LYSW stands for Last Year Same week. LYSW comparison is is on like to like basis
1st Week November - 2020 Consumption (% of LYSW)*
Figures in Rs. Mn.
73%87%105%80%83%
• Consumption across our major malls have seen further improvement in first week of November, 2020.
• At a portfolio level, consumption is now at 85% of same period last year.
• Consumption has benefited from (1) increase in mall operational hours across cities, (2) resumption of F&B and (3) pickup on account of festive season.
• Withmultiplexes opening up fromNovember and the ongoing festiveseason, we expect mall consumptionto continue the upward trajectory.
% of LYSW

817
652 605
404 379 266
High Street Phoenix &Palladium
PMC Bangalore PMC Pune PMC Mumbai PMC & PalladiumChennai
Phoenix PalassioLucknow
NA
Please note Above nos are indicative unaudited numbers and presented for illustration purpose. The actual numbers could be ma terially different from indicative numbers.LYSM stands for Last Year Same Month. October LYSM comparison is average of October, 2019 & November, 2019 consumption and is on like to like basis
October 2020 Consumption (% of LYSM on like to like basis)*
Figures in Rs. Mn.
50%50%60%60%53%
• October 2020 consumption was up 44% over September 2020.
• In fact, our newly launched Palassio mall also witnessed 50% MoM improvement in consumption at Rs266 mn withTrading Density of Rs890 in October, 2020.
Consumption in October 2020 up 44% MoM over September 2020

Month Total Area(msf)
Permissible Area(msf)
Area Operational(msf)
Permissible Area Operational (%)
June 2020 5.96 1.35 1.13 84.1%
July 2020 6.90 1.74 1.54 88.8%
August 2020 6.90 4.10 3.66 89.1%
September 2020 6.90 5.05 4.67 92.4%
October 2020 6.90 5.60 4.95 87.7%
November 2020* 6.90 5.69 5.21 91.5%
* As on 07th November, 2020
• All of our malls are now operational from September, 2020 v/s 3 malls in June, 2020.
• Our Area under operation across major malls is at ~92% in October, 2020.
• With multiplexes gradually reopening from November across cities, operational area is set to rise further in Q3
Area Operationalisation Trend since re-opening of malls

1,161 1,177
726 534
291
High Street Phoenix &Palladium
PMC Bangalore PMC Pune PMC Mumbai PMC & Palladium Chennai
57 days 82 days 57 days 57 days 30 days
Please note: Above nos are indicative unaudited numbers and presented for illustration purpose. The actual numbers could be materially different from indicative numbers.
Q2 FY21 Consumption (% of Q2 FY20 – On like to like basis)*
39%47%50%49%
Figures in Rs. Mn.
56%
• Q2FY20 base adjusted to reflect comparable operating days as well non permissible categories such as Multiplexes & F&B.
• Major malls across regions were operational 27-82 days in Q2FY21.
• Consumption as % of Q2FY20 (on like to like basis) was at 40%-55% mainly due to restriction in timing post re-opening of malls inQ2FY21.
• Malls were operating for 60-75% of operational hours in Q2FY21 v/s Q2FY20.
Q2 FY21 – Consumption Trajectory across major malls

559 602
817
Jun-20 Jul-20 Aug-20 Sep-20 Oct-20
Monthly Consumption (Rs Mn)
54%57%
53%
Aug-20 Sep-20 Oct-20
Avg Daily Consumption (% of LYSM)
52%66%
93%
Aug-20 Sep-20 Oct-20
Avg Daily Consumption on Last Weekend of the Month
(% of LYSM)
Consumption at HSP has grown at 36%MoM at Rs 817 million in October 2020
October, 2019 base was high due to bothDussehra & Diwali being in the samemonth.
Adjusting for October 2019 base (averageout October & November 2019 base on liketo like basis), October consumption as % ofLYSM (adjusting for high base due tofestivals) improved to 53% while onweekends it was 93%
**
Mall was shut in the months of June and July. It was
operational for 27 days in August.
Please note Above nos are indicative unaudited numbers and presented for illustration purpose. The actual numbers could be materially different from indicative numbers and all comparison are on like to l ike basis.LYSM stands for Last Year Same Month. *October % is calculated based on average of October, 2019 & November, 2019 consumption
High Street Phoenix & Palladium – Consumption Trajectory

270 251
471 455
652
Jun-20 Jul-20 Aug-20 Sep-20 Oct-20
Monthly Consumption (Rs Mn)
PMC Bangalore was operational for 23 days in June and 21 days
in July
39%42%
50% 52%
60%
Jun-20 Jul-20 Aug-20 Sep-20 Oct-20
Avg Daily Consumption (% of LYSM)
42%
61%71%
86%93%
Jun-20 Jul-20 Aug-20 Sep-20 Oct-20
Avg Daily Consumption on Last Weekend of the Month
(% of LYSM)
Consumption at PMC Bangalore grew 43%MoM at Rs 652 million in October, 2020
October, 2019 base was high due to bothDussehra & Diwali being in the samemonth.
Adjusting for October 2019 base (averageout October & November 2019 base on liketo like basis), October consumption as % ofLYSM (adjusting for high base due tofestivals) improved to 60% while onweekends it was 93%*
*
Please note Above nos are indicative unaudited numbers and presented for illustration purpose. The actual numbers could be materially different from indicative numbers and all comparison are on like to l ike basis.LYSM stands for Last Year Same Month. *October % is calculated based on average of October, 2019 & November, 2019 consumption
Phoenix Marketcity Bangalore – Consumption Trajectory

356 370
605
Jun-20 Jul-20 Aug-20 Sep-20 Oct-20
Monthly Consumption (Rs Mn)
53%48%
60%
Aug-20 Sep-20 Oct-20
Avg Daily Consumption (% of LYSM)
67% 70%
97%
Aug-20 Sep-20 Oct-20
Avg Daily Consumption on Last Weekend of the Month
(% of LYSM)
Pune Mall consumption has grown at 64%MoM at Rs 605 million in October 2020
October, 2019 base was high due to bothDussehra & Diwali being in the samemonth.
Adjusting for October 2019 base (averageout October & November 2019 base on liketo like basis), October consumption as % ofLYSM (adjusting for high base due tofestivals) improved to 60% while onweekends it was 97%*
*
Please note Above nos are indicative unaudited numbers and presented for illustration purpose. The actual numbers could be materially different from indicative numbers and all comparison are on like to l ike basis.LYSM stands for Last Year Same Month. *October % is calculated based on average of October, 2019 & November, 2019 consumption
Mall was shut in the months of June and July
and was operational for 27 days in August.
Phoenix Marketcity Pune – Consumption Trajectory

264 270
404
Jun-20 Jul-20 Aug-20 Sep-20 Oct-20
Monthly Consumption (Rs Mn)
47% 47%50%
Aug-20 Sep-20 Oct-20
Avg Daily Consumption (% of LYSM)
58%66%
73%
Aug-20 Sep-20 Oct-20
Avg Daily Consumption on Last Weekend of the Month
(% of LYSM)
Consumption at PMC Mumbvai has grownat 50% MoM at Rs 404 million in October2020
October, 2019 base was high due to bothDussehra & Diwali being in the samemonth.
Adjusting for October 2019 base (averageout October & November 2019 base on liketo like basis), October consumption as % ofLYSM (adjusting for high base due tofestivals) improved to 50% while onweekends it was 73%
*
*
Please note Above nos are indicative unaudited numbers and presented for illustration purpose. The actual numbers could be materially different from indicative numbers and all comparison are on like to l ike basis.LYSM stands for Last Year Same Month. *October % is calculated based on average of October, 2019 & November, 2019 consumption
Mall was shut in the months of June and July
and was operational for 27 days in August.
Phoenix Marketcity Mumbai – Consumption Trajectory

291
379
Jun-20 Jul-20 Aug-20 Sep-20 Oct-20
Monthly Consumption (Rs Mn)
39%
50%
Sep-20 Oct-20
Avg Daily Consumption (% of LYSM)
45%
81%
Sep-20 Oct-20
Avg Daily Consumption on Last Weekend of the Month
(% of LYSM)
PMC Chennai + Palladium consumption hasgrown at 30% MoM at Rs 379 million inOctober 2020
October, 2019 base was high due to bothDussehra & Diwali being in the samemonth.
Adjusting for October 2019 base (averageout October & November 2019 base on liketo like basis), October consumption as % ofLYSM (adjusting for high base due tofestivals) improved to 50% while onweekends it was 81%
*
*
Mall was shut in the months of June, July and August
Please note Above nos are indicative unaudited numbers and presented for illustration purpose. The actual numbers could be materially different from indicative numbers and all comparison are on like to l ike basis.LYSM stands for Last Year Same Month. *October % is calculated based on average of October, 2019 & November, 2019 consumption
Phoenix Marketcity & Palladium Chennai – Consumption Trajectory
44
111
178
266
Jul-20 Aug-20 Sep-20 Oct-20
Monthly Consumption (Rs Mn)
Consumption at Phoenix Palassio, hasgrown at 50% MoM to Rs 266 million inOctober 2020
Currently 57% of GLA at Phoenix Palassio istrading and operational
Within 4 months of launch, Trading Densityhas reached Rs890 psft pm in October,2020
Since launch, there are 136 Brands thathave opened stores in Phoenix Palassio;currently 38 additional stores are under fitout.
Please note Above nos are indicative unaudited numbers and presented for illustration purpose. The actual numbers could be ma terially different from indicative numbers.
174
399
631
890
Jul-20 Aug-20 Sep-20 Oct-20
Trading Density
Phoenix Palassio Lucknow – Consumption Trajectory

Business UpdateBusiness Performance - RetailFinancial ResultsAnnexure

High Street Phoenix & Palladium
17
(Rs Mn) Q2 FY21 Q2 FY20% of Q2
FY20H1 FY21 H1 FY20
% of H1 FY20
Rental 334 879 38% 678 1,760 39%
CAM & Others
115 252 46% 173 504 34%
Total Income 449 1,131 40% 851 2,264 38%
Asset EBITDA 236 767 639 1,547
EBIDTA Margin as % of Rental
71% 87% 94% 88%
SPV EBITDA 204 665 31% 475 1,365 35%
Note: The Rental income also includes income generated from Commercial assets owned by PML

Income Split for PML (Standalone Entity)
18
(Rs Mn) Project Name Q2 FY20 Q3 FY20 Q4 FY20 FY20 Q1 FY21 Q2 FY21
Commercial Asset
Phoenix House 33 34 35 150 32 31
Centrium 20 19 16 75 14 9
Art Guild House 54 56 57 212 54 65
Total 107 109 108 437 100 105
Retail Asset High Street Phoenix 772 837 672 3,050 244 229
Total Rental Income reported by PML Standalone
879 946 780 3,486 344 334
PML (Standalone entity) owns the following assets:
• Retail – High Street Phoenix & Palladium: Leasable area of 0.77 msf
• Phoenix House: Leasable area of 0.10 msf
• Centrium: Leasable area of 0.12 msf
• Art Guild House: Leasable area of 0.16 msf

Phoenix Marketcity Bangalore
19
(Rs Mn) Q2 FY21 Q2 FY20% of Q2
FY20H1 FY21 H1 FY20
% of H1 FY20
Rental 128 360 36% 248 719 34%
CAM & Others
107 183 59% 179 367 49%
Total Income 235 543 43% 427 1,086 39%
EBIDTA 148 373 40% 283 758 37%
EBIDTA Margin as % of Rental
115% 104% 114% 105%

Phoenix Marketcity Pune
20
(Rs Mn) Q2 FY21 Q2 FY20% of Q2
FY20H1 FY21 H1 FY20
% of H1 FY20
Rental 136 427 32% 261 859 30%
CAM & Others
98 200 49% 145 406 36%
Total Income 235 627 37% 407 1,265 32%
EBIDTA 138 436 32% 256 876 29%
EBIDTA Margin as % of Rental
101% 102% 98% 102%

Phoenix Marketcity Mumbai
21
(Rs Mn) Q2 FY21 Q2 FY20% of Q2
FY20H1 FY21 H1 FY20
% of H1 FY20
Rental 87 320 27% 174 644 27%
CAM & Others
98 221 44% 151 402 37%
Total Income 185 542 34% 324 1,046 31%
EBIDTA 96 332 29% 174 654 27%
EBIDTA Margin as % of Rental
110% 103% 100% 102%

Phoenix Marketcity & Palladium Chennai
22
(Rs Mn) Q2 FY21 Q2 FY20% of Q2
FY20H1 FY21 H1 FY20
% of H1 FY20
Rental 74 475 16% 208 942 22%
CAM & Others
88 220 40% 145 455 32%
Total Income 161 695 23% 352 1,397 25%
EBIDTA 64 440 15% 189 936 20%
EBIDTA Margin as % of Rental
87% 93% 91% 99%

Phoenix Palassio, Lucknow
23
(Rs Mn) Q2 FY21
Rental 37
CAM & Others 60
Total Income 97
EBIDTA 37
EBIDTA Margin as % of Rental
100%
Phoenix Palassio became operational on 8th of July 2020. Hence, prior period numbers are not applicable

Phoenix United, Lucknow
24
(Rs Mn) Q2 FY21 Q2 FY20% of Q2
FY20H1 FY21 H1 FY20
% of H1 FY20
Rental 37 79 48% 59 156 38%
CAM & Others
29 53 55% 58 102 57%
Total Income 67 132 51% 117 258 45%
EBIDTA 25 74 34% 52 146 36%
EBIDTA Margin as % of Rental
68% 94% 88% 94%

Phoenix United, Bareilly
25
(Rs Mn) Q2 FY21 Q2 FY20% of Q2
FY20H1 FY21 H1 FY20
% of H1 FY20
Rental 28 55 51% 40 111 36%
CAM & Others
33 44 76% 59 87 68%
Total Income 61 98 62% 99 198 50%
EBIDTA 33 47 70% 50 107 47%
EBIDTA Margin as % of Rental
117% 86% 125% 96%

Update on under-construction Assets
26
PMC Wakad PMC Hebbal PMC IndorePalladium,
Ahmedabad
Proposed Retail GLA Retail GLA - 1.1 msfOffice GLA – 0.6 msf
Retail GLA - 1.2 msfOffice GLA – 1.2 msf
Retail GLA – 1 msf Retail GLA – 0.7 msf
Equity invested till Sept 2020
Rs. 4,857 mn Rs. 8,616 mn Rs. 3,325 mn Rs. 4,825 mn
Status update
Development Risks LOW LOW LOW LOW
27

Brownfield Acquisition
28
Phoenix Palassio• Possession in August 2018• Completed construction and opened to public
in less than 24 months

Phoenix Palassio, Lucknow – West Entrance with Spectacular Musical Fountain
29
0.90 msft
Total Leasable Area
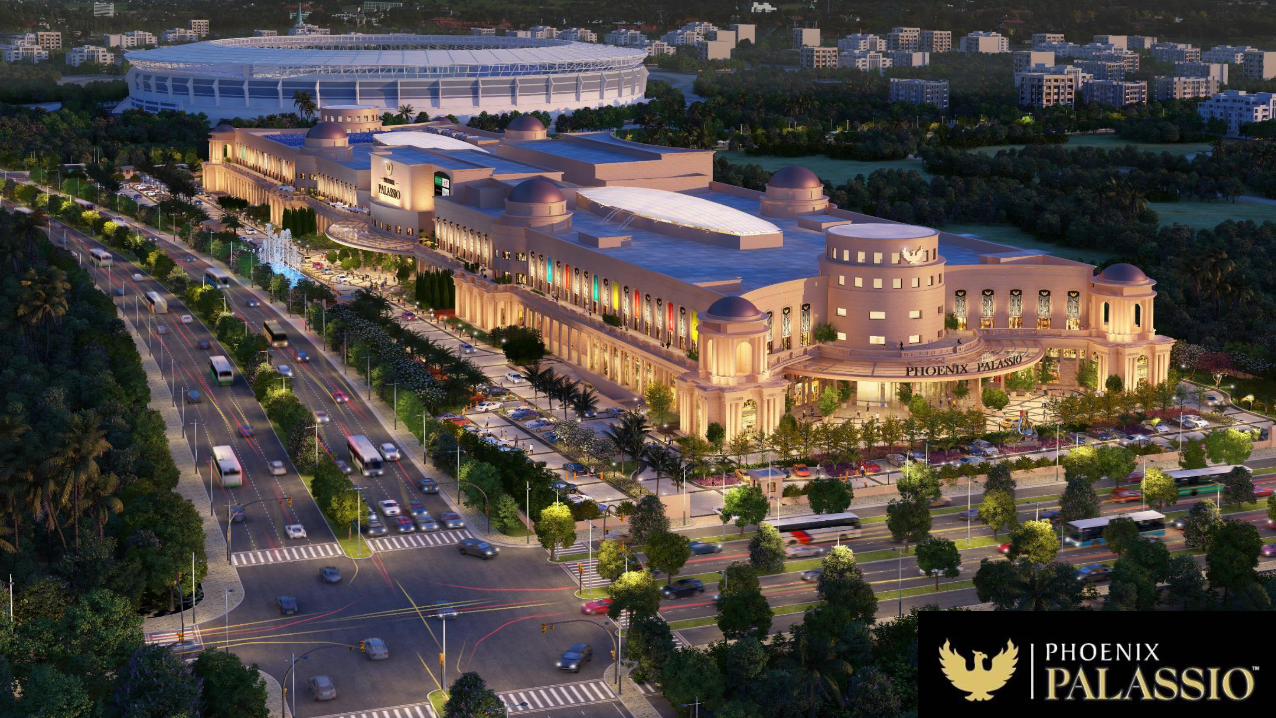
Expansive Spaces…Opulent Interiors…breathtaking Chandeliers
30

Festive Decor
31

State of Art Multiplex now operational
32
Palladium Ahmedabad
33Indicative Render
The Luxury mall of Gujarat

Phoenix Millennium Pune
34
The New Epicentre for West Pune
Indicative Render

Concept Architect – Callison
Mall of Asia, Bangalore
35
The Largest Retail led Mixed-use development in Bangalore
Indicative Render

Phoenix Citadel Indore
36
The biggest Retail Destination of Madhya Pradesh
Indicative Render

Phoenix Citadel – Opulent Grand Arrivals, Venetian Chandeliers & Murano glasswork
37Indicative Render
Indicative Render Indicative Render

Business UpdateBusiness Performance - HospitalityFinancial ResultsAnnexure
Palladium, Chennai

Q2 FY21 Q2 FY20% of Q2
FY20H1 FY21 H1 FY20
% of H1 FY20
Revenue from Rooms (Rs. mn)
60 304 36% 109 622 18%
Revenue from F&B and Banqueting (Rs. mn)
24 311 11% 34 626 5%
Other Operating Income (Rs. mn)
16 61 60% 36 125 29%
Total Income (Rs. mn)
99 675 27% 180 1,373 13%
Operating EBITDA(Rs. mn)
-33 237 -74 491
EBITDA margins 36% 36%
Occupancy (%) 24% 77% 20% 79%
ARR (Rs.) 6,480 11,006 59% 7,451 10,959 68%
The St. Regis, Mumbai
39

Q2 FY21 Q2 FY20 H1 FY21 H1 FY20
Revenue from Rooms(Rs. mn)
3 35 3 72
Revenue from F&B and Banqueting (Rs. mn)
3 27 3 61
Other Operating Income(Rs.mn)
0 4 0 8
Total Income (Rs. mn) 6 66 6 141
Occupancy (%) 7.7% 61% 7.7% 62%
ARR (Rs.) 3,663 3,309 3,663 3,332
Courtyard by Marriott, Agra
40Hotel operations were shut since march and re-opened on 8th Aug 2020. Hence, numbers are not comparable with previous year

Business UpdateBusiness Performance - CommercialFinancial ResultsAnnexure
Phoenix Marketcity, Pune

Project Name
Total Area (msf)
Area Sold (msf)
Net Leasable Area (msf)
Area Leased (msf)
Phoenix House 0.09 - 0.09 0.08
Centrium 0.28 0.16 0.12#
0.08
Art Guild House 0.80 0.17@
0.63@
0.54
Phoenix Paragon Plaza 0.43 0.12 0.31 0.16
Fountainhead – Tower 1
0.17 0.00 0.17 0.16
Total 1.79 0.46 1.33 1.02
@Total Area sold is 0.38 msf out of which PML owns 0.17 msf – this area is also counted in area available for lease^Rental Income from Phoenix House is part of Standalone results #Area owned by PML
Our Annuity Income Generating Commercial Portfolio
42
OPERATIONAL OFFICE PORTFOLIO (1.79 MSF)
OFFICE PORTFOLIO UNDER DEVELOPMENT (1.08 MSF)
OFFICE PORTFOLIO ( 1.08 MSF)
Fountainhead –Tower 2 & 3
Pune 0.66
Phoenix MarketCity Chennai 0.42
Total 1.08

Total Area (msf)
Area Sold (msf)
Net Leasable
Area (msf)
Area Leased (msf)
Average Rate
(Rs./sq.ft)
Art Guild House
0.80 0.17@
0.63@
0.54 106
@Total Area sold is 0.38 msf out of which PML owns 0.17 msf – this area is also counted in area available for lease
Art Guild House has leased 85% of area as of June 2020
Operational Update – Art Guild House
43
Q2 FY21 Q2 FY20 H1FY21 H1FY20
Total Income (Rs. mn)
134 156 290 304
EBITDA (Rs. mn)
93 89 219 167
EBITDA as % ofTotal Income
69% 57% 75% 55%

Total Area (msf)
Area Sold (msf)
Net Leasable
Area (msf)
Area Leased (msf)
Average Rate
(Rs./sq.ft)
Phoenix Paragon Plaza
0.43 0.12 0.31 0.16 108
Operational Update – Phoenix Paragon Plaza
44
Q2 FY21 Q2 FY20 H1FY21 H1FY20
Total Income (Rs. mn)
81 72 165 144
EBITDA (Rs. mn)
66 41 139 85
EBITDA as % ofTotal Income
81% 57% 84% 59%

Total Area (msf)
Area Sold (msf)
Net Leasable
Area (msf)
Area Leased (msf)
Average Rate
(Rs./sq.ft)
Fountainhead –Tower 1
0.17 0.00 0.17 0.16 86
Fountainhead –Tower 2
0.66Part of Commercial Portfolio under
Development – Tower 2 & Tower 3 are currently under development
Fountainhead –Tower 3
Operational Update – Fountainhead Towers 1, 2 & 3
45
Q2 FY21 Q2 FY20 H1FY21 H1FY20
Total Income (Rs. mn)
42 35 82 65
EBITDA (Rs. mn)
35 27 70 49
EBITDA as % ofTotal Income
84% 77% 85% 75%

Offices Fountainhead Tower 3
~0.40 msft
Existing Mall (LG + G + 3)
Offices Fountainhead Tower 2
~0.25 msft
Offices Fountainhead Tower 1
~0.17 msft
Growth by Densification

Fountainhead Pune – Premium Office Spaces
47
Fountainhead Pune Remarks
Tower 1 95% area leased and operational
Tower 2 OC received on 6th October 2020
Tower 3 4 months away from completion

Fountainhead Pune – Tower 2 and Tower 3 Construction Status
48
Tower 2 – Construction Completed, OC Received
Tower 3 – East Side Façade WIP

Business UpdateBusiness Performance - ResidentialFinancial ResultsAnnexure
Phoenix Marketcity, Mumbai
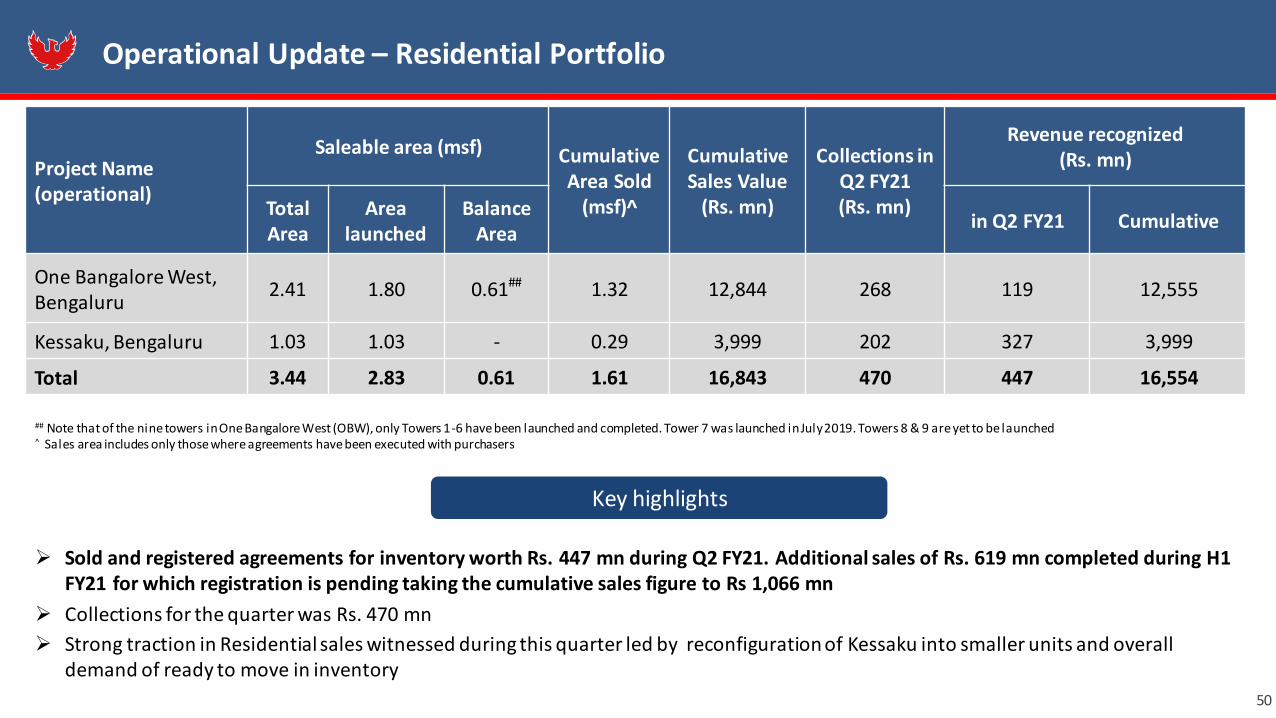
Operational Update – Residential Portfolio
50
## Note that of the nine towers in One Bangalore West (OBW), only Towers 1-6 have been launched and completed. Tower 7 was launched in July 2019. Towers 8 & 9 are yet to be launched ^ Sales area includes only those where agreements have been executed with purchasers
Project Name (operational)
Saleable area (msf) Cumulative Area Sold
(msf)^
Cumulative Sales Value
(Rs. mn)
Collections in Q2 FY21 (Rs. mn)
Revenue recognized (Rs. mn)
Total Area
Area launched
Balance Area
in Q2 FY21 Cumulative
One Bangalore West, Bengaluru
2.41 1.80 0.61## 1.32 12,844 268 119 12,555
Kessaku, Bengaluru 1.03 1.03 - 0.29 3,999 202 327 3,999
Total 3.44 2.83 0.61 1.61 16,843 470 447 16,554
Sold and registered agreements for inventory worth Rs. 447 mn during Q2 FY21. Additional sales of Rs. 619 mn completed during H1FY21 for which registration is pending taking the cumulative sales figure to Rs 1,066 mn
Collections for the quarter was Rs. 470 mn
Strong traction in Residential sales witnessed during this quarter led by reconfiguration of Kessaku into smaller units and overalldemand of ready to move in inventory
Key highlights

Kessaku – Choices Galore for Customers
51
Layout Options
3.5 & 4 BHK HOMES 3 & 4.5 BHK HOMES
Reconfiguration of units in Faia and Zefa (3 to 4.5 BHK’sfrom the earlier 6 to 8 BHK’s) provide discerning customersan even larger plethora of unit sizes and finishing options tochoose from

Kessaku – Choices Galore for Customers
52
BARESHELL Blockwork + Electrical Conduiting + Façade
HEAVENLY TOILET Bareshell+ Beautifully full fitted toilets with world class fittings
LUXURIOUS Marble flooring in Living, Dining + laminated wooden flooring in Bedrooms
MASTERPIECE Heavenly Toilet + Luxurious
GLORIOUS Masterpiece + Wallpaper in Living + 1 Master Suite
• Kessaku offers its customers bespoke options to customize their apartments• Getting a wide array of Fit-out & Layout options to choose from is well appreciated by the discerning
customers translating into quicker conversion of sales
Fit-out Options
Faia & Zefa offers configurations starting from 3.5 BHKs making the product unique for customers aspiring luxurious living spaces.

One Bangalore West, Bangalore
53Actual Site Picture

Kessaku, Bangalore
54Actual Site Picture

Business UpdateBusiness PerformanceFinancial ResultsAnnexure
Phoenix Marketcity, Mumbai

(Rs. mn) Q2 FY21 Q2 FY20% of Q1
FY20 H1 FY21 H1 FY20
% of H1 FY20
FY2020
Income from operations 449 1,131 40% 851 2,264 38% 4,444
EBITDA 204 665 31% 473 1,365 35% 2,592
EBITDA Margin (%) 46% 59% 56% 60% 58%
Profit Before Tax and exceptional item 10 658 2% 18 1,116 2% 1,796
Profit after tax & before comprehensive income
7 587 1% 15 943 2% 1476
Diluted EPS (Rs.) 0.05 3.82 1% 0.09 6.13 2% 9.60
Q2 & H1 FY21 Standalone P&L
56
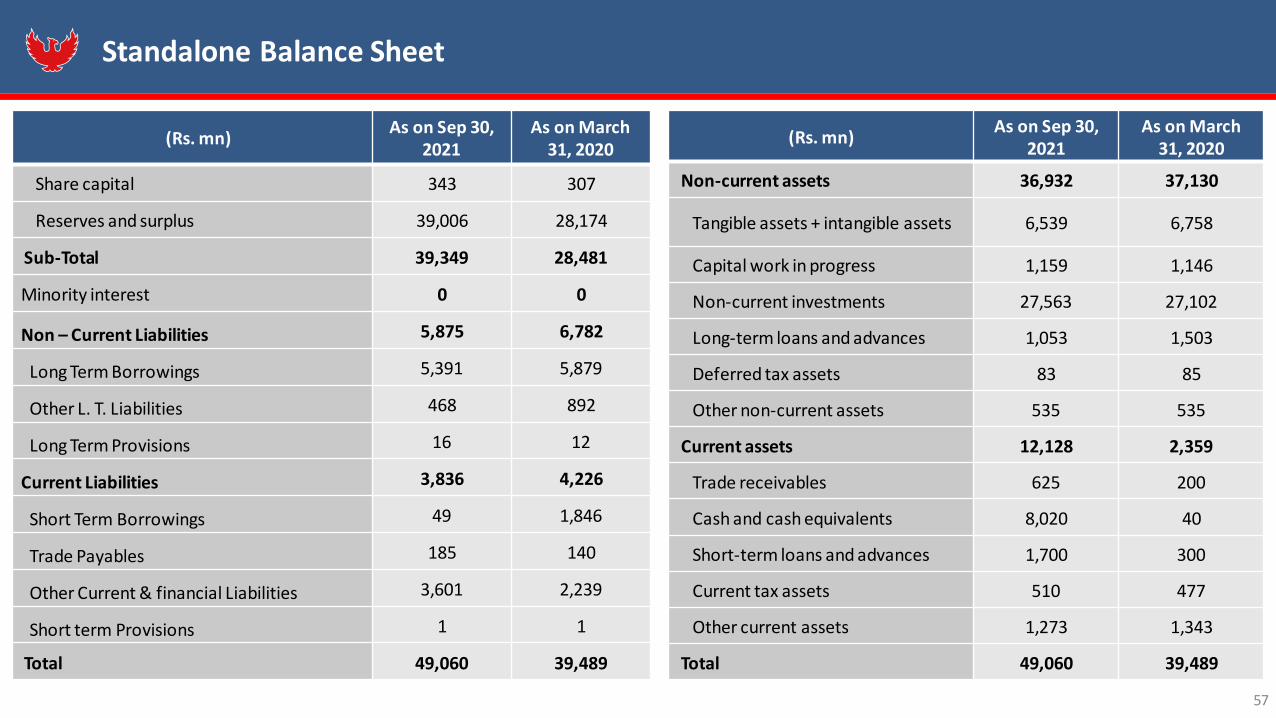
(Rs. mn)As on Sep 30,
2021As on March
31, 2020
Non-current assets 36,932 37,130
Tangible assets + intangible assets 6,539 6,758
Capital work in progress 1,159 1,146
Non-current investments 27,563 27,102
Long-term loans and advances 1,053 1,503
Deferred tax assets 83 85
Other non-current assets 535 535
Current assets 12,128 2,359
Trade receivables 625 200
Cash and cash equivalents 8,020 40
Short-term loans and advances 1,700 300
Current tax assets 510 477
Other current assets 1,273 1,343
Total 49,060 39,489
57
(Rs. mn) As on Sep 30,
2021As on March
31, 2020
Share capital 343 307
Reserves and surplus 39,006 28,174
Sub-Total 39,349 28,481
Minority interest 0 0
Non – Current Liabilities 5,875 6,782
Long Term Borrowings 5,391 5,879
Other L. T. Liabilities 468 892
Long Term Provisions 16 12
Current Liabilities 3,836 4,226
Short Term Borrowings 49 1,846
Trade Payables 185 140
Other Current & financial Liabilities 3,601 2,239
Short term Provisions 1 1
Total 49,060 39,489
Standalone Balance Sheet

(Rs. mn) Q2 FY21 Q2 FY20% of Q2
FY20H1 FY21 H1 FY20
% of H1FY20
FY2020
Income from operations 2,149 4,151 52% 3,496 10,301 34% 19,411
Retail 1,361 3,024 45% 2,387 6,070 39% 11,993
Residential 447 112 399% 447 2,183 20% 2,794
Commercial 248 264 94% 473 514 92% 1,138
Hospitality & Others 92 751 12% 188 1,534 12% 3,486
EBITDA 917 2,107 44% 1,619 5,034 32% 9,671
EBITDA Margin (%) 43% 51% 46% 49% 50%
Profit after tax -400 642 -905 2,111 3,559
PAT after minority interest & before other comprehensive income
-359 657 - -783 1,961 - 3,347
PAT after minority interest & after other comprehensive income
-351 655 - -713 1,732 - 2,826
Diluted EPS (Rs.) -2.21 4.27 - -4.97 12.75 - 21.77
Q2 & H1 FY21 Consolidated P&L
58

(Rs. mn) As on Sep 30,
2020As on March
31, 2020(Rs. mn)
As on Sep 30, 2021
As on March31, 2020
Share capital 343 307 Non-current assets 88,943 88,111
Reserves and surplus 46,879 36,777 Tangible assets 65,482 60,795
Intangible Assets (including Goodwill) 3,729 3,732
Sub-Total 47,221 37,084 Capital work in progress 11,113 15,341
Minority interest 13,118 12,788 Non-current investments 4,355 4,280
Non-current liabilities 34,342 36,215 Long-term loans and advances 163 121
Long-term borrowings 32,773 34,053 Deferred tax assets 676 612
Other long-term borrowings 1,438 2,033 Other non-current assets 3,425 3,229
Long-term provisions 131 129 Current assets 25,170 17,363
Current Liabilities 19,431 19,387 Trade receivables 3,099 2,017
Short-term borrowings 4,622 7,022 Cash and cash equivalents 10,528 3,024
Trade payables 1,022 1,103 Short-term loans and advances 131 97
Other current liabilities 13,091 10,600 Current tax assets 1,065 1,431
Short-term provisions 696 661 Other current assets 10,347 10,794
Total 1,14,114 1,05,474 Total 1,14,114 1,05,474
59
Consolidated Balance Sheet

Status Asset Class Amount (Rs. mn)
Operational
Retail 35,521
Hospitality 4,956
Commercial 2,430
Residential 1,037
Sub-total (A) 43,945
Under-development
Retail 100
Commercial 660
Sub-total (B) 760
Grand Total (A+B) 44,705
Debt Profile as on 30th September 2020
60
Average cost of debt down to 8.88% in Q2FY21 from 9.14%; further downward repricingexpected in Dec & Jan
Lowest rate on borrowing stands at 7.5%
96% of Debt is long-term. Debt on theoperational portfolio is primarily lease-rentaldiscounting for retail and commercial orbacked by steady Hotel revenues
11.8%
11.0%
10.2%
8.94%9.38%
9.19% 9.14%8.88%
Mar
-15
Mar
-16
Mar
-17
Mar
-18
Mar
-19
Mar
-20
Jun-
20
Sep
-20
Effective cost of debt (%)

61
Fund Raising has further strengthened PML’s balance sheet
Rs. 7,480 mn
Net Cash Position
June 2020
Rs. 475 mnCash generated despite
properties being shut during the lock-down
July – August 2020
Rs. 10,890 mn
Successfully raised through QIP
August 2020
Rs. 18,505 mn
Group Liquidity
30 September 2020
Strong Cash Position despite lockdown; QIP proceeds improved Group liquidity
QIP Proceeds
War Chest for AcquisitionsSafety Net

Business UpdateBusiness PerformanceFinancial ResultsAnnexure
Palladium Chennai

Q2 FY21 Debt Across Subsidiaries
63
Operational
Under Development
Asset Type SPV Asset Name PML OwnershipQ1 FY21 Debt
(Rs. Mn)Q2 FY21 (Rs. Mn.)
Retail & Mixed-Use
PML Standalone High Street Phoenix, Mumbai 100% 8,316 6,835
Classic Mall DevelopmentPhoenix MarketCity, Chennai
50% 7,379 7,567The Crest C (Residential)
Vamona DevelopersPhoenix MarketCity, Pune
100% 6,474 5,568East Court (Commercial)
Island Star Mall Developers
Phoenix MarketCity, Bangalore 51% 3,891 3,486
Offbeat Developers
Phoenix MarketCity, Mumbai
100% 6,876 6,304Art Guild House (Commercial)
Centrium (Commercial)
Blackwood Developers Phoenix United, Bareilly 100% 969 933
UPAL Developers Phoenix United, Lucknow 100% 759 705
Graceworks Realty & Leisure
Phoenix Paragon Plaza (Commercial) 67% 1,075 1,117
Destiny Hospitality Phoenix Palassio, Lucknow 100% 5,161 5,437
Hotel & Residential
Palladium ConstructionsOne Bangalore West & Kessaku (Residential)Courtyard by Marriott, Agra (Hotel)
80% 1,633 1,587
Pallazzio Hotels & Leisure The St. Regis, Mumbai 73% 4,329 4,406
Office Alliance Spaces Fountainhead 75% 621 660
Retail SGH Realty LLP Palladium, Ahmedabad 50% 5 100Total Total 47,489 44,705

Sr. No Top Institutional Investors % Shareholding
1 SCHRODER 6.11%
2 GIC 4.33%
3 ICICI PRUDENTIAL AMC 2.72%
4 TT FUNDS 2.59%
5 FIDELITY 1.80%
6 ADITYA BIRLA SUNLIFE MF 1.69%
7 UTI 1.69%
8 MOTILAL OSWAL 1.64%
9 DSP MF 1.52%
10 INVESCO MF 1.39%
11 VANGUARD 1.39%
Total – Top 11 Institutional Investors
26.87%
Shareholding Pattern
45.56%
33.87%
15.77%
3.01% 1.79%
Promoters FII DII Public Corporate bodies
Shareholding Pattern as on 30th Sept 2020
64

July 20 Aug 20 Aug 20 Sep 20 Oct 20
• Three malls – PMCBangalore, PU Lucknow andPU Bareilly re-opened.
• Area permitted to open wasat ~61% among three mallsand timing were restricted at11am to 7 pm
• Opening of F&B andtiming for PMCBextended to 10 am to 10pm for Retailers and 12pm for F&B
• Phoenix Palassio launched on 08th July,• Malls operating with significant restrictions• PMC Bangalore – operational for 21 days in
July• Phoenix Palassio – operational for 18 days
in July• PU Lucknow & Bareilly malls – operational
for 25 days in July
• PMC & Palladium Chennai
re-opened.
• Area permitted to openwas at ~83% among threemalls and timing wererestricted at 10 am to
8pm
• F&B, Restaurants & Food courtsresumed in HSP, PMC Pune & Mumbaiwith extended timing from 9 am to9.30 pm for Retailer and 11.30 pm forF&B.
• Central government came out withguidelines for opening of Multiplexes.State govt to follow suit.
June 20
• Malls in Maharashtra ie
HSP, PMC Mumbai & Punere-opened
• Area permitted to open
was at ~72% among threemalls and timing wererestricted at 9am to 7 pm
• In late October, timing for
PMC & Palladium,Chennai revised to 11mto 10pm (weekday) & 10am to 10 om (weekends)
Re-opening of malls: timeline of key events

Varun ParwalContact: +91 22 3001 6800Email: [email protected]
Rohan Rege / Bijay SharmaContact: +91 22 6169 5988Email: [email protected]
Website: https://www.thephoenixmills.com/investors
66
Advait PhatarfodContact: +91 75069 35707Email: [email protected]
Deepak Purswani, CFAContact: +91 99204 35178Email: [email protected]
Thank you