Andorka Rudolf-Bukodi Erzsébet-Harcsa István: Társadalmi ...
Upload
khangminh22Category
view
0download
0
Szent István UniversityPostgraduate School of Veterinary Science
Clinical endocrinology of leptin in ruminants
Ph.D. dissertation
Written byMargit Kulcsár
Supervisor: � Prof. Péter Rudas
2007
Szent István EgyetemÁllatorvos-tudományi Doktori Iskola
Az értekezés az egyéni tanrendu felkészülo Kulcsár Margit dr. tud. munkatársnak (SzIE Állatorvos-tudományi Kar, Szülészeti és Szaporodásbiológiai Tanszék) a 1996 – 2005 között végzett kísérleti munkái, illetve az ezek nyomán készült, 2005. aug. 31-ig közlésre beküldött publikációi alapján készült, angol nyelven, magyar és angol nyelvu összefoglalással.
A jelölt témavezetoje: � Prof. Dr. Péter Rudas, DScTémabizottsági tag: Prof. Dr. Szabó József, DSc
Az értekezés címe: Clinical endocrinology of leptin in ruminants
Az értekezés a Prof. Solti László elnökletével 2007. ápr. 13-án tartott munkahelyi vita nyomán nyerte el végleges formáját.
Nyolc példányban került kinyomtatásra és benyújtásra. Ez a ___. példány.
Budapest, 2007. ápr. 15.
____________________Kulcsár Margit dr.
tud. munkatársegyéni tanrendu felkészülo
____________________Dr. Solti László
DSc, az MTA levelezo tagjatv. egyet. tanár
3
ContentList of abbreviationsConversion of traditional and SI unitsÖsszefoglalás 1Summary 31. Introduction 52. Aims 73. Physiological aspects of clinical application: a review of literature 8
3.1. Leptin: the “voice of adipocytes” 83.2. Leptin in the circulation 103.3. Factors modifying the circulating leptin level 133.4. Regulation of leptin production 163.5. The regulatory role of leptin 17
3.5.1. Leptin and the hypothalamus-hypophysis axis 183.5.2. Leptin and energy homeostasis 193.5.3. Leptin and reproduction 20
3.6. Leptin in pregnancy and lactation 233.7. Leptin in pathology of viral and prion-associated diseases 263.8. Leptin and the inflammation-challenged cytokine-endocrine cascade 263.9. Leptin in the current production- reproduction- and clinical-oriented research 31
4. Materials and methods 324.1. Animal experimentation. Farm conditions 324.2. Collection, preparation and storage of samples 334.3. Laboratory procedures 34
4.3.1. Radioimmunoassay for leptin 344.3.2. Other locally developed endocrine assay procedures 39
4.4. Statistics 415. Studies 42
5.1. Biological validation of the leptin assay (Exp. 1a, 1b, 1c, 1d and 1e) 425.2. Influence of pregnancy stage and number of fetuses on maternal plasma leptin in
ewes (Exp. 2)49
5.3. Plasma leptin levels of normo- and hyperketonaemic late-pregnant ewes(Exp. 3)
55
5.4. Plasma leptin and ovarian function in postpartum dairy cows (Exp. 4a andExp. 4b)
64
5.5. Plasma leptin levels in normo- and hyperketonaemic dairy cows during the peri-parturient period (Exp. 5a and 5b)
83
5.6. Effects of fat supplementation in postpartum dairy cows (Exp. 6) 915.7. Effects of inflammatory diseases with intensive endotoxin / cytokine release:
postpartum mastitis (Exp. 7a, Exp. 7b) and puerperal metritis (Exp. 7c)95
6. New scientific results 1117. References 112Suppl. 1: The candidate’s publications related to the present dissertation 135Suppl. 2: Further leptin-related publications of the candidate 137Acknowledgement 138
4
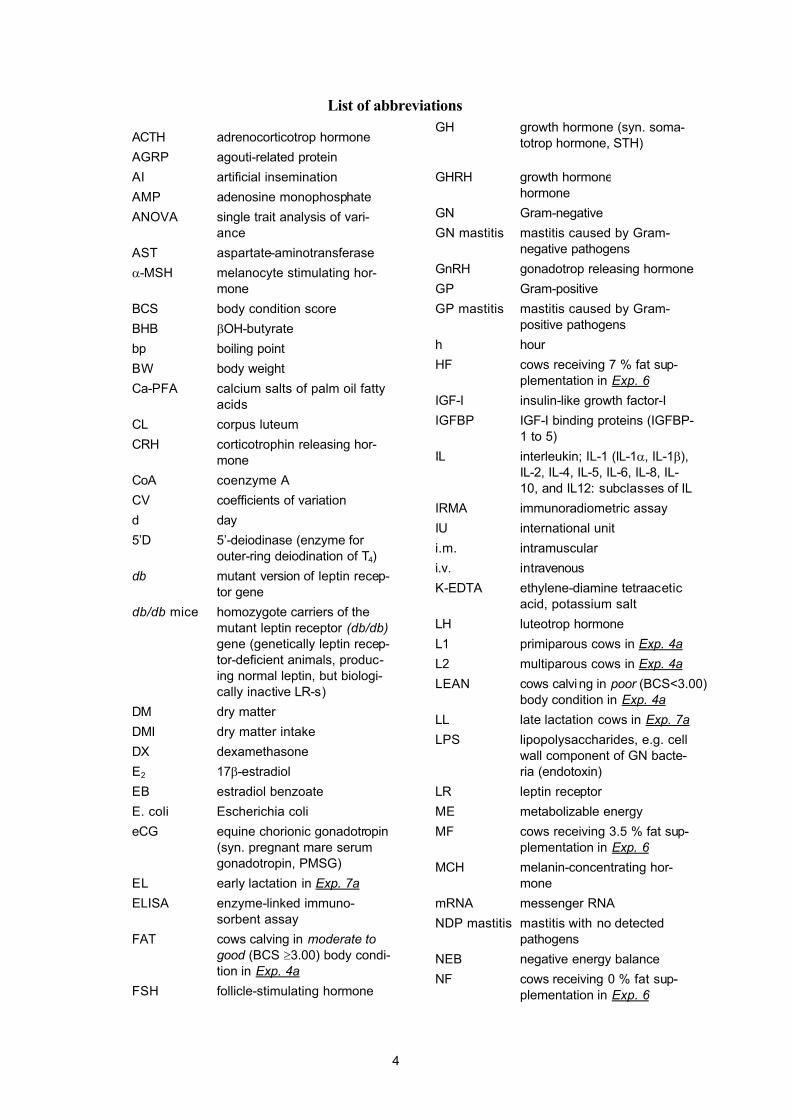
List of abbreviations
ACTH adrenocorticotrop hormone
AGRP agouti-related protein
AI artificial insemination
AMP adenosine monophosphate
ANOVA single trait analysis of vari-ance
AST aspartate-aminotransferase
α-MSH melanocyte stimulating hor-mone
BCS body condition score
BHB βOH-butyrate
bp boiling point
BW body weight
Ca-PFA calcium salts of palm oil fatty acids
CL corpus luteum
CRH corticotrophin releasing hor-mone
CoA coenzyme A
CV coefficients of variation
d day
5’D 5’-deiodinase (enzyme for outer-ring deiodination of T4)
db mutant version of leptin recep-tor gene
db/db mice homozygote carriers of the mutant leptin receptor (db/db)
gene (genetically leptin recep-tor-deficient animals, produc-ing normal leptin, but biologi-cally inactive LR-s)
DM dry matter
DMI dry matter intake
DX dexamethasone
E2 17β-estradiol
EB estradiol benzoate
E. coli Escherichia coli
eCG equine chorionic gonadotropin(syn. pregnant mare serum gonadotropin, PMSG)
EL early lactation in Exp. 7a
ELISA enzyme-linked immuno-sorbent assay
FAT cows calving in moderate to
good (BCS ≥3.00) body condi-tion in Exp. 4a
FSH follicle-stimulating hormone
GH growth hormone (syn. soma-totrop hormone, STH)
GHRH growth hormone releasinghormone
GN Gram-negative
GN mastitis mastitis caused by Gram-negative pathogens
GnRH gonadotrop releasing hormone
GP Gram-positive
GP mastitis mastitis caused by Gram-positive pathogens
h hour
HF cows receiving 7 % fat sup-plementation in Exp. 6
IGF-I insulin-like growth factor-I
IGFBP IGF-I binding proteins (IGFBP-1 to 5)
IL interleukin; IL-1 (IL-1α, IL-1β),IL-2, IL-4, IL-5, IL-6, IL-8, IL-10, and IL12: subclasses of IL
IRMA immunoradiometric assay
IU international unit
i.m. intramuscular
i.v. intravenous
K-EDTA ethylene-diamine tetraaceticacid, potassium salt
LH luteotrop hormone
L1 primiparous cows in Exp. 4a
L2 multiparous cows in Exp. 4a
LEAN cows calving in poor (BCS<3.00) body condition in Exp. 4a
LL late lactation cows in Exp. 7a
LPS lipopolysaccharides, e.g. cell wall component of GN bacte-ria (endotoxin)
LR leptin receptor
ME metabolizable energy
MF cows receiving 3.5 % fat sup-plementation in Exp. 6
MCH melanin-concentrating hor-mone
mRNA messenger RNA
NDP mastitis mastitis with no detected pathogens
NEB negative energy balance
NF cows receiving 0 % fat sup-plementation in Exp. 6
5
NEFA non-esterified fatty acids(syn.: free fatty acids, FFA)
NPY neuropeptide Y
ob obese gene
ob/ob mice homozygote carriers of the mutant “obese (ob) gene” (ge-netically leptin-deficient ani-mals, producing biologically inactive leptin, but normal LR-s)
P4 progesterone
P4-met fecal P4 metabolite
PMm puerperal metritis, mild form (rectal temperature <40.5 oC)
PMS puerperal metritis, severe, toxic form (at least once be-tween d 3 and 15: rectal tem-perature >40.5 oC, with simul-taneous anorexia)
PC post challenge (e.g. time elapsed since endotoxin chal-lenge)
POMC proopio-melanocortin
pp postpartum
rbleptin recombinant bovine leptin
rhleptin recombinant human leptin
roleptin recombinant ovine leptin
rbTNF-α recombinant bovine tumor necrosis factor-α
RIA radioimmuno assay (3H-RIA,125I-RIA: 3H- or 125I-labelled ver-sion of this assay)
RP rectal palpation
rT3 reverse-triiodothyronine(3,3',5'-triiodothyronine)
S. aureus Staphylococcus aureus
SCC somatic cell count
SD standard deviation
SEM standard error of the mean
SOCS cytokine signaling proteins
Str. Streptococcus
T3 triiodothyronine(3,3',5-triiodothyronine)
T4 thyroxine
TCH total cholesterol
TNF-α tumor necrosis factor-α
TMR total mixed ration
TRH thyrotropin releasing hormone
TRIS tris-(hydroxymethyl)-aminomethane base
TSH thyroid stimulating hormone
wk week
vs. versus
WAT white adipose tissue
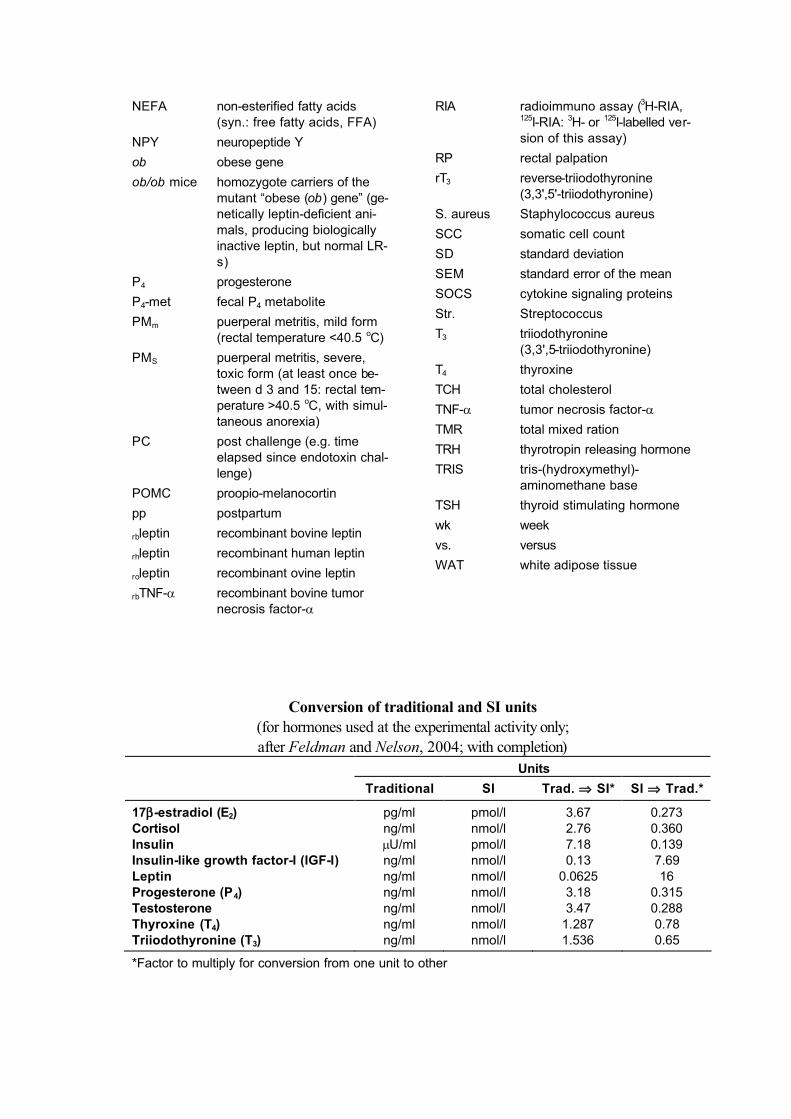
Conversion of traditional and SI units (for hormones used at the experimental activity only;after Feldman and Nelson, 2004; with completion)
Units
Traditional SI Trad. ⇒ SI* SI ⇒ Trad.*
17β-estradiol (E2) pg/ml pmol/l 3.67 0.273Cortisol ng/ml nmol/l 2.76 0.360Insulin µU/ml pmol/l 7.18 0.139Insulin-like growth factor-I (IGF-I) ng/ml nmol/l 0.13 7.69Leptin ng/ml nmol/l 0.0625 16Progesterone (P4) ng/ml nmol/l 3.18 0.315Testosterone ng/ml nmol/l 3.47 0.288Thyroxine (T4) ng/ml nmol/l 1.287 0.78Triiodothyronine (T3) ng/ml nmol/l 1.536 0.65
*Factor to multiply for conversion from one unit to other
1
Összefoglalás
A leptin egyike a nagyrészt a fehér zsírszövet által termelt citokinszeru protein
hormonoknak. A testzsír-depók triglicerid telítettsége, illetve a takarmányozás szintje
(energetikai egyensúly) az a két legfontosabb tényezo, ami az adipocytákban meghatá-
rozza a leptin génexpressziójának a mértékét, illetve ezzel szoros összefüggésben a
plazma leptinszintjét. A leptin egyik fontos élettani szerepe, hogy a metabolikus szig-
nálmechanizmus részeként informálja a tápláltsági állapotról az ivari muködést centráli-
san szabályzó, a hypothalamusban lokalizált GnRH-termelo neuronokat. E szerepe
megengedo jellegunek tunik, és elsosorban a petefészek-muködés ciklikussá válásakor
jelentos, azaz mindazokban az állapotokban (pubertás, ellés utáni idoszak, tenyész-
szezon kezdete), amikor egy anovulációs-acikliás idoszak multával az állat ovulál, majd
ezt követoen petefészkének muködése ciklikussá válik. Másrészt laboratóriumi rágcsá-
lókon és foemlosökön szerzett tapasztalatok arról tanúskodnak, hogy a plazma leptin
szintjét az életkor, az ivar, a szaporodásbiológiai státusz (ivarérés, vemhesség, laktá-
ció, ellés utáni idoszak), továbbá az egészségi állapot is befolyásolja. E fajokban intra-
vénás endotoxin terhelés nyomán, Gram-negatív baktériumok okozta szepszisben, va-
lamint egyes intenzív citokin-felszabadulással járó megbetegedésekben a plazma leptin
szintje emelkedik, aminek jelentosége lehet a táplálékfelvétel ezt követo csökkenésé-
ben. A házi emlosök (mindenek elott a kérodzok) plazma leptin szintjét befolyásoló té-
nyezokre vonatkozó ismereteink napjainkban folyamatosan gyarapodnak ugyan, de –
elsosorban az analitikai nehézségekbol következoen – a laboratóriumi rágcsálókon és
foemlosökön nyert tapasztalatokhoz képest még mindig nem kelloen szélesköruek, és
nem egyszer ellentmondásoktól sem mentesek. Mindezek a bizonytalanságok napjain-
kig meghiúsították a leptin klinikai diagnosztikai célú felhasználását.
Laboratóriumunk újabban egy kérodzokbol származó vérszérum/plazma minták
leptin tartalmának a meghatározására szolgáló, fajcsoport-specifikus mérorendszert
(125I-RIA) adaptált, amelyet sikerrel használunk szarvasmarhában és kiskérodzo fajok-
ban. A vonatkozó irodalom rövid áttekintését követoen értekezésemben ismertetem hét,
e módszer alkalmazásával végzett kísérletsorozat eredményeit.
Elso lépésként módszerünkkel sikerrel reprodukáltunk néhány, az irodalmi adatok
alapján várható tendenciát (pl. a leptin szintjének a 24 órás táplálékmegvonást követo,
vagy a laktáció kezdetén tapasztalható csökkenése; a diurnális ingadozás hiánya), ez-
zel is bizonyítva eredményeink élettani megbízhatóságát (1a, 1b, 1c és 1d kísérlet).
További, új tudományos eredménynek tekintheto tapasztalataink az alábbiakban
összegezhetoek: (1) A plazma leptin szintje anyajuhokban magasabb, mint kosokban.
2
Kérodzokben a plazma leptin szintje a ciklus tüszo- és sárgatest-fázisában, továbbá
ovariectomiát követoen, illetve ösztrogén-visszapótlás nyomán nem változik; ezzel
szemben kasztráció nyomán emelkedik, a tesztoszteron kezelés nyomán pedig ismét
csökken. Ennek alapján megállapítható, hogy – a szexuálszteroid hormonok nem te-
kinthetoek ugyan a leptinprodukció elsodleges regulátorának – a leptinnek a hímivarban
mérheto alacsonyabb szintjéért a here tesztoszteron termelése a felelos (1c, 1d és 1e
kísérlet). (2) Anyajuhokban a plazma leptinszintjének a vemhességgel kapcsolatos
emelkedése összefüggést mutat a magzatok számával, illetve a progeszteron szintjé-
vel. A vemhesség egyes szakaszainak a befolyásoló szerepe azonban meghaladja e
járulékos tényezok hatását (2. kísérlet). (3) Az anyajuhok vemhességi ketózisának
szubklinikai formája a vehemépítés energiaszükségletének a kielégítetlenségét tükrözo
komplex endokrinológiai következményekkel jár, ami a leptin szintjének a csökkenését
is magában foglalja. Ha a biológiai tenyészidoszakon kívül (néhány héttel az ellést, és
közvetlenül a választást követoen) ismét ovulációt / ciklikus petefészek-muködést indu-
kálunk, állománytársaikhoz viszonyítva a korábban ketózisos anyajuhokban a plazma
leptinszintje alacsonyabb lehet, miközben csökken az ovariális válaszkészségük és
fertilitásuk is (3. kísérlet). (4) Amikor tejhasznú tehenekben az ellés körüli metabolikus
és endokrinológiai változásokat – ide értve a plazma leptinszintjének a változásait is –
kívánjuk nyomon követni, tekintettel kell lennünk az egyes életkor-csoportok közötti kü-
lönbségekre is. Az endokrin szignálmechanizmus, ami tejhasznú tehenekben az ellés
utáni negatív energetikai egyensúlyról, illetve a testzsír-raktárak telítettségérol tájékoztat-
ja az ivari muködés központi szabályozását, magában foglalja a plazma IGF-I és a
leptinszintjét (4a és 4b kísérlet). (5) Az ellés körüli idoszakban, továbbá a laktáció elso
heteiben a normo- és hyperketonaemiás tehenek plazma leptinszintjében jelentos kü-
lönbségek igazolhatóak: azok az állatok, amelyekben az ellést követoen emelkedett
ketonanyag-szintek (βOH-vajsav: >1.00 mmol/l) fordultak elo, alacsonyabb plazma
leptin-koncentrációkkal jellemezhetoek (5a és 5b kísérlet). (6) Védett zsírforrásként a
pálmaolaj zsírsavainak Ca-sóit (7,0 és 3,5 ill. 0 %, abraktakarmányhoz kevert koncent-
rátum formájában, a laktáció elso 8 hetében) etetve tejhasznú tehenekben nem tapasz-
taltunk jelentos különbségeket a plazma leptin, inzulin, T3, T4 és IGF-I szintjében. (7)
Tejhasznú tehenekben a laktáció kezdetén gyakran eloforduló, intenzív endotoxin /
citokin-felszabadulással járó gyulladásos kórképek (purerperalis metritis, súlyos általá-
nos tünetekkel is kísért mastitis) számos metabolikus hormonnak a vérplazmában
mérheto szintjét befolyásolják, így a leptin koncentrációját is csökkentik. A leptin szintjé-
nek a változása azonban inkább következménye, mintsem oka az e megbetegedések
során tapasztalható takarmányfelvétel-csökkenésnek (7a, 7b és 7c kísérlet).
3
Úgy gondoljuk, eredményeink hasznos alapként szolgálhatnak a leptin diagnoszti-
kai és prognosztikai értékének a megítéléséhez a termelés- és reprodukció-orientált,
illetve a klinikai jellegu kutatómunkában.
Summary
Leptin is one of the cytokine-like protein hormones of the white adipose tissue.
The triglyceride content of lipid depots associated with the current feeding level (energy
balance) is the primary determinant of leptin gene expression in adipocytes, and the
circulating leptin level. Leptin plays an important role in signaling nutritional status to the
central regulation of reproduction (hypothalamic GnRH-producing neurons), and ap-
pears to be a permissive factor especially in the initiation of cyclicity, e.g. in modulation
of ovarian function shifting from anovulatory-acyclic to ovulatory-cyclic (puberty, re-
sumption of cyclicity after parturition and at the beginning of the breeding season). On
the other hand studies in lab rodents and Primates have revealed that plasma leptin is
influenced also by the age, gender and physiological status (puberty, pregnancy, lacta-
tion / postpartum period), furthermore by the health condition: intravenous endotoxin
challenge or Gram-negative sepsis, and some diseased conditions with intensive cyto-
kine release evoke an increase in plasma leptin, which is thought to depress the subse-
quent feed intake. Although increasing body of information is available nowadays, but –
comparing to that one in lab rodents and Primates – our knowledge on factors influenc-
ing the plasma leptin level in farm mammals (mostly in ruminants), as well as on the
diagnostic and prognostic value of this hormone in care of reproduction is still rather
limited and sometimes contradictory, predominantly due to the analytical difficulties.
Due to these uncertainties the clinical (diagnostic, prognostic) application of leptin has
failed so far.
Recently a ruminant-specific 125I-RIA was adapted in our lab, which is success-
fully used for quantification of leptin in bovine, ovine and caprine plasma/serum sam-
ples. After giving a brief review of the relevant literature, in this dissertation I summarize
the results of 7 series of experiments with using this assay system in sheep and cattle.
With this 125I-RIA we could reproduce some tendencies known from the literature
(such as the fasting-induced and lactation-related decrease in plasma leptin; the lack of
diurnal changes), which proved the biological validity of our results (Exp. 1a, 1b, 1c and
1d). Our further experiences revealed the followings: (1) The plasma leptin content is
higher in ewes than in rams. There are no cycle-related changes in plasma leptin of
ruminants, and it remains also unchanged after ovariectomy and estrogen replacement.
4
However, after castration elevated plasma leptin content was measured, which was
reduced again by testosterone replacement. Upon these data we think that although the
gonadal steroids are not principal regulators of leptin production, testosterone is re-
sponsible for the gender dichotomy of plasma leptin (Exp. 1c, 1d, 1e). (2) The degree of
pregnancy-associated hyperleptinaemia is affected by the number of fetuses and level
of progesterone in ewes. However, pregnancy stage is a more important regulator than
these additional factors (Exp. 2). (3) The subclinical form of ovine ketosis is character-
ized by complex endocrine alterations reflecting the pregnancy-associated energy im-
balance, which include a decrease in plasma leptin. If out of the breeding season (some
weeks after lambing, immediately after weaning) the ovarian cyclicity is induced again,
the plasma leptin level, furthermore the ovarian response and fertility of formerly ketotic
ewes may be depressed (Exp. 3). (4) In dairy cows the age-related differences must be
considered when the peri-parturient metabolic and endocrine changes – including the
changes in plasma leptin – are monitored. The endocrine signals that most likely could
inform the reproductive axis regarding the postpartum negative energy balance and the
level of body reserves, include IGF-I and leptin (Exp. 4a and 4b). (5) During the peri-
parturient period and at the beginning of lactation, obvious differences were demon-
strated between the circulating leptin levels of normo- and hyperketonaemic dairy cows,
with lower leptin content in plasma of those which have had >1.00 mmol/l βOH-butyrate
since calving (Exp. 5a and 5b). (6) Consumption of a diet enriched with calcium salts of
palm oil fatty acids (7.0 and 3.5 vs. 0 % of Ca-PFA; in concentrate fed for the first 8
weeks of lactation) did not influence the plasma leptin, insulin, T3, T4 and IGF-I levels in
dairy cows (Exp. 6). (7) In postpartum dairy cows inflammatory diseases with intensive
endotoxin / cytokine release (such as puerperal metritis, severe forms of clinical masti-
tis) influence the circulating levels of metabolic hormones, depressing also the leptin
content. However, these changes in plasma leptin are only consequences, rather than
the causative elements of anorexia associated with infection-induced inflammatory re-
sponse in ruminants (Exp. 7a, 7b and 7c). We think these experiences represent re-
markable contribution to the successful use of leptin in further production- reproduction-
and clinical-oriented research.
5
1. Introduction
Leptin, the long-sought, cytokine-like protein hormone of adipocytes was identified by
Zhang et al. (1994). Its production rate and actual plasma level are in positive relation with
the triglyceride content of producer cells, and reflect the actual energy balance of organism.
Leptin is one of the signal proteins of the white adipose tissue (WAT): its circulating level in-
forms the hypothalamic region of central nervous system on degree of lipid saturation in the
periphery (visceral and subcutaneous fat stores), playing important role in long-time (ho-
meorhetic; syn. teleophoretic) regulation of feed intake and reproduction (reviewed by
Houseknecht et al., 1998; Bokori, 2000; Schneider, 2004; Chilliard et al., 2005; Zieba et
al., 2005). So since its discovery leptin has been in the focus of interest of nutritionists, repro-
ductionists and clinicians both in the human and veterinary medicine. Between 1994 and 2001
knowledge of leptin physiology progressed impressively in rodents and humans, but less rap-
idly in farm mammals and other species, due to difficulties encountered for the development of
specific tools to study leptin gene expression and plasma leptin in them.
Studies on plasma leptin level for any forms of practice-related application require high-
performance, sensitive and specific assay techniques (125I-RIA or ELISA). Due to the spe-
cies-based differences in its amino acid sequence (Zhang et al., 1997; Blache et al., 2000), its
low immunogenicity (Chilliard et al., 2005), and the technical difficulties of in vitro produc-
tion of this protein molecule (Gertler et al., 1998), the progress in assaying plasma leptin of
domestic mammals was slow at the beginning, in the first few years of the about 13-year-long
leptin history. As a first promising step, a “multispecies” leptin 125I-RIA1 was developed only in
the late nineties. Since than several data have been published, assaying leptin with this method
in bovine (Chilliard et al., 1998; Akerlind et al., 1999; Kawakita et al., 2001; Maciel et al.,
2001; Soliman et al., 2002; Accorsi et al., 2005), ovine (Soliman et al., 2001), porcine (Es-
tienne et al., 2000; Barb et al., 2001a), equine (Fitzgerald and McManus, 2000; McManus
and Fitzgerald, 2000; Gentry and Thomson, 2002; Gentry et al., 2002; Bruce, 2004;
Cartmill, 2004; Ferreira-Dias et al., 2005; Waller et al., 2006), rabbit (Corico et al., 2002)
and feline plasma (Backus et al., 2000).
1 XL-85K Multi-Species Leptin RIA kit, Linco Research, St. Luis, USA
6
In 1999 this technique was adapted and validated also in our lab. Our first experiences
were introduced is some papers (Huszenicza et al., 2001; Nikolic et al., 2003), and partly in
a DSc dissertation (Huszenicza, 2003). Since the beginning of our leptin research we have
been working in close cooperation with the team of Profs. P. Rudas and T. Bartha (Szent
István University, Faculty of Veterinary Science, Dept. of Physiology and Biochemistry, Bu-
dapest): their activity is focused on some molecular aspects, e.g. the intramammary leptin and
leptin receptor (LR) gene expression (papers: Sayed-Ahmed et al., 2003 and 2004; Bartha et
al., 2005; PhD dissertation: Sayed-Ahmed, 2004). Their results are considered, as a remark-
able contribution to our current leptin-related knowledge, and appreciated very much by the
competent international scientific community.
With this “multispecies” leptin 125I-RIA in ruminants, however, unexpectedly high levels
(not correlating with the actual body fat content and energy balance) were measured in sam-
ples of about 4-20 % of individuals (Kulcsár et al., unpubl. data; Butler et al., personal com.;
Delavaud et al., 2000, 2002 and 2004, Chilliard et al., 2005). Due to this uncertainty in
sheep and cattle, currently this method is offered for assaying leptin content in porcine, equine
and feline plasma, rather than in samples from ruminants. Ruminant-specific leptin assays have
been available only since 2000: currently some local versions of about 6 assay systems (Bla-
che et al., 2000; Delavaud et al., 2000; Ehrhardt et al., 2000; Kauter et al., 2000; Thomas
et al., 2001; Sauerwein et al., 2004) are used all over the world. Unfortunately, up to our
current knowledge none of these ruminant-specific methods are commercially available in form
of a ready-to-use diagnostic kit.
Using a specific anti-ovine leptin antibody gifted us by Chilliard and Delavaud2, in
2001-2002 we developed and validated a local version of the ruminant-specific 125I-RIA of
Delavaud et al. (2000 and 2002). This new method gave us an opportunity to re-analyze and
re-evaluate several hundreds of frozen samples collected in our earlier studies, and since than
in cooperation with some other teams numerous new experiments have also been conducted.
In the current dissertation I wish to summarize and evaluate the experiences of the first 7 of
these studies.
2 Herbivore Research Unit, Adipose Tissue and Milk Lipids Group, INRA, Saint-Genes-Champanelle, France; risen in
rabbits against recombinant ovine leptin of Gertler et al. (1998).
7
2. Aims Although increasing body of information is available nowadays, comparing to that one in
lab rodents and Primates our current knowledge on factors influencing the plasma leptin level
in ruminants is still rather limited and sometimes contradictory. Due to these uncertainties the
clinical (diagnostic, prognostic) application of leptin has failed so far.
Using our ruminant-specific 125I-RIA, the first responsibility was to check and improve
the biological validity of findings provided by this laboratory procedure. For this purpose,
we planned to reproduce some tendencies known from the literature, such as the effects of (i)
24 h feed deprivation, (ii) reproductive status and lactation (iii) and gender (including the surgi-
cal removal of gonads, and the influence of gonadal steroid replacement), as well as the pres-
ence or absence of cycle-related and diurnal changes (Exp. 1a, 1b, 1c, 1.d and 1e). Later on
6 series of original trials were conducted, in order to study the followings:
(1) Whether in prolific Merino ewes, during the early and mid pregnancy (i) the number of
fetuses, (ii) the gestation-associated continuous gestagen load, and (iii) the plasma levels of
insulin may interact with the circulating leptin content (Exp. 2).
(2) In spring-lambing Merino ewes affected by gestational toxaemia (i) what kind of endocrine
alteration – including changes in plasma leptin level – may occur, and (ii) what may be the
reproductive consequences of this disease in a large-scale flock, when ovulation and ovar-
ian cyclicity is induced soon after weaning, out of the breeding season (Exp. 3).
(3) In healthy dairy (Holstein Friesian) cows what are (i) the peri-parturient and postpartum
changes of plasma leptin concentrations along with the βOH-butyrate (BHB), non-
esterified fatty acid (NEFA), insulin, insulin-like growth factor-I (IGF-I) and thyroid hor-
mone profiles, as well as (ii) the influence of parity and body condition at parturition on
endocrine and metabolite patterns and reproductive parameters (Exp. 4a). Furthermore,
(iii) is there any difference in plasma levels of these metabolic hormones and metabolites in
cows with already cyclic vs. still acyclic ovarian function at the desirable time of the first
postpartum insemination (Exp. 4b).
(4) In cows kept in large-scale dairy herds, are there any interrelationships between the BHB
profile and insulin and leptin during the peri-parturient and postpartum period (Exp. 5a
and 5b)?
8
(5) May supplementation with a commercially available inert (by-pass) fat source influence the
plasma leptin levels (and the circulating insulin, IGF-I and thyroid hormones) in postpartum
dairy cows (Exp. 6).
(6) May inflammatory diseases with intensive endotoxin/cytokine release (such as puerperal
metritis and mastitis, which occur frequently in postpartum dairy cows), interfere with
circulating levels of leptin and other metabolic hormones (Exp. 7a, 7b, and 7c).
3. Physiological aspects of clinical application: a review of literature
3.1. Leptin: the “voice of adipocytes”
The endocrine-like activity of WAT has been supposed for a long time, since in the
early fifties a genetic form of obesity with excessive feed intake and infertility was observed in
mice. Breeding data revealed that this phenomenon had to be the result of a recessive mutation
of a responsible gene, which was called “obese (ob) gene” (Ingalls et al., 1950)3. Kennedy
(1953) postulated that the amount of body fat and feeding is regulated by the central nervous
system through a blood-born product, which signals via the hypothalamus by a negative feed-
back mechanism (“lipostasis theory”). However, the ob gene, and its 167-amino-acid-long
protein product called leptin (Fig. 3.1.1.) were discovered only in 1994 (Zhang et al.,
1994).
3 Up to our current knowledge the homozygote carriers of the mutant “obese (ob) gene” – so-called ob/ob mice – are
genetically leptin-deficient animals, producing biologically inactive leptin, but normal LR-s. In them a cytosine to thymidine
change at codon 105 changes the amino acid arginine to a stop codon. That causes premature termination of transcrip-
tion of the leptin gene, resulting in synthesis of a non-functional protein.
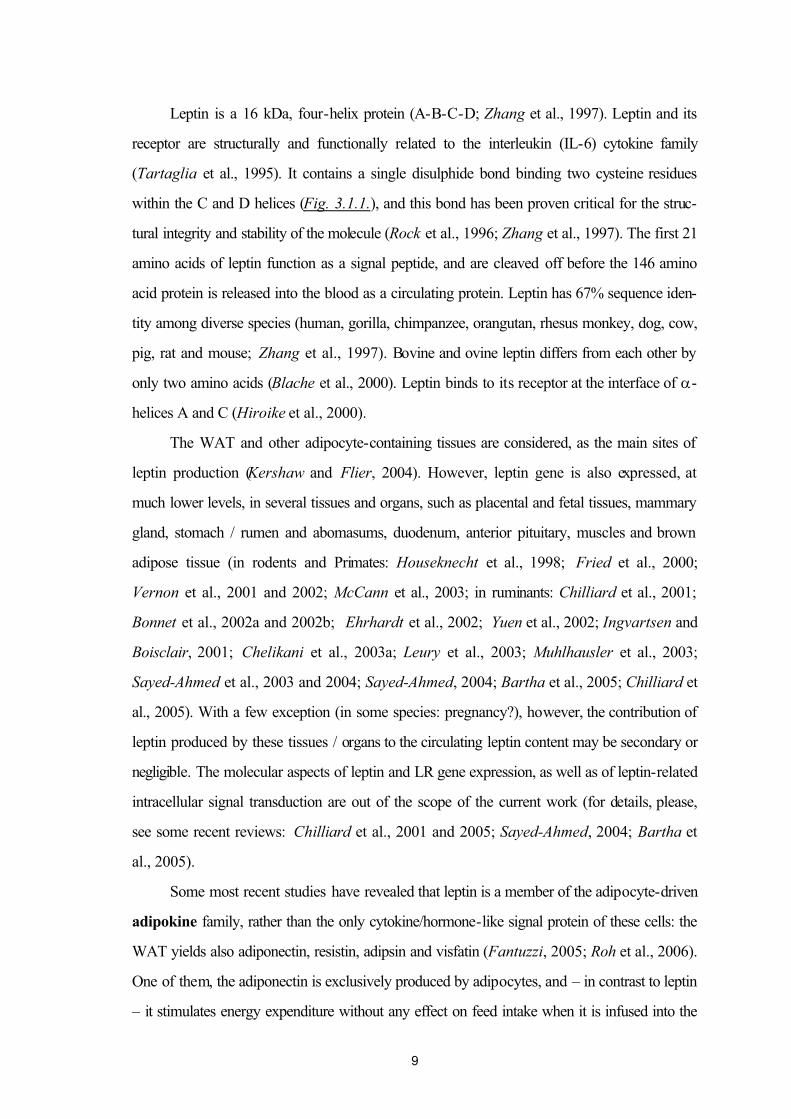
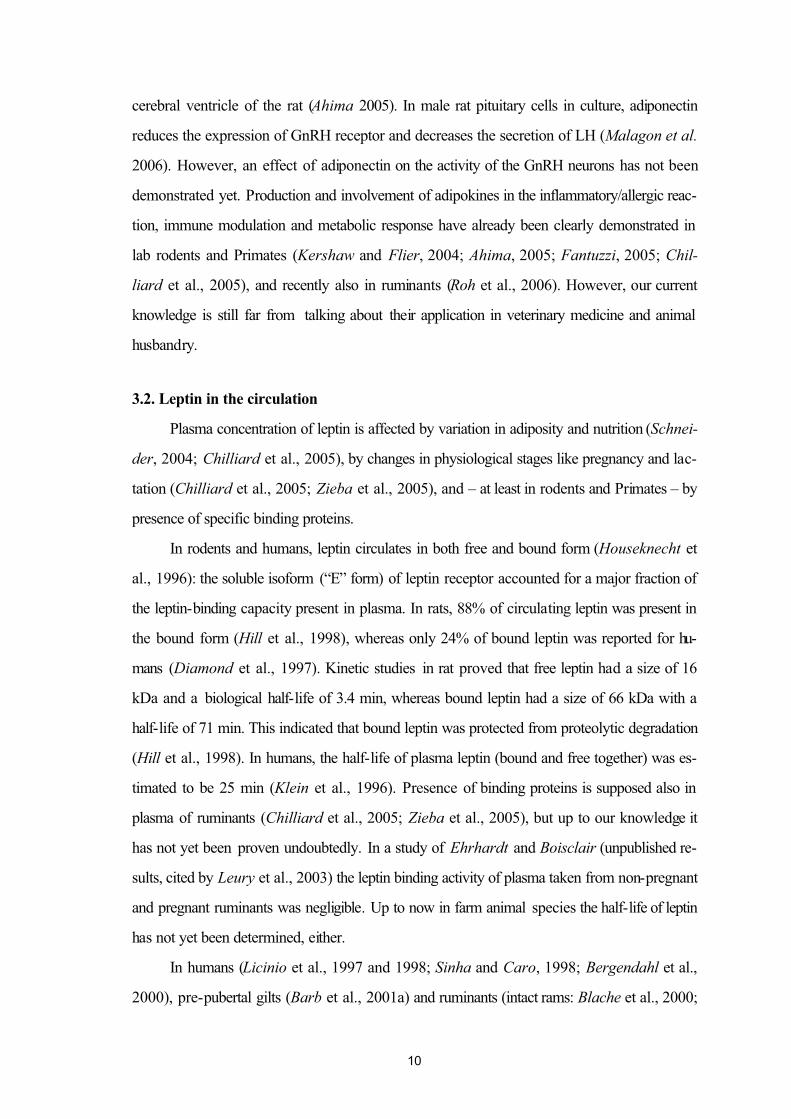
Fig. 3.1.1. The spherical structure of leptin molecule: it forms a four-helix bundle (A-B-C-D) with one disulphide bond (between the two cysteineslocated at the 96th and 146th position), which is essential for its stability. This structure isconsistent with a classification as a cytokine four-helix bundle (Zhang et al., 1997)
9
Leptin is a 16 kDa, four-helix protein (A-B-C-D; Zhang et al., 1997). Leptin and its
receptor are structurally and functionally related to the interleukin (IL-6) cytokine family
(Tartaglia et al., 1995). It contains a single disulphide bond binding two cysteine residues
within the C and D helices (Fig. 3.1.1.), and this bond has been proven critical for the struc-
tural integrity and stability of the molecule (Rock et al., 1996; Zhang et al., 1997). The first 21
amino acids of leptin function as a signal peptide, and are cleaved off before the 146 amino
acid protein is released into the blood as a circulating protein. Leptin has 67% sequence iden-
tity among diverse species (human, gorilla, chimpanzee, orangutan, rhesus monkey, dog, cow,
pig, rat and mouse; Zhang et al., 1997). Bovine and ovine leptin differs from each other by
only two amino acids (Blache et al., 2000). Leptin binds to its receptor at the interface of α-
helices A and C (Hiroike et al., 2000).
The WAT and other adipocyte-containing tissues are considered, as the main sites of
leptin production (Kershaw and Flier, 2004). However, leptin gene is also expressed, at
much lower levels, in several tissues and organs, such as placental and fetal tissues, mammary
gland, stomach / rumen and abomasums, duodenum, anterior pituitary, muscles and brown
adipose tissue (in rodents and Primates: Houseknecht et al., 1998; Fried et al., 2000;
Vernon et al., 2001 and 2002; McCann et al., 2003; in ruminants: Chilliard et al., 2001;
Bonnet et al., 2002a and 2002b; Ehrhardt et al., 2002; Yuen et al., 2002; Ingvartsen and
Boisclair, 2001; Chelikani et al., 2003a; Leury et al., 2003; Muhlhausler et al., 2003;
Sayed-Ahmed et al., 2003 and 2004; Sayed-Ahmed, 2004; Bartha et al., 2005; Chilliard et
al., 2005). With a few exception (in some species: pregnancy?), however, the contribution of
leptin produced by these tissues / organs to the circulating leptin content may be secondary or
negligible. The molecular aspects of leptin and LR gene expression, as well as of leptin-related
intracellular signal transduction are out of the scope of the current work (for details, please,
see some recent reviews: Chilliard et al., 2001 and 2005; Sayed-Ahmed, 2004; Bartha et
al., 2005).
Some most recent studies have revealed that leptin is a member of the adipocyte-driven
adipokine family, rather than the only cytokine/hormone-like signal protein of these cells: the
WAT yields also adiponectin, resistin, adipsin and visfatin (Fantuzzi, 2005; Roh et al., 2006).
One of them, the adiponectin is exclusively produced by adipocytes, and – in contrast to leptin
– it stimulates energy expenditure without any effect on feed intake when it is infused into the
10
cerebral ventricle of the rat (Ahima 2005). In male rat pituitary cells in culture, adiponectin
reduces the expression of GnRH receptor and decreases the secretion of LH (Malagon et al.
2006). However, an effect of adiponectin on the activity of the GnRH neurons has not been
demonstrated yet. Production and involvement of adipokines in the inflammatory/allergic reac-
tion, immune modulation and metabolic response have already been clearly demonstrated in
lab rodents and Primates (Kershaw and Flier, 2004; Ahima, 2005; Fantuzzi, 2005; Chil-
liard et al., 2005), and recently also in ruminants (Roh et al., 2006). However, our current
knowledge is still far from talking about their application in veterinary medicine and animal
husbandry.
3.2. Leptin in the circulation
Plasma concentration of leptin is affected by variation in adiposity and nutrition (Schnei-
der, 2004; Chilliard et al., 2005), by changes in physiological stages like pregnancy and lac-
tation (Chilliard et al., 2005; Zieba et al., 2005), and – at least in rodents and Primates – by
presence of specific binding proteins.
In rodents and humans, leptin circulates in both free and bound form (Houseknecht et
al., 1996): the soluble isoform (“E” form) of leptin receptor accounted for a major fraction of
the leptin-binding capacity present in plasma. In rats, 88% of circulating leptin was present in
the bound form (Hill et al., 1998), whereas only 24% of bound leptin was reported for hu-
mans (Diamond et al., 1997). Kinetic studies in rat proved that free leptin had a size of 16
kDa and a biological half-life of 3.4 min, whereas bound leptin had a size of 66 kDa with a
half-life of 71 min. This indicated that bound leptin was protected from proteolytic degradation
(Hill et al., 1998). In humans, the half-life of plasma leptin (bound and free together) was es-
timated to be 25 min (Klein et al., 1996). Presence of binding proteins is supposed also in
plasma of ruminants (Chilliard et al., 2005; Zieba et al., 2005), but up to our knowledge it
has not yet been proven undoubtedly. In a study of Ehrhardt and Boisclair (unpublished re-
sults, cited by Leury et al., 2003) the leptin binding activity of plasma taken from non-pregnant
and pregnant ruminants was negligible. Up to now in farm animal species the half-life of leptin
has not yet been determined, either.
In humans (Licinio et al., 1997 and 1998; Sinha and Caro, 1998; Bergendahl et al.,
2000), pre-pubertal gilts (Barb et al., 2001a) and ruminants (intact rams: Blache et al., 2000;
11
Marie et al., 2001; Holstein steers: Kawakati et al., 2001; mature, non-lactating ewes:
Daniel et al., 2002a) concentrations of leptin in the circulation varied in an episodic manner.
In women leptin levels related inversely to pituitary-adrenal function, with a lack of correlation
between mean 24 h levels and pulsatility (Licinio et al., 1997 and 1998), and short-term fast-
ing depressed both the circulating concentration of leptin and leptin pulse amplitudes (Bergen-
dahl et al., 2000). Similarly, also in gilts (Barb et al., 2001a) and ewes (Daniel et al., 2002a)
feed deprivation reduced the circulating leptin concentration and its pulsatility. Despite the epi-
sodic character the leptin levels of thin-fed and fat-fasted ewes (varying in the intermediate
range; 5-10 ng/ml4) differed clearly from those of fat-fed (varying in the highest range; 12-20
ng/ml) and thin-fasted animals (varying in the lowest range; 1-3 ng/ml); in thin-fasted ewes the
plasma leptin was very low and almost non-pulsatile (Daniel et al., 2002a). In humans
(Licinio et al., 1997; Sinha and Caro, 1998), rodents (Cha et al., 2000) and horses (Cart-
mill, 2004) plasma leptin levels showed also a clear diurnal variation, with maximum levels
between midnight and early morning, and a nadir at noon to afternoon. In dogs serum leptin
content changed diurnally in association with feeding-fasting cycles, and was much higher in fat
than in thin animals (Ishioka et al., 2005; Jeusette et al., 2005). In these monogastric species
also a slight postprandial increase was reported to occur. In ruminants, however, the absorp-
tion of a wide variety of nutrients and other compounds (including volatile fatty acids) is per-
manent from the forestomach, and the outflow of ruminal juice into the duodenum is almost
continuous (Dziuk, 1990), which influences also the (endocrine and exocrine) pancreatic func-
tions (Martin and Crump, 2003). Perhaps due to the same mechanisms, the diurnal and post-
prandial variations of leptin are missing in ruminants. In ewes, profiles of plasma leptin were
episodic in nature, but did not differ in a circadian manner (Daniel et al., 2002a). In a recent
study (Kadokawa et al., 2006) in postpartum dairy cows neither pulsatile, nor diurnal changes
were seen (although samples were taken for assaying leptin in this study only once an hour for
8 h, which may not be frequent and long enough for clear detection of pulsatile and/or cir-
cadian rhythms. The plasma leptin level was in a low range, <1.5 ng/ml5, during the early
weeks of lactation). Leptin pulsatility is missing also in lactating rodents (rat: Pickavance et al.,
4 If cited, the absolute values are given, as those were published in original, e.g. in traditional form (ng/ml) or in SI units
(nmol/l). Our own data are always given in nmol/l. Conversion: 1 ng/ml = 0,0625 nmol/l; 1 nmol/l = 16 ng/ml.
5 Technical note: Due to the different assay procedures the absolute values measured in different labs are incomparable.
The Australian-Japanese method of Blache et al. (2000) always produces the lowest absolute values.
12
1998) and Primates (women: Fried et al., 2000; Henson and Castracane, 2003). In conclu-
sion, the pulsatile and/or diurnal rhythms represent only relatively moderate variability in
plasma leptin, which may be missing in certain species (e.g. diurnal changes in ruminants)
and/or conditions (e.g. pulsatility during starvation or lactation). The effects of body fat con-
tent, nutrition (short-time fasting or long-time feed restriction), reproductive status (lactation; in
some species: pregnancy) and also certain diseased conditions are more robust, and can be
clearly recognized (further details: see later).
In lab rodents and Primates leptin is synthesized and released into the circulation in pro-
portion to the amount of body fat, reflecting primarily the triglyceride content of lipid depots,
furthermore the current balance of energy metabolism (Houseknecht et al., 1998; Morio et
al., 1999; Bokori, 2000; Vernon et al., 2001 and 2002). Similar tendencies were reported to
occur in monogastric farm mammals (pig: Barb et al., 2001b; horse: Bruce, 2004; Cartmill,
2004), and also in ruminants (ewe: Delavaud et al., 2000; cattle: Delavaud et al., 2002 and
2004; Lents et al., 2005). In adult ovariectomized ewes with total body fat content of 20-40
% and fed at different levels for 8 weeks, leptinaemia linked positively to individual body fat-
ness explaining 35 % of leptin variations, whereas 17 % of leptin variations were attributed to
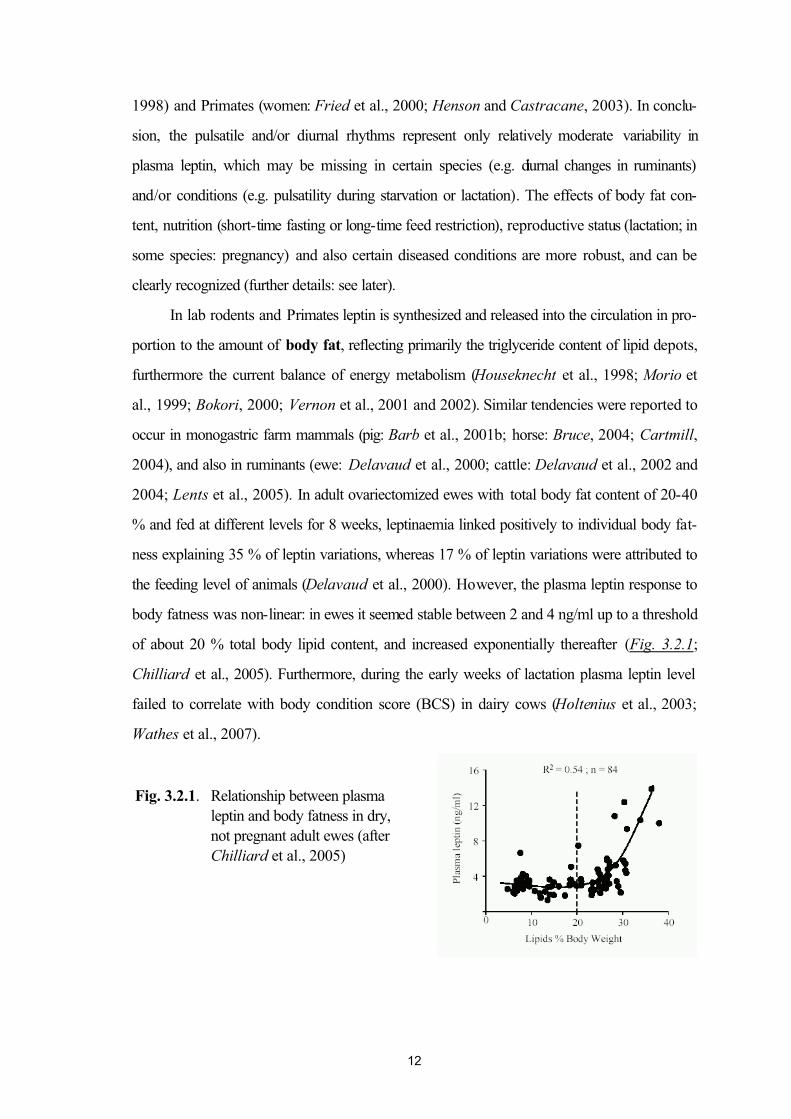
the feeding level of animals (Delavaud et al., 2000). However, the plasma leptin response to
body fatness was non-linear: in ewes it seemed stable between 2 and 4 ng/ml up to a threshold
of about 20 % total body lipid content, and increased exponentially thereafter (Fig. 3.2.1;
Chilliard et al., 2005). Furthermore, during the early weeks of lactation plasma leptin level
failed to correlate with body condition score (BCS) in dairy cows (Holtenius et al., 2003;
Wathes et al., 2007).
Fig. 3.2.1. Relationship between plasma leptin and body fatness in dry, not pregnant adult ewes (after Chilliard et al., 2005)
13
3.3. Factors modifying the circulating leptin level
In mammals the effects of nutrition on circulating leptin level may be combined with con-
sequences of reproductive status (pregnancy, lactation), and also the gender-related and ge-
netic differences may be significant.
Acute or long-term changes in feed composition or feed restriction caused changes in
plasma leptin in ruminants (Amstalden et al., 2000; Chelikani et al., 2003a; Chilliard et al.,
2005; Lents et al., 2005). In pregnant ewes and adult rams, the concentration of plasma leptin
elevated within 5 days after increasing the dietary intake from low to high (Blache et al., 2000;
Thomas et al., 2001). Complete feed deprivation caused a rapid fall in plasma leptin (sheep:
Marie et al., 2001; cattle: Amstalden et al., 2000; Chelikani et al., 2004). In cattle, this fall in
leptin level coincided with an immediate, apparent decrease of insulin, and increase of non-
esterified fatty acids (NEFA), furthermore a less rapid, but also remarkable elevation of
growth hormone (GH), and depression of insulin-like growth factor-I (IGF-I). All these
changes were obvious after 24 h fasting, and were more pronounced in milking cows (on day
55±8 of lactation) than in late-pregnant non-lactating cows, or post-pubertal heifers. The si-
multaneous decrease in blood glucose level was less evident, but significant in milking cows
and heifers, whereas no change was seen in late-pregnant animals (Chelikani et al., 2004).
Long-term feed restriction decreased plasma leptin concentration in sheep (Delavaud et al.,
2000; Ehrhardt et al., 2000; Morrison et al., 2001). Acute changes in plasma leptin were the
result of changes in leptin mRNA expression in adipose tissue: in prepubertal heifers 48 h of
total feed deprivation markedly reduced the leptin mRNA content in adipose tissue (and the
circulating concentrations of leptin and insulin, whereas neither mean levels nor secretory dy-
namics of GH were affected; Amstalden et al., 2000).
In accordance with those found in lab rodents (Horlick et al., 2000; Vernon et al.,
2001 and 2002; Abizaid et al., 2004) and Primates (Fried et al., 2000; Henson and Castra-
cane, 2003; Mann and Plant, 2003), in adult dairy cattle the highest levels of leptin were
observed in well-fed post-pubertal heifers and non-lactating late-pregnant cows, whereas the
lowest values were measured in the early weeks of lactation (Kadokawa et al., 2000; Block
et al., 2001; Geary et al., 2003; Holtenius et al., 2003; Leury et al., 2003; Liefers et al.,
2003; Chelikani et al., 2004; Accorsi et al., 2005; Kadokawa et al., 2006; Wathes et al.,
2007), when cows are in negative energy balance (NEB), and their body condition is decreas-
14
ing. Although the NEB of postpartum cows by itself is a physiological phenomenon, it induces
a wide variety of endocrine changes, including a sharp reduction in plasma leptin content. In a
study of Block et al. (2001) the plasma leptin level was reduced by approximately 50% after
calving, and remained depressed during lactation, despite a gradual improvement of energy
balance. To determine whether NEB caused this reduction in circulating leptin, cows were
either milked or not milked after parturition: absence of milk removal eliminated the NEB, and
doubled the plasma concentration of leptin in postpartum cows. During late pregnancy and
early lactation the same tendency was found also in ewes (McFadin et al., 2002), sows (Es-
tienne et al., 2000) and mares (Heidler et al., 2000). Contrary, however, in a study of
Kokkonen et al. (2005), plasma leptin concentration was associated with body fatness, but
not with estimated energy balance. Furthermore, in many species including cattle, these lacta-
tion-dependent peri-parturient changes may be influenced by several, still undefined feeding-
and management-related factors and disease conditions, show age/parity-associated variabil-
ity, furthermore seasonal, genetic and perhaps also breed-connected differences (Bocquier et
al., 1998; Chilliard et al., 1998 and 2001; Reist et al., 2003; Nikolic et al., 2004; Delavaud
et al., 2004; Liefers et al., 2004; Chilliard et al., 2005; Accorsi et al., 2005; Zieba et al.,
2005; Wathes et al., 2007). The further pregnancy- and lactation-associated differences in
circulating leptin level are discussed elsewhere in this dissertation (see Chapters 3.6. and 5.2.).
Acting on the level of hypothalamus-anterior pituitary axis, and directly on gonads, leptin
is deeply involved in regulation of reproduction (details are discussed in Chapters 3.5.3. and
3.6.). It is less known, however, that at least in lab rodents and Primates, after accounting for
body fat the second most important determinant of plasma leptin is gender, resulting in more
circulating leptin in females than males of equivalent body fat (Rosenbaum and Liebel, 1999;
Rosenbaum et al., 2001). This tendency has been conformed recently also in rabbit (Corico
et al., 2002), cattle (Geary et al., 2003) and horse (Cartmill, 2004). Testosterone therapy
reduces the plasma leptin in hypogonadal men (Sih et al., 1997), and simultaneously with the
testosterone increase leptin levels have been observed to decline, as boys progress through
puberty (Horlick et al., 2000). Human in vitro adipose tissue cultures of female origin pro-
duced leptin at a significantly higher rate than samples taken from men. Androgens inhibited,
whereas 17ß-estradiol (E2) stimulated the in vitro leptin release, but both the androgen-
related inhibition and E2-dependent stimulation were restricted on samples of female origin
15
(Shimizu et al, 1997; Casabiell et al., 1998; Pineiro et al., 1998). 8 weeks after operation
the plasma leptin was significantly lower in ovariectomized rats than in controls, and the treat-
ment with E2 prevented this decrease (Chu et al, 1999). In intact female rats E2 given for 2
days increased the leptin mRNA content of adipose tissue between 2 and 6 h, and the plasma
leptin at 12 h after the injection (Brann et al., 1999). Experiences with intact, cyclic women
demonstrate a trend for an increase in circulating leptin values towards the late follicular phase
and higher values in the luteal than in the follicular phase (Messinis et al., 1998; Ludwig et al.,
2000; Phipps et al., 2001), which was not influenced by isoflavonic phytoestrogen intake
(Phipps et al., 2001). In contrast, only little cycle-dependent variation was seen in another
study (Stock et al., 1999). Ovariectomized women showed significantly lower plasma leptin
level 4 days after operation (Messinis et al., 1999), but the influences of anesthetic drugs and
reduced food intake could not be excluded in the postoperative period. However, transdermal
administration of E2 plus progesterone (P4) – but not E2 alone – could prevent this decrease
(Messinis et al., 2000). When intact, cyclic women were treated, E2 alone was unable to in-
duce any change in circulating leptin, while during E2 plus P4 administration a significant in-
crease in leptin values occurred in the early follicular phase (Messinis et al., 2001). In cyclic
women superovulated with FSH the plasma leptin concentrations increased gradually from
early to mid follicular phase to levels that were significantly higher than in spontaneous cycles
of the same persons. In the first half of the follicular phase a significant positive correlation ex-
isted between the leptin and E2 concentrations. However, leptin values did not increase further
during the late follicular phase (Messinis et al., 1998; Stock et al., 1999). After menopausa
leptin values are still relatively high, but lower than in pre-menopausal persons (Shimizu et al,
1997). However, there are also many conflicting results published, because not all studies used
the correction for body mass index or for fat mass. It is still also unclear, whether the synthetic
analogues of sexual steroids widely used for contraception in humans, and induc-
tion/synchronization of ovarian cyclicy (in moderate dose; in farm mammals), or suppression of
ovulatory activity (in large dose; in population control of pets, zoo and sometimes of wild ani-
mals) may influence the gene expression and/or plasma levels of leptin.
In cattle also a missense mutation of the leptin receptor gene was reported to influence
the circulating leptin level (Liefers et al., 2004): the plasma leptin content associated with the
genotype during late pregnancy, but not during the early weeks of lactation. In horses an idio-
16
pathic form of hyperleptinaemia with unspecified (genetic?) origin was observed (Cartmill,
2004; Waller et al., 2006). The affected mares had continuously higher (but not supraphysi-
ological) plasma leptin levels, than their stud mates with the same body condition, and receiv-
ing the same diet. They were also hyperglycaemic and hyperinsulinaemic, had elevated T3 con-
centrations, and displayed exaggerated insulin and glucose responses to a standard synthetic
glucocorticoid (dexamethasone, DX) treatment (Cartmill, 2004). After a standard-dose glu-
cose challenge these “high leptin” mares had greater insulin response, and a faster rate of glu-
cose clearance (Waller et al., 2006).
3.4. Regulation of leptin production
There are several (neuro)endocrine and other factors regulating the leptin synthesis. It is
generally accepted (Halleux et al., 1998; Houseknecht et al., 1998 and 2000; Bokori, 2000;
Flier et al., 2000; Fried et al., 2000; Glasow and Bornstein, 2000; Kieffer et al., 2000;
Vernon et al., 2001 and 2002; Sweeney, 2002; Considine, 2003; McCann et al,. 2003;
Fantuzzi, 2005) that in lab rodents and Primates the leptin gene expression in adipocytes
and/or circulating level of leptin are stimulated by insulin, glucocorticoids, bacterial endotoxin
and pre-inflammatory cytokines [such as tumor necrosis factor-α (TNF-α) and interleukin
(IL)-1β (IL-1β)], and suppressed by adrenergic stimulation, whereas production and plasma
concentration of insulin and glucocorticoids are decreased, as well as of catecholamines are
increased by leptin. The circulating leptin may interact also with plasma levels and/or experi-
mental administration of GH, IGF-I, prolactin, glucagon and thyroid hormones, as well as with
genital steroids. In monogastric farm mammals (Fitzgerald and McManus, 2000; McManus
and Fitzgerald, 2000; Barb et al., 2001a and 2001b; Bruce, 2004; Cartmill, 2004) and
ruminants (Chilliard et al., 1998 and 2001; Leury et al., 2003; Accorsi et al., 2005; Chil-
liard et al., 2005; Lents et al., 2005; Wathes et al., 2007) these endocrine interactions are
still less known, despite the recently conducted extensive studies.
Glucocorticoids and leptin interact on different levels of regulation. Via its receptors in
the hypothalamus, as well as on various adrenal cell populations leptin modulates both the hy-
pothalamic-pituitary-adrenal axis and the systemic sympathetic/adrenomedullary system, which
are closely linked to the regulation of energy balance and body weight (Gaillard et al., 2000;
Considine, 2003). Leptin decreased the ACTH-stimulated release of steroid hormones in
17
vitro without any effect on cell proliferation (Glasow and Bornstein, 2000). Near term a sig-
nificant positive correlation was found between plasma concentrations of leptin and cortisol,
and fetal adrenalectomy prevented the ontogenic rise in plasma leptin in ovine fetuses (Fore-
head et al., 2002).
In Primates cortisol (Fried et al, 2000; Gaillard et al., 2000), and also treatment with
synthetic glucocorticoids (DX; Papaspyrou-Rao et al., 1997; Casabiell et al., 1998; Halleux
et al., 1998), in synergism with insulin, directly stimulate leptin synthesis in adipocytes both in
vitro and in vivo, although the details and clinical relevance of this mechanism have not been
fully understood yet. Nevertheless, cortisol does not appear to have a direct role in the serum
leptin increase of obese human subjects (Considine, 2003). In the adipose tissue 11β-
hydroxysteroid dehydrogenase modulates the glucocorticoid concentrations by re-activating
glucocorticoids from inactive metabolites, which may be an important local regulator of leptin
synthesis and release (Sandeep and Walker, 2001). Insulin, DX and their combination in-
crease the leptin production by ovine adipose tissue explants. The effects of these two hor-
mones are additive and largely independent. Maximal leptin production was seen after adding
100 nmol DX in the incubation medium (Faulconnier et al., 2003). Also bovine adipocytes
are sensitive (but perhaps less responsive than human adipocytes) to the stimulatory effects of
glucocorticoids on leptin production: in cultured human adipocytes 50 nmol of DX increased
the leptin secretion (Halleux et al., 1998), whereas in bovine adipose tissue culture only dou-
ble (100 nmol) concentrations of DX stimulated the leptin mRNA level (Housecknecht et al.,
2000). DX treatment increased the plasma leptin levels in human subjects at 24-48 h (Papas-
pyrou-Rao et al., 1997), and also in dogs (Ishioka et al., 2002) and horses (Cartmill, 2004).
In contrast, in multiparous non-lactating cows the 10-day administration of DX (44 µg/kg per
day) increased the glucose and insulin levels, and decreased the IGF-I and IGF-II concentra-
tions, but failed to alter with plasma leptin (Maciel et al., 2001).
3.5. The regulatory role of leptin
As hypothesized by Kennedy (1953), leptin plays a central role in regulation of energy
homeostasis (appetite, energy expenditure, nutrient partitioning among tissues) and body com-
position, furthermore of hormone secretion by several endocrine glands, reproduction, immune
and renal functions, hematopoiesis, angiogenesis, cell differentiation and proliferation (reviewed
18
by Houseknecht et al., 1998 and 2000; Bokori, 2000; Fantuzzi and Faggioni, 2000;
Vernon et al., 2001; Barb et al., 2001b; Sweeney, 2002; Considine, 2003; Lado-Abeal and
Norman, 2003; McCann et al., 2003; Spicer, 2003; Waddell and Smith, 2003; Barb et al.,
2004; Ahima, 2005; Chilliard et al., 2005; Zieba et al., 2005).
3.5.1. Leptin and the hypothalamus-hypophysis axis
Within the central nervous system, the hypothalamus is the main site of leptin action with
respect to controlling feed intake, energy expenditure and reproduction (Ahima, 2005).
Unlike those in most other tissues, in the central nervous system the capillary endothel cells are
joined by tight junctions and devoid of intercellular spaces and transendothelial channels. Due
to its molecular weight leptin enters from the blood to the brain through a specific saturable
mechanism: the “C” and perhaps “A” isoforms of LR were thought to act as a “leptin trans-
porter” (Smith et al, 2002). As reviewed recently by Ahima (2005), in normal animals, leptin
transport to brain is partially saturated over a wide physiological range, from low levels associ-
ated with fasting to high levels in obesity. In rodents, blood-brain leptin transport is decreased
in diet-induced obesity and aging, and might contribute to leptin resistance, excess adiposity
and glucose intolerance. In humans, concentrations of leptin are 100-1000-fold higher in
plasma than in cerebrospinal fluid, and correlate positively with total body fat mass. The cere-
brospinal fluid to plasma leptin ratio is lower in obesity, suggesting a reduction in efficiency of
leptin uptake.
Numerous studies evaluated the localization of LR messenger RNA (mRNA) within the
hypothalamus in several species (rodents, primates: Ahima, 2005; ruminants: Dyer et al.,
1997; Ren et al., 2002): LR is enriched in the arcuate, dorsomedial, ventromedial and ventral
premamillary hypothalamic nuclei. Moderate levels of LR mRNA are detectable in the
periventricular region and posterior hypothalamic nucleus, whereas low levels are found in the
paraventricular nucleus and lateral hypothalamic area. Among them the arcuate nucleus, medial
preoptic area, and median eminence are rich also in GnRH neurons (Dyer et al., 1997). The
hypothalamus transduces leptin signals into neural responses, which cause alterations in feed
intake, and reproduction (Tang-Christensen et al., 1999; Ahima, 2005). LR mRNA has
been co-localized with neuropeptides involved in energy homeostasis, as well as in growth
hormone releasing hormone (GHRH) and/or gonadotropin releasing hormone (GnRH) pro-
19
duction. Neuropeptide Y (NPY) and agouti-related protein (AGRP), which stimulate feeding,
are present in the same neurons in the medial arcuate nucleus. An increase in leptin directly
suppresses the signaling of NPY and AGRP, thus inhibits feed intake (Kotz et al., 1998; Jang
et al., 2000; Ahima, 2005). Other orexigenic peptides, such as melanin-concentrating hor-
mone (MCH) and orexins, are synthesized in the lateral hypothalamic area, and are inhibited
indirectly by leptin. Because MCH and orexin neurons project to the cerebral cortex, they
might provide a channel for transducing the effect of leptin to higher centers to coordinate
feeding with sleep-wake cycles and other complex functions. Leptin increases the levels of
anorectic peptides, α-melanocyte stimulating hormone (α-MSH) derived from proopio-
melanocortin (POMC) and cocaine and amphetamine-regulated transcript, in the lateral arcu-
ate nucleus. Second order neurons that synthesize corticotropin-releasing hormone (CRH),
thyrotropin-releasing hormone (TRH) and oxytocin in the paraventricular nucleus, are con-
trolled indirectly by leptin, and mediate the inhibitory effects of leptin on feed intake, stimula-
tion of thermogenesis and neuroendocrine secretion (Ahima, 2005).
Leptin administration stimulated the production of the gonadotrophins (LH and FSH)
from the hypophysis mainly via GnRH-neurons in the hypothalamus (Woller et al., 2001; Wa-
tanobe, 2002; Amstalden et al., 2003). Also direct hypophyseal effects of leptin on secretion
of FSH and LH may exist, since full-length LR mRNA was present in the anterior pituitary of
sheep (Dyer et al., 1997) and pigs (Lin et al., 2000). Leptin also directly affected basal and
GHRH-mediated GH secretion from the hypophysis (McMahon et al., 2001; Zieba et al.,
2003a).
3.5.2. Leptin and energy homeostasis
When plasma leptin is elevated, the appetite and dry matter intake may be reduced.
Leptin decreases insulin and glucocorticoids, and stimulates GH, catecholamine and thyroid
hormone secretions. It could act not only as an endocrine signal in the brain and/or in the large
number of peripheral tissues in which LR is expressed, but also as an autocrine/paracrine regu-
latory factor within tissues where it is produced (Barb et al., 2001b; Kershaw and Flier,
2004; Chilliard et al., 2005; Zieba et al., 2005). Due to its effects on the central nervous
system and endocrine glands, and/or to its direct peripheral role, leptin (i) increases the insulin
sensitivity, glucose utilization and energy expenditure (in muscles), (ii) enhances the fatty acid
20
oxidation (in muscles and liver), (iii) stimulates the lipolysis (in WAT), and (iv) inhibits the lipo-
genesis (in hepatocytes and/or WAT). This stimulation of fatty acid oxidation is probably the
key event for the tissue lipid lowering and insulin-sensitizing effects of leptin (Ahima et al.,
1996; Havel, 2004). This was demonstrated recently to occur through a direct or indirect (via
either the central nervous system, or a putative inhibition of stearoyl-CoA desaturase-1 activ-
ity) stimulation of AMP kinase, which inactivates the acetyl-CoA carboxylase and decreases
the malonyl-CoA concentration, thus stimulating the intra-mitochondrial carnitine palmitoyl
transferase-1-mediated fatty acid oxidation (Cohen et al., 2002; Unger, 2003). This complex
physiological role of leptin identified at the beginning in lab rodents, has already been demon-
strated in Primates (Blücher and Mantzoros, 2003; Henson and Castracane, 2003;
Messinis and Domali, 2003), and recently also in monogastric farm mammals (pig: Spurlock
et al., 1998; Barb et al, 2001b, Barb and Kraeling, 2004; horse: Fitzgerald and McManus,
2000; McManus and Fitzgerald, 2000) and ruminants (Chilliard et al., 1998, 2001 and
2005; Ingvartsen and Boisclair, 2001; Vernon et al., 2001 and 2002; Zieba et al., 2005).
Injections of leptin caused a rapid decrease in feed intake and body weight in mice
(Campfield et al., 1995; Halaas et al., 1995), monkeys (Tang-Christensen et al., 1999) and
pigs (Barb et al., 1998). When genetically obese (ob/ob) mice were pair-fed with leptin-
treated ob/ob animals, they lost 30 % less weight than the leptin treated ob/ob mice (Camp-
field et al., 1995). This data suggested that besides its effect on feed intake via hypothalamic
NPY neurons, leptin could also play an important role in regulating fat mobilization (Halaas et
al., 1995). Using an ovariectomized ewe model, the satiety effect of leptin was also observed
in ruminants by administration of recombinant human leptin in ewes for 3 days. This treatment
caused a decrease in voluntary dry matter intake to approximately a third of the normal intake
(Henry et al., 1999). However, this effect was lost when the ewe lambs were underfed and
leptin was administered (Morrison et al., 2001).
3.5.3. Leptin and reproduction
The involvement of an adipocyte-yielded hormone in regulation of reproduction was
supposed by the first studies with homozygote carriers of the mutant “obese (ob) gene”: these
ob/ob mice were infertile with atrophized genitals (Ingalls et al., 1950), due to the compete
lack of their gonadotrophin production. In later experiments with ob/ob mice (Barash et al.,
21
1996; Chehab et al., 1996) leptin treatment increased serum LH and FSH concentrations,
ovarian and testicular weight and sperm counts. Furthermore, repeated administration of leptin
to female ob/ob mice resulted in ovulation, and after copulation also pregnancy and parturition.
Leptin administration stimulated GnRH producing neurons in the hypothalamus, and directly
stimulated the hypophysis to produce LH and FSH. In rodents, in the arcuate nucleus leptin
binding increased during fasting (Baskin et al., 1999), and fasting for 48 h on d 13 and 14
postpartum prolonged lactational anestrus, a response that is eliminated by central or periph-
eral administration of leptin (Abizaid et al., 2004). In ruminants less information is available,
but leptin seems to be responsible for changes in LH secretion in animals that are suffering
severe energy shortage. In ruminants, recombinant ovine leptin administration to fasted mature
beef cows stimulated LH secretion (Amstalden et al., 2002), and in fasted ovariectomized
dairy cows leptin affected LH secretion in a dose-dependent manner (Zieba et al., 2003b).
However, also contradictory findings were published. In ovariectomized food-restricted ewes,
and in well-fed and undernourished ewe lambs, intracerebro-ventricular infusions of recombi-
nant ovine leptin did not affect plasma concentrations of LH or FSH, LH pulse frequency or
amplitude (Henry et al., 1999; Morrison et al., 2001). Furthermore, intravenous administra-
tion of leptin did not affect LH secretion in growing pre-pubertal ewe lambs (Morrison et al.,
2002). Despite these inconsistencies, which may result from differences (in nutrition, body
condition, reproductive status and/or gender) of animals used in various studies, the concept
on permissive role of leptin modulating the central regulation of reproduction is fully accepted
nowadays (Smith et al, 2002; Williams et al., 2002; Barb et al., 2004; Zieba et al., 2005).
Leptin acts also directly in the ovary, and is supposed to influence the cell proliferation
and steroidogenic activity there. However, our related knowledge is limited. In an in vitro cell
culture study, high doses of leptin, equivalent with elevated (supraphysiological: 10 to 300
ng/ml) plasma concentrations, could both increase the insulin-induced proliferation of thecal
cells, and inhibit steroidogenesis in bovine ovarian tissues (Spicer et al., 2000; Spicer, 2003).
These supraphysiological levels may occur in obese women suffering from type-2 diabetes,
and are thought to have relevance in pathogenesis of polycystic ovary syndrome (Magoffin et
al., 2003). [However, the correspondingly high plasma levels of leptin are exceptional in farm
mammals: in our lab we have never measured yet leptin levels of about >0.850 nmol/l (= 13.6
ng/ml) and >1.250 nmol/l (= 20.0 ng/ml) in samples taken from lactating and non-lactating
22
ruminants, respectively.] In ewes with ovarian autotransplant the passive immunization against
leptin increased the E2 secretion, whereas the direct ovarian arterial infusion of low dose leptin
decreased the E2 and stimulated the P4 production (Kendall et al., 2004).
The first ovulation and the subsequent onset of cyclic ovarian function at puberty, in the
postpartum period and – in seasonal breeders – at the beginning of the breeding season
are strictly influenced by nutrition and body condition (Senger, 2003; Schneider, 2004). The
key driver of ovarian transition is the increase in GnRH / LH pulse frequency. Since the late
eighties metabolic hormones (insulin, IGF-I, and recently also leptin) have been postulated as
modulators in this mechanism (in rodents and Primates: Blücher and Mantzoros, 2003; Mann
and Plant, 2003; Abizaid et al., 2004; pig: Barb et al., 2001a, 2001b and 2004; horse: Gen-
try and Thomson, 2002; Gentry et al., 2002; Heidler et al., 2002; Waller et al., 2006; rumi-
nants: Chilliard et al., 1998; Smith et al., 2002; Williams et al., 2002; Diskin et al., 2003;
Foster and Jackson, 2003; Zieba et al., 2005; Blache et al., 2007).
The clearest involvement of these metabolic hormones has been demonstrated in post-
partum dairy cows : during the early weeks of lactation the NEB is associated with reduced
plasma concentrations of insulin, IGF-I, and leptin, and increased secretion of GH (Beam and
Butler, 1997, 1998 and 1999; Kadokawa et al., 2000; Block et al., 2001; Huszenicza et al.,
2001; Butler et al., 2003). Also thyroid hormones are involved in the metabolic adaptation to
early lactation (Blum et al., 1983; Pethes et al., 1985; Capuco et al., 2001; for further details
please, see our recent review: Huszenicza et al., 2002). These hormones are thought to act at
hypothalamic, pituitary, and ovarian levels to link changes in reproductive activity to changes in
energy balance. The earliest data of Kadokawa et al. (2000) showed that BCS was still ele-
vated when leptin concentrations began to decrease several days before parturition, and were
still reduced when leptin concentrations started to increase before the postpartum first ovula-
tion. This tendency in leptin-ovary interaction was confirmed soon by others (Huszenicza et
al., 2001; Liefers et al., 2003). In a recent trial of Kadokawa et al. (2006) multiparous cows
(n=18) were studied on d 14 postpartum, before the first ovulation, and during the period of
NEB. Blood (plasma) samples were taken at 10-min intervals for 8 h. All samples were as-
sayed for LH and GH, and hourly samples for NEFA, insulin, IGF-I and leptin. Frequency of
LH pulses was correlated positively with energy balance (r= +0.51) and plasma leptin concen-
trations (r= +0.73). Amplitude of the LH pulses was correlated only with leptin (r= +0.53).
23
Frequency of GH pulses was not correlated with any measure of LH secretion, but was corre-
lated negatively with plasma concentrations of insulin (r= -0.62) and IGF-I (r= -0.61). First
ovulation was observed 34±4 d after parturition. These observations reveal an important link-
age between pulsatile LH secretion and blood leptin concentrations during the early postpar-
tum period in dairy cows, when their energy balance is negative, and may explain the delay in
ovulation. Thus, it seems likely that leptin and IGF-I interact in controlling the resumption of
cyclic ovarian function, which confirms the proposed permissive role of leptin in modulation of
ovarian function shifting from anovulatory-acyclic to ovulatory-cyclic (Smith et al, 2002; Wil-
liams et al., 2002; Zieba et al., 2005; Blache et al., 2007).
At the beginning of the breeding season (during the late winter - early spring transi-
tional period), mares in poor body condition, and receiving restricted daily ration exhibited
lower leptin levels and more prolonged anovulatory season, compared to those in high body
condition, and affected by the same feed restriction (Gentry et al., 2002). However, the ovar-
ian pattern of mares with continuously high plasma leptin levels (idiopathic hyperleptinaemia;
see also Chapter 3.3.) was the same, as of their stud mates with the same body condition, and
receiving the same diet, but showing normal (lower) plasma leptin (Waller et al., 2006). It
proves that the excessive (but not supraphysiological) leptin concentrations – given by a con-
stant, good body condition – do not modulate the time of first ovulation.
In a most recent study interaction of insulin, IGF-I and leptin has been demonstrated
also in modulation of male puberty (Brito et al., 2007).
3.6. Leptin in pregnancy and lactation
According to the experiences in lab rodents and Primates (Ashworth et al., 2000;
Christou et al., 2003; Henson and Castracane, 2003; Islami and Bischof, 2003; Waddell
and Smith, 2003; Yoon et al., 2005; Zieba et al., 2005), both leptin and LR mRNA are pre-
sent in the endometrium and placenta, and also in the fetus. So – simultaneously with a meta-
bolic effect of maternal leptin (see below, and also in Chapter 3.5.2.) – the local intrauterine
activity of leptin-LR system may be an important regulator of implantation, as well as of the
placental and fetal growth and development.
Maternal leptin levels may vary depending on the stages of pregnancy and lactation
(Bonnet et al, 2002a; Vernon et al., 2002). During pregnancy the plasma leptin increases
24
significantly in several species, due to either the enhanced expression of placental leptin mRNA
(in Primates and rat), or a dramatic elevation in plasma content of soluble LR, which serve as
binding proteins in circulation, and decrease the renal leptin clearance (in mice) (Ashworth et
al., 2000; Henson and Castracane, 2003; Islami and Bischof, 2003; Waddell and Smith,
2003). In ruminants the degree of placental leptin gene expression is negligible (Ehrhardt et
al., 2001; Vernon et al., 2002), and the current knowledge is uncertain concerning the pres-
ence or absence of circulating leptin binding proteins in the blood (Chapter 3.2.). Despite of
these facts, along the gestation elevated plasma leptin levels were reported to occur in ewes
(Ehrhardt et al., 2001; Thomas et al., 2001) and nulliparous (but not in lactating primiparous)
goats (Bonnet et al., 2005). It is not known, however, whether this pregnancy-related eleva-
tion in ovine leptin is associated with number of fetuses, circulating level of insulin and
gestagens, and – during the latest days of gestation – with hyperketonaemia / pregnancy tox-
aemia. In cattle, no study has been performed yet to measure leptin levels during early and mid
pregnancy in non-lactating animals. During late pregnancy the plasma leptin was high in not
milked, dry cows, and it declined to a nadir towards parturition (Kadokawa et al., 2000;
Block at al., 2001; Liefers et al., 2003). Not only in cattle but in all mammalian species which
have been investigated, these peri-parturient changes may be age/parity-related, associated
with the feed intake and health of the animal, and also influenced by the management and feed-
ing system/technology. However, further studies are required to reveal the details.
The increase in leptin concentration during pregnancy seems to be paradoxical as this is
a period of increased nutritional demands, thus not a period in which the actions of leptin are
expected to increase. However, simultaneously with this pregnancy-associated elevation of
plasma leptin level, in rodents and Primates (and presumably also in ruminants) a leptin resis-
tance state is present (Mounzih et al., 1998; Ashworth et al., 2000; Seeber et al., 2002;
Henson and Castracane, 2003; Islami and Bischof, 2003; Waddell and Smith, 2003),
which prevents a decrease in feed intake (see also Chapter 3.5.2.). This pregnancy-associated
leptin resistance has clear species-dependent characters. (i) In mice, concentration of circulat-
ing binding proteins (soluble LR) is elevated, so most plasma leptin is present in a bound, inac-
tive form. (ii) In rat and Primates, decreased hypothalamic expression of the signaling form of
the LR, and/or an impaired transport of leptin across the blood brain barrier (see also Chapter
3.5.1.) might be responsible for the leptin resistance during pregnancy (Garcia et al., 2000;
25
Seeber et al., 2002). In pregnant ruminants, no studies on hypothalamic leptin receptor ex-
pression, or leptin permeability of blood-brain barrier have been performed yet. Due to this
leptin resistance during pregnancy, the negative feedback signal of elevated level of leptin on
dry matter intake is not present, and the consequent raise in body condition results in further
increase in leptin gene expression. This was confirmed in studies with rodents (Kawai et al.,
1997), and also with sheep (Ehrhardt et al., 2001).
After parturition this resistance state decreases, because more LRs – both long (signal-
ing) and short (transport) forms – are expressed at hypothalamic level (Garcia et al., 2000;
Sorensen et al., 2002), which results in a higher sensitivity to leptin. There is a possibility that a
certain level of hypothalamic sensitivity to leptin has to be reached before GnRH neurons are
activated and able to stimulate gonadotrophin secretion from the hypophysis (see also Chapter
3.5.3.).
As it was mentioned earlier (Chapter 3.3.), regardless of the species the circulating
leptin level starts to decline rapidly towards parturition. Several hypotheses have been pro-
posed for the reasons of this decline. In lab rodents the suckling stimulus by itself did not ap-
pear to influence the decrease in leptin concentration (Brogan et al., 1999). Pickavance et al.
(1998) observed that the food intake-induced leptin increase was eliminated during lactation
and they speculated that the hypoleptinemia may be an important factor promoting the hyper-
phagia resulted from lactation. The energetic cost of milk production is a determining factor in
falling of circulating leptin levels towards and during lactation. In dairy cows, towards lactation
NEB is initiated due to a decline in dry matter intake together with an increased energy de-
mand of the fetus (Hayirli et al., 2002). As a result adiposity decreases, which down-
regulates the leptin expression. Block et al. (2001) showed that there was a large similarity
between the periparturient energy balance and plasma leptin curves. This suggests that a pos-
sible explanation of the decline in leptin levels towards parturition is the fatty acid mobilization
from the adipose tissue. Also the inhibition of leptin expression by adipose tissue in early lacta-
tion (Block et al., 2001; Sorensen et al., 2002) could be one of the reasons of the low leptin
levels during lactation. Another option is the regulation of leptin expression by insulin and GH.
The onset of NEB around parturition was also associated with decreased plasma insulin and
increased plasma GH (Block et al., 2001), suggesting that both hormones could mediate a
portion of the effect of energy balance on plasma leptin. Evidence supporting this idea exists in
26
rodents and humans, with insulin increasing and GH decreasing plasma leptin (Ahima and
Flier, 2003). Administration of insulin increased circulating leptin in both late pregnant and
early lactating cows, whereas GH treatment did not reduce plasma leptin (Block et al., 2003;
Leury et al. 2003). This suggested that GH has no direct effect on leptin concentrations during
the periparturient period. Sauerwein et al. (2004) investigated early pregnant (10 weeks) and
non-pregnant (100 days postpartum) cows, and found that GH treatment reduced leptin con-
centrations only during early pregnancy. So it may be concluded, that in ruminants the decline
in plasma leptin levels towards parturition is probably caused by several mechanisms. These
are the decline in adiposity, the decreased expression of leptin in adipose cells and the decline
in insulin concentrations.
3.7. Leptin in pathology of viral and prion-associated diseases
Persistent infection with bovine viral diarrhea virus was reported to cause diabetes melli-
tus in heifers (Murondoti et al., 1999). Diabetes mellitus is an important area of leptin-related
research in the human medicine, with clear clinical orientation. To the best of our knowledge,
however, there have not been data available on leptin levels in diabetic cattle. Multiple endo-
crine alterations are common features in prion-associated neurodegenerative disorders.
Scrapie-affected ewes exhibited more elevated mean insulin and GH concentrations, higher
GH pulse frequencies and lower total thyroxine (T4) levels than their healthy counterparts, but
their plasma IGF-I and leptin remained unchanged (Viguié et al., 2004).
3.8. Leptin in the inflammation-challenged cytokine-endocrine cascade
The inflammatory response to bacterial infections, especially that one induced by Gram-
negative (GN) pathogens and the subsequent endotoxin release, involves a complex cyto-
kine-endocrine cascade, with the multiple implication of leptin (McCann et al., 2003). Natural
or experimental infection with GN pathogens, like the administration of endotoxin induce in-
tense release of pro-inflammatory mediators, such as cytokines (IL-s, TNF-α and others),
eicosanoids (leukotrienes and other prostanoids) and oxygen free radicals (nitric oxide and
others), furthermore histamine, serotonin and complement fragments in the blood stream (in
GN sepsis) or in the infected organ (in cattle: Escherichia coli mastitis, puerperal metritis)
(Giri et al., 1984; Cullor, 1992; Salyers and Whitt, 1994; Sandholm et al., 1995; Sordillo
27
and Daley, 1995; Dohmen et al., 2000; Mateus et al. 2003; pathophysiology of endotoxin
loading and neutralization: reviewed by Jánosi et al., 1998). Although the outer membrane of
Gram-positive (GP) pathogens does not contain endotoxin, many layers of a mucopeptide
(peptidoglycan) are located in their cell wall. Like endotoxin this component of GP pathogens
has been supposed to possess the capability for inducing pyretic and cytokine (TNF-α) re-
sponses (Salyers and Whitt, 1994; Sordillo and Daley, 1995). As a recent improvement,
milk-derived cells from affected mammary glands contained increased amounts mRNA for IL-
1α, IL-1β , IL-10, IL12 and TNF-α in response to chronic Staphylococcus aureus (S.
aureus) infection (Riolett et al., 2001), and enhanced TNF-α, IL-1β and IL-8 release was
observed in experimentally induced Streptococcus uberis mastitis (Rambeaud et al., 2003).
These cytokine-mediated neuroendocrine changes play key role in induction of systemic
signs and metabolic consequences of the inflammatory process. When the pro-inflammatory
cytokines (TNF-α, IL-s) and other products of activated immune cells (mainly of macro-
phages) reach the central nervous system, these mediators initiate pyretic reaction and
marked changes in secretory pattern and/or serum level of numerous hormones. The cyto-
kine-induced endocrine alterations have dose- and species-dependent character (Cullor,
1992; Sandholm et al., 1995; Sordillo and Daley, 1995), and involve the malfunctions of the
anterior pituitary, adrenal (both the cortical and medullar parts) and thyroid glands, the endo-
crine pancreas, furthermore the GH-IGF-I axis and gonad (further details are given in Chapter
5.7., and also in some of our recent review papers: Huszenicza et al., 2004; Kulcsár et al.,
2005; Földi et al., 2006).
There is increasing evidence obtained in lab rodents (Houseknecht et al., 1998; Fan-
tuzzi and Faggioni, 2000; McCann et al., 2003) and primates (Landman et al., 2003; Xiao
et al., 2003) showing that leptin exerts numerous effects on inflammatory response and im-
mune system. However, data evaluating the same role of leptin in domestic mammals (pig:
Spurlock et al., 1998; Leininger et al., 2000; Barb et al. 2001b; ruminants: Soliman et al.,
2001 and 2002; Nikolic et al., 2003; Waldron et al., 2003) are just at the beginning to
emerge. Although the seasonal changes of plasma leptin and immune status were studied re-
cently in mares (Ferreira-Dias et al., 2005), up to now there have not been data yet on in-
flammation-related leptin changes in the horse.
28
The earliest data on leptin suggested that it might be the signal protein by which informa-
tion regarding the adequacy of peripheral fat stores is communicated to the central nervous
system, with decreases in plasma leptin content playing a central role in triggering adaptive
responses to starvation (Ahima et al., 1996). Leptin regulates both the appetite and the energy
expenditure. So it was attractive to postulate that the endotoxin-induced hyperleptinemia sup-
presses the appetite and prevents the usual compensatory responses to starvation. The pri-
mary etiologic role of this mechanism was hypothesized in anorexia and cachexia, syndromes
of depressed appetite and weight loss related to endotoxicosis and many chronic diseases
including cancer (Berkowitz et al., 1998). Both the endotoxin and TNF-α administrations
prevented the fasting-induced decrease of leptin mRNA and plasma leptin in hamsters (Grun-
feld et al., 1996). Increasing doses of E. coli endotoxin resulted in dose-dependent elevations
of leptin mRNA in fat cells, as well as of plasma leptin level in mice. Changes in fat cell leptin
mRNA concentrations were preceded by a threefold increase in adipocyte TNF-α mRNA.
Moreover, exogenous TNF-α was sufficient to induce changes in leptin mRNA identical to
those seen with endotoxin (Berkowitz et al., 1998), suggesting that endotoxin alters the syn-
thesis of this protein in the fat tissue, and this effect is mediated by TNF-α.
Leptin can modulate the inflammatory response: rhesus monkeys with low plasma leptin
level (Xiao et al., 2003) and genetically leptin-deficient (ob/ob) or leptin receptor-deficient
(db/db) mice (Faggioni et al., 1997; Takahashi et al., 1999; Madiehe et al., 2003) are more
sensitive to endotoxin and TNF-α than their counterparts. In normal mice, fasting is associated
with a fall in leptin levels and an increased susceptibility to endotoxin shock. Both the fasting-
induced and ob/ob-related forms of increased endotoxin sensitivity can be reversed by leptin
administration (Faggioni et al., 1999 and 2000a). In rhesus monkeys both the single-dose
(100-200 µg) and repeated-dose (6 injections of 100 µg/occasion over a 4-d period) en-
dotoxin administrations induced leptin release in all animals (Landman et al., 2003). However,
their pre-treatment with recombinant human leptin (rhleptin, at a dose of 50 µg/h) diminished
the cytokine and hypothalamic-pituitary-adrenal responses to endotoxin (Xiao et al., 2003).
There was a significant correlation between the mean baseline leptin level and the percent in-
crease in leptin over baseline on the last day of the multiple endotoxin treatment (Landman et
al., 2003). Low-dose (2-3 ng/kg) intravenous administration of E. coli endotoxin was re-
ported to increase the circulating leptin level in healthy postmenopausal women (Landman et
29
al., 2003). Thus, leptin appears to exert important anti-inflammatory effects. Currently it is still
unknown whether increased basal leptin levels are protective during a subsequent episode of
sepsis, but these data suggest that suppressed leptin levels during starvation or wasting illness
could increase the vulnerability to sepsis. It has been thought since the beginning (Stouthard et
al., 1995) that circulating inflammatory cytokines (IL-1β and TNF-α), rather than the locally
produced TNF-α, are responsible for the observed effects of endotoxin on leptin mRNA in
adipocytes and plasma leptin (Grunfeld et al., 1996; Sarraf et al., 1997; Faggioni et al.,
1998; Finck et al., 1998; Francis et al., 1999). Endotoxin failed to stimulate leptin in IL-1β-
deficient mice or in normal mice treated with the soluble IL-1 receptor (Faggioni et al., 1998;
Francis et al., 1999). Systemic cytokines could act directly on the adipocyte, or indirectly, via
diverse effects on hormonal secretion and autonomic nervous system activity. In rats ketamine
anesthesia decreased the plasma leptin concentration within 10 min to a minimum at 120 min,
followed by a rebound at 360 min, and largely blunted the endotoxin-induced leptin release.
Also further evidences summarized in Table 3.8.1. propose the implication of neurohormonal
control mechanisms (Mastronardi et al., 2001; McCann et al., 2003), suggesting that leptin
release is inhibited by the sympathetic nervous system, and this inhibitory effect is mediated
principally by α-adrenergic receptors. Dopaminergic neurons may inhibit the basal and en-
dotoxin-induced leptin release by suppression of prolactin release from the anterior pituitary.
As it has been discussed, endotoxin also stimulates the hypothalamus-anterior pituitary-
adrenal axis, which may exert secondary effects on leptin release. Glucocorticoids have been
reported to block the endotoxin-induced leptin release (Mastronardi et al., 2000). The at-
tenuation of the ACTH and cortisol responses to endotoxin in leptin treated monkeys (Land-
man et al., 2003) may be secondary to a less extended release of pro-inflammatory cytokines
which are known to mediate the stimulatory effects of endotoxin on the hypothalamus-
pituitary-adrenal axis (Turnbull and Rivier, 1999). Leptin also stimulates the expression of
POMC in the hypothalamus which is processed to α MSH (Mol and Rijnberk, 1997), a neu-
ropeptid which has well-documented anti-inflammatory effects (Cheung et al. 1997). α-MSH
can modulate the inflammatory response by acting on melanocortin receptors both within the
brain and on immune cells in the periphery. It is thus likely that endotoxin affects leptin expres-
sion and release by more than one mechanism and that there may be species differences with
respect to the regulatory mechanisms of leptin response to endotoxin.
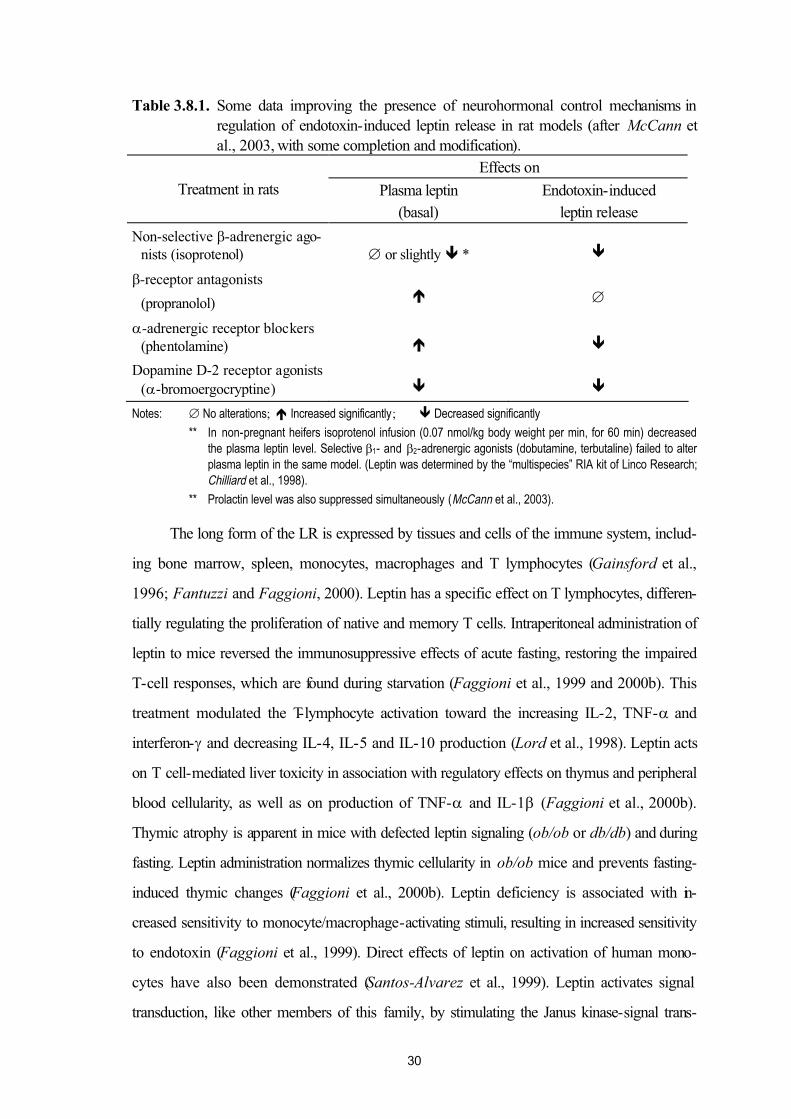
30
Table 3.8.1. Some data improving the presence of neurohormonal control mechanisms in regulation of endotoxin-induced leptin release in rat models (after McCann etal., 2003, with some completion and modification).
Effects onTreatment in rats Plasma leptin
(basal)Endotoxin-induced
leptin release
Non-selective β-adrenergic ago-nists (isoprotenol) ∅ or slightly ê * ê
β-receptor antagonists
(propranolol) é ∅
α-adrenergic receptor blockers(phentolamine) é ê
Dopamine D-2 receptor agonists(α-bromoergocryptine) ê ê
Notes: ∅ No alterations; é Increased significantly; ê Decreased significantly
** In non-pregnant heifers isoprotenol infusion (0.07 nmol/kg body weight per min, for 60 min) decreased
the plasma leptin level. Selective β1- and β2-adrenergic agonists (dobutamine, terbutaline) failed to alter
plasma leptin in the same model. (Leptin was determined by the “multispecies” RIA kit of Linco Research;
Chilliard et al., 1998).
** Prolactin level was also suppressed simultaneously (McCann et al., 2003).
The long form of the LR is expressed by tissues and cells of the immune system, includ-
ing bone marrow, spleen, monocytes, macrophages and T lymphocytes (Gainsford et al.,
1996; Fantuzzi and Faggioni, 2000). Leptin has a specific effect on T lymphocytes, differen-
tially regulating the proliferation of native and memory T cells. Intraperitoneal administration of
leptin to mice reversed the immunosuppressive effects of acute fasting, restoring the impaired
T-cell responses, which are found during starvation (Faggioni et al., 1999 and 2000b). This
treatment modulated the T-lymphocyte activation toward the increasing IL-2, TNF-α and
interferon-γ and decreasing IL-4, IL-5 and IL-10 production (Lord et al., 1998). Leptin acts
on T cell-mediated liver toxicity in association with regulatory effects on thymus and peripheral
blood cellularity, as well as on production of TNF-α and IL-1β (Faggioni et al., 2000b).
Thymic atrophy is apparent in mice with defected leptin signaling (ob/ob or db/db) and during
fasting. Leptin administration normalizes thymic cellularity in ob/ob mice and prevents fasting-
induced thymic changes (Faggioni et al., 2000b). Leptin deficiency is associated with in-
creased sensitivity to monocyte/macrophage-activating stimuli, resulting in increased sensitivity
to endotoxin (Faggioni et al., 1999). Direct effects of leptin on activation of human mono-
cytes have also been demonstrated (Santos-Alvarez et al., 1999). Leptin activates signal
transduction, like other members of this family, by stimulating the Janus kinase-signal trans-
31
ducer and activator of transcription pathway. Leptin also induces the expression of SOCS-3,
a member of the suppressor of cytokine signaling (SOCS) proteins, which inhibits cytokine
signal transduction (Bjorbaek et al., 1998; Auernhammer et al., 2001). Leptin may modulate
the production of pro-inflammatory and anti-inflammatory cytokines and may also affect cyto-
kine signaling by a variety of mechanisms, including activation of SOCS-3. Thus leptin has a
role in linking nutritional status to cognate cellular immune function, and provides a molecular
mechanism to account for the immune dysfunction observed in starvation.
The course of the endotoxin-induced leptin response is quite different in rodents com-
pared to primates. In mice and rat the experimental administration of endotoxin evoked a rapid
and long-lasting increase in plasma leptin concentrations with the first detected elevation within
10 min (due to a endotoxin-stimulated release of stored hormone from the pinocytotic vesicles
of adipocytes), and a plateau of its doubled circulating level from 2 to 6 h (accounted for the
highly significant increase in leptin mRNA) (Finck et al., 1998; Francis et al., 1999; Mastro-
nardi et al., 2000). In contrast, in human and monkey subjects no effect is seen during the
initial 7-h period after endotoxin injection, but a stimulatory effect becomes evident by 16-24-
h after injection (Landman et al., 2003). The reasons for these species-related differences are
currently unknown. We discussed only the short-term effects of endotoxin administration: cur-
rently it is still unknown whether long-standing infections are characterized by chronically ele-
vated leptin levels.
3.9. Leptin in the current production- reproduction- and clinical-oriented research
In the human medicine, searching of new principles and drugs for reducing the body fat
content / body weight was the main driving force of clinical-oriented leptin research at the be-
ginning. However, leptin administration is suitable to induce weight loss only in patients with
non-functional leptin in their circulation, and this genetic aberration is very exceptional. So the
physiological limitation of this concept was recognized soon. Since than some leptin-related
aspects of type-2 diabetes and some associated problems (polycystic ovary syndrome), hypo-
thalamic form of amenorrhea, pregnancy eclampsia, some inflammatory and autoimmune dis-
eases (asthma, inflammatory bowel disease, rheumatoid arthritis, GN sepsis), as well as of
multiple sclerosis have been in the focus of researchers’ interest (Sinha and Caro, 1998; Ma-
goffin et al., 2003; Poston, 2003; Warren and Dominguez, 2003; Fantuzzi, 2005). Beside
32
some obesity and diabetes research in pat carnivores and horses, in the veterinary medicine
and animal husbandry the physiological role and diagnostic value of leptin are studied in asso-
ciation with nutritional aspects of reproduction, monitoring the effect of some feed additives,
and as a parameter of carcass quality.
4. Materials and Methods
All experiments were conducted within the framework of bilateral (French - Hungarian)
or trilateral (French - Uruguayan - Hungarian, French - Finnish - Hungarian or French - Ser-
bian - Hungarian) international cooperations. Laboratory and statistical procedures and other
methods generally used throughout the studies are described here in this chapter. Some clinical
procedures and statistical methods employed only in one experiment are detailed where that
trial is introduced.
4.1. Animal experimentation. Farm conditions
Animal experimentation was performed in compliance with local regulations where the
trial was conducted, and was permitted and controlled by the competent units of State Veteri-
nary Service (in Hungary), or by the Committee of Bioethics of Veterinary Faculties in Monte-
video (Uruguay; Exp. 4a), Belgrade (Serbia; Exp. 5a) and Helsinki (Finland; Exp. 6 and
Exp. 7a).
For Exp. 2, 4a, 6 and 7a animals of experimental farms were used. Except for these
studies, all the other trials were conducted in commercial flocks and dairy herds in Serbia
(Exp. 5a) or in Hungary (all other trials). Farm conditions and feeding system of three bovine
(Exp. 4a, 6 and 7a), and all of the ovine studies (Exp. 1c, 1d, 2 and 3) are introduced at the
description of experiments.
The further studies in cattle were carried out in one to eight of the same 12 large-scale
dairy herds in Hungary (Exp. 1a, 1b, 1d, 4b, 5b, 7b and 7c) or Serbia (Exp. 5a). In all herds
the cows were kept and fed in free housing system year round, in groups of 80-100 individu-
als, which were formed in accordance with the monthly checked average daily milk produc-
tion. Dry cows were housed separately. The animals calved in continuously used maternity
barns. Calves were weaned immediately after calving, or when the dams left this unit at the end
of the colostral period. Separated groups were formed for fresh-milking young (parity 1) and
33
older (parity ≥2) cows. Groups of cows were fed with total mixed ration (TMR) of ensilaged
maize and alfalfa products, alfalfa and grass hay, as well as with concentrate containing cereals
completed with vitamins and minerals, with no technical facilities for individual feeding. Their
daily ration was calculated in accordance with the NRC (2001) recommendations. Free ac-
cess to drinking water was provided in all experiments. Neither pasturing, nor regular physical
exercise was available. The course of uterine involution was regularly controlled with rectal
palpation (RP) and vaginoscopy, and the bacterial complications were treated with commer-
cially available antimicrobials and uterotonica. Except for those in Exp. 1a and 1e, all cows
showing estrus on day about ≥50 were inseminated (AI), and those not returning to estrus
were checked for pregnancy by RP on day 45-60 after AI. The body condition (BCS) of
cows was estimated using a scale from 1 (emaciated) to 5 (fat) according to Edmonson et al.
(1989). Animals were scored to the nearest quarter point.
4.2. Collection, preparation and storage of samples
In order to determine most of the hormones (leptin, IGF-I, insulin, T3, T4, testosterone,
P4, E2, LH) and metabolites (glucose, NEFA, ßOH-butyrate, BHB and total cholesterol,
TCH), blood samples were taken generally from the jugular or coccygeal (tail) veins in cattle,
and from the jugular vessel in sheep, into sodium fluoride containing tubes (for assaying glu-
cose only; Exp. 3), as well as into heparinized tubes (for any other parameters in all studies).
In Exp. 6 only, the plasma NEFA content was analyzed simultaneously also in plasma samples
collected from the superficial epigastric (mammary) vein. If another schedule is not indicated,
samples were always collected before the morning feeding. All these samples were cooled and
centrifuged within 60 min; plasma was harvested immediately, and stored at +4 oC (if assayed
<48 h), or -20 oC or -60 oC (if assayed only later).
Milk samples for P4 determination were taken from the healthy udder quarters into po-
tassium dichromate containing tubes, and were stored at +4 Co until the assay (Exp. 4b). All
milk samples were assayed within 21 days after collection.
In Exp. 2. also feces (5-10 g) was collected for assaying progesterone metabolites (P4-
met). For this purpose, fecal samples were taken from the rectum, put into plastic sacs, and
frozen and stored at -20 oC until analyzed for P4-met within some weeks.
34
4.3. Laboratory procedures
Laboratory procedures used to assay the various endocrine and metabolic parameters
in the different studies are summarized in Tables 4.3.1. and 4.3.2.
4.3.1. Radioimmunoassay for leptin
Plasma leptin concentration was quantified by a modified version of the ruminant-
specific, homologous, double-antibody, non-equilibrium 125I-RIA of Delavaud et al. (2000,
2002). The current adaptation of this assay was based on the use of an anti-ovine leptin anti-
body yielded by Delavaud et al. (2000) in rabbit. Instead of recombinant ovine leptin, how-
ever, in this version a commercially available form of recombinant bovine leptin (rbleptin6) was
used for radioiodination, as well as for preparing the standards. Furthermore the bound and
free ligands were separated by a magnetisable immunosorbent suspension7, rather than apply-
ing a specific anti-rabbit second antibody. The rbleptin was labeled with 125I by Chloramine T
method (after Hunter and Greenwood, 1962, with modification). Briefly, 5 µg rbleptin in 10 µl
solvent was reacted with 30 MBq 125I (in form of NaI8) and 10 µg Chloramine T9 in boric
acid-borate buffer (0.1 mol, pH 8.6). After one minute mixing the reaction was stopped by
adding 20 µg sodium metabisulfite9. The 125I-rbleptin was separated in a column (20 cm long x
6 DSL-RO 1708-100, Diagnostic Systems Laboratories, Inc., Webster, Texas, USA7 1.0 mg/ml; containing magnetisable iron oxide microparticules coated by anti-rabbit goat IgG; particle size: 1-5 µm; minimum
binding capacity: 2,5 µg IgG/mg (MIS-4100; Isotope Institute Co. Ltd., Budapest, Hungary)8 Institute of Isotopes Co. Ltd., Budapest, Hungary9 Reanal Ltd, Budapest, Hungary

35
Tab
le 4
.3.1
.Ass
ay p
roce
dure
s us
ed fo
r qua
ntifi
catio
n of
var
ious
hor
mon
es in
plas
ma,
milk
and
feca
l sam
ples
Exp
erim
ent
Par
amet
erM
eth
od1a
1b1c
1d1e
23
4a4b
5a5b
67a
7b7c
Horm
on
es i
n p
lasm
a s
am
ple
s
Lep
tin
Loc
al12
5 I-R
IAa
ÈÈ
ÈÈ
ÈÈ
ÈÈ
ÈÈ
ÈÈ
ÈÈ
È
Loc
al12
5 I-R
IAa
ÈÈ
ÈÈ
ÈÈ
Insu
lin-l
ike
grow
th
fact
or-I
(IG
F-I
)12
5 I-IR
MA
(com
-m
erc.
)bÈ
È
Tes
tost
eron
eL
ocal
3 H-R
IAa
È
Loc
al3 H
-RIA
aÈ
ÈÈ
ÈÈ
Pro
gest
eron
e (P
4)12
5 I-R
IA(c
omm
erc.
)cÈ
Cor
tiso
lL
ocal
3 H-R
IAa
ÈÈ
È
125 I-
RIA
(com
mer
c.)d
ÈÈ
ÈÈ
ÈÈ
ÈIn
sulin
125 I-
IRM
A(c
om-
mer
c.)e
ÈÈ
È
125 I-
RIA
(com
mer
c.)f
ÈÈ
ÈÈ
Thy
roxi
ne (
T4)
125 I-
RIA
(com
mer
c.)g
ÈÈ
È
125 I-
RIA
(com
mer
c.)f
ÈÈ
ÈÈ
Tri
iodo
thyr
onin
e(T
3)12
5 I-R
IA(c
omm
erc.
)gÈ
ÈÈ
17β
-est
rad
iol (
E2)
125 I-
RIA
(com
mer
c.)h
È
LH
EL
ISA
(co
mm
erc.
)iÈ
Ho
rmo
nes
in m
ilk
sa
mp
les
Pro
gest
eron
e (P
4)L
ocal
EL
ISA
aÈ
Ho
rmo
ne
met
ab
oli
tes
in f
eca
l sa
mp
les
Pro
gest
eron
e m
eta-
bol
ites
(P
4-m
et)
Loc
al E
LIS
Aa
È
Sam
ples
we
reus
ually
assa
yed
for
vario
us h
orm
ones
in t
he i
soto
pe la
bora
tory
of
Dep
artm
ent o
f O
bste
trics
and
Rep
rodu
ctio
n (F
acul
ty o
f Vet
erin
ary
Sci
ence
, Bud
apes
t, H
unga
ry),
und
er th
e gu
idan
ce o
f
the
cand
idat
e.
Th
e o
nly
exce
ptio
ns w
ere
the
pla
sma
IGF
-I (
inE
xp. 3
,4a,
4b,7
a,7b
and
7c)
and
P4
(inE
xp. 4
a on
ly),
whi
ch w
ere
quan
tifie
d in
par
tner
labo
rato
ries
(IG
F-I
: Ins
titut
e fo
r th
e A
pplic
atio
n of
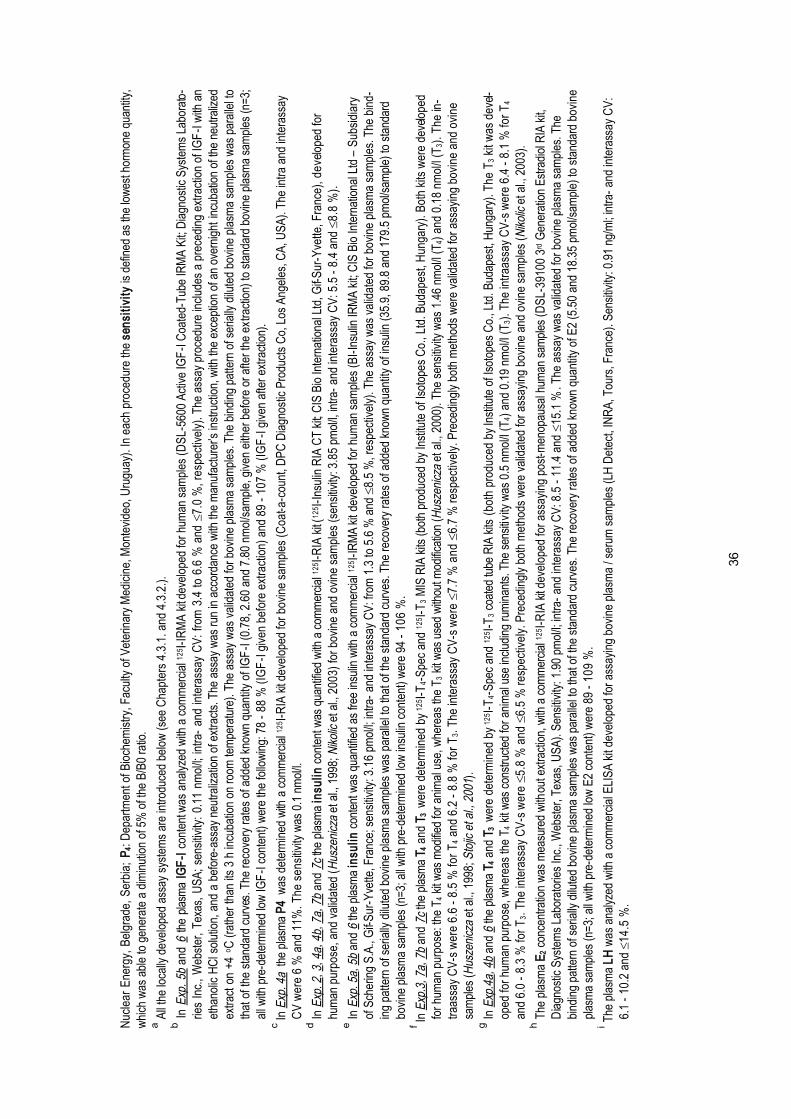
36
Nuc
lear
Ene
rgy,
Bel
grad
e, S
erbi
a; P
4: D
epar
tmen
t of B
ioch
emis
try,
Fac
ulty
of V
eter
inar
y M
edic
ine,
Mon
tevi
deo,
Uru
guay
). In
eac
h pr
oced
ure
the
sensi
tivi
ty is
def
ined
as
the
low
est h
orm
one
quan
tity,
whi
ch w
as a
ble
to g
ener
ate
a di
min
utio
n of
5%
of t
he B
/B0
ratio
.a
All
the
loca
lly d
evel
oped
ass
ay s
yste
ms
are
intr
oduc
ed b
elow
(se
eC
hapt
ers
4.3.
1. a
nd 4
.3.2
.).
bIn
Exp
. 5b
and
6 t
he p
lasm
aIG
F-I
con
tent
was
ana
lyze
d w
ith a
com
mer
cial
12
5I-
IRM
Aki
t dev
elop
ed fo
r hu
man
sam
ples
(DS
L-5
600
Act
ive
IGF
-I C
oate
d-T
ube
IRM
A K
it; D
iagn
ostic
Sys
tem
s La
bora
to-
ries
Inc.
, W
ebst
er,
Tex
as,
US
A;
sens
itivi
ty:
0.11
nm
ol/l;
int
ra-
and
inte
rass
ay C
V:
from
3.4
to
6.6
% a
nd ≤
7.0
%,
resp
ectiv
ely)
. The
ass
ay p
roce
dure
incl
udes
a p
rece
ding
ext
ract
ion
of IG
F-I
with
an
etha
nolic
HC
l sol
utio
n, a
nd a
bef
ore-
assa
y ne
utra
lizat
ion
of e
xtra
cts.
The
ass
ay w
as r
un in
acc
orda
nce
with
the
man
ufac
ture
r’s in
stru
ctio
n, w
ith th
e ex
cept
ion
of a
n ov
erni
ght
incu
batio
n of
the
neut
raliz
ed
extr
act
on +
4 oC
(ra
ther
than
its
3 h
incu
batio
n on
roo
m te
mpe
ratu
re).
The
ass
ay w
as v
alid
ated
for
bovi
ne p
lasm
a sa
mpl
es. T
he b
indi
ng p
atte
rn o
f ser
ially
dilu
ted
bovi
ne p
lasm
a sa
mpl
es w
as p
aral
lel t
o
that
of
the
stan
dard
cur
ves.
The
rec
over
y ra
tes
of a
dded
kno
wn
quan
tity
of IG
F-I
(0.
78, 2
.60
and
7.80
nm
ol/s
ampl
e, g
iven
eith
er b
efor
e or
afte
r th
e ex
trac
tion)
to s
tand
ard
bovi
ne p
lasm
a sa
mpl
es (
n=3;
all w
ith p
re-d
eter
min
ed lo
w IG
F-I
con
tent
) w
ere
the
follo
win
g: 7
8 -
88
% (
IGF
-I g
iven
bef
ore
extr
actio
n) a
nd 8
9 -
10
7 %
(IG
F-I
giv
en a
fter
extr
actio
n).
c In E
xp. 4
a th
e pl
asm
a P
4w
as d
eter
min
ed w
ith a
com
mer
cial
12
5I-
RIA
kitd
evel
oped
for
bovi
ne s
ampl
es (
Co
at-
a-co
unt,
DP
C D
iagn
ostic
Pro
duct
s C
o, L
os A
ngel
es, C
A, U
SA
). T
he in
tra
and
inte
rass
ay
CV
we
re 6
% a
nd
11
%.
Th
e s
en
sitiv
ity w
as 0
.1 n
mol
/l.d
InE
xp. 2
,3,4
a,4b
,7a,
7b a
nd 7
c th
e pl
asm
a in
sulin
con
tent
was
qua
ntifi
ed w
ith a
com
mer
cial
12
5I-
RIA
kit (
12
5I-
Insu
lin R
IA C
T k
it; C
IS B
io In
tern
atio
nal L
td, G
if-S
ur-Y
vette
, Fra
nce)
, d
eve
lope
d fo
r
hum
anpu
rpos
e, a
nd v
alid
ated
(H
usze
nicz
a et
al.,
199
8; N
ikol
ic e
t al.,
200
3)fo
r bo
vine
and
ovi
ne s
ampl
es (
sens
itivi
ty:3
.85
pmol
/l, in
tra-
and
inte
rass
ay C
V: 5
.5 -
8.4
and
≤8
.8 %
).e
In E
xp. 5
a,5b
and
6 th
e pl
asm
a in
sulin
cont
entw
as q
uant
ified
as
free
insu
lin w
ith a
com
mer
cial
12
5I-
IRM
A k
it de
velo
ped
for
hum
an s
ampl
es (
BI-
Insu
lin IR
MA
kit;
CIS
Bio
Inte
rnat
iona
l Ltd
– S
ubsi
diar
y
of S
cher
ing
S.A
., G
if-S
ur-Y
vette
, Fra
nce;
sen
sitiv
ity: 3
.16
pmol
/l; in
tra-
and
inte
rass
ay C
V: f
rom
1.3
to 5
.6 %
and
≤8.
5 %
, res
pect
ivel
y). T
he a
ssay
was
val
idat
ed fo
r bo
vine
pla
sma
sam
ples
. The
bin
d-
ing
patte
rn o
f ser
ially
dilu
ted
bovi
ne p
lasm
a sa
mpl
es w
as p
aral
lel t
o th
at o
f the
sta
ndar
d cu
rves
. The
rec
over
y ra
tes
of a
dded
kno
wn
quan
tity
of in
sulin
(35
.9, 8
9.8
and
179.
5 pm
ol/s
ampl
e) to
sta
ndar
d
bovi
ne p
lasm
a sa
mpl
es (
n=3;
all
with
pre
-det
erm
ined
low
insu
lin c
onte
nt)
wer
e 94
- 1
06
%.
f In E
xp.3
,7a,
7b a
nd 7
c th
e pl
asm
a T 4
and
T3
wer
e de
term
ined
by
12
5I-
T4-S
pec
and
12
5I-
T3 M
IS R
IA k
its (
both
pro
duce
d by
Inst
itute
of I
soto
pes
Co.
, Ltd
. Bud
apes
t, H
unga
ry).
Bot
h ki
ts w
ere
deve
lope
d
for
hum
an p
urpo
se: t
he T
4 k
it w
as m
odifi
ed fo
r an
imal
use
, whe
reas
the
T3 k
it w
as u
sed
with
out m
odifi
catio
n (H
usze
nicz
a et
al.,
200
0). T
he s
ensi
tivity
was
1.4
6 nm
ol/l
(T4)
and
0.18
nm
ol/l
(T3).
Th
e in
-
traa
ssay
CV
-s w
ere
6.6
- 8.
5 %
fo
r T
4 a
nd 6
.2-
8.8
% f
or
T3. T
he in
tera
ssay
CV
-s w
ere
≤7.
7 %
an
d ≤
6.7
% r
espe
ctiv
ely.
Pre
cedi
ngly
bot
h m
etho
ds w
ere
valid
ated
for
assa
ying
bov
ine
and
ovin
e
sam
ples
(H
usze
nicz
a et
al.,
199
8; S
tojic
et a
l., 2
001)
.g
InE
xp.4
a,4b
and
6 th
e pl
asm
a T 4
and
T3
wer
e de
term
ined
by
12
5I-
T4-S
pec
and
12
5I-
T3 c
oate
d tu
be R
IA k
its (
both
pro
duce
d by
Inst
itute
of I
soto
pes
Co.
, Ltd
. Bud
apes
t, H
unga
ry).
Th
e T
3 k
it w
as d
evel
-
oped
for
hum
an p
urpo
se, w
here
as th
e T
4 k
it w
as c
onst
ruct
ed fo
r an
imal
use
incl
udin
g ru
min
ants
. The
sen
sitiv
ity w
as 0
.5 n
mol
/l (T
4)
and
0.19
nm
ol/l
(T3).
The
intr
aass
ay C
V-s
wer
e 6.
4 -
8.1
% f
or
T4
and
6.0
- 8
.3 %
fo
r T
3. T
he in
tera
ssay
CV
-s w
ere
≤5
.8 %
an
d ≤
6.5
% r
espe
ctiv
ely.
Pre
cedi
ngly
bot
h m
etho
ds w
ere
valid
ated
for
assa
ying
bov
ine
and
ovin
e sa
mpl
es (
Nik
olic
et a
l., 2
003)
.h
The
pla
sma
E2
conc
entr
atio
n w
as m
easu
red
with
out e
xtra
ctio
n, w
ith a
com
mer
cial
12
5I-
RIA
kitd
evel
oped
for
assa
ying
pos
t-men
opau
salh
uman
sam
ples
(D
SL
-391
00 3
rd G
ener
atio
n E
stra
diol
RIA
kit,
Dia
gnos
tic S
yste
ms
Labo
rato
ries
Inc.
, Web
ster
, Tex
as, U
SA
). S
ensi
tivity
: 1.9
0 pm
ol/l;
intr
a- a
nd in
tera
ssay
CV
: 8.5
- 1
1.4
and ≤
15.1
%.T
he a
ssay
was
val
idat
ed fo
r bo
vine
pla
sma
sam
ples
. The
bind
ing
patte
rn o
f ser
ially
dilu
ted
bovi
ne p
lasm
a sa
mpl
es w
as p
aral
lel t
o th
at o
f the
sta
ndar
d cu
rves
. The
rec
over
y ra
tes
of a
dded
kno
wn
quan
tity
of E
2 (5
.50
and
18.3
5 pm
ol/s
ampl
e) to
sta
ndar
d bo
vine
plas
ma
sam
ples
(n=
3; a
ll w
ith p
re-d
eter
min
ed lo
w E
2 co
nten
t) w
ere
89 -
10
9 %
.i T
he p
lasm
a L
H w
as a
naly
zed
with
a c
omm
erci
al E
LIS
A k
it de
velo
ped
for
assa
ying
bov
ine
plas
ma
/ ser
um s
ampl
es (
LH D
etec
t, IN
RA
, Tou
rs, F
ranc
e). S
ensi
tivity
: 0.9
1 ng
/ml;
intr
a- a
nd in
tera
ssay
CV
:
6.1
- 10
.2 a
nd ≤
14
.5 %
.
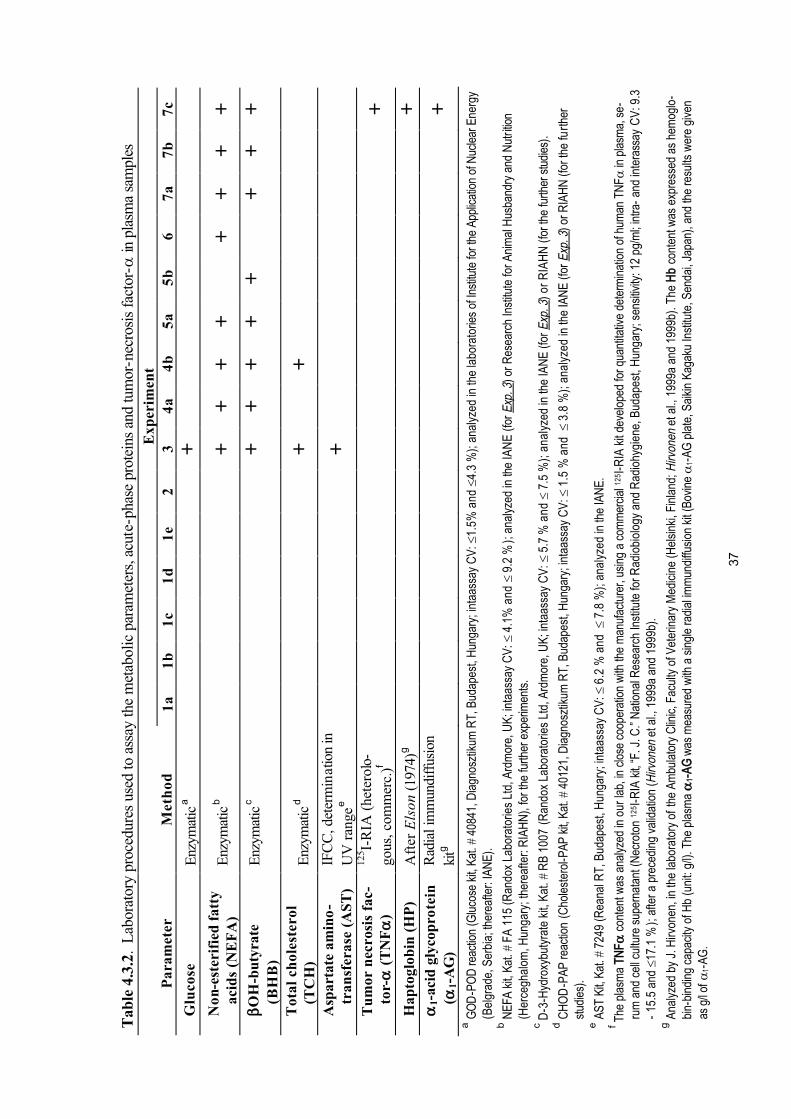
37
Tab
le 4
.3.2
.L
abor
ator
y pr
oced
ures
use
d to
ass
ay th
e m
etab
olic
par
amet
ers,
acu
te-p
hase
pro
tein
s an
d tu
mor
-nec
rosi
s fa
ctor
-α in
pla
sma
sam
ples
Exp
erim
ent
Par
amet
erM
eth
od1a
1b1c
1d1e
23
4a4b
5a5b
67a
7b7c
Glu
cose
Enz
ymat
ica
È
Non
-est
erif
ied
fat
ty
acid
s (N
EF
A)
Enz
ymat
icb
ÈÈ
ÈÈ
ÈÈ
ÈÈ
βO
H-b
utyr
ate
(BH
B)
Enz
ymat
icc
ÈÈ
ÈÈ
ÈÈ
ÈÈ
Tot
al c
hol
este
rol
(TC
H)
Enz
ymat
icd
ÈÈ
Asp
arta
te a
min
o-
tran
sfer
ase
(AST
)IF
CC
, det
erm
inat
ion
in
UV
ran
gee
È
Tu
mor
nec
rosi
s fa
c-to
r-α
(T
NFα
)
125 I-
RIA
(het
erol
o-go
us, c
omm
erc.
)fÈ
Hap
togl
obin
(H
P)
Aft
erE
lson
(19
74)g
È
α1-
acid
gly
copr
otei
n(α
1-A
G)
Rad
ial i
mm
undi
ffus
ion
kitg
È
aG
OD
-PO
D r
eact
ion
(Glu
cose
kit,
Kat
. # 4
0841
, Dia
gnos
ztik
um R
T, B
udap
est,
Hun
gary
; int
aass
ay C
V: ≤
1.5
% a
nd≤
4.3
%);
ana
lyze
d in
the
labo
rato
ries
of In
stitu
te fo
r th
e A
pplic
atio
n of
Nuc
lear
Ene
rgy
(Bel
grad
e, S
erbi
a; th
erea
fter:
IAN
E).
bN
EF
A k
it, K
at. #
FA
115
(R
ando
x La
bora
torie
s Lt
d, A
rdm
ore,
UK
; int
aass
ay C
V: ≤
4.1
% a
nd
≤ 9
.2 %
); a
naly
zed
in th
eIA
NE
(fo
rE
xp. 3
) or
Res
earc
h In
stitu
te fo
r A
nim
al H
usba
ndry
and
Nut
ritio
n
(Her
cegh
alom
, Hun
gary
; the
reaf
ter:
RIA
HN
), fo
r th
e fu
rthe
r ex
perim
ents
.c
D-3
-Hyd
roxy
buty
rate
kit,
Kat
. # R
B 1
007
(Ran
dox
Labo
rato
ries
Ltd,
Ard
mor
e, U
K; i
ntaa
ssay
CV
: ≤5.
7%
an
d ≤
7.5
%);
an
aly
zed
in th
e IA
NE
(fo
r E
xp. 3
) o
rR
IAH
N (
for
the
furt
her
stud
ies)
.d
CH
OD
-PA
P r
eact
ion
(Cho
lest
erol
-PA
P k
it, K
at. #
401
21, D
iagn
oszt
ikum
RT
, Bud
apes
t, H
unga
ry; i
ntaa
ssay
CV
: ≤ 1
.5 %
an
d≤
3.8
%);
an
aly
zed
in th
e IA
NE
(fo
r E
xp. 3
) or
RIA
HN
(fo
r th
e fu
rthe
r
stud
ies)
.e
AS
T K
it, K
at. #
724
9 (R
eana
l RT
, Bud
apes
t, H
unga
ry; i
ntaa
ssay
CV
: ≤ 6
.2 %
an
d≤
7.8
%);
an
aly
zed
in th
e IA
NE
.f T
he p
lasm
a TN
Fα
con
tent
was
ana
lyze
d in
ou
r la
b, in
clo
se c
oope
ratio
n w
ith th
e m
anuf
actu
rer,
usi
ng a
com
mer
cial
12
5I-
RIA
kit d
evel
oped
for
quan
titat
ive
dete
rmin
atio
n of
hum
an T
NFα
in p
lasm
a, s
e-
rum
and
cel
l cul
ture
sup
erna
tant
(N
ecro
ton
12
5I-
RIA
kit,
“F. J
. C.”
Nat
iona
l Res
earc
h In
stitu
te fo
r R
adio
biol
ogy
and
Rad
iohy
gien
e, B
udap
est,
Hun
gary
; sen
sitiv
ity:1
2pg
/ml;
intr
a- a
nd in
tera
ssay
CV
: 9.3
- 15
.5 a
nd ≤
17.1
%);
afte
r a
prec
edin
g va
lidat
ion
(Hirv
onen
et a
l., 1
999a
and
199
9b).
g A
naly
zed
by J
. Hirv
onen
, in
the
labo
rato
ry o
f th
e A
mbu
lato
ry C
linic
, Fac
ulty
of V
eter
inar
y M
edic
ine
(Hel
sink
i, F
inla
nd;H
irvon
en e
t al.,
199
9a a
nd 1
999b
). T
he
Hb
con
tent
was
exp
ress
ed a
s he
mog
lo-
bin-
bind
ing
capa
city
of H
b (u
nit:
g/l).
The
pla
sma α
1-A
G w
as m
easu
red
with
a s
ingl
e ra
dial
imm
undi
ffusi
on k
it (B
ovin
e α
1-A
G p
late
, Sai
kin
Kag
aku
Inst
itute
, Sen
dai,
Japa
n), a
nd th
e re
sults
wer
e gi
ven
as g
/l of
α1-A
G.
38
1 cm diameter) filled with Sephadex G 50-fine10. 1-ml fractions were collected, and 1-1 ml
glycerol9 was added to each fraction containing 125I-rbleptin. The free iodine to 125I-rbleptin
ratio was determined by thin layer chromatography on DC-Alufolien Kieselgel 6011. The tripli-
cates of standards were prepared from a stock preparation of rbleptin (1 µg/ml) at the follow-
ing concentrations: 0.0833, 0.125, 0.25, 0.40, 0.75, 2.00, 2.50, 4.00 and 5.00 ng/tube (in 50
µl).
The same assay procedure was carried out with both the bovine and ovine plasma sam-
ples: 100 µl horse serum was added to all the standards, as well as to the B0 and NSB tubes
to obtain a similar protein matrix as in samples. As samples and quality control tubes (n=3;
with 0.058±0.004, 0.241±0.008 and 0.577±0.023 nmol/l levels, as regular quality control
samples with “low”, “medium” and “high” leptin content in each assay run), triplicate aliquots
of 100 µl plasma were used. Standard, quality control and sample tubes were vortexed with
50 µl of diluted leptin antiserum (in a final dilution of 1:10.000), and then were incubated for
overnight at +4 oC. After that, 100 µl of 125I-rbleptin (12-13 000 cpm; in assay buffer) was
added to each tube, and after vortexing the process was continued with a second overnight
incubation at +4 oC. Bound and free ligands were then separated by adding 500 µl ice-cold
magnetisable immunosorbent suspension12. Then, the tubes were incubated for 30 min. at
room temperature. After centrifugation (3600 g, 30 min., + 4 oC) all the tubes were put in a
magnetic separator13, and the supernatant was decanted. The remaining radioactivity on the
microparticules was quantified by an automatic gamma counter14. The leptin content was cal-
culated by 1224-310 MultiCalc v2.7 program15.
Under routine use the sensitivity of this assay (defined as the lower quantity able to gen-
erate a diminution of 5% of the B/B0 ratio) was 0.032 nmol/l. The calculated inter- or intraas-
say coefficients of variation (CV) were 12.15, 5.61 and 6.13 %, or 10.06, 4.57 and 5.28 %
in ranges of quality control samples with “low”, “medium” and “high” leptin content, respec-
tively.
10 No. 17-0042-01 (Pharmacia, Uppsala, Sweden)
11 Art. No. 5553 (Merck Lab., Darmstadt, Germany)12 Institute of Isotopes Co. Ltd., Budapest, Hungary
13 Amersham Lab., Little Chalfont, Buckinghamshire, England
14 Wallac-1470 Wizard (Perkin Elmer, Turku, Finland)
15 Perkin Elmer, Turku, Finland
39
The binding pattern of serially diluted bovine and ovine plasma samples was parallel to
that of the standard curves. The recovery rates of added known quantity of rbleptin (0.125,
0.250 and 0.500 nmol/sample) to standard bovine and ovine plasma samples (n=6 in each
species) varied between 95 and 106 %.
4.3.2. Other locally developed endocrine assay procedures
Local versions of methods were used for assaying IGF-I, testosterone, cortisol and
progesterone (P4; except for Exp 4a) in plasma, P4 in milk, and P4 metabolites (P4-met) in
feces.
Neutralized acid-ethanol extracts of bovine plasma were analyzed for IGF-I using a het-
erologous 125I-RIA system, which was developed in cooperation with a lab in Belgrade (Nikolic
et al., 2001). This method was suitable for assaying ovine plasma without any further changes.
Briefly, aliquots of serum or plasma (0.15 ml) were mixed and allowed to stand with 0.85 ml
solution containing ethanol (87.5%) and 2 mol HCl (12.5%) for 30 min (Daughaday et al.,
1982). After centrifugation for 30 min at 3000 x g the supernatant (0.5 ml) was neutralized with
0.855M tris-(hydroxyl-methyl)-aminomethane (TRIS) base and kept for at least 2 h at -18 oC
(Breier et al., 1991). Following further centrifugation, aliquots of the supernatant were assayed.
Blank extracts of 0.15 ml assay buffer were prepared in parallel. In the assay human IGF-I16
labeled with 125I was used as the tracer, and polyclonal rabbit antibodies to human IGF-I17 as
the reagent. Since bovine IGF-I has the same amino acid composition as human IGF-I (Sim-
men, 1991), recombinant human IGF-I was used as the working standard (0.063 - 6.25
ng/tube). Cross-reactivity with IGF-II at 50% inhibition of tracer binding was 0.054%. Repro-
ducibility was checked by including the reference preparation (WHO 87/518) in each test. The
mean sensitivity, intra- and interassay CVs were 0.20 nmol/l, ≤6.2 and ≤12.0 %, respectively, in
both the bovine and ovine samples (Nikolic et al., 2001).
Plasma testosterone concentrations were determined with a direct 3H-RIA developed
for assaying human plasma (Csernus, 1982), which was adopted and validated for samples of
many species including sheep (Kulcsár, unpublished; for details: Table 4.3.3). The canine and
rabbit versions of this assay were published elsewhere (Dahlbom et al., 1995; Fodor et al.,
2003).
16 ICN Biomedicals Inc., Aurora, USA
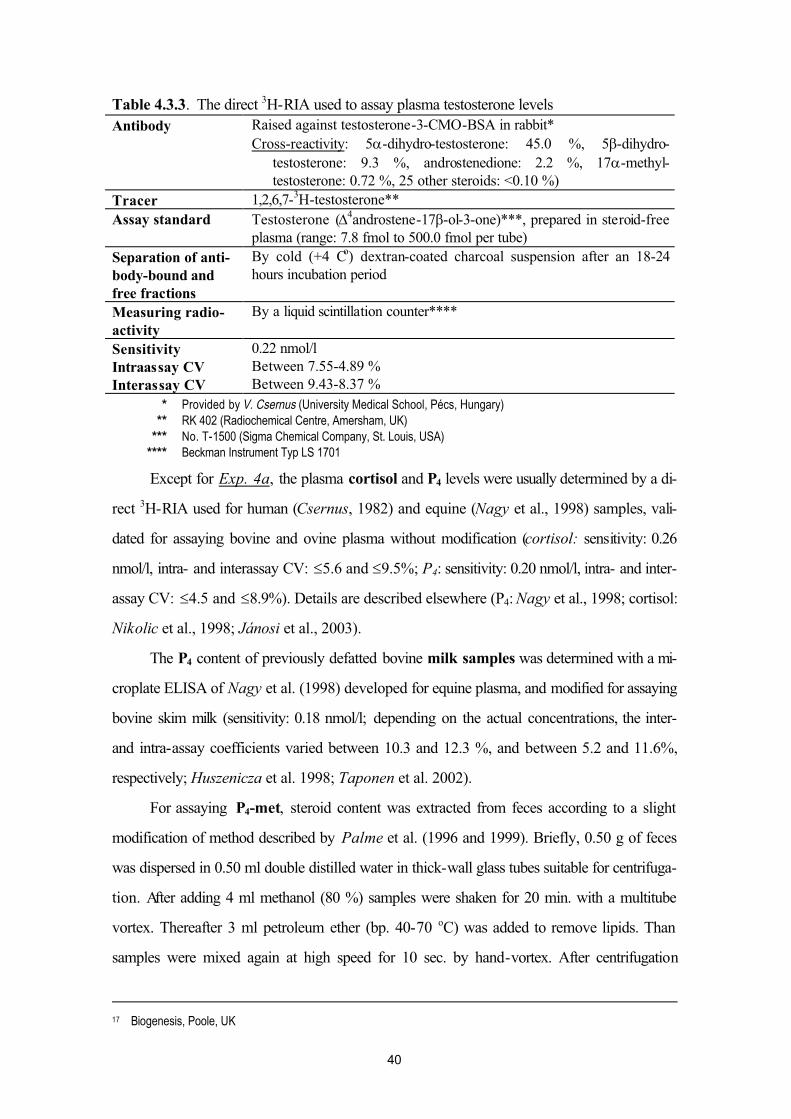
40
Table 4.3.3. The direct 3H-RIA used to assay plasma testosterone levelsAntibody Raised against testosterone-3-CMO-BSA in rabbit*
Cross-reactivity: 5α-dihydro-testosterone: 45.0 %, 5β-dihydro-testosterone: 9.3 %, androstenedione: 2.2 %, 17α-methyl-testosterone: 0.72 %, 25 other steroids: <0.10 %)
Tracer 1,2,6,7-3H-testosterone**Assay standard Testosterone (∆4androstene-17β-ol-3-one)***, prepared in steroid-free
plasma (range: 7.8 fmol to 500.0 fmol per tube)Separation of anti-body-bound and free fractions
By cold (+4 Co) dextran-coated charcoal suspension after an 18-24hours incubation period
Measuring radio-activity
By a liquid scintillation counter****
Sensitivity 0.22 nmol/lIntraassay CV Between 7.55-4.89 % Interassay CV Between 9.43-8.37 %
*
**
***
****
Provided by V. Csernus (University Medical School, Pécs, Hungary)
RK 402 (Radiochemical Centre, Amersham, UK)
No. T-1500 (Sigma Chemical Company, St. Louis, USA)
Beckman Instrument Typ LS 1701
Except for Exp. 4a, the plasma cortisol and P4 levels were usually determined by a di-
rect 3H-RIA used for human (Csernus, 1982) and equine (Nagy et al., 1998) samples, vali-
dated for assaying bovine and ovine plasma without modification (cortisol: sensitivity: 0.26
nmol/l, intra- and interassay CV: ≤5.6 and ≤9.5%; P4: sensitivity: 0.20 nmol/l, intra- and inter-
assay CV: ≤4.5 and ≤8.9%). Details are described elsewhere (P4: Nagy et al., 1998; cortisol:
Nikolic et al., 1998; Jánosi et al., 2003).
The P4 content of previously defatted bovine milk samples was determined with a mi-
croplate ELISA of Nagy et al. (1998) developed for equine plasma, and modified for assaying
bovine skim milk (sensitivity: 0.18 nmol/l; depending on the actual concentrations, the inter-
and intra-assay coefficients varied between 10.3 and 12.3 %, and between 5.2 and 11.6%,
respectively; Huszenicza et al. 1998; Taponen et al. 2002).
For assaying P4-met, steroid content was extracted from feces according to a slight
modification of method described by Palme et al. (1996 and 1999). Briefly, 0.50 g of feces
was dispersed in 0.50 ml double distilled water in thick-wall glass tubes suitable for centrifuga-
tion. After adding 4 ml methanol (80 %) samples were shaken for 20 min. with a multitube
vortex. Thereafter 3 ml petroleum ether (bp. 40-70 oC) was added to remove lipids. Than
samples were mixed again at high speed for 10 sec. by hand-vortex. After centrifugation
17 Biogenesis, Poole, UK
41
(3600 g, 30 min., + 4 oC) samples were taken at -70 oC for 25-30 minutes to separate the
three phases of petroleum ether (above), methanol (in middle) and the frozen water with the
extracted feces (below). 0.5-1 ml of the methanol phase was pipetted into clean tubes, than
1:10, 1:20 or 1:50 working solutions were diluted with PBS buffer (pH: 7.4) when low or high
P4-met levels were expected, respectively (if values were out of the expected range, the sam-
ple was re-assayed). P4-met concentrations were measured in triplicate 20 µl aliquots of fecal
extracts with a micro-plate ELISA (Nagy et al., 1998), based on the use of an anti-P4 mono-
clonal antibody (5D4) cross-reacting with wide range of gestagen metabolites (Siklódi et al.,
1995)18.
In all of these assay systems the binding pattern of serially diluted bovine, ovine plasma
and fecal extract samples was parallel to that of the standard curves. The recovery rates of
added known quantity of hormones were the following: (i) standards of tested steroids19 to
bovine and ovine plasma samples (n=3): between 89 and 108 %; (ii) P4 and 5β-pregnan-
3,20-dion (125, 250 and 500 nmol/g of each) to methanolic extract of standard ovine fecal
samples (n=3): between 93 and 102 %; (iii) 5β-pregnan-3,20-dion (125, 250 and 500
nmol/g) to standard ovine fecal samples (n=3): between 78 and 87 %.
4.4. Statistics
For presentation of results the group means and their standard errors (SEM) were
expressed. The results were usually subjected to chi-square (χ2) test (distributions), Student’s
t test (pair-wise comparison of group means), or a single trait analysis of variance (ANOVA;
for comparison of 3 or more group means in a particular stage). If ANOVA proved significant
difference, the least significant differences were calculated at 5% (LSDP<0.05) for further com-
parison. In Exp. 4a Tukey-Kramer test was conducted to analyze the between-group differ-
ences. Temporal patterns were usually tested by repeated measures ANOVA (Exp. 1c, 1d,
1e, 2, 5a and 7c), or by one-way ANOVA with a post hoc testing by Neuman-Keuls test
(Exp. 7a and 7b). Interrelations were estimated by using Pearson correlation, linear and quad-
18 5β-pregnan-3,20-dion: 100 %; 11α-OH-progesterone: 20 %; 5α-progesterone -3,20-dion: 15,6 %; 17α-OH-
progesterone: 3,6 %; pregnenolon: 1.8 %; 11β-OH-progesterone: 1.6 %
19 All from Steraloids Inc., Newport, USA
42
ratic regression, or mixed procedure of SAS (2000)20 (only in Exp. 4a). These methods were
employed and conducted, as suggested by Juvancz and Paksy (1982), Snedecor and Coch-
ran (1982) and Petrie and Watson (1999). Analyses were done using the Windows-XP Ex-
cel program and the statistical package S-PLUS (2000)21 or SAS (2000)19. Further details of
statistical methods are also given at the description of studies.
5. Studies
5.1. Biological validation of the leptin assay (Exp. 1a, 1b, 1c, 1d and 1e)
After the development of our leptin assay the first responsibility was to check and im-
prove the biological validity of findings with this laboratory procedure. For this purpose, five
experiments were conducted. Within the framework of these studies we wished to reproduce
some tendencies known from the literature, such as the effects of
(i) 24 h feed deprivation (in mid- to late-lactation dairy cows: Exp. 1a),
(ii) reproductive status and lactation (late pregnancy vs. early and mid lactation in dairy cows:
Exp. 1b),
(iii) gender, furthermore ovariectomy / estrogen administration, and castration / testosterone
replacement (in sheep: Exp.1c and Exp. 1d), as well as
(iv) presence or absence of cycle-related changes (in non-lactating ewes: Exp. 1d; in dairy
cows, about 9-10 weeks after calving: Exp. 1e) and diurnal variability (in lactating cows:
Exp. 1e).
Exp. 1a
Animals. Sampling
In a large scale dairy farm non-pregnant lactating Holstein Friesian cows (n=6; BW:
545-625 kg; BCS: 2.75-3.50; parity: 3 to 5) were involved in this study. The cows calved
137-191 days earlier, and yielded 7.8-23.0 kg/day milk. All of them had been culled due to
chronic recurrent mastitis, and produced high somatic cell count milk (>500 000/ml in individ-
ual bulk milk samples), but were clinically symptomless at the time of sampling. After morning
20 Statistical Analysis System (SAS Institute Inc., Cary, NC, USA); by A. Meikle (Faculty of Veterinary Medicine, Monte-
video, Uruguay; Exp. 4a), T. Kokkonen and T. Lehtolainen (Faculty of Veterinary Medicine, Helsinki, Finland; Exp. 6,
7a, 7b and 7c).
21 MathSoft Inc. (Seattle, Washington, USA); by J. Reiczigel and A. Gáspárdy).
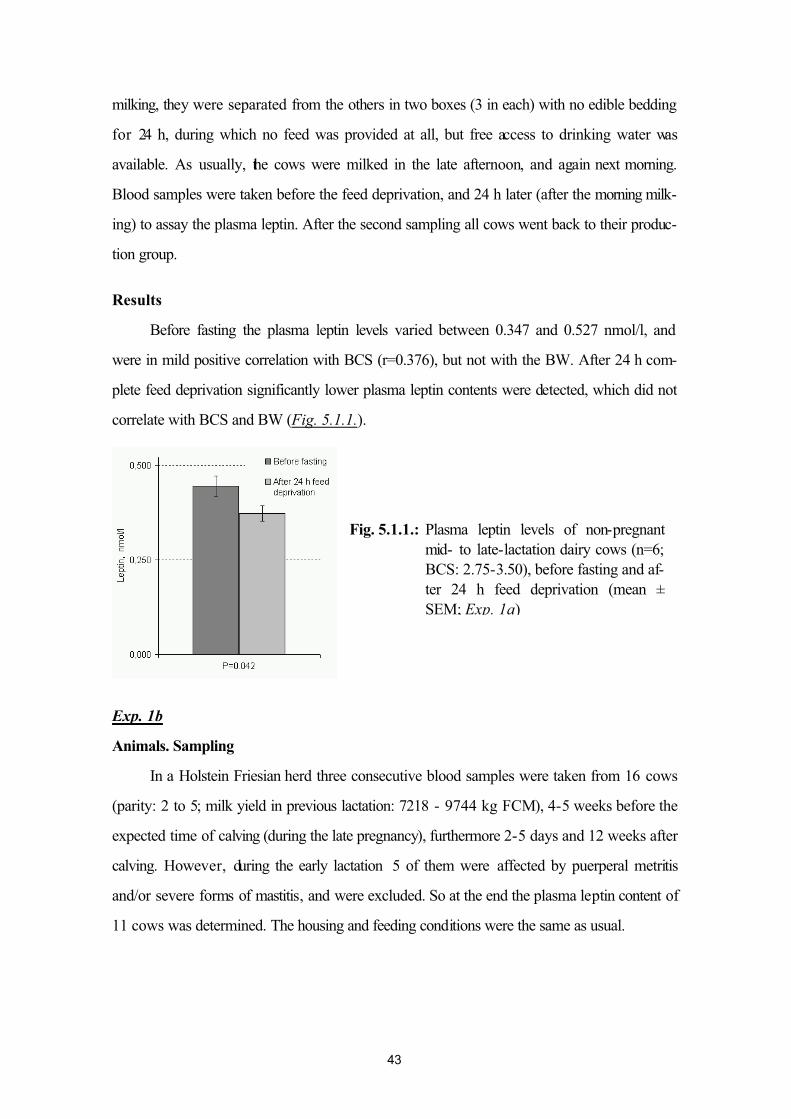
43
milking, they were separated from the others in two boxes (3 in each) with no edible bedding
for 24 h, during which no feed was provided at all, but free access to drinking water was
available. As usually, the cows were milked in the late afternoon, and again next morning.
Blood samples were taken before the feed deprivation, and 24 h later (after the morning milk-
ing) to assay the plasma leptin. After the second sampling all cows went back to their produc-
tion group.
Results
Before fasting the plasma leptin levels varied between 0.347 and 0.527 nmol/l, and
were in mild positive correlation with BCS (r=0.376), but not with the BW. After 24 h com-
plete feed deprivation significantly lower plasma leptin contents were detected, which did not
correlate with BCS and BW (Fig. 5.1.1.).
Exp. 1b
Animals. Sampling
In a Holstein Friesian herd three consecutive blood samples were taken from 16 cows
(parity: 2 to 5; milk yield in previous lactation: 7218 - 9744 kg FCM), 4-5 weeks before the
expected time of calving (during the late pregnancy), furthermore 2-5 days and 12 weeks after
calving. However, during the early lactation 5 of them were affected by puerperal metritis
and/or severe forms of mastitis, and were excluded. So at the end the plasma leptin content of
11 cows was determined. The housing and feeding conditions were the same as usual.
Fig. 5.1.1.: Plasma leptin levels of non-pregnantmid- to late-lactation dairy cows (n=6; BCS: 2.75-3.50), before fasting and af-ter 24 h feed deprivation (mean ±SEM; Exp. 1a)
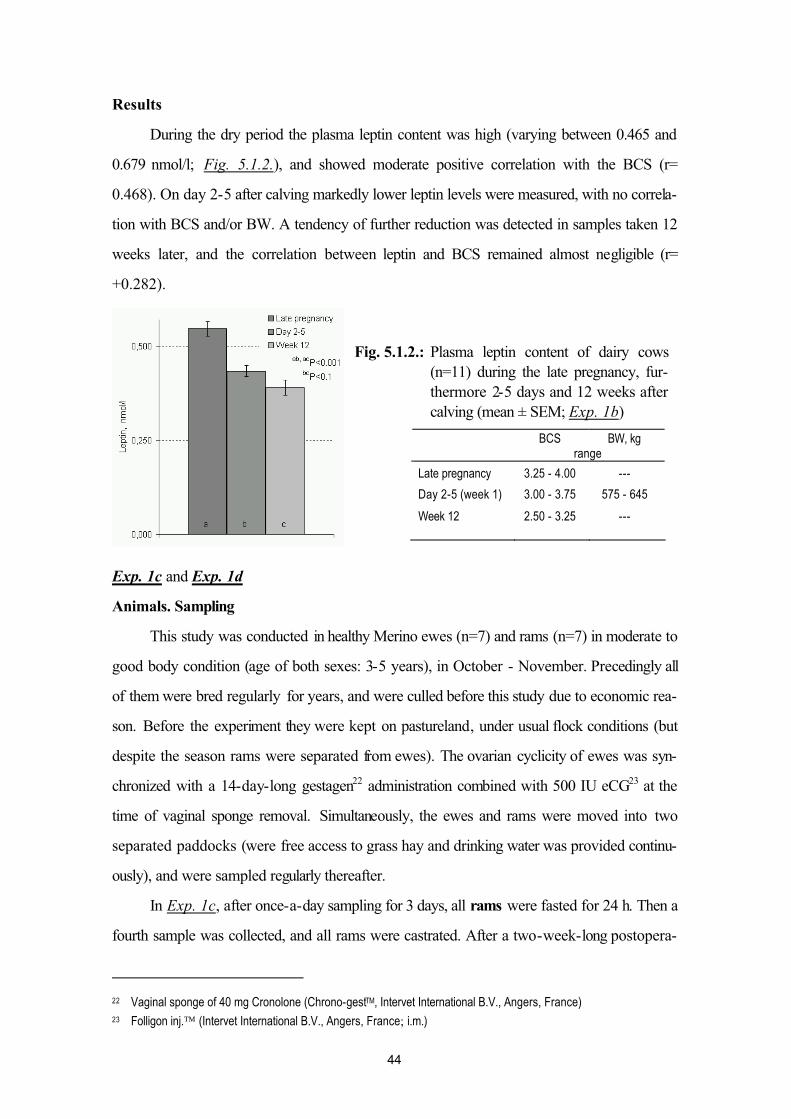
44
Results
During the dry period the plasma leptin content was high (varying between 0.465 and
0.679 nmol/l; Fig. 5.1.2.), and showed moderate positive correlation with the BCS (r=
0.468). On day 2-5 after calving markedly lower leptin levels were measured, with no correla-
tion with BCS and/or BW. A tendency of further reduction was detected in samples taken 12
weeks later, and the correlation between leptin and BCS remained almost negligible (r=
+0.282).
Exp. 1c and Exp. 1d
Animals. Sampling
This study was conducted in healthy Merino ewes (n=7) and rams (n=7) in moderate to
good body condition (age of both sexes: 3-5 years), in October - November. Precedingly all
of them were bred regularly for years, and were culled before this study due to economic rea-
son. Before the experiment they were kept on pastureland, under usual flock conditions (but
despite the season rams were separated from ewes). The ovarian cyclicity of ewes was syn-
chronized with a 14-day-long gestagen22 administration combined with 500 IU eCG23 at the
time of vaginal sponge removal. Simultaneously, the ewes and rams were moved into two
separated paddocks (were free access to grass hay and drinking water was provided continu-
ously), and were sampled regularly thereafter.
In Exp. 1c, after once-a-day sampling for 3 days, all rams were fasted for 24 h. Then a
fourth sample was collected, and all rams were castrated. After a two-week-long postopera-
22 Vaginal sponge of 40 mg Cronolone (Chrono-gestTM, Intervet International B.V., Angers, France)
23 Folligon inj. (Intervet International B.V., Angers, France; i.m.)
Fig. 5.1.2.: Plasma leptin content of dairy cows(n=11) during the late pregnancy, fur-thermore 2-5 days and 12 weeks after calving (mean ± SEM; Exp. 1b)
BCS BW, kgrange
Late pregnancy 3.25 - 4.00 ---
Day 2-5 (week 1) 3.00 - 3.75 575 - 645
Week 12 2.50 - 3.25 ---
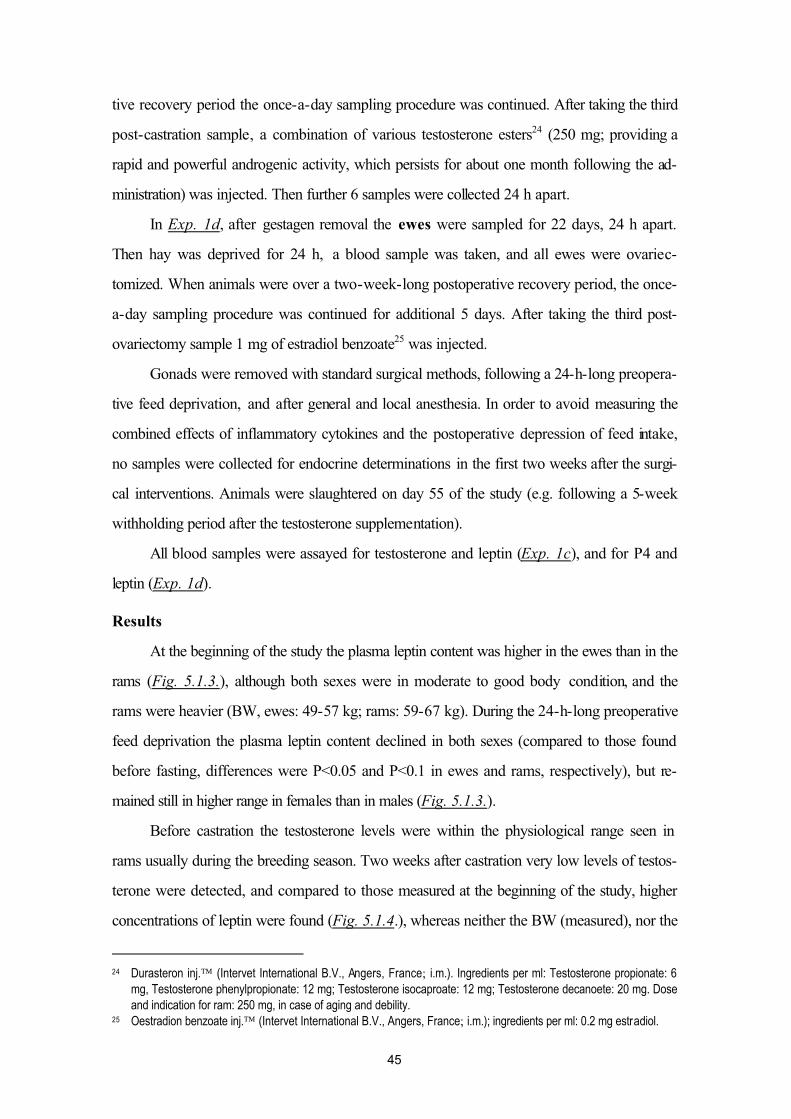
45
tive recovery period the once-a-day sampling procedure was continued. After taking the third
post-castration sample, a combination of various testosterone esters24 (250 mg; providing a
rapid and powerful androgenic activity, which persists for about one month following the ad-
ministration) was injected. Then further 6 samples were collected 24 h apart.
In Exp. 1d, after gestagen removal the ewes were sampled for 22 days, 24 h apart.
Then hay was deprived for 24 h, a blood sample was taken, and all ewes were ovariec-
tomized. When animals were over a two-week-long postoperative recovery period, the once-
a-day sampling procedure was continued for additional 5 days. After taking the third post-
ovariectomy sample 1 mg of estradiol benzoate25 was injected.
Gonads were removed with standard surgical methods, following a 24-h-long preopera-
tive feed deprivation, and after general and local anesthesia. In order to avoid measuring the
combined effects of inflammatory cytokines and the postoperative depression of feed intake,
no samples were collected for endocrine determinations in the first two weeks after the surgi-
cal interventions. Animals were slaughtered on day 55 of the study (e.g. following a 5-week
withholding period after the testosterone supplementation).
All blood samples were assayed for testosterone and leptin (Exp. 1c), and for P4 and
leptin (Exp. 1d).
Results
At the beginning of the study the plasma leptin content was higher in the ewes than in the
rams (Fig. 5.1.3.), although both sexes were in moderate to good body condition, and the
rams were heavier (BW, ewes: 49-57 kg; rams: 59-67 kg). During the 24-h-long preoperative
feed deprivation the plasma leptin content declined in both sexes (compared to those found
before fasting, differences were P<0.05 and P<0.1 in ewes and rams, respectively), but re-
mained still in higher range in females than in males (Fig. 5.1.3.).
Before castration the testosterone levels were within the physiological range seen in
rams usually during the breeding season. Two weeks after castration very low levels of testos-
terone were detected, and compared to those measured at the beginning of the study, higher
concentrations of leptin were found (Fig. 5.1.4.), whereas neither the BW (measured), nor the
24 Durasteron inj. (Intervet International B.V., Angers, France; i.m.). Ingredients per ml: Testosterone propionate: 6
mg, Testosterone phenylpropionate: 12 mg; Testosterone isocaproate: 12 mg; Testosterone decanoete: 20 mg. Dose
and indication for ram: 250 mg, in case of aging and debility.25 Oestradion benzoate inj. (Intervet International B.V., Angers, France; i.m.); ingredients per ml: 0.2 mg estradiol.
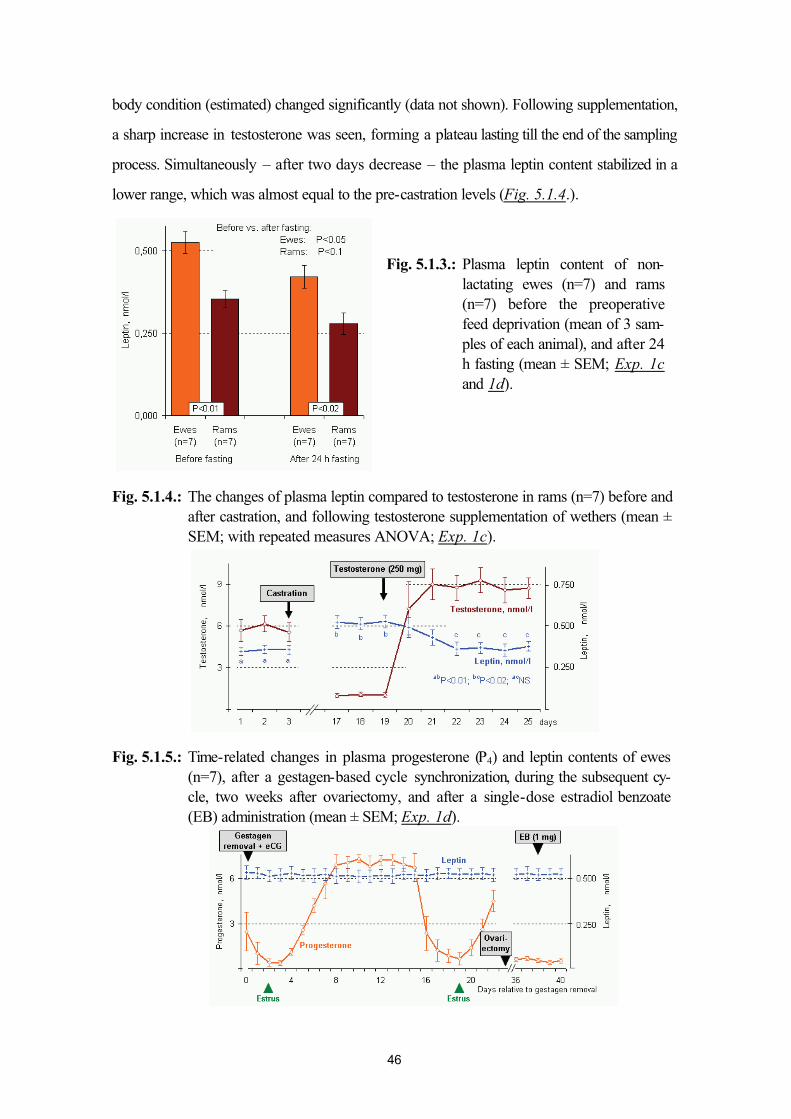
46
body condition (estimated) changed significantly (data not shown). Following supplementation,
a sharp increase in testosterone was seen, forming a plateau lasting till the end of the sampling
process. Simultaneously – after two days decrease – the plasma leptin content stabilized in a
lower range, which was almost equal to the pre-castration levels (Fig. 5.1.4.).
Fig. 5.1.4.: The changes of plasma leptin compared to testosterone in rams (n=7) before and after castration, and following testosterone supplementation of wethers (mean ± SEM; with repeated measures ANOVA; Exp. 1c).
Fig. 5.1.5.: Time-related changes in plasma progesterone (P4) and leptin contents of ewes (n=7), after a gestagen-based cycle synchronization, during the subsequent cy-cle, two weeks after ovariectomy, and after a single-dose estradiol benzoate (EB) administration (mean ± SEM; Exp. 1d).
Fig. 5.1.3.: Plasma leptin content of non-lactating ewes (n=7) and rams(n=7) before the preoperativefeed deprivation (mean of 3 sam-ples of each animal), and after 24 h fasting (mean ± SEM; Exp. 1cand 1d).
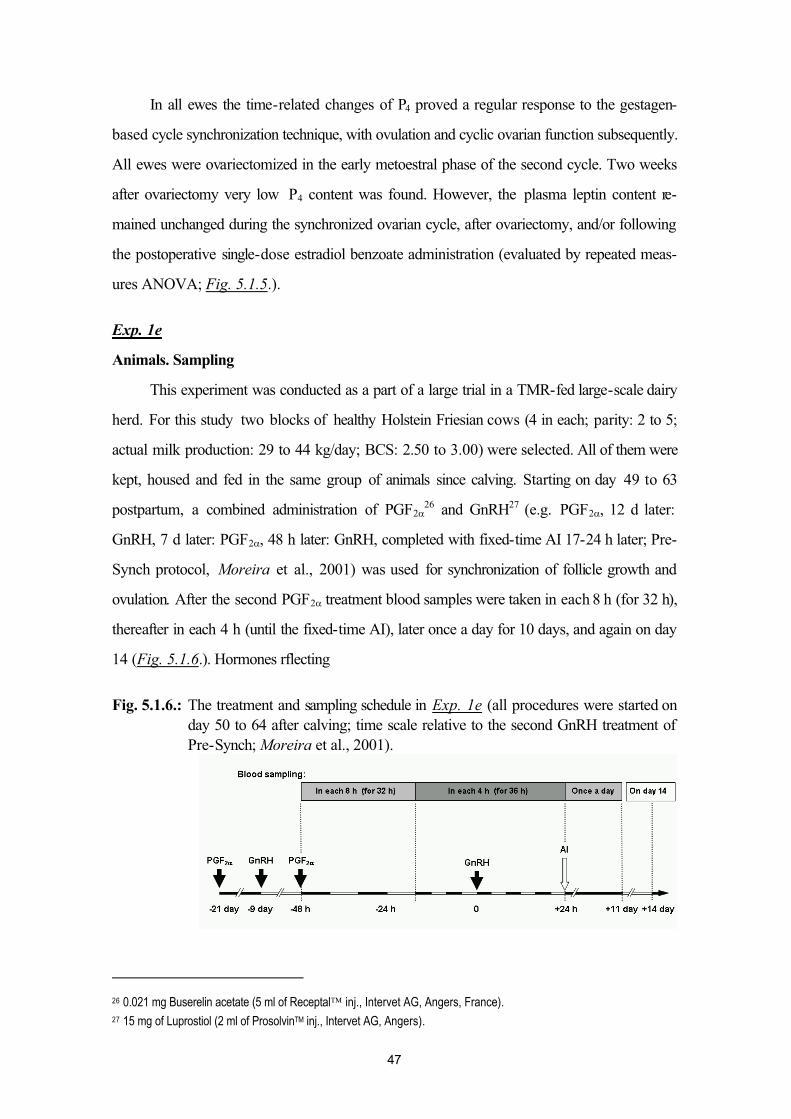
47
In all ewes the time-related changes of P4 proved a regular response to the gestagen-
based cycle synchronization technique, with ovulation and cyclic ovarian function subsequently.
All ewes were ovariectomized in the early metoestral phase of the second cycle. Two weeks
after ovariectomy very low P4 content was found. However, the plasma leptin content re-
mained unchanged during the synchronized ovarian cycle, after ovariectomy, and/or following
the postoperative single-dose estradiol benzoate administration (evaluated by repeated meas-
ures ANOVA; Fig. 5.1.5.).
Exp. 1e
Animals. Sampling
This experiment was conducted as a part of a large trial in a TMR-fed large-scale dairy
herd. For this study two blocks of healthy Holstein Friesian cows (4 in each; parity: 2 to 5;
actual milk production: 29 to 44 kg/day; BCS: 2.50 to 3.00) were selected. All of them were
kept, housed and fed in the same group of animals since calving. Starting on day 49 to 63
postpartum, a combined administration of PGF2α26 and GnRH27 (e.g. PGF2α, 12 d later:
GnRH, 7 d later: PGF2α, 48 h later: GnRH, completed with fixed-time AI 17-24 h later; Pre-
Synch protocol, Moreira et al., 2001) was used for synchronization of follicle growth and
ovulation. After the second PGF2α treatment blood samples were taken in each 8 h (for 32 h),
thereafter in each 4 h (until the fixed-time AI), later once a day for 10 days, and again on day
14 (Fig. 5.1.6.). Hormones rflecting
Fig. 5.1.6.: The treatment and sampling schedule in Exp. 1e (all procedures were started on day 50 to 64 after calving; time scale relative to the second GnRH treatment of Pre-Synch; Moreira et al., 2001).
26 0.021 mg Buserelin acetate (5 ml of Receptal inj., Intervet AG, Angers, France).
27 15 mg of Luprostiol (2 ml of ProsolvinTM inj., Intervet AG, Angers).
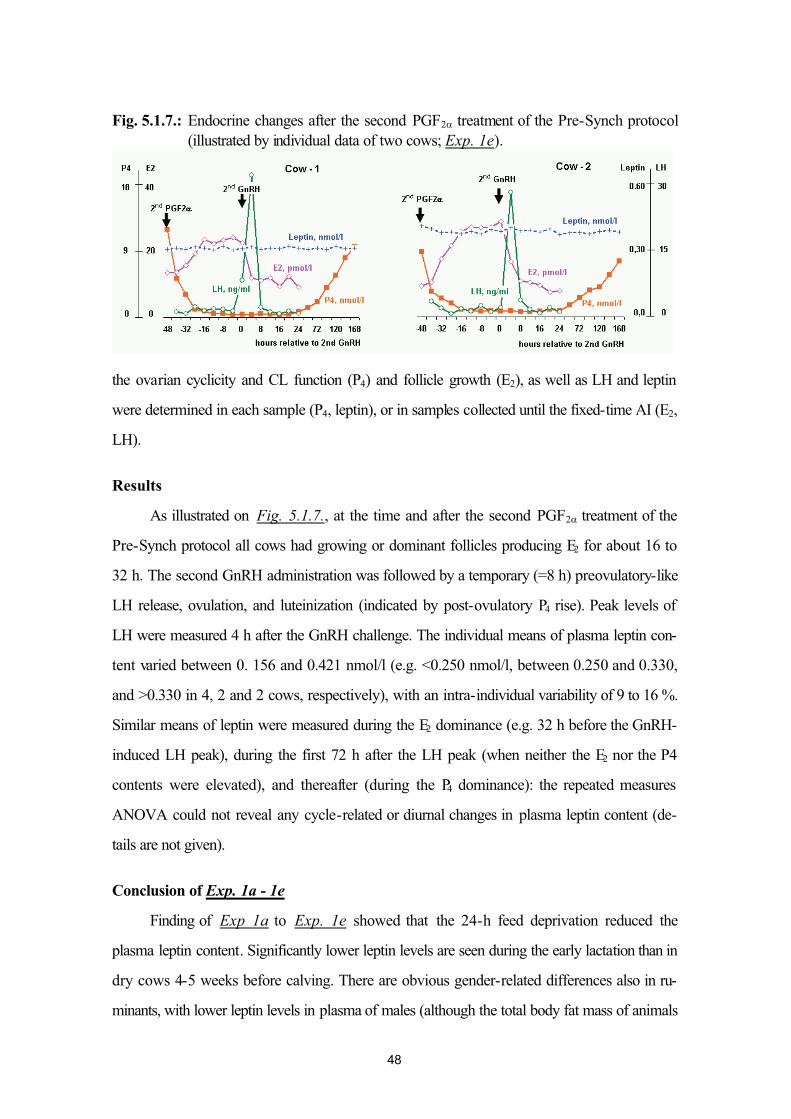
48
Fig. 5.1.7.: Endocrine changes after the second PGF2α treatment of the Pre-Synch protocol(illustrated by individual data of two cows; Exp. 1e).
the ovarian cyclicity and CL function (P4) and follicle growth (E2), as well as LH and leptin
were determined in each sample (P4, leptin), or in samples collected until the fixed-time AI (E2,
LH).
Results
As illustrated on Fig. 5.1.7., at the time and after the second PGF2α treatment of the
Pre-Synch protocol all cows had growing or dominant follicles producing E2 for about 16 to
32 h. The second GnRH administration was followed by a temporary (=8 h) preovulatory-like
LH release, ovulation, and luteinization (indicated by post-ovulatory P4 rise). Peak levels of
LH were measured 4 h after the GnRH challenge. The individual means of plasma leptin con-
tent varied between 0. 156 and 0.421 nmol/l (e.g. <0.250 nmol/l, between 0.250 and 0.330,
and >0.330 in 4, 2 and 2 cows, respectively), with an intra-individual variability of 9 to 16 %.
Similar means of leptin were measured during the E2 dominance (e.g. 32 h before the GnRH-
induced LH peak), during the first 72 h after the LH peak (when neither the E2 nor the P4
contents were elevated), and thereafter (during the P4 dominance): the repeated measures
ANOVA could not reveal any cycle-related or diurnal changes in plasma leptin content (de-
tails are not given).
Conclusion of Exp. 1a - 1e
Finding of Exp 1a to Exp. 1e showed that the 24-h feed deprivation reduced the
plasma leptin content. Significantly lower leptin levels are seen during the early lactation than in
dry cows 4-5 weeks before calving. There are obvious gender-related differences also in ru-
minants, with lower leptin levels in plasma of males (although the total body fat mass of animals
49
was not determined). These sex-dependent differences are mediated by the suppressive effect
of testosterone: two weeks after castration the leptin levels increase, whereas in wethers the
high-dose slow-release testosterone administration depresses the plasma leptin again. How-
ever, neither cycle-related, nor diurnal changes seem to occur in plasma leptin contents of ru-
minants: in cyclic ewes and cows we could not detect any changes in plasma leptin, and also
the ovariectomy, and the E2 treatment administered two weeks later failed to alter the circulat-
ing leptin (tested only in ewes). These findings fully agreed with the data of literature (discussed
in Chapter 3.3.), improved the reliability of our leptin assay system, and – regarding the gender
dichotomy and the lack of cycle-related changes in plasma leptin of ruminants – represented
also novelty value.
5.2. Influence of pregnancy stage and number of fetuses on maternal plasma leptin in
ewes (Exp. 2)
As it was discussed in Chapter 3.6., along the gestation elevated plasma leptin levels
were reported to occur in ewes (Ehrhardt et al., 2001; Thomas et al., 2001) and nulliparous
(but not in lactating primiparous) goats (Bonnet et al., 2005). However, there have not been
available data yet showing whether this pregnancy-associated hyperleptinaemia of small rumi-
nants interacts with the number of fetuses and/or with the gestation-related increase of sexual
steroids and insulin.
Our purpose was to study whether during the early and mid pregnancy (i) the number of
fetuses, (ii) the gestation-associated continuous gestagen load, and (iii) the plasma levels of
insulin interact with the circulating leptin in ewes. The gestagen load was quantified with deter-
mination of plasma P4 and fecal P4 metabolite (P4-met) contents.
Materials and methods
The study was conducted on Prolific Merino ewes (n=61; age: 2 to 5 years; body
weight: 33 - 43 kg) of mild to moderate body condition at the experimental farm of University
of Debrecen at the end of the breeding season in January. During the first 72 days the group of
animals was kept in a pen, and fed ad libitum with grass hay, whereas after the beginning of
the grazing season in April they were moved to a pasture land on alkaline soil, providing abun-
dant grass until lambing in June. Free access to drinking water was available throughout the
50
experiment. In January 2002 the ovarian activity of ewes was induced / synchronized with a
14-day-long gestagen28 administration, combined with 500 IU eCG29 at the time of vaginal
sponge removal. Sixty hours later the ewes were inseminated (AI) once with fresh diluted se-
men, which was deposited with Salamon’s method (Evans and Maxwell, 1987) by laparo-
scopy, after 24-hour feed and water deprivation. Pregnancy rate and number of fetuses were
calculated upon the data of lambing in June.
At the beginning of the feed deprivation preceding the AI (d 0) and again 41, 81 and
101 d later blood samples (10 ml) were taken assaying for P4, insulin and leptin. Simultane-
ously also feces (5-10 g) was collected for P4-met. Body weight was measured simultaneously
with the first sampling.
Pregnancy-related changes in plasma levels of these hormones were evaluated by re-
peated measures ANOVA (S-PLUS) using time (d 41, d 81, and d 101) as the within subject
factor, the number of fetuses (1, 2, and ≥3) as a between subject factor and the initial (d 0)
measurement as a covariate.
Results
Data of 56 ewes were evaluated, whereas the others were excluded due to incomplete
sampling (n=4), or conception later than the AI in late January (n=1). Twenty-four of the 56
animals (43 %) conceived at the AI studied, and delivered one (n=12), two (n=6) or 3 to 5
lambs (n=6) after a regular gestation in June.
With the exception of 4, all the other ewes had low plasma P4 and fecal P4-met concen-
trations (<1.50 nmol/l and <250 nmol/g, respectively) at the time of AI, representing the range
known as physiological in the follicular phase of cyclic small ruminants (Schwarzenberger et
al., 1996; Pereira et al., 2006). None of these 4 individuals with elevated plasma P4 (1.57 to
4.54 nmol/l) and fecal P4-met (268 to 424 nmol/g) contents conceived at that time. During
pregnancy the P4 and P4-met levels rose continuously, peaking in the last samples taken on d
101 of gestation (Fig. 5.2.1.). The plasma P4 and fecal P4-met were in significant positive
correlation in all stages of the study (r= 0.526, 0.612, 0.810 and 0.881 on d 0, 41, 81 and
101, respectively; P<0.001). The P4 and P4-met contents of those not conceived at the AI
remained low (details are not given), proving the lack of cyclic ovarian function in this season.
28 Vaginal sponge of 40 mg Cronolone (Chrono-gestTM, Intervet International B.V., Angers, France)
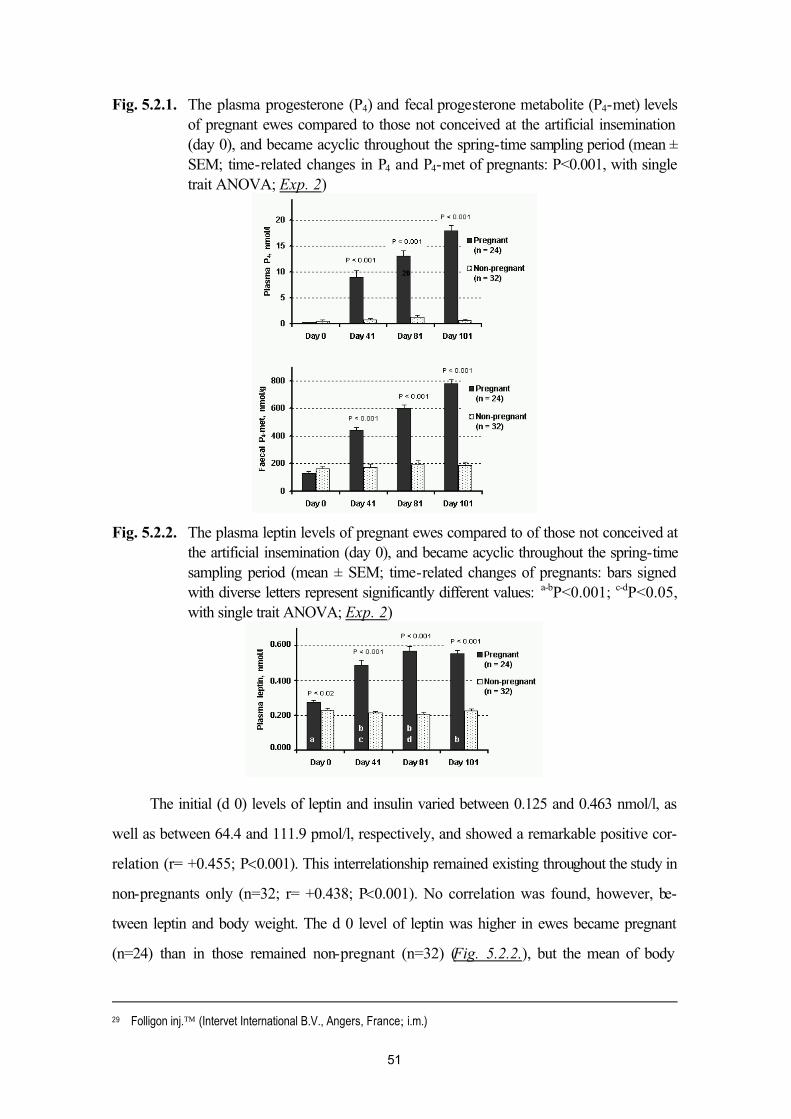
51
Fig. 5.2.1. The plasma progesterone (P4) and fecal progesterone metabolite (P4-met) levels of pregnant ewes compared to those not conceived at the artificial insemination (day 0), and became acyclic throughout the spring-time sampling period (mean ± SEM; time-related changes in P4 and P4-met of pregnants: P<0.001, with single trait ANOVA; Exp. 2)
Fig. 5.2.2. The plasma leptin levels of pregnant ewes compared to of those not conceived at the artificial insemination (day 0), and became acyclic throughout the spring-timesampling period (mean ± SEM; time-related changes of pregnants: bars signed with diverse letters represent significantly different values: a-bP<0.001; c-dP<0.05,with single trait ANOVA; Exp. 2)
The initial (d 0) levels of leptin and insulin varied between 0.125 and 0.463 nmol/l, as
well as between 64.4 and 111.9 pmol/l, respectively, and showed a remarkable positive cor-
relation (r= +0.455; P<0.001). This interrelationship remained existing throughout the study in
non-pregnants only (n=32; r= +0.438; P<0.001). No correlation was found, however, be-
tween leptin and body weight. The d 0 level of leptin was higher in ewes became pregnant
(n=24) than in those remained non-pregnant (n=32) (Fig. 5.2.2.), but the mean of body
29 Folligon inj. (Intervet International B.V., Angers, France; i.m.)
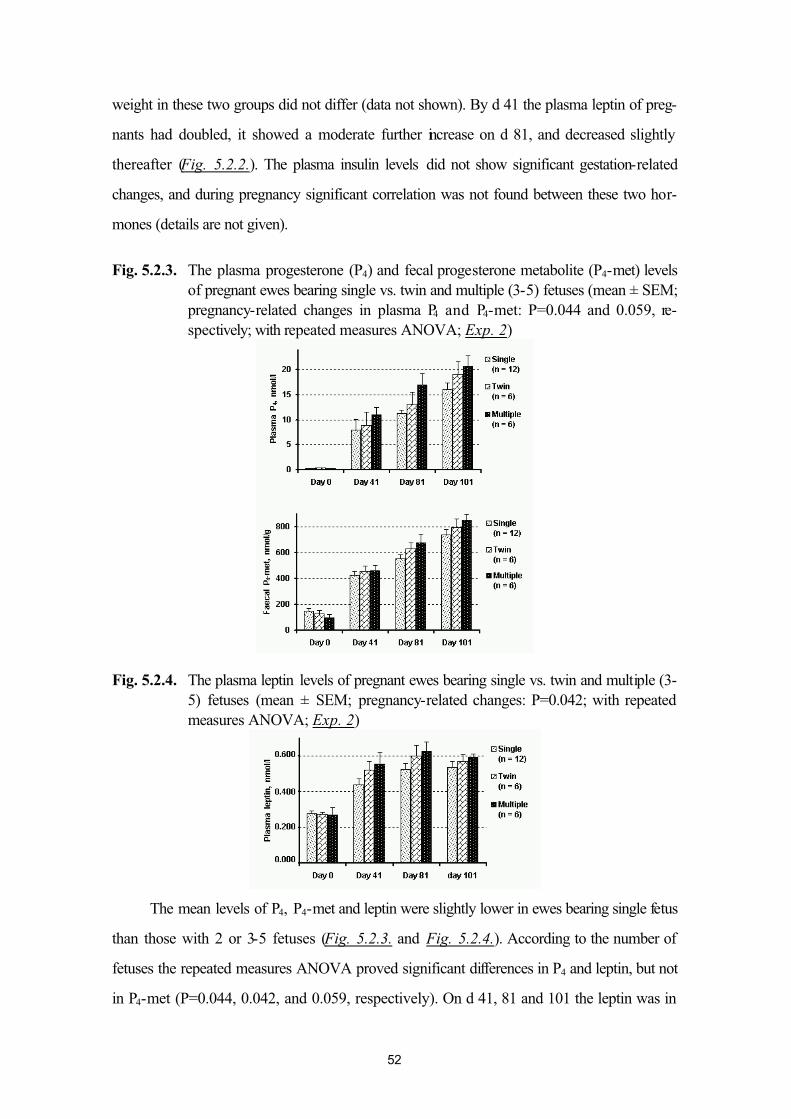
52
weight in these two groups did not differ (data not shown). By d 41 the plasma leptin of preg-
nants had doubled, it showed a moderate further increase on d 81, and decreased slightly
thereafter (Fig. 5.2.2.). The plasma insulin levels did not show significant gestation-related
changes, and during pregnancy significant correlation was not found between these two hor-
mones (details are not given).
Fig. 5.2.3. The plasma progesterone (P4) and fecal progesterone metabolite (P4-met) levels of pregnant ewes bearing single vs. twin and multiple (3-5) fetuses (mean ± SEM; pregnancy-related changes in plasma P4 and P4-met: P=0.044 and 0.059, re-spectively; with repeated measures ANOVA; Exp. 2)
Fig. 5.2.4. The plasma leptin levels of pregnant ewes bearing single vs. twin and multiple (3-5) fetuses (mean ± SEM; pregnancy-related changes: P=0.042; with repeated measures ANOVA; Exp. 2)
The mean levels of P4, P4-met and leptin were slightly lower in ewes bearing single fetus
than those with 2 or 3-5 fetuses (Fig. 5.2.3. and Fig. 5.2.4.). According to the number of
fetuses the repeated measures ANOVA proved significant differences in P4 and leptin, but not
in P4-met (P=0.044, 0.042, and 0.059, respectively). On d 41, 81 and 101 the leptin was in
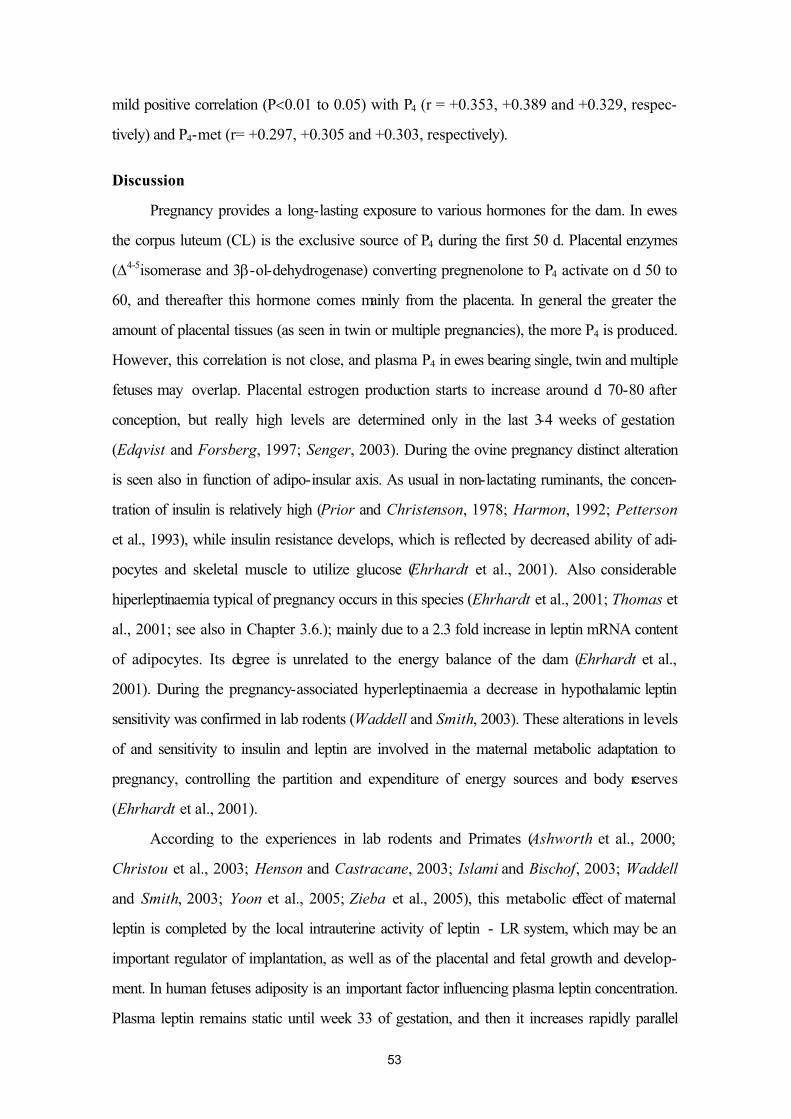
53
mild positive correlation (P<0.01 to 0.05) with P4 (r = +0.353, +0.389 and +0.329, respec-
tively) and P4-met (r= +0.297, +0.305 and +0.303, respectively).
Discussion
Pregnancy provides a long-lasting exposure to various hormones for the dam. In ewes
the corpus luteum (CL) is the exclusive source of P4 during the first 50 d. Placental enzymes
(∆4-5isomerase and 3β-ol-dehydrogenase) converting pregnenolone to P4 activate on d 50 to
60, and thereafter this hormone comes mainly from the placenta. In general the greater the
amount of placental tissues (as seen in twin or multiple pregnancies), the more P4 is produced.
However, this correlation is not close, and plasma P4 in ewes bearing single, twin and multiple
fetuses may overlap. Placental estrogen production starts to increase around d 70-80 after
conception, but really high levels are determined only in the last 3-4 weeks of gestation
(Edqvist and Forsberg, 1997; Senger, 2003). During the ovine pregnancy distinct alteration
is seen also in function of adipo-insular axis. As usual in non-lactating ruminants, the concen-
tration of insulin is relatively high (Prior and Christenson, 1978; Harmon, 1992; Petterson
et al., 1993), while insulin resistance develops, which is reflected by decreased ability of adi-
pocytes and skeletal muscle to utilize glucose (Ehrhardt et al., 2001). Also considerable
hiperleptinaemia typical of pregnancy occurs in this species (Ehrhardt et al., 2001; Thomas et
al., 2001; see also in Chapter 3.6.); mainly due to a 2.3 fold increase in leptin mRNA content
of adipocytes. Its degree is unrelated to the energy balance of the dam (Ehrhardt et al.,
2001). During the pregnancy-associated hyperleptinaemia a decrease in hypothalamic leptin
sensitivity was confirmed in lab rodents (Waddell and Smith, 2003). These alterations in levels
of and sensitivity to insulin and leptin are involved in the maternal metabolic adaptation to
pregnancy, controlling the partition and expenditure of energy sources and body reserves
(Ehrhardt et al., 2001).
According to the experiences in lab rodents and Primates (Ashworth et al., 2000;
Christou et al., 2003; Henson and Castracane, 2003; Islami and Bischof, 2003; Waddell
and Smith, 2003; Yoon et al., 2005; Zieba et al., 2005), this metabolic effect of maternal
leptin is completed by the local intrauterine activity of leptin - LR system, which may be an
important regulator of implantation, as well as of the placental and fetal growth and develop-
ment. In human fetuses adiposity is an important factor influencing plasma leptin concentration.
Plasma leptin remains static until week 33 of gestation, and then it increases rapidly parallel
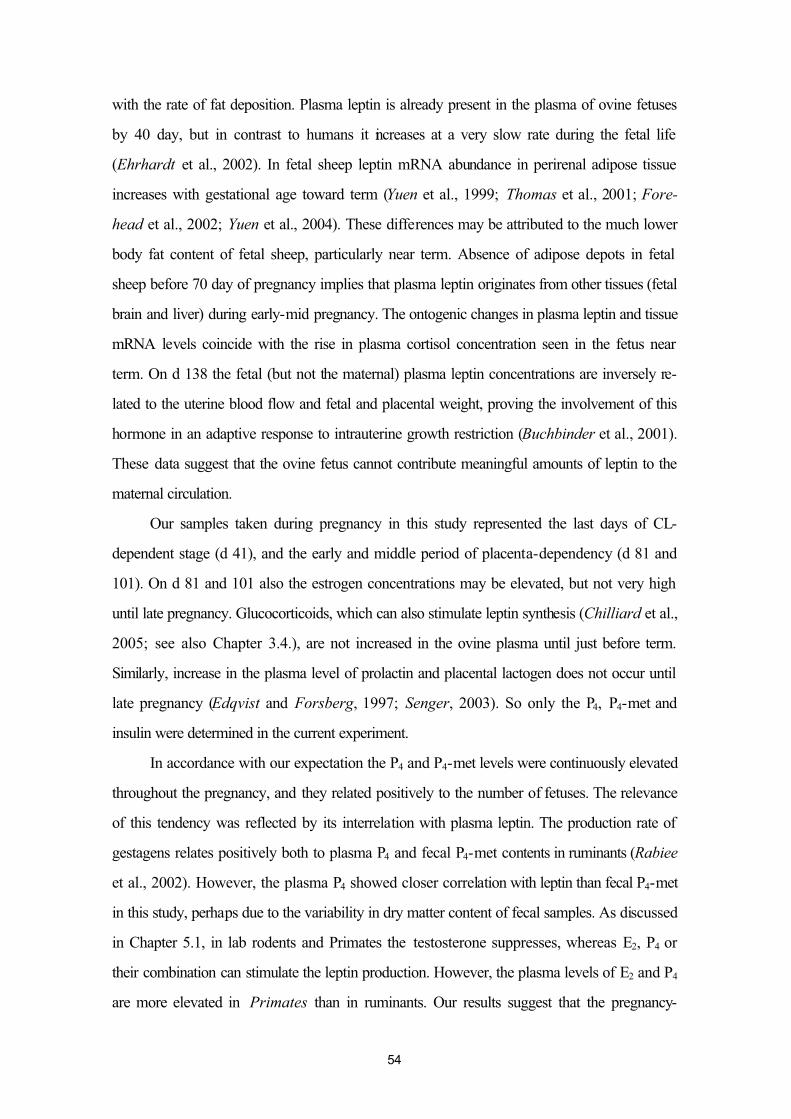
54
with the rate of fat deposition. Plasma leptin is already present in the plasma of ovine fetuses
by 40 day, but in contrast to humans it increases at a very slow rate during the fetal life
(Ehrhardt et al., 2002). In fetal sheep leptin mRNA abundance in perirenal adipose tissue
increases with gestational age toward term (Yuen et al., 1999; Thomas et al., 2001; Fore-
head et al., 2002; Yuen et al., 2004). These differences may be attributed to the much lower
body fat content of fetal sheep, particularly near term. Absence of adipose depots in fetal
sheep before 70 day of pregnancy implies that plasma leptin originates from other tissues (fetal
brain and liver) during early-mid pregnancy. The ontogenic changes in plasma leptin and tissue
mRNA levels coincide with the rise in plasma cortisol concentration seen in the fetus near
term. On d 138 the fetal (but not the maternal) plasma leptin concentrations are inversely re-
lated to the uterine blood flow and fetal and placental weight, proving the involvement of this
hormone in an adaptive response to intrauterine growth restriction (Buchbinder et al., 2001).
These data suggest that the ovine fetus cannot contribute meaningful amounts of leptin to the
maternal circulation.
Our samples taken during pregnancy in this study represented the last days of CL-
dependent stage (d 41), and the early and middle period of placenta-dependency (d 81 and
101). On d 81 and 101 also the estrogen concentrations may be elevated, but not very high
until late pregnancy. Glucocorticoids, which can also stimulate leptin synthesis (Chilliard et al.,
2005; see also Chapter 3.4.), are not increased in the ovine plasma until just before term.
Similarly, increase in the plasma level of prolactin and placental lactogen does not occur until
late pregnancy (Edqvist and Forsberg, 1997; Senger, 2003). So only the P4, P4-met and
insulin were determined in the current experiment.
In accordance with our expectation the P4 and P4-met levels were continuously elevated
throughout the pregnancy, and they related positively to the number of fetuses. The relevance
of this tendency was reflected by its interrelation with plasma leptin. The production rate of
gestagens relates positively both to plasma P4 and fecal P4-met contents in ruminants (Rabiee
et al., 2002). However, the plasma P4 showed closer correlation with leptin than fecal P4-met
in this study, perhaps due to the variability in dry matter content of fecal samples. As discussed
in Chapter 5.1, in lab rodents and Primates the testosterone suppresses, whereas E2, P4 or
their combination can stimulate the leptin production. However, the plasma levels of E2 and P4
are more elevated in Primates than in ruminants. Our results suggest that the pregnancy-
55
associated long-term increase of gestagens may be one of the factors enhancing the leptin pro-
duction in pregnant ewes.
The plasma insulin levels were relatively high in the d 0 samples, and comparing to the
initial values no further changes were seen throughout the gestation. The insulin and leptin con-
centrations correlated only before AI, and in non-pregnant animals, but not during pregnancy,
which confirms the finding of Ehrhardt et al. (2001) that in ewes the gestation-challenged
increase in leptin production is not related to changes in insulin or whole-body glucose re-
sponse to insulin.
Body condition relates well with plasma leptin in ewes (r=+0.68; Delavaud et al.,
2000). However, lack of significant correlation was observed between the body weight and
plasma leptin of dams in this study, obviously due to the pregnancy-associated leptin resis-
tance, and the age-related variability in size of our animals. Confirming this idea the animals
conceived at AI had higher plasma leptin than those not conceived, which suggests that ewes
in better condition can become pregnant more easily at the end or out of the breeding season.
We think that the body weight was not enough sensitive parameter to detect this tendency:
future studies using more precise parameters of body fat content should be required to prove
this hypothesis.
As a summary of these results we think that although the degree of pregnancy-
associated hyperleptinaemia is affected by number of fetuses and level of P4 in ewes, but preg-
nancy stage is a more important regulator than these additional factors.
5.3. Plasma leptin levels of normo- and hyperketonaemic late-pregnant ewes (Exp. 3)
There are several hormonal components in pathogenesis of hyperketonaemia and keto-
sis in postpartum dairy cattle. Lower rate of insulin to glucagon and GH is proved to act as the
main endocrine factor (Sartin et al., 1988), which is completed with depressed circulating
concentrations of IGF-I, T4 and T3, whereas the plasma level of the inactivated thyroid hor-
mone formation (rT3) increases (Huszenicza et al., 2006; see also in Chapter 5.5.). These
endocrine alterations reflect the current severity of NEB (Pethes et al., 1985; Ronge et al.,
1988), and have a crucial role in pathomechanism of NEB/ketosis-related ovarian malfunc-
tions in dairy cattle (Butler, 2000 and 2003; Diskin et al., 2003).
56
A related metabolic disorder (ovine ketosis; syn. gestational or pregnancy toxaemia) is
known to occur in late pregnant ewes bearing twins or multiple fetuses, as a consequence of
relative undernourishment of these dams during the last 2 to 4 weeks of gestation. Reduced
capacity of dry matter intake resulted from the physically compressed rumen, consumption of
low energy containing daily ration, and/or poor utilization of the available energy sources may
induce the depletion of intrahepatic glycogen store, with unstable blood glucose levels, a rapid
mobilization of fat reserves, and a concomitant increase in ketone production (Pastor et al.,
2001). The insufficient pancreatic β-cell function is a known factor of pathogenesis. However,
there are only quite a few data available on the endocrine aspects of this disease (Harmon,
1990; Henze et al., 1998; Van Saun, 2000): there have not been available data yet showing
how this pregnancy-associated hyperleptinaemia of ewes interacts with hyperketonaemia /
gestational toxaemia. Furthermore, the subsequent reproductive performance of survivals has
not been studied yet, either.
Leptin acts central role in regulation of energy metabolism (see also Chapter 3.5.2.), so
both in cattle and sheep its involvement may be hypothesized, but has not been clearly proved
in pathogenesis of ketosis.
The aims of this trial were to study (i) the endocrine alterations – including the supposed
changes in plasma leptin level – in gestational toxaemia of spring-lambing Merino ewes kept
under intensive large-scale farm conditions, and (ii) the reproductive consequences of this dis-
ease when the affected animals receive a gestagen + eCG based treatment regime to induce
their ovarian cyclicity soon after weaning, out of the breeding season.
Materials and methods
Farm conditions. Case history
Using the opportunity of a natural incidence of gestational toxemia this trial was carried
out in a Merino flock, where – as a regular part of the breeding technology – hormonal proce-
dures were frequently used for synchronization of estruses in breeding season, and for induc-
tion of ovarian cyclicity out of the breeding season. In the proceeding summer ewes (parity: 1
to 4; n=121) were kept on a riverside pastureland with abundant grass production. In the sec-
ond half of August 300 g/day/animal concentrate was also fed. At the end of August the ovar-
57
ian cyclicity was synchronized with a gestagen + eCG treatment30 Ewes in estrus were insemi-
nated (AI) once with fresh diluted semen 48 hours after gestagen removal. Thereafter, rams
were introduced into the flock to breed the ewes coming into estrus later. After the grazing
season the animals were fed ad libitum with grass hay. From the day 105 of pregnancy 350
g/day/animal concentrate was given, and this ratio was planned to continue till the end of preg-
nancy. Unfortunately, however, the further feeding of concentrate was ceased at day 125 of
gestation, because of the owner’s unexpected temporary financial difficulty. Between days 136
and 139 of pregnancy, three ewes suddenly died after a short faintness. At that time the owner
asked for our assistance to diagnose this disease and to prevent the further losses.
Examinations during late pregnancy
At the inspection of the flock on day 140 after AI another cadaver was found. At ne-
cropsy its liver showed the signs of excessive fatty infiltration, and using a dip-and-read strip
test31 large quantity of ketone bodies was detected in the urine. In the uterus there were three
well-developed, but already dead fetuses. The anamnesis and these observations raised the
suspicion of gestational toxaemia. The owner requested us to monitor the ketone status of the
whole flock, in order to select and treat the affected individuals. So while the immediate re-
start of the concentrate feeding was recommended, on the same day (e.g. day 140 of preg-
nancy) blood samples were taken. Plasma BHB content was determined within 48 hours. All
ewes with BHB level ≥1.60 mmol/l were considered to suffer from the subclinical form of ke-
tosis (Henze et al., 1998), and on day 143 of pregnancy the animals were started to receive a
3-day-long peroral antiketogenic treatment (20 g Propylene glycol + 16 g Sodium propionate
+ 1 g Nicotinic acid amide + 8 g Choline chloride per day)32. In addition to this, within the
framework of our research program later we analyzed the plasma activity of aspartate-
aminotransferase (AST), as well as the levels of certain metabolites (glucose, NEFA, and total
cholesterol, TCH) and metabolic hormones (insulin, T4, T3, cortisol, IGF-I and leptin). At
lambing the viability and number of newborn lambs were recorded.
30 14-day-long gestagen (vaginal sponge of 40 mg Cronolone; Chrono-gestTM, Intervet International B.V., Angers,
France) plus 500 IU eCG (Folligon inj., Intervet International B.V., Angers, France; i.m., simultaneously with the
gestagen removal) administration.
31 Ketostix test (Ames Company, Division of Miles Laboratories Limited, Stoke Poges, England)
32 Energa Veyxol solution, Veyx-Pharma GmbH, Schwarzenborn, Germany)
58
Farming conditions after lambing
After parturition the lambs were allowed to suckle their mothers, and the ewes were
milked for 72-75 days. During the lactation period the dams received grass hay ad libitum,
which was completed with 450-500 g/day/animal concentrate. When the weather allowed it
the ewes were let to the pasture again. However, through the evening and morning hours grass
hay was given ad libitum. The lambs were weaned at 72-75 days of age, and the dams were
dried off simultaneously.
Induction of cyclic ovarian function. Checking the metabolism and ovarian response
On day 78-80 postpartum (at the beginning of May) all ewes received a gestagen +
eCG treatment33 to induce their cyclic ovarian function again. They were inseminated at the
same time and way as previously in the autumn period, regardless of the presence of visible
estrus. At the time of AI (on day 92-94 after lambing), and 10 days later again, blood samples
were collected from each ewe. The same metabolites and hormones were determined from the
samples taken at AI as previously on day 140 of pregnancy. In order to monitor the ovarian
response to the cycle-inducing treatment the P4 content was also assayed (in both samples).
We considered as a proof of ovulation and successful cycle induction if the P4 increased from
the base-line level at AI to =3.20 nmol/l detecting luteal activity 10 days later. Also the data on
the next lambing were collected in the subsequent autumn period.
Results
Another pregnant ewe died before starting the antiketogenic treatment. After that, how-
ever, no further animal died. Altogether, 116 dams lambed, 102 of them on days 149 to 152
after the AI. Each newborn lamb was healthy. The 14 ewes lambed 14-18 days later than the
others, indicating that they had conceived from a natural mating by rams, rather than at the AI,
were not considered thereafter. The 102 dams conceiving at the AI delivered single lamb
(n=41), twins (n=57) or triplets (n=4). Hereafter, we introduced and evaluated the metabolic
and reproductive data of the 98 ewes which conceived at the AI and delivered and suckled
one or two lambs.
3314-day-long gestagen (vaginal sponge of 30 mg Cronolone; Chrono-gestTM, Intervet International B.V., Angers,
France) plus 500 IU eCG (Folligon inj., Intervet International B.V., Angers, France; i.m., simultaneously with the
gestagen removal) administration.
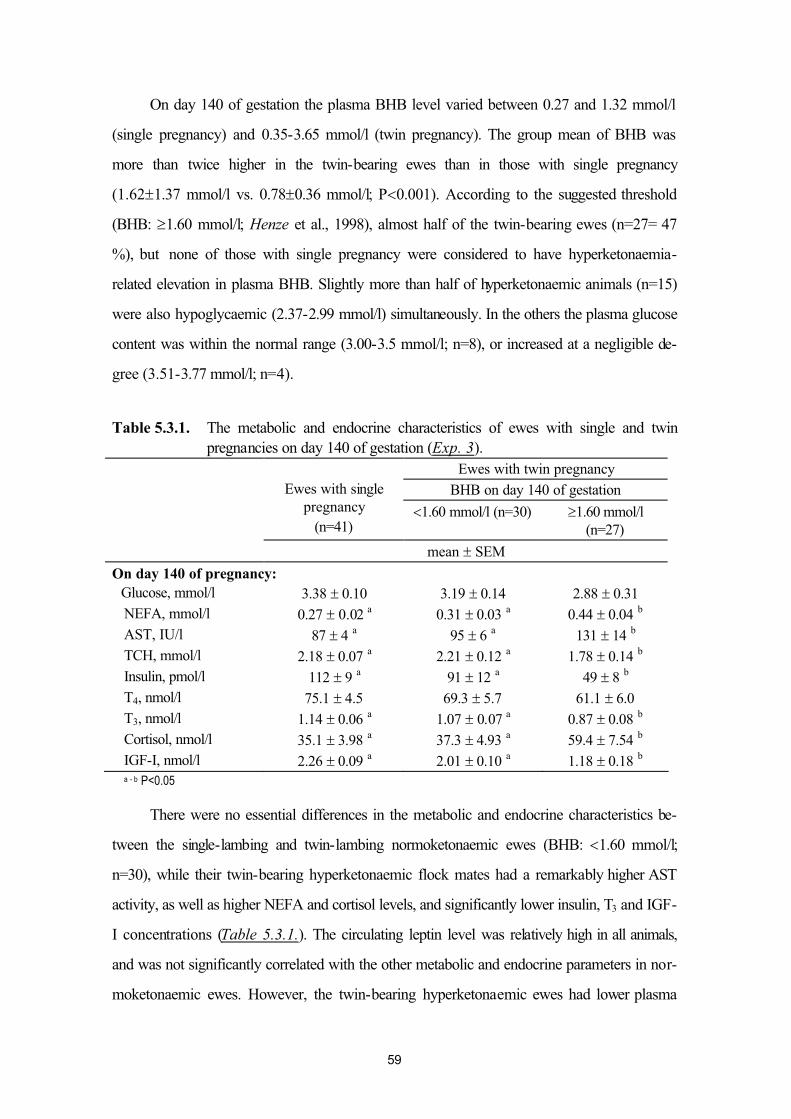
59
On day 140 of gestation the plasma BHB level varied between 0.27 and 1.32 mmol/l
(single pregnancy) and 0.35-3.65 mmol/l (twin pregnancy). The group mean of BHB was
more than twice higher in the twin-bearing ewes than in those with single pregnancy
(1.62±1.37 mmol/l vs. 0.78±0.36 mmol/l; P<0.001). According to the suggested threshold
(BHB: ≥1.60 mmol/l; Henze et al., 1998), almost half of the twin-bearing ewes (n=27= 47
%), but none of those with single pregnancy were considered to have hyperketonaemia-
related elevation in plasma BHB. Slightly more than half of hyperketonaemic animals (n=15)
were also hypoglycaemic (2.37-2.99 mmol/l) simultaneously. In the others the plasma glucose
content was within the normal range (3.00-3.5 mmol/l; n=8), or increased at a negligible de-
gree (3.51-3.77 mmol/l; n=4).
Table 5.3.1. The metabolic and endocrine characteristics of ewes with single and twinpregnancies on day 140 of gestation (Exp. 3).
Ewes with twin pregnancy
BHB on day 140 of gestationEwes with singlepregnancy
(n=41)<1.60 mmol/l (n=30) ≥1.60 mmol/l
(n=27)
mean ± SEM
On day 140 of pregnancy:Glucose, mmol/l 3.38 ± 0.10 3.19 ± 0.14 2.88 ± 0.31 NEFA, mmol/l 0.27 ± 0.02 a 0.31 ± 0.03 a 0.44 ± 0.04 b
AST, IU/l 87 ± 4 a 95 ± 6 a 131 ± 14 b
TCH, mmol/l 2.18 ± 0.07 a 2.21 ± 0.12 a 1.78 ± 0.14 b
Insulin, pmol/l 112 ± 9 a 91 ± 12 a 49 ± 8 b
T4, nmol/l 75.1 ± 4.5 69.3 ± 5.7 61.1 ± 6.0 T3, nmol/l 1.14 ± 0.06 a 1.07 ± 0.07 a 0.87 ± 0.08 b
Cortisol, nmol/l 35.1 ± 3.98 a 37.3 ± 4.93 a 59.4 ± 7.54 b
IGF-I, nmol/l 2.26 ± 0.09 a 2.01 ± 0.10 a 1.18 ± 0.18 b
a - b P<0.05
There were no essential differences in the metabolic and endocrine characteristics be-
tween the single-lambing and twin-lambing normoketonaemic ewes (BHB: <1.60 mmol/l;
n=30), while their twin-bearing hyperketonaemic flock mates had a remarkably higher AST
activity, as well as higher NEFA and cortisol levels, and significantly lower insulin, T3 and IGF-
I concentrations (Table 5.3.1.). The circulating leptin level was relatively high in all animals,
and was not significantly correlated with the other metabolic and endocrine parameters in nor-
moketonaemic ewes. However, the twin-bearing hyperketonaemic ewes had lower plasma
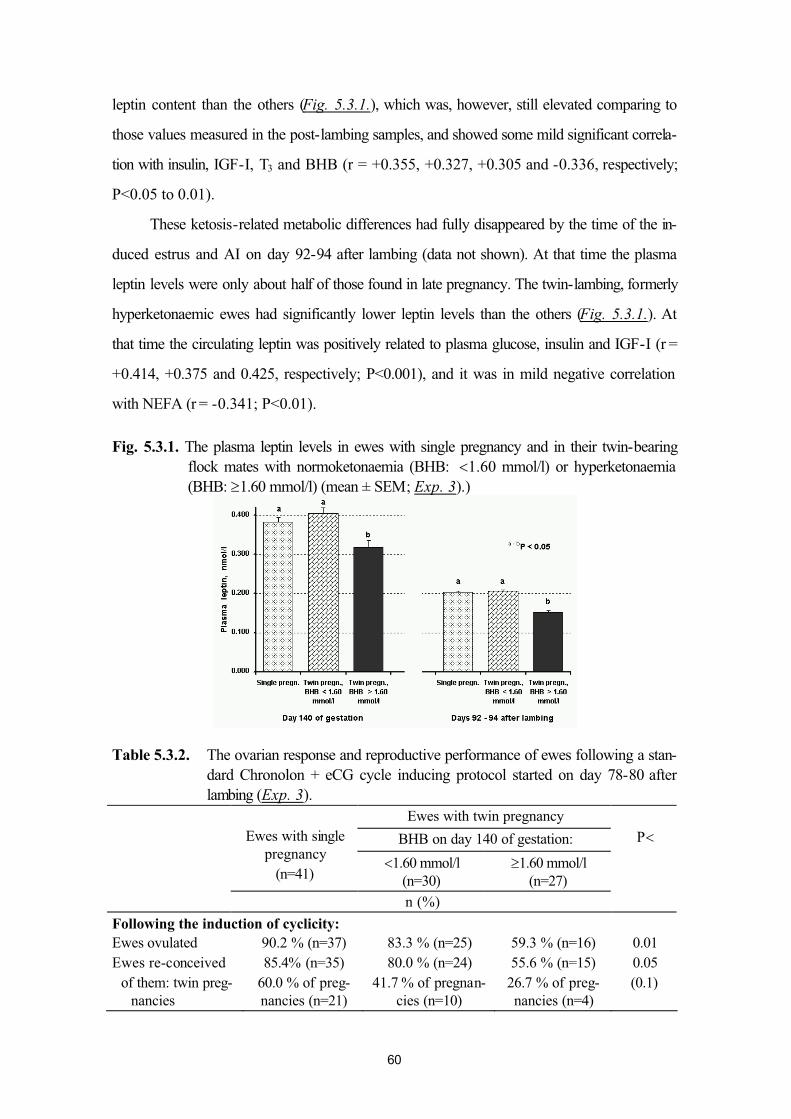
60
leptin content than the others (Fig. 5.3.1.), which was, however, still elevated comparing to
those values measured in the post-lambing samples, and showed some mild significant correla-
tion with insulin, IGF-I, T3 and BHB (r = +0.355, +0.327, +0.305 and -0.336, respectively;
P<0.05 to 0.01).
These ketosis-related metabolic differences had fully disappeared by the time of the in-
duced estrus and AI on day 92-94 after lambing (data not shown). At that time the plasma
leptin levels were only about half of those found in late pregnancy. The twin-lambing, formerly
hyperketonaemic ewes had significantly lower leptin levels than the others (Fig. 5.3.1.). At
that time the circulating leptin was positively related to plasma glucose, insulin and IGF-I (r =
+0.414, +0.375 and 0.425, respectively; P<0.001), and it was in mild negative correlation
with NEFA (r = -0.341; P<0.01).
Fig. 5.3.1. The plasma leptin levels in ewes with single pregnancy and in their twin-bearingflock mates with normoketonaemia (BHB: <1.60 mmol/l) or hyperketonaemia (BHB: ≥1.60 mmol/l) (mean ± SEM; Exp. 3).)
Table 5.3.2. The ovarian response and reproductive performance of ewes following a stan-dard Chronolon + eCG cycle inducing protocol started on day 78-80 after lambing (Exp. 3).
Ewes with twin pregnancy
BHB on day 140 of gestation:Ewes with singlepregnancy
(n=41)<1.60 mmol/l
(n=30)≥1.60 mmol/l
(n=27)
n (%)
P<
Following the induction of cyclicity:Ewes ovulated 90.2 % (n=37) 83.3 % (n=25) 59.3 % (n=16) 0.01Ewes re-conceived 85.4% (n=35) 80.0 % (n=24) 55.6 % (n=15) 0.05
of them: twin preg-nancies
60.0 % of preg-nancies (n=21)
41.7 % of pregnan-cies (n=10)
26.7 % of preg-nancies (n=4)
(0.1)
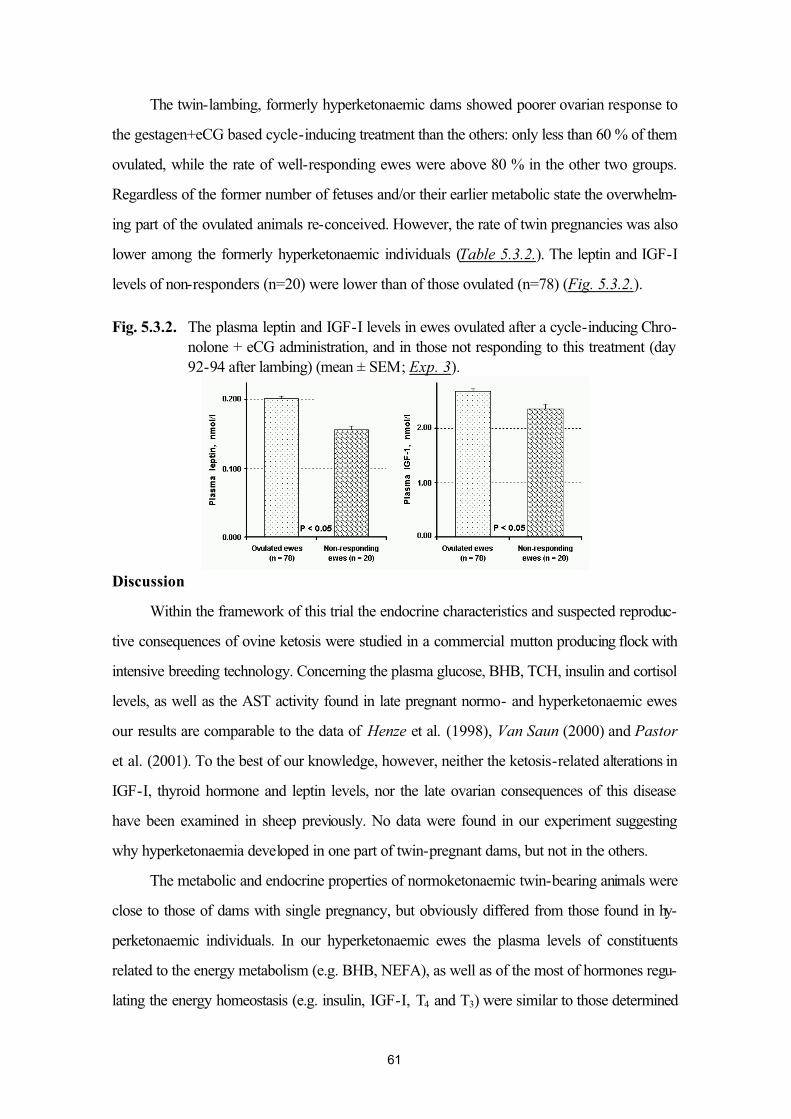
61
The twin-lambing, formerly hyperketonaemic dams showed poorer ovarian response to
the gestagen+eCG based cycle-inducing treatment than the others: only less than 60 % of them
ovulated, while the rate of well-responding ewes were above 80 % in the other two groups.
Regardless of the former number of fetuses and/or their earlier metabolic state the overwhelm-
ing part of the ovulated animals re-conceived. However, the rate of twin pregnancies was also
lower among the formerly hyperketonaemic individuals (Table 5.3.2.). The leptin and IGF-I
levels of non-responders (n=20) were lower than of those ovulated (n=78) (Fig. 5.3.2.).
Fig. 5.3.2. The plasma leptin and IGF-I levels in ewes ovulated after a cycle-inducing Chro-nolone + eCG administration, and in those not responding to this treatment (day 92-94 after lambing) (mean ± SEM; Exp. 3).
Discussion
Within the framework of this trial the endocrine characteristics and suspected reproduc-
tive consequences of ovine ketosis were studied in a commercial mutton producing flock with
intensive breeding technology. Concerning the plasma glucose, BHB, TCH, insulin and cortisol
levels, as well as the AST activity found in late pregnant normo- and hyperketonaemic ewes
our results are comparable to the data of Henze et al. (1998), Van Saun (2000) and Pastor
et al. (2001). To the best of our knowledge, however, neither the ketosis-related alterations in
IGF-I, thyroid hormone and leptin levels, nor the late ovarian consequences of this disease
have been examined in sheep previously. No data were found in our experiment suggesting
why hyperketonaemia developed in one part of twin-pregnant dams, but not in the others.
The metabolic and endocrine properties of normoketonaemic twin-bearing animals were
close to those of dams with single pregnancy, but obviously differed from those found in hy-
perketonaemic individuals. In our hyperketonaemic ewes the plasma levels of constituents
related to the energy metabolism (e.g. BHB, NEFA), as well as of the most of hormones regu-
lating the energy homeostasis (e.g. insulin, IGF-I, T4 and T3) were similar to those determined
62
in feed-restricted (Agenäs et al., 2003; Chelikani et al., 2004) or high-producing (Wensing
et al., 1997) postpartum dairy cows, and reflected NEB-related tendencies (Ronge et al.,
1988; Chilliard et al., 1998; Veerkamp et al., 2003). In accordance with the experiences of
Henze et al. (1998) these findings reinforce the supposed role of lower than normal secretory
capacity of pancreatic β-cells and/or the low level of insulin in plasma, as primary endocrine
factors in the pathogenesis of pregnancy toxaemia. As observed in cattle (Ronge et al., 1988;
Diskin et al., 2003), the decreased concentration of IGF-I may reflect the NEB also in late
pregnant hyperketonaemic ewes. In response to feed deprivation low insulin and IGF-I levels
were seen also in pregnant beef cows (Lents et al., 2005) and postpartum dairy cows
(Agenäs et al., 2003; Chelikani et al., 2004). The low plasma levels of thyroid hormones can
be explained by the increased degree of their inactivation (inner-ring deiodation) in peripheral
tissues, and/or alternatively by the decreased capacity of T4 activation (namely the outer-ring
deiodation of T4), diminishing the transformation of T4 to T3 (Pethes et al. 1985; Ronge et al.,
1988; Huszenicza et al., 2006; Lents et al., 2005). As reviewed earlier (Huszenicza et al.,
2002), these changes represent important mechanisms in adaptation to NEB.
The temporary hyperleptinaemia resulted from a gestation-induced 2.3 fold increase in
leptin mRNA content of adipocytes is one of the species-based characteristics of ovine preg-
nancy (Ehrhardt et al., 2001; Thomas et al., 2001; see also in Chapters 3.5.3. and 5.2.). Its
actual degree is unrelated to the energy balance of the dam (Ehrhardt et al., 2001), but it is
associated with the stage of gestation (Ehrhardt et al., 2001; Thomas et al., 2001), and – as
seen in Chapter 5.2. – also with the number of fetuses. In dairy cows the peri-parturient leptin
levels were the highest during the late pregnancy and declined by about 50 % after calving.
The plasma leptin concentration remained depressed during early lactation despite a gradual
improvement in energy balance. This postpartum reduction in circulating leptin was the obvious
consequence of NEB, because leptin remained high in cows not milked at that time. Plasma
leptin was positively correlated with concentrations of insulin and glucose, while related nega-
tively to GH and NEFA (Block et al., 2001). Similar peri-parturient decrease was not seen in
ewes (McFadin et al., 2002), but sampling was started relatively late at that study, only one
week before the expected time of lambing. Ehrhardt et al. (2001) could detect almost the
same concentration of plasma leptin on 15-22 days after lambing, as 20 to 40 days before
breeding, and this level was significantly lower than those found in mid and late pregnancy. In
63
accordance with the earlier observations (Ehrhardt et al., 2001; own data in Chapter 5.2.), in
the current study the level of leptin was much higher on d 140 of gestation then that detected
on d 92-94 after lambing. However, the mean of leptin content was lower in the twin-bearing
hyperketonaemic dams than in the others, demonstrating the combined effects of NEB and
gestation on leptin production. Certain undefined gestation-related factors are known to in-
crease the abundance of leptin mRNA in adipocytes of pregnant ewes (Ehrhardt et al.,
2001). These factors are supposed to override the effect of NEB on circulating level of leptin
in ketotic dams for a while. The situation seems to be different in late pregnant dairy cows in
positive energy balance, where feeding level clearly interacts with pregnancy stage on plasma
leptin level (Holtenius et al., 2003). The actual feeding level (rather than body fat content or
stage of gestation) was the primary factor determining the plasma leptin concentration also in
feed-restricted pregnant beef cows (Lents et al., 2005). All the ketosis-induced metabolic
differences completely disappeared during lactation. The significantly lower plasma leptin level
of formerly hyperketonaemic ewes was the only exception existing at the time of the induced
estrus and AI on day 92-94 after lambing, perhaps due to a longer and more intensive loss of
whole-body lipid reserves presumed in these animals. Unfitness of the feeding system to the
intensive breeding technology could also be responsible for these prolonged differences.
In this study fewer formerly hyperketonaemic than normoketonaemic ewes responded
with ovulation to a standard cycle-inducing procedure, and those ovulated after this treatment
were characterized by somewhat higher leptin and IGF-I levels than the non-responding indi-
viduals. The same tendency with the advantage of normoketonaemic dams was observed also
in the rate of re-conceived animals. Of course the direct effects of lower leptin and IGF-I lev-
els on hypothalamic-anterior pituitary GnRH/LH secretion and/or on follicular growth and
maturation (Spicer et al., 1993; Spicer and Stewart, 1996; Zieba et al., 2005) can not be
completely excluded. However, it could be hypothesized that these tendencies in leptin and
IGF-I reflect only the smaller cell size and triglyceride content of adipocytes, and the poorer
body condition, rather than they are involved as direct causative agents in pathophysiology of
the poorer reproductive performance. In other respects, a hyperketonaemia-related impair-
ment of follicular development is supposed to be a more likely reason of the poor ovarian re-
sponse. The time needed for development of primordial follicular structures into pre-ovulatory
follicles is longer in sheep than in cattle, and it takes approximately 180 days (Cahill and
64
Mauleon, 1980; Monniaux et al., 1997a and 1997b). So in the current study the dominant
follicles expected to yield fully competent oocytes following the induction of cyclicity on day
92-94 after lambing started to develop before delivery. Therefore in the affected dams the
developing follicles were exposed to all the hyperketonaemia-related metabolic and endocrine
changes. The long-lasting effects of NEB and its decompensation (ketosis, fatty liver) on intra-
follicular steroidogenic capacity and oocyte quality are well-documented in high-producing
dairy cows (Wensing et al., 1997; Kruip et al., 1999; O’Callaghan and Boland, 1999;
Gwazdauskas et al., 2000; Walters et al., 2002; Vanholder et al., 2005 and 2006). So, the
poor reproductive performance of our formerly hyperketonaemic ewes could be based mainly
on an analogue follicular malfunction. Further studies are needed, however, to prove this hy-
pothesis. These reproductive consequences of pregnancy toxaemia could be recognized in this
study, because our ewes lambed in winter time, and their ovarian cyclicity was attempted to be
induced just at the end of lactation, in animals out of the breeding season. By the time of the
traditional breeding season in autumn these impairments would have been eliminated obviously.
Of course it can not be stated that the gestational toxaemia in sheep acts a nearly similar role in
the possible reasons of reproductive disorders as the NEB and its consequences in postpar-
tum dairy cows. However, occasionally we have to count with this form of diminished repro-
ductive performance also in ewes targeted by intensive breeding technology. It might have
particular importance in dairy flocks.
As concluding remarks of this study the subclinical form of ovine ketosis is characterized
by complex endocrine alterations, reflecting NEB. However, in late pregnant ketotic ewes the
leptin level seems to be influenced also by leptin resistance, and certain further NEB-unrelated
factors, which remained undefined in this trial. If some weeks after lambing the ovarian cyclic-
ity is induced out of the breeding season, the plasma leptin level, ovarian response and fertility
of formerly ketotic ewes may be depressed.
5.4. Plasma leptin and ovarian function in postpartum dairy cows
(Exp. 4a, Exp. 4b)
Genetic selection for milk production during the last decades has been associated with
decreased reproductive efficiency in dairy cows (Lucy, 2001). However, reduced fertility is
not a direct consequence of the high genetic merit (Veerkamp et al., 2003; Wathes et al.,
65
2003 and 2007): also a high-producing dairy cow can re-conceive at a reasonable time (day
50-60 to 100-120) after calving, if – not regarding the andrological aspects currently – (i) the
dam ovulates from one of the first 3-4 waves of follicle growth, her ovarian function becomes
cyclic, and she shows estrus thereafter, (ii) her uterine involution is finished with a complete
histological regeneration of the endometrium, (iii) she is capable of ovulating a fully competent
oocyte, furthermore (iv) after AI and fertilization the endocrine and metabolic conditions pro-
vide a proper intratubal/intrauterine environment for the developing embryo (recently reviewed
by Huszenicza, 2003; Huszenicza et al., 2003).
The first postpartum ovulation and resumption of ovarian cyclicity is a milestone on the
way to re-conception, which is closely related to the NEB in this period: the time to the begin-
ning of the recovery of energy balance is positively correlated with the time to first ovulation
(Butler et al. 1981; Beam and Butler, 1999). Butler and Smith (1989) found that cows that
lost less than 0.5 units of body condition score (BCS) during the first 5 weeks postpartum had
higher conception rates at the first service than cows that lost more than 0.5 BCS. The physio-
logical pathways by which the hypothalamic-pituitary-ovarian axis is informed about the ener-
getic status of the animal are complex, and involve several metabolites and hormones such as
the GH - IGF-I system, insulin, thyroid hormones and leptin (Blache et al., 2007). Spicer et
al. (1990) were the first in proposing that the effect of NEB on the time of first ovulation may
be mediated by the IGF-I. Although GH concentrations are usually high in early-lactating ru-
minants, the intrahepatic production of its mediator IGF-I is diminished (Chilliard, 1999).
Circulating concentrations of IGF-I in the peri-partum period were good indicators of the ca-
pacity of energy-restricted cows to resume cyclicity after parturition (Roberts et al. 1997).
Cows with ovulatory estrogen-active (E2-producing) follicles had higher circulating IGF-I con-
centrations during the first 2 weeks than cows with anovulatory follicles (Beam and Butler
1997, 1998). Both the insulin and IGF-I are known to stimulate the in vitro steroidogenesis
and proliferation of bovine thecal and granulosal cell cultures (Spicer et al. 1993; Spicer and
Stewart 1996). Likewise, cows that ovulated within 35 days postpartum presented higher
IGF-I concentrations as well as higher glucose and insulin and lower NEFA and BHB concen-
trations (Huszenicza et al., 2001). Cows in postpartum NEB have also low concentrations of
thyroid hormones (Pethes et al. 1985; Capuco et al. 2001). A role of these hormones in
66
regulating steroidogenesis has been reported (Spicer 2001), but data regarding their effect on
ovarian function in vivo is limited and controversial (Huszenicza et al. 2002).
As it was discussed earlier (Chapters 3.3. and 3.5.), leptin acts as an energy reserve sig-
nal for the hypothalamic regions that control feeding behavior, metabolism and endocrine func-
tion, so as to maintain energy homeostasis, and its plasma concentrations vary with changes in
body weight and percentage of body fat (Delavaud et al. 2002). Dairy cows often lose over
60 % of their body fat during early lactation (Tamminga et al. 1997; Chilliard 1999), and it
was shown that leptin concentration declined shortly before parturition (Kadokawa et al.
2000; Block et al. 2001; Liefers et al. 2003). Less agreement is on leptin concentrations after
parturition: increasing (Kadokawa et al. 2000), unchanged (Huszenicza et al. 2001), dimin-
ished (Block et al. 2001; Holtenius et al. 2003), or a transient increase (Liefers et al. 2003)
have been reported. The postpartum leptin reduction is likely to be due in part to the NEB
because plasma leptin remained high in cows not milked after parturition (Block et al. 2001).
There are only few reports on the relation between leptin concentrations and resumption of
cyclic ovarian activity during the postpartum period (Kadokawa et al. 2000; Huszenicza et al.
2001; Liefers et al. 2003; Kadokawa et al. 2006). The interval from parturition to first ovula-
tion correlated significantly with the interval from parturition to leptin nadir, but was not corre-
lated with the prepartum, pre- and/or postovulatory leptin values (Kadokawa et al. 2000).
Liefers et al. (2003) found that although there was lack of relationship between leptin and first
postpartum luteal activity, higher leptin concentrations were associated with shorter intervals to
first observed oestrus. However, the supposed altering effects of inflammatory diseases with
intensive endotoxin / cytokine release (puerperal metritis, mastitis; see also in Chapters 3.8.
and 5.7.) were not taken into consideration in these early field studies.
The objective of Exp. 4a was (i) to characterize the insulin, IGF-I, thyroid hormones and
leptin concentrations along with BHB and NEFA profiles in healthy dairy cows. In addition,
(ii) the effect of parity and BCS at parturition on endocrine and metabolite patterns and repro-
ductive parameters were determined. Furthermore, in Exp. 4b we wished to compare the
plasma levels of these metabolic hormones and metabolites in cows with already cyclic vs. still
acyclic ovarian function at the desirable time of the first postpartum AI.
67
Materials and methods
Exp. 4a
Holstein Friesian cows with 2 to 5 parturitions (parity: ≥2, multiparous cows; n=23) and
cows without previous parturitions (parity: 1, primiparous cows; n=24) (average 305 day milk
yield: 6000 and 4800 kg respectively) calving in the autumn period of the southern hemisphere
(April) were selected from a dairy herd (experimental farm of the Agronomy College; Pay-
sandú, Uruguay). Animals were grazing on improved pastures (mixture of grasses and leg-
umes) and three weeks before parturition they were offered a diet that consisted in a mixture
of 12 kg of corn silage and 4 kg of a commercial concentrate (14 % CP, 7.11 MJ NEl/kg)
which were given once a day, and bales of Setaria Itálica, ad libitum. After parturition cows
had access to a daily strip of pasture (mixture of grasses and legumes), 15 kg (fresh basis) of
corn silage (33 % DM, 6.8 % CP) and 6 kg DM of a commercial concentrate (17 % CP, 1.7
MCal Nel/kg). The pasture sward mass (1650 ± 230 kg DM) was estimated with a compara-
tive yield method adapted from Haydock and Shaw (1975), and an allowance of 15 to 18 kg
of DM per cow per day was offered through weekly adjustments of the daily strip size. The
cow had access to the grazing plot between the morning and the afternoon milking. The corn
silage was fed in the afternoon (after milking), and the concentrate equally distributed during
milking time (twice a day). Cows were milked twice a day and milk production was measured
every 15 days. BCS was determined every 15 days by the same person from 2 months before
until the third month after parturition. At the same time, body weight (BW) was determined.
The BCS at parturition was determined by using the BCS closest to parturition, and animals
were assigned into two groups, e.g. groups of cows calving in relatively poor (<3.00: n=20),
or moderate to good body condition (≥3.00: n=22)34. Accordingly, terms of LEAN and FAT
cows were used thereafter in this study. Estrus was detected twice a day, and animals were
inseminated 12 h after heat detection (voluntary waiting period = 50 days). Reproduction was
seasonally with a breeding period of 5 months (from May to September). Pregnancy diagnosis
was performed by rectal palpation 45 days after artificial insemination. Blood samples were
obtained three times a week, from around 30 days prepartum to 60 days postpartum. The re-
initiation of ovarian cyclicity was determined by P4 concentrations in plasma 3 times per week.
Reproductive parameters measured were days to first ovulation, intervals from parturition to
68
first service and to conception. Samples taken every 10 days from one month before to two
months after parturition were assayed for metabolites (NEFA, BHB)35 and metabolic hor-
mones.
In this study the milk production, BCS, metabolites and hormonal concentrations were
analyzed by mixed procedure (Statistical Analysis System, SAS Institute Inc., Cary, NC,
USA 2000). The statistical model included the effects of parity (categories: primiparous=L1 or
multiparous=L2), BCS at parturition (BCS <3.00 or ≥3.00), days including pre and postpar-
tum periods (linear and quadratic functions) and interactions. The covariance structure was
autoregressive order 1 and cow within parity*BCS at parturition was set as random effect.
Functions were calculated for each dependent variable and differences in the estimates of the
curves were analyzed according to parity and BCS at parturition. Postpartum days were cate-
gorized in intervals of 10 days during the experimental period (day 0 = day of parturition) and
data are presented in graphs as group means ± pooled standard error. To study reproductive
parameters a general linear model was used and the fixed effects were parity and BCS at par-
turition. Tukey-Kramer tests were conducted to analyze differences between groups. The re-
initiation of ovarian cyclicity was defined as the day when P4 increased from basal concentra-
tions in two consecutive samples of >1.60 nmol/l or one sample of >3.20 nmol/l. If no detect-
able P4 was observed until day ≈70 postpartum, the last day of sampling was arbitrarily con-
sidered as the initiation of ovarian cyclicity for that cow. Correlation coefficients were calcu-
lated to study relationships between variables (Proc Corr, SAS). Factors affecting the re-
initiation of ovarian cyclicity were evaluated by regression analysis using a backwards elimina-
tion procedure (initial inclusion of all independent variables and sequential elimination of the
variables with P >0.10 using the regression procedure of SAS) to determine those with P
<0.10. The dependent variable was the re-initiation of ovarian cyclicity and the independent
variables included were parity, BCS at parturition, BW, actual BCS, milk production, NEFA,
BHB, insulin, T3, T4, IGF-I and leptin. The last observation before the re-initiation of ovarian
cyclicity in each cow was included in this study. Regression analyses were performed to study
relationships between leptin and BCS, leptin and NEFA and leptin and IGF-I before and after
parturition in cows with low and high BCS at parturition.
34 BCS of excluded animals (n=5) are not involved.
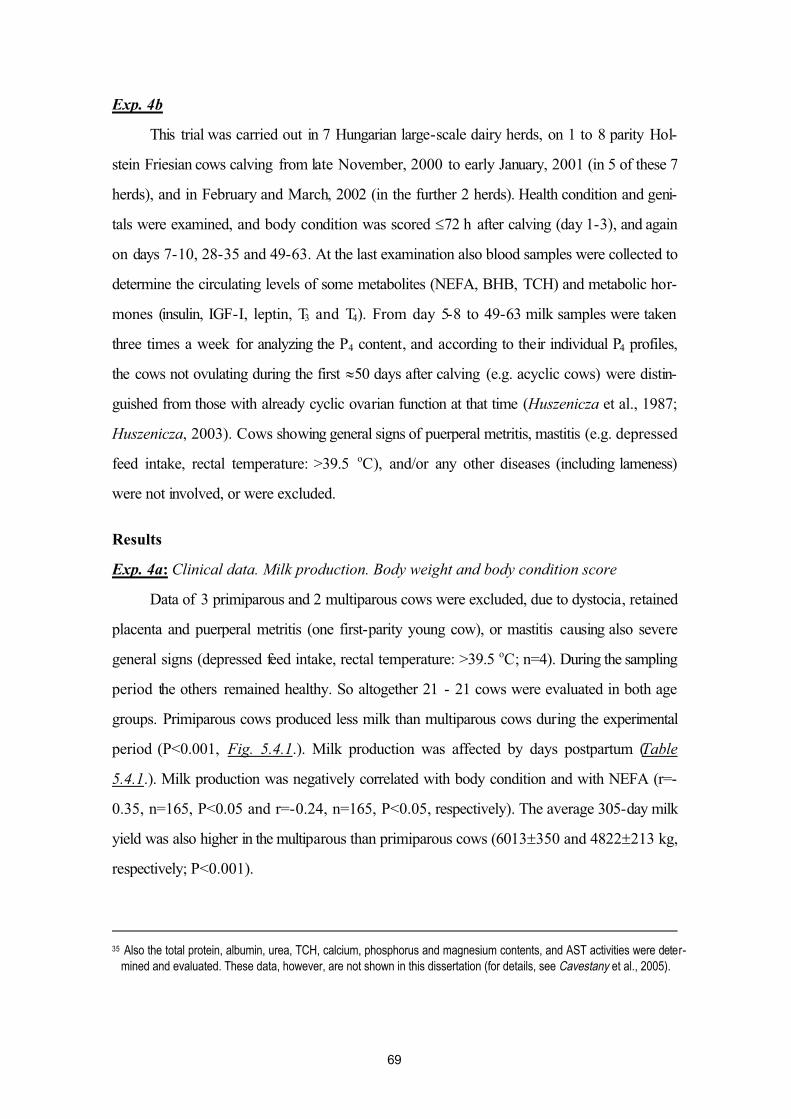
69
Exp. 4b
This trial was carried out in 7 Hungarian large-scale dairy herds, on 1 to 8 parity Hol-
stein Friesian cows calving from late November, 2000 to early January, 2001 (in 5 of these 7
herds), and in February and March, 2002 (in the further 2 herds). Health condition and geni-
tals were examined, and body condition was scored ≤72 h after calving (day 1-3), and again
on days 7-10, 28-35 and 49-63. At the last examination also blood samples were collected to
determine the circulating levels of some metabolites (NEFA, BHB, TCH) and metabolic hor-
mones (insulin, IGF-I, leptin, T3 and T4). From day 5-8 to 49-63 milk samples were taken
three times a week for analyzing the P4 content, and according to their individual P4 profiles,
the cows not ovulating during the first ≈50 days after calving (e.g. acyclic cows) were distin-
guished from those with already cyclic ovarian function at that time (Huszenicza et al., 1987;
Huszenicza, 2003). Cows showing general signs of puerperal metritis, mastitis (e.g. depressed
feed intake, rectal temperature: >39.5 oC), and/or any other diseases (including lameness)
were not involved, or were excluded.
Results
Exp. 4a: Clinical data. Milk production. Body weight and body condition score
Data of 3 primiparous and 2 multiparous cows were excluded, due to dystocia, retained
placenta and puerperal metritis (one first-parity young cow), or mastitis causing also severe
general signs (depressed feed intake, rectal temperature: >39.5 oC; n=4). During the sampling
period the others remained healthy. So altogether 21 - 21 cows were evaluated in both age
groups. Primiparous cows produced less milk than multiparous cows during the experimental
period (P<0.001, Fig. 5.4.1.). Milk production was affected by days postpartum (Table
5.4.1.). Milk production was negatively correlated with body condition and with NEFA (r=-
0.35, n=165, P<0.05 and r=-0.24, n=165, P<0.05, respectively). The average 305-day milk
yield was also higher in the multiparous than primiparous cows (6013±350 and 4822±213 kg,
respectively; P<0.001).
35 Also the total protein, albumin, urea, TCH, calcium, phosphorus and magnesium contents, and AST activities were deter-
mined and evaluated. These data, however, are not shown in this dissertation (for details, see Cavestany et al., 2005).
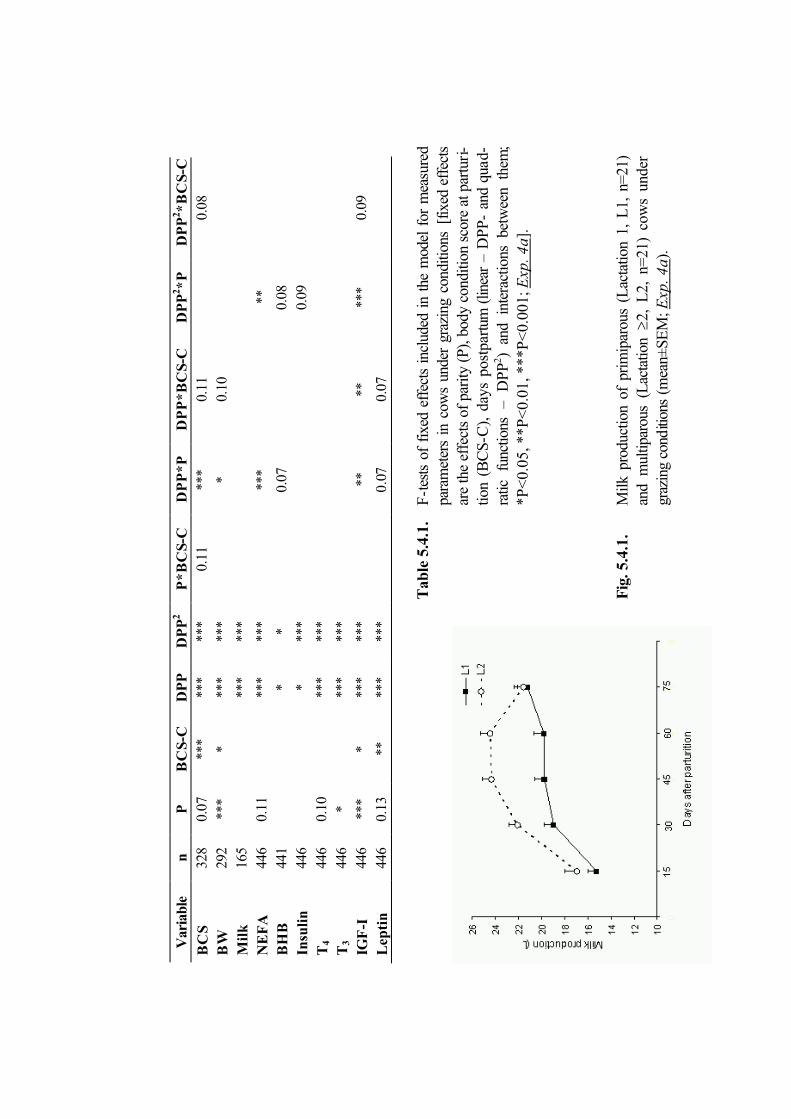
Var
iabl
en
PB
CS-
CD
PP
DP
P2
P*B
CS-
CD
PP
*PD
PP
*BC
S-C
DP
P2 *P
DP
P2 *B
CS-
C
BC
S32
80.
07**
***
***
*0.
11**
*0.
110.
08
BW
292
***
***
***
**
0.10
Mil
k16
5**
***
*
NE
FA
446
0.11
***
***
***
**
BH
B44
1*
*0.
070.
08
Insu
lin44
6*
***
0.09
T4
446
0.10
***
***
T3
446
***
***
*
IGF
-I44
6**
**
***
***
****
***
0.09
Lep
tin
446
0.13
****
***
*0.
070.
07
Tab
le 5
.4.1
.F
-tes
ts o
f fix
ed e
ffec
ts i
nclu
ded
in t
he m
odel
for
mea
sure
dpa
ram
eter
s in
cow
s un
der
graz
ing
cond
ition
s [f
ixed
eff
ects
ar
e th
e ef
fect
s of
par
ity (
P), b
ody
cond
ition
sco
re a
t par
turi
-tio
n (B
CS-
C),
day
s po
stpa
rtum
(lin
ear
– D
PP-
and
quad
-ra
tic
func
tions
–D
PP2 )
and
inte
ract
ions
bet
wee
n th
em;
*P<
0.05
, **P
<0.
01, *
**P
<0.
001;
Exp
. 4a]
.
Fig
.5.4
.1.
Milk
pro
duct
ion
of p
rimip
arou
s (L
acta
tion
1, L
1, n
=21)
an
d m
ultip
arou
s (L
acta
tion≥
2, L
2, n
=21)
cow
s un
der
graz
ing
cond
ition
s (m
ean±
SEM
;Exp
. 4a)
.
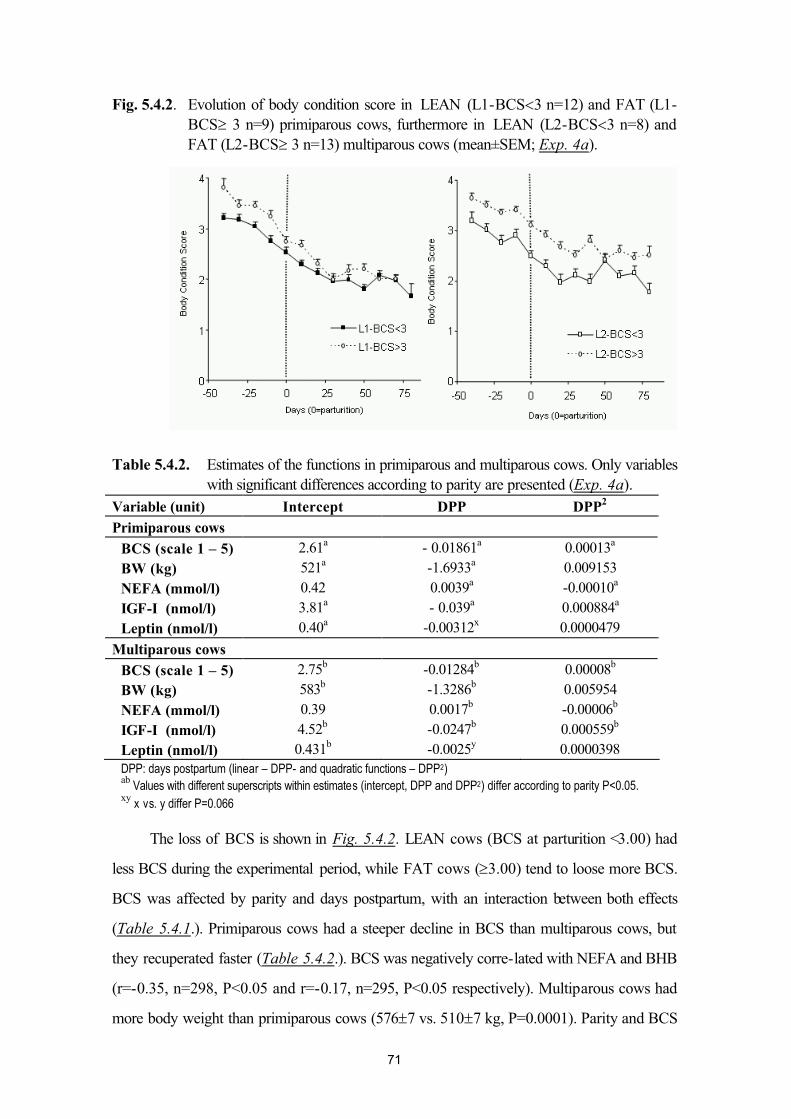
71
Fig. 5.4.2. Evolution of body condition score in LEAN (L1-BCS<3 n=12) and FAT (L1-BCS≥ 3 n=9) primiparous cows, furthermore in LEAN (L2-BCS<3 n=8) and FAT (L2-BCS≥ 3 n=13) multiparous cows (mean±SEM; Exp. 4a).
Table 5.4.2. Estimates of the functions in primiparous and multiparous cows. Only variables with significant differences according to parity are presented (Exp. 4a).
Variable (unit) Intercept DPP DPP2
Primiparous cows
BCS (scale 1 – 5) 2.61a - 0.01861a 0.00013a
BW (kg) 521a -1.6933a 0.009153
NEFA (mmol/l) 0.42 0.0039a -0.00010a
IGF-I (nmol/l) 3.81a - 0.039a 0.000884a
Leptin (nmol/l) 0.40a -0.00312x 0.0000479
Multiparous cows
BCS (scale 1 – 5) 2.75b -0.01284b 0.00008b
BW (kg) 583b -1.3286b 0.005954
NEFA (mmol/l) 0.39 0.0017b -0.00006b
IGF-I (nmol/l) 4.52b -0.0247b 0.000559b
Leptin (nmol/l) 0.431b -0.0025y 0.0000398DPP: days postpartum (linear – DPP- and quadratic functions – DPP2)ab
Values with different superscripts within estimates (intercept, DPP and DPP2) differ according to parity P<0.05. xy
x vs. y differ P=0.066
The loss of BCS is shown in Fig. 5.4.2. LEAN cows (BCS at parturition <3.00) had
less BCS during the experimental period, while FAT cows (≥3.00) tend to loose more BCS.
BCS was affected by parity and days postpartum, with an interaction between both effects
(Table 5.4.1.). Primiparous cows had a steeper decline in BCS than multiparous cows, but
they recuperated faster (Table 5.4.2.). BCS was negatively corre-lated with NEFA and BHB
(r=-0.35, n=298, P<0.05 and r=-0.17, n=295, P<0.05 respectively). Multiparous cows had
more body weight than primiparous cows (576±7 vs. 510±7 kg, P=0.0001). Parity and BCS
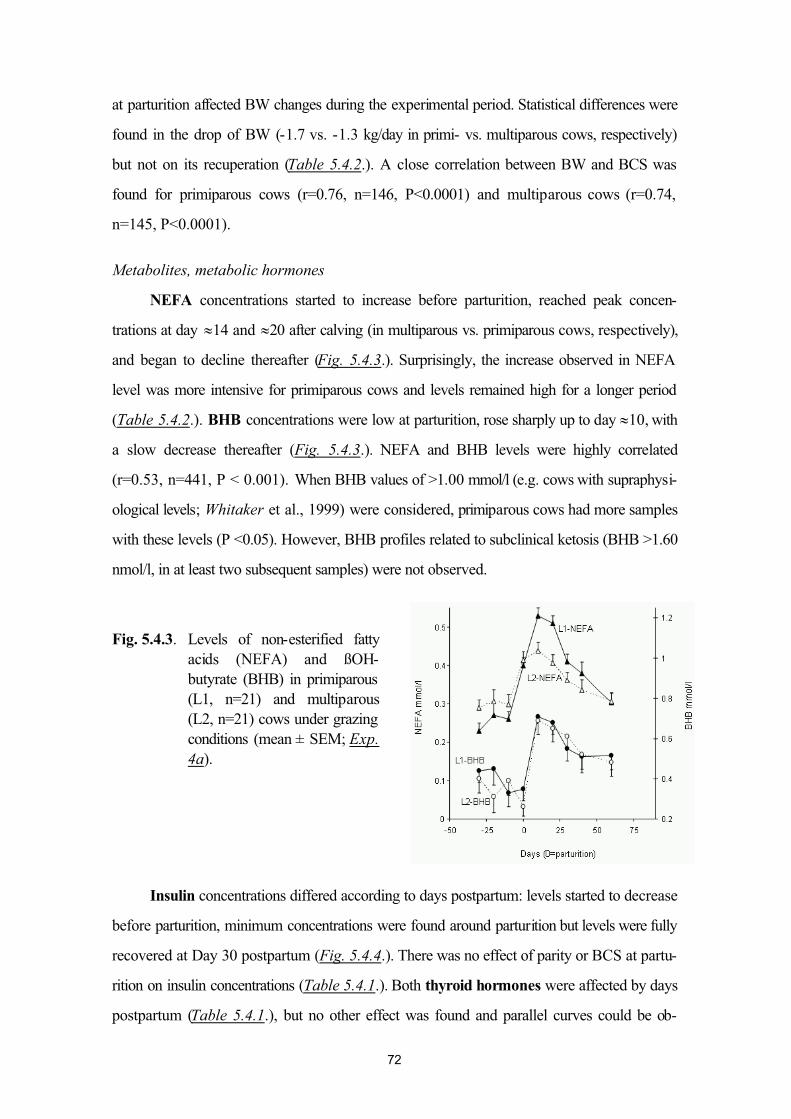
72
at parturition affected BW changes during the experimental period. Statistical differences were
found in the drop of BW (-1.7 vs. -1.3 kg/day in primi- vs. multiparous cows, respectively)
but not on its recuperation (Table 5.4.2.). A close correlation between BW and BCS was
found for primiparous cows (r=0.76, n=146, P<0.0001) and multiparous cows (r=0.74,
n=145, P<0.0001).
Metabolites, metabolic hormones
NEFA concentrations started to increase before parturition, reached peak concen-
trations at day ≈14 and ≈20 after calving (in multiparous vs. primiparous cows, respectively),
and began to decline thereafter (Fig. 5.4.3.). Surprisingly, the increase observed in NEFA
level was more intensive for primiparous cows and levels remained high for a longer period
(Table 5.4.2.). BHB concentrations were low at parturition, rose sharply up to day ≈10, with
a slow decrease thereafter (Fig. 5.4.3.). NEFA and BHB levels were highly correlated
(r=0.53, n=441, P < 0.001). When BHB values of >1.00 mmol/l (e.g. cows with supraphysi-
ological levels; Whitaker et al., 1999) were considered, primiparous cows had more samples
with these levels (P <0.05). However, BHB profiles related to subclinical ketosis (BHB >1.60
nmol/l, in at least two subsequent samples) were not observed.
Fig. 5.4.3. Levels of non-esterified fattyacids (NEFA) and ßOH-butyrate (BHB) in primiparous (L1, n=21) and multiparous(L2, n=21) cows under grazing conditions (mean ± SEM; Exp.4a).
Insulin concentrations differed according to days postpartum: levels started to decrease
before parturition, minimum concentrations were found around parturition but levels were fully
recovered at Day 30 postpartum (Fig. 5.4.4.). There was no effect of parity or BCS at partu-
rition on insulin concentrations (Table 5.4.1.). Both thyroid hormones were affected by days
postpartum (Table 5.4.1.), but no other effect was found and parallel curves could be ob-
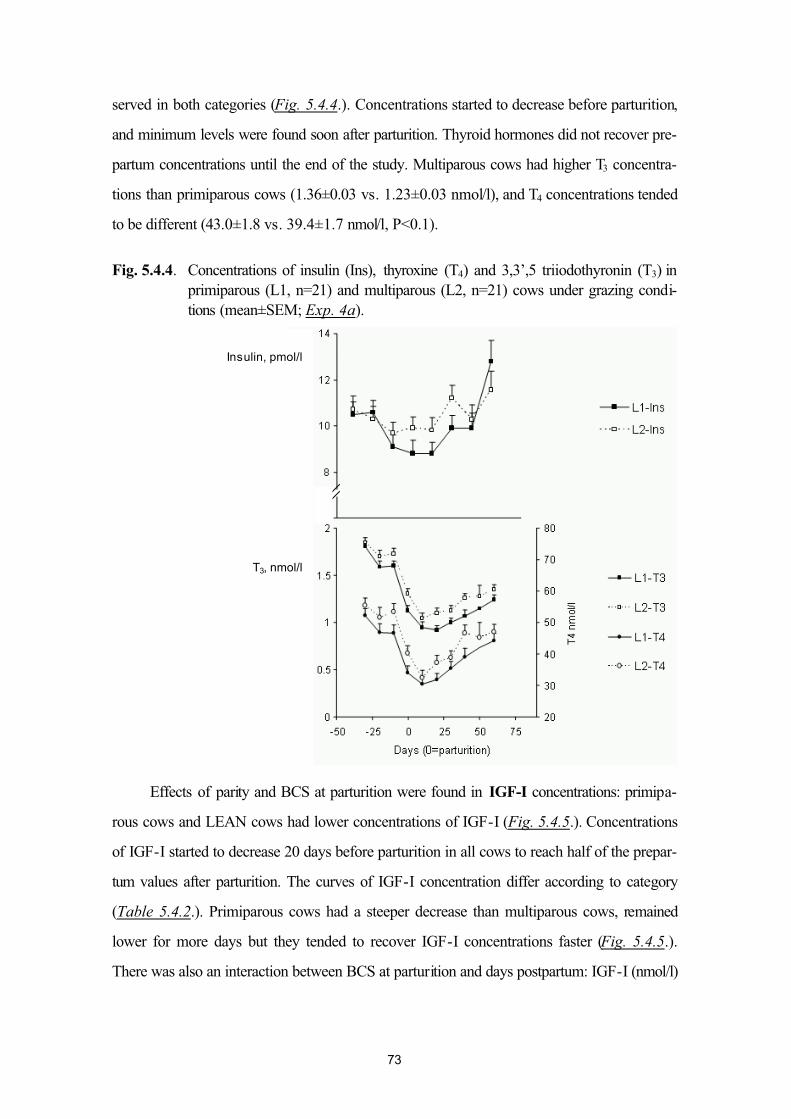
73
served in both categories (Fig. 5.4.4.). Concentrations started to decrease before parturition,
and minimum levels were found soon after parturition. Thyroid hormones did not recover pre-
partum concentrations until the end of the study. Multiparous cows had higher T3 concentra-
tions than primiparous cows (1.36±0.03 vs. 1.23±0.03 nmol/l), and T4 concentrations tended
to be different (43.0±1.8 vs. 39.4±1.7 nmol/l, P<0.1).
Fig. 5.4.4. Concentrations of insulin (Ins), thyroxine (T4) and 3,3’,5 triiodothyronin (T3) in primiparous (L1, n=21) and multiparous (L2, n=21) cows under grazing condi-tions (mean±SEM; Exp. 4a).
Effects of parity and BCS at parturition were found in IGF-I concentrations: primipa-
rous cows and LEAN cows had lower concentrations of IGF-I (Fig. 5.4.5.). Concentrations
of IGF-I started to decrease 20 days before parturition in all cows to reach half of the prepar-
tum values after parturition. The curves of IGF-I concentration differ according to category
(Table 5.4.2.). Primiparous cows had a steeper decrease than multiparous cows, remained
lower for more days but they tended to recover IGF-I concentrations faster (Fig. 5.4.5.).
There was also an interaction between BCS at parturition and days postpartum: IGF-I (nmol/l)
Insulin, pmol/l
T3, nmol/l
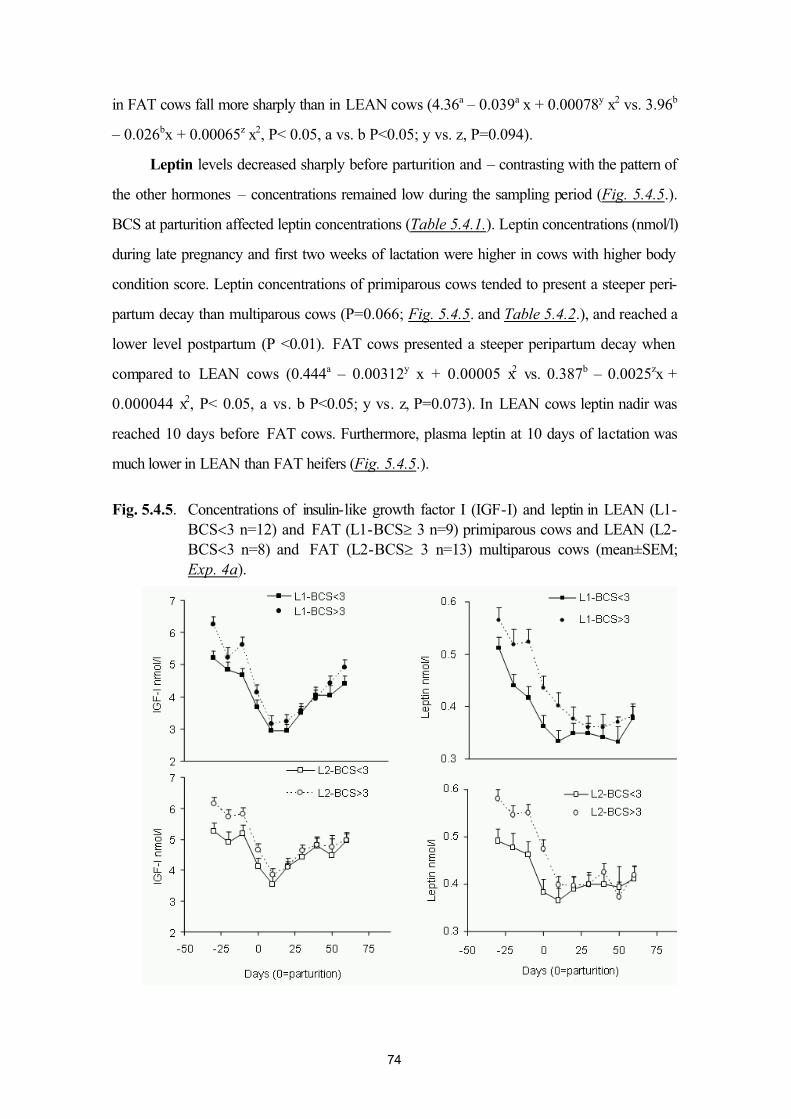
74
in FAT cows fall more sharply than in LEAN cows (4.36a – 0.039a x + 0.00078y x2 vs. 3.96b
– 0.026bx + 0.00065z x2, P< 0.05, a vs. b P<0.05; y vs. z, P=0.094).
Leptin levels decreased sharply before parturition and – contrasting with the pattern of
the other hormones – concentrations remained low during the sampling period (Fig. 5.4.5.).
BCS at parturition affected leptin concentrations (Table 5.4.1.). Leptin concentrations (nmol/l)
during late pregnancy and first two weeks of lactation were higher in cows with higher body
condition score. Leptin concentrations of primiparous cows tended to present a steeper peri-
partum decay than multiparous cows (P=0.066; Fig. 5.4.5. and Table 5.4.2.), and reached a
lower level postpartum (P <0.01). FAT cows presented a steeper peripartum decay when
compared to LEAN cows (0.444a – 0.00312y x + 0.00005 x2 vs. 0.387b – 0.0025zx +
0.000044 x2, P< 0.05, a vs. b P<0.05; y vs. z, P=0.073). In LEAN cows leptin nadir was
reached 10 days before FAT cows. Furthermore, plasma leptin at 10 days of lactation was
much lower in LEAN than FAT heifers (Fig. 5.4.5.).
Fig. 5.4.5. Concentrations of insulin-like growth factor I (IGF-I) and leptin in LEAN (L1-BCS<3 n=12) and FAT (L1-BCS≥ 3 n=9) primiparous cows and LEAN (L2-BCS<3 n=8) and FAT (L2-BCS≥ 3 n=13) multiparous cows (mean±SEM;Exp. 4a).
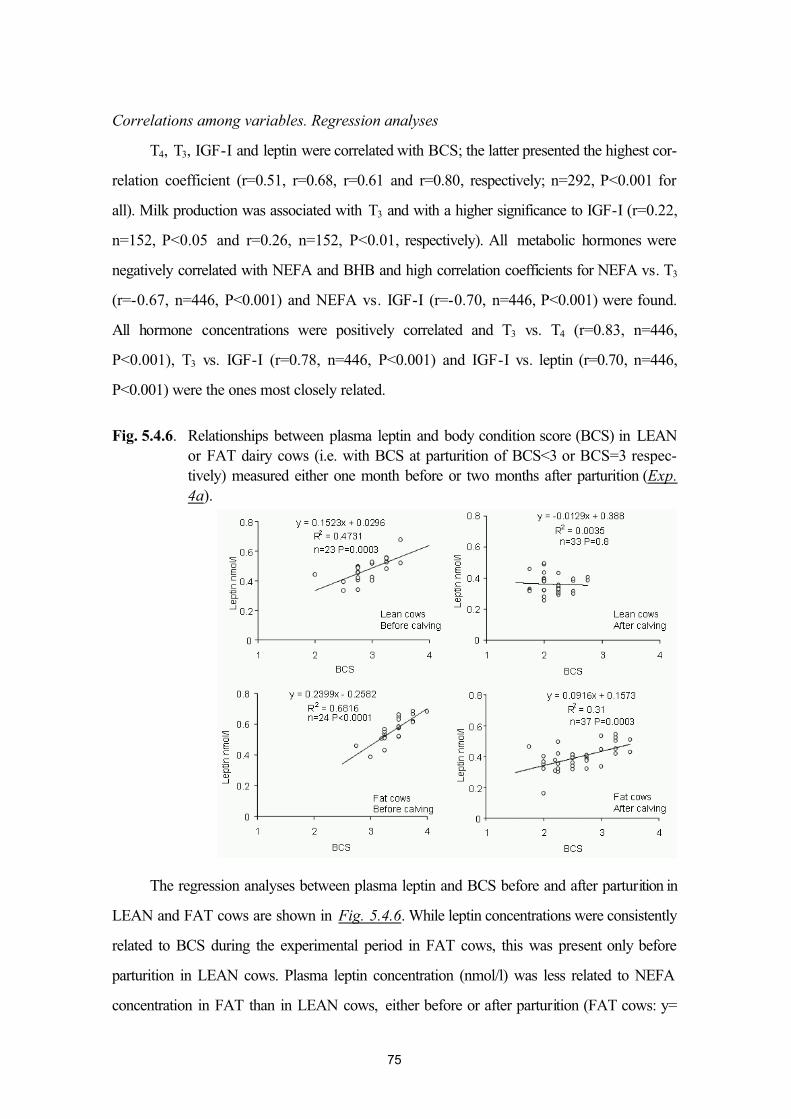
75
Correlations among variables. Regression analyses
T4, T3, IGF-I and leptin were correlated with BCS; the latter presented the highest cor-
relation coefficient (r=0.51, r=0.68, r=0.61 and r=0.80, respectively; n=292, P<0.001 for
all). Milk production was associated with T3 and with a higher significance to IGF-I (r=0.22,
n=152, P<0.05 and r=0.26, n=152, P<0.01, respectively). All metabolic hormones were
negatively correlated with NEFA and BHB and high correlation coefficients for NEFA vs. T3
(r=-0.67, n=446, P<0.001) and NEFA vs. IGF-I (r=-0.70, n=446, P<0.001) were found.
All hormone concentrations were positively correlated and T3 vs. T4 (r=0.83, n=446,
P<0.001), T3 vs. IGF-I (r=0.78, n=446, P<0.001) and IGF-I vs. leptin (r=0.70, n=446,
P<0.001) were the ones most closely related.
Fig. 5.4.6. Relationships between plasma leptin and body condition score (BCS) in LEANor FAT dairy cows (i.e. with BCS at parturition of BCS<3 or BCS=3 respec-tively) measured either one month before or two months after parturition (Exp.4a).
The regression analyses between plasma leptin and BCS before and after parturition in
LEAN and FAT cows are shown in Fig. 5.4.6. While leptin concentrations were consistently
related to BCS during the experimental period in FAT cows, this was present only before
parturition in LEAN cows. Plasma leptin concentration (nmol/l) was less related to NEFA
concentration in FAT than in LEAN cows, either before or after parturition (FAT cows: y=
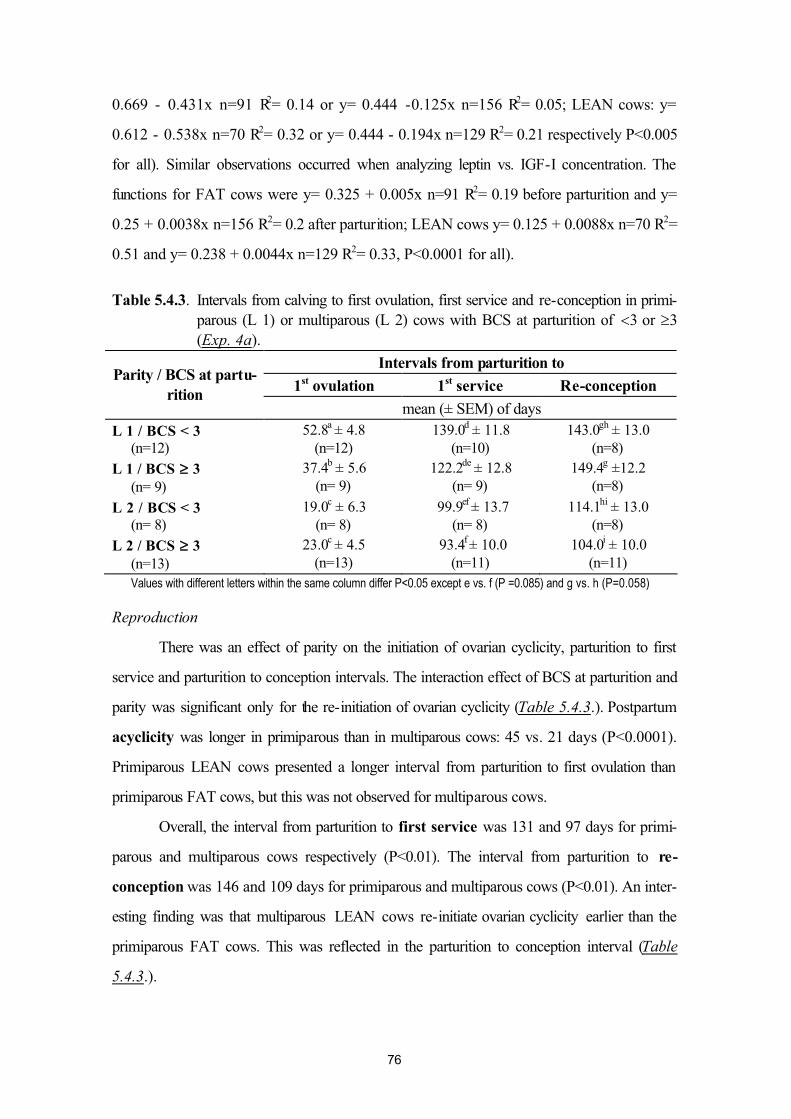
76
0.669 - 0.431x n=91 R2= 0.14 or y= 0.444 -0.125x n=156 R2= 0.05; LEAN cows: y=
0.612 - 0.538x n=70 R2= 0.32 or y= 0.444 - 0.194x n=129 R2= 0.21 respectively P<0.005
for all). Similar observations occurred when analyzing leptin vs. IGF-I concentration. The
functions for FAT cows were y= 0.325 + 0.005x n=91 R2= 0.19 before parturition and y=
0.25 + 0.0038x n=156 R2= 0.2 after parturition; LEAN cows y= 0.125 + 0.0088x n=70 R2=
0.51 and y= 0.238 + 0.0044x n=129 R2= 0.33, P<0.0001 for all).
Table 5.4.3. Intervals from calving to first ovulation, first service and re-conception in primi-parous (L 1) or multiparous (L 2) cows with BCS at parturition of <3 or ≥3(Exp. 4a).
Intervals from parturition to
1st ovulation 1st service Re-conceptionParity / BCS at partu-
ritionmean (± SEM) of days
L 1 / BCS < 3(n=12)
52.8a ± 4.8(n=12)
139.0d ± 11.8(n=10)
143.0gh ± 13.0(n=8)
L 1 / BCS ≥ 3(n= 9)
37.4b ± 5.6(n= 9)
122.2de ± 12.8(n= 9)
149.4g ±12.2(n=8)
L 2 / BCS < 3(n= 8)
19.0c ± 6.3(n= 8)
99.9ef ± 13.7(n= 8)
114.1hi ± 13.0(n=8)
L 2 / BCS ≥ 3(n=13)
23.0c ± 4.5(n=13)
93.4f ± 10.0(n=11)
104.0i ± 10.0(n=11)
Values with different letters within the same column differ P<0.05 except e vs. f (P =0.085) and g vs. h (P=0.058)
Reproduction
There was an effect of parity on the initiation of ovarian cyclicity, parturition to first
service and parturition to conception intervals. The interaction effect of BCS at parturition and
parity was significant only for the re-initiation of ovarian cyclicity (Table 5.4.3.). Postpartum
acyclicity was longer in primiparous than in multiparous cows: 45 vs. 21 days (P<0.0001).
Primiparous LEAN cows presented a longer interval from parturition to first ovulation than
primiparous FAT cows, but this was not observed for multiparous cows.
Overall, the interval from parturition to first service was 131 and 97 days for primi-
parous and multiparous cows respectively (P<0.01). The interval from parturition to re-
conception was 146 and 109 days for primiparous and multiparous cows (P<0.01). An inter-
esting finding was that multiparous LEAN cows re-initiate ovarian cyclicity earlier than the
primiparous FAT cows. This was reflected in the parturition to conception interval (Table
5.4.3.).
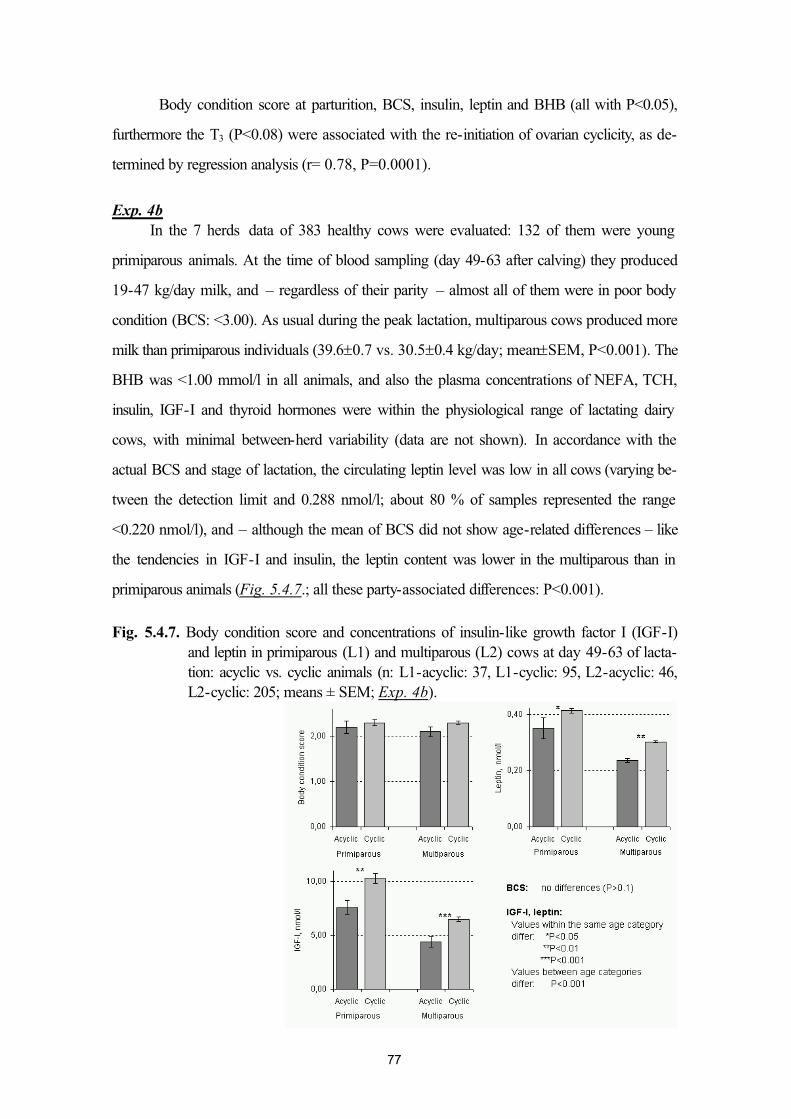
77
Body condition score at parturition, BCS, insulin, leptin and BHB (all with P<0.05),
furthermore the T3 (P<0.08) were associated with the re-initiation of ovarian cyclicity, as de-
termined by regression analysis (r= 0.78, P=0.0001).
Exp. 4b
In the 7 herds data of 383 healthy cows were evaluated: 132 of them were young
primiparous animals. At the time of blood sampling (day 49-63 after calving) they produced
19-47 kg/day milk, and – regardless of their parity – almost all of them were in poor body
condition (BCS: <3.00). As usual during the peak lactation, multiparous cows produced more
milk than primiparous individuals (39.6±0.7 vs. 30.5±0.4 kg/day; mean±SEM, P<0.001). The
BHB was <1.00 mmol/l in all animals, and also the plasma concentrations of NEFA, TCH,
insulin, IGF-I and thyroid hormones were within the physiological range of lactating dairy
cows, with minimal between-herd variability (data are not shown). In accordance with the
actual BCS and stage of lactation, the circulating leptin level was low in all cows (varying be-
tween the detection limit and 0.288 nmol/l; about 80 % of samples represented the range
<0.220 nmol/l), and – although the mean of BCS did not show age-related differences – like
the tendencies in IGF-I and insulin, the leptin content was lower in the multiparous than in
primiparous animals (Fig. 5.4.7.; all these party-associated differences: P<0.001).
Fig. 5.4.7. Body condition score and concentrations of insulin-like growth factor I (IGF-I)and leptin in primiparous (L1) and multiparous (L2) cows at day 49-63 of lacta-tion: acyclic vs. cyclic animals (n: L1-acyclic: 37, L1-cyclic: 95, L2-acyclic: 46, L2-cyclic: 205; means ± SEM; Exp. 4b).
78
Most of the cows ovulated during the first 7 weeks of lactation: the ovarian activity re-
mained still acyclic only in 83 animals (22 %). The rate of acyclic cows varied between 16 and
25 %, but the between-herd differences were not significant. However, by day 50 more
primiparous than multiparous cows did not ovulate yet (37/132 = 28% vs. 46/251 = 18 %,
respectively; P<0.001). Although their BCS was similar, in both age categories the acyclic
animals were characterized by lower levels of leptin and IGF-I than the cyclic cows (Fig.
5.4.7.). If, however, data of primi- and multiparous animals were pooled, due to the age-
dependent variability differences between acyclic and cyclic cows were not significant. There
were no further differences in plasma levels of NEFA, BHB, TCH, insulin and thyroid hor-
mones, either (details are not given).
Discussion
In Exp. 4a we intended to collect basic data on peri-parturient changes of leptin. There-
fore we wanted to avoid the suspected influence of endotoxin / cytokine induced hormonal
interactions discussed in Chapters 3.8. and 5.7, which may be intensive first of all during the
earliest 2 to 4 weeks of lactation (for further details, see also our related papers: Jánosi et al.,
1998 and 2003; Huszenicza et al., 2004 and 2005; Földi et al., 2006). So the Exp. 4a was
conducted in grazing animals, in a small experimental herd, where – due to the better hygienic
conditions – the incidence of mastitis caused by environmental pathogens, as well as of bac-
terial complications of uterine involution (such as puerperal metritis) is usually low (Bruun
et al., 2002; Sheldon and Dobson 2004). However, in pasture-fed cows the peri-parturient
changes in body condition, as well as in plasma levels of certain metabolites and metabolic
hormones may be different from those seen in animals fed total mixed ration (TMR) in large-
scale daily herds. Although the physiological mechanisms that the dairy cow undergoes to
adapt to lactation requirements is basically similar among different production systems, the
energy demands due to regular physical exercise and grazing might modify the transformations
that take place during this period (Nagy et al., 1984, Roche et al., 2005; Chagas et al.,
2006). Moreover, dry matter intake in this production system is usually lower than in confined
systems, and may be insufficient to sustain the high milk production that can be achieved with
the genetic potential (Kolver and Muller, 1998).
Data of Exp. 4a demonstrated that parity affects NEFA, T3, T4 and IGF-I concentra-
tions as well as reproductive parameters in dairy cows while BCS at parturition has an effect
79
on IGF-I and leptin concentrations and reproductive parameters. Body condition decreased
from 30 days before parturition, and this trend was steeper during the first 4 weeks after par-
turition. NEFA and BHB levels increased around parturition, reflecting the NEB of animals
(Invgarsten and Andersen, 2000). In this study the primiparous cows had lower BCS than
multiparous cows and this is consistent with the higher NEFA levels and the greater number of
BHB samples >1.00 mmol/l in this category (supraphysiological levels, according to Whitaker
et al. 1999). This probably is related to increased needs for growth in primiparous cows oc-
curring simultaneously with the demands of lactation, and their lower feed intake capacity
(Rémond et al. 1991). In large-scale TMR-fed dairy herds in Hungary (Huszenicza et al.,
1988) the peri-parturient metabolic and hormonal changes of primiparous animals are usually
more intensive than those seen in multiparous cows (Wathes et al., 2007), which are in agree-
ment with these experiences. The only exception is that the keton (BHB) production is usually
more elevated in multiparous than in young primiparous cows (Huszenicza et al., 1988; Wa-
thes et al., 2007). Clear age-related variability of leptin and IGF-I was found also in the Exp.
4b.
Studies investigating the potential metabolic signals for the reproductive axis have been
focused primarily on blood metabolites and metabolic hormones known to fluctuate during
altered states of energy metabolism. Decreased insulin concentrations around parturition were
found in agreement with previous reports (Holtenius et al. 2003). Insulin plays a central role in
homeostatic control of energy metabolism and its concentration is positively correlated with
energy intake (Chilliard et al. 1998). The diminished concentration is consistent with the re-
duction in dry matter intake that characterizes this period (Bertics et al. 1992). Both insulin
and IGF-I are known to stimulate follicular growth (Spicer et al. 1993), however in this study
insulin did not seem to be related to reinitiation of ovarian cyclicity: insulin concentrations were
fully recovered 30 days postpartum and while multiparous cows ovulated before that period,
primiparous cows ovulated afterwards.
The peripheral tissues try to fit their current local energy metabolism to the postpartum
catabolic condition, for example by interfering in the path of thyroid hormones resulting in di-
minished circulation as observed here as well by others (Kunz and Blum, 1985; Pethes et al.
1985; Heyden et al. 1993; Tiirats, 1997). Lower concentrations of T3 were found in primipa-
rous cows, which is in disagreement with data of Cisse et al. (1991) who suggested that higher
80
T3 concentrations in first lactation could be due to a lower milk yield since thyroid hormones
are excreted by the mammary gland. On the other hand, a lower level of T3 was reported to
be associated with lower energy balance (Blum et al. 1983), which seems to be the case in
our study taking into account that primiparous cows presented comparative greater body con-
dition loss and an overall misbalanced metabolic condition. This could explain the apparent
discrepancy with the study of Cisse et al (1991), in which heifers and cows had the same en-
ergy balances. Low thyroid hormone concentrations have been suggested to be associated
with low reproductive performance in the postpartum cow (Huszenicza et al. 2002;
Huszenicza, 2003).
In Exp. 4a, parity affected IGF-I concentrations, as primiparous cows had lower values
of this hormone. This contrasts with findings of Wathes et al. (2003, 2007), and also the re-
sults of Exp. 4b, where IGF-I concentrations were higher in the younger animals. Since it has
been suggested that low insulin and IGF-I are the metabolic signals that delay ovulation (Beam
and Butler, 1999) and IGF-I concentrations were high in primiparous cows, Taylor et al.
(2003) suggested that in this category – which is still growing – insulin concentrations may be
limiting, whereas in older cows a closer association is observed between IGF-I and fertility
parameters. The results of Exp. 4a do not support this hypothesis, since primiparous cows
presented lower IGF-I but similar insulin concentrations, and presented a delayed ovulation
when compared to multiparous cows. Peri-parturient metabolic differences of pastured and
TMR-fed dairy cows may also explain these contradictions. IGF-I concentrations were good
indicators of the capacity to resume cyclicity after parturition in agreement with Roberts et al.
(1997): FAT cows and multiparous cows had higher IGF-I concentrations and better repro-
ductive performance.
As previously reported in adult dry non-pregnant ruminants (Delavaud et al. 2000,
2002), plasma leptin content in this study was a good indicator of body fatness (BCS) in peri-
partum dairy cows, especially when measured 3 weeks before calving, i.e. at a stage where
leptin is highly expressed. On the other hand, Holtenius et al. (2003) reported no relation
between leptin concentrations and BCS after parturition. Differences among studies could be
due to the different production system, energy intake, energy balance, range of BCS among
cows, genetic background and/or frequency of sampling. In the Exp. 4a leptin concentrations
started to decrease by 20 days before parturition in agreement with other studies (Kadokawa
81
et al. 2000; Block et al. 2001; Liefers et al. 2003), and then remained low until 2 months after
parturition. This tendency is at variance with the reported increase around day 10 postpartum
(Kadokawa et al. 2000), or the progressive increase from week 1 to week 12 (Reist et al.
2003), the unchanged concentrations up to week 5 (Huszenicza et al. 2001), or with the tran-
sient increase at week 2 (Liefers et al. 2003), but consistent with the lower concentrations
found by Block et al. (2001) and Holtenius et al. (2003).
In the Exp. 4a baseline leptin levels were reached later postpartum in FAT cows con-
sistent with a later maximal loss in BCS in these animals, suggesting that the decrease in leptin
concentrations due to NEB may be masked in FAT cows by the amount secreted by the adi-
pose tissue reserves, that may be still high during the first month of lactation. This hypothesis is
supported by the regression analyses of plasma leptin during pre- and postpartum period in
LEAN and FAT cows: while no association was found between leptin levels and BCS after
parturition in LEAN cows, this was maintained in FAT cows during the same period. Overall,
our results suggest interactions between the effects of BCS, parity and lactation stage on peri-
partum leptin regulation.
The reinitiation of ovarian cyclicity was delayed in primiparous cows and in LEAN ani-
mals and this was consistent with longer intervals from parturition to first service and to con-
ception in these animals. The anestrous duration was associated with BCS loss and was longer
in primiparous cows as shown previously (Butler and Smith 1989). These authors and others
(Huszenicza et al. 1987, 1988) demonstrated that the sooner the cows restore the energy
balance, the sooner they will start cycling and will become pregnant. It is interesting to point
out that multiparous LEAN cows resumed cyclic activity sooner than primiparous FAT cows
and this could be due to the patterns of the endocrine signals or to NEB due to lower intake,
ascendant lactation curve and/or growth requirements in heifers. All these parameters could
indeed be related to the high body lipid mobilization (Verite and Chilliard, 1992), BCS loss
(Rémond et al. 1991) and higher plasma NEFA (Cisse et al. 1991), that were more intensive
in primiparous cows vs. multiparous cows in Exp. 4a, despite the fact the formers yielded less
milk. In this study parity was a more important effect for reproductive performance than BCS
at parturition; it should be taken in account that these animals were under grazing conditions,
where an effect such as dominance for food availability is present (Grant and Albright,
2001).
82
Cows with better reproductive performance had higher IGF-I and leptin concentrations.
Similarly, a negative relationship between IGF-I concentrations after parturition and the inter-
val to the resumption of ovarian cyclicity was reported (Butler 2000). Data regarding leptin
and reproductive performance is conflicting. Cows with decreased leptin have been linked to
delayed onset of cyclicity or longer intervals to first oestrus during the postpartum period (Ka-
dokawa et al. 2000; Liefers et al. 2003). Similarly, a slightly increasing tendency of leptin
pattern was seen in cows resuming their ovarian cyclicity within 35 days (Huszenicza et al.
2001). In two most recent field trials (Mann et al., 2005; Wathes et al., 2007) using milk P4
profiles to monitor the ovarian function, delayed onset of cyclicity and other cycle abnormali-
ties were associated with increased milk yield, elevated plasma BHB and reduced plasma
leptin and IGF-I concentrations, as well as with lower BW and BCS of the affected cows.
Latest model studies in dairy cattle illustrated a close link between plasma leptin concentrations
and LH pulsatility during the postpartum period (correlations of leptin with LH pulse fre-
quency, and with amplitude of the LH pulses were r=+0.73 and r=+0.53, respectively; Ka-
dokawa et al. 2006), although a triggering role for leptin in the termination of anoestrus was
not always supported (Chagas et al. 2006).
The data presented here does not support the theory that the restoration in leptin con-
centrations activate the hypothalamic-pituitary-ovarian axis, since unlike the other hormones, it
remained low until 60 days postpartum. On the other hand, not only the hormone concentra-
tion itself and the tissue sensitivity to it (receptors) are important for the reproductive axis, but
also the hormonal dynamics, (e.g., leptin decay – as for IGF-I – was more precipitous in
primiparous cows) could be read by the endocrine system as a different signal. As previously
reported (Bocquier et al. 1998; Clarke and Henry et al. 1999) our results suggest that leptin
may play a permissive role when increasing above a critical threshold in the activation of the
hypothalamus-pituitary axis and consequent reinitation of ovarian activity in the postpartum
cow. This would allow cows, which are in good condition at parturition and thus have a higher
leptinaemia during early lactation, to have a facilitated reproductive activity. The most recent
observations (Mann et al., 2005; Chagas et al. 2006; Kadokawa et al. 2006; Wathes et al.,
2007) are in full agreement with our findings in Exp. 4a and 4b. Of course these data were not
yet available for us when our experiments were conducted and published. Currently the theory
83
on permissive role of leptin in regulation of resumption of ovarian cyclicity is fully accepted
(Zieba et al., 2005; see also in Chapter 3.5.3.)
In Exp. 4b data of primiparous and multiparous cows ovulating during the first 7 weeks
of lactation were compared to those remained still acyclic in this period. At the time of sam-
pling (day 49-63) the cyclic cows had higher IGF-I and leptin levels than their acyclic herd
mates. However, none of their other parameters differed. The lack of more obvious metabolic
differences may be due to the fact that cows showing the pathognostic clinical symptoms of
metabolic disorders (such as ketosis) had been excluded from the study, furthermore most of
the cows must have been over the nadir of NEB, e.g. the phase of lactation characterized by
the highest NEFA and ketone levels. The first postpartum ovulation of our still acyclic cows
must have been postponed by this earlier metabolic condition: at sampling the long-lasting
acyclicity and the poor BCS were the only coinciding clinical consequences. The metabolic
impairment of these cows was proven, however, by their low IGF-I and leptin.
In summary, the age-related differences must be considered when the peri-parturient
metabolic and endocrine changes are monitored. Under grazing conditions primiparous cows
showed a metabolic/endocrine profile more disbalanced when compared to multiparous cows,
reflecting that they are recovering from the negative energy balance period with more difficulty.
The endocrine signals that most likely could inform the reproductive axis regarding the NEB
and/or the level of body reserves that may explain the reproductive performance found in this
study were IGF-I and leptin.
5.5. Plasma leptin levels in normo- and hyperketonaemic dairy cows during the peri-
parturient period (Exp. 5a and 5b)
Ketosis (accompanied usually with remarkable lipid accumulation in the liver) is known,
as a consequence of decompensated NEB in high-producing postpartum dairy cows (Chil-
liard et al., 1998; Duffield et al., 1998; Whitaker et al., 1999). Several endocrine aspects of
this metabolic disorder have already been reported or supposed to occur: the lower than nor-
mal rate of insulin to glucagon and GH was proved as the main endocrine factor of its patho-
genesis (Sartin et al., 1988), and also the role of thyroid and adrenocortical (mal)functions
was hypothesized long time ago (Hill et al., 1950; Robertson et al., 1957; Durdevic et al.,
1980). Since then the involvement of thyroid hormones in postpartum adaptation of energy
84
metabolism has become fully accepted (Kunz and Blum, 1985; Pethes et al., 1985; Tiirats,
1997), and glucocorticoids have been widely used in therapy of bovine ketosis for many years
(Baird, 1980). Low concentrations of IGF-I (Ronge et al., 1988) and leptin (Block et al.
2001) were proved to reflect the degree of energy imbalance of cows in early period of lacta-
tion (Ronge et al., 1988; Chelikani et al., 2004). However, only limited data are available on
plasma leptin of hyperketonaemic individuals (Reist et al., 2003). In one of our former trials
we studied extensively the endocrine characteristics coinciding with hyperketonaemia in post-
partum Holstein Friesian cows showing various forms of BHB pattern36 (Huszenicza et al.,
2006). Simultaneously with the hyperketonaemic stage increased NEFA, depressed TCh and
glucose, furthermore decreased insulin, IGF-I, T4 and T3 concentrations were detected in al-
most all the cases. Overt endocrine alterations were found, however, only in the long-lasting
forms of hyperketonaemia. The TRH-stimulated T4 and T3 responses remained almost unaf-
fected proving intact thyroid function in most of the cows; depressed thyroid response was
detected only in the most severe cases of long-lasting hyperketonaemia. The cows character-
ized by lower than normal (<mean - SD of normoketonaemic cows) ACTH-stimulated corti-
sol response on days 1-3 after calving showed poorer chance for spontaneous recovery. The
involvement of leptin in ketosis-related endocrine cascade, however, was not studied in that
experiment.
As it was discussed earlier (Chapters 3.3., 3.6. and 5.4.), the plasma leptin concentra-
tion of non-lactating, late-pregnant cows is high, and starts to decline 2-3 weeks before calv-
ing. Despite the pregnancy-related leptin resistance, these high prepartum levels of leptin may
be hypothesized to suppress the dry matter intake, which might be an additional factor predis-
posing for hyperketonaemia, whereas the more intensive form of NEB may result in more
rapid and/or more obvious peri/post-parturient decline of plasma leptin in hyperketonaemic
individuals. Up to now, however, these ideas have remained poorly documented. In the Exp.
5a and 5b we wanted to study the interaction of BHB with insulin and leptin in multiparous
Holstein Friesian cows kept in commercial dairy herds during the peri-parturient period.
36 According to Whitaker et al. (1999), plasma BHB of >1.00 mmol/l was considered as a supraphysisological level, and
was called as hyperketonaemia in this study.
85
Materials and methods
Farm conditions. Animals. Sampling
Exp. 5a
This study was conducted in a large-scale dairy herd, on group-fed multiparous (parity: 3
to 5) Holstein Friesian cows producing at least 6000 kg of milk/305-d in the previous lactation.
On day 259-265 of gestation the cows expected to calve in February and March were scored
for BCS. All healthy individuals meeting these inclusion criteria (parity, minimum milk yield,
expected calving date) were selected for this study: they were separated from the others in a
different paddock (for 14-16 days), and later in boxes of the maternity unit (3-4 cows in each;
in the latest days of pregnancy, at calving and thereafter for 7 days). The group of late-pregnant
cows received the same diet (consisting of 3.5 kg commercial concentrate mixed into 15 kg of
maize silage, with free access to grass hay available ad libitum) for 14-16 days. Thereafter
(when the cows were placed in boxes of 3-4 animals) growing quantity of concentrate and
corn silage was given: the quantity of concentrate increased continuously (with about 1.0 kg in
every alternate days till the end of the sampling period, with the maximum of 9.0 kg on day 7
after calving), whereas increased quantity (25 kg) of maize silage was given only after calving.
This ration was administered twice a day, in equal portions. Grass hay was available ad libi-
tum also in this period. The cows were milked twice a day. All cows left the maternity unit 7
days after calving, when they were examined for puerperal metritis37, and their BCS was re-
corded again. Blood samples were taken regularly, e.g. at inclusion (on day 259-265 of gesta-
tion), again two times 7 days apart, and thereafter once a day until day 7 after calving.
Exp. 5b
Cows (parity ≥2; milk yield in previous lactation: at least 4500 kg) calving within a 4-5
week-long study period38 in 8 large-scale dairy herds were involved in the experiment. Animals
were kept in loose-housing systems, and were milked twice daily. Cows were fed a ration of
maize silage, alfalfa, grass hay and concentrate (including vitamins and minerals) in accordance
with NRC (2001) recommendations. Once between day 4-12 postpartum all cows were ex-
37 Presence of malodorous, reddish-brown, watery vaginal discharge.
38 Between February and June.
86
amined for the presence of clinical mastitis and puerperal metritis, and simultaneously they were
sampled for assaying metabolites and hormones.
Analysis of samples. Evaluation
All samples (taken before the morning feeding) were analyzed for BHB, leptin and in-
sulin, as well as for NEFA (in Exp. 5a only) and IGF-I (in Exp. 5b only). All cows were sam-
pled; however, data of those with severe mastitis39 and/or retained fetal membrane resulting in
puerperal metritis40 were not evaluated. In accordance with Whitaker et al. (1999), 1.00
mmol/l of BHB was used as the cut-off value between normo- and hyperketonaemia.
Results
In Exp. 5a and Exp. 5b data of 22 and 253 cows not showing overt clinical signs of
any diseases were evaluated, respectively.
On day 259-265 of gestation all cows of Exp. 5a were in moderate to good condition
(mean of BCS: 3.7; range: between 3.00 and 4.25); their plasma leptin content was high
(0.623±0.020 nmol/l; range: between 0.448 and 0.782 nmol/l), and the BCS was in close
positive correlation with circulating levels of leptin (r = +0.507; P<0.001). Seven days after
calving poorer BCS (mean of BCS: 3.2; range: between 2.50 and 3.75) and significantly lower
plasma leptin levels (0.315±0.018 nmol/l; P<0.0001; range: 0.141 and 0.431 nmol/l) were
detected, and only a week positive correlation existed between these two parameters (r =
+0.271; P<0.048). The plasma BHB started to increase some days before calving, with wide
individual variation (Fig. 5.5.1.). Three forms of peri-parturient BHB pattern were observed.
In most of the animals the BHB levels never exceeded the threshold value of 1.00 mmol/l
(normoketonaemic cows; n=9), or were elevated only on the day of, and/or one day after
calving (transient ketone increase; n=7). In the further cows (n=6), however, the ketone
body elevation became significant 2 days before calving (BHB levels compared to those on
day 18-22 before calving: P<0.05), the BHB levels reached threshold of 1.00 mmol/l on day -
2 to 0 (day 0 = day of calving), and and remained elevated in at least 5 consecutive days (in 4
cows: in all samples collected thereafter; continuous form of hyperketonaemia; n=6). Signifi-
cant time-related changes (P<0.001) were detected by repeated measures ANOVA also in
39 Inappetance, rectal temperature >40.5 oC
40 Presence of malodorous, reddish-brown vaginal discharge.
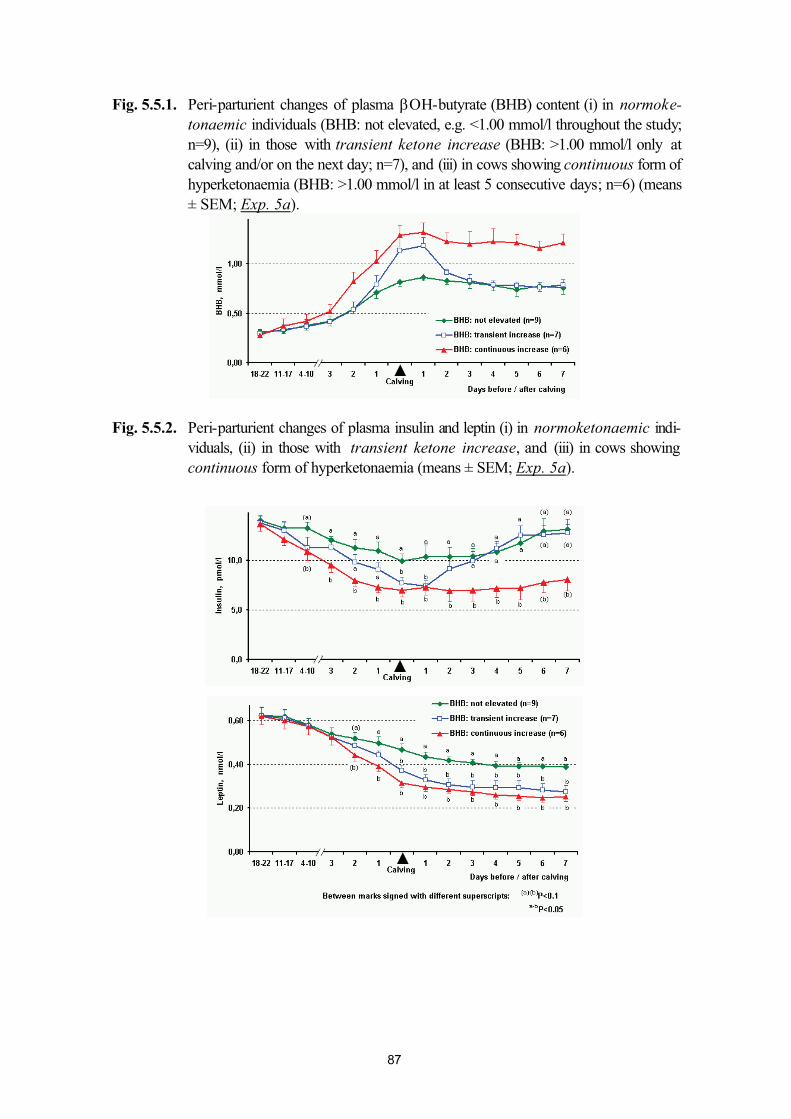
87
Fig. 5.5.1. Peri-parturient changes of plasma βOH-butyrate (BHB) content (i) in normoke-tonaemic individuals (BHB: not elevated, e.g. <1.00 mmol/l throughout the study;n=9), (ii) in those with transient ketone increase (BHB: >1.00 mmol/l only atcalving and/or on the next day; n=7), and (iii) in cows showing continuous form of hyperketonaemia (BHB: >1.00 mmol/l in at least 5 consecutive days; n=6) (means± SEM; Exp. 5a).
Fig. 5.5.2. Peri-parturient changes of plasma insulin and leptin (i) in normoketonaemic indi-viduals, (ii) in those with transient ketone increase, and (iii) in cows showing continuous form of hyperketonaemia (means ± SEM; Exp. 5a).
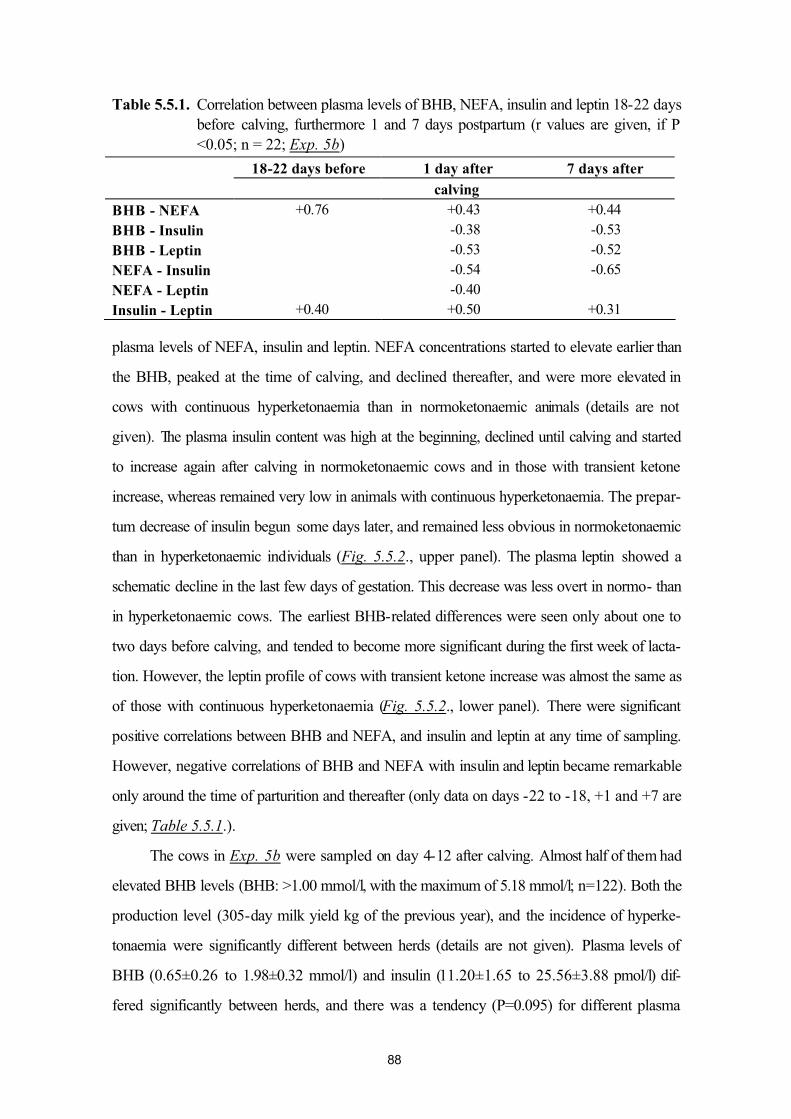
88
Table 5.5.1. Correlation between plasma levels of BHB, NEFA, insulin and leptin 18-22 days before calving, furthermore 1 and 7 days postpartum (r values are given, if P <0.05; n = 22; Exp. 5b)
18-22 days before 1 day after 7 days after
calving
BHB - NEFA +0.76 +0.43 +0.44
BHB - Insulin -0.38 -0.53
BHB - Leptin -0.53 -0.52
NEFA - Insulin -0.54 -0.65
NEFA - Leptin -0.40
Insulin - Leptin +0.40 +0.50 +0.31
plasma levels of NEFA, insulin and leptin. NEFA concentrations started to elevate earlier than
the BHB, peaked at the time of calving, and declined thereafter, and were more elevated in
cows with continuous hyperketonaemia than in normoketonaemic animals (details are not
given). The plasma insulin content was high at the beginning, declined until calving and started
to increase again after calving in normoketonaemic cows and in those with transient ketone
increase, whereas remained very low in animals with continuous hyperketonaemia. The prepar-
tum decrease of insulin begun some days later, and remained less obvious in normoketonaemic
than in hyperketonaemic individuals (Fig. 5.5.2., upper panel). The plasma leptin showed a
schematic decline in the last few days of gestation. This decrease was less overt in normo- than
in hyperketonaemic cows. The earliest BHB-related differences were seen only about one to
two days before calving, and tended to become more significant during the first week of lacta-
tion. However, the leptin profile of cows with transient ketone increase was almost the same as
of those with continuous hyperketonaemia (Fig. 5.5.2., lower panel). There were significant
positive correlations between BHB and NEFA, and insulin and leptin at any time of sampling.
However, negative correlations of BHB and NEFA with insulin and leptin became remarkable
only around the time of parturition and thereafter (only data on days -22 to -18, +1 and +7 are
given; Table 5.5.1.).
The cows in Exp. 5b were sampled on day 4-12 after calving. Almost half of them had
elevated BHB levels (BHB: >1.00 mmol/l, with the maximum of 5.18 mmol/l; n=122). Both the
production level (305-day milk yield kg of the previous year), and the incidence of hyperke-
tonaemia were significantly different between herds (details are not given). Plasma levels of
BHB (0.65±0.26 to 1.98±0.32 mmol/l) and insulin (11.20±1.65 to 25.56±3.88 pmol/l) dif-
fered significantly between herds, and there was a tendency (P=0.095) for different plasma
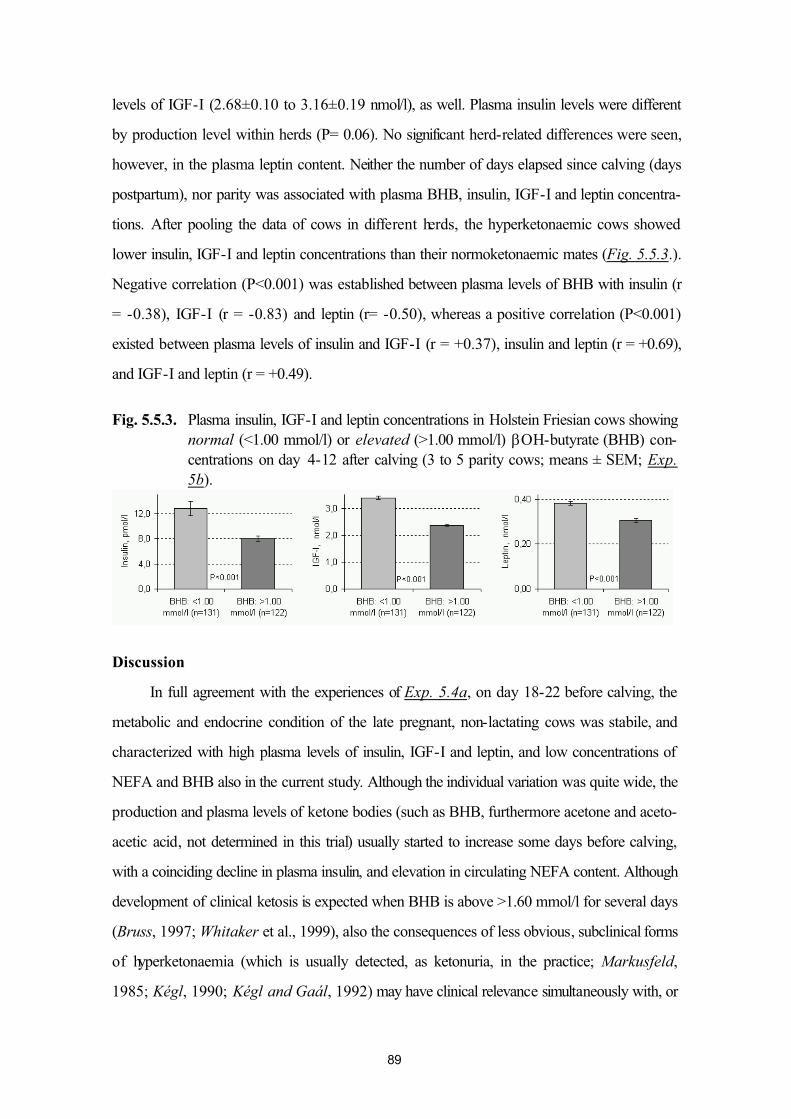
89
levels of IGF-I (2.68±0.10 to 3.16±0.19 nmol/l), as well. Plasma insulin levels were different
by production level within herds (P= 0.06). No significant herd-related differences were seen,
however, in the plasma leptin content. Neither the number of days elapsed since calving (days
postpartum), nor parity was associated with plasma BHB, insulin, IGF-I and leptin concentra-
tions. After pooling the data of cows in different herds, the hyperketonaemic cows showed
lower insulin, IGF-I and leptin concentrations than their normoketonaemic mates (Fig. 5.5.3.).
Negative correlation (P<0.001) was established between plasma levels of BHB with insulin (r
= -0.38), IGF-I (r = -0.83) and leptin (r= -0.50), whereas a positive correlation (P<0.001)
existed between plasma levels of insulin and IGF-I (r = +0.37), insulin and leptin (r = +0.69),
and IGF-I and leptin (r = +0.49).
Fig. 5.5.3. Plasma insulin, IGF-I and leptin concentrations in Holstein Friesian cows showingnormal (<1.00 mmol/l) or elevated (>1.00 mmol/l) βOH-butyrate (BHB) con-centrations on day 4-12 after calving (3 to 5 parity cows; means ± SEM; Exp.5b).
Discussion
In full agreement with the experiences of Exp. 5.4a, on day 18-22 before calving, the
metabolic and endocrine condition of the late pregnant, non-lactating cows was stabile, and
characterized with high plasma levels of insulin, IGF-I and leptin, and low concentrations of
NEFA and BHB also in the current study. Although the individual variation was quite wide, the
production and plasma levels of ketone bodies (such as BHB, furthermore acetone and aceto-
acetic acid, not determined in this trial) usually started to increase some days before calving,
with a coinciding decline in plasma insulin, and elevation in circulating NEFA content. Although
development of clinical ketosis is expected when BHB is above >1.60 mmol/l for several days
(Bruss, 1997; Whitaker et al., 1999), also the consequences of less obvious, subclinical forms
of hyperketonaemia (which is usually detected, as ketonuria, in the practice; Markusfeld,
1985; Kégl, 1990; Kégl and Gaál, 1992) may have clinical relevance simultaneously with, or
90
soon after calving. Due to the BHB elevation and decreased IGF-I content, in these cows the
capacity of intrauterine and intramammary anti-microbial self-defense mechanisms (first of all
the migration and killing activity of neutrophil granulocytes) is impaired, predisposing the af-
fected animal for puerperal metritis and mastitis (Hussain, 1989; Cai et al., 1994; Wensing et
al., 1997; Suriyasathaporn et al., 1999 and 2000; Zerbe et al., 2000; Jánosi et al., 2003;
Vangroenweghe et al., 2005). Furthermore, also the postpartum resumption of cyclic ovarian
function may be postponed, and at the desirable time of first insemination the quality of oocyte
may be impaired (Wensing et al., 1997; Veerkamp et al., 2003; Huszenicza, 2003;
Huszenicza et al., 2006).
In accordance with some other reports (Kadokawa et al., 2000; Block et al., 2001;
Liefers et al., 2003; Chagas et al., 2006; Kadokawa et al., 2006), as well as with our earlier
findings (Exp. 4a), in late-pregnant non-lactating cows the plasma leptin was elevated, was in
positive correlation with the BCS, and declined towards parturition also in the current study.
Like the observation of Holtenius et al. (2003), low leptin concentration with mild correlation
with BCS was found about one week after calving. As it was discussed also in Chapters 3.3.
and 3.6., this decrease in plasma leptin of late pregnant cows may be due to a decline in dry
matter intake together with an increased energy demand of the fetus (Hayirli et al., 2002),
furthermore due to changes in production and plasma level of insulin and GH initiated by this
pre-calving NEB. In dairy cattle the onset of NEB was associated with decreased plasma
insulin and increased plasma GH (Block et al., 2001 and 2003; Leury et al., 2003). Admini-
stration of insulin increased circulating leptin in both late pregnant and early lactating cows,
whereas GH treatment did not reduce plasma leptin (Block et al., 2003; Leury et al., 2003),
suggesting that insulin rather than GH is the main endocrine regulator of leptin concentrations
during the periparturient period. The experiences of our current studies are in agreement with
these observations. In Exp. 5a the cows with continuous hyperketonaemia showed higher
BHB and lower insulin levels than their normoketonaemic mates from day 4-10 before calving,
and these tendencies existed throughout the study. Also the plasma leptin started to decrease
at that time, however, the first significant differences between the normo- and hyperketonae-
mic cows were observed some days later, only on day 2 before calving. The BHB and insulin
patterns of those with transient ketone increase around parturition represented an intermediate
position. It was interesting to see that in cows, which had shown elevated BHB levels for a
91
while, the postpartum leptin levels were low subsequently in the first week of lactation, regard-
less of the presence or absence of coinciding BHB elevation. This tendency proved distinct
BHB-related changes in function of adipo-insular axis in hyperketonaemic cows, resulting in
long-time depression in circulating leptin level. Impairments in endocrine regulation of energy
homeostasis were reflected also in data of cows in Exp. 5b, sampled only once between days
4 and 12 after calving.
As a conclusion, these data demonstrate obvious differences between circulating leptin
levels of normo- and hyperketonaemic dairy cows during the peri-parturient period and at the
beginning of lactation, with lower leptin content in plasma of those which have had >1.00
mmol/l BHB. It has remained still unknown, whether this hypoleptinaemia may promote the
hyperphagia of lactation, and if so, why this promoting effect exists only in certain individuals
(e.g. in those with transient ketone increase). However, this low leptin level seems to be a con-
sequence, rather than a causative factor in pathogenesis of subclinical ketosis.
5.6. Effects of fat supplementation in postpartum dairy cows (Exp. 6)
Fat supplementation of early lactation diets is an attractive alternative to diminish the
gap between energy intake and the demand of high milk yield. Energy density of fat is high and
long chain fatty acids are used efficiently for milk fat synthesis. Large amounts of fat may,
however, have a negative impact on microbial fiber digestion in the rumen and reduce feed
intake. Feeding inert fats with melting point lower than the normal temperature of the ruminal
juice or calcium salts of fatty acids alleviates this problem (Coppock and Wilks, 1991). An-
other potential drawback of fat supplementation can be, paradoxically, increased lipid mobili-
zation from adipose tissue, which is possibly facilitated by decreased blood insulin or merely a
consequence of increased milk yield (Chilliard, 1993, Staples et al., 1998). In monogastric
models the high-fat diet feeding reduced the diurnal variation of plasma leptin concentration (in
rats; Cha et al., 2000), a one-week fat supplementation (2 % conjugated linoleic acid, pro-
vided as a safflower oil enriched diet) reduced the serum leptin levels (in rats; Yamasaki et al.,
2000), but a similar diet elevated the circulating leptin level in rabbits (Corino et al., 2002).
The intravenous administration of an aqueous emulsion of 20 % soybean oil did not affect
plasma leptin, insulin and IGF-I concentrations in early-lactation dairy cows, whereas stimu-
lated the leptin secretion (but not the insulin and IGF-I) in late-lactation animals (Chelikani et
92
al., 2003b). In 2002-2003 fat supplementation was a widely used technology in dairy herds,
but up to our knowledge no data had been published yet on its influence on circulating leptin
levels. So in cooperation with Finnish nutritionists we studied the effects of a commercially
available inert fat source on insulin and leptin levels in postpartum dairy cows.
Material and methods
In a randomized complete block design 24 high-producing Ayrshire cows were di-
vided to groups with 0 (Group NF; n=8), 3.5 (Group MF; n=8) or 7% (Group HF; n=8) of
calcium salts of palm fatty acids (Ca-PFA) in concentrate41,42. For the first 8 weeks of lacta-
tion, cows were kept and fed individually; grass silage was provided ad libitum, and concen-
trate allowance was increased to 15 kg/d within 20 days. Metabolizable energy content of the
silage was 11.0 MJ/kg dry matter, whereas the metabolizable energy contents of the concen-
trates were 12.6, 13.1 and 13.6 MJ/kg DM for NF, MF and HF, respectively43.
Milk yield and feed intake were recorded daily. Milk samples for composition analyses
were taken at 1, 2, 4, 6 and 8 wk after parturition. Body weights were recorded daily during
the week of calving, and at 2, 4, 6 and 8 wk after calving. At the day of calving, furthermore 4
and 8 weeks later the body fat reserves (represented by subcutaneous fat depths) were meas-
ured with a real-time B-mode ultrasonographic scanning method44 of Kokkonen et al (2005)
at 3 locations, as follows: (i) on the left transversal process of the fourthlumbar vertebra, 2 to
3 cm medially from the lateral end, (ii) in the middle of the line connecting the ventral corner of
the left tuber coxae and the dorsal tuberosity of the left tuber ischiadicum, and (iii) on the same
line, 8 cm cranially from the dorsal tuberosity of the tuber ischiadicum. Fat depth at a particular
time was given as a mean of values determined at these 3 locations. Blood samples were
taken from the superficial epigastric (mammary) vein at 1, 3, 5, 7, 14, 21, 28, and 56 d after
calving and from the coccygeal (tail) vessel 5 and 28 d after calving.
The data for milk yield, composition, and feed intake from weeks 1 to 4 and weeks 5 to
8, as well as blood composition data from 1 to 28 d, were analyzed as repeated measures.
41 Raisio Feed Ltd, Raisio, Finland
42 Also a digestibility experiment was conducted with 12 cows, using acid-insoluble ash, as an internal marker. These
data, however, are out of the subject of the current dissertation, and are not presented and discussed in details there-
after.
43 According to the national standard in Finland, the metabolizable energy content of constituents were calculated and
given in this study.
44 Aloka SSD-210DXII, equipped with a 7.5-MHz transducer (Aloka Co. Ltd., Tokyo, Japan)
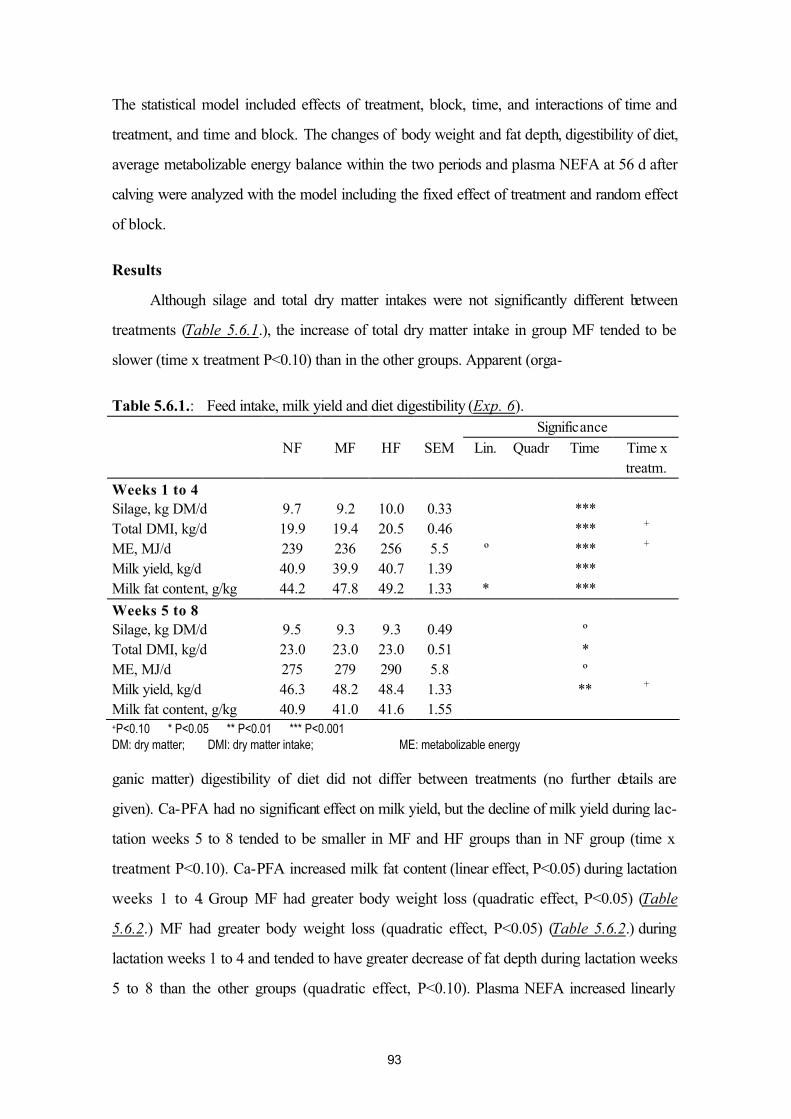
93
The statistical model included effects of treatment, block, time, and interactions of time and
treatment, and time and block. The changes of body weight and fat depth, digestibility of diet,
average metabolizable energy balance within the two periods and plasma NEFA at 56 d after
calving were analyzed with the model including the fixed effect of treatment and random effect
of block.
Results
Although silage and total dry matter intakes were not significantly different between
treatments (Table 5.6.1.), the increase of total dry matter intake in group MF tended to be
slower (time x treatment P<0.10) than in the other groups. Apparent (orga-
Table 5.6.1.: Feed intake, milk yield and diet digestibility (Exp. 6).Significance
NF MF HF SEM Lin. Quadr Time Time x treatm.
Weeks 1 to 4Silage, kg DM/d 9.7 9.2 10.0 0.33 ***Total DMI, kg/d 19.9 19.4 20.5 0.46 *** +
ME, MJ/d 239 236 256 5.5 º *** +
Milk yield, kg/d 40.9 39.9 40.7 1.39 ***Milk fat content, g/kg 44.2 47.8 49.2 1.33 * ***
Weeks 5 to 8Silage, kg DM/d 9.5 9.3 9.3 0.49 ºTotal DMI, kg/d 23.0 23.0 23.0 0.51 *ME, MJ/d 275 279 290 5.8 ºMilk yield, kg/d 46.3 48.2 48.4 1.33 ** +
Milk fat content, g/kg 40.9 41.0 41.6 1.55+P<0.10 * P<0.05 ** P<0.01 *** P<0.001
DM: dry matter; DMI: dry matter intake; ME: metabolizable energy
ganic matter) digestibility of diet did not differ between treatments (no further details are
given). Ca-PFA had no significant effect on milk yield, but the decline of milk yield during lac-
tation weeks 5 to 8 tended to be smaller in MF and HF groups than in NF group (time x
treatment P<0.10). Ca-PFA increased milk fat content (linear effect, P<0.05) during lactation
weeks 1 to 4. Group MF had greater body weight loss (quadratic effect, P<0.05) (Table
5.6.2.) MF had greater body weight loss (quadratic effect, P<0.05) (Table 5.6.2.) during
lactation weeks 1 to 4 and tended to have greater decrease of fat depth during lactation weeks
5 to 8 than the other groups (quadratic effect, P<0.10). Plasma NEFA increased linearly
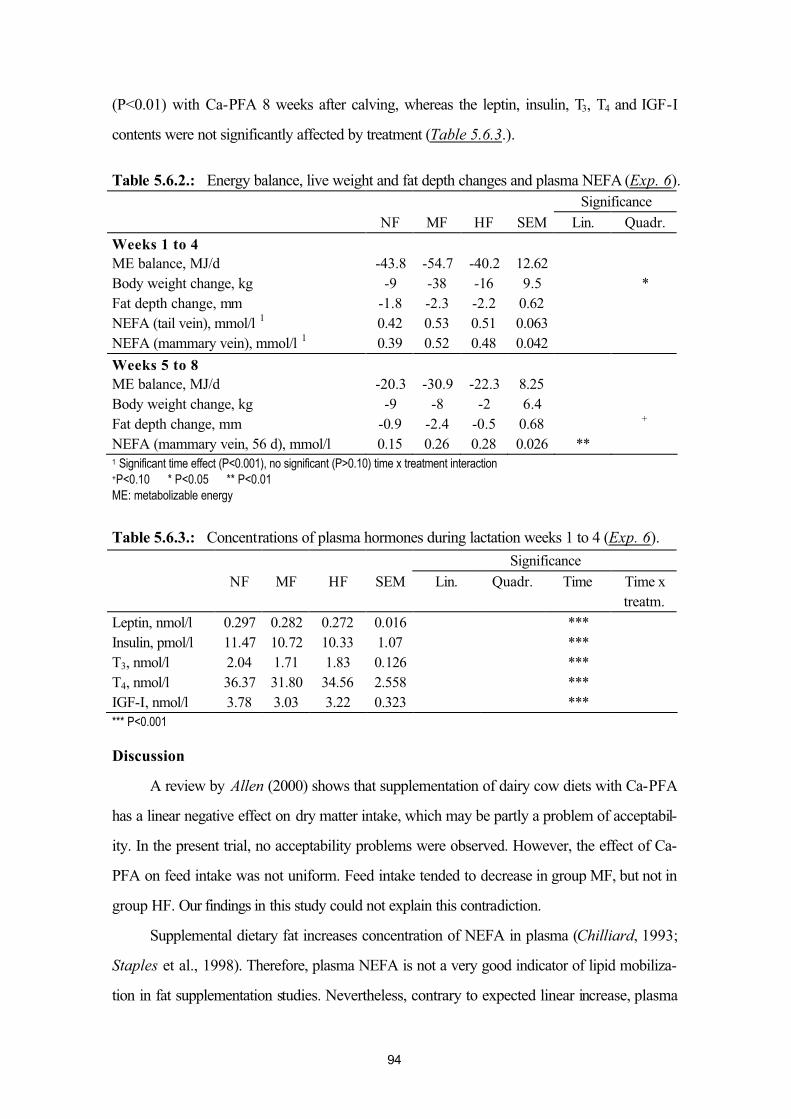
94
(P<0.01) with Ca-PFA 8 weeks after calving, whereas the leptin, insulin, T3, T4 and IGF-I
contents were not significantly affected by treatment (Table 5.6.3.).
Table 5.6.2.: Energy balance, live weight and fat depth changes and plasma NEFA (Exp. 6).Significance
NF MF HF SEM Lin. Quadr.
Weeks 1 to 4ME balance, MJ/d -43.8 -54.7 -40.2 12.62Body weight change, kg -9 -38 -16 9.5 *Fat depth change, mm -1.8 -2.3 -2.2 0.62NEFA (tail vein), mmol/l 1 0.42 0.53 0.51 0.063NEFA (mammary vein), mmol/l 1 0.39 0.52 0.48 0.042
Weeks 5 to 8ME balance, MJ/d -20.3 -30.9 -22.3 8.25Body weight change, kg -9 -8 -2 6.4Fat depth change, mm -0.9 -2.4 -0.5 0.68 +
NEFA (mammary vein, 56 d), mmol/l 0.15 0.26 0.28 0.026 **1 Significant time effect (P<0.001), no significant (P>0.10) time x treatment interaction+P<0.10 * P<0.05 ** P<0.01
ME: metabolizable energy
Table 5.6.3.: Concentrations of plasma hormones during lactation weeks 1 to 4 (Exp. 6).
Significance
NF MF HF SEM Lin. Quadr. Time Time x treatm.
Leptin, nmol/l 0.297 0.282 0.272 0.016 ***Insulin, pmol/l 11.47 10.72 10.33 1.07 ***T3, nmol/l 2.04 1.71 1.83 0.126 ***T4, nmol/l 36.37 31.80 34.56 2.558 ***IGF-I, nmol/l 3.78 3.03 3.22 0.323 ****** P<0.001
Discussion
A review by Allen (2000) shows that supplementation of dairy cow diets with Ca-PFA
has a linear negative effect on dry matter intake, which may be partly a problem of acceptabil-
ity. In the present trial, no acceptability problems were observed. However, the effect of Ca-
PFA on feed intake was not uniform. Feed intake tended to decrease in group MF, but not in
group HF. Our findings in this study could not explain this contradiction.
Supplemental dietary fat increases concentration of NEFA in plasma (Chilliard, 1993;
Staples et al., 1998). Therefore, plasma NEFA is not a very good indicator of lipid mobiliza-
tion in fat supplementation studies. Nevertheless, contrary to expected linear increase, plasma
95
NEFA (in mammary vein) tended to be highest in MF group (P=0.11, quadratic effect) during
lactation weeks 1 to 4. Along with greater body weight and fat depth loss, this gives evidence
for increased tissue mobilization in group MF. Reviews by Chilliard (1993) and Staples et al.
(1998) suggested that dietary fat supplementation with saturated fatty acid sources may de-
press plasma insulin and enhance lipolysis in adipose tissue. The present study cannot fully
confirm this theory, as there were no significant differences in plasma concentrations of insulin,
IGF-I, T4, T3 and leptin. In a recent study of Kay et al. (2006) 600 g/day supplementation
with conjugated linoleic acid increased the milk yield, but failed to affect plasma glucose, insu-
lin, leptin and NEFA in transition dairy cows grazing fresh pasture in New Zealand. However,
due to the differences between pastured and concentrate-fed animals, the metabolic conse-
quences of polyunsaturated fatty acid supplementation (including the supposed changes of
leptin) should be studied also in TMR-fed animals.
As a conclusion, the consumption of the studied diet – enriched with calcium salts of
palm fatty acids (Ca-PFA) in concentrate for the first 8 weeks of lactation – did not influence
the plasma leptin, insulin, T3, T4 and IGF-I levels. However, this diet elevated the milk fat con-
tent during lactation weeks 1 to 4, and tended to increase the persistency of peak yield during
lactation weeks 5 to 8. Although a tendency towards increased lipid mobilization was ob-
served with medium Ca-PFA, no consistent shift towards increased catabolism was seen with
Ca-PFA.
5.7. Effects of inflammatory diseases with intensive endotoxin / cytokine release:
postpartum mastitis (Exp. 7a, Exp. 7b) and puerperal metritis (Exp. 7c)
In high-producing dairy cows perhaps the postpartum mastitis (mainly the cases re-
sulted from GN infections) and puerperal metritis are the two most important poly-etiological
inflammatory diseases, which have (besides microbial factors) also metabolic and endocrine
elements with the supposed involvement of leptin in the pathogenesis. Postpartum mastitis is
caused only by one pathogen, and represents a rapid (usually taking for 24-72 hours, but often
robust) endotoxin and cytokine challenge for the host, which sometimes is followed by bacte-
raemia (Sandholm et al., 1995). In contrast, puerperal metritis is a more sustained inflamma-
tory process with multi-bacterial etiology and a risk for toxic and septic complications (taking
for 2-3 to 10-15 days, so causing a protracted, but not very intensive release of endotoxin and
96
cytokines in mild cases; Mateus et al., 2003; Sheldon and Dobson 2004). The further aspects
of pathogenesis are summarized in our recent reviews (Huszenicza et al., 2004; Földi et al.,
2006), but are not detailed here, due to the size limit of this dissertation. In our current work
we wished to determine, whether there are any changes in circulating leptin levels related to
these diseases in postpartum dairy cows. Three experiments were conducted: a model study
with experimental intramammary endotoxin challenge (Exp. 7a; where also responses shown
during the early vs. late lactation were compared), furthermore two field studies, with natural
cases of postpartum mastitis (Exp. 7b) and puerperal metritis (Exp. 7c).
Materials and methods
Exp. 7a
In this model study 9 clinically healthy Finnish Ayrshire cows participated: two of them
were primiparous and seven multiparous (2-4 parity)45 . Cows were fed good quality grass
silage and hay freely, and concentrate was given twice daily. They were milked twice a day at
6 am and 5 pm, and their milk yield was 17 to 38 kg per day in early lactation, and 5 to 19 kg
per day in late lactation. All the cows were free from mastitis pathogens46, and had low SCC
in their milk (<150 000 cells /ml). A cross-over design was used: each cow (serving as its own
control) was challenged twice, in the early lactation period (EL; 6 to 15 days of lactation),
and in the late lactation period (LL; 137 to 77 days before the next parturition). Cows were
randomly allocated into two groups; one group was challenged in the EL, and the other group
in the LL for the first time. After the morning milking cows were infused into one hind quarter
with 100 µg of endotoxin (E. coli 0111:B4 lipopolysaccharide B)47 diluted into 5 ml of sterile
physiological saline (0.9 % w/v NaCl). The same quarter was used at both challenges. Sys-
temic and local signs of mastitis were recorded throughout the experiment. Systemic signs in-
cluded general disposition, heart rate, rectal temperature, and appetite; local signs included
swelling, temperature, and pain in the udder. Milk’s appearance in the challenged quarter was
also recorded. Systemic and local signs and milk appearance were scored from 1 to 3, using
also half numbers. In this scoring system 1 resembled normal and 3 severe reaction, meaning
45 One more cow was involved, but it had to be excluded, as it did not re-conceive following the experimental endotoxin
challenge in the early lactation period.
46 Proven by repeated sampling for bacteriology previously.
47 E. coli 0111:B4 LPS, Bacto, Difco Laboratories Inc., Detroit, MI, USA.
97
systemically rectal temperature >40.5 oC, anorexia and depression, locally severe swelling and
pain into udder, and milk appearance changed to watery or pus-like (Pyörälä et al. 1994)48.
Severity of the response was assessed: <2 was classified as mild, >2 but <3 as moderate, and
3 as severe response.
Blood (plasma) samples were taken from each cow at the time of endotoxin challenge
(0 h), furthermore 2, 4, 8, 12, 24, 32, 48, and 72 h thereafter, and concentrations of NEFA,
BHB, cortisol, IGF-I, insulin, leptin, T4 and T3 were determined49.
Exp. 7b
This field trial was carried out in a Hungarian large-scale dairy herd with ≈1800 Hol-
stein Friesian cows kept under free housing conditions. The farm, which was free of Str. aga-
lactiae, had a continuous mastitis control program, and produced low (<400 000 / ml) SCC
milk for many years. All identified cases of S. aureus mastitis were immediately separated, and
these cows were culled soon. The cows calved in maternity boxes in groups of 3-4 animals,
and calves were weaned when their dams left the unit at the end of the colostral period. Sepa-
rated groups were formed for fresh-milking primi- and multiparous animals. During early
weeks of lactation all cows were milked50 3 times a day ≈8 h apart (at ≈8.00-9.30 h, 15.30-
17.00 h and 23.00-0.30 h), and were checked for mastitis51 at the beginning of each milking.
As a regular practice of the udder health care, clinical mastitis was diagnosed when the macro-
scopic appearance of milk was changed, with or without any other local and/or generally signs.
Within the framework of the current experiment we followed the supposed endocrine
alterations in multiparous (≥2 parity) cows affected by natural outbreak of mastitis on days
1-14 after calving. From early April to late June 1998, all new cases of postpartum mastitis
diagnosed in the herd at morning milking (e.g. at ≈8.00-9.30 h) were involved, if also systemic
signs including anorexia were observed. As controls, healthy herd mates (almost identical in
parity, days of lactation and current milk yield) were selected. In order to avoid the interfer-
48 The response-parameter was formed by calculating the average of these scores. This parameter is handled as con-
tinuous parameter and it fits well to the normal distribution curve.
49 In addition also (i) some haematological parameters (packed cell volume, hemoglobin, total and differential leukocyte
count) were determined, (ii) at each time point quarter-based milk samples were collected for somatic cell counting and
measuring of N-acetyl-β-D-glucose-amininidase activity, furthermore (iii) the daily milk yield was recorded. These
data, however, were published elsewhere (Lehtolainen et al., 2003), and are not included in the current dissertation.
50 In a milking house; milking parlors were furnished with BouMatic technology.
51 With macroscopic appearance of milk in the first few jets milked out manually.
98
ence with other complications, however, only cow produced low SCC milk in the previous
lactation were assigned, furthermore those needed manual assistance within the birth canal at
calving (dystocia), were affected by retained fetal membrane (RFM), and/or showed signs of
puerperal metritis, were not involved (dystocia, RFM), or were excluded from the evaluation
(puerperal metritis).
All the selected cows were removed, and separated from the others in the sanitary unit
of the farm until their complete recovery (mastitic cows), or until the end of the sampling proc-
ess (controls). This unit was a stanchion barn, where all animals were kept tied down, and
were fed as in the maternity unit (immediate postpartum cows) or in their producing group
(fresh milkers). In the sanitary unit the affected udder quarters were sampled for bacteriology,
and (after a complete milking-out) were treated with intracysternal administration of 250 mg
cephoperasone52. Cows showing severe systemic signs (rectal temperature: >40.5 Co and/or
serious anorexia and depression, or recumbency) received also 1 mg/kg BW of ceftiofur53,
repeated 24 h apart for 3-5 days. (The healthy controls were not sampled for bacteriology,
and of course they were not treated.) All the mastitis-affected and control cows were regularly
sampled for NEFA, BHB, cortisol, IGF-I, insulin, leptin, T4 and T3. For this purpose blood
samples were taken first time at ≈14.00 h (on day of assignment, which represented the h ≈7
to 14 of clinical course), and again five times 6 h apart (e.g. at 20.00 h, 02.00 h, 8.00 h, 14.00
h and 20.00 h) thereafter. From the aseptic milk samples the mastitis pathogens were isolated
and the pure cultures were identified based on the recommendations of Quinn et al. (1994)
and Sandholm et al. (1995)54. If more than one mastitis pathogen was isolated, the data of
animals were not evaluated. For final evaluation the mastitis-affected cows were blocked into
one of 3 sub-groups depending on the category of pathogen isolated, e.g. GP or GN bacteria,
or cases with no detected pathogens (NDP), and their data were compared to each others, as
well as to those of the healthy controls. Due to the limited number of cases, and their similar
clinical appearance and endocrine consequences, however, data from cows with GN and
NDP mastitis were evaluated together, as endotoxin mastitis.
52 Pathozone intramammary inf. (Pfizer AH, Exton, PA, USA)
53 Excenel sterile powder pro inj. (Pharmacia AH, Puurs, Belgium; currently: Pfizer AH, Exton, PA, USA), 50 mg in
aqua dest., as intramuscular inj.
54 By Szilárd Jánosi (Department of Bacteriology, Central Veterinary Institute, Budapest, Hungary)
99
Exp. 7c
In a large-scale Hungarian dairy herd, development of puerperal metritis and the re-
lated changes in plasma levels of leptin, some other metabolic hormones and metabolites, as
well as of certain cytokines and acute phase proteins were studied in ≥2nd parity cows predis-
posed for this disease (RFM: n=10; dystocia: n=31; calving date: January to May 1997). BW
and BCS were determined 3 d after calving and again on d 28-30. Starting on d 3 postpartum
repeated vaginoscopy and rectal palpation were performed once a day until d 15, and thereaf-
ter at 2-3 d intervals until d ≈45, and also the rectal temperature was taken at the same time.
General condition of cows, furthermore quality of cervical discharge, size and tonicity of the
uterus, and possible adhesions were recorded. The putrid character of discharge (e.g. foul-
smelling, reddish-brown, watery exudate with some necrotic debris) was the main diagnostic
criterion of puerperal metritis. All cows showing these pathognostic signs received an intrauter-
ine antibiotic therapy: an oxytetracycline-neomycin combination55 (before d ≈15), and either a
cephapirine56 or an oxytetracycline-furazolidone-clioquinol57 containing preparation (between
d ≈15 and ≈45 after calving). This treatment was repeated 1 to 6 times, and was combined
with daily administration of ergot alkaloids58. Those affected by severe (toxic) form of puer-
peral metritis (PMS; e.g. at least once between d 3 and 15 after calving: rectal temperature
>40.5 oC, with simultaneous anorexia) were treated also with 3 mg/kg of oxytetracycline59,
intramuscularly. Simultaneously the daily milk yield was recorded, and blood samples were
collected once a day until d 15, and thereafter 3 times a week until d ≈45 for assaying proges-
terone, NEFA, BHB, IGF-I, insulin, leptin, T4, T3 and TNFα levels and some acute phase
proteins, such as haptoglobin (HP) and α1-acid glycoprotein (α1-AG). On d 9 after calving
blood samples were taken in every 4 h for 24 h to analyze the diurnal leptin and TNFα pat-
terns. Also uterine swab samples were taken for bacteriology at the beginning of the sampling
period (e.g. before antibiotics are administered at the first time), 3 and 10 d later, and again at
the 4 to 5 wk after calving. The uterine pathogens were isolated and identified60, as described
55 Exuter intrauterine tabl. (Biogal, Debrecen, Hungary)
56 Metricure intrauterine inf. (Intervet International B.V.; Boxmeer, The Netherlands)
57 Metrijet intrauterine inf. (Intervet International B.V.; Boxmeer, The Netherlands; not available since 1998)
58 10 ml of Ergotin-N inj. (Alvetra GmBH, Neumünster, Germany; not available since 1998)
59 Engemycin inj. (Intervet International B.V.; Boxmeer, The Netherlands)
60 By Mihaly Fodor and Maria Vamos (Unit for Bacteriology, Central Laboratory, Jósa Andras Hospital, Nyiregyháza)
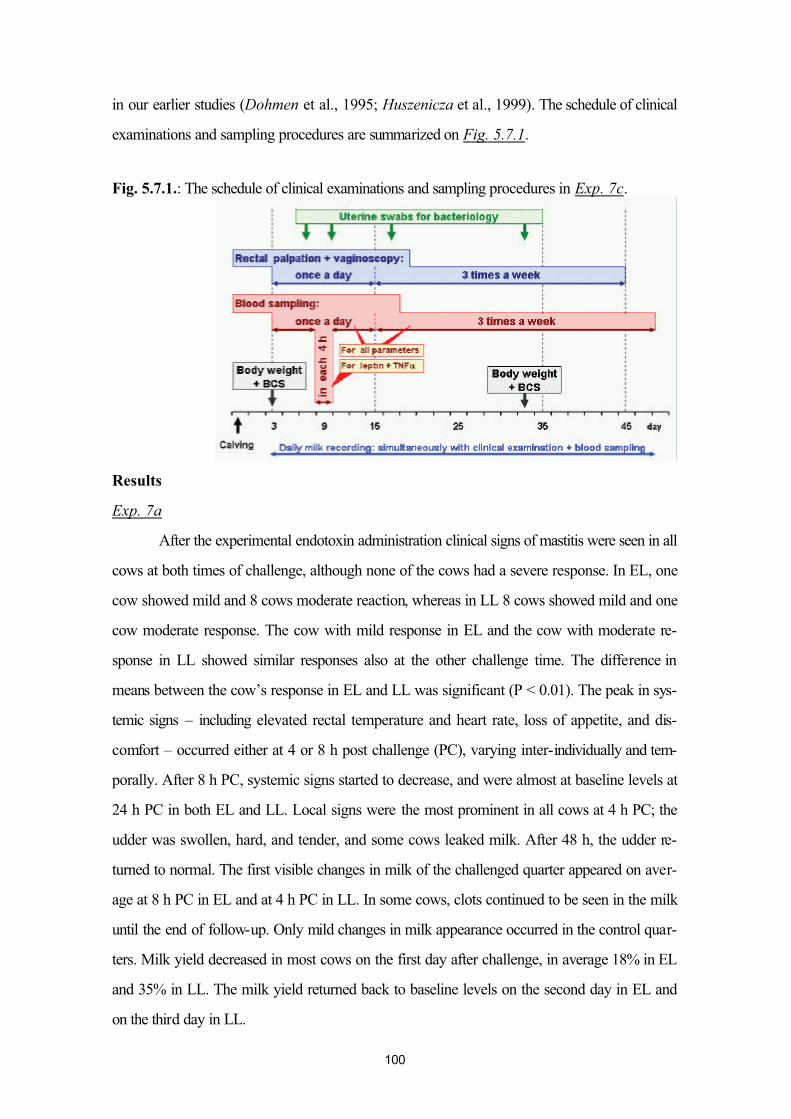
100
in our earlier studies (Dohmen et al., 1995; Huszenicza et al., 1999). The schedule of clinical
examinations and sampling procedures are summarized on Fig. 5.7.1.
Fig. 5.7.1.: The schedule of clinical examinations and sampling procedures in Exp. 7c.
Results
Exp. 7a
After the experimental endotoxin administration clinical signs of mastitis were seen in all
cows at both times of challenge, although none of the cows had a severe response. In EL, one
cow showed mild and 8 cows moderate reaction, whereas in LL 8 cows showed mild and one
cow moderate response. The cow with mild response in EL and the cow with moderate re-
sponse in LL showed similar responses also at the other challenge time. The difference in
means between the cow’s response in EL and LL was significant (P < 0.01). The peak in sys-
temic signs – including elevated rectal temperature and heart rate, loss of appetite, and dis-
comfort – occurred either at 4 or 8 h post challenge (PC), varying inter-individually and tem-
porally. After 8 h PC, systemic signs started to decrease, and were almost at baseline levels at
24 h PC in both EL and LL. Local signs were the most prominent in all cows at 4 h PC; the
udder was swollen, hard, and tender, and some cows leaked milk. After 48 h, the udder re-
turned to normal. The first visible changes in milk of the challenged quarter appeared on aver-
age at 8 h PC in EL and at 4 h PC in LL. In some cows, clots continued to be seen in the milk
until the end of follow-up. Only mild changes in milk appearance occurred in the control quar-
ters. Milk yield decreased in most cows on the first day after challenge, in average 18% in EL
and 35% in LL. The milk yield returned back to baseline levels on the second day in EL and
on the third day in LL.
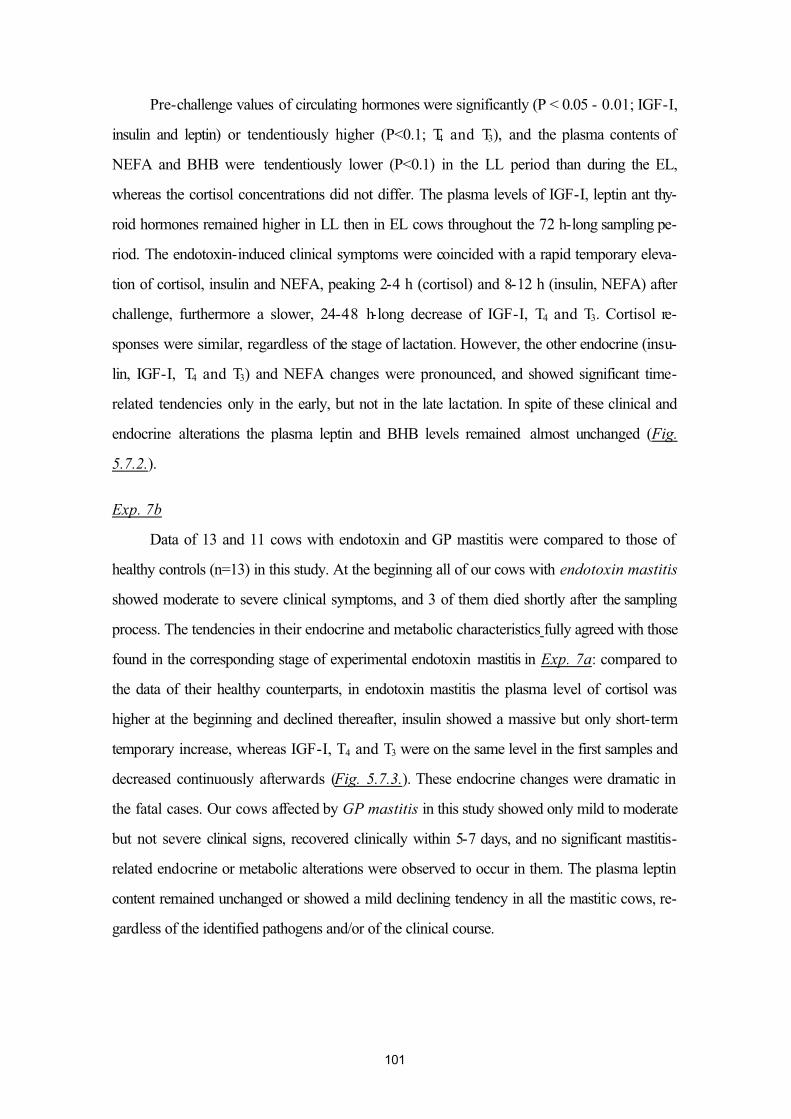
101
Pre-challenge values of circulating hormones were significantly (P < 0.05 - 0.01; IGF-I,
insulin and leptin) or tendentiously higher (P<0.1; T4 and T3), and the plasma contents of
NEFA and BHB were tendentiously lower (P<0.1) in the LL period than during the EL,
whereas the cortisol concentrations did not differ. The plasma levels of IGF-I, leptin ant thy-
roid hormones remained higher in LL then in EL cows throughout the 72 h-long sampling pe-
riod. The endotoxin-induced clinical symptoms were coincided with a rapid temporary eleva-
tion of cortisol, insulin and NEFA, peaking 2-4 h (cortisol) and 8-12 h (insulin, NEFA) after
challenge, furthermore a slower, 24-48 h-long decrease of IGF-I, T4 and T3. Cortisol re-
sponses were similar, regardless of the stage of lactation. However, the other endocrine (insu-
lin, IGF-I, T4 and T3) and NEFA changes were pronounced, and showed significant time-
related tendencies only in the early, but not in the late lactation. In spite of these clinical and
endocrine alterations the plasma leptin and BHB levels remained almost unchanged (Fig.
5.7.2.).
Exp. 7b
Data of 13 and 11 cows with endotoxin and GP mastitis were compared to those of
healthy controls (n=13) in this study. At the beginning all of our cows with endotoxin mastitis
showed moderate to severe clinical symptoms, and 3 of them died shortly after the sampling
process. The tendencies in their endocrine and metabolic characteristics fully agreed with those
found in the corresponding stage of experimental endotoxin mastitis in Exp. 7a: compared to
the data of their healthy counterparts, in endotoxin mastitis the plasma level of cortisol was
higher at the beginning and declined thereafter, insulin showed a massive but only short-term
temporary increase, whereas IGF-I, T4 and T3 were on the same level in the first samples and
decreased continuously afterwards (Fig. 5.7.3.). These endocrine changes were dramatic in
the fatal cases. Our cows affected by GP mastitis in this study showed only mild to moderate
but not severe clinical signs, recovered clinically within 5-7 days, and no significant mastitis-
related endocrine or metabolic alterations were observed to occur in them. The plasma leptin
content remained unchanged or showed a mild declining tendency in all the mastitic cows, re-
gardless of the identified pathogens and/or of the clinical course.
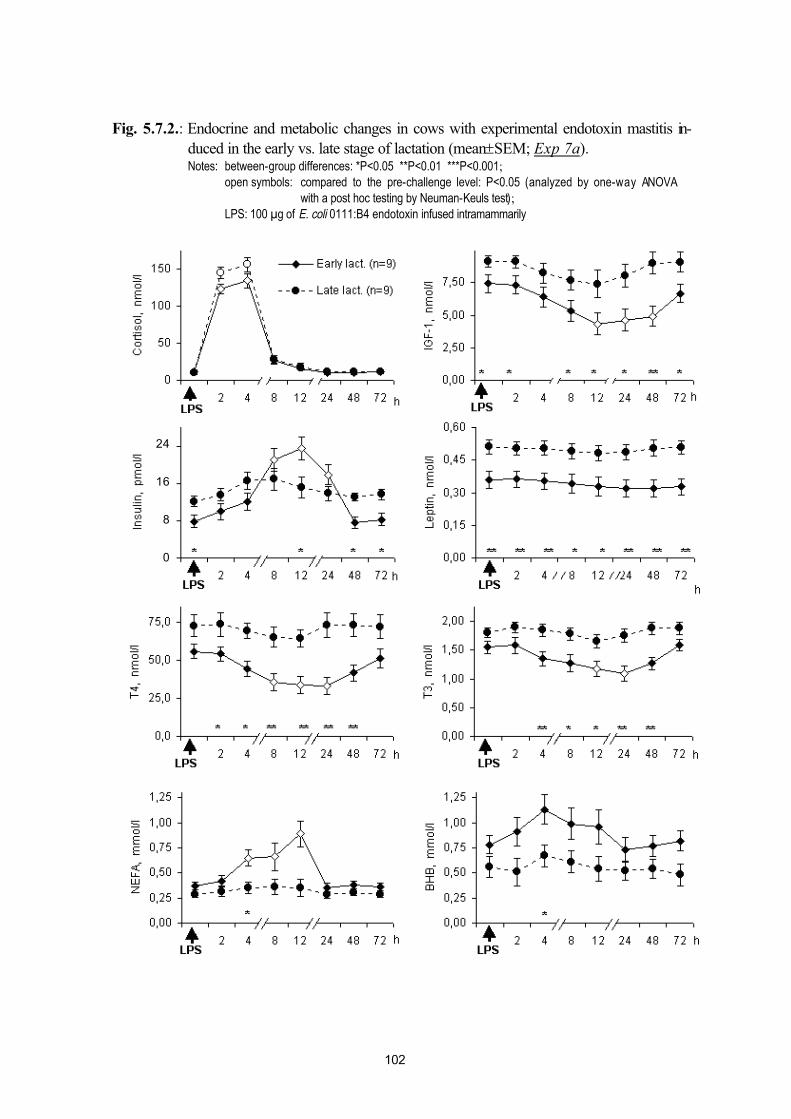
102
Fig. 5.7.2.: Endocrine and metabolic changes in cows with experimental endotoxin mastitis in-duced in the early vs. late stage of lactation (mean±SEM; Exp 7a).Notes: between-group differences: *P<0.05 **P<0.01 ***P<0.001;
open symbols: compared to the pre-challenge level: P<0.05 (analyzed by one-way ANOVA
with a post hoc testing by Neuman-Keuls test);
LPS: 100 µg of E. coli 0111:B4 endotoxin infused intramammarily
24
16
8
0
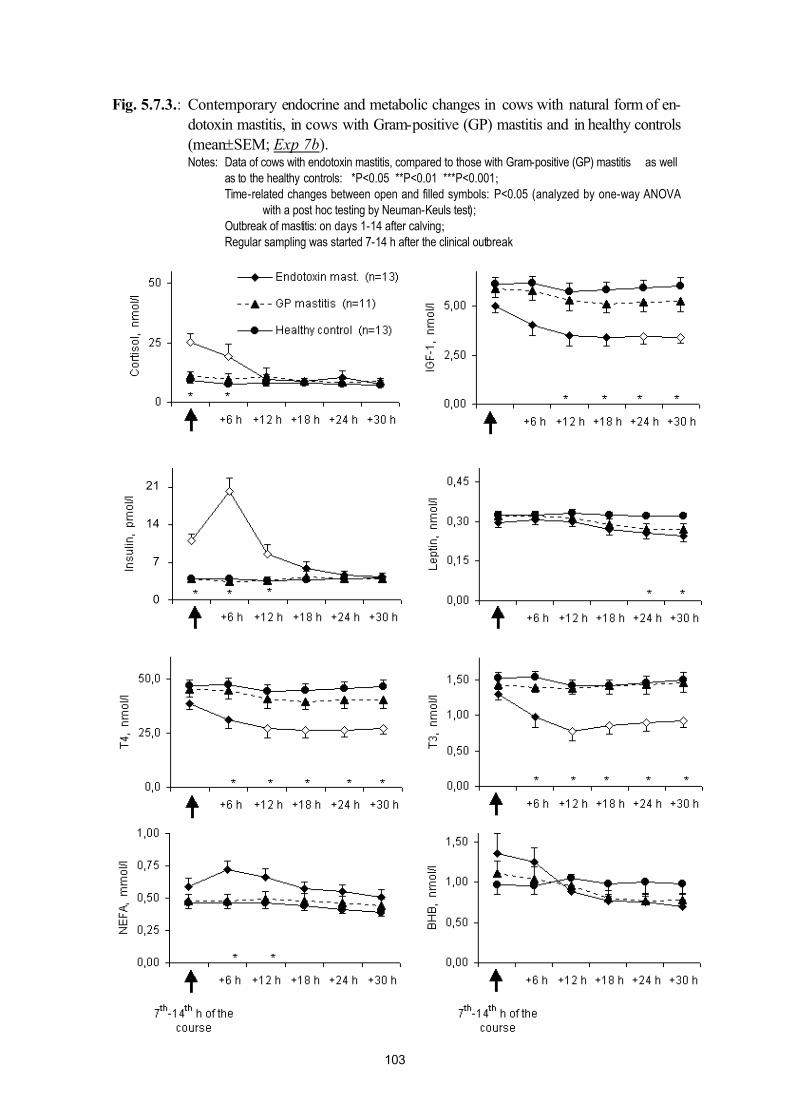
103
Fig. 5.7.3.: Contemporary endocrine and metabolic changes in cows with natural form of en-dotoxin mastitis, in cows with Gram-positive (GP) mastitis and in healthy controls(mean±SEM; Exp 7b).Notes: Data of cows with endotoxin mastitis, compared to those with Gram-positive (GP) mastitis as well
as to the healthy controls: *P<0.05 **P<0.01 ***P<0.001;
Time-related changes between open and filled symbols: P<0.05 (analyzed by one-way ANOVA
with a post hoc testing by Neuman-Keuls test);
Outbreak of mastitis: on days 1-14 after calving;
Regular sampling was started 7-14 h after the clinical outbreak
21
14
7
0
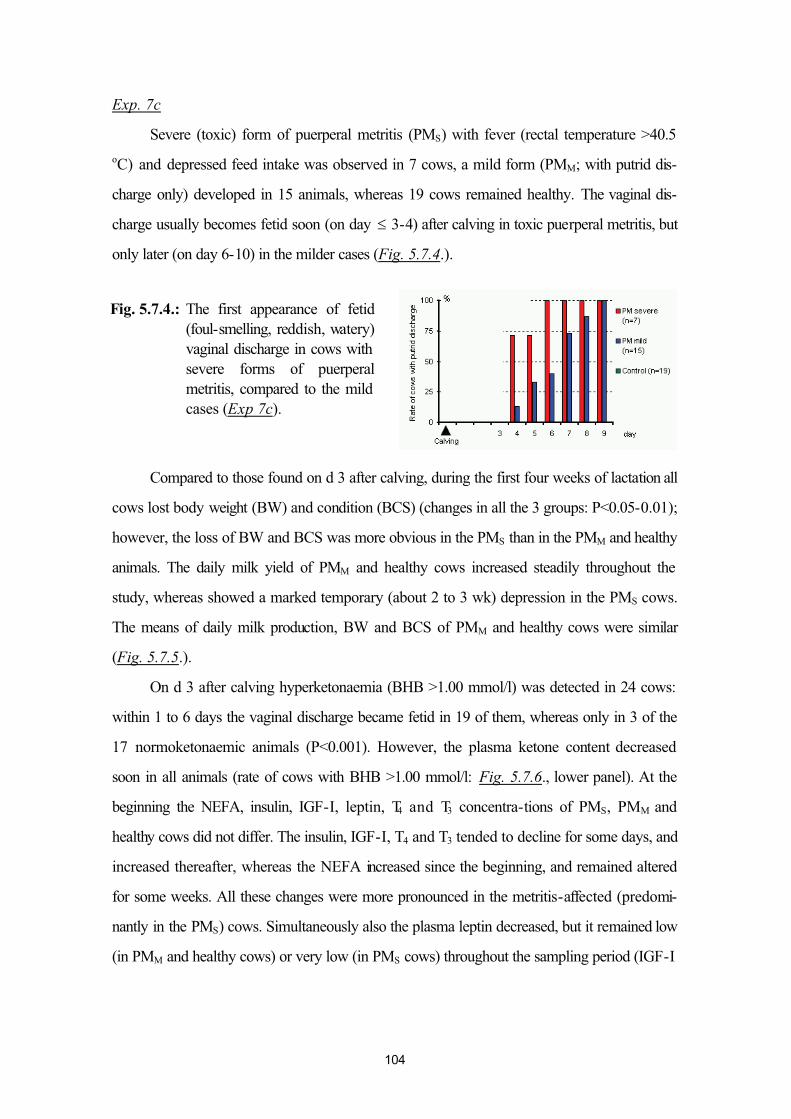
104
Exp. 7c
Severe (toxic) form of puerperal metritis (PMS) with fever (rectal temperature >40.5
oC) and depressed feed intake was observed in 7 cows, a mild form (PMM; with putrid dis-
charge only) developed in 15 animals, whereas 19 cows remained healthy. The vaginal dis-
charge usually becomes fetid soon (on day ≤ 3-4) after calving in toxic puerperal metritis, but
only later (on day 6-10) in the milder cases (Fig. 5.7.4.).
Compared to those found on d 3 after calving, during the first four weeks of lactation all
cows lost body weight (BW) and condition (BCS) (changes in all the 3 groups: P<0.05-0.01);
however, the loss of BW and BCS was more obvious in the PMS than in the PMM and healthy
animals. The daily milk yield of PMM and healthy cows increased steadily throughout the
study, whereas showed a marked temporary (about 2 to 3 wk) depression in the PMS cows.
The means of daily milk production, BW and BCS of PMM and healthy cows were similar
(Fig. 5.7.5.).
On d 3 after calving hyperketonaemia (BHB >1.00 mmol/l) was detected in 24 cows:
within 1 to 6 days the vaginal discharge became fetid in 19 of them, whereas only in 3 of the
17 normoketonaemic animals (P<0.001). However, the plasma ketone content decreased
soon in all animals (rate of cows with BHB >1.00 mmol/l: Fig. 5.7.6., lower panel). At the
beginning the NEFA, insulin, IGF-I, leptin, T4 and T3 concentra-tions of PMS, PMM and
healthy cows did not differ. The insulin, IGF-I, T4 and T3 tended to decline for some days, and
increased thereafter, whereas the NEFA increased since the beginning, and remained altered
for some weeks. All these changes were more pronounced in the metritis-affected (predomi-
nantly in the PMS) cows. Simultaneously also the plasma leptin decreased, but it remained low
(in PMM and healthy cows) or very low (in PMS cows) throughout the sampling period (IGF-I
Fig. 5.7.4.: The first appearance of fetid(foul-smelling, reddish, watery)vaginal discharge in cows with severe forms of puerperalmetritis, compared to the mild cases (Exp 7c).
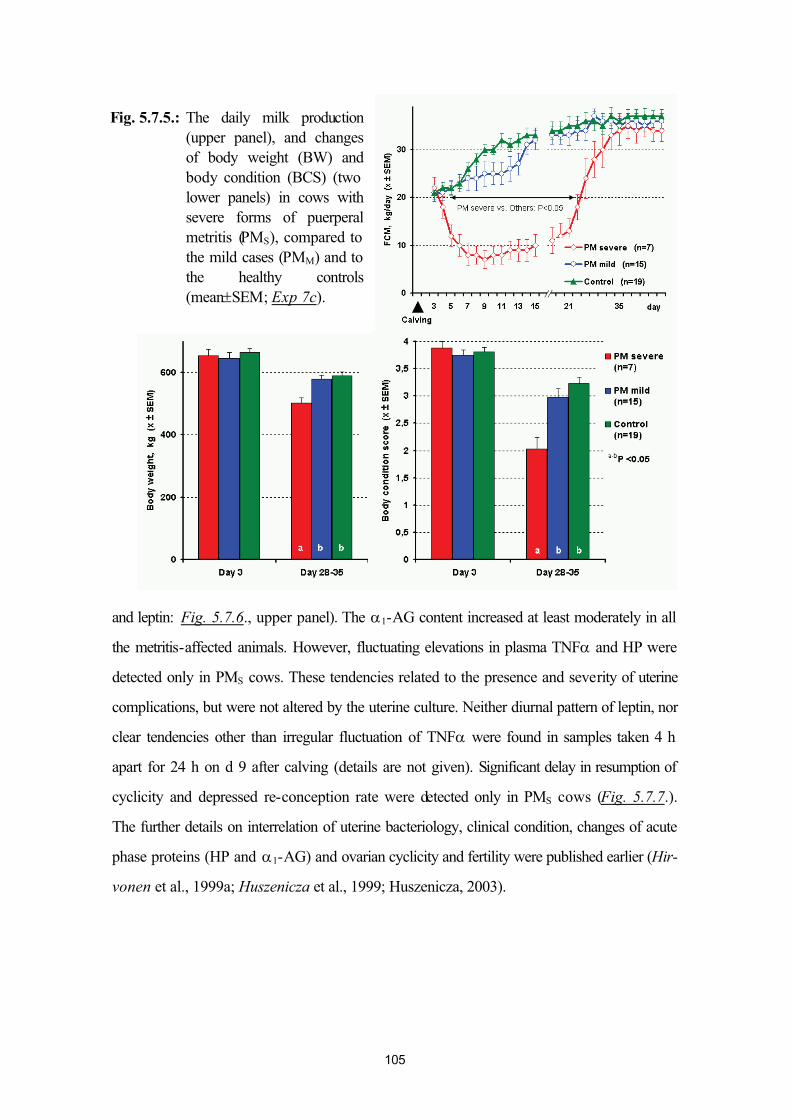
105
and leptin: Fig. 5.7.6., upper panel). The α1-AG content increased at least moderately in all
the metritis-affected animals. However, fluctuating elevations in plasma TNFα and HP were
detected only in PMS cows. These tendencies related to the presence and severity of uterine
complications, but were not altered by the uterine culture. Neither diurnal pattern of leptin, nor
clear tendencies other than irregular fluctuation of TNFα were found in samples taken 4 h
apart for 24 h on d 9 after calving (details are not given). Significant delay in resumption of
cyclicity and depressed re-conception rate were detected only in PMS cows (Fig. 5.7.7.).
The further details on interrelation of uterine bacteriology, clinical condition, changes of acute
phase proteins (HP and α1-AG) and ovarian cyclicity and fertility were published earlier (Hir-
vonen et al., 1999a; Huszenicza et al., 1999; Huszenicza, 2003).
Fig. 5.7.5.: The daily milk production(upper panel), and changesof body weight (BW) andbody condition (BCS) (two lower panels) in cows withsevere forms of puerperalmetritis (PMS), compared to the mild cases (PMM) and to the healthy controls(mean±SEM; Exp 7c).
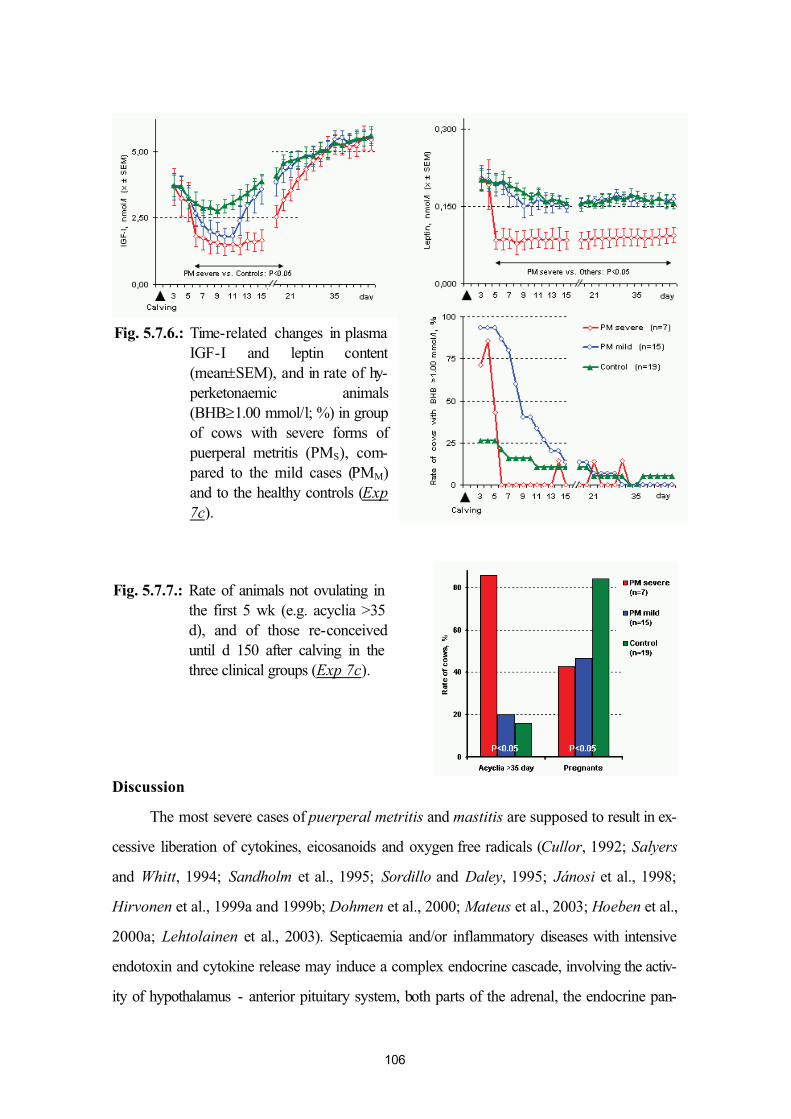
106
Discussion
The most severe cases of puerperal metritis and mastitis are supposed to result in ex-
cessive liberation of cytokines, eicosanoids and oxygen free radicals (Cullor, 1992; Salyers
and Whitt, 1994; Sandholm et al., 1995; Sordillo and Daley, 1995; Jánosi et al., 1998;
Hirvonen et al., 1999a and 1999b; Dohmen et al., 2000; Mateus et al., 2003; Hoeben et al.,
2000a; Lehtolainen et al., 2003). Septicaemia and/or inflammatory diseases with intensive
endotoxin and cytokine release may induce a complex endocrine cascade, involving the activ-
ity of hypothalamus - anterior pituitary system, both parts of the adrenal, the endocrine pan-
Fig. 5.7.6.: Time-related changes in plasma IGF-I and leptin content(mean±SEM), and in rate of hy-perketonaemic animals(BHB≥1.00 mmol/l; %) in group of cows with severe forms ofpuerperal metritis (PMS), com-pared to the mild cases (PMM)and to the healthy controls (Exp7c).
Fig. 5.7.7.: Rate of animals not ovulating in the first 5 wk (e.g. acyclia >35 d), and of those re-conceiveduntil d 150 after calving in the three clinical groups (Exp 7c).
107
creas, furthermore the thyroid hormone and GH / IGF-I production and metabolism (Elsasser
et al., 1995, 1996 and 2005). As it was discussed earlier (Chapter 3.8.), in lab rodents and
Primates also distinct changes have already been demonstrated in leptin gene expression and
circulating leptin levels (Landman et al., 2003; McCann et al., 2003; Xiao et al., 2003), sug-
gesting that leptin can be both released in response to inflammatory cytokines, and act to at-
tenuate the responses to these cytokines. Plasma leptin was elevated in human subjects of
acute sepsis (Bornstein et al., 1998; Torpy et al., 1998; Arnalich et al., 1999), with 3-fold
higher levels in patients who survived the septic episode than in non-survivors (Bornstein at
al., 1998). However, to the best of our knowledge the involvement of leptin in the inflamma-
tory-induced cytokine-endocrine cascade has not been studied yet in mastitis and puerperal
metritis of postpartum dairy cows.
As seen in rodent models (Kakizaki et al., 1999; Gaillard et al., 2000), the initial cyto-
kine (TNF-α and IL-1β) response increases the hypothalamic release of corticotrophin-
releasing hormone that activates the pituitary-adrenal axis also in ruminants. Both the intra-
venous (iv) and intramammary forms of endotoxin challenge are followed by dose-dependent
temporary (≤6-8 hr) elevation of plasma cortisol level also in lactating cows (Hirvonen et al.,
1999b; Waldron et al., 2003). Peak levels are seen 2-4 h after challenge (Soliman et al.,
2002; Waldron et al., 2003). The experimental administration of purified recombinant bovine
TNF-α (rbTNF-α) induces similar but shorter elevation in plasma cortisol level (Soliman et
al., 2002).
After iv endotoxin administration increasing prolactin levels were seen in rats (Rettori
et al., 1994). In cows obvious increase in prolactin production was observed only after iv but
not after intramammary endotoxin challenge, and it was supposed to play role in the immun-
modulation but not in the milk production of the udder (Jackson et al., 1990). In sows the
experimental endotoxin administration was capable of decreasing both the prolactin level and
milk production in the first week after farrowing but not later (Smith and Wagner, 1984 and
1985). In rat models there are a variety of other cytokine-induced changes in the central nerv-
ous system, as well, such as alterations of central and peripheral catecholamine levels (Song
et al., 1999; Wang and White, 1999), and of neurotransmitter release in the hypothalamus
(Mohan-Kumar et al., 1999). These hypothalamic changes are likely involved in the
pathomechanism of endotoxin-induced impairments in the basal and preovulatory-like LH
108
secretion (Rettori et al., 1994; McCann et al., 2003), which were observed to occur and to
damage the final maturation and ovulation of antral follicles not only in lab rodents (McCann et
al., 2003), but also in ruminants (heifers: Suzuki et al., 2001; ewes: Battaglia et al., 2000;
Daniel et al., 2002b; for further details on reproduction, please, see 3 of our most recent pa-
pers: Huszenicza et al., 2004 and 2005; Földi et al., 2006).
Experimental endotoxin treatment decreased plasma GH levels in rats (Rettori et al.,
1994), whereas in cattle (Elsasser et al., 1995 and 1996) and sheep (Daniel et al., 2002b), it
induced mild to moderate elevations in circulating GH concentrations, and a slower but
marked reduction in plasma levels of IGF-I. This endotoxin action on GH secretion is medi-
ated by TNF-α and IL-1β (Daniel et al., 2005). The uncoupling of the GH-IGF-I axis dem-
onstrated by Elsasser et al. (1995 and 1996) was accompanied by a decrease in production
of one of the IGF-I binding proteins (IGFBP-2). A simultaneous decline in IGF-I and a mod-
erate elevation in IGFBP-1 plasma levels contrasted with the increase in GH secretion suggest
that endotoxin causes also a state of resistance to GH, which is exacerbated by a simultaneous
reduction in IGF-I bioavailability (Briard et al., 2000). In a most recent trial (Waldron et al.,
2003) the iv endotoxin challenge failed to induce any change in GH and IGF-I levels of multi-
parous lactating dairy cows. However, IGFBP-s influencing the bioavailability of this hormone
were not studied there.
The endotoxin-induced endocrine cascade involves also the glucoregulatory pancreatic
hormones. Simultaneously with the TNF-α and cortisol elevations a significant, but only tran-
sient increase in insulin levels (Steiger et al., 1999; Waldron et al., 2003), and a clearly dose-
dependent, more obvious growth in glucagon levels (Waldron et al., 2003) were reported to
occur. Following temporary hyperglycemia insulin resistance and decreased glucose concen-
trations were observed 6 and 24 h after the endotoxin challenge (McMahon et al., 1998).
Similar changes in glucose and insulin levels, as well as in insulin resistance were induced also
by iv administration of rbTNF-α (Kushibiki et al., 2000; Soliman et al., 2002). The exact
mechanism inducing these endotoxin-related alterations in endocrine pancreatic function has
not been fully understood: beside the effect of nitric oxide and TNF-α also the early elevation
of plasma cortisol and catecholamine levels or sympathetic neuroendocrine changes may be
implicated (Waldron et al., 2003).
109
A number of infectious and inflammatory (mainly endotoxin-mediated) diseases may be
associated with subsequent, obvious changes in thyroid status. This so-called euthyroid sick
syndrome is observed during systemic non-thyroidal illness, and consists of decreasing plasma
concentration of the active thyroid hormone (T3) with a simultaneous elevation in its inactive
metabolite (rT3) and, in severe cases, a reduction in T4 and TSH concentrations. Most of these
changes are caused by a lower T3 production rate mainly due to the diminished extrathyroidal
enzymatic activation (e.g. outer-ring deiodination) of T4 by 5’-deiodinase (5’D), in combina-
tion with a decreased rT3 clearance rate (Wartofsky and Burman, 1982). TNF-α and IL-1
may inhibit the TSH release from pituitary cells, and decrease the activity of type-I 5’D in thy-
roid and liver tissues (Haastaren et al., 1994; Rettori et al., 1994; Hashimoto et al., 1995),
which reduce the production and circulating level of T4, and inhibit the transformation of T4 to
T3 (Bartalena et al., 1998; Bertók 1998). In endotoxin-treated cows Kahl et al. (2000) re-
ported decreased 5’D activity in the liver, which resulted in lower T3/T4 ratio and declining
plasma concentrations of thyroid hormones.
In lactating cows simultaneously with these endotoxin-induced endocrine alterations
marked changes were reported to occur also in plasma levels of certain energy-related me-
tabolites: concentrations of glucose tended to increase initially and subsequently declined,
there was a tendency for increased NEFA levels, whereas plasma ketones (BHB) decreased
linearly by dose after endotoxin infusion (Waldron et al., 2003).
In accordance with the literature cited above, the studied elements of en-
dotoxin/cytokine-induced multiple endocrine response reflected the expected tendencies in all
of our 3 related experiments: concentrations of insulin and glucose tended to increase initially
and subsequently declined (although sampling was frequent enough to detect these some-
hours-long temporary changes only in our mastitis studies), there was a tendency for tempo-
rary increased NEFA levels, whereas plasma levels of T4, T3, IGF-I and leptin decreased.
Endocrine changes found after natural outbreak of mastitis (in Exp. 7b) reflected the same
tendencies as seen in the corresponding stage of the course after intramammary endotoxin
challenge in Exp. 7a, and clearly related to dose detected in puerperal metritis (in Exp.
7c).The same alterations were recorded to occur in plasma levels of energy-related metabo-
lites, hormones and also in endotoxin- or TNFα-treated lactating cows (Elsasser et al., 1995
and 1996; Kushibiki et al., 2000; Soliman et al., 2002; Waldron et al., 2003; Elsasser et al.,
110
2005), and in the natural cases of GN mastitis early in the postpartum period (Nikolic et al.,
2003).
Cows’ responses to standard intramammary endotoxin challenge in Exp. 7a, defined by
local and systemic signs, to intramammarily infused E. coli endotoxin were significantly more
severe in EL than in LL. The more severe response in EL has also been observed in experi-
mental E. coli mastitis models (Hill et al., 1979; Shuster et al., 1996), which have, however,
used different groups of cows over time. Our cross-over study design diminished the interindi-
vidual variation (Pyörälä et al., 1994). All animals responded rapidly to the endotoxin infu-
sion, consistent with earlier studies (Hoeben et al., 2000a; Mehrzad et al., 2001). Local signs
were clearly seen at 2 h post challenge (PC), and systemic signs at 4 to 8 h PC. Cows had
similar local responses both in EL and LL, but systemic responses were more severe in EL.
Both local and systemic signs are mediated by TNFa and interleukins, which are produced by
macrophages in the mammary gland. Differences in their production and kinetics may cause
variation in local and systemic signs (Hoeben et al., 2000a and 2000b). NEFA and BHB val-
ues were higher, whereas IGF-I, leptin and thyroid hormone levels were much lower in EL
than in LL throughout the experiment, which reflects the metabolic state of early lactation,
characterized by fat mobilization and possible subclinical ketosis (Burvenich et al., 1994; Jor-
ritsma et al., 2001; although none of these alterations of LL cows were very overt, perhaps
due to the well-defined individual feeding of animals in this model study). This has been sug-
gested to interfere with neutrophil functions (Hoeben et al., 1997; Suriyasathaporn et al.,
1999 and 2000; Sartorelli et al., 1999 and 2000; Zerbe et al., 2000), and could be one rea-
son for more severe inflammatory response seen in EL cows in this study.
In Exp. 7b, when specific pathogens were not isolated (NDP mastitis) the data were
pooled with those from cows affected by GN mastitis in the current study. Chronic subclinical
Staphylococcus aureus (S. aureus) infections can also result in false negative findings in mas-
titis bacteriology (Sandholm et al. 1995). However, cows producing milk with continuously
elevated SCC were not involved in this study. So in accordance with Fang and Pyörälä
(1996) we think that at the beginning, most of our cases with NDP mastitis were infected with
GN bacteria (mainly E. coli), but before sampling, the original pathogens were eliminated by
the self-defense mechanisms of the udder.
111
We conclude that in postpartum dairy cows also the inflammatory diseases with inten-
sive cytokine / endotoxin release (such as puerperal metritis and severe forms of clinical masti-
tis) influence the circulating levels of metabolic hormones including a depression in plasma
leptin. The GN mastitis can induce the same endocrine alterations as the experimental (iv or
intramammary) endotoxin or rbTNFα challenges. However, in natural cases these changes may
vary within a wide range, and may be more protracted and robust. Our cows with puerperal
metritis showed more obvious catabolic changes than the controls. The leptin level dropped
immediately in all cases, as a part of the inflammatory reaction, and remained continuously low
thereafter. We think these changes in plasma leptin are the consequences, rather than the
causative elements of anorexia associated with infection-induced inflammatory response in
postpartum dairy cows.
6. New scientific results
The below results are thought to represent remarkable novelty value:
1) There are no cycle-related changes in plasma leptin of ruminants. Although the gonadal
steroids are not principal regulators of the circulating leptin content, but testosterone is re-
sponsible for the gender dichotomy of plasma leptin (Exp. 1c, 1d, 1e).
2) The degree of pregnancy-associated hyperleptinaemia is affected by number of fetuses
and level of progesterone in ewes. However, pregnancy stage is a more important regula-
tor than these additional factors (Exp. 2).
3) The subclinical form of ovine ketosis is characterized by complex endocrine alterations
reflecting the pregnancy-associated energy imbalance, which include a decrease in plasma
leptin. If out of the breeding season (some weeks after lambing, immediately after wean-
ing) the ovarian cyclicity is induced again, the plasma leptin level, furthermore the ovarian
response and fertility of formerly ketotic ewes may be depressed (Exp. 3).
4) In dairy cows the age-related differences must be considered when the peri-parturient
metabolic and endocrine changes – including the changes in plasma leptin – are monitored.
The endocrine signals that most likely could inform the reproductive axis regarding the
NEB and the level of body reserves, include IGF-I and leptin (Exp. 4a and 4b).
5) During the peri-parturient period and at the beginning of lactation, obvious differences can
be demonstrated between the circulating leptin levels of normo- and hyperketonaemic
112
dairy cows, with lower leptin content in plasma of those which have had >1.00 mmol/l
βOH-butyrate since calving (Exp. 5a and 5b).
6) Consumption of a diet enriched with calcium salts of palm fatty acids does not influence
the plasma leptin (Exp. 6).
7) In postpartum dairy cows also the inflammatory diseases with intensive endotoxin / cyto-
kine release (puerperal metritis, severe forms of clinical mastitis) influence the circulating
levels of metabolic hormones, depressing also the leptin content. However, these changes
in plasma leptin are only consequences, rather than the causative elements of anorexia as-
sociated with infection-induced inflammatory response in ruminants (Exp. 7a, 7b and 7c).
8. ReferencesAbizaid A, Kyriazis D. Woodside B (2004): Effects of leptin administration on lactational
infertility in food-restricted rats depend on milk delivery. Am. J. Physiol. (Regul. Integr.Comp. Physiol.), 286. R217-225.
Accorsi PA, Govoni N, Gaiani R, Pezzi C, Seren E, Tamanini C (2005): Leptin, GH, prolac-tin, insulin and metabolic parameters throughout the dry period and lactation in dairy cows. Reprod. Dom. Anim., 40. 217-223.
Agenäs S, Dahlborn K, Holtenius K (2003): Changes in metabolism and milk production during and after feed deprivation in primiparous cows selected for different milk fat content. Livest. Prod. Sci., 83. 153-164.
Ahima RS, Prabakaran D, Mantzoros C, Qu D, Lowell B, Maratos EF, Flier JS (1996): Role of leptin in the neuroendocrine response to fasting. Nature, 382. 250-252.
Ahima RS, Flier JS (2003): Leptin. Annual Rev. Physiol., 62. 413-437.
Ahima RS (2005): Central action of adipocyte hormones. Trends Endocrinol. Metab., 16. 307-313.
Allen MS (2000): Effects of diet on short-term regulation of feed intake by lactating dairy cattle. J. Dairy Sci. 83. 1598-1624.
Akerlind M, Emanuelson M, Dahlborn K, Holtenius K (1999): Glucose challenge in early lactating dairy cows selected for high or low milk-fat concentration. Anim. Sci., 68. 717-722.
Amstalden M, Garcia MR, Williams SW, Stanko RL, Nizielski SE, Morrison CD, Keisler DH, Williams GL (2000): Leptin gene expression, circulating leptin, and luteinizing hor-mone pulsatility are acutely responsive to short-term fasting in prepubertal heifers: relationships to circulating insulin and insulin-like growth factor I. Biol. Reprod., 63. 127-133.
Amstalden M, Garcia MR, Stanko RL, Nizielski SE, Morrison CD, Keisler DH, Williams GL (2002): Central infusion of recombinant ovine leptin normalizes plasma insulin and stimulates a novel hypersecretion of luteinizing hormone after short-term fasting in mature beef cows. Biol. Reprod., 66. 1555-1561.
Amstalden M, Zieba DA, Edwards JF, Harms PG, Welsh TH, Stanko RL, Williams GL (2003): Leptin acts at the bovine adenohypophysis to enhance basal and GnRH-mediated release of LH: differential effects are dependent upon nutritional history. Biol Reprod, 69. 1539-1544.

113
Arnalich F, Lopez J, Codoceo R, Jimnez M, Madem R, Montiel C (1999): Relationship of plasma leptin to plasma cytokines and human survival in sepsis and septic shock. J. Infect. Dis., 180. 908-911.
Ashworth CJ, Haggard N, Thomas L, Mercer JG, Wallace JM, Lea RG (2000): Placentalleptin. Rev. Reprod., 5. 18-24.
Auernhammer CJ, Melmed S (2001): The central role of SOCS-3 in integrating the neuro-immunoendocrine interface. J. Clin. Invest., 108. 1735-1740.
Backus RC, Havel PJ, Gingerich RL, Rogers QR (2000): Relationship between serum leptin immunreactivity and body fat mass as estimated by use of a novel gas-phaseFurier transform infrared spectroscopy deuterium dilution method in cats. Am. J. Vet. Res., 61. 796-801.
Baird GD (1980): Primary ketosis in the high-producing dairy cow: clinical and subclinical disorders, treatment, prevention and outlook. J. Dairy Sci., 65. 1-10.
Barash IA, Cheung CC, Weigle DS, Ren H, Kabigting EB, Kuijper JL, Clifton DK, Steiner RA (1996): Leptin is a metabolic signal to the reproductive system. Endocrinology, 137. 3144-3147.
Barb CR, Yan X, Azain MJ, Kraeling RR, Rampacek GB, Ramsay TG (1998): Recombinantporcine leptin reduces feed intake and stimulates growth hormone secretion in swine. Domest. Anim. Endocrinol., 15. 77-86.
Barb CR, Barrett JB, Kraeling RR, Rampacek, GB (2001a): Serum leptin concentrations,luteinizing hormone and growth hormone secretion during feed and metabolic fuel re-striction in the prepubertal gilt. Domest. Anim. Endocrin., 20. 47-63.
Barb CR, Hausman GJ, Houseknecht KL. (2001b): Biology of leptin in the pig. Domest.Anim. Endocrin., 21. 297-317.
Barb CR, Kraeling RR (2004): Role of leptin in the regulation of gonadotropin secretion in farm animals. Anim. Reprod. Sci., 82-83. 155-167.
Bartalena LF, Bogazzi F, Brogioni S, Grasso L, Martino E (1998): Role of cytokines in the pathogenesis of the euthyroid sick syndrome. Eur. J. Endocrinol., 138. 603-614.
Bartha T, Sayed-Ahmed A, Rudas P (2005): Expression of leptin and its receptors in vari-ous tissues of ruminants. Domest. Anim. Endocrin., 29. 193-202.
Baskin DG, Breininger JF, Bonigut S, Miller MA (1999): Leptin binding in the arcuate nu-cleus is increased during fasting. Brain Res., 828. 154-158. 312.
Battaglia DF, Krasa HB, Padmanabhan V, Viguie C, Karsch FJ (2000): Endocrine altera-tions that underline endotoxin-induced disruption of the follicular phase in ewes. Biol. Reprod., 62. 45-53.
Beam SW, Butler WR (1997): Energy balance and ovarian follicle development prior to the first ovulation postpartum in dairy cows receiving three concentrations of dietary fat. Biol. Reprod., 56. 133-142.
Beam SW, Butler WR (1998): Energy balance, metabolic hormones, and early postpartumfollicular development in dairy cows fed prilled lipid. J. Dairy Sci., 81. 121-131.
Beam SW, Butler WR (1999): Effects of energy balance on follicular development and firstovulation in postpartum dairy cow. J. Reprod. Fert., Suppl 54. 411-424.
Bergendahl MA, Iranmanesh A, Evans WS, Veldhuis JD (2000): Short-term fasting selec-tively suppresses leptin pulse mass and 24-h rhythmic leptin release in healthy mid-luteal phase women without disturbing leptin pulse frequency or its entropy control. J. Clin. Endocrinol. Metab., 85. 207-213.
Berkowitz DE, Brown D, Lee KM, Emala C, Palmer D, An Y, Breslow M (1998): Endotoxin-induced alteration in the expression of leptin and β3-adrenergic receptor in adipose tissue. Am. J. Physiol. (Endocrinol. Metab.), 274. E992-E997.
Bertics SJ, Grummer RR, Cadorniga-Valino C, Stoddard EE (1992): Effect of prepartumdry matter intake on liver triglyceride concentration and early lactation. J. Dairy Sci., 75. 1914-1922.
114
Bertók L (1998): Endotoxin and endocrine system. Domest. Anim. Endocrinol., 15. 305-308.
Bjorbaek C, Elmquist JK, Frantz JD, Shoelson SE, Flier JS (1998): Identification of SOCS-3as a potential mediator of central leptin resistance. Mol. Cell., l. 619-625.
Blache D, Tellam RL, Chagas LM, Blackberry MA, Vercoe PE, Martin GB (2000): Level of nutrition affects leptin concentrations in plasma and cerebrospinal fluid in sheep. J. Endocrinol., 165. 625-637.
Blache D, Chagas LM, Martin GB (2007): Nutritional inputs into the reproductive neuroen-docrine control system – a multidimensional perspective. Reproduction, in press.
Block SS, Butler WR, Ehrhardt RA, Bell AW, Van Amburgh ME, Boisclair YR. (2001): De-creased concentration of plasma leptin in periparturient dairy cows is caused by negative energy balance. J. Endocrinol., 171. 339-348.
Block SS, Rhoads RP, Bauman DE, Ehrhardt RA, McGuire MA, Crooker BA, Griinari JM, Mackle TR, Weber WJ, Van Amburgh ME, Boisclair YR (2003): Demonstration of a role for insulin in the regulation of leptin in lactating dairy cows. J. Dairy. Sci., 86. 3508-3515.
Blücher S, Mantzoros CS (2003): Leptin and pubertal development in humans. In: Henson MC, Castracane VD (eds): Leptin and reproduction. Kluwer Academic / Plenum Pub-lishers, New York, pp 151-168.
Blum JW, Kunz P, Leunenberger H, Gautschi K, Keller M (1983): Thyroid hormones, blood plasma metabolites and hematological parameters in relationship to milk yield in dairy cows. Anim. Prod., 36. 93-101.
Bocquier F, Bonnet M, Faulconnier Y, Guerre-Millo M, Martin P, Chilliard Y (1998): Effects of photoperiod and feeding level on perirenal adipose tissue metabolic activity and leptin synthesis in the ovariectomized ewe. Reprod. Nut. Dev., 38. 489-498.
Bokori J (2000): Role of leptin in regulation of physiological processes and feed intake / A leptin szerepe az élettani folyamatok és a takarmányfelvétel szabályozásában (in Hungarian, with English summary). Magy. Áo. Lapja, 122. 436-441.
Bonnet M, Delavaud C, Laud K, Gourdou I, Leroux C, Djiane J, Chilliard Y. (2002a): Mam-mary leptin synthesis, milk leptin and their putative physiological roles. Reprod. Nutr. Dev., 42. 399-413.
Bonnet M, Gourdou I, Leroux C, Chilliard Y, Djiane J (2002b): Leptin expression in the ovine mammary gland: putative sequential involvement of adipose, epithelial, and myoepithelial cells during pregnancy and lactation. J. Anim. Sci., 80. 723-728.
Bonnet M, Delavaud C, Rouel J., Chilliard Y. (2005): Pregnancy increases plasma leptin in nulliparous but not primiparous goats while lactation depresses it. Domest. Anim. En-docrin., 28. 216-223.
Bornstein SR, Licinio J, Tauchnitz R, Engelmann L, Negno AB, Gold P, Chrousos GP (1998): Plasma leptin levels are increased in survivors of acute sepsis: associatedloss of diurnal rhythm, in cortisol and leptin secretion. J. Clin. Endocrinol. Metab., 83. 280-283.
Brann DW, De Sevilla L, Zamorano PL, Mahesh VB (1999): Regulation of leptin gene ex-pression and secretion by steroid hormones. Steroids, 64. 559-663.
Breier BH, Gallaher BW, Gluckman PD (1991): Radioimmunoassay for insulin-like growth factor-I: solutions to some potential problems and pitfalls. J. Endocrinol., 128. 347-357.
Briard N, Dadoun F, Pommier G, Sauze N, Lebouc Y, Oliver C, Dutour A, IGF-I / IGFBPssystem response to endotoxin challenge in sheep (2000): J. Endocrinol., 164. 361-369.
Brito LFC, Barth AD, Rawlings, NC, Wilde, RE, Crews, DH, Priya SP, Kastelic J (2007):Effects of nutrition during calfhood and peri-pubertal period on serum concentrationsof metabolic hormones, gonadotrophins and testosterone, and on sexual develop-ment in bulls. Domest. Anim. Endocrin., in press.
115
Brogan RS, Mitchell SE, Trayhurn P, Smith MS (1999): Suppression of leptin during lacta-tion: contribution of the suckling stimulus versus milk production. Endocrinology, 140. 2621-2627.
Bruss ML (1997): Lipids and ketones. In: Kaneko JJ, Harvey JW, Bruss M L (eds.): Clinical biochemistry of domestic animals. Academic Press, San Diego, London, Boston, New York, Sydney, Tokyo, Toronto, 83-115.
Bruun J, Ersboll AK, Alban L (2002): Risk factors for metritis in Danish dairy cows. Prev. Vet. Med., 54. 179-190.
Buchbinder A, Lang U, Baker RS, Khoury JC, Mershon J, Clark KE (2001): Leptin in the ovine fetus correlates with fetal and placental size. Am. J. Obstet. Gynecol., 185. 786-791.
Burvenich C, Paape MJ, Hill AW, Guidry AJ, Miller RH, Heyneman R, Kremer WDJ, Brand A (1994): Role of the neutrophil leukocyte in the local and systemic reactions during experimentally induced E. coli mastitis in cows immediately after calving. Vet. Quart. 16. 45-50.
Butler WR, Everett RW, Coppok CE (1981): The relationships between energy balance, milk production and ovulation in postpartum Holstein cows. J. Anim. Sci., 53. 742-748.
Butler WR, Smith RD (1989): Interrelationship between energy balance and postpartum reproductive function in dairy cattle. J. Dairy Sci., 72. 767-783.
Butler WR (2000): Nutritional interactions with reproductive performance in dairy cattle.Anim. Reprod. Sci., 60. 449-457.
Butler WR (2003): Energy balance relationships with follicular development, ovulation and fertility in postpartum dairy cows. Livest. Prod. Sci., 83. 211-218.
Cahill LP, Mauleon P (1980): Influences of season, cycle and breed on follicular growth rates in sheep. J. Reprod. Fert., 58. 321-328.
Cai TQ, Weston P, Lund LA, Brodie B, McKenna D, Wagner WC (1994): Association be-tween neutrophil functions and periparturient disorders in cows. Am. J. Vet. Res., 55. 934-943.
Capuco AV, Wood DL, Elsasser TH, Kahl S, Erdmann RA, Van Tassell CP, Lefcourt A, Piperova LS (2001): Effect of somatotropin on thyroid hormones and cytokines in lac-tating dairy cows during ad libitum and restricted feed intake. J. Dairy Sci., 84. 2430-2439.
Campfield LA, Smith FJ, Guisez Y, Devos R, Burn P (1995): Recombinant mouse OB pro-tein: evidence for a peripheral signal linking adiposity and central neural networks. Science, 269. 546-549.
Cartmill JA (2004): Leptin in horses: influences of body condition, gender, insulin insensi-tivity, feeding and dexamethasone. PhD dissertation. Kansas State University, Man-hattan, USA
Casabiell X, Pineiro V, Peino R, Lage M, Camina JP, Gallego R, Vallejo LG, Dieguez C, Casauneva FF (1998): Gender differences in both spontaneous and stimulated leptin secretion by human omental adipose tissue in vitro: dexamethasone and estradiolstimulate leptin release in women, but not in men. J. Clin. Endocrinol. Metab., 83. 2149-2155.
Cavestany D, Blanc JE, Kulcsár M, Uriarte G, Chilibroste P, Meikle A, Fébel H, Ferraris A,Krall, E (2005): Metabolic profiles of the transition dairy cow under a pasture-basedmilk production system. J. Vet. Med. A., 52. 1-7.
Cha MC, Chou CJ, Boozer CN (2000): High-fat diet feeding reduced the diurnal variationof plasma leptin concentration in rats. Metabolism, 49. 503-507.
Chagas LM, Rhodes FM, Blache D, Gore PJS, MacDonald KA, Verkerk GA (2006): Pre-calving feeding and body condition effects on metabolic responses and postpartum anestrus in grazing primiparous dairy cows. J. Dairy Sci., 89. 1981-1989.
116
Chehab FF, Lim ME, Lu R (1996): Correction of the sterility defect in homozygous obese female mice by treatment with the human recombinant leptin. Nat. Genet., 12. 318-320.
Chelikani PK, Glimm DR, Kennelly JJ. (2003a): Short communication: Tissue distribution of leptin and leptin receptor mRNA in the bovine. J. Dairy Sci., 86. 2369-2372.
Chelikani PK, Keisler DH, Kennelly JJ (2003b): Response of plasma leptin concentration to jugular infusion of glucose or lipid is dependent on the stage of lactation of Holstein cows. J. Nutr., 133. 4163-4171.
Chelikani PK, Ambrose JD, Keisler DH, Kennelly JJ (2004): Effects of short-term fasting on plasma concentrations of leptin and other hormones and metabolites in dairy cattle. Domest. Anim. Endocrin., 26. 33-48.
Cheung CC, Clifton DK, Steiner RA (1997): Proopio-melanocortin neurons are direct tar-gets for leptin in the hypothalamus. Endocrinology, 138. 4489-4492.
Chilliard Y (1993): Dietary fat and adipose tissue metabolism in ruminants, pigs, and ro-dents: A review. J. Dairy Sci., 76. 3897-3931
Chilliard Y, Bocquier F, Delavaud C, Guerre-Millo M, Bonnet M, Martin P, Faulconnier Y, Ferlay A (1998): Leptin in ruminants: effects of species, breed, adiposity, photope-riod, β-agonists and nutritional status. Proc. Cornell Nutrition Conference for Feed Manufacturers (20-22 Oct., 1998, Rochester, NY), Cornell University, pp. 65-74.
Chilliard Y (1999): Metabolic adaptations and nutrient partitioning in the lactating animal. In: Martinet J, Houdebine LM, Head HH (eds): Biology of lactation. Paris, France, In-serm/INRA. pp 503-552.
Chilliard Y, Bonnet M, Delavaud C, Faulconnier Y, Leroux C, Djiane J (2001): Leptin in ruminants. Gene expression in adipose tissue and mammary gland, and regulation of plasma concentration. Domest. Anim. Endocrin., 21. 271-295.
Chilliard Y, Delavaud C, Bonnet M (2005): Leptin expression in ruminants: nutritional and physiological regulations in relation with energy metabolism: A review. Domest. Anim. Endocrin., 29. 3-22.
Christou H, Serdy S Mantzoros CS (2003): Leptin and fetal growth and development. In: Henson MC, Castracane VD (eds): Leptin and reproduction. Kluwer Academic / Ple-num Publishers, New York, pp 189-200.
Chu SC, Chou YC, Liu JY, Chen CH, Shyu JC, Chou FP (1999): Fluctuations of serumleptin level in rats after ovariectomy and the influence of estrogen supplementation. Life Sci., 64. 2299-2306.
Cisse M, Chilliard Y, Coxam V, Davicco MJ, Remond B (1991): Slow release somatotropinin dairy heifers and cows fed two concentrations of energy concentrate. 2. Plasma hormones and metabolites. J. Dairy Sci. 74. 1382-1394.
Clarke IJ, Henry BA (1999): Leptin and reproduction. Rev. Reprod., 4. 48-55.
Cohen P, Miyazaki M, Socci ND, Hagge-Greenberg A, Liedtke W, Soukas AA, Sharma R, Hudgins LC, Ntambi JM, Friedman JM (2002): Role for stearoyl-CoA desaturase-1 in leptin-mediated weight loss. Science, 297. 240-243.
Considine RV (2003): Endocrine regulation of leptin production. In: Henson MC, Castra-cane VD (eds): Leptin and reproduction. Kluwer Academic / Plenum Publishers, New York, pp 39-52.
Coppock C.E., Wilks D.E., (1991): Supplemental fat in high-energy rations for lactating cows: effects on intake, digestion, milk yield, and composition. J. Anim. Sci., 69. 3826-3837.
Corico C, Mourot J, Magni S, Pastorelli, Rossi F (2002): Influence of dietary conjugated linoleic acid on growth, meat quality, lipogenesis, plasma leptin and physiological vari-ables of lipid metabolism in rabbits. J. Anim. Sci., 80. 1020-1028.
117
Csernus V. (1982): Antibodies of high affinity and specificity for radioimmunological de-termination of progesterone, testosterone, estradiol-17β and cortisol. In: Görög, S. (ed.): Advances in steroid analysis I. Akadémiai Kiadó, Budapest, pp. 171-177.
Cullor JS (1992): Shock attributable to bacteraemia and endotoxaemia in cattle: clinical and experimental findings. J. Am. Vet. Med. Assoc., 200. 1894-1902.
Daniel JA, Whitlock BK, Baker JA, Steele B, Morrison CD, Keisler DH, Sartin JL (2002a): Effect of body fat mass and nutritional status on 24-hour leptin profiles in ewes. J. Anim. Sci., 80. 1083-1089.
Daniel JA, Whitlock BK, Wagner CG, Sartin JL (2002b): Regulation of the growth hormoneand luteinizing hormone response to endotoxin in sheep. Domest. Anim. Endocrinol.,23. 361-370.
Daniel JA, Elsasser TH, Martinez A, Steele B, Sartin JL (2005): Interleukin-1β and tumor necrosis factor-α mediation of endotoxin action on growth hormone. Am. J. Physiol. (Endocrinol. Metab.), 289. E650-E657
Daughaday WH, Parker KA, Borowsky S, Trivedi B, Kapadia M. (1982): Measurement of somatomedin-related peptides in fetal, neonatal and maternal rat serum by insulin-like growth factor (IGF)-I radioimmunoassay, IGF-II radioreceptor assay (RRA) and multiplication stimulating activity RRA after acid-ethanol extraction. Endocrinol., 110. 575-581.
Delavaud C, Bocquier F, Chilliard Y, Keisler DH, Gertler A, Kann G (2000): Plasma leptin determination in ruminants: effect of nutritional status and body fatness on plasma leptin concentration assessed by a specific RIA in sheep. J. Endocrinol., 165. 519-526.
Delavaud C, Ferlay A, Faulconnier Y, Bocquier F, Chilliard Y (2002): Plasma leptin con-centration in adult cattle: effect of breed, adiposity, feeding level and meal intake. J. Anim. Sci., 80. 1317-1328.
Delavaud C, Agenas S, Holtenius K, Chilliard Y (2004): Interactions between energy in-take level, physiological state and methodology for determination of plasma leptin in bovine species. Reprod. Nutr. Dev., 44. 151.
Dahlbom M, Andersson M, Huszenicza Gy, Alenko M (1995): Poor semen quality of Irish wolfhounds: a clinical, hormonal and spermatological study. J. Small Animal Practice, 36. 547-552.
Diamond FB, Eichler DC, Duckett G, Jorgensen EV, Shulman D, Root AW (1997): Demon-stration of a leptin binding factor in human serum. Biochem. Biophys. Res. Commun.,233. 818-822.
Diskin MG, Mackey DR, Roche JF, Sreenan JM (2003): Effects of nutrition and metabolicstatus on circulating hormones and ovarian follicle development in cattle. Anim. Re-prod. Sci., 78. 345-370.
Dohmen MJV, Lohuis JACM, Huszenicza Gy, Nagy P, Gacs M (1995): Relations between bacteriological and clinical findings in cows with subacute/chronic endometritis.Theriogenology, 43. 1379-1388.
Dohmen MJW, Joop K, Sturk A, Bols PEJ, Lohuis JACM (2000): Relationship between in-tra-uterine bacterial contamination, endotoxin levels and the development of endo-metritis in postpartum cows with dystocia or retained placenta. Theriogenology, 54. 1019-1032
Dyer CJ, Simmons JM, Matteri RL, Keisler DH (1997): Leptin receptor mRNA is expressedin ewe anterior pituitary and adipose tissues and is differentially expressed in hypo-thalamic regions of well- fed and feed-restricted ewes. Domest. Anim. Endocrinol., 14. 119-128.
Duffield TF, Sandals D, Leslie KE, Lissemore K, McBride BW, Lumsden JH, Dick P, Bagg R (1998): Efficacy of monensin for the prevention of subclinical ketosis in lactating dairy cows. J. Dairy Sci., 81. 2866-2873.
118
Durdevic D, Stojic V, Jovanovic MJ, Radakovic N. (1980): Concentration of thyroxine and cortisol in the blood serum of ketotic cows. Acta Vet. (Beograd), 30. 7-12.
Dziuk HE (1990): Digestion in the ruminal stomach. In: Swenson MJ (ed): Dukes’ physiol-ogy of domestic animals. Ithaca, Cornell University Press, 10th edition, 320-339.
Edmonson AJ, Lean LJ, Weaver LD, Farver T, Webster G (1989): A body condition scoring chart for Holstein dairy cows. J. Dairy Sci., 72. 68-78.
Edqvist LE, Forsberg M (1997): Clinical reproductive endocrinology. In: Kaneko JJ, HarveyJW, Bruss ML (eds.): Clinical biochemistry of domestic animals. Academic Press, San Diego, London, Boston, New York, Sydney, Tokyo, Toronto, 589-618.
Ehrhardt RA, Slepetis RM, Siegal-Willott J, Van Amburg ME, Bell AW, Boisclair YR (2000): Development of a specific radioimmunoassay to measure physiological changes of circulating leptin in cattle and sheep. J. Endocrinol., 166. 519-528.
Ehrhardt RA, Slepetis RM, Bell AW, Boisclair YR (2001): Maternal leptin is elevated duringpregnancy in sheep. Domest. Anim. Endocrin., 21. 85-96.
Ehrhardt RA, Bell AW, Boisclair YR (2002): Spatial and developmental regulation of leptin in fetal sheep. Am. J. Physiol. (Regul. Integr. Comp. Physiol.), 282. R1628-1635.
Elsasser TH, Blum J, Kahl S, Sartin J (2005): Metabolic and endocrine effects of en-dotoxin: sources of variability in the host response. In: Krüger M (ed.): Clinical conse-quences of endotoxicosis in cattle. Proc. of 3rd Internat. Cong. Vet. Med., Congress Center Leipzig, pp. 109-133.
Elsasser TH, Caperna TJ, Rumsey TS (1995): Endotoxin administration decreases plasma insulin-like growth factor (IGF)-1 and IGF-binding protein-2 in Angus x Herefordsteers independent of changes in nutritional intake. J. Endocrinol., 144. 109-117.
Elsasser TH, Richards M, Collier R, Hartnell GF (1996): Physiological responses to repeatendotoxin challenge are selectively affected by recombinant bovine somatotropin ad-ministration to calves. Domest. Anim. Endocrinol., 13. 91-103.
Elson EC (1974): Quantitative determination of serum haptoglobin. Am. J. Clin. Pathol.,62. 655-663.
Estienne MJ, Harper AF, Barb CR, Azain MJ (2000): Concentrations of leptin in serum and milk collected from lactating sows differing in body condition. Domest. Anim. Endo-crin., 19. 275-280.
Evans G, Maxwell WMC (1987): Salamon’s artificial insemination of sheep and goats. But-terworths, Sydney, pp 7-63.
Faggioni R, Fantuzzi G, Fuller J, Dinarello CA, Feingold KR, Grunfeld C (1998): IL-lβ me-diates leptin induction during inflammation. Am. J. Physiol. (Regul. Integr. Comp. Physiol.), 274. R204-209.
Faggioni R, Fantuzzi G, Gabay C, Moser A, Dinarello CA, Feingold KR, Grunfeld C (1999): Leptin deficiency enhances sensitivity to endotoxin-induced lethality. Am. J. Physiol. (Regul. Integr. Comp. Physiol.), 276. R136-142.
Faggioni R, Fuller J, Moser A, Feingold KR, Grünfeld C (1997): LPS-induced anorexia in leptin-deficient (ob/ob) and leptin receptor-deficient (db/db) mice. Am. J. Physiol. (Regul. Integr. Comp. Physiol.), 273. R181-R186.
Faggioni R, Moser A, Feingold KR, Grunfeld C (2000a): Reduced leptin levels in starva-tion increase susceptibility to endotoxin shock. Am. J. Pathol., 156. 1781-1787.
Faggioni R, Jones-Carson J, Reed DA, Dinarellom CA, Feingold KR, Grunfeld C, FantuzziG (2000b): Leptin-deficient (ob/ob) mice are protected from T cell-mediated hepato-toxicity: role of tumor necrosis factor-α and IL-1β. Proc. Natl. Acad. Sci. USA, 97. 2367-2372.
Fang WW, Pyörälä S (1996): Mastitis-causing Escherichia coli: serum sensitivity and sus-ceptibility to selected antibacterials in milk. J. Dairy Sci., 79. 76-82.
Fantuzzi G (2005): Adipose tissue, adipokines, and inflammation. J. Allergy Clin. Immunol.,115. 911-919.
119
Fantuzzi G, Faggioni R (2000): Leptin in the regulation of immunity, inflammation, and hematopoiesis. J. Leukocyte Biol., 68. 437-446.
Faulconnier Y, Delevaud C, Chilliard Y (2003): Insulin and (or) dexamethasone effects on leptin production and metabolic activities of ovine adipose tissue explants. Reprod. Nutr. Dev., 43. 237-250.
Feldman EC, Nelson RW (2004): Canine and feline endocrinology and reproduction. 3rd
edition. Saunders, St. Luis, MI, USA
Ferreira-Dias G, Claudino F, Carvalho H, Agricola R, Alpoim-Moreira J, Robalo-Silva J. (2005): Seasonal reproduction in the mare: possible role of plasma leptin, body weight and immune status. Domest. Anim. Endocrin., 29. 203-213.
Finck BN, Kelley KW, Dantzer R, Johnson RW (1998): In vivo and in vitro evidence for the involvement of tumor necrosis factor-α in the induction of leptin by lipopolysaccha-ride. Endocrinology, 139. 2278-2283.
Fitzgerald BP, McManus CJ (2000): Photoperiodic versus metabolic signals as determi-nants of seasonal anestrus in the mare. Biol. Reprod., 63. 335-340.
Flier JS, Harris M, Hollenberg A (2000): Leptin, nutrition, and the thyroid: the why, the wherefore, and the wiring. J. Clinic. Invest., 105. 859-861.
Fodor K, Zöldág L, Fekete S, Bersényi A, Gáspárdy A, Andrásofszky E, Kulcsár M, Eszes F, Shani M (2003): Influence on feeding intensity on the growth, body composition and sexual maturity of male New Zealand White rabbits. Acta Vet. Hung., 51., 305-319.
Forehead AJ, Thomas L, Crabtree J, Haggard N, Gardne, S, Giussani A, Fowden AL (2002): Plasma leptin concentration in fetal sheep during late gestation: ontogenyand effect of glucocorticoids. Endocrinology, 143. 1166-1173.
Foster DL, Jackson LM (2003): Integration of leptin with other signals regulating the timingof puberty: lessons learned from the sheep model. In: Henson MC, Castracane VD (eds): Leptin and reproduction. Kluwer Academic / Plenum Publishers, New York, pp 169-188.
Földi J, Kulcsár M, Pécsi A, Huyghe B., de Sa C, Lohuis JACM, Cox P, Huszenicza Gy (2006): Bacterial complications of postpartum uterine involution in cattle. Anim. Re-prod. Sci., 96. 265-281.
Francis J, Mohan-Kumar PS, Mohan-Kumar, SM, Quadri, SK (1999): Systemic administra-tion of lipopolysaccharide increases plasma leptin levels: blockade by soluble inter-leukin-1 receptor. Endocr. J., 10. 291-295.
Fried SK, Ricci MR, Russel CD, Laferrere B. Regulation of leptin production in humans(2000): J. Nutr., 130. 3127-3131.
Gaillard RC, Spinedi E, Chautard T, Pralong P (2000): Cytokines, leptin and hypothalamo-pituitary-adrenal axis. Ann. N. Y. Acad. Sci., 917. 647-657.
Gainsford T, Wilson TA, Metcalf D, Handman E, McFarlane C, Nga A, Nicola NA, Alexan-der WS, Hilton DJ (1996): Leptin can induce proliferation, differentiation, and func-tional activation of hemopoietic cells. Proc. Natl. Acad. Sci. USA, 93. 14564-14568.
Garcia MD, Casanueva FF, Dieguez C, Senaris RM (2000): Gestational profile of leptin messenger ribonucleic acid (mRNA) content in the placenta and adipose tissue in the rat, and regulation of the mRNA levels of the leptin receptor subtypes in the hypo-thalamus during pregnancy and lactation. Biol. Reprod., 62. 698-703.
Geary TW, McFadin EL, MacNeil MD, Grigs EE, Short RE, Funston RN, Keisler DH (2003): Leptin as a predictor of carcass composition in beef cattle. J. Anim. Sci., 81. 1-8.
Gentry LR, Thompson DL (2002): The relationship between body condition, leptin and reproductive and hormonal characteristics of mares during the seasonal anovulatory period. Theriogenology, 58. 563-566.
120
Gentry LR, Thompson DL, Gentry TG, Davis KA, Godke RA, Cartmill (2002): The relation-ship between body condition and reproductive characteristics of mares during the seasonal anovulatory period. J. Anim. Sci., 80. 2695-2703.
Gertler AJ, Simmonds J, Keisler DH (1998): Large-scale preparation of biologically active recombinant ovine obese protein (leptin). FEBS Lett., 422. 137-140.
Giri SN, Chen Z, Carrol EJ (1984): Role of prostaglandins in pathogenesis of bovine mas-titis induced by Escherichia coli endotoxin. Am. J. Vet. Res., 45. 586-591.
Glasow A, Bornstein SR (2000): Leptin and the adrenal gland. Eur. J. Clin. Invest., 30. 39-45.
Grant RJ, Albright JL (2001): Effect of animal grouping on feeding behavior and intake of dairy cattle. Joint ADSA-ASAS Annual Meeting. J Dairy Sci 84 Elect. SupplementE156-E163.
Grunfeld C, Zhao C, Fuller J, Pollack A, Moser A, Friedman J, Feingold KR (1996): En-dotoxin and cytokines induced expression of leptin, the ob gene product, in hamsters.J. Clin. Invest., 97. 2152-2157.
Gwazdauskas FC, Kendrick KW, Pryor AW, Bailey TL (2000): Impact of follicular aspirationon folliculogenesis as influenced by dietary energy and stage of lactation. J. Dairy Sci., 83. 1625-1634.
Haastaren vaan GAC, Meer van der MJM, Hermus ARMM, Linkels E, Klootwijk W, KapteinE, Toor van H, Sweep CGJ, Visser TJ, Greef de WJ. (1994): Different effects of con-tinuous infusion of IL-1 and IL-6 on the hypothalamic-hypophyseal-thyroid axis. Endo-crinology, 135. 1336-1345.
Halaas JL, Gajiwala KS, Maffei M, Cohen SL, Chait BT, Rabinowitz D, Lallone RL, Burley SK, Friedman JM (1995): Weight-reducing effects of the plasma protein encoded by the obese gene. Science, 269. 543-546.
Halleux CM, Servais I, Reul BA, Detry R, Brichard SM (1998): Multihormonal control of obgene expression and leptin secretion from cultured humane visceral adipose tissue: increased responsiveness to glucocorticoids in obesity. J. Clin. Endocrinol. Metab., 83. 902-910.
Harmon DL (1992): Impact of nutrition on pancreatic exocrine and endocrine secretion in ruminants: a review. J. Anim. Sci., 70. 1290-1301.
Hashimoto H, Igarashi N, Miyawaki T, Sato T (1995): Effects of TNF-α, IL-1β, and IL-6 on type-I iodothyronine 5’-deiodination in rat thyroid cell line, FRTL-5. J. Interferon. Cy-tokine Res., 15. 367-375.
Havel PJ (2004): Update on adipocyte hormones: regulation of energy balance and car-bohydrate/lipid metabolism. Diabetes, 53. Suppl. 1. 143-151.
Haydock KP, Shaw NH (1975): The comparative yield method for estimating dry matteryield of pasture. Austr. J. Exp. Agricult. Anim. Husb., 15. 663-670.
Hayirli A, Grummer RR, Nordheim EV, Crump PM (2002): Animal and dietary factors af-fecting feed intake during the pre-fresh transition period in Holsteins. J. Dairy Sci., 85. 3430-3443.
Heidler B, Sauerwein H, Heintges U, Aurich J, Pohl W, Aurich C (2002): Metabolic profiles and plasma leptin concentrations in lactating and non-lactating mares. Theriogenol-ogy, 58. 557-561.
Henry BA, Goding JW, Alexander WS, Tilbrook AJ, Canny BJ, Dunshea F, Rao A, Mansell A, Clarke IJ (1999): Central administration of leptin to ovariectomized ewes inhibits food intake without affecting the secretion of hormones from the pituitary gland: evi-dence for a dissociation of effects on appetite and neuroendocrine function. Endocri-nology, 140. 1175-1182.
Henson MC, Castracane VD (2003): Leptin in Primate pregnancy. In: Henson MC, Castra-cane VD (eds): Leptin and reproduction. Kluwer Academic / Plenum Publishers, New York, pp 239-263.
121
Henze P, Bickhardt K, Fuhrmann H, Sallmann HP (1998): Spontaneous pregnancy toxae-mia (ketosis) in sheep and the role of insulin. J. Vet. Med. A, 45. 255-266.
Heyden JM, Williams JE, Collier JJ (1993): Plasma growth hormone, insulin-like growthfactor, insulin, and thyroid hormone association with body protein and fat accretion in steers undergoing compensatory gain after dietary energy restriction. J. Anim. Sci., 71. 3327-3338.
Hill SR, Reiss RS, Forsham PH, Thorn GW (1950): The effect of adrenocorticotrophin and cortisone on thyroid function: Thyroid-adrenal-cortical interrelationships. J. Clin. En-docrinol., 11. 137-138.
Hill AW, Shears AL, Hibbit KG (1979): The pathogenesis of experimental Escherichia colimastitis in newly calved dairy cows. Res. Vet. Sci. 26:97-101.
Hill RA, Margetic S, Pegg GG, Gazzola C (1998): Leptin: its pharmacokinetics and tissue distribution. Int. J. Obes. Relat. Metab. Disord., 22. 765-70.
Hiroike T, Higo J, Jingami H, Toh H (2000): Homology modeling of human leptin / leptin receptor complex. Biochem. Biophys. Res. Commun., 275. 154-158.
Hirvonen J, Huszenicza Gy, Kulcsár M, Pyörälä S (1999a): Acute-phase response in dairy cows with postpartum metritis. Theriogenology, 51. 1071-1083.
Hirvonen J, Pyörälä S, Huszenicza Gy, Kulcsár M, Eklund K, Saloniemi H (1999b): Acute phase response in experimentally induced Escherichia coli mastitis of dairy cows. Acta Vet. Scand., 40. 35-46.
Hoeben D, Heyneman R., Burvenich C. (1997): Elevated levels of β-hydroxybutyric acid in periparturient cows and in vitro effect on respiratory burst activity of bovine neutro-phils. Vet. Immunol. Immunopathol. 58. 165-170.
Hoeben D, Burvenich C, Trevisi E, Bertoni G, Hamann J, Bruckmaier RM, Blum JW(2000a): Role of endotoxin and TNF -α in the pathogenesis of experimentally induced coliform mastitis in periparturient cows. J. Dairy Res., 67. 503-514.
Hoeben D, Monfardini E, Opsomer G, Burvenich C, Dosogne H, De Kruif A, Beckers J-F(2000b): Chemiluminescence of bovine polymorphonuclear leucocytes during the pe-riparturient period and relation with metabolic markers and bovine pregnancy-associated glycoprotein. J. Dairy Res. 67:249-259.
Holtenius K, Agenäs S, Delavaud C, Chilliard Y (2003): Effects of feeding intensity during the dry period. 2. Metabolic and hormonal responses. J. Dairy Sci., 86. 883-891.
Horlick MB, Rosenbaum M, Nicolson M, Levine LS, Fedun B, Wang J, Pierson RN, Leibel RL. (2000): Effect of puberty on the relationship between circulating leptin and body composition. J. Clin. Endocrinol. Metab., 85. 2509-2518.
Houseknecht KL, Mantzoros CS, Kuliawat R, Hadro E, Flier JS, Kahn BB (1996): Evidencefor leptin binding to proteins in serum of rodents and humans: modulation with obe-sity. Diabetes, 1638-1643.
Houseknecht KL, Baile CA, Matteri RL, Spurlock ME (1998): The biology of leptin: A re-view. J. Anim. Sci., 76. 1405-1420.
Housecknecht KL, Portocarrero CP, Ji S, Lemenager R, Spurlock ME (2000): Growth hor-mone regulates leptin gene expression in bovine adipose tissue: correlation with adi-pose IGF-I expression. J. Endocrinol., 164. 51-57.
Hunter WM, Greenwood FC (1962): Preparation of iodine-131 labeled human growth hor-mone of high specific activity. Nature, 194. 495-497.
Hussain AM (1989): Bovine uterine defense mechanisms: a review. J. Vet. Med. B, 36. 641-651.
Huszenicza Gy, Molnár L, Solti L, Haraszti J (1987): Postpartal ovarian function in Holsteinand crossbred cows on large scale farms in Hungary. J. Vet. Med. A, 34. 249-263.
Huszenicza Gy, Haraszti J, Molnár L, Solti L, Fekete S, Ekés K, Yaro AC (1988): Some metabolic characteristics of dairy cows with different post partum ovarian function. J. Vet. Med. A. 35. 506-515.
122
Huszenicza Gy, Jánosi Sz, Kulcsár M, Kóródi P, Dieleman SJ, Bartyik J, Ribiczei-Szabó P. (1998): Gram negative mastitis in early lactation may interfere with ovarian and cer-tain endocrine functions and metabolism in dairy cows. Reprod. Dom. Anim., 33. 147-153.
Huszenicza Gy, Fodor M, Gacs M, Kulcsár M, Dohmen MJV, Vámos M, Porkoláb L., Kégl T, Bartyik J, Lohuis JACM, Jánosi Sz, Szita G (1999): Uterine bacteriology, resumptionof cyclic ovarian activity and fertility in postpartum cows kept in large-scale dairy herds. Reprod. Dom. Anim., 34. 237-245.
Huszenicza Gy, Nagy P, Juhász J, Kóródi P, Kulcsár M, Reiczigel J, Guillaume D, Rudas P, Solti L (2000): The relationship between thyroid function and expression of seasonal reproductive activity in mares. J. Reprod. Fert., Suppl. 56. 163-172.
Huszenicza Gy, Kulcsár M, Nikolic JA, Schmidt J, Kóródi P, Kátai L, Dieleman S, Ribiczei-Szabo P, Rudas P (2001): Plasma leptin concentration and its interrelation with some blood metabolites, metabolic hormones and the resumption of cyclic ovarian function in postpartum dairy cows supplemented with Monensin or inert fat in feed. In: DiskinMG (ed.): Fertility in the high-producing dairy cow. Br. Soc. Anim. Sci. (Edinburgh, UK), Occasional publications, No. 26. Vol. 2, pp. 405-409.
Huszenicza Gy, Kulcsár M, Rudas P. (2002): Clinical endocrinology of thyroid gland func-tions in ruminants: a review of literature. Vet. Med. Cz., 47, 191-202.
Huszenicza Gy (2003): Data to physio-pathology and clinical aspects of postpartum ovar-ian malfunctions in ruminants and horse (in Hungarian). DSc Dissertation. Szent Ist-van University, faculty of Veterinary Science, Budapest (Adatok a petefészek-muködés ellés utáni idoszakban eloforduló egyes zavarainak a kórélettanához és klinikumához kérodzokben és lóban. MTA doktori értekezés. SzIE Állatorvos-tudományi Kar, Budapest)
Huszenicza Gy, Kátai L., Kulcsár M, Pécsi T, Kiss G, Delavaud C, Fébel H, Chilliard Y, Driancourt MA, Butler WR (2003): Metabolic factors influencing fertility at the first postpartum insemination in high-producing dairy cows. Proc. of 15
th European A.I.
Vets’ Meeting (8-11 October, 2003, Budapest, Hungary), pp. 16-25.
Huszenicza Gy, Jánosi Sz, Gáspárdy A, Kulcsár M (2004): Endocrine aspects in patho-genesis of mastitis in postpartum dairy cows. Anim. Reprod. Sci., 82-83. 389-400.
Huszenicza Gy, Jánosi Sz, Kulcsár M, Kóródi P, Reiczigel J, Kátai L, Peters AR, De Rensis,F (2005): Effects of clinical mastitis on ovarian function in postpartum dairy cows. Re-prod. Dom. Anim., 40. 199-204.
Huszenicza Gy., Kulcsár M., Kóródi P., Bartyik J., Rudas P., Ribiczey-Szabó P., Nikolic, J.A., Samanc, H., Ivanov, I., Gvozdic, D. (2006): Adrenocortical and thyroid function, hormone and metabolite profiles and the onset of ovarian cyclicity in dairy cows suf-fering from various forms of ketosis. Acta Vet. Beograd, 56. 25-36.
Ingalls AM, Dickie MM, Snell GD (1950): Obese, a new mutation in the house mouse. J. Hered., 41. 317-318.
Ingvartsen KL, Andersen JB (2000): Integration of metabolism and intake regulation: a review focusing on periparturient animals. J. Dairy Sci., 83. 1573-1597.
Ingvartsen KL, Boisclair YR. (2001): Leptin and the regulation of food intake, energy ho-meostasis and immunity with special focus on periparturient ruminants. Domest. Anim. Endocrin., 21. 215-250.
Ishioka K., Soliman MM, Honjon T, Shibata H, Kimura K, Saito M (2002): Dexamethasone increases serum leptin concentration in dogs. Vet. J., 164. 295-297.
Ishioka K., Hatai H, Komabayashi K, Soliman MM, Shibata H, Honjoh T, Kimura K, Saito M (2005): Diurnal variation of serum leptin in dog: effects of fasting and re-feeding. Vet. J., 169. 85-90.
Islami D, Bischof P (2003): Leptin in the placenta. In: Henson MC, Castracane VD (eds): Leptin and reproduction. Kluwer Academic / Plenum Publishers, New York, 2003; pp 201-220.
123
Jackson JA, Shuster DE, Silvia WJ, Harmon RJ (1990): Physiological responses to in-tramammary or intravenous treatment with endotoxin in lactating dairy cows. J. Dairy Sci., 73. 627-632.
Jang M, Mistry A, Swick AG, Romsos DR (2000): Leptin rapidly inhibits hypothalamic neu-ropeptide Y secretion and stimulates corticotropin-releasing hormone secretion in adrenalectomized mice. J. Nutr., 130. 2813-2820.
Jánosi Sz, Huszenicza Gy, Kulcsár M, Kóródi P (1998): Endocrine and reproductive con-sequences of certain endotoxin-mediated diseases in farm mammals. A review. Acta Vet. Hung., 46. 71-84.
Jánosi Sz, Kulcsár M, Kóródi P, Kátai L, Reiczigel J, Dieleman SJ, Nikolic JA, Sályi G, Ribiczei-Szabó P, Huszenicza Gy (2003): The energy imbalance related predisposi-tion for mastitis in group-fed high-producing postpartum dairy cows. Acta Vet. Hung., 51. 409-424.
Jeusette CI, Detilleux J, Shibata H, Saito M, Honjoh T, Delobel A, Istasse L, Diez M (2005):Effects of chronic obesity and weight loss on plasma ghrelin and leptin concentrationsin dog. Res. Vet. Sci., 79. 169-175.
Jorritsma R, Jorritsma H, Schukken YH, Bartlett PC, Wensing T, Wentink GH (2001): Prevalence and indicators of post partum fatty infiltration of liver in nine commercialdairy herds in The Netherlands. Livest. Prod. Sci., 68. 53-60.
Juvancz I, Paksy A (1982): Medical biometry (In Hungarian). Medicina Kiadó, Budapest
Kadokawa H, Blache D, Yamada Y, Martin GB (2000): Relationships between changes in plasma concentrations of leptin before and after parturition and the timing of first post-partum ovulation in high-producing Holstein dairy cows. Reprod. Fertil. Dev., 12. 405-411.
Kadokawa H, Blache D, Martin GB (2006): Plasma leptin concentrations correlate with luteinizing hormone secretion in early postpartum Holstein cows. J. Dairy Sci., 89. 3020-3027.
Kahl S, Elsasser TH, Blum JW (2000): Effect of endotoxin challenge on hepatic 5’-deiodinase activity in cattle. Domest. Anim. Endocrinol., 18. 133-143.
Kakizaki Y, Watanobe H, Kohsaka A, Suda T (1999): Temporal profiles of interleukin-1-beta, interleukin-6 and tumor necrosis factor-alpha in the plasma and hypothalamic paraventricular nucleus after intravenous or intraperitoneal administration of lipopoly-saccharide in the rat: estimation by push-pull perfusion. Endocr. J., 46. 487-496.
Kauter K, Ball M, Kearney P, Tellam R, McFarlane JR (2000): Adrenaline, insulin and glu-cagon do not have acute effects on plasma leptin levels in sheep: development and characterization of an ovine leptin ELISA. J. Endocrinol., 166. 127-135.
Kawai M, Yamaguchi M, Murakami T, Shima K, Murata Y, Kishi K (1997): The placenta is not the main source of leptin production in pregnant rat: gestational profile of leptin in plasma and adipose tissues. Biochem. Biophys. Res. Commun., 240. 798-802.
Kawakita Y, Abe H, Hodate K (2001): Twentyfour-hour variation of plasma leptin concen-tration and pulsatile leptin secretion in cattle. Asian-Austr. J. Anim. Sci., 14. 1209-1215.
Kay JK, Roche JR, Moore CE, Baumgard LH (2006): Effects of dietary conjugated linoleic acid on production and metabolic parameters in transition dairy cows grazing fresh pasture. J. Dairy Res., 73. 367-377.
Kégl T (1990): Studies on ketonuria and experiences of its detection in a Holstein Friesianherd / A ketonuria vizsgálatának és ellenõrzésének tapasztalatai egy holstein-fríz ál-lományban (in Hungarian, with English summary). Magy. Áo. Lapja, 45. 393-398.
Kégl T, Gaál T (1992): Ketonuria index: a new practicable parameter for estimation of energetic balance in dairy cows / Ketonuriás index: egy új, gyakorlatias mutatószám a tejelõ tehenek energia-egyensúlyának megitélésére (in Hungarian, with English sum-mary). Magy. Áo. Lapja, 47. 159-161.
124
Kendall NR, Gutierrez CG, Scaramuzzi RJ, Baird DT, Webb R, Cambell BK (2004): Direct in vivo effects of leptin on ovarian steroidogenesis in sheep. Reproduction, 128. 757-765.
Kennedy GC (1953): The role of depot fat in the hypothalamic control of food intake in the rat. Proc. R. Soc. Lond. B, 140. 579-592.
Kershaw EE, Flier JS (2004): Adipose tissue as an endocrine organ. J. Clin. Endocrinol. Metab., 89. 2548-2556.
Kieffer T, Habener JF (2000): The adipo-insular axis: effects of leptin on pancreatic β-cells. Am. J. Physiol. (Endocrinol. Metab.), 278. E1-E14.
Klein S, Coppack SW, Mohamed-Ali V, Landt M (1996): Adipose tissue leptin productionand plasma leptin kinetics in humans. Diabetes, 45. 984-987.
Kokkonen T, Taponen J, Anttila T, Syrjala-Qvist L, Delavaud C, Chilliard Y, Tuori M, Tesfa AT (2005): Effect of body fatness and glucogenic supplement on lipid and protein mobilization and plasma leptin in dairy cows. J. Dairy Sci. 88:1127-1141.
Kolver ES, Muller LD (1998): Performance and nutrient intake of high producing Holsteincows consuming pasture or a total mixed ration. J. Dairy Sci., 81. 1403-1411.
Kotz CM, Briggs JE, Pomonis JD, Grace MK, Levine AS, Billington CJ (1998): Neural site of leptin influence on neuropeptide Y signaling pathways altering feeding and uncou-pling protein. Am. J. Physiol. (Regul. Integr. Comp. Physiol.), 275. R478-484.
Kruip TAM, Wensing T, Vos PLAM (1999): Characteristics of abnormal puerperium in dairy cattle and the rationale for common treatments. In: Diskin MG (ed.): Fertility in high producing dairy cow. Br. Soc. Anim. Sci. (Edinburgh, UK), Occasional PublicationNo 26, 63-79.
Kunz PL, Blum JW (1985): Relationships between energy balances and blood levels of hormones and metabolites in dairy cows during late pregnancy and early lactation. Z. Tierphysiol. Tierernährg. u. Futtermittelkde, 54. 239-248.
Kushibiki S, Hodate K, Ueda Y, Shingu H, Mori Y, Itoh T, Yokomizo Y (2000): Administra-tion of recombinant bovine tumor necrosis factor-α affects intermediary metabolism and insulin and growth hormone secretion in dairy heifers. J. Anim. Sci., 78. 2164-2171.
Lado-Abeal J, Norman RL. (2003): Leptin and reproduction in the male. In: Henson MC, Castracane VD (eds): Leptin and reproduction. Kluwer Academic / Plenum Publish-ers, New York, pp 117-132.
Landman RE, Puder JJ, Xiao E, Freda PU, Ferin M, Wardlaw SL (2003): Endotoxin stimu-lates leptin in the human and non-human primate. J. Clin. Endocrinol. Metab., 88. 1285-1291.
Lehtolainen T, Suominen S, Katila T, Pyörälä S (2003): Effect of intramammary Es-cherichia coli endotoxin in early- vs. late-lactating dairy cows. J. Dairy Sci., 86. 2327-2333.
Leininger MT, Portocarrero CP, Schinckel AP, Spurlock ME, Bidwell CA, Nielsen KL, Houseknecht KL (2000): Physiological response to acute endotoxaemia in swine: ef-fect of genotype on energy metabolism and leptin. Domest. Anim. Endocrinol., 18. 71-82.
Lents CA, Wetteman RP, White FJ, Rubio I, Ciccioli NH, Spicer LJ, Keisler DH, Payton ME (2005): Influence of nutrient intake and body fat on concentrations of insulin-likegrowth factor-1, insulin, thyroxine and leptin in plasma of gestating beef cows. J. Anim. Sci., 83. 586-596.
Leury BJ, Baumgard LH, Block SS, Segoale N, Ehrhardt RA, Rhoads RP, Bauman DE, Bell AW, Boisclair YR (2003): Effect of insulin and growth hormone on plasma leptin in pe-riparturient dairy cows. Am. J. Physiol. (Regul. Integr. Comp. Physiol.), 285. R1107-1115.
125
Licinio J, Mantzoros C, Negrao AB, Cizza G, Wong ML, Borgiorno PB, Chrousos GP, Karp B, Allen C, Flier JS, Gold, PW (1997): Human leptin levels are pulsatile and inverselyrelated to pituitary-adrenal function. Nat. Med. 3. 575-579.
Licinio J, Negrao AB, Mantzoros C, Kaklamani V, Wong ML, Borgiorno PB, Negro PP, Mulla A, Veldhuis JD, Cearnal L, , Flier JS, Gold, PW (1998): Sex differences in circu-lating humane leptin pulse amplitude: clinical implications. J. Clin. Endocrinol. Metab.83. 4140-4147.
Liefers SC, Veerkamp RF, te Pas MFW, Delavaud C, Chilliard Y, van der Lende T (2003): Leptin concentrations in relation to energy balance, milk yield, intake, live weight, andoestrus in dairy cows. J. Dairy Sci., 86. 799-807.
Liefers SC, Veerkamp RF, te Pas MFW, Delavaud C, Chilliard Y, van der Lende T (2004): A missense mutation of the bovine leptin receptor gene is associated with leptin con-centrations during late pregnancy. Anim. Genetics, 35. 138-141.
Lin J, Barb CR, Matteri RL, Kraeling RR, Chen X, Meinersmann RJ, Rampacek GB (2000): Long form leptin receptor mRNA expression in the brain, pituitary, and other tissues in the pig. Domest. Anim. Endocrinol., 19. 53-61.
Lord GM, Matarese G, Howard JK, Baker RJ, Bloom SR, Lechler, RI (1998): Leptin modu-lates the T-cell immune response and reverses starvation-induced immunosuppres-sion. Nature, 394. 897-901.
Lucy MC (2001): Reproductive loss in high-producing dairy cattle: where will it end? J. Dairy Sci., 84. 1277-1293.
Ludwig M, Klein HH, Diedrich K, Ortmann I. (2000): Serum leptin concentrations through-out the menstrual cycle. Arch. Gynecol. Obstet., 263. 99-101.
Magoffin DA, Duggel PS, Norman RJ (2003): The role of leptin in polycystic ovary syn-drome. In: Henson MC, Castracane VD (eds): Leptin and reproduction. Kluwer Aca-demic / Plenum Publishers, New York, pp 299-310.;
Maciel SM, Chamberlain CS, Wettemann RP, Spicer LJ (2001): Dexamethasone influ-ences endocrine and ovarian function in dairy cattle. 84. 1998-2009.
Madiehe AM, Mitchell TD, Harris RBS (2003): Hyperleptinemia and reduced TNF -α secre-tion cause resistance of db/db mice to endotoxin. Am. J. Physiol. (Regul. Integr. Comp. Physiol.), 284. R763-R770.
Malagon MM, Rodriguez-Pacheco F, Martinez-Fuentes AJ, Tovar S, Pinilla L, Tena-Sempere M, Dieguez C, Castano JP (2006): Regulation of pituitary cell function by the adipokine adiponectin. Front. Neuroendocrin., 27. 35-35.
Mann DR, Plant MP (2003): Leptin and pubertal development in higher primates. In: Henson MC, Castracane VD (eds): Leptin and reproduction. Kluwer Academic / Ple-num Publishers, New York, pp 133-150.
Mann GE, Mann SJ, Blache D, Webb, R. (2005): Metabolic variables and plasma leptin concentrations in dairy cows exhibiting reproductive cycle abnormalities identified through milk progesterone monitoring during the post partum period. Anim. Reprod. Sci., 88. 191-202.
Marie M, Findlay PA, Thomas L, Adam CL (2001): Daily patterns of plasma leptin in sheep: effects of photoperiod and food intake. J. Endocrinol., 170. 277-286.
Markusfeld O (1985): Relationship between overfeeding, metritis and ketosis in high yield-ing dairy cows. Vet. Rec., 116. 489-491.
Martin PA, Crump MH (2003): The endocrine pancreas In: Pineda MH, Dooley MP (eds): McDonald’s veterinary endocrinology and reproduction. Iowa State Press, 5th edition,141-163.
Mastronardi CA, Yu WH, Rettori V, McCann, J (2000): Lipopolysaccharide-induced leptin release is not mediated by nitric oxide, but is blocked by dexamethasone. Neuroim-munomodulation, 8. 91-97.
126
Mastronardi CA, Yu WH, Srivastava VK, Dees WL, McCann SM (2001): Lipopolysaccha-ride-induced leptin release is neurally controlled. Proc. Natl. Acad. Sci. USA, 98. 14720-14725.
Mateus L, Lope de Costa L, Diniz P, Ziecik AJ (2003): Relationship between endotoxin and prostaglandin (PGE2 and PGFM) concentrations and ovarian function in dairy cows with puerperal endometritis. Anim. Repr. Sci., 76. 143-154.
McCann SM, Karanth S, Yu WH, Mastronardi SA (2003): Neuroendocrine regulation of leptin secretion and its role in nitric oxide secretion. In: Henson MC, Castracane VD (eds): Leptin and reproduction. Kluwer Academic / Plenum Publishers, New York, pp 15-37.
McFadin EL, Morrison CD, Buff PR, Whitley NC, Keisler DH (2002). Leptin concentrationsin periparturient ewes and their subsequent offspring. J. Anim. Sci., 80. 738-743.
McMahon CD, Elsasser TH, Gunter DR, Sanders LG, Steele BP, Sartin L (1998): Estra-diol/progesterone implants increase food intake, reduce hyperglycemia and increase insulin resistance in endotoxic steers. J. Endocrinol., 159. 469-478.
McMahon CD, Radcliff RP, Lookingland KJ, Tucker HA (2001): Neuroregulation of growth hormone secretion in domestic animals. Domest. Anim. Endocrinol., 20. 65-87.
McManus CJ, Fitzgerald BP (2000): Effects of a single day of feed restriction on changes in serum leptin, gonadotropins, prolactin and metabolites in aged and young mares. Domest. Anim. Endocrin., 19. 1-13.
Mehrzad J, Dosogne H, Meyer E, Burvenich C (2001): Local and systemic effects of en-dotoxin mastitis on the chemiluminescence of milk and blood neutrophils in dairy cows. Vet. Res., 32. 131-144.
Messinis IE, Milingos, SD, Zikopoulus K, Kollios G, Seferiadis K, Lolis D (1998): Leptin concentrations in the follicular phase of spontaneous cycles and cycles superovu-lated with follicle stimulating hormone. Hum. Reprod., 13. 1152-1156.
Messinis IE, Milingos, SD, Alexandris E, Kariotis I, Kollios G, Seferiadis K (1999): Leptin concentrations in normal women following bilateral ovariectomy. Hum. Reprod., 14. 913-918.
Messinis IE, Kariotis I, Milingos, SD, Kollios G, Seferiadis K (2000): Treatment of normal women with oestradiol plus progesterone prevents the decrease of leptin concentra-tions induced by ovariectomy. Hum. Reprod., 15. 2383-2387.
Messinis IE, Papageorgiou I, Milingos, SD, Asprodini E, Kollios G, Seferiadis K (2001): Oestradiol plus progesterone treatment increases serum leptin concentrations in nor-mal women. Hum. Reprod., 16. 1827-1832.
Messinis IE, Domali E (2003): Regulation and roles of leptin during the menstrual cycle and menopause. In: Henson MC, Castracane VD (eds): Leptin and reproduction. Klu-wer Academic / Plenum Publishers, New York, pp 53-76.
Mohan-Kumar SM, Mohan-Kumar PS, Quadri SK (1999): Lipopolysaccharide-inducedchanges in monoamines in specific areas of the brain: blockade by interleukin-1 re-ceptor antagonist. Brain Res., 824. 232-237.
Mol J, Rijnberk A (1997): Pituitary function. In: Kaneko JJ, Harvey JW, Bruss ML. (eds.): Clinical biochemistry of domestic animals. Academic Press, San Diego, London, Bos-ton, New York, Sydney, Tokyo, Toronto, pp. 517-551.
Monniaux D, Huet C, Besnard N, Clement F, Bosc M, Pisselet C, Mongel P, Mariana JC (1997a): Follicular growth and ovarian dynamics in mammals. J. Reprod. Fert., Suppl. 51. 3-23.
Monniaux D, Mongen P, Besnard N, Huet C, Pisselet C (1997b): Growth factors and antralfollicular development in domestic ruminants. Theriogenology, 47. 3-12.
Moreira F, Orland C, Risco CA, Mattos R, Lopes F, Thatcher WW (2001): Effects of pre-synchronization and bovine somatotropin on pregnancy rates to a timed artificial in-semination protocol in lactating dairy cows. J. Dairy Sci., 84. 1646-1659.
127
Morio B, Gachon AM, Boirie Y, Rousset P, Gachon P, Beaufrere B, Ritz P (1999): Lipoly-sis, fatness, gender and plasma leptin concentrations in healthy, normal-weight sub-jects. Eur. J. Nutr., 38. 14-19.
Morrison CD, Daniel JA, Holmberg BJ, Djiane J, Raver N, Gertler A, Keisler DH (2001): Central infusion of leptin into well-fed and undernourished ewe lambs: effects on feed intake and serum concentrations of growth hormone and luteinizing hormone. J. En-docrinol., 168. 317-324.
Morrison CD, Wood R, McFadin EL, Whitley NC, Keisler DH (2002): Effect of intravenous infusion of recombinant ovine leptin on feed intake and serum concentrations of GH, LH, insulin, IGF-1, cortisol, and thyroxine in growing prepubertal ewe lambs. Domest. Anim. Endocrinol., 22. 103-112.
Mounzih K, Qiu J, Ewart-Toland A, Chehab FF (1998): Leptin is not necessary for gesta-tion and parturition, but regulates maternal nutrition via a leptin resistance state. En-docrinology, 139. 5259-5262.
Muhlhausler BS, Roberts CT, Yuen BS, Marrocco E, Budge H, Symonds ME, McFarlane JR, Kauter KG, Stagg P, Pearse JK, McMillen IC (2003): Determinants of fetal leptin synthesis, fat mass, and circulating leptin concentrations in well-nourished ewes in late pregnancy. Endocrinology, 144. 4947-4954.
Murondoti A, van der Kolk JH, van der Linde-Sipman JS (1999): Type 1 diabetes mellitusin a pregnant heifer persistently infected with bovine viral diarrhea virus. Vet. Rec., 144. 268-269.
Nagy E, Belle K, Huszenicza Gy, Rénes I, Molnár L, Haraszti J, Gönye S (1984): Practicalexperiences about forecasting the so-called fatty liver disease of dairy cows / Gyakor-lati tapasztalatok a szarvasmarha un. zsírmáj-szindrómájának elorejelzésérol (in Hun-garian, with English summary). Magy. Áo. Lapja, 39. 421-425.
Nagy P, Solti L, Kulcsár M, Reiczigel J, Huszenicza Gy, Abaváry-Mihály K, Wöfling A (1998): Progesterone determination in equine plasma using different immunoassays. Acta Vet. Hung., 46. 501-513.
Nikolic JA, Samanc H, Begovic J, Krsmanovic J, Aleksic S, Miscevic B, Huszenicza Gy, Damjanovic Z. (1998): Basal serum cortisol concentrations in cattle. Acta Vet. (Beo-grad), 48. 265-276.
Nikolic JA, Kulcsár M, Kátai L, Nedic O, Jánosi Sz, Huszenicza Gy (2003): Periparturient endocrine and metabolic changes in healthy cows and in those affected by various forms of mastitis. J. Vet. Med. A, 50. 22-29.
Nikolic JA, Nedic O, Samanch H, Aleksic S, Miscevic B, Kulcsár M (2001): Peripheral circu-lating insulin-like growth factor-I and II in cattle. Acta Vet. Hung., 49. 53-63.
NRC (2001): Nutrient Requirements of Dairy Cattle. 7th ed., National Academy Press, Washington, DC, USA
O’Callaghan D, Boland P (1999): Nutritional effects on ovulation, embryo development and establishment of pregnancy in ruminants. Anim. Sci., 68. 299-314.
Palme R, Fischer P, Schildorfer H, Ismail MN (1996): Excretion of infused 14C-steroid hor-mones via feces and urine in domestic livestock. Anim. Reprod. Sci., 43. 43–63.
Palme R, Robia C, Messmann S, Hofer J, Möstl E (1999): Measurement of fecal cortisol metabolites in ruminants: a non-invasive parameter of adrenocortical function. Wien. Tierärz. Monats. 86. 237–241.
Papaspyrou-Rao S, Schneider SH, Petersen RN, Fried SK (1997): Dexamethasone in-creases leptin expression in humans in vivo. J. Clin. Endocrinol. Metab., 82. 1635-1637.
Pastor J, Loste A, Saez T. (2001): Gestational toxaemia in sheep. Pequenos Ruminantes,2. 18-24.
Pereira RJG, Polegato BF, de Souza S, Negão JA, Duarte JMB (2006): Monitoring ovarian cycles and pregnancy in brown brocket deer (Mazama gouazoubira) by measurementof fecal progesterone metabolites. Theriogenology, 62. 387-399.
128
Pethes G, Bokori J, Rudas P, Frenyo VL, Fekete S (1985): Thyroxine, triiodothyronine,revere-triiodothyronine, and other physiological characteristics of periparturient cows fed restricted energy. J. Dairy Sci., 68. 1148-1154.
Petrie A, Watson P (1999): Statistics for veterinary and animal science. Balckwell ScienceLtd, Oxford, UK
Petterson JA, Dushea FR, Ehrhardt RA, Bell AW (1993): Pregnancy and undernutrition alter glucose metabolic response to insulin in sheep. J. Nutr., 123. 1286-1295.
Phipps WR, Wangen KE, Duncan AM, Merz-Demlow, BE, Xu X, Kurzer MS (2001): Lack of effects of isoflavonic phytoestrogene intake on leptin concentrations in premeno-pausal and postmenopausal women. Fertil. Steril., 75. 1059-1064.
Pickavance L, Tadayon M, Williams G, Vernon RG (1998): Lactation suppresses diurnalrhythm of serum leptin. Biochem. Biophys. Res. Commun., 248. 196-199.
Pineiro V, Casabiell X, Peino R, Lage M, Camina JP, Menendez C, Baltar J, Dieguez C, Casauneva FF (1999): Dihydrotestosterone, stanazol, androstenedione and dihy-droepiandrosterone sulphate inhibit leptin secretion in female but not male samples of omental adipose tissue in vitro: lack of effect of testosterone. J. Endocrinol., 160. 425-432.
Poston L (2003): Does leptin play a role in pre-eclamsia? In: Henson MC, Castracane VD (eds): Leptin and reproduction. Kluwer Academic / Plenum Publishers, New York, pp 299-310.
Prior RL, Christenson RK (1978): Insulin and glucose effects on glucose metabolism in pregnant and non-pregnant ewes. J. Anim. Sci., 46. 201-210.
Pyörälä S, Kaartinen L, Käck H, Rainio V (1994): Efficacy of two therapy regimes for treat-ment of experimentally induced Escherichia coli mastitis in the bovine. J. Dairy Sci. 77:453-461.
Quinn PJ, Carter ME, Markey B, Carter GR, (1994): Clinical veterinary microbiology.Mosby-Year Book Europe Limited Publ, London, UK
Rabiee AR, Macmillan KL, Schwarzenberger F, Wright PJ (2002): Effects of level of feed-ing and progesterone dose on plasma and fecal progesterone in ovariectomizedcows. Anim. Reprod. Sci., 73. 185-195.
Rambeaud M, Almeida RA, Pighetti GM, Oliver SP (2003): Dynamics of leukocytes and cytokines during experimentally induced Streptococcus uberis mastitis. Vet. Immunol. Immunopath., 96. 193-205.
Reist M, Erdin D, von Euw D, Tschuemperlin K, Leuenberger H, Delavaud C, Chilliard Y, Hammon HM, Kuenzi N, Blum JW (2003): Concentrate feeding strategy in lactating dairy cows: metabolic and endocrine changes with emphasis on leptin. J. Dairy Sci., 86. 1690-1706.
Rémond B, Cisse M, Ollier A, Chilliard Y (1991): Slow release somatotropin in dairy heifersand cows fed two levels of energy concentrate. J. Dairy Sci., 74. 1370-1381.
Ren MQ, Wegner J, Bellmann O, Brockmann GA, Schneider F, Teuscher F, Ender K (2002): Comparing mRNA levels of genes encoding leptin, leptin receptor, and lipo-protein lipase between dairy and beef cattle. Domest. Anim. Endocrinol., 23. 371-381.
Rettori V, Dees WL, Hiney JK, Lyson K, McCann J (1994): An interleukin-1α-like neuronal system in the preoptic-hypothalamic region and its induction by bacterial lipopolysac-charide in concentrations which alter pituitary hormone release. Neuroimmunomodu-lation, 1. 251-258.
Riolett C, Rainard P, Poutrel B (2001): Cell subpopulations and cytokine expression in cow milk in response to chronic Staphylococcus aureus infection. J. Dairy Sci., 84. 1077-1084.
Roberts AJ, Nugent RA, Klindt J, Jenkins TG (1997): Circulating insulin-like growth factor 1, insulin-like growth factor binding proteins, growth hormone, and resumption of oes-trus in postpartum cows subjected to dietary energy restriction. J. Anim. Sci., 75. 1909-1917.
129
Robertson WG, Lennon HD, Bailey WW, Mixner JP (1957): Interrelationships amongplasma 17-hydroxycorticosteroide levels, plasma protein-bound iodine levels, and ke-tosis in dairy cattle. J. Dairy Sci., 40. 732-738.
Rock FL, Altmann SW, van Heek M., Kastelein RA, Bazan JF (1996): The leptin hae-mopoietic cytokine fold is stabilized by an intrachain disulfide bond. Horm. Metab. Res., 28. 649-652.
Roche JR, Kolver ES, Kay, JK (2005): Influence of precalving feed allowance on peripartu-rient metabolic and hormonal responses and milk production in grazing dairy cows. J. Dairy Sci., 88. 677-689.
Roh SG, Hishikawa D, Hong YH, Sasaki S (2006): Control of adipogenesis in ruminants.Anim. Sci. J., 77. 472-477.
Ronge H, Blum J, Clement C, Jans F, Leuenberger H, Binder H (1988): Somatomedin C in dairy cows related to energy and protein supply and to milk production. Anim. Prod., 47. 165-183.
Rosenbaum M, Liebel RL (1999): Role of gonadal steroids in the sexual dimorphism in body composition and circulating concentrations of leptin. J. Clin. Endocr. Metab., 84. 1784-1789.
Rosenbaum M, Pietrobelli A, Vasselli JR, Heymsfield SB, Liebel RL (2001): Sexual dimor-phism in circulating leptin concentrations is not accounted for by differences in adi-pose tissue distribution. Int. J. Obes. Relat. Metab. Disord., 25. 1365-1371.
Salyers AA, Whitt DD (1994): Bacterial pathogenesis – a molecular approach. ASM Press, Washington, DC, USA
Sandeep TC, Walker BR (2001): Pathophysiology of modulation of local glucocorticoid levels by 11β-hydroxysteroid dehydrogenases. Trends Endocrinol. Metab., 12. 446-453.
Sandholm M, Honkanen-Buzalski T, Kaartinen L, Pyörälä S (1995): The bovine udder and mastitis. University of Helsinki, Faculty of Veterinary Medicine, Helsinki, Finland
Santos-Alvarez J, Goberna R, Sanchez-Margalet V (1999): Human leptin stimulates prolif-eration and activation of human circulating monocytes. Cell. Immunol., 194. 6-11.
Sarraf P, Frederich RC, Turner EM, Ma G, Jaskowiak NT, Rivet DJ, Flier JS, Lowell BB, Fanker DL, Alexander HR (1997): Multiple cytokines and acute inflammation raise mouse leptin levels: potential role in inflammatory anorexia. J. Exp. Med., 185. 171-175
Sartin JL, Kemppainnen RJ, Cummins KA, Williams JC (1988): Plasma concentrations of metabolic hormones in high and low producing dairy cows. J. Dairy Sci., 71. 650-657.
Sartorelli P, Paltrinieri S, Agnes F (1999): Non-specific immunity and ketone bodies I. In vitro studies on chemotaxis and phagocytosis of ovine neutrophils. J. Vet. Med. A, 46. 613-619.
Sartorelli P, Paltrinieri S, Comazi S (2000): Non-specific immunity and ketone bodies II. In vitro studies on adherence and superoxide anion production in ovine neutrophils. J. Vet. Med. A, 47. 1-8.
Sauerwein H, Heintges U, Hennies M, Selhorst T, Daxenberger A (2004): Growth hormoneinduced alterations of leptin serum concentrations in dairy cows as measured by a novel enzyme immunoassay. Livest. Prod. Sci., 87. 189-195.
Sayed-Ahmed A, Elmorsy SE, Bartha T, Rudas P (2003): Partial cloning and localization of leptin and leptin receptor in the mammary gland of the Egyptian water buffalo. Do-mest. Anim. Endocr., 25. 303-314.
Sayed-Ahmed A, Kulcsár M, Rudas P, Bartha T (2004): Expression and localization of leptin and leptin receptor in the mammary gland of the dry and lactating non-pregnantcow. Acta Vet. Hung., 52. 97-111.
130
Sayed-Ahmed A (2004): Molecular and cellular investigation of leptin hormone and its receptors in large ruminants. PhD dissertation. Szent István University, Faculty of Vet-erinary Science, Budapest, Hungary
Schneider JE (2004): Energy balance and reproduction. Physiol. Behav., 81. 289-317.
Schwarzenberger F, Möstl E, Palme R, Bamberg E (1996): Fecal steroid analysis for non-invasive monitoring of reproductive status in farm, wild and zoo animals. Anim. Re-prod. Sci., 42:515-526.
Seeber RM, Smith JT, Waddell BJ (2002): Plasma leptin-binding activity and hypothalamicleptin receptor expression during pregnancy and lactation in the rat. Biol. Reprod., 66. 1762-1767.
Senger PL (2003): Pathways to pregnancy and parturition. 2nd Edition. Current Concep-tions Inc., Washington State University, Pullman, WA.
Sheldon IM, Dobson H. (2004): Postpartum uterine health in cattle. Anim. Reprod. Sci., 82-83. 295-306.
Shimizu H, Shimomura Y, Nakanishi Y, Futawatari T, Ohtani K, Sato N, Mori M (1997): Es-trogen increases in vitro leptin production in rats and human subjects. J. Endocrinol.,154. 285-292.
Shuster E, Lee EK, Kehrli ME (1996): Bacterial growth, inflammatory cytokine production,and neutrophil recruitment during coliform mastitis in cows within ten days after calv-ing, compared with cows at midlactation. Am. J. Vet. Res., 11. 1569-1575.
Sih R, Morley JE, Kaiser FE, Perry HM, Patrick P, Ross C (1997): Testosterone replace-ment in older hypogonadal men: a 12-month randomized controlled trial. J. Clin. En-docrinol. Metab., 82. 1661-1667.
Siklódi B, Barna-Vetró I, Solti L. (1995): Latent immunization to produce high affinity monoclonal antibodies to progesterone. Hybridoma, 14. 79-84.
Simmen FA. (1991): Expression of the insulin-like growth factor-I gene and its products: complex regulation by tissue specific and hormonal factors. Dom. Anim. Endocrinol., 8. 165-178.
Sinha MK, Caro JF (1998): Clinical aspects of leptin. Vit. Horm., 54. 1-30.
Smith BB, Wagner WC (1984): Suppression of prolactin in pigs by Escherichia coli en-dotoxin. Science, 224. 605-609.
Smith BB, Wagner WC (1985): Effect of Escherichia coli endotoxin and thyrotropin-releasing hormone on prolactin in lactating sows. Am. J. Vet. Res., 46. 175-182.
Smith GD, Jackson LM, Foster DL (2002): Leptin regulation of reproductive function and fertility. Theriogenology, 57. 73-86.
Snedecor GW, Cochran WG (1982): Statistical methods. 7th ed. The Iowa State UniversityPress, Ames
Soliman M, Abdelhardy S, Fattouh I, Ishioka K, Kitamura H, Kimura K, Saito M (2001): No alterations in serum leptin levels during acute endotoxaemia in sheep. J. Vet. Med. Sci., 63. 1143-1145.
Soliman M, Ishioka K, Kimura K, Kushibiki S, Saito M (2002): Plasma leptin responses to lipopolysaccharide and tumor necrosis factor-α in cows. Jpn. J. Vet. Res., 50. 107-114.
Song DK, Im YB, Jung JS, Suh HW, Huh SO, Park SW, Wie MB, Kim YH (1999): Differentialinvolvement of central and peripheral norepinephrine in the central lipopolysaccha-ride-induced interleukin-6 responses in mice. J. Neurochem., 72. 1625-1633.
Sordillo L, Daley M. Role of cytokines in the prevention and treatment of bovine mastitis(1995): In: Myers MJ, Murtaugh MP (eds): Cytokines in animal health and disease. Marcel Dekker Publ., New York, pp. 389-419.
Sorensen A, Adam CL, Findlay PA, Marie M, Thomas L, Travers MT, Vernon RG (2002): Leptin secretion and hypothalamic neuropeptide and receptor gene expression in sheep. Am. J. Physiol. (Regul. Integr. Comp. Physiol.), 282. R1227-1235.
131
Spicer LJ, Tucker WB, Adams GD (1990): Insulin-like growth factors in dairy cows: rela-tionship among energy balance, body condition, ovarian activity and estrous behav-ior. J. Dairy Sci., 73. 929-937.
Spicer LJ, Alpizar E, Echternkamp SE (1993): Effects of insulin, insulin-like growth factor I, and gonadotropins on bovine granulosa cell proliferation, progesterone production, estradiol production, and (or) insulin-like growth factor I production in vitro. J. Anim. Sci., 71. 1232-1241.
Spicer LJ, Stewart RE (1996): Interactions among basic fibroblast growth factor, epidermalgrowth factor, insulin, and insulin-like growth factor-I (IGF-I) on cell numbers and ster-oidogenesis of bovine thecal cells: role of IGF-I receptors. Biol. Reprod., 54. 255-263.
Spicer LJ, Chamberlain CS, Francisco CC (2000): Ovarian action of leptin: effects on in-sulin-like growth factor-I-stimulated function of granulosa and thecal cells. Endocrine, 12. 53-59.
Spicer LJ (2001): Leptin: a possible metabolic signal affecting reproduction. Dom. Anim. Endocr., 21. 251-270.
Spicer LJ (2003): The effect of leptin on ovarian steroidogenesis. In: Henson MC, Castra-cane VD (eds): Leptin and reproduction. Kluwer Academic / Plenum Publishers, New York, pp 97-110.
Spurlock ME, Ranalletta MA, Cornelius SG, Frank GR, Willis GM, Ji S, Grant AL, Bidwell CA (1998): Leptin expression in porcine adipose tissue is not increased by endotoxin but is reduced by growth hormone. J. Interferon. Cytokine Res., 18. 1051-1058.
Staples CR, Burke JM, Thatcher WW (1998): Influence of supplemental fats on reproduc-tive tissues and performance of lactating cows. J. Dairy Sci. 81. 856-871.
Steiger M, Senn M, Altreuther G, Werling D, Sutter F, Kreuzer M, Langhans W (1999): Effect of prolonged low-dose lipopolysaccharide infusion on feed intake and metabo-lism in heifers. J. Anim. Sci., 77. 2523-2532.
Stock SM, Sande EM, Bremme KA (1999): Leptin levels vary significantly during the men-strual cycle, pregnancy, and in vitro fertilization treatment: possible relation to estra-diol. Fertil. Steril., 72. 657-662.
Stojic V, Gvozdic D, Kirovski D, Nikolic JA, Huszenicza Gy, Šamanc H, Ivanov I. (2001): Serum thyroxine and triiodothyronine concentrations prior to and after delivery in primiparous Holstein cows. Acta Veterinaria (Beograd), 51. 3-8.
Stouthard JML, Rominj JN, van der Poll T, Endert E, Klein S, Bakker PJM, Veenhof CHN, Sauerwein HP (1995): Endocrinologic and metabolic effects of interleukin-6 in hu-mans. Am. J. Physiol. (Endocrinol. Metab.), 268. E813-E819.
Suriyasathaporn W, Daemen AJJM, Noordhuizen-Stassen EN, Dieleman SJ, Nielen M, Schukken YH (1999): Beta-hydroxybutyrate levels in peripheral blood, and ketone bodies supplemented in culture media affect the in vitro chemotaxis of bovine leuko-cytes. Vet. Immunol. Immunopathol., 68. 177-186.
Suriyasathaporn W, Heuer C, Noordhuizen-Stassen, E, Schukken YH (2000): Hyper-ketonaemia and the impairment of udder defense: a review. Vet. Res., 31. 397-412.
Suzuki C, Yoshioka K, Iwamura S, Hirose H (2001): Endotoxin induces delayed ovulationfollowing endocrine aberration during the prooestrus phase in Holstein heifers. Do-mest. Anim. Endocrinol., 20. 267-278.
Sweeney G (2002): Leptin signaling. Cell Signal, 14. 655-663.
Takahashi N, Wealput W, Guisez Y (1999): Leptin is an endogenous protective protein against the toxicity exerted by tumor necrosis factor. J. Exp. Med., 189. 207-212.
Tamminga S, Luteijn PA, Meijer RGM (1997): Changes in composition and energy contentof liveweight loss in dairy cows with time after parturition. Livest. Prod. Sci., 52. 31-39.
Tang-Christensen M, Havel PJ, Jacobs RR, Larsen PJ, Cameron JL (1999): Central ad-ministration of leptin inhibits food intake and activates the sympathetic nervous sys-tem in rhesus macaques. J. Clin. Endocrinol. Metab., 84. 711-717.
132
Taponen J, Kulcsár M, Kátai L, Huszenicza Gy, Rodriguez Martinez H, Katila T. (2002): Short estrous cycles and estrous signs after premature ovulations induced with clo-prostenol and gonadotropin-releasing hormone in cyclic dairy cows. Theriogenology, 58. 1291-1302.
Tartaglia LA, Dembski M, Weng X, Deng N, Culpepper J, Devos R, Richards GJ, Camp-field LA, Clark FT, Deeds J (1995): Identification and expression cloning of a leptin receptor, OB-R. Cell, 83. 1263-1271.
Taylor VJ, Beever DE, Bryant MJ, Wathes DC (2003): Metabolic profiles and progesteronecycles in first lactation dairy cows. Theriogenology, 59. 1661-1677.
Thomas L, Wallace JM, Aitken RP, Mercer JG, Trayhurn P, Hoggard N (2001): Circulatingleptin during ovine pregnancy in relation to maternal nutrition, body composition and pregnancy outcome. J. Endocrinol., 169. 465-476.
Tiirats T. (1997): Thyroxine, triiodothyronine and reverse-triiodothyronine concentrationsin blood plasma in relation to lactational stage, milk yield, energy and dietary protein intake in Estonian dairy cows. Acta Vet. Scand., 38. 339-348.
Torpy DJ, Bornstein SR, Chrousos GP (1998): Leptin and interleukin-6 in sepsis. Horm. Metab. Res., 30. 726-729.
Turnbull AV, Rivier CL (1999): Regulation of the hypothalamic-pituitary-adrenal axis bycytokines: actions and mechanisms of action. Physiol. Rev., 79. 1-71.
Unger RH (2003): Weapons of lean body mass destruction: the role of ectopic lipids in the metabolic syndrome. Minireview. Endocrinology, 144. 5159-5165.
Van Saun R (2000): Pregnancy toxaemia in a flock of sheep. J. Am. Vet. Med. Ass., 217. 1536-1539.
Vangroenweghe F, Lamote I, Burvenich C. (2005): Physiology of the periparturient period and its relation to severity of clinical mastitis. Domest. Anim. Endocrinol., 29. 283-293.
Vanholder T, Leroy JL, Van Soom A, Opsomer G, Maes D, Corin M, de Kruif A (2005): Effect of non-esterified fatty acids on bovine granulosa cell steroidogenesis and pro-liferation in vitro. Anim. Reprod. Sci., 87. 33-44.
Vanholder T, Leroy JL, Van Soom A., Maes D, Coryn M, Fiers T, de Kruif A, Opsomer G (2006): Effect of non-esterified fatty acids on bovine theca cell steroidogenesis and proliferation in vitro. Anim. Reprod. Sci., 92. 51-63.
Veerkamp RF, Beerda B, van der Lende T. (2003): Effects of genetic selection for milk yield on energy balance, levels of hormones and metabolites in lactating cattle, and possible links to reduced fertility. Livest. Prod. Sci., 83. 257-275.
Verite R, Chilliard Y (1992): Effect of age of dairy cows on body composition changes throughout the lactation cycle as measured with deuteriated water. Ann. Zootech., 41. 118.
Vernon RG, Denis RGP, Sorensen A (2001): Signals of adiposity. Domest. Anim. Endo-crin., 21. 197-214.
Vernon RG, Denis RG, Sorensen A, Williams G (2002): Leptin and the adaptation of lacta-tion in rodents and ruminants. Horm. Metab. Res., 34. 678-685.
Viguié C, Chilliard Y, Gayrard V, Picard-Hagen N, Monget P, Dutour A, Toutain P-L(2004): Alterations of somatotropic function in prion disease in sheep. J. Endocrinol., 183. 427-435.
Waddell BJ, Smith J. (2003): Leptin in rodent pregnancy. In: Henson MC, Castracane VD (eds): Leptin and reproduction. Kluwer Academic / Plenum Publishers, New York, pp 221-238.
Waldron MR, Nishida T, Nonnecke BJ, Overton TR (2003): Effect of lipopolysaccharide on indices of peripheral and hepatic metabolism in lactating cows. J. Dairy Sci., 86. 3447-3459.
133
Waller CA, Thompson DL, Cartmill JA, Storer WA, Huff NK (2006): Reproduction in high body condition mares with high versus low leptin concentrations. Theriogenology, 66. 923-928.
Walters AH, Pryor AW, Bailey TL, Pearson RE, Gwazdauskas FC (2002): Milk yield, en-ergy balance, hormone, follicular and oocyte measure in early and mid-lactation Hol-stein cows. Theriogenology, 57. 949-961.
Wartofsky L, Burman KD (1982): Alterations in thyroid function in patients with systemic illnesses: the “euthyroid sick syndrome”. Endocr. Rev., 3. 164-217.
Warren MP, Dominguez JE (2003): Leptin in hypothalamic amenorrhea. In: Henson MC, Castracane VD (eds): Leptin and reproduction. Kluwer Academic / Plenum Publish-ers, New York, pp 311-332.
Watanobe H (2002): Leptin directly acts within the hypothalamus to stimulate gonadotro-pin-releasing hormone secretion in vivo in rats. J. Physiol., 545. 255-268.
Wathes DC, Taylor VJ, Cheng Z, Mann GE (2003): Follicle growth, corpus luteum function and their effects on embryo development in postpartum dairy cows. Reproduction,Suppl. 61. 1-19.
Wathes DC, Cheng Z, Bourne N, Taylor VJ, Coffey MP, Brotherstone S (2007): Differ-ences between primiparous and multiparous dairy cows in the inter-relationships be-tween metabolic traits, milk yield and body condition score in the periparturient pe-riod. Domest. Anim. Endocr., in press.
Wensing T, Kruip T, Geelen MJH, Wentink GH, van den Top, AM (1997): Postpartum fatty liver in high-producing dairy cows in practice and in animal studies. The connection with health, production and reproduction problems. Comp. Haemat. Internat., 7. 167-171.
Whitaker DA, Goodger WJ, Garcia M, Perera BMAO, Wittwer F (1999): Use of metabolic profiles in dairy cattle in tropical and suptropical countries on smallholder dairy farms. Prev. Vet. Med., 38. 119-131.
Williams GL, Amstalden M, Garcia MR, Stanko RL, Nizielski SE, Morrison CD, Keisler DH (2002): Leptin and its role in the central regulation of reproduction in cattle. Dom. Anim. Endocrinol., 23. 339-349.
Woller M, Tessmer S, Neff D, Nguema AA, Roo BV, Waechter-Brulla D (2001): Leptin stimulates gonadotropin releasing hormone release from cultured intact hemihypotha-lamic and enzymatically dispersed neurons. Exp. Biol. Med., 226. 591-596.
Xiao E, Zhang LX, Vulliémoz NR, Ferin M, Wardlaw SL (2003): Leptin modulates inflamma-tory cytokine and neuroendocrine responses to endotoxin in the primate. Endocrinol-ogy, 144. 4350-4353.
Yamasaki M, Mansho K, Origo Y, Kasai M, Tachibana, Yamada K (2000): Acute reductionof serum leptin level by dietary conjugate linoleic acid in Sprague-Dawley rats. J. Nutr. Biochem., 11. 467-471.
Yoon SJ, Cha KY, Lee KA (2005): Leptin receptors are down-regulated in uterine implan-tation sites compared to inter-implantation sites. Mol. Cell. Endocrinol., 232. 27-35.
Yuen BS, Owens PC, McFarlane JR, Symonds ME, Edwards LJ, Kauter KG, McMillen IC (2002): Circulating leptin concentrations are positively related to leptin messenger RNA expression in the adipose tissue of fetal sheep in the pregnant ewe fed at or be-low maintenance energy requirements during late gestation. Biol. Reprod., 67. 911-916.
Yuen BS, McMillen IC, Symonds ME, Owens PC (1999): Abundance of leptin mRNA in fetal adipose tissue is related to fetal body weight. J. Endocrinol., 163. 11-14.
Yuen BS, Owens PC, Symonds ME, Keisler DH, McFarlane JR, Kauter KG, McMillen I C (2004): Effects of leptin on fetal plasma adrenocorticotopic hormone and cortisol con-centrations and the timing of parturition in the sheep. Biol. Reprod,. 70. 1650-1657.
134
Zerbe H, Schneider N, Leibold W, Wensing T, Kruip TAM, Schuberth HJ (2000): Altered functional and immunophenotypical properties of neutrophil granulocytes in postpar-tum cows associated with fatty liver. Theriogenology, 54. 771-786.
Zhang Y, Basinski MB, Beals JM, Briggs SL, Churgay LM, Clawson DK, DiMarchi RD, Furman RC, Hale JE, Hsiung HM, Schoner BE, Smith DP, Zhang XY, Wery, JP, Schveitz RW (1997): Crystal structure of the obese protein leptin-E100. Nature, 387. 206-209.
Zhang Y, Proenca R, Maffei M, Barone M, Leopold L, Friedman JM (1994): Positionalcloning of the mouse obese gene and its human homologue. Nature, 372. 425-432.
Zieba DA, Amstalden M, Morton S, Gallino JL, Edwards JF, Harms PG, Williams GL (2003a): Effects of leptin on basal and GHRH-stimulated GH secretion from the bo-vine adenohypophysis are dependent upon nutritional status. J. Endocrinol., 178. 83-89.
Zieba DA, Amstalden M, Maciel MN, Keisler DH, Raver N, Gertler A, Williams GL (2003b): Divergent effects of leptin on luteinizing hormone and insulin secretion are dose de-pendent. Exp. Biol. Med., 228. 325-330.
Zieba DA, Amstalden M, Williams GL (2005): Regulatory role of leptin in reproduction and metabolism: a comparative review. Domest. Anim. Endocrin., 28. 166-185.
135
Suppl. 1
The candidate’s publications related to the present dissertation1. Full-text papers published in peer-reviewed journals in English:
1.1. Nikolic, J.A., Nedic, O., Samanch, H., Aleksic, S., Miscevic, B., Kulcsár, M.: Periph-eral circulating insulin-like growth factor-I and II in cattle. Acta Vet. Hung., 2001. 49.53-63. (IF: 0.420)
1.2. Meikle, A., Kulcsár, M., Chilliard, Y., Fébel, H., Delavaud, C., Cavestany, D., Chili-broste, P.: Effects of parity and body condition score at calving on endocrine and repro-ductive parameters of the dairy cow under grazing conditions. Reproduction, 2004. 127.727-737. (IF: 2.181)
1.3. Huszenicza Gy., Jánosi Sz., Gáspárdy A., Kulcsár M.: Endocrine aspects in pathogene-sis of mastitis in postpartum dairy cows. Anim. Reprod. Sci., 2004. 82-83. 389-400.(IF: 1.410)
1.4. Kokkonen, T., Taponen, J., Tuori, M., Lohenoja, S., Kulcsár, M., Delavaud, C., Chil-liard, Y., Tesfa A.T.: Effects of fat supplementation in early lactation dairy cows. J. Anim. Feed Sci., 2004. 13. Suppl. 1. 499-502. (IF: 0.416)
1.5. Cavestany, D., Blanc, J.E., Kulcsár, M., Uriarte, G., Chilibroste, P., Meikle, A., Fébel, H., Ferraris, A., Krall, E.: Metabolic profiles of the transition dairy cow under a pasture-based milk production system. J. Vet. Med. A., 2005. 52. 1-7. (IF: 0.756)
1.6. Kulcsár M., Jánosi Sz., Lehtolainen T., Kátai L., Delavaud C., Balogh O., Chilliard Y., Pyörälä S., Rudas P., Huszenicza Gy.: Feeding-unrelated factors influencing the plasma leptin level in ruminants. Domest. Anim. Endocrin., 2005. 29. 214-226. (IF: 1.559)
1.7. Kulcsár M., Dankó G., Magdy, H.G.I., Reiczigel J., Forgach T, Proháczik A., De-lavaud, A., Magyar K., Chilliard, Y., Solti L., Huszenicza Gy.: Pregnancy stage and num-ber of fetuses may influence maternal plasma leptin in ewes. Acta Vet. Hung., 2006. 54.221-234. (last known IF in 2005: 0.530)
1.8. Kulcsár M., Dankó G., Delavaud, C., Mircu, C., Nikolic, A.J., Gáspárdy A., Cernescu,H., Chilliard, Y., Cseh S., Rudas P., Huszenicza Gy.: Endocrine characteristics of late pregnant hyperketonaemic ewes and their reproductive performance following the induc-tion of ovarian cyclicity out of the breeding season. Acta Vet. Hung., 2006. 54. 235-249. (last known IF in 2005: 0.530)
1.9. Földi J., Kulcsár M., Pécsi A., Huyghe, B., de Sa, C., Lohuis, J.A.C.M., Cox, P., Huszenicza Gy.: Bacterial complications of postpartum uterine involution in cattle. Anim.Reprod. Sci., 2006. 96. 265-281. (last known IF in 2005: 2.136)
2. Full-text papers published in peer-reviewed journals in Hungarian:
2.1. Huszenicza Gy., Kulcsár M., Kátai L., Balogh O.: A nagy tejtermelésu tehén takarmán-yozásának, tejtermelésének és szaporodóképességének kapcsolata. Irodalmi áttekintés. 2. A petefészek muködése az ellés utáni idoszakban. Magy. Áo. Lapja, 2003. 125 (58).75-82. (IF: 0.089)
136
2.2. Kátai L., Kulcsár M., Kiss G., Huszenicza Gy.: A nagy tejtermelésu tehén takarmán-yozásának, tejtermelésének és szaporodóképességének kapcsolata. Irodalmi áttekintés. 3. Az újravemhesülés zavarai. Magy. Áo. Lapja, 2003. 125 (58). 143-146.
(IF: 0.089)
2.3. Huszenicza Gy., Kulcsár M., Dankó G., Balogh O., Gaál T.: A nagy tejtermelésu tehén takarmányozásának, tejtermelésének és szaporodóképességének kapcsolata. Irodalmi át-tekintés. 4. A ketonanyag-képzodés fokozódása és annak klinikai következményei.Magy. Áo. Lapja, 2003. 125 (58). 203-208. (IF: 0.089)
2.4. Faigl V., Marton A., Keresztes M., Novotniné Dankó G., Csatári G., Antal J., Nagy S., Árnyasi M., Kulcsár M., Cseh S., Huszenicza Gy.: Az anyajuhok szaporodási teljesít-ményének növelésével összefüggo egyes újabb élettani kérdések és ezek technológiai vonatkozásai. Irodalmi áttekintés. Magy. Áo. Lapja, 2005. 127 (60). 586-593. (IF:0.114)
2.5. Pécsi A., Földi J., Kulcsár M., Pécsi T., Huszenicza Gy.: Az involúció bakteriális ere-detu szövodményei szarvasmarhában. Irodalmi áttekintés. 1. rész. Magy. Áo. Lapja,2006. 128. 721-730. (last known IF in 2005: 0.114)
3. Abstracts published in peer-reviewed journals in English:
3.1. Huszenicza Gy., Kulcsár M., Jánosi Sz., Lehtolainen, T., Danko, G., Kátai L., De-lavaud, C., Magdy H.G.I., Balogh O., Chilliard, Y., Pyörälä, S., Rudas, P.: Feeding-unrelated factors influencing the plasma leptin level in ruminants. Abstract. Biotechnology,Agronomy, Society and Environment, 2004. 8. 22.
3.2. Kulcsár M., Jánosi Sz., Kátai, L., Kóródi P., Balogh O., Delavaud, C., Chilliard, Y.: Mastitis-related endocrine alterations in postpartum dairy cows. Abstract. Reprod. Dom. Anim., 2004. 39. 289.
3.3. Kulcsár M., Lehtolainen, T., Balogh O., Delavaud, C., Chilliard, Y., Pyörälä, S.: Ex-perimental endotoxin mastitis fails to alter the plasma leptin level in dairy cows. Abstract. Reprod. Dom. Anim., 2004. 39. 290.
3.4. Huszenicza Gy., Kulcsár M., Jánosi Sz, Lehtolainen T., Delavaud C, Chilliard Y, Pyörälä S: Effects of Gram-negative mastitis on plasma leptin level in dairy cows. Ab-stract. Tierärztliche Praxis, 2004. 32(G). 107.
3.5. Huszenicza Gy., Jánosi Sz., Kulcsár M.: Effects of Gram-negative mastitis on ovarianactivity in postpartum (pp) dairy cows. Abstract. Tierärztliche Praxis, 2004. 32. 107.
3.6. Kulcsár M., Kátai L., Balogh O., Pécsi A., Dalevaud, C., Földi J., Hirvonen, J., Faigl V., Chilliard, Y., Huszenicza, Gy.: Metabolic and endocrine changes, inflammatory pro-teins and ovarian activity in dairy cows with acute puerperal metritis. Abstract. Reprod.Dom. Anim., 2005. 40. 407.
4. Full-text papers published in conference proceeding books
4.1. Huszenicza, Gy., Kátai, L., Kulcsár, M., Pécsi T., Kiss G., Delavaud, C., Fébel H., Chilliard, Y., Driancourt, M.A., Butler, W.R.: Metabolic factors influencing fertility at the first postpartum insemination in high-producing dairy cows. Proc. of 15th European A.I. Vets’ Meeting (8-11 October, 2003, Budapest, Hungary), pp. 16-25.
137
4.2. Huszenicza, Gy., Kulcsár, M., Kátai, L., Balogh, O., Meikle, A., Fébel, H., Delavaud,C., Pécsi, A., Földi, J., Cavestany, D., Chilliard, Y., Fekete, S.: Metabolic factors influ-encing the onset of cyclic ovarian function and fertility in postpartum dairy cows. Proc. of the 8th Internat. Conf. of the European Society of Veterinary and Comparative Nu-trition (Sept. 23-25, 2004, Budapest, Hungary), pp. 17-37.
4.3. Kulcsár M., Jánosi Sz., Lehtolainen T., Delavaud, C, Chilliard, Y., Pyörälä, S.,Huszenicza Gy.: Effects of Gram-negative mastitis on plasma leptin level in dairy cows. Proc. 3. Leipziger Tierärztekongress: Endotoxikosen bei Rinden. (22 Jan. 2005, Leipzig, Deutsland), pp. 133-151.
Suppl. 2
Further leptin-related publications of the candidate
1. Full-text papers published in peer-reviewed journals:
1.1. Nikolic, J. A., Kulcsár, M., Kátai, L., Nedic, O., Jánosi, Sz., Huszenicza, Gy.: Peripar-turient endocrine and metabolic changes in healthy cows and in those affected by various forms of mastitis. J. Vet. Med. A, 2003. 50. 22-29. (IF: 0,558)
1.2. Sayed-Ahmed, A., Kulcsár, M., Rudas, P., Bartha, T.: Expression and localization of leptin and leptin receptor in the mammary gland of the dry and lactating non-pregnantcow. Acta Vet. Hung., 2004. 52. 97-111. (IF: 0,566)
1.3. Cavestany, D., Kulcsár, M., Crespi, D., Chilliard, Y., La Manna, A., Balogh, O., Keresztes, M., Delavaud, C., Huszenicza, Gy., Meikle, A.: Effect of prepartum energeticsupplementation on production and reproductive characteristics, and metabolic and hor-monal profiles in dairy cows under grazing conditions. J. Dairy Sci., submitted for publ. (last known IF in 2005: 2.240)
2. Further full-text leptin-related papers
2.1. Huszenicza, Gy., Kulcsár, M., Nikolic, J. A., Schmidt, J., Kóródi, P., Kátai, L., Diele-man, S., Ribiczei-Szabo, P., Rudas, P.: Plasma leptin concentration and its interrelation with some blood metabolites, metabolic hormones and the resumption of cyclic ovarian function in postpartum dairy cows supplemented with Monensin or inert fat in feed. In: Diskin, M.G. (ed.): Fertility in the high-producing dairy cow. British Society of Animal Science (Edinburgh, United Kingdom), Occasional publications, 2001., No. 26., Vol. 2., pp. 405-409.
2.2. Huszenicza Gy., Kulcsár M., Kátai L., Balogh O., Balogh-Pál B.: Az endokrin ritmusokösszhangjának példája a szaporodásbiológiában: a ciklikus petefészek-muködés újrain-dulása az ellés utáni idoszakban nagy tejtermelésu szarvasmarhában. In: Csernus V., Mess B.: Biológiai órák: ritmikus biológiai folyamatok az élovilágban. Akadémiai Kiadó, Budapest, 2006. pp. 137-150.
138
In commemoration of � Prof. Péter Rudas
AcknowledgementThe author expresses her sincerely gratitude to her former supervisor, Prof. Péter Rudas,
for the important and continuous support of this work, for his irreplaceable contribution.
On behalf of her team the candidate has to thank Prof. Y. Chilliard and C. Delavaud(INRA, INRA, Saint-Genes-Champanelle, France) for providing the ruminant-specific leptin antibody (which was one of the important technical prerequisites of this assay development), for their exceptional, friendly help and attitude, and for their unnumbered valuable advice.
This complex subject required a wide range of multilateral cooperation with researchers of many institutes and nations, lasting for several years. The author warmly thanks all the partic i-pants, especially
� T. Forgách and Gy. Jánoki (National Research Institute for Radiobiology and Radiohygiene, Budapest, Hungary);
Prof. Magdy H. G. Ishak (Atomic Energy Authority, Nuclear Research Center, Cairo, Egypt);Cs. Keszei and A. Németh (Institute of Isotopes Co. Ltd., Budapest, Hungary);
H. Fébel (Research Institute for Animal Breeding and Nutrition, Herceghalom, Hungary);Prof. S. Pyörälä, J. Taponen, � J. Hirvonen, T. Lehtolainen and T. Kokkonen
(Faculty of Veterinary Medicine, Helsinki, Finland);A. Meikle , Prof. D. Cavestany and P. Chilibroste
(Faculty of Veterinary Medicine, Montevideo, Uruguay);J. A. Nikolic (Institute for the Application of Nuclear Energy, Belgrade, Serbia);I. Ivanov and H. Samanch (Faculty of Veterinary Medicine, Belgrade, Serbia);
J. Reiczigel and A. Gáspárdy (Budapest, Hungary);and all the local practitioners and staff members of herds and flocks
(where the experiments were conducted)for their kind assistance, contribution and support.
I am grateful to our technicians, assistants and the academic staff of our department, for supporting this activity with their own work. I express my extra thanks our department headprofessors, Gy. Pethes, J. Haraszti and L. Solti, for their patience, furthermore our retired tech-nicians, B. Budai, E. Kiss and I. Simon-Czigány, and the former and current youngs and extra-mural members of our team, O. Balogh, G. Dankó, J. Földi, Sz. Jánosi, L. Kátai, P. Kóródiand O. Szepes, for their valuable technical assistance.
I thank the efforts of Profs T. Bartha, L. Bárdos, S. Cseh, S. Fekete , J. Haraszti, F.Husvéth, F. Kutas, Gy. Pethes, G. Sályi, L. Solti, J. Szabó, O. Szenci and L. Zöldág, the con-tribution of my closest colleagues and friends, V. Faigl, M. Keresztes, K. Oppel and K. Paksy,and especially the generous assistance of my reviewers, Profs P. Gálfi and M. Mézes, who allwere so kind to read the preliminary form of this dissertation, and with their innumerous advice and revision helped me a lot to improve the quality of the current final version.
The financial support (project numbers: FKFP-0270, OTKA-T/016 473 and OTKA-T/034435) is gratefully acknowledged.
Finally, I express my thanks to my family for encouraging me continuously, and for the time what I could put into this dissertation.
Budapest, 17 March 2007
Margit Kulcsár DVMDepartment of Obstetrics and Reproduction
Faculty of Veterinary Science, Budapest
Copyright © 2022 FDOKUMEN