Systemic response to Campylobacter jejuni infection by profiling gene transcription in the spleens...
11
ORIGINAL PAPER Systemic response to Campylobacter jejuni infection by profiling gene transcription in the spleens of two genetic lines of chickens Xianyao Li & Christina L. Swaggerty & Michael H. Kogut & Hsin-I Chiang & Ying Wang & Kenneth J. Genovese & Haiqi He & Fiona M. McCarthy & Shane C. Burgess & Igal Y. Pevzner & Huaijun Zhou Received: 26 April 2011 /Accepted: 23 June 2011 /Published online: 7 July 2011 # Springer-Verlag 2011 Abstract Campylobacter jejuni (C. jejuni) is a leading cause of human bacterial enteritis worldwide with poultry products being a major source of C. jejuni contamination. The chicken is the natural reservoir of C. jejuni where bacteria colonize the digestive tract of poultry, but rarely cause symptoms of disease. To understand the systemic molecular response mechanisms to C. jejuni infection in chickens, total splenic RNA was isolated and applied to a whole genome chicken microarray for comparison between infected (I) and non-infected (N) chickens within and between genetic lines A and B. There were more total splenic host genes responding to the infection in resistant line A than in susceptible line B. Specifically, genes for lymphocyte activation, differentiation and humoral response, and Ig light and heavy chain were upregulated in the resistant line. In the susceptible line, genes for regulation of erythrocyte differentiation, hemopoiesis, and RNA biosynthetic process were all downregulated. An interac- tion analysis between genetic lines and treatment demon- strated distinct defense mechanisms between lines: the resistant line promoted apoptosis and cytochrome c release from mitochondria, whereas the susceptible line responded with a downregulation of both functions. This was the first time that such systemic defensive mechanisms against C. jejuni infection have been reported. The results of this study revealed novel molecular mechanisms of the systemic host responses to C. jejuni infection in chickens that warrant further investigation. Keywords Chicken . C. jejuni . Transcriptome . Resistant . Susceptible Introduction Campylobacter jejuni (C. jejuni) is a leading cause of food- borne disease in humans in developed countries (Altekruse et al. 1999; van Putten et al. 2009; Gruntar et al. 2010) with poultry products being a major source of contamination. The chicken is the natural reservoir of C. jejuni (Altekruse et al. 1999) where bacteria colonize the digestive tract of Xianyao Li and Christina L. Swaggerty contributed equally to this work. Electronic supplementary material The online version of this article (doi:10.1007/s00251-011-0557-1) contains supplementary material, which is available to authorized users. X. Li : H.-I. Chiang : Y. Wang : H. Zhou (*) Department of Poultry Science, Texas A&M University, College Station, TX 77843, USA e-mail: [email protected] C. L. Swaggerty : M. H. Kogut (*) : K. J. Genovese : H. He United States Department of Agriculture, Agricultural Research Service, Southern Plains Agricultural Research Center, College Station, TX 77845, USA e-mail: [email protected] F. M. McCarthy : S. C. Burgess Department of Basic Sciences, College of Veterinary Medicine, Mississippi State University, Starkville, MS 39762, USA I. Y. Pevzner Cobb-Vantress, Inc., Siloam Springs, AR 72761, USA X. Li College of Animal Science and Technology, Shandong Agricultural University, Taian, Shandong 271018, China Immunogenetics (2012) 64:59–69 DOI 10.1007/s00251-011-0557-1
-
Upload
independent -
Category
Documents
-
view
2 -
download
0
Transcript of Systemic response to Campylobacter jejuni infection by profiling gene transcription in the spleens...
ORIGINAL PAPER
Systemic response to Campylobacter jejuni infectionby profiling gene transcription in the spleens of two geneticlines of chickens
Xianyao Li & Christina L. Swaggerty & Michael H. Kogut & Hsin-I Chiang &
Ying Wang & Kenneth J. Genovese & Haiqi He & Fiona M. McCarthy &
Shane C. Burgess & Igal Y. Pevzner & Huaijun Zhou
Received: 26 April 2011 /Accepted: 23 June 2011 /Published online: 7 July 2011# Springer-Verlag 2011
Abstract Campylobacter jejuni (C. jejuni) is a leadingcause of human bacterial enteritis worldwide with poultryproducts being a major source of C. jejuni contamination.The chicken is the natural reservoir of C. jejuni wherebacteria colonize the digestive tract of poultry, but rarelycause symptoms of disease. To understand the systemicmolecular response mechanisms to C. jejuni infection in
chickens, total splenic RNA was isolated and applied to awhole genome chicken microarray for comparison betweeninfected (I) and non-infected (N) chickens within andbetween genetic lines A and B. There were more totalsplenic host genes responding to the infection in resistantline A than in susceptible line B. Specifically, genes forlymphocyte activation, differentiation and humoral response,and Ig light and heavy chain were upregulated in theresistant line. In the susceptible line, genes for regulationof erythrocyte differentiation, hemopoiesis, and RNAbiosynthetic process were all downregulated. An interac-tion analysis between genetic lines and treatment demon-strated distinct defense mechanisms between lines: theresistant line promoted apoptosis and cytochrome c releasefrom mitochondria, whereas the susceptible line respondedwith a downregulation of both functions. This was the firsttime that such systemic defensive mechanisms against C.jejuni infection have been reported. The results of this studyrevealed novel molecular mechanisms of the systemic hostresponses to C. jejuni infection in chickens that warrantfurther investigation.
Keywords Chicken .C. jejuni . Transcriptome . Resistant .
Susceptible
Introduction
Campylobacter jejuni (C. jejuni) is a leading cause of food-borne disease in humans in developed countries (Altekruseet al. 1999; van Putten et al. 2009; Gruntar et al. 2010) withpoultry products being a major source of contamination.The chicken is the natural reservoir of C. jejuni (Altekruseet al. 1999) where bacteria colonize the digestive tract of
Xianyao Li and Christina L. Swaggerty contributed equally to thiswork.
Electronic supplementary material The online version of this article(doi:10.1007/s00251-011-0557-1) contains supplementary material,which is available to authorized users.
X. Li :H.-I. Chiang :Y. Wang :H. Zhou (*)Department of Poultry Science, Texas A&M University,College Station, TX 77843, USAe-mail: [email protected]
C. L. Swaggerty :M. H. Kogut (*) :K. J. Genovese :H. HeUnited States Department of Agriculture, Agricultural ResearchService, Southern Plains Agricultural Research Center,College Station, TX 77845, USAe-mail: [email protected]
F. M. McCarthy : S. C. BurgessDepartment of Basic Sciences, College of Veterinary Medicine,Mississippi State University,Starkville, MS 39762, USA
I. Y. PevznerCobb-Vantress, Inc.,Siloam Springs, AR 72761, USA
X. LiCollege of Animal Science and Technology,Shandong Agricultural University,Taian, Shandong 271018, China
Immunogenetics (2012) 64:59–69DOI 10.1007/s00251-011-0557-1
poultry but rarely cause signs of disease (Beery et al. 1988).Improved hygiene practices do not appear to be effective incontrolling C. jejuni colonization in poultry due towidespread environmental contamination by the bacteria(Boyd et al. 2005). Even more disturbing is that C. jejuni isresistant to many antibiotics including quinolone (Acar andGoldstein 1997); thereby increasing the concerns for C.jejuni as a major food safety organism.
In comparison to other food safety enteric bacteria suchas Salmonella, C. jejuni pathogenesis is still poorlyunderstood (van Putten et al. 2009). Studies have shownthat the host’s genetic background plays an important rolein the response to C. jejuni (Stern et al. 1990; Boyd et al.2005; Li et al. 2008b). We have previously shown differentsusceptibility patterns to cecal colonization by C. jejunibetween two chicken lines (line A vs. line B), where line Ais more resistant to cecal colonization compared to line B(Li et al. 2008b). These two chicken lines have shownsimilar susceptibility patterns in response to differentpathogens including Salmonella, Enterococcus, and Eimeria,i.e., with line A being more resistant while line B is moresusceptible to all of the infections (Ferro et al. 2004;Swaggerty et al. 2005a; Swaggerty et al. 2005b; Li et al.2008b; Swaggerty et al. 2011).
The local intestinal response to C. jejuni infection in thececum has been investigated by profiling the host geneexpression in these two lines of chickens using a wholechicken genome 44K Agilent microarray (Li et al. 2010).However, C. jejuni has been shown to colonize the liver andthe spleen of chickens in 48 h after challenge (Meade et al.2008; Smith et al. 2008). As a secondary lymphoid organ ofthe avian immune system, profiling changes in genetranscription in the spleen during a C. jejuni infectionshould provide further insights into the systemic hostresponse at the molecular and cellular levels in chickens.Therefore, a genetic model of two lines of chickens thatdiffer in their phenotypes to C. jejuni cecal colonizationwas used. The objectives of the present study were twofold:(1) to evaluate the differences in spleen gene expressionbetween these two lines of chickens and (2) to identifydifferentially expressed genes in the spleen within linesfollowing C. jejuni infection.
Materials and methods
Chickens, C. jejuni infection, and sample collection
Two chicken lines, A and B, were obtained from acommercial breeding company. The bacterial challenge andsample collection were performed as described previously(Li et al. 2008b). In brief, C. jejuni strain 5088 was enrichedin Bolton broth (Oxoid, Basingstoke, UK) at 42°C for 40 h.
Within each line, 80 1-day-old chickens were orally infectedwith 0.5 ml of inoculants for a final dose of 1.8×10⁵ colonyforming units (cfu) per chicken, and 40 chickens from eachline were mock-infected with phosphate-buffered saline ascontrols. All animal experiments were conducted accordingto the guidelines of the Institutional Animal Care and UseCommittee at Texas A&M University and the United StatesDepartment of Agriculture.
Both infected (I) and non-infected (N) birds were sacrificedat day 7 post-infection (pi). The cecal contents were collectedfor bacterial enumeration. The number of C. jejuni colonizingthe ceca on day 7 pi in line A (1.39 log10 cfu±0.14) issignificantly lower than that in line B (3.50 log10 cfu±0.15)(Li et al. 2008b). The spleen was aseptically harvested fromthe same chickens used for the cecal study (Li et al. 2010)and immediately immersed in ten volumes of RNAlater(Ambion, Austin, TX) for isolation of total RNA.
Total RNA isolation, experimental design, sample labeling,and hybridization
A 20-mg sample was removed from RNAlater-stabilizedspleen tissue, cut into pieces and placed in a 2-ml centrifugetube containing 600 μl of TRI Reagent (Ambion, Austin,TX). The PRO200 homogenizer (PRO Scientific, Oxford,CT) was used to homogenize the lysate. Total RNA wasisolated from each homogenized sample using MagMax™-96 Total Nucleic Acid Isolation Kit (Ambion, Austin, TX)according to the manufacturer’s protocol. Thirty-twoindividual RNA samples were isolated from each infectedline (infected line A (AI), infected line B (BI)) and 16 fromeach non-infected line (non-infected line A (AN), non-infected line B (BN)), in total, 96 individual RNA sampleswere isolated. Two samples in each group were randomlyselected to make a pool with equal amounts of RNA.Sixteen pools were made with each infected line (AI andBI) and eight with each non-infected line (AN and BN), fora total of 48 pools of RNA.
A chicken 44K Agilent microarray and pair-comparisondesign were utilized in the current study to provide fourdifferent comparisons: line A vs. line B (AN/BN and AI/BI)and infected vs. non-infected (AI/AN, BI/BN) and 16biological replicates were used in each comparison withdye balance with the exception of the AN/BN comparisonwhich had eight biological replicates.
A 400-ng sample of total RNA from each pooled samplewas used for labeling. A pool labeled with Cy3 or Cy5 washybridized with another pool labeled with Cy5 or Cy3 andthen incubated at 65°C for 17 h. The post-hybridizationwashes were performed according to the manufacturer’srecommendation. The labeling, hybridization, and washingprocedures were followed with Agilent’s recommendationand are described in detail (Li et al. 2008a).
60 Immunogenetics (2012) 64:59–69
Microarray data analysis
Before normalization, a signal intensity of each probe wasfiltered against negative controls in the microarray. Differentcomparisons were made between two lines (AN/BN and AI/BI) and between infected and non-infected within each line(AI/AN and BI/BN). Data normalization was performed usinglocally weighted regression or smoothing scatter plots(Cleveland 1974; Yang et al. 2002) by R project (http://www.r-project.org). The normalized natural log intensitieswere analyzed by SAS using a mixed model (SAS, Cary,NC) with fixed effect of treatment (I or N), line (A or B) anddye (Cy5 or Cy3), interaction between genetic line andtreatment, and random effect of slide and array. A P<0.01was considered as significant. False discovery rate (FDR) (qvalues) was calculated using the R program according toStorey and Tibshirani’s method (Storey and Tibshirani 2003).Minimum information about a microarray experiment infor-mation about this experiment has been deposited in NCBI’sGene Expression Omnibus (Barrett et al. 2007). Theaccession numbers are: platform, GPL6413; series,GSE18541.
Functional annotations for those differentially expressed geneswere performed through theDAVIDBioinformatics Resources6.7 Beta (Dennis et al. 2003; Huang et al. 2009). Statisticsrelated to over representation of functional categories wereperformed using DAVID, which is based upon a Fisherexact statistical methodology similar to that described byAl-Shahrour and colleagues (Al-Shahrour et al. 2004). Theenriched gene ontology (GO) terms obtained from DAVIDwere assigned into immune class through CateGOrizer(Hu et al. 2008) to group the functional terms.
Quantitative real-time PCR
Quantitative real-time PCR (qRT-PCR) was performed aspreviously described (Li et al. 2008a) with the listed
primers (Table 1). Briefly, 1 μg of total RNA was reverse-transcribed into cDNA using random hexamers andThermoscript™ RT-PCR system (Invitrogen, Carlsbad,CA), and the reagents were loaded by an EppendorfepMotion 5070 workstation (Eppendorf, Westbury, NY).The amplification was performed as one cycle of 95°Cfor 10 min, 40 cycles of 59°C for 15 s, and 59°C for1 min using the SYBR Green Master Mix and ABI Prism7900HT system (Applied Biosystems, Foster City, CA).The chicken β-actin gene was used as the internalstandard to correct the input of cDNA. Triplicate qRT-PCRs were performed on each cDNA, and the averageCt was used for further analysis. The relative quantifica-tion values were calculated using the 2−ΔΔCt method(Livak and Schmittgen 2001).
Results
Identification of differentially expressed genesbetween lines
The genetic difference between these two lines wascompared by identifying the number of significantlyexpressed genes in the spleen between line A and line Bfor both infected and non-infected chickens.
1. Comparison of the gene expression profile betweennon-infected birds from each line
The gene expression profile of the spleen betweenlines A and B before infection (AN vs. BN) werecompared, and 1,081 genes were differentiallyexpressed between line A and line B (P<0.01) withan FDR of 0.19. Of the 1,081 genes, 461 genes hadhigher expression levels in line A than line B, whereas620 genes had a higher expression in line B than lineA. For the genes with higher expression levels in line
Table 1 Primers for qRT-PCR
Gene Accession no. Forward primer (5′-3′) Reverse primer (5′-3′)
CD8a Z22726 TTCTTCCCAGCCACAACAAC GCATCGTCGTCTTCTGGTCT
CXCL13 BX264625 ACCACAACTGCCTTCATTCC TTTCTTCTTCAGCTTCGGGA
HSP90a CO635775 GCGTTTGCTGATTCTGTGAG GAGCAATCTCAGCCTGGAAG
Ig VJC M33050 CTCGAACATCCCTTCACGAT CGTTCAGCTCCTCCTTTGAC
IRF4 AF320331 ATCTACTGGGATGGGCCTCT CCTGGTACCTTGGAAGTGGA
PNPT1 CR386192 ACTGCCTTGCAGGTTGATCT GTCTGGGTTTTGCCAGTGTT
HES1 AY225440 GAGATGACGGTGAAGCACCT GACAGGAACCTCGTCACCTC
ID4 AY040530 CGACCCGGTAAGAGGCTGGC TGGAGCCGTGCTCGTCCCTC
NGF BU313448 GTGCTGGGAGAGGTCAACAT TCAGTGCTTTGACGAAGGTG
β-actin L08165 ACGTCTCACTGGATTTCGAGCAGG TGCATCCTGTCAGCAATGCCAG
IRF4 interferon regulatory factor 4
Immunogenetics (2012) 64:59–69 61
A, 285 had a fold change >2, and 16 genes had a foldchange >10. The highest fold change (394.28) wasobserved for Nuf2. Among the genes with a higherexpression in line B, 405 had a fold change >2, and 27genes had a fold change >10. The highest fold change(107.27) was observed for a chicken EST (BX268464).
2. Comparison of the gene expression profile of the spleenbetween C. jejuni-infected chickens from each line
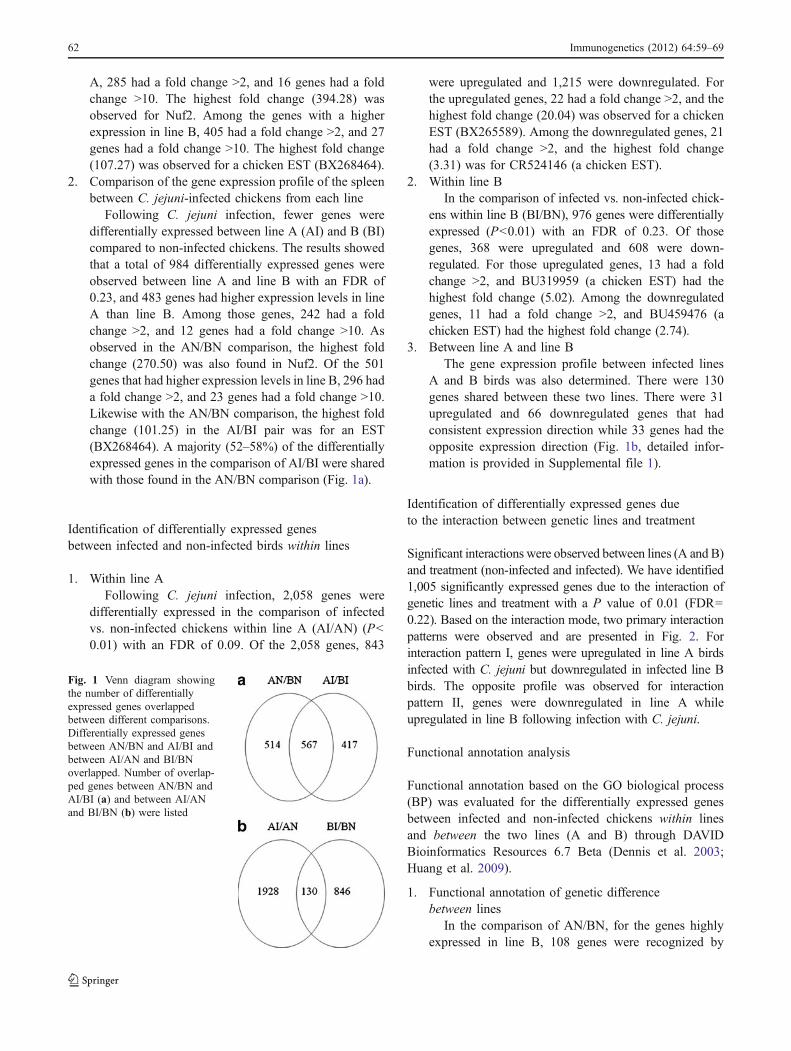
Following C. jejuni infection, fewer genes weredifferentially expressed between line A (AI) and B (BI)compared to non-infected chickens. The results showedthat a total of 984 differentially expressed genes wereobserved between line A and line B with an FDR of0.23, and 483 genes had higher expression levels in lineA than line B. Among those genes, 242 had a foldchange >2, and 12 genes had a fold change >10. Asobserved in the AN/BN comparison, the highest foldchange (270.50) was also found in Nuf2. Of the 501genes that had higher expression levels in line B, 296 hada fold change >2, and 23 genes had a fold change >10.Likewise with the AN/BN comparison, the highest foldchange (101.25) in the AI/BI pair was for an EST(BX268464). A majority (52–58%) of the differentiallyexpressed genes in the comparison of AI/BI were sharedwith those found in the AN/BN comparison (Fig. 1a).
Identification of differentially expressed genesbetween infected and non-infected birds within lines
1. Within line AFollowing C. jejuni infection, 2,058 genes were
differentially expressed in the comparison of infectedvs. non-infected chickens within line A (AI/AN) (P<0.01) with an FDR of 0.09. Of the 2,058 genes, 843
were upregulated and 1,215 were downregulated. Forthe upregulated genes, 22 had a fold change >2, and thehighest fold change (20.04) was observed for a chickenEST (BX265589). Among the downregulated genes, 21had a fold change >2, and the highest fold change(3.31) was for CR524146 (a chicken EST).
2. Within line BIn the comparison of infected vs. non-infected chick-
ens within line B (BI/BN), 976 genes were differentiallyexpressed (P<0.01) with an FDR of 0.23. Of thosegenes, 368 were upregulated and 608 were down-regulated. For those upregulated genes, 13 had a foldchange >2, and BU319959 (a chicken EST) had thehighest fold change (5.02). Among the downregulatedgenes, 11 had a fold change >2, and BU459476 (achicken EST) had the highest fold change (2.74).
3. Between line A and line BThe gene expression profile between infected lines
A and B birds was also determined. There were 130genes shared between these two lines. There were 31upregulated and 66 downregulated genes that hadconsistent expression direction while 33 genes had theopposite expression direction (Fig. 1b, detailed infor-mation is provided in Supplemental file 1).
Identification of differentially expressed genes dueto the interaction between genetic lines and treatment
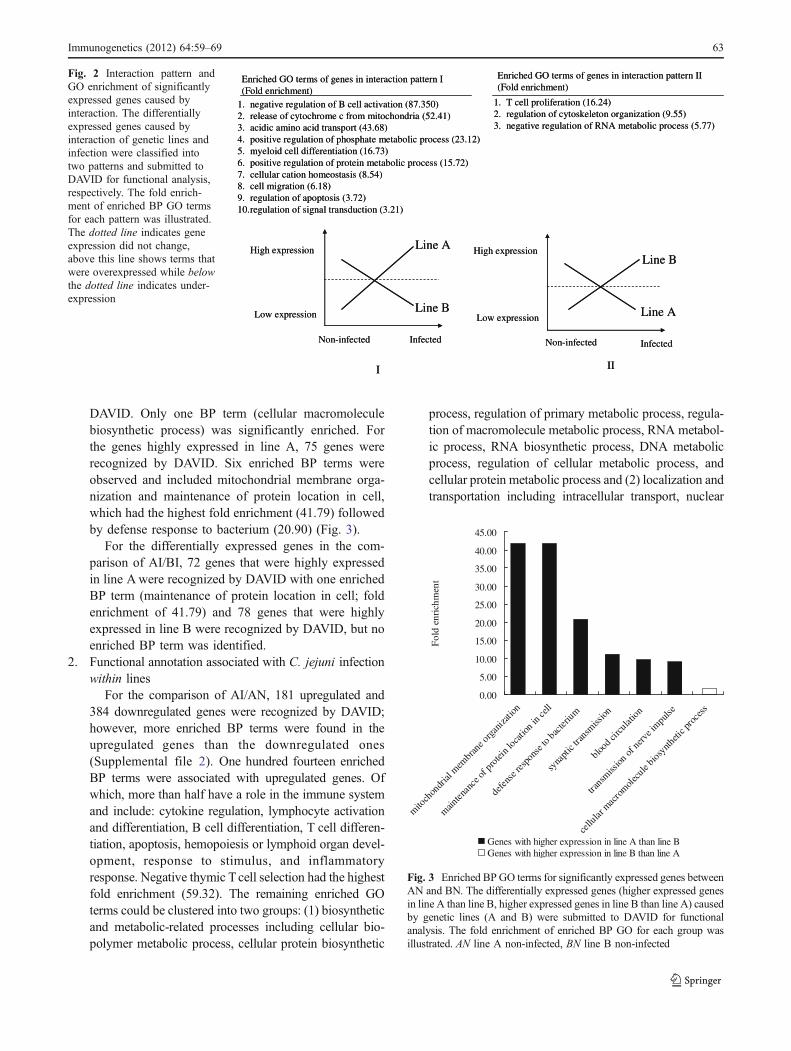
Significant interactions were observed between lines (A and B)and treatment (non-infected and infected). We have identified1,005 significantly expressed genes due to the interaction ofgenetic lines and treatment with a P value of 0.01 (FDR=0.22). Based on the interaction mode, two primary interactionpatterns were observed and are presented in Fig. 2. Forinteraction pattern I, genes were upregulated in line A birdsinfected with C. jejuni but downregulated in infected line Bbirds. The opposite profile was observed for interactionpattern II, genes were downregulated in line A whileupregulated in line B following infection with C. jejuni.
Functional annotation analysis
Functional annotation based on the GO biological process(BP) was evaluated for the differentially expressed genesbetween infected and non-infected chickens within linesand between the two lines (A and B) through DAVIDBioinformatics Resources 6.7 Beta (Dennis et al. 2003;Huang et al. 2009).
1. Functional annotation of genetic differencebetween lines
In the comparison of AN/BN, for the genes highlyexpressed in line B, 108 genes were recognized by
Fig. 1 Venn diagram showingthe number of differentiallyexpressed genes overlappedbetween different comparisons.Differentially expressed genesbetween AN/BN and AI/BI andbetween AI/AN and BI/BNoverlapped. Number of overlap-ped genes between AN/BN andAI/BI (a) and between AI/ANand BI/BN (b) were listed
62 Immunogenetics (2012) 64:59–69
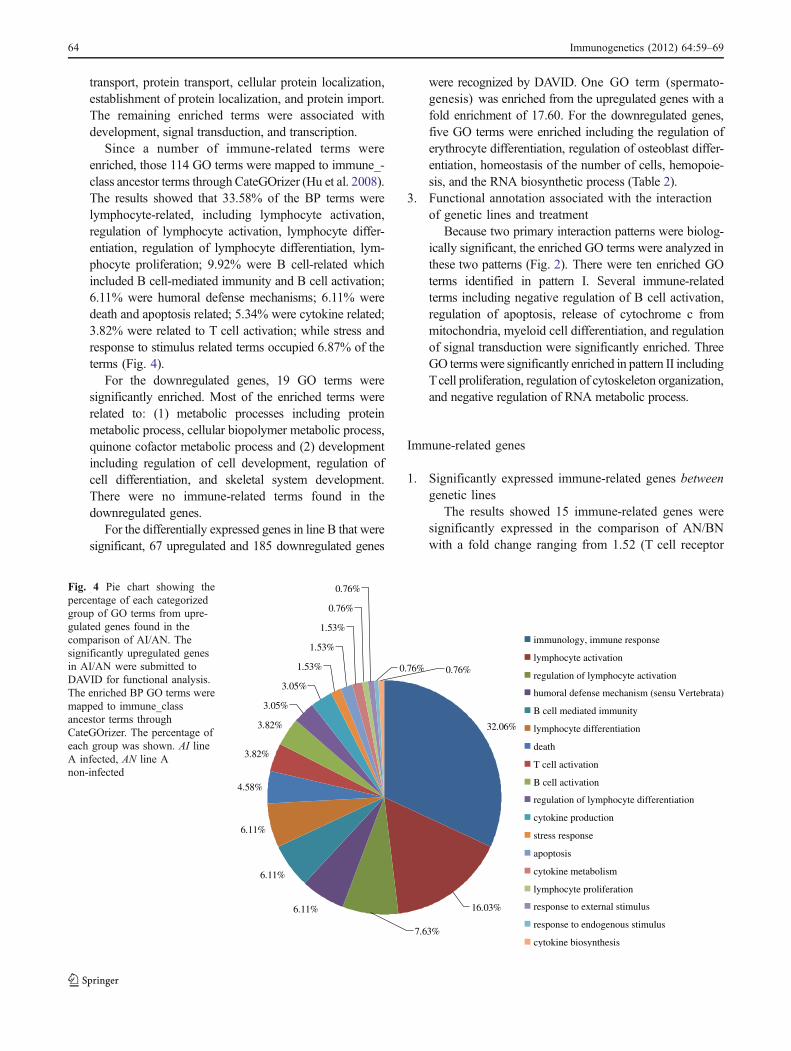
DAVID. Only one BP term (cellular macromoleculebiosynthetic process) was significantly enriched. Forthe genes highly expressed in line A, 75 genes wererecognized by DAVID. Six enriched BP terms wereobserved and included mitochondrial membrane orga-nization and maintenance of protein location in cell,which had the highest fold enrichment (41.79) followedby defense response to bacterium (20.90) (Fig. 3).
For the differentially expressed genes in the com-parison of AI/BI, 72 genes that were highly expressedin line Awere recognized by DAVID with one enrichedBP term (maintenance of protein location in cell; foldenrichment of 41.79) and 78 genes that were highlyexpressed in line B were recognized by DAVID, but noenriched BP term was identified.
2. Functional annotation associated with C. jejuni infectionwithin lines
For the comparison of AI/AN, 181 upregulated and384 downregulated genes were recognized by DAVID;however, more enriched BP terms were found in theupregulated genes than the downregulated ones(Supplemental file 2). One hundred fourteen enrichedBP terms were associated with upregulated genes. Ofwhich, more than half have a role in the immune systemand include: cytokine regulation, lymphocyte activationand differentiation, B cell differentiation, T cell differen-tiation, apoptosis, hemopoiesis or lymphoid organ devel-opment, response to stimulus, and inflammatoryresponse. Negative thymic Tcell selection had the highestfold enrichment (59.32). The remaining enriched GOterms could be clustered into two groups: (1) biosyntheticand metabolic-related processes including cellular bio-polymer metabolic process, cellular protein biosynthetic
process, regulation of primary metabolic process, regula-tion of macromolecule metabolic process, RNA metabol-ic process, RNA biosynthetic process, DNA metabolicprocess, regulation of cellular metabolic process, andcellular protein metabolic process and (2) localization andtransportation including intracellular transport, nuclear
0.00
5.00
10.00
15.00
20.00
25.00
30.00
35.00
40.00
45.00
mito
chon
drial
mem
bran
e org
aniza
tion
main
tenan
ce of
prote
in loc
ation
in ce
ll
defen
se re
spon
se to
bacte
rium
syna
ptic tra
nsmiss
ion
bloo
d circ
ulatio
n
trans
miss
ionof
nerv
e impu
lse
cellu
lar m
acro
molec
ule b
iosyn
thetic
proc
ess
Fol
d en
rich
men
t
Genes with higher expression in line A than line BGenes with higher expression in line B than line A
Fig. 3 Enriched BP GO terms for significantly expressed genes betweenAN and BN. The differentially expressed genes (higher expressed genesin line A than line B, higher expressed genes in line B than line A) causedby genetic lines (A and B) were submitted to DAVID for functionalanalysis. The fold enrichment of enriched BP GO for each group wasillustrated. AN line A non-infected, BN line B non-infected
1. negative regulation of B cell activation (87.350)2. release of cytochrome c from mitochondria (52.41)3. acidic amino acid transport (43.68)4. positive regulation of phosphate metabolic process (23.12)5. myeloid cell differentiation (16.73)6. positive regulation of protein metabolic process (15.72)7. cellular cation homeostasis (8.54)8. cell migration (6.18)9. regulation of apoptosis (3.72)10.regulation of signal transduction (3.21)
1. T cell proliferation (16.24)2. regulation of cytoskeleton organization (9.55)3. negative regulation of RNA metabolic process (5.77)
Enriched GO terms of genes in interaction pattern I (Fold enrichment)
Enriched GO terms of genes in interaction pattern II (Fold enrichment)
I II
Line A
Line B
Non-infected Infected Non-infected Infected
Line A
Line B
Low expression
High expression
Low expression
High expression
Fig. 2 Interaction pattern andGO enrichment of significantlyexpressed genes caused byinteraction. The differentiallyexpressed genes caused byinteraction of genetic lines andinfection were classified intotwo patterns and submitted toDAVID for functional analysis,respectively. The fold enrich-ment of enriched BP GO termsfor each pattern was illustrated.The dotted line indicates geneexpression did not change,above this line shows terms thatwere overexpressed while belowthe dotted line indicates under-expression
Immunogenetics (2012) 64:59–69 63
transport, protein transport, cellular protein localization,establishment of protein localization, and protein import.The remaining enriched terms were associated withdevelopment, signal transduction, and transcription.
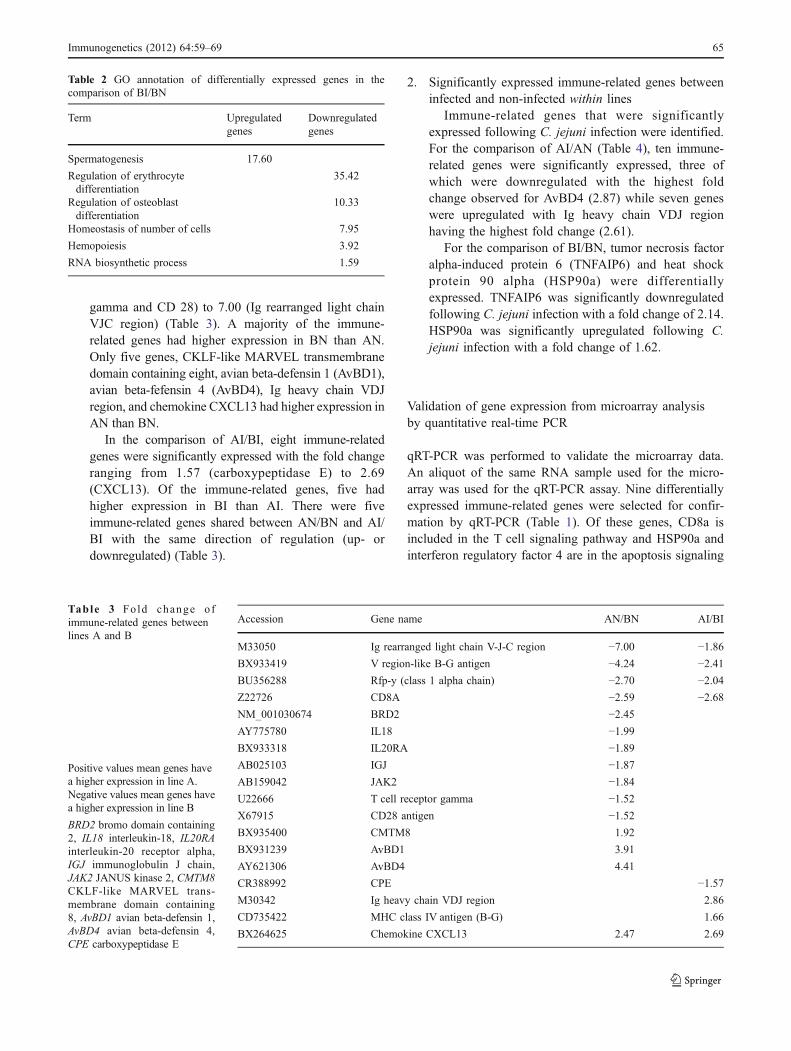
Since a number of immune-related terms wereenriched, those 114 GO terms were mapped to immune_-class ancestor terms through CateGOrizer (Hu et al. 2008).The results showed that 33.58% of the BP terms werelymphocyte-related, including lymphocyte activation,regulation of lymphocyte activation, lymphocyte differ-entiation, regulation of lymphocyte differentiation, lym-phocyte proliferation; 9.92% were B cell-related whichincluded B cell-mediated immunity and B cell activation;6.11% were humoral defense mechanisms; 6.11% weredeath and apoptosis related; 5.34% were cytokine related;3.82% were related to T cell activation; while stress andresponse to stimulus related terms occupied 6.87% of theterms (Fig. 4).
For the downregulated genes, 19 GO terms weresignificantly enriched. Most of the enriched terms wererelated to: (1) metabolic processes including proteinmetabolic process, cellular biopolymer metabolic process,quinone cofactor metabolic process and (2) developmentincluding regulation of cell development, regulation ofcell differentiation, and skeletal system development.There were no immune-related terms found in thedownregulated genes.
For the differentially expressed genes in line B that weresignificant, 67 upregulated and 185 downregulated genes
were recognized by DAVID. One GO term (spermato-genesis) was enriched from the upregulated genes with afold enrichment of 17.60. For the downregulated genes,five GO terms were enriched including the regulation oferythrocyte differentiation, regulation of osteoblast differ-entiation, homeostasis of the number of cells, hemopoie-sis, and the RNA biosynthetic process (Table 2).
3. Functional annotation associated with the interactionof genetic lines and treatment
Because two primary interaction patterns were biolog-ically significant, the enriched GO terms were analyzed inthese two patterns (Fig. 2). There were ten enriched GOterms identified in pattern I. Several immune-relatedterms including negative regulation of B cell activation,regulation of apoptosis, release of cytochrome c frommitochondria, myeloid cell differentiation, and regulationof signal transduction were significantly enriched. ThreeGO termswere significantly enriched in pattern II includingTcell proliferation, regulation of cytoskeleton organization,and negative regulation of RNA metabolic process.
Immune-related genes
1. Significantly expressed immune-related genes betweengenetic lines
The results showed 15 immune-related genes weresignificantly expressed in the comparison of AN/BNwith a fold change ranging from 1.52 (T cell receptor
32.06%
6.11%
6.11%
6.11%
4.58%
3.82%
3.82%
3.05%
3.05%
1.53%
1.53%
1.53%
0.76%
0.76%
16.03%
7.63%
0.76%0.76%
immunology, immune response
lymphocyte activation
regulation of lymphocyte activation
humoral defense mechanism (sensu Vertebrata)
B cell mediated immunity
lymphocyte differentiation
death
T cell activation
B cell activation
regulation of lymphocyte differentiation
cytokine production
stress response
apoptosis
cytokine metabolism
lymphocyte proliferation
response to external stimulus
response to endogenous stimulus
cytokine biosynthesis
Fig. 4 Pie chart showing thepercentage of each categorizedgroup of GO terms from upre-gulated genes found in thecomparison of AI/AN. Thesignificantly upregulated genesin AI/AN were submitted toDAVID for functional analysis.The enriched BP GO terms weremapped to immune_classancestor terms throughCateGOrizer. The percentage ofeach group was shown. AI lineA infected, AN line Anon-infected
64 Immunogenetics (2012) 64:59–69
gamma and CD 28) to 7.00 (Ig rearranged light chainVJC region) (Table 3). A majority of the immune-related genes had higher expression in BN than AN.Only five genes, CKLF-like MARVEL transmembranedomain containing eight, avian beta-defensin 1 (AvBD1),avian beta-fefensin 4 (AvBD4), Ig heavy chain VDJregion, and chemokine CXCL13 had higher expression inAN than BN.
In the comparison of AI/BI, eight immune-relatedgenes were significantly expressed with the fold changeranging from 1.57 (carboxypeptidase E) to 2.69(CXCL13). Of the immune-related genes, five hadhigher expression in BI than AI. There were fiveimmune-related genes shared between AN/BN and AI/BI with the same direction of regulation (up- ordownregulated) (Table 3).
2. Significantly expressed immune-related genes betweeninfected and non-infected within lines
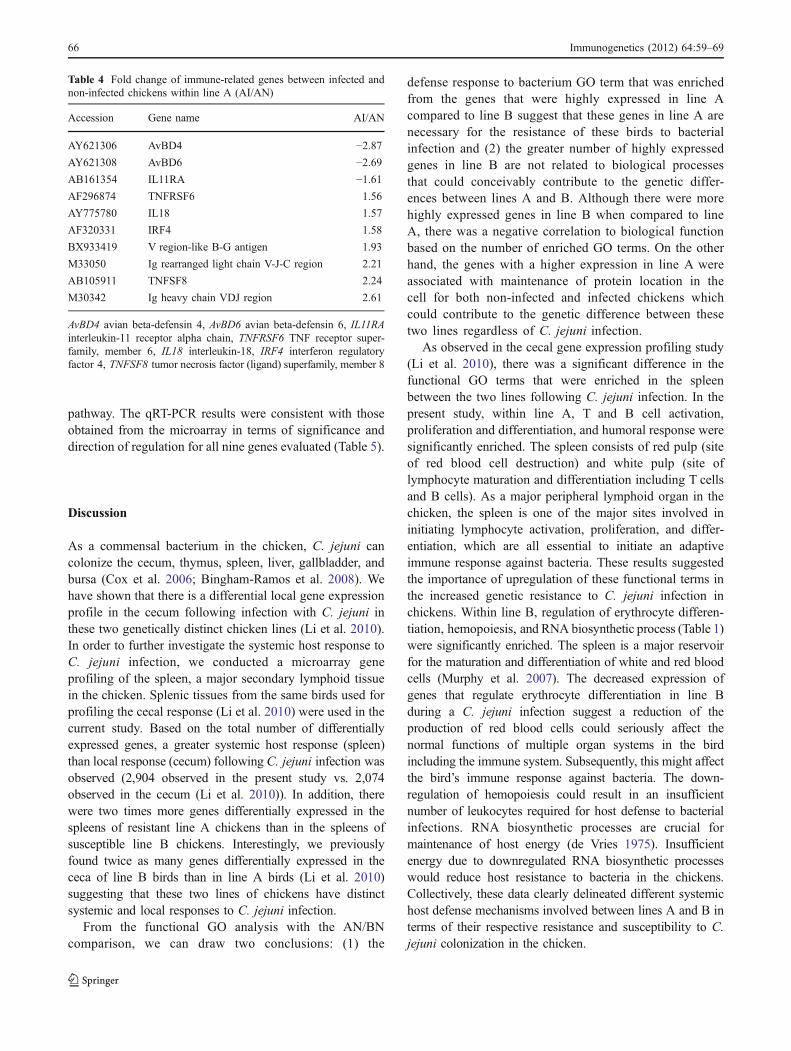
Immune-related genes that were significantlyexpressed following C. jejuni infection were identified.For the comparison of AI/AN (Table 4), ten immune-related genes were significantly expressed, three ofwhich were downregulated with the highest foldchange observed for AvBD4 (2.87) while seven geneswere upregulated with Ig heavy chain VDJ regionhaving the highest fold change (2.61).
For the comparison of BI/BN, tumor necrosis factoralpha-induced protein 6 (TNFAIP6) and heat shockprotein 90 alpha (HSP90a) were differentiallyexpressed. TNFAIP6 was significantly downregulatedfollowing C. jejuni infection with a fold change of 2.14.HSP90a was significantly upregulated following C.jejuni infection with a fold change of 1.62.
Validation of gene expression from microarray analysisby quantitative real-time PCR
qRT-PCR was performed to validate the microarray data.An aliquot of the same RNA sample used for the micro-array was used for the qRT-PCR assay. Nine differentiallyexpressed immune-related genes were selected for confir-mation by qRT-PCR (Table 1). Of these genes, CD8a isincluded in the T cell signaling pathway and HSP90a andinterferon regulatory factor 4 are in the apoptosis signaling
Table 2 GO annotation of differentially expressed genes in thecomparison of BI/BN
Term Upregulatedgenes
Downregulatedgenes
Spermatogenesis 17.60
Regulation of erythrocytedifferentiation
35.42
Regulation of osteoblastdifferentiation
10.33
Homeostasis of number of cells 7.95
Hemopoiesis 3.92
RNA biosynthetic process 1.59
Accession Gene name AN/BN AI/BI
M33050 Ig rearranged light chain V-J-C region −7.00 −1.86BX933419 V region-like B-G antigen −4.24 −2.41BU356288 Rfp-y (class 1 alpha chain) −2.70 −2.04Z22726 CD8A −2.59 −2.68NM_001030674 BRD2 −2.45AY775780 IL18 −1.99BX933318 IL20RA −1.89AB025103 IGJ −1.87AB159042 JAK2 −1.84U22666 T cell receptor gamma −1.52X67915 CD28 antigen −1.52BX935400 CMTM8 1.92
BX931239 AvBD1 3.91
AY621306 AvBD4 4.41
CR388992 CPE −1.57M30342 Ig heavy chain VDJ region 2.86
CD735422 MHC class IV antigen (B-G) 1.66
BX264625 Chemokine CXCL13 2.47 2.69
Table 3 Fold change ofimmune-related genes betweenlines A and B
Positive values mean genes havea higher expression in line A.Negative values mean genes havea higher expression in line B
BRD2 bromo domain containing2, IL18 interleukin-18, IL20RAinterleukin-20 receptor alpha,IGJ immunoglobulin J chain,JAK2 JANUS kinase 2, CMTM8CKLF-like MARVEL trans-membrane domain containing8, AvBD1 avian beta-defensin 1,AvBD4 avian beta-defensin 4,CPE carboxypeptidase E
Immunogenetics (2012) 64:59–69 65
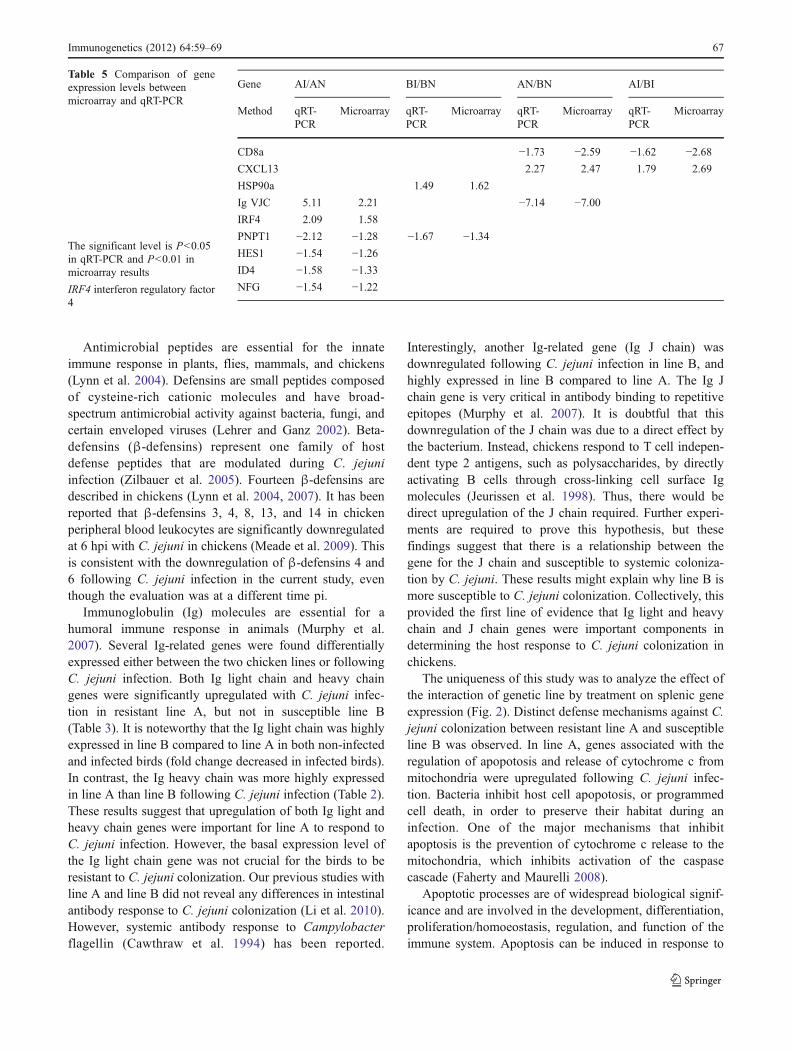
pathway. The qRT-PCR results were consistent with thoseobtained from the microarray in terms of significance anddirection of regulation for all nine genes evaluated (Table 5).
Discussion
As a commensal bacterium in the chicken, C. jejuni cancolonize the cecum, thymus, spleen, liver, gallbladder, andbursa (Cox et al. 2006; Bingham-Ramos et al. 2008). Wehave shown that there is a differential local gene expressionprofile in the cecum following infection with C. jejuni inthese two genetically distinct chicken lines (Li et al. 2010).In order to further investigate the systemic host response toC. jejuni infection, we conducted a microarray geneprofiling of the spleen, a major secondary lymphoid tissuein the chicken. Splenic tissues from the same birds used forprofiling the cecal response (Li et al. 2010) were used in thecurrent study. Based on the total number of differentiallyexpressed genes, a greater systemic host response (spleen)than local response (cecum) following C. jejuni infection wasobserved (2,904 observed in the present study vs. 2,074observed in the cecum (Li et al. 2010)). In addition, therewere two times more genes differentially expressed in thespleens of resistant line A chickens than in the spleens ofsusceptible line B chickens. Interestingly, we previouslyfound twice as many genes differentially expressed in thececa of line B birds than in line A birds (Li et al. 2010)suggesting that these two lines of chickens have distinctsystemic and local responses to C. jejuni infection.
From the functional GO analysis with the AN/BNcomparison, we can draw two conclusions: (1) the
defense response to bacterium GO term that was enrichedfrom the genes that were highly expressed in line Acompared to line B suggest that these genes in line A arenecessary for the resistance of these birds to bacterialinfection and (2) the greater number of highly expressedgenes in line B are not related to biological processesthat could conceivably contribute to the genetic differ-ences between lines A and B. Although there were morehighly expressed genes in line B when compared to lineA, there was a negative correlation to biological functionbased on the number of enriched GO terms. On the otherhand, the genes with a higher expression in line A wereassociated with maintenance of protein location in thecell for both non-infected and infected chickens whichcould contribute to the genetic difference between thesetwo lines regardless of C. jejuni infection.
As observed in the cecal gene expression profiling study(Li et al. 2010), there was a significant difference in thefunctional GO terms that were enriched in the spleenbetween the two lines following C. jejuni infection. In thepresent study, within line A, T and B cell activation,proliferation and differentiation, and humoral response weresignificantly enriched. The spleen consists of red pulp (siteof red blood cell destruction) and white pulp (site oflymphocyte maturation and differentiation including T cellsand B cells). As a major peripheral lymphoid organ in thechicken, the spleen is one of the major sites involved ininitiating lymphocyte activation, proliferation, and differ-entiation, which are all essential to initiate an adaptiveimmune response against bacteria. These results suggestedthe importance of upregulation of these functional terms inthe increased genetic resistance to C. jejuni infection inchickens. Within line B, regulation of erythrocyte differen-tiation, hemopoiesis, and RNA biosynthetic process (Table 1)were significantly enriched. The spleen is a major reservoirfor the maturation and differentiation of white and red bloodcells (Murphy et al. 2007). The decreased expression ofgenes that regulate erythrocyte differentiation in line Bduring a C. jejuni infection suggest a reduction of theproduction of red blood cells could seriously affect thenormal functions of multiple organ systems in the birdincluding the immune system. Subsequently, this might affectthe bird’s immune response against bacteria. The down-regulation of hemopoiesis could result in an insufficientnumber of leukocytes required for host defense to bacterialinfections. RNA biosynthetic processes are crucial formaintenance of host energy (de Vries 1975). Insufficientenergy due to downregulated RNA biosynthetic processeswould reduce host resistance to bacteria in the chickens.Collectively, these data clearly delineated different systemichost defense mechanisms involved between lines A and B interms of their respective resistance and susceptibility to C.jejuni colonization in the chicken.
Table 4 Fold change of immune-related genes between infected andnon-infected chickens within line A (AI/AN)
Accession Gene name AI/AN
AY621306 AvBD4 −2.87AY621308 AvBD6 −2.69AB161354 IL11RA −1.61AF296874 TNFRSF6 1.56
AY775780 IL18 1.57
AF320331 IRF4 1.58
BX933419 V region-like B-G antigen 1.93
M33050 Ig rearranged light chain V-J-C region 2.21
AB105911 TNFSF8 2.24
M30342 Ig heavy chain VDJ region 2.61
AvBD4 avian beta-defensin 4, AvBD6 avian beta-defensin 6, IL11RAinterleukin-11 receptor alpha chain, TNFRSF6 TNF receptor super-family, member 6, IL18 interleukin-18, IRF4 interferon regulatoryfactor 4, TNFSF8 tumor necrosis factor (ligand) superfamily, member 8
66 Immunogenetics (2012) 64:59–69
Antimicrobial peptides are essential for the innateimmune response in plants, flies, mammals, and chickens(Lynn et al. 2004). Defensins are small peptides composedof cysteine-rich cationic molecules and have broad-spectrum antimicrobial activity against bacteria, fungi, andcertain enveloped viruses (Lehrer and Ganz 2002). Beta-defensins (β-defensins) represent one family of hostdefense peptides that are modulated during C. jejuniinfection (Zilbauer et al. 2005). Fourteen β-defensins aredescribed in chickens (Lynn et al. 2004, 2007). It has beenreported that β-defensins 3, 4, 8, 13, and 14 in chickenperipheral blood leukocytes are significantly downregulatedat 6 hpi with C. jejuni in chickens (Meade et al. 2009). Thisis consistent with the downregulation of β-defensins 4 and6 following C. jejuni infection in the current study, eventhough the evaluation was at a different time pi.
Immunoglobulin (Ig) molecules are essential for ahumoral immune response in animals (Murphy et al.2007). Several Ig-related genes were found differentiallyexpressed either between the two chicken lines or followingC. jejuni infection. Both Ig light chain and heavy chaingenes were significantly upregulated with C. jejuni infec-tion in resistant line A, but not in susceptible line B(Table 3). It is noteworthy that the Ig light chain was highlyexpressed in line B compared to line A in both non-infectedand infected birds (fold change decreased in infected birds).In contrast, the Ig heavy chain was more highly expressedin line A than line B following C. jejuni infection (Table 2).These results suggest that upregulation of both Ig light andheavy chain genes were important for line A to respond toC. jejuni infection. However, the basal expression level ofthe Ig light chain gene was not crucial for the birds to beresistant to C. jejuni colonization. Our previous studies withline A and line B did not reveal any differences in intestinalantibody response to C. jejuni colonization (Li et al. 2010).However, systemic antibody response to Campylobacterflagellin (Cawthraw et al. 1994) has been reported.
Interestingly, another Ig-related gene (Ig J chain) wasdownregulated following C. jejuni infection in line B, andhighly expressed in line B compared to line A. The Ig Jchain gene is very critical in antibody binding to repetitiveepitopes (Murphy et al. 2007). It is doubtful that thisdownregulation of the J chain was due to a direct effect bythe bacterium. Instead, chickens respond to T cell indepen-dent type 2 antigens, such as polysaccharides, by directlyactivating B cells through cross-linking cell surface Igmolecules (Jeurissen et al. 1998). Thus, there would bedirect upregulation of the J chain required. Further experi-ments are required to prove this hypothesis, but thesefindings suggest that there is a relationship between thegene for the J chain and susceptible to systemic coloniza-tion by C. jejuni. These results might explain why line B ismore susceptible to C. jejuni colonization. Collectively, thisprovided the first line of evidence that Ig light and heavychain and J chain genes were important components indetermining the host response to C. jejuni colonization inchickens.
The uniqueness of this study was to analyze the effect ofthe interaction of genetic line by treatment on splenic geneexpression (Fig. 2). Distinct defense mechanisms against C.jejuni colonization between resistant line A and susceptibleline B was observed. In line A, genes associated with theregulation of apopotosis and release of cytochrome c frommitochondria were upregulated following C. jejuni infec-tion. Bacteria inhibit host cell apopotosis, or programmedcell death, in order to preserve their habitat during aninfection. One of the major mechanisms that inhibitapoptosis is the prevention of cytochrome c release to themitochondria, which inhibits activation of the caspasecascade (Faherty and Maurelli 2008).
Apoptotic processes are of widespread biological signif-icance and are involved in the development, differentiation,proliferation/homoeostasis, regulation, and function of theimmune system. Apoptosis can be induced in response to
Gene AI/AN BI/BN AN/BN AI/BI
Method qRT-PCR
Microarray qRT-PCR
Microarray qRT-PCR
Microarray qRT-PCR
Microarray
CD8a −1.73 −2.59 −1.62 −2.68CXCL13 2.27 2.47 1.79 2.69
HSP90a 1.49 1.62
Ig VJC 5.11 2.21 −7.14 −7.00IRF4 2.09 1.58
PNPT1 −2.12 −1.28 −1.67 −1.34HES1 −1.54 −1.26ID4 −1.58 −1.33NFG −1.54 −1.22
Table 5 Comparison of geneexpression levels betweenmicroarray and qRT-PCR
The significant level is P<0.05in qRT-PCR and P<0.01 inmicroarray results
IRF4 interferon regulatory factor4
Immunogenetics (2012) 64:59–69 67
various signals from inside and outside the cell and reducebacterial viability. Intrinsic (mitochondrial) apoptosis playsa central role in the propagation of death signals originatingfrom inside the cell. Activated pro-apoptotic moleculescreate pores in the mitochondrial membrane and thereafterdisruption of the mitochondrial inner transmembranepotential and permeability transition occur (Wickstrum etal. 2007). Proteins released from the mitochondrial inter-membrane space to the cytosol include cytochrome c,which activates apoptosome containing cytochrome c,Apaf-1 and dATP (Diaz de Tuesta et al. 2001). Theapoptosome activates caspase 9, which is another initiatorcaspase, and thus is able to mediate the caspase cascade byactivating caspase 3 (Janicke et al. 1998). Intrinsicapoptosis is regulated by the pro-apoptotic Bcl-2 family(Bid, Bax, Bak); the anti-apoptotic Bcl-2 family (Bcl-2 andBclxL), and mitochondrial proteins known as secondmitochondria-derived activators of caspases (SMACs) andtheir ligands, the inhibitors of apoptosis proteins (IAPs).The control and regulation of apoptotic mitochondrialevents occur through members of the Bcl-2 family ofproteins.
Therefore, the upregulation of apoptosis genes in theinteraction pattern I provides a snapshot of the protectiveinnate defenses in line A. This is the first time, to ourknowledge, it is reported in C. jejuni infection.
Many bacteria require host cell cytoskeleton involvementfor invasion. To invade Caco-2 cells, Listeria monocytogenesand Salmonella typhimurium require functional actin cytos-keletons (Mills and Finlay 1994; Gaillard and Finlay 1996),whereas C. jejuni requires a functional microtubule systembut not an intact actin cytoskeleton (Hu and Kopecko 1999;Kopecko et al. 2001). The lack of cytoskeletal requirementsof a very low-efficiency invader like Campylobacter mightreflect an intrinsic host macropinocytic pathway(s). The fewbacteria internalized by this mechanism might be efficientlycompromised by normal phagolysosomal destruction. Theincreased expression of genes that regulate cytoskeletalorganization in line B birds as seen in interactive pattern IIappears to be a potential host defense in C. jejuni colonizingsusceptible birds.
Conclusions
The transcriptome approach used in this study provided aglobal overview of genes and the functional entitiesinvolved in the spleen during a response to C. jejuniinfection in two genetically distinct chicken lines. Insummary, different systemic responses in the spleen wereobserved compared to the local cecal response. FollowingC. jejuni infection, there was more host response geneexpression in the resistant birds compared to the susceptible
birds in terms of gene expression in the spleen. Functionalanalysis revealed that genes related to defense response tobacteria were highly expressed in resistant line A comparedto susceptible line B. Specifically, lymphocyte activation,differentiation, and humoral response were upregulated inthe resistant line, while regulation of erythrocyte differen-tiation, hemopoiesis, and RNA biosynthetic process weresignificantly downregulated in the susceptible line. Inaddition, upregulation of Ig light and heavy chain-relatedgenes was observed in the resistant line. The interactionanalysis between genetic line and treatment demonstrateddistinct defense mechanisms between resistant and suscep-tible lines: the resistant line promoted apoptosis andcytochrome c release from mitochondria while the suscep-tible line suppressed them. This was the first time that suchdefensive mechanism against C. jejuni was reported.
Acknowledgments The authors thank Norman J. Stern from PoultryMicrobiological Safety Research Unit, USDA, Athens, GA for kindlyproviding the bacterial strain. This project was supported by NationalResearch Initiative Grant no. 2007–35604–17903 from the USDACooperative State Research, Education, and Extension Service AnimalGenome program. The mention of commercial products is for the solepurpose of providing specific information and not a recommendationor endorsement by the USDA.
References
Acar JF, Goldstein FW (1997) Trends in bacterial resistance tofluoroquinolones. Clin Infect Dis 24(Suppl 1):S67–S73
Al-Shahrour F, Diaz-Uriarte R, Dopazo J (2004) FatiGO: a web toolfor finding significant associations of gene ontology terms withgroups of genes. Bioinformatics 20(4):578–580
Altekruse SF, Stern NJ, Fields PI, Swerdlow DL (1999) Campylobacterjejuni—an emerging foodborne pathogen. Emerg Infect Dis 5(1):28–35
Barrett T, Troup DB, Wilhite SE, Ledoux P, Rudnev D, Evangelista C,Kim IF, Soboleva A, TomashevskyM, Edgar R (2007) NCBI GEO:mining tens of millions of expression profiles—database and toolsupdate. Nucleic Acids Res 35(Database issue):D760–D765
Beery JT, Hugdahl MB, Doyle MP (1988) Colonization of gastroin-testinal tracts of chicks by Campylobacter jejuni. Appl EnvironMicrobiol 54(10):2365–2370
Bingham-Ramos LK, Ribardo DA, Hiendrixson DR (2008) Colonizationcharacteristics of Campylobacter jejuni in a natural avian host108th general meeting of American Society for Microbiology.Boston, MA, pp. D-047.
Boyd Y, Herbert EG, Marston KL, Jones MA, Barrow PA (2005) Hostgenes affect intestinal colonisation of newly hatched chickens byCampylobacter jejuni. Immunogenetics 57(3–4):248–253
Cawthraw S, Ayling R, Nuijten P, Wassenar T, Newell D (1994)Isotype, specificity, and kinetics of systemic an mucosal anti-bodies to Campylobacter jejuni antigens, including flagellin,during experimental oral infections of chickens. Avian Dis38:341–349
Cleveland WS (1974) Robust locally weighted regression andsmoothing scatterplots. J Am Stat Assoc 74:829–836
Cox NA, Richardson LJ, Buhr RJ, Bailey JS, Wilson JL, Hiett KL(2006) Detection of Campylobacter jejuni in various lymphoid
68 Immunogenetics (2012) 64:59–69
organs of broiler breeder hens after oral or intravaginalinoculation. Poult Sci 85(8):1378–1382
de Vries FWTP (1975) The cost of maintenance processes in plantcells. Ann Bot 39(1):77–92
Dennis G Jr, Sherman BT, Hosack DA, Yang J, Gao W, Lane HC,Lempicki RA (2003) DAVID: database for annotation, visualization,and integrated discovery. Genome Biol 4(5):P3
Diaz de Tuesta AM, Chow Q, Geijo Martinez MP, Dimas Nunez J,Diaz de Tuesta FJ, Herranz CR, Val Perez E (2001) Tularemiaoutbreak in the province of Cuenca associated with crabhandling. Rev Clin Esp 201(7):385–389
Faherty CS, Maurelli AT (2008) Staying alive: bacterial inhibition ofapoptosis during infection. Trends Microbiol 16(4):173–180
Ferro PJ, Swaggerty CL, Kaiser P, Pevzner IY, Kogut MH (2004)Heterophils isolated from chickens resistant to extra-intestinalSalmonella enteritidis infection express higher levels of pro-inflammatory cytokine mRNA following infection than hetero-phils from susceptible chickens. Epidemiol Infect 132(6):1029–1037
Gaillard J, Finlay B (1996) Effect of cell polarization and differentiationon entry of Listeria monocytogenes into the enterocyte-like Caco-2cell line. Infect Immun 64(4):1299–1308
Gruntar I, Ocepek M, Avbersek J, Micunovic J, Pate M (2010) Apulsed-field gel electrophoresis study of the genetic diversity ofCampylobacter jejuni and Campylobacter coli in poultry flocksin Slovenia. Acta Vet Hung 58(1):19–28
Hu L, Kopecko DJ (1999) Campylobacter jejuni 81–176 associateswith microtubules and dynein during invasion of humanintestinal cells. Infect Immun 67(8):4171–4182
Hu Z, Bao J, Reecy JM (2008) CateGOrizer: a web-based program tobatch analyze gene ontology classification categories. OnlineJournal of Bioinformatics 9(2):108–112
Huang DW, Sherman BT, Lempicki RA (2009) Systematic andintegrative analysis of large gene lists using DAVID bioinformaticsresources. Nat Protocols 4(1):44–57
Janicke RU, Ng P, SprengartML, Porter AG (1998) Caspase-3 is requiredfor alpha-fodrin cleavage but dispensable for cleavage of other deathsubstrates in apoptosis. J Biol Chem 273(25):15540–15545
Jeurissen SH, Janse EM, van Rooijen N, Claassen E (1998) Inadequateanti-polysaccharide antibody responses in the chicken. Immunobiol-ogy 198(4):385–95
Kopecko DJ, Hu L, Zaal KJ (2001) Campylobacter jejuni—microtubule-dependent invasion. Trends Microbiol 9(8):389–396
Lehrer RI, Ganz T (2002) Defensins of vertebrate animals. Curr OpinImmunol 14(1):96–102
Li X, Chiang HI, Zhu J, Dowd SE, Zhou H (2008a) Characterizationof a newly developed chicken 44K Agilent microarray. BMCGenomics 9(1):60
Li X, Swaggerty CL, Kogut MH, Chiang H, Wang Y, Genovese KJ,He H, Stern NJ, Pevzner IY, Zhou H (2008b) The paternal effectof Campylobacter jejuni colonization in ceca in broilers. PoultSci 87(9):1742–1747
Li X, Swaggerty CL, Kogut MH, Chiang HI, Wang Y, Genovese KJ,He H, Zhou H (2010) Gene expression profiling of the local cecalresponse of genetic chicken lines that differ in their susceptibilityto Campylobacter jejuni colonization. PLoS One 5(7):e11827
Livak KJ, Schmittgen TD (2001) Analysis of relative gene expressiondata using real-time quantitative PCR and the 2(−Delta Delta C(T)) Method. Methods 25:402–408
Lynn DJ, Higgs R, Gaines S, Tierney J, James T, Lloyd AT, Fares MA,Mulcahy G, O’Farrelly C (2004) Bioinformatic discovery andinitial characterisation of nine novel antimicrobial peptide genesin the chicken. Immunogenetics 56(3):170–177
Lynn DJ, Higgs R, Lloyd AT, O’Farrelly C, Herve-Grepinet V, Nys Y,Brinkman FS, Yu PL, Soulier A, Kaiser P, Zhang G, Lehrer RI(2007) Avian beta-defensin nomenclature: a community proposedupdate. Immunol Lett 110(1):86–89
Meade KG, Narciandi F, Cahalane S, Reiman C, Allan B, O’Farrelly C(2008) Comparative in vivo infection models yield insights onearly host immune response to Campylobacter in chickens.Immunogenetics 61(2):101–110
Meade KG, Narciandi F, Cahalane S, Reiman C, Allan B, O’Farrelly C(2009) Comparative in vivo infection models yield insights onearly host immune response to Campylobacter in chickens.Immunogenetics 61(2):101–110
Mills SD, Finlay BB (1994) Comparison of Salmonella typhi andSalmonella typhimurium invasion, intracellular growth andlocalization in cultured human epithelial cells. Microb Pathog17(6):409–423
Murphy KM, Travers JP, Walport M (2007) Janeway’s immunobiology(immunobiology: the immune system (Janeway)). GarlandScience, New York
Smith CK, AbuounM, Cawthraw SA, Humphrey TJ, Rothwell L, KaiserP, Barrow PA, JonesMA (2008)Campylobacter colonization of thechicken induces a proinflammatory response in mucosal tissues.FEMS Immunol Med Microbiol 54(1):114–21
Stern NJ, Meinersmann RJ, Cox NA, Bailey JS, Blankenship LC(1990) Influence of host lineage on cecal colonization byCampylobacter jejuni in chickens. Avian Dis 34(3):602–606
Storey JD, Tibshirani R (2003) Statistical significance for genomewidestudies. Proc Natl Acad Sci U S A 100(16):9440–9445
Swaggerty CL, Ferro PJ, Pevzner IY, Kogut MH (2005a) Heterophilsare associated with resistance to systemic Salmonella enteritidisinfections in genetically distinct chicken lines. FEMS ImmunolMed Microbiol 43(2):149–154
Swaggerty CL, Lowry VK, Ferro PJ, Pevzner IY, Kogut MH (2005b)Disparity in susceptibility to vancomycin-resistant Enterococcusorgan invasion in commercial broiler chickens that differ in innateimmune responsiveness. Food & Agricultural Immunology 16(1):1–15
Swaggerty CL, Genovese KJ, He H, Duke SE, Pevzner IY, Kogut MH(2011) Broiler breeders with an efficient innate immune responseare more resistant to Eimeria tenella. Poult Sci 90(5):1014–1019
van Putten JP, van Alphen LB, Wosten MM, de Zoete MR (2009)Molecular mechanisms of campylobacter infection. Curr TopMicrobiol Immunol 337:197–229
Wickstrum JR, Hong KJ, Bokhari S, Reed N, McWilliams N, HorvatRT, Parmely MJ (2007) Coactivating signals for the hepaticlymphocyte gamma interferon response to Francisella tularensis.Infect Immun 75(3):1335–1342
Yang YH, Dudoit S, Luu P, Lin DM, Peng V, Ngai J, Speed TP (2002)Normalization for cDNA microarray data: a robust compositemethod addressing single and multiple slide systematic variation.Nucleic Acids Res 30(4):e15
Zilbauer M, Dorrell N, Boughan PK, Harris A, Wren BW, Klein NJ,Bajaj-Elliott M (2005) Intestinal innate immunity to Campylobacterjejuni results in induction of bactericidal human beta-defensins 2and 3. Infect Immun 73(11):7281–7289
Immunogenetics (2012) 64:59–69 69