System-wide molecular evidence for phenotypic buffering in Arabidopsis
36
Supplementary Information 1 System-wide molecular evidence for phenotypic buffering in Arabidopsis Jingyuan Fu 1,2,9 , Joost J.B. Keurentjes 3-5,9 , Harro Bouwmeester 4-6 , Twan America 5,6 , Francel W.A. Verstappen 4-6 , Jane L. Ward 7 , Michael H. Beale 7 , Ric C.H. de Vos 5,6 , Martijn Dijkstra 1 , Richard A. Scheltema 1 , Frank Johannes 1 , Maarten Koornneef 3,8 , Dick Vreugdenhil 4 , Rainer Breitling 1 and Ritsert C. Jansen 1,2 1 Groningen Bioinformatics Centre, University of Groningen, The Netherlands. 2 Department of Genetics, University Medical Centre Groningen, University of Groningen, The Netherlands. 3 Laboratory of Genetics, Wageningen University, The Netherlands. 4 Laboratory of Plant Physiology, Wageningen University, The Netherlands. 5 Centre for Biosystems Genomics, Wageningen, The Netherlands. 6 Plant Research International, Wageningen, The Netherlands. 7 Rothamsted Research, National Centre for Plant and Microbial Metabolomics, Harpenden, Herts, UK. 8 Max Planck Institute for Plant Breeding Research, Cologne, Germany. 9 These authors contributed equally to this work. Correspondence should be addressed to R.C.J. ([email protected]). Nature Genetics: doi:10.1038/ng.308
-
Upload
independent -
Category
Documents
-
view
4 -
download
0
Transcript of System-wide molecular evidence for phenotypic buffering in Arabidopsis

Supplementary Information
1
System-wide molecular evidence for phenotypic buffering in Arabidopsis
Jingyuan Fu1,2,9, Joost J.B. Keurentjes3-5,9, Harro Bouwmeester4-6, Twan America5,6,
Francel W.A. Verstappen4-6, Jane L. Ward7, Michael H. Beale7, Ric C.H. de Vos5,6,
Martijn Dijkstra1, Richard A. Scheltema1, Frank Johannes1, Maarten Koornneef3,8, Dick
Vreugdenhil4, Rainer Breitling1 and Ritsert C. Jansen1,2
1Groningen Bioinformatics Centre, University of Groningen, The Netherlands. 2Department of Genetics, University Medical Centre Groningen, University of Groningen,
The Netherlands. 3Laboratory of Genetics, Wageningen University, The Netherlands. 4Laboratory of Plant Physiology, Wageningen University, The Netherlands. 5Centre for Biosystems Genomics, Wageningen, The Netherlands. 6Plant Research International, Wageningen, The Netherlands. 7Rothamsted Research, National Centre for Plant and Microbial Metabolomics,
Harpenden, Herts, UK. 8Max Planck Institute for Plant Breeding Research, Cologne, Germany. 9These authors contributed equally to this work.
Correspondence should be addressed to R.C.J. ([email protected]).
Nature Genetics: doi:10.1038/ng.308

Supplementary Information
2
Table of contents
Supplementary Tables:.................................................................................................3
Supplementary Table 1: All 139 phenotypic (morphological, physiological, pathological) and 98 biochemical traits collected from the literature. ............................3
Supplementary Figures ..............................................................................................18
Supplementary Figure 1: Hotspots and other QTLs ...................................................18 Supplementary Figure 2: Phenotypic trait categories .................................................20 Supplementary Figure 3: Further analysis of trait data collected from literature..........21 Supplementary Figure 4: The genetic map.................................................................22 Supplementary Figure 5: Traits mapping to QTL hotspots: QTL likelihood profiles.....23
Supplementary Methods.............................................................................................30
1. Plant growth conditions and harvesting ..................................................................30 2. New molecular data we have generated on all RILs...............................................30 3. Molecular data we have previously generated on all RILs ......................................33 4. Phenotypic data collected on the same RILs..........................................................33 5. Statistical analysis..................................................................................................34
Nature Genetics: doi:10.1038/ng.308

Supplementary Information
3
Supplementary Tables:
Supplementary Table 1: All 139 phenotypic (morphological, physiological,
pathological) and 98 biochemical traits collected from the literature.
No. Trait ID Trait Category Description Ref
1 LDVer-FT flowering time Flowering time under long daylight conditions
and after vernalization treatment
1
2 LDVer-RLN rosette number Rosette leaf number under long daylight
conditions and after vernalization treatment
1
3 LDVer-CLN cauline number Cauline leaf number under long daylight
conditions and after vernalization treatment
1
4 LDVer-TLN leaf number Total leaf number under long daylight
conditions and after vernalization treatment
1
5 LD-FT flowering time Flowering time under long daylight conditions
(without vernalization)
1
6 LD-RLN rosette number Rosette leaf number under long daylight
conditions (without vernalization)
1
7 LD-CLN cauline number Cauline leaf number under long daylight
conditions (without vernalization)
1
8 LD-TLN leaf number Total leaf number under long daylight
conditions (without vernalization)
1
9 SD-FT flowering time Flowering time under short daylight conditions 1
10 SD-RLN rosette number Rosette leaf number under short daylight
conditions
1
11 SD-CLN cauline number Cauline leaf number under short daylight
conditions
1
12 SD-TLN leaf number Total leaf number under short daylight
conditions
1
13 SL seed length Seed length (in mm) 2
14 SW seed weight Seed weight (mg per 100 seeds) 2
15 FL fruit length Fruit length (in mm) 2
16 OL ovary length Ovary length (in mm) 2
17 ON ovule number Ovule number per fruit 2
18 SN seed number Seed number per fruit 2
Nature Genetics: doi:10.1038/ng.308

Supplementary Information
4
19 Unf ovule number Unfertilized ovule number per fruit 2
20 TLN leaf number Total leaf number 2
21 LLL leaf length Largest leaf length (in mm) 2
22 PH plant height Plant height (in cm) 2
23 SSN shoot number Side shoot number 2
24 FN fruit number Fruit number in the main stem 2
25 Sw seed weight Seed weight of 100 seeds (in milligram) 3
26 Sucrose sugar content Mean sucrose content in micrograms per
seed milligram
3
27 Raffinose sugar content Mean raffinose content in micrograms per
seed milligram
3
28 Stachyose sugar content Mean stachyose content in micrograms per
seed milligram
3
29 CD0d germination Mean germination percentage after 0 days of
CD treatment
3
30 CD4d germination Mean germination percentage after 4 days of
CD treatment
3
31 CD4/0d germination Fraction of the mean germination percentage
after 4 days of CD treatment in relation to the
mean germination percentage after 0 days of
CD treatment
3
32 pCD0d germination Probit of the mean germination percentage
after 0 days CD treatment
3
33 pCD4d germination Probit of the mean germination percentage
after 4 days CD treatment
3
34 pCD4/0d germination Probit of the fraction of mean germination
percentage after 4 days of CD treatment in
relation to the mean germination percentage
after 0 days of CD treatment
3
35 germ4y germination Mean germination percentage after 4 years of
seed storage
3
36 pgerm4y germination Probit of germination percentage after 4 years
of seed storage
3
37 White hypocotyl length Mean hypocotyl length of seedlings grown
under white light
4
38 Blue hypocotyl length Mean hypocotyl length of seedlings grown
under blue light
4
Nature Genetics: doi:10.1038/ng.308

Supplementary Information
5
39 Red hypocotyl length Mean hypocotyl length of seedlings grown
under red light
4
40 Far-red hypocotyl length Mean hypocotyl length of seedlings grown
under far-red light
4
41 Dark hypocotyl length Mean hypocotyl length of seedlings grown in
darkness
4
42 Ga hypocotyl length Mean hypocotyl length of seedlings grown
under white light with gibberellin
4
43 Brz hypocotyl length Mean hypocotyl length of seedlings grown in
darkness and with brassinazole
4
44 sgewicht seed weight Seed weight (in mg) 5
45 sphytate phytate/phosphate
content
Phytate content in milligrams per gram seed 5
46 sphosphate phytate/phosphate
content
Phosphate content in milligrams per gram
seed
5
47 lPhosphate phytate/phosphate
content
Phosphate content in micrograms per gram
leaf (fresh weight)
5
48 lPhytate phytate/phosphate
content
Phytate content in micrograms per gram leaf
(fresh weight)
5
49 ldtof flowering time Time to flower (bolting) under long daylight
condition
6
50 ldrln rosette number Rosette leaf number under long daylight
condition
6
51 ldrd rosette dismeter Rosette diameter under long daylight
condition
6
52 ldph plant height Plant height (cm) under long daylight
condition
6
53 ldtm maturation time Time to maturate under long daylight
condition
6
54 ldlr reproductive length Length of reproductive phase under long
daylight condition
6
55 ldtea axil number Total number elongated axils under long
daylight condition
6
56 ldnec cauline number Cauline leaves at maturity under long daylight
condition
6
57 ldnmf flower number Number of main axis fruits/flowers at maturity
under long daylight condition
6
Nature Genetics: doi:10.1038/ng.308

Supplementary Information
6
58 ldtim inflorescence
number
Total number inflorescence meristems under
long daylight condition
6
59 ldtaf flower number Number of axilliar fruits/flowers at maturity
under long daylight condition
6
60 ldtef flower number Total number early flowers under long
daylight condition
6
61 ldtf flower number Total number of flowers under long daylight
condition
6
62 sdtof flowering time Time to flower (bolting) under short daylight
condition
7
63 sdrln rosette number Rosette Leaf number under short daylight
condition
7
64 sdrd rosette diameter Rosette diameter under short daylight
condition
7
65 sdph plant height Plant height (cm) under short daylight
condition
7
66 sdtm maturation time Time to maturate under short daylight
condition
7
67 sdlr reproductive length Length of reproductive phase under short
daylight condition
7
68 sdtea axil number Total number elongated axils under short
daylight condition
7
69 sdnec cauline number Cauline leaves at maturity under short
daylight condition
7
70 sdnmf flower number Number of main axis fruits/flowers at maturity
under short daylight condition
7
71 sdtim inflorescence
number
Total number inflorescence meristems under
short daylight condition
7
72 sdtaf flower number Number of axilliar fruits/flowers at maturity
under short daylight condition
7
73 sdtef flower number Total number of early flowers under short
daylight condition
7
74 sdtf flower number Total number of flowers under short daylight
condition
7
75 T.ni_A insect resistance Levels of feeding damage of Trichoplusia ni
(Area mm2)
8
76 P.Xyl._A insect resistance Levels of feeding damage of Plutella 8
Nature Genetics: doi:10.1038/ng.308

Supplementary Information
7
Xylostella (Area mm2)
77 Leaf Size_A insect resistance Leaf size for insect experiment (Area mm2) 8
78 P.Xyl_R insect resistance Ranking of feeding damage of Plutella
xylostella
8
79 P.Xyl_percent insect resistance Percent of leaves resistant to Plutella
xylostella
8
80 Extract PGM activity Phosphoglucomutase activity in total plant
extracts (nmol.s-1.gDW-1)
9
81 PGM_Cot PGM activity Rank of phosphoglucomutase activity in
cotyledons
9
82 PGM_Apex PGM activity Rank of phosphoglucomutase activity in apex 9
83 PGM_Hypoc PGM activity Rank of phosphoglucomutase activity in
hypocotyl
9
84 PGM_Roots PGM activity Rank of phosphoglucomutase activity in roots 9
85 PGM_Rootneck PGM activity Rank of phosphoglucomutase activity in root
neck
9
86 PGM_Roottip PGM activity Rank of phosphoglucomutase activity in root
tip
9
87 Roothairs PGM activity Rank of phosphoglucomutase activity in root
hairs
9
88 GermAV1 germination Average percentage of germination 1 week
after harvest
10
89 GermAV3 germination Average percentage of germination 3 weeks
after harvest
10
90 GermAV6 germination Average percentage of germination 6 weeks
after harvest
10
91 GermAV10 germination Average percentage of germination 10 weeks
after harvest
10
92 GermAV15 germination Average percentage of germination 15 weeks
after harvest
10
93 GermAV21 germination Average percentage of germination 21 weeks
after harvest
10
94 DSDS50 germination Days of storage for 50% germination 10
95 HypOsc hypocotyl length Hypocotyl length in darkness 11
96 HypRLp hypocotyl length Hypocotyl length after far-red light pulse 11
97 HypRp hypocotyl length Hypocotyl length after red light pulse 11
Nature Genetics: doi:10.1038/ng.308

Supplementary Information
8
98 HypRLc hypocotyl length Hypocotyl length in continuous far-red light 11
99 HypVLFR hypocotyl length VLFR response of hypocotyl length 11
100 HypLFR hypocotyl length LFR response of hypocotyl length 11
101 HypHIR hypocotyl length HIR response of hypocotyl length 11
102 CotRLp cotyledon
unfolding
Cotyledon unfolding after far-red light pulse 11
103 CotRp cotyledon
unfolding
Cotyledon unfolding after red light pulse 11
104 CotRLc cotyledon
unfolding
Cotyledon unfolding in continuous far-red light 11
105 CotVLFR cotyledon
unfolding
VLFR response of cotyledon unfolding 11
106 CotLFR cotyledon
unfolding
LFR response of cotyledon unfolding 11
107 CotHIR cotyledon
unfolding
HIR response of cotyledon unfolding 11
108 Survival-LD cold resistance Percentage of plants that survive at –8°C in
long daylight photoperiod
12
109 ArcSin Survival-
LD
cold resistance Angular transformation of mean freezing
tolerance in long daylight
12
110 Survival-SD cold resistance Percentage of plants that survive at –8°C in
short daylight photoperiod
12
111 ArcSin Survival-
SD
cold resistance Angular transformation of mean freezing
tolerance in short day
12
112 Period leaf move Period of leaf movement 13
113 Oil (%) oil content Seed oil content 14
114 Oil16:0 oil content Fatty acid 16:0 content 14
115 Oil18:0 oil content Fatty acid 18:0 content 14
116 Oil18:1 oil content Fatty acid 18:1 content 14
117 Oil18:2 oil content Fatty acid 18:2 content 14
118 Oil18:3 oil content Fatty acid 18:3 content 14
119 Oil20:1 oil content Fatty acid 20:1 content 14
120 Per12oC leaf move Period of leaf movement at 12°C 15
121 Amp12oC leaf move Amplitude of leave movement at 12°C 15
122 Per22oC leaf move Period of leaf movement at 22°C 15
123 Amp22oC leaf move Amplitude of leaf movement at 22°C 15
124 Per27oC leaf move Period of leaf movement at 27°C 15
Nature Genetics: doi:10.1038/ng.308

Supplementary Information
9
125 Amp27oC leaf move Amplitude of leaf movement at 27°C 15
126 Root root length Root length of 7-day old seedlings 16
127 Hypocotyl hypocotyl length Hypocotyl length of 7-day old seedlings 16
128 Inv soluble invertase activity Soluble invertase activity 16
129 Inv insoluble invertase activity Insoluble invertase activity 16
130 Inv_Cot invertase activity Invertase activity in cotyledons (staining) 16
131 Inv_Apex invertase activity Invertase activity in apex (staining) 16
132 Inv_Hypoc invertase activity Invertase activity in hypocotyl (staining) 16
133 Inv_upHypoc invertase activity Invertase activity in upper part hypocotyl
(staining)
16
134 Inv_lowHypoc invertase activity Invertase activity in lower part hypocotyl
(staining)
16
135 Inv_upRoot invertase activity Invertase activity in upper part root (staining) 16
136 Inv_midRoot invertase activity Invertase activity in middle part root (staining) 16
137 Inv_lowRoot invertase activity Invertase activity in lower part root (staining) 16
138 Inv_Root invertase activity Average invertase activity in roots (staining) 16
139 Inv_Rootneck invertase activity Invertase activity in root neck (staining) 16
140 Inv_Roottip invertase activity Invertase activity in root tip (staining) 16
141 Inv_upHairs invertase activity Invertase activity in root hairs of upper part
root (staining)
16
142 Inv_midHairs invertase activity Invertase activity in root hairs of middle part
root (staining)
16
143 Inv_lowHairs invertase activity Invertase activity in root hairs of lower part
root (staining)
16
144 Inv_Hairs invertase activity Average invertase activity in root hairs
(staining)
16
145 FT flowering time Flowering time 17
146 Inf_ML inflorescence
length
Main inflorescence length at first silique 17
147 Inf_TL inflorescence
length
Total length of the main inflorescence 17
148 BB_N branch number Basal branch number 17
149 Inf_MN branch number Main inflorescence branch number 17
150 Branch_TN branch number Total branch number 17
151 DTF-LA flowering time Days to flowering, autumn-winter, low density 18
152 DTF-HA flowering time Days to flowering, autumn-winter, high
density
18
Nature Genetics: doi:10.1038/ng.308

Supplementary Information
10
153 DTF-LS flowering time Days to flowering, spring, low density 18
154 DTF-HS flowering time Days to flowering, spring, high density 18
155 TLN-LA leaf number Total leaf number, autumn-winter, low density 18
156 TLN-HA leaf number Total leaf number, autumn-winter, high
density
18
157 TLN-LS leaf number Total leaf number, spring, low density 18
158 TLN-HS leaf number Total leaf number, spring, high density 18
159 LL6-LN leaf length Longevity of the 6th leaf of non-fertilized
plants
19
160 B-LN flowering time Days to bolting of non-fertilized plants 19
161 TLN-LN rosette number Rosette leaf number of non-fertilized plants 19
162 RL-LN rosette length Post-bolting rosette longevity of non-fertilized
plants
19
163 DW-LN mass weight Above-ground dry weight of senesced non-
fertilized plants
19
164 LL6-HN leaf length Longevity of the 6th leaf of fertilized plants 19
165 B-HN flowering time Days to bolting of fertilized plants 19
166 TLN-HN rosette number Rosette leaf number of fertilized plants 19
167 RL-HN rosette length Post-bolting rosette longevity of fertilized
plants
19
168 DW-HN mass weight Above-ground dry weight of senesced
fertilized plants
19
169 Cen Sat satellite repeat Centromeric satellite repeats 20
170 Al tol. root length Root length in the Al test solution/root length
in the control
21
171 FM mass weight Weight of fresh matter 22
172 DM mass weight Weight of dry matter 22
173 DMC mass weight Dry matter content per unit fresh weight 22
174 NO3FM Ni60 Nitrate concentration relative to the weight of
fresh matter
22
175 KFM K39 Potassium concentration relative to the weight
of fresh matter
23
176 KDM K39 Potassium concentration relative to the weight
of dry matter
23
177 CAB2Luc_LD CAB2 activity Timing of peak CAB2LUC+ reporter activity
after a 12 h light and 12 h dark cycle
24
178 CAB2Luc_LLD CAB2 activity Timing of peak CAB2LUC+ reporter activity 24
Nature Genetics: doi:10.1038/ng.308

Supplementary Information
11
after a 21 h light and 3 h dark cycle
179 CAB2Luc_SD CAB2 activity Timing of peak CAB2LUC+ reporter activity
after a 3 h light and 21 h dark cycle
24
180 Luc-LD Luc expression Expression of LUCIFERASE at long day cycle
of 12 h light and 12 h dark
24
181 Luc_SD Luc expression Expression of LUCIFERASE responding to
transform from long day of 12 h light and 12 h
dark to short day of 3 h light and 21 h dark
24
182 Luc_LLD_SD Luc expression Expression of LUCIFERASE responding to
transform from very long day of 21 h light and
3 h dark to short day of 3 h light and 21 h dark
24
183 protein 12S protein content Alpha-subunits of 12S globulin cruciferin B
(CRB) seed storage protein
25
184 Anthocyanin anthocyanin
content
Anthocyanin accumulation in seedlings grown
on excess sucrose
26
185 Glu sens sugar sensitivity Glucose sensitivity, % of green seedlings
grown on excess of glucose
27
186 Cross-overs cross-over Frequency of crossover breakpoints 28
187 Kalium K39 Potassium (K) content in seeds 29
188 Natrium Na23 Sodium (Na) content in seeds 29
189 Calcium Ca43 Calcium (Ca) content in seeds 29
190 Magnesium Mg25 Magnesium (Mg) content in seeds 29
191 Iron Fe56 Iron (Fe) content in seeds 29
192 Manganese Mn55 Manganese (Mn) content in seeds 29
193 Zinc Zn66 Zinc (Zn) content in seeds 29
194 C13 C13 Carbon isotope ratio relative to the V-PDB
standard (RPDB)
30
195 Li7+Fe Li7 Li7 concentration in shoot under Fe sufficient
conditions
31
196 B11+Fe B11 B11 concentration in shoot under Fe sufficient
conditions
31
197 Na23+Fe Na23 Na23 concentration in shoot under Fe
sufficient conditions
31
198 Mg25+Fe Mg25 Mg25 concentration in shoot under Fe
sufficient conditions
31
199 P31+Fe P31 P31 concentration in shoot under Fe sufficient
conditions
31
Nature Genetics: doi:10.1038/ng.308

Supplementary Information
12
200 K39+Fe K39 K39 concentration in shoot under Fe sufficient
conditions
31
201 Ca43+Fe Ca43 Ca43 concentration in shoot under Fe
sufficient conditions
31
202 Mn55+Fe Mn55 Mn55 concentration in shoot under Fe
sufficient conditions
31
203 Fe56+Fe Fe56 Fe56 concentration in shoot under Fe
sufficient conditions
31
204 Co59+Fe Co59 Co59 concentration in shoot under Fe
sufficient conditions
31
205 Ni60+Fe Ni60 Ni60 concentration in shoot under Fe
sufficient conditions
31
206 Cu65+Fe Cu65 Cu65 concentration in shoot under Fe
sufficient conditions
31
207 Zn66+Fe Zn66 Zn66 concentration in shoot under Fe
sufficient conditions
31
208 As75+Fe As75 As75 concentration in shoot under Fe
sufficient conditions
31
209 Se77+Fe Se77 Se77 concentration in shoot under Fe
sufficient conditions
31
210 Mo95+Fe Mo95 Mo95 concentration in shoot under Fe
sufficient conditions
31
211 Cd111+Fe Cd111 Cd111 concentration in shoot under Fe
sufficient conditions
31
212 Li7-Fe Li7 Li7 concentration in shoot under Fe deficient
conditions
31
213 B11-Fe B11 B11 concentration in shoot under Fe deficient
conditions
31
214 Na23-Fe Na23 Na23 concentration in shoot under Fe
deficient conditions
31
215 Mg25-Fe Mg25 Mg25 concentration in shoot under Fe
deficient conditions
31
216 P31-Fe P31 P31 concentration in shoot under Fe deficient
conditions
31
217 K39-Fe K39 K39 concentration in shoot under Fe deficient
conditions
31
218 Ca43-Fe Ca43 Ca43 concentration in shoot under Fe 31
Nature Genetics: doi:10.1038/ng.308

Supplementary Information
13
deficient conditions
219 Mn55-Fe Mn55 Mn55 concentration in shoot under Fe
deficient conditions
31
220 Fe56-Fe Fe56 Fe56 concentration in shoot under Fe
deficient conditions
31
221 Co59-Fe Co59 Co59 concentration in shoot under Fe
deficient conditions
31
222 Ni60-Fe Ni60 Ni60 concentration in shoot under Fe deficient
conditions
31
223 Cu65-Fe Cu65 Cu65 concentration in shoot under Fe
deficient conditions
31
224 Zn66-Fe Zn66 Zn66 concentration in shoot under Fe
deficient conditions
31
225 As75-Fe As75 As75 concentration in shoot under Fe
deficient conditions
31
226 Se77-Fe Se77 Se77 concentration in shoot under Fe
deficient conditions
31
227 Mo95-Fe Mo95 Mo95 concentration in shoot under Fe
deficient conditions
31
228 Cd111-Fe Cd111 Cd111 concentration in shoot under Fe
deficient conditions
31
229 Cs_Gsoil Cs uptake Cs uptake from soil per gram shoot fresh
weight
32
230 FW_soil shoot weight Shoot fresh weight 32
231 Cs_Psoil Cs uptake Cs uptake from soil per plant (Cs content x
shoot fresh weight)
32
232 Cs_Gagar Cs uptake Cs uptake from agar per gram shoot fresh
weight
33
233 FW_agar shoot weight Shoot fresh weight 33
234 Cs_Pagar Cs uptake Cs uptake from agar per plant (Cs content x
FW)
33
235 SYMP symptom
development
Symptom development after inoculation with
PPV-Rankovic (pICPPVnk)
34
236 ACC virus accumulation Virus accumulation after inoculation with
PPV-Rankovic (pICPPVnk)
34
237 PPV-PS symptom
development
Symptom development after inoculation with
PPV-PS
35
Nature Genetics: doi:10.1038/ng.308

Supplementary Information
14
References
1. Alonso-Blanco,C., El-Assal,S.E., Coupland,G., & Koornneef,M. Analysis of
natural allelic variation at flowering time loci in the Landsberg erecta and Cape
Verde Islands ecotypes of Arabidopsis thaliana. Genetics 149, 749-764 (1998).
2. Alonso-Blanco,C., Blankestijn-de,V.H., Hanhart,C.J., & Koornneef,M. Natural
allelic variation at seed size loci in relation to other life history traits of
Arabidopsis thaliana. Proc. Natl. Acad. Sci. U. S. A 96, 4710-4717 (1999).
3. Bentsink,L. et al. Genetic analysis of seed-soluble oligosaccharides in relation to
seed storability of Arabidopsis. Plant Physiol 124, 1595-1604 (2000).
4. Borevitz,J.O. et al. Quantitative trait loci controlling light and hormone response
in two accessions of Arabidopsis thaliana. Genetics 160, 683-696 (2002).
5. Bentsink,L., Yuan,K., Koornneef,M., & Vreugdenhil,D. The genetics of phytate
and phosphate accumulation in seeds and leaves of Arabidopsis thaliana, using
natural variation. Theor. Appl. Genet. 106, 1234-1243 (2003).
6. Ungerer,M.C., Halldorsdottir,S.S., Modliszewski,J.L., Mackay,T.F., &
Purugganan,M.D. Quantitative trait loci for inflorescence development in
Arabidopsis thaliana. Genetics 160, 1133-1151 (2002).
7. Ungerer,M.C., Halldorsdottir,S.S., Purugganan,M.D., & Mackay,T.F. Genotype-
environment interactions at quantitative trait loci affecting inflorescence
development in Arabidopsis thaliana. Genetics 165, 353-365 (2003).
8. Kliebenstein,D., Pedersen,D., Barker,B., & Mitchell-Olds,T. Comparative analysis
of quantitative trait loci controlling glucosinolates, myrosinase and insect
resistance in Arabidopsis thaliana. Genetics 161, 325-332 (2002).
9. Sergeeva,L.I. et al. Histochemical analysis reveals organ-specific quantitative
trait loci for enzyme activities in Arabidopsis. Plant Physiol 134, 237-245 (2004).
Nature Genetics: doi:10.1038/ng.308

Supplementary Information
15
10. Alonso-Blanco,C., Bentsink,L., Hanhart,C.J., Blankestijn-de,V.H., & Koornneef,M.
Analysis of natural allelic variation at seed dormancy loci of Arabidopsis thaliana.
Genetics 164, 711-729 (2003).
11. Botto,J.F., onso-Blanco,C., Garzaron,I., Sanchez,R.A., & Casal,J.J. The Cape
Verde Islands allele of cryptochrome 2 enhances cotyledon unfolding in the
absence of blue light in Arabidopsis. Plant Physiol 133, 1547-1556 (2003).
12. Alonso-Blanco,C. et al. Genetic and molecular analyses of natural variation
indicate CBF2 as a candidate gene for underlying a freezing tolerance
quantitative trait locus in Arabidopsis. Plant Physiol 139, 1304-1312 (2005).
13. Swarup,K. et al. Natural allelic variation identifies new genes in the Arabidopsis
circadian system. Plant J. 20, 67-77 (1999).
14. Hobbs,D.H., Flintham,J.E., & Hills,M.J. Genetic control of storage oil synthesis in
seeds of Arabidopsis. Plant Physiol 136, 3341-3349 (2004).
15. Edwards,K.D., Lynn,J.R., Gyula,P., Nagy,F., & Millar,A.J. Natural allelic variation
in the temperature-compensation mechanisms of the Arabidopsis thaliana
circadian clock. Genetics 170, 387-310 (2005).
16. Sergeeva,L.I. et al. Vacuolar invertase regulates elongation of Arabidopsis
thaliana roots as revealed by QTL and mutant analysis. Proc. Natl. Acad. Sci. U.
S. A 103, 2994-2999 (2006).
17. Keurentjes,J.J. et al. Development of a near-isogenic line population of
Arabidopsis thaliana and comparison of mapping power with a recombinant
inbred line population. Genetics 175, 891-905 (2007).
18. Botto,J.F. & Coluccio,M.P. Seasonal and plant-density dependency for
quantitative trait loci affecting flowering time in multiple populations of
Arabidopsis thaliana. Plant Cell Environ. 30, 1465-1479 (2007).
19. Luquez,V.M. et al. Quantitative trait loci analysis of leaf and plant longevity in
Arabidopsis thaliana. J. Exp. Bot. 57, 1363-1372 (2006).
Nature Genetics: doi:10.1038/ng.308

Supplementary Information
16
20. Ito,H., Miura,A., Takashima,K., & Kakutani,T. Ecotype-specific and chromosome-
specific expansion of variant centromeric satellites in Arabidopsis thaliana. Mol.
Genet. Genomics 277, 23-30 (2007).
21. Kobayashi,Y., Fututa,Y., Ohno,T., Hara,T., & Koyama,H. Quantitative trait loci
controlling aluminium tolerance in two accessions of Arabidopsis thaliana
(Landsberg erecta and Cape Verde Islands). Plant Cell Environ. 28, 1516-1524
(2005).
22. Harada,H., Kuromori,T., Hirayama,T., Shinozaki,K., & Leigh,R.A. Quantitative
trait loci analysis of nitrate storage in Arabidopsis leading to an investigation of
the contribution of the anion channel gene, AtCLC-c, to variation in nitrate levels.
J. Exp. Bot. 55, 2005-2014 (2004).
23. Harada,H. & Leigh,R.A. Genetic mapping of natural variation in potassium
concentrations in shoots of Arabidopsis thaliana. J. Exp. Bot. 57, 953-960 (2006).
24. Darrah,C. et al. Analysis of phase of LUCIFERASE expression reveals novel
circadian quantitative trait loci in Arabidopsis. Plant Physiol 131, 1464-1474
(2006).
25. Hou,A. et al. Two naturally occurring deletion mutants of 12S seed storage
proteins in Arabidopsis thaliana. Planta 222, 512-520 (2005).
26. Teng,S., Keurentjes,J., Bentsink,L., Koornneef,M., & Smeekens,S. Sucrose-
specific induction of anthocyanin biosynthesis in Arabidopsis requires the
MYB75/PAP1 gene. Plant Physiol 139, 1831-1852 (2005).
27. Teng,S., Rognoni,S., Bentsink,L., & Smeekens,S. The Arabidopsis GSQ5/DOG1
Cvi allele is induced by the ABA-mediated sugar signalling pathway and
enhances sugar sensitivity by stimulating ABI4 expression. Plant J. 55, 372-381
(2008).
28. Esch,E., Szymaniak,J.M., Yates,H., Pawlowski,W.P., & Buckler,E.S. Using
crossover breakpoints in recombinant inbred lines to identify quantitative trait loci
controlling the global recombination frequency. Genetics 177, 1851-1858 (2007).
Nature Genetics: doi:10.1038/ng.308

Supplementary Information
17
29. Vreugdenhil,D., Aarts,M.G.M., Koornneef,M., Nelissen,H., & Ernst,W.H.O.
Natural variation and QTL analysis for cationic mineral content in seeds of
Arabidopsis thaliana. Plant Cell Environ. 27, 828-839 (2004).
30. Juenger,T. et al. Identification and characterization of QTL underlying whole-
plant physiology in Arabidopsis thaliana: d13C, stomatal conductance, and
transpiration efficiency. Plant Cell Environ 28, 687-708 (2005).
31. Baxter,I. et al. Purdue ionomics information management system. An integrated
functional genomics platform. Plant Physiol 143, 600-611 (2007).
32. White,P.J. et al. Selecting plants to minimise radiocaesium in the food chain.
Plant and Soil 249, 177-186 (2003).
33. Payne,K.A. et al. Natural genetic variation in caesium (Cs) accumulation by
Arabidopsis thaliana. New Phytologist 162, 535-548 (2004).
34. Sicard,O. et al. Identification of quantitative trait loci controlling symptom
development during viral infection in Arabidopsis thaliana. Molecular Plant-
Microbe Interactions 21, 198-207 (2008).
35. Decroocq,V. et al. Multiple resistance traits control Plum pox virus infection in
Arabidopsis thaliana. Molecular Plant-Microbe Interactions 19, 541-549 (2006).
Nature Genetics: doi:10.1038/ng.308

Supplementary Information
18
Supplementary Figures
Supplementary Figure 1: Hotspots and other QTLs
The distribution of the number of traits that map to each of the six hotspots (pink and
blue balls) and/or to the other genome regions (grey ball) is shown. A blue ball indicates
that the hotspot was not significant, while a pink ball indicates the hotspot was significant
at the given level. Dark lines between two balls report the number of traits that mapped
to the two corresponding hotspot loci (in which case the trait has two or more QTLs).
Grey lines report the number of traits that mapped to one or more hotspots and to
another genome region.
Most transcripts and proteins map to one QTL only. Many metabolites map to
two QTLs and patterns of connectivity emerge, e.g. many metabolites possess one
hotspot mQTL and one other non-hotspot mQTL, which suggests that the whole
metabolome has a correlated structure rather than that most hotspot mQTLs were
observed for a selected set of metabolites only. Metabolic and phenotypic traits can also
map to multiple hotspots, e.g. 33 phenotypic traits map to CRY2 and one of the other
hotspots, which suggests that different subordinate network components became
connected.
Together, these six hot spots influence 16%, 25%, 55% and 77% of 4,832, 253,
7,158 and 116 transcript, protein, metabolite and phenotypic traits with QTLs,
respectively, when a window of 5 cM around the hot spot is used to account for
imperfect mapping resolution in the QTL analysis; 13%, 15%, 50% and 69% when using
a 2 cM window.
Nature Genetics: doi:10.1038/ng.308

Supplementary Information
19
Nature Genetics: doi:10.1038/ng.308

Supplementary Information
20
Supplementary Figure 2: Phenotypic trait categories
The phenotypic traits collected from the literature (Supplementary Table 1) could be
partly redundant, because occasionally very similar traits have been measured multiple
times, although under different conditions, at different stages, or by different groups. We
grouped the 139 traits into 35 distinct phenotypic trait categories. 33 phenotypic trait
categories have traits with QTLs (116 traits in total). 31 phenotypic trait categories (94%)
have at least one trait with a QTL in a window of 5 cM around a hotspot (blue cells). See
Supplementary Fig. 3 for further analysis.
Nature Genetics: doi:10.1038/ng.308

Supplementary Information
21
Supplementary Figure 3: Further analysis of trait data collected from literature
(a) Phenotypic traits. The 139 phenotypic traits (Supplementary Table 1) were
grouped into 35 distinct categories (Supplementary Figure 2). We here show the heat
maps with and without categorization. If multiple traits belong to the same category and
map to the same locus, we counted it as a single QTL for this category. Clearly, the two
phQTL distributions are almost identical and not affected much by potential redundancy
within phenotypic trait categories. Consequently, the system-wide effects of the six
hotspots are also almost identical. The number of phenotypic traits with a hotspot QTL
is: 89 out of 116 traits with a QTL (77%). The number of trait categories with a hotspot
QTL is: 31 out of 33 categories with a QTL (94%).
(b) Biochemical traits. The 98 biochemical traits collected from the literature
predominantly consisted of 49 traits for 19 distinct ions, and 28 traits for 3 distinct
proteins only. Therefore we here show the heat maps with and without categorization for
the larger collection of ions only. The number of ion traits with a hotspot QTL, is: 22 out
of 32 traits with a QTL (69%). The number of ion trait categories with a hotspot QTL is:
14 out of 16 categories with a QTL (88%), using a window of 5 cM around the hotspot to
account for imperfect mapping resolution in QTL analysis.
Nature Genetics: doi:10.1038/ng.308
Supplementary Information
22
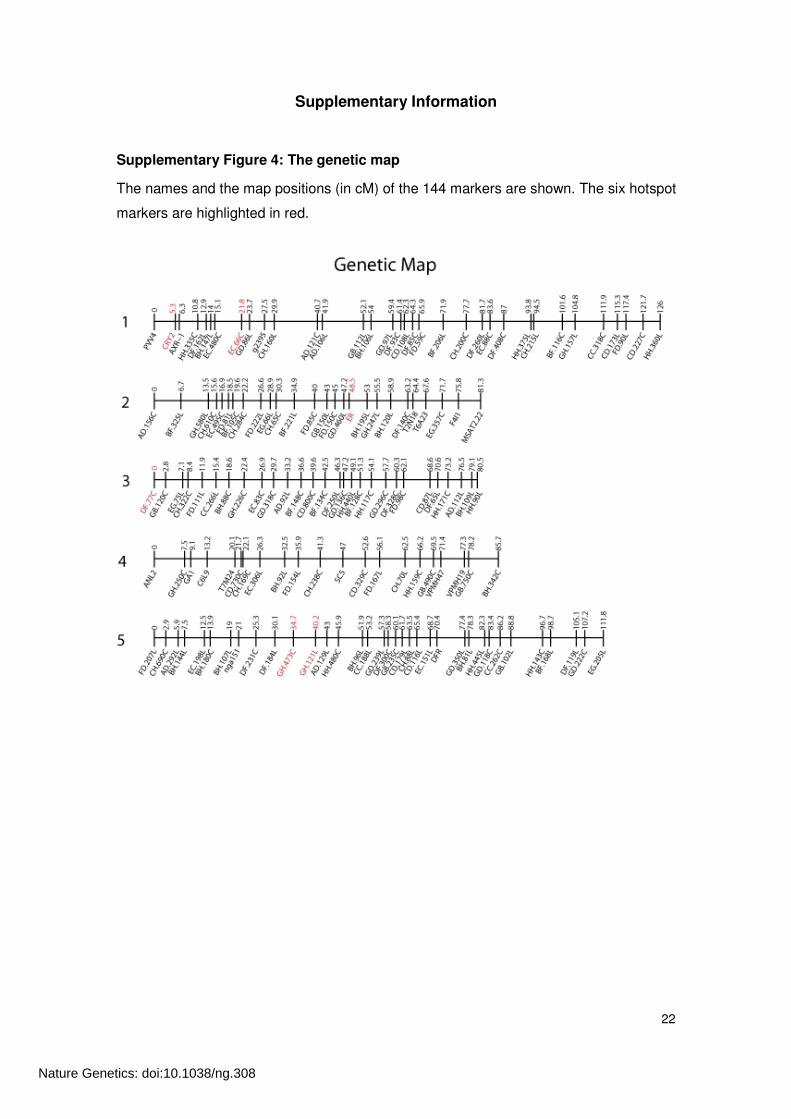
Supplementary Figure 4: The genetic map
The names and the map positions (in cM) of the 144 markers are shown. The six hotspot
markers are highlighted in red.
Nature Genetics: doi:10.1038/ng.308

Supplementary Information
23
Supplementary Figure 5: Traits mapping to QTL hotspots: QTL likelihood profiles.
We detected six QTL hotspots on the genome. QTL likelihood profiles of individual
molecular and phenotypic traits mapping to these hotspots can be accessed via six
different figures: Supplementary Fig. 5a for traits that map to hotspot 1,
Supplementary Fig. 5b for traits that map to hotspot 2, and so on. Traits that map to
two or more hotspots will appear in two or more figures.
The first row in Supplementary Fig. 5a shows a heat map of the average QTL
profile for all traits that map to hotspot 1 (located at marker 2) and that also map to
marker 143 (there are 144 markers in total, but no traits map to marker 2 and marker
144). The second row refers to all traits that map to hotspot 1 and to marker 142, and so
on (in this and in the five other figures). The numbers at the right-hand side of the heat
map indicate the number of transcript-, protein-, metabolite- and phenotypic traits in the
row. Chromosomes are indicated and the red dashed lines are the chromosome
borders.
The heat maps are hyperlinked to the QTL likelihood profiles of the traits on
http://gbic.biol.rug.nl/supplementary/2008/phenotypic_buffering/supFig5.htm. Clicking on
a row of the heat map will open a new window showing the QTL likelihood profiles of
individual traits.
Nature Genetics: doi:10.1038/ng.308

Supplementary Information
24
Fig 5a. Traits mapping to hotspot CRY2.
Nature Genetics: doi:10.1038/ng.308

Supplementary Information
25
Fig 5b. Traits mapping to hotspot EC.66C
Nature Genetics: doi:10.1038/ng.308

Supplementary Information
26
Fig. 5c. Traits mapping to hotspot ER
Nature Genetics: doi:10.1038/ng.308

Supplementary Information
27
Fig. 5d. Traits mapping to hotspot DF.77C
Nature Genetics: doi:10.1038/ng.308

Supplementary Information
28
Fig. 5e. Traits mapping to hotspot GH.473C
Nature Genetics: doi:10.1038/ng.308

Supplementary Information
29
Fig. 5f. Traits mapping to hotspot GH.121L
Nature Genetics: doi:10.1038/ng.308

Supplementary Information
30
Supplementary Methods
1. Plant growth conditions and harvesting
Seeds of RILs were sown on 10 ml ½ MS agar (2%) in Ø 6 cm Petri dishes. Per line five
replicate dishes were sown on five consecutive days with a density of a few hundred
seeds per Petri dish. Petri dishes were placed in a cold room at 4°C for 7 days in the
dark to promote uniform germination. Subsequently dishes were randomly placed in five
blocks in a climate chamber, where each block contained one replicate dish of each line.
Growing conditions were 16 h light (30 W.m−2) at 20°C, 8 h dark at 15°C and 75%
relative humidity. After 6 days the lids of the Petri dishes were removed to ensure
seedlings were free of condensed water on the day of harvesting. On day 7, seedlings
were harvested by submerging the complete Petri dish briefly in liquid nitrogen and
scraping off the aerial parts with a razor blade. Harvesting started 7 hours into the light
period and all lines were harvested in random order within 2 hours. Per line, plant
material from two dishes was harvested to make one replicate sample and from the
other three dishes to make the second. Plant material was ground in liquid nitrogen and
stored at −80°C until further processing (full details see ref1).
2. New molecular data we have generated on all RILs
2.1 2D-PAGE
For protein extraction, (liquid nitrogen) frozen Arabidopsis seedlings were ground with
pestle and mortar. To 100 mg material, weighed in a 2 ml screw-cap tube, we added 1.5
ml of 10%TCA, 0.3% DTT (w/v) in acetone. Samples were homogenized in the
FastPrep® system (Qbiogene, Irvine, USA) for 45 seconds at a speed of 6.5 rpm and
incubated at −20ºC for at least one hour, with occasional vortexing. The homogenate
was centrifuged for 30 minutes at 20,800 g 4ºC). The supernatant was decanted and the
pellet was washed twice with 1.5ml acetone (10 mM DTT). After air-drying, the pellet
was solubilized in 200 µl TUCD buffer (6 M urea, 2 M thio-urea, 2% (w/v) CHAPS and 30
mM Tris-HCl pH8,5). Protein amount was measured using the RC/DC assay (Bio-Rad)
using BSA as reference. Some sample extracts with low protein concentration were
concentrated and cleaned using the clean-up kit (GE Healthcare, manufacturer’s
protocol) and dissolved TUCD buffer to a final protein concentration of 5 ug/ul.
Nature Genetics: doi:10.1038/ng.308

Supplementary Information
31
Proteins were labeled using the fluorescent CyDyes from the Difference Gel
Electrophoresis (DIGE®) technology (GE Healthcare, Sweden) according to the
manufacturer’s protocol. For each sample, 50 µg of protein was labeled with 0.4 nmol
Cy3 or Cy5. For internal standard, a reference sample was prepared by mixing equal
protein amounts of all samples (131 in total). This mixture was labeled with Cy2. Each
2D-gel contains one sample labeled with Cy3, one labeled with Cy5 and the internal
standard labeled with Cy2.
The first-dimension isoelectric focusing was performed using 24 cm immobilized
pH gradient strips (GE Healthcare) with a linear pH range of 4 to 7 in an Ettan IPGPhor
isoelectric focusing system. Cydye 2, 3 & 5 labeled samples (total of 150 µg protein)
were diluted in 0.5% IPG buffer (pH 4-7 and pH 3-10, 1:1) and TUCD buffer to a volume
of 450 µl and loaded into the strips by rehydration. The focusing was run overnight at
20ºC with the following settings: 30 V for 1 h, 500 V for 1 h, from 500 V to 1000 V in 6 h,
from 1000 V to 8000 V in 3 h, and finally 8000 V until a total of 60,000 Vhour was
reached. After IEF the strips were equilibrated at room temperature in equilibration buffer
(6 M urea, 50 mM Tris-HCl pH 8.8, 30% (v/v) glycerol, 2% (w/v) SDS containing 1%
(w/v) DTT for 15 minutes and after that in the same buffer containing 2.5% (w/v)
iodoacetamide for 10 minutes. The second dimension was run in the ISO-DALT system
(GE healthcare) on 11% SDS-PAGE slab gels. Electrophoresis was performed at 30 V
for 1 hour followed by 90 V overnight at 10ºC. The gels were scanned remaining in the
glass plate, using the Ettan DIGE Imager (GE Healthcare, using the manufacturer’s
setting for CyDye detection).
Gel images were analyzed with the Decyder software V6.5 (GE Healthcare).
Automated spot detection was performed (estimated number of spots 2500). The
detected spots were then filtered based on spot area (>270), spot volume (>1.1e104),
peak height (>80), peak slope (< 0.75) to exclude background noise and dust particles.
The internal standard in each gel was used to automatically match all images to the
reference (the gel with the most detected spots). The matching was checked and
corrected by hand with the help of land-marking clear spots that were visible in all
images and rematching the dataset.
2.2 GC-TOF-MS
Frozen and ground samples of approximately 50 mg fresh weight were weighed
accurately in a 2 ml Eppendorf vial with punctured lid, and 1.4 ml cold methanol and
Nature Genetics: doi:10.1038/ng.308

Supplementary Information
32
ribitol as internal standard were added. Samples were extracted for 20 min in a shaking
water bath at 70oC. After centrifuging at 21000 g for 5 min, 500 µL of the supernatant
was transferred to a new 2 ml Eppendorf vial. A two-phase extraction method was used
to separate polar and apolar compounds by adding 500 µl water and 700 µl chloroform2.
After vortexing and centrifugation at 21000 g for 5 min, 200 µL of the polar phase was
dried under vacuum. The dried extracts were derivatized by methoximation and
trimethylsilylation essentially as described2 using a CombiPal robot for on-line
derivatization. Octadecane was added to the o-methylhydroxiaminehydrochloride in
pyridine to check for accuracy of the pipetting of the robot.
Samples were injected with an Optic3 injector (ATAS) at 70oC with a gradient of
6oC/sec to 240oC using a split flow of 10 ml and a column flow of 2 ml in a GC6890N gas
chromatograph (Agilent Technologies) on a ZB50 capillary column (30 m x 0.32 mm i.d.,
0.25 µm DF; Phenomenex) with a column temperature of 70oC for 2 minutes and a
gradient of 10oC/min to 310oC and a final time of 3 min. The GC was coupled to a
Pegasus III time-of-flight mass spectrometer (LECO) and compounds were detected at a
scanning rate of 20 spectra per second (mass 50-600). Metalign™ software
(www.metalign.nl) was used to extract all mass signals detected and to align these
signals across the samples3.
2.3 1H NMR
NMR sample preparation was carried out according to the procedures described in ref4, 5.
NMR extractions were performed for three technical replicates of each biological sample.
Freeze-dried leaf samples (15 mg) were extracted at 500C for 10 min with 80:20
D2O:CD3OD (1 ml) containing 0.05% w/v d4-TSP. After cooling and centrifugation (15
minutes), the supernatant was transferred to a clean Eppendorf tube and heated to 90oC
for 2 min. Samples were then cooled to 8oC for 30 min before centrifugation (10 min).
750 �l of the supernatant was transferred to a 5 mm NMR tube for 1H NMR analysis.
NMR extractions were performed for three replicates of each biological sample. 1H NMR spectra were acquired under automation at 300ºK on an Avance
Spectrometer (Bruker, Coventry, UK) operating at 600.0528 MHz, equipped with a 5 mm
Selective Inverse Probe. Spectra were collected using a water suppression pulse
sequence with a relaxation delay of 5 s. Each spectrum was acquired using 128 scans of
64,000 data points with a spectral width of 7309.99 Hz. Spectra were automatically
Fourier transformed using an exponential window with a line broadening value of 0.5 Hz.
Nature Genetics: doi:10.1038/ng.308

Supplementary Information
33
Phasing and baseline correction were carried out within the instrument software. 1H
chemical shifts were referenced to d4-TSP at �0.00. 1H NMR spectra were automatically reduced, using Amix (Analysis of MIXtures
software, Bruker Biospin, Coventry, UK), to ASCII files containing integrated regions or
“buckets” of equal width (0.01 ppm). Spectral intensities were scaled to the d4-TSP
region (�0.05 to −0.05). The ASCII file was imported into Excel for the addition of sample
details. The regions for unsuppressed water (�4.865-4.775), d4-MeOH (�3.335-3.285)
and d4-TSP (�0.05 to −0.05) were removed.
Identification of individual metabolites was achieved by comparing to authentic
standards whose spectra were collected under the same experimental conditions.
3. Molecular data we have previously generated on all RILs
3.1 mRNA-microarrays
Total RNA of each line was isolated from two biological replicates by using phenol-
chloroform extraction. Genome-wide gene expression analysis was carried out using
two-color microarrays provide by the Galbraith laboratory (University of Arizona, Tucson,
AZ) with Qiagen Operon (Valencia, CA/Alameda, CA) Arabidopsis genome oligo set
Version 2.10.2.). For details see ref6.
3.2 HPLC-QTOF-MS
Frozen and ground samples of approximately 100 mg were weighed in 2.2 ml Eppendorf
tubes. Aqueous-methanol extracts were prepared from each RIL and separated using an
Alliance 2795 HT system (Waters Corporation) equipped with a Luna C18-reversed
phase column (150 x 2.1 mm, 3 µm; Phenomenex, CA). Compounds eluting from the
column were detected on-line, first by a Waters 996 photodiode array detector at 200-
600 nm and then by a Q-TOF Ultima MS (Waters) with Electron Spray Ionization (ESI)
source. Ions were detected in negative mode in the range of m/z 100 to 1500, using a
scan time of 900 msec and an inter-scan delay of 100 msec. For details see ref1.
4. Phenotypic data collected on the same RILs
We defined phenotypic trait as the observable morphological, physiological, pathological
or biochemical characteristics of an organism as determined by traditional low-
throughput measurement technologies. Alternative definitions are possible, for example,
Nature Genetics: doi:10.1038/ng.308

Supplementary Information
34
excluding molecular traits such as ion content or enzyme activities. Such reassignments
did not have a major impact on our results.
We have collected all publicly available phenotypic and biochemical data on the
Ler × Cvi recombinant inbred population from the literature. Supplementary Table 1
lists all the phenotypic and biochemical traits and gives the corresponding literature
reference. Traits can be clustered into more general categories, such as flowering and
germination (physiological). Supplementary Fig. 2 and Supplementary Fig. 3 show our
analysis results for categorized traits.
5. Statistical analysis
5.1 QTL mapping
We performed QTL mapping using two-part multiple-QTL models7 for transcript, protein,
metabolite and phenotypic trait data. The overall false discovery rate (FDR) was set to
0.05. Traits can map to one or more QTLs, and for each QTL the most significant marker
was stored for QTL hotspot analysis (see below).
5.2 QTL hotspot analysis
We computed significance thresholds for (i) detection of QTLs hotspots per level, and (ii)
detection of hotspots that appear across multiple levels (‘system-wide QTL hotspots’).
QTL hotspots per level. We used QTL and permutation analysis to compute significance
thresholds for detection of QTL hotspots. Redundancy in the biomolecular or phenotypic
profiling can lead to correlated traits. In the absence of a common genetic basis, such
correlation may still inflate the number of false QTLs at particular loci if trait data are
permuted. We therefore permuted marker data to maintain the correlation structure in
the trait data. This gives appropriate significance thresholds for detection of QTL
hotspots8. For each of 250 permutations we analyzed all > 40,000 traits to map QTLs,
stored the most significant marker for each QTL, counted the number of significant QTLs
over all traits for each marker, stored the maximum value along the genome, and used
them to derive significant thresholds for hotspot detection per level (P value=0.05).
Nature Genetics: doi:10.1038/ng.308

Supplementary Information
35
System-wide QTL hotspots. We used the observed QTL hotspots and permutation
analysis to compute significance thresholds for detection of QTL hotspots that appear at
multiple levels. Using the results from the QTL analysis per level, we ranked the markers
per level from the one with the highest to that with the lowest number of traits mapping to
it. We used a rank-product test9 to find markers that rank significantly high at multiple
levels. For each of 5,000 permutations we computed the P-values for the rank-product
test at each of the 144 markers, and used them to derive a threshold for hotspot
detection at a false discovery rate (FDR) of 5%. QTL hotspots with significant rank-test
results (suggesting significant downstream effects) are indicated with arrows above the
heat maps (Fig. 1 in main paper).
References
1. Keurentjes,J.J. et al. The genetics of plant metabolism. Nat. Genet. 38, 842-849
(2006).
2. Lisec,J., Schauer,N., Kopka,J., Willmitzer,L., & Fernie,A.R. Gas chromatography
mass spectrometry-based metabolite profiling in plants. Nat. Protoc. 1, 387-396
(2006).
3. Tikunov,Y. et al. A novel approach for nontargeted data analysis for
metabolomics. Large-scale profiling of tomato fruit volatiles. Plant Physiol 139,
1125-1137 (2005).
4. Baker,J.M. et al. A metabolomic study of substantial equivalence of field-grown
genetically modified wheat. Plant Biotechnol. J. 4, 381-392 (2006).
5. Ward,J.L., Harris,C., Lewis,J., & Beale,M.H. Assessment of 1H NMR
spectroscopy and multivariate analysis as a technique for metabolite
fingerprinting of Arabidopsis thaliana. Phytochemistry 62, 949-957 (2003).
6. Keurentjes,J.J. et al. Regulatory network construction in Arabidopsis by using
genome-wide gene expression quantitative trait loci. Proc. Natl. Acad. Sci. U. S.
A 104, 1708-1713 (2007).
Nature Genetics: doi:10.1038/ng.308

Supplementary Information
36
7. Fu,J., Swertz,M.A., Keurentjes,J.J., & Jansen,R.C. MetaNetwork: a
computational protocol for the genetic study of metabolic networks. Nat. Protoc.
2, 685-694 (2007).
8. de Koning,D.J. & Haley,C.S. Genetical genomics in humans and model
organisms. Trends Genet. 21, 377-381 (2005).
9. Breitling,R., Armengaud,P., Amtmann,A., & Herzyk,P. Rank products: a simple,
yet powerful, new method to detect differentially regulated genes in replicated
microarray experiments. FEBS Lett. 573, 83-92 (2004).
Nature Genetics: doi:10.1038/ng.308