Synthesis and characterization of excess magnesium MgB 2 superconductor under inert carbon...
21
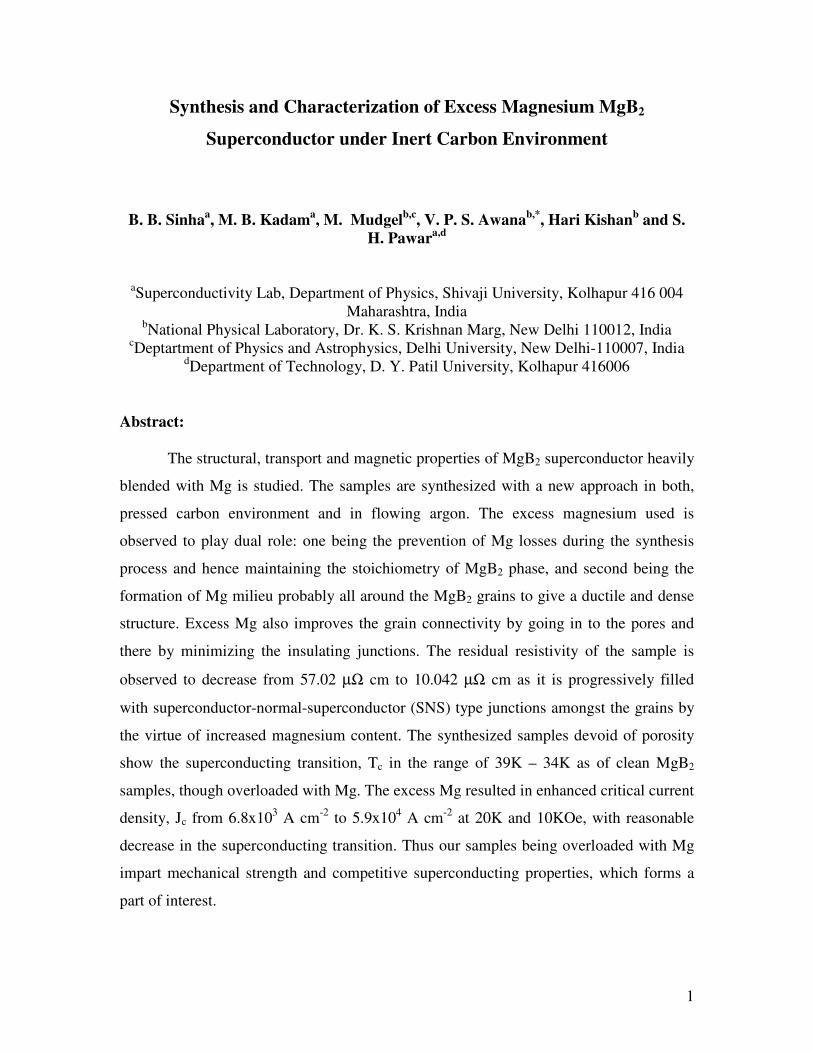
1 Synthesis and Characterization of Excess Magnesium MgB 2 Superconductor under Inert Carbon Environment B. B. Sinha a , M. B. Kadam a , M. Mudgel b,c , V. P. S. Awana b,* , Hari Kishan b and S. H. Pawar a,d a Superconductivity Lab, Department of Physics, Shivaji University, Kolhapur 416 004 Maharashtra, India b National Physical Laboratory, Dr. K. S. Krishnan Marg, New Delhi 110012, India c Deptartment of Physics and Astrophysics, Delhi University, New Delhi-110007, India d Department of Technology, D. Y. Patil University, Kolhapur 416006 Abstract: The structural, transport and magnetic properties of MgB 2 superconductor heavily blended with Mg is studied. The samples are synthesized with a new approach in both, pressed carbon environment and in flowing argon. The excess magnesium used is observed to play dual role: one being the prevention of Mg losses during the synthesis process and hence maintaining the stoichiometry of MgB 2 phase, and second being the formation of Mg milieu probably all around the MgB 2 grains to give a ductile and dense structure. Excess Mg also improves the grain connectivity by going in to the pores and there by minimizing the insulating junctions. The residual resistivity of the sample is observed to decrease from 57.02 μΩ cm to 10.042 μΩ cm as it is progressively filled with superconductor-normal-superconductor (SNS) type junctions amongst the grains by the virtue of increased magnesium content. The synthesized samples devoid of porosity show the superconducting transition, T c in the range of 39K – 34K as of clean MgB 2 samples, though overloaded with Mg. The excess Mg resulted in enhanced critical current density, J c from 6.8x10 3 A cm -2 to 5.9x10 4 A cm -2 at 20K and 10KOe, with reasonable decrease in the superconducting transition. Thus our samples being overloaded with Mg impart mechanical strength and competitive superconducting properties, which forms a part of interest.
-
Upload
independent -
Category
Documents
-
view
4 -
download
0
Transcript of Synthesis and characterization of excess magnesium MgB 2 superconductor under inert carbon...
1
Synthesis and Characterization of Excess Magnesium MgB2
Superconductor under Inert Carbon Environment
B. B. Sinhaa, M. B. Kadam
a, M. Mudgel
b,c, V. P. S. Awana
b,*, Hari Kishan
b and S.
H. Pawara,d
aSuperconductivity Lab, Department of Physics, Shivaji University, Kolhapur 416 004 Maharashtra, India
bNational Physical Laboratory, Dr. K. S. Krishnan Marg, New Delhi 110012, India cDeptartment of Physics and Astrophysics, Delhi University, New Delhi-110007, India
dDepartment of Technology, D. Y. Patil University, Kolhapur 416006
Abstract:
The structural, transport and magnetic properties of MgB2 superconductor heavily
blended with Mg is studied. The samples are synthesized with a new approach in both,
pressed carbon environment and in flowing argon. The excess magnesium used is
observed to play dual role: one being the prevention of Mg losses during the synthesis
process and hence maintaining the stoichiometry of MgB2 phase, and second being the
formation of Mg milieu probably all around the MgB2 grains to give a ductile and dense
structure. Excess Mg also improves the grain connectivity by going in to the pores and
there by minimizing the insulating junctions. The residual resistivity of the sample is
observed to decrease from 57.02 µΩ cm to 10.042 µΩ cm as it is progressively filled
with superconductor-normal-superconductor (SNS) type junctions amongst the grains by
the virtue of increased magnesium content. The synthesized samples devoid of porosity
show the superconducting transition, Tc in the range of 39K – 34K as of clean MgB2
samples, though overloaded with Mg. The excess Mg resulted in enhanced critical current
density, Jc from 6.8x10³ A cm-2 to 5.9x10⁴ A cm-2 at 20K and 10KOe, with reasonable
decrease in the superconducting transition. Thus our samples being overloaded with Mg
impart mechanical strength and competitive superconducting properties, which forms a
part of interest.
2
PACS No. 74.70.Ad, 61.05.C, 68.37.Hk, 74.25.Fy, 74.25.Ha, 74.25.Sv
Keywords: Mg doped MgB2 superconductor, Transport properties, Critical current
density, Flux Pinning
*Corresponding Author:
Dr. V.P.S. Awana
Fax No. 0091-11-45609310: Phone no. 0091-11-45609210
[email protected]: www.freewebs.com/vpsawana/

3
Introduction:
The MgB2 superconductor with a highest Tc of 39 K [1] and multiple gap [2, 3]
superconductivity is one of the interesting superconductors. Besides, it is a BCS
superconductor [4] having Tc with in strong coupling BCS limit [5]. Any attempts to
increase the superconducting transition temperature [6-9] have not achieved success yet
[10-12], due to its typical phonon coupling mechanism [13-18]. But the other critical
parameters like critical current density, and upper critical field can be enhanced
remarkably by nano- particle doping [19-26]. Moreover, the mechanical properties of
MgB2 superconductor also vary depending upon the dopant as well as on the synthesis
route. The synthesis route partially dictates the density of the sample and the impurity
level influencing the properties of MgB2 phase. The synthesis technique for MgB2
superconductor so far needed a pressurized environment to achieve better
superconducting properties. The samples synthesized under pressure are comparatively
dense [27] than those synthesized in ambient environment [28] and hence have high
superconducting homogeneity with reduced weak links and subsequently possess high
critical current density [29].
In present work, instead of expensive nano particles we introduce a cheaper way
to enhance critical current density of MgB2 through heavy blending of Mg in MgB2 as
against mere doping. Also the blending of Mg may result in better ductile strength
[30,31], which is good for fabrication of wires/tapes. Secondly, the samples are
synthesized by a new versatile easy technique in a pressed carbon environment under
flowing argon avoiding expensive HPHT (high pressure high temperature) method. The
effect of excess Mg on the transport as well as magnetic properties of MgB2 is studied
systematically. The enhancement of critical current density is observed with increasing
content of Mg.
Experimental
The solid-state reaction route was followed for the synthesis of superconducting
MgB2 samples. The primary constituents used were 99% pure Mg powder and 99% pure
4
amorphous boron powder. The components were blended using agate mortar with excess
of Mg for about 3 hours. Both stoichiometric and off-stoichiometric samples were
prepared by varying Mg and B content in different Mg:B ratio of 1:2 (stoichiometric) ,
1:1 (double the amount of Mg as compared to stoichiometry) and 1.5:1 (triple the amount
of Mg as compared to stoichiometry) to give samples coded as M1, M2, and M3
respectively. The blend with these different ratios of Mg:B was transformed into pellet
form under the pressure of 10 tons/cm2. The pellet was then placed in a stainless steel
tube with length of about 1 foot, near the closed end and embedded in carbon powder
which was filled along the whole length of the tube and pressed in a tightly packed
manner to form a column of carbon powder. This column of carbon would act as a simple
barricade to prevent the loss of Mg and sustain Mg pressure in assembly. The pellet was
covered with Mg powder, being used as a spacer in between carbon powder and the
pellet. The whole tube was placed into tube furnace in a position such that the sample
reaches at the core of the furnace so as to have a sufficient temperature gradient along the
length of carbon column. The tube of the furnace was evacuated and argon was flushed
during the heat treatment to remove the remnant air or oxygen from the environment.
Once the argon was flushed, the sample was heated at 900oC for about 3 hours. The
highly dense samples obtained after heat treatment were tested for their structure by XRD
measurement studies using Cu Kα radiations in the 2θ range of 20-80°. The growth
morphology of the sample was studied by scanning electron microscopy (SEM) JEOL
JSM 6360. The samples were further tested for its superconductivity by resistivity
meausurements through standard four-probe technique, using atomized APD closed cycle
refrigerating system. The superconductivity in the sample was also confirmed through
field cooled and zero field cooled measurement. The critical current density of the
samples was extracted from the plot of magnetization with respect to field using Beans
critical state model [32] considering the sample as a whole responsible for critical current
density as against individual grains. The magnetization measurements were done with a
quantum Design SQUID magnetometer (MPMS-XL). The sample dimensions used for
the measurements were more or less rod type. The flux pinning force was calculated and
was studied for the effect of excess magnesium used in the synthesis of the MgB2
samples.

5
Result and Discussion:
(i) X-ray diffraction studies:
The samples prepared by the proposed synthesis technique were subjected to X-
ray diffraction analysis to confirm its structure. The powder XRD patterns for all three
samples M1, M2 and M3 with the Mg:B ratio of 1:2, 1:1 and 1.5:1 are as shown in the
figure 1 (a-c) respectively. As seen in the figures the main phase for all the samples is
MgB2 crystallized in hexagonal structure. None of the phase consisting of carbon was
detected which indicates that the samples were well insulated from carbon powder used.
The Mg metal forms the next major phase present in the sample. As the amount of Mg in
the sample increases, the intensity for the Mg phase peak increases. The calculated lattice
parameters for all the samples are as given in Table 1. It is observed that with increase in
Mg content the inplane a-axis lattice parameter decreases while the inter plane c-axis
lattice parameter increases. This leads to an ultimate increase in the aspect ratio (c/a) of
the MgB2 structure in the sample. Also its remarkable to note that with increase in Mg
content, the samples become increasingly textured along the (100) direction in
comparison with any other planes. This may be due to infiltration of Mg in to the MgB2
lattice, which resulted in merely modified crystal structure. No other intermediate phase
between Mg and MgB2 is observed in the sample. There is neither BOx insulating layer
nor the formation of MgB4 insulating phases as mentioned in Ref. [33], occurs at the
grain boundaries. Only an extra peak of MgO is noticed which may have formed due to
traces of oxygen present in the ambiance. The intensity of MgO peak increases with the
increasing Mg content.
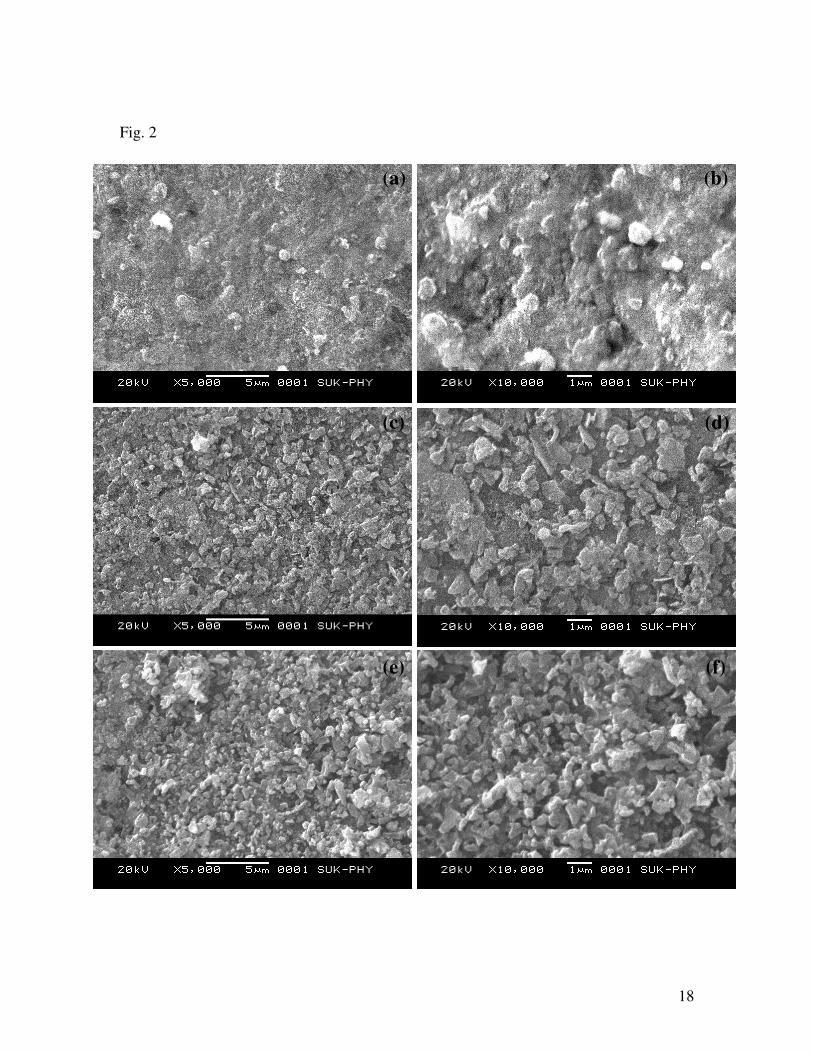
(ii)Morphological Studies:
Figure 2 (a, c & e) shows the morphology of M1, M2 and M3 samples
respectively at the magnification of 5000x. The surface morphology of the samples
appears to become rough with the increase in Mg content. Moreover it is remarkable to
note that even though the amount of Mg in the sample is increased, there is hardly any
porosity observed in present samples. MgB2 samples are usually porous due to high vapor

6
pressure of Mg [34]. To have a more clear understanding the high-resolution morphology
of the samples is given [Figure 2(b, d & f)], which also reveals pores free morphology of
samples even in the case of excess Mg samples. This indicates that the excess Mg used
have not ventured in to MgB2 lattice beyond the solubility limit but have separated out
itself from the MgB2 grain to form MgB2/Mg matrix. Moreover, MgO formed during
synthesis also may enhance the grain connectivity and core density of MgB2 matrix. It
could also cause the grain boundary pinning and contribute towards the enhancement of
critical current density [35].
(iii)Electrical transport studies:
The electrical transport measurements with respect to decrease in temperature for
the samples M1, M2 and M3 are shown in the figure 3. It is seen that the superconducting
transition for sample M1 was observed at 38.67 K while the samples M2 and M3 showed
the transitions at about 35.25K and 34.38K respectively. Sample M1 with stoichiometric
proportion of Mg and B showed an exponential temperature dependence of resistivity
while other samples M2 and M3 with excess Mg showed linear temperature dependence
of resistivity up to the superconducting transition. Superconducting transition in the
sample M1 appears to be quite sharp while as the amount of Mg increases the transition
width increases for M2 and M3. It is interesting to note that the residual resistivity
ρ(40K) for the samples decreases with the increase in the Mg content but ρ(300K) does
not change in a regular fashion.
It is known that the inclusion of impurity in MgB2 lattice reduces the Tc of the
sample [36-38] due to scattering effects [39-41]. Here, though sample M1 consists of Mg
as depicted in XRD, the transition temperature observed is not reduced and is quite sharp.
This implies that whatever Mg present, is at grain boundaries as pores eliminators and
has not infiltrated in to MgB2 lattice as an impurity. This is in agreement with the fact
that the crystal structure of sample M1 remained structurally undistorted. As the amount
of Mg is increased for sample M2 and M3, transition temperature gradually gets
decreased to 35.25K and 34.38K respectively. This indicates that though the Mg remains
at the grain boundaries, if excess, it infiltrates in to the MgB2 grains to a certain solubility
limit to decrease Tc by making the MgB2 grains less clean though not dirty [2]. Though

7
the amount of Mg is considerably increased (doubled for M2 and tripled for M3) in
present case as compared to reports earlier [31, 42], the transition temperature still
remains more or less competitive if compared. This strongly supports the fact that Mg
goes into the MgB2 lattice only up to certain solubility limit and beyond that accumulates
around the MgB2 grain boundaries to make SNS type junctions. This can be further
supported by the observed temperature dependence of resistivity for samples M2 and M3
which becomes linear as compared to exponential behaviour of sample M1, with increase
in Mg content. The residual resistivity ρ(40K) values are observed to decrease with
increased amount of Mg, which may be due to the formation of low resistive phases of
Mg (1.6 µΩ cm at 300K), which provides current percolation, along with the increase in
the density of the sample due to Mg accumulation. It also appears that though the
transition temperature for samples M2 and M3 remains more or less same, the transition
width for the sample M3 is increased remarkably as compared to that of sample M2. The
increased broadening in the superconducting transition for sample M3 is accompanied
with the drastic decrease in the overall resistivity. This is due to the enhanced formation
of nothing but dense Mg metal matrix in the sample, which surrounds the
superconducting MgB2 grains all over the sample. The increased RRR(ρ300/ρ40) value in
case of M2 and M3 samples is also due to the Excess Mg present at the grain boundaries
so that current find a less resistive path and relatively more slope is observed in the R-T
curve.
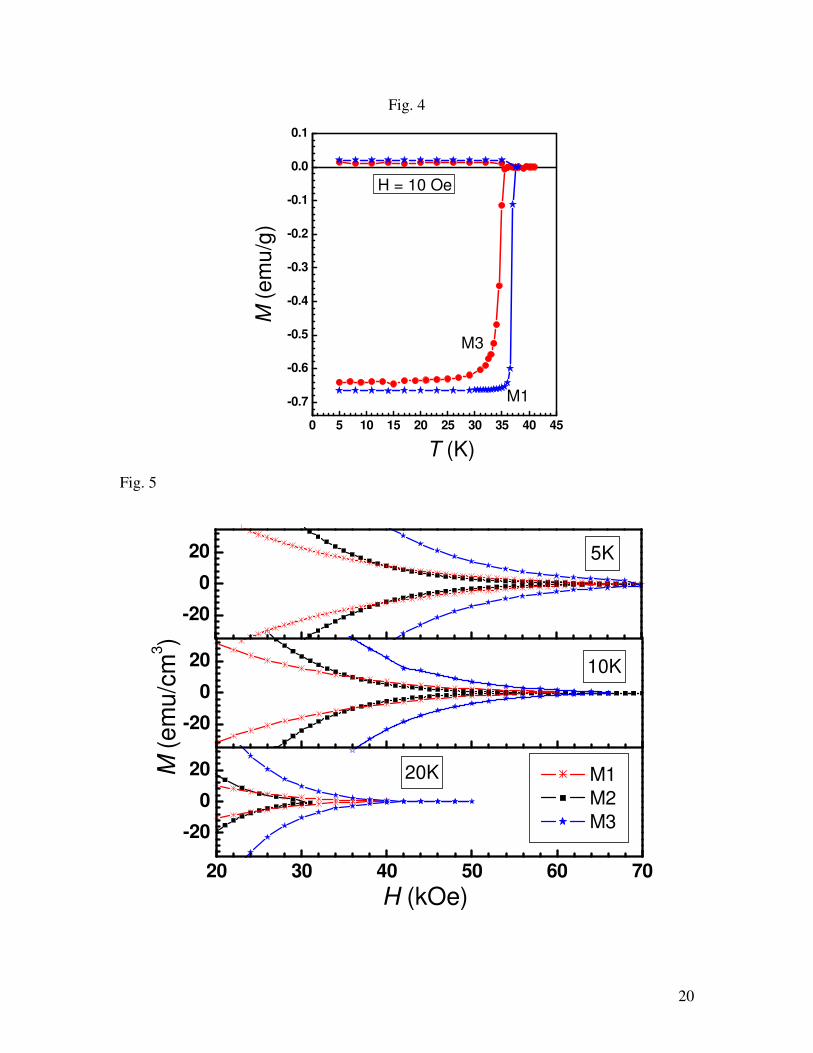
(iv)DC susceptibility measurements:
Figure 4 shows the zero field cooled (ZFC) and field cooled (FC) plots at 10 Oe
for the samples M1 and M3 which forms the two extreme samples with the ratios 1:2 and
1.5:1 respectively. It is observed that for both the samples ZFC branch shows a sharp
one-step diamagnetic transition at 37.5K and 35.5K respectively for M1 and M3 samples.
Thus the transition temperature decreases with the increase in the Mg content, which is in
agreement with the transitions observed in resistivity measurements. The sample M3 with
more Mg content showed somewhat rounded nature after superconducting transition
before it attains the saturation down to 5K; the same is not as prominent as in sample M1.
Moreover the extent of diamagnetic signal decreases with increased Mg content. It is

8
interesting to notice FC plots where both the samples show paramagnetic Meissner effect
(PME) [in confirmation with Ref. 43, 44] with the transition at same temperature as that
of ZFC plot. This confirms the formation of SNS type of junctions [43,45], which leads
to trapped flux and weak FC signal [46]. This is in agreement with the observed XRD in
which extra phase of Mg was observed which takes part in the formation of SNS
junctions to give rise to PME. The presence of SNS junctions in the samples prove the
formation of Mg metal matrix around the superconducting MgB2 grains.
(v)Magnetization measurements:
The magnetic hysteresis behavior (M-H) for all the samples M1, M2 and M3 at
5K, 10K and 20K is shown in Figure 5 under the applied field up to 70 kOe. For
stoichiometric sample M1, the M-H loop closes much before than the excess Mg samples
M2 and M3 at all measured temperature of 5, 10 and 20K. Quantitatively at 20K, the M-
H loop closes at about 30 kOe for sample M1 while it remains open above 40 kOe for
M3. Thus, additions of Mg apparently increase the irreversibility field, Hirr values of the
samples.
The Jc values were calculated from these M(H) response by revisiting the beans
model [32] with the sample dimensions . The Jc plots for M1, M2 and M3 samples at 20K
are shown in the Figure 6. Inset shows the same at 20 K. It reveals that the critical current
density for the samples with increased Mg content is improved considerably as compared
to the stoichiometric M1 sample. At the temperature of 20K, the critical current density
value for the sample M1 comes out to be 6.8x10³ A cm-2 at 10 kOe while the same is
enhanced to 3.4x10⁴ A cm-2 and 5.9x10⁴ A cm-2 for the Mg added M2 and M3 samples
respectively. Thus Jc increases by an order of magnitude with Mg doping in
stoichiometric MgB2. The similar behavior of increase in Jc is also noticed at lower
temperatures of 5 and 10K. Thus we come to the conclusion that although excess Mg
results into decrease in transition temperature but at the same time it successfully acts as
a pinning centre; introduces some other pinning centres like MgO and in turn results into
significant enhancement of Hirr and Jc(H) values. The observed values of critical
parameters for stoichiometric sample M1 are competitive with the literature [47,48] and
we have introduced a way to enhance it’s superconducting performance just by varying

9
the stoichiometry without using any foreign particle. Thus the Mg doping seems to be a
cheaper and easier way in comparison to the costly nano particle doped MgB2 samples.
The flux pinning behavior of the samples at T=10K is shown in Figure 7. The
relationship between flux pinning force and critical current density could be described by
[49-51],
Fp = µo Jc(H) H
where µo is the magnetic permeability in vacuum. Main panel in Figure 7 show the
variation of reduced flux pinning force with field while the inset plots total flux pinning
force. In both, the flux pinning plots for sample M2 is shifted slightly towards higher
field as compared to the sample M1 while M3 shows a profound shift towards higher
field. This indicates improvement in the flux pinning forces for samples M2 and M3 as
compared to that of sample M1 in confirmation with the Jc (H) results. As far as the type
of pinning is concerned, it is the combination of grain boundary pinning due to Mg and
MgO present outside the lattice and the pinning due to point defects, which arise from
Mg inclusion in MgB2 matrix [50]. The fact is supported by the behavior of Flux pinning
plots for samples M2 and M3 in which the peak is not only broadened but also gets
shifted towards right say by about 1 Tesla in case of M3. Hence the flux pinning plots
again support the fact that the Mg added into the samples acts as an effective flux pinning
centers, which results in the improvement of critical current density of the sample.
Conclusions:
The superconducting properties of the MgB2 sample heavily loaded with Mg
having the Mg:B ratio or 1:2, 1:1 and 1.5:1 are studied successfully. It is remarkable to
observe that though the sample is heavily loaded with Mg, the sample speculated to have
maximum Mg concentration showed the superconducting transition at about 34 K with a
mere decrease in transition temperature of about 5 K. The addition of Mg in the sample
resulted in overall decrease in the resistivity of the sample, which is due to accumulation
of Mg around the MgB2 grains to form a superconductor-metal matrix and
simultaneously improving the overall density of the samples. The enhancement in the
irreversibility field was observed from the magnetization curves with the increase in Mg
content. The overall presence of Mg metal matrix in the sample enhanced the flux
10
pinning properties with increase in pinning centers. This in turn enhanced the critical
current density of the samples from 6.8x10³ A cm-2 to 5.9x10⁴ A cm-2 at 20K and 10 kOe.
Hence it is interesting to have such a sample with enhanced critical parameters just by
varying the stoichiometry of the sample, which could be considered for the fabrication of
wire or tapes for various applications.
Acknowledgement
The authors from NPL would like to thank Dr. Vikram Kumar (DNPL) for his great
interest in present work. Prof. E. Takayama muromachi is acknowledged for the
magnetization measurements at 7Tesla- SQUID magnetometer (MPMS-XL). M. Mudgel
and B. B. Sinha would like to thank the CSIR for the award of Senior Research
Fellowship to pursue their Ph. D degree.

11
References:
[1] J. Nagamatsu, N. Nakagawa, T. Muranaka, Y. Zenitani and J. Akimitsu, Nature 410
(2001) 63.
[2] A. Y. Liu, I. I. Mazin and J. Kortus, Phys. Rev. Lett. 87 (2001) 087005.
[3] Yuxing Wang, Fr´ed´eric Bouquet, Ilya Sheikin, Pierre Toulemonde, Bernard
Revaz, Michael Eisterer, Harald W.Weber, Joerg Hinderer, Alain Junod, J. Phys.
Condens. Matter 15 (2003) 883–893.
[4] I. I. Mazin and V. P. Antropov, Physica C 385 (2003) 49.
[5] J. Bardeen, L. N. Cooper, and J. R. Schrieffer, Phys. Rev. 108 ( 1957) 5 1175.
[6] J. E. Hirsch, Phys. Lett. A 282 (2001)392.
[7] S. Suzuki, S. Higai, and K. Nakao, J. Phys. Soc. Jpn. 70 (2001) 1206.
[8] G. Satta, G. Profeta, F. Bernardini, A. Continenza, and S. Massidda, Phys. Rev. B
64 (2001)104507.
[9] S. L. Bud’ko, G. Lapertot, C. Petrovic, C. E. Cunningham, N. Anderson, P. C.
Canfield, Phys. Rev. Lett. 86 (2001) 1877.
[10] Y. G. Zhao, X. P. Zhang, P. T. Qiao, H. T. Zhang, S. L. Jia, B. S. Cao, M. H. Zhu,
Z. H. Han, X. L. Wang and B. L. Gu, Physica C 361 (2001) 91
[11] J. S. Slusky, N. Rogado, K. A. Regan, M. A. Heyward, P. Khalifa, T. He, K.
Inumaru, S. Loureiro, M. K. Aaas, H. Zanbdergen and R. J. Cava, Nature 410 (2001)
343.
[12] I. Felner, Physica C 353 (2001)11.
[13] Y. Kong, O.V. Dolgov, O. Jepsen, and O. K. Andersen, Phys. Rev. B 64 (2001)
020501(R).
[14] K. P. Bohnen, R. Heid, and B. Renker, Phys. Rev. Lett. 86 (2001) 5771.
[15] K. Kunc, I. Loa, K. Syassen, R. K. Kremer, and K. Ahn, J Phys. Condens. Matter
13 (2001) 9945.
[16] A. A. Golubov, J. Kortus, O.V. Dolgov, O. Jepsen, Y. Kong, O. K. Andersen, B. J.
Gibson, K. Ahn, and R. K. Kremer, J. Phys. Condens. Matter 14 (2002)1353.
[17] H. Choi, D. Roundy, H. Sun, M. L. Cohen, and S. G. Louie, Phys. Rev. B 66
(2002) 020513(R).

12
[18] H. Choi, D. Roundy, H. Sun, M. L. Cohen, and S. G. Louie, Nature (London) 418
(2002) 758 .
[19] V. P. S. Awana, M. Isobe, K. P. Singh, E. Takayama-Muromachi and H. Kishan,
Supercond. Sci. Technol. 19 (2006) 551–555.
[20] A.Vajpayee, H. Huhtinen, V. P. S. Awana, A. Gupta, R. Rawat, N. P. Lalla, H.
Kishan, R. Laiho, I. Felner and A. V. Narlikar, Supercond. Sci. Technol. 20 (2007)
S155–S158.
[21] A. Vajpayee, V. P. S. Awana, H. Kishan, A.V. Narlikar, G.L. Bhalla, and X.L.
Wang, J. Appl. Phys. 103 (2008) 07C708.
[22] A. Vajpayee, V.P.S. Awana,G. L. Bhalla and H. Kishan, Nanotechnology 19
(2008) 125708.
[23] M. Mudgel, V.P.S. Awana,G. L. Bhalla and H. Kishan, Solid State Commun 146
(2008) 30-334.
[24] A. Gurevich, Phys. Rev. B 67 (2003)184515.
[25] R. H. T. Wlike, S. L. Bud’ko, P. C. Canfield, D. K. Finnemore, R. J. Suplinskas
and S. T. Hannanhs, Phys. Rev. Lett. 92 (2004) 217003.
[26] V. Braccini, A. Gurevich, J. E. Giencke, M. C. Jewell, C. B. Eom, D. C.
Larbalestier, A. Pogrebnyakov, Y. Cui, B. T. Liu, Y. F. Hu, J. M. Redwing, Q. Li, X.
X. Xi, R. K. Singh, R. Gandikota, J. Kim, B. Wilkens, N. Newman, J. Rowell, B.
Moeckly, V. Ferrando, C. Tarantini, D. Marre, M. Putti, C. Ferdeghini, R. Vaglio and
E. Haanappel, Phys. Rev. B 71 (2005) 012504.
[27] N. A. Frederick, Shi Li, M. B. Maple, V. F. Nesterenko, S. S. Indrakanti, Physica
C 363 (2001)1.
[28] Y. Zhao, Y. Feng, C. H. Cheng, L. Zhou, Y. Wu, T. Machi, Y. Fudamoto, N.
Koshizuka, and M. Murakami, App. Phys. Lett. 79 (2001) 1154.
[29] A. Serquis, X.Y. Liao, Y.T. Zhu, J.Y. Coulter, J.Y. Huang, J O. Willis, D.E.
Peterson, F.M. Mueller, N.O. Moreno J.D. Thompson, S.S. Indrakanti and V.F.
Nesterenko, J. Appl Phys. 92 (2002) 351.
[30] M. L. Young, J. DeFouw, J. D. Almer and D. C. Duannd, Acta Materialia 55
(2007) 3467.

13
[31] M. Egilmez, L. Ozyuzer, M. Tanoglu, S. Okur, O. Kamer and Y. Oner, Supercond.
Sci. Technol. 19 (2006) 359
[32] C. P. Bean, Rev. Mod. Phys. 36 (1961) 31.
[33] T. C. Shields, K. Kawano, D. Holdom, and J. S. Abell, Supercond. Sci. Technol.
15 (2002) 202.
[34] S. C. Yan, G. Yan, C. F. Liu, Y. F. Lu and L. Zhou, J.Alloys and compd. 437
(2007) 298
[35] C. H. Jiang, H. Hatakeyama and H. Kumakura, Physica C 423 (2005) 45
[36] M. Mudgel, V. P. S. Awana, H. Kishan, and G. L. Bhalla, Physica C 467 (2007)
31-37.
[37] M. Mudgel, V. P. S. Awana, H. Kishan, Rajeev Rawat, S. Balamurugan, G.L.
Bhalla and A.V. Narlikar, Mod. Phys. Lett. B, 21 (2007) 875-883
[38] M. Putti, C. Ferdeghini, M. Monni, I. Pallecchi, C. Tarantini, P.Manfrinetti, A.
Palenzona, D. Daghero, R.S. Gonnelli, V.A. Stepanov, Phys. Rev. B 71 (2005) 144505
[39] V. A. Moskalenko, M. E. Palistrant, V. M. Vakalyuk, Usp. Fiz. Nauk 161 (1991)
155.
[40] A. A. Golubov, I. I. Mazin, Phys. Rev. B 55 (1997) 15146.
[41] P. I. Arseev, N. K. Fedorov, S. O. Loiko, Solid State Commun. 124 (2002) 257.
[42] L. Cao, Z. Zhang, H. Wen and W. Wang, Appl. Phys. Lett. 86 (2006)123113.
[43] I. Felner, V. P. S. Awana, Monika Mudgel, and H. Kishan, J. Applied. Physics,
101 (2007) 09G101
[44] H. Sozeri, L. Dorosinskii, U. Topal, I. Ercan, Physica C 408–410 (2004) 109–110
[45] W. Braunisch, N. Knauf, V. Kataev, S. Newhausen, R. Grutz, B. Roden, D.
Khomskii, and D. Wohlleben, Phys. Rev. Lett. 68 (1992) 1908
[46] V. P. S. Awana, M. Isobe, K. P. Singh, E. Takayama-Muromachi, H. Kishan,
Supercond. Sci. Technol. 19 (2006)551-555.
[47] V.P.S. Awana, A. Vajpayee, M. Mudgel, V. Ganesan, A.M. Awasthi, G.L. Bhalla
and H. Kishan, Eur. Phys. J. B 62 (2008) 281–294
[48] V.P.S. Awanaa, Rajeev Rawat, Anurag Gupta, M. Isobe, K.P. Singh, Arpita
Vajpayee,H. Kishan, E. Takayama-Muromachi, A.V. Narlikar, Solid State
Communications 139 (2006) 306–309T.
14
[49] M. T. Shen, G. Li, C. H. Cheng and Y. Zhao, Supercond. Sci. Technol. 19 (2006)
1219.
[50] C. Tarantini, H. U. Abersold, C. Bernini, V. Braccini, C. Fredeghini, U.
Gambardella, E. Lehmann, P. manfrinetti, A. Palenzona, I. Pallecchi, M. Vignolo, M.
Putti, Physica C 463-465 (2007) 211.
[51] E. Martinez, P. Mikheenko, M. Martinez-lopez, A. Millan, A. Bevan and J. S.
Abell, Phys. Rev. B 75 (2007)134515.
15
Figure captions
Figure 1. XRD pattern for different samples with Mg:B ratio of (a) 1:2, (b) 1:1 (c) 1.5:1
Figure 2. SEM picture with two different magnifications 5000 x and 10000 x respectively
of samples M1 (a) & (b), M2 (c) & (d) and M3 (e) & (f).
Figure 3. Resistivity plots for samples M1, M2 and M3 with different Mg:B ratio of 1:2,
1:1 and 1.5:1 respectively. Inset shows the transition zone of all samples in enlarged
view.
Figure 4. Field cooled and Zero field cooled plots for the samples M1 and M3.
Figure 5. Magnetization plots for the samples M1, M2 and M3 at three different
temperatures of 5K, 10K and 20K.
Figure 6. Critical current density plots for the samples M1, M2 and M3 at (a) T=20K, the
inset shows the same at 10K.
Figure 8. Reduced Flux pinning plots for the samples M1, M2 and M3 at T=10K, inset
shows the variation of unnormalized total flux pinning force with field.

16
Table1. Lattice parameters and c/a ratio for the samples M1, M2 and M3
Sample a(Å) c(Å) c/a
M1 3.0838 3.539 1.147
M2 3.0754 3.5547 1.155
M3 3.0727 3.5534 1.156

17
Fig. 1
20 30 40 50 60 70 80
(0 0
1)
*
$
(1 0
0)
*
$
(1 0
1 )
*
$
(0 0
2)
*
$
(1 1
0)
*
$
#
(1 1
1)
*
$
(2 0
0 )
*
#
(2 0
1)
*
$
(0 0
1)
*
$
(1 0
0)
*
$ (1
0 1
) *
$
(0 0
2)
*
$
(1 1
0)
*$
#
(1 1
1)
*$
$
(2 0
0 )
*$
#
(2 0
1)
*$
(0 0
1)
*
$
(1 0
0)
*
$
(1 0
1 )
*
$
(0 0
2)
*
$
(1 1
0)
* $
#
(1 1
1)
*$
$
(2 0
0 )
*$
#
(2 0
1)
*$
(a)
2θ (deg)
1:2 M1
(b)
I (A
rbitra
ry u
nits)
1:1 M2
(c)
1.5:1 M3* MgB
2
$ Mg# MgO
18
Fig. 2
(a) (b)
(c)
(d)
(e) (f)

19
Fig. 3
0 50 100 150 200 250 3000.0
0.2
0.4
0.6
0.8
1.0
Rh
o(T
)/R
ho
(30
0)
T (K)
M1 M2 M3
20
Fig. 4
0 5 10 15 20 25 30 35 40 45
-0.7
-0.6
-0.5
-0.4
-0.3
-0.2
-0.1
0.0
0.1
M (
em
u/g
)
T (K)
H = 10 Oe
M3
M1
Fig. 5
20 30 40 50 60 70
-20
0
20 20K
H (kOe)
-20
0
20
M1 M2 M3
10K
-20
0
20
5K
M (
em
u/c
m3)

21
Fig. 6
5 10 15 20 25 30 35 40
103
104
105
10 20 30 40 50 60 7010
2
103
104
105
T = 10K
Jc (
A/c
m2)
H (kOe)
M1
M2 M3
Jc (
A/c
m2)
T = 20K
M1 M2 M3
H (kOe)
Fig. 7
0 10 20 30 40 50 60 70 800.0
0.2
0.4
0.6
0.8
1.0
0 10 20 30 40 50 600.0
2.0x10⁴
4.0x10⁴
6.0x10⁴
8.0x10⁴
1.0x10⁵
T = 10 KFp
H(kOe)
M1 M2 M3
T = 10K
Fp / F
p,m
ax
H (kOe)
M1 M2 M3