Sustainable use and management of natural resources
72
Sustainable use and management of natural resources EEA Report No 9/2005 ISSN 1725-9177
-
Upload
khangminh22 -
Category
Documents
-
view
4 -
download
0
Transcript of Sustainable use and management of natural resources

Sustainable use and management of natural resources
EEA Report No 9/2005
ISSN 1725-9177

X

EEA Report No 9/2005
Sustainable use and management of natural resources

Cover design: EEACover photos: © EEA; Source: Pawel Kazmierczyk, 2005Layout: EEA
Legal notice The contents of this publication do not necessarily reflect the official opinions of the European Commission or other institutions of the European Communities. Neither the European Environment Agency nor any person or company acting on behalf of the Agency is responsible for the use that may be made of the information contained in this report.
All rights reserved No part of this publication may be reproduced in any form or by any means electronic or mechanical, including photocopying, recording or by any information storage retrieval system, without the permission in writing from the copyright holder. For translation or reproduction rights please contact EEA (address information below).
Information about the European Union is available on the Internet. It can be accessed through the Europa server (http://europa.eu.int).
Luxembourg: Office for Official Publications of the European Communities, 2005
ISBN 92-9167-770-1ISSN 1725-9177
© EEA, Copenhagen 2005
European Environment AgencyKongens Nytorv 61050 Copenhagen KDenmarkTel.: +45 33 36 71 00Fax: +45 33 36 71 99Web: www.eea.eu.intEnquiries: www.eea.eu.int/enquiries

3
Contents
Sustainable use and management of natural resources
Contents
Acknowledgements .................................................................................................... 4
Summary .................................................................................................................... 5
1 Introduction .......................................................................................................... 9
2 Drivers of resource use ....................................................................................... 112.1 Demographic developments ..............................................................................112.2 Economic growth .............................................................................................122.3 Patterns of development ..................................................................................132.4 Growing resource use in the global context ........................................................15
3 Natural resources and their use .......................................................................... 183.1 Material flows and material intensity ..................................................................193.2 Renewable resources .......................................................................................233.3 Non-renewable resources .................................................................................34
4 Policy responses .................................................................................................. 464.1 Examples of individual policies ..........................................................................474.2 The challenges of policy integration ....................................................................474.3 Resource economics and the role of prices .........................................................524.4 Implications for competition .............................................................................53
5 Outstanding questions ........................................................................................ 58
Abbreviations and definitions ................................................................................... 63
References .............................................................................................................. 65

Sustainable use and management of natural resources4
Acknowledgements
This report was written by the expert team of the European Topic Centre on Resource and Waste Management (ETC/RWM), consisting of Stephan Moll, Mette Skovgaard and Philipp Schepelmann. It was coordinated and edited by Paweł Kaźmierczyk (EEA), under the general guidance of Jock Martin (EEA) and Jeff Huntington (EEA).
The information and analysis in the report is based on six background papers compiled and edited by the ETC/RWM. Background papers on 'general policy issues', 'land use', and 'material flows and waste' were prepared by Stephan Moll, Philipp Schepelmann, Mette Skovgaard, Helmut Schütz, Stefan Bringezu and Raimund Bleischwitz. A background paper on 'forestry' was written by Jo Van Brusselen, Markus Lier, Andreas Schuck, Richard Fischer and Bruce Michie from the European Topic Centre on Nature and Biodiversity/European Forest Institute. A background paper on 'water use' was prepared by Peter Kristensen, European Topic Centre for Water/Danish National Environmental Research Institute. A background paper on 'fisheries' was prepared by Gunnar Album from the Trygg Mat Foundation, Norway.
The EEA gratefully acknowledges the contributions of the advisory group set up for this report. The advisory group, whose extensive knowledge and experience benefited this work, consisted of:
Mr. Andrew Terry, IUCN — The World Conservation Union, Regional Office for Europe, Brussels
Mr. Bill Duncan, Assurre, Brussels
Ms. Caroline Raes, DG Enterprise and Industry, European Commission
Mr. David Capper, DEFRA, United Kingdom
Mr. Frans Vollenbroek, DG Environment, European Commission
Ms. Helen Mountford, Environment Directorate, OECD
Ms. Helga Weisz, IFF-Social Ecology, Klagenfurt University, Austria
Mr. Michael Massey, DTI, United Kingdom
Mr. Peter Eder, DG Joint Research Centre, European Commission
Mr. René Kemp, University of Maastricht, the Netherlands
Mr. Rocky Harris, DEFRA, United Kingdom
Mr. Uno Svedin, Director of International Affairs, Formas, Sweden
Mr. William Floyd, GOPA, European Commission.
Acknowledgements

5
Summary
Sustainable use and management of natural resources
Summary
Background
The EU sixth environment action programme (6EAP) expressly calls for 'breaking the linkages between economic growth and resource use'. This report, which contributes to the EEA's five-year report 'The European environment — State and outlook 2005', was prepared in recognition of the importance of the sustainable use and management of natural resources on the policy agenda.
Given the broad coverage of 'natural resources', it was decided to focus on a handful of natural resources: fisheries, forestry, water, fossil fuels, metals and construction minerals, and land use.
Global driving forces
The main driving forces of resource consumption are population and economic growth, and the pattern of development, broadly defined to include technological level, economic structure, and the patterns of production and consumption. The projected 50 % growth in the global population over the next fifty years will put a significant pressure on the environment.
If, over the next fifty years, the population of the developing countries achieves levels of material wealth similar to today's levels in industrialised countries, world consumption of resources would increase by a factor ranging from two to five.
Without dramatic technological improvements or changes in the patterns of consumption, growth in resource use and environmental impacts due to increased population and economic growth in developing countries are likely to outweigh technological efficiency gains in industrialised countries.
European patterns of resource use
In Europe, the relationship between the main driving forces that determine resource use differs
from that at the global level. With population growth limited, the main driving forces are economic growth and the pattern of development.
The European model of wealth is based on a high level of resource consumption, including energy and materials. Current material consumption in industrialised countries is between 31 and 74 tonnes/person/year (total material consumption), and environmentally most significant is the consumption of materials for housing, food and mobility. The average material intensity in the EU-25 is slightly less than in the United States, but twice as high as in Japan. The picture is similar for energy intensity, where the efficiency of the Japanese economy is even more pronounced.
There are large differences between EU countries. On average, resource and energy productivity in western Europe is several times higher than in the new EU Member States in central and eastern Europe. Material intensity varies from 11.1 kg/EUR of GDP in Estonia to 0.7 kg/EUR in France.
Some relative decoupling of economic growth from materials and energy consumption has been achieved in many EU countries during the past decade. This did not necessarily lead to an absolute decrease in environmental pressures, because absolute resource use has generally remained steady over the past two decades. In part, this decoupling may be due to increased imports of natural resources, substituting for their declining production or extraction in Europe.
Measuring the use of resources and its impact on the environment
High use of natural resources increases the pressure on these sources (e.g. maintaining the availability of supplies and ensuring sustainable yields) and on sinks (e.g. managing the environmental impacts of resource use, and whether ecosystems can absorb discharges). It is generally accepted that there are physical limits to continuing economic growth based on resource use.

Sustainable use and management of natural resources
Summary
6
However, there are many uncertainties in assessing reserves and the regeneration dynamics of natural resources. The overall consumption of material resources is known only for a small number of countries. Eurostat's MFA indicators have been compiled for some countries, but the tools to measure resource use and the related environmental impacts is still at an early stage of development. However, while the world population is growing and industrialisation is increasing rapidly, the availability of natural resources is not likely to rise dramatically.
Pressure on natural sources
Few Europeans suffer from permanent water shortages or poor water quality, although the situation varies with time and place — there still are many locations under threat from human activities, leading to overexploitation of aquifers and low quality of surface waters. Overall, there has recently been a slight decline (8–9 %) in water abstraction in the EU-15. There has been significant progress over the past two decades in reducing discharges from point sources such as big cities and industrial plants, but far less in controlling those from diffuse sources, in particular from agriculture.
The case of fisheries is a prime example of a policy effort which has not resulted in sustainable resource management in practice. About one third of global fish stocks are already overexploited. Most fish stocks in European waters are overfished or fully exploited, mainly due to overfishing, but also because of coastal and marine pollution, and changes in ecosystems. During the 1990s, constant overfishing threatened fish populations and provoked conflicts affecting EU Member States.
Forest is a natural resource with a very long tradition of sustainable use and management. The area covered by forests in Europe is around 36 %, and on average, has been increasing by half a million hectares a year in recent years. However, European forests showed a continuing deterioration in crown condition between 1989 and 1995. Studies after 1995 show a stabilisation at high defoliation levels, with almost a quarter of the sample trees rated as damaged in 2003. Although the pressure of acidification on forest ecosystems has decreased, evidence of impacts of climate change on forestry has appeared in recent years.
More than 90 % of primary energy supply in the EU is based on fossil energy carriers. Each year, almost 4 tonnes of fossil fuels are consumed per capita in the EU-15, and about half of that is imported.
Energy consumption is increasing, mainly because of growth in the transport sector, but also in the household and service sectors. At the same time, environmental pressures are decoupling from energy use in the EU-15, where fossil fuel-related emissions of air pollutants (SO2, NOX, NMVOC, particles) have declined significantly over the past decade, mainly through the use of end-of-pipe technology measures. Emissions of CO2, however, remain unabated.
Growing global trade, and Europe's increasing dependence on imports, may lead to problems of security of supply. In the second half of the 20th century, the volume of global trade grew by a factor of 6 to 8 for raw materials, and more than 40 for semi-manufactured and finished goods. Supply disruptions and shortages could negatively affect the European economy. The likelihood of conflicts between countries as a result of shortages of resources may also increase, as demonstrated by cases involving oil, water access, and fishing rights.
Pressure on sinks
The global increase in material consumption will affect the atmosphere, where capacities to absorb CO2 emissions without a change in climate seem to have been surpassed. Growing volumes of municipal and industrial wastes have to be handled. Many metals, such as gold, nickel and copper, are extracted using environmentally-intensive mining technologies, which result in large quantities of mining waste, contamination of soils and destruction of landscape, negative effects on biodiversity and natural water cycles, and high energy consumption.
Extraction of construction minerals, including sand, gravel, clay, and limestone, and natural stones, causes noise and air pollution in addition to most of the problems encountered in the extraction of metals. One particular environmental problem linked with the consumption of construction minerals is the transformation of land into built-up area, resulting in significant losses of the basic natural functions of the land.
Currently, 47 % of European land is used for agriculture, 36 % for forestry, and 17 % for other purposes, including settlements and infrastructure. Leaving aside the environmental impacts of agriculture, which are beyond the scope of this report, the three most important threats to European soils are sealing, erosion, and contamination. In Europe, around 26 million ha are subject to water erosion, and about 1 million to wind erosion.

Summary
Sustainable use and management of natural resources 7
The increase in the rate of sealing has far outstripped the growth in population. In Germany, for example, the amount of land used for settlements and infrastructure grew by 93 ha per day in 2003, with about half of that (equivalent to eighty football fields) being sealed every day. Soil fertility can decline very rapidly as a result of contamination, erosion, or sealing. The time for natural recovery is very long (in central Europe, the rate of soil generation is about 5 cm in 500 years).
Policy fragmentation
Almost every Community policy affects the use and management of natural resources. Among the most important are the common agricultural policy, the common fisheries policy, regional development policy, and transport and energy policies. A number of cross-cutting environmental strategies address the sustainable use and management of resources, including the sustainable development strategy, the 6th environment action programme, and the planned thematic strategies on the prevention and recycling of waste and on the sustainable use of natural resources. However, in the absence of a coherent resource policy, every policy domain has tended to develop its own approach to using and managing natural resources.
So far, there is no single EU institution responsible for coordinating policies to achieve the sustainable management of resources or for collecting the data necessary to understand the situation and monitor progress. No priority sectors or resources for policy intervention have been indicated, and few quantitative targets have been proposed.
Strategic responses
On the whole, EU environmental policies have resulted in better management of the environmental impacts of resource use. There have been a number of successes of European environmental policies since the 1970s, especially in the areas of water and air quality.
However, a main focus of the legislation has been on industrial point sources of pollution, and the initial response from industry has been to resort to 'end-of-pipe' measures, which require substantial investment. According to the European Commission's estimates for 1990–2010, implementation of seven directives in the area of water and air protection will cost some EUR 230 billion, with additional annual operating costs of around EUR 10 billion.
Ongoing policy debate shows the need for better integration of environment- and resource-related considerations into sectoral and other policy areas. Recently, EU and some national policies have increasingly focused on decoupling resource use and environmental impacts from economic growth. It is generally agreed that the most effective approach will vary depending on the specific resource.
Due to the 'rebound effect,' (incremental gains in technical efficiency being offset by more widespread consumption), it is unlikely that resource use can be reduced by technological improvements alone. The sustainability of current lifestyles and consumption patterns may have to be critically reviewed. The right price signals are an effective tool for improving resource efficiency and influencing consumption patterns. For example, the cost of environmental impacts should be factored into the prices of products and services. It may also be necessary to reduce subsidies that sustain practices with negative environmental impacts.
Implications for competition
While critics argue that environmental protection and sustainable management of resources are costly and reduce competitiveness, a coherent policy response can bring about many positive economic effects. Large investments in environmental protection have helped to create around two million jobs in the European eco-industry. The industry, which accounts for about one-third of the global market, is already highly competitive, especially in the areas of efficient use of fossil fuel energy and technologies for renewable energy use.
Given the large differences in resource efficiency between EU countries, there are many opportunities for improving the efficiency of the more resource-demanding economies. This could be achieved partly by transfers within the EU of today's technologies. Increasing the efficiency of resource use in sectors with high materials and energy costs will directly increase the global competitiveness of European industries.
Emphasis on material and energy efficiency can also help to reduce unemployment, because economic restructuring and cost-saving strategies traditionally target the labour force first, despite the fact that labour productivity in Europe is already high, having increased by some 270 % between 1960 and 2002, compared with 100 % for materials and barely 20 % for energy.

Sustainable use and management of natural resources�
Summary
Outstanding questions
There have been vigorous discussions among stakeholders about the priorities or the best approach to address the use of natural resources. Some of the outstanding questions in the policy debate revolve around the availability of methods to estimate the environmental impacts of resource
use; focus of policy on environmental impacts or on scarcity of resources; choice between relative decoupling and dematerialisation/absolute decrease of resource use as the main policy goal; what priority areas or specific resources should be the focus of policy intervention; and how to set targets and measure progress in sustainable use and management of resources.

9
Introduction
Sustainable use and management of natural resources
1 Introduction
world. Given the broad coverage of the term 'natural resources (1)', a decision was made at the outset to focus the analysis on a selection of natural resources: fisheries, forestry, water, fossil fuels, metals and construction minerals, and land use. The factors behind this choice included ensuring a mix of renewable and non-renewable resources, the policy relevance and political importance of the resources, and the ability to illustrate the various policy approaches.
Development of a policy on resources is still at an early stage, and many important questions remain open. The report aims to present how the use of natural resources has been managed, including both successes and failures. Where there are controversies or disagreements about the best way forward — and there are many — the points of view and arguments of various stakeholders are presented, without advocating a certain approach
Human wealth is based on the use and consumption of natural resources, including materials, energy and land. Continued increase in resource use and the related environmental impacts can have a multitude of negative effects leading to ecological crises and security threats. The sustainable use and management of natural resources have therefore come into focus and have been the subject of many policy discussions over more than a decade, beginning with the summit in Rio de Janeiro in 1992.
The EU has been putting increasing emphasis on this topic, especially since the adoption in 2001 of the EU sustainable development strategy and the sixth environment action programme (6EAP). The 6EAP expressly calls for 'breaking the linkages between economic growth and resource use' (Box 1.1).
This report focuses on our ability to continue to provide for our needs by drawing on the natural
Box 1.1 6EAP and sustainable use and management of natural resources
Objectives and priority areas for action on the sustainable use and management of natural resources and wastes in the 6EAP are as follows:
• '…aiming at ensuring that the consumption of resources and their associated impacts do not exceed the carrying capacity of the environment and breaking the linkages between economic growth and resource use. In this context the indicative target to achieve a percentage of 22 % of the electricity production from renewable energies by 2010 in the Community is recalled with a view to increasing drastically resource and energy efficiency;
• achieving a significant overall reduction in the volumes of waste generated through waste prevention initiatives, better resource efficiency and a shift towards more sustainable production and consumption patterns;
• a significant reduction in the quantity of waste going to disposal and the volumes of hazardous waste produced while avoiding an increase of emissions to air, water and soil;
• encouraging re-use and for wastes that are still generated: the level of their hazardousness should be reduced and they should present as little risk as possible; preference should be given to recovery and especially to recycling; the quantity of waste for disposal should be minimised and should be safely disposed of; waste intended for disposal should be treated as closely as possible to the place of its generation, to the extent that this does not lead to a decrease in the efficiency in waste treatment operations.'
Source: 6EAP.
(1) The European Commission (CEC, 2003) defines natural resources to include: raw materials (e.g. minerals, fossil energy carriers, biomass), environmental media (e.g. air, water, soil), flow resources (wind, geothermal, tidal and solar energy), and space (land use for human settlements, infrastructure, industry, mineral extraction, agriculture and forestry).

Sustainable use and management of natural resources10
Introduction
or prescribing a specific course of action. After all, there are no easy answers to such questions as: 'is further economic growth really necessary?', 'should society focus on achieving a relative decoupling of impacts from resource use or rather strive for a general dematerialisation and absolute reduction of use of resources?' and 'is resource scarcity a bigger problem than environmental impacts?'
Following loosely the DPSIR analytical framework (Box 1.2), the report begins with a study of the driving forces behind resource consumption (drivers). This is followed by a review of natural
resources and their use (state), covering a sample of renewable and non-renewable resources. Existing policies that influence the use and management of resources are then presented (responses), and finally some questions which are the subject of ongoing policy debate are addressed.
Several issues relating to sustainable use of resources are covered in other reports which contribute to the EEA's five-year report 'The European environment — State and outlook 2005'. In particular, they include EU consumption patterns, biodiversity, agriculture, renewable energy, and scenarios and outlooks.
Box 1.2 The DPSIR framework
DPSIR is a general framework for organising information about the state of the environment. Conceptually, the framework assumes cause-effect relationships between interacting components of social, economic, and environmental systems, which include:
Drivers — the anthropogenic forces that lead to pressures on the environment. The drivers include population growth, economic production and consumption activities, and developments in the needs and activities of individuals (e.g. leisure activities). In the context of sustainable use of resources, examples of drivers include industrial production activities where resources are extracted and transformed into goods and services (e.g. fossil fuels into electricity).
Pressures — pressures are the ways in which drivers are expressed physically, reflecting the interlinkages between a human activity and the surrounding natural environment. On the 'input' side, pressures comprise extraction of materials from nature for use in human activities (e.g. fossil fuels, minerals, and biomass, use of land), while on the 'output side' pressures include of discharges of pollutants and generation of waste (e.g. CO2 emissions, wastewater, mining waste)
State — the properties of the ecosystem itself. Pressures exerted by human activities influence the state of ecosystems, by altering the natural bio-geo-chemical material cycles. State refers to the condition of different environmental compartments and systems in physical (e.g. temperature), chemical (e.g. atmospheric CO2 concentrations) or biological (fish stocks) variables. Up to a certain threshold, the natural ecosystems can cope with and accommodate human-induced disturbances; however, these 'carrying capacities' are not very well known.
Impact — impacts on population, economy and ecosystems caused by the changes in state. Impacts can include ill health, biodiversity loss, or economic damage. For instance, higher atmospheric concentrations of CO2 cause higher average temperatures which again alter natural ecosystems and may have an impact on human health (e.g. cardiac diseases).
Response — actions taken by society as well as governments to prevent, compensate, or adapt to changes in the state of the environment. Responses tend to aim to change drivers (i.e. human activities) so as to avoid pressures. For instance, responses can aim at raising the efficiency of products and processes, through stimulating the development and penetration of clean technologies.
Variations of DPSIR framework include PSR (e.g. OECD, 1994), DSR (e.g. UNCSD, 1996).

11
Drivers of resource use
Sustainable use and management of natural resources
2 Drivers of resource use
Over the past 50 years, humans have changed ecosystems more rapidly and extensively than in any comparable period in human history, largely to meet rapidly growing demands for food, fresh water, timber, fibre and fuel. This has resulted in substantial gains in human well-being and economic development, but these gains have been achieved at growing costs in the form of the degradation of many ecosystems (Millennium Ecosystem Assessment, 2005).
What is driving our material and energy use to the extent that it is becoming a global environmental problem and a threat to future generations? There is no simple answer to this question, because a number of interdependent socio-economic and environmental factors are at play. Nevertheless, there are three basic factors which determine the growth of resource consumption, and the resulting environmental impacts of human production and consumption patterns.
The first is the size of the population. The more people who need to cover their material needs, the more resources are consumed. The second is how and to what extent we meet our needs. The third is the pattern of development, broadly defined to
include technological level, economic structure, and the patterns of production and consumption.
In a globalised world, these factors need to be considered in the global context, to better understand the magnitude and urgency of the challenge to both global and European production and consumption patterns.
2.1 Demographic developments
Global demographic patterns have an impact on the environment which follows a fairly basic relationship: more people mean more pressure on the environment. The extent and nature of the pressure, however, also depends on the socio-economic situation and technological developments.
According to the UN World population prospects (UN, 2003) the global population is expected to increase by almost 50 % in the first half of the 21st century, from 6.3 billion in mid-2003 to 8.9 billion by 2050 on the assumption of medium fertility. Details are shown in Table 2.1, where low and high fertility variants as well as a continuation of current fertility rates are also shown. Most of the increase
Table 2.1 Estimated and projected population of the world by major development groups, 1950, 2000 and 2050 according to different fertility variants
Estimated population (millions) Population in 2050 (millions)
Major area 1950 2000 2003 Low Medium High Constant
World 2 519 6 071 6 301 7 409 � 919 10 633 12 754
More developed regions 813 1 194 1 203 1 084 1 220 1 370 1.1�
Less developed regions 1 706 4 877 5 09� 6 325 7 699 9 263 11 56�
Least developed regions 200 66� 71� 1 417 1 675 1 960 3 019
Other less developed countries
1 505 4 209 4 380 4 908 6 025 7 303 8 549
Note: Less developed regions: all countries in Africa, Asia (excluding Japan), and Latin America and the Caribbean, and the regions of Melanesia, Micronesia, and Polynesia. More developed regions: all countries in Europe, North America, Australia, New Zealand, and Japan.
Source: UN, 2003.

Sustainable use and management of natural resources
Drivers of resource use
12
0
1
2
3
4
5
6
Developing countries OECD
Population (thousand million)
0
5 000
10 000
15 000
20 000
25 000
30 000
GDP per capita(PPP USD)
Population (thousand million)
GDP per capita (PPP USD)
is projected to take place in the developing parts of the world, where the needs are greatest, and will be particularly rapid in the least developed countries.
The population of the developing countries is projected to nearly double over the next 50 years, but to stagnate or even decline in the industrialised countries. Population growth is therefore a prominent driver of resource consumption in developing countries, but has ceased to be a main driving force in most European countries.
Nevertheless, the growing demand of increasing populations in developing countries will have an impact on the use of resources in Europe. For resources which are consumed or traded world-wide, such as oil, fish and tropical timber (and in cases of global environmental problems such as climate change), global population growth is a driver of resource use which needs to be taken into consideration in European decision-making.
There is also a tendency for the number of households to increase, due to fewer people living in each household, an increasing number of single households, and longer life expectancy. This tends to increase overall resource consumption as more households need to cover their needs, and the trend is especially pronounced in the most developed countries.
2.2 Economic growth
Ensuring economic growth is a central objective of policy-making. The key indicator of economic growth is GDP, which is a measure of the value of products and services created by an economy.
Worldwide, economic growth over the past 30 years has averaged about 3 % per year, more than doubling the size of the global economy over the period. However, there are significant disparities between developed and developing countries. At the turn of the century, per capita GDP in OECD countries was around USD (2) 25 000, compared with USD 4 000 in developing countries (Figure 2.1).
GDP growth between 1986 and 2000 was faster in the developing than in the developed world. GDP in developing countries almost doubled, but increased by only about 40 % in the developed world (Figure 2.2). However, despite this fairly optimistic picture based on growth rate, the actual gap between rich and the poor countries has increased. The near doubling of GDP in developing countries was from a rather low level, while the 40 % growth was on top of already high GDP in developed economies. The situation is further aggravated by the fact that wealth is more unevenly distributed in developing than in developed countries — large parts of the population in developing countries live in poverty (UN, 2004).
(2) Measured in purchasing power parity (PPP).
Figure 2.1 Population and GDP per capita in OECD and developing countries, 2002
Source: UNDP, 2004.
Figure 2.2 Growth of GDP in developed and developing countries
80
100
120
140
160
180
200
1987
1988
1989
1990
1991
1992
1993
1994
1995
1996
1997
1998
1999
2000
2001
Index (1986 = 100)
Developed countries
Developing countries
1986
Source: WRI, 2003.

Drivers of resource use
Sustainable use and management of natural resources 13
World trade is another driving force of resource and energy consumption. It is important for achieving economic growth, and countries need to exchange raw materials or semi-products in order to produce final goods and services which can then be sold on the world market.
The physical dimension of economic growth is especially visible in the context of globalisation (Figure 2.3). The expansion of global trade has been much faster than the growth of GDP. In the second half of the 20th century, global trade volumes grew by a factor of 6 to 8 for raw materials, and as much as 40 for manufactures (semi-finished and finished goods) (WTO, 2002). Today, it is widely taken for granted that food, clothing or electronic devices, for instance, may come from remote areas of the world. But in analysing the impacts that they have on the environment, one should keep in mind that products and commodities can cause impacts throughout their life-cycle: when they are produced, transported, used, and finally, when they become waste.
2.3 Patterns of development
The third driving force of the consumption of resources is the pattern of development. Broadly defined, the 'pattern of development' encompasses the types of technology used to satisfy needs, the
structure of the economy, and patterns of production and consumption.
The use of natural resources and the resulting impacts are obviously strongly influenced by the prevailing type and efficiency of available technologies (3). Major technological innovations, such as the steam machine or electricity, marked the era of industrialisation throughout the 19th and the 20th centuries. However, any revolutionary technological change is accompanied by fundamental social, institutional and economic changes which create both opportunities and risks. For example, the introduction of fossil energy-based technologies to replace human and animal labour significantly improved production efficiency, increased wealth and changed lifestyles, but was also accompanied by an enormous increase in resource use, creating unprecedented environmental pressures.
In recent years, it has been argued that technology is one of the main drivers for achieving decoupling of environmental pressure from economic growth. Technological change can be both the driver and the result of socio-economic change, and it involves changes in the means by which goods are produced and in the characteristics of the products themselves (OECD, 2001). But the introduction of a new technology can be a double-edged sword: it may create or mitigate environmental pressure, and increase or reduce the use of natural resources.
In case of the industrialised economies, there have been significant improvements in energy and resource efficiency for most products and services, and technological progress has generally led to saving natural resources or labour (although some of the per-unit efficiency gains may have been offset by more widespread consumption). Research, development and diffusion of new technology are important elements in technological change. Even though the proportion of environmentally-motivated R&D is rather small, preliminary studies show that more than half of R&D expenditure has had environmentally positive side-effects (Kemp, 2005). As shown in Figure 2.4, expenditure on R&D in the EU has been increasing since 1998. Overall EU research spending represented 1.93 % of GDP in 2002, compared with 2.76 % in the United States, 2.91 % in Korea, and 3.12 % in Japan. The EU policy objective is to increase public and private investment
(3) The very term 'technology,' when introduced by Johann Beckmann in 1769, was defined as 'the science of the processing of natural products.'
* World merchandise exports (volume index = value deflated by unit value).
Source: WTO, 2003.
Figure 2.3 Growth of world trade*
0500
1 000
1 500
2 000
2 500
3 000
3 500
4 000
4 500
5 000
1950
1953
1956
1959
1962
1965
1968
1971
1974
1977
1980
1983
1986
1989
1992
1995
1998
2001
Volume index (1950 = 100)
ManufacturesMining productsAgricultural products

Sustainable use and management of natural resources
Drivers of resource use
14
Figure 2.4 Structural indicator, gross domestic expenditure on R&D
1.70
1.75
1.80
1.85
1.90
1.95
2.00
2.05
1993
1994
1995
1996
1997
1998
1999
2000
2001
2002
2003
As percentage of GDP
EU (25 countries) EU (15 countries)
Source: Eurostat, 2005: Structural Indicators — online (http://europa.eu.int/comm/eurostat/newcronos/reference/display.do?screen=detailref&language=en&product=EU_MAIN_TREE&root=EU_MAIN_TREE/basic/strind/innore/ir021).
in research to 3 % of GDP by 2010. In April 2005 the European Commission set out plans to double the research budget to 70 billion Euro, in an effort to increase Europe's growth and competitiveness. The Commission estimates that the doubling of R&D funds will lead to a 0.96 % increase in economic growth by 2030, and will create nearly 1 million jobs.
Another important factor is the structure of the economy. All production activities involve the use and transformation of natural resources. By changing production patterns and especially by switching from resource-intensive industries (such as the production of metals or extraction of resources) to less resource-intensive industries (such as manufacturing), the resource efficiency of a national economy can increase.
Providing services also requires resource inputs (e.g. for heating and transportation), although the relationship with the use of resources is less evident.
Figure 2.5 Structural indicator, energy intensity of the economy
0
200
400
600
800
1 000
1 200
1 400
1 600
1 800
2 000
1999 2002
US
Japa
n
EU-2
5
Euro
zon
e 12
EU-1
5
Belgium
Czec
h Re
public
Denmar
k
German
y
Esto
nia
Greec
e
Spain
Irelan
d
Fran
ceIta
ly
Cypr
us
Latv
ia
Lith
uania
Luxe
mbo
urg
Hunga
ry
Malta
Nethe
rland
s
Austria
Poland
Portug
al
Slov
enia
Slov
akia
Finlan
d
Swed
en
Unite
d Ki
ngdo
m
Croa
tia
Roman
ia
Turk
ey
Bulgar
ia
Gross inland consumption of energy divided by GPD (index, 1995 = 100)Kgoe (kilogram of oil equivalent) per EUR 1 000
Source: Eurostat (2005): Structural indicators — online (http://europa.eu.int/comm/eurostat/newcronos/reference/display.do?screen=detailref&language=en&product=EU_strind&root=EU_strind/strind/enviro/en020).

Drivers of resource use
Sustainable use and management of natural resources 15
Service-oriented economies tend to maintain a fairly stable use of basic resources compared with economies based mainly on the extraction and processing of basic natural resources. Generally speaking, the resource efficiency of an economy is expected to improve as the share of services in the economy increases. However, with growing affluence, the consumption of some resources will increase, for example fuel for private transportation and water for household use.
Developed countries with advanced technologies tend to need fewer natural resources per unit of economic growth than countries which are still in the early stages of industrialisation. Most EU Member States have already entered the stage of 'post-industrial growth', with a structural change towards a service-oriented and knowledge-based economy.
In the global context, however, many developing countries have entered the phase of resource-intensive industrialisation fairly recently, or will do so in the near future. They are expected to go through similar technological and economic changes to those in developed countries some 50 or 100 years ago — although more rapidly. Industrialisation traditionally leads to an increase in resource use, because it involves the introduction of technologies which require high resource inputs (e.g. power plants, steel mills and metal foundries, cement plants). The industrialisation of large economies will therefore significantly increase resource consumption and the pressure on the global environment. For example China, which is already developing the largest steel and coal industries in the world, is rapidly developing heavy industries that follow the traditional industrial development pattern. Industrialisation and growth may also create opportunities for technological 'leapfrogging' through technology transfer, perhaps further strengthened by the implementation of emission-trading schemes.
There are also large differences between individual countries within the EU (Figure 2.5). The 2004
Spring report to the European Council revealed a large east-west gap in both economic performance and the levels of energy and resource efficiency (CEC, 2004a). For example, the energy intensity of the Czech Republic, one of the most technologically-advanced new Member States, is about five times higher than the EU-15 average. This is not just a reflection of the efficiency of the technologies used, but results from the structure of the economy, with a significant share of GDP coming from production. The positive trend is that several countries in central and eastern Europe are reducing their intensity of resource use. In the long-term, such a reduction could help decrease environmental pressure, although the investment needs are significant.
Given these regional variations, a 'Factor 4' increase in energy efficiency as described by Weizsäcker and Lovins (1997) seems to be a necessary structural adjustment. The latest EEA findings (2003) suggest that there are differences in the EU of a factor of four to five in material productivity as well as in energy efficiency. Given the expected growth rates of the new Member States and regional spill-over of technologies in central and eastern Europe, the challenges and opportunities for eco-efficient technological change is evident. There is also an important link between trade and technological development, since increasing trade and foreign investment can provide opportunities for more rapid uptake of new, more efficient and environmentally-friendly technologies.
2.4 Growing resource use in the global context
The projected 50 % growth of the global population over the next 50 years will put a significant pressure on the environment. Most of the growth will be in the developing countries, which will contain 85 % of the world's population within a couple of decades.
Most of the developing countries are in the phase of early industrialisation, when the building of infrastructure and heavy industry results in high
Box 2.1 Relative decoupling versus reduction of environmental impacts
In many EU countries, the economy in recent years has been growing at a faster rate than resource use. The EU economy grew by almost 50 % since the 19�0s, while the use of energy and renewable and non-renewable resources remained fairly constant. This means that there has been a relative decoupling of resource and energy consumption from economic growth. However, some environmental scientists argue that it is not clear whether such a relative decoupling has led to any absolute decrease in environmental impacts, given that absolute resource use has not decreased.

Sustainable use and management of natural resources
Drivers of resource use
16
demand for materials and energy and leads to environmental degradation. Moreover, their rapidly growing population will require more goods and services to support their needs. How will this trend affect the use of resources and environmental pressures on a global scale?
The first estimates of the overall use of materials show that total material consumption (TMC) of industrialised countries ranges between 31 and 74 tonnes per capita. If the rest of the world's population were to adopt similar levels of material consumption in the next 50 years, and assuming a world population of 9 billion by then, worldwide consumption of resources including 'hidden flows' could amount to between 279 and 666 billion tonnes. This would increase global material flows by a factor of two to five (Bringezu et al., 2003).
A similar conclusion comes from using another indicator, domestic material consumption (DMC). Global used domestic extraction was estimated at about 55 billion tonnes in 2002 (Behrends and Giljum, 2005). The DMC of industrialised countries ranges from 15 tonnes per capita in Japan to 26 tonnes in Australia (Bringezu et al., 2003).
Extrapolating those per capita DMC values to a world population of 9 billion in 2050 leads to a figure of global used domestic extraction ranging from 135 to 234 billion tonnes (excluding 'hidden flows'). This corresponds to an increase by a factor of 2.5 to 4.3 from 2002. The projected trend is clear. Although these indicators focus on the consumption of resources, past experience shows that the associated environmental impacts can also be expected to increase. Even if the exact relationship between the increase in resource use and the resulting environmental impacts is not yet clear, the projected increase in resource use highlights the importance of pursuing an effective decoupling policy, including in developing countries where the growth of resource use is expected to be highest.
It is sometimes argued that the increased use of resources in developing countries, fuelled by population growth and economic development, may outweigh any efficiency gains in industrialised countries, and that developing countries should therefore ensure that their development does not come at the expense of the environment. However, it is interesting to examine the current patterns of resource use and compare the situation in
Table 2.2 World population and energy use 1971–2000
1971 2000 Change in %Population in millions 3 754.3 6 054.1 61 %Energy use Mt oil equivalent 5 450.0 9 938.0 �2 %Energy use per capita kg oil equivalent 1 451.7 1 641.5 13 %
Source: World Bank (World Development Indicators, 2003).
Table 2.3 Energy use and main socio-economic drivers in OECD and non-OECD countries, 1971 and 2000
OECD 1971 2000 Change in %
Population millions ��5 1 132 2� %
Energy use Mt oil equivalent 3 386 5 317 57 %
Energy use per capita toe per capita 3.83 4.70 23 %
GDP billion constant '95 USD 11 804 27 733 135 %
GDP per capita constant '95 USD per capita 13 338 24 499 84 %
Energy intensity Kg oil eq./USD 0.29 0.19 – 34 %
Non-OECD 1971 2000 Change in %
Population millions 2 �69 4 922 72 %
Energy use Mt oil equivalent 2 064 4 631 124 %
Energy use per capita toe per capita 0.72 0.94 31 %
GDP billion constant '95 USD 2 1�6 6 379 192 %
GDP per capita constant '95 USD 762 1 296 70 %
Energy intensity Kg oil eq./USD 0.94 0.72 – 23 %
Source: ETC/RWM own calculations based on World Bank (World Development Indicators, 2003).

Drivers of resource use
Sustainable use and management of natural resources 17
developing and industrialised countries. It has long been argued that the industrialised countries are responsible for a disproportionally high share of global resource consumption, leading to the north-south divide, and giving rise to concerns about global social equity. Whether these claims are justified can be illustrated by the example of energy use.
Fossil energy carriers as an illustration of global resource consumption patterns
While there are sufficient data on the development of population and economic performance worldwide, overall consumption of natural resources is only known for a small, although increasing, number of countries. However, in the absence of sufficient data on global resource use, the consumption of fossil energy carriers can provide insights into the global consumption of resources, and help put European resource use into perspective. Because of the physical and socio-economic implications of the energy sector, lessons can be learned about the use, geographic distribution and management of natural resources in general.
There are several reasons why energy can be used as illustration for resource use patterns. First, fossil energy carriers are a key resource in industrialised societies, and make up a significant part of total resource consumption. Secondly, energy is always required to extract and process other natural resources, such as steel or cement, and economic activities in these primary sectors are therefore reflected in energy use. Last but not least, good quality data on fossil energy carriers is available for many countries.
As Table 2.2 shows, the world's population increased by 61 % between 1971 and 2000 and energy use by 82 %. Average per capita energy consumption
therefore grew by 13 %, and energy consumption grew more rapidly than the population.
Energy consumption is not evenly distributed (Table 2.3). In 1971, about 885 million people lived in the OECD countries. This affluent quarter of the world's population consumed around 62 % of the world's energy. In 2000, the share of population of the OECD countries decreased to around 19 % but they still consumed 54 % of global energy supply. The remaining 80 % of the world population consumed less than half of world energy use. Put differently, the population of OECD countries consumes about five times more energy per capita than the rest of the world, and in absolute figures, significantly more energy than the developing world.
From Table 2.3 it can also be seen that the OECD countries managed to improve their energy intensity by 33 % over three decades, mainly through investment in new technologies and a shift towards service-based economies. They achieved a relative decoupling of economic growth from energy use (84 % economic growth compared with 57 % growth in energy consumption). The non-OECD countries reduced their energy intensity by 23 %, but their economic development was accompanied by a steep increase in energy use (70 % economic growth compared with 124 % increase in energy use), which confirms that early industrialisation is generally accompanied by increasing resource use.
In general, there are some examples that the consumption of material and energy in Europe has relatively decoupled from economic growth (although there are few cases of a documented decrease of environmental impacts). Given the continued increase in resource use in absolute terms, Europe is still contributing to an increasing pressure on global resources (see Box 2.1 and Chapter 5 for more details).

Sustainable use and management of natural resources1�
Natural resources and their use
3 Natural resources and their use
A wide range of activities of the world's population — extraction of resources, industrial production, consumption of goods and services, mobility, leisure — results in massive flows of materials. Raw materials are extracted, transformed into products and goods, transported to other parts of the world and, sooner or later, released back to the natural environment as waste or emissions.
The Earth is a closed material system, and this sets certain limits to economic growth. These are clearly related to the availability of natural resources, where the environment plays the role of a 'source'. For some non-renewable resources, including many metals and construction minerals, security of supply does not currently give cause for concern; for others, such as fossil fuels and land, availability is already becoming a problem which is almost certain to grow. For many renewable resources,
such as fish stocks, forests and water, the key challenge is to ensure their sustainable regeneration by safeguarding the reproductive capacities of ecosystems (also known as 'maintenance of natural capital').
Other limits result from the finite ability of the environment to act as a 'sink' to absorb discharges and emissions of pollutants and wastes without serious damage. For example, human-induced carbon dioxide emissions are already causing climate change, and the ozone layer is and continues to be damaged by CFC emissions. The contamination of groundwater and soils by large quantities of wastewater is another example of how human activities can affect the environment.
This chapter begins with a brief analysis of material flows in Europe, as this provides the
Figure 3.1 Economy-wide material balance scheme (excluding water and air)
Note: Water flows are excluded because they represent enormous mass flows (one order of magnitude more than all other materials). Accounts for water flows should therefore be drawn up and presented separately (Eurostat, 2001). Air is omitted for the same reason. Emissions to soils are included in the category 'dissipative use'.
Source: Eurostat, 2001.
Input
Domestic extraction:· fossil fuels· minerals· biomass
Economy Output
Unused domestic extraction
Imports
Indirect flows associated to imports
Material accumulation (net addition to stock)
Material throughput (per year)
Recycling
To nature· emissions to air· waste landfilled· emissions to water· dissipative use
Unused domestic extraction
Exports
Indirect flows associated to exports

19
Natural resources and their use
Sustainable use and management of natural resources
most aggregated indicator of resource use. We then discuss the state and the trends regarding the use of selected non-renewable and renewable resources: fisheries, forestry, water, fossil fuels, metals and construction minerals, and land. While these examples do not cover all the possible aspects of the sustainable use and management of natural resources, they were chosen on the basis of their policy relevance and political importance and their ability to illustrate the various policy approaches, and to ensure a mix of renewable and non-renewable resources. Chapter 4 presents some of the challenges to formulating a policy response, using energy, fishery and land as examples.
3.1 Material flows and material intensity
The entire life cycle of material resources, from extraction, through use in the production and consumption of goods and services, to the end of their useful life as waste, can give rise to environmental impacts. Material flow accounting (MFA) throughout an economy is a tool for systematically accounting for all material input and output flows that cross the functional border between the economy and the environment, including imports and exports. The concept of MFA is illustrated in Figure 3.1.
Box 3.1 From pressures to impacts
One of the main concerns related to the increasing use of natural resources is the environmental impacts that this causes. For example, environmental pressures result from discharges of pollutants, releases of harmful substances, consumption of resources beyond reproductive capacities and conversion of natural land into urban zones. These cause environmental impacts as changes in environmental conditions affect human beings, ecosystems and man-made infrastructure.
There is considerable experience in quantifying the use of natural resources. Pressures can be expressed in terms of quantities of pollutants discharged, weights or volumes of resource extracted or material consumed, volumes of fish or timber harvested, or, at the most aggregated level, presented as material flows in tonnes. However, converting these pressures, which are sometimes referred to as impact potentials, into environmental impacts is much more challenging.
With current knowledge, it cannot be conclusively determined whether the relationship between the consumption of materials or energy carriers and its environmental impacts is linear or non-linear. Some experts argue that there is little evidence of any link — for example, the hydrological cycle will replenish abstracted water, and new forests will compensate for timber harvested. Others believe that the relationship is likely to be progressive rather than linear, because ecosystems can often tolerate some pressure without damage, while further pressure will lead to rapid damage or collapse. Preliminary research shows that, as a general rule of thumb, the higher the use of materials, energy and land, the higher the resulting impact potentials on the environment (Van der Voet, 2004) (4).
To address this gap in knowledge, the European Commission has commissioned research to develop an environmentally-weighted indicator of material consumption that combines mass flows and impact potentials based on life-cycles. Other research on the life-cycle-wide environmental impact potentials of product groups is carried out using input-output analysis.
(4) More detailed discussion of the relation between resource use and environmental impacts can be found in a recent joint study by CML Leiden, CE Delft and the Wuppertal Institute 'Policy review on decoupling: development of indicators to assess decoupling of economic development and environmental pressure in the EU-25 and AC-3 countries' which can be downloaded from the CML website: www.leidenuniv.nl/cml/ssp/.

Sustainable use and management of natural resources
Natural resources and their use
20
Figure 3.2 Composition of aggregated resource use (DMC), 2001
0
5
10
15
20
25
30
35
40
Italy
Unite
d Kin
gdom
Nethe
rland
s
Fran
ce
Portug
al
EU-1
5Sp
ain
Belgium
/
Luxe
mbo
urg
Germ
any
Aust
ria
Swed
en
Greec
e
Denm
ark
Ireland
Finland
Tonnes per capita
Fossil fuels Industrial minerals, ores Construction minerals Biomass
Source: Eurostat/IFF, 2004.
Figure 3.3 Relative decoupling of resource use and economic growth in the EU-15
Gross domestic product at market prices in millions of Euro (at 1995 prices and exchange rates)Gross inland energy consumption in thousand tonnes of oil equivalent (TOE)Emission of greenhouse gases (global warming potential, CO2 equivalent, 1 000 tonnes)
EMC (environmentally weighted material consumption) — normalised (World 95) and equally weighted scores
DMC (1 000 tonnes)
1990 1991 1992 1993 1994 1995 1996 1997 1998 1999 2000 2001 2002
80
85
90
95
100
105
110
115
120
125
130
Index (1990 = 100))
Sources: Eurostat NewCronos online database (GDP, energy, greenhouse gas emissions); van der Voet et al., 2004 (EMC); Eurostat/IFF, 2004 (DMC).

Natural resources and their use
Sustainable use and management of natural resources 21
In order to monitor economy-wide material flows, Eurostat (2001) has developed a number of indicators, which characterise the throughput of material resources in a national economy. While MFA-based indicators are considered to be 'pressure indicators,' they have proved to correlate highly with environmental impact potentials at the aggregated system level (van der Voet et al., 2004), and can thus be used as a proxy for the total environmental impact potential of an economy (Box 3.1).
For the EU-15 as a whole, aggregated material use (e.g. domestic material consumption (DMC)) has changed little over the past two decades, at about 15–16 tonnes per capita per year (Moll, Bringezu and Schütz, 2003). However, material consumption per capita varies considerably, from some 12 tonnes/capita in Italy to 38 tonnes/capita in Finland (see Figure 3.2).
Over the past decade, relative decoupling of economic growth from material and energy consumption has occurred in many EU countries (see Figure 3.3 for the EU-15 as a whole). This means that the increase in resource consumption
(materials and energy) was no longer proportional to the rate of economic growth. Two proxy indicators for environmental impacts (emissions of greenhouse gases, and environmentally-weighted material consumption) also show a similar relative decoupling. However, even though Europeans tend to use resources more efficiently, we do not use fewer resources in absolute terms. There are few, if any, indications of absolute decoupling, that is a decrease in actual consumption of materials, and of energy in particular.
Material intensity, which is a measure of the efficiency of an economy, can be expressed by the amount of materials consumed (DMC) per unit of GDP (5). Several factors determine material intensity, including the structure of the economy (basic industry and raw material processing versus hi-tech manufacturing), share of the service sector in GDP, consumption patterns, construction activities, and the main sources of energy (e.g. high share of nuclear energy in France, use of oil shale for energy production in Estonia). The material intensity of EU Member States varies considerably, from 11.1 kg/EUR in Estonia to 0.7 kg/EUR in France (Figure 3.4). For the EU-25, the average material intensity is
(5) A debate continues among experts whether DMC, DMI or another material indicator should be used to measure material intensity. While DMC/GDP is most commonly used, some experts point out that since DMC excludes export, this approach is methodologically inaccurate since export — excluded in DMC — does contribute to GDP.
Figure 3.4 Material intensity of European economies
Sources: Wuppertal Institute, 2005; Eurostat, 2004; van der Voet et al.,2004.
0.00
2.00
4.00
6.00
8.00
10.00
12.00
14.00
16.00
18.00
USA
Japa
n
Braz
il
EU-2
5
EU-1
5
Aus
tria
Belgium
/Lux
embo
urg
Den
mar
k
Finland
Fra
nce
Ger
man
y
Gre
ece
Ire
land
Ita
ly
Net
herla
nds
Por
tuga
l
Spa
in
Swed
en
Unite
d Ki
ngdo
m
Cyp
rus
Cze
ch R
epub
lic
Eston
ia
Hun
gary
Lat
via
Lith
uania
Malta
Polan
d
Slova
kia
Slove
nia
Bulga
ria
Rom
ania
Cro
atia
Tur
key
Ice
land
Nor
way
1992 2000
Domestic (direct) material consumption (DMC) divided by GDP (index, 1995 = 100)Kg per Euro

Sustainable use and management of natural resources
Natural resources and their use
22
Box 3.2 Virtual water
The amount of water consumed in the production of goods is the 'virtual water' it 'contains'. International trade allows water-scarce countries to import high water-consuming products, thus making water available for other purposes. The total 'water footprint' of a country is a useful indicator of its call on global water resources.
Showing the 'virtual water' content of various goods can help increase water-awareness. For example, the choice of diet has a major impact on 'virtual water' consumption. If the entire global population were to adopt a western-style diet, about 75 % more water would be needed for food production.
Some examples of 'virtual water' content include: • approximately 1 000 litres of water to produce 1 kg of wheat • some 2 700 litres of water to produce 1 kg of eggs• about 13 500 litres of water to produce 1 kg of beef.
Source: World Water Council, 2004, http://www.worldwatercouncil.org/virtual_water/synthesis.shtml.
Figure 3.5 Domestic extraction (used) versus imports of materials, EU-15 1970–2001
Source: Eurostat/IFF, 2004.
Fossil fuels
0.00
0.50
1.00
1.50
2.00
2.50
3.00
1970 1980 1990 2000
Tonnes per capita
Domestic extraction used — fossil fuels
Imports — fossil fuels
Industrial minerals, ores
0.00
0.10
0.20
0.30
0.40
0.50
0.60
0.70
0.80
0.90
1970 1980 1990 2000
Tonnes per capita
Domestic extraction used — industrial minerals, ores
Imports — industrial minerals, ores
approximately 1 kg DMC/Euro. For comparison, this is slightly lower than in the US, but twice as high as in Japan. The picture is similar for energy intensity (as shown in Figure 2.5), where the efficiency of the Japanese economy is even more pronounced.
With two exceptions, there is a clear trend of material intensity improving over the period
1992–2000. However, there are large differences between countries. While the figures for the EU-15 range from 0.7 kg/Euro in France to 1.8 kg/Euro in Greece, material intensity in most of the ten new EU Members States is several times higher than the EU average (6). This may indicate a considerable potential for improvement, although it should also be kept in mind that many earlier
(6) The magnitude of this difference will also depend on the choice of method for the calculation of GDP. The graphs used in this report are based on GDP in constant 1995 prices, in order to be consistent with the Eurostat approach. However, if the purchasing power parity approach had been used to calculate the GDP, the differences between old and new Member States would be much lower (it is estimated that the material intensity figures of new Member States could decrease by some 50 %).

Natural resources and their use
Sustainable use and management of natural resources 23
economy-wide material efficiency improvements have been accompanied by an absolute increase in material use (growth of GDP was just faster than material consumption, so material intensity was improving). This situation may also occur in the new EU Member States, as their integration into the economic area of the EU may require absolute increases in material use.
While the relative decoupling shown in Figure 3.3 is undoubtedly good news, some of it may have been achieved as a result of increased imports. In absolute terms, Europe as a whole is not using fewer material resources, but relies increasingly on those extracted abroad. In most European countries, domestic extraction of material resources has decreased while imports have increased, as a result of macro-economic restructuring, rising domestic costs of production, availability of cheaper products from abroad, and removal of trade barriers. This applies in particular to fossil fuels and metals, as shown in Figure 3.5.
The substitution of domestic production with imports takes some strain off the European environment, and results in a relative decoupling in terms of mass balance. However, some environmental experts point out that this means that environmental pressures associated with resource extraction occur in the country of origin of the commodity. Those pressures can be significant — for example, each tonne of imported metal can 'leave behind' as much as an equivalent of 20 tonnes of hidden flows (so-called 'ecological rucksacks'). Thus, as imported material resources are used to produce goods and services in Europe, the environmental burden of extraction may be 'shifted' abroad. Damage may be further aggravated by the fact that such countries often have lower social and environmental standards than the EU.
One interesting example of global burden-shifting is the emerging issue of consumption of 'virtual water' as a result of global trade in agricultural products (Box 3.2).
3.2 Renewable resources
Renewable resources are characterised by their ability to regenerate within a relatively short period. For their use to be sustainable, their consumption or extraction rate needs to be maintained within the reproductive capacity of the natural systems, which should also take into account the fact that for many renewable resources, extraction rates must leave enough of these resources in the ecosystem
in order to maintain its resilience and biodiversity. The following sections review the examples of water resources, fisheries and forests.
3.2.1 Water resources
Although indestructible, freshwater is a finite and precious resource essential for sustaining life, supporting economic activities, and for the environment itself.
Water resources in Europe are, in many locations, under threat from a range of human activities, which lead to problems of overexploitation and low quality of inland waters. There are many reasons why water resources are coming under pressure: increasing populations, economic growth, intensive agriculture, rapid urbanisation, growing tourism and leisure activities, as well as the lack of proper supply and treatment facilities or institutional arrangements for water management.
Not all water uses put equal stress on water resources. To reach the goal of sustainable water management a balance has to be achieved between the abstractive uses of water (e.g. abstraction for public water supply, irrigation and industrial use), in-stream uses (e.g. recreation, ecosystem maintenance), discharges of effluents and the impacts of diffuse sources. This requires that quantity, quality, and ecological effects are all taken into account.
Water quantity
Water and populations are unevenly distributed, so countries and regions experience differing degrees of water stress. Precipitation is highest in the western part of Europe and in regions with mountains. Annual average run-off from rainfall varies from more than 3 000 mm in western Norway to less than 25 mm in southern and central Spain, and is about 100 mm over large areas of eastern Europe. In absolute terms, the total renewable freshwater resource in Europe is around 3 500 km3/year.
Thirteen countries have less than 5 000 m3/capita/year while the northern countries generally have the highest water resources per capita. However, few Europeans suffer from the devastating water shortages and poor water quality experienced by people in many areas of the world. Overall, Europe abstracts a relatively small portion of its total water resources each year. Total water abstraction in Europe is about 292 km3 per year, about 8 % of the total freshwater resource. Total abstraction fell by

Sustainable use and management of natural resources
Natural resources and their use
24
10 % between 1990 and 2001. Nonetheless, figures at such a high level of aggregation do not fully reflect region-specific factors (Box 3.4). Moreover, the water balance fluctuates continuously, not only from one year to another, but also over the course of the year. For example, agriculture places a major demand on water resources, particularly when the resources are least able to cope.
The main source of abstracted freshwater in Europe is surface water, which typically accounts for between 70 % and 90 % of total freshwater abstraction. The remainder comes from groundwater sources, with minimal additional contributions from desalination of seawater (in Spain). While southern European countries suffer most frequently from water shortages and quality problems, the situation in Europe varies considerably from place to place, and time to time. Water availability per capita and water exploitation index are shown in Figure 3.6.
In the period 1990 to 2001, the most marked change in total water abstraction occurred in the south-eastern European countries (Turkey, Cyprus and Malta) where total abstractions increased by 40 %, while abstraction decreased by 40 % in the northern,
central and eastern countries. Total water abstraction in the EU-15 Member States fell by 8 to 9 % both in the northern and in the southern countries.
When the water withdrawal ratio is less than 10 %, water stress is considered low (7). A ratio in the range of 10 to 20 % indicates that water availability is becoming a constraint on development and that significant investment is needed to provide adequate supplies. When the ratio exceeds 20 %, both supply and demand will need to be managed and conflicts between competing uses will need to be resolved. Four countries (Cyprus, Malta, Spain and Italy) already withdraw more than 20 % of the available water resources, and a further seven withdraw between 10 and 20 %. Moreover, some countries which are relatively water-rich on a national scale have extensive arid or semi-arid regions. For example, there are big differences in water availability between the north and south of Spain, Portugal and Italy.
Different sectors have different demand for water. The main drivers of water use are agriculture (irrigation), urbanisation, population growth, lifestyles, including tourism, and the need for
(7) Some experts point out that reducing water use is reasonable even in countries with no overall water scarcity, given that long-term natural variations in rainfall can cause droughts lasting several years, and high water use may cause regional and seasonal water scarcity 'hot spots' which may result in water pollution.
Box 3.3 Water protection goals in EU policies
Water resources need to be managed carefully to ensure that people have access to affordable and safe drinking water and sanitation, without depleting water reserves or damaging ecosystems. The 6th environment action programme and the water framework directive recognised that the major challenges in the area of freshwater are:
• to ensure that rates of extraction from water resources are sustainable over the long term, and to promote sustainable water use based on a long-term protection of available water resources;
• to protect, enhance and prevent further deterioration of the status of aquatic ecosystems;• to ensure the progressive reduction of pollution of groundwater and to prevent its further pollution;• to achieve levels of water quality that do not give rise to unacceptable impacts or risks to human health
and the environment.
Box 3.4 Economic transition and water consumption in central and eastern Europe
Economic transition in central and eastern European countries during the 1990s had a tremendous impact on water consumption in the region. The decrease in industrial activity, especially in water-intensive heavy industries such as steel and mining, led to decreases of up to 70 % in water abstraction for industrial use. The amount of water abstracted for agriculture also decreased by a similar percentage. Abstraction for public water supply declined by 30 % after the fees for water supply were increased to reflect water costs and water meters were installed in houses.

Natural resources and their use
Sustainable use and management of natural resources 25
Figure 3.6 Water availability and exploitation in Europe
Source: EEA, 2003: Water indicators report, TR 1/2003.
Iceland
Finland
Bulgaria
Netherlands
United Kingdom
Germany
Annual water availability per capita by country, 2001
0 5 000 10 000 15 000 20 000 25 000 30 000
Malta
Denmark
Belgium
Poland
Spain
Italy
Turkey
Greece
Portugal
Slovenia
Ireland
Latvia
Estonia
Sweden
Norway
> 1 700 m3/cap/year < 1 700 m3/cap/year
Czech Republic
Cyprus
Luxembourg
Lithuania
Hungary
Austria
Slovak Republic
Romania
France
Water exploitation index (WEI) by country, 1990 and 2001
0 20 40 60 80%
WEI 2001 WEI 1990
IcelandNorway
LatviaSlovak Republic
SwedenSloveniaFinlandIreland
BulgariaNetherlands
HungaryLuxembourg
AustriaEstonia
United KingdomDenmarkLithuania
Czech RepublicGreece
PortugalFrancePolandTurkey
RomaniaGermany
SpainItaly
CyprusBelgium
Malta

Sustainable use and management of natural resources
Natural resources and their use
26
water for industrial processes and cooling at power plants. As shown in Figure 3.7, on average, 37 % of total water use is for agriculture, 33 % for energy production (including cooling), 18 % for urban use, and 12 % for industry (excluding cooling). Abstractions for agriculture remained almost unchanged over the period, while those for urban use and energy decreased by 11 % and for industry by 33 %. Irrigation is the most significant use of water in agriculture in southern countries, accounting for 50 to 80 % of water use. In central Europe energy production (including cooling water), followed by urban use are generally the main users. In particular, Belgium, Germany and Estonia use more than half of their abstracted water for energy production. Tourism, one of the fastest increasing socio-economic activities in Europe, places severe, often seasonal, pressures on water resources, and the increase in demand is often associated with recreational uses such as swimming pools, golf courses, and aquatic parks as well as by a much increased population during holiday seasons.
Water availability problems occur when the demand exceeds the amount available during a certain period. This happens frequently in areas with low rainfall and high population density, and in areas with intensive agricultural or industrial activity.
Overexploitation of groundwater occurs when groundwater abstraction exceeds recharge rates. Apart from causing problems of water supply, overexploitation causes deterioration of water quality, and leads to the drying out of water courses, loss of habitats and wetland areas, and salt-water intrusion into aquifers.
Large areas of the Mediterranean coastline in Italy, Spain and Turkey, as well as some parts of Denmark, are affected by saltwater intrusion (Figure 3.8). The main cause is groundwater over-abstraction for public water supply, including tourism. Groundwater over-abstraction is also a recurring problem in several countries in Central Europe.
Climatic conditions also influence water resources and thus water availability. In the 21st century, a temperature increase of between 0.1 and 0.4 °C per decade is expected in Europe. Even though there are still some uncertainties about climate change predictions, the maximum of this temperature increase is expected to occur in southern Europe in the summer and in eastern Europe in the winter. The predicted pattern of future changes in annual precipitation includes widespread increases in precipitation in northern Europe, rather small decreases across southern Europe, and small or
Figure 3.7 Trends in European water use
Notes: Western (Central + Nordic): Austria, Belgium, Denmark, Finland, Germany, Iceland, Ireland, Luxembourg, Netherlands, Norway, Sweden, Switzerland, and the United Kingdom. Western (Southern): France, Greece, Italy, Portugal, and Spain. AC (Southern): Cyprus, Malta and Turkey. AC (Northern): Bulgaria, Czech Republic, Estonia, Hungary, Latvia, Lithuania, Poland, Romania, Slovak Republic, and Slovenia.
Source: EEA water quality fact sheet (9/02/05) based on data from Eurostat.
Water abstraction in different regions of Europe
0
20
40
60
80
100
120
140
160
1990 1992 1994 1996 1998 2000 2002
Billion m3
AC (northern)AC (southern)
Western (central and nordic)Western (southern)
0
20
40
60
80
100
120
1990 1992 1994 1996 1998 2000 2002
Billion m3
Total urban useTotal agriculture
Total industry Total use for energy
Trends in sectoral water use

Natural resources and their use
Sustainable use and management of natural resources 27
uncertain changes in central Europe. Most of Europe will become wetter in the winter, but southern Europe may get dryer winters.
The effects of climate change on water resources will vary depending on the region. Climate change will affect both demand and availability, and may have impacts on water-dependent ecosystems. Changes in climate may increase demand, in particular for agriculture and public water supply. Warming will lead to an increase in evaporation, which may have
harmful effects on wetlands and aquatic ecosystems. It may also result in changes in the chemical and biological condition of waters and soils. Higher winter temperatures and less precipitation as snow will have a direct impact on the seasonal flow regime of many rivers.
Water quality
The three prerequisites for good ecological quality of water resources are that water should be clean (good
Box 3.5 Water use and agriculture
The scale and importance of irrigation is most significant in the member countries or regions that have arid climates, but far from negligible in most other member countries. In arid countries such as Cyprus, Malta, Greece, parts of Spain, Portugal, Italy and Turkey, irrigation accounts for more than 60 % of water use. In the more humid and temperate member countries irrigation is carried out mainly to complement natural rainfall, and its share of total water use is generally less than 10 %.
In the EU-15, 85 % of irrigated land is in the Mediterranean area (France, Spain, Italy, Portugal, and Greece). In the acceding and the new 10 countries, the major part (93 %) is in Romania and Turkey. Traditionally, much of the irrigation in Europe has consisted of gravity-fed systems. However, in an increasing number of regions in the north and south, irrigation by sprinklers using pressure, often drawing water from groundwater, is the most common practice. It is often in these areas that the quantities of water used, and thus the impacts on the environment, are the largest (IEEP, 2000).
The environmental impacts of irrigation vary considerably between countries and regions. Irrigation can affect the environment through impacts on water quantity (e.g. lowering the groundwater table and affecting river flow), water quality through increased content of salts and pollutants, and soil, biodiversity and landscapes. Secondary impacts such as increased fertiliser and pesticide use also result from irrigated agriculture.
Figure 3.8 Groundwater exploitation and saltwater intrusion in Europe
Source: EEA/ETC-W, 2003.
-10°-20°-30°
0°
0°
10°
10° 20°
20°
30°
30°
40°
40°
50°
50°
60° 70° 80°
40°
40°
50°
50°
60°Salt water intrusiondue to groundwateroverexploitation
No data
No groundwateroverexploitation
Salt waterintrusion
Outside data coverage
Data available
Groundwateroverexploitation
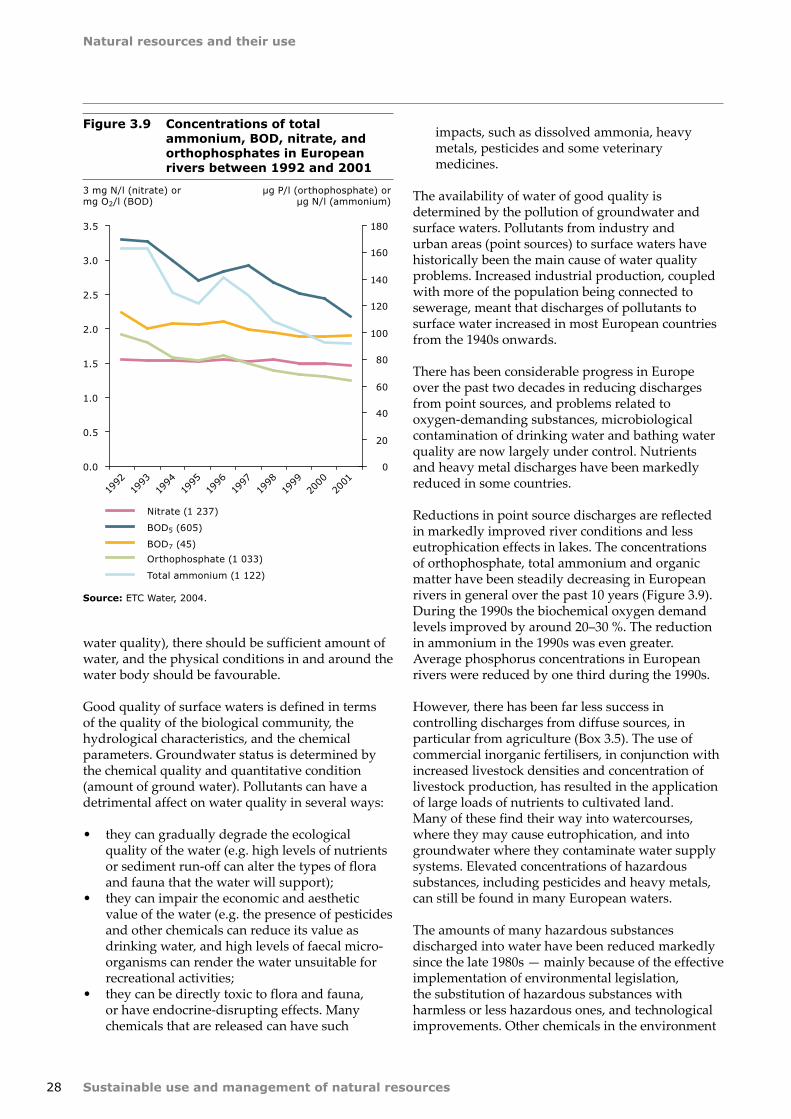
Sustainable use and management of natural resources
Natural resources and their use
2�
water quality), there should be sufficient amount of water, and the physical conditions in and around the water body should be favourable.
Good quality of surface waters is defined in terms of the quality of the biological community, the hydrological characteristics, and the chemical parameters. Groundwater status is determined by the chemical quality and quantitative condition (amount of ground water). Pollutants can have a detrimental affect on water quality in several ways:
• they can gradually degrade the ecological quality of the water (e.g. high levels of nutrients or sediment run-off can alter the types of flora and fauna that the water will support);
• they can impair the economic and aesthetic value of the water (e.g. the presence of pesticides and other chemicals can reduce its value as drinking water, and high levels of faecal micro-organisms can render the water unsuitable for recreational activities;
• they can be directly toxic to flora and fauna, or have endocrine-disrupting effects. Many chemicals that are released can have such
impacts, such as dissolved ammonia, heavy metals, pesticides and some veterinary medicines.
The availability of water of good quality is determined by the pollution of groundwater and surface waters. Pollutants from industry and urban areas (point sources) to surface waters have historically been the main cause of water quality problems. Increased industrial production, coupled with more of the population being connected to sewerage, meant that discharges of pollutants to surface water increased in most European countries from the 1940s onwards.
There has been considerable progress in Europe over the past two decades in reducing discharges from point sources, and problems related to oxygen-demanding substances, microbiological contamination of drinking water and bathing water quality are now largely under control. Nutrients and heavy metal discharges have been markedly reduced in some countries.
Reductions in point source discharges are reflected in markedly improved river conditions and less eutrophication effects in lakes. The concentrations of orthophosphate, total ammonium and organic matter have been steadily decreasing in European rivers in general over the past 10 years (Figure 3.9). During the 1990s the biochemical oxygen demand levels improved by around 20–30 %. The reduction in ammonium in the 1990s was even greater. Average phosphorus concentrations in European rivers were reduced by one third during the 1990s.
However, there has been far less success in controlling discharges from diffuse sources, in particular from agriculture (Box 3.5). The use of commercial inorganic fertilisers, in conjunction with increased livestock densities and concentration of livestock production, has resulted in the application of large loads of nutrients to cultivated land. Many of these find their way into watercourses, where they may cause eutrophication, and into groundwater where they contaminate water supply systems. Elevated concentrations of hazardous substances, including pesticides and heavy metals, can still be found in many European waters.
The amounts of many hazardous substances discharged into water have been reduced markedly since the late 1980s — mainly because of the effective implementation of environmental legislation, the substitution of hazardous substances with harmless or less hazardous ones, and technological improvements. Other chemicals in the environment
Figure 3.9 Concentrations of total ammonium, BOD, nitrate, and orthophosphates in European rivers between 1992 and 2001
Source: ETC Water, 2004.
Nitrate (1 237)
BOD5 (605)
BOD7 (45)
Orthophosphate (1 033)
Total ammonium (1 122)
0.0
0.5
1.0
1.5
2.0
2.5
3.0
3.5
0
20
40
60
80
100
120
140
160
180
3 mg N/l (nitrate) or mg O2/l (BOD)
µg P/l (orthophosphate) orµg N/l (ammonium)
1992
1993
1994
1995
1996
1997
1998
1999
2000
2001

Natural resources and their use
Sustainable use and management of natural resources 29
are also of potential concern, but relatively little information is available about their presence and effects on the water environment. One emerging issue is the presence of endocrine-disrupting substances in water, with sexual disruption in aquatic animals being reported by several European countries.
3.2.2 Fish stocks
World production of fish amounted to approximately 124 million tonnes in 2000, with Europe accounting for 15 %. The seas around Europe provide about 10 % of world fish catches (FAO). European fish production increased by 25 % during the first half of the 1990s (see Figure 3.10), then, after peaking at more than 12 million tonnes in 1997, declined to about 11 million tonnes in 2000. This corresponds well with the global trend over the same period.
Europe is one of the world's largest markets for processed fish and aquaculture products, with the value of the whole production chain (fishing, aquaculture and processing) exceeding 20 billion Euro for the EU-15 in 1998. Europe is also
increasingly a net importer of fish — imports into the EU-15 increased from 6.9 million tonnes in 1990, to 9.4 million tonnes in 2003.
Our understanding of fish population dynamics and the impact human activities have on them is limited. Catch statistics are not a very precise indicator of the success of management. A decrease in the catch of a stock can be a sign of a more responsible quota policy, or that the stock is being overfished. Similarly, in economic terms, increased catches may be a sign that the stock is healthy and giving more harvest, or that the spawning stock is being depleted at the cost of future catches. Moreover, the nature of the ecosystems, current knowledge of stock dynamics, and the availability of fishery statistics allow only a limited insight into the issue. The key factor affecting the status of fish resources is overfishing, but natural environmental change and fluctuation, anthropogenic effects on the environment, and changes in ecosystems also have an effect.
It is estimated that globally, about one third of fish stocks are already overexploited. In European coastal seas, the eastern Atlantic, the Mediterranean
Figure 3.10 Total European capture production (landings), 1990–2000
Notes: Western Europe: Belgium, Denmark, Finland, France, Germany, Greece, Iceland, Ireland, Italy, Monaco, Netherlands, Norway, Portugal, Spain, Sweden, United Kingdom. Central and eastern Europe: Albania, Bosnia and Herzegovina, Bulgaria, Croatia, Cyprus, Estonia, Latria, Lithuania, Malta, Poland, Romania, Slovenia, Turkey, Federal Republic of Yugoslavia.
Sources: FAO Fishstat Plus.
0
2
4
6
8
10
12
14
1990 1991 1992 1993 1994 1995 1996 1997 1998 1999 2000
Million tonnes
Western Europe Central and eastern Europe

Sustainable use and management of natural resources
Natural resources and their use
30
and Black Seas, many stocks are now considered to be outside safe biological limits, and some are in a critical state, either fully or overexploited.
The International Council for the Exploration of the Sea (ICES) considers all European stocks of Atlantic cod and Atlantic mackerel to be at risk, either because the spawning stock biomass is too low, or because fishing mortality is too high. Stocks of eastern North Atlantic blue-fin tuna are also a cause of concern. In the case of North Atlantic and the Baltic, most of the demersal fish stocks are overexploited. Of the total of 78 stocks assessed by ICES in 2004, 25 were already outside safe biological limits and 13 were harvested outside safe biological limits (8). Eighteen stocks were regarded as sustainably exploited, the situation for the rest was uncertain or unknown. The deep-sea fish stocks in the North East Atlantic are generally also overfished.
Less information on the state of stocks is available for species in the Mediterranean and Black Seas, and fishery landings trends often provide the only
indication of changes that have occurred in the past. Of 36 assessments of the hake stock in the Mediterranean, 28 concluded that it is overfished and 7 that it is fully exploited. Of 32 red mullet assessments, 18 found it overfished. Most of the targeted demersal fish stocks and the large pelagics stocks are considered either fully exploited or even overfished. For the smaller pelagics the picture was more diverse, with only 2 of 14 assessments of the anchovy stock rating it as overfished, and the sardine stock rated as within safe limits.
In recent years, the Black Sea has faced a crisis. Several pelagic resources, including the critically important anchovy fishery, collapsed in 1989–1992. Although some recovery has since been seen for several pelagic stocks, fishing capacity continues to rise unchecked. Bonito, mackerel and bluefish were already depleted in the 1970s and 1980s, and landings of migratory pelagics, and anadromous species remain substantially below earlier levels, with a serious risk of commercial extinction for some sturgeon stocks. The decline of commercial stocks is
Box 3.6 OSPAR and ten ecological quality issues for the marine environment
Under the auspices of the OSPAR Convention for the protection of the marine environment of the North-East Atlantic, North Sea states and the European Community are developing a coherent and integrated set of ecological quality objectives as part of an ecosystem approach. The set should help provide a practical, scientifically-based and consistent method for implementing the ecosystem approach to the management of human activities that affect the marine environment.
The aim is to manage '…human activities in such a way that the marine ecosystem will continue to sustain the legitimate uses of the sea (that is, the ecosystem is healthy) and will continue to meet the needs of present and future generations (that is, the ecosystem is sustainable).'
The ongoing work focuses on developing ecological quality objectives for ten issues:
- commercial fish species- threatened and declining species - marine mammals - seabirds- fish communities - benthic communities - plankton communities- habitats - oxygen consumption- nutrient budgets and production. These ten issues cover the ecological quality objectives needed at the species, community and ecosystem level, and largely cover the range from structural (diversity) to functional (processes) aspects of the ecosystem.
(�) 'Outside safe biological limits' means that the spawning stock is smaller than the recommended precautionary level. 'Harvested outside safe biological limits' means that the fishing pressure is higher than the recommended precautionary level.

Natural resources and their use
Sustainable use and management of natural resources 31
such that in the 1980s only five stocks were exploited compared with 26 in the 1960s and 1970s (Black Sea Commission, 2002).
Region-specific data on highly migratory species such as tuna are scarce. The stock of blue-fin tuna (the only tuna species for which relatively comprehensive data were available), is considered overexploited to fully exploited in European seas, and catches exceed the sustainable level by 25 %. Swordfish are also considered overexploited, except for the albacore species in Atlantic waters.
In addition to exceeding sustainable yield rates and the ensuing overfishing, fishery resources have also been affected by adverse environmental conditions (coastal and marine pollution, land run-off, and climate change). For example, the existence of some species as commercially exploitable was in question during the second half of the 1990s due to eutrophication.
The consequences of overfishing are difficult to quantify. The complex interactions between stocks, and the effects of fishing activity on non-target species like the sea-bottom ecosystems, have been poorly studied, compared with research on economically-important species. There is, however, growing concern over the long-term effects of fisheries on the ecosystem.
The direct effects include removal of the target species such as cod and haddock resulting in changes in the size and age structure of their populations; reduction of biodiversity through killing non-target populations of fish (discards), and seabirds, marine mammals, turtles and benthic marine life; and structural alterations to the seabed habitat by fishing and other human activities. The indirect effects include changes in the food web impacting the predators and prey of the species affected; environmental effects of dumping discards and organic detritus (e.g. offal); and mortality caused by lost fishing gear ('ghost fishing').
The growing concern over the long-term effects of fisheries on the ecosystem is reflected in the recent emphasis on ecosystem management. One interesting example of how the issue of ecological quality of the marine environment is addressed is the work of OSPAR based on the ecosystems approach (Box 3.6).
The case of fisheries is a prime example of a policy effort that has not resulted in sustainable resource
management in practice. All countries of the EU subscribe to the FAO code of conduct for responsible fisheries, which defines a responsible policy as one which ensures 'effective conservation, management and development of living aquatic resources with due respect for the ecosystem and biodiversity in order to provide, both for present and future generations, a vital source of food, employment, recreation, trade, and economic well-being for people.' However, the catch quotas set by the Fisheries Council in the past often have not reflected the opinion of ICES and other scientific bodies as to stock status. Poor enforcement of the quotas agreed, and illegal or 'black' catches have also contributed to overfishing.
Therefore, even though a range of alternative management regimes has been introduced in the European seas, most of them have failed to achieve the policy objectives, mainly because the forces driving overexploitation have not been addressed. The greatest current environmental concerns are the persistent chronic overexploitation and the fact that declining catches have not reduced fishing pressures. Much work is currently going on to address the problems: a code of conduct for responsible fisheries in Europe has been proposed by the Commission, and a number of action plans
Figure 3.11 Spawning stock biomass and fishing pressure for North Sea cod 1963–2002
Note: The black line corresponds to the precautionary spawning stock biomass (SSB) level of 150 000 tonnes and the precautionary Fishing pressure of F = 0.65. F is an indicator of fishing mortality represented as a logarithmic function of catch per stock of given age groups (F 2–4 means fishing mortality of year classes 2 to 4-years old), F = 10 is 100 %.
Source: ICES, 2003.
0
50 000
100 000
150 000
200 000
250 000
300 000
1963
1966
1969
1972
1975
1978
1981
1984
1987
1990
1993
1996
1999
2002
Spawning stock biomass (SSB)Tonnes
– 0.05
0.15
0.35
0.55
0.75
0.95
1.15
1.35
Fishing pressure (F)
SSB F 2–4

Sustainable use and management of natural resources
Natural resources and their use
32
and strategies have been adopted by the Community as part of the reform process, such as measures to counter the socio-economic and regional consequences of fleet restructuring, reprogramming of structural aid, and including social measures.
In the following section, the use and management of fish as a renewable resource is illustrated by the example of the cod. Exploitation of cod stocks has attracted considerable public attention in recent years. It is an example of a marine fish resource under pressure, and it is one of the best-studied stocks, with relatively good data on population dynamics and human exploitation.
For cod in the North Sea (Figure 3.11) the spawning stock biomass (SSB — shaded area) has been below the recommended level for more than 20 years. Fishing pressure (the fluctuating line) has been above the precautionary level (horizontal line) since 1971. For the cod stocks in the North Sea, Skagerrak, the Irish Sea and the areas west of Scotland, the International Council for the Exploration of the Seas (ICES) has recommended a total stop to the fisheries. The same applies to the coastal cod off Norway.
Overfishing of the stock for so many years has resulted in a small and young spawning stock and poor recruitment. In the periods where spawning stock biomass was above the precautionary level of 150 000 tonnes, the average number of recruits (measured as one-year-old fish the year after) was 390 million. During the period 1988–2002, when the spawning stock biomass was below the precautionary level, recruitment was less than 250 million.
For North Sea cod, the optimal catch age/size is 6–7 years when the fish weigh about 8 kg. Up to this age, individual growth outweighs natural mortality. Included in these calculations is the fact that larger fish are more expensive per kg than small fish (9). Projections show that a shift of fishing pressure would give a higher spawning stock biomass and the annual value of the yield could double from around EUR 200 to 400 million.
One example of the inter-relationships of the marine eco-web is the issue of the food requirements of an increased stock of North Sea cod, and its impacts on other fisheries. The present North Sea fishery is dominated by the industrial fishery for sprat, sand-eels, blue whiting and other small pelagics, which is the basis for fishmeal and oil. Increased stocks of larger fish would probably reduce this fishery,
which in turn may result in a need to reduce fish farming of predatory fish like salmon and trout. Further consequences of industrial fishery (e.g. on sand eels) could be a decrease of food supply for sea birds such as black-legged kittiwakes.
The case of the North Sea cod provides an important lesson about the sustainable use and management of fish stocks: there is an economic benefit in letting stocks and fish grow, instead of keeping them at today's low levels. In the long run, managing renewable resources sustainably can bring about positive synergies between ecological, social and economic factors.
There does not need to be a trade-off between the economy and ecology, and the two can be reconciled. The sustainable use and management of fish stocks can lead to obvious economic and social benefits, by creating larger yields and allowing a stable development of local fishing communities. Ensuring the natural regeneration of its biological base is the physical prerequisite for the future of European fisheries.
3.2.3 Forests
Forests are a natural resource for which the notion of sustainable management has a very long tradition. Already in the fifth century BC Plato wrote about the effects of unsustainable practices regarding forests, referring to the deforestation of the hills around Athens as a result of logging for shipbuilding and to clear agricultural land. In fact, the very term 'sustainable' was first used to refer to the sustainable yield of forest resources in the 18th century by von Carlowitz, who stressed that forest resources should be used with caution to achieve continuity between increment and felling.
Forests, which account for 36 % of Europe's territory, provide a wide range of functions. Ecological functions include maintaining the physical and chemical stability of the soil, protection of groundwater and local climate, and conserving biological diversity. Economic functions include the production of wood and non-wood products, and generating employment in forest-related industry chains. Social functions include supporting tourism and leisure, eco-education and the landscape.
Forest area in most European countries is increasing by an average for the EEA-31 of about 0.5 million ha/year, with the Mediterranean countries, particularly
(9) Prices for Barents Sea cod are used. North Sea auction prices are considerably higher. With better management and more normal catches prices will probably decrease, although they may be higher than Barents Sea prices due to closeness to the market.

Natural resources and their use
Sustainable use and management of natural resources 33
Spain, southern France, Portugal, Turkey, Greece and Italy reporting the largest increases. Several countries (Finland, Bulgaria, Latvia, Poland, Romania, Sweden and Turkey) showed a decrease in 'forest area available for wood supply' which indicates an increasing focus of their national policies towards non-wood goods and services such as nature protection and conservation. As the growth rate is above the felling rate, the timber stock is increasing.
However, the vitality of a tree is reflected mainly by the condition of its crown, and crown condition in European forests is strongly affected by atmospheric pollution. During recent decades, European forests have been under considerable pressure from industrial emissions, showing a continuous deterioration in crown condition between 1989 and 1995. Results since 1995 show a stabilisation at a high defoliation level, with almost a quarter of the sample trees rated as damaged in 2003 (UNECE, 2004).
Industrial emissions of sulphur dioxide and nitrogen oxide decreased substantially in the 1990s, as a result of the installation of desulphurisation systems, the
switch from coal as a fossil fuel, and the contraction of energy-intensive sectors, especially in central and eastern European countries. This brought about positive effects for forests and forest soils.
While the pressure on forest ecosystems from acidification has decreased, more evidence of climate change and its impacts on forestry has appeared over recent years. Climate change is expected to lead to increased abiotic and biotic disturbances, including drought, salinisation, increased spring and autumn frost risk, and insect and pathogen damage. On the other hand, it has been observed that changes in average air temperature, precipitation, elevated CO2 concentrations and changes in nitrogen deposition can result in increased forest growth.
Over two thirds of Europeans live in urban areas, where forests have an important function as a green buffer between expanding urban areas. In many rural areas, populations are declining and agricultural land is being abandoned for social and economic reasons. As forestry offers a good alternative land use option, financial support is granted for the conversion of agricultural land into forestry (it is a strategy of the EU common agricultural policy to set aside agricultural land to counter over-production). However, in regions where open space is scarce, land use competition and resulting forest fragmentation can have a negative impact on forest stability and biodiversity. Forest fragmentation, leading to smaller management units, can negatively affect the cost-effectiveness of forest operations.
The largest forest-related industry chains include forestry, production of wood and non-wood products, and pulp and paper industries. In 2000, about 2.2 million people were employed in the forest sector (including: 'forestry' and 'wood and pulp and paper industries') in the EEA countries, with the wood industries accounting for 43 %, pulp and paper for 35 % and forestry for 22 % of the total.
Box 3.7 Criteria and indicators for sustainable forest management
Criteria and indicators are needed to monitor the multiple roles that forests play in society. Six pan-European criteria developed by the conference on the protection of forests in Europe cover:
• global carbon cycles• forest ecosystem health and vitality• productive functions of forests (wood and non-wood)• biological diversity• protective functions in forest management (notably soil and water)• socio-economic functions and conditions.
Figure 3.12 Economic yield per recruit (1-year olds) for North Sea cod
Sources: ICES, Institute of Marine Research, Norway. Calculations by Album, 2004.
0.00
0.20
0.40
0.60
0.80
1.00
1.20
1.40
1.60
1.80
1 3 5 7 9
Caught at age
EUR/recruit
8642 10

Sustainable use and management of natural resources
Natural resources and their use
34
In several European countries, the contribution of forest-related manufacturing sectors to GDP is considerable, as shown in Figure 3.13.
In most EEA member countries, the growing stock has allowed a steady increase in the consumption of all forest products and thus an expansion of forest-based industry. Between 1992 and 2002, the consumption of forest products in the EEA countries increased by between 15 and 45 %, depending on the product category. The consumption of durable products like 'sawn wood' showed the lowest increases and 'wood-based panels' the highest. The consumption of products with a short life-span more than doubled.
On the other hand, although the value of forest products has increased in absolute terms, the share of GDP represented by forest-based industries has decreased from 2 to 1.3 % over the past 20 years. One of the reasons is the general decrease in unit prices, in particular for solid wood products. Declining prices for forest products are a serious problem for sustaining forestry operations at a level that guarantees optimal forest stand development, and employment in forestry has been decreasing steadily. On the positive side, intensified competition and technological innovations which have changed the wood industry allow low quality timber and timber of small dimensions to be processed into high quality and valuable products. This has led to an increase in the share of panel consumption relative to that of other forest products like sawn wood, thus protecting old-growth forest resources.
In 1997, the EU adopted a forest strategy for the period 1998–2003, which is now under revision.
Many of its objectives have been achieved but a few important issues remain open. Some experts argue that there has been limited integration of the strategy into existing national forest programmes, and work needs to be done to achieve a more integrated approach to forest policy. Ecological and sustainability concerns will need to be taken into account in forest management.
Sustainable management of the expanding forests will have to include growing ecologically-adapted species, and addressing the acidification of soils and climate change (Box 3.7). Biodiversity loss and habitat change will be of concern if the increase in forest area is the result of conversion of native bush and scrubland to plantations based on the use of introduced tree species not suitable for local soil and habitat conditions.
3.3 Non-renewable resources
The term 'non-renewable' refers to resources whose natural regeneration cycle is extremely long. For example, fossil fuels and soils do regenerate, but this takes thousands of years. As a result, non-renewable resources are generally regarded as finite, and their consumption as 'irreversible'.
There are various ways of reducing the use and impacts of the consumption of non-renewable resources. One option is to decrease the pressures arising over the whole life-cycle of a resource, from extraction to waste. This includes more efficient production or improved efficiency of use, as with more fuel-efficient cars, or aluminium cans with
Box 3.8 Agriculture, biomass, and renewable energy
Biomass from agricultural harvest constitutes the largest part of biomass resource use. It is determined mainly by the demand for food, and particularly by food consumption patterns (e.g. meat versus vegetarian food) and by the way biomass is processed into food products. In general, Europe's relatively constant population means that biomass use that is driven by food demand is expected to remain fairly stable. A significant share of the biomass consumed in the EU is imported. In particular, the import of soybeans for fodder is increasing, which exerts certain pressures on the global environment and thereby significantly contributes to the global land use requirements caused by the EU. European agriculture policies (CAP) and consumer consumption patterns are key drivers of the volumes of different agricultural products.
Recently, energy-related policies have provided incentives to encourage the use of biomass, especially biofuels, for the production of renewable energy. Environmental and cost-effectiveness considerations need to guide the use of biomass for energy purposes. First, the use of biomass for transport fuels is rather inefficient, and alternative uses of biomass, e.g. for heating, may result in a greater reduction in the environmental burden caused by fossil fuel use. Second, there is limited amount of land available within the EU and also at the global level to be used for this purpose. Given the growth in global food demand, large areas of land are unlikely to be available for non-food biomass production without the need for a large increase in production intensity which is likely to have significant negative environmental effects.

Natural resources and their use
Sustainable use and management of natural resources 35
thinner walls. Another possibility is to extend their life-cycle, by maintenance, reuse, and recycling. The substitution of some non-renewables by renewable resources can also be an option (e.g. increased use of wood in some construction, or substitution of petroleum by biofuels), although this may be limited by the reproductive capacities of nature and the space available to produce renewable resources, and should be carefully assessed to avoid problem shifting (Box 3.8).
The recent direction of policies related to the use of non-renewable resources is based on the premise that '… there is little evidence that scarcity of non-renewable resources is a serious threat to sustainable development…(10)' This may be true for many resources, such as iron ore or bauxites and most construction minerals. However, for other resources, such as fossil fuels and land, scarcity is a more real threat. With this 'irreversibility' of consumption of a finite resource, some participants in the policy debate argue that scarcity should be considered on
a par with negative environmental impacts. As the availability of future supplies of non-renewables will depend on the rate of consumption, they go on to recommend that their sustainable management should be based on the precautionary principle and prevention: reduction, recycling and substitution.
There also remains the question of justice and intergenerational equity. The World commission on environment and development (Brundtland, 1987) report suggested that the use of resources should be managed in such a way that future generations should neither be burdened with the negative environmental impacts of our consumption of resources nor be unable to cover their needs using existing natural resources.
The following sections discuss four non-renewable resources: metals, construction minerals, fossil fuels and land.
3.3.1 Metals
The consumption of metals, and the resources used in their production, is a good example of how international trade flows determine the extent and location of environmental pressures. Most of the metal ores used in Europe are imported. Total metal ore consumption was about 220 million
Figure 3.14 Metal ores: domestic extraction, imports, exports, and domestic consumption, EU-15, 1970–2001
Source: Eurostat/IFF, 2004.
0
50
100
150
200
250
300
1970 1975 1980 1985 1990 1995 2000
Million tonnes
Imports
Domestic consumption
Exports
Domestic extraction
(10) Page 13, COM (2003) 572.
Figure 3.13 Share of forest-related manufacturing activities in total gross value added, selected European countries 2000
Note: Note that the graph does not inlude the NACE section A category (agriculture, forestry and hunting) as data were not available to disaggregate it into individual components.
Source: Eurostat NewCronos online database.
0.0 1.0 2.0 3.0 4.0 5.0 6.0 7.0 8.0
AustriaBelgium
Czech RepublicGermanyDenmark
SpainFinlandFranceGreece
HungaryIceland
ItalyLithuania
LuxembourgNetherlands
NorwayPortugalRomaniaSwedenSlovakia
United Kingdom
Percentage of total gross value added
NACE DD: Manufacture of wood and wood products
NACE DE: Manufacture of pulp, paper and paper products; publishing and printing

Sustainable use and management of natural resources
Natural resources and their use
36
World EuropeanUnion
(EU-15)
United States
Japan Africa Latin-america
China
Iron and steel
Production of iron ore
million tonnes 1051 22 63 0 46 249 224
share in world production
100 % 2 % 6 % 0 % 4 % 24 % 21 %
Apparent consumption of steel
million tonnes 765 142 103 73 15 40 170
share in world consumption
100 % 19 % 13 % 10 % 2 % 5 % 22 %
kg per capita 125 376 362 576 19 77 134
Bauxite and aluminiumProduction of bauxite
million tonnes 146 0 0 0 1� 36 �
share in world production
100 % 0 % 0 % 0 % 12 % 25 % 5 %
Apparent consumption of primary aluminium
million tonnes 24 5 5 2 0 1 3
share in world consumption
100 % 20 % 23 % 8 % 2 % 4 % 15 %
kg per capita 3.9 12.6 19.1 15.� 0.5 1.6 2.7
Copper
Mine production of copper
million tonnes 13.63 0.1� 1.34 0 0.52 6.05 0.56
share in world production
100 % 1 % 10 % 0 % 4 % 44 % 4 %
Apparent consumption of copper
million tonnes 15.52 1.84 1.� 1.43 0.41 4.03 1.43
share in world consumption
100 % 12 % 12 % 9 % 3 % 26 % 9 %
kg per capita 2.5 4.9 6.3 11.2 0.5 7.7 1.1
Zinc
Production of zinc million tonnes �.96 0.67 0.84 0.04 0.23 1.�5 1.57
share in world production
100 % 7 % 9 % 0 % 3 % 21 % 18 %
Apparent consumption of zinc
million tonnes �.65 2.16 1.11 0.63 0.16 0.5� 1.46
share in world consumption
100 % 25 % 13 % 7 % 2 % 7 % 17 %
kg per capita 1.4 5.7 3.9 5 0.2 1.1 1.1
Lead
Mine production of lead
million tonnes 3.00 0.19 0.47 0.01 0.15 0.47 0.60
share in world production
100 % 6 % 16 % 0 % 5 % 16 % 20 %
Apparent consumption of lead
million tonnes 6.43 1.74 1.69 0.2� 0.13 0.41 0.65
share in world consumption
100 % 27 % 26 % 4 % 2 % 6 % 10 %
kg per capita 1.1 4.6 5.9 2.2 0.2 0.� 0.5
Nickel
Mine production of nickel
million tonnes 1.23 0.02 0 0 0.07 0.22 0.05
share in world production
100 % 2 % 0 % 0 % 5 % 17 % 4 %
Apparent consumption of nickel
million tonnes 1.11 0.41 0.13 0.16 0.03 0.02 0.09
share in world consumption
100 % 37 % 12 % 15 % 3 % 2 % 8 %
kg per capita 0.2 1.1 0.5 1.3 0.0 0.1 0.1
Sources: ETC/RWM calculations based on Natural Resources Canada, 2002; International Iron and Steel Institute, 2002; and World Bank, 2003.
Table 3.1 Production and consumption of selected metal resources, 2001

Natural resources and their use
Sustainable use and management of natural resources 37
tonnes in 2001, but only 20 % of this was produced domestically. Domestic extraction of metal ores declined from 150 million tonnes in 1971 to 43 million tonnes in 2001 (Figure 3.14).
The metals with the highest consumption in the EU-15 include steel and iron, aluminium, zinc, copper and lead, as shown in Table 3.1. The EU-15's share of the total global consumption of metals ranged from 12 % for copper to 37 % for nickel.
Trends in use, and the related environmental impacts, vary from one metal to another. The main problems for steel and aluminium are the volumes used and energy consumption, for lead and cadmium it is eco-toxicity and health impacts, while for copper and precious metals the amounts of waste generated during production are of main concern.
All phases of the life-cycle of metals, from mining through production and manufacturing to use and final disposal, are environmentally relevant. Extraction processes are often very damaging to landscapes, and mining wastes are the largest waste stream in Europe. A number of metals, such as gold, nickel and copper, are extracted with environmentally-intensive mining technologies, resulting in large quantities of waste, contamination of soils, landscape destruction and negative effects on natural water cycles (see e.g. Kippenberger, 1999; IIED/WBCSD, 2002; Ayres, 2003; Miranda et al., 2003). The further stages of processing, i.e. concentrating and refining crude metal ore, smelting, forming, etc. are very energy-intensive. This uses other non-renewable resources (e.g. fossil fuels) and leads to air emissions, which contribute to environmental problems such as climate change, air pollution and acidification.
The environmental impacts of the use phase are determined mainly by the final product in which the metal is embodied, and have less to do with the nature of the metal itself. Here, the energy used by the end product is relevant, for example for heating buildings, fuelling transport vehicles, or providing electricity for refrigerators, electric and electronic equipment. However, there are inherent methodological difficulties in setting up clear system boundaries to account for the environmental impacts of metals over the entire life cycle.
Metals generally have a long life-cycle and only a small fraction of the metal input per year ends up immediately in the waste stream, like metals in short-life products such as packaging material (e.g. aluminium cans). Otherwise, most of the metals in
final products are stocked within the economy for several years, as they are used mainly in durable consumer goods (including private buildings) and infrastructures, including the capital stock of industries (i.e. machinery equipment and industry buildings). For some metals, such as copper, zinc and tin (heavy metals) dissipative losses and corrosion during use may be of concern. For example, high concentrations of some heavy metals in sewage sludge stem from diffuse sources such as zinc-coated steel products and copper-based roofs, gutters and water pipes.
Steel is a very important metal resource because of the high quantities in use and the environmental impacts caused by energy-intensive processing. In the EU, most of the iron ore needed to produce steel is imported. Significant amounts of iron ore are still mined only in Sweden (International Iron and Steel Institute, 2003). However, Europe is among the world's top steel producers and consumers, accounting for about 20 % of the world's crude steel production. This is another example of increasing imports of semi-manufactured and finished products. While driven mainly by economic factors, such substitution may help reduce domestic environmental pressures, with environmentally-intensive processing 'outsourced' to the rest of the world, while net consumption has not decreased.
Figure 3.15 Apparent steel consumption, imports of iron and steel, and CO2 emissions from metal production, EU-15, 1995–2001
Source: International Iron and Steel Institute, 2003; Eurostat.
20
40
60
80
100
120
140
160
1995 1996 1997 1998 1999 2000 2001
Index (1995 = 100)
Apparent steel consumption (million metric tonnes finished steel products)
Carbon dioxide emissions by metal production (1 000 tonnes)
Imports ECSC steel product from third countries, EU15 (1 000 tonnes)

Sustainable use and management of natural resources
Natural resources and their use
38
Figure 3.15 shows that the apparent (11) consumption of steel in the EU-15 increased by about 10 % between 1995 and 2001 while estimated CO2 emissions from metal production decreased slightly. At first sight, this may indicate a decoupling of environmental pressures from resource use. However, imports of steel products have been increasing, replacing domestically-produced products, and the CO2 emissions related to the imported steel are emitted and accounted for in the exporting country.
Recycling is the most common way of extending the life-cycle of metals. It saves primary raw material inputs, and reduces the extraction of crude metal ores and the associated environmental impacts. Processing secondary raw metals is also in many cases less environmentally intensive than producing primary raw metals, particularly in the case of aluminium. For some metals, high recycling rates have already been achieved — the share of the secondary fraction (the share of scrap
Figure 3.16 Recycling flows of aluminium
Source: Bringezu et al., 1995.
Aluminium ores
Scrapings, premolten AI
New scrap filings
A B
Domestic use
Old scrap
Mould casting semimanufacturing final manufacturing
Consumers
Waste management
Primary AI (primary fraction 72 %)
Secondary AI (secondary fraction 28 %)
Scrap-composition
3 % premolten AI16 % scrapings24 % filings24 % other new scrap33 % old scrap
A/(A+B)recycling rate
Disposal
Recycling potential:
Transport devices 90 % Mechanical engineering incl. optics 80 % Building and construction 80 % Other 0 % or unknown
Recycling
in the total input to production/smelting) for silver, copper and lead exceeds 50 % and is about 35–50 % for steel, aluminium and zinc. However, the amounts of metals currently being recycled cannot substitute for all primary metals because of the continuing increase in demand. In this context, the large amounts of metals stocked in buildings, infrastructure and durable goods may be seen as future metal sources, rather than future wastes. However, increasing the recycling of metals requires adequate product design that facilitates the dismantling of products after their useful life (e.g. end-of-life vehicles, electrical and electronic equipment, machinery), and economic feasibility and environmental benefits need to be carefully analysed.
Monitoring of recycling is not as straightforward as one may expect. There are several ways of measuring recycling rates (see Figure 3.16). Many indicators are used, including the composition of scrap reused in secondary smelters, the fraction of
(11) Apparent consumption = production + imports – exports. The statistical term 'apparent' indicates that a given figure is a result of calculation including various factors and estimates. For instance, 'apparent consumption of steel' is calculated as domestic production of steel plus imports, minus exports. Estimates are used to convert processed goods containing steel (e.g. ships, cars) into steel weight equivalent.

Natural resources and their use
Sustainable use and management of natural resources 39
reused material per total amount of waste produced, the recycling rate of old scrap, and the amount of old scrap used for the production of aluminium.
Recycling of scrap and processing of secondary aluminium is also interlinked with additional energy and material flows, and evaluations should take account of the overall environmental impact of these flows. In some cases, recycling may be associated with a higher burden on the environment than the route of primary processing. In such cases high recycling rates are counterproductive. Recycling rates per se may therefore not be an indicator of progress towards sustainability, and additional information may be necessary to make an informed judgment.
3.3.2 Construction minerals
Construction minerals include sand, gravel, natural stones, clay, limestone, and other less-used minerals, such as quartz, chalk, anhydrite and gypsum. Sand and gravel, followed by natural stone, account for by far the largest share of use of construction minerals, as demonstrated by the example of Germany in Figure 3.17.
In the EU-15, domestic material consumption of construction minerals increased somewhat during the 1990s, to around 2.6 billion tonnes (about 7.0
tonnes per capita) per year. Construction minerals are mainly extracted and used domestically, and trade is less significant.
Construction minerals have a rather long life. The specific environmental impacts per tonne may be relatively moderate but the volumes are very high, making construction minerals environmentally significant.
As with metals, environmental pressures arise during the entire life-cycle. Extraction processes tend to be very damaging to landscapes, generate noise, and have negative impacts on biodiversity, although they are less damaging than the extraction of fossil fuels or metals. The subsequent processing stages, such as the manufacture of cement, glass, ceramics, bricks and tiles, are of high environmental relevance. They are very energy-intensive and result in large amounts of air emissions. In Germany, for example, about 5 % of total CO2 emissions are directly emitted by this manufacturing sector (12), not including indirect emissions, for example from the electricity used (FSOG, 2003).
Construction materials are then used in buildings and infrastructures, with a life expectancy of 30 years or more, whose use is characterised by high environmental maintenance costs. As with metals, the environmental impacts of the use phase are determined mainly by the structures in which they are embodied rather than by the material itself. In fact, many experts argue that the environmental
(12) NACE code 26, manufacturing of cement, glass, ceramics, tiles, etc.
Figure 3.17 Use of construction minerals in Germany, 2001
Source: Federal Statistical Office, 2004.
49 %
35 %
9 %
5 % 2 %
Sand and gravel
Natural stone
Limestone and dolomit
Clays
Others
Figure 3.18 Annual domestic consumption of construction minerals, EU-15 1970–2001
Source: Eurostat/IFF, 2004.
0
500
1 000
1 500
2 000
2 500
3 000
Million tonnes
1970
1972
1974
1976
1978
1980
1982
1984
1986
1988
1990
1992
1998
1996
1994
2000

Sustainable use and management of natural resources
Natural resources and their use
40
impacts of the use and disposal of construction minerals are much higher than those of extraction. Buildings have high energy requirements for heating, cooling and lighting. The larger the stock of buildings, the higher the maintenance costs. Increasing transport infrastructures may induce additional traffic, which is one of the most important driving forces of climate change. Similarly to metals, the accounting of life-cycle impacts here is hindered by difficulties in setting up system boundaries, to avoid the problem of double counting.
After the use phase, construction minerals become demolition wastes, which constitute about one third of total waste generated in Europe (EEA, 2003). Recycling of construction minerals may reduce the need for the extraction of virgin raw materials. However, the amount of demolition waste that can potentially be recycled is only about 0.8 tonne per capita annually, compared with 7 to 8 tonnes per capita of excavated virgin raw materials. This means that secondary construction minerals can only substitute for primary resource requirements to a limited degree. An alternative approach would be to substitute minerals with renewable construction materials (e.g. wood, bio-fibre).
The sustainable use of construction minerals requires a reduction of environmental impacts throughout their life-cycle. Emissions and waste arising from the energy-intensive manufacturing processes (e.g. production of cement, glass and ceramics) may be reduced by the use of cleaner and more efficient process technologies.
Land requirements for buildings could be reduced through construction on brownfield sites (abandoned industrial areas) or a higher concentration of buildings in urban areas. Finally, the construction of buildings and infrastructures could move to designs where less construction materials are required. Innovations in design and planning are also needed to reduce the energy requirements of buildings and infrastructures.
Finally, an important issue related to the increasing consumption of construction minerals is the transformation of land into built-up area, accompanied by significant losses of its basic natural functions (Section 3.3.4).
3.3.3 Fossil fuels
Fossil fuels are one of the most important and strategic natural resources in modern societies. Since the invention of the steam engine, fossil fuels have been the primary natural resource for satisfying the growing energy needs of industrialised countries.
Every year, almost 4 tonnes of fossil fuels are consumed per capita in the EU-15. Domestic
Figure 3.19 Domestic consumption of fossil fuels, EU-15, 1970–2001
Source: Eurostat/IFF, 2004.
0.00
0.50
1.00
1.50
2.00
2.50
3.00
3.50
4.00
4.50
5.00
1970 1975 1980 1985 1990 1995 2000
Tonnes per capita
Coal
Crude oil
Natural gas
Other fossils
Figure 3.20 Domestic extraction and imports of fossil fuels, and CO2 emissions, EU-25
Source: Eurostat, Wuppertal Institute, 2005.
80
85
90
95
100
105
110
115
120
1992
1993
1994
1995
1996
1997
1998
1999
2000
Index (1992 = 100)
Domestic extraction of fossil energy carriers (1 000 tonnes)
Imports of fossil energy carriers (1 000 tonnes)
CO2 emissions (1 000 tonnes)

Natural resources and their use
Sustainable use and management of natural resources 41
consumption of fossil fuels has been decreasing steadily since the 1980s, mainly as a result of reduced consumption of coal. Crude oil consumption has remained fairly constant, and the use of natural gas has increased (Figure 3.19). However, this is consumption based on the weight of the energy carriers consumed, and energy use in energy units, e.g. Joules, has not declined. Indeed, total energy consumption in the EU has been rising since the mid-1990s, and this trend is projected to continue. Burning fossil fuels, the main source of greenhouse gas emissions, is expected to remain the largest energy source in Europe for the next 30 years (EEA, 2004).
Roughly half of the fossil energy carrier input to the EU economy is imported. The share of imports increased steadily throughout the 1990s, and for the EU-15, the increase between 1992 and 2000 was more than 10 %, while domestic extraction decreased by a similar amount (see Figure 3.20). This dependency on imported fossil energy carriers is expected to continue to rise, due to the depletion of domestic resources (e.g. the North Sea oil fields).
The combustion of fossil energy carriers leads to a number of environmental pressures, the most important being emissions of greenhouse gases, air pollutants such as SO2, NOX and non-methane volatile compounds (NMVOCs), and particles. Other pressures related to fossil fuels are pollution by oil from coastal refineries, off-shore installations and tanker spills, landscape destruction and groundwater table reductions from coal mining, and spills (oil) and leakages (gas) from pipelines.
The consumption of fossil fuels is increasing, mainly because of growth in the transport sector, but also in the household and service sectors. At the same time, environmental pressures are decoupling from energy carrier use, except for carbon dioxide. In the EU-15, fossil fuel-related emissions of air pollutants (SO2, NOX, NMVOC, particles) were significantly reduced during the 1980s and 1990s, mainly through the use of end-of-pipe-technologies. Total energy-related greenhouse gas emissions decreased slightly over the past decade, but CO2 emissions increased slightly.
Fossil fuels are non-renewable and global reserves are finite. The question is therefore not whether, but when the reserves will be exhausted. In the case of crude oil in particular, scarcity is an issue. Although the search for and documentation of new oil reserves is difficult and controversial, some estimates show that the mid-depletion point of worldwide crude oil reserves could be reached
within the next 10–20 years (e.g. Campbell, 2003; IEA, 2004; Federal Ministry of Economics and Labour, 2002). Moreover, proven reserves of oil are unevenly distributed in the world. The Persian Gulf holds about 60 % of documented world reserves. Political and economic stability in the oil-producer regions affects security of supply, and this is especially relevant for the EU which is importing oil on a larger and larger scale. It is expected that dependency on imported energies will increase substantially in the coming decades (CEC, 2000a). Record-high oil prices last year, and their damping impact on economic growth, give a foretaste of the possible consequences of shortages of oil.
Oil, as a strategic resource essential for any industrialised economy, is a good example of a resource whose sustainable use has to be analysed in a global context. The future security of supply will be determined not only by the available reserves, but also by consumption in all world regions. Increasing per-capita demand in less-developed countries, which until now consumed far less energy than the industrialised countries, will have a strong impact. Some policy-makers indicate that in the wider context of sustainable development, a strategy on sustainable use also needs to consider scarcity issues and security of supply in order to take informed decisions, develop strategies and focus research activities.
3.3.4 Land use
The term 'land' is quite broad and includes several elements: the soil, land (the earth's crust) and the concept of 'landscape'. Land performs a variety of environmental, economic, social and cultural functions. About 47 % of European land is used for agriculture, 36 % for forestry, 17 % for other uses, including settlements and infrastructure (see Figure 3.21).
Land is a resource that cannot be 'consumed' like other natural resources. While the use of other resources (e.g. timber, fuels or minerals) means that they are removed and processed into other physical states, land as such tends to remain in place (only in extreme cases of erosion, large-scale excavations, and natural disasters may land be totally removed). The physical manifestation of the use of land ranges from altering the properties of the soil, changing the land cover (e.g. land can be built on and natural habitats structurally altered) to transforming the landscape (e.g. construction of dams, or development of large urban or industrial centres).

Sustainable use and management of natural resources
Natural resources and their use
42
Soil is the upper layer of what is usually referred to as 'land'. The fertility of the soil can decline very rapidly as a result of contamination, erosion, or sealing, and the time for natural recovery may be centuries. As a rule of thumb for central Europe, the rate of soil generation is about 5 cm in 500 years (Graßl, 1998). As a result, policies for protecting land often choose soil protection as a starting point. The European Commission's Communication on the thematic strategy for soil protection (COM (2002) 179) considers soil as 'essentially non-
renewable with potentially rapid degradation rates and extremely slow formation and regeneration processes'.
The multiple functions of land are threatened by various pressures related to human activities. The physical, chemical and biotic changes in soils and the ecosystems near the surface can result in land degradation, loss of its natural properties, and thus a decreasing functionality. Soil degradation is already a recognised policy issue in Europe, where the three most important threats to soils are:
• sealing• erosion• contamination.
Sealing refers to a partial or complete isolation of the soil from the atmosphere by an impermeable cover (e.g. asphalt pavements) or buildings. Sealing usually leads to a partial removal of abiotic functions and an almost complete destruction of the biotic functions of the original ecosystems. Sealing increases water run-off by decreasing percolation and evaporation. In cities, water run-off is usually canalised in the public sewer systems. All this reduces the storage, buffering and transformation functions of the soil, and has a strong impact on groundwater recharge and the quality and availability of surface water. The change in evapo-transpiration is also a main contributor to the change of microclimatic conditions in cities.
Figure 3.23 Area affected by erosion
Source: EEA, 2003.
Agricultural area affected
Non-agricultural area affected
10 20 30 40 50 60 70
Azerbaijan
Bulgaria
Italy*
Armenia
Ukraine
Czech Republic*
Albania
Spain
Russia
Kazakhstan
Kyrgyzstan
Tajikistan
Greece
Slovak Republic
Moldova
Hungary*
Poland
Georgia
Cyprus
Latvia*
Lithuania*
Belarus
Austria
Estonia*
0%
* Data for agricultural area not available
Figure 3.22 Built-up land in relation to population
Source: EEA, 2004.
94
96
98
100
102
104
106
108
110
112
Time (years)
Built-up area and populationIndex (1990 = 100)
Built-up area
Total population
* Data for 2000 or latest available year
1990 1995 2000*
Figure 3.21 Land use in the EU-15
Source: FAO, 2004.
Agricultural area
47 %
All other land
17 %
Forest and woodland
36 %

Natural resources and their use
Sustainable use and management of natural resources 43
Sealing is prevalent in and around all major European cities and industrial centres (Box 3.9). Although the projected increase in urbanisation is fairly small in relative terms, the absolute amount of additional built-up area is substantial (EEA, 2000). Traditionally, the urban concentration of population took place in areas with the most fertile soils (e.g. valleys, estuaries), at the expense of productive agricultural land. Today, in addition to urbanisation, tourism and transport are major driving forces of soil sealing. Transport infrastructure, as well as leading to negative effects of sealing, is also the main contributor to increasing fragmentation of the landscape.
Between 1975 and 1990 the relative increase in urbanisation was highest on the Atlantic coast of France and around the Mediterranean Sea (southern Spain, the Mediterranean islands, southern France and Italy) (EEA/UNEP, 2000). The projected relative increase of settlements is highest in areas with low population density (Portugal, Sweden, Finland and Ireland). Moreover, the increase in built-up areas has far outstripped the growth in population (Figure 3.22). In Europe, built-up area expanded by 20 % during the past two decades, much faster than the population increase of 6 % (CEC, 2003).
Soil erosion is the removal of soil by wind and water. This natural process is intensified by human activities, such as deforestation for agricultural purposes, changes in hydrological conditions, overgrazing and other inappropriate agricultural activities (see Box 3.10). Erosion can lead to soil degradation and eventually complete destruction. With a growing world population, increased pressures lead to a loss of an estimated 10 million ha of fertile land per year. In Europe, around 26 million ha are subject to water erosion and about 1 million to wind erosion (CEC, 2002).
The most severe water-related erosion occurs in southern Europe and central and eastern Europe
(Figure 3.23), due mainly to intense seasonal rainfall, overgrazing and the use of inappropriate crops. The typical barren lime hills of the Mediterranean landscapes are in most cases not a natural phenomenon, but a sign of human-induced degradation which was already reported 3 000 years ago. The combination of climatic factors, steep slopes, thin vegetation cover and poor agricultural practice has led to constant soil thinning and decreasing soil productivity. In central and eastern Europe, large state-owned farms have created huge areas of cropland which are often insufficiently protected against wind and water erosion.
Soil contamination is the human-induced deposition of harmful substances which are not a product of natural accumulation or soil formation. Many human activities, ranging from mining activities, industrial and agricultural production to road transport, result in pollution that can accumulate in the soil or result in biological and chemical reactions in the soil. Soil contamination can be localised (e.g. related to industrial sites) or diffuse (the result of deposition of a pollutant over a wide area). The most common sources of local soil contamination are:
• mines (e.g. disposal of tailings, acid mine drainage, catalytic reagents)
• industrial facilities (e.g. chemicals, heavy metals)• military sites (e.g. fuels, military chemicals)• waste landfills (e.g. leachate).
There is uncertainty about the risks posed by locally-contaminated sites (Figure 3.24). According to early investigations, the number of contaminated sites in the EU-15 may range from 300 000 to 1.5 million (EEA, 1999a). The accession of the new Member States has further increased the uncertainty. Contamination from point sources may lead to high risks to human health and ecological functions. Toxic and often persistent substances can enter water bodies, accumulate in the food chain or may be directly ingested by animals and people.
Box 3.9 Soil sealing and football fields
In 2000, the rate of increase in areas for settlements and infrastructure in Germany was a staggering 130 ha per day. This fell to 93 ha per day in 2003 due to economic conditions. Settlements account for about �0 % of this growth and transport infrastructure for the remaining 20 %. About half of this area, equivalent to eighty football fields per day, is effectively sealed. In the 2002 Sustainability Strategy, the German government set the target of reducing the increase of areas for new settlements and infra-structure to a maximum of 30 ha a day by 2020.
Source: Federal Government of Germany, 2003.

Sustainable use and management of natural resources
Natural resources and their use
44
Figure 3.24 Probable problem areas of local contamination in Europe
Source: EEA/UNEP, 2000.
Area with high probability (location of areas of heavy industry)
Data availability
Few dataNo data
Evidence of contamination(industry/contamination type)
Coal minesShale miningMetal minesPhosphate minesOil and gas extraction
Metal smeltersChemical industryMixed industryPower generation
Waste disposalWaste (also radioactive)Radioactive contaminationHeavy metals
Box 3.10 Land use for agriculture
Agriculture uses soils and water as a resource for food production, and at the same time impacts these resources. The impact of agriculture is demonstrated by the fact that more land has been converted to cropland since 1945 than in the eighteenth and nineteenth centuries combined. The extent and causes of the environmental impacts of agriculture, notably by farm and crop type, vary significantly across Europe. Nevertheless, the continuing search for efficiency, lower costs and increased scale of production is resulting in substantial pressures on the environment, landscapes and biodiversity, particularly in the most intensively farmed areas. At the same time, agriculture remains essential to the maintenance of many cultural landscapes.
Agricultural production throughout the continent continues to rely on non-farm resources such as inorganic fertilisers and pesticides. However, there has been a decline in the use of these resources and, particularly in eastern Europe, a reduction in the pressure on the environment. Recent shifts to environmentally-friendly production systems are apparent, for example to organic production or conservation tillage systems. Organic farming covered about 4 % of the total agricultural area of the EU-15 in 2003. The development of certified organic farming in other European regions still lags significantly behind this figure.
In terms of resource conservation, the most important impacts of arable and livestock production are those relating to soil erosion and nutrient leaching, respectively. Soil erosion is particularly severe in the Mediterranean region and parts of eastern Europe, and increases with the share of arable land of total land use, mitigated by physical background factors (slope, soil type, rainfall patterns) and farming practices. Nutrient leaching is caused where the application of livestock manure and mineral fertilisers exceeds the nutrient demand of crops. The highest nutrient surpluses are found in areas of intensive livestock production, particularly in north-western Europe.
While agriculture can exert significant pressure on the environment, it is itself subject to negative environmental impacts linked to air pollution and urban development. Soil sealing by transport or housing infrastructure eliminates many thousand hectares of agricultural land every year, particularly in western Europe.

Natural resources and their use
Sustainable use and management of natural resources 45
Figure 3.25 Soil contamination by heavy metals
The energy sector is the main source of diffuse contamination of European soil. The use of fossil fuels results in massive emissions of SO2 and NOX, which was the main driving force behind the widespread acidification of soil and water bodies in central and northern European countries. Although there has been considerable progress in combating SO2 emissions, further emissions of NOX continue to cause acidification and eutrophication.
One specific example of soil contamination occurs through the application of sewage sludge from
wastewater treatment works handling effluent from industrial facilities.
Currently, less than 5 % of the EU farmland is treated with sewage sludge, and most sludge contains only tiny amounts of heavy metals. While the nutrients in this sludge can improve soil fertility in the short term, the heavy metals may accumulate, potentially damaging long-term fertility (Figure 3.25). The impacts will generally depend on the extent of heavy metal contamination of the sludge.
-10°-20°-30°
0°
0°
10°
10° 20°
20°
30°
30°
40° 50° 60°
40°
40°
50°
50°
60°
60°
Pb enrichment and concentration in agricultural soils and pasture lands
Pb enrichment factor
0.14–1
1–2
2–3
3–5
> 5
Pb concentration in topsoil
mg/kg
< 10
10–16
16–26
26–38
38–50
50–64
> 64
Outside data coverage
Note: Only randomly selected enrichment value dots shown for Austria, Bulgaria and Slovakia.
Source: Baltic Soil Survey (BSS), the Foregs Geochemical Baseline Mapping Programme and Eionet, 2003.

Sustainable use and management of natural resources46
Policy responses
4 Policy responses
The sustainable use and management of natural resources is a relatively new issue on the policy agenda, which is clearly reflected in current policy responses. This chapter presents some of the main strategies and policies that have a major influence on the use of resources, and illustrates some challenges to policy integration. The role of resource economics and implications for competitiveness are also reviewed.
Managing resources in a sustainable way has three different points of intervention: resource extraction or imports, production and consumption, and management of wastes and emissions, as illustrated in Figure 4.1 (Bringezu, 2002). Existing policy responses, such as the regulatory framework, economic instruments and various strategies, already target these intervention points, although a debate continues about which of the three points offers the best potential for improvement. There
is an emerging consensus that the most effective approach will vary depending on the particular resource and impacts being addressed.
A variety of policy instruments are used to manage the use of resources. Some countries have introduced raw material taxes on the extraction of minerals (sand, gravel, limestone, etc). Taxes on raw materials should provide an incentive to optimise the use of such resources. Other policy instruments used to influence extraction include licences for the extraction of certain raw materials and limits to the quantities extracted.
The integrated product policy (IPP) is an example of an instrument targeting the production and consumption phase. The IPP aims to stimulate product designs with efficient use of raw materials in production, and perhaps increased recycleability of products. The directive on the
Figure 4.1 Intervention points for sustainable resource management
Source: Bringezu, 2002.
Raw materials extraction Imports
Production1 2 3
Taxes for raw materials, licence, self-commitment
Integrated product policy, recycling quotas
Changes for waste and emissions, technical standards
1 2 3
Consumption
Waste management
Emissions
Waste depositions
Natural resources Raw materials
Products
Industrial waste
Recovery, recycling
Domestic waste
Mining waste, extraction waste

47
Policy responses
Sustainable use and management of natural resources
energy performance of buildings focuses on energy efficiency. Another example is the economic instruments used to manage demand for resources, with water pricing being a prime example.
Examples of policy responses aimed at the waste phase are emission standards for waste treatment facilities, for example the landfill and incineration directives. Other instruments are bans on the landfilling of certain wastes, and taxes on landfilling, both of which provide an incentive to recycle more waste.
A policy that targets the sustainable use and management of natural resources should connect all three intervention points. Imports and exports of resources and goods are also important in this respect. In a globalised economy, resource inputs and waste outputs have global effects, which can result in shifting the burden from one region to another.
4.1 Examples of individual policies
The EU Strategy for sustainable development and the 6EAP aim to provide strategic guidance and ensure policy coherence, affecting all policy-making in the EU. On a more detailed level, various policy initiatives influence resource consumption. In general, one may distinguish between policies for tackling specific environmental problems (environmental policies), and policies which are not targeted specifically at environmental issues (non-environmental policies). The latter can often influence resource use more than the former (e.g. common agricultural policy or transport policy).
Table 4.1 presents an overview of a selection of environmentally-driven policy responses. The list is not exhaustive; rather, it is intended to present the broad array of policy instruments that affect resource use. In particular, it omits the large variety of non-environmental policy responses.
National strategies for sustainable development have been developed in most European countries.
However, the use of the terms 'resources' and 'decoupling' is not consistent, and varies from one country to another. Most countries formulate their objectives in terms of resource efficiency, but only a few relate their objectives to various formulations of the 'carrying capacity' concept (NERI et al., 2004). Table 4.2 presents a selection of national objectives dealing with the concepts of decoupling and Factor 4 in EU Member States.
The examples illustrate the disparity between the strategies, in terms of objectives, time-horizon and the level of specification. Targets are related to a baseline year, different in each case.
4.2 The challenges of policy integration
Many non-environmental policies have an immediate or medium-term effect on resource use and its environmental implications. Some examples include (CEC, 2003b):
• economic policy, where the drive for economic growth results in the use of resources;
• fiscal policy, where the traditional approach of taxing human resources rather than resource use has favoured increasing labour productivity over resource productivity;
• agricultural policy, where the objectives of the common agricultural policy (CAP) are extending beyond agricultural productivity to integrate environmental concerns for the sustainable use of water and soil;
• fisheries policy, where the common fisheries policy (CFP) aims to provide coherent measures for the conservation, management and exploitation of living aquatic resources, including limiting the environmental impact of fishing in ways consistent with other Community policies;
• energy policy, where one aim is to ensure safe energy supply;
• transport policy, where the use of land for transport infrastructure can, for example, lead to habitat fragmentation.

Sustainable use and management of natural resources
Policy responses
48
Table 4.1 Policy responses, sustainable use of natural resources
Title Year of adoption Overall purpose Tools and measuresEU Strategy for sustainable development
2001 With respect to sustainable use of resources, to 'break the links between economic growth, the use of resources and the generation of waste'
Integrated Product Policy to reduce resource use and the environmental impacts of waste; instituting a system of resource productivity measurement; review of subsidies in CAP and CFP
Sixth environment action programme
Adopted 2002: covers 2001–2010
Sustainable use of natural resources and management of waste. Consumption of renewable and non-renewable resources should not exceed the carrying capacity of the environment.
Decoupling of resource use from economic growth
Resource efficiency
Dematerialisation of the economy
Waste prevention
Delivery through thematic strategies (see below)
Thematic strategy on the sustainable use of resources
Expected autumn 2005
Decoupling of environmental impacts of resource use from economic growth
(expected)
Gathering knowledge and access to knowledge; developing indicators for resource use; international panel on decoupling; national action plans; sectoral action plans
Thematic strategy on the prevention and recycling of waste
Expected autumn 2005
Promotion of waste prevention
Promotion of waste recycling
Closing the waste recycling standards gap
(expected/considered)
REACH (chemicals); waste management plans; best available technology; market-based instruments; producer responsibility; prescriptive instruments (bans, orders)
Cardiff process (Art. 6 of the EC Treaty)
199� Integration of environmental concerns into all Community policies
Energy: energy efficiency and increased use of renewable energy
Agriculture: sustainable cultivation practices
Industry (non-energy extractive): BAT document; increased use of voluntary initiatives
Integrated pollution prevention and control directive (IPPC)
1996 Harmonisation of rules for permitting (highly polluting) industrial installations, i.e. to avoid environmental dumping
Technical requirements; permits; BAT documents; public access to information
Integrated product policy (IPP)
2003 (Communication)
Reduction of the negative environmental impacts of products throughout their life-cycle
(expected)
Life-cycle assessments; enhanced coordination and coherence between existing and future environment-related product policy instruments; focus on products with the greatest potential for environmental improvement
Environmental technology platforms (within ETAP)
2004 (Communication)
Promotion of the development and introduction into service of new sustainable technologies
Research; establishment of technology platforms; networking and knowledge-sharing; funding/financing; awareness-raising
Waste framework directive (*)
1975 Protection of human health and the environment against harmful effects caused by waste
Waste hierarchy; network of disposal installations; waste management planning; permitting, registration, inspection
Mining waste directive
Proposal of 2003, not yet adopted
Improvement of safety in mining waste management
Prevention of soil and water pollution
Stability of waste management facilities
Minimum requirements; operating permits; waste characterisation; closure plans; financial security
Water framework directive
2000 Protection of inland surface waters, transitional waters (estuaries), coastal waters and groundwater
Mapping, analysis and registration of waters; river basin management plans; monitoring programmes; recovery of costs for water services; programme of measures
Common Fisheries Policy (CFP)
2001 (Green paper)
2002 (Strategy — aquaculture)
2002 (Communication)
Fishing the right amount, the right size and the right way
Sustainable fisheries
Regulations on the amount of fish taken from the sea; structural adaptations of the fishing and aquaculture industries; common organisation of the market; fisheries agreements
Forestry strategy Adopted 199�
Covers 1998–2003
Revision in 2005
Sustainable forest management Combating illegal and unauthorised logging; certification of sustainable management; monitoring, EU action plan for sustainable forest management
(*) In addition to the waste framework directive, a number of directives address specific waste streams or specific treatment op-tions. Some of these directives may be regarded as having a (direct/indirect) influence on the sustainable use and manage-ment of natural resources: directive on the restriction of the use of certain hazardous substances in electrical and electronic equipment; packaging waste directive; battery directive; end-of-life vehicle directive; landfill directive.

Policy responses
Sustainable use and management of natural resources 49
Many incentives built into those non-environmental policies have an impact on the life-cycle of individual resources. Construction minerals, land use and energy may serve as illustrative examples.
The environmental effects associated with the life-cycle of construction minerals include the loss and fragmentation of natural areas and the subsequent loss of biodiversity, the emission of CO2 due to the maintenance of buildings (heating), and the large amount of construction and demolition waste. The main drivers of the use of construction minerals are the demand for houses and infrastructure, and the prevailing material-intensive type of engineering. Both are influenced mainly by non-environmental policies: economic (e.g. investment programmes), fiscal (e.g. tax reduction schemes for homeowners), social (e.g. rent subsidies), educational (e.g. curricula for engineers and architects), and transport policies (e.g. infrastructure planning). A study by the German Federal Environmental Agency (Buchert et al., 2003) showed that policy intervention to limit urban sprawl increase the density of urban housing, and a preference for reconstruction of existing buildings rather than building new houses on virgin land, had strong positive results for a variety of environmental
pressures, including reduced land use for houses and roads, decreasing energy use for heating and transport, and less consumption of building materials.
Land is another resource for which policy incentives are scattered over a number of non-environmental policies, including the Trans-European Networks, the common agricultural policy (CAP), the Natura 2000 network the Structural Funds (regional policy). However, there is no co-ordinated land use or spatial planning in the EU. Instead, Europe has a multitude of different spatial planning regimes at the national and regional levels. In Germany, for example, there are 16 different spatial planning regimes in the individual Länder.
Concerning the CAP and CFP measures, some experts argue that they have often contributed to overexploiting renewable resources and loss of biodiversity, rather than to safeguarding these. Finally, the use and management of fossil-energy carriers are also affected by non-environmental policies, such as subsidies to coal mining. The role of subsidies has recently been gaining increasing attention in the context of stimulating certain patterns of resource use (Box 4.1).
Table 4.2 National objectives concerning decoupling in Europe
Country Target Document DateAustria Increasing resource productivity
by Factor 4Austrian strategy for sustainable development
Endorsed by Austrian Council of Ministers on 30 April 2002
Belgium Decoupling natural resource use from economic growth
Federal plan for sustainable development 2004–2008
September 2004
Denmark Limit resource consumption to 25 % of current consumption
Denmark's national strategy for sustainable development: A shared future — balanced development, the Danish government
August 2002
Germany Double energy and raw material productivity by 2020.
In the long term, achieve Factor 4 improvement
German strategy for sustainable development
Passed by the Federal cabinet on 17 April 2002
Ireland Progressive decoupling of economic activity from environmental degradation
Ireland's strategy for sustainable development: Department of the environment and local government
2002
Italy Reduce TMR by 25 % by 2010, 75 % by 2030, and 90 % by 2050
Environmental strategy action plan for sustainable development, Ministry of the environment and land protection
Approved by the Inter-ministerial Committee for Economic Planning on 2 August 2002
Netherlands Dematerialisation by a factor 2 to 4 in year 2030
Fourth national environmental policy plan
October 2001
Poland Reduce material intensity by 40 % between 1990 and 2010
National environmental policy for 2003–2006
December 2002
Portugal Reduce resource consumption by a factor of 1.5 in industrial companies
National strategy for sustainable development 2005–2015
July 2004

Sustainable use and management of natural resources
Policy responses
50
The integration of environmental concerns into non-environmental policies is already a guiding principle of Community policy. The Cardiff process aims to better reflect environmental concerns in prominent policy sectors such as agriculture, energy, transport and industry. The resource strategy will further emphasise the importance of the integration of environmental concerns into other policies that affect the environmental impacts of natural resource use.
In addition, in 2001, the EU adopted the directive on the assessment on certain plans and programmes on the environment ('Strategic Environmental Assessment') to ensure that the environmental consequences of certain plans and programmes are identified and assessed during their preparation and before their adoption.
Below, three examples of challenges for policy integration are presented: energy, fisheries and land. The objective is to illustrate the considerable variation in the complexity of policy integration in these different areas rather than to review the complete range of policies that affect these resources.
Energy
The global and environmental dimensions of resource use are both already reflected in the EU energy policy objectives.
The EU is strongly dependent on the supply of fossil energy carriers from abroad: about half of the energy requirements are currently imported. If no action is taken, external energy dependency and the related vulnerability is expected rise to more than 70 %. The Commission proposes to decrease energy
demand and harmonise energy taxation in a Green Paper (CEC 2000a). A number of measures have been put in place, some successful, other less so. On the supply side, more efforts are needed to utilise the potential of renewable energy sources. Other proposals include directives on electricity from renewable sources and biofuels, an EU action plan on energy efficiency, and other measures.
Although the reduction of atmospheric pollution from energy use is one of the major success stories of European environmental policy, it is due mainly to fuel substitution and the use of end-of-pipe technologies to abate selected pollutants, primarily particulates and SO2. However, in the case of greenhouse gases, further efforts are necessary to decrease resource use in absolute terms (i.e. consumption of fossil energy carriers) to reduce the environmental impacts.
In the case of transport, it seems difficult to decouple CO2 emissions from transport, which are expected to rise (EEA, 2001) if no further action is taken. First experiences in Germany (Kloas et al., 2004) indicate that higher transport costs through eco-taxation can help to diminish transport growth.
The EU is switching from coal to the relatively cleaner natural gas, but after 2010 no further switching is expected. Furthermore, some nuclear installations will retire. If this is not compensated by energy saving measures and a switch to renewable energy sources, their share will be simply replaced by fossil fuel plants, and increases in carbon dioxide emissions. Projections of future energy demand imply that the growth rate of primary energy from renewable sources needs to more than double to attain the EU indicative target of 12 % by 2010 (EEA, 2002). A major barrier to the introduction of clean
Box 4.1 'Perverse' subsidies
Many non-environmental subsidies have a significant influence on the use and consumption of resources. The scale of subsidies can be staggering: for example, government subsidies paid to the agricultural sectors of OECD countries between 2001 and 2003 averaged more than USD 324 billion annually, or one third of the global value of agricultural products in 2000. Annual subsidies to conventional energy, which encourage greater use of fossil fuels and consequently emissions of greenhouse gases, are estimated to have been USD 250–300 billion in the mid-1990s. Other sectors where subsidies are common include water, fisheries, and forestry (Millennium Assessment Report 2005).
Some economists and policy analysts argue that subsidies in areas such as agriculture, regional development, energy supply and transport have an inadvertent negative (hence 'perverse') effect on resource consumption and the related environmental effects. Some participants in the policy debate argue that, in the framework of a general review of subsidies, only subsidies that lead to negative environmental impacts should be targeted, rather than those leading to an increased consumption of resources. Further work is needed to analyse these 'perverse subsidies' in more detail.

Policy responses
Sustainable use and management of natural resources 51
energy is the inertia of energy infrastructure, which has a very long life-span.
The common fisheries policy
Although the main objective of the current reform of the CFP is sustainable resource management, sustainable use and management of fish stocks have not yet been achieved. In coastal fisheries, only a few stocks are managed in a sustainable way and even fewer are managed in a way that gives their maximum sustainable yield — the guiding principle of the United Nations Law of the Sea Convention. As a result, European fish stocks and marine ecosystems are overexploited, and the economic value of the industry is far less than what it could be.
Since fishery is based on natural resources with their own limits, continuous growth of output from the industry is not possible. However, sustainable resource management and changes in the structure of the fishing fleet could result in an industry which is competitive, less polluting, and offers vital employment for coastal communities.
Managing fish stocks sustainably implies that as fish stocks fluctuate, the capacity of the fishing fleet should be adapted to the changing size of fish stocks. In lean periods, catches should be reduced in order to avoid irreversible harm to fish populations. It appears that a major obstacle to a transition towards more sustainable management of fish stocks is often the micro-economic situation of the European fisheries. Large, capital-intensive fishing vessels tend to be less flexible as there is often a constant economic pressure to pay interest on bank loans, and yet it is these large ships that have the highest capacity for catching and processing fish. As a result, waiting for stocks to grow is most expensive for the large, efficient but capital-intensive fishing fleets. Hence they continue to overfish even though, for most stocks in European waters, there would be a long-term economic gain in letting stocks and fish grow.
Since 1 January 2003, the EU has had a reformed common fisheries policy, which partly takes the above factors into consideration. The main changes are:
• A long-term approach: until now measures concerning fishing opportunities and related measures have been taken annually. Under the new CFP, the objectives and measures will be set with a long-term perspective.
• A new policy for the fleets: - a fleet policy that places the responsibility for matching fishing capacity to fishing possibilities with the Member States; - a phasing-out of public aid to private investors for modernising fishing vessels, while upholding aid to improve security and working conditions on board.
• Harmonisation of national control systems and sanctions throughout the EU, and an extension of the Commission inspectors' powers.
• Stakeholder involvement: Regional advisory councils (RACs) will be created, in which fishermen and scientists will be joined by other stakeholders.
Land use
In the current institutional setting of the EU, there is little or no prospect of a coordinated transition towards sustainable use and management of land. Competences are scattered across local, regional, national or European levels, and among different sectors. Examples of Community policies which impact land use include the Trans-European Networks, the common agricultural policy (CAP), the Natura 2000-network and Structural Fund interventions.
There is no coordinated land use or spatial planning in the EU. Although the European Spatial Observatory Network (ESPON) was created to ensure a degree of coordinated monitoring of spatial development, the planning and implementation of land use policies are still largely dominated by sectoral policies. About 80 % of European land is used either for forests (36 %) or agriculture (44 %). This means that sectoral policies related to forestry and agriculture are most important for a sustainable use and management of land.
Agriculture is strongly influenced by direct Community interventions in the framework of the CAP. Agriculture can be an important factor behind land degradation. For example, it can contribute to land contamination, soil compacting, nutrient leaching and erosion. While agriculture has historically contributed to increasing biodiversity, the intensification of production has put substantial pressure on habitats. Since the 1992 CAP reform, the EU has gradually moved away from supporting productivity increases towards direct payments for farmers who provide different kinds of services (13) including sustainable rural development and the protection and improvement of agricultural land
(13) CEC, 1999.

Sustainable use and management of natural resources
Policy responses
52
and biodiversity. By decoupling most of the direct payments from production, the pressure resulting from intensive agriculture is expected to decrease.
Mobility and urbanisation are other powerful drivers of changing land use patterns, but the EU has no direct policy competence in urban development or infrastructure planning, where the onus is on national authorities. The Community policy most relevant to the development of settlements and infrastructure is the regional policy, but there is currently little prospect for changing cohesion policies so as to dramatically decrease further sealing and fragmentation of European landscapes. Better integration of land use issues in the EU regional policy is a challenge which is still far from being met with appropriate measures.
4.3 Resource economics and the role of prices
The 5th environment action programme (Council Regulation 93/C 138/01) coined the phrase 'getting the prices right'. The economics-driven approach emphasised the role of prices:
'Economic valuation can help economic agents to take environmental impacts into account when they take investment or consumption decisions. Where market forces are relevant, prices should reflect the full cost to society of production and consumption, including the environmental costs. … In order to get the prices right and to create market-based incentives for environmentally friendly behaviour, the use of economic and fiscal instruments will have to constitute an increasingly important part of the overall approach. The fundamental aim of these instruments will be to internalise all external environmental costs during the whole life-cycle of products from source through production, distribution, use and disposal, so that environmentally friendly products will not be at a competitive disadvantage in the market place vis-à-vis products which cause pollution and waste.'
In the case of natural resource use, this general economic approach reflects findings in resource economics to some degree. Hotelling (1931) and El Serafy (1989) formulated fundamental principles implying that the price of an exhaustible resource should cover extraction costs (including a reasonable return for employed capital as income) as well as a component that can be re-invested in renewable resources, in order to generate a steady flow of income in the long term. The income
from non-renewable resource exploitation would then gradually be replaced by income from the use of renewable resources (see also Daly and Townsend, 1993), while their reduced stock would be compensated for by increases in the use of renewable resources. The higher prices would give an incentive to substitute a non-renewable resource with other alternatives, and to develop new technologies, just as it makes recycling of waste more worthwhile.
Resource economics theories suggest that the functioning of the market should be the most important determinant of sustainable resource management. According to theory, resource use would be sustainable if:
• correct prices are applied to resources;• an economic rent is imposed on privately-
operated extractions;• the external costs of all stages of resource use are
internalised; • sufficient competitiveness is ensured;• all 'perverse' subsidies are removed.
Ideal theoretical conditions, however, hardly apply to real markets. The 'Hotelling/El Serafy rule' assumes fully competitive markets, where prices respond swiftly to any scarcity of natural resources. In reality, real market prices are often distorted by subsidies and taxes. Exploitation and extraction of natural resources is one of the most heavily subsidised sectors world-wide (Box 4.4), and under those conditions, prices and price changes do not necessarily signal scarcity as the theory would assume.
Furthermore, analysing the economics of mineral extraction, Reynolds (1999) pointed out that improved extraction technologies and processes lead to lower prices, despite increasing resource scarcity. This might lead to market participants' expectation of continuing low prices for natural resources. Actors expect low prices because they are used to them, and because prices are shaped by different factors, not just physical scarcity of supply (Box 4.2). However, after a long period of fairly stable prices, price increases may rapidly become very steep or even come as a shock resulting from delayed adaptation of markets. Market actors would need interpretative devices to formulate appropriate strategies.
Technological change in resource-transforming industries is another explanatory factor in resource markets, which are usually characterised by high capital intensity, and require long and

Policy responses
Sustainable use and management of natural resources 53
expensive R&D for any change to take place. Market coordination is often undertaken through contracts among firms, rather than by free competition (see e.g. iron and steel markets). Generally, an incremental change is preferred, making substitution of one material by another rather difficult. Moreover, due to already-made investments in a technology, inertia exists in the choice of resource use. Hence, firms may be 'trapped' and find it difficult, if not impossible, to shift toward other resources (Arthur, 1989; and Walker, 2000). An example of this mechanism is the choice of videocassette standards. The Beta system is believed to have been a better system, but VHS were more successful in their licensing practices, and the VHS is now the most widespread system (Margolis, 2005). Thus, with the video cassettes at home of the VHS type, the consumer is likely to choose VHS again when buying a new video recorder.
Further down the resource chain, diffusion of innovation processes and changing patterns of consumption require time to take effect. Quite often, radical change requires a transformation of infrastructures. Market diffusion of new motor fuels, for instance, depends on filling stations. Alternative vehicle technologies (such as fuel cells based on hydrogen) need some twenty years of R&D before they can meet consumer demands. While these characteristics do not prevent markets from slowing extraction of known reserves, when scarcity of supply becomes serious, they may prevent markets from switching to another technology (Bleischwitz, 2003).
A possible approach would be to create incentives for innovation and change towards sustainable resource management. This is well in line with the Environmental technology action plan, ETAP (CEC,
2004b), but would need to be accompanied by other incentives and a broader view of natural resources as a whole.
4.4 Implications for competition
Critics of strong environmental protection and the sustainable use of resources argue that the implementation of environmental policies is costly, complicated, and harms competitiveness. If the main response to policy requirements is to resort to end-of-pipe measures, this will indeed increase costs. However, a coherent policy response can also have positive economic effects. Improving resource efficiency is a win-win opportunity (14), which can help to improve competitiveness and increase employment at the same time.
This is not to suggest that there will not be some difficult decisions to make, or that environmental protection should be seen as an engine for jobs. However, there is evidence that environmental policies, if properly formulated, need not have overall negative impacts on employment. Meanwhile, the integrated 'greening' of commonly-used products and services, such as fuel-efficient cars or household appliances, zero-emission buildings, renewable energy technologies, or other innovations as yet unknown, should improve resource efficiency, decrease environmental impacts, and still provide the services required.
4.4.1 The Lisbon Strategy
At the summit in Lisbon in March 2000, the European Council declared the new strategic goal for 2010: the European Union should become 'the most competitive knowledge-based economy in the
Box 4.2 Resource pricing and water consumption
The right price signals, including taxes, tradable permits, or subsidy reform, can be a very effective tool for improving resource efficiency and influencing consumption patterns. The basic premise is that the costs of environmental impacts should be factored into the price of products and services, and that this will quickly and strongly influence consumption. For example, the introduction of full-cost water pricing in a number of EU countries has significantly reduced water use per capita, particularly in the household sector. However, few countries have managed to implement full cost-recovery pricing for irrigation water because of political obstacles. The use of incentive pricing in the management of resources is even less common, although it is a fairly widespread tool for demand management in electricity supply.
(14) Some experts warn that in most cases, the easy win-win opportunities have already been realised, and the ones that have not are those where there would be some losers (e.g. with subsidy reform, the environment and the economy overall may win, but at the expense of employment in the agriculture or mining sectors).

Sustainable use and management of natural resources
Policy responses
54
world with sustainable economic growth and more and better employment opportunities and greater social cohesion'.
The new vision presented at the Lisbon summit was complemented by quantitative targets and timetables. The structural indicators chosen to monitor socio-economic progress have become a central instrument of political control in the EU. According to the Feira European Council in June 2000, the European Commission is to table a so-called 'Synthesis Report' for each Spring Council, based on the structural indicators and benchmarks (Box 4.3). The Commission and the Council have also established a central indicator-based monitoring and reporting tool for political decision-making and assessment (CEC, 2004a).
In February 2005, a mid-term review of the Lisbon Strategy was published (15), concluding that '… Europe is far from achieving the potential for change that the Lisbon Strategy offers'. The key approach of the renewed Lisbon Strategy, spelled out in the document 'Working together for growth
and jobs — a new start for the Lisbon Strategy' is to focus efforts around two principal tasks: delivering stronger, lasting growth and creating more and better jobs.
Critics of the revised Lisbon agenda note that the importance of the environment has declined, and argue that the sustainable use of resources is of value in its own right. However, the revised proposal clearly recognises that:
'…lasting success for the Union depends on addressing a range of resource and environmental challenges which if left unchecked will act as a brake on future growth. This goes to the heart of sustainable development. … Europe must rise to this challenge and take the lead in shifting towards more sustainable patterns of production and consumption. … Moreover, by getting more output from given inputs, innovation leading to productivity growth can also make a significant contribution to ensuring that economic growth is increasingly environmentally sustainable. This is why eco-innovations need to be strongly promoted, notably in transport and energy.'
Box 4.3 Spring reports and structural indicators
In November 2000, the Commission and the Council agreed on a preliminary list of 35 indicators, based on a Council decision of March 2000 (CEC, 2000). The result presented to the 2002 Council in Nice is, according to the Commission, a comprehensive summary of the most important performance indicators.
The structural indicators will be used to:
• monitor progress in achieving the identified targets and implementing policies;• assess the effectiveness of the policies.
In March 2001, the Stockholm European Council expanded the scope of the structural indicator set from purely socio-economic objectives to also cover sustainability. In particular, the heads of state and governments were interested in the possible contribution that the environment technology sector could make to promoting growth and employment.
Since the Stockholm meeting, the areas of interest for the synthesis reports are:
• employment• innovation• economic reform• social cohesion • environmental aspects of sustainable development.
On the whole, the Spring reporting highlights the different dimensions of European integration and can thus help to increase policy coherence. A comprehensive overview is also necessary given the considerable expansion of the EU into very heterogeneous regions. Also within this framework, the sustainable use and management of natural resources could be monitored by the Lisbon Strategy, using indicators based on material flows. This view is supported by a recent OECD Council recommendation on material flows and resource productivity (OECD, 2004).
(15) http://europa.eu.int/growthandjobs/index_en.htm.

Policy responses
Sustainable use and management of natural resources 55
Given the Lisbon Strategy's objectives of improving competitiveness, ensuring growth, and creating jobs, it is crucial to demonstrate how sustainable management of resources can contribute to the revised objectives of the Lisbon Strategy.
There are two obvious areas where the Lisbon Strategy and the emerging resource strategy 'intersect': employment in eco-industries and increased competitiveness through cost-saving.
4.4.2 Employment in eco-industries
European eco-industry is already highly competitive on the global market, and it is one of the few sectors where the original Lisbon objective of becoming globally competitive and ensuring high employment seem to have been achieved.
Eco-industries are defined as (16) '…activities which produce goods and services to measure, prevent, limit, minimise or correct environmental damage to water, air and soil, as well as problems related to waste, noise and eco-systems. This includes cleaner technologies, products and services that reduce environmental risk and minimise pollution and resource use'. Broadly, eco-industries can be divided into three categories:
• Pollution management: air-pollution control, wastewater treatment, waste management, remediation and clean up of contaminated land and water, noise and vibration control, environmental analysis and assessment, environmental research and development, environmental administration (public sector), and environmental management (private sector);
• Cleaner technologies and products: cleaner or more resource-efficient technologies, processes and products;
• Resource management: potable water treatment and distribution, recycled materials, renewable energy plants, and nature protection.
Direct employment in EU-15 eco-industries already exceeds 2 million, including around 1.5 million jobs in pollution management and some 650 000 in resource management. The eco-industry's share of total employment in the EU-15 is about 1.3 %. A high-end estimate of total employment generated by the demand for environmental goods and services is around 4 million jobs (Ecotec, 2002).
In 1999, the estimated value added by eco-industries, based on direct labour costs, was about EUR 100 billion, an increase from EUR 35 billion in 1994. Investment in eco-industries in the EU-15 each year total some EUR 54 billion, with subsequent benefits for construction, capital goods industries and associated services (Ecotec, 2002).
Growth rates in EU-15 eco-industries are high. According to the US Department of Commerce (Ecotec, 2002), the annual growth rate of eco-industries in western industrialised countries in 1998/1999 was between 7 % and 9 %. Moreover, the growth of this sector seems to continue even at times of economic stagnation. In Germany, for example, the Federal Statistical Agency has confirmed an eco-industry growth of 3.7 % during 2001, while overall economic growth was only 0.8 %. Exports by German eco-industry in that year grew by an impressive 19.3 %.
The EU, along with the US and Japan, is among the global market leaders for eco-products and services, a fast-growing global market of about EUR 550 billion per year (Ecotec, 2002). 85 % of the world market for eco-products and services is dominated by the USA, the EU and Japan, and the EU-15's share of eco-products and services accounts for about one third of the still growing world market.
Overall, global demand for European environmental products and services is increasing. Europe could profit from the transfer of technology and know-how, by exporting both traditional end-of-pipe environmental technologies and eco-efficient products and services. The demand for resource-efficient products and services is likely to increase due to the global growth of resource use, and will be strongest in the areas of fossil energy resources and renewable energy technologies. Due to the long-term scarcity of crude oil, resource-efficient products, such as fuel-efficient motor vehicles, and renewable energy technologies such as wind turbines, are also well positioned to gain importance on global markets. Weizsäcker et al. (1997) and Schmidt-Bleek (2004) have shown many examples of products and services where resource savings of up to a Factor 10 are attainable.
Finally, it is expected that the expansion of the EU eastwards, which extended the environmental acquis communautaire to ten new countries with a combined population of 110 million, will stimulate growth in the now 'domestic' EU eco-industry sector. Subsequent expansion of the EU will further support this trend.
(16) According to the OECD/Eurostat (1999), The Environmental Goods and Services Industry — Manual for Data Collection and Analysis, ECOTEC, 2002.

Sustainable use and management of natural resources
Policy responses
56
4.4.3 Increased competitiveness through cost savings
Better management of materials and energy conservation can offer significant potential for cost savings. In many manufacturing sectors the cost of materials and energy is much higher than labour costs. Increasing the efficiency of resource use will directly improve competitiveness.
In order to remain competitive, industry continuously strives to increase its energy and material efficiency. Methods of increasing material efficiency include 'design for competitiveness' which aims at reducing customers' costs by modifying design specifications, and 'zero-loss management' which is a budgeting approach aimed at reducing material and energy losses. These have been effectively applied in a variety of industries. The two methods together are estimated to be able to increase material efficiency by 20 % (Fischer, 2003). In general, opportunities for cost savings are largest for water and non-renewable resources for which prices are already relatively high.
Although there is little systematic research in this field, some statistical evidence shows that improving resource and energy productivity can be a better way of increasing overall macro-economic competitiveness than focussing on labour costs. For example, the cost structure of manufacturing industry in Germany (Table 4.3) shows that materials and energy make up some 35–50 % of total costs for companies, with labour costs constituting only about 20 %, and other costs (including depreciation) make up another third. While the situation will vary from sector to sector and country to country, data from Eurostat's NewCronos for the EU-25 confirm that labour costs in manufacturing constitute some 20 % (or even less) of total costs.
As a result, improving material efficiency clearly deserves more attention as a key to reducing costs and increasing competitiveness.
Despite the potential for improving material and energy productivity, most macro-economic
Table 4.3 Cost structure in selected economic sectors, Germany
Economic sector Material costs Labour costs Other costsShare of gross output (%)
Manufacturing industry including:
- Food production
- Chemical industry
- Metal production and processing
- Car manufacturing
41.5
49.9
35.1
52.3
52.0
21.4
15.0
19.5
19.9
1�.6
37.1
35.1
45.4
29.�
29.4Construction 26.5 32.9 40.6
Note: Material costs include the cost of materials and energy. Labour costs include costs involving temporary employees. Other costs include industrial services e.g. waste management, depreciation, data processing, consultancy and membership fees. Data for 2000.
Source: German Federal Statistical Agency, 2003.
Figure 4.2 Labour productivity, material productivity, and energy productivity, EU-15, 1960–2002
Note: Labour productivity: GDP per annual working hours (1999 USD (converted at EKS PPPs) per hour); material productivity: GDP per domestic material consumption (DMC) (EUR per kg); energy productivity: GDP per total primary energy supply (TPES) (thousand 1995 USD per toe).
Sources: Groningen Growth and Development Centre and The Conference Board, Total Economy Database, 2004; EUROSTAT/IFF, 2004; IEA, 2001; Federal Statistical Office, 2003.
–
50
100
150
200
250
300
350
400
1960 1970 1980 1990 2000
Index (1960 = 100)
Energy productivityMaterials productivity
Labour productivity

Policy responses
Sustainable use and management of natural resources 57
restructuring and fiscal reform programmes tend to focus on reducing labour costs. However, labour productivity is already high, having improved by more than 270 % over the past four decades as a result of social security and tax schemes, which have concentrated mainly on income taxes, making labour relatively more expensive than resources. In the same period, the productivity of energy and raw materials increased by much less, 20 % and 100 % respectively (Figure 4.2).
While this may be partly explained by the high share of services in developed economies, it is mainly the manufacturing sector which is under pressure to improve competitiveness, since manufactured products (machinery, motor vehicles, chemicals, etc) are traded on global markets. Services, in contrast, are traded mainly on domestic markets (public administration, health services, public transport, etc.) and are therefore less exposed to global competition.
Figure 4.2 demonstrates that one way of achieving the competitiveness target of the Lisbon Strategy could be to focus not only on improving labour
productivity, but also strongly on resource and energy productivity, as suggested in the revised Lisbon Strategy.
A recent study set out to model the effects of dematerialisation on economic growth and the state budget in Germany. It concluded that if material and energy savings were re-invested in research and development and engineering strategies, 2.3 % GDP growth, an additional 750 thousand jobs, and decreased public spending on social welfare could be achieved (Fischer et al., 2004). This is a powerful conclusion in support of the sustainable use of resources, and more work should be undertaken to test and verify these findings in other countries.
In summary, economic policies could be designed to give more incentives to increasing the productivity of materials and energy, rather than focusing on increasing labour productivity, which usually results in less employment. This conclusion is not new; it had already been recognised in the early 1990s in the 'Delors white paper on growth, competitiveness and employment' (Box 4.4).
Box 4.4 Sustainability and a new economic development model
The current model of development seems to be extremely inefficient in using the primary production factors, labour and nature: 'The serious economic and social problems the Community currently faces are the result of some fundamental inefficiencies: an 'under-use' of the quality and quantity of the labour force, combined with an 'over-use' of natural and environmental resources. …The basic challenge of a new economic development model is to reverse the present negative relationship between environmental conditions and the quality of life…'
Source: CEC, 1993.
Sustainable use and management of natural resources5�
Outstanding questions
5 Outstanding questions
While the need to develop a coherent and efficient policy for ensuring a more sustainable use of resources is accepted by all those involved, stakeholders have not always agreed about priorities and the best way to address the problems. This chapter presents some of the issues which have proved both important and controversial during the policy debate in recent years.
Relative decoupling versus dematerialisation
This is one area where there has been much discussion about the very basics of the policy approach. Should the policy focus on achieving relative decoupling of economic growth from the environmental impacts of resource use, following the 'knowledge-based approach'? After all, material use is not an evil per se, and some stakeholders argue that there may be cases where total material use has gone up without an increase in environmental impacts (e.g. the use of certified tropical timber, where overall consumption has gone up, but the impacts have decreased).
Other experts believe that society should strive for a general dematerialisation, and that a sustainable resource policy ought to promote an absolute reduction in the use of resources. The advocates of this approach argue that it would be more in line with the precautionary principle and intergenerational equity.
There is already some evidence that an absolute reduction in resource use is likely to be accompanied by less impact. A recent study prepared for the Commission concluded that the higher the resource use, the higher the associated impact potentials, and this has been observed at the aggregate level for European countries over the past decade (van der Voet et al., 2004).
There is no easy or 'correct' answer to this dilemma. There is indeed a distinction between relative decoupling and absolute reduction of
impacts. Absolute decoupling can be achieved: one example is the phase-out of lead from gasoline, with dramatically reduced lead emissions despite increases in transport. However, a much more common situation is that emissions of pollutants (pressures) continue to grow.
It has been suggested that such a preventive 'dematerialisation approach' is a good addition to the focus on impacts. The two approaches are not contradictory, and can complement each other.
Focus on environmental impacts or scarcity of resources
The European Commission has emphasised that the policy focus of the resource strategy should be on decreasing environmental impacts rather than on the scarcity issue (COM (2003) 572). The Commission presented several reasons why the scarcity of non-renewable resources may not be of immediate concern: in recent years, the increase in the documented reserves of resources has outpaced their consumption; reliably confirmed reserves are only a fraction of total physical reserves which could be made available; and there is a large potential for improving resource efficiency and recycling of materials. Moreover, substitution of resources could make scarcity less important, at least for certain materials. In theory even the scarcity of oil may not be a problem in the long term, if other energy sources are developed that produce energy at a competitive price and with less environmental impact.
Another argument is that the focus on environmental impacts rather than resource consumption will enable growing economies to expand. The use of resources would continue to grow, but would be more efficient from both an economic and an environmental point of view (for example through technology transfers and 'leap-frogging'). This probably can be achieved, even though it will require considerable efforts to decouple impacts from resource use.

59
Outstanding questions
Sustainable use and management of natural resources
However, some stakeholders do not fully agree with the idea of putting the issue of scarcity of resources to one side, because of concerns for inter-generational equity or their preference for the precautionary principle. They also note that there are no 'one size fits all' solutions — for some resources, such as fossil fuels, fisheries and land, scarcity may be a much bigger issue than for materials such as iron, water, or timber. For instance, oil and gas, and indeed coal, are vital raw materials for the chemical and other industries and it may be far harder to substitute for this than for their energy use.
Measuring environmental impacts
Focusing policy on the environmental impacts of resource use may well be the best and most pragmatic approach. However, some participants in the policy debate stress that there are many practical limitations that should be kept in mind when choosing such an approach. Few reliable or well-tested methods and tools are currently available for
monitoring the decoupling of economic growth from the environmental impacts of resource use, or even for reliably measuring the environmental impacts of resource use (Box 5.1).
First, there is the question of how to estimate the environmental impacts of resource use. Most resources are used to produce many kinds of products, with different life cycles and impacts at different stages of their life. For example, how can one compare the environmental impacts of extraction of construction materials (e.g. air pollution, waste generation) with those of the roads which are constructed from them (e.g. air pollution, soil sealing, noise, or landscape fragmentation)? Work to develop tools for calculating impacts is already going on under the auspices of the European Commission, OECD, and national programmes, but there are still many open questions regarding the choice of methodology.
Second, whatever results are produced, there will always be uncertainties associated with them. Most
Box 5.1 Resource use and environmental impacts
Environmental impacts are typically grouped into several impact categories, including:
• acidification• climate change and global warming• ecotoxicity• human toxicity• eutrophication• photochemical ozone formation (summer smog)• stratospheric ozone depletion.
The relationship between resource use and environmental impacts is not well understood and documented. A recent Commission study (CEC, 2004d) noted that consolidated advice on priorities for policy development are limited by the 'persisting weaknesses in environmental impact assessment models'.
Except for the impacts directly related to resource extraction, there are only a few instances where a causal relationship between a specific resource use and its environmental impacts can be demonstrated. They include global warming and the acidifying effect of the consumption of fossil fuels, and health-related impacts of metal refining.
Concerning indicators, no single aggregate measure or index is yet available for 'impacts of use of natural resources.' CEC 2004d notes that 'the immediate possibilities the (currently available) studies offer to establish direct links between indicators of resource use and indicators of environmental impacts are more limited and additional research is required to explore such links.'

Sustainable use and management of natural resources
Outstanding questions
60
environmental pressures have long-term impacts, and current knowledge of how the release of substances affects the environment may not be sufficient to assess the impacts in fifty or a hundred years, and new impacts may be discovered. For example, the damage caused by CFCs to the ozone layer was completely unknown barely thirty years ago. Some experts therefore argue that, in the absence of universally-agreed scientific conclusions, the precautionary principle should be applied (see Box 5.2).
Third, the amount of time needed to examine and measure, or estimate, the environmental impacts of resource use can be considerable. For example, depending on the methodology used and the resources being studied, it may take a long time to analyse all the impacts and reach conclusions on which resources lead to the highest impacts. Such 'paralysis by analysis' can hinder effective policy intervention. It is important, and a major challenge, to achieve a broad level of acceptance and consensus among authorities, industry and consumers regarding the methodology and the conclusions. Some of these stakeholders have different interests, goals and incentives. For example,
when a resource or a product is identified as having high environmental impacts, it should become a target for policy intervention which will have consequences for the industries and manufacturers that use or produce it. The ongoing debate about the environmental advantages of recycling paper, compared with incinerating it or producing paper from virgin material demonstrates how conflicting interests can lead to a protracted discussion about the 'optimal' approach.
In this context it is sometimes pointed out that reducing resource use in absolute terms will automatically lead to fewer impacts, even if we do not know precisely how much a change in resource consumption will change the resulting environmental impacts.
Priority areas
Despite the methodological problems presented above, the information that already exists on the environmental impacts of resource use can provide a starting point. Some experts (17) have suggested
Box 5.2 Late lessons from early warnings
An EEA study examined fourteen cases where enough was now known about their impacts to enable conclusions to be drawn about how well they were dealt with by governments and civil society. The aim was to see if anything could be learnt from these cases to help prevent, or at least minimise, future impacts of other agents that may turn out to be harmful, without stifling innovation or compromising science. Twelve lessons emerged:
1. Acknowledge and respond to ignorance, as well as uncertainty and risk, in technology appraisal and public policymaking.
2. Provide adequate long-term environmental and health monitoring and research into early warnings.3. Identify and work to reduce 'blind spots' and gaps in scientific knowledge.4. Identify and reduce interdisciplinary obstacles to learning.5. Ensure that real-world conditions are adequately accounted for in regulatory appraisals.6. Systematically scrutinise the claimed justifications and benefits alongside the potential risks.7. Evaluate a range of alternative options for meeting needs alongside the option under appraisal, and
promote more robust, diverse and adaptable technologies so as to minimise the costs of surprises and maximise the benefits of innovation.
�. Use 'lay' and local knowledge, as well as relevant specialist expertise in the appraisal.9. Take full account of the assumptions and values of different social groups.10. Maintain the regulatory independence of interested parties while retaining an inclusive approach to
information and opinion gathering.11. Identify and reduce institutional obstacles to learning and action.12. Avoid 'paralysis by analysis' by acting to reduce potential harm when there are reasonable grounds for
concern.
Source: EEA, 2001.
(17) See e.g. CEC, 2004d; Moll et al., 2004; van der Voet et al., 2003; Tukker et al., 2004. (van der Voet, E.; van Oers, L.; Nikolic, I., 2003: Weighting materials: not just a matter of weight. CML Report No. 160, Leiden: Leiden University, Centre of Environmental Science).

Outstanding questions
Sustainable use and management of natural resources 61
that the broad production and consumption areas of housing, mobility and nutrition are the ones most relevant from an environmental perspective. Other research, carried out as a pilot study for Germany (Moll et al., 2004), identified eight 'final-demand' product groups with large life-cycle-wide resource use and environmental impact potentials:
1. Construction2. Food products and beverages3. Motor vehicles, trailers and semi-trailers4. Electricity, gas, steam, and hot water supply5. Basic metals6. Agricultural products7. Chemicals and chemical products8. Machinery equipment.
Concerning materials, preliminary research for the EU-25 and the remaining three accession countries (Bulgaria, Romania and Turkey) as a whole listed the ten material categories with the highest environmental impacts (van der Voet et al., 2004a). Both mass flows and impacts per unit weight were taken into account by combining information on material flows and life cycle impact assessment.
1. Animal products2. Crops3. Plastics4. Oil for heating and transport5. Concrete6. Hard coal for electricity7. Brown coal for electricity8. Iron and steel9. Gas for heating10. Paper and board.
The next material categories on the priority list were: glass; oil for electricity; aluminium; ceramics; gas for electricity; clay; lead; nickel; hard coal for heating; and zinc.
The 2004 report on the environmental impact of resource use by the Joint Research Centre (CEC, 2004d) identified eight 'core activities' as the cause of the largest share of major environmental pressures from human activities:
• Combustion processes• Solvent use• Agriculture• Metal extraction and refining• Dissipative uses of heavy metals• Housing and infrastructure• Marine activities• Chemical industry.
Thus, some stakeholders argue that while recognising the need for a scientifically-proven input into the policy-making process, a general indication of priorities for action is already available.
The European Commission recognises that much work in this field is under way in the research community, although the information and results are widely spread. In order to obtain adequate information on environmental impacts, the Commission has suggested that access to existing information should be improved by making it available from a single place, a 'one-stop shop'.
Setting targets and measuring progress
The sustainable use and management of natural resources is a relatively new policy field. In the policy cycle, the first steps involve identifying and understanding the issues, problems or concerns that are commanding the attention of the Community, and then developing a policy response. The next steps involve analysing alternative options and setting targets.
Formulation of a resource policy is at an early stage. Guiding principles such as decoupling, eco-efficiency and resource productivity have already been introduced by the Johannesburg plan of implementation, the EU sustainable development strategy, and the 6th EAP. However, those principles are fairly general in nature, and in addition to declaring strategic preferences, it may be necessary to formulate concrete objectives and set measurable targets.
A discussion is under way about how to set appropriate targets and what they should be, and how to measure progress. Some stakeholders argue that we need to establish measurable quantitative goals (e.g. based on aggregated indicators for energy use, raw material consumption, or land use). Others feel that mature and methodologically-sound impact indicators are needed before any targets can be set.
Indicators are needed to 'translate' the general guiding principles into quantitative targets. No consensus has yet been reached on what such indicators should be, and different participants in the policy process have different views. A set of aggregate material flow indicators (see Section 3.1) is available which could be used to monitor overall resource use in the EU and Member States. Aggregate indicators which measure the potential impacts of resource use rather than the material flows are under development, but not yet available

Sustainable use and management of natural resources62
Outstanding questions
(van der Voet et al., 2004). Ecological footprints and input/output-based NAMEAs (national account matrix including environmental accounts) are other examples of tools which have been proposed by the stakeholders. Some experts suggest that rather than focusing on aggregated macro-level indicators, what is needed is a framework of indicators for specific sectors or resources (e.g. water abstraction), or a 'basket' of decoupling indicators, such as the 18 indicators published by the UK in April 2005 (18).
It seems clear that the development of indicators for resource use and measuring decoupling of economic growth from environmental impacts of resource use should be high on the priority list in the framework of a future resource policy.
Shifting of environmental burdens abroad as a result of global trade
On the global scale, resource use is set to increase. Some developing countries, such as China, will soon reach per capita resource use levels similar to those in industrialised western countries. The associated environmental impacts of this increased resource use will also increase globally (e.g. emissions of greenhouse gases).
Countries possess different natural resources. Some specialise in manufacturing highly-processed products, even if their resource base is poor. Such differences are the basis of global trade in commodities and the generation of income. However, they also mean that many resources are transported to other parts of the world where they are consumed or used as an input for the production of goods. After consumption, wastes may be transported to yet other parts of the world, where they are disposed of or managed. As a result of this global trade, the environmental impacts of a particular product or resource may occur in several countries.
In most EU countries, the trend has been to reduce domestic extraction of raw materials and meet
the demand through increased imports. At first glance, it may appear as though consumption of resources in the EU has decreased, and indeed many indicators do show such a 'relative' decoupling. However, the extraction of resources generates large amounts of waste and causes environmental impacts which 'remain' in the exporting countries. This means that, even if national statistics on consumption of resources show declining figures, environmental burdens may just have been shifted to developing countries, where labour may be cheaper and environmental standards less strict.
Some stakeholders assert that this is a healthy example of market forces in action. If it is cheaper to import steel than to produce it domestically, imported steel should replace national production. On the other hand, environmentalists warn that 'relative decoupling' should not be achieved by 'exporting' pressure abroad.
Perhaps the most succinct summary of the open environmental issues relevant to the Thematic strategy on resources was presented in the recent JRC-IPTS report on the environmental impact of the use of natural resources (CEC, 2004d). The report concludes that for effective policy development, scientific input to the resources strategy '…should be provided in close relation to parallel research and dialogue on:
• a precaution-based approach to a resources strategy building on existing knowledge;
• an approach based on the scarcity of resources in Europe and globally;
• an approach building on equality among the different parts of the world;
• the requirements of different methods of linking the state of the environment to resource consumption (through materials, product groups, consumption areas, etc);
• the abatement strategies used in cases of resources where policies are already in place.'
(1�) http://www.defra.gov.uk/environment/statistics/scp/index.htm.

63
Abbreviations and definitions
Sustainable use and management of natural resources
Apparent consumption Statistical term, with 'apparent' indicating that a given figure is a result of calculation including various factors and estimates. For instance, 'apparent consumption of steel' is calculated as domestic production of steel plus imports, minus exports. Estimates are used to convert processed goods containing steel (e.g. ships, cars) into steel weight equivalent.
Decoupling (relative and absolute)
Decoupling occurs if the growth rate of an environmental pressure is less than that of a given economic driving force (e.g. GDP) over a certain period. Relative decoupling occurs when an environmental pressure grows, but more slowly than the underlying economic driver. Absolute decoupling is when an environmental pressure decreases while the economy grows.
Dematerialisation Defined by UNEP as 'the reduction of total material and energy throughput of any product and service, and thus the limitation of its environmental impact. This includes reduction of raw materials at the production stage, of energy and material inputs at the use stage, and of waste at the disposal stage.'
Direct material input (DMI) and domestic material consumption (DMC)
Indicators that measure the input of materials (excluding water and air) which are directly used in the economy. DMI includes used domestic extraction and physical imports (mass weight of imported goods); DMC is DMI minus exports (mass weight of exported goods).
Eco-efficient products and services
Products and services that prevent, limit, minimise or correct environmental damage to water, air and soil, as well as problems related to waste, noise and eco-systems. This includes cleaner technologies, products and services that reduce environmental risk and minimise pollution and resource use.
Eco-industry Defined by OECD/Eurostat (1999) as 'activities which produce goods and services to measure, prevent, limit, minimise or correct environmental damage to water, air and soil, as well as problems related to waste, noise and eco-systems. This includes cleaner technologies, products and services that reduce environmental risk and minimise pollution and resource use'.
Energy or material intensity Ratio of energy or material consumption to economic or physical output. At the national level, energy intensity is the ratio of total domestic, primary energy consumption or final energy consumption to gross domestic product or physical output.
Environmental impacts Impacts on humans, ecosystems and economies resulting from changes in environmental quality.
Environmental pressures The release of substances (emissions), physical and biological agents, the use of resources and the use of land. The pressures exerted by society are transported and transformed in a variety of natural processes to manifest themselves in changes in environmental conditions.
Factor 4 Refers to a hypothetical fourfold increase in resource productivity, brought about by simultaneously doubling wealth and halving resource consumption.
Gross domestic product (GDP) The total output of goods and services produced by an economy in a given period, usually a year, valued at market prices.
Material (resource) use The use of raw materials by humans. Raw materials comprise renewables (e.g. agricultural biomass, fish, timber, etc.) and non-renewables (e.g. fossil fuels, industrial minerals, metal ores, construction minerals).
Abbreviations and definitions

Sustainable use and management of natural resources64
Abbreviations and definitions
Natural resources The European Commission defines natural resources to include: raw materials (e.g. minerals, fossil energy carriers, biomass), environmental media (e.g. air, water, soil), flow resources (wind, geothermal, tidal and solar energy), and space (land use for human settlements, infrastructure, industry, mineral extraction, agriculture and forestry).
In this report, the term natural resources broadly covers raw materials, water, energy, and land.
Precautionary principle Defined in EEA (1999) to permit a lower level of proof of harm to be used in policy-making whenever the consequences of waiting for higher levels of proof may be very costly and/or irreversible.
Resource (material) productivity Defined as the efficiency with which energy and materials are used throughout the economy, i.e. the value added per unit of resource input, e.g. GDP divided by total energy consumption.
Structural indicator Structural indicators are used in the Commission's annual synthesis report to the European Council to show progress towards the Lisbon objectives. They cover the five domains of employment, innovation and research, economic reform, social cohesion and environment as well as the general economic background.
Total material requirement (TMR) and total material consumption (TMC)
Indicators of resource use that take into account domestic material extraction and indirect flows associated with domestic extraction and imports (so-called 'hidden flows' that do not directly enter the domestic economy). TMR includes used and unused domestic extraction, imports, and indirect flows associated with imports; TMC subtracts exports and indirect flows associated with exports from TMR.

65
References
Sustainable use and management of natural resources
References
Arthur, B. W. 1989. Competing technologies, increasing returns, and Lock-In by historical small events. Economic Journal 99 (March), pp. 116–131.
Ayres, E. (2003): The Hidden Shame of the Global Industrial Economy. World Watch magazine January/February 2004 (download: http://www.worldwatch.org/pubs/mag/2004/171/)
Behrens, A. and Giljum, S. (2005): Die materielle Basis der Weltwirtschaft und ihre globale Ungleichverteilung — Erste Zeichen einer Entkopplung. In: Ökologisches Wirtschaften 1/2005, p. 28–29.
BIO Intelligence Service, O2 France (2003): Study on external environmental effects related to the life cycle of products and services. Directorate General Environment (Sustainable Development and Policy support) European Commission.
Bleischwitz, R. (2003). Cognitive and Institutional Perspectives of Eco-Efficiency. Ecological Economics, Vol. 46, pp. 453–467.
Bringezu, S. (2002): Towards Sustainable Resource Management of the European Union. Wuppertal Papers 121, Wuppertal Institute, Wuppertal.
Bringezu, S., Behrensmeier, R., Schütz, H. (1995): Material Flow Accounts Part I: General Aspects, Aluminium, National Overall Accounts. Final Report of Phase I of the EUROSTAT Project 'Material Flow Accounts of Selected Products and Substances Harmful to the Environment' SOEC No. 48950001, finished 21 December 1995; EUROSTAT Doc. MFS/97/6 presented to the Sub-Group Meeting on Statistics on Scarce and Hazardous Materials of the Working Group 'STATISTICS OF THE ENVIRONMENT' Joint Eurostat/EFTA Group, 26 and 27 January 1998, Luxemburg.
Bringezu, S., Schütz, H., Moll, S. (2003): Rationale for and Interpretation of Economy-Wide Material Flow Analysis and Derived Indicators. In Journal of Industrial Ecology No. 2, Vol. 7, Massachusetts Institute of Technology and Yale University, pp. 42–64.
Brundtland, G. (1987): Our common future: The World Commission on Environment and Development, Oxford, Oxford University Press.
Buchert, M. Fritsche, U., Jenseit, W., Rausch, L., Deilmann, C., Schiller, G., Siedentop, S., Lipkow, A. (2003): Material-flow-related components for a national sustainable development strategy — linking the construction and housing sector with the complementary area of 'public infrastructure'. Executive Summary. Berlin.
Cambell, C.J. (ed.) (2003): The Essence of Oil and Gas Depletion. Collected Papers and Excerpts. Brentwood: MultiScience Publishing Group.
CEC Commission of the European Communities (1993): White paper on growth, competitiveness, and employment. COM (1993) 700. Brussels.
CEC Commission of the European Communities (1999): Communication from the Commission to the Council. Towards a sustainable agriculture. COM (1999) 22. Brussels.
CEC Commission of the European Communities (2000): Structural Indicators. COM (2000) 594. Brussels.
CEC Commission of the European Communities (2000a): Green Paper: Towards a European Strategy for security of energy supply. COM (2000) 769 final, Brussels.
CEC Commission of the European Communities (2002): Sixth Community Environment Action Programme; (6EAP) published in Official Journal of the European Communities L 242 of 10/9/2002.
CEC Commission of the European Communities (2002): Communication from the Commission to the Council, the European Parliament, the economic and Social Committee and the Committee of the Regions. Towards a Thematic Strategy for Soil Protection. COM (2002) 179. Brussels.
CEC Commission of the European Communities (2003): Development of a Thematic Strategy for the sustainable use of natural resources. Communication by the Commission

Sustainable use and management of natural resources
References
66
to the Council and the European Parliament. COM (2003) 572. Brussels.
CEC Commission of the European Communities (2003a): Integrated Product Policy: Building on Environmental Life-Cycle Thinking. COM(2003)302 final, Brussels, 18.6.2003.
CEC Commission of the European Communities (2003b): Towards a Thematic Strategy on the Prevention and Recycling of Waste. COM(2003)301 final, Brussels (download: http://www.europa.eu.int/comm/environment/waste/strategy.htm).
CEC Commission of the European Communities (2004): Thematic Strategies — Progress Report. Background paper for Environment Council meeting, December 2004.
CEC Commission of the European Communities (2004a): Delivering Lisbon. Reforms for the enlarged Union. Report from the Commission to the Spring European Council. COM (2004) 29. Brussels.
CEC Commission of the European Communities (2004b): Stimulating Technologies for Sustainable Development: An Environmental Technologies Action Plan for the European Union. Communication from the Commission to the Council and the European Parliament. COM (2004) 38. Brussels.
CEC Commission of the European Communities (2004c), Assessing the actions to be undertaken as part of the Thematic Strategy on the Sustainable Use of Natural Resources, Consultation Document (6 December 2004 until 30 January 2005).
CEC Commission of the European Communities/Joint Research Centre (2004d): Environmental Impact of the Use of Natural Resources. Technical Report EUR 21485.
Daly, H. (1973): Towards a Steady-State Economy. San Francisco: W.H. Freeman.
Daly, H. and Kenneth N. Townsend (1993) VALUING THE EARTH: Economics, Ecology, Ethics. MIT Press.
Ecotec (2002). Analysis of the EU Eco-Industries, their Employment and Export Potential. Study for DG Environment. Brussels.
EEA (1999) Environment in the European Union at the turn of the century. Page 278. Environmental assessment report No 2.
EEA (1999a). Management of contaminated sites in Western Europe.
EEA (2001): TERM 2001: Indicators tracking transport and environment integration in the European Union. Environmental issues series no. 23, EEA. Copenhagen.
EEA (2002): Environmental signals 2002 — Benchmarking the millennium. Environmental assessment report No 9 Available at http://reports.eea.eu.int/environmental_assessment_report_2002_9/en.
EEA (2003): Europe's environment: the third assessment. Environmental assessment report No. 10. EEA, Copenhagen. http://www.eea.eu.int/.
EEA (2003): Europe's water: An indicator-based assessment. Topic report No 1/2003, p. 93 and p. 97. EEA, Copenhagen. http://www.eea.eu.int/.
EEA (2004): EEA Signals 2004 — A European Environment Agency update on selected issues. EEA. Copenhagen.
EEA (2005), Background Paper for the High-Level Economists meeting on 27 January 2005, unpublished.
EEA (2005), The European environment — State and outlook 2005. EEA, Copenhagen.
EEA/UNEP (2000). Down to Earth: Soil degradation and sustainable development in Europe. A challenge for the 21rst century. Environmental issues series No. 16.
Ehrlich, P.R./ Ehrlich, A.H. (1990). The population explosion. New York: Simon & Schuster.
El Serafy, S. (1989) 'The Proper Calculation of Income from Depletable Natural Resources.' In Y. J. Ahmad, S. El Serafy, and E. Lutz, eds., Environmental Accounting for Sustainable Development, a UNEP-World Bank Symposium. Washington, D.C.: The World Bank.
European Council (1993): Resolution of the Council and the Representatives of the Governments of the Member States on a Community programme of policy and action in relation to the environment and sustainable development (5th Environmental Action Programme). Council Regulation 93/C 138/01, Official Journal of the European Commission No C 138/1.
Eurostat (2001): Economy-wide material flow accounts and derived indicators (Edition 2000). A methodological guide. European Communities. Luxembourg.
Eurostat/IFF (2004): Economy-wide Material Flow Accounts and Indicators of Resource Use for the EU-15: 1970–2001, Series B, (prepared by Helga Weisz, Christof Amann, Nina Eisenmenger, Fridolin Krausmann), June 2004.

References
Sustainable use and management of natural resources 67
FAO (2004) (http://dataservice.eea.eu.int/dataservice/metadetails.asp?id=658).
FAO: FAOSTAT online-database. http://faostat.fao.org/default.jsp?language=EN.
Federal Ministry of Economics and Labour (2002): Reserves, Resources and Availability of Energy Resources 2002. Berlin: Federal Ministry of Economics and Labour.
Federal Statistical Office (2002): Statistical Yearbook 2002, Bonn 2003, p. 189.
Federal Statistical Office (2003): Umweltnutzung und Wirtschaft (Environment Use and Economy). Wiesbaden.
Federal Statistical Office (2004): Integrated Environmental and Economic Accounting: Materials and Energy Flow Accounts 2003. Federal Statistical Office Germany, Wiesbaden.
(Statistisches Bundesamt (2004): Umweltökonomische Gesamtrechnungen: Material- und Energieflussrechnungen 2003. Fachserie 19, Reihe 5, Statistisches Bundesamt, Wiesbaden).
Financial Times Europe, 4 April 2005, 'Brussels to outline €70bn spending plan on research to close gap with its rivals'.
Fischer, H./ Lichtblau, K./ Meyer, B./ Scheelhaase, J. (2004). Wachstums- und Beschäftigungsimpulse rentabler Materialeinsparungen. In: Hamburgisches Welt-Wirtschafts-Archiv. 84. Jahrgang, Heft 4.
FSOG (Federal Statistical Office Germany) (2003): Integrated Environmental and Economic Accounting — Material and Energy Flow Accounts 2003. Series FS 19 R 5, Wiesbaden. (Statistisches Bundesamt (2003): Umweltökonomische Gesamtrechnungen — Material- und Energieflussrechnungen 2003. Fachserie 19, Reihe 5, Wiesbaden).
Graßl, H. (1997): Brisante Mischung. Böden und globaler Wandel. In: Politische Ökologie. Sonderheft 10. p. 17–22.
Groningen Growth and Development Centre and The Conference Board, Total Economy Database, August 2004, http://www.ggdc.net.
GUA (2000). GUA — Gesellschaft für umfassende Analysen (2000). Analysis of the fundamental concepts of resource management. Vienna: GUA (http://www.europa.eu.int/comm/environment/enveco/waste/guareport.pdf).
Hotelling, H. (1931). The Economics of Exhaustible Resources. In Journal of Political Economy. 39, pp. 137–175.
IEA (2001): International Energy Agency. Energy Statistics and Balances Diskettes Services, Paris.
IEA (2002): International Energy Agency. Energy Statistics and Balances Diskette Service, Paris.
IEA (2004): World energy outlook 2004, Paris.
IEED/WBCSD (2002): International Institute for Environment and Development (IIED), World Business Council for Sustainable Development (WBCSD) (2002): Breaking New Ground: The Report of the Mining, Minerals and Sustainable Development Project (MMSD). Earthscan Publications Ltd, London and Sterling, VA.
Institut Wallon de développement économique et social et d'aménagement du territoire, Vlaamse Instelling voor Technologisch Onderzoek (vito) (2002): Identifying key products for the federal product & environment policy (Federal Services of Environment, Department on Product Policy). Draft final report.
International Iron and Steel Institute (2003): World steel in figures. Brussels: IISI.
Kippenberger, C. (1999): Stoffmengenflüsse und Energiebedarf bei der Gewinnung ausgewählter mineralischer Rohstoffe — Auswertende Zusammenfassung. Geologisches Jahrbuch, Sonderhefte Reihe H, Heft SH10, Hannover: Bundesanstalt für Geowissenschaften und Rohstoffe.
Kloas, J., Kuhfeld, H., Kunert, U. (2004): Straßenverkehr: Eher Ausweichreaktionen auf hohe Kraftstoffpreise als Verringerung der Fahrleistungen. In: Wochenbericht des DIW Berlin, Nr. 41/2004.
Millennium Ecosystem Assessment (2005): Millennium Ecosystem Assessment Synthesis Report (download http://www.millenniumassessment.org/en/index.aspx).
Ministry of Environment of the Republic of Poland (2002): Polityka ekologiczna państwa na lata 2003–2006 z uwzględnieniem perspektywy na lata 2007–2010 (download: http://www.mos.gov.pl/1materialy_informacyjne/raporty_opracowania/polityka_ekologiczna_2003_2006.pdf).
Miranda, M., Burris, P., Bingcang, J.F., Shearman, P., Briones, J.O., La Viña, A., Menard, S. (2003): Mining and Critical Ecosystems: Mapping the Risks. Washington DC: World Resources Institute (download: http://pubs.wri.org/pubs_pdf.cfm?PubID=3874).

Sustainable use and management of natural resources
References
6�
Moll, S., Bringezu, S., Schütz, H. (2003): Resource Use in European Countries: An Estimate of Materials and Waste Streams in the Community, Including Imports and Exports Using the Instrument of Material Flow Analysis (Zero-Study). Copenhagen: European Topic Centre on Waste and Material Flows.
Moll, S., Acosta, J., Villanueva, A. (2004): Environmental implications of resource use — insights from input-output analyses. European Topic Centre on Waste and Material Flows, Copenhagen (download: http://eea.eionet.eu.int:8980/Members/irc/eionet-cir-cle/etcwmf/library?l=/implementation_plan/ip_2003/deliverables_2003_1/report_20041doc/_EN_1.0_&a=d).
NERI, DTC/W and ECON (2004), Study 1: Public Private Interface, Second Draft of the Final Report, unpublished, European Commission, DG Environment.
OECD/Eurostat (1999) [The Environmental Goods and Services Industry — Manual for Data Collection and Analysis]; cited in ECOTEC 2002.
OECD (2001). Environmental Outlook, 308 p.
OECD (2004). Recommendation of the Council on Material Flows and resource productivity. Endorsed by Environment Ministers on 20 April 2004. Adopted by the OECD Council on 21 April 2004. OECD. Paris.
Reynolds, D.B. (1999): The Mineral Economy: How Prices and Costs can Falsely Signal Decreasing Scarcity. In Ecological Economics, Vol. 31, No. 1, pp. 155–166.
Rosenberg, N., 1994. Exploring the Black Box. Technology, Economics, and History. Cambridge University Press, Cambridge.
Schmidt-Bleek, F. (2004). Der ökologische Rucksack: Wirtschaft für eine Zukunft mit Zukunft. Hirzel, Stuttgart.
Tukker, A., Huppes, G., Geerken, T. Van Holderbeke, M. Nielsen, P. (2004): Evaluation of the Environmental Impacts of Products (EIPRO). Evaluation of existing studies and consequences for method development. EIPRO Working Paper 23 April 2004, Brussels.
UN (2003): World Population Prospects: The 2002 Revision. Highlights. New York: United Nations.
UNECE/EC (United Nations Economic Commission for Europe and European Commission), 2004. The Conditions of Forests in Europe. 2004 Executive Report. UNECE, Geneva, Switzerland.
UNDP (2004): Human Development Report 2004 — Cultural Liberty in Today's Diverse World. New York, Oxford: Oxford University Press.
Van der Voet, E., van Oers, L., Moll, S., Schütz, H., Bringezu, S., de Bruyn, S., Sevenster, M., Warringa, G. (2004): Policy Review on Decoupling: Development of indicators to assess decoupling of economic development and environmental pressure in the EU-25 and AC-3 countries. CML report 166, Leiden: Institute of Environmental Sciences (CML), Leiden University — Department Industrial Ecology.
Walker, W. (2000). Entrapment in large technological systems: Institutional commitment and power relations. Research Policy 29, pp. 833–846.
Weizsäcker, E. U./A. Lovins (1997). Factor Four: doubling wealth — halving resource use. Earthscan, London.
World Bank (2003): World Development Indicators 2003 online (http://devdata.worldbank.org/data-query/).
World Trade Organisation WTO (2003): International Trade Statistics 2003. Geneva (http://www.wto.org/english/res_e/statis_e/statis_e.htm).
World Water Council (ed.) (2004): E-Conference Synthesis: Virtual Water Trade — Conscious Choices (http://www.worldwatercouncil.org/virtual_water/documents/virtual_water_final_synthesis.pdf).
WRI (2003): World Resources Institute CAIT version 1.5 — Climate Analysis Indicators Tool (http://cait.wri.org/).
Wuppertal Institute (2005): DMC database of Wuppertal Institute after several sources.

European Environment Agency
Sustainable use and management of natural resources
2005 — 6� pp. — 21 x 29.7 cm
ISBN 92-9167-770-1
SALES AND SUBSCRIPTIONS
Publications for sale produced by the Office for Official Publications of the European Communities are available from our sales agents throughout the world.
How do I set about obtaining a publication?Once you have obtained the list of sales agents, contact the sales agent of your choice and place your order.
How do I obtain the list of sales agents?• Go to the Publications Office website http://publications.eu.int/• Or apply for a paper copy by fax +352 2929 42758

European Environment AgencyKongens Nytorv 61050 Copenhagen KDenmark
Tel.: +45 33 36 71 00Fax: +45 33 36 71 99
Web: www.eea.eu.intEnquiries: www.eea.eu.int/enquiries
TH
-AL-0
5-0
05-E
N-C
Price (excluding VAT): EUR 15.00