Sustainable Urban Transport in the Asia-Pacific Region for the ...
156
Sustainable Urban Transport in the Asia-Pacific Region for the 2030 Agenda Recommendations towards safe, green, smart and inclusive urban transport Bangkok, October 2021
-
Upload
khangminh22 -
Category
Documents
-
view
3 -
download
0
Transcript of Sustainable Urban Transport in the Asia-Pacific Region for the ...
Sustainable Urban Transport in the Asia-Pacific Region for the 2030 Agenda Recommendations towards safe, green, smart and inclusive urban transport
Bangkok, October 2021
ii
SUSTAINABLE URBAN TRANSPORT IN THE ASIA-PACIFIC REGION FOR THE 2030 AGENDA
The Economic and Social Commission for Asia and the Pacific (ESCAP) is the most inclusive intergovernmental platform in the Asia-Pacific region. The Commission promotes cooperation among its 53 member States and 9 associate members in pursuit of solutions to sustainable development challenges. ESCAP is one of the five regional commissions of the United Nations. The ESCAP secretariat supports inclusive, resilient and sustainable development in the region by generating action-oriented knowledge, and by providing technical assistance and capacity-building services in support of national development objectives, regional agreements and the implementation of the 2030 Agenda for Sustainable Development.
iii
SUSTAINABLE URBAN TRANSPORT IN THE ASIA-PACIFIC REGION FOR THE 2030 AGENDA
The views expressed in this publication are those of the authors and do not necessarily reflect the views of the United Nations Secretariat. The opinions, figures and estimates set forth in this publication are the responsibility of the authors and should not necessarily be considered as reflecting the views or carrying the endorsement of the United Nations.
The designations employed and the presentation of the material in this publication do not imply the expression of any opinion whatsoever on the part of the Secretariat of the United Nations concerning the legal status of any country, territory city, or area, or of its authorities, or concerning the delimitation of its frontiers or boundaries.
Mention of firm names and commercial products does not imply the endorsement of the United Nations.
This publication may be reproduced in whole or in part for educational or non-profit purposes without special permission from the copyright holder, provided that the source is acknowledged.
The ESCAP Publications Office would appreciate receiving a copy of any publication that uses this publication as a source. No use may be made of this publication for resale or any other commercial purpose whatsoever without prior permission. Applications for such permission, with a statement of the purpose and extent or reproduction, should be addressed to the Secretary of the Publications Board, United Nations, New York.
United Nations publication issued by the Sustainable Transport Section, Transport Division, ESCAP.
United Nations publication Copyright
© United Nations 2021
All rights reserved
Published in Thailand
Sustainable Urban Transport in the Asia-Pacific Region for the 2030 Agenda Recommendations towards safe, green, smart and inclusive urban transport
iv
SUSTAINABLE URBAN TRANSPORT IN THE ASIA-PACIFIC REGION FOR THE 2030 AGENDA
Acknowledgments
The report was prepared under the overall guidance, supervision and technical inputs of Ishtiaque Ahmed, PhD, Economic Affairs Officer, Sustainable Transport Section as the Project Lead. Valuable advice was extended by Weimin Ren, Director of Transport Division and Thanattaporn Rasamit, Chief, Sustainable Transport Section. Kamol Debnath Dip, Nadia Binte Mohammad and Muhammad Qawi Hossain provided useful inputs to the documents as interns of the Sustainable Transport Section. Anchalika Phasukit provided support to the publication.
This report was prepared by Romain Pison, Senior Digital and Transport Specialist, Avantir, United States, with national case expertise and contributions of, in alphabetical order by countries, Xumei Chen, Associate Professor, Director for Policy and Standard Division, China Urban Sustainable Transport Research Center, China Academy of Transportation Sciences, Ministry of Transport, (China), Himani Jain, Principal Consultant, P4Planning Consultants, (India), Vadim Donchenko, Scientific Leader/First Deputy Director General, Scientific and Research Institute of Motor Transport, (Russian Federation), and Vu Anh Tuan, Director, Vietnamese-German Transport Research Centre, Vietnamese-German University, Viet Nam.
Useful comments on the report were provided by Michael Anyala of the Asian Development Bank (ADB), Ram Tiwaree of Environment and Development Division and Michael Williamson of Energy Division of ESCAP, Ganesh Raj Joshi of the United Nations Centre for Regional Development (UNCRD), Debashish Bhattacharjee of UN-Habitat, Auert Joelle of the World Health Organization (WHO).
Grateful acknowledgment is made to the Government of the Russian Federation for the generous funding of this study and useful technical comments on the report.
Experts and delegates from member countries, academia, research institutions and the civil society offered valuable comments on the development of this document.
v
SUSTAINABLE URBAN TRANSPORT IN THE ASIA-PACIFIC REGION FOR THE 2030 AGENDA
Abbreviations
BRT: Bus Rapid Transit
CAGR: Compound Annual Growth Rate
CCTV: closed circuit TV
EEA: European Environment Agency
GDP: gross domestic product
IEA: International Energy Agency
IPCC: Intergovernmental Panel on Climate Change
JICA: Japan International Cooperation Agency
MaaS: Mobility as a Service
MRT: Mass Rapid Transit
M2W: Motorized Two-wheelers
PPP: public private partnership
UNCRD: United Nation Centre for Regional Development
UNFCCC: United Nations Framework Convention on Climate Change
WHO: World Health Organization
vi
SUSTAINABLE URBAN TRANSPORT IN THE ASIA-PACIFIC REGION FOR THE 2030 AGENDA
Executive Summary
A shift towards sustainable transport could save hundreds of thousands of lives every year and deliver savings of $70 trillion by 2050 through improved road safety, reduced air pollution and lower carbon emissions. The transformation to sustainable transport requires a redirection, rather than a substantial increase in infrastructure expenditure, and can be realized through an annual investment of approximately $2 trillion worldwide, similar to the current “business as usual” spending of $1.4 trillion to $2.1 trillion. Investment required in public transport in the years to come will be very large and investment decisions taken need to be coherent with the goal of enhancing access to opportunities. This implies shifting the focus of mobility policies from accommodating traffic growth through expanding road capacity to facilitating access through more affordable and sustainable transport modes, covering formal and informal public transport, walking and cycling. When considering full transport costs, including fuel, expenses and congestion costs, sustainable transport can deliver savings of $70 trillion by 2050.
Asia and the Pacific has been recording rapid population growth and urbanization. The region became predominantly urban in 2019 for the first time ever. With more than 2.3 billion people in the region living in cities, the need for a sustainable urban future has never been greater (ESCAP, 2019c). This rapid growth and increased urbanization will continue to put pressure on urban transport systems and infrastructure, leading to congestion, crashes and increased consumption of fossil fuels. For most Asian-Pacific countries, urbanization challenges are derived mainly from high population growth concentrated in a few cities.
Public transport should be the main transport system of choice in large cities, with more options and better services to improve accessibility and inclusivity. Non-motorized transport should become the norm in small and medium cities. In megalopolises and megacities, a rapid commuting service network with reasonable division of labour (such as trunk railway, intercity railway, city (suburb) railway and urban rail transit) should be built to promote the “one network” of rail transit operation to emphasize rail transit as the backbone of large passenger flow. Non-motorized transport also includes walking and cycling. Notably, many households rely on walking and
cycling as a way to access opportunities and public transport, and in many cases, simply improving walking conditions may increase accessibility.
In the four target countries of this study (China, India, the Russian Federation and Viet Nam) the development of demand-responsive public transport is key to improving urban transport resilience. Attention should be paid to the transportation connections between urban and rural areas to ensure that rural residents can enjoy safe and high-quality public transportation services. Analysis shows that specific attention should be placed on the needs of vulnerable groups in developing strategies for linking urban and peripheral areas.
Adhering to “people-oriented” concepts ensures that transport planning leads to urban sustainability and enhanced traffic resilience. In the process of rapid urbanization, it is necessary to highlight the importance of “people-oriented” urban planning social inclusion in transport is paramount and can help boost affordability and coverage.
In small- and medium-sized cities, there needs to be a shift from infrastructure construction towards service improvement. In large cities, a compact urban development pattern with intensive land use, mixed functions and public transport orientation should be promoted.
A comprehensive systemic approach is key to ensure urban transport sustainability. Efforts to solve the problems of urban congestion with disconnected and simplistic solutions (for example, by expanding the road infrastructure) have proven to be counterproductive.
A sound regulatory framework and quality governance of planning authorities are needed to effectively promote sustainable urban transport. Multi-level institutional rearrangements are essential to prevent the fragmentation and effectively coordinate activities related to planning, development and operation for integrated urban transport infrastructure and services.
In the light of the above needs and objectives, eight key recommendations, supported by some of the best-case studies in the Asia and Pacific region, have been drafted. The objective of these recommendations
vii
SUSTAINABLE URBAN TRANSPORT IN THE ASIA-PACIFIC REGION FOR THE 2030 AGENDA
is to show how national and municipal policymakers can take action towards achieving sustainable transport. Some recommendations directly apply to the decision-making level, while the rest will only be successful if they originate through participatory processes to ensure that respond to people’s needs.
1. Ensure political leadership in transport related decisions
A review of best practices and lessons learned from Asia clearly shows the need for policy support and local leadership in order to implement successful measures in making urban transport sustainable. In fact, Asian cities have managed to implement sustainable measures, thanks to strong political will to overcome transport congestion, ensure greater and more appropriate space sharing among means of transport and provide increased safety and security for travellers. The popular appeal of a measure depends on the positive attitude of public authorities towards modifying urban transport planning – and as such, the political leadership of city-level decision makers is key to shaping the future of transport in the cities of tomorrow.
Governments at all levels should promote the concept of people-oriented urban transport development and embed this concept throughout all aspects of urban transport planning, construction, operations and management. Urban transport management should be regarded as a “major multi-dimensional activity ”. A “major strategy” should be established in order to attract a strong leader to lead departments of transportation, planning, natural resources, finance, public security, and others to make roads and streets truly serve people’s travel need and support green travel rather than cars.
2. Proactively plan for a just and socially inclusive urban transport transition
Some key measures are intended to strengthen tenure security for the urban poor; enhance climate resilience and gender equality by educating all young people; use revenue from fossil fuel subsidy reform or carbon taxes to compensate people who bear the costs of climate action; support local governments to make well-located, serviced land available for growing urban populations; support community-led upgrading of informal settlements; and anticipate, protecting and supporting the workforce of the future, including by developing transition plans for people whose livelihoods are dependent on fossil fuels or work for
fossil fuel-based industries. A circular and systemic approach is paramount to create a living, human city where everything is used, reused and interconnected. Isolating specific solutions will only have a limited and probably short-term impact. Integrated development can lead to large economies in terms of logistics and will help to build a more resilient city, from its main infrastructures to its individual buildings.
In small- and medium-sized cities, more attention should be paid to the travel needs of the people rather than infrastructure construction. The planning direction of urban transport should be changed from “infrastructure” to” “people’s travel” as well as from station construction to service improvement. In emerging cities, the urban transport system should be built based on its own characteristics to avoid traffic congestion during road construction, which is common in in megacities. In addition, it is very important to make full use of the golden age of urban formation to build a transportation facility system suitable for the development of green travel modes, such as walking and cycling, to avoid the lock-in effect of transportation infrastructure in large cities.
3. Fully integrate gender-based dimensions in the mobility and infrastructure analysis and implementation
The region requires efficient, well-built and well-maintained infrastructure to foster inclusive growth for all people and ensure that the dividends of economic growth are equitably shared. This entails adopting a gender-sensitive perspective as analysis in the cities in the Asia-Pacific region indicates that urban mobility policy action needs to be even more gender-sensitive.
Lower employment rates, part-time roles and low-wage positions are the main factors that determine a sensible difference between genders in the labour market, in social life and in transport behaviour. Furthermore, even at retirement, gender needs are notable, given that women make up the majority of the elderly population. The picture emerging in the Asia-Pacific region is one in which there is a difference in travel characteristics between men and women in terms transport modes used, distance travelled, the daily number of trips and their pattern; women predominantly use non-motorized transport.
The gender imbalance emerging from current patterns and trends in mobility and transport reveals the existence of a disparity, which essentially affects three different aspects: the lack of knowledge of gender
viii
SUSTAINABLE URBAN TRANSPORT IN THE ASIA-PACIFIC REGION FOR THE 2030 AGENDA
issues and the scarcity of gender mobility data and statistics; the need to plan gender-tailored mobility services; and the need to better exploit the synergies between urban and mobility planning.
Lessons learned from experiences across Europe and Asia and the Pacific indicate that, in addition to the large information gap to be filled by improving gender-based statistical data and research, the measures implemented at local levels are usually pilot projects, presenting implementation and sustainability problems due to the lack of dedicated public funds projects. Furthermore, addressing women’s mobility requires integration of transport and welfare policies, which may increase the complexity and length of the decision-making process.
4. Foster transport decarbonization in our cities
Decarbonization of all modes of transport by 2050 is possible – but action must be taken now. Cost-effective solutions for passenger and freight transport are available and have been tested at scale (electrified mobility solutions, shared and integrated with walking, cycling and public transport). This study shows that concerted national and urban policy together with business action is required to avoid unnecessary trips, shift to efficient modes and improve vehicles and fuels. Aligning national policies behind compact, connected, clean cities can make a difference in the Asia Pacific region.
Key measures involve reforming energy markets to decarbonize the electricity grid; reaching net-zero operating emissions in all buildings with minimal use of carbon offsets; decarbonizing the electricity grid; banning the sale of fossil fuel-powered vehicles and ending the subsidies to the whole carbon economy; adopting green alternatives to steel and cement; and shifting away from building detached housing in established cities. Senior decision makers in India, for example, are suggesting that the sale of fossil fuel-powered passenger cars and two-wheelers be prohibited from 2030. These policies for safe, clean, efficient and affordable mobility for all must be part of all low-carbon transport actions. Calculations show that investments in sustainable low-carbon transport offer great value for money and bring substantial, long-term, economy-wide benefits, while improving social equity.
In Asian cities, it is also necessary to pay close attention to the development of e-bikes. The practice of e-bikes in many cities in southern China has proved that it
can be an efficient vehicle for short-distance travel in subtropical and temperate cities and is practical in small- and medium-sized cities in hills and mountains. At the same time, it also has unique advantages of reducing energy consumption and pollutant emissions. Accordingly, decision makers should not implement a policy to ban them.
The walking and cycling environment needs to be improved. It is necessary to improve the standards and management system for the construction of pedestrian and bicycle facilities. Pedestrian and bicycle lanes should be set up in accordance with regulations for the new construction and reconstruction of urban roads. Setting up special bicycle roads in areas where conditions permit should be encouraged. In China the greatest obstacle to increasing the proportion of active travel is the right of way and traffic order, which need to be solved through policies and infrastructure construction. It is necessary to continue to solve such problems by setting non-motorized vehicle lanes and sidewalks, and building a safe, continuous and comfortable traffic system.
5. Target urban transport financial sustainability with new business models
Overall, the findings of the analysis support the view cities must aim to achieve financial sustainability for their urban transport systems by combining innovative multitier financing with astute investments. Innovative financing refers to the revenue side, which can increase if different financial instruments are combined and managed effectively. More astute investments associated with the expenditure side, means strategically choosing to develop cost-effective projects that contribute towards solving short-term difficulties while working to achieve long-term transport sustainability goals. More specifically, it is acknowledged that from the revenue-side perspective, the observed underfinancing of the transport sector stems from existing price distortions that have tacitly contributed to the subsidizing of certain mode inefficiencies, particularly those of the private car.
Public transport development remains challenging as there is a lack of a comprehensive tariff policy for public transport in local areas. The fare and subsidy policy in megacities of Asia have been successful in providing affordable public transport services to social groups, especially students. However, mass rapid transit systems (specially MRT and BRT lines) may be at risk, as it would be difficult to introduce new fares that are more than the existing fares and it is more difficult to
ix
SUSTAINABLE URBAN TRANSPORT IN THE ASIA-PACIFIC REGION FOR THE 2030 AGENDA
continue to improve the quality of current services. Accordingly, the megacities need to consider reforming their fare and subsidy policy in coming years with and consider introducing new railways and BRT lines and improving city bus networks, as well consider fare integration between these transit modes.
Accordingly, an ideal financing strategy should aim at setting financial instruments at prices that charge users for the total costs of using a given infrastructure or transport service; this pricing practice will correct market distortions, educate user behaviour and increase revenue to a level equal to or above expenditures. Regarding the COVID-19 pandemic, transport flows have been seriously disrupted and a balance between ensuring connectivity and providing a safe experience is crucial. Public or private transport providers may need temporary financial support, which may present an opportunity to favour operators that follow sustainable best practices.
6. Improve technological innovation supported by awareness and expezrtise
In several of the cities observed for this study, some innovative measures that rely on technological and digital innovation have proven to be useful for the implementation of local transport policies for people. In many policy initiatives, intelligent transport systems have been used to assess traffic flow, carry out remote monitoring and provide instant information to users. Knowledge and expertise in relation to intelligent transport systems technology is vital to ensure the smooth implementation of a mobility plan. Some examples of information technologies are digital and mobile applications, which are used to provide citizens with real-time information, ease the use of different transport modes, engage stakeholders in decision-making and actively involve them in campaigns and incentive programmes. Special attention has to be paid at how these mechanisms are designed and deployed in order to protect users’ privacy by using secure, decentralized and anonymized structures. Knowledge and expertise are also crucial to this regard.
The demand for app-based taxi services is increasing rapidly, which, in turn, is hindering the growth of traditional taxi demand. The popularity of app-based delivery services in general and app-based food delivery services in particular has also grown significantly in recent years. The fast pace of life and the development of the modern urban wave have led to significant changes in the eating habits of many people. App-based taxi services and app-based
delivery services have led to significant changes in the travel behaviour of citizens. In terms of legislation, there is an ongoing debate over the identification of the classification of ride hailing apps, as to whether they are a taxi service or a platform service. This distinction is to support authorities in regulating new mobility services and create fair competition among service providers. Regardless of the results of this debate, these new mobility services are offering solutions to intermodal connectivity, demand responsiveness and urban resiliency against disruptions, most notably the one caused by the COVID-19 outbreak. As such, true collaboration between authorities and ride-sharing companies is needed to gain mutual benefits to meet growing travel demand and achieve sustainable urban mobility.
7. Involve stakeholders and obtain public support in transport plans
An assessment of the successful transformative project in cities shows the need for comprehensive communication and information tools to reach stakeholders. The opinions held by members of the public and transport users about proposed sustainable urban transport measures must be assessed in order to achieve greater acceptance and reach a better understanding of people’s travel patterns and how transport planning can make a positive change in travel behaviour. By involving users, it is more likely that behavioural change will be achieved, as demonstrated in numerous cities. A community has to be supported by a flexible design and empowered through citizen participation mechanisms. This will distinguish a residential development from a living city and is applicable to the dialogue with the neighbouring towns, which should also benefit from transportation projects.
Cities should concentrate on the care of vulnerable groups in the development of city traffic, especially to make it possible for persons with disabilities, the elderly and children to enjoy safe, comfortable, and convenient public transport services. A city traffic system, especially public transport facilities, vehicles and services, should enable them to fully participate in their social lives. Cities need to promote the accessibility of urban roads, bus stations and vehicle facilities in addition to developing new modes of transportation and on-demand travel services that adapt to the ageing trend.
x
SUSTAINABLE URBAN TRANSPORT IN THE ASIA-PACIFIC REGION FOR THE 2030 AGENDA
8. Intertwine urban governance with transport master planning
As a result of devolution and decentralization, cities and urban authorities are receiving more autonomy and authority to plan, make decisions and implement projects. These authorities need support in exercising their power, such as developing legal and regulatory frameworks, enhancing institutional coordination, ensuring effective public participation, and making effective and timely evidence-based decisions. There are many examples of city leaderships leading the transformation of cities and developing exemplary public transport systems, which can be followed to enable world-class sustainable public transport systems. Delays in decision-making and project implementation translate into increased costs to economies. In order to improve project governance, accountability frameworks, inspection and monitoring guidelines, and quality assurance plans should be formulated and strictly followed.
Each city should develop an integrated sustainable urban transport master plan that meets the mobility needs of its urban residents based on the use of public transportation systems with future growth and expansion in mind. The plan should incorporate all modes of transport, including active modes, such as pedestrian facilities and cycling, and promote road safety, barrier-free access, inclusiveness and intermodal transfer facilities. The master plan should be developed through a public consultation process, with the support of experts, to ensure citizen-ownership. It should serve as a blueprint for all related projects and programmes, taking into account the expansion of urban areas, changes in demand and travel patterns.
After the master plan is developed, a commitment to from all stakeholders is required to implement it through the mobilization of resources, prioritization and development of projects. Many Asian cities have invested in and developed urban public transport systems through private sector participation. For example, the private sectors in Hong Kong, China and Tokyo are developing metro and suburban railways that fully integrate land-use and transport planning to maximize value capture. Implementation of urban transport plans also needs a high level of coordination among multiple agencies at all levels of government (national, provincial, and urban/local).
In the process of rapid urbanization, special attention should be paid to forecasts related to traffic demands, and the formulation of planning should rely on the
forward-looking prediction of traffic demands. It is necessary to scientifically formulate urban land and space planning, urban comprehensive transportation planning, public transportation and other special plans. It is also necessary to adjust and control the traffic distribution from its source through planning to achieve a balance of urban occupation and residence, to reduce invalid travel, and to achieve energy conservation and emission reduction.
In large cities, it is necessary to promote the establishment of a compact urban development pattern with intensive land use, mixed functions and public transport orientation. To promote the development of public transport, formulation of comprehensive development and utilization policies of public transport land need to be accelerated. For example, the” three-in-one” development mode of construction, operation, and property was implemented in Shenzhen, China by giving transport operators reserved land rights along key transport corridors.

xi
SUSTAINABLE URBAN TRANSPORT IN THE ASIA-PACIFIC REGION FOR THE 2030 AGENDA
Contents
Acknowledgments iv
Abbreviations v
Executive Summary vi
Chapter 1: Urban transport trends and challenges in Asia and the Pacific 1
Chapter 2: Goals for Sustainable Urban Transport in Asia and the Pacific 57
Chapter 3: Findings and Lessons from Four Countries 71
Chapter 4: How to Make Urban Transport Sustainable in the Asia-Pacific Region 85
Chapter 5: Recommendations 132
Bibliography 137
Figures, Titles, Boxes
FIGURE 1. Key pillars for adaptation to the new normal for urban transport operations 3FIGURE 2. Takeaway-only food delivery services 5FIGURE 3. Chinese Urbanization Rate and Total Population during 2010 to 2018 8FIGURE 4. China’s vehicle ownership per thousand people during 2014 to 2019 9FIGURE 5. Historical Population Growth Rate 11FIGURE 6. On-road vehicle stock in India 12FIGURE 7. Modal split of work trips in urban centers of India distributed by the size of cities 12FIGURE 8. Work trip modal share and length of work trips in urban India (2011) 13FIGURE 9. Dynamics of motorization level in the Russian Federation in the period 1990–2018,
cars/1000 people 14FIGURE 10. Numbers of motorcycles and cars in Viet Nam (1995–2016) 15FIGURE 11. Rail-based mass transit systems in Asian cities 16FIGURE 12. Public transport mode share in selected Asian cities, 2015 17FIGURE 13. Mass transit system in selected cities, 2015 19FIGURE 14. Passenger capacity and costs for urban transit systems. Bus Rapid Transit:
Planning Guide, 2007 20FIGURE 15. Suroboyo Bus System 21FIGURE 16. A railway station in the ring road of Moscow 23FIGURE 17. Modal shift challenge in Binh Duong City, 2019 24FIGURE 18. The first waterbus route in Ho Chi Minh City 25FIGURE 19. Rental bicycle system at Ho Chi Minh City National University 25FIGURE 20. Walking streets in the central area of Ho Chi Minh City 26FIGURE 21. Pedestrian street network plan by 2025 in the Ho Chi Minh City central area 26FIGURE 22. Road Traffic death for our 4 countries, and road user death (%), 2018 28FIGURE 23. Distribution of road traffic deaths by type of road user, 2017 29FIGURE 24. Road traffic fatalities and fatality rate in ESCAP region in 2013 and 2016 30FIGURE 25. Road Traffic Crashes and Fatalities trend in India 31
xii
SUSTAINABLE URBAN TRANSPORT IN THE ASIA-PACIFIC REGION FOR THE 2030 AGENDA
FIGURE 26. Worst performing cities in terms of road safety in India (2018) 33FIGURE 27. Road crash fatalities in Viet Nam (2001–2018). 33FIGURE 28. Traffic congestion in major cities in Asia 36FIGURE 29. Peak hour congestion (per cent extra travel time) in Asian cities. 37FIGURE 30. Contributions of particulate matter in Indian cities (2011) 38FIGURE 31. Contributions of particulate matter in Indian cities (2011) 38FIGURE 32. Change of pollutant emissions from motor vehicles in the atmospheric air in the
Russian Federation, (thousand tons) 39FIGURE 33. Electric bus in Moscow 40FIGURE 34. Comparison of hourly average Air Quality Index in Hanoi in 2016 and 2017 40FIGURE 35. Climate change in the Asia- Pacific region, 2014 42FIGURE 36. Impacts of climate change in the Asia-Pacific region 43FIGURE 37. Greenhouse gas emissions in the Asia-Pacific region (million tonnes of CO2
equivalent), 2010. 44FIGURE 38. Major resilience characteristics that should be built in as part of an urban resilience
solution 44FIGURE 39. Electric bus in Moscow 46FIGURE 40. Share of CO2 emissions (in MT) 47FIGURE 41. Government of Viet Nam resolution on climate change with measures towards 2050 48FIGURE 42. Intelligent transport system short- and long-term goals in four major areas 50FIGURE 43. Car Rental in Moscow 51FIGURE 44a. Center for Traffic Management in Khabarovsk 54FIGURE 44b. Special monitor in the Khabarovsk Center for Traffic Management 54FIGURE 45. Diesel bus emitting black smog in Ho Chi Minh 55FIGURE 46. On-street car parking management and pricing in Ho Chi Minh 56FIGURE 47. Projected urban population in Asia and the Pacific, 2019 to 2050 60FIGURE 48. Recent international agreements towards sustainable development 60FIGURE 49. Overview of some sustainability related impacts from transport 64FIGURE 50. Sustainable transport impacts on achieving the Sustainable Development Goals 64FIGURE 51. Contribution of urban transport and road safety to the Sustainable Development Goals 66FIGURE 52. The Sustainable Urban Transport Index 68FIGURE 53. Basic characteristics of the four pilot cities 68FIGURE 54. SUTI spider diagram for Jakarta 69FIGURE 55. Sustainable Urban Transit Index spider diagramme for Kathmandu 69FIGURE 56. Sustainable Urban Transit Index spider diagramme for Hanoi 70FIGURE 57. Sustainable Urban Transit Index spider diagramme for Colombo 70FIGURE 58. Review of transit- oriented development implementation in three Indian cities 76FIGURE 59. DIMTS Buses at a Depot in Delhi 77FIGURE 60. Janmarg BRT buses lined up at a bus stop 77FIGURE 61. Bengaluru Metropolitan Transport Corporation buses lined up at a depot 78FIGURE 62. Change of social risk index in the Russian Federation for the period from 2000 to 2019 80FIGURE 63. Planned mass transit network in Ho Chi Minh City 82FIGURE 64. Development plan for Ho Chi Minh Metropolitan Region 83FIGURE 65. Shares of firms and employments in the Ho Chi Minh metropolitan region 84FIGURE 66. Example of a national transport strategy from Malaysia 88FIGURE 67. Factors needed in a successful national sustainable transport strategy 89FIGURE 68. How to create a framework for a national transport strategy 90FIGURE 69. Ho Chi Minh Metropolitan Region Plan 91FIGURE 70. Sustainable transport instrument overview – Level of Implementation and responsible
stakeholders 96FIGURE 71. Sustainable transport instrument overview – Contribution to greenhouse gas reduction,
co-benefits 97FIGURE 72. Bike rental point 100FIGURE 73. Accessible buses in Khabarovsk 101
xiii
SUSTAINABLE URBAN TRANSPORT IN THE ASIA-PACIFIC REGION FOR THE 2030 AGENDA
FIGURE 74. Three strategic directions for cities 104FIGURE 75. Differences between traditional transport planning and sustainable urban mobility
planning 105FIGURE 76. Low-carbon measures that could cut urban emissions 107FIGURE 77. Technically feasible potential to reduce greenhouse gas emissions from cities by 2050,
by sector 109FIGURE 78. New Electric Car Sales by Country between 2013 and 2018 (‘000s) 110FIGURE 79. Key abatement options for zero-carbon cities 112FIGURE 80. Urban public transport system in Shenzhen, China 113FIGURE 81. Uniform electronic travel card in Khabarovsk 114FIGURE 82. Big data’s basic layers needed for smart infrastructure 116FIGURE 83. Shuttle service bus 117FIGURE 84. Bangalore City Traffic Management Centre 118FIGURE 85. The strengths and weaknesses of various new technologies 119FIGURE 86. Alwar Vahini fleet 121FIGURE 87. Bicycle transport by tourists in Hue and Hoi An, Viet Nam 130FIGURE 88. Walking streets surrounding Turtle Lake in Hanoi City 130FIGURE 89. Flow-density relationship in a motorcycle traffic system 131
11
Chapter 1 Urban transport trends and challenges in Asia and the Pacific
2
SUSTAINABLE URBAN TRANSPORT IN THE ASIA-PACIFIC REGION FOR THE 2030 AGENDA
Introduction
The pattern of urbanization occurring throughout Asia and the Pacific presents great challenges as well as unique opportunities to address environmental degradation, social inequity and poverty. Numerous studies have focused on trends, challenges and innovations related to urban transport sustainability around the world. The purpose of this report is to highlight potential best practices to guide Asia-Pacific cities in a path towards sustainability.
With more than 2.3 billion people in the region living in cities, the need for a sustainable urban future has never been greater. However, urbanization is a source a global growth but it also poses many problems. Investment gaps are widening, transparency and citizen participation is scarce, inequalities are rising (OECD, 2019) and territorial and social cohesion is at risk (Fleurbaey and others, 2018). Moreover, land-use policies are massively ailing (Seto and others, 2012; Angel and others, 2016) and the ecological footprint of human activities is rising faster than ever before (Wackernagel, 1996;; Sachs, 2015).
The traditional approach to transport policy has focused on generating physical movement and increasing speeds as opposed to guaranteeing access. This has often resulted in induced demand, exacerbating congestion, pollution and greenhouse gas emissions. Car-oriented expansion has also compromised public transport and facilities for walking and cycling, with land allocated to roads and road space predominantly allocated to private vehicles.
A focus on private motorized transport also tends to exacerbate inequality and social exclusion. By shifting the focus of policies and investment from accommodating traffic growth to improving accessibility, governments should consider delivering simultaneously on a wide set of sustainability goals. Only a holistic vision of sustainability can tackle these challenges by harmonizing social, economic, environmental and institutional dimensions.
It took 30 years for the Intergovernmental Panel on Climate Change (IPCC) to build evidence, knowledge and the role of science-to-society regarding climate change. At this pace, it will be necessary to wait until 2050 to deploy science-to-policy partnerships in the field of urbanization, with a priority on informality, urban planning and design and green and blue infrastructures (Parnell and others, 2018). Because of the limitations of natural resources and the regeneration of eco-systems is questioned, 2050 is way too far in the horizon (Silvain
and others, 2018; Nofal and others, 2019).
Following over a decade of loosely coordinated action and policymaking at combined micro, metro, and macro-scales (Buchoud, Nicolas and Phan, 2019), the world is now at a turning point. As illustrated by the Nationally Determined Contributions (NDCs) associated with the Paris Agreement, it is now on the way of being transformed into applicable policies.
The word “sustainability” has often been misappropriated. It is important to understand the global role of sustainability a new and implementable way of conceiving mankind’s relationship with nature in which man becomes part of the cycle instead of being a disruptive element. Sustainability means preserving and developing physical and environmental assets for future generations. It also means including and empowering people to give them equal chances and developing business models that use innovation to create value through positive impacts.
Sustainable transport presents enormous opportunities, such as the potential to save hundreds of thousands of lives every year through improved road safety and reduced air pollution and to result in a reduction in carbon emissions by several gigatons. The transformation to sustainable transport requires a redirection, rather than any substantial increase in infrastructure expenditure and can be realized through an annual investment of approximately $2 trillion, similar to the current “business as usual” spending of $1.4 trillion to $2.1 trillion. When considering full transport costs, including fuel, operational expenses, losses due to congestion and vehicles, sustainable transport can deliver savings of $70 trillion by 2050. In addition, improvements in border administration, transport and communication infrastructure could increase global gross domestic product (GDP) by $2.6 trillion, or 4.7 per cent.
There is also an urgent need to address the staggering social, environmental and economic costs associated with “business as usual”. Every year, 1.35 million people die in road crashes (WHO; 2018). Road traffic injuries are the leading killer of children and young adults, and more than half of global road traffic deaths are among pedestrians, cyclists and motorcyclists who are still too often neglected in road traffic systems. In addition, 4.2 million people die prematurely due to outdoor pollution, including from transport sources (WHO, 2016). Some 91 per cent of those premature deaths have occurred in low- and middle-income countries, with the greatest number being in the WHO South-East
3
SUSTAINABLE URBAN TRANSPORT IN THE ASIA-PACIFIC REGION FOR THE 2030 AGENDA
Asia and Western Pacific regions. Some 23 per cent of energy-related greenhouse gas emissions come from transport, and road congestion is a tremendous burden on the economy, currently accounting for 2 to 5 per
cent of GDP in Asia, and as high as 10 per cent of GDP in some cities of emerging economies, including Beijing, São Paulo, and Lima.
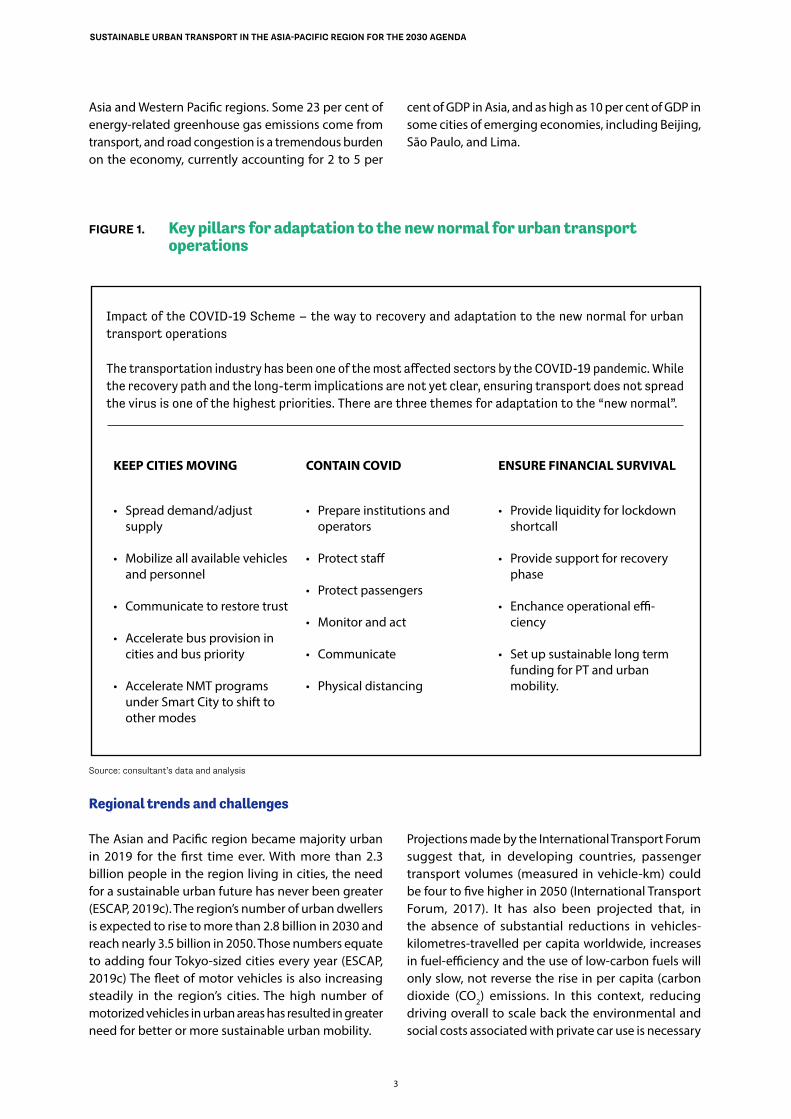
FIGURE 1. Key pillars for adaptation to the new normal for urban transport operations
Impact of the COVID-19 Scheme – the way to recovery and adaptation to the new normal for urban transport operations
The transportation industry has been one of the most affected sectors by the COVID-19 pandemic. While the recovery path and the long-term implications are not yet clear, ensuring transport does not spread the virus is one of the highest priorities. There are three themes for adaptation to the “new normal”.
KEEP CITIES MOVING CONTAIN COVID ENSURE FINANCIAL SURVIVAL
• Spread demand/adjust supply
• Mobilize all available vehicles and personnel
• Communicate to restore trust
• Accelerate bus provision in cities and bus priority
• Accelerate NMT programs under Smart City to shift to other modes
• Prepare institutions and operators
• Protect staff
• Protect passengers
• Monitor and act
• Communicate
• Physical distancing
• Provide liquidity for lockdown shortcall
• Provide support for recovery phase
• Enchance operational effi-ciency
• Set up sustainable long term funding for PT and urban mobility.
Source: consultant’s data and analysis
Regional trends and challenges
The Asian and Pacific region became majority urban in 2019 for the first time ever. With more than 2.3 billion people in the region living in cities, the need for a sustainable urban future has never been greater (ESCAP, 2019c). The region’s number of urban dwellers is expected to rise to more than 2.8 billion in 2030 and reach nearly 3.5 billion in 2050. Those numbers equate to adding four Tokyo-sized cities every year (ESCAP, 2019c) The fleet of motor vehicles is also increasing steadily in the region’s cities. The high number of motorized vehicles in urban areas has resulted in greater need for better or more sustainable urban mobility.
Projections made by the International Transport Forum suggest that, in developing countries, passenger transport volumes (measured in vehicle-km) could be four to five higher in 2050 (International Transport Forum, 2017). It has also been projected that, in the absence of substantial reductions in vehicles-kilometres-travelled per capita worldwide, increases in fuel-efficiency and the use of low-carbon fuels will only slow, not reverse the rise in per capita (carbon dioxide (CO2) emissions. In this context, reducing driving overall to scale back the environmental and social costs associated with private car use is necessary
4
SUSTAINABLE URBAN TRANSPORT IN THE ASIA-PACIFIC REGION FOR THE 2030 AGENDA
to meet sustainability objectives. In the long run, this may not be so much a necessary greenhouse gas emissions reduction strategy but more a strategy for urban attractiveness.
The rapid growth and increased urbanization will continue to put stress on urban transport systems and infrastructure, leading to congestion, crashes and more consumption of fossil fuels, and correspondingly an increase in greenhouse gas emissions. Quality of life issues, such as loss of productivity and health will also suffer as follow-on impacts. For most Central Asian countries, urbanization challenges are derived mainly from high population growth concentrated in a few cities. These pressures are intensified by shrinking employment opportunities in rural areas resulting from limited land and water resources. Migrants from rural areas mostly settle in large cities, where urban housing, infrastructure and employment opportunities are not meeting the demand from new residents. These issues are aggravated by limited electricity supply in most densely populated areas and high transportation costs for small- and medium-size businesses in rural areas.
These challenges can be divided into physical-geographical constraints, increased migration, and differences in the models of economic reforms. First, a major challenge of urbanization stems from the limited supply of water, land and energy resources in most countries of the region, which makes extensive agricultural growth unfeasible in the long term. By 2025, accessible agricultural land per capita in the region will decrease by an average of 19 per cent. Second, limited opportunities for agricultural growth have resulted in high rates of internal and/or external migration in Central Asia. Internal migration consists mainly of the flow of surplus labour from rural to urban areas. Shrinking employment opportunities in rural areas have been buffered to date by increased external labour migration in which incomes are derived through remittances.
A way forward
By creating more mixed-use urban districts where people can live, work, study, shop and enjoy recreational activities without excessive travel, and combining them with city-wide, high-capacity public transport, cities can benefit from agglomeration effects, using resources more efficiently and achieving greater prosperity and social inclusion at lower costs.
Foundations of good urbanism are inherent to many successful interventions in cities around the world.
They are part of social urbanism in Medellin, Colombia, with its focus on linking new transport with social infrastructures, and efforts in Seoul to activate public space within the urban core. The transit-oriented urban intensification strategy applied in London, which is informed by its spatial development plan, has facilitated more successful, sustainable growth not unlike that of the more land-constrained Tokyo.
The investment needed in public transport in the years to come in Asia and the Pacific will be very large. Investment decisions need to be coherent with the goal of enhancing access to opportunities. This implies shifting the focus of mobility policies from accommodating traffic growth through expanding road capacity to facilitating access through more affordable and sustainable transport modes, covering formal and informal public transport, walking and cycling. Often the lack of, or poor access to, public transport options is central to limitations on access to jobs, educational institutions, health facilities and social networks.
Nevertheless, reversing business-as-usual urbanization trends requires more ambitious and coherent action. It requires joined-up interventions from the national to the local levels that take into account that urban development is shaped by policies at multiple levels.
5
SUSTAINABLE URBAN TRANSPORT IN THE ASIA-PACIFIC REGION FOR THE 2030 AGENDA
CASE STUDY
Impact of COVID-19 Pandemic on urban transport in Viet Nam
Between March and May 2020, Viet Nam imple-mented social-distancing measures to cope with the Covid-19 pandemic; all city bus, intercity coaches, taxis, railway, and airway services were stopped. Bus and taxi ridership decreased by 80 per cent compared to the same period in 2019. However, the negative impacts continued long after service resumption.
City bus systems resumed operations in May 2020, but very few passengers were willing to use bus services due to psychological fears about the virus spread. The authority of Ho Chi Minh City reported that bus passengers were only 40 per cent of number achieved in the same period in 2019. Consequently, public transport service providers face serious financial difficulties.
Even after the pandemic, the public transport systems are likely to remain extremely weak-ened, jeopardizing strategies to expand the public transport network. Municipal governments have implemented a series of financial support measures, such as lower bank interest rates, tax reductions, financial support to employees and exemption of road maintenance fees until the end of 2020. Furthermore, transport departments are adjusting bus subsidy schemes in 2020 to cover the operating costs during and after the pandemic periods.
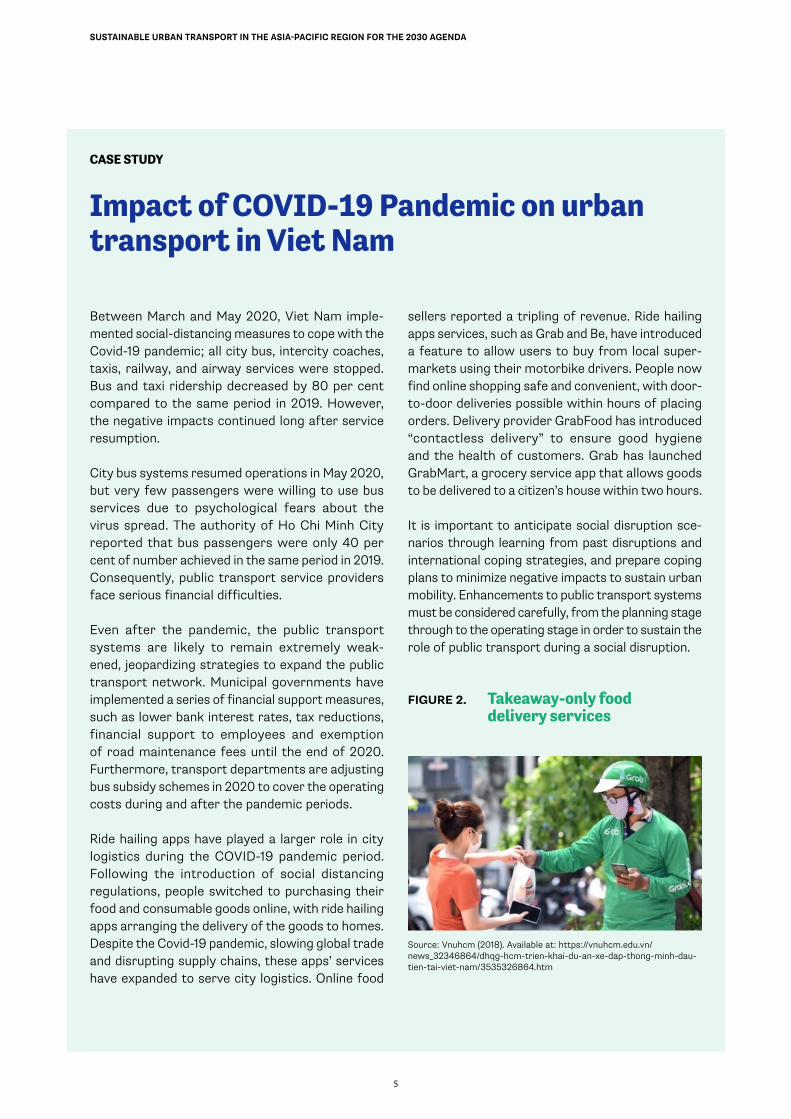
Ride hailing apps have played a larger role in city logistics during the COVID-19 pandemic period. Following the introduction of social distancing regulations, people switched to purchasing their food and consumable goods online, with ride hailing apps arranging the delivery of the goods to homes. Despite the Covid-19 pandemic, slowing global trade and disrupting supply chains, these apps’ services have expanded to serve city logistics. Online food
sellers reported a tripling of revenue. Ride hailing apps services, such as Grab and Be, have introduced a feature to allow users to buy from local super-markets using their motorbike drivers. People now find online shopping safe and convenient, with door-to-door deliveries possible within hours of placing orders. Delivery provider GrabFood has introduced “contactless delivery” to ensure good hygiene and the health of customers. Grab has launched GrabMart, a grocery service app that allows goods to be delivered to a citizen’s house within two hours.
It is important to anticipate social disruption sce-narios through learning from past disruptions and international coping strategies, and prepare coping plans to minimize negative impacts to sustain urban mobility. Enhancements to public transport systems must be considered carefully, from the planning stage through to the operating stage in order to sustain the role of public transport during a social disruption.
FIGURE 2. Takeaway-only food delivery services
Source: Vnuhcm (2018). Available at: https://vnuhcm.edu.vn/news_32346864/dhqg-hcm-trien-khai-du-an-xe-dap-thong-minh-dau-tien-tai-viet-nam/3535326864.htm
6
SUSTAINABLE URBAN TRANSPORT IN THE ASIA-PACIFIC REGION FOR THE 2030 AGENDA
1.1 Urbanization and motorization
Introduction
Urban areas are the “engine” to economic growth and employment, and the foremost producers of knowledge and innovation. Towns and cities are the hubs and drivers of economic activity and welfare. Urban transport systems are vital to the economic functioning of cities through the provision of accessibility for goods and commuters. Similarly, they are vital to the welfare of the population by providing accessibility for all social activities.
However, due to the extensive economic activity in urban areas, many Asian cities face numerous problems related to or caused by transport and traffic. Economic and social transformation has rapidly increased the levels of mobility. The growth of private car use has been accompanied by increased urban sprawl and commuting, whereas in many cases public transport networks have not been developed at the same rate.
In addition to this, transport systems generate negative external effects. Congestion, air and noise pollution, and road safety are examples of commonly shared problems in Asian cities. In addition to these direct impacts, urban transport also affects social development, social inclusion and accessibility for people with reduced mobility. The need for sustainable mobility has been receiving increasing attention. Asian cities face the challenge of how to enhance mobility, ensure accessibility and create high-quality and efficient transport systems while at the same time reduce congestion, pollution and crashes.
In many cities in developed and developing countries, congestion, pollution, shifting economic centres and demographic patterns present imminent threats to lives and livelihoods. The transport landscape in urban agglomerations is often highly inequitable, with poor and people with disabilities lacking adequate means to access the economic and social centres of the cities. The burden of climate change adds another layer of urgency and complexity to the problems that decision makers must address in their quest to create sustainable cities.
Congestion is increasing while access is decreasing. Transport-caused air pollution appears to be on the increase. Crash rates per km have been declining, but total fatalities per km still remain among the highest in the world. Social issues are often not considered. The
economics of public transport are marginally positive, but they are threatened by the increased use of private vehicles. Perhaps most encouraging is the way in which governance is improving, with a hard push for cleaner fuels and vehicles, and better road safety. Whether the policy process can increase safety and access for the poor and for those who walk or cycle, still remains to be seen.
Regional trends and challenges
Between 1960 and 2017, the world’s urban population quadrupled from approximately one billion to more than four billion people. United Nations demographers estimate that Asia and the Pacific became majority urban for the first time in 2019. The region’s urban population exceeded 2.3 billion, comprising 54 per cent of all urban dwellers on the planet. The number of urban dwellers is expected to rise to more than 2.8 billion in 2030 and reach nearly 3.5 billion in 2050. Those numbers equate to adding four Tokyo-sized cities every year (United Nations, 2019). In addition, in recent decades polycentric metropolitan regions consisting of a number of connected large urban areas have evolved, which present a new set of challenges for transport planning.
Urbanization and public spaces: a dependency in the making
Urbanization enables people to come together to benefit from economies of agglomeration through increased productivity due to economic density, accelerated innovation from knowledge spillovers, and greater mobility and access to jobs and services. However, it also puts immense pressure on land and natural resources. As a result, the urban environment is often riddled with undesirable outcomes, such as housing shortages and unaffordability of the poor basic services, increased pollution and congestion. The extent to which cities will continue to be sustainable as they grow depends on how they manage the trade-offs between the benefits of urban agglomeration and the costs of unplanned urbanization processes.
In the public realm – the urban spaces between buildings, such as streets and open space – the frictional forces of urbanization and their negative externalities manifest themselves in many forms, including into neglected parks and open spaces that become collectors of trash and pollution, streets that divide communities without consideration for pedestrians, and vehicular traffic that dominates the use of public spaces. In the city of Dhaka, for example – home to one of the world’s
7
SUSTAINABLE URBAN TRANSPORT IN THE ASIA-PACIFIC REGION FOR THE 2030 AGENDA
densest urban populations at about 510 persons per hectare (United Nations Department of Economic and Social Affairs, 2018) – traffic moves only slightly faster than the walking pace, at approximately 7 km per hour (World Bank 2017). Poor-quality, uncomfortable, and unhealthy urban environments and public spaces have, therefore taken a toll on liveability, resilience and competitiveness in many of the world’s densest cities. As a result, citizens who rely on public spaces to access jobs and services, enjoy open spaces and greenery, or earn their livelihoods – such as the operators of street markets and vendors that form a sizable part of the informal economy (Skinner, Orleans Reed and Harvey 2018) – are affected disproportionately.
Motorization and informal transport
Motorization has increased rapidly in the Asia-Pacific region. Most countries recorded growth of the motorization rate (vehicles/1,000 inhabitants) from 2014 to 2015. This rate in highly motorized countries, such as Australia, Japan, New Zealand, and the Republic of Korea increased from 402-796 in 2014 to 417-819 in 2015, and the rate in less motorized countries, such as India, Pakistan, the Philippines and Viet Nam increased from 20-36 in 2014 to 22-38 in 2015. Motor vehicle fleets in the region double every five to seven years. By 2035, it is estimated that China alone will be home to approximately 350 million private cars, which is 10 times the figure for 2008. Also, private vehicles in India are estimated to increase threefold.
In addition to the growing number of private vehicles, powered two and three-wheelers are believed to constitute a major share of the vehicle population in South and South East Asia’s cities (related data on this are scarce). Due to the growing numbers of private vehicles and unreliable public transport systems, regional cities and member States are finding it difficult to attract more commuters to use public transport. Other factors, such as ease of access, affordability, flexibility and convenience, have added to the business viability of informal motorized modes.
Because these transit modes often operate under little or no regulations, the service quality can be poor and the operations unsafe and polluting. In Jakarta, the slower and smaller vehicles are confined to peripheral parts of the city and on narrow roads, out of concern for safety and traffic discipline. In Bangkok, they are not licensed to transport passengers. In Manila, jeepneys stop and pick up passengers at their convenience without regard to road safety. Since 2000, Viet Nam has banned three-wheeled motorbikes with open
cargo bins in the front for goods transport. In Ho Chi Minh City, these are considered inefficient modes, as they take up nearly as much space as a car, but greatly contribute to traffic congestion.
Informal transport is inefficient; reform is needed. Massive gaps in public transport infrastructure have contributed to the emergence of paratransit or quasi-formal transport networks that in some cases have become the predominant form of collective transport. These informal modes appear to be significantly important for economic and social sustainability, as they transport lower-income groups to workplaces, as well as provide employment opportunities. Given the role that informal transport plays in filling accessibility gaps, there is a recognized need to engage with these operators on a path towards operational reform. In particular, the quality of service provided by private operators needs to be dramatically improved.
There is no single clear pathway for modernizing or including informal operators in a centrally planned system. However, several short-term measures, including changes to concessions and service agreements, and training given to operators, have reaped benefits for several cities. A ban on these modes may adversely affect the economic situation of lower-income groups. These modes compete with regular taxis, buses, and light rail systems by providing low fares and better door-to-door services. There may be sufficient incentives for service improvements in the informal transport when public transport is also promoted and improved in parallel. For example, in an attempt to regulate tuk-tuks, Phuket (Thailand) plans to introduce fare meters in them to ensure that they remain viable while the public transportation system is being upgraded.
Two-stroke engine vehicles in developing cities in Asia fall into two categories: two-wheelers and three-wheelers. Two-wheelers which include mopeds, scooters and motorcycles, are used mostly for personal transportation, although in Bangkok and some other cities – including cities in Viet Nam and Indonesia – motorcycles are also used for public transportation or paratransit. Three-wheelers include small taxis, such as auto-rickshaws in India and Sri Lanka, baby taxis in Bangladesh, and tuk-tuks in Thailand. They are usually used to carry three passengers – and larger vehicles, such as Tempos in Bangladesh, Nepal, and parts of India, can carry as many as a dozen passengers.
Two- and three-wheelers play an important role in the transport market in Asia. India, China, Viet Nam,
8
SUSTAINABLE URBAN TRANSPORT IN THE ASIA-PACIFIC REGION FOR THE 2030 AGENDA
and Indonesia have a large number of two-wheelers, which are used mostly for personal transport. Three-wheelers are typically used as short-distance taxis. In Sri Lanka, some families buy three-wheelers for private use, attracted by the lower price of the vehicles relative to passenger cars. More than half of the motor vehicle fleet in China, Thailand, and Malaysia consists of two-wheelers; in Indonesia, Viet Nam and Taiwan Province of China, this figure exceeds two thirds of the fleet. Two- and three-wheelers are predominant vehicles in the fleets of Dhaka (Bangladesh), Ho Chi Minh (Viet Nam), Denpasar (Indonesia), and Delhi (India). However, there is not always a close correspondence between the number of vehicles registered and those in use, making it important to use reliable data when conducting an analysis.
China
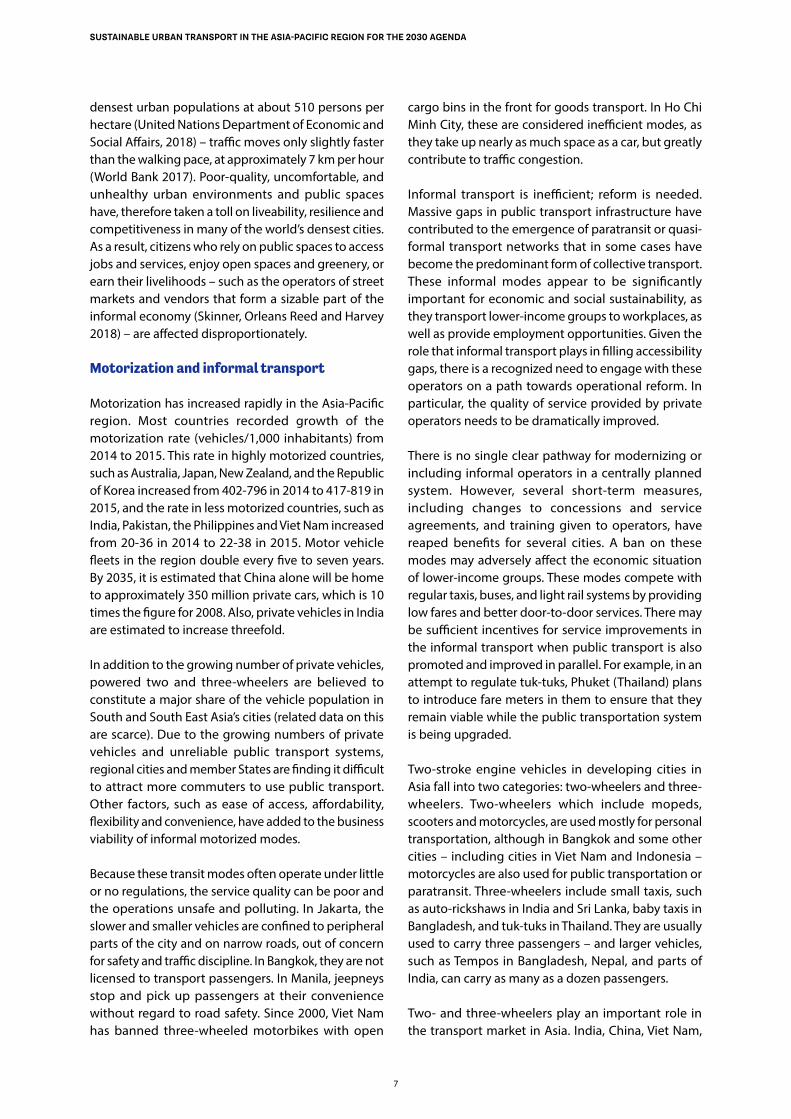
Amid the rapid development of China in recent years, the country’s urbanization process and motorization development level have undergone tremendous changes. According to data from the National Bureau of Statistics, the urbanization process in China increased rapidly from 2010 to 2018. The urbanization rate climbed from 47.5 per cent to 59.58 per cent, which means around 15 million new people enter the city from countryside every year.
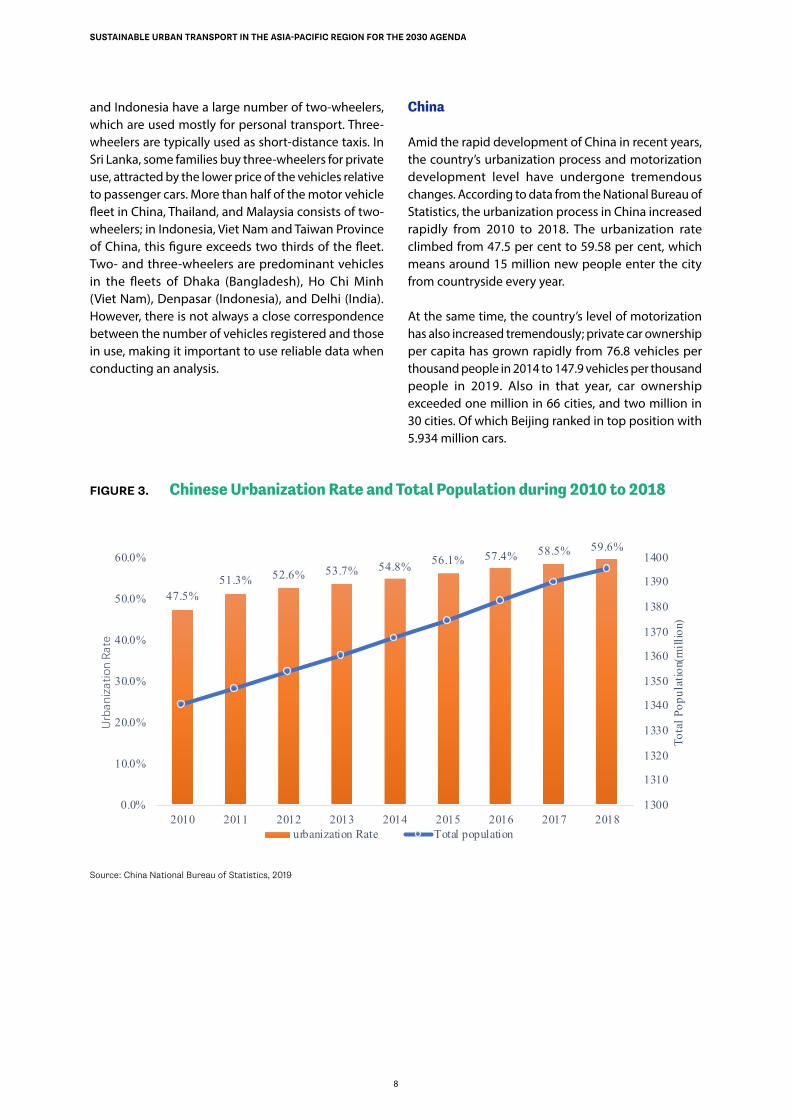
At the same time, the country’s level of motorization has also increased tremendously; private car ownership per capita has grown rapidly from 76.8 vehicles per thousand people in 2014 to 147.9 vehicles per thousand people in 2019. Also in that year, car ownership exceeded one million in 66 cities, and two million in 30 cities. Of which Beijing ranked in top position with 5.934 million cars.
FIGURE 3. Chinese Urbanization Rate and Total Population during 2010 to 2018
47.5%51.3% 52.6% 53.7% 54.8% 56.1% 57.4% 58.5% 59.6%
1300
1310
1320
1330
1340
1350
1360
1370
1380
1390
1400
0.0%
10.0%
20.0%
30.0%
40.0%
50.0%
60.0%
2010 2011 2012 2013 2014 2015 2016 2017 2018
Tota
l Pop
ulat
ion(
mill
ion)
Urb
aniz
atio
n Ra
te
urbanization Rate Total population
Source: China National Bureau of Statistics, 2019
9
SUSTAINABLE URBAN TRANSPORT IN THE ASIA-PACIFIC REGION FOR THE 2030 AGENDA
FIGURE 4. China’s vehicle ownership per thousand people during 2014 to 2019
0.0
50.0
100.0
150.0
200.0
250.0
300.0
2014 2015 2016 2017 2018 2019
vehi
cle
owne
rshi
p pe
r tho
usan
d pe
ople
Motor vehicle Civil Car Private Car
Source: China Ministry of Public Security, 2020
The rapid motorization development of China has been uneven. This can be attribute to the uneven development of cities with different population sizes and economic development levels. There are more than three million vehicles in 11 cities, including Chongqing, Suzhou, Shanghai, Zhengzhou, Shenzhen, Xi’an, Wuhan, Dongguan, and Tianjin. By region, of the 30 cities with more than two million cars in 2019, 21 are on the eastern coast, accounting for 70 per cent. It not only includes the first- and second-tier cities, such as Beijing, Shanghai, Guangzhou, Shenzhen, Nanjing, and Hangzhou, but also prefecture-level cities, such as Jinhua, Tangshan, Linyi, and Weifang. In addition, there are eight cities in the Midwestern part of the country, including seven provincial capitals and one municipality.
Rapid urban expansion has led to the acceleration of motorization. The selection includes four megacities with the most developed economies in China. Cities recording extensive growth are Beijing, Shanghai, Guangzhou, Shenzhen, and Shenyang in the Northeast, Lanzhou in the Northwest, Tianjin in the North, Jinan, Hangzhou in the East, Wuhan in the Central China and Chengdu in the South-West. Built-up areas in major cities have grown rapidly in the past decade, but the density of road networks has not increased significantly. Urban transport congestion has gradually spread from megacities and large cities to small- and medium cities in China.
In recent years, some regions in China have optimized the construction mode of urban rail transit stations, increased business services, housing and public
supporting functions, promoted composite land use and improved land output benefits. According to a statistic based on a survey from typical Chinese cities, Beijing, Hangzhou, Guangzhou and some other places have developed 16 comprehensive rail transit development projects, with 10 projects under construction, and another 50 approved construction projects. They have accumulated rich experience in practical exploration and policy innovation (China, Ministry of Natural Resources, 2020) .
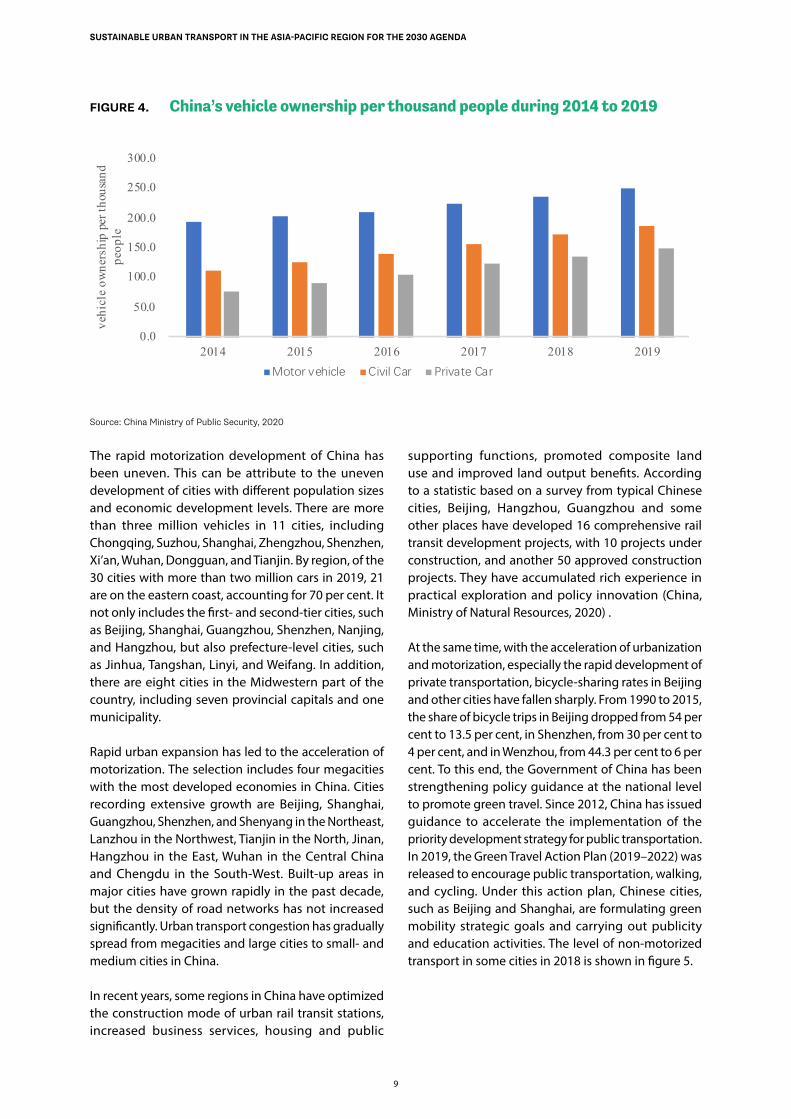
At the same time, with the acceleration of urbanization and motorization, especially the rapid development of private transportation, bicycle-sharing rates in Beijing and other cities have fallen sharply. From 1990 to 2015, the share of bicycle trips in Beijing dropped from 54 per cent to 13.5 per cent, in Shenzhen, from 30 per cent to 4 per cent, and in Wenzhou, from 44.3 per cent to 6 per cent. To this end, the Government of China has been strengthening policy guidance at the national level to promote green travel. Since 2012, China has issued guidance to accelerate the implementation of the priority development strategy for public transportation. In 2019, the Green Travel Action Plan (2019–2022) was released to encourage public transportation, walking, and cycling. Under this action plan, Chinese cities, such as Beijing and Shanghai, are formulating green mobility strategic goals and carrying out publicity and education activities. The level of non-motorized transport in some cities in 2018 is shown in figure 5.
10
SUSTAINABLE URBAN TRANSPORT IN THE ASIA-PACIFIC REGION FOR THE 2030 AGENDA
TABLE 1. Modal share of active and public transport commuting in several Chinese cities in 2018
CityShare of public transport in motorized mobility
Share of active transport1
Qingdao 58.80 per cent --
Urumqi 64.31 per cent --
Hefei 56.92 per cent 36.23 per cent
Jinan 54.25 per cent --
Fuzhou 48.19 per cent 64.72 per cent
Harbin 56.20 per cent --
Huhhot 54.36 per cent --
Liuzhou 48.80 per cent --
Nanchang 60.54 per cent 42.29 per cent
Shenyang 61.24 per cent 33.22 per cent
Shijiazhuang 54.27 per cent 66.50 per cent
Xi'an 61.69 per cent 41.43 per cent
Chongqing 60.20 per cent --
Zhuzhou 49.21 per cent 34.50 per cent
Source: Data collected from the China Academy of transportation Sciences in 2020.
India
1 Active transport here refers to cycling and walking.
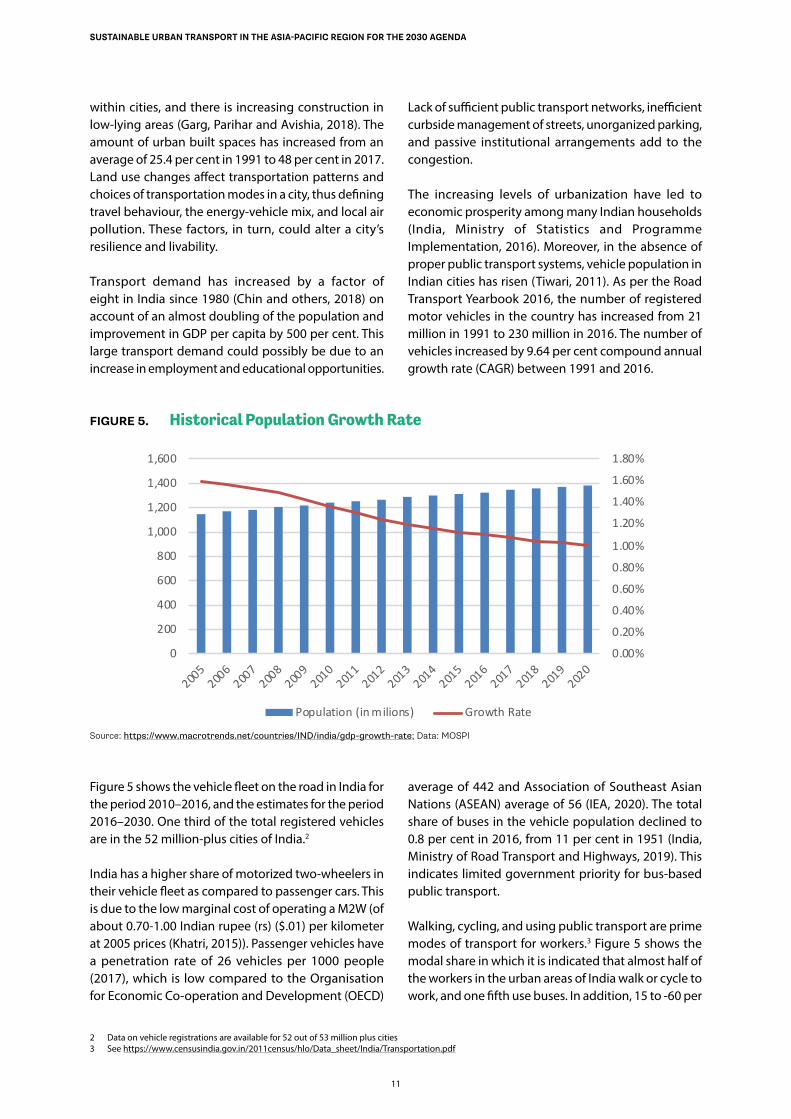
The natural growth rate of the population of India decreased gradually from 1.59 to 0.99 between 2005 and 2020. It is expected to decline only after 2060 as per United Nation estimates (after peaking at 1.65 billion). Accordingly, a larger rate of urbanization and economic growth is anticipated for India, along with an increasing younger demography.
An estimated one third of the new upcoming fast--growing towns in India are within 50 km of large cities or megacities. These suburbs are concentrated in 1 per cent of country’s land area but they account for about 18 per cent of the employment. The combination of rapid growth of individual modes of transport, poor and expensive public transport services, and slow commuting speeds have resulted in an exodus of business and factories from large Indian cities. Businesses located in peripheries struggle to access local and regional markets and face higher costs. The freight rate between metropolitan cores and peripheries in India are 5.2 per ton-km, twice the national average and five times the cost in the United States of America.
The metropolitan and million plus cities cores (central city and area of 5 km radius) recorded a decline in employment over the past two decades, while growth in but peripheral towns and villages experienced growth in hi-tech manufacturing, real estate, and other manufacturing sectors. The key reasons for the decline in growth are a disparity in access to basic services and limitations in transportation and freight services.
The upcoming towns are characterized by low-density sprawl with large spatial footprints. Small and big urban cities often form a spatial continuum. Some 37 such multi-city urban agglomerations exist in the country and most the unique and long is the stop Delhi-Lahore agglomeration with a population of 73 million (Elllis and Roberts, 2016). Urban footprints are estimated to be growing at twice the rate of urban populations, resulting in increasing urban trip lengths and time taken (Ellis and Roberts, 2016).
The agriculture land around cities is decreasing, built-up areas are increasing in sub-urban areas, green and open spaces (30 per cent to 21 per cent) are be reduced
11
SUSTAINABLE URBAN TRANSPORT IN THE ASIA-PACIFIC REGION FOR THE 2030 AGENDA
within cities, and there is increasing construction in low-lying areas (Garg, Parihar and Avishia, 2018). The amount of urban built spaces has increased from an average of 25.4 per cent in 1991 to 48 per cent in 2017. Land use changes affect transportation patterns and choices of transportation modes in a city, thus defining travel behaviour, the energy-vehicle mix, and local air pollution. These factors, in turn, could alter a city’s resilience and livability.
Transport demand has increased by a factor of eight in India since 1980 (Chin and others, 2018) on account of an almost doubling of the population and improvement in GDP per capita by 500 per cent. This large transport demand could possibly be due to an increase in employment and educational opportunities.
2 Data on vehicle registrations are available for 52 out of 53 million plus cities3 See https://www.censusindia.gov.in/2011census/hlo/Data_sheet/India/Transportation.pdf
Lack of sufficient public transport networks, inefficient curbside management of streets, unorganized parking, and passive institutional arrangements add to the congestion.
The increasing levels of urbanization have led to economic prosperity among many Indian households (India, Ministry of Statistics and Programme Implementation, 2016). Moreover, in the absence of proper public transport systems, vehicle population in Indian cities has risen (Tiwari, 2011). As per the Road Transport Yearbook 2016, the number of registered motor vehicles in the country has increased from 21 million in 1991 to 230 million in 2016. The number of vehicles increased by 9.64 per cent compound annual growth rate (CAGR) between 1991 and 2016.
FIGURE 5. Historical Population Growth Rate
0.00%
0.20%
0.40%
0.60%
0.80%
1.00%
1.20%
1.40%
1.60%
1.80%
0
200
400
600
800
1,000
1,200
1,400
1,600
2005
2006
2007
2008
2009
2010
2011
2012
2013
2014
2015
2016
2017
2018
2019
2020
Population (in milions) Growth Rate
Source: https://www.macrotrends.net/countries/IND/india/gdp-growth-rate; Data: MOSPI
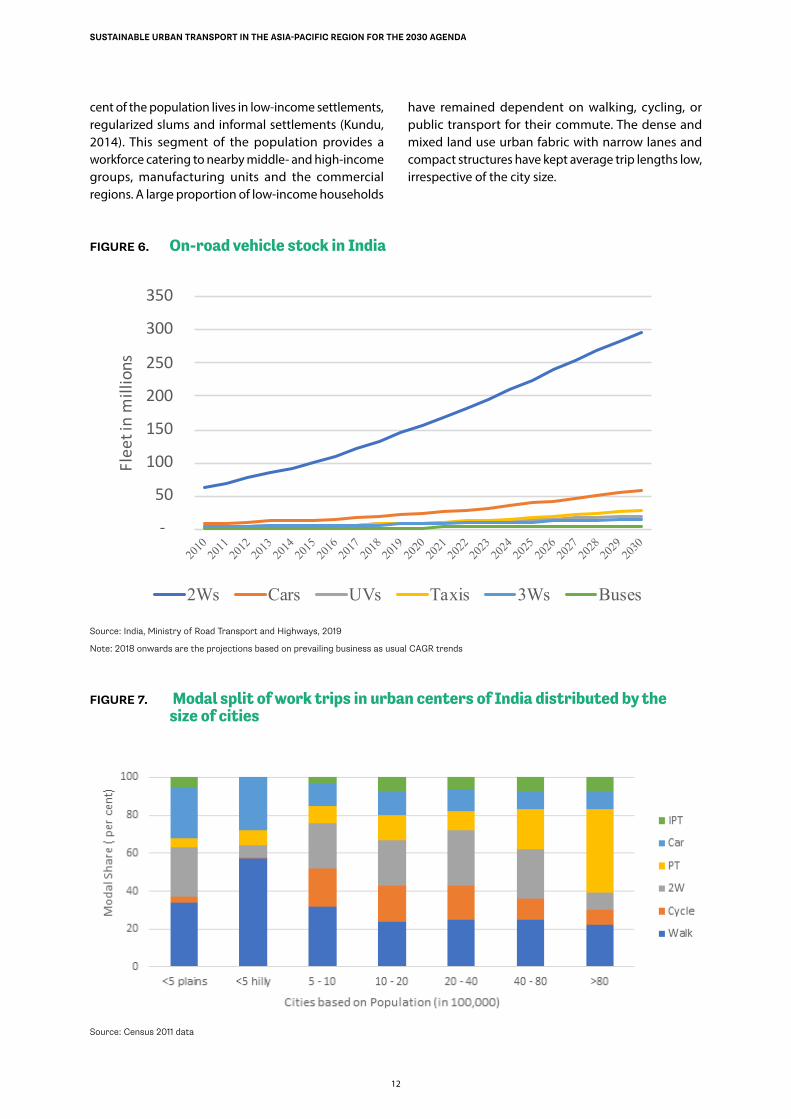
Figure 5 shows the vehicle fleet on the road in India for the period 2010–2016, and the estimates for the period 2016–2030. One third of the total registered vehicles are in the 52 million-plus cities of India.2
India has a higher share of motorized two-wheelers in their vehicle fleet as compared to passenger cars. This is due to the low marginal cost of operating a M2W (of about 0.70-1.00 Indian rupee (rs) ($.01) per kilometer at 2005 prices (Khatri, 2015)). Passenger vehicles have a penetration rate of 26 vehicles per 1000 people (2017), which is low compared to the Organisation for Economic Co-operation and Development (OECD)
average of 442 and Association of Southeast Asian Nations (ASEAN) average of 56 (IEA, 2020). The total share of buses in the vehicle population declined to 0.8 per cent in 2016, from 11 per cent in 1951 (India, Ministry of Road Transport and Highways, 2019). This indicates limited government priority for bus-based public transport.
Walking, cycling, and using public transport are prime modes of transport for workers.3 Figure 5 shows the modal share in which it is indicated that almost half of the workers in the urban areas of India walk or cycle to work, and one fifth use buses. In addition, 15 to -60 per
12
SUSTAINABLE URBAN TRANSPORT IN THE ASIA-PACIFIC REGION FOR THE 2030 AGENDA
cent of the population lives in low-income settlements, regularized slums and informal settlements (Kundu, 2014). This segment of the population provides a workforce catering to nearby middle- and high-income groups, manufacturing units and the commercial regions. A large proportion of low-income households
have remained dependent on walking, cycling, or public transport for their commute. The dense and mixed land use urban fabric with narrow lanes and compact structures have kept average trip lengths low, irrespective of the city size.
FIGURE 6. On-road vehicle stock in India
-
50
100
150
200
250
300
350
201020112012201320142015201620172018201920202021202220232024202520262027202820292030
Flee
t in
mill
ions
2Ws Cars UVs Taxis 3Ws Buses
Source: India, Ministry of Road Transport and Highways, 2019
Note: 2018 onwards are the projections based on prevailing business as usual CAGR trends
FIGURE 7. Modal split of work trips in urban centers of India distributed by the size of cities
Source: Census 2011 data
13
SUSTAINABLE URBAN TRANSPORT IN THE ASIA-PACIFIC REGION FOR THE 2030 AGENDA
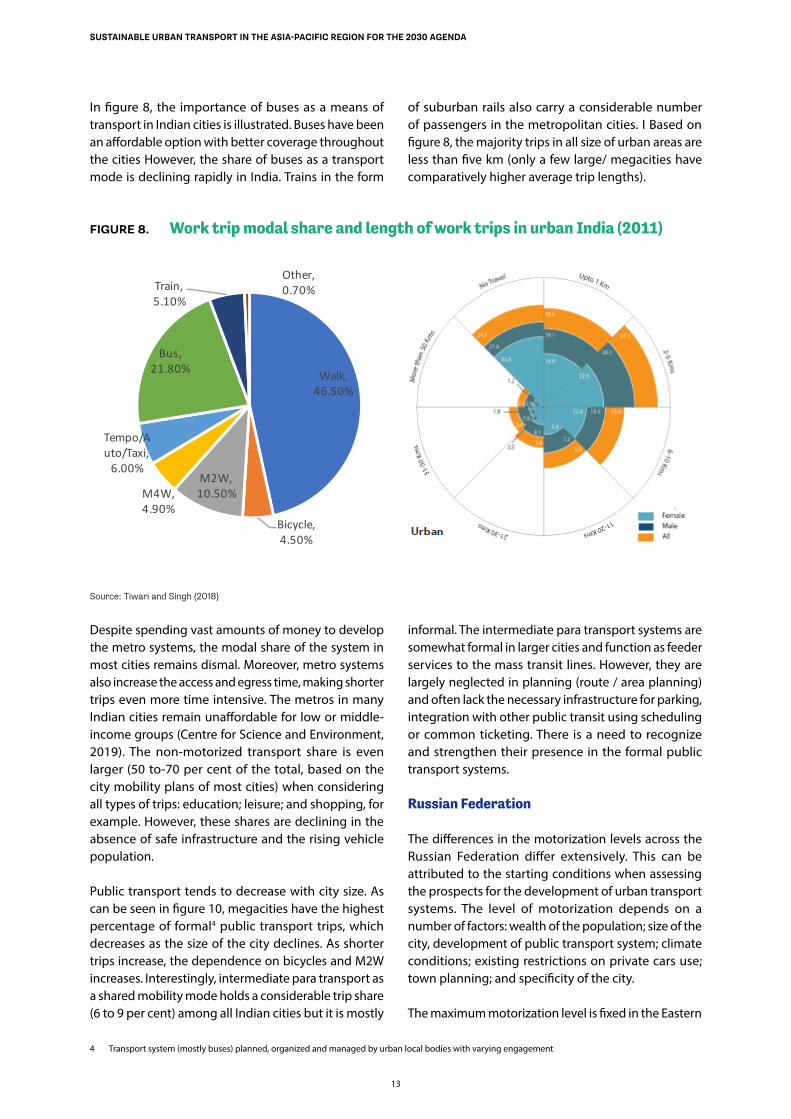
In figure 8, the importance of buses as a means of transport in Indian cities is illustrated. Buses have been an affordable option with better coverage throughout the cities However, the share of buses as a transport mode is declining rapidly in India. Trains in the form
4 Transport system (mostly buses) planned, organized and managed by urban local bodies with varying engagement
of suburban rails also carry a considerable number of passengers in the metropolitan cities. I Based on figure 8, the majority trips in all size of urban areas are less than five km (only a few large/ megacities have comparatively higher average trip lengths).
FIGURE 8. Work trip modal share and length of work trips in urban India (2011)
Walk, 46.50%
Bicycle, 4.50%
M2W, 10.50%M4W,
4.90%
Tempo/Auto/Taxi,
6.00%
Bus, 21.80%
Train, 5.10%
Other, 0.70%
Source: Tiwari and Singh (2018)
Despite spending vast amounts of money to develop the metro systems, the modal share of the system in most cities remains dismal. Moreover, metro systems also increase the access and egress time, making shorter trips even more time intensive. The metros in many Indian cities remain unaffordable for low or middle-income groups (Centre for Science and Environment, 2019). The non-motorized transport share is even larger (50 to-70 per cent of the total, based on the city mobility plans of most cities) when considering all types of trips: education; leisure; and shopping, for example. However, these shares are declining in the absence of safe infrastructure and the rising vehicle population.
Public transport tends to decrease with city size. As can be seen in figure 10, megacities have the highest percentage of formal4 public transport trips, which decreases as the size of the city declines. As shorter trips increase, the dependence on bicycles and M2W increases. Interestingly, intermediate para transport as a shared mobility mode holds a considerable trip share (6 to 9 per cent) among all Indian cities but it is mostly
informal. The intermediate para transport systems are somewhat formal in larger cities and function as feeder services to the mass transit lines. However, they are largely neglected in planning (route / area planning) and often lack the necessary infrastructure for parking, integration with other public transit using scheduling or common ticketing. There is a need to recognize and strengthen their presence in the formal public transport systems.
Russian Federation
The differences in the motorization levels across the Russian Federation differ extensively. This can be attributed to the starting conditions when assessing the prospects for the development of urban transport systems. The level of motorization depends on a number of factors: wealth of the population; size of the city, development of public transport system; climate conditions; existing restrictions on private cars use; town planning; and specificity of the city.
The maximum motorization level is fixed in the Eastern
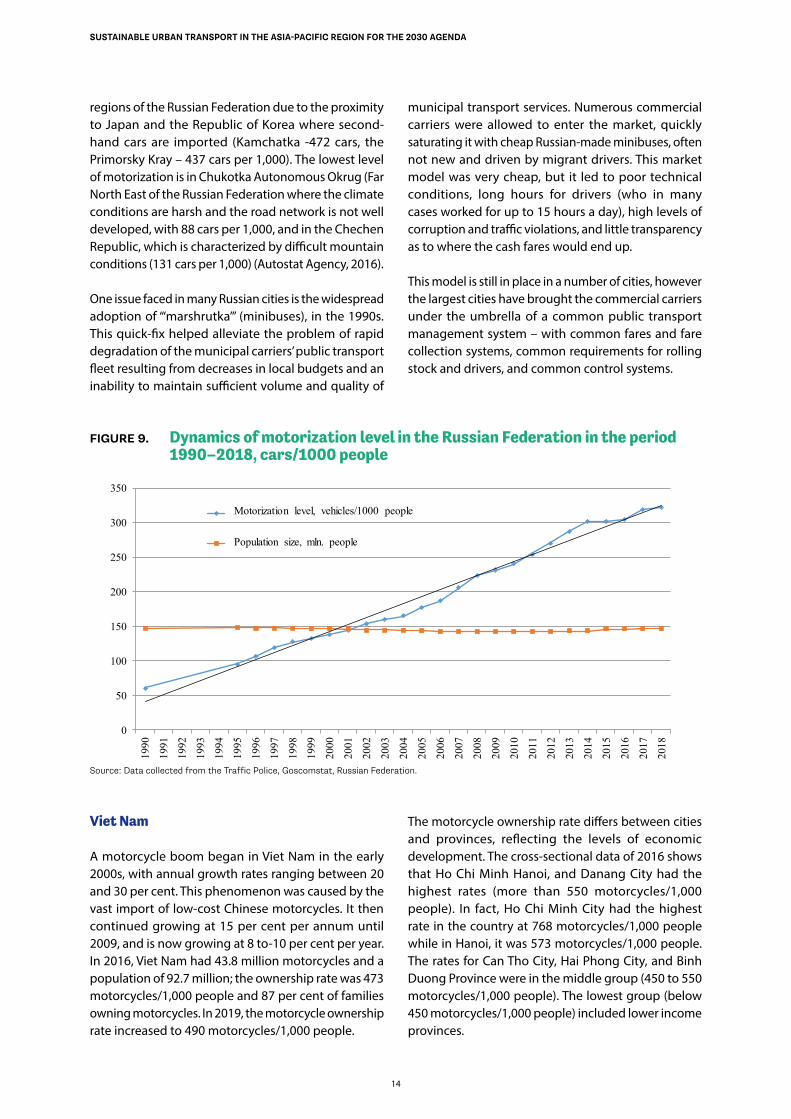
14
SUSTAINABLE URBAN TRANSPORT IN THE ASIA-PACIFIC REGION FOR THE 2030 AGENDA
regions of the Russian Federation due to the proximity to Japan and the Republic of Korea where second-hand cars are imported (Kamchatka -472 cars, the Primorsky Kray – 437 cars per 1,000). The lowest level of motorization is in Chukotka Autonomous Okrug (Far North East of the Russian Federation where the climate conditions are harsh and the road network is not well developed, with 88 cars per 1,000, and in the Chechen Republic, which is characterized by difficult mountain conditions (131 cars per 1,000) (Autostat Agency, 2016).
One issue faced in many Russian cities is the widespread adoption of “‘marshrutka”’ (minibuses), in the 1990s. This quick-fix helped alleviate the problem of rapid degradation of the municipal carriers’ public transport fleet resulting from decreases in local budgets and an inability to maintain sufficient volume and quality of
municipal transport services. Numerous commercial carriers were allowed to enter the market, quickly saturating it with cheap Russian-made minibuses, often not new and driven by migrant drivers. This market model was very cheap, but it led to poor technical conditions, long hours for drivers (who in many cases worked for up to 15 hours a day), high levels of corruption and traffic violations, and little transparency as to where the cash fares would end up.
This model is still in place in a number of cities, however the largest cities have brought the commercial carriers under the umbrella of a common public transport management system – with common fares and fare collection systems, common requirements for rolling stock and drivers, and common control systems.
FIGURE 9. Dynamics of motorization level in the Russian Federation in the period 1990–2018, cars/1000 people
0
50
100
150
200
250
300
350
1990
1991
1992
1993
1994
1995
1996
1997
1998
1999
2000
2001
2002
2003
2004
2005
2006
2007
2008
2009
2010
2011
2012
2013
2014
2015
2016
2017
2018
Уровень автомобилизации, АТС/1000 чел.
Численность населения, млн. чел.
Motorization level, vehicles/1000 people
Population size, mln. people
Source: Data collected from the Traffic Police, Goscomstat, Russian Federation.
Viet Nam
A motorcycle boom began in Viet Nam in the early 2000s, with annual growth rates ranging between 20 and 30 per cent. This phenomenon was caused by the vast import of low-cost Chinese motorcycles. It then continued growing at 15 per cent per annum until 2009, and is now growing at 8 to-10 per cent per year. In 2016, Viet Nam had 43.8 million motorcycles and a population of 92.7 million; the ownership rate was 473 motorcycles/1,000 people and 87 per cent of families owning motorcycles. In 2019, the motorcycle ownership rate increased to 490 motorcycles/1,000 people.
The motorcycle ownership rate differs between cities and provinces, reflecting the levels of economic development. The cross-sectional data of 2016 shows that Ho Chi Minh Hanoi, and Danang City had the highest rates (more than 550 motorcycles/1,000 people). In fact, Ho Chi Minh City had the highest rate in the country at 768 motorcycles/1,000 people while in Hanoi, it was 573 motorcycles/1,000 people. The rates for Can Tho City, Hai Phong City, and Binh Duong Province were in the middle group (450 to 550 motorcycles/1,000 people). The lowest group (below 450 motorcycles/1,000 people) included lower income provinces.
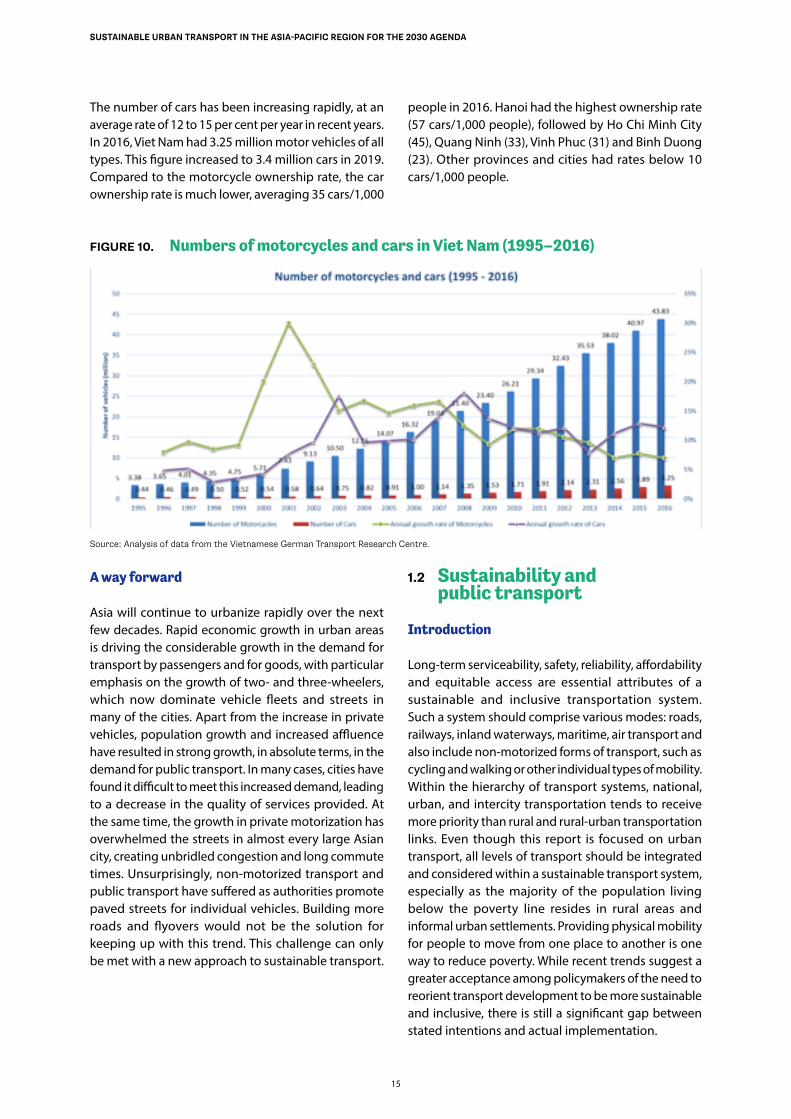
15
SUSTAINABLE URBAN TRANSPORT IN THE ASIA-PACIFIC REGION FOR THE 2030 AGENDA
The number of cars has been increasing rapidly, at an average rate of 12 to 15 per cent per year in recent years. In 2016, Viet Nam had 3.25 million motor vehicles of all types. This figure increased to 3.4 million cars in 2019. Compared to the motorcycle ownership rate, the car ownership rate is much lower, averaging 35 cars/1,000
people in 2016. Hanoi had the highest ownership rate (57 cars/1,000 people), followed by Ho Chi Minh City (45), Quang Ninh (33), Vinh Phuc (31) and Binh Duong (23). Other provinces and cities had rates below 10 cars/1,000 people.
FIGURE 10. Numbers of motorcycles and cars in Viet Nam (1995–2016)
Source: Analysis of data from the Vietnamese German Transport Research Centre.
A way forward
Asia will continue to urbanize rapidly over the next few decades. Rapid economic growth in urban areas is driving the considerable growth in the demand for transport by passengers and for goods, with particular emphasis on the growth of two- and three-wheelers, which now dominate vehicle fleets and streets in many of the cities. Apart from the increase in private vehicles, population growth and increased affluence have resulted in strong growth, in absolute terms, in the demand for public transport. In many cases, cities have found it difficult to meet this increased demand, leading to a decrease in the quality of services provided. At the same time, the growth in private motorization has overwhelmed the streets in almost every large Asian city, creating unbridled congestion and long commute times. Unsurprisingly, non-motorized transport and public transport have suffered as authorities promote paved streets for individual vehicles. Building more roads and flyovers would not be the solution for keeping up with this trend. This challenge can only be met with a new approach to sustainable transport.
1.2 Sustainability and public transport
Introduction
Long-term serviceability, safety, reliability, affordability and equitable access are essential attributes of a sustainable and inclusive transportation system. Such a system should comprise various modes: roads, railways, inland waterways, maritime, air transport and also include non-motorized forms of transport, such as cycling and walking or other individual types of mobility. Within the hierarchy of transport systems, national, urban, and intercity transportation tends to receive more priority than rural and rural-urban transportation links. Even though this report is focused on urban transport, all levels of transport should be integrated and considered within a sustainable transport system, especially as the majority of the population living below the poverty line resides in rural areas and informal urban settlements. Providing physical mobility for people to move from one place to another is one way to reduce poverty. While recent trends suggest a greater acceptance among policymakers of the need to reorient transport development to be more sustainable and inclusive, there is still a significant gap between stated intentions and actual implementation.
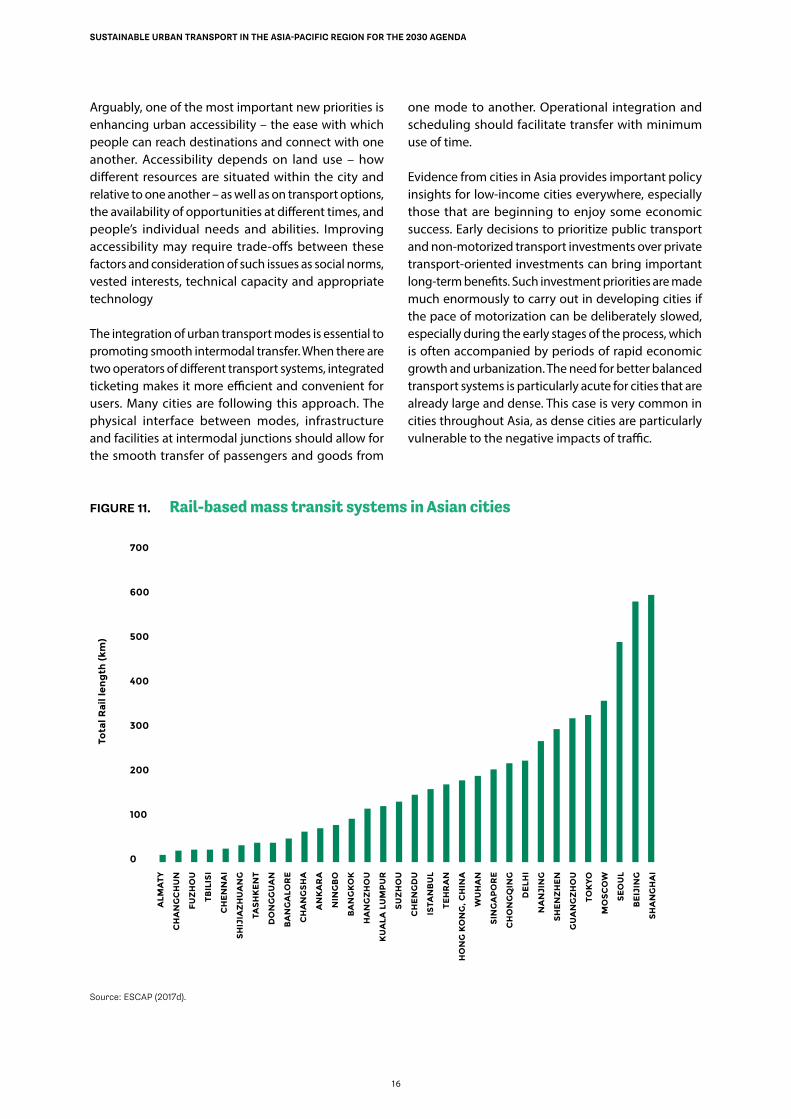
16
SUSTAINABLE URBAN TRANSPORT IN THE ASIA-PACIFIC REGION FOR THE 2030 AGENDA
Arguably, one of the most important new priorities is enhancing urban accessibility – the ease with which people can reach destinations and connect with one another. Accessibility depends on land use – how different resources are situated within the city and relative to one another – as well as on transport options, the availability of opportunities at different times, and people’s individual needs and abilities. Improving accessibility may require trade-offs between these factors and consideration of such issues as social norms, vested interests, technical capacity and appropriate technology
The integration of urban transport modes is essential to promoting smooth intermodal transfer. When there are two operators of different transport systems, integrated ticketing makes it more efficient and convenient for users. Many cities are following this approach. The physical interface between modes, infrastructure and facilities at intermodal junctions should allow for the smooth transfer of passengers and goods from
one mode to another. Operational integration and scheduling should facilitate transfer with minimum use of time.
Evidence from cities in Asia provides important policy insights for low-income cities everywhere, especially those that are beginning to enjoy some economic success. Early decisions to prioritize public transport and non-motorized transport investments over private transport-oriented investments can bring important long-term benefits. Such investment priorities are made much enormously to carry out in developing cities if the pace of motorization can be deliberately slowed, especially during the early stages of the process, which is often accompanied by periods of rapid economic growth and urbanization. The need for better balanced transport systems is particularly acute for cities that are already large and dense. This case is very common in cities throughout Asia, as dense cities are particularly vulnerable to the negative impacts of traffic.
FIGURE 11. Rail-based mass transit systems in Asian cities
Review of developments in transport in Asia and the Pacific 2017
Chapter 4 : Urban transport 122
1. Rail-based mass transit systems
The past two years have seen signi cant growth in urban metro-rail lengths in many major cities across Asia. Figure 4.6 provides the latest updates on rail-based mass transit developments in selected cities. Cities such as Beijing, Seoul and Shanghai have a substantial number of rail-based urban transport networks. The construction of rail-based urban mass transit systems is progressing in many Chinese cities (Baotou, Jinan, Lanzhou, Urumqi and Xiamen), Indian cities (Chandigarh, Gandhinagar, Kanpur, Lucknow, Nagpur and Pune), Iranian cities (Ahvaz, Karai, Kermanshah and Qom) as well as in Bangkok, Dhaka, Hanoi, Jakarta, Ho Chi Minh and Lahore.
Figure 4.7 shows the share of the public transport mode in selected Asian cities and re ects the high share of public transport modes in cities like Manila (59.04 per cent), Hong Kong, China (52.2 per cent), Mumbai (45 per cent) and Singapore (44 per cent). Cities such as Ho Chi Minh (1.6 per cent), Kuala Lumpur (7.2 per cent) and Tehran (12.7 per cent) have a low public transport mode share. Even though cities such as Bangkok, Jakarta and Manila show a high public transport mode share, road tra ic congestion is very severe. Cities with a low public transport mode share should work to improve public transport facilities.
FIGURE 4.6. RAIL-BASED MASS TRANSIT SYSTEMS
IN ASIAN CITIES
700
600
500
400
300
200
100
0
ALM
AT
Y
CH
AN
GC
HU
N
FU
ZH
OU
TB
ILIS
I
CH
EN
NA
I
SH
IJIA
ZH
UA
NG
TAS
HK
EN
T
DO
NG
GU
AN
BA
NG
ALO
RE
CH
AN
GS
HA
AN
KA
RA
NIN
GB
O
BA
NG
KO
K
HA
NG
ZH
OU
KU
ALA
LU
MP
UR
SU
ZH
OU
CH
EN
GD
U
ISTA
NB
UL
TE
HR
AN
HO
NG
KO
NG
, CH
INA
WU
HA
N
SIN
GA
PO
RE
CH
ON
GQ
ING
DE
LHI
NA
NJI
NG
SH
EN
ZH
EN
GU
AN
GZ
HO
U
TOK
YO
MO
SC
OW
SE
OU
L
BE
IJIN
G
SH
AN
GH
AI
Tota
l Ra
il le
ng
th (
km
)
Source: compiled from various sources.
Source: ESCAP (2017d).
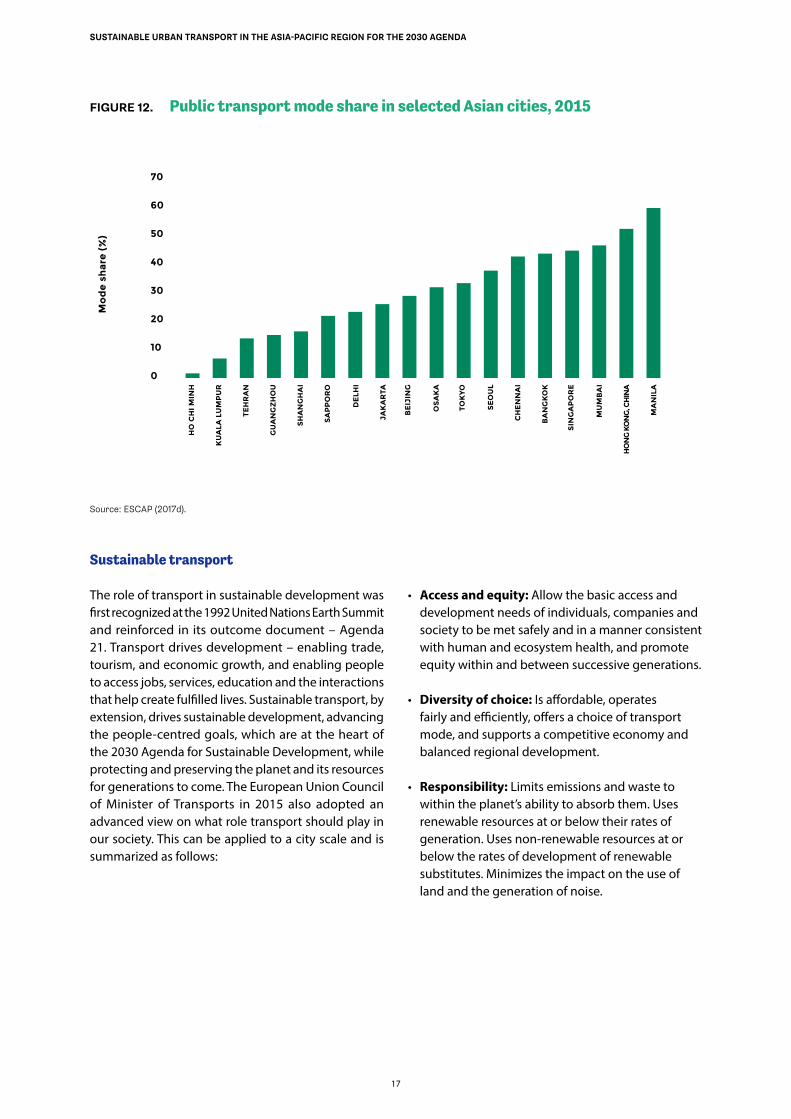
17
SUSTAINABLE URBAN TRANSPORT IN THE ASIA-PACIFIC REGION FOR THE 2030 AGENDA
FIGURE 12. Public transport mode share in selected Asian cities, 2015
Review of developments in transport in Asia and the Pacific 2017
Chapter 4 : Urban transport 123
Much progress has been made in the public transport mode share across the region, but the optimum balance between public (rail and bus) and private (cars and non-motorized transport) is still unclear. Figure 4.8 presents the operating costs of public transport systems in selected Asian cities. It shows Sapporo in Japan has the highest annual operating cost while cities such as Ho Chi Minh, Shanghai, and Beijing have a low annual operating cost. Figure 4.8 further illustrates the cost-bene t trade-o s of a higher public transport mode share and the capital investments required to achieve it.
Cities such as Bangkok and Manila have achieved a high mode share with relatively low operating costs. While Hong Kong, China as well as Singapore pay a comparatively high price to maintain a high mode share. Osaka, Tokyo and Seoul have to bear high operating costs to maintain a 32-36 per cent modal share. On the other hand, while at the same operating cost of US$0.06 per passenger kilometre, the mode share appears increasingly variable across cities such as Kuala Lumpur (7 per cent), Guangzhou (14 per cent) and Singapore (44 per cent). This suggests Asian cities that wish to increase their public transport mode share and progressing cities such as Kuala Lumpur and Guangzhou have much opportunity to maximize
cost e iciency. The high operating costs, as in the case of Sapporo and Osaka, could continue to be a stumbling block for the adoption of such systems, especially for cities with low GDP. Despite this situation, cities should attempt to nd their context-speci c balance, drawing inspiration from cities such as Seoul that appear to have struck a good relative balance between operating costs and high mode share.
2. Non-motorized transport
Non-motorized transport (NMT) such as walking and cycling is also gaining popularity in regional cities. Country and city authorities are developing infrastructure for non-motorized transport as part of their integrated public transport plans. Cities are also promoting car-free days and lanes ( gure 4.9). Likewise, bicycle use has been growing and many schemes for public bicycle sharing are emerging. China, Japan, India, the Philippines, the Republic of Korea, Singapore and Thailand are in various stages of rolling out or encouraging bicycle sharing. These systems, enabled by mobile phone technology, RFID cards or other payment systems, allow transit users to reduce the time of last-mile trips from the public transport station.
FIGURE 4.7. PUBLIC TRANSPORT MODE SHARE IN
SELECTED ASIAN CITIES
Mo
de
sh
are
(%
)
70
60
50
40
30
20
10
0
HO
CH
I M
INH
KU
ALA
LU
MP
UR
TE
HR
AN
GU
AN
GZ
HO
U
SH
AN
GH
AI
SA
PP
OR
O
DE
LHI
JAK
AR
TA
BE
IJIN
G
OS
AK
A
TOK
YO
SE
OU
L
CH
EN
NA
I
BA
NG
KO
K
SIN
GA
PO
RE
MU
MB
AI
HO
NG
KO
NG
, CH
INA
MA
NIL
A
Source: De Gruyter and others.9
Source: ESCAP (2017d).
Sustainable transport
The role of transport in sustainable development was first recognized at the 1992 United Nations Earth Summit and reinforced in its outcome document – Agenda 21. Transport drives development – enabling trade, tourism, and economic growth, and enabling people to access jobs, services, education and the interactions that help create fulfilled lives. Sustainable transport, by extension, drives sustainable development, advancing the people-centred goals, which are at the heart of the 2030 Agenda for Sustainable Development, while protecting and preserving the planet and its resources for generations to come. The European Union Council of Minister of Transports in 2015 also adopted an advanced view on what role transport should play in our society. This can be applied to a city scale and is summarized as follows:
• Access and equity: Allow the basic access and development needs of individuals, companies and society to be met safely and in a manner consistent with human and ecosystem health, and promote equity within and between successive generations.
• Diversity of choice: Is affordable, operates fairly and efficiently, offers a choice of transport mode, and supports a competitive economy and balanced regional development.
• Responsibility: Limits emissions and waste to within the planet’s ability to absorb them. Uses renewable resources at or below their rates of generation. Uses non-renewable resources at or below the rates of development of renewable substitutes. Minimizes the impact on the use of land and the generation of noise.
18
SUSTAINABLE URBAN TRANSPORT IN THE ASIA-PACIFIC REGION FOR THE 2030 AGENDA
CASE STUDY:
Avoid – Shift – Improve. An approach for urban transport in Viet Nam
The terms sustainable transport and mobility allude to paradigms and strategies that have been devel-oped to help make transport more sustainable. The sustainable mobility paradigm promotes a broad range of strategies (United Nations, 2016; Banister 2008) to (a) avoid unnecessary transport or demand (“avoid”); (b) shift transport from individual motor-ized transport to active modes and public transport (“shift”); and (c) promote clean fuels and vehicles and efficient traffic management (“Improve”). In Viet Nam, the paradigm is shown through the following policies and goals:
Avoid
• Control private vehicle use. Hanoi, Ho Chi Minh City, and three other medium-sized cities (Can Tho, Dang Nang and Hai Phong) have formulated policies to control and gradually ban the use of motorcycles in urban central areas. Financial instruments, such as vehicle registration fees, parking management and congestion charging, can lower the usage of private cars to relieve road congestion and create budgets for infrastructure improvements.
• Increase coordination with land-use development at transit stations. Ho Chi Minh City is looking to develop transit-oriented development at every station of the MRT1 line and is, examining the design, infrastructure arrangements, and land-use plans for the areas surrounding stations. A centre for land fund development is being developed in major cities, which will operate under the umbrella of the metropolis authorities.
Shift
• Develop urban railways networks to serve as backbones for future development.
• Expand existing city bus networks.
• Utilize water systems. As many cities in Viet Nam are endowed with a network of rivers and canals, a water-bus system is being developed to diversify public transport and encourage tourism.
• Revitalize non-motorized transport to supplement transit systems, such as rental bicycle schemes and bicycle-sharing services.
• Improve the pedestrian environment. Ho Chi Minh City and Hanoi have developed and improved their pedestrian environment. The central business district area of these cities could be fully pedestrianized to improve the environment and enhance connectivity to transit systems.
Control
• Invest in the urban road network. Measures to mobilize financing for key urban highway/expressway projects must be formulated urgently.
• Leverage the global smart city strategy. Under the Ho Chi Minh City’ “Smart Strategy for 2017-2020, Vision to 2025”, the city aims to adopt industry 4.0 technologies, such as a shared public database, administration centre, an information security centre, and a simulation research and forecast institution.
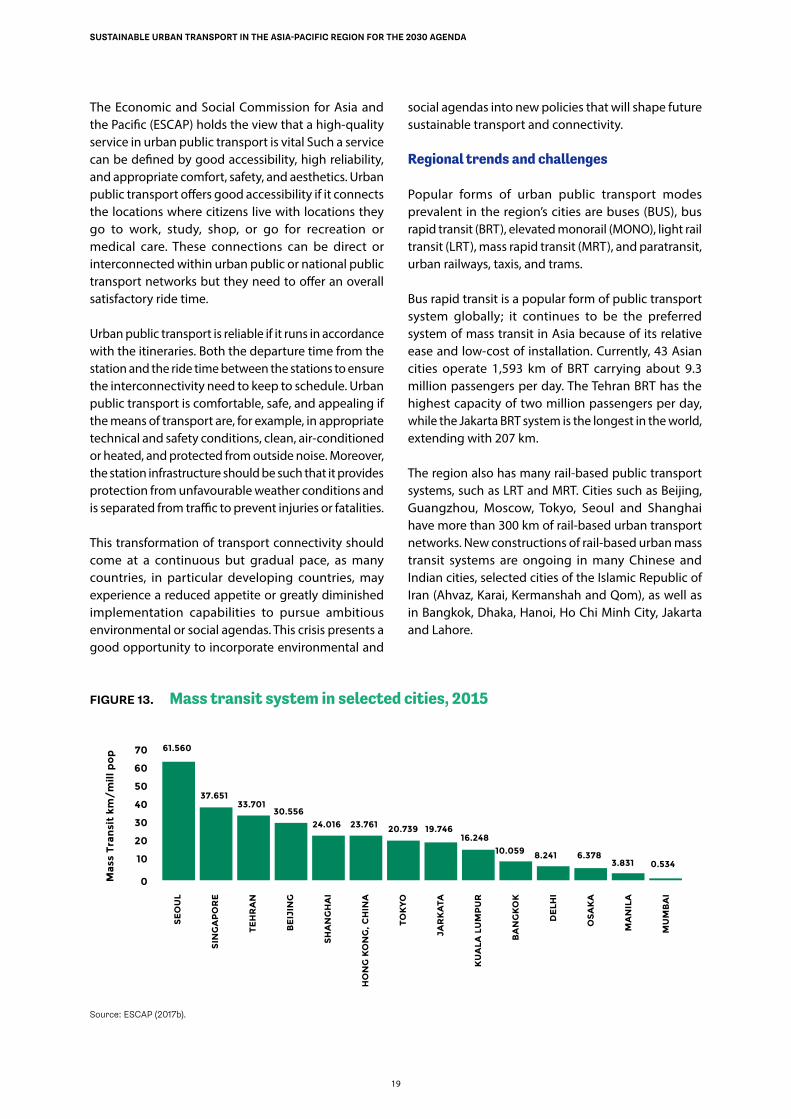
19
SUSTAINABLE URBAN TRANSPORT IN THE ASIA-PACIFIC REGION FOR THE 2030 AGENDA
The Economic and Social Commission for Asia and the Pacific (ESCAP) holds the view that a high-quality service in urban public transport is vital Such a service can be defined by good accessibility, high reliability, and appropriate comfort, safety, and aesthetics. Urban public transport offers good accessibility if it connects the locations where citizens live with locations they go to work, study, shop, or go for recreation or medical care. These connections can be direct or interconnected within urban public or national public transport networks but they need to offer an overall satisfactory ride time.
Urban public transport is reliable if it runs in accordance with the itineraries. Both the departure time from the station and the ride time between the stations to ensure the interconnectivity need to keep to schedule. Urban public transport is comfortable, safe, and appealing if the means of transport are, for example, in appropriate technical and safety conditions, clean, air-conditioned or heated, and protected from outside noise. Moreover, the station infrastructure should be such that it provides protection from unfavourable weather conditions and is separated from traffic to prevent injuries or fatalities.
This transformation of transport connectivity should come at a continuous but gradual pace, as many countries, in particular developing countries, may experience a reduced appetite or greatly diminished implementation capabilities to pursue ambitious environmental or social agendas. This crisis presents a good opportunity to incorporate environmental and
social agendas into new policies that will shape future sustainable transport and connectivity.
Regional trends and challenges
Popular forms of urban public transport modes prevalent in the region’s cities are buses (BUS), bus rapid transit (BRT), elevated monorail (MONO), light rail transit (LRT), mass rapid transit (MRT), and paratransit, urban railways, taxis, and trams.
Bus rapid transit is a popular form of public transport system globally; it continues to be the preferred system of mass transit in Asia because of its relative ease and low-cost of installation. Currently, 43 Asian cities operate 1,593 km of BRT carrying about 9.3 million passengers per day. The Tehran BRT has the highest capacity of two million passengers per day, while the Jakarta BRT system is the longest in the world, extending with 207 km.
The region also has many rail-based public transport systems, such as LRT and MRT. Cities such as Beijing, Guangzhou, Moscow, Tokyo, Seoul and Shanghai have more than 300 km of rail-based urban transport networks. New constructions of rail-based urban mass transit systems are ongoing in many Chinese and Indian cities, selected cities of the Islamic Republic of Iran (Ahvaz, Karai, Kermanshah and Qom), as well as in Bangkok, Dhaka, Hanoi, Ho Chi Minh City, Jakarta and Lahore.
FIGURE 13. Mass transit system in selected cities, 2015
Review of developments in transport in Asia and the Pacific 2017
Chapter 4 : Urban transport 127
FIGURE 4.12. MASS TRANSIT SYSTEM IN SELECTED CITIES
FIGURE 4.13. MASS TRANSIT LENGTH AND CITIES’ GDP
Source: De Gruyter and others.
Ma
ss T
ran
sit
km
/m
ill p
op 61.560
37.65133.701
30.55624.016 23.761 20.739 19.746
16.24810.059 8.241 6.378
3.831 0.534
70
60
50
40
30
20
10
0
SE
OU
L
SIN
GA
PO
RE
TE
HR
AN
BE
IJIN
G
SH
AN
GH
AI
HO
NG
KO
NG
, CH
INA
TOK
YO
JAR
KA
TA
KU
ALA
LU
MP
UR
BA
NG
KO
K
DE
LHI
OS
AK
A
MA
NIL
A
MU
MB
AI
Source: De Gruyter and others.
10 000 20 000 30 000 40 000 50 000 60 000 70 000 80 000
Ma
ss T
ran
sit
, km
City GDP,United States dollars
900
800
700
600
500
400
300
200
100
0
TOKYO
HONGKONG, CHINA
SINGAPORE
TEHRAN
JAKARTA
MUMBAI
MANILA
BANGKOK
KUALA LUMPUR
BEIJING
SHANGHISEOUL
OSAKA
DELHI
Source: ESCAP (2017b).
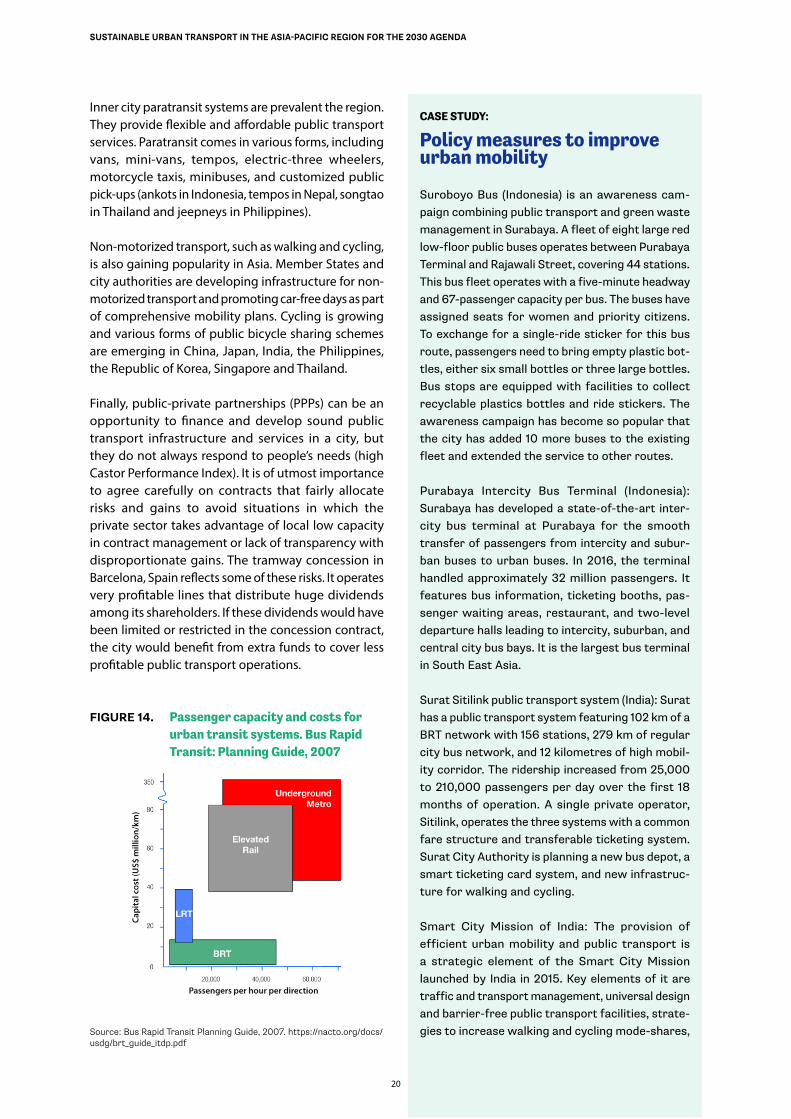
20
SUSTAINABLE URBAN TRANSPORT IN THE ASIA-PACIFIC REGION FOR THE 2030 AGENDA
Inner city paratransit systems are prevalent the region. They provide flexible and affordable public transport services. Paratransit comes in various forms, including vans, mini-vans, tempos, electric-three wheelers, motorcycle taxis, minibuses, and customized public pick-ups (ankots in Indonesia, tempos in Nepal, songtao in Thailand and jeepneys in Philippines).
Non-motorized transport, such as walking and cycling, is also gaining popularity in Asia. Member States and city authorities are developing infrastructure for non-motorized transport and promoting car-free days as part of comprehensive mobility plans. Cycling is growing and various forms of public bicycle sharing schemes are emerging in China, Japan, India, the Philippines, the Republic of Korea, Singapore and Thailand.
Finally, public-private partnerships (PPPs) can be an opportunity to finance and develop sound public transport infrastructure and services in a city, but they do not always respond to people’s needs (high Castor Performance Index). It is of utmost importance to agree carefully on contracts that fairly allocate risks and gains to avoid situations in which the private sector takes advantage of local low capacity in contract management or lack of transparency with disproportionate gains. The tramway concession in Barcelona, Spain reflects some of these risks. It operates very profitable lines that distribute huge dividends among its shareholders. If these dividends would have been limited or restricted in the concession contract, the city would benefit from extra funds to cover less profitable public transport operations.
FIGURE 14. Passenger capacity and costs for urban transit systems. Bus Rapid Transit: Planning Guide, 2007
CASE STUDY:
Policy measures to improve urban mobility
Suroboyo Bus (Indonesia) is an awareness cam-paign combining public transport and green waste management in Surabaya. A fleet of eight large red low-floor public buses operates between Purabaya Terminal and Rajawali Street, covering 44 stations. This bus fleet operates with a five-minute headway and 67-passenger capacity per bus. The buses have assigned seats for women and priority citizens. To exchange for a single-ride sticker for this bus route, passengers need to bring empty plastic bot-tles, either six small bottles or three large bottles. Bus stops are equipped with facilities to collect recyclable plastics bottles and ride stickers. The awareness campaign has become so popular that the city has added 10 more buses to the existing fleet and extended the service to other routes.
Purabaya Intercity Bus Terminal (Indonesia): Surabaya has developed a state-of-the-art inter-city bus terminal at Purabaya for the smooth transfer of passengers from intercity and subur-ban buses to urban buses. In 2016, the terminal handled approximately 32 million passengers. It features bus information, ticketing booths, pas-senger waiting areas, restaurant, and two-level departure halls leading to intercity, suburban, and central city bus bays. It is the largest bus terminal in South East Asia.
Surat Sitilink public transport system (India): Surat has a public transport system featuring 102 km of a BRT network with 156 stations, 279 km of regular city bus network, and 12 kilometres of high mobil-ity corridor. The ridership increased from 25,000 to 210,000 passengers per day over the first 18 months of operation. A single private operator, Sitilink, operates the three systems with a common fare structure and transferable ticketing system. Surat City Authority is planning a new bus depot, a smart ticketing card system, and new infrastruc-ture for walking and cycling.
Smart City Mission of India: The provision of efficient urban mobility and public transport is a strategic element of the Smart City Mission launched by India in 2015. Key elements of it are traffic and transport management, universal design and barrier-free public transport facilities, strate-gies to increase walking and cycling mode-shares, Source: Bus Rapid Transit Planning Guide, 2007. https://nacto.org/docs/
usdg/brt_guide_itdp.pdf
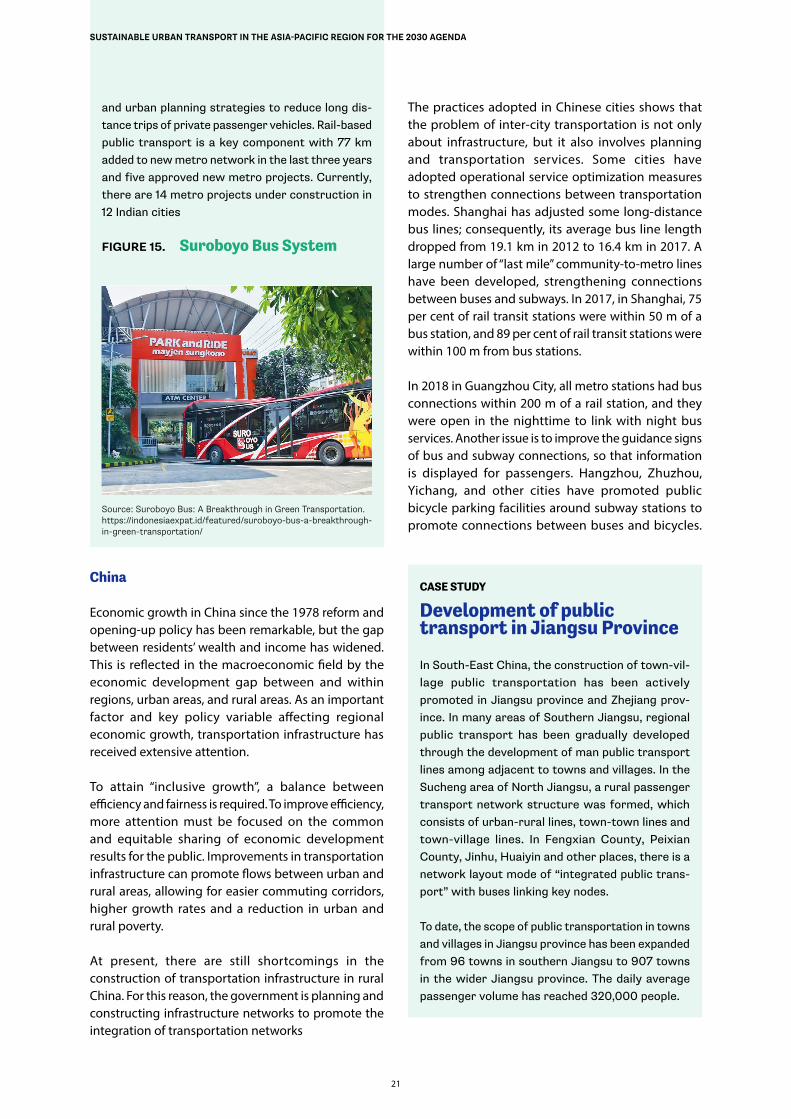
21
SUSTAINABLE URBAN TRANSPORT IN THE ASIA-PACIFIC REGION FOR THE 2030 AGENDA
and urban planning strategies to reduce long dis-tance trips of private passenger vehicles. Rail-based public transport is a key component with 77 km added to new metro network in the last three years and five approved new metro projects. Currently, there are 14 metro projects under construction in 12 Indian cities
FIGURE 15. Suroboyo Bus System
Source: Suroboyo Bus: A Breakthrough in Green Transportation. https://indonesiaexpat.id/featured/suroboyo-bus-a-breakthrough-in-green-transportation/
China
Economic growth in China since the 1978 reform and opening-up policy has been remarkable, but the gap between residents’ wealth and income has widened. This is reflected in the macroeconomic field by the economic development gap between and within regions, urban areas, and rural areas. As an important factor and key policy variable affecting regional economic growth, transportation infrastructure has received extensive attention.
To attain “inclusive growth”, a balance between efficiency and fairness is required. To improve efficiency, more attention must be focused on the common and equitable sharing of economic development results for the public. Improvements in transportation infrastructure can promote flows between urban and rural areas, allowing for easier commuting corridors, higher growth rates and a reduction in urban and rural poverty.
At present, there are still shortcomings in the construction of transportation infrastructure in rural China. For this reason, the government is planning and constructing infrastructure networks to promote the integration of transportation networks
The practices adopted in Chinese cities shows that the problem of inter-city transportation is not only about infrastructure, but it also involves planning and transportation services. Some cities have adopted operational service optimization measures to strengthen connections between transportation modes. Shanghai has adjusted some long-distance bus lines; consequently, its average bus line length dropped from 19.1 km in 2012 to 16.4 km in 2017. A large number of “last mile” community-to-metro lines have been developed, strengthening connections between buses and subways. In 2017, in Shanghai, 75 per cent of rail transit stations were within 50 m of a bus station, and 89 per cent of rail transit stations were within 100 m from bus stations.
In 2018 in Guangzhou City, all metro stations had bus connections within 200 m of a rail station, and they were open in the nighttime to link with night bus services. Another issue is to improve the guidance signs of bus and subway connections, so that information is displayed for passengers. Hangzhou, Zhuzhou, Yichang, and other cities have promoted public bicycle parking facilities around subway stations to promote connections between buses and bicycles.
CASE STUDY
Development of public transport in Jiangsu Province
In South-East China, the construction of town-vil-lage public transportation has been actively promoted in Jiangsu province and Zhejiang prov-ince. In many areas of Southern Jiangsu, regional public transport has been gradually developed through the development of man public transport lines among adjacent to towns and villages. In the Sucheng area of North Jiangsu, a rural passenger transport network structure was formed, which consists of urban-rural lines, town-town lines and town-village lines. In Fengxian County, Peixian County, Jinhu, Huaiyin and other places, there is a network layout mode of “integrated public trans-port” with buses linking key nodes.
To date, the scope of public transportation in towns and villages in Jiangsu province has been expanded from 96 towns in southern Jiangsu to 907 towns in the wider Jiangsu province. The daily average passenger volume has reached 320,000 people.
22
SUSTAINABLE URBAN TRANSPORT IN THE ASIA-PACIFIC REGION FOR THE 2030 AGENDA
India
Indian cities mostly look like their United States counterparts characterized more by sprawl than compactness. Urban design rests with city planning authorities, including the integration of transport modes. The central government is responsible for developing guidelines and policies covering issues, such as the granting of partial or full funds for song Tao the development or setting of vehicle emission and safety standards. Transport and urban development are dealt with at the state level.
Though the importance of establishing a unified transport authority (is deemed as being efficient, this entity still has a legal step to cross. Lack of political interest, system inertia and vested interests have resulted in a fragmented ecosystem of several actors. Below is a list of functions and the authority tasked with handling them:
• Urban and transport planning (municipal corporations/development authority);
• Registration, taxes, licensing, permits, vehicle roadworthiness and Pollution Under Control certificates (Regional Transport Authority);
• Road construction (Public Works Department);
• Public transport operations (Special Purpose Vehicles, city transport undertakings);
• Freight, manufacturing hubs and commercial establishments (traders union and Department of Industry and Commerce);
• Traffic management (police).
Local government was strengthened under the 1992 Seventy-fourth Constitutional Amendment Act, which provided for the following:
• Creation of the Urban Metropolitan Transport Authority. Initially, there were multiple organizations involved in handling various activities related to transport in a city or a metropolitan region. This Authority is the answer to the institutional overlaps and gaps. A major task for it is to develop a comprehensive mobility plan for the entire region.
• Creation of the Urban Transport Fund. Local governments were given the power to generate
their own funds through taxes and levies. Funds generated for the Urban Transport Fund can be used for efforts to improve mobility.
As urban transport is a state subject, transport departments are responsible for preparing state transport policies, urban transport policies, road policies and road safety policies. These contain detailed accounts of transport demand in the state (supported by local demands in each region or city) and the connectivity between rural and urban areas and adjoining states. To date, less than 10 Indian states out of 28 have a state transport policy. A few of these have incorporated a brief account of urban transport into the state transport policies. Only Maharashtra has developed a detailed state urban transport policy applicable to its 350+ towns and cities.
At the city level, comprehensive development plans are being formulated as guiding documents by the state’s town and country planning organization. Most Indian cities have failed to do this, resulting in urban planning and transport integration being a key missing feature. Even though this exercise has been carried out since the 1960s, it has had little impact. While local government has a duty to implement the comprehensive development plans, this is not sacrosanct and the implementation agencies have serious capacity constraints.
Russian Federation
Connectivity is an important characteristic of transport networks. In many large Russian cities, the area as historically been divided by natural barriers, such as rivers, ravines, reservoirs and hills, or by engineering infrastructure, such as railways, leading to a significant extension of transport correspondence and overrunning of urban transport. One key task for city authorities is to link national transport networks to urban systems through the construction of the city’s road infrastructure, bridges and overpasses, and off-street transport links.
As an example of the city’s success, the Magistral integrated routes have connections with public transport routes, social routes, and the Moscow Central Cycle Railroad and the Moscow Central Diameters city train stops. Some 103 buses have been purchased for the route and, thanks to its dedicated lanes, this surface public transport option runs as regularly as metro trains. In other cities, such as Kazan and Yekaterinburg, similar plans have been implemented or are expected to be deployed soon.
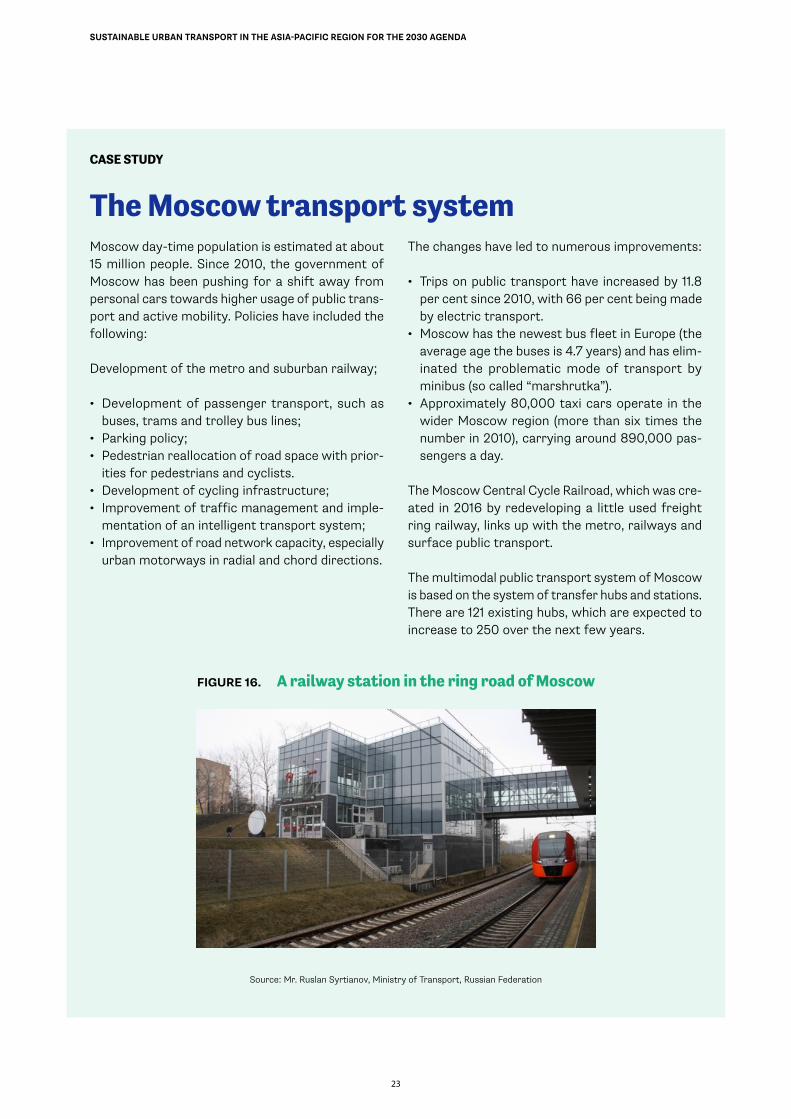
23
SUSTAINABLE URBAN TRANSPORT IN THE ASIA-PACIFIC REGION FOR THE 2030 AGENDA
CASE STUDY
The Moscow transport systemMoscow day-time population is estimated at about 15 million people. Since 2010, the government of Moscow has been pushing for a shift away from personal cars towards higher usage of public trans-port and active mobility. Policies have included the following:
Development of the metro and suburban railway;
• Development of passenger transport, such as buses, trams and trolley bus lines;
• Parking policy;• Pedestrian reallocation of road space with prior-
ities for pedestrians and cyclists.• Development of cycling infrastructure;• Improvement of traffic management and imple-
mentation of an intelligent transport system;• Improvement of road network capacity, especially
urban motorways in radial and chord directions.
The changes have led to numerous improvements:
• Trips on public transport have increased by 11.8 per cent since 2010, with 66 per cent being made by electric transport.
• Moscow has the newest bus fleet in Europe (the average age the buses is 4.7 years) and has elim-inated the problematic mode of transport by minibus (so called “marshrutka”).
• Approximately 80,000 taxi cars operate in the wider Moscow region (more than six times the number in 2010), carrying around 890,000 pas-sengers a day.
The Moscow Central Cycle Railroad, which was cre-ated in 2016 by redeveloping a little used freight ring railway, links up with the metro, railways and surface public transport.
The multimodal public transport system of Moscow is based on the system of transfer hubs and stations. There are 121 existing hubs, which are expected to increase to 250 over the next few years.
FIGURE 16. A railway station in the ring road of Moscow
Source: Mr. Ruslan Syrtianov, Ministry of Transport, Russian Federation

24
SUSTAINABLE URBAN TRANSPORT IN THE ASIA-PACIFIC REGION FOR THE 2030 AGENDA
One key lesson learned from experience in the Russian Federation is that a regulatory framework is needed to effectively promote sustainable urban transport. Russian legislation and regulations define a multitude of various planning documents that can be used to structure transport planning, such as programmes for the integrated development of transport infrastructure of settlements and urban districts, integrated schemes for public transport services and integrated traffic management schemes. The main task of transport planning is to determine the appropriate parameters of the transport system (route network topology, infrastructure, rolling stock and transportation organization) that meet the transport needs of the metropolitan area. In particular, these programmes should ensure the following:
• Transport infrastructure development is aligned with urban development in settlements and urban districts;
• Safety conditions for road users;
• Priority conditions for public transport;
• Favourable conditions for pedestrian and bicycle traffic.
• Packages of transport planning documents have been developed in most major Russian cities. As of April 2020, some 1,572 cities have developed integrated traffic management schemes. In addition, the Government encourages the development of transport planning documents, as the creation them is a prerequisite to be included in the state-supported project for the development of “Safe and Quality Roads”.
Viet Nam
Travel demand management policies – how urban planning can work
Urban planning and transport service planning are vital to prepare for the actual delivery of public transport services. The need for a public entity to carry out planning functions comes from an equity and efficiency point of view. There are various ways to deliver these services, however it must be assumed that, left entirely to a commercial organization with profit as its priority, only commercially viable routes would be served at the expense of more deprived areas. Similarly, the profit motive could restrict services to peak periods. Viet Nam offers an example of how cities can operate and deliver
planning functions effectively and efficiently.
Improvement of city bus services to feed and link with urban railways
FIGURE 17. Modal shift challenge in Binh Duong City, 2019
Source: JICA, Almec Corporation and Tokyu Corporation (2018)
Ho Chi Minh City is planning to reform and expand its bus network to meet increased travel demand. Bus fleets are continuously renewed to improve passenger comfort and reduce emissions. Compressed natural gas vehicles are being introduced as an eco-transport mode, saving 23 per cent on fuel costs compared to diesel vehicles. In addition, bus priority lanes are being piloted along several urban road corridors to increase bus travel speed and improve the reliability of the operations.
An example of good practice is the Enhancing Management Capacity of Public Transport System in Binh Duong City project, the so-called Binh Duong Modal Shift Challenge. This project was a joint effort of Binh Duong People’s Committee, the Japan International Cooperation Agency (JICA) and Becamex-Tokyu Bus company to help facilitate a modal shift away from motorcycles to public transport. Becamex IDC (a local firm) and Tokyu Group (a foreign firm) founded Becamex-Tokyu Bus as a joint venture to run bus services connecting the old city (Thu Dau Mot)
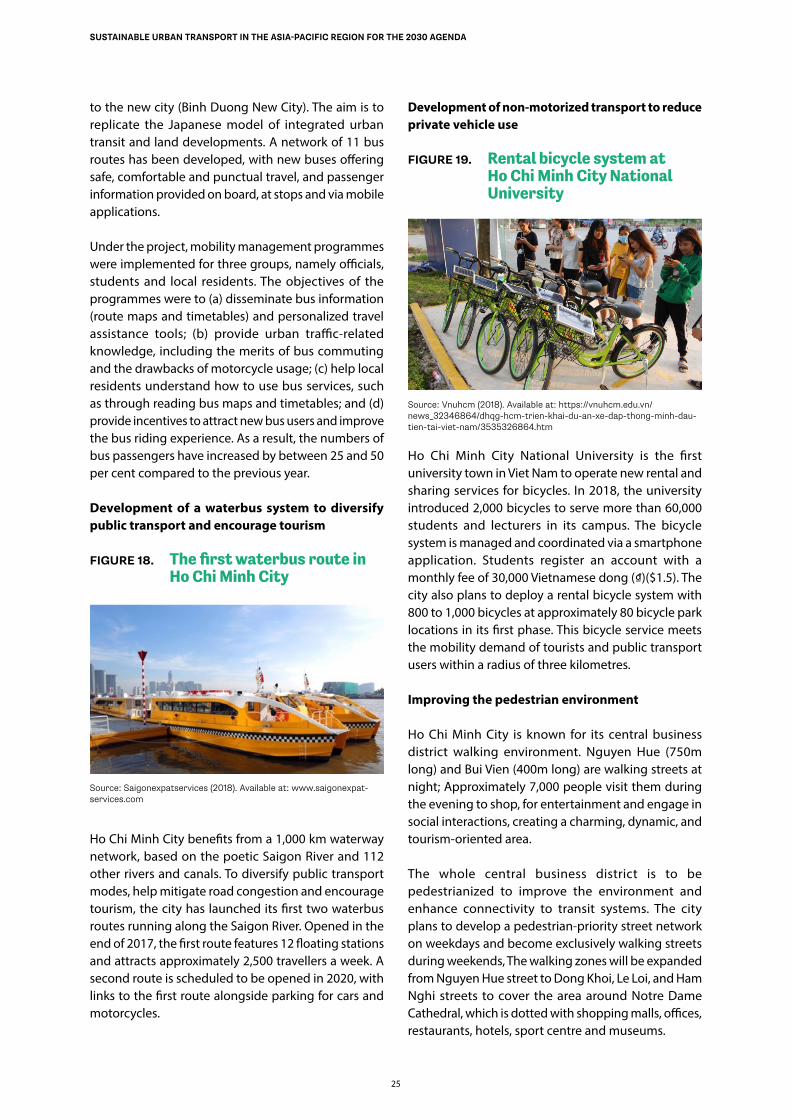
25
SUSTAINABLE URBAN TRANSPORT IN THE ASIA-PACIFIC REGION FOR THE 2030 AGENDA
to the new city (Binh Duong New City). The aim is to replicate the Japanese model of integrated urban transit and land developments. A network of 11 bus routes has been developed, with new buses offering safe, comfortable and punctual travel, and passenger information provided on board, at stops and via mobile applications.
Under the project, mobility management programmes were implemented for three groups, namely officials, students and local residents. The objectives of the programmes were to (a) disseminate bus information (route maps and timetables) and personalized travel assistance tools; (b) provide urban traffic-related knowledge, including the merits of bus commuting and the drawbacks of motorcycle usage; (c) help local residents understand how to use bus services, such as through reading bus maps and timetables; and (d) provide incentives to attract new bus users and improve the bus riding experience. As a result, the numbers of bus passengers have increased by between 25 and 50 per cent compared to the previous year.
Development of a waterbus system to diversify public transport and encourage tourism
FIGURE 18. The first waterbus route in Ho Chi Minh City
Source: Saigonexpatservices (2018). Available at: www.saigonexpat-services.com
Ho Chi Minh City benefits from a 1,000 km waterway network, based on the poetic Saigon River and 112 other rivers and canals. To diversify public transport modes, help mitigate road congestion and encourage tourism, the city has launched its first two waterbus routes running along the Saigon River. Opened in the end of 2017, the first route features 12 floating stations and attracts approximately 2,500 travellers a week. A second route is scheduled to be opened in 2020, with links to the first route alongside parking for cars and motorcycles.
Development of non-motorized transport to reduce private vehicle use
FIGURE 19. Rental bicycle system at Ho Chi Minh City National University
Source: Vnuhcm (2018). Available at: https://vnuhcm.edu.vn/news_32346864/dhqg-hcm-trien-khai-du-an-xe-dap-thong-minh-dau-tien-tai-viet-nam/3535326864.htm
Ho Chi Minh City National University is the first university town in Viet Nam to operate new rental and sharing services for bicycles. In 2018, the university introduced 2,000 bicycles to serve more than 60,000 students and lecturers in its campus. The bicycle system is managed and coordinated via a smartphone application. Students register an account with a monthly fee of 30,000 Vietnamese dong (₫)($1.5). The city also plans to deploy a rental bicycle system with 800 to 1,000 bicycles at approximately 80 bicycle park locations in its first phase. This bicycle service meets the mobility demand of tourists and public transport users within a radius of three kilometres.
Improving the pedestrian environment
Ho Chi Minh City is known for its central business district walking environment. Nguyen Hue (750m long) and Bui Vien (400m long) are walking streets at night; Approximately 7,000 people visit them during the evening to shop, for entertainment and engage in social interactions, creating a charming, dynamic, and tourism-oriented area.
The whole central business district is to be pedestrianized to improve the environment and enhance connectivity to transit systems. The city plans to develop a pedestrian-priority street network on weekdays and become exclusively walking streets during weekends, The walking zones will be expanded from Nguyen Hue street to Dong Khoi, Le Loi, and Ham Nghi streets to cover the area around Notre Dame Cathedral, which is dotted with shopping malls, offices, restaurants, hotels, sport centre and museums.
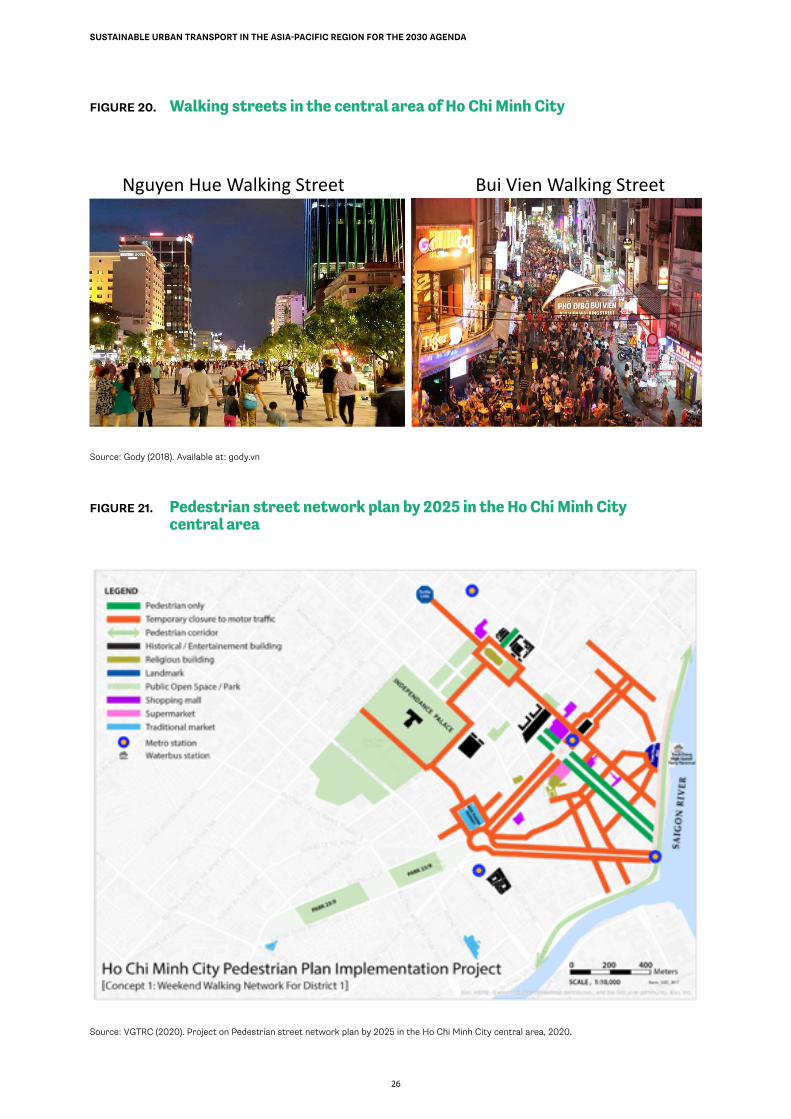
26
SUSTAINABLE URBAN TRANSPORT IN THE ASIA-PACIFIC REGION FOR THE 2030 AGENDA
FIGURE 20. Walking streets in the central area of Ho Chi Minh City
Nguyen Hue Walking Street Bui Vien Walking Street
Source: Gody (2018). Available at: gody.vn
FIGURE 21. Pedestrian street network plan by 2025 in the Ho Chi Minh City central area
Source: VGTRC (2020). Project on Pedestrian street network plan by 2025 in the Ho Chi Minh City central area, 2020.
27
SUSTAINABLE URBAN TRANSPORT IN THE ASIA-PACIFIC REGION FOR THE 2030 AGENDA
A way forward
Social sustainability measures can create inequities related to access and opportunity, or put some groups at a disadvantage. In much of Asia, the most obvious aspect of social sustainability reflects the social systems that have sprung up around mass transit and small-scale transport (three-wheelers, mini-buses). Thousands of families depend on income from small transport operators, of which some are honest and some our shady. In Asia, three-wheeler and conventional taxi drivers are often a strong force against transport reform towards larger, more efficient vehicles and lower emissions.
Equity of access is vital for developing socially sustainability transport. In some circumstances, congestion and poor access to transport can fall heavily on the poor or disadvantaged groups. This can be measured by differences in modal shares, travel times, travel ease and travel costs that arise between rich and poor, men and women, persons with disabilities and able-bodied persons, or private car/ two-wheeler users versus those using other modes of transport. Private vehicles can monopolize streets, with pedestrians, cyclists, and the those with disabilities having fewer safe choices for travel. Offering unequal access to cars and other vehicles, and non-motorized transport, penalizes those who walk, cycle, or ride buses – generally the economically stretched. As private vehicles tend to be the privilege of the middle or upper classes, and public motorized transport is used mainly by the middle classes, in rapidly urbanizing cities, the poor are left with fewer choices, making it more difficult for them when seeking employment. There may also be discrimination against women, who often face harassment on public transport or have less access to the most rapid and safest modes of transport. In short, a transport system in which affordable access is not assured for all is not sustainable, as such a system freezes some people out of the economic and personal development that transport access can bring.
Finally, there are growing inequities linked to safety and clean air in Asian cities. Those walking, cycling and riding mass transit tend to breathe the worst air, and those living in some parts of the city may face more transport-based pollution than others. Above all, pedestrians and cyclists suffer disproportionately more from traffic crashes, while the proportion of people whose personal security is threatened when walking, cycling, or riding mass transit is higher than that of people who are travelling in their own cars.
5 https://undocs.org/en/A/RES/74/299
1.3 Urban road safety
Introduction
Social sustainability is the ability to reflect a concern about the rights of individuals and communities to enjoy the pursuit of healthy and socially rewarding lives, free from discrimination, danger, crime and anti-social behaviour. From the perspective of social sustainability, transportation projects should enhance quality of life by ensuring the safety and health to all road users, provide good access to key services, ensure equity between different community and generation groups and encourage citizen participation in the related decision-making. Process. The concept of social sustainability is relatively new, although road safety and community severance have long been considered in transportation planning.
Given the rise of motorized transport throughout the world in recent years, road crash analysis and prevention is now a priority challenge for policymakers. In 2010, the General Assembly proclaimed the period 2011–2020 as “the Decade of Action for Road Safety” (Resolution 64/255), with the aim to stabilize and then reducing the projected levels of road fatalities on a global scale. To achieve this, the World Health Organization (WHO) and the United Nations regional commissions, in cooperation with the United Nations Road Safety Collaboration and other stakeholders, were asked to prepare a plan of action for the decade as a guiding document to support the implementation of its ambitious objectives, fostering road safety management expertise, improving the safety levels of transport networks and vehicles, influencing the behaviour of road users accordingly, and enhancing post-crash responses. In addition, under resolution 64/255, the General Assembly invited WHO and the United Nations regional commissions to coordinate regular monitoring, within the framework of the United Nations Road Safety Collaboration, of global progress towards meeting the targets identified in the plan of action through global status reports on road safety and other appropriate monitoring tools (WHO, 2010).
On 31 August 2020, the General Assembly adopted Resolution 74/299 on improving global road safety which proclaimed the period 2021–2030 as the Second Decade of Action for Road Safety, with a goal of reducing road traffic fatalities and injuries by at least 50 per cent from 2021 to 2030, and in this regard called upon member countries to continue action through 2030 on all the road safety-related targets of the Sustainable Development Goals, including target 3.6.5
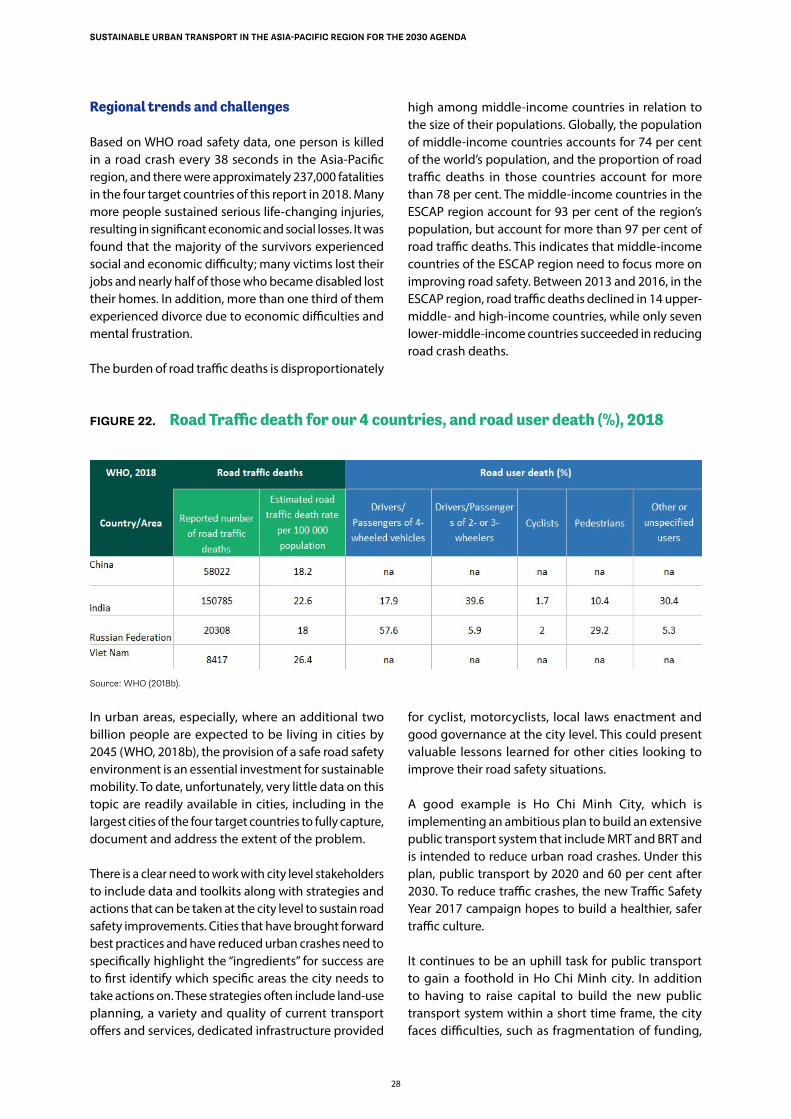
28
SUSTAINABLE URBAN TRANSPORT IN THE ASIA-PACIFIC REGION FOR THE 2030 AGENDA
Regional trends and challenges
Based on WHO road safety data, one person is killed in a road crash every 38 seconds in the Asia-Pacific region, and there were approximately 237,000 fatalities in the four target countries of this report in 2018. Many more people sustained serious life-changing injuries, resulting in significant economic and social losses. It was found that the majority of the survivors experienced social and economic difficulty; many victims lost their jobs and nearly half of those who became disabled lost their homes. In addition, more than one third of them experienced divorce due to economic difficulties and mental frustration.
The burden of road traffic deaths is disproportionately
high among middle-income countries in relation to the size of their populations. Globally, the population of middle-income countries accounts for 74 per cent of the world’s population, and the proportion of road traffic deaths in those countries account for more than 78 per cent. The middle-income countries in the ESCAP region account for 93 per cent of the region’s population, but account for more than 97 per cent of road traffic deaths. This indicates that middle-income countries of the ESCAP region need to focus more on improving road safety. Between 2013 and 2016, in the ESCAP region, road traffic deaths declined in 14 upper-middle- and high-income countries, while only seven lower-middle-income countries succeeded in reducing road crash deaths.
FIGURE 22. Road Traffic death for our 4 countries, and road user death (%), 2018
Source: WHO (2018b).
In urban areas, especially, where an additional two billion people are expected to be living in cities by 2045 (WHO, 2018b), the provision of a safe road safety environment is an essential investment for sustainable mobility. To date, unfortunately, very little data on this topic are readily available in cities, including in the largest cities of the four target countries to fully capture, document and address the extent of the problem.
There is a clear need to work with city level stakeholders to include data and toolkits along with strategies and actions that can be taken at the city level to sustain road safety improvements. Cities that have brought forward best practices and have reduced urban crashes need to specifically highlight the “ingredients” for success are to first identify which specific areas the city needs to take actions on. These strategies often include land-use planning, a variety and quality of current transport offers and services, dedicated infrastructure provided
for cyclist, motorcyclists, local laws enactment and good governance at the city level. This could present valuable lessons learned for other cities looking to improve their road safety situations.
A good example is Ho Chi Minh City, which is implementing an ambitious plan to build an extensive public transport system that include MRT and BRT and is intended to reduce urban road crashes. Under this plan, public transport by 2020 and 60 per cent after 2030. To reduce traffic crashes, the new Traffic Safety Year 2017 campaign hopes to build a healthier, safer traffic culture.
It continues to be an uphill task for public transport to gain a foothold in Ho Chi Minh city. In addition to having to raise capital to build the new public transport system within a short time frame, the city faces difficulties, such as fragmentation of funding,
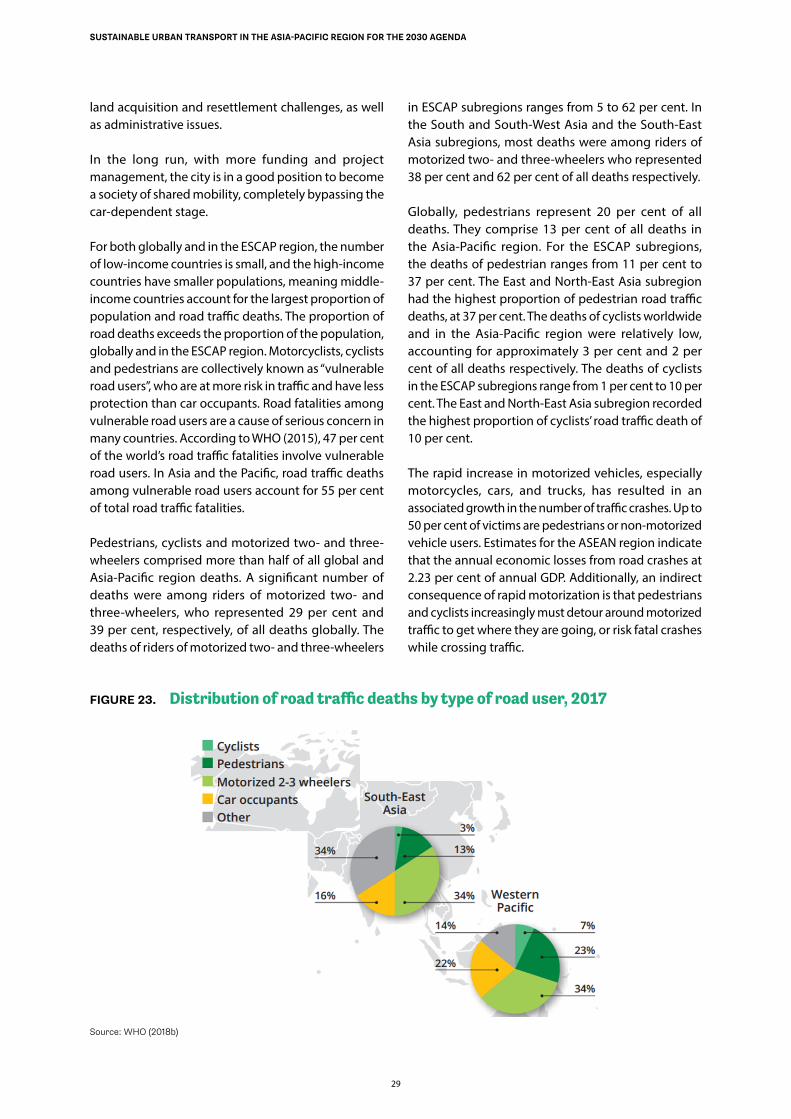
29
SUSTAINABLE URBAN TRANSPORT IN THE ASIA-PACIFIC REGION FOR THE 2030 AGENDA
land acquisition and resettlement challenges, as well as administrative issues.
In the long run, with more funding and project management, the city is in a good position to become a society of shared mobility, completely bypassing the car-dependent stage.
For both globally and in the ESCAP region, the number of low-income countries is small, and the high-income countries have smaller populations, meaning middle-income countries account for the largest proportion of population and road traffic deaths. The proportion of road deaths exceeds the proportion of the population, globally and in the ESCAP region. Motorcyclists, cyclists and pedestrians are collectively known as “vulnerable road users”, who are at more risk in traffic and have less protection than car occupants. Road fatalities among vulnerable road users are a cause of serious concern in many countries. According to WHO (2015), 47 per cent of the world’s road traffic fatalities involve vulnerable road users. In Asia and the Pacific, road traffic deaths among vulnerable road users account for 55 per cent of total road traffic fatalities.
Pedestrians, cyclists and motorized two- and three-wheelers comprised more than half of all global and Asia-Pacific region deaths. A significant number of deaths were among riders of motorized two- and three-wheelers, who represented 29 per cent and 39 per cent, respectively, of all deaths globally. The deaths of riders of motorized two- and three-wheelers
in ESCAP subregions ranges from 5 to 62 per cent. In the South and South-West Asia and the South-East Asia subregions, most deaths were among riders of motorized two- and three-wheelers who represented 38 per cent and 62 per cent of all deaths respectively.
Globally, pedestrians represent 20 per cent of all deaths. They comprise 13 per cent of all deaths in the Asia-Pacific region. For the ESCAP subregions, the deaths of pedestrian ranges from 11 per cent to 37 per cent. The East and North-East Asia subregion had the highest proportion of pedestrian road traffic deaths, at 37 per cent. The deaths of cyclists worldwide and in the Asia-Pacific region were relatively low, accounting for approximately 3 per cent and 2 per cent of all deaths respectively. The deaths of cyclists in the ESCAP subregions range from 1 per cent to 10 per cent. The East and North-East Asia subregion recorded the highest proportion of cyclists’ road traffic death of 10 per cent.
The rapid increase in motorized vehicles, especially motorcycles, cars, and trucks, has resulted in an associated growth in the number of traffic crashes. Up to 50 per cent of victims are pedestrians or non-motorized vehicle users. Estimates for the ASEAN region indicate that the annual economic losses from road crashes at 2.23 per cent of annual GDP. Additionally, an indirect consequence of rapid motorization is that pedestrians and cyclists increasingly must detour around motorized traffic to get where they are going, or risk fatal crashes while crossing traffic.
FIGURE 23. Distribution of road traffic deaths by type of road user, 2017
Source: WHO (2018b)
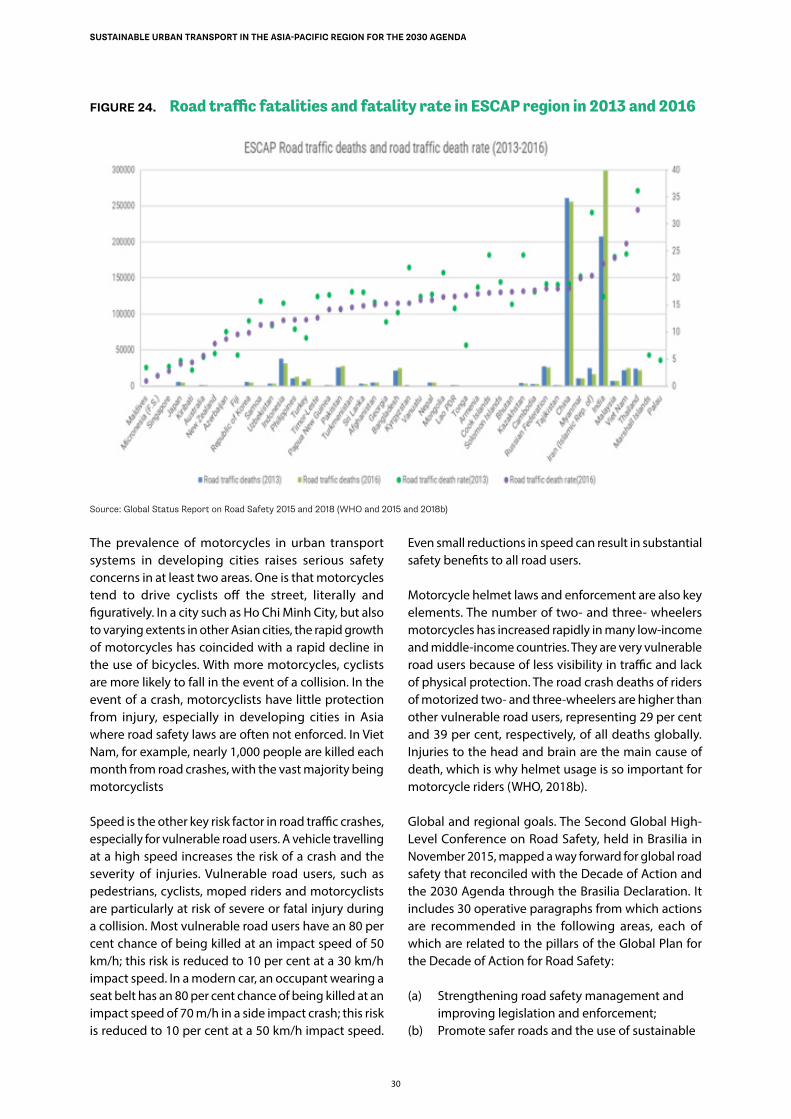
30
SUSTAINABLE URBAN TRANSPORT IN THE ASIA-PACIFIC REGION FOR THE 2030 AGENDA
FIGURE 24. Road traffic fatalities and fatality rate in ESCAP region in 2013 and 2016
Source: Global Status Report on Road Safety 2015 and 2018 (WHO and 2015 and 2018b)
The prevalence of motorcycles in urban transport systems in developing cities raises serious safety concerns in at least two areas. One is that motorcycles tend to drive cyclists off the street, literally and figuratively. In a city such as Ho Chi Minh City, but also to varying extents in other Asian cities, the rapid growth of motorcycles has coincided with a rapid decline in the use of bicycles. With more motorcycles, cyclists are more likely to fall in the event of a collision. In the event of a crash, motorcyclists have little protection from injury, especially in developing cities in Asia where road safety laws are often not enforced. In Viet Nam, for example, nearly 1,000 people are killed each month from road crashes, with the vast majority being motorcyclists
Speed is the other key risk factor in road traffic crashes, especially for vulnerable road users. A vehicle travelling at a high speed increases the risk of a crash and the severity of injuries. Vulnerable road users, such as pedestrians, cyclists, moped riders and motorcyclists are particularly at risk of severe or fatal injury during a collision. Most vulnerable road users have an 80 per cent chance of being killed at an impact speed of 50 km/h; this risk is reduced to 10 per cent at a 30 km/h impact speed. In a modern car, an occupant wearing a seat belt has an 80 per cent chance of being killed at an impact speed of 70 m/h in a side impact crash; this risk is reduced to 10 per cent at a 50 km/h impact speed.
Even small reductions in speed can result in substantial safety benefits to all road users.
Motorcycle helmet laws and enforcement are also key elements. The number of two- and three- wheelers motorcycles has increased rapidly in many low-income and middle-income countries. They are very vulnerable road users because of less visibility in traffic and lack of physical protection. The road crash deaths of riders of motorized two- and three-wheelers are higher than other vulnerable road users, representing 29 per cent and 39 per cent, respectively, of all deaths globally. Injuries to the head and brain are the main cause of death, which is why helmet usage is so important for motorcycle riders (WHO, 2018b).
Global and regional goals. The Second Global High-Level Conference on Road Safety, held in Brasilia in November 2015, mapped a way forward for global road safety that reconciled with the Decade of Action and the 2030 Agenda through the Brasilia Declaration. It includes 30 operative paragraphs from which actions are recommended in the following areas, each of which are related to the pillars of the Global Plan for the Decade of Action for Road Safety:
(a) Strengthening road safety management and improving legislation and enforcement;
(b) Promote safer roads and the use of sustainable
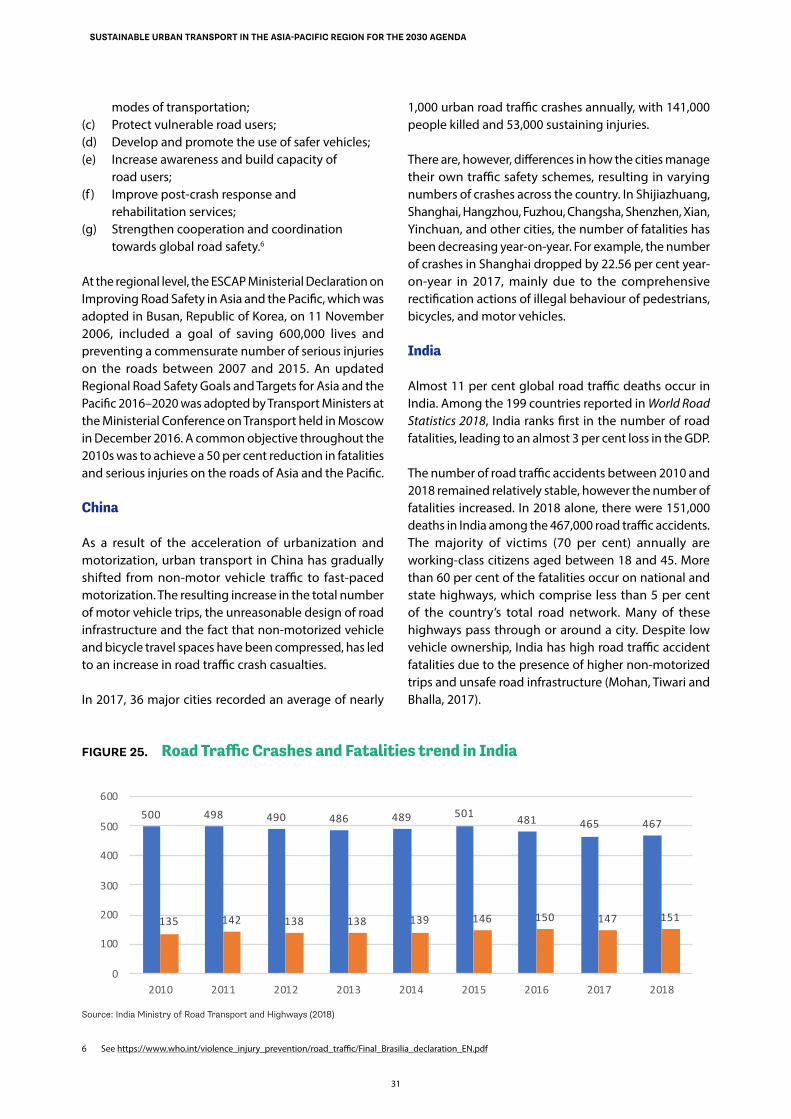
31
SUSTAINABLE URBAN TRANSPORT IN THE ASIA-PACIFIC REGION FOR THE 2030 AGENDA
modes of transportation;(c) Protect vulnerable road users;(d) Develop and promote the use of safer vehicles;(e) Increase awareness and build capacity of
road users;(f ) Improve post-crash response and
rehabilitation services;(g) Strengthen cooperation and coordination
towards global road safety.6
At the regional level, the ESCAP Ministerial Declaration on Improving Road Safety in Asia and the Pacific, which was adopted in Busan, Republic of Korea, on 11 November 2006, included a goal of saving 600,000 lives and preventing a commensurate number of serious injuries on the roads between 2007 and 2015. An updated Regional Road Safety Goals and Targets for Asia and the Pacific 2016–2020 was adopted by Transport Ministers at the Ministerial Conference on Transport held in Moscow in December 2016. A common objective throughout the 2010s was to achieve a 50 per cent reduction in fatalities and serious injuries on the roads of Asia and the Pacific.
China
As a result of the acceleration of urbanization and motorization, urban transport in China has gradually shifted from non-motor vehicle traffic to fast-paced motorization. The resulting increase in the total number of motor vehicle trips, the unreasonable design of road infrastructure and the fact that non-motorized vehicle and bicycle travel spaces have been compressed, has led to an increase in road traffic crash casualties.
In 2017, 36 major cities recorded an average of nearly
6 See https://www.who.int/violence_injury_prevention/road_traffic/Final_Brasilia_declaration_EN.pdf
1,000 urban road traffic crashes annually, with 141,000 people killed and 53,000 sustaining injuries.
There are, however, differences in how the cities manage their own traffic safety schemes, resulting in varying numbers of crashes across the country. In Shijiazhuang, Shanghai, Hangzhou, Fuzhou, Changsha, Shenzhen, Xian, Yinchuan, and other cities, the number of fatalities has been decreasing year-on-year. For example, the number of crashes in Shanghai dropped by 22.56 per cent year-on-year in 2017, mainly due to the comprehensive rectification actions of illegal behaviour of pedestrians, bicycles, and motor vehicles.
India
Almost 11 per cent global road traffic deaths occur in India. Among the 199 countries reported in World Road Statistics 2018, India ranks first in the number of road fatalities, leading to an almost 3 per cent loss in the GDP.
The number of road traffic accidents between 2010 and 2018 remained relatively stable, however the number of fatalities increased. In 2018 alone, there were 151,000 deaths in India among the 467,000 road traffic accidents. The majority of victims (70 per cent) annually are working-class citizens aged between 18 and 45. More than 60 per cent of the fatalities occur on national and state highways, which comprise less than 5 per cent of the country’s total road network. Many of these highways pass through or around a city. Despite low vehicle ownership, India has high road traffic accident fatalities due to the presence of higher non-motorized trips and unsafe road infrastructure (Mohan, Tiwari and Bhalla, 2017).
FIGURE 25. Road Traffic Crashes and Fatalities trend in India
500 498 490 486 489 501 481 465 467
135 142 138 138 139 146 150 147 151
0
100
200
300
400
500
600
2010 2011 2012 2013 2014 2015 2016 2017 2018
Number of Crashes ('000) Fatalities ('000)Source: India Ministry of Road Transport and Highways (2018)
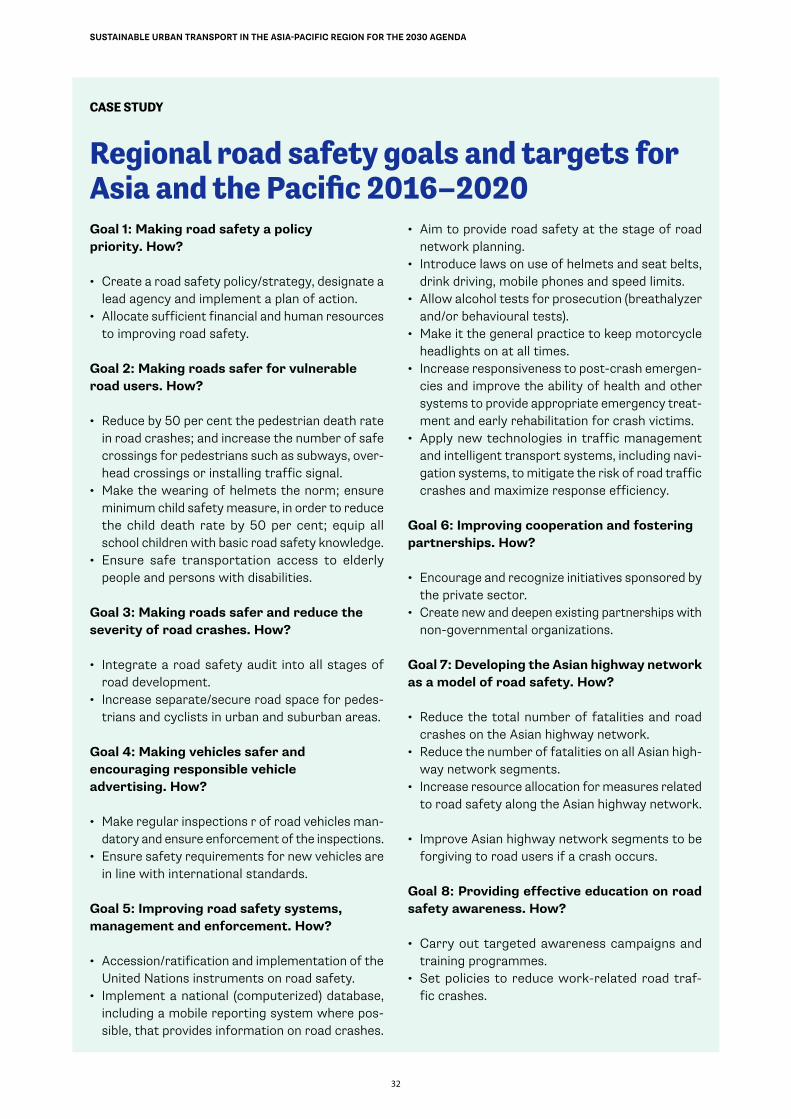
32
SUSTAINABLE URBAN TRANSPORT IN THE ASIA-PACIFIC REGION FOR THE 2030 AGENDA
CASE STUDY
Regional road safety goals and targets for Asia and the Pacific 2016–2020Goal 1: Making road safety a policy priority. How?
• Create a road safety policy/strategy, designate a lead agency and implement a plan of action.
• Allocate sufficient financial and human resources to improving road safety.
Goal 2: Making roads safer for vulnerable road users. How?
• Reduce by 50 per cent the pedestrian death rate in road crashes; and increase the number of safe crossings for pedestrians such as subways, over-head crossings or installing traffic signal.
• Make the wearing of helmets the norm; ensure minimum child safety measure, in order to reduce the child death rate by 50 per cent; equip all school children with basic road safety knowledge.
• Ensure safe transportation access to elderly people and persons with disabilities.
Goal 3: Making roads safer and reduce the severity of road crashes. How?
• Integrate a road safety audit into all stages of road development.
• Increase separate/secure road space for pedes-trians and cyclists in urban and suburban areas.
Goal 4: Making vehicles safer and encouraging responsible vehicle advertising. How?
• Make regular inspections r of road vehicles man-datory and ensure enforcement of the inspections.
• Ensure safety requirements for new vehicles are in line with international standards.
Goal 5: Improving road safety systems, management and enforcement. How?
• Accession/ratification and implementation of the United Nations instruments on road safety.
• Implement a national (computerized) database, including a mobile reporting system where pos-sible, that provides information on road crashes.
• Aim to provide road safety at the stage of road network planning.
• Introduce laws on use of helmets and seat belts, drink driving, mobile phones and speed limits.
• Allow alcohol tests for prosecution (breathalyzer and/or behavioural tests).
• Make it the general practice to keep motorcycle headlights on at all times.
• Increase responsiveness to post-crash emergen-cies and improve the ability of health and other systems to provide appropriate emergency treat-ment and early rehabilitation for crash victims.
• Apply new technologies in traffic management and intelligent transport systems, including navi-gation systems, to mitigate the risk of road traffic crashes and maximize response efficiency.
Goal 6: Improving cooperation and fostering partnerships. How?
• Encourage and recognize initiatives sponsored by the private sector.
• Create new and deepen existing partnerships with non-governmental organizations.
Goal 7: Developing the Asian highway network as a model of road safety. How?
• Reduce the total number of fatalities and road crashes on the Asian highway network.
• Reduce the number of fatalities on all Asian high-way network segments.
• Increase resource allocation for measures related to road safety along the Asian highway network.
• Improve Asian highway network segments to be forgiving to road users if a crash occurs.
Goal 8: Providing effective education on road safety awareness. How?
• Carry out targeted awareness campaigns and training programmes.
• Set policies to reduce work-related road traf-fic crashes.
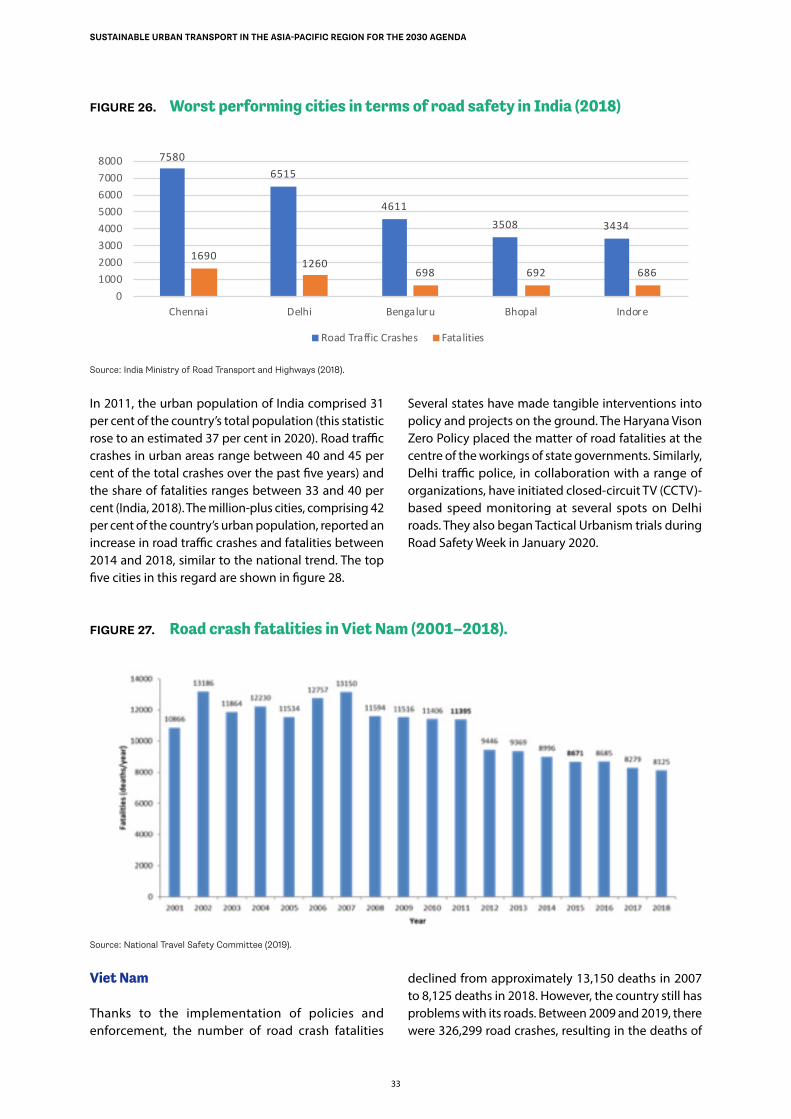
33
SUSTAINABLE URBAN TRANSPORT IN THE ASIA-PACIFIC REGION FOR THE 2030 AGENDA
FIGURE 26. Worst performing cities in terms of road safety in India (2018)
75806515
46113508 3434
16901260
698 692 686
010002000300040005000600070008000
Chennai Delhi Bengaluru Bhopal Indore
Road Traffic Crashes Fatalities
Source: India Ministry of Road Transport and Highways (2018).
In 2011, the urban population of India comprised 31 per cent of the country’s total population (this statistic rose to an estimated 37 per cent in 2020). Road traffic crashes in urban areas range between 40 and 45 per cent of the total crashes over the past five years) and the share of fatalities ranges between 33 and 40 per cent (India, 2018). The million-plus cities, comprising 42 per cent of the country’s urban population, reported an increase in road traffic crashes and fatalities between 2014 and 2018, similar to the national trend. The top five cities in this regard are shown in figure 28.
Several states have made tangible interventions into policy and projects on the ground. The Haryana Vison Zero Policy placed the matter of road fatalities at the centre of the workings of state governments. Similarly, Delhi traffic police, in collaboration with a range of organizations, have initiated closed-circuit TV (CCTV)-based speed monitoring at several spots on Delhi roads. They also began Tactical Urbanism trials during Road Safety Week in January 2020.
FIGURE 27. Road crash fatalities in Viet Nam (2001–2018).
Source: National Travel Safety Committee (2019).
Viet Nam
Thanks to the implementation of policies and enforcement, the number of road crash fatalities
declined from approximately 13,150 deaths in 2007 to 8,125 deaths in 2018. However, the country still has problems with its roads. Between 2009 and 2019, there were 326,299 road crashes, resulting in the deaths of
34
SUSTAINABLE URBAN TRANSPORT IN THE ASIA-PACIFIC REGION FOR THE 2030 AGENDA
97,721 people and injuries to 329,756 people (MOS, 2019). Despite lower fatality numbers, the death toll from road accident in Viet Nam is higher than in other countries in the Asia-Pacific region) (WHO, 2015).
There is a clear gender split in the country: men are involved in 85 per cent of all crashes. The statistics also reveal that age may be an issue, with 86 per cent of all crashes involving those aged between 27 and 55. Almost 34 per cent of road fatalities occur on urban roads, many of which are on national urban highways. Motorcycle users, meanwhile, are involved in 70 per cent of total road crashes, followed by car users (27 per cent).
The Government of Viet Nam has implemented a number of policies to improve road traffic safety. In 2007, the Government passed a regulation requiring motorcycle riders to wear a helmet (Resolution 32/2007/NQ-CP). One year later the number of road fatalities dropped from 13,150 to 11,594. In 2008, the Law of Road Traffic was passed, and in 2011, the then prime minister issued a governmental resolution to strengthen actions and programmes for road safety and congestion mitigation (Resolution 88/2011/NQ-CP). In 2012 the Ministry of Transport formulated the National Strategy for Road Traffic Safety to 2020 and a vision to 2030, comprising solutions and policies related to safer infrastructure, safer road users, safer vehicles and better traffic safety management. These two policies have contributed to remarkable reductions in road fatalities, from 11,395 deaths in 2011 to 8,125 deaths in 2018. The Government has also promulgated a zero-tolerance alcohol regulation (Decree 100/2019/ND-CP) in January 2020 to tackle drunk driving (which contributed to 28 per cent of serious road crashes in 2009/10). Compared to the first quarter of 2019, road been crashes, fatalities and injuries decreased by 9.7 per cent, 14.9 per cent, and 16.6 per cent, respectively (National Travel Safety Committee, 2020).
A way forward
Traditionally, road safety policies are intended to reduce the likelihood of road crashes and their severities by improving road infrastructure; educating road users, improving vehicle technology, and enforcing well designed traffic rules. While these are important actions, equally important should be a focus on the promotion of safer modes, such as public transport, and by reducing exposure. Studies show that cities and regions with less private car travel have lower rates of crashes and fatalities. Cities with high public transport mode shares tend to have lower city-wide traffic fatality
rates. Sustainable forms of urbanization, such as higher density and better street connectivity that allow for lower speeds, can also improve road safety.
The safe system approach is at the core of the Plan of Action of the United Nations Decade of Action, in which it is stated that for all countries, whatever their level of development, the guiding principles are those included in the “safe system”, which are the following:
(h) Human beings can make mistakes that can lead to road crashes.
(i) The human body by nature has a limited ability to sustain crash forces.
(j) It is a shared responsibility between stakeholders, such as road users, road managers and vehicle manufacturers, to take appropriate actions to ensure that road crashes do not lead to serious or fatal injuries.
The Vision Zero approach relies on the same principles. Vision Zero is a multinational road traffic safety project that is targeted to achieve a road system with no fatalities or serious injuries involving road traffic. It started in Sweden and was approved by the Parliament in October 1997. A core principle of the vision is that “Life and health can never be exchanged for other benefits within the society” rather than the more conventional comparison between costs and benefits, in which a monetary value is placed on life and health, and that value is used to decide how much money to spend on a road network towards the benefit of decreasing risk.
In the target countries, the state of Haryana, in India, became the first state to officially adopt the Vision Zero approach by launching Haryana Vision Zero program. The chief minister of Haryana launched the programme on 3 May 2017. The programme initially covered 10 districts of Haryana and generated positive results. It has been expanded to all the districts of the state and is having a positive impact.
Member countries of ESCAP are recommended to prioritize the improvement of vulnerable road user safety in their respective countries. In terms of road safety targets, ESCAP member countries that have not adopted a road safety target in line with the regionally and globally adopted road safety targets should consider doing so for the next decade.
35
SUSTAINABLE URBAN TRANSPORT IN THE ASIA-PACIFIC REGION FOR THE 2030 AGENDA
1.4 Congestion and pollution
Introduction
“A city living on total automotive dependence becomes dysfunctional, inefficient and inconvenient for life. The goal of the transport system is to move people, not vehicles.” – B. Vuchic, Transportation for Liveable Cities
Congestion in urban environments is a complex phenomenon made up of many dimensions: demographic, social and economic characteristics, land-use patterns; car-ownership; availability of public transport; availability of parking; and urban freight transport and goods delivery. These factors determine where people live and work, where businesses locate, the location of different activities and how people access these locations.
Congestion costs have several components, including, among them, air pollution, costs of delays and unreliability of journey times. In addition, with all things being equal, high levels of congestion increase fuels consumption, greenhouse gas and air pollutant emissions, and noise, while reducing the attractiveness of locations to work and live in. These factors shape activity patterns, which, in turn, generate a demand for travel. This demand results in traffic on the urban road network. When the volume of car traffic exceeds available capacity, congestion arises.
The average percentage delay in 2013 compared to the “free flow” situation in a sample of 58 European Union cities range from 14 per cent in Malmo (Sweden) to 39 per cent in Palermo (Italy). In cities outside Europe the average delays often can be higher. For example, in 22 Chinese cities, the average delays in 2013 were between 23 and 56 per cent, while in Rio de Janeiro, Brazil, it was 55 per cent, Mexico City (54 per cent) and Sao Paulo, Brazil (46 per cent).
Transport accounts for a large proportion of global emissions and congestion accentuates the impact. Air quality is an important element in ensuring the sustainable development of a city. Transport, industry, power plants, agriculture, households and waste management all contribute to air pollution. According to the European Environment Agency (EEA) Air Quality in Europe Report (2014), high levels of nitrogen dioxide (NO2) exposure can lead to coughing and shortness of breath. People who have extensive exposure to NO2 for a long time have a higher risk of respiratory disease. Additionally, particulate
matter that is small enough (PM2.5 and PM10) can enter the lungs and cause health problems, while ozone near the ground can cause a number of health issues. It can irritate the respiratory system, aggravate asthma and chronic lung diseases, and may cause permanent lung damage.
Noise pollution is also caused by traffic, as well as by construction, industry and some recreational activities. The external costs of noise in the European Union amount to at least 0.35 per cent of its GDP and are mostly caused by road traffic. This is equivalent to external costs of more than 40 billion euros (€) ($48 billion) per year. Noise has direct and indirect health effects. Urbanization, a growing demand for motorized transport and inefficient urban planning are the main driving forces behind environmental noise exposure.
Regional trends and challenges
In 2016, Asian cities experienced severe traffic congestions ranging from 30 to 50 per cent (defined as an increase in overall travel times when compared to a free flow situation). The worst traffic jams were in Bangkok (61 per cent), Jakarta (58 per cent) and Chongqing (52 per cent).
Air quality has worsened because of the rise in transportation, even as authorities have forced reductions in emissions from fixed sources. The main pollutants of concern are particulate matter (PM), especially PM10 and PM2.5, NOX, and hydrocarbons. Increasing NOX levels contribute to an increase in ozone levels. The rapid growth in the number of vehicles is the factor preventing ambient air quality levels from meeting guideline values set by WHO, despite recent technical improvements. A particular danger for Asia is that typically more than half of all trips are carried out by walking, cycling, or in open two- or three-wheelers, resulting in an unusually high exposure of the mobile population to emissions.
Air pollution, in particular, has a steep economic cost, in addition to the staggering human cost. In China, India and the 35 OECD countries, the cost is estimated to be $3.5 trillion annually in terms of ill health and lives lost. Data from OECD countries show that approximately 50 per cent of that economic burden results from road transport pollution. While air pollution in OECD countries has fallen recently, in part due to emission controls, it has increased in China and India as the increase in road traffic outpaces tighter emission regulations. Reducing air pollution from transport and other sources would clearly be a boon to some of the largest economies in the world.
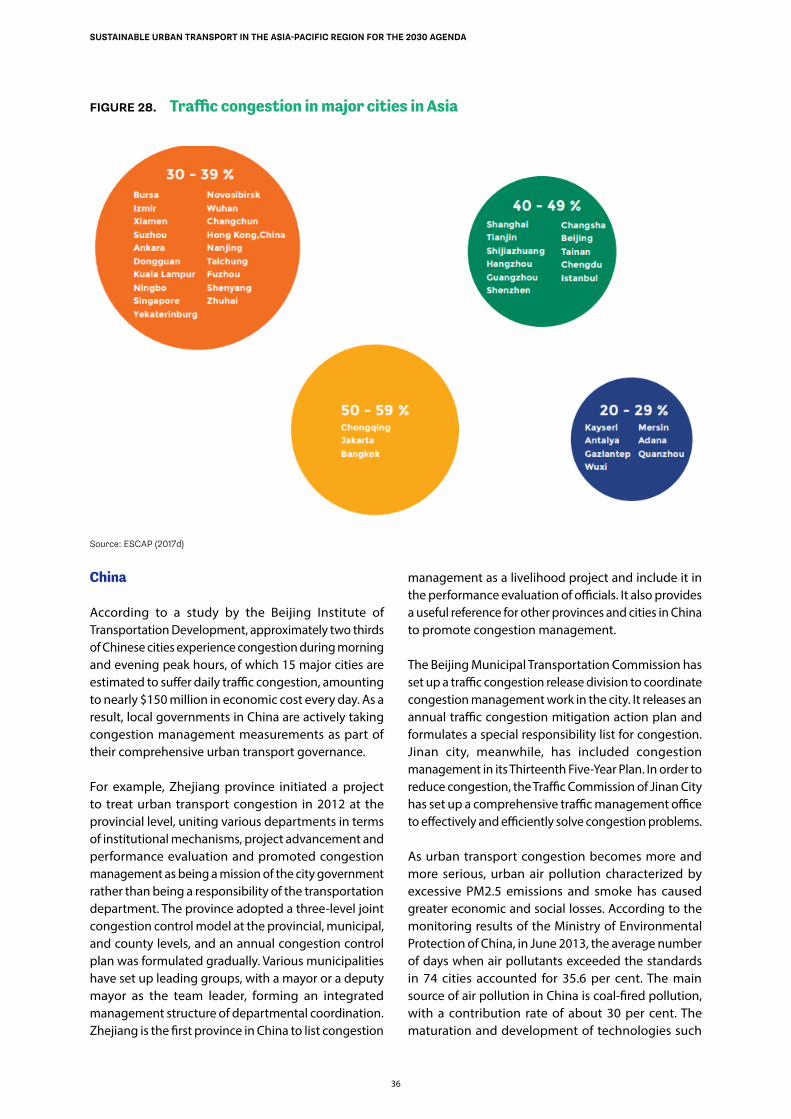
36
SUSTAINABLE URBAN TRANSPORT IN THE ASIA-PACIFIC REGION FOR THE 2030 AGENDA
FIGURE 28. Traffic congestion in major cities in Asia
Source: ESCAP (2017d)
China
According to a study by the Beijing Institute of Transportation Development, approximately two thirds of Chinese cities experience congestion during morning and evening peak hours, of which 15 major cities are estimated to suffer daily traffic congestion, amounting to nearly $150 million in economic cost every day. As a result, local governments in China are actively taking congestion management measurements as part of their comprehensive urban transport governance.
For example, Zhejiang province initiated a project to treat urban transport congestion in 2012 at the provincial level, uniting various departments in terms of institutional mechanisms, project advancement and performance evaluation and promoted congestion management as being a mission of the city government rather than being a responsibility of the transportation department. The province adopted a three-level joint congestion control model at the provincial, municipal, and county levels, and an annual congestion control plan was formulated gradually. Various municipalities have set up leading groups, with a mayor or a deputy mayor as the team leader, forming an integrated management structure of departmental coordination. Zhejiang is the first province in China to list congestion
management as a livelihood project and include it in the performance evaluation of officials. It also provides a useful reference for other provinces and cities in China to promote congestion management.
The Beijing Municipal Transportation Commission has set up a traffic congestion release division to coordinate congestion management work in the city. It releases an annual traffic congestion mitigation action plan and formulates a special responsibility list for congestion. Jinan city, meanwhile, has included congestion management in its Thirteenth Five-Year Plan. In order to reduce congestion, the Traffic Commission of Jinan City has set up a comprehensive traffic management office to effectively and efficiently solve congestion problems.
As urban transport congestion becomes more and more serious, urban air pollution characterized by excessive PM2.5 emissions and smoke has caused greater economic and social losses. According to the monitoring results of the Ministry of Environmental Protection of China, in June 2013, the average number of days when air pollutants exceeded the standards in 74 cities accounted for 35.6 per cent. The main source of air pollution in China is coal-fired pollution, with a contribution rate of about 30 per cent. The maturation and development of technologies such
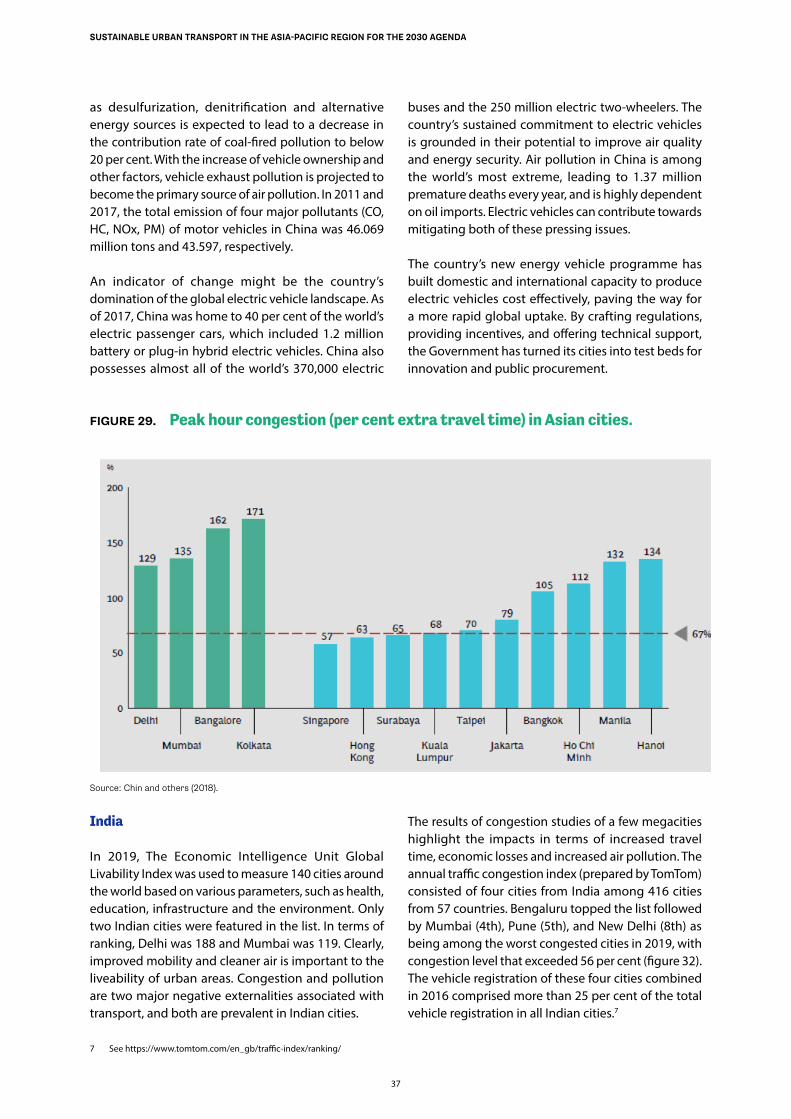
37
SUSTAINABLE URBAN TRANSPORT IN THE ASIA-PACIFIC REGION FOR THE 2030 AGENDA
as desulfurization, denitrification and alternative energy sources is expected to lead to a decrease in the contribution rate of coal-fired pollution to below 20 per cent. With the increase of vehicle ownership and other factors, vehicle exhaust pollution is projected to become the primary source of air pollution. In 2011 and 2017, the total emission of four major pollutants (CO, HC, NOx, PM) of motor vehicles in China was 46.069 million tons and 43.597, respectively.
An indicator of change might be the country’s domination of the global electric vehicle landscape. As of 2017, China was home to 40 per cent of the world’s electric passenger cars, which included 1.2 million battery or plug-in hybrid electric vehicles. China also possesses almost all of the world’s 370,000 electric
7 See https://www.tomtom.com/en_gb/traffic-index/ranking/
buses and the 250 million electric two-wheelers. The country’s sustained commitment to electric vehicles is grounded in their potential to improve air quality and energy security. Air pollution in China is among the world’s most extreme, leading to 1.37 million premature deaths every year, and is highly dependent on oil imports. Electric vehicles can contribute towards mitigating both of these pressing issues.
The country’s new energy vehicle programme has built domestic and international capacity to produce electric vehicles cost effectively, paving the way for a more rapid global uptake. By crafting regulations, providing incentives, and offering technical support, the Government has turned its cities into test beds for innovation and public procurement.
FIGURE 29. Peak hour congestion (per cent extra travel time) in Asian cities.
Source: Chin and others (2018).
India
In 2019, The Economic Intelligence Unit Global Livability Index was used to measure 140 cities around the world based on various parameters, such as health, education, infrastructure and the environment. Only two Indian cities were featured in the list. In terms of ranking, Delhi was 188 and Mumbai was 119. Clearly, improved mobility and cleaner air is important to the liveability of urban areas. Congestion and pollution are two major negative externalities associated with transport, and both are prevalent in Indian cities.
The results of congestion studies of a few megacities highlight the impacts in terms of increased travel time, economic losses and increased air pollution. The annual traffic congestion index (prepared by TomTom) consisted of four cities from India among 416 cities from 57 countries. Bengaluru topped the list followed by Mumbai (4th), Pune (5th), and New Delhi (8th) as being among the worst congested cities in 2019, with congestion level that exceeded 56 per cent (figure 32). The vehicle registration of these four cities combined in 2016 comprised more than 25 per cent of the total vehicle registration in all Indian cities.7
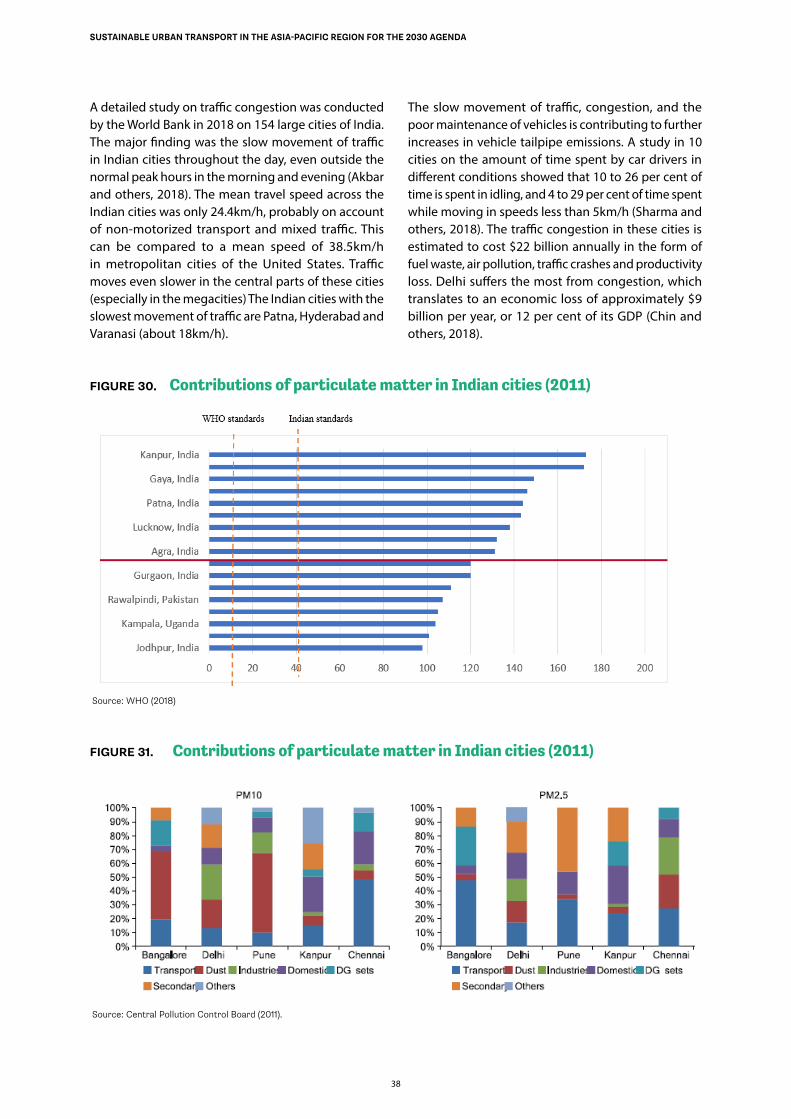
38
SUSTAINABLE URBAN TRANSPORT IN THE ASIA-PACIFIC REGION FOR THE 2030 AGENDA
A detailed study on traffic congestion was conducted by the World Bank in 2018 on 154 large cities of India. The major finding was the slow movement of traffic in Indian cities throughout the day, even outside the normal peak hours in the morning and evening (Akbar and others, 2018). The mean travel speed across the Indian cities was only 24.4km/h, probably on account of non-motorized transport and mixed traffic. This can be compared to a mean speed of 38.5km/h in metropolitan cities of the United States. Traffic moves even slower in the central parts of these cities (especially in the megacities) The Indian cities with the slowest movement of traffic are Patna, Hyderabad and Varanasi (about 18km/h).
The slow movement of traffic, congestion, and the poor maintenance of vehicles is contributing to further increases in vehicle tailpipe emissions. A study in 10 cities on the amount of time spent by car drivers in different conditions showed that 10 to 26 per cent of time is spent in idling, and 4 to 29 per cent of time spent while moving in speeds less than 5km/h (Sharma and others, 2018). The traffic congestion in these cities is estimated to cost $22 billion annually in the form of fuel waste, air pollution, traffic crashes and productivity loss. Delhi suffers the most from congestion, which translates to an economic loss of approximately $9 billion per year, or 12 per cent of its GDP (Chin and others, 2018).
FIGURE 30. Contributions of particulate matter in Indian cities (2011)
Source: WHO (2018)
FIGURE 31. Contributions of particulate matter in Indian cities (2011)
Source: Central Pollution Control Board (2011).
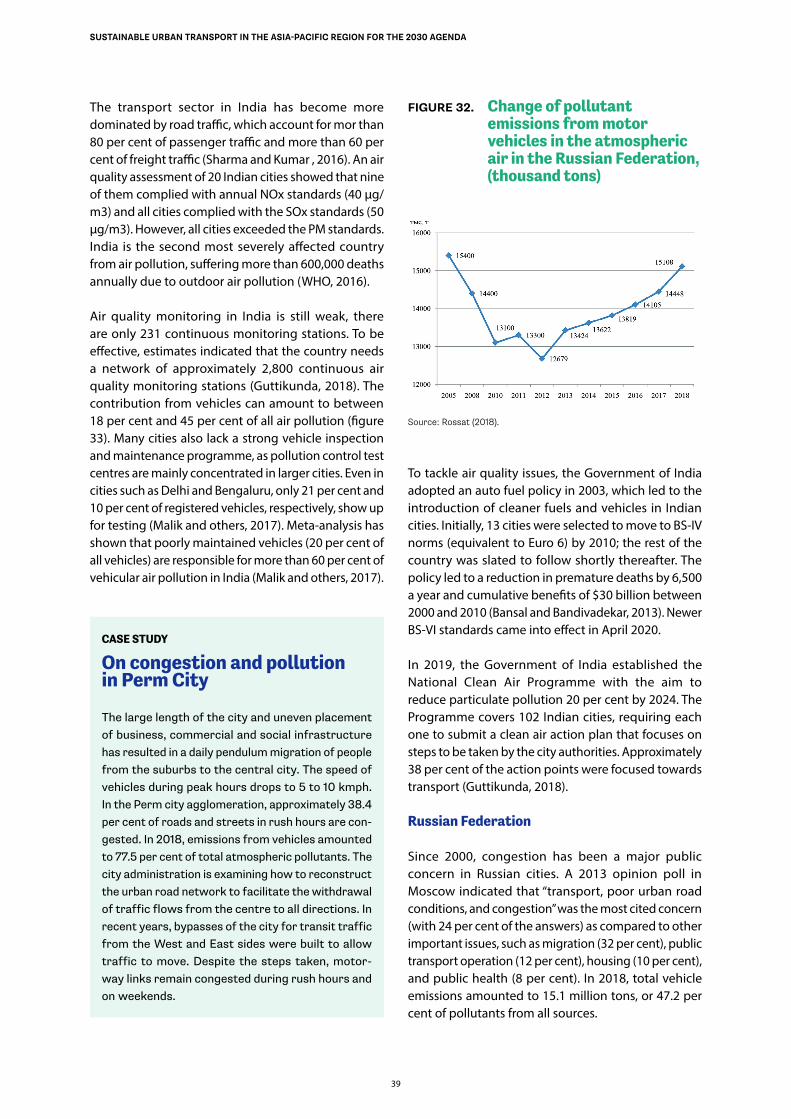
39
SUSTAINABLE URBAN TRANSPORT IN THE ASIA-PACIFIC REGION FOR THE 2030 AGENDA
The transport sector in India has become more dominated by road traffic, which account for mor than 80 per cent of passenger traffic and more than 60 per cent of freight traffic (Sharma and Kumar , 2016). An air quality assessment of 20 Indian cities showed that nine of them complied with annual NOx standards (40 μg/m3) and all cities complied with the SOx standards (50 μg/m3). However, all cities exceeded the PM standards. India is the second most severely affected country from air pollution, suffering more than 600,000 deaths annually due to outdoor air pollution (WHO, 2016).
Air quality monitoring in India is still weak, there are only 231 continuous monitoring stations. To be effective, estimates indicated that the country needs a network of approximately 2,800 continuous air quality monitoring stations (Guttikunda, 2018). The contribution from vehicles can amount to between 18 per cent and 45 per cent of all air pollution (figure 33). Many cities also lack a strong vehicle inspection and maintenance programme, as pollution control test centres are mainly concentrated in larger cities. Even in cities such as Delhi and Bengaluru, only 21 per cent and 10 per cent of registered vehicles, respectively, show up for testing (Malik and others, 2017). Meta-analysis has shown that poorly maintained vehicles (20 per cent of all vehicles) are responsible for more than 60 per cent of vehicular air pollution in India (Malik and others, 2017).
CASE STUDY
On congestion and pollution in Perm City
The large length of the city and uneven placement of business, commercial and social infrastructure has resulted in a daily pendulum migration of people from the suburbs to the central city. The speed of vehicles during peak hours drops to 5 to 10 kmph. In the Perm city agglomeration, approximately 38.4 per cent of roads and streets in rush hours are con-gested. In 2018, emissions from vehicles amounted to 77.5 per cent of total atmospheric pollutants. The city administration is examining how to reconstruct the urban road network to facilitate the withdrawal of traffic flows from the centre to all directions. In recent years, bypasses of the city for transit traffic from the West and East sides were built to allow traffic to move. Despite the steps taken, motor-way links remain congested during rush hours and on weekends.
FIGURE 32. Change of pollutant emissions from motor vehicles in the atmospheric air in the Russian Federation, (thousand tons)
Source: Rossat (2018).
To tackle air quality issues, the Government of India adopted an auto fuel policy in 2003, which led to the introduction of cleaner fuels and vehicles in Indian cities. Initially, 13 cities were selected to move to BS-IV norms (equivalent to Euro 6) by 2010; the rest of the country was slated to follow shortly thereafter. The policy led to a reduction in premature deaths by 6,500 a year and cumulative benefits of $30 billion between 2000 and 2010 (Bansal and Bandivadekar, 2013). Newer BS-VI standards came into effect in April 2020.
In 2019, the Government of India established the National Clean Air Programme with the aim to reduce particulate pollution 20 per cent by 2024. The Programme covers 102 Indian cities, requiring each one to submit a clean air action plan that focuses on steps to be taken by the city authorities. Approximately 38 per cent of the action points were focused towards transport (Guttikunda, 2018).
Russian Federation
Since 2000, congestion has been a major public concern in Russian cities. A 2013 opinion poll in Moscow indicated that “transport, poor urban road conditions, and congestion” was the most cited concern (with 24 per cent of the answers) as compared to other important issues, such as migration (32 per cent), public transport operation (12 per cent), housing (10 per cent), and public health (8 per cent). In 2018, total vehicle emissions amounted to 15.1 million tons, or 47.2 per cent of pollutants from all sources.
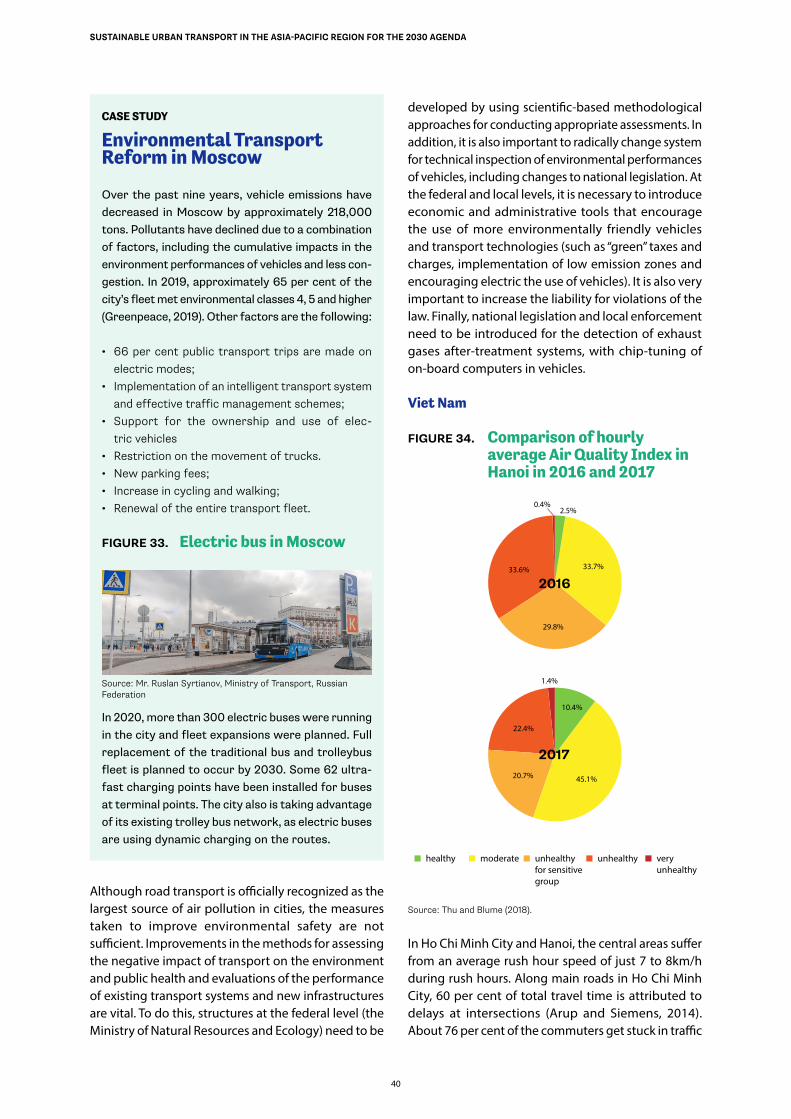
40
SUSTAINABLE URBAN TRANSPORT IN THE ASIA-PACIFIC REGION FOR THE 2030 AGENDA
CASE STUDY
Environmental Transport Reform in Moscow
Over the past nine years, vehicle emissions have decreased in Moscow by approximately 218,000 tons. Pollutants have declined due to a combination of factors, including the cumulative impacts in the environment performances of vehicles and less con-gestion. In 2019, approximately 65 per cent of the city’s fleet met environmental classes 4, 5 and higher (Greenpeace, 2019). Other factors are the following:
• 66 per cent public transport trips are made on electric modes;
• Implementation of an intelligent transport system and effective traffic management schemes;
• Support for the ownership and use of elec-tric vehicles
• Restriction on the movement of trucks.• New parking fees;• Increase in cycling and walking;• Renewal of the entire transport fleet.
FIGURE 33. Electric bus in Moscow
Source: Mr. Ruslan Syrtianov, Ministry of Transport, Russian Federation
In 2020, more than 300 electric buses were running in the city and fleet expansions were planned. Full replacement of the traditional bus and trolleybus fleet is planned to occur by 2030. Some 62 ultra-fast charging points have been installed for buses at terminal points. The city also is taking advantage of its existing trolley bus network, as electric buses are using dynamic charging on the routes.
Although road transport is officially recognized as the largest source of air pollution in cities, the measures taken to improve environmental safety are not sufficient. Improvements in the methods for assessing the negative impact of transport on the environment and public health and evaluations of the performance of existing transport systems and new infrastructures are vital. To do this, structures at the federal level (the Ministry of Natural Resources and Ecology) need to be
developed by using scientific-based methodological approaches for conducting appropriate assessments. In addition, it is also important to radically change system for technical inspection of environmental performances of vehicles, including changes to national legislation. At the federal and local levels, it is necessary to introduce economic and administrative tools that encourage the use of more environmentally friendly vehicles and transport technologies (such as “green” taxes and charges, implementation of low emission zones and encouraging electric the use of vehicles). It is also very important to increase the liability for violations of the law. Finally, national legislation and local enforcement need to be introduced for the detection of exhaust gases after-treatment systems, with chip-tuning of on-board computers in vehicles.
Viet Nam
FIGURE 34. Comparison of hourly average Air Quality Index in Hanoi in 2016 and 2017
2016
2017
33.7%33.6%
29.8%
45.1%20.7%
22.4%
10.4%
1.4%
2.5%0.4%
healthy moderate unhealthyfor sensitivegroup
unhealthy veryunhealthy
Source: Thu and Blume (2018).
In Ho Chi Minh City and Hanoi, the central areas suffer from an average rush hour speed of just 7 to 8km/h during rush hours. Along main roads in Ho Chi Minh City, 60 per cent of total travel time is attributed to delays at intersections (Arup and Siemens, 2014). About 76 per cent of the commuters get stuck in traffic
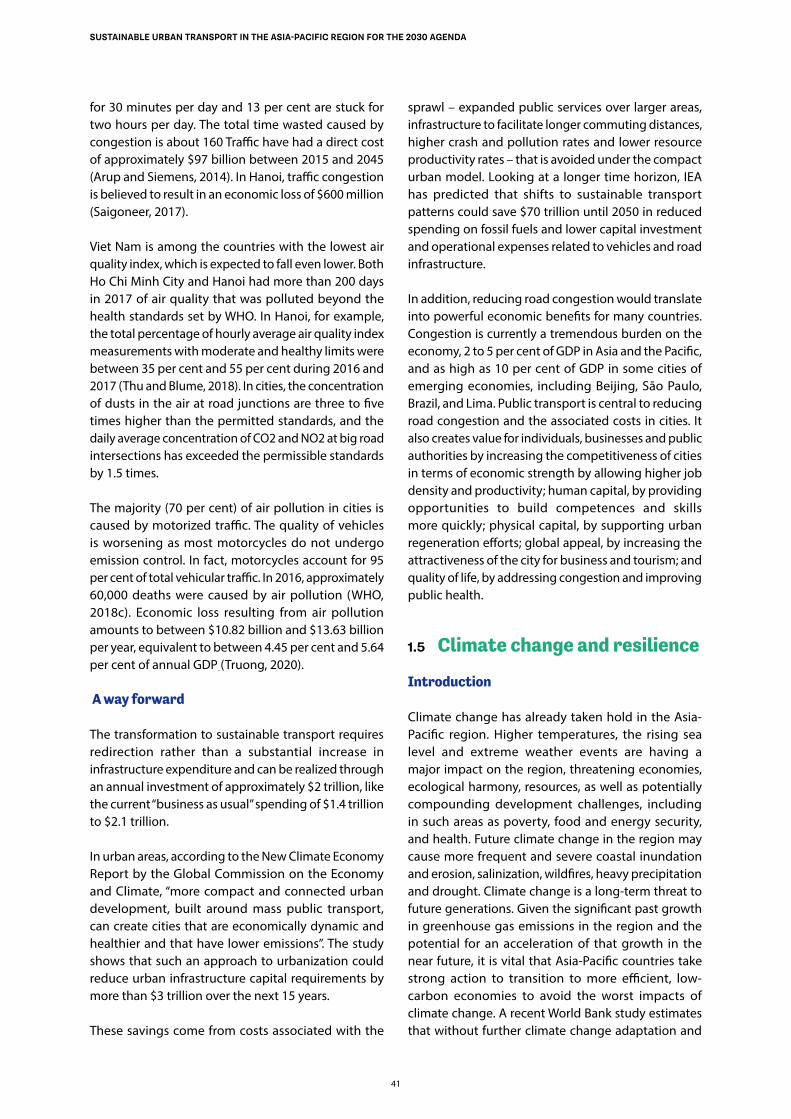
41
SUSTAINABLE URBAN TRANSPORT IN THE ASIA-PACIFIC REGION FOR THE 2030 AGENDA
for 30 minutes per day and 13 per cent are stuck for two hours per day. The total time wasted caused by congestion is about 160 Traffic have had a direct cost of approximately $97 billion between 2015 and 2045 (Arup and Siemens, 2014). In Hanoi, traffic congestion is believed to result in an economic loss of $600 million (Saigoneer, 2017).
Viet Nam is among the countries with the lowest air quality index, which is expected to fall even lower. Both Ho Chi Minh City and Hanoi had more than 200 days in 2017 of air quality that was polluted beyond the health standards set by WHO. In Hanoi, for example, the total percentage of hourly average air quality index measurements with moderate and healthy limits were between 35 per cent and 55 per cent during 2016 and 2017 (Thu and Blume, 2018). In cities, the concentration of dusts in the air at road junctions are three to five times higher than the permitted standards, and the daily average concentration of CO2 and NO2 at big road intersections has exceeded the permissible standards by 1.5 times.
The majority (70 per cent) of air pollution in cities is caused by motorized traffic. The quality of vehicles is worsening as most motorcycles do not undergo emission control. In fact, motorcycles account for 95 per cent of total vehicular traffic. In 2016, approximately 60,000 deaths were caused by air pollution (WHO, 2018c). Economic loss resulting from air pollution amounts to between $10.82 billion and $13.63 billion per year, equivalent to between 4.45 per cent and 5.64 per cent of annual GDP (Truong, 2020).
A way forward
The transformation to sustainable transport requires redirection rather than a substantial increase in infrastructure expenditure and can be realized through an annual investment of approximately $2 trillion, like the current “business as usual” spending of $1.4 trillion to $2.1 trillion.
In urban areas, according to the New Climate Economy Report by the Global Commission on the Economy and Climate, “more compact and connected urban development, built around mass public transport, can create cities that are economically dynamic and healthier and that have lower emissions”. The study shows that such an approach to urbanization could reduce urban infrastructure capital requirements by more than $3 trillion over the next 15 years.
These savings come from costs associated with the
sprawl – expanded public services over larger areas, infrastructure to facilitate longer commuting distances, higher crash and pollution rates and lower resource productivity rates – that is avoided under the compact urban model. Looking at a longer time horizon, IEA has predicted that shifts to sustainable transport patterns could save $70 trillion until 2050 in reduced spending on fossil fuels and lower capital investment and operational expenses related to vehicles and road infrastructure.
In addition, reducing road congestion would translate into powerful economic benefits for many countries. Congestion is currently a tremendous burden on the economy, 2 to 5 per cent of GDP in Asia and the Pacific, and as high as 10 per cent of GDP in some cities of emerging economies, including Beijing, São Paulo, Brazil, and Lima. Public transport is central to reducing road congestion and the associated costs in cities. It also creates value for individuals, businesses and public authorities by increasing the competitiveness of cities in terms of economic strength by allowing higher job density and productivity; human capital, by providing opportunities to build competences and skills more quickly; physical capital, by supporting urban regeneration efforts; global appeal, by increasing the attractiveness of the city for business and tourism; and quality of life, by addressing congestion and improving public health.
1.5 Climate change and resilience
Introduction
Climate change has already taken hold in the Asia-Pacific region. Higher temperatures, the rising sea level and extreme weather events are having a major impact on the region, threatening economies, ecological harmony, resources, as well as potentially compounding development challenges, including in such areas as poverty, food and energy security, and health. Future climate change in the region may cause more frequent and severe coastal inundation and erosion, salinization, wildfires, heavy precipitation and drought. Climate change is a long-term threat to future generations. Given the significant past growth in greenhouse gas emissions in the region and the potential for an acceleration of that growth in the near future, it is vital that Asia-Pacific countries take strong action to transition to more efficient, low-carbon economies to avoid the worst impacts of climate change. A recent World Bank study estimates that without further climate change adaptation and
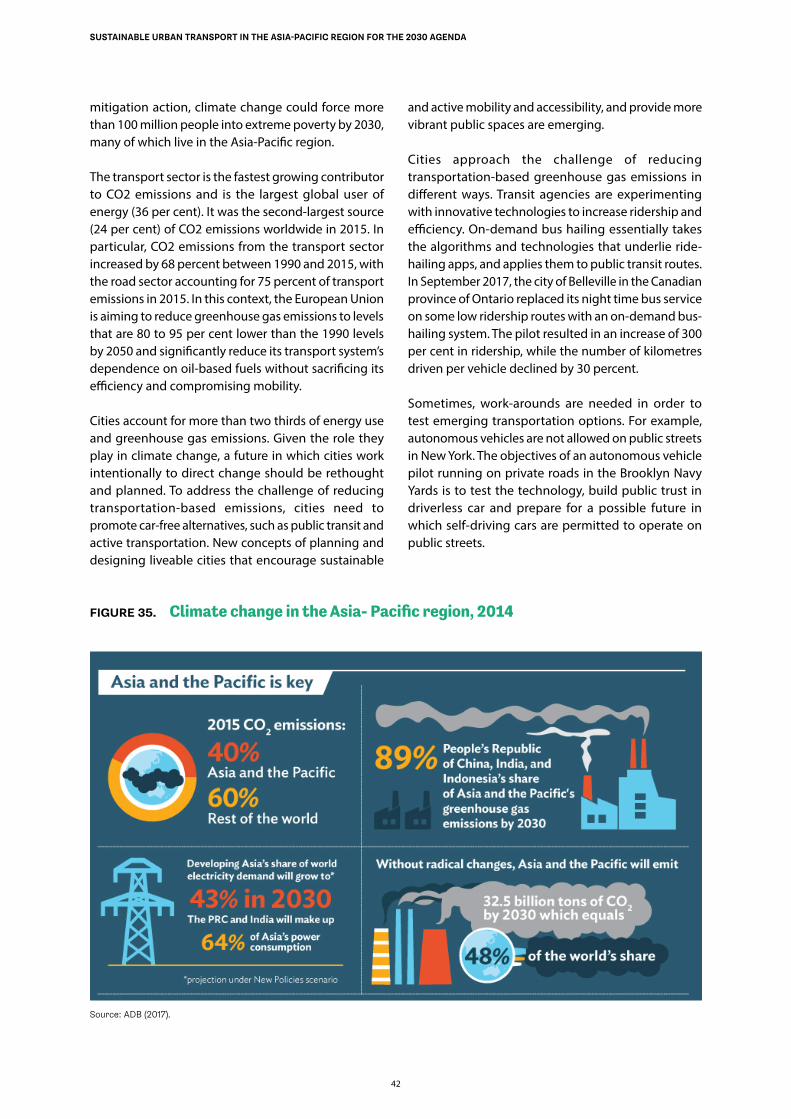
42
SUSTAINABLE URBAN TRANSPORT IN THE ASIA-PACIFIC REGION FOR THE 2030 AGENDA
mitigation action, climate change could force more than 100 million people into extreme poverty by 2030, many of which live in the Asia-Pacific region.
The transport sector is the fastest growing contributor to CO2 emissions and is the largest global user of energy (36 per cent). It was the second-largest source (24 per cent) of CO2 emissions worldwide in 2015. In particular, CO2 emissions from the transport sector increased by 68 percent between 1990 and 2015, with the road sector accounting for 75 percent of transport emissions in 2015. In this context, the European Union is aiming to reduce greenhouse gas emissions to levels that are 80 to 95 per cent lower than the 1990 levels by 2050 and significantly reduce its transport system’s dependence on oil-based fuels without sacrificing its efficiency and compromising mobility.
Cities account for more than two thirds of energy use and greenhouse gas emissions. Given the role they play in climate change, a future in which cities work intentionally to direct change should be rethought and planned. To address the challenge of reducing transportation-based emissions, cities need to promote car-free alternatives, such as public transit and active transportation. New concepts of planning and designing liveable cities that encourage sustainable
and active mobility and accessibility, and provide more vibrant public spaces are emerging.
Cities approach the challenge of reducing transportation-based greenhouse gas emissions in different ways. Transit agencies are experimenting with innovative technologies to increase ridership and efficiency. On-demand bus hailing essentially takes the algorithms and technologies that underlie ride-hailing apps, and applies them to public transit routes. In September 2017, the city of Belleville in the Canadian province of Ontario replaced its night time bus service on some low ridership routes with an on-demand bus-hailing system. The pilot resulted in an increase of 300 per cent in ridership, while the number of kilometres driven per vehicle declined by 30 percent.
Sometimes, work-arounds are needed in order to test emerging transportation options. For example, autonomous vehicles are not allowed on public streets in New York. The objectives of an autonomous vehicle pilot running on private roads in the Brooklyn Navy Yards is to test the technology, build public trust in driverless car and prepare for a possible future in which self-driving cars are permitted to operate on public streets.
FIGURE 35. Climate change in the Asia- Pacific region, 2014
Source: ADB (2017).
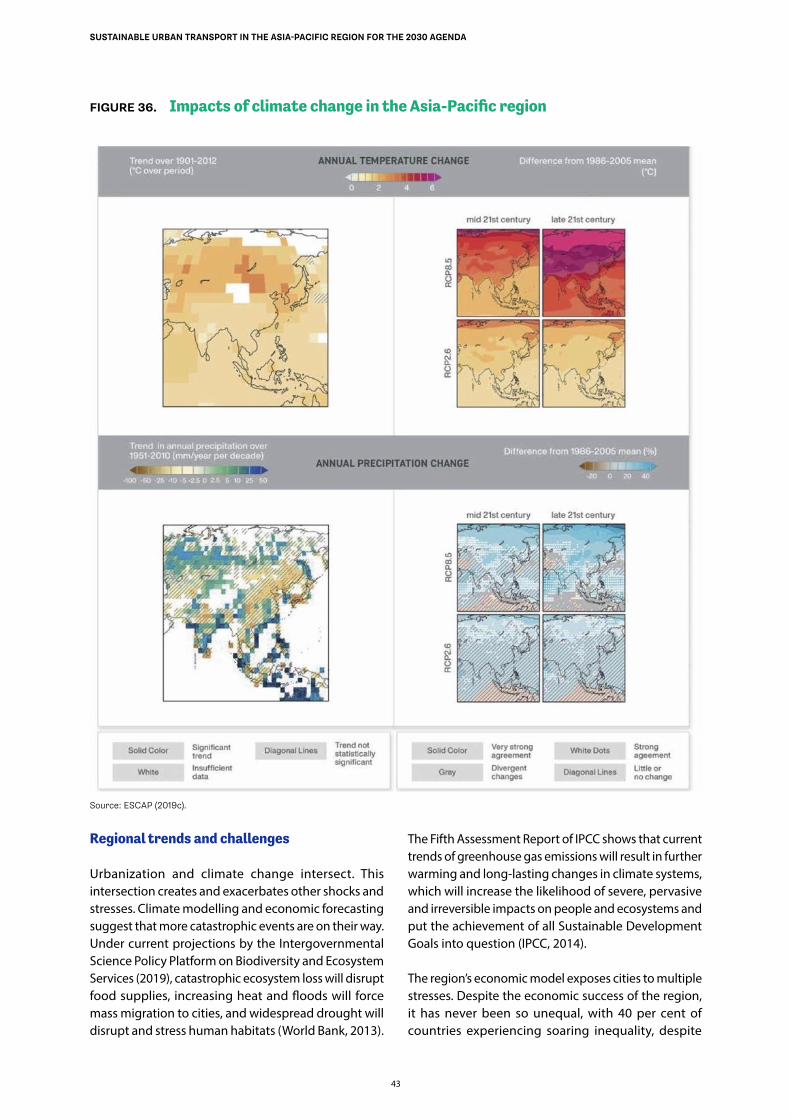
43
SUSTAINABLE URBAN TRANSPORT IN THE ASIA-PACIFIC REGION FOR THE 2030 AGENDA
FIGURE 36. Impacts of climate change in the Asia-Pacific region
Source: ESCAP (2019c).
Regional trends and challenges
Urbanization and climate change intersect. This intersection creates and exacerbates other shocks and stresses. Climate modelling and economic forecasting suggest that more catastrophic events are on their way. Under current projections by the Intergovernmental Science Policy Platform on Biodiversity and Ecosystem Services (2019), catastrophic ecosystem loss will disrupt food supplies, increasing heat and floods will force mass migration to cities, and widespread drought will disrupt and stress human habitats (World Bank, 2013).
The Fifth Assessment Report of IPCC shows that current trends of greenhouse gas emissions will result in further warming and long-lasting changes in climate systems, which will increase the likelihood of severe, pervasive and irreversible impacts on people and ecosystems and put the achievement of all Sustainable Development Goals into question (IPCC, 2014).
The region’s economic model exposes cities to multiple stresses. Despite the economic success of the region, it has never been so unequal, with 40 per cent of countries experiencing soaring inequality, despite
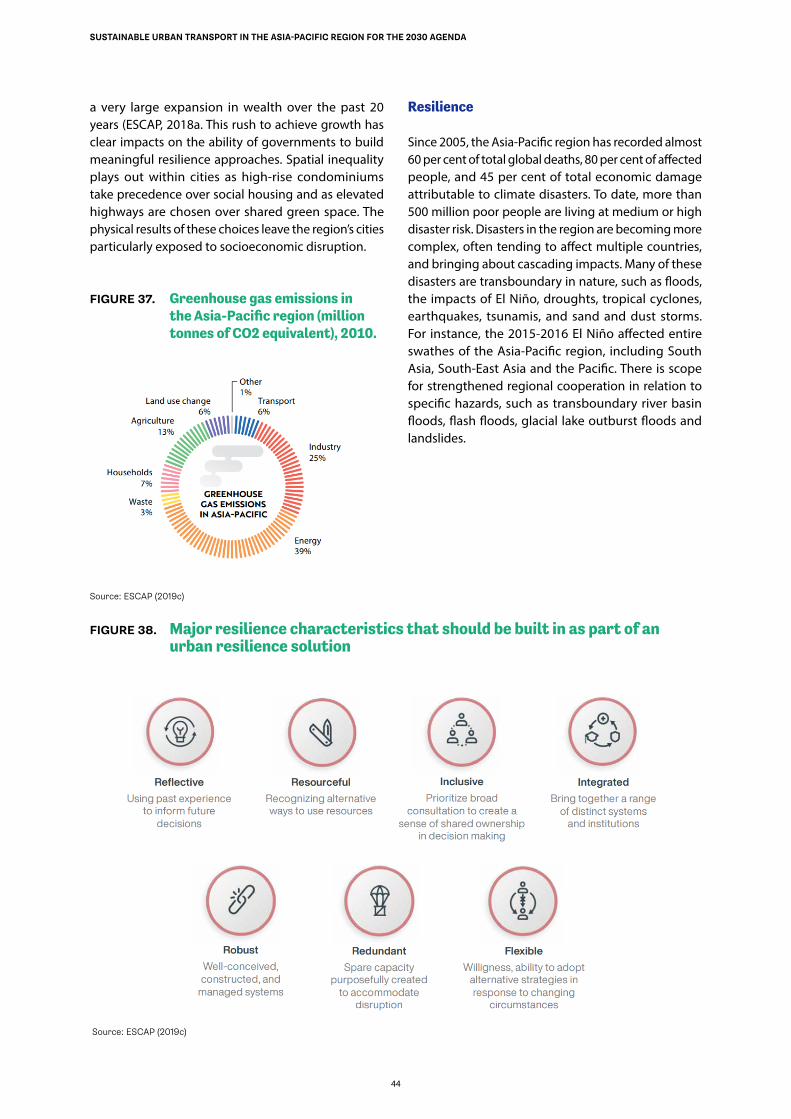
44
SUSTAINABLE URBAN TRANSPORT IN THE ASIA-PACIFIC REGION FOR THE 2030 AGENDA
a very large expansion in wealth over the past 20 years (ESCAP, 2018a. This rush to achieve growth has clear impacts on the ability of governments to build meaningful resilience approaches. Spatial inequality plays out within cities as high-rise condominiums take precedence over social housing and as elevated highways are chosen over shared green space. The physical results of these choices leave the region’s cities particularly exposed to socioeconomic disruption.
FIGURE 37. Greenhouse gas emissions in the Asia-Pacific region (million tonnes of CO2 equivalent), 2010.
Source: ESCAP (2019c)
Resilience
Since 2005, the Asia-Pacific region has recorded almost 60 per cent of total global deaths, 80 per cent of affected people, and 45 per cent of total economic damage attributable to climate disasters. To date, more than 500 million poor people are living at medium or high disaster risk. Disasters in the region are becoming more complex, often tending to affect multiple countries, and bringing about cascading impacts. Many of these disasters are transboundary in nature, such as floods, the impacts of El Nino, droughts, tropical cyclones, earthquakes, tsunamis, and sand and dust storms. For instance, the 2015-2016 El Nino affected entire swathes of the Asia-Pacific region, including South Asia, South-East Asia and the Pacific. There is scope for strengthened regional cooperation in relation to specific hazards, such as transboundary river basin floods, flash floods, glacial lake outburst floods and landslides.
FIGURE 38. Major resilience characteristics that should be built in as part of an urban resilience solution
Source: ESCAP (2019c)
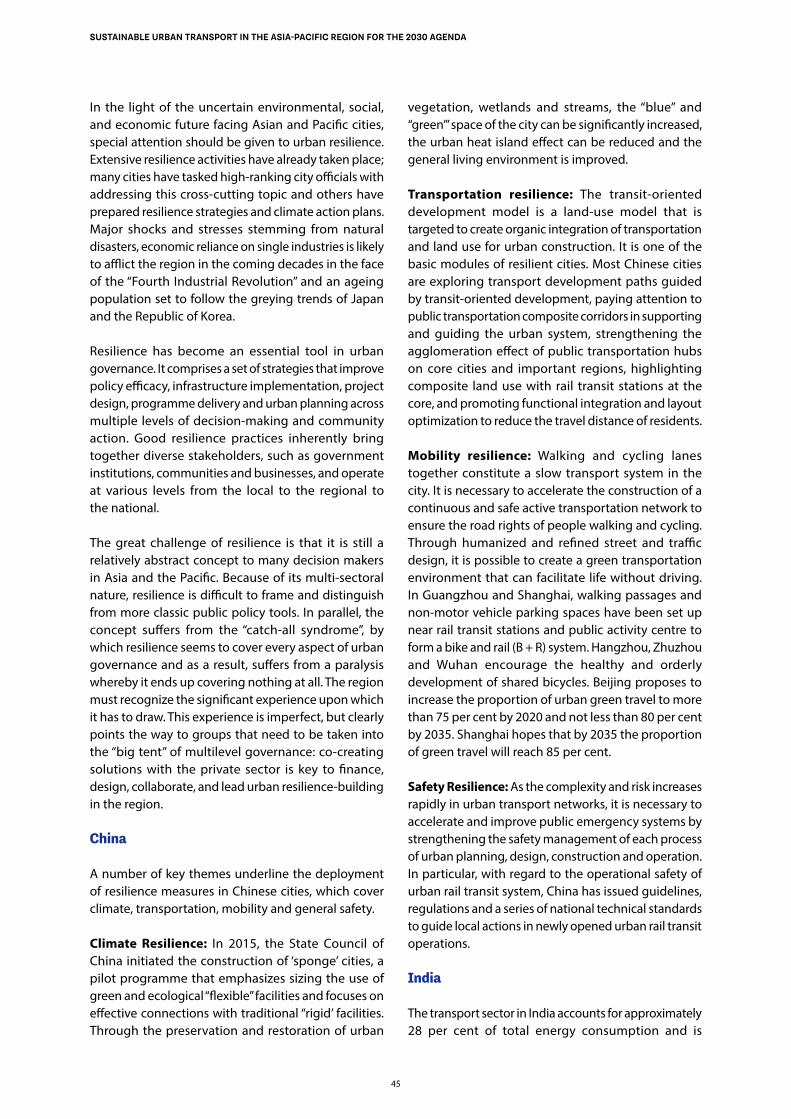
45
SUSTAINABLE URBAN TRANSPORT IN THE ASIA-PACIFIC REGION FOR THE 2030 AGENDA
In the light of the uncertain environmental, social, and economic future facing Asian and Pacific cities, special attention should be given to urban resilience. Extensive resilience activities have already taken place; many cities have tasked high-ranking city officials with addressing this cross-cutting topic and others have prepared resilience strategies and climate action plans. Major shocks and stresses stemming from natural disasters, economic reliance on single industries is likely to afflict the region in the coming decades in the face of the “Fourth Industrial Revolution” and an ageing population set to follow the greying trends of Japan and the Republic of Korea.
Resilience has become an essential tool in urban governance. It comprises a set of strategies that improve policy efficacy, infrastructure implementation, project design, programme delivery and urban planning across multiple levels of decision-making and community action. Good resilience practices inherently bring together diverse stakeholders, such as government institutions, communities and businesses, and operate at various levels from the local to the regional to the national.
The great challenge of resilience is that it is still a relatively abstract concept to many decision makers in Asia and the Pacific. Because of its multi-sectoral nature, resilience is difficult to frame and distinguish from more classic public policy tools. In parallel, the concept suffers from the “catch-all syndrome”, by which resilience seems to cover every aspect of urban governance and as a result, suffers from a paralysis whereby it ends up covering nothing at all. The region must recognize the significant experience upon which it has to draw. This experience is imperfect, but clearly points the way to groups that need to be taken into the “big tent” of multilevel governance: co-creating solutions with the private sector is key to finance, design, collaborate, and lead urban resilience-building in the region.
China
A number of key themes underline the deployment of resilience measures in Chinese cities, which cover climate, transportation, mobility and general safety.
Climate Resilience: In 2015, the State Council of China initiated the construction of ‘sponge’ cities, a pilot programme that emphasizes sizing the use of green and ecological “flexible” facilities and focuses on effective connections with traditional “rigid’ facilities. Through the preservation and restoration of urban
vegetation, wetlands and streams, the “blue” and “green”’ space of the city can be significantly increased, the urban heat island effect can be reduced and the general living environment is improved.
Transportation resilience: The transit-oriented development model is a land-use model that is targeted to create organic integration of transportation and land use for urban construction. It is one of the basic modules of resilient cities. Most Chinese cities are exploring transport development paths guided by transit-oriented development, paying attention to public transportation composite corridors in supporting and guiding the urban system, strengthening the agglomeration effect of public transportation hubs on core cities and important regions, highlighting composite land use with rail transit stations at the core, and promoting functional integration and layout optimization to reduce the travel distance of residents.
Mobility resilience: Walking and cycling lanes together constitute a slow transport system in the city. It is necessary to accelerate the construction of a continuous and safe active transportation network to ensure the road rights of people walking and cycling. Through humanized and refined street and traffic design, it is possible to create a green transportation environment that can facilitate life without driving. In Guangzhou and Shanghai, walking passages and non-motor vehicle parking spaces have been set up near rail transit stations and public activity centre to form a bike and rail (B + R) system. Hangzhou, Zhuzhou and Wuhan encourage the healthy and orderly development of shared bicycles. Beijing proposes to increase the proportion of urban green travel to more than 75 per cent by 2020 and not less than 80 per cent by 2035. Shanghai hopes that by 2035 the proportion of green travel will reach 85 per cent.
Safety Resilience: As the complexity and risk increases rapidly in urban transport networks, it is necessary to accelerate and improve public emergency systems by strengthening the safety management of each process of urban planning, design, construction and operation. In particular, with regard to the operational safety of urban rail transit system, China has issued guidelines, regulations and a series of national technical standards to guide local actions in newly opened urban rail transit operations.
India
The transport sector in India accounts for approximately 28 per cent of total energy consumption and is
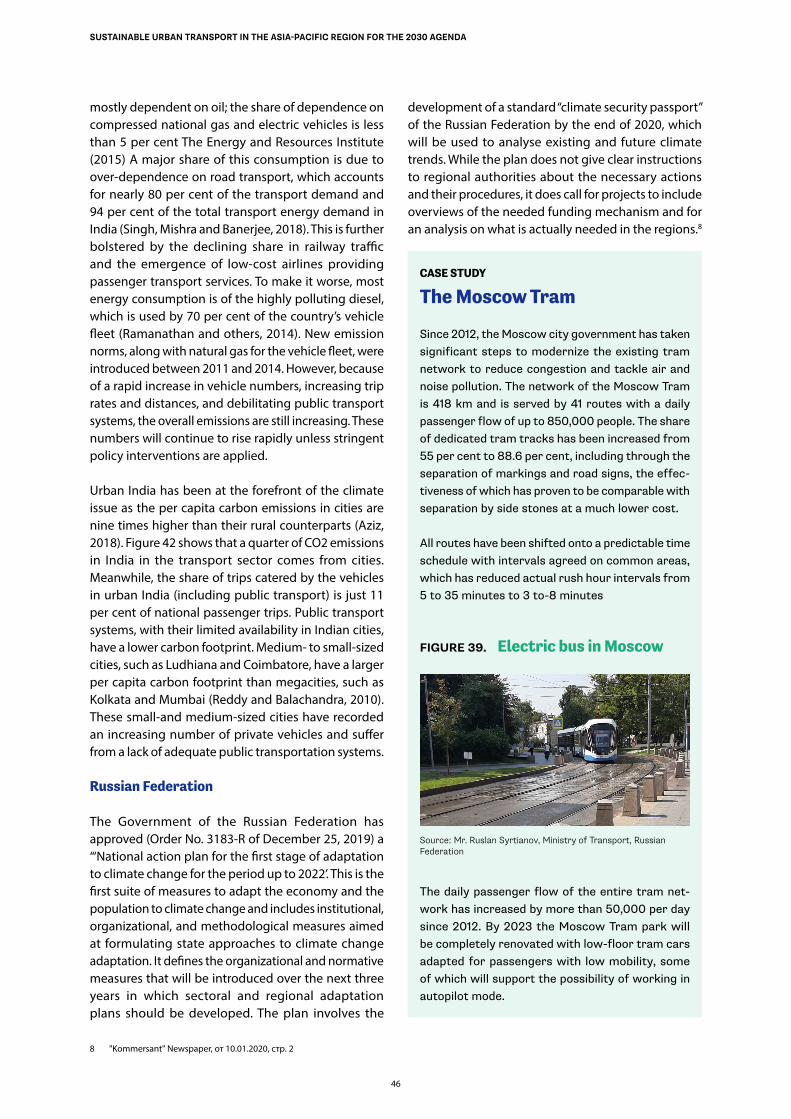
46
SUSTAINABLE URBAN TRANSPORT IN THE ASIA-PACIFIC REGION FOR THE 2030 AGENDA
mostly dependent on oil; the share of dependence on compressed national gas and electric vehicles is less than 5 per cent The Energy and Resources Institute (2015) A major share of this consumption is due to over-dependence on road transport, which accounts for nearly 80 per cent of the transport demand and 94 per cent of the total transport energy demand in India (Singh, Mishra and Banerjee, 2018). This is further bolstered by the declining share in railway traffic and the emergence of low-cost airlines providing passenger transport services. To make it worse, most energy consumption is of the highly polluting diesel, which is used by 70 per cent of the country’s vehicle fleet (Ramanathan and others, 2014). New emission norms, along with natural gas for the vehicle fleet, were introduced between 2011 and 2014. However, because of a rapid increase in vehicle numbers, increasing trip rates and distances, and debilitating public transport systems, the overall emissions are still increasing. These numbers will continue to rise rapidly unless stringent policy interventions are applied.
Urban India has been at the forefront of the climate issue as the per capita carbon emissions in cities are nine times higher than their rural counterparts (Aziz, 2018). Figure 42 shows that a quarter of CO2 emissions in India in the transport sector comes from cities. Meanwhile, the share of trips catered by the vehicles in urban India (including public transport) is just 11 per cent of national passenger trips. Public transport systems, with their limited availability in Indian cities, have a lower carbon footprint. Medium- to small-sized cities, such as Ludhiana and Coimbatore, have a larger per capita carbon footprint than megacities, such as Kolkata and Mumbai (Reddy and Balachandra, 2010). These small-and medium-sized cities have recorded an increasing number of private vehicles and suffer from a lack of adequate public transportation systems.
Russian Federation
The Government of the Russian Federation has approved (Order No. 3183-R of December 25, 2019) a “‘National action plan for the first stage of adaptation to climate change for the period up to 2022’. This is the first suite of measures to adapt the economy and the population to climate change and includes institutional, organizational, and methodological measures aimed at formulating state approaches to climate change adaptation. It defines the organizational and normative measures that will be introduced over the next three years in which sectoral and regional adaptation plans should be developed. The plan involves the
8 "Kommersant" Newspaper, от 10.01.2020, стр. 2
development of a standard “climate security passport” of the Russian Federation by the end of 2020, which will be used to analyse existing and future climate trends. While the plan does not give clear instructions to regional authorities about the necessary actions and their procedures, it does call for projects to include overviews of the needed funding mechanism and for an analysis on what is actually needed in the regions.8
CASE STUDY
The Moscow Tram
Since 2012, the Moscow city government has taken significant steps to modernize the existing tram network to reduce congestion and tackle air and noise pollution. The network of the Moscow Tram is 418 km and is served by 41 routes with a daily passenger flow of up to 850,000 people. The share of dedicated tram tracks has been increased from 55 per cent to 88.6 per cent, including through the separation of markings and road signs, the effec-tiveness of which has proven to be comparable with separation by side stones at a much lower cost.
All routes have been shifted onto a predictable time schedule with intervals agreed on common areas, which has reduced actual rush hour intervals from 5 to 35 minutes to 3 to-8 minutes
FIGURE 39. Electric bus in Moscow
Source: Mr. Ruslan Syrtianov, Ministry of Transport, Russian Federation
The daily passenger flow of the entire tram net-work has increased by more than 50,000 per day since 2012. By 2023 the Moscow Tram park will be completely renovated with low-floor tram cars adapted for passengers with low mobility, some of which will support the possibility of working in autopilot mode.
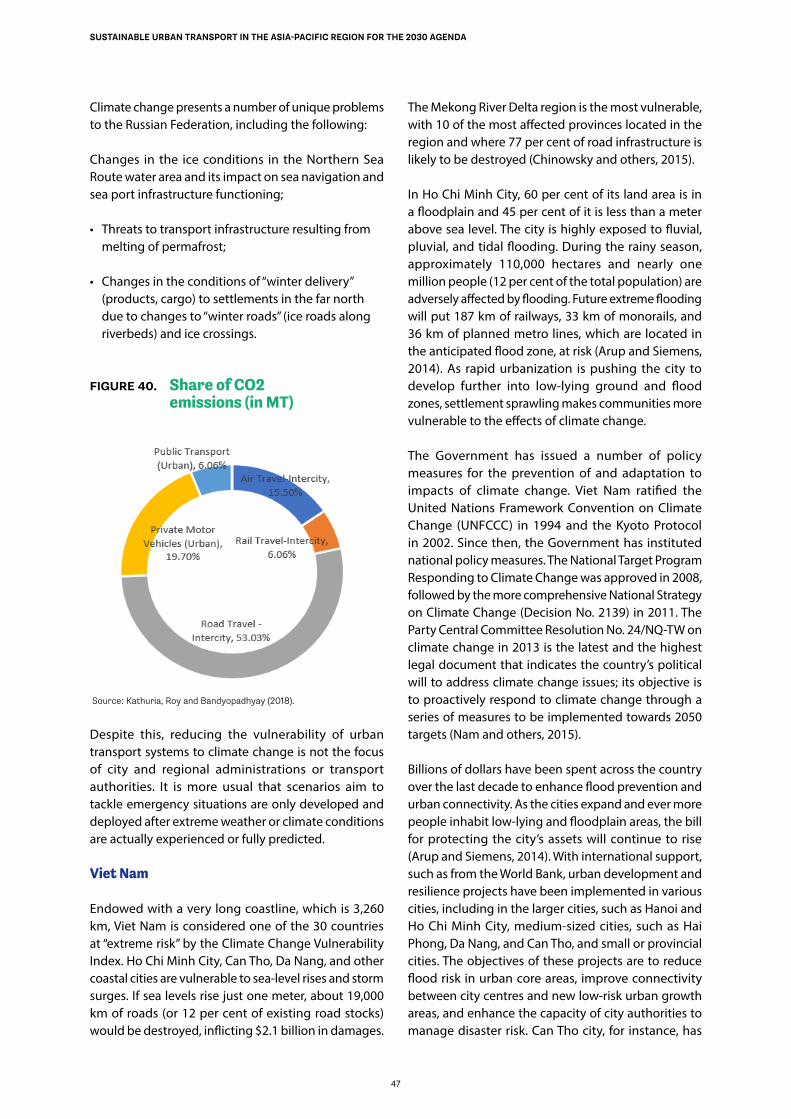
47
SUSTAINABLE URBAN TRANSPORT IN THE ASIA-PACIFIC REGION FOR THE 2030 AGENDA
Climate change presents a number of unique problems to the Russian Federation, including the following:
Changes in the ice conditions in the Northern Sea Route water area and its impact on sea navigation and sea port infrastructure functioning;
• Threats to transport infrastructure resulting from melting of permafrost;
• Changes in the conditions of “winter delivery” (products, cargo) to settlements in the far north due to changes to “winter roads” (ice roads along riverbeds) and ice crossings.
FIGURE 40. Share of CO2 emissions (in MT)
Source: Kathuria, Roy and Bandyopadhyay (2018).
Despite this, reducing the vulnerability of urban transport systems to climate change is not the focus of city and regional administrations or transport authorities. It is more usual that scenarios aim to tackle emergency situations are only developed and deployed after extreme weather or climate conditions are actually experienced or fully predicted.
Viet Nam
Endowed with a very long coastline, which is 3,260 km, Viet Nam is considered one of the 30 countries at “extreme risk” by the Climate Change Vulnerability Index. Ho Chi Minh City, Can Tho, Da Nang, and other coastal cities are vulnerable to sea-level rises and storm surges. If sea levels rise just one meter, about 19,000 km of roads (or 12 per cent of existing road stocks) would be destroyed, inflicting $2.1 billion in damages.
The Mekong River Delta region is the most vulnerable, with 10 of the most affected provinces located in the region and where 77 per cent of road infrastructure is likely to be destroyed (Chinowsky and others, 2015).
In Ho Chi Minh City, 60 per cent of its land area is in a floodplain and 45 per cent of it is less than a meter above sea level. The city is highly exposed to fluvial, pluvial, and tidal flooding. During the rainy season, approximately 110,000 hectares and nearly one million people (12 per cent of the total population) are adversely affected by flooding. Future extreme flooding will put 187 km of railways, 33 km of monorails, and 36 km of planned metro lines, which are located in the anticipated flood zone, at risk (Arup and Siemens, 2014). As rapid urbanization is pushing the city to develop further into low-lying ground and flood zones, settlement sprawling makes communities more vulnerable to the effects of climate change.
The Government has issued a number of policy measures for the prevention of and adaptation to impacts of climate change. Viet Nam ratified the United Nations Framework Convention on Climate Change (UNFCCC) in 1994 and the Kyoto Protocol in 2002. Since then, the Government has instituted national policy measures. The National Target Program Responding to Climate Change was approved in 2008, followed by the more comprehensive National Strategy on Climate Change (Decision No. 2139) in 2011. The Party Central Committee Resolution No. 24/NQ-TW on climate change in 2013 is the latest and the highest legal document that indicates the country’s political will to address climate change issues; its objective is to proactively respond to climate change through a series of measures to be implemented towards 2050 targets (Nam and others, 2015).
Billions of dollars have been spent across the country over the last decade to enhance flood prevention and urban connectivity. As the cities expand and ever more people inhabit low-lying and floodplain areas, the bill for protecting the city’s assets will continue to rise (Arup and Siemens, 2014). With international support, such as from the World Bank, urban development and resilience projects have been implemented in various cities, including in the larger cities, such as Hanoi and Ho Chi Minh City, medium-sized cities, such as Hai Phong, Da Nang, and Can Tho, and small or provincial cities. The objectives of these projects are to reduce flood risk in urban core areas, improve connectivity between city centres and new low-risk urban growth areas, and enhance the capacity of city authorities to manage disaster risk. Can Tho city, for instance, has
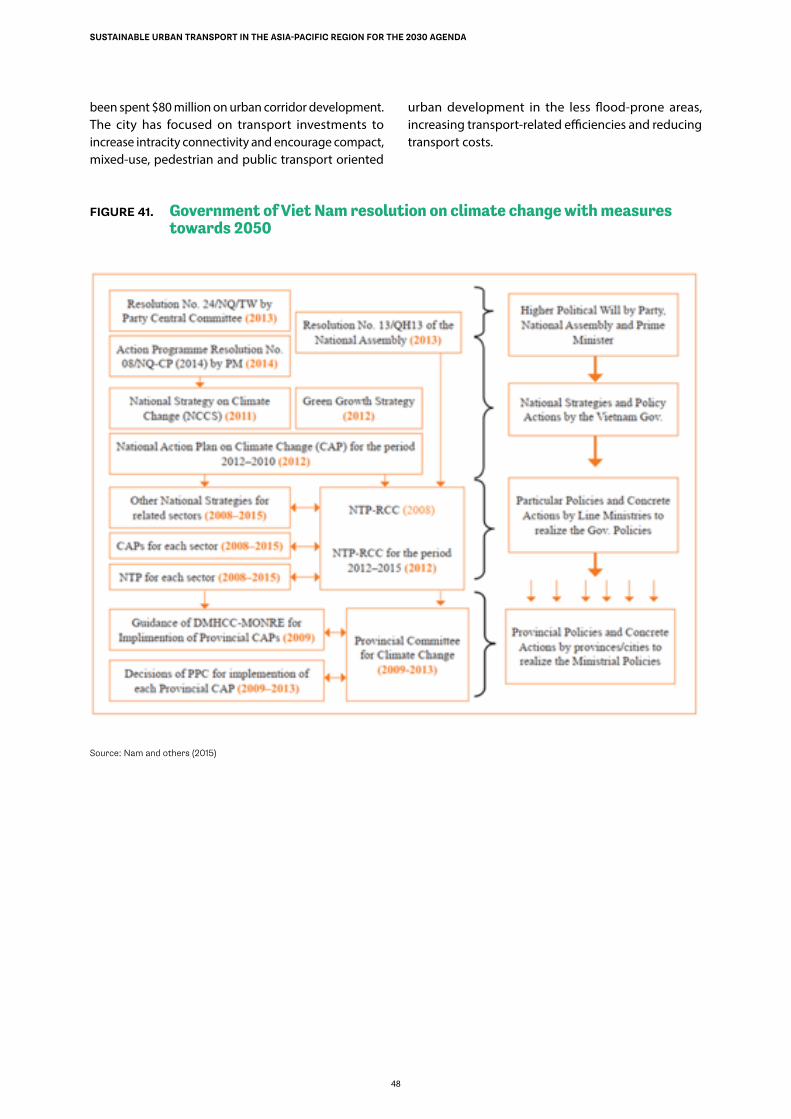
48
SUSTAINABLE URBAN TRANSPORT IN THE ASIA-PACIFIC REGION FOR THE 2030 AGENDA
been spent $80 million on urban corridor development. The city has focused on transport investments to increase intracity connectivity and encourage compact, mixed-use, pedestrian and public transport oriented
urban development in the less flood-prone areas, increasing transport-related efficiencies and reducing transport costs.
FIGURE 41. Government of Viet Nam resolution on climate change with measures towards 2050
Source: Nam and others (2015)
49
SUSTAINABLE URBAN TRANSPORT IN THE ASIA-PACIFIC REGION FOR THE 2030 AGENDA
A way forward
Recasting the role of nature and natural systems is starting to play an important role in urban resilience. Planning tools aligned under the Paris Agreement or Sendai Framework provide critical normative frameworks, while development banks provide a pipeline of needed infrastructure that helps governments build urban resilience. Along those lines, micro, low-tech and nature-based approaches are becoming increasingly important as resilience practitioners recognize the lower cost of leveraging ecosystem services to protect cities against resource depletion and extreme weather.
Speed, however, is key for efforts to increase urban resilience in the era of climate change. For mitigation, the challenges from delayed actions to reduce greenhouse gas emissions include the risk of cost escalation, locked-in carbon-emitting infrastructure, stranded assets, and reduced flexibility in future response options (IPCC, 2018). For adaptation, delayed action in the present may reduce options for climate-resilient pathways in the future, with current failures to address the effects of emerging climate stressors already eroding the basis for sustainable development and offsetting previous gains (Denton and others, 2014). Delay comes with huge penalties, not just in the increasing financial costs, but by making the problems even harder to solve. The region’s cities should keep the following maxim in mind: “Winning slowly is the same as losing” (McKibben, 2017).
Technological disruptors, such as automation, digitization and the knowledge economy, might offer an opportunity to gain some speed but it also poses challenges. As globalization has brought significant growth, it has also augured rapid technological changes that have major implications for urban resilience. There is keen interest among private sector actors and governments on the possible impacts that technology, in particular automation, will have on the future of work (ESCAP, 2019c).
1.6 Digital cities and services to users
Introduction
Cities are facing both promises and pitfalls brought on by the digital revolution. More efficient Internet and smartphone penetration has enabled unprecedented access to information and the ability to connect
individuals. The vast amount of data generated in real time across the urban environment makes it possible to understand and respond more effectively and promptly to challenges in cities. Mobile web access for services, such as ride-sharing has triggered a lifestyle shift in cities. E-hailing and food delivery apps have created job opportunities with greater flexibility. These technological shifts are transforming the way people connect with one another, conduct business, provide services, and live their lives in urban areas. For city leaders, technological advancement offers numerous opportunities that can address urban challenges and help them make informed decisions effectively.
CASE STUDY
Smart Cities and Privacy
In 2017, a Google affiliate, Sidewalk Labs, won a proposal to develop a 12-acre section of the east-ern waterfront of Toronto. The proposal left open the possibility to develop as many as 800 acres of the city’s Port Lands area in the coming years. Originally seen as a tool for addressing affordability and transportation issues in the city, the Quayside was meant to be one of the world’s first “smart city”, drawing on environmentally conscious design and emerging technologies to “accelerate urban innovation and serve as a beacon for cities around the world”. Sidewalk Labs intends to build 2,500 housing units, nearly half of which will be under market value. Despite initial public support for the project, the Quayside has been dogged by fears of data harvesting, privacy concerns and an overall lack of transparency.
Roger McNamee, an early investor in Facebook and Google, is co-founder of Silver Lake Partners, one of the world’s largest technology investors. “No matter what Google is offering, the value to Toronto cannot possibly approach the value your city is giving up,” he wrote. “It is a dystopian vision that has no place in a democratic society.” He warned that technology companies, such as Google cannot be trusted to safely manage the data they collect on residents. “The smart city project on the Toronto waterfront is the most highly evolved version to date of… surveillance capitalism”, he wrote to the city council, suggesting Google will use “algorithms to nudge human behaviour” in ways to “favour its business”.
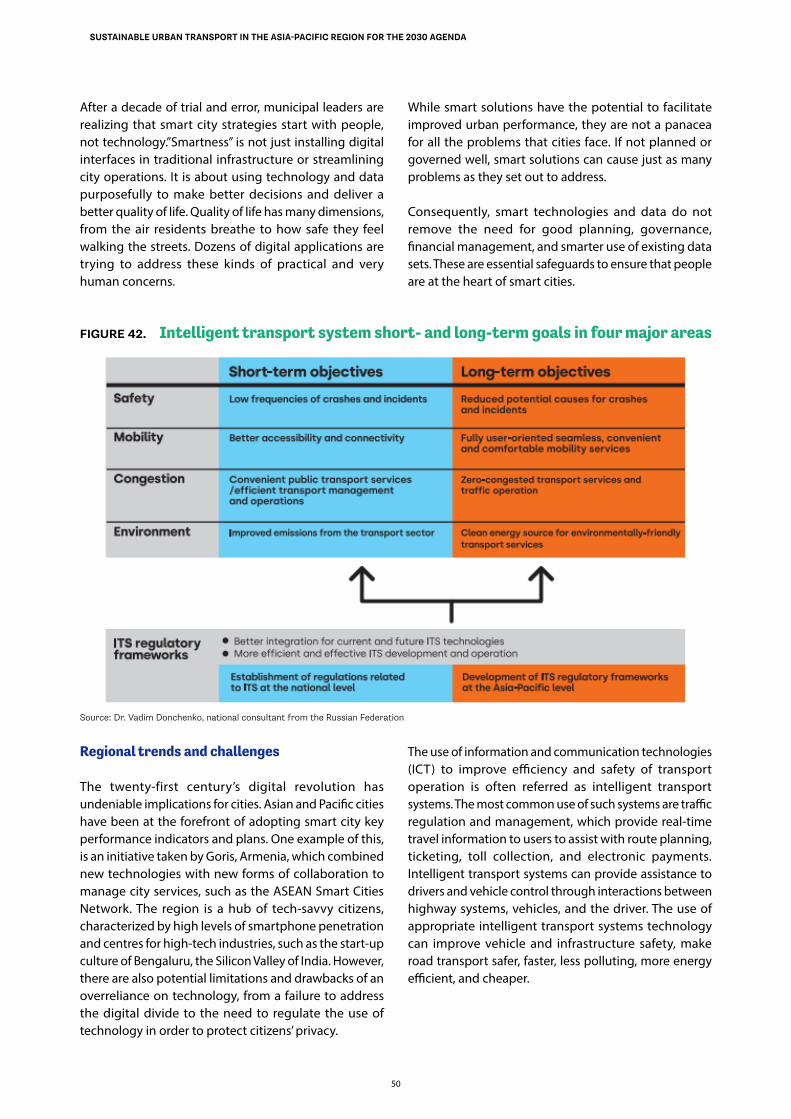
50
SUSTAINABLE URBAN TRANSPORT IN THE ASIA-PACIFIC REGION FOR THE 2030 AGENDA
After a decade of trial and error, municipal leaders are realizing that smart city strategies start with people, not technology.”Smartness” is not just installing digital interfaces in traditional infrastructure or streamlining city operations. It is about using technology and data purposefully to make better decisions and deliver a better quality of life. Quality of life has many dimensions, from the air residents breathe to how safe they feel walking the streets. Dozens of digital applications are trying to address these kinds of practical and very human concerns.
While smart solutions have the potential to facilitate improved urban performance, they are not a panacea for all the problems that cities face. If not planned or governed well, smart solutions can cause just as many problems as they set out to address.
Consequently, smart technologies and data do not remove the need for good planning, governance, financial management, and smarter use of existing data sets. These are essential safeguards to ensure that people are at the heart of smart cities.
FIGURE 42. Intelligent transport system short- and long-term goals in four major areas
Source: Dr. Vadim Donchenko, national consultant from the Russian Federation
Regional trends and challenges
The twenty-first century’s digital revolution has undeniable implications for cities. Asian and Pacific cities have been at the forefront of adopting smart city key performance indicators and plans. One example of this, is an initiative taken by Goris, Armenia, which combined new technologies with new forms of collaboration to manage city services, such as the ASEAN Smart Cities Network. The region is a hub of tech-savvy citizens, characterized by high levels of smartphone penetration and centres for high-tech industries, such as the start-up culture of Bengaluru, the Silicon Valley of India. However, there are also potential limitations and drawbacks of an overreliance on technology, from a failure to address the digital divide to the need to regulate the use of technology in order to protect citizens’ privacy.
The use of information and communication technologies (ICT) to improve efficiency and safety of transport operation is often referred as intelligent transport systems. The most common use of such systems are traffic regulation and management, which provide real-time travel information to users to assist with route planning, ticketing, toll collection, and electronic payments. Intelligent transport systems can provide assistance to drivers and vehicle control through interactions between highway systems, vehicles, and the driver. The use of appropriate intelligent transport systems technology can improve vehicle and infrastructure safety, make road transport safer, faster, less polluting, more energy efficient, and cheaper.
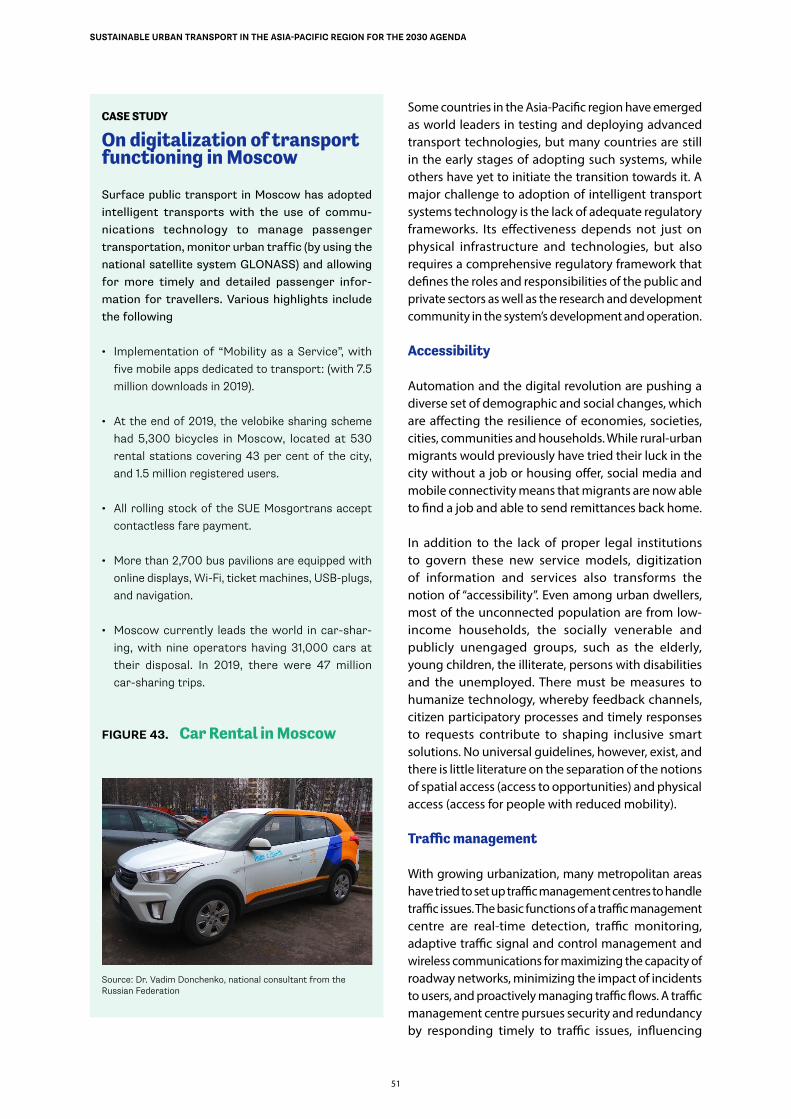
51
SUSTAINABLE URBAN TRANSPORT IN THE ASIA-PACIFIC REGION FOR THE 2030 AGENDA
CASE STUDY
On digitalization of transport functioning in Moscow
Surface public transport in Moscow has adopted intelligent transports with the use of commu-nications technology to manage passenger transportation, monitor urban traffic (by using the national satellite system GLONASS) and allowing for more timely and detailed passenger infor-mation for travellers. Various highlights include the following
• Implementation of “Mobility as a Service”, with five mobile apps dedicated to transport: (with 7.5 million downloads in 2019).
• At the end of 2019, the velobike sharing scheme had 5,300 bicycles in Moscow, located at 530 rental stations covering 43 per cent of the city, and 1.5 million registered users.
• All rolling stock of the SUE Mosgortrans accept contactless fare payment.
• More than 2,700 bus pavilions are equipped with online displays, Wi-Fi, ticket machines, USB-plugs, and navigation.
• Moscow currently leads the world in car-shar-ing, with nine operators having 31,000 cars at their disposal. In 2019, there were 47 million car-sharing trips.
FIGURE 43. Car Rental in Moscow
Source: Dr. Vadim Donchenko, national consultant from the Russian Federation
Some countries in the Asia-Pacific region have emerged as world leaders in testing and deploying advanced transport technologies, but many countries are still in the early stages of adopting such systems, while others have yet to initiate the transition towards it. A major challenge to adoption of intelligent transport systems technology is the lack of adequate regulatory frameworks. Its effectiveness depends not just on physical infrastructure and technologies, but also requires a comprehensive regulatory framework that defines the roles and responsibilities of the public and private sectors as well as the research and development community in the system’s development and operation.
Accessibility
Automation and the digital revolution are pushing a diverse set of demographic and social changes, which are affecting the resilience of economies, societies, cities, communities and households. While rural-urban migrants would previously have tried their luck in the city without a job or housing offer, social media and mobile connectivity means that migrants are now able to find a job and able to send remittances back home.
In addition to the lack of proper legal institutions to govern these new service models, digitization of information and services also transforms the notion of “accessibility”. Even among urban dwellers, most of the unconnected population are from low-income households, the socially venerable and publicly unengaged groups, such as the elderly, young children, the illiterate, persons with disabilities and the unemployed. There must be measures to humanize technology, whereby feedback channels, citizen participatory processes and timely responses to requests contribute to shaping inclusive smart solutions. No universal guidelines, however, exist, and there is little literature on the separation of the notions of spatial access (access to opportunities) and physical access (access for people with reduced mobility).
Traffic management
With growing urbanization, many metropolitan areas have tried to set up traffic management centres to handle traffic issues. The basic functions of a traffic management centre are real-time detection, traffic monitoring, adaptive traffic signal and control management and wireless communications for maximizing the capacity of roadway networks, minimizing the impact of incidents to users, and proactively managing traffic flows. A traffic management centre pursues security and redundancy by responding timely to traffic issues, influencing
52
SUSTAINABLE URBAN TRANSPORT IN THE ASIA-PACIFIC REGION FOR THE 2030 AGENDA
the operation of traffic signals, disseminating timely and accurate information, and interacting with other transport modes and agencies.
Connected and autonomous vehicles
It may be still some time before autonomous vehicles, also called “self-driving” or “driverless” vehicles, take to the roads, but vehicles are already “talking” to each other as they speed along highways and are alerting drivers to prevent collisions. Vehicle-to-Vehicle (V2V), Vehicle-to-Infrastructure (V2I), and Vehicle-to-Everything (V2X) are emerging “smart transport” technologies that enable moving vehicles to communicate with each other and with road infrastructure and other objects in order to improve traffic safety and travel convenience.
Autonomous vehicles, connected vehicles (V2V, V2I and V2X), and Mobility as a Service (MaaS) platforms that promote seamless connectivity are being tested and adopted in China, Seoul, Singapore and Tokyo. Advanced multi-lane, free- flow toll gates are being used in Turkey while Viet Nam is using “black box” cruise control safety systems. A number of countries in the region are using cutting-edge technologies to facilitate smooth traffic flow, keep travellers updated with trip traffic information and automatically collect tolls.
Mobility as a Service (MaaS)
Recent changes in technology, sociodemography and user behaviour are helping forward a move towards multimodal transport services – combining existing transport modes. MaaS offers a seamless service across all existing transport modes by providing customized trip information and services. It is expected to provide cost-efficient mobility options to users, which, in turn, will reduce expenditures associated with personal vehicle purchase and maintenance.
Flexible demand mobility services and shared mobility are presented as the way forward to achieve MaaS. However, the introduction of ride sharing mobility services in urban areas is challenging the balance between private and public transport. The use of mobile applications has enabled private operators to easily reach customers, collect data and learn from the usage of the service. Mostly, operators can work in isolation, which is disruptive and not sustainable at scale. Mobility services operators do not follow a specific strategy prior to activating a service but undergo a process of trial and error in an attempt to attract demand, however, they could provide a useful asset for the public transport sector, extending the
catchment area of services and acting as feeders for fixed scheduled public transport.
CASE STUDY
On innovation and cities
Helsinki, Amsterdam, Copenhagen, the Paris Region, Stavanger, Norway, and Tallinn, Estonia have all been announced as being part of AI4Cities, a three-year European Union-funded project bringing together leading European cities looking for artifi-cial intelligence (AI) solutions to reduce greenhouse gas emissions and meet climate commitments.
Through AI4Cities, these cities and regions will go through a pre-commercial procurement process, an innovation procurement tool that enables the public sector to steer the development of new solu-tions directly towards its needs. First, the buying authorities will define the needs and requirements for solutions in the energy and the mobility fields that they would like to see developed in order to move towards carbon neutrality. Then, they will challenge start-ups, small and medium-sized enterprises, bigger companies, and other relevant stakeholders to design innovative solutions apply-ing the use of AI and related enabling technologies, such as 5G, Internet of things), cloud computing, and big data applications.
AI4Cities is a living example how sustainability and innovation go hand in hand, providing practi-cal open-source solutions to the challenges ahead using the tangible tool of public procurement.
In Asia and the Pacific, Singapore is implementing the smart mobility concept. Beeline is a smart mobility platform based on the open cloud, which offers demand-based shuttle bus services for commuters through data analysis tools. Users can reserve seats on buses registered by private bus companies and find the location of the buses with suggested travel routes. Singapore has been developing the concept of Mobility-on-Demand as one of the solutions to the first-and-last mile problem.
Big data
Whether autonomous vehicles live up to their promise, most city dwellers travel on public transport and will continue to do so. Data that reveal behavioural patterns can provide rich insights for transport planners to
53
SUSTAINABLE URBAN TRANSPORT IN THE ASIA-PACIFIC REGION FOR THE 2030 AGENDA
enhance mobility services to serve residents’ needs. For example, many Seoul residents travel the city at night, such as students, small business owners and night-shift sanitation workers (Seoul Solution, 2014). Pre-existing night bus routes, typically designed based on an empirical understanding of the desired origins and destinations of night travellers, did not adequately serve the travel needs of these residents. Taxis were the only option, but they also charged late-night fees and sometimes refused to take passengers or illegally demanded overpriced fares. Cell phone data were overlaid with taxi ride data for planners to understand the pattern of traffic demands and to plan the new night bus routes that best serve the travel needs of people.
Artificial Intelligence
Real-time sensors coupled with big data analysis can be effective traffic management tools even though they raise major privacy concerns. Chinese e-commerce giant Alibaba developed a cloud-based system called City Brain in its headquarters city of Hangzhou. The integrated platform deploys AI to gather traffic data from the transportation bureau, video footage from traffic cameras, location data of buses and cars from the global positioning system (GPS) and many others to learn traffic flows at more than 1,000 locations (Toh and Erasmus, 2019). With an arrangement in place that ensures that the public sector retains ownership of citizen data, in 2016, the city permitted Alibaba to control 104 traffic signals in the Xiaoshan district (Beall, 2018). Average travel time on roads with automated traffic signal controlled by City Brain has been reduced by three minutes. The system has moved beyond coordinating traffic signals and has begun to automatically detect road crashes and illegal parking, facilitating more effective municipal responses to potential gridlock triggers. The City Brain system will soon be applied in Kuala Lumpur and several other cities (Beall, 2018). By contrast, the system has been criticized for its adherence to privacy protection.
China
Construction of the “digital city” has been proceeding since 2006, with a key component being advances in transportation. It can be highlighted through three features. First, through congestion monitoring of the network. Second, monitoring the status and dynamic operator of public transport. Third, monitoring passenger flow. These three factors help government decision makers devise plans, assist operators in optimizing operation plans and make it possible
for passengers to get travel information from smart mobile phones.
National level actions include formulating information development policies, deploying network constructions and platform constructions, and formulating and issuing relevant national standards. An interministerial coordination working group for new smart cities was established to jointly develop an evaluation index system and strengthen the policy release of various departments. To be successful, it is necessary to integrate and further develop big data, the digital economy and Internet plus and use smart city tools to strengthen top-level designs and urban planning to form multi-faceted and multi-field collaborative working practices.
In 2019, the Ministry of Housing and Urban Rural Development issued the technical standard for the urban comprehensive management and services platform. This draft standardized the functions of the urban integrated management service platform in terms of platform requirements, database requirements, data-sharing and exchange interface, and the operation and maintenance. The Information System for Digitized Supervision and Management of City comes with a framework covering four structural levels: national, ministerial, provincial and urban.
India
“Smart City Mission 2015” is an ambitious initiative, which relies on technology-based smart solutions for improving the quality of urban life by providing a clean, sustainable environment in 100 selected cities ( Vibha, U, 2016). The Government of India has committed 480 billion India rupees (Rs) ($6.5 billion) over a five-year period for the 100 selected cities. The state governments are expected to contribute around the same amount, bringing the potential fund up to around Rs 1 trillion. The mission has a broad remit of retrofitting and/or redeveloping pockets of existing cities or developing green-field smart cities. Intelligent transport solutions with a city-wide impact are also on the agenda. A special purpose vehicle has been set up to lead drive the Smart Cities mission, unlike AMRUT (the Atal Mission for Rejuvenation and Urban Transformation) which will be operated by the urban local governments (Ahluwalia, 2019).
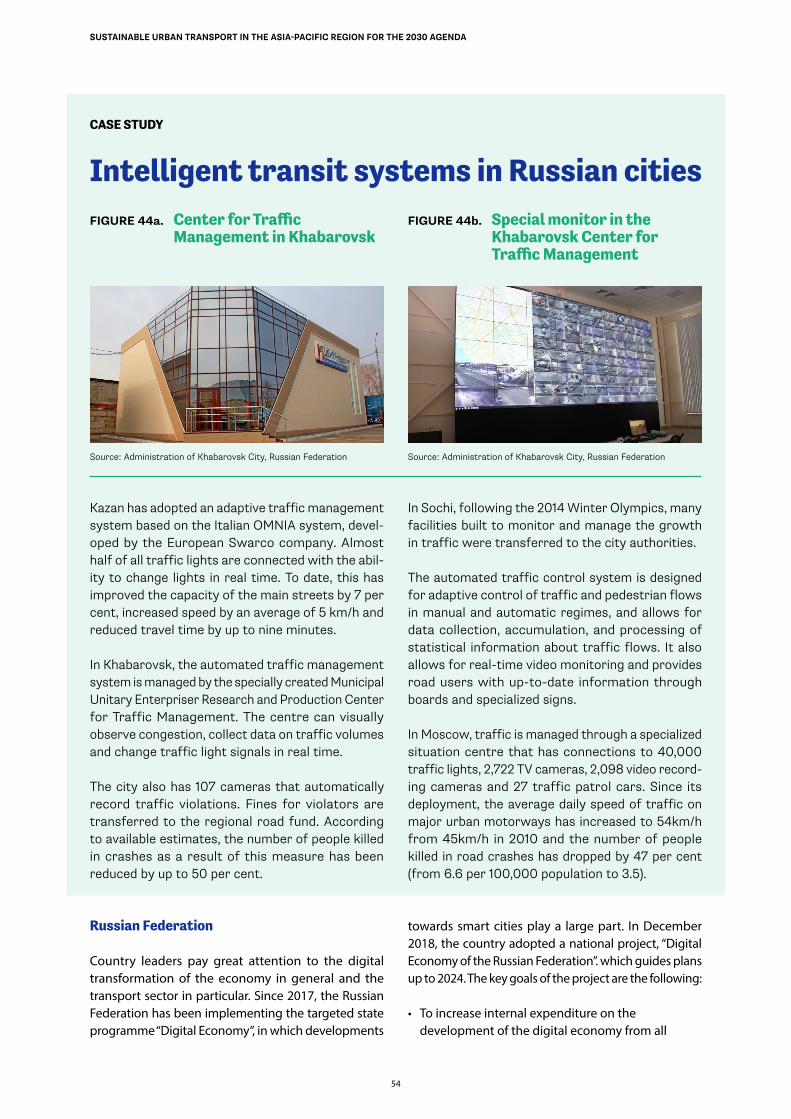
54
SUSTAINABLE URBAN TRANSPORT IN THE ASIA-PACIFIC REGION FOR THE 2030 AGENDA
CASE STUDY
Intelligent transit systems in Russian citiesFIGURE 44a. Center for Traffic
Management in KhabarovskFIGURE 44b. Special monitor in the
Khabarovsk Center for Traffic Management
Kazan has adopted an adaptive traffic management system based on the Italian OMNIA system, devel-oped by the European Swarco company. Almost half of all traffic lights are connected with the abil-ity to change lights in real time. To date, this has improved the capacity of the main streets by 7 per cent, increased speed by an average of 5 km/h and reduced travel time by up to nine minutes.
In Khabarovsk, the automated traffic management system is managed by the specially created Municipal Unitary Enterpriser Research and Production Center for Traffic Management. The centre can visually observe congestion, collect data on traffic volumes and change traffic light signals in real time.
The city also has 107 cameras that automatically record traffic violations. Fines for violators are transferred to the regional road fund. According to available estimates, the number of people killed in crashes as a result of this measure has been reduced by up to 50 per cent.
In Sochi, following the 2014 Winter Olympics, many facilities built to monitor and manage the growth in traffic were transferred to the city authorities.
The automated traffic control system is designed for adaptive control of traffic and pedestrian flows in manual and automatic regimes, and allows for data collection, accumulation, and processing of statistical information about traffic flows. It also allows for real-time video monitoring and provides road users with up-to-date information through boards and specialized signs.
In Moscow, traffic is managed through a specialized situation centre that has connections to 40,000 traffic lights, 2,722 TV cameras, 2,098 video record-ing cameras and 27 traffic patrol cars. Since its deployment, the average daily speed of traffic on major urban motorways has increased to 54km/h from 45km/h in 2010 and the number of people killed in road crashes has dropped by 47 per cent (from 6.6 per 100,000 population to 3.5).
Russian Federation
Country leaders pay great attention to the digital transformation of the economy in general and the transport sector in particular. Since 2017, the Russian Federation has been implementing the targeted state programme “Digital Economy”, in which developments
towards smart cities play a large part. In December 2018, the country adopted a national project, “Digital Economy of the Russian Federation”. which guides plans up to 2024. The key goals of the project are the following:
• To increase internal expenditure on the development of the digital economy from all
Source: Administration of Khabarovsk City, Russian Federation Source: Administration of Khabarovsk City, Russian Federation
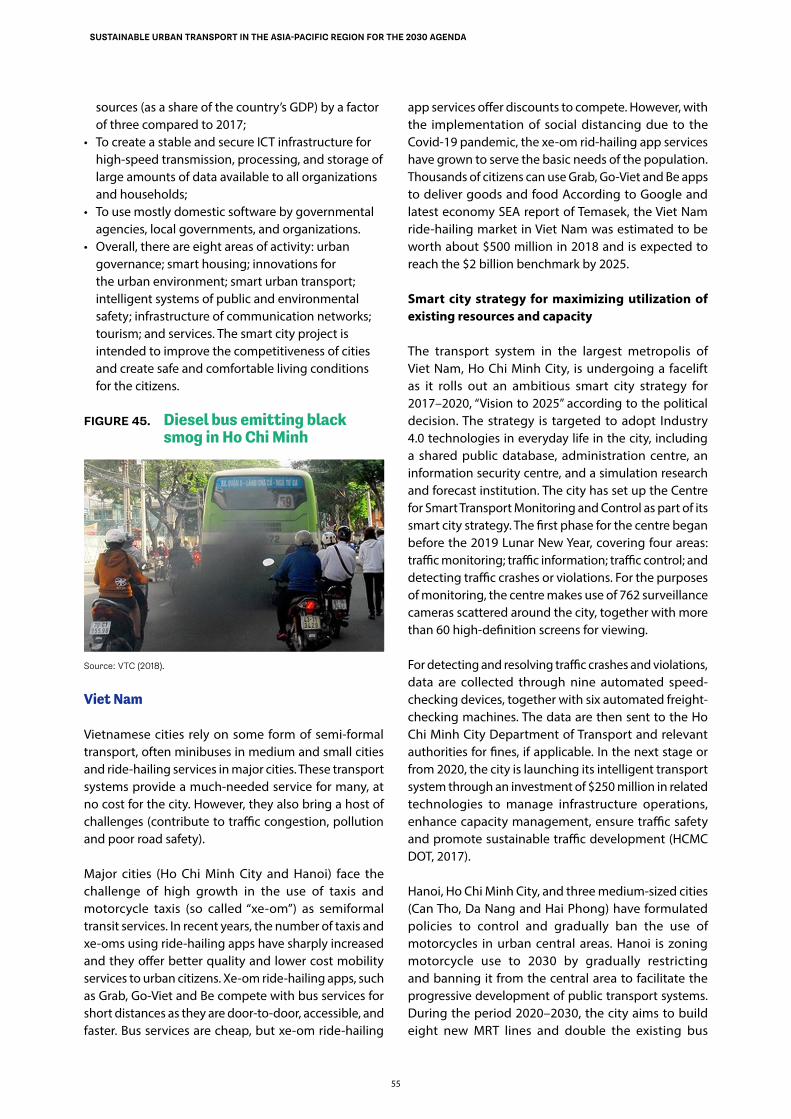
55
SUSTAINABLE URBAN TRANSPORT IN THE ASIA-PACIFIC REGION FOR THE 2030 AGENDA
sources (as a share of the country’s GDP) by a factor of three compared to 2017;
• To create a stable and secure ICT infrastructure for high-speed transmission, processing, and storage of large amounts of data available to all organizations and households;
• To use mostly domestic software by governmental agencies, local governments, and organizations.
• Overall, there are eight areas of activity: urban governance; smart housing; innovations for the urban environment; smart urban transport; intelligent systems of public and environmental safety; infrastructure of communication networks; tourism; and services. The smart city project is intended to improve the competitiveness of cities and create safe and comfortable living conditions for the citizens.
FIGURE 45. Diesel bus emitting black smog in Ho Chi Minh
Source: VTC (2018).
Viet Nam
Vietnamese cities rely on some form of semi-formal transport, often minibuses in medium and small cities and ride-hailing services in major cities. These transport systems provide a much-needed service for many, at no cost for the city. However, they also bring a host of challenges (contribute to traffic congestion, pollution and poor road safety).
Major cities (Ho Chi Minh City and Hanoi) face the challenge of high growth in the use of taxis and motorcycle taxis (so called “xe-om”) as semiformal transit services. In recent years, the number of taxis and xe-oms using ride-hailing apps have sharply increased and they offer better quality and lower cost mobility services to urban citizens. Xe-om ride-hailing apps, such as Grab, Go-Viet and Be compete with bus services for short distances as they are door-to-door, accessible, and faster. Bus services are cheap, but xe-om ride-hailing
app services offer discounts to compete. However, with the implementation of social distancing due to the Covid-19 pandemic, the xe-om rid-hailing app services have grown to serve the basic needs of the population. Thousands of citizens can use Grab, Go-Viet and Be apps to deliver goods and food According to Google and latest economy SEA report of Temasek, the Viet Nam ride-hailing market in Viet Nam was estimated to be worth about $500 million in 2018 and is expected to reach the $2 billion benchmark by 2025.
Smart city strategy for maximizing utilization of existing resources and capacity
The transport system in the largest metropolis of Viet Nam, Ho Chi Minh City, is undergoing a facelift as it rolls out an ambitious smart city strategy for 2017–2020, “Vision to 2025” according to the political decision. The strategy is targeted to adopt Industry 4.0 technologies in everyday life in the city, including a shared public database, administration centre, an information security centre, and a simulation research and forecast institution. The city has set up the Centre for Smart Transport Monitoring and Control as part of its smart city strategy. The first phase for the centre began before the 2019 Lunar New Year, covering four areas: traffic monitoring; traffic information; traffic control; and detecting traffic crashes or violations. For the purposes of monitoring, the centre makes use of 762 surveillance cameras scattered around the city, together with more than 60 high-definition screens for viewing.
For detecting and resolving traffic crashes and violations, data are collected through nine automated speed-checking devices, together with six automated freight-checking machines. The data are then sent to the Ho Chi Minh City Department of Transport and relevant authorities for fines, if applicable. In the next stage or from 2020, the city is launching its intelligent transport system through an investment of $250 million in related technologies to manage infrastructure operations, enhance capacity management, ensure traffic safety and promote sustainable traffic development (HCMC DOT, 2017).
Hanoi, Ho Chi Minh City, and three medium-sized cities (Can Tho, Da Nang and Hai Phong) have formulated policies to control and gradually ban the use of motorcycles in urban central areas. Hanoi is zoning motorcycle use to 2030 by gradually restricting and banning it from the central area to facilitate the progressive development of public transport systems. During the period 2020–2030, the city aims to build eight new MRT lines and double the existing bus
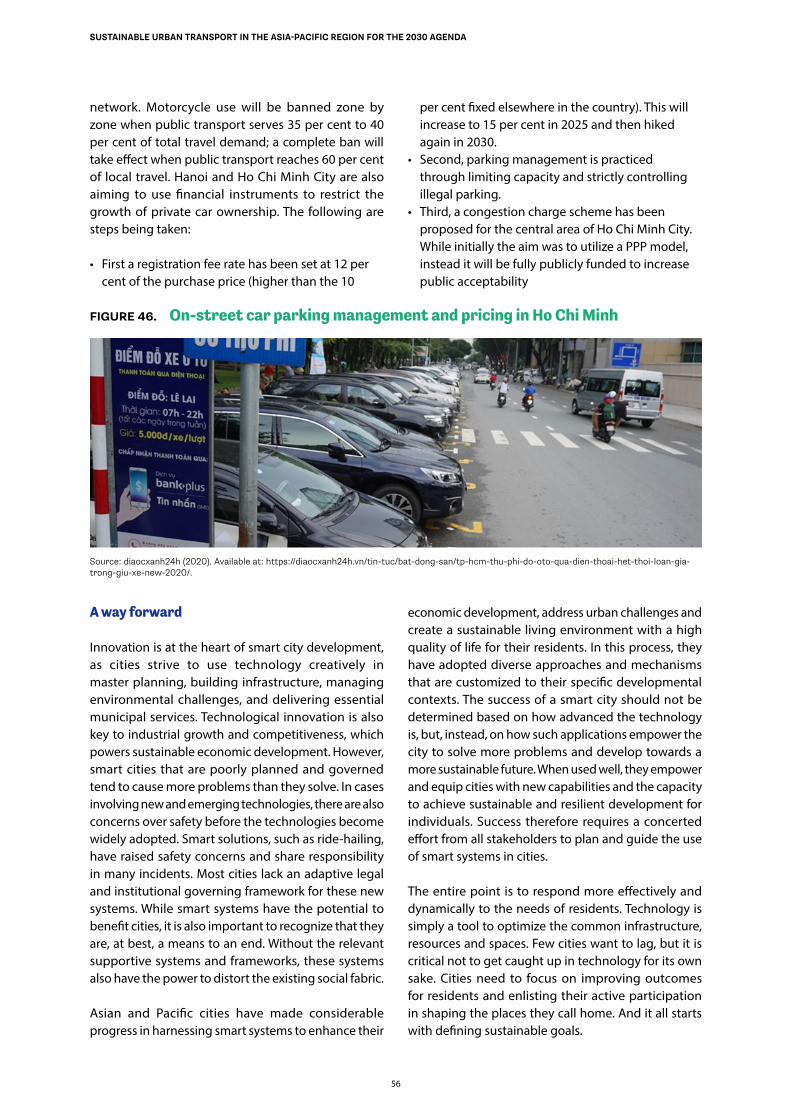
56
SUSTAINABLE URBAN TRANSPORT IN THE ASIA-PACIFIC REGION FOR THE 2030 AGENDA
network. Motorcycle use will be banned zone by zone when public transport serves 35 per cent to 40 per cent of total travel demand; a complete ban will take effect when public transport reaches 60 per cent of local travel. Hanoi and Ho Chi Minh City are also aiming to use financial instruments to restrict the growth of private car ownership. The following are steps being taken:
• First a registration fee rate has been set at 12 per cent of the purchase price (higher than the 10
per cent fixed elsewhere in the country). This will increase to 15 per cent in 2025 and then hiked again in 2030.
• Second, parking management is practiced through limiting capacity and strictly controlling illegal parking.
• Third, a congestion charge scheme has been proposed for the central area of Ho Chi Minh City. While initially the aim was to utilize a PPP model, instead it will be fully publicly funded to increase public acceptability
FIGURE 46. On-street car parking management and pricing in Ho Chi Minh
Source: diaocxanh24h (2020). Available at: https://diaocxanh24h.vn/tin-tuc/bat-dong-san/tp-hcm-thu-phi-do-oto-qua-dien-thoai-het-thoi-loan-gia-trong-giu-xe-new-2020/.
A way forward
Innovation is at the heart of smart city development, as cities strive to use technology creatively in master planning, building infrastructure, managing environmental challenges, and delivering essential municipal services. Technological innovation is also key to industrial growth and competitiveness, which powers sustainable economic development. However, smart cities that are poorly planned and governed tend to cause more problems than they solve. In cases involving new and emerging technologies, there are also concerns over safety before the technologies become widely adopted. Smart solutions, such as ride-hailing, have raised safety concerns and share responsibility in many incidents. Most cities lack an adaptive legal and institutional governing framework for these new systems. While smart systems have the potential to benefit cities, it is also important to recognize that they are, at best, a means to an end. Without the relevant supportive systems and frameworks, these systems also have the power to distort the existing social fabric.
Asian and Pacific cities have made considerable progress in harnessing smart systems to enhance their
economic development, address urban challenges and create a sustainable living environment with a high quality of life for their residents. In this process, they have adopted diverse approaches and mechanisms that are customized to their specific developmental contexts. The success of a smart city should not be determined based on how advanced the technology is, but, instead, on how such applications empower the city to solve more problems and develop towards a more sustainable future. When used well, they empower and equip cities with new capabilities and the capacity to achieve sustainable and resilient development for individuals. Success therefore requires a concerted effort from all stakeholders to plan and guide the use of smart systems in cities.
The entire point is to respond more effectively and dynamically to the needs of residents. Technology is simply a tool to optimize the common infrastructure, resources and spaces. Few cities want to lag, but it is critical not to get caught up in technology for its own sake. Cities need to focus on improving outcomes for residents and enlisting their active participation in shaping the places they call home. And it all starts with defining sustainable goals.
5757
Chapter 2 Goals for Sustainable Urban Transport in Asia and the Pacific
58
SUSTAINABLE URBAN TRANSPORT IN THE ASIA-PACIFIC REGION FOR THE 2030 AGENDA
Introduction
Transport contributes to social development by enabling labour mobility and facilitating access to markets, employment, health care, educational opportunities and other social services. Many rural communities are isolated by distance, terrain and poverty from these economic and social opportunities. Transport connectivity helps to narrow these gaps and make access more inclusive. According to the World Bank Rural Access Index, nearly one-third (more than one billion) of the world’s rural population, 98 per cent of whom are in developing countries, do not have adequate access to road transport systems. Rural connectivity is of utmost importance in such areas as poverty reduction, health, education and employment generation as well as in the overall rural development of the region
A reduction of energy consumption in the transport sector can have extensive benefits for the environment. The transport sector accounts for nearly 28 per cent of total global energy consumption and 64.5 per cent of global oil consumption. The sector’s share of global oil consumption has grown nearly three times during the past four decades, a trend that is continuing to increase. More than 460 million tons of oil equivalent of energy is consumed by the transport sector in the Asia-Pacific region, of which 87.24 per cent is by road transport. The share of energy consumption by road transport is expected to remain dominant
Transport has a major role to play in economic development at national and international levels. It provides access to economic and social activities and opportunities for individuals and businesses. It helps link suppliers and consumers, making division of labour, specialization and full use of comparative advantage possible. Studies also show that improvement in all transport infrastructure sectors will result in a reduction in trade costs and foster increased trade flow.
Sustainable development is the desired overall trajectory of development for people, the economy and the planet. Transport, therefore, needs to operate within boundaries defined by sustainable development. Key elements to be observed when measuring for sustainable development are the following:
• The basic World Commission on Environment and Development definition of sustainable development made in 1987 (A/42/427) – “Meeting the needs of the present without compromising the ability of future generations to meet their own needs”;
• The definition of sustainable transport – OECD, Vancouver, 1996;
• The three dimensions or pillars of sustainable development, the social, environmental and economic one, also known as the “‘triple bottom line”, or as People, Planet, Prosperity in the 2030 Development Agenda,
• the Sustainable Development Goals that are part of the 2030 Development Agenda, and the associated targets, measurement, and reporting frameworks.
A way forward
To examine the prosperity and quality of life of countries, looking solely at economic factors, such as GDP or economic growth, is not sufficient. Other factors of major significance for people’s daily lives also need to be included, such as health, housing, employment, education, income and air and water quality. Accordingly, it important to compile measurements that give a good overview and can serve as the basis for an assessment of the real prosperity and quality of life.
These indicators are intended to complement traditional economic measures, such as GDP, and monitor trends in people’s well-being. They are meant to look at the broader picture and inform government policy formulation. The indicators are linked to the Sustainable Development Goals. They are based on official statistics and allow for international comparison. Developing such indicators is a step towards ensuring a common understanding of the factors that make our lives better.
With regards to transportation, the indicators measuring the feeling of safety at night, particulate matter and greenhouse gas emissions are especially relevant to assess the sustainability of a transport system, including the environmental and social dimensions. They should be complemented with other indicators that consider, for instance, the connectivity, accessibility, affordability, reliability, efficiency, and inclusivity of the system.
59
SUSTAINABLE URBAN TRANSPORT IN THE ASIA-PACIFIC REGION FOR THE 2030 AGENDA
2.1 The 2030 Agenda for Sustainable Development
Introduction
The 2030 Agenda for Sustainable Development and the accompanying Sustainable Development Goals were adopted by the General Assembly in September 2015. Unlike the Millennium Development Goals, the Sustainable Development Goals apply to all countries, both developed and developing, and set bold, aspirational goals, such as eliminating poverty, ending hunger, and ensuring universal primary and secondary education. While the Millennium Development Goals had only one target with an urban focus – to achieve substantial improvement in the lives of a minimum of 100 million slum dwellers by 2020 –Goal 11 of the Sustainable Development Goals is dedicated to cities: Make cities and human settlements inclusive, safe, resilient, and sustainable. Under Goal 11, urbanization is recognized for the first time as a transformative force for development and cities should be enabled to take the lead in addressing many global challenges. Most of the 234 statistical indicators to measure global progress towards the Sustainable Development Goals have an urban dimension and about one third of the Goals’ indicators are measured at the local rather than national level (UN-Habitat, 2018). In short, any country serious about meeting its obligations to achieve the Sustainable Development Goals will find the path to sustainable development runs through its cities (United Cities and Local Governments, 2018).
“We resolve, between now and 2030, to end poverty and hunger everywhere; to combat inequalities within and among countries; to build peaceful, just and inclusive societies; to protect human rights and promote gender equality and the empowerment of women and girls; and to ensure the lasting protection of the planet and its natural resources.” – 2030 Agenda for Sustainable Development
The 2030 Agenda comprises 17 Sustainable Development Goals with 169 associated targets, which are integrated and indivisible. Never before have world leaders pledged common actions and endeavours across such a broad and universal policy agenda.
Realizing gender equality and the empowerment of women and girls will make a crucial contribution to progress across all the Goals and targets. The
achievement of full human potential and of sustainable development is not possible if one half of humanity continues to be denied its full human rights and opportunities. Women and girls must enjoy equal access to quality education, economic resources and political participation as well as equal opportunities with men and boys for employment, leadership and decision-making at all levels.
In the 2030 Agenda, sustainable urban development and management is recognized as being crucial to the quality of life of people and commits to work with local authorities. In addition, a commitment is made to renew and plan cities and human settlements as a way to foster community cohesion and personal security and to stimulate innovation and employment.
Finally, it is stated in the 2030 Agenda that the Sustainable Development Goals and targets are integrated and indivisible, global in nature and universally applicable, while taking into account different national realities, capacities, and levels of development and respecting national policies and priorities.
International framework
In addition to the 2030 Agenda, a set of international agreements are directing the transition to a sustainable urban ecosystem. In chronological order, the first of these global agreements is the Sendai Framework for Disaster Risk Reduction 2015–2030, adopted at the Third United Nations World Conference on Disaster Risk Reduction in Japan, in March 2015. Under the Agreement, it is acknowledged that responsibility to reduce disaster risk should be shared with other stakeholders, including local governments and the private sector.
The second agreement is the Addis Ababa Action Agenda, adopted in July 2015. The Agenda underscores the necessity for new financial architecture that can support the global sustainability agendas. It explicitly recognizes and supports the role of local governments and calls for domestic public resources, domestic private finance, international private finance, international development cooperation and sustainable debt to help meet the estimated $1 trillion to $1.5 trillion required annually to fill the infrastructure gap in developing countries.
The third global agreement is the mentioned 2030 Agenda. The fourth major convention is the Paris Agreement on Climate Change, which was adopted
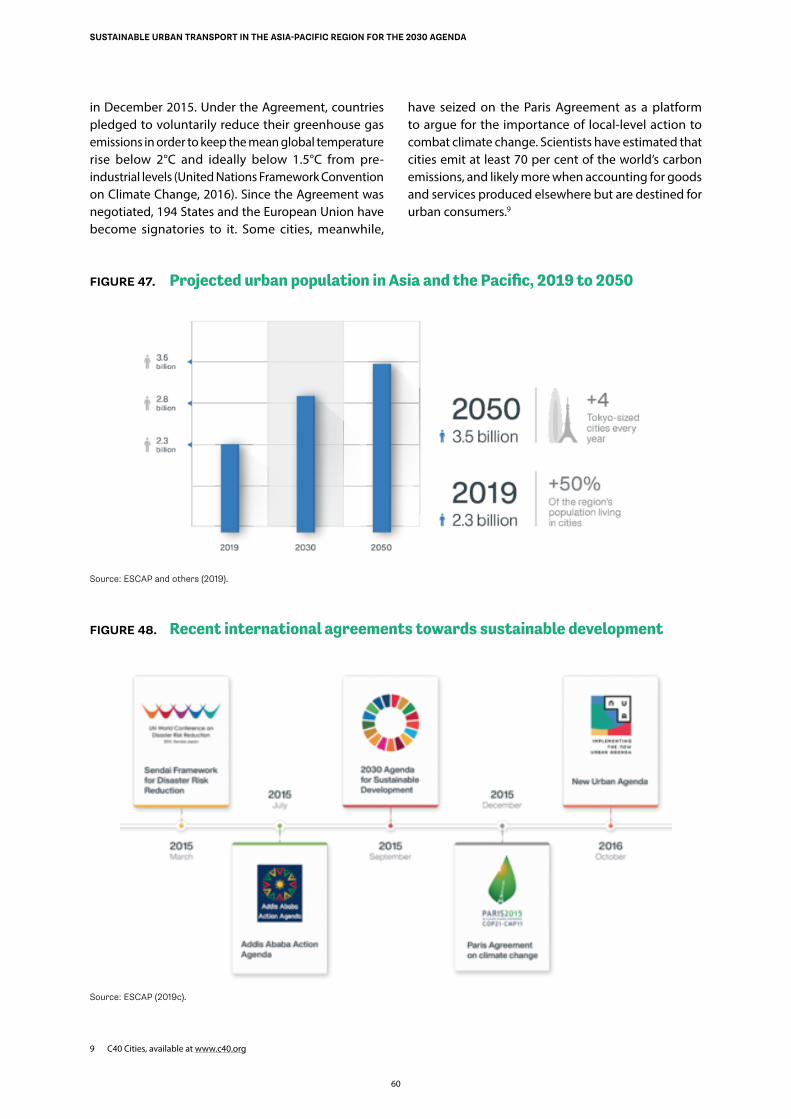
60
SUSTAINABLE URBAN TRANSPORT IN THE ASIA-PACIFIC REGION FOR THE 2030 AGENDA
in December 2015. Under the Agreement, countries pledged to voluntarily reduce their greenhouse gas emissions in order to keep the mean global temperature rise below 2°C and ideally below 1.5°C from pre-industrial levels (United Nations Framework Convention on Climate Change, 2016). Since the Agreement was negotiated, 194 States and the European Union have become signatories to it. Some cities, meanwhile,
9 C40 Cities, available at www.c40.org
have seized on the Paris Agreement as a platform to argue for the importance of local-level action to combat climate change. Scientists have estimated that cities emit at least 70 per cent of the world’s carbon emissions, and likely more when accounting for goods and services produced elsewhere but are destined for urban consumers.9
FIGURE 47. Projected urban population in Asia and the Pacific, 2019 to 2050
Source: ESCAP and others (2019).
FIGURE 48. Recent international agreements towards sustainable development
Source: ESCAP (2019c).
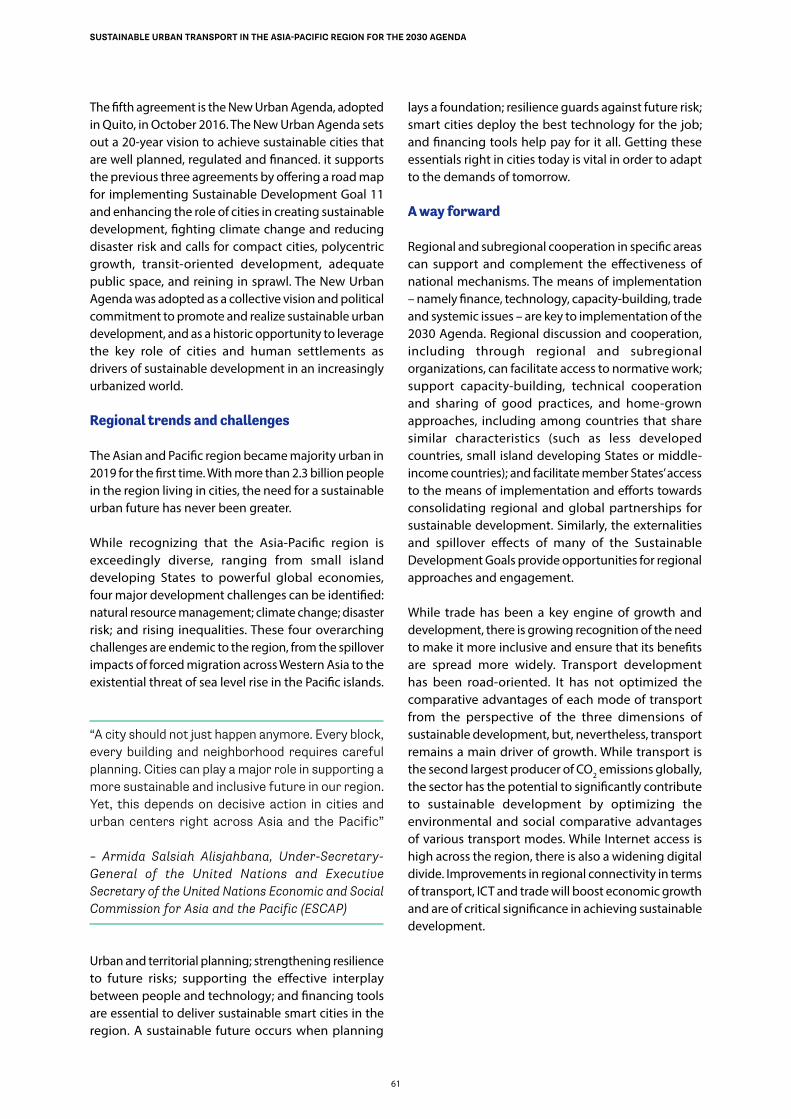
61
SUSTAINABLE URBAN TRANSPORT IN THE ASIA-PACIFIC REGION FOR THE 2030 AGENDA
The fifth agreement is the New Urban Agenda, adopted in Quito, in October 2016. The New Urban Agenda sets out a 20-year vision to achieve sustainable cities that are well planned, regulated and financed. it supports the previous three agreements by offering a road map for implementing Sustainable Development Goal 11 and enhancing the role of cities in creating sustainable development, fighting climate change and reducing disaster risk and calls for compact cities, polycentric growth, transit-oriented development, adequate public space, and reining in sprawl. The New Urban Agenda was adopted as a collective vision and political commitment to promote and realize sustainable urban development, and as a historic opportunity to leverage the key role of cities and human settlements as drivers of sustainable development in an increasingly urbanized world.
Regional trends and challenges
The Asian and Pacific region became majority urban in 2019 for the first time. With more than 2.3 billion people in the region living in cities, the need for a sustainable urban future has never been greater.
While recognizing that the Asia-Pacific region is exceedingly diverse, ranging from small island developing States to powerful global economies, four major development challenges can be identified: natural resource management; climate change; disaster risk; and rising inequalities. These four overarching challenges are endemic to the region, from the spillover impacts of forced migration across Western Asia to the existential threat of sea level rise in the Pacific islands.
“A city should not just happen anymore. Every block, every building and neighborhood requires careful planning. Cities can play a major role in supporting a more sustainable and inclusive future in our region. Yet, this depends on decisive action in cities and urban centers right across Asia and the Pacific” – Armida Salsiah Alisjahbana, Under-Secretary-General of the United Nations and Executive Secretary of the United Nations Economic and Social Commission for Asia and the Pacific (ESCAP)
Urban and territorial planning; strengthening resilience to future risks; supporting the effective interplay between people and technology; and financing tools are essential to deliver sustainable smart cities in the region. A sustainable future occurs when planning
lays a foundation; resilience guards against future risk; smart cities deploy the best technology for the job; and financing tools help pay for it all. Getting these essentials right in cities today is vital in order to adapt to the demands of tomorrow.
A way forward
Regional and subregional cooperation in specific areas can support and complement the effectiveness of national mechanisms. The means of implementation – namely finance, technology, capacity-building, trade and systemic issues – are key to implementation of the 2030 Agenda. Regional discussion and cooperation, including through regional and subregional organizations, can facilitate access to normative work; support capacity-building, technical cooperation and sharing of good practices, and home-grown approaches, including among countries that share similar characteristics (such as less developed countries, small island developing States or middle-income countries); and facilitate member States’ access to the means of implementation and efforts towards consolidating regional and global partnerships for sustainable development. Similarly, the externalities and spillover effects of many of the Sustainable Development Goals provide opportunities for regional approaches and engagement.
While trade has been a key engine of growth and development, there is growing recognition of the need to make it more inclusive and ensure that its benefits are spread more widely. Transport development has been road-oriented. It has not optimized the comparative advantages of each mode of transport from the perspective of the three dimensions of sustainable development, but, nevertheless, transport remains a main driver of growth. While transport is the second largest producer of CO2 emissions globally, the sector has the potential to significantly contribute to sustainable development by optimizing the environmental and social comparative advantages of various transport modes. While Internet access is high across the region, there is also a widening digital divide. Improvements in regional connectivity in terms of transport, ICT and trade will boost economic growth and are of critical significance in achieving sustainable development.
62
SUSTAINABLE URBAN TRANSPORT IN THE ASIA-PACIFIC REGION FOR THE 2030 AGENDA
CASE STUDY
Regional Environmentally Sustainable Transport Forum in Asia – An emerging platform for advancing transport policy towards Achieving the Sustainable Development Goals
Since 2005, the annual Regional Environmentally Sustainable Transport (EST) Forum in Asia has been a venue for high-level governmental decision makers from Asian countries to meet and discuss how to address transport challenges in an environmentally and socially sustainable way. The Forum uniquely brings together multiple line ministries and agen-cies, such as the transport, environment, health, urban development and energy entities to discuss multi-sectoral policy issues concerning the trans-port sector. At the fifth Regional Environmentally Sustainable Transport (EST) Forum, held in Bangkok, from 23 to 25 August 2010, the participants adopted the Bangkok 2020 Declaration (2010–2020), which included 20 goals and a recommended set of benchmarks among Asian countries for their overall decisions in transport policy, planning, and development. This Declaration is an unprecedented voluntary commitment of the twenty-two signatory countries.
With the coordination support of UNCRD-DSDG (United Nations Department of Economic and Social Affairs/ Division of Sustainable Development Goals), the Forum fosters a common understanding across Asia on essential elements of environmentally sus-tainable transport and the need for an integrated approach – Avoid, Shift and Improve – for address-ing unsustainable transport practices, and to build safer, liveable, resilient and sustainable cities and communities in the region. Starting with ASEAN + 4 (China, Japan, Republic of Korea, and Mongolia), the Forum gradually expanded to cover twenty-five countries, including countries in South Asia, the Russian Federation, Timor-Leste and the Islamic Republic of Iran.
The Forum has played a critical role in shaping regional views and perceptions towards next gen-eration transport solutions for the world’s most populous and economically dynamic region. The Bangkok 2020 demonstrates a regional com-mitment to measure for achieving safe, secure, reliable, affordable, efficient, people-centric and environmentally friendly transport in rapidly urban-izing Asia.
The policy discussions at the Forum are aligned with the 2030 Agenda and the Sustainable Development Goals, the 2015 Paris Agreement and other relevant global agreements that have set out objectives and/or targets on improving rural and urban access and national connectivity and economic, social, and envi-ronmental sustainability that guide the development of the transport sector in Asia and the Pacific. The Forum has also successfully brought together sev-enty-three Asian cities to sign the Kyoto Declaration for the promotion of environmentally sustainable transport towards realizing resilient, smart and liveable cities in Asia, which has been an impor-tant contribution towards achieving Sustainable Development Goal 11, among others.
The Forum has also emerged as a potential plat-form for bilateral and multilateral donor agencies, multilateral development banks, and international organizations to identify areas for possible capacity building activities, technical cooperation and invest-ments related to sustainable transport. The Forum is in a process of chalking out the new and suc-cessor Declaration on environmentally sustainable transport (2021–2030) aligned with the Sustainable Development Goals and the Paris Agreement on Climate Change, among others.
63
SUSTAINABLE URBAN TRANSPORT IN THE ASIA-PACIFIC REGION FOR THE 2030 AGENDA
CASE STUDY
UN-HABITAT Action Framework for the Implementation of the New Urban Agenda (2017)
Action area 1: National urban policies: design and implement solid, consensual, and results-based national urban policies that strengthen multisector and multi-scale coordination.
Action area 2: Urban legal frameworks: establish robust and transparent urban legal frameworks with efficient instruments and mechanisms that guarantee compliance and enforcement capacity, accountabil-ity and public participation in urban planning and development.
Action area 3: Urban and territorial planning and design: integrate forward-thinking urban and territo-rial planning and design with participative instruments and mechanisms capable of addressing the challenges of current and future urban systems.
Action area 4: Urban economy and municipal finances: strengthen municipal finances, local fiscal systems and the instruments and capacities to innovate and develop new and improved financing mechanisms for urban investment.
Action area 5: Local implementation: improve capacities and local instruments to guide sustainable urbanization and promote solid partnerships between the diverse actors and sectors involved in sustainable urban development.
Action area 6: Monitoring, reporting and revision mechanisms: reinforce human, technical and finan-cial capacities in all sectors in order to monitor progress towards sustainable urban development and Sustainable Development Goal alignment for the monitoring, reporting and revising associated policies, programmes, plans and projects.
2.2 The 2030 Agenda for Sustainable Transport
Introduction
The rapid urban development globally is making the provision of sustainable urban transport a major issue. The adoption of the 2030 Agenda has provided a new impetus to address global development challenges including for transport in urban areas.
Realizing the Sustainable Development Goals is dependent on making progress towards sustainable transport. Global progress in reducing greenhouse gas emissions cannot be realized without decisive action towards achieving sustainable transport, and countries cannot provide food security or health care without the provision of reliable and sustainable transport systems to underpin these advances. Young people cannot attend school, women cannot be assured opportunities for employment and empowerment, and people with disabilities and elderly people cannot maintain their independence and dignity without safe transport that is accessible and enables access to all that people need.
Personal security for all passengers is critical. Goals of biodiversity and ocean health also have significant intersections with the promotion of smart, sustainable transport practices across regions and across modes.
Sustainable Development Goals and transport
Under the 2030 Agenda, transport is mainstreamed across several of the Sustainable Development Goals and targets, especially those related to food security, health, energy, economic growth, infrastructure, and cities and human settlements. The importance of transport for climate action is further recognized under the United Nations Framework Convention on Climate Change (UNFCCC). Some of the Sustainable Development Goals are directly and indirectly connected to sustainable transport through targets and indicators. For instance, the Goal on ensuring health and well-being includes a target to addressing deaths and injuries from road crashes (3.6); the Goal on inclusive, safe, resilient and sustainable cities includes a target to improve accessibility for all expanding public transport (11.2); and target 13.1 is aimed at strengthening resilience and adaptive capacity to climate-related hazards and natural disasters. Other recent and emerging global and regional commitments, such as the Habitat III Summit and its outcome, the New Urban Agenda, and the Ministerial Declaration on Sustainable Transport Connectivity in Asia and the Pacific further emphasize the urgent need to tackle urban transport challenges.
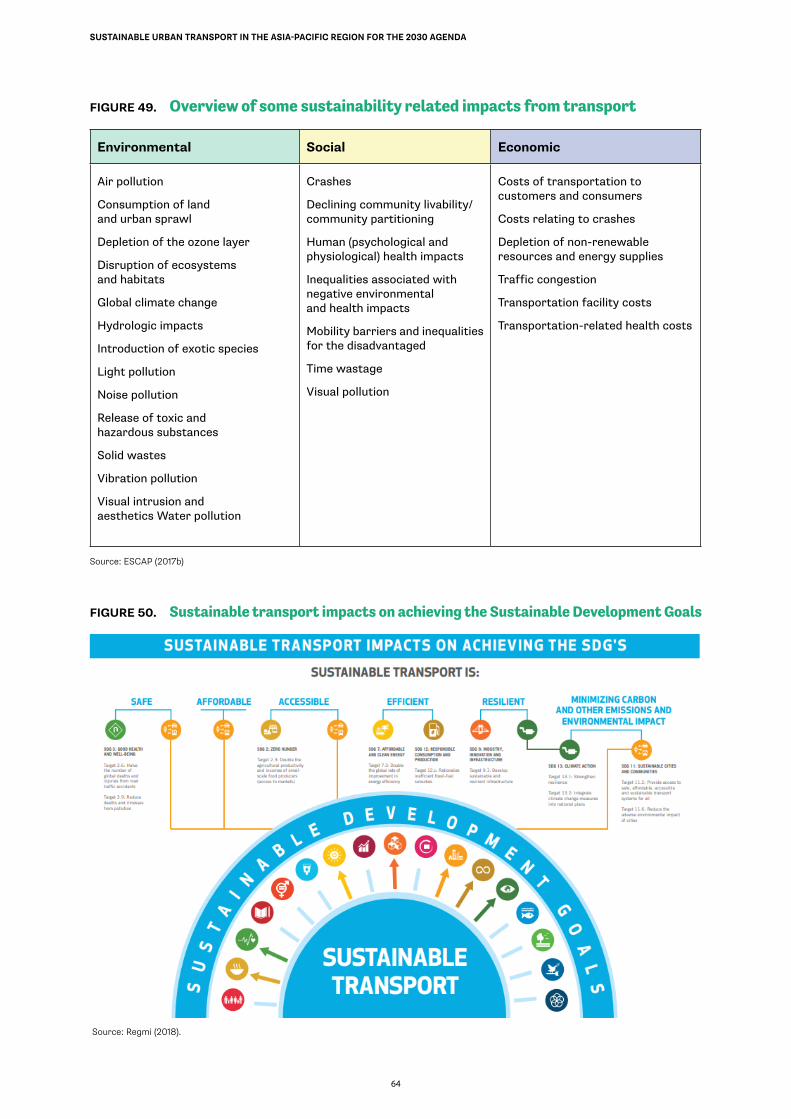
64
SUSTAINABLE URBAN TRANSPORT IN THE ASIA-PACIFIC REGION FOR THE 2030 AGENDA
FIGURE 49. Overview of some sustainability related impacts from transport
Environmental Social Economic
Air pollution
Consumption of land and urban sprawl
Depletion of the ozone layer
Disruption of ecosystems and habitats
Global climate change
Hydrologic impacts
Introduction of exotic species
Light pollution
Noise pollution
Release of toxic and hazardous substances
Solid wastes
Vibration pollution
Visual intrusion and aesthetics Water pollution
Crashes
Declining community livability/ community partitioning
Human (psychological and physiological) health impacts
Inequalities associated with negative environmental and health impacts
Mobility barriers and inequalities for the disadvantaged
Time wastage
Visual pollution
Costs of transportation to customers and consumers
Costs relating to crashes
Depletion of non-renewable resources and energy supplies
Traffic congestion
Transportation facility costs
Transportation-related health costs
Source: ESCAP (2017b)
FIGURE 50. Sustainable transport impacts on achieving the Sustainable Development Goals
Source: Regmi (2018).
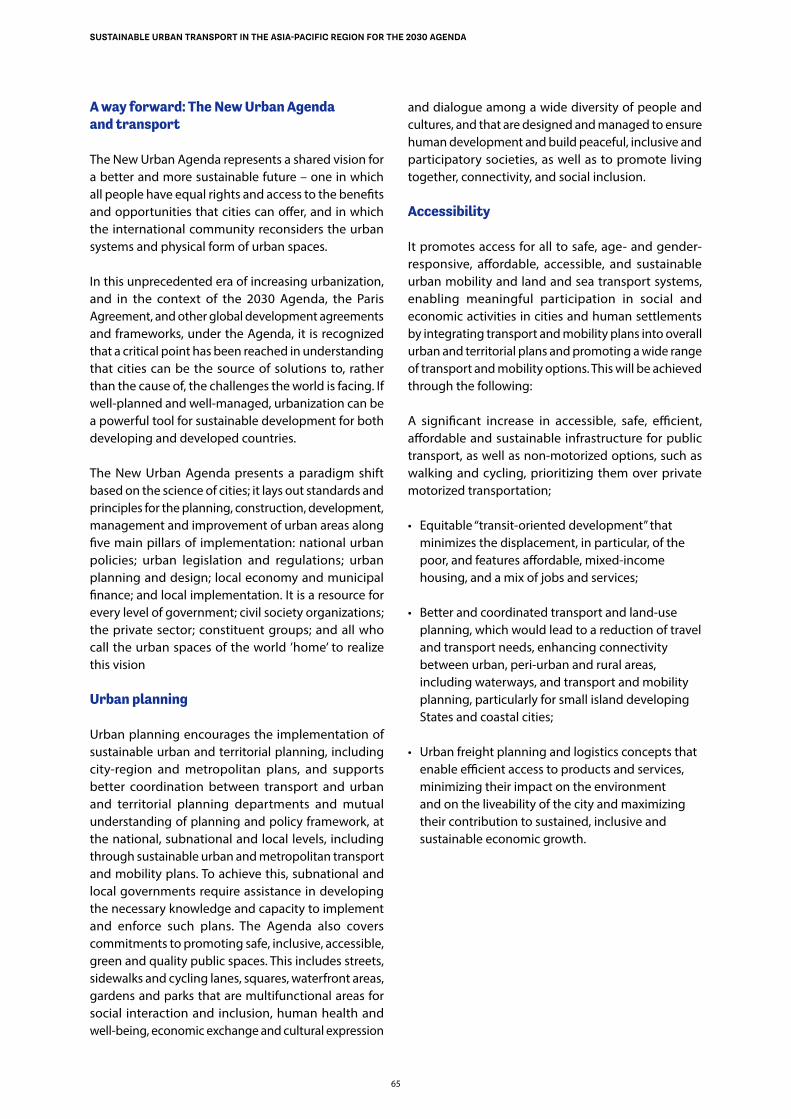
65
SUSTAINABLE URBAN TRANSPORT IN THE ASIA-PACIFIC REGION FOR THE 2030 AGENDA
A way forward: The New Urban Agenda and transport
The New Urban Agenda represents a shared vision for a better and more sustainable future – one in which all people have equal rights and access to the benefits and opportunities that cities can offer, and in which the international community reconsiders the urban systems and physical form of urban spaces.
In this unprecedented era of increasing urbanization, and in the context of the 2030 Agenda, the Paris Agreement, and other global development agreements and frameworks, under the Agenda, it is recognized that a critical point has been reached in understanding that cities can be the source of solutions to, rather than the cause of, the challenges the world is facing. If well-planned and well-managed, urbanization can be a powerful tool for sustainable development for both developing and developed countries.
The New Urban Agenda presents a paradigm shift based on the science of cities; it lays out standards and principles for the planning, construction, development, management and improvement of urban areas along five main pillars of implementation: national urban policies; urban legislation and regulations; urban planning and design; local economy and municipal finance; and local implementation. It is a resource for every level of government; civil society organizations; the private sector; constituent groups; and all who call the urban spaces of the world ’home’ to realize this vision
Urban planning
Urban planning encourages the implementation of sustainable urban and territorial planning, including city-region and metropolitan plans, and supports better coordination between transport and urban and territorial planning departments and mutual understanding of planning and policy framework, at the national, subnational and local levels, including through sustainable urban and metropolitan transport and mobility plans. To achieve this, subnational and local governments require assistance in developing the necessary knowledge and capacity to implement and enforce such plans. The Agenda also covers commitments to promoting safe, inclusive, accessible, green and quality public spaces. This includes streets, sidewalks and cycling lanes, squares, waterfront areas, gardens and parks that are multifunctional areas for social interaction and inclusion, human health and well-being, economic exchange and cultural expression
and dialogue among a wide diversity of people and cultures, and that are designed and managed to ensure human development and build peaceful, inclusive and participatory societies, as well as to promote living together, connectivity, and social inclusion.
Accessibility
It promotes access for all to safe, age- and gender-responsive, affordable, accessible, and sustainable urban mobility and land and sea transport systems, enabling meaningful participation in social and economic activities in cities and human settlements by integrating transport and mobility plans into overall urban and territorial plans and promoting a wide range of transport and mobility options. This will be achieved through the following:
A significant increase in accessible, safe, efficient, affordable and sustainable infrastructure for public transport, as well as non-motorized options, such as walking and cycling, prioritizing them over private motorized transportation;
• Equitable “transit-oriented development” that minimizes the displacement, in particular, of the poor, and features affordable, mixed-income housing, and a mix of jobs and services;
• Better and coordinated transport and land-use planning, which would lead to a reduction of travel and transport needs, enhancing connectivity between urban, peri-urban and rural areas, including waterways, and transport and mobility planning, particularly for small island developing States and coastal cities;
• Urban freight planning and logistics concepts that enable efficient access to products and services, minimizing their impact on the environment and on the liveability of the city and maximizing their contribution to sustained, inclusive and sustainable economic growth.
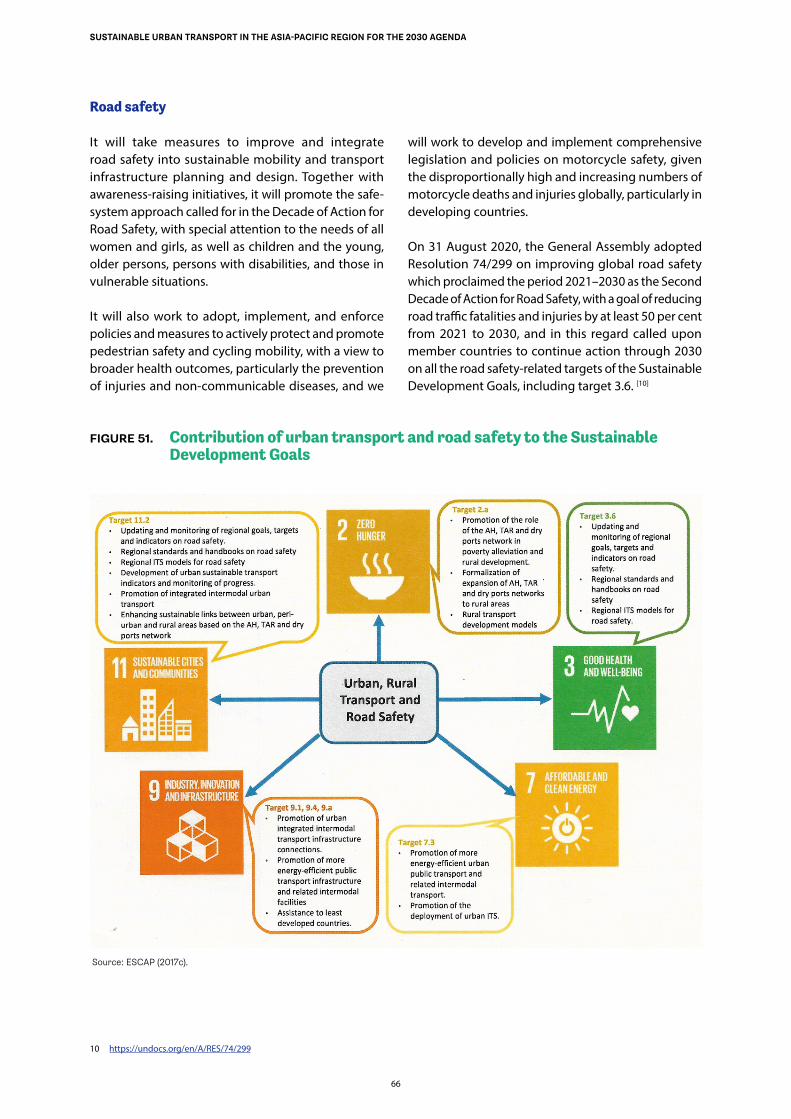
66
SUSTAINABLE URBAN TRANSPORT IN THE ASIA-PACIFIC REGION FOR THE 2030 AGENDA
Road safety
10 https://undocs.org/en/A/RES/74/299
It will take measures to improve and integrate road safety into sustainable mobility and transport infrastructure planning and design. Together with awareness-raising initiatives, it will promote the safe-system approach called for in the Decade of Action for Road Safety, with special attention to the needs of all women and girls, as well as children and the young, older persons, persons with disabilities, and those in vulnerable situations.
It will also work to adopt, implement, and enforce policies and measures to actively protect and promote pedestrian safety and cycling mobility, with a view to broader health outcomes, particularly the prevention of injuries and non-communicable diseases, and we
will work to develop and implement comprehensive legislation and policies on motorcycle safety, given the disproportionally high and increasing numbers of motorcycle deaths and injuries globally, particularly in developing countries.
On 31 August 2020, the General Assembly adopted Resolution 74/299 on improving global road safety which proclaimed the period 2021–2030 as the Second Decade of Action for Road Safety, with a goal of reducing road traffic fatalities and injuries by at least 50 per cent from 2021 to 2030, and in this regard called upon member countries to continue action through 2030 on all the road safety-related targets of the Sustainable Development Goals, including target 3.6. [10]
FIGURE 51. Contribution of urban transport and road safety to the Sustainable Development Goals
Source: ESCAP (2017c).
67
SUSTAINABLE URBAN TRANSPORT IN THE ASIA-PACIFIC REGION FOR THE 2030 AGENDA
2.3 ESCAP Sustainable Urban Transport Index
Introduction
The growth and concentration of motor vehicles in Asian cities has led to increased demand for urban mobility. Renewed commitments of Asian cities are required in order to achieve Sustainable Development Goal target 11.2 on urban mobility and to enhance overall sustainability of urban transport systems and services. Cities and countries need to track the progress made in improving urban mobility.
To know if transport is becoming more sustainable and how to enact policies to strengthen sustainability, data that measure the details of transport activity and its side-effects and externalities are required. These data can be transformed into useful tools used for the diagnosis, choice and implementation of cures for transport problems, and for the impact of implementation, evaluation of progress and corrective rebalancing.
Even though, there is not one dedicated Sustainable Development Goal for transport defined in the 2030 Development Agenda. transport will nevertheless be important for achieving many of the Goals, and several of the specific targets address transport directly. In the absence of comprehensive standard frameworks and tools to measure the state of urban transport systems in an Asian context, ESCAP has developed the Sustainable Urban Transport Index, which is comprised of 10 key urban transport indicators (Gudmundsson and Madan, 2017).
The Sustainable Urban Transport Index
The Sustainable Urban Transport Index is based on ten key urban transport indicators representing transport systems, and the environmental, social and economic dimensions of sustainability. The results from the Index can support city policymakers in formulating evidence-based policies and measures to improve urban mobility. They help in efforts to summarize, track, and compare the state of urban mobility in Asian cities.
In the process to develop the Sustainable Urban Index, a conceptual framework was drafted based on existing literature and policies on sustainable development and transport, including the Sustainable Development Goals. The framework ensures that the index reflects topics that are important for measuring sustainable urban transport. The tool was designed to assess and
evaluate sustainable urban transport systems for cities in the Asia-Pacific region.
Indicators were identified, reviewed, and selected for the index. This was based on a review of existing indicator reports and studies, the application of indicator selection criteria and the review of a draft set of indicators made at the Expert Group Meeting on Planning and Development of Sustainable Urban Transportation Systems held in Kathmandu on 22 and 23 September 2016, which led to a consolidated concise list of ten indicators for the index. The final step was to construct the index. This involved decisions on ways to normalize, weigh and calculate its elements.
Indicators are based on the levels of clean air, safety and access or their opposites, air pollution, crashes, and congestion. Other indicators measure economic aspects of transportation, while others measure the social and equity characteristics of the system. Finally, a group of indicators describe the state of governance. Above all, these indicators allow stakeholders to quantify the past present and current changes in transport and its sustainability.
Ultimately, the goal of developing a system of transportation indicators is to build powerful tools for policymaking. These tools can be used summarize trends and relationships that describe the most important activities, outputs, and side effects – both positive and negative – of transportation activities. These tools provide a description of the progress of transportation from vision to reality. In addition, the same indicator base supports communication with stakeholders.
The Sustainable Urban Transport Index has the potential to serve as a quantitative tool for countries and cities of the region to assess urban transport systems and services. It can help identify policy gaps, prioritize additional measures and investment strategies required to improve urban transport systems and services. It is expected that more cities and countries would gradually adopt the standardized data collection methods and apply the indictors and index.
The index can also serve as a tool to monitor progress towards the achievement of Sustainable Development Goal target 11.2.
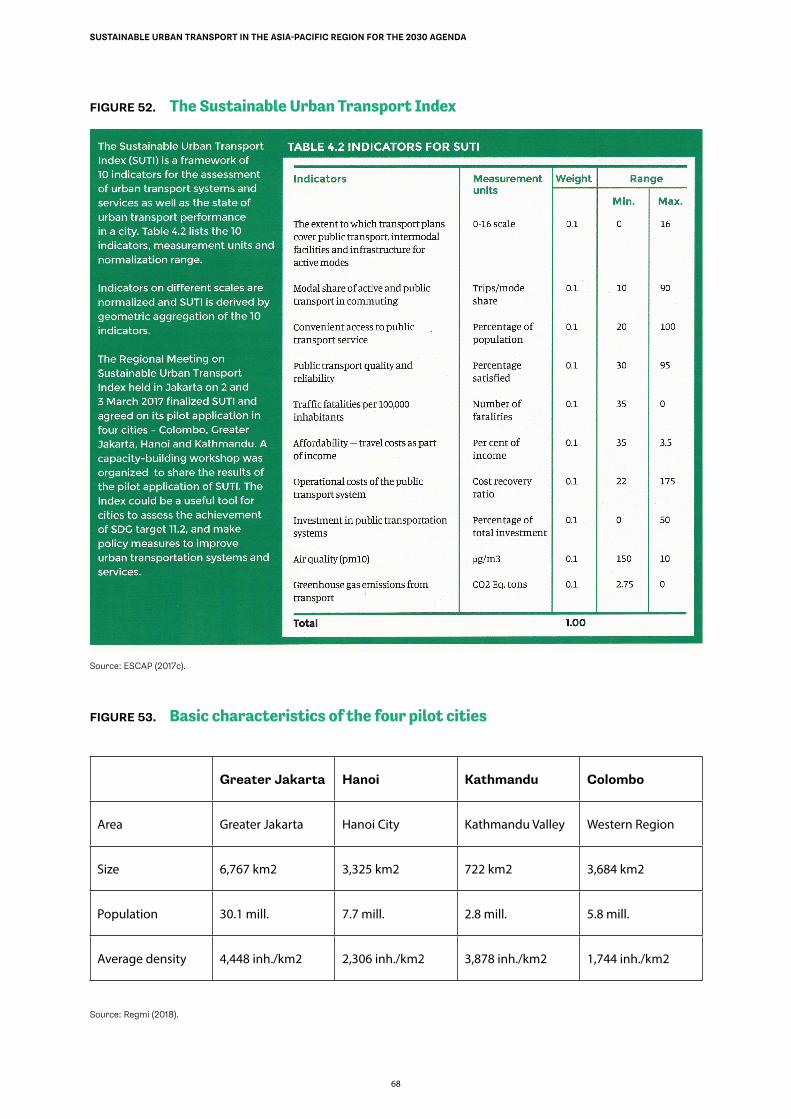
68
SUSTAINABLE URBAN TRANSPORT IN THE ASIA-PACIFIC REGION FOR THE 2030 AGENDA
FIGURE 52. The Sustainable Urban Transport Index
Source: ESCAP (2017c).
FIGURE 53. Basic characteristics of the four pilot cities
Greater Jakarta Hanoi Kathmandu Colombo
Area Greater Jakarta Hanoi City Kathmandu Valley Western Region
Size 6,767 km2 3,325 km2 722 km2 3,684 km2
Population 30.1 mill. 7.7 mill. 2.8 mill. 5.8 mill.
Average density 4,448 inh./km2 2,306 inh./km2 3,878 inh./km2 1,744 inh./km2
Source: Regmi (2018).
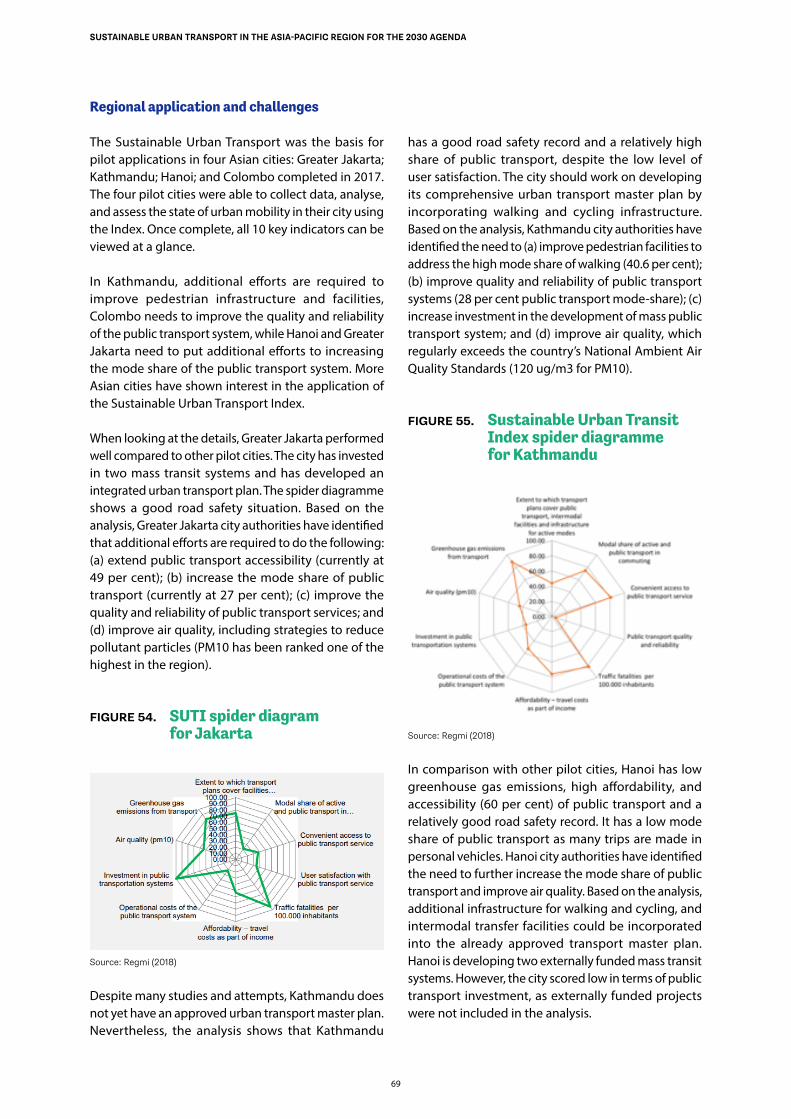
69
SUSTAINABLE URBAN TRANSPORT IN THE ASIA-PACIFIC REGION FOR THE 2030 AGENDA
Regional application and challenges
The Sustainable Urban Transport was the basis for pilot applications in four Asian cities: Greater Jakarta; Kathmandu; Hanoi; and Colombo completed in 2017. The four pilot cities were able to collect data, analyse, and assess the state of urban mobility in their city using the Index. Once complete, all 10 key indicators can be viewed at a glance.
In Kathmandu, additional efforts are required to improve pedestrian infrastructure and facilities, Colombo needs to improve the quality and reliability of the public transport system, while Hanoi and Greater Jakarta need to put additional efforts to increasing the mode share of the public transport system. More Asian cities have shown interest in the application of the Sustainable Urban Transport Index.
When looking at the details, Greater Jakarta performed well compared to other pilot cities. The city has invested in two mass transit systems and has developed an integrated urban transport plan. The spider diagramme shows a good road safety situation. Based on the analysis, Greater Jakarta city authorities have identified that additional efforts are required to do the following: (a) extend public transport accessibility (currently at 49 per cent); (b) increase the mode share of public transport (currently at 27 per cent); (c) improve the quality and reliability of public transport services; and (d) improve air quality, including strategies to reduce pollutant particles (PM10 has been ranked one of the highest in the region).
FIGURE 54. SUTI spider diagram for Jakarta
Source: Regmi (2018)
Despite many studies and attempts, Kathmandu does not yet have an approved urban transport master plan. Nevertheless, the analysis shows that Kathmandu
has a good road safety record and a relatively high share of public transport, despite the low level of user satisfaction. The city should work on developing its comprehensive urban transport master plan by incorporating walking and cycling infrastructure. Based on the analysis, Kathmandu city authorities have identified the need to (a) improve pedestrian facilities to address the high mode share of walking (40.6 per cent); (b) improve quality and reliability of public transport systems (28 per cent public transport mode-share); (c) increase investment in the development of mass public transport system; and (d) improve air quality, which regularly exceeds the country’s National Ambient Air Quality Standards (120 ug/m3 for PM10).
FIGURE 55. Sustainable Urban Transit Index spider diagramme for Kathmandu
Source: Regmi (2018)
In comparison with other pilot cities, Hanoi has low greenhouse gas emissions, high affordability, and accessibility (60 per cent) of public transport and a relatively good road safety record. It has a low mode share of public transport as many trips are made in personal vehicles. Hanoi city authorities have identified the need to further increase the mode share of public transport and improve air quality. Based on the analysis, additional infrastructure for walking and cycling, and intermodal transfer facilities could be incorporated into the already approved transport master plan. Hanoi is developing two externally funded mass transit systems. However, the city scored low in terms of public transport investment, as externally funded projects were not included in the analysis.
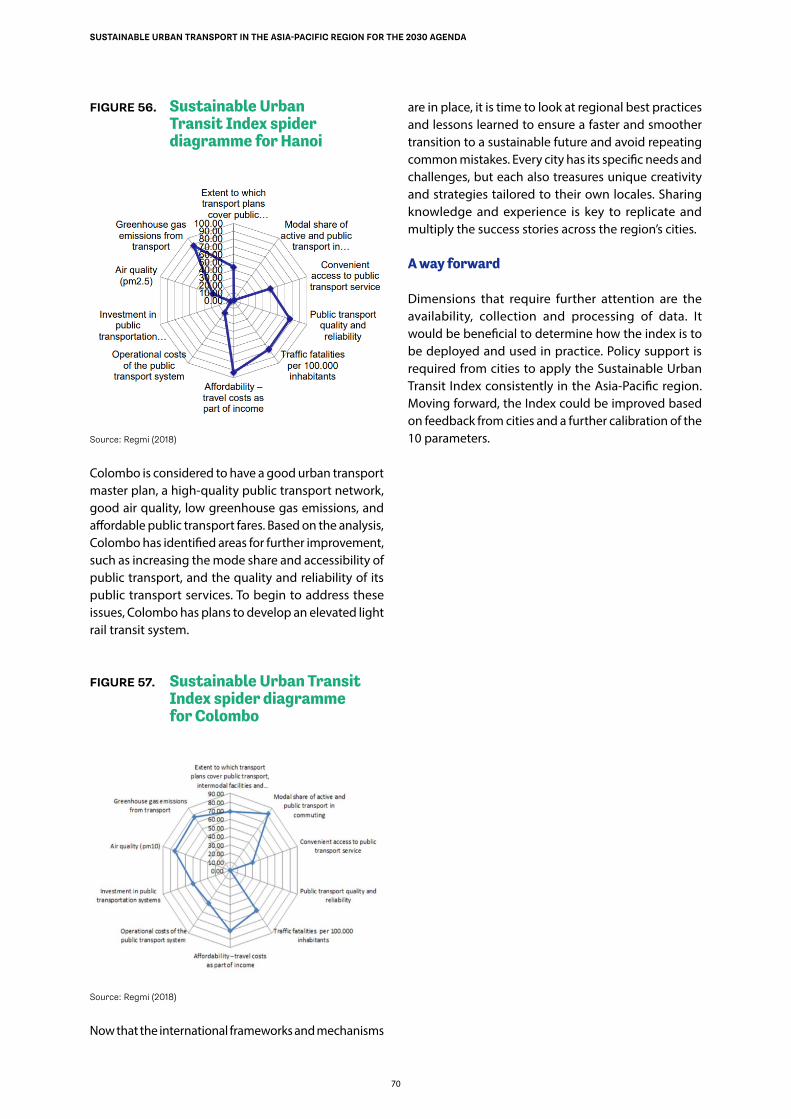
70
SUSTAINABLE URBAN TRANSPORT IN THE ASIA-PACIFIC REGION FOR THE 2030 AGENDA
FIGURE 56. Sustainable Urban Transit Index spider diagramme for Hanoi
Source: Regmi (2018)
Colombo is considered to have a good urban transport master plan, a high-quality public transport network, good air quality, low greenhouse gas emissions, and affordable public transport fares. Based on the analysis, Colombo has identified areas for further improvement, such as increasing the mode share and accessibility of public transport, and the quality and reliability of its public transport services. To begin to address these issues, Colombo has plans to develop an elevated light rail transit system.
FIGURE 57. Sustainable Urban Transit Index spider diagramme for Colombo
Source: Regmi (2018)
Now that the international frameworks and mechanisms
are in place, it is time to look at regional best practices and lessons learned to ensure a faster and smoother transition to a sustainable future and avoid repeating common mistakes. Every city has its specific needs and challenges, but each also treasures unique creativity and strategies tailored to their own locales. Sharing knowledge and experience is key to replicate and multiply the success stories across the region’s cities.
A way forward
Dimensions that require further attention are the availability, collection and processing of data. It would be beneficial to determine how the index is to be deployed and used in practice. Policy support is required from cities to apply the Sustainable Urban Transit Index consistently in the Asia-Pacific region. Moving forward, the Index could be improved based on feedback from cities and a further calibration of the 10 parameters.
7171
Chapter 3 Findings and Lessons from Four Countries
72
SUSTAINABLE URBAN TRANSPORT IN THE ASIA-PACIFIC REGION FOR THE 2030 AGENDA
3.1 China
China has been implementing various strategies to improve urban transport with varying results, a number of which can be examined to identify the main trends and challenges encountered in Chinese cities today.
Urban transport planning
Transportation planning in China includes a five-year development timetable for a comprehensive transport network. The departments involved in national-level planning are the National Development and Reform Commission, the Ministry of Transport, and the Ministry of Housing and Urban-Rural Development. While these organizations lead urban development at the national level, regional and city governments are given some flexibility in how they operate and adhere to the national laws. Since 2019, the trend of regional integrated planning of urban agglomeration has been strengthened. For example, Shanghai and Jiangsu have jointly formulated a public transport service policy that links the two areas.
Guangzhou, Beijing, Shanghai, Nanjing, and other cities have introduced the transit-oriented development model in urban development planning to improve public transportation and address the negative impacts associated with the increasing number of privately owned cars.
Social inclusion in transport
At the end of 2017, shared bicycle schemes had helped to reduce carbon emissions by nearly seven million tons, according to the forty-first Statistical Report on Internet Development in China.11 Riding to and from work is becoming a new option for commuters along the route. There are numerous successful examples of this in Chinese cities. For example, the Huilongguang-Shangdi bicycle lane (the first bicycle special lane in Beijing) has helped to overcome the commuting problem between Huilongguang and Shangdi, which involves a commuting population of approximately 11,600.
Mobility as a Service
Some 87 cities in China have taken measures to improve public transport infrastructure, complete a rapid commuting system, create a diversified public transport service system and enhance the construction of urban intelligent public transport system. The
11 See www.cnnic.net.cn/hlwfzyj/hlwxzbg/hlwtjbg/201803/t20180305_70249.htm
punctuality rate of urban buses and trolley buses have improved in 13 cities, alongside the average operating speed during morning and evening commutes. The punctuality rate of buses in Hohhot and Xi’an has improved, while operating speeds in Shijiazhuang and Jinan in the morning and evening peak periods have risen drastically.
In recent years, the use of mobile payments has developed rapidly. By the end of 2019, some 275 cities in China had connected their all-in-one transportation cards, with more than 24 million cards issued nationwide, covering buses, subways, taxis, ferries, light rail, public bicycles and other travel modes. More than 100 cities, including, among them, Beijing, Shanghai, Tianjin, Guangzhou, Wuhan and Zhengzhou, are accepting mobile payments as part of their public transportation service. By April 2018, the purchase amount of QR codes on the Guangzhou Metro exceeded the cash purchase amount.
CASE STUDY
Transport Community (TC) mode of Shunde District, Foshan City.
In 2010, public transport reforms were implemented in the Shunde District of Foshan City, involving multi-organizational cooperation involving the gov-ernment, a third-party management company (the TC Management Company), and transport opera-tors. The project has used government investment to kickstart rapid changes in the public transporta-tion service. The government bears the full revenue risk of public transport line ticketing, increases financial subsidies for public transport services, rapidly expands the public transport service net-work, and optimizes the quality of public transport services. This has notably resulted in improvements to less popular and remote lines, and reduced the problem of riders ”missing” bus stops. In addition, competition has been introduced to promote ser-vice the improvements. Before the reforms, more than 80 per cent of the bus lines in the Shunde District were operated by the Shunqi Company. The introduction of two new operators – Xinxieli and Hongyun – and the strict implementation of regulations to ensure no one operator can have a market share of more than 50 per cent, promotes competition, and obliges operators to improve their service to attract and retain customers.
73
SUSTAINABLE URBAN TRANSPORT IN THE ASIA-PACIFIC REGION FOR THE 2030 AGENDA
CASE STUDY
Zhengzhou launched customized public transport services
In Zhengzhou, a customized bus service sets its route according to the actual needs of the pas-senger, adopting a one-stop direct bus service. A dedicated telephone reservation platform allows users to make bookings, which can also be done on the WeChat service platform. In March 2017, the number of passengers served surpassed 180,000.
CASE STUDY
The auction policy on private car license in Shanghai
Shanghai is the only city in China that carries out a quota auction of private car license plates. Under the “new car quota” control policy, car ownership in the city was 4.1 million by the end of 2019. In contrast, Beijing had nearly six million registered cars. The auction is a method of total vehicle con-trol that can help tackle congestion, however there are issues that can be difficult to address, such as problems with the re-auction of second-hand license plates.
Challenges
Some lessons can be extracted from the process of urban transportation planning in China. First, the urban master planning pays little attention to actual transport demands, and use of the urban land use layout could be better incorporated into overarching plans. The relationship between urban road system planning, land-use planning and transport planning has not yet been fully integrated. Second, the country may have focused too heavily on large-scale construction projects when smaller, localized and context-specific solutions may have been effective. Despite constructions of large-scale rail and tram systems, the intensity of passenger flow remains too low. Third, despite being a beehive of bicycles, in many cities in China, the number of private cars is increasing rapidly, causing further issues of congestion and air pollution. Fourth, compared to international guidelines, the country’s work on street design is still in its infancy stage. While there have been moves towards new concepts in urban
road layouts and new bicycle lanes, more still needs to be done. Finally, although China has made impressive progress towards MaaS systems, the country overall is lagging its competitors. Currently, only Shanghai provides up-to-date schedules for the stops along routes; Many cities only provide information on the start and end stops.
3.2 India
Management of urban transport in India is fragmented. The norm is multiple agencies at different levels of government being responsible for various infrastructure and services. However, both top-down and bottom-up methods can be used to promote sustainable transport in the country.
CASE STUDY
Karnataka bus services
The state of Karnataka is emblematic of many regions in India. It has a large urban capital (in this case Bengaluru) surrounded by smaller cities and rural areas with poor transportation links. For years, Karnataka has suffered from having a poor and outdated bus services, which has resulted in overcrowding, overcharging, and often unrelia-ble timetables. To combat this, the North Eastern Karnataka Road Transport Corporation started providing intercity services to its provincial areas. Traffic and transportation surveys were carried out to identify suitable new corridors; municipal cor-porations were created to deploy new supporting infrastructure; new specifications were standard-ized for new and existing buses; and an intelligent transit service was rolled out in phases. As a result, Karnataka and its surrounding areas have enjoyed a modal shift towards public transport, which has resulted in a reduction in congestion and marginal profits for cities (a rare scenario in India). This form of transport integration can act as a model for the entire country, as each Indian state has a small number of dense urban centres and a significant population residing in surrounding areas with often poor transport links.
At the state level, Maharashtra offers a unique example of how to develop effective urban transport policies that can set targets and approaches, provide for
74
SUSTAINABLE URBAN TRANSPORT IN THE ASIA-PACIFIC REGION FOR THE 2030 AGENDA
technical capacity, leverage funding and introduce other implementation support. Transport and urban planning are competencies of the state; the national government can only suggest changes or nudge them through incentives and funding programmes. A tool used effectively by a few cities is the creation of the Unified Metropolitan Transport Authority at the substate level, (which generally encompasses large cities and their surrounding environments. In Hyderabad and Kochi, for example, the Urban Metropolitan Transit Authority acts as the planning and coordinating body for all entities.
For a bottom-up approach, meanwhile, a larger onus is placed on resident’s welfare associations, civil society organizations and other stakeholders. Citizen participation can be seen as a form of co-production, which can address the needs of various segments of society and allow for free flow of information among service producers, planners, and users. Bangalore and Pune offer robust examples of highly aware and technically sound groups of civil society organizations that engage closely with policy and project initiatives.
CASE STUDY
Guidelines for the design of streets in Shanghai.
In October 2016, the first urban level street space design standard was issued in Shanghai in an attempt to “re-huanize” street design. The design goals focus on the four areas: safety; green-ing; vitality; and wisdom. The guideline calls for the establishment of a multi-party coordination mechanism, strengthening of the coordination and communication of the planning, transportation, and police departments, and strengthening the integra-tion of urban and traffic design.
Trends
Some 70 per cent of the country’s urban population lives in towns with a population less than 100,000. Together they account for 265 million of the total urban population of 377 million in urban India. The main problems involve infrastructure, the lack of planning and developmental norms and poor governance structures. Despite the deployment of national-level urban transport and renewal policies, many smaller and medium sized towns remain neglected.
Urban Transport Management and Institutional Organization
In India, urban transport management is divided between the state and city levels of governments. Often overlapping roles of agencies leading to duplication of responsibilities and even gaps in coverage. This, in turn, often results in inefficiencies and power struggles. Multiple laws at the central and subnational/state government levels also create conflicts, resulting in a fragmented institutional structure for urban transport.
Very few cities have created urban mass transportation administrations with legal status. Some operate with committee-like structures. In 2011, there were 53 million-plus cities, but only 15 such urban mass transportation administrations across the country. Discussions to create such authorities are ongoing across India, however the implementation time frame is not clear. For an urban mass transit authority to be effective, the legal and regulatory framework (passed at a state assembly) should support its creation and sustenance.
It is clear that advocacy is stronger, and media and citizen engagement more intense, when a wide variety of organizations can come together to promote common initiatives. For example, the Indian grant foundation SSEF has created and supported a coalition of civil society organizations and non-governmental organizations called SUMNet (Sustainable Urban Mobility Network), which have made strides while working on joint issues of sustainable mobility, road safety, and accessibility issues.
Urban mass transportation administration plans and coordination of seamless transport in Kochi
The creation of an urban mass transportation administration in Kochi offers an example of the full integration of public transportation under one roof. The city-level transport authority can focus purely on urban transport, and comes from a recommendation of the 2006 National Urban Transport Policy of India. Despite this policy being enacted in 2006, little progress has been made on the creation of urban mass transit administrations elsewhere in India.
The urban mass transit administration manages buses, metros, intermediate para transport and ferries, and offers seamless ticketing using common mobility cards, the usage of intelligent transit systems across various modes, and has powers to upgrade streets and
75
SUSTAINABLE URBAN TRANSPORT IN THE ASIA-PACIFIC REGION FOR THE 2030 AGENDA
provide better “last mile” connectivity. Although there are numerous stakeholders involved (such as the Kochi Metropolitan Development Authority, Kochi Metro Rail Limited and the Kerala State Transport Department) the single-authority model can allow for more efficient decision-making structures.
Participatory Planning: SUMNet
The Sustainable Urban Mobility Network (SUMNet) is a democratic, secular and membership-based coalition of individuals, voluntary organizations, and civil society networks and movements, which seeks to improve the democratic processes of decision-making. The aim is to allow wider input over transport decisions to make transport universally accessible, safe, secure, economically viable and environmentally sound. The group helps local communities shape policies around public transportation, aiming to introduce democracy at various scales (from the project level up to the federal government) and improve public education. This is a replicable model that can bring in the expertise of external organizations, such as non-governmental organizations. Successes include deploying pedal rickshaws as part of smart city deployments, enforcing intermediate para transport in tier 2 and tier 3 cities, and providing reliable income streams for transport operators.12
To improve connectivity between metropolitan cores and their urban peripheries, a number of priority areas have been identified:
• Reform of the land valuation process to ease land transactions and local revenue generation (property taxes, land sales and leases).
• Integrate urban planning processes to complement land to be used as financing tool (the Floor Space Index limits is used as an effective density management and infrastructure financing mechanism).
• Resolve the role of urban planning coming under multiple jurisdictions.
• Provide financial autonomy to the country’s urban local bodies.
Transit oriented development
Transit oriented development, mainly seen as a solution in developed countries, has emerged as
12 For more information visit https://www.sumnet.in/
a recent trend in India. Mumbai and Ahmedabad have made bold decisions to manage densification. Ahmedabad envisions better streets, a higher quality public realm, and better infrastructure for new residential zones. The government of Jharkhand meanwhile, has an inclusive transit-oriented development policy (2017) to focus on safe and accessible walking and cycling facilities integrated with reliable and high-quality public transport. However, successful and sustained changes on the ground invariably require the backing of well-framed policies.
The Ministry of Housing and Urban Affairs came up with a national transit-oriented development policy in 2017 to urge state governments to formulate their own transit-oriented development policy. Various Indian cities have taken up the challenge, such as New Delhi, Navi Mumbai, Kochi, Ahmedabad and Naya Raipur. The policy focus is on the creation of high-capacity mixed land use development within walking distance of transit lines, with an influence zone ranging from 500 m to 800 m of transit lines. The policy promotes the usage of public transport to increase the accessibility and safety of all road users, to reduce travel demand and prevent urban sprawl, and includes attempts to limit greenhouse emissions. However, initial attempts in Delhi have led to some concerns as to the actual environmental impacts, such as tree loss. Table 4 shows highlights of the countries’ experience in transit-oriented development.
All the Indian cities opting for transit-oriented development have promoted intense development around transit stations by providing increased Floor Space Index, promoting non-motorized transport, and redesigning public spaces. However, Indian cities already have higher densities than elsewhere. Accordingly, transit-oriented development must be examined from a different perspective to improve quality of life (Petkar and Hamond, 2013). One main concept that underpins transit-oriented development is that the main access and egress trips from transit lines will be by walking and cycling. In India, however, paratransit is a major carrier of passengers from metros and trains (Ann, Jiang and Yamamoto, 2019). It is important to integrate the low-income demographics and a combination of grocery, retail, and other amenities into land use. Consequently, the usual transit-oriented development policies must be reexamined to develop a more comprehensive approach based on conditions in India.
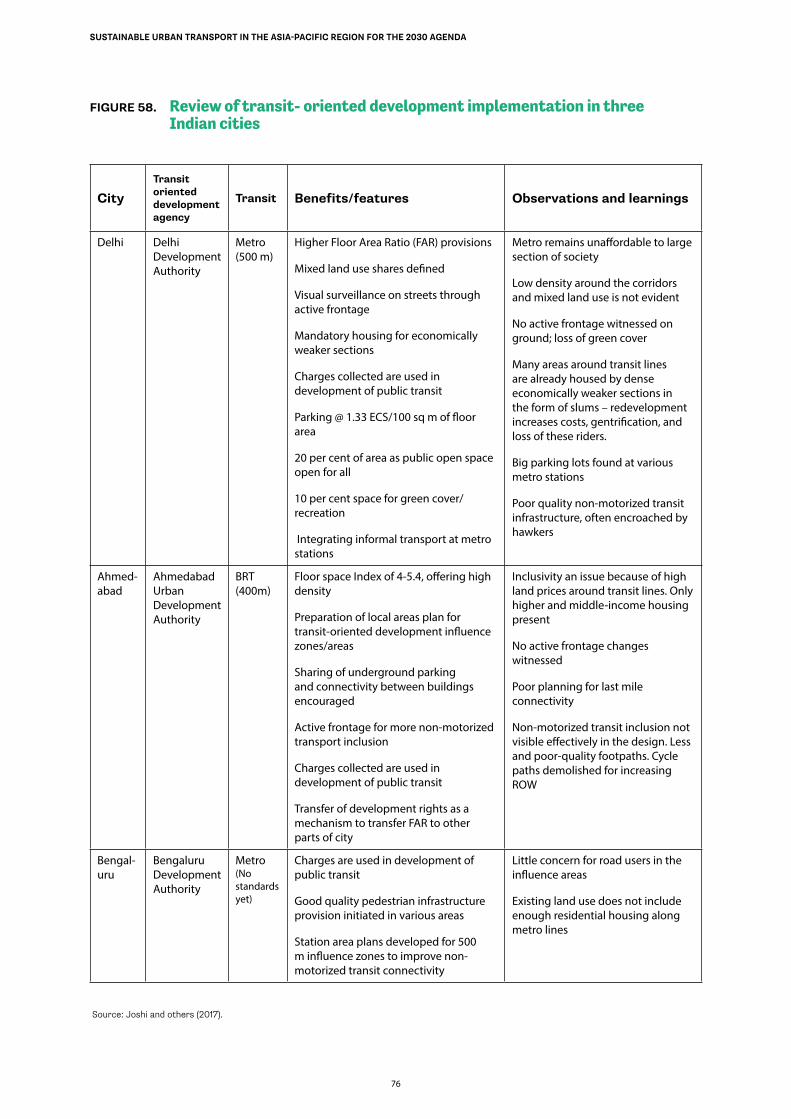
76
SUSTAINABLE URBAN TRANSPORT IN THE ASIA-PACIFIC REGION FOR THE 2030 AGENDA
FIGURE 58. Review of transit- oriented development implementation in three Indian cities
CityTransit oriented development agency
Transit Benefits/features Observations and learnings
Delhi Delhi Development Authority
Metro (500 m)
Higher Floor Area Ratio (FAR) provisions
Mixed land use shares defined
Visual surveillance on streets through active frontage
Mandatory housing for economically weaker sections
Charges collected are used in development of public transit
Parking @ 1.33 ECS/100 sq m of floor area
20 per cent of area as public open space open for all
10 per cent space for green cover/recreation
Integrating informal transport at metro stations
Metro remains unaffordable to large section of society
Low density around the corridors and mixed land use is not evident
No active frontage witnessed on ground; loss of green cover
Many areas around transit lines are already housed by dense economically weaker sections in the form of slums – redevelopment increases costs, gentrification, and loss of these riders.
Big parking lots found at various metro stations
Poor quality non-motorized transit infrastructure, often encroached by hawkers
Ahmed-abad
Ahmedabad Urban Development Authority
BRT (400m)
Floor space Index of 4-5.4, offering high density
Preparation of local areas plan for transit-oriented development influence zones/areas
Sharing of underground parking and connectivity between buildings encouraged
Active frontage for more non-motorized transport inclusion
Charges collected are used in development of public transit
Transfer of development rights as a mechanism to transfer FAR to other parts of city
Inclusivity an issue because of high land prices around transit lines. Only higher and middle-income housing present
No active frontage changes witnessed
Poor planning for last mile connectivity
Non-motorized transit inclusion not visible effectively in the design. Less and poor-quality footpaths. Cycle paths demolished for increasing ROW
Bengal-uru
Bengaluru Development Authority
Metro (No standards yet)
Charges are used in development of public transit
Good quality pedestrian infrastructure provision initiated in various areas
Station area plans developed for 500 m influence zones to improve non-motorized transit connectivity
Little concern for road users in the influence areas
Existing land use does not include enough residential housing along metro lines
Source: Joshi and others (2017).
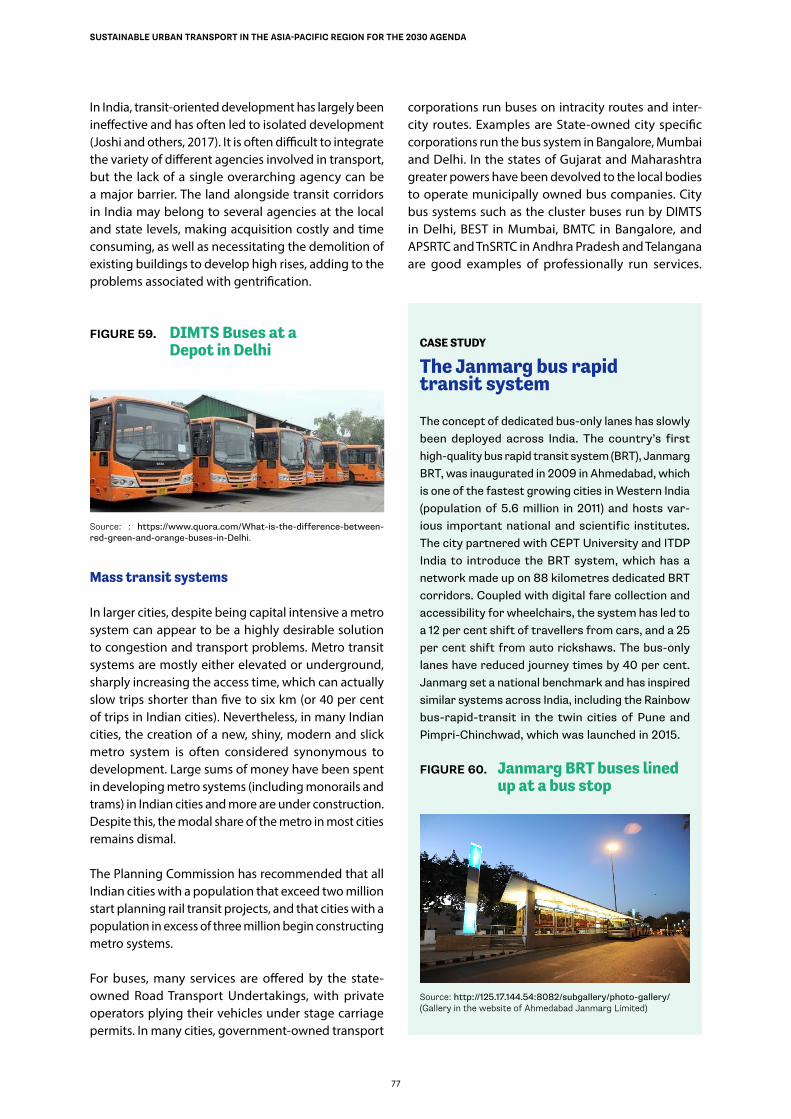
77
SUSTAINABLE URBAN TRANSPORT IN THE ASIA-PACIFIC REGION FOR THE 2030 AGENDA
In India, transit-oriented development has largely been ineffective and has often led to isolated development (Joshi and others, 2017). It is often difficult to integrate the variety of different agencies involved in transport, but the lack of a single overarching agency can be a major barrier. The land alongside transit corridors in India may belong to several agencies at the local and state levels, making acquisition costly and time consuming, as well as necessitating the demolition of existing buildings to develop high rises, adding to the problems associated with gentrification.
FIGURE 59. DIMTS Buses at a Depot in Delhi
Source: : https://www.quora.com/What-is-the-difference-between-red-green-and-orange-buses-in-Delhi.
Mass transit systems
In larger cities, despite being capital intensive a metro system can appear to be a highly desirable solution to congestion and transport problems. Metro transit systems are mostly either elevated or underground, sharply increasing the access time, which can actually slow trips shorter than five to six km (or 40 per cent of trips in Indian cities). Nevertheless, in many Indian cities, the creation of a new, shiny, modern and slick metro system is often considered synonymous to development. Large sums of money have been spent in developing metro systems (including monorails and trams) in Indian cities and more are under construction. Despite this, the modal share of the metro in most cities remains dismal.
The Planning Commission has recommended that all Indian cities with a population that exceed two million start planning rail transit projects, and that cities with a population in excess of three million begin constructing metro systems.
For buses, many services are offered by the state-owned Road Transport Undertakings, with private operators plying their vehicles under stage carriage permits. In many cities, government-owned transport
corporations run buses on intracity routes and inter-city routes. Examples are State-owned city specific corporations run the bus system in Bangalore, Mumbai and Delhi. In the states of Gujarat and Maharashtra greater powers have been devolved to the local bodies to operate municipally owned bus companies. City bus systems such as the cluster buses run by DIMTS in Delhi, BEST in Mumbai, BMTC in Bangalore, and APSRTC and TnSRTC in Andhra Pradesh and Telangana are good examples of professionally run services.
CASE STUDY
The Janmarg bus rapid transit system
The concept of dedicated bus-only lanes has slowly been deployed across India. The country’s first high-quality bus rapid transit system (BRT), Janmarg BRT, was inaugurated in 2009 in Ahmedabad, which is one of the fastest growing cities in Western India (population of 5.6 million in 2011) and hosts var-ious important national and scientific institutes. The city partnered with CEPT University and ITDP India to introduce the BRT system, which has a network made up on 88 kilometres dedicated BRT corridors. Coupled with digital fare collection and accessibility for wheelchairs, the system has led to a 12 per cent shift of travellers from cars, and a 25 per cent shift from auto rickshaws. The bus-only lanes have reduced journey times by 40 per cent. Janmarg set a national benchmark and has inspired similar systems across India, including the Rainbow bus-rapid-transit in the twin cities of Pune and Pimpri-Chinchwad, which was launched in 2015.
FIGURE 60. Janmarg BRT buses lined up at a bus stop
Source: http://125.17.144.54:8082/subgallery/photo-gallery/ (Gallery in the website of Ahmedabad Janmarg Limited)
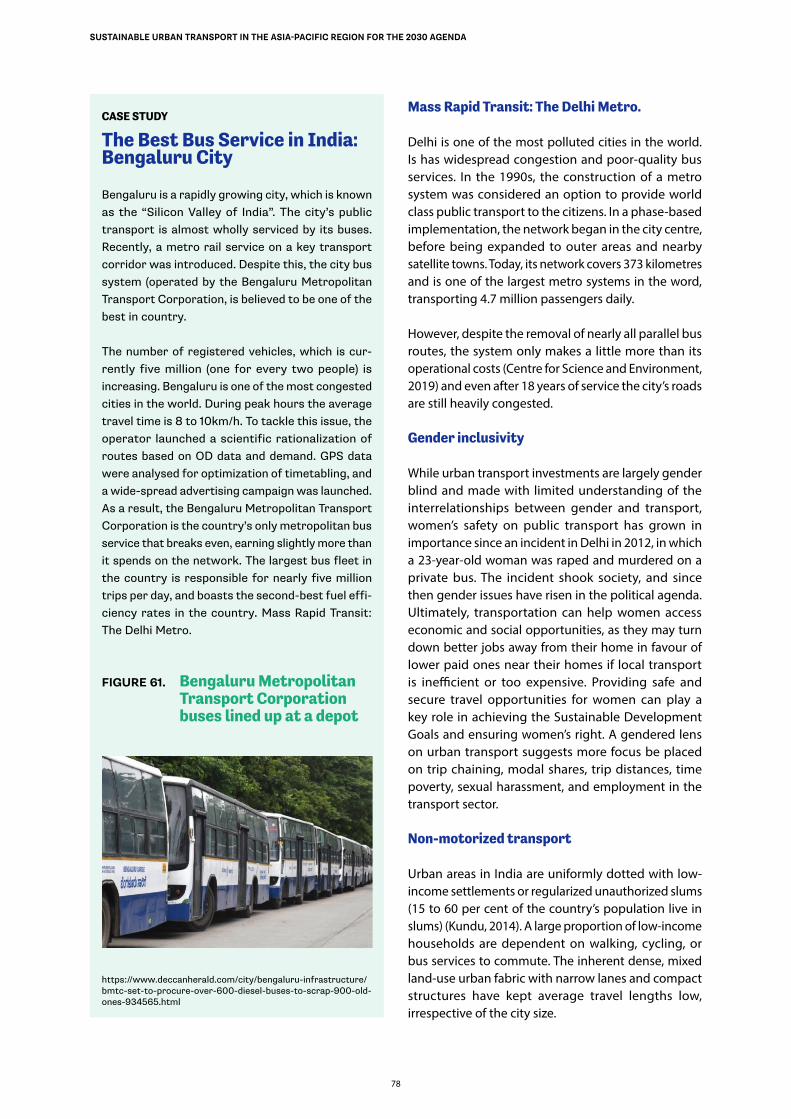
78
SUSTAINABLE URBAN TRANSPORT IN THE ASIA-PACIFIC REGION FOR THE 2030 AGENDA
CASE STUDY
The Best Bus Service in India: Bengaluru City
Bengaluru is a rapidly growing city, which is known as the “Silicon Valley of India”. The city’s public transport is almost wholly serviced by its buses. Recently, a metro rail service on a key transport corridor was introduced. Despite this, the city bus system (operated by the Bengaluru Metropolitan Transport Corporation, is believed to be one of the best in country.
The number of registered vehicles, which is cur-rently five million (one for every two people) is increasing. Bengaluru is one of the most congested cities in the world. During peak hours the average travel time is 8 to 10km/h. To tackle this issue, the operator launched a scientific rationalization of routes based on OD data and demand. GPS data were analysed for optimization of timetabling, and a wide-spread advertising campaign was launched. As a result, the Bengaluru Metropolitan Transport Corporation is the country’s only metropolitan bus service that breaks even, earning slightly more than it spends on the network. The largest bus fleet in the country is responsible for nearly five million trips per day, and boasts the second-best fuel effi-ciency rates in the country. Mass Rapid Transit: The Delhi Metro.
FIGURE 61. Bengaluru Metropolitan Transport Corporation buses lined up at a depot
https://www.deccanherald.com/city/bengaluru-infrastructure/bmtc-set-to-procure-over-600-diesel-buses-to-scrap-900-old-ones-934565.html
Mass Rapid Transit: The Delhi Metro.
Delhi is one of the most polluted cities in the world. Is has widespread congestion and poor-quality bus services. In the 1990s, the construction of a metro system was considered an option to provide world class public transport to the citizens. In a phase-based implementation, the network began in the city centre, before being expanded to outer areas and nearby satellite towns. Today, its network covers 373 kilometres and is one of the largest metro systems in the word, transporting 4.7 million passengers daily.
However, despite the removal of nearly all parallel bus routes, the system only makes a little more than its operational costs (Centre for Science and Environment, 2019) and even after 18 years of service the city’s roads are still heavily congested.
Gender inclusivity
While urban transport investments are largely gender blind and made with limited understanding of the interrelationships between gender and transport, women’s safety on public transport has grown in importance since an incident in Delhi in 2012, in which a 23-year-old woman was raped and murdered on a private bus. The incident shook society, and since then gender issues have risen in the political agenda. Ultimately, transportation can help women access economic and social opportunities, as they may turn down better jobs away from their home in favour of lower paid ones near their homes if local transport is inefficient or too expensive. Providing safe and secure travel opportunities for women can play a key role in achieving the Sustainable Development Goals and ensuring women’s right. A gendered lens on urban transport suggests more focus be placed on trip chaining, modal shares, trip distances, time poverty, sexual harassment, and employment in the transport sector.
Non-motorized transport
Urban areas in India are uniformly dotted with low-income settlements or regularized unauthorized slums (15 to 60 per cent of the country’s population live in slums) (Kundu, 2014). A large proportion of low-income households are dependent on walking, cycling, or bus services to commute. The inherent dense, mixed land-use urban fabric with narrow lanes and compact structures have kept average travel lengths low, irrespective of the city size.
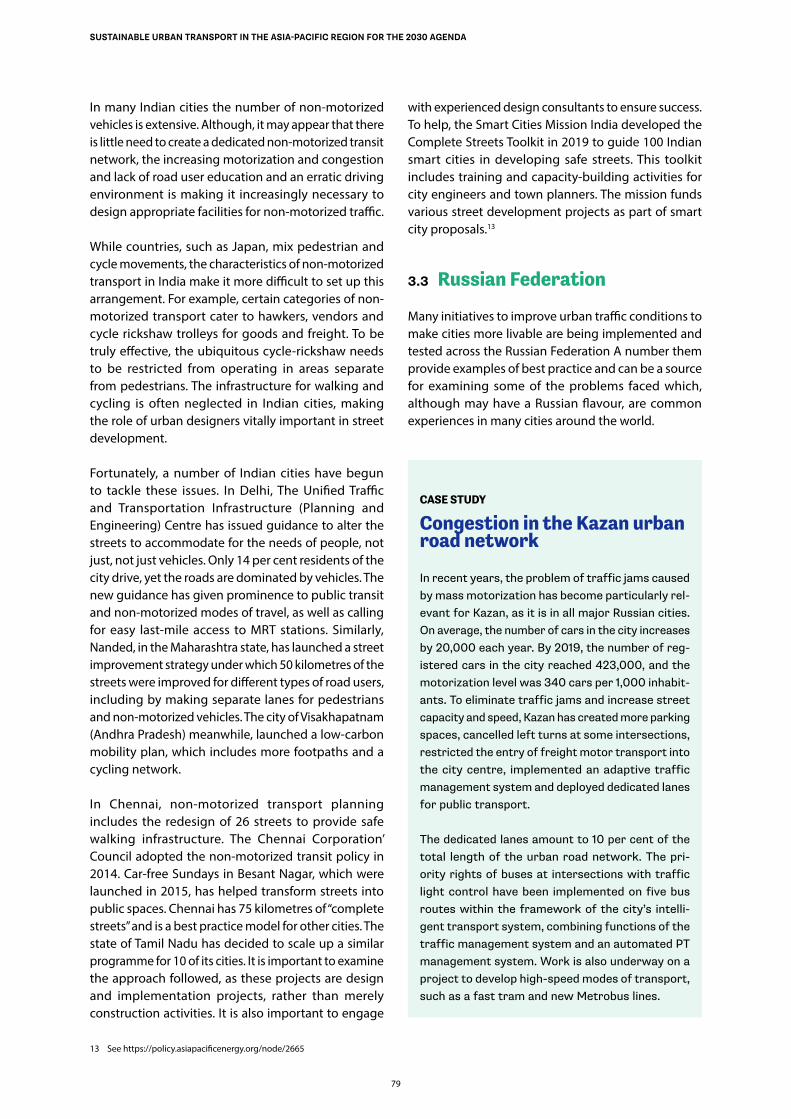
79
SUSTAINABLE URBAN TRANSPORT IN THE ASIA-PACIFIC REGION FOR THE 2030 AGENDA
In many Indian cities the number of non-motorized vehicles is extensive. Although, it may appear that there is little need to create a dedicated non-motorized transit network, the increasing motorization and congestion and lack of road user education and an erratic driving environment is making it increasingly necessary to design appropriate facilities for non-motorized traffic.
While countries, such as Japan, mix pedestrian and cycle movements, the characteristics of non-motorized transport in India make it more difficult to set up this arrangement. For example, certain categories of non-motorized transport cater to hawkers, vendors and cycle rickshaw trolleys for goods and freight. To be truly effective, the ubiquitous cycle-rickshaw needs to be restricted from operating in areas separate from pedestrians. The infrastructure for walking and cycling is often neglected in Indian cities, making the role of urban designers vitally important in street development.
Fortunately, a number of Indian cities have begun to tackle these issues. In Delhi, The Unified Traffic and Transportation Infrastructure (Planning and Engineering) Centre has issued guidance to alter the streets to accommodate for the needs of people, not just, not just vehicles. Only 14 per cent residents of the city drive, yet the roads are dominated by vehicles. The new guidance has given prominence to public transit and non-motorized modes of travel, as well as calling for easy last-mile access to MRT stations. Similarly, Nanded, in the Maharashtra state, has launched a street improvement strategy under which 50 kilometres of the streets were improved for different types of road users, including by making separate lanes for pedestrians and non-motorized vehicles. The city of Visakhapatnam (Andhra Pradesh) meanwhile, launched a low-carbon mobility plan, which includes more footpaths and a cycling network.
In Chennai, non-motorized transport planning includes the redesign of 26 streets to provide safe walking infrastructure. The Chennai Corporation’ Council adopted the non-motorized transit policy in 2014. Car-free Sundays in Besant Nagar, which were launched in 2015, has helped transform streets into public spaces. Chennai has 75 kilometres of “complete streets” and is a best practice model for other cities. The state of Tamil Nadu has decided to scale up a similar programme for 10 of its cities. It is important to examine the approach followed, as these projects are design and implementation projects, rather than merely construction activities. It is also important to engage
13 See https://policy.asiapacificenergy.org/node/2665
with experienced design consultants to ensure success. To help, the Smart Cities Mission India developed the Complete Streets Toolkit in 2019 to guide 100 Indian smart cities in developing safe streets. This toolkit includes training and capacity-building activities for city engineers and town planners. The mission funds various street development projects as part of smart city proposals.13
3.3 Russian Federation
Many initiatives to improve urban traffic conditions to make cities more livable are being implemented and tested across the Russian Federation A number them provide examples of best practice and can be a source for examining some of the problems faced which, although may have a Russian flavour, are common experiences in many cities around the world.
CASE STUDY
Congestion in the Kazan urban road network
In recent years, the problem of traffic jams caused by mass motorization has become particularly rel-evant for Kazan, as it is in all major Russian cities. On average, the number of cars in the city increases by 20,000 each year. By 2019, the number of reg-istered cars in the city reached 423,000, and the motorization level was 340 cars per 1,000 inhabit-ants. To eliminate traffic jams and increase street capacity and speed, Kazan has created more parking spaces, cancelled left turns at some intersections, restricted the entry of freight motor transport into the city centre, implemented an adaptive traffic management system and deployed dedicated lanes for public transport.
The dedicated lanes amount to 10 per cent of the total length of the urban road network. The pri-ority rights of buses at intersections with traffic light control have been implemented on five bus routes within the framework of the city’s intelli-gent transport system, combining functions of the traffic management system and an automated PT management system. Work is also underway on a project to develop high-speed modes of transport, such as a fast tram and new Metrobus lines.
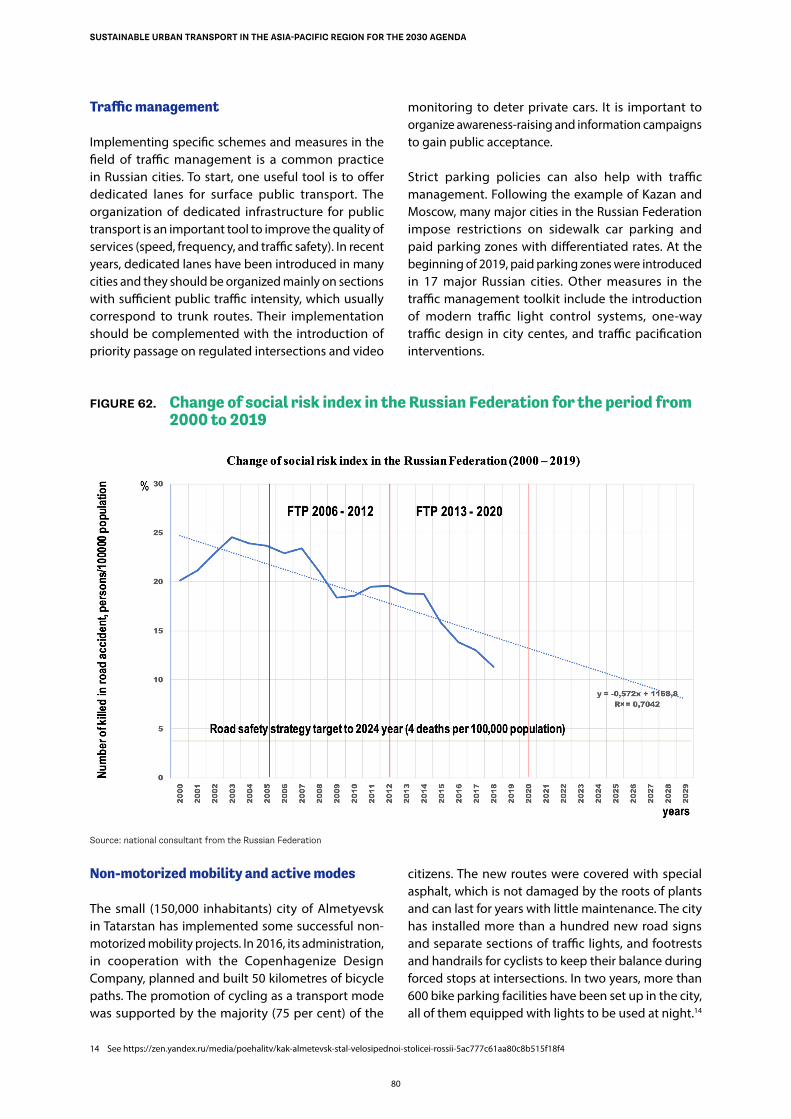
80
SUSTAINABLE URBAN TRANSPORT IN THE ASIA-PACIFIC REGION FOR THE 2030 AGENDA
Traffic management
Implementing specific schemes and measures in the field of traffic management is a common practice in Russian cities. To start, one useful tool is to offer dedicated lanes for surface public transport. The organization of dedicated infrastructure for public transport is an important tool to improve the quality of services (speed, frequency, and traffic safety). In recent years, dedicated lanes have been introduced in many cities and they should be organized mainly on sections with sufficient public traffic intensity, which usually correspond to trunk routes. Their implementation should be complemented with the introduction of priority passage on regulated intersections and video
14 See https://zen.yandex.ru/media/poehalitv/kak-almetevsk-stal-velosipednoi-stolicei-rossii-5ac777c61aa80c8b515f18f4
monitoring to deter private cars. It is important to organize awareness-raising and information campaigns to gain public acceptance.
Strict parking policies can also help with traffic management. Following the example of Kazan and Moscow, many major cities in the Russian Federation impose restrictions on sidewalk car parking and paid parking zones with differentiated rates. At the beginning of 2019, paid parking zones were introduced in 17 major Russian cities. Other measures in the traffic management toolkit include the introduction of modern traffic light control systems, one-way traffic design in city centes, and traffic pacification interventions.
FIGURE 62. Change of social risk index in the Russian Federation for the period from 2000 to 2019
Source: national consultant from the Russian Federation
Non-motorized mobility and active modes
The small (150,000 inhabitants) city of Almetyevsk in Tatarstan has implemented some successful non-motorized mobility projects. In 2016, its administration, in cooperation with the Copenhagenize Design Company, planned and built 50 kilometres of bicycle paths. The promotion of cycling as a transport mode was supported by the majority (75 per cent) of the
citizens. The new routes were covered with special asphalt, which is not damaged by the roots of plants and can last for years with little maintenance. The city has installed more than a hundred new road signs and separate sections of traffic lights, and footrests and handrails for cyclists to keep their balance during forced stops at intersections. In two years, more than 600 bike parking facilities have been set up in the city, all of them equipped with lights to be used at night.14
81
SUSTAINABLE URBAN TRANSPORT IN THE ASIA-PACIFIC REGION FOR THE 2030 AGENDA
CASE STUDY
Transport planning in Perm City
Perm, a Russian city close to the Ural Mountain range, is engaged in a number initiatives to reorgan-ize its authority structure, particularly in relation to traffic management. The Perm Directorate of Road Traffic is responsible for engineering work relating to the installation and management of traffic man-agement and traffic control facilities, as well as the appropriate arrangement of streets and roads. In 2018 and 2019, the city launched a number of transport-related schemes, with intention to add to the existing multi-modal transport macro-model of road traffic:
• Integrated Scheme of Traffic Management in the Perm region for the period between 2019 and 2033, including proposals to develop trans-port services;
• Recommendations for the integrated develop-ment of transport infrastructure of the Perm agglomeration and municipalities;
• Promotion of inter-municipal communication relating to public transport.
Digitalization of urban transport services and the use of navigation systems data
One of the most important sources of digital information in urban transport management systems is data from satellite navigation systems and mobile operators that allow for the positioning of vehicles, individual users, and cargo units. Since 2009, the Russian Federation has introduced the global navigation satellite system GLONASS into civil operation. This satellite positioning technology allows for the roll-out of intelligent transport systems, such as monitoring the operation of transport and the management of various types of road transport at various levels. It can provide real-time information to citizens and organizations about transport services in the region; administrators access to raw data for assessing the transport situation; and prompt information to the emergency services.
Navigation systems data and traffic safety
ERA-GLONASS, the Russian State emergency response system for crashes, is technologically compatible with the
European e-Call system. The system was designed to enable emergency services to respond as quickly as possible to car crashes and other incidents. Thanks to its introduction, doctors, firefighters and rescuers can quickly receive information about incidents, reducing the rate of death and injuries. Digital technologies have also proven to be effective in ensuring transport security. At the beginning of 2020, approximately 4.6 million cars were equipped with panic buttons. During 2019, the system received about 26,000 calls.
Challenges
Despite the progress made in reforming transport systems in Russian cities, there remains many outstanding issues that have to be solved to improve the efficiency and sustainability of urban transport and improve the quality of life for residents.
Inconsistency of urban planning and transport policies
The growth of multi-story housing development (as a result of renovation programmes in many Russian cities), coupled with a lack of transit-oriented development, has led to an increase in population density without any corresponding development of jobs and services. This, in turn, is increasing transport demand in a system already suffering from limited capacity. Such inconsistency in urban development and transport translates into an increase of the “hypermobility” of the population and increasing congestion of the transport network. There is a clear need for widespread implementation of principles and models of modern urban planning, which can reduce and rationalize transport demand (such as the introduction of a polycentric model of city development and the deployment of new urbanism and its 10 principles issues, which includes covering pedestrian accessibility and mixed use).
Insufficient dissemination and citizen participation in transport decisions
In some cases, there is a lack of proper discussion in terms of urban and transport planning with residents and external stakeholders. As an example, many city authorities refuse to use trolleybuses in their networks, without giving an underlying rationale. In other cities, parking restrictions are imposed without any consultation, especially in peripheral urban areas. It such cases, parking policy are sometimes being used as an instrument to raise funds rather than regulating and redistributing transport demand.
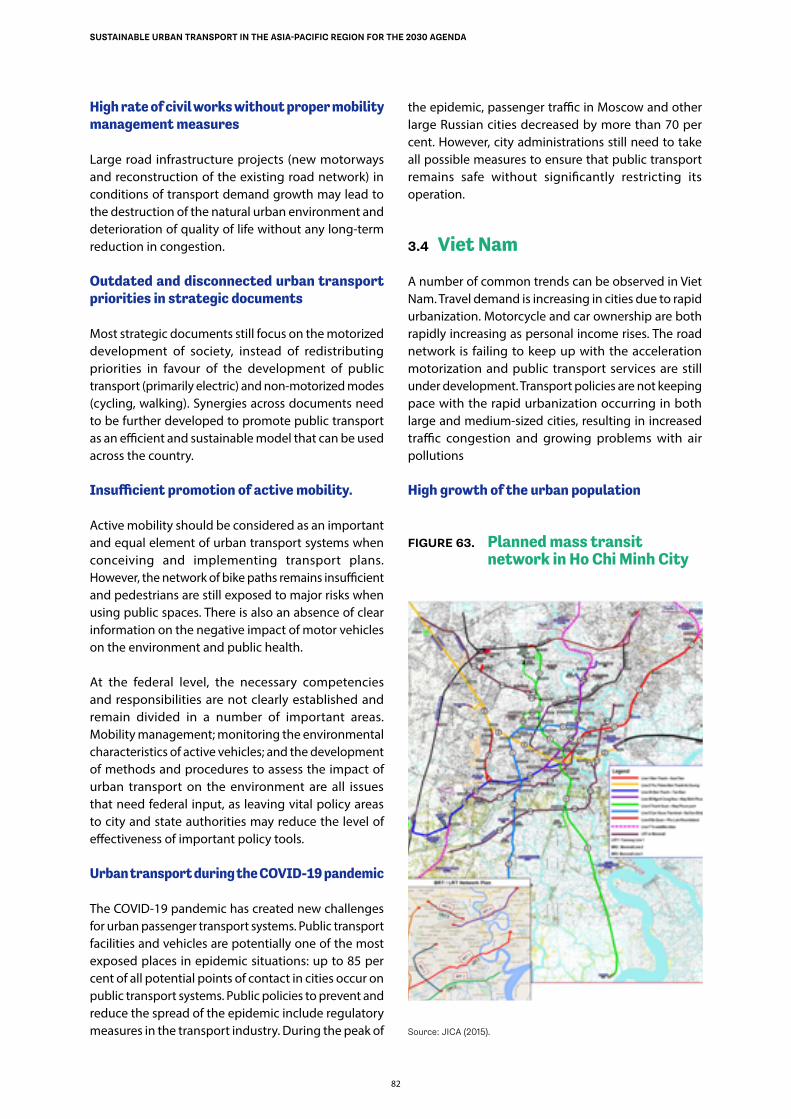
82
SUSTAINABLE URBAN TRANSPORT IN THE ASIA-PACIFIC REGION FOR THE 2030 AGENDA
High rate of civil works without proper mobility management measures
Large road infrastructure projects (new motorways and reconstruction of the existing road network) in conditions of transport demand growth may lead to the destruction of the natural urban environment and deterioration of quality of life without any long-term reduction in congestion.
Outdated and disconnected urban transport priorities in strategic documents
Most strategic documents still focus on the motorized development of society, instead of redistributing priorities in favour of the development of public transport (primarily electric) and non-motorized modes (cycling, walking). Synergies across documents need to be further developed to promote public transport as an efficient and sustainable model that can be used across the country.
Insufficient promotion of active mobility.
Active mobility should be considered as an important and equal element of urban transport systems when conceiving and implementing transport plans. However, the network of bike paths remains insufficient and pedestrians are still exposed to major risks when using public spaces. There is also an absence of clear information on the negative impact of motor vehicles on the environment and public health.
At the federal level, the necessary competencies and responsibilities are not clearly established and remain divided in a number of important areas. Mobility management; monitoring the environmental characteristics of active vehicles; and the development of methods and procedures to assess the impact of urban transport on the environment are all issues that need federal input, as leaving vital policy areas to city and state authorities may reduce the level of effectiveness of important policy tools.
Urban transport during the COVID-19 pandemic
The COVID-19 pandemic has created new challenges for urban passenger transport systems. Public transport facilities and vehicles are potentially one of the most exposed places in epidemic situations: up to 85 per cent of all potential points of contact in cities occur on public transport systems. Public policies to prevent and reduce the spread of the epidemic include regulatory measures in the transport industry. During the peak of
the epidemic, passenger traffic in Moscow and other large Russian cities decreased by more than 70 per cent. However, city administrations still need to take all possible measures to ensure that public transport remains safe without significantly restricting its operation.
3.4 Viet Nam
A number of common trends can be observed in Viet Nam. Travel demand is increasing in cities due to rapid urbanization. Motorcycle and car ownership are both rapidly increasing as personal income rises. The road network is failing to keep up with the acceleration motorization and public transport services are still under development. Transport policies are not keeping pace with the rapid urbanization occurring in both large and medium-sized cities, resulting in increased traffic congestion and growing problems with air pollutions
High growth of the urban population
FIGURE 63. Planned mass transit network in Ho Chi Minh City
Source: JICA (2015).
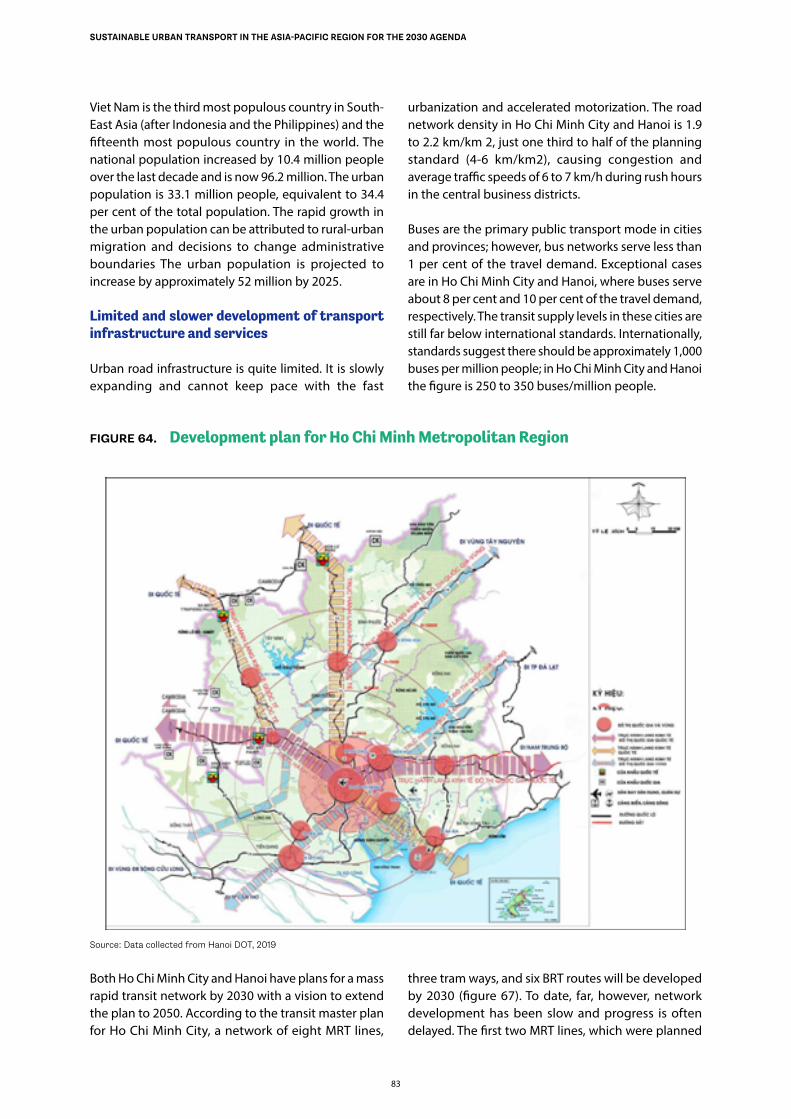
83
SUSTAINABLE URBAN TRANSPORT IN THE ASIA-PACIFIC REGION FOR THE 2030 AGENDA
Viet Nam is the third most populous country in South-East Asia (after Indonesia and the Philippines) and the fifteenth most populous country in the world. The national population increased by 10.4 million people over the last decade and is now 96.2 million. The urban population is 33.1 million people, equivalent to 34.4 per cent of the total population. The rapid growth in the urban population can be attributed to rural-urban migration and decisions to change administrative boundaries The urban population is projected to increase by approximately 52 million by 2025.
Limited and slower development of transport infrastructure and services
Urban road infrastructure is quite limited. It is slowly expanding and cannot keep pace with the fast
urbanization and accelerated motorization. The road network density in Ho Chi Minh City and Hanoi is 1.9 to 2.2 km/km 2, just one third to half of the planning standard (4-6 km/km2), causing congestion and average traffic speeds of 6 to 7 km/h during rush hours in the central business districts.
Buses are the primary public transport mode in cities and provinces; however, bus networks serve less than 1 per cent of the travel demand. Exceptional cases are in Ho Chi Minh City and Hanoi, where buses serve about 8 per cent and 10 per cent of the travel demand, respectively. The transit supply levels in these cities are still far below international standards. Internationally, standards suggest there should be approximately 1,000 buses per million people; in Ho Chi Minh City and Hanoi the figure is 250 to 350 buses/million people.
FIGURE 64. Development plan for Ho Chi Minh Metropolitan Region
Source: Data collected from Hanoi DOT, 2019
Both Ho Chi Minh City and Hanoi have plans for a mass rapid transit network by 2030 with a vision to extend the plan to 2050. According to the transit master plan for Ho Chi Minh City, a network of eight MRT lines,
three tram ways, and six BRT routes will be developed by 2030 (figure 67). To date, far, however, network development has been slow and progress is often delayed. The first two MRT lines, which were planned
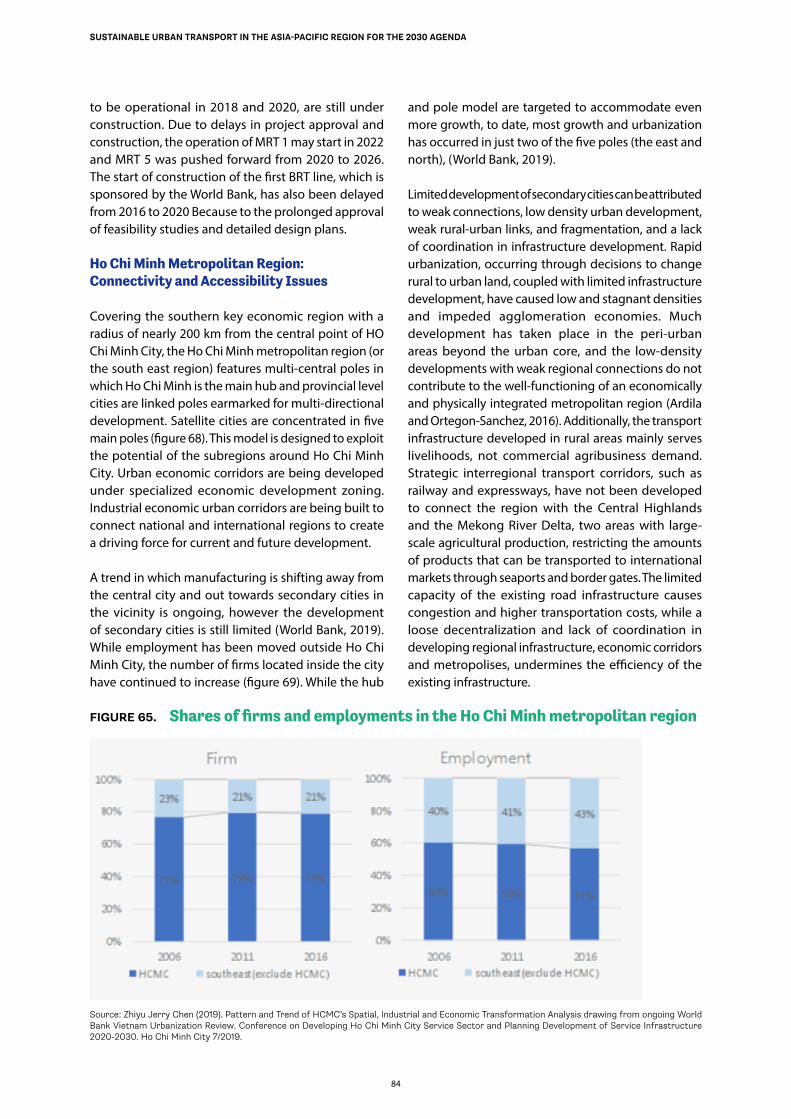
84
SUSTAINABLE URBAN TRANSPORT IN THE ASIA-PACIFIC REGION FOR THE 2030 AGENDA
to be operational in 2018 and 2020, are still under construction. Due to delays in project approval and construction, the operation of MRT 1 may start in 2022 and MRT 5 was pushed forward from 2020 to 2026. The start of construction of the first BRT line, which is sponsored by the World Bank, has also been delayed from 2016 to 2020 Because to the prolonged approval of feasibility studies and detailed design plans.
Ho Chi Minh Metropolitan Region: Connectivity and Accessibility Issues
Covering the southern key economic region with a radius of nearly 200 km from the central point of HO Chi Minh City, the Ho Chi Minh metropolitan region (or the south east region) features multi-central poles in which Ho Chi Minh is the main hub and provincial level cities are linked poles earmarked for multi-directional development. Satellite cities are concentrated in five main poles (figure 68). This model is designed to exploit the potential of the subregions around Ho Chi Minh City. Urban economic corridors are being developed under specialized economic development zoning. Industrial economic urban corridors are being built to connect national and international regions to create a driving force for current and future development.
A trend in which manufacturing is shifting away from the central city and out towards secondary cities in the vicinity is ongoing, however the development of secondary cities is still limited (World Bank, 2019). While employment has been moved outside Ho Chi Minh City, the number of firms located inside the city have continued to increase (figure 69). While the hub
and pole model are targeted to accommodate even more growth, to date, most growth and urbanization has occurred in just two of the five poles (the east and north), (World Bank, 2019).
Limited development of secondary cities can be attributed to weak connections, low density urban development, weak rural-urban links, and fragmentation, and a lack of coordination in infrastructure development. Rapid urbanization, occurring through decisions to change rural to urban land, coupled with limited infrastructure development, have caused low and stagnant densities and impeded agglomeration economies. Much development has taken place in the peri-urban areas beyond the urban core, and the low-density developments with weak regional connections do not contribute to the well-functioning of an economically and physically integrated metropolitan region (Ardila and Ortegon-Sanchez, 2016). Additionally, the transport infrastructure developed in rural areas mainly serves livelihoods, not commercial agribusiness demand. Strategic interregional transport corridors, such as railway and expressways, have not been developed to connect the region with the Central Highlands and the Mekong River Delta, two areas with large-scale agricultural production, restricting the amounts of products that can be transported to international markets through seaports and border gates. The limited capacity of the existing road infrastructure causes congestion and higher transportation costs, while a loose decentralization and lack of coordination in developing regional infrastructure, economic corridors and metropolises, undermines the efficiency of the existing infrastructure.
FIGURE 65. Shares of firms and employments in the Ho Chi Minh metropolitan region
Source: Zhiyu Jerry Chen (2019). Pattern and Trend of HCMC’s Spatial, Industrial and Economic Transformation Analysis drawing from ongoing World Bank Vietnam Urbanization Review. Conference on Developing Ho Chi Minh City Service Sector and Planning Development of Service Infrastructure 2020-2030. Ho Chi Minh City 7/2019.
8585
Chapter 4 How to Make Urban Transport Sustainable in the Asia-Pacific Region
86
SUSTAINABLE URBAN TRANSPORT IN THE ASIA-PACIFIC REGION FOR THE 2030 AGENDA
Introduction
Holistic and systemic thinking are key for sustainable transport in cities. Even more so in a sustainable city as the whole population should be integrated with dignity and opportunities should be given to all classes. Most of all, there must be a real community – which is also the only resilient protection against slow and expensive social disintegration and the specter of an eventual collapse of the city from a “vision” to a “failed experiment”. The sense of community transpires through shared public transportation services, for instance. Community is vital, not as an add-on or a meeting hall tucked into the corner of a formless mass of dwellings, but as something supported by design for the essentials of the community.
In that sense, technology is not the end target, but instead best practices help the structuring of the design, management and the maintenance of the city on the basis of people, good communication and appropriate systems, such as intelligent transport systems for traffic management.
Resilience is a key attribute for cities. It is achieved by ensuring flexibility and avoiding rigid design or management approaches that might exclude future innovation or solutions that may not be visible (or even conceivable) at the outset of the city’s development. Resilience works in synergy with its environment, as adaption to the ecosystem is key to ensure resilience. A city cannot be sustainable in any meaningful sense of the word unless it works with nature to restore biodiversity and maintain ecosystem health.
An urban “fractal” design, that looks at cities through various granularity and the level of scope and size (streets and neighbourhoods), combined with continual scenario planning, is a way to address small and large scales simultaneously as being interrelated and interdependent, yet separate enough to contain, comprehend, and manage at the design and administration levels.
From these holistic guidelines for sustainable cities and their transport systems, it is possible to sketch priority areas and ways in which Asian countries can intervene to make transportation systems more sustainable and inclusive.
Integrated land use and urban transportation planning
Urban transportation planning should consider
land-use planning and the growth patterns of cities. Integrated transport master plans should be developed considering future growth and expansion. Short, medium and long-term transportation plans need to be developed and implemented. The plans should consider integration of all modes of transport such as roads, subways, light rail transit (LRT), BRT, railways, bicycle routes and walkways, and allow for seamless intermodal transfer of users. Various modes of public transport within a city should not be designed and developed as competing modes – but as complementary modes. Usually, a trip needs to use a combination of modes, including walking – which depends on patterns of spatial development and the availability of transport services. Multimodal transport and transit stations need to be accessible and have walking and cycling, and parking facilities for bicycles available nearby.
Public transportation systems
Once the various elements of urban transportation infrastructure are developed based on an integrated urban transportation plan, then public transportation services should be provided to the urban population, including the marginalized urban poor. There could be various forms of interconnected public transport, such as buses, BRT, LRT, subways and metro systems, trams and urban railways, depending on the size and economy of the city. To reduce dependency on private transport, policies to increase the share of public transport modes are essential. Public transport should be planned to be safe, secure, reliable, frequent, convenient, affordable and comfortable. The elimination of subsidies for competing modes of transport, such as private cars and taxis, is essential to developing a vibrant and functioning public transport system, along with the enforcement of laws against unsafe and undesirable forms of transport. Coordination among various public transport modes and routes, integrating timetables, and providing real-time information to users can enhance the efficiency of operations and services. One important aspect of using various modes is fare integration and integrated ticketing, which makes it more efficient, attractive and convenient for users. Many cities are using integrated ticketing in public transport
Transportation demand management
Mobility management measures include a wide range of measures, such as transportation demand management. Modal shift (demand distribution) can be induced through transportation demand management measures, such as public transport
87
SUSTAINABLE URBAN TRANSPORT IN THE ASIA-PACIFIC REGION FOR THE 2030 AGENDA
improvement. Demand reduction (“avoid”) can also be achieved using transit demand management measures. Mobility management measures can include strategies or policies directed to modify the transportation offer, for instance.
Transportation demand management measures, such as the promotion of public transport and discouraging private vehicles, can be taken to improve operational efficiency, limit traffic congestion and improve traffic flows in urban areas. Some common policies are parking restrictions and pricing, congestion charging, area licensing schemes, electronic road pricing, car-sharing, designation of high occupancy lanes and the improvement of public transportation services. The introduction of congestion charging in Central London led to a 19 per cent CO2 emissions reduction and 37 per cent increase in travel speed.
Fiscal instruments used as part of transportation demand management measures need to be integrated to ensure traffic demand is managed. They may be used to influence all decisions from whether to own a vehicle to the choice of itinerary to the time of commuting. Accordingly, excessive car use is most successfully addressed by a complete set of tools that includes strategies for managing vehicle ownership – purchase and circulation taxes, auctioning of permits to buy cars, among other options – as well as charges on the use of cars – fuel taxes and road pricing. Other transport-related taxes and pricing inefficiencies need to be aligned. In particular, ensuring that the price of parking reflects its costs more closely is as important as internalizing the cost of congestion in urban transport prices.
Singapore uses an extensive package of fiscal and non-fiscal instruments to manage car ownership and use. The Government manages traffic congestion by limiting car ownership through permits to own a vehicle, which are auctioned periodically and by pricing road use. Public transport systems are extensive, affordable and efficient; the highest share of passenger traffic is carried by bus. Singapore uses an integrated approach to plan transport and urban development. Approvals for all new developments are contingent on satisfactory accessibility and extensions to public transport networks are decided together with major housing and commercial development projects. The introduction of electronic road pricing in Singapore has reduced total traffic within a cordon area by 14 per cent and increased travel speed by 22 per cent.
Non-motorized transport
Non-motorized transport is a viable alternative mode of transport, which reduces air pollution and CO2 emissions and conserves fossil fuel. Two popular forms of non-motorized transport are walking and cycling. The range of non-motorized transport infrastructure is vast, as it includes pedestrian sidewalks, cycle tracks, sky walks, pedestrian zones, the provision of free or rental cycles in cities, bicycle parking areas near stations, car-free zones and car free days. The construction of sky walkways below some of the sky train lines and the installation of elevators has increased mobility and use of public transportation in cities, such as Bangkok.
4.1 Overall strategies to bolster sustainable urban public transport
To meet the urban mobility challenge, it is essential that cities implement one of the following three strategies. The choice of the strategy is dependent on the maturity and the share of sustainable transport in the modal split:
1. Rethink the system: Cities in mature countries with a high proportion of motorized individual transport need to shape political agendas to fundamentally redesign their mobility systems so that they become more orientated towards public transport and sustainability.
2. Network the system: For mature cities with a high share of sustainable transport modes, the next step must be to fully integrate the travel value chain to foster seamless, multimodal mobility while ensuring ‘’one face to the customer” and to increase the overall attractiveness of public transport by service extension. This group contains the majority of cities in Europe Hong Kong, China, Singapore, Seoul, Tokyo, Toronto and Buenos Aires.
3. Establish a sustainable core: For cities in emerging countries with partly underdeveloped mobility systems, the objective is to establish a sustainable mobility core that satisfies short-term demand at a reasonable cost without replicating the mistakes from developed countries. With access to emerging transport infrastructure and technologies, these cities have the opportunity to become the test-beds and breeding grounds for tomorrow’s urban mobility systems.
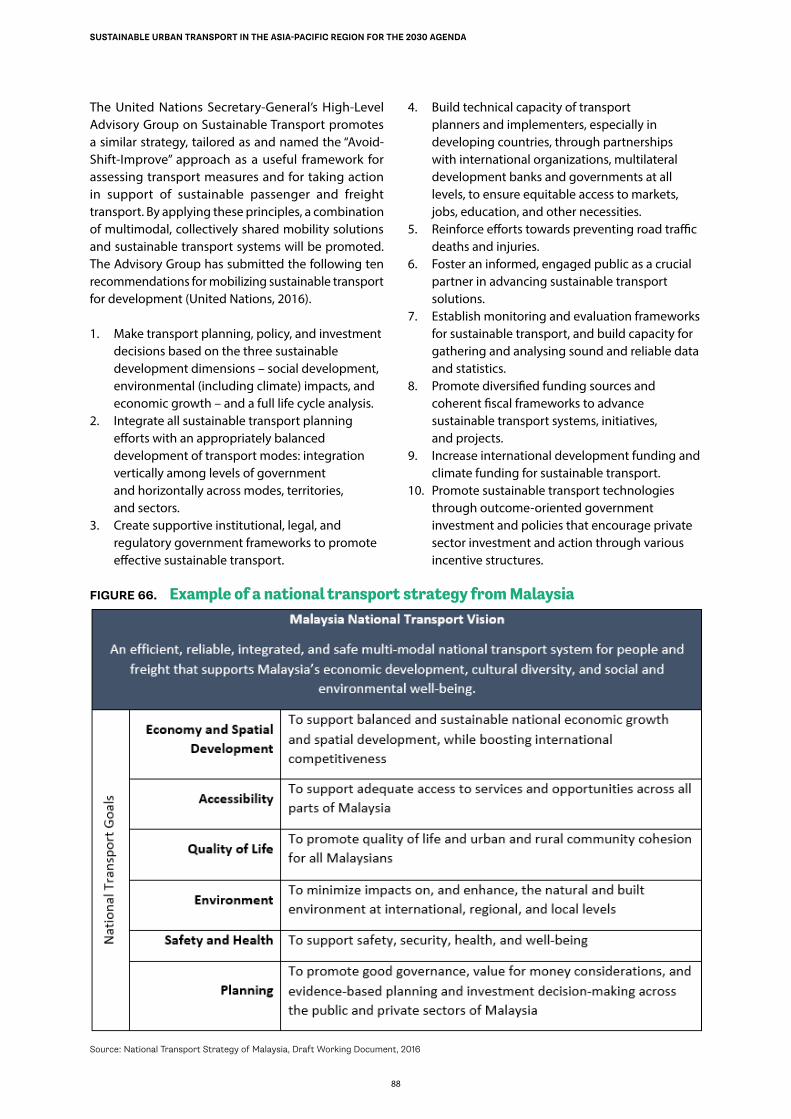
88
SUSTAINABLE URBAN TRANSPORT IN THE ASIA-PACIFIC REGION FOR THE 2030 AGENDA
The United Nations Secretary-General’s High-Level Advisory Group on Sustainable Transport promotes a similar strategy, tailored as and named the “Avoid-Shift-Improve” approach as a useful framework for assessing transport measures and for taking action in support of sustainable passenger and freight transport. By applying these principles, a combination of multimodal, collectively shared mobility solutions and sustainable transport systems will be promoted. The Advisory Group has submitted the following ten recommendations for mobilizing sustainable transport for development (United Nations, 2016).
1. Make transport planning, policy, and investment decisions based on the three sustainable development dimensions – social development, environmental (including climate) impacts, and economic growth – and a full life cycle analysis.
2. Integrate all sustainable transport planning efforts with an appropriately balanced development of transport modes: integration vertically among levels of government and horizontally across modes, territories, and sectors.
3. Create supportive institutional, legal, and regulatory government frameworks to promote effective sustainable transport.
4. Build technical capacity of transport planners and implementers, especially in developing countries, through partnerships with international organizations, multilateral development banks and governments at all levels, to ensure equitable access to markets, jobs, education, and other necessities.
5. Reinforce efforts towards preventing road traffic deaths and injuries.
6. Foster an informed, engaged public as a crucial partner in advancing sustainable transport solutions.
7. Establish monitoring and evaluation frameworks for sustainable transport, and build capacity for gathering and analysing sound and reliable data and statistics.
8. Promote diversified funding sources and coherent fiscal frameworks to advance sustainable transport systems, initiatives, and projects.
9. Increase international development funding and climate funding for sustainable transport.
10. Promote sustainable transport technologies through outcome-oriented government investment and policies that encourage private sector investment and action through various incentive structures.
FIGURE 66. Example of a national transport strategy from Malaysia
Source: National Transport Strategy of Malaysia, Draft Working Document, 2016

89
SUSTAINABLE URBAN TRANSPORT IN THE ASIA-PACIFIC REGION FOR THE 2030 AGENDA
FIGURE 67. Factors needed in a successful national sustainable transport strategy
A national sustainable transport strategy
A national sustainable transport strategy is a document generated by a government to provide a holistic framework for developing a country’s transport system in the short-, medium-, and long-term. Given the broad scope of national transport issues and impacts, this strategy will be relevant to all levels of society and government. The strategy will refer to all modes and types of transport, including road, rail, maritime, air, and waterway; urban and rural; and freight and passenger. It is, therefore, an all-inclusive strategy.
The aim of the strategy is to provide an overarching framework that is comprised of the following components: (a) national transportation goals and/or objectives; (b) policy principles; (c) strategies; and (d) interventions, policies and actions. A strategy is the highest level of projection for a country and consequently is an umbrella document for other more localized or less comprehensive documents, such as regional or modal master plans or lists of projects.
A national transport policy document and a national transport strategy provide key challenges, objectives and policy principles, neither document presents a
Source: National Transport Strategy of Malaysia, Draft Working Document, 2016
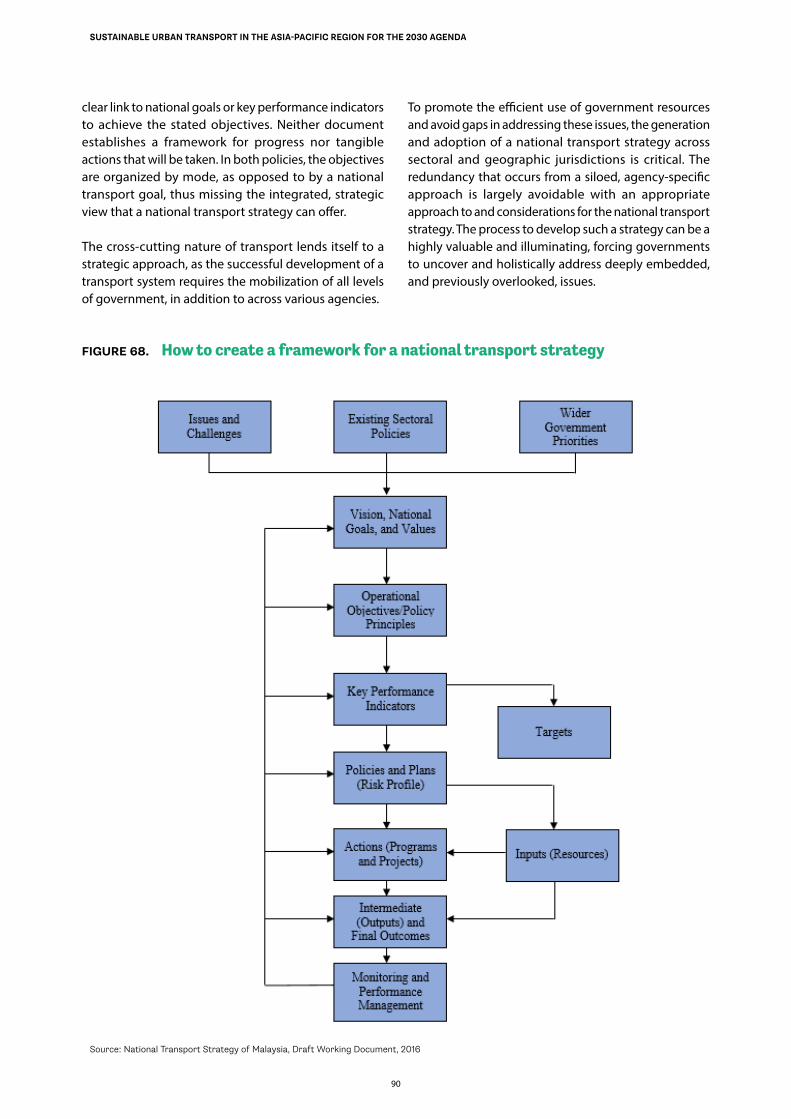
90
SUSTAINABLE URBAN TRANSPORT IN THE ASIA-PACIFIC REGION FOR THE 2030 AGENDA
clear link to national goals or key performance indicators to achieve the stated objectives. Neither document establishes a framework for progress nor tangible actions that will be taken. In both policies, the objectives are organized by mode, as opposed to by a national transport goal, thus missing the integrated, strategic view that a national transport strategy can offer.
The cross-cutting nature of transport lends itself to a strategic approach, as the successful development of a transport system requires the mobilization of all levels of government, in addition to across various agencies.
To promote the efficient use of government resources and avoid gaps in addressing these issues, the generation and adoption of a national transport strategy across sectoral and geographic jurisdictions is critical. The redundancy that occurs from a siloed, agency-specific approach is largely avoidable with an appropriate approach to and considerations for the national transport strategy. The process to develop such a strategy can be a highly valuable and illuminating, forcing governments to uncover and holistically address deeply embedded, and previously overlooked, issues.
FIGURE 68. How to create a framework for a national transport strategy
Source: National Transport Strategy of Malaysia, Draft Working Document, 2016
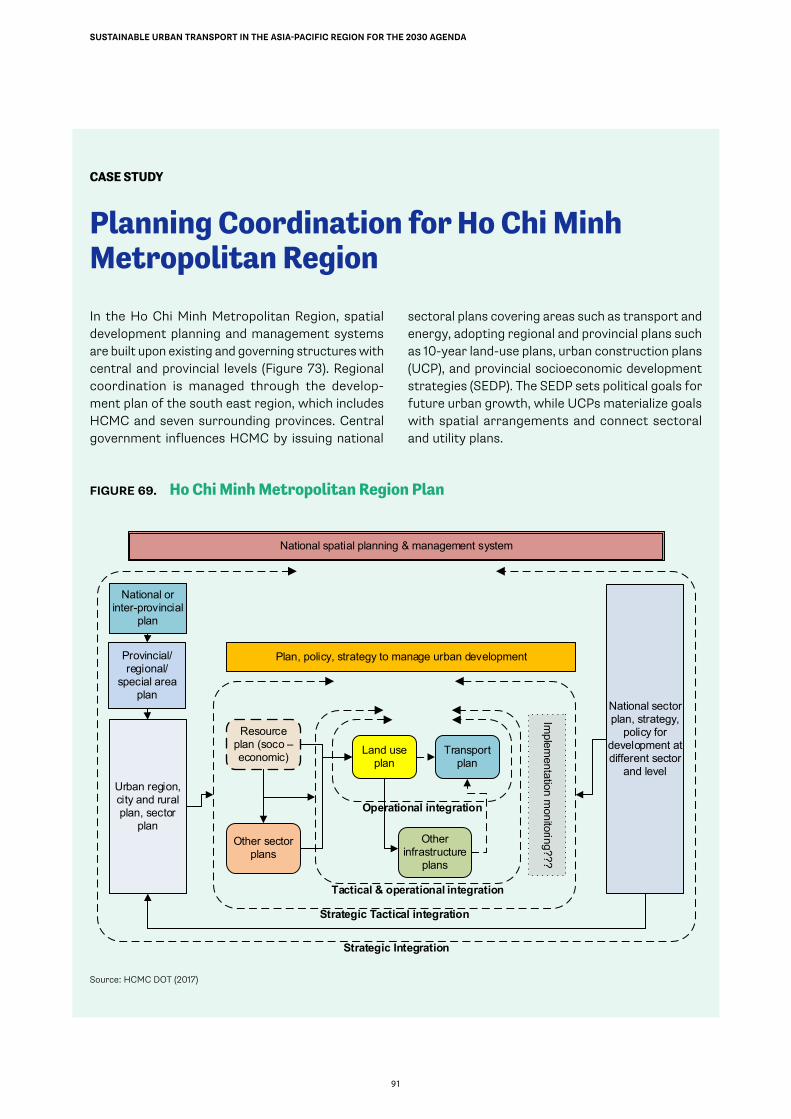
91
SUSTAINABLE URBAN TRANSPORT IN THE ASIA-PACIFIC REGION FOR THE 2030 AGENDA
CASE STUDY
Planning Coordination for Ho Chi Minh Metropolitan Region
In the Ho Chi Minh Metropolitan Region, spatial development planning and management systems are built upon existing and governing structures with central and provincial levels (Figure 73). Regional coordination is managed through the develop-ment plan of the south east region, which includes HCMC and seven surrounding provinces. Central government influences HCMC by issuing national
sectoral plans covering areas such as transport and energy, adopting regional and provincial plans such as 10-year land-use plans, urban construction plans (UCP), and provincial socioeconomic development strategies (SEDP). The SEDP sets political goals for future urban growth, while UCPs materialize goals with spatial arrangements and connect sectoral and utility plans.
FIGURE 69. Ho Chi Minh Metropolitan Region Plan
National spatial planning & management system
Plan, policy, strategy to manage urban development
Land use plan
Transport plan
Other infrastructure
plans
Strategic Integration
Strategic Tactical integration
Resource plan (soco – economic)
Urban region, city and rural plan, sector
plan
Provincial/regional/
special area plan
National or inter-provincial
plan
National sector plan, strategy,
policy for development at different sector
and level
Operational integration
Implem
entation monitoring???
Tactical & operational integration
Other sector plans
Source: HCMC DOT (2017)
92
SUSTAINABLE URBAN TRANSPORT IN THE ASIA-PACIFIC REGION FOR THE 2030 AGENDA
CASE STUDY
Connecting the flows in Tokyo
As the urban landscape of Tokyo has evolved, devel-opments have become increasingly sophisticated and complicated. There has been an increasing concentration of people in the city centre for both work and recreation. The city’s metro system is one of the world’s busiest, serving 3.3 billion pas-sengers annually.
To prevent crowding and disorder in key locations, the city has created connections to allow pedestrian traffic to flow better. Efficient, layered connections were built to link sprawling underground pedestrian networks at metro stations. Walkways were wid-ened, and some were doubled in width. They were connected to improved street-level infrastructure, and designed to link seamlessly.
A new core retail area was established which linked Tokyo and Yurakucho stations, serving a combined 1.2 million passengers daily in 2016. Spaces were opened for events and exhibitions. The central business district has become a highly accessible, attractive public space, drawing large crowds with visitors to the office district, which more than tri-pled on weekends.
Planning matters. A key enabler was the estab-lishment of a widespread underground network at key transport nodes – all that was needed was to connect them. By creating compact, mixed-used developments around public transport nodes, workplaces and social activities were brought closer to the people. An increase in human traffic can be induced and accommodated through infra-structural enhancements, which creates a busy yet vibrant and orderly environment.
How to transcribe a national sustainable transport policy into actions
To achieve its objectives, and ultimately contribute towards achieving national goals and a sustainable transport sector, previously agreed policy principles must be followed. This ensures that policymakers are making decisions guided by the same framework, with the purpose of achieving national transport goals in a cohesive and complementary manner. Figure 71 presents a few example policy principles that could be adapted for a national transport strategy.
The strategic objectives for a transport sector must be operationalized within the larger context of a monitoring and performance management framework, consistent with the approach defined below. Meeting the identified objectives should be a whole-of-government undertaking, with responsibility for their achievement spread across different agencies, requiring collaboration and joint working.
Sustainable urban mobility plans are key instruments for planning and can help foster balanced development and more complete integration of different urban mobility modes. This planning concept highlights that urban mobility is primarily about people. It emphasizes citizen and stakeholder engagement, as well as fostering changes in mobility behavior.
The sustainable urban mobility plan concept considers the functional urban area and proposes that action on urban mobility be embedded into a wider urban and territorial strategy. Accordingly, these plans should be developed in cooperation across different policy areas and sectors, including, among them, transport, land-use and spatial planning, environment, economic development, social policy, health and road safety; across different levels of government and administration; and with authorities in neighbouring areas – both urban and rural.
Planning instruments come as a second instrument. They are measures that focus on the “smarter” planning of infrastructure, namely planning that helps reduce or optimize transport, encompassing public transport and non-motorized modes, such as cycling and walking.
Smart infrastructure planning and design influences the demand for and the efficiency of transport. The need to travel can be reduced when the various forms of land use, such as residential houses, offices, shops and public services are not separated in different city quarters, but instead are mixed within close proximity of one another – a strategy termed “mixed land use”. A smart mixture can significantly reduce the need to travel (or distances travelled), which leads to a decrease in energy consumption and emissions. In addition, smart infrastructure design can also include non-motorized transport modes, such as walking and cycling, from the very beginning of urban design and planning. Good access to public transport has the potential to be a major contributor to lower emissions as public transport is, in most cases, more energy efficient.
93
SUSTAINABLE URBAN TRANSPORT IN THE ASIA-PACIFIC REGION FOR THE 2030 AGENDA
CASE STUDY
Management of the transport system of Perm city
Perm is a large city with a population that exceeds one million. It is a major administrative, industrial, scientific, and cultural centre of the region and is the fourth largest city in the Russian Federation by area. Several administrative (executive) bodies deal with the planning and organization of the city’s transport systems:
• Department of Transport of City Administration, which is responsible for organizing public transport services within the borders of the city of Perm;
• Department of Roads and Municipal Improvement of the City Administration, which is responsible for organizing construction, reconstruction, repair and maintenance of local roads, traffic management, road safety and parking facilities;
• Department of Urban Planning and Architecture of the City Administration, which ensures sustain-able development, urban zoning and planning. The department also is developing a spatial develop-ment strategy.
These administrative bodies are part of the system of local self-government. Their activities are subor-dinate to legislation. The executive body performs its functions on the basis of and in compliance with the Constitution of the Russian Federation, federal legislation, presidential decrees, laws of federal subjects, and municipalities. Administrative bodies organize the execution of decisions of a rep-resentative body of local self-government, resolve issues of local significance, and carry out executive and administrative activities in the territory of the municipality.
Planning for public transport and non-motorized modes is the most granular level of planning in the strategy. On one hand, the provision of new and improved public transport is essential to reduce emissions of greenhouse gases. “Public transport” can include buses, rail, light rail, metro, and underground systems. Attractive, accessible, and reliable public transport systems can provide the basis for alternative mode use in cities. On the other hand, encouraging and facilitating increased levels of walking and cycling is essential for a sustainable transport strategy. Cycling
and walking as modes do not produce any direct emissions. As emissions from motorized transport are highest at a cold start of the engine, short trips are disproportionately polluting. These shorter trips are most suitable for non-motorized modes.
Regulatory instruments
Regulatory instruments can be implemented by public administrations or the political bodies at the national, regional/provincial or local levels and may include fuel consumption regulations, physical restraint measures, traffic management measures, regulations on parking and speed limits.
To achieve a “quick-win” in reducing emissions from vehicles, city authorities should consider implementing measures that physically restrict access for certain motorized vehicles. When implemented successfully, such measures can successfully reduce traffic volumes and associated greenhouse gas emissions. Furthermore, they can increase the attractiveness of public transport and improve the quality of public space and the quality of life in cities.
Low emission zones are areas where access is permitted only to vehicles or classes of vehicles meeting a prescribed standard of emissions. Local transport and planning authorities can determine an area within a city from which certain vehicles (usually older, more polluting vehicles) will be banned from entering. Such restrictions obviously help to improve local air quality and reduce greenhouse gas emissions if the area is large enough and can encourage people to use alternative modes. However, this instrument assumes that emission standards are applied to vehicles being used within the city, and to set up and enforce the restrictions, a high-level of administration and technology is required.
Traffic management measures and the regulation of parking spaces are also effective regulatory instruments. In places where the implementation of physical restraint measures is difficult, transport authorities may wish to use traffic management measures to smooth traffic flows. This helps ease congestion, and consequently, improves fuel efficiency and reduces emissions. As with road space, the provision of parking is closely linked to demand. Parking in developing cities is a particular problem, as highways and walkways are often littered with parked vehicles. Parking supply restrictions can make car use unattractive and contribute towards a modal shift. These restrictions are often implemented alongside parking pricing measures.
94
SUSTAINABLE URBAN TRANSPORT IN THE ASIA-PACIFIC REGION FOR THE 2030 AGENDA
CASE STUDY
Parking policy in Russian cities
Perm City. The number of cars in the city in 2019 was 252,969 (240 cars per 1,000 residents). Parking policy is implemented through the ’Parking Space of Perm’ framework, which was launched to solve the problem of chaotic parking of cars on the streets and create conditions for convenient movement of pedestrians and vehicles. The cost of car parking in specially designated parking spaces is 20 rubles (about US$0.26) per hour, while a motorcycle or moped costs 10 rubles per hour.
Kazan City. A unified city parking space system, using Russian-developed software, combines pay-ment, control, and information subsystems to be able to manage 30,000 parking spaces, covering not just the city but neighboring authorities.
For user convenience, 10 electronic information boards are installed on entrances to parking lots. These are linked to Kazan parking space portal and displays information about the number of available parking spaces. Payment can be made by using parking meters located near parking lots using bank cards or international payment systems, a trans-port card, sending an SMS message, or by using the mobile app ‘Kazan Parking’
Parking fees depend on parking occupancy rates, and is set taking into account the turnover of parking spaces and their load, which should not fall below 50 per cent and should not exceed 85 per cent during peak hours.
In 2016, as part of the expansion of the unified urban parking space, the Executive Committee of Kazan, organized the first flat municipal paid park-ing for 150 parking spaces combined with cycling parking for 50 places. Any car owner can rent a bike for free while parking their car.
Economic Instruments
While economic instruments were often used for financing infrastructure costs, one key aim of economic instruments as that they are currently used to discourage the use of private vehicles (or others) or encourage more (energy-) efficient use of transport through the charges or taxes on transport. The use of these economic instruments often is intended to internalize external costs, such as taking into account the effects of greenhouse gas emissions. The instruments discussed here include road pricing, vehicle taxation and parking pricing.
Road pricing, and vehicle taxation are the most common instruments. The motivations for road pricing are various. They include reducing congestion and reducing emissions. Most drivers in urban areas only pay a fraction of the costs associated with car traffic. Demand, therefore, greatly exceeds the optimum. The objective of road pricing is to readjust the price of driving, and encourage the use of alternative modes. Other approaches are vehicle taxation, which consists of charging vehicle ownership. Vehicle taxes based on a CO2 emissions criterion can be an important leverage in efforts to force reductions in average CO2 emissions from new cars. Vehicle taxes or feebates may have a large impact on purchasing behaviour by incentivizing consumers to shift to driving low-carbon models.
Awareness, communication and information instruments
There are a number of information instruments available to decision makers to complement – or act as an alternative – to more resource-intensive instruments. These “soft” measures may induce behavioural changes of transport users through raising awareness of alternatives modes. Typical examples are public awareness campaigns, mobility management and driver education.
Public awareness campaigns and mobility management
Public awareness campaigns can take many forms. They are mostly used to inform the public about the travel alternatives available to them or about the environmental, economic, and social impacts of (motorized) transport. Marketing of sustainable transport solutions is essential when attempting to secure public acceptance. Accordingly, they should always be taken into consideration when promoting sustainable transport policies.
95
SUSTAINABLE URBAN TRANSPORT IN THE ASIA-PACIFIC REGION FOR THE 2030 AGENDA
Driver behaviour training and education / eco-driving
The way in which a vehicle is driven or maintained has a direct impact on fuel consumption, and subsequently operating costs and emissions. Through the provision of “eco-driving” education and training, driver behaviour can be altered to achieve greater fuel efficiencies. Estimates show that average fuel savings (and emission reductions) are in the range of 10 to 15 per cent. Potential fuel saving by individuals may be up to 25 per cent. Key methods for improving fuel efficiency are related to driving style/behaviour (speed, braking and acceleration, engine idling, carrying capacity and cold starts) and vehicle conditions, engine maintenance, tires, oil and air filters and the vehicle’s age.
Technology based strategy
The key approach to be taken to achieve reduced greenhouse gas emissions from transport is to change travel behavior and/or the technology used. Planning, regulatory, economic, and information instruments can be used to achieve behavioural change and technological change.
Policy crafting, governance, and stakeholder engagement
Policy instruments go hand in hand with the need to develop national frameworks, strategies and guidelines for sustainable transport systems. Countries need to evaluate existing policies and their transportation systems, identify policy gaps, adopt innovative strategies and polices and adopt appropriate technology and integrated approaches for sustainable and inclusive transport development.
National and local governments, municipalities and city councils are key stakeholders in developing a sustainable and inclusive urban transportation system. A targeted programme should be planned to establish or strengthen institutional linkages and coordination among national, local, and city agencies. In addition, private sector transport operators and logistics service providers also need to be involved in the development and operation of transport systems and apply the concept of sustainability in their business practices, and their operations and services need to be used fully.
Because transport is a complex issue with implications for a wide range of sectors and populations, economic actors and individuals, policymakers are most successful when they pursue an integrated approach to achieve
sustainable transport – horizontal integration among sectors, institutions and modes, and vertical integration among levels of jurisdiction and authority. The need to effectively integrate transport and land-use policy and planning has long been recognized, but in too many cases, policy development and planning is still carried out in silos. By approaching land-use and transport planning as two sides of the same (access) coin, decision makers are in a better position to create more effective transport corridors, parking and street designs, efforts to enhance multimodal transport, and “placemaking” (creating public spaces to foster community interaction and enhance quality of life). Integrated planning helps cities develop mobility solutions that are low-carbon, affordable and resilient to advance the goal of compact, connected and coordinated cities in order to address the challenge of urban sprawl and the associated public and farmland grabbing that undermines the economic viability of rural areas.
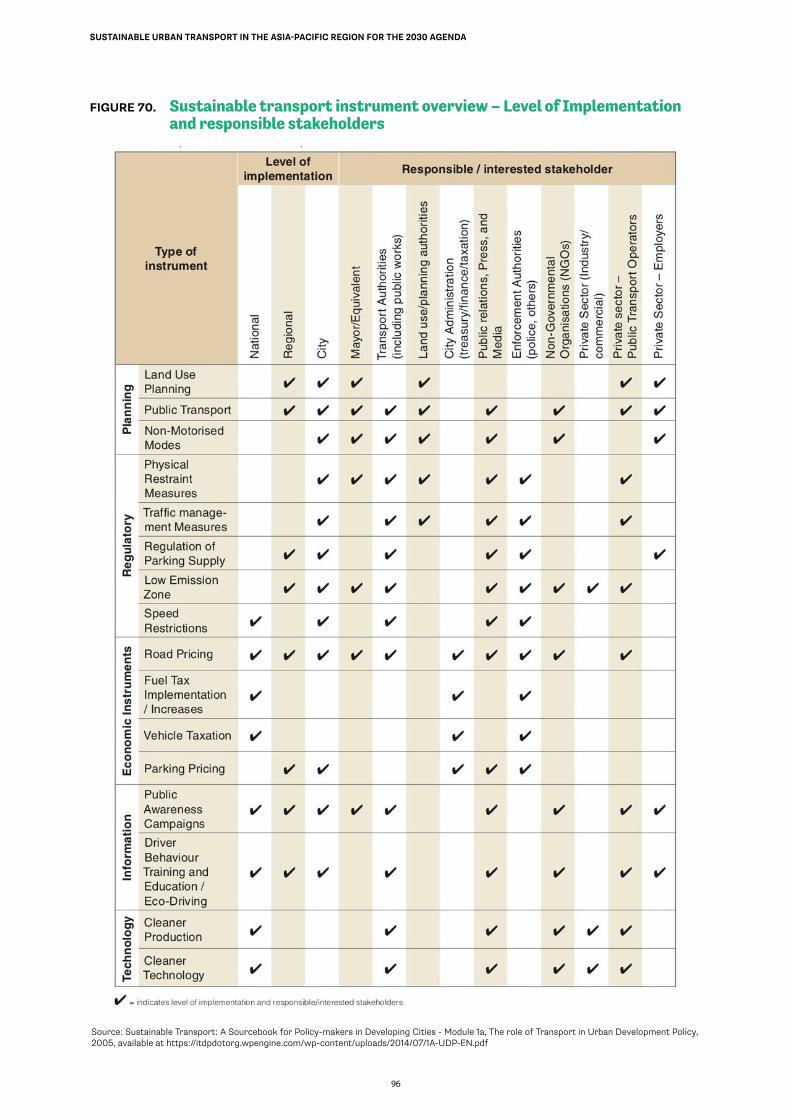
96
SUSTAINABLE URBAN TRANSPORT IN THE ASIA-PACIFIC REGION FOR THE 2030 AGENDA
FIGURE 70. Sustainable transport instrument overview – Level of Implementation and responsible stakeholders
Source: Sustainable Transport: A Sourcebook for Policy-makers in Developing Cities - Module 1a, The role of Transport in Urban Development Policy, 2005, available at https://itdpdotorg.wpengine.com/wp-content/uploads/2014/07/1A-UDP-EN.pdf
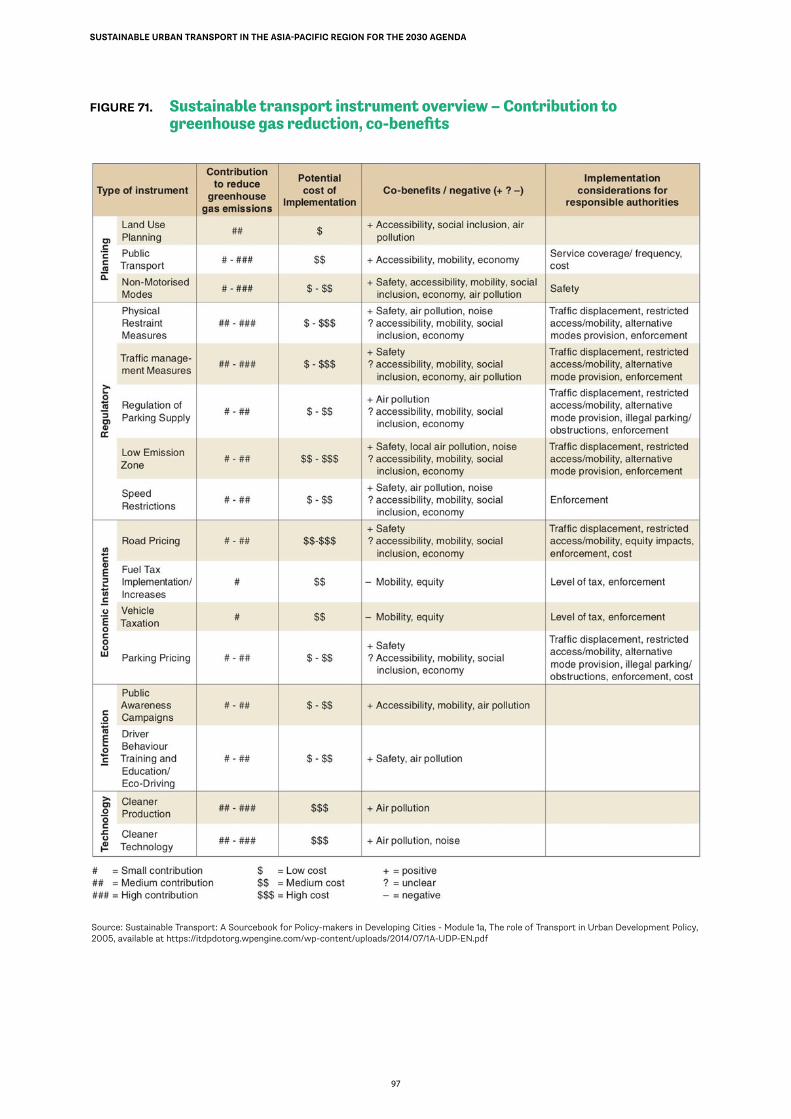
97
SUSTAINABLE URBAN TRANSPORT IN THE ASIA-PACIFIC REGION FOR THE 2030 AGENDA
FIGURE 71. Sustainable transport instrument overview – Contribution to greenhouse gas reduction, co-benefits
Source: Sustainable Transport: A Sourcebook for Policy-makers in Developing Cities - Module 1a, The role of Transport in Urban Development Policy, 2005, available at https://itdpdotorg.wpengine.com/wp-content/uploads/2014/07/1A-UDP-EN.pdf
98
SUSTAINABLE URBAN TRANSPORT IN THE ASIA-PACIFIC REGION FOR THE 2030 AGENDA
CASE STUDY
NUTP 2006 and urban planning and transport changes
Following Indian independence in 1947, urban trans-port did not become part of the government’s agenda until its sixth Five Year Plan (1982-87). The National Urban Transport Policy (NUTP) envis-aged better public transportation facilities in the cities along with the promotion of Non-Motorized Transport (NMT). The primary aim was to improve the mobility of people rather than vehicles. The coverage of the policy was focused on cities with a population of more than a million, meaning it over-looked cities containing almost 70 per cent of India’s urban population.
One major objective of the NUTP was to integrate land use and transport planning through formulation of plans at city level. Another major recommenda-tion was the setting up of local institutes to take control of all transport related activities (Unified Metropolitan Transport Authority, UMTA) under one umbrella.
The formal metro and bus systems in many Indian cities has only been in development for around a decade, following the introduction of various gov-ernment schemes and policies such as the by using JnNURM (National Urban Renewal Mission) and the NUTP. Before this, a majority of Indian cities were
dependent on unorganized modes of transport such as tempos, auto rickshaws, cycle rickshaws, and small buses.
JnNURM allocated approximately 11 per cent of its mission budget ($20 billion) to urban transporta-tion. Approximately 138 projects were undertaken with one third of the funding being allocated to Mass Transit Systems, with half allocated to road and highway construction (EMBARQ and Shakti Foundation, 2010).
UMTAs were set up at the city level, with nodal transport agencies created at state level, along-side the creation of Urban Transport Funds (UTF). However, only 4 per cent of funds were allocated to NMT projects, with most going to parking schemes, road construction and the metro system. This has led to exclusion of pedestrian and bicycle users, who constitute 40 per cent of total mode split in India.
There has been growing recognition that cities need technical support, leading to the create of Centers of Excellence in Delhi, Chennai, Ahmedabad, and Warangal to undertake research and help build man-power capacity.
Governance frameworks for effective policy making
Well-intentioned policies formulated at global or national levels may not be adopted or properly implemented at the local level if they are not coherent with local priorities. This is particularly important for the Sustainable Development Goals, as efforts to achieve them need to be implemented on the ground, in many cases at the subnational and local levels.
Many countries also lack guiding national policy frameworks for cities. The New Urban Agenda, an outcome of the Habitat III Conference, calls for “a renewed local-national partnership, in which
stakeholders and local and subnational governments are strategic partners of national governments, building a strong national system of cities and well-balanced territorial development, in support of national development targets.”
National urban policies that focus on mixed land use, compact city forms and transit-oriented development can advance sustainable transport objectives. To achieve that objective, the role of metropolitan transport authorities needs to be reinforced as an efficient model to address coordination among jurisdictions at all territorial scales and among different stakeholders (International Transport Forum, 2018).
99
SUSTAINABLE URBAN TRANSPORT IN THE ASIA-PACIFIC REGION FOR THE 2030 AGENDA
Stakeholder engagement and public awareness
Transport policies shape and are shaped by a wide range of stakeholders, including, among them, governments, transport authorities and operators, financial institutions, businesses and enterprises of all sizes, community organizations, research institutions and individual experts. Public consultation is a mandated element of transport legislation in many countries. Some countries are pursuing participatory budgeting. Stakeholder engagement can help to identify the need and demand for transport services. These approaches also help ensure that a range of perspectives is considered, adding legitimacy to decisions, enabling co-decision making, and creating a sense of ownership among stakeholders and citizens.
Public education and public information campaigns represent important tools to achieve behavioural change. If young people – and people of all ages – can learn in school and through the media and outreach campaigns about the benefits of sustainable transport, they will be more likely to make sustainable choices in the future. These choices will be reinforced further if public transport options are attractive, accessible and safe.
4.2 Decarbonize and reduce environmental impact
What does it mean to thrive for functional, decarbonized, vibrant cities?
Cities have always played a central role in economic development by bringing workers and entrepreneurs together, spurring innovation and sharing resources (including infrastructure) more efficiently. This should be good news for developing Asia: by 2050, there is projected to be 2.96 billion people living in the region’s towns and cities – 64 per cent of the entire population. This is up from 1.84 billion (or 46 per cent of the population) in 2017.
Unfortunately, while the region’s cities are sure to grow in size, they may fail to fulfil their potential as engines of growth and job creation due to underinvestment in urban infrastructure, lack of affordable housing and unsynchronized spatial and economic planning.
First, policymakers must achieve a more accurate and granular understanding of how their countries are urbanizing. New data sources are needed because official statistics often fail to capture the true urban
footprint of cities. This may be because they rely on municipal boundaries drawn decades ago. Satellite imagery, however, shows clearly that developing Asian cities are expanding without regard to those boundaries, forming what is referred to as “natural cities”. This means urban planning cannot simply stop at the city limits. Efficient transport networks that extend from neighbourhoods to workplaces prevent fragmentation of a city’s labour market.
Second, policymakers must think of cities as labour markets. Cities are much more than places of work, but they cannot thrive unless both enterprises and workers can function well in them. This requires that travel within the city or city cluster is rapid and cheap, firms and households can
easily relocate from one part of a city to another and real estate is affordable.
Asian cities need to do a lot on these fronts. Tests using Google Maps in 278 natural cities show considerable congestion during peak travel times in many large cities, such as Metro Manila, Dhaka, and Bengaluru. Moreover, in 199 of the cities reviewed, a quarter of the surveyed trips could not be made by public transport at all, while for the other three quarters, travel by public transport, including walking to and from the transport hub, was three times longer than by car. This clearly shows that Asian cities must invest much more to attain efficient public transport if businesses are to attract workers and flourish. The transport system must combine trains, buses, taxis, ride-sharing, and less formal services, such as jeepneys and auto rickshaws – and regulate them well – to improve mobility.
“Public spaces”, in the simplest terms, are the spaces between buildings and facilities that are open to the public. They are comprised broadly of three types of urban spaces: streets and pedestrian access; open and green spaces, including parks, plazas, waterbodies, and waterfronts; and public facilities, such as libraries, community centres and municipal markets (UN-Habitat, 2013b). They range from informal street corners where people gather to prominent city plazas and landmarks. Global experience has shown how these varied types of public spaces can directly contribute to cities’ functionalities, including social interactions, urban health, labour markets, and urban environment, to name a few.
Streets are public spaces that range from narrow pedestrian alleys in historic cities to large boulevards, such as La Rambla in Barcelona and the avenues
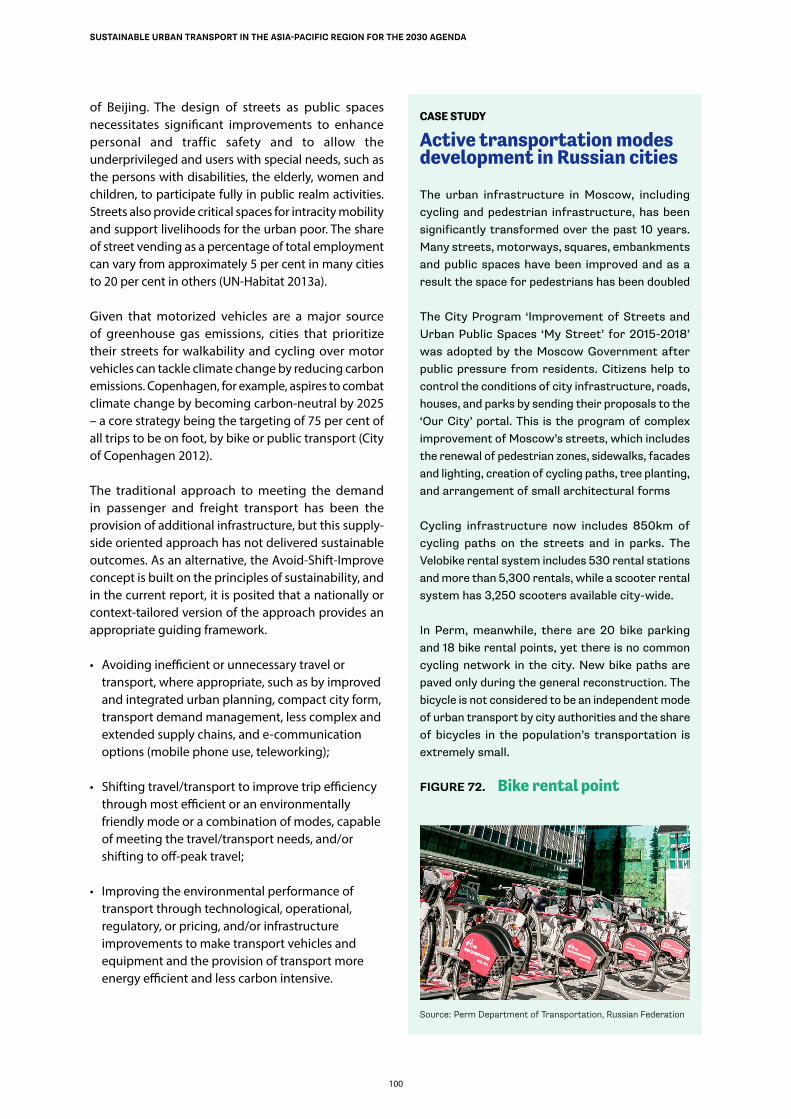
100
SUSTAINABLE URBAN TRANSPORT IN THE ASIA-PACIFIC REGION FOR THE 2030 AGENDA
of Beijing. The design of streets as public spaces necessitates significant improvements to enhance personal and traffic safety and to allow the underprivileged and users with special needs, such as the persons with disabilities, the elderly, women and children, to participate fully in public realm activities. Streets also provide critical spaces for intracity mobility and support livelihoods for the urban poor. The share of street vending as a percentage of total employment can vary from approximately 5 per cent in many cities to 20 per cent in others (UN-Habitat 2013a).
Given that motorized vehicles are a major source of greenhouse gas emissions, cities that prioritize their streets for walkability and cycling over motor vehicles can tackle climate change by reducing carbon emissions. Copenhagen, for example, aspires to combat climate change by becoming carbon-neutral by 2025 – a core strategy being the targeting of 75 per cent of all trips to be on foot, by bike or public transport (City of Copenhagen 2012).
The traditional approach to meeting the demand in passenger and freight transport has been the provision of additional infrastructure, but this supply-side oriented approach has not delivered sustainable outcomes. As an alternative, the Avoid-Shift-Improve concept is built on the principles of sustainability, and in the current report, it is posited that a nationally or context-tailored version of the approach provides an appropriate guiding framework.
• Avoiding inefficient or unnecessary travel or transport, where appropriate, such as by improved and integrated urban planning, compact city form, transport demand management, less complex and extended supply chains, and e-communication options (mobile phone use, teleworking);
• Shifting travel/transport to improve trip efficiency through most efficient or an environmentally friendly mode or a combination of modes, capable of meeting the travel/transport needs, and/or shifting to off-peak travel;
• Improving the environmental performance of transport through technological, operational, regulatory, or pricing, and/or infrastructure improvements to make transport vehicles and equipment and the provision of transport more energy efficient and less carbon intensive.
CASE STUDY
Active transportation modes development in Russian cities
The urban infrastructure in Moscow, including cycling and pedestrian infrastructure, has been significantly transformed over the past 10 years. Many streets, motorways, squares, embankments and public spaces have been improved and as a result the space for pedestrians has been doubled
The City Program ‘Improvement of Streets and Urban Public Spaces ‘My Street’ for 2015-2018’ was adopted by the Moscow Government after public pressure from residents. Citizens help to control the conditions of city infrastructure, roads, houses, and parks by sending their proposals to the ‘Our City’ portal. This is the program of complex improvement of Moscow’s streets, which includes the renewal of pedestrian zones, sidewalks, facades and lighting, creation of cycling paths, tree planting, and arrangement of small architectural forms
Cycling infrastructure now includes 850km of cycling paths on the streets and in parks. The Velobike rental system includes 530 rental stations and more than 5,300 rentals, while a scooter rental system has 3,250 scooters available city-wide.
In Perm, meanwhile, there are 20 bike parking and 18 bike rental points, yet there is no common cycling network in the city. New bike paths are paved only during the general reconstruction. The bicycle is not considered to be an independent mode of urban transport by city authorities and the share of bicycles in the population’s transportation is extremely small.
FIGURE 72. Bike rental point
Source: Perm Department of Transportation, Russian Federation
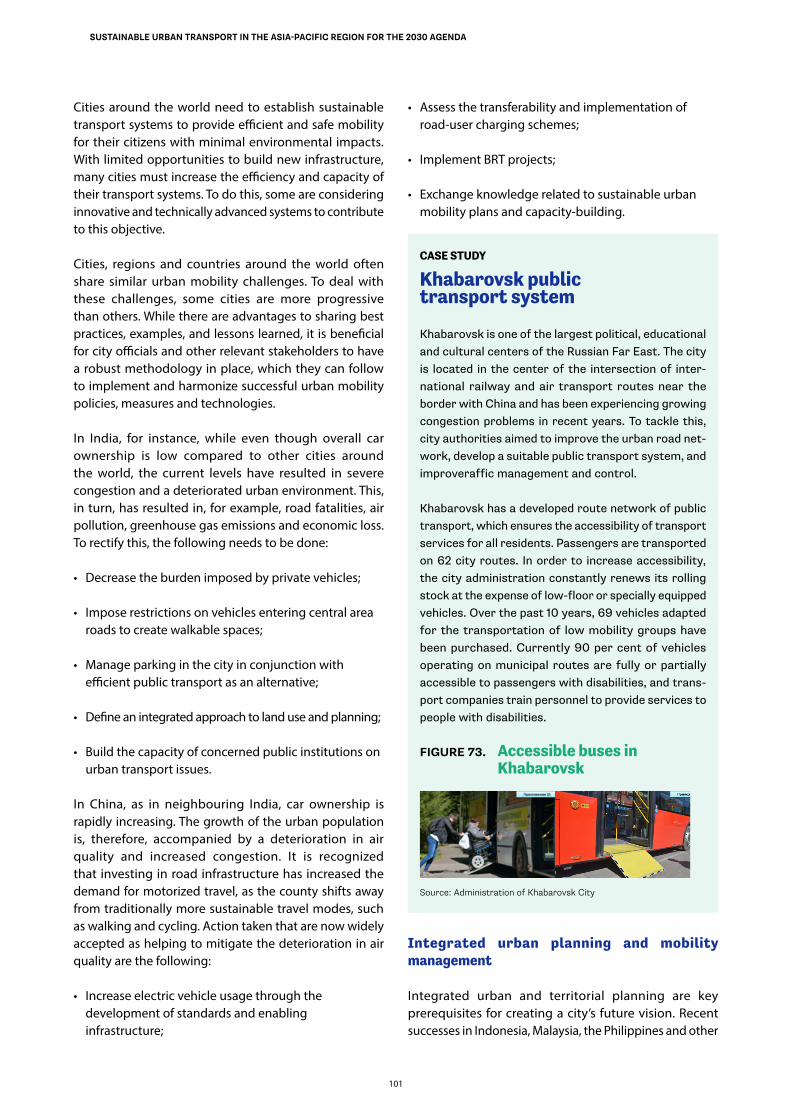
101
SUSTAINABLE URBAN TRANSPORT IN THE ASIA-PACIFIC REGION FOR THE 2030 AGENDA
Cities around the world need to establish sustainable transport systems to provide efficient and safe mobility for their citizens with minimal environmental impacts. With limited opportunities to build new infrastructure, many cities must increase the efficiency and capacity of their transport systems. To do this, some are considering innovative and technically advanced systems to contribute to this objective.
Cities, regions and countries around the world often share similar urban mobility challenges. To deal with these challenges, some cities are more progressive than others. While there are advantages to sharing best practices, examples, and lessons learned, it is beneficial for city officials and other relevant stakeholders to have a robust methodology in place, which they can follow to implement and harmonize successful urban mobility policies, measures and technologies.
In India, for instance, while even though overall car ownership is low compared to other cities around the world, the current levels have resulted in severe congestion and a deteriorated urban environment. This, in turn, has resulted in, for example, road fatalities, air pollution, greenhouse gas emissions and economic loss. To rectify this, the following needs to be done:
• Decrease the burden imposed by private vehicles;
• Impose restrictions on vehicles entering central area roads to create walkable spaces;
• Manage parking in the city in conjunction with efficient public transport as an alternative;
• Define an integrated approach to land use and planning;
• Build the capacity of concerned public institutions on urban transport issues.
In China, as in neighbouring India, car ownership is rapidly increasing. The growth of the urban population is, therefore, accompanied by a deterioration in air quality and increased congestion. It is recognized that investing in road infrastructure has increased the demand for motorized travel, as the county shifts away from traditionally more sustainable travel modes, such as walking and cycling. Action taken that are now widely accepted as helping to mitigate the deterioration in air quality are the following:
• Increase electric vehicle usage through the development of standards and enabling infrastructure;
• Assess the transferability and implementation of road-user charging schemes;
• Implement BRT projects;
• Exchange knowledge related to sustainable urban mobility plans and capacity-building.
CASE STUDY
Khabarovsk public transport system
Khabarovsk is one of the largest political, educational and cultural centers of the Russian Far East. The city is located in the center of the intersection of inter-national railway and air transport routes near the border with China and has been experiencing growing congestion problems in recent years. To tackle this, city authorities aimed to improve the urban road net-work, develop a suitable public transport system, and improveraffic management and control.
Khabarovsk has a developed route network of public transport, which ensures the accessibility of transport services for all residents. Passengers are transported on 62 city routes. In order to increase accessibility, the city administration constantly renews its rolling stock at the expense of low-floor or specially equipped vehicles. Over the past 10 years, 69 vehicles adapted for the transportation of low mobility groups have been purchased. Currently 90 per cent of vehicles operating on municipal routes are fully or partially accessible to passengers with disabilities, and trans-port companies train personnel to provide services to people with disabilities.
FIGURE 73. Accessible buses in Khabarovsk
Integrated urban planning and mobility management
Integrated urban and territorial planning are key prerequisites for creating a city’s future vision. Recent successes in Indonesia, Malaysia, the Philippines and other
Source: Administration of Khabarovsk City
102
SUSTAINABLE URBAN TRANSPORT IN THE ASIA-PACIFIC REGION FOR THE 2030 AGENDA
Asian countries in areas, such as strengthening local planning and developing national systems of cities, have helped Asian and Pacific cities rise to the top of global liveability rankings and the peer influence of planning education and institutes in Australia, Japan, the Republic of Korea and Singapore.
CASE STUDY
Leaving Cars Behind in Singapore
Singapore already has a robust system of inte-grated land use and transport planning, but accommodating a growing population on limited land has required a shift towards more space-ef-ficient modes of transport.
More incentives are being introduced for people to use public transport and embrace new options such as personal mobility devices (PMDs). Folding bikes and PMDs are now allowed on trains and bus all day, and numerous bike-sharing services have kicked off. From 2016, property developers are required to submit a walking and cycling plan in development applications.
Public transport usage now makes up 66 per cent of all peak-hour journeys. Various transport forms are common these days, including Uber and Grab ride-share services and Personal Mobility Device (PMDs). Riding a PMD is even seen as fashionable. Since the passing of the Active Mobility Bill in 2017, PMD users have increased significantly to at least 25,000, with about 25 per cent using their devices daily.
By welcoming new technologies while helping stakeholders and users adapt to change, Singapore is focusing on people’s needs and working with the market to find mutually beneficial solutions. This allows for greater systemic innovation, and is a prerequisite for achieving ‘mobility as a service’.
More planning is being carried out in the region than ever before. Professional planning capacity and better government institutions are support planning policy and decentralization in many countries, which is propelling more and better local planning. Through technological innovation, planning data and tools have also become more accessible, affordable and efficient. This development benefits most stakeholders, including most levels of government, the private sector
and most importantly civil society. Monitoring and participation are now easier, but regulatory frameworks in many places have not caught up.
Countries in the region are moving forward with national spatial frameworks, city-region planning and local planning for urban regeneration. National territorial planning frameworks are becoming stronger and more ambitious, extending their economic development goals and incorporating a range of sustainability issues. Systems that include networks of cities are in vogue and they are becoming greener. City-region planning arrangements are becoming more effective at coordination as they seek to bring effective and resilient benefits from continuing city expansion.
Malaysia is a good example of recent progress in integrated urban planning. The country’s national planning framework has become more comprehensive and integrated in recent years, with its National Physical Plan being an important component. Across the board, Malaysia has acquired reasonable institutional capacity for strategic spatial planning with regulatory controls at the national, state, and local levels.
The region’s most recent and far-reaching transformation in sustainable national spatial planning frameworks has occurred in China. In March 2018, the Government moved the mandate to regulate the national planning strategy to a strengthened Ministry of Land Resources, ensuring that a single agency would oversee the utilization of both land resources and natural assets across the entire regulatory spectrum of land use and strategic planning (China Centre for Urban Development and UN-Habitat, 2018). This change is similar to what was done in Indonesia in 2014, but the impact is potentially more far-reaching, as China has in place a strong spatial planning framework.
Urban and territorial planning is also increasingly important for reducing vulnerability to natural disasters and building resilience to shocks and stresses. Because of sea-level rise and land subsidence, adaptation planning strategies for many large delta cities in the region require expansion planning towards safer areas, in addition to adaptation action in inner cities and along waterways, such as in the Ho Chi Minh City 2013 Climate Change Adaptation Strategy. Many adaptation features are about local as well as technical solutions, from tidal barriers to pavement permeability improvements (Viet Nam Climate Adaptation Partnership, 2013). The experience of Ho Chi Minh City highlights how planning for water can accommodate high-quality urban development and design, but can also result in
103
SUSTAINABLE URBAN TRANSPORT IN THE ASIA-PACIFIC REGION FOR THE 2030 AGENDA
gentrification if not distributed equitably to all high-risk parts of the city. For this reason, comprehensive planning at a city-region scale is important.
CASE STUDY
Moving the masses in Yangon
In Yangon, people spend hours each day travelling on heavily congested streets. Lack of planning and funding has led to poor road infrastructure and an overstretched public transport system. The pri-vate car population doubled from 2011 to 2015 due to relaxed import limits. Indiscriminate roadside parking takes up capacity and worsens the public transport experience.
The Project for Comprehensive Urban Transport Plan for Greater Yangon was formed in 2013, with long-term plans up to 2035. PPPs oversee the implementation of proposed solutions and provide much-needed funding. Aside from a BRT system, circular railway improvements are planned to cut waiting times from 45 minutes to 10 minutes.
The BRT Lite scheme was launched in 2016 to gradually replace the notoriously dangerous “BM” buses. Street infrastructure has been improved to enhance safety and flow, and to make courteous road behaviour a practice. This includes construct-ing flyovers, planting concrete blocks to delineate lanes and installing smart traffic lights. Citizens have responded positively and are demanding more improvements.
Improvements take time, especially if the infra-structure is outdated, such as the railway signal systems of Yangon, which date back to the 1960s. However, with a comprehensive, detailed plan to introduce various forms of rapid transport (bus, light rail, and metro) and a new inflow of investments, the city can use its existing trans-port corridors to reduce dependency on cars and develop shared mobility.
Urban and territorial planning is the basic building block for creating better urban places. Cities that were guided by plans can point to better outcomes. They provide adequate housing, efficient transport, and plentiful jobs aligned with the expectations of a growing or shrinking populations. Ideally, these plans do not stop at the city limits; they take into account
the entire metropolitan area across local jurisdictions and even extend into rural areas, accounting for the full economic geography of a city-region. Even for cities that had expanded chaotically or otherwise have not benefited from thoughtful planning, it is never too late to start. Planners must be flexible and deal with current circumstances, as only in the case of new towns are planners starting from a blank slate. Whatever the current state of a city, its future will be better assured if guided by a plan. Ultimately, planning is a lynchpin to establish a baseline ahead of an uncertain future of global shocks and stresses, ranging from climate change effects to natural disasters and automation.
Multiple cities around the world indicate that a sustainable urban transportation system can be achieved through (a) organization of urban space – land-use planning and finding better solutions to meet the needs through action in other areas, (b) making common services and opportunities accessible by walking and non-motorized transport by reducing the adverse impact on the environment, (c) development of a balanced integrated transport system that ensures efficient travel using multiple modes, (d) technological standards and (e) organization of freight distribution and delivery facilities and services.
One of the major goals of sustainable transportation is to reduce travel demand, especially the trips made by motorized transport, which includes not only private vehicles but also motorized public transport, and to increase the amount of non-motorized transport, such as cycling and walking. To achieve this, cities should start diverting from designing car-oriented cities to pedestrian and bicycle-friendly cities. The usage of non-motorized transportation can be promoted by designing compact mixed-use developments in the city. It is also very important that cities integrate transportation planning and land use planning.
Making urban centres as accessible as possible requires making choices about the use of urban space. Loading and unloading spaces, bus lanes, cars, parking, pedestrian facilities, cycle lanes, and parking all compete for urban road space. Cities have to manage these competing demands according to local priorities and circumstances. Urban vehicle access regulations can help optimize urban access, improve air quality and contribute to the goal of phasing out conventionally fueled cars in cities by 2050.
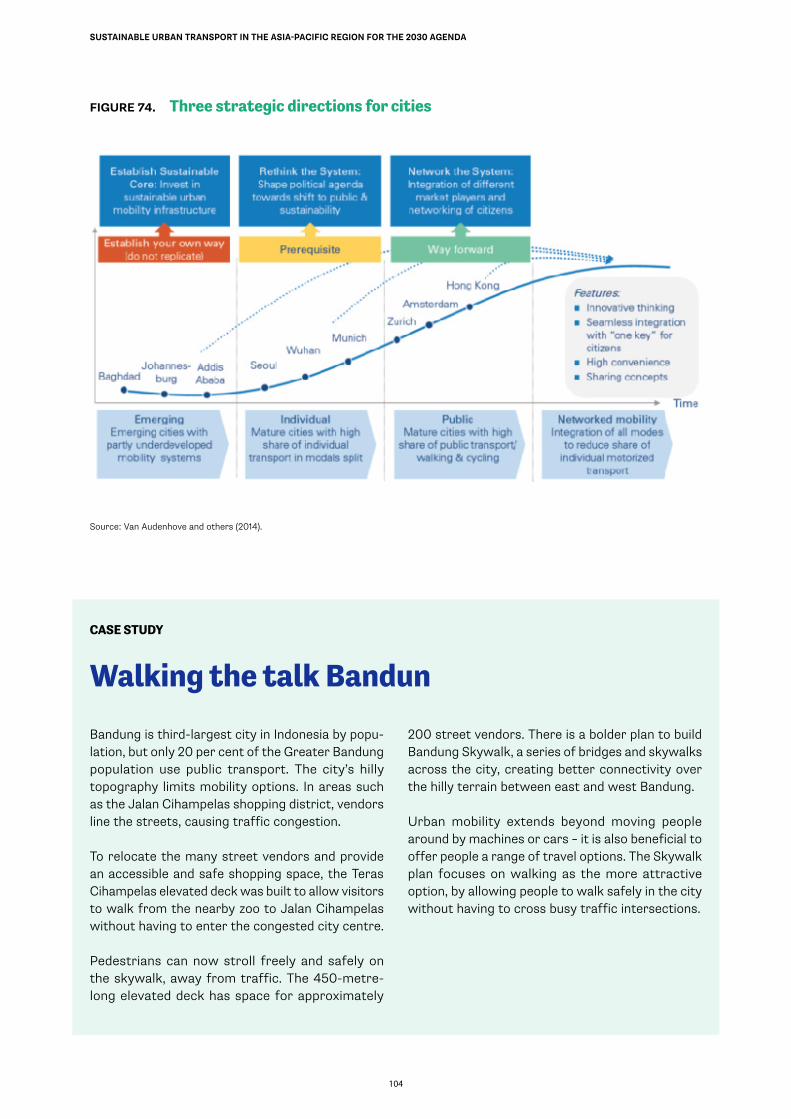
104
SUSTAINABLE URBAN TRANSPORT IN THE ASIA-PACIFIC REGION FOR THE 2030 AGENDA
FIGURE 74. Three strategic directions for cities
Source: Van Audenhove and others (2014).
CASE STUDY
Walking the talk Bandun
Bandung is third-largest city in Indonesia by popu-lation, but only 20 per cent of the Greater Bandung population use public transport. The city’s hilly topography limits mobility options. In areas such as the Jalan Cihampelas shopping district, vendors line the streets, causing traffic congestion.
To relocate the many street vendors and provide an accessible and safe shopping space, the Teras Cihampelas elevated deck was built to allow visitors to walk from the nearby zoo to Jalan Cihampelas without having to enter the congested city centre.
Pedestrians can now stroll freely and safely on the skywalk, away from traffic. The 450-metre-long elevated deck has space for approximately
200 street vendors. There is a bolder plan to build Bandung Skywalk, a series of bridges and skywalks across the city, creating better connectivity over the hilly terrain between east and west Bandung.
Urban mobility extends beyond moving people around by machines or cars – it is also beneficial to offer people a range of travel options. The Skywalk plan focuses on walking as the more attractive option, by allowing people to walk safely in the city without having to cross busy traffic intersections.
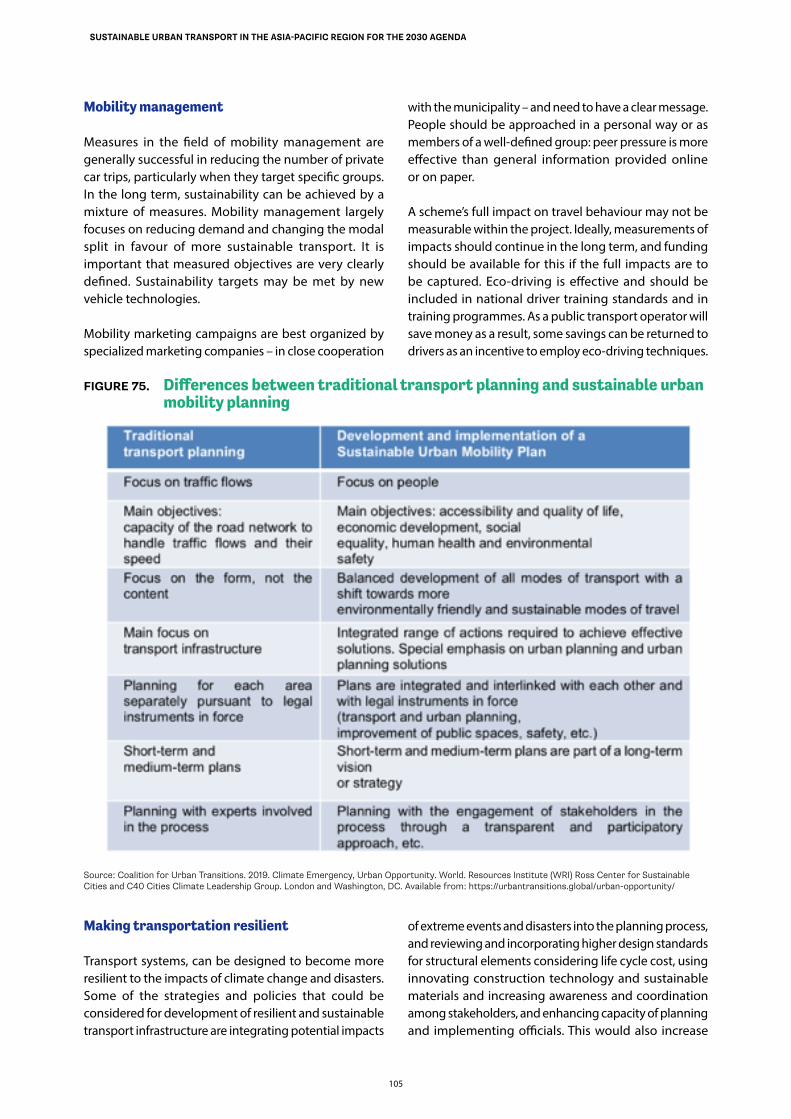
105
SUSTAINABLE URBAN TRANSPORT IN THE ASIA-PACIFIC REGION FOR THE 2030 AGENDA
Mobility management
Measures in the field of mobility management are generally successful in reducing the number of private car trips, particularly when they target specific groups. In the long term, sustainability can be achieved by a mixture of measures. Mobility management largely focuses on reducing demand and changing the modal split in favour of more sustainable transport. It is important that measured objectives are very clearly defined. Sustainability targets may be met by new vehicle technologies.
Mobility marketing campaigns are best organized by specialized marketing companies – in close cooperation
with the municipality – and need to have a clear message. People should be approached in a personal way or as members of a well-defined group: peer pressure is more effective than general information provided online or on paper.
A scheme’s full impact on travel behaviour may not be measurable within the project. Ideally, measurements of impacts should continue in the long term, and funding should be available for this if the full impacts are to be captured. Eco-driving is effective and should be included in national driver training standards and in training programmes. As a public transport operator will save money as a result, some savings can be returned to drivers as an incentive to employ eco-driving techniques.
FIGURE 75. Differences between traditional transport planning and sustainable urban mobility planning
Making transportation resilient
Transport systems, can be designed to become more resilient to the impacts of climate change and disasters. Some of the strategies and policies that could be considered for development of resilient and sustainable transport infrastructure are integrating potential impacts
of extreme events and disasters into the planning process, and reviewing and incorporating higher design standards for structural elements considering life cycle cost, using innovating construction technology and sustainable materials and increasing awareness and coordination among stakeholders, and enhancing capacity of planning and implementing officials. This would also increase
Source: Coalition for Urban Transitions. 2019. Climate Emergency, Urban Opportunity. World. Resources Institute (WRI) Ross Center for Sustainable Cities and C40 Cities Climate Leadership Group. London and Washington, DC. Available from: https://urbantransitions.global/urban-opportunity/
106
SUSTAINABLE URBAN TRANSPORT IN THE ASIA-PACIFIC REGION FOR THE 2030 AGENDA
the serviceability and life of costly structures. For example, in the United States after Hurricane Katrina, the clearance height of bridges was increased and in Canada, the design of the Confederation Bridge allows for a one-metre sea-level rise.
CASE STUDY:
Sharing the ride Taipei
On average, more than one million motorcyclists commute from New Taipei City to Taipei daily. Bicycles have often had to compete with motor-bikes and motor vehicles for road space, posing high risks to cyclists.
A world-class cycling environment and a public bike-sharing scheme, called YouBike, was devel-oped in 2011. Its premise was to have cycling compete with motorbikes, and to create parking spaces for bicycles that do not mix with motor-bikes or scooters. The government also rationalized car usage fees and increased dedicated spaces for walking and cycling. Real-time traffic and Youbike data were made public, which allowed users to pre-dict YouBike’s usage and availability.
Taipei is on track to build an extensive cycling net-work of more than 500nkm. Cycling has become an established part of urban mobility; Five per cent of all journeys made on bicycle, and 50 per cent of cyclists are women. By 2018, people will be able to access one of 400 YouBike stations within a 10-minute walk from anywhere in the city. The government of Taipei aims to achieve a 12 per cent modal share for bicycles by 2020.
The city’s success can be attributed to sustained efforts in understanding the public’s evolving behav-iours and preferences. With sufficient infrastructure and meaningful data, commuters are encouraged to use the bike-sharing service, making cycling trendy and an everyday mode of transport. This also gen-erates data, which the city capitalizes on to further improve its systems and planning decisions.
In mountainous areas, roadside slopes can be made more stable through bioengineering using living plants, as what has been done in Nepal. Combined with civil engineering measures, these steps can provide cost-effective and environmentally friendly solutions. Drains can also be built with extra capacity to handle surges in water flow. The Bipartisan Policy Center
offers a list of policy options. Transport planners and designers may consider and evaluate design options to increase resiliency while planning new transportation infrastructure, as usually it would be costlier and difficult to enhance their resiliency after construction.
Car-independent lifestyles
The experiences of the CIVITAS Plus cities, which implemented car-independent lifestyle measures gave rise to recommendations from which other cities can benefit. Despite the encouraging results achieved by the CIVITAS Plus cities, there is a continued need to increase awareness and to incentivize users to test new technologies and determine the positive benefits for themselves. It is essential to define a long-term vision for sustainable transport, with specific attention to the promotion of cycling and walking. This vision should entail integrating measures into the overall transport network from a multi-modal perspective. When several cycling and walking interventions are implemented at the same time, or within a short interval, their impacts can be far greater due to the synergetic effect.
Stakeholders should be involved in strong partnerships. Communication and active involvement are vital at each stage of measure implementation. It is very important to communicate what is being done. The target group needs to be given information, and members of the public need to be engaged in order to support modal shift and change travel behavior.
CIVITAS recommends taking a long-term view of evaluation and carrying out a public health appraisal of the measures. Behavioural change takes time, and health and economic impacts resulting from higher levels of physical activity can only be captured in the longer term.
It might also be helpful to count on extra investments for, and synergies with, vertical transport solutions that respond to challenging topography. A detailed planning and feasibility study would help avoid unexpected costs.
Tailored car-sharing and car-pooling business models can help to meet the needs of both private users and business users. This would optimize the use of vehicles during the day, and could help to increase the number of subscribers. One approach might be to provide a corporate pooling card. It would also be a good idea to target businesses located in suburban areas that have limited parking spaces or those that are not well served by public transport, as such conditions can generate a high level of demand.
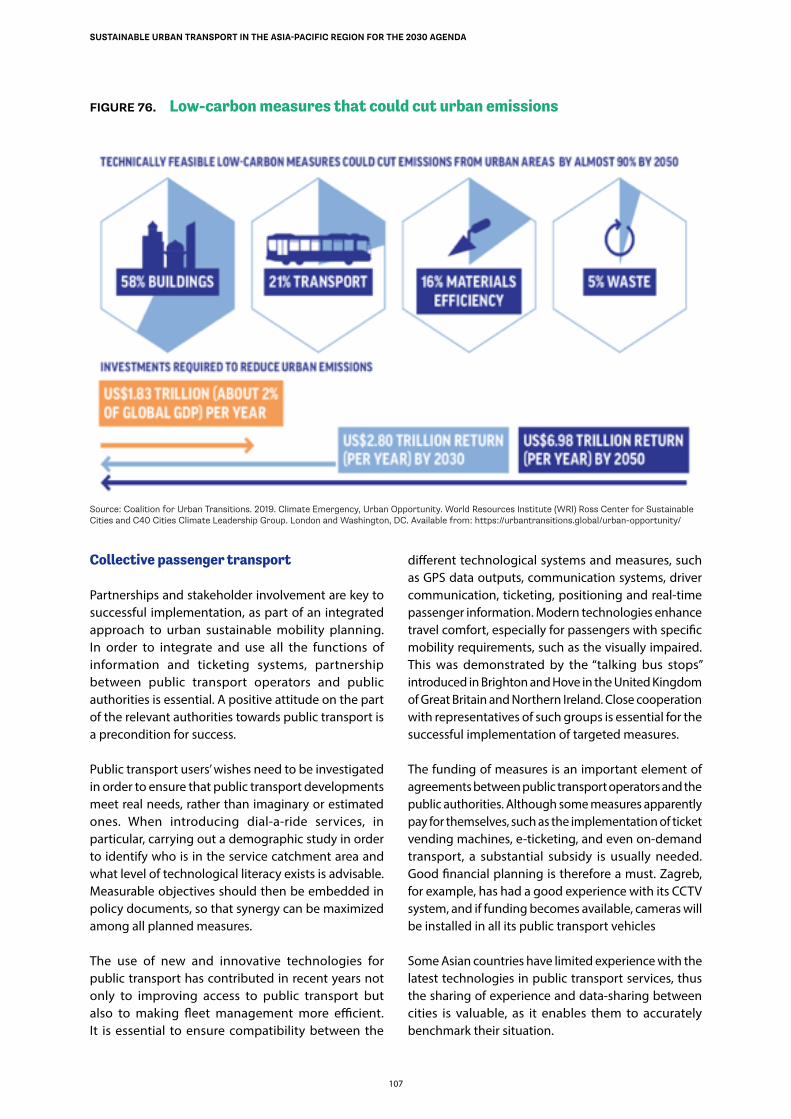
107
SUSTAINABLE URBAN TRANSPORT IN THE ASIA-PACIFIC REGION FOR THE 2030 AGENDA
FIGURE 76. Low-carbon measures that could cut urban emissions
Source: Coalition for Urban Transitions. 2019. Climate Emergency, Urban Opportunity. World Resources Institute (WRI) Ross Center for Sustainable Cities and C40 Cities Climate Leadership Group. London and Washington, DC. Available from: https://urbantransitions.global/urban-opportunity/
Collective passenger transport
Partnerships and stakeholder involvement are key to successful implementation, as part of an integrated approach to urban sustainable mobility planning. In order to integrate and use all the functions of information and ticketing systems, partnership between public transport operators and public authorities is essential. A positive attitude on the part of the relevant authorities towards public transport is a precondition for success.
Public transport users’ wishes need to be investigated in order to ensure that public transport developments meet real needs, rather than imaginary or estimated ones. When introducing dial-a-ride services, in particular, carrying out a demographic study in order to identify who is in the service catchment area and what level of technological literacy exists is advisable. Measurable objectives should then be embedded in policy documents, so that synergy can be maximized among all planned measures.
The use of new and innovative technologies for public transport has contributed in recent years not only to improving access to public transport but also to making fleet management more efficient. It is essential to ensure compatibility between the
different technological systems and measures, such as GPS data outputs, communication systems, driver communication, ticketing, positioning and real-time passenger information. Modern technologies enhance travel comfort, especially for passengers with specific mobility requirements, such as the visually impaired. This was demonstrated by the “talking bus stops” introduced in Brighton and Hove in the United Kingdom of Great Britain and Northern Ireland. Close cooperation with representatives of such groups is essential for the successful implementation of targeted measures.
The funding of measures is an important element of agreements between public transport operators and the public authorities. Although some measures apparently pay for themselves, such as the implementation of ticket vending machines, e-ticketing, and even on-demand transport, a substantial subsidy is usually needed. Good financial planning is therefore a must. Zagreb, for example, has had a good experience with its CCTV system, and if funding becomes available, cameras will be installed in all its public transport vehicles
Some Asian countries have limited experience with the latest technologies in public transport services, thus the sharing of experience and data-sharing between cities is valuable, as it enables them to accurately benchmark their situation.
108
SUSTAINABLE URBAN TRANSPORT IN THE ASIA-PACIFIC REGION FOR THE 2030 AGENDA
Users moving away from car ownership by switching to car-sharing services can bring about major social effects, such as improving the well-being of the population through saving on car purchases; reducing the space taken up by parked cars; lower consumption of resources used for the manufacture of cars and their components; less waste associated with the operation and scrapping of vehicles; and reduced pollutant emissions (by transport companies relying on environmentally friendly vehicles and by cutting the excess mileage of vehicles in search of parking spaces).
As of 2016, there were more than 1.000 public bike-sharing systems operating in more than 50 countries around the world, up from 11 cities around the world in 2004. The latest trend in bike-sharing is largely a scale-free floating system, a new market led by Asian companies, which became global in less than five years, although Germany, for example, introduced the concept of free-floating bike-sharing in 2000. Bike-sharing is no longer a local or a municipal issue; it has become a global mobility and transit issue, notwithstanding complex environmental consequences.
Clean fuels and vehicles
The successful implementation of a measure, or a package of measures in a given city should provide grounds for transferring the experience to other cities if the following recommendations are followed
1. National and international standards for biofuels are needed in order to instill confidence among users and providers and to promote alternative fuel consumption. Without such standards, it is difficult to ensure consistent supplies. Contractual quality conditions are required to overcome barriers associated with fuel provision. The widespread deployment of alternative fuels requires coherent taxation and legislative approaches for the different fuel types at regional levels and to attain local political and management support.
2. Stakeholder involvement is necessary in the switch towards clean vehicles and fuels. As governments adjust regulations, through exchange and debate, users will become better informed and more likely to accept changes. Additional expertise is needed to develop effective awareness campaigns and to identify solutions to overcome the slow uptake of incentive schemes.
3. Retrofitting older municipal and public vehicles to run on alternative fuels may be a cost-effective short- to medium-term solution that allows current fleets to continue to be used beyond their current lifespan (in terms of Euro standards), as well as implementation of environmental requirements for private vehicle fleets.
4. Cities wishing to deploy more sustainable vehicle fleets need access to relevant technical and operational expertise to help select, operate and maintain their fleets. Such expertise is often outside the scope of the traditional competences of their staff. The costs of hybrid vehicles remain higher than the costs of conventional vehicles. Consequently, the sustainability benefits should be promoted.
5. Reductions in greenhouse gas emissions and improvements in air quality should be complemented by the promotion of emission-free mobility. Affordable parking alternatives outside the city centre should be created, and footpaths should be provided. Overall, this would help to reduce the number of vehicles entering the city centre.
Greenhouse gas emissions in cities can be brought close to net-zero by using proven technologies and practices. A bundle of technically feasible low-carbon measures could cut emissions from key urban sectors by almost 90 per cent by 2050.
In absolute terms, these savings are greater than the combined 2014 energy-related emissions of the two largest emitting countries, China and the United States. Some 58 per cent of these carbon savings come from the buildings sector, 21 per cent from the transport sector, 16 per cent from materials efficiency and 5 per cent from the waste sector.
The investments required to reduce urban emissions are projected to be $1.83 trillion (about 2 per cent of global GDP) per year, but they would generate annual savings worth $2.80 trillion in 2030 and $6.98 trillion in 2050. This yields a net present value of $23.9 trillion. This estimate is conservative. With higher energy prices and more rapid technological learning rates, the net present value estimate of these investments rises to $38.2 trillion. These figures do not include wider benefits, such as long-run productivity gains or improved public health.
In zero-carbon cities, people will be healthier and
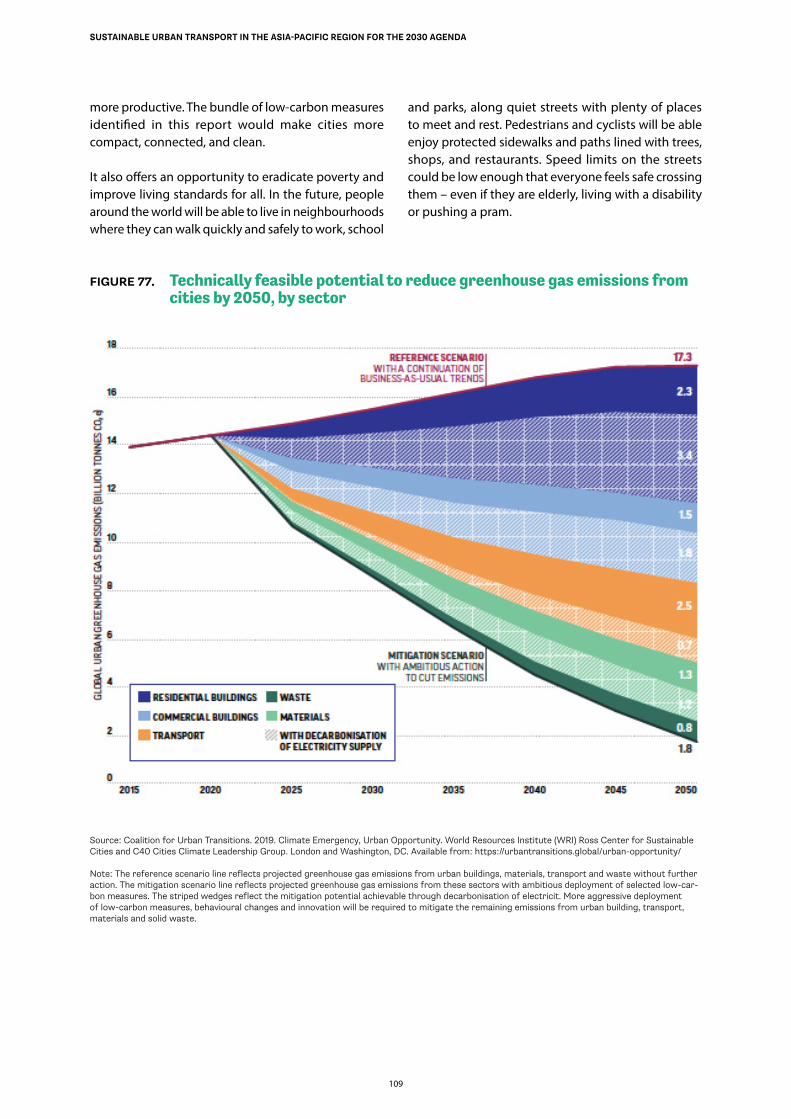
109
SUSTAINABLE URBAN TRANSPORT IN THE ASIA-PACIFIC REGION FOR THE 2030 AGENDA
more productive. The bundle of low-carbon measures identified in this report would make cities more compact, connected, and clean.
It also offers an opportunity to eradicate poverty and improve living standards for all. In the future, people around the world will be able to live in neighbourhoods where they can walk quickly and safely to work, school
and parks, along quiet streets with plenty of places to meet and rest. Pedestrians and cyclists will be able enjoy protected sidewalks and paths lined with trees, shops, and restaurants. Speed limits on the streets could be low enough that everyone feels safe crossing them – even if they are elderly, living with a disability or pushing a pram.
FIGURE 77. Technically feasible potential to reduce greenhouse gas emissions from cities by 2050, by sector
Source: Coalition for Urban Transitions. 2019. Climate Emergency, Urban Opportunity. World Resources Institute (WRI) Ross Center for Sustainable Cities and C40 Cities Climate Leadership Group. London and Washington, DC. Available from: https://urbantransitions.global/urban-opportunity/ Note: The reference scenario line reflects projected greenhouse gas emissions from urban buildings, materials, transport and waste without further action. The mitigation scenario line reflects projected greenhouse gas emissions from these sectors with ambitious deployment of selected low-car-bon measures. The striped wedges reflect the mitigation potential achievable through decarbonisation of electricit. More aggressive deployment of low-carbon measures, behavioural changes and innovation will be required to mitigate the remaining emissions from urban building, transport, materials and solid waste.
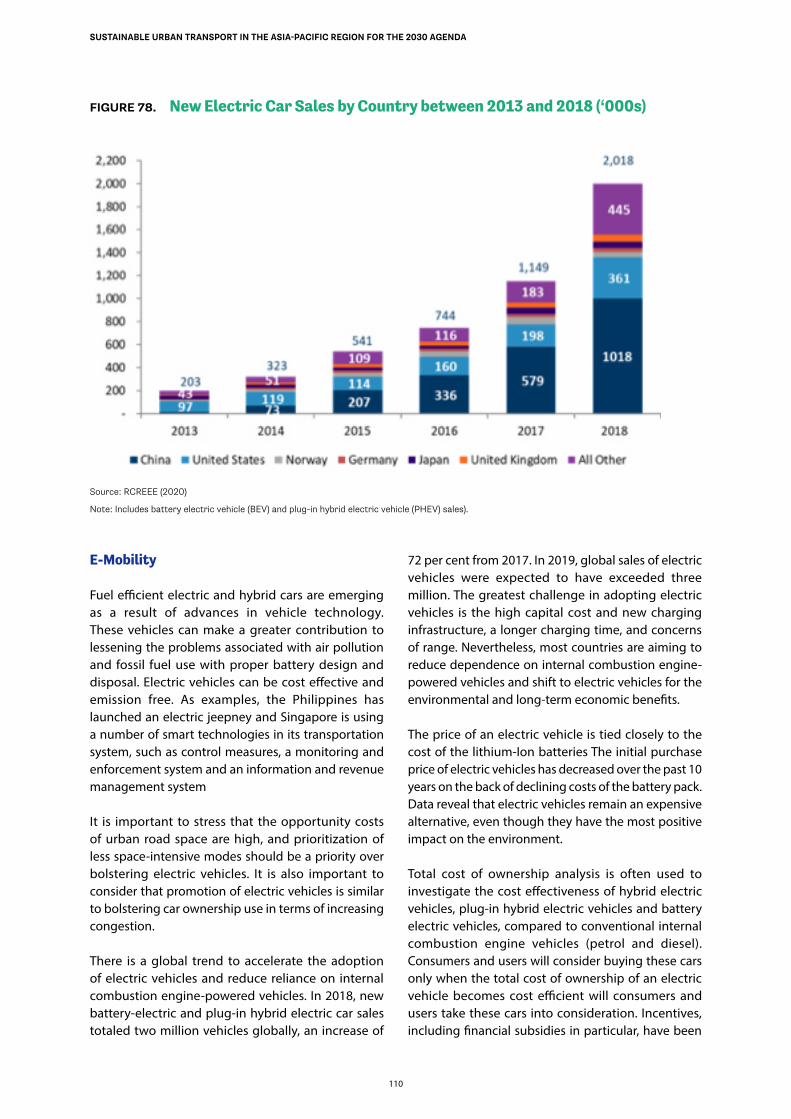
110
SUSTAINABLE URBAN TRANSPORT IN THE ASIA-PACIFIC REGION FOR THE 2030 AGENDA
FIGURE 78. New Electric Car Sales by Country between 2013 and 2018 (‘000s)
Source: RCREEE (2020)
Note: Includes battery electric vehicle (BEV) and plug-in hybrid electric vehicle (PHEV) sales).
E-Mobility
Fuel efficient electric and hybrid cars are emerging as a result of advances in vehicle technology. These vehicles can make a greater contribution to lessening the problems associated with air pollution and fossil fuel use with proper battery design and disposal. Electric vehicles can be cost effective and emission free. As examples, the Philippines has launched an electric jeepney and Singapore is using a number of smart technologies in its transportation system, such as control measures, a monitoring and enforcement system and an information and revenue management system
It is important to stress that the opportunity costs of urban road space are high, and prioritization of less space-intensive modes should be a priority over bolstering electric vehicles. It is also important to consider that promotion of electric vehicles is similar to bolstering car ownership use in terms of increasing congestion.
There is a global trend to accelerate the adoption of electric vehicles and reduce reliance on internal combustion engine-powered vehicles. In 2018, new battery-electric and plug-in hybrid electric car sales totaled two million vehicles globally, an increase of
72 per cent from 2017. In 2019, global sales of electric vehicles were expected to have exceeded three million. The greatest challenge in adopting electric vehicles is the high capital cost and new charging infrastructure, a longer charging time, and concerns of range. Nevertheless, most countries are aiming to reduce dependence on internal combustion engine-powered vehicles and shift to electric vehicles for the environmental and long-term economic benefits.
The price of an electric vehicle is tied closely to the cost of the lithium-Ion batteries The initial purchase price of electric vehicles has decreased over the past 10 years on the back of declining costs of the battery pack. Data reveal that electric vehicles remain an expensive alternative, even though they have the most positive impact on the environment.
Total cost of ownership analysis is often used to investigate the cost effectiveness of hybrid electric vehicles, plug-in hybrid electric vehicles and battery electric vehicles, compared to conventional internal combustion engine vehicles (petrol and diesel). Consumers and users will consider buying these cars only when the total cost of ownership of an electric vehicle becomes cost efficient will consumers and users take these cars into consideration. Incentives, including financial subsidies in particular, have been
111
SUSTAINABLE URBAN TRANSPORT IN THE ASIA-PACIFIC REGION FOR THE 2030 AGENDA
proven to be a major factor in encouraging the uptake of electric vehicles. In many countries, fiscal incentives can be paired with non-financial incentives to spur the deployment of electric vehicles, such as in the form of waivers on regulations that limit the availability of license plates (as applied by China) access to restricted urban areas and exemptions from usage fees for road networks (as applied in London and Birmingham, United Kingdom) or parking fees (in Singapore).
When considering exhaust or tailpipe emissions, it is evident that electric vehicles compare favourably against internal combustion engine-powered vehicles, as they do not produce any direct emissions. However, there are opponents to electric vehicles who argue that any total cost of ownership considerations for electric vehicles need to include indirect or upstream emissions caused by energy production and distribution, as well as during the manufacturing of the vehicles themselves.
Research has shown that electric vehicles still perform far better in terms of greenhouse gas emissions even if the electricity grid is highly powered by fossil fuels.
Greenhouse gas emissions also result from the production of vehicles and their components, specifically in the case of electric vehicles, from batteries – research indicates that if the batteries are sourced from Western Europe, Japan, or the Republic of Korea, the carbon footprint is lower as compared to those produced in China. Specifically, it is stated that production location and chemistry are both factors in the carbon footprint resulting from the battery manufacturing process. For instance, in the United States, 43 kg/kWh of greenhouse gas emissions is generated in the production of lithium nickel cobalt aluminum batteries and 37–58 kg/kWh for lithium nickel manganese cobalt batteries, while in China, under a coal intensive electricity mix, the emissions are 82 kg/kWh for nickel cobalt aluminum batteries and 105–111 kg/kWh for nickel manganese cobalt batteries. A comparison between the carbon footprints from different battery production methods and typical internal combustion engines in Europe is shown in figure 87.
Based on this information, the impact of greenhouse gas emissions caused by battery production can be reduced because electric batteries can be repurposed for stationary applications after reaching the end of their useful lifespan. Moreover, electric vehicles save on vehicle manufacturing-related emissions because less materials are used to manufacture engines, there is less or no usage of oils and lubricants, and the lifespan
of the vehicle is longer, owing to less vibrations and longer-lasting parts.
Lifetime mileage and greenhouse gas are important aspects when considering the profitability of electric vehicles. These types of vehicles have lower operating costs, but higher capital costs. A high mileage will, therefore, favour cost recovery. E-buses and urban electric trucks, in general, have higher total cost of ownership than conventional units. However, the total cost of ownership can be comparable to conventional units if maintenance costs are lower, the commercial lifetime of the electric vehicle is longer, and the battery stacks are optimized by recharging the vehicle quickly during the day.
The impact on overall greenhouse gas emission reductions will be greater by deploying commercial electric vehicles, such as electric buses, instead of private units, owing to the higher fuel usage and mileage, and the longer lifespan of commercial vehicles. Replacing one urban diesel bus with an electric unit has the same impact as replacing 35 fossil fuel passenger cars or 300 motorcycles. Bridging the total cost of ownership gap between conventional and electric vehicles will enable public and private fleet operators to mitigate the initial cost barriers experienced when making a decision to invest in new vehicle fleets.
Historically, Central Asian cities had extensive trolleybus networks that were remnants from the Soviet era, however the majority of these systems have fallen into disrepair and have been gradually replaced with compressed natural gas, liquefied petroleum gas and diesel buses. Many of these routes are ideal arenas for the deployment of electric vehicles. In Kazakhstan, for instance, Almaty is the only city with an operational trolleybus system. The city is in discussions to finance the renewal of the fleet through the purchase of 200 new hybrid trolleybuses and associated depot equipment. Other cities are electrifying their bus networks, and by 2025 there should well more than 5,000 new E-buses deployed across the major cities of the country (Egemen and Qazaqstan 2015).
Given the growing number of e-bus manufacturers that are establishing their manufacturing facilities in Kazakhstan, it is reasonable to expect that e-buses will gain more traction and market share as these vehicles come online. There is already a manufacturing plant in Kostanay and at the end of 2019, Yutong and Kazakhstan-based vehicle manufacturer and distributor Saryarka AvtoProm announced plans to construct a plant in Nur-Sultan.
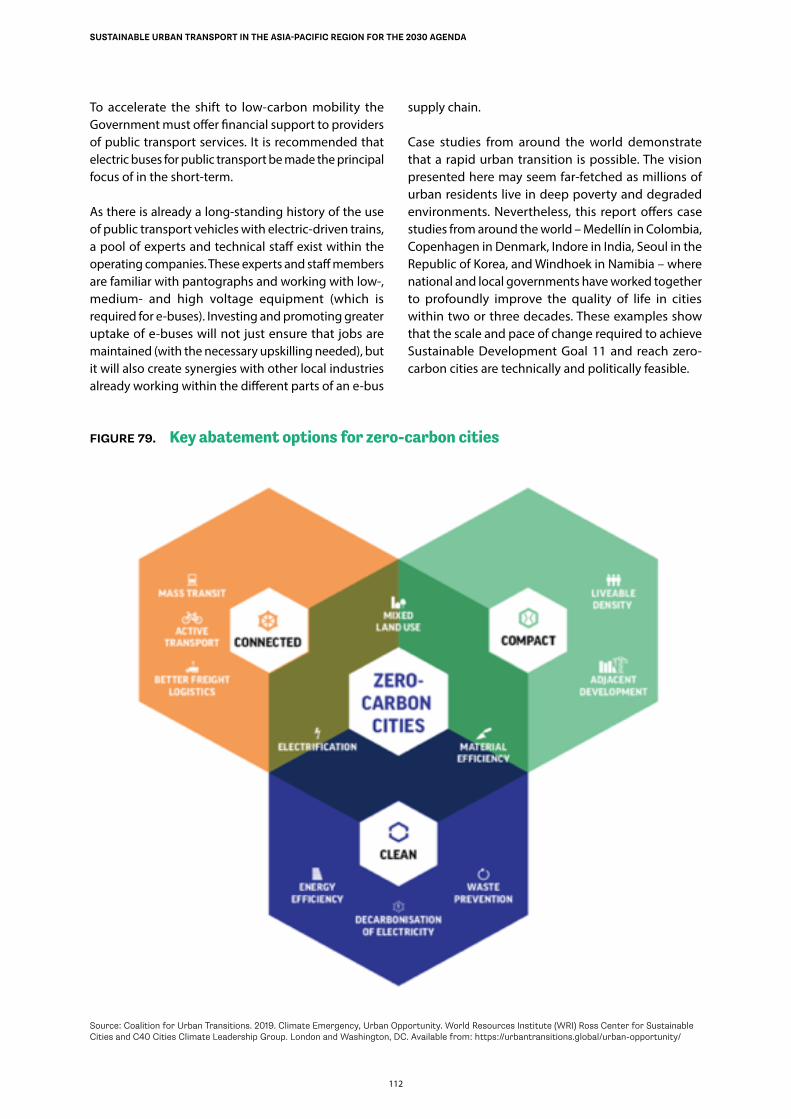
112
SUSTAINABLE URBAN TRANSPORT IN THE ASIA-PACIFIC REGION FOR THE 2030 AGENDA
To accelerate the shift to low-carbon mobility the Government must offer financial support to providers of public transport services. It is recommended that electric buses for public transport be made the principal focus of in the short-term.
As there is already a long-standing history of the use of public transport vehicles with electric-driven trains, a pool of experts and technical staff exist within the operating companies. These experts and staff members are familiar with pantographs and working with low-, medium- and high voltage equipment (which is required for e-buses). Investing and promoting greater uptake of e-buses will not just ensure that jobs are maintained (with the necessary upskilling needed), but it will also create synergies with other local industries already working within the different parts of an e-bus
supply chain.
Case studies from around the world demonstrate that a rapid urban transition is possible. The vision presented here may seem far-fetched as millions of urban residents live in deep poverty and degraded environments. Nevertheless, this report offers case studies from around the world – Medellín in Colombia, Copenhagen in Denmark, Indore in India, Seoul in the Republic of Korea, and Windhoek in Namibia – where national and local governments have worked together to profoundly improve the quality of life in cities within two or three decades. These examples show that the scale and pace of change required to achieve Sustainable Development Goal 11 and reach zero-carbon cities are technically and politically feasible.
FIGURE 79. Key abatement options for zero-carbon cities
Source: Coalition for Urban Transitions. 2019. Climate Emergency, Urban Opportunity. World Resources Institute (WRI) Ross Center for Sustainable Cities and C40 Cities Climate Leadership Group. London and Washington, DC. Available from: https://urbantransitions.global/urban-opportunity/
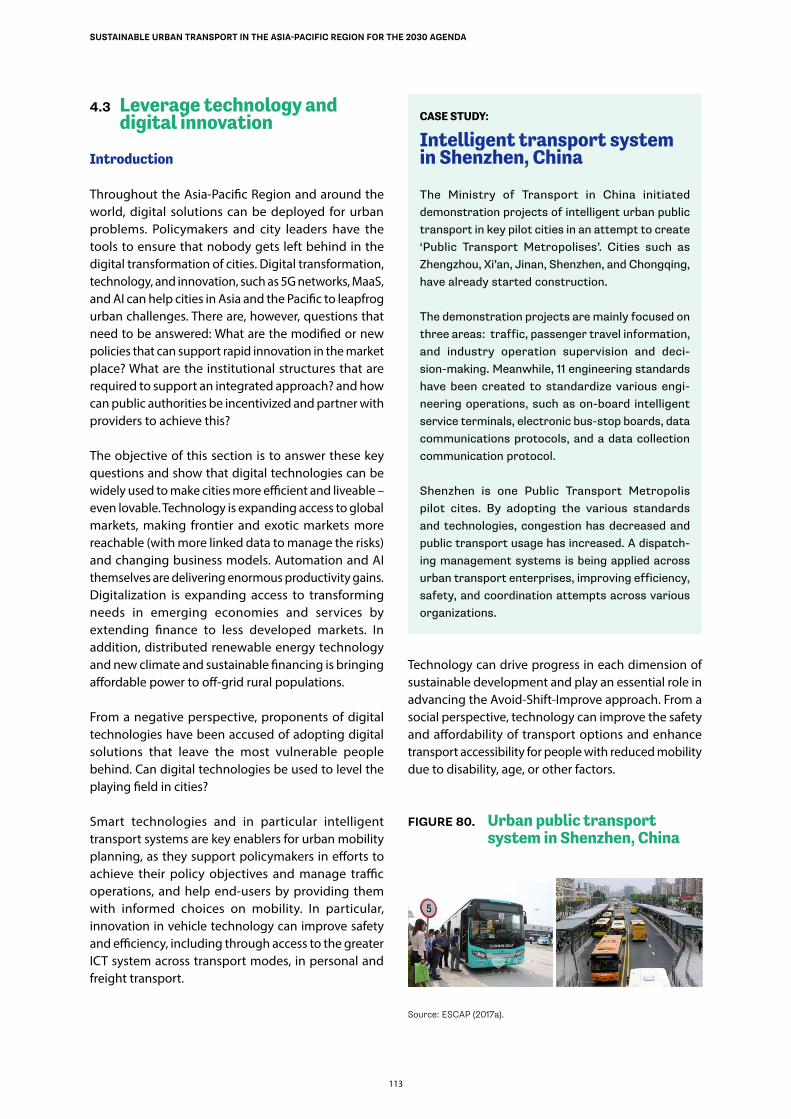
113
SUSTAINABLE URBAN TRANSPORT IN THE ASIA-PACIFIC REGION FOR THE 2030 AGENDA
4.3 Leverage technology and digital innovation
Introduction
Throughout the Asia-Pacific Region and around the world, digital solutions can be deployed for urban problems. Policymakers and city leaders have the tools to ensure that nobody gets left behind in the digital transformation of cities. Digital transformation, technology, and innovation, such as 5G networks, MaaS, and AI can help cities in Asia and the Pacific to leapfrog urban challenges. There are, however, questions that need to be answered: What are the modified or new policies that can support rapid innovation in the market place? What are the institutional structures that are required to support an integrated approach? and how can public authorities be incentivized and partner with providers to achieve this?
The objective of this section is to answer these key questions and show that digital technologies can be widely used to make cities more efficient and liveable – even lovable. Technology is expanding access to global markets, making frontier and exotic markets more reachable (with more linked data to manage the risks) and changing business models. Automation and AI themselves are delivering enormous productivity gains. Digitalization is expanding access to transforming needs in emerging economies and services by extending finance to less developed markets. In addition, distributed renewable energy technology and new climate and sustainable financing is bringing affordable power to off-grid rural populations.
From a negative perspective, proponents of digital technologies have been accused of adopting digital solutions that leave the most vulnerable people behind. Can digital technologies be used to level the playing field in cities?
Smart technologies and in particular intelligent transport systems are key enablers for urban mobility planning, as they support policymakers in efforts to achieve their policy objectives and manage traffic operations, and help end-users by providing them with informed choices on mobility. In particular, innovation in vehicle technology can improve safety and efficiency, including through access to the greater ICT system across transport modes, in personal and freight transport.
CASE STUDY:
Intelligent transport system in Shenzhen, China
The Ministry of Transport in China initiated demonstration projects of intelligent urban public transport in key pilot cities in an attempt to create ‘Public Transport Metropolises’. Cities such as Zhengzhou, Xi’an, Jinan, Shenzhen, and Chongqing, have already started construction.
The demonstration projects are mainly focused on three areas: traffic, passenger travel information, and industry operation supervision and deci-sion-making. Meanwhile, 11 engineering standards have been created to standardize various engi-neering operations, such as on-board intelligent service terminals, electronic bus-stop boards, data communications protocols, and a data collection communication protocol.
Shenzhen is one Public Transport Metropolis pilot cites. By adopting the various standards and technologies, congestion has decreased and public transport usage has increased. A dispatch-ing management systems is being applied across urban transport enterprises, improving efficiency, safety, and coordination attempts across various organizations.
Technology can drive progress in each dimension of sustainable development and play an essential role in advancing the Avoid-Shift-Improve approach. From a social perspective, technology can improve the safety and affordability of transport options and enhance transport accessibility for people with reduced mobility due to disability, age, or other factors.
FIGURE 80. Urban public transport system in Shenzhen, China
Source: ESCAP (2017a).
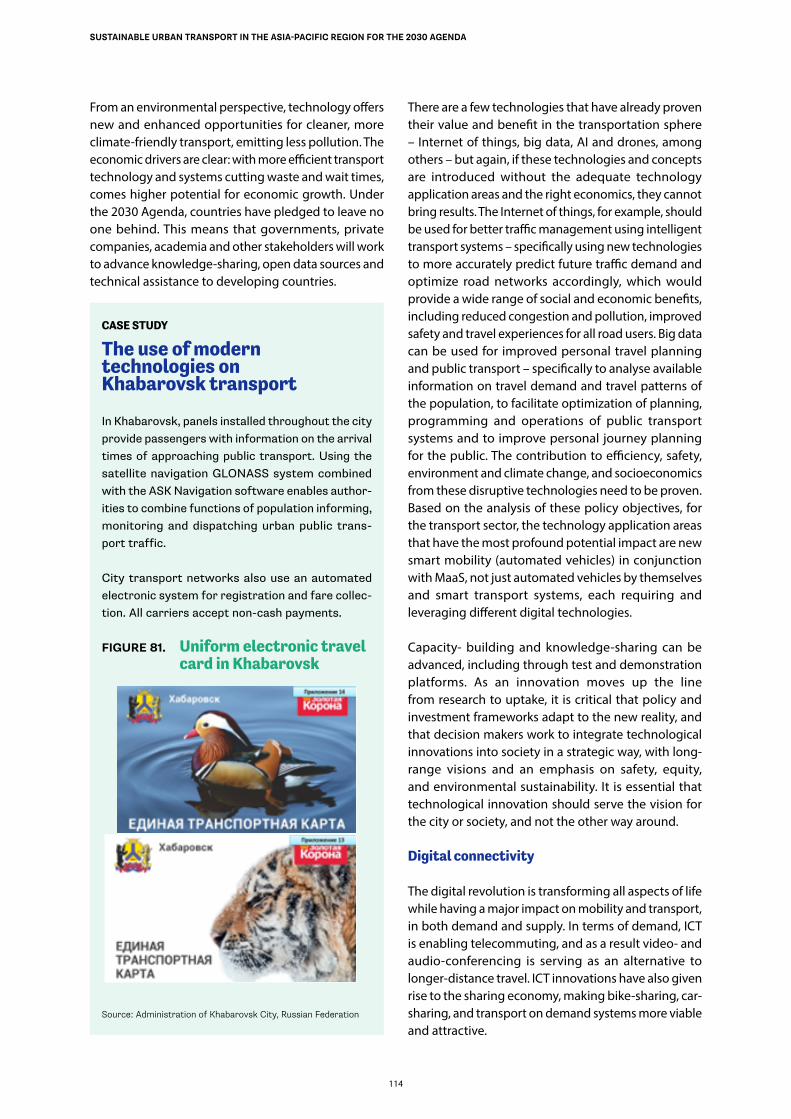
114
SUSTAINABLE URBAN TRANSPORT IN THE ASIA-PACIFIC REGION FOR THE 2030 AGENDA
From an environmental perspective, technology offers new and enhanced opportunities for cleaner, more climate-friendly transport, emitting less pollution. The economic drivers are clear: with more efficient transport technology and systems cutting waste and wait times, comes higher potential for economic growth. Under the 2030 Agenda, countries have pledged to leave no one behind. This means that governments, private companies, academia and other stakeholders will work to advance knowledge-sharing, open data sources and technical assistance to developing countries.
CASE STUDY
The use of modern technologies on Khabarovsk transport
In Khabarovsk, panels installed throughout the city provide passengers with information on the arrival times of approaching public transport. Using the satellite navigation GLONASS system combined with the ASK Navigation software enables author-ities to combine functions of population informing, monitoring and dispatching urban public trans-port traffic.
City transport networks also use an automated electronic system for registration and fare collec-tion. All carriers accept non-cash payments.
FIGURE 81. Uniform electronic travel card in Khabarovsk
Source: Administration of Khabarovsk City, Russian Federation
There are a few technologies that have already proven their value and benefit in the transportation sphere – Internet of things, big data, AI and drones, among others – but again, if these technologies and concepts are introduced without the adequate technology application areas and the right economics, they cannot bring results. The Internet of things, for example, should be used for better traffic management using intelligent transport systems – specifically using new technologies to more accurately predict future traffic demand and optimize road networks accordingly, which would provide a wide range of social and economic benefits, including reduced congestion and pollution, improved safety and travel experiences for all road users. Big data can be used for improved personal travel planning and public transport – specifically to analyse available information on travel demand and travel patterns of the population, to facilitate optimization of planning, programming and operations of public transport systems and to improve personal journey planning for the public. The contribution to efficiency, safety, environment and climate change, and socioeconomics from these disruptive technologies need to be proven. Based on the analysis of these policy objectives, for the transport sector, the technology application areas that have the most profound potential impact are new smart mobility (automated vehicles) in conjunction with MaaS, not just automated vehicles by themselves and smart transport systems, each requiring and leveraging different digital technologies.
Capacity- building and knowledge-sharing can be advanced, including through test and demonstration platforms. As an innovation moves up the line from research to uptake, it is critical that policy and investment frameworks adapt to the new reality, and that decision makers work to integrate technological innovations into society in a strategic way, with long-range visions and an emphasis on safety, equity, and environmental sustainability. It is essential that technological innovation should serve the vision for the city or society, and not the other way around.
Digital connectivity
The digital revolution is transforming all aspects of life while having a major impact on mobility and transport, in both demand and supply. In terms of demand, ICT is enabling telecommuting, and as a result video- and audio-conferencing is serving as an alternative to longer-distance travel. ICT innovations have also given rise to the sharing economy, making bike-sharing, car-sharing, and transport on demand systems more viable and attractive.
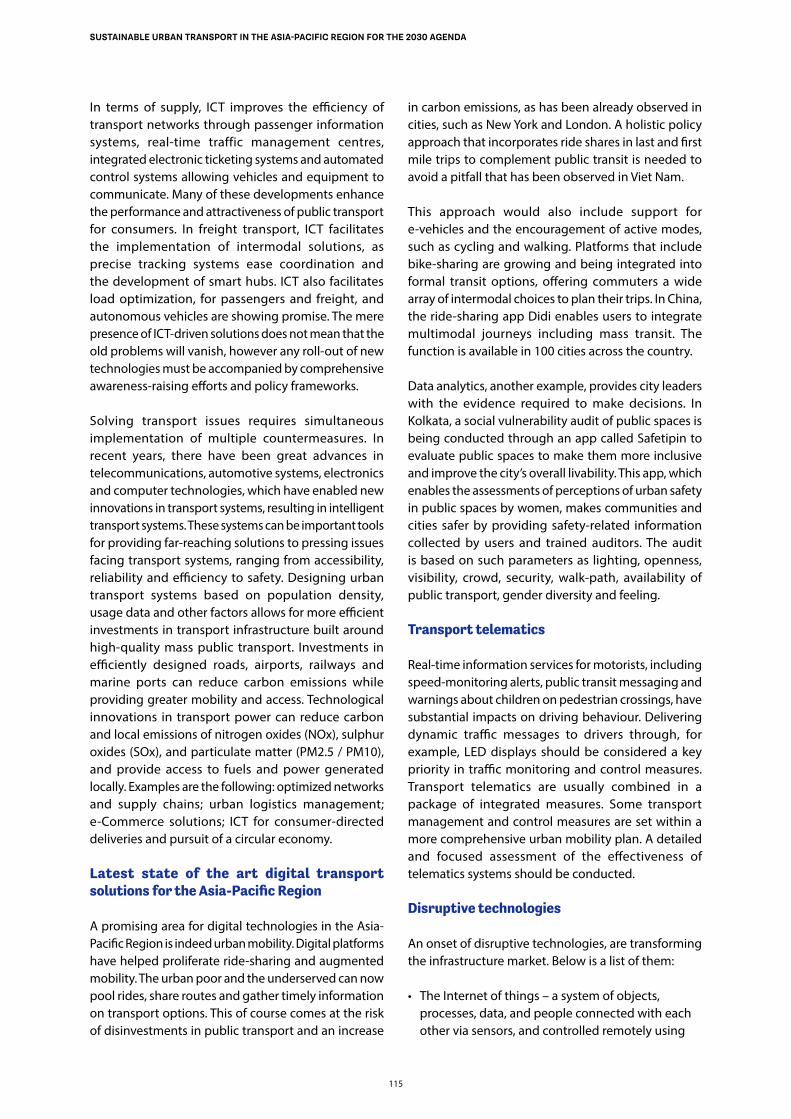
115
SUSTAINABLE URBAN TRANSPORT IN THE ASIA-PACIFIC REGION FOR THE 2030 AGENDA
In terms of supply, ICT improves the efficiency of transport networks through passenger information systems, real-time traffic management centres, integrated electronic ticketing systems and automated control systems allowing vehicles and equipment to communicate. Many of these developments enhance the performance and attractiveness of public transport for consumers. In freight transport, ICT facilitates the implementation of intermodal solutions, as precise tracking systems ease coordination and the development of smart hubs. ICT also facilitates load optimization, for passengers and freight, and autonomous vehicles are showing promise. The mere presence of ICT-driven solutions does not mean that the old problems will vanish, however any roll-out of new technologies must be accompanied by comprehensive awareness-raising efforts and policy frameworks.
Solving transport issues requires simultaneous implementation of multiple countermeasures. In recent years, there have been great advances in telecommunications, automotive systems, electronics and computer technologies, which have enabled new innovations in transport systems, resulting in intelligent transport systems. These systems can be important tools for providing far-reaching solutions to pressing issues facing transport systems, ranging from accessibility, reliability and efficiency to safety. Designing urban transport systems based on population density, usage data and other factors allows for more efficient investments in transport infrastructure built around high-quality mass public transport. Investments in efficiently designed roads, airports, railways and marine ports can reduce carbon emissions while providing greater mobility and access. Technological innovations in transport power can reduce carbon and local emissions of nitrogen oxides (NOx), sulphur oxides (SOx), and particulate matter (PM2.5 / PM10), and provide access to fuels and power generated locally. Examples are the following: optimized networks and supply chains; urban logistics management; e-Commerce solutions; ICT for consumer-directed deliveries and pursuit of a circular economy.
Latest state of the art digital transport solutions for the Asia-Pacific Region
A promising area for digital technologies in the Asia-Pacific Region is indeed urban mobility. Digital platforms have helped proliferate ride-sharing and augmented mobility. The urban poor and the underserved can now pool rides, share routes and gather timely information on transport options. This of course comes at the risk of disinvestments in public transport and an increase
in carbon emissions, as has been already observed in cities, such as New York and London. A holistic policy approach that incorporates ride shares in last and first mile trips to complement public transit is needed to avoid a pitfall that has been observed in Viet Nam.
This approach would also include support for e-vehicles and the encouragement of active modes, such as cycling and walking. Platforms that include bike-sharing are growing and being integrated into formal transit options, offering commuters a wide array of intermodal choices to plan their trips. In China, the ride-sharing app Didi enables users to integrate multimodal journeys including mass transit. The function is available in 100 cities across the country.
Data analytics, another example, provides city leaders with the evidence required to make decisions. In Kolkata, a social vulnerability audit of public spaces is being conducted through an app called Safetipin to evaluate public spaces to make them more inclusive and improve the city’s overall livability. This app, which enables the assessments of perceptions of urban safety in public spaces by women, makes communities and cities safer by providing safety-related information collected by users and trained auditors. The audit is based on such parameters as lighting, openness, visibility, crowd, security, walk-path, availability of public transport, gender diversity and feeling.
Transport telematics
Real-time information services for motorists, including speed-monitoring alerts, public transit messaging and warnings about children on pedestrian crossings, have substantial impacts on driving behaviour. Delivering dynamic traffic messages to drivers through, for example, LED displays should be considered a key priority in traffic monitoring and control measures. Transport telematics are usually combined in a package of integrated measures. Some transport management and control measures are set within a more comprehensive urban mobility plan. A detailed and focused assessment of the effectiveness of telematics systems should be conducted.
Disruptive technologies
An onset of disruptive technologies, are transforming the infrastructure market. Below is a list of them:
• The Internet of things – a system of objects, processes, data, and people connected with each other via sensors, and controlled remotely using
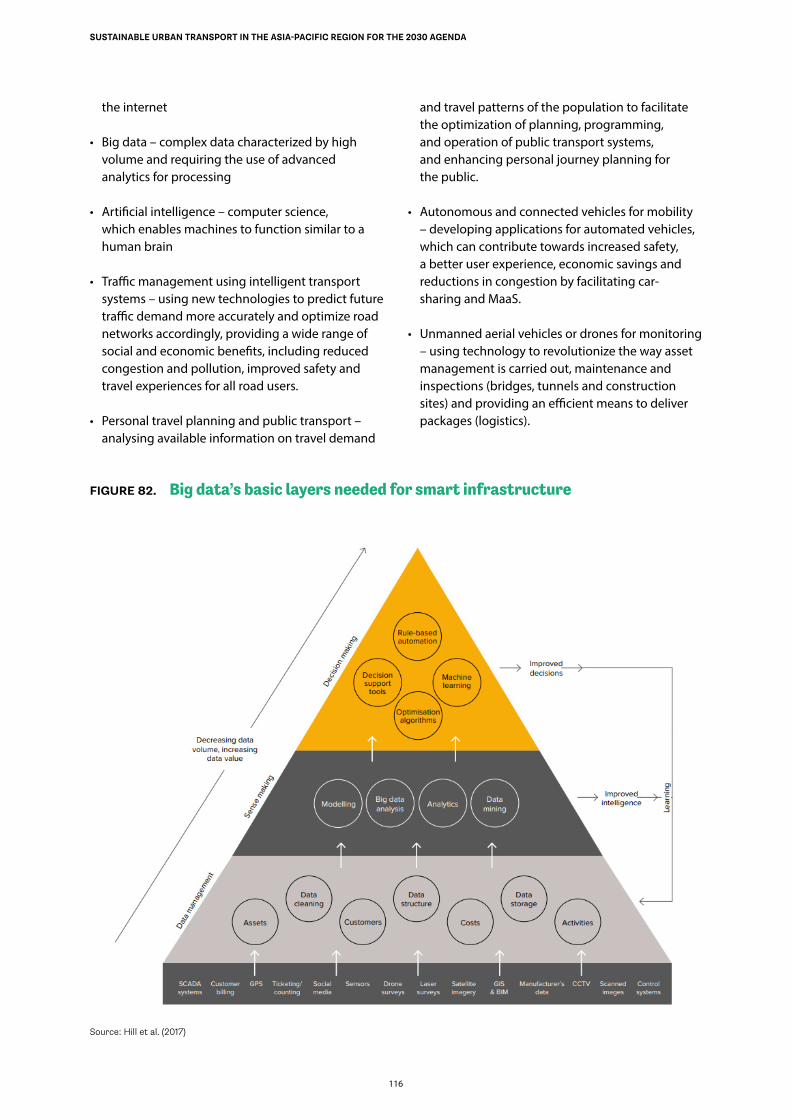
116
SUSTAINABLE URBAN TRANSPORT IN THE ASIA-PACIFIC REGION FOR THE 2030 AGENDA
the internet
• Big data – complex data characterized by high volume and requiring the use of advanced analytics for processing
• Artificial intelligence – computer science, which enables machines to function similar to a human brain
• Traffic management using intelligent transport systems – using new technologies to predict future traffic demand more accurately and optimize road networks accordingly, providing a wide range of social and economic benefits, including reduced congestion and pollution, improved safety and travel experiences for all road users.
• Personal travel planning and public transport – analysing available information on travel demand
and travel patterns of the population to facilitate the optimization of planning, programming, and operation of public transport systems, and enhancing personal journey planning for the public.
• Autonomous and connected vehicles for mobility – developing applications for automated vehicles, which can contribute towards increased safety, a better user experience, economic savings and reductions in congestion by facilitating car-sharing and MaaS.
• Unmanned aerial vehicles or drones for monitoring – using technology to revolutionize the way asset management is carried out, maintenance and inspections (bridges, tunnels and construction sites) and providing an efficient means to deliver packages (logistics).
FIGURE 82. Big data’s basic layers needed for smart infrastructure
Source: Hill et al. (2017)
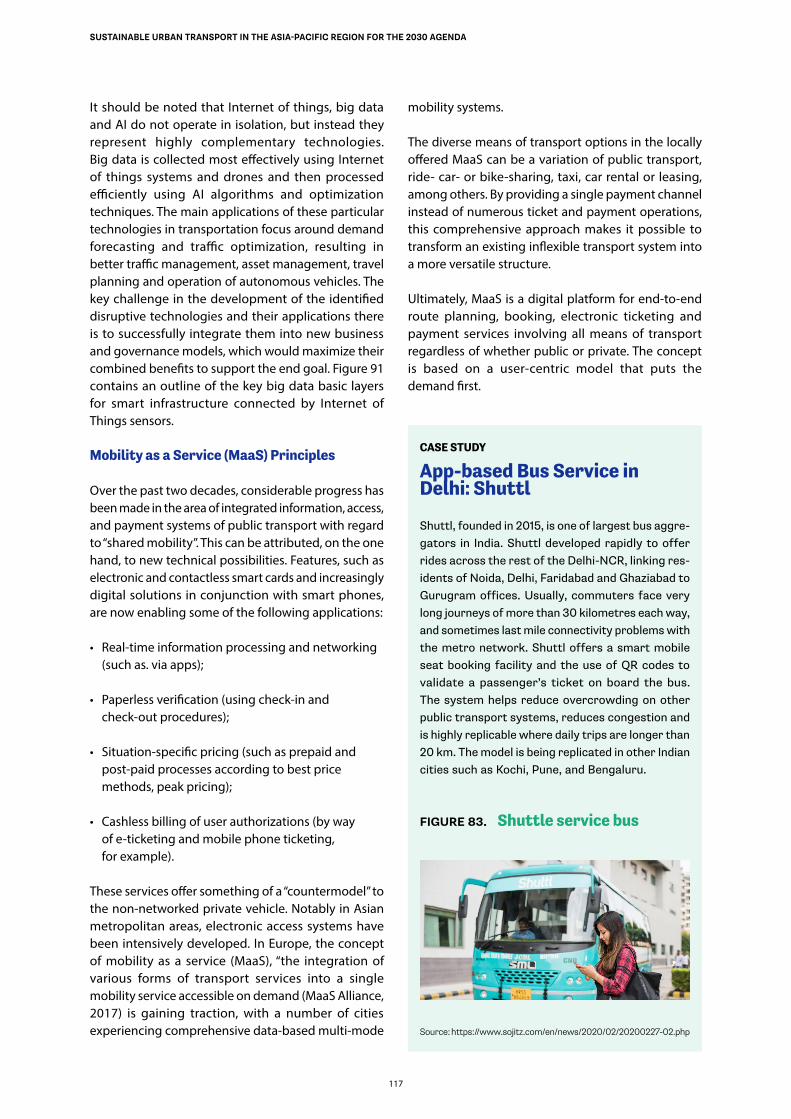
117
SUSTAINABLE URBAN TRANSPORT IN THE ASIA-PACIFIC REGION FOR THE 2030 AGENDA
It should be noted that Internet of things, big data and AI do not operate in isolation, but instead they represent highly complementary technologies. Big data is collected most effectively using Internet of things systems and drones and then processed efficiently using AI algorithms and optimization techniques. The main applications of these particular technologies in transportation focus around demand forecasting and traffic optimization, resulting in better traffic management, asset management, travel planning and operation of autonomous vehicles. The key challenge in the development of the identified disruptive technologies and their applications there is to successfully integrate them into new business and governance models, which would maximize their combined benefits to support the end goal. Figure 91 contains an outline of the key big data basic layers for smart infrastructure connected by Internet of Things sensors.
Mobility as a Service (MaaS) Principles
Over the past two decades, considerable progress has been made in the area of integrated information, access, and payment systems of public transport with regard to “shared mobility”. This can be attributed, on the one hand, to new technical possibilities. Features, such as electronic and contactless smart cards and increasingly digital solutions in conjunction with smart phones, are now enabling some of the following applications:
• Real-time information processing and networking (such as. via apps);
• Paperless verification (using check-in and check-out procedures);
• Situation-specific pricing (such as prepaid and post-paid processes according to best price methods, peak pricing);
• Cashless billing of user authorizations (by way of e-ticketing and mobile phone ticketing, for example).
These services offer something of a “countermodel” to the non-networked private vehicle. Notably in Asian metropolitan areas, electronic access systems have been intensively developed. In Europe, the concept of mobility as a service (MaaS), “the integration of various forms of transport services into a single mobility service accessible on demand (MaaS Alliance, 2017) is gaining traction, with a number of cities experiencing comprehensive data-based multi-mode
mobility systems.
The diverse means of transport options in the locally offered MaaS can be a variation of public transport, ride- car- or bike-sharing, taxi, car rental or leasing, among others. By providing a single payment channel instead of numerous ticket and payment operations, this comprehensive approach makes it possible to transform an existing inflexible transport system into a more versatile structure.
Ultimately, MaaS is a digital platform for end-to-end route planning, booking, electronic ticketing and payment services involving all means of transport regardless of whether public or private. The concept is based on a user-centric model that puts the demand first.
CASE STUDY
App-based Bus Service in Delhi: Shuttl
Shuttl, founded in 2015, is one of largest bus aggre-gators in India. Shuttl developed rapidly to offer rides across the rest of the Delhi-NCR, linking res-idents of Noida, Delhi, Faridabad and Ghaziabad to Gurugram offices. Usually, commuters face very long journeys of more than 30 kilometres each way, and sometimes last mile connectivity problems with the metro network. Shuttl offers a smart mobile seat booking facility and the use of QR codes to validate a passenger’s ticket on board the bus. The system helps reduce overcrowding on other public transport systems, reduces congestion and is highly replicable where daily trips are longer than 20 km. The model is being replicated in other Indian cities such as Kochi, Pune, and Bengaluru.
FIGURE 83. Shuttle service bus
Source: https://www.sojitz.com/en/news/2020/02/20200227-02.php
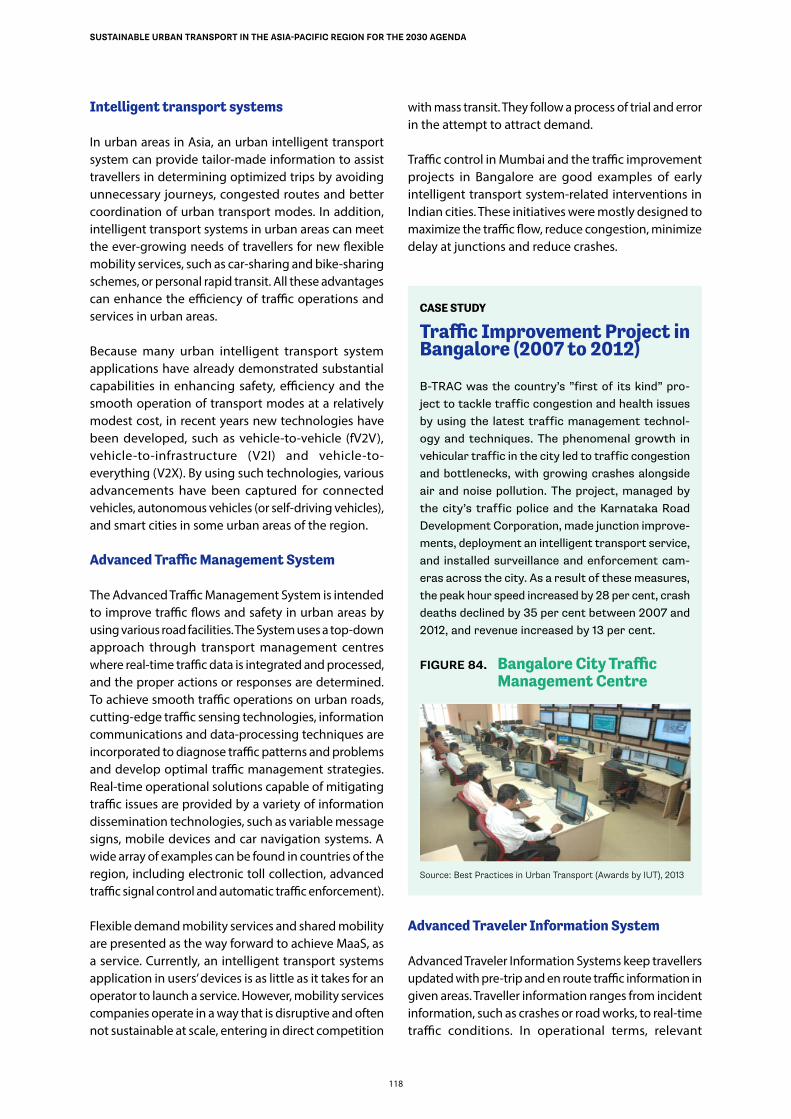
118
SUSTAINABLE URBAN TRANSPORT IN THE ASIA-PACIFIC REGION FOR THE 2030 AGENDA
Intelligent transport systems
In urban areas in Asia, an urban intelligent transport system can provide tailor-made information to assist travellers in determining optimized trips by avoiding unnecessary journeys, congested routes and better coordination of urban transport modes. In addition, intelligent transport systems in urban areas can meet the ever-growing needs of travellers for new flexible mobility services, such as car-sharing and bike-sharing schemes, or personal rapid transit. All these advantages can enhance the efficiency of traffic operations and services in urban areas.
Because many urban intelligent transport system applications have already demonstrated substantial capabilities in enhancing safety, efficiency and the smooth operation of transport modes at a relatively modest cost, in recent years new technologies have been developed, such as vehicle-to-vehicle (fV2V), vehicle-to-infrastructure (V2I) and vehicle-to-everything (V2X). By using such technologies, various advancements have been captured for connected vehicles, autonomous vehicles (or self-driving vehicles), and smart cities in some urban areas of the region.
Advanced Traffic Management System
The Advanced Traffic Management System is intended to improve traffic flows and safety in urban areas by using various road facilities. The System uses a top-down approach through transport management centres where real-time traffic data is integrated and processed, and the proper actions or responses are determined. To achieve smooth traffic operations on urban roads, cutting-edge traffic sensing technologies, information communications and data-processing techniques are incorporated to diagnose traffic patterns and problems and develop optimal traffic management strategies. Real-time operational solutions capable of mitigating traffic issues are provided by a variety of information dissemination technologies, such as variable message signs, mobile devices and car navigation systems. A wide array of examples can be found in countries of the region, including electronic toll collection, advanced traffic signal control and automatic traffic enforcement).
Flexible demand mobility services and shared mobility are presented as the way forward to achieve MaaS, as a service. Currently, an intelligent transport systems application in users’ devices is as little as it takes for an operator to launch a service. However, mobility services companies operate in a way that is disruptive and often not sustainable at scale, entering in direct competition
with mass transit. They follow a process of trial and error in the attempt to attract demand.
Traffic control in Mumbai and the traffic improvement projects in Bangalore are good examples of early intelligent transport system-related interventions in Indian cities. These initiatives were mostly designed to maximize the traffic flow, reduce congestion, minimize delay at junctions and reduce crashes.
CASE STUDY
Traffic Improvement Project in Bangalore (2007 to 2012)
B-TRAC was the country’s ”first of its kind” pro-ject to tackle traffic congestion and health issues by using the latest traffic management technol-ogy and techniques. The phenomenal growth in vehicular traffic in the city led to traffic congestion and bottlenecks, with growing crashes alongside air and noise pollution. The project, managed by the city’s traffic police and the Karnataka Road Development Corporation, made junction improve-ments, deployment an intelligent transport service, and installed surveillance and enforcement cam-eras across the city. As a result of these measures, the peak hour speed increased by 28 per cent, crash deaths declined by 35 per cent between 2007 and 2012, and revenue increased by 13 per cent.
FIGURE 84. Bangalore City Traffic Management Centre
Source: Best Practices in Urban Transport (Awards by IUT), 2013
Advanced Traveler Information System
Advanced Traveler Information Systems keep travellers updated with pre-trip and en route traffic information in given areas. Traveller information ranges from incident information, such as crashes or road works, to real-time traffic conditions. In operational terms, relevant
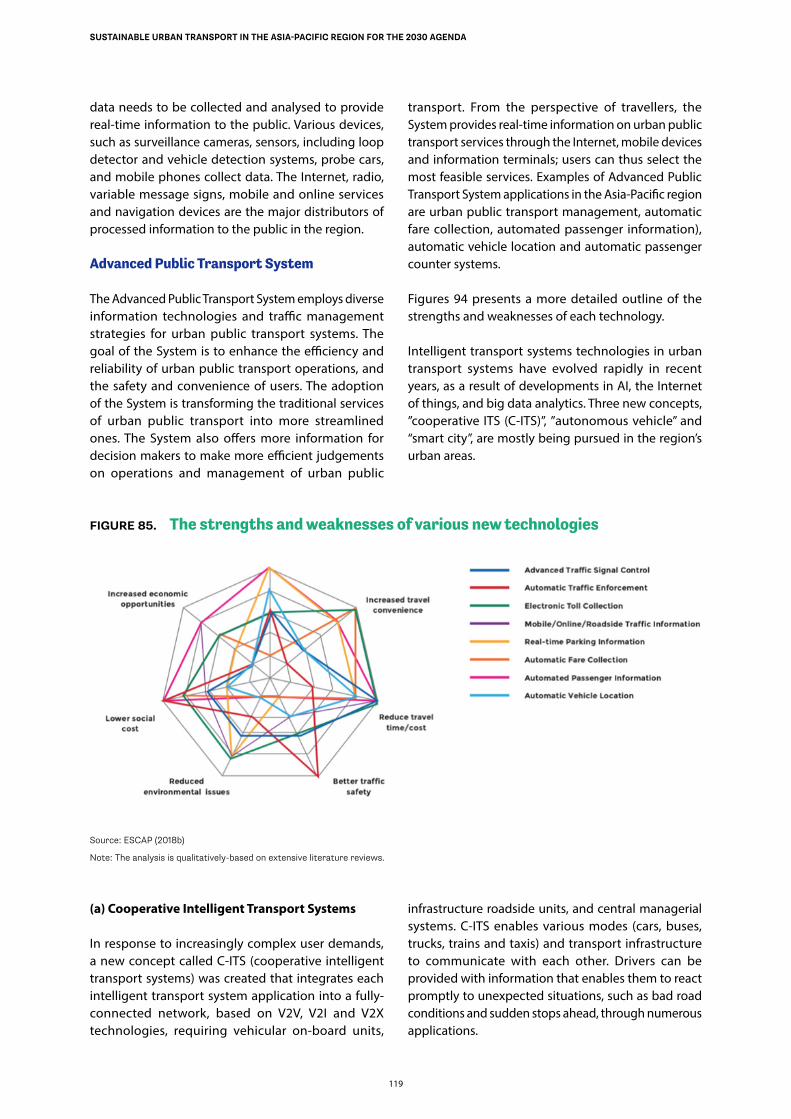
data needs to be collected and analysed to provide real-time information to the public. Various devices, such as surveillance cameras, sensors, including loop detector and vehicle detection systems, probe cars, and mobile phones collect data. The Internet, radio, variable message signs, mobile and online services and navigation devices are the major distributors of processed information to the public in the region.
Advanced Public Transport System
The Advanced Public Transport System employs diverse information technologies and traffic management strategies for urban public transport systems. The goal of the System is to enhance the efficiency and reliability of urban public transport operations, and the safety and convenience of users. The adoption of the System is transforming the traditional services of urban public transport into more streamlined ones. The System also offers more information for decision makers to make more efficient judgements on operations and management of urban public
transport. From the perspective of travellers, the System provides real-time information on urban public transport services through the Internet, mobile devices and information terminals; users can thus select the most feasible services. Examples of Advanced Public Transport System applications in the Asia-Pacific region are urban public transport management, automatic fare collection, automated passenger information), automatic vehicle location and automatic passenger counter systems.
Figures 94 presents a more detailed outline of the strengths and weaknesses of each technology.
Intelligent transport systems technologies in urban transport systems have evolved rapidly in recent years, as a result of developments in AI, the Internet of things, and big data analytics. Three new concepts, ”cooperative ITS (C-ITS)”, ”autonomous vehicle” and “smart city”, are mostly being pursued in the region’s urban areas.
FIGURE 85. The strengths and weaknesses of various new technologies
Source: ESCAP (2018b)
Note: The analysis is qualitatively-based on extensive literature reviews.
(a) Cooperative Intelligent Transport Systems
In response to increasingly complex user demands, a new concept called C-ITS (cooperative intelligent transport systems) was created that integrates each intelligent transport system application into a fully-connected network, based on V2V, V2I and V2X technologies, requiring vehicular on-board units,
infrastructure roadside units, and central managerial systems. C-ITS enables various modes (cars, buses, trucks, trains and taxis) and transport infrastructure to communicate with each other. Drivers can be provided with information that enables them to react promptly to unexpected situations, such as bad road conditions and sudden stops ahead, through numerous applications.
119
SUSTAINABLE URBAN TRANSPORT IN THE ASIA-PACIFIC REGION FOR THE 2030 AGENDA
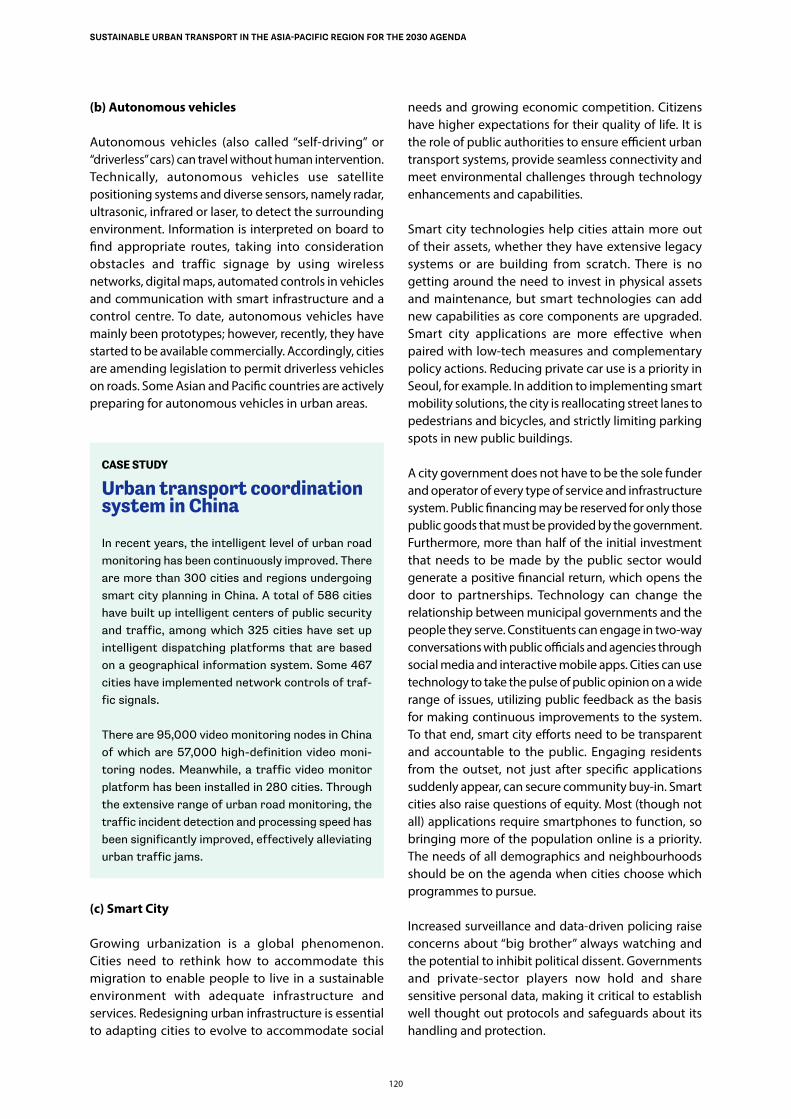
120
SUSTAINABLE URBAN TRANSPORT IN THE ASIA-PACIFIC REGION FOR THE 2030 AGENDA
(b) Autonomous vehicles
Autonomous vehicles (also called “self-driving” or “driverless” cars) can travel without human intervention. Technically, autonomous vehicles use satellite positioning systems and diverse sensors, namely radar, ultrasonic, infrared or laser, to detect the surrounding environment. Information is interpreted on board to find appropriate routes, taking into consideration obstacles and traffic signage by using wireless networks, digital maps, automated controls in vehicles and communication with smart infrastructure and a control centre. To date, autonomous vehicles have mainly been prototypes; however, recently, they have started to be available commercially. Accordingly, cities are amending legislation to permit driverless vehicles on roads. Some Asian and Pacific countries are actively preparing for autonomous vehicles in urban areas.
CASE STUDY
Urban transport coordination system in China
In recent years, the intelligent level of urban road monitoring has been continuously improved. There are more than 300 cities and regions undergoing smart city planning in China. A total of 586 cities have built up intelligent centers of public security and traffic, among which 325 cities have set up intelligent dispatching platforms that are based on a geographical information system. Some 467 cities have implemented network controls of traf-fic signals.
There are 95,000 video monitoring nodes in China of which are 57,000 high-definition video moni-toring nodes. Meanwhile, a traffic video monitor platform has been installed in 280 cities. Through the extensive range of urban road monitoring, the traffic incident detection and processing speed has been significantly improved, effectively alleviating urban traffic jams.
(c) Smart City
Growing urbanization is a global phenomenon. Cities need to rethink how to accommodate this migration to enable people to live in a sustainable environment with adequate infrastructure and services. Redesigning urban infrastructure is essential to adapting cities to evolve to accommodate social
needs and growing economic competition. Citizens have higher expectations for their quality of life. It is the role of public authorities to ensure efficient urban transport systems, provide seamless connectivity and meet environmental challenges through technology enhancements and capabilities.
Smart city technologies help cities attain more out of their assets, whether they have extensive legacy systems or are building from scratch. There is no getting around the need to invest in physical assets and maintenance, but smart technologies can add new capabilities as core components are upgraded. Smart city applications are more effective when paired with low-tech measures and complementary policy actions. Reducing private car use is a priority in Seoul, for example. In addition to implementing smart mobility solutions, the city is reallocating street lanes to pedestrians and bicycles, and strictly limiting parking spots in new public buildings.
A city government does not have to be the sole funder and operator of every type of service and infrastructure system. Public financing may be reserved for only those public goods that must be provided by the government. Furthermore, more than half of the initial investment that needs to be made by the public sector would generate a positive financial return, which opens the door to partnerships. Technology can change the relationship between municipal governments and the people they serve. Constituents can engage in two-way conversations with public officials and agencies through social media and interactive mobile apps. Cities can use technology to take the pulse of public opinion on a wide range of issues, utilizing public feedback as the basis for making continuous improvements to the system. To that end, smart city efforts need to be transparent and accountable to the public. Engaging residents from the outset, not just after specific applications suddenly appear, can secure community buy-in. Smart cities also raise questions of equity. Most (though not all) applications require smartphones to function, so bringing more of the population online is a priority. The needs of all demographics and neighbourhoods should be on the agenda when cities choose which programmes to pursue.
Increased surveillance and data-driven policing raise concerns about “big brother” always watching and the potential to inhibit political dissent. Governments and private-sector players now hold and share sensitive personal data, making it critical to establish well thought out protocols and safeguards about its handling and protection.
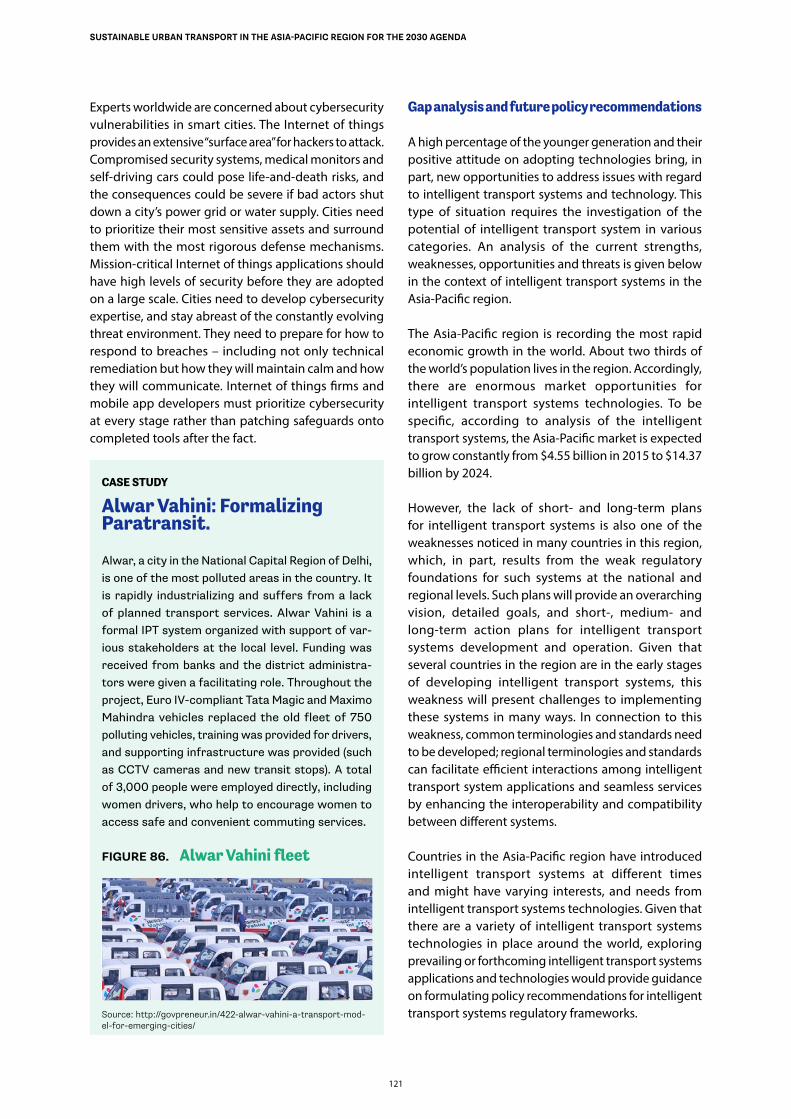
121
SUSTAINABLE URBAN TRANSPORT IN THE ASIA-PACIFIC REGION FOR THE 2030 AGENDA
Experts worldwide are concerned about cybersecurity vulnerabilities in smart cities. The Internet of things provides an extensive “surface area” for hackers to attack. Compromised security systems, medical monitors and self-driving cars could pose life-and-death risks, and the consequences could be severe if bad actors shut down a city’s power grid or water supply. Cities need to prioritize their most sensitive assets and surround them with the most rigorous defense mechanisms. Mission-critical Internet of things applications should have high levels of security before they are adopted on a large scale. Cities need to develop cybersecurity expertise, and stay abreast of the constantly evolving threat environment. They need to prepare for how to respond to breaches – including not only technical remediation but how they will maintain calm and how they will communicate. Internet of things firms and mobile app developers must prioritize cybersecurity at every stage rather than patching safeguards onto completed tools after the fact.
CASE STUDY
Alwar Vahini: Formalizing Paratransit.
Alwar, a city in the National Capital Region of Delhi, is one of the most polluted areas in the country. It is rapidly industrializing and suffers from a lack of planned transport services. Alwar Vahini is a formal IPT system organized with support of var-ious stakeholders at the local level. Funding was received from banks and the district administra-tors were given a facilitating role. Throughout the project, Euro IV-compliant Tata Magic and Maximo Mahindra vehicles replaced the old fleet of 750 polluting vehicles, training was provided for drivers, and supporting infrastructure was provided (such as CCTV cameras and new transit stops). A total of 3,000 people were employed directly, including women drivers, who help to encourage women to access safe and convenient commuting services.
FIGURE 86. Alwar Vahini fleet
Source: http://govpreneur.in/422-alwar-vahini-a-transport-mod-el-for-emerging-cities/
Gap analysis and future policy recommendations
A high percentage of the younger generation and their positive attitude on adopting technologies bring, in part, new opportunities to address issues with regard to intelligent transport systems and technology. This type of situation requires the investigation of the potential of intelligent transport system in various categories. An analysis of the current strengths, weaknesses, opportunities and threats is given below in the context of intelligent transport systems in the Asia-Pacific region.
The Asia-Pacific region is recording the most rapid economic growth in the world. About two thirds of the world’s population lives in the region. Accordingly, there are enormous market opportunities for intelligent transport systems technologies. To be specific, according to analysis of the intelligent transport systems, the Asia-Pacific market is expected to grow constantly from $4.55 billion in 2015 to $14.37 billion by 2024.
However, the lack of short- and long-term plans for intelligent transport systems is also one of the weaknesses noticed in many countries in this region, which, in part, results from the weak regulatory foundations for such systems at the national and regional levels. Such plans will provide an overarching vision, detailed goals, and short-, medium- and long-term action plans for intelligent transport systems development and operation. Given that several countries in the region are in the early stages of developing intelligent transport systems, this weakness will present challenges to implementing these systems in many ways. In connection to this weakness, common terminologies and standards need to be developed; regional terminologies and standards can facilitate efficient interactions among intelligent transport system applications and seamless services by enhancing the interoperability and compatibility between different systems.
Countries in the Asia-Pacific region have introduced intelligent transport systems at different times and might have varying interests, and needs from intelligent transport systems technologies. Given that there are a variety of intelligent transport systems technologies in place around the world, exploring prevailing or forthcoming intelligent transport systems applications and technologies would provide guidance on formulating policy recommendations for intelligent transport systems regulatory frameworks.
122
SUSTAINABLE URBAN TRANSPORT IN THE ASIA-PACIFIC REGION FOR THE 2030 AGENDA
A few Indian cities, despite having different organizations running different services, are trying to achieve integration and seamless connectivity. Kochi is in the process to set up a nodal agency for transport, which will include the Kochi Metro Rail Limited, Kochi Metropolitan Transport Co-operative and a cooperative society for paratransit operators. This integration will be the first of its kind in India and will include common mobility payment facilities as well. The intermediate para transport services will also be regularized through the provision of, for example, training, fuel subsidies, work schedules (Gadepalli, 2016).
Finally, digital solutions are helping to provide a platform to enable participation in decision-making and access to services, and to increase transparency and accountability. The most vulnerable often have limited accessibility and skills. To bridge the digital divide, the city of San Francisco spearheaded the San Francisco Digital Equity Initiative to help marginalized communities gain access and skills required to leverage digital solutions and improve their quality of their life.
While digital solutions are not the answer to all challenges that are faced by cities, they can be successfully deployed to reduce inequity in cities. Digital technologies are fundamentally changing approaches to the design of urban systems, but the governance and business models need to be aligned to ensure that all segments of the society gain from these technological applications.
Digital technologies can significantly modify the effectiveness of existing assets, such as cars operating better together and new innovations, including, among them electric vehicles and smart grids. Integrating technologies together can yield significant co-benefits relating to data collection and processing, with a compounded disruption potential. To do that, infrastructure investments, such as dedicated roads for autonomous vehicles, are required to fully leverage the benefits – without them, potential benefits could be partially or fully negated, thereby reducing the overall economic viability of these technologies.
As shown, disruptive technologies pose new risks – to economic and societal inclusion, and to environmental and systemic sustainability –for governments and for businesses. As they are reshaping the nature of work and increasing the risk of growing inequality in shifting economies, the transition needs to be supported with strategic vocational training and digitalization of the labour force. Few businesses have the capacity, without support, to identify and provide training to attain
the types of skills necessary in the fourth industrial revolution.
Without a clear strategy, there is a technology-related risk of ”gappening” (a neologism for a gap that is happening before our eyes) between those with the means to access new technologies and to acquire skills for the new economy – and those without the means. If the enabling environment to be competitive does not adapt, businesses will not be able to pursue new opportunities, including those offered internationally, and there will be a clear widening of the gap related to productivity, giving first mover advantages and fostering growth accelerations only in certain sectors and locations. As technological changes become embedded in human and organizational relationships, societal trust and happiness could diminish and the traditional workplace dynamics may be disrupted.
CASE STUDY
Humanising the Streets
As Shanghai has grown in affluence, more people have aspired towards the status symbol of owning private cars. Between 2009 and 2014, motor vehicle mileage doubled. By 2014, the city’s car ownership exceeded 10 per cent of the national car population. Cars dominate Shanghai’s 12,000km of road space, leaving little room for much else.
Shanghai created a mission to return streets to its people, and make streets ’Safe, Green, Vigorous and Smart’ through a set of urban development guidelines. This sparked a shift in focus from engi-neering and road traffic towards design of spaces and the environment. Artistic and cultural attrac-tions were set up to encourage walking, while smart technologies improved the monitoring and integration of public street facilities.
Shanghai’s spaces became more interactive, acces-sible, and aesthetically pleasing. By downplaying vehicular transport, streets were made safer and more convenient to walk and cycle. Community life and leisure activities flourished, while neighbour-hoods became cleaner and greener.
Shanghai got the fundamentals right by reviewing traffic planning and street design before fine-tun-ing in favour of pedestrians, cyclists, and public transit users. Widened walkways became common ground for public-private collaborations, bringing life and personality to the streets.
123
SUSTAINABLE URBAN TRANSPORT IN THE ASIA-PACIFIC REGION FOR THE 2030 AGENDA
To counter this, cities must use policy tools to integrate non-technological solutions into projects to promote equity, and to ensure that the poor, disadvantaged, and vulnerable have the tools and channels required to be in a position to fully participate. Projects should be
monitored closely to ensure that developmental goals are being met. Putting urban citizens at the centre of solutions, technology-based and otherwise, is key to making sure that no one is left behind.
CASE STUDY
The United Nations and the Sustainable Development Goals for an inclusive approach
Leaving no one behind. The 2030 Agenda will succeed only if it reaches all countries, all com-munities and all people – if no one is left behind. As Bénédicte Frankinet, the Permanent Representative of Belgium to the United Nations, said, “the suc-cess of the [Sustainable Development] Goals will be determined by how much the lives of the most vulnerable are improved”.
Sustainable transport plays a fundamental role in overcoming the social exclusion of vulnerable groups. Sustainable Development Goal target 11.2 explicitly calls on the international community to work toward sustainable transport for all people: By 2030, provide access to safe, affordable, acces-sible and sustainable transport systems for all, improving road safety, notably by expanding public transport, with special attention to the needs of those in vulnerable situations, women, children, persons with disabilities and older persons.
By enabling women to access markets and jobs, and a range of social and health services, transport promotes women’s economic empowerment and social inclusion. Essential to this is that transport systems are designed to safeguard the personal security of all travellers. Station and route plan-ning, community awareness-raising, and effective policing are critical to increase the confidence of
young and older women to move freely in public places and use public transport.
Transport services must also be physically acces-sible to the elderly and persons with disabilities. Article 9 of the United Nations Convention on the Rights of Persons with Disabilities sets out the imperative that “in order to enable persons with disabilities to live independently and participate fully in all aspects of life, appropriate measures should be taken to ensure to persons with disabil-ities access, on an equal basis with others, to the physical environment, to transportation, to infor-mation and communications, including information and communications technologies and systems, and to other facilities and services open or provided to the public, both in urban and in rural areas.”
It is increasingly recognized by transport author-ities, service providers, and operators that improvements to the accessibility of the trans-port system as a whole will mean a better quality of transport for all users. Higher quality vehicle design, infrastructure, driver training, information and many other factors contribute to a more equi-table system, and in this way, accessibility is a key element in ensuring the social sustainability of the transport sector.
4.4 Ensure social inclusion and safety
How can cities improve the terms on which individuals and groups take part in the life of the cities and improve
the ability, increase the opportunities, and build the dignity of those disadvantaged on the basis of their identity to use city services and transport? In the context of an ageing population, and lower-income, how can sustainable transport address these challenges? Which
124
SUSTAINABLE URBAN TRANSPORT IN THE ASIA-PACIFIC REGION FOR THE 2030 AGENDA
services can support that?
Accessibility refers to people’s ability to reach goods, services and activities, which is the ultimate goal of most transport activities. It is a precondition for people’s ability to participate in society and for the economic development of cities, regions, and countries.
The first perspective is accessibility for people and goods to the urban transport network in the urban area and between local urban transport networks and regional, national, and international transport networks, in the sense of “availability’. The second perspective is accessibility of the urban transport system for senior citizens and persons with disabilities or that have reduced mobility.
Transport drives development, links people, connects local communities to the world, builds markets and facilitates trade. In turn, sustainable transport drives sustainable development, which is fundamental to meeting the needs of people in their personal and economic lives, while respecting the ability of future generations to meet their needs.
For decades, transport policies focused on providing mobility based on motorized transport and improving traffic speed. Using the word “access” in the context of transport was synonymous with building new roads and other infrastructure which mainly was beneficial for using private cars. The motivation was access to transport. With the shift to sustainable transport comes a paradigm-shifting focus on people and their quality of life – the concept of access through transport, as well as increased attention to safety and social equity in transport.
In terms of road safety, and despite the limited resources, various road safety activities have been implemented between 2015 and 2017. Across the region, awareness-raising campaigns have been conducted to alter road-user behaviour. One of the more effective disseminating channels for road safety messages is media and television. In 2016, Myanmar broadcasted road safety video clips of the Global Road Safety Ambassador, Michelle Yeoh, on prime-time national television on a daily basis.
To improve road safety infrastructure, Viet Nam, in 2015, conducted, for the first time, a road safety audit for new road construction. Meanwhile, Pakistan has budgeted $9.3million to address road safety blackspots on the national highways during 2016 and 2017. In Thailand and Viet Nam, tracking devices are being installed to
monitor driving hours, rest time and driving speed.
In addition, Road Safety Month, which was launched by Singapore in May 2107 focuses on road safety for motorcyclists, the elderly pedestrians and children and on cultivating good “road sense”. Bangladesh tackles its main causes of road crashes and injuries by launching campaigns against unsafe overtaking and riding motorcycles without helmets. It is also revising its existing Motor Vehicle Act 1983 to reduce road crashes.
In addition, a long-term programme to improve child safety was launched by the Republic of Korea in 1995. After two decades of implementing various policies, child traffic fatalities declined by 96 per cent in 2016, compared with the highest child fatalities figure in 1988.
The auto-centric street design environments are contributing to the common perception of cycling as an unsafe mode of travel and a “poor man’s vehicle”. In India, cities lack bicycle lanes and proper pavements. This, coupled with heavily congested roads creates a danger to cyclists. Furthermore, the low costs of bicycles may make it more economical to buy than to rent, especially with a very flourishing market of used, second hand and third hand bicycles and other vehicles.
Despite negligible investments in cycling infrastructure facilities, bicycles have not disappeared from Indian streets. This indicates that current users are captive and they have no other affordable option. Recent research on the country’s urban transportation sector provides enough evidence to prove that there is a strong correlation between cycling and income levels. As income levels increase, cycling ridership and ownership decreases in urban areas (Jain and Tiwari, 2016). Cycling is associated with high risk on Indian roads. Once the captive users have an economic option to move to another mode (mostly bus or motorized-two-wheelers), they shift immediately. With a diminishing market, the cycling industry also continues to face challenges in sustaining a viable business model to stay competitive globally. As cities expand, an increase in travel distances is also discouraging the use of non-motorized transport modes. Policy measures, modifications to road design standards – bicycle lane, tracks or traffic calming, along with institutional capacity-building and other interventions will be needed to ensure that the share of cycling is maintained, or even increased.
125
SUSTAINABLE URBAN TRANSPORT IN THE ASIA-PACIFIC REGION FOR THE 2030 AGENDA
CASE STUDY
The holistic approach for inclusive transport in Sweden and with gender-based considerations
The Government of Sweden has prioritized a holistic approach to inclusive transport policies by collect-ing gender-specific statistics and requiring new project proposals to include gender analyses. As noted by Matthias Landgren, State Secretary to the Minister for Infrastructure, Sweden: “You need a holistic approach. If you don’t have that, you can make progress on some steps, but you will not see the full benefits.”
Inclusiveness in the planning process of cities and communities is becoming even more important. The city of Umeå in northern Sweden is aiming to create an inclusive, safe environment for all. The “the gen-dered landscape” approach is being used to educate and create awareness about the importance of a cohesive understanding of gendered-power struc-tures concerning all urban planning in the city, through the following examples:
The park: Freezone
One example is the Freezone park, a collaboration involving different parts of the municipality and groups of girls and young women in the city. The collaboration has led to a better understanding of expectations that young women deal with every day and the need for public spaces where there are no preconceptions. This new knowledge resulted in a park being built in the city centre.
The station tunnel: gender issues in urban planning
Increased lighting, rounded corners and a large entrance in the middle are a few examples of a gender equality-based approach to building the new station tunnel in Umeå. The tunnel, which connects the city centre with the neighbourhood of Haga, is a good example of how physical planning can benefit from a gender equality approach.
Raising awareness about issues of power
The architects have worked on space, height, day-light, rounded edges, a gradual gradient, artwork and maximum transparency. Adopting a gender equality approach to this project has meant rais-ing awareness of issues regarding power in public spaces, male violence towards women and how the city is perceived in terms of violence, a sense of security and accessibility.
Wider and brighter
The new tunnel is wider and brighter, with optimized lighting at all entrances. An additional entrance in the middle is another example of how the tunnel has been designed to create a sense of security in a place that can sometimes be perceived as unsafe. Rounded corners allow for a better view as you enter the tunnel and there is nowhere for potential aggressors to hide.
Umeå is highlighting the importance of social sus-tainability and inclusiveness in urban planning, aiming to achieve an equal society with good quality of life for all. In 2019, Umeå initiated a call for the new European Award for Social Progress, together with 12 other cities in the European Union.
126
SUSTAINABLE URBAN TRANSPORT IN THE ASIA-PACIFIC REGION FOR THE 2030 AGENDA
A city for people
A major structuring element of the new city model is abundant in high-quality pedestrian public space. As has been correctly addressed in various Chinese cities, there should be at least as much public pedestrian space as road space. Physically protected bicycle paths, large, exclusively pedestrian avenues and greenways should crisscross the city in all directions. No child should grow farther than three blocks from a park. Large tracts of land around cities should become parks; cross country pedestrian and bicycle paths through the adjacent countryside should readily permit all citizens to be in contact with nature; all waterfronts should have public access and the basic infrastructure for it.
In urban areas, women face daily challenges. They use public transport more than men and heavily depend on these systems for their mobility needs. The travel patterns of women also differ from those of men in developed and developing countries, and in rural and urban areas. Differences are evident in modal choice, time of travel, trip purpose, routes, trip chains and travel distance. These distinctions stem from systemic differences in access to resources, household responsibilities, travel preferences and social norms surrounding mobility for women. Women experience unequalled time and resource constraints with respect to their travel as a result.
More resources should be invested in pursuing a better understanding of gender differences in transport. Policymakers are challenged by the lack of gender-disaggregated mobility data, which are crucial for developing inclusive solutions. A fundamental data gap exists, which prevents cities, countries and regions from gaining an understanding women’s transport experiences and patterns and how to address them. Transport systems traditionally built by men, for men, have far-reaching implications, which break across siloed policy areas. In many regions, women are the predominant users of public transport yet their needs are frequently not just ignored, but are completely unknown.
In this regard, having an effective policy framework in place would accelerate progress in deploying intelligent transport systems in the region. The framework could provide general policy recommendations for member countries and their development partners when formulating specific national master plans on intelligent transport systems. It is also expected that the policy framework can support the construction of a truly integrated and user-friendly transport systems
through intelligent transport systems by facilitating broader collaboration and involvement of interested public agencies, research organizations, and private companies involved in the intelligent transport systems area. This eventually supports efforts to achieve Sustainable Development Goal 9 and particularly Goal 11 (to make cities and human settlements inclusive, safe, resilient and sustainable), and target 11.2.
According to the International Labour Organization, limited access and lack of safe transport is the greatest obstacle to women’s participation in the labour market, as it reduces their probability of involvement by up to 16.5 per cent. Women are 47 per cent more likely to suffer severe injuries in car crashes because safety features are designed for men. Eighty-one per cent of females also have experienced harassment in public spaces, including on public transport and in the areas related to it. New mobility will not be successful unless it considers the importance, not of the users, but the differences among the users. Gender-disaggregated data can provide a clear picture of problems that should be addressed in the first instance. However, the crucial issue is to put all users’ needs at the centre of the problem before talking about technology.
Women now travel widely for employment, education and leisure yet they still experience many constraints to mobility. In most countries, women still take on a larger share of care-related activities, which often dictates their travel patterns and behaviours – and the number of trips they take usually increases when they have a family. McGurkin and Murakami (1999) found that having a child under five years old increases trip chaining by 54 percent for working women and by 19 per cent for working men and therefore women are economically sensitive to the cost of transport. Additionally, young women, including mothers, have become more active in out-of-home, non-work activities and their trip chaining has become more complex, compared to that of their male counterparts.
Women use private and public transport differently than men. Specifically, women tend to make shorter, more frequent trips, often carrying items or are accompanied by children. This can mean that women face higher mobility costs than men. Ultimately there are unique constraints and often more complex trip-based activities that need to be better understood.
Women are significantly underrepresented within the workforce in the transport sector. This is particularly relevant at higher levels, such as on boards of directors and in leadership positions. Many barriers to the greater

127
SUSTAINABLE URBAN TRANSPORT IN THE ASIA-PACIFIC REGION FOR THE 2030 AGENDA
recruitment, retention and advancement of women in transport professions arise because the sector has traditionally been male dominated. This leads to a lack of examples of female professionals at all levels of responsibility, and a lack of awareness of the range of occupations that are available in the sector.
After decades of designing streets to move large
numbers of vehicles as efficiently as possible, cities are finally rediscovering the benefits of designing safe and liveable streets that balance the needs of all users. It is time to change practices and redefine what constitutes successful streets. Streets should not be evaluated in isolation or as transportation projects alone. Instead, each design presents an opportunity to ask what overall benefits can be gained.
“The importance of pedestrian public spaces cannot be measured. It cannot be proven mathematically that wider sidewalks, pedestrian streets, and more or better parks make people happier; much less measure how much happier. However, if we reflect, most things that are important in life cannot be measured either: Friendship, beauty, love, and loyalty are examples. There is a curious difference between parks and other public investments. If people lack transport, running water, or other traditional public services, they will feel very unsatisfied. But if they do have those services, they do not get much satisfaction out of it. On the contrary, if they lack parks or other pedestrian spaces, they will not be particularly dissatisfied. But if they do have them, they will derive out of it ceaseless satisfaction. It is so, because most government services are means to a better life; while pedestrian spaces are an end in themselves; they practically ARE a better life in themselves. At first it may seem that in developing cities with so many unmet needs, high quality pedestrian spaces would be a frivolity. On the contrary, in places where citizens lack so much in terms of amenities and consumption, it is quicker and more effective to distribute quality of life through public goods such as parks, plazas, and sidewalks, than to increase the personal incomes of the poor. It is impossible to provide citizens certain individual consumer goods and services such as cars, computers, or trips to Paris. It is however possible to provide them with excellent schools, libraries, sidewalks, and parks. Low-income privations are not as evident during work time. It is during leisure time that the difference with upper-income groups is most felt. While upper-income people—increasingly turning to large, enclave-style gated communities and housing estates with freeway access near the edges of large developing cities—have cars, go to clubs, country houses, theatres, restaurants and on vacations, for the poor public space is the only leisure alternative to television and walking around in shopping malls. Parks, plazas, pedestrian streets and sidewalks are essential for social harmony. High quality sidewalks are the most basic element of a people-centred city. It is frequent that images of high-rises and highways are used to portray a city’s advance. It would be useful to reflect on this point based on previous or current experiences in Chinese cities: who are they built for and how? Parks and public space are also important to a harmonic society, because they are the only places where people meet as equals. In our highly hierarchical societies, we meet separated by our socio- economic differences. The chief executive officer perhaps meets the janitor, but from his position of power. In walkways and parks everyone meets as equals.” – Enrique Peñalosa, former mayor of Bogotá
Citizen participation, equity and inclusion
It is clear at this point that people will play a central role in the construction of the city. Their behaviours, induced by design choices and participation mechanisms, will build a common and always evolving identity.
The concept of sustainability, which includes resiliency, integration, efficient soil use, use of local resources, accessibility, identity, health and functionality, translates into planning guidelines under which the “adaptive planning” stands out. In fact, it is necessary to be able to review a proposed design periodically to address the identified issues and take into account
128
SUSTAINABLE URBAN TRANSPORT IN THE ASIA-PACIFIC REGION FOR THE 2030 AGENDA
the new neighbours’ opinion. At the same time, areas that will only be developed after many years should accommodate transitory uses, which is referred to as “‘meanwhile urbanism”
Social Equity
In an era of increasing inequality, cities must ensure that the most valuable public spaces offer safe and equitable use to all, regardless of ability, age, or income. This empowers the most vulnerable users with safe and reliable mobility choices. A city serves its citizens better through a street design that increases access to jobs and schools, benefits individual health, improves sanitation and encourages strong communities.
Social Interaction
Well-designed streets connect people with their communities, providing opportunities to meet people, see friends and feel socially connected. Streets with reduced traffic volumes and speeds extend the territory of the private spaces that line the street, increasing the opportunity for social interaction.
Empowerment and Social Inclusion
Streets should be spaces of empowerment for the vulnerable. For people burdened with poverty or living in cultures that face social inclusion challenges, streets should serve as an inclusive place.
Human experience
Human experience of neighbourhoods and cities is shaped by streets. The ease at which people move from one place to another, access services, enjoy their surroundings, and feel safe affects their mental health and comfort.
Public health and safety
Every year, millions of people die unnecessarily from preventable causes, such as traffic violence or chronic diseases related to poor air quality and lack of physical activity. Street design must promote safe environments for all users and offer healthy choices that facilitate active transportation, such as walking, cycling, and using public transit. Streets should improve access to healthy food options, mitigate noise levels, and provide landscaping and trees that improve air and water quality.
Safe streets save lives More than 1.2 million people die
on roads around the world every year. That is equivalent to approximately one person dying every 30 seconds, or more than 3,400 people dying every day of the year. Many of these deaths occur on urban roads and are preventable crashes caused by behaviour induced by street design.
Creating safe streets is a critical responsibility shared by designers, engineers, regulators, and civic leaders. Even in the cities with the best safety records, the threat of traffic violence makes movement around the city a potentially dangerous daily activity. Highway-like Street designs that prioritize automobiles over vulnerable users and encourage high speeds fail to provide safe environments.
Studies from around the globe have shown that most traffic deaths, especially the easily preventable pedestrian deaths, occur on a small percentage of arterial streets. These streets are rendered dangerous by design. Examples of dangerous designs are as follows:
• Wide streets that invite speeding and lack safe crossings.
• Streets that act as front yards, but allow aggressive behaviour by those passing through.
• Highway-like surface streets where motorcyclists and public transport passengers are at risk from large speed differentials, and where sidewalks are missing or substandard.
The combination of high traffic speeds and volumes, long crossings, and large distances between marked crossings make a street a fatal corridor for vulnerable users.
Safety and Access
People feel more comfortable using safe streets. Urban streets must be designed for slower traffic speeds and include sidewalks, lighting, benches, and shade to support a safe experience. Streets provide links to critical services, such as health care and education and require safe, secure, and accessible routes. Street design should provide spaces that enhance urban safety and support crime prevention.
129
SUSTAINABLE URBAN TRANSPORT IN THE ASIA-PACIFIC REGION FOR THE 2030 AGENDA
CASE STUDY
Moving on from motorbikes in Ho Chi Minh City
Ho Chi Minh City is the economic heart of Viet Nam. With robust economic growth and an increasing population, it has become a ”motorcycle-dependent city” with approximately six million motorbikes and various affiliated problems. Pedestrian walkways are congested resulting from poorly regulated motorcycle parking. In 2014, some 65 per cent of the 875 traffic crashes involved motorbikes, result-ing in 713 deaths.
The city has an ambitious plan to build an extensive public transport system, which will include MRT and BRT corridors. Accordingly, public transport is slated to make up 25 per cent of city travel by 2020 and 60 per cent after 2030. To reduce traffic crashes, the new Traffic Safety Year 2017 campaign is targeted promote the building of a healthier, safer traffic culture.
It continues to be an uphill task for public transport to gain a foothold in Ho Chi Minh City. In addition to having to raise capital to build the new public transport system within a short time frame, the city faces difficulties, such as fragmentation of funding, land acquisition and resettlement chal-lenges, as well as administrative issues.
Time is a key factor in real estate development. Complex projects require a longer, phased imple-mentation, with flexibility in timing. Construction costs in the city’s growing infrastructure sector will make progress uncertain until contract experience is gained, and local industry capacity and skills are further developed.
In the long run, with more funding and project man-agement, Ho Chi Minh City is in a good position to become a society of shared mobility, completely bypassing the car-dependent stage.
Social inclusion in Viet Nam – how to combine affordability and coverage. Affordable fare policy
There are contrasting stories pertaining to public transport fare and subsidy policies in Viet Nam. Hanoi and Ho Chi Minh City are exceptional cases, where public transport has been continuously subsidized and plays a significant role in urban transport. In the other cities and provinces of the country, bus services have played a marginal role, comprising a share of less than 1 per cent, with all local governments (except Hanoi and Ho Chi Minh City) gradually reducing subsidy levels due to budgetary constraints. Until the end of 2016, the Ministry of Transport strongly requested all cities and provinces to provide bus fare subsidies, increase investment in public transport infrastructure, and extend other types of assistance to bus operators, such as preferential interest rates. As a result, many cities and provinces have started to invest more in their infrastructure operators. However, public transport development is still challenging, as there is a lack of comprehensive policy for public transport in local areas.
Over the past few decades, Ho Chi Minh City has successfully developed a bus city for it resident, despite a number of challenges that needed to be overcome. The city has a bus network of more than 140 routes, of which 107 routes are subsidized. In addition, 45 bus routes serve commuting workers under the form of subsidized service contracts, and 155 schools are providing school bus services with government subsidies.
Though operation costs and subsidies have increased in recent years, the subsidy-cost ratio has dropped from 68 per cent in 2002 to 34 per cent in recent years. In the meantime, subsidy by ridership rate has been decreasing. It can be said that the fare and subsidy policy has been successful in providing affordable public transport services to social groups, especially students and low-income workers, but setting the fares too low may risk the future development of mass rapid transit systems (such as the MRT and BRT lines). Ho Chi Minh City needs to consider reforming its fare and subsidy policy, taking into consideration the introduction of new railways, BRT lines, and the need to double the city bus network.
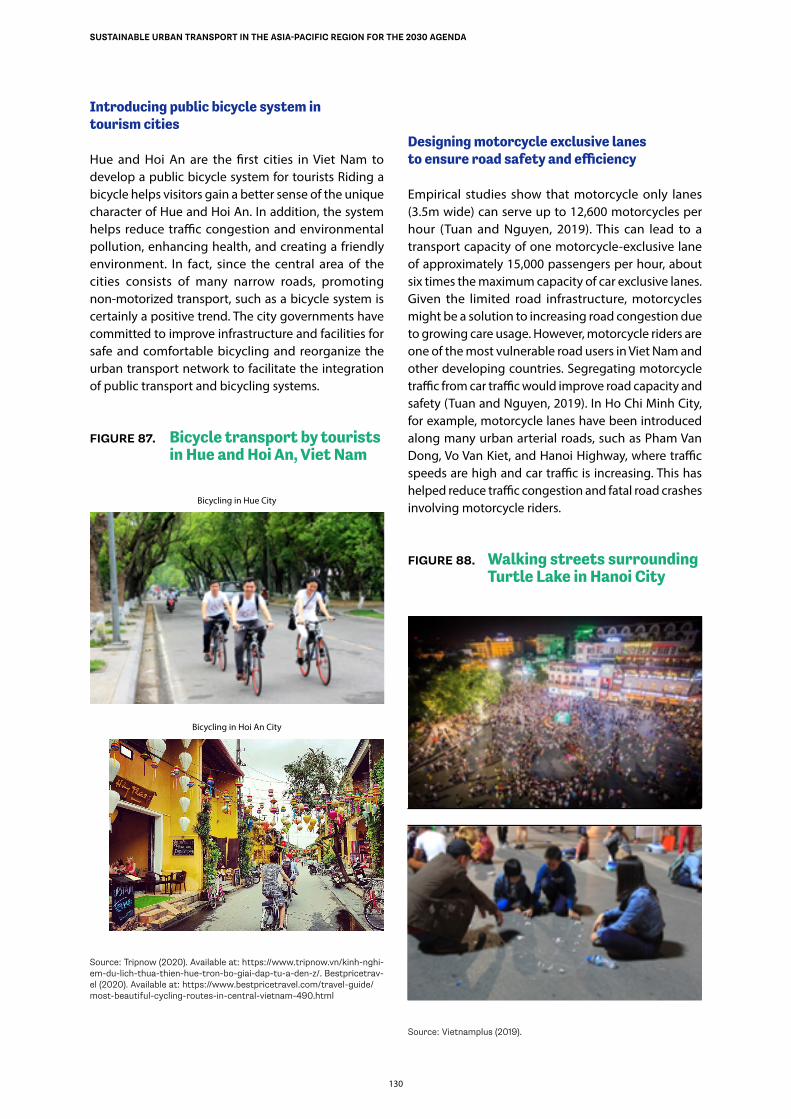
130
SUSTAINABLE URBAN TRANSPORT IN THE ASIA-PACIFIC REGION FOR THE 2030 AGENDA
Introducing public bicycle system in tourism cities
Hue and Hoi An are the first cities in Viet Nam to develop a public bicycle system for tourists Riding a bicycle helps visitors gain a better sense of the unique character of Hue and Hoi An. In addition, the system helps reduce traffic congestion and environmental pollution, enhancing health, and creating a friendly environment. In fact, since the central area of the cities consists of many narrow roads, promoting non-motorized transport, such as a bicycle system is certainly a positive trend. The city governments have committed to improve infrastructure and facilities for safe and comfortable bicycling and reorganize the urban transport network to facilitate the integration of public transport and bicycling systems.
FIGURE 87. Bicycle transport by tourists in Hue and Hoi An, Viet Nam
Bicycling in Hue City
Bicycling in Hoi An City
Source: Tripnow (2020). Available at: https://www.tripnow.vn/kinh-nghi-em-du-lich-thua-thien-hue-tron-bo-giai-dap-tu-a-den-z/. Bestpricetrav-el (2020). Available at: https://www.bestpricetravel.com/travel-guide/most-beautiful-cycling-routes-in-central-vietnam-490.html
Designing motorcycle exclusive lanes to ensure road safety and efficiency
Empirical studies show that motorcycle only lanes (3.5m wide) can serve up to 12,600 motorcycles per hour (Tuan and Nguyen, 2019). This can lead to a transport capacity of one motorcycle-exclusive lane of approximately 15,000 passengers per hour, about six times the maximum capacity of car exclusive lanes. Given the limited road infrastructure, motorcycles might be a solution to increasing road congestion due to growing care usage. However, motorcycle riders are one of the most vulnerable road users in Viet Nam and other developing countries. Segregating motorcycle traffic from car traffic would improve road capacity and safety (Tuan and Nguyen, 2019). In Ho Chi Minh City, for example, motorcycle lanes have been introduced along many urban arterial roads, such as Pham Van Dong, Vo Van Kiet, and Hanoi Highway, where traffic speeds are high and car traffic is increasing. This has helped reduce traffic congestion and fatal road crashes involving motorcycle riders.
FIGURE 88. Walking streets surrounding Turtle Lake in Hanoi City
Source: Vietnamplus (2019).
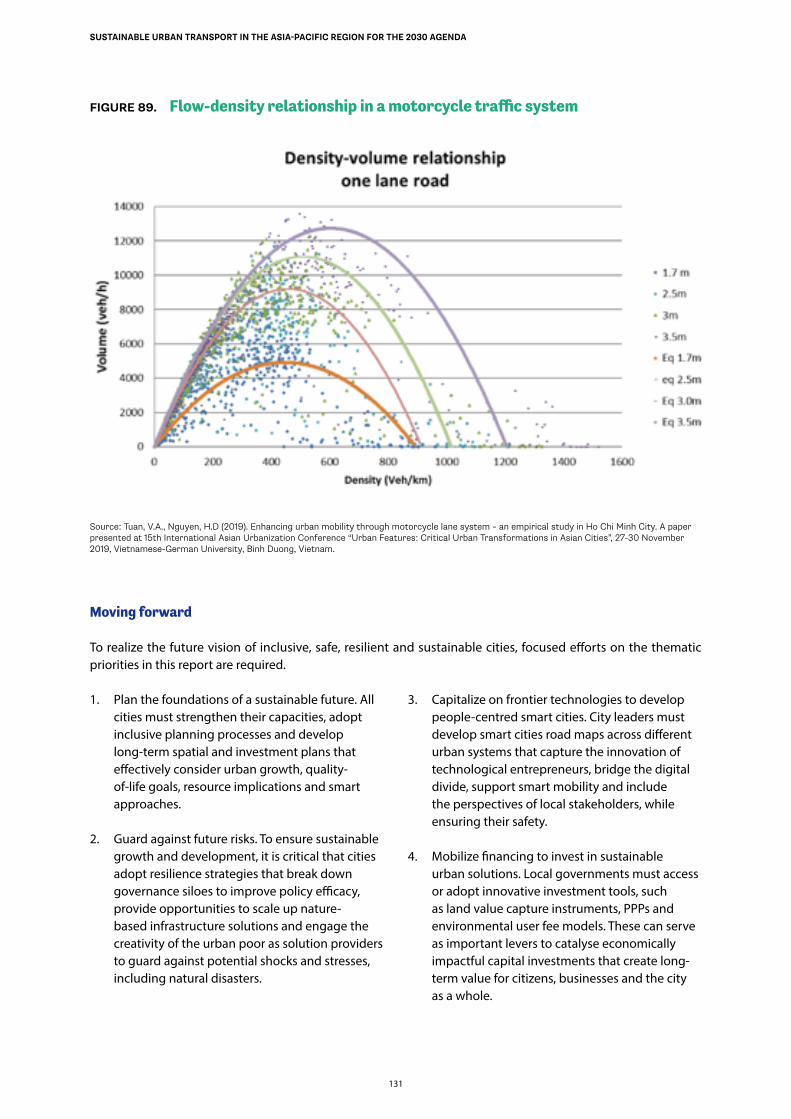
FIGURE 89. Flow-density relationship in a motorcycle traffic system
Source: Tuan, V.A., Nguyen, H.D (2019). Enhancing urban mobility through motorcycle lane system – an empirical study in Ho Chi Minh City. A paper presented at 15th International Asian Urbanization Conference “Urban Features: Critical Urban Transformations in Asian Cities”, 27-30 November 2019, Vietnamese-German University, Binh Duong, Vietnam.
Moving forward
To realize the future vision of inclusive, safe, resilient and sustainable cities, focused efforts on the thematic priorities in this report are required.
1. Plan the foundations of a sustainable future. All cities must strengthen their capacities, adopt inclusive planning processes and develop long-term spatial and investment plans that effectively consider urban growth, quality-of-life goals, resource implications and smart approaches.
2. Guard against future risks. To ensure sustainable growth and development, it is critical that cities adopt resilience strategies that break down governance siloes to improve policy efficacy, provide opportunities to scale up nature-based infrastructure solutions and engage the creativity of the urban poor as solution providers to guard against potential shocks and stresses, including natural disasters.
3. Capitalize on frontier technologies to develop people-centred smart cities. City leaders must develop smart cities road maps across different urban systems that capture the innovation of technological entrepreneurs, bridge the digital divide, support smart mobility and include the perspectives of local stakeholders, while ensuring their safety.
4. Mobilize financing to invest in sustainable urban solutions. Local governments must access or adopt innovative investment tools, such as land value capture instruments, PPPs and environmental user fee models. These can serve as important levers to catalyse economically impactful capital investments that create long- term value for citizens, businesses and the city as a whole.
131
SUSTAINABLE URBAN TRANSPORT IN THE ASIA-PACIFIC REGION FOR THE 2030 AGENDA
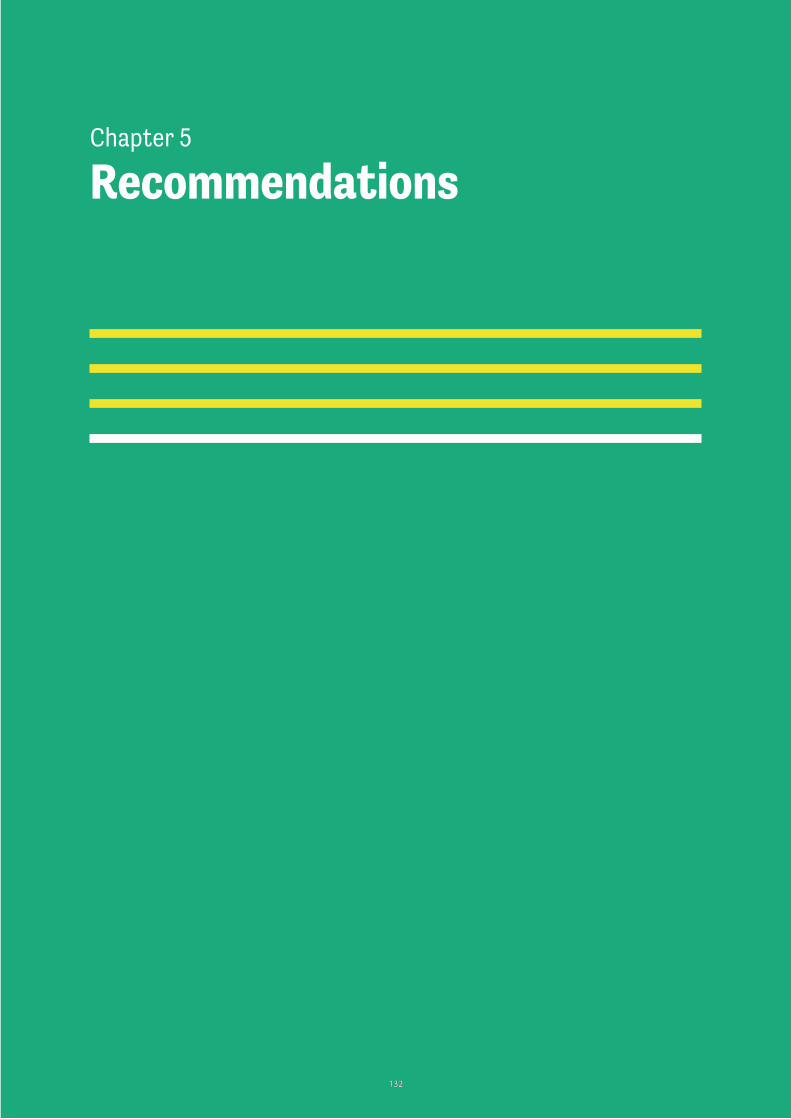
132132
Chapter 5 Recommendations
133
SUSTAINABLE URBAN TRANSPORT IN THE ASIA-PACIFIC REGION FOR THE 2030 AGENDA
5.1 Recommendations
This section includes a practical and clear road map of recommendations extracted from the best-case studies in the Asian and Pacific region with the objective to show how national and municipal policymakers can take action towards achieving sustainable transport. Some recommendations directly apply to the decision-making level, while the rest will only be successful if they originate through participatory processes, making sure they respond to people’s needs. Within each group, they are presented in a gradual implementation level, starting with core ones.
1. Ensure political leadership in transport related decisions
The review of best practices and lessons learned from Asia clearly shows the need for policy support and local leadership for successful measures in making urban transport sustainable. Asian cities have managed to implement sustainable measures, thanks to strong political will to overcome transport congestion, ensure greater and more appropriate space sharing among means of transport, and provide increased safety and security for travellers. The popular appeal of a measure depends on the positive attitude of public authorities towards modifying urban transport planning – and as such, the political leadership of city-level decision makers is key to shaping the future of transport in the cities of tomorrow.
Governments at all levels should establish the concept of people-oriented urban transport development and embed that concept throughout all aspects of urban transport planning, construction, operation and management. Urban transport management should be regarded as a major project, and a major strategy, and a “major strategy should be established in order to have a strong leader to lead departments of transportation, planning, natural resources, finance, public security, and others and make roads and streets that truly serve people’s travel and green travel rather than cars.
2. Proactively plan for a just and socially inclusive urban transport transition
Key measures are strengthening tenure security for the urban poor; enhancing climate resilience and gender equality by educating all young people; using revenues from fossil fuel subsidy reform or carbon taxes to compensate people who bear the costs of climate action; supporting local governments to make well-located, serviced land available for growing urban
populations; supporting community-led upgrading of informal settlements; and anticipating, protecting and supporting the workforce of the future, including by developing transition plans for fossil fuel-based workers and industries. A circular and systemic approach is paramount in order to create a living, human city where everything is used, reused and interconnected. Isolating specific solutions will only have a limited and probably short-term impact. Integrated development can lead to large economies in terms of logistics and will help build a more resilient model city, from its main infrastructures to its individual buildings.
In small and medium-sized cities, more attention should be paid to people’s travels rather than to infrastructure construction The planning direction of urban transport should be changed from focusing on infrastructure to focusing on people’s travel and from station construction to service improvement. In the emerging cities, the urban transport system should be built based on its own characteristics to avoid the repetition of the “’road construction-traffic congestion-road construction way in megacities. In addition, it is very important to make full use of the golden age of urban formation to form a transportation facility system suitable for the development of green travel modes, such as walking and cycling so as to avoid the lock-in effect of transportation infrastructure in large cities.
3. Fully integrate gender- based dimensions in the mobility and infrastructure analysis and implementation
The region requires efficient, well-built and well-maintained infrastructure to foster inclusive growth for all people and ensure that the dividends of economic growth are equitably shared. This entails considering the need to adopt a gender-sensitive perspective as the analysis in the cities in the Asia-Pacific region reveals that urban mobility policy action needs to be even more gender-sensitive.
Lower employment rates, part-time roles and low-wage positions are the main factors that determine a sensible difference between genders regarding the labour market, social life and transport behaviour. Furthermore, even at retirement, gender needs are notable, given that women make up the predominant share of the elder population. The picture that emerges in the Asia-Pacific Region is one in which women travel differently than men in relation to transport modes used, distance travelled, the daily number of trips and their pattern, which is a predominance of non-motorized transport modes used by women.
134
SUSTAINABLE URBAN TRANSPORT IN THE ASIA-PACIFIC REGION FOR THE 2030 AGENDA
The gender imbalance emerging from current patterns and trends in mobility and transport reveals the existence of a disparity, which essentially affects three different aspects: lack of knowledge of gender issues and the scarcity of gender mobility data and statistics, need to plan gender-tailored mobility services and need to better exploit the synergies between urban and mobility planning.
Lessons learned from experiences across Europe and Asia and the Pacific show that, in addition to the large information gap to be filled by improving gender-based statistical data and research, the measures implemented at the local level are usually pilot projects, presenting implementation and sustainability problems stemming from the lack of dedicated public funds projects. Furthermore, addressing women’s mobility requires interaction between transport and welfare policies which may increase the complexity and length of the decision-making process.
4. Foster transport decarbonization in cities
Decarbonization of all modes of transport by 2050 is possible – but action is needed now. Cost-effective solutions for passenger and freight transport are available and have been tested at scale (electrified mobility solutions, shared and integrated with walking, cycling, and public transport). The analysis indicates that concerted national and urban policy together with business action is required to avoid unnecessary trips to enable a shift to efficient modes, and to improve the efficiency of vehicles and fuels. Aligning national policies behind compact, connected, clean cities, can make the difference in the Asia Pacific region.
Key measures are reforming energy markets to decarbonize the electricity grid; reaching net-zero operating emissions in all buildings with minimal use of carbon offsets; decarbonizing the electricity grid; banning the sale of fossil fuel-powered vehicles; and ending the subsidies to the whole carbon economy; adopting green alternatives to steel and cement; and shifting away from building detached housing in established cities. Senior decision makers in India, for example, are suggesting that the sale of fossil fuel-powered passenger cars and two-wheelers be prohibited starting in 2030. These policies for safe, clean, efficient and affordable mobility for all must be part of low-carbon transport actions. Calculations show that investments in sustainable low-carbon transport offer great value for money, and bring substantial, long-term, economy-wide benefits while improving social equity.
In Asian cities, it is also necessary to pay close attention to the development of e-bikes. The practice of e-bikes in many cities in southern China has proved that it can serve the short-distance travel in subtropical and temperate cities. It has good application scenarios in small- and medium-sized cities in hills and mountains. At the same time, it also has its unique advantages in reducing energy consumption and pollutant emissions. Accordingly, decision makers should not simply implement a policy to ban them.
The walking and cycling environment needs to be improved starting with the standards and management system for the construction of pedestrian and bicycle facilities. Pedestrian and bicycle lanes should be set up in accordance with the regulations for the new construction and reconstruction of urban roads. Special bicycle roads in areas where conditions permit also need to be set up. The practice of China has proved that the largest obstacle to the increase of the proportion of active travel is related to the right of way and traffic order, which need to be addressed through policies and infrastructure construction. It is necessary to continue to tackle such problems as the common slab setting of non-motor vehicle lanes and sidewalks, and build a safe, continuous, and comfortable slow traffic system.
5. Target urban transport financial sustainability with new business models
Overall, the findings of the analysis support the view that cities must aim to achieve financial sustainability for their urban transport systems by combining innovative multitier financing and wiser investments. Innovative financing refers to the revenue side, which can increase if different financial instruments are combined and managed effectively. Wiser investments, associated with the expenditure side means strategically choosing to develop cost-effective projects that contribute to addressing short-term difficulties while working to achieve long-term transport sustainability goals. More specifically, when considering the revenue-side perspective, it is necessary to acknowledge that the observed underfinancing of the transport sector stems from the existing price distortions that have tacitly contributed to the subsidizing of certain mode inefficiencies, in particular those that are directed to private cars.
Public transport development remains challenging as there is a lack of a comprehensive tariff policy for public transport in local areas. The fare and subsidy policy in megacities of Asia have been very successful in providing affordable public transport services to
135
SUSTAINABLE URBAN TRANSPORT IN THE ASIA-PACIFIC REGION FOR THE 2030 AGENDA
social groups, especially students and low-income workers. However, setting fare levels that are too low may risk the future development of mass rapid transit systems (specially MRT and BRT lines), as it would be difficult to introduce new fares at a much higher level, making it difficult to continue to improve the quality of current services. Accordingly, the megacities need to consider reforming their fare and subsidy policies under which of new railways, BRT lines, and improved city bus networks are considered and fare integration between these transit modes is facilitated.
Accordingly, an ideal financing strategy should target setting financial instruments at prices that charge users for the total costs of utilizing a given infrastructure or transport service; this pricing would correct market distortions, educate user behavior, and increase revenue to a level equal to or above expenditures. In terms of the COVID-19 pandemic, transport flows have been seriously disrupted. A balance between ensuring connectivity and providing a safe experience is crucial. Public or private transport providers might need temporary financial support, offering a perfect chance to privilege those operators that follow sustainable best practices.
6. Improve technological innovation supported by awareness and expertise
In several cities reviewed for the study, some innovative measures relying on technological and digital innovation have proven to be useful in the implementation of local transport policies for people. In many policy initiatives, intelligent transport systems have been used to assess traffic flow, carry out remote monitoring and provide instant information to users. Knowledge and expertise in relation to intelligent transport system technology is vital to ensure the smooth implementation of a mobility plan. Examples of information technologies are digital and mobile applications that provide citizens with real-time information, ease the use of different transport modes, engage stakeholders in decision making and actively involve them in campaigns and incentive programmes. Special attention has to be paid at how these mechanisms are designed and deployed in order to protect a user’s privacy by using secure, decentralized and anonymized structures. Knowledge and expertise are also crucial in this regard.
The demand for app-based taxi services is rapidly growing, which is hindering the growth of traditional taxi demand. The popularity of app-based delivery services in general and app-based food delivery services in particular has grown strongly in recent
years. The fast pace of life and the development of the modern urban wave have led to significant changes in the eating habits of many people. App-based taxi services and app-based delivery services have led to significant changes in the travel behaviour of citizens. In terms of legislation, there is an ongoing debate over the identification of ride-hailing apps, as to whether they are a taxi service or a platform service. This distinction is needed to support authorities in regulating new mobility services and to create fair competition among service providers. Regardless of the results of this debate, such new mobility services are offering solutions to intermodal connectivity, demand responsiveness and urban resiliency against disruptions, notably the one caused by the COVID-19 outbreak. As such, it calls for a true collaboration between authorities and ride-sharing companies to gain mutual benefits to meet growing travel demand and achieve sustainable urban mobility.
7. Involve stakeholders and obtain public support in transport plans
The assessment of the successful transformative project in cities shows the need for comprehensive communication and information tools to reach stakeholders. The opinions held by members of the public and transport users about proposed sustainable urban transport measures must be assessed in order to achieve greater acceptance and gain a better understanding of people’s travel patterns and how transport planning can make a positive change in travel behaviour. By involving users, it is more likely that behavioral change will be achieved, as demonstrated in numerous cities. The community has to be supported by a flexible design and empowered through citizen participation mechanisms. This would distinguish a residential development from a living city and applies to the dialogue with the neighbouring towns, which should also benefit from transportation projects.
Cities should focus on the care of vulnerable groups in the development of city traffic, especially to enable persons with disabilities, the elderly, and children to enjoy safe, comfortable, and convenient public transport services. The city traffic system, especially public transport facilities, vehicles and services, should enable them to fully participate in their social lives. Cities need to promote the accessibility of urban roads, bus stations and vehicle facilities and develop new modes of transportation and on-demand travel services that adapt to the ageing trend (China Ageing Research Center, 2018).
136
SUSTAINABLE URBAN TRANSPORT IN THE ASIA-PACIFIC REGION FOR THE 2030 AGENDA
8. Intertwine urban governance with transport master planning
As a result of devolution and decentralization, cities and urban authorities are receiving more autonomy and authority to plan, make decisions and implement projects. At the same time, these authorities need support in exercising their power, such as developing legal and regulatory frameworks, enhancing institutional coordination, ensuring effective public participation and making effective and timely evidence-based decisions. There are many examples of city leaderships that have led to the transformation of cities and development of exemplary public transport systems, which can be followed to enable world-class sustainable public transport systems. Delays in decision-making and project implementation results in increased costs to economies. To improve project governance, accountability frameworks, inspection and monitoring guidelines and quality assurance plans should be formulated and strictly followed.
Each city should develop an integrated sustainable urban transport master plan that meets the mobility needs of its residents based on the use of public transportation systems with future growth and expansion in mind. The plan should incorporate all modes of transport, including active modes, such as pedestrian facilities and cycling, while encouraging road safety, barrier-free access, inclusiveness and intermodal transfer facilities. It should be developed through a public consultation process, with the support of experts, to ensure citizen ownership. The master plan should serve as a blueprint for all related projects and programmes, taking into account the expansion of urban areas, changes in demand and travel patterns.
After the master plan is developed, there must be a commitment from the stakeholders to implement it through the mobilization of resources, prioritization and development of projects. Many Asian cities have invested in and developed urban public transport systems through private sector participation. For example, in Hong Kong, China, metro and suburban railways are being developed by the private sector and Tokyo has commissioned the private sector to develop a system that fully integrate land-use and transport planning to maximize value capture. Implementation of urban transport plans also requires a high level of coordination among multiple agencies at all levels of government (national, provincial, and urban /local).
In the process of dealing with rapid urbanization, special attention should be paid to projected traffic demands.,
It is necessary to scientifically formulate urban land and space planning, urban comprehensive transportation planning, public transportation and other special plans. and adjust and control traffic distribution from its source through planning to achieve a balance in urban occupation and residence to reduce invalid travel and to achieve energy conservation and emission reduction.
In large cities, it is necessary to promote the establishment of a compact urban development pattern with intensive land use, mixed functions and public transport orientation. To promote the development of public transport, formulation of comprehensive development and utilization of policies pertaining to public transport land should be accelerated. For example, the “three-in-one” development mode of construction, operation, and property has been implemented in Shenzhen: by giving the transport operators reserved land rights along key transport corridors, a coordinated development strategy of rail transit construction, operation and resource property can be implemented.
137
SUSTAINABLE URBAN TRANSPORT IN THE ASIA-PACIFIC REGION FOR THE 2030 AGENDA
Bibliography
Ahluwalia, Isher (2019) Urban Governance In India, Journal Of Urban Affairs, Vol. 41, No. 1, Pp. 83−102.
Akbar, Prottoy, and others (2018). Mobility and congestion in urban India. Working paper 25218. World Bank Group. Available as https://faculty.wharton.upenn.edu/wp-content/uploads/2018/06/TravelIndia.pdf
Angel, Schlomo, and others (eds.) (2016). The Atlas of Urban Expansion. Volume I: Areas and Densities. New York: NYU Urban Expansion Program at New York University, UN-Habitat, and the Lincoln Institute of Land Policy .
Ann, Sangeetha, Meilan Jiang, and Toshiyuki Yamamoto. (2019). Re-examination of standards for TOD influence zones in India. The Journal of Transport and Land Use, vol. 2, No.1, pp. 679–700.
Ardila, Artura, and Ardriana Ortegon-Sanchez (2016). Sustainable Urban Transport Financing from the Sidewalk to the Subway: Capital, Operations and Maintenance Financing. Washington, D.C.: World Bank
Arup and Siemens. (2014). Resilient urban mobility: a case study of resilient transport in Ho Chi Minh City. Avalable at https://www.arup.com/perspectives/publications/research/section/resilient-urban-mobility--a-case-study-of-integrated-transport-in-ho-chi-minh-city
Asian Development Bank (ADB) (2017). Climate change in Asia and the Pacific []. Asian Development Bank; Asian Development Bank. Available at https://www.adb.org/news/infographics/climate-change-asia-and-pacific
Autostat Agency (2016). Available at: https://www.autostat.ru/infographics/38282/AUTOSTAT
Aziz, Zeba (2018). Low-carbon pathways for urban development and mobility in India. In Low Carbon Pathways for Growth in India. Rajat Kathuria, Saon Ray and Kuntala Bandyopadhyay (eds.). Singapore: Springer.
Banister, David (2008). The sustainable mobility paradigm. Transport Policy, vol. 15, No. 2, pp 73−80.
Bansal, Guarav, and Anup Bandivadekar (2013). Overview of India’s vehicle emissions control programme. Washington DC: International Council on Clean Transportation.
Beall, Abigail (2018) In China, Alibaba’s data-hungry AI is controlling (and watching) cities. Wired, 30 May 2018. Available athttps://www.wired.co.uk/article/alibaba-city-brain-artificial-intelligence-china-kuala-lumpur, accessed November 2018.
Buchoud, Nicolas, and Lan-Phuong Phan (2019). Smart Cities, from infrastructures to social K? IBA Heildelberg (ed). In IBA Lab 6. Die Wissenstadt von Morgen.
Central Pollution Control Board (2011). Air quality monitoring, emission inventory and source apportionment study for Indian cities. Available at https://theasthmafiles.org/content/air-quality-monitoring-emission-inventory-and-source-apportionment-study-indian-cities
Centre for Science and Environment (2019) The Cost of Urban Commute: Balancing Affordability and Sustainability, New Delhi: Centre for Science and Environment.
Chin, Vincent, and others (2018). Unlocking cities: the impact of ridesharing across India. Available at https://image-src.bcg.com/Images/BCG-Unlocking-Cities-Ridesharing-India_tcm9-185213.pdf
138
SUSTAINABLE URBAN TRANSPORT IN THE ASIA-PACIFIC REGION FOR THE 2030 AGENDA
China Ageing Research Center (2018). Survey report on the living conditions of elder people in urban and rural China. Beijing: Social Science Documentation Press.
China, Ministry of Natural Resources (2020). Recommended Catalogue of Land-saving Modes for Comprehensive Development and Utilization of Above-ground and Underground Space in Rail Transit.
China, Ministry of Public Security (2020). Motor vehicle and driver statistics 2019.
China, National Bureau of Statistics (2019). Annual Statistical Bulletin.
Chinowsky, Paul, and others (2015). Road infrastructure and climate change in Viet Nam. Sustainability, vol. 7, No. 5, pp. 5452–5470.
Decree No. 100/2019/ND-CP. (2019). Decree on administrative penalties for road traffic offences and rail transport offences.
Denton, Fatima, and others (2014). Resilient pathways: adaptation, mitigation, and sustainable development. In Climate Change 2014 Impacts, Adaption and Vulnerability. Part A: Global and Sectoral Aspects Contribution of the Working Group II to the Fifth Assessment Report of the Intergovernmental Panel on Climate Change. C.B. Field and other (eds.) Cambridge, UK and New York: Cambridge University Press.
Egemen and Qazaqstan (2015). Kazakhstan to introduce electric buses. 24 December. Available at https://en.egemen.kz/article/216394-kazakhstan-to-introduce-electric-buses
Ellis, Peter, and Mark Roberts (2016) Leveraging Urbanization in South Asia: Managing Spatial Transformation for Prosperity and Livability. Washington, D.C.: International Bank for Reconstruction and Development/World Bank.
Fleurbaey, Marc, and others (2019). A Manifesto for Social Progress: Ideas for a Better Society. Cambridge, UK, Cambridge University Press.
Gadepalli, Ravi (2016). Role of intermediate public transport in Indian cities. Economic and Political Weekly, vol. 51, No. 9, pp. 46–49.
Garg, Amit, Shurtika Parihar, and Vidhee Avishia (2018). Land Use Change Trends Of Indian Cities: A Bird’s-Eye View Vulnerabilities of Unplanned Urban Growth. SAGE Publications India.
Guttikunda, Sarath. (2018). Indian National Clean Air Programme. Available at www.urbanemissions.info/blog-pieces/india-ncap-review/
Gudmundsson, Henrik, and Madann Regmi. (2017). Developing the sustainable urban transport index. Transport and Communication Bulletin for Asia and the Pacific (No. 87). Available at https://www.unescap.org/sites/default/files/bulletin87_3%20Developing%20the%20Sustainable%20Urban%20Transport%20Index_0.pdf
Guttikunda, Sarath, K. A. Nishadh, and Puja Jawahar (2019). Air pollution knowledge assessments for 20 Indian cities. Urban Climate, vol. 27, pp. 124 –141.
HCMC DOT (2017). TP.HCM đầu tư 250 triệu USD xây dựng giao thông dung minh (in Vietnamese).
India Ministry of Road Transport and Highways (2018). Road Accidents in India. New Delhi: Ministry of Road Transport and Highways.
India Ministry of Road Transport and Highways (2019). Road Transport Year Book 2016-17. Available at https://morth.nic.in/sites/default/files/Road%20Transport%20Year%20Book%202016-17.pdf
139
SUSTAINABLE URBAN TRANSPORT IN THE ASIA-PACIFIC REGION FOR THE 2030 AGENDA
India Ministry of Statistics and Programme Implementation (2016). Sixth Economic Census: Available at http://mospi.nic.in/all-india-report-sixth-economic-census
India Ministry of Urban Development (2014). Developing operations documents for Urban Metropolitan Transport Authority and Urban Transport Fund.
Intergovernmental Panel on Climate Change (IPCC) (2018) Global Warming of 1.5 oC. Available at https://www.ipcc.ch/sr15/
International Energy Agency (IEA) (2020). India 2020: Energy Policy Review. New Delhi:
International Transport Forum (2017), Integrating urban public transport systems and cycling. Roundtable report 26 April. Available at https://www.itf-oecd.org/integrated-sustainable-urban-transport-roundtable
International Transport Forum. (2018) Social impacts of road pricing: summary and conclusion. Available at https://www.itf-oecd.org/sites/default/files/docs/social-impacts-road-pricing.pdf
Jain, Deepty, and Geetam Tiwar. (2016). How the present would have looked like? Impact of non-motorized transport and public transport infrastructure on travel behavior, energy consumption and CO2 emissions–Delhi, Pune and Patna. Sustainable cities and society, vol.22, pp. 1−10.
Joshi, Rutul, and others (2017). Transit oriented development: lessons from Indian experiences. CUE working paper 36. Ahmedabad: Centre for Urban Equity, CEPT University. Available at https://cept.ac.in/UserFiles/File/CUE/Working%20Papers/Revised%20New/36CUEWP-36_TOD%20Lessons%20from%20Indian%20Experiences.pdf
Kathuria, Rajat, Saon Ray and Kuntala Bandyopadhyay (eds.) (2018). Low Carbon Pathways for Growth in India. Singapore, Springer.
Khatri, Pallavi (2015). Literature review on feasibility study of city bus service in Godhra city. International Journal for Scientific Research and Development, vol. 3, No. 1, pp. 30–33.
Kundu, Debolina (ed.) (2014). Cities for all. Available at https://www.niua.org/sites/all/files/cites_for_all.pdf
MaaS Alliance, (2017). Guidelines and recommendations to create the foundations for a thriving MaaS ecosystem. Available at https://maas-alliance.eu/wp-content/uploads/sites/9/2017/09/MaaS-WhitePaper_final_040917-2.pdf
Malik, Jai, and others (2017). Improving inspection and maintenance system for in-use vehicles in India. Available at https://autodocbox.com/Electric_Vehicle/99600808-Position-paper-improving-inspection-and-maintenance-system-for-in-use-vehicles-in-india-contents-the-energy-and-resources-institute.html
Mc Gurkin, Nancy, and Elaine Murakami (1999). Examining trip-chaining behavior: comparison of travel by men and women. Transportation Research Record Journal of the Transportation Research Board, vol. 1693, No. 1.
McKibben, Bill (2017).Winning slowly is the same as losing. Rolling Stone, 1 December. Available at www.rollingstone.com/politics/politics-news/bill-mckibben-winning-slowly-is-the-same-as-losing-198205/
Mohan, Dinesh, Gettam Tiwari, and Khavi Bhalla (2017). Road safety in India: status report 2016. Available at https://www.roadsafetynetwork.in/wp-content/uploads/2019/01/tripp-road-safety-in-india-status-report-2015.pdf
Nam, Nguyen, and others (2015). Local planning for climate adaptation: Viet Nam’s experience. Asian cities climate resilience, working paper 24:2015. Available at https://pubs.iied.org/sites/default/files/pdfs/migrate/10741IIED.pdf
140
SUSTAINABLE URBAN TRANSPORT IN THE ASIA-PACIFIC REGION FOR THE 2030 AGENDA
National Travel Safety Committee (2018). NTSC’s report on traffic crashes (in Vietnamese).
National Travel Safety Committee (2019). NTSC’s report on traffic crashes (in Vietnamese).
National Travel Safety Committee (2020). NTSC’s report on traffic crashes in March and the first 3 months of 2020 (in Vietnamese).
Nofal, Beatriz, and others (2019). Policy and institutional framework for delivering on sustainable infrastructure. G20 Insights. Available at g20-insights.org/policy_briefs/policy-and-institutional-framework-for-delivering-on-sustainable-infrastructure/
Organisation for Economic Co-operation and Development (OECD) (2019) Economic Outlook for Southeast Asia, China and India 2020 : Rethinking Education for Digital Era. Paris: OECD Publications.
Petkar, Arati, and Sneha Hamond (2013). A study of transit-oriented development in Indian context. International Conference on Advances in Engineering and Technology. Pune: Elsevier.
Ramanathan, Verrabhadran, and others (2014). India-California Air Pollution Mitigation Program: options to reduce road transport pollution in India. New Delhi: The Energy and Resources Institute.
Regional Center for Renewable Energy and Energy Efficiency (RCREEE), published in June 2020 at:
https://www.rcreee.org/content/rcreee-explores-emobilty-opportunities-and-challenges-cairo-egypt
Reddy, Sudhahara, and P. Balachandra (2010). Dynamics of urban mobility: a comparative analysis of megacities of India. Indira Gandhi Institute of Development Research, Mumbai Working Papers 2010-023. Mumbai, India: Indira Gandhi Institute of Development Research.
Regmi, Madan (2018). Sustainable urban transport index for Asian cities. Intergovernmental Eleventh Regional Environmentally Sustainable Transport (Est) Forum in Asia. Ulaan Baatar, 2−5 October. Background Paper for EST Plenary Session-6. Available at https://Www.Uncrd.Or.Jp/Content/Documents/6994Background%20Paper%20(2)%20for%20EST%20Plenary%20Session%206-11th%20Regiona%20ES.Pdf
Rossat (2018) Russian Statistical Yearbook. Available at http://ghdx.healthdata.org/record/russia-statistical-yearbook-2018/
Sachs, Jeffrey (2015) The Age of Sustainable Development. New York, Columbia University Press,
Saigoneer (2017). Traffic jams are costing Hanoi $600mn annually: studies. 10 July.
Seoul Solution (2014) The change of Seoul city air quality policy. Available at https://seoulsolution.kr/ko/node/3025).
Seto, Karen, and others (2012). Urban land teleconnections and sustainability. PNAS, vol. 109, No. 20, pp. 7687−7692.
Sharma, Sumit, and Atal Kumar (2016). Air pollution emissions scenario for India. New Delhi: The Energy and Resources Institute.
Sharma, Sumit, and others (2018). Measures to control air pollution in urban centres of India. Policy brief: Mumbai: The Energy and Resources Institute.
Silvain, Jean-François, and others (2018). La lutte contre l’érosion de la biodiversité doit être une priorité internationale. Le Monde, 10 January.
141
SUSTAINABLE URBAN TRANSPORT IN THE ASIA-PACIFIC REGION FOR THE 2030 AGENDA
Singh, Namita, Trupti Mishra, and Rangan Banerjee (2018). Greenhouse gas emissions in India’s Road Transport Sector. In Climate Change Signals and Response, Chandra. Venkataraman, Trupti. Mishra, Subimal Ghosh and Subhankar Karmakar. Singapore: Springer.
The Energy and Resources Institute (2015). Energy Security Outlook: Defining a Secure and Sustainable Energy Future for India. New Delhi: The Energy and Resources Institute
Thu, Nguyen, and Lars Blume (2018). Air quality report: air quality in Viet Nam in 2017. Available at https://cleanairday.vn/wp-content/uploads/2019/04/AQR_ENG_FINAL.pdf
Tiwari, Geetam (2011). Key mobility challenges in Indian cities. International Transport Forum Discussion Papers, No. 2011/18, Paris: OECD Publishing.
Tiwari, Geetam and Nishant Singh. (2018). Travel to work in India: current patterns and future concerns. TRIPP-PR-18-01. New Delhi: Transportation Research and Injury Prevention Programme.
Toh, Michelle, and Leonie Erasmus (2019). Alibaba’s “City Brain” is slashing congestion in its hometown. CNN, 15 January. Available at https://www.cnn.com/2019/01/15/tech/alibaba-city-brain-hangzhou/index.html
Truong, Dinh (2020). Air pollution’s effects on Viet Nam’s economic structure. Vietnamnet, 11 February. Available at https://vietnamnet.vn/en/sci-tech-environment/air-pollution-s-effects-on-vietnam-s-economic-structure-614682.html
Tuan, Vu, and Huynh Nguyen (2019). through motorcycle lane system – an empirical study in Ho Chi Minh City. A paper presented at fifteenth International Asian Urbanization Conference “Urban Features: Critical Urban Transformations in Asian Cities”, Ho Chi Minh City, Viet Nam 27-30 November 2019, Vietnamese-German University, Binh Duong, Viet Nam.
UN HABITAT (2013a) Planning and Design for Sustainable Urban Mobility: Global Report on Human Settlements 2013. New York: Routledge.
UN HABITAT(2013b) Transport and mobility snapshots. Available at https://unhabitat.org/books/transport-and-mobility-snapshots/
UN HABITAT (2018) Streets as Public Spaces and Drivers of Urban Prosperity. Nairobi: UN-HABITAT.
United Cities and Local Governments (2018) Annual report. Available at https://www.uclg.org/sites/default/files/annual_report_2018.pdf
United Nations (2016). Mobilizing sustainable transport for development. analysis and policy. Recommendations from the United Nations Secretary-General’s High-Level Advisory Group on Sustainable Transport. New York: United Nations.
United Nations (2016). United Nations Framework Convention on Climate Change. Available at:https://unfccc.int/process-and-meetings/the-convention/what-is-the-united-nations-framework-convention-on-climate-change
United Nations, Economic and Social Commission for Asia and Pacific (ESCAP) (2012). Sustainable urban transportation systems: an overview. Bangkok: ESCAP.
United Nations, Economic and Social Commission for Asia and Pacific (ESCAP) (2017a) Monograph Series on Sustainable and Inclusive Transport – Assessment of Urban Transport Systems, October 2017. Bangkok: ESCAP.
142
SUSTAINABLE URBAN TRANSPORT IN THE ASIA-PACIFIC REGION FOR THE 2030 AGENDA
United Nations, Economic and Social Commission for Asia and Pacific (ESCAP) (2017b). Review of Developments in Transport in Asia and the Pacific 2017 (United Nations publication, Sales No. E.18.II.F.6).
United Nations, Economic and Social Commission for Asia and Pacific (ESCAP) (2018a) Inequality in Asia and the Pacific in the era of the 2030 Agenda for Sustainable Development (United Nations publication, Sales No. E.18.II.F.13)
United Nations, Economic and Social Commission for Asia and Pacific (ESCAP) (2018b) Policy framework for the use and deployment of intelligent transport systems in Asia and the Pacific. Available at https://www.unescap.org/sites/default/d8files/knowledge-products/June_Policy%20Framework%20for%20the%20Use%20and%20Deployment%20of%20ITS%20in%20Asia%20and%20the%20Pacific.pdf
United Nations, Economic and Social Commission for Asia and Pacific (ESCAP) (2019a) Guidelines for the regulatory frameworks of intelligent transport systems in Asia and the Pacific. Available at https://www.unescap.org/sites/default/d8files/knowledge-products/Guidelines_for_the_Regulatory_Frameworks_of_ITS.pdf
United Nations, Economic and Social Commission for Asia and Pacific (ESCAP) (2019b) Intelligent transport systems. Transport and Communications Bulletin for Asia and the Pacific, N.88, Bangkok: ESCAP.
United Nations, Economic and Social Commission for Asia and Pacific (ESCAP) (2019c). The Future of Asian and Pacific Cities: Transformative Pathways Towards Sustainable Urban Development. Available at- https://www.unescap.org/sites/default/files/publications/Future%20of%20AP%20Cities%20Report%202019_0.pdf
United Nations, Economic and Social Commission for Asia and Pacific (ESCAP) (2019d). Using smart transport technologies to mitigate greenhouse gas emissions from the transport sector in Asia and the Pacific. Available at https://www.unescap.org/sites/default/d8files/knowledge-products/Chapter01%20-%20Smart%20Transport%20Technologies.pdf
Van Audenhove, François-Joseph, and others (2014). The future of urban mobility – 2.0 imperatives to shape extended mobility ecosystems of tomorrow. Available at https://www.adlittle.com/sites/default/files/viewpoints/2014_ADL_UITP_Future_of_Urban_Mobility_2_0_Full_study.pdf
Vibha Upadhyaya (2016). Smart Cities: A vision for Development of Indian Cities. Imperial Journal of Interdisciplinary Research (IJIR), 2 (10).
Wackernagel, Mathis, and William Rees. (1996). Our Ecological Footprint: Reducing Human Impact on the Earth. Ann Arbor, Michigan New Society Publishers.
World Bank(2013). Urbanization beyond Municipal Boundaries – Directions in Development - Countries and Regions Washington, D.C.: World Bank.
World Bank (2017). The World Bank Annual Report 2017. Washington, DC: World Bank.
World Bank_(2019). Viet Nam Development Report 2019. Washington, D.C.: International Bank for Reconstruction and Development/The World Bank.
World Health Organization (WHO) (2015) Global Status Report on Road Safety 2015. Geneva: WHO.
World Health Organization (WHO) (2016) Ambient Air Pollution: A Global Assessment of Exposure and Burden of Disease. Geneva: WHO.
World Health Organization (WHO) _(2018a). Global Ambient Air Quality Database. Available from https://www.who.int/airpollution/data/cities/en/
143
SUSTAINABLE URBAN TRANSPORT IN THE ASIA-PACIFIC REGION FOR THE 2030 AGENDA
World Health Organization (WHO) (2018b). Global status report on road safety 2018. Geneva, WHO.
World Health Organization (WHO) (2018c). More than 60 000 deaths in Viet Nam each year linked to air pollution. 6 June. Available at https://www.who.int/vietnam/news/detail/02-05-2018-more-than-60-000-deaths-in-viet-nam-each-year-linked-to-air-pollution
World Resources Institute (2019). Fiscal policies and taxation incentives for improved public bus systems in India. Available at https://shaktifoundation.in/report/fiscal-policies-taxation-incentives-improved-public-bus-systems-india/