Sustainable supply of non-food biomass for a resource ...
55
Sustainable supply of non-food biomass for a resource efficient bioeconomy A review paper on the state-of-the-art
-
Upload
khangminh22 -
Category
Documents
-
view
1 -
download
0
Transcript of Sustainable supply of non-food biomass for a resource ...

Sustainable supply of non-food biomass
for a resource efficient bioeconomy
A review paper on the state-of-the-art

2
Authors: Cosette Khawaja, Rainer Janssen
Reviewers: Calliope Panoutsou, Luc Pelkmans, Berien Elbersen, Melvin Askew, Manolis Karampinis, Matthias Dees, Ludger Wenzelides
Published: © 2014 by WIP - Renewable Energies
Sylvensteinstr. 2, 81369 Munich, Germany
Contact: Cosette Khawaja, Rainer Janssen
WIP - Renewable Energies
Tel.: +49 89 720 12 740
Tel.: +49 89 720 12 743
www.wip-munich.de
Website: www.s2biom.eu
Copyright: All rights reserved. No part of this paper may be reproduced in any form or by any means, in order to be used for commercial purposes, without permission in writing from the publisher. The authors do not guarantee the correctness and/or the completeness of the information and the data included or described in this paper.
Disclaimer: The sole responsibility for the content of this paper lies within the authors. It does not necessarily reflect the opinion of the European Union. The European Commission is not responsible for any use that may be made of the information contained therein.

3
Table of content
Acknowledgements .................................................................................................. 5
The S2Biom project .................................................................................................. 6
Summary ................................................................................................................... 7
1. Introduction ......................................................................................................... 9
2. Forest biomass in EU-28 .................................................................................. 10
2.1. Present use of forest biomass ................................................................... 10
2.2. Sustainable potential supply of forest biomass .......................................... 13
2.3. EU policies for sustainable supply of forest biomass ................................. 18
3. Non-food lignocellulosic crops in EU-28 ........................................................ 21
3.1. Present use of non-food lignocellulosic crops ........................................... 21
3.2. Sustainable potential supply of non-food lignocellulosic crops .................. 21
3.3. EU policies for sustainable supply of non-food lignocellulosic crops ......... 23
4. Agricultural residues in EU-28 ......................................................................... 26
4.1. Present use of agricultural residues .......................................................... 26
4.2. Sustainable potential supply of agricultural residues ................................. 26
4.2.1. Primary agricultural residues ...........................................................................27
4.2.1.1. Crop residues ..............................................................................................27
4.2.1.2. Pruning residues ..........................................................................................30
4.2.1.3. Livestock residues .......................................................................................32
4.2.1.4. Other primary residues ................................................................................33
4.2.2. Secondary agricultural residues ......................................................................34
4.2.2.1. Secondary crop residues .............................................................................34
4.2.2.2. Secondary animal residues ..........................................................................35
4.2.3. Total potential supply from agricultural residues ..............................................35
4.3. EU policies for sustainable supply of agricultural residues ........................ 35
5. Residual biomass from waste in EU-28 .......................................................... 36
5.1. Present use of residual biomass from waste ............................................. 36
5.2. Sustainable potential supply of residual biomass from waste .................... 36
5.2.1. Biodegradable Municipal Waste ......................................................................36
5.2.2. Common sludge ..............................................................................................37
5.3. EU policies for sustainable supply of biomass from waste ........................ 39

4
6. Conclusion ........................................................................................................ 41
Abbreviations .......................................................................................................... 44
Conversion rates .................................................................................................... 44
List of Figures ......................................................................................................... 45
List of Tables .......................................................................................................... 45
List of references .................................................................................................... 46
Annex I: Overview of voluntary sustainability certification schemes applied
to solid biomass: FSC, PEFC, NTA 8080, GGL and Laborelec label ... 50

5
Acknowledgements
This review paper was elaborated in the framework of the S2Biom project (grant
agreement number 608622), supported by the European Commission through the
Seventh Framework Programme (FP7). The authors would like to thank the
European Commission for the support of the S2Biom project as well as the reviewers
and S2Biom partners for their contribution to this paper.

6
The S2Biom project
The S2Biom project - Delivery of sustainable supply of non-food biomass to support a
“resource-efficient” Bioeconomy in Europe - supports the sustainable delivery of non-
food biomass feedstock at local, regional and pan-European level through developing
strategies and roadmaps that will be informed by a “computerized and easy to use”
toolset (and respective databases) with updated harmonized datasets at local,
regional, national and pan-European level for EU-28, Western Balkans, Moldova,
Turkey and Ukraine. Further information about the project and the partners involved
are available under www.s2biom.eu.
The S2Biom project consortium:
Project coordinator
Scientific coordinator
Project partners
7
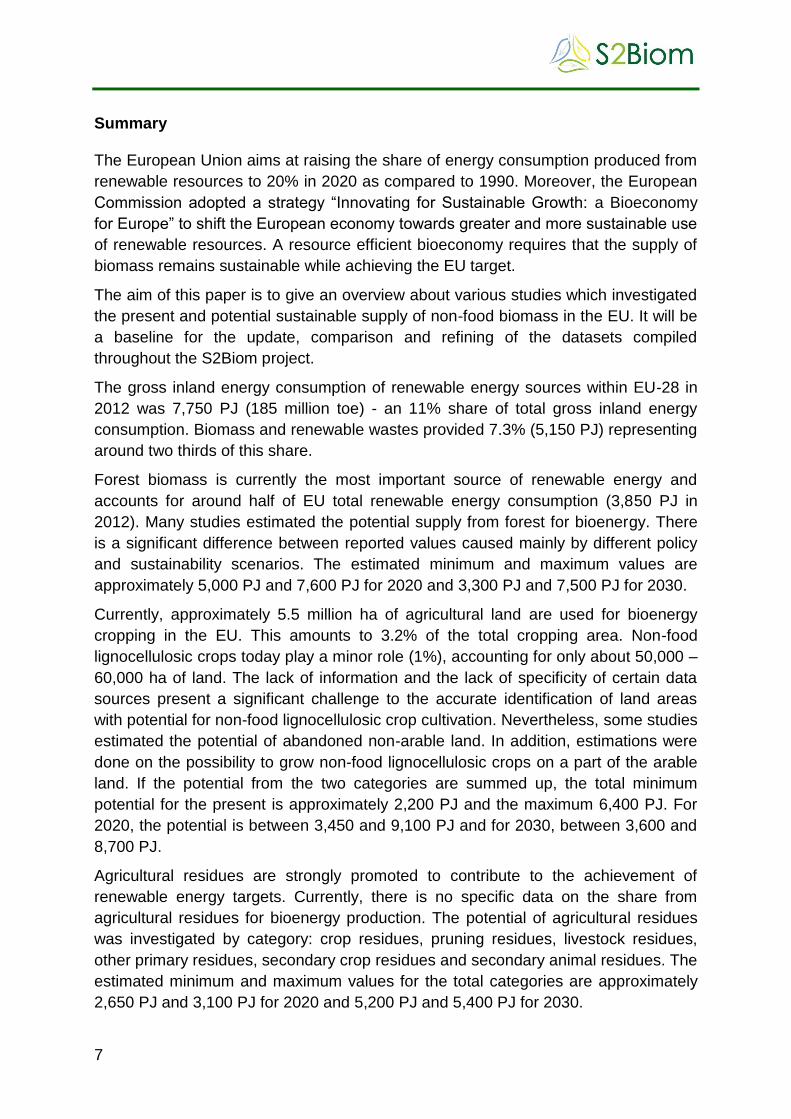
Summary
The European Union aims at raising the share of energy consumption produced from
renewable resources to 20% in 2020 as compared to 1990. Moreover, the European
Commission adopted a strategy “Innovating for Sustainable Growth: a Bioeconomy
for Europe” to shift the European economy towards greater and more sustainable use
of renewable resources. A resource efficient bioeconomy requires that the supply of
biomass remains sustainable while achieving the EU target.
The aim of this paper is to give an overview about various studies which investigated
the present and potential sustainable supply of non-food biomass in the EU. It will be
a baseline for the update, comparison and refining of the datasets compiled
throughout the S2Biom project.
The gross inland energy consumption of renewable energy sources within EU-28 in
2012 was 7,750 PJ (185 million toe) - an 11% share of total gross inland energy
consumption. Biomass and renewable wastes provided 7.3% (5,150 PJ) representing
around two thirds of this share.
Forest biomass is currently the most important source of renewable energy and
accounts for around half of EU total renewable energy consumption (3,850 PJ in
2012). Many studies estimated the potential supply from forest for bioenergy. There
is a significant difference between reported values caused mainly by different policy
and sustainability scenarios. The estimated minimum and maximum values are
approximately 5,000 PJ and 7,600 PJ for 2020 and 3,300 PJ and 7,500 PJ for 2030.
Currently, approximately 5.5 million ha of agricultural land are used for bioenergy
cropping in the EU. This amounts to 3.2% of the total cropping area. Non-food
lignocellulosic crops today play a minor role (1%), accounting for only about 50,000 –
60,000 ha of land. The lack of information and the lack of specificity of certain data
sources present a significant challenge to the accurate identification of land areas
with potential for non-food lignocellulosic crop cultivation. Nevertheless, some studies
estimated the potential of abandoned non-arable land. In addition, estimations were
done on the possibility to grow non-food lignocellulosic crops on a part of the arable
land. If the potential from the two categories are summed up, the total minimum
potential for the present is approximately 2,200 PJ and the maximum 6,400 PJ. For
2020, the potential is between 3,450 and 9,100 PJ and for 2030, between 3,600 and
8,700 PJ.
Agricultural residues are strongly promoted to contribute to the achievement of
renewable energy targets. Currently, there is no specific data on the share from
agricultural residues for bioenergy production. The potential of agricultural residues
was investigated by category: crop residues, pruning residues, livestock residues,
other primary residues, secondary crop residues and secondary animal residues. The
estimated minimum and maximum values for the total categories are approximately
2,650 PJ and 3,100 PJ for 2020 and 5,200 PJ and 5,400 PJ for 2030.
8
Residual biomass from waste is another source of biomass supply for bioenergy
production in the EU. This includes the biodegradable fraction of municipal solid
waste, common sludges and kitchen oils and fats. The gross energy consumption of
the biodegradable fraction of municipal solid waste was 370 PJ in 2012 in EU-28.
The estimated minimum and maximum values for the total categories are
approximately 900 PJ and 1,850 PJ for 2020 and 850 PJ and 1,850 PJ for 2030.
These estimations show that the EU is able to provide between 6,900 PJ and 16,600
PJ from biomass for its energy consumption today. These estimates could increase
to 10,600 PJ and 21,350 PJ in 2020, and to 10,850 PJ and 22,700 PJ in 2030.
The current supply of biomass for energy is not exhausted and biomass can supply
more in the future. However the lack of precise data makes it challenging to estimate
these figures. In addition, the estimates vary to a large extent due to different
definitions of potential and due to different methods applied. Nevertheless most of
the studies reviewed agree that:
Biomass potentials from forestry and waste are relatively stable over time
Waste and agricultural residues has a potential that is currently barely exploited
for energy generation
Large uncertainty exists on how much biomass from agriculture can be supplied.
For the future, non-food lignocellulosic crops and agricultural residues seem to be
the key for a genuine expansion of biomass supply once biomass from forestry
and waste are stable.
The S2Biom project aims at fulfilling the gaps of uncertainties by providing updated
harmonized datasets on the sustainable delivery of non-food lignocellulosic biomass
at local, regional and pan-European level. Moreover it develops strategies and
roadmaps that are informed by a “computerized and easy to use” toolset.

9
1. Introduction
The targets of the EU climate change and energy policy for 2020 are to decrease
greenhouse gas emissions (GHG) by 20%, to increase energy efficiency by 20% and
to raise the share of energy consumption produced from renewable resources to 20%
as compared to 1990. For 2030, the targets are set for a 40% GHG reduction and a
27% share of energy consumption produced from renewable resources compared to
1990.
The primary production of renewable energy within the EU-28 in 2012 was 177
million tonnes of oil equivalent (toe) (7,400 PJ) - a 22.3% share of total primary
energy production from all sources. Among renewable energies, the most important
source in the EU-28 was biomass and renewable waste, accounting for 65.5% of
primary renewables production in 2012 [1].
The gross inland energy consumption1 of renewable energy sources within the
EU-28 in 2012 was approximately 185 million toe (7,750 PJ) - an 11% share of total
gross inland energy consumption. Biomass and renewable wastes provided 7.3%
(123 million toe or 5,150 PJ) representing around two thirds of this share [1].
According to the National Renewable Energy Action Plans it is expected that the use
of other types of renewable energies increases in comparison to bioenergy in 2020,
but the use of bioenergy is still expected to further increase to about 140 million toe
(5,900 PJ) in 2020 [2].
The European Commission has adopted a strategy “Innovating for Sustainable
Growth: a Bioeconomy for Europe” to shift the European economy towards greater
and more sustainable use of renewable resources. The goal is a more innovative and
low-emissions economy, reconciling demands for sustainable agriculture and
fisheries, food security, and the sustainable use of renewable biological resources for
industrial purposes, while ensuring biodiversity and environmental protection.
A resource efficient bioeconomy requires that the supply of biomass remains
sustainable while achieving the EU target. The first step to achieve this target is to
investigate the availability of biomass supply for bioenergy production. This review
paper gives an overview about the state-of-the-art of the present use and potential of
sustainable supply of non-food biomass in EU-28 including forest biomass, non-food
lignocellulosic crops, agricultural residues, and residual biomass from waste.
1 Gross inland energy consumption = primary production + recovered products + net imports + variations of stocks – bunkers.

10
2. Forest biomass in EU-28
Forests are defined by the FAO (Food and Agriculture Organization of the United
Nations) as land with a tree canopy cover of more than 10% and an area of more
than 0.5 ha, comprising trees able to reach a minimum height of 5 m at maturity in
situ.
Other wooded land is land of more than 0.5 ha not classified as a forest. It has a
canopy cover of 5% to 10%, comprising trees able to reach a height of 5 m at
maturity in situ. Alternatively, it has a canopy cover of more than 10% comprising
shrubs, bushes and trees. Neither forests nor other wooded land include land that is
predominantly under agricultural or urban use.
Forests have a variety of ecological functions, serving as habitats for plant and
animal species, helping to protect water and soil resources, as well as contributing to
the fight against climate change by absorbing carbon dioxide that would otherwise
remain in the atmosphere. They also safeguard our infrastructure and settlements by
preventing landslides or avalanches in mountainous regions. In addition, forests are
an important economic factor as suppliers of wood not only for wood products but
also for bioenergy.
Forest biomass is currently the most important source of renewable energy and
accounts for around half of the EU’s total renewable energy consumption (92.5
million toe or 3,850 PJ in 2012). According to the National Renewable Energy Action
Plans, biomass (mainly woody) used for heating, cooling and electricity is expected to
supply about 42% of the 20% renewable energy target for 2020 [3].
2.1. Present use of forest biomass
According to Eurostat, the EU-28 had approximately 180 million ha of forests and
other wooded land in 2010, corresponding to 42.4% of its land area [4]. The EU’s
forests and other wooded land cover approximately the same proportion of land area
as that used for agriculture (Table 1).
Sweden recorded the largest area covered by forest and other wooded land in 2010
(31.2 million ha), followed by Spain (27.7 million ha), Finland (23.3 million ha), France
(17.6 million ha), Germany (11.1 million ha) and Italy (10.9 million ha). The least
densely wooded Member States were Malta, the Netherlands, Ireland and the United
Kingdom.
Between 2000 and 2010, wooded area in the EU increased through natural
expansion and afforestation by a total of 3.5 million ha, a rise of 2%. Only four of the
EU Member States recorded a fall in their areas of wooded land, with Denmark
recording the largest reduction (-5%) ahead of Portugal, Slovenia and Finland. In
relative terms, the largest expansions in wooded area were recorded in Ireland
(21.4%), while Bulgaria and Latvia both recorded increases in excess of 10%.

11
Just under 60% of the EU‑28 forests were privately owned in 2010. There were 11
Member States where the share of privately owned forest was above the EU‑28
average with 98.4% in Portugal. By contrast, the share of privately owned forest was
below 20% in Poland and Bulgaria (where the lowest proportion was recorded, at
13.2%) (Table 1).
The growing stock (the living tree component of the standing volume) of forest and
other wooded land in the EU-28 totalled some 24.4 billion m³ (over bark) in 2010:
Germany had the highest share (14.3%), followed by Sweden (13.8%) and France
(10.6%). Germany also had the largest growing stock in forests available for wood
supply in 2010, some 3.5 billion m³, while Finland, Poland, France and Sweden each
reported between 2.0 and 2.6 billion m³. The net annual increment (growth) in forests
available for wood supply was also highest in Germany with 107 million m³ in 2010
(13.8% of the total increase for the EU-28), while Sweden, France and Finland each
accounted for around 12% of the annual increment across the EU.
Table 1: EU-28 forest area, ownership and stock in 2010 [4].
Country
Land area
without inland water
Forest and
other wooded
land
Forest
Forest ownership
Forest and other wooded
land
Forest available for wood supply
Public Private Growing stock Net
annual increment
(1 000 ha) % % (1 000 m3 over bark)
Belgium 3,033 706 678 44.3 55.7 167,900 164,288 5,289
Bulgaria 10,893 3,927 3,927 86.8 13.2 656,000 435,000 14,677
Czech Republic 7,723 2,657 2,657 76.8 23.2 769,300 737,650 23,086
Denmark 4,243 591 544 23.7 76.3 109,500 111,862 5,796
Germany 34,877 11,076 11,076 51.5 48.5 3,492,000 3,466,179 107,000
Estonia 4,343 2,350 2,217 39.0 61.0 455,200 398,300 11,201
Ireland 6,839 789 739 54.3 45.7 74,300 74,300 3,588
Greece 13,082 6,539 3,903 77.5 22.5 185,000 170,385 4,511
Spain 50,176 27,748 18,173 29.4 70.6 913,900 783,900 45,842
France 55,010 17,572 15,954 25.8 74.2 2,584,000 2,453,193 94,367
Croatia 5,659 2,474 1,920 72.7 27.3 415,590 334,400 7,423
Italy 29,511 10,916 9,149 33.6 66.4 1,448,300 1,285,330 32,543
Cyprus 921 387 173 68.7 31.3 8,829 3,269 38
Latvia 6,220 3,467 3,354 49.4 50.6 634,900 584,000 18,333
Lithuania 6,268 2,240 2,160 63.5 36.5 472,200 408,022 10,750
Luxembourg 259 88 87 47.1 52.9 25,950 25,756 650
Hungary 8,961 2,029 2,029 57.8 42.2 359,387 259,154 11,099
Malta 32 0 0 - - 80 0 0
Netherlands 3,372 365 365 50.4 49.6 70,000 56,000 2,250
Austria 8,241 4,006 3,887 25.7 74.3 1,135,000 1,106,722 25,136
Poland 30,633 9,337 9,337 82.2 17.8 2,049,000 2,092,000 68,519
Portugal 9,068 3,611 3,456 1.6 98.4 187,800 154,000 19,087
Romania 23,016 6,733 6,573 67.7 32.3 1,390,200 1,098,328 33,984
Slovenia 2,014 1,274 1,253 23.2 76.8 417,000 389,927 9,165
Slovakia 4,810 1,933 1,933 50.6 49.4 514,100 477,600 13,193
Finland 30,389 23,269 22,157 30.3 69.7 2,199,391 2,024,000 91,038
Sweden 40,734 31,247 28,203 26.8 73.2 3,369,300 2,651,100 96,486
United Kingdom 24,251 2,901 2,881 33.3 66.7 380,000 340,000 20,700
EU-28 424,578 180,232 158,785 40.3 59.7 24,484,127 22,084,665 775,750

12
Forests available for wood supply are forests where no legal, economic, or
environmental restrictions cause constraints on the sustainable supply of wood. They
do not include protected forests.
The growing stock of the forest and other wooded land available for wood supply in
EU-28 accounted for 22 billion m³ in 2010 (over bark) equivalent to around 90% of
the total growing stock of forest and other wooded land (Table 1).
The primary energy production from forestry in the EU-27 in 2010 accounted for 9.8%
of the total primary energy (80.8 million toe or 3,400 PJ) and for 48.5% of the total
renewable energy according to [5]. In the forestry sector, the differences among
Member States in the production of renewable energy are not very pronounced.
According to the project EUBIONET III [6] which assessed the wood use flow in
Europe based on data from Eurostat, FAO and national partners in the project
(Figure 1) (updated in 2012), the available stock of forests accounted for
25,717 million m3 (solid wood) of which 246 million m3 (0.95%) were used for
bioenergy and 982 million m3 (3.8%) for other purposes. The bioenergy flows are
marked in red in Figure 1. The highest stream is supplied from the forest stock in
form of firewood (82.1 million m3), followed by black liquor from the pulp industry
(66.1 million m3) and sawmill industry (35.8 million m3). The heating value of the
wood used for bioenergy was estimated to be about 80 million toe (3,350 PJ).
Figure 1: Wood use flow in EU-28 in 2012 [6].

13
2.2. Sustainable potential supply of forest biomass
In order to increase wood supply on short and long term from European forests the
following measures can be implemented:
Increasing the productivity of standing forest area which will increase the harvest
level of the forest that is productively used. This can be done by taking
silvicultural measures such as site preparation, fertilisation, weed control,
protection measures, species and provenance selection, spacing, thinning
intensity and better managing production time,
Increasing the harvest area by starting to remove the annual increment from the
unexploited forests,
Removing a larger amount of logging and forest residues from the forest,
Investing in the development of new technology in procurement and in the use of
energy wood,
Motivating forest owners to harvest in time and/or start exploiting parts of their
forest that were unused.
However, all these measures might have constraints with respect to the sustainability
of future forest biomass supply. Constraints can be technical (e.g. losses from
harvesting and logging techniques, road infrastructure and logistics), social (e.g.
forest owners unwillingness to manage forests), economic (e.g. increase of wood
price) and environmental (e.g. biodiversity, nutrient losses).
Until today, there is no general agreement on the sustainable potential of wood
supply for bioenergy production in Europe. Therefore an overview on different
estimates is presented below.
The European Forest Sector Outlook Study (EFSOS) II [7] prepared by UNECE
(United Nations Economic Commission for Europe) and FAO in 2011, presents
varying scenarios for the European forest sector up to 2030, based on differing
assumptions about priorities and policy choices. The reference scenario in this study
was based on the Intergovernmental Panel on Climate Change (IPCC) B2 storyline
which describes a world in which the emphasis is on local solutions to economic,
social, and environmental sustainability. It is a world with continuously increasing
global population, intermediate levels of economic development, and slow and
diverse technological change.
The EFSOS II study shows that if no major policies or strategies are changed in the
forest sector and trends outside it follow the lines described by the IPCC B2 storyline
(Reference scenario), consumption of forest products and wood energy will grow
steadily up to 1,167 million m3 round wood equivalent (RWE) equivalent to
approximately 156 million toe (6,550 PJ) and wood supply will expand to
1,179 million m3 RWE to meet this demand (158 million toe or 6,600 PJ) (Figure 2).
All components of supply will have to expand, especially harvest residues. However,
due to the increased demand for wood for energy, wood prices are likely to increase.

14
Figure 2 shows the supply and demand of the reference scenario in comparison with
three other scenarios. The main conclusions of these scenarios are the following:
1. Maximising biomass carbon scenario (2030 Carbon): To maximise the forest
sector’s contribution to climate change mitigation, the best strategy is to combine
forest management focused on carbon accumulation in the forest, longer rotations
and a greater share of thinnings, with a steady flow of wood for products and
energy. In the long term however, the sequestration capacity limit of the forest will
be reached, and the only potential for further mitigation will be regular harvesting,
to store the carbon in harvested wood products or to avoid emissions from non-
renewable materials and energy sources. The demand and supply in this scenario
will stay more or less constant compared with the Reference scenario.
Figure 2: Supply/demand balance in the quantified scenarios, 2010-2030 [7].
2. Priority to biodiversity scenario (2030 Biodiversity): If biodiversity was given
priority, for instance by setting aside more land for biodiversity conservation and
changing forest management to favour biodiversity, the supply of wood from the
European forest would be 12% less than in the Reference scenario. This
necessitates reduced consumption of products and energy, and/or increased
imports from other regions and/or intensified use of other sources like landscape
care wood and wood originating from conservation management and short
rotation coppice.
3. Promoting wood energy scenario (2030 Wood energy): If wood is to play its part
in reaching the targets for renewable energy, with rather favourable assumptions
about energy efficiency and increases for other renewable energies, and without
expanding forest area, wood supply would have to be mobilised strongly,
increasing by nearly 50% in twenty years. However the mobilisation of such high

15
volumes would have significant environmental, financial and institutional costs. To
achieve this level of highly intensive silviculture and harvesting, strong political will
would be necessary to modify many framework conditions for wood supply. The
very high levels of extraction of residues and stumps would adversely affect
nutrient flows, soil carbon content and thus water holding capacity and
biodiversity. Forests would also be less attractive for recreation.
To increase European wood supply from outside the existing forest sector, it
would be necessary to establish short rotation coppice on agricultural or other
types of land. This could significantly reduce the pressure on the existing
European forest and help to build the share of renewables in energy supply, but
at the cost of trade-offs with other land uses and, depending on site selection
processes, it will have both negative and positive effects on landscape,
biodiversity, air, water, soil quality and ecosystem services.
Demand for energy wood is directly determined by the efficiency with which it is
used. The most energy efficient ways in general are for heat production or in CHP
installations. The distribution of the resource also influences the efficiency of the
wood energy pathway, as transporting large volumes of bulky, moist wood is
inefficient. Use efficiency is improved if transport distances are kept short, or if
wood energy is transported in concentrated forms, such as pellets or biofuels.
Efficient wood burning installations equipped with the necessary filters prevent the
emission of fine particles which are harmful to human health.
A method developed for EFSOS II, which builds on the sustainability assessment of
SoEF (State of Europe’s Forests) 2011, has been used to review the sustainability of
the Reference scenario and all three quantified policy scenarios. Most sustainability
parameters, in this experimental method, are relatively satisfactory. The main
concern is for biodiversity, as increased harvest pressure in all scenarios, except for
the Priority to biodiversity scenario lowers the amount of deadwood and reduces the
share of old stands. The Promoting wood energy scenario shows sustainability
concerns with regards to forest resources and carbon, due to the heavy pressure of
increased wood extraction to meet the renewable energy targets.
In comparison with the presented scenarios from EFSOS II, a more conservative
view on potential future supply of forest biomass in Europe is expressed by several
NGO. For example Birdlife International, European International Bureau and
Transport and Environment have commissioned the International Institute for
Sustainability Analysis and Strategy (IINAS) in cooperation with the European Forest
Institute (EFI) and Joanneum Research (JR) to carry out a study on the sustainability
of woody bioenergy in the EU [8]. The study underlines the following main
observations:
Europe’s use of wood for material and energy purposes in 2010 was already
relatively close to the estimated 2030 potential of wood, if we are to see only low
environmental and climate risks. A significant increase in the use of wood
compared to 2010 will probably lead to increased reliance on imports,

16
displacement of wood use in other sectors and increased pressure on forests both
in Europe and elsewhere. The domestic (low-risk) potential of wood in 2030 for
material and energy use as estimated in this study (208 million toe or 8,700 PJ)
would be exhausted if the use of wood for energy is increased by only 50% from
the 2010 level of use.
Only the use of woody residues for energy, either from forest harvesting,
industrial processes or landscape care offer real climate benefits within a policy
relevant time scale, since they are the only woody biomass feedstock with GHG
intensities below those of fossil fuels.
The potential for low-risk woody biomass in the EU is not enough to meet the
expected demand (210 million toe or 8,800 PJ) as proposed by the European
Commission for all uses by 2030.
The sustainability scenario showed that woody bioenergy could contribute
sustainably to the EU’s energy needs with up to about 103 million toe (4,300 PJ)
by 2030, satisfying 7% of all energy production demand with minimal
environmental impacts and without relying on imports. This would require
increased cascading use of wood for paper and packaging to reduce wood
demand for materials, increased recycling of post-consumer wood from which
some energy could be recovered, as well as increased use of short rotation
coppice (SRC) instead of wood from forests. As a result of this, the overall
consumption of wood from forests available for different uses would be well
below amounts which would pose a risk to the climate and the environment.
Current policies will lead to significant GHG emissions from the use of wood
energy by 2030. Without additional measures, woody bioenergy use will not
reach carbon neutrality even in a 100-year timeframe. With the correct policy
choices promoting cascading use of wood and disincentivising the use of wood
with high GHG intensity like stemwood, net biogenic GHG emissions of woody
bioenergy use could be brought to nearly zero by 2030.
The Biomass Futures project also provided estimates on the supply of wood for
energy use in EU-27 for 2010, 2020 and 2030 based on the EUWOOD project [9].
The results are presented in Table 2. The EUWOOD project estimated the amounts
of wood energy supply for 2020 and 2030 at about 119 million toe (5,000 PJ) and
162 million toe (6,800 PJ), respectively [10].
Table 2: Estimation of total potential forest supply for 2010, 2020 and 2030 in EU-27 [9].
Forest products for bioenergy use 2010 2020 2030
Energy potential (PJ) Additionally harvestable round wood 1,719 1,586 1,613
Primary forestry residues 849 1,724 1,752
Sawmill by-products 380 423 474
Saw-dust 188 209 234
Other industrial wood residues 194 229 272
Black liquor 261 701 366
Post-consumer wood 318 368 412
Total 3,909 5,239 5,123

17
The estimated energy potentials of wood supply from forest for 2010, 2020 and 2030
in the EU are summarised in Table 3.
Table 3: Studies estimating wood supply from forest for bioenergy use for 2010, 2020 and 2030 in EU-27.
Studies estimating wood supply from forest for bioenergy use
2010 2020 2030
Energy potential (PJ) EFSOS II 2,434
EFSOS II - Reference scenario 3,274
EFSOS II - biodiversity 3,274
EFSOS II - Promoting wood energy 4,084
EFSOS II - biomass carbon 3,274
Biomass Futures 3,909 5,239 5,123
EUWOOD 2,200 5,000 6,800
IINAS 3,000 3,6502 4,300
The different existing estimations of forest potential supply for bioenergy production,
(minimum and maximum values) are illustrated in Figure 3. It is clear that there is a
significant difference between these values caused primarily by different policy and
sustainability scenarios.
Figure 3: Minimum and maximum estimated bioenergy potential from forest biomass in the EU for 2010, 2020 and 2030.
The actual energy use from forest biomass was approximately 92.5 million toe
(3,850 PJ) in 2012, but according to Biomass futures project which recorded the
maximum estimated values there is still a large amount of wood from forest that could
be exploited for bioenergy use under the 2010 policy requirements.
2 This value is linearly extrapolated from the values of 2010 and 2030
0
1,000
2,000
3,000
4,000
5,000
6,000
7,000
8,000
2010 2020 2030
PJ
Year
Minimum
Maximum

18
2.3. EU policies for sustainable supply of forest biomass
The EU has a long history of contributing through its policies to implementing
sustainable forest management and to Member States’ decisions on forests although
there is no common EU forest policy or guiding framework for forest-related issues.
Important developments have taken place including the Europe 2020 strategy for
growth and jobs, the Resource Efficiency Roadmap, Rural Development Policy,
Industrial Policy, the EU Climate and Energy Package with its 2020 targets, the Plant
Health and Reproductive Materials Strategy and the Biodiversity and Bioeconomy
Strategies [11] [12].
Since 1990, FOREST EUROPE (The Ministerial Conference on the Protection of
Forests in Europe) which is the pan-European political process for the sustainable
management of the continent’s forests has been developing common strategies for
its 46 member countries and the European Union on how to protect and sustainably
manage forests. The collaboration of the ministers responsible for forests in Europe
has had a great economic, environmental and social impact on the national and
international level. FOREST EUROPE has led to achievements such as the
guidelines, criteria and indicators for sustainable forest management. The approach
of Forest Europe follows two main pillars. The first pillar defines objectives for
sustainable forest management and ensures and supports its implementation via
policy measures in a range from informing actors to legislation and measures to
prevent breach of sectorial law with focus on combatting illegal logging. The second
pillar involves monitoring based on commonly agreed criteria and indicators that have
evolved from environmental criteria to a set of criteria that currently covers the
ecological, economic and socio-cultural dimensions [13].
In 1998 the EU made the first attempt to adopt an EU-wide framework for forestry by
creating the 1998 Forestry Strategy [14] based on subsidiarity and shared
responsibility. The strategy established a framework for forest-related actions that
support sustainable forest management and are based on cooperative, beneficial
links between EU and Member State policies and initiatives. The Forest Action Plan
[15] 2007-2011 was an important instrument for implementing the strategy and
addressed four objectives: competitiveness, environment, quality of life and
coordination and communication. Co-financing of forestry measures under the Rural
Development Regulation has been and will remain the main means of EU-level
funding.
In 2013, the EU forest strategy has been renewed based on an ex-post evaluation of
the Forest Action Plan. This strategy aims to put forests and the forest sector at the
heart of the path towards a green economy and to value the benefits that forests can
deliver sustainably, while ensuring their protection. The strategy, and its
implementation, built on existing legislation and international initiatives, including
work carried out under FOREST EUROPE [16], consider the special situation of
small forest owners, and address market-based private-sector tools such as

19
certification. The strategy also focuses on increasing sustainable wood mobilisation
and the cascading principle, prioritising products of higher added value, creating
more jobs and contributing to a better carbon balance. All parties involved need to
show a strong long term commitment and political support. A review will be carried
out by 2018 to assess progress in implementing the strategy.
The EU Renewable Energy Directive [17] (RED) lays down sustainability criteria for
biofuels for transport and bio-liquids used in other sectors, but not for solid and
gaseous biomass used for electricity, heating and cooling. In February 2010, as
required by Article 17(9) of the RED, the EC published a Report on sustainability
requirements for the use of solid and gaseous biomass sources in electricity, heating
and cooling [18]. The EC decided not to introduce EU binding criteria but to adopt
non-binding recommendations to Member States that had already introduced or
planned to introduce national biomass sustainability requirements like Belgium, The
Netherlands, the United Kingdom and Denmark [19].
In 2014, the EC published a report on the state of play on the sustainability of solid
and gaseous biomass used for electricity, heating and cooling in the EU [20], here it
analysed the key internal market and sustainability issues related to biomass for heat
and power generation. The main conclusions of this report were the following:
Since currently a limited number of Member States have adopted broadly
consistent sustainability schemes and no apparent internal market barriers have
been identified so far, it is considered that the risk of market distortion caused by
national sustainability regulations can be effectively managed through the
existing EU tools on technical standards.
The EC has discussed the most important sustainability risks of large-scale
biomass production and use for energy, and reviewed how they are currently
being addressed at EU level. The vast majority of the biomass used today in the
EU for heat and power are considered to provide significant GHG savings
compared with fossil fuels even though a number of knowledge gaps still exist.
Through the reporting requirements under the Renewable Energy Directive, and
other policy initiatives related to the bioeconomy, the EC will closely monitor the
origin and the end-use of biomass in the EU, with a view to taking appropriate
corrective action, if needed. In this way, the Union and its Member States can
ensure a stable and predictable regulatory framework for meeting the 2020
energy and climate targets, while at the same time taking action to minimize the
risks of unintended sustainability impacts.
In The EU there are some sustainability certification schemes. In the SolidStandards
project, an updated overview of these schemes (both existing and in preparation) in
the EU-27 is described [21]. The overview includes factsheets of sustainability
certification initiatives for solid biomass, a comparative analysis of sustainability
certification initiatives for solid biomass and a contextual review of sustainability
criteria recommended by the EC for solid biomass.

20
Annex I gives an overview of the voluntary sustainability certification schemes
applied to solid biomass: FSC, PEFC, NTA 8080, GGL and Laborelec label.
Originally created as Industrial Wood Pellets Buyers (IWPB) to facilitate
intercompany trading of solid woody biomass, the industry-led initiative Sustainable
Biomass Partnership (SBP) [22] was formed in 2013. SBP is driven by major
European utilities that use biomass, mostly in the form of wood pellets, in large
thermal power plants. SBP’s vision is an economically, environmentally and socially
sustainable solid biomass supply-chain that contributes to a low-carbon economy.
SBP is currently focusing on developing tools to provide assurance that woody
biomass is sourced from legal and sustainable sources. SBP recognises fully the
credibility of existing and well-proven forest certification schemes, FSC and PEFC,
and does not wish to compete with or replicate them. Unfortunately there is limited
uptake of certification in some key forest-source areas and the schemes themselves
do not yet cover all the key requirements of biomass users.
Therefore, SBP is working to develop solutions, short-term and long-term, to address
both these issues and is in discussion with both schemes on how these challenges
might be overcome.
SBP immediate priority is to develop standards and processes allowing companies in
the biomass sector to demonstrate compliance with legal, regulatory and
sustainability requirements relating to woody biomass.
The SBP designed a Biomass Assurance Framework representing a clear statement
of principles, standards and processes necessary to demonstrate such compliance.
Wherever possible, use is made of the FSC and PEFC standards and processes
already applied to other forest product streams. Further refinement and strengthening
of these SBP standards will follow as necessary.

21
3. Non-food lignocellulosic crops in EU-28
Non-food lignocellulosic crops are crops that are unsuitable for human or animal food
consumption and are grown exclusively or primarily for the purpose of producing
biomass for energy and/or material purposes in an agricultural rather than a forestry
context. Nearly all of the crops considered within this definition are perennial in
nature, i.e. they can be cut and harvested for biomass over successive years without
re-cultivation or sowing. The whole crop can be harvested and used for energy
production. Two broad types of energy crops are considered, perennial herbaceous
crops (Miscanthus, switchgrass, reed canary grass, giant reed, perennial rye grass)
and woody crops known as short rotation coppice (SRC) (e.g. willow, poplar,
eucalyptus, paulownia).
3.1. Present use of non-food lignocellulosic crops
Based on a compilation of a wide range of data sources it is estimated that at present
there are approximately 5.5 million ha of agricultural land on which bioenergy
cropping takes place. This amounts to 3.2% of the total cropping area [10].
Most of this land is cultivated with oil crops for biodiesel production (82%) or sugar
and starch crops that are used for the production of bioethanol (11%), mostly in
France and Germany but also in the UK, Poland and Romania. Crops grown as
feedstock for biogas production (e.g. maize) also take up an important part of that
land (7%), especially in Germany. Until today non-food lignocellulosic crops for
electricity and heat generation play a minor role (1%), accounting for only about
50,000 – 60,000 ha of land. The largest areas of non-food lignocellulosic crops are in
the UK (mainly miscanthus and willow), Sweden (willow, reed canary grass), Finland
(reed canary grass), Germany (miscanthus, willow), Spain and Italy (miscanthus,
poplar). Statistics of non-food lignocellulosic crops plantations are almost inexistent in
many European countries.
3.2. Sustainable potential supply of non-food lignocellulosic crops
In order to assess the potential supply of non-food lignocellulosic crops for bioenergy,
it is important to assess the areas where these crops can be potentially cultivated if
arable land is not to be considered. These areas include: fallow land in agriculture,
other unutilised land within the current agricultural land area, recently abandoned
agricultural land, recently abandoned arable land and contaminated land.
The Institute for European Environmental Policy (IEEP) assessed the potential
contribution of non-food lignocellulosic crops to Europe’s future energy [23]. The
study showed that the lack of information and the lack of specificity of certain data
sources present a significant challenge to the accurate identification of land areas
with potential for non-food lignocellulosic crop cultivation. The figures in Table 4
suggest a hypothetical area of land that could be investigated further for growing

22
non-food lignocellulosic crops production of about 1.35 million ha. This is
approximately one third of the area cultivated for biofuel feedstock production in
2010. The aggregated figure presented is formed through a combination of estimates
of various land use types and areas. Whether or not these areas could or would be
cultivated in practice remains a major question. Economic, environmental and social
barriers to cultivation would need to be overcome, and the sustainability considered
alongside local investment in collection and processing activities. These additional
constraints could further limit the potential areas of land in the categories reviewed.
Table 4: Categories of land considered in IEEP study for non-food lignocellulosic crop production [23].
Agricultural land Area (ha)
Recently abandoned cropland (<5 years old) 200,000
(Recently abandoned) Grassland moving out of agricultural use since 2009, most likely out of production, includes transitions to urban land
600,000
Fallow land in agricultural rotation, most of which is needed for agronomic purposes 200,000
Other underutilised land within the current UAA but not permanent grassland 300,000
Non-agricultural land
Suitable contaminated sites (excluding areas suited only for afforestation 50,000
Total potentially available land based on optimistic assessments of area 1,350,000
If the 1.35 million ha of land were to be cultivated, a total of between 7.7 and 16.7
million dry tonnes of biomass could be produced annually with embedded energy
content between 3.3 and 7.2 million toe (140 PJ and 300 PJ).
In the EEA-ETC/SIA study [25] and the Biomass Futures project [26] a different
approach was taken to estimating land availability for dedicated cropping. The focus
was on future land availability and tries to identify abandoned agriculture land
between 2004 and 2020. The land estimates in the study builds on CAPRI model
results. The use of the CAPRI results is very logical as it is the only available model
which predicts the EU markets and production responses at the regional level for the
whole EU-27. It simulates the most probable land use changes in European
agricultural sector. For the EEA and Biomass Futures study the CAPRI baseline was
used. It takes into account the most recent Common Agricultural Policy (CAP) Health
Check reform, the 2020 RES Targets and the most recent OECD-FAO projections on
agricultural prices, population and welfare developments [27]. In the EEA and
Biomass Futures assessment it is expected that dedicated cropping with perennials
for bioenergy production is most likely to take place on land that is neither needed for
the production of food and feed nor for biofuel crops. The EEA-ETC/SIA study and
the Biomass Futures study made the same analysis but used different scenarios.
The results of the EEA-ETC/SIA study assessment for 2020 showed that land
availability for dedicated perennial biomass crops in EU-27 ranges between 6.8 and
12 million ha. The biomass produced on this land is estimated to be between 86 and
118 million dry tonnes. The primary energy produced from this biomass is estimated

23
to be between 33 million toe (1,400 PJ) and 45 million toe (1,900 PJ) considering a
heating factor of 16 PJ/million tonnes.
In the Biomass Futures study where only some environmental constraints in the
cropping phase were taken into account, the primary energy potential for non-food
lingocellulosic crops is assessed to be approximately between 51.6 million toe
(2,150 PJ) and 70 million toe (2,950 PJ) in 2020 and between 36.8 million toe
(1,550 PJ) and 60.8 million toe (2,550 PJ) in 2030.
Overall it is clear that there are plenty of land resources in the EU available that are
not going to be used for food and feed production and where non-food lignocellulosic
crops can be grown. Part of these lands will have an agricultural status but many will
have a marginal status and not included any longer in any agricultural or forest land
statistic. Ownership of some of these lands may also be unclear. Whether these
lands can be brought into dedicated cropping land is very much dependent of future
market forces, stimulation measure and sustainability requirements applied nationally
and locally.
If in addition a part from arable land would be used for non-food lignocellulosic crops
production, the estimations will be much higher. In order to estimate how much
arable land is available, first it is necessary to estimate the area needed for food
production. In the EU-27 this is calculated to be about 111 million ha of arable land
and about 69 million ha of permanent grassland. The population of EU-27 is unlikely
to increase rapidly in the near future. Nielsen et al. estimated that assuming a
moderate diet (mixed vegetable-animal products), about 62% of the arable land
would be needed to feed the population of EU-27 [24]. According to the study, if 10%,
20% and 30% of arable land were used for bioenergy crops in EU-27, the potential
bioenergy produced will account for about 49 million toe (2,050 PJ), 98 million toe
(4,100 PJ) and 146 million toe (6,100 PJ), respectively assuming yields of 10 tonnes
dry matter per ha.
If the potential from land suitable for non-food lignocellulosic crops mentioned above
and additional arable lands are summed up, the total minimum estimated potential for
the present will be approximately 52 million toe (2,200 PJ) and the maximum 153
million toe (6,400 PJ). For 2020, the potential will be between 82 and 217 million toe
(3,450 and 9,100 PJ) and for 2030, between 86 and 208 million toe (3,600 and 8,700
PJ).
3.3. EU policies for sustainable supply of non-food lignocellulosic crops
Perennial herbaceous crops and short rotation coppice grown on agricultural
land in the EU have to meet a series of statutory environmental rules regarding the
quality of water, soils and air as any other agricultural biomass, whether used for
food, feed, material or energy (see CAP cross compliance rules).

24
Non-food lignocellulosic crops can undergo two lines of energy conversion pathways:
the production of second generation transport biofuels or the production of heat and
power, knowing that currently the second option is more common.
In case the end product is transport biofuel, it needs to comply with the sustainability
criteria set out in the Renewable Energy Directive 2009/28/EC in order to be eligible
for the targets or any other public support. If the crops are used for heat and power
generation, no sustainability criteria for solid biomass were set by the European
Commission, as it is the case for solid biomass produced from forestry.
Policy makers have begun to address the impact of land use change, both direct and
indirect, associated with the use of conventional (food and feed) crops for conversion
into biofuels. As the debate has progressed there has been an increasing perception
that non-food lignocellulosic crops, which can be grown on marginal and degraded
land, offer one option to limit the impacts of displacing food and feed production from
current farmland. If non-food lignocellulosic crops are grown on agricultural land, the
impact of land use is again in question.
The reformed Common Agricultural Policy (CAP) affects the use of land for bioenergy
production through two pillars: Direct Payment and Rural Development [28] [29].
The first pillar - Direct Payments - will move away from allocations per Member
State and per farmer within the Member State based on historical references. This
will mean a clear and genuine convergence of payments not only between Member
States, but also within Member States. Direct payments are largely decoupled: there
will be no direct incentives supporting the production of bioenergy from energy crops.
Moreover, Greening Payment is introduced meaning that a significant share of the
subsidy will in future be linked to rewarding farmers for the provision of environmental
public goods.
The second pillar of the CAP, through its Rural Development measures, encourages
the supply of bioenergy from agriculture and forestry and the use of bioenergy on
farms and in rural areas. It will be up to Member States / regions to decide which
measures they use (and how) in order to achieve targets set against six broad
"priorities" and their more detailed "focus areas" (sub-priorities). The six priorities
cover:
Fostering knowledge transfer and innovation;
Enhancing competitiveness of all types of agriculture and the sustainable
management of forests;
Promoting food chain organisation, including processing and marketing and
risk management;
Restoring, preserving and enhancing ecosystems;
Promoting resource efficiency and the transition to a low-carbon economy;
Promoting social inclusion, poverty reduction and economic development in
rural areas

25
Beyond 2020 the policy landscape surrounding biofuels and bioenergy could change
dramatically. On 22 January 2014, the EC set out its vision for EU climate and energy
policy up to 2030 proposing significant changes from the current status. The EC
envisages no ‘public support’ for biofuels produced from food–based feedstocks, and
no longer foresees any transport specific targets for renewables post 2020. This may,
depending on how it would be implemented, offer an opportunity for non-food
lignocellulosic crops to expand in area [30].
26
4. Agricultural residues in EU-28
Agricultural residues are generally divided into two categories: primary agricultural
residues which are residues resulting from primary agricultural operations (e.g.
straw, manure) and secondary agricultural residues which are produced during the
processing of crops into food or other products (e.g. bagasse). Both primary and
secondary agricultural residues can be used for energy production. They can be
classified in two categories depending on their moisture content: dry residues which
have low moisture content (e.g. straw) and are more suitable for combustion and
gasification processes and wet residues (e.g. slurry) with high moisture content
making them energetically inefficient to use for combustion or gasification, and
financially and energetically costly to transport. Wet residues are therefore more
suitable for biogas production. Second generation bioethanol can be produced from
dry or wet residues with high ligno-cellulose content (e.g. straw, grass).
Many agricultural residues may have alternative uses or markets such as soil nutrient
recycling and improvement purposes, and any decision to use them for energy must
be made in the context of these alternatives.
Agricultural residues are strongly promoted to contribute to the achievement of
renewable energy targets since competition for resources and land is largely avoided.
4.1. Present use of agricultural residues
According to Eurostat in 2010 the primary renewable energy production from
agriculture in the EU-27 represented 2.1% of the total primary energy produced (17.6
million toe or 750 PJ) and accounted for 10.6% of the total renewable energy
production [5]. Most of this share comes from energy crops. There is no data on the
share from agricultural residues for bioenergy production on EU level. Nevertheless,
it is valuable to mention that in some member states e.g. Denmark, the annual
consumption of straw for heat and power production accounted for 16% of the
national renewable energy production in 2012 which is equivalent to approximately
0.5 million toe or 20 PJ [31].
4.2. Sustainable potential supply of agricultural residues
Agricultural residues are produced from different sources. In order to increase the
accuracy in estimating the potential supply in this paper, agricultural residues have
been divided and assessed according to the following categories:
Primary agricultural residues
o Crop residues
o Pruning residues
o Livestock residue
o Other residues
Secondary agricultural residues

27
4.2.1. Primary agricultural residues
4.2.1.1. Crop residues
Crop residues are parts of the crop that are not harvested during standard
agricultural operations. In the European Union there are large differences between
Member States in terms of cultivated area, types of crops and yields, due to climate
conditions, specific soil condition and farming practices.
The use of agricultural crop residues for bioenergy production requires accurate data
on their availability by crop type. Crop yields depend upon specific local agro-
ecological conditions (climate and precipitation pattern, soil properties, etc.), plant
varieties, farming techniques, etc.
Data on crop yields are directly available, while data on their residues are not, since
the aim of agricultural production was mainly to maximize the yield of main food/feed
product in the past. Crop residue yields are very variable and depend on plant
variety, crop yield, climate and soil conditions, whether the crop is irrigated or rain-
fed, farming practices, harvesting techniques and the cutting height. The availability
of residues depends on the amount that can be removed from land keeping land
fertility maintained and on their competitive use for agricultural or industrial purposes.
There are many studies which estimated crop residue availability in the EU. A study
by ICCT (International Council on Clean Transportation) assessed the total crop
residue production at 367 million tonnes per year and the current net availability of
crop residues for bioenergy at 122 million tonnes per year based on FAOSTAT data
on yields and total annual production of these crops from 2002–2011 (Table 5) [32].
This is equivalent to approximtely 2,150 PJ.
Table 5: Projected production and availability of crop residues in 2011, 2020 and 2030 [32].
Crop type
2011 Total residue
production
2011 Residue
availability
2020 Total residue
production
2020 Residue
availability
2030 Total residue
production
2030 Residue
availability
Million tonnes
Barley 65 22 70 23 74 25
Maize 62 21 66 22 70 23
Oats 10 3 11 4 12 4
Rapeseed 18 6 20 7 22 7
Rice 2 1 2 1 2 1
Rye 11 4 12 4 12 4
Soybeans 2 1 2 1 2 1
Sunflower 9 3 10 3 12 4
Triticale 13 4 13 4 14 5
Wheat 144 48 154 51 163 54
Sugar beet 30 10 31 10 32 11
EU-28 367 122 393 131 417 139

28
For 2030, the ICCT study estimated the availability of crop residues following the
European Commission’s (2012) projections of agricultural production to 2022.
Changes in crop production to 2030 were then linearly extrapolated. The projected
residue availability for 2030 is only slightly higher than the figure for 2011 estimated
at 139 million tonnes (Table 5). In terms of energy this figure is equivalent to
approximately 2,450 PJ.
A study by the Bloomberg New Energy Finance [33] estimated residue production
available for bioenergy production at 151 million t/year in 2030 equivalent to 2,650 PJ
approximately assuming 82.5% of residues are required for soil quality.
Many other studies have estimated the potential of crop residues for bioenergy in
addition to other residues. Figure 4 illustrate the crop residues share in these studies
in EU-27.
Figure 4: Various assessments for crop residue potential and availability in EU-27 [34].
The graph shows that there are significant differences between the estimated results,
depending on the different assumptions considered. These relate to the variability in
relation to crop type cultivation, changing market conditions, as well as competitive
uses of agricultural residues, including the different energy uses of biomass (heat,
electricity generation, and biofuels), biochemical and other bio-products.

29
A study conducted by JRC [35] assessed the availability of 8 crop residues (wheat,
barley, oats, rye, rice, maize, sunflower and rapeseed) in the EU-27. In order to
provide estimates of the crop residues that can be used for bioenergy production, the
study took into account the crop and residue production, environmental constraints
for collection and competitive uses in the livestock sector or for
horticulture/mushroom production.
The total amount of crop residues produced in EU-27 every year was estimated at
258 million dry tonnes per year on average based on residue yields and crop areas.
The share of the 8 different crop residues in EU-27 is shown in Figure 5. For the 10-
year period (1998-2007), a variation of crop residue production between 200 and 305
million dry tonnes per year at EU level was identified.
The analysis of sustainable removal rates concluded that, on average, about 40% of
wheat, barley, rye, oat residues and 50% of the maize, rapeseed and sunflower
residues can be collected, if environmental and harvesting constraints are taken into
account.
Figure 5: Share of 8 crop residues produced in EU-27 [35].
Based on the sustainable removal rates of crop residues, residue-to-crop yield and
seed and straw moisture content, the amount of collectable crop residues was
estimated at an average of 111 million tonnes dry matter of crop residues/year in EU-
27. However, this amount can vary between 86 and 133 million tonnes dry
matter/year depending on crop residue production.
The average consumption of straw for animal breeding and mushroom production
was estimated at 28 million tonnes per year. Therefore, the sustainable total average
amount of crop residues available for bioenergy production in EU-27 is 83 million
tonnes per year. In terms of energy the estimated value is equivalent to
approximately 37 million toe (1,550 PJ). The estimation was based on Lower Heating
Value (LHV) of 17.5 PJ/t dry matter for crop residues. The data also show a higher
temporal variability of available residues in the EU, from 26 million toe (1,090 PJ) to a
maximum of 45 million toe per year (1,900 PJ), depending on the various conditions
considered. This yearly variation ranges between +23% and -28% compared with
average data.

30
Thus, at EU-27 level, the use of agricultural crop residues alone could in average
contribute 3.2% of final energy consumption. However, this figure ranges from
minimum 2.3% to maximum 4%, depending on the availability of residues in different
years.
As a summary, the minimum and maximum values of energy potential from crop
residues according to the studies above for 2011 and 2030 are presented in Figure 6.
Crop residues potential estimation for 2020 was calculated as an average of the
values of 2010 and 2030. Secondary crop residues were estimated to supply the
same amount of energy for 2020 and 2030 as it was for 2011.
Figure 6: Minimum and maximum estimated bioenergy potential from crop residues in the EU for 2011, 2020 and 2030.
4.2.1.2. Pruning residues
Woody material from pruning and cutting can deliver a large potential of biomass. In
some regions of the EU, plantations of soft fruit, citrus, olives and vineyards cover
quite a significant area. The Biomass Futures project assessed the potential supply
of these residues by combining the permanent cropping areas with average harvest
ratios per type of permanent crop. The harvest ratios were derived from several
publications (Table 6).
In the Mediterranean region, pruning residues could be an important resource with
Spain as the largest contributor followed by Italy, Greece and Portugal (Table 7). The
largest potential is delivered by vineyards and olives.
0
500
1,000
1,500
2,000
2,500
3,000
2011 2020 2030
PJ
Year
Minimum
Maximum

31
Table 6: Average residue harvest ratios per type of permanent crop [10].
Land use category Residue yields tonnes dry matter / ha / year
Fruit and berry plantations - total
2.15 Temperate climate fruit and berry plantations
Subtropical climate fruit and berry plantations
Nuts fruit and berry plantations 2.15
Citrus plantations 2.75
Olive plantations - table olives 1.77
Olive plantations - oil production
Vineyards - quality wine
2.81 Vineyards - other wines
Vineyards - table grapes
Vineyards - raisins
Table 7: Potential from woody residues of fruit trees, nuts and berry plantations, olives, citrus and vineyards (ktoe) in 2004, 2020 and 2030 [10].
Country 2004 2020 2030
ktoe
Austria 68 48 39
Belgium/Luxembourg 14 18 26
Bulgaria 81 242 106
Cyprus 33 31 17
Czech Republic 33 10 29
Denmark 6 6 6
Estonia 2 2 1
Finland 3 8 7
France 1,133 996 760
Germany 162 135 129
Greece 858 801 1,163
Hungary 150 255 130
Ireland 1 0 2
Italy 1,966 2,067 1,624
Latvia 20 7 1
Lithuania 23 14 18
Luxembourg 0 0 0
Malta 1 0 3
Netherlands 16 13 14
Poland 260 323 360
Portugal 564 586 512
Romania 318 314 150
Slovakia 26 9 5
Slovenia 27 20 18
Spain 3,570 4,164 3,680
Sweden 2 22 5
United Kingdom 25 15 31
EU27 9,362 10,106 8,836
The potential supply of pruning residues seems to remain relatively stable according
to Biomass Futures assessment. It was estimated at about 10 million toe (423 PJ) in
2020 and 9 million toe (370 PJ) in 2030.

32
With respect to potential applications for bioenergy production, primary residues face
constraints due to their relatively high ash content resulting from the high share of
bark and the presence of agrochemicals on the biomass surface influencing the flue
gases emissions. Therefore, pruning residues are considered low quality fuel and can
be used for combustion technologies aimed for low quality fuels.
4.2.1.3. Livestock residues
Livestock residues or residues from animal husbandry include primarily animal
manure. According to the inventory of manure processing activities in the EU
conducted by the European Commission in 2011 [36], the entire manure production
in the EU that is potentially available for manure processing, for energy recovery and
other purposes is estimated at 1.4 billion tonnes (wet) (Table 8). The largest
production is in France, followed by Germany.
Table 8: Estimated amount of livestock manure produced from pigs, cattle and chicken in the EU Member States by major livestock manure types [36].
Country Pig Cattle Poultry Total
1,000 tonnes / year
Austria 3,538 24,648 1,378 29,564
Belgium 7,189 31,289 2,762 41,241
Bulgaria 904 6,971 1,668 9,545
Cyprus 537 685 276 1,499
Czech Republic 2,203 16,652 2,286 21,142
Denmark 14,279 19,010 1,828 35,117
Estonia 422 2,937 167 3,524
Finland 1,595 11,333 468 13,395
France 17,098 229,436 16,732 263,264
Germany 31,039 159,756 11,218 202,013
Greece 1,087 7,652 3,023 11,762
Hungary 3,905 8,652 2,963 15,519
Ireland 1,696 82,885 - 84,580
Italy 10,681 75,578 2,472 88,731
Latvia 442 4,693 380 5,515
Lithuania 1,036 9,515 840 11,390
Luxembourg 93 2,425 9 2,527
Malta 76 219 47 343
Netherlands 13,978 49,315 9,222 72,515
Poland 16,485 70,344 11,801 98,630
Portugal 2,701 17,756 3,707 24,164
Romania 7,127 33,123 8,021 48,272
Slovakia 855 5,971 1,260 8,086
Slovenia 499 5,800 418 6,716
Spain 30,351 74,297 13,120 117,766
Sweden 1,764 18,985 680 21,430
United Kingdom 5,312 122,190 16,161 143,663
EU-27 176,893 1,092,112 112,905 1,381,911

33
The figures make it possible to assess the share of livestock manure processing for
the individual Member State and for EU as a whole. Currently 7.8% of the livestock
manure in the EU is being processed which is equal to about 108 million tonnes, but
the study does not estimate the bioenergy production from these figures.
Biogas production is one of the important manure processing technologies having
considerable positive effects on the environment, the climate, the waste handling and
the renewable energy production, but there are many other processing technologies
which are implemented and researched in Europe.
Biomass Futures estimated the energy potential from manure in EU-27 for 2004,
2020 and 2030 at 57 million toe (2,400 PJ), 47 million toe (1,950 PJ) and 50 million
toe (2,100 PJ), respectively indicating that manure production is going to decrease
because of reduced livestock numbers.
The BioBoost project estimated the total theoretical potential of residues from
livestock production in Europe at about 1,450 PJ. However, despite the high
theoretical potential, there were no possibilities of obtaining this type of biomass in
most regions, considering the needs of soil conservation. The total technical potential
was assessed at 21 PJ only [37].
4.2.1.4. Other primary residues
There are many other primary residues from agriculture that can supply biomass for
bioenergy such as mowing from permanent grasslands occurring in agricultural land
areas, in areas like recreational or nature conservation areas or dykes and
abandoned grasslands. Management of abandoned areas through mowing could
often be beneficial for biodiversity as low levels of human disturbance stimulate larger
diversity because it prevents one plant species from becoming dominant over others
and thus creates new ecological niches for a range of species.
According to Biomass Futures project, the potential of abandoned grassland cuttings
in EU-27 seems to be non-negligent in 2020 (3.65 million toe or 153 PJ), but towards
2030 it is expected that most of these lands will be converted to productive use again
for grazing or cropping production, which brings down the potential to 0.26 million toe
(11 PJ). The figures provide a limited quantification of the biomass potential from
grasslands as they exclude the potential from non-agricultural lands.
Roadside verge grass can be another source of biomass supply. In Biomass Futures
project the supply was estimated at approximately 1.09 million toe (46 PJ) in 2010 in
EU-27. Roadside verge grass may be an interesting resource to complement the
woody-feedstock potential in regions where large biomass conversion installations
are based. The estimated potential towards 2020 and 2030 is 1.14 million toe (48 PJ)
and 1.16 million toe (49 PJ) indicating a limited, but stable biomass source.

34
4.2.2. Secondary agricultural residues
Secondary agricultural residues are by-products of industrial processing of crops and
animals into food or other products. They may be referred to as agro-industrial
residues. Unlike crop residues, which are available on the field and must be collected
over a wide area, agro-industrial residues are easy to collect at the processing site
and their logistics are thus greatly simplified.
4.2.2.1. Secondary crop residues
The availability of agro-industrial residues on a European level has not been widely
studied. The actual amount of residues produced by a given process depends not
only on the quality of the incoming raw material but also on the process itself. Some
reported values of crop residues are [38]:
Olive husks representing approximately 23% of olive oil production. The
moisture is variable depending on the process and can be up to 30% - though
usually it is much lower
Rice husks representing approximately 16% of rice production, with a moisture
content of 10%
Cotton ginning residues representing approximately 10% of cotton production,
with a moisture content of 17%
The EUBIONET III project estimated the unexploited agro-industrial residues
potential of crops in 17 European countries (Latvia, Estonia, Lithuania, Slovenia,
Czech Republic, Slovakia, The Netherlands, Austria, Germany, Italy, Greece,
Portugal, Spain, Sweden, Norway, Finland and Denmark) at more than 2.4 million toe
(100 PJ) excluding animal excrements and straw [39] (Table 9).
Table 9: Estimated energy production potential from unexploited agro-industrial crop residues [39].
Country 2011
PJ/y
Austria 18.97
Czech Republic 12.00
Denmark 10.89
Estonia 0
Finland 2.5
Germany 4.40
Greece 10.20
Italy 24.28
Latvia 0.876
Lithuania 0.670
Netherlands 0
Portugal 1.39
Slovakia 8.09
Slovenia 0.31
Spain 2.67
Sweden 6.08
Total 103.36

35
4.2.2.2. Secondary animal residues
The residues mapped in this category are defined by Eurostat as “Animal waste of
food preparation and products”.
In the Biomass Futures project, the total current potential of energy from animal agro-
industry was estimated at about 2.8 million toe (115 PJ) in EU-27. However, whether
this potential is really completely available for bioenergy generation is very much in
question. In many EU countries, particularly Germany, Sweden, Finland and Ireland,
this type of waste is already recovered, but not only for energy conversion. The
potential towards 2020 and 2030 are both estimated at about 2.9 million toe (120 PJ).
4.2.3. Total potential supply from agricultural residues
Figure 7 sums up the values of the potential of all agricultural residues for bioenergy
production and shows the minimum and maximum values estimated for 20103, 2020
and 20304.
Figure 7: Minimum and maximum estimated bioenergy potential from agricultural residues in the EU for 2010, 2020 and 2030.
4.3. EU policies for sustainable supply of agricultural residues
Policies on the land use for agriculture follow the CAP (please see section 3.3).
3 Data existing for 2011 for some categories were used for 2010
4 Minimum values of livestock residues potential for 2020 and 2030 were estimated the same as those of 2010
0
1,000
2,000
3,000
4,000
5,000
6,000
2010 2020 2030 2010 2020 2030
PJ
Minimum values Maximum values
Pruning residues Livestock residues Secondary crop residues
Secondary animal residues Other primary residues Crop residues
36
5. Residual biomass from waste in EU-28
Waste is most commonly, and according to the EU Waste Framework Directive,
defined as material which an entity wishes to dispose of. National perception of this
definition varies to a large extent. In the context of biomass, waste will occur in the
forestry and agricultural businesses as well as in biodegradable municipal waste
(BMW). As forestry and agriculture have already been covered, this section covers
only BMW and common sludges.
Biowaste is a putrescible, generally wet waste. There are two major streams – green
waste from parks, gardens etc. and kitchen waste. The former includes usually 50-
60% water and more wood (lignocellulose) and the latter contains no wood but up to
80% water. Waste management options for bio-waste include, in addition to
prevention at source, collection (separately or with mixed waste), anaerobic digestion
and composting, incineration with and without energy recovery, and landfilling. Waste
management processes which can produce energy are anaerobic digestion and
incineration
5.1. Present use of residual biomass from waste
The overall potential for separately collected bio-waste is estimated at up to
150kg/inhabitant/year, including kitchen and garden waste from households, park
and garden waste from public estates, and waste from the food industry (80 million
tonnes for EU-27). About 30% of this potential (24 million tonnes) is collected
separately and treated biologically [40].
In 2012, total Municipal Solid Waste (MSW) in the EU was treated in different ways:
33% was landfilled, 24% incinerated, 27% recycled and 14% composted. In 2001
56% was landfilled, 17% incinerated, 17% recycled and 10% composted in 2001 [41].
Total MSW includes the biodegradable portion in addition to solid waste (plastics
etc). In the EU bio-waste constitutes usually between 30% and 40% (but ranges from
18% up to 60%) of MSW. According to Eurostat the gross energy consumption of the
renewable part of MSW was about 8.84 million toe (370 PJ) in 2012 in EU-28.
5.2. Sustainable potential supply of residual biomass from waste
5.2.1. Biodegradable Municipal Waste
Biodegradable municipal waste (BMW) is defined by the Council Directive
(1999/31/EC)72 as any waste that is capable of undergoing anaerobic or aerobic
decomposition, such as food and garden waste, and paper and paperboard.
A study by the EEA (2006) [42] estimated the total potential of BMW for 2010, 2020
and 2030. The estimation is based on the assumption that BMW currently incinerated
or landfilled without energy recovery is available for incineration with energy
recovery. Similarly waste that is currently composted is assumed to be first

37
anaerobically digested in order to allow energy recovery. The digestate is then
composted.
The EEA study also assumed that waste generation can be reduced by 25 % by
2030, due to household waste prevention measures. The fraction of waste that is
biodegradable is assumed to remain constant in the future.
Results showed that the potential of bioenergy production from BMW is
approximately 19 million toe (795 PJ) for 2010, 17 million toe (715 PJ) for 2020 and
16 million toe (670 PJ) for 2030.
Siemons et al. (2004) estimated the total potential of BMW for 2010 and 2020
assuming the following [43]:
Member states will fulfil their obligations at the lastest time possible. Thus, a
reduction to 35 % of the 1995 number is assumed for 2020
All EU-27 comply fully with the Landfill Directive
In case countries presently produce less BMW for landfill than stated in the
Landfill Directive, these countries will limit the amount of landfilled waste at the
present level, and not increase these quantities
All BMW that does not go to landfill is available for incineration
The moisture content of BMW was estimated at 35% (wet basis).
The results show that the energy recovered from BMW from landfill gas and from
incineration with energy recovery amounts to approximately 24 million toe (1,000 PJ)
in 2010 and 36 million toe (1,500 PJ) in 2020 (Table 10). For the energy potential of
landfill gas, the maximum quantity of gas that can be extracted from a given quantity
of dumped waste is taken, using a calorific value of 3.71 GJ/tonne dry BMW.
Table 10: Availability of BMW for bioenergy production in EU-27 for 2010 and 2020 [43].
2010 2020
million toe
Landfill gas 4.68 2.49
Incineration with energy recovery 19.01 33.71
Total 23.69 36.20
Other types of waste that can be considered under this category are used oils and
fats. The Biomass Futures project has estimated the potential of this category at 2.10
million toe (88 PJ), 2.17 million toe (91 PJ) and 2.16 million toe (90 PJ) for 2010,
2020 and 2030, respectively.
5.2.2. Common sludge
The category common sludge which is defined by Eurostat as “Industrial effluent
sludge” includes all kinds of sludge originating from wastes, waste water treatment
and water preparation. Biomass Futures project estimated the total current potential
of common sludges at about 7.8 million toe (325 PJ), particularly concentrated in the

38
UK, France, Italy and Spain. For 2020 and 2030, the estimation is 8.1million toe
(340 PJ) and 8.2 million toe (340 PJ), respectively.
Siemons et al. estimated the potential of common sludges at about 2.4 million toe
(100 PJ) in 2010 and 2.6 million toe (110 PJ) in 2020 [43]. The quantities of sewage
sludge were taken as a measure for the amount of biogas that could be produced. It
was assumed that 1 dry tonne of sewage sludge could produce 9 GJ of energy.
The present recovery rate of this category is still very low in most EU countries. This
is related to the limited possibilities to recover this waste other than into energy.
Today most of the sludge is incinerated and/or deposited on the land (e.g.
agriculture) and only a small part is already used for energy recovery (e.g. biogas
production), like in Germany, France and Finland.
Figure 8 presents the minimum and maximum estimated values of residual biomass
waste potential for bioenergy production in the EU. The maximum value for energy
supply from municipal waste and the minimum value from sludge for 2030 were
estimated to be the same as the values for 2020.
Figure 8: Minimum and maximum estimated bioenergy potential from residual waste biomass for 2010, 2020 and 2030 in the EU.
0
200
400
600
800
1,000
1,200
1,400
1,600
1,800
2,000
2010 2020 2030 Present 2020 2030
PJ
Minimum values Maximim values
Oils and fats Municipal waste Sludge
39
5.3. EU policies for sustainable supply of biomass from waste
About 33% of municipal waste in the EU was landfilled in 2012. The European
Landfill Directive 1999/31/EC sets strict diversion targets for the landfilling of
biodegradable waste. Article 5 states that in 2016 the biodegradable municipal waste
going to landfills must be reduced to 35% of the total amount (by weight) of
biodegradable municipal waste produced in 1995.
Article 1 of the Waste Framework Directive 2008/98/EC says that Member States
shall take measures to promote high quality recycling and, to this end, shall set up
separate collections of waste where technically, environmentally and economically
practicable and appropriate to meet the necessary quality standards for the relevant
recycling sectors.
Member States shall take measures, as appropriate, and in accordance with Articles
4 and 13, to encourage:
the separate collection of bio-waste with a view to composting and digestion of
bio-waste;
the treatment of bio-waste in a way that fulfils a high level of environmental
protection;
the use of environmentally safe materials produced from bio-waste.
An important issue that would affect the handling and fate of bio-waste is the end-of-
waste criteria. The JRC-IPTS reported its contribution to the development of the end-
of-waste criteria for biodegradable waste subject to biological treatment
(compost/digestate) in accordance with Article 6 of Directive 2008/98/EC of the
European Parliament and of the Council on waste (the Waste Framework Directive)
[44]. The report “End-of-waste criteria for biodegradable waste subjected to biological
treatment (compost and digestate)” includes a possible set of end-of-waste criteria
and shows how the proposals were developed based on a comprehensive
technoeconomic analysis of the biodegradable waste derived compost/digestate
production chain and an analysis of the economic, environmental and legal impacts
when such compost/digestate ceases to be waste.
The report proposes that the end-of-waste material should be hygienised and
stabilized compost and digestate materials should be obtained through a biological
waste treatment process using input materials originating exclusively from:
a. the separate collection of bio-waste and/or;
b. manure and/or;
c. living or dead organisms or parts thereof, provided the latter are unprocessed
or processed only by manual, mechanical or gravitational means, by
dissolution in water, by flotation, by extraction with water, by steam distillation
or by heating solely to remove water, or which are extracted from air by any
means and/or;

40
d. processed living or dead organisms or parts thereof other than c., as well as
biodegradable packaging materials, provided all such materials are certified
biodegradable according to EN 13432, EN 14995 or equivalent and 90%
biodegradability in 6 months has been demonstrated in a single or combined
composting and/or anaerobic digestion process and/or;
e. any material listed in points a., b., c. and/or d. that has previously been
composted and/or digested;
Input materials must not be contaminated. Contaminated is defined as having a level
of chemical, biological or physical contamination that may cause difficulties in
meeting the end-of-waste output product quality requirements or that may result in
other adverse environmental or human health impacts from the normal use of the
output compost/digestate material.
The material excludes compost and digestate materials partially or completely
derived from
a. the organic fraction of mixed municipal household waste separated through
mechanical, physicochemical, biological and/or manual treatment and/or;
b. sewage sludge and/or;
c. sludges derived from the paper industry and/or;
d. sludges derived from materials other than those included in the scope and/or;
e. animal by-product category 1 materials according to ABP Regulation (EC) No
1069/2009 and/or;
f. animal by-product category 2 and/or 3 materials for which composting and/or
digestion is not allowed according to ABP Regulation (EC) No 1069/2009 and
implementing Regulation (EU) 142/2011.
Compost or digestate materials partially or completely derived from contaminated
input materials, regardless of their origin, are also excluded.
The JRC –IPCT report mentions also the limits of heavy metals and pollutants.
The industrial emissions directive (2010/75/EC) covers management and emissions
from large composting and digestion plants dealing with waste. The permit conditions
including emission limit values must be based on the Best Available Techniques
(BAT), as defined in the IPPC Directive. For biological treatments, the limits are the
following:
Disposal of non-hazardous waste with a capacity exceeding 50 tonnes per day
Recovery, or a mix of recovery and disposal, of non-hazardous waste with a
capacity exceeding 75 tonnes per day
When the only waste treatment activity carried out is anaerobic digestion, the
capacity threshold for this activity shall be 100 tonnes per day.
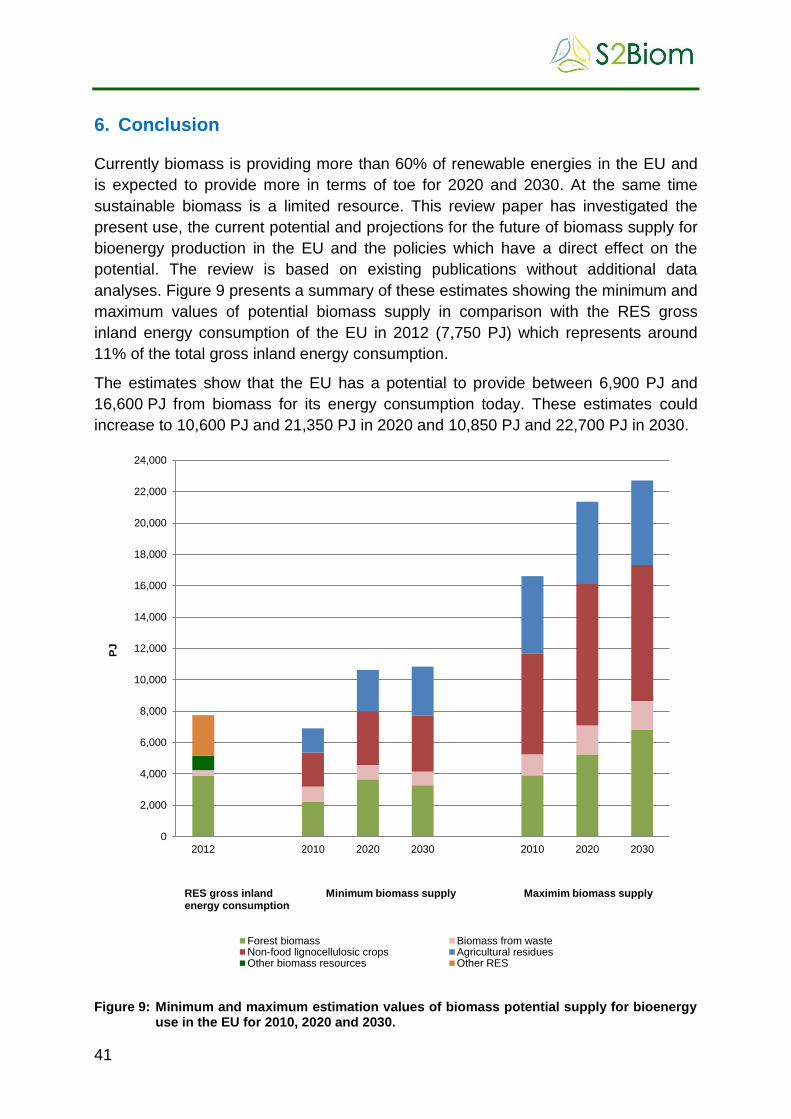
41
6. Conclusion
Currently biomass is providing more than 60% of renewable energies in the EU and
is expected to provide more in terms of toe for 2020 and 2030. At the same time
sustainable biomass is a limited resource. This review paper has investigated the
present use, the current potential and projections for the future of biomass supply for
bioenergy production in the EU and the policies which have a direct effect on the
potential. The review is based on existing publications without additional data
analyses. Figure 9 presents a summary of these estimates showing the minimum and
maximum values of potential biomass supply in comparison with the RES gross
inland energy consumption of the EU in 2012 (7,750 PJ) which represents around
11% of the total gross inland energy consumption.
The estimates show that the EU has a potential to provide between 6,900 PJ and
16,600 PJ from biomass for its energy consumption today. These estimates could
increase to 10,600 PJ and 21,350 PJ in 2020 and 10,850 PJ and 22,700 PJ in 2030.
Figure 9: Minimum and maximum estimation values of biomass potential supply for bioenergy use in the EU for 2010, 2020 and 2030.
0
2,000
4,000
6,000
8,000
10,000
12,000
14,000
16,000
18,000
20,000
22,000
24,000
2012 2010 2020 2030 2010 2020 2030
PJ
RES gross inland Minimum biomass supply Maximim biomass supply energy consumption
Forest biomass Biomass from wasteNon-food lignocellulosic crops Agricultural residuesOther biomass resources Other RES

42
In 2012 the gross inland energy consumption from biomass accounted for 7.3% of
the total consumption (5,150 PJ). More than 75% of the biomass was supplied by
forest biomass.
In conclusion, the current supply of biomass for energy is not exhausted and biomass
can supply more in the future. However, the lack of precise data makes it challenging
to estimate these figures. In addition, the estimates vary to a large extent due to
different definitions of potential and due to different methods applied. Nevertheless
most of the studies reviewed agree that:
Biomass potentials from forestry and waste are relatively stable over time
Waste and agricultural residues has a potential that is currently barely exploited
for energy generation
Large uncertainty exists on how much biomass from agriculture can be supplied.
For the future, non-food lignocellulosic crops and agricultural residues seem to be
the key for a genuine expansion of biomass supply once biomass from forestry
and waste are stable.
Within the BEE project a study on the status of biomass resource assessment was
done in 2010 [45]. At that time a huge diversity of results has been also observed.
The assessment showed that the potential of energy from biomass was much greater
for dedicated energy crops on agricultural land than that for residues from forestry
and agricultural systems and organic waste. Some years later, as shows this review
paper, the updated assessment of bioenergy potential from different sources still
shows big differences.
The S2Biom project aims at filling the gaps of uncertainties by providing updated
harmonized datasets on the sustainable delivery of non-food lignocellulosic biomass
at local, regional and pan-European level for energy and material use. Moreover it
develops strategies and roadmaps that are informed by a “computerized and easy to
use” toolset.
In the S2Biom project, the research work foreseen covers the entire biomass delivery
chain from primary biomass to end-use of non-food products and from logistics, pre-
treatment to conversion technologies. All these aspects are being assessed in order
to facilitate the integrated design and evaluation of optimal biomass delivery chains
and networks at European, national, regional and local scales. This approach will
support the design of strategies for the development of a viable bio-based economy.
The project activities are implemented in three individual but strongly interrelated
Themes:
Theme 1 focuses on methodological approaches, data collection and estimation
of sustainable biomass potentials, resource efficient pathways and optimal
logistical supply routes as well as the development of a computerised toolset. The
work outputs, apart from the toolset will include fully populated databases at local,
regional and pan-European levels as well as manuals for their operation,
maintenance and updates.

43
Theme 2 makes use of the findings of Theme 1 and develops a Vision, Strategies
and a R&D roadmap for the delivery of sustainable non-food biomass feedstocks
at local, regional and pan-European level.
Theme 3 validates the findings from Themes 1 and 2 and ensures the project
outreach. This is performed through selected case studies which efficiently
capture the different scales of applications for biomass supply chains in a
sufficient number of regions across Europe.

44
Abbreviations
BMW : Biodegradable Municipal Waste
CAP : Common Agricultural Policy
EC : European Commission
EFSOS : The European Forest Sector Outlook Study
EU : European Union
FAO : Food and Agriculture Organisation
FSC : Forest Stewardship Council
GGL : Green Gold Label
GHG : Greenhouse gases
ha : Hectare
IPCC : Intergovernmental Panel on Climate Change
ktoe : Kilo tonnes of oil equivalent
m : Metre
m3 : Cubic metre
MSW : Municipal Solid Waste
NGO : Non-governmental organization
NTA : Dutch technical agreement
PEFC : Programme for endorsement of Forest Certification Scheme
PJ : Petajoule
RED : Renewable Energy Directive
RWE : Round wood equivalent
SBP : Sustainable Biomass Partnership
SRC : Short Rotation Coppices
toe : Tonnes of oil equivalent
Conversion rates
1 million toe = 41.87 PJ
1 million m3 solid wood = 1.43 million m3 RWE
1 million m3 solid wood = 8 PJ
1 million tonnes of agricultural residues = 17.5 PJ.

45
List of Figures
Figure 1: Wood use flow in EU-28 in 2012 ................................................................... 12
Figure 2: Supply/demand balance in the quantified scenarios, 2010-2030. ................. 14
Figure 3: Minimum and maximum estimated bioenergy potential from forest biomass
in the EU for 2010, 2020 and 2030. ............................................................... 17
Figure 4: Various assessments for crop residue potential and availability in EU-27..28
Figure 5: Share of 8 crop residues produced in EU-27 ................................................. 29
Figure 6: Minimum and maximum estimated bioenergy potential from crop residues
in the EU for 2011, 2020 and 2030. ............................................................... 30
Figure 7: Minimum and maximum estimated bioenergy potential from agricultural
residues in the EU for 2010, 2020 and 2030. ................................................ 35
Figure 8: Minimum and maximum estimated bioenergy potential from residual waste
biomass for 2010, 2020 and 2030 in the EU ................................................. 38
Figure 9: Minimum and maximum estimation values of biomass potential supply for
bioenergy use in the EU for 2010, 2020 and 2030. ....................................... 41
List of Tables
Table 1: EU-28 forest area, ownership and stock in 2010. .......................................... 11
Table 2: Estimation of total potential forest supply for 2010, 2020 and 2030 in
EU-27. ........................................................................................................... 16
Table 3: Studies estimating wood supply from forest for bioenergy use for 2010,
2020 and 2030 in EU-27. ............................................................................... 17
Table 4: Categories of land considered in IEEP study for non-food lignocellulosic
crop production. ............................................................................................. 22
Table 5: Projected production and availability of crop residues in 2011, 2020 and
2030 .............................................................................................................. 27
Table 6: Average residue harvest ratios per type of permanent crop. ......................... 31
Table 7: Potential from woody residues of fruit trees, nuts and berry plantations,
olives, citrus and vineyards (ktoe) in 2004, 2020 and 2030. .......................... 31
Table 8: Estimated amount of livestock manure produced from pigs, cattle and
chicken in the EU Member States by major livestock manure types. ............ 32
Table 9: Estimated energy production potential from unexploited agro-industrial crop
residues ......................................................................................................... 34
Table 10: Availability of BMW for bioenergy production in EU-27 for 2010 and 2020 ... 37

46
List of references
1. Eurostat, 2014, Renewable energy statistics
http://epp.eurostat.ec.europa.eu/statistics_explained/index.php/Renewable_energ
y_statistics
2. Szabo M., Jaeger-Waldau A., Monforti-Ferrario F., Scarlat N., Bloem J.,
Quicheron M., Ossenbrink H., 2011, Technical assessment of the Renewable
Action Plans, European Commission - Joint Research Centre, EUR 24926 EN,
ISBN 978-92-79-21049-5, 2011
3. COM(2013) 659, A new EU Forest Strategy: for forests and the forest-based
sector, European Commission,
http://ec.europa.eu/agriculture/forest/strategy/communication_en.pdf
4. Eurostat, 2014, Forest area and ownership 2010,
http://epp.eurostat.ec.europa.eu/statistics_explained/index.php/File:Forest_area_
and_ownership,_2010_AgriPB13.png
5. Eurostat, 2013, Agri-environmental indicator – renewable energy production,
http://epp.eurostat.ec.europa.eu/statistics_explained/index.php/Agri-
environmental_indicator_-_renewable_energy_production
6. Keränen J., Alakangas E., 2011, Report on the competition and price situation of
woody biomass use in forest industry and energy sector, EUBIONET III Project,
Deliverable 7.1, http://www.eubionet.net
7. UN, 2011, EFSOS II: The European Forest Sector Outlook Study II, United
Nations publication, ISSN 1020-2269, ISBN 978-92-1-117051-,
http://www.unece.org/fileadmin/DAM/timber/publications/sp-28.pdf
8. IINAS, EFI, JR, 2014, Forest biomass for energy in the EU: current trends, carbon
balance and sustainable potential, study by IINAS - International Institute for
Sustainability Analysis and Strategy, EFI - European Forest Institute, and JR -
Joanneum Research, 2014, for BirdLife Europe, EEB, and Transport &
Environment,
http://192.168.0.121:9091/servlet/com.trend.iwss.user.servlet.sendfile?downloadfil
e=IRES-796369414-E7E230A0-18139-18109-1
9. Mantau U., Saal U., Prins K., Steierer F., Lindner M., Verkerk H., Eggers J., Leek
N., Oldenburger J., Askainen A., Anttila P., 2010, EUwood project, Methodology
report: Real potential for changes in growth and use of EU forests.
http://ec.europa.eu/energy/renewables/events/index_en.htm
10. Elbersen B., Startisky I., Hengeveld G., Schelhaas M.J., Naeff H., Böttcher H.,
2012, Atlas of EU biomass potentials - Spatially detailed and quantified overview
of EU biomass potential taking into account the main criteria determining biomass
availability from different sources. Biomass Futures project, Deliverable 3.3,
http://www.biomassfutures.eu/
11. COM(2011) 244, Our life insurance, our natural capital: an EU biodiversity
strategy to 2020. European Commission
http://ec.europa.eu/environment/nature/biodiversity/comm2006/pdf/2020/1_EN_A
CT_part1_v7%5B1%5D.pdf
47
12. COM(2012) 60, Innovating for Sustainable Growth: A Bioeconomy for Europe.
European Commission,
http://ec.europa.eu/research/bioeconomy/pdf/201202_innovating_sustainable_gro
wth.pdf
13. FOREST EUROPE website, 2014, http://www.foresteurope.org
14. Council Resolution of 15 December 1998 on a forestry strategy for the EU,
http://eur-
lex.europa.eu/LexUriServ/LexUriServ.do?uri=OJ:C:1999:056:0001:0004:EN:PD
15. COM(2006) 302, Communication from the commission to the council and the
European parliament on an EU forest action plan, http://eur-lex.europa.eu/legal-
content/EN/TXT/PDF/?uri=CELEX:52006DC0302&qid=1417100271002&from=E
N
16. Pan-European political process for the sustainable management of the continent’s
forests
17. Directive 2009/28/EC of the European Parliament and of the Council of 23 April
2009 on the promotion of the use of energy from renewable sources and
amending and subsequently repealing Directives 2001/77/EC and 2003/30/EC,
http://eur-lex.europa.eu/legal-content/EN/ALL/?uri=CELEX:32009L0028
18. COM(2010) 11, Report from the commission to the council and the European
parliament on sustainability requirements for the use of solid and gaseous
biomass sources in electricity, heating and cooling, European Commission,
http://eur-
lex.europa.eu/LexUriServ/LexUriServ.do?uri=COM:2010:0011:FIN:EN:PDF
19. Iriarte L., Fritsche U.R., 2014, Impact of promotion mechanisms for advanced and
low-iLUC biofuels on markets – Wood pellets from the US to the EU, IEA
Bioenergy, Task 40: Sustainable International Bioenergy Trade.
20. SWD(2014) 259, Commission staff working document, State of play on the
sustainability of solid and gaseous biomass used for electricity, heating and
cooling in the EU, European Commission,
http://ec.europa.eu/energy/renewables/bioenergy/doc/2014_biomass_state_of_pl
ay_.pdf
21. Goh C.S., Junginger M., 2012, Report for the overview and analysis of
sustainability certification initiatives,SolidStandards Project, Deliverable 5.1,
http://www.solidstandards.eu/sustainabilty.html
22. SBP, 2014, Consultation on the Biomass Assurance Framework, SBP -
Sustainable Biomass Partnership,
http://www.sustainablebiomasspartnership.org/documents/SBP-BAF-
Consultation-Paper-March-2014.pdf
23. Allen B., Kretschmer B., Baldock D., Menadue H., Nanni S., Tucker G., 2014,
Space for energy crops – assessing the potential contribution to Europe’s energy
future. Report produced for BirdLife Europe, European Environmental Bureau and
Transport & Environment. IEEP, London,

48
http://192.168.0.121:9091/servlet/com.trend.iwss.user.servlet.sendfile?downloadfil
e=IRES-565071975-E62F9378-5870-5840-9
24. Nielsen H., J. B., Oleskowicz-Popiel, P., Al Seadi T., 2007, Energy crop potentials
for bioenergy in EU-27, Proceedings of 15th European Biomass Conference &
Exhibition: 94 –103
25. ETC/SIA, 2013, Review of the EU bioenergy potential from a resource efficiency
perspective, Background report to EEA study, Alterra, Wageningen
26. Elbersen B.S., Fritsche U.R., Petersen J.E., Lesschen J.P., Böttcher H.,
Overmars K., 2013, Assessing the effect of stricter sustainability criteria on EU
biomass crop potential Biofuels, Bioproducts & Biorefining Journal, DOI:
10.1002/bbb.1396
27. EC, 2010, Prospects for agricultural markets and income in the EU 2010-2020.
European Commission, Brussels, http://ec.europa.eu
/agriculture/publi/caprep/prospects2010/index_en.htm
28. EC, 2013, Memo: CAP Reform – an explanation of the main elements, European
Commission, http://europa.eu/rapid/press-release_MEMO-13-621_en.htm
29. COM(2011) 627, Proposal for a regulation of the European Parliament and of the
Council on support for rural development by the European Agricultural Fund for
Rural Development (EAFRD), European Commission,
http://ec.europa.eu/agriculture/cap-post-2013/legal-proposals/com627/627_en.pdf
30. Allen B., Kretschmer B., Baldock D., Menadue H., Nanni S., Tucker G., 2014,
Space for energy crops – assessing the potential contribution to Europe’s energy
future. Report produced for BirdLife Europe, European Environmental Bureau and
Transport & Environment. IEEP, London
31. IEA, 2013, Agricultural residues for bioenergy and biorefineries,
http://www.ieabioenergytask43.org/wp-content/uploads/2014/07/IEA-Bioenergy-
inter-Task-project_Ag-residue-mobilization_Ver2_18June20131.pdf
32. Searle S., Malins C., 2013, White paper: Availability of cellulosic residues and
wastes in the EU,
http://theicct.org/sites/default/files/publications/ICCT_EUcellulosic-waste-
residues_20131022.pdf
33. Bloomberg New Energy Finance, 2012, Moving towards a next-generation
ethanol economy, http://www.novozymes.com/en/sustainability/benefits-for-the-
world/biobased-economy/white-papers-on-biofuels/Documents/Next-
Generation%20Ethanol%20Economy_Executive%20Summary.pdf
34. Monforti F., Bodis K., Scarlat N., Dallemand J.F, 2012, The possible contribution
of agricultural crop residues to renewable energy targets in Europe: A spatially
explicit study, Renewable and Sustainable Energy Reviews 19(2013)666–677
35. Scarlat N., Martinov M., Dallemand J.F., 2010, Assessment of the availability of
agricultural crop residues in the European Union: Potential and limitations for
bioenergy use, Waste Management 30 (2010) 1889–1897

49
36. Foged, Lyngsø H., Flotats X., Bonmati Blasi A., Palatsi J., Magri A., Schelde K.M.,
2011, Inventory of manure processing activities in Europe, Technical Report No. I
concerning “Manure Processing Activities in Europe” to the European
Commission, Directorate-General Environment. 138 pp., http://agro-technology-
atlas.eu/docs/21010_technical_report_I_inventory.pdf
37. Pudelko R., Borzecka-Walker M., Czaban P., Faber A., 2013, The feedstock
potential assessment for EU-27 + Switzerland in NUTS-3, BioBoost project -
Biomass based energy intermediates boosting biofuel production. D.1.2.
www.bioboost.eu
38. The Bioenergy System Planners Handbook - BISYPLAN, 2012,
http://bisyplan.bioenarea.eu/html-files-en/02-02.html
39. Hinge J., Perednis E., Faber A., Martikainen A., Nibbi L., Aho M., 2011,:
Unexploited biomass sources, availability and combustion properties, EUBIONET
III Project, Deliverable 5.1, http://www.eubionet.net
40. COM(2008) 811, Green Paper on the management of bio-waste in the European
Union, European Commission, http://eur-lex.europa.eu/legal-
content/EN/TXT/PDF/?uri=CELEX:52008DC0811&from=EN
41. Eurostat - news release, 2013, Environment in the EU27,
http://epp.eurostat.ec.europa.eu/cache/ITY_PUBLIC/8-04032013-BP/EN/8-
04032013-BP-EN.PDF
42. EEA, 2006. How much bioenergy can Europe produce without harming the
environment? EEA Report No7/2006. Copenhagen
43. Siemons R., Vis M., van den Berg D, Mc Chesney I., Whiteley M., Nikolaou N.,
2004, Bio-energy's role in the EU energy market - A view of developments until
2020: Report to the European Commission.
44. Saveyn H., Eder P., 2014, End-of-waste criteria for biodegradable waste
subjected to biological treatment (compost & digestate): Technical proposals, JRC
scientific and policy reports, http://ftp.jrc.es/EURdoc/JRC87124.pdf
45. Rettenmaier N., Schorb A., Köppen S., Berndes G., Christou M. Dees M., Domac
J., Eleftheriadis I., Goltsev V., Kaiba D., Kunikowski G., Lakyda P., Lethonen A.,
Lindner M., Pekkanen J., Röder J., Torén J., Vasylyshyn R., Veijonen K.,
Vesterinen P., Wirsenius S., Zheliezna T., Zibtsev S. (2010). Status of biomass
resource assessments. Version 3. Biomass Energy Europe. Project report. FP 7
Grant Agreement 213417, http://www.eu-bee.eu

Annex I: Overview of voluntary sustainability certification schemes applied to solid biomass: FSC, PEFC, NTA 8080, GGL and
Laborelec label
FSC PEFC GGL5 Laborelec Label NTA 8080
Website www.fsc.org www.pefc.org www.greengoldcertified.org www.laborelec.be www.sustainable-biomass.org/
A. General aspects
1 Description of organization (owner) and scheme
FSC is an independent, non-governmental, not-for-profit organization. The FSC Principles and Criteria (P&C) set out best practices for forest management.
PEFC is an international not-for-profit membership organization endorses national forest certification schemes PEFC International describes the requirements for standardising bodies in the development and revision of forest management and scheme-specific chain of custody standards.
Owned by Green Gold Label Foundation which was established by RWE and Control Union. GGL is certification system for sustainable biomass covering production, processing, transport and final energy transformation.
Owned by GDF-SUEZ / Electrabel EPA, developed by Laborelec. Laborelec label is a biomass verification procedure used by Electrabel (mainly for co-firing in power plants).
The Netherlands Standardization Institute (NEN) is a private, non-profit organization. NEN is the independent owner of NTA 8080. NTA 8080 is a certification system describes the requirements for sustainably produced biomass for energy applications (power, heat & cold and transportation fuels).
2 Applied since 1993 2000 2002 N/A 2011
3 Biomass focus Biomass feedstock from forests and forest plantations It covers all product raw materials produced in forests, including timber and non-timber forest products (NTFPs)
Biomass feedstock from forests and forest plantations It covers all product raw materials produced in forests, including timber and non-timber forest products (NTFPs)
Biomass / biofuel / bio-liquids for energy production and biofuel conversion. It covers agricultural / forestry products and also residual products.
Mainly for wood pellets All biomass for all types of biomass end-uses (electricity, heat & cold and transportation fuels)
4 Objective To promote the responsible management of the world’s forests
To promote the sustainable forest management especially among small forest managers
To ensure importation of sustainable biomass for energy, power production and chemical purposes
To offer a scheme that adds up the wishes of all regional authorities in Belgium for green certificates
To offer a way for suppliers and buyers of biomass to distinguish sustainable products, based on verifiable requirements translated from Dutch and European sustainability criteria
5 Recognition by No bilateral recognition. See Document WP D5.1-1
Mutual recognition between PEFC endorsed schemes.
The UK: Approved by Ofgem in March 2012.
N/A The EC has recognized the ‘NTA 8080’ scheme for demonstrating compliance with the sustainability criteria under Directives 98/70/EC and 2009/28/EC of the European Parliament and of the Council in July 2012. The Decision is valid for a period of five years after it enters into force
5 The GGL foundation is used as the new governance structure for the new sustainability standard based on the Initiative Wood Pellets Buyers (IWPB) principles. IWPB is a working panel grouping the major
European utilities firing wood pellets in large power plants GDF SUEZ, RWE, E.On, Vattenfall, Drax Plc, and Dong, as well as certifying companies SGS, Inspectorate, and Control Union. Laborelec participates in this work panel as a technical expert. The IWPB is developing a common sustainability approach for solid biomass in large scale power plants. See Document WP D5.1-1 for details.

FSC PEFC GGL5 Laborelec Label NTA 8080
B. Functions and coverage
1 Management (Elected) The board of directors and the Director General
(Elected) The board of directors and the Secretary General
The Executive Board, the Advisory Board and the Technical Committee.
GDF-SUEZ/Electrabel TPM/Fuel Procurement is in charge of the daily application of the verification procedure
NEN Scheme Ownership - an integrated division of the NEN Office
2 Membership and Decision-making
FSC membership is open to a wide range of organizations and individuals (NGOs, unions, market actors and etc.). The decision-making body is made up of the three membership chambers (environmental, social and economic), which are further split into North and South sub-chambers. The purpose is to maintain the balance of voting power between different interests without having to limit the number of members.
There are two categories of membership with voting rights: (1) National members (or "National Governing Bodies") are independent, national organizations established to develop and implement a PEFC system within their country, (2) International Stakeholder members are international entities including NGOs, companies, and associations committed to supporting PEFC's principles.
The Executive Board (elected by existing members) is responsible for strategic decision making and is ultimately responsible for the initiative, with the advices from the Advisory Board (evenly represented by all stakeholders).
The system was designed by SGS Belgium and Laborelec.
A Committee of Experts has been set up to draft, establish and maintain the certification scheme, through consultation process in the form of working groups, consultation rounds, etc. The committee is responsible for involving the stakeholders in the maintenance of the scheme.
3 Target groups and coverage
(i) Forest management units (ii) Actors along the supply
chain taking ownership of FSC certified biomass (processing, transformation, manufacturing and distribution)
It could be for individual, or in the form of projects - one-off and complex products FSC certified without each involved participant having to become individually FSC certified
PEFC’s target group is national forest certification schemes. The target groups of these national schemes are generally similar to those of FSC (see left column). Individual national schemes may additionally include other target groups.
Suppliers (producers, processors, traders) and buyers of biomass.
Suppliers (producers, processors, traders) and buyers of biomass Mainly for wood pellets.
Suppliers (producers, processors, traders) and buyers of biomass. It covers solid, liquid and gaseous biomass. Note that NTA 8080 and CAN/CSA-Z809 are the only two standards with sustainability criteria for solid biomass (noting that CSA is not developed for bioenergy)
4 Geographical coverage (2012)
Producers: No. of countries: 80 Total area: 155 million ha (43% in Europe; 40% in USA) No. of certificates: 1124 CoC: Total countries: 106 Total certificates: 23462 (49% in Europe) (As of 15 June 2012)
Producers: No. of countries: 29 Total area: 243 million ha (60% in USA; 33% in Europe) CoC: Total countries: 61 Total certificates: 9069 (84% in Europe) (As of 15 June 2012)
Producers: Canada, USA, Portugal, Baltic States Consumers: The Netherlands and the UK
Consumers: Belgium International
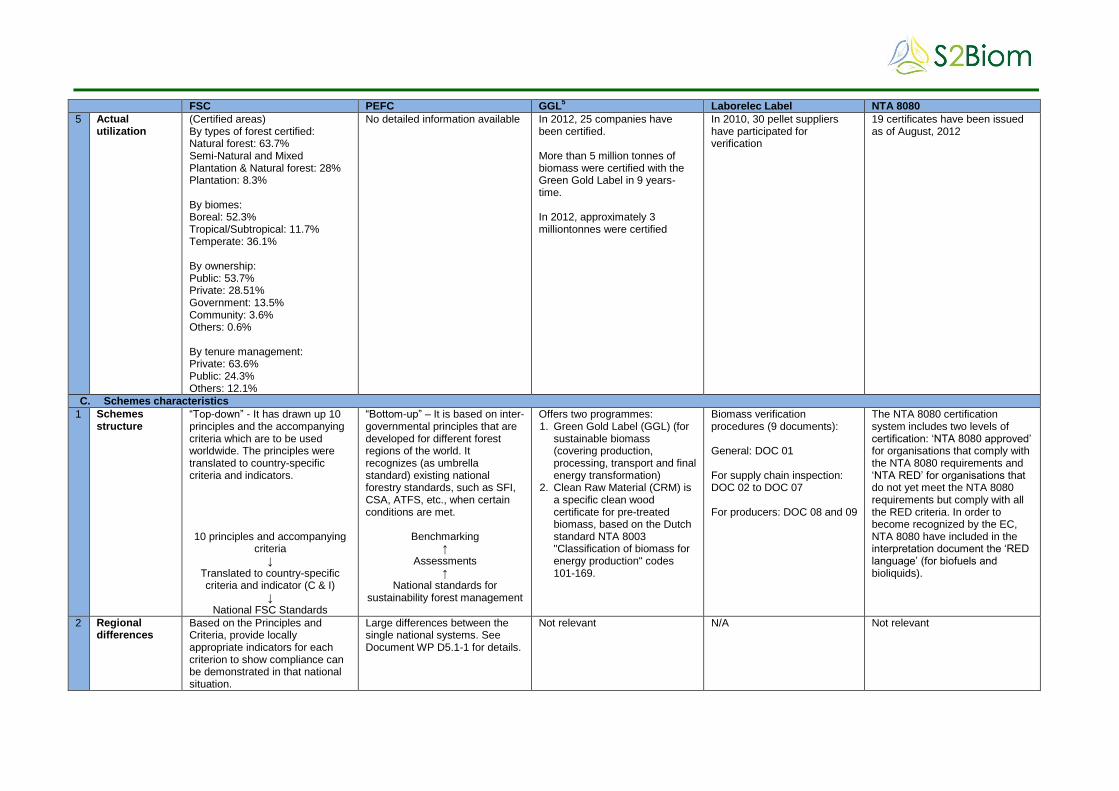
FSC PEFC GGL5 Laborelec Label NTA 8080
5 Actual utilization
(Certified areas) By types of forest certified: Natural forest: 63.7% Semi-Natural and Mixed Plantation & Natural forest: 28% Plantation: 8.3% By biomes: Boreal: 52.3% Tropical/Subtropical: 11.7% Temperate: 36.1% By ownership: Public: 53.7% Private: 28.51% Government: 13.5% Community: 3.6% Others: 0.6% By tenure management: Private: 63.6% Public: 24.3% Others: 12.1%
No detailed information available In 2012, 25 companies have been certified. More than 5 million tonnes of biomass were certified with the Green Gold Label in 9 years-time. In 2012, approximately 3 milliontonnes were certified
In 2010, 30 pellet suppliers have participated for verification
19 certificates have been issued as of August, 2012
C. Schemes characteristics
1 Schemes structure
“Top-down” - It has drawn up 10 principles and the accompanying criteria which are to be used worldwide. The principles were translated to country-specific criteria and indicators. 10 principles and accompanying
criteria ↓
Translated to country-specific criteria and indicator (C & I)
↓ National FSC Standards
“Bottom-up” – It is based on inter-governmental principles that are developed for different forest regions of the world. It recognizes (as umbrella standard) existing national forestry standards, such as SFI, CSA, ATFS, etc., when certain conditions are met.
Benchmarking ↑
Assessments ↑
National standards for sustainability forest management
Offers two programmes: 1. Green Gold Label (GGL) (for
sustainable biomass (covering production, processing, transport and final energy transformation)
2. Clean Raw Material (CRM) is a specific clean wood certificate for pre-treated biomass, based on the Dutch standard NTA 8003 "Classification of biomass for energy production" codes 101-169.
Biomass verification procedures (9 documents): General: DOC 01 For supply chain inspection: DOC 02 to DOC 07
For producers: DOC 08 and 09
The NTA 8080 certification system includes two levels of certification: ‘NTA 8080 approved’ for organisations that comply with the NTA 8080 requirements and ‘NTA RED’ for organisations that do not yet meet the NTA 8080 requirements but comply with all the RED criteria. In order to become recognized by the EC, NTA 8080 have included in the interpretation document the ‘RED language’ (for biofuels and bioliquids).
2 Regional differences
Based on the Principles and Criteria, provide locally appropriate indicators for each criterion to show compliance can be demonstrated in that national situation.
Large differences between the single national systems. See Document WP D5.1-1 for details.
Not relevant N/A Not relevant

FSC PEFC GGL5 Laborelec Label NTA 8080
D. Certification systems set-up
1 Standard setting
All FSC standards and policies are developed by the Policy and Standards Unit based at the FSC International Center in Bonn.
Standard Setting (PEFC ST 1001:2010) describes the requirements for standardising bodies in the development and revision of forest management and scheme-specific chain of custody standards.
Various Working Groups where specific topics are addressed, for example the development of the Green Gold Label standards, accreditation procedures, communication, engagement with governments etc. The Working Groups are multi- stakeholder governing bodies.
The system was designed by Laborelec and SGS Belgium
See B-2.
2 Standards documents
www.fsc.org/standards.340.htm
www.pefc.org/standards/ technical-documentation/ pefc-international- standards-2010
www.greengoldcertified.org/ site/pagina.php?id=11
www.laborelec.be/ENG/ biomass-verification- procedure/
http://www.sustainable-biomass.org/publicaties/3941
3 Forest management: Principles and Standards
10 principles as in (a) a. FSC STD 01 001 V4-0 EN
FSC Principles and Criteria for Forest Stewardship
b. FSC-STD-01-002 V1-0 EN Glossary of Terms
c. FSC STD 01 003 V1 0 EN SLIMF Eligibility Criteria
d. FSC STD 01 003a EN SLIMF Eligibility Criteria Addendum 2010-09-07
e. FSC-STD-01 005 V1-0 EN Dispute resolution system
f. FSC STD 30 005 V1-0 EN Standard for Group Entities in Forest Management Groups
Sustainability principles and criteria vary significantly between PEFC endorsed schemes in number, structure and contents, but SFM standards must fulfill a set of minimum requirements laid out in the International PEFC standard: PEFC ST 1003:2010
GGLS5: Forestry standards - derived from existing and
internationally recognised forest management standard;
Following may also comply: 1. FSC – (incl. FSC Controlled) 2. PEFC 3. CSA-SFM (incl. SFI Fiber
Sourcing, but only with individual chain of custody data)
4. SFI 5. FFCS 6. Approved pre-scope
certificate of one of the endorsed forest management certification systems, with the intention of full certification
DOC 08: Inspection Procedure for Forestry Based Company - 10 principles First principle on GHG and energy balance is mainly assessed following the experienced procedure of Laborelec-SGS. For the other principles, the assessment will be based on the QUALIFOR and NTA inputs. If any FSC certificate covering the surfaces where the wood to be processed was harvested is provided, no further verification of the Principles 2 to 10 is needed.
NTA 8080 describes the sustainability criteria that are based on the so-called Cramer criteria:
GHG (emissions & carbon stock);
competition with other applications;
biodiversity;
environment (soil, water and air);
prosperity;
social well-being. NTA 8081 describes the certification requirements including those applicable to group certification and the use of residues and waste. An interpretation document further elaborates on the requirements in NTA 8080
4 Agricultural standards
Not applicable Not applicable GGLS2: Agricultural criteria - based on the United Nations sustainable development program Agenda 21. This standard is to be used for approval of the agricultural source when no other certification system is available. Following may also comply: 1. GlobalGAP
2. All programmes that certify organics as per EU, Japanese and/or US regulations
N/A See D-3

FSC PEFC GGL5 Laborelec Label NTA 8080
5 Chain of Custody (CoC)
Policy: FSC guidelines for certification bodies fsc-pol-40-002 (2004) EN: Group chain of custody (CoC) certification Standard: a. FSC STD 40 003 V1-0 EN
Multi site Chain of Custody b. FSC STD 40 004 V2-1 EN
Chain of Custody Certification c. FSC STD 40 004a V2-0 EN
FSC Product Classification d. FSC STD 40 004b V1-0 EN
FSC Species Terminology e. FSC STD 40 006 V1-0 EN
Project Certification f. FSC STD 40 007 V2-0 EN
Sourcing Reclaimed Materials
PEFC ST 2002:2010: Chain of Custody
GGLS1: Chain of Custody and Processing – Trader GGLS4: Transaction and Product Certificate CRM1: Chain of custody and processing standards - CRM is the counterpart of GGL1 for CRM material. Where GGL focuses on sustainability, CRM is used to prove that clean wood is used for the production of e.g. torrefied material. CRM 2: Transaction Certificate - the counterpart of GGL4 for CRM material, covering a specifically described amount of clean wood, leading to a CRM Transaction Certificate.
DOC02: Pellet Supplier Declaration Form DOC 03: Pellet Supplier Audit Procedure DOC 04: Pellet Transport Declaration Form DOC 05: Energy and Carbon Balance Form DOC 06: Pellet Supplier Declaration Form
See Document WP D5.1-1
6 Other standards
Standards that apply to multiple types of certificate holders: a. FSC STD 50 001 V1-2 EN
Certificate Holder Trademark Requirements
b. FSC TMK 50 201 V1-0 EN Requirements for promotional use of FSC trademarks (also applies to non-certified commercial organizations)
Standards that apply to FSC accredited certification bodies: a. FSC STD 20 001 V3-0 EN
General Requirements for FSC Certification Bodies - application of ISO/IEC Guide 65:1996 (E)
FSC Controlled Wood controls the non-certified material in FSC products avoid timber from the most destructive and harmful practices, such as illegal logging or human rights abuses: a. FSC STD 30 010 V2-0 EN
Controlled Wood standard for FM enterprises
Standards for multiple types of certificate holders: a. Group Forest Management
Certification (PEFC ST 1002:2010)
b. PEFC Logo Usage Rules (PEFC ST 2001:2008 v2)
c. Annex 7 - Endorsement and Mutual Recognition of National Schemes and their Revision
Standards that apply to certification bodies: Certification Body Requirements – Chain of Custody (PEFC ST 2003:2012) PEFC Due Diligence System (DDS) for avoidance of raw material from controversial sources (Included in CoC)
GGLS6: Use at power plant -specifically for power plants; follows the conversion process of the biomass into electricity and lays down requirements for policy, administration, safety, mass balance calculation, etc. GGLS7: Stewardship criteria – For raw materials from other sources (from high conservation value areas as well as material coming from parks, public gardens and green spaces) GGLS8 GHGs and energy balance calculation - an inventory is made of all components that influence GHG emissions within the chain, such as energy use for processing and storage, fuels used in transport.
DOC 09 Inspection Procedure for Sawmill Industry requires at least: - the evaluation of the
overall energy balance for the supply of each biomass feedstock
- the full traceability of the resources that were used for manufacturing the biomass and the evidence that those resources are managed in a sustained way
See D-3

FSC PEFC GGL5 Laborelec Label NTA 8080
b. FSC STD 40 005 V2-1 EN Company Evaluation of Controlled Wood
E. Others
1 Certification bodies
Only FSC accredited certification bodies are authorized to issue FSC certificates. See Document WP D5.1-1 Certification bodies are accredited by ASI according to FSC STD 20 001 V3-0 EN General Requirements for FSC Certification Bodies - application of ISO/IEC Guide 65:1996 (E).
Varies among nationally endorsed schemes, but there is a total of 374 certification bodies accredited for PEFC certification
Control Union SGS Belgium (Inspection and independent reporting)
Certification is done by certifying bodies that have entered into an agreement with NEN. See Document WP D5.1-1 for the list.
2 Cost See Document WP D5.1-1 See Document WP D5.1-1 Approximately €0,10 per metric tonne of biomass
The costs is less than 0.05 € of the biomass fuel cost
Certificate cost for operators: Annual fee per certificate [€50- €200] annual membership fee [€50-€5,000, depending on turnover] OR fee per metric ton [€0.03]. The annual fee is collected by the CB and subsequently transferred to the scheme manager.
3 Policy relation Forest management shall respect all national and local laws and administrative requirements. In signatory countries, the provisions of all binding international agreements such as CITES, ILO Conventions, ITTA, and Convention on Biological Diversity, shall be respected.
Forest management shall comply with legislation applicable to forest management issues including forest management practices; nature and environmental protection; protected and endangered species; property, tenure and land-use rights for indigenous people; health, labour and safety issues; and the payment of royalties and taxes. For a country which has signed a FLEGT Voluntary Partnership Agreement (VPA) between the European Union and the producing country, the “legislation applicable to forest management” is defined by the VPA agreement.
European level: A decision from the European Commission is pending for the approval of the newly developed GGL – RED standard under the Renewable Energy Directive (RED). The UK: Currently, the GGL - RED standard is the only voluntary system that has been approved by Ofgem.
Applied to all Belgium Green certificates (5 different Green Certificates mechanisms are running in Belgium: 2 different in Flanders (1 Green, 1 Cogen), 1 in Wallonia, 1 in Brussels and 1 at the Federal level)
The Dutch government wishes to incorporate sustainability criteria for biomass into the relevant policy instruments. In the short term this regards the Dutch subsidy arrangement for electricity production and the obligation for biofuels for road transport. In the longer term the Dutch government wishes to promote a wider application of these sustainability criteria. The EC has recognized the ‘NTA 8080’ scheme for demonstrating compliance with the sustainability criteria under Directives 98/70/EC and 2009/28/EC of the European Parliament and of the Council in July 2012. The Decision is valid for a period of five years after it enters into force.