Sustainable supply chain network design: a multicriteria perspective
45
Background and Motivation Literature The Model Examples Sustainable Supply Chain Network Design: A Multicriteria Perspective Anna Nagurney 1 Ladimer S. Nagurney 2 1 Isenberg School of Management University of Massachusetts Amherst, Massachusetts 01003 2 Department of Electrical and Computer Engineering University of Hartford West Hartford, Connecticut 06117 ALIO-INFORMS Joint International Conference Buenos Aires, Argentina June 6 - 9, 2010 Anna Nagurney Sustainable Supply Chain Network Design
Transcript of Sustainable supply chain network design: a multicriteria perspective
Background and Motivation Literature The Model Examples Summary
Sustainable Supply Chain Network Design:A Multicriteria Perspective
Anna Nagurney1 Ladimer S. Nagurney2
1Isenberg School of ManagementUniversity of Massachusetts
Amherst, Massachusetts 01003
2Department of Electrical and Computer EngineeringUniversity of Hartford
West Hartford, Connecticut 06117
ALIO-INFORMS Joint International ConferenceBuenos Aires, Argentina
June 6 - 9, 2010
Anna Nagurney Sustainable Supply Chain Network Design
Background and Motivation Literature The Model Examples Summary
Acknowledgments
The first author’s research was supported by the John F. SmithMemorial Fund at the University of Massachusetts Amherst. Thissupport is gratefully acknowledged.
The second author acknowledges financial support from theUniversity of Hartford while he was on sabbatical leave at the NSFERC Center CASA at the University of Massachusetts Amherst.
Anna Nagurney Sustainable Supply Chain Network Design
Background and Motivation Literature The Model Examples Summary
Outline
Background and Motivation
An Overview of Some of the Relevant Literature
The Sustainable Supply Chain Network Design Model
Numerical Examples
Summary and Conclusions
Anna Nagurney Sustainable Supply Chain Network Design

Background and Motivation Literature The Model Examples Summary
Background and Motivation
Supply chain networks providethe infrastructure for theproduction, storage, anddistribution of products as variedas pharmaceuticals, vehicles,computers, food products,furniture, and clothing,throughout the globe.
Anna Nagurney Sustainable Supply Chain Network Design
Background and Motivation Literature The Model Examples Summary
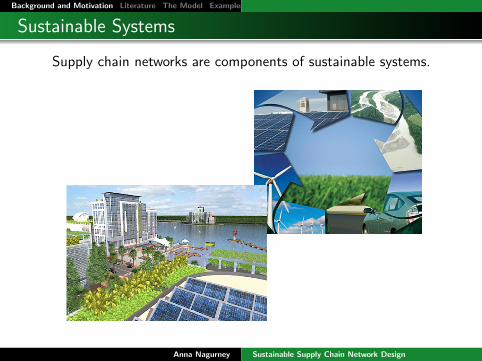
Sustainable Systems
Supply chain networks are components of sustainable systems.
Anna Nagurney Sustainable Supply Chain Network Design
Background and Motivation Literature The Model Examples Summary
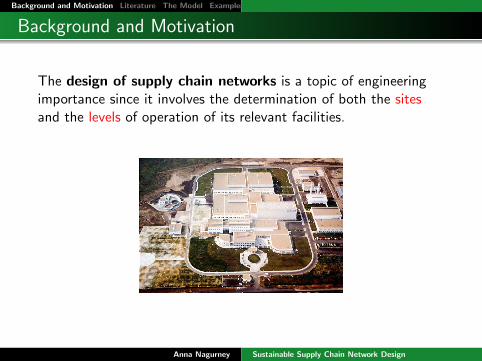
Background and Motivation
The design of supply chain networks is a topic of engineeringimportance since it involves the determination of both the sitesand the levels of operation of its relevant facilities.
Anna Nagurney Sustainable Supply Chain Network Design
Background and Motivation Literature The Model Examples Summary
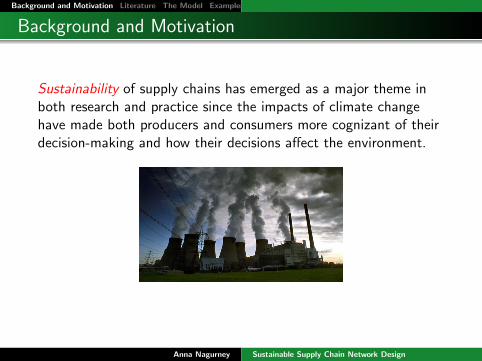
Background and Motivation
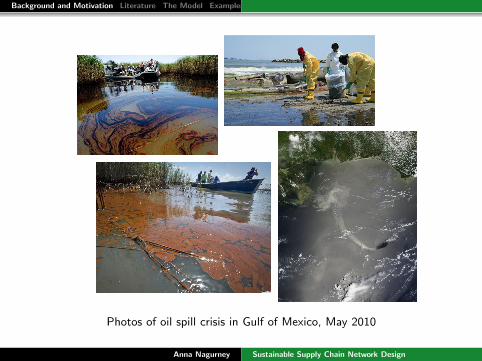
Sustainability of supply chains has emerged as a major theme inboth research and practice since the impacts of climate changehave made both producers and consumers more cognizant of theirdecision-making and how their decisions affect the environment.
Anna Nagurney Sustainable Supply Chain Network Design
Background and Motivation Literature The Model Examples Summary
Photos of oil spill crisis in Gulf of Mexico, May 2010
Anna Nagurney Sustainable Supply Chain Network Design

Background and Motivation Literature The Model Examples Summary
Environmental Effects of Globalization
Businesses, and, in particular, supply chains, have becomeincreasingly globalized.
However, criticism of globalization has increased, specifically, bythose concerned about the environment on the basis that globalfree trade may result in the growth of global pollution.
For example, free trade may shift pollution-intensive manufacturingprocesses from countries with strict environmental regulations tothose with less restrictive ones.
Anna Nagurney Sustainable Supply Chain Network Design

Background and Motivation Literature The Model Examples Summary
Environmentally-Friendly Supply Chains
Nevertheless, legal requirements and evolving consumer tastes areplacing pressure on manufacturers and distributors to become moreenvironmentally-friendly. (Bloemhof-Ruwaard et al. (1995), Hill(1997), and Ingram (2002))
Poor environmental performance at any stage of the supply chainprocess may damage what is considered a firm’s premier asset, itsreputation (Fabian (2000)).
Anna Nagurney Sustainable Supply Chain Network Design
Background and Motivation Literature The Model Examples Summary
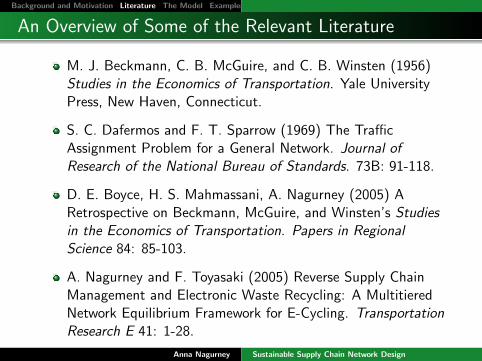
An Overview of Some of the Relevant Literature
M. J. Beckmann, C. B. McGuire, and C. B. Winsten (1956)Studies in the Economics of Transportation. Yale UniversityPress, New Haven, Connecticut.
S. C. Dafermos and F. T. Sparrow (1969) The TrafficAssignment Problem for a General Network. Journal ofResearch of the National Bureau of Standards. 73B: 91-118.
D. E. Boyce, H. S. Mahmassani, A. Nagurney (2005) ARetrospective on Beckmann, McGuire, and Winsten’s Studiesin the Economics of Transportation. Papers in RegionalScience 84: 85-103.
A. Nagurney and F. Toyasaki (2005) Reverse Supply ChainManagement and Electronic Waste Recycling: A MultitieredNetwork Equilibrium Framework for E-Cycling. TransportationResearch E 41: 1-28.
Anna Nagurney Sustainable Supply Chain Network Design
Background and Motivation Literature The Model Examples Summary
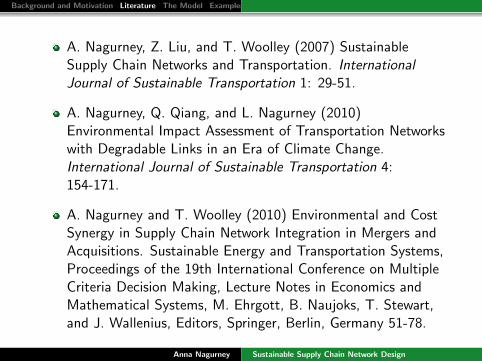
A. Nagurney, Z. Liu, and T. Woolley (2007) SustainableSupply Chain Networks and Transportation. InternationalJournal of Sustainable Transportation 1: 29-51.
A. Nagurney, Q. Qiang, and L. Nagurney (2010)Environmental Impact Assessment of Transportation Networkswith Degradable Links in an Era of Climate Change.International Journal of Sustainable Transportation 4:154-171.
A. Nagurney and T. Woolley (2010) Environmental and CostSynergy in Supply Chain Network Integration in Mergers andAcquisitions. Sustainable Energy and Transportation Systems,Proceedings of the 19th International Conference on MultipleCriteria Decision Making, Lecture Notes in Economics andMathematical Systems, M. Ehrgott, B. Naujoks, T. Stewart,and J. Wallenius, Editors, Springer, Berlin, Germany 51-78.
Anna Nagurney Sustainable Supply Chain Network Design
Background and Motivation Literature The Model Examples Summary
This talk is based on the paper:
Sustainable Supply Chain Network Design: A MulticriteriaPerspective,
A. Nagurney and Ladimer S. Nagurney, to appear in theInternational Journal of Sustainable Engineering,
where additional background information as well as references canbe found.
Anna Nagurney Sustainable Supply Chain Network Design
Background and Motivation Literature The Model Examples Summary
The Sustainable Supply Chain Network Design Model
We assume a network topology where the top level (origin) node 0corresponds to the firm and the bottom level (destination) nodescorrespond to the demand sites, which can correspond, forexample, to retailers or consumers.
The paths joining the origin node to the destination nodesrepresent sequences of supply chain network activities that ensurethat the product is produced and, ultimately, delivered to thedemand sites.
There are nM possible manufacturing facilities/plants, nD possibledistribution centers to serve the n possible demand locations withthe respective demands given by: d1, d2, . . ., dn.
Anna Nagurney Sustainable Supply Chain Network Design
Background and Motivation Literature The Model Examples Summary
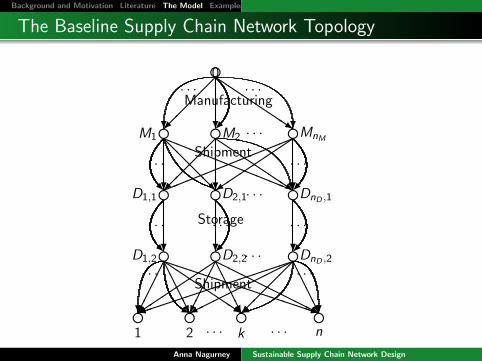
The Baseline Supply Chain Network Topology
f0�
��
� ?
QQs
· · ·
? ?
· · ·Manufacturing
M1 M2 MnMf f · · · f?
@@
@@R
aaaaaaaaaa?
��
��
QQs?
��
��
��+
!!!!!!!!!!
· · ·R N
· · ·Shipment
D1,1 D2,1 DnD ,1f f · · · f? ? ?
· · ·R
· · ·
· · ·Storage
D1,2 D2,2 DnD ,2f f · · · f��
��
��
���
��
��
AAAAU
������������)
��
��
��+
��
���
AAAAU
HHH
HHHHHj
��
���
AAAAU
QQs
PPPPPPPPPPPPq
· · ·
? j � ?
· · ·
f f f· · ·
fShipment
1 2 · · · k n
Anna Nagurney Sustainable Supply Chain Network Design
Background and Motivation Literature The Model Examples Summary
The Sustainable Supply Chain Network Design Model
The links from the top-tiered node 0 are connected to the possiblemanufacturing nodes of the firm, which are denoted, respectively,by: M1, . . . ,MnM
, and these links represent the manufacturinglinks.
The links from the manufacturing nodes, in turn, are connected tothe possible distribution center nodes of the firm which aredenoted by D1,1, . . . ,DnD ,1. These links correspond to the possibleshipment links.
The links joining nodes D1,1, . . . ,DnD ,1 with nodes D1,2, . . . ,DnD ,2
correspond to the possible storage links. Finally, there are possibleshipment links joining the nodes D1,2, . . . ,DnD ,2 with the demandnodes: 1, . . . , n.
Anna Nagurney Sustainable Supply Chain Network Design
Background and Motivation Literature The Model Examples Summary
The Sustainable Supply Chain Network Design Model
Multiple alternative manufacturing links correspond to differentpossible technologies associated with a given manufacturing plant,which may also result in different levels of environmental emissions.
Similarly, for shipments and storage, we may have multiplealternative links which represent different modes of transportationand different storage technologies, respectively.
Anna Nagurney Sustainable Supply Chain Network Design
Background and Motivation Literature The Model Examples Summary
The Sustainable Supply Chain Network Design Model
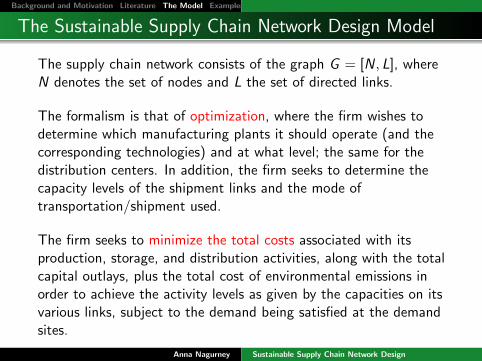
The supply chain network consists of the graph G = [N, L], whereN denotes the set of nodes and L the set of directed links.
The formalism is that of optimization, where the firm wishes todetermine which manufacturing plants it should operate (and thecorresponding technologies) and at what level; the same for thedistribution centers. In addition, the firm seeks to determine thecapacity levels of the shipment links and the mode oftransportation/shipment used.
The firm seeks to minimize the total costs associated with itsproduction, storage, and distribution activities, along with the totalcapital outlays, plus the total cost of environmental emissions inorder to achieve the activity levels as given by the capacities on itsvarious links, subject to the demand being satisfied at the demandsites.
Anna Nagurney Sustainable Supply Chain Network Design
Background and Motivation Literature The Model Examples Summary
The Notation
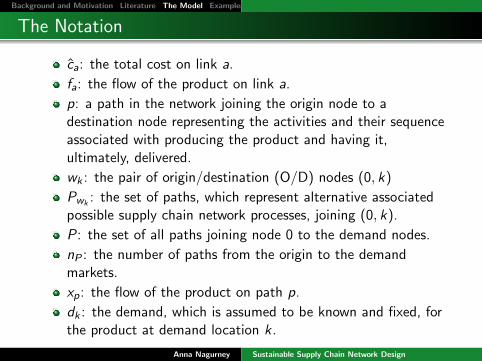
ca: the total cost on link a.
fa: the flow of the product on link a.
p: a path in the network joining the origin node to adestination node representing the activities and their sequenceassociated with producing the product and having it,ultimately, delivered.
wk : the pair of origin/destination (O/D) nodes (0, k)
Pwk: the set of paths, which represent alternative associated
possible supply chain network processes, joining (0, k).
P: the set of all paths joining node 0 to the demand nodes.
nP : the number of paths from the origin to the demandmarkets.
xp: the flow of the product on path p.
dk : the demand, which is assumed to be known and fixed, forthe product at demand location k.
Anna Nagurney Sustainable Supply Chain Network Design
Background and Motivation Literature The Model Examples Summary
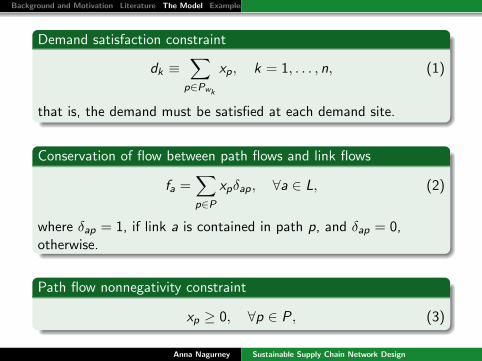
Demand satisfaction constraint
dk ≡∑
p∈Pwk
xp, k = 1, . . . , n, (1)
that is, the demand must be satisfied at each demand site.
Conservation of flow between path flows and link flows
fa =∑p∈P
xpδap, ∀a ∈ L, (2)
where δap = 1, if link a is contained in path p, and δap = 0,otherwise.
Path flow nonnegativity constraint
xp ≥ 0, ∀p ∈ P, (3)
Anna Nagurney Sustainable Supply Chain Network Design
Background and Motivation Literature The Model Examples Summary
Formulation
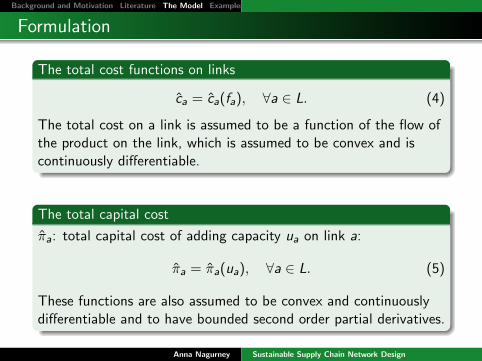
The total cost functions on links
ca = ca(fa), ∀a ∈ L. (4)
The total cost on a link is assumed to be a function of the flow ofthe product on the link, which is assumed to be convex and iscontinuously differentiable.
The total capital cost
πa: total capital cost of adding capacity ua on link a:
πa = πa(ua), ∀a ∈ L. (5)
These functions are also assumed to be convex and continuouslydifferentiable and to have bounded second order partial derivatives.
Anna Nagurney Sustainable Supply Chain Network Design
Background and Motivation Literature The Model Examples Summary
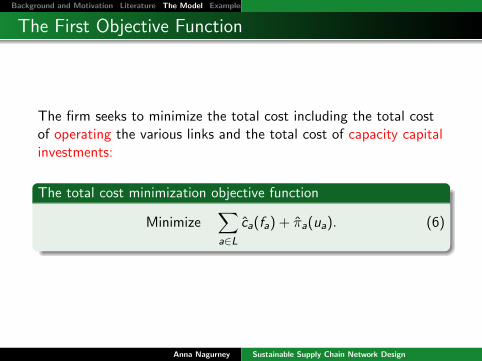
The First Objective Function
The firm seeks to minimize the total cost including the total costof operating the various links and the total cost of capacity capitalinvestments:
The total cost minimization objective function
Minimize∑a∈L
ca(fa) + πa(ua). (6)
Anna Nagurney Sustainable Supply Chain Network Design
Background and Motivation Literature The Model Examples Summary
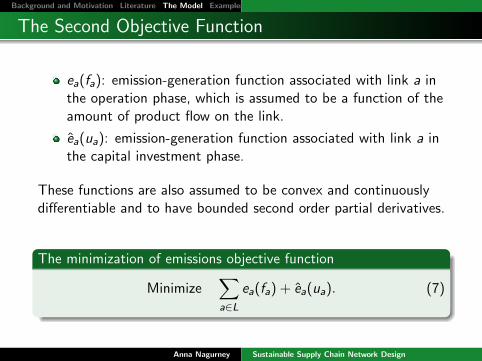
The Second Objective Function
ea(fa): emission-generation function associated with link a inthe operation phase, which is assumed to be a function of theamount of product flow on the link.
ea(ua): emission-generation function associated with link a inthe capital investment phase.
These functions are also assumed to be convex and continuouslydifferentiable and to have bounded second order partial derivatives.
The minimization of emissions objective function
Minimize∑a∈L
ea(fa) + ea(ua). (7)
Anna Nagurney Sustainable Supply Chain Network Design
Background and Motivation Literature The Model Examples Summary
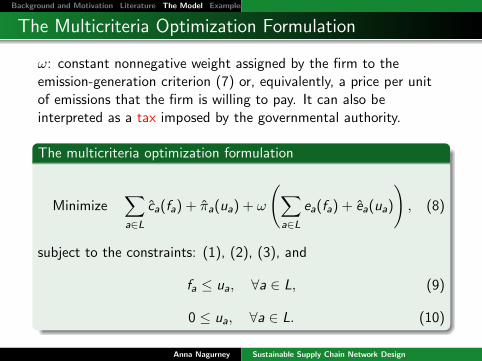
The Multicriteria Optimization Formulation
ω: constant nonnegative weight assigned by the firm to theemission-generation criterion (7) or, equivalently, a price per unitof emissions that the firm is willing to pay. It can also beinterpreted as a tax imposed by the governmental authority.
The multicriteria optimization formulation
Minimize∑a∈L
ca(fa) + πa(ua) + ω
(∑a∈L
ea(fa) + ea(ua)
), (8)
subject to the constraints: (1), (2), (3), and
fa ≤ ua, ∀a ∈ L, (9)
0 ≤ ua, ∀a ∈ L. (10)
Anna Nagurney Sustainable Supply Chain Network Design
Background and Motivation Literature The Model Examples Summary
The Variational Inequality Formulation
Our optimization problem is characterized, under our assumptions,by a convex objective function and a convex feasible set.
βa: the Lagrange multiplier associated with constraint (9) for eachlink a ∈ L.
β∗a : the associated optimal Lagrange multiplier.
These terms may also be interpreted as the price or value of anadditional unit of capacity on link a. We group these Lagrangemultipliers into the respective vectors β and β∗.
Anna Nagurney Sustainable Supply Chain Network Design
Background and Motivation Literature The Model Examples Summary
The Variational Inequality Formulation
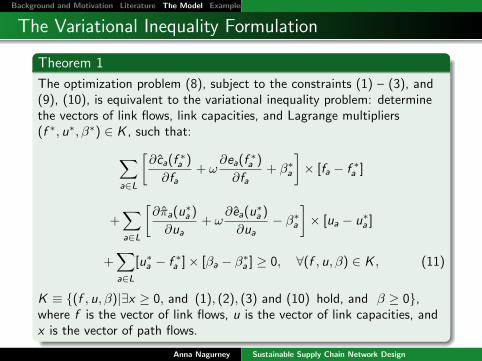
Theorem 1
The optimization problem (8), subject to the constraints (1) – (3), and(9), (10), is equivalent to the variational inequality problem: determinethe vectors of link flows, link capacities, and Lagrange multipliers(f ∗, u∗, β∗) ∈ K , such that:∑
a∈L
[∂ca(f
∗a )
∂fa+ ω
∂ea(f∗a )
∂fa+ β∗a
]× [fa − f ∗a ]
+∑a∈L
[∂πa(u
∗a )
∂ua+ ω
∂ea(u∗a )
∂ua− β∗a
]× [ua − u∗a ]
+∑a∈L
[u∗a − f ∗a ]× [βa − β∗a ] ≥ 0, ∀(f , u, β) ∈ K , (11)
K ≡ {(f , u, β)|∃x ≥ 0, and (1), (2), (3) and (10) hold, and β ≥ 0},where f is the vector of link flows, u is the vector of link capacities, andx is the vector of path flows.
Anna Nagurney Sustainable Supply Chain Network Design
Background and Motivation Literature The Model Examples Summary
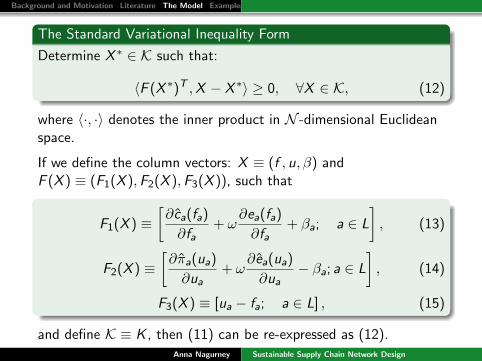
The Standard Variational Inequality Form
Determine X ∗ ∈ K such that:
〈F (X ∗)T ,X − X ∗〉 ≥ 0, ∀X ∈ K, (12)
where 〈·, ·〉 denotes the inner product in N -dimensional Euclideanspace.
If we define the column vectors: X ≡ (f , u, β) andF (X ) ≡ (F1(X ),F2(X ),F3(X )), such that
F1(X ) ≡[∂ca(fa)
∂fa+ ω
∂ea(fa)
∂fa+ βa; a ∈ L
], (13)
F2(X ) ≡[∂πa(ua)
∂ua+ ω
∂ea(ua)
∂ua− βa; a ∈ L
], (14)
F3(X ) ≡ [ua − fa; a ∈ L] , (15)
and define K ≡ K , then (11) can be re-expressed as (12).Anna Nagurney Sustainable Supply Chain Network Design
Background and Motivation Literature The Model Examples Summary
The Solution Method
Variational inequality (11) can be easily solved using the modifiedprojection method.
For the solution of the embedded network problems, we utilize thewell-known equilibration algorithm (system-optimization version) ofDafermos and Sparrow (1969), which has been widely applied.Recall that the modified projection method (cf. Korpelevich(1977)) is guaranteed to converge to a solution of a variationalinequality problem, provided that the function that enters thevariational inequality problem is monotone and Lipschitzcontinuous and that a solution exists.
The solution (f ∗, u∗) to (11) minimizes the objective function (8)associated with the design of the sustainable supply chain network.
Anna Nagurney Sustainable Supply Chain Network Design
Background and Motivation Literature The Model Examples Summary
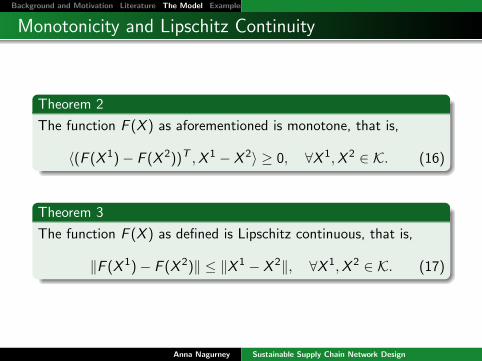
Monotonicity and Lipschitz Continuity
Theorem 2
The function F (X ) as aforementioned is monotone, that is,
〈(F (X 1)− F (X 2))T ,X 1 − X 2〉 ≥ 0, ∀X 1,X 2 ∈ K. (16)
Theorem 3
The function F (X ) as defined is Lipschitz continuous, that is,
‖F (X 1)− F (X 2)‖ ≤ ‖X 1 − X 2‖, ∀X 1,X 2 ∈ K. (17)
Anna Nagurney Sustainable Supply Chain Network Design
Background and Motivation Literature The Model Examples Summary
Convergence
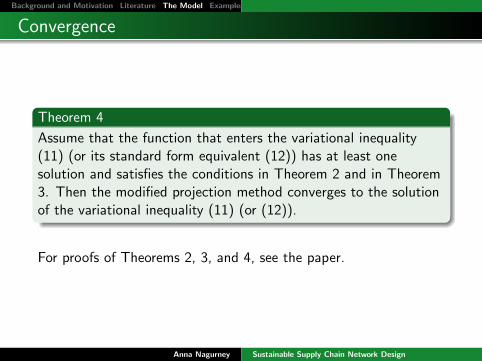
Theorem 4
Assume that the function that enters the variational inequality(11) (or its standard form equivalent (12)) has at least onesolution and satisfies the conditions in Theorem 2 and in Theorem3. Then the modified projection method converges to the solutionof the variational inequality (11) (or (12)).
For proofs of Theorems 2, 3, and 4, see the paper.
Anna Nagurney Sustainable Supply Chain Network Design
Background and Motivation Literature The Model Examples Summary
Numerical Examples
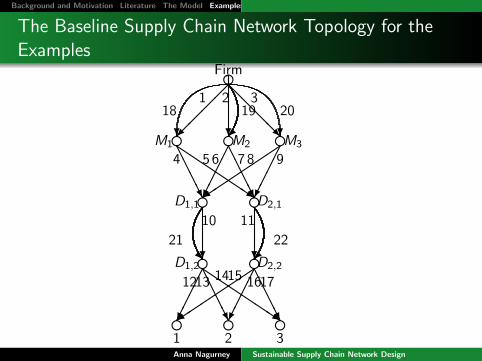
The baseline supply chain network topology for all the examples isas depicted next with the links defined by numbers.
The numerical examples consisted of a firm faced with 3 possiblemanufacturing plants, each of which had 2 possible technologies; 2distribution centers, each of which also had 2 distinct technologies,and the firm had to supply the 3 demand points. There was only asingle mode of transportation/shipment available between eachmanufacturing plant and each distribution center and betweeneach distribution center at a given demand point.
The common input data for the three examples is reported inTable 1.
Anna Nagurney Sustainable Supply Chain Network Design
Background and Motivation Literature The Model Examples Summary
The Baseline Supply Chain Network Topology for theExamples f1Firm
��
�� ?
@@
@@R
1 2 320
?
19
18
?f f fM1 M2 M3AAAAU
QQs
��
���
AAAAU
��
��
��+
��
���
4 56 78 9
f fD1,1 D2,1
? ?
10 11
22
21Rf fD1,2 D2,2
��
���
AAAAU
��
��
��+
��
���
AAAAU
QQs
1213 1415 1617
f f f1 2 3Anna Nagurney Sustainable Supply Chain Network Design
Background and Motivation Literature The Model Examples Summary
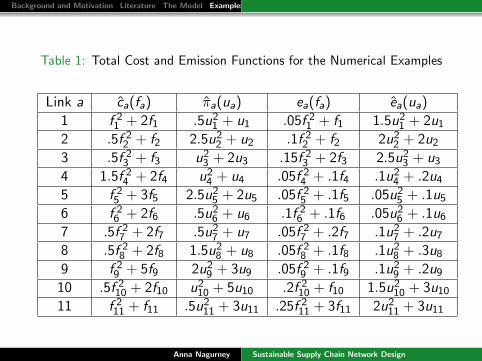
Table 1: Total Cost and Emission Functions for the Numerical Examples
Link a ca(fa) πa(ua) ea(fa) ea(ua)
1 f 21 + 2f1 .5u2
1 + u1 .05f 21 + f1 1.5u2
1 + 2u1
2 .5f 22 + f2 2.5u2
2 + u2 .1f 22 + f2 2u2
2 + 2u2
3 .5f 23 + f3 u2
3 + 2u3 .15f 23 + 2f3 2.5u2
3 + u3
4 1.5f 24 + 2f4 u2
4 + u4 .05f 24 + .1f4 .1u2
4 + .2u4
5 f 25 + 3f5 2.5u2
5 + 2u5 .05f 25 + .1f5 .05u2
5 + .1u5
6 f 26 + 2f6 .5u2
6 + u6 .1f 26 + .1f6 .05u2
6 + .1u6
7 .5f 27 + 2f7 .5u2
7 + u7 .05f 27 + .2f7 .1u2
7 + .2u7
8 .5f 28 + 2f8 1.5u2
8 + u8 .05f 28 + .1f8 .1u2
8 + .3u8
9 f 29 + 5f9 2u2
9 + 3u9 .05f 29 + .1f9 .1u2
9 + .2u9
10 .5f 210 + 2f10 u2
10 + 5u10 .2f 210 + f10 1.5u2
10 + 3u10
11 f 211 + f11 .5u2
11 + 3u11 .25f 211 + 3f11 2u2
11 + 3u11
Anna Nagurney Sustainable Supply Chain Network Design
Background and Motivation Literature The Model Examples Summary
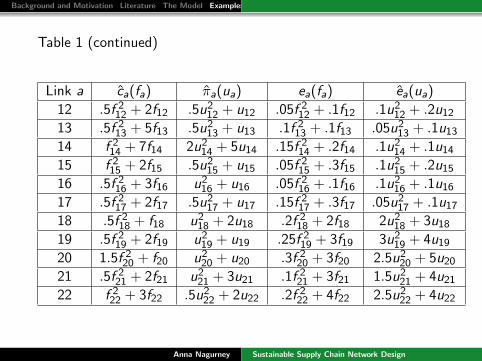
Table 1 (continued)
Link a ca(fa) πa(ua) ea(fa) ea(ua)
12 .5f 212 + 2f12 .5u2
12 + u12 .05f 212 + .1f12 .1u2
12 + .2u12
13 .5f 213 + 5f13 .5u2
13 + u13 .1f 213 + .1f13 .05u2
13 + .1u13
14 f 214 + 7f14 2u2
14 + 5u14 .15f 214 + .2f14 .1u2
14 + .1u14
15 f 215 + 2f15 .5u2
15 + u15 .05f 215 + .3f15 .1u2
15 + .2u15
16 .5f 216 + 3f16 u2
16 + u16 .05f 216 + .1f16 .1u2
16 + .1u16
17 .5f 217 + 2f17 .5u2
17 + u17 .15f 217 + .3f17 .05u2
17 + .1u17
18 .5f 218 + f18 u2
18 + 2u18 .2f 218 + 2f18 2u2
18 + 3u18
19 .5f 219 + 2f19 u2
19 + u19 .25f 219 + 3f19 3u2
19 + 4u19
20 1.5f 220 + f20 u2
20 + u20 .3f 220 + 3f20 2.5u2
20 + 5u20
21 .5f 221 + 2f21 u2
21 + 3u21 .1f 221 + 3f21 1.5u2
21 + 4u21
22 f 222 + 3f22 .5u2
22 + 2u22 .2f 222 + 4f22 2.5u2
22 + 4u22
Anna Nagurney Sustainable Supply Chain Network Design
Background and Motivation Literature The Model Examples Summary
The Solution Method for the Numerical Examples
The modified projected method was implemented in FORTRAN,and a Unix system at the University of Massachusetts Amherst wasused for all the computations.
We initialized the algorithm by equally distributing the demand ateach demand site among all the paths joining the firm node 0 tothe demand node. All other variables, that is, the link capacitiesand the Lagrange multipliers, were initialized to zero.
Anna Nagurney Sustainable Supply Chain Network Design
Background and Motivation Literature The Model Examples Summary
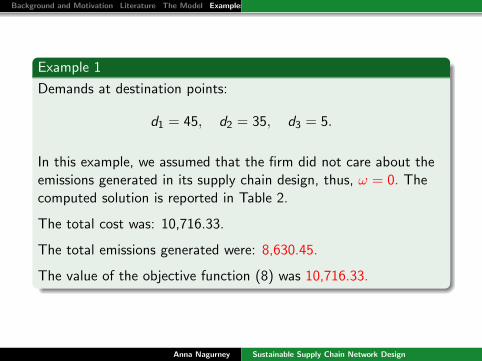
Example 1
Demands at destination points:
d1 = 45, d2 = 35, d3 = 5.
In this example, we assumed that the firm did not care about theemissions generated in its supply chain design, thus, ω = 0. Thecomputed solution is reported in Table 2.
The total cost was: 10,716.33.
The total emissions generated were: 8,630.45.
The value of the objective function (8) was 10,716.33.
Anna Nagurney Sustainable Supply Chain Network Design
Background and Motivation Literature The Model Examples Summary
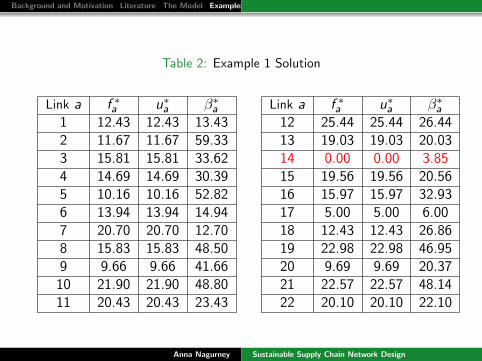
Table 2: Example 1 Solution
Link a f ∗a u∗a β∗a Link a f ∗a u∗a β∗a1 12.43 12.43 13.43 12 25.44 25.44 26.442 11.67 11.67 59.33 13 19.03 19.03 20.033 15.81 15.81 33.62 14 0.00 0.00 3.854 14.69 14.69 30.39 15 19.56 19.56 20.565 10.16 10.16 52.82 16 15.97 15.97 32.936 13.94 13.94 14.94 17 5.00 5.00 6.007 20.70 20.70 12.70 18 12.43 12.43 26.868 15.83 15.83 48.50 19 22.98 22.98 46.959 9.66 9.66 41.66 20 9.69 9.69 20.3710 21.90 21.90 48.80 21 22.57 22.57 48.1411 20.43 20.43 23.43 22 20.10 20.10 22.10
Anna Nagurney Sustainable Supply Chain Network Design
Background and Motivation Literature The Model Examples Summary
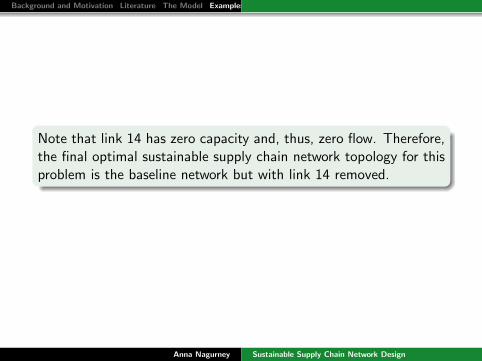
Note that link 14 has zero capacity and, thus, zero flow. Therefore,the final optimal sustainable supply chain network topology for thisproblem is the baseline network but with link 14 removed.
Anna Nagurney Sustainable Supply Chain Network Design
Background and Motivation Literature The Model Examples Summary
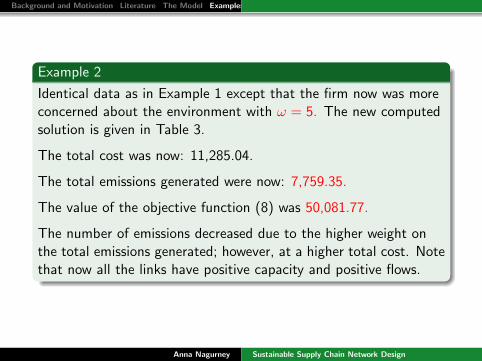
Example 2
Identical data as in Example 1 except that the firm now was moreconcerned about the environment with ω = 5. The new computedsolution is given in Table 3.
The total cost was now: 11,285.04.
The total emissions generated were now: 7,759.35.
The value of the objective function (8) was 50,081.77.
The number of emissions decreased due to the higher weight onthe total emissions generated; however, at a higher total cost. Notethat now all the links have positive capacity and positive flows.
Anna Nagurney Sustainable Supply Chain Network Design
Background and Motivation Literature The Model Examples Summary
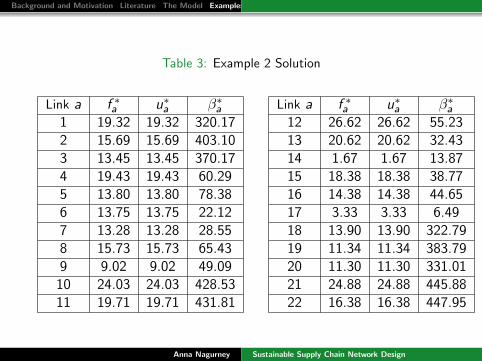
Table 3: Example 2 Solution
Link a f ∗a u∗a β∗a Link a f ∗a u∗a β∗a1 19.32 19.32 320.17 12 26.62 26.62 55.232 15.69 15.69 403.10 13 20.62 20.62 32.433 13.45 13.45 370.17 14 1.67 1.67 13.874 19.43 19.43 60.29 15 18.38 18.38 38.775 13.80 13.80 78.38 16 14.38 14.38 44.656 13.75 13.75 22.12 17 3.33 3.33 6.497 13.28 13.28 28.55 18 13.90 13.90 322.798 15.73 15.73 65.43 19 11.34 11.34 383.799 9.02 9.02 49.09 20 11.30 11.30 331.0110 24.03 24.03 428.53 21 24.88 24.88 445.8811 19.71 19.71 431.81 22 16.38 16.38 447.95
Anna Nagurney Sustainable Supply Chain Network Design
Background and Motivation Literature The Model Examples Summary
Observe that whereas links 1 and 18 had similar amounts ofproduct flows in Example 1, in Example 2, the production shiftedfrom link 18 to link 1 at about a 50% increase, since link 1corresponded to a more environmentally-friendly technology.
Similar behavior occurred with links 2 and 19.
Anna Nagurney Sustainable Supply Chain Network Design
Background and Motivation Literature The Model Examples Summary
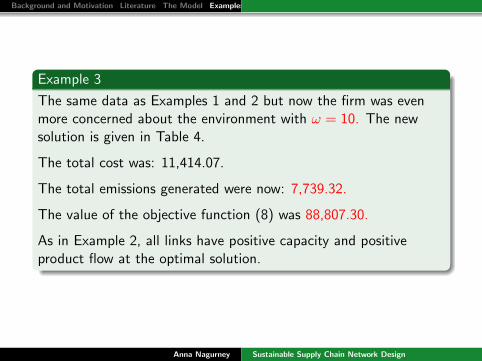
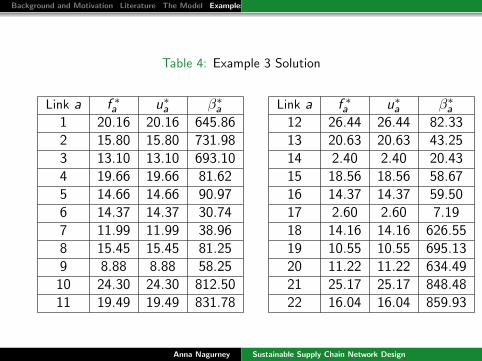
Example 3
The same data as Examples 1 and 2 but now the firm was evenmore concerned about the environment with ω = 10. The newsolution is given in Table 4.
The total cost was: 11,414.07.
The total emissions generated were now: 7,739.32.
The value of the objective function (8) was 88,807.30.
As in Example 2, all links have positive capacity and positiveproduct flow at the optimal solution.
Anna Nagurney Sustainable Supply Chain Network Design
Background and Motivation Literature The Model Examples Summary
Table 4: Example 3 Solution
Link a f ∗a u∗a β∗a Link a f ∗a u∗a β∗a1 20.16 20.16 645.86 12 26.44 26.44 82.332 15.80 15.80 731.98 13 20.63 20.63 43.253 13.10 13.10 693.10 14 2.40 2.40 20.434 19.66 19.66 81.62 15 18.56 18.56 58.675 14.66 14.66 90.97 16 14.37 14.37 59.506 14.37 14.37 30.74 17 2.60 2.60 7.197 11.99 11.99 38.96 18 14.16 14.16 626.558 15.45 15.45 81.25 19 10.55 10.55 695.139 8.88 8.88 58.25 20 11.22 11.22 634.4910 24.30 24.30 812.50 21 25.17 25.17 848.4811 19.49 19.49 831.78 22 16.04 16.04 859.93
Anna Nagurney Sustainable Supply Chain Network Design
Background and Motivation Literature The Model Examples Summary
Summary and Conclusions
We developed a sustainable supply chain network designmodel that allows for the evaluation of environmentalmulticriteria decision-making. Using the presented formalism,a firm may engineer its supply chain to be not only fiscallycost effective, but also environmentally responsible.
The model utilizes cost minimization within asystem-optimization perspective while taking into account thecapital investment cost, the operational cost, as well as thetotal emissions generated.
The supply chain network design model allows us to determinethe optimal capacity for every single activity of the supplychain network along with the optimal operational productflows and yields emission information.
Anna Nagurney Sustainable Supply Chain Network Design

Background and Motivation Literature The Model Examples Summary
Thank You!
For more information, see: http://supernet.som.umass.eduAnna Nagurney Sustainable Supply Chain Network Design