Sustainable Energy Use in Dar es Salaam - TSpace
303
Sustainable Energy Use in Dar es Salaam: Current Trends, Future Scenarios, and Policy Options by Alice Chibulu Luo A thesis submitted in conformity with the requirements for the degree of Doctor of Philosophy Department of Civil and Mineral Engineering University of Toronto © Copyright by Alice Chibulu Luo 2021
-
Upload
khangminh22 -
Category
Documents
-
view
4 -
download
0
Transcript of Sustainable Energy Use in Dar es Salaam - TSpace

i
Sustainable Energy Use in Dar es Salaam: Current Trends, Future Scenarios, and Policy Options
by
Alice Chibulu Luo
A thesis submitted in conformity with the requirements for the degree of Doctor of Philosophy
Department of Civil and Mineral Engineering University of Toronto
© Copyright by Alice Chibulu Luo 2021

ii
Sustainable Energy Use in Dar es Salaam: Current Trends,
Future Scenarios, and Policy Options
Alice Chibulu Luo
Doctor of Philosophy
Department of Civil and Mineral Engineering
University of Toronto
2021
Abstract
In 2019, Africa accounted for only 5% of global energy demand and 3.7% of energy-related
carbon dioxide emissions. However, Africa’s rapid urbanization will contribute to rising energy
use and emissions, both regionally and globally. Using the case of Dar es Salaam, Tanzania, this
thesis offers new insights relevant to the discourse on Africa’s evolving energy landscape. The
thesis: (1) Estimates possible changes in Dar es Salaam’s residential energy use and greenhouse
gas (GHG) emissions between 2015 and 2050, (2) Identifies key household and transport-related
drivers of energy use and GHG emissions, (3) Assesses variations in energy use at the sub-city
(ward) level, i.e., between settlements of differing socio-economic profiles and spatial location in
the city, and (4) Examines institutional and societal factors that may constrain low-carbon
development in Dar es Salaam.
Three studies are presented to address the four aforementioned thesis aims. The first study –
Modelling Future Patterns of Urbanization, Residential Energy Use and Greenhouse Gas
Emissions in Dar es Salaam with the Shared Socio-Economic Pathways – employs a scenario-
framework to scope different urban growth and GHG emissions pathways in Dar es Salaam. The

iii
work demonstrates an approach for projecting GHG emissions in an Africa city context that may
be data constrained. The second study – Does Location Matter? Investigating the Spatial and
Socio-Economic Drivers of Residential Energy Use in Dar es Salaam – shows the differences
and clustering of energy use that exist at the ward level, and employs statistical methods to
correlate energy use with different socio-economic and spatial characteristics of wards. The final
study – Assessing Institutional and Societal Barriers to Low-Carbon Development in Dar es
Salaam – asserts that processes to implement low-carbon measures (e.g., electrification and
public transport projects) would need to engage multiple stakeholders in a collaborative process
to leverage the power and mandate of different institutions. Together, these studies seek to
inform energy and urban planning policies in Dar es Salaam that (1) enhance synergies between
GHG mitigation investments, (2) support implementation strategies that consciously account for
local energy use realities and infrastructure access needs, and (3) acknowledge linkages between
sustainability, climate change, and socio-economic development strategies.

iv
Acknowledgements
I have thought about this moment many times over the course of my PhD research. The moment
where I get to reflect on the people who have been a source of unwavering guidance, support,
and friendship throughout my research journey. I am finally here. Thinking back to the start.
Reflecting on the journey. And completely overwhelmed with gratitude.
To start, I would not be here without the support of the most wonderful supervisor a PhD student
could ask for: Dr. Heather MacLean. Since the beginning, Heather has given me space to delve
into different topics (some of which have not made it to the pages of this thesis) and discover my
research purpose. I have appreciated our many discussions and check-ins on research or life in
general. Heather was also tremendously supportive during my various travels to Tanzania and
Zambia for fieldwork. Thank you, Heather, for everything. Embarking on this PhD journey
under your guidance has been amazing. I hope this will not be the end of our research
collaboration and that we can work together again sometime in the future.
I would also like to acknowledge Dr. Daniel Posen and Dr. Daniel (Dan) Hoornweg. Daniel
joined as a member of my supervisory committee in 2017. This was an excellent choice. I am
most inspired by Daniel’s critical thinking and high level of detail in analysis and problem
solving. Thanks to his support, I improved immensely on various technical aspects of my work,
especially my statistical analysis skills. Daniel also inspired me to learn to program in R and
Python, which was critical to synthesizing my field data. Thank you, Daniel, you have been
wonderful to work with.
I recall hearing about Dr. Dan Hoornweg’s work during my time at the World Bank in
Washington, DC. Colleagues at the Global Environment Facility (GEF) lauded him for his
contributions to the World Bank’s Sustainable Cities Program. When I started the PhD program
in 2015, I knew that I wanted to meet him and, if possible, collaborate on research. I am now
very grateful for Dan’s mentorship and support. It was in an early phone conversation with him
that we discussed the scale and challenge of urban growth in Africa. I did not fully know it at the
time, but this conversation influenced my decision to shift gears and focus my work on African
v
cities. Dan’s knowledge on various urban sustainability topics is admirable. He is always quick
to email interesting news headlines, twitter posts or research papers. Dan, I could not thank you
enough for your support over the years, I have really appreciated our collaboration.
I would also like to extend thanks to my “EESC-A” family. The Engineering Education for
Sustainable City in Africa (EESC-A) project allowed me to expand my research tentacles
towards other “Africa-focused” initiatives on campus. Many thanks to Dr. Murray Metcalfe, Dr.
Nadine Ibrahim, and Dr. Rahim Rezaie who I worked with as an “EESC-A Global Leader”.
Being a part of the EESC-A leadership team was undoubtedly a key highlight of my research
journey. I will dearly miss our meetings, lunches, and coffees at L’Espresso “when Murray is in
town”. Murray and Nadine, I think back to 2018, grateful by your insistence to travel from
Toronto to Dar es Salaam to mark EESC-A’s presence at my policy workshop. Having you in
Dar es Salaam during the busy days leading up to the event was just what I needed to push
through the intensive planning and preparations. My memory is still painted with the joyous
image of our after-workshop dinner and celebration on the beachfront of Oyster Bay.
I am also indebted to various local partners in Dar es Salaam and Lusaka. Special thanks to Dr.
Nathalie Jean-Baptiste and Dr. Gilbert Siame for introducing me to relevant individuals in local
and national government and for being a source of constant support during my fieldwork. Thanks
to the Institute on Human Settlements Studies at Ardhi University and the Centre for Urban
Planning and Research at the University of Zambia. To the International Growth Centre, who
provided funding support for the household surveys and policy workshop in Dar es Salaam, and
especially André Castro and Claire Lwehabura for their support. Finally, thanks to Wivina
Mushobozi, Hilary Mvungi, Gloria Punjila, Daud Lema, Daniel Sifael and Samike Mashiku for
being my trusted and hardworking enumerators for the household surveys. To Kevin Onjiko, for
helping with critical GIS inputs and digitizing travel data collected during the household surveys.
And to the team at Ideas in Action, especially Sam Kiware, Godfrey Siwingwa, John Ross,
Farida Katunzi and Dickson Msaky, for coordinating the field team, and helping me to secure
local government clearances for the fieldwork.

vi
Returning to Canada, I would like to thank the supportive staff in the Department of Civil
Engineering, from the Business Office to the Communications Team, who work to make life
easy for graduate students. Thanks to the students and professors whom I have discussed
research with; especially Dr. Eric Miller, Dr. Marianne Touchie, Dr. Alec Hay, Dr. David Meyer,
and colleagues and friends in the “Saxe-Posen-MacLean” (SPM) Group.
I would also like to acknowledge the various institutions that have awarded me funding and
fellowship opportunities over the course of my studies. Namely: the International Development
Research Centre Canada (IDRC) (Doctoral Research Award), the Centre for Global Engineering
(CGEN) (Annual Scholarship), the International Growth Centre (IGC) (Small Project Fund as
part of IGC Tanzania research projects), and the Natural Sciences and Engineering Research
Council of Canada (NSERC). A special thanks to the International Institute for Applied Systems
Analysis (IIASA) for the opportunity to participate in the Young Scientists Summer Program
(YSSP) in 2016. Also, to the Institute on Municipal Finance and Governance (IMFG) for
awarding me their Graduate Student Fellowship in 2018, and to Dr. Enid Slack (Director of the
IMFG) for her support and comments on various urban governance dimensions of my work.
Finally, I would like to thank my incredible family and friends both in Canada and abroad.
To my mother, who has a PhD herself, thank you for the many conversations and words of
encouragement when I needed them the most. To my husband, Kwame, no words can describe
my deep appreciation for you. Thank you for being with me through this journey and helping me
to see the lessons and opportunities in every challenge. And last, but not least, to my daughter,
Olivia. You are the reason I do this work, in the hope to secure a brighter and more sustainable
future for you. This thesis is dedicated to you.
vii
Table of Contents
Abstract .......................................................................................................................................... ii
Acknowledgements ...................................................................................................................... iv
List of Tables .............................................................................................................................. xiii
List of Figures .............................................................................................................................. xv
Nomenclature ........................................................................................................................... xviii
Chapter 1 Introduction................................................................................................................. 1
1.1 Energy Use in Africa: An Evolving Landscape .............................................................. 1
1.2 Thesis Objectives and Questions .................................................................................... 8
1.3 Outline of Thesis Chapters.............................................................................................. 9
1.4 Author Contributions .................................................................................................... 14
1.5 Note on Fieldwork and Policy Workshops ................................................................... 16
1.6 Related Media ............................................................................................................... 17
1.7. References for Chapter 1 .............................................................................................. 19
Chapter 2 Background and Literature Review ....................................................................... 24
2.1 Sustainable Development, Cities, and their Energy Use .............................................. 24
2.2 Africa’s Urban Energy Context .................................................................................... 27
2.3 Background on Dar es Salaam (Tanzania) .................................................................... 30
2.3.1 The dual nature of Dar es Salaam’s expansion ......................................................... 30
2.3.2 Climate and Energy Policies in Tanzania and Future Prospects............................... 32
2.4 Quantifying Urban Sustainability ................................................................................. 34
2.4.1 Life Cycle Assessment (LCA) .................................................................................. 35
2.4.2 Urban Metabolism (UM) .......................................................................................... 37
2.4.3 Scenario-Based Approaches (Long-Term Energy Modelling) ................................. 41
2.5 Bottom-up (Fieldwork) Approaches to Collecting Data ............................................... 43

viii
2.5.1 Structured Surveys .................................................................................................... 44
2.5.2 Unstructured and Semi-Structured Surveys .............................................................. 46
2.6 Concluding Remarks ..................................................................................................... 47
2.7 References for Chapter 2 .............................................................................................. 48
Chapter 3 Modelling Future Patterns of Urbanization, Residential Energy Use and
Greenhouse Gas Emissions in Dar es Salaam with the Shared Socio-Economic Pathways 59
3.1 Abstract ......................................................................................................................... 59
3.2 Introduction ................................................................................................................... 60
3.3 Literature Review: Infrastructure and Energy Transitions in Africa and Other Global
South Cities ............................................................................................................................... 62
3.4 Case Study of Dar es Salaam, Tanzania ....................................................................... 66
3.5 Methods......................................................................................................................... 67
3.5.1 Dar es Salaam’s Urbanization Narratives ................................................................. 68
3.5.2 Modelling Using the LEAP Platform ....................................................................... 70
3.6 Results and Discussion ................................................................................................. 82
3.6.1 Changes in Dar es Salaam’s Total Population and Density ...................................... 82
3.6.2 Dar es Salaam’s current and future GHG Emissions ................................................ 85
3.6.3 Household Emissions ................................................................................................ 86
3.6.4 Transport Emissions.................................................................................................. 88
3.6.5 Correlation Between Total Residential Emissions, GDP and Population ................ 91
3.6.6 Comparing Dar es Salaam’s Emissions Projections with other Global South Cities 92
3.6.7 Implementing Aggressive GHG Mitigation Policies under SSP1 ............................ 94
3.7 Research Limitations and Areas of Future Work ......................................................... 94
3.8 Conclusions and Implications for Energy Policy.......................................................... 95
3.9 Supplementary Material ................................................................................................ 98
3.9.1 Global Warming Potentials for Major GHGs ........................................................... 98
3.9.2 GHG Emissions Factors ............................................................................................ 99

ix
3.9.3 Electric Power Development Scenarios .................................................................. 100
3.9.4 Comparing Dar es Salaam’s Projected Emissions with Global Cities .................... 102
3.9.5 Influence of GDP on Dar es Salaam’s Emissions ................................................... 103
3.9.6 Dar es Salaam’s Projected Biogenic Emissions to 2050 ........................................ 104
3.9.7 Assuming “Aggressive GHG Mitigation” Under SSP1.......................................... 105
3.9.8 Dar es Salaam’s BRT .............................................................................................. 106
3.9.9 Quantifying GHG emissions in LEAP .................................................................... 107
3.10 References for Chapter 3 ............................................................................................ 109
Chapter 4 Does Location Matter? Investigating the Spatial and Socio-Economic Drivers of
Residential Energy Use in Dar es Salaam ............................................................................... 122
4.1 Abstract ....................................................................................................................... 122
4.2 Introduction ................................................................................................................. 123
4.3 Methods....................................................................................................................... 127
4.3.1 Study Region ........................................................................................................... 127
4.3.2 Methods Overview .................................................................................................. 128
4.3.3 Description of Fieldwork ........................................................................................ 128
4.4 Sample Design and Survey Method ............................................................................ 130
4.5 Approach to Quantifying Residential Energy Use ...................................................... 132
4.6 Statistical Methods ...................................................................................................... 133
4.6.1 Analysis of Variance ............................................................................................... 133
4.6.2 Principal Component Analysis ............................................................................... 133
4.6.3 Multivariate Regression Models ............................................................................. 135
4.7 Results and Discussion ............................................................................................... 136
4.7.1 Differences in Residential Energy Use across the Surveyed Wards ....................... 136
4.7.3 Effect of Ward Type on Residential Energy Use .................................................... 139
4.7.4 Effect of Cooking Fuel Choice and other Socio-Economic and Spatial Factors on
Household-Related Energy Use .......................................................................................... 142

x
4.7.5 Effect of Public Transport Use and other Socio-Economic and Spatial Factors on
Transport-Related Energy Use ............................................................................................ 146
4.8 Policy Considerations ................................................................................................. 149
4.9 Study Limitations ........................................................................................................ 151
4.10 Concluding Remarks ................................................................................................... 152
4.11 Supplementary Material .............................................................................................. 153
4.11.1 Recruitment of Field Team ..................................................................................... 153
4.11.2 Research Ethics Approvals and Local Clearances .................................................. 153
4.11.3 Quantifying Energy Use ......................................................................................... 154
4.11.4 Principal Component Scores by Ward .................................................................... 157
4.11.5 Description of Variables Used in OLS and Tobit Regressions ............................... 158
4.11.6 Summary of Data Variables Relevant to the Study ................................................ 161
4.11.7 Correlation Matrix Showing Variable Relationships .............................................. 173
4.11.8 Effect of Cooking Fuel Choice on Household Energy Use .................................... 174
4.11.9 Full set of results from OLS and Tobit Regressions ............................................... 177
4.11.10 Multi-logit Regressions to Interpret Travel Behavior ............................................ 186
4.11.11 Inequalities in Energy Use ..................................................................................... 188
4.12 References for Chapter 4 ............................................................................................ 192
Chapter 5 Assessing Institutional and Societal Barriers to Low-Carbon Development in
Dar es Salaam ............................................................................................................................ 199
5.1 Abstract ....................................................................................................................... 199
5.2 Introduction ................................................................................................................. 200
5.3 Literature Review........................................................................................................ 203
5.3.1 The Role of Institutions in Supporting Climate Change (Mitigation and Adaptation)
Responses in African Cities ................................................................................................ 203
5.3.2 Community Energy Use Behaviors in African Cities ............................................. 204
5.3.3 Household Energy Use in Dar es Salaam and Tanzania ......................................... 205
xi
5.4 Institutions of Urban Governance in Dar es Salaam ................................................... 206
5.5 Methods....................................................................................................................... 209
5.5.1 Interviews with Key Informants and Thematic Analysis ....................................... 210
5.5.2 Household Surveys ................................................................................................. 211
5.5.3 Household Survey Data Cleaning and Statistical Analysis .................................... 214
5.6 Results and Discussion ............................................................................................... 216
5.6.1 Dar es Salaam Key Informant Interviews ............................................................... 216
5.6.2 Dar es Salaam Household Surveys ......................................................................... 221
5.6.3 Linking Findings from Key Informant Interviews and Household Surveys in Dar es
Salaam ................................................................................................................................. 227
5.7 Conclusions – Which Institution(s) should “Take the Lead” to Enable Low-Carbon
Development in Dar es Salaam? ............................................................................................. 228
5.8 Supplementary Material .............................................................................................. 230
5.8.1 Interview Guide for Key Informant Interviews ...................................................... 231
5.8.2 Mapping of Dar es Salaam Key Informant Responses ........................................... 232
5.8.3 Preliminary Work in Lusaka ................................................................................... 235
5.9 References for Chapter 5 ............................................................................................ 238
Chapter 6 Conclusions .............................................................................................................. 245
6.1 Objective 1: Estimate current and future residential energy use and GHG emissions in
Dar es Salaam ......................................................................................................................... 245
6.2 Objective 2: Identify key drivers of residential energy use and GHG emissions in Dar
es Salaam ................................................................................................................................ 248
6.3 Objective 3: Assess differences in residential energy use that may exist at the Dar es
Salaam sub-city (ward) level .................................................................................................. 250
6.4 Objective 4: Assess the institutional and societal factors that may constrain low-carbon
development in Dar es Salaam ................................................................................................ 251
6.5 Concluding Remarks Linking Thesis Objectives and Questions ................................ 253

xii
6.6 Future Work ................................................................................................................ 254
6.6.1 Linkages Between Urban Sustainability and Resilience ........................................ 254
6.6.2 Piloting Energy Use/GHG emission Studies in other African Cities ..................... 256
6.6.3 Accounting for Upstream (Scope 3) GHG Emissions ............................................ 256
6.6.4 Developing Roadmaps and Financing Structures to Support Low-Carbon Initiatives
in Cities ............................................................................................................................... 257
6.7 Final Thesis Remarks .................................................................................................. 259
6.8 Supplementary Material .............................................................................................. 260
6.8.1 LEAP Model Results (Presentation Format) .......................................................... 260
6.9 References for Chapter 6 ............................................................................................ 261
Appendix A: Dar es Salaam Household Survey ..................................................................... 264
Appendix B: Policy Workshop in Dar es Salaam .................................................................. 282
Appendix C: Policy Workshop in Lusaka .............................................................................. 284

xiii
List of Tables
Table 2.1. Selected studies that employ Life Cycle Assessment (LCA) and Urban Metabolism
(UM) approaches to quantifying aspects of urban sustainability across different global cities. .. 39
Table 3.1. Dar es Salaam’s Urbanization Narratives inspired by the SSPs: SSP1 (Sustainability),
SSP2 (BAU) and SSP3 (Fragmented)........................................................................................... 70
Table 3.2. Key indicators and underlying assumptions for estimating Dar es Salaam’s residential
energy use and GHG emissions for SSP1 (Sustainability), SSP2 (BAU), and SSP3 (Fragmented)
narratives from 2015 to 2050. ....................................................................................................... 72
Table 3.3. Modelling assumptions for changes in household energy use for SSP1
(Sustainability), SSP2 (BAU), and SSP3 (Fragmented) narratives. ............................................. 79
Table 3.4. Total residential emissions from household and transport activities in Dar es Salaam
by activity. Results for SSP1 (Sustainability), SSP2 (BAU) and SSP3 (Fragmented) narratives
for 2030 and 2050. ........................................................................................................................ 89
Table 3.5. Comparing GHG emissions results and main drivers of GHG emissions for selected
cities or regions in the Global South. ............................................................................................ 93
Table 4.1. Socio-economic, spatial characteristics and sampling data for surveyed wards in the
Dar es Salaam region. ................................................................................................................. 129
Table 4.2. Principal Component (PC) loadings on variables associated with household wealth.
Household responses were binary in nature, where households indicated yes (coded as 1), or
“no” (coded as 0) in their responses. PC loadings are compared with the proportion of the
surveyed households that responded yes, for the entire sample, and for households in Msasani
and Kawe (the two high-income wards). .................................................................................... 134
Table 4.3. Results from LSD test results showing differences in mean household-related energy
use based on household cooking fuel choice among surveyed households in the Dar es Salaam
region. ‘A’ represents the high energy using groups, and E the lowest. Surveyed households

xiv
grouped with the same letter indicate no statistically significant difference between group means.
..................................................................................................................................................... 144
Table 4.4. Multivariate OLS and Tobit regression results showing the statistical relationship
between cooking fuel choice, selected spatial and socio-economic variables, and household-
related energy use across the surveyed households in the Dar es Salaam region. ...................... 145
Table 4.5. Multivariate OLS and Tobit regression results showing the statistical relationship
between public transport use, selected spatial and socio-economic variables, and transport-related
energy use across the surveyed households in the Dar es Salaam region. .................................. 148
Table 5.1. Socio-economic and spatial characteristics of wards surveyed in Dar es Salaam1 ... 213
Table 5.2. Structured survey questions administered to households in Dar es Salaam1,2 .......... 214
Table 5.3. Results from household surveys and chi-square tests showing the effect of ward type
on household survey responses to questions on household electricity access, cooking behavior
and perceptions on charcoal use. ................................................................................................ 225
Table 5.4. Results from household surveys and chi-square tests showing the effect of ward type
on household survey responses to questions on household travel behavior and perceptions on the
affordability and accessibility of the BRT service (i.e., relative to the “dala-dala” minibus
service). ....................................................................................................................................... 226
Table 6.1. Carrying capacity analysis for different urban infrastructures .................................. 255

xv
List of Figures
Figure 1.1. City populations (in millions) and estimated average annual urban growth rates
between 2020 and 2035. Cities are ordered according to their average annual urban growth rate
to show that the top 9 fastest growing cities in the sample are African cities. I developed the
figure using data from the United Nations (UN, 2018). ................................................................. 3
Figure 1.2. Schematic diagram showing linkages between thesis objectives, methods, and main
papers/chapters (i.e., Chapters 3, 4, and 5). .................................................................................. 13
Figure 2.1. Comparing total CO2 emissions from fuel combustion from 1971 to 2017 for the
World, OECD member countries, the top three highest-emitting countries (China, the United
States and India) and the Africa region. Historically, Africa’s CO2 emissions have been low,
representing only 1.7% of world CO2 emissions in 1971 and 3.6% in 2017. CO2 emission are
attributed to fuel combustion from the use of coal, oil, and natural gas (IEA, 2019b). I compiled
the figure using data from the International Energy Agency (IEA, 2019b). ................................ 26
Figure 2.2. Msasani ward (“Oysterbay” segment) – a formal settlement in Dar es Salaam and
home to the City’s wealthiest communities. Photo taken by Alice Chibulu Luo. ........................ 31
Figure 2.3. Mwananyamala – an informal settlement in Dar es Salaam that is currently
undergoing regularization. I refer to this settlement as mixed to reflect these ongoing efforts to
upgrade and redevelop certain areas in the ward. Photo taken by Alice Chibulu Luo. ................ 32
Figure 2.4. The different life cycle stages typically covered in an LCA each with its own
associated environmental exchanges in terms of energy and mass requirements and waste and
pollutant emissions. The gray box indicates that only the use stage is typically accounted for in
traditional UM studies and the up and downstream burdens tend to remain unaccounted for
(Note: EoL refers to “End of Life”). Source: (Goldstein et al., 2013), page 3. ............................ 37
Figure 2.5. Keko ward. One of the surveyed wards in the fieldwork sample. The ward is home to
several low-income communities in Dar es Salaam. Photo taken by Alice Chibulu Luo. ........... 45
xvi
Figure 3.1. Average population densities (by ward) and major arterial roads (Bagamoyo, Kilwa,
Morogoro and Nyerere) in Dar es Salaam. I compiled the map in ArcGIS using ward population
data from the 2012 National Census Report (Government of Tanzania, 2016b, 2017a). ............. 66
Figure 3.2. Changes in Dar es Salaam's population from 2015 to 2050 for SSP1 (Sustainable),
SSP2 (BAU) and SSP3 (Fragmented) narratives. My LEAP model calculates energy use and
emissions to the year 2050; though, estimates are extended to 2100 to illustrate the eventual
slow-down in Dar es Salaam’s population under SSP1. Dar es Salaam’s population continues to
increase at a higher rate for SSP2 and SSP3. ................................................................................ 83
Figure 3.3. Spatial population projections for Dar es Salaam from 2015 to 2050 for SSP1
(Sustainable Growth), SSP2 (BAU Growth) and SSP3 (Fragmented Growth) narratives. .......... 84
Figure 4.1. Map showing surveyed wards in the Dar es Salaam region relative to the city center
and BRT line (Phase 1). .............................................................................................................. 130
Figure 4.2. Variation in energy use across the sampled wards. Residential energy use from both
household-related and transport-related activities (A). Energy use from household-related
activities (B). Energy use from transport-related activities (C). ................................................. 137
Figure 4.3. Results from post-hoc tests (i.e., Fisher’s LSD) showing ward level differences in
residential energy use (at a significance level of 5%). Wards are ordered according to their mean
residential energy use i.e., high, medium-high, medium-low and low residential energy use.
Wards shown in the same circle or intersection have no significant differences between them. 139
Figure 4.4. Average relative shares of total household energy use by type of fuel in the Dar es
Salaam surveyed wards. .............................................................................................................. 140
Figure 4.5. Average relative shares of total transport energy use among surveyed wards in the
Dar es Salaam region according to transport mode (A). Proportion of households that reported
the use of a private vehicle among the surveyed wards (B). ...................................................... 141
Figure 4.6. Differences in household and transport-related energy use across surveyed wards in
Dar es Salaam. Thesize of bubble indicates average ward density. Surveyed wards map along

xvii
four major typologies of energy use (based on their mean household-related and transport-related
energy use, respectively): (A) Low-Low (Kimara); (B) Medium-Low (Sinza, Buguruni, Manzese
and Mwananyamala); (C) High-Low (Keko); and (D) High-High (Msasani and Kawe). .......... 150
Figure 5.1. Institutions of urban governance in Tanzania and for Dar es Salaam region. Direction
of arrow indicates the direction of reporting between institutions in local and national
government. This figure was created by the author (Alice Chibulu Luo) based on descriptions
provided by key informants during interviews, and other supporting information received from
PORALG, with their permission................................................................................................. 208
Figure 5.2. Summary of responses from interviews with Dar es Salaam key informants, selected
across national and local government institutions, donor agencies, academia and the private
sector. .......................................................................................................................................... 217
Figure 6.1. Proposed Steering Committee of local champions from PORALG, sector ministries,
city and municipal councils, multilateral development banks (MDBs), service providers, and
regulators..................................................................................................................................... 252

xviii
Nomenclature
BRT – Bus Rapid Transit
GDP – Gross Domestic Product
GHG – Greenhouse Gas
GWP – Global Warming Potential
HDI – Human Development Index
IAM – Integrated Assessment Model
IEA – International Energy Agency
INDC – Intended Nationally Determined Contribution
IPCC – Intergovernmental Panel on Climate Change
LEAP – Long-Range Energy Alternatives Planning Software
LPG – Liquefied Petroleum Gas
LULUCF – Land Use Land-Use Change and Forestry
SDGs – Sustainable Development Goals
SSA – sub-Saharan Africa
SSPs – Shared Socio-Economic Pathways
UN – United Nations
UNFCCC – United Nations Framework Convention on Climate Change
WHO – World Health Organization

1
Chapter 1
Introduction
1.1 Energy Use in Africa: An Evolving Landscape
As of 2019, economic activities in Africa – particularly the sub-Saharan Africa region –
contribute little to the global energy landscape. According to the International Energy Agency
(IEA), sub-Saharan Africa accounts for only 5% of global energy demand and 3.7% of energy-
related carbon dioxide (CO2) emissions (IEA, 2019a). However, these emissions are anticipated
to rise considerably in coming years. Urbanization will increase the region’s energy use and
associated greenhouse gas (GHG) emissions (which encompass CO2 emissions) due to higher
energy use from residential activities, electricity generation, transportation and industry (Bai et
al., 2018; IEA, 2019a; Nagendra et al., 2018; Steckel et al., 2020). Steckel et al. (2020) also show
that carbon-intensive electric power, including new coal-fired capacity in sub-Saharan Africa
will contribute significantly to the region’s future “carbonization”.
For many cities, GHG emissions are mostly attributed to the energy use of city residents. In
2019, the IEA reported that the residential sector accounted for 64% of sub-Saharan Africa’s
energy use, compared to only 14%, 15%, and 8% from industry, transport, and other energy-
using sectors (IEA, 2019a). Moreover, in cities such as Lagos (Nigeria), Cape Town (South
Africa) and Abidjan (Côte d'Ivoire), GHG emissions from residential buildings (not including
biomass use) and on-road transportation (including domestic transport) have accounted for the
largest share of urban GHG emissions in 2015, i.e., 42% (Lagos), 47% (Cape Town) and 56%
(Abidjan) (C40 Cities, 2017). GHG emissions from industry (including manufacturing and
commercial/services activities) have been the second largest category, i.e., 32% (Lagos), 43%
(Cape Town) and 33% (Abidjan) (remaining GHG emissions have been from solid waste
disposal and waste-water treatment). Rising energy use and GHG emissions from residential
activities and other key sectors (e.g., industry) are linked to higher population and Gross
Domestic Product (GDP) levels anticipated in the next stages of the region’s urbanization (Dioha
& Kumar, 2020; IEA, 2019a; Steckel et al., 2020; Stone & Wiswedel, 2018).

2
Of the projected 2.2 billion people who may be added to the global urban population between
2017 and 2050, over half (1.3 billion) are expected to be in Africa (UN, 2018). Figure 1.1
compares the 30 largest cities globally – as estimated by their populations in 2020 (UN, 2018) –
with the 15 largest African cities. I rank cities according to their estimated annual urban growth
rate, i.e., the average annual rate of change in urban population, between 2020 and 2035 (UN,
2018). Rankings show that the top 9 fastest growing cities between 2020 and 2035 are all
African cities (i.e., Dar es Salaam to Abidjan, Figure 1.1). The largest city in the sample, Tokyo
(estimated population of 37 million in 2020), is expected to grow at a declining rate (-0.25%
annually) between 2020 and 2035. This can be compared to annual urban growth rates exceeding
4% between 2020 and 2035 in Dar es Salaam (6.7 million), Addis Ababa (4.8 million),
Mogadishu (2.3 million) and Kinshasa (14.3 million).
Despite Africa’s rapid urbanization, the region’s cities are largely overlooked in current research
on urban energy use and GHG emissions. In the chapter on human settlements, infrastructure and
spatial planning in the Intergovernmental Panel on Climate Change’s (IPCC) Fifth Assessment
Report (AR5), the authors stated that case-studies from African cities are particularly limited,
and their review “reflects this limitation in the literature” ((IPCC, 2014), page 951). Similarly,
Lamb et al. (2019) developed a database of over 4,000 case-study examples that demonstrated
climate mitigation responses in global cities and showcased “city scale reforms” in
transportation, building design and urban form. The authors concluded that “cities in world
regions with the highest future mitigation relevance” (i.e., Africa) “are systematically under-
represented” in the literature ((Lamb et al., 2019), page 279). Africa’s high urban growth rates
(Figure 1.1) suggests an urgency to initiate more research on urban energy use and GHG
emissions in the region as to identify opportunities to establish low-carbon patterns of urban
development.

3
Figure 1.1. City populations (in millions) and estimated average annual urban growth rates
between 2020 and 2035. Cities are ordered according to their average annual urban growth rate
to show that the top 9 fastest growing cities in the sample are African cities. I developed the
figure using data from the United Nations (UN, 2018).
- 5 0 5 10 15 20 25 30 35 40
OsakaTokyo
MoscowParis
Rio de JaneiroLos Angeles
New YorkSão Paulo
Buenos AiresMexico City
IstanbulDurbanTianjin
ShenzhenBeijing
CasablancaGuangzhou
ShanghaiJohannesburg
ChongqingKolkataManila
MumbaiAlexandria
CairoDelhi
KarachiAccra
BangaloreDhakaLahore
AbidjanKano
LagosLuandaNairobi
KinshasaMogadishu
Addis AbabaDar es Salaam
Average annual urban growth rate (%) (2020 to 2035)
2020 Population (millions)
The top 9 fastest
growing cities
projected between
2020 and 2035 are
all African cities.

4
By the end of the 21st Century, Hoornweg and Pope (2017) have asserted that Africa’s urban
growth could shift the world's largest cities from Asia and Latin America today (based on 2010
data) to Africa. The authors projected that population levels in Lagos (Nigeria), Kinshasa
(Congo) and Dar es Salaam (Tanzania) could exceed 70 million (in each individual city) by the
year 2100 (Hoornweg & Pope, 2017). From a CO2 emissions perspective, some studies have
shown that Africa’s growth could accelerate the region’s CO2 emissions to reach as high as 20%
to 23% of global emissions by 2100 (Calvin et al., 2016; Lucas et al., 2015). These changes
would represent a five-fold increase from the region’s 3.7% contribution (as of 2019, IEA,
2019a), or be equivalent to the combined (2016) emissions of the United States and Canada
(IEA, 2017b).
To avoid a potential “lock-in” to such carbon-intensive patterns of urban growth, studies have
called on African cities and their local governments to integrate low-carbon and climate-
resilience strategies as part of their existing urban planning and development policies, e.g., Bai et
al. (2018), Cartwright et al. (2015), Colenbrander et al. (2019), Lwasa et al. (2018), Solecki et al.
(2018), and Ürge-Vorsatz et al. (2018). Authors of these studies agree that the changing urban
form and economy of African cities may lock-in their future energy use and GHG emissions.
Therefore, these next stages of urban development could present an opportunity for African cities
to “leapfrog” the carbon-intensive and environmentally destructive development historically
experienced among Global North cities (Europe and North America), i.e., leapfrogging could
advance low-carbon and climate-resilient urban development.
However, the urbanization of African cities comes with several challenges. To start, urbanization
is often coupled with high vulnerability to climate-induced risks such as flooding, droughts, sea
level rise, and storm surges (Lwasa et al., 2018). For example, approximately 8% of Dar es
Salaam (Tanzania) lies within a low-elevation zone, where an estimated 210,000 people are
vulnerable to sea level rise and coastal flooding (Kebede & Nicholls, 2012). In addition, local
government authorities (municipalities) are often overburdened with competing development
agendas such as addressing the wide-spread urban poverty and informality in cities (over 60% of
Africa’s urban population lives in informal settlements) (Bawakyillenuo et al., 2018; Lall et al.,
2017; Lwasa et al., 2018; UN-Habitat, 2014). Local governments are also limited in their

5
capacity to spearhead climate change mitigation or adaptation responses at the local level due to
governance structures that allocate more power to national or state-led institutions (Dellas et al.,
2018; Shemdoe et al., 2015).
To make progress on low-carbon and climate-resilient development, researchers have called on
African cities to prioritize the following policy and research actions: (1) implementing climate
change mitigation responses to support broader development agendas at the city, national or
regional level (Bawakyillenuo et al., 2018; Lwasa et al., 2018), (2) enabling partnerships
between local and national authorities during the implementation of climate change mitigation
and adaptation initiatives in cities (Bawakyillenuo et al., 2018; Shemdoe et al., 2015), (3)
engaging higher level national government institutions and the private sector in financing city
level initiatives (Diep et al., 2016; Kithiia & Dowling, 2010; Leck & Simon, 2018; Tait &
Euston-Brown, 2017), and (4) estimating energy use and GHG emissions trends in African cities
and highlighting the “lived” experiences of city residents (IPCC, 2014; Lamb et al., 2019;
Nagendra et al., 2018). My work in Chapter 3, Chapter 4 and Chapter 5 uses the case of Dar es
Salaam to explore these policy and research priorities.
My work also identifies three gaps in the literature that – if addressed – could inform progress on
the policy and research priorities discussed above. Firstly, except for some regional and cross-
country comparisons (e.g., Currie et al. (2017), Lucas et al. (2017), Stone & Wiswedel (2018),
and van der Zwaan et al. (2018)), few studies have estimated or projected urban energy use or
GHG/CO2 emissions trends for different African cities – possibly, as suggested by Steckel et al.
(2020) “owing to the small role they play in current emissions” ((Steckel et al., 2020), page 83).
This gap suggests a need for research that examines energy use or emissions trends (e.g., current
and future changes) within individual cities, and identifies key sectors (e.g., residential,
transportation and industrial) driving changes in energy use/GHG emissions at the city level.
Secondly, studies of Currie et al. (2017), Stone and Wiswedel (2018), and van der Zwaan et al.
(2018) estimated energy use and emissions at the aggregate city or regional level and did not
account for differences in energy use at the sub-city (settlement, neighborhood or ward) level.
Only a handful of studies (e.g., Jagarnath and Thambiran (2018) and Strydom et al. (2020)) have
estimated resource (material and energy) use at the sub-city level to identify the specific
6
neighborhoods and economic activities that have contributed to resource use and GHG emissions
in cities. For example, Jagarnath and Thambiran, (2018) estimated neighborhood level GHG
emissions for the Durban metropolitan area using spatially disaggregated activity data (e.g.,
postal codes, ward populations, and firm addresses) collected from national census surveys and
sector reports (e.g., transport, industry, residential, and waste sectors). By showing differences in
emissions for specific groups and economic activities, the authors have called on city
governments to tailor mitigation efforts (e.g., supporting more aggressive GHG mitigation in the
highest emissions zones in south, central and north Durban) and address inequalities in
infrastructure access among the poorest and lowest-emitting neighborhoods. In Cape Town,
Strydom et al. (2020) have likewise suggested that interventions to support sustainable urban
energy use should consider the socio-economic profiles of neighborhoods. The authors showed
differences in energy use using electricity, gas, charcoal, and wood use data collected from
selected low, middle, and high-income neighborhoods in Cape Town (Strydom et al., 2020).
However, studies of Jagarnath and Thambiran (2018) and Strydom et al. (2020) exemplify the
larger presence of case-studies from South African cities. There is a general lack of studies from
other African cities, which would be critical to informing cross-country comparisons or reviews
of energy use/GHG emissions trends in different cities or settlements across the region.
Furthermore, for many African cities, implementation strategies to enable progress on low-
carbon development at the city level are often poorly articulated. For example, the African
Union’s Agenda 2063 outlines a strategic framework to promote low-carbon development at the
regional level, and calls on governments to deliver “modern, efficient, reliable, cost-effective,
renewable and environmentally friendly energy to all African households, businesses, industries
and institutions” ((African Union, 2014), page 16). However, the Agenda does not include
recommendations for cities to realize the recommended strategies. Furthermore, with the
exception of studies by Bawakyillenuo et al. (2018) and Tait and Euston-Brown (2017), current
literature offers few examples of city actions to promote low-carbon development at the city
level – refer to Chapter 5, for a literature review on the institutional factors that have constrained
progress on climate change responses in African cities.
This thesis aims to evaluate energy use trends and discourse around low-carbon development

7
using the case of Dar es Salaam. In particular, the thesis contributes to the literature gaps
discussed above and addresses four research objectives: Objective 1: Estimate current and future
residential energy use and GHG emissions in Dar es Salaam (see Section 1.3 for details on this
city choice/selection); Objective 2: Identify key drivers of residential energy use and GHG
emissions in Dar es Salaam; Objective 3: Assess differences in residential energy use that may
exist at the Dar es Salaam sub-city (ward) level; and Objective 4: Assess the institutional and
societal factors that may constrain low-carbon development in Dar es Salaam. I focus my work
on the residential sector, which, as previously highlighted, contributes to much of the urban
energy use and GHG emissions at the regional and city level (though, other sectors, e.g., industry
or waste, could be incorporated in future work, see Chapter 6). I use the term “residential energy
use” or “residential GHG emissions” throughout the thesis to refer to the sum of energy uses or
GHG emissions from domestic household and transportation activities. The following Section
(1.2) outlines specific research questions to be addressed for each of the four thesis objectives.
8
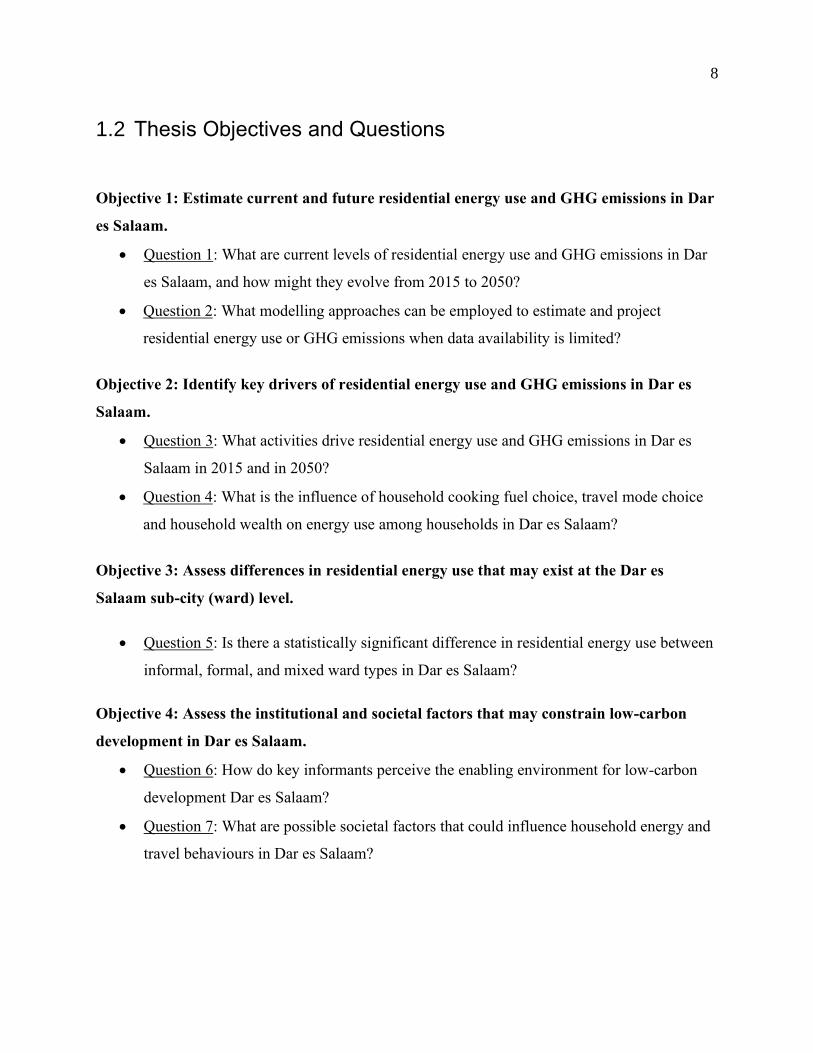
1.2 Thesis Objectives and Questions
Objective 1: Estimate current and future residential energy use and GHG emissions in Dar
es Salaam.
• Question 1: What are current levels of residential energy use and GHG emissions in Dar
es Salaam, and how might they evolve from 2015 to 2050?
• Question 2: What modelling approaches can be employed to estimate and project
residential energy use or GHG emissions when data availability is limited?
Objective 2: Identify key drivers of residential energy use and GHG emissions in Dar es
Salaam.
• Question 3: What activities drive residential energy use and GHG emissions in Dar es
Salaam in 2015 and in 2050?
• Question 4: What is the influence of household cooking fuel choice, travel mode choice
and household wealth on energy use among households in Dar es Salaam?
Objective 3: Assess differences in residential energy use that may exist at the Dar es
Salaam sub-city (ward) level.
• Question 5: Is there a statistically significant difference in residential energy use between
informal, formal, and mixed ward types in Dar es Salaam?
Objective 4: Assess the institutional and societal factors that may constrain low-carbon
development in Dar es Salaam.
• Question 6: How do key informants perceive the enabling environment for low-carbon
development Dar es Salaam?
• Question 7: What are possible societal factors that could influence household energy and
travel behaviours in Dar es Salaam?

9
1.3 Outline of Thesis Chapters
The thesis comprises of three studies (presented in Chapters 3 to 5), each written as an individual
journal paper. The papers offer new insights to the discourse on Africa’s urban energy landscape
and address the research gaps discussed previously (Section 1.1). I selected Dar es Salaam
(Tanzania) as a case study for two reasons: (1) the city is among the fastest-growing cities in the
region, alongside other cities such as Lagos (Nigeria), Addis Ababa (Ethiopia), and Kinshasa
(Congo) (see Figure 1.1); and (2) I established strong networks with local researchers,
policymakers and universities during an earlier field trip to Dar es Salaam in September 2017,
where I presented research at the International Association for People and Environment Studies
(IAPS) Symposium hosted by the Institute of Human Settlements Studies (IHSS) at Ardhi
University. This early trip culminated in research partnerships being established with IHSS and
Ideas in Action Limited (who supported the delivery of the household surveys). Details on these
collaborations are provided in Chapter 4 and Chapter 5, and supplementary material appended at
the end of these chapters.
I also conducted additional field trip to Lusaka (Zambia) in January 2017 (and later, from
November 2018 to February 2019), where I established a partnership with the Center for Urban
Research and Planning (CURP) at the University of Zambia. However, resource constraints
compromised my ability to deliver a concrete study in Lusaka, though some preliminary findings
from the Lusaka work are mentioned in the supplementary material of Chapter 5.
The thesis chapters are described as follows. Full details of the three papers’ citations and
contributions of the authors are included in Section 1.4.
• Chapter 2 is a background chapter that outlines a history on the discourse on sustainable
development, cities, and their energy use. I also focus on the Africa region, and highlight
the region’s importance to sustainable development discourse. Later in the chapter, I
describe key methods that are relevant to the thesis, i.e., Life Cycle Assessment (LCA),
Urban Metabolism (UM), scenario-based energy modelling approaches, data elicitation
methods, and statistical analysis.

10
• Chapter 3 – Modelling Future Patterns of Urbanization, Residential Energy Use and
Greenhouse Gas Emissions in Dar es Salaam with the Shared Socio-Economic Pathways
– is the first journal paper of the thesis. The work presents the first projection of
residential energy use and GHG emissions in an African city, Dar es Salaam. My
projections are based on urbanization narratives that are inspired by the Shared Socio-
Economic Pathways (SSPs), a scenario framework developed within the climate research
community to support integrated analysis of future climate change impacts,
vulnerabilities, adaptation, and mitigation (IIASA, 2015). Studies have employed the
SSPs to model socio-economic “futures” across a range climate change and
environmental megatrends and/or drivers, e.g., population growth (KC & Lutz, 2017),
urbanization (Jiang & O’Neill, 2017), energy use (Bauer et al., 2017), air pollution (Rao
et al., 2017) and land-use change (Popp et al., 2017). The original SSPs are based on five
narratives or “storylines”, each with different consequences for global and regional socio-
economic development under increasing climate uncertainty (O’Neill et al., 2017). Only a
handful of studies have applied the SSP narratives at the city level (e.g., Kamei et al.
(2016); Hoornweg and Pope (2017)), and none for any major African city. Therefore, I
present the first known application of the SSPs to Dar es Salaam and demonstrate a
method for projecting energy use and GHG emissions in a developing country that may
be data constrained. The work also shows the wide uncertainty in long-term GHG
emissions projections, while also showing the order of magnitude jump in emissions that
can be expected in Dar es Salaam to 2050 (even under optimistic scenarios).
• Chapter 4 – Does Location Matter? Investigating the Spatial and Socio-Economic
Drivers of Residential Energy Use in Dar es Salaam – is the second paper. The work
“zooms in” to the Dar es Salaam ward to assess residents’ lived experiences. Specifically,
the work assesses differences in residential energy use among surveyed wards in Dar es
Salaam and elucidates the spatial and socio-economic drivers of energy use. I led
fieldwork activities in Dar es Salaam between September and November 2018, and with
the support of a 10-person team, administered surveys to 1,363 households in the city.
We (the field team) randomly sampled households across eight socio-economically and
11
geographically diverse informal, mixed, and formal wards to ensure that the final sample
reflected the diverse typology of settlements in Dar es Salaam. Among key findings, I
show (1) the differences in residential energy use among the surveyed wards, (2) the
statistical relationship between residential energy use and ward type, and (3) the
influence of spatial and socio-economic factors (e.g., land-use, density, cooking fuel
choices, and household wealth, among other variables) on household and transport-
related energy use, respectively. For policymakers, I highlight that movement towards
higher levels of energy use and a shift toward modern fuels (i.e., electricity and transport
oils) could be expected as Dar es Salaam urbanizes and develops socio-economically.
Finally, by clustering surveyed wards according to their household and transport-related
energy use, I show the need for differentiated approaches to implementing energy
policies in Dar es Salaam.
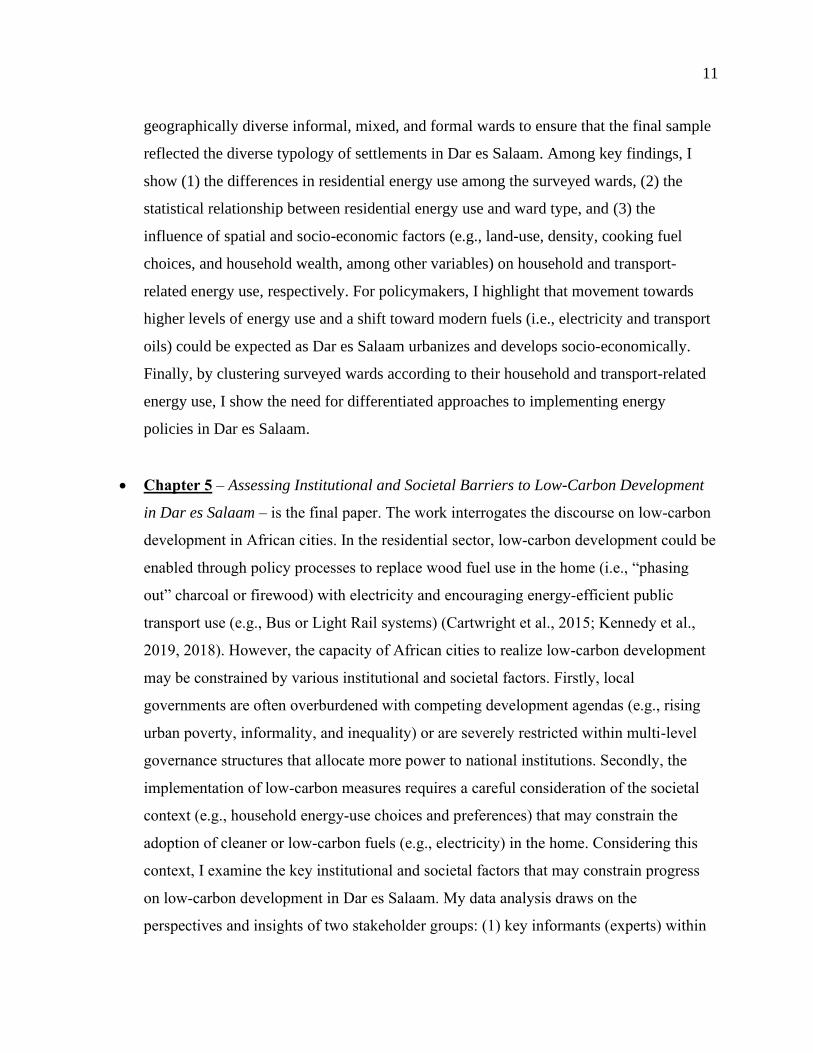
• Chapter 5 – Assessing Institutional and Societal Barriers to Low-Carbon Development
in Dar es Salaam – is the final paper. The work interrogates the discourse on low-carbon
development in African cities. In the residential sector, low-carbon development could be
enabled through policy processes to replace wood fuel use in the home (i.e., “phasing
out” charcoal or firewood) with electricity and encouraging energy-efficient public
transport use (e.g., Bus or Light Rail systems) (Cartwright et al., 2015; Kennedy et al.,
2019, 2018). However, the capacity of African cities to realize low-carbon development
may be constrained by various institutional and societal factors. Firstly, local
governments are often overburdened with competing development agendas (e.g., rising
urban poverty, informality, and inequality) or are severely restricted within multi-level
governance structures that allocate more power to national institutions. Secondly, the
implementation of low-carbon measures requires a careful consideration of the societal
context (e.g., household energy-use choices and preferences) that may constrain the
adoption of cleaner or low-carbon fuels (e.g., electricity) in the home. Considering this
context, I examine the key institutional and societal factors that may constrain progress
on low-carbon development in Dar es Salaam. My data analysis draws on the
perspectives and insights of two stakeholder groups: (1) key informants (experts) within

12
national and local government institutions, donor agencies, academia and the private
sector, and (2) surveyed households. I engaged key informants via semi-structured
interviews conducted in person (details in the supplementary material appended to
Chapter 5) and used the same household survey presented in Chapter 4 to (1) examine the
perspectives of surveyed households in Dar es Salaam, and (2) highlight societal aspects
that are not included in my previous study (Chapter 4). To ensure higher uptake of low-
carbon measures within cities, I recommend that stakeholders address existing
institutional barriers to low-carbon development in Dar es Salaam, and at the same time,
engage communities during the planning and implementation of low-carbon projects
(e.g., electrification projects initiated at the city or national level, or planned phase
extensions to the BRT in Dar es Salaam).
• Chapter 6 presents the main conclusions and contributions of the thesis and reflects on
areas of future work.
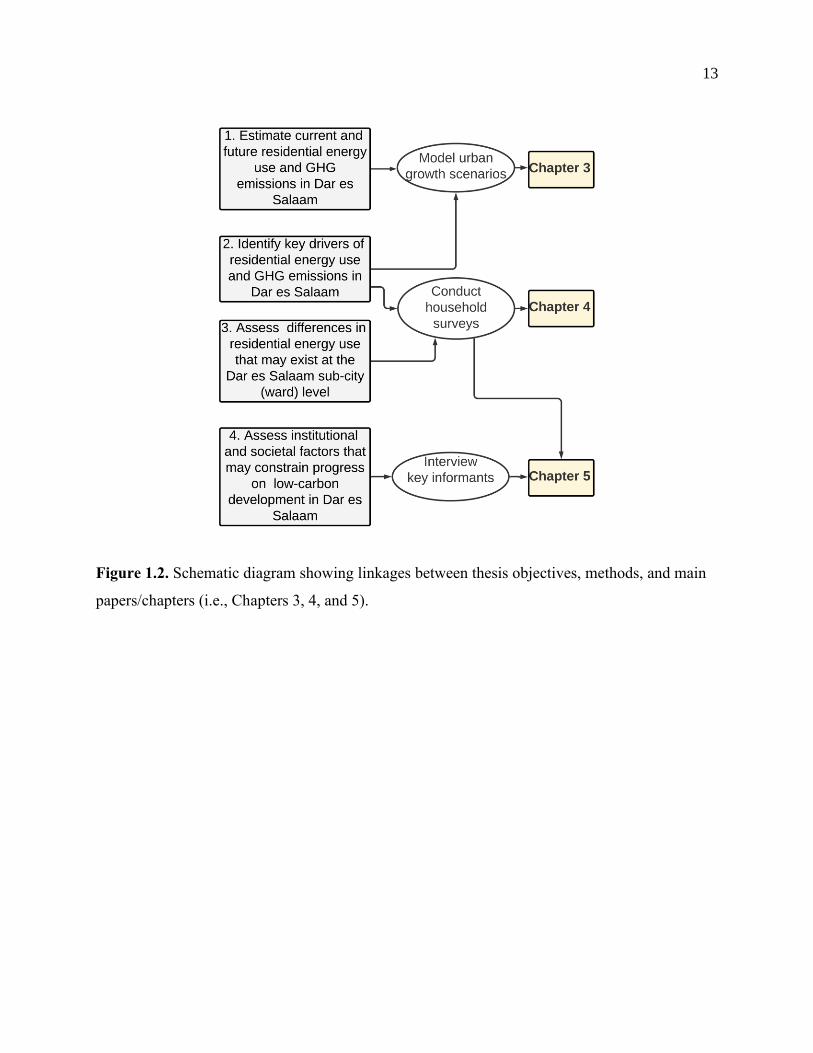
At a high level, the organization of the thesis, showing linkages across each of the thesis
objectives, questions and papers are detailed in Figure 1.2.
Chapter 3 and Chapter 4 have been published, and Chapter 5 is being prepared for publication.
Papers have been written in a structure as guided by the peer-reviewed journals, and there may
be some limited repetition in background/literature review and methods among the papers.
13
Figure 1.2. Schematic diagram showing linkages between thesis objectives, methods, and main
papers/chapters (i.e., Chapters 3, 4, and 5).

14
1.4 Author Contributions
The citations for the papers related to this thesis (i.e., Chapters 3 to 5) are below along with the
contributions of all authors.
Chapter 3:
• Luo, C., Posen, I. D., Hoornweg, D., & MacLean, H. L. (2020). Modelling future patterns of
urbanization, residential energy use and greenhouse gas emissions in Dar es Salaam with the
Shared Socio-Economic Pathways. Journal of Cleaner Production, 254.
https://doi.org/10.1016/j.jclepro.2020.119998
As first author, I conceptualized the initial research idea, wrote the first draft, and subsequent
drafts, of the paper, and designed the methods and modelling approach that integrated the SSPs
within the Long-Range Energy Alternatives Planning (LEAP) software. As co-authors,
Professors Daniel Posen (committee member), Daniel Hoornweg (committee member), and
Heather L. MacLean (primary supervisor) edited and commented on the various drafts of the
paper, assisted with improvements to literature review, methods and modelling approach, and
provided overall guidance on the research scope and conclusions. The study was partly funded
through a research grant with the Natural Sciences and Engineering Research Council of Canada
(NSERC) provided by Professor MacLean.
Chapter 4:
• Luo, C., Posen, I. D. & MacLean, H. L. (2020). Does location matter? Investigating the
spatial and socio-economic drivers of residential energy use in Dar es Salaam. Environ. Res.
Lett. https://doi.org/10.1088/1748-9326/abd42e
For this study, I led the fieldwork activities in Dar es Salaam, designed initial and subsequent
drafts of the household survey/questionnaire, conducted data cleaning and statistical analysis,
and wrote the first draft, and subsequent drafts, of the paper. Co-authors, Professors Daniel
Posen, and Heather L. MacLean, assisted in conceptualizing the research objectives and
questions, supported data analysis and visualization approaches, and conducted several reviews

15
of the statistical models and methods. They also commented on and edited the various drafts of
the paper and provided overall guidance on the research conclusions and implications for policy.
The study was partly funded through a research grant with the Natural Sciences and Engineering
Research Council of Canada (NSERC) provided by Professor MacLean. Additional funding for
this work was also provided by the International Development Research Centre (IDRC) Canada
(Doctoral Research Award); the Institute on Municipal Finance and Governance (IMFG) at the
Munk School of Global Affairs at the University of Toronto (Graduate Fellowship); and the
International Growth Centre (IGC) (Small Project Fund).
Chapter 5:
• Luo, C., Jean-Baptiste, N., Siame, G., MacLean, H. L (2020). Assessing institutional and
societal barriers of low-carbon growth in Dar es Salaam. In preparation for submission to
Cities.
In this final study, I led the field activities in both Dar es Salaam and Lusaka (finding from
Lusaka are presented in the supplementary material of Chapter 5), including outreach and
engagement with key informants who were selected for interview in-country (Tanzania and
Zambia) and via email or telephone communication. I wrote the first draft of the paper and
subsequent drafts following comment and review from co-authors. As co-authors, Dr. Nathalie
Jean-Baptiste and Dr. Gilbert Siame facilitated engagement with stakeholders in local and
national government and supported planning of workshops in Dar es Salaam and Lusaka (details
in Section 1.5). They also commented on and edited drafts of the paper and provided city-
specific details and clarifications to the paper, where relevant, given their expertise and
knowledge of urban planning issues in Dar es Salaam and Lusaka. Professor MacLean provided
overall guidance to the research, which included reviewing and editing drafts of the paper. Like
the first two papers, this study was partly funded through a research grant with the Natural
Sciences and Engineering Research Council of Canada (NSERC) provided by Professor
MacLean. Additional funding for this work was also provided by the International Development
Research Centre (IDRC) Canada (Doctoral Research Award); the Institute on Municipal Finance
and Governance (IMFG) at the Munk School of Global Affairs at the University of Toronto
(Graduate Fellowship); and the International Growth Centre (IGC) (Small Project Fund).

16
1.5 Note on Fieldwork and Policy Workshops
Studies in Chapter 4 and Chapter 5 employ data from household surveys and key informant
interviews collected during fieldwork in Dar es Salaam and Lusaka in 2018/2019. Ethics
clearance through the University of Toronto Ethics Review Board (REB) was confirmed prior to
the start of these activities in August 2018 (details in Chapter 4: Section 4.11). Household
surveys (Chapter 4) were administered by a ten-person field team. The final sample resulted in
1,363 surveys completed across eight formal, informal and mixed wards of Dar es Salaam. Key
informant interviews (Chapter 5) included discussions with selected experts across local and
national government agencies, academic institutions, the private sector, civil society
organizations and donor groups (e.g., the World Bank, African Development Bank, United
Nations Development Program, and others) in both Dar es Salaam (Tanzania) and Lusaka
(Zambia) (although analysis on field data in Lusaka are not included in the thesis given the
limited nature of the work conducted in the city). Twenty-four and sixteen key informants were
interviewed in Dar es Salaam and Lusaka, respectively (details in Chapter 5).
Fieldwork also culminated in two policy workshops hosted in partnership with the International
Growth Centre (IGC) and local universities (Ardhi University and the University of Zambia) in
November 2018 (Dar es Salaam) and February 2019 (Lusaka). Workshops engaged stakeholders
in interactive dialogue on strategies for “steering low-carbon growth and sustainable energy use”
in key infrastructure sectors such as electricity production, transportation and housing (pictures
from both workshops are shown in Appendix B and Appendix C). In attendance was a diverse
group of stakeholders from government, academic and private institutions, including
representatives from the Dar es Salaam and Lusaka City Councils, sector-based ministries (e.g.,
energy, transport and local government), electricity and gas companies, civil society and donor
groups. Due to research ethics restrictions, workshop outputs are not included in the scope of the
work presented in Chapter 5. Overall, discussions created an interest among stakeholders to
continue the dialogue and support ongoing policy processes to promote low-carbon development
in Dar es Salaam and Lusaka.

17
1.6 Related Media
Household surveys in Dar es Salaam
• https://www.youtube.com/watch?v=ySli6u5-QNU&t=146s
Details of household surveys conducted in Dar es Salaam in 2018. The field team had the
opportunity to visit different parts of the city and observe, first-hand, the energy use realities and
needs of residents. Funding for the field activities was provided by the International
Development Research Centre Canada (IDRC), the International Growth Centre (IGC) (Tanzania
Office), and the Natural Sciences and Engineering Research Council of Canada (NSERC).
Policy workshop in Dar es Salaam
• https://www.youtube.com/watch?v=KAAmYs7zyis
Highlights the outcomes of the “Steering Sustainable Energy Use and Low-Carbon Growth in
Dar es Salaam” workshop hosted by the University of Toronto and the International Growth
Centre (IGC) on November 7th, 2018. In attendance was a diverse group of stakeholders from
government, academic and private institutions, including the Dar es Salaam City Council, the
Dar es Salaam Bus Rapid Transit (DART) Agency, and TANESCO (Tanzania’s main electricity
supply company). Stakeholders participated in an interactive dialogue on key institutional and
financing strategies for low-carbon investments in key sectors such as electricity production,
transportation, and housing.

18
Press
• IIASA (2020). African cities are critical to global climate change mitigation. IIASA Nexus
Blog. Retrieved from: https://blog.iiasa.ac.at/2020/02/20/african-cities-are-critical-to-global-
climate-mitigation/
• Irving, Tyler (2019). A global approach to sustainable cities engineering. University of
Toronto Engineering News. Retrieved from: https://news.engineering.utoronto.ca/a-global-
approach-to-sustainable-cities-engineering/
• Dixon, Keenan (2018). Low-carbon growth in Dar es Salaam | A workshop on governance
and finance strategies organized by PhD Candidate Chibulu Luo. News: Department of Civil
& Mineral Engineering. Retrieved from: https://civmin.utoronto.ca/low-carbon-growth-in-
dar-es-salaam-tanzania-a-workshop-on-governance-and-finance-strategies-organized-by-phd-
candidate-chibulu-luo/

19
1.7. References for Chapter 1
African Union (2014) Agenda 2063 The Africa We Want, African Union. Available at:
https://au.int/en/agenda2063/overview (Accessed: 24 February, 2021).
Bai, X. et al. (2018) ‘Six research priorities for cities and climate change’, Nature, pp. 23–25.
doi: 10.1038/d41586-018-02409-z.
Bauer, N. et al. (2017) ‘Shared Socio-Economic Pathways of the Energy Sector – Quantifying
the Narratives’, Global Environmental Change, 42, pp. 316–330. doi:
10.1016/j.gloenvcha.2016.07.006.
Bawakyillenuo, S. et al. (2018) ‘Sustainable Energy Transitions in Sub-Saharan African Cities:
The Role of Local Government’, in Urban Energy Transition. doi: 10.1016/b978-0-08-
102074-6.00042-5.
C40 Cities (2017) GHG Interactive Dashboard Data. London, UK. Available at:
http://www.c40.org/other/gpc-dashboard (Accessed: 29 October, 2019).
Calvin, K. et al. (2016) ‘The effect of African growth on future global energy, emissions, and
regional development’, Climatic Change, 136(1), pp. 109–125. doi: 10.1007/s10584-013-
0964-4.
Cartwright, A. et al. (2015) ‘Better Growth , Better Climate , Better Cities Rethinking and
Redirecting Urbanisation in Africa’, The Global Commission on the Economy and
Climate. Available at: https://newclimateeconomy.report/workingpapers/wp-
content/uploads/sites/5/2016/04/NCE-APP-final.pdf (Accessed: 24 February, 2021).
Colenbrander, S. et al. (2019) ‘The scope for low-carbon development in Kigali, Rwanda: An
economic appraisal’, Sustainable Development. doi: 10.1002/sd.1906.
Currie, P. K., Musango, J. K. and May, N. D. (2017) ‘Urban metabolism: A review with
reference to Cape Town’, Cities, 70, pp. 91–110. doi: 10.1016/j.cities.2017.06.005.
20
Dellas, E. et al. (2018) ‘Local and Regional Governments in the Follow-up and Review of
Global Sustainability Agendas’. Available at: https://www.adelphi.de/en/publication/local-
and-regional-governments-follow-and-review-global-sustainability-agendas (Accessed: 24
February, 2021).
Diep, L., Archer, D. and Gueye, C. (2016) Decentralisation in West Africa: the implications for
urban climate change governance: the cases of Saint-Louis (Senegal) and Bobo-Dioulasso
(Burkina Faso). IIED Working Paper. Available at: https://pubs.iied.org/10769IIED
(Accesssed: 24 February, 2021).
Dioha, M. O. and Kumar, A. (2020) ‘Exploring sustainable energy transitions in sub-Saharan
Africa residential sector: The case of Nigeria’, Renewable and Sustainable Energy
Reviews. doi: 10.1016/j.rser.2019.109510.
Hoornweg, D. and Pope, K. (2017) ‘Population predictions for the world’s largest cities in the
21st century’, Environment and Urbanization, 29(1), pp. 195–216. doi:
10.1177/0956247816663557.
IEA (2017) World Energy Outlook. Available at: https://www.iea.org/reports/world-energy-
outlook-2017.
IEA (2019) Africa Energy Outlook 2019. Available at: https://www.iea.org/reports/africa-
energy-outlook-2019 (Accessed 24 February, 2021).
IIASA (2015) SSP Database 2012-2015. Available at: https://tntcat.iiasa.ac.at/SspDb (Accessed
24 February, 2021).
IPCC (2014) ‘Human Settlements, Infrastructure, and Spatial Planning (Chapter 12)’, Climate
Change 2014: Mitigation of Climate Change. Contribution of Working Group III to the
Fifth Assessment Report of the Intergovernmental Panel on Climate Change, pp. 923–
1000. doi: 10.1017/CBO9781107415416.018.
Jagarnath, M. and Thambiran, T. (2018) ‘Greenhouse gas emissions profiles of neighbourhoods
in Durban, South Africa – an initial investigation’, Environment and Urbanization, 30(1),

21
pp. 191–214. doi: 10.1177/0956247817713471.
Jiang, L. and O’Neill, B. C. (2017) ‘Global urbanization projections for the Shared
Socioeconomic Pathways’, Global Environmental Change, 42, pp. 193–199. doi:
10.1016/j.gloenvcha.2015.03.008.
Kamei, M., Hanaki, K. and Kurisu, K. (2016) ‘Tokyo’s long-term socioeconomic pathways:
Towards a sustainable future’, Sustainable Cities and Society, 27, pp. 73–82. doi:
10.1016/j.scs.2016.07.002.
KC, S. and Lutz, W. (2017) ‘The human core of the shared socioeconomic pathways: Population
scenarios by age, sex and level of education for all countries to 2100’, Global
Environmental Change, 42, pp. 181–192. doi: 10.1016/j.gloenvcha.2014.06.004.
Kebede, A. S. and Nicholls, R. J. (2012) ‘Exposure and vulnerability to climate extremes:
Population and asset exposure to coastal flooding in Dar es Salaam, Tanzania’, Regional
Environmental Change. doi: 10.1007/s10113-011-0239-4.
Kennedy, C. et al. (2018) ‘Keeping global climate change within 1.5 °C through net negative
electric cities’, Current Opinion in Environmental Sustainability, pp. 18–25. doi:
10.1016/j.cosust.2018.02.009.
Kennedy, C., Stewart, I. D. and Westphal, M. I. (2019) ‘Shifting Currents: Opportunity for Low-
Carbon Electric Cities in the Global South’, (January), pp. 1–36. Available at:
https://www.wri.org/publication/shifting-currents.
Kithiia, J. and Dowling, R. (2010) ‘An integrated city-level planning process to address the
impacts of climate change in Kenya: The case of Mombasa’, Cities. doi:
10.1016/j.cities.2010.08.001.
Lall, S. V., Henderson, J. V. and Venables, A. J. (2017) Africa’s Cities: Opening Doors to the
World. World Bank. doi: 10.1596/978-1-4648-1044-2.
Lamb, W. F. et al. (2019) ‘Learning about urban climate solutions from case studies’, Nature
22
Climate Change. doi: 10.1038/s41558-019-0440-x.
Leck, H. and Simon, D. (2018) ‘Local authority responses to climate change in South Africa:
The challenges of transboundary governance’, Sustainability (Switzerland). doi:
10.3390/su10072542.
Lucas, P., Dagnachew, A. and Hof, A. (2017) Towards universal electricity access in Sub-
Saharan Africa A quantitative analysis of technology and investment requirements Policy
Report. Available at: http://www.pbl.nl/sites/default/files/cms/publicaties/pbl-2017-
towards-universal-electricity-access-in-sub-saharan-africa-1952.pdf (Accessed October 19,
2020).
Lucas, P. L. et al. (2015) ‘Future energy system challenges for Africa: Insights from Integrated
Assessment Models’, Energy Policy, 86, pp. 705–717. doi: 10.1016/j.enpol.2015.08.017.
Lwasa, S. et al. (2018) ‘Scenarios for adaptation and mitigation in urban Africa under 1.5 °C
global warming’, Current Opinion in Environmental Sustainability. doi:
10.1016/j.cosust.2018.02.012.
Nagendra, H. et al. (2018) ‘The urban south and the predicament of global sustainability’, Nature
Sustainability. doi: 10.1038/s41893-018-0101-5.
O’Neill, B. C. et al. (2017) ‘The roads ahead: Narratives for shared socioeconomic pathways
describing world futures in the 21st century’, Global Environmental Change, 42, pp. 169–
180. doi: 10.1016/j.gloenvcha.2015.01.004.
Popp, A. et al. (2017) ‘Land-use futures in the shared socio-economic pathways’, Global
Environmental Change, 42, pp. 331–345. doi: 10.1016/j.gloenvcha.2016.10.002.
Rao, S. et al. (2017) ‘Future air pollution in the Shared Socio-economic Pathways’, Global
Environmental Change, 42, pp. 346–358. doi: 10.1016/j.gloenvcha.2016.05.012.
Shemdoe, R., Kassenga, G. and Mbuligwe, S. (2015) ‘Implementing climate change adaptation
and mitigation interventions at the local government levels in Tanzania: Where do we

23
start?’, Current Opinion in Environmental Sustainability. doi:
10.1016/j.cosust.2015.01.002.
Solecki, W. et al. (2018) ‘City transformations in a 1.5 °c warmer world’, Nature Climate
Change. doi: 10.1038/s41558-018-0101-5.
Steckel, J. C. et al. (2020) ‘Coal and carbonization in sub-Saharan Africa’, Nature Climate
Change. doi: 10.1038/s41558-019-0649-8.
Stone, A. and Wiswedel, S. (2018) ‘Modelling the Urban Energy Future of Sub-Saharan Africa’,
in International Energy Workshop. Maryland, USA: University of Maryland, p. 13.
Available at: http://samsetproject.net/outputs/ (Accessed October 19, 2020).
Strydom, A., Musango, J. K. and Currie, P. K. (2020) ‘Connecting energy services, carriers and
flows: Rethinking household energy metabolism in Cape Town, South Africa’, Energy
Research and Social Science. doi: 10.1016/j.erss.2019.101313.
Tait, L. and Euston-Brown, M. (2017) ‘What role can African cities play in low-carbon
development? A multilevel governance perspective of Ghana, Uganda and South Africa’,
Journal of Energy in Southern Africa. doi: 10.17159/2413-3051/2017/v28i3a1959.
UN-Habitat (2014) The State of African Cities 2014: Re-Imagining Sustainable Urban
Transitions. doi: 10.1177/0021909614547604.
UN (2018) World Urbanization Prospects (2018 Revision). Available at:
https://population.un.org/wup/ (Accessed October 19, 2020).
Ürge-Vorsatz, Di. et al. (2018) ‘Locking in positive climate responses in cities’, Nature Climate
Change, pp. 174–177. doi: 10.1038/s41558-018-0100-6.
van der Zwaan, B. et al. (2018) ‘An integrated assessment of pathways for low-carbon
development in Africa’, Energy Policy, 117, pp. 387–395. doi:
10.1016/j.enpol.2018.03.017.

24
Chapter 2
Background and Literature Review
This Chapter presents a background and review of relevant literature on (1) sustainable
development, cities and their energy use, (2) why African cities are important to discourse on
energy use, and (3) methods that are important in the context of the thesis, i.e., common
engineering approaches to measuring urban sustainability (life cycle assessment, urban
metabolism, and scenario-based energy modelling approaches), and bottom-up data collection
methods and elicitation (e.g., qualitative and quantitative survey methods and data analysis).
2.1 Sustainable Development, Cities, and their Energy Use
In their 1987 Our Common Future report to the United Nations, the Brundtland Commission
defined sustainable development as “development that meets the needs of the present without
compromising the ability of future generations to meet their own needs” (Brundtland
Commission, 1987). At the time, the Commission called on governments to support “a new era
of economic growth” through policies that protect and expand the earth’s environmental
resources (Brundtland Commission, 1987). The reality of the 21st Century, however, is that
human activities have destabilized the earth’s environmental resource base and constrained
sustainable development (Nakicenovic et al., 2016; Rockström et al., 2009; Steffen et al., 2015).
Rockström et al. (2009) proclaimed that climate change, land-use change, and biodiversity loss
caused by human activities – in what they call the “Anthropocene” – have influenced
“irreversible changes” to the earth’s system beyond critical thresholds or “planetary boundaries”
(Rockström et al., 2009). In a later report, Nakicenovic et al. (2016) asserted that transgression of
these planetary boundaries has been associated with the industrialization and economic growth of
Global North regions (i.e., Europe and North America) in the 20th Century. This industrial era
accelerated the Anthropocene effect and resulted in “global-scale environmental problems”
25
((Nakicenovic et al., 2016), page 7). Looking into the 21st Century, the authors affirmed that
leapfrogging from the fossil fuel intensive path of these Global North regions is possible in the
Global South (i.e., parts of Asia, Latin America, and Africa). They write: “The global North now
needs to abruptly and immediately embark on sustainable zero-emissions development pathways
while the global South would need to avoid repeating the historical experience of the global
North and proceed immediately on a sustainable development pathway” ((Nakicenovic et al.,
2016), page 12).
Urban growth is among the key global megatrends that influences sustainable development
pathways. Since the time of the Brundtland report, the United Nations and the broader
development community have not historically considered policy actions in cities as a priority for
sustainable development. Only in the advent of the United Nation’s 2030 Agenda for Sustainable
Development in 2015 were cities explicitly recognized and included in the discourse (UN, 2015).
Specifically, the 2030 Agenda calls governments to act on 17 Sustainable Development Goals
(SDGs) that enable environmental, social, and economic development, globally. Together, the
goals are ambitious, and represent a global vision to “shift the world to a sustainable and resilient
path”. SDG 11 imagines that cities will be “inclusive, safe, resilient and sustainable” by the year
2030, and is supported by 10 targets that capture this vision. Specifically, “inclusive” cities are
realized when access to affordable and basic urban infrastructure is available for “for all”
populations (e.g., housing, transport systems, public spaces). “Safe” cities ensure that urban
infrastructure is accessible and safe for vulnerable populations, e.g., women, children, the
elderly, or persons with disabilities. “Resilient” cities result in minimal economic and
environmental losses from climate change and other environmental disasters, especially for the
urban poor or communities in “vulnerable situations”. And finally, “sustainable” cities prioritize
integrated policies and actions for GHG mitigation and adaptation to climate change (UN, 2015).
My thesis work largely focuses on the “inclusive” and “sustainable” dimensions of SDG 11. For
example, my policy recommendations call on policymakers to support energy sector and GHG
mitigation investments that align with broader socio-economic development goals and the needs
of the poorest and vulnerable communities (see Chapters 3 to 5). I do not explicitly incorporate
the “safe” and “resilient” dimensions of sustainability in the scope of my work, but my research
findings could inform future research on safety and resilience (details in Chapter 6).

26
Figure 2.1 compares total carbon dioxide (CO2) emissions from oil, gas and coal combustion for
the World and the top CO2 emitting countries and regions (i.e., OECD member countries, China,
the United States and India) relative to the Africa region. In 2017, economic activities in China,
the United States and India accounted for half (49%) of total world CO2 emissions, compared to
only 3.6% in Africa (IEA, 2019b). The anticipated build-up of urban infrastructure in developing
regions, particularly in Africa, will lead to higher energy use and GHG emissions in these
regions during the remainder of the 21st Century (IPCC, 2014). Within countries, cities may
drive most future energy demand and GHG emissions in Africa (IPCC, 2014).
Figure 2.1. Comparing total CO2 emissions from fuel combustion from 1971 to 2017 for the
World, OECD member countries, the top three highest-emitting countries (China, the United
States and India) and the Africa region. Historically, Africa’s CO2 emissions have been low,
representing only 1.7% of world CO2 emissions in 1971 and 3.6% in 2017. CO2 emission are
attributed to fuel combustion from the use of coal, oil, and natural gas (IEA, 2019b). I compiled
the figure using data from the International Energy Agency (IEA, 2019b).
World
OECD
China
United States
IndiaAfrica
-
5 000
10 000
15 000
20 000
25 000
30 000
35 000
19
71
19
75
19
79
19
83
19
87
19
91
19
95
19
99
20
03
2007
20
11
20
15
CO
2em
issi
ons
(mil
lion t
onnes
)

27
2.2 Africa’s Urban Energy Context
As of 2019, the Africa region accounted for only 5% of global energy demand and 3.7% of
energy-related CO2 emissions (IEA, 2019a, 2019c). African cities will be a key driver of
anticipated increases in the region’s future contribution to global energy demand and CO2
emissions (and to levels that may become significant at the global scale) (IPCC, 2014; van der
Zwaan et al., 2018). According to the Africa Development Bank, between $130 and $170 billion
a year in infrastructure investments would be required to support Africa’s economic growth
(AfDB, 2018). The region’s infrastructure demands present a unique opportunity to build more
sustainable cities through policies and investments that promote low-carbon and resilient
communities (especially benefitting the poor).
According to the Intergovernmental Panel on Climate Change (IPCC), cities and urban areas
account for between 67% and 76% of global energy use and 71% and 76% of global CO2
emissions (based on 2005 data) (IPCC, 2014), mostly due to economic activities in Global North
cities and some developed Global South cities (e.g., Chinese and Indian cities). The low urban
energy use and CO2/GHG emissions of African cities is due to their low material and energy use,
and limited infrastructure availability and supply. For example, Kennedy et al. (2014) compared
the energy use and GHG emissions of 22 global cities across Europe, Asia, North America, and
Africa (i.e., Dar es Salaam, the poorest city in their sample based on GDP). Study findings
showed that estimated urban GHG emissions in Dar es Salaam (0.56 tCO2e/capita) represented
only 3% of levels reported in the highest emitting U.S. city, Denver (21.54 tCO2e/capita)
(Kennedy et al., 2014). In a later study (Kennedy et al., 2015), the authors estimated that energy
and material use was lowest in developing cities in Asia and Africa (e.g., Lagos), arguably
because cities are “consuming resources at rates below those that support a basic standard of
living for all citizens”. The study by Grubler et al. (2013) shows similar disparities between
regions. By quantifying direct final energy use across 225 global cities, which included a sample
of 19 African cities, the authors estimated energy use of between 17 GJ/capita (Dar es Salaam)
and 44 GJ/capita (Cape Town) for selected African cities, compared to between 74 GJ/capita
(London) and 163 GJ/capita (Los Angeles) among European and North American cities.

28
However, the studies of Kennedy et al. (2014, 2015) and Grubler et al. (2013) did not consider
future changes in GHG emissions across their sampled cities. At the regional level, the
“Supporting African Municipalities in Sustainable Energy Transitions” project (SAMSET) is
among the few regional studies that project changes in urban energy use and GHG emissions in
Africa (Stone & Wiswedel, 2018). The study employs data for 47 African countries aggregated
into four regions: East Africa, West Africa, Central Africa, and Southern Africa. The authors
project, under a Business-as-Usual scenario, that urban energy use in the region doubles by as
early as 2025, and quadruples by 2040 (most growth in demand is within the transport and
industrial sectors) (Stone & Wiswedel, 2018). In comparison, I estimate a much larger increase
in the case of Dar es Salaam – i.e., GHG emissions could rise by 310% to 2300% between 2015
and 2050 due to potentially higher electricity access levels in 2050 and carbon-intensive
electricity generation powered by coal and natural gas (see Chapter 3, Table 3.4).
Studies of Calvin et al. (2016), Lucas et al. (2015) and van der Zwaan et al. (2018) have similarly
projected changes in GHG emissions at the Africa regional level (i.e., for both rural and urban
areas) and identify opportunities to spur low-carbon development in the region. For example, van
der Zwaan et al. (2018) employed an integrated assessment model (IAM) to model energy
demand and supply pathways for low-carbon development in Africa (including North African
countries). Their findings showed that while Africa’s GHG emissions could become substantial
at a global scale by 2050, the region could leapfrog fossil-fuel based growth with large-scale use
of renewable energy options (van der Zwaan et al., 2018).
Another set of studies has conducted sector-specific or economy-wide energy use or GHG
emissions analysis at the national level, e.g., Kemausuor et al. (2015) (future bioenergy use in
Ghana), Emodi et al. (2017) (future energy demand in Nigeria, economy-wide) and Mahumane
and Mulder (2016) (future energy demand in Mozambique, economy-wide). While other studies,
though not projective in their approach, have employed “urban metabolism” (UM) frameworks
to quantify current flows of resources (i.e., materials, energy and waste) that shape African cities
and their surrounding hinterlands. For example, Currie et al. (2015; 2017) estimated energy and
material flows for 120 different African cities. According to the study authors, higher-income
cities such as Johannesburg and Casablanca showed higher construction material and fossil fuel

29
use (e.g., coal, natural gas, and transport oils) due to their larger industry sectors. Lower-income
cities such Dar es Salaam, Luanda (Angola), and Kinshasa (Congo) showed higher biomass use
due to their more rural and agricultural-based economies (Currie et al., 2015; Currie & Musango,
2017). Other UM studies conducted in African cities include studies for Cairo (Huzayyin &
Salem, 2013; Kennedy et al., 2015), Lagos (Kennedy et al. 2015), and Cape Town (Hoekman &
von Blottnitz, 2017). However, none of the above studies accounted for local differences in
energy use and access at the settlement level, i.e., to assess which communities, neighborhoods,
or income groups account for the most resource (material and energy) use in cities.
In Chapter 4 of this thesis, I show that assessing differences in resource use at the settlement
level could inform more differentiated policy actions, e.g., targeting GHG mitigation efforts in
high-consuming neighborhoods, and energy access policies/initiatives in low-consuming ones.
While my earlier work in Chapter 3 presents the first known estimates of current (i.e., 2015) and
future energy use and GHG emissions pathways in Dar es Salaam. The study estimates Dar es
Salaam’s GHG emissions in the residential sector and highlights the key household and
transport-related activities that are influencing rising energy use and GHG emissions in the city.
Furthermore, Chapter 4 and Chapter 5 also examine socio-economic and policy-related questions
that are not explicitly considered in Chapter 3, or work by Currie et al. (2015; 2017), Kennedy et
al. (2015), and others as discussed above. The work assesses the local reality in terms of how Dar
es Salaam residents’ access and use fuels (e.g., electricity, charcoal, or gas) and the institutional
and societal constraints to communities adopting low-GHG or low-carbon measures. These
aspects are important to consider given the unique challenges that African cities face, i.e., where
urban growth is occurring in tandem with competing development challenges, and where local
governments are often over-burdened and under-capacitated to address resident demands.
Therefore, accounting for local differences in energy use and access, and the institutional or
societal factors that influence the use of low-carbon measures within communities, may support
more effective urban planning and implementation of energy policy visions.

30
2.3 Background on Dar es Salaam (Tanzania)
With an estimated population of 5.1 million as of 2020, Dar es Salaam is the largest city and
economic hub of Tanzania. It is also Africa’s fastest growing city (see Figure 1.1 in Chapter 1)
and will possibly become one of the world’s largest mega-cities by 2050 (Hoornweg & Pope,
2016). Spatially, Dar es Salaam exhibits a monocentric and radial form, with the highest
infrastructure and population densities concentrated in the city center, and along the four major
arterial roads: to the north along Bagamoyo road, west along Morogoro road, south-west along
Nyerere road and south along Kilwa road (Lupala, 2002) (for a detailed map of Dar es Salaam
refer to Chapter 3 and 4 – Figure 3.1 and Figure 4.1).
2.3.1 The dual nature of Dar es Salaam’s expansion
Spatially, the Dar es Salaam consists of both “formal” and “informal” areas, which reflects the
dual nature of the city’s expansion. Most residents live in informal areas (over 70%, Limbumba
& Ngware (2016)) with most households built on untenured land, and where home ownership is
organized at the local level without undergoing the formal legal procedures. The rapid growth of
informal areas – particularly in peripheral locations where rural land is being developed and
incorporated into the city – has fueled much of the city’s urban sprawl and heightened demand
for infrastructure services (Andreasen et al., 2017).
Findings from my fieldwork show that widely used definitions of “slum” are poorly suited to the
Dar es Salaam context given the variation in socio-economic conditions and building types that
one observes throughout the city, and particularly in informal settlements. According to the
United Nations Human Settlements Program (UN-HABITAT, 2006), a slum household is
defined as “a group of individuals living under the same roof in an urban area who lack one or
more of the following: (1) Durable housing of a permanent nature that protects against extreme
climate conditions; (2) Sufficient living space which means not more than three people sharing
the same room; (3) Easy access to safe water in sufficient amounts at an affordable price; (4)
Access to adequate sanitation in the form of a private or public toilet shared by a reasonable
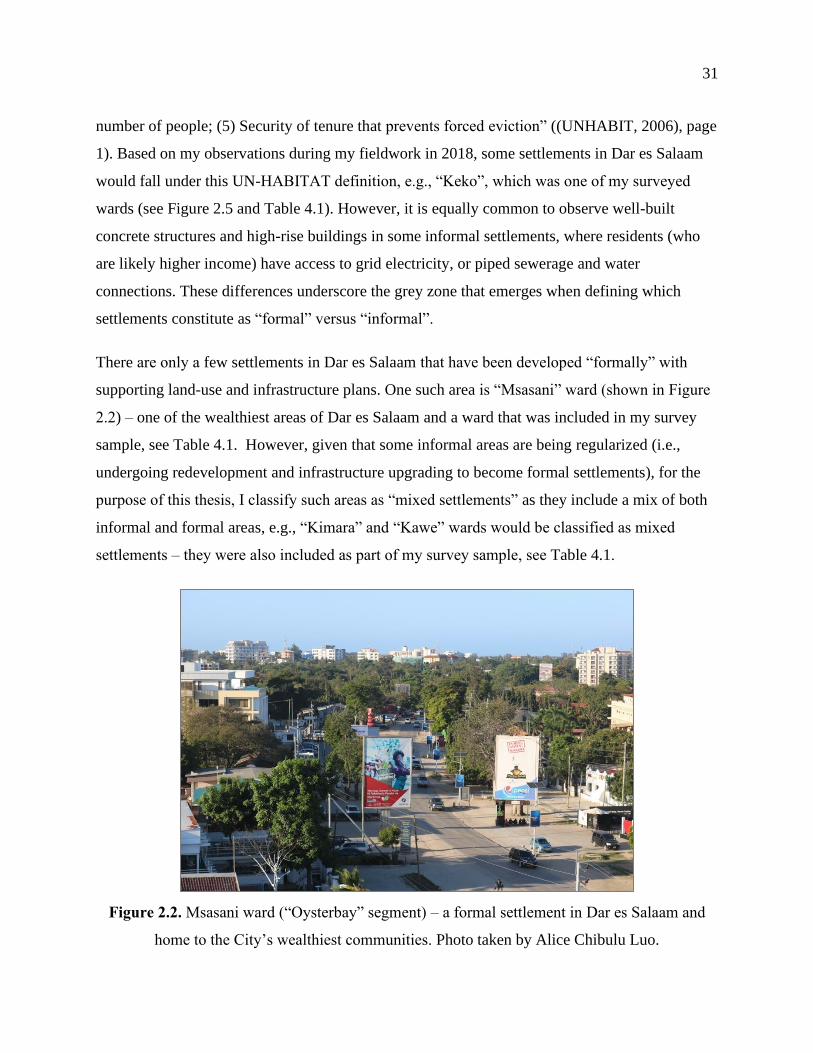
31
number of people; (5) Security of tenure that prevents forced eviction” ((UNHABIT, 2006), page
1). Based on my observations during my fieldwork in 2018, some settlements in Dar es Salaam
would fall under this UN-HABITAT definition, e.g., “Keko”, which was one of my surveyed
wards (see Figure 2.5 and Table 4.1). However, it is equally common to observe well-built
concrete structures and high-rise buildings in some informal settlements, where residents (who
are likely higher income) have access to grid electricity, or piped sewerage and water
connections. These differences underscore the grey zone that emerges when defining which
settlements constitute as “formal” versus “informal”.
There are only a few settlements in Dar es Salaam that have been developed “formally” with
supporting land-use and infrastructure plans. One such area is “Msasani” ward (shown in Figure
2.2) – one of the wealthiest areas of Dar es Salaam and a ward that was included in my survey
sample, see Table 4.1. However, given that some informal areas are being regularized (i.e.,
undergoing redevelopment and infrastructure upgrading to become formal settlements), for the
purpose of this thesis, I classify such areas as “mixed settlements” as they include a mix of both
informal and formal areas, e.g., “Kimara” and “Kawe” wards would be classified as mixed
settlements – they were also included as part of my survey sample, see Table 4.1.
Figure 2.2. Msasani ward (“Oysterbay” segment) – a formal settlement in Dar es Salaam and
home to the City’s wealthiest communities. Photo taken by Alice Chibulu Luo.
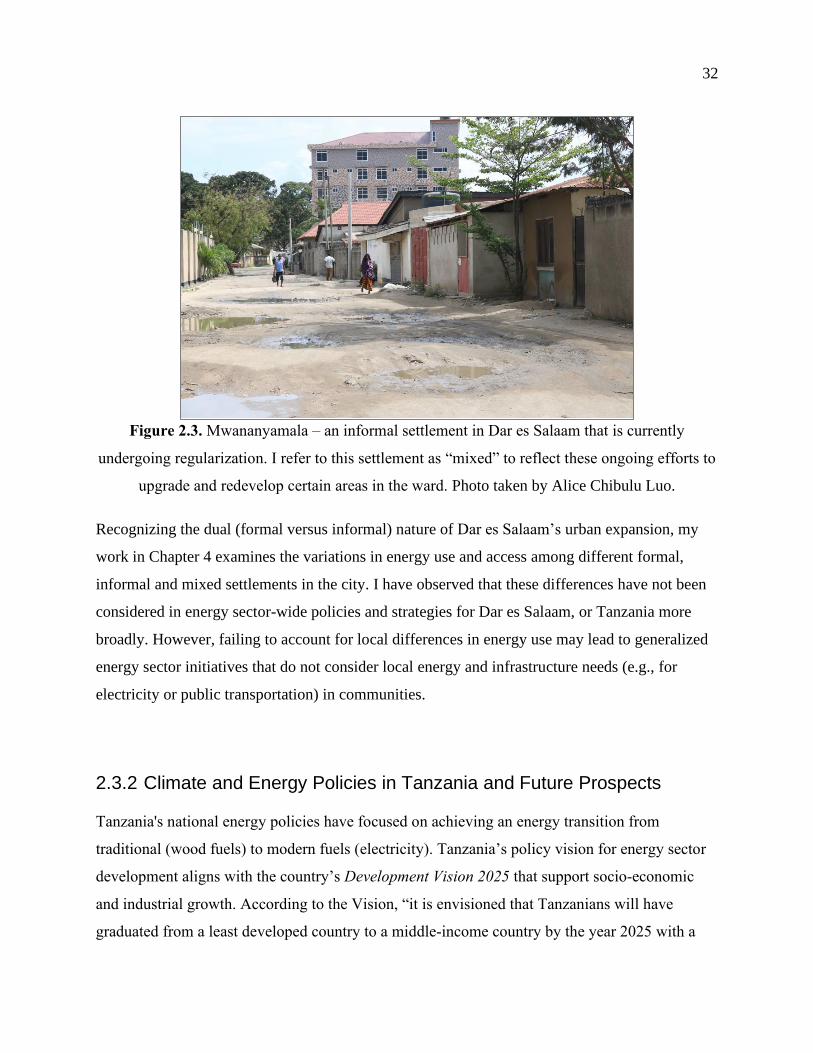
32
Figure 2.3. Mwananyamala – an informal settlement in Dar es Salaam that is currently
undergoing regularization. I refer to this settlement as “mixed” to reflect these ongoing efforts to
upgrade and redevelop certain areas in the ward. Photo taken by Alice Chibulu Luo.
Recognizing the dual (formal versus informal) nature of Dar es Salaam’s urban expansion, my
work in Chapter 4 examines the variations in energy use and access among different formal,
informal and mixed settlements in the city. I have observed that these differences have not been
considered in energy sector-wide policies and strategies for Dar es Salaam, or Tanzania more
broadly. However, failing to account for local differences in energy use may lead to generalized
energy sector initiatives that do not consider local energy and infrastructure needs (e.g., for
electricity or public transportation) in communities.
2.3.2 Climate and Energy Policies in Tanzania and Future Prospects
Tanzania's national energy policies have focused on achieving an energy transition from
traditional (wood fuels) to modern fuels (electricity). Tanzania’s policy vision for energy sector
development aligns with the country’s Development Vision 2025 that support socio-economic
and industrial growth. According to the Vision, “it is envisioned that Tanzanians will have
graduated from a least developed country to a middle-income country by the year 2025 with a
33
high level of human development. The economy will have been transformed from a low
productivity agricultural economy to a semi-industrialized one led by modernized and highly
productive agricultural activities which are effectively integrated and buttressed by supportive
industrial and service activities in the rural and urban areas” ((Government of Tanzania, 2000),
page 2).
Energy and climate change policies, including the national Power System Master Plan
(Government of Tanzania, 2016), Intended Nationally Determined Contributions (Government
of Tanzania, 2015a), and the Sustainable Energy for All Action Agenda (Government of
Tanzania, 2015b), seek to align with Vision 2025 and view energy sector development as a key
driver of economic growth across the country – although, as discussed in Chapter 5, specific
implementation strategies have been poorly articulated by relevant stakeholders and institutions.
Policies have largely promoted aggressive electrification ambitions, as detailed below, and the
need to reduce community dependance on wood fuels. For example, the Action Agenda aims to
increase the percentage of the Tanzanian population with access to modern cooking solutions
from 16% in 2012 to >35% in 2025 (Government of Tanzania, 2015b).
However, the reality is that wood fuels (or biomass) have continued to dominate Tanzania’s
energy mix. As of 2014, wood fuels – namely, charcoal and firewood – have accounted for 90%
of final energy use in Tanzania (Government of Tanzania, 2014). Wood fuel use is also common
among Dar es Salaam households despite the city’s higher electrification level. As of 2016, an
estimated 75% of Dar es Salaam households had access to electricity (compared to the rural and
urban averages of 17% and 65%, respectively) (Government of Tanzania, 2016). Wood fuel use
is often present in the form of “fuel stacking”, where households use a combination of traditional
and modern fuels for household needs. According to Tanzania’s 2017 Energy Access Situation
Report, most Dar es Salaam households reported using charcoal for cooking (88%), compared to
gas (27%), kerosene (22%), firewood (14%), and electricity (1%) (Government of Tanzania,
2017). In comparison, results from my work in Chapter 4 show that between 53% (Keko) and
67% (Mwananyamala) of households reported fuel stacking for cooking, compared to less than
1% of households that used only electricity (Chapter 4 , Section 4.11.6).

34
Tanzania’s Action Agenda (Government of Tanzania, 2018) envisions that over 75% of the
national population will be connected to electricity by 2030 (compared to a national
electrification level of 33% in 2016, Government of Tanzania, 2016). Relatedly, my
sustainability (SSP1) and business as usual (SSP2) scenarios in Chapter 3 project a shift to 100%
electrification by 2050. However, as shown from my work, rising electricity access levels may
result in higher GHG emissions from electricity generation (Chapter 3), given the largely fossil-
fuel intensive generation mix in Tanzania.
As of 2016, Tanzania’s electricity generation mix has been dominated by natural gas (59%);
hydropower (35%), Heavy Fuel Oil (HFO) (5.7%) and biomass (0.3%) account for the remaining
fractions (Government of Tanzania, 2017). The Tanzanian government is exploring other fossil
fuels for electrification (i.e., coal) between 2016 and 2040, with the most fossil fuel intensive
scenario (“Scenario-3”) in the country’s 2016 Power System Master Plan projecting a future mix
of natural gas (35%), coal (40%), hydropower (20%), and renewables (solar and wind) (5%) in
2040. In comparison, the recommended scenario (“Scenario 2”) is equally fossil fossil fuel
reliant, i.e., natural gas (40%), hydropower (20%), coal (35%), and solar and wind (5%).
(Government of Tanzania, 2016). This means that the carbon-intensity of electrification in
Tanzania will drive rising GHG emissions. In Chapter 3, I estimate the GHG intensity to range
between 405 and 435 gCO2e/kWh, compared to the global (IEA) target of 140gCO2e/kWh (IEA,
2017). Therefore, actions to decarbonize the grid with renewable power (wind, solar or
geothermal power) could lead to substantial GHG emissions savings as illustrated in my
“aggressive GHG mitigation” scenario in Chapter 3, Section 3.6.7.
2.4 Quantifying Urban Sustainability
Life Cycle Assessment (LCA) and urban metabolism (UM) (described in Sections 2.4.1 and
2.4.2) are widely used engineering methods for measuring urban sustainability, and therefore are
relevant background material for this thesis. Together, these methods offer a systems-based
approach to quantify urban resource use (i.e., consumption of energy, water and materials in
cities) and scoping urban GHG emissions and their environmental impacts.
35
2.4.1 Life Cycle Assessment (LCA)
Broadly, LCA describes a method for assessing the environmental impacts of a product or
service over its entire life cycle, i.e., from the initial gathering of raw material from the earth,
until the point at which all residuals are returned to the earth or “cradle-to-grave” (El Haggar,
2005). According to the International Organization for Standardization, there are five
components to an LCA (ISO, 2006):
(1) Goal: intended application and reasons for carrying out the study.
(2) Scope: product/system being studied, system boundary, assumptions, and limitations.
(3) Inventory analysis: data collection, calculation, and validation of data (e.g.,
completeness check, sensitivity analysis, mass balance checks etc.).
(4) Impact assessment: impact categories (e.g., climate change/GHG emissions), indicators
(e.g., infrared radiative forcing), characterization factors (e.g., global warming potential
for each greenhouse gas).
(5) Interpretation of results: identification of significant issues, valuation of completeness
and consistency, conclusions, limitations, and recommendations.
I focus my review specifically on studies that have used LCA to assess the GHG emissions and
global warming impacts associated with urban energy and material use, e.g., GHG emissions
attributable to the construction and use of urban infrastructure such as roads, housing,
transportation and waste systems (see studies by Chavez et al. (2012), Hillman et al. (2011),
Hillman and Ramaswami (2010), and Kennedy et al. (2010)). In this context, LCA can be
employed to assess urban GHG emissions other environmental aspects (e.g., air pollution or
land-use change) for different phases of the infrastructure life cycle: e.g., construction,
use/operation, and end-of-life (see Figure 2.2), as well as emissions “embodied” in urban
materials (e.g., food, water, or concrete) (Ramaswami et al., 2008).

36
Most inventories of GHG emissions at the city level focus on the “use/operation” phase of the
infrastructure life cycle, where emissions are “scoped” at different spatial scales, e.g.,
quantifying GHG emissions that occur within the city, or expanding the scope to include
emissions from upstream and downstream activities that are attributable to activities within the
city boundary (e.g., upstream electricity generation or downstream waste processes)
(WBCSD/WRI, 2014). The Global Protocol for Community-Scale Greenhouse Gas Emission
Inventories (GPC) presents the most widely used standard for GHG emissions reporting for
cities. These include “Scope 1” emissions that are produced within the city boundary; “Scope 2”
emissions that are from electricity generation at the power plant as a consequence of grid-
supplied electricity, heat and cooling within the city boundary; and “Scope 3” emissions that are
from upstream infrastructures and supply chains outside of the city boundary (Kennedy et al.,
2010; WBCSD/WRI, 2014).
Accounting for Scope 3 emissions (when data are available) can offer a more holistic picture of
the GHG implications of urban activities. For example, Chavez et al. (2012) estimated that in-
boundary (Scope 1 and 2) GHG emissions accounted for 68% of Delhi's total GHG emissions,
i.e., emissions from residential, commercial, industrial and transport activities (including
electricity generation). In comparison, the authors also showed that out-of-boundary (Scope 3)
GHG emissions contributed the remaining 32% of Delhi’s total GHG emissions, i.e., GHG
emissions from fuel processing, air travel, cement use, and food production outside the city. A
later study by Chen et al. (2016) compared GHG emissions across 25 sectors for selected
Chinese and Australian cities. The study authors found that in-boundary and out-of-boundary
GHG emissions from construction (including GHG emissions embodied in imports and exports)
was the largest contributor to emissions, i.e., representing 21%–24% and 23%–41% of the total
carbon footprint in Australian and Chinese cities, respectively.
Finally, only a handful of studies have employed LCA to quantify the GHG emissions in Africa,
e.g., see studies for Kampala, (Lwasa, 2017), Durban (Jagarnath & Thambiran, 2018), Cape
Town (Kennedy et al., 2009), and sub-Saharan Africa (Godfrey & Xiao, 2015; Stone &
Wiswedel, 2018). To my knowledge, my work in Chapter 3 presents the first estimates of GHG
emissions in the Dar es Salaam context.

37
2.4.2 Urban Metabolism (UM)
LCA and UM are related concepts. UM provides a “snapshot” of urban material and energy
flows in cities (i.e., in the context of a larger LCA study) but does not show the full
environmental implications of such flows (Figure 2.2.). The metabolism of cities, according to
Kennedy et al. (2007), is the “the sum total of the technical and socio-economic processes that
occur in cities, resulting in growth, production of energy, and elimination of waste”. It is a
method for quantifying inter-dependent inputs, outputs, and storage of energy, water, nutrients,
materials, and waste in cities (Maranghi et al., 2020).
Figure 2.4. The different life cycle stages typically covered in an LCA each with its own
associated environmental exchanges in terms of energy and mass requirements and waste and
pollutant emissions. The gray box indicates that only the use stage is typically accounted for in
traditional UM studies and the up and downstream burdens tend to remain unaccounted for
(Note: EoL refers to “End of Life”). Source: (Goldstein et al., 2013), page 3.
Goldstein et al. (2013) outlines the different stages typically covered in an LCA and highlights
the “use” stage that is the boundary/scope for most UM analysis (see Figure 2.4). Material Flow
Analysis (MFA) is among the most common accounting methods used in UM studies (Goldstein
et al., 2013; Pincetl et al., 2012). MFA studies use the principles of mass conservation to
quantify the stocks and flows of energy and materials in cities, i.e., mass in = mass out + stock
change (Pincetl et al., 2012). However, the MFA approach is unable to estimate environmental
burdens (e.g., GHG emissions) associated with resource flows (Pincetl, 2012). To account for
these limitations, some studies employ integrated UM/MFA and LCA models to present a more
holistic picture of urban energy and material flows, and their environmental impacts, e.g., see
studies of García-Guaita et al. (2018) and Goldstein et al. (2013).

38
Table 2.1. presents a broad overview of example studies that apply LCA and UM approaches to
sustainability assessment across global cities. As shown in the Table: (a) there are a few
examples of studies from African cities, and (b) energy use/GHG emissions are quantified at the
city scale (i.e., based on the study boundary or scope) – there are limited examples of sub-city
level to assess the neighborhoods or settlements that may contribute most to urban material and
energy use/GHG emissions.
My work in Chapter 3 and Chapter 4 employs an LCA and UM approach to address these gaps in
the literature. However, some limitations of my work are that (1) I estimate Scope 1 and 2
residential emissions for Dar es Salaam as upstream (Scope 3) level data was unavailable for
most household and transport activities, and (2) I do not assess other environmental impacts
associated with resource use, e.g., biodiversity loss, land-use changes, or indoor air pollution
associated with household wood fuel use. These are important areas of future work which I
highlight in the conclusions (Chapter 6).

39
Table 2.1. Selected studies that employ Life Cycle Assessment (LCA) and Urban Metabolism
(UM) approaches to quantifying aspects of urban sustainability across different global cities.
# Source Study
Region
Continent Method Flow
(or resource)
Boundary
(and Scope
when GHG
emissions are
estimated)
1. Kennedy et al. (2009) Global cities Global LCA GHG emissions City (Scopes 1,
2, and 3)
2. Hillman & Ramaswami
(2010)
Selection of
U.S. cities
North
America
LCA GHG emissions City (Scopes 1,
2, and 3)
3. Chavez et al. (2012) Delhi, India Asia LCA GHG emissions City (Scopes 1,
2, and 3)
4. Chen et al. (2016) Selection of
cities in China
and Australia
Global LCA GHG emissions City (Scopes 1,
2, and 3)
5. Dhakal (2009) Selection of
Chinese cities
Asia LCA GHG emissions City (Scope 1)
6. Lwasa (2017) Kampala,
Uganda
Africa LCA GHG emissions City (Scopes 1
and 2)
7. Heinonen & Junnila
(2011)
Helsinki and
Porvoo,
Finland
Europe LCA GHG emissions City (Scopes 1,
2, and 3)
8. Ivanova et al. (2017) European
Union (EU)
Europe LCA GHG emissions EU countries
(Scopes 1, 2,
and 3)
9. Jagarnath & Thambiran
(2018)
Durban Africa LCA GHG emissions City (Scopes 1
and 2)
10. Stone & Wiswedel,
(2018)
Selection of
African cities
Africa LCA GHG emissions City (Scopes 1
and 2)
11. Huzayyin & Salem,
(2013)
Cairo Africa LCA GHG emissions City (Scopes 1
and 2)
12. Pichler et al. (2017) Global cities Global LCA GHG emissions City (Scopes 1,
2, and 3)
13. Fragkias et al. (2013) U.S. Cities North
America
LCA GHG emissions City (Scopes 1
and 2)

40
# Source Study
Region
Continent Method Flows
(or resource)
Boundary
(and Scope
when GHG
emissions are
estimated)
14. Facchini et al. (2017) Global cities Global UM Material and
energy
City
15. Nagpure et al. (2018) Selected
Indian cities
India UM Material, energy
and water
City
16. Hoekman & von
Blottnitz (2017)
Cape Town Africa UM Materials, energy
and water
City
17. P. K. Currie et al.
(2017)
Cape Town Africa UM Materials, energy
and water
City
18. P. Currie et al. (2015) Selected
African cities
Africa UM Materials, energy
and water
City
19. Kennedy et al. (2015) Global cities Global UM Materials, energy
and water
Global
20. Niza et al. (2009) Lisbon,
Portugal
Europe UM Materials and
energy
City
21. Rosado et al. (2016) Selected
Swedish cities
Europe UM Materials and
energy
City
22. García-Guaita et al.
(2018)
Santiago de
Compostela,
Spain
Europe UM + LCA Materials, energy,
water, and GHG
emissions
City (Scopes 1,
2, and 3)
23. Goldstein et al. (2013) Global cities Global UM + LCA Materials, energy,
water, and GHG
emissions
City (Scopes 1,
2, and 3)
24. Quinn & Fernández
(2011)
US North
America
UM Materials and
energy
City
41
2.4.3 Scenario-Based Approaches (Long-Term Energy Modelling)
Recognizing the scale and investments required to support a low-carbon and climate-resilient
future, researchers have employed scenario-based models to project future energy use and GHG
emissions for different cities, countries, or regions. As described by Iyer & Edmonds (2018),
these models are often “based on sophisticated forward-looking energy-economic models that
consider a combination of technologies and their attributes together with market-related forces to
facilitate decision-making under deep uncertainty” ((Iyer & Edmonds, 2018), page 357).
Furthermore, given the large number of variables and processes that underlay most energy
scenarios, Iyer & Edmonds (2018) also recommended that researchers (1) acknowledge the
limitations of the models and assumptions used, and (2) contextualize their findings by
discussing other external factors that may influence future outcomes. In projecting residential
energy and GHG emissions in Dar es Salaam (i.e., between 2015 and 2050), I incorporate some
of the recommendations proposed by Iyer & Edmond (2018), i.e., that findings from this work
provide broad insights to possible energy/GHG emissions futures in Dar es Salaam, but these
pathways could change due to underlying uncertainties in model assumptions and other
contextual factors not considered in the study (e.g., changes in socio-economic conditions or
policy processes) (see Chapter 3).
Only a few studies have projected changes in energy use and/or GHG emissions of African
cities (e.g. (Godfrey & Xiao, 2015; SEA, 2015; Stone & Wiswedel, 2018)). For example, Stone
and Wiswedel (2018) employed a scenario-based method – using the Stockholm Environment
Institute’s Long-Range Energy Alternatives Planning (LEAP) software – to project urban energy
use and GHG emissions (from residential, industrial and transport activities) for the entire sub-
Saharan Africa region between 2012 and 2040. The authors’ baseline (reference) scenario
showed that urban energy use in sub-Saharan Africa increases fourfold by 2040, with GHG
emissions rising 280% (Stone & Wiswedel, 2018). LEAP studies are also available for selected
Asian and Latin American cities. For example, Huang et al (2019) used LEAP to project GHG
emissions in the city of Guangzhou (China). The authors showed that Guangzhou’s GHG
emissions could peak by 2023 assuming that current climate mitigation policies are implemented

42
(Huang et al., 2019). Other LEAP studies are available for São Paulo (Collaço, Dias, et al., 2019;
Collaço, Simoes, et al., 2019), Panama (McPherson & Karney, 2014), Bangkok (Phdungsilp,
2010), and various Chinese cities (Fan et al., 2017; Lin et al., 2018; Yang et al., 2017; Zhou et
al., 2016)
Outside of LEAP, researchers have employed sector-specific scenario models and frameworks to
model changes in energy use/GHG emissions for buildings (e.g., Lin et al. (2017), Li et al.
(2019) and Mokhtara et al. (2019)), transportation (e.g., Pongthanaisawan and Sorapipatana
(2013), Aggarwal and Jain (2016), Dhar et al. (2017) and Du et al. (2017)) and industry (e.g.,
Wang et al. (2013) and de Souza et al. (2018)). While, another set of studies have employed
Integrated Assessment Models (IAMs) to forecast long-term energy and emissions scenarios,
e.g., Riahi et al. (2017), van Sluisveld et al. (2018), Silva Herran et al. (2019) and Wu et al.
(2019). Additional details on the above-mentioned literature are presented in Chapter 3.
The study in Chapter 3 employs a LEAP model to estimate current and future changes in Dar es
Salaam’s residential energy use and GHG emissions (between 2015 and 2050). I chose to use
LEAP given its wide use in a range of developing country contexts, i.e., see studies for São
Paulo (Collaço, Dias, et al., 2019; Collaço, Simoes, et al., 2019), Panama (McPherson & Karney,
2014), and others mentioned above. The tool has also been used by developing countries across
Africa, Asia and Latin America to develop national energy and GHG emissions scenarios to
report their Intended Nationally Determined Contributions (INDCs) as part of commitments
under the Paris Climate Change Agreement (Heaps, 2016; SEI, 2018).
My modelled scenarios in LEAP are inspired by the Shared Socio-Economic Pathways (SSPs), a
scenario-based framework for envisioning future pathways of socio-economic development, i.e.,
changes in society and ecosystems over a century time scale (to the year 2100) (O’Neill et al.,
2017, 2014; Riahi et al., 2017). The climate change research community has combined the SSPs
with IAMs to model development pathways across a range of societal and ecosystem drivers,
e.g., global population growth (KC & Lutz, 2017), urbanization (Jiang & O’Neill, 2017), energy
use (Bauer et al., 2017), air pollution (Rao et al., 2017) and land use change (Popp et al., 2017).
The SSPs offer “narratives” or “storylines” that describe different socio-economic outcomes
from the above-mentioned drivers (population growth, urbanization, energy use, etc.), which can

43
later inform policy analysis and future climate change actions (O’Neill et al., 2017). Only a few
studies have applied the SSP narratives at the city level, including the study of Kamei et al.
(2016) on Tokyo, and the global study of Hoornweg and Pope (2017), although the authors did
not quantify future energy use/GHG emissions of cities studied (additional details on this
literature is in Chapter 3). To my knowledge, my study in Chapter 3 is the first to employ the
SSPs for the purpose of projecting GHG emissions and energy use in Dar es Salaam, or indeed,
any major African city.
2.5 Bottom-up (Fieldwork) Approaches to Collecting Data
My work in Chapter 3 employs a scenario-based approach to estimate residential energy use and
GHG emissions in Dar es Salaam. However, this early work did not disaggregate energy
use/GHG emissions at a smaller spatial scale (e.g., the ward or settlement level), which I note as
a research limitation of the work in Chapter 3. To address this research gap, I led a more detailed
study based on fieldwork (presented in Chapter 4) to assess differences in residential energy use
patterns in a set of wards across Dar es Salaam. The overall aim of this work was to assess
differences in energy use at the ward or settlement level with the aim of better informing urban
planning and energy policies in Dar es Salaam/Tanzania.
I led fieldwork activities in Dar es Salaam between August and November 2018. Activities were
mostly funded through research grants provided by the International Growth Centre (Small
Project Fund) and the International Development Research Centre Canada (Doctoral Research
Award). We (the field team) employed both quantitative and qualitative approaches to field data
collection. Quantitative approaches involved structured interviews with 1,363 households
selected across 8 formal, informal and mixes wards in the Dar es Salaam region. Qualitative
methods included semi-structured interviews with key informants selected across local and
national government, the private sector, civil society and donor groups in Dar es Salaam. A
general background on quantitative and qualitative survey research methods is presented in this
section and their overall relevance in the context of this thesis. A more detailed account of
fieldwork activities is presented in the methods of Chapter 4 and Chapter 5.
44
2.5.1 Structured Surveys
The structured survey is a commonly applied method in quantitative research and consists of
standardized questions and response types (Cheung, 2014; Fontana & Prokos, 2016). Interview
formats are controlled and similar for all respondents, where “the interviewer controls the pace
of the interview by treating the questionnaire as though it were a theoretical script to be followed
in a standardized and straightforward manner” ((Fontana & Prokos, 2016), page 16). Because
respondents receive the same set of questions, in the same order and sequence, structured surveys
are easily replicable and scalable across a large sample (e.g., over 100 respondents). Depending
on research objectives, time and budget, surveys can also be self-administered over the phone or
via email (Cheung, 2014). Data collected is often coded and incorporated with statistical analysis
(e.g., regression modelling, refer to Chapter 4) or other quantitative methods (e.g., data
visualization or GIS).
Government-funded national census or sector-specific surveys (e.g., on electricity access or
household fuel choices) are a type of structured survey administered in-person. Other examples,
funded through various donor groups, include the US “Demographic Health Surveys” (DHS)
(https://dhsprogram.com/), the World Bank’s “Living Standards Measurement Study” (LSMS)
(https://worldbank.org/en/programs/lsms), and the United Nation’s “Multiple Indicator Cluster
Surveys” (MICS) (https://mics.unicef.org/) (UN, 2005). Collected data from these government or
donor programs include a diverse set of sector-specific or socio-economic indicators, which are
often incorporated in current literature, including studies on urban energy use. For example,
Nagpure et al. (2018) estimate the energy material use (e.g., electricity, gas and water use) of
low-income households in Indian cities using data from India’s national census report, and
various district and city level surveys and master plans (Nagpure et al., 2018). Likewise,
Choumert-Nkolo et al. (2017; 2019) use a national dataset published through the World Bank
LSMS to assess key socio-economic drivers of household fuel choices in Tanzania. In cases
where national or city data is not available, other studies have used “expert elicitation” to
estimate, define or map current or future changes in technology, system or environmental
processes, e.g., estimating oil sands GHG emissions in Canada (McKellar et al., 2017), defining

45
a community's infrastructure vulnerability and resilience in disasters (Chang et al., 2014), or
mapping energy system and SDG linkages (Fuso Nerini et al., 2018).
In Chapter 4 and Chapter 5, I employ structured surveys to ascertain community level
differences in residential energy use among households in Dar es Salaam. The structured format
allowed for large sample of surveys to be completed (i.e., over 1,300 households completed the
survey) but did not offer scope for respondents or interviewers to delve deeper into specific
questions when needed. My research findings could inform future studies that employ
unstructured surveys (detailed in section 2.5.2) to understand specific cultural or community
aspects or “ways of life” that are not captured using structured formats. Finally, we (the field
team) administered the survey in person given the objective to select a socio-economically
diverse set of wards, including harder to reach households in informal settlements, e.g., Keko
ward, shown in Figure 2.5, is home to several low-income communities in Dar es Salaam.
Figure 2.5. Keko ward. One of the surveyed wards in the fieldwork sample. The ward is home to
several low-income communities in Dar es Salaam. Photo taken by Alice Chibulu Luo.

46
The survey consisted of over 70 questions (shown in Appendix A) and covered a range of topics,
including household demographics, energy use, and travel behaviours (details in Chapter 4 and
Chapter 5). Field team members participated in a two-day training to ensure proper interpretation
of survey questions and to avoid interview biases, e.g., where ineffective or unprofessional
delivery of survey questions by the interviewer could influence respondent answers (Fontana &
Prokos, 2016). During the training, we facilitated mock interviews among field team members,
including live pilot testing of survey questions with households in “Kijitonyama” ward.
2.5.2 Unstructured and Semi-Structured Surveys
Semi-structured and unstructured surveys (or qualitative interviews) stem largely from the social
sciences but are widely applied in engineering research. According to Rubin and Rubin (2012),
“Qualitative interviews are conversations in which a researcher gently guides a conversational
partner in an extended discussion. The researcher elicits depth and detail about the research topic
by following up on answers given by the interviewee during the discussion. Unlike survey
research, in which the same questions are asked to all participants, in qualitative interviews each
conversation is unique, as researchers match their questions to what each interviewee knows and
is willing to share” ((Rubin & Rubin, 2012), page 4). Surveys can also occur in the context of
participant observation or ethnographic interviews (Fontana & Prokos, 2016), i.e., where
information gathered depends on the unique context, culture and setting in which participants are
being observed or studied. These methods can lead to a deeper understanding of community
culture, language, and way of life (Fontana & Prokos, 2016).
A semi-structured interview is a specific kind unstructured interview where the interviewer relies
on an interview guide (i.e., a consistent set of questions or topics), but as noted by Blee & Taylor
(2002), retains flexibility “to digress and to probe based on interactions during the interview”
((Blee & Taylor, 2002), page 92). This guided format still provides a “breadth and depth of
information” and “the opportunity to discover the respondent’s experience and interpretation of
reality”. Rubin & Rubin (2012) highlight the different role of the interviewer during unstructured
or semi-structured interviewing, i.e., unstructured interviews are meant to “obtain a general

47
flavor” respondent perceptions, compared to semi-structured interviews that are guided by a
specific set of questions ((Rubin & Rubin, 2012) page 4). Sanchez (2014) also highlights this
difference by describing unstructured interviews as “similar to natural conversations” where
“researchers ask questions that are largely unscripted”. Relatedly, key informant interviews
presented in Chapter 5 are based on semi-structured interviews to ascertain the key barriers to
low-carbon development in Dar es Salaam. Criteria for identifying key informants are detailed in
Chapter 5. However, broadly, the process involved a consideration of the individual’s prior
work, research, expertise and/or present position within the institution they represented. In total,
24 key informants were interviewed in Dar es Salaam (affiliations of interviewed participants are
specified in the results section of Chapter 5).
2.6 Concluding Remarks
Urban energy use is integral to the discourse on sustainable development. Research shows that
the anticipated growth in energy use among African cities may cause the region’s GHG
emissions to become significant at the global level. However, current literature on urban energy
use and GHG emissions offers few case studies on African cities. This has translated to calls to
action among researchers for studies that (1) quantify energy use and GHG emissions for
different African cities (and at different scales, e.g., city-specific or regional), (2) highlight the
local reality in terms of how urban residents’ access and use energy, and (3) examine the key
institutional and societal barriers of low-carbon development in cities. Papers presented in this
thesis (i.e., Chapters 3 to 5) aim to address these research gaps and contribute to the discourse on
Africa’s changing energy landscape. Using the case of Dar es Salaam (Tanzania): the first study
defines a method for projecting residential energy use and GHG emissions “futures” in the city
between 2015 and 2050; the second study shows the heterogeneity in energy use among
surveyed formal, informal, and mixed Dar es Salaam wards; and the final study examines the
institutional and societal factors that may constrain low-carbon development in the city. Insights
from these studies aim to inform more effective urban planning and energy policies that support
the energy and socio-economic needs of residents (especially the poor).

48
2.7 References for Chapter 2
AfDB (2018) African economic outlook. African Development Bank Group. Available at:
https://www.afdb.org/fileadmin/uploads/afdb/Documents/Publications/African_Economic_
Outlook_2018_-_EN.pdf (Accessed: March 1, 2021).
Andreasen, et al. (2017). Suburbanisation, homeownership and aspirations and urban housing:
Exploring urban expansion in Dar es Salaam. Urban Studies. doi:
10.1177/0042098016643303.
Bauer, N. et al. (2017) ‘Shared Socio-Economic Pathways of the Energy Sector – Quantifying
the Narratives’, Global Environmental Change, 42, pp. 316–330. doi:
10.1016/j.gloenvcha.2016.07.006.
Blee, K. M. and Taylor, V. (2002) ‘Semi-structured interviewing in social movement research’,
in Methods of Social Movement Research.
Brundtland Commission (1987) Report of the World Commission on Environment and
Development: Our Common Future. Available at:
https://sustainabledevelopment.un.org/content/documents/5987our-common-future.pdf
(Accessed: March 1, 2021).
Chang, S. E. et al. (2014) ‘Toward disaster-resilient cities: Characterizing resilience of
infrastructure systems with expert judgments’, Risk Analysis. doi: 10.1111/risa.12133.
Chavez, A. et al. (2012) ‘Implementing Trans-Boundary Infrastructure-Based Greenhouse Gas
Accounting for Delhi, India: Data Availability and Methods’, Journal of Industrial
Ecology, 16(6), pp. 814–828. doi: 10.1111/j.1530-9290.2012.00546.x.
Chen, G. et al. (2016) ‘Transnational city carbon footprint networks – Exploring carbon links
between Australian and Chinese cities’, Applied Energy, 184, pp. 1082–1092. doi:
10.1016/j.apenergy.2016.08.053.
Cheung, A. K. L. (2014) ‘Structured Questionnaires’, in Encyclopedia of Quality of Life and

49
Well-Being Research. doi: 10.1007/978-94-007-0753-5_2888.
Choumert-Nkolo, J., Combes Motel, P. and Le Roux, L. (2017) ‘Stacking up the ladder: A panel
data analysis of Tanzanian household energy choices’. doi:
10.1016/j.worlddev.2018.11.016.
Choumert-Nkolo, J., Combes Motel, P. and Le Roux, L. (2019) ‘Stacking up the ladder: A panel
data analysis of Tanzanian household energy choices’, World Development. doi:
10.1016/j.worlddev.2018.11.016.
Collaço, F. M. de A., Simoes, S. G., et al. (2019) ‘The dawn of urban energy planning –
Synergies between energy and urban planning for São Paulo (Brazil) megacity’, Journal of
Cleaner Production, 215, pp. 458–479. doi: 10.1016/j.jclepro.2019.01.013.
Collaço, F. M. de A., Dias, L. P., et al. (2019) ‘What if São Paulo (Brazil) would like to become
a renewable and endogenous energy -based megacity?’, Renewable Energy. doi:
10.1016/j.renene.2019.01.073.
Currie, P. et al. (2015) ‘Towards Urban Resource Flow Estimates in Data Scarce Environments:
The Case of African Cities’, Journal of Environmental Protection, 06(09), pp. 1066–1083.
doi: 10.4236/jep.2015.69094.
Currie, P. K. and Musango, J. K. (2017) ‘African Urbanization: Assimilating Urban Metabolism
into Sustainability Discourse and Practice’, Journal of Industrial Ecology, 21(5), pp. 1262–
1276. doi: 10.1111/jiec.12517.
Currie, P. K., Musango, J. K. and May, N. D. (2017) ‘Urban metabolism: A review with
reference to Cape Town’, Cities, 70, pp. 91–110. doi: 10.1016/j.cities.2017.06.005.
Dhakal, S. (2009) ‘Urban energy use and carbon emissions from cities in China and policy
implications’, Energy Policy, 37(11), pp. 4208–4219. doi: 10.1016/j.enpol.2009.05.020.
Emodi, N. V. et al. (2017) ‘Energy policy for low carbon development in Nigeria: A LEAP
model application’, Renewable and Sustainable Energy Reviews. doi:

50
10.1016/j.rser.2016.09.118.
Facchini, A. et al. (2017) ‘The energy metabolism of megacities’, Applied Energy, 186, pp. 86–
95. doi: 10.1016/j.apenergy.2016.09.025.
Fan, J. L. et al. (2017) ‘Energy demand and greenhouse gas emissions of urban passenger
transport in the Internet era: A case study of Beijing’, Journal of Cleaner Production, 165,
pp. 177–189. doi: 10.1016/j.jclepro.2017.07.106.
Fontana, A. and Prokos, A. H. (2016) The interview: from formal to postmodern. Routledge.
Fragkias, M. et al. (2013) ‘Does Size Matter? Scaling of CO2 Emissions and U.S. Urban Areas’,
PLoS ONE, 8(6). doi: 10.1371/journal.pone.0064727.
Fuso Nerini, F. et al. (2018) ‘Mapping synergies and trade-offs between energy and the
Sustainable Development Goals’, Nature Energy. doi: 10.1038/s41560-017-0036-5.
García-Guaita, F. et al. (2018) ‘Integrating Urban Metabolism, Material Flow Analysis and Life
Cycle Assessment in the environmental evaluation of Santiago de Compostela’,
Sustainable Cities and Society. doi: 10.1016/j.scs.2018.04.027.
Godfrey, N. and Xiao, Z. (2015) The Contribution of African Cities to the Economy and Climate.
Working Paper. Available at:
https://newclimateeconomy.report/workingpapers/workingpaper/the-contribution-of-
african-cities-to-the-economy-and-climate/ (Accessed: March 1, 2021).
Goldstein, B. et al. (2013) ‘Quantification of urban metabolism through coupling with the life
cycle assessment framework: Concept development and case study’, Environmental
Research Letters, 8(3). doi: 10.1088/1748-9326/8/3/035024.
Government of Tanzania. (2000). Tanzania Vision 2025. Available at:
http://www.mof.go.tz/mofdocs/overarch/vision2025.htm (Accessed: February 7, 2021).

51
Government of Tanzania (2014) Second National Communication to the Framework Convention
on Climate Change. Available at: https://unfccc.int/sites/default/files/resource/tzanc2.pdf
(Accessed: February 7, 2021).
Government of Tanzania (2015a). Intended Nationally Determined Contributions. Available at:
https://www4.unfccc.int/sites/ndcstaging/PublishedDocuments/The%20United%20Republi
c%20of%20Tanzania%20First%20NDC/The%20United%20Republic%20of%20Tanzania
%20First%20NDC.pdf (Accessed: February 7, 2021).
Government of Tanzania (2015b) Tanzania’s SE4All Action Agenda. Available at:
https://www.seforall.org/sites/default/files/TANZANIA_AA-Final.pdf (Accessed:
February 7, 2021).
Government of Tanzania (2016) Power System Master Plan - Update 2016. Dar es Salaam.
Available at: https://www.infoafrica.it/wp-content/uploads/2017/02/Power-System-Master-
Plan-PSMP-2016-Update.pdf (Accessed: February 7, 2021).
Government of Tanzania (2017) Energy Access Situation Report (2016). Available at:
http://rea.go.tz/NewsCenter/TabId/130/ArtMID/639/ArticleID/91/Energy-Access-
Situation-Report-2016-Tanzania-Mainland.aspx (Accessed: February 7, 2021).
Grubler, A. et al. (2013) ‘Urban Energy Systems’, Global Energy Assessment (GEA), pp. 1307–
1400. doi: 10.1017/CBO9780511793677.024.
El Haggar, S. M. (2005) ‘Rural and developing country solutions’, in Environmental Solutions.
doi: 10.1016/B978-012088441-4/50015-0.
Heaps, C. (2016) Long-range Energy Alternatives Planning (LEAP) system [Software version:
2018.1.14]. Somerville, MA, USA.
Heinonen, J. and Junnila, S. (2011) ‘Case study on the carbon consumption of two metropolitan
cities’, International Journal of Life Cycle Assessment, 16(6), pp. 569–579. doi:
10.1007/s11367-011-0289-3.

52
Hillman, T., Janson, B. and Ramaswami, A. (2011) ‘Spatial Allocation of Transportation
Greenhouse Gas Emissions at the City Scale’, Journal of Transportation Engineering,
137(6), pp. 416–425. doi: 10.1061/(ASCE)TE.1943-5436.0000136.
Hillman, T. and Ramaswami, A. (2010) ‘Greenhouse gas emission footprints and energy use
benchmarks for eight U.S. cities’, Environmental Science and Technology, 44(6), pp.
1902–1910. doi: 10.1021/es9024194.
Hoekman, P. and von Blottnitz, H. (2017) ‘Cape Town’s Metabolism: Insights from a Material
Flow Analysis’, Journal of Industrial Ecology, 21(5), pp. 1237–1249. doi:
10.1111/jiec.12508.
Hoornweg, D. and Pope, K. (2017) ‘Population predictions for the world’s largest cities in the
21st century’, Environment and Urbanization, 29(1), pp. 195–216. doi:
10.1177/0956247816663557.Huang, Y. et al. (2019) ‘Exploring potential pathways
towards urban greenhouse gas peaks: A case study of Guangzhou, China’, Applied Energy,
251. doi: 10.1016/j.apenergy.2019.113369.
Huzayyin, A. S. and Salem, H. (2013) ‘Analysis of thirty years evolution of urban growth,
transport demand and supply, energy consumption, greenhouse and pollutants emissions in
Greater Cairo’, Research in Transportation Economics, 40(1), pp. 104–115. doi:
10.1016/j.retrec.2012.06.035.
IEA (2017) ‘Energy Technology Perspectives 2017’, Technology, pp. 1–82. doi:
10.1787/energy_tech-2017-en.
IEA (2019a) Africa Energy Outlook 2019. Available at: https://www.iea.org/reports/africa-
energy-outlook-2019 (Accessed: February 7, 2021).
IEA (2019b) ‘CO2 Emisions from Fuel Combustion’, IEA Publications. Available at:
https://www.iea.org/reports/co2-emissions-from-fuel-combustion-overview (Accessed:
February 7, 2021).
IEA (2019c) ‘World Energy Balances 2019’, World Energy Balances. Available at:

53
iea.org/reports/world-energy-balances-overview (Accessed: February 7, 2021).
IPCC (2014) ‘Human Settlements, Infrastructure, and Spatial Planning (Chapter 12)’, Climate
Change 2014: Mitigation of Climate Change. Contribution of Working Group III to the
Fifth Assessment Report of the Intergovernmental Panel on Climate Change, pp. 923–
1000. doi: 10.1017/CBO9781107415416.018.
ISO (2006) ‘14040: Environmental management–life cycle assessment—Principles and
framework’, International Organization for Standardization.
Ivanova, D. et al. (2017) ‘Mapping the carbon footprint of EU regions’, Environmental Research
Letters, 12(5). doi: 10.1088/1748-9326/aa6da9.
Iyer, G. and Edmonds, J. (2018) ‘Interpreting energy scenarios’, Nature Energy, 3(5), pp. 357–
358. doi: 10.1038/s41560-018-0145-9.
Jagarnath, M. and Thambiran, T. (2018) ‘Greenhouse gas emissions profiles of neighbourhoods
in Durban, South Africa – an initial investigation’, Environment and Urbanization, 30(1),
pp. 191–214. doi: 10.1177/0956247817713471.
Jiang, L. and O’Neill, B. C. (2017) ‘Global urbanization projections for the Shared
Socioeconomic Pathways’, Global Environmental Change, 42, pp. 193–199. doi:
10.1016/j.gloenvcha.2015.03.008.
KC, S. and Lutz, W. (2017) ‘The human core of the shared socioeconomic pathways: Population
scenarios by age, sex and level of education for all countries to 2100’, Global
Environmental Change, 42, pp. 181–192. doi: 10.1016/j.gloenvcha.2014.06.004.
Kemausuor, F., Nygaard, I. and Mackenzie, G. (2015) ‘Prospects for bioenergy use in Ghana
using Long-range Energy Alternatives Planning model’, Energy. doi:
10.1016/j.energy.2015.08.104.
Kennedy, C. et al. (2009) ‘Greenhouse gas emissions from global cities’, Environmental Science
and Technology, 43(19), pp. 7297–7302. doi: 10.1021/es900213p.

54
Kennedy, C. et al. (2010) ‘Methodology for inventorying greenhouse gas emissions from global
cities’, Energy Policy, 38(9), pp. 4828–4837. doi: 10.1016/j.enpol.2009.08.050.
Kennedy, C. et al. (2015) ‘Energy and material flows of megacities’, Proceedings of the
National Academy of Sciences, 112(19), pp. 5985–5990. doi: 10.1073/pnas.1504315112.
Kennedy, C., Cuddihy, J. and Engel-Yan, J. (2007) ‘The changing metabolism of cities’, Journal
of Industrial Ecology, 11(2), pp. 43–59. doi: 10.1162/jie.2007.1107.
Kennedy, C. and Hoornweg, D. (2012) ‘Mainstreaming Urban Metabolism’, Journal of
Industrial Ecology, 16(6), pp. 780–782. doi: 10.1111/j.1530-9290.2012.00548.x.
Kennedy, C., Ibrahim, N. and Hoornweg, D. (2014) ‘Low-carbon infrastructure strategies for
cities’, Nature Climate Change, 4(5), pp. 343–346. doi: 10.1038/nclimate2160.
Limbumba, T. M., & Ngware, N. (2016). Informal housing options and locations for poor urban
dwellers in Dar es Salaam City. Journal of Social Sciences Research. Available at:
https://ideas.repec.org/a/arp/tjssrr/2016p93-99.html (Accessed: February 7, 2021).
Lin, J. et al. (2018) ‘Scenario analysis of urban GHG peak and mitigation co-benefits: A case
study of Xiamen City, China’, Journal of Cleaner Production, 171, pp. 972–983. doi:
10.1016/j.jclepro.2017.10.040.
Lupala, J. (2002). Urban types in rapidly urbanising cities: Analysis of Formal and Informal
settlements in Dar es Salaam, Tanzania. KTH, Department of Infrastructure, Division of
Urban Studies.
Lwasa, S. (2017) ‘Options for reduction of greenhouse gas emissions in the low-emitting city
and metropolitan region of Kampala’, Carbon Management, 8(3), pp. 263–276. doi:
10.1080/17583004.2017.1330592.
Mahumane, G. and Mulder, P. (2016) ‘Introducing MOZLEAP: An integrated long-run scenario
model of the emerging energy sector of Mozambique’, Energy Economics. doi:
10.1016/j.eneco.2016.08.010.

55
Maranghi, S. et al. (2020) ‘Integrating urban metabolism and life cycle assessment to analyse
urban sustainability’, Ecological Indicators. doi: 10.1016/j.ecolind.2020.106074.
McKellar, J. M. et al. (2017) ‘Expectations and drivers of future greenhouse gas emissions from
Canada’s oil sands: An expert elicitation’, Energy Policy. doi:
10.1016/j.enpol.2016.10.014.
McPherson, M. and Karney, B. (2014) ‘Long-term scenario alternatives and their implications:
LEAP model application of Panama’s electricity sector’, Energy Policy, 68, pp. 146–157.
doi: 10.1016/j.enpol.2014.01.028.
Nagpure, A. S., Reiner, M. and Ramaswami, A. (2018) ‘Resource requirements of inclusive
urban development in India: Insights from ten cities’, Environmental Research Letters,
13(2). doi: 10.1088/1748-9326/aaa4fc.
Nakicenovic, N. et al. (2016) ‘Global Commons in the Anthropocene: World Development on a
Stable and Resilient Planet’, IIASA Working Paper. Available at:
http://pure.iiasa.ac.at/id/eprint/14003/ (Accessed: March 1, 2021).
Niza, S., Rosado, L. and Ferrdo, P. (2009) ‘Urban metabolism methodological advances in urban
material flow accounting based on the lisbon case study’, Journal of Industrial Ecology,
13(3), pp. 384–405. doi: 10.1111/j.1530-9290.2009.00130.x.
O’Neill, B. C. et al. (2014) ‘A new scenario framework for climate change research: The concept
of shared socioeconomic pathways’, Climatic Change, 122(3), pp. 387–400. doi:
10.1007/s10584-013-0905-2.
O’Neill, B. C. et al. (2017) ‘The roads ahead: Narratives for shared socioeconomic pathways
describing world futures in the 21st century’, Global Environmental Change, 42, pp. 169–
180. doi: 10.1016/j.gloenvcha.2015.01.004.
Phdungsilp, A. (2010) ‘Integrated energy and carbon modeling with a decision support system:
Policy scenarios for low-carbon city development in Bangkok’, Energy Policy, 38(9), pp.
4808–4817. doi: 10.1016/j.enpol.2009.10.026.

56
Pichler, P. P. et al. (2017) ‘Reducing Urban Greenhouse Gas Footprints’, Scientific Reports,
7(1). doi: 10.1038/s41598-017-15303-x.
Pincetl, S. (2012) ‘A living city: Using urban metabolism analysis to view cities as life forms’,
Metropolitan Sustainability: Understanding and Improving the Urban Environment, pp. 3–
25. doi: 10.1533/9780857096463.1.3.
Pincetl, S., Bunje, P. and Holmes, T. (2012) ‘An expanded urban metabolism method: Toward a
systems approach for assessing urban energy processes and causes’, Landscape and Urban
Planning, 107(3), pp. 193–202. doi: 10.1016/j.landurbplan.2012.06.006.
Popp, A. et al. (2017) ‘Land-use futures in the shared socio-economic pathways’, Global
Environmental Change, 42, pp. 331–345. doi: 10.1016/j.gloenvcha.2016.10.002.
Quinn, D. and Fernández, J. E. (2011) ‘Standardized Analysis of Urban Form Urban Systems &
Infrastructure Background : Cities and complexity’, 2011 Ieee International Symposium on
Sustainable Systems and Technology (Issst).
Ramaswami, A. et al. (2008) ‘A demand-centered, hybrid life-cycle methodology for city-scale
greenhouse gas inventories’, Environmental Science and Technology, 42(17), pp. 6455–
6461. doi: 10.1021/es702992q.
Rao, S. et al. (2017) ‘Future air pollution in the Shared Socio-economic Pathways’, Global
Environmental Change, 42, pp. 346–358. doi: 10.1016/j.gloenvcha.2016.05.012.
Riahi, K. et al. (2017) ‘The Shared Socioeconomic Pathways and their energy, land use, and
greenhouse gas emissions implications: An overview’, Global Environmental Change, 42,
pp. 153–168. doi: 10.1016/j.gloenvcha.2016.05.009.
Rockström, J. et al. (2009) ‘A safe operating space for humanity’, Nature, pp. 472–475. doi:
10.1038/461472a.
Rosado, L., Kalmykova, Y. and Patrício, J. (2016) ‘Urban metabolism profiles. An empirical
analysis of the material flow characteristics of three metropolitan areas in Sweden’,

57
Journal of Cleaner Production, 126, pp. 206–217. doi: 10.1016/j.jclepro.2016.02.139.
Rubin, H. and Rubin, I. (2012) Qualitative Interviewing (2nd ed.): The Art of Hearing Data,
Qualitative Interviewing (2nd ed.): The Art of Hearing Data. doi:
10.4135/9781452226651.
Sanchez, C. (2014) ‘Unstructured Interviews’, in Encyclopedia of Quality of Life and Well-Being
Research. doi: 10.1007/978-94-007-0753-5_3121.
SEA (2015) ‘Modelling the Urban Energy Future of Sub-Saharan Africa, Sustainable Energy
Africa’. Working Paper. Sustainable Energy Africa and SAMSET – Supporting Sub-
Saharan Africa’s Municipalities with Sustainable Energy Transitions. Available at:
https://www.africancityenergy.org/uploads/resource_26.pdf (Accessed: March 1, 2021).
SEI (2018) Using LEAP for GHG Mitigation Assessment. Available at:
https://unfccc.int/sites/default/files/resource/LEAP UNFCCC Nov 2018.pdf.
Steffen, W. et al. (2015) ‘Planetary boundaries: Guiding human development on a changing
planet’, Science. doi: 10.1126/science.1259855.
Stone, A. and Wiswedel, S. (2018) ‘Modelling the Urban Energy Future of Sub-Saharan Africa’,
in International Energy Workshop. Maryland, USA: University of Maryland, p. 13.
Available at: http://samsetproject.net/outputs/.
UN (2005) Household Sample Surveys in Developing and Transition Countries, Studies in
Methods. United Nations Department of Economic and Social Affairs. Available at:
https://unstats.un.org/unsd/hhsurveys/pdf/household_surveys.pdf (Accessed: 16 July,
2020).
UN (2015) Transforming our world: the 2030 Agenda for Sustainable Development. Available
at: https://sdgs.un.org/2030agenda (Accessed: 16 July, 2020).
UN-HABITAT (2006) Slums: Some Definitions. Available at:
https://mirror.unhabitat.org/documents/media_centre/sowcr2006/SOWCR%205.pdf
58
(Accessed: February 8, 2021)
WBCSD/WRI (2014) Global Protocol for Community-Scale Greenhouse Gas Emission
Inventories. Available at: http://ghgprotocol.org/city-accounting.
Yang, Dewei et al. (2017) ‘Sectoral energy-carbon nexus and low-carbon policy alternatives:
A case study of Ningbo, China’, Journal of Cleaner Production, 156, pp. 480–490. doi:
10.1016/j.jclepro.2017.04.068.
Zhou, J. et al. (2016) ‘Implications of the 11th and 12th Five-Year Plans for energy conservation
and CO2 and air pollutants reduction: A case study from the city of Urumqi, China’,
Journal of Cleaner Production, 112, pp. 1767–1777. doi: 10.1016/j.jclepro.2015.08.015.
van der Zwaan, B. et al. (2018) ‘An integrated assessment of pathways for low-carbon
development in Africa’, Energy Policy, 117, pp. 387–395. doi:
10.1016/j.enpol.2018.03.017.

59
Chapter 3
Modelling Future Patterns of Urbanization, Residential
Energy Use and Greenhouse Gas Emissions in Dar es
Salaam with the Shared Socio-Economic Pathways
This Chapter is based on a published paper with the following citation.
• Luo, C., Posen, I. D., Hoornweg, D., & MacLean, H. L. (2020). Modelling future patterns
of urbanization, residential energy use and greenhouse gas emissions in Dar es Salaam
with the Shared Socio-Economic Pathways. Journal of Cleaner Production, 254.
https://doi.org/10.1016/j.jclepro.2020.119998
3.1 Abstract
This paper presents three scenarios of urban growth, energy use and greenhouse gas (GHG)
emissions in Dar es Salaam using narratives that are consistent with the Shared Socio-Economic
Pathways (SSPs). I estimate residential energy demand and GHG emissions from 2015 to 2050
for household activities (including upstream electricity generation) and passenger (road)
transport (Scopes 1 and 2). I project that by 2050, Dar es Salaam’s total residential emissions
would increase from 1,400 ktCO2e (in 2015) up to 25,000 – 33,000 ktCO2e (SSP1); 11,000 –
19,000 ktCO2e (SSP2); and 5,700 – 11,000 ktCO2e (SSP3), with ranges corresponding to
different assumptions about household size. This correlates with an increase in per capita
emissions from 0.2 tCO2e in 2015 to 1.5 – 2 tCO2e (SSP1); 0.7 – 1.3 tCO2e (SSP2); and 0.5 – 0.9
tCO2e (SSP3). Higher emissions in SSP1 (the sustainability scenario) are driven by a higher
urban population in 2050 and increased energy access and electricity consumption. Through
aggressive GHG mitigation policies focused on decarbonization of the electricity sector and road
transport, total emissions under SSP1 can be reduced by ~66% in 2050. Study insights aim to
60
inform policies that identify and capture synergies between low-GHG investments and broader
socio-economic development goals in African cities.
3.2 Introduction
How emerging Global South cities – especially in the Africa region – mitigate and adapt to
climate change is critical to future sustainability. By the end of the century, over 30 African
cities are expected to be among the world’s largest megacities (with populations exceeding 10
million) (Hoornweg and Pope, 2017) compared to two megacities in 2017 (Lagos and Kinshasa)
(WorldAtlas, 2017; UN, 2018). Though the region accounts for only 3.7% of global energy-
related greenhouse gas (GHG) emissions, rapid urbanization and economic growth will increase
future energy demand and GHG emissions (IEA, 2019). The growth of new urban infrastructure,
such as power plants, roads, water supply and sewer systems, will push the region’s aggregate
material and energy use to much higher levels (Westphal et al., 2017). Urban sprawl, and
persistent decline in urban population density, will be an additional driver of energy demand and
emissions (Angel et al., 2011). Therefore, steering African cities towards a low-GHG future is
critical to energy policy and planning as urban growth will impact global emissions due to the
projected expansion of Africa’s population (Godfrey and Xiao, 2015; Calvin et al., 2016).
However, literature on the future energy and GHG emissions transitions of African cities is
limited to a few studies, e.g., Godfrey and Xiao (2015) and SEA (2015a). This calls for research
that investigates different scenarios of urban growth and energy use in African cities, and,
specifically, identifies key sectors (e.g., residential, transportation and industrial) driving these
changes within individual cities.
There are two main contributions of this paper. To my knowledge, I present the first projections
of possible changes in residential energy use and GHG emissions, i.e., from domestic activities,
including household and transportation activities, in Dar es Salaam, Tanzania, one of the largest
and fastest growing cities in Africa (Hoornweg and Pope, 2017). My analysis highlights the
household and transportation drivers that are the primary contributors to future GHG emissions
in Dar es Salaam, providing insights for policy makers and urban planners. The projections are to

61
2050 and use the Shared Socio-Economic Pathways (SSPs) as a guiding narrative. The SSPs
were originally established by the climate change research community to facilitate integrated
analysis of future climate impacts, vulnerabilities, adaptation, and mitigation (Riahi et al., 2017).
There have been only a few applications of the SSPs at the city-level (e.g., Kamei et al. (2016)
and Hoornweg and Pope (2017)), and none for the purpose of projecting GHG emissions and
energy use in Dar es Salaam or any other major African city.
Second, the paper presents a method for scoping GHG emissions pathways in a relatively
data-poor environment, and demonstrates how the SSPs can be used to develop urban growth
scenarios. Current urban energy use or GHG emissions studies tend to focus on Global North
cities (where data sources and methods are more robust), despite calls to action for research
attention and focus on the Global South (especially in the Africa region) (IPCC, 2014; van der
Zwaan et al., 2018). The lack of research is further reflected by the few studies that have
estimated energy and GHG emissions flows in African cities, e.g., Kampala (Lwasa, 2017),
Lagos (Kennedy et al., 2015) and Cape Town (Hoekman and von Blottnitz, 2017). However,
these studies do not discuss expected changes in future GHG emissions in the manner presented
in this paper. My results show the wide uncertainty in these future projections, while
simultaneously demonstrating the order of magnitude jump in emissions that can be expected in
Dar es Salaam even under optimistic scenarios.
I focus on the residential sector as it is a large “end-use” sector in the Africa region (IEA, 2014,
2019). Regional estimates indicate that 66% of final energy use occurs in the residential sector
(largely due to biomass use), compared to 21% in the industrial, agricultural and services sectors
(IEA, 2014). From a fossil fuel perspective (i.e., not including biomass use), residential GHG
emissions still account for a large share of urban GHG emissions. For example, in large African
cities such as Lagos and Accra, GHG emissions from residential buildings (due to household
electricity use for lighting, heating and cooling) were estimated at ~30% (2015) and ~23%
(2015), respectively, of total stationery and transport emissions, compared to ~14% and ~5%
from industry (i.e., manufacturing and construction) (C40 Cities, 2017). Furthermore, while there
is no available estimate of residential GHG emissions in Dar es Salaam (outside of the ones
generated within this study), national GHG inventories estimate that electricity production and

62
transportation (including for residential use) accounted for ~38% of Tanzania’s total energy
sector emissions (in 2014), compared to ~7% for industry (WRI, 2015). GHG emissions from
industry would generally vary on a case-by-case basis or may be linked to industry specific
regulations, and therefore emissions projections for industry would scale differently compared to
residential emissions. For the above reasons, the focus of this paper is on residential activities,
although industrial activities could be incorporated in future work.
To accomplish the contributions outlined above, this paper:
(1) Estimates the current (2015) emissions in Dar es Salaam and presents narratives (based
on the SSPs) that project future changes in GHG emissions from domestic households,
including public and private vehicle travel (Scopes 1 and 2), between 2015 and 2050.
(2) Assesses which household and transportation activities are the primary contributors to
emissions to 2050.
(3) Analyzes how spatial factors such as urban population density influence energy use and
GHG emissions.
(4) Provides actionable urban policy recommendations that can support a low-GHG and
sustainable energy transition in Dar es Salaam, and the Africa region more broadly.
3.3 Literature Review: Infrastructure and Energy Transitions in
Africa and Other Global South Cities
The African Development Bank estimates the scale of investments required to build Africa’s
future infrastructure at between $130 and $170 billion a year (AfDB, 2018). This infrastructure
demand presents a unique opportunity to build more sustainable (and resilient) cities with
policies that promote low-GHG and resilient communities (that especially benefit the poor).
However, the urbanization of African cities comes with unique challenges. Unlike the
transformation in Europe and North American cities, whose urbanization was correlated with
industrialization and economic growth (Currie and Musango, 2017), these associations are not
evident in the Africa region (Allen, 2014). Rather, urban growth has been predominately

63
“splintered” and reinforced by socio-economic challenges such as poverty, inequality and
vulnerability to climate change (Allen, 2014; Currie and Musango, 2017). Splintered urbanism
has heightened inequalities, as basic infrastructure services, such as electricity, water supply and
public transportation, are often limited or non-existent for the poorest neighborhoods (Allen,
2014; Currie and Musango, 2017). In this regard, studies find that low levels of infrastructure
stock (and urban wealth) in African cities is a key reason for their limited energy use and GHG
emissions compared to higher-income cities (Kennedy et al., 2015).
A handful of prior studies have compared electricity use, transportation emissions and/or direct
final energy use among global cities (e.g., Schulz (2010); Grubler et al. (2013) and Kennedy et
al. (2014)), and report values for Dar es Salaam (0.16 MWh/capita, ~1 tCO2e/capita and
17GJ/capita) that are far lower than their counterparts in the U.S. (9 – 10 MWh/capita and 4
tCO2e/capita or greater) or Canada (162 GJ/capita in Toronto). Another set of studies quantify
the flows of materials, energy, and waste in cities using urban metabolism frameworks.
Metabolism assessments are available for a limited number of African cities, including Lagos
(Kennedy et al, 2015) , Kampala (Lwasa, 2017), Durban (Jagarnath and Thambiran, 2018) and
Cape Town (Hoekman and von Blottnitz, 2017). Increasing resource access remains a key
challenge for these cities. For example, the study by Kennedy et al. (2015; page 5988) conclude
that developing cities in Asia and Africa (e.g., Lagos) are “consuming resources at rates below
those that support a basic standard of living for all citizens”. This is consistent with other
literature that correlates resource use and GDP/capita or Human Development Index (HDI)
ratings in African cities (Currie et al., 2015; Currie and Musango, 2017).
Only a few studies have projected energy use and GHG emissions pathways in African cities
(e.g., Senatla (2011), Godfrey and Xiao (2015), SEA (2015a) and Stone and Wiswedel (2018)).
However, there are several studies in other regions of the Global South, especially Asian and
Latin American cities (e.g., McPherson and Karney (2014), Collaço et al. (2019) and Huang et
al. (2019)). Emissions pathways are estimated using scenario-based models that aggregate data
across different urban sectors. For example, Stone and Wiswedel (2018) used the Stockholm
Environment Institute’s Long-Range Energy Alternatives Planning (LEAP) software to assess
the scale of GHG emissions growth (from residential, industrial and transport activities) in urban

64
Africa from 2012 to 2040. The authors’ results indicated that urban energy demand in African
cities could increase fourfold by 2040, with GHG emissions rising 280%. This would shift the
region’s share of global emissions from 1% (in 2012) to 4% in 2040. In China, Huang et al.
(2019) used LEAP to project peak levels of GHG emissions in the city of Guangzhou. Findings
showed that while emissions will peak by 2023 under existing climate mitigation policies, the
peak could be moved forward to 2020 with more stringent energy conservation and policies,
including (among other interventions): (1) adjusting the energy mix and mode of passenger
transport; (2) and replacing coal and oil use with electricity and natural gas in the industrial
sector; and (3) enabling large scale-up of renewable energy power. Similar applications of the
LEAP model at the city-level are available for São Paulo (Collaço et al., 2019), Panama
(McPherson and Karney, 2014), Bangkok (Phdungsilp, 2010), and several Chinese cities (Zhou
et al., 2016; Fan et al., 2017; Yang et al., 2017; Lin et al., 2018), among others.
Outside of LEAP, researchers have employed models and frameworks designed for specific
sectors, including buildings (e.g., Lin et al. (2017), Li et al. (2019) and Mokhtara et al. (2019)),
transportation (e.g., Pongthanaisawan and Sorapipatana (2013), Aggarwal and Jain (2016), Dhar
et al. (2017) and Du et al. (2017)) and industry (e.g., Wang et al. (2013) and de Souza et al.
(2018)). Other studies have used Integrated Assessment Models (IAMs) to forecast long-term
energy and emissions scenarios (e.g., Riahi et al. (2017), van Sluisveld et al. (2018), Silva Herran
et al. (2019) and Wu et al. (2019)). IAM literature remains limited in the Africa region, with
notable exceptions by Lucas et al. (2015), Calvin et al. (2016), and van der Zwaan et al. (2018).
In particular, van der Zwaan et al. (2018) modeled pathways for low-carbon development in
Africa (including North African countries) using the “TIAM-ECN” IAM model and simulated
the development of energy economies over time. Their findings showed that while Africa’s GHG
emissions could become substantial at a global scale by 2050, the region could “leapfrog” fossil-
fuel based growth with large-scale use of renewable energy options (van der Zwaan et al., 2018).
A final set of studies have coupled IAMs with the SSPs to project a range of socio-economic
trends, such as future changes in global population (KC and Lutz, 2017), urbanization (Jiang and
O’Neill, 2017), energy use (Bauer et al., 2017) and air pollution (Rao et al., 2017). However, a
number of research gaps remain in the IAM and SSP literature. Local or city level data has not

65
been widely incorporated into models and there is need for additional research at lower
geographic scales, i.e., to enable local dynamics to be incorporated into IAMs (Cronin et al.,
2018). Currently, studies by Kamei et al. (2016) and Hoornweg and Pope (2017) are among the
few studies that translate the SSP narratives to the city level (though, do not use an IAM
approach). Kamei et al. (2016) determined long-term socioeconomic scenarios in Tokyo based
on a theoretical model and expert interviews, while Hoornweg and Pope (2017) coupled their
narratives with regression models to project urbanization trends in the world’s largest cities to
2050, 2075 and 2100.
Gaps in modelling approaches remain, and researchers have called for additional studies in
developing regions, especially Africa (Cronin et al., 2018; van der Zwaan et al., 2018). This
paper contributes to the growing SSP literature and provides the first application of SSPs in Dar
es Salaam or Tanzania. The novelty in my approach is embedded in my assumed scenarios and
projections. Assessments of urban energy and/or material flows in Kampala (Lwasa, 2017),
Lagos (Kennedy et al., 2015), Durban (Jagarnath and Thambiran, 2018), and others
aforementioned, did not estimate changes in energy use or GHG emissions over time. Therefore,
by estimating current (2015) and possible changes in GHG emissions in Dar es Salaam to the
year 2050, my work may derive insights on the emissions pathways of other African cities.
Considering that the IAMs (including the SSPs) have not been applied to city level analysis
(Cronin et al., 2018), I couple my SSP narratives with a LEAP modelling approach. The LEAP
tool has been widely used to estimate long-term energy use and GHG emissions futures in
developing countries. Finally, my work also shows the opportunity for Dar es Salaam to
implement policies that support low-GHG urbanization. The urbanization narratives modelled in
this paper – SSP1 (Sustainable Growth), SSP2 (BAU Growth), and SSP3 (Fragmented Growth)
(described in the Methods) – present distinct urbanization, energy use and GHG emissions
futures for Dar es Salaam. The narratives provide a basis for identifying (1) key household and
transportation drivers of GHG emissions in Dar es Salaam, and (2) investments that can support
future emissions reductions (which could potentially be generalizable to other large African
cities).

66
3.4 Case Study of Dar es Salaam, Tanzania
Dar es Salaam is the largest city and economic hub of Tanzania. In 2015 (the current year
considered in this study) Dar es Salaam had an estimated population of 5.1 million (or 1.3
million households, assuming an average household size of four persons per household) (World
Bank, 2018). The city is experiencing significant changes in urban form, although it is noted that
the city masterplan was last updated in 1979 (Government of Tanzania, 2017a). Structurally, Dar
es Salaam exhibits a monocentric and radial urban form, with highest population densities
clustered around the city center and along the four major arterial roads, i.e., to the north along
Bagamoyo road, north-west along Morogoro road, south-west along Nyerere road and south
along Kilwa road (Figure 3.1).
Figure 3.1. Average population densities (by ward) and major arterial roads (Bagamoyo, Kilwa,
Morogoro and Nyerere) in Dar es Salaam. I compiled the map in ArcGIS using ward population
data from the 2012 National Census Report (Government of Tanzania, 2016b, 2017a).
Generally, energy sector statistics in Tanzania are reported at the national level, including
through the National Communications to the United Nations Framework Convention on Climate

67
Change (UNFCCC) (Government of Tanzania, 2015). An estimated ~75% of Dar es Salaam
households have access to electricity (DHS Program, 2016; Government of Tanzania, 2017b).
Despite high electrification levels compared to rural areas (Government of Tanzania, 2017b),
urban households experience frequent power cuts and fluctuations in voltage that can damage
electric appliances (Garside and Wood, 2018). To compensate for electricity shortages, “fuel
stacking”, where households use a combination of other fuels such as firewood, charcoal,
liquefied petroleum gas (LPG) or kerosene (in addition to electricity) is widespread (Lusambo,
2016). It is estimated that only 2% of Dar es Salaam households use only electricity for cooking
and heating needs (DHS Program, 2016).
In the transport sector, approximately 62% of all passenger trips (~81% of vehicle trips) are by
small minibuses called “dala-dalas” (Mkalawa and Haixiao, 2014). Other modes include private
cars, including taxis (16% of vehicle trips); and motorcycles and tricycles, known locally as
“bodas” and “bajajis” (3% of vehicle trips) (Table 3.2) (Mkalawa and Haixiao, 2014). The dala-
dala service is widely used by low-income communities given its affordability, though it is often
characterized by poor service quality, untrained bus operators and non-adherence to traffic rules
and regulations (Nkurunziza et al., 2012). To improve standards of service, the city is
implementing a six-phase Bus Rapid Transit (BRT) system, with main corridors operating along
the four major arterial roads (Government of Tanzania, 2017a). Phase 1 of the BRT was
completed in 2016 and operates along Morogoro road (Figure 3.1), which traverses from Dar es
Salaam’s high-income central business district towards middle- and low-income residential areas
in the west. Plans to expand the BRT up to six phases are currently underway (World Bank,
2017b). More detail about the BRT implementation is available in the supplementary material
appended to the end of this Chapter (Section 3.9.8).
3.5 Methods
I model future pathways of energy use and GHG emissions in Dar es Salaam from 2015 (current
year) to 2050 with a focus on the residential sector, including associated public and private road
transportation. I include direct (Scope 1) emissions from households (i.e., emissions from the use

68
of charcoal, firewood, kerosene or liquefied petroleum gas (LPG), and emissions from road
travel using private vehicles or public transport modes), as well as upstream (Scope 2) emissions
from electricity generation (for household use or electric vehicle charging). We broadly describe
these activities as “residential” in the remainder of the paper. I do not account for emissions from
fuel production, or from commercial and industrial activities, including air, railway, or marine
transport. I also do not include embodied (Scope 3) emissions associated with product
manufacture and shipping.
The focus on residential energy use and emissions is due to the large contributions of these
activities compared to industrial activities, or other productive sectors. Domestic use of biomass
(i.e., charcoal and fuel wood) accounts for over 90% of final energy consumption in Tanzania
(Government of Tanzania, 2014a). However, biogenic carbon emissions from biomass
combustion, as well as emissions from Land Use Land-Use Change and Forestry (LULUCF) are
not included in emissions inventories for the energy sector category. Emissions accounted for in
the sector include national electricity (~11%), road transportation (~27%), manufacturing and
construction (~7%), and commercial, residential, and agricultural activities (~55%) (WRI, 2015).
All GHG emissions are stated in kilotons of carbon dioxide equivalents (ktCO2e), which includes
CO2, methane, and nitrous oxide. GHG emissions are calculated using 100-year global warming
potentials (GWP) (IPCC, 2013). GWPs and emissions factors for all household and transport fuels
are listed in the supplementary information (Section 3.9).
3.5.1 Dar es Salaam’s Urbanization Narratives
My urbanization narratives are inspired by the SSPs which have been developed and modelled
by climate change researchers (e.g., Riahi et al. (2017)). The original SSPs are based on five
narratives or “storylines”, each with different consequences for global and regional socio-
economic development under increasing climate uncertainty (O’Neill et al., 2017). I focus
specifically on SSP1 (“Sustainability”), SSP2 (“Business As Usual”) and SSP3 (“Fragmented”)

69
as they sufficiently illustrate a range of possible futures that encompass results from SSP4
(“Inequality”) and SSP5 (“Fossil Fueled Development”).
The narratives presented in this paper are simplified baseline projections of Dar es Salaam’s
future energy use and GHG emissions. Each narrative is distinct and highlights different energy
use dynamics and outcomes. I assume no additional climate mitigation actions beyond the
baseline narratives (and as outlined in the Methods). Therefore, in Section 3.6.7, I include an
additional mitigation scenario that facilitates the examination of aggressive GHG mitigation
policies focused on decarbonization of electricity and road transportation, and assesses which
activities have the potential to drive the largest emissions reductions to 2050. Table 3.1 describes
Dar es Salaam’s urbanization narratives and justifications, as appropriate.

70
Table 3.1. Dar es Salaam’s Urbanization Narratives inspired by the SSPs: SSP1 (Sustainability),
SSP2 (BAU) and SSP3 (Fragmented)
Indicators SSP1: Sustainability SSP2: Business-As-Usual
(BAU)
SSP3: Fragmented
Population
▪ Fast initial population
growth by 2050.
▪ Lowest peak in population
after 2050.
▪ Moderate population growth,
consistent with historic
growth trends.
▪ Moderate peak in population
after 2050.
▪ Slow initial population
growth.
▪ Highest peak in population
after 2050.
Households
▪ 100% electrification is
realized by 2050
▪ Net-zero consumption of
traditional fossil fuels (i.e.,
charcoal and wood) by 2050.
▪ 100% electrification by
2050.
▪ Households continue to rely
on traditional fossil fuels in
2050.
▪ No change in electrification
levels from 2015.
▪ Households continue to rely
on traditional fossil fuels in
2050.
Passenger
Transport
▪ Phases 1 to 4 of the BRT are
complete by 2050.
▪ BRT ridership accounts for
40% of total passenger trips,
similar to reported ridership
in Latin American and
Chinese cities (WRI, 2018).
▪ Fuel efficiency of light-duty
vehicles (LDVs) improves to
OECD levels, in line with
global targets to 2050
(OECD/IEA, 2017a).
▪ Phases 1 to 4 of the BRT are
complete by 2050.
▪ BRT ridership accounts for
15% of total passenger trips,
consistent with existing BRT
implementation plans (World
Bank, 2017b).
▪ Fuel efficiency of LDVs
progresses to the same levels
observed in middle- and
high-income cities today.
▪ Phases 1 to 4 of the BRT are
complete by 2050.
▪ BRT ridership accounts for
15% of total passenger trips,
with future BRT expansion
plans halting post-2050.
▪ Fuel efficiency of LDVs
progresses to the same levels
observed in middle- and
high-income cities today.
3.5.2 Modelling Using the LEAP Platform
For each SSP narrative, I use the LEAP modelling platform (Heaps, 2016) to calculate Dar es
Salaam’s residential energy use and GHG emissions to 2050. The platform offers a transparent
way of structuring complex energy data, projecting different demand and supply scenarios, and
integrating factors such as population growth, GDP and policy changes to energy sector analysis
(Heaps, 2008, 2016). LEAP has not been employed to model energy use and GHG emissions in
Dar es Salaam or Tanzania.
71
Modelling capabilities include built-in calculations to determine energy use and GHG emissions
based on time-varying data points (Heaps, 2008, 2016). The platform’s Technology and Energy
Database includes GHG emissions data for a range of fuels based on the Intergovernmental Panel
on Climate Change (IPCC) guidelines. The supplementary material (Section 3.9.9) provides
more detail about the calculation structure within LEAP.
3.5.2.1 Data Sources and Underlying Assumptions (2015 to 2050)
I estimate Dar es Salaam’s residential energy use and GHG emissions using the following data
and assumptions (see Table 3.2): (1) population, GDP and household size; (2) population
density; (3) the GHG intensity of electrification; (4) fuel use at the household level; and (5) fuel
use for road transportation. The following sections describe my approach in sourcing data. I also
caveat that where data is not available for Dar es Salaam, I draw from national estimates, or
proxy data from other Global South cities.

72
Table 3.2. Key indicators and underlying assumptions for estimating Dar es Salaam’s residential energy use and GHG emissions for SSP1
(Sustainability), SSP2 (BAU), and SSP3 (Fragmented) narratives from 2015 to 2050.
# Indicator Unit Current year –
2015
Data source for
current year SSP1 – 2050 SSP2 – 2050 SSP3 – 2050
Data source for
assumptions to
2050
1 Population million 5.1 (World Bank,
2018) 16 15 12 Equation 3.1
2 GDP/Capita USD $ 1,100 (IIASA, 2015) 4,700 2,500 1,500 (IIASA, 2015)
3 Household (HH)
size persons/HH 4
(Government of
Tanzania, 2014b) [2 – 4] [2 – 4] [2 – 4]
Reduction to 2
persons/HH at the
lower bound reflects
the lowest HH size
observed globally
today (UN, 2017)
4 Number of
households million 1.3
(Government of
Tanzania, 2014b) [4 – 12] [4 – 8] [3 – 6] Own calculation
5
Average
population
density
persons/km2 3,100 (Government of
Tanzania, 2014b) 3,100 3,300 3,500
Downscaled 1km2
population density
projections from
(Jones and O’Neill,
2016) (Figure 3.3).
6
% change in
average urban
population
density
0% 6% 13%

73
# Indicator Unit Current year –
2015
Data source for
current year SSP1 – 2050 SSP2 – 2050 SSP3 – 2050
Data source for
assumptions to
2050
7 Electrification
level
% of total
households 75
(Government of
Tanzania, 2017b) 100 100 75
(Government of
Tanzania, 2017b)
8 GHG intensity of
electricity gCO2e/kWh 405 Author calculation 4053 4353 4353 Own calculation
9 Electricity use1, 4
GJ/HH/yr.
5 (IEA, 2014) 46 25 18
Assumption based
on SSP narratives
for total household
energy use (Table
3.3).
10 LPG use1, 4 4 (Drazu et al.,
2015)
0 16 10
11 Kerosene use1, 4 1 0 13 7
12 Firewood use1,4
16 (Drazu et al.,
2015) 0 0 8
13 Charcoal use1,4 21 (SEA, 2015b,
2015a) 0 0 10
14 Annual VKT per
capita km 870
(Mkalawa and
Haixiao, 2014;
World Bank,
2017a)
870 860 840
Elasticity between
density and VKT
(Guerra, 2014)

74
# Indicator Unit Current year –
2015
Data source for
current year SSP1 – 2050 SSP2 – 2050 SSP3 – 2050
Data source for
assumptions to
2050
15 LDV
% of total
vehicle trips
16%
(Mkalawa and
Haixiao 2014)
12% 15% 15%
Based on assumption
that relative change
in vehicle trips will
mostly shift from
dala-dala to BRT as
stated in Methods,
with small changes
in LDV and
motorcycle/tricycle
use.
17
Dala-dala
(standard bus: 40-
seater)
81% 55% 67% 67%
18
Boda or Bajaji
(motorcycle or
tricycle)
3% 3% 3% 3%
16 BRT
0%2 (World Bank,
2017b) 30% 15% 15%
Based on projected
completion of BRT
Phases 1 to 4 (see
(World Bank,
2017b))
19 Electric Vehicles4
0 (IEA, 2017a, 2018) 1% 0.1% 0.1% (IEA, 2017a, 2018)
20 Fuel use5
(LDV)
litres/100km
12 (World Bank,
2017a) 4.4 7.4 7.4 (IEA, 2014, 2017a)
21 Fuel use5
(BRT) 38
(DART Agency,
2017) No change. Own assumption

75
# Indicator Unit Current year –
2015
Data source for
current year SSP1 – 2050 SSP2 – 2050 SSP3 – 2050
Data source for
assumptions to
2050
22 Fuel use5
(dala-dala)
33
23 Fuel use5
(Boda or Bajaji) 1.8 (IEA/GFEI, 2015)
Load factor by vehicle mode (from 2015 to 2050):
▪ LDVs – 1.8 passengers/vehicle (World Bank, 2017a)
▪ Dala-dala – 40 passengers/vehicle (DART Agency, 2017)
▪ BRT – 150 passengers/vehicle (DART Agency, 2017)
▪ Boda or Bajaji – 1.2 passengers/vehicle (World Bank, 2017a)
Table Notes: 1 Total household energy use remains constant for all future projections, though the relative shares of fuel use change based on the SSP narrative. 2 I assume no BRT ridership in 2015. Phase 1 of the BRT was fully operational in May 2016 (DART, 2017). 3 I assume different changes in the generation mix depending on the scenario (Section 3.9.3) 4 EV projections are based on current IEA estimates for South Africa (SSP2 and SSP3) and Europe (SSP1). 5 Refer to Section 3.9.2 for emissions factors for all fuels used in the LEAP model.

76
3.5.2.2 Population, GDP, and Household Size
For each SSP narrative, we estimate Dar es Salaam’s future population to 2050 as follows:
(Equation 3.1)
Where “Year” represents the year of prediction, “TP” represents Tanzania’s total population (in
millions) for the given year, “TUP” represents Tanzania’s urban population level (as a
percentage) for the given year, and “PS” is the population share of Dar es Salaam (as a
percentage of the total urban population) for the given year.
I determine Tanzania’s total population (TP) and urban population level (TUP) from the existing
population and urbanization projections for the SSPs (Jiang and O’Neill, 2017; KC and Lutz,
2017), which include data from 2010 to 2100. Over the last 20 years, Dar es Salaam has
consistently accounted for approximately 30% of the country’s total urban population (World
Bank, 2018). I assume this share will remain at 30% across all future scenarios (while a rate of
30% may seem low, I expect that this is consistent with the large growth also expected in other
Tanzanian cities). Finally, I estimate GDP per capita between 2015 and 2050 by dividing
Tanzania’s projected GDP, available in the SSP database (IIASA, 2015), by Tanzania’s
projected total population (TP).
3.5.2.3 Household Size
I estimate the average household size in Dar es Salaam at four persons per household in 2015
(Table 3.2) (DHS Program, 2016). Across all SSPs, Tanzania’s total fertility rate (TFR) is
projected to fall (Lutz et al., 2014), suggesting that household size will likely decrease in the
future. To estimate future changes in household size and impact on household energy use and
emissions, I consider two bounding scenarios – (1) as an upper estimate, I assume household size
remains constant at four persons per household to 2050; and (2) as a lower estimate, I assume an
eventual reduction in household size to 2 persons per household by 2050, consistent with the
77
lowest household estimates observed globally today (UN, 2017). This also serves the purpose of
allowing per capita energy to increase as a function decreasing household size. For example, my
assumption that total household energy use remains constant to 2050 (Table 3), implicitly
increases per capita energy use with the reduction in household size. Therefore, while I am
unable to create a more refined estimate of changes in total household energy use in Dar es
Salaam due to data limitations, my modelling explores some possible futures in GHG emissions
across a range of estimates (based on both constant and changing household size).
3.5.2.4 Population Density
I project Dar es Salaam’s average population density using Jones and O’Neill’s (2016) spatial
projections which map global and regional changes in urban, rural and total population (based on
1km2 grids) from 2010 to 2100. By considering only those grids that fall within Dar es Salaam’s
administrative boundary, I calculate changes in the city’s urban density (i.e., sprawl or
concentration) for each processed layer (for SSP1, SSP2 and SSP3).
3.5.2.5 Electricity Generation
Currently, Tanzania's electricity generation mix is dominated by natural gas (59%) (Section
3.9.3); hydropower (35%), Heavy Fuel Oil (HFO) (5.7%) and biomass (0.3%) account for the
remaining fractions (Government of Tanzania, 2017c). By 2040, Tanzania aims to expand the
generation mix to include coal, solar, wind and geothermal sources (Government of Tanzania,
2016a). According to Tanzania’s Intended Nationally Determined Contribution (INDC)
(Government of Tanzania, 2015), geothermal potential is estimated at 5GW and hydropower at
4.7GW (though installed capacity is currently 0.6GW (Government of Tanzania, 2016a)). My
LEAP model assumes different transformations in the generation mix for each SSP narrative.
SSP1 assumes a 10% penetration of renewable energy, consistent with the highest level of
renewable energy penetration scenario (“Scenario 6”) considered in Tanzania’s National Power
Plan (Government of Tanzania, 2016a). SSP2 and SSP3 assume a shift in the generation mix to
natural gas (40%), hydropower (20%), coal (35%), and 5% penetration of renewable energy (i.e.,

78
solar and wind sources) by 2050. These advancements are consistent with the preferred scenario
envisioned under Tanzania’s National Power Plan (“Scenario 2”) (Government of Tanzania,
2016a).
3.5.2.6 Household Activities
I estimate energy use and GHG emissions associated with fuels used for space and water heating,
cooking, lighting, and appliance use within the city (Scope 1), and associated emissions from
electricity generation (Scope 2). In 2015, Dar es Salaam’s household electricity use was
estimated at 1,250 kWh/household (HH)/yr. (~5 GJ/HH/yr.). This is consistent with the World
Bank’s “Tier-4” level of electricity access, where households use electricity for lighting and
some medium-power appliances (e.g., television, radio, phone charger) (World Bank, 2015). By
2035, Tanzania plans to achieve a national electrification rate of 90% (Government of Tanzania,
2016a). Therefore, my modelling assumes that 100% electrification is realized for SSP1 and
SSP2 by 2050. SSP3 assumes no progress is made, with electrification remaining at 75%.
In most households, charcoal or LPG are widely used in combination with electricity. For
example, in 2015, 75% of households in Dar es Salaam used electricity and 69% used charcoal
(DHS Program, 2016; Government of Tanzania, 2017b), meaning that some households were
using both charcoal and electricity for daily needs. Other household fuels include LPG (14%),
wood (6%) and kerosene (6%). I implicitly account for these fuel stacking behaviors by
calculating the total household energy use (in GJ/HH/yr.) and estimate the relative change in fuel
use shares (i.e., charcoal, firewood, LPG and kerosene) for each SSP narrative (Table 3.3).
Moreover, all future scenarios assume that total household energy use remains constant, though I
change both the household size and the relative energy use shares from the different fuel sources
based on the SSP narrative. Finally, although household energy use remains constant, I report
results in each scenario for both constant and decreasing household sizes, with the latter
implicitly allowing growth in household energy use per person. Refining these projections for
household energy use is an important area for future work.

79
Table 3.3. Modelling assumptions for changes in household energy use for SSP1
(Sustainability), SSP2 (BAU), and SSP3 (Fragmented) narratives.
Scenario % share of total
household energy use in
2015 (current year)
Estimated changes in energy use (by fuel) to 2050
SSP1:
Sustainability
Electricity: 11%
(5 GJ/HH/yr.)
LPG: 9%
(4 GJ/HH/yr.)
Kerosene: 2%
(1 GJ/HH/yr.)
Charcoal: 46%
(21 GJ/HH/yr.)
Firewood: 32% (16
GJ/HH/yr.)
Electricity accounts for 100% of total household energy
by 2050.
Charcoal and wood use phased out by 2030.
LPG and kerosene use peak to 35% and 28% of total
household energy in 20301, followed by a decline and
eventual phase out by 2050.
Total change in energy use (i.e. from phased out
charcoal, LPG, and kerosene) shifts to electricity.
SSP2: BAU Electricity accounts for 100% of total household energy
by 2050.
Charcoal and wood use halve by 2030 but are entirely
phased out by 2050.
Total change in energy use (i.e., from phased out
charcoal and wood) shifts to electricity, LPG, and
kerosene, in equal amounts2.
SSP3:
Fragmented
Electricity accounts for 38% of total household energy
by 2050.
Charcoal and wood use halve by 2050.
Change in total energy use (i.e., from reduced charcoal
and wood) shifts to electricity, LPG, and kerosene, in
equal amounts2.
Table Notes: 1 The eventual phase out of charcoal in 2030 shifts total energy use towards electricity, LPG and kerosene
between 2015 and 2030. This shift is what drives the peak in LPG and kerosene use in 2030. However, we
assume that LPG and kerosene use will eventually decline post-2030 with improved electricity access and
economic growth in Dar es Salaam, 2 The change in total energy use from charcoal and firewood use is divided by 3 with amounts (in GJ/HH/yr)
transferred to electricity, LPG and kerosene (see Table 3.2).
80
3.5.2.7 Transport Activities
I project future changes in travel demand based on annual vehicle kilometers travelled (VKT)
which accounts for city travel by LDVs and public transit, i.e., dala-dalas, “bajajis” (tricycles),
“bodas” (motorcycles), and the BRT. For 2015 (the current year), I estimate VKT as a product of
the average number of vehicle trips (1.2 trips/person/day (World Bank, 2017a)); average trip
distance (20 kilometers (World Bank, 2017a)); mode share; and load factor. Empirical evidence
from other developing cities (e.g., Latin America) shows statistically significant correlations
between the urban built environment and VKT, e.g., Zegras (2010) and Guerra (2014). To
estimate the correlation between VKT and population density, my modelling applies results from
Guerra (2014), i.e., using an uncensored latent VKT value that reduces modelling bias associated
with different household travel behaviors, a 1% increase in population density is correlated with
a 0.03% reduction in VKT (Guerra, 2014). I apply this correlation to my LEAP calculations to
estimate the future change in VKT with changes in density for each SSP narrative. All vehicle
load factors and fuel consumption estimates are in Table 3.2.
3.5.2.7.1 Electric Vehicles
I anticipate that some penetration of electric vehicles in Dar es Salaam is likely, given the
existing policies and plans to increase production of EVs globally (IEA, 2018). However, it is
difficult to make reasonable projections for Dar es Salaam to 2050 given the limited data
available on the EV market potential in East Africa. Currently, South Africa is the only African
country with electric vehicles, representing only 0.1% of passenger vehicle stock (OECD/IEA,
2017b). My SSP2 and SSP3 narratives estimate that Dar es Salaam realizes a similar level of
EVs in the LDV fleet by 2050 (Table 3.2); while SSP1 estimates an increase to 1%, similar to
levels observed in Europe today (e.g., the Netherlands and Sweden) (IEA, 2018). This seemingly
low level of EV penetration is consistent with my assumption that these are baseline projections
with no special measures taken toward GHG mitigation beyond the broad narrative of each
scenario. This assumption is relaxed in my discussion of aggressive GHG mitigation scenarios in

81
Section 3.6.7. Finally, I assume electricity consumption of 27 kWh per vehicle-kilometer,
consistent with IEA estimates (IEA, 2018).
3.5.2.7.2 The BRT
For all scenarios, I assume that Dar es Salaam completes Phases 1 to 4 of the BRT by 2050,
consistent with current implementation plans (Section 3.9.8). Completion of the four phases
would result in approximately 900,000 riders per day (World Bank, 2017b), equivalent to 15% of
total passenger trips in 2015. SSP2 and SSP3 assume that BRT trips increase to 15% (of all
passenger trips), while SSP1 assumes a higher increase to 40%, similar to levels reported in
Latin American and Chinese cities (UITP, 2015; WRI, 2018). I estimate BRT fuel consumption
at 38 liters/100km (DART Agency, 2017) (Table 3.2), similar to consumption profiles in Latin
America and Asian cities, e.g., 33 litres/100km (Jaipur, India) and 40 litres/100km (Quito,
Ecuador) (WRI, 2018). I also assume that BRT fuel consumption remains at this level to 2050.
3.5.2.7.3 Minibuses (“dala-dalas”)
I assume no changes in dala-dala fuel consumption to 2050, i.e., consumption remains at 33
litres/100km (DART Agency, 2017), given the current plans to reduce dala-dala use with a shift
to BRT (World Bank, 2017b).
3.5.2.7.4 Light Duty Vehicles (LDV)
Fuel consumption estimates for the LDV fleet (~12 litres/100km) are taken from (World Bank,
2017b). Projecting to 2050, SSP1 envisions that LDV fuel consumption improves to 4.4
litres/100km, consistent with IEA targets (IEA, 2017b; OECD/IEA, 2017a). SSP2 and SSP3
assume a less aggressive improvement to 7.4 litres/100km, consistent with projections to 2040
for the Africa region (OECD/IEA, 2014).
82
3.6 Results and Discussion
3.6.1 Changes in Dar es Salaam’s Total Population and Density
Across each of the SSPs, Dar es Salaam is shown to experience substantial population growth
between 2015 and 2050. Projections for Dar es Salaam’s population to 2050 are based on
Equation (3). In all scenarios, Dar es Salaam becomes a megacity by 2050, with the city’s
population growing to 16 million under SSP1, 15 million under SSP2 and 12 million under SSP3
(illustrated in Figure 3.2). Dar es Salaam experiences the fastest urbanization rate under SSP1,
while moderate and slow urbanization occurs under SSP2 and SSP3, respectively. My SSP1
population projection for 2030 (9.2 million in Dar es Salaam) is within 15% of the United
Nation’s World Urbanization Projections (WUP) estimate for 2030 (~10.7 million) (UN, 2018).
In addition, Hoornweg and Pope (2017) extrapolate the WUP dataset to 2100 and project Dar es
Salaam’s population at 16 million in 2050. This is consistent with my SSP1 and SSP2 estimates.
My urban growth assumptions based on Jiang and O’Neill (2017) who project substantial urban
growth in Tanzania across each of the SSPs. Their estimates to 2050 project up to 60% (SSP1),
50% (SSP2) and 30% (SSP3) urbanization in Tanzania (Jiang and O’Neill, 2017), increasing the
urban share of Tanzania’s population by 7% to 37% between 2015 and mid-century (2050). My
calculations show that this is equivalent to absolute population increases of 12 million (SSP1),
11 million (SSP2) and 7.5 million (SSP3) between 2015 and 2050 (Figure 3.2).
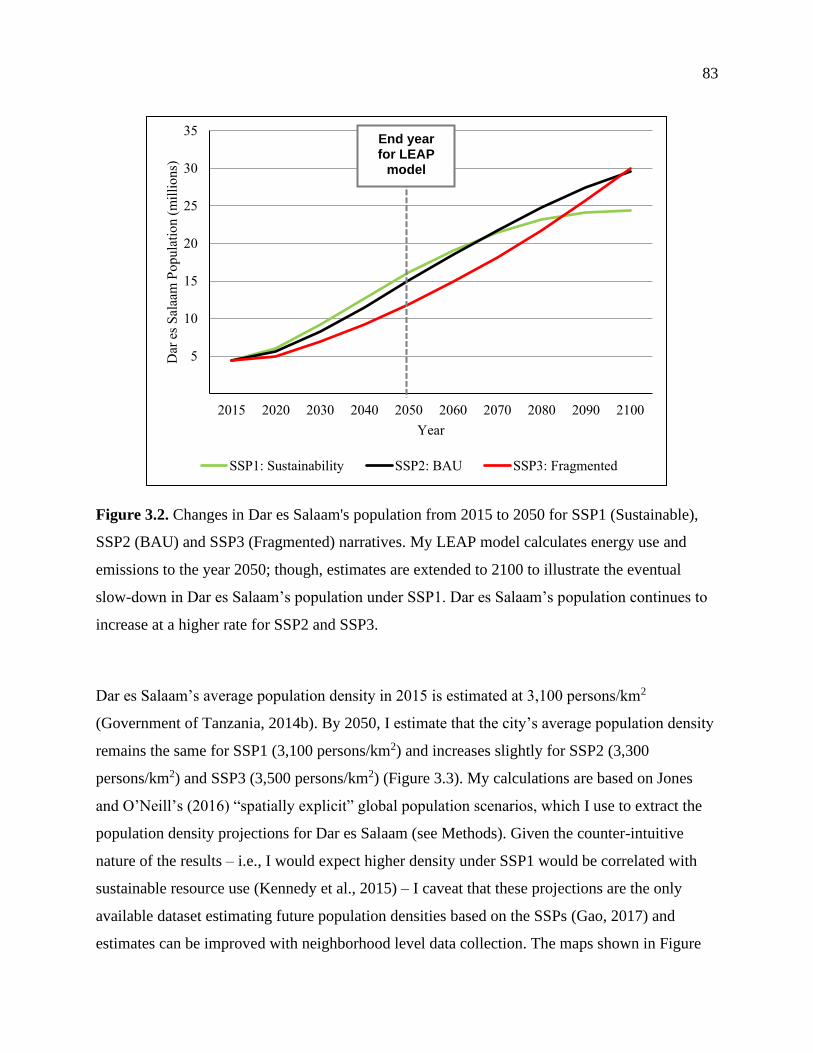
83
Figure 3.2. Changes in Dar es Salaam's population from 2015 to 2050 for SSP1 (Sustainable),
SSP2 (BAU) and SSP3 (Fragmented) narratives. My LEAP model calculates energy use and
emissions to the year 2050; though, estimates are extended to 2100 to illustrate the eventual
slow-down in Dar es Salaam’s population under SSP1. Dar es Salaam’s population continues to
increase at a higher rate for SSP2 and SSP3.
Dar es Salaam’s average population density in 2015 is estimated at 3,100 persons/km2
(Government of Tanzania, 2014b). By 2050, I estimate that the city’s average population density
remains the same for SSP1 (3,100 persons/km2) and increases slightly for SSP2 (3,300
persons/km2) and SSP3 (3,500 persons/km2) (Figure 3.3). My calculations are based on Jones
and O’Neill’s (2016) “spatially explicit” global population scenarios, which I use to extract the
population density projections for Dar es Salaam (see Methods). Given the counter-intuitive
nature of the results – i.e., I would expect higher density under SSP1 would be correlated with
sustainable resource use (Kennedy et al., 2015) – I caveat that these projections are the only
available dataset estimating future population densities based on the SSPs (Gao, 2017) and
estimates can be improved with neighborhood level data collection. The maps shown in Figure
5
10
15
20
25
30
35
2015 2020 2030 2040 2050 2060 2070 2080 2090 2100
Dar
es
Sal
aam
Po
pu
lati
on
(m
illi
on
s)
Year
SSP1: Sustainability SSP2: BAU SSP3: Fragmented
End year for LEAP
model

84
3.3 do not illustrate the growth in Dar es Salaam’s spatial extent; for example, the likely urban
sprawl given the estimated population increases that are projected for each SSP narrative.
Therefore, the maps should not be interpreted as accurate projections of density changes of
specific neighborhoods. Rather, they provide a baseline assessment of the differences in density
change, at the city level, among the three SSP narratives. For example, the sustainability scenario
(SSP1) shows higher population densities closer to the city centre and along the four major
arterial roads (key development areas for the BRT expansion). While settlement patterns for
BAU (SSP2) and fragmented (SSP3) scenarios are more dispersed, i.e., they show higher
densities closer to the periphery, particularly in the south-east region of the city (Figure 3.3).
Overall, these assumed changes in density for each scenario could inform policies and strategies
for future urban infrastructure investment (e.g., the BRT line expansion) in Dar es Salaam.
Figure 3.3. Spatial population projections for Dar es Salaam from 2015 to 2050 for SSP1
(Sustainable Growth), SSP2 (BAU Growth) and SSP3 (Fragmented Growth) narratives.

85
3.6.2 Dar es Salaam’s current and future GHG Emissions
Across each of the SSP narratives, population growth is a major driver of rising residential
energy use and GHG emissions in Dar es Salaam. In 2015, I estimate total residential emissions,
i.e., from domestic households and transport activities, at 1,400 ktCO2e (Table 3.4). In 2014,
total energy sector emissions in Tanzania were reported at 22.26 MtCO2e (WRI, 2015). Dar es
Salaam accounts for approximately 10% of Tanzania’s total population (World Bank, 2018);
therefore, I roughly estimate the city’s total energy sector emissions at 2,226 ktCO2e. Emissions
from domestic households and road transport count for approximately 80% of national energy
sector emissions (Government of Tanzania, 2014a), which would scale to approximately 1,780
ktCO2e for Dar es Salaam. Therefore, my estimate of 1,400 ktCO2e for residential sector
emissions in 2015 (i.e., resulting from energy uses from domestic household and transport
activities) is consistent with the national dataset (within ~18%), as I do not account for energy
use in the commercial and industrial sectors.
By 2050, I estimate that Dar es Salaam’s total residential emissions will increase to between
25,000 ktCO2e and 33,000 ktCO2e (SSP1); 11,000 ktCO2e and 19,000 ktCO2e (SSP2); and 5,700
ktCO2e and 11,000 ktCO2e (SSP3). This is correlated with an increase in per capita emissions
from 0.2 tCO2e in 2015 to between 1.5 tCO2e and 2 tCO2e (SSP1); 0.7 tCO2e and1.3 tCO2e
(SSP2); and 0.4 tCO2e and 0.9 tCO2e (SSP3) (Table 3.4). My estimates represent a 4 to 24-fold
increase in emissions to 2050 (relative to 2015), due to the higher urban population in 2050 and
increased energy access and electricity consumption. Increased emissions from household
electricity use are due to the assumed continued use of fossil fuels for electricity production,
consistent with projections under Tanzania’s national power plan (Government of Tanzania,
2016a). The Tanzanian government projects that natural gas and coal will continue to dominate
Tanzania’s electricity mix to 2040, accounting for 40% and 30%-35%, respectively of the mix
(Government of Tanzania, 2016a). I apply these projections across each of my scenarios (see
Section 3.9.3).
To my knowledge, there are no other projections of residential GHG emissions in individual
African cities against which to compare my results. However, a growing number of regional

86
studies indicate an overall upward trend in GHG emissions due to increased electricity access
and economic activity in the region. For example, Calvin et al. (2016) estimate that GHG
emissions in the sub-Saharan Africa region will increase by 2.7 % to 3.8% per year from 2005 to
2100 (or by ~122% to ~171% by 2050). The International Energy Agency (IEA) projects slightly
lower levels of growth, estimating an ~ 80% increase in GHG emissions in sub-Saharan Africa
by 2040 (i.e., from 1,141 Mt CO2 to 2,051 Mt CO2 in 2040) under their “Current Policies”
scenario (IEA, 2017b). While, van der Zwaan et al. (2018) estimate a 100% (2-fold) increase in
GHG emissions in continental Africa (including North Africa) from 2015 to 2050 under their
“reference scenario”, and a 30% to 40% increase by assuming (1) a 4% annual increase in the
CO2 price (“TAX” scenario) or (2) a 20% reduction in global emissions by 2050 (“CAP”
scenario). In contrast, the results presented in this paper are applicable to the city rather than the
regional level (as the above-mentioned regional studies combine both rural and urban data). This
partially explains the variation in results, and my substantially higher estimates, given the larger
concentration of energy use in cities. Moreover, my emissions scenarios are presented as a range,
based on assumptions of household size, with the upper estimate reflecting the lower household
size assumption (given that total household energy use is kept constant – see Methods).
3.6.3 Household Emissions
Between 80% and 90% of total residential emissions are due to household electricity use, given
that 70% to 75% of the electricity mix is from natural gas and coal to 2050 (Section 3.9.3). The
increasing number of households – particularly under SSP1 – is what fundamentally drives
emissions from electricity production (assuming that total household energy use remains
constant to 2050). Table 2 shows that electrifying all households under SSP1 and SSP2
narratives will be equivalent to electrifying an additional 3 to 11 million households in 2050
(from 1.3 million households in 2015). Moreover, the GHG intensity of electricity generation
remains high even under SSP1 (remaining at ~405 gCO2e/kWh in 2050) (Table 3.2) – a level
that well exceeds the IEA target of 254 gCO2e/kWh by 2060 (IEA, 2017a). Given that the
narratives defined in this paper do not assume aggressive GHG mitigation policies – and instead,
87
offer baseline trajectories to 2050 – I find that the highest GHG emissions are associated with
SSP1. Therefore, my findings highlight the opportunity for more aggressive GHG mitigation
policies to reduce the GHG intensity of electricity generation (such as integrating renewable
sources) to offset future residential emissions increases in Dar es Salaam.
The fact that an SSP3 trajectory results in the lowest residential emissions is largely due to the
inequalities in access that are reinforced under this scenario, i.e., no changes in electrification
from 2015, and a 25% lower population under SSP3, compared to SSP1. Under SSP1 and SSP2,
Dar es Salaam will likely surpass in absolute terms, in 2050, the current (2013 – 2015) GHG
emission levels of North American and European cities (C40 Cities, 2017). On a per capita basis,
I find that emissions remain low compared to other global cities, assuming that total household
energy use remains constant. For example, per capita emissions (from buildings and
transportation) in cities such as New York, San Francisco or London (where data is more robust)
were estimated at 5.7 tCO2e/capita (in 2014), 5.5 tCO2e/capita (in 2015), and 4.5 tCO2e/capita
(in 2013) (C40 Cities, 2017), compared with only 0.5 tCO2e/capita to 2 tCO2e/capita across my
scenarios (Section 3.9.4).
Finally, I do not account for biogenic carbon emissions from charcoal or wood burning but
illustrate biogenic emissions for each scenario in Section 3.9.6, which increase to ~2,500 ktCO2e
– 5,000 ktCO2e under SSP3 (which assumes a continued reliance on charcoal to 2050).
Ultimately, increasing charcoal use under SSP3 may degrade forests in Dar es Salaam’s
surrounding rural areas, given that the city already consumes nearly 70% of all charcoal
produced in Tanzania, which impacts an estimated 2.8 million hectares of forests (~8.5% of
Tanzania’s total forest cover) (Msuya et al., 2011). The use of wood fuels (i.e., charcoal and
firewood) is also linked to premature mortality and morbidity from indoor air pollution (WHO,
2012). Globally, the World Health Organization (WHO) estimates that over four million
premature deaths were attributed to household air pollution from the traditional use of biomass
fuels for daily cooking activities in 2012 (WHO, 2012).
88
3.6.4 Transport Emissions
Road transport is a smaller driver of total residential emissions compared to household
emissions. Overall, total emissions from transport increase from 490 ktCO2e (in 2015) to 600
ktCO2e (SSP1); 900 ktCO2e (SSP2); and 700 ktCO2e (SSP3) in 2050 (Table 3.4). I find that
annual VKT per capita does not change substantially across any of the narratives (Table 3.2),
with the highest drop (only ~3%) in VKT per capita, projected under SSP3, which is due to the
slightly higher population density assumed under this narrative. In addition, although population
increases by three to four times by 2050, transportation emissions in all scenarios increase much
more slowly. This is due primarily to improving fuel economy and changes in mode share
(responsible for a 20% - 60% drop in per capita transportation emissions relative to 2015).
Across all scenarios, emissions from LDV travel (with minimal ridesharing) dominate;
accounting for over 80% of transport emissions (Table 3.4).

89
Table 3.4. Total residential emissions from household and transport activities in Dar es Salaam by activity. Results for SSP1
(Sustainability), SSP2 (BAU) and SSP3 (Fragmented) narratives for 2030 and 2050.
Current Year – 2015 SSP1 – 2030 SSP2 – 2030 SSP3 – 2030 SSP1 – 2050 SSP2 – 2050 SSP3 – 2050
HOUSEHOLD
▪ Electricity use
ktCO2e
700 [6,400 - 7,100]1 [3,200 - 4,100] [1,900 – 2,400] [24,000 – 32,000] [9,000 – 17,000] [4,500 – 8,900]
▪ LPG use 60 [300 – 390] [230 – 290] [130 – 170] - [700 – 1,300] [330 – 650]
▪ Kerosene use 10 [170 – 210] [110 – 140] [50 – 60] - [400 – 700] [200 – 300]
▪ Charcoal use2 120 - [90 – 120] [80 – 140] - - [130 – 260]
▪ Wood use2 20 20 20 20 - - [20 – 50]
TOTAL (Household) ktCO2e 910 [6,700 - 7,500] [3,700 – 4,700] [2,200 - 2,800] [24,000 - 32,000] [10,000 - 18,000] [5,000 - 10,000]
TRANSPORT
▪ LDV use
ktCO2e
440 560 600 500 500 800 600
▪ Dala-dala use 20 40 40 30 50 60 40
▪ Bajaji or Boda use 30 50 40 40 80 80 50
▪ BRT use - 0.4 0.2 0.1 2.0 0.7 0.3
TOTAL (Transport) ktCO2e 490 700 700 600 600 900 700

90
Current Year – 2015 SSP1 – 2030 SSP2 – 2030 SSP3 – 2030 SSP1 – 2050 SSP2 – 2050 SSP3 – 2050
TOTAL RESIDENTIAL
(Household + Transport) ktCO2e 1,400 [7,400 – 8,200] [4,400 – 5,400] [2,800 – 3,400] [25,000 – 33,000] [11,000 – 19,000] [5,700 – 11,000]
TOTAL RESIDENTIAL
(per capita) tCO2e/capita 0.2 [0.8 – 0.9] [0.5 – 0.6] [0.4 – 0.5] [1.5 – 2] [0.7 – 1.3] [0.5 – 0.9]
[% change in total residential emissions] [430% – 500%] [210% – 290%] [100% – 140%] [1700% – 2300%] [690% - 1300%] [310% -660%]
Table Notes:
1 Variation in GHG emissions due to variation in household size for each SSP narrative. See Table 3.2.
2 LEAP model does not account for carbon dioxide emissions from charcoal and wood use (biogenic CO2). See Section 3.9.6 for estimates of biogenic CO2 emissions.
▪ Values rounded to 2 significant figures. Values do not represent the precision of the estimates in the LEAP model.
▪ Totals do not add due to rounding.
▪ Refer to Section 3.9.2 for emissions factors for all fuels used in the LEAP model.
▪ Refer to Section 6.8, for a summary of these results shown in PowerPoint presentation format.

91
3.6.5 Correlation Between Total Residential Emissions, GDP and
Population
By plotting population and total residential emissions on a logarithmic scale, I find that
population is positively and linearly correlated with GHG emissions for all SSPs. For example,
my findings show a 1% increase in total population is correlated with a 2.2% to 2.4% increase in
total residential emissions for SSP1, compared to an increase of 1.7% to 2.1% for SSP2 and
1.5% to 2.2% for SSP3. Dar es Salaam’s population growth is projected to result in a super-
linear scaling relationship for all SSP narratives, with emissions growing at 150% to 240% faster
rates than population to 2050. While some studies have shown a linear (Fragkias et al., 2013) and
sub-linear (Kennedy et al., 2015) scaling relationship between city population and emissions,
these correlations have been weakest in low-GDP cities (including African cities) given their low
levels of access to basic infrastructure services such as electricity (Kennedy et al., 2015).
Urban growth in low-GDP cities such as Dar es Salaam requires that resource use increases to a
threshold that supports sustainable living standards for residents. My results show that emissions
in Dar es Salaam increase super-linearly due to improved energy access and electricity-use, and
the likely high GHG-intensity of new electricity sources to 2050 (Table 3.3). Furthermore, the
large growth in emissions is influenced by the potential drop in household size and assumption
that traditional sources being phased out (wood and charcoal) would result in low emissions
reductions due to the exclusion of biogenic CO2 emissions from the emissions accounting.
SSP1 is associated with the highest level of economic growth (IIASA, 2015). Projections show
that Tanzania is expected to experience a nearly eight-fold increase in GDP under SSP1, from
USD 49 billion in 2015 to USD 400 billion in 2050, while under SSP2 and SSP3, GDP is
expected to increase to USD 260 billion and USD 177 billion, respectively. These estimates are
available in the SSP database (IIASA, 2015). Therefore, plotting Dar es Salaam’s annual
residential emissions per capita against the projected GDP per capita (using a logarithmic scale)
reveals a weak (sub-linear) correlation between GDP and emissions. For example, a 1% increase
in GDP per capita is correlated with an increase of 0.07% to 0.1% for SSP1 and SSP2, and 0% to
0.1% for SSP3 (Section 3.9.5). As my model does not explicitly account for the likely rise in
92
demand for household energy services and transportation in response to growing GDP, these
correlations are (a) likely underestimated, and (b) not explicitly causal (though potentially linked
via the SSP narratives).
3.6.6 Comparing Dar es Salaam’s Emissions Projections with other Global
South Cities
A limited number of studies project changes in residential GHG emissions in individual African
cities, or at the regional level. The studies reveal an overall increasing trend in GHG emissions,
though at much lower rates than projected in my paper. Like the current study, some of the
studies find that electricity-based emissions play a dominant role in emissions increases (Table
5). However, accounting methods vary among the studies, where electricity emissions are
calculated separately or included within a larger energy sector. For example, in their “BASE”
scenario, Senatla (2011) show that electricity generation contributes more than 95% of
Gauteng’s residential sector GHG emissions between 2007 and 2030. Regional projections by
Stone and Wiswedel (2018) estimate a 240% increase in total urban emissions between 2012 and
2040, with transport and industry (including electricity use from industry) being the largest
contributors. Similarly, studies in other regions of the Global South (i.e., Asia and Latin
America) show that transportation and industry drive GHG emissions given their more advanced
levels of socio-economic development. Table 3.5 compares my results with those of other studies
in the literature to (1) demonstrate the large difference between my results and example results
from other regions, and (2) further illustrate the need for additional GHG emissions studies in
large African cities such as Dar es Salaam.

93
Table 3.5. Comparing GHG emissions results and main drivers of GHG emissions for selected
cities or regions in the Global South.
Study City/Region Scope Projection
timeline
Percentage
change in GHG
emissions from
starting year
Main driver
of GHG
emissions
This paper Da es Salaam,
Tanzania
Residential
sector
emissions
2015 – 2050 310% - 2300%
Electricity
(Electricity use
increases from
5GJ/HH/yr. in
2015 to 18 –
46GJ/HH/yr. in
2050 – see
Table 3.2)
Senatla (2011) Gauteng, South
Africa
Residential
sector
emissions
2007 – 2030 ~100%1 Electricity
Stone and
Wiswedel (2018)
Sub-Saharan
Africa
Total urban
emissions2
2012 - 2040 240%1 Transport and
Industry
Godfrey and Xiao
(2015)
Sub-Saharan
Africa
Total urban
emissions2
2012 – 2030 61%1 Variable based
on city income
categorization
(i.e., middle-
income or least
developed city)
Collaço et al.
(2019)
São Paulo, Brazil Total urban
emissions2
2014 – 2030 43% Transport
Huang et al.
(2019)
Guangzhou,
China
Total urban
emissions2
2010 – 2030 ~20% Industry and
Transport
Table Notes:
1Projections are based on business-as-usual or baseline scenarios mentioned in each study. 2Total urban emissions refer to emissions in all urban sectors, including industrial, commercial, residential and
transportation. Though, studies may use other categories in their accounting approach.

94
3.6.7 Implementing Aggressive GHG Mitigation Policies under SSP1
Of all regions in Africa, East Africa has the highest renewable energy potential (Lucas et al.,
2017). Estimates project that Tanzania can realize the following grid mix under an SSP1
narrative by 2040: 12% hydropower, 30% solar, 21% wind, and 14% geothermal (leaving 23%
for natural gas and coal combined) (Lucas et al., 2017). These estimates are consistent with
regional models for electricity generation in East Africa and reflect the more rapid development
of renewables (wind and solar) in rural areas. The different electricity generation scenarios are
detailed in Section 3.9.3. I include an additional narrative (based on SSP1 data and assumptions;
see Table 3.3) to test the impact of aggressive decarbonization of electricity, combined with low-
GHG investments in transportation. Actions examined are as follows.
• 70% of the electricity generation to be from solar, wind and geothermal sources by 2050
(Lucas et al., 2017).
• The BRT system carries ~50% of all passenger trips.
• 60% of the LDV fleet is electrified by 2050, consistent with global trends (IEA, 2017a).
As shown in Section 3.9.3, generating 70% of electricity from renewable sources in 2050 would
reduce the GHG intensity of the grid to ~129 gCO2e/kWh, compared to 405 gCO2e/kWh under
SSP1 (Table 3.3). By 2050, total residential emissions would increase to 7,400 ktCO2e – 11,000
ktCO2e, which is ~66% lower than under my original sustainability narrative (SSP1), though still
far higher than current (2015) emissions. Total residential emissions for this aggressive GHG
mitigation narrative, are compared with those of the other SSP narratives in Section 3.9.7.
3.7 Research Limitations and Areas of Future Work
There are important areas of future work that are not explicitly considered in my modelling.
First, the assumption that household energy use remains constant is an important limitation. This
assumption is expected to underestimate demand for energy in a developing economy such as
Dar es Salaam. Thus, my scenarios are likely conservative, even though they show an order of
magnitude increase in GHG emissions by 2050 (ranging from 4 to 24 times the 2015 level, as

95
detailed in the results and conclusions). Second, if vehicle manufacturers fulfill commitments to
scale up production of EVs or hydrogen fuel cell vehicles in the coming decades (IEA, 2018),
and these become more broadly affordable, Tanzania may see growth in EVs by 2050 beyond the
estimates assumed in my model (Table 3.2). Also, improvements in road infrastructure and
public transit (with the BRT expansion) may result in induced or latent travel demand similar to
trends observed in European and North American cities (Cervero, 2002; Noland and Lem, 2002),
which will impact transport-related emissions. Third, my estimates exclude Scope 3 or upstream
emissions from infrastructure supply chains, which could also contribute substantially to
projected GHG emissions. For example, research conducted in Delhi, India estimated that up to
32% of the city’s emissions was due to out-of-boundary (Scope 3) activities such as fuel
processing, air travel, cement use, and food production (Chavez et al., 2012). Fourth, biogenic
emissions from charcoal use are considered as carbon neutral, consistent with IPCC guidelines.
However, biogenic emissions would nearly double (assuming HH size reduces to two persons
per household by 2050) under SSP3 (Section 3.9.6), influencing land degradation and public
health outcomes (due to indoor air pollution). Finally, as noted in my introduction and methods,
future work could also incorporate emissions from other sectors, especially industry, which are
expected to contribute substantially to future energy demand in the Africa region (IEA, 2019).
3.8 Conclusions and Implications for Energy Policy
In this paper, I:
• Provide the first projection of residential energy use and GHG emissions in Dar es
Salaam and demonstrate the use of the SSPs at the city scale.
• Analyze the key drivers of residential energy use and GHG emissions in a large SSA city,
Dar es Salaam, offering new insights for the Africa region.
• Demonstrate a method for projecting emissions in a data-poor environment.
• Show the wide uncertainty in these future projections, while also demonstrating the order
of magnitude jump in emissions that can be expected in Dar es Salaam to 2050.

96
Key results are summarized as follows:
• Dar es Salaam is projected to experience a 4 to 24-fold increase in residential GHG
emissions by 2050. Though Dar es Salaam’s current (2015) emissions of 1,400 ktCO2e
(~ 0.2 tCO2e/capita) are low compared to the emissions of other global cities (see S5),
emissions are expected to increase to between 5,700 ktCO2e (~ 0.5 tCO2e/capita) and
33,000 ktCO2e (~ 2 tCO2e/capita by 2050). The upper estimate is as high as the recorded
emissions of Global North cities such as New York, San Francisco, and London, among
others.
• Electricity access (e.g., for lighting, heating and cooling) is the largest driver of
residential emissions to 2050. Assuming that total household energy use remains
constant to 2050, with the relative shares of fuel use changing for each SSP narrative
(Table 3.3), I estimate that GHG emissions from electricity production (due to improved
electrification and access to services) will be a major driver of future residential
emissions in Dar es Salaam, i.e., accounting for between 80% and 90% of total residential
emissions. This is largely due to continued reliance on fossil fuels for electricity
generation. Even under SSP1 (the sustainability scenario), I project that fossil fuels will
account for a dominant portion of Tanzania’s electricity mix, i.e., 40% and 30% from
natural gas and coal, respectively, compared to 20% and 10% from hydro and other
renewables (i.e., wind and solar) (Section 3.9.3).
• Across all scenarios, Dar es Salaam’s residential emissions increase super-linearly
with population size, mainly due to household electricity use. The high GHG intensity
of electricity – which remains at 405 gCO2e/kWh for SSP1 and SSP2 – results in a 6 to
35-fold increase in total household emissions relative to 2015.
• The sustainability scenario (SSP1) has the highest residential emissions due to
increased household and transportation energy services. This suggests a particularly
acute need to promote low-GHG development in Dar es Salaam to reduce any tension
between social and environmental goals.
• Dar es Salaam’s current low emissions provides an opportunity to design a low-
GHG future. This will hinge on the implementation of low-GHG investments
(namely, the decarbonization of electricity production) during these next stages of

97
urban growth. As shown in my aggressive GHG mitigation scenario (Section 3.6.7),
decarbonizing Tanzania’s electricity grid through the use of renewable energy sources
such as solar, wind and geothermal could reduce the city’s total residential emissions by
up to 66% by 2050 (SSP1). However, realizing this pathway will hinge on the
development of urban policies and financing for aggressive GHG mitigation during these
next stages of urban growth.
Lastly, though not explicitly explored in this paper, realizing a low-GHG transition in Dar es
Salaam requires the consideration of the city’s broader socio-economic development goals.
Policies need to leverage synergies between energy sector investments, i.e., financing to
decarbonize electricity with renewable technologies or scale-up public transport with the BRT
network, and socio-economic development objectives at the city and national level. For example,
given that Dar es Salaam is growing amidst other socio-economic challenges, including urban
inequality, poverty and climate change, policy actions would require cross-sectoral collaboration
between key stakeholders, government agencies, infrastructure service providers and the private
sector to identify co-benefits between low-GHG investments and priorities in key sectors. This
will be critical for ensuring that low-GHG investments improve the living standards of
marginalized groups and that they benefit from the transition.

98
3.9 Supplementary Material
The supplementary material includes supporting methods, calculations and background data that
are important in the context of this chapter (Chapter 3). Tables and figures are presented with the
letter “S” in their caption title, and are referenced throughout the main body of this chapter,
where relevant.
3.9.1 Global Warming Potentials for Major GHGs
Table S 3.1. 100-year Global Warming Potentials (GWP) for major GHGs. The values
represented in the table are from the IPCC Fifth Assessment Report (AR5) (IPCC, 2013) and are
included within the LEAP software. Note that the GWP values for non-CO2 gases do not include
climate-carbon feedbacks (climate-carbon feedbacks in response to the reference gas CO2 are
always included) (IPCC, 2013).
Effect GWP (100 yr.: CO2e)
Carbon Dioxide (CO2) 1
Carbon Dioxide (CO2)
(Biogenic)
0
Methane (CH4) 28
Nitrous Oxide (N2O) 265

99
3.9.2 GHG Emissions Factors
Table S 3.2. Assumed emissions factors (for all major GHGs) from residential fuel uses in Dar
es Salaam. Emission factors are taken from the 2006 IPCC Guidelines and are included within
LEAP’s Technology and Environment Database (TED) (Beers et al., 2006). Information can also
be sourced from the IPCC Emissions Factor Database (EFDB) (https://www.ipcc-
nggip.iges.or.jp/EFDB/main.php).
CO2 CO2
(Biogenic)
Methane Nitrous
Oxide
tons/TJ tons/TJ kg/TJ kg/TJ
Natural Gas 72.92 - 5 0.6
Coal 92.64 - 1 1.4
LPG 72.92 - 10 0.6
Kerosene 72.55 - 10 0.6
Firewood - 109.56 300 4
Charcoal - 109.56 200 1
Gasoline 69.3
10 0.6
Diesel 74.1
10 0.6
Solar - - - -
Wind - - - -
Hydropower - - - -

100
3.9.3 Electric Power Development Scenarios
Table S 3.3. Estimated electric power development scenarios for SSP1 (Sustainable Growth),
SSP2 (BAU Growth) and SSP3 (Fragmented Growth) narratives for Dar es Salaam. Changes in
the generation mix under SSP2 and SSP3 are based on the preferred option (“Scenario 2”) under
Tanzania’s Power System Master Plan (Government of Tanzania, 2016b). Changes for SSP1 are
consistent with the most aggressive scenario for renewable energy integration under the Plan
(“Scenario 6”).
Fuel Source
2015
(baseline1)
SSP1
(2050)
SSP2
(2050)
SSP3
(2050)
Aggressive
Climate Action
(2050)
Natural Gas 59% 40% 40% 40% 13%
Hydropower 35% 20% 20% 20% 12%
Heavy Fuel Oil 5.7% 0% 0% 0% 0%
Biomass 0.3% 0% 0% 0% 0%
Coal 0% 30% 35% 35% 10%
Solar PV 0% 5% 2.5% 2.5% 30%
Wind 0% 5% 2.5% 2.5% 21%
Geothermal 0% 0% 0% 0% 14%
Total 100% 100% 100% 100% 100%
1Baseline year estimates for Tanzania’s generation mix are extracted from the Energy and Water Utilities Regulatory
Authority (EWURA) Annual Report (for the year ended 30th June 2017) (see: http://www.ewura.go.tz/wp-
content/uploads/2018/03/Annual-Report-for-the-Year-Ended-30th-June-2017.pdf)

101
Table S 3.4. GHG intensity (gCO2e/kWh) of Dar es Salaam’s electricity grid for SSP1
(Sustainable Growth), SSP2 (BAU Growth) and SSP3 (Fragmented Growth) narratives. Note
that the GHG intensity of electrification is the same for SSP2 and SSP3 (refer to Table 2 in
Methods in the manuscript). Aggressive actions to decarbonize Tanzania’s electricity grid with
renewable energy sources would reduce the GHG intensity of electrification by ~70% relative to
SSP2 and SSP3 (i.e., to ~129 gCO2e/kWh) in 2050.
0
50
100
150
200
250
300
350
400
450
500
201
5
201
6
201
8
202
0
202
2
202
4
202
6
202
8
203
0
203
2
203
4
203
6
203
8
204
0
204
2
204
4
204
6
204
8
205
0
gC
O2e/K
Wh
Year
SSP1 SSP3 Aggressive SSP1

102
3.9.4 Comparing Dar es Salaam’s Projected Emissions with Global Cities
Table S 3.5. Total (per capita) residential emissions compared to equivalent emissions in other
global cities (stationary energy and transport only). Data taken from C40 Cities GHG emissions
interactive dashboard (C40 Cities, 2017). Range in emissions for SSP1 (Sustainable Growth),
SSP2 (BAU Growth) and SSP3 (Fragmented Growth) corresponds to LEAP model assumptions
on household size.
City Year Per Capita GHG Emissions
(tCO2e/capita)
Dar es Salaam (SSP1)
2050
[1.5 – 2]
Dar es Salaam (SSP2) [0.7 – 1.3]
Dar es Salaam (SSP3) [0.5 – 0.9]
New York City 2014 5.7
Bangkok 2013 5.4
London 2013 4.5
Johannesburg 2015 4.8
Durban 2013 6.5
Lagos 2013 0.9
Cape Town 2015 4.7
Chennai 2015 2.6
Tshwane 2014 5.5
Toronto 2013 5.8
Rio de Janeiro 2012 2.3
Bogotá 2012 1.5
Amman 2014 2.1
San Francisco 2015 5.5
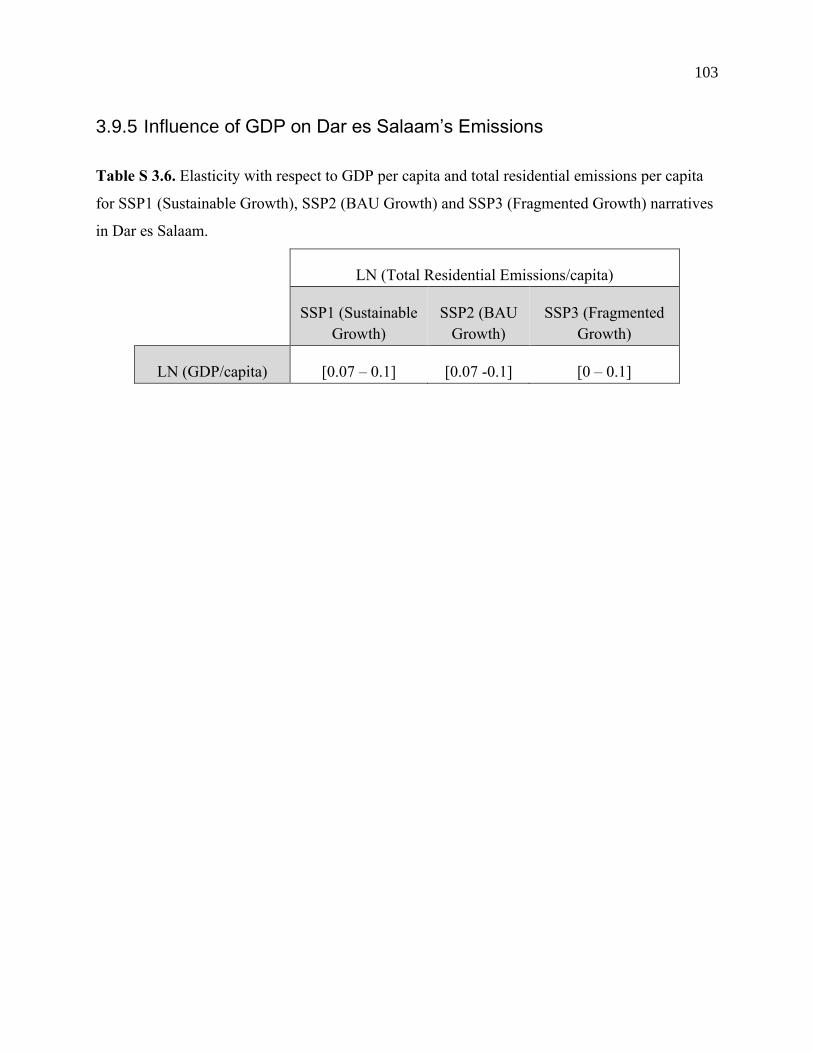
103
3.9.5 Influence of GDP on Dar es Salaam’s Emissions
Table S 3.6. Elasticity with respect to GDP per capita and total residential emissions per capita
for SSP1 (Sustainable Growth), SSP2 (BAU Growth) and SSP3 (Fragmented Growth) narratives
in Dar es Salaam.
LN (Total Residential Emissions/capita)
SSP1 (Sustainable
Growth)
SSP2 (BAU
Growth)
SSP3 (Fragmented
Growth)
LN (GDP/capita) [0.07 – 0.1] [0.07 -0.1] [0 – 0.1]

104
3.9.6 Dar es Salaam’s Projected Biogenic Emissions to 2050
Table S 3.7. LEAP model1 results showing biogenic CO2 emissions from charcoal and wood burning for all SSP narratives, SSP1
(Sustainable Growth), SSP2 (BAU Growth) and SSP3 (Fragmented Growth) from 2015 to 2050.
SCENARIO EFFECTS 2015 2016 2017 2018 2019 2020 2030 2040 2050
SSP1
(Sustainability)
CO2 (Biogenic) emissions
assuming 4 persons/HH
2,300
2,200
2,100
2,000
1,900
1,800
-
-
-
CO2 (Biogenic) emissions
assuming 2 persons/HH
2,300
2,300
2,200
2,100
2,000
1,900
-
-
-
SSP2 (BAU)
CO2 (Biogenic) emissions
assuming 4 persons/HH
2,300
2,200
2,200
2,200
2,100
2,100
1,800
1,200
-
CO2 (Biogenic) emissions
assuming 2 persons/HH
2,300
2,300
2,300
2,300
2,300
2,300
2,300
1,900
-
SSP3
(Fragmented)
CO2 (Biogenic) emissions
assuming 4 persons/HH
2,300
2,200
2,200
2,200
2,100
2,000
2,200
2,500
2,500
CO2 (Biogenic) emissions
assuming 2 persons/HH
2,300
2,300
2,300
2,300
2,300
2,300
2,800
3,800
5,000
1LEAP does not include biogenic CO2 emissions from charcoal and wood burning. Consistent with IPCC guidelines, bioenergy is considered as “carbon neutral”
given the assumption that emissions from these sources are already accounted for in the Agriculture, Forestry and Other Land-Use (AFOLU) sector (IPCC, 2015).
However, the table presents the scale of biogenic CO2 emissions increase for each SSP narrative to offer broader context on the additional emissions that would
arise from charcoal and wood burning in Dar es Salaam. (Note: Values are rounded to 2 significant figures.)

105
3.9.7 Assuming “Aggressive GHG Mitigation” Under SSP1
[4 persons/HH]
[2 persons/HH]
Figure S 3.1. Emissions from aggressive GHG mitigation policies under SSP1. I find that this
scenario would result in up to 70% reduction in emissions relative to the initial SSP1 baseline
narrative. The values presented in the two figures below show the variation in emissions, based
on the different assumptions for household size.
0
5,000
10,000
15,000
20,000
25,000
30,000
2015
2018
2021
2024
2027
2030
2033
2036
2039
2042
2045
2048
GH
G e
mis
sio
ns (ktC
O2e)
SSP1_4 persons/HH
SSP2_4 persons/HH
SSP3_4 persons/HH
AggressiveSSP1_4persons/HH
0
5,000
10,000
15,000
20,000
25,000
30,000
35,000
2015
2018
2021
2024
2027
2030
2033
2036
2039
2042
2045
2048
GH
G e
mis
sio
ns (ktC
O2e)
SSP1_2 persons/HH
SSP2_ 2 persons/HH
SSP3_ 2 persons/HH
AggressiveSSP1_2persons/HH

106
3.9.8 Dar es Salaam’s BRT
Figure S 3.2. Implementation Phases of Dar es Salaam’s BRT. Source of image: (Government of
Tanzania, n.d.)
The BRT, also known as the Dar es Salaam Bus Rapid Transit (DART) system, was developed
to reduce overall congestion and improve public transport conditions for city residents. Overall,
Phase 1 (currently in operation as of 2016) is accessible along ~21 kilometers of road, with 27
bus stations and five terminals (Government of Tanzania, 2017a; IGC, 2018). Plans to expand
the BRT corridor up to six phases are currently underway, with main lines running along the
city’s major roads (Morogoro, Bagamoyo, Nyerere and Kilwa). This would increase BRT
accessibility to the majority of residents. By the end of phase 6, the BRT is expected to cover a
total network of ~133km in BRT corridors, 18 terminals and 228 stations (Government of
Tanzania, 2017a).
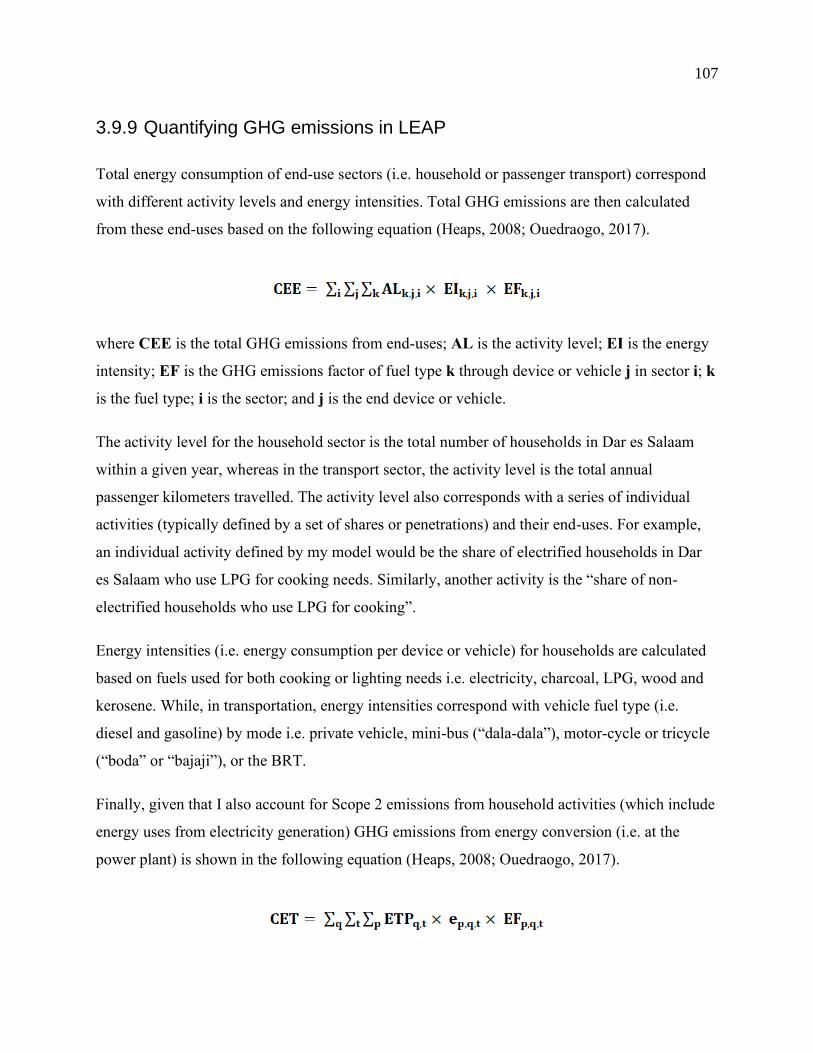
107
3.9.9 Quantifying GHG emissions in LEAP
Total energy consumption of end-use sectors (i.e. household or passenger transport) correspond
with different activity levels and energy intensities. Total GHG emissions are then calculated
from these end-uses based on the following equation (Heaps, 2008; Ouedraogo, 2017).
where CEE is the total GHG emissions from end-uses; AL is the activity level; EI is the energy
intensity; EF is the GHG emissions factor of fuel type k through device or vehicle j in sector i; k
is the fuel type; i is the sector; and j is the end device or vehicle.
The activity level for the household sector is the total number of households in Dar es Salaam
within a given year, whereas in the transport sector, the activity level is the total annual
passenger kilometers travelled. The activity level also corresponds with a series of individual
activities (typically defined by a set of shares or penetrations) and their end-uses. For example,
an individual activity defined by my model would be the share of electrified households in Dar
es Salaam who use LPG for cooking needs. Similarly, another activity is the “share of non-
electrified households who use LPG for cooking”.
Energy intensities (i.e. energy consumption per device or vehicle) for households are calculated
based on fuels used for both cooking or lighting needs i.e. electricity, charcoal, LPG, wood and
kerosene. While, in transportation, energy intensities correspond with vehicle fuel type (i.e.
diesel and gasoline) by mode i.e. private vehicle, mini-bus (“dala-dala”), motor-cycle or tricycle
(“boda” or “bajaji”), or the BRT.
Finally, given that I also account for Scope 2 emissions from household activities (which include
energy uses from electricity generation) GHG emissions from energy conversion (i.e. at the
power plant) is shown in the following equation (Heaps, 2008; Ouedraogo, 2017).

108
where CET is the total GHG emissions from processing and conversion; ETP is the energy
transformation product; e is the energy consumption of fuel type p to produce unit secondary
fuel type t in equipment q; EF is the emission factor of producing secondary energy t from
primary energy p through equipment q.
Therefore, total GHG emissions are calculated based on emissions from end uses and energy
conversion (i.e., the sum of the two above-mentioned equations).

109
3.10 References for Chapter 3
AfDB (2018) African economic outlook. African Development Bank Group. Available at:
https://www.afdb.org/fileadmin/uploads/afdb/Documents/Publications/African_Economic_
Outlook_2018_-_EN.pdf (Accessed February 7, 2021).
Aggarwal, P. and Jain, S. (2016) ‘Energy demand and CO2 emissions from urban on-road
transport in Delhi: current and future projections under various policy measures’, Journal
of Cleaner Production, 128, pp. 48–61. doi: 10.1016/j.jclepro.2014.12.012.
Allen, A. (2014) ‘Peri-Urbanization and the Political Ecology of Differential Sustainability’, in
The Routledge Handbook on Cities of the Global South. doi:
10.4324/9780203387832.ch43.
Angel, S. et al. (2011) ‘The dimensions of global urban expansion: Estimates and projections for
all countries, 2000-2050’, Progress in Planning, 75(2), pp. 53–107. doi:
10.1016/j.progress.2011.04.001.
Bauer, N. et al. (2017) ‘Shared Socio-Economic Pathways of the Energy Sector – Quantifying
the Narratives’, Global Environmental Change, 42, pp. 316–330. doi:
10.1016/j.gloenvcha.2016.07.006.
C40 Cities (2017) GHG Interactive Dashboard Data. London, UK. Available at:
http://www.c40.org/other/gpc-dashboard (Accessed: 29 October, 2019).
Calvin, K. et al. (2016) ‘The effect of African growth on future global energy, emissions, and
regional development’, Climatic Change, 136(1), pp. 109–125. doi: 10.1007/s10584-013-
0964-4.
Cervero, R. (2002) ‘Induced travel demand: Research design, empirical evidence, and normative
policies’, Journal of Planning Literature, 17(1), pp. 3–20. doi: 10.1177/088122017001001.

110
Chavez, A. et al. (2012) ‘Implementing Trans-Boundary Infrastructure-Based Greenhouse Gas
Accounting for Delhi, India: Data Availability and Methods’, Journal of Industrial
Ecology, 16(6), pp. 814–828. doi: 10.1111/j.1530-9290.2012.00546.x.
Collaço, F. M. de A. et al. (2019) ‘The dawn of urban energy planning – Synergies between
energy and urban planning for São Paulo (Brazil) megacity’, Journal of Cleaner
Production, 215, pp. 458–479. doi: 10.1016/j.jclepro.2019.01.013.
Cronin, J., Anandarajah, G. and Dessens, O. (2018) ‘Climate change impacts on the energy
system: a review of trends and gaps’, Climatic Change. Climatic Change, 151(2), pp. 79–
93. doi: 10.1007/s10584-018-2265-4.
Currie, P. et al. (2015) ‘Towards Urban Resource Flow Estimates in Data Scarce Environments:
The Case of African Cities’, Journal of Environmental Protection, 06(09), pp. 1066–1083.
doi: 10.4236/jep.2015.69094.
Currie, P. and Musango, J. K. (2017) ‘African Urbanization: Assimilating Urban Metabolism
into Sustainability Discourse and Practice’, Journal of Industrial Ecology, 21(5), pp. 1262–
1276. doi: 10.1111/jiec.12517.
DART Agency (2017) BRT Bus Information. Dar es Salaam. Unpublished document that was
shared following early consultations with DART engineers during a field visit to Dar es
Salaam in 2017.
Dhar, S., Pathak, M. and Shukla, P. R. (2017) ‘Electric vehicles and India’s low carbon
passenger transport: a long-term co-benefits assessment’, Journal of Cleaner Production,
146, pp. 139–148. doi: 10.1016/j.jclepro.2016.05.111.
DHS Program (2016) Tanzania: Demographic and Health Survey and Malaria Indicator Survey
(2015/2016). Available at: https://dhsprogram.com/pubs/pdf/FR321/FR321.pdf.
Drazu, C., Olweny, M. and Kazoora, G. (2015) ‘Household energy use in Uganda: existing
sources, consumption, and future challenges’, Living and Learning: Research for a Better

111
Built Environment: 49th International Conference of the Architectural Science Association
2015, 2012(2008), pp. 352–361.
Du, H. et al. (2017) ‘Pathways for energy conservation and emissions mitigation in road
transport up to 2030: A case study of the Jing-Jin-Ji area, China’, Journal of Cleaner
Production. doi: 10.1016/j.jclepro.2017.06.054.
Engelfriet, L. and Koomen, E. (2018) ‘The impact of urban form on commuting in large Chinese
cities’, Transportation, pp. 1269–1295. doi: 10.1007/s11116-017-9762-6.
Fan, J. L. et al. (2017) ‘Energy demand and greenhouse gas emissions of urban passenger
transport in the Internet era: A case study of Beijing’, Journal of Cleaner Production, 165,
pp. 177–189. doi: 10.1016/j.jclepro.2017.07.106.
Fragkias, M. et al. (2013) ‘Does Size Matter? Scaling of CO2 Emissions and U.S. Urban Areas’,
PLoS ONE, 8(6). doi: 10.1371/journal.pone.0064727.
Gao, J. (2017) Downscaling Global Spatial Population Projections from 1/8-degree to 1-km
Grid Cells, NCAR Technical Note. Boulder, Colorado. doi:
http://dx.doi.org/10.5065/D60Z721H.
Garside, B. and Wood, D. (2018) Improving Tanzania’s power quality: can data help?. (IIED).
Available at: https://www.iied.org/improving-tanzanias-power-quality-can-data-help
(Accessed: 15 March, 2018).
Godfrey, N. and Xiao, Z. (2015) The Contribution of African Cities to the Economy and Climate.
Working Paper. Available at:
https://newclimateeconomy.report/workingpapers/workingpaper/the-contribution-of-
african-cities-to-the-economy-and-climate/ (Accessed: March 1, 2021).
Government of Tanzania (2014a) Second National Communication to the Framework
Convention on Climate Change. Available at:
https://unfccc.int/sites/default/files/resource/tzanc2.pdf (Accessed: February 7, 2021).

112
Government of Tanzania (2014b) ‘Basic Demographic and Socio-Economic Profile – 2012
Population and Housing Census’, National Bureau of Statistics, Ministry of Finance, Dar
es Salaam. Available at:
https://www.nbs.go.tz/nbs/takwimu/census2012/Basic_Demographic_and_Socio-
Economic_Profile_PopularVersion-KeyFindings_2012_PHC_EnglishVersion.pdf
(Accessed: February 7, 2021).
Government of Tanzania (2015). Intended Nationally Determined Contributions. Available at:
https://www4.unfccc.int/sites/ndcstaging/PublishedDocuments/The%20United%20Republi
c%20of%20Tanzania%20First%20NDC/The%20United%20Republic%20of%20Tanzania
%20First%20NDC.pdf (Accessed: February 7, 2021).
Government of Tanzania (2016a) Power System Master Plan - Update 2016. Dar es Salaam.
Available at: https://www.infoafrica.it/wp-content/uploads/2017/02/Power-System-Master-
Plan-PSMP-2016-Update.pdf (Accessed: February 7, 2021).
Government of Tanzania (2016b) ‘Dar es Salaam Region: Basic Demographic and Socio-
Economic Profile – 2012 Population and Housing Census’, National Bureau of Statistics,
Ministry of Finance, Dar es Salaam. Available at:
https://www.nbs.go.tz/index.php/en/regional-profiles (Accessed: February 7, 2021).
Government of Tanzania (2017a) Dar es Salaam City Master Plan (2012 - 2032). Unpublished
document.
Government of Tanzania (2017b) Energy Access Situation Report (2016). Available at:
http://rea.go.tz/NewsCenter/TabId/130/ArtMID/639/ArticleID/91/Energy-Access-
Situation-Report-2016-Tanzania-Mainland.aspx (Accessed: February 7, 2021).
Government of Tanzania (2017c) EWURA: Annual Report. Dar es Salaam. Available at:
https://www.ewura.go.tz/wp-content/uploads/2019/06/Annual-Report-for-the-Year-Ended-
30th-June-2017.pdf (Accessed: February 7, 2021).

113
Grubler, A. et al. (2013) ‘Urban Energy Systems’, Global Energy Assessment (GEA), pp. 1307–
1400. doi: 10.1017/CBO9780511793677.024.
Guerra, E. (2014) ‘The Built Environment and Car Use in Mexico City: Is the Relationship
Changing over Time?’, Journal of Planning Education and Research, 34(4), pp. 394–408.
doi: 10.1177/0739456X14545170.
Heaps, C. (2008) ‘An introduction to LEAP’, Stockholm Environment Institute, pp. 1–16.
Available at: http://www.leap2000.org/documents/LEAPIntro.pdf (Accessed: October 19,
2019).
Heaps, C. (2016) Long-range Energy Alternatives Planning (LEAP) system [Software version:
2018.1.14]. Somerville, MA, USA.
Hoekman, P. and von Blottnitz, H. (2017) ‘Cape Town’s Metabolism: Insights from a Material
Flow Analysis’, Journal of Industrial Ecology, 21(5), pp. 1237–1249. doi:
10.1111/jiec.12508.
Hoornweg, D. and Pope, K. (2017) ‘Population predictions for the world’s largest cities in the
21st century’, Environment and Urbanization, 29(1), pp. 195–216. doi:
10.1177/0956247816663557.
Huang, Y. et al. (2019) ‘Exploring potential pathways towards urban greenhouse gas peaks: A
case study of Guangzhou, China’, Applied Energy, 251. doi:
10.1016/j.apenergy.2019.113369.
IEA/GFEI (2015) Baseline survey on Uganda’s National Average Automotive Fuel Economy.
Available at: https://www.fiafoundation.org/media/461028/africa_vehicle-fuel-economy-
baseline-for-uganda.pdf.
IEA (2014) ‘Energy in Africa Today’, in Africa Energy Outlook. Available at:
https://www.iea.org/publications/freepublications/publication/africa-energy-outlook.html.

114
IEA (2017a) ‘Energy Technology Perspectives 2017’, Technology, pp. 1–82. doi:
10.1787/energy_tech-2017-en.
IEA (2017b) ‘World Energy Outlook 2017’, International Energy Agency. doi: 10.1787/weo-
2017-en.
IEA (2018) Global Electric Vehicle Outlook 2018, Global EV Outlook. doi: EIA-0383(2016).
IEA (2019) Africa Energy Outlook 2019. Available at: https://www.iea.org/reports/africa-
energy-outlook-2019.
IIASA (2015) SSP Database 2012-2015. https://tntcat.iiasa.ac.at/SspDb. Available at:
https://tntcat.iiasa.ac.at/SspDb.
IPCC (2013) ‘Anthropogenic and natural radiative forcing (Chapter 8)’, in Climate Change 2013
the Physical Science Basis: Working Group I Contribution to the Fifth Assessment Report
of the Intergovernmental Panel on Climate Change. doi:
10.1017/CBO9781107415324.018.
IPCC (2014) ‘Human Settlements, Infrastructure, and Spatial Planning (Chapter 12)’, Climate
Change 2014: Mitigation of Climate Change. Contribution of Working Group III to the
Fifth Assessment Report of the Intergovernmental Panel on Climate Change, pp. 923–
1000. doi: 10.1017/CBO9781107415416.018.
Jagarnath, M. and Thambiran, T. (2018) ‘Greenhouse gas emissions profiles of neighbourhoods
in Durban, South Africa – an initial investigation’, Environment and Urbanization, 30(1),
pp. 191–214. doi: 10.1177/0956247817713471.
Jiang, L. and O’Neill, B. C. (2017) ‘Global urbanization projections for the Shared
Socioeconomic Pathways’, Global Environmental Change, 42, pp. 193–199. doi:
10.1016/j.gloenvcha.2015.03.008.

115
Jones, B. and O’Neill, B. C. (2016) ‘Spatially explicit global population scenarios consistent
with the Shared Socioeconomic Pathways’, Environmental Research Letters, 11(8). doi:
10.1088/1748-9326/11/8/084003.
Kamei, M., Hanaki, K. and Kurisu, K. (2016) ‘Tokyo’s long-term socioeconomic pathways:
Towards a sustainable future’, Sustainable Cities and Society, 27, pp. 73–82. doi:
10.1016/j.scs.2016.07.002.
KC, S. and Lutz, W. (2017) ‘The human core of the shared socioeconomic pathways: Population
scenarios by age, sex and level of education for all countries to 2100’, Global
Environmental Change, 42, pp. 181–192. doi: 10.1016/j.gloenvcha.2014.06.004.
Kennedy, C. et al. (2015) ‘Energy and material flows of megacities’, Proceedings of the
National Academy of Sciences, 112(19), pp. 5985–5990. doi: 10.1073/pnas.1504315112.
Kennedy, C., Ibrahim, N. and Hoornweg, D. (2014) ‘Low-carbon infrastructure strategies for
cities’, Nature Climate Change, 4(5), pp. 343–346. doi: 10.1038/nclimate2160.
Li, X. et al. (2019) ‘Low carbon heating and cooling of residential buildings in cities in the hot
summer and cold winter zone - A bottom-up engineering stock modeling approach’,
Journal of Cleaner Production, 220, pp. 271–288. doi: 10.1016/j.jclepro.2019.02.023.
Lin, C., Liu, G. and Müller, D. B. (2017) ‘Characterizing the role of built environment stocks in
human development and emission growth’, Resources, Conservation and Recycling, 123,
pp. 67–72. doi: 10.1016/j.resconrec.2016.07.004.
Lin, J. et al. (2018) ‘Scenario analysis of urban GHG peak and mitigation co-benefits: A case
study of Xiamen City, China’, Journal of Cleaner Production, 171, pp. 972–983. doi:
10.1016/j.jclepro.2017.10.040.
Lucas, P., Dagnachew, A. and Hof, A. (2017) Towards universal electricity access in Sub-
Saharan Africa A quantitative analysis of technology and investment requirements Policy
Report. Available at: http://www.pbl.nl/sites/default/files/cms/publicaties/pbl-2017-
towards-universal-electricity-access-in-sub-saharan-africa-1952.pdf.

116
Lucas, P. L. et al. (2015) ‘Future energy system challenges for Africa: Insights from Integrated
Assessment Models’, Energy Policy, 86, pp. 705–717. doi: 10.1016/j.enpol.2015.08.017.
Lusambo, L. (2016) ‘Household Energy Consumption Patterns in Tanzania’, Journal of
Ecosystem & Ecography, 01(s5). doi: 10.4172/2157-7625.s5-007.
Lutz, W., Butz, W. P. and KC, S. (2014) World Population and Human Capital in the Twenty-
First Century, Oxford Scholarship Online. doi:
10.1093/acprof:oso/9780198703167.001.0001.
Lwasa, S. (2017) ‘Options for reduction of greenhouse gas emissions in the low-emitting city
and metropolitan region of Kampala’, Carbon Management, 8(3), pp. 263–276. doi:
10.1080/17583004.2017.1330592.
McPherson, M. and Karney, B. (2014) ‘Long-term scenario alternatives and their implications:
LEAP model application of Panama’s electricity sector’, Energy Policy, 68, pp. 146–157.
doi: 10.1016/j.enpol.2014.01.028.
Mkalawa, C. C. and Haixiao, P. (2014) ‘Dar es Salaam city temporal growth and its influence on
transportation’, Urban, Planning and Transport Research. Routledge, 2(1), pp. 423–446.
doi: 10.1080/21650020.2014.978951.
Mokhtara, C. et al. (2019) ‘Pathways to plus-energy buildings in Algeria: Design optimization
method based on GIS and multi-criteria decision-making’, Energy Procedia, 162, pp. 171–
180. doi: 10.1016/j.egypro.2019.04.019.
Msuya, N., Masanja, E. and Temu, A. K. (2011) ‘Environmental Burden of Charcoal Production
and Use in Dar es Salaam, Tanzania’, Journal of Environmental Protection, 02(10), pp.
1364–1369. doi: 10.4236/jep.2011.210158.
Nkurunziza, A. et al. (2012) ‘Spatial variation of transit service quality preferences in Dar-es-
Salaam’, Journal of Transport Geography, 24, pp. 12–21. doi:
10.1016/j.jtrangeo.2012.06.001.

117
Noland, R. B. and Lem, L. L. (2002) ‘A review of the evidence for induced travel and changes in
transportation and environmental policy in the US and the UK’, Transportation Research
Part D: Transport and Environment, 7(1), pp. 1–26. doi: 10.1016/S1361-9209(01)00009-
8.
O’Neill, B. C. et al. (2017) ‘The roads ahead: Narratives for shared socioeconomic pathways
describing world futures in the 21st century’, Global Environmental Change, 42, pp. 169–
180. doi: 10.1016/j.gloenvcha.2015.01.004.
OECD/IEA (2017a) ‘International Comparison of Light-duty Vehicle Fuel Economy 2005-2015
Ten years of fuel economy benchmarking’, IEA Publications. Available at:
http://www.iea.org/publications/freepublications/publication/wp15ldvcomparison.pdf.
OECD/IEA (2017b) ‘South Africa’s New Passenger Vehicle CO2 Emissions Baseline Analysis’.
Available at: https://www.fiafoundation.org/media/461198/south-africa-pv-emission-
stds_icct-white-paper_17012018_vf-1.pdf.
Phdungsilp, A. (2010) ‘Integrated energy and carbon modeling with a decision support system:
Policy scenarios for low-carbon city development in Bangkok’, Energy Policy, 38(9), pp.
4808–4817. doi: 10.1016/j.enpol.2009.10.026.
Pongthanaisawan, J. and Sorapipatana, C. (2013) ‘Greenhouse gas emissions from Thailand’s
transport sector: Trends and mitigation options’, Applied Energy, 101, pp. 288–298. doi:
10.1016/j.apenergy.2011.09.026.
Rao, S. et al. (2017) ‘Future air pollution in the Shared Socio-economic Pathways’, Global
Environmental Change, 42, pp. 346–358. doi: 10.1016/j.gloenvcha.2016.05.012.
Riahi, K. et al. (2017) ‘The Shared Socioeconomic Pathways and their energy, land use, and
greenhouse gas emissions implications: An overview’, Global Environmental Change, 42,
pp. 153–168. doi: 10.1016/j.gloenvcha.2016.05.009.

118
Schulz, N. (2010) Urban Energy Consumption Database and Estimations of Urban Energy
Intensities, Global Energy Assessment (GEA) - Supplementary Information. Laxenburg,
Austria.
SEA (2015a) ‘Modelling the Urban Energy Future of Sub-Saharan Africa (Working Paper)’.
Sustainable Energy Africa and SAMSET – Supporting Sub-Saharan Africa’s Municipalities
with Sustainable Energy Transitions. Available at:
https://www.africancityenergy.org/uploads/resource_26.pdf (Accessed: March 1, 2021).
SEA (2015b) ‘Modelling Urban Sub-Saharan Africa (Technical Report)’. Sustainable Energy
Africa and SAMSET – Supporting Sub-Saharan Africa’s Municipalities with Sustainable
Energy Transitions. Available at:
https://www.africancityenergy.org/uploads/resource_151.pdf (Accessed: March 1, 2021).
Senatla, ’Mamahloko (2011) Determining the Impacts of Selected Energy Policies on Gauteng’s
Residential Energy Consumption and the Associated Emissions using LEAP as a tool for
Analysis: Implications for sustainable livelihoods for the poor. University of Cape Town.
Available at: https://open.uct.ac.za/handle/11427/11516.
Silva Herran, D., Tachiiri, K. and Matsumoto, K. (2019) ‘Global energy system transformations
in mitigation scenarios considering climate uncertainties’, Applied Energy, 243, pp. 119–
131. doi: 10.1016/j.apenergy.2019.03.069.
van Sluisveld, M. A. E. et al. (2018) ‘Comparing future patterns of energy system change in 2 °C
scenarios to expert projections’, Global Environmental Change, 50, pp. 201–211. doi:
10.1016/j.gloenvcha.2018.03.009.
de Souza, J. F. T. et al. (2018) ‘Industrial low carbon futures: A regional marginal abatement
cost curve for Sao Paulo, Brazil’, Journal of Cleaner Production, 200, pp. 680–686. doi:
10.1016/j.jclepro.2018.07.206.

119
Stone, A. and Wiswedel, S. (2018) ‘Modelling the Urban Energy Future of Sub-Saharan Africa’,
in International Energy Workshop. Maryland, USA: University of Maryland, p. 13.
Available at: http://samsetproject.net/outputs/.
UITP (2015) ‘Mobility in Cities Database’. Available at:
https://www.uitp.org/publications/mobility-in-cities-database/.
UN (2017) Household Size and Composition Around the World. Available at:
https://digitallibrary.un.org/record/3799696/files/household_size_and_composition_around
_the_world_2017_data_booklet.pdf.
UN (2018) World Urbanization Prospects (2018 Revision). Available at:
https://population.un.org/wup/ (Accessed October 19, 2020).
Wang, Hongsheng et al. (2013) ‘Carbon reduction potentials of China’s industrial parks: A case
study of Suzhou Industry Park’, Energy, 55, pp. 668–675. doi:
10.1016/j.energy.2013.01.034.
Westphal, M. et al. (2017) ‘Powering Cities in the Global South: How Energy Access for All
Benefits the Economy and the Environment’, World Resources Institute, p. 55. Available
at: http://www.wrirosscities.org/sites/default/files/WRR_Energy_Final.pdf.
WHO (2012) ‘Burden of disease from Household Air Pollution for 2012’, World Health
Organization, Global Health Risks, 1(February), pp. 1–17. doi: 10.1016/S0140-
6736(12)61766-8.Smith.
World Bank (2015) Beyond connections - Energy Access Redefined. Conceptualization report.
Available at: http://www.worldbank.org/content/dam/Worldbank/Topics/Energy and
Extract/Beyond_Connections_Energy_Access_Redefined_Exec_ESMAP_2015.pdf.
World Bank (2017a) CURB: Climate Action for Urban Sustainability. Available at:
https://www.worldbank.org/en/topic/urbandevelopment/brief/the-curb-tool-climate-action-
for-urban-sustainability.

120
World Bank (2017b) ‘Dar es Salaam Urban Transport Improvement Project – Project Appraisal
Document’. Available at: https://documents.worldbank.org/en/publication/documents-
reports/documentdetail/794251489201242940/tanzania-dar-es-salaam-urban-transport-
improvement-project (Accessed: 15 March, 2018).
World Bank (2018) World Bank Open Data. Available at: https://data.worldbank.org/ (Accessed:
15 March, 2018).
WorldAtlas (2017) 15 Biggest Cities In Africa. Available at:
https://www.worldatlas.com/articles/15-biggest-cities-in-africa.html (Accessed: 15 May,
2018).
WRI (2015) Climate Analysis Indicators Tool (CAIT). Climate Data Explorer. 2015, World
Resources Institute. Available at: http://cait.wri.org/historical.
WRI (2018) Global BRT Data. Available at: https://brtdata.org/ (Accessed: 13 September, 2018).
Wu, L. et al. (2019) ‘Global carbon reduction and economic growth under autonomous
economies’, Journal of Cleaner Production. Elsevier Ltd, 224, pp. 719–728. doi:
10.1016/j.jclepro.2019.03.225.
Yang, Dewei et al. (2017) ‘Sectoral energy-carbon nexus and low-carbon policy alternatives:
A case study of Ningbo, China’, Journal of Cleaner Production, 156, pp. 480–490. doi:
10.1016/j.jclepro.2017.04.068.
Zegras, C. (2010) ‘The built environment and motor vehicle ownership and use: Evidence from
Santiago de Chile’, Urban Studies, 47(8), pp. 1793–1817. doi:
10.1177/0042098009356125.
Zhou, J. et al. (2016) ‘Implications of the 11th and 12th Five-Year Plans for energy conservation
and CO2 and air pollutants reduction: A case study from the city of Urumqi, China’,
Journal of Cleaner Production, 112, pp. 1767–1777. doi: 10.1016/j.jclepro.2015.08.015.

121
van der Zwaan, B. et al. (2018) ‘An integrated assessment of pathways for low-carbon
development in Africa’, Energy Policy, 117, pp. 387–395. doi:
10.1016/j.enpol.2018.03.017.

122
Chapter 4
Does Location Matter? Investigating the Spatial and
Socio-Economic Drivers of Residential Energy Use in Dar
es Salaam
This Chapter is based on a published paper with the following citation.
• Luo, C., Posen, I. D. & MacLean, H. L. (2020). Does location matter? Investigating the
spatial and socio-economic drivers of residential energy use in Dar es Salaam. Environ.
Res. Lett. https://doi.org/10.1088/1748-9326/abd42e
4.1 Abstract
Africa is set to become a key contributor to global energy demand. Urban growth and the energy
use of city residents will drive much of the region’s changing energy picture. However, few
studies have assessed residential energy use among African cities, and the heterogeneity in
energy use at the sub-city scale. I use the case of Dar es Salaam, which is among Africa's fastest-
growing cities, and to my knowledge, present the first disaggregated estimates of residential
energy use at the ward level. I show three main findings. First, I find a statistically significant
difference in mean residential energy use among the surveyed wards, which group into four
clusters representing distinct levels of household and transport-related energy use. These results
show that mean residential energy use (the sum of household and transport-related energy use) is
not always correlated with the socio-economic or spatial characteristics of wards – e.g., Msasani
(high-income, formal ward) showed similar residential energy use as Keko (low-income,
informal ward). Second, I show differences in energy use and fuel switching that occur between
low-income and high-income wards: wood fuel (i.e., charcoal) is a majority contributor to

123
residential energy use in low-income wards (Buguruni, Keko and Manzese), compared to gas,
electricity and transport oils in high-income wards (Msasani and Kawe). Finally, regression
models indicate that ward density has a statistically significant effect on transport-related energy
use, while fuel stacking and proxies for household wealth have a statistically significant effect on
household-related energy use. To conclude, I recommend that policymakers account for ward
level differences in residential energy use when crafting energy sector strategies for Dar es
Salaam (e.g., electrification, energy-efficient cooking, or public transportation initiatives).
Policymakers may also anticipate possible convergence towards higher levels of energy use and
a shift towards modern fuels, as wards develop socio-economically over time.
4.2 Introduction
Current literature presents few examples of the energy use of African cities at the sub-city scale
(i.e., the settlement or ward level). The Africa region accounts for only 5% of global energy
demand (IEA, 2014), and 3.7% of (2018) global energy-related greenhouse gas (GHG) emissions
(IEA, 2019a). However, urbanization and economic activity in the region could increase future
energy use and GHG emissions to reach as high as 20% to 23% of global emissions in 2100
(Calvin et al., 2016; Lucas et al., 2015), equivalent to the current (2016) emissions of the United
States and Canada (IEA, 2017b). Despite these staggering trends, most regional studies only
quantify energy and/or material use (e.g., water and waste consumption) at the aggregated city
scale (e.g., (Currie & Musango, 2017; Currie et al., 2015; Hoekman & von Blottnitz, 2017;
Olaniyan et al., 2018)), and generally, studies have drawn two main conclusions. First, that
estimated national or city-level electricity use is strikingly low vis-à-vis other developed
countries, e.g., between 90 and 135kWh per household per month in Nigeria (in 2017) (Olaniyan
et al., 2018), compared to 909 kWh per household per month in the United States (in 2018) (EIA,
2018). Second, there are wide disparities in energy use within and between African cities, e.g.,
between rural and urban areas (Olaniyan et al., 2018), or high-GDP and low-GDP cities (Currie
et al., 2015). Relatedly, some studies that have disaggregated energy use at the sub-city scale
(e.g., (Hughes-Cromwick, 1985; Chowdhury et al., 2019; Smit et al., 2019; Strydom et al.,

124
2020)) highlight the inequalities in infrastructure access for different population groups, and the
low energy use of informal settlements (which are sometimes the most deprived settlements
though constitute most urban residential land-use). However, how energy use varies across
different settlement types (e.g., between formal or informal settlements) is largely unknown, and
could result in policy measures that do not consider the local reality, i.e., the heterogeneity that
may exist between settlements (and populations) of differing socio-economic status, or spatial
location within an individual city.
This study broadly addresses these existing data gaps. Specifically, I elucidate the spatial and
socio-economic drivers of residential energy use that could be considered in the advancement of
energy policies in Dar es Salaam, which is among the fastest growing cities in Africa, alongside
Lagos, Lusaka and Accra, among others (UN, 2018). If policymakers understand the
heterogeneity in energy uses that exists between populations, this could inform different
approaches to implementing policy visions at the settlement level (e.g., in formal versus informal
settlements). Current literature on urban infrastructure in Africa has shown that centralized
structures of services delivery (e.g., via state-led utilities) often do not result in equal access to
services for the poor. For example, studies have highlighted inequalities in the delivery of water
and sanitation services in Dar es Salaam (Monstadt and Schramm, 2017) and Kampala (Uganda)
(Lawhon et al., 2018), or electrification in Accra (Ghana) (Silver, 2015), Cotonou (Benin) and
Ibdan (Nigeria) (Rateau and Jaglin, 2020). Authors of these studies have also highlighted the
broader societal and urban governance factors that influence service delivery and the need to
integrate “hybrid” or “decentralized" solutions to ensure more equitable infrastructure
configurations, e.g., engaging informal service providers or local communities in the provision of
services. However, authors of these studies – particularly energy-specific studies of Silver (2015)
and Rateau and Jaglin (2020) – did not quantify differences in electricity or energy use among
communities (e.g., kilowatt hours (kWh) of electricity, or gigajoules of energy per household) as
I do in this chapter. Specifically, I show that considering the intra-community differences in
energy access could support the implementation of differentiated energy sector strategies that
account for local community needs and their different lived experiences.

125
I assume that rates of urbanization and economic growth projected for Dar es Salaam (UN, 2018)
could play a role in driving future energy convergence, as historically observed in China (Fan et
al., 2017) and India (Chaturvedi et al., 2014), for example. Therefore, by quantifying energy uses
at the settlement level, policymakers could anticipate future changes and differences in demand,
e.g., if lower consuming settlements catch up to the per capita rates of higher consuming ones.
Similar trends could unfold at the aggregated city level in Dar es Salaam, and the sub-city (ward)
data presented in this study could predicate possible changes at the settlement level. For
example, a more rapid increase in energy use could be expected among low-income wards that
become more developed over time, compared to a gradual and slower increase in energy use
among high-income wards whose consumption is evolving, e.g., from wood fuels (charcoal and
firewood) to modern fuels (electricity or transport oils).
My study focuses on residential energy use, which accounts for most of Tanzania’s energy
demand (70% as of 2017, (IEA, 2019c)). Specifically, I focus on (1) total residential energy use,
(2) cooking fuels, and (3) transport energy. There are several factors that are likely to drive large
changes in these specific categories. To begin, Tanzania has an ambitious policy vision to
develop their energy sector, including access to reliable, affordable, and efficient energy for all
(Government of Tanzania, 2015a, 2015b). Improved access will drive higher residential energy
use and GHG emissions (Luo et al., 2020), which would require clear understanding of ward
level differences to manage these possible changes. The country's Action Agenda (Government
of Tanzania, 2015b) promotes universal access to modern cooking solutions by 2030, i.e.,
replacing wood fuels (charcoal and firewood) with electricity or liquefied petroleum gas (“gas”)
to promote the sustainable use of wood fuels and alleviate their associated health burdens (e.g.,
from indoor air pollution). In 2018, wood fuels accounted for 93% of energy used for cooking by
Tanzanian households. This can be compared to only 5% from gas, 1% from kerosene and 1%
from electricity (IEA, 2019a).
In the transport sector, rising private vehicle travel and urban wealth will contribute to higher
transport energy in Dar es Salaam (Chapter 3). As of 2015, the local “dala-dala” minibus
accounted for most passenger trips given its high use among the city’s low-income population
(though is characterized by poor service quality). Improvements to the public transport network

126
are currently underway, largely through the city’s Bus Rapid Transit (BRT) system, to attract
broader use from different population segments (Government of Tanzania, 2017a).
To realize my stated research goals, I examine:
(1) Differences in residential energy use (i.e., the combined energy use from household and
transport-related activities) between selected formal, informal and mixed wards of Dar es
Salaam.
(2) The statistical relationship between: (1) ward type and residential energy use; (2) cooking
fuel choice and household-related energy use; (3) public transport use and transport-
related energy use; and (4) other spatial and socio-economic factors (e.g., land-use, ward
density and wealth) and household-related and transport-related energy use, respectively.
This work builds on prior studies (e.g., (Lee, 2013; Sun et al., 2014; Mensah and Adu, 2015;
Sakah et al., 2019)) that have similarly examined the statistical relationship between household
energy use and/or cooking fuel choices and their socio-economic and spatial profiles (e.g.,
expenditure, income, education, location and infrastructure access) in other countries. For
example, Lee (2013) examined the effect of household expenditures, location (rural or urban
area), education and water access levels on household electricity, kerosene, and wood fuel use in
Uganda. In Ghana, Mensah and Adu employed similar methods as Lee (2013) but did not
include electricity use or water access as variables in their analysis (Mensah and Adu, 2015).
In the case of Dar es Salaam, available estimates for residential energy use (e.g., electricity, gas,
or charcoal use) (e.g. (Government of Tanzania, 2017b), (NBS, 2013)) are mostly aggregated at
the national or city level. For example, electricity use estimates for Dar es Salaam in the 2017
Energy Access Situation Report (Government of Tanzania, 2017b) encompass the city’s five
major districts (data at the ward level are not provided). To my knowledge, studies have not
disaggregated energy uses across different settlements in Dar es Salaam or other Tanzanian
cities, though data are available at the settlement level for other African cities, e.g., electricity
use patterns in Johannesburg (South Africa) and Ndola (Zambia) (Roy Chowdhury et al., 2019),
and household energy use in Nairobi (Kenya) (Hughes-Cromwick, 1985). Therefore, my current
study offers possible insights to the different energy behaviours of Dar es Salaam residents, and

127
the spatial and socio-economic drivers that could be considered when implementing energy
policies in the city.
4.3 Methods
4.3.1 Study Region
Dar es Salaam is the largest city and one of 31 administrative regions in Tanzania. It is a port
city, located along Africa’s eastern coast, and a major hub for international trade. The
metropolitan area, i.e., the “Dar es Salaam region”, has a population of 6.1 million (as of 2018),
which accounts for 32% of Tanzania’s total urban population (World Bank, 2018). The city’s
population is estimated to more than double in size by the year 2050, i.e., between 15 and 16
million in 2050 (Chapter 3). At the sub-city scale, the Dar es Salaam region is sub-divided into
90 wards (NBS, 2013), situated within larger districts (of which there are five: Ilala, Kinondoni,
Temeke, Ubungo and Kigamboni). Wards consist of “informal”, “formal” or “mixed”
settlements, containing various low, middle and high-income households. The term “informal”
refers to the nature of land tenure where land and home ownership is organized privately
between individuals without regulation by local or national government (Kironde, 2000; Lupala,
2002). Such activities are regulated by government in formal settlements. Mixed settlements
contain both formal and informal areas within the same sub-city boundary.
Among other socio-economic factors, I consider the influence of the city’s Bus Rapid Transit
(BRT) system that began operation (i.e., phase 1) in 2016. The system has received widespread
recognition globally (e.g., (ITDP, 2017; World Bank, 2017)) given the few examples of
successful BRT operations in African cities (not including Johannesburg and Cape Town). The
phase 1 line operates along 21km of road, carries 160,000 passengers a day on average (ITDP,
2017), and traverses the north-west segment of the city, i.e., Kimara to Kivukoni along
Morogoro Road, shown in Figure 4.1. The completed system is expected to cover 137 kilometers
of road, to be built in 6 sequential phases; as of June 2020, construction and tendering for phases
2 and 3 (44 km) is underway (DART, 2020).

128
4.3.2 Methods Overview
At a high level, I:
• Conducted fieldwork (with the support of a field team) to collect household level energy
use data across eight wards in Dar es Salaam.
• Estimated mean residential energy use (i.e., in GJ/HH/year), including disaggregated
household- and transport-related energy use, in the surveyed wards.
• Employed Analysis of Variance (ANOVA) to test the effect of ward type and cooking
fuel choice on mean residential and household-related energy use, respectively.
• Employed multivariate Ordinary Least Squares (OLS) and Tobit regressions (coupled
with Principal Component Analysis) to model the statistical relationship between cooking
fuel choice, public transport use, and other spatial and socio-economic factors on
household-related and transport-related energy use, respectively.
4.3.3 Description of Fieldwork
Fieldwork was conducted in Dar es Salaam between August and November 2018. A prior
fieldtrip was organized in 2017 for early pilot testing of the survey/questionnaire. I recruited a
10-person field team through in-person interviews in August 2018 (more details in the
supplementary material, Section 4.11.1). In total, surveys were completed for 1,363 households
across a socio-economically and spatially diverse set of wards (8 wards in total, which
represented 9% of all wards in Dar es Salaam). Ethics clearances received for the study are
outlined in the supplementary material, Section 4.11.2. Table 4.1 summarizes key socio-
economic, spatial, and sampling data for the surveyed wards. Of the total number of households
surveyed, most were in informal and mixed settlements to reflect the higher proportion of the
population in Dar es Salaam living in these types of settlements.
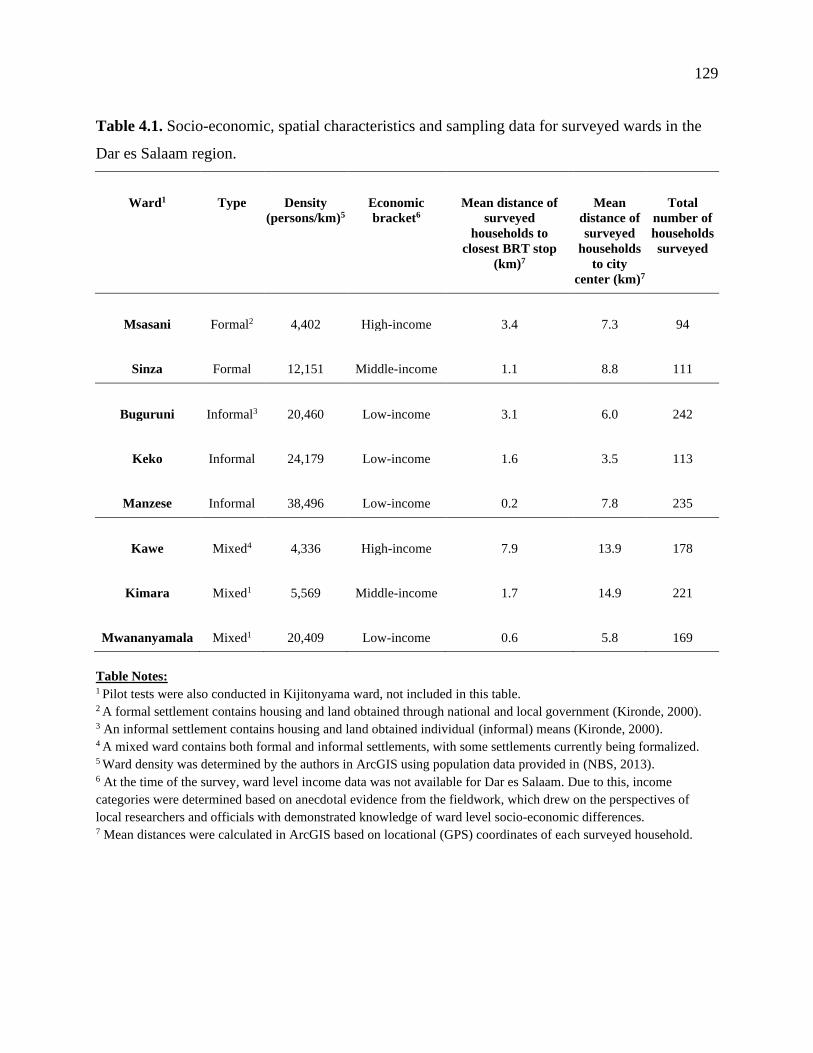
129
Table 4.1. Socio-economic, spatial characteristics and sampling data for surveyed wards in the
Dar es Salaam region.
Ward1 Type Density
(persons/km)5
Economic
bracket6
Mean distance of
surveyed
households to
closest BRT stop
(km)7
Mean
distance of
surveyed
households
to city
center (km)7
Total
number of
households
surveyed
Msasani Formal2 4,402 High-income 3.4 7.3 94
Sinza Formal 12,151 Middle-income 1.1 8.8 111
Buguruni Informal3 20,460 Low-income 3.1 6.0 242
Keko Informal 24,179 Low-income 1.6 3.5 113
Manzese Informal 38,496 Low-income 0.2 7.8 235
Kawe Mixed4 4,336 High-income 7.9 13.9 178
Kimara Mixed1 5,569 Middle-income 1.7 14.9 221
Mwananyamala Mixed1 20,409 Low-income 0.6 5.8 169
Table Notes: 1 Pilot tests were also conducted in Kijitonyama ward, not included in this table. 2 A formal settlement contains housing and land obtained through national and local government (Kironde, 2000). 3 An informal settlement contains housing and land obtained individual (informal) means (Kironde, 2000). 4 A mixed ward contains both formal and informal settlements, with some settlements currently being formalized. 5 Ward density was determined by the authors in ArcGIS using population data provided in (NBS, 2013). 6 At the time of the survey, ward level income data was not available for Dar es Salaam. Due to this, income
categories were determined based on anecdotal evidence from the fieldwork, which drew on the perspectives of
local researchers and officials with demonstrated knowledge of ward level socio-economic differences. 7 Mean distances were calculated in ArcGIS based on locational (GPS) coordinates of each surveyed household.
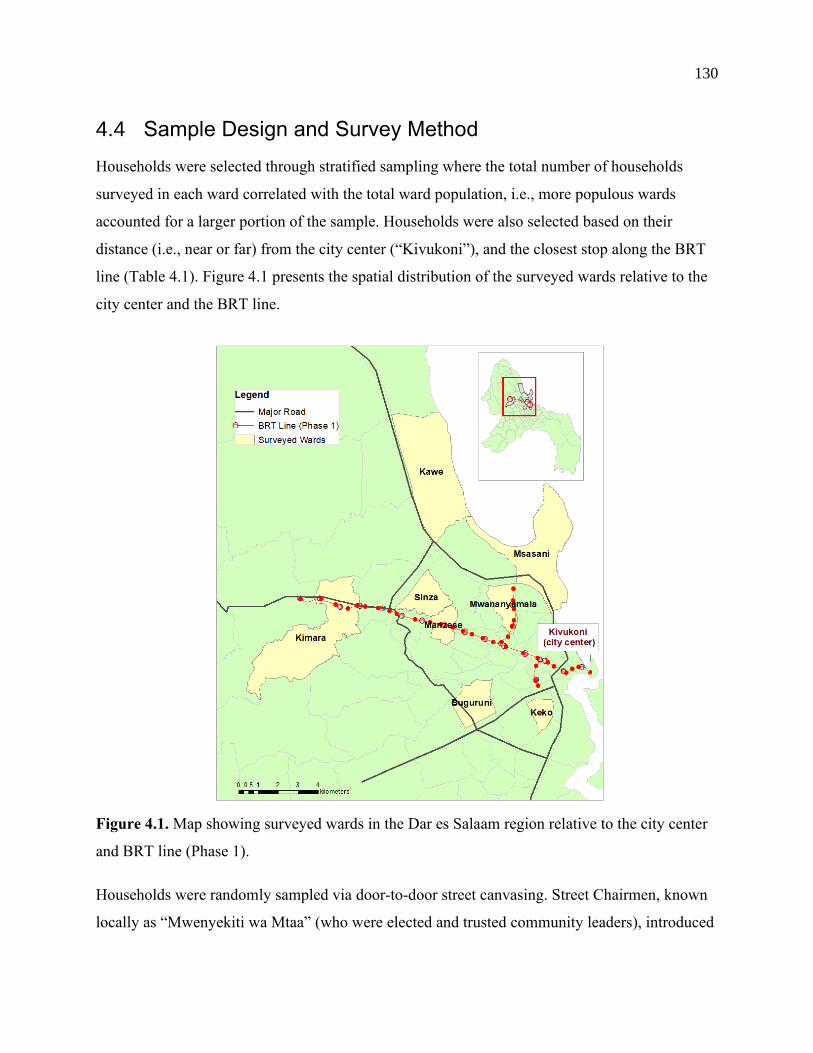
130
4.4 Sample Design and Survey Method
Households were selected through stratified sampling where the total number of households
surveyed in each ward correlated with the total ward population, i.e., more populous wards
accounted for a larger portion of the sample. Households were also selected based on their
distance (i.e., near or far) from the city center (“Kivukoni”), and the closest stop along the BRT
line (Table 4.1). Figure 4.1 presents the spatial distribution of the surveyed wards relative to the
city center and the BRT line.
Figure 4.1. Map showing surveyed wards in the Dar es Salaam region relative to the city center
and BRT line (Phase 1).
Households were randomly sampled via door-to-door street canvasing. Street Chairmen, known
locally as “Mwenyekiti wa Mtaa” (who were elected and trusted community leaders), introduced

131
the field team to interview participants prior to each interview. Interview participants included
consenting adults (household members) with the capacity to respond to the survey questions.
Only consenting individuals who could report on household member composition, energy needs
and activities, and weekly commuting patterns, were selected.
The survey was administered digitally via android tablets that were configured with locational
features (GPS) for storing geo-spatial data at the ward level, i.e., the location of each surveyed
household, street names, and travel destinations. Survey questions were sectioned as follows (see
Appendix A for full question set):
• Demographic and household information, including the number of household members,
education levels and living arrangements (e.g., single, or shared household).
• Locational data, e.g., household location, trip routes and destinations.
• Fuel consumption estimates, e.g., charcoal, gas and electricity use.
• Cooking fuel choices e.g., with charcoal, gas and/or electric stove.
• Electric appliance ownership e.g., washing machine, refrigerator, television, among other
regular household appliances.
• Travel mode choices e.g., private vehicle (including Uber or Taxi) and/or public modes
such as the BRT, “dala-dala” (local minibus), “boda-boda” (motorcycle), “bajaji”
(tricycle). The dala-dala, boda and bajaji operate within an informal network where
transit routes and use fares are not institutionalized at the city level (Government of
Tanzania, 2017a).
To mitigate possible risks associated with identification, each household was assigned a random
household identification number (names and genders of participants were not collected). Only
participants that completed the informed consent were interviewed. Finally, if a household was
unoccupied at the time of a visit or if a member declined to participate in the survey, then the
next closest household was surveyed. In total, 1,679 households were visited, with results as
follows: 1,363 (81%) completed the survey, 210 (13%) were not at home, and 106 (6%) refused
to participate.

132
4.5 Approach to Quantifying Residential Energy Use
I use the term “residential energy use” to refer to the sum of energy uses from both household-
and transport-related activities. Energy use was estimated based on fuel use and travel behaviors
reported by surveyed households.
For household-related activities, this included:
• Kilowatt hours of electricity used per household per year (kWh/HH/year) based on pre-
paid electricity receipts. In Tanzania, households can purchase pre-paid electricity units
to provide electricity for daily, weekly, or monthly needs.
• Kilograms of charcoal used for cooking per household per year (kg/HH/year) based on
number of bag(s) used per day, week, or month (in kg).
• Kilograms of gas used for cooking per household per year (kg/HH/year) based on number
of cylinder(s) used per day, week, or month (in kg).
I broadly describe household charcoal and firewood use as “wood fuel” use. However, I do not
include firewood use in my estimates for residential energy use. Early pilot tests (in 2017)
showed that interview participants were unable to estimate their consumption (i.e., in kg) of
kerosene and firewood for cooking. My previous study, which aggregated energy uses at the city
level for the year 2015 (Chapter 4) concluded that kerosene accounted for only 2% of Dar es
Salaam’s residential energy use. Similarly, the International Energy Agency (IEA) estimates that
kerosene accounted for only 1% of energy use at the national (Tanzania) level for 2018 (IEA,
2019a). My prior work reported higher firewood use (32%), but based on this survey, only 8%
reported using firewoodfor cooking (even though households did not report on specific amounts,
i.e., kg of firewood). For these reasons, I concluded that excluding both kerosene and firewood
from my final estimates would not have a major impact on my results. However, their omission
is an important limitation that could be considered in future studies in Dar es Salaam and other
African cities.
For transport-related activities, interviewed participants reported on the travel behavior of each
household member during an average working day during the week. This included reporting on

133
“start” and “end” points for each trip (including transfer points), travel modes used, and common
routes taken (e.g., names of major roads). The trip data was later converted to latitude and
longitude coordinates based on locational (GPS) data collected from the survey. Travel routes
and trip distances for each household member were estimated and digitized in ArcGIS by the
authors and the support of a GIS consultant. Note, I did not incorporate questions on vehicle fuel
use (e.g., diesel or gasoline) and efficiency in the survey as respondents were unable to answer
these questions during pilot tests. Vehicle fuel use and efficiencies (by travel mode) were
determined based on World Bank (2016) data.
The supplementary material (Section 4.11.3) outlines equations used to estimate energy use from
household- and transport-related activities (in GJ/HH/year), respectively; as well as the fuel
conversion factors applied in this study.
4.6 Statistical Methods
4.6.1 Analysis of Variance
One-way Analysis of Variance (ANOVA) tests were applied to determine whether there was a
statistically significant effect of (1) ward type on mean residential energy use and (2) cooking
fuel choice on household-related energy use. Where there was a statistically significant effect,
post-hoc tests, i.e., Fisher’s Least Significant Differences (LSD) test, were applied to determine
which sample groups were statistically different.
4.6.2 Principal Component Analysis
Due to privacy concerns raised during initial pilot tests, the field team was unable to collect data
on household income (i.e., average earnings per household). Instead, I relied on other indicators
(or proxies) for wealth, based on data collected from the survey (Table 4.2). I employed Principal
Component Analysis (PCA) to reduce these indicators to a smaller set of principal components
(or “PCs”), while still retaining much of the variation in the original variables (Jolliffe, 2002).
Landgraf’s “Logistic PCA” package in R was employed given the binary nature of the data, i.e.,
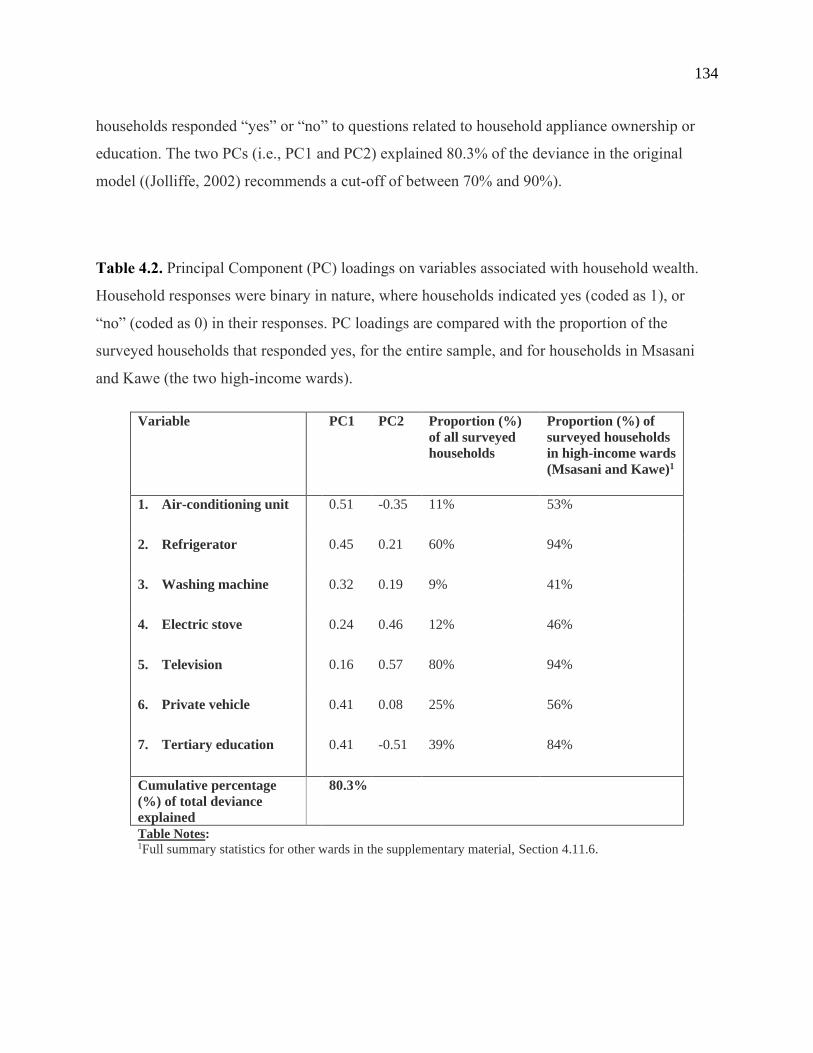
134
households responded “yes” or “no” to questions related to household appliance ownership or
education. The two PCs (i.e., PC1 and PC2) explained 80.3% of the deviance in the original
model ((Jolliffe, 2002) recommends a cut-off of between 70% and 90%).
Table 4.2. Principal Component (PC) loadings on variables associated with household wealth.
Household responses were binary in nature, where households indicated yes (coded as 1), or
“no” (coded as 0) in their responses. PC loadings are compared with the proportion of the
surveyed households that responded yes, for the entire sample, and for households in Msasani
and Kawe (the two high-income wards).
Variable PC1 PC2 Proportion (%)
of all surveyed
households
Proportion (%) of
surveyed households
in high-income wards
(Msasani and Kawe)1
1. Air-conditioning unit
0.51 -0.35 11% 53%
2. Refrigerator
0.45 0.21 60% 94%
3. Washing machine
0.32 0.19 9% 41%
4. Electric stove
0.24 0.46 12% 46%
5. Television
0.16 0.57 80% 94%
6. Private vehicle
0.41 0.08 25% 56%
7. Tertiary education
0.41 -0.51 39% 84%
Cumulative percentage
(%) of total deviance
explained
80.3%
Table Notes: 1Full summary statistics for other wards in the supplementary material, Section 4.11.6.

135
I interpret the PC loadings, shown in Table 4.2, in two ways. Firstly, PC1 provides a general
picture of household wealth, and households could be sub-divided based on their position along
the PC1 dimension. High loadings on PC1 (e.g., owning an air-conditioning unit, refrigerator)
could indicate wealthier households (Table 4.2). For example, households in Msasani and Kawe
(high-income wards) reported higher levels of appliance use compared to levels in all surveyed
wards and had higher PC1 scores on average (boxplots showing PC scores by ward are shown in
Section 4.11.4). I am unable to clearly interpret PC2; note that it may not be strictly related to
wealth, given that Msasani and Kawe do not have higher PC2 scores compared to other wards
(Table 4.2). However, high PC2 loadings for convenience appliances (e.g., television, electric
stove) could indicate a household’s predisposition for these common technologies.
4.6.3 Multivariate Regression Models
I employed multivariate Ordinary Least Squares (OLS) and Tobit (or censored) regressions to
model the influence of socio-economic and spatial variables on household-related and transport-
related energy use. The supplementary material (Section 4.11.5) provides a description of data
variables used in both models. Similar to the study of Lee (2013), I conducted OLS and Tobit
regressions to model variable relationships. Household PC1 and PC2 scores were also applied as
independent proxy variables in an attempt to control for household wealth, which resulted in
improved regression results, i.e., coefficients for PC1 and PC2 showed a statistically significant
and positive correlation with household-related and transport-related energy use (details in Table
4.4 and Table 4.5). Comparative results with the seven original variables applied as independent
proxy variables are shown in the supplementary material (Section 4.11.9), where, in some cases,
there was no discernable relationship between the original variables and household-related or
transport-related energy use, respectively.
The Tobit model was left-censored at zero, which allowed for the regression to inherently
account for data clustering at zero (as some households reported zero household- related or
transport-related energy use i.e., they did not cook at home or use motorized transport). The OLS
model did not account for this data clustering (i.e., the regression incorporated households with
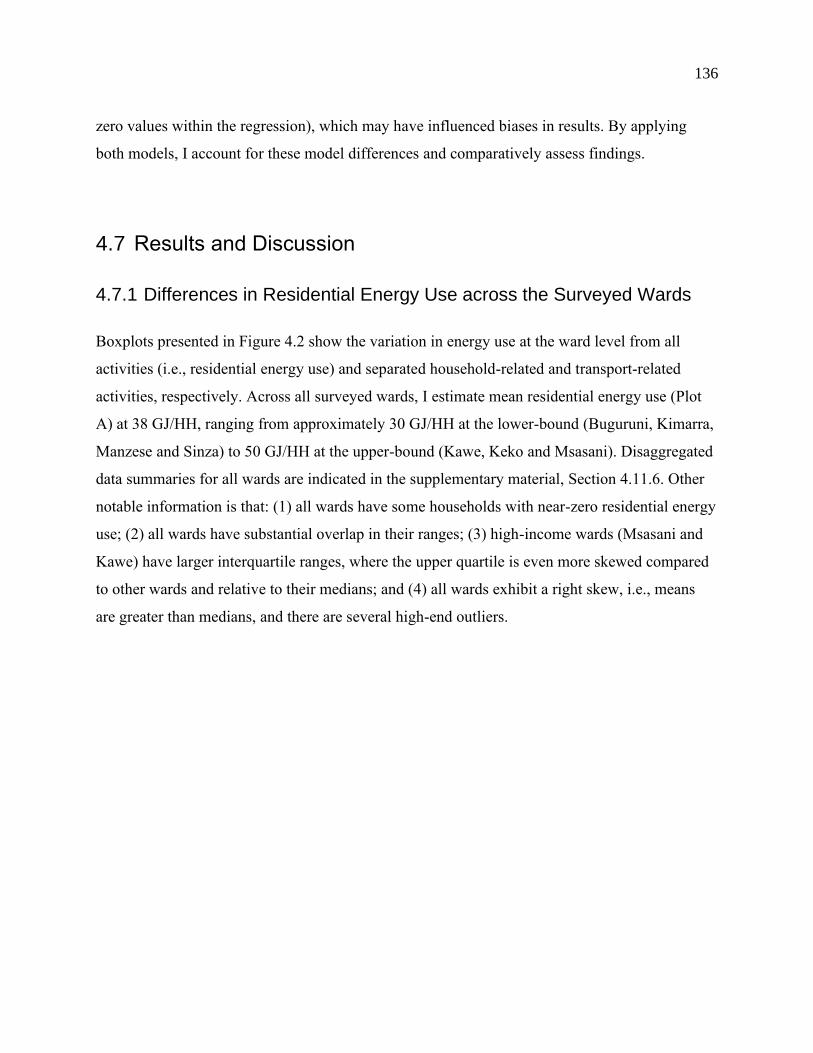
136
zero values within the regression), which may have influenced biases in results. By applying
both models, I account for these model differences and comparatively assess findings.
4.7 Results and Discussion
4.7.1 Differences in Residential Energy Use across the Surveyed Wards
Boxplots presented in Figure 4.2 show the variation in energy use at the ward level from all
activities (i.e., residential energy use) and separated household-related and transport-related
activities, respectively. Across all surveyed wards, I estimate mean residential energy use (Plot
A) at 38 GJ/HH, ranging from approximately 30 GJ/HH at the lower-bound (Buguruni, Kimarra,
Manzese and Sinza) to 50 GJ/HH at the upper-bound (Kawe, Keko and Msasani). Disaggregated
data summaries for all wards are indicated in the supplementary material, Section 4.11.6. Other
notable information is that: (1) all wards have some households with near-zero residential energy
use; (2) all wards have substantial overlap in their ranges; (3) high-income wards (Msasani and
Kawe) have larger interquartile ranges, where the upper quartile is even more skewed compared
to other wards and relative to their medians; and (4) all wards exhibit a right skew, i.e., means
are greater than medians, and there are several high-end outliers.

137
A. Total Residential B. Household
Legend C. Transport
Figure 4.2. Variation in energy use across the sampled wards. Residential energy use from both
household-related and transport-related activities (A). Energy use from household-related
activities (B). Energy use from transport-related activities (C).

138
Mean household-related energy use ranges between 20 GJ/HH (Kimara) and 40 GJ/HH (Kawe
and Keko) across the surveyed wards (data ranges are wide and right-skewed, i.e., mean values
are higher than medians, and there are several high-end outliers) (Figure 4.2, Plot B). My
estimates are higher than averages reported for Global South cities in Asia (e.g., 21 GJ/HH in
Jakarta (Surahman & Kubota, 2018) and 9.6 GJ/HH in Nepal (Shahi et al., 2020)), but lower than
those in North America (e.g., 105 GJ/HH in Canada (Statistics Canada, 2011), and 101 GJ/HH in
the United States (Nakagami et al., 2008)). Notably, however, I find that some households use
energy at rates comparable to or exceeding the averages in North America (see outliers in Figure
2, Plot B). Across the surveyed wards, between 1% (Kimara) and 10% (Kawe) of households
already exceed the average household energy use in the United States.
Data ranges for transport-related energy use are narrower (Figure 4.2, Plot C), due to several
households having an absence of motorized travel (i.e., by private vehicle or public transport).
Excluding Kawe and Msasani, I estimate near-zero values for mean and median transport-related
energy use (and zero interquartile ranges). However, wide disparities are present within and
between wards (shown as outliers, Figure 2, Plot C). Similar trends exist when the cumulative
share of transport-related energy use is plotted against the cumulative share of all surveyed
households (supplementary material, Section 4.11.11), where consumption is unequally
distributed towards a few (possibly wealthier) households.
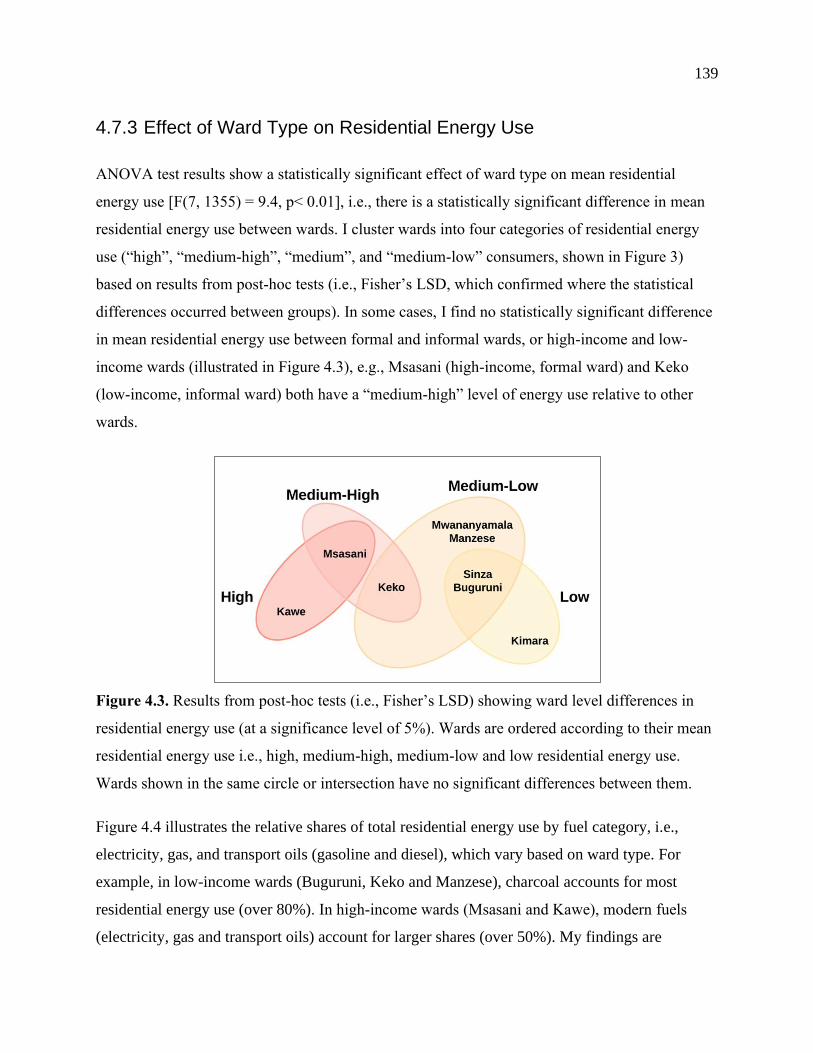
139
4.7.3 Effect of Ward Type on Residential Energy Use
ANOVA test results show a statistically significant effect of ward type on mean residential
energy use [F(7, 1355) = 9.4, p< 0.01], i.e., there is a statistically significant difference in mean
residential energy use between wards. I cluster wards into four categories of residential energy
use (“high”, “medium-high”, “medium”, and “medium-low” consumers, shown in Figure 3)
based on results from post-hoc tests (i.e., Fisher’s LSD, which confirmed where the statistical
differences occurred between groups). In some cases, I find no statistically significant difference
in mean residential energy use between formal and informal wards, or high-income and low-
income wards (illustrated in Figure 4.3), e.g., Msasani (high-income, formal ward) and Keko
(low-income, informal ward) both have a “medium-high” level of energy use relative to other
wards.
Figure 4.3. Results from post-hoc tests (i.e., Fisher’s LSD) showing ward level differences in
residential energy use (at a significance level of 5%). Wards are ordered according to their mean
residential energy use i.e., high, medium-high, medium-low and low residential energy use.
Wards shown in the same circle or intersection have no significant differences between them.
Figure 4.4 illustrates the relative shares of total residential energy use by fuel category, i.e.,
electricity, gas, and transport oils (gasoline and diesel), which vary based on ward type. For
example, in low-income wards (Buguruni, Keko and Manzese), charcoal accounts for most
residential energy use (over 80%). In high-income wards (Msasani and Kawe), modern fuels
(electricity, gas and transport oils) account for larger shares (over 50%). My findings are

140
consistent with other studies in the Africa region that have similarly shown higher wood fuel use
among low-income households and higher gas/electricity use among high-income households.
For example, the historic study of Hughes-Cromwick (1985) disaggregated urban household
energy use (by income group) among surveyed households in Nairobi (Kenya). The study found
that wood fuels (charcoal) accounted for most residential energy use among low-income
households, i.e., 89% of households in the lowest income group used wood fuels for cooking
compared to 31% in the highest income group (Hughes-Cromwick, 1985). More recent studies
for South Africa (Bohlmann and Inglesi-Lotz, 2018), Uganda (Katutsi et al., 2020) and Zambia
(Mulenga et al., 2019) similarly found considerable wood fuel use among surveyed low-income
and high-income households. However, distinct from this current study, the authors of these
studies did not include transport energy in their estimate for residential energy use, which means
that the energy use estimates from previous studies of Hughes-Cromwick (1985) and others are
likely underestimated.
Figure 4.4. Average relative shares of total household energy use by type of fuel in the Dar es
Salaam surveyed wards.
In transportation, I find that private vehicle travel accounts for most transport-related energy use,
which could indicate underlying disparities in ward-level transport options. This is further
illustrated in Figure 4.5, which shows the relative share of transport-related energy use by mode

141
(Figure 4.5, Plot A) compared to the total number of households that reported the use of a private
vehicle (Figure 4.5, Plot B). Disparities are most striking in informal (low-income) wards, where
the few households that used a private vehicle (5% or less) contribute 50% to 80% of transport-
related energy use. Furthermore, energy use in transportation is the most unequally distributed
across surveyed households. Adapted Lorenz curves showing inequalities in energy use yield the
highest inequality measure (Gini coefficients) for transport-related energy use (see
supplementary material, Section 4.11.11). For example, I estimate a Gini coefficient (Ge) of 0.87
for transport-related energy use (where Ge = 1 indicates the highest level of inequality),
compared to 0.38 for household-related energy use (Section 4.11.11). Comparing my results with
other global regions, I find similar differences: e.g., 0.407 for China (total household energy use,
(Wu et al., 2017)), 0.87 for Kenya (electricity use, (Jacobson et al., 2005)), and 0.14 and 0.28 for
Canada (electricity and gas use, (Mirnezami, 2014)).
A. Average relative share of transport energy use by mode
B. Proportion of surveyed households using a private vehicle
Figure 4.5. Average relative shares of total transport energy use among surveyed wards in the
Dar es Salaam region according to transport mode (A). Proportion of households that reported
the use of a private vehicle among the surveyed wards (B).

142
4.7.4 Effect of Cooking Fuel Choice and other Socio-Economic and Spatial
Factors on Household-Related Energy Use
I find that most surveyed household do not use electricity for cooking despite relatively high
electrification levels at the ward level, i.e., between 75% (Buguruni) and 100% (Msasani and
Sinza) of surveyed wards were electrified (supplementary material, Section 4.11.6), but only 9%
of households reported using electricity as a cooking fuel. The remaining 81% used a
combination of gas, wood fuels (charcoal) and kerosene as a cooking fuel (Table 4.3). Other
studies in the Africa region have likewise shown limited electricity use compared to wood fuels
and gas among households in rural and urban areas, e.g., Mozambique (Castán Broto et al.,
2020), Ghana (Mensah and Adu, 2015), Uganda (Katutsi et al., 2020), and South Africa
(Bohlmann and Inglesi-Lotz, 2018). Though a more recent study for Lagos (Edomah and
Ndulue, 2020) has shown that increases in electricity use for cooking could be anticipated in the
near term (i.e., 2020 onwards) due to the coronavirus (COVID-19) pandemic and mandatory
stay-at-home lockdowns.
I also find that electrification levels in Buguruni (75%) are consistent with averages for the Dar
es Salaam region reported in Tanzania’s energy access report (i.e., 75% in 2016), which is much
higher than the national and rural average of 36% and 16% in 2016 (Government of Tanzania,
2017b). However, variation in ward level energy use is not considered in the energy access
report – data are generalized for the entire city region. For example, higher electrification levels
in other wards (e.g., Msasani) are not considered in reported data, or the variation in electricity
sources (e.g., grid-supplied electricity, community generators or solar panels). In the
supplementary material (Section 4.11.8.), I show the different sources of electricity among my
surveyed households, i.e., from a low of 72% (Buguruni) to a high of 100% (Msasani and Sinza)
from grid-supplied electricity, from a low of 0% (Buguruni) to a high of 25% (Msasani) from
community or private generators, and from a low of 0% (Mwananyamala) to a high of 5%
(Kawe) from solar panels. Note that these ranges do not add to 100% as some households
reported multiple sources of electricity supply.
143
Across all surveyed wards, 62% of households fuel stacked, though, with some variation at the
ward level (see the supplementary material, Section 4.11.6, for data summaries by ward).
Households that fuel stack (i.e., use two or more fuels for cooking needs) are correlated with
higher household-related energy use. ANOVA tests found a statistically significant effect of
cooking fuel choice on mean household-related energy use [F(11,1349) = 59.05, p< 0.01]. Post-
hoc (LSD) tests that map the effect of cooking fuel choice on mean household-related energy use
show five groupings of households (A to E) (see Table 4.3). However, note that results in Table
4.3 should not be over-interpreted given the different levels of reporting from households, e.g., in
the highest group (A), only one household reported fuel-stacking with electricity, charcoal and
“other” (i.e., either kerosene or firewood). Considering these limitations, I find that households
that fuel stack with three fuels (6% of all households surveyed) generally appear to be the highest
energy users (Table 4.3, group A). Except for charcoal, using a single fuel (e.g., only gas, or only
electricity) is associated with lower household-related energy use.
Results from OLS and Tobit regressions correlate fuel stacking with 35% higher household-
related energy use (i.e., taking the exponent of the coefficient, ~0.3, shown in OLS and Tobit
models – Table 4.4). Fuel stacking with electricity, charcoal and kerosene/firewood (3% of
households surveyed) is correlated with the highest household-related energy use (11 and 13
times more, based on estimated coefficients: 2.5 and 2.7 for OLS and Tobit models, respectively)
relative to households that use only electricity (reference case). Finally, changes along PC1 and
PC2, which I interpret as wealth and possibly propensity to invest in common appliances,
respectively, show a significant and positive correlation with household-related energy use. My
findings are consistent with other studies that likewise found positive and significant correlations
relating both income and fuel stacking to household energy use and/or fuel choices in Tanzania,
e.g., (Choumert-Nkolo et al., 2019; D’Agostino et al., 2015).

144
Table 4.3. Results from LSD test results showing differences in mean household-related energy
use based on household cooking fuel choice among surveyed households in the Dar es Salaam
region. ‘A’ represents the high energy using groups, and E the lowest. Surveyed households
grouped with the same letter indicate no statistically significant difference between group means.
Cooking fuel choice1 Dependent variable:
log(Household)2
Ordered
groupings3
Number (and %) of
households surveyed5
Electricity, charcoal, and other4 4.7 A 1 (0.1%)
Electricity, gas and charcoal 3.62 AB 43 (3.2%)
Charcoal and electricity 3.59 ABC 2 (0.1%)
Gas, charcoal and other4 3.47 ABC 37 (2.7%)
Only charcoal 3.42 BC 305 (22.4%)
Gas and charcoal 3.41 C 549 (40.3%)
Gas and electricity 3.35 C 73 (5.4%)
Charcoal and other4 3.3 C 133 (9.8%)
Only gas 2.51 D 193 (14.2%)
Gas and other4 2.23 D 8 (0.6%)
Only electricity 1.37 DE 1 (0.1%)
Only other4 0.64 E 16 (1.2%)
Significance (ANOVA) p<0.01***
Table Notes:
1 My dataset included no household reporting of the following cooking fuel choice combinations: (1) electricity, gas
and other (i.e., either kerosene or firewood), (2) charcoal and other, and (3) electricity and other.
2 Household-related energy use estimates were log transformed to reduce skewness. Note, household-related energy
use is estimated based on the sum of energy uses from household charcoal, gas and electricity use.
3 Variables with one or more of the same letters are not statistically different from each other.
4 “Other” refers to either kerosene or firewood. Note, these fuels are not included in my final estimate for household-
related energy use.
5 Total households surveyed sum to 1,363. Break-down by ward and additional summary statistics in the
supplementary material, Section 4.11.6 and Section 4.11.8.
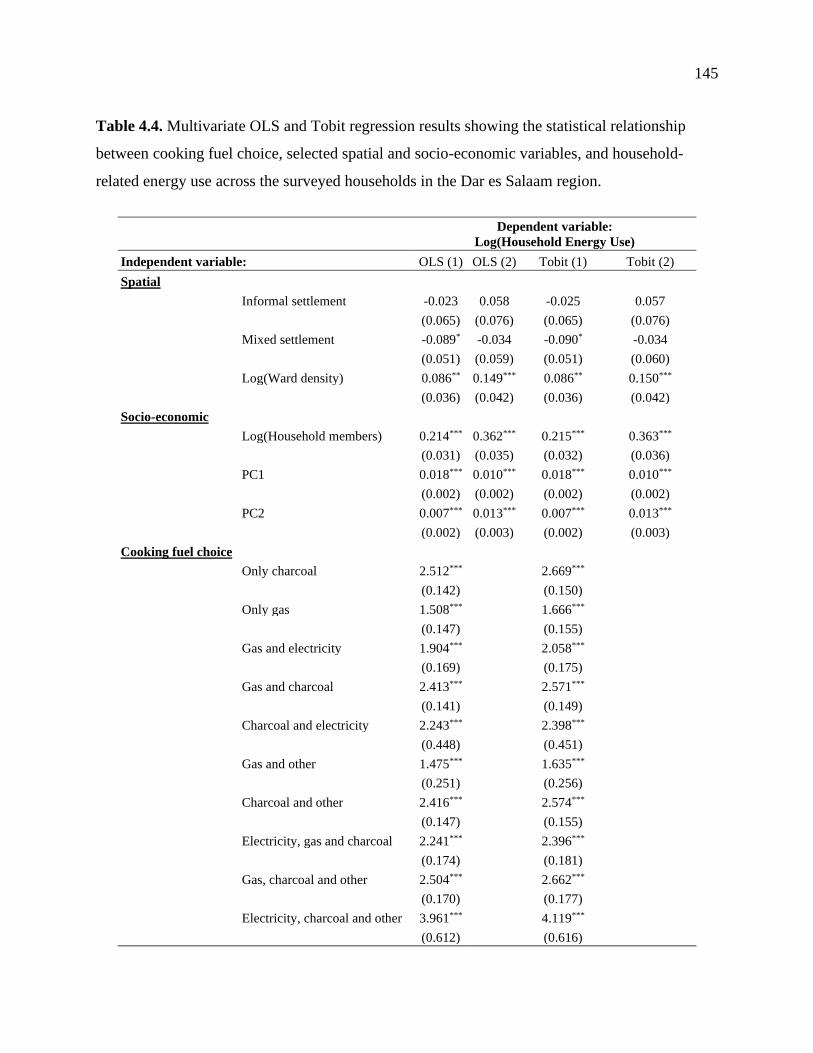
145
Table 4.4. Multivariate OLS and Tobit regression results showing the statistical relationship
between cooking fuel choice, selected spatial and socio-economic variables, and household-
related energy use across the surveyed households in the Dar es Salaam region.
Dependent variable:
Log(Household Energy Use)
Independent variable: OLS (1) OLS (2) Tobit (1) Tobit (2)
Spatial
Informal settlement -0.023 0.058 -0.025 0.057
(0.065) (0.076) (0.065) (0.076)
Mixed settlement -0.089* -0.034 -0.090* -0.034
(0.051) (0.059) (0.051) (0.060)
Log(Ward density) 0.086** 0.149*** 0.086** 0.150***
(0.036) (0.042) (0.036) (0.042)
Socio-economic
Log(Household members) 0.214*** 0.362*** 0.215*** 0.363***
(0.031) (0.035) (0.032) (0.036)
PC1 0.018*** 0.010*** 0.018*** 0.010***
(0.002) (0.002) (0.002) (0.002)
PC2 0.007*** 0.013*** 0.007*** 0.013***
(0.002) (0.003) (0.002) (0.003)
Cooking fuel choice
Only charcoal 2.512*** 2.669***
(0.142) (0.150)
Only gas 1.508*** 1.666***
(0.147) (0.155)
Gas and electricity 1.904*** 2.058***
(0.169) (0.175)
Gas and charcoal 2.413*** 2.571***
(0.141) (0.149)
Charcoal and electricity 2.243*** 2.398***
(0.448) (0.451)
Gas and other 1.475*** 1.635***
(0.251) (0.256)
Charcoal and other 2.416*** 2.574***
(0.147) (0.155)
Electricity, gas and charcoal 2.241*** 2.396***
(0.174) (0.181)
Gas, charcoal and other 2.504*** 2.662***
(0.170) (0.177)
Electricity, charcoal and other 3.961*** 4.119***
(0.612) (0.616)

146
Dependent variable:
Log(Household Energy Use)
Independent variable: OLS (1) OLS (2) Tobit (1) Tobit (2)
Fuel stack when cooking 0.326*** 0.328***
(0.040) (0.040)
Constant 0.067 1.129*** -0.094 1.116***
(0.357) (0.378) (0.362) (0.381)
Observations
1,363
1,363
1,363
(Censored:14)
1,363
(Censored: 14)
Pseudo R2 (McFadden) 0.805 0.769
R2 0.418 0.193
Adjusted R2 0.411 0.188
Table Notes:
• *p<0.1; **p<0.05; ***p<0.01.
• Standard error denoted by values in parentheses.
• Reference variables not included in table: Formal settlement; Only electricity (for cooking).
• “Other” refers to either kerosene or firewood. Note that these fuels are not included in my final
estimate for household-related energy use.
• See supplementary material for: (1) supporting correlation matrix of all data variables (Section 4.11.6),
and (2) Full-set of results from OLS and Tobit regressions, i.e., including original proxy variables
(education and appliance ownership) applied as predictors (Section 4.11.9).
4.7.5 Effect of Public Transport Use and other Socio-Economic and Spatial
Factors on Transport-Related Energy Use
I find a positive and significant correlation between transport-related energy use and the PC1
dimension for wealth (Table 4.5). Msasani and Kawe (high-income wards) contribute the highest
transport-related energy use (consistent with their high PC1 scores). Furthermore, using public
transport as part of a household’s commuting activities (i.e., either by BRT, dala-dala, bajaji or
boda) is correlated with 13% lower transport-related energy use (for the OLS model. Results
were indiscernible for the Tobit model). Public transport use (particularly use of the dala-dala) is
higher in informal wards, e.g., 93% of households in Buguruni reported using public transport as
part of their weekly communing, compared to 67% of households in Msasani (supplementary
material, Section 4.11.6). To interpret these differences in resident travel behavior, we conducted
multinomial logit regressions to assess spatial and socio-economic factors affecting travel mode
choice (see supplementary material, Section 4.11.10). Findings suggest that household wealth

147
(assumed based on coefficients along the PC1 dimension of wealth) is significantly and
positively correlated with households’ choice to use private vehicles (including taxi or Uber
rides) relative to the dala-dala. Moreover, even though the BRT is perceived to be more
expensive than the dala-dala (see Chapter 5), distance to the city center (Kivukoni) is a key
predictor of increased BRT use. Households that are further away from the city center are 17
times more likely to use the BRT relative to the dala-dala (taking the exponent of the coefficient,
2.9. See supplementary material, Section 4.11.10).
Relatedly, distance from the city center is correlated with higher transport-related energy use,
e.g., a 100% increase in distance between residence location and the city center is correlated with
2% and 3% higher transport-related energy (Table 4.5). I also find a negative and significant
relationship between ward density and transport-related energy use, where a 100% increase in
density is correlated with 19% or 16% lower transport-related energy use. These findings are
consistent with other literature that associates higher urban densities with lower transport-related
energy use, e.g., (Creutzig et al., 2015; IPCC, 2014; VandeWeghe & Kennedy, 2007). However,
in the case of Dar es Salaam, higher densities may not directly indicate a sustainable or energy-
efficient transport system. Considering the unique context in which African cities are urbanizing,
where urban growth is coupled with other challenges, including urban poverty and informality,
this negative correlation may be due to other hidden socio-economic factors (e.g., financial
constraints that prohibit the use of motorized transport) not explicitly considered in this study.
Details on these aspects are beyond the scope of this research and would be an important area of
future work.
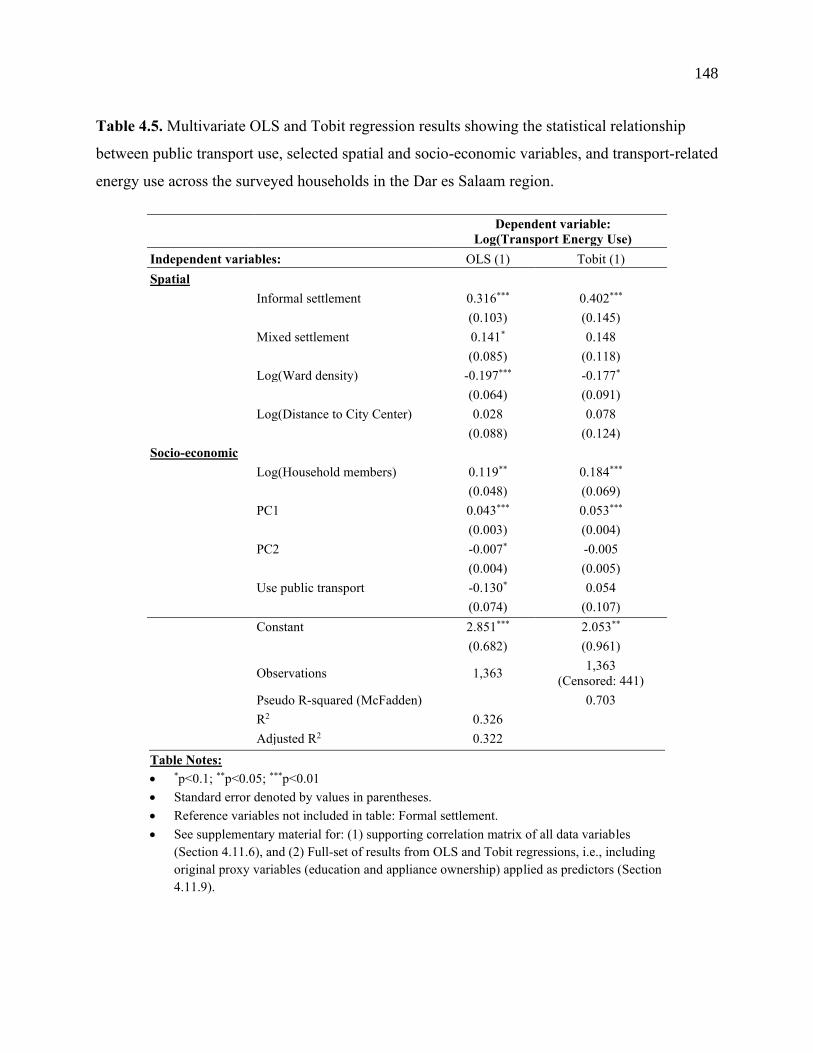
148
Table 4.5. Multivariate OLS and Tobit regression results showing the statistical relationship
between public transport use, selected spatial and socio-economic variables, and transport-related
energy use across the surveyed households in the Dar es Salaam region.
Dependent variable:
Log(Transport Energy Use)
Independent variables: OLS (1) Tobit (1)
Spatial
Informal settlement 0.316*** 0.402***
(0.103) (0.145)
Mixed settlement 0.141* 0.148
(0.085) (0.118)
Log(Ward density) -0.197*** -0.177*
(0.064) (0.091)
Log(Distance to City Center) 0.028 0.078
(0.088) (0.124)
Socio-economic
Log(Household members) 0.119** 0.184***
(0.048) (0.069)
PC1 0.043*** 0.053***
(0.003) (0.004)
PC2 -0.007* -0.005
(0.004) (0.005)
Use public transport -0.130* 0.054
(0.074) (0.107)
Constant 2.851*** 2.053**
(0.682) (0.961)
Observations 1,363
1,363
(Censored: 441)
Pseudo R-squared (McFadden) 0.703
R2 0.326
Adjusted R2 0.322
Table Notes:
• *p<0.1; **p<0.05; ***p<0.01
• Standard error denoted by values in parentheses.
• Reference variables not included in table: Formal settlement.
• See supplementary material for: (1) supporting correlation matrix of all data variables
(Section 4.11.6), and (2) Full-set of results from OLS and Tobit regressions, i.e., including
original proxy variables (education and appliance ownership) applied as predictors (Section
4.11.9).

149
4.8 Policy Considerations
The results presented in this study are suggestive and causality is not asssumed. Considering this
context, three main findings are clear: (1) there is a statistically significant difference in mean
residential energy use among Dar es Salaam wards, where differences are between four distinct
clusters of household and transport-related energy use (which I illustrate in Figure 4.6); (2) a
shift in fuel consumption, i.e., from traditional (charcoal) to modern fuels
(electricity/gas/transport oils), is evident from low-income to high-income wards; and (3)
consumption of charcoal (typically present in fuel stacking) and private vehicle use are major
drivers of household and transport-related energy use, respectively.
Figure 4.6 shows mean household-related energy use versus transport-related energy use across
the surveyed wards, where I identify four clusters of wards, which represent different levels of
household-related and transport-related energy use, respectively : (A) Low-Low (Kimara); (B)
Medium-Low (Sinza, Buguruni, Manzese and Mwananyamala); (C) High-Low (Keko); and (D)
High-High (Msasani and Kawe – the high income wards). This clustering suggests that a
possible transition in energy use may occur as wards develop from A to D (Figure 4.6), where
convergence towards higher energy use could be expected as more wards consume at levels
similar to Kawe/Msasani in the future (and where a switch to more modern fuels could be
expected). I also find that fuel stacking plays a critical role in rising energy demand and could be
considered in the context of ongoing policy measures promoting electrification and energy
efficiency. For example, 100% electricity use, or fuel stacking with electricity and gas, could be
encouraged as wards develop socio-economically (e.g., towards D, Figure 4.6) to promote a
gradual phase-out of charcoal use. Whereas, 100% gas use, or fuel stacking with gas and
charcoal (which is associated with lower energy use than using only charcoal, Table 4.4), could
be considered for wards “in transition” (e.g., A to C, Figure 4.6). The use of energy-efficient
charcoal and gas stoves, which are already stated as a key consideration in Tanzania’s energy
policies, e.g., (Government of Tanzania, 2015b), could be promoted alongside these
differentiated interventions.
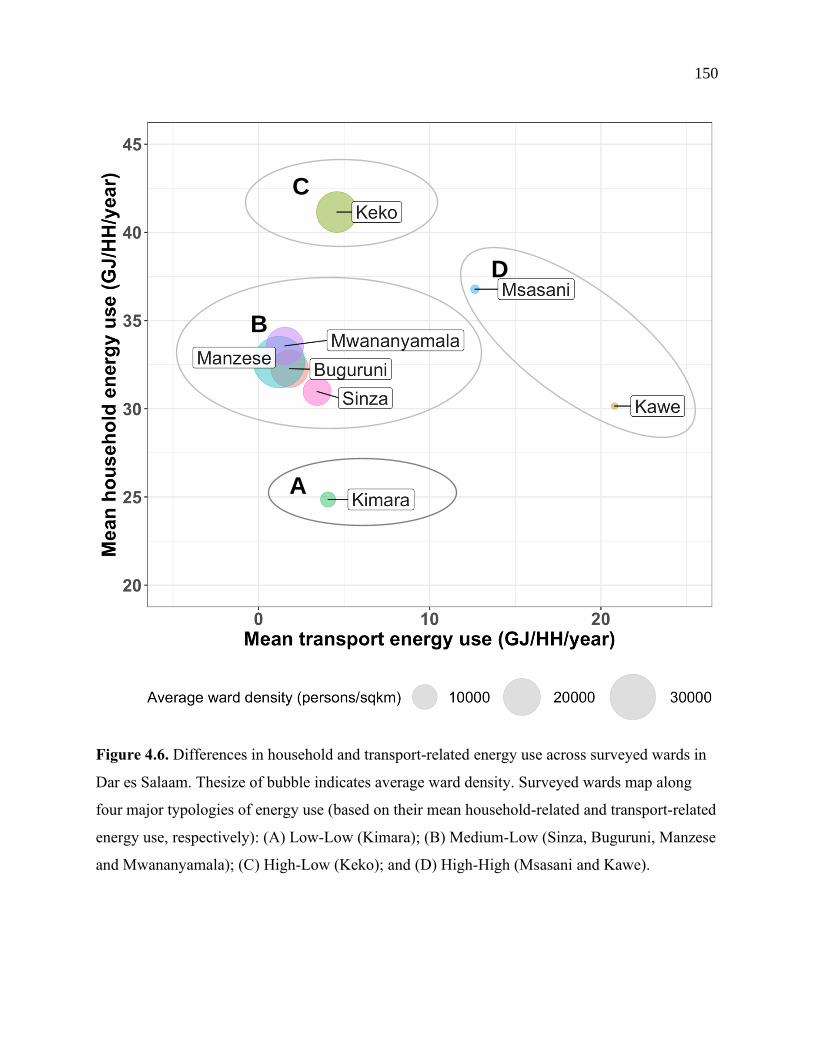
150
Figure 4.6. Differences in household and transport-related energy use across surveyed wards in
Dar es Salaam. Thesize of bubble indicates average ward density. Surveyed wards map along
four major typologies of energy use (based on their mean household-related and transport-related
energy use, respectively): (A) Low-Low (Kimara); (B) Medium-Low (Sinza, Buguruni, Manzese
and Mwananyamala); (C) High-Low (Keko); and (D) High-High (Msasani and Kawe).
A
B
C
D

151
In transportation, public transport use, particularly BRT use, could be encouraged in all wards,
but more so in wards such as Msasani/Kawe (cluster D) with high levels of transport related
energy use due to their higher private vehicle travel (Figure 4.6). Therefore, policymakers would
need to balance investments in public transport and the BRT service across a wide range of
settlements in the city: (a) to improve access/affordability (especially for informal, low-income
wards with limited travel options) and (b) to control transport-related energy use (especially in
wealthier wards due to their higher private vehicle use). These efforts could feed into ongoing
urban planning policies (e.g., Government of Tanzania (2017a)) that already envision an energy-
efficient and accessible transport system in Dar es Salaam.
4.9 Study Limitations
I highlight three study limitations linked to my methods and results. Firstly, as stated in the
methods, I was unable to collect data on firewood and kerosene use (households were unable to
estimate their consumption for these specific categories during pilot surveys in Kijitonyama
ward). Therefore, my values for household-related energy use may be under-estimated in some
cases. I also did not include weekend or leisure travel in my transportation estimates, even
though these may have an effect on transport-related energy use and associated GHG emissions.
For example, in their review paper, Czepkiewicz et al. (2018) found significant positive
correlations between urban density and GHG emissions in transportation when long-distance
travel is included in the analysis (i.e., from car weekend trips and international flights).
Secondly, my structured survey did not allow for further analysis of contextual factors (e.g.,
cultural, or local beliefs) that may influence residential energy use. Therefore, future work could
incorporate qualitative methods, e.g., participant observation or ethnographic approaches, as to
confirm or validate the data we collected in the structured survey. Except for electricity data that
was collected via household electricity bills, charcoal, gas, and transport data were reliant on
self-reported data, and surveyed households may have under or over-estimated their energy use
or travel behaviors.

152
Finally, future work may broaden the scope of analysis by (1) tracking changes in residential
energy use over time (e.g., to validate our assumptions of energy convergence), (2) conducting
similar studies in other cities in Tanzania or African countries to compare research findings, (3)
estimating GHG implications of energy use and other environmental impacts (e.g., health
burdens associated with air pollution), including geographic mapping to identify settlements or
populations that contribute most to urban GHG emissions, and (4) engaging with policymakers
to develop strategies to translate our data into meaningful policy actions.
4.10 Concluding Remarks
To my knowledge, I present the first estimates of disaggregated ward level residential energy use
for Dar es Salaam. I find a statistically significant difference in energy use among the surveyed
wards, which can be grouped into four clusters, each representing distinct levels of residential
(household and transport-related) energy use. These findings suggest the need for differentiated
approaches to implementing energy policies at the sub-city scale. In addition, I highlight that
movement towards higher levels of energy use could be expected with continued urban growth in
Dar es Salaam (and possibly, other African cities), e.g., towards Msasani/Kawe levels, or those
of outliers shown in Figure 4.2. At the same time, fuel switching towards more modern fuels
(especially for cooking, e.g., electricity and gas) could be expected with rising wealth, fuel
stacking and travel distances, among other socio-economic and spatial factors, contributing to
higher residential energy use. Finally, my calculations show the different household and
transport-related drivers of residential energy use at the ward level. However, other contextual
factors (i.e., culture, society and urban governance structures) that influence infrastructure
service delivery would need to be considered alongside differentiated policy interventions.
153
4.11 Supplementary Material
The supplementary material includes supporting methods, calculations and background data that
are important in the context of this chapter (Chapter 4). Tables and figures are presented with the
letter “S” in their caption title, and are referenced throughout the main body of this chapter,
where relevant.
4.11.1 Recruitment of Field Team
The field team was recruited following interviews conducted in August 2018. The field team
consisted of ten members: Alice Chibulu Luo (Lead Researcher), six graduate students from
Ardhi University, and three experienced staff (including a Field Supervisor). The experienced
staff were from Ideas in Action Ltd., a local research company, recruited under the study to
support field coordination (see: https://www.iact.co.tz/). Each member signed a contract that
detailed terms of the field work, remuneration and training requirements. In early September
2018, members participated in a 2-day training, which included pilot testing of the questionnaire
in Kijitonyama ward.
4.11.2 Research Ethics Approvals and Local Clearances
The study received research approvals/clearances from institutions listed below.
(1) The Human Sciences Research Ethics Board (REB) at the University of Toronto.
Approval granted on November 11th, 2017. Protocol Reference #: 34987.
(2) The Tanzania Commission for Science and Technology (COSTECH) in Dar es
Salaam. Approval granted on May 7th, 2018. Research Permit #: 2018-327-NA-2018-
133.
(3) Various regional, district and ward level institutions. Approvals were granted in
August and September 2018. Ideas in Action Ltd. supported the authors in following-up
with local government authorities. This included submitting research introduction letters

154
and the COSTECH approval (item 2, noted above) to the Regional Administrative
Secretary, within the office of the Regional Commissioner, who granted research
clearance in the Dar es Salaam region. Subsequent approvals were obtained from district
and ward level authorities in Kinondoni, Ubungo, Ilala and Temeke districts, and
Msasani, Sinza, Manzese, Keko, Buguruni, Mwananyamala, Kawe and Kimara wards.
4.11.3 Quantifying Energy Use
I use the term “residential energy use” to refer to the sum of energy uses from both household
and transport-related activities. I determined energy use from household activities based on
reported household electricity, charcoal, and gas use, and from transport activities based on the
commuting behavior of household members during an average weekday (i.e., Monday to Friday).
Results from pilot tests in Kijitonyama ward showed that household reporting on weekday trips
showed a more consistent picture of household travel behavior, and therefore, my calculations do
not consider possible variations due to weekend travel. Interviewed participants were questioned
on “start” and “end” locations of average weekday trips (including transfer stops), travel modes
used, and common routes taken, e.g., names of major roads. I digitized and quantified travel
routes and travel distances for each trip using the trip data for each household (Mr. Kevin
Onjiko, Research Consultant, was recruited to support me with this work).
Equations (1) and (2) show my approach to estimating annual energy use from household and
transport-related activities, respectively, and Table S 4.1 summarizes the fuel conversion factors
applied in the study.
(1) Equation 1: Annual household-related energy use (in GJ/HH/year) from charcoal and
gas and electricity use in the home.
𝐻𝐸 = 𝐸𝐷𝐶 × 𝐶𝐹 × 365
CF = 0.0036 GJ/kWh (for electricity)
CF = 0.0295 GJ/kg (for charcoal)
CF = 0.0473 GJ/kg (for gas)

155
Where, for each fuel, HE is the estimated household-related energy use in GJ/HH/year.
EDC is the estimated daily consumption in kg (for charcoal and gas) or daily kWh for
electricity. CF is the fuel conversion factor, which varies according to fuel type (using
estimates shown in Table S 4.1). All values are multiplied by 365 to convert from daily to
annual use.
(2) Equation 2: For each household member, annual transport-related energy use (in
GJ/passenger/year) from private and public vehicle travel by household members. Note
that the final reported value in GJ/HH/year is the sum of all household members’
transport-related energy use for each surveyed household.
𝑇𝐸 = 𝐸𝐼 × 𝑇𝐷 × 𝐷 × 𝐶𝐹 × 365
𝐸𝐼 = 1
(𝐹𝐸 × 𝐿𝐹)
CF = 0.0443 GJ/kg (for gasoline)
CF = 0.043 GJ/kg (for diesel)
Where, for each mode, TE is the estimated transport-related energy use in
GJ/passenger/year, EI is the energy intensity (liters/passenger-kilometer), which is the
inverse product of FE, the fuel economy (vehicle-kilometer/liter) (shown in Table S 1,
Notes) and LF, the load factor (passengers/vehicle) taken from (World Bank, 2016) and
(DART, 2017) (shown in Table S 4.1, Notes). TD is the daily vehicle travel distance
(kilometers) estimated from data digitization in ArcGIS. D is the vehicle fuel density (in
kilograms/liter) (Engineering ToolBox, 2003). CF is the fuel conversion factor (based on
estimates shown in Table S 1). I assume the following fuel uses within the vehicle fleet
taken from (World Bank, 2016) and (Chapter 3): BRT: diesel (100%); bajaji and boda-
boda: gasoline (100%); dala-dala: gasoline (80%) and diesel (20%); and private vehicle:
gasoline (90%) and diesel (10%). All values are multiplied by 365 to estimate annual use.
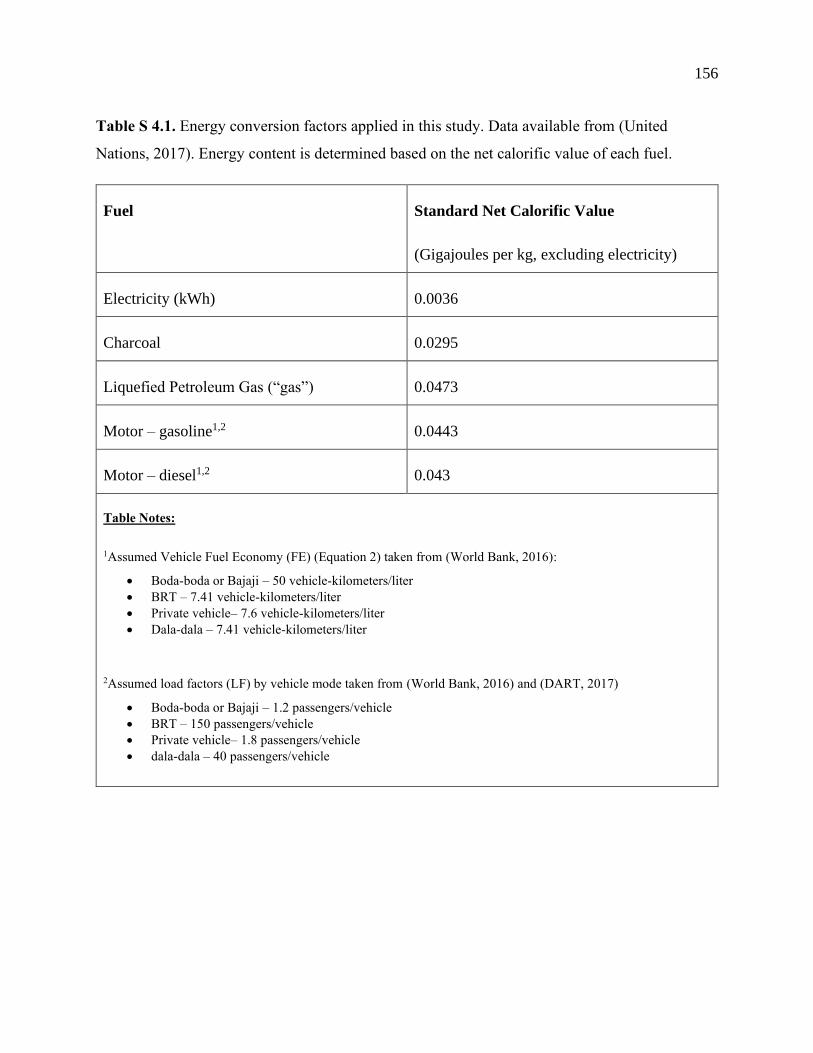
156
Table S 4.1. Energy conversion factors applied in this study. Data available from (United
Nations, 2017). Energy content is determined based on the net calorific value of each fuel.
Fuel Standard Net Calorific Value
(Gigajoules per kg, excluding electricity)
Electricity (kWh) 0.0036
Charcoal 0.0295
Liquefied Petroleum Gas (“gas”) 0.0473
Motor – gasoline1,2 0.0443
Motor – diesel1,2 0.043
Table Notes:
1Assumed Vehicle Fuel Economy (FE) (Equation 2) taken from (World Bank, 2016):
• Boda-boda or Bajaji – 50 vehicle-kilometers/liter
• BRT – 7.41 vehicle-kilometers/liter
• Private vehicle– 7.6 vehicle-kilometers/liter
• Dala-dala – 7.41 vehicle-kilometers/liter
2Assumed load factors (LF) by vehicle mode taken from (World Bank, 2016) and (DART, 2017)
• Boda-boda or Bajaji – 1.2 passengers/vehicle
• BRT – 150 passengers/vehicle
• Private vehicle– 1.8 passengers/vehicle
• dala-dala – 40 passengers/vehicle

157
4.11.4 Principal Component Scores by Ward
Figure S 4.1. Variation in PC1 scores by ward (which indicate household wealth). High PC1
scores in Kawe and Msasani are indicated in the boxplots, supporting my assumption that these
wards are generally presumed as high-income by Dar es Salaam locals.
Figure S 4.2. Variation in PC2 scores by ward (which indicate possible propensity for common
electric appliances). Box plot ranges appear similar, indicating no clear difference in PC2 scores
across the surveyed wards.

158
4.11.5 Description of Variables Used in OLS and Tobit Regressions
Table S 4.2. Description of variables used in OLS and Tobit models showing the influence of
cooking fuel choice1, public transport use and other socio-economic and spatial variables on
household related and transport-related energy use, respectively.
Variable Description as applied in this study
Dependent variables
(Note: variables are log transformed, where relevant, to reduce skewness)
Log(Residential
Energy)
The natural log of residential energy use (in GJ/HH),
which is the sum of both household-related and
transport-related energy among surveyed households.
Log(Household Energy) The natural log of household-related energy use (in
GJ/HH), which is the sum of energy use from
charcoal, gas and electricity use among surveyed
households.
Log(Transport Energy) The natural log of transport-related energy use (in
GJ/HH) which is the sum of energy use from private
vehicle, dala-dala, bajaji and BRT travel among
surveyed households.
Independent variables
Spatial
Informal settlement Settlement contains housing and land obtained
through informal means i.e., through individuals
(Kironde, 2000).
Formal settlement Settlement contains housing and land obtained
through national and local government (Kironde,
2000).
Mixed settlement Settlement contains both formal and informal
settlements, with some areas currently being
formalized.

159
Log(Ward Density) Natural log of surveyed ward density, measured as
people per square kilometer based on 2012 census
data (NBS, 2013).
Distance to Kivukoni Average distance of surveyed wards to the city center
(Kivukoni) which is also the last stop south-east of
the BRT line (Phase 1).
Socio-economic
Log(Household
Members)
Natural log of total household members (both adults
and children) within an individual household
surveyed.
PC1 First Principal Component dimension.
PC2 Second Principal Component dimension.
Use public transport Household uses public transport, which encompasses
one or more of the following travel modes: the BRT,
boda-boda, bajaji or dala-dala
Cooking fuel
choice
Only gas Household uses only gas for cooking.
Only charcoal Household uses only charcoal for cooking.
Only electricity Household uses only electricity for cooking
Charcoal and electricity Household uses charcoal and electricity for cooking.
Gas and electricity Household uses gas and electricity for cooking.
Gas and charcoal Household uses gas and charcoal for cooking.
Gas and other Household uses gas and other fuel (i.e., either
kerosene or fuelwood) for cooking.
Charcoal and other Household uses charcoal and other fuel (i.e., either
kerosene or fuelwood) for cooking
Electricity, gas and
charcoal
Household uses electricity, gas and charcoal for
cooking.

160
Electricity, charcoal and
other
Household uses electricity, charcoal and other fuel
(i.e., either kerosene or wood) for cooking.
Gas, charcoal and other Household uses gas, charcoal and other fuel (i.e.,
either kerosene or wood) for cooking.
Fuel stacking Household fuel stacks (i.e., uses 2 or more fuels for
cooking).
Table Notes: 1 Due to an absence of reporting by households, we excluded following cooking fuel choice combinations from
my analysis: (1) gas, electricity and other (i.e., either kerosene or wood), (2) charcoal and other, and (3)
electricity and other.

161
4.11.6 Summary of Data Variables Relevant to the Study
Table S 4.3. Full summary statistics for key variables relevant to this study. Surveys were conducted across a socio-economically and
spatially diverse set of wards (8 in total, shown in alphabetical order), which represented a total sample size of 1,363 households.
Buguruni
(N=242)
Kawe
(N=178)
Keko
(N=113)
Kimara
(N=221)
Manzese
(N=235)
Msasani
(N=94)
Mwananyamala
(N=169)
Sinza
(N=111)
Overall
(N=1363)
Number of household
members
Mean (SD) 5 (3) 5 (2) 5 (3) 5 (2) 6 (3) 5 (2) 5 (3) 5 (2) 5 (3)
Median [Min, Max] 5 [1, 20] 5 [1, 10] 4 [1, 10] 5 [1, 10] 5 [1, 20] 5 [1, 10] 5 [1, 10] 5 [1, 10] 5 [1, 20]
Number of household rooms
Mean (SD) 5 (3) 8 (4) 5 (3) 6 (3) 5 (4) 8 (4) 5 (3) 5 (3) 6 (4)
Median [Min, Max] 4 [1, 20] 8 [1, 30] 5 [1, 10] 6 [1, 30] 4 [1, 40] 7 [1, 20] 4 [1, 20] 5 [0, 10] 5 [0, 40]
Primary education
No 179 (74.0%) 171 (96.1%) 82 (72.6%) 202 (91.4%) 174 (74.0%) 92 (97.9%) 142 (84.0%) 105 (94.6%) 1147 (84.2%)
Yes 63 (26.0%) 7 (3.9%) 31 (27.4%) 19 (8.6%) 61 (26.0%) 2 (2.1%) 27 (16.0%) 6 (5.4%) 216 (15.8%)
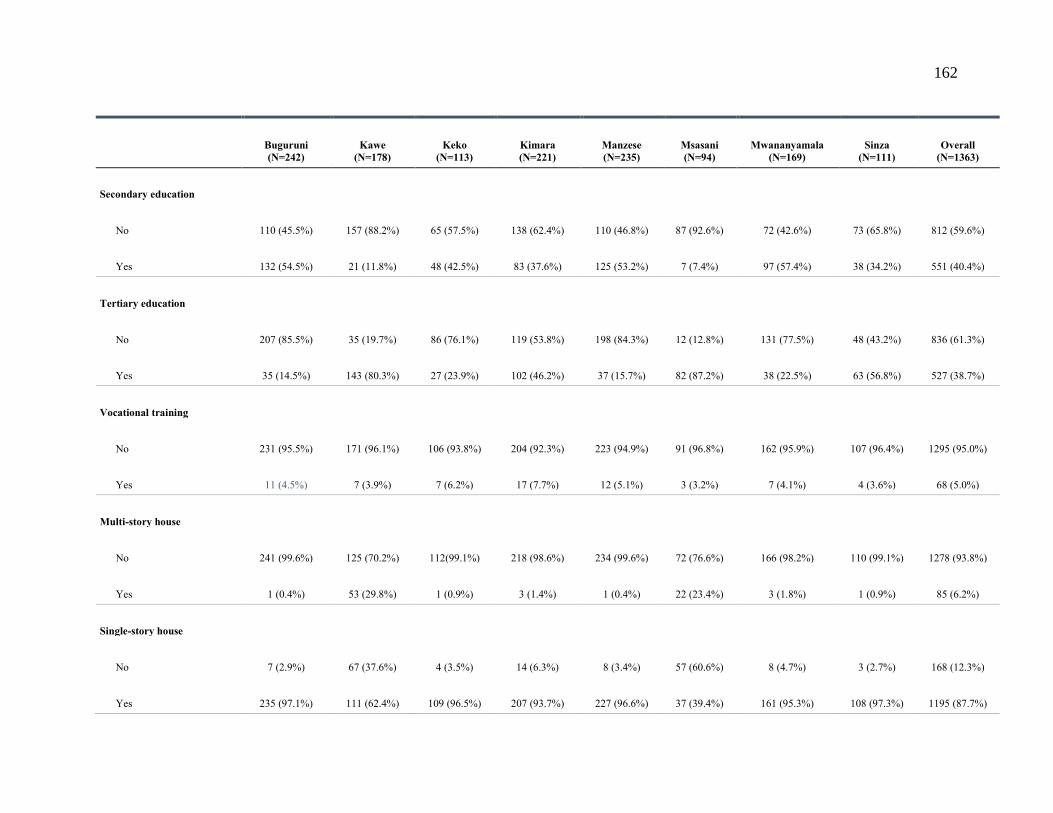
162
Buguruni
(N=242)
Kawe
(N=178)
Keko
(N=113)
Kimara
(N=221)
Manzese
(N=235)
Msasani
(N=94)
Mwananyamala
(N=169)
Sinza
(N=111)
Overall
(N=1363)
Secondary education
No 110 (45.5%) 157 (88.2%) 65 (57.5%) 138 (62.4%) 110 (46.8%) 87 (92.6%) 72 (42.6%) 73 (65.8%) 812 (59.6%)
Yes 132 (54.5%) 21 (11.8%) 48 (42.5%) 83 (37.6%) 125 (53.2%) 7 (7.4%) 97 (57.4%) 38 (34.2%) 551 (40.4%)
Tertiary education
No 207 (85.5%) 35 (19.7%) 86 (76.1%) 119 (53.8%) 198 (84.3%) 12 (12.8%) 131 (77.5%) 48 (43.2%) 836 (61.3%)
Yes 35 (14.5%) 143 (80.3%) 27 (23.9%) 102 (46.2%) 37 (15.7%) 82 (87.2%) 38 (22.5%) 63 (56.8%) 527 (38.7%)
Vocational training
No 231 (95.5%) 171 (96.1%) 106 (93.8%) 204 (92.3%) 223 (94.9%) 91 (96.8%) 162 (95.9%) 107 (96.4%) 1295 (95.0%)
Yes 11 (4.5%) 7 (3.9%) 7 (6.2%) 17 (7.7%) 12 (5.1%) 3 (3.2%) 7 (4.1%) 4 (3.6%) 68 (5.0%)
Multi-story house
No 241 (99.6%) 125 (70.2%) 112(99.1%) 218 (98.6%) 234 (99.6%) 72 (76.6%) 166 (98.2%) 110 (99.1%) 1278 (93.8%)
Yes 1 (0.4%) 53 (29.8%) 1 (0.9%) 3 (1.4%) 1 (0.4%) 22 (23.4%) 3 (1.8%) 1 (0.9%) 85 (6.2%)
Single-story house
No 7 (2.9%) 67 (37.6%) 4 (3.5%) 14 (6.3%) 8 (3.4%) 57 (60.6%) 8 (4.7%) 3 (2.7%) 168 (12.3%)
Yes 235 (97.1%) 111 (62.4%) 109 (96.5%) 207 (93.7%) 227 (96.6%) 37 (39.4%) 161 (95.3%) 108 (97.3%) 1195 (87.7%)
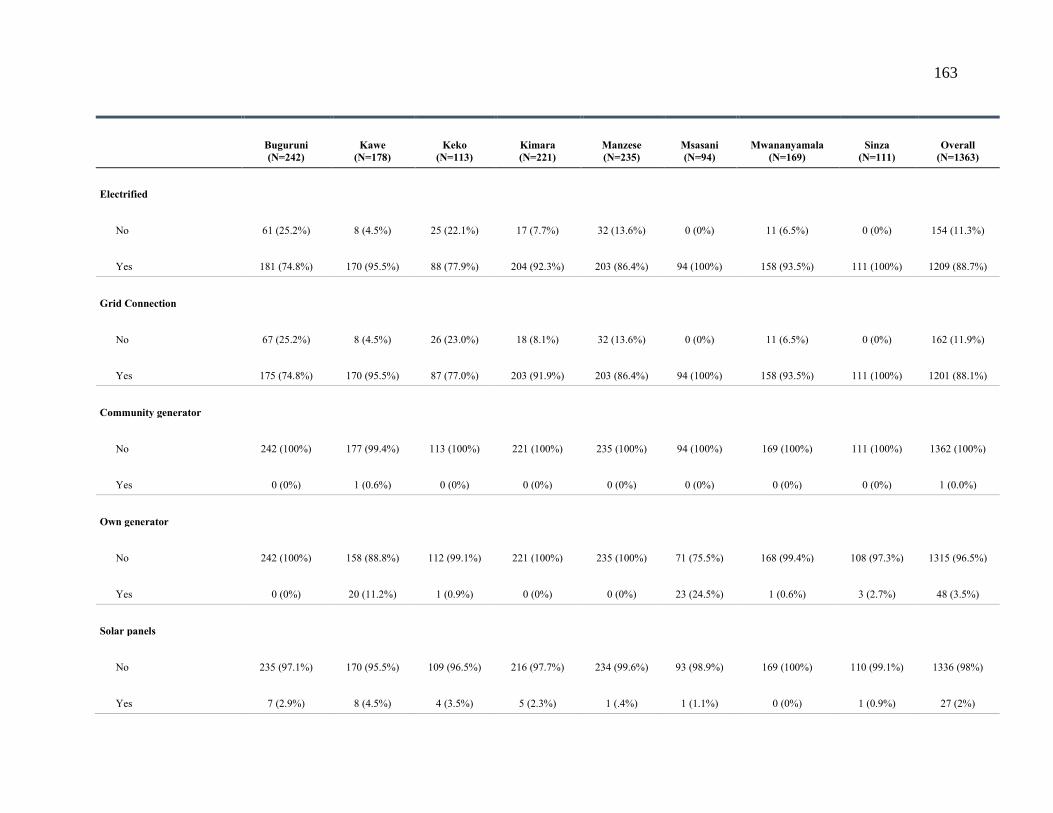
163
Buguruni
(N=242)
Kawe
(N=178)
Keko
(N=113)
Kimara
(N=221)
Manzese
(N=235)
Msasani
(N=94)
Mwananyamala
(N=169)
Sinza
(N=111)
Overall
(N=1363)
Electrified
No 61 (25.2%) 8 (4.5%) 25 (22.1%) 17 (7.7%) 32 (13.6%) 0 (0%) 11 (6.5%) 0 (0%) 154 (11.3%)
Yes 181 (74.8%) 170 (95.5%) 88 (77.9%) 204 (92.3%) 203 (86.4%) 94 (100%) 158 (93.5%) 111 (100%) 1209 (88.7%)
Grid Connection
No 67 (25.2%) 8 (4.5%) 26 (23.0%) 18 (8.1%) 32 (13.6%) 0 (0%) 11 (6.5%) 0 (0%) 162 (11.9%)
Yes 175 (74.8%) 170 (95.5%) 87 (77.0%) 203 (91.9%) 203 (86.4%) 94 (100%) 158 (93.5%) 111 (100%) 1201 (88.1%)
Community generator
No 242 (100%) 177 (99.4%) 113 (100%) 221 (100%) 235 (100%) 94 (100%) 169 (100%) 111 (100%) 1362 (100%)
Yes 0 (0%) 1 (0.6%) 0 (0%) 0 (0%) 0 (0%) 0 (0%) 0 (0%) 0 (0%) 1 (0.0%)
Own generator
No 242 (100%) 158 (88.8%) 112 (99.1%) 221 (100%) 235 (100%) 71 (75.5%) 168 (99.4%) 108 (97.3%) 1315 (96.5%)
Yes 0 (0%) 20 (11.2%) 1 (0.9%) 0 (0%) 0 (0%) 23 (24.5%) 1 (0.6%) 3 (2.7%) 48 (3.5%)
Solar panels
No 235 (97.1%) 170 (95.5%) 109 (96.5%) 216 (97.7%) 234 (99.6%) 93 (98.9%) 169 (100%) 110 (99.1%) 1336 (98%)
Yes 7 (2.9%) 8 (4.5%) 4 (3.5%) 5 (2.3%) 1 (.4%) 1 (1.1%) 0 (0%) 1 (0.9%) 27 (2%)

164
Buguruni
(N=242)
Kawe
(N=178)
Keko
(N=113)
Kimara
(N=221)
Manzese
(N=235)
Msasani
(N=94)
Mwananyamala
(N=169)
Sinza
(N=111)
Overall
(N=1363)
Monthly electricity use
(kWh)
Mean (SD) 60 (80) 300 (300) 60 (90) 80 (90) 60 (60) 500 (500) 100 (100) 100 (200) 100 (200)
Median [Min, Max] 30 [0, 600] 200 [0, 3000] 30 [0, 700] 50 [0, 700] 50 [0, 400] 300 [0,
3000] 70 [0, 900] 90 [0, 1000] 70 [0, 3000]
Own air conditioning unit
No 242 (100%) 106 (59.6%) 113 (100%) 215 (97.3%) 233 (99.1%) 32 (34.0%) 167 (98.8%) 105 (94.6%) 1213 (89.0%)
Yes 0 (0%) 72 (40.4%) 0 (0%) 6 (2.7%) 2 (0.9%) 62 (66.0%) 2 (1.2%) 6 (5.4%) 150 (11.0%)
Own electric stove
No 238 (98.3%) 115 (64.6%) 111 (98.2%) 208 (94.1%) 233 (99.1%) 41 (43.6%) 161 (95.3%) 95 (85.6%) 1202 (88.2%)
Yes 4 (1.7%) 63 (35.4%) 2 (1.8%) 13 (5.9%) 2 (0.9%) 53 (56.4%) 8 (4.7%) 16 (14.4%) 161 (11.8%)
Own refrigerator
No 156 (64.5%) 16 (9.0%) 72 (63.7%) 74 (33.5%) 129 (54.9%) 3 (3.2%) 68 (40.2%) 23 (20.7%) 541 (39.7%)
Yes 86 (35.5%) 162 (91.0%) 41 (36.3%) 147 (66.5%) 106 (45.1%) 91 (96.8%) 101 (59.8%) 88 (79.3%) 822 (60.3%)

165
Buguruni
(N=242)
Kawe
(N=178)
Keko
(N=113)
Kimara
(N=221)
Manzese
(N=235)
Msasani
(N=94)
Mwananyamala
(N=169)
Sinza
(N=111)
Overall
(N=1363)
Own television
No 88 (36.4%) 12 (6.7%) 31 (27.4%) 36 (16.3%) 69 (29.4%) 5 (5.3%) 29 (17.2%) 8 (7.2%) 278 (20.4%)
Yes 154 (63.6%) 166 (93.3%) 82 (72.6%) 185 (83.7%) 166 (70.6%) 89 (94.7%) 140 (82.8%) 103 (92.8%) 1085 (79.6%)
Own washing Machine
No 241 (99.6%) 125 (70.2%) 112 (99.1%) 213 (96.4%) 234 (99.6%) 45 (47.9%) 167 (98.8%) 108 (97.3%) 1245 (91.3%)
Yes 1 (0.4%) 53 (29.8%) 1 (0.9%) 8 (3.6%) 1 (0.4%) 49 (52.1%) 2 (1.2%) 3 (2.7%) 118 (8.7%)
Own private vehicle
No 224 (92.6%) 43 (24.2%) 105 (92.9%) 173 (78.3%) 223 (94.9%) 13 (13.8%) 153 (90.5%) 83 (74.8%) 1017 (74.6%)
Yes 18 (7.4%) 135 (75.8%) 8 (7.1%) 48 (21.7%) 12 (5.1%) 81 (86.2%) 16 (9.5%) 28 (25.2%) 346 (25.4%)
Fuel stack when cooking
No 109 (45.0%) 58 (32.6%) 53 (46.9%) 69 (31.2%) 98 (41.7%) 38 (40.4%) 53 (31.4%) 39 (35.1%) 517 (37.9%)
Yes 133 (55.0%) 120 (67.4%) 60 (53.1%) 152 (68.8%) 137 (58.3%) 56 (59.6%) 116 (68.6%) 72 (64.9%) 846 (62.1%)
Only gas (for cooking)
No 231 (95.5%) 126 (70.8%) 106 (93.8%) 186 (84.2%) 220 (93.6%) 57 (60.6%) 154 (91.1%) 90 (81.1%) 1170 (85.8%)
Yes 11 (4.5%) 52 (29.2%) 7 (6.2%) 35 (15.8%) 15 (6.4%) 37 (39.4%) 15 (8.9%) 21 (18.9%) 193 (14.2%)

166
Buguruni
(N=242)
Kawe
(N=178)
Keko
(N=113)
Kimara
(N=221)
Manzese
(N=235)
Msasani
(N=94)
Mwananyamala
(N=169)
Sinza
(N=111)
Overall
(N=1363)
Only electricity (for
cooking)
No 242 (100%) 178 (100%) 113 (100%) 221 (100%) 235 (100%) 94 (100%) 169 (100%) 110 (99.1%) 1362 (99.9%)
Yes 0 (0%) 0 (0%) 0 (0%) 0 (0%) 0 (0%) 0 (0%) 0 (0%) 1 (0.9%) 1 (0.1%)
Only charcoal (for cooking)
No 151 (62.4%) 172 (96.6%) 69 (61.1%) 191 (86.4%) 155 (66.0%) 93 (98.9%) 133 (78.7%) 94 (84.7%) 1058 (77.6%)
Yes 91 (37.6%) 6 (3.4%) 44 (38.9%) 30 (13.6%) 80 (34.0%) 1 (1.1%) 36 (21.3%) 17 (15.3%) 305 (22.4%)
Only other (i.e., kerosene or
gas) (for cooking)
No 235 (97.1%) 178 (100%) 111 (98.2%) 217 (98.2%) 232 (98.7%) 94 (100%) 169 (100%) 111 (100%) 1347 (98.8%)
Yes 7 (2.9%) 0 (0%) 2 (1.8%) 4 (1.8%) 3 (1.3%) 0 (0%) 0 (0%) 0 (0%) 16 (1.2%)
Gas and electricity (for
cooking)
No 242 (100%) 147 (82.6%) 113 (100%) 220 (99.5%) 235 (100%) 60 (63.8%) 167 (98.8%) 106 (95.5%) 1290 (94.6%)
Yes 0 (0%) 31 (17.4%) 0 (0%) 1 (0.5%) 0 (0%) 34 (36.2%) 2 (1.2%) 5 (4.5%) 73 (5.4%)

167
Buguruni
(N=242)
Kawe
(N=178)
Keko
(N=113)
Kimara
(N=221)
Manzese
(N=235)
Msasani
(N=94)
Mwananyamala
(N=169)
Sinza
(N=111)
Overall
(N=1363)
Gas and charcoal (for
cooking)
No 145 (59.9%) 119 (66.9%) 79 (69.9%) 104 (47.1%) 146 (62.1%) 83 (88.3%) 80 (47.3%) 58 (52.3%) 814 (59.7%)
Yes 97 (40.1%) 59 (33.1%) 34 (30.1%) 117 (52.9%) 89 (37.9%) 11 (11.7%) 89 (52.7%) 53 (47.7%) 549 (40.3%)
Charcoal and electricity (for
cooking)
No 241 (99.6%) 178 (100%) 113 (100%) 221 (100%) 235 (100%) 94 (100%) 169 (100%) 110 (99.1%) 1361 (99.9%)
Yes 1 (0.4%) 0 (0%) 0 (0%) 0 (0%) 0 (0%) 0 (0%) 0 (0%) 1 (0.9%) 2 (0.1%)
Gas and other (i.e., kerosene
or gas) (for cooking)
No 240 (99.2%) 176 (98.9%) 113 (100%) 218 (98.6%) 234 (99.6%) 94 (100%) 169 (100%) 111 (100%) 1355 (99.4%)
Yes 2 (0.8%) 2 (1.1%) 0 (0%) 3 (1.4%) 1 (0.4%) 0 (0%) 0 (0%) 0 (0%) 8 (0.6%)
Charcoal and other (i.e.,
kerosene or gas) (for
cooking)
No 213 (88.0%) 173 (97.2%) 92 (81.4%) 207 (93.7%) 193 (82.1%) 94 (100%) 150 (88.8%) 108 (97.3%) 1230 (90.2%)
Yes 29 (12.0%) 5 (2.8%) 21 (18.6%) 14 (6.3%) 42 (17.9%) 0 (0%) 19 (11.2%) 3 (2.7%) 133 (9.8%)

168
Buguruni
(N=242)
Kawe
(N=178)
Keko
(N=113)
Kimara
(N=221)
Manzese
(N=235)
Msasani
(N=94)
Mwananyamala
(N=169)
Sinza
(N=111)
Overall
(N=1363)
Electricity, gas and charcoal
(for cooking)
No 241 (99.6%) 161 (90.4%) 112 (99.1%) 215 (97.3%) 235 (100%) 84 (89.4%) 168 (99.4%) 104 (93.7%) 1320 (96.8%)
Yes 1 (0.4%) 17 (9.6%) 1 (0.9%) 6 (2.7%) 0 (0%) 10 (10.6%) 1 (0.6%) 7 (6.3%) 43 (3.2%)
Gas, charcoal and other (for
cooking)
No 239 (98.8%) 172 (96.6%) 109 (96.5%) 211 (95.5%) 230 (97.9%) 93 (98.9%) 164 (97.0%) 108 (97.3%) 1326 (97.3%)
Yes 3 (1.2%) 6 (3.4%) 4 (3.5%) 10 (4.5%) 5 (2.1%) 1 (1.1%) 5 (3.0%) 3 (2.7%) 37 (2.7%)
Electricity, charcoal and
other (i.e., kerosene or gas)
(for cooking)
No 242 (100%) 178 (100%) 113 (100%) 220 (99.5%) 235 (100%) 94 (100%) 169 (100%) 111 (100%) 1362 (99.9%)
Yes 0 (0%) 0 (0%) 0 (0%) 1 (0.5%) 0 (0%) 0 (0%) 0 (0%) 0 (0%) 1 (0.1%)
Use public transport
No 18 (7.4%) 47 (26.4%) 14 (12.4%) 23 (10.4%) 37 (15.7%) 31 (33.0%) 18 (10.7%) 14 (12.6%) 202 (14.8%)
Yes 224 (92.6%) 131 (73.6%) 99 (87.6%) 198 (89.6%) 198 (84.3%) 63 (67.0%) 151 (89.3%) 97 (87.4%) 1161 (85.2%)

169
Buguruni
(N=242)
Kawe
(N=178)
Keko
(N=113)
Kimara
(N=221)
Manzese
(N=235)
Msasani
(N=94)
Mwananyamala
(N=169)
Sinza
(N=111)
Overall
(N=1363)
Use bajaji (tricycle)
No 241 (99.6%) 168 (94.4%) 113 (100%) 194 (87.8%) 233 (99.1%) 92 (97.9%) 165 (97.6%) 109 (98.2%) 1315 (96.5%)
Yes 1 (0.4%) 10 (5.6%) 0 (0%) 27 (12.2%) 2 (0.9%) 2 (2.1%) 4 (2.4%) 2 (1.8%) 48 (3.5%)
Use boda-boda (motorcycle)
No 215 (88.8%) 172 (96.6%) 110 (97.3%) 201 (91.0%) 214 (91.1%) 94 (100%) 155 (91.7%) 97 (87.4%) 1258 (92.3%)
Yes 27 (11.2%) 6 (3.4%) 3 (2.7%) 20 (9.0%) 21 (8.9%) 0 (0%) 14 (8.3%) 14 (12.6%) 105 (7.7%)
Use BRT
No 240 (99.2%) 176 (98.9%) 112 (99.1%) 142 (64.3%) 192 (81.7%) 94 (100%) 156 (92.3%) 100 (90.1%) 1212 (88.9%)
Yes 2 (0.8%) 2 (1.1%) 1 (0.9%) 79 (35.7%) 43 (18.3%) 0 (0%) 13 (7.7%) 11 (9.9%) 151 (11.1%)
Use dala-dala (local bus)
No 86 (35.5%) 138 (77.5%) 51 (45.1%) 153 (69.2%) 123 (52.3%) 85 (90.4%) 79 (46.7%) 59 (53.2%) 774 (56.8%)
Yes 156 (64.5%) 40 (22.5%) 62 (54.9%) 68 (30.8%) 112 (47.7%) 9 (9.6%) 90 (53.3%) 52 (46.8%) 589 (43.2%)
Use private vehicle
No 233 (96.3%) 85 (47.8%) 107 (94.7%) 196 (88.7%) 223 (94.9%) 37 (39.4%) 159 (94.1%) 93 (83.8%) 1133 (83.1%)
Yes 9 (3.7%) 93 (52.2%) 6 (5.3%) 25 (11.3%) 12 (5.1%) 57 (60.6%) 10 (5.9%) 18 (16.2%) 230 (16.9%)
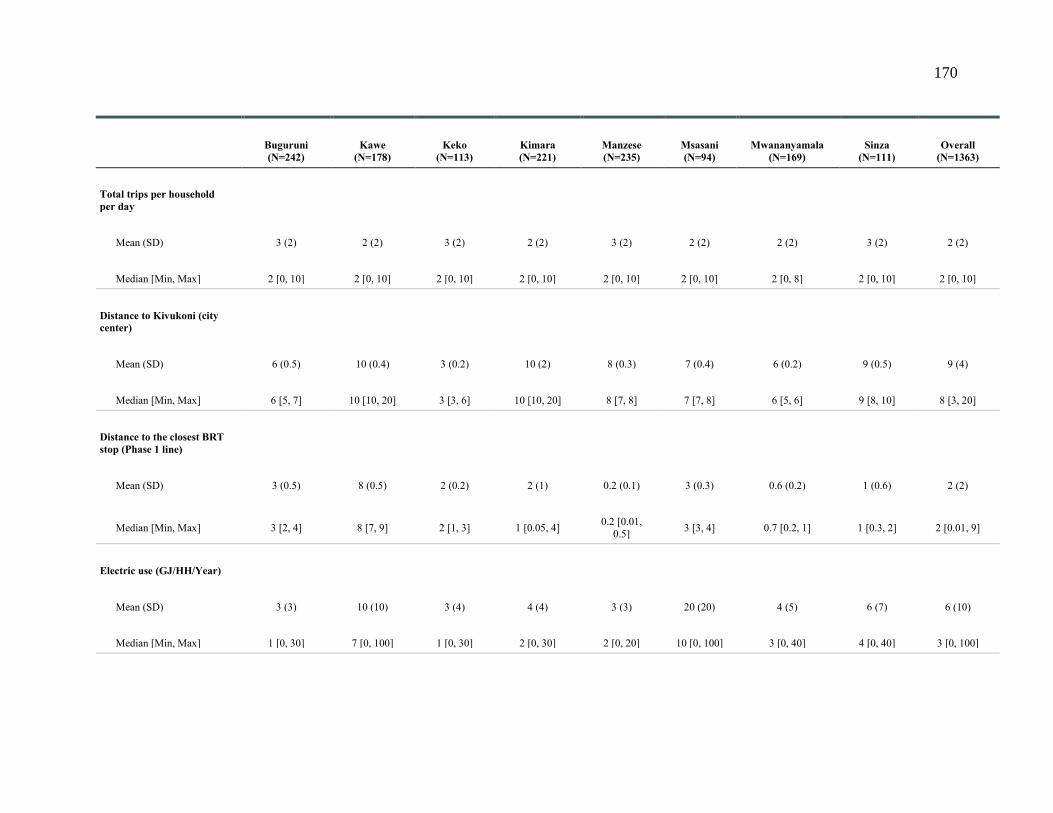
170
Buguruni
(N=242)
Kawe
(N=178)
Keko
(N=113)
Kimara
(N=221)
Manzese
(N=235)
Msasani
(N=94)
Mwananyamala
(N=169)
Sinza
(N=111)
Overall
(N=1363)
Total trips per household
per day
Mean (SD) 3 (2) 2 (2) 3 (2) 2 (2) 3 (2) 2 (2) 2 (2) 3 (2) 2 (2)
Median [Min, Max] 2 [0, 10] 2 [0, 10] 2 [0, 10] 2 [0, 10] 2 [0, 10] 2 [0, 10] 2 [0, 8] 2 [0, 10] 2 [0, 10]
Distance to Kivukoni (city
center)
Mean (SD) 6 (0.5) 10 (0.4) 3 (0.2) 10 (2) 8 (0.3) 7 (0.4) 6 (0.2) 9 (0.5) 9 (4)
Median [Min, Max] 6 [5, 7] 10 [10, 20] 3 [3, 6] 10 [10, 20] 8 [7, 8] 7 [7, 8] 6 [5, 6] 9 [8, 10] 8 [3, 20]
Distance to the closest BRT
stop (Phase 1 line)
Mean (SD) 3 (0.5) 8 (0.5) 2 (0.2) 2 (1) 0.2 (0.1) 3 (0.3) 0.6 (0.2) 1 (0.6) 2 (2)
Median [Min, Max] 3 [2, 4] 8 [7, 9] 2 [1, 3] 1 [0.05, 4] 0.2 [0.01,
0.5] 3 [3, 4] 0.7 [0.2, 1] 1 [0.3, 2] 2 [0.01, 9]
Electric use (GJ/HH/Year)
Mean (SD) 3 (3) 10 (10) 3 (4) 4 (4) 3 (3) 20 (20) 4 (5) 6 (7) 6 (10)
Median [Min, Max] 1 [0, 30] 7 [0, 100] 1 [0, 30] 2 [0, 30] 2 [0, 20] 10 [0, 100] 3 [0, 40] 4 [0, 40] 3 [0, 100]
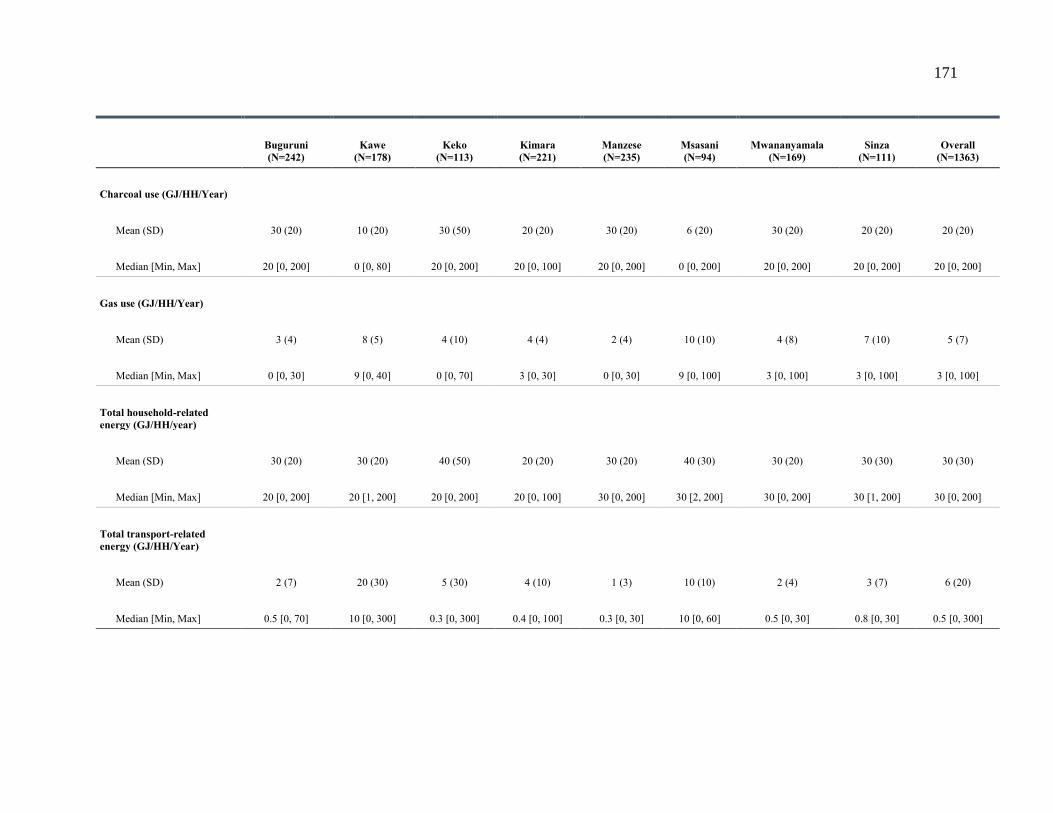
171
Buguruni
(N=242)
Kawe
(N=178)
Keko
(N=113)
Kimara
(N=221)
Manzese
(N=235)
Msasani
(N=94)
Mwananyamala
(N=169)
Sinza
(N=111)
Overall
(N=1363)
Charcoal use (GJ/HH/Year)
Mean (SD) 30 (20) 10 (20) 30 (50) 20 (20) 30 (20) 6 (20) 30 (20) 20 (20) 20 (20)
Median [Min, Max] 20 [0, 200] 0 [0, 80] 20 [0, 200] 20 [0, 100] 20 [0, 200] 0 [0, 200] 20 [0, 200] 20 [0, 200] 20 [0, 200]
Gas use (GJ/HH/Year)
Mean (SD) 3 (4) 8 (5) 4 (10) 4 (4) 2 (4) 10 (10) 4 (8) 7 (10) 5 (7)
Median [Min, Max] 0 [0, 30] 9 [0, 40] 0 [0, 70] 3 [0, 30] 0 [0, 30] 9 [0, 100] 3 [0, 100] 3 [0, 100] 3 [0, 100]
Total household-related
energy (GJ/HH/year)
Mean (SD) 30 (20) 30 (20) 40 (50) 20 (20) 30 (20) 40 (30) 30 (20) 30 (30) 30 (30)
Median [Min, Max] 20 [0, 200] 20 [1, 200] 20 [0, 200] 20 [0, 100] 30 [0, 200] 30 [2, 200] 30 [0, 200] 30 [1, 200] 30 [0, 200]
Total transport-related
energy (GJ/HH/Year)
Mean (SD) 2 (7) 20 (30) 5 (30) 4 (10) 1 (3) 10 (10) 2 (4) 3 (7) 6 (20)
Median [Min, Max] 0.5 [0, 70] 10 [0, 300] 0.3 [0, 300] 0.4 [0, 100] 0.3 [0, 30] 10 [0, 60] 0.5 [0, 30] 0.8 [0, 30] 0.5 [0, 300]

172
Buguruni
(N=242)
Kawe
(N=178)
Keko
(N=113)
Kimara
(N=221)
Manzese
(N=235)
Msasani
(N=94)
Mwananyamala
(N=169)
Sinza
(N=111)
Overall
(N=1363)
Total residential energy
(GJ/HH/Year)
Mean (SD) 30 (30) 50 (40) 50 (50) 30 (20) 30 (20) 50 (40) 40 (20) 30 (30) 40 (30)
Median [Min, Max] 30 [0, 200] 40 [3, 300] 30 [0, 300] 30 [0, 100] 30 [0.5, 200] 40 [2, 200] 30 [0.3, 200] 30 [2, 200] 30 [0, 300]

173
4.11.7 Correlation Matrix Showing Variable Relationships
Figure S 4.3. Correlation matrix showing the linear relationships between paired variables.
Positive coefficients of correlation are shown in a graduating blue color (where darkest blue
color indicates the strongest positive correlation) on the color ramp. Negative coefficients of
correlation are indicated in a graduating red color (where the darkest red indicates the strongest
negative correlation) on the color ramp.

174
4.11.8 Effect of Cooking Fuel Choice on Household Energy Use
Table S 4.4. Results from LSD test results showing differences in mean household-related energy use according to household cooking
choice among the surveyed wards in the Dar es Salaam region. Groups within each ward are identified by letters and ordered
according to their household-related energy use. Note that Group ‘A’, which indicates the highest energy using households within
each ward, may be different between wards. Households grouped with the same letter indicate no statistically significant difference
between their group means.
Dependent variable (disaggregated by ward):
Log (Household Energy)2
(Group indicated by letter(s), ordered within each ward3)
Note: NRO refers to No Recorded Observation.
Independent variable:
Cooking choice1 Msasani Sinza Buguruni Keko Manzese Mwananyamala Kawe Kimara
Electricity, charcoal, and other4 NRO NRO NRO NRO NRO NRO NRO 4.7
A
Electricity, gas and charcoal 3.7 3.5 3.6 3.7 NRO 3.8 3.7 3.4
AB A A A A A BC
Charcoal and electricity NRO 3.2 3.9 NRO NRO NRO NRO NRO
AB A
Gas, charcoal and other4 4.1 3.7 3.6 3.6 3.4 3.4 3.1 3.5
AB A A A A A B AB
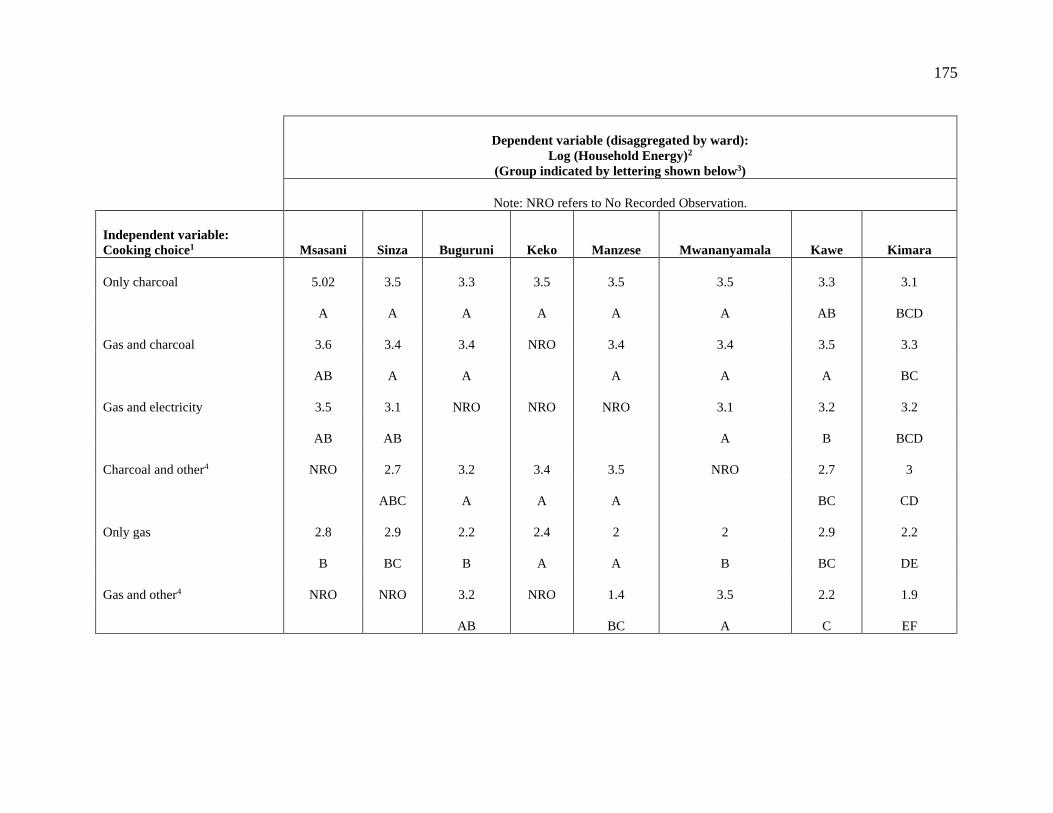
175
Dependent variable (disaggregated by ward):
Log (Household Energy)2
(Group indicated by lettering shown below3)
Note: NRO refers to No Recorded Observation.
Independent variable:
Cooking choice1 Msasani Sinza Buguruni Keko Manzese Mwananyamala Kawe Kimara
Only charcoal 5.02 3.5 3.3 3.5 3.5 3.5 3.3 3.1
A A A A A A AB BCD
Gas and charcoal 3.6 3.4 3.4 NRO 3.4 3.4 3.5 3.3
AB A A A A A BC
Gas and electricity 3.5 3.1 NRO NRO NRO 3.1 3.2 3.2
AB AB A B BCD
Charcoal and other4 NRO 2.7 3.2 3.4 3.5 NRO 2.7 3
ABC A A A BC CD
Only gas 2.8 2.9 2.2 2.4 2 2 2.9 2.2
B BC B A A B BC DE
Gas and other4 NRO NRO 3.2 NRO 1.4 3.5 2.2 1.9
AB BC A C EF
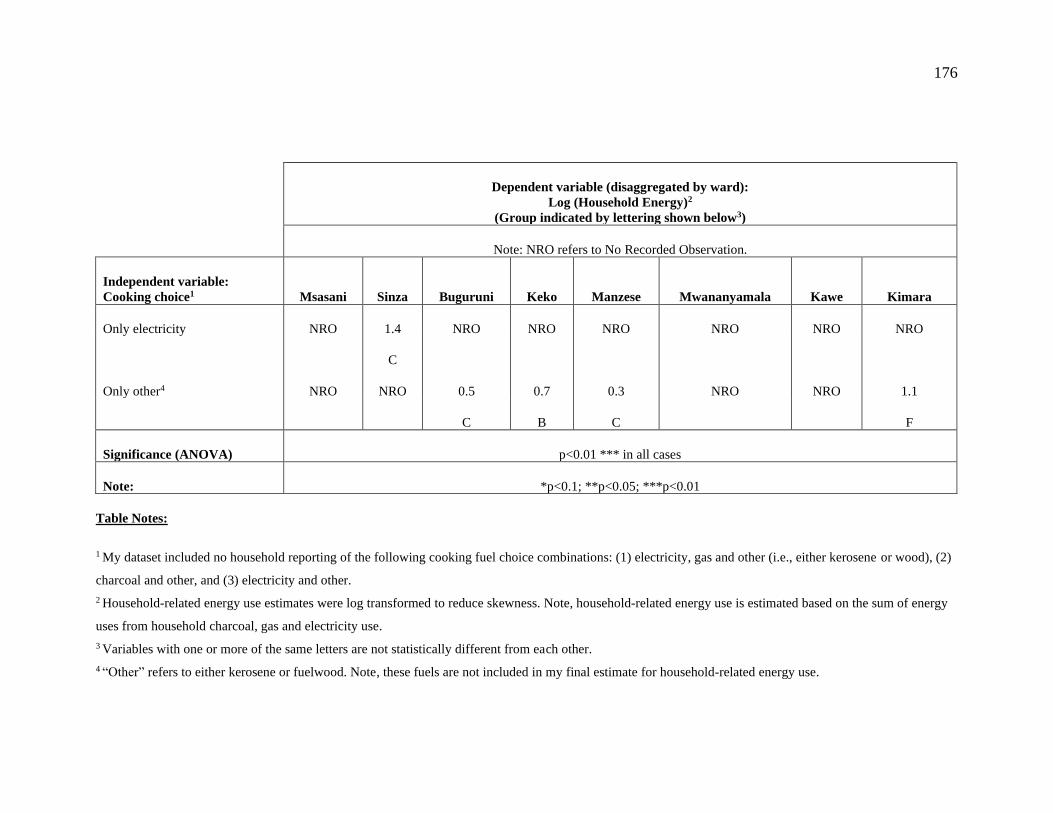
176
Dependent variable (disaggregated by ward):
Log (Household Energy)2
(Group indicated by lettering shown below3)
Note: NRO refers to No Recorded Observation.
Independent variable:
Cooking choice1 Msasani Sinza Buguruni Keko Manzese Mwananyamala Kawe Kimara
Only electricity NRO 1.4 NRO NRO NRO NRO NRO NRO
C
Only other4 NRO NRO 0.5 0.7 0.3 NRO NRO 1.1
C B C F
Significance (ANOVA) p<0.01 *** in all cases
Note: *p<0.1; **p<0.05; ***p<0.01
Table Notes:
1 My dataset included no household reporting of the following cooking fuel choice combinations: (1) electricity, gas and other (i.e., either kerosene or wood), (2)
charcoal and other, and (3) electricity and other.
2 Household-related energy use estimates were log transformed to reduce skewness. Note, household-related energy use is estimated based on the sum of energy
uses from household charcoal, gas and electricity use.
3 Variables with one or more of the same letters are not statistically different from each other.
4 “Other” refers to either kerosene or fuelwood. Note, these fuels are not included in my final estimate for household-related energy use.

177
4.11.9 Full set of results from OLS and Tobit Regressions
Table S 4.5. Multivariate OLS and Tobit regression results showing the statistical relationship between cooking fuel choice, selected
spatial and socio-economic variables, and household-related energy use across surveyed households in the Dar es Salaam region. We
compare results when Principal Component (PC) scores and original proxy variables for household wealth are applied as predictors.
Coefficients for PC1 and PC2 are statistically significant in all cases (p<0.01). While, in some cases, there was no discernable
relationship between some of the original variables (e.g., electric stove and tertiary education) and household-related energy use.
Dependent variable:
Log(Household Energy)
Independent variable: OLS (1) OLS (2) OLS (3) OLS (4) Tobit (5) Tobit (6) Tobit (7) Tobit (8)
Spatial
Informal settlement -0.023 0.058 -0.033 0.060 -0.025 0.057 -0.034 0.059
(0.065) (0.076) (0.066) (0.076) (0.065) (0.076) (0.066) (0.077)
Mixed settlement -0.089* -0.034 -0.085 -0.037 -0.090* -0.034 -0.085* -0.038
(0.051) (0.059) (0.051) (0.060) (0.051) (0.060) (0.051) (0.060)
Log(Ward density) 0.086** 0.149*** 0.093** 0.143*** 0.086** 0.150*** 0.093** 0.143***
(0.036) (0.042) (0.037) (0.043) (0.036) (0.042) (0.037) (0.043)

178
Dependent variable:
Log(Household Energy)
Independent variable: OLS (1) OLS (2) OLS (3) OLS (4) Tobit (5) Tobit (6) Tobit (7) Tobit (8)
Socio-economic
Log(Household members) 0.214*** 0.362*** 0.219*** 0.366*** 0.215*** 0.363*** 0.219*** 0.367***
(0.031) (0.035) (0.032) (0.036) (0.032) (0.036) (0.032) (0.036)
PC1 0.018*** 0.010***
0.018*** 0.010***
(0.002) (0.002)
(0.002) (0.002)
PC2 0.007*** 0.013***
0.007*** 0.013***
(0.002) (0.003)
(0.002) (0.003)
Tertiary education
0.060 -0.063
0.062 -0.062
(0.042) (0.049)
(0.042) (0.049)
Own vehicle
0.155*** 0.050
0.156*** 0.049
(0.054) (0.063)
(0.054) (0.063)
Own air-conditioning unit
0.246*** 0.180**
0.245*** 0.180**
(0.071) (0.083)
(0.071) (0.083)
Own electric stove
0.124 0.033
0.126 0.033
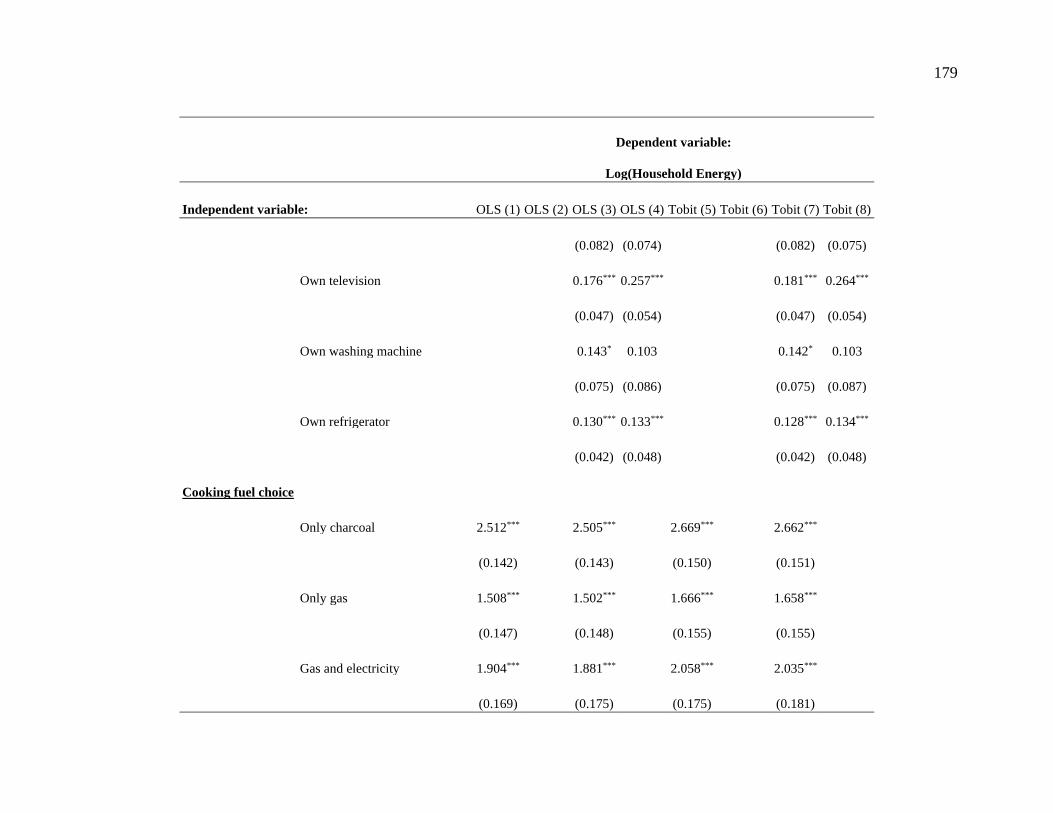
179
Dependent variable:
Log(Household Energy)
Independent variable: OLS (1) OLS (2) OLS (3) OLS (4) Tobit (5) Tobit (6) Tobit (7) Tobit (8)
(0.082) (0.074)
(0.082) (0.075)
Own television
0.176*** 0.257***
0.181*** 0.264***
(0.047) (0.054)
(0.047) (0.054)
Own washing machine
0.143* 0.103
0.142* 0.103
(0.075) (0.086)
(0.075) (0.087)
Own refrigerator
0.130*** 0.133***
0.128*** 0.134***
(0.042) (0.048)
(0.042) (0.048)
Cooking fuel choice
Only charcoal 2.512***
2.505***
2.669***
2.662***
(0.142)
(0.143)
(0.150)
(0.151)
Only gas 1.508***
1.502***
1.666***
1.658***
(0.147)
(0.148)
(0.155)
(0.155)
Gas and electricity 1.904***
1.881***
2.058***
2.035***
(0.169)
(0.175)
(0.175)
(0.181)

180
Dependent variable:
Log(Household Energy)
Independent variable: OLS (1) OLS (2) OLS (3) OLS (4) Tobit (5) Tobit (6) Tobit (7) Tobit (8)
Gas and charcoal 2.413***
2.413***
2.571***
2.570***
(0.141)
(0.143)
(0.149)
(0.150)
Charcoal and electricity 2.243***
2.276***
2.398***
2.430***
(0.448)
(0.452)
(0.451)
(0.455)
Gas and other 1.475***
1.481***
1.635***
1.640***
(0.251)
(0.252)
(0.256)
(0.257)
Charcoal and other 2.416***
2.407***
2.574***
2.564***
(0.147)
(0.148)
(0.155)
(0.155)
Electricity, gas and charcoal 2.241***
2.249***
2.396***
2.402***
(0.174)
(0.180)
(0.181)
(0.186)
Gas, charcoal and other 2.504***
2.506***
2.662***
2.663***
(0.170)
(0.171)
(0.177)
(0.178)
Electricity, charcoal and other 3.961***
3.913***
4.119***
4.069***
(0.612)
(0.613)
(0.616)
(0.615)

181
Dependent variable:
Log(Household Energy)
Independent variable: OLS (1) OLS (2) OLS (3) OLS (4) Tobit (5) Tobit (6) Tobit (7) Tobit (8)
Fuel stack when cooking
0.326***
0.332***
0.328***
0.334***
(0.040)
(0.040)
(0.040)
(0.040)
Constant 0.067 1.129*** -0.496 0.808** -0.094 1.116*** -0.660* 0.792**
(0.357) (0.378) (0.371) (0.402) (0.362) (0.381) (0.375) (0.404)
Observations 1,363 1,363 1,363 1,363 1,363 1,363 1,363 1,363
(Censored: 14)
Pseudo R2 (McFadden)
0.805 0.769 0.805 0.805
R2 0.418 0.193 0.420 0.198
Adjusted R2 0.411 0.188 0.411 0.191
Table Notes:
• *p<0.1; **p<0.05; ***p<0.01.
• Standard error denoted by values in parentheses.
• Reference variables not included in table: Formal settlement; Only electricity (for cooking).
• “Other” refers to either kerosene or fuelwood. Note that these fuels are not included in my final estimate for household-
related energy use.
• S8, includes a supporting correlation matrix of all data variables.
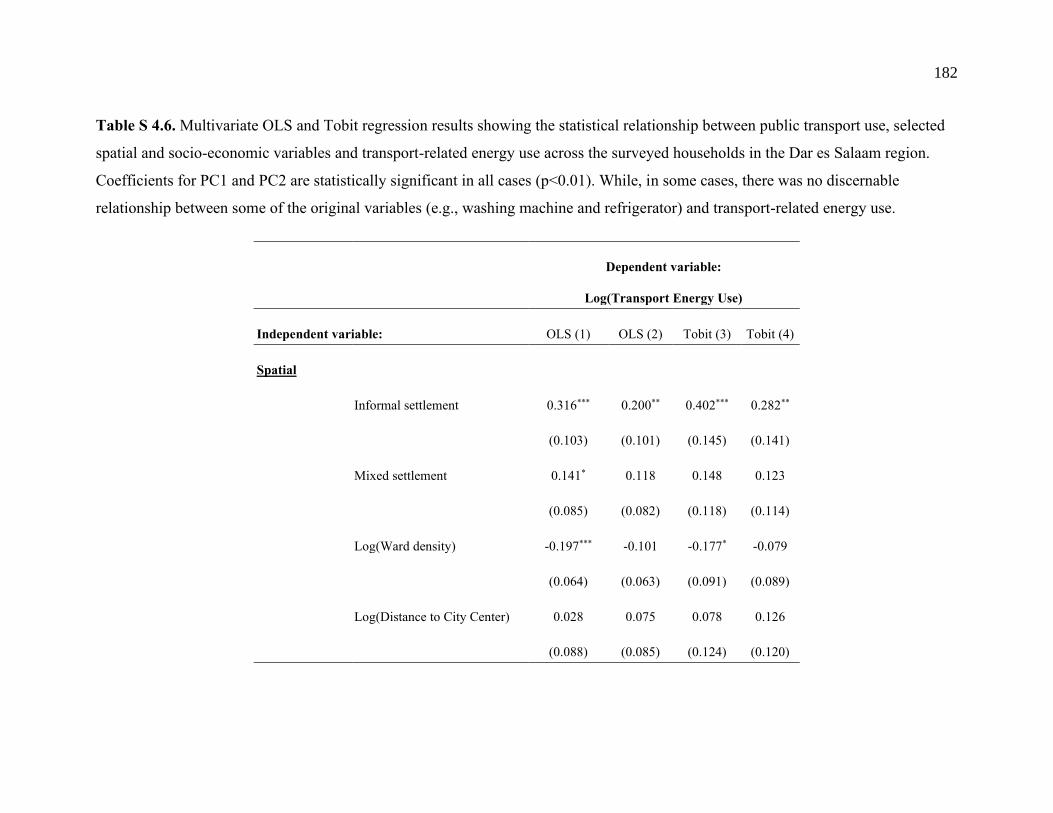
182
Table S 4.6. Multivariate OLS and Tobit regression results showing the statistical relationship between public transport use, selected
spatial and socio-economic variables and transport-related energy use across the surveyed households in the Dar es Salaam region.
Coefficients for PC1 and PC2 are statistically significant in all cases (p<0.01). While, in some cases, there was no discernable
relationship between some of the original variables (e.g., washing machine and refrigerator) and transport-related energy use.
Dependent variable:
Log(Transport Energy Use)
Independent variable: OLS (1) OLS (2) Tobit (3) Tobit (4)
Spatial
Informal settlement 0.316*** 0.200** 0.402*** 0.282**
(0.103) (0.101) (0.145) (0.141)
Mixed settlement 0.141* 0.118 0.148 0.123
(0.085) (0.082) (0.118) (0.114)
Log(Ward density) -0.197*** -0.101 -0.177* -0.079
(0.064) (0.063) (0.091) (0.089)
Log(Distance to City Center) 0.028 0.075 0.078 0.126
(0.088) (0.085) (0.124) (0.120)
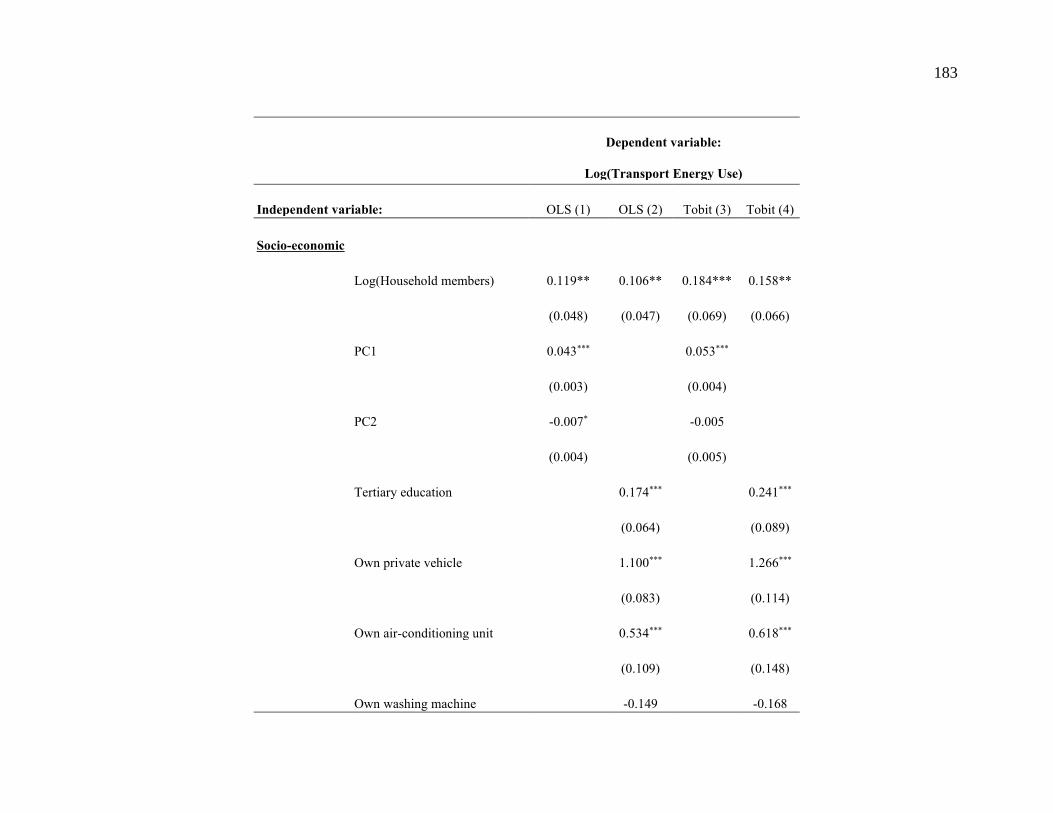
183
Dependent variable:
Log(Transport Energy Use)
Independent variable: OLS (1) OLS (2) Tobit (3) Tobit (4)
Socio-economic
Log(Household members) 0.119** 0.106** 0.184*** 0.158**
(0.048) (0.047) (0.069) (0.066)
PC1 0.043***
0.053***
(0.003)
(0.004)
PC2 -0.007*
-0.005
(0.004)
(0.005)
Tertiary education
0.174***
0.241***
(0.064) (0.089)
Own private vehicle
1.100***
1.266***
(0.083)
(0.114)
Own air-conditioning unit
0.534***
0.618***
(0.109)
(0.148)
Own washing machine
-0.149
-0.168

184
Dependent variable:
Log(Transport Energy Use)
Independent variable: OLS (1) OLS (2) Tobit (3) Tobit (4)
(0.114)
(0.155)
Own refrigerator
0.062
0.093
(0.063)
(0.089)
Own television
0.070
0.196*
(0.070)
(0.101)
Own electric stove
0.169*
0.171
(0.097)
(0.133)
Use public transport -0.130* -0.055 0.054 0.128
(0.074) (0.072) (0.107) (0.104)
Constant 2.851*** 0.919 2.053** -0.151
(0.682) (0.693) (0.961) (0.978)
Observations 1,363 1,363 1,363 1,363
(Censored: 441)
Pseudo R2 (McFadden)
0.702 0.709

185
Dependent variable:
Log(Transport Energy Use)
OLS (1) OLS (2) Tobit (3) Tobit (4)
R2 0.326 0.379
Adjusted R2 0.322 0.373
Table Notes:
• *p<0.1; **p<0.05; ***p<0.01
• Standard error denoted by values in parentheses.
• Reference variables not included in table: Formal settlement.
• Supplementary material, S8, includes a supporting correlation matrix of all data variables.

186
4.11.10 Multi-logit Regressions to Interpret Travel Behavior
Table S 4.7. Results from multi-logit regression models showing the effect of selected socio-
economic variables on the travel mode choice of residents in the surveyed wards in the Dar es
Salaam region.
Travel Mode Choice
Bicycle/Walk Boda/Bajaji BRT Private vehicle Taxi/Uber
Model I Model II Model III Model IV Model V
Spatial
Formal settlement -0.169 -1.061*** -2.441*** -0.550*** -0.035
(0.194) (0.213) (0.245) (0.202) (0.501)
Informal settlement 0.342*** -1.289*** -1.892*** -0.443** -0.712
(0.131) (0.178) (0.190) (0.184) (0.448)
Mixed settlement 0.042 -0.959*** -2.085*** -0.565** 0.280
(0.168) (0.239) (0.285) (0.279) (0.545)
Distance to the city center -0.337* 1.621*** 2.981*** 1.092*** -0.766
(0.174) (0.234) (0.274) (0.274) (0.555)
Socio-economic
Log(Household members) -0.071 -0.173 -0.041 0.198 -0.668
(0.114) (0.161) (0.159) (0.179) (0.431)
PC1 -0.029*** -0.016** -0.013* 0.149*** 0.069***
(0.007) (0.008) (0.007) (0.007) (0.016)
PC2 0.011 0.030*** 0.018* 0.022** 0.059**
(0.008) (0.010) (0.010) (0.010) (0.026)

187
Travel Mode Choice
Bicycle/Walk Boda/Bajaji BRT Private vehicle Taxi/Uber
Model I Model II Model III Model IV Model V
Use public transport -1.163*** -0.859*** 0.018 -1.632*** 0.148
(0.172) (0.228) (0.290) (0.198) (0.748)
Constant 0.215 -3.310*** -6.418*** -1.559*** -0.468
(0.363) (0.510) (0.586) (0.552) (1.219)
Table Notes:
• ***p < 0.01; **p < 0.05; *p < 0.1
• Standard error denoted by values in parentheses.
• Reference mode not included in the table: Dala-dala

188
4.11.11 Inequalities in Energy Use
In economics, Lorenz curves are typically used to estimate income inequality (Kammen &
Kirubi, 2008), but in this case, we use them to show inequalities in energy use across the
surveyed Dar es Salaam households. Other studies have applied similar methods, e.g., (Jacobson
et al., 2005; Kammen & Kirubi, 2008; Wu et al., 2017). I used the same method outlined in
(Jacobson et al., 2005) and (Kammen & Kirubi, 2008). First, I calculated each household’s share
of total energy use, i.e., their energy use divided by the total for the entire sample. Second, I
sorted households from the lowest to highest energy user, i.e., based on their relative share of
total energy use. I then plotted adapted Lorenz curves for residential energy use, household-
related and transport-related energy use, separately. Finally, I calculated Gini coefficients for
each plot. Citing directly from Jacobson et al. (2005), “the Gini coefficient for energy
consumption is calculated as:
where Xi = (number of energy users in population group i)/(total population) and Yi = (quantity
of energy used by population group i)/(total energy use), with Yi ordered from lowest to highest
energy consumption. The Gini coefficient ranges from perfect equity among all members of the
population (Ge = 0) to complete inequity (Ge = 1). Because more than one Lorenz distribution of
a resource can lead to the same Gini value, it is often instrumental to view both metrics
simultaneously.” ((Jacobson et al., 2005), page 1826)
Adapted Lorenz curves and estimated Gini coefficients for energy use (Ge) across the surveyed
households are shown in Figure S 4.4 to Figure S 4.6.

189
Figure S 4.4. Adapted Lorenz curve showing inequality in residential energy use across the
surveyed households in Dar es Salaam. Gini coefficients range from perfect equality (Ge=0) to
complete inequity (Ge=1) (Kammen & Kirubi, 2008). Inequality is indicated as the distance
between the curved line (shown in black) and the diagonal straight line (which indicates perfect
equality, shown in blue) that extends from the origin to the end point.
Energy Gini coefficient (Ge): 0.39

190
Figure S 4.5. Adapted Lorenz curve showing inequality in household-related energy use across
the surveyed households in Dar es Salaam. Gini coefficients range from perfect equality (Ge=0)
to complete inequity (Ge=1) (Kammen & Kirubi, 2008). Inequality is indicated as the distance
between the curved line (shown in black) and the diagonal straight line (which indicates perfect
equality, shown in blue) that extends from the origin to the end point.
Energy Gini coefficient (Ge): 0.38
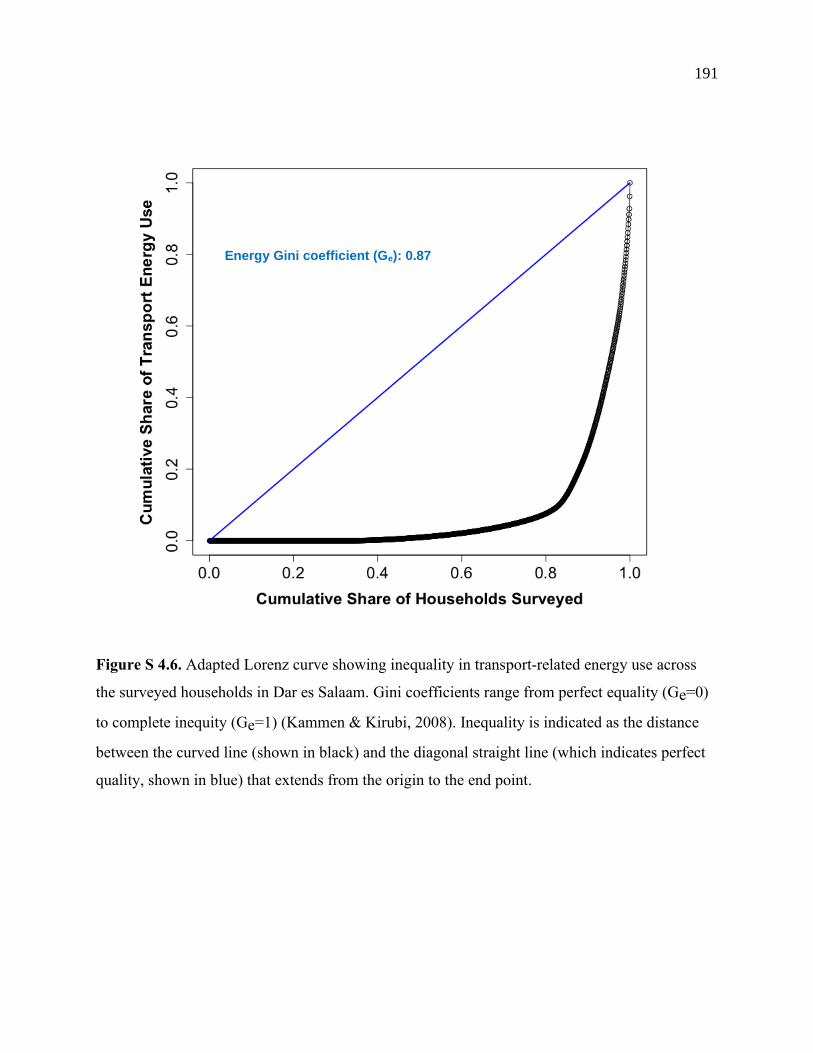
191
Figure S 4.6. Adapted Lorenz curve showing inequality in transport-related energy use across
the surveyed households in Dar es Salaam. Gini coefficients range from perfect equality (Ge=0)
to complete inequity (Ge=1) (Kammen & Kirubi, 2008). Inequality is indicated as the distance
between the curved line (shown in black) and the diagonal straight line (which indicates perfect
quality, shown in blue) that extends from the origin to the end point.
Energy Gini coefficient (Ge): 0.87

192
4.12 References for Chapter 4
Bohlmann, J. A. and Inglesi-Lotz, R. (2018) ‘Analysing the South African residential sector’s
energy profile’, Renewable and Sustainable Energy Reviews. doi:
10.1016/j.rser.2018.07.052.
Calvin, K. et al. (2016) ‘The effect of African growth on future global energy, emissions, and
regional development’, Climatic Change, 136(1), pp. 109–125.
Castán Broto, V., Arthur, M. de F. S. R. and Guibrunet, L. (2020) ‘Energy profiles among urban
elite households in Mozambique: Explaining the persistence of charcoal in urban areas’,
Energy Research and Social Science. doi: 10.1016/j.erss.2020.101478.
Chaturvedi, V. et al. (2014) ‘Long term building energy demand for India: Disaggregating end
use energy services in an integrated assessment modeling framework’, Energy Policy. doi:
10.1016/j.enpol.2012.11.021.
Choumert-Nkolo, J., Combes Motel, P. and Le Roux, L. (2019) ‘Stacking up the ladder: A panel
data analysis of Tanzanian household energy choices’, World Development. doi:
10.1016/j.worlddev.2018.11.016.
Creutzig, F. et al. (2015) ‘Global typology of urban energy use and potentials for an urbanization
mitigation wedge’, Proceedings of the National Academy of Sciences, 112(20), pp. 6283–
6288. doi: 10.1073/pnas.1315545112.
Currie, P. et al. (2015) ‘Towards Urban Resource Flow Estimates in Data Scarce Environments:
The Case of African Cities’, Journal of Environmental Protection, 06(09), pp. 1066–1083.
doi: 10.4236/jep.2015.69094.
Currie, P. K. and Musango, J. K. (2017) ‘African Urbanization: Assimilating Urban Metabolism
into Sustainability Discourse and Practice’, Journal of Industrial Ecology, 21(5), pp. 1262–
1276. doi: 10.1111/jiec.12517.
Czepkiewicz, M., Heinonen, J. and Ottelin, J. (2018) ‘Why do urbanites travel more than do
193
others? A review of associations between urban form and long-distance leisure travel’,
Environmental Research Letters. doi: 10.1088/1748-9326/aac9d2.
D’Agostino, A. L., Urpelainen, J. and Xu, A. (2015) ‘Socio-economic determinants of charcoal
expenditures in Tanzania: Evidence from panel data’, Energy Economics. doi:
10.1016/j.eneco.2015.03.007.
DART (2020) Ongoing Projects. Available at: https://www.dart.go.tz/ (Accessed: 7 July, 2020).
Edomah, N. and Ndulue, G. (2020) ‘Energy transition in a lockdown: An analysis of the impact
of COVID-19 on changes in electricity demand in Lagos Nigeria’, Global Transitions. doi:
10.1016/j.glt.2020.07.002.
EIA (2018) Data Tables: Electric Sales, Revenue, and Average Price (Table: T5.A. Residential
average monthly bill by Census Division, and State). Available at:
https://www.eia.gov/electricity/sales_revenue_price/.
Fan, J. L., Zhang, Y. J. and Wang, B. (2017) ‘The impact of urbanization on residential energy
consumption in China: An aggregated and disaggregated analysis’, Renewable and
Sustainable Energy Reviews. doi: 10.1016/j.rser.2016.10.066.
Government of Tanzania (2015a) National Energy Policy. Available at:
https://www.ewura.go.tz/wp-content/uploads/2016/08/National-Energy-Policy.pdf.
Government of Tanzania (2015b) Tanzania’s SE4All Action Agenda. Available at:
https://www.seforall.org/sites/default/files/TANZANIA_AA-Final.pdf.
Government of Tanzania (2017a) Dar es Salaam City Master Plan (2012 - 2032). Unpublished
document.
Government of Tanzania (2017b) Energy Access Situation Report (2016). Available at:
http://rea.go.tz/NewsCenter/TabId/130/ArtMID/639/ArticleID/91/Energy-Access-
Situation-Report-2016-Tanzania-Mainland.aspx (Accessed: February 7, 2021).
Hoekman, P. and von Blottnitz, H. (2017) ‘Cape Town’s Metabolism: Insights from a Material

194
Flow Analysis’, Journal of Industrial Ecology, 21(5), pp. 1237–1249. doi:
10.1111/jiec.12508.
Hughes-Cromwick, E. L. (1985) ‘Nairobi households and their energy use. An economic
analysis of consumption patterns’, Energy Economics. doi: 10.1016/0140-9883(85)90048-
9.
IEA (2014) ‘Energy in Africa Today’, in Africa Energy Outlook. Available at:
https://www.iea.org/publications/freepublications/publication/africa-energy-outlook.html.
IEA (2019a) Africa Energy Outlook 2019. Available at: https://www.iea.org/reports/africa-
energy-outlook-2019.
IEA (2019b) ‘CO2 Emisions from Fuel Combustion’. Available at:
https://www.iea.org/reports/co2-emissions-from-fuel-combustion-overview.
IEA (2019c) ‘World Energy Balances 2019’. Available at: https://www.iea.org/reports/world-
energy-balances-overview.
IPCC (2014) ‘Human Settlements, Infrastructure, and Spatial Planning (Chapter 12)’, Climate
Change 2014: Mitigation of Climate Change. Contribution of Working Group III to the
Fifth Assessment Report of the Intergovernmental Panel on Climate Change, pp. 923–
1000. doi: 10.1017/CBO9781107415416.018.
ITDP (2017) Dar es Salaam, Tanzania Wins 2018 Sustainable Transport Award. Available at:
https://www.itdp.org/2017/07/07/dar-es-salaam-wins-2018-sta/ (Accessed: 30 June 2020).
Jacobson, A., Milman, A. D. and Kammen, D. M. (2005) ‘Letting the (energy) Gini out of the
bottle: Lorenz curves of cumulative electricity consumption and Gini coefficients as
metrics of energy distribution and equity’, Energy Policy. doi:
10.1016/j.enpol.2004.02.017.
Jolliffe, I. T. (2002) ‘Principal Component Analysis, Second Edition’, Encyclopedia of Statistics
in Behavioral Science. doi: 10.2307/1270093.

195
Katutsi, V., Dickson, T. and Migisha, A. G. (2020) ‘Drivers of Fuel Choice for Cooking among
Uganda’s Households’, Open Journal of Energy Efficiency, 09(03), pp. 111–129. doi:
10.4236/ojee.2020.93008.
Kironde, J. M. L. (2000) ‘Understanding land markets in African urban areas: The case of Dar es
Salaam, Tanzania’, Habitat International. doi: 10.1016/S0197-3975(99)00035-1.
Lawhon, M. et al. (2018) ‘Thinking through heterogeneous infrastructure configurations’, Urban
Studies. doi: 10.1177/0042098017720149.
Lee, L. Y. T. (2013) ‘Household energy mix in Uganda’, Energy Economics. doi:
10.1016/j.eneco.2013.05.010.
Lucas, P. L. et al. (2015) ‘Future energy system challenges for Africa: Insights from Integrated
Assessment Models’, Energy Policy, 86, pp. 705–717. doi: 10.1016/j.enpol.2015.08.017.
Luo, C., Jean-Baptiste, N., Siame, G., MacLean, H.L. (2020). Assessing institutional and societal
barriers to low-carbon development in Dar es Salaam. PhD Thesis Chapter. University of
Toronto.
Luo, C., Posen, I. D., et al. (2020) ‘Modelling future patterns of urbanization, residential energy
use and greenhouse gas emissions in Dar es Salaam with the Shared Socio-Economic
Pathways’, Journal of Cleaner Production, 254. doi: 10.1016/j.jclepro.2020.119998.
Lupala, J. M. (2002) Urban Types in Rapidly Urbanizing Cities: Analysis of Formal and
Informal settlements in Dar es Salaam. Doctoral Thesis. Available at: https://www.diva-
portal.org/smash/get/diva2:9224/FULLTEXT01.pd.
Mensah, J. T. and Adu, G. (2015) ‘An empirical analysis of household energy choice in Ghana’,
Renewable and Sustainable Energy Reviews. doi: 10.1016/j.rser.2015.07.050.
Mirnezami, S. R. (2014) ‘Electricity inequality in Canada: Should pricing reforms eliminate
subsidies to encourage efficient usage?’, Utilities Policy. doi: 10.1016/j.jup.2014.08.001.
196
Monstadt, J. and Schramm, S. (2017) ‘Toward The Networked City? Translating Technological
ideals and Planning Models in Water and Sanitation Systems in Dar es Salaam’,
International Journal of Urban and Regional Research. doi: 10.1111/1468-2427.12436.
Mulenga, B. P., Tembo, S. T. and Richardson, R. B. (2019) ‘Electricity access and charcoal
consumption among urban households in Zambia’, Development Southern Africa, 36(5),
pp. 585–599. doi: 10.1080/0376835X.2018.1517036.
Nakagami, H., Murakoshi, C. and Iwafune, Y. (2008) International Comparison of Household
Energy Consumption and Its Indicator, ACEEE Summer Study on Energy Efficiency in
Buildings.
NBS (2013) 2012 Population and housing census; Population Distribution by Adminstrative
Areas. Dar es Salaam: National Bureau of Statistics. Available at:
https://www.nbs.go.tz/nbs/takwimu/census2012/Basic_Demographic_and_Socio-
Economic_Profile_PopularVersion-KeyFindings_2012_PHC_EnglishVersion.pdf
(Accessed: February 7, 2021).
Olaniyan, K. et al. (2018) ‘Estimating residential electricity consumption in Nigeria to support
energy transitions’, Sustainability (Switzerland). doi: 10.3390/su10051440.
Rateau, M. and Jaglin, S. (2020) ‘Co-production of access and hybridisation of configurations: a
socio-technical approach to urban electricity in Cotonou and Ibadan’, International Journal
of Urban Sustainable Development. doi: 10.1080/19463138.2020.1780241.
Roy Chowdhury, P. K. et al. (2019) ‘Electricity consumption patterns within cities: application
of a data-driven settlement characterization method’, International Journal of Digital
Earth. doi: 10.1080/17538947.2018.1556355.
Sakah, M. et al. (2019) ‘A study of appliance ownership and electricity consumption
determinants in urban Ghanaian households’, Sustainable Cities and Society. doi:
10.1016/j.scs.2018.10.019.
Shahi, D. K., Rijal, H. B. and Shukuya, M. (2020) ‘A study on household energy-use patterns in
197
rural, semi-urban and urban areas of Nepal based on field survey’, Energy and Buildings.
Elsevier B.V., 223, p. 110095. doi: 10.1016/j.enbuild.2020.110095.
Silver, J. (2015) ‘Disrupted Infrastructures: An Urban Political Ecology of Interrupted Electricity
in Accra’, International Journal of Urban and Regional Research, 39(5), pp. 984–1003.
doi: 10.1111/1468-2427.12317.
Smit, S., Musango, J. K. and Brent, A. C. (2019) ‘Understanding electricity legitimacy dynamics
in an urban informal settlement in South Africa: A Community Based System Dynamics
approach’, Energy for Sustainable Development. doi: 10.1016/j.esd.2019.01.004.
Statistics Canada (2011) Households and the Environment: Energy Use. Ottowa. Available at:
https://www150.statcan.gc.ca/n1/en/pub/11-526-s/11-526-s2013002-eng.pdf?st=JTjrakpI.
Strydom, A., Musango, J. K. and Currie, P. K. (2020) ‘Connecting energy services, carriers and
flows: Rethinking household energy metabolism in Cape Town, South Africa’, Energy
Research and Social Science. doi: 10.1016/j.erss.2019.101313.
Sun, C. et al. (2014) ‘Household pathway selection of energy consumption during urbanization
process in China’, Energy Conversion and Management. doi:
10.1016/j.enconman.2014.04.038.
Surahman, U. and Kubota, T. (2018) ‘Household energy consumption and CO 2 emissions for
residential buildings in Jakarta and Bandung of Indonesia’, in Sustainable Houses and
Living in the Hot-Humid Climates of Asia. doi: 10.1007/978-981-10-8465-2_32.
UN (2018) World Urbanization Prospects (2018 Revision). Available at:
https://population.un.org/wup/ (Accessed October 19, 2020).
VandeWeghe, J. R. and Kennedy, C. (2007) ‘A Spatial Analysis of Residential Greenhouse Gas
Emissions in the Toronto Census Metropolitan Area’, Journal of Industrial Ecology, 11(2),
pp. 133–144. doi: 10.1162/jie.2007.1220.
World Bank (2016) The CURB Tool: Climate Action for Urban Sustainability, World Bank.

198
World Bank (2017) Can Dar es Salaam become the next global model on transit-oriented
development? Available at: https://blogs.worldbank.org/sustainablecities/can-dar-es-
salaam-become-next-global-model-transit-oriented-development (Accessed: 30 June
2020).
World Bank (2018) World Development Indicators. Available at:
https://databank.worldbank.org/source/world-development-indicators.
World Bank (2019) Dar es Salaam Metropolitan Development Project (Benchmarking Transit
Oriented Development). Available at:
http://documents1.worldbank.org/curated/en/818701555088451429/pdf/Volume-3-
Benchmarking-Transit-Oriented-Development.pdf.
Wu, S., Zheng, X. and Wei, C. (2017) ‘Measurement of inequality using household energy
consumption data in rural China’, Nature Energy. doi: 10.1038/s41560-017-0003-1.
199
Chapter 5
Assessing Institutional and Societal Barriers to Low-
Carbon Development in Dar es Salaam
This Chapter is based on a paper being prepared for submission to a peer-reviewed journal,
citation below.
• Luo, C., Jean-Baptiste, N., Siame, G., MacLean, H.L. (2020). Assessing institutional and
societal barriers to low-carbon development in Dar es Salaam. In preparation for submission
to Cities.
5.1 Abstract
The ongoing and expected future growth of African cities presents an opportunity for
stakeholders to promote and adopt low-carbon measures. This study interrogates this discourse
and assesses the institutional and societal barriers that may constrain low-carbon development in
African cities using the case of Dar es Salaam. Findings from interviews with key informants
from national and local government institutions, donor agencies, academia and the private sector
suggest that the following institutional factors constrain the implementation of low-carbon
initiatives in Dar es Salaam: (1) few ongoing city-level initiatives despite robust policy
frameworks for national and local climate change response, (2) limited jurisdiction and capacity
of local authorities to spearhead initiatives in key sectors (e.g., transportation and energy), and
(3) unawareness of policy processes that engage and sensitize key stakeholders, across multiple
sectors, on low-carbon measures. Findings from surveyed households further indicate that the
cost and accessibility of low-carbon measures in the residential sector, e.g., electricity use in the
home, or the Bus Rapid Transit (BRT) system for commuting, constrain use and uptake among
Dar es Salaam residents. To promote higher uptake of low-carbon measures in Dar es Salaam, I
recommend for collaborative engagement between a cross-cutting group of stakeholders (e.g.,

200
local and national government, the private sector, donor groups, and infrastructure services
providers) to prioritize and implement low-carbon projects in Dar es Salaam (e.g., electrification
initiatives, or planned extensions to the BRT line). Furthermore, local government authorities
(e.g., Municipalities and the Dar es Salaam City Council) could take leadership to (1) ensure that
low-carbon projects consider the societal context (e.g., household energy use and travel behavior,
or the affordability and availability of the BRT service to communities), and (2) engage local
communities throughout implementation and planning processes to ensure that overall project
objectives align with their socio-economic needs. Finally, while Dar es Salaam was studied in
this chapter, these recommendations are expected to be broadly applicable to other cities in the
Africa region.
5.2 Introduction
On average, residents of Dar es Salaam use about 17 gigajoules per capita (GJ/capita) of energy
annually, based on 2011 estimates of Grubler et al. (2013). To put this in perspective, this is
about 27% of the energy used by a resident of Paris (63 GJ/capita), 59% of São Paulo (29
GJ/capita), and 13% of New York (127 GJ/capita) (Kennedy et al., 2015). In the absence of
policy measures to support low-carbon development, according to my recent work (Chapter 3),
Dar es Salaam’s energy use and associated greenhouse gas (GHG) emissions could increase from
1,400 kilotons of carbon dioxide equivalents (ktCO2e) in 2015 to up to 33,000 ktCO2e in 2050
(Table 3.4). The latter value is similar to current (2013 to 2015) emissions reported for other
major global cities such as New York, San Francisco, and London (Chapter 3). Regionally, van
der Zwaan et al. (2018) assert that Africa’s CO2 emissions will become significant at a global
level. The authors project Africa could contribute as much as 18% of global CO2 emissions in
2050 (van der Zwaan et al., 2018), which would be a five-fold increase from Africa’s 3.7%
contribution in 2018 (IEA, 2019a) and equivalent to the combined 2018 contribution of the
United States and Canada (IEA, 2019b). To avoid this possible future, stakeholders – including
researchers and development practitioners – have called on African governments to “to act” and
prioritize low-carbon development as cities expand, e.g., (AfDB, n.d.; Cartwright et al., 2015;
Colenbrander et al., 2019). Most critically, stakeholders highlight the potential for low-carbon

201
development to spur additional socio-economic gains (e.g., accelerated economic growth,
poverty reduction and job creation) across the continent.
Low-carbon development, as defined in this paper, includes city actions to reduce the carbon (or
GHG) intensity or urban activities. This may include policies and investments to replace
traditional fuels for cooking with modern options (e.g., electricity) or promoting sustainable
public transport or non-motorized travel (Kennedy et al., 2019), among other measures. In the
context of Africa, regional reports and studies (e.g., African Union (2014), Tait & Euston-Brown
(2017), Bawakyillenuo et al. (2018)) have called on policymakers in local and national
government to incorporate low-carbon development as part of their urban planning and
development goals. Meanwhile, other authors have asserted that low-carbon development could
be enabled through initiatives that avoid a “lock-in” to GHG or carbon-intensive urban growth
(IPCC, 2014; Cartwright et al., 2015; Kennedy et al., 2014, 2018, 2019). Specifically, the work
of Kennedy et al. (2014; 2018; 2019) describes different urban infrastructure strategies to support
low-development, including (1) low-carbon electricity generation and supply from renewable
sources such as solar, hydro, wind and geothermal; (2) the use of electric appliances, engines and
devices (i.e., electrification); and (3) energy efficiency measures (e.g., use of efficient electric
appliances or transport modes).
However, the capacity of African cities to effectively implement low-carbon initiatives may be
constrained by various institutional and societal factors. Firstly, local governments are often
overburdened with competing development agendas (e.g., rising urban poverty, informality and
inequality (Lall et al., 2017)), or they are severely restricted within multi-level governance
arrangements that allocate more power to national government institutions (Bawakyillenuo et al.,
2018; Tait and Euston-Brown, 2017). Secondly, societal factors present additional challenges as
community energy consumption behaviors may be influenced by various socio-economic factors,
e.g., individual preferences for public or private transportation (Nkurunziza, et al. 2012; Salon &
Aligula, 2012) or household energy choices (Bisu et al., 2016; Makonese et al., 2018;
Uhunamure et al., 2017; Doggart et al., 2020). Findings from these specific studies are detailed
in the literature review (Section 5.3). However, with the exception of the study by Doggart et al.
(2020), no other study has simultaneously included both expert judgments of key informants

202
(i.e., technical experts in national and local government institutions, donor agencies, academia
and the private sector, among other groups) and judgments of community members in the
authors' assessments and/or policy recommendations. In this paper, I argue that local government
authorities (e.g., Municipalities and the Dar es Salaam City Council) – as the most visible
institution to urban residents – are uniquely positioned to ensure that low-carbon projects (e.g.,
wide-scale electrification or public transport projects) align with the socio-economic needs of
communities (especially the poor). Therefore, enabling progress on low-carbon development
would require two-pronged approach, i.e., addressing barriers to low-carbon development from
an institutional perspective, and ensuring that policies account for societal factors (i.e., resident
energy choices and travel behaviors) that may enable or constrain the wider uptake of low-
carbon investments in communities.
This study aims to address these gaps in the literature. Specifically, I identify possible
institutional and societal factors that may constrain progress on low-carbon development in Dar
es Salaam. For example, how do institutions of urban governance influence progress on low-
carbon development? What societal factors and supply considerations (e.g., availability of fuels
for cooking or transport options) contribute to household cooking fuel and travel mode choices?
And what are resident perceptions on the environmental and health burdens associated with the
use of wood-based fuels (i.e., charcoal)? To answer these questions, I draw on the perspectives
of two stakeholder groups in Dar es Salaam: (1) key informants (experts) across national and
local government institutions, donor agencies, academia and the private sector (see Figure 5.2),
and (2) surveyed households across eight Dar es Salaam wards (Table 5.1). My other work
(Chapter 4) is based on the same household survey and presents the differences in residential
energy use among the surveyed wards. This current study examines institutional and societal
aspects, which were not considered in my previous work, but which constitute an essential part
of the overall survey and research objectives (details in Methods, Section 5.5).
I selected Dar es Salaam as a case study as it is the fastest-growing city in East Africa, estimated
to grow at over 4% annually between 2020 and 2035 (UN, 2018; Figure 1.1). Dar es Salaam is
also the largest city in Tanzania, with a population of 6.1 million people as of 2018, and the most
important city for business and economic activity (see Chapter 4). I also focus my analysis on the
203
residential sector given the sector’s high contribution to energy use in Africa. According to the
International Energy Agency (IEA), the residential sector accounted for 64% of energy demand
in sub-Saharan Africa, compared to 14% from industry, 15% from transportation (including
domestic and commercial transportation), and 8% from other energy-using sectors (IEA, 2019a).
This current paper extends on my previous work (Chapter 4) and uses the term “residential
energy use” to refer to domestic household and transport-related energy use, behaviors, and
perspectives, as well as various demographic aspects.
There are four remaining sections of this paper. Section 5.3 reviews the literature on institutional
responses to urban climate change (mitigation and adaptation) in African cities, and specifically,
in Dar es Salaam. Section 5.5 presents the research methods, i.e., Dar es Salaam key informant
interviews, household surveys, and their analyses. Sections 5.6 and 5.7 discuss overall research
findings and conclusions.
5.3 Literature Review
5.3.1 The Role of Institutions in Supporting Climate Change (Mitigation and
Adaptation) Responses in African Cities
Literature on urban governance in African cities asserts that processes of collaboration between
national and local institutions influence progress on climate change adaptation and mitigation
(low-carbon development) in African cities (Diep et al., 2016; Herslund et al., 2018; Leck &
Simon, 2018; Vedeld et al., 2016, 2015). For example, Leck and Simon (2018) conducted in-
depth, semi-structured interviews with government officials in two neighboring municipalities in
South Africa: eThekwini and Ugu (the latter is predominantly rural). The authors found that
weak “inter-municipal collaboration” across the two city regions significantly impeded progress
on local climate change adaptation responses. In Saint Louis (Senegal), Vedeld et al. (2016)
conducted interviews with public, private and civil society officials across local and national
government. In their policy recommendations, the authors suggested that progress on climate
204
change adaptation in Saint Louis could accelerated through collaborative processes that engaged
local and national authorities (Vedeld et al., 2016).
The few regional studies focusing on climate change/GHG mitigation have similarly suggested
that collaboration between national and local governments (municipalities) would be required to
support low-carbon development in cities, e.g., Bawakyillenuo et al. (2018) and Tait and Euston-
Brown (2017). In the case of Dar es Salaam, Shemdoe et al. (2015) recommended technical
training and capacity building among local officials to improve local responses to climate change
mitigation and adaptation in the metropolitan region (Shemdoe et al., 2015). However,
Bawakyillenuo et al. (2018), Tait and Euston-Brown (2017), and Shemdoe et al. (2015) did not
consider or integrate the community context in their policy recommendations.
5.3.2 Community Energy Use Behaviors in African Cities
There is a body of literature, distinct from the one reviewed in Section 5.3.1, that relies on
household surveys to understand the societal factors that influence community energy use or
travel behaviors, e.g., the household’s choice to use charcoal instead of electricity or gas for
cooking (Bisu et al., 2016; Kimemia & Annegarn, 2011; Mensah & Adu, 2015; Salon & Aligula,
2012; Van der Kroon et al., 2014) or private vehicles instead of non-motorized options or public
transport (Nkurunziza, Zuidgeest, & Van Maarseveen, 2012; Salon & Aligula, 2012). For
example, Bisu et al. (2016) examined factors affecting household energy choices in Bauchi
(Nigeria) using data collected from 100 households. The results showed that kerosene was used
by most households as a primary cooking fuel (41% of households), followed by wood (35%),
liquefied petroleum gas (“gas”) (24%), and charcoal (20%) (no household reported use of
electricity or solar energy) (Bisu et al., 2016). In the transport sector, Salon and Aligula (2012)
used survey data to examine travel behavior in Nairobi (Kenya). In the absence of policies for
safe and reliable non-motorized or public transport, the authors projected that sharp increases in
car ownership could be expected given anticipated rises in household wealth expected with
future economic growth in Nairobi (Salon & Aligula, 2012).
205
5.3.3 Household Energy Use in Dar es Salaam and Tanzania
There have been a limited number of studies on household energy use or travel choices in Dar es
Salaam, or Tanzania, more broadly, e.g., Choumert-Nkolo et al. (2019) and D’Agostino et al.
(2015). Choumert-Nkolo et al. (2019) assessed household cooking fuel choices in Tanzania and
showed that improvements in household socio-economic status (i.e., household income) was
correlated with a larger diversity of fuels purchased and a propensity for “fuel stacking”, i.e.,
where households use a combination of two or more fuels for cooking (Choumert-Nkolo et al,
2019). In transportation, few studies have assessed resident travel behaviors in Dar es Salaam.
Using interview data from 174 households sampled across five peripheral settlements, Andreasen
and Møller-Jensen (2017) examined the travel mode choice of communities in Dar es Salaam.
The authors showed that 131 of the 174 surveyed participants depended on the local minibuses
(“dala-dala”) for commuting as it is the cheapest form of public transport in Dar es Salaam. To
encourage greater use of public transport, the authors recommended the scale-up of public
transport services in peripheral communities (which remain largely un-serviced) among their key
policy recommendations. Other transport studies in Dar es Salaam have also suggested the need
for improved non-motorized transport options for residents, e.g., Mkalawa and Haixiao (2014)
and Nkurunziza, Zuidgeest, and Van Maarseveen (2012).
The current study offers new insights on possible barriers to low-carbon development in Dar es
Salaam from an institutional perspective. For this, I draw on insights from interviews with
selected key informants within national and local government institutions, donor agencies,
academia and the private sector. Secondly, based on our household surveys of 1,363 households
sampled across formal, informal, and mixed settlements in the city, I assess the household energy
use and travel behaviors of Dar es Salaam residents, as these activities contribute to total
residential energy use in the city, as demonstrated in my previous work (see Chapter 4). The
originality of my study results from drawing insights from both the qualitative key informant
interviews and the primary household data we (the field team) collected. The study uses insights
from a wide range of key informants and findings from household surveys to understand the
institutional and societal context that may be essential to informing progress on low-carbon
development in Dar es Salaam.

206
5.4 Institutions of Urban Governance in Dar es Salaam
In this section, I discuss the institutions of urban governance for the Dar es Salaam region and
their relative power to coordinate policies and project financing decisions (refer to Sections 2.3,
3.4, and 4.3.1 for additional background information on Dar es Salaam). Outlining these power
structures provides critical context for understanding the possible role of institutions (i.e.,
national, and local government authorities) to coordinate low-carbon projects in Dar es Salaam.
Figure 5.1 maps the institutions of urban governance in Tanzania and for the Dar es Salaam
region. At the highest level, the Regional Administration and Local Government – a body within
the office of the President (also known as “PORALG”) – coordinates all regional and local
government activities in Tanzania and works alongside sector ministries to develop policies and
projects in key infrastructure sectors (e.g., transportation or energy). The Regional
Administration for the Dar es Salaam region (still at the level of the national or central
government) is headed by a Regional Commissioner, who is appointed by the President, and
plays an oversight and coordinating role, including oversight on the duties and functions of local
government authorities. At the level of local government, the city has a two-tier governance
structure, i.e., urban activities are coordinated by both the Dar es Salaam City Council and five
autonomous Municipal Councils (or Districts: Kinondoni, Ilala, Ubungo, Temeke and
Kigamboni). Day to day urban management mostly occurs at the City and Municipal Council
level, where local government authorities control questions of land use, service delivery (e.g.,
solid waste management) and have the power to levy taxes and fees (e.g., service taxes, or
market and bus fees). The Dar es Salaam City Council also coordinates cross-cutting issues
between the Municipal Councils. From an administrative perspective, the Dar es Salaam City
Council is headed by an elected Mayor, and each Municipal Council has their own budget,
management process, and District Commissioner and Executive Director (who report to national
government, i.e., the Regional Commissioner and PORALG). Municipal Councils are further
sub-divided into divisions (“Wards”), then streets (“Mtaa”), which are the city’s smallest
administrative units (Figure 5.1).

207
Other aspects relevant to this study are Tanzania’s ongoing policy processes for charcoal use and
public transportation. Firstly, Tanzania’s biomass strategy envisions a 50% reduction in urban
charcoal use between 2015 and 2050 to be realized through households’ use of improved
cookstoves. The national energy policy and action agenda envisions that 75% (or more) of
Tanzania’s households will substitute their charcoal use with modern alternatives, i.e., electricity
or liquefied petroleum gas (“gas”) by 2030 (Government of Tanzania, 2015). Secondly, transport
and urban development policies for the Dar es Salam region (e.g., Government of Tanzania,
2017) aim to improve the efficiency of public transport, mostly through the Bus Rapid Transit
(BRT) system. The BRT development is coordinated at the national level (i.e., through PORALG
and the Ministry of Local Government, Figure 5.1), though policy processes have engaged local
government institutions (e.g., the Dar es Salaam City Council and Municipal Councils) in design
and implementation activities. The Phase 1 line of the BRT is currently in operation (as of 2016),
and future phase extensions are being planned (additional details on the BRT are provided in
Chapter 3 and Chapter 4).

208
Figure 5.1. Institutions of urban governance in Tanzania and for Dar es Salaam region. Direction
of arrow indicates the direction of reporting between institutions in local and national
government. This figure was created by the author (Alice Chibulu Luo) based on descriptions
provided by key informants during interviews, and other supporting information received from
PORALG, with their permission.

209
5.5 Methods
I employed a phased approach to the study. First, I conducted semi-structured interviews with
key informants from government, academia, the private sector, and civil society to examine the
key barriers to progress on low-carbon development in Dar es Salaam (further details in Section
5.5.1). I used qualitative methods (thematic analysis) to elucidate key informant perspectives on
the institutional factors that constrain the implementation of low-carbon initiatives in Dar es
Salaam. Second, I surveyed households, sampled across eight Dar es Salaam wards (Table 5.1),
and employed statistical methods (chi-square tests) to test the statistical effects of different
settlement types (e.g., informal, formal, or mixed wards) on household energy choices and travel
behaviors.
Field activities (i.e., key informant interviews and household surveys) were conducted in Dar es
Salaam between August 2018 and November 2018. Earlier visits to Dar es Salaam in the
previous year (September 2017) allowed me to establish partnerships with local universities and
researchers, pilot early versions of the survey, and receive feedback from community members
on the survey’s overall interpretation and sensitivity to the local context. The study received
research ethics approval through the University of Toronto Ethics Review Board and the
Tanzania Commission for Science and Technology (details in Chapter 4, Section 4.11.2).
Subsequent field activities were also conducted in Lusaka (Zambia) between November 2018
and February 2019 (where I also hosted a policy workshop, as discussed in Section 1.5).
However, due to resource constraints, I was unable to complete a full study in Lusaka. I broadly
summarize preliminary findings from key informant interviews conducted in Lusaka in the
supplementary material (Section 5.8.1) but do not incorporate them within the main body of this
chapter. Conducting more detailed comparative work and field activities in Lusaka (and possibly,
other African cities) would be an important area of future work.

210
5.5.1 Interviews with Key Informants and Thematic Analysis
I conducted in-person, semi-structured interviews with key informants from local and national
government institutions, academia, and the private sector. The key informants were identified
based on their prior work, research, expertise, or present position within the institution they
represented, e.g., engineers, managers, specialists, professors and urban planners who worked in
urban planning, transportation, and energy sectors. I summarize the affiliations and expertise of
the interviewed key informants in the supplementary material, Table S 5.1. The first set of
experts was identified through early outreach (via email or telephone) using networks established
from initial visits in 2017. These initial experts were then invited to suggest additional
participants/interviewees who I subsequently contacted for interview. I also conducted
introductory discussions (in-person or via telephone) with each participant to describe the overall
research objectives, and in some cases, ensured that letters of “research introduction” were
provided to their respective institutions (as some experts declined to participate without the
approval of existing within their organizations).
I developed open-ended interview questions, and these were designed to cover a range of urban
planning, transportation, and energy access topics. The interview format was adapted based on
participant expertise or knowledge of any of the topics. For example, transport sector experts had
the liberty to address only the transport-related questions, or all questions if they had knowledge
of other topics. Interviews lasted approximately one hour and were conducted only after
informed consent was obtained. The following three questions informed the main themes
presented in Section 5.6.1, although the full set of guiding questions is detailed in the
supplementary material (Section 5.8.1).
1. What are your general thoughts on how Dar es Salaam is promoting low-carbon
development?
2. In your opinion, what are key institutional factors that enable or constrain the adoption of
low-carbon initiatives or measures at the city or national level?
3. Are you aware of any urban sector projects or processes that focus on GHG mitigation or
low-carbon development in Dar es Salaam?

211
Interviews were digitally recorded with participant consent or summarized via hand-written
notes. Recorded formats were transcribed using an automated transcription tool (“f4transkript”).
Approximately 3 to 4 interviews were completed each week resulting in a final sample of 24 key
informants, as shown in Figure 5.2. The final sample size was determined when content
saturation was observed during subsequent interviews (i.e., new themes or concepts did not
emerge with additional interview participants). The use of content saturation in determining
sample size has been widely applied in qualitative research (see Bengtsson (2016), Trotter
(2012), and Wolf & Moser (2011)) and therefore was deemed appropriate for this study. Finally,
the transcribed interviews were analyzed using thematic analysis (Bengtsson, 2016), i.e., where
prevailing themes and ideas that emerged from the interviews were coded manually based on key
words and phrases that were commonly used by experts.
5.5.2 Household Surveys
Structured household surveys were conducted in Dar es Salaam for six weeks between August
and October 2018 (additional details on the survey are outlined in Section 4.11.1 and 4.11.2). At
the start of our survey activities, research permits were obtained from city, district and ward level
authorities, i.e., the Regional Administrative Secretary, District Council Directors (for
Kinondoni, Temeke, Ubungo and Ilala districts), and Ward Directors in the 8 pre-selected wards.
Wards were selected based on their estimated density (according to 2012 census data);
residential land-use; assumed average household income, determined based on anecdotal
feedback from the field team and local community members; and estimated distance from the
closest BRT stop along the current line (Phase 1).
It is important to note that residential land-uses in Dar es Salaam are complex, and there are
several nomenclatures to describe the different residential land-use structures in the city, see
studies by Kironde (2000; 2006), Kombe (2005), and Lupala (2002). The current study describes
settlements as either “formal” or “informal”. Formal wards have land or housing transfers mostly
regulated by local or national government, compared to informal wards where there are informal
arrangements through individuals (Kironde, 2000; 2006). We also surveyed households from

212
“mixed” settlements, which are comprised of both formal and informal settlements within the
same sub-city boundary. Other common terms in the literature to describe these differences
include “unplanned” and “planned” settlements, or “customary” and “non-customary” land (see
studies by Kombe (2005) and Lupala (2002)). The socio-economic and spatial characteristics of
the surveyed wards are shown in Table 5.1. We interviewed a total of 1,363 households across
the 8 wards.
We adopted a stratified random sampling approach in which proportional numbers of households
were randomly selected and interviewed in each ward, i.e., estimated based on the ward
population density, additional details can also be found in Chapter 4. Our final sample covered a
spatially and socio-economically diverse set of wards to ensure that the final sample reflected the
range of household and ward typologies present in Dar es Salaam.

213
Table 5.1. Socio-economic and spatial characteristics of wards surveyed in Dar es Salaam1
Name Ward
density
(people/sq.-
km)
Residential
land-use
Average
household
income
(assumed)2
Mean distance
of surveyed
wards to
closest BRT
stop (km)
Total
number of
households
surveyed
Msasani 4,402 Formal High-income 3.4 94
Sinza 12,151 Formal Middle-income 1.1 111
Buguruni 20,460 Informal Low-income 3.1 242
Keko 4,336 Informal Low-income 1.6 113
Manzese 38,496 Informal Low-income 0.2 235
Kawe 24,179 Mix High-income 7.9 178
Kimara 5,569 Mix Middle-income 1.7 221
Mwananyamala 20,409 Mix Low-income 0.6 169
Total households surveyed 1,363
Table Notes:
1 Map of wards visited is shown in supplementary file.
2 Income categories were determined anecdotally based on insights and local knowledge of the city from residents,
researchers, and the field team members.
Surveys were administered in Swahili and later translated into English. The field team
participated in a 3-day mandatory training in both English and Swahili prior to administering the
surveys. Questions were structured and required participants to respond to a set of pre-
determined open-ended and closed-ended questions. In some cases, Likert scale responses were
required, i.e., participants were asked to rank their preferences or opinions over a pre-defined
range. Questions that were most relevant to this study are detailed in Table 5.2.

214
Table 5.2. Structured survey questions administered to households in Dar es Salaam1,2
Household energy behaviors
1. Does the household have access to electricity?3
2. What is your preferred stove for cooking? (i.e., electricity, charcoal, gas or other)?
3. What is the main factor that influences the household's choice to use a non-electric stove for
cooking? (i.e., charcoal or gas)4
4. Would the household support the eventual phase-out of charcoal use in Dar es Salaam?3
5. Are you aware of the negative health impacts associated with charcoal use for cooking?3
Household travel behaviors and perceptions of the BRT service
1. Does the household own a private car?3
2. Does the household use public transport during the weekday?3
3. What is the household’s main mode of travel (i.e., represents the largest travel distance per day)?
4. How accessible is the BRT service to your neighborhood?4
5. How affordable is the BRT service relative to the “dala-dala” mini-bus service?4
Table Notes:
1 Only the questions relevant to this study are presented in this table. See Appendix A for the full questionnaire.
2 The survey was based on a structured questionnaire.
3 This question was based on a Yes/No response.
4 A ranking of options was presented, and participants were required to select one response, scale: 1 = not
accessible/affordable at all, 6 = extremely accessible/affordable.
5.5.3 Household Survey Data Cleaning and Statistical Analysis
Household survey response data were cleaned and restructured for analysis using the R
programming language. My final data tables (Table 5.3 and Table 5.4) summarize responses
based on the proportion of total households that responded to each of the survey questions. Given
the categorical nature of the analyzed survey responses, Pearson’s chi-square tests of
independence (or association) were employed to test the statistical relationship between
household responses and ward type (the list of surveyed wards is presented in Table 5.1). Chi-
square tests are a widely recognized statistical method for analyzing categorical survey data and

215
have been used in various Africa region studies examining household energy choices (e.g.,
electricity, charcoal, firewood, and other fuels), e.g., Nigeria (Ifegbesan et al., 2016; Kiyawa &
Yakubu, 2017), South Africa (Uhunamure et al., 2017) and Zimbabwe (Campbell et al., 2003).
Chi-square tests are usually performed at a 5% significance level, meaning that the test yields a
statistically significant result when p-values are below 0.05. Therefore, in the context of this
research, p-values less than 0.05 would indicate that survey responses are statistically dependent
on ward type.
Employing chi-square tests to determine whether survey responses were statistically dependent
on ward type allowed me to answer questions such as, are household perceptions on charcoal use
statistically different at the ward level? Are household perceptions of the BRT relative to the
local mini-bus (“dala-dala”) statistically different at the ward level? My previous work (Chapter
4) employed other statistical methods (i.e., Analysis of Variance and multivariate regression
models) to show the statistical relationship between estimated energy use among the surveyed
wards and ward type but did not examine the societal factors that influence household energy use
behaviors (i.e., household perceptions of different fuels or transport options) as in the current
chapter.
216
5.6 Results and Discussion
This section first presents results from the key informant interviews (i.e., the institutional
perspective), followed by those from the household surveys (i.e., the societal perspective), and
lastly, links the two sets of findings and suggests an approach or “way forward” for stakeholders
to support progress on low-carbon development in Dar es Salaam.
5.6.1 Dar es Salaam Key Informant Interviews
I interviewed 24 key informants in Dar es Salaam with demonstrated expertise in the following
sectors: urban planning, transport and energy (details in supplementary material, Section 5.8.2).
Of the 24 key informants, 6 were from academia (referred to as “Academic”), 7 from national
government (“NGOV”), 3 from local government (“Municipality”), 4 from non-governmental
organizations or donor agencies (“NGO-Donor”), and 4 from the private sector (“Private
Sector”).
As shown in Figure 5.2, key informants expressed the following as factors that may be
constraining progress on low-carbon development in Dar es Salaam: (1) Policies exist, but
implementation processes are inadequate, (2) Local authorities (Municipal and City Councils,
see Figure 5.1) have little jurisdiction, (3) Limited funding and own-source-revenue collection
among local authorities constrains their capacity to spearhead their own initiatives, and (4)
Interviewees were unaware of processes that enabled stakeholders to engage on low-carbon
initiatives in Dar es Salaam. Table S 5.1 in the supplementary material shows a more detailed
mapping of the key informant responses.
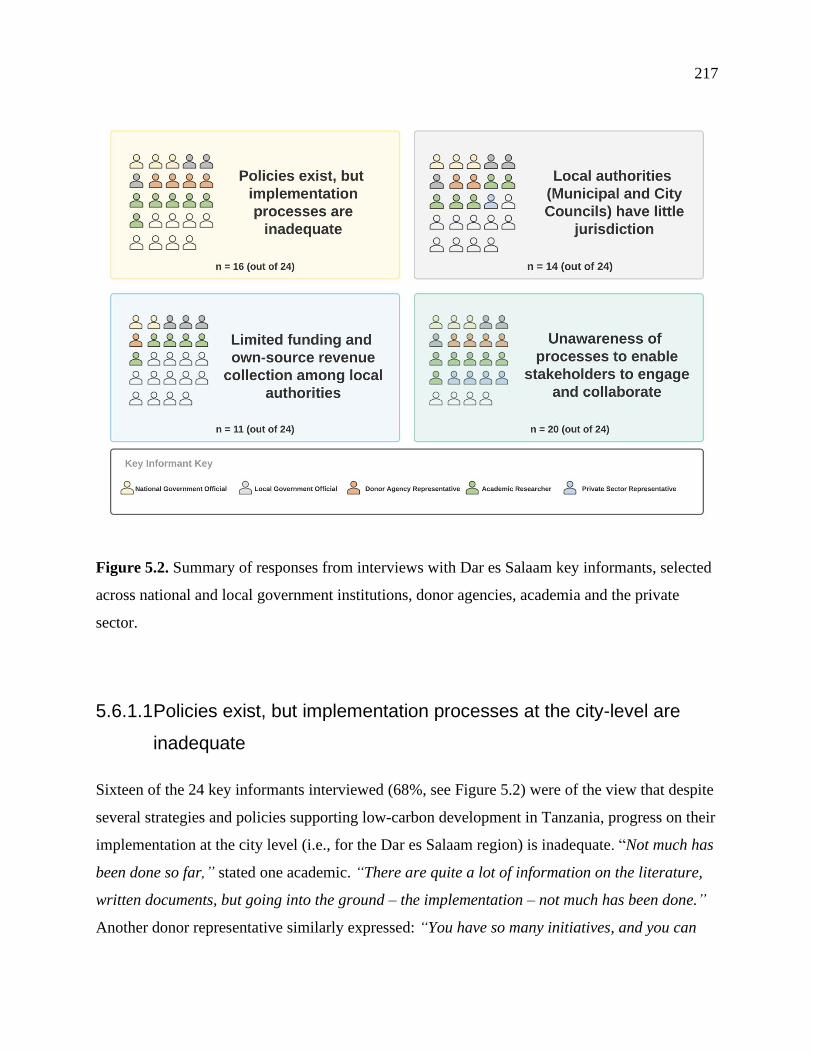
217
Figure 5.2. Summary of responses from interviews with Dar es Salaam key informants, selected
across national and local government institutions, donor agencies, academia and the private
sector.
5.6.1.1 Policies exist, but implementation processes at the city-level are
inadequate
Sixteen of the 24 key informants interviewed (68%, see Figure 5.2) were of the view that despite
several strategies and policies supporting low-carbon development in Tanzania, progress on their
implementation at the city level (i.e., for the Dar es Salaam region) is inadequate. “Not much has
been done so far,” stated one academic. “There are quite a lot of information on the literature,
written documents, but going into the ground – the implementation – not much has been done.”
Another donor representative similarly expressed: “You have so many initiatives, and you can

218
always wonder if they belong to the same country. You know, because there is Sustainable
Energy for All, the Action Agenda that Tanzania adopted, you have Scaling-up Renewable
Energy, you have Paris Agreements, SDGs, you have so many things and Tanzania participates.
But the actual deployment, implementation of it, is usually a question mark.” Another official
from national government described Tanzania’s energy sector policies and noted that intended
plans are not widely reflected at the city level: “As I said, the energy sector planning that we
have in Tanzania – most of the plans are at the country level (the national level). I am not sure of
planning at the city level when it comes to energy.”
5.6.1.2 Local authorities have little jurisdiction
Historically, the relationship between national and local government in Tanzania has been
focused on consolidating power at the national level with little autonomy given to the local
authorities (TULab, 2019). After the independence of Tanganyika in 1961, the country inherited
the colonial system where local authorities were used as vehicles to provide basic social services
(Kombe & Namangaya, 2016). However, by 1974, this initiative was reversed and the national
government through other regional bodies (e.g., the Regional Commissioner’s Office and
PORALG) became the main provider of services, retaining most, if not all decision-making
powers (TULab, 2019). The Tanzanian Local Government Reform Act introduced in 1998 – and
based on the principle of decentralization – aimed to empower local authorities with more
political, administrative and fiscal control by offering more expenditure responsibility to lower
administrative levels and enabling the collection of local government authorities’ own revenues
from different sources (e.g., through projects with the private sector or development agencies).
The reality, as suggested by 14 of the 24 key informants (58%, Figure 5.2), is that local
authorities have limited jurisdiction to influence policy processes and direct investments for the
implementation of low-carbon projects in Dar es Salaam. “Indeed, the decentralization policy
exists; but the reality is that the central government is slowly taking over the city”, stated one
donor representative. National government authorities (i.e., PORALG and the sector ministries,
see Figure 5.1) retain most decision-making power in key sectors that are important to low-
carbon development (e.g., energy and transport). Sector ministries and national utilities
219
coordinate investments in key infrastructure sectors (e.g., electrification, road transport, and
public transportation), which highlights the centralized structures of infrastructure service
delivery in Tanzania.
5.6.1.3 Limited funding and own-source revenue collection among local
authorities constrains their capacity to spearhead their own
initiatives
The existing funding constraints among local authorities was a critical issue highlighted by
almost half of the key informants (11 out of 24, i.e., 46%, see Figure 5.2). The views expressed
by these key informants are consistent with other local studies showing that 80% to 90% of
current local government budgets are disbursed through intergovernmental transfers from
national government institutions (e.g., PORALG) (Government of Tanzania, 2016a). These
funding flows underscore the sizable dependence of local governments on national government
funds, which limits their autonomy to implement low-carbon projects in their jurisdictions.
Relatedly, two key informants from government and academia also highlighted that local
authorities were limited in their capacity to coordinate budgets and funding flows from donor
groups (e.g., the World Bank). Therefore, these key informants expressed that funding flows
needed to be coordinated at the national level where financial management systems were more
robust but noted that implementation of low-carbon projects should engage both local authorities
and communities in a collaborative process. According to one official in national government,
“Even though the implementation of low-carbon investments will be done at the sector level, it
needs to include all stakeholders. But currently, every sector is planning on its own.” Similarly,
other studies (e.g., (Diep et al., 2016; Leck & Simon, 2018; Tait & Euston-Brown, 2017; Vedeld
et al., 2016)) have highlighted the benefits of multiple stakeholder collaboration in enabling
progress on local climate change adaptation or mitigation responses in African cities.
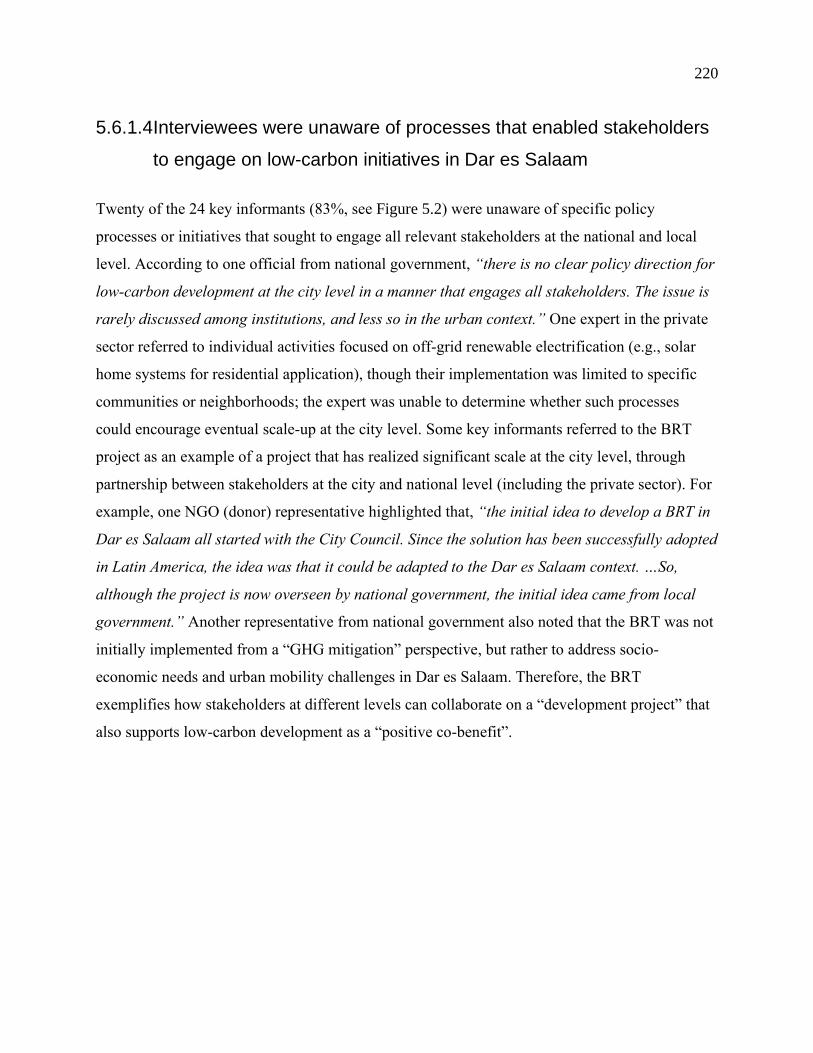
220
5.6.1.4 Interviewees were unaware of processes that enabled stakeholders
to engage on low-carbon initiatives in Dar es Salaam
Twenty of the 24 key informants (83%, see Figure 5.2) were unaware of specific policy
processes or initiatives that sought to engage all relevant stakeholders at the national and local
level. According to one official from national government, “there is no clear policy direction for
low-carbon development at the city level in a manner that engages all stakeholders. The issue is
rarely discussed among institutions, and less so in the urban context.” One expert in the private
sector referred to individual activities focused on off-grid renewable electrification (e.g., solar
home systems for residential application), though their implementation was limited to specific
communities or neighborhoods; the expert was unable to determine whether such processes
could encourage eventual scale-up at the city level. Some key informants referred to the BRT
project as an example of a project that has realized significant scale at the city level, through
partnership between stakeholders at the city and national level (including the private sector). For
example, one NGO (donor) representative highlighted that, “the initial idea to develop a BRT in
Dar es Salaam all started with the City Council. Since the solution has been successfully adopted
in Latin America, the idea was that it could be adapted to the Dar es Salaam context. …So,
although the project is now overseen by national government, the initial idea came from local
government.” Another representative from national government also noted that the BRT was not
initially implemented from a “GHG mitigation” perspective, but rather to address socio-
economic needs and urban mobility challenges in Dar es Salaam. Therefore, the BRT
exemplifies how stakeholders at different levels can collaborate on a “development project” that
also supports low-carbon development as a “positive co-benefit”.

221
5.6.2 Dar es Salaam Household Surveys
I present the results from statistical analysis (chi-square tests) that was conducted using data
from household responses to questions shown in Table 5.2. Household findings are
disaggregated into the following sections: (1) energy access, (2) cooking behavior, (3)
perceptions on charcoal use, (4) travel behavior, and (5) perceptions on the affordability and
availability of the BRT service.
5.6.2.1 Household Electricity Access
Chi-square tests show a statistically significant effect of ward type on reported electricity access
levels among surveyed households (p<0.01), i.e., high and middle-income wards (Msasani,
Sinza, Kawe, Mwananyamala and Kimara) are more likely to report “having access to
electricity” compared to low-income wards (Buguruni, Manzese and Keko), details in Table 5.3.
Overall, between 75% (Buguruni) and 100% (Msasani and Sinza) of surveyed households
reported having access to an electricity connection. The lower-bound estimate (75%) is
consistent with electricity access levels reported for the Dar es Salaam region in 2017 (i.e., 75%
in 2017, see Government of Tanzania (2017)). However, the higher upper-bound estimate
(100%) may suggest two things: (1) my survey sample is not entirely representative of the city-
wide (Dar es Salaam) average and additional data collection may be required to confirm my
estimates, or (2) the city-wide data is under-estimated as it does not consider the heterogeneity in
electricity access at the ward level (i.e., as shown in this study and my previous work in Chapter
4). Nonetheless, my findings demonstrate the higher electricity access levels in Dar es Salaam
compared to the national (Tanzania) average of 33% and rural average of 17% in 2016
(Government of Tanzania, 2017). The heterogeneity in the city’s electricity access is also similar
to levels reported for other African cities, e.g., 95% in Kampala (Uganda) (2018/2019 data), 87%
in Nairobi (2014 data), and 76% in Lusaka (Zambia) (2018 data) (DHS Program, 2020).

222
5.6.2.2 Household Cooking Behavior
Despite the generally high electricity access levels, I find that between 51% (Msasani) and 99%
(Keko) of households reported that they did not use electricity for cooking. Chi-square tests
show a statistically significant effect of ward type on household cooking behavior (p<0.01), i.e.,
high-income wards (Msasani and Kawe) are more likely to report using electricity for cooking
(49% and 29% of households) compared to low-income wards (less than 1% of households in
Keko and Manzese).
My previous study (Chapter 4) showed that charcoal is a majority contributor to household-
related energy use among low-income wards (Buguruni, Keko, and Manzese). Similarly, chi-
square tests show a statistically significant effect of ward type on charcoal use, i.e., low-income
wards are more likely to use charcoal as a cooking fuel (95% of households). This includes
households that “fuel stack”, i.e., they use charcoal in combination with one or more other fuels
for cooking. In Chapter 4 I also disaggregated the different fuel combinations among households
that fuel stack and examines the statistical relationship between fuel stacking and household-
related energy use. Findings from this previous work show that charcoal use is typically present
in fuel stacking and is significantly correlated with higher household-related energy use, while
cooking with only electricity or only gas is correlated with lower household-related energy use
(Chapter 4).
Charcoal and gas are widely perceived as “more affordable” cooking fuels. Between 74% (Sinza)
and 85% (Keko) of surveyed households perceived non-electric fuels (i.e., charcoal and gas) as
“more affordable” fuel sources. The high p-value (i.e., p = 0.254, Table 5.3) indicates that
households’ perceptions of charcoal, wood or gas stoves as “more affordable” are common
among all wards, i.e., these perceptions are independent of ward type.
5.6.2.3 Household Perceptions on Charcoal Use
Between 44% (Mwananyamala) and 51% (Buguruni) of surveyed households “disagreed” with
policies promoting a charcoal phase out, while between 24% (Keko) and 42% (Manzese)

223
“agreed”s with such policies. And between 15% (Manzese) and 27% (Keko) were “neutral”
details in Table 5.3). The high p-value (p = 0.141) indicates that variations in household opinions
are common among all wards, i.e., independent of ward type.
Households in low-income and informal wards are also less aware of the “health effects”
associated with charcoal use. On household sensitivity to the “negative consequences” of
charcoal use, which refers to the health burdens from indoor air pollution associated with
charcoal use, I found a statistically significant relationship between household responses and
ward type (p < 0.01). Respondents from Buguruni and Keko, in particular, have less awareness
of these consequences: 54% and 56% of households reported that they were not aware of the
“negative health consequences associated with using a charcoal stove for cooking”, compared to
35% and 32% of households in high-income wards (Msasani and Kawe) (Table 5.3). Finally,
based on anecdotal observations from our field interactions, even though some households stated
knowledge or awareness of the negative effects of charcoal use, i.e, between 44% (Keko) and
68% (Kawe), existing economic challenges and the perceived high associated with electricity or
gas use (e.g., due to the high upfront cost of purchasing an electric or gas stove) were among the
key reasons for continued charcoal use in general.
5.6.2.4 Household Travel Behavior
Households in low and middle-income wards (e.g., Keko and Kimara) are more likely to use
public transport – i.e., local mini-buses (“dala-dalas”), motorcycles (“bodas”), tricycles
(“bajajis”) or the BRT – during the working week (Monday to Friday, which are the days we
surveyed) relative to high-income wards (e.g., Msasani). For example, between 67% (Msasani)
and 93% (Buguruni) of households stated that they used public transport during the working
week (see Table 5.4).
Households in low-income wards are more likely to travel by dala-dala as their main travel mode
(between 43% and 63% of households in Keko, Buguruni and Manzese, Table 5.4), while high-
income wards are more likely use private vehicles as their main mode (between 49% and 59% of
224
households in Msasani and Kawe). Based on anecdotal evidence from the fieldwork, I observed
that some households in Msasani and Kawe were among Dar es Salaam’s elite class. and during
the course of interviewing, expressed an overall preference for private vehicles due to safety
concerns (the issue of public transport safety has also been noted by Andreasen and Møller-
Jensen (2017). Respondents also cited wanting to avoid long-commuting times (and possible
route transfers) associated with dala-dala use.
5.6.2.5 Household Perceptions on the Accessibility and Affordability of
the BRT Service
Household perceptions on the accessibility and affordability of the BRT service (i.e., the Phase 1
line) were correlated with ward type (p<0.01). Between 29% (Kimara) and 58% (Keko) of
surveyed households stated that the BRT was “not accessible” within their community (Table
5.4). Relatedly, some households believed the BRT was “not affordable” compared to the local
mini-bus (dala-dala) service. While, between 30% (Mwananyamala) and 55% (Keko) of
households perceived the BRT as “not affordable” relative to the existing dala-dala service.
Other households were “neutral” on the question of BRT affordability (between 12% (Keko) and
26% (Mwananyamala)) or agreed that it was “affordable” (between 31% (Kawe) and 44%
(Mwananyamala)). These findings suggest that ongoing efforts to expand the BRT service,
which was referenced among key informants (Section 5.6.1), are needed to deliver a competitive
service, i.e., in terms of affordability and accessibility that is equivalent or better than other
public transport modes. This would improve perceptions of the BRT service and encourage
higher BRT use within communities. Therefore, processes to enable multi-stakeholder
collaboration on low-carbon development as recommended in Section 5.6.1 could engage
residents in mapping of preferred routes, locations or stops to be serviced by future BRT lines.

225
Table 5.3. Results from household surveys and chi-square tests showing the effect of ward type on household
survey responses to questions on household electricity access, cooking behavior and perceptions on charcoal use.
Msasani
(N=94)
Kawe
(N=178)
Mwanayamala
(N=169)
Kimara
(N=221)
Sinza
(N=111)
Buguruni
(N=242)
Keko
(N=113)
Manzese
(N=235) Significance
Income
bracket1 High High Middle Middle Middle Low Low Low
1. Does the household have access to electricity?
No 0% 4% 6% 8% 0% 25% 22% 14% p<0.01***
Yes 100% 96% 94% 92% 100% 75% 78% 86%
2. What type of fuel(s) does the household use for cooking?
Charcoal
No 80% 46% 11% 19% 24% 8% 8% 8% p<0.01***
Yes 20% 55% 89% 81% 76% 92% 92% 92%
Electricity
No 51% 71% 98% 97% 87% 99% 99% 100% p<0.01***
Yes 49% 29% 2% 3% 13% 1% 1% 0%
Gas
No 1% 6% 34% 23% 20% 53% 59% 53% p<0.01***
Yes 99% 94% 66% 77% 80% 47% 41% 47%
Other
No 100% 100% 91% 99% 97% 90% 91% 82% p<0.01***
Yes 0% 0% 9% 1% 3% 10% 9% 18%
3. What is the main factor that influences the household's choice to use a non-electric stove (i.e., charcoal or gas) for cooking?
It is more
affordable 80% 83% 82% 82% 74% 79% 85% 84% p = 0.254
It is
widely
accessible
9% 6% 5% 6% 11% 10% 11% 5%
Other 11% 12% 8% 12% 12% 10% 4% 11%
4. Would the household support the eventual phase out of charcoal use in Dar es Salaam?
Agree 36% 32% 38% 33% 41% 30% 24% 42% p=0.141
Neutral 18% 19% 18% 16% 16% 19% 27% 16%
Disagree 46% 49% 44% 50% 43% 51% 50% 42%
5. Are you aware of the negative health consequences associated with using charcoal for cooking?
No 35% 32% 40% 35% 38% 54% 56% 43% p<0.01***
Yes 65% 68% 60% 65% 62% 46% 44% 57%
Table Notes: 1Income categories were determined based on the field team’s knowledge and expertise of neighborhood types in the Dar es Salaam region.
• Totals do not always add to 100% due to rounding.
• *p<0.1; **p<0.05; ***p<0.01.

226
Table 5.4. Results from household surveys and chi-square tests showing the effect of ward type on household
survey responses to questions on household travel behavior and perceptions on the affordability and accessibility
of the BRT service (i.e., relative to the “dala-dala” minibus service).
Msasani Kawe Mwanayamala Kimara Sinza Buguruni Keko Manzese Significance
Income
bracket1 High High Middle Middle Middle Low Low Low
1. Does your household use a private car during the working week?
No 40% 48% 6% 11% 84% 96% 95% 95% p<0.01***
Yes 60% 52% 94% 89% 16% 4% 5% 5%
2. Does your household use public transport during the working week?
No 33% 27% 13% 10% 13% 7% 12% 16% p<0.01***
Yes 67% 73% 87% 90% 87% 93% 88% 84%
3. What is your household's main mode of travel during the working week?
BRT
No 100% 99% 95% 69% 90% 99% 100% 84% p<0.01***
Yes 0% 1% 5% 31% 10% 1% 0% 16%
Dala-dala
No 93% 81% 49% 78% 60% 37% 51% 57% p<0.01***
Yes 8% 19% 51% 22% 41% 63% 49% 43%
Private vehicle
No 41% 51% 96% 91% 87% 96% 96% 97% p<0.01***
Yes 59% 49% 4% 9% 13% 4% 4% 3%
4. How accessible is the BRT service in your neighborhood?
Accessible 51% 68% 51% 71% 47% 58% 43% 60% p<0.01***
Not accessible 49% 32% 49% 29% 53% 42% 58% 40%
5. How affordable is the BRT relative to the existing dala-dala service?
Affordable 40% 31% 44% 42% 42% 35% 34% 40% p<0.01***
Neutral 16% 18% 26% 12% 13% 18% 12% 20%
Not affordable 44% 51% 30% 46% 45% 48% 55% 40%
Table Notes: 1Income categories were determined based on the field team’s knowledge and expertise of neighborhood types in the Dar es Salaam region.
• Totals do not always add to 100% due to rounding.
• *p<0.1; **p<0.05; ***p<0.01.
• Due to the small sample size, the use of the boda/bajaji was not considered in the statistical analysis.

227
5.6.3 Linking Findings from Key Informant Interviews and Household
Surveys in Dar es Salaam
Findings from the key informant interviews suggest a call to action to stakeholders to reflect on
the following constraints to low-carbon development from an institutional perspective: (1)
Policies exist, but implementation processes are inadequate; (2) Local government authorities
have little jurisdiction; (3) Funding constraints and insufficient own-source-revenue collection
limit the capacity of local government authorities to spearhead their own initiatives; and (4)
Policy processes to support collaboration among key stakeholders are inadequate.
Based on the current structure of urban governance for the metropolitan region (Figure 5.1), key
informants suggested that national government authorities (PORALG and sector ministries) hold
the most power to initiate climate change policies and projects Dar es Salaam, including low-
carbon projects (e.g., public transportation initiatives, or renewable electrification). Although
Tanzania’s decentralization policy supports own source revenue collection among local
government authorities, urban governance in the metropolitan region is highly centralized and
coordinated at the national level, i.e., between 80% to 90% of local government funds are
transferred through PORALG and the sector ministries (Government of Tanzania, 2016a).
Therefore, investments to support low-carbon development would need to engage national and
local government authorities on specific mandates. For example, City Council and Municipal
Councils could take leadership in engaging national government authorities around a priority set
of project/investments that would be eventually funded through national government. However,
local governments could also play a key role in ensuring that investments account for the societal
context, i.e., community needs and their socio-economic challenges. Results from household
surveys (Section 5.6.2) show that (1) Dar es Salaam’s electrification levels are generally high,
(2) most households do not use electricity for cooking, (3) fuels other than electricity are widely
perceived as more affordable and close to half of households (between 44% and 51%) disagreed
with policies promoting a charcoal phase out, (4) households in low-income and informal wards
are less aware of the “health effects” associated with charcoal use, and (5) there are significant
differences in travel choices among surveyed wards. Therefore, these societal factors (e.g.,

228
community preference for non-electric cooking, or sensitivity around charcoal use and its
negative health effects) should be considered in the implementation of low-carbon projects. This
is likely to require leadership from multiple stakeholders through a collaborative process that
leverages the power and mandate of different institutions. I conclude by outlining a possible
structure for such a process in the following Section (5.7).
5.7 Conclusions – Which Institution(s) should “Take the Lead” to
Enable Low-Carbon Development in Dar es Salaam?
This study shows the institutional and societal barriers that may constrain low-carbon
development in Dar es Salaam. Findings from interviews with key informants and surveyed
households suggest that leadership on low-carbon development in Dar es Salaam will require
multi-stakeholder processes of collaboration that engage stakeholders across both local and
national government, donor agencies, infrastructure service providers, and local communities.
“Champions” within each stakeholder group could be identified and invited as official members
of a task force or steering committee (as suggested by some key informants), tasked with the
responsibility to (1) establish a pipeline of low-carbon projects to be implemented in Dar es
Salaam over a specified time period (e.g., the next 5 years); (2) define roles and responsibilities
for different institutions based on their power and capacity to lead in specific activities or policy
processes; and (3) ensure that selected institutions deliver on their roles/responsibilities through
monitoring and evaluation of progress towards envisioned goals and objectives.
As an example, steering committee members could include representatives of PORALG and
sector ministries (e.g., Ministry of Local Government, Energy and Transport), City and
Municipal Councils, donor institutions, and infrastructure service providers (including the private
sector). Roles and responsibilities for each institution could include the following.
• PORALG and sector ministries: coordinate funding and investment towards low-
carbon projects in Dar es Salaam, while also ensuring that projects align with broader
urban planning and energy sector goals. PORALG and the sector ministries would also
229
lead policy development and financing of low-carbon projects – although developing a
priority set of pipeline low-carbon projects would require partnership and engagement of
other members of the steering committee, i.e., City and Municipal Councils, funding
institutions, and infrastructure service providers, among other stakeholders.
• Dar es Salaam City and Municipal Councils: ensure that the “voices” of lower-level
jurisdictions, e.g., wards and streets (“mtaas”) (Figure 5.1), are considered as pipeline
projects are developed. Their roles/responsibilities could also include (1) engaging with
community members via focus group discussions, or community-specific activities, and
(2) collecting community data and information on energy use and travel patterns (data
presented in this study could inform these secondary processes).
• Multilateral Development Banks (MDBs) (e.g., the World Bank, Africa
Development Bank) and the private sector: develop additional financing options for
pipeline projects (e.g., grants, concessional loans or private equity) to accelerate their
implementation in Dar es Salaam. Institutions could also lead mapping efforts to identify
example projects, business models, or technologies that would be considered “bankable”
and therefore attractive to MDB or private sector finance.
• Energy utilities, transport authorities, and regulators: improve existing approaches to
infrastructure service delivery, e.g., supporting electrification efforts among low-income
wards where access levels are lowest, or introducing subsidies to encourage electricity
and gas use for cooking among low-income wards.
To conclude, effective collaboration among the above institutions would ensure progress toward
low-carbon development in Dar es Salaam, where leadership from City and Municipal councils
would ensure the societal context is adequately considered in all stages of project development
and implementation.

230
5.8 Supplementary Material
The supplementary material includes supporting methods, calculations and background data that
are important in the context of this chapter (Chapter 5). Tables and figures are presented with the
letter “S” in their caption title, and are referenced throughout the main body of this chapter,
where relevant.

231
5.8.1 Interview Guide for Key Informant Interviews
KEY INFORMANT INTERVIEWS – QUESTION GUIDE
▪ What are your general observations on the urban development process in your city?
▪ Can you comment on the institutional framework for urban governance in your city with respect to:
o Key institutions and organizations involved in urban governance?
o How urban governance is evolving i.e. what are the main opportunities and challenges?
o Any policy processes responding to the challenges of rapid urbanization?
o Key research bodies coordinating and collecting data on urban infrastructure e.g., electricity
access and use, transportation demand, or other aspects? And how does this data feed into the
existing urban development process?
o Any innovations or changes taking place that are relevant to mention?
▪ What are your general thoughts on how the city is promoting low-carbon development? Please provide
examples.
▪ In your opinion, what are key institutional factors that enable or constrain the adoption of low-carbon
measures at the city or national level?
▪ Are you aware of any urban sector projects or processes that focus on climate change mitigation or low-
carbon development in the city?
▪ Are you aware of any institutions at the local or national level have the power to structure policies
and/or interventions to enable low-carbon development? For example, policies or interventions to
support public transport use? Or a transition to modern fuels such as electricity or gas? Or reducing the
domestic use of charcoal?
▪ Is there a working or active master plan for the city?
o If so, what are the main elements of the plan?
o What are its limitations?
▪ Are you aware of any policies or processes that examine then nexus between energy use, greenhouse gas
(GHG) emissions and spatial planning in the city?
o If so, what are they?
▪ What are the existing policy processes to manage and coordinate processes for energy use and GHG
emissions management at the city or national level?
o What are the main priorities in this regard?
o What are the infrastructure sectors being prioritized?
o Are these processes linked to national level targets?
▪ What are your general observations on energy use in key sectors e.g., transportation or housing, in the
city?
▪ Are there any other aspects you would like to comment on?

232
5.8.2 Mapping of Dar es Salaam Key Informant Responses
Table S 5.1. Mapping of key informant responses based on main themes that emerged from interviews. Key informants who stated
opinions that were generally consistent with one or more of the four themes are identified with a check mark (√).
# Code Affiliation and
Expertise
1: Policies exist, but
implementation
processes at the city-
level are inadequate
2: Local authorities
have little jurisdiction
3:Limited funding and
own-source revenue
collection among local
authorities constrains
their capacity to
spearhead their own
initiatives
4: Interviewees were
unaware of processes
that enabled
stakeholders to engage
on low-carbon
initiatives in Dar es
Salaam
Urban Planning
1. Academic1 Professor, Ardhi
University
√ √ √ √
2. Academic2 Professor, Ardhi
University
√ √ √ √
3. Academic3 Professor, Ardhi
University
√ √ √ √
4. Academic4 Professor, Ardhi
University
√ √ √ √
5. Academic5 Professor, University of
Dar es Salaam
√ √ √
6. Municipality1 Director, Dar es Salaam
City Council
√ √ √ √
7. Municipality2 Urban Planner, Dar es
Salaam City Council
√ √ √ √

233
# Code Affiliation and
Expertise
1: Policies exist, but
implementation
processes at the city-
level are inadequate
2: Local authorities
have little jurisdiction
3:Limited funding and
own-source revenue
collection among local
authorities constrains
their capacity to
spearhead their own
initiatives
4: Interviewees were
unaware of processes
that enabled
stakeholders to engage
on low-carbon
initiatives in Dar es
Salaam
8. Municipality3 Urban Planner, Dar es
Salaam City Council
√ √ √ √
9. NGO1 Specialist, Donor
Agency (Multilateral)
√ √ √
Transport
10. NGOV1 Engineer, Dar es Salaam
Rapid Transit Agency
√
11. NGOV2 Engineer, Dar es Salaam
Rapid Transit Agency
12. NGOV3 Engineer, Dar es Salaam
Rapid Transit Agency
13. NGOV4 Engineer, Tanzania
National Roads Agency
√ √
14. Academic6 Researcher, University
of Dar es Salaam
√ √ √
15. NGO2 Specialist, Donor
Agency (Multilateral)
√ √ √

234
# Code Affiliation and
Expertise
1: Policies exist, but
implementation
processes at the city-
level are inadequate
2: Local authorities
have little jurisdiction
3:Limited funding and
own-source revenue
collection among local
authorities constrains
their capacity to
spearhead their own
initiatives
4: Interviewees were
unaware of processes
that enabled
stakeholders to engage
on low-carbon
initiatives in Dar es
Salaam
Energy
16. NGOV5 Engineer, Tanzania
Electric Supply
Company Limited
√ √ √
17. NGOV6 Manager, Energy and
Water Utilities
Regulatory Authority
√ √
18. NGOV7 Director, President’s
Office – Regional and
Local Government
√ √ √
19. NGO3 Specialist, Donor
Agency (Multilateral)
√ √ √
20. NGO4 Specialist, Donor
Agency (Multilateral)
√ √
21. PS1 Manager, Private Sector √
22. PS2 Manager, Private Sector √
23. PS3 Manager, Private Sector √ √
24. PS4 Manager, Private Sector √
Total 16 14 11 20
235
5.8.3 Preliminary Work in Lusaka
This section presents findings from subsequent interviews with key informants in Lusaka. I
conducted interviews between November and February 2018 to broadly compare insights with
those from Dar es Salaam. Insights from Lusaka serve as a subordinate case – my analysis of key
informant responses is generalized, and I do not complete a detailed mapping of key informant
responses. Rather, I broadly reflect on common and distinct themes and findings. This is a
limitation of my study, and future work could incorporate more detailed engagement with key
informants in Lusaka, and other cities in Africa.
In total, I interviewed 17 key informants in Lusaka who were professors, managers and
specialists in urban planning, energy, climate change, and transport sectors. Table S 5.2
summarizes the affiliations and expertise of the Lusaka key informants. In summary, f the 17
interviewed key informants, 2 were from academia (also coded as “Academic”), 9 from national
government (“NGOV”), 1 from local government (“Municipality”), 3 from non-governmental
organizations or donor agencies (“NGO-Donor”), and 2 from the private sector (“Private
Sector”).
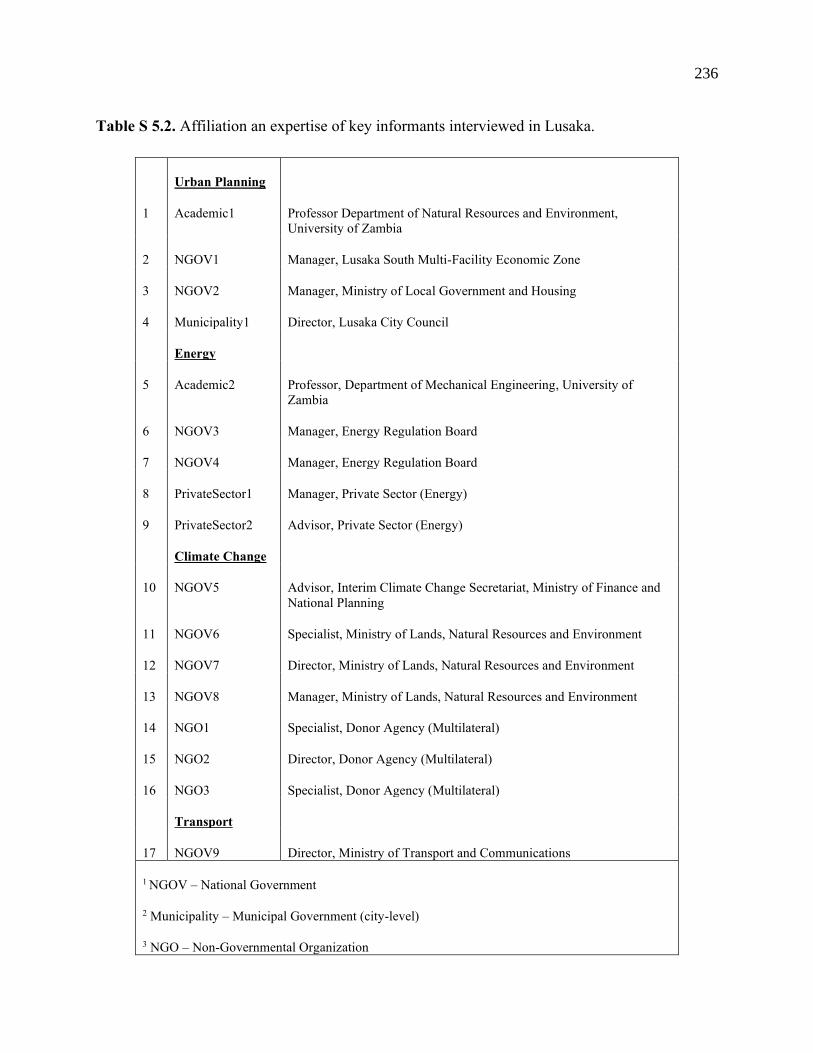
236
Table S 5.2. Affiliation an expertise of key informants interviewed in Lusaka.
Urban Planning
1 Academic1 Professor Department of Natural Resources and Environment,
University of Zambia
2 NGOV1 Manager, Lusaka South Multi-Facility Economic Zone
3 NGOV2 Manager, Ministry of Local Government and Housing
4 Municipality1 Director, Lusaka City Council
Energy
5 Academic2 Professor, Department of Mechanical Engineering, University of
Zambia
6 NGOV3 Manager, Energy Regulation Board
7 NGOV4 Manager, Energy Regulation Board
8 PrivateSector1 Manager, Private Sector (Energy)
9 PrivateSector2 Advisor, Private Sector (Energy)
Climate Change
10 NGOV5 Advisor, Interim Climate Change Secretariat, Ministry of Finance and
National Planning
11 NGOV6 Specialist, Ministry of Lands, Natural Resources and Environment
12 NGOV7 Director, Ministry of Lands, Natural Resources and Environment
13 NGOV8 Manager, Ministry of Lands, Natural Resources and Environment
14 NGO1 Specialist, Donor Agency (Multilateral)
15 NGO2 Director, Donor Agency (Multilateral)
16 NGO3 Specialist, Donor Agency (Multilateral)
Transport
17 NGOV9 Director, Ministry of Transport and Communications
1 NGOV – National Government
2 Municipality – Municipal Government (city-level)
3 NGO – Non-Governmental Organization

237
5.8.3.1 Lusaka Key Informant Interviews
Urban governance in Zambia is a mix of top-down and bottom-up processes. Zambia’s long-
standing commitment to decentralization has allowed local authorities to retain some
responsibility over urban activities. However, similar to Dar es Salaam, key informants in
Lusaka expressed that local authorities have remained constrained in their capacity to coordinate
climate responses in key infrastructure sectors, i.e., transportation and energy (which fall outside
the mandate of local authorities) (PMRC Zambia, 2016). Specifically, some key informants
expressed that national institutions (e.g., ministries) coordinated most infrastructure initiatives,
though local governments are engaged in the design, preparation, and implementation activities,
where relevant. Others in national government and the private sector highlighted the handful of
initiatives at the city level that may contribute to low-carbon development in Lusaka, e.g., solar
electrification initiatives through the Lusaka South Multi-Facility Economic Zone and feasibility
studies for a Light Rail Tram (LRT) system.
Finally, like Dar es Salaam, key informants in Lusaka were unaware of specific policy processes
that sought to engage stakeholders around low-carbon initiatives in Lusaka. One key informant
from national government highlighted that urban climate change responses (e.g., mitigation or
adaptation) were often planned in “ad-hoc” manner, despite a robust policy framework for low-
carbon development at the national and city level. Relatedly, others from national government
and NGO (donor) groups noted that donor funding for infrastructure in Zambia is largely
directed towards “rural development” given lower levels of socio-economic development in
these regions. As a result, investment in urban areas often lag those in rural areas and fail to
engage a diverse group of stakeholders in a collaborative process to promote low-carbon
development in Lusaka.

238
5.9 References for Chapter 5
AfDB. (n.d.). Africa’s Opportunity for Low Carbon Growth – Focusing on Energy Access for
All. Available at: https://www.afdb.org/fileadmin/uploads/afdb/Documents/Generic-
Documents/Africa%27s%20Opportunity%20for%20Low%20Carbon%20Growth.pdf
(Accessed: March 1, 2021)
African Union (2014) Agenda 2063 The Africa We Want, African Union. Available at:
https://au.int/en/agenda2063/overview (Accessed: 24 February, 2021).
Andreasen, M. H., & Møller-Jensen, L. (2017). Access to the city: Mobility patterns, transport
and accessibility in peripheral settlements of Dar es Salaam. Journal of Transport
Geography. https://doi.org/10.1016/j.jtrangeo.2017.05.005
Bawakyillenuo, S., Olweny, M., Anderson, M., & Borchers, M. (2018). Sustainable Energy
Transitions in Sub-Saharan African Cities: The Role of Local Government. In Urban
Energy Transition. https://doi.org/10.1016/b978-0-08-102074-6.00042-5
Bengtsson, M. (2016). How to plan and perform a qualitative study using content analysis.
NursingPlus Open. https://doi.org/10.1016/j.npls.2016.01.001
Bisu, D. Y., Kuhe, A., & Iortyer, H. A. (2016). Urban household cooking energy choice: an
example of Bauchi metropolis, Nigeria. Energy, Sustainability and Society.
https://doi.org/10.1186/s13705-016-0080-1
Calvin, K., Pachauri, S., De Cian, E., & Mouratiadou, I. (2016). The effect of African growth on
future global energy, emissions, and regional development. Climatic Change, 136(1), 109–
125. https://doi.org/10.1007/s10584-013-0964-4
Campbell, B. M., Vermeullen, S. J., Mangono, J. J., & Mabugu, R. (2003). The energy transition
in action: Urban domestic fuel choices in a changing Zimbabwe. Energy Policy.
https://doi.org/10.1016/S0301-4215(02)00098-8
Cartwright, A. et al. (2015) ‘Better Growth , Better Climate , Better Cities Rethinking and

239
Redirecting Urbanisation in Africa’, The Global Commission on the Economy and
Climate. Available at: https://newclimateeconomy.report/workingpapers/wp-
content/uploads/sites/5/2016/04/NCE-APP-final.pdf (Accessed: 24 February, 2021).
Choumert-Nkolo, J., Combes Motel, P., & Le Roux, L. (2019). Stacking up the ladder: A panel
data analysis of Tanzanian household energy choices. World Development.
https://doi.org/10.1016/j.worlddev.2018.11.016
Colenbrander, S., Sudmant, A., Chilundika, N., & Gouldson, A. (2019). The scope for low-
carbon development in Kigali, Rwanda: An economic appraisal. Sustainable Development.
D’Agostino, A. L., Urpelainen, J. and Xu, A. (2015) ‘Socio-economic determinants of charcoal
expenditures in Tanzania: Evidence from panel data’, Energy Economics. doi:
10.1016/j.eneco.2015.03.007.
DHS Program (2020). DHS Program STATcompiler. Available at: https://statcompiler.com/en/
(Accessed: October 2nd 2020).
Diep, L., Archer, D., & Gueye, C. (2016). Decentralisation in West Africa: the implications for
urban climate change governance: the cases of Saint-Louis (Senegal) and Bobo-Dioulasso
(Burkina Faso). IIED Working Paper.
Evans, M., Yu, S., Staniszewski, A., Jin, L., & Denysenko, A. (2018). The international
implications of national and local coordination on building energy codes: Case studies in
six cities. Journal of Cleaner Production. https://doi.org/10.1016/j.jclepro.2018.04.142
Government of Tanzania. (2016). National Five Year Development Plan (2016/2017 -
2020/2021). Available at: http://extwprlegs1.fao.org/docs/pdf/tan166449.pdf (Accessed:
February 7, 2021).
Government of Tanzania (2017) Energy Access Situation Report (2016). Available at:
http://rea.go.tz/NewsCenter/TabId/130/ArtMID/639/ArticleID/91/Energy-Access-
Situation-Report-2016-Tanzania-Mainland.aspx (Accessed: February 7, 2021).

240
Grubler, A., Bai, X., Buettner, T., Dhakal, S., Fisk, D. J., Ichinose, T., … Sathaye, J. (2013).
Urban Energy Systems. Global Energy Assessment (GEA), 1307–1400.
https://doi.org/10.1017/CBO9780511793677.024
Herslund, L., Backhaus, A., Fryd, O., Jørgensen, G., Jensen, M. B., Limbumba, T. M., …
Yeshitela, K. (2018). Conditions and opportunities for green infrastructure – Aiming for
green, water-resilient cities in Addis Ababa and Dar es Salaam. Landscape and Urban
Planning. https://doi.org/10.1016/j.landurbplan.2016.10.008
IEA. (2019a). Africa Energy Outlook 2019. Available at: https://www.iea.org/reports/africa-
energy-outlook-2019.
IEA. (2019b). CO2 Emisions from Fuel Combustion. Available at:
https://www.iea.org/reports/co2-emissions-from-fuel-combustion-overview.
IEA. (2019c). World Energy Balances 2019. Available at: https://www.iea.org/reports/world-
energy-balances-overview.
Ifegbesan, A. P., Rampedi, I. T., & Annegarn, H. J. (2016). Nigerian households’ cooking energy
use, determinants of choice, and some implications for human health and environmental
sustainability. Habitat International. https://doi.org/10.1016/j.habitatint.2016.02.001
Kennedy, C., Ibrahim, N., & Hoornweg, D. (2014). Low-carbon infrastructure strategies for
cities. Nature Climate Change, 4(5), 343–346. https://doi.org/10.1038/nclimate2160
Kennedy, C., Stewart, I. D., & Westphal, M. I. (2019). Shifting Currents: Opportunity for Low-
Carbon Electric Cities in the Global South, (January), 1–36.
Kennedy, C., Stewart, I. D., Westphal, M. I., Facchini, A., & Mele, R. (2018). Keeping global
climate change within 1.5 °C through net negative electric cities. Current Opinion in
Environmental Sustainability. https://doi.org/10.1016/j.cosust.2018.02.009
Kennedy, C., Stewart, I., Facchini, A., Cersosimo, I., Mele, R., Chen, B., … Sahin, A. D. (2015).
Energy and material flows of megacities. Proceedings of the National Academy of
241
Sciences, 112(19), 5985–5990. https://doi.org/10.1073/pnas.1504315112
Kimemia, D., & Annegarn, H. (2011). An urban biomass energy economy in Johannesburg,
South Africa. Energy for Sustainable Development.
https://doi.org/10.1016/j.esd.2011.10.002
Kironde, J. M. L. (2000). Understanding land markets in African urban areas: The case of Dar es
Salaam, Tanzania. Habitat International. https://doi.org/10.1016/S0197-3975(99)00035-1
Kironde, J. M. L. (2006). The regulatory framework, unplanned development and urban poverty:
Findings from Dar es Salaam, Tanzania. Land Use Policy.
https://doi.org/10.1016/j.landusepol.2005.07.004
Kiyawa, A. I., & Yakubu, I. (2017). Socio-economic Factors Influencing Household Energy
Choices in Kano Metropolis , Nigeria. American Journal of Energy Science, 4(3), 10–17.
Kombe, W. (2005). Land use dynamics in peri-urban areas and their implications on the urban
growth and form: The case of Dar es Salaam, Tanzania. Habitat International.
https://doi.org/10.1016/S0197-3975(03)00076-6
Kombe, W., & Namangaya, A. (2016). Decentralisation and urban governance: Trends and
lessons from cities in Tanzania. In Springer Geography. https://doi.org/10.1007/978-3-
319-29367-7_5
Lall, S. V., Henderson, J. V., & Venables, A. J. (2017). Africa’s Cities: Opening Doors to the
World. World Bank. https://doi.org/10.1596/978-1-4648-1044-2
Leck, H., & Simon, D. (2018). Local authority responses to climate change in South Africa: The
challenges of transboundary governance. Sustainability (Switzerland).
https://doi.org/10.3390/su10072542
Lupala, J. M. (2002). Urban Types in Rapidly Urbanizing Cities: Analysis of Formal and
Informal settlements in Dar es Salaam (PhD Thesis).
Makonese, T., Ifegbesan, A. P., & Rampedi, I. T. (2018). Household cooking fuel use patterns
242
and determinants across southern Africa: Evidence from the demographic and health
survey data. Energy and Environment. https://doi.org/10.1177/0958305X17739475
Mensah, J. T., & Adu, G. (2015). An empirical analysis of household energy choice in Ghana.
Renewable and Sustainable Energy Reviews. https://doi.org/10.1016/j.rser.2015.07.050
Mkalawa, C. C., & Haixiao, P. (2014). Dar es Salaam city temporal growth and its influence on
transportation. Urban, Planning and Transport Research, 2(1), 423–446.
https://doi.org/10.1080/21650020.2014.978951
Morten, M., Bryan, G., Siddiqi, B., & Balboni, C. (2020). Evaluating the Impacts of the Dar es
Salaam Bus Rapid Transit System. Available at: https://www.3ieimpact.org/evidence-
hub/publications/impact-evaluations/evaluating-impacts-dar-es-salaam-bus-rapid-transit.
Mulenga, B. P., Tembo, S. T., & Richardson, R. B. (2019). Electricity access and charcoal
consumption among urban households in Zambia. Development Southern Africa, 36(5),
585–599. https://doi.org/10.1080/0376835X.2018.1517036
Nkurunziza, A., Zuidgeest, M., Brussel, M., & Van den Bosch, F. (2012). Spatial variation of
transit service quality preferences in Dar-es-Salaam. Journal of Transport Geography, 24,
12–21. https://doi.org/10.1016/j.jtrangeo.2012.06.001
Nkurunziza, A., Zuidgeest, M., Brussel, M., & Van Maarseveen, M. (2012). Examining the
potential for modal change: Motivators and barriers for bicycle commuting in Dar-es-
salaam. Transport Policy, 24, 249–259. https://doi.org/10.1016/j.tranpol.2012.09.002
Nkurunziza, A., Zuidgeest, M., & Van Maarseveen, M. (2012). Identifying potential cycling
market segments in Dar-es-Salaam, Tanzania. Habitat International.
https://doi.org/10.1016/j.habitatint.2011.06.002
Pasquini, L. (2019). The urban governance of climate change adaptation in least-developed
African countries and in small cities: the engagement of local decision-makers in Dar es
Salaam, Tanzania, and Karonga, Malawi. Climate and Development.
https://doi.org/10.1080/17565529.2019.1632166

243
PMRC Zambia. (2016). Decentralisation Policy Analysis Improved Service Delivery for
Sustainable Social and Economic Development: Unlocking Zambia’s Potential.
Salon, D., & Aligula, E. M. (2012). Urban travel in Nairobi, Kenya: Analysis, insights, and
opportunities. Journal of Transport Geography.
https://doi.org/10.1016/j.jtrangeo.2011.11.019
Shemdoe, R., Kassenga, G., & Mbuligwe, S. (2015). Implementing climate change adaptation
and mitigation interventions at the local government levels in Tanzania: Where do we
start? Current Opinion in Environmental Sustainability.
https://doi.org/10.1016/j.cosust.2015.01.002
Tait, L., & Euston-Brown, M. (2017). What role can African cities play in low-carbon
development? A multilevel governance perspective of Ghana, Uganda and South Africa.
Journal of Energy in Southern Africa. https://doi.org/10.17159/2413-
3051/2017/v28i3a1959
Tembo, S. T. ., Mulenga, B. P. ., & Sitko, N. (2015). Cooking Fuel Choice in Urban Zambia :
Implications on Forest Cover. Working Paper No. 94, (94), 1–31. Retrieved from
http://www.aec.msu.edu/fs2/zambia/index.htm%0Ahttp://www.iapri.org.zm
Thornton, S., & Garrett, K. J. (1995). Ethnography as a bridge to multicultural practice. Journal
of Social Work Education. https://doi.org/10.1080/10437797.1995.10778840
Trotter, R. T. (2012). Qualitative research sample design and sample size: Resolving and
unresolved issues and inferential imperatives. Preventive Medicine.
https://doi.org/10.1016/j.ypmed.2012.07.003
TULab. (2019). Harnessing Urbanisation for Development: Roadmap for Tanzania’s Urban
Development Policy. London and Washington DC.
Uhunamure, S. E., Nethengwe, N. S., & Musyoki, A. (2017). Driving forces for fuelwood use in
households in the Thulamela municipality, South Africa. Journal of Energy in Southern
Africa. https://doi.org/10.17159/2413-3051/2017/v28i1a1635
244
UN-Habitat. (2015). Global Urban Indicators Database.
UN (2018) World Urbanization Prospects (2018 Revision). Available at:
https://population.un.org/wup/ (Accessed October 19, 2020).
Van der Kroon, B., Brouwer, R., & Van Beukering, P. J. H. (2014). The impact of the household
decision environment on fuel choice behavior. Energy Economics.
https://doi.org/10.1016/j.eneco.2014.04.008
van der Zwaan, B., Kober, T., Longa, F. D., van der Laan, A., & Jan Kramer, G. (2018). An
integrated assessment of pathways for low-carbon development in Africa. Energy Policy,
117, 387–395. https://doi.org/10.1016/j.enpol.2018.03.017
Van Staden, M., Marques, A., & Villaseñor, E. (2014). Urban low emissions development
strategies and action plans. In Energy Procedia.
https://doi.org/10.1016/j.egypro.2014.10.293
Vedeld, T., Coly, A., Ndour, N. M., & Hellevik, S. (2016). Climate adaptation at what scale?
Multi-level governance, resilience, and coproduction in Saint Louis, Senegal. Natural
Hazards. https://doi.org/10.1007/s11069-015-1875-7
Vedeld, T., Kombe, W. J., Kweka-Msale, C., Ndour, N. M., Coly, A., & Hellevik, S. (2015).
Multi-level Governance, Resilience to Flood Risks and Coproduction in Urban Africa (pp.
287–318). https://doi.org/10.1007/978-3-319-03982-4_9
Wolf, J., & Moser, S. C. (2011). Individual understandings, perceptions, and engagement with
climate change: Insights from in-depth studies across the world. Wiley Interdisciplinary
Reviews: Climate Change. https://doi.org/10.1002/wcc.120
World Bank (2018) World Development Indicators. Available at:
https://databank.worldbank.org/source/world-development-indicators.
245
Chapter 6
Conclusions
This thesis addresses four main objectives: Objective 1: Estimate current and future residential
energy use and GHG emissions in Dar es Salaam; Objective 2: Identify key drivers of residential
energy use and GHG emissions in Dar es Salaam; Objective 3: Assess differences in residential
energy use that may exist at the Dar es Salaam sub-city (ward) level; and Objective 4: Assess the
institutional and societal factors that may constrain low-carbon development in Dar es Salaam
(also stated in Section 1.2). This chapter describes the main conclusions for each research
objective and question, and discusses research limitations and areas of future work.
6.1 Objective 1: Estimate current and future residential energy
use and GHG emissions in Dar es Salaam
Question 1: What are current levels of residential energy use and GHG emissions in Dar es
Salaam, and how might they evolve from 2015 to 2050?
In Chapter 3, I estimate residential energy use for the average Dar es Salaam household at
46GJ/HH/year in 2015. This level of consumption is associated with residential greenhouse gas
(GHG) emissions of 1,400 ktCO2e (or 0.2 tCO2e/capita). Looking to 2050, I project that Dar es
Salaam may see a 4 to 24-fold increase in residential GHG emissions between 2015 and 2050,
which corresponds with a range of between 5,700 ktCO2e (0.5 tCO2e/capita) and 33,000 ktCO2e
(2 tCO2e/capita). These findings indicate that Dar es Salaam’s absolute residential emissions
could catch up to (2012 to 2015) levels reported in cities such as New York, San Francisco and
London (as shown in Section 6.8). Although, emissions changes on a per capita basis are less
sizeable, i.e., increasing 1 to 10-fold between 2015 and 2050. At the highest level (2
tCO2e/capita), per capita emissions still remain at 3-times less than those observed in New York
in 2015 (5.7 tCO2e/capita, see Section 3.9.4), for example.
246
My work in Chapter 3 was inspired by the Shared Socio-Economic Pathways (SSPs), which I
discuss in detail in Chapter 2 and Chapter 3 (Section 2.4.3 and 3.5.1). I used the SSPs as a basis
for projecting annual residential energy use and GHG emissions in Dar es Salaam between 2015
and 2050. Although, some key limitations of this early work were that (1) I did not validate my
model assumptions and estimates (shown in Table 3.2) with household survey data, and (2) I
later collected household data in as part of work for Chapter 4 and Chapter 5, although data were
not incorporated into the LEAP model to compare differences in findings. These data
comparisons would be an essential part of my future work. Furthermore, for studies interested to
apply the LEAP model approach to other cities in Africa, I would suggest that: (1) researchers
develop models that that incorporate and compare model results based on field data collected at
the local level (i.e., household surveys initiated in participating cities), and (2) conduct structured
workshops and interviews with infrastructure experts, policymakers and community members
(i.e., via expert elicitation) to refine the different SSP narratives and develop city-specific
“futures” that account for the unique political, societal and infrastructure contexts of cities.
As mentioned, my work in Chapter 4 and Chapter 5 employed household energy use data that
was collected as part of field work activities in Dar es Salaam in 2018. I initiated these activities
to account for differences in energy use at the ward or settlement level. Results from this
fieldwork show that mean residential energy use of surveyed households was approximately
38GJ/HH/year – this value incorporated a range of 30GJ/HH/year for low-consuming wards
(e.g., Kimara) and 50GJ/HH/year for high-consuming wards (e.g., Kawe). Comparing my results
with those in Chapter 3, I found that the estimated value from my previous work (46GJ/HH/year)
falls within this range but also 21% higher than the mean value estimated from my field data,
i.e., due to the higher electricity and gas use assumed in the SSP model, which may have resulted
in a slightly over-estimated energy use and GHG emissions values.

247
Question 2: What modelling approaches can be employed to estimate and project
residential energy use or GHG emissions when data availability is limited?
I use the Long-Range Energy Alternatives Planning (LEAP) modelling tool (Heaps, 2016) to
estimate Dar es Salaam’s current and future residential energy use and GHG emissions to 2050.
My assumptions for each SSP narrative (see Table 3.1, Chapter 3) inform my approach to
modelling three distinct urban growth and GHG emissions pathways in LEAP. I chose LEAP as
a modelling tool given its wide use in modelling energy/GHG emissions futures in the Africa
region, e.g., see studies of Kemausuor et al. (2015), Mahumane & Mulder (2016), and SEA
(2015), and other Global South cities where data availability may be limited, e.g., São
Paulo (Collaço et al., 2019), Panama (McPherson and Karney, 2014), Bangkok (Phdungsilp,
2010), and several Chinese cities (Zhou et al., 2016; Fan et al., 2017; Yang et al., 2017; Lin et
al., 2018). At the national level, 37 developing countries (as of 2018) have used LEAP to
develop their national emissions scenarios as part of their Intended Nationally Determined
Contributions (INDCs) to the United Nations Framework Convention on Climate Change (SEI,
2018). However, to my knowledge, LEAP has not been used to model energy use and/or GHG
emissions futures in Dar es Salaam or Tanzania.
My estimates for Dar es Salaam’s energy use/GHG emissions for 2015 and 2050 are informed by
various input indicators and assumptions. These include population levels, household size, the
electric grid mix, household activities (e.g., fuel uses and travel behaviors). See Table 3.2 and
Table 3.3, for key parameters and underlying assumptions that I integrated within the LEAP
platform. Finally, LEAP’s Technology and Energy Database includes GHG emissions data for a
range of fuels based on the Intergovernmental Panel on Climate Change (IPCC) guidelines. The
supplementary material appended to Chapter 3 (Section 3.9.9) details the GHG emissions
calculation structure within LEAP.

248
6.2 Objective 2: Identify key drivers of residential energy use and
GHG emissions in Dar es Salaam
Question 3: What activities drive residential energy use and GHG emissions in Dar es
Salaam in 2015 and in 2050?
Throughout the thesis, I use the term “residential energy use” to refer to energy uses from
domestic household and transport-related activities. At the aggregate city level (Chapter 3),
household-related energy use, mostly from wood fuel use (charcoal and firewood), contributes
the majority share of residential energy use in Dar es Salaam. Charcoal and firewood account for
78% of household-related energy use, compared to 11% from electricity, 9% from LPG “gas”
and 2% from kerosene (Table 3.3, Chapter 3). In my later work (Chapter 4), I likewise show that
charcoal use, which is typically present in with fuel stacking, is a majority contributor to
residential energy use among low-income wards especially, e.g., over 80% of residential energy
use in Buguruni and Keko.
However, it is clear that the conversion from energy use (i.e., GJ of energy) to GHG emissions –
i.e., the global warming potential of different fuels represented in tons of carbon dioxide
equivalents (CO2e) – is not one-to-one. There is need to consider different metrics (i.e., energy
use vs. GHG emissions) when assessing drivers of energy use in cities. For example, even
though charcoal accounts for most household-related energy use in Dar es Salaam, it does not
contribute most to GHG emissions. For example, I show that charcoal accounts for 44% of
household-related energy use at the aggregated city level (Chapter 3), and over 80% among
surveyed low-income wards (Buguruni, Keko and Manzese) (Chapter 4). But when I convert
these energy values to GHG emissions in my LEAP model, GHG emissions from charcoal are
carbon neutral given the assumption that these emissions are biogenic and have limited global
warming potential. This assumption in the model is consistent with the 2006 IPCC guidelines
which does not count biogenic emissions from wood fuel burning in the energy sector (as these
values are assumed to be counted in the Agriculture, Forestry, and Land-Use (AFOLU) sector
(IPCC, 2006)). However, it is clear that charcoal is an important energy driver, and policy
measures for aggressive climate change mitigation in Dar es Salaam should consider reducing

249
charcoal use, alongside efforts to decarbonize electrification and transportation, which were my
recommended areas of policy action in Chapter 3.
Therefore, future extensions of my work in Chapter 3 could explore the implications of
continued charcoal use in Dar es Salaam, especially under an SSP3 scenario, which does not
assume a phase-out of charcoal use by 2050 (see Table 3.3). It is also clear from my findings in
Chapter 4 and Chapter 5 that while charcoal use may be less-GHG intensive from a global
warming perspective, its continued use among households could lead to other environmental and
health burdens (e.g., from indoor air pollution) – although, I did not consider broader
environmental and health burdens as part of the thesis work. Therefore, while my findings in
Chapter 3 provide an overall (city-wide) picture of GHG emissions in Dar es Salaam, it is
important to consider other environmental implications of wood fuel use as energy sector and
GHG-mitigation policies and actions are developed in Dar es Salaam, and Tanzania more
broadly.
Question 4: What is the influence of household cooking fuel choice, travel mode choice and
household wealth on energy use among households in Dar es Salaam?
In Chapter 3, findings show a statistically significant effect of cooking fuel choice on mean
household energy use (p< 0.01). I also find that fuel stacking has a significant effect on
household-related energy use, and in particular, households that fuel stack with three fuels (6%
of households surveyed) generally appear to be the highest energy users (Table 4.3). Based on
results from OLS and Tobit regressions, fuel stacking is correlated with ~35% higher household-
related energy use among surveyed wards (i.e., relative to households that do not fuel stack).
Households that fuel stack with electricity, charcoal, and kerosene/firewood (3% of households
surveyed) are correlated with the highest household-related energy (11 and 13 times more)
relative to households that use only electricity (reference case). Finally, among other socio-
economic indicators, I find a significant effect of household wealth – which I assume based on
other indicators (proxies) for wealth (Section 4.6.2, Chapter 4) – and household-related energy
use. These findings are consistent with other studies that likewise found positive and significant
250
correlations relating both income and fuel stacking to household energy use in Tanzania, e.g.,
Choumert-Nkolo et al. (2019) and D’Agostino et al. (2015).
In transportation, OLS regression outputs show that using public transport as part of a
household’s commuting activities is correlated with 13% lower transport-related energy use.
Public transport use (particularly use of the local minibus, “dala-dala”) is higher in informal
wards, e.g., 93% of households in Buguruni reported using public transport as part of their
weekly communing, compared to 67% of households in Msasani (Table S 4.3). I also find a
positive and significant correlation between transport-related energy use and proxies for
household wealth (Section 4.6.2), i.e., high-income wards (Msasani and Kawe) contribute the
highest transport-related energy use, largely due to higher levels of private vehicle use in these
wards (see Figure 4.5).
6.3 Objective 3: Assess differences in residential energy use that
may exist at the Dar es Salaam sub-city (ward) level
Question 5: Is there a statistically significant difference in residential energy use between
informal, formal, and mixed ward types in Dar es Salaam?
Using Analysis of Variance (ANOVA) in Chapter 4, I find a statistically significant difference in
mean residential energy use between the different surveyed wards in Dar es Salaam (p< 0.01). I
also conduct additional post-hoc tests (i.e., Fisher’s Least Squared Differences) map where these
differences existed for the different ward types. Results from post-hoc tests indicate 4 distinct
categories of wards based on their energy use, i.e., “high”, “medium-high”, “medium”, and
“medium-low” energy users (see Figure 4.3).
As shown in Figure 4.3, in some cases I find no statistically significant difference in mean
residential energy use between formal and informal wards, or high-income and low-income
wards, e.g., Msasani (high-income, formal ward) and Keko (low-income, informal ward) both
have a “medium-high” level of energy use relative to other wards. In other cases, there is a

251
statistically significant difference in mean residential energy use between wards e.g., between
Kawe and Keko, or Keko and Kimara (Figure 4.3).
6.4 Objective 4: Assess the institutional and societal factors that
may constrain low-carbon development in Dar es Salaam
Question 6: How do key informants perceive the enabling environment for low-carbon
development Dar es Salaam?
In Chapter 5, I draw on the perspectives of key informants, i.e., selected experts across various
local and national government, academia, civil society and the private sector, to ascertain
possible institutional barriers to low-carbon development in Dar es Salaam. Findings from
interviews with key informants suggest the following institutional constraints to low-carbon
development in Dar es Salaam: (1) Policies exist, but implementation processes are inadequate;
(2) Local government authorities have little jurisdiction; (3) Funding constraints and insufficient
own-source-revenue collection limit the capacity of local government authorities to spearhead
their own initiatives; and (4) Policy processes to support collaboration among key stakeholders
are inadequate. Based on these findings, I assert that the implementation of low-carbon projects
would need to engage multiple stakeholders in a collaborative process to leverage the power and
mandate of different institutions. This collaborative process may be enabled through a dedicated
“steering committee” tasked with the mandate to develop a roadmap for implementing low-
carbon projects in the city. I also highlight that the steering committee should consist a mixed
group of stakeholders from local and national government (i.e., PORALG, sector ministries, Dar
es Salaam City and Municipal Councils, donor agencies, and infrastructure service providers etc.,
see Figure 6.1). At the same time, local government authorities (i.e., the Dar es Salaam City and
Municipal Councils), as the closest government institution to urban residents, could take
leadership in ensuring that the societal/community context is always considered in the
implementation of low-carbon projects.
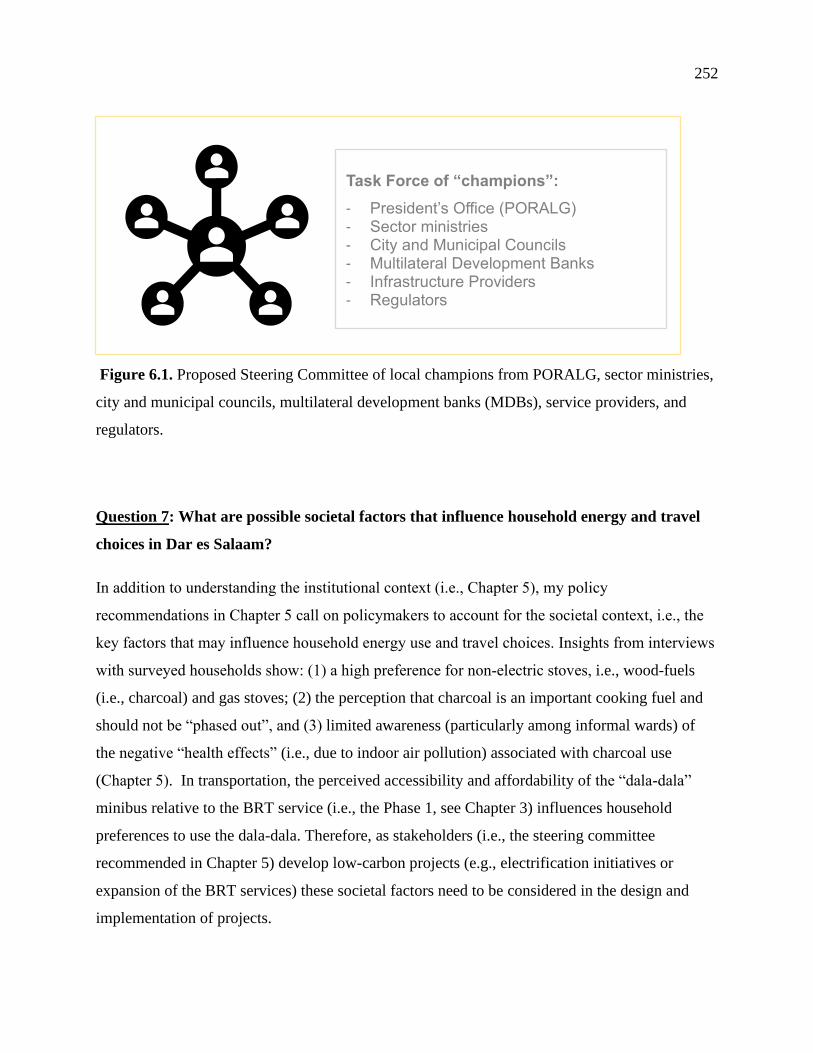
252
Figure 6.1. Proposed Steering Committee of local champions from PORALG, sector ministries,
city and municipal councils, multilateral development banks (MDBs), service providers, and
regulators.
Question 7: What are possible societal factors that influence household energy and travel
choices in Dar es Salaam?
In addition to understanding the institutional context (i.e., Chapter 5), my policy
recommendations in Chapter 5 call on policymakers to account for the societal context, i.e., the
key factors that may influence household energy use and travel choices. Insights from interviews
with surveyed households show: (1) a high preference for non-electric stoves, i.e., wood-fuels
(i.e., charcoal) and gas stoves; (2) the perception that charcoal is an important cooking fuel and
should not be “phased out”, and (3) limited awareness (particularly among informal wards) of
the negative “health effects” (i.e., due to indoor air pollution) associated with charcoal use
(Chapter 5). In transportation, the perceived accessibility and affordability of the “dala-dala”
minibus relative to the BRT service (i.e., the Phase 1, see Chapter 3) influences household
preferences to use the dala-dala. Therefore, as stakeholders (i.e., the steering committee
recommended in Chapter 5) develop low-carbon projects (e.g., electrification initiatives or
expansion of the BRT services) these societal factors need to be considered in the design and
implementation of projects.
Task Force of “champions”:
- President’s Office (PORALG) - Sector ministries - City and Municipal Councils - Multilateral Development Banks - Infrastructure Providers - Regulators

253
6.5 Concluding Remarks Linking Thesis Objectives and
Questions
My work in Chapter 3 shows that GHG emissions in Dar es Salaam may cover a wide range of
future scenarios. However, as demonstrated in my later work in Chapter 4, it is important to
couple long-term energy models and GHG assessments with local data that consider differences
in energy use at the settlement (or ward level). Findings from my surveys in Dar es Salaam show
a high level of inequality and difference in the way households’ access and use energy sources
and transport infrastructure. Therefore, most future increases in GHG emissions may be
attributed to high-consuming and wealthier households (i.e., in wards such as Kawe and Masani).
While my work in Chapter 4 did not quantify differences in GHG emissions among surveyed
households, future work would need to consider these socio-economic differences among
households as part of GHG emissions projections.
Differences in my findings across thesis chapters (i.e., Chapters 3 to 5) show that it is important
to consider a range of metrics (e.g., GHG emissions versus total energy use) when assessing
drivers of energy use and GHG emissions in African cities. This is clearly demonstrated in the
case of charcoal, which is an important driver of energy use (i.e., from a GJ per household
perspective), but does not contribute substantially to GHG emissions (i.e., from a tCO2e per
household perspective). Given these differences, it is important that the results from my LEAP
model – which do not consider biogenic emissions from charcoal – should be expanded to
consider other environmental impacts (e.g., land use changes or air pollution). Therefore, an
important area of future work would be to consider a larger set of impact indicators for each
household fuel (i.e., charcoal, gas, electricity or kerosene) to assess the broader environmental
implications of their use.
Finally, it would be important to engage a diverse set of actors when developing and
implementing strategies. In the case of Dar es Salaam, overall success would rely on political
leadership at the highest level (i.e., leadership from the Office of the President) to ensure that
envisioned strategies translate to meaningful policy actions.

254
6.6 Future Work
I have identified four key areas of future work that would make for interesting post-doctoral
work or research within an international development context: for example, with the World Bank
Group, World Resources Institute, or C40 Cities, or other multilateral agencies working on urban
sustainability issues. These include (1) examining the linkages between urban sustainability and
resilience, (2) piloting energy use/GHG emission studies in other African cities, (3) accounting
for (Scope 3) GHG emissions, (4) developing a road map and financing structures, including
private sector finance, to support GHG mitigation efforts.
6.6.1 Linkages Between Urban Sustainability and Resilience
Urban resilience is not explicitly considered in the work presented in this thesis, but the concept
is an important dimension of urban sustainability. The injustice in climate change is that African
cities, though contribute least to climate change, are most burdened by climate-induced risks and
vulnerabilities. Current discourse on urban resilience recognizes that urban growth should occur
in tandem with efforts to protect cities from climate-induced disasters (Fankhauser, 2017). The
concept is often also used interchangeably with “climate change adaptation” to describe
processes of adjusting to climate change or alleviating its negative impacts (Fankhauser, 2017).
In my previous work with the Global Environment Facility (GEF) and the World Bank (i.e., prior
to starting my doctoral studies), I supported country work to “mainstream” climate change
adaptation with sector-specific plans and strategies in developing regions (including Africa).
Programs focused on adaptation actions in key economic sectors e.g., urban planning, natural
resources management, energy, and infrastructure, among others. Arguably, if developing
countries can “climate-proof” their development sectors, i.e., through climate change adaptation
actions, they can achieve both economic and adaptation benefits. The notion of “climate-resilient
development” is therefore critical to the region’s development.
I was previously interested to continue work on urban resilience within the scope of my doctoral
research (and focus on African cities). At the time, I conducted broad literature reviews on

255
resilience as to identify key research gaps, and later developed a conceptual framework to
diagnose resilience in African cities from an engineering perspective. This work was based the
notion of infrastructure “carrying capacity”, which describes the optimum material or energy
demands that can be “carried” by infrastructure systems in changing urban environments. I
hypothesized that crossing carrying capacities could induce significant changes in infrastructure
performance and impact community resilience. Therefore, the high population growth in African
cities would put pressures on urban infrastructure beyond their carrying capacities and
compromise infrastructure resilience and the ability for systems withstand climate-related
disasters. For communities, compromised infrastructure resilience would also limit the
availability of services for the poor during these disaster events.
Table 6.1 provides an illustrative example on the data requirements related to my early work on
urban resilience. For example, the “current resource use” would show the net material and
energy use of the end user (i.e., building, neighborhood, or city). The “available capacity” would
estimate the carrying capacity of the infrastructure system (e.g., estimated from infrastructure
service providers, building owners and/or utility companies). Where capacity estimates are
unknown, expert elicitation could be employed to specify a range of values. Infrastructure
resilience would therefore be quantified based on the difference between the available capacity
and the current resource use.
Table 6.1. Carrying capacity analysis for different urban infrastructures
Urban
Infrastructure
Estimated Use (per day)
Available Capacity
Water ▪ m3 per day. Determined from
infrastructure service
providers, utility
companies, or expert
elicitation
Energy (electricity) ▪ kWh of per day.
Solid waste ▪ Kilograms per day
Public transport (e.g.,
BRT bus)
▪ Passengers/day

256
Carrying capacity data (i.e., “available capacity” estimates shown in Table 6.1) are unavailable
for most African cities and especially for informal settlements. These constraints limited my
progress on this work. Contingent on funding availability for data collection and additional
fieldwork, this would be an important area of future research. Some of the data collected during
my fieldwork in Dar es Salaam could support energy sector inputs, while data collection for
other sectors would need to engage a range of stakeholders (e.g., government agencies,
infrastructure service providers and the private sector).
6.6.2 Piloting Energy Use/GHG emission Studies in other African Cities
Future work could also employ similar studies in other African cities and enable comparative
reviews of energy use. Disaggregated studies (i.e., those employed at the sub-city level) could
also estimate inequalities in energy use and access for different energy use sectors. For example,
in Chapter 4, I use Gini coefficients (Ge) to estimate the inequality in energy use among the
surveyed wards. Findings showed that inequality was highest for transport related energy use
(indicated by the high Ge of 0.87) i.e., only a few households account for the majority share of
energy use in the transport sector. It would be important to consider if similar patterns exist for
other African cities. Research approaches could also integrate qualitative methods (e.g.,
observational, or unstructured interviews) to assess community way of life and the cultural or
local factors that influence energy use. While some of these aspects are highlighted through the
structured surveys, we conducted in Dar es Salaam, this format did not allow for informal
interactions with communities. Unstructured methods could capture additional cultural aspects
that have not previously been considered in this thesis or urban energy research more broadly.
6.6.3 Accounting for Upstream (Scope 3) GHG Emissions
Quantifying emissions from upstream (Scope 3) processes would support more holistic
accounting of urban GHG emissions. In Chapter 3, I only consider for Scope 1 and 2 emissions
attributed to residential activities in Dar es Salaam. Unavailable data on upstream and
257
downstream GHG emissions (that are attributed to energy use in the Dar es Salaam) limited the
research scope and accounting methods applied in my research. Some authors have already
shown that scope 3 GHG emissions account for a majority share of total emissions for individual
fuel uses (e.g., charcoal use, see (Ekeh et al., 2014; FAO, 2016; Fisher et al., 2011)). A study by
(Ekeh et al., 2014) shows that direct emissions from charcoal use accounted for 47% percent of
total emission in Kampala (Uganda), compared to 53% from upstream production processes.
Similarly, the Food and Agricultural Organization (FAO) estimate that GHG emissions from
charcoal use and use are mostly associated with upstream wood sourcing (~ 21 to 69 percent)
and burning (~28 to 61 percent), compared to end use in the home (approximately 9 to 18
percent) (FAO, 2016). These studies show that accounting for scope 3 GHG emissions can better
reflect the full extent of environmental impacts associated with urban activities. Accounting
methods can be a data-intensive process, and future work would need to engage a diverse set of
stakeholders (including the private sector) around data collection efforts for different scope 3
processes (e.g., GHG emissions from upstream transportation or downstream waste processes).
6.6.4 Developing Roadmaps and Financing Structures to Support Low-
Carbon Initiatives in Cities
Policy workshops hosted as part of the thesis research engaged stakeholders in a dialogue on
strategies to enable low-carbon development in Dar es Salaam and Lusaka. Discussions also
engaged stakeholders around the following question: “Which governing body or institutions are
best equipped to take the lead in implementing low-carbon measures in Dar es Salaam/Lusaka?”
(see agenda in Appendix). Participants shared several examples of key institutions, e.g., local
government authorities, designated line ministries or designated units within the President’s or
Vice President’s Office. Drawing on these insights, future work could employ structured or
unstructured surveys with selected institutions at the city or national level to develop roadmaps
or approaches for “leading” institutions to collaborate on low-carbon initiatives.
Roadmaps could also outline mechanisms to scale up financing for low-carbon measures. For
example, governments could consider a dedicated budget allocation for low-carbon measures at
258
the city or national level. For example, governments could set up an “infrastructure” fund for
low-carbon investment. Similar funds are available in other sectors, for example, road
development is funded through the National Roads Agency (TANROADS) in Tanzania and the
Road Development Agency (RDA) in Zambia. Research could also assess options for scaling-up
own-source revenues among local government authorities. For example, through may be through
different financing structures such as concessional loans or grants provided by the World Bank
and other entities, climate change finance provided by the Global Environment Facility or the
Climate Investment Funds.
The private sector could also help countries close fulfill infrastructure funding gaps, estimated at
$130 and $170 billion a year, according to the African Development Bank (AfDB, 2018). While
new loans and grants to help countries respond to COVID-19 pandemic, e.g., (World Bank,
2020), could present opportunities to channel funds towards low-carbon measures. For example,
the World Bank is including resources for off-grid solar electricity and battery power systems as
part of COVID-19 response strategies in the energy. Established contracts (e.g., with ministries
of energy, utility companies or the private sector) could serve as basis for larger electrification
projects (e.g., solar powered microgrids or integrating renewable supply within the on-grid
network) and provide incentive for private sector investment in technologies.
259
6.7 Final Thesis Remarks
Africa’s current and ongoing urbanization means that future energy use and GHG emissions,
both regionally and globally, will concentrate in African cities. In the case of Dar es Salaam,
rising energy and population levels could increase the city’s GHG emissions to reach as high as
24 times 2015 levels in 2050. The anticipated rise in Dar es Salaam’s GHG emissions, as shown
in Chapter 3, could provide some insight to the GHG emissions pathways of other fast-growing
cities in the Africa region. Therefore, if investments for low-carbon (or low-GHG) development
are prioritized in this current and early stage of Africa’s urban growth (e.g., through investments
to decarbonize electricity generation and transportation sectors), cities could leapfrog towards
low-GHG and resilient communities (that also benefit the poor).
At the same time, implementing low-carbon projects would require policymakers to account for
broader urban planning and socio-economic goals, and the intra-community differences in
energy use that may exist at the sub-city (settlement or ward) level (see Chapter 4). Related to
this, it would be important to recognize the unique institutional and societal context in which
African cities are growing, and the critical role of local government authorities in ensuring that
societal context (e.g., local community behaviours) are considered in project design and
implementation processes (see Chapter 5).
Finally, this thesis has presented several exciting opportunities for future work that I look
forward to exploring over the course of my career.
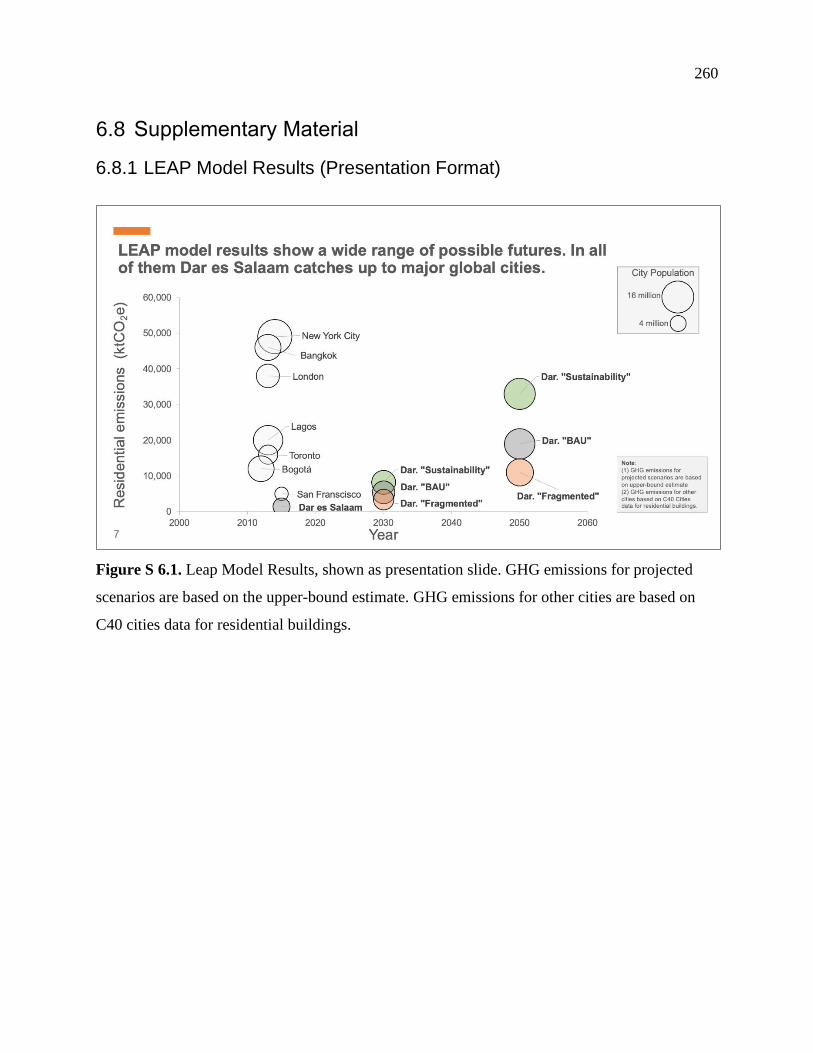
260
6.8 Supplementary Material
6.8.1 LEAP Model Results (Presentation Format)
Figure S 6.1. Leap Model Results, shown as presentation slide. GHG emissions for projected
scenarios are based on the upper-bound estimate. GHG emissions for other cities are based on
C40 cities data for residential buildings.
261
6.9 References for Chapter 6
AfDB (2018) African economic outlook. African Development Bank Group. Available at:
https://www.afdb.org/fileadmin/uploads/afdb/Documents/Publications/African_Economic_
Outlook_2018_-_EN.pdf.
Choumert-Nkolo, J., Combes Motel, P. and Le Roux, L. (2019) ‘Stacking up the ladder: A panel
data analysis of Tanzanian household energy choices’, World Development. doi:
10.1016/j.worlddev.2018.11.016.
D’Agostino, A. L., Urpelainen, J. and Xu, A. (2015) ‘Socio-economic determinants of charcoal
expenditures in Tanzania: Evidence from panel data’, Energy Economics. doi:
10.1016/j.eneco.2015.03.007.
Ekeh, O., Fangmeier, A. and Müller, J. (2014) ‘Quantifying greenhouse gases from the
production, transportation and utilization of charcoal in developing countries: A case study
of Kampala, Uganda’, International Journal of Life Cycle Assessment, 19(9), pp. 1643–
1652. doi: 10.1007/s11367-014-0765-7.
FAO (2016) Greening the Charcoal Value Chain. Available at:
http://www.fao.org/documents/card/en/c/a19084da-53ca-4ec8-a0dc-0200d8390d65/.
Fisher, B. et al. (2011) ‘Implementation and opportunity costs of reducing deforestation and
forest degradation in Tanzania’, Nature Climate Change. doi: 10.1038/nclimate1119.
Government of Tanzania (2015) Tanzania’s SE4All Action Agenda. Available at:
https://www.seforall.org/sites/default/files/TANZANIA_AA-Final.pdf.
Government of Tanzania (2016) Power System Master Plan - Update 2016. Dar es Salaam.
Available at: https://www.infoafrica.it/wp-content/uploads/2017/02/Power-System-Master-
Plan-PSMP-2016-Update.pdf (Accessed: February 7, 2021).

262
Government of Tanzania (2017) Energy Access Situation Report (2016). Available at:
http://rea.go.tz/NewsCenter/TabId/130/ArtMID/639/ArticleID/91/Energy-Access-
Situation-Report-2016-Tanzania-Mainland.aspx (Accessed: February 7, 2021).
Heaps, C. (2016) Long-range Energy Alternatives Planning (LEAP) system [Software version:
2018.1.14]. Somerville, MA, USA.
IEA (2017) ‘Energy Technology Perspectives 2017’, Technology, pp. 1–82. doi:
10.1787/energy_tech-2017-en.
Kemausuor, F., Nygaard, I. and Mackenzie, G. (2015) ‘Prospects for bioenergy use in Ghana
using Long-range Energy Alternatives Planning model’, Energy. doi:
10.1016/j.energy.2015.08.104.
Mahumane, G. and Mulder, P. (2016) ‘Introducing MOZLEAP: An integrated long-run scenario
model of the emerging energy sector of Mozambique’, Energy Economics. doi:
10.1016/j.eneco.2016.08.010.
Nakagami, H., Murakoshi, C. and Iwafune, Y. (2008) International Comparison of Household
Energy Consumption and Its Indicator, ACEEE Summer Study on Energy Efficiency in
Buildings. Available at:
https://www.aceee.org/files/proceedings/2008/data/papers/8_24.pdf.
Riahi, K. et al. (2017) ‘The Shared Socioeconomic Pathways and their energy, land use, and
greenhouse gas emissions implications: An overview’, Global Environmental Change, 42,
pp. 153–168. doi: 10.1016/j.gloenvcha.2016.05.009.
SEA (2015) ‘Modelling the Urban Energy Future of Sub-Saharan Africa, Sustainable Energy
Africa’. Working Paper. Sustainable Energy Africa and SAMSET – Supporting Sub-
Saharan Africa’s Municipalities with Sustainable Energy Transitions. Available at:
https://www.africancityenergy.org/uploads/resource_26.pdf (Accessed: March 1, 2021).
SEI (2018) Using LEAP for GHG Mitigation Assessment. Available at:

263
https://unfccc.int/sites/default/files/resource/LEAP UNFCCC Nov 2018.pdf.
Statistics Canada (2011) Households and the Environment: Energy Use. Ottowa. Available at:
https://www150.statcan.gc.ca/n1/en/pub/11-526-s/11-526-s2013002-eng.pdf?st=JTjrakpI.
World Bank (2020) Investments in Renewable Energy can support Post COVID-19
(Coronavirus) Economic Recovery in the Maldives. Available at:
https://www.worldbank.org/en/news/press-release/2020/06/15/investment-renewable-
energy-covid-coronavirus-economic-recovery-maldives.
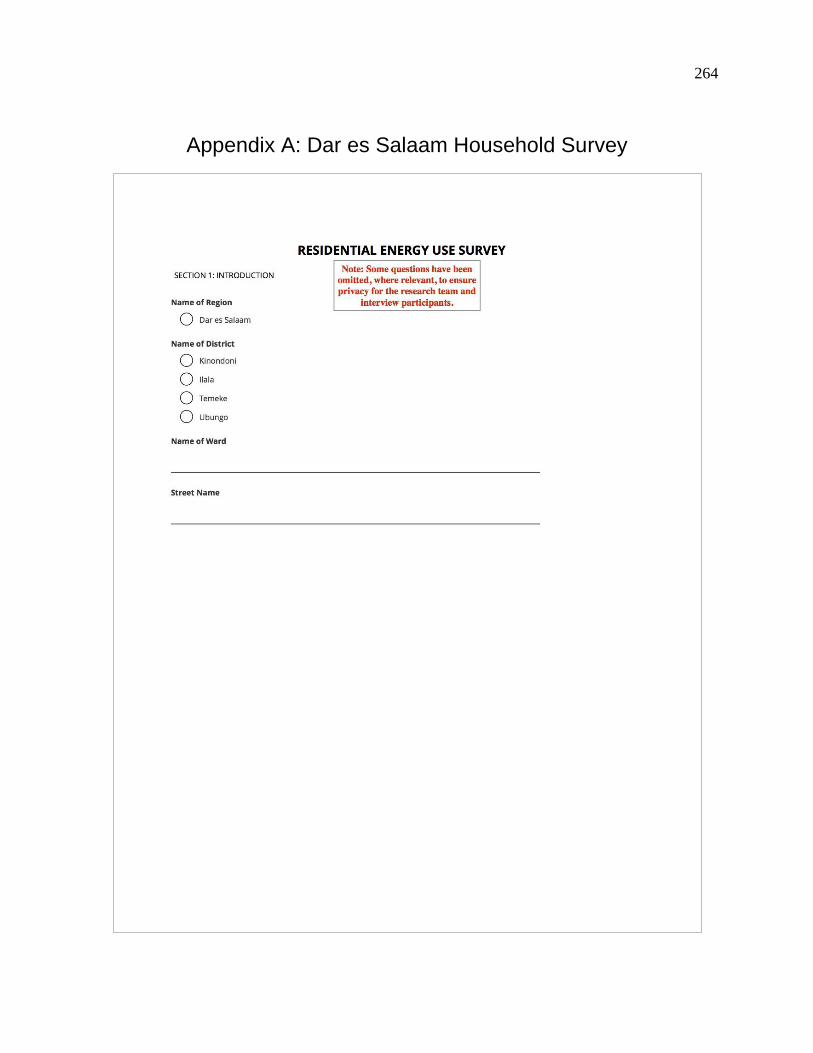
264
Appendix A: Dar es Salaam Household Survey

265

266

267

268

269

270

271

272

273

274

275

276

277

278

279

280

281

282
Appendix B: Policy Workshop in Dar es Salaam

283
Photos by Victor Faustine,
KababahGraphics,
Dar es Salaam
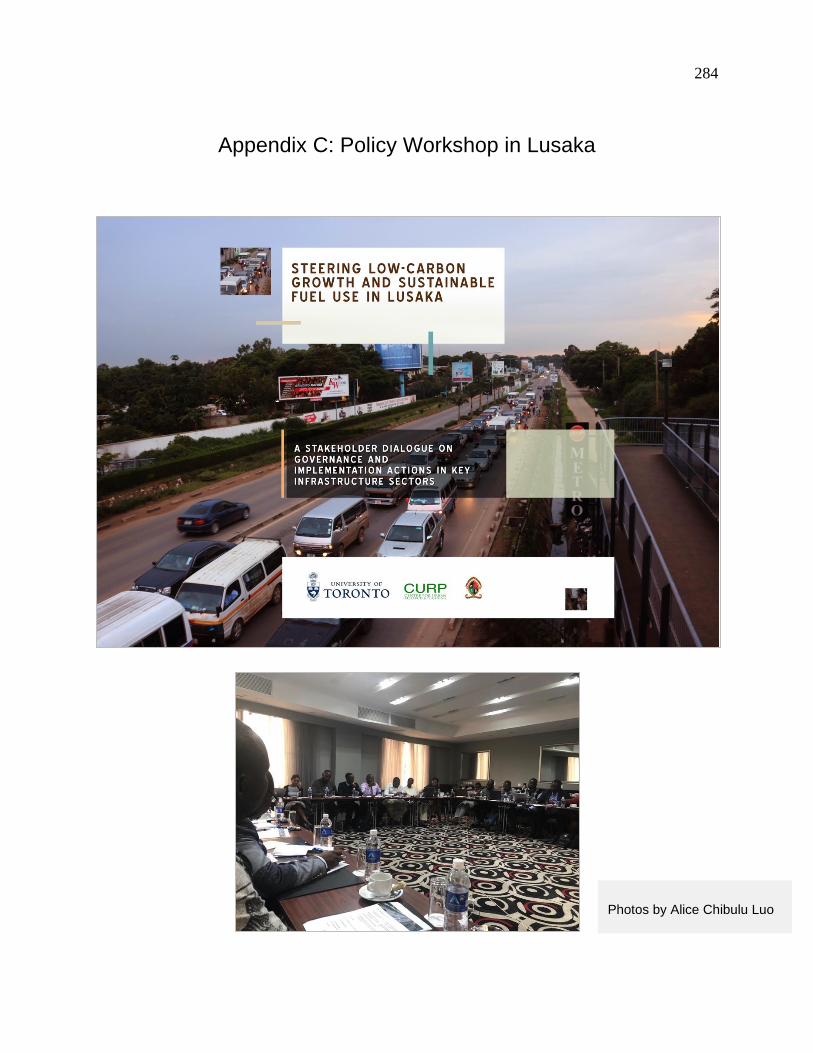
284
Appendix C: Policy Workshop in Lusaka
Photos by Alice Chibulu Luo

285