Groundwater vulnerability to petroleum hydrocarbons pollution of quaternary sand aquifer in Dar es...
19
Groundwater vulnerability to petroleum hydrocarbons pollution of quaternary sand aquifer in Dar es Salaam, Tanzania I. C. Mjemah 1, , R.R.A.M. Mato 2 & R. Thunvik 3 ABSTRACT: Groundwater is inherently susceptible to contamination from anthropogenic activities and remediation is very expensive and often impractical. Prevention of contamination is hence critical in effective groundwater management. In this paper, an attempt has been made to assess the aquifer’s vulnerability to petroleum hydrocarbons contamination in Dar es Salaam City, Tanzania. Potential benefit from mapping vulnerability is that it aids in the prioritisation of monitoring boreholes located in high vulnerable area, as well as providing bases for developing appropriate groundwater protection strategies. The DRASTIC model coupled to ArcView-GIS and HSSM model were used in vulnerability assessment. The results from these models have clearly demonstrated that the aquifers in the Dar es Salaam City are likely to be affected from petroleum hydrocarbons, because the pollution sources are located to a moderate and high vulnerability class, which covers about 80% of the Dar es Salaam City. Furthermore, the gasoline estimated arrival time is about 1 year for transport from the ground surface to a water table aquifer at a depth of 7 m. The current situation of petroleum hydrocarbons found in potable water shows very low concentrations (<2.5g/l) compared to the limits of the Tanzania standards of about 0.5 mg/l. However, as the gasoline takes even decade or centuries to migrate through aquifers, the concentrations are likely to increase if no preventive measures are taken. Keywords: Aquifers, ArcView-GIS, Dar es Salaam City, DRASTIC index, HSSM, Petroleum hydrocarbons. 1. INTRODUCTION Groundwater is a precious source of drinking water in many parts of the world. If contaminated, however, groundwater may pose a serious health hazard. Since the late 1970s nitrate, bacteria, and lately pesticide detections in groundwater have increased rapidly and stimulated research on the subsurface fate of contaminants (Corwin et al., 1997). Groundwater can be contaminated through a wide variety of human activities. These include the land disposal of waste materials and sewage, and the leaching of fertilisers and pesticides. The discharge of domestic, agricultural, and industrial effluent onto, and into, the ground has also increased recently because of the intensification of landuse and the high cost of alternative disposal systems. This land- based 'treatment' of effluent is often encouraged, without regard to the possibility of groundwater contamination. 1, Corresponding author; Dr. Mjemah I.C. is a Lecturer and Head, Department of Physical sciences, at SUA. His contact address is P.O. Box 3038, Morogoro, Tanzania. Tel./fax: +255-23-260304. E-mail : [email protected] 2 Dr. Rubhera R.A.M. Mato is a Senior Lecturer and Head, Department of Environmental Sciences and Management at Ardhi University (ARU). His contact address is P.O. Box 35176, Dar es Salaam, Tanzania. E-mail: [email protected] 3 Prof. R. Thunvik is a professor in the 3 Department of Land and Water Resources Engineering at Royal Institute of Technology (KTH). His contact address is SE-100 44 Stockholm, Sweden. Email: [email protected] 1
Transcript of Groundwater vulnerability to petroleum hydrocarbons pollution of quaternary sand aquifer in Dar es...

Groundwater vulnerability to petroleum hydrocarbons pollution of quaternary sand aquifer in Dar es Salaam, Tanzania
I. C. Mjemah1,, R.R.A.M. Mato2 & R. Thunvik3
ABSTRACT: Groundwater is inherently susceptible to contamination from anthropogenic activities and remediation is very expensive and often impractical. Prevention of contamination is hence critical in effective groundwater management. In this paper, an attempt has been made to assess the aquifer’s vulnerability to petroleum hydrocarbons contamination in Dar es Salaam City, Tanzania. Potential benefit from mapping vulnerability is that it aids in the prioritisation of monitoring boreholes located in high vulnerable area, as well as providing bases for developing appropriate groundwater protection strategies. The DRASTIC model coupled to ArcView-GIS and HSSM model were used in vulnerability assessment. The results from these models have clearly demonstrated that the aquifers in the Dar es Salaam City are likely to be affected from petroleum hydrocarbons, because the pollution sources are located to a moderate and high vulnerability class, which covers about 80% of the Dar es Salaam City. Furthermore, the gasoline estimated arrival time is about 1 year for transport from the ground surface to a water table aquifer at a depth of 7 m. The current situation of petroleum hydrocarbons found in potable water shows very low concentrations (<2.5g/l) compared to the limits of the Tanzania standards of about 0.5 mg/l. However, as the gasoline takes even decade or centuries to migrate through aquifers, the concentrations are likely to increase if no preventive measures are taken. Keywords: Aquifers, ArcView-GIS, Dar es Salaam City, DRASTIC index, HSSM, Petroleum hydrocarbons. 1. INTRODUCTION Groundwater is a precious source of drinking water in many parts of the world. If contaminated, however, groundwater may pose a serious health hazard. Since the late 1970s nitrate, bacteria, and lately pesticide detections in groundwater have increased rapidly and stimulated research on the subsurface fate of contaminants (Corwin et al., 1997). Groundwater can be contaminated through a wide variety of human activities. These include the land disposal of waste materials and sewage, and the leaching of fertilisers and pesticides. The discharge of domestic, agricultural, and industrial effluent onto, and into, the ground has also increased recently because of the intensification of landuse and the high cost of alternative disposal systems. This land-based 'treatment' of effluent is often encouraged, without regard to the possibility of groundwater contamination.
1, Corresponding author; Dr. Mjemah I.C. is a Lecturer and Head, Department of Physical sciences, at SUA. His contact address is P.O. Box 3038, Morogoro, Tanzania. Tel./fax: +255-23-260304. E-mail : [email protected] 2 Dr. Rubhera R.A.M. Mato is a Senior Lecturer and Head, Department of Environmental Sciences and Management at Ardhi University (ARU). His contact address is P.O. Box 35176, Dar es Salaam, Tanzania. E-mail: [email protected] 3 Prof. R. Thunvik is a professor in the 3Department of Land and Water Resources Engineering at Royal Institute of Technology (KTH). His contact address is SE-100 44 Stockholm, Sweden. Email: [email protected]
1
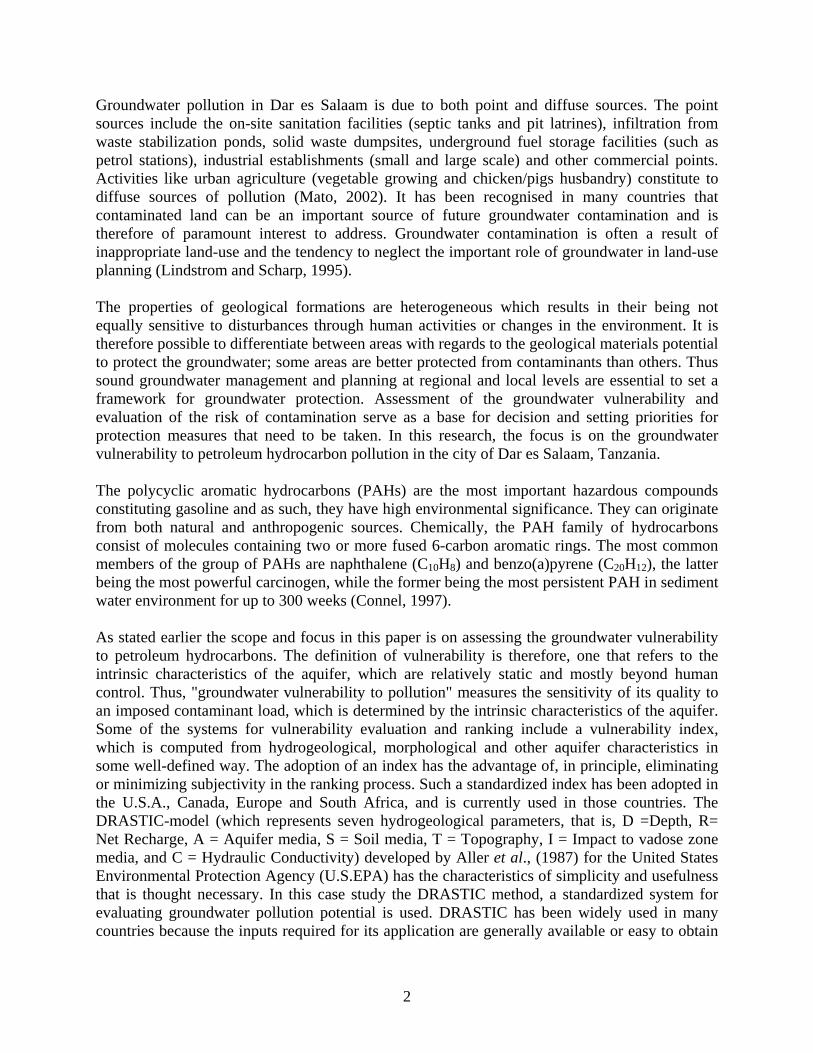
Groundwater pollution in Dar es Salaam is due to both point and diffuse sources. The point sources include the on-site sanitation facilities (septic tanks and pit latrines), infiltration from waste stabilization ponds, solid waste dumpsites, underground fuel storage facilities (such as petrol stations), industrial establishments (small and large scale) and other commercial points. Activities like urban agriculture (vegetable growing and chicken/pigs husbandry) constitute to diffuse sources of pollution (Mato, 2002). It has been recognised in many countries that contaminated land can be an important source of future groundwater contamination and is therefore of paramount interest to address. Groundwater contamination is often a result of inappropriate land-use and the tendency to neglect the important role of groundwater in land-use planning (Lindstrom and Scharp, 1995). The properties of geological formations are heterogeneous which results in their being not equally sensitive to disturbances through human activities or changes in the environment. It is therefore possible to differentiate between areas with regards to the geological materials potential to protect the groundwater; some areas are better protected from contaminants than others. Thus sound groundwater management and planning at regional and local levels are essential to set a framework for groundwater protection. Assessment of the groundwater vulnerability and evaluation of the risk of contamination serve as a base for decision and setting priorities for protection measures that need to be taken. In this research, the focus is on the groundwater vulnerability to petroleum hydrocarbon pollution in the city of Dar es Salaam, Tanzania. The polycyclic aromatic hydrocarbons (PAHs) are the most important hazardous compounds constituting gasoline and as such, they have high environmental significance. They can originate from both natural and anthropogenic sources. Chemically, the PAH family of hydrocarbons consist of molecules containing two or more fused 6-carbon aromatic rings. The most common members of the group of PAHs are naphthalene (C10H8) and benzo(a)pyrene (C20H12), the latter being the most powerful carcinogen, while the former being the most persistent PAH in sediment water environment for up to 300 weeks (Connel, 1997). As stated earlier the scope and focus in this paper is on assessing the groundwater vulnerability to petroleum hydrocarbons. The definition of vulnerability is therefore, one that refers to the intrinsic characteristics of the aquifer, which are relatively static and mostly beyond human control. Thus, "groundwater vulnerability to pollution" measures the sensitivity of its quality to an imposed contaminant load, which is determined by the intrinsic characteristics of the aquifer. Some of the systems for vulnerability evaluation and ranking include a vulnerability index, which is computed from hydrogeological, morphological and other aquifer characteristics in some well-defined way. The adoption of an index has the advantage of, in principle, eliminating or minimizing subjectivity in the ranking process. Such a standardized index has been adopted in the U.S.A., Canada, Europe and South Africa, and is currently used in those countries. The DRASTIC-model (which represents seven hydrogeological parameters, that is, D =Depth, R= Net Recharge, A = Aquifer media, S = Soil media, T = Topography, I = Impact to vadose zone media, and C = Hydraulic Conductivity) developed by Aller et al., (1987) for the United States Environmental Protection Agency (U.S.EPA) has the characteristics of simplicity and usefulness that is thought necessary. In this case study the DRASTIC method, a standardized system for evaluating groundwater pollution potential is used. DRASTIC has been widely used in many countries because the inputs required for its application are generally available or easy to obtain
2

from public agencies. Another model used is the Hydrocarbon Spill Screening Model (HSSM). This model is used to complement the DRASTIC model on assessing groundwater vulnerability to petroleum hydrocarbons pollution. 2. MATERIALS AND METHODS The study area Hydrogeological settings of the study area The study area extends from the Kisarawe/Pugu Hills west of Dar-es-Salaam City to the Indian Ocean in the east, and from the Mzinga River in the south to the Mbezi River in the north. It was selected based on the hydrogeological boundaries. The area covers part of two administrative regions: Coast Region and Dar-es-Salaam Region, where the recharge and discharge areas are located. It is located at latitudes 6°44’S and 7°00’S; longitudes 39°00’E and 39°19’E, with an area of about 700 km2 (Figure 1). The estimated population of the study area, according to a 2002 national census, was 2.5 million. But the current population is estimated at 4 million.
Figure 1: Hydrogeological map of the study area with location of boreholes used in the cross section (Mjemah et al., 2009) The study area comprises three major parts, distinguished by the geological formations outcropping: the central coastal plain with Quaternary fluviatile-deltaic sediments, the deltaic Mio-Pliocene clay-bound sands and gravels in the northwest and southeast and the Lower
3

Miocene fluviatile sandstones of Pugu Hills in the west of the study area (see Figure 1). The Quaternary deposits of Pleistocene to Recent periods have total thickness of approximately 150 m within Dar-es-Salaam City area. They overlay the deltaic deposits of Mio-Pliocene age, which consist of clay-bound sands and gravels, with a thickness around 1000 m (> 740 m at Kimbiji borehole) (Kent et al., 1971); they can be considered as the base of the groundwater reservoir. Underlying the clay-bound sands and gravels are the kaolinitic Pugu Sandstones with a thickness of more than 1000 m that are well developed in the central part of the Dar-es-Salaam embayment. However, in Pugu Hills, they are found with a thickness of only 300 m (Kent et al., 1971), since part of it, together with the clay-bound sands has been eroded to fill the Pleistocene coastal plain. The groundwater reservoir in Dar-es-Salaam area, in the coastal plain, mainly consists of two aquifers: the unconfined and the semi-confined aquifer. These aquifers are mainly consisting of sands and are separated by a unit of lower permeability (clay aquitard) (Figure 2).
Figure 2: Hydrogeological cross section C’’-C’ of the study area, location of the profile is shown in Figure 1 above (Mjemah et al., 2009) Developing groundwater vulnerability map Data sources This study was carried out using information collected from previous work (Mato, 2002; Mjemah et al., 2002), field observations and informal interviews. The attribute data on the existing boreholes in the study area were obtained from boreholes completion reports data from DDCA (2006), which consisted of well log information, physical and chemical water quality. Other data used include; the Dar es Salaam metropolitan map, metrological data collected for 20 years, Tanzanian Temporary Standards of Physical and Chemical Quality of Potable water and a handheld Global Positioning System (GPS) receiver (Garmin II plus person navigator version 3.0) as well as ArcView (version 3.2) GIS software.
4

ARCView GIS configuration A GPS was used to locate 400 drinking water boreholes (see Figure 4) and sources of petroleum hydrocarbon pollution, that is, garages, petrol filling stations and depots. The Universal Transverse Mercator (UTM) coordinates for each of the boreholes as well as sources of pollution were entered in a spreadsheet using Microsoft Excel and saved in a DBASE IV file format, then the data were imported to ArcView GIS for analysis. Furthermore, the groundwater vulnerability map was created using the DRASTIC approach, firstly devised by the US EPA to provide a systematic evaluation of the potential for groundwater contamination that is consistent on a national basis (Aller, et al., 1987). The ArcView GIS was used to compile the geospatial data and finally the Groundwater vulnerability Map was generated. The DRASTIC Model The DRASTIC parameters (Table 1) are the hydrogeologic parameters, which affect water transport from the soil surface to the aquifer. Table 1: Hydrological parameters used in the DRASTIC system with their rating range and weighting factors (after Aller et al., 1987)
Acronym Hydrological parameter Rating range Weight factor D Depth to groundwater 1-10 5 R Net Recharge rate 1-9 4 A Aquifer media 1-10 3 S Soil media 1-10 2 T Topography 1-10 1 I Impact of the Vadose zone 1-10 5 C Hydraulic Conductivity of aquifer 1-10 3
The DRASTIC parameters are weighted and then summed to come up with a vulnerability rating or DRASTIC index (Equation 1). DRASTIC assumes that all contaminants are introduced at the soil surface, move with the water and transported to groundwater by precipitation, and the depth to water is to the regional aquifer and perched zones are not considered. However, although it is easy to identify examples in which this assumption is false, a DRASTIC designed to provide a tool for relative vulnerability assessment. DRASTIC model has been prepared using the concept of hydrogeologic settings as described in details in the following sections. A hydrogeologic setting is a composite description of all the major geologic and hydrologic factors, which affect the control of groundwater movement into, through and out of an area (Aller, et al., 1987). Ratings for the DRASTIC parameters applied in the study area The rating was done by substituting the weight factors of the seven parameters as constants in DRASTIC INDEX (DI) Equation 1: DI = 5DR + 4RR + 3AR +2SR + 1TR +5IR +3CR (1)
5

The following is a description of the method used to obtain the DI component for each of the seven parameters of hydrogeologic settings of study area, which was mainly based on the well log data extracted from Drilling and Dam Construction Agency’s (DDCA, 2006) boreholes completion reports. Navulur (1996) recommended DRASTIC index ranges for qualitative risk categories as shown in Table 2 , and also as a useful tool in policy and decision-making in management strategies. The DRASTIC method is developed to evaluate the vulnerability of groundwater in regions of size 40 ha or larger.
Table 2: DRASTIC index ranges for qualitative risk categories (after Navulur, 1996)
DRASTIC qualitative category Low
Vulnerability Moderate Vulnerability
High Vulnerability
Very high Vulnerability
DRASTIC Index (DI)
1-100 101-140 141-200 >200
Depth to water The depth to water is important because it determines the thickness of the material through which infiltrating water must travel before reaching the aquifer. The depth to the water affects the time available for a contaminant to undergo chemical and biological reactions such as dispersion, oxidation, natural attenuation, sorption and others. A low depth to water parameter will lead to a higher vulnerability rating. Depth to water was measured by use of dipper, the water level measurement instrument. It was taken from the surface to the static water table (see Figure 2). The depth to water obtained was then converted to feet, as DRASTIC model requires, since the depth to water was taken in meter unit. Table 3 shows the ranges and ratings for the depth to groundwater; this was used to select rating to the corresponding range. The selected rating was then multiplied by the assigned weight for depth to water, which for this case was 5 (Table 1) in order to obtain the DI component (D) for depth to water. The similar procedure was repeated for all boreholes examined in the study area. Table 3: Ranges and ratings for the Depth to groundwater in DRASTIC model (after Aller et al., 1987)
Range (ft) Rating 0-5 10 5-15 9 15-30 7 30-50 5 50-75 3 75-100 2 100+ 1
Net recharge The primary source of groundwater typically is precipitation that infiltrates through the surface of the ground and percolates to the water table. The net recharge represents the amount of water
6

per unit area of land, which penetrates the ground surface and reaches the water table. This recharge water is thus available to transport a contaminant vertically to the water table and horizontally within the aquifer. The greater the recharge, the greater the potential for groundwater pollution. This general statement is true until the amount of recharge is great enough to cause dilution of the contaminant, at which point the groundwater pollution potential ceases to increase and may actually decrease. Table 4: Ranges and ratings for net Recharge in DRASTIC model (after Aller et al., 1987)
Range (Inches) Rating 0-2 1 2-4 3 4-7 6 7-10 8 10+ 9
The Dar es Salaam Region gets the annual rainfall average between 1000 mm to 1400 mm. The long term average recharge of 240.7 mm/year to the aquifer was estimated by using the balance method of Thornthwaite and Mather (1957) which is equal to 93.4 hm3/year for the whole sand aquifer (Mjemah et al., 2009). This annual recharge rate of 240.7 mm lies between 7–10 inches range and corresponding with a net recharge rating of 8 (Table 4). The corresponding rating was then multiplied by the assigned weight for net recharge, which in this case was 4 (Table 1) in order to obtain the DI component (R) for net recharge. The same value obtained was then applied for all boreholes examined in the study area. Aquifer media An aquifer media refers to the consolidated or unconsolidated rock that serves as an aquifer (such as sand and gravel or limestone). An aquifer is defined as a subsurface rock unit, which will yield sufficient quantities of water for use. The flow system within the aquifer is affected by the aquifer medium. The aquifer medium influences the amount of effective surface area of materials with which the contaminant may come in contact with, within the aquifer. In general, the larger, the grain size and the more fractures or openings within the aquifer, the higher the permeability and the lower the attenuation capacity of the aquifer media. Since the DRASTIC model is valid only in unconfined aquifer, the aquifer media in unconfined aquifer was the only one considered (see Figure 2). Table 5 shows the range and typical rating used for evaluation, where for example sand and gravel corresponding with a typical rating of 8, and clay was given rating of 2 (as the case in massive shale). In this case the aquifer media is sand as seen in Figure 2. Then the corresponding rating (i.e. 8) is multiplied by the assigned weight for the aquifer media, which is 3 (Table 1), in order to obtain the DI component (A) for the aquifer media. The same value was then applied for all boreholes examined in the study area since all boreholes are located in unconfined aquifer which is sand.
7
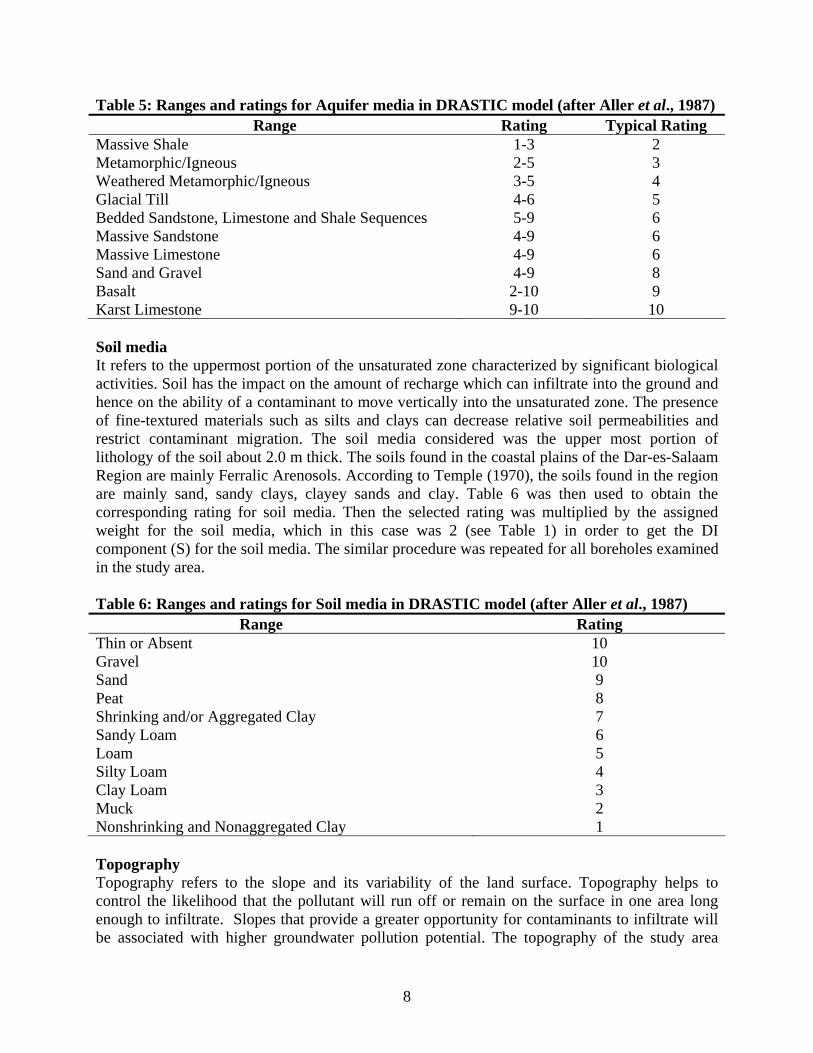
Table 5: Ranges and ratings for Aquifer media in DRASTIC model (after Aller et al., 1987) Range Rating Typical Rating
Massive Shale 1-3 2 Metamorphic/Igneous 2-5 3 Weathered Metamorphic/Igneous 3-5 4 Glacial Till 4-6 5 Bedded Sandstone, Limestone and Shale Sequences 5-9 6 Massive Sandstone 4-9 6 Massive Limestone 4-9 6 Sand and Gravel 4-9 8 Basalt 2-10 9 Karst Limestone 9-10 10 Soil media It refers to the uppermost portion of the unsaturated zone characterized by significant biological activities. Soil has the impact on the amount of recharge which can infiltrate into the ground and hence on the ability of a contaminant to move vertically into the unsaturated zone. The presence of fine-textured materials such as silts and clays can decrease relative soil permeabilities and restrict contaminant migration. The soil media considered was the upper most portion of lithology of the soil about 2.0 m thick. The soils found in the coastal plains of the Dar-es-Salaam Region are mainly Ferralic Arenosols. According to Temple (1970), the soils found in the region are mainly sand, sandy clays, clayey sands and clay. Table 6 was then used to obtain the corresponding rating for soil media. Then the selected rating was multiplied by the assigned weight for the soil media, which in this case was 2 (see Table 1) in order to get the DI component (S) for the soil media. The similar procedure was repeated for all boreholes examined in the study area. Table 6: Ranges and ratings for Soil media in DRASTIC model (after Aller et al., 1987) Range Rating Thin or Absent 10 Gravel 10 Sand 9 Peat 8 Shrinking and/or Aggregated Clay 7 Sandy Loam 6 Loam 5 Silty Loam 4 Clay Loam 3 Muck 2 Nonshrinking and Nonaggregated Clay 1 Topography Topography refers to the slope and its variability of the land surface. Topography helps to control the likelihood that the pollutant will run off or remain on the surface in one area long enough to infiltrate. Slopes that provide a greater opportunity for contaminants to infiltrate will be associated with higher groundwater pollution potential. The topography of the study area
8

consists at one side of a series of elevations forming hills and on the other hand of the coastal plain referred to as terraces by Msindai (1988). Among the most important hills are Pugu Hills with a maximum elevation of 280 m above mean sea level. To the east, the topography drops to 0 m above sea level in the shoreline of the Indian Ocean. The Dar es Salaam City is located in relatively flat land with the topography ranging from 0% – 4% (Mato, 2002). The study area is divided into 3 main landform classes, namely the coastal plain and the uplands, which include a higher region to the west (Pugu Hills, where Pugu Sandstone is outcropping) and an area of intermediate altitude in the northwest and at the southeastern limit (in the deltaic clay-bound sands and gravels formation). The three areas are clearly distinguished on the slope map in Figure 3: in the coastal plain, slopes are very gentle (0 – 2%; blue); in the “clay-bound sands” area, slopes are mainly intermediate (2 – 6%; green); in Pugu Hills, slopes are steep (> 6%; red and pink).
39 39.05 39.1 39.15 39.2 39.25 39.3 39.35 39.4 39.45 39.5-7
-6.95
-6.9
-6.85
-6.8
-6.75
-6.7
5 50
Km
Legend:
Figure 3 Surface slope map of the study area (Mjemah, 2007)
The method used to come up with the slope value for each borehole was to assign average topography within the urban ward. Table 7 was then used to obtain the corresponding rating for topography. The corresponding rating was then multiplied by the assigned weight, which in this case was 1 in order to obtain the DI component (T) for topography. The similar procedure was repeated for all boreholes examined in the study area.
9
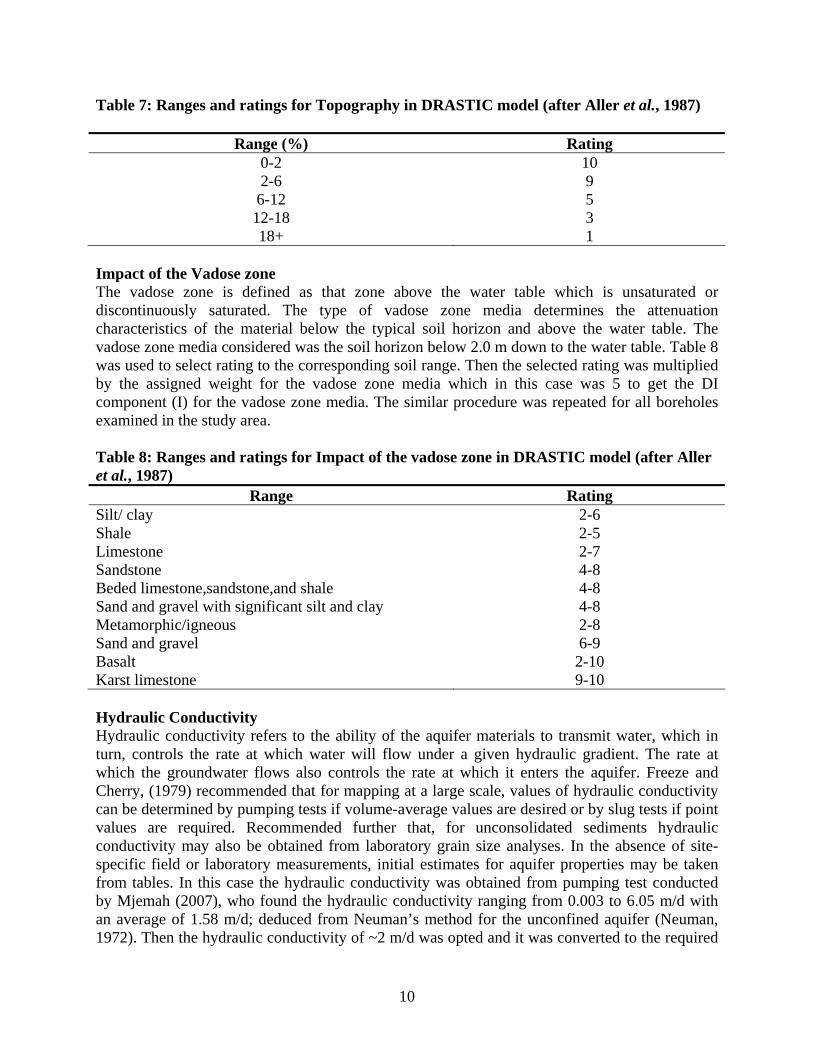
Table 7: Ranges and ratings for Topography in DRASTIC model (after Aller et al., 1987)
Range (%) Rating 0-2 10 2-6 9 6-12 5 12-18 3 18+ 1
Impact of the Vadose zone The vadose zone is defined as that zone above the water table which is unsaturated or discontinuously saturated. The type of vadose zone media determines the attenuation characteristics of the material below the typical soil horizon and above the water table. The vadose zone media considered was the soil horizon below 2.0 m down to the water table. Table 8 was used to select rating to the corresponding soil range. Then the selected rating was multiplied by the assigned weight for the vadose zone media which in this case was 5 to get the DI component (I) for the vadose zone media. The similar procedure was repeated for all boreholes examined in the study area. Table 8: Ranges and ratings for Impact of the vadose zone in DRASTIC model (after Aller et al., 1987)
Range Rating Silt/ clay 2-6 Shale 2-5 Limestone 2-7 Sandstone 4-8 Beded limestone,sandstone,and shale 4-8 Sand and gravel with significant silt and clay 4-8 Metamorphic/igneous 2-8 Sand and gravel 6-9 Basalt 2-10 Karst limestone 9-10 Hydraulic Conductivity Hydraulic conductivity refers to the ability of the aquifer materials to transmit water, which in turn, controls the rate at which water will flow under a given hydraulic gradient. The rate at which the groundwater flows also controls the rate at which it enters the aquifer. Freeze and Cherry, (1979) recommended that for mapping at a large scale, values of hydraulic conductivity can be determined by pumping tests if volume-average values are desired or by slug tests if point values are required. Recommended further that, for unconsolidated sediments hydraulic conductivity may also be obtained from laboratory grain size analyses. In the absence of site-specific field or laboratory measurements, initial estimates for aquifer properties may be taken from tables. In this case the hydraulic conductivity was obtained from pumping test conducted by Mjemah (2007), who found the hydraulic conductivity ranging from 0.003 to 6.05 m/d with an average of 1.58 m/d; deduced from Neuman’s method for the unconfined aquifer (Neuman, 1972). Then the hydraulic conductivity of ~2 m/d was opted and it was converted to the required
10

units for DRASTIC, which is gallons per day per square feet (gpd/ft2) i.e. 49.08 gpd/ft2. From Table 9 the corresponding rating for hydraulic conductivity is 1. The corresponding rating was then multiplied by the assigned weight, i.e. 3 (Table 1) to obtain the DI component (C) for hydraulic conductivity. The same hydraulic conductivity was applied to all boreholes examined in the study area. Table 9: Ranges and ratings for hydraulic Conductivity in DRASTIC model (after Aller et al., 1987)
Range (gpd/ft2 ) Rating 1-100 1
100-300 2 300-700 4 700-1000 6 1000-2000 8
2000+ 10
The HSSM Model
The Hydrocarbon Spill Screening Model (HSSM) is a United State Environmental Protection Agency (U.S. EPA) model, which simulates subsurface releases of light non-aqueous phase liquids (LNAPLs) in homogeneous soils (Weaver et al., 1995). The HSSM model includes separate modules for LNAPL flow through the vadose zone, spreading in the capillary fringe, and transport of chemical constituents of the LNAPL in a water-table aquifer. These modules are based on simplified conceptualisations of the flow and transport phenomena, which were used so that the resulting model would be practical, though approximate tool (Weaver et al., 1995). It has two modules, that is the Kinematic Oily Pollutant Transport (KOPT) and OILENS modules which address the vadose zone flow and transport of the LNAPL in groundwater respectively. In this simulation only the KOPT model with no dissolved contaminant was needed. Also a “per unit area” simulation was performed because only transport time through the vadose zone was required. Governing equations for the KOPT module In this study, an estimate needed is the time gasoline would take to reach the water table, since this would help an emergency response and monitoring program to be prepared for above ground storage tank facility or accidental spill of gasoline, before gasoline reaches the water table. The vadose zone determines the attenuation characteristics of the material below typical soil horizon and above the water table. From the lithological description of boreholes examined, found in the borehole drilled records for the entire study area show that the vadose zone in the area is composed mostly of sand soil. The KOPT module assumes the liquids are incompressible and the medium non-deformable. The NAPL is assumed to be composed of two components, the water and NAPL itself (which is a chemical of environmental concern), where the water immiscible phase acts as a carrier. The concentration of dissolved constituents is assumed to have no effect upon the fluid transport properties including densities, dynamic viscosities, and surface tensions (Charbeneau, et al.,
11

1995). The flow of the NAPL is governed by the two parts of the generalized method of characteristics solution. Equations 3 and 4 the classical solution, are used where the NAPL saturation varies continuously, in which case both partial derivatives appearing in the continuity Equation 2 exist in the solution domain. Where, Equation 5, the generalized solution, is used to determine the speed and position of the front at the leading edge of the NAPL. In KOPT, these equations are solved first and then, determination of the distribution of the NAPL in the profile follows (Charbeneau, et al., 1995).
0,
z
S
dS
SSdK
t
S o
o
avgwoeoo (2)
00 dt
dS (3)
o
avgwoeo
dS
SSdK
dt
dz ,1
(4)
21
21
21
21
oo
eoeo
oo
oo
SS
KK
SS
dt
dz
(5)
Ks = 21
22
ce
wrm
hC (6)
Where; C = is a constant taken as 270 wr = the residual water content m = maximum water content hce = air entry head in an air/water system
= the pore size distribution index qo = NAPL flux Keo = effective conductivity to NAPL So = NAPL saturation Sw(avg) = Water associated with average annual recharge rate = porosity Table10 shows the parameters values used in KOPT module simulation. The simulation was done for 10 years duration keeping in minds that the sources of petroleum hydrocarbons were on operation for more than this period of time. The constant head ponding was used, since this condition is used to simulate a hydrocarbon tank rupture, which is contained within a berm, for example. The initial time of NAPL release was assumed to be 0 day and the end time at a time of 0.05 day (1 hour and 12 minutes) and thereafter was set gain to 0.5 day (12 hours). During this interval the ponding depth was assumed to remain constant at 0.05 m. Additionally, only a “per unit area” was simulated where the source radius was set to be 0.5642 m so that the resulting source area is 1.00 meters. The hydraulic conductivity (Ks) in cm/s (Equation 6) of the system is estimated from Equation 7, parameter values used are from Weaver et al., (1995).
12

Ks = scmxhce
/1014.221
270 322
2
(7)
Where, the air entry head (hce) is in cm. The value is then converted to the required units of m/d by multiplying by 864 to give a Ks of ~2 m/d. The average depth to water table from the ground surface in study area found to be 7 m, in spite of the fluctuations on water table, between dry and wet seasons. Therefore, the depth to water table applied for simulation was 7 m since KOPT module only treats the vadose zone, above the water table. Table 10: Input parameters used in the simulation Parameter Rationale Value Water phase viscosity Standard value 1.0 cp Water phase density Standard value 1.0g/cm3 Water phase surface tension Assumed 65.0 dyne/cm Maximum relative permeability during infiltration
Assumed 0.5
Recharge input type Specify saturation Water saturation Specified water saturation 0.35
Saturated vertical hydraulic conductivity
Estimated from Brakensiek et al., 1981, which is the same with the obtained through pumping test.
2 m/d
Brooks and Corey’s pore size distribution index
0.368
Air entry head 35.3 cm Residual water saturation HSSM requires saturation input rather than
“content “ input 0.05 0.017/0.349
Porosity 0.349 Ratio of horizontal to vertical conductivity
Arbitrary value as this parameter is not used in KOPT
5
Porosity 0.349 Depth to water table Arbitrary value as only KOPT is used to
vadose zone 7.0 m
NAPL phase density Typical value for gasoline 0.75 g/cm3 NAPL phase viscosity Typical value for gasoline 0.45 cp Residual NAPL saturation (Vadose zone)
Estimated 0.10
NAPL surface tension Estimated 26.0 dyne/cm Radius of the NAPL source A “per unit area” simulation is desired, the
value 0.5642 results in a 1.0 m2 source area 0.5642 m
Simulation ending time Simulated the release for 4000 and 8000days
10 and 20years
Maximum solution time step Used a relatively large value, because 8000 days are simulated
0.5 day
Constant head ponding Initial time of release is 0.0 day and ending time varied with constant ponding depth of 0.05 m
0.5 and 0.05 day
Minimum time between printed steps Used a value smaller than the minimum solution time step.
0.05 day
13

RESULTS AND DISCUSSION Boreholes location The fieldwork campaigns were conducted in August 2004 and August 2006, where 400 boreholes were visited and mapped (Figure 4). In the study area there is over 2000 recorded boreholes drilled by Drilling and Dam Construction Agency (DDCA) by the year 2006. Most of the boreholes visited are located in Ilala and Temeke Municipalities. These areas have geological characteristics which favor the groundwater recharge and hence have productive aquifers.
Figure 4: Borehole locations visited and mapped
Groundwater vulnerability Map The resulting DRASTIC index represents a relative measure of groundwater vulnerability. The higher, the DRASTIC index, the greater the vulnerability of the aquifer to contamination. Three classes of vulnerability ranking have been displayed to describe the relative assessment of the probability of a groundwater resource to contamination: low, moderate, and high. These classes are shown as distinct colours on the vulnerability map (Figure 5). The results from these models have clearly demonstrated that the aquifers in the Dar es Salaam City are likely to be affected more from petroleum hydrocarbons, because the pollution sources are located to a moderate and high vulnerability class, which covers about 80% of the Dar es Salaam City. The areas that are likely to be affected include; Upanga West, Mabibo, Tandale, Temeke, Kinondoni and Ilala since these areas are located in areas with the high water table with sand soil, which has relatively high permeability. The moderate vulnerability in some area like Yombo Vituka, Kipawa, Tabata part of Ukonga, and others. this could be contributed by the presence of sandy clay soil and low water table.
14

#S
#S
#S
#S
#S
#S
#S
#S#S
#S
#S#S
#S
#S
#S
#S
#S
#S
#S
#S#S
#S#S
#S
#S
#S
#S
#S
#S
#S
#S#S
#S
#S
#S
#S
#S
#S
#S
#S
#S
#S
#S
#S
#S
#S #S
#S
#S
#S
#S
#S
#S
#S
#S
#S
#S
#S
#S
#S
#S
#S
#S#S#S
#S
#S#S
#S
#S #S
#S#S
#S#S#S
#S #S#S#S#S #S#S#S #S#S #S#S
#S #S#S#S #S #S#S#S#S
#S#S
#S
#S #S#S#S#S #S#S
#S#S #S#S #S
#S#S#S
#S#S
#S
#SUBUNGO
UKONGA
KAWE
KINYEREZI
KI
MBAGALA
MSASANI
YOMBO VITUKA
KIPAWA VIJIBWENI
TABATA
CHARAMBE
MABIBO
KEKO
TEMEKE
KURASINI
TANDALE
ILALA
VINGUNGUTI
MTONI
KINONDONI
KIVUKONIMZIMUNI
MCHAFUKOGE
Pugu_road
Morogoro_road
Kilw
a_ro
ad
Bagam
oyo_road
Mzinga_river
Kizinga_river
Mbe
zi_river
Msimba
zi_riv
er
Msimbazi_river
Kisarawe
Pugu Hills
0 10000 Kilometers
N
Legend:
504000
504000
513000
513000
522000
522000
531000
531000
9234000 9234000
9243000 9243000
9252000 9252000
No DataHigh VulneabilityModerate VulnerabilityLow Vulnerability
Groundwater Vulnerability Categories
Study Area BoundaryMain RoadsCoastlineMain Rivers
Urban WardsIndian ocean
#S Boreholes Location
Figure 5: DRASTIC index groundwater vulnerability map of Dar es Salaam metropolitan Aquifers can be polluted from both point and non-point sources. While non-point sources are particularly difficult to predict and control, point sources or potential point sources can be used as a first step in assessing vulnerability. Figure 6 shows identified potential sources of petroleum hydrocarbons contamination along with groundwater public water supplies. It can also be observed that all the garages, depots and fuel filling stations are located in the high vulnerable area, which directly indicates the risk of groundwater contamination. This map provides a visual representation of the magnitude of the task of protecting groundwater from contamination, since potential sources of contamination are not geographically separated from public water supplies to any considerable degree. Most of the public water supply wells drilled on site nearby petrol filling stations Mato (2002). However, the risk of petroleum hydrocarbon contamination differs from one area to another, depending on some factors like type of the hydrocarbon source, quantities being handled, handling procedures and safety installations available and the groundwater vulnerability categories in which the facility is located. The groundwater vulnerability map of the study area shows more than 80% of the sources of petroleum hydrocarbons examined are located in the moderate and high vulnerability categories. Vindi (2000) and Mato (2002) revealed the presence of total petroleum hydrocarbons (TPH), benzene, toluene, ethylbenzene and xylenes (BTEX) in
15

some of production boreholes in the study area. Luckily enough, the investigation done shows that the petroleum hydrocarbons concentrations were relatively low and were within the Tanzania standards of drinking water, where the maximum allowable limit is 0.5 mg/l.
#S
#S
#S
#S
#S
#S
#S
#S#S#S
#S#S
#S
#S
#S
#S
#S
#S
#S
#S#S
#S#S
#S
#S
#S
#S
#S
#S
#S
#S#S
#S
#S
#S
#S
#S
#S
#S
#S
#S
#S
#S
#S
#S
#S #S
#S
#S
#S
#S
#S
#S
#S
#S
#S
#S
#S
#S
#S
#S
#S
#S
#S#S#S
#S
#S#S
#S
#S #S#S
#S#S#S
#S#S #S#S#S#S #S
#S#S #S#S #S#S#S #S#S#S #S #S#S
#S#S#S
#S
#S
#S #S #S#S#S #S #S#S#S #S
#S #S#S
#S#S#S#S
#S
#S
$T
$T$T
$T%U
%U
%U
%U
%U%U%U%U
%U
%U
%U&\
&\&\&\&\
&\&\&\&\
&\
&\
&\
&\ &\
&\
&\&\&\&\&\&\&\&\
&\&\
&\
&\&\
&\&\
&\
&\
&\
&\
&\
&\
&\
&\
&\
&\
&\&\
&\
&\&\
&\
&\ &\
&\
&\
Pugu_ro
ad
Morogoro_road
Kilw
a_ro
ad
Bagamoyo_
road
Mzinga_
river
Kizinga_river
Mbe
zi_river
Msimba
zi_riv
er
Msimbazi_river
Kisarawe
Pugu Hills
0 10000 Kilometers
N
No DataHigh VulneabilityModerate VulnerabilityLow Vulnerability
Groundwater Vulnerability Categories
Study Area BoundaryMain RoadsCoastlineMain RiversIndian ocean
#S Boreholes Location$T Depots%U Garages&\ Fuel StationsLegend:
504000
504000
513000
513000
522000
522000
531000
531000
9225000 9225000
9234000 9234000
9243000 9243000
9252000 9252000
Figure 6: Sources of petroleum hydrocarbons locations
Gasoline migration time
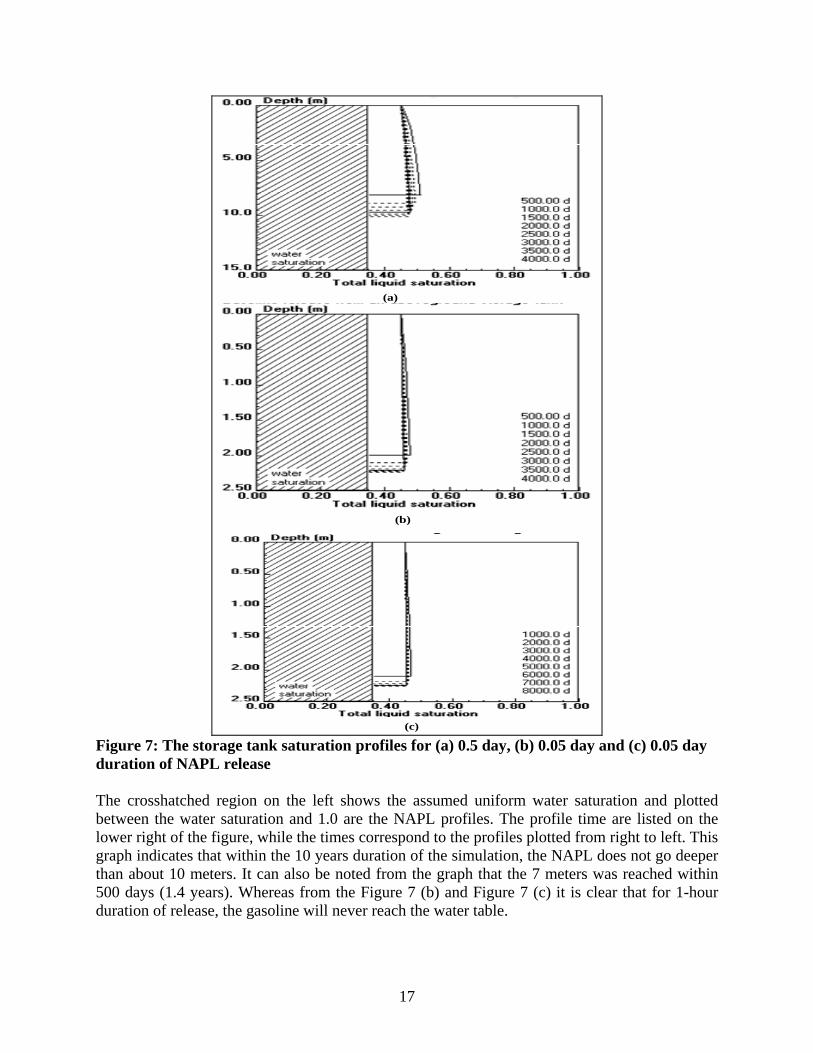
Figure 7 (a) shows the saturation profiles from the simulation of gasoline release from an above ground storage in the vadose zone on the assumption that the initial time of NAPL release begins at a time of 0 day and ending at 0.5 day (12 hours). Furthermore, during this interval the ponding depth was assumed to remain constant at 0.05 m. However, the constant head ponding condition preferred in this study because it does not specify the volume of gasoline, which enters the soil, it only indicates that enough gasoline (Figure 7a) is supplied to maintain the depth of 0.05 m ponding depth for 12 hours.
16
(a)
(b)
(c) Figure 7: The storage tank saturation profiles for (a) 0.5 day, (b) 0.05 day and (c) 0.05 day duration of NAPL release The crosshatched region on the left shows the assumed uniform water saturation and plotted between the water saturation and 1.0 are the NAPL profiles. The profile time are listed on the lower right of the figure, while the times correspond to the profiles plotted from right to left. This graph indicates that within the 10 years duration of the simulation, the NAPL does not go deeper than about 10 meters. It can also be noted from the graph that the 7 meters was reached within 500 days (1.4 years). Whereas from the Figure 7 (b) and Figure 7 (c) it is clear that for 1-hour duration of release, the gasoline will never reach the water table.
17

It was noted through oral interview conducted in the study area that, 26% of Oil Companies have been in operation for more than 50 years (Mato, 2002), time enough for the gasoline to reach the productive aquifers located about 20-70 m deep in Dar es Salaam. However, pity enough 71% out of 31 petrol filling stations interviewed have not replaced the underground storage tanks for more than 20 years ago; thus, there is a possibility of potential groundwater contamination from leakage, since a common life expectancy of buried oil tanks is 10–15 years. The data showed that some petrol filling stations started since 1950 and are still in operation without replacement of tanks. CONCLUSIONS Groundwater is often treated significantly less than surface water, as it tends to be a cleaner source. This also means that if contamination occurs, it is more likely to have a negative effect on the population, as less steps are present to remove the contaminant before it reaches the public. The results from these two models, that is DRASTIC and HSSM model have clearly demonstrated that the Dar es Salaam City is threatened from petroleum hydrocarbons, since the pollution sources are located in the area with moderate and high vulnerability and easy subsurface migration of NAPL in vadose zone. The current situation of petroleum hydrocarbons found in potable water shows very low concentrations (<2.5g/l) and are within the limits of the Tanzania standards of about 0.5 mg/l. However, as the gasoline takes even decade or centuries to migrate through aquifers the concentrations are likely to increase if no preventive measures are taken. The wells within the high vulnerability category have to be given priority during groundwater monitoring. The current land use practices have to be revised in order to prevent the groundwater from further contamination. Additionally, there is a need of developing appropriate groundwater protection strategies and by-laws, which will help to stop ongoing illegal drilling of boreholes.
ACKNOWLEDGEMENTS
The authors wish to express their sincere thanks to the Swedish International Development Agency (SIDA) for funding this study. The authors highly appreciate the help from all other persons that provided information and/or assistance during data collection.
REFERENCES
Aller, L., Bennet, T., Lehr, J.H. and Petty, R.J., 1987. DRASTIC: a standardized system for evaluating groundwater pollution potential using hydrogeological settings. US- Environmental Protection Agency. Charbeneau, R.J. et al. 1995. The Hydrocarbons Spill Screening Model (HSSM), Volume 2:
Theoretical Background and Source Codes. U.S. EPA. Washington DC. 204660. Connel, D.W., 1997. Basic concepts of environmental chemistry. Lewis Publishers. New Tork. Corwin, D.L., Vaughan, P.J., and Laoque, K., 1997. Environmental Science & Technology, Vol. 31, pp. 2157-2175.
18

19
Drilling and Dam Construction Agency, DDCA, 2006. Working files, Dar es Salaam. Freeze, R. A. and Cherry, J. A., 1979. Groundwater. Prentice-Hall, Inc., Englewood Cliffs, New
Jersey. Kent, P.E., Hunt, J.A. and Johnstone, M.A. 1971. The geology and geophysics of coastal
Tanzania. Geophysical paper no. 6, Natural Environmental Research Council. Inst. Geol. Sci. H.M.S.O.
Lindstrom, R., Scharp, C., 1995. Approaches to groundwater vulnerability assessment: a state of the artreport. Division of Land and Water Resources, Royal Institute of Technology, Stockholm.
Mato, R.R.A.M., 2002. Groundwater Pollution in Urban Dar es Salaam, Tanzania: assessing Vulnerability and Protection Priorities. University Press, Eindhoven University of Technology, The Netherlands. Mjemah, I.C., Mato, R.R.A.M and Thunvik, R. 2002. Assessing groundwater vulnerability to
petroleum hydrocarbons pollution in Dar es Salaam City, Tanzania. M.Sc. Thesis, Royal Institute of Technology (KTH), Sweden.
Mjemah, I.C., 2007. Hydrogeological and hydrogeochemical investigation of a Coastal Aquifer in Dar-es-Salaam, Tanzania. PhD Thesis, Ghent University, Belgium
Mjemah, I.C., Van Camp, M., Walraevens, K. 2009. Groundwater exploitation and hydraulic parameter estimation for a Quaternary aquifer in Dar-es-Salaam, Tanzania. Elsevier, Journal of African Earth Sciences, 55 pp.134–146.
Msindai, K., 1988. Engineering geological aspects of soil and rocks in the Dar es Salaam region of Tanzania. Institute of quaternary geology, University of Turku.
Navulur, K.C.S., 1996. Groundwater evaluation to non-point source nitrate pollution for large area using GIS. Ph.D. Thesis, Purdue University, West Lafayette, Indianapolis, USA. pp. 461 – 503.
Neuman, S.P., 1972. Theory of Flow in Unconfined Aquifers Considering Delayed Response of the Water Table. Water Resources Research. Vol. 8, No 4, pp. 1031-1045.
Temple, P., 1970. Aspects of the Geomorphology of the Dar-es-Salaam Area. In: Dar-es-Salaam – City, Port and Region. Tanzania Notes and Records, 71, 21-54. Dar-es-Salaam, Tanzania.
Thornthwaite, C.W. and Mather, J.R., 1957. Instructions and tables for computing potential evapotranspiration and the water balance. Publications in Climatology, Vol.10 (3), pp.183 – 311 Laboratory of Climatology, Drexel Institute of Technology, Centerton, New Jersey, USA.
Vindi, N., 2000. Waste lubrication oil management in Dar es Salaam. B.Sc. Dissertation. Department of Environmental Engineering, University College of Lands and Architectural Studies (UCLAS), Dar es Salaam. Unpublished.
Weaver, J. W., Charbeneau, R. J., Tauxe, J. D., Lien, B. K., and Provost, J. B., 1995. Hydrocarbon Spill Screening Model (HSSM), Volume I: User’s Guide. International groundwater modelling centre USA.