Sustainable Development in the Food Supply Chain
120
SUSTAINABLE DEVELOPMENT IN THE FOOD SUPPLY CHAIN SAMRAD ISMAYILOV
Transcript of Sustainable Development in the Food Supply Chain
SUSTAINABLE DEVELOPMENT IN THE FOOD SUPPLY
CHAIN
SAMRAD ISMAYILOV

ii
iii
ABSTRACT
There is great interest in localization and safety of food as there are increased number of
people thinking about their health and becoming savvy about what they consume and
how it affects the environment, so they increased responsiveness as well, which make
think majority of companies to focus on sustainability strategy which comprises in itself
environmental, social and economical pillar, in order to provide people with the safe, and
healthy food with including food security, democracy, and sovereignty. This thesis
examines how food supply chain affects environmental change.
Due to increasing world population, the environmental impact of food supply chain is
getting bigger in global perspective and which cause companies to think how to provide
more food which will not harm the environment and people. Research from different
books and academic papers which is about sustainability in food supply chain have been
taken into consideration. The books which are used: Cheryl Baldwin: “Sustainability in
the Food Industry” and Ruben O. Morawicki: “Handbook of Sustainability for the Food
Sciences”.
Hereafter, sustainability should be included in each phase of the food supply chain,
starting from the processing till the disposal and cradle to cradle model should be used.
Food waste and food loss must be diminished which it is possible to minimize them but
companies still face with food waste and loss which shows uncoordinated system of
crew. Pesticides are used for growing food which further will cause damage to human
health. Food transportation and distribution causing global warming and during the
processing food the gasses that are global warming potential are emitted to air which
further create green house gas effect. Recycling is considered to be the solution to
diminish the environmental footprint, which is reusing the disposal in its system.
Packaging is using nonrenewable energy and creating waste. Currently companies are
focusing on sustainability more than before and want to use packaging which reduce the
food waste and while recycling could cause less contamination.
Key words: Food security, sustainability, food waste, packaging, food supply chain
iv
ACKNOWLEDGMENTS
Gratitude is a great virtue. This dissertation becomes possible to me with the help of
many people in many ways. For the idea writing about food, came to my mind on the first
semester during the prof. Larsen’s lecture on Corporate Strategy course. Further
combining it with sustainability, I came up with the help of Prof. Dr. Frank-Martin Belz
lecture on Sustainability Marketing and Sustainability Innovation during studying in
Technische Universitat Munchen.
Thanks to Prof. Larsen for supervision and sharing ideas with me.
Special gratitude to the USI Library crew, who helped me a lot.
I want to thank for the support my family, and friends.
v
TABLE OF CONTENTS
Chapter Page
ABSTRACT ....................................................................................................................... iii ACKNOWLEDGMENTS ................................................................................................. iv
TABLE OF CONTENTS .................................................................................................... v List of Abbreviations ........................................................................................................ vii CHAPTER I: Introduction .................................................................................................. 1
1.1 Food supply chain ..................................................................................................... 2
CHAPTER II: Background and Literature Review ............................................................ 8 2.1. Sustainability............................................................................................................ 8
2.2. Food Democracy ...................................................................................................... 9 2.3. Food sovereignty .................................................................................................... 10 2.4. Food citizenship ..................................................................................................... 12
2.4.1. Sustainable food .............................................................................................. 14 2.4.2. Food security ................................................................................................... 14
2.5. Why sustainability? ............................................................................................ 15 2.5.1. Consumerism ...................................................................................................... 16 2.6. Sustainable development ....................................................................................... 19
2.6.1. Sustainable food supply chain ........................................................................ 23 2.7. Unsustainable consumption ................................................................................... 26
2.7.1. Food waste ...................................................................................................... 28
2.7.2. Wastewater ...................................................................................................... 30
2.7.3. Solid Waste ..................................................................................................... 30 2.7.4. Air Emissions .................................................................................................. 31
2.8. Environmental impact of food supply chain .......................................................... 32 2.9. Ecological footprint and climate change................................................................ 33 2.10. Food Safety, Health, and Nutrition ...................................................................... 38 2.12. What is sustainable food company? ..................................................................... 43
2.12.2. Raw materials and ingredients made from renewable resources .................. 43 2.12.3. Water neutral ................................................................................................. 43 2.12.4. Net-zero air emission .................................................................................... 44 2.12.5. Biodegradable liquid and solid wastes .......................................................... 45
2.13. Packaging ............................................................................................................. 45
2.14. Reuse .................................................................................................................... 48 2.14.1. Recycling ...................................................................................................... 49
2.14.2. Composting ................................................................................................... 50 2.14.3. Edible Packaging .......................................................................................... 50
2.15. Distribution .......................................................................................................... 51 2.16. Life Cycle Assessment (LCA) ............................................................................. 58
CHAPTER III: RESULTS ................................................................................................ 64 3.1 Ecolabling........................................................................................................... 64 3.2 Use of waste ....................................................................................................... 69
vi
3.3 Companies that are involved into sustainability program .................................. 70
3.4 Food Scandals .................................................................................................... 75 CHAPTER IV: CONCLUSION ....................................................................................... 78 Appendix ........................................................................................................................... 80
Appendix A ................................................................................................................... 80 An Energy Intensive Supply Chain............................................................................... 80 Appendix B ................................................................................................................... 81 Appendix C ................................................................................................................... 82 Appendix D ................................................................................................................... 83
Appendix E ................................................................................................................... 84 Appendix F.................................................................................................................... 85 Appendix G ................................................................................................................... 86 Appendix H ................................................................................................................... 92
Appendix I .................................................................................................................... 93 Appendix J .................................................................................................................... 93
Appendix K ................................................................................................................... 94 Appendix L ................................................................................................................... 94
Appendix M .................................................................................................................. 95 REFERENCES ................................................................................................................. 96
vii
List of Abbreviations
CFC- Chlorofluorocarbons
DGP- Deutsche Gesellschaft fur Pharmakologie (German Association of Pharmacology)
EPA- Environmental Protection Agency
FAO- Food Agriculture Organization
FAOSTAT- Food Agriculture Organization Statistics
FSC- Forest Stewardship Council
GMO- Genetically Modified Organism
HCFCs- Hydrochlorofluorocarbons
HFCs- Hydrofluorocarbons
IFOAM- International Organic Federation of Agriculture Movements
IFPRI- International Food Policy Research Institute
LCA- Life Cycle Assessment
LOHAS- Lifestyle of Health and Sustainability
MSC- Marine Stewardship Council
PLA- Polylactic acid
PNAS- Proceedings of the National Academy of Sciences
QCL- Quality Controlled Logistics
UNEP- United Nations Environment Programme
WBCSD- World Business Council for Sustainable Development
WFC- World Food Council
WHO- World Health Organization
WWF- World Wildlife Fund
1
CHAPTER I: Introduction
In our fast developing environment sustainability issue becomes one of the frequently
discussed topics. Nowadays, most of the food, which is consumed by the world
population is supplied by the food industries. There are lots of industries involved in
sustainability. The reason, why I choose sustainability in the food supply chain is
because; food is one of our most essential daily needs, it is salvation for human life, it
gives us energy to work, and to play. It makes us grow healthy and strong. Without food
we die. All living things—plants, animals, and human—need food to live and grow. All
foods that we eat come from plants and animals. But world populations do not eat the
same foods. Some people in Central Asia live mostly on milk and milk products. Eskimos
live mostly on consumption of meat and fish products while the San Blas Indians of
Panama eat mostly fruit and vegetables. Some group of countries eat foods that other do
not eat. For instance, certain groups in Iran enjoy sheep’s eyes. Food plays a significant
role in development of nations. In countries where food is scarce, people spend most of
their time getting enough to eat. This usually slow the process of progress, due to people
have little time to devote to industry, science, government and art. In nations where food
is abundant and easy to get, people have more time to spend in activities that lead to
progress, human betterment, development and successfully flourishing their environment.
Providing good, sustainable food for everybody is one of the major problems of modern
life. There have been many wars for capturing fertile lands, and controlling rich food
producing lands. But it is no longer necessary to go to war for food. The nations of the
world are now using scientific knowledge to research and find solution of their food
problems. They work together in the United Nations Agriculture organization (FAO1) to
help hungry nations produce more food.
The research question is based on “why people should develop sustainability food supply
chain?” Thus main objective of the thesis is to focus on drawbacks of food industries,
their damages to people lives and environment, and moving towards the sustainable food
1 FAO is an international agency which collects and gives information on the production,
consumption, and distribution of food throughout the world.
2
supply chain. Sustainable development of food supply chain is being highly recognized
by the world biggest companies such as: Procter and Gamble, Nestle, and Unilever.
A Further goal is to scrutinize the purchasing of food in people’s daily life and the effect
of genetically modified products on people’s health. The requisite focus is developing
sustainable food supply chain in order to diminish ecological footprint.
Advantages of sustainable process comprises lower production costs, increased market
share, improved relationship with stakeholders, improved product function and quality,
last but not least reduce the risks (WBCSD, 2002).
Food safety is connected with people’s livelihood, the responsibility is extremely heavy
(Sloan, 2007). Today people are more aware of food that they are consuming, as they are
paying close attention to what they are purchasing. In fast changing environments people
get news very fast, through nontraditional channels like, social networks (Twitter,
Facebook and so on). Thus people are aware of the food that can harm their health, so
while buying products they are interested in nutrition facts, they are also paying close
attention to the label that been used by the company such as, bio, fair-trade, rainforest
alliance certified, marine stewardship council (MSC), forest stewardship council (FSC)
etc.. But people should also take into consideration that this can be also a Greenwashing.
Development of sustainable agriculture and food supply chain must be significant part of
long term economic and environmental planning, because corresponding food and
liveable environment are both crucial for the long term survival of our species.
Environmental concerns are moving further in priority to many of customers.
In order to answer research question, methodology which I used in my dissertation is
based on qualitative studies about sustainability in the food supply chain. I focused more
on researches from the book, academic papers and websites of the companies and
associations dealing and involving in sustainability practice. All the data that are used in
dissertation are acquired from secondary sources.
1.1 Food supply chain
Supply is the network that is dealing with production, delivery and selling of the
products. Supply chain management involves in itself arrangement of ingredients,
3
seasons, weather condition, and limited shelf life of food products. In comparison to other
supply chains, it takes into consideration the perishability factor of foods. Managers must
consider handling and time, including need for special transportation, storage, and
distribution system and delivery of food to consumers, safe, visually attractive, and with
the highest nutritional value. Due to sophisticated supply chain the availability of fruits
and vegetables does not change significantly during the year, the only drawback for this
kind of production may be the perceived taste that customers will distinguish it from
seasonal fruits or vegetables. Price level is also varying during seasonal and non-seasonal
products. Highly perishable fruits such as strawberries and raspberries are available year
around with the help of coordinated effort of producers, processors, and distributors.
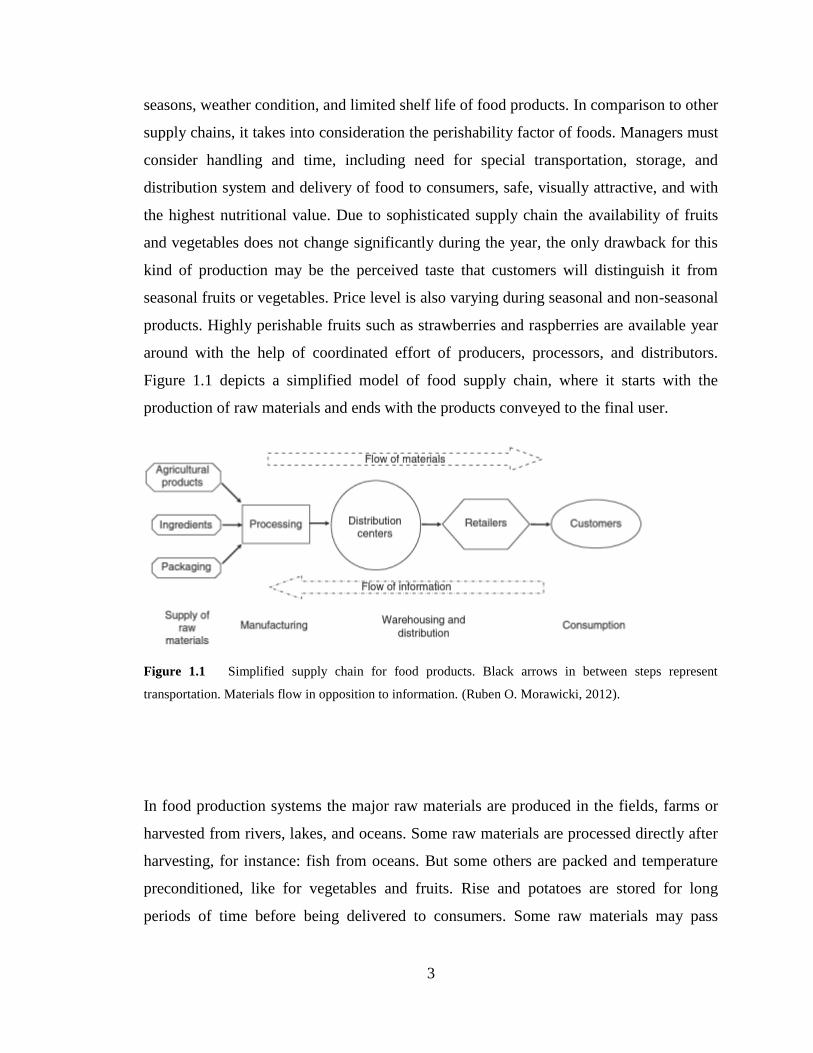
Figure 1.1 depicts a simplified model of food supply chain, where it starts with the
production of raw materials and ends with the products conveyed to the final user.
Figure 1.1 Simplified supply chain for food products. Black arrows in between steps represent
transportation. Materials flow in opposition to information. (Ruben O. Morawicki, 2012).
In food production systems the major raw materials are produced in the fields, farms or
harvested from rivers, lakes, and oceans. Some raw materials are processed directly after
harvesting, for instance: fish from oceans. But some others are packed and temperature
preconditioned, like for vegetables and fruits. Rise and potatoes are stored for long
periods of time before being delivered to consumers. Some raw materials may pass
4
through several manufacturing stages at various locations of supply chain before reaching
the consumers. For example, wheat is harvested then has been transported to mills where
it is going to be transformed into flour. Further, flour is retailed to consumers or sold to
the bread and baking industry, which further process it. Ingredients are deemed to be the
second component of the supply of the raw materials and can be domestically supplied
from all around the world (Ruben Morawicki, 2012). Packaging is the third important
element of the supply of materials for the safe and better distribution of food products.
Foster et al. (2006) have classified food production in three degrees, which are: low-,
medium-, and high-processed foods. Fruits and vegetables are considered low-processed
foods, because they are commercialized as fresh and demand minimal processing,
washing, sorting, and packaging. Canned and frozen products and bread type of products
are deemed to be medium processed foods. To the high-processed foods include products
such as ready to eat meals, which involve in several suppliers of raw material, ingredients
and processes.
After processing food is packaged and kept in warehouses, the temperature is regulated
according to the product that has been kept; it can be either in room temperature or in
freezers as needed. Further processed packaged food is transported from warehouses to
the distribution centers. Distribution centers are equipped with environmental control,
which provides food products with the corresponding temperature conditions.
Distribution centers are playing order processing role in supply chain mechanism as this
phase is responsible for the fulfillment of orders that come from retailers and wholesalers.
Food retailers have direct contact with the customers. They are the last link in the food
production and distribution channel. Food retailers include convenience stores, grocery
stores, and online companies. Restaurants take the place of retailers in foodservice supply
chain.
Customers are the definitive users of the food supply chain. The ultimate impact of how
the product has been processed will be checked from the customers’ point of view, as if
the quality of the product is high or was the product dangerous and so on. Consumers are
one of the main actors of the chain as they generate revenue, credibility, loyalty and can
make the companies change towards the sustainability in their food supply chain.
“A supply chain is a system of organizations, people, activities, information, and
5
resources involved in moving a product or service from supplier to customer” (Canadian
Supply Chain Sector Council). Supply chain activities transform raw materials, natural
resources, and components into a finished product that is conveyed to the end customer.
In complex supply chain systems, used products may re-enter the supply chain at any
point where residual value is recyclable. A food supply chain or food system refers to the
processes that describe how food from a farm ends up on our tables. The processes
include production, processing, distribution, retailing, consumption and disposal2.
In majority of the stages of the food supply chain companies face with the problem of
environmental impact of foods towards the Earth. As the customers also become much
savvier about what they consume, they require safe food and make companies to think
about this issue. Food companies starting thinking about this issue and they start to focus
on the sustainability of their supply chain and improve the efficiency. Thus companies
focus more on energy intense supply chain.
Food supply chains are set of organizations, that are producing and distributing animal
based products or vegetables to consumers (van der Vorst et al., 2005). Due to diseases
that connected with food, and globalization of food production, consumers become
savvy, and becoming more interested in the origin of the product, which leads to a
growing interest in traceability, freshness and quality of what they have bought.
Concerning about the safety of foods, it has been created the need for additional
protection in the food supply chain, like traceability (Ruben M., 2012). Perishability
factor of food makes food supply chain different from nonfood supply chain. Product
traceability can be useful in any supply chain. Under EU law, “traceability” means the
ability to track any food, nutrition, food-producing animal or substance that will be used
for consumption, through all stages of processing, production, and distribution. Giving
information to the consumers about the origin of their product can be win-win situation.
For instance, through “followfish” consumers can type the code, that is depicted in the
package of fish product and track it in the website (www.followfish.de), in order to see
from which sea it has been caught. With traceability companies can build bridges
between suppliers and end users. Traceability is needed, because it is significant that
when national authorities or food businesses identify a risk they can trace it back to its
2 See Appendix A: An Energy Intensive Supply Chain.
6
source in order to swiftly isolate the problem and keep contaminated products from
reaching consumers.
The EU is providing almost €12million to the 5-year TRACE project, which kicked off in
January 2005. This project supported by over 50 European organizations and one from
China, the enterprise will deliver integrated traceability systems, guides to traceability
best practice, and food verification systems, specifically in the chicken, mineral water,
meat, honey and cereal sectors. Food trace has been designed for strengthening
traceability procedures between businesses. It searches to set up a clear identification
system and a network of databases so that information can be centralized and shared
(European Communities, 2007).
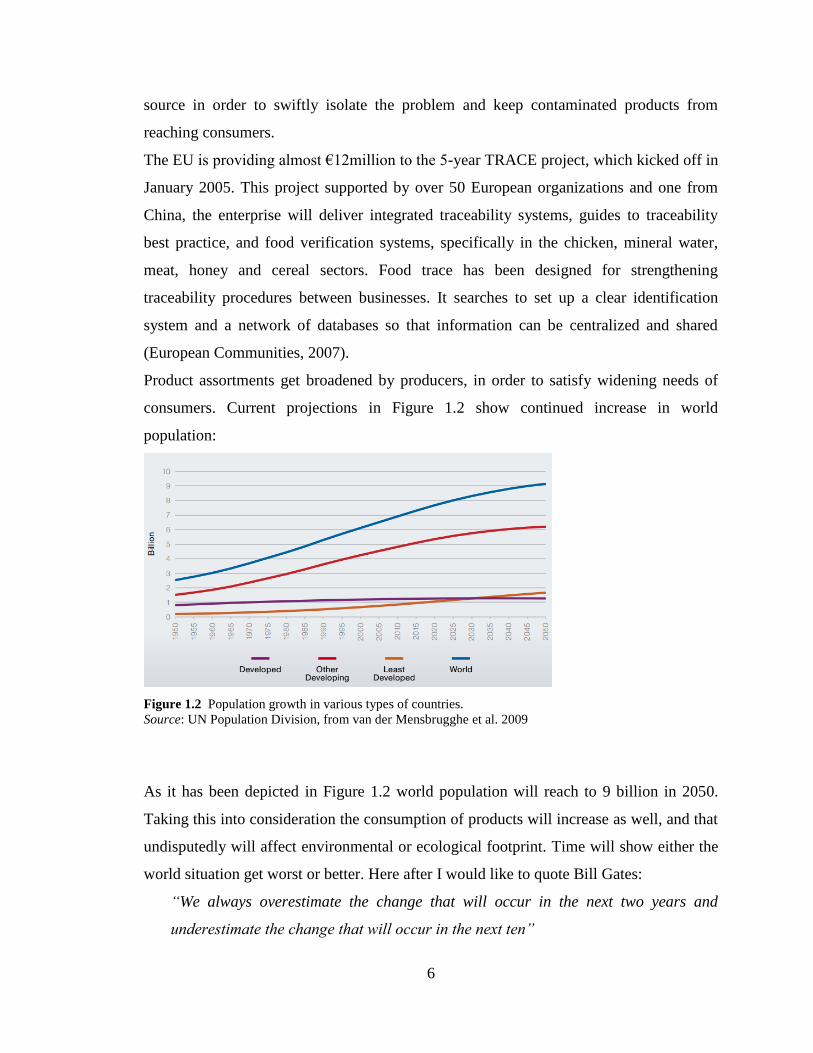
Product assortments get broadened by producers, in order to satisfy widening needs of
consumers. Current projections in Figure 1.2 show continued increase in world
population:
Figure 1.2 Population growth in various types of countries.
Source: UN Population Division, from van der Mensbrugghe et al. 2009
As it has been depicted in Figure 1.2 world population will reach to 9 billion in 2050.
Taking this into consideration the consumption of products will increase as well, and that
undisputedly will affect environmental or ecological footprint. Time will show either the
world situation get worst or better. Here after I would like to quote Bill Gates:
“We always overestimate the change that will occur in the next two years and
underestimate the change that will occur in the next ten”
7
Taking into consideration climate change during last decades, companies and consumers
should move towards the sustainable products.
Food supply chain management has become an essential issue in both business and public
agendas. It demands a various management approach which considers intrinsic
characteristics of food products and process but traditional supply chain management aim
is responsiveness and cost. Over the last few decades practitioners have given large
importance to the food supply chain management than ever before. In addition to that
recently food supply chain connected with the new trend, which is called sustainability.
Sustainability is an issue that assists to meet the needs of world populations, without
damaging world for the future generations (Linton et al., 2007). Sustainability aims to
improve the quality of living not only for existing people but for coming generation as
well (Bloemhof, 2005). Through the sustainability consumers would perceive foods more
secure and safe. Nowadays NGOs need to work close with each other in order to ensure
food democracy—safe, justly produced sustainable food for all mankind.
In general food supply chain must take into account food democracy, food sovereignty,
and food security. It must not only be focused on economic needs of the company,
especially food companies which are emphasize their involvement in the sustainability
practice.
The purpose is to see how the food supply chain and consumption of foods affect the
environment and ways to improve it, provide people with healthy, nutritious food, that
will not cause diseases.

8
CHAPTER II: Background and Literature Review
2.1. Sustainability
Sustainability is about reducing environmental footprint and ensuring of keeping natural
resources for the future generation without damaging the environment. Nowadays
sustainability become trend, each company integrate sustainability into its corporate
marketing strategy. With the developing the strong food democracy, people will be able
to get the access to transformation of agro-food systems in to the long run, which is
obliviously closely related with the sustainability issues. By having sustainability as a
strategy, companies have a robust support on preserving natural resources to their
descendants and they get close involvement on global issues related to the Earth. In
1980s in The United States sustainability appeared as strong issue in helping for the
solution of food and agriculture. Even though for some companies sustainability may
appear as fading trend that will disappear soon, the food industry growing so fast that is
quickly catching up with the concept of the sustainability. Sustainability might be a
solution to the depletion of natural resources that the whole economic system is based on.
Climate change is the main issue that results in the natural disasters that appears in
modern life, thus for the long-term survival companies move towards sustainable
development. Sustainable development is considered vital for each company, especially
to the food supply chain industry. As food supply chain directly may harm the world
population through diseases and environmental pollution.
Definition for the sustainability is following:
“A sustainable product or process is one that constrains resource consumption and
waste generation to an acceptable level, makes a positive contribution to the satisfaction
of human needs, and provides enduring economic value to the business enterprise”.
Bakshi and Fiksel, 2003
9
2.2. Food Democracy
In mid 1990s ‘food democracy’ was referring to the long process of pursuit for bettering
the food industry for all, not to the few (Lang T. & M. Koc et al. 1999). Food democracy
is striving to arrange the production and consumption of food at a close geographic
location, meanwhile rising opportunities for the democratically managed cooperation
between producers and consumers. The idea of food democracy, defines food as a life
good that should ideally exist within democratic control (The Authors Journal. 2009).
Food democracy can be built into food culture. The term food democracy is being used in
different ways, but it mostly focus on the interest of the mass, the ‘bottom-up’ over ‘top
down’, for building of social movement to implant right into culture and expectations
(Lang T. and M. Heasman. 2004). Through food democracy it should be ensured that
everyone has the access to the affordable, healthy foods and world population should be
ensured about the food security. Health of the people and the planet is closely linked. So
if people have healthy planet, the existing and future generation will live healthy life as
well. Health shows us how we can manage four domains of existence: the psychological
(biological), the material (our environment), the social (human interaction), and the
cognitive or life world (culture) (Lang T, Barling D and M Caraher. 2001). Opposite to
the food democracy we can place ‘food control’, in which food is being used as a vehicle
of control. Using food as political weapon is not something new. For instance, in US
Public Law 480’s utilization of food aid in foreign policy (George S. 1976) or think about
sugar, slaves, and trade (Mintz SW. 1985). When the British state re-exerted some food
control in World Wars One and Two, it did so facing strong lack of food (Woolton TE.
1959). But food democratic campaigns were also alleging demands for appropriate food
(Paulus I. 1974) living wages (Hannington W. 1977), and recognition for women and
children (Rathbone E. 1924). In 1939, UK produced only a third of its food needs but
colonial preference collapsed in dreadful war circumstances, and local production was
rebuilt to two thirds of needs by 1945 and result in the Agriculture Act: never again
enfeeble food capacity. However time passed by UK could not maintain the focus on
local food consumption. UK production is dropping. It is currently 63% self-sufficient,
while 74% for local foods are growable in UK (Defra. 2006). The food trade breach is
10
becoming bigger, approximately £22 billion of food and drink is imported, 68% of which
comes from different countries in EU (Food and Drink Federation. 2006).
The idea of food democracy has been further scrutinized by Hassanein, who signifies that
“food democracy ideally means that all members of an agro-food system have equal and
effective opportunities for participation in shaping that system, as well as knowledge
about the relevant alternative ways of designing and operating the system” (Hassanein ,
N. 2003). From this, it is clearly shows that food democracy is based upon a concept
where world population should create their own agro-food system, shape the food system
for their own needs, rather than to step aside and be a simple, passive spectators
(Hassanein. 2003).
The concepts such as: ‘food democracy’, ‘food sovereignty’ and ‘food citizenship’ are
similar. In 1990s Tim Lang came up with the concept of food democracy, in order to
increase the corporate control and absence of people interest in food system (Lang &
Heasman, 2004). Lang supported the need to democratize the food system and look at
‘food as a locus of democratic process’, which is substantially a consideration for
enhancing the role of citizens in the management and control of the food system. Food
system change is not driven by farmers, it is driven by consumers. Eating is agricultural
act. Consumers are beginning to stand up and take control the food system.
2.3. Food sovereignty
The idea of ‘food sovereignty’, was developed in a bottom-up manner by the
international movement of farmers Via Campesina3 from 1996 onwards (Wittmann et al.,
2010), the concept was going largely in the same way as the food democracy concept, it
has been considered having an even stronger rights-based focus and being more clear
from producer perspective. With the food sovereignty it has been understood, that is the
right of the people to decide about their food and agricultural policies (Patel, 2009). The
3 Via Campensina is an international movement which coordinates peasant organizations of small and
middle size producers, agriculture workers, and indigenous communities from Asia, America, Africa, and
Europe. It is defending family farm based sustainable agriculture and was the group that invented the term
“Food sovereignty”.
11
term ‘Food sovereignty’ is used for reaching particular problems of society, such as,
starvation and malnutrition, it is also about improving the development in the rural areas,
also to make better world population livelihood through sustainability. This approach is
considered for the development of people betterment in agriculture section, and dealing
with food security as well. There is not exact definition for the ‘Food Sovereignty’, but
one of the mostly used is from People’s Food Sovereignty Network (2002):
“Food Sovereignty is the right of peoples to define their own food and agriculture; to
protect and regulate domestic agricultural production and trade in order to achieve
sustainable development objectives; to determine the extent to which they want to be self-
reliant; to restrict the dumping of products in their markets; and to provide local
fisheries-based communities the priority in managing the use of and the rights to aquatic
resources. Food Sovereignty does not negate trade, but rather it promotes the
formulation of trade policies and practices that serve the rights of peoples to food and to
safe, healthy and ecologically sustainable production”.
The food is a basic human right. The concept of food sovereignty is wide spread
nowadays, many NGOs using this definition in their policy documentation. Food and
Agriculture Organization of the United Nations have started to use this concept as well.
This concept is mostly focus on the poverty, starvation and malnutrition of mankind.
During the World Food Summit, it has been declared that ‘Food Sovereignty is
precondition to genuine food security’, and the right to a food can be seen as an
instrument to achieve it (World Food Summit, Future without hunger, 1996). Food
sovereignty is the right of the people and communities for the good, healthy and safe
food. Further, it is about having rights for the agricultural and food policies, and
implementing sustainability strategies in production and distribution of the food.
The definitions of the Food sovereignty contain the following elements:
The right to food;
Advantage is given to the local agricultural production in order to focus on
feeding people locally;
The right is given to the smallholder farmers to produce food and an
identification of Farmers Rights;

12
Water, seeds, land, and livestock breeds accessed by the smallholder farmers,
fisherfolk, pastoralists and landless people. The fight against genetically modified
organisms;
The rights to consumers to determine for themselves what they would like to
consume, and how and by whom it is produced;
The people’s involvement in agricultural policy decision-making;
The right of countries to defend themselves from underpriced agricultural and
food imports;
The identification of the rights of women that are playing major role in
agricultural production, and in food production particular;
Connecting the agricultural prices to production costs and stop all forms of
dumping.
Agroecology as a way not only to produce food but also to get sustainable
livelihoods, living landscape and environmental integrity (Michael Windfuhr and
Jennie Jonsén, 2005).
It has been found out that food sovereignty consists new forms of ‘agrarian cititzenship’
as ‘a model of rural action that’ guards against both state abuses and the market by
accomplishing the role of civil society and democratic communication (Wittmann. 2009).
For the Olivier De Schutter (United Nations Special Rapporteur on the Right to Food) the
right to food is
“The right to have regular, permanent and unrestricted access, either directly or by
means of financial purchases, to quantitatively and qualitatively adequate and sufficient
food corresponding to the cultural traditions of the people to which the consumer
belongs, and which ensure a physical and mental, individual and collective, fulfilling and
dignified life free of fear”.
2.4. Food citizenship
Using the concept of ‘citizenship’ relating with the agriculture and food was uncommon
in Europe, meanwhile in United States and Canada there is worthy literature about ‘food
citizenship’. In the late 1990s there was concept of ‘civic agriculture’ which is strongly
13
developed in the community-based conception of multifunctional and localized
agriculture defined as ‘a locally organized system of agriculture and food production
characterized by networks of producers who are bound together with place’ (Lyson,
2005). Civic agriculture has the possibility to change individuals that are lack of interest
towards the agriculture and food, into active food citizens (Lyson, 2005).
‘Food citizenship is the practice of being engaged in food-related behaviors that support,
rather than, the development of a democratic, socially and economically just, and
environmentally sustainable food system, to the exclusion of practices and processes that
evidently threaten these ideals’ (Wilkins, 2005).
As a critique of corporate policy and loss of food skills within the public, the concept of
food citizenship was used to show the need to move beyond food as a commodity and
people as consumers (Welsh and MacRae, 1998). In the analysis of Welsh and MacRae
they established four dimensions to the process that lower food citizenship: 1. corporate
control over food chain; 2. Manipulation of the supermarket environment; 3. Providing
customers with limited product information; and 4. Emphasizing processed and
convenience foods—which demand less skills of shoppers and eaters—over less
processed ones.
Food citizenship is surrounding alternative food movements and networks (Baker, 2010).
Through consumer behavior perspective food citizenship is accepted as buying of local
foods which create a demand for alternative sustainable consumption (Seyfang, 2006).
Food citizenship can be understood as people who choose life like ‘Lifestyle of Health
and Sustainability (LOHAS)’. Their purchases mostly focus on sustainable products
which will not threaten the world life with its consumption. Local foods are considered to
be sustainable and food citizenship procurement based on them.
Locavorism can be considered as food citizens because their consumption mostly focus
on local foods as well. Locavorism term became well known in 2005 by a group of food
citizenship in San Francisco who started website, www.locavores.com, to encourage their
attempt to eat only food that had been grown or harvested within 100 miles of San
Francisco, for a month (Time, 2006).
14
2.4.1. Sustainable food
Food citizens are the people who are taking social and environmental issues into
consideration, while purchasing or consumption. Their purchase mostly focuses by the
‘local food’ which is produced through the sustainable food process. Food citizens pay
attention to the labels as well, which shows that the product is made sustainable and
organic. They are influenced by the fairtrade, bio, organic, FSC, MSC and etc. logos
while buying foods. It has been accepted that sustainable food is healthier for people and
the Earth. In the food chain sustainable food concept encourages different environmental,
health, and social ideas. When thinking about sustainable food, it should be pure from the
environmental, social, and economic perspective. From the environmental perspective in
the production of food, it should be utilize less finite resources such as oil, and emit less
greenhouse gasses, for the social perspective food should be treated well in the supply
chain, for economic is making money for the further investment in sustainability or for
the betterment of the world population. The World Health Organization says that what is
good for health is usually good for the environment. From it come up that sustainable
food is good for both planet and the people.
2.4.2. Food security
Food security exists when all people have physical and economic access to sufficient,
safe and nutritious food that meets their dietary needs and food preferences for an active
and healthy lifestyle (World food summit. 1996). The four pillars food security is:
availability, access, utilization and stability (FAO 2009). Food aspect - it is an integral
part of the concept of food Security. Time passing by, food security need to change as
well, in order to face new threats and barriers to achieving food security.
Food security is not just about producing food, it is people of having access to food, the
food which is healthy and nutritious. And all these things together stably produced, and
that’s where the sustainability comes in terms of how can we have sustainable food
security. As the climate change, population increase, consumer behavior change we are
facing a very difficult time in terms of food security for everybody on planet Earth.
15
There are lots of challenges of the poor nationalities to have access to food (Amartya Sen,
1981). In the meeting of the World Food Council (WFC) in 1982 there were discussions
about ‘Food security for people’. Further in 1983 the Council of the FAO and the WFC
come up with the recommendation to the further definition for the food security and
included the access of the individual to food (WFC, 1983; FAO, 1983).
2.5. Why sustainability?
People psychology is based on consuming as much stuff as they see. People are obsessed
with all their stuff. Stuff moves from the following process; extraction, production,
distribution, consumption and to disposal. All together this system is called the materials
economy. In extraction phase; it is about taking natural resources from the Earth. For
instance: fossil fuels, water, animals, plants, wood, minerals and coal. In production, it is
related of using energy and chemicals to natural resources for making products.
Genetically modified foods can be included to this phase. Further, is about transporting
and selling the products to the wholesalers or retailers. Consumption: buying and using
the products. Disposal phase: waste is being dumped, burned or recovered for further
recycling. In reality there are lots of things that missing in this material economy. From
one thing this system looks pretty fine, but the truth is that, this system is crisis, it is
linear system, and we are living in a finite planet. We cannot run a linear system on a
finite planet indefinitely. Every step along the way, this system is interacting with the real
world. It is interacting with societies, cultures, economies, the environment and all the
way long it is bumping against the limits. The limits of the system; one of the major
things that are missing is people. People live and work all along in this system. Next,
what is missing; the system starts with extraction, which is fancy word for natural
resource exploitation. With extraction, people chopped the trees, the use up excessive
measure of water, and they wipe out the animals, with putting them in endangered
situation. So here we are running up against our first limit, we are running out of
resources, we are using too much stuff. It can be hard for us, people to hear this, but this
is the truth, we cannot run away from this situation, we have got to deal with it. In the
16
past three decades, 1/3 of the planet’s natural resources have been consumed (Paul
Hawken, Amory Lovins and L. Hunter Lovins, 1999). We are cutting, mining, harming
and trashing the place so fast. They were undermining the planet’s variability for people
to live here. In the US less than 4% of original forest left (Lester Brown, Michael Renner,
and Christopher Flavin, 1998). 40% of the waterways in the US have become
undrinkable (American Rivers, Americas Most Endangered Rivers, 1998). The problem
is not just we are using too much stuff but we are using more than our share.
2.5.1. Consumerism
The concept of consumerism is about people consumption of nonessential goods in
excessive amount, and this notion benefits the economic system. Consumerism becomes
an emerging phenomenon in developing countries and it is widespread among middle
class customers, this notion creates similar buying power of inhabitants who are not all
affluent (Robins and de Leeuw, 2001). Further, globalization of economy gives access to
the many products that were inaccessible in some countries (Mayell, 2004).
Consumption is encouraged to be as a tool of happiness for the consumers. But buying
power does a little for overall satisfaction of people, they just keep going on consuming,
for them holding basic freedoms are more important than material factors (Smil, 2003).
The drawback of consumerism is that in most cases it deploys nonrenewable natural
resources and materials that cannot be sustained in the long run.
US have 5 % of the world’s population, but they are using 30% of the world’s resources
(John L Seitz, 2001) and creating 30% of world’s waste (Frances Harris. 2004). If
everybody consumes that US rates people would need 3 to 5 planets (Mathis
Wackernagel and William Rees. 1996) but we only got one planet. 75% of global
fisheries now are fished at or beyond capacity (World Summit on Sustainable
Development. 2002). Misuse of forests leads to destruction of the trees, which are
important for the fresh air. In the material economy system, if you do not own or buy you
do not have value, that’s how consumerism has been created.
Next, the materials are moved to production system and here it has been used energy to
mix toxic chemicals in with the natural resources to make toxic contaminated products.

17
People interact with all the chemicals that they exposed to everyday. These toxics build
up the food chain and concentrated in our bodies. Human breast milk is the food that is
considered to be on the top of the food chain. From this come up that, with the smallest
member of our societies are babies, and are getting the highest lifetime dose of toxic
chemicals from breast feeding from their mothers. It is an incredible violation. Breast
feeding must be the most fundamental human active nurturing; it should be sacred and
safe. Breast feeding is still best for nurturing the babies and mothers should definitely
keep breast feeding. The people who bear the biggest part of these toxic chemicals are
factory workers, many of whom are women of reproductive age they are working with
reproductive toxins and more other toxics. The women that work in these factories and
exposed to toxics are the reproductive aged women that do not have any other options.
Globally 200.000 people a day are moving from the environment that sustained them for
generations into cities (Ken Livingstone. 2007), many to live in slumps, looking for work
no matter how toxic that work maybe. As it has been seen it is not just resources that
have been wasted along the system but people, too, whole community is getting wasted.
A lot of toxics leave the factories in products but even more leave as byproducts or
pollution, and it is a lot of pollution. The pollution is considered to be another limit.
Companies that want to overcome this problem, move the factories overseas, pollute
someone else’s land. But a lot of that pollution is coming right back, carried by the wind
currents. Through the usage of natural resources and producing products the process
moves for the further phase, distribution. In this phase all the toxic contaminated junk is
being sold as quickly as possible. The goal in here is to keep the people buying and keep
the inventory moving.
The heart of the system, the engine that drives the system is consumption. Protecting this
phase becomes top priority for the government and corporations. Government and
corporations encourage people to shop. We, people are become nations of consumers.
Their primary identity has become that of being consumers, not mothers, teachers,
farmers, but consumers. The primary value for the people that is creating importance is
consuming. People are shopping frequently, keeping the materials flowing. Majority of
staff that people run through the system is being trashed within 6 months. The
consumption rate was not always that high, the average US person now consumes twice
18
as much as they did 50 years ago (Juliet B. Schor and Douglas Holt. 2000). And this
system was actually designed for making people to consume. The government and
Corporations thought about how to expand and grow the economy, and retail analyst
Victor Lebow articulated the solution that becomes the norm for the whole system. He
said: “our enormously productive economy demands that we make consumption our way
of life, that we convert the buying and use of goods into rituals, that we seek our spiritual
satisfaction, and our ego satisfaction in consumption. We need things consumed, burned
up, replaced and discarded at an ever-accelerating rate”.
Companies uses two of their most relevant strategies, which are; planned obsolescence
(Vance Packard et al., 1960) and perceived obsolescence (Vance Packard, 1960). Planned
obsolescence means the product is designed in such a way that it becomes useless in short
period of time, and that makes customers to go and make further consumptions. But
sometimes stuff cannot break fast enough in order keep consumers to purchase, so there
is another concept, perceived obsolescence. Perceived obsolescence persuades us to get
rid of stuff that is still functional and useful. This can happen through fashion and model
changes, that are one of the consumerism issues, that make us, people to be accepted in
society and cope with the people. In this strategy advertising and media plays great role,
in influencing people choices in purchase decision and make people just go shopping. In
US people do shopping 3—4 times as many hours as their counterparts in Europe do
(Gary Cross, 1993).
The last phase of the material economy is disposal. At the huge rate of consumption, in
the end it all goes in the garbage, and this takes process to disposal. Each of people in US
makes 4,5 pounds of trash a day (U.S. Environmental Protection Agency, 2007). This
number is twice what each of people made thirty years ago (U.S. Environmental
Protection Agency, 2001). The garbage either gets through to the landfill, or burned and
then troughed to the big hole that is made in landfill. Each way contaminate the air,
water, land, and causes one of the main global problems, the climate change (Heather
Rogers, 2005).
This system is in crisis, as it is previously mentioned, the system face with lots of limits.
It will not work like this; people should change their point of view and move towards
19
sustainable production system. Nowadays there is a new school that is thinking about this
stuff and it is based on sustainability: Zero Waste, Green Chemistry, Renewable Energy
and so on.
The sustainability supply chain should be implemented in every production system, in
order to lessen the burden of the Earth and put effort against climate change, which
causes to the lots of people lives.
2.6. Sustainable development
Sustainable development concept becomes one of the main issues in modern economy,
majority of companies implement sustainability strategies into their business. With the
sustainable development companies try to meet the need of the current population
without damaging the world and make it worst for the future generations (United Nations
General Assembly, 1987). Sustainable development is about using natural resources
without degrading the planet. Natural resources are significant components for
sustainable future.
Food supply chain management is a significant process in food industry. Nowadays the
concept of sustainability comprises into food supply chain and becomes Sustainable Food
Supply Chain. Sustainable development deals with keeping the balance between three
aspects of it, which are ecological, social and economical issues, for the long term
betterment of human life (Aiking and Boer, 2004). In the modern life consumers interests
towards a sustainable food is growing. Government also become cautions about food
security, and implement strict rules on food safety and sustainability problems, which are
dealing not only with their economical issue but also take into consideration social and
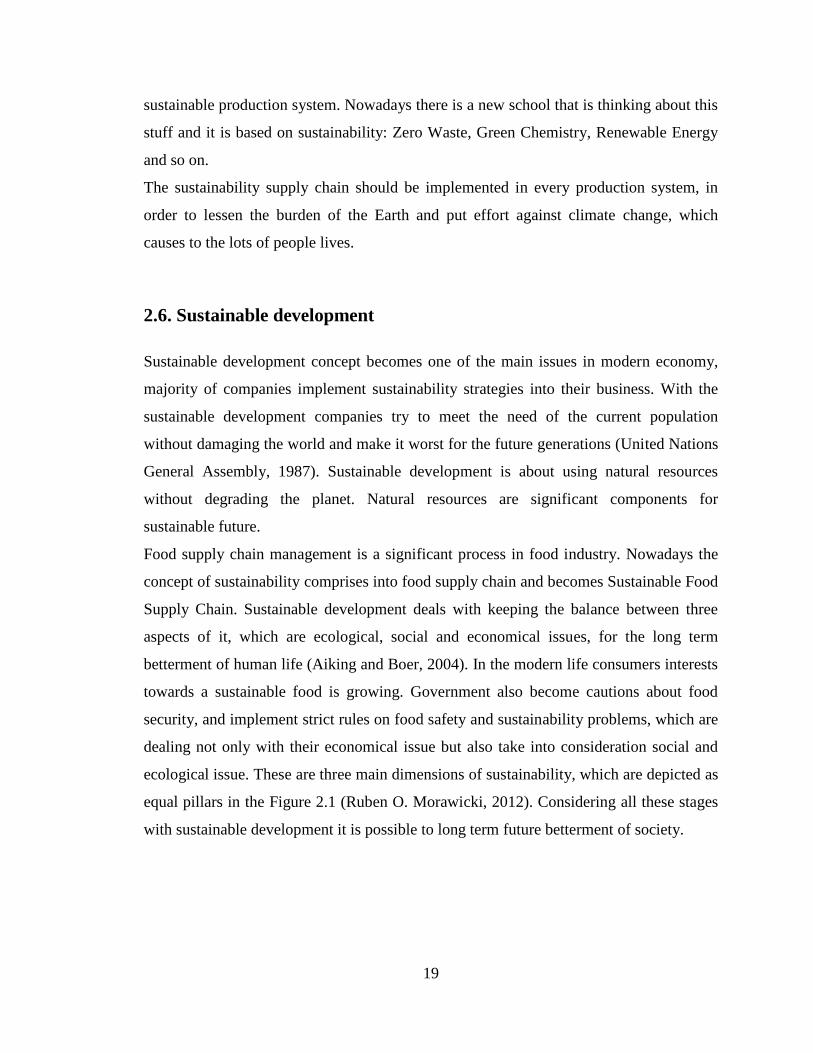
ecological issue. These are three main dimensions of sustainability, which are depicted as
equal pillars in the Figure 2.1 (Ruben O. Morawicki, 2012). Considering all these stages
with sustainable development it is possible to long term future betterment of society.
20
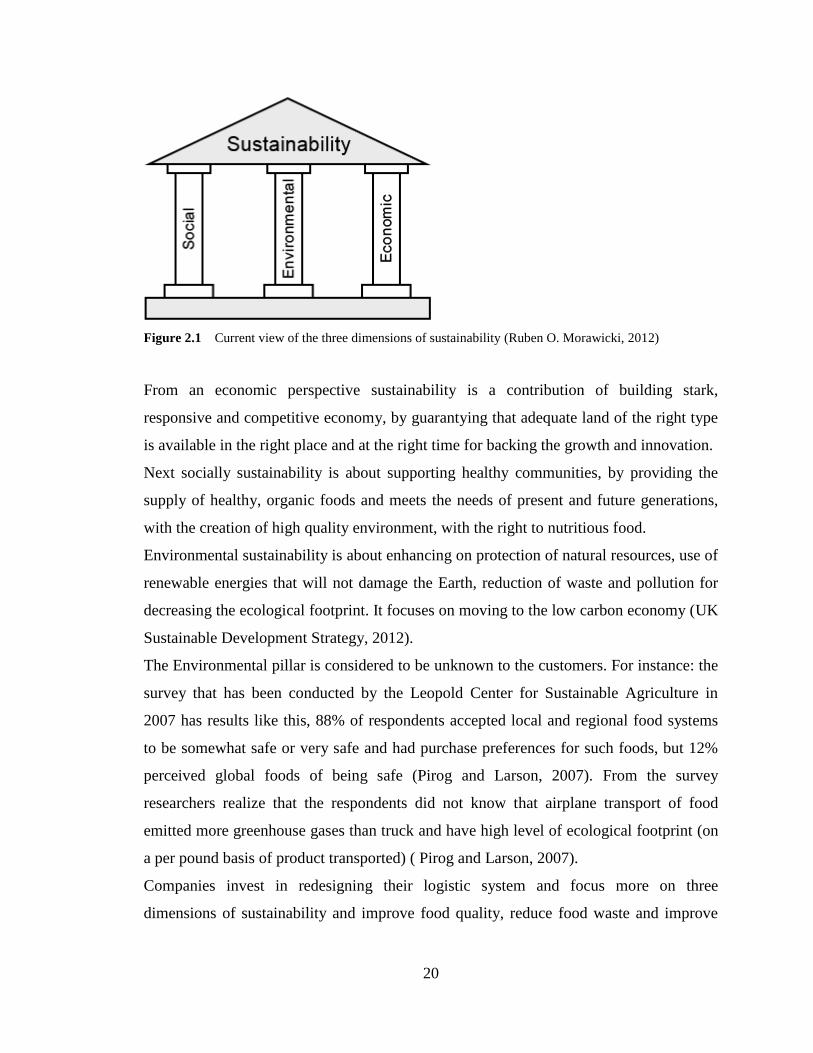
Figure 2.1 Current view of the three dimensions of sustainability (Ruben O. Morawicki, 2012)
From an economic perspective sustainability is a contribution of building stark,
responsive and competitive economy, by guarantying that adequate land of the right type
is available in the right place and at the right time for backing the growth and innovation.
Next socially sustainability is about supporting healthy communities, by providing the
supply of healthy, organic foods and meets the needs of present and future generations,
with the creation of high quality environment, with the right to nutritious food.
Environmental sustainability is about enhancing on protection of natural resources, use of
renewable energies that will not damage the Earth, reduction of waste and pollution for
decreasing the ecological footprint. It focuses on moving to the low carbon economy (UK
Sustainable Development Strategy, 2012).
The Environmental pillar is considered to be unknown to the customers. For instance: the
survey that has been conducted by the Leopold Center for Sustainable Agriculture in
2007 has results like this, 88% of respondents accepted local and regional food systems
to be somewhat safe or very safe and had purchase preferences for such foods, but 12%
perceived global foods of being safe (Pirog and Larson, 2007). From the survey
researchers realize that the respondents did not know that airplane transport of food
emitted more greenhouse gases than truck and have high level of ecological footprint (on
a per pound basis of product transported) ( Pirog and Larson, 2007).
Companies invest in redesigning their logistic system and focus more on three
dimensions of sustainability and improve food quality, reduce food waste and improve
21
sustainability and transparency. The traditional performance indicator for supply chain
“cost” replaced by the Triple Bottom Line concept which is closer to sustainability and
comprise in itself Profit, Planet and People (van der Vorst et al,. 2005). Over time passing
people become more concern about the environmental pillar of sustainability as well.
Environmental pillar is the most important system in sustainability. Companies take
natural resources from environmental pillar. While from the business perspective, a
company to be sustainable, all it need is to make money. But taking into consideration a
social pillar of sustainability companies need to meet the needs of the consumers. The
food companies pay income to the employees, and provide food for the social subsystem.
Further, food companies and employees pay taxes to government which benefits the
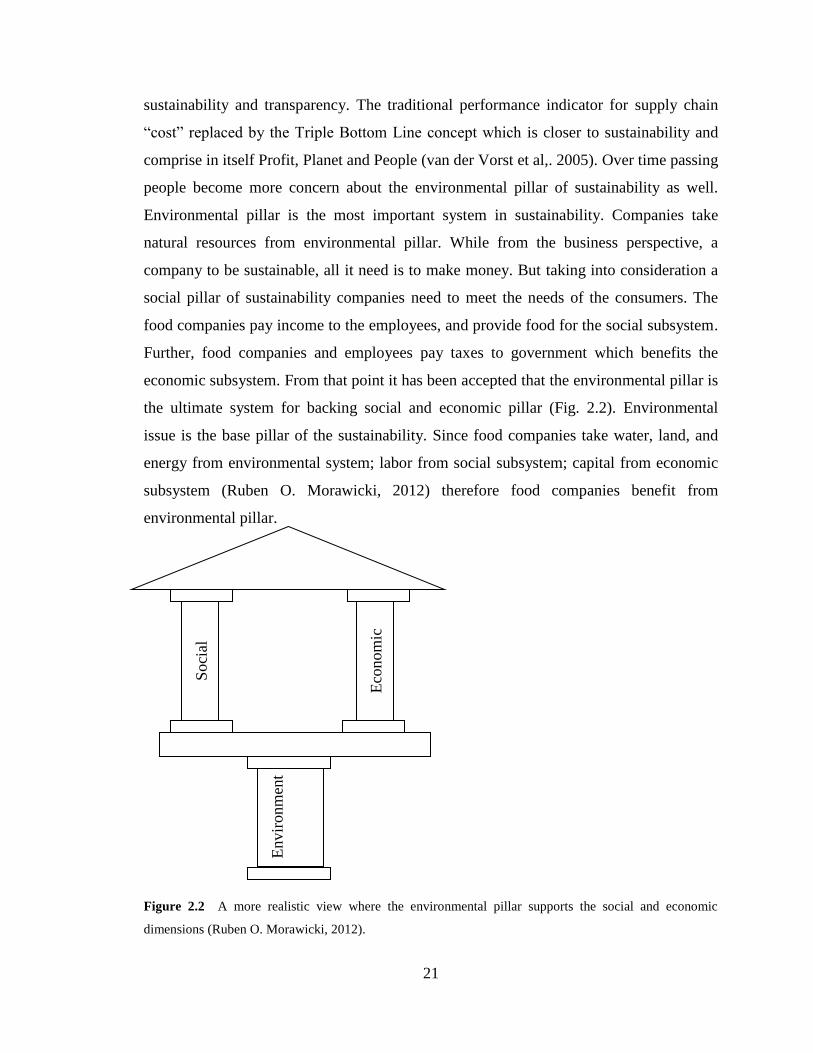
economic subsystem. From that point it has been accepted that the environmental pillar is
the ultimate system for backing social and economic pillar (Fig. 2.2). Environmental
issue is the base pillar of the sustainability. Since food companies take water, land, and
energy from environmental system; labor from social subsystem; capital from economic
subsystem (Ruben O. Morawicki, 2012) therefore food companies benefit from
environmental pillar.
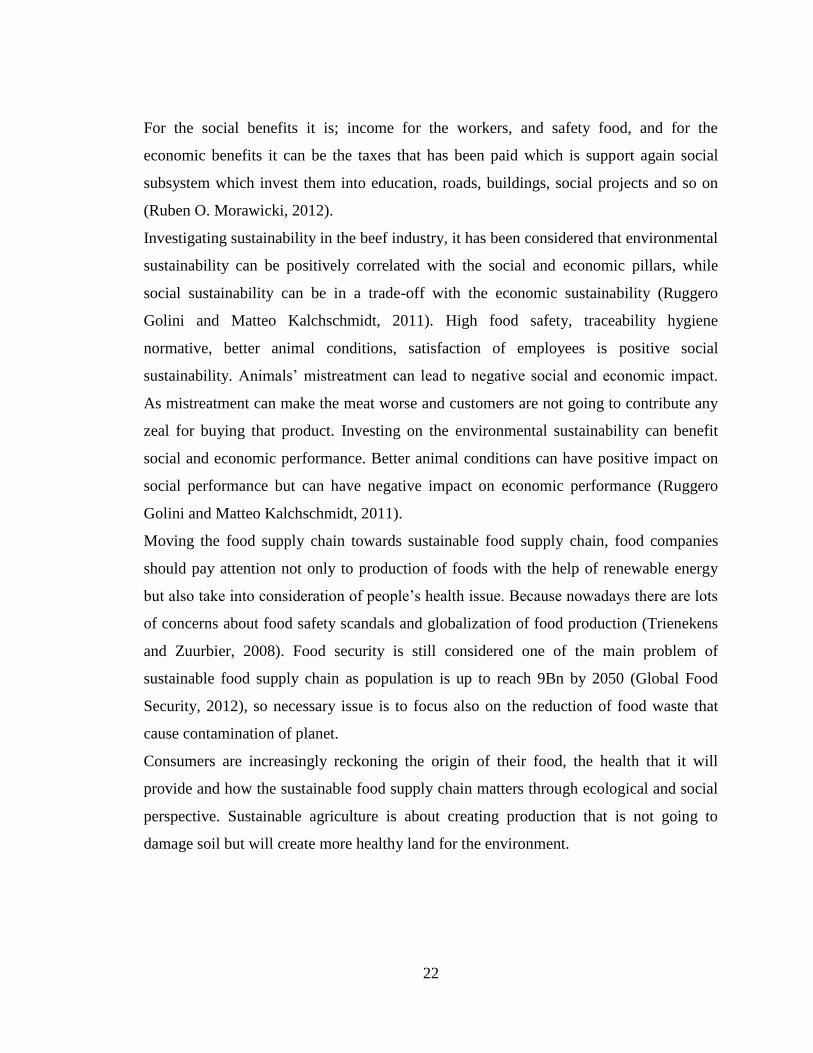
Figure 2.2 A more realistic view where the environmental pillar supports the social and economic
dimensions (Ruben O. Morawicki, 2012).
Soci
al
Envir
onm
ent
Eco
nom
ic
22
For the social benefits it is; income for the workers, and safety food, and for the
economic benefits it can be the taxes that has been paid which is support again social
subsystem which invest them into education, roads, buildings, social projects and so on
(Ruben O. Morawicki, 2012).
Investigating sustainability in the beef industry, it has been considered that environmental
sustainability can be positively correlated with the social and economic pillars, while
social sustainability can be in a trade-off with the economic sustainability (Ruggero
Golini and Matteo Kalchschmidt, 2011). High food safety, traceability hygiene
normative, better animal conditions, satisfaction of employees is positive social
sustainability. Animals’ mistreatment can lead to negative social and economic impact.
As mistreatment can make the meat worse and customers are not going to contribute any
zeal for buying that product. Investing on the environmental sustainability can benefit
social and economic performance. Better animal conditions can have positive impact on
social performance but can have negative impact on economic performance (Ruggero
Golini and Matteo Kalchschmidt, 2011).
Moving the food supply chain towards sustainable food supply chain, food companies
should pay attention not only to production of foods with the help of renewable energy
but also take into consideration of people’s health issue. Because nowadays there are lots
of concerns about food safety scandals and globalization of food production (Trienekens
and Zuurbier, 2008). Food security is still considered one of the main problem of
sustainable food supply chain as population is up to reach 9Bn by 2050 (Global Food
Security, 2012), so necessary issue is to focus also on the reduction of food waste that
cause contamination of planet.
Consumers are increasingly reckoning the origin of their food, the health that it will
provide and how the sustainable food supply chain matters through ecological and social
perspective. Sustainable agriculture is about creating production that is not going to
damage soil but will create more healthy land for the environment.
23
2.6.1. Sustainable food supply chain
The purpose of food supply chain is to provide customers with the right amount of
product, right level of quality and with appropriate shelf life4. With sustainable food
supply chain food companies can get competitive advantage. (Ahumada and Villalobos,
2011). The basic goal of sustainable food supply chain is of being cautious about
operation impact on environment and social and guarantee satisfaction of customers with
the most effective and efficient way. The UK Sustainable Development Commission
(SDC; DEFRA 2002) has gathered various opinions of stakeholders’ point of view in
order to create an internationally applicable description of ‘sustainable food supply
chains’ which are following:
1. Produce safe food, for the market demand, meet the need of food citizens, as
according food security and democracy everyone has the right for the nutritious
food, and create accurate information about the food that they are consuming
through traceability.
2. Backing the vitality and diversity of urban and rural economies and communities.
3. Empower viable maintenance to be made from sustainable land management.
4. Operate and esteem within the limits of natural resources, like; soil, water and
biodiversity.
5. Gradually accomplishing high standards of environmental performance by
minimizing energy consumption, reducing resource inputs and by using
renewable energy wherever applicable.
6. Assure for all employees that are involved in food chain a harmless and hygienic
working environment, and provide them with high social welfare and training.
7. Reach compatibly high standards of animal health, better condition, and welfare.
8. Sustain resources accessible for growing food and use the alternative land for the
other significant needs of society.
4 The shelf life of a product is length of the time, starting from the day it is produced before the product
considered unacceptable for consumption or become obsolete (Donslaar et al., 2006)

24
Several actors, which are working within food industries, need to make applicable
changes to their supply chains in order to make it more sustainable. Sustainable food
supply chain generates safe production and while consuming it brings well-being for the
generations. Sustainable food supply chain can be contributed within following three
groups that will make food logistics efficient and long term:
1) Cost reduction and improved responsiveness.
2) Better food quality and minimization of food waste
3) Improved sustainability and transparency (Mehmet Soysal et al.).
These groups can be considered as phases of sustainable food supply chain management.
Cost reduction and improved responsiveness
Nowadays consumers of the food sector demand high quality food and that make
companies produce more safe food, and also deliver it with competitive prices
(Trienekens and Zuurbier, 2008). Thus the companies in order to satisfy different
demands or tastes of customers and to lower cost, they are sourcing their necessary
products for their operations (van der Vorst et al., 2005). From here globalization of food
industries appear. Supply chain management focus on reducing operations’ cost.
Obviously issues in food supply chains are more complicated than in the past (Bilgen and
Ozkarahan, 2007) and due to economic crisis food industry companies focus mainly on
cost reduction.
Another main concern of food supply chain is responsiveness. It is based on the time of
placement and accepting an order from customers and also companies agile response
towards fast changing customers’ needs. Responsiveness is a key issue for keeping
customer satisfaction and the customer service in the food industry, where it should be
adequately with the customers’ expectations and their experiences. The main factors for
establishing supply chain are following (Gunasekaran et al., 2008): minimizing the lead
time for information and materials flow, timely bases information sharing, shortening
total cycle time, coordinate the workflow in various level of supply chain, making good
decisions for backing the system, integrating information about operations. There is also
trade-off between these two concepts; cost reduction and improving responsiveness (van
der Vorst et al,. 2005). By increasing competition and variety of products, companies
25
decrease the inventory size in order to reduce inventory costs, but meanwhile if they
decrease the inventory size they cannot meet the needs of customers on time and that
decreases responsiveness as well. So food supply chain companies should keep
reasonable and applicable balance between these two concepts: reduction of cost versus
improving responsiveness.
Better food quality and reduction of food waste
Improving the quality of food and reduction of food waste is considered one of the main
issues in the transition between supply chain and sustainable supply chain. In the food
supply chain there is continuous change in the quality of the food, starting from the
materials that leave the grower or the meat products that leave slaughter houses, to the
moment that it reaches consumers (Dabbene et al., 2008). Perishable foods have lower
shelf life than non-perishable foods. Perishable products require special care that can
cope with the challenges of diminishing deterioration rate, such as temperature control
mode (van Donselaar et al., 2006). Nowadays several organizations have been created in
dealing with the issue of the food, such as; the Food and agriculture Organization (FAO),
the World Health Organization (WHO), UN and World Trade Organizations (Trienekens
and Zuurbier, 2008). These organizations objectives is based on providing world
population with healthy food, they are doing many things to achieve this, such as, setting
norms, standards, providing technical support, controlling or assessing the process.
Dealing with the perishability issue of products, van der Vorst et al. (2007, 2011) have
proposed idea of Quality Controlled Logistic (QCL) and said that better supply chain
design can be built if the quality of the products will be tracked long the process of
supply chain. There should be new innovative models being developed for reduction of
food waste, and dealing with perishability. Quality of food diminishes linearly and
considered useless after some period of time (Zanoni and Zavanella. 2007; Eksioglu and
Jin. 2006). For paying attention to the perishability of the product, companies in the food
industry should pay attention to the temperature, and determine the best temperature
throughout the chain (Rong and Grunow. 2010; van der Vorst et al., 2009).
26
Improved sustainability and transparency
Sustainability concerns are quickly growing in the food supply chain. EU is one of the
main followers of sustainability issue (Linton et al., 2007). There are several significant
EU regulations related with sustainability supply chain, such as, The General Food Law
(Regulatio EC/178/2002) and The Waste Electrical and Electronic equipment (WEEE)
(Directive 2002/96/EC) (Bloemhof, 2005). Sustainability approach affects the decision of
the stakeholders in the food supply chains. With the sustainability the traditional supply
chain link to itself three pillars of sustainability (Environmental, economical, social)
(Chaabane et al., 2012) with the consideration of the food quality.
Traceability has also growing impact on food supply chain. Consumers nowadays are
becoming savvier, and they interested about what happened to the product as it went
through the supply chain (Vis, 2012). Traceability is emphasizing more on people and
planet aspect of sustainability. If companies want to reach traceability, tracking, and
tracing the product throughout the value chain, they should strengthen integration,
communication, and cooperation actors within their value chain (Fritz and Schiefer,
2008).
2.7. Unsustainable consumption
Unsustainable consumption leads to lessen the planet life, and worsen the health of the
people. Examples for the unsustainable consumption can be: overfishing, deployment of
non renewable resources, and waste, bad working conditions, animal mistreatment and so
on. As the majority of the food companies outsource they create high ecological
footprint. Excessive usage of land and contamination of it brings to useless soil. The
farmland on which food production depends is rapidly losing its fertility, because of
intensive agriculture practice (UNEP). UNEP estimates that due to excessive agriculture
practice, during the 20th century 2 billon hectares of arable land were lost their fertility.
Two to five million hectares are facing with the same fate each year (Nellemann et al.,
2009). According to International Food Policy Research Institute 24% of total global land
area has been influenced by the land degradation – estimating the loss of 20 million tons
27
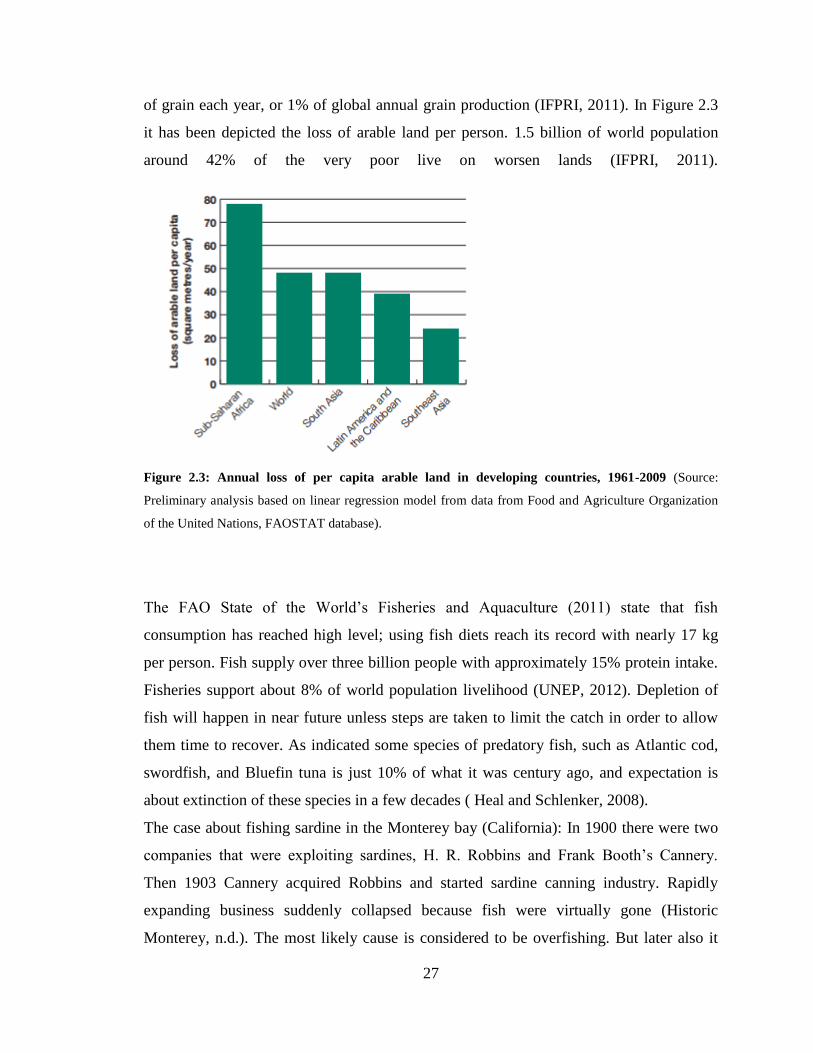
of grain each year, or 1% of global annual grain production (IFPRI, 2011). In Figure 2.3
it has been depicted the loss of arable land per person. 1.5 billion of world population
around 42% of the very poor live on worsen lands (IFPRI, 2011).
Figure 2.3: Annual loss of per capita arable land in developing countries, 1961-2009 (Source:
Preliminary analysis based on linear regression model from data from Food and Agriculture Organization
of the United Nations, FAOSTAT database).
The FAO State of the World’s Fisheries and Aquaculture (2011) state that fish
consumption has reached high level; using fish diets reach its record with nearly 17 kg
per person. Fish supply over three billion people with approximately 15% protein intake.
Fisheries support about 8% of world population livelihood (UNEP, 2012). Depletion of
fish will happen in near future unless steps are taken to limit the catch in order to allow
them time to recover. As indicated some species of predatory fish, such as Atlantic cod,
swordfish, and Bluefin tuna is just 10% of what it was century ago, and expectation is
about extinction of these species in a few decades ( Heal and Schlenker, 2008).
The case about fishing sardine in the Monterey bay (California): In 1900 there were two
companies that were exploiting sardines, H. R. Robbins and Frank Booth’s Cannery.
Then 1903 Cannery acquired Robbins and started sardine canning industry. Rapidly
expanding business suddenly collapsed because fish were virtually gone (Historic
Monterey, n.d.). The most likely cause is considered to be overfishing. But later also it
28
has been appeared that a natural boom – and – bust cycle caused small changes in the
water temperature which affected to the decline of the sardines in Pacific Ocean
(Cascorbi, 2004). Obviously it is seem that in both cases that affect vanishing of sardines
affected by unsustainable consumption. People in Monterey had an assumption that the
natural resources were unlimited and would last forever, thus that brings for the
overfishing, overexploitation of resources. At those times people were strongly believed
that “oceans were inexhaustible and that man could not affect the species at sea” (Glantz
and Thompson, 1981, p.113). Today sardines are back to California, but their
consumption is strictly regulated. Nowadays, 75% of world’s fish have been
overexploited or fished to its biological limit (UNEP, 2012). For preserving fish and meet
the need of growing population, FAO’s World Aquaculture found out that global fish
production from aquaculture grew up to 60% between 2000-2008, from 32.4 million
tonnes to 52.5 million tonnes.
2.7.1. Food waste
From unsustainable consumption the environment faced with large amount of wastes.
The main types of waste are considered to be; solid, emission, and water (Niranjan and
Shilton, 1994). Majority of the industrial spheres generate wastes and by products. For
example: in cheese production, cheese have been separated from the milk, which is not
going to be used, it is a by-product (Erkman, 1997). The enterprises do not want to keep
the wastes in their places, and they want to find several ways of getting rid of it. But
frequently environment is acting as recipient of all these wastes, including the waste with
high toxicity and creates contamination (Cheryl Baldwin, 2009). These wastes plays
major role in the deterioration of planet. Approximately every year 1.3 billion tonnes
food produced for people, gets lost or wasted, according to FAO commission (11 May
2011). According to Global Food Losses and Food Waste5, industrialized and developing
countries disperse almost the same quantities of foods—respectively 670 and 630 million
tones. Consumers in rich countries every year waste approximately 222 million tonnes
5 Global Food Losses and Food Waste, was commissioned by FAO from the Swedish Institute for Food and
Biotechnology (SIK).
29
food which is almost the entire net food production of sub-Saharan Africa (230 million
tonnes).
Food losses occur at production, harvest, and processing levels. This situation mostly
occurs in developing countries, because of weak infrastructure, low levels of technology
and low investment in the food supply chain. Food waste is more related to the
industrialized countries. It is most often caused by both retailers and consumers throwing
away perfectly edible foodstuffs into the trash. In Europe and North America per person
waste by consumers is between 95-115kg a year, while in sub-Saharan Africa and South
and Southeast Asia each throw away only 6-11kg a year (FAO, 2011). 40% of food
losses in developing countries occur in post-harvest and processing levels, but in
industrialized countries more than 40% of losses take place at retail and consumer stages
(FAO). For small farmers, loss of food during harvest and in storage reasoned with the
loss of the income meanwhile high prices for the poor consumers. While food losses, the
dissipation of resources also occur. To these resources can be included water, land,
energy, which is while using them result greenhouse gasses emission. Food losses and
wastes in middle and high income countries happen mostly related with customers’
behavior and lack of communication among various actors in food supply chain, which
creates complication in the process. Food companies while producing foods should focus
on the quality and appearance as well. Through the surveys it has been indicated that
consumers pay attention more to the quality and taste of the food rather than to its
appearance (FAO). Thus, we can see that customers have the power to influence the food
producers to focus on the quality of the food. Analysis of the National Resources Defense
Council found that grocery stores and other food retailers in US are losing about $15
billion a year, due to unsold fruits and vegetables, and about half of the US food supply
being uneaten. From that point commercial and charity organizations could develop a
strategy and work with food retailers in order to collect and then sell or use products that
have been disposed but are still in good condition from the safety, nutrition and taste
perspective. Waste is also appearing because of the firms’ policy, they make consumers
to purchase in order to make money. For instance customers in rich countries are
encouraged to buy more, “Buy three, pay two” promotion. In consumption phase of the
food supply chain it is all about consumers and retailers. They should organize and think
30
about their food purchase policy. They should be informed about the impact and scarce of
natural resources.
Food processing companies are considered to be one of the major pollutants in the light
industrial sector. Light industrial sector comprises in itself textile and dyeing, food
processing, electroplating, and leather tanning subsectors (Fryer, 1995; Frijns et al.,
2000). In food processing industries the large waste producers are following: milk, cocoa,
chocolate, sugar confections, meat processing, and brewing/distillation (Niranjan and
Shilton, 1994). But industries that are generating waste should think about refining it,
because wastes still may contain some valuable components. But majority of food
processing industries do not do it for several reasons: they do not have the knowledge of
how to extract these valuable components; the economic benefit is low; absence of
legislation which may empower industries for reusing the waste.
2.7.2. Wastewater
Wastewater hold in itself biological materials and dissolved solid. According to World
Health Organization (1993), yeast manufacturing, frozen shrimp processing, sugar cane
distilleries, grapefruit canning generate high amount of wastewater.
Meat processing generates high amount of wastewater, too (Carawan and Pilkington,
1986). Water is raw material in meat packing industry. Complex slaughterhouses
generate high amount wastewater as they use water for sanitizer and cleaning reasons
(Hrudey, 1984). In slaughtering main pollutant is blood (Higgins, 1995).
In dairy food plant water is being used a lot; in rinsing and washing the tanks, cans,
processing equipments, dirt, fuel oil, dust, ash from boilers (Marshall and Harper, 1984).
2.7.3. Solid Waste
Solid waste from different food industries: canning fruits, vegetables, fish generate high
amount of solid waste. From packing house there are bones, inedible meat as a solid
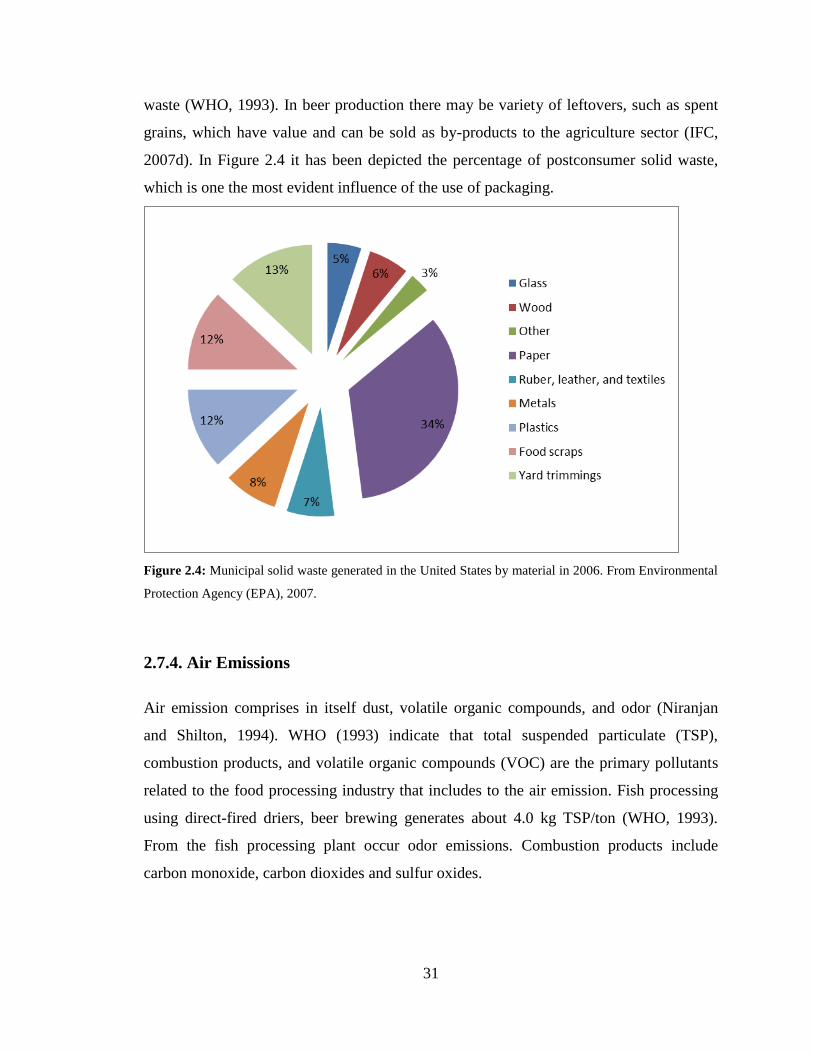
31
waste (WHO, 1993). In beer production there may be variety of leftovers, such as spent
grains, which have value and can be sold as by-products to the agriculture sector (IFC,
2007d). In Figure 2.4 it has been depicted the percentage of postconsumer solid waste,
which is one the most evident influence of the use of packaging.
Figure 2.4: Municipal solid waste generated in the United States by material in 2006. From Environmental
Protection Agency (EPA), 2007.
2.7.4. Air Emissions
Air emission comprises in itself dust, volatile organic compounds, and odor (Niranjan
and Shilton, 1994). WHO (1993) indicate that total suspended particulate (TSP),
combustion products, and volatile organic compounds (VOC) are the primary pollutants
related to the food processing industry that includes to the air emission. Fish processing
using direct-fired driers, beer brewing generates about 4.0 kg TSP/ton (WHO, 1993).
From the fish processing plant occur odor emissions. Combustion products include
carbon monoxide, carbon dioxides and sulfur oxides.
32
2.8. Environmental impact of food supply chain
The world food production is increasing as the population and demand is also increasing
for the food. Expansion of agriculture land is one of the obvious results of agriculture. It
takes time, place and expenses for providing people with ecological services. But
expansion of agriculture lands has its own consequences towards the nature, which result
in deforestation6 and cause release of carbon dioxide to the atmosphere. In US virgin
forests shrunk from 820 million acres in 1620 to about 138 million acres in 1920
(Greeley, 1925). Deforestation was occurring not only because of agriculture use but also
for the exploitation of timber. The US is not alone that is losing virgin forest for
commercial purpose, it has been conducted that by the year of 2030 55% of Amazon
rainforest will be cleared for cattle ranches, for agriculture and commercial use (WWF,
2007). Borneo and Sumatra tropical forests have been deforested for the palm oil
plantations. Deforestation has reached to 130 million hectares over the past decade. This
area is equal to the joint area of France, Italy, and Spain. While deforestation is still
continues in Africa and South America, the recent reports suggest that the global
deforestation rate is declined to 20% since 1990s, because of afforestation efforts
reported by China and Europe. Greenhouse gasses emitted from agriculture, which will
cause climate change in the future. Agriculture also has impact to water use, because
productivity of irrigated crops is approximately three times more than just being watered
by rain (FAO, 2005). For the irrigating and storing water for energy production purposes
in areas of big rivers, large dams have been constructed. Dams have direct impact on
some local species, for instance to salmon that migrate yearly to spawn. Excessive
extraction of irrigation water results in making it not able to reach the oceans. One of the
examples is Aral Sea that is located between Kazakhstan and Uzbekistan, which has been
gradually shrinking due to excessive extraction of irrigation water from rivers which has
been feeding Aral Sea7.
Animal production has several direct and indirect impacts on the environment. Feed
production, which is about using the land for feed crops and production and application
6 See Appendix B: Deforestation of island Borneo 7 See Appendix C: Satellite view Aral Sea
33
of pesticides, is included to the indirect impact. Direct environmental impact include: use
of land, pollutants that are releasing to water streams, emission of dust and
microorganisms, physical and chemical impact on the land, emission of greenhouse
gasses and ammonia (Ruben M. 2012).
2.9. Ecological footprint and climate change
Human beings, in order to satisfy their needs, they extract fossil fuels and nonrenewable
resources which is degrading the Earth. Earth is the support system that provides us with
major things for mankind survival, such as, water, oxygen, dwelling and food, so we
should take care of it with trying to diminishing our ecological footprint. The ecological
footprint is a scale that measures the productive land with the natural ecosystem needed
per person to support a lifestyle (Ruben O. Morawicki). People are using land for many
reasons like, food production, housing, waste treatment, building roads and so on. It has
been seen that ecological foot print is higher in the rich societies. The global ecological
footprint is approximately 2.2 hectares per capita and it is differentiate in various
countries8 (Global Footprint Network, 2010). Ecological footprint can be computed for
the cities, organization, individuals, and countries. The Earth’s has carrying capacity in
which it is connected with the biocapacity, and count biological productivity of the land
which is not equally distributed around the world. Carrying capacity is the maximum
number of world population the planet can support vaguely while providing them with
food, shelter, water and so on. 50% of biocapacity is contained in eight countries, such as,
USA, Brazil, China, Canada, Russia, Australia, Argentina, and India. Some of the
countries ecological footprint surpasses their biocapacity this makes them importers of
biocapacity. From the eight mentioned countries, USA, India and China are main
importers and the rest are exporters of biocapacity (World Wildlife Fund, 2008). As it has
been measured by the Global Footprint Network, per person global ecological footprint is
2.7 hectares and subtracting it from the global biocapacity, which is 1.8 hectares per
capita, resulted in net ecological deficit 0.9, which means that people are living beyond
8 See Appendix D: Ecological footprint and biocapacity of selected countries in the world
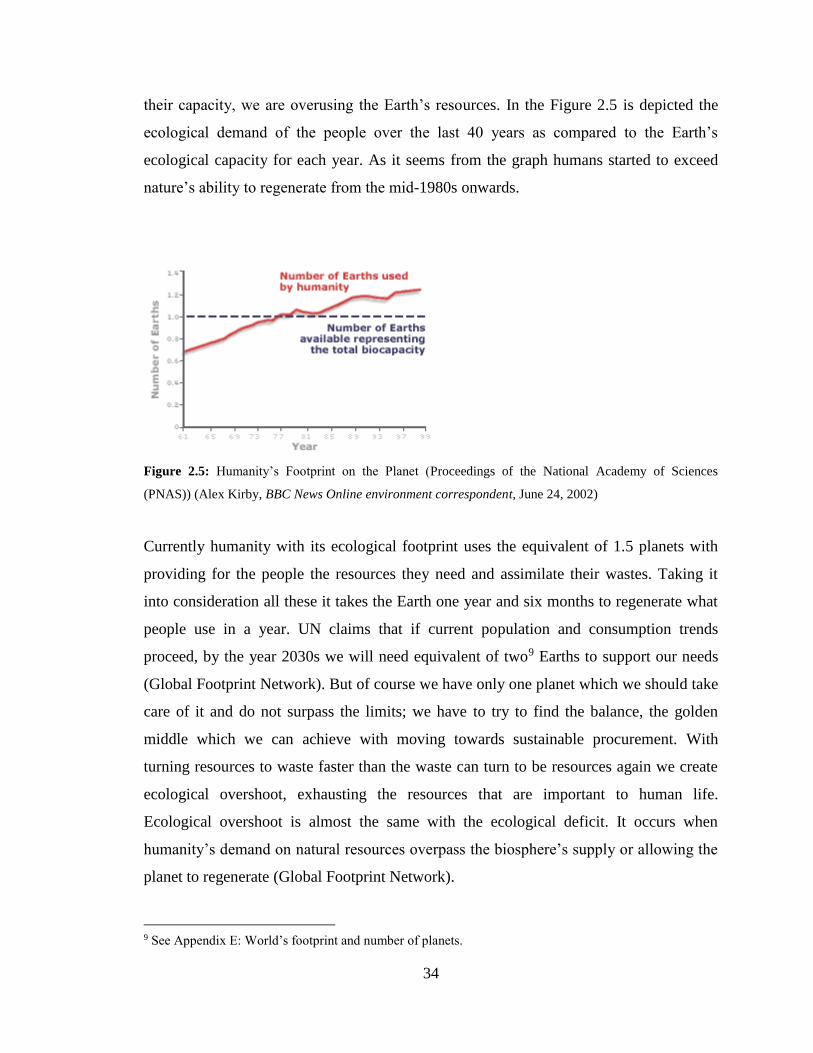
34
their capacity, we are overusing the Earth’s resources. In the Figure 2.5 is depicted the
ecological demand of the people over the last 40 years as compared to the Earth’s
ecological capacity for each year. As it seems from the graph humans started to exceed
nature’s ability to regenerate from the mid-1980s onwards.
Figure 2.5: Humanity’s Footprint on the Planet (Proceedings of the National Academy of Sciences
(PNAS)) (Alex Kirby, BBC News Online environment correspondent, June 24, 2002)
Currently humanity with its ecological footprint uses the equivalent of 1.5 planets with
providing for the people the resources they need and assimilate their wastes. Taking it
into consideration all these it takes the Earth one year and six months to regenerate what
people use in a year. UN claims that if current population and consumption trends
proceed, by the year 2030s we will need equivalent of two9 Earths to support our needs
(Global Footprint Network). But of course we have only one planet which we should take
care of it and do not surpass the limits; we have to try to find the balance, the golden
middle which we can achieve with moving towards sustainable procurement. With
turning resources to waste faster than the waste can turn to be resources again we create
ecological overshoot, exhausting the resources that are important to human life.
Ecological overshoot is almost the same with the ecological deficit. It occurs when
humanity’s demand on natural resources overpass the biosphere’s supply or allowing the
planet to regenerate (Global Footprint Network).
9 See Appendix E: World’s footprint and number of planets.
35
According to the WWF’s bi-annual Living Report, Denmark is considered of having the
world’s fourth largest ecological footprint and the largest in the Europe. The other three
largest ecological footprints belong to Kuwait, Qatar and The United Arab Emirates.
According to the report United States is the fifth in the list. The main reason of Danish to
have the high amount of ecological footprint it is due to its meat consumption and
production. Global Footprint Network which calculates the ecological footprint, admit
that the main reason the ecological footprint is high in Denmark, is because of lots of
land outside Denmark is necessitate to produce animal feed. Organic Denmark10 states
about diet changes towards vegetable proteins in the whole industrialized world as one of
the solutions to the environmental crisis. They suggest that the Danish production of
animal products for exports should be evaluated according to global sustainability issue,
health, and safety demands.
The existing food supply has shown lots of impacts that make the system unsustainable.
To these impacts include; unseasonal production of foods, high intensity of animal
production, lots of waste that come out of foods which can also be by-products, use of
energy, distribution, and packaging. Supply chain has significant influence to climate
change as it is depicted in Figure 2.6, agriculture alone generate 17-32% of global
greenhouse gas emissions (Bellarby et al., 2008).
10 Organic Denmark is a non-profit organization. Their objective is to increase knowledge about organics
among Danes, to encourage organic production and sales in Denmark, and to promote sales and exports of
Danish organic growers and producers.
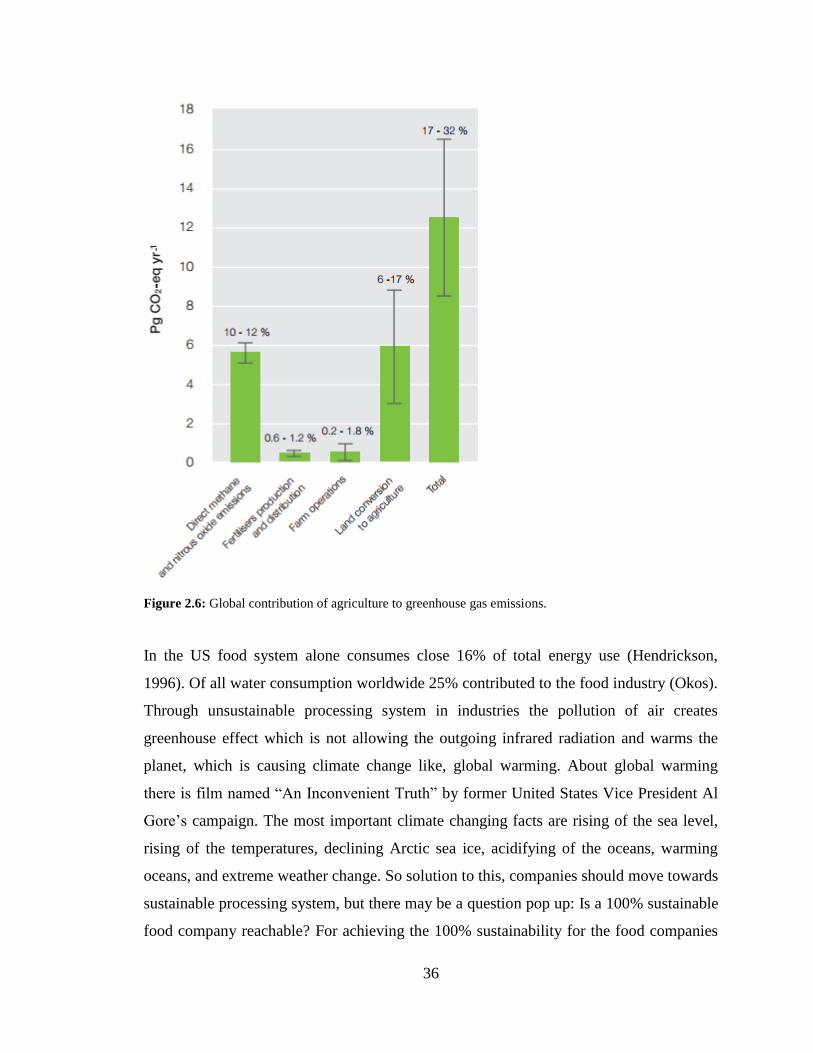
36
Figure 2.6: Global contribution of agriculture to greenhouse gas emissions.
In the US food system alone consumes close 16% of total energy use (Hendrickson,
1996). Of all water consumption worldwide 25% contributed to the food industry (Okos).
Through unsustainable processing system in industries the pollution of air creates
greenhouse effect which is not allowing the outgoing infrared radiation and warms the
planet, which is causing climate change like, global warming. About global warming
there is film named “An Inconvenient Truth” by former United States Vice President Al
Gore’s campaign. The most important climate changing facts are rising of the sea level,
rising of the temperatures, declining Arctic sea ice, acidifying of the oceans, warming
oceans, and extreme weather change. So solution to this, companies should move towards
sustainable processing system, but there may be a question pop up: Is a 100% sustainable
food company reachable? For achieving the 100% sustainability for the food companies
37
is considered to be desirable because with that they not only focus their business on the
economical pillar but also social and environmental. Currently attaining 100%
sustainability maybe sophisticated issue, due to lack of access to renewable energies like,
solar or wind. Another limit in achieving 100% sustainability may be lack of ingredients
and packaging materials that are made from renewable resources. Nonetheless many
ingredients used in food industry are renewable based, but they have been produced with
non-renewable fuel (Ruben O. Morawicki, 2012). Next limit can be greenhouse gases
such as; nitrous oxide and methane come from raw materials production (Ruben O.
Morawicki, 2012). Nitrous oxide is resulting from livestock; methane is main emission
from the meat and milk production. The consumption of milk and meat can be reduced by
better diets (Leng, 1993), but it cannot be eliminated. As we can see nowadays attaining
100% sustainability is difficult, but it is not mean that companies should stop their
strategies towards sustainability, they should move forward and scrutinize possibilities
for achieving the sustainability in their businesses.
In food supply chains the issues that cause the climate change are included into
production and post-production system where wastes being burned and the gasses that
have been extracted from them, contaminate the air. Climate change make changes to the
Earth surface11 as well.
The sea level has risen 0.17 m in the last 100 years (Church and White, 2006).
Recording started from 1880 shows an increase in temperature of 0.8 C (Voiland,
2010).
Oceans’ acidity is incrementing as a result of the carbon dioxide absorption from
the burning of the fossil fuels (Sabine et al., 2004).
Extreme weather events that have been indicated by the Climate Extreme Index,
which is in aggregate of many weather indicators, show that since the early 1970s
extreme conditions in U.S. weather have increased (Gleason et al., 2008).
People are extracting their needs from the Earth beyond its capacity without giving break
to the planet in order to regenerate itself.
11 See Appendix F: Retreat of Muir Glacier Bay National Park in Alaska as seen in 1941 (top) and 2004
(bottom)
38
2.10. Food Safety, Health, and Nutrition
People concerns about their health make them pay attention of what they are buying, is
the food produced sustainable and safe. Nowadays in many poor countries there are many
people that suffer from hunger, and malnutrition. According to Lederer (2007) about
18,000 children die each day from hunger. Estimations are that 1.2 billion people may be
starving by the year 2025 (Runge and Senauer, 2007). In the United States according to
the Centre for Disease Control and Prevention considered that 76 million people are sick,
325,000 are hospitalized, and 5,000 die annually from the food poisoning (Mays, 1999).
It has been found that food-borne disease ranks in high stage of infectious disease in the
coming century (Cohen, 2000). The most widespread food-borne pathogens are
connected with animal products, of which comes from factory farms and high-speed
processing facilities (Cheryl Baldwin, 2009). There expanding concern about growing
number of practices that relates to feeding livestock with antimicrobial agents, the
feeding of rendered materials to food animals, increased focus on longer shelf life and
reservation by refrigeration only (Cohen, 2000).
The antibiotics that give incentive to growth in animal agriculture are one of the major
factors that lead the growth in antibiotic resistance in humans (Horrigan et al., 2002;
Sapkota et al., 2007). Antibiotic medications are used to kill bacteria and cure people
from bacteria that can cause illness and disease. Antibiotics play one of the major roles in
the human health. Many diseases that once caused people death now can be cured with
antibiotics. But some bacteria get used to commonly used antibiotics and human body has
been created new “antibiotic resistant bacteria”. An antibiotic resistance is one of the
main health crisis, eroding the discovery of antibiotics and their exposure to clinical
medicine. Antibiotics may have some positive effects on livestock meanwhile it is clear
that deployment of these antibiotics in feeding process of animals leads to “the increase
of antibiotic-resistant bacteria of human significance” (Mathew et al., 2007). Agriculture
antibiotic use presents a major initiative of antibiotic resistance worldwide for four
reasons:
39
1. It is the largest use of antibiotics in the worldwide.
2. More of the use of the antibiotics in agriculture results in subtherapeutic exposure
of bacteria.
3. Drugs of every essential class are utilized in agriculture.
4. World populations are exposed to antibiotic-resistant pathogens through
consumption of animal products (Cheryl Baldwin, 2009).
Thus feeding animals with antibiotics and while eating, their expose into our body may
cause real health problems, because these antibiotics will reduce or eliminate the drugs’
effectiveness, due to enzymes produced by the resistance genes can break down the
antibiotics. With the appearance of antibiotic resistant bacteria in people’s body make
harder to treat them with antibiotics (Horrigan et al., 2002).
Appearing pathogens are also expanding concern, and while partnered with antibiotic
resistance, the potential situation is alarming. This kind of situation has been noticed
recently with the incidence of methicillin-resistant Staphylococcus aureus (MRSA).
Another concern about food supply is a neurologic disease in cattle known as bovine
spongiform encephalopathy that may cause degenerative neurologic disease in humans.
The United States Environmental Protection Agency has stated that current farming
practices are account for 70% of the pollution in the rivers and streams (Cook, 1998).
Such pollutions are harmful for people and may cause certain cancers or reproductive and
endocrine system disorders (Horrigan et al., 2002). Herbicides, fungicides, and fumigants
in every class of pesticide – organophosphates, carbamates, pyrethroids, and especially
organochlorides – have at least one agent capable of influencing a reproductive or
developmental endpoint in laboratory animals or people (Frazier, 2007). While majority
of toxic pesticides have been tabooed, there are still exposure to the pesticides in some
countries. Frazier discovered that exposure of men or women to specific pesticides at
sufficient doses may increase the risk of sperm abnormalities, decreased fertility in male,
spontaneous abortion, birth defects or delay of fetal growth. Pesticides from workplace or
environmental exposures can enter to breast milk (Jing et al., 2008; Mahjoubi-Samet et
al., 2008; Polder et al., 2008; Raab et al., 2008; and Wang et al., 2008).
Food safety is the main concern for the customers, they are thinking about their nutrition.
People started to come up with the idea that food controls the health. Currently in the
40
world lots of food scandals appearing that is strongly related with safety of food. In the
following it has been shown some examples of the food scandals in different countries.
German food scandal; this scandal is mostly occurred about the horsemeat. The current
discovery of phenylbutazone in British horsemeat has caused outrage and interest.
Phenylbutazone is a nonsteroidal anti-inflammatory drug (NSAID) for the short-term
treatment of pain and fever in animals. Phenylbutazone is often reffered as bute (New
York Times. 2012). In the United States and United Kingdom, it is no longer approved
for human use as it can cause severe damages to human body and can have adverse
effects such as suppression of white blood cell production and aplastic anemia. In
Germany products like frozen lasagna that was labeled in nutrition food facts that it
contains beef but instead it contained horsemeat. This issue occurred not only in
Germany but also in other European countries as well. Food controllers from the British
Food Standards Agency (FSA) have found traces of bute in horsemeat intended for
human consumption. Some of them were exported to France before researchers found
that they were contained the painkiller, and may have entered the food chain.
Phenylbutazone has been off the market since 1980s in the US, but in Germany it is
prescribed only for three specific sicknesses: gout, chronic polyathritis and the rare
rheumatic Bekhterev’s Disease, which can cause full rigidity of the spine. Lutz Hein the
head of the German Association of Pharmacology (DGP) stated that “It is definitely not
an over-the-counter drug like Aspirin or Ibuprofen”. Side effects of the bute may include
in itself, stomach and intestinal problems. Veterinarians use bute to treat effected muscles
in horses. Vice-chair of the horse committee in the German Chamber of Veterinarians
Hubertus Lutz is an expert in regulations related to the horsemeat. Discovery of bute in
British carcasses will lead to a meat scandal, because according to Lutz horses that are
taken to the slaughterhouses should never be exposed to the bute in their lifetime. Lutz
said: “Every horse in Europe has an equine passport, which has to be updated after every
purchase or medical treatment; all medications must be listed in the passport. And
slaughter horses must not receive any phenylbutazone”. Germany’s state and federal
governments have agreed for making plan to prevent false labeling of meat products due
to the Europe-wide horsemeat scandal. The ministers from Germany’s 16 stated insisted
and claimed to federal government to increase the fines and penalties who falsify the
41
nutrition facts of the product. The ministers also offered that food companies be legally
required for reporting the cases of about falsely labeled products. Currently, food
companies only have to report to the state regulators if the health of consumers is at risk.
The state and federal governments also discussed about introducing website where the
consumers can be informed about recalled meat products. The world’s one of the big
food companies Swiss-based Nestle recalled beef pasta meals in Italy and Spain after
finding the traces of horse DNA. Falsifying the labeling of the meat products creates
unethical behavior of companies towards consumers. For instance, false label on
beefburgers that shows it is beef but actually it contains horsemeat and horsemeat is
considered a taboo food many countries. Falsifying pork as it is beef which is pork
considered a taboo in Muslim and Jewish communities.
There was a milk scandal in China in 2008. It was about a food safety incident, involving
milk and infant formula, and other food components which are adulterated with
melamine. By November 2008, China reported 300,000 victims, with six infants dying
due to kidney stones and other kidney damage, and 54,000 babies being hospitalized. The
chemical that has been added to the milk appeared to have a high protein content. This
event raised an issue about food safety and political corruption in China, and damaged
the reputation of China’s food export especially with the dairy products.
In 2004 watered-down milk caused 13 infants (BBC, 2004) death due to malnutrition. It
has been found 10 brands fake milk powder on sale in China.
There are several other disease which are mad cow/BSE (Bovine Spongiform
Encephalophaty), salmonella in eggs.
Facing all this malnutrition worldwide, the best for eliminating or reducing the food
system being corrupted, companies should focus on sustainability. Sustainability meaning
here is not only the using green technology and producing food or going green, it is also
about comprising food safety in itself which will focus on healthy nutrition to people and
future. Heller and Keoleian (2000) offer, “A sustainable food system must be founded on
sustainable diet. In the most general sense, this would be a diet that matched energy
intake with energy expenditure while supplying necessary nutrients for a healthy
lifestyle”. In 2004, 66% of adults in US were overweight or obese (University of
Michigan, 2006). With such a diet people in US face three major disease that cause death,
42
which are certain cancers, heart disease, and stroke. United States diet is strongly focus
on the animal products, which are containing high saturated fat, low in fiber, and being
the source of dietary cholesterol, so this kind nutrition brings the people to the chronic
diseases that they face in the near future with this kind of diet (Horrigan et al., 2002).
Chronic diseases are more common disease in the places that consumption of meat is
high (FAO). United States 67% of people’s dietary protein is being obtained through
animal products (Pimentel and Pimentel, 1996). According to public health experts
decreasing of meat consumption to approximately 60% per day, would help in developed
countries to reduce excess weight and obesity, through this people can reach to the health
life (Compassion in World Farming, 2008). Of course they should not eliminate the meat
consumption because human body needs vitamins that meat contains. While reducing the
consumption of meat people will also contribute to the well being of society and
environment as meat production emits lots of greenhouse gasses. Excessive amount of
meat consumption leads to climate change. Cattle are the most inefficient in their energy
consumption; they are requiring 7kg of grain in order to produce 1 kg beef (Brown et al.,
1998). Climate change and meat consumption are connected with each other, as one of
the reasons may be deforestation in the Amazon rainforest to make room for the
livestock. 17% of greenhouse gas emissions are produced by clearing these forests it is
more than the entire transport sector (Felicity Brown, 2009). China’s level of meat
consumption doubled between 1990 and 2002. In 1961 Chinese consumed about 3.6 kg
per capita, while in 2002 they increased the number till 52.4 kg each; half of the world’s
pork is currently consumed in China. United States and United Kingdom are among the
countries that keep almost stable the meat consumption per person; it is 124.8 kg in 2002.
Denmark is the largest meat consumer; in 2002 it reached 145.9 kg per capita12.
Developing sustainability issue in the meat supply chain it should be involved in every
phase of its production; starting from the feeding system to packaging, distribution,
transportation. Farmers should also think about animal welfare and treat them in good
conditions.
.
12 See Appendix G: Meat consumption per capita in different countries of the world.
43
2.12. What is sustainable food company?
Actors involving sustainability strategy into their food companies’ supply chain,
processing, distribution and post consumption disposal have the following characteristics:
1. Rely mostly on the renewable energy.
2. Count on the ingredients and raw material made from the renewable resources
with renewable energy.
3. It is water neutral.
4. Has net-zero air emission.
5. Produces absolutely biodegradable liquid and solid wastes at a rate and level that
could be easily degraded by nature.
Having these into companies portfolio is challenging mission for nowadays, as it has
been mentioned before, attaining 100% sustainability is still not possible, but companies
moving towards it and achieve highly appreciated results.
2.12.2. Raw materials and ingredients made from renewable resources
Glass, wood, paper, metal, cotton, cellophane which are used as packaging materials are
not made from the fossil feedstocks. Aluminum cans can be recycled over and over into
new cans with a minimal yield loss. Glass is made from silica, which requires energy for
its manufacturing and extraction, thus having relatively environmental impact relying on
the location of the mine. Salt is obtained from mining, which is nonrenewable or by
evaporation of seawater that could be considered as renewable. In sustainable food
company all the ingredients and materials should come from the renewable sources and
should be produced using renewable energy (Ruben O. Morawicki, 2012).
2.12.3. Water neutral
Food production is a water intense system. Water usage is high in this system, especially
in agriculture for producing raw materials in the fields need more water. Water used for
44
processing can be extracted from different sources, like from superficial water; rivers,
lakes; and aquifers. Aquifer exhaustion is a challenge situation for many areas of the
world where agriculture operations have benefited from the wealth of the subterranean
water. In agricultures aquifers have been pumped at high rate which did not allow them
for replenishment, thus making the system unsustainable. A sustainable food company
would use surface water with minimum tapping of subterranean water in order to allow
aquifers to replenish (Ruben O. Morawicki, 2012. p13). Water use would be optimized,
and diminish the companies water footprint. Food companies can use several strategies
for diminishing the water use in their production. For instance: they can reuse water in
the same system; recycle water and use it in other processes. Coca-cola is using water
recycling strategy in its operations. Coca-cola in Australia recycles filter backwash water
by sending it back to the water treatment plant, which after treatment is going to be used
in the manufacturing process (Judd and Jefferson. 2003).
2.12.4. Net-zero air emission
In the food production system air emission comes from agriculture activities,
transportation, processing, storage, and distribution. The emission results in thicken the
layer of the atmosphere by increasing the level of the greenhouse gasses, which causes
the climate change. To this emission included following gasses: carbon dioxide, methane,
hydrofluorocarbons (HFCs), and nitrous oxide. There are also several substances that
damage the Ozone layer, which are: chlorofluorocarbons (CFCs), methyl bromide,
hydrochlorofluorocarbons (HCFCs) and halons. Methane is produced during the animal
waste, rice cultivation and crop leftover burning. Large amount of nitrous oxide is
emitted during fertilization of soils. HFCs released in food production come from
stationary and mobile refrigeration equipment. In sustainable food company emission of
greenhouse gasses would be reduced or eliminated. By changing agriculture practices and
use of soil, companies can reduce carbon dioxide emission. In the transportation phase of
food supply chain, company can use electric cars or cars with renewable fuels for
eliminating carbon dioxide emission (Ruben O. Morawicki, 2012. p13). Refrigeration
45
systems that are using HFCs which causes depletion of Ozone could be replaced with
systems that use carbon dioxide or ammonia as working fluids.
2.12.5. Biodegradable liquid and solid wastes
The liquid that runs from food processing plants is considered to be biodegradable. But
the liquid may contain some content of dissolved solids which demands mechanical
energy for degradation. This mechanical energy produced through electricity that is
generated by nonrenewable fossil fuels. For making this process sustainable companies
should use either renewable energies or alternative technologies for degrading materials.
Anaerobic digestion is another choice to the traditional aerobic systems that will not only
save the mechanical energy but also create the possibility to produce biogas for energy
generation. Anaerobic system is mature technology, which is appropriate for streams with
high biоchemical oxygen demand, like the ones from food processing plants. The big
amount of solid food wastes are coming from food preparation and pieces either from
home or by production in the food service sector. These materials are biodegradable
(Ruben O. Morawicki, 2012. p14).
2.13. Packaging
Packaging is playing role of saving the food and protecting it from damage and loss.
Quality and rational packaging may reduce the food waste. Food waste is common
incident in developed and developing countries; hunger and even famine are widespread.
Packaging is being challenged to meet ecological roles as well in order to provide
sustainable packaging that will reduce environmental contamination as reducing solid
waste and increasing recycling process. Packaging uses nonrenewable resources, creates
waste, consume natural resources and use energy (Envirowise, 2008). It has been found
that almost 95% of the environmental impact is from production of the packaging and
only 5% is in the disposal. Container size may have more environmental impact rather
than cup material or the cup manufacturing process. In the study guided by the Center of
46
Sustainable Systems at University of Michigan, it has been established that 32 oz yogurt
containers consumed 27% less energy to produce and distribute rather than 8 oz
containers. (Brachfeld et al., 2001). Leading sustainability strategies for packaging is to
reduce material, energy use, and waste. Packaging also influences solid waste stream.
Biobased papckaging is appearing to be as an option for minimizing resource depletion.
Light weighting packages reduce the transportation cost as heavier packaging options are
costly. During the 1970s introduction of polyester packaging such as polyethylene
terephthalate (PET) was widespread for the replacement of bottled carbonated soft drinks.
Glass, which is recycled and made from recycled materials, is being more and more
replaced by light weighting plastic containers. Stoneyfield Farm states that the energy
that is used for the glass package for its manufacture and transport is outweighing the
energy use over the entire life of plastic containers that goes into manufacturing and
transporting, thus Stoneyfield Farm is using plastic containers for their yogurt products.
Through lamination or combination, multilayer packages can be achieved with low mass
package structure. But these mixed materials are not practical to recycle because of high
cost of separation of the material, also since the materials are made by nonrenewable
sources and cannot be recycled, their benefits may be limited, during the life cycle
analysis is conducted on the package. Nowadays for achieving environmentally friendly
packaging effective use of materials has been growing. For example, Danone launches
sustainable yogurt cup in the German market. Danone has switched from polystyrene
cups to polylactic acid (PLA) cups, which considered as biobased packaging. The new
PLA yogurt cup is the result of close collaboration with WWF-Germany and IngeoTM
producer NatureWorks LLC (Minnetonka, 2011). According to a life cycle assessment
study, which is held by the Heidelberg based LCA Institute for Energy and
Environmental Research (IFEU), the switch to PLA improves the products’ packaging
carbon footprint for about 25% and use 43% less fossil resources compared to the
previous packaging. In Europe Danone is the first company, which shifts towards
environmentally friendly packaging for a yogurt product. CEO of Danone in Germany
and Switzerland Andreas Ostermayr says: “With our partners, we have taken a first
significant step in the packaging development of the future”. Low carbon footprint Ingeo
biopolymers appeared from 100% renewable resources, which compete with oil based
47
plastics. Together with NatureWorks, and WWF are working to achieve the International
Sustainability and Carbon Certification for the new Activia packaging (Minnetonka,
NatureWorks LLC, 2011).
Nowadays PLA packaging materials have strong interest from the companies. Polylactic
acid (PLA) is an example of polymer synthesized from biomass substance. Biomass
packaging materials are typically cellulose or starch based (Haugaard and Mortensen.
2003). PLA is a lactic polymer, where lactic acid is produced from organic products like
corn sugar. PLA has been promoted to be near to PET. PLA is thermally sensitive, it
softens at <1050F, thus it has been mostly used for the refrigerated cold fill products, like
fresh-cut vegetables, yogurt, salads and so on (Cheryl J. Baldwin, 2009).
Zero waste is considered one of the corporate goals of Wal-Mart. Wal-Mart plans to
deploy 114 million PLA containers a year that company executives estimate is going to
save 800,000 barrels of oil annually. The major PLA supplier, Nature Works LLC found
that production of PLA uses 65% less energy than producing conventional plastics, it also
produce 68% fewer greenhouse gasses, and comprise no toxins (Elizabeth Royte. August
2006).
Further, Unilever expel an outer carton from its Knorr vegetable soup mix and presented
a new shipping and display box, which has created a 50% packaging reduction, 280 few
pallets, and 6 fewer trucks a year for transporting the same quantity of product
(McTaggart. 2008).
Annually about 200 million tons of municipal solid waste (MSW) have been generated in
the USA. In Figure 2.10 has been depicted composition of municipal solid waste in the
US.
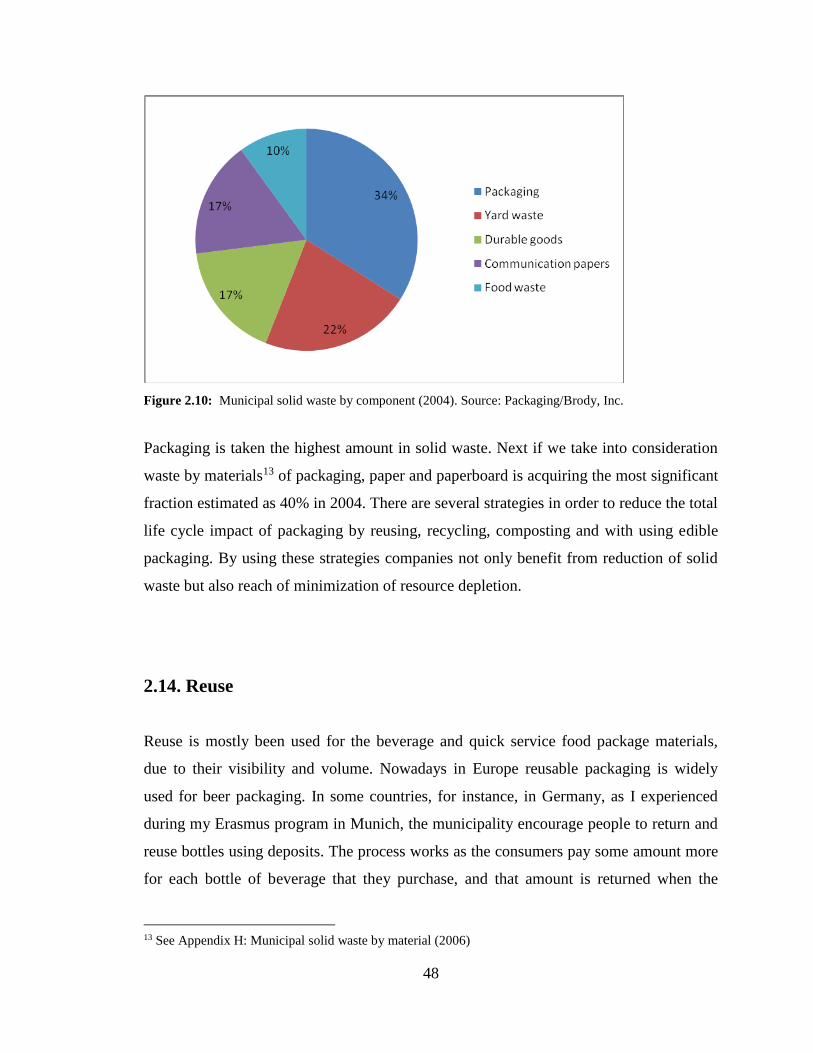
48
Figure 2.10: Municipal solid waste by component (2004). Source: Packaging/Brody, Inc.
Packaging is taken the highest amount in solid waste. Next if we take into consideration
waste by materials13 of packaging, paper and paperboard is acquiring the most significant
fraction estimated as 40% in 2004. There are several strategies in order to reduce the total
life cycle impact of packaging by reusing, recycling, composting and with using edible
packaging. By using these strategies companies not only benefit from reduction of solid
waste but also reach of minimization of resource depletion.
2.14. Reuse
Reuse is mostly been used for the beverage and quick service food package materials,
due to their visibility and volume. Nowadays in Europe reusable packaging is widely
used for beer packaging. In some countries, for instance, in Germany, as I experienced
during my Erasmus program in Munich, the municipality encourage people to return and
reuse bottles using deposits. The process works as the consumers pay some amount more
for each bottle of beverage that they purchase, and that amount is returned when the
13 See Appendix H: Municipal solid waste by material (2006)
49
bottle is taken back. Programs like this still appearing in the United States, states such as
Michigan and Oregon. Reusable packaging should pass from the sanitation process of
each use, because it may be a source of microbiological contaminant.
2.14.1. Recycling
Recycling is the diversion of materials like food package and solid waste stream for the
use as a package for the new products. The European Union Directive on Packaging and
Packaging waste from 1994, activate important focus on recovery of packaging through
recycling. Recycling can be used as closed loop and open loop. In closed loop recycling
the material is used for the similar or identical package products. In open loop recycling,
the package materials are returned and are used for any end product. In both these
recycling processes the package material is being removed from the waste flow.
Nevertheless, for removing, returning, and for recycling processes energy is required.
Further, recycling requires extra cost, due to separation, collecting, and sorting of
materials. With the recycling process companies can achieve, diminishing the solid
waste, energy maintenance, the materials may provide companies with less expensive
raw materials, and reduce emission these are considered for advantages, but it has
disadvantages as well, like recovered material may be more expensive than the virgin
material also recovered materials require water usage and each time the material has been
recycled, it faces with reduction of it functional properties. For instance, each time that
recycled paperboard is processed it get shorten of the fiber. In the US usage of recovered
paper and paperboard saves approximately 20—40% energy, compared to virgin material
(EPA, 2008). Recycled paperboard usually cannot be used as primary packaging due to
potential for contamination of contents which is in contact with food. Kellogg uses about
90% recovered content in its cereal cartons (Envirowise, 2008). Recycling of aluminum
is considered favorable, due to high cost of electrical energy for refining aluminum from
ore. Recovered aluminum saves about 90% energy compared to virgin material (EPA,
2008).
50
2.14.2. Composting
The European Union considers composting as a form of recycling. Biodegradable
packaging is compostable. Composting is appropriate for organic material. Due to
sustainability context composting of paper and paperboard materials are insufficient.
While degradation organic materials generate greenhouse gases, like carbon dioxide,
methane and so on.
2.14.3. Edible Packaging
The aim of edible packaging is to substitute package materials form nonrenewable
sources which is hydrocarbon plastics. There are several sources used for edible
packaging, which are plant derived from annually renewable sources, like cellulose,
starch, biopolymers, protein, lipids, and monomers from microbiological fermentation
(Cheryl B., 2009). Edible packaging waste is considered not compostable. There are
several advantages of edible packaging, such as: edible packages can be consumed
together with the food and leaving no visible residual for disposal; it degrades more
swiftly with comparison to glass, paper and metal; considered sustainable as it is made
from renewable resources; it can act as barrier between components of various foods to
slow down internal deterioration. There are also some disadvantages of edible packaging,
which are, they are costly and limited functionality. Limited functionality is because of
edible packaging is hydroscopic.
Sustainable packaging is considered one of the significant aims of the businesses’,
nowadays as they are moving toward environmental and social perspective in order to
provide safe and healthy life for individuals and communities throughout its life cycle.
For meeting this approach companies should focus on cradle-to-cradle model. The role of
packaging is about to protect the foods from deterioration or damage in its distribution.
Less waste, using renewable resources and renewable energy can improve sustainability
packaging in the food supply chain. By the reduction of the reliance on nonrenewable
resources, minimization of resource use, reducing waste, and minimizing energy use can
cause minimization of life cycle impact of packaging.
51
2.15. Distribution
Distribution is one of the main stages of food supply chain, as it is connected with the
delivery of food to the final user or retailers, in which food perishability, food safety
should be taken into consideration. In every stages of sustainable food supply chain, three
pillars of sustainability should be comprised in the system, which are environmental,
economical, and social. In order to meet the sustainability standards in distribution phase,
the efficiency improvements, replacement of older technologies with new ones which
will have less impact on the environment, improvement logistics system which comprises
in itself sustainability issue should be taken into consideration. In transportation
nonrenewable fuel consumption should be reduced by using shorter routes or by more
fuel efficient transport vehicles (Cheryl J. Baldwin, 2009). Companies also can substitute
current fuel with the new renewable fuel, such as biodiesel14 for the distribution of the
food, they can move from the global and national to regional food distribution systems
which will focus on regional infrastructure for providing the majority of foodstuff. Food
distribution includes various ways of transportation, storage methods which join the
agricultural production, processing, manufacturing, retailing and consumption systems.
Nowadays there are various modes of transport and storage accessible for the
contemporary food distribution. Rail and sea transports are commonly used for the long
distance transportation, while road and air may be considered fast and flexible. Right
storage and handling system are significant for the transportation of food, because of
foods nature they can be spoiled or degraded in uncontrolled circumstances, thus
companies pay strong attention for managing storage conditions in warehouses and
shipping vessels, and refrigeration system of the transports. Refrigeration assists food
transportation for the long distances, especially for food products which they have
specific keeping temperature. Foods that considered in essence alive, refrigeration plays
crucial role, as it prevents or slows the metabolic rates which result in spoilage and
bacterial growth. In order to improve the way of food being transported ISO 9000
14 Biodiesel relates to a vegetable oil or animal fat based diesel fuel consisting of long chain alkyl esters.
52
standards for international trade are required for maintaining quality and reliability of
foods (Cheryl J. Baldwin, 2009). The usage of transportation and storage technologies
connects the places of food production and procurement. Food distribution should be
appeared as adjusting the conditions and logistical foundation supporting main
developments in food systems. In the modern life, companies are becoming more
concerned about sustainability concept, thus for the distribution section of the food
supply chain, taking into consideration environmental pillar, food miles, carbon dioxide,
and energy consumption are indicators related to distribution. Food miles refer to the
distance which food has traveled from where it was produced to the consumption point.
Energy consumption shows the fuels which are necessary for transportation and the
energy which is demanded for the different ways of storage conditions of food. Carbon
dioxide emission is included to this aspect as well.
Economic indicators of distribution are profitability, the percentage of food lost, wages,
employment, labor productivity, and transport efficiency. The social indicators of
distribution are nutritional value of the food, food safety, fair trade initiatives, and quality
of life and worker satisfaction. Nutritional value of food incorporates in itself the shelf
life and perishability of the food. Some of these indicators may be included in more than
one section, for instance; food loss or spoilage of food is not only about economic issue
but also contains environmental impact, as spoiled food can emit methane gas from
decomposition in a landfill, food lost also may be contributed to social impact, as loss of
food can be contributed for rescuing hunger and poor people, or while being degraded it
can be delivered to municipal composting programs for the environmental benefit
(Cheryl J. Baldwin, 2009).
For enrollment in sustainability program companies should focus on reduction of carbon
footprints and greenhouse gas emissions, decreasing of solid waste, minimizing reliance
on nonrenewable energies, improve efficiencies.
Currently food industries involved in international distribution. For instance if we enter a
supermarket in US we can observe that there are bananas from Guatemala and tomatoes
from Mexico. It is obvious that places that they do not have special conditions for
growing the fruits that requires specific atmosphere or condition, these countries will
import fruits that they are not able to grow from other countries. The global food
53
distribution expanded because of increasing amount of population and rise in
supermarkets, shipping and storage technology innovation, growth of urban areas and
international trade. The increasing part of the global food distribution is grocery stores.
The growing number of supermarkets is clearly observed nowadays everywhere, and this
growth led to the tendency to shift from individual store procurement system to a
centralized distribution system which will serve a region, like city, state, and country
(Cheryl J. Baldwin, 2009). This centralization is about using central warehouses for the
distribution to the stores. With the help of centralization distribution system can increase
efficiency and decrease overall product costs by decreasing coordination and other
transaction costs (Regmi, 2001). Centralized distribution system is also encouraged by
the growth interest of the government about the food quality and safety. With such
standards they can prevent widespread diseases like food borne to occur and also paying
close attention to contamination. Centralization system can reduce the costs related with
meeting the standards, and also assists coordinate logistics along the supply chain. For
lowering the transaction costs supermarkets are searching alliances with the suppliers.
Reardon et al. (2005) determined that increased consolidation of supermarkets, combined
with the aim of supermarkets to attain year round supplies of different fresh foods, has
brought to horizontal joint ventures and other strategic alliances between firms in the
northern and southern hemispheres. With the help of these alliances supermarkets can be
supplied by tropical fruits year round. For instance, mangoes accessible for purchase in
the United States come from Central and South American countries. The mango season in
Ecuador is usually October till January, while in Mexico the season lasts from March
through September, with the help of the alliances between firms in two continents,
supermarkets in the United States can be provided with mango sales year round.
Technology innovation has also caused the growth in global food distribution. Shipping
containers are playing major factor in the reduction of world transportation costs. In
1960s refrigerated mobile containers were developed. With assists of refrigerated
containers the amount of transporting perishable foods increased. Further with the
tracking technologies companies can track their cargo around the world, with the help of
these technologies permit shippers and carriers to monitor the quality of product, reduce
costs, and shorten delivery time (Regmi, 2001).
54
The growth of urban population, the rise of incomes and some of the lifestyle changes
may have also contributed to the growth of the global distribution (Reardon et al., 2003).
As the urban population is increasing and they are more intend to eat higher value foods
like meat and vegetable, rather than cereal based diet. All these growth on technological
innovation, urbanization and trade have crucial impact on the global food distribution
system. In order to overcome the challenges that supermarkets face, like environmental
deterioration, they should move towards sustainable global distribution system and for
that perspective supermarkets have implemented standards which protect food safety and
quality, technology innovation allows the diffusion of products worldwide by increasing
efficiency and lowering the excessive usage of biocapacity of planet. Worldwide
transportation can emit large amounts of greenhouse gasses which increase use of carbon
footprint and cause climate change. Schlich and Fleissner (2005) stated that lamb which
is imported from New Zealand had a lower energy turnover than regionally produced
lamb in Germany, even taking into consideration shipping from New Zealand. In
distribution phase of food supply chain transports play significant role which cause to
think companies how to reduce fuel consumption and dependence on nonrenewable
energy source which one day will reach its peak.
Refrigerated transport generates two types of emissions which are energy usage for
providing lower temperature and from refrigerant leaks. In refrigerated vehicles in order
to generate energy and provide related temperature for the carried food, fuel consumption
plays important role which cause carbon dioxide emission, but the use of carbon footprint
can be reduced with using biodiesel or electric engine. Refrigerant leaks, is about release
of CFCs and HCFCs into the atmosphere which will cause damage of ozone layer and
results in vulnerability of the Earth against ultra violet rays. For that reason production of
these compounds was banned worldwide and substituted by the hydrofluorocarbons
(HFCs). Even though HFCs not damaging stratospheric ozone, they preserve extremely
high global warming potential. The usage of CFCs and HCFCs have been banned but in
old refrigeration equipment including refrigerated vehicles they are still in use (Cheryl J.
Baldwin, 2009).
The goal of companies is to have zero carbon emission but now it is still not attainable,
but they can reduce carbon footprint with using electrification railroad without burning
55
fossil fuels. For now it can be only possible only for the short distances. Electrification of
cargo trucks and ships would depend on the evolution of the high energy density and low
weight batteries. At the present time using of hydrogen or synthetic fuels are not mature.
Fuel efficiency in truck can be improved with operational betterment such as
optimization of logistics, reducing speed, and right maintenance. Fuel usage of long haul
trucks can be decreased by technological improvements which include reduction of
weight, increasing engine efficiency, and decreasing aerodynamic drag. Small truck
could benefit from hybrid engine. For fuel efficiency reduction of idling is also important
as drivers keep their engines running in order to maintain the cabin warm or cool or
providing energy for light or entertainment systems while resting overnight. Sometimes
in cold climates engines left idling due to difficult starts (Stodolsky et al., 2000) but this
issue can be solved with setting electric block heaters to maintain the engine warm
overnight in cold temperature. There is also another factor that can influence fuel
economy which is driver’s behavior. According to Cummins Engine Company (2007) the
most efficient driver may achieve 30 percent better fuel mileage than the least efficient
ones. Behaviors like coasting to a stop instead of staying on accelerator until the last
moment and then breaking hard, fuel savings maybe possible with driving high percent
distance in cruise control, and minimize percentage of idling. The use of long
combination vehicles instead of conventional configurations leads to a significant
reduction of fuel usage per tonne of product transported.
Marine shipping is considered to be one of the most energy efficient type of
transportation types. It assists around 80 percent of world commerce and contributed to
about 3.3 percent of global carbon dioxide emissions from international and regional
fleets (Mehling, 2009). The efficiency of fuel consumption of ships comes from their
ability to carry large amounts of cargo at low speeds. Even though it is estimated that
marine shipping is emitting less carbon dioxide, still emissions from ship engines are
much dirtier than any road engine and involved in ocean contamination. Marine engines
use fuel which contains high level of sulfur that will cause sulfur dioxide emission. In
order to reduce the impact and emissions of sulfur dioxide from ships, regulations are
requiring desulfurized fuels with content of sulfur between 1 and 1.5 percent or by using
scrubbers eliminate sulfur dioxide from combustion gases. The International Maritime
56
Organization (IMO) has found several operational and technical steps that could reduce
ships’ fuel consumption meanwhile reduce carbon dioxide emissions. From the
operational perspective, logistics organization, which comprises fleet management and
trip optimization, can reduce fuel consumption essentially on all ships. From the technical
perspective the reduction of speed, more hydrodynamic hull designs and better
propulsion system may result in reduction of fuel consumption (IMO, 2009).
Approximately 60 percent of the total cost of running a cargo ship is fuel (“Sailing ships
with a new twist,” 2005). Taking this into account reduction of fuel consumption is not
only reducing environment impact but also provide economical advantage. It is obvious
that wind is cheaper than oil, thus wind power may assist reducing fuel consumption in
maritime vessels. There is particular technology which can help to reduce ship’s annual
fuel costs by 10 to 35% by using an auxiliary giant kite installed at high altitudes and
connected to the ship via a towing rope. The towing kite15 has an area between 150 to 600
square meters and can pull cargo ships, tankers and fishing trawlers by taking advantage
of wind at high altitude. Towing kites can operate at altitudes between 100 and 300
meters above the sea level where winds are 25 percent more powerful and more stable
than close to the sea level. So by using long towing cable the kite can be used far up from
the ship into strong wind currents. Once the kite is used the power of the engine is
reduced and saving the fuel. Under optimal wind conditions fuel usage can be gradually
reduced by up to 50% (SkySails, 2009).
Trains are considered to be fuel efficient due to their low rolling resistance, with low
grade slopes, circulation at fixed speeds for long distances, rails which can admit heavier
loads than roads, and low aerodynamic resistance in comparison to other vehicles.
Transportation is main segment of the United States economy. Traditionally in US rail
and water transport have been used for moving lower value agriculture like, corn, wheat,
and soybeans. In some cases rail is also used to move semi perishable foods, like,
potatoes, onions, and squash. In the United States over the past 25 years the percentage of
food transported by trucks has increased, while the percentage of rail transport is
decreased. Trucks are the most common way of transporting food. Air transport is used
for highly perishable and high value food products. United States carbon dioxide
15 See Appendix I: SkySail
57
emissions from transportation have increased about 40% from 1985 to 2005 (USDOE,
2006). Later on in 2007 food retailers in the United States agreed to be more proactive
about environmental concerns. Environmental issues comprises fuel use and greenhouse
gas emissions, air pollution, packaging disposal, and total energy use. According to
“Food Industry Sustainability”, (2006) by Transport 2000, a U.K. based consulting
company provided a report to the United Kingdom’s Department of Environment, Food,
and Rural Affairs (DEFRA), which indicated that a lower carbon emission food system
would have these features:
Efficient operation and management of all processing
Least use of temperature controlled storage
Usage of more seasonal and local production, products would be sourced as
locally as possible
Logistical efficiency, for instance; increased fuel efficiency and controlling the
loads
For food industries in order to improve vehicles utilization and efficiency comprises the
following:
Collaborating among operators
New transport refrigeration technologies, in order to diminish energy
consumption and leakage
Improving vehicle full rates
Deploying improved technologies for optimizing vehicle routing
By using improved technologies and provide vehicles with more eco friendly refrigerated
system there is ecoFridge which is designed and manufactured in Europe. EcoFridge is
powered with nitrogen, which eliminates greenhouse gas emission and reducing energy
use (Cheryl J. Baldwin, 2009).
While taking into account environmental and social concern for food distribution system,
climate change, traffic congestion, noise levels of vehicles, and fair wages for workers
which are involved in food transport should be taken into consideration.
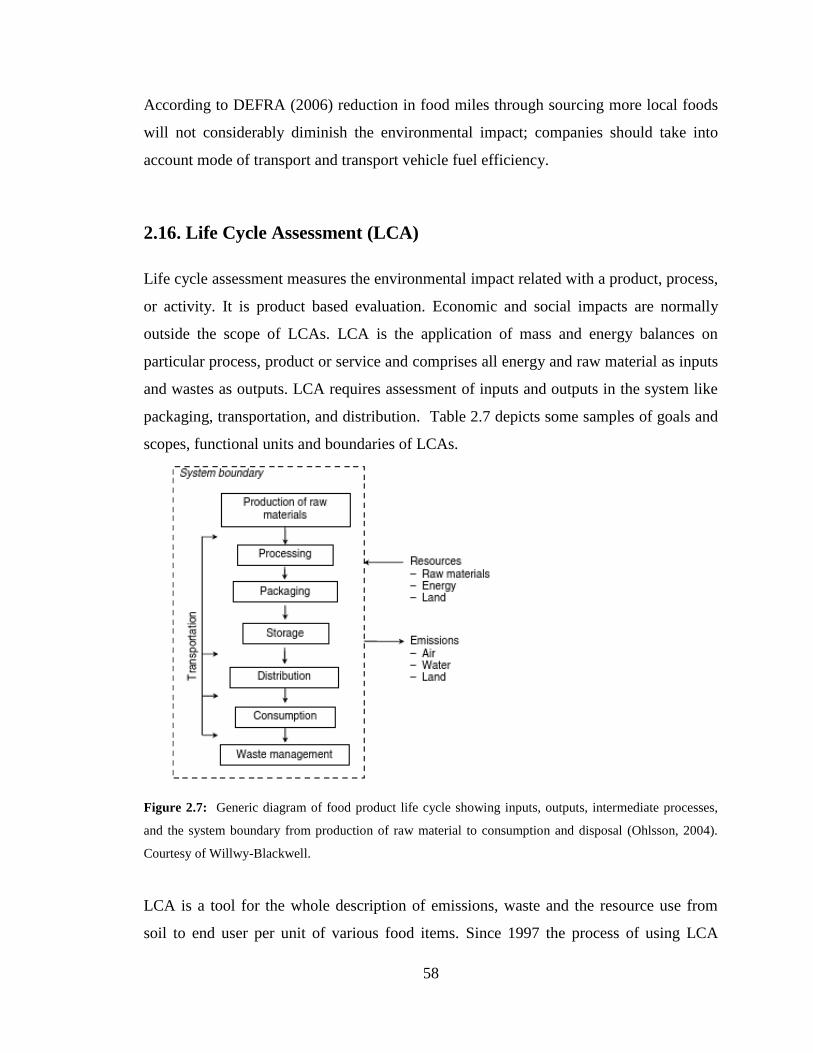
58
According to DEFRA (2006) reduction in food miles through sourcing more local foods
will not considerably diminish the environmental impact; companies should take into
account mode of transport and transport vehicle fuel efficiency.
2.16. Life Cycle Assessment (LCA)
Life cycle assessment measures the environmental impact related with a product, process,
or activity. It is product based evaluation. Economic and social impacts are normally
outside the scope of LCAs. LCA is the application of mass and energy balances on
particular process, product or service and comprises all energy and raw material as inputs
and wastes as outputs. LCA requires assessment of inputs and outputs in the system like
packaging, transportation, and distribution. Table 2.7 depicts some samples of goals and
scopes, functional units and boundaries of LCAs.
Figure 2.7: Generic diagram of food product life cycle showing inputs, outputs, intermediate processes,
and the system boundary from production of raw material to consumption and disposal (Ohlsson, 2004).
Courtesy of Willwy-Blackwell.
LCA is a tool for the whole description of emissions, waste and the resource use from
soil to end user per unit of various food items. Since 1997 the process of using LCA
59
studies has been standardized by the International Organization for Standardization
(ISO). The latest standards of ISO 14040 and ISO 14044 adopted in 2006 provide an
overview of the framework and guidelines of LCA. According to these standards the
process of LCA consists of four interrelated phases, which are following:
1. Definition of goal and scope.
2. Life cycle inventory analysis.
3. Impact assessment.
4. Interpretation.
Life Cycle Assessment approach for a food product is based on reduction of its
cumulative environmental impact (European Commission, 2003).
1. Definition of goal and scope it is about defining the boundaries and the processes.
The aim of the LCA might be the consideration of similarities or dissimilarities of
two alternative packages like; glass with plastic bottles. The scope refers to the
functional unit of analysis, the system boundaries, geographic extent of coverage,
assumptions, limitations, and so on. The concept of the functionality is used to
compare alternative ways of giving a specific functionality or utility to the
consumer. System boundaries involve in the how far to follow the life cycle of
milk which can be bottled or in a board container, and to which stages to include
the analysis. If the objective is to study environmental impact of milk production
from animal feeding to disposal of used packages, then the boundary has to
encompass all steps in the process, which has been depicted in the Figure 3.7, in
addition to other subsystems such as animal treatment, electricity generation,
water purification, water treatment, and so on. But if the interest is limited in
focusing in comprehending the impact of the processing part, then boundaries are
set around the processing and distribution.
2. Inventory analysis is about identifying material and energy flows and
environmental releases related to the functional unit of analysis. In this stage of
LCA inputs and outputs of processes are measured in physical terms. Inputs in
data collection are renewable and nonrenewable energy, water, raw materials, and
so on. Outputs are co-products; environmental releases to air, methane, carbon
60
dioxide, sulfur oxide; effluents released to water, biological oxygen demand;
generation of solid waste (Roy et al., 2009). When the inputs and outputs are
identified numerical terms needs to be established. In this phase may be
concerned data on transport, extraction or raw material, processing of raw
materials, production packaging materials like plastic and cardboard, electricity
use, and disposal of waste materials can be found in commercial LCA databases
(Roy et al., 2009).
3. Impact assessment is about assessing the environmental effects of the inventory
analysis. This phase is mostly focusing on how the outcomes of the life cycle
inventory have the impact on human health and environmental degradation and
resource usage. The aim of life cycle impact assessment is about connecting
resource extractions from nature and emissions into environment and their
damages. This phase of LCA comprises in itself five steps, which according to
ISO 14040, step 5 is optional.
Step 1. Selection and definition of environmental impact categories. For instance:
climate change, acidification, ozone depletion, human health, human toxicity, and
so on.
Step 2. Assignment of inventory input and output data within the impact
categories, this also called classification. For example: hydrofluorocarbons impact
on Ozone depletion, carbon dioxide on climate change or acidification in oceans.
Step 3. Computation of category indicators, also known as characterization. For
instance: how hydrochloric acid (HCI) has impact on Acidifaction.
Step 4. Showing the data after characterization.
Step 5. This element of life cycle impact assessment is optional and comprises in
itself: grouping, normalization, data quality analysis.
4. Last phase of LCA is life cycle interpretation, which is about interpreting
assessments and drawing conclusions from the assessments. According to the ISO
14040 the interpretation issue needs to evaluate and check the information
resulting from the inventory and impact assessment, and also explain the
limitations of the conducted LCA, and provide recommendations.
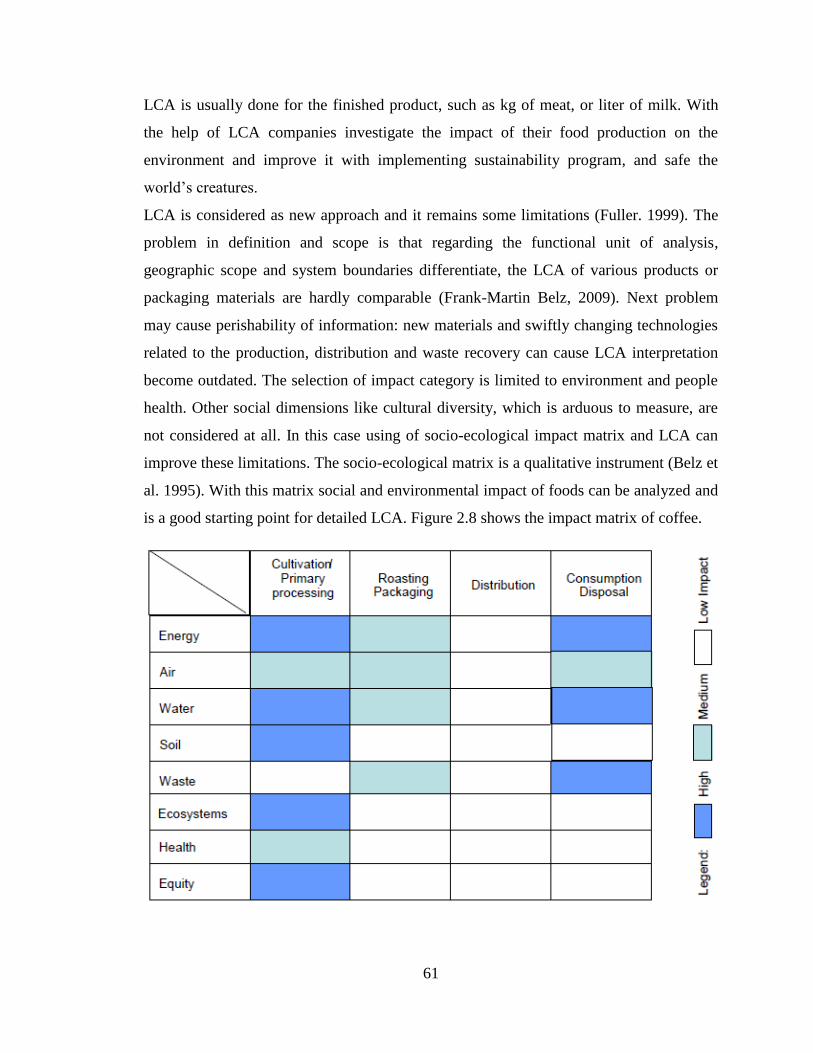
61
LCA is usually done for the finished product, such as kg of meat, or liter of milk. With
the help of LCA companies investigate the impact of their food production on the
environment and improve it with implementing sustainability program, and safe the
world’s creatures.
LCA is considered as new approach and it remains some limitations (Fuller. 1999). The
problem in definition and scope is that regarding the functional unit of analysis,
geographic scope and system boundaries differentiate, the LCA of various products or
packaging materials are hardly comparable (Frank-Martin Belz, 2009). Next problem
may cause perishability of information: new materials and swiftly changing technologies
related to the production, distribution and waste recovery can cause LCA interpretation
become outdated. The selection of impact category is limited to environment and people
health. Other social dimensions like cultural diversity, which is arduous to measure, are
not considered at all. In this case using of socio-ecological impact matrix and LCA can
improve these limitations. The socio-ecological matrix is a qualitative instrument (Belz et
al. 1995). With this matrix social and environmental impact of foods can be analyzed and
is a good starting point for detailed LCA. Figure 2.8 shows the impact matrix of coffee.
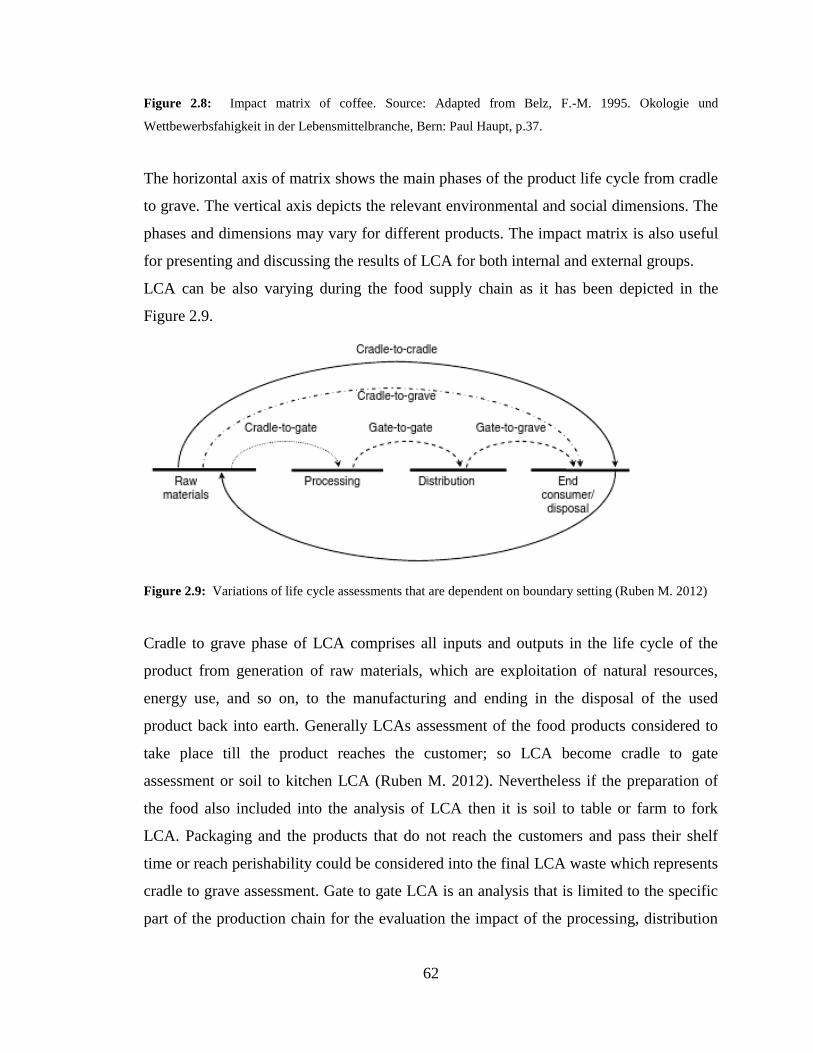
62
Figure 2.8: Impact matrix of coffee. Source: Adapted from Belz, F.-M. 1995. Okologie und
Wettbewerbsfahigkeit in der Lebensmittelbranche, Bern: Paul Haupt, p.37.
The horizontal axis of matrix shows the main phases of the product life cycle from cradle
to grave. The vertical axis depicts the relevant environmental and social dimensions. The
phases and dimensions may vary for different products. The impact matrix is also useful
for presenting and discussing the results of LCA for both internal and external groups.
LCA can be also varying during the food supply chain as it has been depicted in the
Figure 2.9.
Figure 2.9: Variations of life cycle assessments that are dependent on boundary setting (Ruben M. 2012)
Cradle to grave phase of LCA comprises all inputs and outputs in the life cycle of the
product from generation of raw materials, which are exploitation of natural resources,
energy use, and so on, to the manufacturing and ending in the disposal of the used
product back into earth. Generally LCAs assessment of the food products considered to
take place till the product reaches the customer; so LCA become cradle to gate
assessment or soil to kitchen LCA (Ruben M. 2012). Nevertheless if the preparation of
the food also included into the analysis of LCA then it is soil to table or farm to fork
LCA. Packaging and the products that do not reach the customers and pass their shelf
time or reach perishability could be considered into the final LCA waste which represents
cradle to grave assessment. Gate to gate LCA is an analysis that is limited to the specific
part of the production chain for the evaluation the impact of the processing, distribution
63
and recycling. A cradle to cradle approach is related to the products that can be recycled
into the same product or can be used for the different production but without
downgrading the recycled material, or just be returned to the soil as compost. Vegetables,
fruits they can be used as compost for the soil. A feasible cradle to cradle approach would
also use renewable energy for manufacturing and distribution. Cradle to cradle approach
mostly taken into consideration for the packaging phase. Food producers should pay
robust support for the sustainable packaging of the foods for the future recycling of them.
A cradle to cradle16 production system is truly sustainable and society needs to move
towards this direction for managing to create sustainable economic system.
16 See Appendix J: Belz cradle to cradle model.
64
CHAPTER III: RESULTS
3.1 Ecolabling
One of the major part of the supply chain is selling the product and gain profit in order to
get the opportunity to expand the business and invest in more eco friendly technologies
which will be involved in sustainability. For selling the food especially if they are
branded companies involve into sustainability marketing. Sustainable marketing is:
“Building and maintaining sustainable relationship with customers, the social
environment and the natural environment; log-term orientation” (Frank-Martin B. 2006).
Labeling plays crucial role in shopping of food and it is considered to be significant way
of communicating with customers about sustainable purchasing. Green labels provide
customers with credible signal of products. Specific labeling strategies can also support
consumers behavior towards recycling, for instance by labeling packages by type of
plastic or any other material to simplify sorting and recycling. Sustainability labeling is
one of the effective communicators that are used by the marketers to encourage or
influence consumers buying behavior. According to survey which is held by Information
Resources, Inc. (IRI, 2007) consumers are increasingly willing to consider social and
environmental aspects when buying food, about 50% of the United States consumers take
into consideration at least one aspect of sustainability in choosing packaged goods items
and selecting the shop for that perspective. Purchase of sustainable foods leads buy
consumers awareness about their health. Main focus have been on foods free of
pesticides, antibiotics, and genetically modified ingredients (Molyneaux, 2007).
Ecolabeling is a drive that creates interest and changes perception of consumers towards
the products, thus companies should be carefully investigate the gap of consumers
experience and expectations in order not to get involved into overpromising or
misrepresenting benefits which is called greenwashing (which conflates ‘greening’ and
‘whitewash’). The term greenwashing was first used by the environmentalist Jay
65
Westerveld, when he noticed strategy of hoteliers of placing notices in hotel rooms about
asking guest to reuse towels in order to ‘save the environment’, but actually the hoteliers
were less interested in reducing their environmental impact, their major interest was by
washing fewer towels to save the costs.
There are also some people who are interested to purchase foods which are produced in
environmentally friendly way, but they pay attention to the values such as, quality, price
and convenience. Companies which are communicating with using eco labels should be
careful in environmental claim and they should practice responsibly to be trustworthy for
gaining long-term success. According to Federal Trade Commission (FTC) in the United
States, marketing is not deceptive or unfair, the important thing is to inform consumers
about sustainable labeling, so they will not be confused in their meaning, because
consumers may assume that all plastic packages are recyclable, but only limited number
of them are considered for recycling. The category of certified products is growing.
Certified product plays main role for giving information on the sustainability of a product
or a company, which is sustainable production like, organic, no genetically modified
organism, fair trade, locally produced and recyclable (BBMG, 2007). Certification shows
verification on the label with a seal or mark which is communicated to the customers.
“Organic” is considered as dominant ecolable for food with surpassing global sales of
food and drink US$40 billion in 2007 (Organic Monitor, 2008a). Organic foods are
grown without use of toxics and pesticides, and growth hormones. They are produced
according to standards which do not allow using genetically modified organisms and
radiation. Organic agriculture regulations have been set in the United States and many
other countries including some EU countries (Huber et al., 2007). Customers demand for
organic foods are more widespread in North America and Europe which include 97% of
global revenues. Other regions like Latin America, Asia, and Australasia are main
producers and exporters of organic foods, nevertheless their internal markets are just
beginning to evolve (Cheryl Baldwin, 2009).
The four largest consumer markets of organic products are; Germany, France, Italy and
the United Kingdom, which is comprising over 75% of regional revenues. Nevertheless,
because of small number of consumers, Denmark, Sweden, and Austria showing high
growth. In countries such as Denmark, Sweden, and Switzerland organic food sales
66
shows about 5% of total food sales (Organic Monitor, 2008a). The Swiss spend the most
on organic food, with number of over US$150 per person (Organic Monitor, 2008a).
Two-thirds of customers agreed about price premium of organic foods and say it is right
that organic foods are expensive, however 10% say the higher prices are not correct
(Organic Monitor, 2008). Approximately half of British customers buy organic food and
about half of them report that they would buy organic food if the price would be cheaper
(Organic Monitor, 2008b). Research which is held by Sainsbury revealed that 31% of
lower income customers are buying organic foods (Organic Monitor, 2008a).
A survey which is conducted by Agence Bio in French found that 81% of men and
women had a positive impression towards sustainable products (Organic Monitor,
2008a). When people are questioned about the reason of buying organic foods, 94%
replied for staying healthy, while 93% stated to be certain of buying a healthy product,
90% of customers consider quality and taste as important factors (Organic Monitor,
2008a). A survey which is held in Italy found that the main reason why consumers buy
organic foods is the absence of pesticides and chemical fertilizers, stated by 86—96% of
respondents (Organic Monitor, 2008a). 75—91% respondents stated that the absence of
genetically modified organisms is important for them, 69—83% says environmental
protection is important reason, and 59—78% stated food safety as significant factor for
them (Organic Monitor, 2008a). Studies in countries such as; Austria, Ireland, and Spain
had similar findings (Organic Monitor, 2008a). According to Harris Interactive (2007)
survey half of all American adults sometimes buy organic foods.
The United States has the largest market for organic foods in the world. The imports are
important for US because demand is exceeding supply, so Latin America region like
Argentina, Mexico, and Brazil export some quantities of organic foods to the United
States market. Australia and New Zealand are considered to be one of the major exporters
of organic foods, focusing on organic lamb, beef, kiwi fruit, wine, apples, and pears.
One of the major drivers for market growth of organic foods is increasing distribution in
conventional grocery channels, like, Wal-Mart, Safeway, and Loblaws are expanding
their organic product ranges buy introducing private label organic products.
67
In 1980 the International Organic Federation of Agriculture Movements (IFOAM)
published the first international organic standards. IFOAM comprises in itself more than
750 member organizations in 108 countries. IFOAM has an organic guarantee system
which provides markets guarantee for claim of being organic through a common system
of standards, verification, and marketing identity.
European Community Regulation which is applied to organic food is Council Regulation.
The aim of the European regulations is to ensure a harmonized framework for the
labeling, inspection, and production of organic foods throughout the European Union. In
European countries imported products should meet European Union organic regulations
in order to be labeled and marketed as organic. Europe has about 160 certification
agencies. The most significant is considered IFOAM. It has designed standards for
organic farming and organic food production that are promoted to harmonize standards
worldwide. Certification agencies must use standards equivalent to IFOAM, in order to
get IFOAM accreditation.
The United States allow four different organic labeling options related for organic
standards, which are following:
100% organic – only products that have been produced in organic way are
permitted to carry “100% organic” declaring label.
Organic – at least 95% of ingredients should be produced by using organic
methods. The rest of the products can only be natural or synthetic contents
recommended by National Organic Standards Board and authorized on the
National List.
Made with organic – it should display 70—95% organic ingredients.
Products which are less than 70% used organic ingredients can list the organic
components only in the ingredients panel.
Fairtrade labeling is one of the worldwide used certificates, which contributes to
sustainable development by proposing better trading conditions to, and provide the rights
of, producer and workers. The first Fairtrade label was applied in Netherlands to coffee in
1988. Further, it has been set to various ranges of products like: tea, nuts, spices, sugar,
cocoa, fresh fruits and vegetables, honey and nuts. Fair trade attaining popularity due to
68
its third world poverty. Consumers accept fairtrade system as a way of encouraging and
backing farmers in lesser developed countries. In 2006 the global market for fairtrade
products was worth approximately US$2.2 billion (Organic Monitor, 2008b). Switzerland
has estimated retail sales of fairtrade product from US$185 million in 2006 (Fairtrade
Labeling Organizations International, 2006). Fairtrade certification provides several
guarantees which are about, providing farmers product with a fair and stable price,
farmers and workers are given additional income in order to be able to improve their
lives, production evokes a great respect for the environment, closer connection developed
between consumers and producers (Cheryl J. Baldwin, 2009).
For sustainable fisheries there is ecolabeling program which is Marine Stewardhip
Council (MSC). The MSC logo is given to the fisheries that meet the requirements for the
environmental standards for the sustainable and well managed fisheries. The MSC
existed since 1999 as independent nonprofit organization. The MSC comprises three
aspects: the condition and wellbeing of fish stocks of fisheries, the impact of fisheries to
the marine ecosystem, and fishery management system. Over 500 companies have
adopted the MSC chain-of-custody standard for seafood traceability.
In 1987 the Rainforest Alliance has been developed for conserving biodiversity and
ensures sustainable livelihoods by improving and changing land use practices, consumer
behavior, and business practices. The Rainforest Alliance has three divisions, sustainable
forestry division, sustainable agriculture division, the tourism division. Production of
foods in sustainable way covered by sustainable agriculture division. Farmers,
landowners who are certified by the Rainforest Alliance must meet the social and
ecological standards which comprise agrochemical reduction, ecosystem protection, and
worker health and safety. The Rainforest Alliance standard is mainly adopted by farms in
Latin American region like, Brazil, Costa Rica, and Peru. The success of Rainforest
Alliance is mostly due to engagement of large corporations like Chiquita, IKEA, Kraft
Foods, and Unilever. In the United Kingdom McDonald’s switched its coffee supply to
certified Rainforest Alliance in 2007. In 2008 McDonald’s proclaim that it would use
Rainforest Alliance certified tea for its 1,200 fast food restaurants (The Daily Telegraph,
2008). Unilever converted its Lipton tea brand to Rainforest Alliance certified.
69
3.2 Use of waste
Moving to the sustainable food supply chain companies should deal with wastes and
losses properly, they should investigate and be knowledgably about how to reuse, and
extract valuable resources from the waste and reduce amount of resources that will
contaminate the environment. Losses almost occurring in every level of food supply
chain. In order to reduce waste and loss companies should pay attention to good
housekeeping, equipment maintenance, and design changes for improving efficiency
(Niranjan and Shilton, 1994). Good housekeeping means that the managers and
subordinates of the company are doing everything right according to environmental
regulations. For improving the housekeeping workers of the company should imply
rational usage of raw material and product loss, and provide employees with training
(Cheryl Baldwin, 2009). For instance in the production of beer exact adjustment of bottle
fillers or adjustment of metal tray under the fillers can reduce the losses of beer during
filling stage (European Commission, 1997). Applying equipment maintenance and design
changes assist in reducing the waste up to 20—30% of costs (Envirowise, 2008). With
inefficient packaging companies lose 4% of product and overall process control in
production line can reduce cost to 5% (Envirowise, 2008).
Recycling, recovery, and reuse of materials are the ways of minimizing the waste. With
this process companies should refine the waste in order to get the useful portion of waste.
For example, in Vigneswaran et al. (1999) found that it is possible to use palm oil waste
as animal feed, recovered fiber as fuel for production of steam in boiler. By-product of
sugar; molasses can be used for livestock feed (Paturau, 1989). High proportion of
molasses in the feeding process of milking dairy cows results in increases the milk yield,
milk protein (Murphy, 1999). Chicken eggshells generated from confectionery
production are considered to perfect calcium source for livestock feed. With the amount
of calcium in chicken eggshell is equal to purified calcium carbonate (Karkkainen et al.,
1997). Several researchers found that there is possibility to reuse coffee grounds as fuel
(Sivetz and Desrosier, 1977; Adams and Dougan, 1985; Silva et al., 1998). Coffee
grounds have been considered perfect fuel in comparison with other biomass, having
70
humidity of 50% they can be burned in the boiler; coffee grounds have high heat of
combustion (Pfluger, 1975).
If the companies are interested in the sustainability and decrease their environmental
footprint, recovery and reuse of resources in waste can involve additional processing
steps, costs, and energy requirements. Processing steps may contain; separation,
concentration, and conversion (Nimi and Gimenez-Mitsotakis, 1994). Enterprises should
consider and balance all the benefits and inputs for implementing this strategy.
3.3 Companies that are involved into sustainability program
Unilever is an Anglo-Dutch company and a global manufacturer of consumer goods.
Unilever strongly believes that sustainability compensate to the triple bottom line
principle. Through this principle it can limit negative impacts. The vision of Unilever is:
“Double the size of the business, whilst reducing our environmental footprint and
increasing our positive social impact”. Unilever wants to add vitality to the life. Unilever
has a sustainable agriculture program. With its sustainable agriculture program Unilever
wants to support several principles, such as: produce crops with high yield and nutritional
quality, keep resource input as low as possible, optimization of renewable resources and
minimization on nonrenewable ones, encourage local communities to protect their
environment. All these principles are included to Unilever’s Lead Agriculture
Programmes. Lead Agriculture Programmes involve groups of farmers, together with
advisors either from Unilever or NGOs in order to search and identify good, sustainable
agriculture practices. Sustainable agriculture is knowledge based, so implementing the
non chemical intensive practices farmers can have organic agriculture. Farmers should
learn how to apply fertilizers, and the amount of it.
Kraft Foods also focuses on developing sustainability food supply chain. Kraft has
developed sustainability wheel, which is focused on design supply chain with the
continuous improvements. Kraft is targeting to reduce 25% energy usage with the help of
energy conservation, transportation optimization, exploitation of alternative energy
71
source. For the efficiency of transportation vehicles included principles like; use of
nitrogen for tire inflation which makes tire to last longer, implement smart reefer
technology, use truck stop electrification. Kraft also use waste to create energy, for
instance; burning coffee chaff, a waste component that generated from roasting and
grinding coffee beans. Further, Kraft partnering with key suppliers for eliminating the
solid waste (Cheryl J. Baldwin, 2009). One of them is Sonoco, which is a key supplier for
a wide range of packaging. Sonoco either reuses the packaging waste into manufacturing
phase or burns it and generate energy, thus Sonoco helps Kraft to reduce solid waste in
the Earth. This can be also example for the cradle to cradle model of LCA.
The Stop & Shop Supermarkets also involved in sustainability with their energy
efficiency scales which include deploying skylights and natural lighting in stores,
refrigeration systems with variable, using non ozone depleting substances, low energy
glass doors, insulation roofing (Stop and Shop, 2008).
Wal-Mart Stores, Inc. is moving towards the zero waste programs. Company is relying on
recycling remaining solid waste. Wal-Mart has already made its fleet 20% efficient,
compared to 2005, by using aerodynamic trucks and using auxiliary power units which is
turning off the engine, but not the heating, cooling and lights (Greenbiz.com, 2008). In
the stores they are using natural light, light-emitting diode (LED) lighting, and reflective
roofs.
SUPERVALU is retail network in US. It has more than 3,400 stores like Club Foods,
Albertsons, Shoppers, Jewel-Osco, Farm Fresh and so on. SUPERVALU involved in
minimizing its environmental footprint through joining EPA GreenChill Advanced
Refrigeration Partnership Program. Thus SUPERVALU now uses only non-ozone-
depleting refrigerators. With this program it reduces emissions of ozone depleting and
greenhouse gas refrigerants every year. Further SUPERVALU has waste reduction
program which involved in recycling and composting. SUPERVALU converts gathered
plastic bags into composite lumber for benches, and 429 million beverage containers
were returned to the stores as part of facilitation-in-state rebate programs (Cheryl
Baldwin, 2009). Albertsons stores turned store compactors into compost containers,
which are filled and took from the stores weekly, and Acme stores in Pennsylvania fill
compost containers which are collected and are converted into high grade soil. All new
72
stores of SUPERVALU are designed with low energy white thermoplastic polyolefins
roofing systems. Between 2000 and 2007, it invested about US$95.2 million in capital on
energy projects that saved over 340 million kilowatts energy per year. It uses energy
efficient lighting systems like natural lights, skylights, LED signs, roof-mounted solar
power collection systems for green roofs. In 2005 SUPERVALU opened its first
Leadership in Energy and Environmental Design (LEED) store in Worcester,
Massachusetts, which was the second LEED certified grocery store in the country.
Marks and Spencer is a leading company which involved in sustainability and considered
to be making the most genuine green efforts of all companies in the United Kingdom
(Chatsworth Communications, 2007). In 2003 Marks and Spencer covers aspects of
production from “field to fork”. The standards comprise traceability, minimize usage of
pesticides, support non-genetically modified foods, ethical trading, and food safety. With
“farm to fork” strategy, the company focused on organic production. However, organic
foods are considered more expensive, Marks and Spencer try to create the margin for
these foods and keep the level of the price more affordable. Further, Marks and Spencer
has been involved in the protection of fish stocks by eliminating the purchase of fish
where the origin of fish stock is unknown. They are also working with Marine
Stewardship Council. Marks and Spencer also uses non-ozone depleting refrigerators.
They use refrigerators with less harmful HFCs, and refrigerators which are consume 4%
less electricity. For transportation they try to use more rail transport system. They donate
unsold foods to the local charities (Cheryl J. Baldwin, 2009.
Frito lay products are owned by PepsiCo and they are strongly committed on
sustainability as they say: “In order to keep our environmental promise, we're continually
innovating, finding new and better ways to reduce emissions from our manufacturing
plants and our delivery vehicles”. Frito Lay is working on reduction of its impact on the
environment. Frito Lay is using solar energy for making Sun Chips. They are using
renewable energy in order to minimize the ecological impact even more. They are also
concerned about developing sustainable packaging for their chips, one of them was Sun
Chips sustainable packaging which was unsuccessful. They used new compostable
package, corn-based bag, which had excess noise. Lots of customers started to complain
about this packaging as they said it is hard to eat the chips and watch TV.
73
There are several ideas from different people which are presented their ideas about
sustainable food and how to develop the concept in the program called TEDx.
In 2012 TEDx which is held in Manhattan, presented by Marianne Cufone about
Recirculating farms-seafood. As the consumers become savvier about their health, their
request for safe, local, and clean food is increased. The government idea was to start
growing more of the fish in US that the people eat instead of importing it, so they
suggested to create giant floating cages in the ocean. The global experience with ocean
fish farming was problematic. It occurs with several drawbacks, such as, habitat damage
of fish, water pollution, marine wild life behavior alterations, increasing infections and
diseases which cause health problem in humans and negative changes to the environment.
The US almost farms everything that people eat, this leads to think about “can we
sustainably raise fish”. This led to many discussions, and research which made them to
come up with the idea of recirculating aquaculture, further they found that it is just one
type of recirculating farm. Recirculating farms can contribute to healthy food in the
United States. Recirculating Farms use clean, recycled water in place of soil to grow
food. There can grow plants through recirculating Hydroponics, fish through recirculating
Aquaculture, and fish and plants together through Aquaponics17. Generally speaking
recirculating farms have one common thing, recycled water. For instance, in Aquaponic
farm, fish in tanks create Nutrients and nutrient filled water is recycled to the plant beds,
where plants absorb those nutrients that they need to grow and the water cleaned, further
cleaned water cycles back to the fish tanks ready for reuse. One of the places that
aquaponics have been used is Cabbage Hill Farms (Mt. Kisco, NY). Cabbage Hill Farm
and Foundation is a non-profit organization, which is using sustainable agriculture, it has
traditional soil base farm, they also raise animals, they grow various types of greens,
vegetable and fruits. Recirculating Farms are closed loop system, this means things in the
farms do not get out and things outside the farm have difficulty to get in, so they can
operate without chemicals and antibiotics, growing more natural food. Recirculating
farms also can be used as reusing waste, like plants absorb nutrients from fish water, or
when taking salads from the system and use them traditionally soil grown plants, it is
fertilizer. One of the most interesting things about the recirculating farms is that they do
17 See Appendix K: How Aquaponics work.
74
not need to be connected to natural water bodies, for filling or drainage, so this means
they can be located anywhere, like indoors, outside, in the hot climate, in the cold
climate, near the coast, and inland. These farms can be put in any community.
Recirculating farms are water efficient, they can reuse up to 99% of the water in the
system, only replacing what lost by evaporation, or waste removal. These farms are also
energy efficient. They can rely on solar, wind, geothermal power. Some farms recycling
other materials for energy, for instance; using oil from restaurants or taking fish waste
from the system and turning it to methane gas to operate generator that helps power
plants. As these farms can be established in any community, farmers can reduce cost on
shipping, and refrigeration, these savings can also be passed to consumers, making good
food more affordable.
The next idea was in TEDx Tokyo event, presented by medical bio expert Dr Yuichi
Mori. He demonstrated how crops can grow almost in any environment, even in space.
With the help of this technology of safe, high quality agriculture crops can be grown
under minimized water and soil consumption. This technology can be utilized for the
lands that contaminated. The cling film like material is based on medical membrane
technology, and called “hydromembrane18”. Seeds are planted in the hydromembrane
which contains all necessary nutrients and water for the plant to grow. The system makes
plants control sugar and amino acids in order to develop, and grow high quality crops,
strawberries and tomatoes grown with this system are sweet and higher nutritional values.
The film has nano size holes, which can absorb the water and nutrition, but it does not let
through any harmful bacteria or germs, so plants do not get sick, thus people do not need
to use agrochemicals, pesticides or fertilizers to grow fruits or vegetables. The sheet can
be laid down almost on any surface, means that crops can be grown almost in any
environment including concrete, non fertile lands, and ice. With this technology infertile
lands can be changed to fertile lands.
Further TEDx held in Zurich, by Roman Gaus—Urban Farming. According UN FAO in
2050 the population will reach 9bn and which 70% will live in cities. The idea of Roman
18 See Appendix L: Hydromembrane
75
is pretty similar to recirculating farms but the location is in specific areas of the city. He
is encouraging farmers to be more close to cities which diminish the transportation level,
which is certainly not efficient for the environment. The system that Roman suggest is
Aquaponics in which fish play role of organic fertilizer for plants. The idea is to use
recycled cargo containers and greenhouses, so on top there are vegetables and in
container fish. The vision is to provide large quantity of food, urban farming. One of the
projects of Urban Farming is to build worldwide first aquaponic rooftop19 farm, growing
fish and plants directly in the city of Basel. With this pilot project of LokDepot in Basel
about 5 tons of vegetables and 800 kg fish can be grown which is food for 100 people.
Moving forward with this project it revealed that in the city of Basel alone there is 2mln
square meter of idle rooftop space, by using just 5% of that through the system of Urban
Farming it can be harvested for 40000 people, so it is a lot potential to grow food in the
city.
3.4 Food Scandals
There are also several food scandals that cause people death like in 1985 was about
diethylene glycol wine scandal in Austria (Sonntagsblitz, 2005). Limited number of
Austrian wineries had illegally adulterated the wines by using toxic substance diethylene
glycol which in ingredient for antifreeze that is used for cars. Wineries added this
substance in order wines to appear sweeter and more full-bodied in the style of late
harvest wines. Many of these wines were transported to Germany. Further the substance
that has been added to the wines revealed by the German wine laboratories performing
quality controls. The affected wines are immediately taken off from the market. People
who were involved into this scandal have been sentenced and fined. Although these
wines are potential health damage, no recorded instances of injures from consumption are
known. Adulterated wines could cause fatal kidney failure.
19 See Appendix M: Rooftop Urban farming.
76
In 1981 toxic oil syndrome happened in Spain which cause over 600 people death (New
York Times, 1987). Its first symptoms appeared to be as lung disease, it resembled to
lung infection and antibiotics were ineffective. The scandal appeared due to consumption
of colza oil which had been intended for industrial used. This oil had been imported as
cheap industrial oil by the company RAPSA in San Sebastian, it had been refined by
company in Seville, and was sold as olive oil by street vendors at weekly street markets.
This oil has been utilized on salads and for cooking. The toxic compounds derived during
the refinement phase.
In 2011 Escherichia coli (E. coli) bacteria caused serious outbreak of food borne illness
in Germany. About 3,950 people were affected, 53 died, 51 of which were in Germany.
Affected people had been come from the visit of Germany and France before becoming
ill. German officials accused Spain about E.coli outbreak for importing cucumbers from
Spain. German officials made incorrect statement about origin of E.coli coming from
cucumbers imported from Spain. The cucumbers were exported from Andalusian
greenhouses and they did not show E. coli contamination (European Commission, 2011) .
Thus researchers started to take into consideration that it may be cross-contamination
during transport in Germany or distribution in Hamburg, and they though most probable
act is cross-contamination inside Germany. When Germany reported that Spanish
cucumbers contain E. coli bacteria, Belgium, Austria and Russia ban on sales of
cucumbers and tomatoes imported from Spain. In Italy food inspectors while testing
cucumbers they have failed to find contamination.
On July 2013 in India while schoolchildren were eating their free midday meal at a
primary school got poisoned (BBC India, 2013). The children who are poisoned were
between five and twelve years old. They fell sick within several minutes of eating a meal
of rice and curried vegetables. Some died almost immediately, and other in the hospital
where they went for treatment. Investigation tests showed that the meal was contaminated
with monocrotophos, a lethal pesticide banned in many countries.
77
For having healthy foods there several organizations have been developed and one of
them is Slow Food. Slow Food is a global, grassroots organization which contains 150
countries as supporters. It links the pleasure of good food with a commitment to their
community and environment. It has been founded in 1989 by Carlo Petrini in Italy. It has
been developed to counter the rise of fast food and fast life and disappearance of local
food, and usage of GMOs. Slow Food has over 100,000 members worldwide. As the
founder and president of Slow Food, Carlo Petrini said: “Slow Food unites the pleasure
of food with responsibility, sustainability and harmony with nature”. Slow Food
Foundation supports the local farming and encourages organizations to move to
sustainable production of foods which are healthier for the people
(http://www.slowfood.com/).
78
CHAPTER IV: CONCLUSION
Food security should be considered. The research showed that the number of customers is
growing towards the interest in the companies that are involved in sustainability, but
being interested is not enough, there should be actions that show that consumers are
buying these products. Nevertheless, since the poverty rate is high, the majority of people
just cannot afford sustainable products.
While doing research about sustainability for the food industry, there were several
limitations such as not so many concrete data has been depicted whether the companies
are involved in the sustainability or not, due to confidentiality. Further companies which
are using labels such as Fairtrade or Rainforest Alliance are considered sustainable
labeling, but sustainability comprises three pillars economical, ecological, and social.
Seems like fairtrade label is more about social phase of sustainability despite it they
should comprise all three aspect.
Generally companies should get involved in sustainability, because that will take us to a
more health and flourishing environment, for that reason companies first should establish
a vision. The vision should outline the companies’ interest in supporting the sustainability
practice and their connection to that system.
While thinking about sustainability enterprises should also take into consideration about
conventional stores, which will make costumers go less to the far located shops and
provide them with sustainable products. Furthermore conventional stores can also use
sustainable lightning and energy consumption, with renewable energy use.
Putting every finding together sustainability food supply chain should include the
following concepts:
Ensure safety of food supply, not pesticides
Provide nutritionally dense food
Provide traceability of product and be credible with customers about the content
of the product
79
Minimize animal products and ingredients, because processing meat generates a
lot greenhouse gasses
Avoid air transportation of food
Process food with minimal inputs; water, raw materials and energy
Move to the processing food with zero waste
Minimize total packaging, and use renewable sources for developing new
packaging, like PLA
Efficiently deliver food to consumer
Create more convenient stores
While making research about food and ecolabling, which made me think that food supply
chain may be an economical issue as for example Spain having an issue about killer
cucumbers which has created bad reputation for Spain cucumber export and stopped in
several countries. Further ecolabling maybe just greenwashing, people cannot be sure to
trust them or not. Food is very important as it carries with it the country of origin as well.
Generally sustainability of food is not depending only on enterprises it also depends on
consumers, the whole system is depend on each other, as for instance; if we recycle every
rubbish to its related litter bin or if we consume the amount that we need and do not need
to through away the outdated product that we bought and kept so long. So we, people
have to control our purchasing routine and recycle everything in a proper way.
Starting from the beginning of the dissertation it was mentioned that world population are
increasing and will reach 9 billion in 2050, therefore people should rethink the way of
their consumption behavior and improve it. As it has been said: “Many a little makes a
mickle”. Which means that even small amount of contribution to betterment of our world
may reach to bigger amounts. If we do not change how the world produces and
distributes its food, then everything will get even worse. People have the solutions; all
they need is the will to act on them. To conclude, we should think about future not only
about today so that’s why companies now are moving to sustainability and we should
also move with them, and we should take into consideration that we should consume the
right amount of everything and let the nature regenerate.
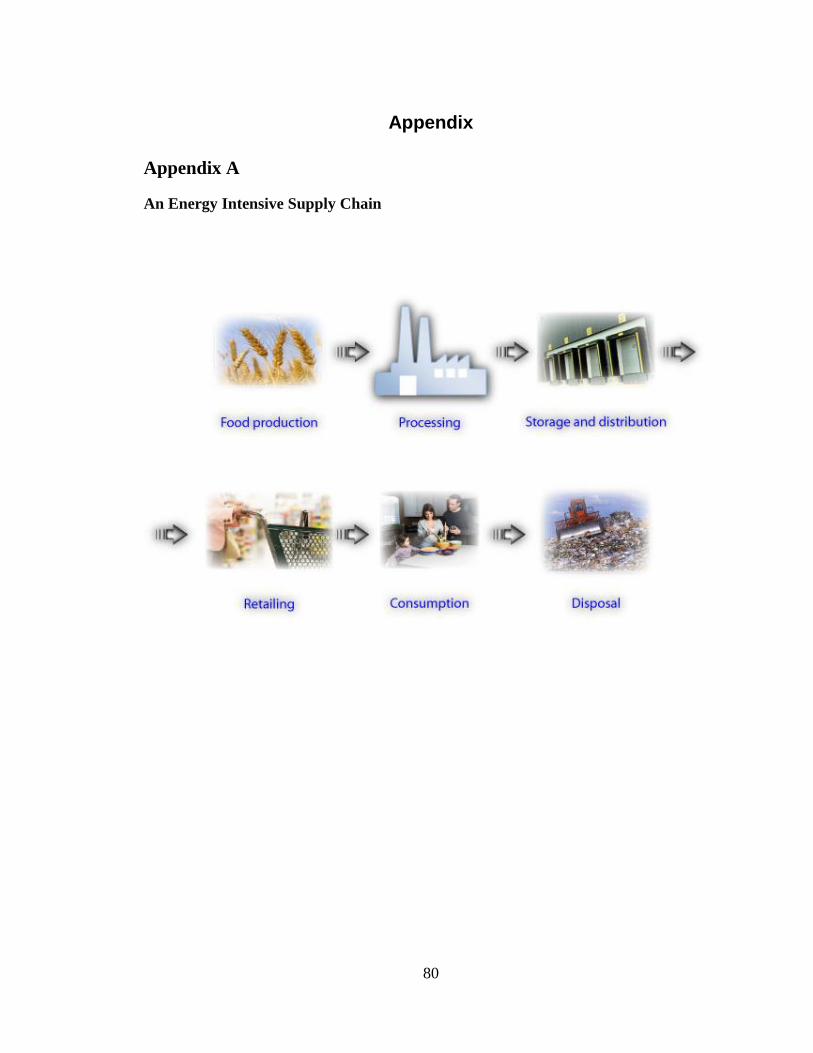
80
Appendix
Appendix A
An Energy Intensive Supply Chain
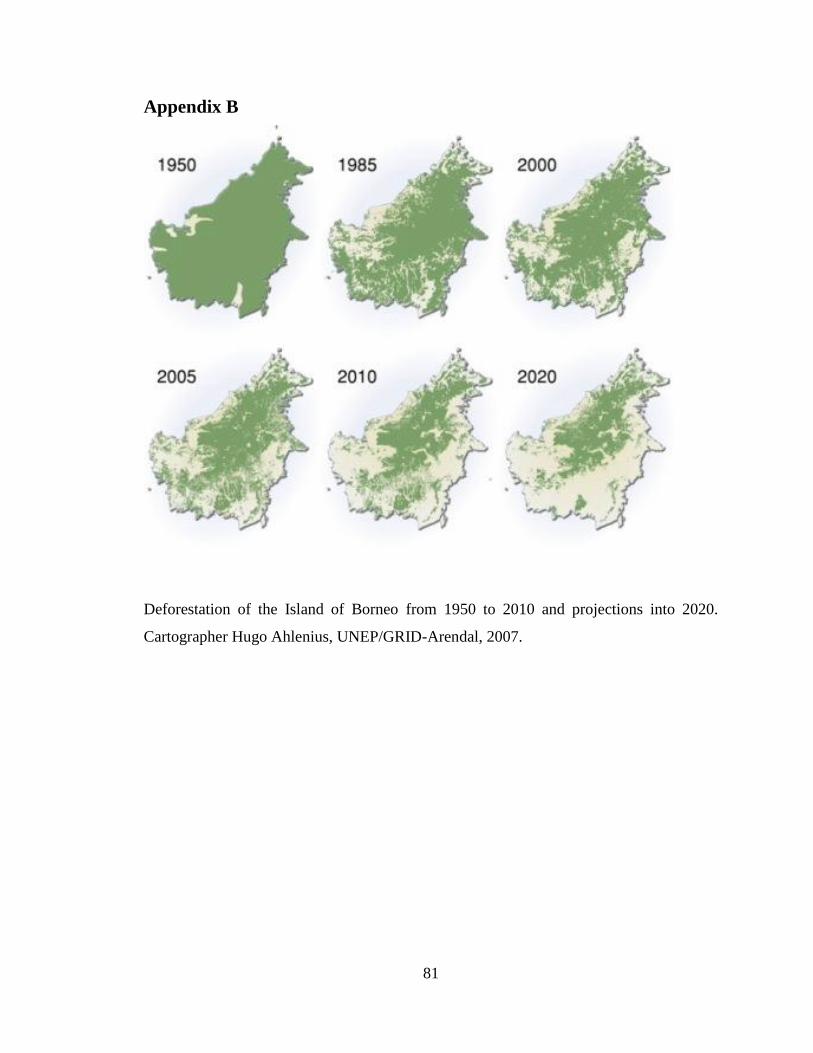
81
Appendix B
Deforestation of the Island of Borneo from 1950 to 2010 and projections into 2020.
Cartographer Hugo Ahlenius, UNEP/GRID-Arendal, 2007.
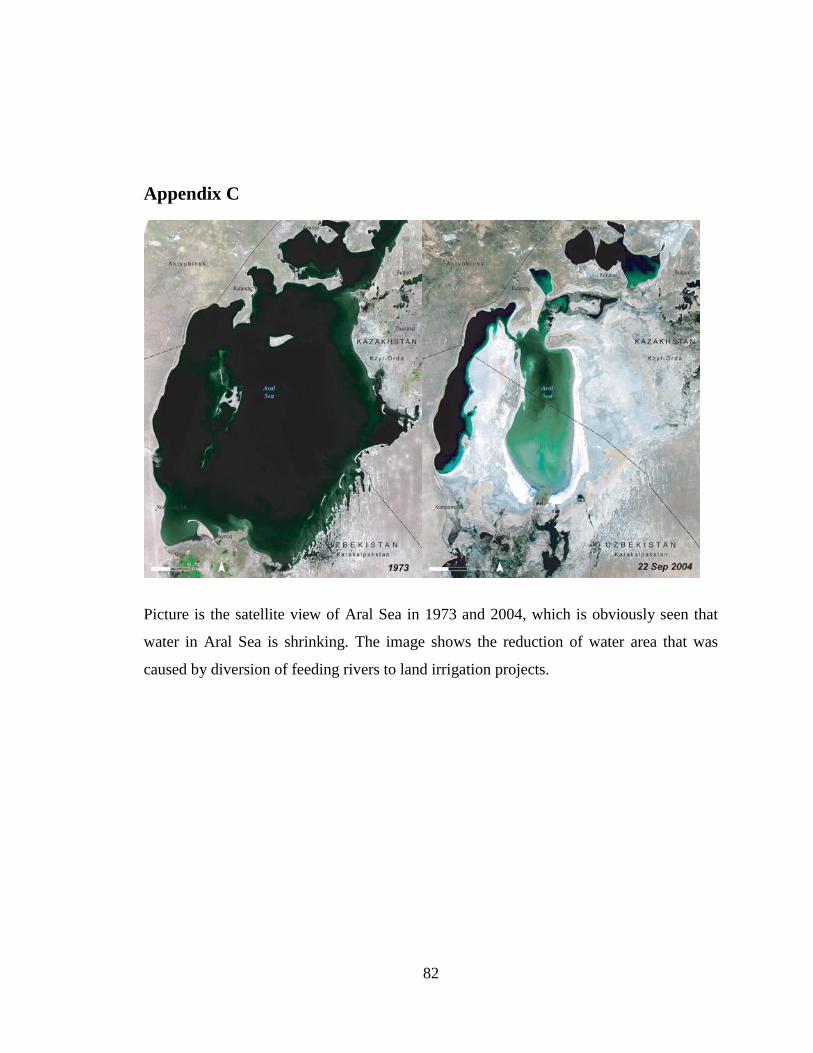
82
Appendix C
Picture is the satellite view of Aral Sea in 1973 and 2004, which is obviously seen that
water in Aral Sea is shrinking. The image shows the reduction of water area that was
caused by diversion of feeding rivers to land irrigation projects.
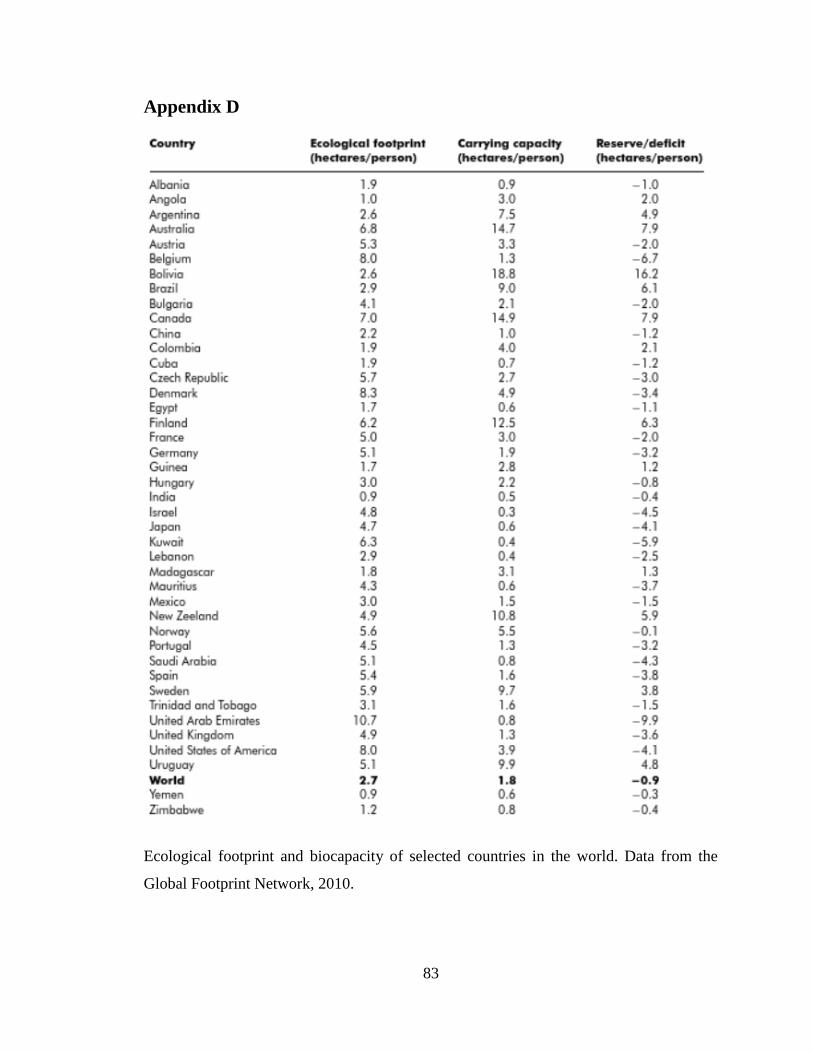
83
Appendix D
Ecological footprint and biocapacity of selected countries in the world. Data from the
Global Footprint Network, 2010.
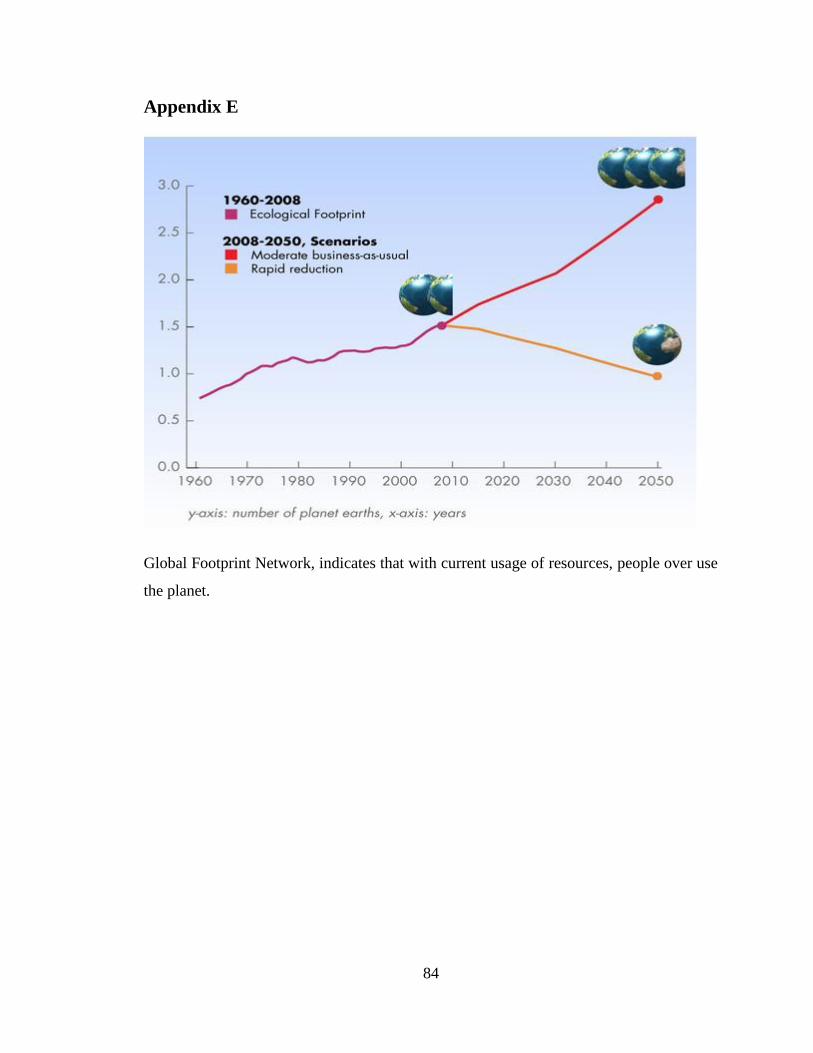
84
Appendix E
Global Footprint Network, indicates that with current usage of resources, people over use
the planet.
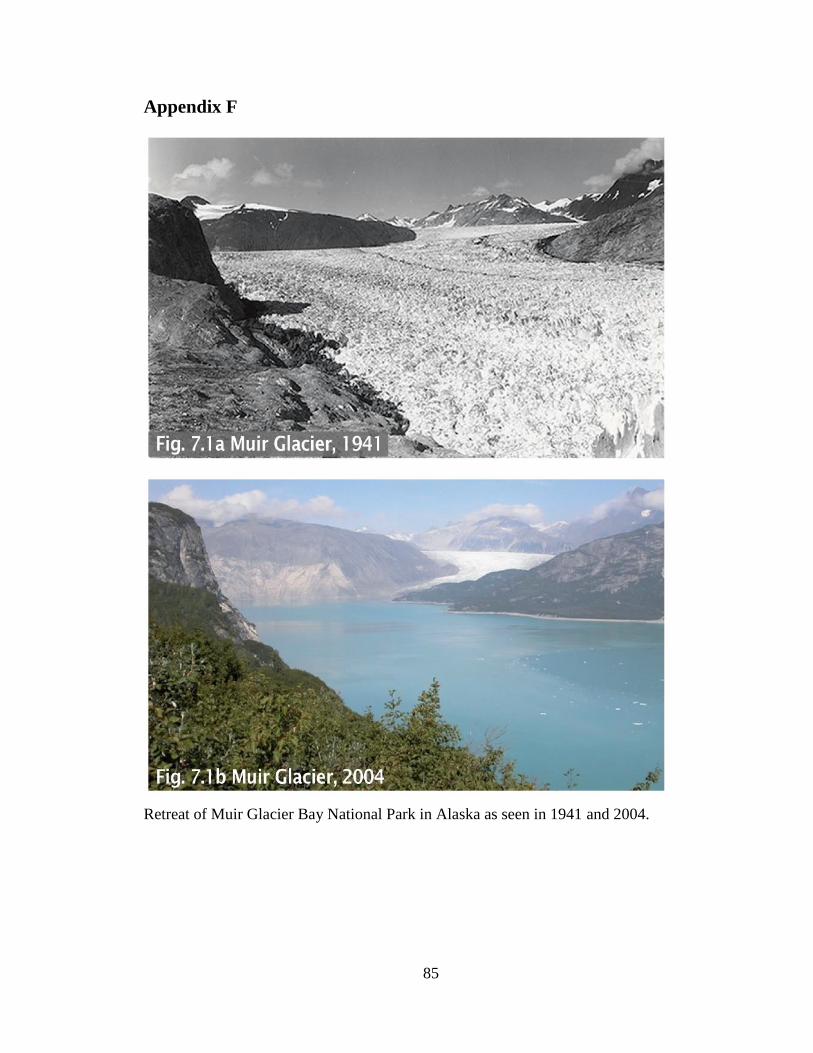
85
Appendix F
Retreat of Muir Glacier Bay National Park in Alaska as seen in 1941 and 2004.

86
Appendix G
Country 2002 2000 1990 1980 1970 1961
• Source: Food and Agriculture Organization of the United Nations (FAO), FAOSTAT on-line statistical service (FAO, Rome, 2004). Available online at: http://apps.fao.org • Meat consumption per capita refers to the total meat retained for use in country per person per year. Total meat includes meat from animals slaughtered in countries, irrespective of their origin, and comprises horsemeat, poultry, and meat from all other domestic or wild animals such as camels, rabbits, reindeer, and game animals • Per capita calculations were conducted by WRI using FAO data on meat production and trade, and using U.N. data on population. Meat consumption was calculated using a trade balance approach - total production plus imports, minus exports
Albania 38.2 29.5 17.8 15.6 14.6 15.3
Algeria 18.3 18.9 17.8 11.1 8.3 11.7
American Samoa 24.9 54.1 125.9 142.4 79.3 100.8
Angola 19 17.4 15.1 15.4 11.2 6.8
Antigua and Barbuda 56 72.2 94.9 51.6 33.4 19.2
Argentina 97.6 104.3 100.6 114.4 110.4 103.6
Armenia 27.7 27.4 .. .. .. ..
Austria 94.1 113.9 103.7 94.7 76.1 65.6
Azerbaijan 15.9 16.1 .. .. .. ..
Bahamas, The 123.6 151.7 100.2 110.7 97 68.4
Bahrain 70.7 63.6 74.8 58.9 18 15.4
Bangladesh 3.1 3.1 2.8 2.4 3.7 3.2
Barbados 88.7 92.6 104.8 82.6 63.6 34.7
Belarus 58.6 59.7 .. .. .. ..
Belgium 86.1 88.2 .. .. .. ..
Belize 74.7 55.3 58.4 38.9 33.3 20.6
Benin 16.2 16.4 11.2 12.1 10.1 8.6
Bhutan 3 3.4 4.2 4.1 3.8 3.3
Bolivia 50 48.5 39.8 41.4 29.3 25.9
Bosnia and Herzegovina 21.4 15.5 .. .. .. ..
Botswana 27.3 23.6 31.2 15.6 39.1 28.9
Brazil 82.4 81 50.2 41.7 30.8 27.8
Brunei 56.4 57.3 48.4 38.9 22.9 16.9
Bulgaria 69.4 61.8 81.4 60.3 40.3 32.3
Burkina Faso 11.2 11.4 11.1 7.7 10.4 8.3
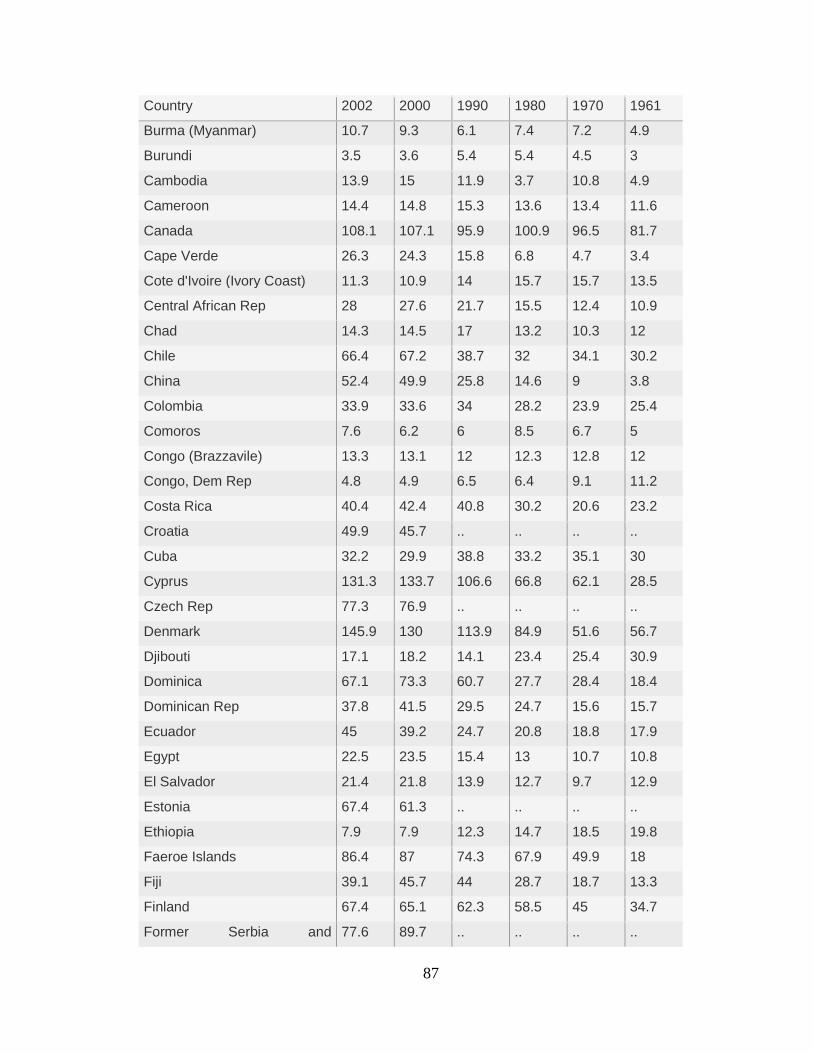
87
Country 2002 2000 1990 1980 1970 1961
Burma (Myanmar) 10.7 9.3 6.1 7.4 7.2 4.9
Burundi 3.5 3.6 5.4 5.4 4.5 3
Cambodia 13.9 15 11.9 3.7 10.8 4.9
Cameroon 14.4 14.8 15.3 13.6 13.4 11.6
Canada 108.1 107.1 95.9 100.9 96.5 81.7
Cape Verde 26.3 24.3 15.8 6.8 4.7 3.4
Cote d'Ivoire (Ivory Coast) 11.3 10.9 14 15.7 15.7 13.5
Central African Rep 28 27.6 21.7 15.5 12.4 10.9
Chad 14.3 14.5 17 13.2 10.3 12
Chile 66.4 67.2 38.7 32 34.1 30.2
China 52.4 49.9 25.8 14.6 9 3.8
Colombia 33.9 33.6 34 28.2 23.9 25.4
Comoros 7.6 6.2 6 8.5 6.7 5
Congo (Brazzavile) 13.3 13.1 12 12.3 12.8 12
Congo, Dem Rep 4.8 4.9 6.5 6.4 9.1 11.2
Costa Rica 40.4 42.4 40.8 30.2 20.6 23.2
Croatia 49.9 45.7 .. .. .. ..
Cuba 32.2 29.9 38.8 33.2 35.1 30
Cyprus 131.3 133.7 106.6 66.8 62.1 28.5
Czech Rep 77.3 76.9 .. .. .. ..
Denmark 145.9 130 113.9 84.9 51.6 56.7
Djibouti 17.1 18.2 14.1 23.4 25.4 30.9
Dominica 67.1 73.3 60.7 27.7 28.4 18.4
Dominican Rep 37.8 41.5 29.5 24.7 15.6 15.7
Ecuador 45 39.2 24.7 20.8 18.8 17.9
Egypt 22.5 23.5 15.4 13 10.7 10.8
El Salvador 21.4 21.8 13.9 12.7 9.7 12.9
Estonia 67.4 61.3 .. .. .. ..
Ethiopia 7.9 7.9 12.3 14.7 18.5 19.8
Faeroe Islands 86.4 87 74.3 67.9 49.9 18
Fiji 39.1 45.7 44 28.7 18.7 13.3
Finland 67.4 65.1 62.3 58.5 45 34.7
Former Serbia and 77.6 89.7 .. .. .. ..
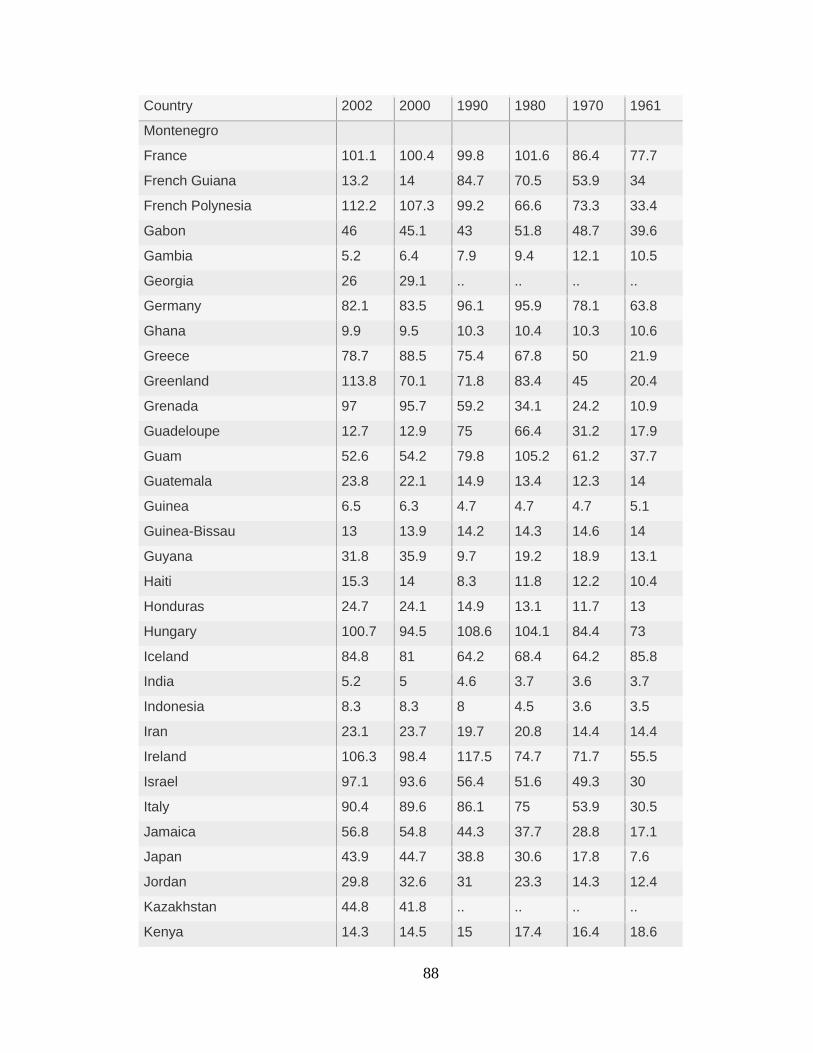
88
Country 2002 2000 1990 1980 1970 1961
Montenegro
France 101.1 100.4 99.8 101.6 86.4 77.7
French Guiana 13.2 14 84.7 70.5 53.9 34
French Polynesia 112.2 107.3 99.2 66.6 73.3 33.4
Gabon 46 45.1 43 51.8 48.7 39.6
Gambia 5.2 6.4 7.9 9.4 12.1 10.5
Georgia 26 29.1 .. .. .. ..
Germany 82.1 83.5 96.1 95.9 78.1 63.8
Ghana 9.9 9.5 10.3 10.4 10.3 10.6
Greece 78.7 88.5 75.4 67.8 50 21.9
Greenland 113.8 70.1 71.8 83.4 45 20.4
Grenada 97 95.7 59.2 34.1 24.2 10.9
Guadeloupe 12.7 12.9 75 66.4 31.2 17.9
Guam 52.6 54.2 79.8 105.2 61.2 37.7
Guatemala 23.8 22.1 14.9 13.4 12.3 14
Guinea 6.5 6.3 4.7 4.7 4.7 5.1
Guinea-Bissau 13 13.9 14.2 14.3 14.6 14
Guyana 31.8 35.9 9.7 19.2 18.9 13.1
Haiti 15.3 14 8.3 11.8 12.2 10.4
Honduras 24.7 24.1 14.9 13.1 11.7 13
Hungary 100.7 94.5 108.6 104.1 84.4 73
Iceland 84.8 81 64.2 68.4 64.2 85.8
India 5.2 5 4.6 3.7 3.6 3.7
Indonesia 8.3 8.3 8 4.5 3.6 3.5
Iran 23.1 23.7 19.7 20.8 14.4 14.4
Ireland 106.3 98.4 117.5 74.7 71.7 55.5
Israel 97.1 93.6 56.4 51.6 49.3 30
Italy 90.4 89.6 86.1 75 53.9 30.5
Jamaica 56.8 54.8 44.3 37.7 28.8 17.1
Japan 43.9 44.7 38.8 30.6 17.8 7.6
Jordan 29.8 32.6 31 23.3 14.3 12.4
Kazakhstan 44.8 41.8 .. .. .. ..
Kenya 14.3 14.5 15 17.4 16.4 18.6
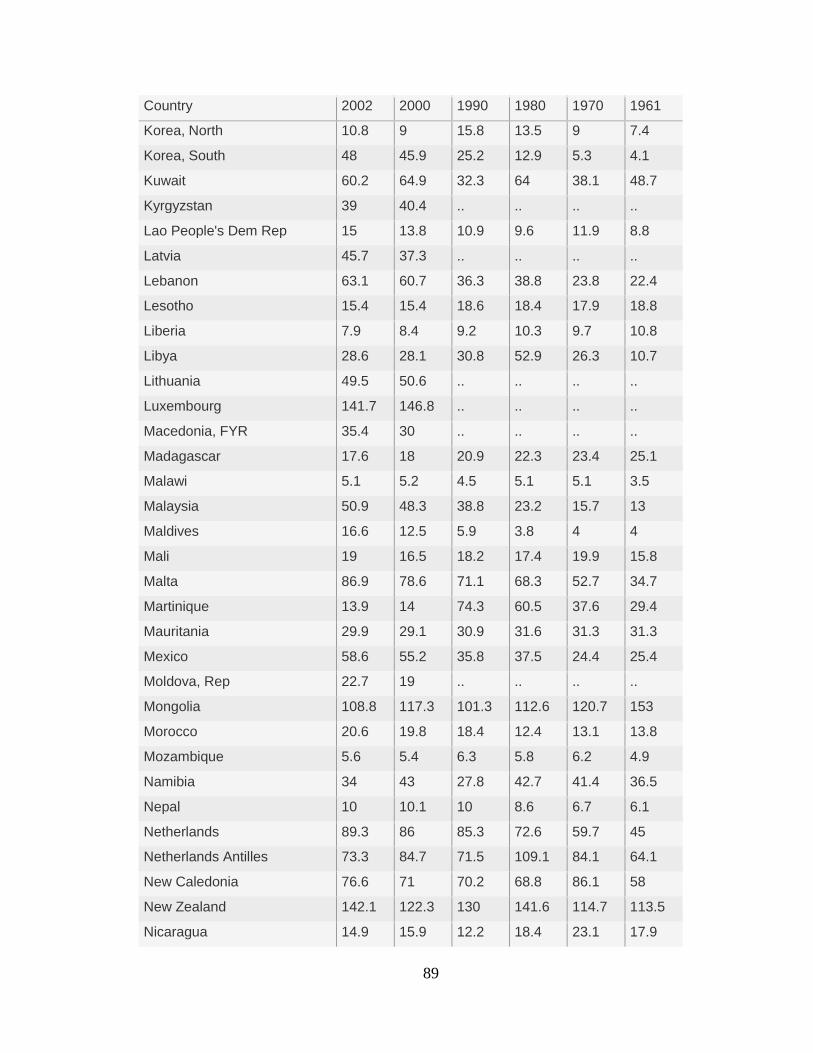
89
Country 2002 2000 1990 1980 1970 1961
Korea, North 10.8 9 15.8 13.5 9 7.4
Korea, South 48 45.9 25.2 12.9 5.3 4.1
Kuwait 60.2 64.9 32.3 64 38.1 48.7
Kyrgyzstan 39 40.4 .. .. .. ..
Lao People's Dem Rep 15 13.8 10.9 9.6 11.9 8.8
Latvia 45.7 37.3 .. .. .. ..
Lebanon 63.1 60.7 36.3 38.8 23.8 22.4
Lesotho 15.4 15.4 18.6 18.4 17.9 18.8
Liberia 7.9 8.4 9.2 10.3 9.7 10.8
Libya 28.6 28.1 30.8 52.9 26.3 10.7
Lithuania 49.5 50.6 .. .. .. ..
Luxembourg 141.7 146.8 .. .. .. ..
Macedonia, FYR 35.4 30 .. .. .. ..
Madagascar 17.6 18 20.9 22.3 23.4 25.1
Malawi 5.1 5.2 4.5 5.1 5.1 3.5
Malaysia 50.9 48.3 38.8 23.2 15.7 13
Maldives 16.6 12.5 5.9 3.8 4 4
Mali 19 16.5 18.2 17.4 19.9 15.8
Malta 86.9 78.6 71.1 68.3 52.7 34.7
Martinique 13.9 14 74.3 60.5 37.6 29.4
Mauritania 29.9 29.1 30.9 31.6 31.3 31.3
Mexico 58.6 55.2 35.8 37.5 24.4 25.4
Moldova, Rep 22.7 19 .. .. .. ..
Mongolia 108.8 117.3 101.3 112.6 120.7 153
Morocco 20.6 19.8 18.4 12.4 13.1 13.8
Mozambique 5.6 5.4 6.3 5.8 6.2 4.9
Namibia 34 43 27.8 42.7 41.4 36.5
Nepal 10 10.1 10 8.6 6.7 6.1
Netherlands 89.3 86 85.3 72.6 59.7 45
Netherlands Antilles 73.3 84.7 71.5 109.1 84.1 64.1
New Caledonia 76.6 71 70.2 68.8 86.1 58
New Zealand 142.1 122.3 130 141.6 114.7 113.5
Nicaragua 14.9 15.9 12.2 18.4 23.1 17.9
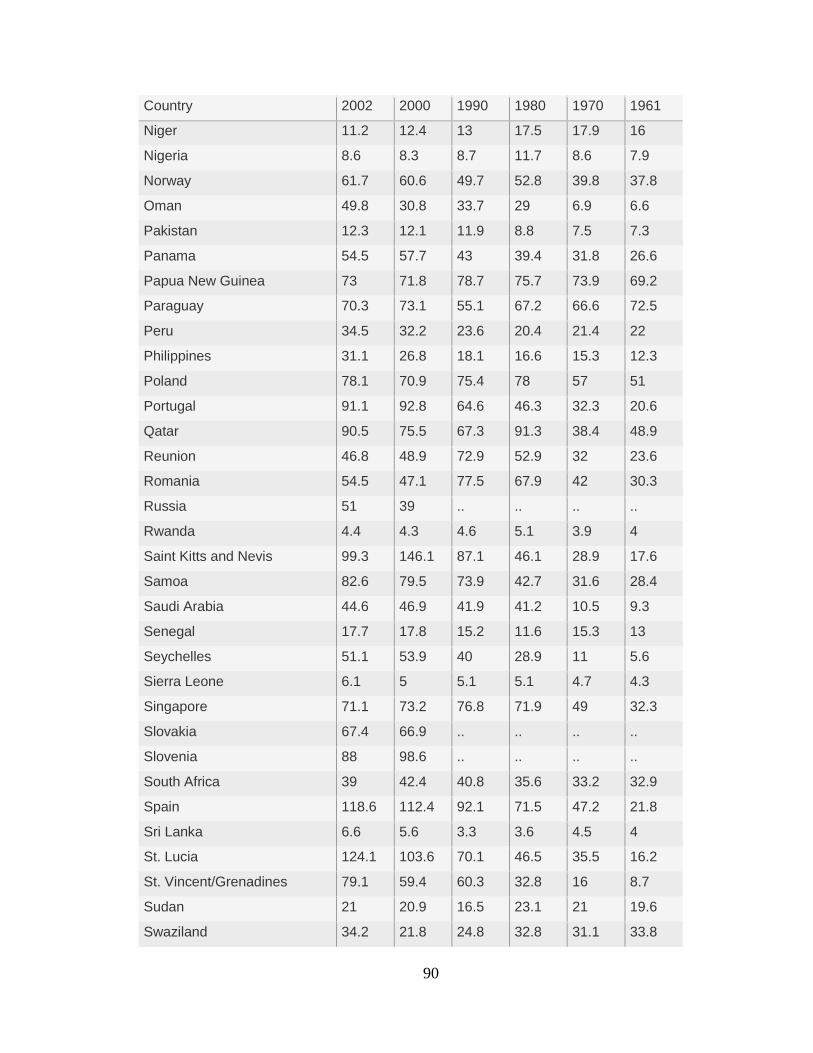
90
Country 2002 2000 1990 1980 1970 1961
Niger 11.2 12.4 13 17.5 17.9 16
Nigeria 8.6 8.3 8.7 11.7 8.6 7.9
Norway 61.7 60.6 49.7 52.8 39.8 37.8
Oman 49.8 30.8 33.7 29 6.9 6.6
Pakistan 12.3 12.1 11.9 8.8 7.5 7.3
Panama 54.5 57.7 43 39.4 31.8 26.6
Papua New Guinea 73 71.8 78.7 75.7 73.9 69.2
Paraguay 70.3 73.1 55.1 67.2 66.6 72.5
Peru 34.5 32.2 23.6 20.4 21.4 22
Philippines 31.1 26.8 18.1 16.6 15.3 12.3
Poland 78.1 70.9 75.4 78 57 51
Portugal 91.1 92.8 64.6 46.3 32.3 20.6
Qatar 90.5 75.5 67.3 91.3 38.4 48.9
Reunion 46.8 48.9 72.9 52.9 32 23.6
Romania 54.5 47.1 77.5 67.9 42 30.3
Russia 51 39 .. .. .. ..
Rwanda 4.4 4.3 4.6 5.1 3.9 4
Saint Kitts and Nevis 99.3 146.1 87.1 46.1 28.9 17.6
Samoa 82.6 79.5 73.9 42.7 31.6 28.4
Saudi Arabia 44.6 46.9 41.9 41.2 10.5 9.3
Senegal 17.7 17.8 15.2 11.6 15.3 13
Seychelles 51.1 53.9 40 28.9 11 5.6
Sierra Leone 6.1 5 5.1 5.1 4.7 4.3
Singapore 71.1 73.2 76.8 71.9 49 32.3
Slovakia 67.4 66.9 .. .. .. ..
Slovenia 88 98.6 .. .. .. ..
South Africa 39 42.4 40.8 35.6 33.2 32.9
Spain 118.6 112.4 92.1 71.5 47.2 21.8
Sri Lanka 6.6 5.6 3.3 3.6 4.5 4
St. Lucia 124.1 103.6 70.1 46.5 35.5 16.2
St. Vincent/Grenadines 79.1 59.4 60.3 32.8 16 8.7
Sudan 21 20.9 16.5 23.1 21 19.6
Swaziland 34.2 21.8 24.8 32.8 31.1 33.8
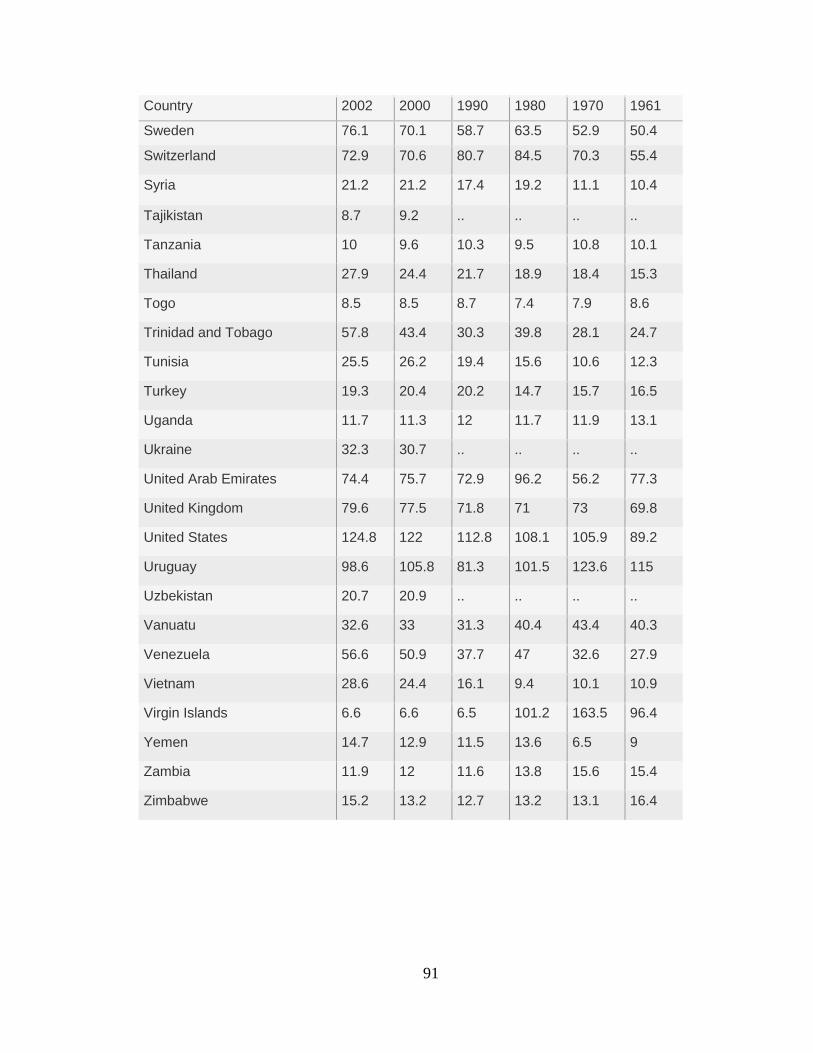
91
Country 2002 2000 1990 1980 1970 1961
Sweden 76.1 70.1 58.7 63.5 52.9 50.4
Switzerland 72.9 70.6 80.7 84.5 70.3 55.4
Syria 21.2 21.2 17.4 19.2 11.1 10.4
Tajikistan 8.7 9.2 .. .. .. ..
Tanzania 10 9.6 10.3 9.5 10.8 10.1
Thailand 27.9 24.4 21.7 18.9 18.4 15.3
Togo 8.5 8.5 8.7 7.4 7.9 8.6
Trinidad and Tobago 57.8 43.4 30.3 39.8 28.1 24.7
Tunisia 25.5 26.2 19.4 15.6 10.6 12.3
Turkey 19.3 20.4 20.2 14.7 15.7 16.5
Uganda 11.7 11.3 12 11.7 11.9 13.1
Ukraine 32.3 30.7 .. .. .. ..
United Arab Emirates 74.4 75.7 72.9 96.2 56.2 77.3
United Kingdom 79.6 77.5 71.8 71 73 69.8
United States 124.8 122 112.8 108.1 105.9 89.2
Uruguay 98.6 105.8 81.3 101.5 123.6 115
Uzbekistan 20.7 20.9 .. .. .. ..
Vanuatu 32.6 33 31.3 40.4 43.4 40.3
Venezuela 56.6 50.9 37.7 47 32.6 27.9
Vietnam 28.6 24.4 16.1 9.4 10.1 10.9
Virgin Islands 6.6 6.6 6.5 101.2 163.5 96.4
Yemen 14.7 12.9 11.5 13.6 6.5 9
Zambia 11.9 12 11.6 13.8 15.6 15.4
Zimbabwe 15.2 13.2 12.7 13.2 13.1 16.4

92
Appendix H
Municipal solid waste generated in the United States by material in 2006. From
Environmental Protection Agency (EPA), 2007.
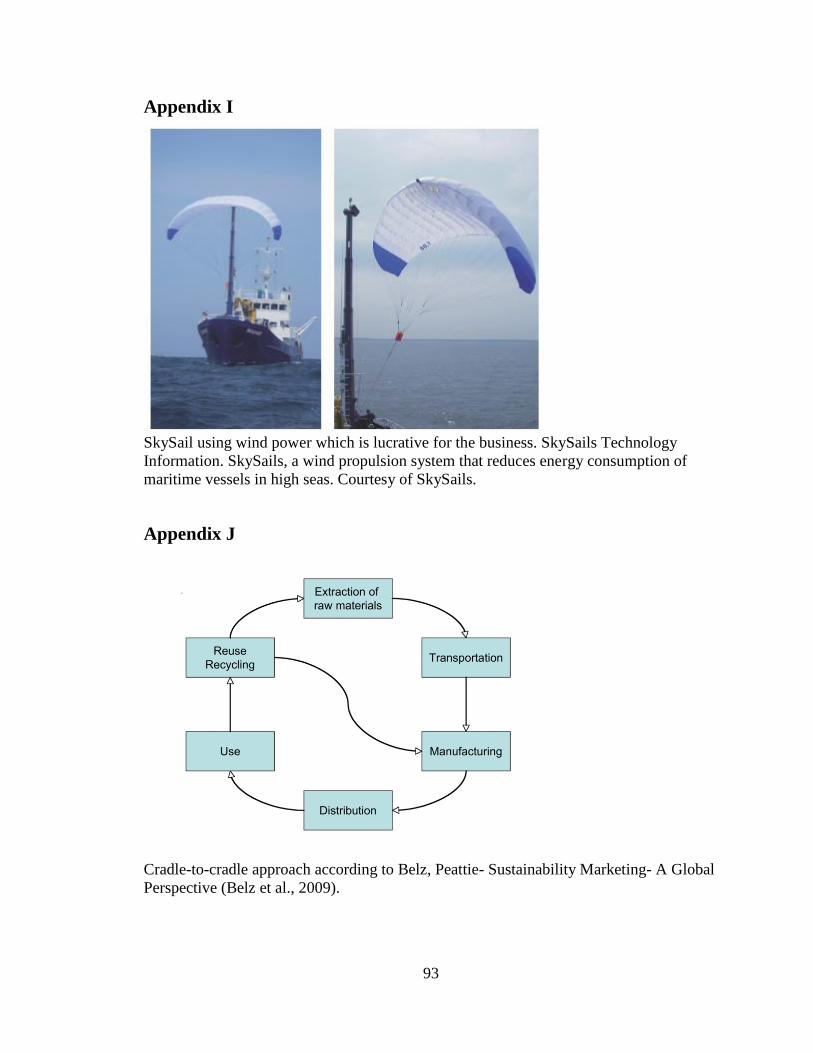
93
Appendix I
SkySail using wind power which is lucrative for the business. SkySails Technology
Information. SkySails, a wind propulsion system that reduces energy consumption of
maritime vessels in high seas. Courtesy of SkySails.
Appendix J
Cradle-to-cradle approach according to Belz, Peattie- Sustainability Marketing- A Global
Perspective (Belz et al., 2009).
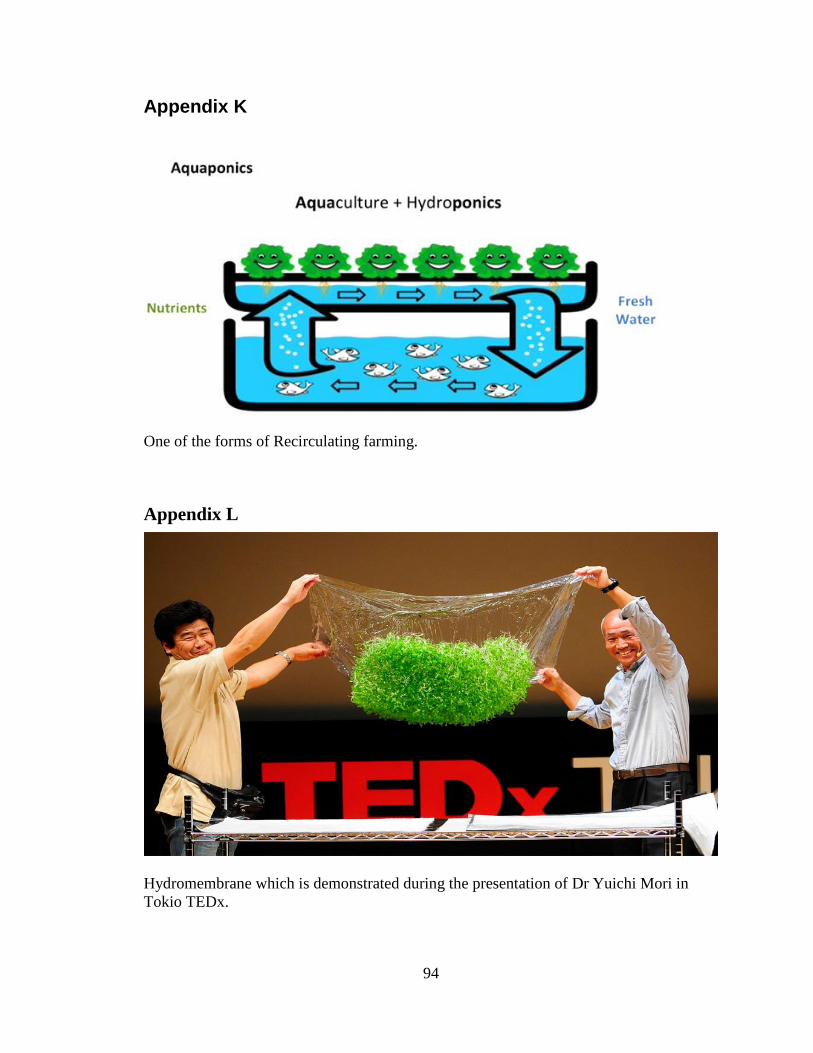
94
Appendix K
One of the forms of Recirculating farming.
Appendix L
Hydromembrane which is demonstrated during the presentation of Dr Yuichi Mori in
Tokio TEDx.
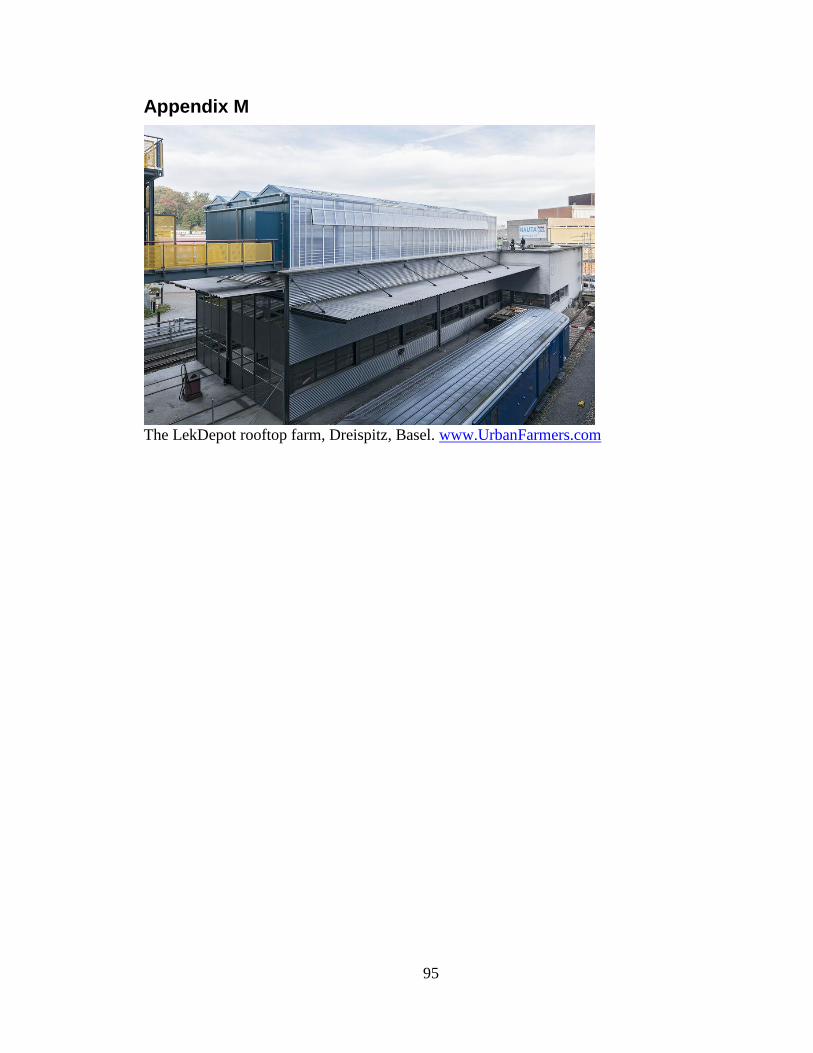
95
Appendix M
The LekDepot rooftop farm, Dreispitz, Basel. www.UrbanFarmers.com
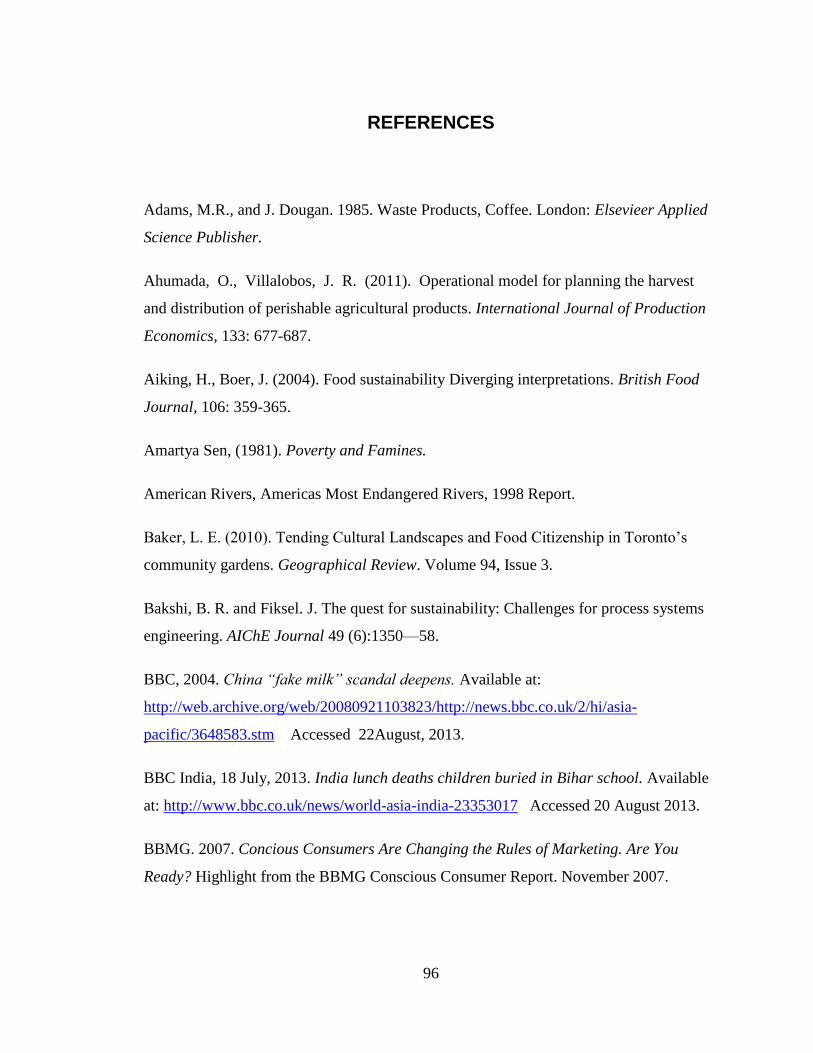
96
REFERENCES
Adams, M.R., and J. Dougan. 1985. Waste Products, Coffee. London: Elsevieer Applied
Science Publisher.
Ahumada, O., Villalobos, J. R. (2011). Operational model for planning the harvest
and distribution of perishable agricultural products. International Journal of Production
Economics, 133: 677-687.
Aiking, H., Boer, J. (2004). Food sustainability Diverging interpretations. British Food
Journal, 106: 359-365.
Amartya Sen, (1981). Poverty and Famines.
American Rivers, Americas Most Endangered Rivers, 1998 Report.
Baker, L. E. (2010). Tending Cultural Landscapes and Food Citizenship in Toronto’s
community gardens. Geographical Review. Volume 94, Issue 3.
Bakshi, B. R. and Fiksel. J. The quest for sustainability: Challenges for process systems
engineering. AIChE Journal 49 (6):1350—58.
BBC, 2004. China “fake milk” scandal deepens. Available at:
http://web.archive.org/web/20080921103823/http://news.bbc.co.uk/2/hi/asia-
pacific/3648583.stm Accessed 22August, 2013.
BBC India, 18 July, 2013. India lunch deaths children buried in Bihar school. Available
at: http://www.bbc.co.uk/news/world-asia-india-23353017 Accessed 20 August 2013.
BBMG. 2007. Concious Consumers Are Changing the Rules of Marketing. Are You
Ready? Highlight from the BBMG Conscious Consumer Report. November 2007.
97
Bellarby, J., B. Foereid, A. Hastings, and P.Smith. 2008. Cool Farming: Climate Impacts
of Agriculture and Mitigation potential. Amsterdam, the Netherlands: Greenpeace.
Belz, F.-M. & Hugenschmidt, H. 1995. ‘Ecology and competitiveness in Swiss
industries‘, Business Strategy and the Environment, 4(4): 229-36.
Belz, F.M. 2006. ‘Marketing in the 21st century’, Business Strategy and the Environment,
15(3): 139-44.
Belz, Frank-Martin and Peattie, Ken, Sustainability Marketing: A Global Perspective,
2009, John Wiley and Sons, Ltd. p. 162
Betsy Taylor and Dave Tilford “Why Consumption Matters”, in The Consumer Society
Reader Edited by Juliet B. Schor and Douglas Holt (2000), p. 467.
Bilgen, B., Ozkarahan, I. (2007). A mixed-integer linear programming model for bulk
grain blending and shipping. International Journal of Production Economics, 107: 555-
571.
Bloemhof, J. (2005). Sustainable supply chains for the future. Medium econometrische
toepassingen, 13: 12-15.
Brachfeld, D., T. Dritz, S. Kodama, A. Phipps, E. Steiner, and G.A. Keoleian. 2001. Life
Cycle Assessment of the Stonyfield Farm Product Delivery System. Center for
Sustainable Systems University of Michigan. Report No. CSS01-03. April 2001.
Brown, L. R., M. Renner, abd C. Flavin. 1998. The Environmental Trends That are
Shaping Our Future. New York: W.W. Norton.
Carawan, R.E., and D.H. Pilkington. 1986. Reduction in Waste Load from a Meat
Processing Plant-Beef. Pp. 27624—27695. Raleigh, NC: North Carolina State
University.
98
Cascorbi, A. 2004. Seafood watch, seafood report: Sardines. Volume I. Available at:
www.montereybayaquarium.org/cr/cr_seafoodwatch/content/media/MBA_SeafoodWatch
_PacificSardineReport.pdf Accessed 20th July 2013
Chaabane, A., Ramudhin, A., and Paquet, M. (2012). Design of sustainable supply
chains under the emission trading scheme. International Journal of Production
Economics, 135: 37-49.
Chatsworth Communications. 2007. UK Big Business Puts Image and Consumer
Pressure Ahead of Genuine Concern for the Environment, According to First Major UK
Survey of Opinion Formers. Press Release. September 23, 2007.
Cheryl J. Baldwin, 2009. Sustainability in the food industry. Biobased packaging, p104-
105.
Cheryl J. Baldwin, 2009. Sustainability in the food industry. Distribution, p62-96.
Church, J. A. and White, N. J. 2006. A 20th century acceleration in global sea level rise.
Geophysical research letters 33, L01602. Doi: 10.1029/2005GL024826.
Cohen, M. L. 2000. Changing patterns of infectious disease. Nature 406: 762-767.
Compassion in World Farming. 2008. Global Warming: Climate Change and Farm
Animal Welfare.
Cook, M. 1998. Reducing water pollution from animal feeding operations. National water
quality inventory, EPA report to congress, EPA 841R001. Washington, DC.
Cummins Engine Company. 2007. Secrets of better fuel economy: The physics of MPG.
Available at: http://komfortkruisers.com/PDF%20Docs/Diesel%20MPG%20Secrets.pdf
Accessed August 23, 2013
99
Dabbene, F., Gay, P., Sacco, N. (2008). Optimisation of fresh-food supply chains
in uncertain environments, Part I: Background and methodology. Biosystems
Engineering, 99: 348-359.
DEFRA 2002 The strategy for sustainable farming and food: facing the future, 51 pp.
London, UK: DEFRA Publications
DEFRA, Food Security and the UK: An Evidence and Analysis Paper. Food Chain
Analysis Group. 2006, Department for Environment, Food and Rural Affairs - Food
Chain Analysis Group.
DEFRA. 2006. Food Industry Sustainability Strategy 2006. Report PB 11649.
Eksioglu, S. D., Jin, M. Z. (2006). Cross-facility production and transportation planning
problem with perishable inventory. Computational Science and Its Applications - Iccsa
2006, Pt 3, 3982: 708-717.
Elizabeth Royte. August 2006. Smithsonian magazine. Corn plastic to the rescue.
Available from: http://www.smithsonianmag.com/science-
nature/plastic.html?c=y&page=1 . Accessed August 1, 2013.
Envirowise. 2008. Food and Drink Essentials: Environmental Information for the
Industry. UK: Envirowise.
Envirowise. 2008. Packaging design for the environment: Reducing costs and Quantities.
UK: Envirowise.
EPA. 2008. Puzzled About Recycling’s Value: Look Beyond the Bin.
Erkman, S. 1197. Industrial Ecology: An historical view. J. Clean. Prod. 5 (1—2): 1—10.
European Commission, 01 June, 2011. Efforts intensify to identify source of E. coli
outbreak in Germany as final tests clear Spanish cucumbers. Available at:
http://europa.eu/rapid/press-release_MEMO-11-366_en.htm Accessed 12 August 2013.
100
European Commission. 1997. Final Report on Cleaner Technologies for Waste
Minimization. Luxemburg: European Commission.
European Commission. 2003. Communication from the commission to the coucil and the
European parliament. Integrated product policy. Building on Environmental Life-Cycle
Thinking. COM (2000) 302 final.
Fair-trade Labeling Organizations. 2007. Annual Report 2006/2007. Bonn, Germany:
Fairtrade Labeling Organizations.
FAO (1983) Progress in Implementation of the Plan of Action to Strengthen World Food
Security. C/83/29. FAO, Rome.
FAO (Food and Agriculture Organization) 2009. Declaration of the World Summit on
Food Security, WSFS 2009/2. Rome: Food and Agriculture Organization of the United
Nations.
FAO of the United Nations. 2005. Water use in agriculture.
FDF. Delivering for the UK Food and Drink Industry. 2006, Food and Drink Federation,
London.
Felicity Brown, 2009. The Gurdian. Available at
http://www.theguardian.com/environment/datablog/2009/sep/02/meat-consumption-per-
capita-climate-change. Accessed 22 July, 2013.
Foster, C., et al. 2006. Environmental impact of food production and consumption: A
report to the Department for Environment, Food, and Rural Affairs. Defra, London:
Manchester Business School.
Frances Harris. 2004. “The U.S. produced approximately 33% of the world’s waste with
4.6% of the world’s population” (Miller 1998) quoted in Global Environmental Issues by.
Frazier, L. 2007. Reproductive disorders associated with pesticide exposure. J.
Agromedicine 12(1):27-37.
101
Frijns, J., P.T. Phuong, and A.P.J. Mol. 2000. Ecological Modernization Theory and
Industrializing Economies: The Case of Vietnam, Ecological Modernization Around the
World: perspectives and critical debates, pp.257—292. London, Portland: Frank Cass.
Fritz, M., Schiefer, G. 2008. Food chain management for sustainable food system
development: a European research agenda. Agribusiness, 24: 440-452.
Fryer, P. 1995. Clean technology in the food industry, clean technology and the
environment, pp. 254—276. London: Blackie Academic & Professional.
Fuller, D. A. 1999.Sustainable marketing. Managerial-ecological Issues, Thousand Oaks,
CA: Sage, pp. 65—8.
Gary Cross, Time and Money (1993), p. 192.
George S. How the other half dies: the real reasons for world hunger. 1976,
Harmondsworth, Penguin.
Glantz, M. H. and Thompson, J. D. 1981. Resource management and environmental
uncertainty: Lessons from coastal upwelling fisheries. Hoboken, NJ: John Wiley & Sons.
Gleason, K. L., et al. 2008. A revised US climate extremes index. Journal of climate 21:
2124—37.
Global Footprint Network. 2010. Available at: www.footprintnetwork.org . Accessed 20
July 2013.
Global footprint network. Accessed July 22, 2013
http://www.footprintnetwork.org/en/index.php/GFN/page/world_footprint/
Greeley, W. B. 1925. The relation of geography to timber supply. Economic Geography 1
(1): 1—14.
Greenbiz.com. 2008. Wal-Mart Expands Sustainability Efforts with Coffee, Trucks.
102
Gunasekaran, A., Lai, K. H., and Cheng, T. C. E. (2008). Responsive supply chain: A
competitive strategy in a networked economy. Omega-International Journal of
Management Science, 36: 549-564.
Hannington W. Unemployed Struggles 1919-1936. 1977 (1936), London, Lawrence and
Wishart.
Hassanein , N. (2003) Practicing food democracy: a pragmatic politics of transformation,
Journal of Rural Studies, 19(1), pp. 77–86.
Haugaard, V. K., and G. Mortensen. 2003. Biobased Food Packaging in
Environmentally—Friendly Food Processing. Cambridge, England: Woodhead
Publishing Limited.
Heal, G. and Schlenker, W. 2008. Sustainable fisheries. Nature 455 (23):1044—45.
Heller, M., and G. Keoleian. 2000. Life Cycle –Based Sustainability Indicators for
Assessment of the US Food System. A report of the Center for Sustainable Systems
University of Michigan. Report No. CSS00-04.
Hendrickson, J. 1996. Energy Use in the US Food System: A Summary of Existing
Research and Analysis. Madison, WI: University of Wisconsin, Center for Integrrated
Agriculture systems.
Higgins, T.E. 1995. Pollution Prevention Handbook. Boca Raton, FL: Lewis Publishers.
Historic Monterey, n.d. Historic timeline. Available at
www.historicmonterey.org/?p=historic_timeline Accessed 20th July 2013.
Horrigan, L., R. S. Lawrence, and P. Walker. 2002. How sustainable agriculture can
address the environmental and human health harms of industrial agriculture. Environ.
Health Perspect. 110(5):445-456.
103
Hrudey, S.E. 1984. “The management of wastewater from the meat and poultry products
industry”. In: Surveys in Industrial Wastewater Treatment: Food and Allied Industries,
eds D. Barnes, C.F. Forster, and S.E. Hrudey. USA: John Wiley & Sons Inc.
Huber, B., L. Kilcher, and O. Schmid. 2007. “Standards and regualtions“. In: The World
of Organic Agriculture: Statistics and Emerging Trends 2007, eds H. Willer, and M.
Yussefi, pp. 55—66. Frick, Switzerland: International Federation of Organic Agriculture
Movements (IFOAM) and the Research Institute of Organic Agriculture.
IFPRI (2011). “Global Food Policy Report”. International Food Policy Research Institute,
Washington, DC http://www.ifpri.org/gfpr/2011.
International Finance Corporation (IFC). 2007d. Environmental, Health and Safety
Guidelines: Breweries. World Bank Group.
International Maritime Organization (IMO). 2009. Prevention of air pollution from ships.
Marine Environment Protection Committee, 59th session, agenda item 4.
IRI. 2007. Times and Trends: A Snapshot of Trends Shaping the CPG Industry:
Sustainability 2007.
Jacquelyn Ottman and Mark Eisen. 26 October, 2010. Available at:
http://blogs.hbr.org/cs/2010/10/green_marketing_myopia_and_the.html Accessed 28
August, 2013.
Jing T., Q.Q. LI, A. Loganath, Y. S. Chong, M. Xiao, and J.P. Obbard. 2008.
Multivariate data analyses of presistent organic pollutants in maternal adipose tissue in
Singapore. Environ. Sci. Technology. 42(7):2681-2687.
John L Seitz: Global Issues: An Introduction, (2001).
Judd, S. and Jefferson, B. 2003. Membranes for industrial wastewater recovery and re-
use. Oxfard: Elsevier, Inc.
104
Karkkainen, M.U.M., J.W. Wiersma, and C.J.E. Lamberg-Allardt. 1997. Postprandial
parathyroid hormone responses to four calcium-rich foodstuff. Am. J. Chin. Nutr.
65:1726—1730.
Ken Livingstone, “Davos 07: the Sound of the City”. 2007.
Lang T and G Rayner. Over coming policy cacophony on obesity: an ecological public
health framework for policy makers. Obesity Reviews, 2007. 8 (Suppl.): 165-181.
Lang T, Barling D and M Caraher. Food, social policy and the environment: Towards a
new model. Social Policy and Administration, 2001. 35(5): 538-558.
Lang T. Food Policy for the 21st century, in For hunger-proof cities: sustainable urban
food systems., M Koc et al. Editors. 1999, International Development Research Centre /
IDRC Books, Ottawa. 216-224.
LanG, T. and Heasman, M. (2004) Food Wars: The Global Battle for Minds, Mouths and
Markets. London: Earthscan Publications.
Lederer, E. 2007. U.N.: Hunger kills 18000kids each day. The Associated press, February
17, 2007.
Leng, R. A. 1993. Quantitative ruminant nutrition—A green science. Australian journal
of agricultural research 44: 363-80.
Lester Brown, Michael Renner, Christopher Flavin, Vital Signs 1998, Worldwatch
Institute, Washington, D.C. “Ninety five to ninety eight percent of forests in the
continental United States have been logged at least once since settlement by
Europeans.” Also, see: “Can’t See the Forest,” by Josh Sevin, in GRIST, 1 March 2000.
“1 to 2 percent of original forests in the U.S. remain undisturbed.”
Linton, J. D., Klassen, R., and Jayaraman, V. (2007). Sustainable supply chains: An
introduction. Journal of Operations Management, 25:1075-1082.
105
Lyson , T.A. (2005) civic agriculture and community problem solving, Culture and
Agriculture, 27(2), pp. 92–98.
Mahjoubi-Samet, A., H. Fetoui, and N. Zeghal. 2008. Nephrotoxicity induced by
dimethoate in adult rats and their suckling pups. Pest. Biochem. Physiol. 91(2):96-103.
Marshall, K.R., and W.J. Harper. 1984. “The treatment of wastes from the dairy
industry”. In: Surveys in Industrial Wastewater Treatment: Food and Allied Industries,
eds D. Barnes, C.F. Forster, and S.E. Hrudey. Boston, London, Melbourne: Pitnam
Advanced Publishing Program.
Mathew, A., R. Cissel, and S. Liamthong. 2007. Antibiotic resistance in bacteria
associated with food animals: A United States perspective of livestock production.
Foodborne Pathog. Dis. 4(2): 115-133.
Mathis Wackernagel and William Rees, Our Ecological Footprint: Reducing Human
Impact on the Earth. 1996.
Mayell, H. 2004. As consumerism spreads, Earth suffers, study says. National
Geographic News.
Mays, J. J. 1999. CDC releases new estimates on foodborne diseases. The Associated
Press, September 16, 1999.
McTaggart, J. 2008. Seeing green. Progressive Grocer January 2008: 44—67.
Mehling, M. 2009. In the market. Carbon & Climate Law Review 3 (4): 494-96.
Mehmet Soysal et al. A review of quantitative models for sustainable food logistics
management: challenges and issues.
MINNETONKA, May 25, 2011. Available at: http://www.natureworksllc.com/news-
and-events/press-releases/2011/05-25-11-Danone-Launch. Accessed 2August 2013.
106
Mintz SW. Sweetness and power: the place of sugar in modern history. 1985,
Harmondsworth, Penguin Books. xxx, 274, [12] of plates.
Molyneaux, M. 2007. The changing face of organic consumers. Food Technol. 61:22-26.
Murphy, J.J. 1999. The effects increasing the proportion of molasses in the diet of milk
dairy cows on milk production and composition. Anim. Feed Sci. Technol. 78:189—198.
National Priorities Project, (2010). http://www.globalresearch.ca/more-than-50-of-us-
government-spending-goes-to-the-military/18852 . Accessed July 14, 2013.
Nellemann, C., M. MacDevette, T. Manders, B. Eickhout, B. Svihus, A. G. Prins and B.
P. Kaltenborn (2009). Environmental Food Crisis – The Environment’s Role in Averting
Future Crisis. UNEP/GRID-Arendal, Arendal.
New York Times, 2 August, 1987. A Long Trial in Spain on Fatal Tainted Food.
Available at: http://www.nytimes.com/1987/08/02/world/a-long-trial-in-spain-on-fatal-
tainted-food.html Accessed on 10 August, 2013.
New York Times. 24 March 2012. “Death and Disarray at America’s Racetracks”.
Nimi, D., and P. Giminez-Mitsotakis. 1994. “Creative solutions for bakery waste
effluent”. In: Environmentally Friendly Food Processing, ed. E. Gaden. New York, NY:
American Institute of Chemical Engineers.
Niranjan K., N. C. Shilton. 1994. “Food processing wastes – their characteristics and an
assessment of processing options”. In: Environmentally Responsible Food Processing, ed.
E.L. Gaden. New York, NY: American Institute of Chemical Engineers.
Ohlsson, T. 2004. Food waste management by life cycle assessment of the food chain.
Journal of Food Science 69 (3): CRH 107-09.
Okos, M. Developing Environmentally and Economically Sustainable food processing
systems.
107
Organic Monitor. 2008a. The Global Market for Organic Food and Drink. London, UK:
Organic Trade Association.
Organic Monitor. 2008b. The European Market for Ethical Fruit and Vegetables.
London, UK: Organic Trade Association.
Patel, R. (2009) Food sovereignty, Journal of Peasant Studies, 36(3), pp. 663–706.
Paturau, J.M. 1989. By-Products of the Cane Sugar Industry: An Introduction to Their
Industrial Utilization, 3rd completely revised edition. Amsterdam-Oxford-New York-
Tokyo.
Paul Hawken, Amory Lovins and L. Hunter Lovins, NaturalCapitalism, Little Brown and
Company, (1999).
Paulus I. The search for pure food. 1974, Oxford, Martin Robertson.
People’s Food Sovereignty Network (2002).
Pfluger, R.A. 1975. Solid Waste: Origin, Collection, Processing and Disposal, pp. 365—
376. Toronto: Wiley Intersciene Publishers.
Pimentel, D., and M. Pimentel, eds. 1996. Food, Energy, and Society. Niwot, CO:
University of Colorado Press.
Pirog, R., and A. Larson. 2007. Consumer Perceptions of the Safety, Health, and
Environmental Impact of Various Scales and Geographic Origin of Food Supply Chain.
Ames, IA: Leopold Center for Sustainable Agriculture. September 2007.
Polder, A., G. W. Gabrielsen, J. Oyvind Odland, T. Savinova, A. Tkachev, K. B. Loken,
and J. U. Skaare. 2008. Spatial and temporal changes of chlorinatedpesticides, PCBs,
dioxins (PCDDs/PCDFs), and brominated flame retardants in human breast milk from
Northern Russia. Sci. Total Environ. 391(1):41-54.
108
Proceedings of the National Academy of Sciences. Alex Kirby report: BBC News Online
Environment correspondent. Available at:
http://news.bbc.co.uk/2/hi/science/nature/2062729.stm . Accessed 22nd July 2013.
Raab, U., U. Preiss, M. Albrecht, N. Shahin, H. Parlar, and H. Fromme, 2008.
Concentrations of polybrominated diphenyl ethers, organchlorine compounds and nitro
musks in mother’s milk from Germany (Bavaria). Chemosphere 72(1):87-94.
Rathbone E. The Disinherited Family: a plea for the endowment of the family. 1924,
London, Edward Arnold.
Reardon, T., C.P. Timmer, C.B. Barrett, and J. Berdegue. 2003. The rise of supermarkets
in Africa, Asia, and Latin America. Am. J. Agric. Econ. 85(5)1140-1146.
Regmi, A. 2001. Changing Structure of Global Food Consumption and Trade. Market
and Trade Economics Division, Economic Research Service, US Department of
Agriculture, Agriculture and Trade Report. WRS-01-1. May 2001.
Robins, N. and de Leeuw, B.2001. Rewiring global consumption: strategies for
transformation. In: H. Lewis, et al., eds. (2001). Design and environment: A global guide
to designing greener goods. Sheffield, UK: Greenleaf Publications.
Rong, A. Y., Grunow, M. (2010). A methodology for controlling dispersion in
food production and distribution. Or Spectrum, 32: 957-978.
Roy, P., et al., 2009. A review of life cycle assessment on some food products. Journal of
Food Engineering 90 (1): 1—10.
Ruben O. Morawicki, 2012. Sustainability for the food sciences.
Ruben O. Morawicki, 2012. Sustainability for the food sciences. Water neutral. Net zero
air emission. Biodegradable liquid and solid waste. p13-14.
Ruggero Golini and Matteo Kalchschmidt, 2011. Sustainability in the food supply chain:
evidence from the Italian beef industry.
109
Runge, C. F., and B. Senauer. 2007. How biofuels would starve the poor. Foreign affairs
May/June 86(3).
Sabine, C. L. et al. 2004. The oceanic sink for antrophogenic CO2. Science 305 (5682):
367—71.
Sailing ships with a new twist. 2005. The Economist 376 (8444): 6-8.
Sapkota, A., F. C. Curriero, K.E. Gibson, and K. J.Schwab. 2007. Antibiotic-resistant
enterococci and fecal indicators in surface water and groundwater impacted by a
concentrated swine feeding operation. Environ. Health Perspect. 115(7):1040-1045.
Schlich, E.H., and U.. Fleissner. 2005. The ecology of scale: Assessment of regional
energy turnover and comparison with global food. Int.J.Life-Cycle Anal. 10(3):219-223.
See: Incineration: A Dying Technology by Neil Tangri (2003); Gone Tomorrow by
Heather Rogers (2005) and “Landfills Are Dangerous” in Rachel’s Democracy and
Health News, September 24, 1998
Seyfang, G. (2006). Ecological citizenship and sustainable consumption: examining local
organic food networks. Journal of Rural Studies. Volume 22, Issue 4, October 2006,
Pages 383-395.
Silva, M.A., S.A. Nebra, M.J. Machado Silva, and C.G. Sanchez. 1998. The use of
biomass residues in the Brazilian soluble coffee industry. Biomass Bioenergy 14(5/6):
457—467.
Sivetz, M., and N.W. Desrosier. 1977. Coffee technology. Westport, CT: AVI Publishing
Co.
SkySails. 2009. SkySails technology information. Available at:
http://ec.europa.eu/environment/life/project/Projects/index.cfm?fuseaction=home.showFi
le&rep=file&fil=SkySails_Technology%20Information.pdf Accessed August 10, 2013.
Sloan, E. 2007. New shades of green. Food Technol. 61.(12):16.
110
Smil, V. 2003. Energy at the crossroads: Global perspectives and uncertainties.
Cambridge, MA: the MIT Press.
Sonntagsblitz, July 10, 2005: Im Wein war nicht nur Wahrheit. “In wine was not only
truth”. Available at:http://www.nordbayern.de/nuernberger-nachrichten/sonntagsblitz/im-
wein-war-nicht-nur-wahrheit-1.712427 Accessed on 10 August 2013.
Stodolsky, F., Gaines. L., and Vyas, A. 2000. Analysis of technology options to reduce
the fuel consumption of idiling trucks. Center for Transportation Research, Argonne
National Laboratory. Available at http://www.transportation.anl.gov/pdfs/TA/15.pdf
Accessed August 23, 2013.
Stop & Shop. 2008. EPA Recognizes Stop and Shop and Giant Food; Only Supermarkets
Receiving 2007 ENERGY STAR Leaders Recognition. Press Release, February 7, 2008.
The Authors Journal compilation. Editorial Board of Antipode. 2009
The Daily Telegraph. 2008. McDonald’s Switches to Rainforest Alliance-Certified Tea.
London, UK, March 27, 2008.
Time, (2006). Local-Food Movement: The Lure of the 100-Mile Diet. Time Magazine:
Health.
Tomlinson, B.R. (2003). "What was the Third World", Journal of Contemporary History,
38(2): 307–321.
Trienekens, J., Zuurbier, P. (2008). Quality and safety standards in the food industry,
developments and challenges. International Journal of Production Economics, 113: 107-
122.
U.S. Environmental Protection Agency, 2007. “In 2005, U.S. residents, businesses, and
institutions produced more than 245 million tons http://www.epa.gov/epaoswer/non-
hw/muncpl/facts-text.htm - chart1 of MSW, which is approximately 4.5 pounds of waste
per person per day.”
111
U.S. Environmental Protection Agency, Office of Solid Waste and Emergency Response,
Municipal Waste in the United States: 2001 Facts and Figures (2003), pp.3 -4.
UK Sustainable Development Strategy Securing the Future. 2012. Available at:
http://www.environment-
agency.gov.uk/static/documents/Business/NPPF_published_27Mar2012.pdf . Accessed
17 July, 2013.
United Nations General Assembly, 1987. Report of the World Commission on
Environment and Development: Our common future.
University of Michigan. 2006. U.S. Food System Fact Sheet. Available from:
http://css.snre.umich.edu/css_doc/CSS01-06.pdf . Accessed July 24, 2013.
USDOE (United States Department of Energy), Energy Information Administration.
2006. U.S. Carbon Dioxide from Energy Sources 2005 Flash Estimate.
Van der Vorst, J. G. A. J., Van Kooten, O., and Luning, P. (2011). Towards a diagnostic
instrument to identify improvement opportunities for quality controlled logistics in
agrifood supply chain networks. International journal on food system dynamics, 2: 94-
105.
Van der Vorst, J. G. A. J., Beulens, A. J. M., and Van Beek, P. (2005). Innovations in
logistics and ICT in food supply chain networks. In: Jongen, W. M. F. & Meulenberg, M.
T. G. (eds.) Innovation in Agri-Food Systems. Eds ed. Wageningen: Wageningen
Academic Publishers.
Van der Vorst, J. G. A. J., Tromp, S. O., and Van Der Zee, D. J.(2009). Simulation
modelling for food supply chain redesign; integrated decision making on product
quality, sustainability and logistics. International Journal of Production Research, 47:
6611-6631.
Van der Vorst, J. G. A. J., Van Kooten, O., Marcelis, W., Luning, P., and Beulens, A. J.
M. (2007). Quality Controlled Logistics in Food Supply Chain Networks: integrated
112
decision-making on quality and logistics to meet advanced customer demands.
Proceedings of the 14 th Euroma 2007 conference, 17-20 June 2007 Ankara.
Vance Packard “Progress through Planned Obsolescence”, The Waste Makers (1960), pp
45 – 57. Also see Made to Break by Giles Slade (2006); and a 20 page pamphlet called
“Ending the Depression through Planned Obsolescence” by Bernard London (1932).
Vance Packard calls perceived obsolescence, “planned obsolescence of desirability.” See
the chapter by that name in The Waste Makers (1960), p 58-66.
Vigneswaran, S., V. Jegatheesan, and C. Visvanathan. 1999. Industrial waste
minimization initiatives in Thailand: Concepts, examples and pilot scale trials. J. Clean.
Prod. 7;43—47.
Vis, J. K. (2012). RE: Seminar on sustainable development: Jan Kees Vis (Guest speaker-
Global Director of Sustainable Sourcing Department, January, 12).
Voiland, A. 2010. 2009: Second warmest year on record; end of warmest decade.
NASA’s Earth Science News Team.
Wang, Y.-R., M. Zhang, Q. Wang, D.-Y. Yang, C.-L. Li, J. Liu, J.-G. Li, H. Li, and X.-
Y. Yang. 2008. Exposure of mother-child and postpartum woman-infant pairs to DDT
and its metabolities in Tianjin, China. Sci. Total Environ. 396(1):34-41.
WBCSD (World Business Council for Sustainable Development). 2002. The Business
Case for Sustainable Developmen. Available from
http://www.wbcsd.org/we/publications/buisness-case.pdf . Accessed July 1, 2013.
Welsh, J. and MacRae , R. (1998) Food citizenship and community food security: lessons
from Toronto, Canada, Canadian Journal of Development Studies, 19(4), pp. 237–255.
WFC (ed.) (1983) Food Security for People – Direct Measures to Reduce Hunger, UN
Doc. WFC/1982/6.
113
Wilkins, J. (2005) eating right here: moving from consumer to food citizen, Agriculture
and Human Values, 22(3), pp. 269–273.
Wittman , H. (2009) Reworking the metabolic rift: La Vía Campesina, agrarian
citizenship, and food sovereignty, Journal of Peasant Studies, 36(4), pp. 805-826.
Wittman , H., Desmarais , AA. and Wiebe , n. (eds) (2010) Food Sovereignty:
Reconnecting Food, Nature and Community. oxford: Pambazuka.
Woolton TE, The Memoirs of the Rt Hon. The Earl of Woolton. 1959, London, Cassell.
World Health Organization (WHO). 1993. Assessment of Sources of Air, Water, and
Land Pollution: A guide to Rapid Source Inventory Techniques and Their Use in
Formulating Environmental control Strategies, Part One: Rapid Inventory Techniques in
Environmental Pollution. Alexander P. Economopoulos, Democritos University of
Thrace.
World Summit on Sustainable Development 2002, “A Framework for Action on
Biodiversity & Ecosystem Management”.
World Wildlife Fund (WWF). 2008. Living planet report. Washington, D.C.: WWF.
Worldwatch Institute, State of the World 2006.
WWF. 2007. Amazon deforestation rates decreasing, rainforests still threatened.
Zanoni, S., Zavanella, L. (2007). Single-vendor single-buyer with integrated tran sport-
inventory system: Models and heuristics in the case of perishable goods. Computers &
Industrial Engineering, 52: 107-123.