Sustainability in the Power Sector 2010 Netherlands final
115
Sustainability in the Power Sector 2010 Update - The Netherlands November 2010 Tim Steinweg, Albert ten Kate & Kristóf Rácz
-
Upload
khangminh22 -
Category
Documents
-
view
1 -
download
0
Transcript of Sustainability in the Power Sector 2010 Netherlands final

Sustainability in the Power Sector
2010 Update - The Netherlands
November 2010
Tim Steinweg, Albert ten Kate & Kristóf Rácz

Sustainability in the Power Sector Update 2010 - The Netherlands
1
Sustainability in the Power Sector
2010 Update - The Netherlands
Tim Steinweg, Albert ten Kate & Kristóf Rácz (SOMO)
Amsterdam, November 2010

2
Colophon
Sustainability in the Power Sector 2010 Update - The Netherlands November 2010 Authors: Tim Steinweg, Albert ten Kate & Kristóf Rácz Cover design: Annelies Vlasblom ISBN: 978-90-71284-61-8 Funding This publication has been produced with the financial assistance of Greenpeace Nederland. The content of this publication is the sole responsibility of SOMO and can in no way be taken to reflect the views of Greenpeace Nederland. Published by
Stichting Onderzoek Multinationale Ondernemingen Centre for Research on Multinational Corporations Sarphatistraat 30 1018 GL Amsterdam The Netherlands Tel: + 31 (20) 6391291 Fax: + 31 (20) 6391321 E-mail: [email protected] Website: www.somo.nl This document is licensed under the Creative Commons Attribution-NonCommercial-NoDerivateWorks 2.5 License.

Sustainability in the Power Sector Update 2010 - The Netherlands
3
Contents
Contents ........................................... ............................................................................... 3 List of Figures.................................... ............................................................................. 5 List of Tables ..................................... ............................................................................. 5 Abbreviations and terminology ...................... .............................................................. 7 Introduction....................................... .............................................................................. 8 Aim and context of the fact sheet series .......................................................................... 8 Report structure................................................................................................................ 8 Methods and scope .......................................................................................................... 9 Information about SOMO ................................................................................................. 9 1 DELTA .............................................. ................................................................ 10 Basic company information .............................................................................................. 10 Installed capacity in Europe ............................................................................................. 10 Electricity supplied in the Netherlands ............................................................................. 11 Investments in new generation capacity in Europe.......................................................... 12 Responsible sourcing ....................................................................................................... 13 2 Dong Energy........................................ ............................................................ 15 Basic company information .............................................................................................. 15 Installed capacity for electricity generation in Europe...................................................... 15 Electricity supplied in the Netherlands ............................................................................. 17 Investments in new generation capacity in Europe.......................................................... 18 Responsible sourcing ....................................................................................................... 20 3 E.ON ................................................................................................................. 25 Basic company information .............................................................................................. 25 Installed capacity for electricity generation in Europe...................................................... 25 Electricity supplied in The Netherlands ............................................................................ 27 Announced investments in new generation capacity in Europe....................................... 28 Responsible sourcing ....................................................................................................... 30 4 Eneco .............................................. ................................................................. 33 Basic company information .............................................................................................. 33 Installed capacity for electricity generation in Europe...................................................... 33 Electricity supplied in The Netherlands ............................................................................ 35 Announced investments in new generation capacity in Europe....................................... 36 Responsible sourcing ....................................................................................................... 37 5 GDF Suez / Electrabel.............................. ....................................................... 39 Basic company information .............................................................................................. 39 Installed capacity and electricity generation in Europe .................................................... 39 Electricity supplied in the Netherlands ............................................................................. 41 Investments in new generation capacity in Europe.......................................................... 42 Responsible sourcing ....................................................................................................... 45 6 Vattenfall/Nuon.................................... ............................................................ 51 Basic company information .............................................................................................. 51 Installed capacity for electricity generation in Europe...................................................... 52 Electricity supplied in The Netherlands ............................................................................ 55 Announced investments in new generation capacity in Europe....................................... 56

4
Responsible sourcing ....................................................................................................... 60 7 RWE/Essent......................................... ............................................................ 67 Basic company information .............................................................................................. 67 Installed capacity for electricity generation in Europe...................................................... 68 Electricity supplied in The Netherlands ............................................................................ 69 Announced investments in new generation capacity in Europe ...................................... 71 Responsible sourcing ....................................................................................................... 75 8 Fuel mix of installed capacity and electricity gene ration in Europe ......... 84 Installed capacity in Europe ............................................................................................. 84 Electricity generated in Europe ........................................................................................ 85 9 Fuel mix of electricity supplied in the Netherlands ..................................... 88 Percentage of renewable energy in electricity supplied................................................... 88 CO2 emissions and radioactive waste.............................................................................. 90 10 Investments in new generation capacity in Europe .. ................................. 93 Investments in renewables............................................................................................... 93 Investments per fuel type ................................................................................................. 95 Investments in nuclear generation ................................................................................... 97 11 Responsible sourcing ............................... ..................................................... 99 12 Methodological Annex ............................... .................................................... 102 Changes from previous years .......................................................................................... 102 ‘Renewable’ vs. ‘Non-renewable’ fuels and sustainability considerations ....................... 105 Investments vs. investment plans .................................................................................... 110 Questionnaire for SOMO’s research on sustainability in the electricity sector ...... 112 Source of fuels ................................................................................................................. 113 Sustainability criteria for sourcing .................................................................................... 113 Electricity trading on the wholesale market...................................................................... 114

Sustainability in the Power Sector Update 2010 - The Netherlands
5
List of Figures
Figure 1: Fuel mix of Delta's installed capacity in Europe, 2009............................................ 11 Figure 2: Fuel mix of electricity supplied by Delta in the Netherlands, 2009 ......................... 12 Figure 3: Fuel mix of Dong Energy's installed capacity in Europe, 2009............................... 16 Figure 4: Fuel mix of electricity generated by Dong Energy in Europe, 2009........................ 16 Figure 5: Fuel mix of electricity supplied by Dong Energy in the Netherlands, 2009............. 18 Figure 6: Fuel mix of E.ON’s installed capacity in Europe, 2009 ........................................... 25 Figure 7: Fuel mix of E.ON’s generated electricity in Europe, 2009 ...................................... 26 Figure 8: Fuel mix of E.ON's supplied electricity in the Benelux, 2009.................................. 27 Figure 9: Fuel mix of Eneco's installed capacity in Europe, 2009.......................................... 34 Figure 10: Fuel mix of Eneco's generated electricity in Europe, 2009................................... 34 Figure 11: Fuel mix of Eneco's supplied electricity in the Netherlands, 2009........................ 35 Figure 12: Fuel mix of GDF Suez's installed capacity in Europe, end of 2008 ...................... 40 Figure 13: Fuel mix of GDF Suez's electricity generation worldwide in 2009 ........................ 40 Figure 14: Fuel mix of Electrabel's supplied electricity in The Netherlands, 2009................. 41 Figure 15: Fuel mix of Vattenfall’s installed capacity in Europe, 2009................................... 52 Figure 16: Fuel mix of Vattenfall’s generated electricity in Europe, 2009.............................. 53 Figure 17: Fuel mix of Nuon’s installed capacity in Europe, 2009 ......................................... 54 Figure 18: Fuel mix of Nuon’s generated electricity in Europe, 2009 .................................... 55 Figure 19: Fuel mix of Nuon’s supplied electricity in The Netherlands and Belgium ............. 56 Figure 20: Fuel mix of RWE’s installed electricity generation capacity in Europe, 2009 ...... 68 Figure 21: Fuel mix of RWE’s electricity generation in Europe, 2009 ................................... 68 Figure 22: Essent NV fuel mix of electricity supplied by Essent in the Netherlands, Belgium and Germany, 2009 ................................................................................................. 70 Figure 23: Essent retail fuel mix of electricity supplied in the Netherlands, 2009 ................. 70 Figure 24: Installed capacity in Europe dedicated to renewable energy, by company, 2009 ....................................................................................................................................... 85 Figure 25: Electricity generated from renewables in Europe, by company, 2009 ................. 86 Figure 26: Renewable installed capacity and electricity generated as percentage of the total, by company, 2009 ........................................................................................................ 87 Figure 27: Renewable and non-renewable electricity supplied in the Netherlands, by company, 2009 ...................................................................................................................... 88 Figure 28: Renewable and non-renewable electricity supplied to retail customers in the Netherlands, by company, 2009 ............................................................................................ 90 Figure 29: CO2 emissions and radioactive waste resulting from electricity supplied in the Netherlands, by company, 2009 ...................................................................................... 91 Figure 30: CO2 emissions and radioactive waste resulting from electricity supply to retail customers in the Netherlands, by company, 2009 ................................................................. 92
List of Tables
Table 1: Fuel mix of Delta's installed capacity in Europe, 2009............................................. 11 Table 2: Emissions and waste resulting from Delta’s electricity supply, 2009....................... 12 Table 3: Delta’s investments in new production capacity ...................................................... 13 Table 4: Delta’s announced plans for investment in new capacity ........................................ 13 Table 5: Fuel mix of Dong's installed capacity and electricity generated in Europe, 2009 .... 17 Table 6: Emissions and waste resulting from Dong’s electricity supply, 2009....................... 18 Table 7: Dong’s announced investments in new production capacity ................................... 18 Table 8: Dong’s announced plans for investment in new capacity ........................................ 19 Table 9: The origin of coal used in production by Dong Energy in 2009 (in %)..................... 20

6
Table 10: E.ON’s installed capacity in Europe (MW) per division and per fuel type, 2009.... 26 Table 11: E.ON’s generated electricity (GWh) in Europe per division and per fuel type, 2009........................................................................................................................................ 27 Table 12: CO2 emissions and radioactive waste production for E.ON’s supplied electricity, 2009........................................................................................................................................ 28 Table 13: E.ON’s investments in new production capacity .................................................... 28 Table 14: E.ON’s announced plans for investment in new capacity...................................... 29 Table 15: Eneco’s installed capacity and generated electricity in Europe per fuel type, 2009........................................................................................................................................ 35 Table 16: CO2 emissions and radioactive waste production for Eneco's supplied electricity, 2009........................................................................................................................................ 35 Table 17: Eneco’s current investments in new production capacity ...................................... 36 Table 18: Eneco’s announced plans for investment in new capacity .................................... 36 Table 19: GDF Suez’s fuel mix of installed capacity in Europe at the end of 2008, and GDF Suez’s worldwide capacity and actual generation in 2009..................................................... 41 Table 20: Emissions and waste resulting from electricity supplied by GDF Suez / Electrabel in the Netherlands, 2009 ........................................................................................................ 41 Table 21: GDF Suez's current investments in new generation capacity in Europe ............... 42 Table 22: GDF Suez's announced plans for investment in new generation capacity in Europe.................................................................................................................................... 43 Table 23: Vattenfall’s installed capacity in Europe (MW) per division and per fuel type, 2009........................................................................................................................................ 53 Table 24: Vattenfall’s generated electricity (TWh) in Europe per division and per fuel type, 2009 .... ................................................................................................................................. 54 Table 25: Fuel mix of Nuon's installed capacity and electricity generation in Europe, 2009........................................................................................................................................ 55 Table 26: CO2 emissions and radioactive waste production for Nuon's supplied electricity, 2009 ........... ......................................................................................................................... . 56 Table 27: Vattenfall/Nuon’s investments in new production capacity ....................................57 Table 28: Vattenfall’s announced plans for investment in new capacity ............................... 58 Table 29: Fuel mix of RWE’s electricity generated and installed capacity in Europe, 2009.. 69 Table 30: Emissions and waste resulting from Essent’s electricity supply in 2009 (Essent NV mix and Essent Retail mix).................................................................................................... 71 Table 31: RWE’s announced investments in new production capacity ................................ 71 Table 32: RWE’s announced plans for investment in new capacity ..................................... 73 Table 33: Fuel mix of installed capacity in Europe by company, in MW, 2009 ..................... 84 Table 34: Fuel mix of electricity generated in Europe by company, in GWh, 2009 ...............86 Table 35: Fuel mix of electricity supplied in the Netherlands by company, in percent, 2009 89 Table 36: Fuel mix of electricity supplied to retail customers in the Netherlands by company, in percent, 2009 .................................................................................................................... 90 Table 37: CO2 emissions and radioactive waste resulting from electricity supply in the Netherlands, per company, in g/kWh, 2009 .......................................................................... 91 Table 38: CO2 emissions and radioactive waste resulting from electricity supply to retail customers in the Netherlands, per company, in g/kWh, 2009 ....... ....................................... 92 Table 39: Current investments compared to electricity generation capacity, in Europe, as of 31 December 2009, per company, in MW .................................................. 93 Table 40: Renewables percentage in the capacity as of 31 December 2009 versus renewables percentage in current investments, per company, in Europe, in MW ................ 94 Table 41: Renewables percentage in capacity after current investments versus renewables percentage in announced plans for investments, per company, in Europe, in MW. .................................................................................................................................... 94 Table 42: Current and prospected relative renewable generation capacity, in Europe, per company, in percent......................................................................................................... 95 Table 43: Current investments (MW) in new generation capacity in Europe, by company and fuel type ........................................................................................................... 95 Table 44: Investments in new generation capacity in Europe, per fuel source (million €) ... ........................................................................................................................... 96 Table 45: Announced plans for investments (MW) in new generation capacity in Europe,

Sustainability in the Power Sector Update 2010 - The Netherlands
7
by company and fuel type ..................................................................................................... 96 Table 46: Additional investment plans for new generation capacity in Europe, by company and fuel source (million €) .......... .......................................................................... 97 Table 47: Current investments in nuclear capacity ............................................................... 97 Table 48: Announced plans for investments in nuclear generation ....................................... 97 Table 49: Measures for responsible sourcing of the companies ........................................... 99 Table 50: Source of coal for Dong Energy, E.ON and RWE, in %....................................... 100 Table 51: SOMO classification of ‘renewable’ and ‘non-renewable’ fuel types.................. . 106
Abbreviations and terminology
CHP Combined Heat and Power GW(h) Gigawatt (hour) MW(h) Megawatt (hour) kW(h) Kilowatt (hour) CCGT Combined Cycle Gas Turbine CCS Carbon Capture and Storage GDF Gaz de France

8
Introduction
Aim and context of the fact sheet series
This 2010 series of power company and thematic fact sheets aims to raise public awareness about sustainability issues in the electricity sector and to improve the sustainability of power companies operating in the Netherlands. The fact sheet series investigates the companies’ performance on incorporating renewable energy sources into their fuel mix for both generation and supply of electricity, and on their investments and future plans with respect to energy sources at both the Dutch and European level. The 2010 fact sheet series is the annual update that is going into its fourth year, and builds on the work from previous years (available at www.somo.nl), but includes a slightly different range of companies due to a number of recent and pending mergers and acquisitions among power companies with operations in the Netherlands. For the first time this year, Essent is fully incorporated in the RWE company profile. SPE, a company covered for the first time, is included in the company profile of its owner EdF. The Vattenfall and Nuon fact sheets were drafted and reviewed separately, and combined into one company profile afterwards. In total, the 2010 series consist of ten company fact sheets; Delta, Dong Energy, E.ON, EdF/SPE, Eneco, Enel, Gdf Suez/Electrabel, Iberdrola, Nuon/Vattenfall and RWE. The company fact sheets form the basis of three separate reports, covering companies active in 1) The Netherlands, 2) Belgium, and an overview of 3) the largest European companies. This report is the version for The Netherlands, and covers the following companies, all active on the Dutch market; � Delta � Dong Energy � E.ON � Eneco � GDF Suez/Electrabel � RWE � Vattenfall/Nuon
Report structure
After this brief introduction, Chapters 1-8 comprise the ten company fact sheets. Each company fact sheet contains information on four measures of sustainability: the company’s current fuel mix for installed capacity and electricity generation in Europe, current fuel mix of electricity supplied in the Netherlands (or Belgium), investments in new generating capacity in Europe, and the socio-economic impacts of the company, with a specific focus on issues present in their supply chains (eg. The sourcing of coal, uranium or biomass). The four thematic fact sheets found in Chapters 9-12 focus on these same four areas and compare the eight companies’ performance in each area.

Sustainability in the Power Sector Update 2010 - The Netherlands
9
Methods and scope
The selection of companies to include in the fact sheet series is based on a number of considerations. The companies that are covered in the Dutch version of this report are selected because they either have installed capacity in The Netherlands, or are investing in new capacity. They are also all active in the Dutch supply market. The scope of the information varies slightly per section. For all generation capacity and investments, use is made of European figures, excluding Russia but including Turkey. For the supply figures, use is made of figures for The Netherlands. Information for the fact sheets was gathered from news articles and databases; company sources such as websites, annual reports and CSR reports; and direct contact (through emails and telephone calls) with company representatives. For the first time this year, a questionnaire was sent to each of the companies. All of the companies were given the opportunity and ample time to review a draft of their fact sheet, provide comments, and correct any factual errors. Most companies provided comments and corrections on the drafts that were incorporated into the final version. More information on the methodology used and different distinctions and classifications made in the fact sheets can be found in the Methodology chapter in Annex 1.
Information about SOMO
The Centre for Research on Multinational Corporations’ (SOMO) activities and research on corporations and their international context focus on sustainable economic and social development and are aimed at promoting sustainable development and the structural eradication of poverty, exploitation, and inequality. SOMO has the following primary goals: � Change through knowledge building: The research SOMO carries out is aimed at
stimulating change. This means that on the one hand, SOMO fulfils a 'watch dog' function; SOMO collects the necessary information and carries out analyses to reveal unsustainable corporate conduct and contradictions in economic and political systems. On the other hand, with its analyses and its alternative proposals, SOMO contributes to the policy development of governments, international organisations, NGOs and corporations.
� Strengthening of civil society in the global North and South: By providing information and facilitating cooperation, SOMO helps to strengthen civil society in the global North and South. SOMO's activities focus on the disclosure of previously fragmented information, the building of networks of NGOs and the training of NGOs. SOMO concentrates its efforts on NGOs that work with Multinational Enterprises and international trade, such as labour unions and human rights, consumer, environmental, gender and development organisations.
� Increasing the impact of civil society organisations: Through its research as well as cooperation with partners from the South, and joint initiatives with other NGOs, SOMO contributes to the debate on CSR. SOMO targets its policy influence, workshops, and public meetings at opinion leaders and decision makers from governments, civil society organisations and the media. SOMO promotes the interests of the global South when participating in policy dialogues, lobby activities, conferences, expert meetings, and other fora.

Delta 10
1 DELTA
Basic company information
Delta NV is a Dutch multi-utility company that supplies a wide range of products and services: electricity, gas and water, water treatment, solar cells, waste management, radio and television signals, internet, and digital telephony over cable. It is an electricity producer in the Netherlands and manages and maintains the networks for electricity, gas, water, and cable. The company operates across the entire electricity supply chain, from generation and fuel purchasing to industrial end-user sales. Delta’s core activity is providing electricity, gas, water, cable, and internet services to domestic customers. The company also services the corporate market with energy, water (including industrial water) and waste management. The company is an important player in the field of industrial and hazardous waste management, whereas domestic waste is also being handled in the Dutch province of Zeeland and in Belgium. From its base in Zeeland, the company’s activities extend to the markets across the Netherlands and other parts of the Benelux region. The company’s industrial and hazardous waste management services cover the larger part of South and Western Europe. Delta’s energy activities are carried out through the following divisions: � Energy: Energy production, energy supply, energy supply to large business clients � Comfort: Energy supply to households and small business clients � Biofuels; production of biodiesel � Solland and Sunergy; two solar power subsidiaries
Other divisions include Infra, Delta Networks (DNWB, will be renamed in 2010), Waste Management Services and a participation in the water company Evides. Although Delta has been contacted several times during the research for this paper, SOMO didn’t get any reaction from the company. This is the reason that the data presented here have not been verified by Delta.
Installed capacity in Europe
Figure 1 reveals the fuel mix of Delta’s electricity generation capacity in 2009. Delta’s total generating capacity in the Netherlands is just below 1200 MW. In 2009 the generation capacity increased with almost 30%. The increase is largely due to the newly built gas powered Sloe power plant in Vlissingen (NL), which was operational in the second half of 2009. Also in 2009 Delta opened its new solar panel park in Willebroek (BE). Regarding natural gas, all of Delta’s gas powered plants are equipped with combined cycle gas turbines (CCGT).

Sustainability in the Power Sector Update 2010 - The Netherlands
11
Figure 1: Fuel mix of Delta's installed capacity in Europe, 2009
Natural Gas57%
Other renew able0%
Coal15%
Wind1%
Nuclear22%
Biomass5%
Renew able6%
Table 1 gives the absolute figures of Delta’s installed capacity in MW’s. Figures are based on Delta's list of plants on its site and the share Delta has in these plants.1 Table 1: Fuel mix of Delta's installed capacity in Europe, 2009 Fuel type 2009 Installed Capacity (MW)
Coal 176.82
Natural Gas (CCGT) 6873
Oil 0
Nuclear 2564
Other Non-renewable 0
Wind 8.55
Hydro 0
Large scale (>10MW) 0
Small scale (<10MW) 0
Biomass 54.456
Stand alone 18.257
Co-fired 36.28
Other renewable 2.69
Total 1,185.35
Delta does not provide any figures about the generated electricity in 2009.
Electricity supplied in the Netherlands
Figure 2 shows the fuel mix of electricity supplied by Delta in the Netherlands, and Table 2 presents the CO2 emissions and radioactive waste production resulting from the generation of the electricity that Delta supplies in the Netherlands. As explained in the methodology chapter, the figures might be influenced by the purchase and trade of green certificates, and do not necessarily reflect the fuel mix received by consumers.

Delta 12
Figure 2: Fuel mix of electricity supplied by Delta in the Netherlands, 2009
Coal22%
Natural Gas54%
Nuclear16%
Other Non-renew able
2%
Renew able6%
Wind3%
Biomass3%
Based on: DELTA stroometiket 200910
Table 2 indicates the emissions and radioactive waste resulting from Delta’s electricity supply in the Netherlands. Table 2: Emissions and waste resulting from Delta’s electricity supply, 2009 Indicator Amount
CO2 (g/kWh) 390
Radioactive waste (µg/kWh) 490 Based on: DELTA stroometiket 200911
Investments in new generation capacity in Europe
Delta’s aim is to be CO2-neutral in its production by 2050. To be able to do this, the company wants to invest in the enlargement of the Borssele nuclear power plant, which when ready, would double Delta’s total installed capacity. As this would require a huge investment on Delta’s part, it is questionable whether Delta will be able to remain independent in the future. Independence on the Dutch energy market is one of Delta’s formulated goals for the future.12 Delta is investing in two wind farms in the Benelux region and is building a biomass powered plant in Ireland. For more detail see Table 3.

Sustainability in the Power Sector Update 2010 - The Netherlands
13
Table 3: Delta’s investments in new production capa city Project name Location Fuel Type Date in
operation Amount (million €)
Output Capacity (MW)
Project Status
Enlargement wind farm Kreekraksluis13
Kreekrak (NL)
Wind 201214 108.515 7516 under construction17
Enlargement wind farm St Vith
St Vith (BE) Wind n/a n/a n/a18 under construction19
Waste burning plant
Meath (IE) Biomass 2011 n/a 1520 under construction21
Table 4 shows the company’s investment plans that have been announced, but are not yet underway. Delta’s biggest investment plan financially and capacity wise is the enlargement of the Borssele nuclear power plant, for which the company is still looking for an investment partner. Table 4: Delta’s announced plans for investment in new capacity Project name Location Fuel Type Date in
operation Amount (million €)
Output Capacity (MW)
Status
Enlargement Sloecentrale
Vlissingen (NL)
Gas (CCGT) n/a n/a 22522 Planning phase23
Borssele II Borssele (NL) Nuclear 201824 75025 250026 Permit application phase27
Tidal power station
Brouwersdam (NL)
Hydro n/a n/a28 5529 Planning phase30
Responsible sourcing
Delta has a section ‘sustainability’ on its website, with the formulated goal to be producing CO2 neutral by 2050.31 In its annual report Delta has a chapter on CSR. Here the company expresses its aim to besides producing CO2-neutral, also to apply this policy in its own company.32 Sources of fuels and electricity trading Delta has no public information on the amounts of coal, biomass and uranium used in its production processes. Regarding the sourcing of its fuels, Delta uses, amongst others, uranium from Australia, Canada and Kazakhstan.33 No public information was found regarding the sources of biomass and coal. Also Delta’s policy on energy trading is unknown. 1 Delta website, over Delta, Stakeholder, Wat doet en waar vindt u Delta, Deelnemingen Delta,
http://www.delta.nl/over_DELTA/stakeholders/wat_doet_en_waar_vindt_u_DELTA/deelnemingen_DELTA/ (10/06/2010)
2 The total capacity of the coal powered Borssele plant is 426 MW, Delta has a 50% share, from this share 83% is powered by coal and 17% by biomass. EPZ website, Kolencentrale, http://www.epz.nl/content.asp?kid=10000036 and http://www.epz.nl/content.asp?kid=10031712&fid=-1&bid=10032132 (10/06/2010)
3 The capacity of 687 MW is composed of 435 MW from the gas powered CCGT Sloecentrale (total capacity is 870 MW, Delta has a 50% share) and 252 MW from the AES ELSTA plant (CCGT) (total capacity is 630 MW, 1/5 is used by DOW Benelux, the remaining electricity is divided between Essent and Delta). Sources: Sloecentrale website, Het project, http://www.sloecentrale.nl/nl/ AES ELSTA bv website, Informatie,

Delta 14
http://www.dekanaalzone.nl/pages/bedrijven/popups/index.php?id=1; AES Corporation website, Global Presence, Europe, Netherlands, http://www.aes.com/aes/index?page=country&cat=NL (10/06/2010)
4 The total capacity of the nuclear part of plant Borssele is 512 MW. Delta has a 50% share. EPZ website, Kerncentrale, http://www.epz.nl/content.asp?kid=10000037 (10/06/2010)
5 The capacity of 8.5 MW is composed of 6 MW from the Borssele plant and 2.5 MW from Windpark Distridam. Total capacity is double for the two, but Delta has a 50% share in both projects. Source: EPZ website, Windpark, http://www.epz.nl/content.asp?kid=10000038 and Windpark Distridam website, http://www.raedthuys.nl/projectoverzicht-windenergie/windpark-distridam.html (10/06/2010)
6 The capacity of 54,45 MW is composed of 18,25 MW (stand alone) from the BMC Moerdijk plant and 36,2 MW (co-fired) from the Borssele plant. (10/06/2010)
7 The total capacity of the BMC Moerdijk biomass plant is 36,5 MW, Delta has a 50% share. BMC Moerdijk website, http://www.bmcmoerdijk.nl/index2.php?pid=2 (10/06/2010)
8 The total capacity of the coal powered Borssele plant is 426 MW, Delta has a 50% share, from this share 83% is powered by coal and 17% by biomass. EPZ website, Kolencentrale, http://www.epz.nl/content.asp?kid=10000036 and http://www.epz.nl/content.asp?kid=10031712&fid=-1&bid=10032132 (10/06/2010).
9 The solar panel park in Willebroek (B). Delta Annual Report 2009, p. 8. 10 Delta website, Stroometiket 2009, http://www.delta.nl/Media/pdf/thuis/stroometiket_2009 (10/06/2010) 11 Ibid. 12 Delta website, Over Delta, Kernenergie, http://www.delta.nl/over_DELTA/kernenergie/ (23/06/2010) 13 Windpark Kreekraksluis bv is owned by Delta, however Eneco also has a share in the project. Windpark
Kreekraksluis website, Project, Initiatiefnemers, http://www.windparkkreekraksluis.nl/generator.php?id=11 (10/06/2010)
14 Windpark Kreekraksluis website, Project, http://www.windparkkreekraksluis.nl/generator.php?id=9 (10/06/2010) 15 Ibid. The invested amount is estimated between 87M euro and 130M euro. 16 Reported capacity is 60-90 MW, for which the average of 75 MW is used for calculation. Windpark Kreekraksluis
website, Veel gestelde vragen, http://www.windparkkreekraksluis.nl/faq.php?id=13 (10/06/2010) Current capacity is 13 MW. The Wind Power website, Wind Farms, Europe, http://www.thewindpower.net/wind-farm-6161.php (14/06/2010).
17 Delta Annual Report 2009, p. 20. 18 Current capacity of wind farm St Vith is 0.5 MW. The Wind Power website, Wind Farms, Europe,
http://www.thewindpower.net/wind-farm-10.php (14/06/2010) 19 Delta Annual Report 2009, p. 19. 20 Total capacity is 20 MW, Delta has a 75% share. 21 The plant is being built by Indaver, which is member of Delta. Indaver CSR report 2009, p. 36. 22 Current capacity is 870 MW (two turbines), the planned expansion would mean the construction of a new 450
MW turbine. Delta and EDF have both a 50% share. J. Kutterink, “Elektriciteitsfabriek in Vlissingen-Oost vandaag geopend - Delta wil centrale uitbreiden”, PZC, 12 February 2010
23 Ibid. 24 D. Bosscher, “Kernenergie, ja! (of we willen of niet)”, Vrij Nederland, 7 November 2009, p. 34. 25 The total costs for the new nuclear plant in Borssele will be around EUR 4-5 bn, Delta is planning to invest
between 500M – 1bn and is looking for investment partners. J. Kutterink, “Tweede kerncentrale kan met (buitenlandse) partner worden gebouwd”, PZC, 2 April 2010.
26 D. Bosscher, “Kernenergie, ja! (of we willen of niet)”, Vrij Nederland, 7 November 2009, p. 34. At this point, Delta is still the sole investor in the new nuclear plant. The company has indicated that it is looking for investment partners, but none have been announced up to date. Therefore, the entire capacity of the new plant is taken up in this profile.
27 “Kernenergie staat overal weer op de agenda”, Dagblad De Pers, 11 November 2009, p. 10. 28 Costs for the tidal power station not known yet, Delta will probably have a share in the project of the province
Zeeland. L. van Heel, “Duikers straks naar de Grevelingen voor het grootste afgezonken wrak”, AD Rivierenland, 19 January 2010, p. 25.
29 Reported capacity is 50-60 MW, for which the average of 55 MW is used for calculation. 30 Website Provincie Zeeland, Milieu en natuur, Duurzaam ondernemen, Projecten, Duurzame Energie,
Getijdencentrale, http://provincie.zeeland.nl/milieu_natuur/duurzaam_ondernemen/projecten/duurzame_energie/getijdencentrale (18/06/2010)
31 Delta website, Over Delta, Duurzaam, http://www.delta.nl/over_DELTA/duurzaam/ (16/06/2010) 32 Delta Annual Report 2009, p. 14. 33 “Visie op brandstofmix in Nederland” Delta brochure, Delta website, Over Delta, Duurzaam, Fossiele
brandstoffen, http://www.delta.nl/over_DELTA/duurzaam/fossiele_brandstoffen/ (18/08/2010)

Sustainability in the Power Sector Update 2010 - The Netherlands
15
2 Dong Energy
Basic company information
Dong Energy is an energy company that is majority owned by the Danish state. It was originally founded to manage the country’s energy resources in the North Sea, and the company has been active in the electricity sector since the early 2000s. Currently, Dong Energy’s business is based on procuring, producing, distributing, and trading in energy and energy-related products in Northern Europe. Dong Energy has operations in Denmark, the Netherlands, the UK, Sweden, Norway and Germany.34 Dong Energy’s activities are structured in four business units: Exploration & Production explores for and produces gas and oil in the North Sea, primarily in the areas around Denmark, the UK, the Faroer Islands, Greenland, and Norway; Generation is the unit in which all the company’s generation activities are located, primarily focusing on wind power and coal; Energy Markets is responsible for the company’s energy trading activities and the selling of energy to wholesale consumers; and Sales & Distribution sells gas, energy, and services to consumers in Denmark, Sweden, Germany, and the Netherlands.35 Dong Energy has approximately 6,000 employees and generated just under DKK 60 billion (EUR 6.6billion) in revenue in 2009.36 Its activities in the Netherlands are currently only focused on energy supply, but the company has bought 50% of Enecogen, a natural gas-fired power station in Rotterdam, which will be operational in 2011.37
Installed capacity for electricity generation in Eu rope
Dong Energy provides detailed information about its generation facilities on its website and gives a breakdown of the various types of renewable fuel sources it uses. 83% of Dong Energy’s power production in 2009 came from thermal power plants of which the majority are fossil fuelled. The remainder came from hydro power and on- and offshore wind farms.38 For the thermal facilities, the company makes the distinction between “central power stations” (where 80% of the company’s electricity is generated39) and “small-scale power stations”. Dong also mentions that their primary fuel source is coal, representing 70% of all fuels used.40 Regarding natural gas, all of Dong Energy’s gas powered plants are combined heat and power (CHP) plants. All of Dong Energy’s thermal facilities are located in Denmark. Its wind parks are located in Denmark, the UK, Poland, Norway Sweden and France, while the company’s only hydro plant (in which Dong has the rights to generate electricity) is located in Sweden.41 Figure 3 shows the fuel mix of Dong Energy’s installed capacity in Europe.

Dong Energy 16
Figure 3: Fuel mix of Dong Energy's installed capac ity in Europe, 2009
Coal57%
Natural Gas10%
Oil 11%
Hydro3%
Biomass3%
Renew able22%
Wind16%
Figure 4 shows the fuel mix of the electricity that was generated by Dong Energy in Europe in 2009. It has to be noted that the figures for coal, natural gas and oil are included in the category ‘other non-renewable’. A surprising fact is that the company has 3% installed capacity in biomass plants, but did not generate any electricity from these plants in the year 2009. Figure 4: Fuel mix of electricity generated by Dong Energy in Europe, 2009
Hydro5%
Wind11%
Renew able16%
Other Non-renew able
84%
Regarding the electricity generated, Dong Energy does not publish any information for its non-renewable fuel types. The only distinction the company makes is ‘thermal generation’ (not renewable) with 15,264 GWh and ‘renewable generation’ with 2,810 GWh, totalling up to 18,074 GWh electricity generated in 2009.42 Within ‘renewable generation’ a distinction is made between electricity generated in wind farms and in hydro plants43, for these numbers see Table 5.

Sustainability in the Power Sector Update 2010 - The Netherlands
17
Table 5 shows the absolute figures of the fuel mix of Dong Energy’s installed capacity (in MW) and generated electricity (in GWh) in 2009. For the non-renewable electricity generated, the figures for coal, natural gas (CHP) and oil are included in the figure for ‘other non-renewable’. Table 5: Fuel mix of Dong's installed capacity and electricity generated in Europe, 2009
Fuel type Installed Capacity (MW) Electricity generated (GWh)
Coal 3,98744 n/a45
Natural Gas (CHP) 72346 n/a47
Oil 75248 n/a49
Nuclear 0 0
Other non-renewable - 15,26450
Wind 1,10451 1,92952
Hydro 20553 88154
Large scale (>10MW) 20555 881
Small scale (<10MW) 0 0
Biomass 232 0
Stand alone 15456 0
Co-fired 7857 0
Other renewable 0 0
Total 7,003 18,07458
Electricity supplied in the Netherlands
Dong Energy is a relatively new player in the Dutch electricity supply market, having been active in the Netherlands only since 2005 when the company purchased Intergas Levering. Since 2007 the company operates under the name of the Danish mother company, Dong Energy.59 Figure 5 shows the fuel mix of the electricity generated by Dong Energy in the Netherlands: the two main sources of electricity generation are natural gas and hydropower. As explained in the methodology chapter, the figures might be influenced by the purchase and trade of green certificates, and do not necessarily reflect the fuel mix received by consumers.

Dong Energy 18
Figure 5: Fuel mix of electricity supplied by Dong Energy in the Netherlands, 2009
Coal16%
Natural Gas46%
Other Non-renew able
2% Hydro30%
Nuclear4%
Renew able32%
Wind2%
Based on: Dong stroometiket 200960
Table 6 indicates the emissions and radioactive waste resulting from Dong Energy’s electricity supply in the Netherlands. Table 6: Emissions and waste resulting from Dong’s electricity supply, 2009 Indicator Amount
CO2 (g/kWh) 315.7
Radioactive waste (µg/kWh) 122 Based on: Dong stroometiket 200961
Investments in new generation capacity in Europe
Dong Energy‘s focus on northern Europe is reflected in the company’s investments in new generation capacity. Dong’s current investments all take place in the UK, Norway, the Netherlands and Poland. Most of the investments are in new wind capacity, while there are also three new natural gas fuelled plants currently under construction. Table 7 shows the company’s investments in new capacity currently underway. Table 7: Dong’s announced investments in new produc tion capacity Project name Location Fuel Type Date in
operation Amount (million €)
Output Capacity (MW)
Project Status
Severn62 Wales (UK) Natural gas (CCGT)
End of 2010 67163 82464 Under construction
Enecogen Rotterdam (NL)
Natural gas (CCGT)
End of 2011 33665 43566 Under construction
Mongstad67 Mongstad (N)
Natural gas (CHP)
201068 37169 260 Under construction70
Karcino Poland Wind Q2 2010 8171 51 Construction complete72
Walney Walney Island (UK)
Wind 2011 90073 27574 Under construction
London Array UK Wind 2012 1,13476 31577 Onshore

Sustainability in the Power Sector Update 2010 - The Netherlands
19
Phase I75 construction started78
Nygårdsfjellet 2
Narvik (N) Wind 201179 2780 1781 Under construction
Mehuken 2 Vågsøy (N) Wind 2010 2082 683 Under construction
Gunfleet Sands 1
UK
Wind 201084 35085 10886 Construction complete87
Gunfleet Sands 2
UK Wind 201088 15089 6490 Construction complete91
Dong is planning to suspend the operations of two coal-fired power station units in the second quarter of 2010. The two units, at Studstrup Power Station near Århus and Asnæs Power Station near Kalundborg, have a total capacity of 980 MW. Overall, this means that Dong Energy’s coal-based power station capacity in Denmark will be reduced by around 25%.92 Besides the planned closure of the two coal-powered stations mentioned, Dong
decided in 2009 to cease building new coal-fired power stations. This also applies to the project exploring the opportunities of building a 1,620-MW coal-powered station at Greifswald in Germany. Whether Dong Energy will withdraw the application for the power station, or sell the project rights is not clear.93 Besides the Greifswald project, the company also dropped out of the planned construction of two 1.600 MW coal plants: one near Hunterston in Scotland (with a total budget of EUR 3.7 bn (GBP 3 bn)) and the other near Emden in Germany. The reasons for the decision are the falling revenues due to the economic and financial crisis.94 As for wind energy, Dong Energy is currently constructing wind farms with a total capacity of just under 1,000 MW and has announced the development of projects with another 1400 MW total capacity. This means that the company is on its way towards its target of a total wind turbine capacity of 3,000 MW by 2020.95 Dong Energy has signed an agreement with Siemens for the supply of 1,800 MW of wind turbines, for a total investment of between €2 billion and €3 billion. The turbines will be used for the Anholt, Walney, London Array and Lincs projects, among others.96
Under the heading 85/15, Dong Energy has set itself the target to reduce CO2 emissions to the effect that by 2040 85% of the company's energy production will derive from CO2-free sources of energy.97 Dong Energy’s other goal with wind power is to become one of the top three suppliers of wind power in the world by 2012.98
Table 8 shows the company’s investment plans that have been announced, but are not yet underway. Table 8: Dong’s announced plans for investment in n ew capacity Project name Location Fuel Type Date in
operation Amount (million €)99
Output Capacity (MW)
Status
Lincs Lincolnshire (UK)
Wind 2012100 224101 67.5102 Planning phase
Burbo Bank extension
Liverpool Bay (UK)
Wind 2016103 n/a 234104 Early planning105
Westermost Rough
Yorkshire (UK)
Wind 2014 n/a 245106 Application submitted
Anholt Anholt island (D)
Wind 2013107 134108 400109 Permits granted
West of Duddon Sands
Irish Sea (UK)
Wind 2012110 n/a 167111 Consented112

Dong Energy 20
Wigtown Bay Irish Sea (UK)
Wind 2017 n/a 280113 Early planning114
Humber Renewables115
Hull (UK) Biomass 2016116 n/a 300117 Announced
Borkum Riffgrund 1&2
Germany Wind 2015118 43119 277120 Consent authorised
London Array, phase II121
UK Wind 2014 666122 185123 Announced
Responsible sourcing
Dong Energy publishes a CSR report, a Quality, Health, Safety and Environmental (QHSE) report (for its division Exploration & Production) and Responsibility targets124 on a yearly basis and has a ‘Responsibility’ section on its website. In addition, the company has a code of conduct for suppliers. This code of conduct is not publicly accessible, although it is available upon request. The document specifies the obligations for its suppliers regarding labour rights, like fair working hours, non-discrimination and child labour as well as corruption measures and environmental standards. Dong Energy’s code of conduct forms a part of the contract with suppliers also including suppliers of raw materials.125 The company mentions on its website that it does inspection visits and third party audits at selected suppliers.126 Dong Energy is reporting according to the Global Reporting Initiative’s (GRI) sustainability reporting guidelines (GRI3) and uses third party verification for these indicators.127 Sources of fuels128 Biomass Approximately all of the biomass used is produced in Europe. The types of biomass which are utilized by Dong Energy include wood chips, wood pallets and straw. Coal Table 9 gives an overview of the origin of coal used by Dong Energy in production. Table 9: The origin of coal used in production by D ong Energy in 2009 (in %) Country of origin Percentage
South Africa 16
USA 11
Norway 4
Australia 4
Poland 1
Russia 37
Colombia 27
TOTAL 100
Electricity trading Dong Energy buys as well as sells most of its own electricity on the Nord Pool power exchange. As the transactions happen on an exchange, the counterpart is not known. The fuel mix of the electricity bought on the market is determined by the Danish transmission system operator Energinet.dk.129

Sustainability in the Power Sector Update 2010 - The Netherlands
21
The total electricity generated in 2009 amounted to 18,074 GWh. The power sales to end customers was 10,723 GWh, of which 8,529 GWh was generated by Dong Energy itself, the rest was bought on Nord Pool.130 34 Dong website, About us, History, http://www.dongenergy.com/EN/About%20us/history/Pages/history.aspx
(28/06/2010) 35 Dong website, About us, Dong Energy in brief, Backgrounder,
http://www.dongenergy.com/en/about%20us/dong%20energy%20in%20brief/pages/background.aspx (28/06/2010)
36 Dong annual report 2009, p. 2. 37 Dong annual report 2009, p. 43. 38 Dong website, Business activities, Generation, Electricity generation,
http://www.dongenergy.com/en/business%20activities/generation/electricity%20generation/pages/electricity%20generation.aspx (28/06/2010)
39 Dong website, Business activities, Generation, Electricity generation, Thermal generation, http://www.dongenergy.com/en/business%20activities/generation/electricity%20generation/thermal%20generation/pages/thermal%20generation.aspx (24/06/2010).
40 Dong website, Business activities, Generation, Electricity generation, Thermal generation, Fuel, http://www.dongenergy.com/en/business%20activities/generation/electricity%20generation/thermal%20generation/pages/fuel.aspx (24/06/2010).
41 Dong also has hydro facilities in Norway, but the company only has a financial stake in these and these will be sold in 2010. Dong website, Business activities, Generation, Electricity generation, Hydro, http://www.dongenergy.com/en/business%20activities/generation/electricity%20generation/pages/hydro.aspx (24/06/2010); “Dong Energy divests hydro assets in Norway for EUR 268.9m”, ADP News Renewable Energy Track, June 25, 2010.
42 Dong annual report 2009, p. 5. 43 It should be noted that Dong applies a different definition of ‘renewable energy’. It does not consider biomass a
renewable fuel, and therefore only lists its wind and hydro facilities for its renewable generation capacity. 44 The 3987 MW capacity is composed of Dong’s several coal-fired central power stations. However, it has to be
noted that the Studsturp power station with a total capacity of 700 MW, which is fuelled by oil, coal and biomass is also included this amount. Dong website, Business activities, Generation, Studsturp power station, http://www.dongenergy.com/EN/business%20activities/generation/electricity%20generation/Primary%20power%20stations/Pages/Studstrup%20Power%20Station.aspx (24/06/2010).
45 Figures are included in the generation figures of “other non-renewable”. 46 The 723 MW capacity is composed of Dong’s several CHP gas-fired central power stations and small-scale
plants. However, it has to be noted that the both the Skaerbaek station with 392 MW and the Svanemolle station with 81 MW, which are fuelled by gas and oil are included in this amount. Dong website, Business activities, Generation, Skaerbaer power station and Svanemolle power station, http://www.dongenergy.com/en/business%20activities/generation/electricity%20generation/primary%20power%20stations/pages/skaerbaek%20power%20station.aspx and http://www.dongenergy.com/en/business%20activities/generation/electricity%20generation/primary%20power%20stations/pages/svanemolle%20power%20station.aspx (24/06/2010).
47 Figures are included in the generation figures of “other non-renewable”. 48 The 752 MW capacity is composed of 740 MW from the Kyndby station and 12 MW from the Herning CHP plant.
.However, it has to be noted that the Studstrup Power Station, the Skærbæk Power Station and the Svanemølle Power Station also co-fire with oil, but these capacity figures are taken up in the figures for coal and gas, respectively. This is due to the fact that no information was found on the ratio’s of co-firing for these plants. Dong website, Business activities, Generation, Kyndby power station and Herning CHP plant, http://www.dongenergy.com/en/business%20activities/generation/electricity%20generation/primary%20power%20stations/pages/kyndby%20power%20station.aspx and http://www.dongenergy.com/en/business%20activities/generation/electricity%20generation/small_scale_chp_plants/pages/herning%20chp%20plant.aspx (24/06/2010).
49 Figures are included in the generation figures of “other non-renewable”. 50 The 15,264 Gwh electricity generated includes the figures for coal, natural gas and oil, as Dong does not report
separately on these figures. Dong annual report 2009, p. 5. 51 Dong annual report 2009, p. 44. The total wind capacity of 1,104 MW is the sum of Dong’s onshore and offshore
wind farms. Dong Energy’s response to a draft version of this profile, email received 06/08/2010. 52 Dong annual report 2009, p. 44. 53 Dong annual report 2009, p. 45. 54 Dong annual report 2009, p. 44. 55 Dong only has large scale hydro plants, in June 2010 the company divested their shares in Salten Kraftsamband
hydro power station (NOR) and only have a minority stake in Indalsälven (SWE) left. Dong Energy’s response to a draft version of this profile, email received 06/08/2010.
56 The 154 MW capacity is composed of Dong’s several small scale plants and waste-to-energy plants. Dong website, Business activities, Generation, Electricity Generation, Small-scale CHP plants and Waste-to-energy plants http://www.dongenergy.com/en/business%20activities/generation/electricity%20generation/small_scale_chp_plants/pages/small-scale%20chp%20plants.aspx and

Dong Energy 22
http://www.dongenergy.com/en/business%20activities/generation/electricity%20generation/waste_to_energy_plants/pages/wastetoenergy%20plants.aspx (24/06/2010).
57 The 78 MW capacity is composed of 67 MW from the Herning CHP plant (total capacity is 95 MW, of which 70% biomass, 17% gas and 13% oil) and 11 MW from the Greena CHP plant (total capacity is 18 MW, of which 60% biomass and 40% coal). However, it has to be noted that both the Ensted Power Station and the Studstrup Power Station co-fire with biomass, but these capacity figures are taken up in the figures for coal. This is due to the fact that no information was found on the ratio’s of co-firing for these plants. Dong website, Business activities, Generation, Herning CHP plant and Greena CHP plant, http://www.dongenergy.com/en/business%20activities/generation/electricity%20generation/small_scale_chp_plants/pages/herning%20chp%20plant.aspx and http://www.dongenergy.com/en/business%20activities/generation/electricity%20generation/small_scale_chp_plants/pages/grenaa%20chp%20plant.aspx (24/06/2010).
58 Dong annual report 2009, p. 40. 59 Dong Energy Nederland website, Alles over Dong Energy, Wie is Dong Energy, http://www.dongenergy.nl/over-
dong-energy/alles-over-dong-energy/Pages/wie-is-dong-energy.aspx (24/06/2010). 60 Dong website, Gas en stroom, Stroometiket, http://www.dongenergy.nl/web/gas-en-stroom/Pages/stroometiket-
dong-energy.aspx (21/06/2010) 61 Ibid. 62 Dong annual report 2009, p. 43. 63 Platts Power in Europe, “PIE’s new plant tracker” May 3, 2010, p. 9. 64 Dong website, Severn Power Station, About Severn,
http://www.dongenergy.com/severnpower/About_Severn/Pages/About_Severn.aspx (29/06/2010) 65 The amount Dong invests in the project is DKK 2.5 bn. Currency conversion rates of 29/06/2010 used,
www.xe.com; Platts Power in Europe, “PIE’s new plant tracker” May 3, 2010, p. 9. 66 Total capacity of the Enecogen plant will be 870 MW, which is a 50-50 joint venture between Dong and Eneco.
Dong annual report 2009, p. 43. 67 Mongstad is a combined heat and power plant (CHP), which is part of the Mongstad Energy Project, supplying
power to Statoil’s nearby refinery. Dong annual report 2009, p. 43; Dong website, Business Activities, Generation, Electricity Generation, Central Power stations, Mongstad Power Station, http://www.dongenergy.com/en/business%20activities/generation/electricity%20generation/primary%20power%20stations/pages/mongstad%20power%20station.aspx (21/06/2010)
68 Ibid. 69 Platts Power in Europe, “PIE’s new plant tracker” May 3, 2010, p. 9. 70 Dong annual report 2009, p. 43. 71 The amount Dong invests is DKK 600 million. Currency conversion rates of 21/06/2010 used, www.xe.com;
Ecoseed website, http://www.ecoseed.org/en/general-green-news/green-politics/green-policies/americas/index.php?option=com_content&view=article&id=1077&Itemid=207 (21/06/2010)
72 Dong annual report 2009, p. 44. 73 Total costs for the Walney offshore wind farm is EUR 1.2 bn. Dong has a 47.9% share. Currency conversion
rates of 21/06/2010 used, www.xe.com; Dong website, Walney, News, “DONG Energy sells minority stake in Walney Offshore Wind Farm” December 23, 2009, http://www.dongenergy.com/Walney/News/data/Pages/DONGEnergysellsminoritystakeinWalneyOffshoreWindFarm.aspx (21/06/2010)
74 Total capacity of the Walney offshore wind farm is 367 MW, Dong sold 25.1% of the project in December 2009. Dong annual report, p. 44.
75 Construction is scheduled in two phases, phase one is expected to be operational in 2012 with a total capacity of 630MW, the rest is to be completed in 2014. Power-technology website, Industry Projects, “London Array Offshore Wind Farm, United Kingdom” http://www.power-technology.com/projects/london-array/ (21/06/2010)
76 Total costs for the two phases will be GBP 3 bn (EUR 3.6 bn), Currency conversion rates of 21/06/2010 used, www.xe.com; Dong has a 50%share. The EUR 1134 mln investment is calculated according to the ratio’s of installed capacity between phase I and phase II: 315 MW – 185 MW. Ibid
77 Total capacity after the construction of the two phases will be 1000 MW, Dong has a 50% share. Ibid. Final investment decision has only been taken on phase I. For this, total capacity is 630 MW. DONG Energy's share is 315 MW due to 50 percent ownership. Dong Energy’s response to a draft version of this profile, email received 06/08/2010.
78 For phase one, offshore construction is scheduled to start early 2011. London Array website, The project, Provisional construction programme, http://www.londonarray.com/about/provisional-construction-programme/ (21/06/2010)
79 Recharge website, “Siemens bags $170m turbine order for Norwegian wind farm” http://www.rechargenews.com/energy/wind/article202338.ece (21/06/2010)
80 Total costs for the project are DKK 300 mln, Currency conversion rates of 28/06/2010 used, www.xe.com; Dong has a 67% share. Dong website, Investor, Company announcements, “DONG Energy Builds Wind Farm in Northern Norway”, August 7, 2009, http://www.dongenergy.com/EN/Investor/releases/Pages/omx%20feed%20list%20details.aspx?omxid=404674 (28/06/2010)
81 Total capacity is 25.3 MW, Dong has a 67% share. Dong annual report 2009, p. 44. 82 Dong Energy’s response to a draft version of this profile, email received 06/08/2010. 83 Total capacity is 18.4 MW, Dong has a 33% share. Dong website, Generation, Renewable energy, Mehuken,
http://www.dongenergy.no/en_/generation/renewable_energy/pages/mehuken.aspx (28/06/2010)

Sustainability in the Power Sector Update 2010 - The Netherlands
23
84 Dong website, Gunfleet Sands, About Gunfleet Sands,
http://www.dongenergy.com/Gunfleetsands/GunfleetSands/AboutGFS/Pages/default.aspx (28/06/2010) 85 Dong Energy’s response to a draft version of this profile, email received 06/08/2010. 86 Dong website, Gunfleet Sands, About Gunfleet Sands,
http://www.dongenergy.com/Gunfleetsands/GunfleetSands/AboutGFS/Pages/default.aspx (28/06/2010) 87 Both Gunfleet Sands projects became operational in March 2010. Dong website, Gunfleet Sands, About
Gunfleet Sands, Press Releases, “DONG Energy supplying green energy to the British”, June 15, 2010 http://www.dongenergy.com/Gunfleetsands/GunfleetSands/News_and_events/data/Pages/DONGEnergysupplyinggreenenergytotheBritish.aspx (28/06/2010)
88 Ibid. 89 Dong Energy’s response to a draft version of this profile, email received 06/08/2010. 90 Dong website, Gunfleet Sands, About Gunfleet Sands, Press Releases, “DONG Energy supplying green energy
to the British”, June 15, 2010 http://www.dongenergy.com/Gunfleetsands/GunfleetSands/News_and_events/data/Pages/DONGEnergysupplyinggreenenergytotheBritish.aspx (28/06/2010)
91 Ibid. 92 Dong annual report 2009, p. 42. 93 Dong annual report 2009, p. 43; “Dong struggles with Greifswald exit”, Platts Power in Europe, May 17, 2010,
News No. 576. 94 T. Webb, “£3bn coal plant will prove if carbon capture can succeed”, The Guardian, March 13, 2010, p. 42; T.
Bieshuizen, “Kolencentrale bij Emden afgeblazen”, Dagblad van het Noorden, October 14, 2009, p. 11. 95 Dong annual report 2009, p. 45. 96 Dong website, Investor, Company announcements, “DONG Energy and Siemens enter into a new supply
agreement regarding offshore wind turbines”, December 12, 2009, http://www.dongenergy.com/EN/Investor/releases/Pages/omx%20feed%20list%20details.aspx?omxid=454279 (28/06/2010)
97 Dong annual report 2009, p. 42. 98 Dong website, Investor, Company announcements, “DONG Energy and Siemens enter into a new supply
agreement regarding offshore wind turbines”, December 12, 2009, http://www.dongenergy.com/EN/Investor/releases/Pages/omx%20feed%20list%20details.aspx?omxid=454279 (28/06/2010)
99 In this column, for the investments indicated as “n/a”, Dong Energy couldn’t provide data on the investments taken, as no final investment decision has been taken on these projects. Email received 06/08/2010.
100 RTT News website, “Centrica To Sell 50% Stake In Lincs Wind Farm To Dong Energy For GBP 50 Mln Cash”, December 23, 2009, http://www.rttnews.com/ArticleView.aspx?Id=1164993&SMap=1 (21/06/2010)
101 Total costs are GBP 750 mln, Dong has a 25% share. Currency conversion rates of 21/06/2010 used, www.xe.com; Ibid, Dong annual report 2009, p. 44.
102 Total capacity is 270 MW, Dong has a 25% share. 103 4 C Offshore website, Wind farms, Burbo Bank extension, http://www.4coffshore.com/windfarms/burbo-bank-
extension-united-kingdom-uk59.html (24/06/2010) 104 Current capacity is 90 MW. Dong website, Burbo, http://www.dongenergy.com/Burbo/Pages/index.aspx
(24/06/2010); Ibid. 105 Ibid. 106 Dong website, Westermost Rough, News, ES Submission,
http://www.dongenergy.com/WestermostRough/News/Pages/ES_submission.aspx (28/06/2010) 107 The wind farm will supply its first power by the end of 2012, the whole project will be ready by the end of 2013.
Dong press release, “DONG Energy to build Anholt offshore wind farm”, June 22, 2010, http://www.dongenergy.com/EN/Investor/releases/Pages/omx%20feed%20list%20details.aspx?omxid=491888 (24/06/2010)
108 The costs for the project are estimated at DKK 10 bn. Currency conversion rates of 24/06/2010 used, www.xe.com; Ibid.
109 Ibid. 110 Construction is to begin in 2012, date of operation is unclear. 4 C Offshore website, Wind farms, West Duddon,
http://www.4coffshore.com/windfarms/windfarms.aspx?windfarmId=UK33 (28/06/2010) 111 Total capacity will be 500 MW, Dong has a 33.3% share. Dong website, Wind energy, UK projects, 4 October
2009, http://www.dongenergy.co.uk/Wind_energy/UK_projects/Pages/UK_projects.aspx (28/06/2010) 112 Ibid. 113 Ibid. 114 4 C Offshore website, Wind farms, Wigtown Bay, http://www.4coffshore.com/windfarms/wigtown-bay-united-
kingdom-uk49.html (28/06/2010) 115 Dong website, Humber Renewables, The project,
http://www.dongenergy.com/humberside/About_Humberside/Pages/Humber%20Renewables.aspx (29/06/2010) 116 This is Hull & East Riding website, News, “East Hull bio-mass plant could create jobs” February 19, 2010,
http://www.thisishullandeastriding.co.uk/news/green-energy-key-future-employment/article-1849009-detail/article.html (28/06/2010)
117 Market wire website, February 24, 2010, “Dong Energy Plans 300-Megawatt Biomass Plant for Hull Port” http://www.marketwire.com/press-release/Dong-Energy-Plans-300-Megawatt-Biomass-Plant-Hull-Port-Industrial-
Info-News-Alert-1122110.htm (28/06/2010)

Dong Energy 24
118 Construction of the offshore wind farm expected to start in 2012. 4 C offshore website, Windfarms, Borkum
Riffgrund, http://www.4coffshore.com/windfarms/borkum-riffgrund-germany-de04.html (29/06/2010) 119 The costs for the project are estimated at DKK 320 mln. Currency conversion rates of 29/06/2010 used,
www.xe.com; Dong press release, “DONG Energy acquires full ownership of offshore wind turbine projects Borkum Riffgrund 1 and 2”, December 17, 2009, http://www.dongenergy.com/EN/Investor/releases/Pages/omx%20feed%20list%20details.aspx?omxid=452838 (29/06/2010)
120 4 C offshore website, Windfarms, Borkum Riffgrund, http://www.4coffshore.com/windfarms/borkum-riffgrund-germany-de04.html (29/06/2010)
121 Construction is scheduled in two phases, phase one is expected to be operational in 2012 with a total capacity of 630MW, the rest is to be completed in 2014. Power-technology website, Industry Projects, “London Array Offshore Wind Farm, United Kingdom” http://www.power-technology.com/projects/london-array/ (21/06/2010)
122 Total costs for the two phases will be GBP 3 bn (EUR 3.6 bn), Currency conversion rates of 21/06/2010 used, www.xe.com; Dong has a 50%share. The EUR 666 mln investment is calculated according to the ratio’s of installed capacity between phase I and phase II: 315 MW – 185 MW. Ibid
123 Total capacity after the construction of the two phases will be 1000 MW, Dong has a 50% share. Ibid. Final investment decision has only been taken on phase I. For phase II the total planned capacity is 370 MW, Dong’s share is 185 MW due to 50% ownership.
124 For the responsibility targets see: Dong website, Responsibility, Reporting, Responsibility goals 2009, http://www.dongenergy.com/en/responsibility_/reporting/pages/responsibility_goals_2009.aspx (29/06/2010)
125 Code of conduct for suppliers received upon request via email on 06/08/2010. 126 Dong website, Responsibility, Code of conduct,
http://www.dongenergy.com/en/responsibility_/society/pages/code_of_conduct.aspx (29/06/2010), Dong Energy’s response to a draft version of this profile, email received 06/08/2010.
127 Dong website, Responsibility, Reports, GRI overview, http://www.dongenergy.com/en/responsibility/reports/pages/gri_overview.aspx (10/08/2010)
128 Information is based on Dong Energy’s response to a draft version of this profile. Email received 06/08/2010. 129 Ibid. 130 Dong annual report 2009, p. 49.

Sustainability in the Power Sector Update 2010 - The Netherlands
25
3 E.ON
Basic company information
E.ON is one of the two largest power companies in Germany. It is active throughout Europe, in Russia and the United States. Through E.ON Benelux, the company is active in the generation and supply markets of the Netherlands. The focus of this profile is on E.ON’s activities in mainland Europe, the UK and Scandinavia. E.ON has six business units active in Europe.131 E.ON Central Europe, of which E.ON Benelux is a subsidiary, is active in generation and supply in the Central European market. E.ON UK, E.ON Nordic, E.ON Italy and E.ON Spain have similar activities in their respective regions. E.ON Climate and Renewables, established in May 2007, is the business unit dealing with the company’s activities in renewable energy sources worldwide. Other business units of E.ON include E.ON Russia, E.ON U.S. Midwest, E.ON Energy Trading, and E.ON Pan European Gas. In 2009, E.ON had a turnover of more than €80 billion and a total of 88,227 employees.
Installed capacity for electricity generation in Eu rope
Figure 6 shows the fuel mix of E.ON’s installed capacity in Europe. Compared to last year, the relative share of renewable capacity went down by 2%. In absolute figures, the installed capacity in Europe totalled 56,214 MW. In The Netherlands, the installed capacity was 1,898 MW and in Belgium 941 MW.132 A number of new facilities came into operation in the first half of 2010, including facilities in France and Germany with a combined new capacity of 1,776 MW.133 At the same time, E.ON has sold off or swapped a number of assets in Germany in 2009, totalling 5,000 MW. Figure 6: Fuel mix of E.ON’s installed capacity in Europe, 2009
Renew able12%
Natural Gas26%
Other renew able0%
Coal33%
Other Non-renewable5%
Nuclear20% Hydro
10%
Oil 4%
Biomass0%
Wind2%
Based on: E.ON Strategy and Key Figures

E.ON 26
Table 10 shows the absolute figures for E.ON’s installed capacity in Europe per fuel type. Table 10: E.ON’s installed capacity in Europe (MW) per division and per fuel type, 2009
Fuel type Central Europe 134
UK135 Nordic 136 Italy 137 Spain 138 Climate & Renewa-
bles 139
Total
Coal140 11,155 4,910 0 980 1,433 0 18,478 Natural Gas 4,852 3,865 0 4,537 1,213 0 14,467 Oil 1,095 1,300 0 0 0 0 2,395 Nuclear 8,555 2,770 0 0 0 11,325 Other Non-renewable 260 255 2,304 0 0 0 2,819 Wind 0 0 0 0 0 1,146 1,146 Hydro 2,420 0 1,768 530 707 25 5,450 Large scale (>10MW) - - - - - - Small scale (<10MW) - - - - - [25] Biomass 0 0 0 0 0 64 64 Stand alone - - - - - [64] Co-fired - - - - - - Other renewable141 69 0 0 0 0 1 70 Total 28,407 10,330 6,842 6,047 3,353 1,236 56,214
Figure 7 shows the fuel mix of the actual generated electricity in Europe by E.ON in 2009. The figures do not include the generation in Spain, for which the company did not publish any information. The figures differ slightly from the global energy mix, as provided on E.ON’s website.142 This is due to the exclusion of the figures from Russia and the USA. The figures for the electricity generated by oil are included in the figures for natural gas. The only significant difference with the installed capacity in Europe is the larger share of nuclear electricity generated and the lower share of natural gas and oil, both of which can be contributed to the Central Europe business unit. Figure 7: Fuel mix of E.ON’s generated electricity in Europe, 2009
Coal31%
Nuclear36%
Renew able11%
Wind2%
Biomass0%
Other renew able1%
Hydro8%
Other Non-renew able
2%
Natural Gas (incl oil)20%
Based on: E.ON Strategy and Key Figures
Table 11 shows the absolute figures for E.ON’s generated electricity in Europe per fuel type.

Sustainability in the Power Sector Update 2010 - The Netherlands
27
Table 11: E.ON’s generated electricity (GWh) in Europe per division and per fuel type, 2009
Fuel type Central Europe 143
UK144 Nordic 145 Italy 146 Spain Climate & Renewa-
bles 147
Total
Coal148 46,930 12,700 0 4,290 n/a 0 63,920 Natural Gas 10,297149 20,100 0 9,900 n/a 0 40,297 Oil - - - - n/a - n/a Nuclear 63,313 0 8,500 0 n/a 0 71,813 Other Non-renewable 1,869150 0 2,400 165 n/a 0 4,434 Wind 0 0 n/a 4,859 4,859 Hydro 6,872 0 8,100 2,145 n/a 33 17,150 Large scale (>10MW) - - - - n/a - -
Small scale (<10MW) - - - - n/a - -
Biomass 0 0 0 n/a 270 270 Stand alone - - - - n/a - -
Co-fired - - - - n/a - -
Other renewable 1,128 0 0 0 n/a 0 1,128 Total 130,389 32,800 19,000 16,500 n/a 5,161 203,871
Electricity supplied in The Netherlands
Figure 8 shows the fuel mix of the electricity that E.ON supplies in the Benelux. E.ON does not provide supply figures broken down for just The Netherlands. The 23% renewable electricity is mostly accounted for by hydro power. As explained in the methodology chapter, the figures might be influenced by the purchase and trade of green certificates, and do not necessarily reflect the fuel mix received by consumers. Figure 8: Fuel mix of E.ON's supplied electricity i n the Benelux, 2009
Coal18%
Natural Gas52%
Wind2%
Biomass6%
Renew able23%
Hydro15%
Nuclear5%
Other Non-renew able
2%
Table 12 shows the CO2 emissions and radioactive waste production related to this supply.

E.ON 28
Table 12: CO 2 emissions and radioactive waste production for E.O N’s supplied electricity, 2009
Indicator Amount
CO2 (g/kWh) 358.8
Radioactive waste (µg/kWh) 140
Announced investments in new generation capacity in Europe
E.ON is heavily investing in new capacity in the coming years, aiming to invest €10 billion in 2010, €8 billion in 2011 and €6 billion in 2012.151 These figures include construction plans as well as asset swaps and purchases. In 2009, E.ON has divested about 5,000MW of capacity in Germany, selling its assets or swapping them for capacity in France and Belgium.152 E.ON has also cancelled the construction of a number of coal plants, including the Wilhelmshaven and Kiel projects, and the Scarweather Sands offshore wind project.153 Table 13 shows E.ON’s investments in new production capacity that are currently underway. Table 13: E.ON’s investments in new production capa city
Project name Location Fuel Type Date in operation
Amount (million €)
Output Capacity
(MW)
Project Status
Datteln154 Germany Coal 2012 1,200 1,100 Limited construction
Maasvlakte155 Netherlands Coal 2012 1,200 1,100 Under construction
Malzenica156 Slovakia Natural gas (CCGT) 2010 500 430 Under
construction
Gönyü157 Hungary Natural gas (CCGT) 2011 400 430 Under
construction
Irshing (unit 4) 158 Germany Natural gas (CCGT) 2011 250 540 Under
construction
Isle of Grain159 Kent (UK) Natural gas (CHP) 2010 564 1,275 Partially in
operation Emile Huchet, Saint Avold160 Lorraine (FR) Natural gas
(CCGT) 2010 470 860 Testing phase
Bahia de Algeciras161 Spain Natural gas
(CCGT) 2010 350 - Testing phase
Robin Rigg162 UK Wind 2010 366 180 In operation London Array Phase 1163 London (UK) Wind 2012 660 189 Under
construction
Rødsand164 Denmark Wind 2010 400 207 Partially in operation
Wielkopolska and Barzowice I Poland Wind n/a n/a 68.7 Under
construction La Victoria and Matabuey Spain Wind n/a n/a 38.4 Under
construction
JV with Abengoa Solar165 Spain
Other Renewable (Solar)
2011 225 50 Under construction
Table 8 shows E.ON’s announced plans for future investments in new production capacity. E.ON announces in its annual report that it is planning to build 3,800 MW of new CCGT capacity.166 This figure is not allocated to specific projects, and is not taken up in the table below to avoid double counting. E.ON Nordic has also announced plans to build 40 new wind turbines, in cooperation with Svaeskog, which will be in operation in 2012 or 2013.167

Sustainability in the Power Sector Update 2010 - The Netherlands
29
No figures for the investment amount or output capacity are given, and this project is therefore not included in the table below. Table 14: E.ON’s announced plans for investment in new capacity
Project name Location Fuel Type Date in operation
Amount (million €)
Output Capacity (MW)
Status
Staudinger168 Germany Coal 2013 1,200 1,100 Planned
Antwerp (BE)
169 Coal 2015 1,500 1,100 Planned
High Marnham170 UK
Natural gas (CCGT)
2016 n/a 1,600 Plans announced
Drakelow171 UK Natural gas (CCGT)
2017 564 2,640 Plans announced/ delayed
Lubmin172 Germany Natural gas (CCGT)
2013 140 600 Plans announced
Hornaing Nord-Pas-de-Calais (FR)
Natural gas (CCGT)
2012 n/a 430 Plans announced
Lucy Bourgogne (FR)
Natural gas (CCGT)
2010 n/a 420 Plans announced
Solvay173 Spain Natural gas (CCGT)
2013 n/a 400 Plans announced
Upgrade of unit O2174
Oskarshamn (SE) Nuclear 2011 n/a 500 Delayed
Fennovoima175 Finland Nuclear 2020 n/a 612 License granted
Horizon Nuclear Power176
Wylfa (Anglesey, Wales, UK)
Nuclear 2020 4,200 1,650
planning application scheduled for 2012
Horizon Nuclear Power177
Oldbury (Gloucestershire, England, UK)
Nuclear 2025 4,200 1,650
Planning application once construction at Wylfa is underway
Royal Portbury Dock178
North Sumerset (UK)
Biomass 2013 789 150 Plans announced
Loctock179 Northwich (UK) Waste n/a n/a 60 Plans
announced
Orkney180 UK
Other renewable (Wave power)
n/a n/a 50 Plans announced
Billingborough Lincolnshire (UK) Wind n/a n/a 51 Plans
announced Humber Gateway181 UK Wind n/a 789 300
Plans announced
Lancashire-Cumbria182 UK Wind n/a n/a 20 Plans
announced
Sussex183 UK Wind n/a n/a 630 Plans announced
Kelmarsh UK Wind n/a n/a 17.5 Plans announced
Carnedd Wen Powys, Wales (UK) Wind n/a n/a 500 Plans
announced

E.ON 30
Responsible sourcing
E.ON’s approach to sustainability can be described as aiming to find a balance between electricity reliability, cost and sustainability. In its Corporate Responsibility report, it states: ‘Reliable, sustainable and affordable energy is the backbone of positive change in the world societally, socially and culturally. Yet at the same time, we must also give even stronger consideration to the interests of future generations.’184 As part of E.ON’s CSR approach, the company has published its Responsible Procurement Principles.185 Here, it outlines the minimum requirements that all suppliers of the company have to adhere to. E.ON explicitly states that this policy also applies to suppliers of raw materials, such as biomass, coal and uranium.186 Sourcing of raw materials E.ON publishes figures on its purchasing of coal as a raw material in 2009. In total, 42.9 million metric tonnes of coal were procured, of which 18.2 originated from the USA, 7.4 from Russia, 4.3 from South Africa and 4.0 from Colombia. In the beginning of 2010, the company conducted audits at coal mines in Colombia and South Africa. For these audits, independent auditors were used, and E.ON has actively engaged in information sharing with civil society. For the sourcing of biomass, the company has a specific policy that determines the criteria for the biomass that the company uses. The policy states that biomass used for electricity should not have a negative effect on the use of land for food production, and it also states that the company prefers to source its biomass in the vicinity of the biomass plants.187 However, it does not provide figures on the origin of the biomass it procures. E.ON also provides information regarding the origin of the uranium it uses; it procures most of the uranium from Canada, Kazakhstan and Uzbekistan, while other sources include Namibia, Canada, Niger, Ukraine and the USA.188 E.ON performed a corporate responsibility audit on its uranium sourcing in 2009. No further information was found regarding the specifics of this audit. Electricity trading E.ON provide detailed figures on the amounts of electricity purchased from outside sources, in relation to its own generation as well as total sales of electricity. In 2009, E.ON procured more than 60% of all the electricity it sold to its customers.189 No information was provided on E.ON’s counterparts for the traded electricity, nor about the fuel sources of the traded electricity. 131 E.ON, Strategy and Key Figures, 2010, p.2. 132 E.ON, Strategy and Key Figures, 2010, p.41. 133 E.ON, Strategy and Key Figures, 2010, p.22. 134 E.ON, Strategy and Key Figures, 2010, p.29 & p.32. 135 E.ON, Strategy and Key Figures, 2010, p.85 & p.87. E.ON categorizes its CHP capacity as ‘other’. The 359 MW
of CHP schemes are added up to the natural gas capacity. 136 E.ON, Strategy and Key Figures, 2010, p.101 & p.103. E.ON categorizes its natural gas and oil capacity as
‘other’. This table uses the same categorization. It should be noted that in other profiles these fuel types are categorized separately.

Sustainability in the Power Sector Update 2010 - The Netherlands
31
137 E.ON, Strategy and Key Figures, 2010, p.148. Of the 4,537 MW of natural gas capacity in Italy, 4,367 MW
comes from CCGT plants. 138 E.ON, Strategy and Key Figures, 2010, p.152. All the natural gas capacity in Spain comes from CCGT facilities. 139 E.ON, Strategy and Key Figures, 2010, p.169. The figures given in this table exclude the 1,720 MW of wind
capacity that E.ON has in North America. 140 E.ON reports separately for its lignite and hard coal capacity. This table has combined these figures for reasons
of comparability. 141 E.ON Central Europe categorizes wind, biomass et al. under ‘other’. This table uses the same categorization. It
should be noted that in other profiles these fuel types are categorized separately. 142 E.ON website, Responsibility, Performance Report 2009, “Sustainable Energy Mix”, no date,
http://www.eon.com/en/responsibility/35071.jsp (16-07-10). 143 E.ON, Strategy and Key Figures, 2010, p.33. 144 E.ON, Strategy and Key Figures, 2010, p.85. 145 E.ON, Strategy and Key Figures, 2010, p.105. 146 E.ON, Strategy and Key Figures, 2010, p.147. Calculated on the basis of the total production figure of 16.5 billion
kWh and the relative figures given on p.147. 147 E.ON, Strategy and Key Figures, 2010, p.169. The wind figures in this column do include North America, as
these figures are not broken down regionally by E.ON. 148 E.ON reports separately for its lignite and hard coal capacity. This table has combined these figures for reasons
of comparability. 149 This figure is calculated by adding the ‘oil/gas’ and the ‘combined heat and power’ figures on p.33 of E.ON,
Strategy and Key Figures, 2010. Due to E.ON’s reporting structure, no figures can be given for ‘oil’ in this table. 150 This includes 1,688 GWh generated from waste incineration. 151 E.ON, Strategy and Key Figures, 2010, p.5. 152 E.ON, Strategy and Key Figures, 2010, p.22. 153 Platts Power in Europe, “PIE’s new plant tracker”, 03-05-10.; E.ON UK website, Press Releases, “DONG Energy
and E.ON decide against developing Scarweather Sands Offshore Wind Farm”, 03-12-09, http://pressreleases.eon-uk.com/blogs/eonukpressreleases/archive/2009/12/03/1473.aspx (15-07-10).
154 E.ON, Strategy and Key Figures, 2010, p.22; Platts Power in Europe, “PIE’s new plant tracker”, 03-05-10; RP Online website, Aktuelles, Wirtschaft, “Kraftwerk Datteln darf weitergebaut warden”, 24-06-10, http://nachrichten.rp-online.de/wirtschaft/kraftwerk-datteln-darf-weitergebaut-werden-1.79630 (15-07-10).
155 E.ON, Strategy and Key Figures, 2010, p.22; Platts Power in Europe, “PIE’s new plant tracker”, 03-05-10. 156 E.ON, Strategy and Key Figures, 2010, p.22; Reuters website, “E.ON starts construction of Slovak power plant”,
06-10-09, http://www.reuters.com/article/idUSL635565720091006 (15-07-10). 157 E.ON, Strategy and Key Figures, 2010, p.22; E.ON Kraftwerke GmbH, Press Release, “Gönyő: E.ON signed
power plant contract with Siemens”, 14-12-07, http://www.eon-eromuvek.com/pages/ekw_en/Press/Press_release/_documents/sajtokozl_1213_eng.pdf (15-07-10).
158 E.ON, Strategy and Key Figures, 2010, p.22; Platts Power in Europe, “PIE’s new plant tracker”, 03-05-10. E.ON and Siemens are investing a total of € 500M.
159 E.ON, Strategy and Key Figures, 2010, p.87; E.ON UK website, Press Releases, “First fire of gas turbine at new Kent power station”, 04-06-10, http://pressreleases.eon-uk.com/blogs/eonukpressreleases/archive/2010/06/04/1555.aspx (15-07-10); Exchange rate 1 January 2010 1 GBP =1.1271 EUR. (http://www.exchangerates.org.uk/GBP-EUR-exchange-rate-history.html)
160 Platts Power in Europe, “PIE’s new plant tracker”, 03-05-10 161 E.ON, Strategy and Key Figures, 2010, p.152; Platts Power in Europe, “PIE’s new plant tracker”, 03-05-10. The
additional capacity for this investment has already been taken up in E.ON’s reported installed capacity. Therefore, the 820 MW is kept out of this table to avoid a double count.
162 E.ON, Strategy and Key Figures, 2010, p.155; Platts Power in Europe, “PIE’s new plant tracker”, 03-05-10. the project is still categorized as an investment, as its capacity has not been included in the consolidated figures mentioned in E.ON’s annual report. Exchange rate 1 January 2010 1 GBP =1.1271 EUR. (http://www.exchangerates.org.uk/GBP-EUR-exchange-rate-history.html)
163 E.ON UK website, Press Releases, “London Array signs contracts worth almost 2bn euros for work on world's largest offshore wind farm”, 14-12-09, http://pressreleases.eon-uk.com/blogs/eonukpressreleases/archive/2009/12/14/1474.aspx (15-07-10); E.ON, Strategy and Key Figures, 2010, p.155.
164 E.ON, Strategy and Key Figures, 2010, p.155; E.ON Climate & Renewables, “E.ON Offshore Wind Energy Factbook”, April 2010, http://www.eon.com/en/downloads/EON_Offshore_Factbook_April_2010_EN.pdf (15-07-10).
165 E.ON, Strategy and Key Figures, 2010, p.156; Abengoa Solar website, About Us, General News News Archive, 2009, “Abengoa Solar and E.ON Climate & Renewables team up to build two 50MW Concentrating Solar Power plants in Spain”, 25-11-09, http://www.abengoasolar.com/corp/web/en/about_us/general/news/archive/2009/solar_20091125.html (16-07-10). The figure provided in this table represents 50% of the joint venture investment.
166 E.ON, Strategy and Key Figures, 2010, p.5. 167 E.ON Nordic website, Press Release, “E.ON och Sveaskog samarbetar kring ny vindkraft i Sverige”, 10-06-10,
http://www.eon-nordic.se/templates/Eon2PressPage.aspx?id=70026&epslanguage=SV (16-07-10). 168 E.ON, Strategy and Key Figures, 2010, p.22; Platts Power in Europe, “PIE’s new plant tracker”, 03-05-10. 169 E.ON, Strategy and Key Figures, 2010, p.22; Platts Power in Europe, “PIE’s new plant tracker”, 03-05-10. 170 Platts Power in Europe, “PIE’s new plant tracker”, 03-05-10.

E.ON 32
171 E.ON UK website, Generation, Planning for the future, “Drakelow CCGT”, no date, http://www.eon-
uk.com/generation/1781.aspx (16-07-10); Platts Power in Europe, “PIE’s new plant tracker”, 03-05-10; R. Mason, “SSE and E.ON delay gas plants on low demand”, The Telegraph, 19-05-10, http://www.telegraph.co.uk/finance/newsbysector/energy/oilandgas/7741675/SSE-and-E.ON-delay-gas-plants-on-low-demand.html (16-07-10); Exchange rate 1 January 2010 1 GBP =1.1271 EUR. (http://www.exchangerates.org.uk/GBP-EUR-exchange-rate-history.html)
172 Platts Power in Europe, “PIE’s new plant tracker”, 03-05-10; E.ON has a 50% share of the 1,200 MW project. 173 Platts Power in Europe, “PIE’s new plant tracker”, 03-05-10. 174 OKG website, Press Release, “Press Release: Government approval for power uprate at Oskarshamn 2 “, 29-
04-10, http://www.okg.se/templates/NewsPage____1013.aspx (16-07-10); OKG website, Press Release, “Press Release: Last Stage of Oskarshamn 2 Modernization To Be Postponed”, 02-07-10, http://www.okg.se/templates/NewsPage1036.aspx (16-07-10).
175 E.ON Nordic website, Press Release, E.ON får bygga ett nytt kärnkraftverk i Finland “”, 01-07-10, http://www.eon.se/templates/Eon2PressPage.aspx?id=70204&epslanguage=SV (16-07-10); E.ON owns 34% of the project, which will have a total capacity of 1,800 MW.
176 Horizon Nuclear Power is a 50/50 joint venture between E.ON UK and RWE npower. It plans to build new nuclear power stations in Wylfa and Oldbury. The total programme is likely to involve more than £15bn of investment. The company anticipates that a possible new nuclear power station at Oldbury could comprise of either two 1,650 MW Areva EPR reactors or up to three 1,100 MW Westinghouse AP1000 reactors; Exchange rate 1 January 2010 1 GBP =1.1271 EUR. (http://www.exchangerates.org.uk/GBP-EUR-exchange-rate-history.html); Horizon Nuclear Power, < http://www.horizonnuclearpower.com/faq_wylfa.php> (14 July 2010); Horizon Nuclear Power, press release “Horizon Nuclear Power on track to deliver first generation by 2020”, 30 March 2010, http://www.horizonnuclearpower.com/downloads/Horizon_Nuclear_Power_announces_development_programme.pdf> (14 July 2010)
177 Horizon Nuclear Power is a 50/50 joint venture between E.ON UK and RWE npower. It plans to build new nuclear power stations in Wylfa and Oldbury. The total programme is likely to involve more than £15bn of investment. The company anticipates that a possible new nuclear power station at Oldbury could comprise of either two 1,650 MW Areva EPR reactors or up to three 1,100 MW Westinghouse AP1000 reactors; Exchange rate 1 January 2010 1 GBP =1.1271 EUR. (http://www.exchangerates.org.uk/GBP-EUR-exchange-rate-history.html); Horizon Nuclear Power, <http://www.horizonnuclearpower.com/faq_oldbury.php> (14 July 2010); Horizon Nuclear Power, press release “Horizon Nuclear Power on track to deliver first generation by 2020”, 30 March 2010, http://www.horizonnuclearpower.com/downloads/Horizon_Nuclear_Power_announces_development_programme.pdf> (14 July 2010)
178 E.ON UK website, Press Releases, “E.ON submits planning application for one of the UK's largest biomass-fired power plants “, 28-08-09, http://pressreleases.eon-uk.com/blogs/eonukpressreleases/archive/2009/08/28/1436.aspx (16-07-10); Platts Power in Europe, “PIE’s new plant tracker”, 03-05-10; Exchange rate 1 January 2010 1 GBP =1.1271 EUR. (http://www.exchangerates.org.uk/GBP-EUR-exchange-rate-history.html)
179 Platts Power in Europe, “PIE’s new plant tracker”, 03-05-10. 180 E.ON UK website, Press Releases, “E.ON delighted by Orkney wave power win”, 16-03-10,
http://pressreleases.eon-uk.com/blogs/eonukpressreleases/archive/2010/03/16/1505.aspx (16-07-10). 181 E.ON UK website, Press Releases, “E.ON's Humber Gateway offshore wind farm moves one step closer “, 29-
10-09, http://pressreleases.eon-uk.com/blogs/eonukpressreleases/archive/2009/10/29/1458.aspx (16-07-10); Exchange rate 1 January 2010 1 GBP =1.1271 EUR. (http://www.exchangerates.org.uk/GBP-EUR-exchange-rate-history.html)
182 E.ON UK website, Press Releases, “E.ON submits scoping statement for proposed new Lancashire-Cumbria borders wind farm”, 04-11-09, http://pressreleases.eon-uk.com/blogs/eonukpressreleases/archive/2009/11/04/1461.aspx (16-07-10).
183 E.ON UK website, Press Releases, “E.ON welcomes award of South Coast Round 3 offshore wind farm zone “, 08-01-10, http://pressreleases.eon-uk.com/blogs/eonukpressreleases/archive/2010/01/08/1481.aspx (16-07-10).
184 E.ON CR Report, 2009, p.3. 185 E.ON Responsible Procurement Policy, 20-03-07,
http://www.eon.com/en/downloads/1107_EON_Procurement_Policy.pdf (16-07-10). 186 E.ON website, Responsibility, Performance Report 2009, “ Responsible Procurement”, no date,
http://www.eon.com/en/responsibility/29272.jsp (16-07-10). 187 E.ON website, Responsibility, Performance Report 2009, “ Responsibility in the Supply Chain”, no date,
http://www.eon.com/en/responsibility/29274.jsp (16-07-10). 188 E.ON website, Responsibility, Performance Report 2009, “ Responsible Procurement”, no date,
http://www.eon.com/en/responsibility/29272.jsp (16-07-10). 189 E.ON Financial Report 2009, Part II/II, http://www.eon.com/en/downloads/EON_Financial_Report_2009_.pdf (10-
08-10), p.14.

Sustainability in the Power Sector Update 2010 - The Netherlands
33
4 Eneco
Basic company information
Eneco Holding N.V. is a non-listed public limited liability company with its official seat in Rotterdam. Eneco was founded in its current form in 1995, when a number of older energy companies merged.61The company has a focus on North West Europe (Dutch, Belgian, French, German and UK markets), where it operates in the fields of production, trade, distribution, and supply of gas, electricity and heat. Eneco has undergone a number of organisational changes over the last year. On the one hand, Eneco was splitting off its infrastructure and distribution companies Joulz and Stedin, as part of unbundling the generation and distribution activities. However, these developments have been put on hold in June 2010, after the Court of Justice in The Hague decided that the unbundling requirements set by the Dutch government were in violation of European law. On the other hand, Eneco has acquired a number of subsidiaries of Econcern, which filed for bankrupcy in 2009. These include Ecostream (solar activities), Evelop (wind generation) and Ecofys (consultancy). These developments have led to a change in business structure as of January 1st, 2010. Eneco now operates within eight business units190; Eneco Supply; Eneco Installation Companies; Eneco Energy Trade; Eneco Heat & Cold; Eneco Wind; Eneco Solar, Bio & Hydro; Strategic Assets and Ecofys. In order to maintain the independence needed for proper consultancy work, Ecofys is not integrated into the Eneco structure, but is kept independent and has its own board of directors. Along with Essent and Nuon, Eneco was traditionally one of the top three network operators in the Netherlands and is the only one that is still owned by Dutch municipalities. The company has 6,600 employees, and in 2009 had a turnover of €5.2 billion.
Installed capacity for electricity generation in Eu rope
Figure 9 shows Eneco’s installed capacity per fuel type. In the last year, the company gained additional wind capacity because of the takeover of Evelop as well as several projects becoming operational.191
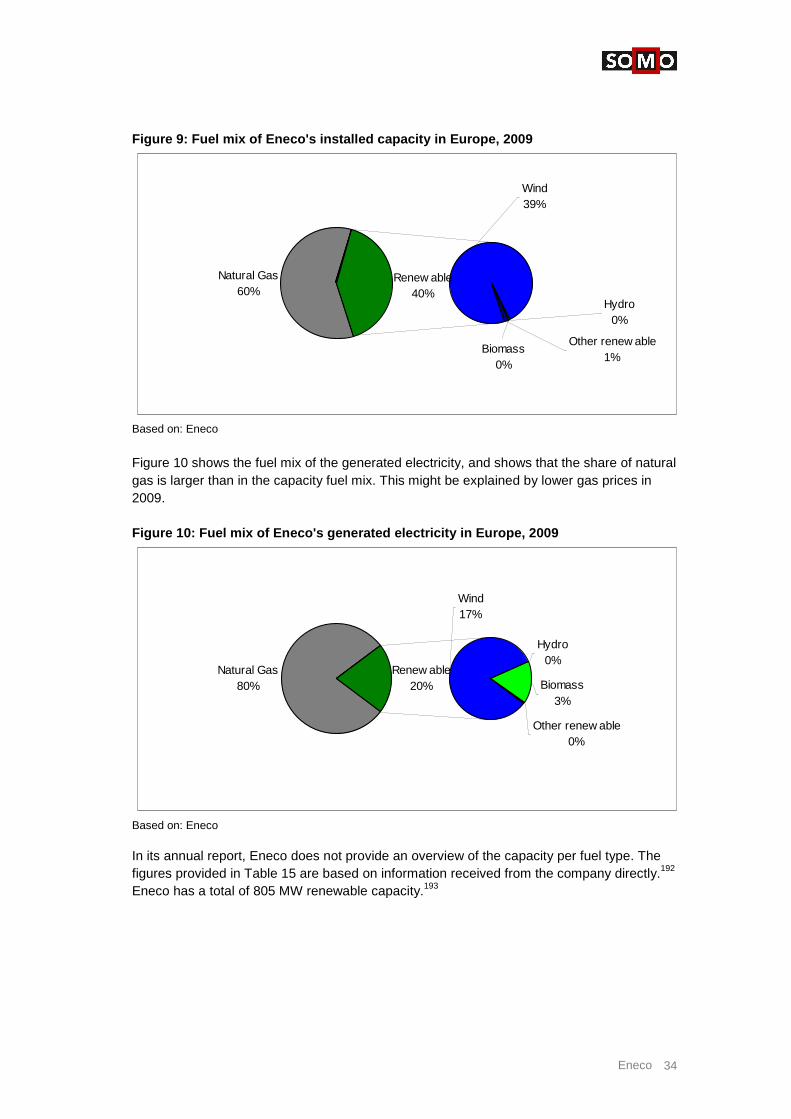
Eneco 34
Figure 9: Fuel mix of Eneco's installed capacity in Europe, 2009
Natural Gas60%
Biomass0%
Hydro0%
Other renew able1%
Wind39%
Renew able40%
Based on: Eneco
Figure 10 shows the fuel mix of the generated electricity, and shows that the share of natural gas is larger than in the capacity fuel mix. This might be explained by lower gas prices in 2009. Figure 10: Fuel mix of Eneco's generated electricit y in Europe, 2009
Natural Gas80%
Hydro0%
Biomass3%
Other renew able0%
Wind17%
Renew able20%
Based on: Eneco
In its annual report, Eneco does not provide an overview of the capacity per fuel type. The figures provided in Table 15 are based on information received from the company directly.192 Eneco has a total of 805 MW renewable capacity.193

Sustainability in the Power Sector Update 2010 - The Netherlands
35
Table 15: Eneco’s installed capacity and generated electricity in Europe per fuel type, 2009
Fuel type 2009 Installed Capacity (MW) 2009 Generated electricity (GWh)
Natural Gas (CHP) 1,245 7,530 Wind 742 1,626 Hydro Small scale (<10MW) 0.1 0.8 Biomass Stand alone 45 328 Other renewable 18 4 Total 2,050 9,488
Electricity supplied in The Netherlands
In total, Eneco supplied 25.311 GWh of electricity in 2009.194 Figure 11 shows the fuel mix of the electricity supplied by Eneco. Compared to previous year, both the share of renewable and natural gas have gone up slightly, while the supply is less dependent on coal and nuclear energy. Figure 11: Fuel mix of Eneco's supplied electricity in the Netherlands, 2009
Coal12%
Natural Gas65%
Nuclear3%
Renew able19%
Hydro13%
Wind4%
Biomass1%
Other Non-renew able
1%
Table 16 shows the CO2 emissions and radioactive waste as reported in Eneco’s stroometiket. Table 16: CO2 emissions and radioactive waste produ ction for Eneco's supplied electricity, 2009 Indicator Amount
CO2 (g/kWh) 340
Radioactive waste (µg/kWh) 100 Source: Eneco195

Eneco 36
Announced investments in new generation capacity in Europe
Table 17: Eneco’s current investments in new production capacity that are currently underway. A number of wind and natural gas facilities that were included in last years overview have since gone into operation, and are included in the section above. Construction has started on a number of onshore and offshore wind farms in The Netherlands, Belgium and the UK. Table 17: Eneco’s current investments in new produc tion capacity Project name Location Fuel Type Date in
operation Amount (million €)
Output Capacity (MW)
Project Status
Enecogen196 Rotterdam (NL)
Natural gas
End of 2011
350 435 Under construction
Tullo UK Wind 2010 21 17.5 Under construction
Luna wind farm197 Heerhugowaard198
Wind 2010 10 6.9 Under construction
Fuji199 Tilburg (NL)
Wind 2011 14 10 Contracting
Martina Cornelia200
Wind 2011 n/a 15 Contracting
Acrres201 Lelystad (NL)
Wind 2011 n/a 7.5 Contracting
EBP extension202 EBP extension (B)
Wind 2010 / 2011
9 6 Under Construction
Perwez (B)203 Perwez (B)204
Wind 2010 9 7.5 Under Construction
Marbais205 Marbais (B)
Wind 2010 9 6 Under Construction
Arendonk (B) 206 Arendonk (B),
Wind n/a n/a 17.5 Under construction
Eeklo207 Eeklo (B) Wind 2011 / 2012
6 4 Permits granted
Puurs208 Puurs (B) Wind 2011 / 2012
6 4 Permits granted
Gouvy (B)209 Gouvy B)210
Wind 2011 17 6.9 Grid connection paid, last stage of development
Table 18 shows the announced plans for new production capacity. Eneco is planning several larger offshore wind projects, including a 900MW wind farm in the UK and a 360MW park in Belgium. Additionally, plans for new projects include some gas and biomass facilities. Table 18: Eneco’s announced plans for investment in new capacity Project name Location Fuel Type Date in
operation Amount (€)
Output Capacity (MW)
Status
- Beringen211 Gas n/a 800 900 Awaiting permits
- Beringen Biomass n/a n/a 12.5 Awaiting permits
- Rotterdam212 Biomass 2015 n/a 20 Plans announced
- North of Netherlands213
Biomass 2012 n/a 50 Plans announced
- unknown Biomass n/a n/a 25 Plans announced

Sustainability in the Power Sector Update 2010 - The Netherlands
37
Q4 (incl. FLOW partnership
North Sea Wind 2015 n/a 97.5 Permits granted (awaiting subsidies)
North Sea Power (50%)214
Knokke (BE) Wind n/a n/a 360 Concession acquired (awaiting subsidies)
Q-10215 Wind 2015 n/a 165 Permits granted (awaiting subsidies)
Scheveningen-Buiten216
North sea Wind 2015 n/a 212 Permits granted
Isle of Wight Offshore Isle of Wight (UK)
Wind 2016 n/a 900
Rights awarded
Lochluichart Estate217
Schotland Wind 2013 80 51 Plans announced
Responsible sourcing
Eneco’s business model is one of sustainable and decentralized electricity generation. The company recognizes the need for sustainability throughout the production chain, and in its Corporate Brochure states the following: ‘Eneco’s power lies in its involvement in all the links of the chain: from production and trading to supply. That is why we have and maintain an overview of all the relevant issues and are not dependent on other companies. That way we can actually make sustainability the focal point of all our actions. It also allows us to initiate integrated sustainability projects in cooperation with others.’218 Raw materials Eneco sources all the biomass it uses in its plants from Belgium, where it purchases agricultural waste. In a response to a draft version of this report, Eneco indicated that it intends to use waste from a Vietnamese furniture plants as raw materials for new to-be-built biomass plants. In its Annual Report, Eneco states that it applies sustainability criteria for the biomass it purchases. More specifically, it states that:
‘In connection with its vertical integration strategy, it is important that Eneco gains access to sustainable residual waste flows. Eneco Energy Trade is responsible for the purchase of biomass for those Eneco plants that depend on these third party waste flows. In order to gain experience in this field, Eneco Energy Trade at present acts as the intermediary between biomass suppliers and customers. Since there is insufficient supply of residual materials in Europe, Eneco is investigating the presence of residual flows on other continents. Eneco applies strict sustainability criteria with regard to biomass. The core elements of the policy are the restriction that biomass flows from other continents may only be used for generating electricity if that is a logical option and the fact that Eneco only uses wood and pure plant oil. Eneco collaborates with the Max Havelaar Foundation and ICCO to ensure that the biomass flow is in accordance with the Fair Trade principles and ICCO standards.’219
Eneco also indicates that the criteria it sets for biomass purchases goes beyond the NTA 8080 norms, the biomass sustainability certification scheme. These criteria are verified by a Sustainability Officer, who operates on a Corporate level and in cooperation with the NEN (Dutch Normalisation Institute) and the Control Union verification body.

Eneco 38
Eneco does not publish any policies regarding the sourcing of coal or uranium for electricity generation. However, this can be explained by the simple fact that Eneco does not generate any electricity using these fuel sources. Electricity trading Eneco generates 47% of all the electricity it supplies to customers. No further details were provided concerning the counterparties or fuel mix of the traded electricity. 190 Energeia, “Bedrijfsstructuur Eneco op de schop”, 31-03-10, http://www.energeia.nl/news.php?ID=42790, (04-07-
10). 191 Eneco, Annual Report 2009, p.30-31. 192 Response to a draft version of this report, email received 04-08-10. 193 Eneco, Annual Report 2009, p.30 194 Eneco website, Eneco Corporate, Financieel, “Kerncijfers”, no date,
http://corporatenl.eneco.nl/Financieel/Pages/Kerncijfers.aspx (05-07-10). 195 Eneco, Annual Report 2009, p.16. 196 Total capacity of the Enecogen plant will be 870 MW, which is a 50-50 joint venture between Dong and Eneco.
Eneco website, Eneco Corporate, Nieuws en Media, Persberichten, “Jaarverslag 2009: ENECO INVESTEERT IN TOEKOMST DUURZAME ENERGIEVOORZIENING”, 29-03-10, http://corporatenl.eneco.nl/nieuws_en_media/Persberichten/Pages/Jaarverslag2009.aspx (05-07-10).
197 Eneco website, Eneco Corporate, News and Media, Press Releases, “ from NIMBY to WIMBY”, 01-05-10,
http://corporateuk.eneco.nl/News_and_Media/pressreleases/Pages/fromNIMBYtoWIMBY.aspx (05-07-10). 198 Eneco, Annual Report 2009, p.31. 199 Input received to a draft version of this report, email received 04-08-10. 200 Input received to a draft version of this report, email received 04-08-10. 201 Input received to a draft version of this report, email received 04-08-10. 202 Input received to a draft version of this report, email received 04-08-10. 203 Eneco, Annual Report 2009, p31 and GE Energy website, Press Releases, “GE Energy's Wind Turbines
Powering Latest Wind Project In Belgium“, 07-03-05, http://www.gepower.com/about/press/en/2005_press/030705.htm (05-07-10).
204 Eneco, Annual Report 2009, p31 and GE Energy website, Press Releases, “GE Energy's Wind Turbines Powering Latest Wind Project In Belgium“, 07-03-05, http://www.gepower.com/about/press/en/2005_press/030705.htm (05-07-10).
205 Input received to a draft version of this report, email received 04-08-10. 206 Eneco, Annual Report 2009, p31 and GE Energy website, Press Releases, “GE Energy's Wind Turbines
Powering Latest Wind Project In Belgium“, 07-03-05, http://www.gepower.com/about/press/en/2005_press/030705.htm (05-07-10).
207 Input received to a draft version of this report, email received 04-08-10. 208 Input received to a draft version of this report, email received 04-08-10. 209 Eneco, Annual Report 2009, p31 and Lavenir.net website, Environnement, “Bientôt cinq éoliennes à Gouvy”, 19-
11-09, http://www.lavenir.net/article/detail.aspx?articleid=372774 (05-07-10). 210 Eneco, Annual Report 2009, p31 and Lavenir.net website, Environnement, “Bientôt cinq éoliennes à Gouvy”, 19-
11-09, http://www.lavenir.net/article/detail.aspx?articleid=372774 (05-07-10). 211 Energeia website, “Beringen toch geïnteresseerd in Eneco-centrale”, 27-11-09,
http://www.energeia.nl/news.php?ID=41757 (05-07-10). 212 Eneco, Annual Report 2009, p.31. The figure of 20 MW is based on input received to a draft version of this
report, email received 04-08-10. 213 Argus website, News, “Dutch utility Eneco to develop biomass plants “, 15-06-10,
http://www.argusmedia.com/pages/NewsBody.aspx?id=711127&menu=yes (05-07-10). 214 Eneco, Annual Report 2009, p.31; Input received to a draft version of this report, email received 04-08-10. 215 Eneco website, Eneco Corporate, Nieuws en Media, Persberichten, “Eneco verkrijgt ontwerp-vergunningen voor
2 windparken op zee”, 02-11-09, http://corporatenl.eneco.nl/nieuws_en_media/Persberichten/Pages/Enecoverkrijgtontwerp-vergunningen.aspx (05-07-10).
216 Eneco website, Eneco Corporate, Nieuws en Media, Persberichten, “Eneco verkrijgt ontwerp-vergunningen voor 2 windparken op zee”, 02-11-09, http://corporatenl.eneco.nl/nieuws_en_media/Persberichten/Pages/Enecoverkrijgtontwerp-vergunningen.aspx (05-07-10).
217 Eneco website, Eneco Corporate, Nieuws en Media, Persberichten, “Rechten voor Lochluichart windpark overgedragen aan Eneco”, 29-03-10, http://corporatenl.eneco.nl/nieuws_en_media/Persberichten/Pages/RechtenLochluichartwindpark.aspx (05-07-10).
218 Eneco, “Moving Ahead”, Corporate Brochure, no date, http://corporateuk.eneco.nl/SiteCollectionDocuments/ENG_CorporateBrochure1209.pdf (05-07-10).
219 Eneco, Annual Report, p.34.

Sustainability in the Power Sector Update 2010 - The Netherlands
39
5 GDF Suez / Electrabel
Basic company information
GDF Suez was created in the merger between Suez and Gaz de France (GDF) that took place in July 2008. The company is one of the main energy providers in the world. GDF Suez is active across the entire energy value chain, in electricity and natural gas upstream to downstream. In 2009 the company’s revenue amounted to €79.9 billion, of which 86% achieved within Europe.220 The main shareholder of GDF Suez is the French government, with 35.9% of the shares as of 31 December 2009.221 In Europe, GDF Suez is established in France, Benelux, Germany, United Kingdom, Norway, Switzerland, Russia, Poland, Romania, Hungary, Italy, Greece, Spain, Portugal, Slovakia and Turkey. Electrabel is part of GDF Suez, and is present in the Benelux. Electrabel is by far the leading producer of electricity in Belgium. Its fleet represents approximately two-thirds of the country’s total installed capacity. Electrabel is currently also the Netherlands’ leading electricity producer, with a share of 20-25% of the country’s generating capacity.222 The fact sheet and a questionnaire was sent by SOMO for review to a representative of Electrabel Nederland. There has been no response to this request. Later on, the fact sheet was sent for review to a representative of GDF Suez Energy Benelux & Germany. The response comprised mainly the Belgium operations of GDF Suez.223 Therefore, the findings in this fact sheet should be interpreted with caution.
Installed capacity and electricity generation in Eu rope
Worldwide, GDF Suez has the capacity to produce 60.5 GW of power. In Europe, the total generation capacity is 38.7 GW. This is 64% of GDF Suez's worldwide capacity.224 For this study, no information could be found regarding the fuel types of installed capacity at 31 December 2009 and electricity generation in 2009 for Europe specifically. Figure 12 reveals the fuel mix of GDF Suez's electricity generation capacity in Europe at the end of 2008. It should be noted that the hydro in the figures 12 and 13 and table 19 includes pumped storage power stations. This is not part of renewable energy, so the actual percentages of hydro may be a few percentages lower.

GDF Suez/Electrabel 40
Figure 12: Fuel mix of GDF Suez's installed capacit y in Europe, end of 2008 225
Wind3%
Biomass1%
Renew able19%Natural Gas
52%
Coal11%
Other Non-renewable2%
Nuclear17% Hydro
14%
Figure 13 reveals the fuel mix of GDF Suez's electricity generation worldwide in 2009. Figure 13: Fuel mix of GDF Suez's electricity gener ation worldwide in 2009 226
Coal11%
Natural Gas49%
Nuclear18%
Wind1%
Biomass1%
Renew able20%
Hydro18%
Other Non-renew able
2%
Table 19 shows the absolute figures of the installed capacity of GDF Suez in Europe at the end of 2008 and its worldwide capacity and actual generation in 2009.

Sustainability in the Power Sector Update 2010 - The Netherlands
41
Table 19: GDF Suez’s fuel mix of installed capacity in Europe at the end of 2008, and GDF Suez’s worldwide capacity and actual generati on in 2009 Fuel type European capacity as
of 31 December 2008 (MW)227
Worldwide capacity as of 31 December
2009 (MW)228
Worldwide generation in 2009
(GWh)229
Coal 4,162 6,700 27,800
Natural Gas 19,598 30,300 124,000
Nuclear 6,356 6,000 45,600
Other non-renewable 643 3,000 5,100
Biomass 530 600 2,500
Wind 1,286 1,200 2,500
Hydro 5,221 12,700 45,600
Other renewable 38 0 0
Total 37,834 60,500 253,100
Electricity supplied in the Netherlands
In the Netherlands, GDF Suez is a major electricity generator through its subsidiary Electrabel Nederland, with a share of approximately 20-25% in the country’s generating capacity. Its production is mainly sold via the wholesale market to industrial consumers and suppliers.230 Electrabel in the Netherlands has seven power plants with a total installed capacity of 4,068 MW.231 Figure 14: Fuel mix of Electrabel's supplied electr icity in The Netherlands, 2009
Coal20%
Natural Gas64%
Wind0%
Other renew able0%
Renew able9%
Hydro9%
Nuclear5%
Other Non-renew able
2%
Based on: Electrabel232
Table 20 presents the CO2 emissions and radioactive waste production resulting from the generation of the electricity that GDF Suez / Electrabel supplies in the Netherlands. Table 20: Emissions and waste resulting from electr icity supplied by GDF Suez / Electrabel in the Netherlands, 2009 233 Indicator Amount CO2 (g/kWh) 422 Radioactive waste (µg/kWh) 144

GDF Suez/Electrabel 42
Investments in new generation capacity in Europe
Table 21 indicates the projects GDF Suez is currently developing in Europe. In addition to the investments explained in the tables 3 and 4, as of first half of 2010 Electrabel’s conventional power plant in Gelderland (590 MW coal) will allow to use up to 25% biomass in co-combustion with coal. The construction has started in January 2009 and the facility has started operating in March 2010. The total capacity of the primarily coal-based power plant will remain unchanged.234 For this reason the investment is not included in the table below. The biomass consists of wood pellets (compressed sawdust). The conversion involved an investment of more than €40 million.235 Wood pellets will also be used in the coal-fueled unit 4 of Rodenhuize (Belgium), which is transformed into a 100% biomass plant with a capacity of 180 MW.236 This transformation involves an investment of €125 million.237 The new plant will be in operation in 2011.238 Table 21: GDF Suez's current investments in new gen eration capacity in Europe
Project name Location Fuel Type
Date in operation
Amount (million
€)
Capacity (MW)
Project Status
Power Plant Maasvlakte Rotterdam (NL) coal/
biomass 2013 1,200 736239 under construction240
Power Plant Wilhelmshaven
Wilhelmshaven (DE)
coal 2012 568241 422242 under construction
Flevo Lelystad (NL) gas (CCGT)
2010 n/a 870243 under construction
SPEM Montoir de Bretagne (FR)
gas (CCGT)
2010 n/a 435244 already built
CombiGolfe Fos-sur-Mer (FR)
gas (CCGT)
mid 2010 270 424245 already built
Degussa Antwerp (BE) gas-fired CHP
mid 2010 21 22 under construction246
Heron II Viotia (GR) gas (CCGT)
2010 n/a 225 under construction247
Repowering Dunamenti
Szazhalombatta (HU)
gas (CCGT)
2011 149248 138249 under construction
acquired by Nuon Almere (NL)250
Natural gas (CHP)
2010 n/a -120 Sold late 2009
Reactors 3 + 4 Cernavoda (RO) nuclear
Unit 3: 2016
Unit 4: 2017
366 132 under construction251
Doel 1, upgrade capacity
Doel 1, Belgium nuclear n/a n/a 40.5 under construction252
France, Italy and Belgium
France, Italy and Belgium
biomass & biogas
n/a n/a 23 under construction253
Several projects France wind 2010/2011 n/a 273254 under construction
Generg wind farms
Portugal (PT) wind n/a n/a 102 under development255
Wind parks Belgium wind n/a n/a 24 under

Sustainability in the Power Sector Update 2010 - The Netherlands
43
construction256
Scotia Wind Craigengelt
South-west of Stirling, Scotland (UK)
wind 2010 n/a 20 under construction257
Wind farm Jarogniew – Moltowo (Poland)
wind early
2011258 n/a 20
under construction259
AceaElectrabel Produzione Group (AEP)
Italy wind n/a n/a 35 under construction260
Other renewables Italy
other renewables
n/a n/a 9 under construction261
Curbans Alpes de Haute Provence (France)
solar August
2011 n/a 33
under construction262
More solar projects
France solar n/a n/a 11263 construction permits obtained
Generg Photovoltaic solar
Portugal solar n/a n/a 5 under construction264
Table 22 lists GDF Suez’s investments that are either still awaiting permission or have merely been announced as plans. A project for an 800 MW planned coal power plant in Stade (DE) was abandoned in February 2010.265 Table 22: GDF Suez's announced plans for investment in new generation capacity in Europe
Project name Location Fuel Type Date in
operation Amount
(million €) Capacity
(MW) Project Status
Power Plant Brunsbüttel
Brunsbüttel (DE) coal n/a n/a 800 in study266
Unit at Vado Ligure
Vado Ligure (IT) coal n/a n/a 161 awaiting
permission267
Power plant Police near Szczecin (PO) coal n/a 2,147 1,432 concept
design268
Power plant Lublin (PO) coal (biomass co-fired)
n/a 536 358 concept design269
Power Plant Romania Constanta (RO) coal and
biomass n/a 2,400 1,600 suspended indefinitely270
Power station Polaniec (south-east Poland)
biomass end of 2012 240271 190
building contract signed272
Power plant Polaniec (south-east Poland)
gas n/a 666 833 concept design273
Electrabel Polaniec S.A.
Near Wloclawek (PO) gas n/a 610 900
construction start within two years274
GDF Suez Energy Romania and Termoelectrica
Borzesti, Bacau county, (RO) gas n/a 400 400
feasibility study finalised275
Morata de Morata de gas n/a 500 1,200 halted by

GDF Suez/Electrabel 44
Tajuña Tajuña (ES) (CCGT) supreme court276
CombiGolfe, second 400 MW tranche
Fos-sur-Mer (FR)
gas (CCGT) n/a n/a 400277
engineering study underway
Ploufragan Brittany (FR) gas n/a n/a 200 administrative approvals pending278
AceaElectrabel Produzione Pontinia (Italy) gas
(CCGT) n/a n/a 162 waiting for permission279
Horizon Energy/ AceaElectrabel
Molise (Italy) gas (CCGT) n/a n/a 81 waiting for
permission280
gas fired plant Schwandorf (DE)
Gas (CCGT) n/a n/a 800 project
stopped?281
One or two gas fired plants
Calbe and Stassfurt in Saxony-Anhalt state (DE)
gas (CCGT) n/a n/a 800 feasibility
study282
Second EPR reactor (25% stake)
Penly site, Normandy (FR) nuclear 2017 n/a 412283
public debate set up in 2010
Third EPR reactor
Rhone Valley (FR) nuclear n/a n/a 1,100 candidate284
One or more nuclear reactors, together with Iberdrola and SSE
United Kingdom nuclear 2020-2025285 n/a 1,350286
pre-development stage287
Renewal concessions by government, total 5,300 MW
France hydro 2015 n/a 1,600
operatorships expected to be awarded between 2013 and 2015288
Tirreno Power: hydroelectric power station IT
n/a (IT) hydro n/a n/a 10 n/a
Compagnie du Vent, Deux Côtes project
Offshore Somme and Seine-Maritime districts (FR)
wind n/a 1,137 401 preliminary studies289
Compagnie du Vent and Shell WindEnergy, Libron
Offshore, France wind 2014 71 29
pre-development stage290
Compagnie du Vent, several small projects in France
Onshore, France wind 2011/2013 396 281
pre-development stage291
Blue4Power I, zone I and II North Sea (BE) wind 2012 n/a n/a
early 2010: request concession granting rejected292
Winds mills next to highway E40
Belgium wind 2011 70 40 construction permits obtained293
Four wind turbines along a canal
Zomergem (Belgium) wind n/a n/a 12
environmental permit requested294

Sustainability in the Power Sector Update 2010 - The Netherlands
45
Wind farm Poland
North of Poland (PO) wind n/a n/a n/a
several projects in development295
Wind farm Italy Site to decide (IT) wind n/a n/a 50 n/a
Wind farms Romania Romania wind n/a n/a n/a budget
allocated296
Tirreno Power photovoltaic Italy
Campania a Sessa Aurunca (It)
solar n/a n/a 6.9 preliminary plan completed297
Solar projects ground-level France solar n/a n/a 206298 in study
Responsible sourcing
In its Activities and Sustainable Development report 2009, GDF Suez makes no reference to supply chain responsibility.299 The company does have an Ethics charter, which includes requirements for suppliers. Among other adherence to the OECD Guidelines for Multinational enterprises is required.300 All Belgium nuclear reactors are operated by GDF Suez. The fuel cycle for Belgian nuclear plants, including the sourcing of uranium oxide concentrate is managed by Synatom (Société Belge des Combustibles Nucléaires), a wholly-owned subsidiary of Electrabel (although the government holds a golden share with special rights). In 2008, Synatom announced a strategic partnership with Powertech for development of Powertech's U.S. uranium mining projects in the US states of Colorado, South Dakota and Wyoming. Synatom currently owns 19.6% of Powertech.301 It was the first time Synatom invested in mining projects. The projects are at the stage of preparation.302 Coal input comprises some 10% of GDF Suez's generation capacity. The company does not make public how many metric tonnes coal it yearly uses for electricity production.303 Each year GDF SUEZ consumes over 2 million metric tons of various types of biomass, to supply electrical and heating plants across Europe, the United States and Brazil.304 GDF Suez has its own certification scheme for biomass. The minimum criteria used focus on: energy balance or CO2 balance for the supply chain; traceability of the primary resources and final product; report by a third party on local resource management and respect of legislations. The company mainly uses wood pellets, wood chips and agricultural waste.305 220 GDF Suez, “2009 Activities and Sustainable Development report”, May 2010,
<www.gdfsuez.com/document/?f=files/en/gdf-suez-radd-09-vus.pdf> (24 June 2010) 221 GDF Suez Reference Document 2009, April 2010, p. 265,
<http://www.gdfsuez.com/en/finance/investors/publications/publications/> (18 June 2010) 222 Electrabel Nederland website, “Onze dienstverlening”, no date, <http://www.electrabel.nl/Over-Electrabel/Wie-
zijn-we/Wat-doen-we.aspx> (2 July 2010) GDF Suez Reference Document 2009, April 2010, p. 37, <http://www.gdfsuez.com/en/finance/investors/publications/publications/> (24 June 2010)
223 E-mail by Robert Imler, corporate communication GDF SUEZ Energy Benelux & Germany on 30 August 2010. 224 These capacities are on “share data basis”. The “share data” include the total capacities of the fully consolidated
companies and the capacities of proportionally consolidated and equity method consolidated companies in proportion to the share held. GDF Suez Reference Document 2009, April 2010, p. 10, <http://www.gdfsuez.com/en/finance/investors/publications/publications/> (24 June 2010)

GDF Suez/Electrabel 46
225 Figures as of 31 December 2008, e-mail by W. Wolters, Manager Strategy & Regulatory Affairs, Electrabel
Nederland, 06 July 2009. 226 On “share data basis”. The “share data” include the total capacities of the fully consolidated companies and the
capacities of proportionally consolidated and equity method consolidated companies in proportion to the share held. GDF Suez Reference Document 2009, April 2010, p. 11, <http://www.gdfsuez.com/en/finance/investors/publications/publications/> (24 June 2010)
227 Figures as of 31 December 2008, e-mail by W. Wolters, Manager Strategy & Regulatory Affairs, Electrabel Nederland, 06 July 2009.
228 On “share data basis”. The “share data” include the total capacities of the fully consolidated companies and the capacities of proportionally consolidated and equity method consolidated companies in proportion to the share held. GDF Suez Reference Document 2009, April 2010, p. 11, <http://www.gdfsuez.com/en/finance/investors/publications/publications/> (24 June 2010)
229 On “share data basis”. The “share data” include the total capacities of the fully consolidated companies and the capacities of proportionally consolidated and equity method consolidated companies in proportion to the share held. GDF Suez Reference Document 2009, April 2010, p. 11, <http://www.gdfsuez.com/en/finance/investors/publications/publications/> (24 June 2010)
230 GDF Suez Reference Document 2009, April 2010, p. 37, <http://www.gdfsuez.com/en/finance/investors/publications/publications/> (24 June 2010) Electrabel Nederland website, “Onze dienstverlening”, no date, <http://www.electrabel.nl/Over-Electrabel/Wie-zijn-we/Wat-doen-we.aspx> (2 July 2010)
231 Electrabel, “Verslag Activiteiten en Duurzame Ontwikkeling 2009”, June 2010, page 56, <http://www.electrabel.be/assets/content/corporate/rac_29_nl_710059DE0B944E2585E950DB46E05A3F.pdf> (31 August 2010)
232 Electrabel website, “Stroometiket”, <http://www.electrabel.nl/Thuis/Producten/Groene_energie/Stroometiket.aspx> (24 June 2010)
233 Electrabel website, “Stroometiket”, <http://www.electrabel.nl/Thuis/Producten/Groene_energie/Stroometiket.aspx> (24 June 2010)
234 GDF Suez Reference Document 2009, April 2010, p. 37, <http://www.gdfsuez.com/en/finance/investors/publications/publications/> (17 June 2010)
235 Electrabel, press release “Opening biomassa installatie Centrale Gelderland”, 22 April 2010, <http://www.electrabel.nl/Over-Electrabel/Nieuws-en-Pers/Persberichten/Opening-biomassa-installatie-Centrale-Gelderland.aspx> (17 June 2010)
236 Electrabel, press release “Electrabel, GDF SUEZ Groep, en Pacific BioEnergy tekenen samenwerkingsakkoord”, 16 February 2010, <http://www.electrabel.com/newsroom/pressreleases_new.aspx?id=1385083> (17 June 2010)
237 Electrabel, press release “100% biomassa in Rodenhuize”, 29 October 2009, <http://www.electrabel.com/newsroom/pressreleases_new.aspx?id=1351285> (17 June 2010)
238 GDF Suez , report “Actions committed to sustainable development, 2010 issue”, p. 8, <http://www.gdfsuez.com/en/group/publications/publications/> (18 June 2010)
239 GDF Suez Reference Document 2009, April 2010, p. 37, <http://www.gdfsuez.com/en/finance/investors/publications/publications/> (17 June 2010)
240 GDF SUEZ, press release “GDF SUEZ begins construction of 800 MW biomass and coal power station in the Netherlands” , 22 June 2010, <http://www.gdfsuez.com/en/finance/press-releases/press-releases/?communique_id=1061>, (18 June 2010)
241 Total investment over 1 billion. Stake GDF Suez is 56.82%. 242 Total capacity 742 MW. End 2008 GDF Suez has a 33.1% stake in WSW Energie & Wasser. WSW has a 15%
stake in the Wilhelmshaven power plant. BKW FMB Energie AG (33%) has a 15% stake in the Wilhelmshaven power plant. This puts the stake of GDF Suez at 56.82%. GDF Suez Reference Document 2009, April 2010, p. 37 and 107, <http://www.gdfsuez.com/en/finance/investors/publications/publications/> (17 June 2010) GDF Suez, presentation Frank Albers, GDF SUEZ Energie Deutschland AG, “Electricity production in the Wadden Sea Region – fossil energy”, 26 November 2009, <http://www.waddensea-forum.org/WGs/EII/Symposium%20BHV/GDF%20SUEZ-Albers.pdf> (18 June 2010)
243 GDF Suez Reference Document 2009, April 2010, p. 37 and 107, p. 26, <http://www.gdfsuez.com/en/finance/investors/publications/publications/> (17 June 2010)
244 GDF Suez Reference Document 2009, April 2010, p. 37 and 107, p. 26, <http://www.gdfsuez.com/en/finance/investors/publications/publications/> (17 June 2010)
245 GDF Suez Reference Document 2009, April 2010, p. 37 and 107, p. 26, <http://www.gdfsuez.com/en/finance/investors/publications/publications/> (17 June 2010)
246 Added capacity 22 MW. Total investment €45 million. 50/50 joint venture between E.ON and Electrabel. Platts Power In Europe, “PiE's new power plant project tracker - April 2010”, 3 May2010. E.ON website, <http://www.eon-energy-projects.com/pages/eep_en/References/References/CHP_Plant_Evonik_Degussa_Antwerpen/index.htm> (29 June 2010)
247 Total capacity 450MW. 50/50 joint venture between GDF SUEZ and GEK TERNA. GDF Suez Reference Document 2009, April 2010, p. 39, <http://www.gdfsuez.com/en/finance/investors/publications/publications/> (17 June 2010) GDF Suez, press release “GEK TERNA AND GDF SUEZ complete the partnership in the Greek power generation market”, 3 June 2009, <http://www.gdfsuez.com/en/finance/press-releases/press-releases/?communique_id=1053> (18 June 2010)

Sustainability in the Power Sector Update 2010 - The Netherlands
47
248 Investment €200 million. Alstom, “Dunamenti Power Plant repowering project”, 16 July 2009,
<http://www.hu.alstom.com/home/projects/current_projects/59572.EN.php?languageId=EN&dir=/home/projects/current_projects/> (18 June 2010)
249 The capacity of the unit will be raised from 215 MWe currently to over 400 MWe. CMI, press release “Dunamenti Erımő Power Plant (Hungary): corner stone laying ceremony in the presence of CMI”, 4 June 2009, <http://www.cmigroupe.com/vpage.php?id=420> (18 June 2010) Electrabel owns a 74.82% interest in Dunamenti. GDF Suez Reference Document 2009, April 2010, p. 402, <http://www.gdfsuez.com/en/finance/investors/publications/publications/> (18 June 2010).
250 Nuon website, Over Nuon, Pers, Persberichten, “Nuon neemt warmtekrachtcentrale in Almere over van Electrabel”, 15-12-09, http://www.nuon.com/nl/pers/persberichten/20091215/index.jsp (08-07-10).
251 Total capacity 1,440 MW. As of 31 December 2009 GDF Suez still has a 9.15% share in Energonuclear. GDF Suez Reference Document 2009, April 2010, p. 37 and 107, p. 462, <http://www.gdfsuez.com/en/finance/investors/publications/publications/> (17 June 2010) In November 2008 an investment agreement was signed between the state nuclear power corporation Societatea Nationala Nuclearelectrica (SNN), with 51% of the project, and Enel, CEZ, GDF Suez, RWE Power (each 9.15%), Iberdrola (6.2%) and ArcelorMittal Galati (6.2%). The consortium, called EnergoNuclear, was formally established in April 2009. Construction cost is expected to be about €4 billion. By September 2009 it was evident that SNN could not raise its share of the funds, and would contribute only 20 to 25%, mostly in kind - heavy water and fuel. The other participants would increase their shares. The first unit is still expected on line in 2016. World Nuclear Association, “Nuclear Power in Romania”, February 2010, <http://www.world-nuclear.org/info/inf93.html> (17 June 2010) “another two nuclear units of at least 700 megawatt at Cernavoda Nuclear Power Plant over 2009-2015”. Website permanent representation Romania to the European Union, “Romanian economic highlights”, 21 January 2010, <http://ue.mae.ro/pdf/2010.01.04_highlights01.pdf> (20 June 2010)
252 Electrabel, “Verslag Activiteiten en Duurzame Ontwikkeling 2009”, June 2010, page 56, <http://www.electrabel.be/assets/content/corporate/rac_29_nl_710059DE0B944E2585E950DB46E05A3F.pdf> (31 August 2010)
253 GDF Suez, presentation “2009 Annual Results”, 4 March 2010, p. 103, <www.gdfsuez.com/document/?f=files/fr/slides-vf.pdf> (18 June 2010)
254 This includes the Hauts Pays (78 MW in Haute-Marne, developed by Erelia) and Germinon (75 MW in the Marne, developed by Eole Generation) facilities, which are among the largest wind farms in France. GDF Suez Reference Document 2009, April 2010, p. 26, <http://www.gdfsuez.com/en/finance/investors/publications/publications/> (17 June 2010) Erelia + LHL (100%, 102 MW), Great (100%, 10 MW), Eole Generation (100%, 97 MW), Maia Eolis (49%, 50 MW), La Compagnie du Vent (56%, 41 MW), CN’Air (49,9%, 34 MW). Total capacity 334 MW, GDF Suez share 273 MW. GDF Suez, presentation “2009 Annual Results”, 4 March 2010, p. 128 and 130, <www.gdfsuez.com/document/?f=files/fr/slides-vf.pdf> (18 June 2010).
255 GDF Suez holds a 42.5% stake in Generg. Total capacity wind projects under development is 240 MW. GDF Suez Reference Document 2009, April 2010, p. 39, <http://www.gdfsuez.com/en/finance/investors/publications/publications/> (17 June 2010)
256 Electrabel, “Verslag Activiteiten en Duurzame Ontwikkeling 2009”, June 2010, page 56, <http://www.electrabel.be/assets/content/corporate/rac_29_nl_710059DE0B944E2585E950DB46E05A3F.pdf> (31 August 2010)
257 GDF Suez Reference Document 2009, April 2010, p. 39, <http://www.gdfsuez.com/en/finance/investors/publications/publications/> (17 June 2010) GDF Suez, press release “GDF SUEZ First UK Wind Farm”, 31 March 2010 <http://www.gdfsuezuk.com/public/page.php?iddossier=735&idarticle=2988> (18 June 2010)
258 ADPnews, “GDF Suez to launch 20.5 MW wind farm in Poland in early 2011” 18 June 2010, <http://adpnews.info/?APP_ACTION=BYSERVICE&sid=11> (20 June 2010)
259 GDF SUEZ’s first Polish wind farm (20 MW) is now under construction in Jarogniew – Moltowo and several other wind-power projects are in development. GDF Suez, press release “GDF SUEZ to build world's largest Biomass Power Unit in Poland strengthening its leading position in Europe”, 7 April 2010, <http://www.gdfsuez.com/en/finance/press-releases/press-releases/?communique_id=1218> (18 June 2010)
260 GDF Suez, presentation “2009 Annual Results”, 4 March 2010, p. 103, <www.gdfsuez.com/document/?f=files/fr/slides-vf.pdf> (18 June 2010)
261 GDF Suez, presentation “2009 Annual Results”, 4 March 2010, p. 103, <www.gdfsuez.com/document/?f=files/fr/slides-vf.pdf> (18 June 2010)
262 Construction and operation of the future facility will be carried out by a specially-created project company made up of GDF SUEZ and two financial partners: EuroFideme 2 (Natixis Environnement & Infrastructure) and SEIEF (Dexia). GDF Suez, press release “GDF SUEZ builds France's largest photovoltaic solar power facility”, 10 February 2010, <http://www.gdfsuez.com/en/finance/press-releases/press-releases/?communique_id=1181> (18 June 2010)
263 Total 44 MW minus Curbans (33 MW) listed apart. GDF Suez Reference Document 2009, April 2010, p. 27, <http://www.gdfsuez.com/en/finance/investors/publications/publications/> (17 June 2010)
264 GDF Suez holds a 42.5% stake in Generg. Total capacity under construction is 12 MWp of photovoltaic solar projects. GDF Suez Reference Document 2009, April 2010, p. 39,<http://www.gdfsuez.com/en/finance/investors/publications/publications/> (17 June 2010)
265 Die Klima-Allianz, press release, “Weiteres Kohlekraftwerk in Deutschland verhindert”, 2 February 2010, <http://www.die-klima-allianz.de/wp-content/uploads/PM_Weiteres-Kohlekraftwerk-in-Deutschland-

GDF Suez/Electrabel 48
verhindert_20100202.pdf> (18 June 2010) GDF Suez Reference Document 2009, April 2010, p. 173, <http://www.gdfsuez.com/en/finance/investors/publications/publications/> (17 June 2010)
266 GDF Suez, <http://nl.engineering-gdfsuez.com/power/references/ (18 June 2010) Reuters, “FACTBOX Controversial German coal-fired power plant projects”, 17 March 2010, <http://uk.reuters.com/article/idUKLDE62G1JG20100317> (18 June 2010) Completion was planned for 2012, but this announcement has been taken back (E-mail W. Wolters, Manager Strategy & Regulatory Affairs, Electrabel Nederland, 6 July 2009).
267 Total capacity 460MW. GDF Suez has a 35% stake in Tirreno Power. Tirenno Power, “azionisti”, <http://www.tirrenopower.com/finance/azionisti.aspx> (18 June 2010). TIRRENO POWER S.P.A., “BILANCIO D’ESERCIZIO AL 31 DICEMBRE 2009”, <http://www.tirrenopower.com/resources/bilanci/73B77F89-8682-4A50-B085-2FCD0FDA334F.pdf> (18 June 2010)
268 Total investment 8,592 million Zloty. Exchange rate: 0.24987 (average 01/01/2010-19/06/2010, <http://nl.exchange-rates.org/history/EUR/PLN/T> BRE Bank Securities, “Update power engineering”, 12 March 2010, <http://i.wp.pl/a/dibre/aspolek/energy_120310.pdf> (18 June 2010)
269 Total investment 4,296 million Zloty. Exchange rate: 0.24987 (average 01/01/2010-19/06/2010, <http://nl.exchange-rates.org/history/EUR/PLN/T> GDF Suez has a stake of 50%. Total capacity 716 MW. BRE Bank Securities, “Update power engineering”, 12 March 2010, <http://i.wp.pl/a/dibre/aspolek/energy_120310.pdf> (18 June 2010) On 11 June 2010 PGE Polska Grupa Energetyczna SA and GDF SUEZ Energia Polska SA signed a preliminary agreement providing for the parties' cooperation on the development of a coal-fired power plant and their equal 50-50 participation in the planned undertaking. Polska Grupa Energetyczna SA, “PGE Signs Agreement with GDF Suez Energia Polska”, 16 June 2010, <http://www.pgesa.pl/en/PGE/PressCenter/PressInformation/Pages/PGESignsAgreementwithGDFSuezEnergiaPolska.aspx> (18 June 2010)
270 “We have allocated a significant budget for the development of the Borzesti, Cernavoda and the wind energy projects,” GDF SUEZ representatives said without, however, mentioning the actual amount. In addition to these projects, the company also planned other investments, such as the construction of two energy production units, one in Constanta and the other one in Galati, large-scale projects that required total funds of up to 2.5 billion euros. “At present such projects are not a priority for GDF SUEZ in Romania, as we chose to focus our resources on more advanced projects,” group’s representatives pointed out. Website permanent representation Romania to the European Union, “Romanian economic highlights”, 21 December 2009, <http://ue.mae.ro/pdf/2009.12.21_highlights51.pdf> (20 June 2010)
271 news2biz, “ENERGY & ENVIRONMENT”, No 173, 23 April 2010, <http://www.news2biz.com/images/publicationimages/SENER-Energy%20and%20Environment-173-a321.pdf> (18 June 2010)
272 The “Green Unit” will burn wood and agri-fuels. It will be located at the site of GDF SUEZ’s 1800 MW co-fired power station (coal/biomass). GDF Suez, press release “GDF SUEZ to build world's largest Biomass Power Unit in Poland strengthening its leading position in Europe”, 7 April 2010, <http://www.gdfsuez.com/en/finance/press-releases/press-releases/?communique_id=1218> (18 June 2010)
273 Total investment 2,666 million Zloty. Exchange rate: 0.24987 (average 01/01/2010-19/06/2010, <http://nl.exchange-rates.org/history/EUR/PLN/T> BRE Bank Securities, “Update power engineering”, 12 March 2010, <http://i.wp.pl/a/dibre/aspolek/energy_120310.pdf> (18 June 2010)
274 GDF Suez subsidiary Electrabel Polaniec S.A. begins construction of a 900 MW gas-fired power plant near Wloclawek. Poland’s gas giant PGNiG will hold a minority stake in the €500 million investment. Emerisk, “Emerge 365: Poland Q1 10”, <http://www.emerisk.com/country/poland> (18 June 2010) Total investment 2,880 million Zloty, exchange rate 0.24987, would be 720 million. (exchange rate average 01/01/2010-19/06/2010, <http://nl.exchange-rates.org/history/EUR/PLN/T> BRE Bank Securities, “Update power engineering”, 12 March 2010, <http://i.wp.pl/a/dibre/aspolek/energy_120310.pdf> (18 June 2010)
275 The Diplomat, “Hold-up for new energy projects”, April 2010, <http://www.thediplomat.ro/articol.php?id=1026> (17 June 2010) The Diplomat, “Outdated power plants face the heat”, June 2010, <http://www.thediplomat.ro/articol.php?id=1209> (17 June 2010)
276 Legal Today, “El Supremo confirma que la central de Morata no es un bien de utilidad pública”, 20 May 2010, <http://www.legaltoday.com/practica-juridica/publico/medio_ambiente/el-supremo-confirma-que-la-central-de-morata-no-es-un-bien-de-utilidad-publica> (19 June 2010) Electrabel Spain, “Morata”, no date, <http://www.electrabel.es/content/corporate/aboutelectrabel/morata_en.asp> (18 June 2010)
277 GDF Suez Reference Document 2009, April 2010, p. 37, <http://www.gdfsuez.com/en/finance/investors/publications/publications/> (17 June 2010)
278 Platts Power In Europe, “PiE's new power plant project tracker - April 2010”, 3 May2010 279 Total capacity 400MW. Platts Power In Europe, “PiE's new power plant project tracker - April 2010”, 3 May2010.
“GDF Suez has a 40.59% interest in Acea-Electrabel”. GDF Suez Reference Document 2009, April 2010, p. 395, <http://www.gdfsuez.com/en/finance/investors/publications/publications/> (29 June 2010).
280 Joint development agreement (50/50) Acea-Electrabel and Horizon Energy. Total capacity 400MW. Platts Power In Europe, “PiE's new power plant project tracker - April 2010”, 3 May2010.

Sustainability in the Power Sector Update 2010 - The Netherlands
49
“GDF Suez has a 40.59% interest in Acea-Electrabel”. GDF Suez Reference Document 2009, April 2010, p. 395, <http://www.gdfsuez.com/en/finance/investors/publications/publications/> (29 June 2010).
281 Finanznachrichten, information from Reuters, 19 April 2010, <http://www.finanznachrichten.de/nachrichten-2010-04/16658063-german-power-gas-sales-rose-in-q1-energy-group-020.htm> (18 June 2010) RWE, “Fiscal 2009 Press Conference, greener, more international and more robust, 25 February 2010, <http://www.rwe.com/web/cms/mediablob/en/387722/data/387366/59908/rwe/investor-relations/Charts-of-press-conference-PDF-Download-.pdf> (18 June 2010)
282 GDF Suez, presentation Frank Albers, GDF SUEZ Energie Deutschland AG, “Electricity production in the Wadden Sea Region – fossil energy”, 26 November 2009, <http://www.waddensea-forum.org/WGs/EII/Symposium%20BHV/GDF%20SUEZ-Albers.pdf> (18 June 2010) Electrabel, “Electrabel considers constructing natural gas power plants in Germany”, 23 January 2008
<http://www.electrabel.com/newsroom/pressreleases_new_en.aspx?id=2008012301> (18 June 2010) Finanznachrichten, information from Reuters, 19 April 2010, <http://www.finanznachrichten.de/nachrichten-2010-04/16658063-german-power-gas-sales-rose-in-q1-energy-group-020.htm> (18 June 2010)
283 The total capacity is 1,650 MW. GDF Suez has 33.33% share. GDF SUEZ and Total agreed on a partnership agreement with respective stakes of 75% and 25% to jointly own this stake. So GDF Suez stake is 25%. World Nuclear Association, “Nuclear Power in France”, June 2010, <http://www.world-nuclear.org/info/inf40.html> (17 June 2010) GDF Suez, press release “GDF SUEZ and Total team up for the EPR project in Penly”, 4 May 2009, <http://www.gdfsuez.com/en/finance/press-releases/press-releases/?communique_id=1034> (18 June 2010)
284 Bloomberg, “EDF Beats GDF Suez to Build New Reactor in France (Update4)”, 30 January 2009, <http://www.bloomberg.com/apps/news?pid=20601072&sid=a5v9iCKYd3OA&refer=energy> (18 June 2010)
TendersInfo, “France : GDF Plans Nuclear Plant for Rhone Valley, an Industrial Info News Alert”, 27 February 2010.
285 “One or more operational nuclear reactors between 2020 and 2025.” GDF Suez , report “Actions committed to sustainable development, 2010 issue”, p. 11, <http://www.gdfsuez.com/en/group/publications/publications/> (18 June 2010)
286 In February 2009, GDF SUEZ (37.5%), Iberdrola (37.5%) and Scottish and Southern Energy (25%) entered a partnership to jointly participate in the development of new nuclear power stations in the UK. The consortium intends to prepare detailed plans for developing a new nuclear power station with a capacity up to 3.6 GW. GDF SUEZ, press release “Iberdrola and Scottish and Southern Energy to acquire site from Nuclear Decommissioning Authority”, 28 October 2009, <http://www.gdfsuez.com/en/finance/press-releases/press-releases/?communique_id=1134> (18 June 2010)
287 In October 2009, a consortium of GDF SUEZ SA, Iberdrola SA and Scottish and Southern Energy Plc (“SSE”) has been successful in securing an option to purchase land for the development of a new nuclear power station at Sellafield on the Cumbrian Coast from the Nuclear Decommissioning Authority (“NDA”). Project is currently in pre-development stage. GDF Suez Reference Document 2009, April 2010, p. 39, <http://www.gdfsuez.com/en/finance/investors/publications/publications/> (17 June 2010) GDF SUEZ, press release “Iberdrola and Scottish and Southern Energy to acquire site from Nuclear Decommissioning Authority”, 28 October 2009, <http://www.gdfsuez.com/en/finance/press-releases/press-releases/?communique_id=1134> (18 June 2010)
288 “GDF Suez wants to boost its French hydropower capacity by the equivalent of the size of a new generation nuclear reactor by 2015.” Source: TendersInfo, “France : GDF Suez eyes more French hydropower capacity-report”, 7 May 2010.
289 Projet des Deux Côtes of La Compagnie du Vent, off the coast of the Somme and Seine-Maritime districts, foresees 141 turbines outputting a total 705 MW. As of 31 December 2009 GDF Suez has a 56.84% stake in La Compagnie du Vent. GDF Suez Reference Document 2009, April 2010, p. 27 and 460, <http://www.gdfsuez.com/en/finance/investors/publications/publications/> (17 June 2010). “2 billion (USD 2.6bn) project” Source: ADP News Renewable Energy Track, “GDF Suez opens public consultation on offshore wind farm”, 3 May 2010.
290 Compagnie du Vent and Shell Windenergy 50/50. As of 31 December 2009 GDF Suez has a 56.84% stake in La Compagnie du Vent. Total capacity 102 MW, total costs 250 million euro. Source: Compagnie du Vent, <http://compagnieduvent.com/parcsprojlibron.html> (25 August 2010)
291 As of 31 December 2009 GDF Suez has a 56.84% stake in La Compagnie du Vent. Listed are all future projects named on the website of La Compagnie du Vent, excluded otherwise mentioned projects and projects under construction as of 31 December 2009. Source: Compagnie du Vent, < http://compagnieduvent.com/parcsproj01.html > (25 August 2010)
292 HLN.BE, “Drie aanvragen voor windmolens in zee afgewezen”, 24 February 2010, <http://www.hln.be/hln/nl/2657/Ecotips/article/detail/1071779/2010/02/24/Drie-aanvragen-voor-windmolens-in-zee-afgewezen.dhtml> (18 June 2010)
293 Total investment €125 million for 29 turbines (each 2 or 3 MW) along the highway E40. Consortium: Electrabel (56%), Infrabel (10%), municipality of Sint-Truiden (23%) and municipality of Landen (11%). Electrabel, “Parc éolien le long de l’E40, réunion d’information”, 30 September 2008, <http://www.electrabel.com/assets/content/news/Reunion_d_information_398_FA700D3C884343108ED6BF3C6103E2D4.pdf> (17 June 2010) Nieuwsblad, “Gingelom krijgt zeven windmolens”, 17 October 2009, <http://www.nieuwsblad.be/article/detail.aspx?articleid=592GPGU3> (17 June 2010) Express.be, “Windmolenpark E40 Brussel-Luik definitief goedgekeurd”, 7 February 2009, <http://www.express.be/sectors/nl/energy/windmolenpark-e40-brussel-luik-definitief-goedgekeurd/102932.htm>

GDF Suez/Electrabel 50
(17 June 2010) Province Vlaams-Brabant, “Vergunning voor 17 windturbines”, 19 January 2010, <http://www.vlaamsbrabant.be/wonen-milieu/milieu-en-natuur/vergunningen/milieuvergunningen/nieuws-17-windturbines.jsp> (17 June 2010)
294 Het Nieuwsblad, “Electrabel wil vier windmolens langs Schipdonkkanaal”, 5 June 2010, <http://www.nieuwsblad.be/article/detail.aspx?articleid=3L2R4LEQ> (18 June 2010)
295 The Group’s first 20 MW wind farm is now under construction in Jarogniew – Moltowo and several other wind-power projects are in development. GDF Suez, press release “GDF SUEZ to build world's largest Biomass Power Unit in Poland strengthening its leading position in Europe”, 7 April 2010, <http://www.gdfsuez.com/en/finance/press-releases/press-releases/?communique_id=1218> (18 June 2010)
296 “We have allocated a significant budget for the development of the Borzesti, Cernavoda and the wind energy projects,” GDF SUEZ representatives said without, however, mentioning the actual amount. In addition to these projects, the company also planned other investments, such as the construction of two energy production units, one in Constanta and the other one in Galati, large-scale projects that required total funds of up to 2.5 billion euros. “At present such projects are not a priority for GDF SUEZ in Romania, as we chose to focus our resources on more advanced projects,” group’s representatives pointed out. Website permanent representation Romania to the European Union, “Romanian economic highlights”, 21 December 2009, <http://ue.mae.ro/pdf/2009.12.21_highlights51.pdf> (20 June 2010)
297 GDF Suez has a 35% stake in Tirreno Power. TIRRENO POWER S.P.A., “BILANCIO D’ESERCIZIO AL 31 DICEMBRE 2009”, p. 11 <http://www.tirrenopower.com/resources/bilanci/73B77F89-8682-4A50-B085-2FCD0FDA334F.pdf> (18 June 2010)
298 Largest project is Curbans (33 MW in the Alpes de Haute Provence) where site construction began in February 2010. GDF Suez Reference Document 2009, April 2010, p. 27, <http://www.gdfsuez.com/en/finance/investors/publications/publications/> (17 June 2010)
299 GDF Suez, “2009 Activities and Sustainable Development report”, May 2010, <www.gdfsuez.com/document/?f=files/en/gdf-suez-radd-09-vus.pdf> (24 June 2010)
300 GDF Suez. “ethics and compliance”, http://www.gdfsuez.com/en/group/ethics-and-compliance/ethics-and-compliance/ (31 August 2010)
301 World Nuclear Association, “Nuclear Power in Belgium”, June 2010, <http://www.world-nuclear.org/info/inf94.html> (24 June 2010) Powertech Uranium Corp., “Strategic Partnership with Synatom”, <http://www.powertechuranium.com/s/SynatomPartnership.asp> (24 June 2010)
302 Synatom, “jaarverslag 2009”, <http://www.synatom.be/files//Jaarverslag%202009.pdf> (24 June 2010) 303 GDF Suez, “2009 Activities and Sustainable Development report”, May 2010,
<www.gdfsuez.com/document/?f=files/en/gdf-suez-radd-09-vus.pdf> (24 June 2010) 304 GDF Suez, “2009 Activities and Sustainable Development report”, May 2010, page 52/53,
<www.gdfsuez.com/document/?f=files/en/gdf-suez-radd-09-vus.pdf> (25 August 2010) 305 Laborelec, presentation Yves Ryckmans “Sustainable biomass for green power”,
<http://www.laborelec.com/pages_files/BM_Sustainable%20biomass%20for%20green%20power-Bestof.pdf> (25 August 2010)

Sustainability in the Power Sector Update 2010 - The Netherlands
51
6 Vattenfall/Nuon
The Nuon and Vattenfall company profiles were drafted and reviewed separately, and combined in the final phase of this research.
Basic company information
Vattenfall Vattenfall is Europe’s fifth largest generator of electricity and largest producer of heat. Consolidated sales in 2009 amounted to €19.8 billion. Vattenfall’s main products are electricity, heat and gas. In electricity, Vattenfall works in all parts of the value chain: generation, transmission, distribution and sales. In heat, Vattenfall is active in production, distribution and sales. Vattenfall is also engaged in production and sales of gas, energy trading, and lignite mining. Vattenfall has approximately 40,000 employees and is 100%-owned by the Swedish state.306 Vattenfall operates in four different markets; Benelux (The Netherlands and Belgium), Central Europe (Germany and Poland), the Nordic countries (Sweden, Finland and Denmark) and the United Kingdom.307 The Group’s operations in 2009 were conducted primarily in six operating segments: � Business Group Pan Europe comprises three Group-wide business units: Wind,
Nuclear and Engineering. � Business Group Central Europe conducts operations in Germany and Poland. � Business Group Nordic conducts operations in Sweden, Finland and Denmark. � Business Group Benelux conducts operations in the Netherlands and Belgium, and
consists of all the Nuon activities, except for its windparks. � Supply & Trading has Group-wide responsibility for market access, price hedging, fuel
purchasing, dispatching for the German and Dutch power plants, and trading. � The segment Other includes treasury operations and other group functions. A draft version of this profile has been sent to Vattenfall, but the company was unable to respond in time. Therefore, the information in this profile has not been verified by Vattenfall and should be interpreted with caution. Nuon N.V. Nuon Energy is a non-listed public limited liability company incorporated in 1998 with its registered office in Amsterdam. On 1 July 2008 Nuon was split into a distribution company (Alliander) and a production and supply company (N.V. Nuon Energy) to prepare for the implementation of the Dutch Independent Network Operations Act (Won), which came into effect one year later. Nuon has operations in the field of generation, trade and supply. In addition to being one of the largest energy suppliers in the Netherlands, the company has interests in energy generation and supply in Belgium, and has trading activities with, among others, the UK and Scandinavia. Nuon provides electricity, natural gas, cooling and heat to approximately 2.6 million customers in the Netherlands and Belgium.308 The company also

Vattenfall/Nuon 52
markets and trades energy, and it offers energy-related services, such as equipment installation and energy saving products. With effect from 1 July 2009, Nuon’s trading activities have organisationally been integrated in Vattenfall’s central energy trading unit and its wind activities organisationally form part of Business Group Pan Europe. As long as these activities are not legally transferred within the Vattenfall Group, the results of these activities will be included in the financial reports of Nuon. Nuon Energy’s business units Exploration & Production, Power Heat & Services, Sales and Business Development & Projects form Vattenfall’s new regional Business Group Benelux. The information that applies to N.V. Nuon Energy has been verified by the company, who used the same scope for the review as for Nuon’s reporting. This includes all of Nuon’s activities in The Netherlands, Belgium and Germany. Purchase and integration On 1 July 2009, Vattenfall acquired 49% of the Nuon shares, for an amount of €4,833 million, giving the company operational control over Nuon. Vattenfall will acquire the remaining 51% of shares in the coming five years under fixed terms. As one of the conditions of the European Competition Authorities, Vattenfall sold off Nuon’s activities in Germany. In March 2010, it was announced that Enervie (formerly Sewag) acquired all of Nuon’s German operations. 309
Installed capacity for electricity generation in Eu rope
Vattenfall (including Nuon) Figure 15 shows the fuel mix of Vattenfall’s installed capacity in Europe as of 31 December 2009. Compared to the situation at the end of 2008, about 4.4 GW is added to the electricity generation capacity. Of this expansion 4.0 GW is explained by the acquisition of 49% of N.V. Nuon Energy. Nuon forms the new operating segment Business Group Benelux, with the exception that the wind power operations of Nuon have been integrated with Business Group Pan Europe.310 The generation capacity of Nuon is 100% incorporated in the capacity figures of Vattenfall as of 31 December 2009. Figure 15: Fuel mix of Vattenfall’s installed capac ity in Europe, 2009
Coal33%
Natural Gas13%
Oil 6%
Nuclear16%
Renew able32%
Hydro29%
Wind2%
Biomass1%

Sustainability in the Power Sector Update 2010 - The Netherlands
53
Table 23 shows the absolute figures for Vattenfall’s installed capacity in Europe per fuel type. Table 23: Vattenfall’s installed capacity in Europe (MW) per division and per fuel type, 2009311
Fuel type Business Group Pan
Europe
Business Group Nordic
Business Group
Central Europe
Business Group
Benelux
Total
Coal312 0 1,490 9,825 883 12,198 Natural Gas 0 320 1,725 2,835 4,880 Oil 0 1,280 788 0 2,068 Nuclear 6,146 0 0 0 6,146 Wind 859 0 0 0 859 Hydro 0 7,989 2,880 0 10,869 Biomass 0 322 44 0 366 Total 7,005 11,401 15,262 3,718 37,386
Figure 16 shows the fuel mix of the actual generated electricity in Europe by Vattenfall in 2009. Figure 16: Fuel mix of Vattenfall’s generated elect ricity in Europe, 2009
Coal52%
Natural Gas3%
Nuclear20%
Wind1%
Biomass1%
Renew able25%
Hydro23%
Table 24 shows the absolute figures for Vattenfall’s generated electricity in Europe per fuel type. As in 2008, the installed capacity for fuel type oil was not used for actual generation of electricity in 2009. Contrary to the installed capacity, the generated electricity by Nuon is not fully incorporated in the figures, but according to the official ownership by Vattenfall (49% as of 31 December 2009) and the official date of the acquisition (1 July 2009). Compared to 2008 and despite the acquisition of Nuon, the amount of electricity generated by Vattenfall decreased in 2009 by 4.5% in 2009.313 The decrease can be mainly explained by smaller output of hydro (15% less due to lower water supply) and nuclear (10% less due to outages).314

Vattenfall/Nuon 54
Table 24: Vattenfall’s generated electricity (TWh) in Europe per division and per fuel type, 2009 315
Fuel type Business Group Pan
Europe
Business Group Nordic
Business Group Central
Europe
Business Group
Benelux
Total
Coal316 0 6.7 61.9 2.6 71.2 Natural Gas 0 0.6 3.5 0.6 4.7 Oil 0 0 0 0 0 Nuclear 28.3 0 0 0 28.3 Wind 1.7 0 0 0 1.7 Hydro 0 29.1 2.5 0 31.6 Biomass 0 0.3 1.1 0 1.4 Total 30.0 36.7 69.0 3.2 138.9
Nuon The information below is gathered separately for Nuon. These figures have also featured in the tables for the Vattenfall section (columns Business Group Benelux), but are provided here with a bit more detail. The notable differences in the figures (Vattenfall section versus this section) can be explained by differences in scope of reporting. This is the case for the installed capacity, where Nuon provides slightly higher figures than Vattenfall’s Benelux division, and for the generated electricity, to which Vattenfall only reports its ownership share. Figure shows the fuel mix of Nuon’s installed capacity. For the large part, this fuel mix has remained the same compared to the previous year. A number of small wind projects became operational in 2009.317 Nuon still has the large majority of its installed capacity in The Netherlands, and most of the 9% renewable capacity is accounted for by offshore and onshore wind projects. Figure 17: Fuel mix of Nuon’s installed capacity in Europe, 2009
Biomass0%
Wind8%
Hydro1%
Coal22%
Other renew able0%
Natural Gas69%
Renew able9%
Based on: Nuon318
Nuon provides detailed figures on the generated electricity in 2009. Figure 18 shows the fuel mix, and shows slightly higher coal figures and slightly lower natural gas figures than its installed capacity. The renewable share is similar to the figures for the installed capacity.

Sustainability in the Power Sector Update 2010 - The Netherlands
55
Figure 18: Fuel mix of Nuon’s generated electricity in Europe, 2009
Coal34%
Natural Gas58%
Renew able9%
Biomass0%
Other renew able0%
Hydro0%
Wind8%
Based on Nuon319
Table 25 shows the absolute figures for Nuon’s installed capacity and electricity generation. Under the category “Natural gas”, Nuon makes the distinction between three different types of gas from which it produces electricity: 12.6% of the generated electricity comes from blast furnace gases generated at the Corus, 28.5% from combined heat and power (CHP) plants, and 15.8% from conventional natural gas plants. Table 25: Fuel mix of Nuon's installed capacity and electricity generation in Europe, 2009320 Fuel type Installed capacity (MW) 321 Generated electricity (GWh) 322 Coal 883323 5,262 Natural Gas 2,767324 8,758 CHP 4,387 Regular 2,427 Blast Furnace 1,944 Oil Nuclear Other Non-renewable Wind 334325 1,275 Hydro 24 72 Large scale (>10MW) 0 Small scale (<10MW) [24326] [72] Biomass 2 16 Stand alone [2327] Co-fired Other renewable 8328 4 Total 4,018 15,387
Electricity supplied in The Netherlands
The figures for the electricity supplied are gathered from Nuon. Vattenfall does not have any supply activities in the Benelux other than Nuon. As Figure 19 reveals, Nuon’s supply mix has a higher share of renewable power than the mix for the electricity it generates itself. These figures are similar to previous years. The 12% renewable electricity represents a total of 2,126 GWh.329 As explained in the methodology

Vattenfall/Nuon 56
chapter, the figures might be influenced by the purchase and trade of green certificates, and do not necessarily reflect the fuel mix received by consumers. Figure 19: Fuel mix of Nuon’s supplied electricity in The Netherlands and Belgium
Coal22%
Natural Gas57%
Hydro5%
Biomass0%
Other renew able0%
Renew able12%
Wind7%
Nuclear5% Other Non-
renew able4%
Based on Nuon330
Table 26 shows the CO2 emissions and radioactive waste production related to the supplied electricity. Table 26: CO2 emissions and radioactive waste produ ction for Nuon's supplied electricity, 2009 Indicator Amount CO2 (g/kWh) 396.6 Radioactive waste (µg/kWh) 190
Announced investments in new generation capacity in Europe
Vattenfall Vattenfall’s investment plan for the period 2010–2014 is worth €19.4 billion331, excluding any acquisitions. The investment plan also encompasses the acquired operations in the Netherlands and Belgium. Most of the investments comprise electricity generation facilities, the rest mainly pertains to electricity and heat networks. Investments in fossil-based electricity generation amount to 53% of the investment plan.332 The breakdown of the fossil-based investments totalling €10.4 billion is as follows: coal €3.9 billion; lignite €2.3 billion; gas €3.8 billion; CCS (carbon capture and storage) €0.4 billion. Investments in renewable energy amount to 17% of the investment plan. The breakdown of the investments totalling €3.2 billion is as follows: wind power €1.9 billion; hydro power €0.7 billion; biomass and waste €0.7 billion. The company also invests €1.4 billion in nuclear power operations in order to improve safety and boost generation capacity.333 In addition to the investments explained in table 4 and 5, Vattenfall plans to rebuild its three coal-fired power plants in Denmark in order to use large quantities of biomass fuel. The MaxBio plan comprises investments of around 700 million, scheduled in the period 2010-

Sustainability in the Power Sector Update 2010 - The Netherlands
57
2018. In 2018, around 0.7 million tonnes of coal per year will be replaced by biomass in combination with coal.334 The total capacity of the plants will remain unchanged. For this reason the investment is not included in the tables below. Nuon Table 27 shows Vattenfall/Nuon’s investments in new production capacity that are currently underway. It includes Nuon’s takeover of a natural gas power plant from Electrabel announced in December 2009. In addition to the new plants that Nuon is building, it also announced the replacement of an existing natural gas plant at the Hemweg location, for a more modern and efficient one with a slightly lower capacity.335 It also exchanged some wind assets in a swap with Electrawinds and Aspiravi.336 This is taken up in the table below as a negative figure in order to avoid double counting. It should be noted that the lower capacity could still generate an equal amount of electricity or more due to a better efficiency. Nuon resumed construction on the first phase of the large, multi-fuel Magnum power plant after having suspended construction for a year and a half. The first phase consist of natural gas facility, while the new coal capacity with gasification technology will be built in the second phase. Table 27: Vattenfall/Nuon’s investments in new prod uction capacity
Company
Project name Location Fuel Type
Date in
operation
Amount (€million)
Output Capacity
(MW)
Project Status
Vattenfall Moorburg Germany coal 2012 2,600 1,640337 under construction338
Vattenfall new unit Boxberg Germany lignite late
2010 1,000 675 under construction339
Vattenfall
combined heat and power unit, Siekierki
Warsaw, Poland
coal/ biomass 2014 800 480 almost
tendered340
Vattenfall boost generation capacity
Forsmark and Ringhals plants, Sweden
nuclear 2011/ 2014 1,250341 450342 under
construction
Vattenfall Abelvattnet Sweden hydro 2010 10 4.6 under construction343
Vattenfall Ormonde wind farm, offshore
in the Irish Sea, 10km off Barrow-In-Furness, England, UK
wind 2011/ 2012 545 150
under construction344
Vattenfall Thanet wind farm, offshore
off the south-east coast of Kent, England, UK
wind 2010 945 300
under construction345

Vattenfall/Nuon 58
Vattenfall
Stor-Rotliden, wind power project, onshore
municipality of Åsele in northern Sweden
wind 2011 135 78 under construction346
Vattenfall Alpha Ventus
45 km off the coast of the island of Borkum, Germany
wind April 2010 66 16 in
operation347
Vattenfall
Repower older turbines
Denmark wind n/a n/a 35 under construction348
Vattenfall
Edinbane, onshore wind power project
the Isle of Skye, Scotland, UK
wind 2010 61 41.4 under construction349
Nuon Almere (NL)350
Natural gas (CHP) 2010 n/a 120
Plant acquired from GDF Suez/Electrabel
Nuon Nuon Magnum (Phase I)351
Eemshaven (NL)
Natural gas (part of a multi-fuel installation)
2012 1,800 1,200352 Construction resumed
Nuon Hemweg 9353
Amsterdam (NL)
Natural gas (CCGT)
2012 n/a 435 Under construction
Nuon Oom Kees354
Wieringermeer (NL) Wind 2010 n/a 6 Under
construction
Nuon Les Eoliennes de Perwez
Perwez (BE) Wind 2010 n/a -4.5 Asset swap
Table 28 shows Vattenfall/Nuon’s announced plans for future investments in new production capacity. Nuon is no longer developing the 450MW natural gas plant in Griesheim, as it will no longer be active on the German market after the mandatory sale of Nuon Germany.355 New plans now only feature investments in natural gas and wind facilities, including a new natural gas plant to be built in Seneffe, Belgium. Nuon has also announced plans for the ‘largest off-shore wind farm in Belgium’, named Seal.356 This project is expected to go into operation in 2012. As no details are given about the investment amount or the output capacity, this project is not taken up in Table 28. Nuon is also constructing a 299 MW wind park in Wales, called Pen Y Cymoedd, which is also not taken up in the table for reasons of scope and consistency. 357 Table 28: Vattenfall/Nuon’s announced plans for inv estment in new capacity
Company Project name Location Fuel type
Date in operation
Amount (€
million)
Output Capacity
(MW) Status
Vattenfall Vattenfall and ZA Puławy
Puławy, Poland
un-decided358
2016-2018 650-900 700 planning phase359
Vattenfall Elektrownia Kozienice
South east Poland coal 2015 288 187 planning
phase360
Vattenfall Elektrownia Kozienice
South east Poland coal n/a 288 187 considered
361

Sustainability in the Power Sector Update 2010 - The Netherlands
59
Vattenfall Elektrownia Gniew – Opalenie
Opalenie, Poland coal n/a 2,560 1,660 planning
phase362
Vattenfall Jänschwalde Near Brandenburg, Germany
coal/CCS 2015 n/a 250363 planning phase364
Vattenfall EC Pruszków Poland coal/ biomass n/a 740 480 planning
phase365
Vattenfall EC Zerań Warsaw, Poland
coal/ biomass n/a 740 480 planning
phase366
Vattenfall Heizkraftwerk Lichterfelde
Berlin, Germany
gas (CCGT)
2014/ 2015 n/a 300 planning
phase367
Vattenfall Heizkraftwerk Klingenberg
Berlin, Germany
gas (CCGT)
2016/ 2019 n/a 300 planning
phase368
Vattenfall Enea Poland biogas 2020 n/a 28 planning phase369
Vattenfall CHP plant Haferweg
Hamburg Altona, Germany
biomass n/a n/a 5
Approval received in January 2010370
Vattenfall district heating plant Märkisches
Märkisches, Germany biomass n/a n/a 5
Approval received in March 2010371
Vattenfall Biomass CHP plant Klingenberg
Klingenberg, Germany biomass n/a n/a 40 Planning
phase372
Vattenfall Aegir Shetland Islands, UK
wave power 2014 n/a 10
planning consent needed373
Vattenfall Tonn Energy Ireland wave power 2020 180 125 in study374
Vattenfall Dan Tysk
70 km northwest of Sylt, Germany
wind n/a n/a 400 Construc-tion starts 2011.375
Vattenfall
first project East Anglia offshore windfarm zone
14km off the coast of Norfolk and Suffolk, England, UK
wind n/a n/a 600
construction expected to commence in 2015.376
Vattenfall
other projects East Anglia offshore windfarm zone
14km off the coast of Norfolk and Suffolk, England, UK
wind n/a n/a 3,000
Construc-tion expected to commence after 2015.377
Vattenfall Kriegers Flak II
Baltic Sea, 30 km south of Trelleborg, Sweden
wind n/a n/a 640
no investment decision yet.378
Vattenfall Taggen Offshore Sweden wind n/a n/a 150
possible construction start 2012379
Vattenfall Trolleboda Offshore Sweden wind n/a n/a 150
not economi-cally viable according to company380

Vattenfall/Nuon 60
Vattenfall Aultmore, onshore
Aultmore Forest, Banffshire, Scotland, UK
wind n/a n/a n/a awaiting permission381
Vattenfall Clashindarroch, onshore
near Huntly in Aberdeen-shire, Scotland, UK
wind n/a n/a 50 awaiting permission382
Vattenfall Kyle, onshore
east of Dalmellington, Scotland, UK
wind n/a n/a n/a in study383
Vattenfall Logiealmond, onshore
Perthshire, Scotland, UK wind n/a n/a n/a
awaiting permission384
Vattenfall Minch Moor, onshore
near Peebles, Scotland, UK
wind n/a n/a n/a awaiting permission385
Vattenfall Ray, onshore
near Kirkwhelping-ton. England, UK
wind n/a n/a n/a awaiting permission386
Vattenfall Whitton, onshore
east of Jedburgh, Scotland, UK
wind n/a n/a 15 awaiting permission387
Vattenfall Enea Poland wind 2020 n/a 75 planning phase388
Nuon Velsen389 natural gas n/a 100 200 Proposed
Nuon Diemen (NL)
390
natural gas (CHP)
2012 n/a 500 Proposed
Nuon Seneffe391 (BE)
natural gas (CCGT)
n/a n/a 450 Proposed
Nuon Beaufort392 Noordzee wind 2015 950 300 Awaiting subsidies
Nuon De Zuidlob393 Zeewolde wind 2012 n/a 108 Proposed
Nuon Duiven (NL)394 wind n/a n/a 12 Awaiting
permits
Nuon Büren (NL)
395 wind n/a n/a 8 Awaiting permits
Nuon Nuon Magnum (Phase II)396
Eemshaven (NL)
coal and biomass n/a n/a 800 Proposed
Nuon Nuon Magnum (Phase II)397
Eemshaven (NL)
natural gas n/a n/a -800 Proposed
Responsible sourcing
Vattenfall/Nuon’s approach to sustainability can be described as aiming to find a balance between electricity reliability, cost and sustainability.398 Nuon’s CSR report states: ‘In our view a sustainable energy supply is clean, affordable and reliable. We want to occupy a prominent position in renewable production capacity, energy saving and clean fossil technologies’. In addition to annual CSR reporting, the company has a Code of Conduct for Employees.

Sustainability in the Power Sector Update 2010 - The Netherlands
61
Vattenfall has a code of conduct for suppliers. Within the code of conduct a reference is made to the UN Global Compact and all ten principles of the Global Compact are elaborated specifically, e.g. the prohibition of forced and compulsory labour, the obligation to provide a safe and healthy workplace, the recognition of the rights of employees to freely associate and the prohibition of any form of discrimination. The code of conduct also mentions that Vattenfall may conduct on-site reviews or audits at suppliers in order to assess ‘progress towards the principles’. Vattenfall also expects suppliers to apply the company’s minimum standards to their subcontractors and sub-suppliers. ‘Suppliers’ as such are not specifically defined, although the website does mention that ‘the broad spectrum of different goods and services procured ranges from fuel for our generation units to outsourced works and services; from large scale investments like turbines to office material and IT solutions’.399 Nuon’s suppliers are also bound to Vattenfall’s Code of Conduct for Suppliers. Raw materials The procurement of coal is not specified by Vattenfall. Vattenfall uses hard coal in its power plants in Germany, Poland and Denmark. When purchasing hard coal, Vattenfall requires its suppliers to adhere to the principles of the UN Global Compact.400 Vattenfall owns and operates lignite mines close to its lignite-fired power plants in the Lausitz region, in eastern Germany.401 Vattenfall is planning to extend its lignite mining in Germany by opening three new lignite mines (Jänschwalde-Nord, Welzow-Süd räumlicher Teilabschnitt II, Nochten Vorranggebiet). The company already has approval to mine 1,340 million tonnes lignite in the Lausitz region. The three extra areas are expected to have a mining capacity of 760 million tonnes of lignite. Nearly 4,000 people would have to be resettled. The company has also plans to open an opencast lignite mine at Gubin-Brody in Poland. At a local referendum conducted in the autumn of 2009 in Gubin 1,855 people voted against the mine compared to 874 being in favour.402 Nuon explicitly states that it does not provide figures for the quantities of raw materials it purchases, because this information would be ‘competition-sensitive’.403 It does indicate that it sources most of its coal directly from coal mines, and that it performs risk reviews on human rights and corruption before closing coal contracts. The results of these risk reviews have not been made public. Nuon mentioned that it is involved in sector wide initiatives to address the sustainability issues identified in the mining phase of the coal supply chain.404 Regarding biomass, Vattenfall does not mention where the biomass used in its plants comes from. However, it does publish an opinion paper on biomass, stating that ‘Vattenfall supports the development of generally adopted sustainability criteria for biomass’ and that ‘Vattenfall’s minimum requirements on all suppliers are criteria based on UN Global Compact. In addition, Vattenfall supports voluntary certification schemes for biomass fuels. Certification schemes referred to by suppliers are assessed by Vattenfall to determine reliability’.405 Nuon mentions that the company applies the ‘Cramer criteria’ for its purchase of biomass. It also actively participates in the ‘Commissie-Corbey’ and the NTA8080 to improve the quality of biomass sustainability standards. In its CSR report, Nuon provides insight in the origin of the biomass it uses: ‘At the biomass plant in Lelystad, about 20 to 25 thousand tonnes of clean wood cuttings are burned annually to provide about 3,000 households with district heating and power. These wood chips come from local woodland of Staatsbosbeheer, the Dutch Forestry Commission. Biomass is co-fired in our power plant at Buggenum, which means that part of the coal is replaced with biomass prior to combustion. This generally

Vattenfall/Nuon 62
takes the form of sawdust and agricultural residues from neighbouring countries.’406 49% of the wood waste it uses is sourced from Germany, the other 59% from The Netherlands. Vattenfall does provide information regarding the origin of the uranium it uses; the uranium is procured from mines in Australia, Namibia and Russia. All suppliers in the uranium purchasing chain are visited and assessed by Vattenfall Nuclear Fuel staff in order to ensure their operations follow Vattenfall’s policies. The company indicates on its website that it makes a thorough evaluation of the uranium suppliers through onsite visits and assessments according to Vattenfall’s environmental and social criteria.407 Nuon does not own any nuclear capacity, and therefore does not purchase uranium as a raw material. Electricity trading In response to the questionnaire sent to Nuon as part of this research, Nuon explains how the electricity it generates bares no link with the electricity it supplies. It states that: ‘All generated power can be offered on the wholesale market, where contracts change hands multiple times and can be split up and combined by various traders and brokers. These contracts do not stipulate the origin of the power produced, other than the country of origin […] This means that it is not possible to trace back from which power producers the energy sourced for end customers originates.’408
Nuon also explains how the fuel mix of the electricity purchased on the spot market is estimated on the basis of the Dutch Standard Fuel Mix and the Imported Fuel Mix, as reported by EnergieNed, the business association of the electricity industry. No information was found regarding Vattenfall’s trading activities. 306 Vattenfall, “annual report 2009”, p.2 and 3, <http://www.vattenfall.com/en/file/2-20100524-110100.pdf> (16 July
2010) 307 Vattenfall website, “Market operations”, updated 21 June 2010, <http://www.vattenfall.com/en/market-
operations.htm> (16 July 2010). 308 Nuon, Annual Report 2009, p.4. 309 Energeia website, “Nuon Duitsland definitief in handen van Enervie na Europees groen licht”, 19-03-10,
http://www.energeia.nl/news.php?ID=42683 (08-07-10). 310 Vattenfall, “annual report 2009”, p.94, <http://www.vattenfall.com/en/file/2-20100524-110100.pdf> (16 July 2010) 311 Data corresponding to Vattenfall’s ownership of the respective facilities. Vattenfall, “annual report 2009”, p.133,
<http://www.vattenfall.com/en/file/2-20100524-110100.pdf> (16 July 2010) 312 Vattenfall reports separately for its lignite and hard coal capacity. This table has combined these figures for
reasons of comparability. 313 In 2009 it was 138.8 TWh, in 2008 it was 145.4 TWh. Vattenfall, “annual report 2009”, p.133,
<http://www.vattenfall.com/en/file/2-20100524-110100.pdf> (16 July 2010) 314 Vattenfall, “annual report 2009”, p.22 and 133, <http://www.vattenfall.com/en/file/2-20100524-110100.pdf> (16
July 2010) 315 Data corresponding to Vattenfall’s ownership in the respective facilities. Vattenfall, “annual report 2009”, p.133,
<http://www.vattenfall.com/en/file/2-20100524-110100.pdf> (16 July 2010) 316 Vattenfall reports separately for its lignite and hard coal capacity. This table has combined these figures for
reasons of comparability. 317 Nuon, Annual Report 2009, p.22. 318 Nuon Corporate Social Responsibility Report 2009, p78. 319 Nuon Corporate Social Responsibility Report 2009, p.19. 320 The figures given in this table are based on Nuon’s CSR report, which provides the most detailed figures for
capacity and generation. 321 Some of these figures are based on SOMO’s own calculations. In its CSR report, Nuon indicates that reporting
on “total installed capacity by fuel source is not always possible due to combined fuel applications in the installations” (Nuon CSR report, p.78). These figures should therefore be interpreted with caution.
322 Nuon’s comments to a draft version of this report, email received 06-08-10. 323 This is the combined capacity of the Buggenum (253 MW) and Hemweg (630 MW) coal plants. 324 This is calculated by taking the total grey capacity (3,650 MW) minus the coal capacity (883 MW). 325 Nuon Corporate Social Responsibility Report 2009, p.50. 326 Idem.

Sustainability in the Power Sector Update 2010 - The Netherlands
63
327 Idem. 328 Idem. 329 Nuon Corporate Social Responsibility Report 2009, p.32. 330 Nuon Corporate Social Responsibility Report 2009, p.36. 331 SEK 201 billion. Exchange rate SEK 10.35 = € 1 332 SEK 100 billion. Exchange rate SEK 10.35 = € 1 333 Vattenfall, “annual report 2009”, p.10, <http://www.vattenfall.com/en/file/2-20100524-110100.pdf> (16 July 2010) 334 The total capacity of the three plants (Amagerværket in Copenhagen, Fynsværket in Odense,
Nordjyllandsværket in Aalborg) is 1,757 MW. Total investment Biomax in excess of 5 billion DKK. Exchange rate as of 1 January 2010: 1 DKK = €7.44155 (http://nl.exchange-rates.org/HistoricalRates/E/EUR/1-1-2010) Vattenfall, “Clean coal from a Vattenfall perspective”, presentation Torbjörn Wahlborg, Senior Executive Vice President Head of Business Group Nordic”, 14 April 2010, p. 6 and 17, <http://www.nog.se/files/Vattenfall.pdf> (16 July 2010) Vattenfall, Press release “Large quantities of biomass replacing coal”, 9 February 2009, <http://www.vattenfall.com/en/news-archive.htm?newsid=BFA3E81D6D6C475E983ABDAABE37A732> (16 July 2010)
335 Nuon website, Over Nuon, Pers, Persberichten, “Nuon vernieuwt productiecapaciteit op Hemweg locatie”, 16-04-10, http://www.nuon.com/nl/pers/persberichten/20100416/index.jsp (08-07-10).
336 Nuon website, Over Nuon, Pers, Nieuwsfeiten, “Nuon verwerft windpark in Wallonië”, 19-03-10, http://www.nuon.com/nl/pers/nieuwsfeiten/20100319/index.jsp (08-07-10).
337 Total capacity of 1,640 MW of electric power and up to 650 MWth for district heating. 338 Vattenfall website, “Das Steinkohlekraftwerk Moorburg, Investition in die Energieversorgung”, no date,
<http://www.vattenfall.de/www/vf/vf_de/225583xberx/225613dasxu/225933bergb/226503kerng/226173kraft/1472202neux-/index.jsp> (16 July 2010) Vattenfall website, “Fernwärme: umweltschonend und komfortabel”, September 2009, <http://www.vattenfall.de/www/vf/vf_de/Gemeinsame_Inhalte/DOCUMENT/154192vatt/Bergbau_und_Kraftwerke/1592024moo/P02179847.pdf> (16 July 2010) Bild, “Bau des Kraftwerks Moorburg geht voran”, 19 October 2009, <http://www.bild.de/BILD/regional/hamburg/dpa/2009/10/19/bau-des-kraftwerks-moorburg-geht-voran.html> (16 July 2010)
339 Vattenfall, “annual report 2009”, p.63, <http://www.vattenfall.com/en/file/2-20100524-110100.pdf> (16 July 2010) DN.SE, “Vattenfall investerar i ekovärsting”, 21 June 2010, <http://www.dn.se/ekonomi/vattenfall-investerar-i-ekovarsting-1.1125523> (16 July 2010)
340 Gazeta Wyborcza, “Poland: Vattenfall to complete € 800 mn power plant tender in Q2/Q3”, 19 January 2010. Polish market online, “New power stations on the horizon”, 11 August 2008, <http://www.polishmarket.com.pl/document/:17833> (19 July 2010)
341 The investment includes measures to improve safety and extend the plants’ useful life. Around SEK 13 Billion is included in the current investment plan for 2010–2014 with regard to the Forsmark and Ringhals nuclear power plants. Vattenfall, “annual report 2009”, p.59, <http://www.vattenfall.com/en/file/2-20100524-110100.pdf> (16 July 2010). Exchange rate SEK 10.35= € 1
342 Uprate Forsmark 1 will be 120 MW in mid-2011. Uprate Forsmark 2 will also be 120 MW. Unit 3 will get a new SEK 900 million generator in 2014, which will contribute to a 190 MW uprate. Total uprate will be 430 MW. These uprates were approved by the government in February 2010 following recommendation from the Swedish Radiation Safety Authority (SSM).Forsmark is owned by Vattenfall 66%, Mellansvensk Kraftgrupp 25.5%, and E.ON Sverige 8.5%. Ringhals is owned by Vattenfall 70.4% and E.ON Sverige 29.6%. Exchange of high-pressure turbines and steam generators at Ringhals in 2011 and other work is expected to yield a further 240 MWe. Ringhals is owned by Vattenfall 70.4% and E.ON Sverige 29.6%. World Nuclear Association, “Nuclear Power in Sweden”, updated 13 July 2010, <http://www.world-nuclear.org/info/inf42.html> (16 July 2010)
343 Vattenfall website, “Abelvattnet - ett nytt vattenkraftverk”, updated 14 July 2010, <http://www.vattenfall.se/sv/abelvattnets-vattenkraftverk.htm> (16 July 2010) The total investment is SEK 100 billion. Exchange rate SEK 10.35= € 1.
344 Total investment £ ~450 million. Exchange rate as 01-07-2010: £1 = € 1.21148 (http://www.exchange-rates.org/history/EUR/GBP/T). Rated power150 MW (30 x 5 MW). Vattenfall, “Vattenfall Capital Markets Day 2009, presentation by: Helene Biström, Senior Executive Vice President, Head of Business Group Pan Europe, 23 September 2009, p.17, <http://www.vattenfall.com/en/file/helene-bistrom-business-group_8459943.pdf> (16 July 2010) Vattenfall website, “Ormonde”, updated 14 June 2010, <http://www.vattenfall.co.uk/en/ormonde.htm> (16 July 2010)
345 Vattenfall website, “Thanet Offshore Wind Farm”, updated 13 July 2010, <http://www.vattenfall.co.uk/en/thanet-offshore-wind-farm.htm> (16 July 2010). The total investment for completing the wind farm is in the order of around £780 million. Exchange rate as 01-07-2010: £1 = € 1.21148 (http://www.exchange-rates.org/history/EUR/GBP/T)
346 Total investment SEK ~1,400 million. Exchange rate SEK 10.35= € 1. Rated power78 MW (29x2 MW & 11x1.8 MW) Vattenfall, “Vattenfall Capital Markets Day 2009, presentation by: Helene Biström, Senior Executive Vice President, Head of Business Group Pan Europe, 23 September 2009, p.16, <http://www.vattenfall.com/en/file/helene-bistrom-business-group_8459943.pdf> (16 July 2010) Vattenfall, “annual report 2009”, p.17, <http://www.vattenfall.com/en/file/2-20100524-110100.pdf> (16 July 2010)

Vattenfall/Nuon 64
347 Alpha Ventus is a development and demonstration plant in which Vattenfall has a 26.25% interest. Vattenfall,
“annual report 2009”, p.69, <http://www.vattenfall.com/en/file/2-20100524-110100.pdf> (16 July 2010) Total capacity is 60 MW. The sums invested by EWE, E.ON and Vattenfall for this pioneer project amount to €250 million. Alpha Ventus, press release “Germany's First Offshore Wind Farm is Formally Commissioned, 27 April 2010, <http://www.alpha-ventus.de/index.php?id=80> (16 July 2010)
348 New turbines with a combined capacity of approximately 75 MW will repower older turbines with total installed capacity of 40 MW. Vattenfall, “annual report 2009”, p.59, <http://www.vattenfall.com/en/file/2-20100524-110100.pdf> (16 July 2010)
349 Vattenfall website, “Edinbane”, updated 15 July 2010, <http://www.vattenfall.co.uk/en/edinbane.htm> (16 July 2010) The total investment for completing the wind farm is in excess of £50 million. Exchange rate as 01-07-2010: £1 = € 1.21148 (http://www.exchange-rates.org/history/EUR/GBP/T)
350 Nuon website, Over Nuon, Pers, Persberichten, “Nuon neemt warmtekrachtcentrale in Almere over van Electrabel”, 15-12-09, http://www.nuon.com/nl/pers/persberichten/20091215/index.jsp (08-07-10).
351 Platts Power in Europe, “PIE’s new plant tracker”, 03-05-10 and Nuon website, Over Nuon, Pers, Nieuwsfeiten, “'Eerste' paal elektriciteitscentrale Nuon Magnum”, 10-12-09, http://www.nuon.com/nl/pers/nieuwsfeiten/20091210/index.jsp (08-07-10).
352 The figure of 1,200 MW total capacity for the Magnum plant was provided by Nuon. Email Pinar Ates, Manager regulatory affairs Nuon received 30-08-2010.
353 Platts Power in Europe, “PIE’s new plant tracker”, 03-05-10. 354 Nuon website, Over Nuon, Pers, Nieuwsfeiten, “Bouw windpark Oom Kees in Wieringermeer gestart”, 08-06-10,
http://www.nuon.com/nl/pers/nieuwsfeiten/20100608/index.jsp (08-07-10). 355 Nuon website, Over Nuon, Pers, Nieuwsfeiten, “Nuon ontwikkelt gasgestookte centrale bij Frankfurt niet verder”,
12-08-09, http://www.nuon.com/nl/pers/nieuwsfeiten/20090812/index.jsp (08-07-10). 356 Platts Power in Europe, “PIE’s new plant tracker”, 03-05-10. 357 Platts Power in Europe, “PIE’s new plant tracker”, 03-05-10. 358 The technology and fuel used in the station has not been defined yet; it will depend on the strategy of both
companies and the decision should be made in the current year. Initially, the plant was to be run by hard coal from the Bogdanka mine, but the new strategy of Vattenfall calls for limiting investments in power blocs run by coal. The investments will also depend on the decision concerning CO2 emission rights for the years 2013-2020.
359 Total capacity 1,400 MW, Vattenfall stake 50%. The cost of the investment is estimated at somewhere between ZL5 and ZL7 billion. To be put in use between 2016 and 2018. Polish News Bulletin, “ZA Pulawy and Vattenfall to Build Power Station”, 26 April 2010. Exchange rate as of 23 April 2010: 1 € = 3.88063 Zloty (http://nl.exchange-rates.org/history/PLN/EUR/T) Environmental impact assessment and a feasibility study should be completed by mid-2012 Dow Jones Newswires, “Vattenfall, Polish Pulawy Ink Power Plant Cooperation Deal”, 23 April 2010, <http://www.foxbusiness.com/story/markets/commodities/vattenfall-polish-pulawy-ink-power-plant-cooperation-deal/> (19 July 2010)
360 Elektrownia "Kozienice" S.A., “ELEKTROWNIA "KOZIENICE" II Sp. z o.o. - The new power unit with the output up to 1000 MW”, 11 August 2010, <http://www.elko.com.pl/elkoweb/site2/site.php?module=info&cmd=detail&id=20&code_channel=contact5&id_channel=4> (19 July 2010) Global Power Report, “Polish government seeks investors for stakes in PAK, Enea generators”, 4 February 2010. Vattenfall holds a 18.67% stake in the Polish power firm Enea. BRE Bank Securities, “Update power engineering”, 12 March 2010, <http://i.wp.pl/a/dibre/aspolek/energy_120310.pdf> (18 June 2010). Total investment 6,000 million Zloty. Exchange rate as of 12 March 2010: € 1 = 3.885 Zloty (http://nl.exchange-rates.org/history/PLN/EUR/T)
361 The company plans to build a 1,000-MW hard coal-fired plant at its 2,880-MW Elektrownia Kozienice station in southeast Poland by 2015, and is considering a second 1,000-MW block at the plant. Global Power Report, “Polish government seeks investors for stakes in PAK, Enea generators”, 4 February 2010. Vattenfall holds a 18.67% stake in the Polish power firm Enea.
362 BRE Bank Securities, “Update power engineering”, 12 March 2010, <http://i.wp.pl/a/dibre/aspolek/energy_120310.pdf> (18 June 2010). Total investment 9,960 million Zloty. Exchange rate as of 12 March 2010: € 1 = 3.885 Zloty (http://nl.exchange-rates.org/history/PLN/EUR/T)
363 Corresponds to 650 Mwth. 364 Vattenfall website, “Demonstration plant in Jänschwalde”, updated 5 March 2010,
<http://www.vattenfall.com/en/ccs/janschwalde.htm> (19 July 2010) Vattenfall’s planned project to build a Carbon Capture and Storage (CCS) demonstration plant at Jänschwalde in Brandenburg, Germany, was awarded up to EUR 180 million in funding from the European Commission. Vattenfall, “annual report 2009”, p.63, <http://www.vattenfall.com/en/file/2-20100524-110100.pdf> (16 July 2010)
365 BRE Bank Securities, “Update power engineering”, 12 March 2010, <http://i.wp.pl/a/dibre/aspolek/energy_120310.pdf> (18 June 2010) Total investment 2,880 million Zloty. Exchange rate as of 12 March 2010: € 1 = 3.885 Zloty (http://nl.exchange-rates.org/history/PLN/EUR/T) Elsam (Dong energy), “Elsamprojekt Polska”, <http://www.elsamprojekt.com.pl/biomasa_eng.html), 19 July 2010.
366 BRE Bank Securities, “Update power engineering”, 12 March 2010, <http://i.wp.pl/a/dibre/aspolek/energy_120310.pdf> (18 June 2010) Total investment 2,880 million Zloty. Exchange rate as of 12 March 2010: € 1 = 3.885 Zloty (http://nl.exchange-rates.org/history/PLN/EUR/T)

Sustainability in the Power Sector Update 2010 - The Netherlands
65
Vattenfall website, “Co-combustion in Poland”, updated 21 June 2010, < http://www.vattenfall.com/en/co-combustion-poland.htm> (19 July 2010)
367 The plan is a gas and steam turbine (CCGT) plant with a total capacity of 230 megawatts (MW) of thermal and 300 MW of electric power. The new building will replace the existing power plant on the site in Lichterfelde. Vattenfall website, “Das Heizkraftwerk Lichterfelde”, no date, <http://www.vattenfall.de/de/lichterfelde/daten-und-fakten-lichterfelde.htm> (16 July 2010)
368 The plan is a gas and steam turbine (CCGT) plant with a total capacity of 230 megawatts (MW) of thermal and 300 MW of electric power. The two additional biomass plants will have a thermal capacity of approximately 150 MW. In 2016, the new CCGT-plant will be connected to the grid. The old HKW Klingenberg will be switched off. The commissioning of the two biomass plants is scheduled for 2017 and 2019. Vattenfall website, “Das Heizkraftwerk Klingenberg”, no date, <http://www.vattenfall.de/de/klingenberg/das-neubauprojekt-klingenberg.htm> (16 July 2010)
369 Enea said it plans to build between 350 MW and 450 MW of wind capacity and around 150 MW of biogas by 2020. Global Power Report, “Polish government seeks investors for stakes in PAK, Enea generators”, 4 February 2010. Vattenfall holds a 18.67% stake in the Polish power firm Enea.
370 thermal capacity of 17 megawatts and an electrical output of five megawatts. Vattenfall Germany, <http://www.vattenfall.de/de/zukunft-der-biomasse.htm> (25 August 2010)
371 thermal capacity of 18 megawatts and an electrical output of five megawatts. Vattenfall Germany, <http://www.vattenfall.de/de/zukunft-der-biomasse.htm> (25 August 2010)
372 Twice a electricity capacity of 20 megawatts and a total heating capacity of 150 megawatts. Vattenfall Germany, <http://www.vattenfall.de/de/zukunft-der-biomasse.htm> (25 August 2010)
373 Aegir Wave Power Ltd is a 51%/49% joint venture between Vattenfall and Pelamis Wave Power. Total capacity first phase is 20 MW. The first phase will be installed by 2014 if planning consent is gained. Pelamis Wave Power and Vattenfall, press release “Partnership Aegir to develop Shetland’s first wave power project”, 15 December 2009, <http://www.pelamiswave.com/media/091215_aegir_launch_national.pdf> (16 July 2010)
374 Tonn Energy is a joint venture of Vattenfall (51%) with Wavebob (49%). In 2020 the company hopes to achieve 250 MW wave energy generation in Ireland. The investment is estimated at €360 million. Tonn Energy, “Consultation Response, Treatment of Small, Renewable and Low Carbon Generators outside the Group Processing Approach” April 2009, <http://www.cer.ie/GetAttachment.aspx?id=cfb7bef1-6e7c-4b47-acf4-fb83ecc68970> (16 July 2010) Short term investment in 5 - 10 MW. Vattenfall, “R&D in Vattenfall”, April 2010, <http://www.vattenfall.com/en/file/2-20100511-091204.pdf> (16 July 2010)
375 Vattenfall, press release “Vattenfall bündelt Windgeschäft in Deutschland und Polen”, 16 June 2009, <http://www.vattenfall.de/www/vf/vf_de/225583xberx/232127press/232157press/232187archi/258228press/index.jsp?pmid=166010&WT.ac=search_success> (16 July 2010) . Vattenfall, “Offshore-Windkraftprojekte von Vattenfall”, no date, <http://www.vattenfall.de/www/vf/vf_de/225583xberx/228647erneu/2014373neu-w/2014942offsh/2016036weite/index.jsp> (16 July 2010)
376 ScottishPower Renewables (50%) and Vattenfall (50%) are the developers of the East Anglia Array offshore windfarm zone. Iberdrola has a 80% stake in Iberdrola Renovables, which has a 100% stake in ScottishPower Renewables. The proposed first project will consist of approximately 240 turbines and will have the capacity to generate up to 1.2 GW of electricity. The East Anglia Array, located in the North Sea off the coast of Norfolk, will have a capacity of up to 7.2 GW and is projected to commence construction in 2015. ScottishPower, press release “ScottishPower Renewables And Vattenfall Award Gardline Hydro Multi Million Pound Contract”, 17 June 2010, <http://www.scottishpower.com/PressReleases_2038.htm> (21June 2010) ScottishPower, press release “Iberdrola Renovables Creates Global Offshore Wind Division In Glasgow To Promote Projects Up To 10,000 MW”, 2 March 2010, <http://www.scottishpower.com/PressReleases_2015.htm> (21June 2010)
377 ScottishPower Renewables (50%) and Vattenfall (50%) are the developers of the East Anglia Array offshore windfarm zone. The proposed first project will consist of approximately 240 turbines and will have the capacity to generate up to 1.2 GW of electricity. The East Anglia Array, located in the North Sea off the coast of Norfolk, will have a capacity of up to 7.2 GW and is projected to commence construction in 2015. ScottishPower, press release “ScottishPower Renewables And Vattenfall Award Gardline Hydro Multi Million Pound Contract”, 17 June 2010, <http://www.scottishpower.com/PressReleases_2038.htm> (21June 2010) ScottishPower, press release “Iberdrola Renovables Creates Global Offshore Wind Division In Glasgow To Promote Projects Up To 10,000 MW”, 2 March 2010, <http://www.scottishpower.com/PressReleases_2015.htm> (21June 2010)
378 If the wind farm meets the demands that Vattenfall makes on its projects and if the Vattenfall Board decides to build the wind farm at Kriegers flak, it is scheduled to be completed in stages during the period between 2014 and 2017. Vattenfall, brochure, “Kriegers Flak wind farm”, January 2010, <http://www.vattenfall.com/en/file/2-20100118-125828.pdf> (16 July 2010)
379 Total capacity 300 MW. Vattenfall stake 50%. Taggen windpark website, <http://www.taggenvindpark.se/2-4.aspx> (16 July 2010)
380 Vattenfall website, “Trolleboda vindkraftpark”, updates 14 July 2010, <http://www.vattenfall.se/sv/trolleboda-vindkraftpark.htm> (16 July 2010) Vattenfall, “Vattenfall Windpower Expansion Plans, presentation Sven-Erik Thor”, 26 May 2009, <http://www.natverketforvindbruk.se/Global/Affarsutveckling/Wind%20Power%20and%20Industry%202009/Presentationer/Block%202%20-%2026%20maj/S-E_Thor_Kalmar_v3.pdf> (16 July 2010)

Vattenfall/Nuon 66
381 compact group of 13 turbines. Vattenfall website, “Aultmore”, updated 19 March 2010,
<http://www.vattenfall.co.uk/en/aultmore.htm> (16 July 2010). 382 A revised proposal was submitted on in May 2009 to Aberdeenshire Council for a wind farm of 18 wind turbines
of up to 2.75 MW. Vattenfall website, “Clashindarroch”, updated 19 March 2010, <http://www.vattenfall.co.uk/en/clashindarroch.htm> (16 July 2010).
383 Scottish Ministers turned down a scheme on Friday 24 October 2008. Vattenfall website, “Kyle”, updated 19 March 2010, <http://www.vattenfall.co.uk/en/kyle.htm> (16 July 2010).
384 14 wind turbine proposal. Vattenfall website, “Logiealmond”, updated 19 March 2010, <http://www.vattenfall.co.uk/en/logiealmond.htm> (16 July 2010).
385 Project comprises 12 turbines. Vattenfall website, “Minch Moor”, updated 19 March 2010, <http://www.vattenfall.co.uk/en/minch-moor.htm> (16 July 2010).
386 Project comprises 16 turbines. Vattenfall website, “Ray”, updated 19 March 2010, <http://www.vattenfall.co.uk/en/ray.htm> (16 July 2010).
387 Project comprises 6 turbines of 2 or 3 MW. Vattenfall website, “Whitton”, updated 19 March 2010, <http://www.vattenfall.co.uk/en/whitton.htm> (16 July 2010).
388 Enea said it plans to build between 350 MW and 450 MW of wind capacity and around 150 MW of biogas by 2020. Global Power Report, “Polish government seeks investors for stakes in PAK, Enea generators”, 4 February 2010. Vattenfall holds a 18.67% stake in the Polish power firm Enea.
389 Platts Power in Europe, “PIE’s new plant tracker”, 03-05-10. 390 Platts Power in Europe, “PIE’s new plant tracker”, 03-05-10 and <http://www.energeia.nl/news.php?ID=36944> 391 Platts Power in Europe, “PIE’s new plant tracker”, 03-05-10. 392 Nuon, Annual Report 2009, p.3. and J. Olthoff, Head of Technology, Vattenfall, “Offshore Windenergy from a
Dutch perspective”, presentation, 28-01-10, http://www.hollandgateway.nl/downloads/0000/0012/Offshore_Windenergy_from_a_Dutch_perspective_-_Jaap_Olthoff.pdf (08-07-10).
393 Platts Power in Europe, “PIE’s new plant tracker”, 03-05-10. 394 Nuon Corporate Social Responsibility Report 2009, p.49. 395 Idem. 396 Figures based on input provided by Nuon as a response to a draft version of this profile. The calculation for the
output capacity is based on a 66% coal and biomass and a 33% natural gas division of the total capacity of 1,200 MW. Email Pinar Ates, Manager regulatory affairs Nuon received 30-08-2010.
397 A negative figure is presented here to avoid double counting. Phase II of the Magnum project will not add additional capacity, but will replace the fuel type of part of the plant from natural gas to coal and biomass.
398 Nuon Corporate Social Responsibility Report 2009, p.II. 399 Vattenfall website, Our company, Operations, Suppliers, Code of conduct for suppliers, updated 21 June 2010,
<http://www.vattenfall.com/en/code-of-conduct-for-suppliers.htm> (19 July 2010) 400 Vattenfall website, Our company, Operations, Power plants, Coal, Coal at Vattenfall, updated 21 June 2010,
<http://www.vattenfall.com/en/coal-at-vattenfall.htm> (19 July 2010) 401 Vattenfall website, Our company, Operations, Power plants, Coal, Coal at Vattenfall, updated 21 June 2010,
<http://www.vattenfall.com/en/coal-at-vattenfall.htm> (19 July 2010) 402 Vattenfall Europe Mining & Generation, Dipl.-Ing. Siegfried Körber, presentation “Braunkohlenförderung Nochten
/ Reichwalde – Garant für langfristige Versorgungssicherheit”, 14 May 2009, <http://www.debriv.de/tools/download.php?filedata=1243369256.pdf&filename=Pr%E4sentation%20K%F6rber.pdf&mimetype=application/pdf> (26 August 2010) Vattenfall Europe Mining & Generation, presentation Herr Prof. Dr. Dähnert, “Das Lausitzer Braunkohlerevier –auf dem Weg zur innovativen Energieregion Lausitz / Spreewald” 23 April 2009, <http://www.ct-ifm.de/Bilder/projekte/Vortrag_Energie_Zukunft.pdf> (26 August 2010) Umweltgruppe Cottbus e.V., <http://www.lausitzer-braunkohle.de/> (26 August 2010)
403 Nuon Corporate Social Responsibility Report 2009, p.80. 404 Meeting between Nuon and SOMO, 13-08-10. 405 A. Rising, “Vattenfall opinion paper on sustainability aspects of bioenergy”, 6 April 2009,
<http://www.vattenfall.com/en/file/opinion-paper-on-sustainabili_8459801.pdf> (19 July 2010) 406 Nuon Corporate Social Responsibility Report 2009, p.45-6. 407 Vattenfall website, “Uranium from mine to nuclear power plant”, updated 21 June 2010,
<http://www.vattenfall.com/en/uranium-from-mine-to-nuclear-.htm> (16 July 2010) 408 Answer given to the questionnaire sent by SOMO, email received 06-08-10.

Sustainability in the Power Sector Update 2010 - The Netherlands
67
7 RWE/Essent
Basic company information
RWE is present in all areas of the electricity and gas value chain. Europe is its market. In addition to Germany, its strategic focus is on the UK, the Benelux region, Central and South Eastern Europe as well as Turkey. The company is the number one power producer in Germany. In terms of sales of electricity, RWE is number two in Germany and the Netherlands, and number three in the UK. The European market position of the RWE Group in terms of sales is number three for electricity and number six for gas. In 2009 the revenue of the RWE Group amounted to €47.7 billion.409 In previous years, SOMO made separate company fact sheets for Essent and RWE. The RWE Group has taken over Essent NV as of 30 September 2009. Essent NV is now responsible for the Benelux market within the RWE Group. This report now only features a fact sheet of the RWE Group. RWE/Essent has made use of the opportunity to review the fact sheet and answer to the questionnaire sent by SOMO. RWE's response was coordinated by Essent in the Netherlands.410
The RWE Group is streamlined according to functional and geographical companies: � The functional companies RWE Innogy (electricity generation from renewable sources
of energy), RWE DEA (upstream oil and gas) and RWE Supply & Trading (trading and gas midstream) have a trans-national setup.
� RWE Power encompasses RWE’s entire UK generation and supply business with the exception of electricity production from renewables, which is overseen by RWE Innogy.
� RWE Group pooled its business in the Netherlands and Belgium in Essent, which was consolidated for the first time as of 30 September 2009. Essent NV is now responsible for the Benelux market. As such the activities of RWE Energy Nederland NV are integrated within Essent NV, effective from 1 October 2009.
� In Germany, RWE Power mines lignite and operates its own fossil-fuel and nuclear power stations. The German electricity production from renewables is run by RWE Innogy. RWE Vertrieb and five regional sales subsidiaries supply private and commercial customers with electricity and gas. RWE Rheinland Westfalen Netz operates RWE’s distribution networks. The electricity transmission grid is operated by the independent electricity transmission operator Amprion. RWE’s energy efficiency activities are concentrated in the RWE Effizienz GmbH.
� In Poland, RWE focuses on electricity supply and the electricity distribution network. In Hungary, RWE concentrates on lignite-based electricity generation, which is managed by Mátra. Via minority interests, RWE is also active in gas sales and water supply in Hungary. In the Czech Republic, the main activity is on gas. The RWE local operations encompass regional supply, distribution, supra-regional transmission, transit and storage. In Slovakia, RWE is active in the electricity network and electricity-end customer businesses as well as gas supply.411

RWE 68
Installed capacity for electricity generation in Eu rope
Figure 20 reveals the fuel mix of RWE’s electricity generation capacity in Europe for the year 2009. The installed capacity was 49.6 GW.412 RWE’s acquisition of Essent added 3.6 GW of installed capacity in The Netherlands. Last year, SOMO made a projection of the fuel mix of RWE's and Essent's capacity combined.413 Compared to those figures, we see a slightly larger share for coal and lignite in this year’s figures, and a slightly lower share of natural gas. The 5% renewable capacity was as projected last year. Figure 20: Fuel mix of RWE’s installed electricity generation capacity in Europe, 2009
Coal54%
Natural Gas18%
Nuclear13%
Other Non-renew able
10%
Renew able5%
Wind3%
Hydro2%
Other renew able0%
Biomass0%
The company's generated electricity amounted to 187.2 TWh in 2009, of which 78% was generated in Germany and 14% in the United Kingdom.414 Figure 21 shows the fuel mix for electricity actually generated in Europe. These figures only include the fourth quarter production figures for Essent and should therefore be interpreted with caution. The figures for renewable production were only reported as a whole, and not broken down per fuel type. Figure 21: Fuel mix of RWE’s electricity generation in Europe, 2009
Coal 62%
Natural Gas 16%
Wind 1%
Nuclear 18%Other Non-
renew able; 1%
Renew able 3%
Hydro 2%
Biomass 0,5%

Sustainability in the Power Sector Update 2010 - The Netherlands
69
Table 29 gives the absolute figures of both the installed capacity and RWE's generated electricity. Table 29: Fuel mix of RWE’s electricity generated a nd installed capacity in Europe, 2009415 Fuel type Installed capacity
2009 (MW) Generated electricity
2009 (GWh) Hard coal 15,540 44,100 Lignite 10,925 70,900 Natural Gas 9,144 29,700 Nuclear 6,295 33,900 Other Non-renewable 5,146 2,100 Renewables 2,532416 6,500 Wind 1,574417 2,200418 Hydro 793 3,400 Biomass 98419 900 Other renewable 67 - Total 49,582 187,200
Electricity supplied in The Netherlands
RWE Group, by means of Essent NV, is the number three in the Netherlands as to power generation.420 In terms of electricity sales, RWE is the number two in the Netherlands. In 2009, RWE supplied 3.5 TWh of electricity to private and commercial customers in the Netherlands and Belgium and 2.0 TWh to industrial and corporate customers in the Netherlands and Belgium.421 The supply of electricity by Essent Belgium in Belgium amounted to 1.5 Twh in 2009. The total supply of RWE/Essent may however have been slightly bigger, because some small suppliers within RWE/Essent are not part of this calculation (Essent Energy Trading and RWE Key Account)422 In the Netherlands and in 2009, RWE's electricity supply business had a market share of 28.4% for households, 26% for small and medium enterprises (SMEs) and 19% with regard to large business customers.423 Essent Belgium had a market share of 2.1% within electricity supplies in Belgium.424 Companies supplying electricity in the Netherlands are obliged to disclose the fuel mix of the electricity as supplied to their customers. This is done by means of the “Stroometiket” (electricity labelling). For this study it was not possible to get a clear view on the fuel mix of the electricity supplied by the RWE Group in the Netherlands in 2009. At first, this is due to the take over by RWE of Essent, officially on 30 September 2009. Electricity supplies by the RWE Group in 2009 comprise supplies by Essent and supplies by RWE Energy Nederland NV. Secondly, the stroometiket of Essent does not reflect its supplies to the Netherlands only, but includes supplies to Belgium and Germany. Essent has not provided figures for the Netherlands specifically. Figure 22 reveals the fuel mix of electricity supplied by Essent in the Netherlands, Belgium and Germany during 2009.425 The figure represents Essent’s electricity supply to all clients. Essent guarantees that the ‘Groene Stroom’ (Green Electricity) it supplies to residential customers is generated from biomass (67%), wind (32%), and hydro (1%).426 Essent estimates this mix might change in 2010.427 Essent has stated: ‘Figure 3 mentions the fuel mix of the Essent NV (Essent NV Mix), prior to takeover by RWE. As such this mix includes electricity sales of our former activities in Germany (swb AG and Kom-Strom). As both these activities were disposed in 2009 and swb AG predominantly uses coal, the Essent NV Mix

RWE 70
does not give a good representation of the fuel mix of Essent under new ownership by RWE and of the fuel mix of electricity supplied in the Netherlands.’428 Figure 22: Essent NV fuel mix of electricity suppli ed by Essent in the Netherlands, Belgium and Germany, 2009
Coal17%
Natural Gas41%
Wind5%
Biomass10%
Renew able36%
Other Non-renew able
2%
Nuclear5%
Hydro20%
Based on: Essent429
Essent has suggested using the Essent Retail Mix as the best mix representing the fuel mix of electricity supplied to B2C (households) and SME customers in the Netherlands.430 This mix does however not include industrial customers. Figure 23 shows the Essent Retail Mix for 2009. Figure 23: Essent retail fuel mix of electricity su pplied in the Netherlands, 2009
Coal14%
Natural Gas34% Biomass
23%Renew able
46%
Other Non-renew able
2%
Nuclear4%
Hydro12%
Wind11%
Based on: Essent431
Table 30 presents the CO2 emissions and radioactive waste production resulting from the electricity supply by Essent in 2009.

Sustainability in the Power Sector Update 2010 - The Netherlands
71
Table 30: Emissions and waste resulting from Essent ’s electricity supply in 2009 (Essent NV mix and Essent Retail mix) 432 Indicator Essent NV mix
(2009) Essent Retail mix (2009)
CO2 (g/kWh) 303 251 Radioactive waste (µg/kWh) 140 110
The fuel mixes of electricity supplied by Essent during 2009 do not include supplies by RWE Energy Nederland NV. RWE Energy Nederland NV is a very small player in the Dutch market, compared to Essent. Therefore the fuel mix for the electricity supplied by RWE Energy Nederland NV in the Netherlands in 2009 is not included into this fact sheet. RWE Energy Nederland NV offers its clients a renewable energy product called Windkracht220 that consists of 100% wind energy.433
Announced investments in new generation capacity in Europe
The planned annual capital expenditures of the RWE Group from 2009 to 2012 comprise €1,700 million for RWE Power (power generation), €1,100 million for RWE npower (power generation/retail), €1,000 million for RWE Innogy (renewable energy), €900 million for RWE Dea (upstream oil & gas) and €1,800 for grid and retail business.434 Essent’s onshore wind project at Westereems has gone into full operation in 2009, and has been included in the installed capacity section.435 Table 31 indicates the projects of the RWE group that are currently under construction in Europe. Table 31: RWE’s announced investments in new produc tion capacity
Project name Location Fuel Type
Date in operation
Amount (million €)
Output Capacity
(MW)
Project Status
Hard coal twin unit facility
Eemshaven, Netherlands
Coal/biomass 2013/2014 2,200436 1,560437 under
construction
Hamm Westfalen, Germany coal 2012 1,550 930
under construction438
Neurath Grevenbroich, Germany
Coal (lignite) 2011 2,500439 700440 under
construction
GKM 9 Grosskraftwerk Mannheim, Germany
coal 2013 480441 364442 under construction
Moerdijk II Moerdijk, Netherlands
gas (CCGT)
end of 2011 500443 430444 under
construction
Claus unit C Maasbracht, Netherlands gas 2012 1,000445 1,275446 under
construction CCGT power plant
Lingen, Emsland, Germany
gas (CCGT)
April 2010447 500448 876 under
construction
4 new 58 MW units
Lingen, Emsland, Germany gas 2011 200 122
under construction449
Staythorpe power station
Nottinghamshire, England, UK
gas (CCGT) Late 2010 900 1,650
under construction 450
Pembroke power plant
Pembroke, Wales, UK
gas (CCGT) 2012 1,100 2,000
under construction451
Denizli Western Turkey. gas (CCGT) 2012 350 542
under construction452
Reactors 3 + 4 Cernavoda, Romania nuclear Unit 3:
2016 366 132 under construction

RWE 72
Unit 4: n/a 453
Selset Scotland, UK hydro 2010 2.8454 0.7 under construction455
Black Rock Nearby Evanton, Scotland, UK hydro 2010 n/a 3.5
under construction456
Ruivares Ruivares, Portugal hydro 2011 n/a 3.6 under construction457
Siadar Isle of Lewis, Scotland, UK
tidal scheme n/a n/a 4
under construction458
Stallingborough Alpha
Lincolnshire, England, UK biomass 2013 n/a 65
under construction459
BMHKW Goch Goch, Germany biomass 2011 n/a 5 under construction460
BMHKW Wittgenstein
Wittgenstein, Germany biomass 2010 n/a 5
under construction461
Tullis Russel Markinch, Scotland, UK biomass 2012 200462 50
under construction463
Südlohn Münsterland region, Germany biogas 2010 n/a 4.1
under construction464
Nordsee Ost offshore wind farm
30 kilometres north-west of Helgoland, Germany
wind 2013 1,000 295 Investment decision made465
Greater Gabbard offshore wind farm, together with SSE
25km off the east coast of England. wind 2011 750466 250
under construction467
Thornton Bank Offshore, next to Oostende, Belgium
wind 2013 254 80 under construction468
Tychowo West Pomerania, Poland wind 2010 50469 34.5
under construction470
San Basilio Onshore, Sardinia, Italy wind 2010 n/a 12.6471
under construction472
Ururi Onshore, region Molise, Italy wind 2010 n/a 13473
under construction474
Danto de Energias S.A.
Castille-Leon, Spain wind 2011 n/a 40
under construction475
Guilhado Onshore, North Portugal wind 2010 n/a 2
under construction476
Causeymire extension
Onshore, Scotland, UK wind ~2011 n/a 7
under construction477
Novar extension
Onshore, Novar Estate, Scotland, UK
wind 2011 n/a 32 under construction478
Kildrummy Onshore, 6 km west of Lumsden, Scotland, UK
wind 2010 n/a 10 under construction479
An Suidhe Onshore, 5 miles west of Inverary, wind 2011 n/a 19.2 under
construction

Sustainability in the Power Sector Update 2010 - The Netherlands
73
Scotland, UK 480
Lochelbank Onshore, Ochil hills nearby Perth, Scotland, UK
wind 2010 n/a 9.6 under construction481
Middleton Farm
Onshore, 5.5 km Northwest of Newton Mearns, Scotland, UK
wind 2012 n/a 15 under construction482
Middlemore Onshore, near Alnwick, England, UK
wind 2011 n/a 54 under construction483
Bradwell Onshore, Bradwell, England, UK
wind 2014 n/a 30 under construction484
Hellrigg Onshore, Hellrigg, England, UK wind 2011 n/a 9
under construction485
Kiln Pit Hill Onshore, Kiln Pit Hill, England, UK wind 2011 n/a 13.8
under construction486
Goole Onshore, Goole, England, UK wind 2011 n/a 37
under construction487
Lindhurst Onshore, next A614, England, UK
wind 2010 n/a 9 under construction488
Bard Offshore 1
Offshore, 90 km from Borkum, North Sea, Germany
wind n/a n/a 6 under construction489
Andasol 3 Granada, South Spain solar 2011 n/a 6.4
under construction490
Table 32 lists RWE's investments that are either still awaiting permission or have merely been announced as plans. Table 32: RWE’s announced plans for investment in n ew capacity
Project name Location Fuel Type
Date in operation
Amount (million €)
Output Capacity
(MW) Status
Niederaußem BoA 4 + 5
Niederaußem, Germany lignite 2015 n/a 2,200 planning
phase491
Arneburg Arneburg, Germany coal 2015 n/a 1,600 planning
phase492 Lignite power plant with coal gasification and CO2 capture
Hürth, Germany lignite (IGCC)
later than 2015 800493 450 planning
phase494
RWE Elektrownia Czeczott
Silesia region, Poland coal n/a 1,125 600
operation date was 2015, now suspended495
Willington Derbyshire, England, UK
gas (CCGT) n/a n/a 2,000
planning application submitted496
Gas Fired Power Station
Genk – Zuid, Belgium
gas (CCGT) 2014 n/a 400 planning
phase497
Tilbury Tilbury. Essex, England, UK
gas (CCGT) n/a n/a 2,000
feasibility study to be started498
Horizon Nuclear Power
Wylfa, Anglesey, Wales, UK) nuclear 2020 4,200 1,650
planning application scheduled for

RWE 74
2012499
Horizon Nuclear Power
Oldbury, Gloucestershire, England, UK
nuclear 2025 4,200 1,650
planning application once construction at Wylfa is underway500
The rivers Danube, Morava and Drina
Serbia and Bosnia-Herzegovina
hydro n/a n/a 1,500501
Memorandum of Understanding signed In November 2009502
Cia Aig near Fort William, in the Scottish Highlands, UK
hydro 2012/ 2013 n/a 3
building permission received503
Braan Trochry, Perthshire, Scotland, UK
hydro n/a n/a 3.5 planning phase504
Maldie Burn Hydro Project
Kylestrome, Scotland, UK hydro n/a n/a 4.5 planning
phase505 Extra 200 MW generating unit
Vianden, Luxembourg hydro 2013/4 n/a 80 Permission
granted506 Anglesey Skerries Tidal Stream Array
off the coast of Anglesey, north Wales, UK
tidal stream n/a n/a 10.5 planning
phase507
Triton Knoll Offshore Wind Farm
off the east coast of England, UK wind 2020 n/a 1,200 in study508
Gwynt y Môr Liverpool Bay, Wales, UK wind 2014 1,200 346 planning
phase509
Atlantic Array project
off the coast South Wales and North Devon, Wales, UK
wind n/a 5,000510 1,500
Zone Development Agreement signed511
Dogger Bank Zone
off the Yorkshire coast, England, UK
wind n/a n/a 2,750
investment decision anticipated around late 2014512
Innogy Nordsee 1 offshore wind farm
40 km north of Juist, North Sea, Germany
wind ~2015 2,800513 960 in development514
Tromp 75km off the coast Callantsoog, Netherlands
wind ~2015 1,000 300 in development515
Several projects Poland wind 2015 500 300 RWE
target516
De Ruijter Oost Netherlands wind n/a n/a 256 planning phase517
Allt Duine Onshore, Scotland, UK wind n/a n/a more than
50 planning phase518
Brechfa Forest
Carmarthenshire, Wales, UK wind n/a n/a up to 107 planning
phase519
Carnedd Wen Wind Farm
north western region Powys, Wales, UK
wind n/a n/a 161 planning phase520
Clocaenog Forest Wind Farm
North Wales, UK wind n/a n/a up to 85 planning phase521
East Heslerton North Yorkshire, England, UK wind n/a n/a n/a planning
phase522 Mynydd y Gwair Wind Farm
Near Pantyffynnon, Wales, UK
wind n/a n/a 38 - 57 planning phase523
Rowantree Scotland, UK wind n/a n/a 60 - 90 planning

Sustainability in the Power Sector Update 2010 - The Netherlands
75
Wind Farm phase524 Nun Wood Wind Farm Proposal
Near Northampton, England, UK
wind n/a n/a 32 - 36 planning phase525
Stroupster Wind Farm
Wick, Caithness, Scotland, UK wind n/a n/a 24 - 35 planning
phase526 Batsworthy Cross Wind Farm
Devon County, England, UK wind n/a n/a 13.5 - 22.5 planning
phase527
Burn of Whilk Wind Farm
11km south west of Wick in Caithness, Scotland, UK
wind n/a n/a up to 27 planning phase528
Cotton Farm Wind Farm
Huntington, England, UK wind n/a n/a 18 - 24 planning
phase529 Fforch Nest Wind Farm Wales, UK wind n/a n/a 25 planning
phase530 Kirkharle Wind Farm
Northumberland, England, UK wind n/a n/a 18 - 24 planning
phase531 Raera Forest Wind Farm
Argyle & Bute, Scotland, UK wind n/a n/a up to 25 planning
phase532 Saxby Wold Wind Farm Proposal
Lincolnshire, England, UK wind n/a n/a up to 21 planning
phase533
Hampole near Doncaster, England, UK wind n/a n/a 10 - 15 planning
phase534
Earls Hall Clacton on Sea, England, UK wind n/a n/a 10 – 11.5 planning
phase535 Langham Wind Farm
Skegness, England, UK wind n/a n/a 9 - 15 planning
phase536 Stobhill Wind Farm
County Durham, England, UK wind n/a n/a up to 7 planning
phase537
Responsible sourcing
The RWE Group has defined ten areas upon which its CSR strategy rests and where action is needed: climate protection; energy efficiency; security of supply; pricing; community engagement; demographic change; supply chain; innovations; occupational health and safety; environmental protection. Supply chain is one of ten defined areas, and the company has a target that at least 95% of the Group-wide procurement volume meets internationally recognised social and environmental standards. All suppliers to the RWE group are subject to the RWE Code of Conduct as introduced in 2005. The code also applies to RWE's own mining activities of lignite. The code rests on the principles of the United Nations’ Global Compact and the OECD guidelines for multinational corporations.538 In its Code of Conduct RWE states that it does not have business relationships with suppliers who are publicly known to be in violation of the Global Compact Initiative of the United Nations in the areas of human rights, labour standards, the environment, and anti-corruption.539 Primary fuels and electricity are procured through RWE Supply & Trading. Coal and lignite In 2009 the use of lignite in power stations of the RWE Group amounted to 92.3 million metric tonnes. The RWE Group extracts the lignite in Germany’s Rhineland and to a lesser extent in Hungary (annually about 8.5 million tonnes). The use of hard coal in RWE power stations amounted to 11.5 million metric tonnes. The RWE group publicly reported about its hard coal purchases by country of origin in 2009. The origin countries were: Russia (37%); Germany (22%); Columbia (15%); UK (10%); South

RWE 76
Africa (9%); other (7%).540 The company did not publicise the names of its suppliers of hard coal and the origin of the coal on mine level. Essent has published the origin countries of the coal it used in 2008 and 2009 in its main power plant Amercentrale. The Amercentrale consumed 2.3 million tonnes of coal in 2009 originating from Columbia (52%), South Africa (30%), Russia (9%), Indonesia (8%) and the USA (1%).541 The Amercentrale consumed 1.7 million tonnes of coal in 2008 originating from South Africa (44%), Columbia (35%), Indonesia (20%), and the USA (1%).542 As of 31 December 2009, the RWE Group has introduced a Counterparty Risk Assessment for assessing coal suppliers in order to ensure that the requirements of the RWE Code of Conduct will be met.543 Essent states that it purchases coal either from international mining companies, or on the global spot market.544 Uranium oxide RWE does not make known the suppliers and origin of the uranium oxide (country/mine level) and how it addresses potential problems with environment, human rights and labour rights during mining. In its CR-report 2009 the RWE Group makes notice of 114 tonnes spent fuel elements in 2009.545 Biomass/biofuels In its CR-report 2009 the RWE Group states that Guidelines for the procurement of biomass are being drafted and purchasing guidelines for biofuels are being considered.546 According to the report “the various rules governing the use of biomass currently in force throughout the RWE Group are to be standardised in the course of 2010.”547 The RWE group did not report the type of materials (palm oil, soy, rapeseed, jatropha, wood waste, etc.) it had procured in 2009. Excluding Essent, the RWE Group used 1.4 million metric tonnes of biomass in 2009.548 In 2009, Essent used only wood as a biomass.549 Essent has its own internal sustainability policy for the sourcing of biomass, to avoid conflicts over environmental and landuse issues. It can track & trace the origins of biomass and it uses a certification scheme called Green Gold Label.550 In 2009 73% of the biomass used by Essent fell under the certification scheme.551 RWE Innogy is to build a factory to produce biomass pellets in the southern part of the US state of Georgia. The plant will have an annual production capacity of 750,000 tonnes, which RWE claims makes it the biggest and most modern of its type in the world. The pellets will be used in pure biomass power plants as well as for the co-firing of coal and biomass. The pellets plant is due to take up operation in 2011. The total investment volume amounts to approx. €120 million.552 409 RWE, “Annual Report 2009”, <http://www.rwe.com/web/cms/en/110822/rwe/investor-relations/financial-reports/>
(15 July 2010) 410 E-mails by Eduard J.F. Wijnoldij Daniëls, CSR Consultant, Essent N.V. on 9, 10 and 17 August 2010. 411 RWE, “Annual Report 2009”, pages 37, 55, 56, <http://www.rwe.com/web/cms/en/110822/rwe/investor-
relations/financial-reports/> (13 August 2010) RWE, “Corporate Social Responsibility Report 2009”, pages 10, 30, 48, 58, <http://www.rwe.com/web/cms/mediablob/en/409784/data/408954/66411/rwe/responsibility/key-data/cr-reports/blob.pdf> (13 August 2010)
412 RWE website, “annual report 2009, excel tables”, <http://www.rwe.com/web/cms/en/110822/rwe/investor-relations/financial-reports/> (13 July 2010).

Sustainability in the Power Sector Update 2010 - The Netherlands
77
413 SOMO, “Sustainability in the Dutch Power Sector; Fact Sheet Series – 2009 update”, October 2009,
http://somo.nl/publications-nl/Publication_3247-nl/ (19-07-10).. 414 RWE website, “annual report 2009, excel tables”, <http://www.rwe.com/web/cms/en/110822/rwe/investor-
relations/financial-reports/> (13 July 2010). 415 RWE website, “annual report 2009, excel tables”, <http://www.rwe.com/web/cms/en/110822/rwe/investor-
relations/financial-reports/> (13 July 2010). 416 RWE, “Annual Report 2009”, page 58, <http://www.rwe.com/web/cms/en/110822/rwe/investor-relations/financial-
reports/> (15 July 2010) 417 E-mail by Eduard J.F. Wijnoldij Daniëls, CSR Consultant, Essent N.V. on 9 August 2010. 418 E-mail by Eduard J.F. Wijnoldij Daniëls, CSR Consultant, Essent N.V. on 9 August 2010. 419 Given the fact that only primary energy sources are mentioned the biomass co-firing option of Essent’s
converted coal-fired power station is not included in the section ‘renewables’, but in the section “coal”. As of 31 December 2009, Essent's biomass co-firing capacity amounted to 295 MW. Sources: Essent Capital Market Day, presentation “Facts & Figures”, 2 June 2010, page 26, <http://www.rwe.com/web/cms/mediablob/en/424264/data/417630/67518/rwe/investor-relations/events-presentations/essent-capital-market-day/Facts-Figures-Essent-Capital-Market-Day-PDF-file-.pdf> (13 August 2010) E-mail by Eduard J.F. Wijnoldij Daniëls, CSR Consultant, Essent N.V. on 9 August 2010.
420 Essent Capital Market Day, presentation “Facts & Figures”, 2 June 2010, <http://www.rwe.com/web/cms/mediablob/en/424264/data/417630/67518/rwe/investor-relations/events-presentations/essent-capital-market-day/Facts-Figures-Essent-Capital-Market-Day-PDF-file-.pdf> (13 August 2010)
421 RWE website, “annual report 2009, excel tables”, <http://www.rwe.com/web/cms/en/110822/rwe/investor-relations/financial-reports/> (13 July 2010).
422 CREG, VREG, CWAPE, BRUGEL, “De ontwikkeling van de elektriciteits- en aardgasmarkten in België, Jaar 2009”, 27 April 2010, <http://www.vreg.be/vreg/documenten/persmededelingen/PERS-2010-2.pdf> (13 August 2010)
423 Essent Capital Market Day, presentation “Facts & Figures”, 2 June 2010, <http://www.rwe.com/web/cms/mediablob/en/424264/data/417630/67518/rwe/investor-relations/events-presentations/essent-capital-market-day/Facts-Figures-Essent-Capital-Market-Day-PDF-file-.pdf> (13 August 2010)
424 CREG, VREG, CWAPE, BRUGEL, “De ontwikkeling van de elektriciteits- en aardgasmarkten in België, Jaar 2009”, 27 April 2010, <http://www.vreg.be/vreg/documenten/persmededelingen/PERS-2010-2.pdf> (13 August 2010)
425 Essent website, “Stroometiket 2009”, <http://www.essent.nl/content/Images/59847_10094%20Stroometiket%20cons.pdf> (13 July 2010). Essent only provides complete (i.e. for both industrial and residential customers, not just residential) supply fuel mixes for all Essent NV units, including those in Belgium and Germany. The figures it provides for just the Netherlands only include residential customers (Essent Retail). Since Essent also supplies electricity to industrial customers in the Netherlands, the Essent NV figures are assumed to provide a more accurate picture of Essent’s total operations in the Netherlands.
426 Essent website, “Stroometiket 2009”, <http://www.essent.nl/content/Images/59847_10094%20Stroometiket%20cons.pdf> (13 July 2010)
427 E-mail by Eduard J.F. Wijnoldij Daniëls, CSR Consultant, Essent N.V. on 9 August 2010. 428 E-mail by Eduard J.F. Wijnoldij Daniëls, CSR Consultant, Essent N.V. on 17 August 2010. 429 Essent website, “Stroometiket 2009”,
<http://www.essent.nl/content/Images/59847_10094%20Stroometiket%20cons.pdf> (13 July 2010) 430 E-mail by Eduard J.F. Wijnoldij Daniëls, CSR Consultant, Essent N.V. on 17 August 2010. 431 Essent website, “Stroometiket 2009”,
<http://www.essent.nl/content/Images/59847_10094%20Stroometiket%20cons.pdf> (13 July 2010) 432 Essent website, “Stroometiket 2009”,
<http://www.essent.nl/content/Images/59847_10094%20Stroometiket%20cons.pdf> (13 July 2010) 433 RWE website, “Samenstelling elektriciteit”, April 2010,
<http://www.rwe.nl/documents/RWE_Stroometiket_2010.pdf> (13 July 2010) 434 RWE, “Fact Book Renewable Energy”, June 2010,
<http://www.rwe.com/web/cms/mediablob/en/108824/data/214382/69621/rwe/investor-relations/events-presentations/factbook/renewable-energy/factbook-renewable-energy-new.pdf> (15 July 2010)
435 Westereems project website, <http://www.westereems.nl> (13 August 2010) 436 Dagblad van het Noorden, “Bouwput Eemshaven”, 15 april 2010,
<http://www.dvhn.nl/nieuws/economie/eco_noorden/article5998473.ece> (13 July 2010) 437 RWE, “Facts & Figures | Update December 2009”, p. 17, 18 December 2010,
<http://www.rwe.com/web/cms/mediablob/en/108808/data/114404/58812/rwe/investor-relations/events-presentations/factbook/Facts-Figures-2009.pdf> (13 July 2010)
438 Construction of Westfalen D and E units, each 800 MW. After completion, Units A and B with a capacity of 160 MW each, will go off stream. RWE has agreed a 25-year cooperation scheme with 23 municipal partners from North Rhine-Westphalia, Hesse, Lower Saxony and Rhineland-Palatinate: the municipal utilities have a share of about 23% in the construction and operation. They are investing over € 450 million and will have a 350-MW share in the output of the new units. RWE power, leaflet “The new Westfalen power plant”, http://www.rwe.com/web/cms/mediablob/en/331232/data/12450/53991/rwe-power-ag/power-plant-new-
RWE 78
build/new-hard-coal-fired-units/Energy-for-the-future-The-new-Westfalen-power-plant.pdf> (15 July 2010) Dec 09: construction delayed since September by faulty boiler steelworks supplied by Alstom and manufactured in China. First 800 MW block was expected to come online in mid-2011, the second due in early 2012 - these dates now probably not possible, RWE says. Platts Power in Europe, “Pie’s new plant tracker”, 3 May 2010.
439 RWE, “FACTS & FIGURES 2010 (Updated August 2010), page 26, <http://www.rwe.com/web/cms/mediablob/de/108808/data/114404/71877/rwe/investor-relations/events-praesentationen/fakten-kompakt/Facts-Figures-2010.pdf> (31 August 2010)
440 Two power plant units will each have a gross capacity of 1,100 megawatt. Sixteen 150-MW units in the Rhenish lignite mining area will gradually be shut down by late 2012. Six 150-MW units will then merely be used as stand-by reserve for the BoA units in Neurath. RWE, “The BoA 2&3 project””, <http://www.rwe.com/web/cms/mediablob/en/2546/data/12030/66013/rwe-power-ag/power-plant-new-build/boa-2-3/links-downloads/Neurath-down.pdf>(15 July 2010) RWE power AG, “BoA 2&3”, <http://www.rwe.com/web/cms/en/12068/rwe-power-ag/power-plant-new-build/boa-2-3/> (15 July 2010). RWE is investing more than 2.2 billion euros in the BoA project.
441 Total capacity is 911 MWe. Total costs are €1.2 billion. GKM is owned by RWE Power AG (40%), EnBW Kraftwerke AG (32%) and MVV RHE GmbH (28%). Grosskraftwerk Mannheim Aktiengesellschaft (GKM), “Der Baustellenreport Nr. 1 / 2010”, <http://www.gkm.de/projekt_block_9/block_9_aktuell/> (15 July 2010) Website GKM, “Unsere Aktionäre”, <http://www.gkm.de/unternehmen/struktur/> (16 June 2010)
442 Total capacity is 911 MWe. Total costs are €1.2 billion. GKM is owned by RWE Power AG (40%), EnBW Kraftwerke AG (32%) and MVV RHE GmbH (28%). Grosskraftwerk Mannheim Aktiengesellschaft (GKM), “Der Baustellenreport Nr. 1 / 2010”, <http://www.gkm.de/projekt_block_9/block_9_aktuell/> (16 July 2010) Website GKM, “Unsere Aktionäre”, <http://www.gkm.de/unternehmen/struktur/> (16 June 2010)
443 AGD, “Essent investeert 1.5 miljard euro in gas”, 29 May 2008, <http://www.agd.nl/1053607/Nieuws/Artikel/Essent-investeert-1,5-miljard-euro-in-gas.htm> (13 July 2010)
444 RWE, “Facts & Figures | Update December 2009”, p. 17, 18 December 2010, <http://www.rwe.com/web/cms/mediablob/en/108808/data/114404/58812/rwe/investor-relations/events-presentations/factbook/Facts-Figures-2009.pdf> (13 July 2010) Essent, “CCGT Moerdijk”, July 2009, <http://www.essent.nl/content/Images/64248_12324_9136_FO_Moerdijk2_v5.pdf> (13 July 2010)
445 AGD, “Essent investeert 1.5 miljard euro in gas”, 29 May 2008, <http://www.agd.nl/1053607/Nieuws/Artikel/Essent-investeert-1,5-miljard-euro-in-gas.htm> (13 July 2010).
446 Unit B (640 MW) was decommissioned in the end of 2008, Unit C will have a capacity of 1.275 MW. Essent, “Clauscentrale C ”, April 2009, <http://www.essent.nl/content/Images/64243_12324_9120_FO_ClausC_NL_v2.pdf> (13 July 2010)
447 Platts Power in Europe, “Pie’s new plant tracker”, 3 May 2010. 448 RWE website, “GuD-Anlage Lingen”, no date, <http://www.rwe.com/web/cms/de/348102/rwe-
technology/kraftwerksneubau/gud-anlage-lingen/> (15 July 2010) 449 RWE Power is to replace two old 55-MW turbines with four new 58-MW units totaling 232 MW at an investment
of eur200 million. Platts Power in Europe, “Pie’s new plant tracker”, 3 May 2010. 450 RWE AG, “New power stations, Staythorpe Power Station”, <http://www.rwe.com/web/cms/en/294312/rwe-
npower/about-us/our-businesses/new-power-stations/staythorpe/> (15 July 2010) 451 RWE npower, “£1bn power station for Pembroke given the go-ahead”, 5 February 2009,
<http://www.rwe.com/web/cms/en/113648/rwe/press-news/press-release/?pmid=4002972> (15 July 2010) Exchange rate 1 January 2010 1 GBP =1.1271 EUR. (http://www.exchangerates.org.uk/GBP-EUR-exchange-rate-history.html) Alstom, “Alstom wins €1 billion contract for the construction of UK’s largest combined cycle power plant”, 27 April 2009, <http://www.alstom.com/pr_corp_v2/2009/corp/57759.EN.php?languageId=EN&dir=/pr_corp_v2/2009/corp/&idRubriqueCourante=23132&cookie=true> (15 July 2010)
452 RWE owns a 70 per cent stake in the joint venture with Turcas. Total investment for the 775 MW CCGT-plant: EUR500 million. Power-GEN worldwide, “RWE gives green light to build 775 MW CCGT plant in Turkey”, May 2010, <http://www.powergenworldwide.com/index/display/articledisplay/7124884207/articles/powergenworldwide/gas-generation/new-projects/2010/05/rwe-gives_green_light.html> (15 July 2010)
453 Total capacity 1,440 MW. As of 31 December 2009 RWE Power still has a 9.15% share in Energonuclear. GDF Suez Reference Document 2009, April 2010, p. 37 and 107, p. 462, <http://www.gdfsuez.com/en/finance/investors/publications/publications/> (17 June 2010) In November 2008 an investment agreement was signed between the state nuclear power corporation Societatea Nationala Nuclearelectrica (SNN), with 51% of the project, and Enel, CEZ, GDF Suez, RWE Power (each 9.15%), Iberdrola (6.2%) and ArcelorMittal Galati (6.2%). The consortium, called EnergoNuclear, was formally established in April 2009. Construction cost is expected to be about €4 billion. By September 2009 it was evident that SNN could not raise its share of the funds, and would contribute only 20 to 25%, mostly in kind - heavy water and fuel. The other participants would increase their shares. The first unit is still expected on line in 2016. World Nuclear Association, “Nuclear Power in Romania”, February 2010, <http://www.world-nuclear.org/info/inf93.html> (17 June 2010) “another two nuclear units of at least 700 MW at Cernavoda Nuclear Power Plant over 2009-2015”. Website permanent representation Romania to the European Union, “Romanian economic highlights”, 21 January 2010, <http://ue.mae.ro/pdf/2010.01.04_highlights01.pdf> (20 June 2010)

Sustainability in the Power Sector Update 2010 - The Netherlands
79
454 NewEnergyFocus, “Tees Valley set for £2.5m hydro station”, 7 January 2010,
<http://www.newenergyfocus.com/do/ecco/view_item?listid=1&listcatid=32&listitemid=3405> (14 July 2010). Exchange rate 7 January 2010: <http://www.exchangerates.org.uk/GBP-EUR-exchange-rate-history.html> (14 July 2010)
455 RWE, “interactive map about RWE Innogy’s assets in Europe”, <http://www.rwe.com/web/cms/en/206488/rwe-innogy/renewable-energies/production-data-live/rwe-renewable-energy-live/> (14 July 2010)
456 RWE, “interactive map about RWE Innogy’s assets in Europe”, <http://www.rwe.com/web/cms/en/206488/rwe-innogy/renewable-energies/production-data-live/rwe-renewable-energy-live/> (14 July 2010)
457 RWE, “interactive map about RWE Innogy’s assets in Europe”, <http://www.rwe.com/web/cms/en/206488/rwe-innogy/renewable-energies/production-data-live/rwe-renewable-energy-live/> (14 July 2010)
458 RWE, “interactive map about RWE Innogy’s assets in Europe”, <http://www.rwe.com/web/cms/en/206488/rwe-innogy/renewable-energies/production-data-live/rwe-renewable-energy-live/> (14 July 2010)
459 RWE, “interactive map about RWE Innogy’s assets in Europe”, <http://www.rwe.com/web/cms/en/206488/rwe-innogy/renewable-energies/production-data-live/rwe-renewable-energy-live/> (14 July 2010)
460 RWE, “interactive map about RWE Innogy’s assets in Europe”, <http://www.rwe.com/web/cms/en/206488/rwe-innogy/renewable-energies/production-data-live/rwe-renewable-energy-live/> (14 July 2010)
461 RWE, “interactive map about RWE Innogy’s assets in Europe”, <http://www.rwe.com/web/cms/en/206488/rwe-innogy/renewable-energies/production-data-live/rwe-renewable-energy-live/> (14 July 2010)
462 Tullis Russell, press release “RWE npower renewables signs Biomass plant deal”, 25 September 2009, <http://www.tullis-russell.co.uk/group/latest-news/?title=RWE+npower+renewables+signs+Biomass+plant+deal> (14 July 2010)
463 RWE, “interactive map about RWE Innogy’s assets in Europe”, <http://www.rwe.com/web/cms/en/206488/rwe-innogy/renewable-energies/production-data-live/rwe-renewable-energy-live/> (14 July 2010)
464 RWE, “interactive map about RWE Innogy’s assets in Europe”, <http://www.rwe.com/web/cms/en/206488/rwe-innogy/renewable-energies/production-data-live/rwe-renewable-energy-live/> (14 July 2010)
465 a total of 48 wind turbines of the 6 megawatt class. RWE Innogy GmbH, press release “RWE Innogy awards contract for offshore foundations to Aker Verdal”, 17 June 2010, <http://www.rwe.com/web/cms/en/113648/rwe/press-news/press-release/?pmid=4005011> (13 July 2010) RWE, press release “RWE Innogy to develop 4,000 megawatt of offshore wind power in the UK”, 08 January 2010, <http://www.rwe.com/web/cms/en/110504/rwe/investor-relations/news/news-ad-hoc-statements/?pmid=4004381> (13 July 2010)
466 Total investment is € 1.5 billion. RWE has a 50% stake. 467 RWE Innogy owns a share of 50 percent in the project. RWE, press release “RWE Innogy to develop 4,000
megawatt of offshore wind power in the UK”, 08 January 2010, <http://www.rwe.com/web/cms/en/110504/rwe/investor-relations/news/news-ad-hoc-statements/?pmid=4004381> (13 July 2010)
468 Total capacity 300 MW, total investment €950 million. Phase 1, 2007 – 2009, 6 * 5 MW, already operating commercially. Phase 2: 2009 – 2011, 24 * 5,25 MW. Phase 3: 2012 – 2013, 24 * 6 MW. C-Power website, <http://www.c-power.be/English/welcome/algemene_info.html> (14 July 2010) RWE has a 26.72% stake. Recharge, “RWE Innogy sinks its teeth into Belgium's Thornton Bank”, 5 May 2009, <http://www.rechargenews.com/energy/wind/article177549.ece> (14 July 2010)
469 The Masuria (commissioned in 2009) and Western Pomerania projects have a combined investment of € 100 million.
470 RWE, “interactive map about RWE Innogy’s assets in Europe”, <http://www.rwe.com/web/cms/en/206488/rwe-innogy/renewable-energies/production-data-live/rwe-renewable-energy-live/> (14 July 2010)
471 The investment in the wind farm will be made jointly by RWE Innogy Italia (51%) and Fri-El Green Power S.p.A. (49%). Total capacity is 24.65 MW.
472 Fri-El, “Green Power press package”, May 2010, <http://www.fri-el.it/images/stories/Cartella_Stampa_Fri-El_Green_Power.pdf> (14 July 2010) RWE, “interactive map about RWE Innogy’s assets in Europe”, <http://www.rwe.com/web/cms/en/206488/rwe-innogy/renewable-energies/production-data-live/rwe-renewable-energy-live/> (14 July 2010)
473 The investment in the wind farm will be made jointly by RWE Innogy Italia (51%) and Fri-El Green Power S.p.A. (49%). 13 wind turbines of the two megawatt class.
474 RWE Innogy, “RWE Innogy invests in second wind farm in Italy”, 22 February 2010, <http://www.rwe.com/web/cms/en/86182/rwe-innogy/news-press/press/?pmid=4004526> (14 July 2010)
475 RWE Innogy has a stake of 93.7 per cent in the Spanish wind power company Danta de Energías S.A. Total capacity is 40 MW. RWE press release, “RWE Innogy koopt meerderheidsbelang in Spaanse windkrachtexploitant”, 11 May 2009, <http://www.rwe.nl/934> (15 July 2010).
476 RWE, “interactive map about RWE Innogy’s assets in Europe”, <http://www.rwe.com/web/cms/en/206488/rwe-innogy/renewable-energies/production-data-live/rwe-renewable-energy-live/> (14 July 2010)
477 RWE, “interactive map about RWE Innogy’s assets in Europe”, <http://www.rwe.com/web/cms/en/206488/rwe-innogy/renewable-energies/production-data-live/rwe-renewable-energy-live/> (14 July 2010)
478 RWE, “interactive map about RWE Innogy’s assets in Europe”, <http://www.rwe.com/web/cms/en/206488/rwe-innogy/renewable-energies/production-data-live/rwe-renewable-energy-live/> (14 July 2010)
479 RWE, “interactive map about RWE Innogy’s assets in Europe”, <http://www.rwe.com/web/cms/en/206488/rwe-innogy/renewable-energies/production-data-live/rwe-renewable-energy-live/> (14 July 2010)
480 RWE, “interactive map about RWE Innogy’s assets in Europe”, <http://www.rwe.com/web/cms/en/206488/rwe-innogy/renewable-energies/production-data-live/rwe-renewable-energy-live/> (14 July 2010)

RWE 80
481 RWE, “interactive map about RWE Innogy’s assets in Europe”, <http://www.rwe.com/web/cms/en/206488/rwe-
innogy/renewable-energies/production-data-live/rwe-renewable-energy-live/> (14 July 2010) 482 RWE, “interactive map about RWE Innogy’s assets in Europe”, <http://www.rwe.com/web/cms/en/206488/rwe-
innogy/renewable-energies/production-data-live/rwe-renewable-energy-live/> (14 July 2010) 483 RWE, “interactive map about RWE Innogy’s assets in Europe”, <http://www.rwe.com/web/cms/en/206488/rwe-
innogy/renewable-energies/production-data-live/rwe-renewable-energy-live/> (14 July 2010) 484 RWE, “interactive map about RWE Innogy’s assets in Europe”, <http://www.rwe.com/web/cms/en/206488/rwe-
innogy/renewable-energies/production-data-live/rwe-renewable-energy-live/> (14 July 2010) 485 RWE, “interactive map about RWE Innogy’s assets in Europe”, <http://www.rwe.com/web/cms/en/206488/rwe-
innogy/renewable-energies/production-data-live/rwe-renewable-energy-live/> (14 July 2010) 486 RWE, “interactive map about RWE Innogy’s assets in Europe”, <http://www.rwe.com/web/cms/en/206488/rwe-
innogy/renewable-energies/production-data-live/rwe-renewable-energy-live/> (14 July 2010) 487 RWE, “interactive map about RWE Innogy’s assets in Europe”, <http://www.rwe.com/web/cms/en/206488/rwe-
innogy/renewable-energies/production-data-live/rwe-renewable-energy-live/> (14 July 2010) RWE npower renewables, “Goole Fields Wind Farm”, <http://www.rwe.com/web/cms/en/304910/rwe-npower-renewables/sites/projects-in-development/wind/goole-fields/the-proposal/> (14 July 2010)
488 RWE, “interactive map about RWE Innogy’s assets in Europe”, <http://www.rwe.com/web/cms/en/206488/rwe-innogy/renewable-energies/production-data-live/rwe-renewable-energy-live/> (14 July 2010)
489 Energy & Ecology, “Enovos Luxembourg S.A. Acquires a Stake in an Offshore Wind Farm”, 2 July 2010. RWE owns 19.8% of Enovos International S.A. The capacity of the stake is 30 MW. Total capacity of the park is 400 MW.
490 Total capacity is 50 MW. RWE Innogy and RheinEnergie jointly hold 25.1% of the shares in this project via an investment holding company (RWE Innogy: 51%, RheinEnergie: 49%). RWE press release, “Stadtwerke München and RWE Innogy realize a parabolic trough power plant in Spain in conjunction with MAN Ferrostaal, RheinEnergie and Solar Millennium“, 10 July 2009, < http://www.rwe.com/web/cms/en/113648/rwe/press-news/press-release/?pmid=4003688> (14 July 2010) RWE, “interactive map about RWE Innogy’s assets in Europe”, <http://www.rwe.com/web/cms/en/206488/rwe-innogy/renewable-energies/production-data-live/rwe-renewable-energy-live/> (14 July 2010)
491 BUND, “Braunkohlenkraftwerk Niederaußem”, <http://www.bund-nrw.de/themen_und_projekte/energie_klima/kohlekraftwerke/kraftwerksplanungen_nrw/bergheim_niederaussem/> (26 August 2010)
492 Greenpeace Germany, “Kohlekraftwerke in Bau oder Planung”, August 2010, <http://www.greenpeace.de/fileadmin/gpd/user_upload/themen/klima/Kohlkraftwerke_im_Bau_und_in_Planung_08_2010.pdf> (26 August 2010)
493 Total cost is €2 billion. RWE invests €1 billion with €800 million for the power plant and €200 for the pipeline and CO2 storage operations.
494 RWE, “IGCC/CCS power plant”, <http://www.rwe.com/web/cms/en/2688/rwe/innovations/power-generation/clean-coal/igcc-ccs-power-plant/> (13 July 2010)
495 A joint venture called RWE Elektrownia Czeczott has been set up by RWE (75%) and the Polish coal producer Kompania Weglowa (KW, 25%). Total capacity 800 MW. TendersInfo, “Poland: RWE and KW will invest EUR 1.5bn in new coal power plant”, 25 August 2009. RWE has decided to give up its project to build a coal power plant in the Silesia region, due to the uncertainty connected with the CO2 emission rights. Rzeczpospolita, “Poland: RWE and KHW suspend power plant construction projects”, 21 June 2010.
496 Directorate of the Department of Energy and Climate Change (DECC), Development Consents and Planning Reform (DCPR) newsletter, December 2009, <http://www.decc.gov.uk/assets/decc/what%20we%20do/uk%20energy%20supply/development%20consents%20and%20planning%20reform/newsletters/1_20100203122844_e_@@_newsletterdecember2009.pdf> (15 July 2010)
497 Essent, “Essent investeert in een nieuwe productiefaciliteit in Genk”, < http://www.essentbouwtingenk.be> (13 July 2010)
498 Exploring options for a new modern combined cycle gas turbine (CCGT) power station with a main unit capacity of around 2,000 MW. In addition, there could be up to 400MW of open cycle gas turbine plant (OCGT) aime for use at peak electricity demands. RWE AG, “New power plants, Tilbury FAQs”, http://www.rwe.com/web/cms/en/365184/rwe-npower/about-us/our-businesses/new-power-stations/tilbury/faqs/ (15 July 2010) RWE npower, “RWE npower continues to explore options for Tilbury”, 5 July 2010, <http://www.npowermediacentre.com/Press-Releases/RWE-npower-continues-to-explore-options-for-Tilbury-e0a.aspx> (15 July 2010)
499 Horizon Nuclear Power is a 50/50 joint venture between E.ON UK and RWE npower. It plans to build new nuclear power stations in Wylfa and Oldbury. The total programme is likely to involve more than £15bn of investment. The company anticipates that a possible new nuclear power station at Oldbury could comprise of either two 1,650MW Areva EPR reactors or up to three 1,100MW Westinghouse AP1000 reactors. Exchange rate 1 January 2010: £1 = €1.1271. (http://www.exchangerates.org.uk/GBP-EUR-exchange-rate-history.html) Horizon Nuclear Power, < http://www.horizonnuclearpower.com/faq_wylfa.php> (14 July 2010) Horizon Nuclear Power, press release “Horizon Nuclear Power on track to deliver first generation by 2020”, 30 March 2010,

Sustainability in the Power Sector Update 2010 - The Netherlands
81
http://www.horizonnuclearpower.com/downloads/Horizon_Nuclear_Power_announces_development_programme.pdf> (14 July 2010)
500 Horizon Nuclear Power is a 50/50 joint venture between E.ON UK and RWE npower. It plans to build new nuclear power stations in Wylfa and Oldbury. The total programme is likely to involve more than £15bn of investment. The company anticipates that a possible new nuclear power station at Oldbury could comprise of either two 1,650MW Areva EPR reactors or up to three 1,100MW Westinghouse AP1000 reactors. Exchange rate 1 January 2010. (http://www.exchangerates.org.uk/GBP-EUR-exchange-rate-history.html) Horizon Nuclear Power, <http://www.horizonnuclearpower.com/faq_oldbury.php> (14 July 2010) Horizon Nuclear Power, press release “Horizon Nuclear Power on track to deliver first generation by 2020”, 30 March 2010, http://www.horizonnuclearpower.com/downloads/Horizon_Nuclear_Power_announces_development_programme.pdf> (14 July 2010)
501 Total capacity is 3,000 MW. Assumed is a stake by RWE of 50%. 502 In November 2009, RWE signed a Memorandum of Understanding with Serbian utility JP Elektroprivreda Srbije
(EPS) and the Serbian government for co-operation on the hydropower projects. The German company will be looking at three potential locations - on the Danube and Morava rivers in Serbia, and a site on the Drina river in the Republic of Srpska, the Serbian entity in Bosnia-Herzegovina. ADP News Renewable Energy Track, “RWE plans to build up to 3 GW of hydropower plants in Serbia, Bosnia”, 18 November 2009.
503 RWE Innogy GmbH, press release “RWE Innogy´s hydro-power expansion projects forge ahead in Scotland”, 1 July 2010, <http://www.rwe.com/web/cms/en/113648/rwe/press-news/press-release/?pmid=4005075> (14 July 2010)
504 RWE npower renewables, “Braan”, <http://www.rwe.com/web/cms/en/307092/rwe-npower-renewables/sites/projects-in-development/hydro/braan/the-project/> (14 July 2010)
505 RWE npower renewables, “Maldie Burn Hydro Project”, <http://www.rwe.com/web/cms/en/309346/rwe-npower-renewables/sites/projects-in-development/hydro/maldie-burn/the-proposal/> (14 July 2010)
506 Luxembourg-based utility Societe Electrique de l'Our (SEO) is 40.3% owned by both Germany's RWE and the Luxembourg government, new 200 MW generating unit. Platts Power in Europe, “Pie’s new plant tracker”, 3 May 2010.
507 RWE npower renewables, “Anglesey Skerries Tidal Stream Array”, <http://www.rwe.com/web/cms/en/309778/rwe-npower-renewables/sites/projects-in-development/marine/skerries/the-proposal/> (14 July 2010)
508 RWE npower renewables, “Projects in Development”, <http://www.rwe.com/web/cms/en/306902/rwe-npower-renewables/sites/projects-in-development/wind/triton-knoll-offshore-wind-farm/the-proposal/> (14 July 2010)
509 Joint venture RWE Innogy (60%), Stadtwerke München (30%) and Siemens (10%). Total investment more than € 2 billion; installed capacity 576 megawatts; 160 wind turbines. Work to start at the end of 2011, completion expected in 2014. RWE, press release “RWE Innogy, Stadtwerke München and Siemens build offshore wind farm Gwynt y Môr”, 04 June 2010, <http://www.rwe.com/web/cms/en/110504/rwe/investor-relations/news/news-ad-hoc-statements/?pmid=4004962> (13 July 2010)
510 £4.5billion. Exchange rate 1 January 2010: £1 = €1.1271. (http://www.exchangerates.org.uk/GBP-EUR-exchange-rate-history.html) North Devon Gazette, “Atlantic Array offshore windfarm developer announced”, 8 January 2010, <http://www.northdevongazette.co.uk/northdevongazette/news/story.aspx?brand=ndgonline&category=news&tBrand=devon24&tCategory=newsndga&itemid=DEED08%20Jan%202010%2012%3A52%3A08%3A690> (14 July 2010)
511 The company hopes to gain planning permission by 2013. RWE, press release “RWE Innogy to develop 4,000 megawatt of offshore wind power in the UK”, 08 January 2010, <http://www.rwe.com/web/cms/en/110504/rwe/investor-relations/news/news-ad-hoc-statements/?pmid=4004381> (13 July 2010)
512 Target capacity entire project is 9,000 Megawatt, with a potential for approximately 13,000 Megawatt. RWE Innogy will develop the Dogger Bank Zone through a consortium called Forewind, which comprises RWE Innogy, UK energy utility Scottish & Southern Energy (SSE) and Norwegian energy companies Statoil and Statkraft. RWE, press release “RWE Innogy to develop 4,000 megawatt of offshore wind power in the UK”, 08 January 2010, <http://www.rwe.com/web/cms/en/110504/rwe/investor-relations/news/news-ad-hoc-statements/?pmid=4004381> (13 July 2010) Forewind has agreed with The Crown Estate a target installed capacity of 9GW, though the zone has a potential for approximately 13GW. Forewind, <http://www.forewind.co.uk/> (14 July 2010) Each company holds a 25% stake in the venture. NewEnergyFocus, <http://www.newenergyfocus.com/do/ecco/view_item?listid=1&listcatid=32&listitemid=2306> (14 July 2010)
513 RWE Innogy GmbH, press release “RWE Innogy chooses Bremerhaven as offshore base port Essen/Bremerhaven”, 10 May 2010, <http://www.rwe.com/web/cms/en/86182/rwe-innogy/news-press/press/?pmid=4004862> (14 July 2010)
514 RWE, “interactive map about RWE Innogy’s assets in Europe”, <http://www.rwe.com/web/cms/en/206488/rwe-innogy/renewable-energies/production-data-live/rwe-renewable-energy-live/> (14 July 2010)
515 Essent, “CSR report 2009”, <http://www.rwe.com/web/cms/mediablob/en/429500/data/408954/65743/rwe/responsibility/key-data/cr-reports/blob.pdf> (13 August 2010)
516 Gazeta Prawna, “Poland: Foreign investors favour wind energy projects”, 23 October 2009.

RWE 82
517 RWE, “Startnotitie (initial license request paper) locatie de Ruyter Oost”, 19 February 2008,
<http://www.inspraakpunt.nl/Images/RWE%20Startnotitie%20Ruyter%20Oost_tcm306-219255.pdf> (15 July 2010)
518 RWE npower renewables, “The Allt Duine Wind Farm Proposal”, <http://www.rwe.com/web/cms/en/306972/rwe-npower-renewables/sites/projects-in-development/wind/allt-duine/the-proposal/> (14 July 2010)
519 RWE npower renewables, “Brechfa Forest”, <http://www.rwe.com/web/cms/en/306036/rwe-npower-renewables/sites/projects-in-development/wind/brechfa-forest/the-proposal/> (14 July 2010)
520 Capacity in the range 130 – 195 MW. RWE npower renewables, “Carnedd Wen Wind Farm and Habitat Restoration Project”, <http://www.rwe.com/web/cms/en/306110/rwe-npower-renewables/sites/projects-in-development/wind/carnedd-wen/the-proposal/> (14 July 2010)
521 RWE npower renewables, “Clocaenog Forest Wind Farm”, <http://www.rwe.com/web/cms/en/306196/rwe-npower-renewables/sites/projects-in-development/wind/clocaenog-forest/the-proposal/> (14 July 2010)
522 RWE npower renewables, “East Heslerton”, <http://www.rwe.com/web/cms/en/391832/rwe-npower-renewables/sites/projects-in-development/wind/the-proposal/> (14 July 2010)
523 RWE npower renewables, “Mynydd y Gwair Wind Farm”, <http://www.rwe.com/web/cms/en/306332/rwe-npower-renewables/sites/projects-in-development/wind/mynydd-y-gwair/the-proposal/> (14 July 2010)
524 RWE npower renewables, “Rowantree Wind Farm”, <http://www.rwe.com/web/cms/en/282198/rwe-npower-renewables/sites/projects-in-development/wind/rowantree/the-proposal/> (14 July 2010)
525 RWE npower renewables, “Nun Wood Wind Farm Proposal”, <http://www.rwe.com/web/cms/en/305628/rwe-npower-renewables/sites/projects-in-development/wind/nun-wood/the-proposal/> (14 July 2010)
526 RWE npower renewables, “Stroupster Wind Farm”, <http://www.rwe.com/web/cms/en/282280/rwe-npower-renewables/sites/projects-in-development/wind/stroupster/> (14 July 2010)
527 RWE npower renewables, “Batsworthy Cross Wind Farm”, <http://www.rwe.com/web/cms/en/282574/rwe-npower-renewables/sites/projects-in-development/wind/batsworthy-cross/the-proposal/> (14 July 2010)
528 RWE npower renewables, “Burn of Whilk Wind Farm”, <http://www.rwe.com/web/cms/en/281256/rwe-npower-renewables/sites/projects-in-development/wind/burn-of-whilk/the-proposal/> (14 July 2010)
529 RWE npower renewables, “Cotton Farm Wind Farm”, <http://www.rwe.com/web/cms/en/294386/rwe-npower-renewables/sites/projects-in-development/wind/cotton-farm/> (14 July 2010)
530 RWE npower renewables, “Fforch Nest Wind Farm”, <http://www.rwe.com/web/cms/en/391832/rwe-npower-renewables/sites/projects-in-development/wind/the-proposal/> (14 July 2010)
531 RWE npower renewables, “Kirkharle Wind Farm”, <http://www.rwe.com/web/cms/en/305228/rwe-npower-renewables/sites/projects-in-development/wind/kirkharle/the-proposal/> (14 July 2010)
532 RWE npower renewables, “Raera Forest Wind Farm”, <http://www.rwe.com/web/cms/en/282146/rwe-npower-renewables/sites/projects-in-development/wind/raera-forest/the-proposal/> (14 July 2010)
533 RWE npower renewables, “Saxby Wold Wind Farm Proposal”, <http://www.rwe.com/web/cms/en/305730/rwe-npower-renewables/sites/projects-in-development/wind/saxby-wold/the-proposal/> (14 July 2010)
534 RWE npower renewables, “Hampole Wind Farm”, <http://www.rwe.com/web/cms/en/304934/rwe-npower-renewables/sites/projects-in-development/wind/hampole/the-proposal/> (14 July 2010)
535 RWE npower renewables, “Earls Hall”, <http://www.rwe.com/web/cms/en/294804/rwe-npower-renewables/sites/projects-in-development/wind/earls-hall/the-proposal/> (14 July 2010)
536 RWE npower renewables, “Langham Wind Farm”, <http://www.rwe.com/web/cms/en/305332/rwe-npower-renewables/sites/projects-in-development/wind/langham/the-proposal/> (14 July 2010)
537 RWE npower renewables, “Stobhill Wind Farm”, <http://www.rwe.com/web/cms/en/305776/rwe-npower-renewables/sites/projects-in-development/wind/stobhill/the-proposal/> (14 July 2010)
538 RWE Group, “Corporate Social Responsibility Report 2009”, page 20, <http://www.rwe.com/web/cms/mediablob/en/409784/data/408954/66411/rwe/responsibility/key-data/cr-reports/blob.pdf> (16 July 2010)
539 RWE, “Code of Conduct”, <http://www.rwe.com/web/cms/en/90780/suppliers/code-of-conduct/> (16 July 2010) 540 RWE Group, “Corporate Social Responsibility Report 2009”, page 41 and 83,
<http://www.rwe.com/web/cms/mediablob/en/409784/data/408954/66411/rwe/responsibility/key-data/cr-reports/blob.pdf> (16 July 2010)
541 Essent, “CSR report 2009”, page 38, <http://www.rwe.com/web/cms/mediablob/en/429500/data/408954/65743/rwe/responsibility/key-data/cr-reports/blob.pdf> (13 August 2010)
542 Essent, “CSR report 2008”, page 35, <http://www.essent.nl/content/overessent/het_bedrijf/mvo/feiten_en_cijfers/index.html> (13 August 2010)
543 RWE Group, “Corporate Social Responsibility Report 2009”, <http://www.rwe.com/web/cms/mediablob/en/409784/data/408954/66411/rwe/responsibility/key-data/cr-reports/blob.pdf> (16 July 2010)
544 Essent website, Activiteiten, Energie, Opwekking, “Inkoop van steenkolen”, no date, <http://www.essent.nl/content/overessent/activiteiten/energie/opwekking/inkoop_van_steenkool/index.html> (19 July 2010).
545 RWE Group, “Corporate Social Responsibility Report 2009”, page 86, <http://www.rwe.com/web/cms/mediablob/en/409784/data/408954/66411/rwe/responsibility/key-data/cr-reports/blob.pdf> (16 July 2010)
546 RWE Group, “Corporate Social Responsibility Report 2009”, <http://www.rwe.com/web/cms/mediablob/en/409784/data/408954/66411/rwe/responsibility/key-data/cr-reports/blob.pdf> (16 July 2010)

Sustainability in the Power Sector Update 2010 - The Netherlands
83
547 RWE Group, “Corporate Social Responsibility Report 2009”, page 41
<http://www.rwe.com/web/cms/mediablob/en/409784/data/408954/66411/rwe/responsibility/key-data/cr-reports/blob.pdf> (19 July 2010)
548 RWE Group, “Corporate Social Responsibility Report 2009”, page 83 <http://www.rwe.com/web/cms/mediablob/en/409784/data/408954/66411/rwe/responsibility/key-data/cr-reports/blob.pdf> (19 July 2010)
549 Essent, “CSR report 2009”, page 38, <http://www.rwe.com/web/cms/mediablob/en/429500/data/408954/65743/rwe/responsibility/key-data/cr-reports/blob.pdf> (13 August 2010)
550 Green Gold Label, <http://www.greengoldcertified.org> (13 August 2010) 551 Essent website, “Biomassa: schone brandstof, schone herkomst?”,
<http://www.essent.nl/content/overessent/het_bedrijf/mvo/markt/certificering_biomassa.html> (13 August 2010) 552 E-mail by Eduard J.F. Wijnoldij Daniëls, CSR Consultant, Essent N.V. on 10 August 2010.

Fuel mix of installed capacity and electricity generation in Europe 84
8 Fuel mix of installed capacity and electricity generation in Europe
This chapter provides a comparison of the fuel mixes of each of the companies’ installed capacity and electricity generated in 2009.
Installed capacity in Europe
Table 33 shows the installed generation capacity in Europe of each company in MW. E.ON is the largest electricity company active in The Netherlands. However, Vattenfall has the most renewable capacity, with more than 12 GW of mostly hydro capacity. Table 33: Fuel mix of installed capacity in Europe by company, in MW, 2009 Fuel type Delta Dong
Energy Eneco E.ON GDF Suez /
Electrabel 553 RWE / Essent
Vattenfall / Nuon
Coal 177 3,987 0 18,478 4,162 26,465 12,198 Natural Gas 687 723 1,245 14,467 19,598 9,144 4,880 Oil 0 752 0 2,395 0 0 2,068 Nuclear 256 0 0 11,325 6,356 6,295 6,146 Other Non-renewable 0 0 0 2,819 643 5,146 0 Wind 9 1,104 742 1,146 1,286 1,574 859 Hydro 0 205 0 5,450 5,221 793 10,869 Large scale 0 205 0 n/a n/a n/a n/a Small scale 0 0 0 n/a n/a n/a n/a Biomass 54 232 45 64 530 98 366 Stand alone 18 154 45 n/a n/a n/a n/a Co-fired 36 78 0 n/a n/a n/a n/a Other renewable 3 0 18 70 38 67 0 Total renewable 66 1,541 805 6,730 7,075 2,532 12,094 Total 1,185 7,003 2,050 56,214 37,834 49,582 37,386 SOMO compilation based on company data
Figure 24 reflects the fuel mix of the installed capacity of the companies based on the percentage that each fuel comprises of the total mix. Eneco and Vattenfall have the highest share of renewable capacity, while RWE/Essent has the lowest. A remarkable fact is that the percentage of Delta’s renewable capacity more than halved in comparison with last year.554

Sustainability in the Power Sector Update 2010 - The Netherlands
85
Figure 24: Installed capacity in Europe dedicated t o renewable energy, by company, 2009
0%10%20%30%40%50%60%70%80%90%
100%
Delta
Dong
Energ
y
Eneco
E.ON
GDF Sue
z/Elec
trabe
l
RWE/E
ssen
t
Vatten
fall
Per
cent
age
of g
ener
atio
n ca
paci
ty
dedi
cate
d to
rene
wab
les
(%)
Renewable
Non-renewable
SOMO compilation based on company data
Electricity generated in Europe
Table 34 shows the electricity that was actually generated in 2009 from the companies’ installed capacity listed above. It should be noted that some companies do not provide figures on their generation figures, so there are a number of gaps in the tables and figures in this section. As Nuon’s figures for 2009 were not wholly incorporated into Vattenfall’s generated electricity, Nuon’s figures are presented separately here. No figures were available at all for Delta.

Fuel mix of installed capacity and electricity generation in Europe 86
Table 34: Fuel mix of electricity generated in Euro pe by company, in GWh, 2009
SOMO compilation based on company data
Figure 25 reflects the fuel mix of the electricity generated by the companies. Vattenfall has the largest share of electricity generated from renewable sources, while RWE has the lowest. Figure 25: Electricity generated from renewables in Europe, by company, 2009
0%10%20%30%40%50%60%70%80%90%
100%
Delta
Dong
Energ
y
Eneco
E.ON
GDF Sue
z/Elec
trabe
l
RWE/E
ssen
t
Vatten
fall
Nuon
Per
cent
age
of g
ener
atio
n ca
paci
ty
dedi
cate
d to
ren
ewab
les
(%)
Renewable
Non-renewable
SOMO compilation based on company data
An interesting picture emerges when we compare the renewable share of each of the companies’ installed capacity, with their generated electricity. Figure 26 gives a bar chart of these relative figures. We see that Eneco has a much smaller share of renewable energy generated than what could be achieved with their renewable capacity.
Fuel type Delta Dong Energy
Eneco E.ON GDF Suez/ Electrabel
RWE Vattenfall Nuon
Coal n/a n/a 0 63,920 27,800 115,000 71,200 5,262
Natural Gas n/a n/a 7,530 40,297 124,000 29,700 4,700 8,758
Oil n/a n/a 0 n/a 0 0 0 0
Nuclear n/a 0 0 71,813 45,600 33,900 28,300 0
Other Non-renewable
n/a 15,264 0 4,434 5,100 2,100 0 0
Wind n/a 1,929 1,626 4,859 2,500 2,200 1,700 1,275
Hydro n/a 881 0.8 17,150 45,600 3,400 31,600 72
Large scale (>10MW)
n/a [881] - - - - - -
Small scale (<10MW)
n/a - [0.8] - - - - [72]
Biomass n/a 0 328 270 2,500 900 1,400 16
Stand alone n/a - [328] - - - - -
Co-fired n/a - - - - - - -
Other renewable
n/a 0 4 1,128 0 0 0 4
Total renewable
n/a 2810 1959 23,407 50,600 6,500 34,700 1,367
Total n/a 18,074 9,488.8 203,871 253,100 187,200 138,900 15,387

Sustainability in the Power Sector Update 2010 - The Netherlands
87
Figure 26: Renewable installed capacity and electri city generated as percentage of the total, by company, 2009
0
5
10
15
20
25
30
35
40
45
Delta
Dong E
nergy
Eneco
E.ON
GDF Sue
z/Elec
trabe
l
RWE/E
ssen
t
Vatten
fall
Nuon
Ren
ewab
le p
erce
ntag
e of
tota
l in
the
Net
herla
nds
Renewable installedcapacity %
Renewable electricitygenerated %
553 Figures for 2009 were not available, so 2008 figures were used. 554 In 2008 Delta had a percentage of 11,7% of renewable installed capacity. J. Wilde-Ramsing, T. Steinweg & M.
Kokke, Sustainability in the Dutch Power Sector – 2009 Update, SOMO publication, October 2009, p. 79.

Fuel mix of electricity supplied in the Netherlands 88
9 Fuel mix of electricity supplied in the Netherlands
This fact sheet compares the companies regarding the fuel mixes of the electricity they supply in the Netherlands and, or in some cases also including neighbouring countries. The CO2 emissions and the radioactive waste resulting from this supply are also compared. The energy labels that each company is obliged to present are taken as the basis of these comparisons. For better comparability, two lists of figures are presented. First, the Dutch market as a whole is viewed at, meaning the retail market together with the market for business customers. This gives the most complete overview of the type of electricity supplied by each of the companies. It should be noted that due to differences in scope and underlying calculations, these figures might be somewhat less comparable. The second set of comparisons is based on the fuel mix. These figures all have the same scope and, for the most part, the same calculation methods and are therefore more comparable. However, these figures do not provide a complete overview, as the large businesses and industries are not taken up.
Percentage of renewable energy in electricity suppl ied
Whole Dutch market Figure 27 illustrates the fuel mix of electricity supplied by the various companies, on the basis of their energy labels. Of all the companies, RWE/Essent supplies the most renewable energy, closely followed by Dong Energy. Delta and GDF Suez/Electrabel supply the least renewable energy. RWE/Essent’s figures are based on Essent NV, the company supplying electricity to Dutch, Belgian and German consumers and businesses. Regarding E.ON, the only available numbers were those for the whole Benelux region, so these are presented in the figure. Figure 27: Renewable and non-renewable electricity supplied in the Netherlands, by company, 2009
0%
20%
40%
60%
80%
100%
Delta
Dong
Energ
y
Eneco
E.ON (B
enel
ux)
GDF Sue
z/Elec
trabe
l
Vatte
nfall
/Nuo
n
RWE/E
ssen
t (NL,
B, D
)
Per
cent
age
of E
lect
ricity
Sup
plie
d by
Fue
l Typ
e
Renewable
Non renewable
SOMO compilation based on company data

Sustainability in the Power Sector Update 2010 - The Netherlands
89
Table 35 provides a numerical overview of the percentages given in Figure 27. Table 35: Fuel mix of electricity supplied in the N etherlands by company, in percent, 2009 Company Non renewable Renewable Total
Delta 93.6 6.4 100
Dong Energy 68.1 31.9 100
Eneco 81.2 18.7 100
E.ON (Benelux) 77.5 22.5 100
GDF Suez / Electrabel 90.7 9.4 100
Vattenfall / Nuon 88 12 100
RWE / Essent (NL, B, D) 64.5 35.5 100
SOMO compilation based on company data
Dutch retail market Figure 28 shows the ratio between renewable and non renewable electricity supplied on the Dutch retail market. These figures are also based on the energy labels which the companies have to report on. The figures slightly differ from the ones reported about the whole Dutch electricity market: Dong Energy has the highest percentage of renewable electricity supply to retail customers, followed by E.ON. The lowest percentages are found at the supply figures of GDF Suez/Electrabel and Nuon. The figures for E.ON represent the Benelux region and the numbers for RWE/Essent also include the Belgian and German retail markets. It has to be noted that the supply figures for retail customers in the Netherlands for GDF Suez/Electrabel were not available, so the for the comparison the figures from Figure 27 and Table 35 were used (numbers for the whole Dutch market, retail and business together). Except for Vattenfall / Nuon, all companies show a higher percentage of renewable supply to their retail customers than to their retail and business customers together. The most striking difference is found for Delta, which has about 6% renewable supply to the market as a whole as opposed to the almost 30% of renewable supply to its retail customers. Also Dong Energy and E.ON show considerable differences in their renewable supply to the whole market and the retail branch: 32% whole to 61% retail and 23% whole to 55% retail, respectively.

Fuel mix of electricity supplied in the Netherlands 90
Figure 28: Renewable and non-renewable electricity supplied to retail customers in the Netherlands, by company, 2009
0%
20%
40%
60%
80%
100%
Delta
Dong E
nerg
y
Eneco
E.ON (B
enelu
x)
GDF S
uez/E
lectra
bel *
Vatten
fall/N
uon
RWE/E
ssen
t (NL,
B, D)
Per
cent
age
of e
lect
ricity
sup
plie
d by
fuel
type
to
reta
il cu
stom
ers
Renew able
Non renew able
* Figures for retail and the business market together
Table 36 provides a numerical overview of the percentages given in 28. Table 36: Fuel mix of electricity supplied to retai l customers in the Netherlands by company, in percent, 2009 Company Non renewable Renewable Total
Delta 70.1 29.9 100
Dong Energy 38.9 61 100
Eneco 68.5 31.5 100
E.ON (Benelux) 45.1 55.2 100
GDF Suez / Electrabel * 90.7 9.4 100
Vattenfall / Nuon 88.8 11.2 100
RWE / Essent (NL, B, D) 53.4 46.6 100 * Figures for retail and the business market together
CO2 emissions and radioactive waste
Whole Dutch market The CO2 emissions and radioactive waste resulting from the electricity supplied by the companies, as shown in Figure 29, resemble the fuel mixes of their electricity supply. The lowest emissions are produced by RWE, which is a direct consequence of their relatively large share of renewable energy. The suppliers with the least sustainable supply mix, GDF Suez/Electrabel, Vattenfall/Nuon and Delta, are also the largest emitters of greenhouse gas. Radioactive waste production correlates with the presence of nuclear energy in each company’s fuel mix for electricity supply. Delta, a company with a large share of nuclear energy in its supply mix, generates by far the most radioactive waste. E.ON, a company that does own significant nuclear capacity, barely supplies energy from this source within The Netherlands.

Sustainability in the Power Sector Update 2010 - The Netherlands
91
The figures for RWE represent the numbers for the Dutch, Belgian and German markets. Regarding E.ON, the only available numbers were those for the whole Benelux region, so these are presented in the figure. Figure 29: CO2 emissions and radioactive waste resu lting from electricity supplied in the Netherlands, by company, 2009
0
100
200
300
400
500
600
Delta
Dong E
nerg
y
Eneco
E.ON (B
enel
ux)
GDF
Suez/E
lectra
bel
Vatte
nfall
/Nuo
n
RWE/E
ssen
t (NL,
B, D
)
CO
2 E
mis
sion
s an
d R
adio
activ
e W
aste
CO2 (g/kWh)
Radioactive w aste(g/kWh x 0.000001)
SOMO compilation based on company data
Table 37 shows the figures as given in the electricity labels of the CO2 emissions and production of radioactive waste for each company. Table 37: CO2 emissions and radioactive waste resul ting from electricity supply in the Netherlands, per company, in g/kWh, 2009
Delta
Dong Energy Eneco
E.ON (Benelux)
GDF Suez/Electrabel
Vattenfall/Nuon
RWE/Essent (NL, B, D)
CO2 emissions 390 315.7 340 358.8 422 396.6 303 Nuclear waste* 490 122 100 140 144 130 140
SOMO compilation based on company data; * Nuclear waste figures in g/kWh x0.000001
Dutch retail market Figure 30 shows the amounts of CO2 emissions and radioactive waste resulting from the supply to retail customers on the Dutch electricity market. The lowest emitter is Dong Energy, followed by E.ON. The companies with the highest emissions are GDF Suez / Electrabel and Vattenfall / Nuon. For radioactive waste, Dong Energy and Vattenfall / Nuon have the lowest pollution figures and again Delta shows the highest concentration of nuclear waste. Eneco does not generate any nuclear waste from its electricity supplied to retail costumers, as it excludes this type of electricity from its fuel mix. The figures for E.ON represent the Benelux region and the numbers for RWE / Essent also include the Belgian and German retail markets. It has to be noted that the figures for

Fuel mix of electricity supplied in the Netherlands 92
emissions and nuclear waste for retail customers in the Netherlands for GDF Suez / Electrabel were not available, so for this company the figures from Figure 29 and Table 37 were used (numbers for the whole Dutch market, retail and business together). In general, the emission and nuclear waste numbers for the retail market are lower than for the Dutch market as a whole, which is a direct consequence of the fact that the share of renewable energy supply is higher in the retail sector, as described above. Vattenfall/Nuon is the only exception in this respect. In this comparison Dong Energy and E.ON are the companies sticking out, with considerable differences in their emission and nuclear waste figures: they are both about 40 percent lower for the retail market than for the Dutch market as a whole. Here it should be mentioned as well that Vattenfall / Nuon’s nuclear waste figures are approximately the half on the retail market when compared to the Dutch market as a whole. Figure 30: CO 2 emissions and radioactive waste resulting from ele ctricity supply to retail customers in the Netherlands, by company , 2009
0
100
200
300
400
500
Delta
Dong
Energ
y
Eneco
E.ON (B
enel
ux)
GDF
Suez/E
lectra
bel *
Vatte
nfall
/Nuo
n
RWE/E
ssen
t (NL,
B, D
)
CO
2 em
issi
ons
and
radi
oact
ive
was
te, r
etai
l sup
ply
in th
e N
ethe
rland
s
CO2 (g/kWh)
Radioactive w aste(g/kWh x 0.000001)
* Figures for retail and the business market together
Table 38 shows the figures as given in the electricity labels of the CO2 emissions and production of radioactive waste for the Dutch retail market for each company. Table 38: CO 2 emissions and radioactive waste resulting from ele ctricity supply to retail customers in the Netherlands, per company, in g/kWh, 2009
Delta
Dong Energy Eneco
E.ON (Benelux)
GDF Suez/ Electrabel *
Vattenfall/ Nuon
RWE/Essent (NL, B, D)
CO2 emissions 292.4 180.4 249 208.9 422 415.8 251 Nuclear waste** 370 70 0 81 144 70 110
* Figures for retail and the business market together; ** Nuclear waste figures in g/kWh x0.000001

Sustainability in the Power Sector Update 2010 - The Netherlands
93
10 Investments in new generation capacity in Europe
This thematic fact sheet examines the companies’ current and announced investments in new electricity generation capacity in Europe, according to the companies' data. Based thereupon it also provides a forecast of the companies’ future relative renewables capacity. A distinction is made between current investments (definite investments in projects that were already under construction as of 31 December 2009) and announced plans for investments (projects that are in various stages of planning and which could still be cancelled or modified by the company).
Investments in renewables
This section analyses the share of renewables in the current and announced investments and provides a forecast of the companies’ future relative renewables capacity. Current investments It should be noted that it was not possible to gather the capacity information for all the current investments. Therefore, some of the figures given in the tables are incomplete and should be interpreted with caution. Also, it should be taken into consideration that investments in co-fired plants (coal and biomass) are accounted for as fossil-fuel investments (see methodology) and investments replacing coal by biomass are not taken into account. For GDF Suez the European capacity as of 31 December 2008 is indicated, because the capacity figures for 2009 were not available.555 Table 39 shows the current investments (in MW) compared to the electricity generation capacity in Europe as of 31 December 2009. Looking at the figures, RWE/Essent is by far the largest investor in new capacity. Table 39: Current investments compared to electrici ty generation capacity, in Europe, as of 31 December 2009, per company, in MW. company capacity
current investments % investments
of capacity Delta 1,185 90 8%
Dong Energy 7,003 2,355 34%
E.ON 56,214 6,468 12%
Eneco 2,050 544 27%
GDF Suez/Electrabel 37,834 3,879 10%
RWE/Essent 49,582 11,707 24%
Vattenfall/Nuon 37,386 5,627 15%
Table 40 shows the renewables percentage in the electricity generation capacity as of 31 December 2009 versus the renewables percentage in the current investments of the companies. Again, some of the figures given in this table are incomplete and should be interpreted with caution for the same reasons as described above for Table 39. However, from the table it can be analysed that there are great differences in the relative renewables

Investments in new generation capacity in Europe 94
capacity of the companies (ranging from 5% for RWE to 39% for Eneco). Further on, at present only RWE/Essent, Dong Energy and Delta invest more in renewables than the present share of renewables in their capacity. As for current investments, all companies together do not seem to increase their share of renewables. Table 40: Renewables percentage in the capacity as of 31 December 2009 versus renewables percentage in current investments, per company, in Europe, in MW.
Capacity Current investments Company
total renewables % total renewables %
Delta 1,185 66 6% 90 90 100%
Dong Energy 7,003 1,541 22% 2,355 836 35%
E.ON 56,214 6,730 12% 6,468 733 11%
Eneco 2,050 805 39% 544 109 20%
GDF Suez/Electrabel
37,834 7,075 19% 3,879 555 14%
RWE/Essent 49,582 2,532 5% 11,707 1,126 10%
Vattenfall/Nuon 37,386 12,094 32% 5,627 627 11%
Announced plans for investments In addition to the projects that are currently being developed, companies have announced plans for various investments to be made in the future. The announced plans have a varying level of concreteness; some plans have been developed in detail and are only awaiting permits, while others are vague plans of possible future investment strategies. The figures for announced investments are more incomplete than the current investments, because for more projects the exact amount of the to be generated electricity in megawatts (MW) was not known. Only the known investment figures (MW) are taken up. This means that a number of projects that are in some stage of planning, but for which no details have been disclosed, are not taken up in this table. It should also be taken into consideration that the announced investments can still be cancelled or modified by the company. Table 41 distinguishes the renewables share in the capacity after the current investments have been realised and the renewables share in the announced plans for investments. RWE/Essent has announced most investments in new renewable capacity (in MW). Vattenfall/Nuon, Dong Energy and Eneco also stand out positively towards renewable energy, compared to the fuel mix of their capacity after the current investments. Table 41: Renewables percentage in capacity after c urrent investments versus renewables percentage in announced plans for inve stments, per company, in Europe, in MW
Capacity after current investments Announced plans for investments Company
total renewables % total renewables %
Delta 1,275 156 12% 2,780 55 2%
Dong Energy 9,358 2,377 25% 2,156 2,156 100%
E.ON 62,682 7,463 12% 14,481 1,719 12%
Eneco 2,594 914 35% 2,793 1,893 68%
GDF Suez/Electrabel
41,713 7,630 18% 15,815 2,826 18%
RWE/Essent 57,631 3,658 6% 22,720 10,170 45%
Vattenfall / Nuon 43,013 12,721 30% 11,415 5,721 50%

Sustainability in the Power Sector Update 2010 - The Netherlands
95
Table 42 shows the relative renewable generation capacity whenever the current investments and the announced plans for investments are to be completed. It should again be noted that only limited weight should be given to the projections summarised in this table. According to the table, the relative renewable generation capacity of RWE/Essent, Dong Energy and Eneco increases significantly. Table 42: Current and prospected relative renewable generation capacity, in Europe, per company, in percent Company Capacity 31-12-2009 Capacity 31-12-2009
+ current investments Capacity 31-12-2009 + current investments +
announced plans for investment
Delta 6% 12% 5%
Dong Energy 22% 25% 39%
E.ON 12% 12% 12%
Eneco 39% 35% 52%
GDF Suez/Electrabel 19% 18% 18%
RWE/Essent 5% 6% 17%
Vattenfall / Nuon 32% 30% 34%
Investments per fuel type
This section overlooks the current and announced investments of the companies per fuel type. The data provide for some insights to which fuel types are popular for present and future investments in electricity generation capacity. Table 43 shows the current investments per fuel type of each company. In the category ‘other renewables’ the figures for biomass are also included. Of all fuel types, investments in natural gas power plants are dominant, followed by coal, wind and nuclear. RWE/Essent and Vattenfall/Nuon invest most in coal. Table 43: Current investments (MW) in new generatio n capacity in Europe, by company and fuel type Company Wind Hydro Other
renewables (including biomass)
Natural gas
Coal Nuclear Other non-renewables
Total
Delta 75 0 15 0 0 0 0 90
Dong Energy
836 0 0 1,519 0 0 0 2,355
E.ON 683 0 50 3,535 2,200 0 0 6,468
Eneco 109 0 0 435 0 0 0 544
GDF Suez/ Electrabel
474 0 81 1,994 1,158 173 0 3,880
RWE/Essent
979 8 140 6,895 3,554 132 0 11,708
Vattenfall/ Nuon
622 5 0 1,755 2,795 450 0 5,627
Total 3,778 13 286 16,133 9,707 755 0 30,672
% 12% 0% 1% 53% 32% 2% 0% 100%
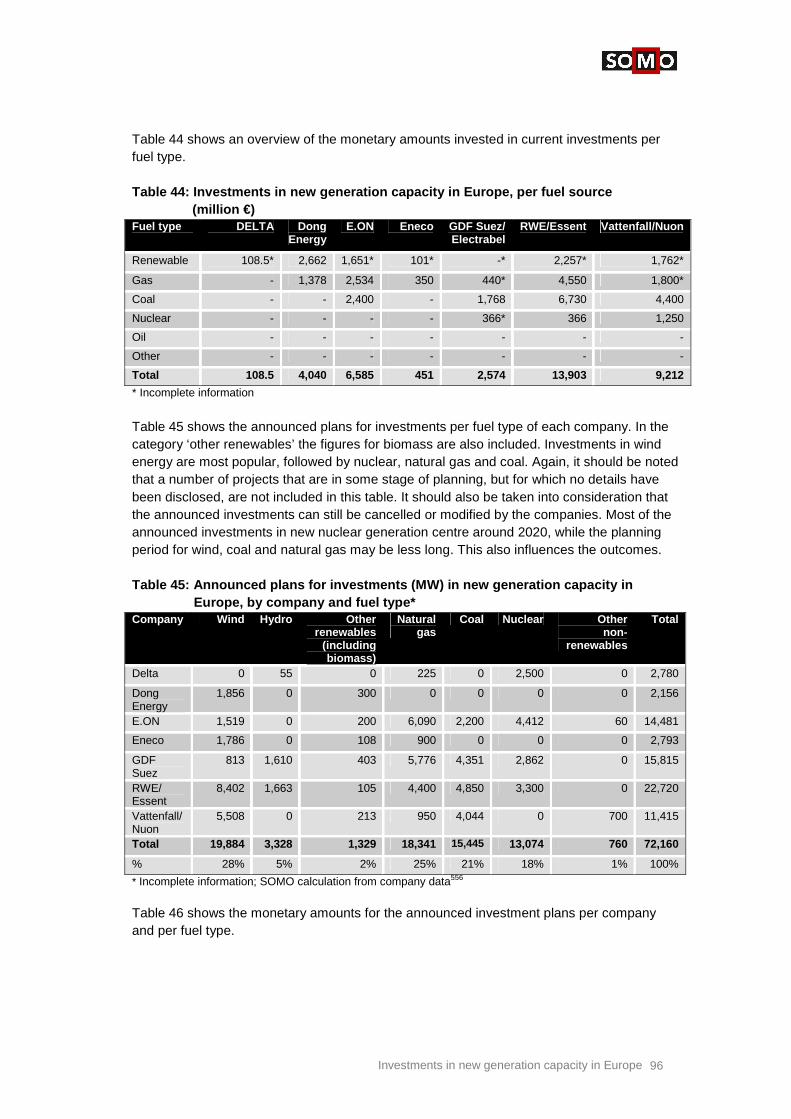
Investments in new generation capacity in Europe 96
Table 44 shows an overview of the monetary amounts invested in current investments per fuel type. Table 44: Investments in new generation capacity in Europe, per fuel source (million €) Fuel type DELTA Dong
Energy E.ON Eneco GDF Suez/
Electrabel RWE/Essent Vattenfall/Nuon
Renewable 108.5* 2,662 1,651* 101* -* 2,257* 1,762*
Gas - 1,378 2,534 350 440* 4,550 1,800*
Coal - - 2,400 - 1,768 6,730 4,400
Nuclear - - - - 366* 366 1,250
Oil - - - - - - -
Other - - - - - - -
Total 108.5 4,040 6,585 451 2,574 13,903 9,212
* Incomplete information
Table 45 shows the announced plans for investments per fuel type of each company. In the category ‘other renewables’ the figures for biomass are also included. Investments in wind energy are most popular, followed by nuclear, natural gas and coal. Again, it should be noted that a number of projects that are in some stage of planning, but for which no details have been disclosed, are not included in this table. It should also be taken into consideration that the announced investments can still be cancelled or modified by the companies. Most of the announced investments in new nuclear generation centre around 2020, while the planning period for wind, coal and natural gas may be less long. This also influences the outcomes. Table 45: Announced plans for investments (MW) in n ew generation capacity in Europe, by company and fuel type* Company Wind Hydro Other
renewables (including biomass)
Natural gas
Coal Nuclear Other non-
renewables
Total
Delta 0 55 0 225 0 2,500 0 2,780
Dong Energy
1,856 0 300 0 0 0 0 2,156
E.ON 1,519 0 200 6,090 2,200 4,412 60 14,481
Eneco 1,786 0 108 900 0 0 0 2,793
GDF Suez
813 1,610 403 5,776 4,351 2,862 0 15,815
RWE/ Essent
8,402 1,663 105 4,400 4,850 3,300 0 22,720
Vattenfall/ Nuon
5,508 0 213 950 4,044 0 700 11,415
Total 19,884 3,328 1,329 18,341 15,445 13,074 760 72,160
% 28% 5% 2% 25% 21% 18% 1% 100%
* Incomplete information; SOMO calculation from company data556
Table 46 shows the monetary amounts for the announced investment plans per company and per fuel type.

Sustainability in the Power Sector Update 2010 - The Netherlands
97
Table 46: Additional investment plans for new gener ation capacity in Europe, by company and fuel source (million €) Fuel type DELTA Dong
Energy Eneco E.ON GDF Suez/
Electrabel Vattenfall/Nuon RWE/Essent
Renewable - 1,067 80* 1,578* 1,914* 950* 10,500*
Gas - - 800 704* 2,176* 100* -*
Coal - - - 2,700 5,083* - 1,925*
Nuclear 750 - - 8,400* -* - 8,400
Oil - - - - - - -
Other - - - -* - 775 -
Total 750 1,067 880 13,382 0 1,825 20,825
* Incomplete information
Investments in nuclear generation
This section presents the combined current investments and announced plans for investments in nuclear generation by companies active in The Netherlands. Table 47: Current investments in nuclear capacity
Company Country Project Date in operation
Amount (€million)
Capacity (MW)
RWE/Essent, Enel, GDF Suez/Electrabel (each 9.15%), Iberdrola (6.2%)
Romania Reactors 3 + 4 Cernavoda
Unit 3: 2016 Unit 4: 2017 1,346 485
Vattenfall/Nuon Sweden boost generation capacity Forsmark and Ringhals plants
2011/2014 1,250 450
GDF Suez/Electrabel
Belgium Doel 1, upgrade capacity
n/a n/a 40.5
Table 48: Announced plans for investments in nuclea r generation
Company Country Project Date in operation
Amount (€million)
Capacity (MW)
Project status
E.ON (50%), RWE/Essent (50%)
England, UK
Horizon Nuclear Power, Oldbury (Gloucestershire)
2025 8,400 3,300 Planning application once construction at Wylfa is underway
E.ON (50%), RWE/Essent (50%)
Wales, UK
Horizon Nuclear Power, Wylfa (Anglesey)
2020 8,400 3,300 planning application scheduled for 2012
GDF Suez/ Electrabel (37.5%), Iberdrola (37.5)
England, UK
Sellafield, Iberdrola/GDF Suez/SSE
2020-2025 n/a 2,700 pre-development stage
E.ON Finland Fennovoima 2020 n/a 612 License granted
GDF Suez/ Electrabel
France Rhone Valley, third EPR reactor
n/a n/a 1,100 Candidate
EdF (50%), GDF Suez
France Penly site, Normandy,
n/a n/a 1,237 Public debate set up in 2010

Investments in new generation capacity in Europe 98
(25%) second EPR reactor
Delta Netherlands
Borssele II 2018 750 2,500 Permit application phase
E.ON Sweden Oskarshamn, upgrade of unit O2
2011 n/a 500 Delayed

Sustainability in the Power Sector Update 2010 - The Netherlands
99
11 Responsible sourcing
This thematic factsheets provides an overview of the measures that the companies have taken to make their sourcing more responsible. In particular, this fact sheets looks at the supply chain responsibility approach of each of the companies, with a particular interest in the way they source their raw materials. Each company was asked to provide information about its CSR policies, its Supply Chain Responsibility approach, where they source their coal, biomass and uranium from, whether they apply sustainability criteria when they source their raw materials, and whether suppliers are audited on these criteria. The information on the efforts per company is provided in the company fact sheets in Chapters 1-7. A description of the methodology can be found in Annex 1. Table 49 provides a schematic overview on each of these points for all the companies covered in this report. It should be noted that with regards to the transparency on the origin of the used raw materials, the electricity sector as a whole is less transparent that some other sectors. While some companies indicate what countries their coal, biomass or uranium comes from, none of the companies provides full disclosure on the names of the companies or specific mines they source from. Table 49: Measures for responsible sourcing of the companies Indicator Delta Dong
Energy E.ON Eneco GDFSuez
/Electrabel Nuon RWE/Essent Vattenfall
CSR policy X X X X X X X X Supplier Code of conduct that applies to raw materials
- X X X (X) X X X
Transparency on origin coal
- X X N/A - - X -
Transparency on origin biomass
- (X) - X (X) X (X) -
Transparency on origin uranium
X N/A X N/A (X) N/A - X
Applies sourcing criteria
- X X X (X) (X) X X
Conducts audits - X X X - (X) - X Based on: company sources, news reports (…) = partially
CSR Policies All companies have some sort of CSR policy. There are of course differences in the quality of the policy, the reporting and the scope, but this research has not compared the companies on those factors. Supplier code of conduct that applies to raw materi als The majority of the companies also have either specific codes of conduct for their suppliers, or have indicated that their internal policies also apply to their suppliers. For most of the companies, such codes of conduct also apply to the suppliers of raw materials such as coal, biomass and uranium. No information was found regarding supplier codes of conduct for Delta. It should be noted that Delta did not review their company profile. It is therefore possible that this company has internal policies that are not published online.

Investments in new generation capacity in Europe 100
Transparency on origin of coal While a number of companies indicated that information about the origin of coal is considered confidential, mostly for commercial reasons, a few other companies did provide insight on where they source their coal from. These are Dong Energy, E.ON and RWE/Essent. Table 50 shows the where these companies source their coal from. Table 50: Source of coal for Dong Energy, E.ON and RWE/Essent, in % Dong Energy E.ON RWE/Essent
Germany 5 22
UK 8 10
Norway 4 1
Spain 2
Poland 1 1
Russia 37 17 37
South Africa 16 10 9
USA 11 42
Colombia 27 9 15
Australia 4 1
Indonesia 1
Other 7
Transparency on the origin of biomass Two of the eight companies provided complete information about the origin of their biomass. These are Eneco and Nuon. Eneco sources all its biomass from agricultural waste in Belgium. The company also indicated its plans to source from a furniture factory in Vietnam in the future. Nuon sources all of its biomass from wood waste in The Netherlands and Germany. Dong Energy provided some information by stating that all its biomass originates from within Europe, while RWE/Essent indicated its plans to build a factory producing biomass pellets in the future, to be used as fuel for electricity. Transparency on the origin of uranium Delta, E.ON and Vattenfall/Nuon reported on the origin of the uranium it uses in its nuclear facilities. Delta lists Australia, Canada and Kazakhstan as countries of origin. E.ON procures its uranium from Canada, Kazakhstan, Uzbekistan, Namibia, Niger, Ukraine and the USA. Vattenfall/Nuon purchases it from Australia, Namibia and Russia. Sourcing criteria Dong Energy, E.ON, Eneco, RWE/Essent, GDF Suez/Electrabel and Vattenfall all use some form of sustainability criteria when they source their raw materials. Most of these companies use the criteria incorporated in their own internal CSR policies, or in their Supplier Codes of Conduct, or refer to international norms such as the UN Global Compact.557 Nuon indicated that it was working on sustainability criteria in the context of a sector-wide initiative, without providing further details. No information about sustainability criteria were found for Delta, but it should again be noted that this company did not review their profile and might have criteria that are not made public.

Sustainability in the Power Sector Update 2010 - The Netherlands
101
Audits Dong Energy, E.ON, Eneco and Vattenfall all conduct audits at mines and plantations of the raw materials they purchase. While the specific details and approaches of these audits might differ from one company to the other, all these companies did indicate that they made use of third parties (or multiple stakeholders) to conduct the audits. Nuon indicated that it was conducting audits at places of origin but does not provide public information in order to not disrupt future common approaches. 555 As explained in the fact sheets. 556 Only the known investment figures (MW) are taken up. This means that a number of projects that are in some
stage of planning, but for which no details have been disclosed, are not taken up in this table. 557 It should be noted that the UN Global Compact has been criticized for its non-committal nature. For more
information, see www.globalcompactcritics.org.

Methodological Annex 102
12 Methodological Annex
2010 is the fourth consecutive year that SOMO has published its report on sustainability in the electricity sector. For a large part, the aim of the research has been the same throughout the years; to provide a comparative overview of the sustainability of the fuel mixes used to generate and supply electricity, and to make projections of future fuel mixes on the basis of current and announced investments in new generation capacity. The 2009 update of the report included a detailed description of the methodology for the research, and described SOMO’s position on a number of current debates that underpinned some of the methodological choices. Throughout the years, relevant public debates about sustainability in the electricity sector have developed and shifted. SOMO has made a number of changes in its methodological approach of this year’s research, in an attempt to better place these public debates in the framework of this research. This chapter describes the methodological approach taken for this research, and the first section elaborates on the methodological changes compared to the research of previous years. The next section describes the underlying considerations for SOMO’s choices on what to consider ‘renewable’ and ‘non-renewable’ fuels. The final section describes the approach to the investments in new generation capacity. These last two sections are similar to the methodological annex in last year’s report.
Changes from previous years
� Responsible sourcing This year is the first time SOMO has included a section on ‘responsible sourcing’. This section replaces the ‘Demand-side initiatives’ that was included in previous reports. The information that is included in this report relates mostly to the sustainability issues that are known to exist in the supply chains of the companies covered in this report. SOMO has structurally collected information on, and conducted an analysis of the following questions;
� Does the company have a CSR policy? � Does the company have a supplier policy or code of conduct? � Does this supplier policy or code of conduct apply to suppliers of raw materials,
such as coal, biomass and uranium? � Does the company provide information regarding the origin of raw materials,
such as coal, biomass and uranium? � Does the company apply environmental, social and human rights criteria when
sourcing raw materials, such as coal, biomass and uranium? � Are the suppliers of these raw materials audited on the basis of such criteria?
By including the responsible sourcing of energy companies, SOMO is touching upon a number of current sustainability issues that the electricity sector is faced with. Recent years have seen an increase in public attention on the greater supply chain of electricity, and several reports have been published dealing with sustainability issues around the mining and

Sustainability in the Power Sector Update 2010 - The Netherlands
103
production of coal558, biomass559 and uranium560. These issues include, among several others, the human rights abuses related to coal mining in Colombia, inadequate environmental and health and safety considerations at uranium mines in Namibia and Niger, and the destruction of rainforests to make way for palm oil plantations in Indonesia. Several electricity companies have been faced with public criticism regarding their roles in such issues, and have taken different measures in response of such criticism. By including this component, SOMO is allowing for a comparison between electricity companies on how they are addressing sustainability issues in their supply chain. � Questionnaire For the first time, SOMO has made use of a questionnaire to collect additional information regarding a number of specific issues. The entire questionnaire can be found in Annex 2. It was sent to each of the companies alongside a draft version of the company profile. Companies were given three weeks to answer the questionnaire, and in total 7 of the 8 companies provided SOMO with an answer. The questionnaire included questions on the following topics;
� The source of fuels; Companies were asked to provide information on the total amounts of coal, biomass and uranium used, and the country of origin for these raw materials.
� The sustainability criteria for sourcing fuels; Companies were asked to provide details of their codes of conduct, and the environmental, social and human rights criteria that were applied and audited at the supplier of coal, biomass and uranium.
� Electricity trading; Companies were asked to provide details about their electricity trading activities, including the share of traded electricity compared to electricity it had produced itself, and the details of the companies that electricity was traded with.
� Specific uncertainties in the company profile. The draft company profiles were sent in conjunction with the questionnaire. In cases were there were uncertainties about information included in these company profiles, concrete questions were included in the questionnaire.
� Fuel mix of supplied electricity Similar to previous years, SOMO compares the electricity company on the basis of the fuel mix that it supplies to end users. The data used for this comparison is based on the so-called ‘stroometiketten’ that all companies supplying the Dutch market are obliged to publish. This year, SOMO indicates in each of the profiles that ‘the figures might be influenced by the purchase and trade of green certificates, and do not necessarily reflect the fuel mix received by consumers’. By stating this, SOMO explicitly recognizes that the fuel mixes reported by the companies do not necessarily reflect the fuel mixes of the electricity that consumers actually receive. This is due to the fact that the fuel mix as reported by companies is based on Certificates of Origin. Certificates of Origin serve as the guarantee that electricity that is sold as being ‘green’, is actually linked to renewable production. Companies producing electricity from wind, hydro, solar and biomass receive one Certificate of Origin per MWh of produced

Methodological Annex 104
electricity. They can sell these certificates on international markets, independent from the generated electricity for which the certificate was granted. In effect, other companies can purchase Certificates of Origin and use these to attach a ‘green’ label to the electricity it supplies to consumers, regardless of the actual fuel type used. A number of flaws in this system have led to criticism from various groups who claimed that it amounted to a misleading of consumers. The Dutch consumer organisation Consumentenbond argues that an electricity company can easily increase its share of green electricity, without having to invest in new renewable capacity, as Certificates of Origin can be purchased very cheaply.561 The system is also prone to ‘double counting’ of green electricity, as there are no guarantees that electricity supplied without the Certificate of Origin can still be presented as ‘green’ (eg. The electricity from Norwegian hydro plants for which the Certificate of Origin has been sold on). Therefore, it is argued that consumers purchasing green electricity do not necessarily contribute to the development of more renewable production capacity. These factors have lead news reports to call green electricity a ‘scam’, and the Consumentenbond to publicly criticize the system, calling it nothing more than a matter of ‘image’. While SOMO recognizes these concerns with the system of Certificates of Origin, it still bases its comparisons on the figures in the ‘stroometiketten’, as these are the only supply figures that are publicly available. SOMO believes that due to these facts, the figures should be interpreted with caution. � Biomass Last year’s methodology chapter included a description of SOMO’s position regarding co-firing of biomass in coal plants. As the biomass co-firing capacity of such a plant can also be used to fire coal, and often is in practice, it can not be considered as renewable capacity. New investments in coal plants with biomass co-firing capacities were therefore considered to be full investments in non-renewable capacity. For the large part, this position remains unchanged, and this year’s methodology regarding the categorization of biomass capacity and new investments is similar to previous years. However, there are a few points worth mentioning here; First of all, SOMO has collected all the available information regarding the electricity that was actually generated, in addition to the installed capacity figures. The figures for generated electricity per fuel type provide a clear image of how much electricity was actually generated using biomass, and how much of the co-firing capacity was put to use. By using these figures in combination with the installed capacity figures, one can identify a company’s strategies regarding the actual use of renewable co-firing capacity. Secondly, SOMO has attempted to gather figures regarding the amounts (in kg) of biomass used by each of the companies. For companies that have co-firing capacity, this also gives another clue regarding the actual use of biomass in such plants. Obviously, the amount of electricity generated with biomass is also dependent on the efficiency of biomass plants. Therefore, the amounts of biomass in kilograms cannot be used to calculate how much co-firing capacity has been used in practice. It does, however, provide another clue on how much a company makes use of biomass facilities.

Sustainability in the Power Sector Update 2010 - The Netherlands
105
Finally, it should be noted that SOMO recognizes that stand alone biomass plants might be less efficient than co-firing facilities and that it is possible that they emit more SOx and other gases due to a lack of flue gas treatment. In this context, it is important to point out that the distinction made by SOMO is based on whether the fuel type is ‘renewable’ or ‘non-renewable’, as explained in the next section. SOMO does not categorize on ‘sustainable’ or ‘non-sustainable, or on the basis of the amounts of greenhouse gases emitted. With this methodological approach, biomass is considered a renewable fuel type, as also explained in the next section, whereas coal is not. New investments in co-firing facilities of new coal plants cannot be categorized as renewable, because that capacity might still be used for coal. � Natural gas In comparison to previous years, this year’s report has tried to make more clear and structural distinctions between different types of natural gas fired capacity. As explained in the next section, there is a lot of variety in terms of efficiency and emissions between traditional natural gas plants, combined cycle gas turbines (CCGTs) and combined heat and power (CHP) plants. In fact, electricity companies can receive green certificates for the latter, on the basis of the amount of heat that is produced. Where the information was known, the type of natural gas capacity is indicated. As not all companies provide a clear breakdown, the different types are still grouped in one ‘natural gas’ category, which as a fossil fuel is considered non-renewable. � Hydro power This year’s research has also tried to systematically collect more detailed information about the types of hydro capacity used. As explained in the next section, a clear distinction can be made between large-scale hydro (>10 MW) and small-scale hydro (<10 MW). When available, these more specified figures are provided in the company profiles. It should be noted that not all companies make this distinction, while others use different definitions. For example, some companies consider plants with less than 50MW capacity to be small scale. ‘Renewable’ vs. ‘Non-renewable’ fuels and sustainab ility considerations This section describes in more detail the theoretical underpinning of the ‘renewable’ and ‘non-renewable’ categories used by SOMO. In the breakdowns of companies’ fuel mixes for electricity generation and supply and in the thematic fact sheets on companies’ investment in various electricity generation technologies, SOMO makes a distinction between fuels and technologies that are considered ‘renewable’ and those that are ‘non-renewable’. In the public perception, corporate communications, and even in scientific literature, the boundaries between these terms and what should be classified as ‘renewable’ is not always clear. For purposes of manageability and facilitating comparison, but with the acknowledgement that it could be viewed as a simplification of a very complex issue, this study makes a distinction between renewable and non-renewable fuel sources; however, as outlined below, some fuels and technologies that are considered as renewable are not necessarily sustainable. In the interests of transparency and clarity, SOMO’s rationale for making the renewable/non-renewable distinction is outlined below for a range of different fuels and technologies. These considerations rely heavily on a recent study by Wilde-Ramsing that aimed to ‘define sustainable electricity provision’.562 Table 51
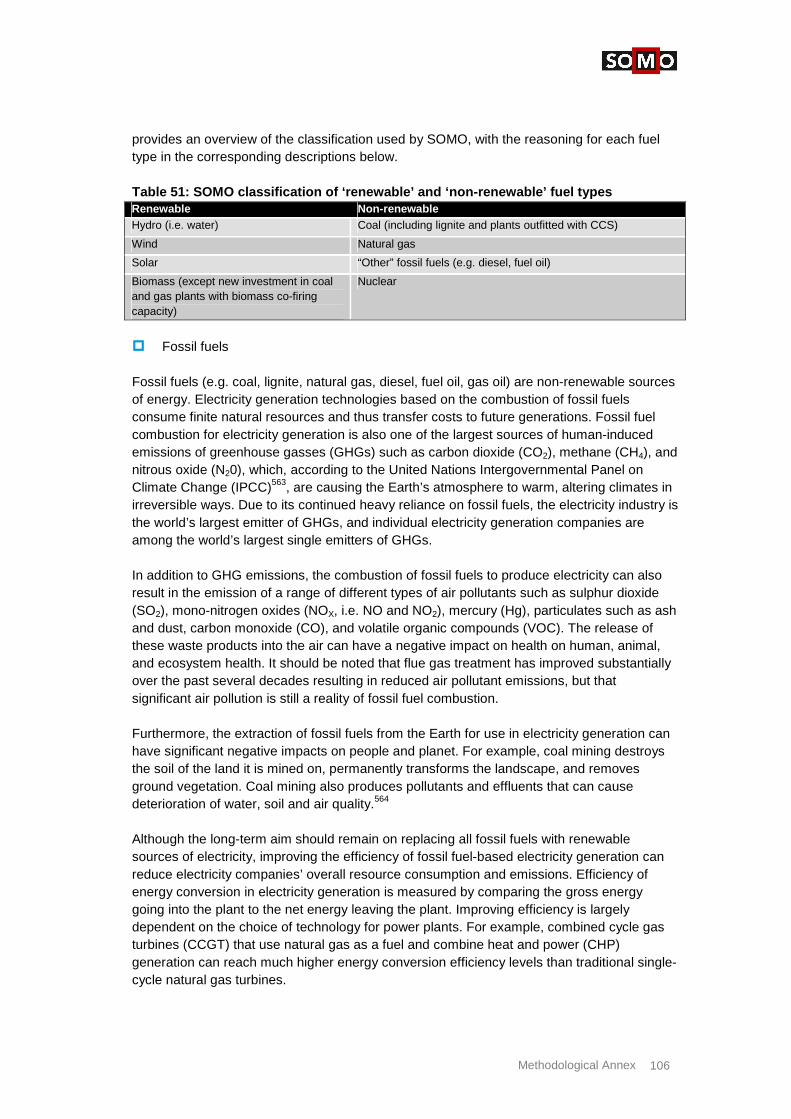
Methodological Annex 106
provides an overview of the classification used by SOMO, with the reasoning for each fuel type in the corresponding descriptions below. Table 51: SOMO classification of ‘renewable’ and ‘n on-renewable’ fuel types Renewable Non-renewable Hydro (i.e. water) Coal (including lignite and plants outfitted with CCS)
Wind Natural gas
Solar “Other” fossil fuels (e.g. diesel, fuel oil)
Biomass (except new investment in coal and gas plants with biomass co-firing capacity)
Nuclear
� Fossil fuels Fossil fuels (e.g. coal, lignite, natural gas, diesel, fuel oil, gas oil) are non-renewable sources of energy. Electricity generation technologies based on the combustion of fossil fuels consume finite natural resources and thus transfer costs to future generations. Fossil fuel combustion for electricity generation is also one of the largest sources of human-induced emissions of greenhouse gasses (GHGs) such as carbon dioxide (CO2), methane (CH4), and nitrous oxide (N20), which, according to the United Nations Intergovernmental Panel on Climate Change (IPCC)563, are causing the Earth’s atmosphere to warm, altering climates in irreversible ways. Due to its continued heavy reliance on fossil fuels, the electricity industry is the world’s largest emitter of GHGs, and individual electricity generation companies are among the world’s largest single emitters of GHGs. In addition to GHG emissions, the combustion of fossil fuels to produce electricity can also result in the emission of a range of different types of air pollutants such as sulphur dioxide (SO2), mono-nitrogen oxides (NOX, i.e. NO and NO2), mercury (Hg), particulates such as ash and dust, carbon monoxide (CO), and volatile organic compounds (VOC). The release of these waste products into the air can have a negative impact on health on human, animal, and ecosystem health. It should be noted that flue gas treatment has improved substantially over the past several decades resulting in reduced air pollutant emissions, but that significant air pollution is still a reality of fossil fuel combustion. Furthermore, the extraction of fossil fuels from the Earth for use in electricity generation can have significant negative impacts on people and planet. For example, coal mining destroys the soil of the land it is mined on, permanently transforms the landscape, and removes ground vegetation. Coal mining also produces pollutants and effluents that can cause deterioration of water, soil and air quality.564 Although the long-term aim should remain on replacing all fossil fuels with renewable sources of electricity, improving the efficiency of fossil fuel-based electricity generation can reduce electricity companies’ overall resource consumption and emissions. Efficiency of energy conversion in electricity generation is measured by comparing the gross energy going into the plant to the net energy leaving the plant. Improving efficiency is largely dependent on the choice of technology for power plants. For example, combined cycle gas turbines (CCGT) that use natural gas as a fuel and combine heat and power (CHP) generation can reach much higher energy conversion efficiency levels than traditional single-cycle natural gas turbines.

Sustainability in the Power Sector Update 2010 - The Netherlands
107
� Nuclear power Nuclear power is generated from uranium, which, like fossil fuels, is not a renewable resource. Electricity generation from nuclear fuel produces various types of solid radioactive waste (high, medium, and low-level radioactivity565). Because of the lack of a technological solution for permanently treating nuclear waste to rid it of dangerous radioactivity, generation of electricity from nuclear fuel represents a transfer of costs and environmental liability to future generations. In addition, despite improvements in nuclear technology, the possibility of human error in using nuclear technology still brings with it the risk of catastrophic impacts on human health and the environment if a reactor melts down, as well as the risk the proliferation of nuclear technology that could be used to produce nuclear weapons. Furthermore, although proponents of nuclear power emphasise that the generation of electricity from nuclear fuel produces no CO2 emissions, what they often fail to recognize (or admit) is that the nuclear fuel production chain does emit CO2 (as well as the supply chains of other electricity generation technologies) caused by the mining of uranium and the industrial processes needed to enrich uranium into useable fuel. In addition, uranium mining is taking place increasingly in African countries such as Niger, Namibia, and Malawi where health and environmental protection is at best weakly-enforced and at worst non-existent, and where the negative impact of exposure to low level radiation among uranium mining workers and communities has been documented.566 For these reasons, SOMO considers nuclear power to be non-renewable. � Biomass Biomass, organic material from living or recently living organisms such as plants and trees, can be combusted to produce electricity. Biomass absorbs CO2 from the atmosphere during its lifetime, then releases this CO2 back into the atmosphere when it is combusted or dies and decomposes, thereby making the use of biomass for electricity less carbon-intensive . Because plants and trees, which are the primary sources of biomass, are generally assumed to be a renewable resource, biomass is also generally considered to be a renewable source of fuel for electricity generation. For these reasons, SOMO will consider investment in and construction of biomass-only power plants to be renewable. However, it should be noted that some biomass-only plants (such as many of those in operation in the Netherlands) have low efficiency levels and have limited flue gas treatment capabilities to reduce the emission of airborne pollutants such as SO2 and NOX. Furthermore, the use of biomass to generate electricity in general raises further questions. For example, the planting and harvesting of biomass (often in developing countries) to be used for electricity generation can have environmental and social impacts that reduce or nullify the positive CO2 balance. Some of the factors that determine if biomass for electricity is truly sustainable include the carbon balance for the entire value chain and lifecycle of the biomass (e.g. transport, emissions due to land use change567), loss of biodiversity due to changes in land use, decent labour standards on plantations and in processing chains, land/food rights of people confronted with land use shifts., etc. If electricity generation from biomass is to truly be sustainable, the entire supply chain of biomass production must also conform to sustainable development standards. Co-firing of biomass in existing coal and natural gas-fired power plants is becoming increasingly popular among electricity generation companies seeking to reduce their CO2 emissions. Co-firing entails combusting biomass along with a fossil fuel, and current technologies allow for co-firing of up to 50% of a coal power plant’s capacity with biomass.
Methodological Annex 108
However, while the potential for co-firing a large amount of biomass in these types of power plants is high, companies do not necessarily have to co-fire that much biomass as the plants are still able to run at full capacity on 100% fossil fuels. In fact, many power plants with a high theoretical capacity for co-firing biomass in practice actually only co-fire a very small percentage of biomass (generally around 10-20%, but sometimes as low as 1-2%), continuing instead with large-scale combustion of fossil fuels. Furthermore, the potential to co-fire biomass can be used by electricity generators to justify constructing new fossil fuel plants or continuing to operate existing plants when, as mentioned above, the amount of biomass actually co-fired remains relatively low, with the end result being that an energy system becomes even more dependent on coal. For these reasons, SOMO will classify any new investment in co-fired power plants under the categories ‘coal’ or ‘natural gas’ (depending on its primary fuel), although the co-firing potential will be noted in the company fact sheet investment tables as ‘Coal and biomass’ or ‘Gas and biomass’; for the calculations in the thematic fact sheets the full investment amount and capacity of the plant will be classified as investment in either coal or natural gas (depending on the type of plant at which co-firing is taking place). The fuel mixes of electricity generated and supplied give a better indication of how much biomass-based electricity is actually being generated and supplied, so these figures will include biomass as ‘renewable’, with a note to readers that this should be viewed cautiously for the above mentioned sustainability reasons (i.e. lack of standardised sustainability criteria and verification, and contribution to continued use of fossil fuel (coal or gas) plants. � Carbon capture and storage Carbon capture and storage (CCS) is one approach to mitigating the global warming effects of fossil fuel-based electricity generation by capturing CO2 as it is emitted at its point source before it enters the atmosphere and storing it underground in (presumably) stable geological formations or underwater. It is seen by some as a short-term solution to avoid the worst impacts of global warming while allowing us to continue our use of fossil fuels. Although some scientists theorise that CCS could reduce the CO2 emissions to the atmosphere of a fossil fuel-based power plant by approximately 80-90%568, investment in this technology will be classified as non-renewable because its primary application will be in facilities that use non-renewable fossil fuels (especially coal) to generate electricity. Furthermore, SOMO considers investment in this technology to be unsustainable for a number of reasons: 1. Even with the best currently available technologies, CCS consumes a huge amount of
extra energy and would increase the fuel needs of a coal-fired power plant by 25-40%.569
2. Investment in CCS does nothing to further the development of truly renewable and sustainable energy technologies or energy efficiency that are needed for “real” sustainability.
3. Currently, CCS technology has not been completely proven safe. Deep ocean storage could contribute to ocean acidification, long-term predictions about the security of underground storage are difficult to make, and there are no guarantees that “stored” CO2 could not leak out back into the atmosphere. The use of CCS is thus inconsistent with the internationally recognised precautionary principle.
For these reasons, SOMO will classify investments in new capacity that are accompanied by CCS technology as investments in coal or natural gas depending the type of plant it is applied to.

Sustainability in the Power Sector Update 2010 - The Netherlands
109
� Hydropower Hydropower is perhaps the most prominent case of a technology that can be considered renewable but not necessarily sustainable. Although water is a renewable source of energy, large-scale (>10MW) hydro is generally not considered sustainable because of the significant negative environmental and social impacts of large dams and reservoirs. Large hydro facilities using dams and reservoirs have a large terrestrial footprint which often requires displacement of human populations. Large hydroelectricity plants can also impact water-related sustainability issues such as water quality (temperature changes, reduced oxygenation, increased potential for algal bloom), sediment transport and erosion, changes to river hydrology and downstream flows, passage of fish species, and pest species (flora and fauna) in reservoirs.570 As a result, large hydroelectric dams present an acute threat to biodiversity given that they often require the flooding of large areas of land. Companies that build large dams sometimes compensate for the loss of biodiversity in the flooded area by purchasing, protecting or creating replacement habitats. However, the replacement habitats may not have the same biodiversity value. Electricity infrastructure that alters natural habitats can alter the migration and breeding habits of animals. Furthermore, although the actual process of electricity generation from water does not emit CO2, hydroelectricity can be a significant source of GHG emissions, especially when it involves large reservoirs in tropical climates. CO2 is released by decomposing vegetation and soils trapped under water when the reservoir was first filled. It should be noted that reservoirs also absorb atmospheric CO2 through photosynthesis by plankton and aquatic plants and that this uptake can occasionally exceed CO2 emissions. However, recent studies suggest that reservoirs also release other GHGs, such as methane (CH4) and nitrous oxide (N2O), which are much more potent than CO2.
571 As a result, the World Commission on Dams asserts that “Where other options offer better solutions, they should be favoured over large dams”.572 Small scale run-of-the-river and mini-hydro projects generally have less impact on aquatic ecosystems and resources than larger projects requiring dams and reservoirs. Small-scale hydro, while also not necessarily free of negative impacts on biodiversity, is generally considered more sustainable. The International Hydropower Association emphasises that small scale (<10MW) run-of-the-river and mini-hydro (<1MW) projects generally have less impact on aquatic ecosystems and resources than larger projects requiring dams and reservoirs.573 However, while it has generally been assumed that small-scale run-of-river projects (which usually have only very small reservoirs) do not cause significant GHG emissions, a 2008 study by the Swiss Federal Institute of Aquatic Science and Technology revealed that a run-of-river facility was emitting significant amounts of methane. Switzerland is a temperate climate; methane emissions from run-of-river reservoirs in the tropics are likely to be even higher.574 SOMO considers hydro to be a renewable source of electricity, but emphasises that even for small-scale hydro to be considered sustainable it must be undertaken in combination with a proper needs assessment, stakeholder consultations, and a thorough evaluation of risks and alternatives. Readers are urged to view hydroelectric facilities, particularly those with more than 10MW of capacity, with a critical eye. � Wind and solar Wind and solar energy are renewable sources of electricity due to their limitless and constantly renewing supply. However, it should be noted that some of the above-mentioned

Methodological Annex 110
sustainability criteria should also be applied to these technologies and their entire supply and production chains. For example, wind farms can have an undesirable impact on the visual landscape and may impact the migration patterns of flocks of migratory birds. The production of photovoltaic solar panels emits CO2 and involves the use of hazardous chemicals that can be dangerous for human health and the environment. That said, because of their limitless supply and relatively low levels of emissions, SOMO considers wind and solar to be the most sustainable mainstream electricity generation technologies on the market, but emphasises that, as with biomass, if electricity generation from solar and wind is to truly be sustainable, the entire supply chain of solar panels and windmills must also conform to sustainable development standards.
Investments vs. investment plans
In each company fact sheet and in the thematic fact sheet on investments, a distinction is made between companies’ current investments in new capacity and companies’ announced plans for investment in new capacity in Europe. This distinction is based on those investments in projects that are already under construction (and for which the investments are definite), and announced plans for investments in projects that are in various stages of planning (and which could still be cancelled or modified by the company). An additional note should be made about the companies’ investments that have become operational in late 2009 or early 2010 or since the company’s last reporting upon which the figures for fuel mixes of installed capacity and electricity generated are based. Such investments are not included in the installed capacity and electricity generated figures, if they are also not reported by the company itself. Instead they are included in the investment tables and its status is noted as ‘In operation’. Finally, it should be noted that several companies have publicly stated how much money they plan to invest in future capacity, without specifying the projects for which this money is reserved. With these figures, there is a high risk of ‘double counting’, as some of the projects for which this money is reserved have been announced, while others have not. It is often not specifically mentioned whether these projects are part of the overall announced investment budget or not. For this reason, overall investment figures that are not assigned to particular investment projects are not taken up in the tables for investment plans, and are not taken up in the thematic fact sheets. However, they are mentioned throughout the text of the company fact sheets. 558 Greenpeace Nederland, “De Wereld achter de Kolenstroom”, March 2008,
http://www.greenpeace.org/raw/content/nederland-old/reports/de-wereld-achter-kolenstroom.pdf (28-06-10); Danwatch, “The Curse of Coal”, May 2010, http://www.danwatch.dk/index.php?option=com_content&view=article&id=239&lang=en (19-07-10).
559 E.g. Friends of the Earth UK, “Losing Ground; The human rights impacts of oil palm plantation expansion in Indonesia”, February 2008, http://www.foe.co.uk/resource/reports/losingground.pdf (28-06-10).
560 LaRRI, “Uranium mining in Namibia; The mystery behind ‘low level radiation”, February 2009, http://somo.nl/publications-nl/Publication_3061-nl (28-06-10). Greenpeace International, “Left in the dust, AREVA’s radioactive legacy in the desert towns of Niger”, April 2010, http://www.greenpeace.org/international/Global/international/publications/nuclear/2010/AREVA_Niger_report.pdf (28-06-2010)
561 NOS Radio 1, “Consumentenbond: Term Groene Stroom is misleidend”, radio interview, 23-09-08, http://www.radio1.nl/contents/1575-consumentenbond-term-groene-stroom-is-misleidend (17-08-10).

Sustainability in the Power Sector Update 2010 - The Netherlands
111
562 J. Wilde-Ramsing, Quality Kilowatts: A normative-empirical approach to the challenge of defining and providing
sustainable electricity in developing countries (Amsterdam and Oslo: SOMO and ProSus/SINTEF, June 2009) http://somo.nl/publications-nl/Publication_3170-nl/view (4 September 2009).
563 Intergovernmental Panel on Climate Change (IPCC), “Climate Change 2007: Synthesis Report”, (Valencia, Spain, November 2007), <http://www.ipcc.ch/ipccreports/ar4-syr.htm> (26 May 09).
564 V. Fthenakis and H.C. Kim, “Land use and electricity generation: A life-cycle analysis”, Renewable and Sustainable Energy Reviews, 2008, in press.
565 For more information on the classification of radioactive waste and definitions of the various levels of radioactivity, see United Nations International Atomic Energy Agency, “Classification of Radioactive Waste: A Safety Guide”, 1994, Vienna, http://www-pub.iaea.org/MTCD/publications/PDF/Pub950e_web.pdf, (7 April 2007).
566 H. Shinondola-Mote, “Uranium Mining in Namibia: A Blessing or a Curse?” Labour Resource and Research Institute (LaRRI), Windhoek, Namibia, 2008, http://somo.nl/publications-nl/Publication_3004-nl/view, (5 June 2009).
567 See, for example, B. Wicke et al. 2008. “Different palm oil production systems for energy purposes and their greenhouse gas implications”, Biomass and Bioenergy 32(12): 1322-1337.
568 Intergovernmental Panel on Climate Change, “IPCC special report on Carbon Dioxide Capture and Storage”. Cambridge University Press, Cambridge and New York, 2005, <www.ipcc.ch> (5 July 2009).
569 Ibid. 570 International Hydropower Association, Sustainability Guidelines, 2004,
http://www.hydropower.org/downloads/IHA%20Sustainability%20Guidelines_Feb04.pdf (9 June 2009). 571 International Rivers, Dirty Hydro: Dams and Greenhouse Gas Emissions, 2008,
http://internationalrivers.org/files/dirtyhydro_final_lorez.pdf (16 June 2009). 572 World Commission on Dams, Dams & Development: A New Framework for Decision-Making, 2008, London and
Sterling, VA: Earthscan Publications Ltd. 573 International Hydropower Association, Sustainability Guidelines, 2004,
http://www.hydropower.org/downloads/IHA%20Sustainability%20Guidelines_Feb04.pdf (9 June 2009). 574 Eawag, Annual Report 2007, Swiss Federal Institute of Aquatic Science and Technology, Dübendorf,
Switzerland, 2008, http://www.eawag.ch/services/publikationen/jahresbericht/eawag-jb_07e.pdf (10 May 2009).

Questionnaire for SOMO’s research on sustainability in the electricity sector 112
Questionnaire for SOMO’s research on sustainability in the electricity sector
This year, SOMO is including a questionnaire as part of its research project into the sustainability of European electricity companies. SOMO is hoping to gather additional information by this means, which would allow for a more comprehensive comparison between the different companies covered in SOMO’s report. The questions in this questionnaire touch upon current sustainability issues that are relevant for companies that generate, trade and supply electricity. This questionnaire is structured in four parts; The first part deals with the source of the raw materials that are used as fuel in power plants. Recent years have seen an increase in public attention on the greater supply chain of electricity, and several reports have been published dealing with sustainability issues around the mining and production of coal575, biomass576 and uranium577. The second part deals with the Supply Chain Responsibility of electricity companies, with a specific focus on sustainability criteria applied to the sourcing of the raw materials used as fuel for electricity. More specifically, SOMO is asking electricity companies whether and how they include social, economic and environmental considerations when purchasing fuels such as coal, biomass and uranium. The third part of the questionnaire deals with the trading of electricity on the spot or wholesale market. SOMO recognizes that this is an important part of the business model of several of the companies it covers, and hopes to gain better insight into this part of the supply chain and to what extent sustainability plays an (integral) part in the daily trading activities. It is important to note that both SOMO and Greenpeace (the commissioner of this research) recognize the commercial sensitivity of some of the information they are asking. If a responding company desires so, SOMO and Greenpeace are willing to keep this information confidential. The final part of the questionnaire contains specific questions that arise from the desk research of SOMO and refer to the draft company fact sheet that is sent by email.
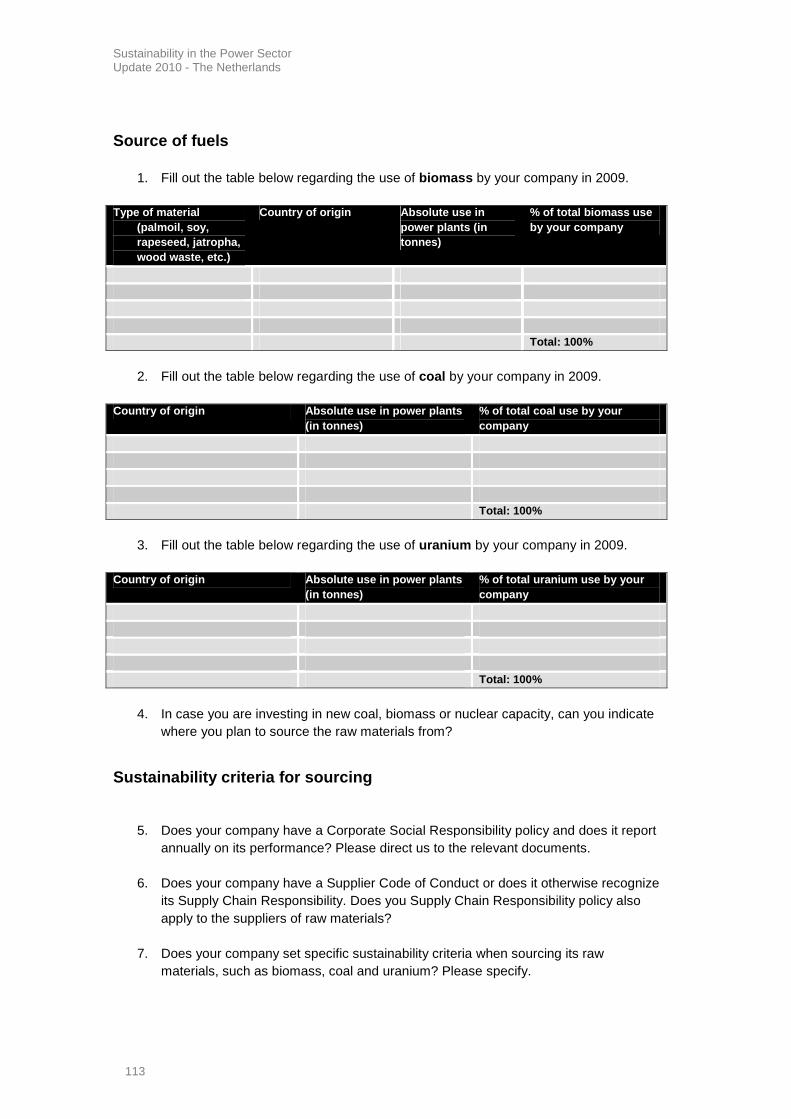
Sustainability in the Power Sector Update 2010 - The Netherlands
113
Source of fuels
1. Fill out the table below regarding the use of biomass by your company in 2009.
Type of material (palmoil, soy, rapeseed, jatropha, wood waste, etc.)
Country of origin Absolute use in power plants (in tonnes)
% of total biomass use by your company
Total: 100%
2. Fill out the table below regarding the use of coal by your company in 2009.
Country of origin Absolute use in power plants (in tonnes)
% of total coal use by your company
Total: 100%
3. Fill out the table below regarding the use of uranium by your company in 2009.
Country of origin Absolute use in power plants (in tonnes)
% of total uranium use by your company
Total: 100%
4. In case you are investing in new coal, biomass or nuclear capacity, can you indicate
where you plan to source the raw materials from?
Sustainability criteria for sourcing
5. Does your company have a Corporate Social Responsibility policy and does it report
annually on its performance? Please direct us to the relevant documents. 6. Does your company have a Supplier Code of Conduct or does it otherwise recognize
its Supply Chain Responsibility. Does you Supply Chain Responsibility policy also apply to the suppliers of raw materials?
7. Does your company set specific sustainability criteria when sourcing its raw
materials, such as biomass, coal and uranium? Please specify.

Questionnaire for SOMO’s research on sustainability in the electricity sector 114
8. How does your company monitor compliance with these sustainability criteria or Supplier Code of Conduct? Please specifiy.
9. In case you are investing in new coal, biomass or nuclear capacity, will you apply
sustainability criteria when sourcing the raw materials for these new power plants?
Electricity trading on the wholesale market
10. What percentage of the electricity your company supplies to consumers is generated by your company? What percentage is purchased on the wholesale or spot markets?
11. Specify the three most important companies that you buy electricity from on the
wholesale or spot markets. Name of the supplier GWh purchased in 2009 % of purchased
electricity % of electricity supplied to consumers
12. Specify the fuel mix of the electricity purchased on wholesale or spot markets.
Fuel type Name of the largest supplier % of purchased electricity
Coal
Natural Gas
Oil
Nuclear Other Non-renewable Wind Hydro Large scale (>10MW) Small scale (<10MW) Biomass Stand alone Co-fired Other renewable Total 575 Greenpeace Nederland, “De Wereld achter de Kolenstroom”, 2009,
http://www.greenpeace.org/raw/content/nederland-old/reports/de-wereld-achter-kolenstroom.pdf (28-06-10). 576 E.g. Friends of the Earth UK, “Losing Ground; The human rights impacts of oil palm plantation expansion in
Indonesia”, February 2008, http://www.foe.co.uk/resource/reports/losingground.pdf (28-06-10). 577 LaRRI, “Uranium mining in Namibia; The mystery behind ‘low level radiation”, February 2009,
http://somo.nl/publications-nl/Publication_3061-nl (28-06-10).