Surveillance of artemisinin and partner drug efficacy in ...
142
Aus der Medizinischen Universitätsklinik und Poliklinik Tübingen Abteilung VII, Tropenmedizin Schwerpunkt: Institut für Tropenmedizin, Reisemedizin, Humanparasitologie Surveillance of artemisinin and partner drug efficacy in uncomplicated Plasmodium falciparum malaria in Coastal Kenya Inaugural-Dissertation zur Erlangung des Doktorgrades der Medizin der Medizinischen Fakultät der Eberhard Karls Universität zu Tübingen vorgelegt von Marschallek, Maria Rebekka 2017
-
Upload
khangminh22 -
Category
Documents
-
view
2 -
download
0
Transcript of Surveillance of artemisinin and partner drug efficacy in ...

Aus der Medizinischen Universitätsklinik und Poliklinik Tübingen
Abteilung VII, Tropenmedizin Schwerpunkt: Institut für Tropenmedizin, Reisemedizin,
Humanparasitologie
Surveillance of artemisinin and partner drug efficacy in uncomplicated Plasmodium falciparum malaria
in Coastal Kenya
Inaugural-Dissertation zur Erlangung des Doktorgrades
der Medizin
der Medizinischen Fakultät der Eberhard Karls Universität
zu Tübingen
vorgelegt von
Marschallek, Maria Rebekka
2017
Dekan: Professor Dr. I. B. Autenrieth
1. Berichterstatter: Professor Dr. S. Borrmann
2. Berichterstatter/in: Professor Dr. M. Willmann
Tag der Disputation: 14.07.2017

Village grown large
I return to the womb.
Smell of fish and sweat of ages
Stored in a bundle
Of palm leaves.
Where bark canoes used to dry
With salt on their spines
Fisherman patching nets
At edge of sea.
Shark spread on table
Under a mango tree–
Nearby heaps of cassava.
Maize and banana was market.
Sand and mosquitoes.
From: “Mombasa” by Amin Kassam
For Kenya, a country that became my second home
1
Table of contents
List of abbreviations A – M ............................................................................ 3
List of abbreviations N – Z ............................................................................. 4
List of figures ..................................................................................................... 5
1. Introduction ................................................................................................. 9
1.1 The burden of malaria and (the burden of) its treatment .................. 9
1.2 Aims of the work presented ................................................................. 11
2. Background ............................................................................................... 12
2.1 Evolution and development of Plasmodium into a human
pathogen and the origin and spread of malaria................................ 12
2.2 Plasmodium and its life cycle .............................................................. 14
2.2.1 The life cycle of Plasmodium falciparum ............................... 14
2.3 Clinical features of malaria .................................................................. 16
2.4 Malaria control strategies ..................................................................... 17
2.5 Antimalarial drugs ................................................................................. 18
2.5.1 Artemisinins ................................................................................ 19
2.5.2 Lumefantrine .............................................................................. 21
2.5.3 Piperaquine ................................................................................ 22
3. Antimalarial drug tolerance and resistance ...................................... 23
3.1 Monitoring drug efficacy ....................................................................... 26
3.1.1 Drug susceptibility in vivo ......................................................... 26
3.1.2 Drug susceptibility ex vivo / in vitro ........................................ 28
4. Material and Methods .............................................................................. 32
4.1 Material ................................................................................................... 32
4.2 Methods .................................................................................................. 34
4.2.1 Study site .................................................................................... 34
4.2.2 Study design .............................................................................. 36
4.2.3 Determination of parasite density in the field ........................ 36
4.2.4 Determination of parasite density in the laboratory ............. 37
4.2.5 Preparation of antimalarial drugs ............................................ 37
4.2.6 Handling of samples in the laboratory ................................... 38
4.2.7 Drug sensitivity testing ex vivo via HRP2 ELISA.................. 40

2
4.2.8 Genotyping of recurrence samples to distinguish between
recrudescence and reinfection ................................................ 44
4.2.9 Statistical analysis ..................................................................... 44
5. Results ........................................................................................................ 46
5.1 Study cohort ........................................................................................... 46
5.1.1 Clinical treatment responses and analysis ............................ 46
5.1.2 Recurrent parasitaemia ............................................................ 56
5.1.3 Ex vivo drug responses and analysis ..................................... 57
5.2 Potential confounding variables on the ex vivo analysis ................ 62
5.2.1 Drug working solutions ............................................................. 63
5.2.2 Drug sensitivity over time of drug storage ............................. 70
5.2.3 Corrected analysis by accounting for the effect of drug
batches........................................................................................ 75
5.3 Drug sensitivity in recurrent parasitaemia samples ......................... 77
6. Discussion ................................................................................................. 80
6.1 Artemisinin drug susceptibility in vivo ................................................ 80
6.2 Drug susceptibility testing ex vivo ...................................................... 86
6.3 Clinical implications and the need for further drug surveillance .... 94
7. Summary ..................................................................................................... 98
7.1 English .................................................................................................... 98
7.2 German ................................................................................................. 100
8. References ............................................................................................... 102
9. Ehrenerklärung ....................................................................................... 121
10. Danksagung ............................................................................................. 122
11. Appendices 1 – 4 .................................................................................... 123

3
List of abbreviations A – M
_rec indicates the samples of isolates of recurrent
parasitaemia
µg Mikrogramm
µl Mikrolitre
ACT Artemisnin-based combination therapy
AL Artemether-lumefantrine
AS Artesunate
BSA Bovine albumine serum
CATMAP Confirmation of Artemisinin Tolerance in Malaria
Parasites Trial
CCM Complete culture medium
CI Confidence interval
CMM Cell medium mixture
DDT Dichlordiphenyltrichlorethan
DHA Dihydroartemisinin
dhfr Dihydrofolate reductase
dhps Dihydroptearate synthase
DNA Desoxyribonucleic acid
ELISA Enzyme-linked immunosorbent assay
et al. et alii / et aliae
etc. et cetera
glurp Glutatmate-rich protein
HEPES 4-(2-hydroxyethyl)-1-piperazineethanesulfonic acid
HRP Horseradish peroxidase
hr(s) Hour(s)
HRP2 Histidine-rich protein 2
IC50 Inhibitory concentration 50 %
KEMRI Kenya Medical Research Institute
log logarithm
LUM Lumefantrine
M Molar
MFQ Mefloquine
ml Milliliter
mM Mikromolar
msp 1 / 2 Merozoite surface protein 1 / 2
4
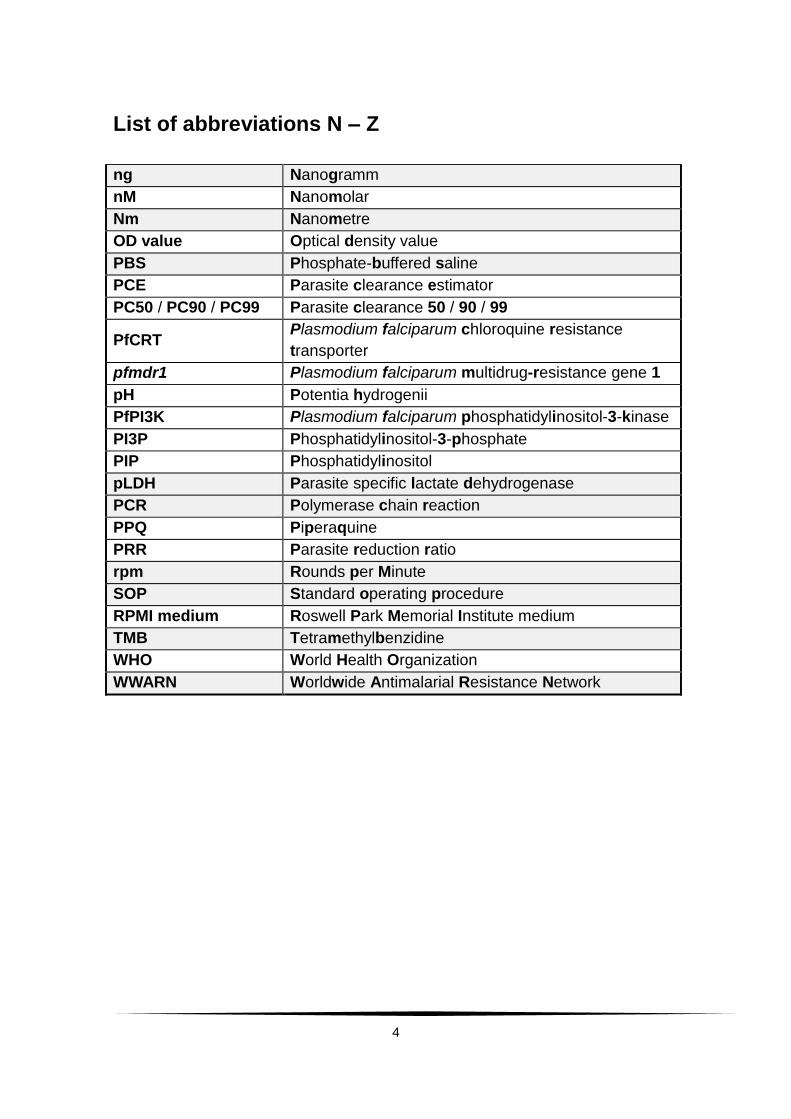
List of abbreviations N – Z
ng Nanogramm
nM Nanomolar
Nm Nanometre
OD value Optical density value
PBS Phosphate-buffered saline
PCE Parasite clearance estimator
PC50 / PC90 / PC99 Parasite clearance 50 / 90 / 99
PfCRT Plasmodium falciparum chloroquine resistance
transporter
pfmdr1 Plasmodium falciparum multidrug-resistance gene 1
pH Potentia hydrogenii
PfPI3K Plasmodium falciparum phosphatidylinositol-3-kinase
PI3P Phosphatidylinositol-3-phosphate
PIP Phosphatidylinositol
pLDH Parasite specific lactate dehydrogenase
PCR Polymerase chain reaction
PPQ Piperaquine
PRR Parasite reduction ratio
rpm Rounds per Minute
SOP Standard operating procedure
RPMI medium Roswell Park Memorial Institute medium
TMB Tetramethylbenzidine
WHO World Health Organization
WWARN Worldwide Antimalarial Resistance Network
5
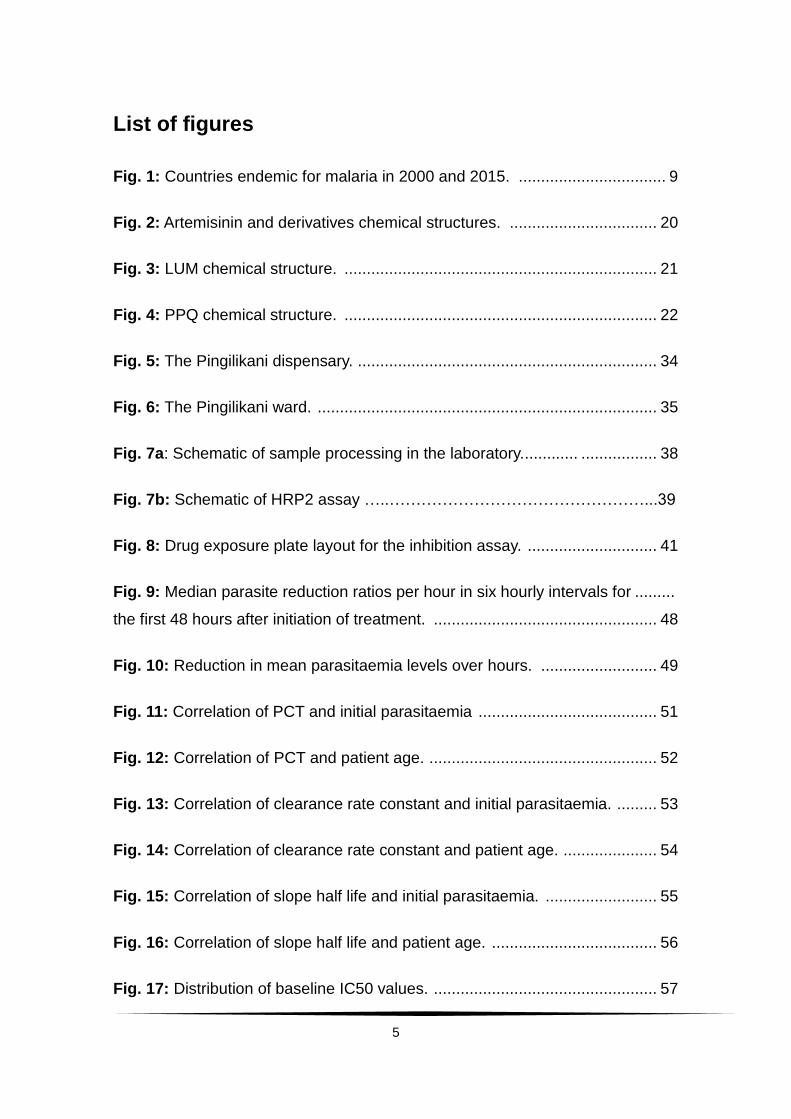
List of figures
Fig. 1: Countries endemic for malaria in 2000 and 2015. ................................. 9
Fig. 2: Artemisinin and derivatives chemical structures. ................................. 20
Fig. 3: LUM chemical structure. ...................................................................... 21
Fig. 4: PPQ chemical structure. ...................................................................... 22
Fig. 5: The Pingilikani dispensary. ................................................................... 34
Fig. 6: The Pingilikani ward. ............................................................................ 35
Fig. 7a: Schematic of sample processing in the laboratory............. ................. 38
Fig. 7b: Schematic of HRP2 assay …..…………………………………………...39
Fig. 8: Drug exposure plate layout for the inhibition assay. ............................. 41
Fig. 9: Median parasite reduction ratios per hour in six hourly intervals for .........
the first 48 hours after initiation of treatment. .................................................. 48
Fig. 10: Reduction in mean parasitaemia levels over hours. .......................... 49
Fig. 11: Correlation of PCT and initial parasitaemia ........................................ 51
Fig. 12: Correlation of PCT and patient age. ................................................... 52
Fig. 13: Correlation of clearance rate constant and initial parasitaemia. ......... 53
Fig. 14: Correlation of clearance rate constant and patient age. ..................... 54
Fig. 15: Correlation of slope half life and initial parasitaemia. ......................... 55
Fig. 16: Correlation of slope half life and patient age. ..................................... 56
Fig. 17: Distribution of baseline IC50 values. .................................................. 57
6
Fig. 18: Scatter plot of IC50 values of AS and DHA. . ...................................... 60
Fig. 19: Scatter plot of IC50 values of PPQ and DHA. . ................................... 60
Fig. 20: Scatter plot of IC50 values of LUM and DHA. . ................................... 60
Fig. 21: Scatter plot of IC50 values of MFQ and DHA. ................................... 60
Fig. 22: Scatter plot of IC50 values of PPQ and AS. . ...................................... 60
Fig. 23: Scatter plot of IC50 values of LUM and AS. . ...................................... 60
Fig. 24: Scatter plot of IC50 values of MFQ and AS. ...................................... 61
Fig. 25: Scatter plot of IC50 values of LUM and PPQ. . ................................... 61
Fig. 26: Scatter plot IC50 values of MFQ and PPQ. ....................................... 61
Fig. 27: Scatter plot of IC50 values of MFQ and LUM. ................................... 61
Fig. 28: Scatter plot of IC50 values of DHA and CQ. ...................................... 61
Fig. 29: Scatter plot of IC50 values of AS and CQ. ......................................... 61
Fig. 30: Scatter plot of IC50 values of LUM and CQ. ...................................... 62
Fig. 31: Scatter plot of IC50 values of PPQ and CQ. ...................................... 62
Fig. 32: Scatter plot of IC50 values of MFQ and CQ. ...................................... 62
Fig. 33: Distribution of AS IC50 values among prepared drug solutions. ........ 64
Fig. 34: Distribution of DHA IC50 values among prepared drug solutions. ..... 65
Fig. 35: Distribution of LUM IC50 values among prepared drug solutions. . .... 66
Fig. 36: Distribution of MFQ IC50 values among prepared drug solutions. ..... 67
7
Fig. 37: Distribution of CQ IC50 values among prepared drug solutions. ....... 68
Fig. 38: Distribution of PPQ IC50 values among prepared drug solutions. . .... 69
Fig. 39: Correlation between days of drug storage and AS IC50 values. ........ 70
Fig. 40: Correlation between days of drug storage and DHA IC50 values. ..... 70
Fig. 41: Correlation between days of drug storage and IC50 values of LUM. . 71
Fig. 42: Correlation between days of drug storage and IC50 values of MFQ. . 71
Fig. 43: Correlation between days of drug storage and IC50 values of CQ. ... 71
Fig. 44: Correlation between days of drug storage and IC50 values of PPQ. . 71
Fig. 45: Scatter plot of AS IC50 values dependent on time of drug storage .........
and drug working solution. ............................................................................... 72
Fig. 46: Scatter plot of DHA IC50 values dependent on time of drug storage ......
and drug working solution. ............................................................................... 73
Fig. 47: Scatter plot of ratio between DHA and AS IC50 values dependent .........
on time of drug storage and drug working solution. ......................................... 74
Fig. 48: Distribution of IC50 values determined in isolates obtained ....................
from recurrent infections. ................................................................................. 77
Fig. 49: Whisker plots showing ex vivo drug responses of matched baseline-
recurrence isolates. ......................................................................................... 79
8
List of tables
Tab. 1: Baseline characteristics of patients from CATMAP. ................................. 46
Tab. 2: Clinical and parasitological results in the study patients. ....................... 47
Tab. 3: Parasite clearance estimation values as calculated by web-based ..........
tool provided by WWARN. ......................................................................................... 50
Tab. 4: Ex vivo susceptibility in nM of isolates of Plasmodium falciparum to .......
AS, DHA, CQ, MQ, LUM and PPQ. ......................................................................... 58
Tab. 5: Spearman (rho) and Pearson (r2) correlation of ex vivo responses. .... 59
Tab. 6: AS IC50 values in nM among prepared drug solutions. .......................... 64
Tab. 7: DHA IC50 values in nM among prepared drug solutions. ...................... 65
Tab. 8: LUM IC50 values in nM among prepared drug solutions. ...................... 66
Tab. 9: MFQ IC50 values in nM among prepared drug solutions. ...................... 67
Tab. 10: CQ IC50 values in nM among prepared drug solutions. ...................... 68
Tab. 11: PPQ IC50 values in nM among prepared drug solutions. .................... 69
Tab. 12: Ex vivo susceptibility (in nM) of AS and DHA when excluding ................
(AS*, DHA*) the working solutions that were potentially confounded. ............... 75
Tab. 13: Pair-wise Spearman (Rho) and Pearson (r2) correlation matrix of .........
ex vivo responses to different compounds after exclusion of ...............................
potentially confounded working solutions VI and VII. . .......................................... 76
Tab. 14: Ex vivo susceptibility of isolates obtained from recurrent infections. .. 78
9
1. Introduction
1.1 The burden of malaria and (the burden of) its treatment
Despite already made great achievements, malaria, and especially the infection
with Plasmodium falciparum, still remains one of the major causes of morbidity
and mortality worldwide (World Health Organization (WHO), World Malaria
Report 2016; Snow, R. W. et al. 2005). The World Health Organization
estimated 200 million malaria episodes in the year of 2015, causing the death of
450.000 people. 90 % of all malaria deaths occur in Africa. The main age group
affected are children under five years of age with 300.000 deaths. An estimated
3.3 billion (3.3 x 10⁹) people worldwide are living at risk of malaria infections,
which is about half the world´s population (WHO, World Malaria Report 2016).
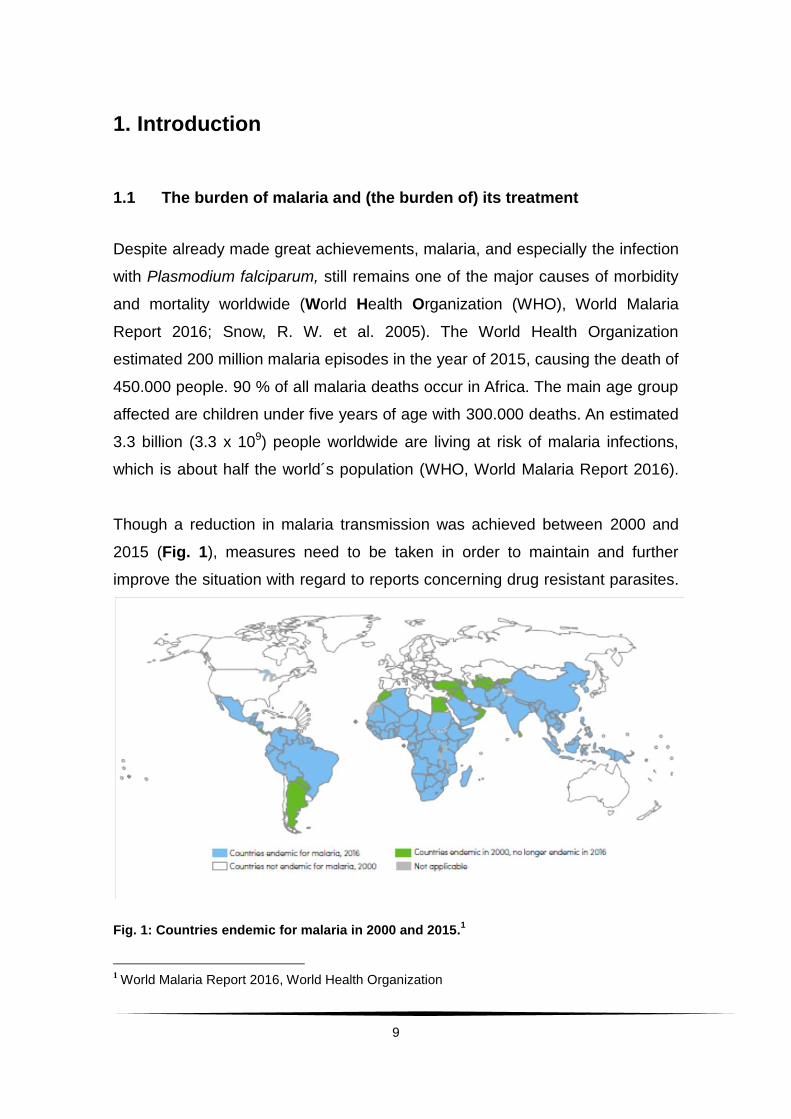
Though a reduction in malaria transmission was achieved between 2000 and
2015 (Fig. 1), measures need to be taken in order to maintain and further
improve the situation with regard to reports concerning drug resistant parasites.
Fig. 1: Countries endemic for malaria in 2000 and 2015.1
1 World Malaria Report 2016, World Health Organization

10
The economic costs of malaria are estimated to be US$ 12 billion per year for
Africa alone, counting only direct losses such as illness, treatment and
premature death.2
The funding for malaria control programs reached a sum of US$ 2.9 billion in
2015– still leaving a gap of US$ 2.2 billion to the yearly needed amount of
US$ 5.1 billion (WHO, World Malaria Report 2016).
Up to now malaria vaccinations have proven to be only of modest protection
(The RTS, S. Clinical Trial Partnership 2012) or are still undergoing trials
(Seder, R. A. et al. 2013). Just recently the RTS, S / AS01 malaria vaccine
phase III trial was completed showing a moderate statistically significant
reduction in malaria cases after vaccination (RTS, S Clinical Trial Partnership
2015). Based on these modest results,
RTS, S (Mosquirix©) has recently been approved by the European Medicine
Agency. Up to now the highest impact still lies with control strategies consisting
of
prevention methods (e.g. insecticide treated nets) and vector control
through (e.g. indoor spraying) and
prompt and effective treatment.
WHO estimated that between 2001 and 2015 almost 7 million lives have been
saved due to, inter alia, malaria control efforts (WHO, World Malaria Report
2016).
Out of Kenya’s 34 million people population there are 25 million still living at risk
of contracting malaria– with geographically varying predictions of the risks
(Noor, A. M. et al. 2009).
To sustain and further improve the significant, if modest, achievements it is
pivotal to evaluate the effectiveness of antimalarial drugs in order to prevent the
emergence and spread of drug resistance in malaria parasites.
2 http://www.rollbackmalaria.org/keyfacts.html (July 08th, 2015)
11
Presently artemisinin derivatives are the most efficient weapon against
P. falciparum. Treatment guidelines promote the combined use, ideally in co-
formulation, with other drugs to sustain this effectiveness as long as possible.
Alarmingly, studies from South-East Asia report about multiple foci of
emergence of parasite tolerance against artemisinins. Drug surveillance has to
provide timely information on which drug combination should be used in each
endemic region to delay the emergence of artemisinin-tolerant parasites as long
as possible.
The combination of artemether-lumefantrine (AL) is the first-line-treatment of
uncomplicated P. falciparum malaria in Kenya since 2006. This decision, and
the finding of the paediatric formula, was mainly based on data collected in Kilifi
(Falade, C. et al. 2005, Abdulla, S. et al. 2008), where also the Confirmation of
Tolerance in Malaria Parasites trial (CATMAP) study was conducted.
1.2 Aims of the work presented
The aims of this work are, therefore,
to present an overview and evaluation of the current artemisinin drug
susceptibility in Kenyan children infected with P. falciparum in vivo, using
parameters such as parasite clearance estimation (PCE), parasite
clearance time (PCT), parasite reduction ratio (PRR) and rate of
recurrent parasitaemia by day 28 and
to establish currrent P. falciparum ex vivo drug responses using the
histidine-rich protein 2 (HRP2) enzyme-linked immunosorbent assay
(ELISA) towards artemisinins and artemisinin partner drugs in order to
discuss susceptibility phenotypes in Coastal Kenya.
12
2. Background
In order to understand the public health impact of malaria and the high
importance of continuous drug surveillance first the evolution of the pathogen
will be presented and its life cycle will be shown. Afterwards the clinical features
of malaria as well as its prevention and treatment possibilities will be explained.
That will lead to the main focus of this work, antimalarial drug resistance and
surveillance of P. falciparum.
2.1 Evolution and development of Plasmodium into a human pathogen
and the origin and spread of malaria
Human malaria is caused by the protozoon Plasmodium, a parasite that is
transmitted by the female Anopheles mosquito. Known for being pathogenic in
humans are P. ovale, P. vivax, P. malariae and P. falciparum. Recently there
have been reports of a fifth species, P. knowlesi, which is mainly found in Old
World monkeys and, therefore, considered a zoonotic pathogen
(Knowles, R. M. and Das Gupta, B. 1932, Singh, B. et al. 2004; Cox-Singh, J. et
al. 2008; Lee, K.-S. et al. 2009; Galinski, M. R. and Barnwell, J. W. 2009).
Plasmodium parasites are unicellular eukaryotes with a complex life cycle.
According to Wilson and Williamson (1997) the ancestor was a free-living
protozoon that developed into a plastid-containing organism through
endosymbiosis of red algae. Before evolving into a vertebrae parasite,
Plasmodium supposedly inhabited the gut of aquatic insect larvae, multiplying
by sexual replication (Wilson, R. J. M. and Williamson, D. H. 1997). These
aquatic insects were ancestors to the Anopheles mosquito. Since the first
appearance of the fly species 150 to 200 million years ago, Plasmodium has
broadened its host range and started to infest multiple different hosts such as
reptiles and birds. Mosquitoes are still essential in the life cycle of Plasmodium:
The Anopheles mosquito functions as the site for sexual replication and as the
13
vector, while humans are infected only by haploid asexual stages, including the
newly formed gametocytes (refer to 2.2).
Numerous studies looked into the evolution of some Plasmodium species into
human pathogens. Waters et al. (Waters, A. P. et al. 1991) performed molecular
experiments with small subunit RNA (ssRNA), finding only remote relatedness
between the different species of human Plasmodium. They concluded that,
rather than one incidence giving way to all four human parasites, multiple
different transfers must have taken place.
Following this assumption, P. falciparum could also have evolved by lateral
transfer from birds. The next hypothesis was in accordance with the formerly
proposed distant relationships between the human pathogens, while also
suggesting a co-evolution of the chimpanzee parasite P. reichenowi and
P. falciparum 6 – 10 million years ago (Escalante, A. A. and Ayala, F. J 1994).
The reliability of these early works was questioned due to limitations in their
experimental methods such as the length in analysed gen loci or the under-
representation of certain taxa (Prugnolle, F. et al. 2011).
Many groups have focused on overcoming these limitations since then. In 2008
Martinsen, E. S. et al. published a full phylogram of the five genera of
haemosporidian parasites. One year later Rich, S. M. et al. (2009) proposed a
fairly recent transfer of P. falciparum from chimpanzees instead of a co-
evolution like Waters et al. had suggested. Then Krief, S. et al. (2010) published
data pointing to the origin of P. falciparum being Bonobos and work by Liu, W. et
al. (2010) claimed gorillas were the source of P. falciparum malaria.
Focusing on P. falciparum, work on mitochondrial desoxyribonucleic acid (DNA)
proposed an origin of human malaria within Africa from where it was able to
spread (Conway, D. J. et al. 2000). The authors place the first “big wave” of
human malaria between 4000 and 5000 years ago, the time of agricultural
revolution in Africa. The shift from a nomadic lifestyle towards the formation of
villages with plenty resources of water to function as mosquito breeding sites as
well as humans providing a constant blood supply for nourishment provided
optimal conditions for the reproduction of the mosquitoes.
14
Further development in agriculture is proposed to have had an immense
influence on the distribution of Plasmodium (Hume, J. C. C. et al. 2003). With
trade thriving and a developing travel culture the parasite was able to spread
easily – now affecting billions of people around the world.
2.2 Plasmodium and its life cycle
In 1880 the French military physician Alphonse Laveran discovered
Plasmodium as the parasite causing malaria. Plasmodium is a unicellular
parasite that belongs to the phylum Apicomplexa, which is characterized by an
apical organelle (or, “apical complex“, hence the name) essential for host cell
invasion (Werk, R. 1985; Mitchell, G. H. and Bannister, L. H. 1988; Joiner, K. A.
and Dubremetz, J. F. 1993; Sam-Yellowe, T. Y. 1996).
There are more than one hundred Plasmodium species3, but only four are
considered pathogenic to humans (refer to 2.1). Plasmodium falciparum is by
far the most malignant and will be the focus for this work.
The parasite undergoes a complex life cycle which partly takes place in the
mosquito and partly in the human host.
2.2.1 The life cycle of Plasmodium falciparum
Through the bite of an infected female Anopheles mosquito P. falciparum
sporozoites are transferred into the tissues of a human host.4
These sporozoites move actively towards nearby blood vessels and enter the
blood stream (Boyd, M. F. and Kitchen, S. F. 1939; Matsuoka, H. et al. 2002;
Aly, A. S. I. et al. 2009). Within minutes sporozoites that have penetrated into
the blood stream are transported to the liver, where they invade hepatocytes
3 http://malaria.wellcome.ac.uk/doc_WTD023864.html (August 10th, 2015)
4 A visualisation of the lifecycle can for example be found in Portugal, S. et al. 2011.
15
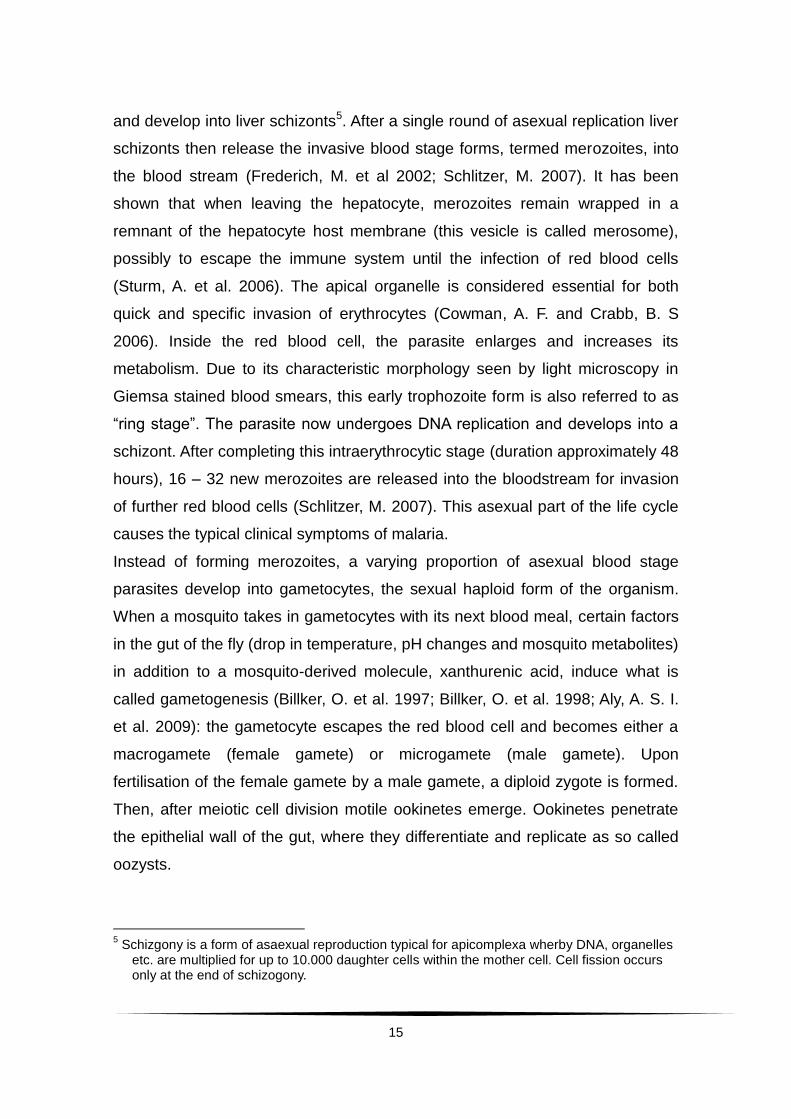
and develop into liver schizonts5. After a single round of asexual replication liver
schizonts then release the invasive blood stage forms, termed merozoites, into
the blood stream (Frederich, M. et al 2002; Schlitzer, M. 2007). It has been
shown that when leaving the hepatocyte, merozoites remain wrapped in a
remnant of the hepatocyte host membrane (this vesicle is called merosome),
possibly to escape the immune system until the infection of red blood cells
(Sturm, A. et al. 2006). The apical organelle is considered essential for both
quick and specific invasion of erythrocytes (Cowman, A. F. and Crabb, B. S
2006). Inside the red blood cell, the parasite enlarges and increases its
metabolism. Due to its characteristic morphology seen by light microscopy in
Giemsa stained blood smears, this early trophozoite form is also referred to as
“ring stage”. The parasite now undergoes DNA replication and develops into a
schizont. After completing this intraerythrocytic stage (duration approximately 48
hours), 16 – 32 new merozoites are released into the bloodstream for invasion
of further red blood cells (Schlitzer, M. 2007). This asexual part of the life cycle
causes the typical clinical symptoms of malaria.
Instead of forming merozoites, a varying proportion of asexual blood stage
parasites develop into gametocytes, the sexual haploid form of the organism.
When a mosquito takes in gametocytes with its next blood meal, certain factors
in the gut of the fly (drop in temperature, pH changes and mosquito metabolites)
in addition to a mosquito-derived molecule, xanthurenic acid, induce what is
called gametogenesis (Billker, O. et al. 1997; Billker, O. et al. 1998; Aly, A. S. I.
et al. 2009): the gametocyte escapes the red blood cell and becomes either a
macrogamete (female gamete) or microgamete (male gamete). Upon
fertilisation of the female gamete by a male gamete, a diploid zygote is formed.
Then, after meiotic cell division motile ookinetes emerge. Ookinetes penetrate
the epithelial wall of the gut, where they differentiate and replicate as so called
oozysts.
5 Schizgony is a form of asaexual reproduction typical for apicomplexa wherby DNA, organelles
etc. are multiplied for up to 10.000 daughter cells within the mother cell. Cell fission occurs only at the end of schizogony.
16
When an oozyst ruptures it releases sporozoites into the body of the mosquito.
These sporozoites now will find their way into the salivary glands of the
mosquito, from where they will be injected into the new host when the mosquito
takes its next blood meal.
2.3 Clinical features of malaria
An infection with Plasmodium falciparum can result in severe or uncomplicated
malaria or even in an asymptomatic infection. This reflects increasing levels of
acquired immunity to the parasite in patients in high transmission areas;
therefore, severe malaria mainly occurs in young children. The symptoms
become milder and eventually disappear as a function of repeated re-infections
during childhood. Most adults in such areas are asymptomatically infected. The
onset of clinical signs after sporozoite inoculation usually takes between 12 to
15 days (Verhage, D. F. et al. 2005; Roestenberg, M. et al. 2009). Symptoms
result exclusively from the asexual erythrocytic stages of Plasmodium. Early
symptoms before the typical fever episodes are unspecific and can be
described as flu-like with headaches, nausea and fatigue. Other symptoms can
include coughing, slight jaundice, myalgia, abdominal pain and / or diarrhoea
and loss of appetite as well as prostration. With increasing parasitaemia the
patient develops irregularly recurring high fever attacks (White, N. J. 2003,
pp. 1226 – 1229).
Uncomplicated malaria can develop into severe malaria within hours presenting
with altered consciousness, respiratory distress, convulsions, pulmonary
oedema, disseminated intravascular coagulopathy, severe anaemia and
hypoglycemia. Despite optimal treatment with intravenous artesunate, the
mortality rate of patients with severe malaria remains between 8.5 – 15%. If
parenteral artesunate is not available and treatment is conducted with quinine,
this mortality rate ranges from 10.9 – 22 % (Dondorp, A. M. 2010; Dondorp, A.
et al. 2005).
17
2.4 Malaria control strategies
In May 1955 the World Health Assembly initiated a malaria eradication
campaign to eliminate the disease worldwide. By 1967 the use of
Dichlordiphenyltrichlorethan (DDT) against mosquitoes and the treatment of
patients with antimalarial drugs had lead to the eradication of malaria in all
developed countries and in some areas of Asia as well as Latin America.
Unfortunately, due to limited practicability in some countries, emergence of
resistance against the insecticide and the development of drug-resistant
parasites imposed problems that prevented worldwide eradication.
A close to 100 % effective vaccine has been a long-term goal of malaria
research. Recently, a recombinant vaccine, RTS, S, has been approved as the
first malaria vaccine. However, it has shown only modest protection for a limited
period of time (The RTS, S Clinical Trials Partnership 2012 and 2015).
Therefore, current control strategies remain focused on prevention and fast and
effective treatment.
Insecticide treated nets and indoor spraying have been implemented for many
years now. Free distribution has led to a wide coverage of nets. For the most
vulnerable groups the WHO recommends chemoprophylaxis, called the
intermittent preventive treatment. This reaches out to infants and pregnant
women. It is carried out with sulfadoxine-pyrimethamine given in the absence of
the disease to suppress infections and prevent malaria.
Efficient treatment of P. falciparum malaria relies on artemisinin-based-
combination therapies (ACT) in all endemic countries (WHO, Guidelines for the
treatment of malaria, 2015).
18
2.5 Antimalarial drugs
The complex life cycle (refer to 2.2) offers different targets for
chemotherapeutics. Antimalarials can be used for treatment and prevention of
infection. Most drugs inhibit asexual blood stage replication (blood
schizontocides); the preerythrocytic (liver stage) effect of medication remains
mainly uncharacterized. The first known (herbal) medicine against malaria was
powdered bark of the cinchona tree, containing the quinoline alkaloids quinine
and quinidine. Sparking off synthetic drug manufacturing in 1891, methylene
blue went through only a short period of usage as antimalarial drug but gave
way to numerous synthetic drugs. Regiments such as plasmochin,
primaquine and mepacrine were replaced by chloroquine (CQ), which
became the major antimalarial drug after the Second World War and sustained
its importance for almost two decades. CQ is thought to interfere with the ability
of the parasite to form haemozoin and, thus, to lead to accumulation of toxic
haeme, a product from the parasite’s haemoglobin metabolism (Chou, A. A. and
Fitch, C. D. 1992; Sullivan, D. J. et al. 1996 b).
In the 1960s the first CQ-resistant strains were reported and by 2005 it was
estimated that around 80 % of the wild Plasmodium falciparum strains are
resistant to this highly sufficient drug regimen (Ginsburg, H. 2005). Much effort
has been put into finding other drugs and synthesising CQ derivatives by
modifying its chemical structure, leading to substances such as amodiaquine,
ferroquine, pyronaridine, and piperaquine (PPQ) to overcome CQ resistance
(Edgcomb, J. H. et al. 1950; Grewal, R. S. 1981; Geary, T. G. and Jensen, J. B.
1983; Ridley, R. G. et al. 1996; Foley, M. and Tilley, L. 1998). Other antimalarial
drugs developed, like mefloquine (MFQ), lumefantrine (LUM) and
halofantrine are analogues of the active antimalarial metabolite quinine and
quinidine from the above mentioned cinchona tree. The artemisinins like
artemether and artesunate (AS) derive from the herb known as sweet
wormwood.
19
Available compounds nowadays are grouped into the following classes:
aryl-aminoalcohols (quinoline-related) such as quinine, quinidine,
chloroquine, amodiaquine, mefloquine, halofantrine, lumefantrine,
piperaquine, primaquine, tafenoquine, ferroquine, pyronaridine
antifolates such as pyrimethamine, proguanil, chlorproguanil,
trimethoprim
artemisinins such as artemisinin, dihydroartemisinin (DHA), artemether,
artesunate (AS)
Since P. falciparum treatment guidelines in Kenya are mainly based on
artemisinins combined with either LUM or PPQ, more detailed information on
these compounds will be provided in the following subchapters.
2.5.1 Artemisinins
Over the past years Artemisinin and its derivatives have proven to be the most
efficient antimalarial drug since CQ. In traditional Chinese medicine “qinghao”
was known for its ability to treat fever. In 1971 the antimalarial effects of the
extract “qinghaosu” from the herb “qinghao” were demonstrated for the first time
(Qinghaosu Antimalaria CoordinatiTeg Research Group 1979; Editorial The
Lancet 1992) and its discovery resulted in a Nobel Prize in 2015 (Nobel Media
AB 2016).
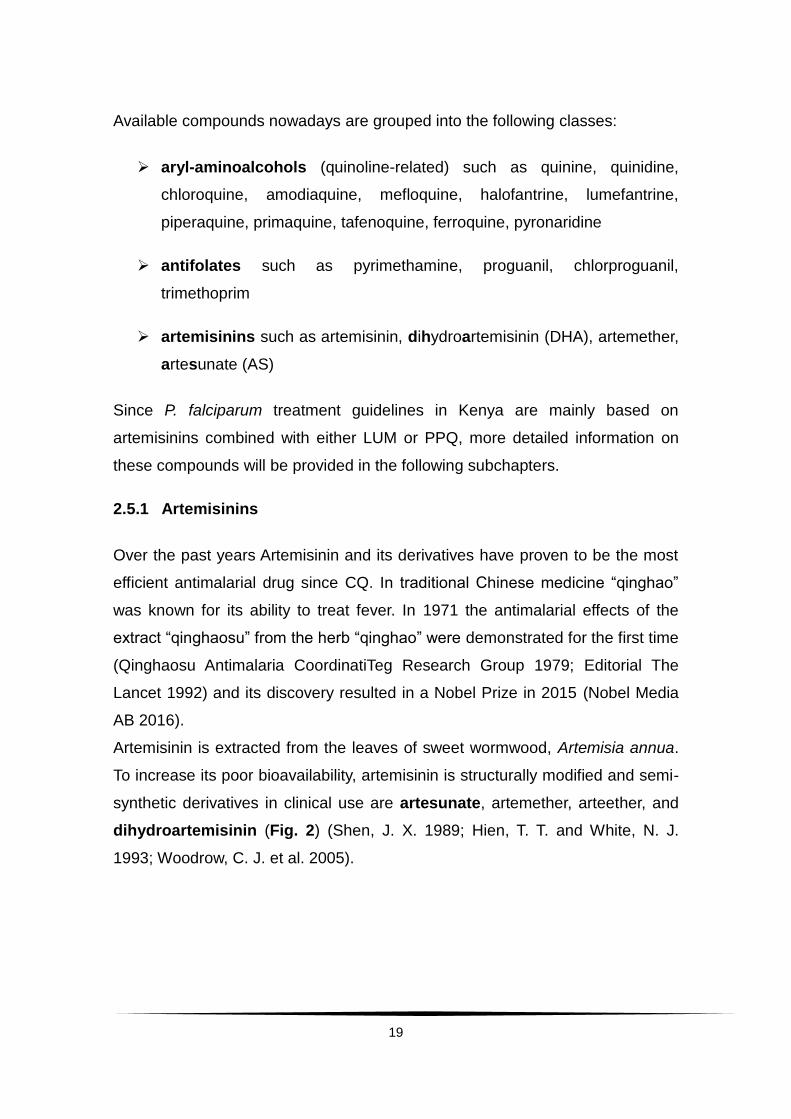
Artemisinin is extracted from the leaves of sweet wormwood, Artemisia annua.
To increase its poor bioavailability, artemisinin is structurally modified and semi-
synthetic derivatives in clinical use are artesunate, artemether, arteether, and
dihydroartemisinin (Fig. 2) (Shen, J. X. 1989; Hien, T. T. and White, N. J.
1993; Woodrow, C. J. et al. 2005).
20
Artemisinins rapidly clear the patients’ blood from malaria parasites and have
the broadest time window of antimalarial effect (from ring forms to early
schizonts) (White, N. J. 2004). In vivo the derivatives are hydrolyzed into the
main active metabolite DHA. This metabolite has a very short elimination half
time of about 45 minutes (Teja-Isavadharm, P. et al. 1996; Batty, K. T. et al.
1998).
Fig. 2: Artemisinin and derivatives chemical structures.6
The exact mechanism of action of artemisinins remains unknown. The key
structural feature of all artemisinins is an endoperoxide. Artemisinins also act
against developing, but not mature, sexual blood stages (Kumar, N. and Zheng,
H. 1990; Meshnick, S. R. 2002; Schlitzer, M. 2007). A reduction in
gametocytaemia can additionally reduce transmission by decreasing the
chances of another mosquito taking up gametocytes through a blood meal on a
malaria patient (Price, R. N. et al. 1996; Okell, L. et al. 2008).
6 Hien, T. T. and White, N. J. 1993
21
Since 2004 the WHO promotes artemisinin derivatives for the treatment of
uncomplicated malaria as the main compound of artemisinin-based combination
therapies (ACT). In ACTs artemisinins account for a rapid onset of parasite
clearance, the combination with a partner drug with a longer half time and
different mode of action, e.g. lumefantrine, is thought to delay the emergence of
resistance (White, N. J. 1999). After the artemisinin is cleared from the body, the
partner drug eliminates the remaining (few) parasites, including those that
possibly are still in or are leaving the dormant stage. Additionally, the partner
drug plays a role in prophylaxis of a new infection by maintaining blood levels
over a longer period of time.
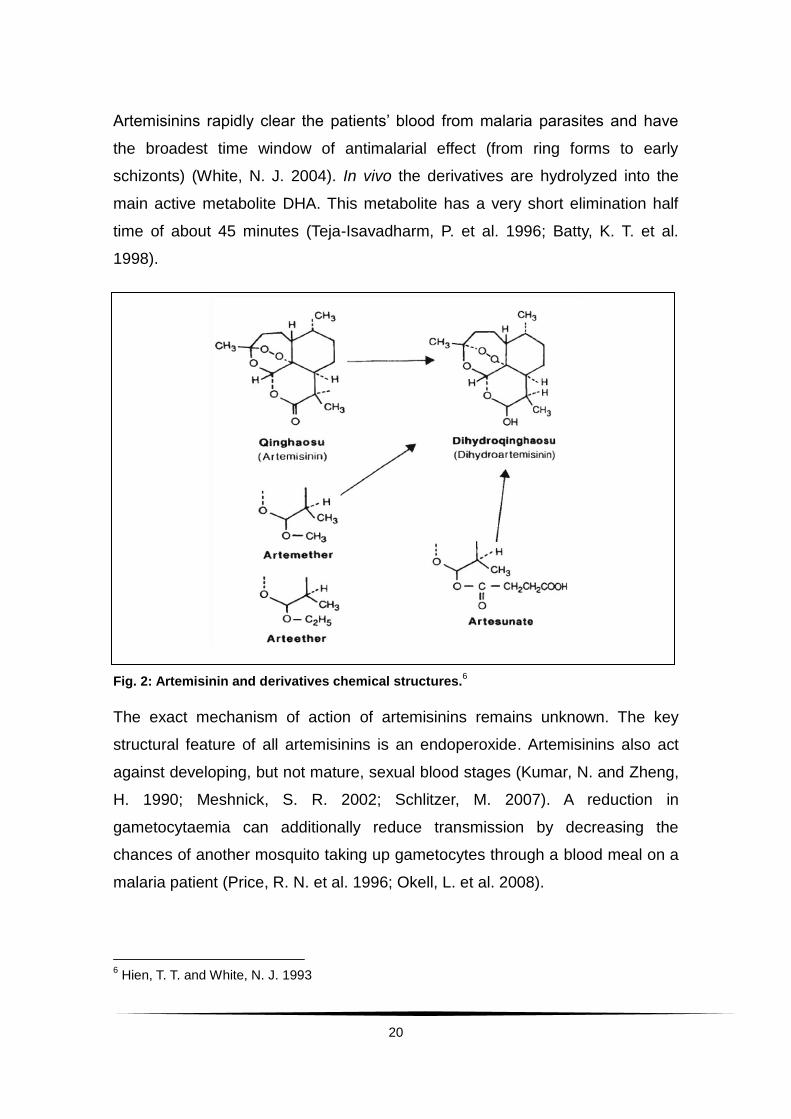
2.5.2 Lumefantrine
LUM was developed by Chinese scientists. Today it is only available in fixed
combination with artemether (Coartem®), which has been the first-line
treatment in Kenya since 2004 (Ministry of Public Health and Sanitation,
National Guidelines for the Diagnosis, Treatment and Prevention of Malaria in
Kenya, 2010). Several studies have been conducted on this combination-
therapy on the study site in Kilifi, including a first safety and efficacy study
(Falade, C. et al. 2005), trials for paediatric formulations (Abdulla, S. et al. 2008)
as well as drug surveillance studies (Borrmann, S. et al. 2011). The last
mentioned study lead to the CATMAP trial in which this work was embedded.
LUM is lipophilic and, thus, absorption increases with the intake of fatty food
(Ezzet, F. et al. 1998). The elimination half-life is estimated to be 3 – 4 days
(Ezzet, F. et al. 2000).
Fig. 3: LUM chemical structure.7
7 http:\\www.sigmaaldrich.com ( August 10
th, 2015)

22
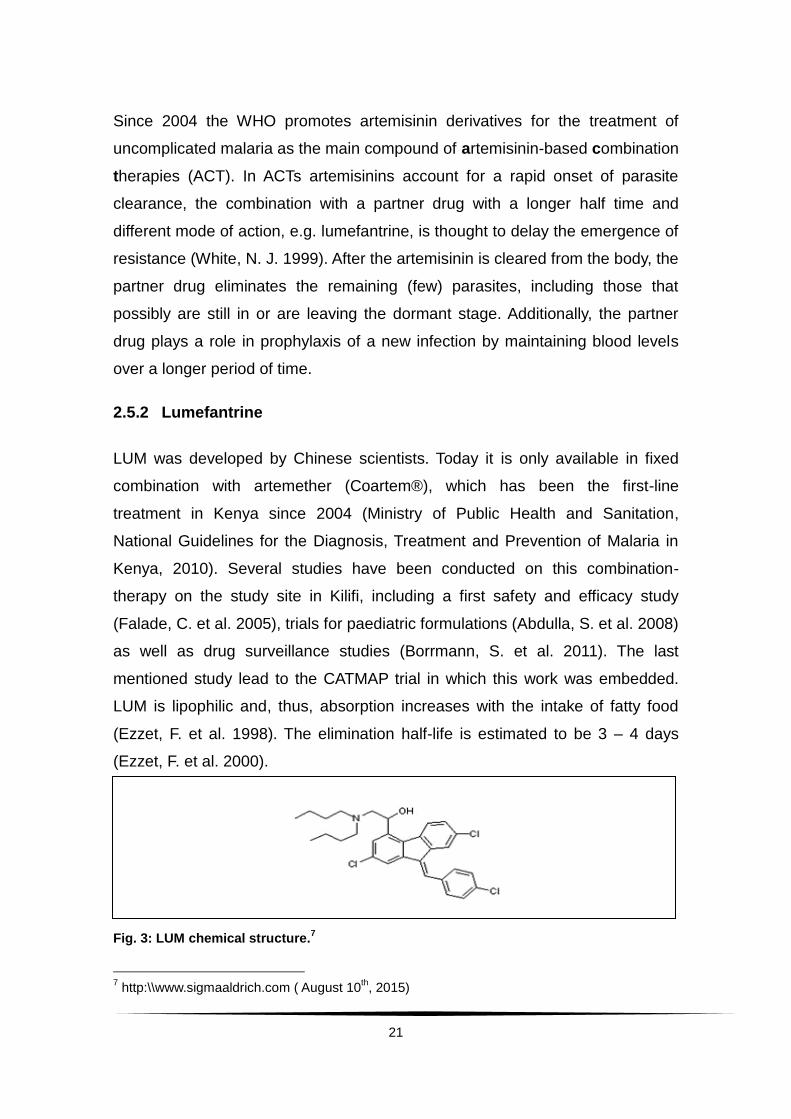
2.5.3 Piperaquine
PPQ is a bisquinoline and one of the drugs synthesised to overcome CQ
resistance. Hypotheses suggest that its activity against CQ-resistant strains
derives from its steric bulk, causing it to be not a suitable substrate for the
Plasmodium falciparum chloroquine resistance transporter (PfCRT), a
transporter involved in chloroquine resistance (Fidock, D. A. et al. 2000).
Another suggestion is that its four positive charges are trapping it inside the
acidic digestive vacuole of Plasmodium (Warhurst, D. C. et al. 2007; Kaur, K. et
al. 2010).
PPQ has mainly been used in China, leading to resistant strains in the country
(Chen, L. et al. 1982; Lan, C. X. et al. 1989; Fan, B. et al. 1998). In Africa it is
still considered highly effective and applied as a combination therapy with DHA.
This combination has been reported to be safe and effective in numerous
studies (Myint, H. Y. et al. 2007; Grande, T. et al. 2007; Abdulla, S. et al. 2008;
Adam, I. et al. 2010), including a multicentre Phase III trial where the Pingilikani
clinic (the study site of the CATMAP trial) was one of the study sites (Bassat, Q.
et al. 2009).
Fig. 4: PPQ chemical structure.8
8 http:\\www.sigmaaldrich.com (August 10
th, 2015)
23
3. Antimalarial drug tolerance and resistance
According to the WHO, antimalarial drug resistance is defined as “the ability of a
parasite strain to survive and / or multiply despite the administration and
absorption of a medicine in doses equal to or higher than those usually
recommended but within tolerance of the subject, provided drug exposure at the
site of infection is adequate” (WHO, Guidelines for the treatment of malaria,
2015, p. 113). This leads to a shift to the right in the dose-response curve of the
drug (White, N. J. 2004).
Increased tolerance to antimalarial drugs has been reported for all classes of
antimalarials, which imposes a great threat to the control of the disease.
Often, the onset of parasite resistance is very easily overlooked by medical
professionals, as most patients seem to improve clinically while undergoing
treatment. In most cases, even parasitaemia will eventually disappear below the
microscopic detection threshold. Three to six weeks after completion of
treatment symptoms may then reoccur. This will commonly be interpreted as a
newly acquired infection with Plasmodium rather than a recrudescence of the
same (resistant) strain. The intervals between fever clearance and reoccurrence
of the clinical symptoms will then become increasingly shorter until the drug
regimen will fail to clear the patient from symptoms completely (WHO,
Guidelines for the treatment of malaria, 2015). This clearly indicates the
importance of constant drug surveillance studies to monitor drug sensitivity
continuously be able to react fast to declining responsiveness.
In 2006 the national Kenyan guidelines adapted the WHO recommendations
and announced AL as the first-line treatment for uncomplicated
P. falciparum malaria. This combination has been proven effective even in areas
of multi-drug-resistant parasites (van Vugt, M. et al. 2000; Hutagalung, R. et al.
2005). Despite its fairly short time in use, there have already been reports about
reduced artemisinin sensitivity in P. falciparum. In 2009 Dondorp, A. M. et al.
described delayed in vivo parasite clearance times after treatment in Western
24
Cambodia. However, no evidence for reduced in vitro drug sensitivity was
found. This was followed by a study which also showed declined
responsiveness to ACTs in vivo in Kenya (Borrmann, S. et al. 2011) with no
indication of drug resistance in vitro.
In the past years much progress has been achieved in understanding
artemisinin resistance better. As said before, by the time of the first description
of delayed response after artemisinin treatment there was no correlate in vitro
when testing drug sensitivity. Cheeseman, I. H. (2012) aimed to identify genome
regions under selective pressure by artemisinin treatment in Western Thailand
and found areas of interest on chromosome 13. Also Borrmann, S. et al. (2013)
studied genes associated with naturally occurring phenotypic variation of
artemisinin susceptibility in Kenya and reported about associations with
chromosome 13.
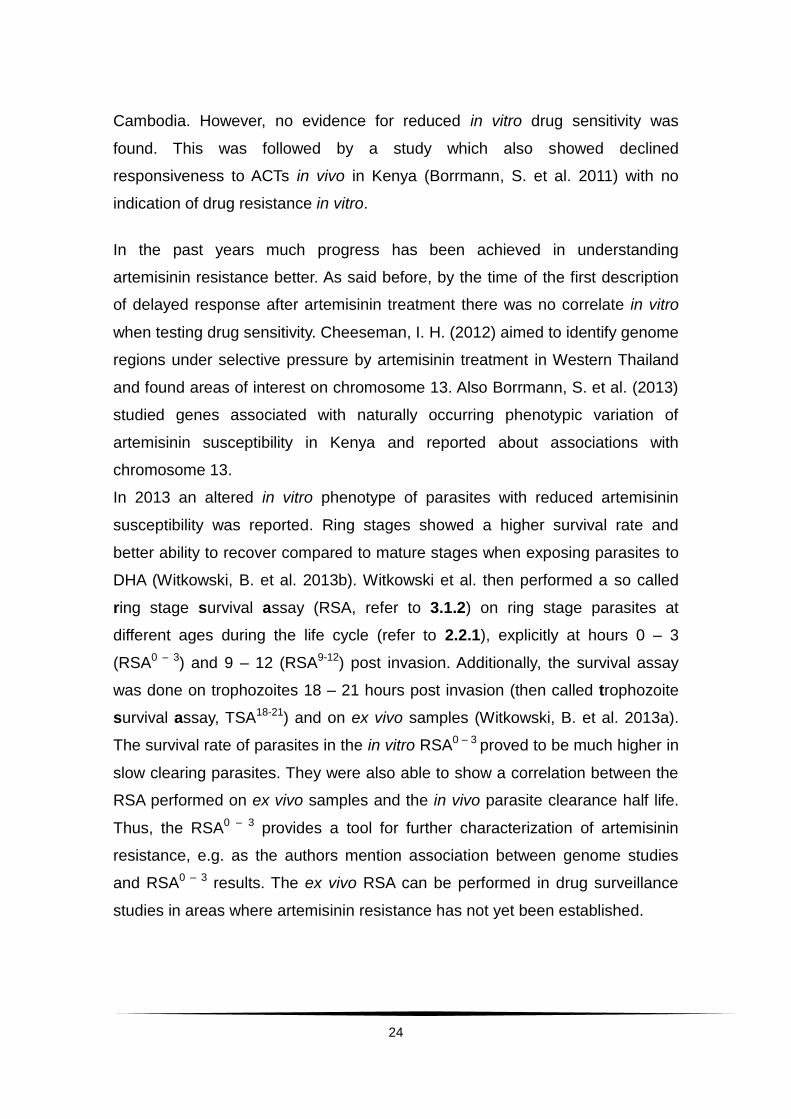
In 2013 an altered in vitro phenotype of parasites with reduced artemisinin
susceptibility was reported. Ring stages showed a higher survival rate and
better ability to recover compared to mature stages when exposing parasites to
DHA (Witkowski, B. et al. 2013b). Witkowski et al. then performed a so called
ring stage survival assay (RSA, refer to 3.1.2) on ring stage parasites at
different ages during the life cycle (refer to 2.2.1), explicitly at hours 0 – 3
(RSA0 – 3) and 9 – 12 (RSA9-12) post invasion. Additionally, the survival assay
was done on trophozoites 18 – 21 hours post invasion (then called trophozoite
survival assay, TSA18-21) and on ex vivo samples (Witkowski, B. et al. 2013a).
The survival rate of parasites in the in vitro RSA0 – 3 proved to be much higher in
slow clearing parasites. They were also able to show a correlation between the
RSA performed on ex vivo samples and the in vivo parasite clearance half life.
Thus, the RSA0 – 3 provides a tool for further characterization of artemisinin
resistance, e.g. as the authors mention association between genome studies
and RSA0 – 3 results. The ex vivo RSA can be performed in drug surveillance
studies in areas where artemisinin resistance has not yet been established.
25
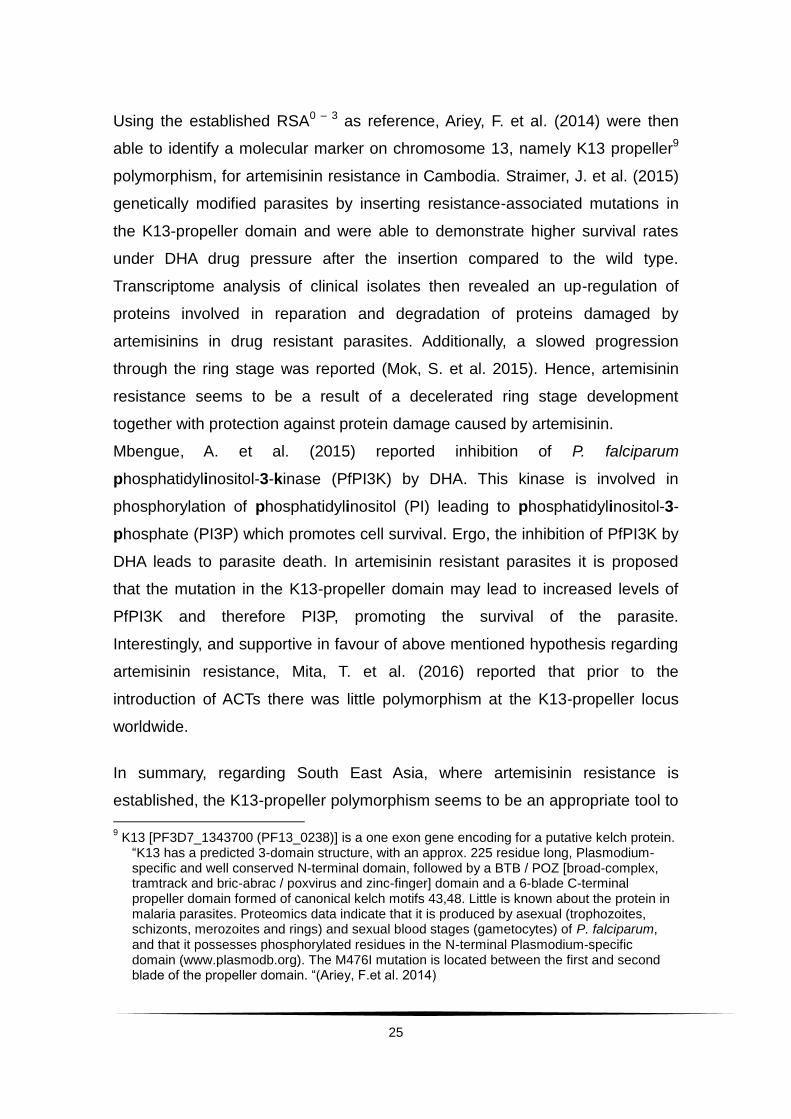
Using the established RSA0 – 3 as reference, Ariey, F. et al. (2014) were then
able to identify a molecular marker on chromosome 13, namely K13 propeller9
polymorphism, for artemisinin resistance in Cambodia. Straimer, J. et al. (2015)
genetically modified parasites by inserting resistance-associated mutations in
the K13-propeller domain and were able to demonstrate higher survival rates
under DHA drug pressure after the insertion compared to the wild type.
Transcriptome analysis of clinical isolates then revealed an up-regulation of
proteins involved in reparation and degradation of proteins damaged by
artemisinins in drug resistant parasites. Additionally, a slowed progression
through the ring stage was reported (Mok, S. et al. 2015). Hence, artemisinin
resistance seems to be a result of a decelerated ring stage development
together with protection against protein damage caused by artemisinin.
Mbengue, A. et al. (2015) reported inhibition of P. falciparum
phosphatidylinositol-3-kinase (PfPI3K) by DHA. This kinase is involved in
phosphorylation of phosphatidylinositol (PI) leading to phosphatidylinositol-3-
phosphate (PI3P) which promotes cell survival. Ergo, the inhibition of PfPI3K by
DHA leads to parasite death. In artemisinin resistant parasites it is proposed
that the mutation in the K13-propeller domain may lead to increased levels of
PfPI3K and therefore PI3P, promoting the survival of the parasite.
Interestingly, and supportive in favour of above mentioned hypothesis regarding
artemisinin resistance, Mita, T. et al. (2016) reported that prior to the
introduction of ACTs there was little polymorphism at the K13-propeller locus
worldwide.
In summary, regarding South East Asia, where artemisinin resistance is
established, the K13-propeller polymorphism seems to be an appropriate tool to
9 K13 [PF3D7_1343700 (PF13_0238)] is a one exon gene encoding for a putative kelch protein.
“K13 has a predicted 3-domain structure, with an approx. 225 residue long, Plasmodium-specific and well conserved N-terminal domain, followed by a BTB / POZ [broad-complex, tramtrack and bric-abrac / poxvirus and zinc-finger] domain and a 6-blade C-terminal propeller domain formed of canonical kelch motifs 43,48. Little is known about the protein in malaria parasites. Proteomics data indicate that it is produced by asexual (trophozoites, schizonts, merozoites and rings) and sexual blood stages (gametocytes) of P. falciparum, and that it possesses phosphorylated residues in the N-terminal Plasmodium-specific domain (www.plasmodb.org). The M476I mutation is located between the first and second blade of the propeller domain. “(Ariey, F.et al. 2014)
26
track the spread of the resistance. The importance for the African region
remains the subject of further studies. K13-polymorphisms have been reported
in Mali, where parasite clearance under ACT remains fast, but were also
present before the introduction of ACTs (Outtara, A. et al. 2015). Kamau, E. et
al. (2015) detected different K13-propeller polymorphisms than the ones found
in Asia in Sub-Saharan Africa, but so far no study investigated the RSA0 – 3 in
association with these findings. Thus, it is crucial to further study molecular
markers and carry out in vivo as well as ex vivo and in vitro drug sensitivity
testing in Africa in various regions to clarify significance of already found
markers and detect others.
3.1 Monitoring drug efficacy
Drug monitoring consists of two main aspects: the efficacy of the drug in an
infected patient (in vivo) and the efficacy outside the patient (ex vivo or in vitro).
Whereas in vitro and ex vivo data are important tools in research and can give
additional information, it is always the result of an artificial set-up. In vivo data
on the other hand provides the actual clinical outcome of treatment that also
depends on various host-related factors and, therefore, cannot be replaced by
in vitro tests. At first sight inter-individual differences of patients in clinical trials
such as e.g. drug metabolism, immunity etc. might seem like an obstacle to get
comparable results. This data is taken under “real life” conditions though and
absolutely necessary for the development of clinical guidelines, the
development of new drugs and much more. This shows a necessity in drug
surveillance for both clinicians and researchers to be aware of and responsive
to changes.
3.1.1 Drug susceptibility in vivo
Besides measuring clinical outcomes such as body temperature and
haematological variables (e.g. haemoglobin), the level of parasitaemia is
documented over time and used as a parameter for the efficacy of the drug(s)
applied. According to WHO standards the duration of required follow-up-time
27
depends on the half-life of the drug(s) applied (at least 28 days,
for combinations with MFQ or PPQ at least 42 days) (WHO, Guidelines for the
treatment of malaria, 2015, pp.112 – 113).
During an infection with Plasmodium, the parasite multiplication rate is used to
describe the rate of multiplication of the parasite. In the absence of any
antimalarial drug activity in non-immune adults this multiplication rate is
estimated to exceed the rate of 10 per asexual cycle (Simpson, J. A. et al.
2002).
The ratio between parasitaemia at onset and at a point of interest after initiation
of treatment (commonly hour 6, 12, 24 and 48) is called parasite reduction ratio
(White, N. J. 1997). The PRR varies depending on the drug applied.
Artemisinins are currently known as the fastest acting antimalarials in vivo
(White, N. J. 2004).
Until recently the PCT, i.e. the time from first drug exposure to the recording of
multiple consecutive negative slides, was the most commonly used parameter
to describe drug efficacy in vivo. The PCT was found to be dependent on
numerous factors such as baseline parasitaemia and the frequency of sampling.
Thus, it proved to be an inaccurate parameter that does not allow comparisons
between individuals or across cohorts of patients (White, N. J. 2011).
A recently proposed method is the PCE. This method requires frequent
sampling and uses a logarithmic transformation of the parasite density data
over time. It starts by identifying different segments of the parasite clearance
curve in the patient (Flegg, J. A. et al. 2011). Clearance times are then
estimated using only the robust, linear segment of the clearance curve over
time. The segments excluded from this estimation are the lag-phase, the tail
and outliers. The lag-phase is caused by effects on mainly sequestered
parasites instead of parasites in the peripheral blood. The tail is the part in the
clearance curve where parasitaemia approaches the detection limit and
counting errors are likely to occur. The slope in the fall of parasitaemia in the
clearance curve after exclusion of lag and tail is proposed to be much less
vulnerable to influences and, consequently, better for comparison of real drug

28
efficacy than the parasite clearance time. The slope half life, thus, indicates the
time needed for the parasitaemia to be reduced by half after excluding lag and
tail. Parasite clearance 50 and 99 are also adapted to the linear part of the
curve and refer to the time it takes for the parasitaemia to be reduced to 50 and
99 % of the admission parasitaemia. The clearance rate constant shows the
fractional reduction of parasites per unit in time. To be able to compare obtained
results to numerous other studies which used either PCT or PCE, including data
from the same study area (Borrmann, S. et al. 2011), both parameters will be
shown and discussed here.
The rate of occurrence of recurrent parasitaemia is another parameter used for
the determination of drug efficiency. Recurrent parasitaemia can occur due to
reinfection with a new parasite or recrudescence of the same parasite. The
second scenario indicates treatment failure. To distinguish between reinfection
and recrudescence, genotyping of highly diverse parasite loci, such as
merozoite surface protein 1(msp1), merozoite surface protein 2 (msp2) and / or
glutatmate-rich protein (glurp), is done.
Blood concentrations of the drug of interest can be measured in order to
distinguish between real treatment failure and failure to achieve effective blood
concentrations, e.g. due to non-adherence of the patient or variable
bioavailability of the drug.
3.1.2 Drug susceptibility ex vivo / in vitro
When measuring drug sensitivity outside the patient, it is crucial to distinguish
between ex vivo and in vitro methods. Also genetic methods can be performed
for specific forms of drug resistance that are confirmed to be associated with
molecular markers (e.g., certain mutations in the pfcrt or Dihydrofolate
reductase (dhfr) and Dihydroptearate synthase (dhps) genes in case of
chloroquine or antifolate resistance, respectively). The drug sensitivity testing is
in general performed by exposing parasites to different drug concentration
levels for a specific of time. Afterwards inhibition will be determined by the effect
of the drug on growth and multiplication.
29
In vitro applies to methods that are carried out on parasites that have been
adapted to parasite culture. Ex vivo methods on the other hand are performed
directly on the patients´ sample. Various different methods have been
developed and established, each with its advantages and disadvantages
(Noedl, H. et al. 2003). Below, a few examples of the many methods are
mentioned.
The simplest method of drug sensitivity testing is the WHO schizont
maturation test that is based on microscopic assessment of schizonts
development following drug exposure in a 24-hour culture. This method can
easily be used in the field but is very work-intensive and is susceptible to inter-
individual variability of assessment.
Isotopic methods, such as the widely used radio-labelled [3H]-hypoxanthine
assay (Desjardins, R. E. et al. 1979), are based on the uptake of the labelled
hypoxanthine by the parasite and the measurement of radioactivity in a liquid
scintillation counter. Reproducible results for high quantities of isolates are the
advantages of this assay, but costly equipment (e.g. liquid scintillation counter)
and the exposure of laboratory staff to and the disposal of radioactive materials
are limiting the use of this assay. The main problem though is the fairly high
parasite density of 0.5 % needed in order to obtain reliable results.
Another method is the detection of parasite specific lactate dehydrogenase
(pLDH) (Piper, R. et al. 1999), which measures the activity of pLDH (an enzyme
actively produced by the parasite during growth and differing from the human
LDH) and allows for quantification of parasites.
Widely used is the SYBR-Green assay. A fluorescent dye, the SYBR-Green,
with affinity to double-stranded DNA, is added to the drug exposed isolate and
fluorescence is measured. This assay produces reliable results from a fairly
high parasitaemia of 0.75 % on. Also samples need to be purified from white
blood cells in order to avoid unspecific DNA staining. This makes it fairly cost-
intensive and unreliable for usage in the field (Vossen, M. G. et al. 2010).
30
One method which can be performed ex vivo as well as in vitro and which was
performed in this study is the Histidine Rich Protein 2 (HRP2) Enzyme-linked
immunosorbent assay (ELISA) (Noedl, H. et al. 2002a). P. falciparum HRP2 has
been identified as a protein associated with Plasmodium falciparum infected
erythrocytes. HRP2 is localized in several cell compartments, including the
parasite cytoplasm. It is known to be histidine-and alanine-rich and synthesised
in each P. falciparum parasite, regardless of its knob-phenotype10 (Rock, E. P.
et al. 1987). HRP2 is found in concentrated packages in the host-erythrocytes
as well as in the host plasma (or culture supernatant) due to secretion by the
parasite (Howard, R. J. et al. 1986). The exact role of HRP2 remains unknown
but it has been suggested to function in the haemoglobin metabolism of
P. falciparum (Sullivan, D. J. et al. 1996a). There is only a slight inhibition in the
production of HRP2 under drug pressure; therefore, it remains a good tool for
drug sensitivity testing (Noedl, H. et al. 2002b). Besides sensitivity testing, rapid
diagnostic tests are also based on the detection of HRP2.
The HRP2 ELISA as an assay for drug sensitivity testing in P. falciparum was
first described in 2002 (Noedl, H. et al. 2002a). Compared to other assays it
does not only require little equipment but also produces reliable results in low
parasitaemia samples, which occur frequently. The assay can be performed ex
vivo, directly on the isolates taken from the patient without prior parasite culture,
leukocyte depletion or usage of radioactive markers. Compared to the WHO
schizont maturation assay it is not subject to individual variability, is far less
labour intensive and provides more accurate results concerning inhibitory
concentrations.
After drug exposure an enzyme-linked immunosorbent assay is performed,
measuring the concentration of HRP2, a protein that is produced by the parasite
throughout its life cycle. This assay needs only fairly low parasitaemia starting
from 0.01 % on and only little equipment. It is easy to reproduce and can quickly
be performed on a great number of isolates at the same time.
10
Erythrocytes infected with P. falciparum show an alteration of the cytoskeleton in the form of protrusions called knobs. These knobs are induced by the parasite (Deitsch, K. W. and Wellems, T. E. 1996) and play a role in cytoadherence (Crabb, B. S. et al. 1997).
31
On ex vivo samples (especially without prior depletion of leukocytes and
samples with low parasitaemia) it has been shown to be superior to the SYBR-
Green method (Chaorattanakawee, S. et al. 2013) and the radio-labelled-
hypoxanthine-reuptake assay (Tritten, L. et al. 2009).
Very recently, as described above, a novel sensitivity assessment test gained
importance with regards to artemisinin drug testing (Witkowski, B. 2013a). The
Survival Assay is performed on ring stage parasites (ring survival assay) and
mature stage parasites (mature survival assay, MSA). Parasites are
synchronized to the stage of interest and at a parasitaemia 1 – 2 % exposed to
six hours of high DHA levels (700 nM). The short exposure to high doses of the
drug is assumed to imitate the drug exposure in vivo better than continuous
exposure to lower doses as it is being done in other sensitivity tests. Depending
of the parasite age post invasion the assay is called RSA0 – 3, referring to
parasites 0 – 3 hours post invasion etc. Then viable second generation rings or
trophozoites will be determined by microscopy after e.g. another 66 hours
(RSA) or 42 hours (MSA) (specific time depends on the age of parasites when
performing drug exposure) of incubation.

32
4. Material and Methods
4.1 Material
Sample processing
Albumax II Gibco Invitrogen, New Zealand
Gentamicin (stock 10 mg / ml) Sigma Aldrich, USA
Giemsa Sigma Aldrich, USA
Glucose 10 % Sigma Aldrich, USA
4-(2-hydroxyethyl)-1-
piperazineethanesulfonic acid (HEPES) Gibco, USA
Human European AB serum Universitätsklinikum Heidelberg,
Germany
Hypoxanthine 10 mM ccpro, Germany
L-Glutamine 200 mM Sigma Aldrich, USA
Methanol Scharlab SL, Spain
NaOH 12 % Sigma Aldrich, USA
Roswell Park Memorial Institute medium
(RPMI) 1640 without L-Glutamine Sigma Aldrich, USA
Solutions
Complete culture medium (CCM): RPMI 1640 without glutamine plus 5 ml L- glutamine plus 3 ml NaHCO3
plus 5 ml hypoxanthine plus 18.5 ml HEPES plus 1.25 ml gentamicin plus 50 ml 5 % albumin II plus 10 ml glucose plus 10 ml human AB serum
The CCM was stored at 4 °C and used for a maximum of one week.
Blocking solution: BSA diluted at 2 % in PBS
Washing solution: Tween 20 diluted at 0.05 % in phosphate buffered saline
(PBS)
33
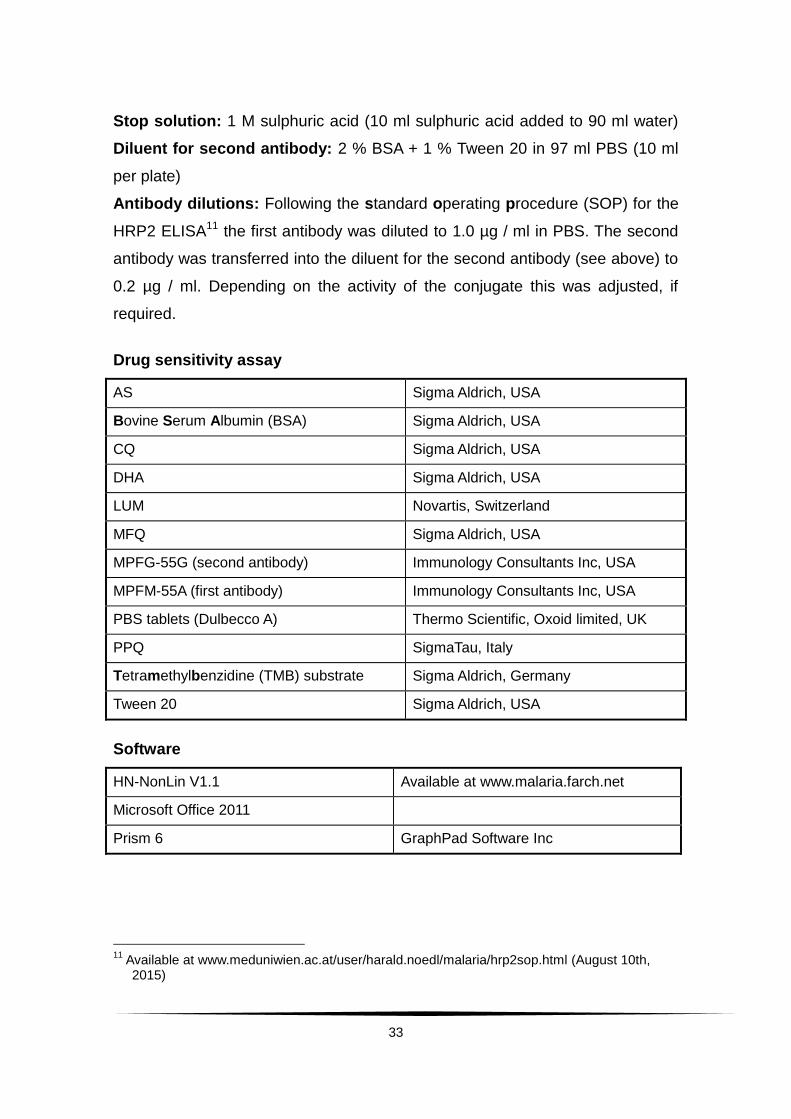
Stop solution: 1 M sulphuric acid (10 ml sulphuric acid added to 90 ml water)
Diluent for second antibody: 2 % BSA + 1 % Tween 20 in 97 ml PBS (10 ml
per plate)
Antibody dilutions: Following the standard operating procedure (SOP) for the
HRP2 ELISA11 the first antibody was diluted to 1.0 µg / ml in PBS. The second
antibody was transferred into the diluent for the second antibody (see above) to
0.2 µg / ml. Depending on the activity of the conjugate this was adjusted, if
required.
Drug sensitivity assay
AS Sigma Aldrich, USA
Bovine Serum Albumin (BSA) Sigma Aldrich, USA
CQ Sigma Aldrich, USA
DHA Sigma Aldrich, USA
LUM Novartis, Switzerland
MFQ Sigma Aldrich, USA
MPFG-55G (second antibody) Immunology Consultants Inc, USA
MPFM-55A (first antibody) Immunology Consultants Inc, USA
PBS tablets (Dulbecco A) Thermo Scientific, Oxoid limited, UK
PPQ SigmaTau, Italy
Tetramethylbenzidine (TMB) substrate Sigma Aldrich, Germany
Tween 20 Sigma Aldrich, USA
Software
HN-NonLin V1.1 Available at www.malaria.farch.net
Microsoft Office 2011
Prism 6 GraphPad Software Inc
11
Available at www.meduniwien.ac.at/user/harald.noedl/malaria/hrp2sop.html (August 10th, 2015)
34
Equipment
Cell culture plates Greiner bio one
EDTA tubes BD Vacutainer, bd USA
ELISA plates Greiner bio one
ELISA plate washer Biotek
ELISA plate reader Synergy 4, Gen 5
Heparin tubes BD Vacutainer, BD USA
Incubator Jencons, Nuaire
Microscope Nikon Eclipse E200, China
Multi-channel pipette Accu Jet Pro, Steinbrenner
Pipette tips Neptunes, USA
4.2 Methods
4.2.1 Study site
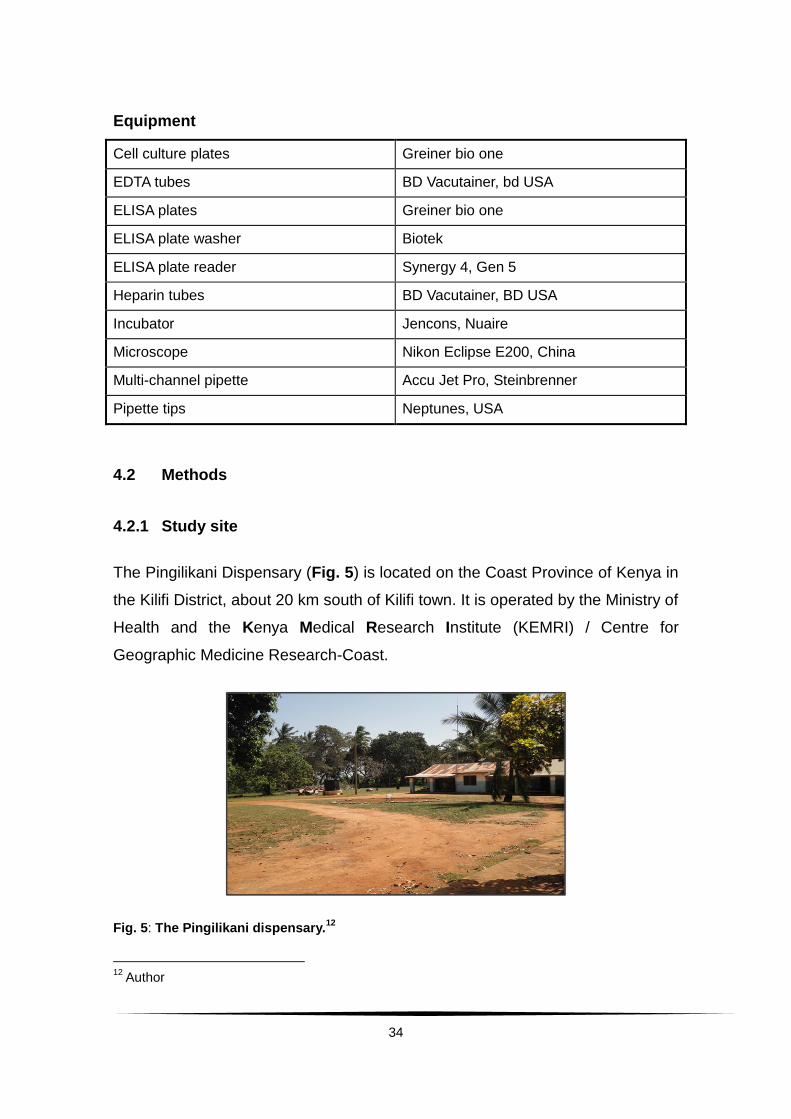
The Pingilikani Dispensary (Fig. 5) is located on the Coast Province of Kenya in
the Kilifi District, about 20 km south of Kilifi town. It is operated by the Ministry of
Health and the Kenya Medical Research Institute (KEMRI) / Centre for
Geographic Medicine Research-Coast.
Fig. 5: The Pingilikani dispensary.12
12
Author

35
A ward is located next to the dispensary where patients were admitted for three
days after enrolment (Fig. 6).
Fig. 6: The Pingilikani ward.13
The clinical team in Pingilikani has been conducting research studies since
2005 (CATMAP study protocol 2011, v.1.3). Perennial transmission of malaria in
the area has been reported with typical peaks within two rainy seasons
throughout the year, one from April to June and the second from October to
November (O’Meara, W. P. et al. 2008). The transmission rate for P. falciparum
has been reported to range between 22 to 53 infective bites per person per year
(Mbogo, C. M. et al. 2003). Bejon, P. et al. (2014) further investigated
transmission in the Kilifi area and found hotspots which then again contained
hotspots, sometimes narrowing down to one single high transmission household
having an impact on the area surrounding it. They conclude that mosquito
ecology as one determinant of malaria transmission could be influenced at a
wide range of spatial scales in the area, ranging from macro- to micro-
geographical characteristics.
13
Author
36
4.2.2 Study design
Investigations were carried out as part of the “Confirmation of Artemisinin
Tolerance in Malaria Parasites trial” (Study ID Number KEMRI_CT_2010/0013,
SSC 1821; NCT Number NCT0119037114). The study was designed as a
single-arm trial observing parasitological and clinical responses of P. falciparum
to a 7-day mono-treatment with AS in order to answer the question if
Plasmodium falciparum infections in Kenya have become less response to
artemisinin treatment. Children who met the inclusion criteria (Appendix 1) were
enrolled after obtaining written informed consent from a parent or a legal
guardian. They were admitted to the paediatric ward in Pingilikani and treated
orally with 2 mg / kg body weight AS for 7 days. Admission was planned for 3
days (day 0 – 3); from day 4 – 6 the children were seen and treated as out-
patients. Follow-up was carried out on days 7, 14, 21, 28 and 42 including
clinical and laboratory check-ups (CATMAP study protocol v1.3 2011,
refer to 14).
This work as part of the CATMAP study is about drug surveillance of artemisinin
and its partner drugs with a more specific focused on the ex vivo data in
comparison with previous data collected in the area. This will be supported by
some of the collected in vivo data of the CATMAP trial.
4.2.3 Determination of parasite density in the field
Parasite density for the clinical outcomes was determined by an experienced
laboratory technician according to the applicable Kilifi slide reading SOP. It was
expressed as the number of asexual parasites per µl of blood by dividing the
number of asexual parasites by the number of white blood cells counted. This
number was multiplied by an assumed fixed white blood cell density of
8,000 / µl.
14
As registered under clinicaltrials.gov, available under https://clinicaltrials.gov/ct2/show/record/NCT01190371?term=CATMAP&rank=1 (June 30th, 2016)
37
Parasite density (per µl) = Number of parasites counted 8,000
Number of leukocytes counted
The parasitaemia values calculated by this method were uploaded to the
Worldwide Antimalarial Resistance Network (WWARN) web-based tool for
calculation of parasite clearance estimation.15
4.2.4 Determination of parasite density in the laboratory
Parasite density was calculated through inspection of 10 microscopic fields. The
number of infected erythrocytes was divided by the number of total red blood
cells to calculate the percentage of parasitaemia. This value was used for
setting up the drug sensitivity assay.
4.2.5 Preparation of antimalarial drugs
All the drugs applied during the course of the ex vivo study were obtained
readily dissolved as so called stock-solutions.
Prior to the set-up of the culture plate each drug had to be diluted down with
RPMI 1640 to create a working solution. Those working-solutions were created
as portrayed in the table below and stored at 4 °C.
Working solutions Medium (ml) Drug stock solution (µl)
CQ 4.991 9.259
MFQ 4.998 1.543
DHA 4.998 1.530
AS 4.998 1.530
LUM 4.990 10.285
PPQ 4.997 3.086
15
Available under: http://www.wwarn.org/tools-resources/toolkit/analyse/parasite-clearance-estimator-pce (June 30th, 2016)

38
4.2.6 Handling of samples in the laboratory
Fig. 7a: Schematic of sample processing in the laboratory.
A The blood sample for ex vivo investigation of the inhibitory concentration 50 % (IC50)
was collected from the study participants before administering the first dose of AS on day 0 as well as on the day of recurrent parasitaemia. 4 ml of venous blood was collected into a heparin tube and stored at 4 °C until cooled transport to the KEMRI Immunology laboratory (within 8 hours after collection). The sample was centrifuged at 2000 rpm for 5 min. The plasma was removed and stored separately (not necessary, removal done since further investigations within the CATMAP study were planned with it). The buffy coat was removed from the sample with a pipette and a thin slide was prepared. The slide was dried, fixed with methanol and stained with 10 % Giemsa for 15 minutes. Reading 10 microscopic fields under a light microscope (oil-immersion, 1000-fold magnification), the percentage of parasitaemia was determined. The volume of blood needed for the HRP2 assay was determined with regards to parasitaemia and an aliquot was made to set up the assay (C-D, see Fig. 7b). The rest of the sample was stored at -80 °C for other investigations within CATMAP.
B The blood sample for genotyping investigations was taken before the first treatment and
on the day of recurrent parasitaemia. 4 ml venous blood was collected into an EDTA tube and stored at 4 °C until cooled transport to the KEMRI Immunology laboratory (within 8 hours after collection). The sample was immediately transferred into a 15 ml tube and the equal amount (1:1) of cold PBS was added before running the sample through a CF11 column for depletion of leukocytes and, consequently, human DNA. After centrifugation (2000 rpm for 5 min) an aliquot was made out of the pellet of favourably 200 µl for polymerase chain reaction (PCR) / genotyping and stored at -80 °C until further processing.
39
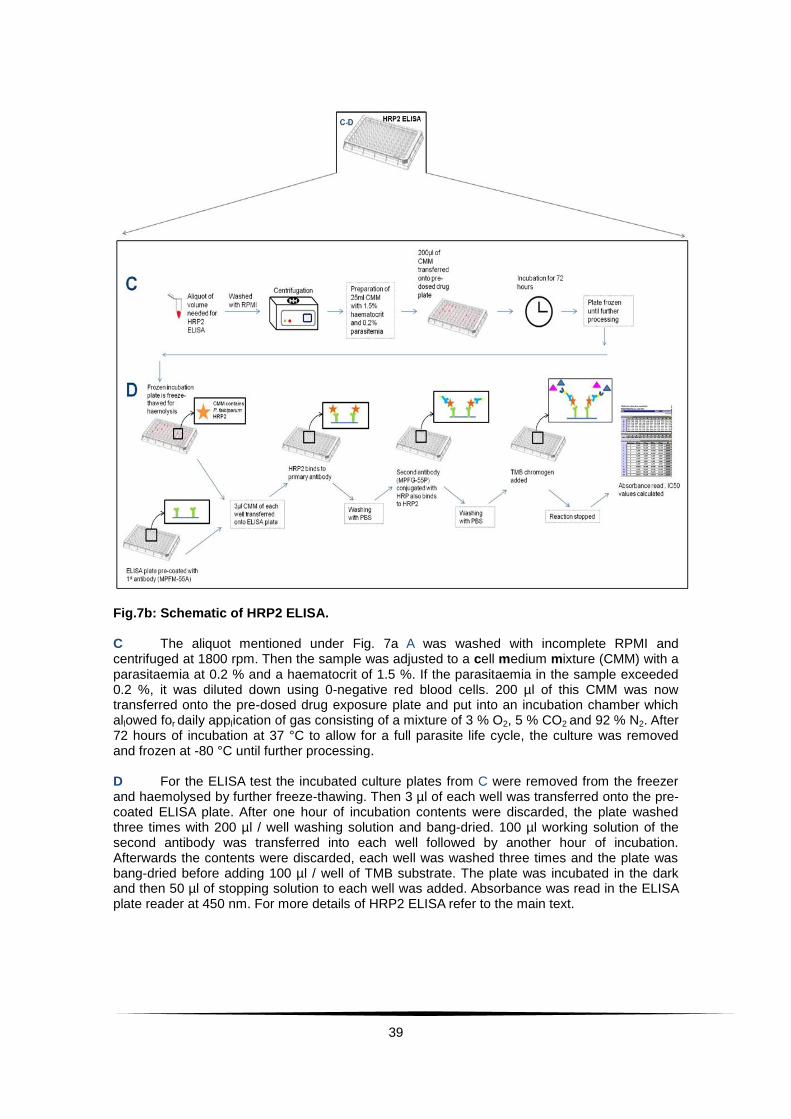
Fig.7b: Schematic of HRP2 ELISA. C The aliquot mentioned under Fig. 7a A was washed with incomplete RPMI and centrifuged at 1800 rpm. Then the sample was adjusted to a cell medium mixture (CMM) with a parasitaemia at 0.2 % and a haematocrit of 1.5 %. If the parasitaemia in the sample exceeded 0.2 %, it was diluted down using 0-negative red blood cells. 200 µl of this CMM was now transferred onto the pre-dosed drug exposure plate and put into an incubation chamber which allowed for daily application of gas consisting of a mixture of 3 % O2, 5 % CO2 and 92 % N2. After 72 hours of incubation at 37 °C to allow for a full parasite life cycle, the culture was removed and frozen at -80 °C until further processing. D For the ELISA test the incubated culture plates from C were removed from the freezer and haemolysed by further freeze-thawing. Then 3 µl of each well was transferred onto the pre-coated ELISA plate. After one hour of incubation contents were discarded, the plate washed three times with 200 µl / well washing solution and bang-dried. 100 µl working solution of the second antibody was transferred into each well followed by another hour of incubation. Afterwards the contents were discarded, each well was washed three times and the plate was bang-dried before adding 100 µl / well of TMB substrate. The plate was incubated in the dark and then 50 µl of stopping solution to each well was added. Absorbance was read in the ELISA plate reader at 450 nm. For more details of HRP2 ELISA refer to the main text.
40
4.2.7 Drug sensitivity testing ex vivo via HRP2 ELISA
The HRP2 ELISA (refer to 3.1.2) was carried out on ex vivo samples to test
drug sensitivity. The drugs chosen for testing were DHA, AS, LUM, MFQ, PPQ
and CQ according to following rationale:
Artemisinin derivatives are considered the most efficient drugs for the treatment
of Plasmodium falciparum malaria. Since monotherapies have been proven to
encourage drug resistance, the artemisinins are combined with a partner drug.
A total of six drugs were tested in the CATMAP study and all results will be
reported here, while the main focus of this work will remain on the artemisinins,
LUM and PPQ.
The IC50s for two artemisinins, namely AS and DHA were chosen to monitor
the efficacy of artemisinins in Kenya. The main active metabolite of all
artemisinins is DHA (Woerdenbag, H. J. et al. 1994; Morris, C. A. et al. 2011;
Hall, A. J. 2013). The exposure to AS itself, consequently, is fairly low in
comparison to DHA (Navaratnam, V. et al. 2000; Olliaro, P. L. et al. 2001;
Morris, C. A. et al. 2011). Testing two artemisinins in the same assay makes it is
also possible to use them as internal control.
LUM belongs to the aryl-amino-alcohol group of antimalarials and is the partner
drug in the current ACT used as first-line treatment in uncomplicated
P. falciparum malaria in Kenya. MFQ belongs to the same group as LUM and
plays an important role in the global treatment and prevention of malaria. MFQ
is used in combination with AS as ACT. Both compounds are thought to have
similar mechanisms of action, supposedly due to the same basic chemical
characteristic, consisting of a hydroxyl group near the ring which is
hypothesized to be the key feature in antimalarial activity (Chien, P. L. and
Cheng, C. C. 1976; Karle, J. M. and Karle, I. L. 1991). Therefore, similar IC50
values can be shown (Basco, L. K. et al. 1998).
PPQ is a bisquinoline (dimeric 4-aminoquinoline) and has been combined with
DHA into an ACT as another option in treatment for P. falciparum malaria.
41
PPQ has been synthesised in order to conquer CQ resistance by adding
structural modifications (Schlitzer, M. 2007). The proposal for the mechanism of
action in the group of aryl-amino-alcohols as well as in the group of 4-
aminoquinolines has been by interference with the haeme polymerization. In
China cross-resistance between CQ and PPQ has been reported (Fan, B. et al.
1998; Yang, H. et al. 1999), but these results could not be reproduced e.g. in
Cameroon (Basco, L. K. and Ringwald, P. 2003). To gather current data from
Kenya, CQ as former first-line treatment was tested here as well.
4.2.7.1 Preparations for HRP2 ELISA
Drug exposure culture plate preparation and layout
On the drug exposure culture plate parasites were incubated under drug
pressure before the ELISA (Fig. 7b, C).
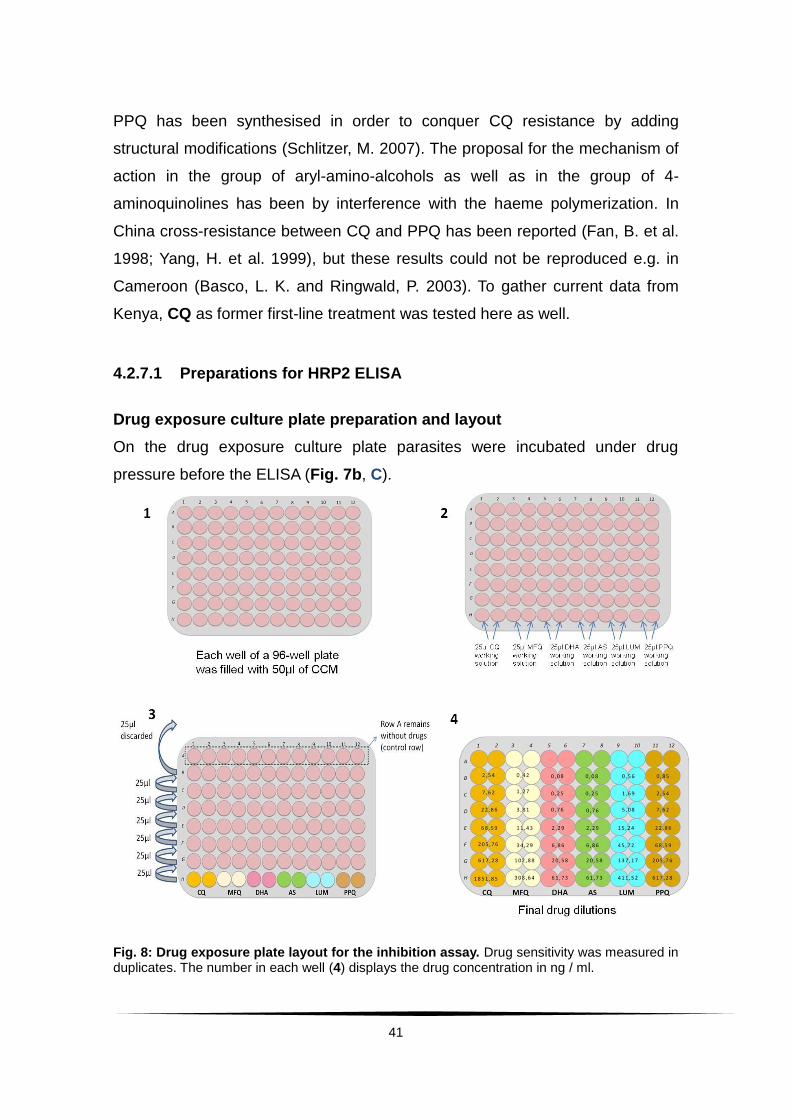
Fig. 8: Drug exposure plate layout for the inhibition assay. Drug sensitivity was measured in duplicates. The number in each well (4) displays the drug concentration in ng / ml.

42
When planning the set-up, in order to find the highest drug solution needed for
full inhibition, the previously reported IC50 values for the area (Borrmann, S. et
al. 2011) were used as reference, leading to a plate layout as shown in
Fig. 8, 4. To prepare for drug dilution, each well of a 96-well plate was filled with
50 µl of CCM (refer to 4.1, solutions) (Fig. 8, 1).
To each well in row H 25 µl working solution of the drug of interest was added in
duplicates (Fig. 8, 2). Using a multi-channel pipette starting in row H the
solution was mixed by pipetting up and down and then 25 µl of the mixture was
transferred from row H into row G. After mixing, now 25 µl was transferred from
row G to F. This procedure was repeated for each row going up, resulting in a 3-
fold dilution per row. 25 µl was discarded after row B to allow each row to
contain the same amount of 50 µl (Fig. 8, 3). Row A was skipped and
functioned as positive control row without drug exposure.
Pre-coating of ELISA plates
For each ELISA plate the primary antibody was diluted to 1 µg / ml in PBS.
100 µl of this mixture was transferred into each well of the ELISA plate using a
multi-channel pipette. The plate was then sealed and incubated overnight at
4 °C. The following day the contents were discarded and the plate bang-dried.
To each well 200 µl of freshly prepared blocking solution was added. After an
incubation time of 2 hours at room temperature the contents were discarded
and the plate bang-dried a second time. Following that the plate was washed
with 200 µl washing solution per well and bang-dried again before adding the
sample.
4.2.7.2 The HRP2 ELISA
The HRP2 ELISA is a sandwich ELISA, whereas a primary antibody is coated
onto the ELISA plate (refer to 4.2.7.1, Pre-coating of ELISA plates) Then the
sample is added and the protein of interest, here HRP2, binds specifically to the
primary antibody. After incubation and removal of unbound material with
washing solution the second antibody is added. This second antibody is
conjugated to an enzyme, called Horseradish peroxidase (HRP). This second
43
antibody now also binds to HRP2 at a different site, thereby “sandwiching” it in
between the primary and the second antibody. After another washing step a
substrate is added. This substrate is a chromogen which changes colour due to
the HRP linked to the second antibody. This colour change depends on the
quantity of the second antibody, and, thus, also the quantity of HRP2. This
colour change can then be measured in an ELISA plate reader to quantify
exactly the presence of HRP2 and, consequently, parasite growth.
For the ELISA (Fig. 7b, D) the incubated drug exposure culture plates were
removed from the freezer and haemolysed by further freeze-thawing until all
wells looked clear. To ensure proper mixing, the content of each well was
pipetted up and down multiple times before transferring 3 µl of each well onto
the pre-coated ELISA plate with a multi-channel pipette. The remaining sample
was frozen again. Allowing for incubation, the plate was left for one hour before
discarding the contents and washing three times with 200 µl / well washing
solution. The plate was then bang-dried.
Now, using a multi-channel pipette, 100 µl working solution of the second
antibody was transferred into each well. This was followed by another hour of
incubation. Afterwards the contents were discarded, each well was washed
three times with 200 µl washing solution and the plate was bang-dried before
adding 100 µl / well of TMB substrate. For seven minutes the plate was
incubated in the dark before adding 50 µl of stopping solution (refer to 4.1,
solutions) to each well. Then absorbance was read in the ELISA plate reader at
450 nm.
Optical density (OD) values were stored in an excel sheet and evaluated with
regard to growth differences between the well with the highest drug exposure
up to the lowest concentration and control wells. The values had to show at
least a 2-fold growth in order to be included in the analysis. In some cases this
limit was not reached, but the values were included in the analysis nevertheless
because they showed a noticeable growth and a distinct half maximal inhibitory
concentration.
44
All included samples were then manually transferred onto the HN-NonLin V1.1
sheet16 provided to calculate IC50 values (ng / ml). The IC50 values were
transferred into nM by using an excel sheet containing the needed formula for
each drug (Appendix 2).
4.2.8 Genotyping of recurrence samples to distinguish between
recrudescence and reinfection
DNA was extracted from matched pairs of parasite isolates from baseline and
recurrence samples (Fig. 7a, B) with a commercial QIAGEN kit. Capillary
electrophoresis analysis of fluorescence-labelled nested msp2-PCR products
was done both in Kilifi and in Germany.
4.2.9 Statistical analysis
Fever was defined as temperature above 37.5 °C. Mean time to fever clearance
was determined if the patient had fever within the first 24 hours. Time to fever
clearance was then calculated from enrolment until two consecutive
documentations of temperature below or equal to 37.5 °C. The parasite
reduction ratio was defined as the parasite count at admission divided by the
parasite count on the hour of interest. This value was then expressed as
logarithm (log10). When parasitaemia falls below the detection level in the
clinical settings, the value 0 is stated by the microscopist. When excluding these
values the PRR is underestimated. Therefore, to accommodate for the ongoing
decline in parasite reduction, the value 0 at hour 12 was substituted by 1, at
hour 18, at hour 12 by 0.5, at hour 24 by 0.1 etc.17. The ratios were determined
by using parasite count at hour 0 as numerator and the hour of interest as
denominator (parasite reduction ratio within the first 6 hours (PRRH6), within 12
hours (PRRH12), within 24 hours (PRRH24) and within 48 hours (PRRH48).
16
Available for download under http:\\www.malaria.farch.net (August 10th, 2015)
17 Refer to http://www.statssa.gov.za/isi2009/ScientificProgramme/IPMS/0607.pdf (May 11th,
2014)

45
In order to determine the development of the reduction ratios as well, the
parasite reduction ratio six hours before was subtracted from the hour of
interest and divided by 6 to obtain a rate / hour for each six hourly interval. The
correlation of patient age and initial parasitaemia with clinical treatment
responses and other independent variables was evaluated by linear regression
analysis. Ex vivo inhibitory concentrations were obtained by using logarithmic
transformed drug concentrations in a polynomial non-linear regression model
(automatically done when copying OD values into the HN-NonLin V.1.1 sheet)
and expressed as geometric mean with the 95 % Confidence Interval (CI). Hints
for cross-resistance were looked for using pair-wise correlation of Spearman
(rho) (non-parametric test), coefficient of correlation of Pearson (r) (parametric
test) including the coefficient of correlation (r2). Wilcoxon´s paired
nonparametric test was used to evaluate differences in the ex vivo drug
responses between baseline and recurrent infections. Linear regression
analysis was done to examine whether the time of drug storage influenced the
IC50 values. When a possible influence was recognised, a non-paired, non-
parametric t-test (between DHA and AS values in- and excluding the
measurements made with the conspicuous drug solutions) was used to check
whether this influence created a statistically significant difference. Numbers
were rounded to two digits after the comma. In some cases, were necessary,
rounding was done to three digits after the comma. Percentages were rounded
to full numbers.
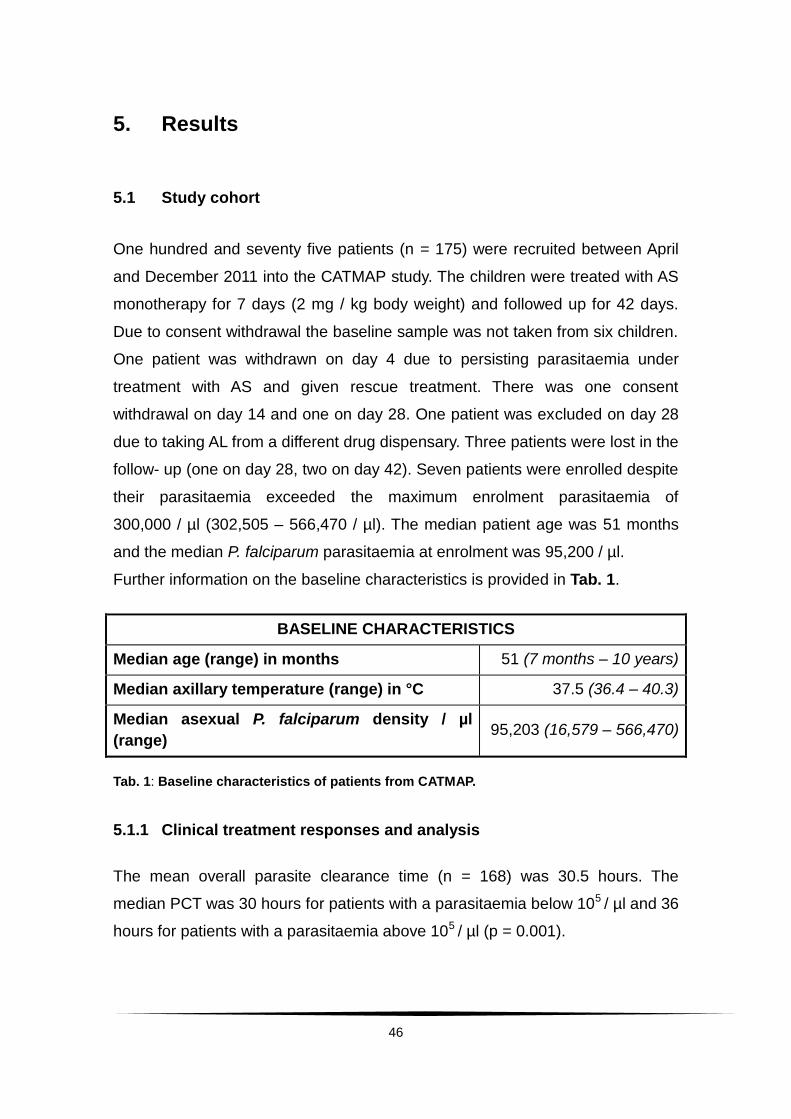
46
5. Results
5.1 Study cohort
One hundred and seventy five patients (n = 175) were recruited between April
and December 2011 into the CATMAP study. The children were treated with AS
monotherapy for 7 days (2 mg / kg body weight) and followed up for 42 days.
Due to consent withdrawal the baseline sample was not taken from six children.
One patient was withdrawn on day 4 due to persisting parasitaemia under
treatment with AS and given rescue treatment. There was one consent
withdrawal on day 14 and one on day 28. One patient was excluded on day 28
due to taking AL from a different drug dispensary. Three patients were lost in the
follow- up (one on day 28, two on day 42). Seven patients were enrolled despite
their parasitaemia exceeded the maximum enrolment parasitaemia of
300,000 / µl (302,505 – 566,470 / µl). The median patient age was 51 months
and the median P. falciparum parasitaemia at enrolment was 95,200 / µl.
Further information on the baseline characteristics is provided in Tab. 1.
BASELINE CHARACTERISTICS
Median age (range) in months 51 (7 months – 10 years)
Median axillary temperature (range) in °C 37.5 (36.4 – 40.3)
Median asexual P. falciparum density / µl
(range) 95,203 (16,579 – 566,470)
Tab. 1: Baseline characteristics of patients from CATMAP.
5.1.1 Clinical treatment responses and analysis
The mean overall parasite clearance time (n = 168) was 30.5 hours. The
median PCT was 30 hours for patients with a parasitaemia below 105 / µl and 36
hours for patients with a parasitaemia above 105 / µl (p = 0.001).
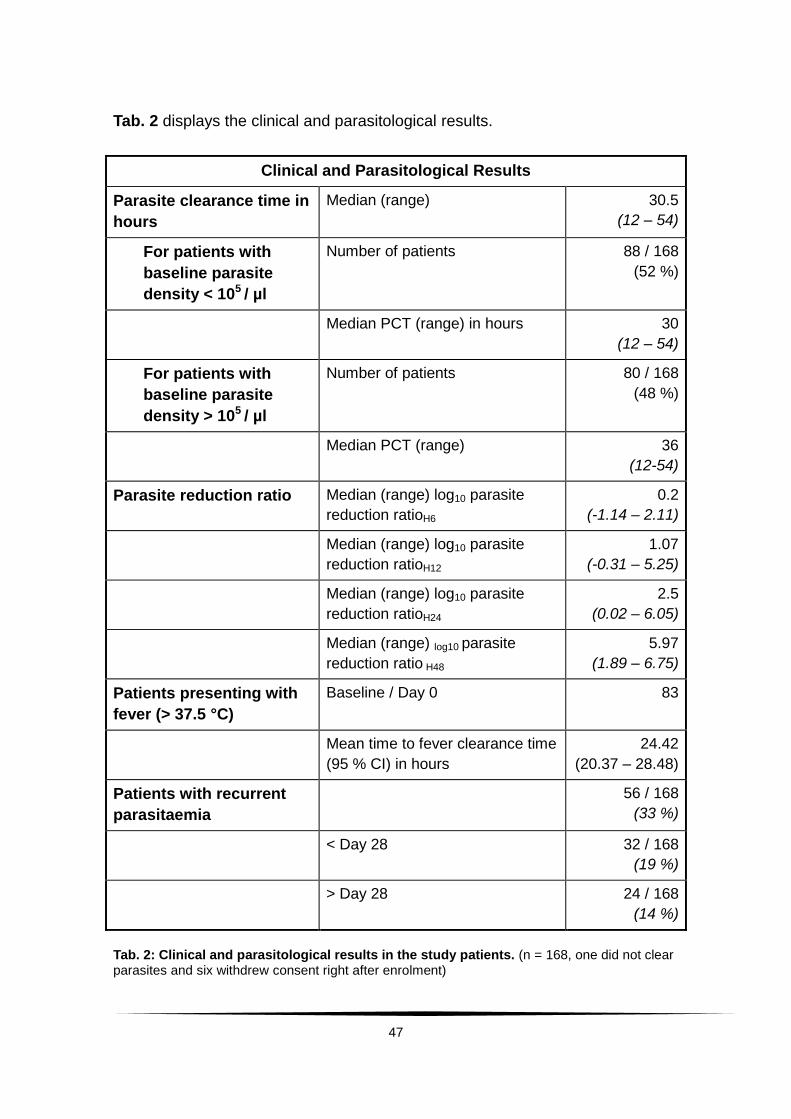
47
Tab. 2 displays the clinical and parasitological results.
Tab. 2: Clinical and parasitological results in the study patients. (n = 168, one did not clear parasites and six withdrew consent right after enrolment)
Clinical and Parasitological Results
Parasite clearance time in
hours
Median (range) 30.5
(12 – 54)
For patients with
baseline parasite
density < 105 / µl
Number of patients 88 / 168
(52 %)
Median PCT (range) in hours 30
(12 – 54)
For patients with
baseline parasite
density > 105 / µl
Number of patients 80 / 168
(48 %)
Median PCT (range) 36
(12-54)
Parasite reduction ratio Median (range) log10 parasite
reduction ratioH6
0.2
(-1.14 – 2.11)
Median (range) log10 parasite
reduction ratioH12
1.07
(-0.31 – 5.25)
Median (range) log10 parasite
reduction ratioH24
2.5
(0.02 – 6.05)
Median (range) log10 parasite
reduction ratio H48
5.97
(1.89 – 6.75)
Patients presenting with
fever (> 37.5 °C)
Baseline / Day 0 83
Mean time to fever clearance time
(95 % CI) in hours
24.42
(20.37 – 28.48)
Patients with recurrent
parasitaemia
56 / 168
(33 %)
< Day 28 32 / 168
(19 %)
> Day 28 24 / 168
(14 %)

48
On day of enrolment elevated body temperature (> 37.5 °C) was recorded in 83
patients, mean time to fever clearance was 24 hours (95 % CI 20 – 28 hours).
On the first day (24 hours) after initiation of treatment there were 117 / 168
patients (Day 1 Parasite Prevalence Rate PPRD1 70 %) with residual
parasitaemia. By hour 48, only 3 patients had residual parasitaemia
(PPRD2 2 %) and by hour 54 all patients were cleared of parasitaemia except of
one patient, who was later excluded and given rescue treatment for suspected
clinical treatment failure.
Most parasites were killed between 6 and 12 hours after the treatment dose.
The increase in parasite reduction was high between hour 6 and 12 after
initiation of treatment (reduction rate rose from 0.2 to 1.07, therefore, from
0.03 / hour to 0.14 / hour). It then decreased until reaching the time of second
artesunate treatment dose at hour 24. After the second dose it increased rapidly
within six hours between hour 24 and 30 (0.08 / hour to 0.55 / hour) to then slow
once again (Fig. 9).
Fig. 9: Median parasite reduction ratios per hour in six hourly intervals for the first 48 hours after initiation of treatment.

49
Fig. 10 shows the reduction in total mean parasitaemia levels over time.
Fig. 10: Reduction in mean parasitaemia levels over hours. Green dots display mean parasitaemia in overall study population over time. Red dots display parasitaemia in one single patient not clearing parasites. Bars show 95 % CI of mean parasite counts.
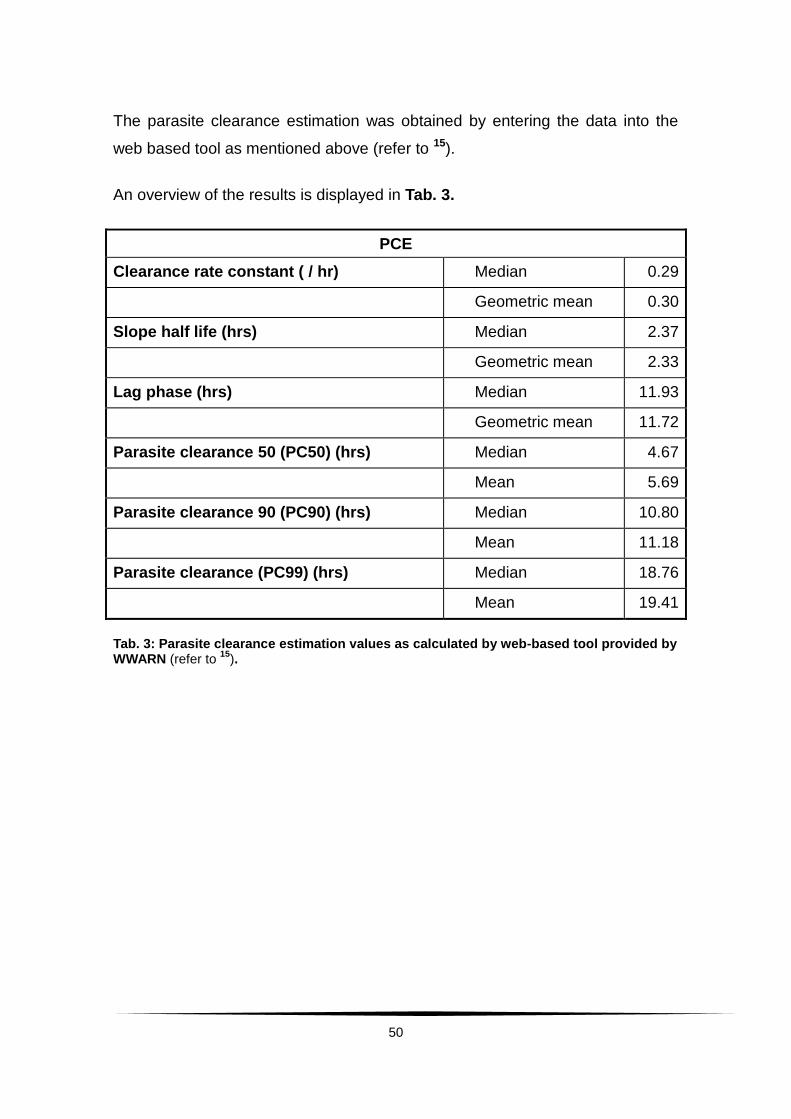
50
The parasite clearance estimation was obtained by entering the data into the
web based tool as mentioned above (refer to 15).
An overview of the results is displayed in Tab. 3.
PCE
Clearance rate constant ( / hr) Median 0.29
Geometric mean 0.30
Slope half life (hrs) Median 2.37
Geometric mean 2.33
Lag phase (hrs) Median 11.93
Geometric mean 11.72
Parasite clearance 50 (PC50) (hrs) Median 4.67
Mean 5.69
Parasite clearance 90 (PC90) (hrs) Median 10.80
Mean 11.18
Parasite clearance (PC99) (hrs) Median 18.76
Mean 19.41
Tab. 3: Parasite clearance estimation values as calculated by web-based tool provided by WWARN (refer to
15).
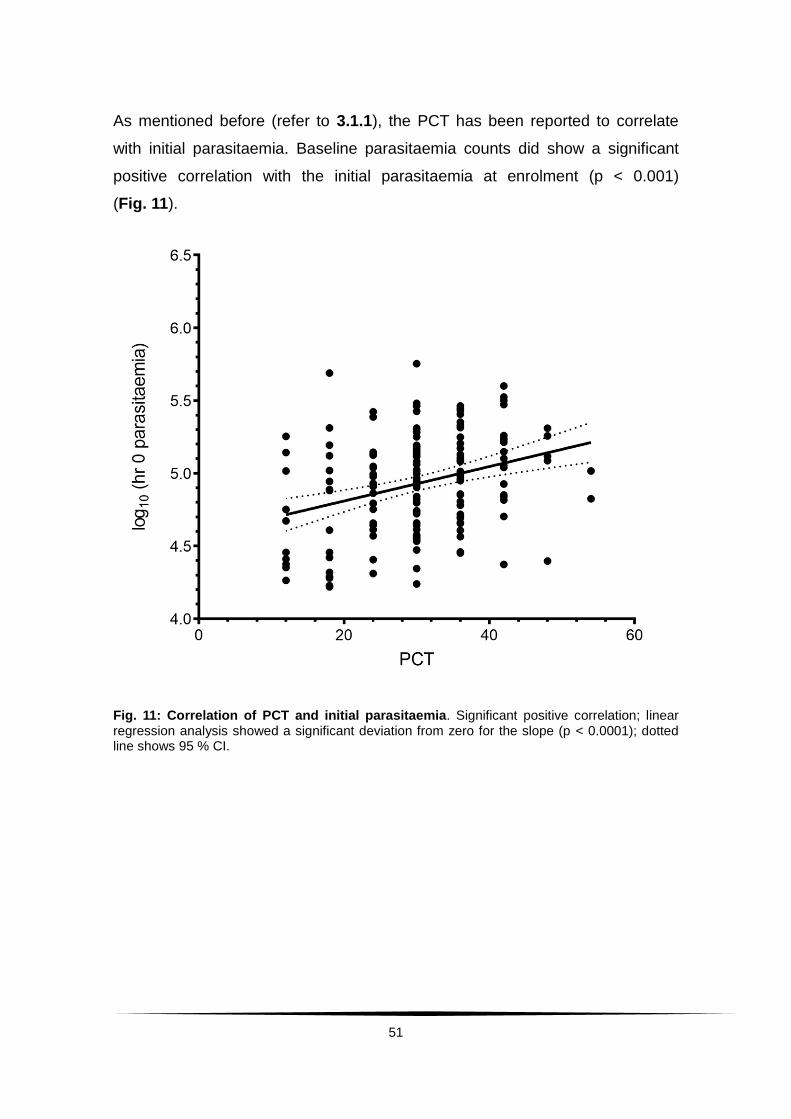
51
As mentioned before (refer to 3.1.1), the PCT has been reported to correlate
with initial parasitaemia. Baseline parasitaemia counts did show a significant
positive correlation with the initial parasitaemia at enrolment (p < 0.001)
(Fig. 11).
Fig. 11: Correlation of PCT and initial parasitaemia. Significant positive correlation; linear regression analysis showed a significant deviation from zero for the slope (p < 0.0001); dotted line shows 95 % CI.

52
No significant correlation could be found between PCT and the age of the
patient (Fig. 12).
Fig. 12: Correlation of PCT and patient age. No significant correlation; dotted line shows 95 % CI.
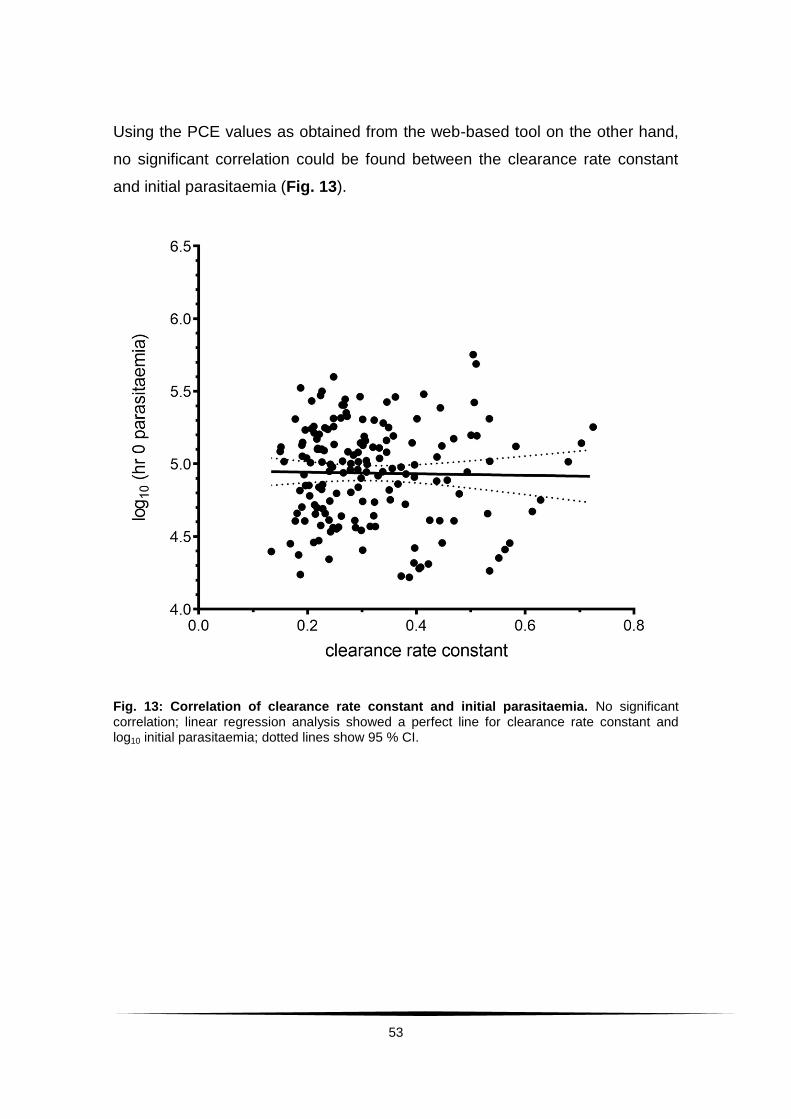
53
Using the PCE values as obtained from the web-based tool on the other hand,
no significant correlation could be found between the clearance rate constant
and initial parasitaemia (Fig. 13).
Fig. 13: Correlation of clearance rate constant and initial parasitaemia. No significant correlation; linear regression analysis showed a perfect line for clearance rate constant and log10 initial parasitaemia; dotted lines show 95 % CI.
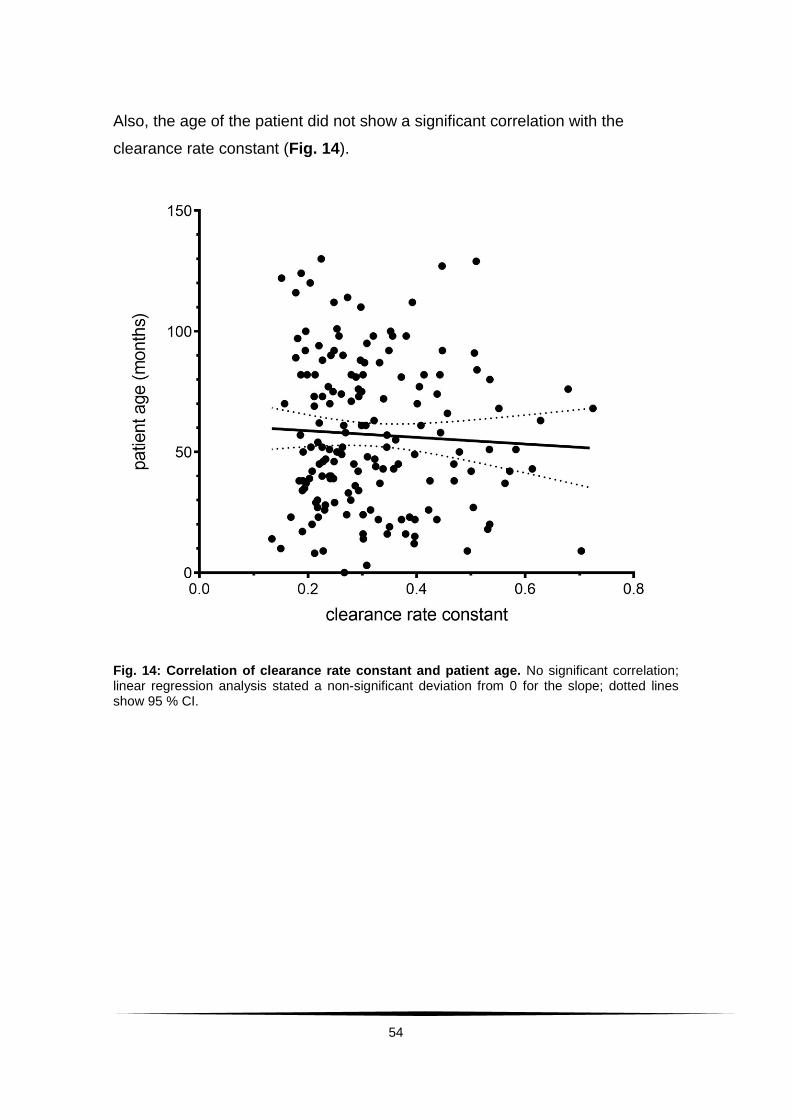
54
Also, the age of the patient did not show a significant correlation with the
clearance rate constant (Fig. 14).
Fig. 14: Correlation of clearance rate constant and patient age. No significant correlation; linear regression analysis stated a non-significant deviation from 0 for the slope; dotted lines show 95 % CI.

55
The same applied for the slope half life (Fig. 15).
Fig. 15: Correlation of slope half life and initial parasitaemia. No significant correlation; linear regression analysis stated a non-significant deviation from 0 for the slope; dotted lines show 95 % CI.
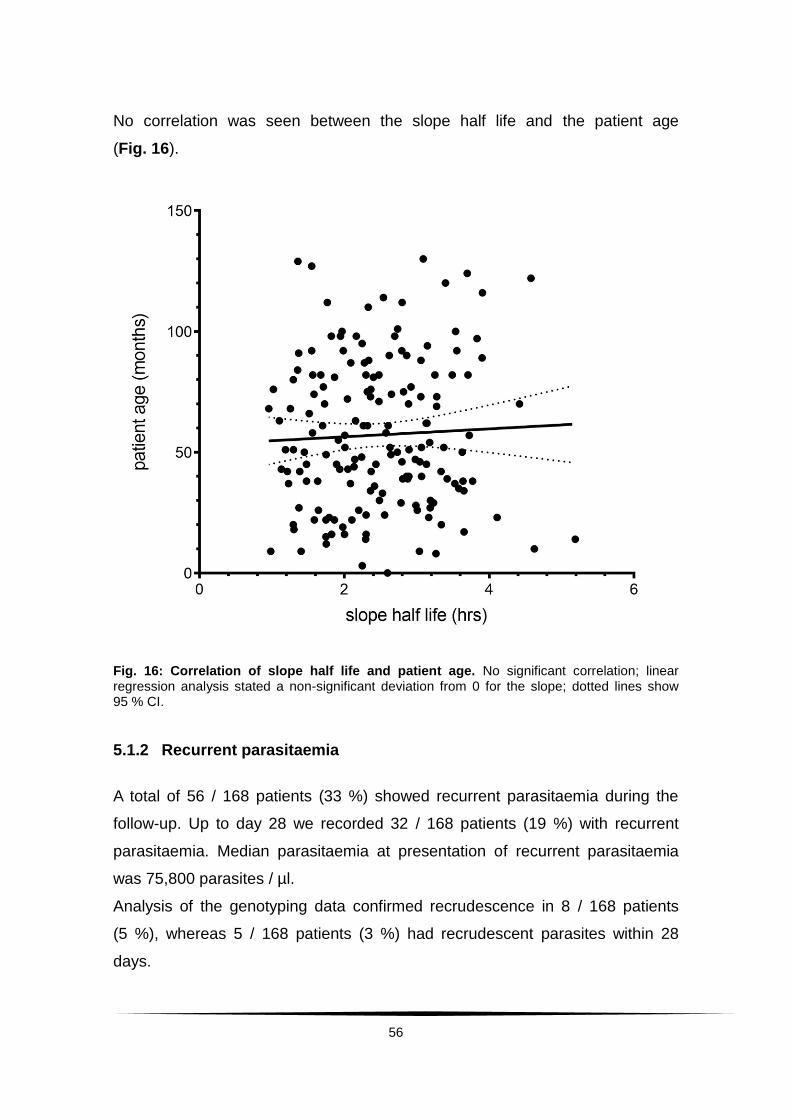
56
No correlation was seen between the slope half life and the patient age
(Fig. 16).
Fig. 16: Correlation of slope half life and patient age. No significant correlation; linear regression analysis stated a non-significant deviation from 0 for the slope; dotted lines show 95 % CI.
5.1.2 Recurrent parasitaemia
A total of 56 / 168 patients (33 %) showed recurrent parasitaemia during the
follow-up. Up to day 28 we recorded 32 / 168 patients (19 %) with recurrent
parasitaemia. Median parasitaemia at presentation of recurrent parasitaemia
was 75,800 parasites / µl.
Analysis of the genotyping data confirmed recrudescence in 8 / 168 patients
(5 %), whereas 5 / 168 patients (3 %) had recrudescent parasites within 28
days.
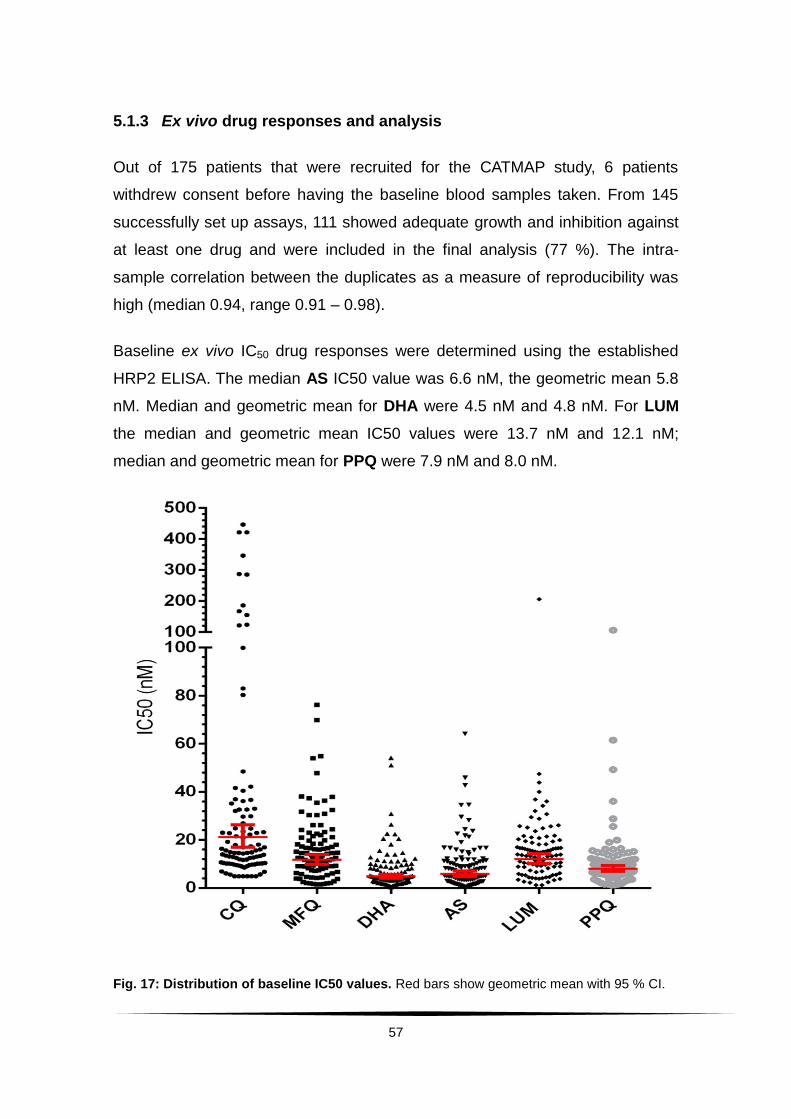
57
5.1.3 Ex vivo drug responses and analysis
Out of 175 patients that were recruited for the CATMAP study, 6 patients
withdrew consent before having the baseline blood samples taken. From 145
successfully set up assays, 111 showed adequate growth and inhibition against
at least one drug and were included in the final analysis (77 %). The intra-
sample correlation between the duplicates as a measure of reproducibility was
high (median 0.94, range 0.91 – 0.98).
Baseline ex vivo IC50 drug responses were determined using the established
HRP2 ELISA. The median AS IC50 value was 6.6 nM, the geometric mean 5.8
nM. Median and geometric mean for DHA were 4.5 nM and 4.8 nM. For LUM
the median and geometric mean IC50 values were 13.7 nM and 12.1 nM;
median and geometric mean for PPQ were 7.9 nM and 8.0 nM.
Fig. 17: Distribution of baseline IC50 values. Red bars show geometric mean with 95 % CI.
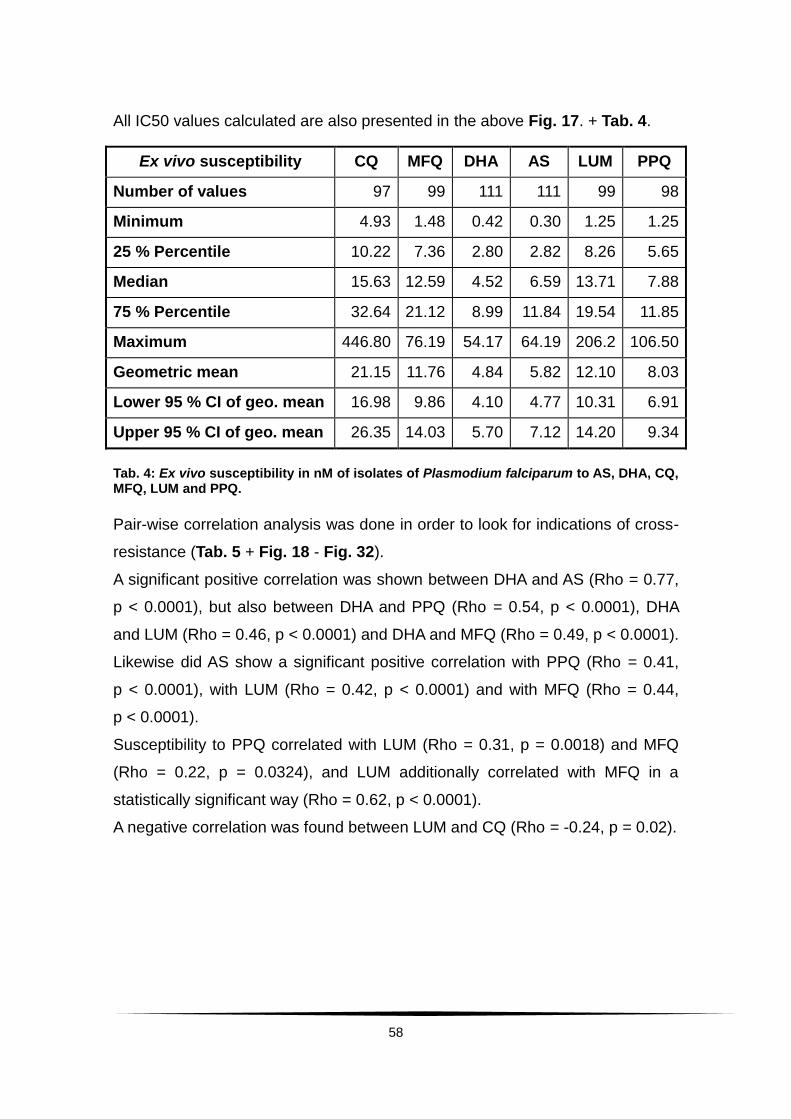
58
All IC50 values calculated are also presented in the above Fig. 17. + Tab. 4.
Ex vivo susceptibility CQ MFQ DHA AS LUM PPQ
Number of values 97 99 111 111 99 98
Minimum 4.93 1.48 0.42 0.30 1.25 1.25
25 % Percentile 10.22 7.36 2.80 2.82 8.26 5.65
Median 15.63 12.59 4.52 6.59 13.71 7.88
75 % Percentile 32.64 21.12 8.99 11.84 19.54 11.85
Maximum 446.80 76.19 54.17 64.19 206.2 106.50
Geometric mean 21.15 11.76 4.84 5.82 12.10 8.03
Lower 95 % CI of geo. mean 16.98 9.86 4.10 4.77 10.31 6.91
Upper 95 % CI of geo. mean 26.35 14.03 5.70 7.12 14.20 9.34
Tab. 4: Ex vivo susceptibility in nM of isolates of Plasmodium falciparum to AS, DHA, CQ, MFQ, LUM and PPQ.
Pair-wise correlation analysis was done in order to look for indications of cross-
resistance (Tab. 5 + Fig. 18 - Fig. 32).
A significant positive correlation was shown between DHA and AS (Rho = 0.77,
p < 0.0001), but also between DHA and PPQ (Rho = 0.54, p < 0.0001), DHA
and LUM (Rho = 0.46, p < 0.0001) and DHA and MFQ (Rho = 0.49, p < 0.0001).
Likewise did AS show a significant positive correlation with PPQ (Rho = 0.41,
p < 0.0001), with LUM (Rho = 0.42, p < 0.0001) and with MFQ (Rho = 0.44,
p < 0.0001).
Susceptibility to PPQ correlated with LUM (Rho = 0.31, p = 0.0018) and MFQ
(Rho = 0.22, p = 0.0324), and LUM additionally correlated with MFQ in a
statistically significant way (Rho = 0.62, p < 0.0001).
A negative correlation was found between LUM and CQ (Rho = -0.24, p = 0.02).
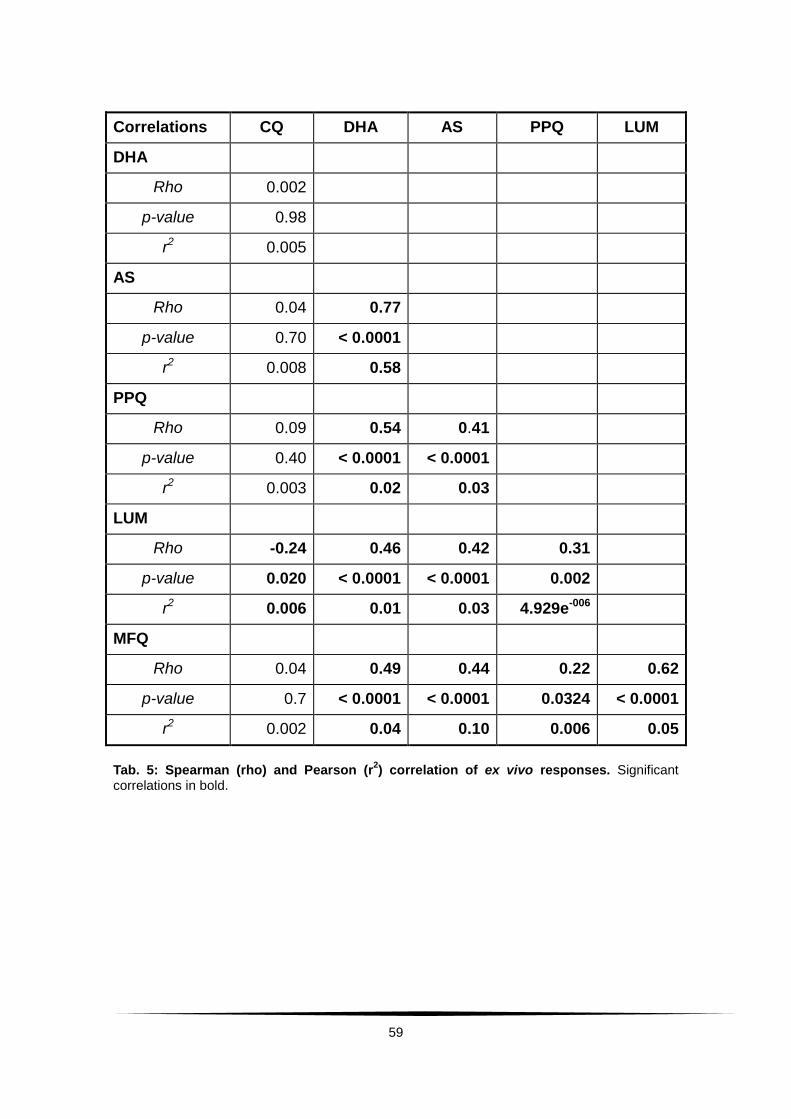
59
Correlations CQ DHA AS PPQ LUM
DHA
Rho 0.002
p-value 0.98
r2 0.005
AS
Rho 0.04 0.77
p-value 0.70 < 0.0001
r2 0.008 0.58
PPQ
Rho 0.09 0.54 0.41
p-value 0.40 < 0.0001 < 0.0001
r2 0.003 0.02 0.03
LUM
Rho -0.24 0.46 0.42 0.31
p-value 0.020 < 0.0001 < 0.0001 0.002
r2 0.006 0.01 0.03 4.929e-006
MFQ
Rho 0.04 0.49 0.44 0.22 0.62
p-value 0.7 < 0.0001 < 0.0001 0.0324 < 0.0001
r2 0.002 0.04 0.10 0.006 0.05
Tab. 5: Spearman (rho) and Pearson (r2) correlation of ex vivo responses. Significant
correlations in bold.
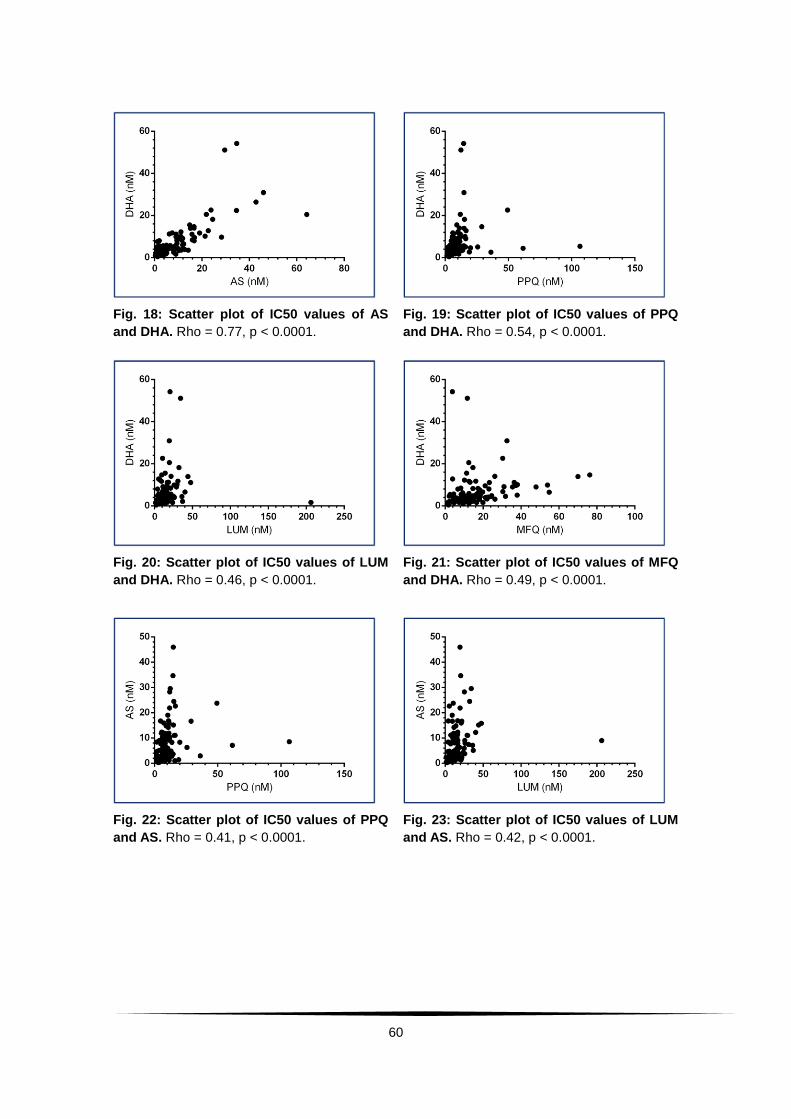
60
Fig. 18: Scatter plot of IC50 values of AS
and DHA. Rho = 0.77, p < 0.0001.
Fig. 19: Scatter plot of IC50 values of PPQ
and DHA. Rho = 0.54, p < 0.0001.
Fig. 20: Scatter plot of IC50 values of LUM
and DHA. Rho = 0.46, p < 0.0001.
Fig. 21: Scatter plot of IC50 values of MFQ
and DHA. Rho = 0.49, p < 0.0001.
Fig. 22: Scatter plot of IC50 values of PPQ
and AS. Rho = 0.41, p < 0.0001.
Fig. 23: Scatter plot of IC50 values of LUM
and AS. Rho = 0.42, p < 0.0001.

61
Fig. 24: Scatter plot of IC50 values of MFQ
and AS. Rho = 0.44, p < 0.0001.
Fig. 25: Scatter plot of IC50 values of LUM
and PPQ. Rho = 0.31, p = 0.0018.
Fig. 26: Scatter plot IC50 values of MFQ
and PPQ. Rho = 0.22, p = 0.0324.
Fig. 27: Scatter plot of IC50 values of MFQ
and LUM. Rho = 0.62, p < 0.0001.
Fig. 28: Scatter plot of IC50 values of DHA
and CQ.
Fig. 29: Scatter plot of IC50 values of AS
and CQ.
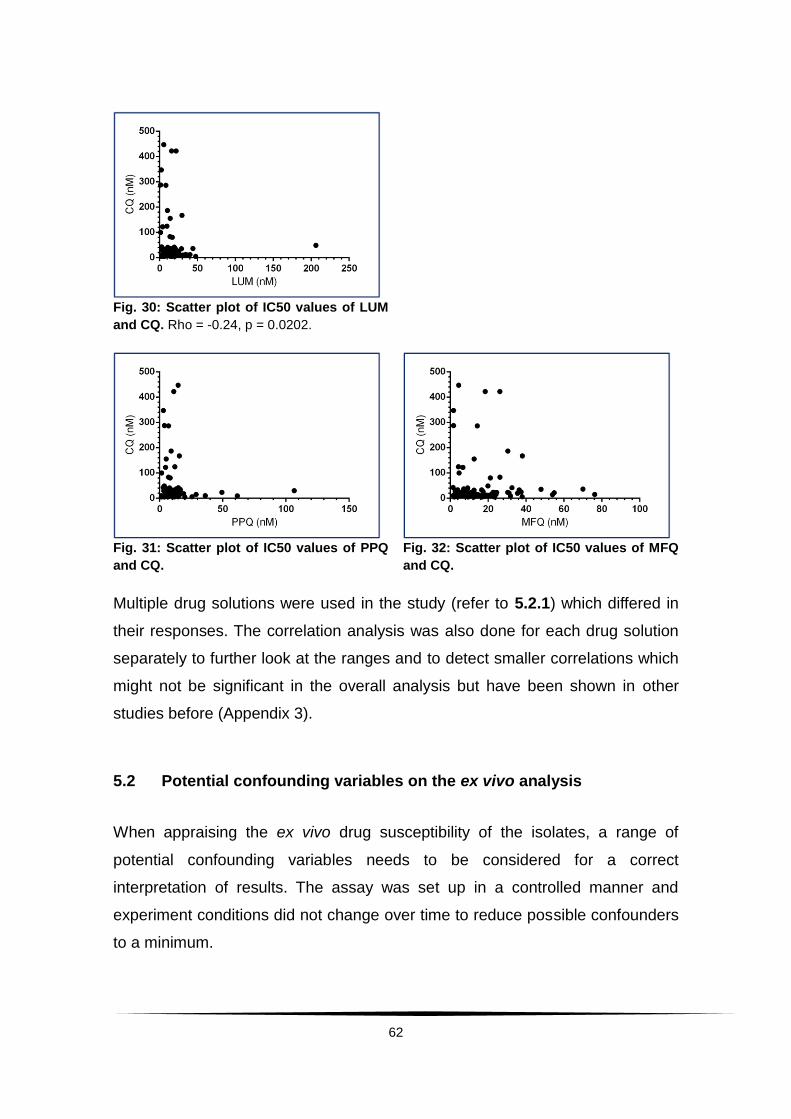
62
Fig. 30: Scatter plot of IC50 values of LUM
and CQ. Rho = -0.24, p = 0.0202.
Fig. 31: Scatter plot of IC50 values of PPQ
and CQ.
Fig. 32: Scatter plot of IC50 values of MFQ
and CQ.
Multiple drug solutions were used in the study (refer to 5.2.1) which differed in
their responses. The correlation analysis was also done for each drug solution
separately to further look at the ranges and to detect smaller correlations which
might not be significant in the overall analysis but have been shown in other
studies before (Appendix 3).
5.2 Potential confounding variables on the ex vivo analysis
When appraising the ex vivo drug susceptibility of the isolates, a range of
potential confounding variables needs to be considered for a correct
interpretation of results. The assay was set up in a controlled manner and
experiment conditions did not change over time to reduce possible confounders
to a minimum.
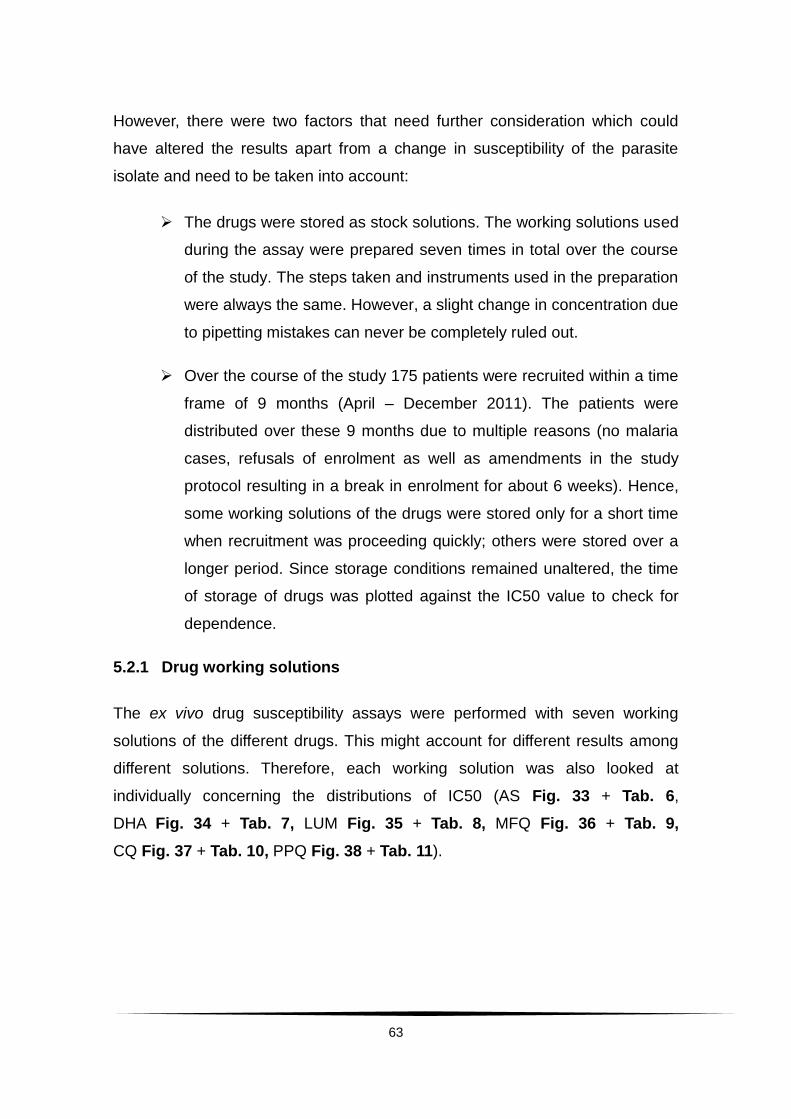
63
However, there were two factors that need further consideration which could
have altered the results apart from a change in susceptibility of the parasite
isolate and need to be taken into account:
The drugs were stored as stock solutions. The working solutions used
during the assay were prepared seven times in total over the course
of the study. The steps taken and instruments used in the preparation
were always the same. However, a slight change in concentration due
to pipetting mistakes can never be completely ruled out.
Over the course of the study 175 patients were recruited within a time
frame of 9 months (April – December 2011). The patients were
distributed over these 9 months due to multiple reasons (no malaria
cases, refusals of enrolment as well as amendments in the study
protocol resulting in a break in enrolment for about 6 weeks). Hence,
some working solutions of the drugs were stored only for a short time
when recruitment was proceeding quickly; others were stored over a
longer period. Since storage conditions remained unaltered, the time
of storage of drugs was plotted against the IC50 value to check for
dependence.
5.2.1 Drug working solutions
The ex vivo drug susceptibility assays were performed with seven working
solutions of the different drugs. This might account for different results among
different solutions. Therefore, each working solution was also looked at
individually concerning the distributions of IC50 (AS Fig. 33 + Tab. 6,
DHA Fig. 34 + Tab. 7, LUM Fig. 35 + Tab. 8, MFQ Fig. 36 + Tab. 9,
CQ Fig. 37 + Tab. 10, PPQ Fig. 38 + Tab. 11).
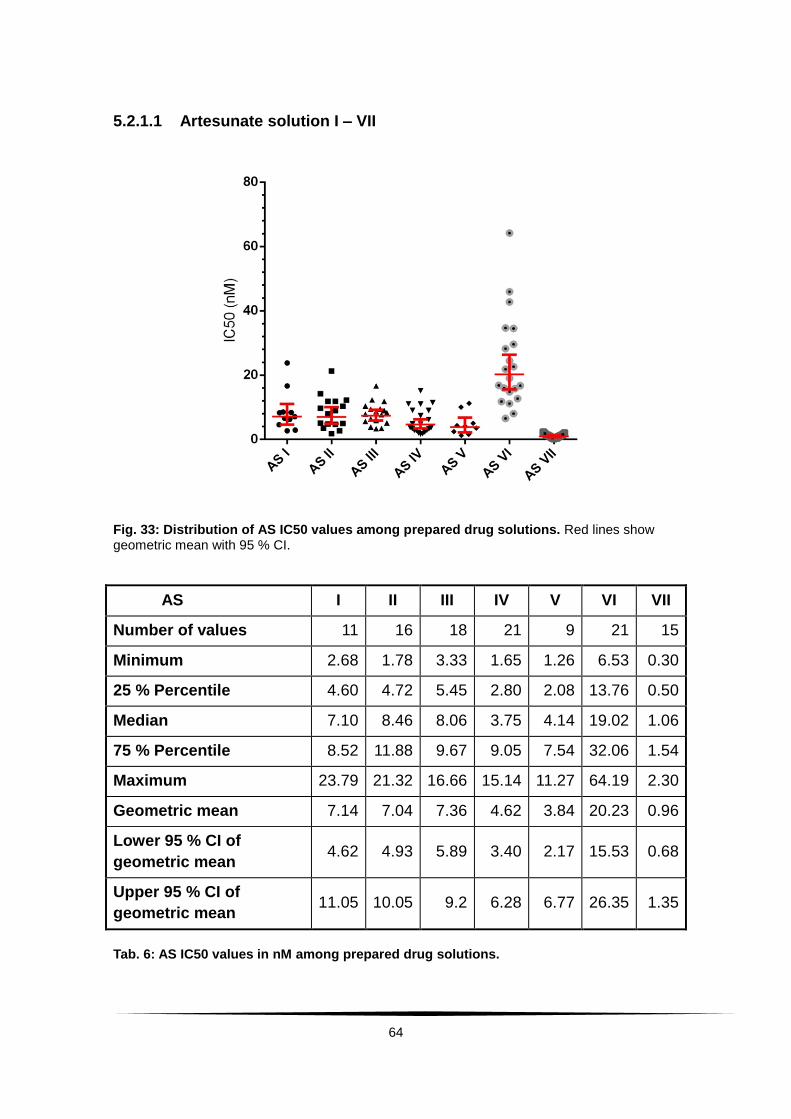
64
5.2.1.1 Artesunate solution I – VII
Fig. 33: Distribution of AS IC50 values among prepared drug solutions. Red lines show geometric mean with 95 % CI.
AS I II III IV V VI VII
Number of values 11 16 18 21 9 21 15
Minimum 2.68 1.78 3.33 1.65 1.26 6.53 0.30
25 % Percentile 4.60 4.72 5.45 2.80 2.08 13.76 0.50
Median 7.10 8.46 8.06 3.75 4.14 19.02 1.06
75 % Percentile 8.52 11.88 9.67 9.05 7.54 32.06 1.54
Maximum 23.79 21.32 16.66 15.14 11.27 64.19 2.30
Geometric mean 7.14 7.04 7.36 4.62 3.84 20.23 0.96
Lower 95 % CI of
geometric mean 4.62 4.93 5.89 3.40 2.17 15.53 0.68
Upper 95 % CI of
geometric mean 11.05 10.05 9.2 6.28 6.77 26.35 1.35
Tab. 6: AS IC50 values in nM among prepared drug solutions.

65
5.2.1.2 Dihydroartemisinin solution I – VII
Fig. 34: Distribution of DHA IC50 values among prepared drug solutions. Red lines show geometric mean with 95 % CI.
DHA I II III IV V VI VII
Number of values 11 16 18 21 9 21 15
Minimum 2.55 0.97 3.04 1.16 0.42 2.56 0.98
25 % Percentile 2.80 1.66 4.01 3.28 1.16 8.19 1.76
Median 4.80 3.44 5.68 4.72 1.69 12.20 2.97
75 % Percentile 5.72 4.46 7.15 9.98 3.62 21.44 5.47
Maximum 22.59 10.18 14.02 13.93 5.87 54.17 8.03
Geometric mean 5.32 2.93 5.30 4.94 1.83 12.98 3.01
Lower 95 % CI of
geometric mean 3.37 2.05 4.30 3.58 0.99 9.10 2.10
Upper 95 % CI of
geometric mean 8.40 4.21 6.52 6.83 3.39 18.51 4.31
Tab. 7: DHA IC50 values in nM among prepared drug solutions.
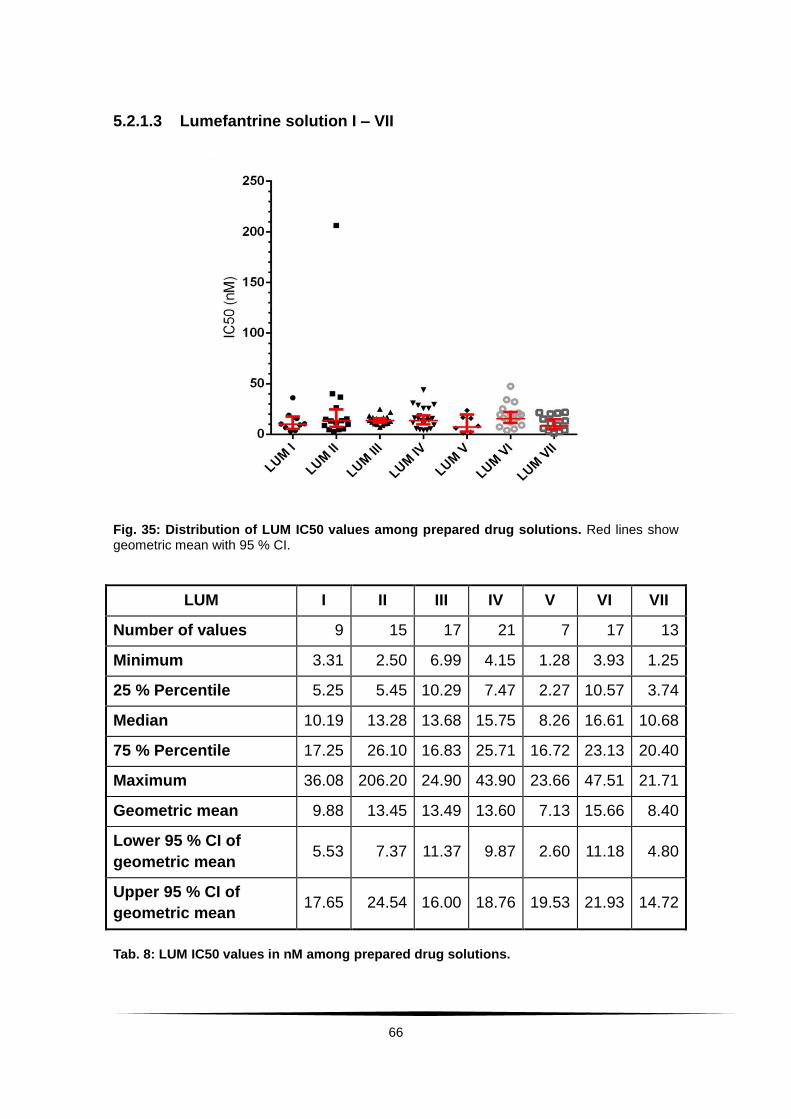
66
5.2.1.3 Lumefantrine solution I – VII
Fig. 35: Distribution of LUM IC50 values among prepared drug solutions. Red lines show geometric mean with 95 % CI.
LUM I II III IV V VI VII
Number of values 9 15 17 21 7 17 13
Minimum 3.31 2.50 6.99 4.15 1.28 3.93 1.25
25 % Percentile 5.25 5.45 10.29 7.47 2.27 10.57 3.74
Median 10.19 13.28 13.68 15.75 8.26 16.61 10.68
75 % Percentile 17.25 26.10 16.83 25.71 16.72 23.13 20.40
Maximum 36.08 206.20 24.90 43.90 23.66 47.51 21.71
Geometric mean 9.88 13.45 13.49 13.60 7.13 15.66 8.40
Lower 95 % CI of
geometric mean 5.53 7.37 11.37 9.87 2.60 11.18 4.80
Upper 95 % CI of
geometric mean 17.65 24.54 16.00 18.76 19.53 21.93 14.72
Tab. 8: LUM IC50 values in nM among prepared drug solutions.

67
5.2.1.4 Mefloquine solution I – VII
Fig. 36: Distribution of MFQ IC50 values among prepared drug solutions. Red lines show geometric mean with 95 % CI.
MFQ I II III IV V VI VII
Number of values 9 15 16 21 7 11 14
Minimum 2.09 1.53 9.04 1.95 1.69 3.87 1.47
25 % Percentile 4.18 4.29 16.22 7.14 4.61 7.36 3.96
Median 14.68 10.09 23.56 13.10 11.92 11.26 8.66
75 % Percentile 34.10 18.44 30.81 27.38 14.25 21.05 16.92
Maximum 76.19 24.10 54.79 69.95 16.54 37.37 23.05
Geometric mean 12.83 8.510 22.58 13.33 8.24 11.79 7.38
Lower 95 % CI of
geometric mean 5.06 5.14 17.74 8.76 3.88 7.61 4.45
Upper 95 % CI of
geometric mean 32.52 14.08 28.76 20.29 17.46 18.27 12.22
Tab. 9: MFQ IC50 values in nM among prepared drug solutions.

68
5.2.1.5 Chloroquine solution I – VII
Fig. 37: Distribution of CQ IC50 values among prepared drug solutions. Red lines show geometric mean with 95 % CI.
CQ I II III IV V VI VII
Number of
values 8 15 16 21 7 17 13
Minimum 4.92 4.92 9.00 9.06 4.92 4.92 6.13
25 % Percentile 6.60 10.18 15.17 11.71 4.92 10.13 7.75
Median 11.62 11.87 21.19 23.29 9.81 13.48 18.12
75 % Percentile 20.96 14.67 66.12 36.39 285.9 28.41 38.71
Maximum 29.87 124.30 421.70 446.80 346.70 121.90 287.20
Geometric mean 11.70 14.49 29.71 30.09 30.13 15.68 21.47
Lower 95 % CI of
geometric mean 6.93 9.53 16.88 17.47 5.21 10.29 11.34
Upper 95 % CI of
geometric mean 19.74 22.04 52.29 51.82 174.30 23.90 40.65
Tab. 10: CQ IC50 values in nM among prepared drug solutions.
69
5.2.1.6 Piperaquine solution I – VII
Fig. 38: Distribution of PPQ IC50 values among prepared drug solutions. Red lines show geometric mean with 95 % CI.
PPQ I II III IV V VI VII
Number of values 9 15 17 21 7 17 12
Minimum 1.63 1.34 4.91 4.58 1.25 4.71 2.12
25 % Percentile 10.88 3.67 6.64 6.52 1.64 8.23 3.44
Median 28.87 5.74 7.87 8.56 3.60 11.02 6.11
75 % Percentile 55.40 7.20 9.49 13.39 7.02 13.45 10.64
Maximum 106.50 12.04 13.73 16.23 10.67 16.43 19.00
Geometric mean 19.95 5.21 8.04 9.11 3.73 10.21 6.22
Lower 95 % CI of
geometric mean 6.39 3.67 7.02 7.62 1.81 8.48 4.04
Upper 95 % CI of
geometric mean 62.29 7.39 9.21 10.90 7.71 12.30 9.57
Tab. 11: PPQ IC50 values in nM among prepared drug solutions.
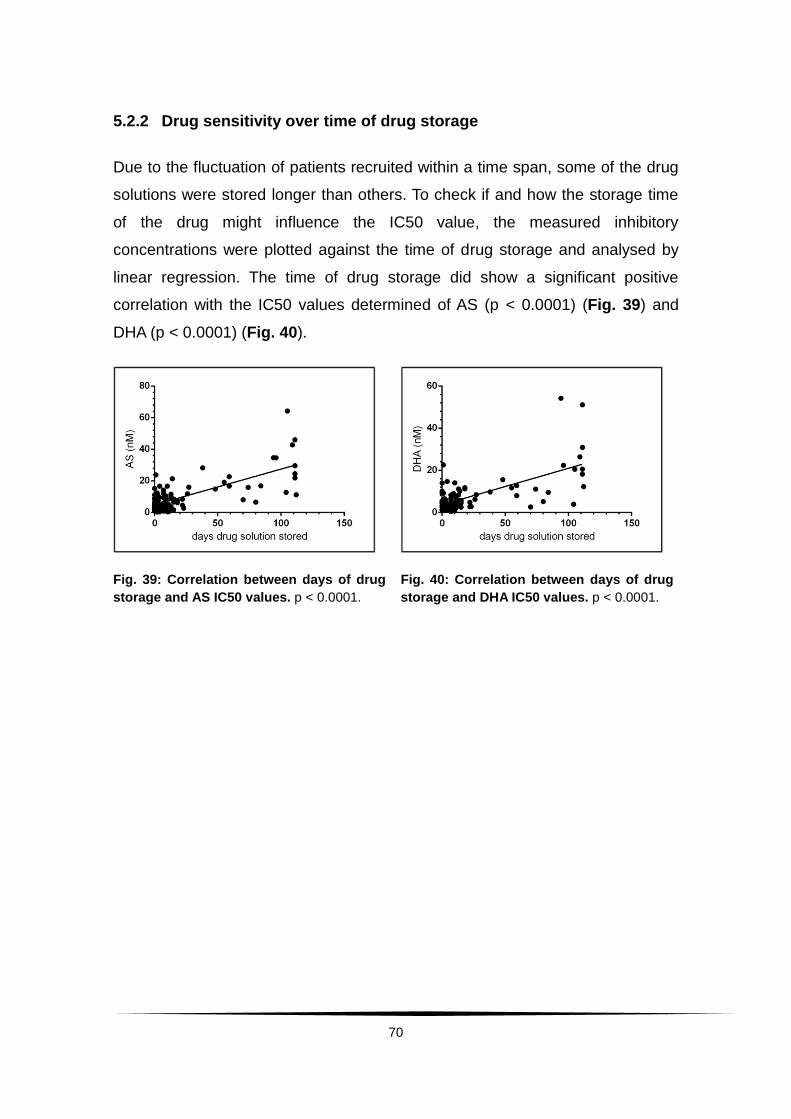
70
5.2.2 Drug sensitivity over time of drug storage
Due to the fluctuation of patients recruited within a time span, some of the drug
solutions were stored longer than others. To check if and how the storage time
of the drug might influence the IC50 value, the measured inhibitory
concentrations were plotted against the time of drug storage and analysed by
linear regression. The time of drug storage did show a significant positive
correlation with the IC50 values determined of AS (p < 0.0001) (Fig. 39) and
DHA (p < 0.0001) (Fig. 40).
Fig. 39: Correlation between days of drug
storage and AS IC50 values. p < 0.0001.
Fig. 40: Correlation between days of drug
storage and DHA IC50 values. p < 0.0001.
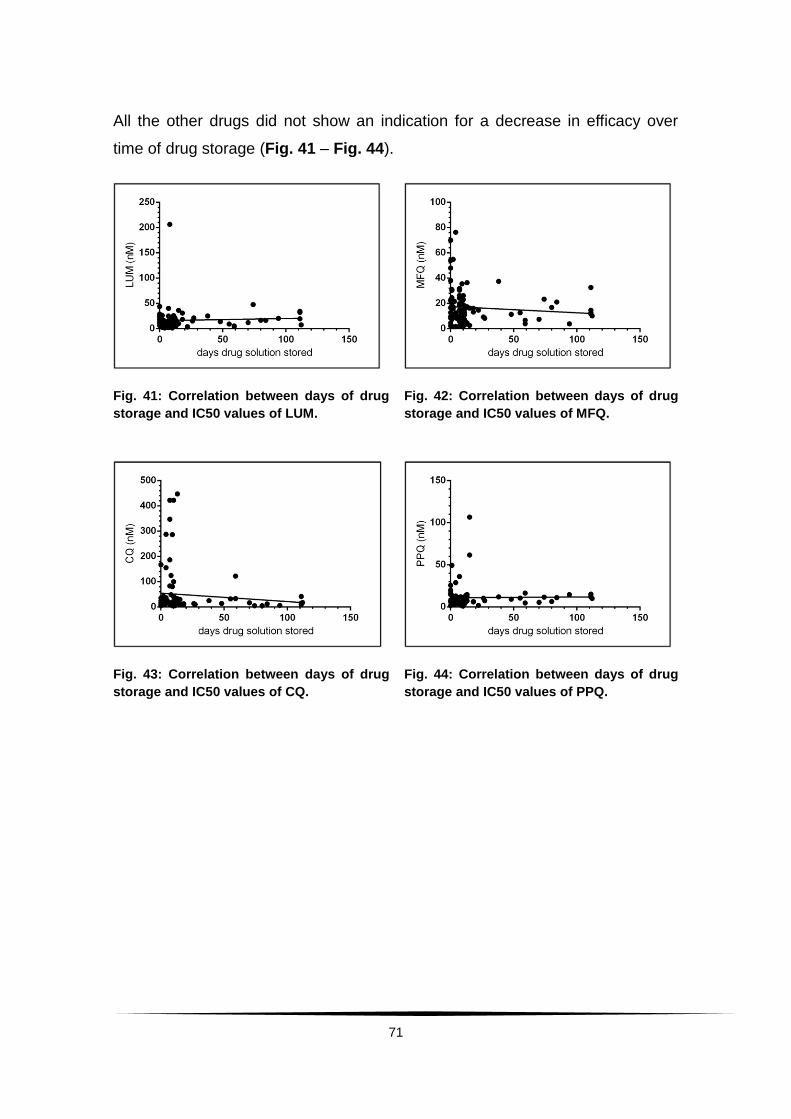
71
All the other drugs did not show an indication for a decrease in efficacy over
time of drug storage (Fig. 41 – Fig. 44).
Fig. 41: Correlation between days of drug
storage and IC50 values of LUM.
Fig. 42: Correlation between days of drug
storage and IC50 values of MFQ.
Fig. 43: Correlation between days of drug
storage and IC50 values of CQ.
Fig. 44: Correlation between days of drug
storage and IC50 values of PPQ.
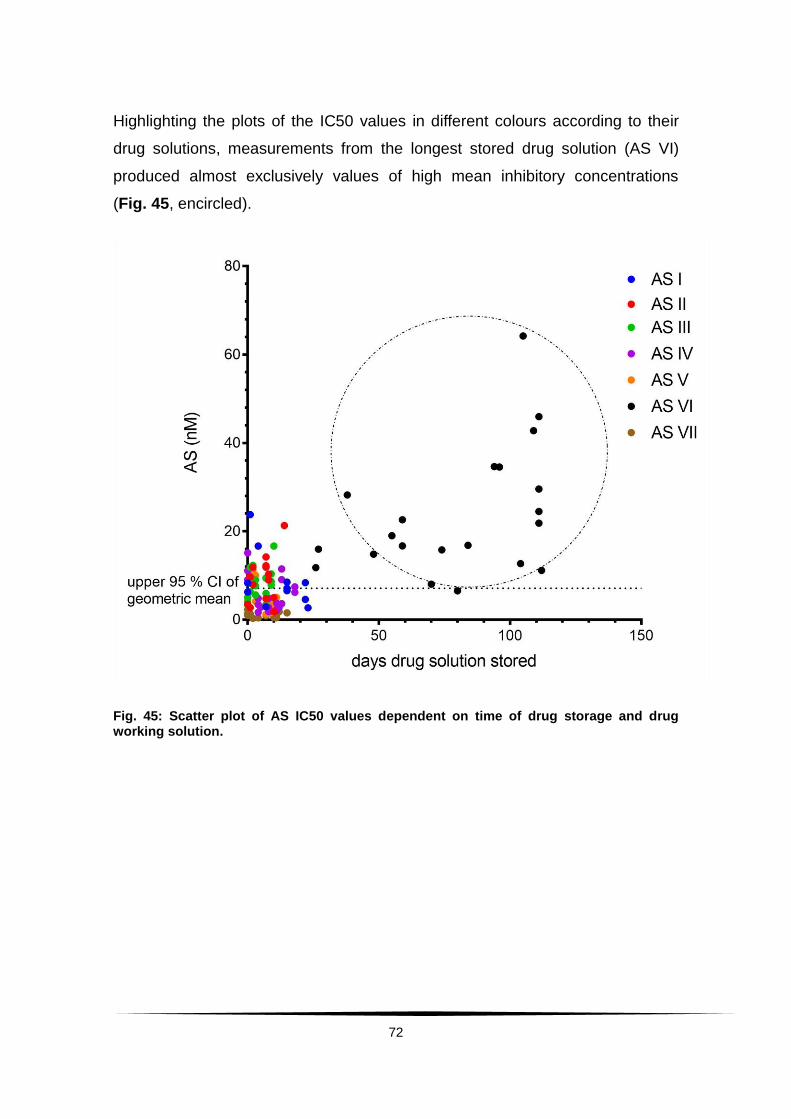
72
Highlighting the plots of the IC50 values in different colours according to their
drug solutions, measurements from the longest stored drug solution (AS VI)
produced almost exclusively values of high mean inhibitory concentrations
(Fig. 45, encircled).
Fig. 45: Scatter plot of AS IC50 values dependent on time of drug storage and drug working solution.
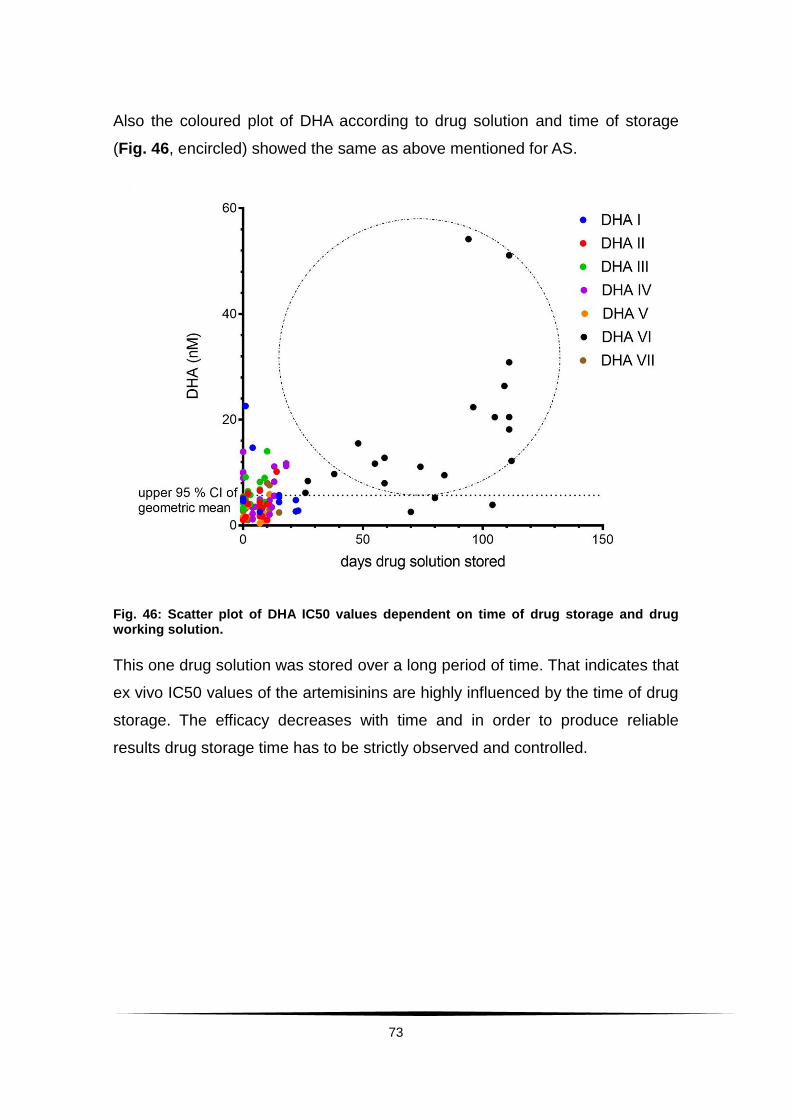
73
Also the coloured plot of DHA according to drug solution and time of storage
(Fig. 46, encircled) showed the same as above mentioned for AS.
Fig. 46: Scatter plot of DHA IC50 values dependent on time of drug storage and drug working solution.
This one drug solution was stored over a long period of time. That indicates that
ex vivo IC50 values of the artemisinins are highly influenced by the time of drug
storage. The efficacy decreases with time and in order to produce reliable
results drug storage time has to be strictly observed and controlled.
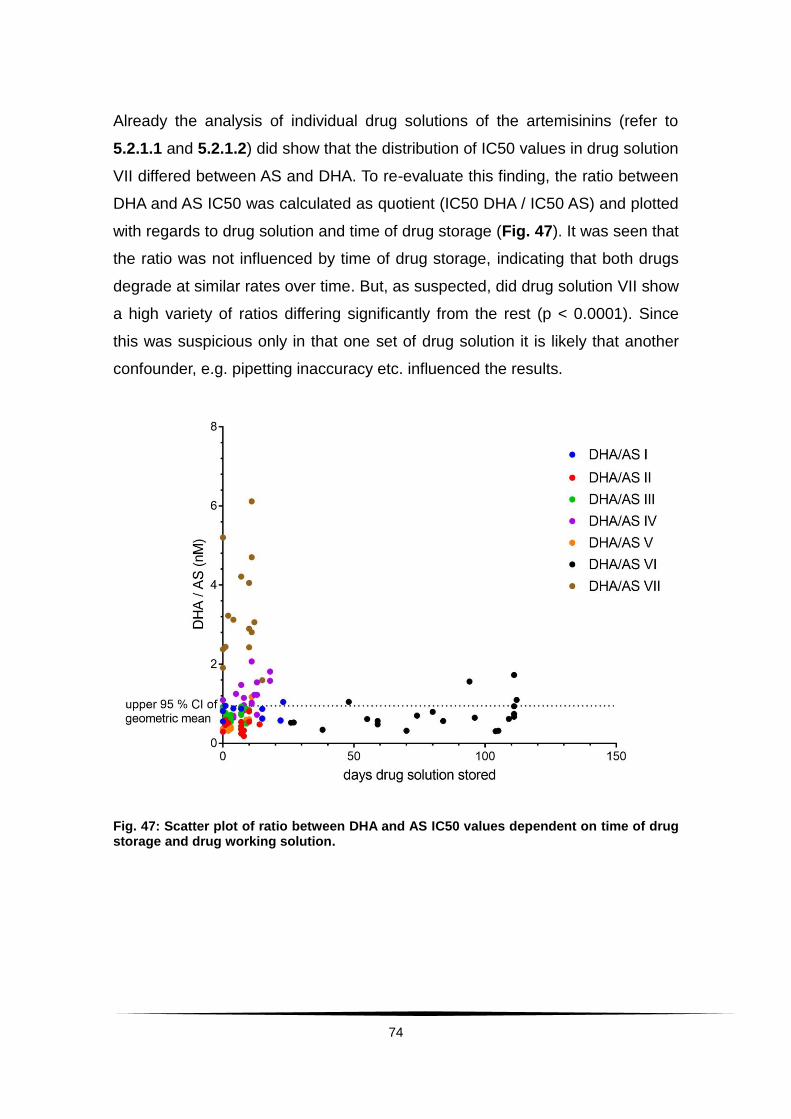
74
Already the analysis of individual drug solutions of the artemisinins (refer to
5.2.1.1 and 5.2.1.2) did show that the distribution of IC50 values in drug solution
VII differed between AS and DHA. To re-evaluate this finding, the ratio between
DHA and AS IC50 was calculated as quotient (IC50 DHA / IC50 AS) and plotted
with regards to drug solution and time of drug storage (Fig. 47). It was seen that
the ratio was not influenced by time of drug storage, indicating that both drugs
degrade at similar rates over time. But, as suspected, did drug solution VII show
a high variety of ratios differing significantly from the rest (p < 0.0001). Since
this was suspicious only in that one set of drug solution it is likely that another
confounder, e.g. pipetting inaccuracy etc. influenced the results.
Fig. 47: Scatter plot of ratio between DHA and AS IC50 values dependent on time of drug storage and drug working solution.
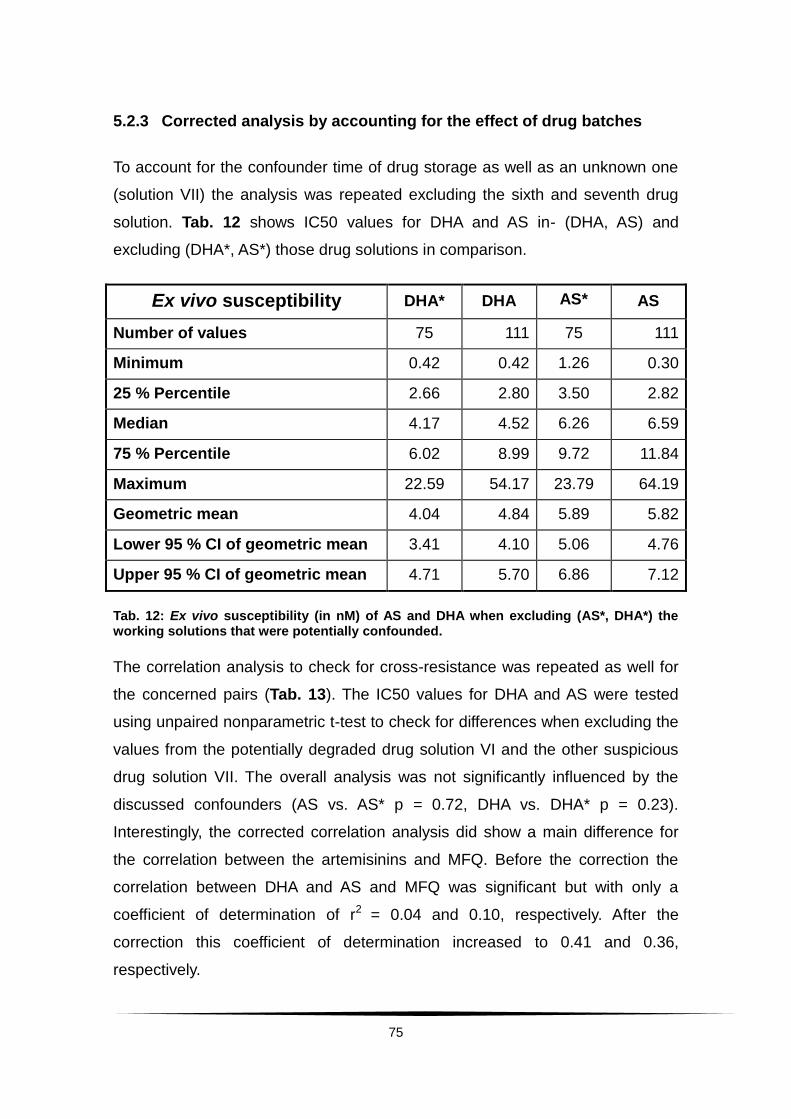
75
5.2.3 Corrected analysis by accounting for the effect of drug batches
To account for the confounder time of drug storage as well as an unknown one
(solution VII) the analysis was repeated excluding the sixth and seventh drug
solution. Tab. 12 shows IC50 values for DHA and AS in- (DHA, AS) and
excluding (DHA*, AS*) those drug solutions in comparison.
Ex vivo susceptibility DHA* DHA AS* AS
Number of values 75 111 75 111
Minimum 0.42 0.42 1.26 0.30
25 % Percentile 2.66 2.80 3.50 2.82
Median 4.17 4.52 6.26 6.59
75 % Percentile 6.02 8.99 9.72 11.84
Maximum 22.59 54.17 23.79 64.19
Geometric mean 4.04 4.84 5.89 5.82
Lower 95 % CI of geometric mean 3.41 4.10 5.06 4.76
Upper 95 % CI of geometric mean 4.71 5.70 6.86 7.12
Tab. 12: Ex vivo susceptibility (in nM) of AS and DHA when excluding (AS*, DHA*) the working solutions that were potentially confounded.
The correlation analysis to check for cross-resistance was repeated as well for
the concerned pairs (Tab. 13). The IC50 values for DHA and AS were tested
using unpaired nonparametric t-test to check for differences when excluding the
values from the potentially degraded drug solution VI and the other suspicious
drug solution VII. The overall analysis was not significantly influenced by the
discussed confounders (AS vs. AS* p = 0.72, DHA vs. DHA* p = 0.23).
Interestingly, the corrected correlation analysis did show a main difference for
the correlation between the artemisinins and MFQ. Before the correction the
correlation between DHA and AS and MFQ was significant but with only a
coefficient of determination of r2 = 0.04 and 0.10, respectively. After the
correction this coefficient of determination increased to 0.41 and 0.36,
respectively.
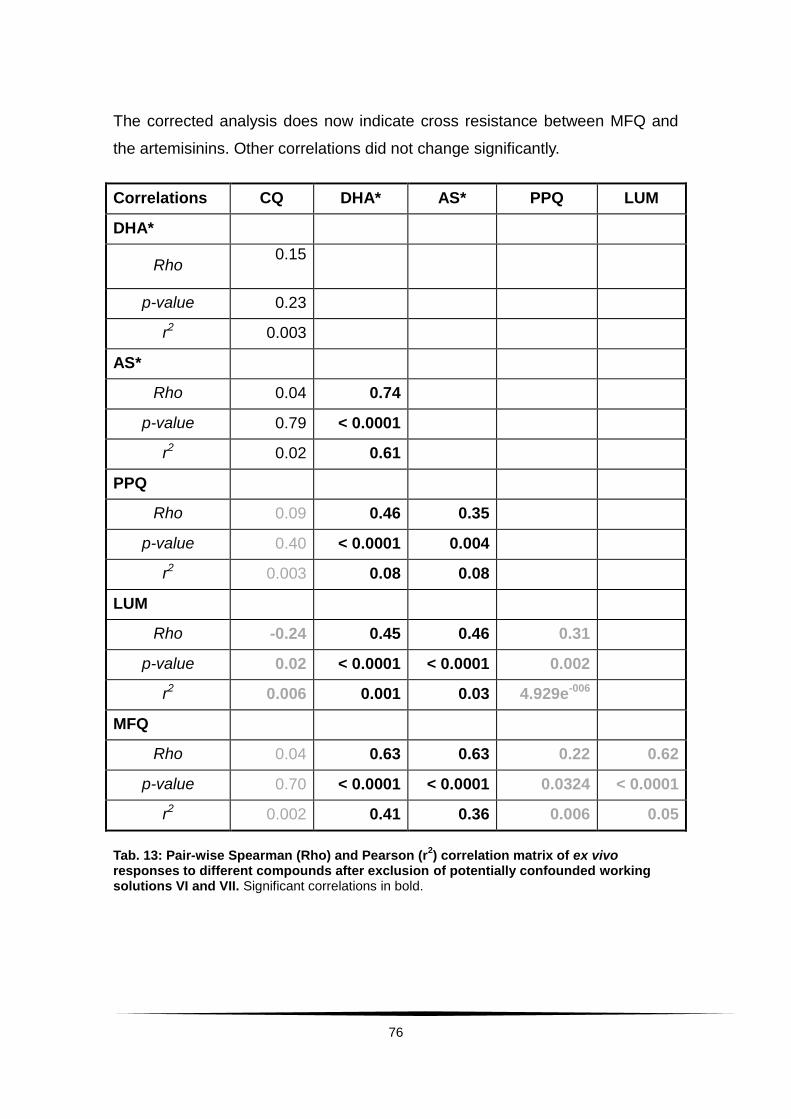
76
The corrected analysis does now indicate cross resistance between MFQ and
the artemisinins. Other correlations did not change significantly.
Correlations CQ DHA* AS* PPQ LUM
DHA*
Rho 0.15
p-value 0.23
r2 0.003
AS*
Rho 0.04 0.74
p-value 0.79 < 0.0001
r2 0.02 0.61
PPQ
Rho 0.09 0.46 0.35
p-value 0.40 < 0.0001 0.004
r2 0.003 0.08 0.08
LUM
Rho -0.24 0.45 0.46 0.31
p-value 0.02 < 0.0001 < 0.0001 0.002
r2 0.006 0.001 0.03 4.929e-006
MFQ
Rho 0.04 0.63 0.63 0.22 0.62
p-value 0.70 < 0.0001 < 0.0001 0.0324 < 0.0001
r2 0.002 0.41 0.36 0.006 0.05
Tab. 13: Pair-wise Spearman (Rho) and Pearson (r2) correlation matrix of ex vivo
responses to different compounds after exclusion of potentially confounded working solutions VI and VII. Significant correlations in bold.
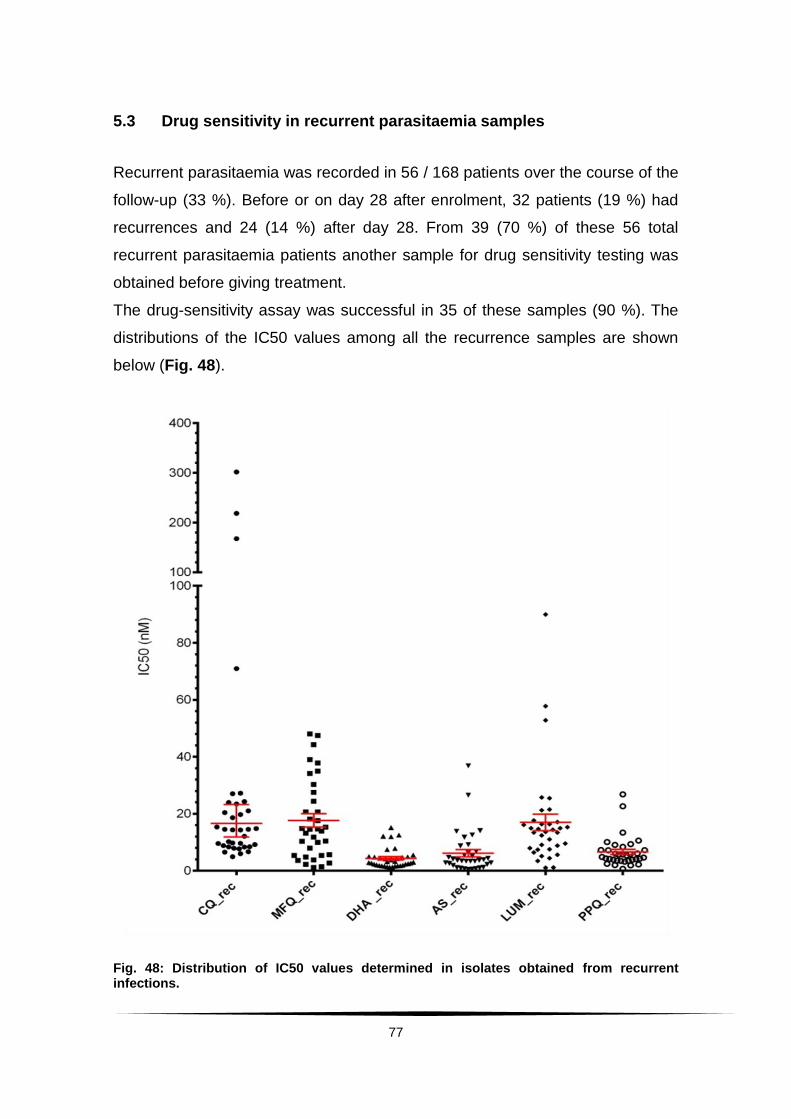
77
5.3 Drug sensitivity in recurrent parasitaemia samples
Recurrent parasitaemia was recorded in 56 / 168 patients over the course of the
follow-up (33 %). Before or on day 28 after enrolment, 32 patients (19 %) had
recurrences and 24 (14 %) after day 28. From 39 (70 %) of these 56 total
recurrent parasitaemia patients another sample for drug sensitivity testing was
obtained before giving treatment.
The drug-sensitivity assay was successful in 35 of these samples (90 %). The
distributions of the IC50 values among all the recurrence samples are shown
below (Fig. 48).
Fig. 48: Distribution of IC50 values determined in isolates obtained from recurrent infections.

78
Results are displayed without regards to the used drug solution. IC50
distributions in recurrent parasitaemia isolates (as shown in 5.2.1 for baseline
samples) can be found as additional information in the Appendix (Appendix 4).
Tab. 14 shows the IC50 values of recurrent samples in detail.
IC50 of isolates from
recurrent infections CQ MFQ DHA AS LUM PPQ
Number of values 35 35 35 35 35 34
Minimum 4.93 1.19 1.29 0.47 1.07 0.67
25 % Percentile 8.41 5.38 1.86 1.86 7.49 3.57
Median 14.35 14.57 3.03 3.70 13.66 5.08
75 % Percentile 23.45 27.48 4.91 6.83 17.11 7.56
Maximum 301.60 47.99 15.14 36.83 89.92 26.81
Geometric mean 16.62 11.95 3.37 3.62 11.76 5.17
Lower 95 % CI of geo. mean 11.89 8.47 2.66 2.52 8.61 4.04
Upper 95 % CI of geo. mean 23.23 16.86 4.27 5.199 16.07 6.61
Tab. 14: Ex vivo susceptibility of isolates obtained from recurrent infections.
A total of 18 matched pairs of samples obtained from baseline and recurrent
infections for ex vivo drug susceptibility testing were collected.
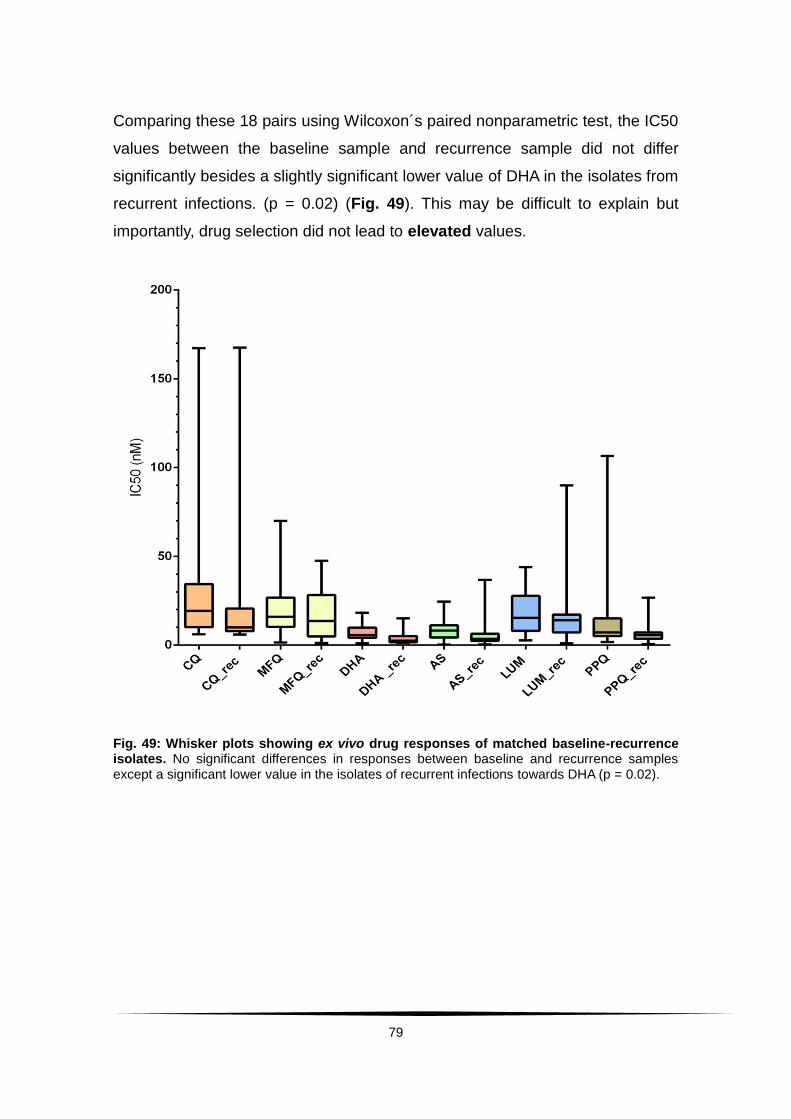
79
Comparing these 18 pairs using Wilcoxon´s paired nonparametric test, the IC50
values between the baseline sample and recurrence sample did not differ
significantly besides a slightly significant lower value of DHA in the isolates from
recurrent infections. (p = 0.02) (Fig. 49). This may be difficult to explain but
importantly, drug selection did not lead to elevated values.
Fig. 49: Whisker plots showing ex vivo drug responses of matched baseline-recurrence isolates. No significant differences in responses between baseline and recurrence samples except a significant lower value in the isolates of recurrent infections towards DHA (p = 0.02).
80
6. Discussion
The continued and uncontrolled use of monotherapies against malaria parasites
has led to widespread reduced susceptibility of almost all known antimalarials.
The introduction of combination therapies was hoped to prevent or at least
delay the emergence of reduced susceptibility to the fastest acting antimalarial
drugs these days, artemisinin derivatives. Drug surveillance studies monitor
drug efficacy and effectiveness to be able to detect and react to declining
responsiveness of malaria parasites as fast as possible.
This chapter will first discuss the in vivo parameters and their limitations before
comparing results obtained here with previous data. Afterwards ex vivo drug
susceptibility testing and its general limitations will be debated. The results
gathered here will be also compared to previous findings. While completing this
work an important study was published reporting a correlation between in vivo
parasite clearance and in vitro artemisinin susceptibility using an assay called
RSA0 – 3 (Witkowski, B. et al. 2013a). The HRP2 ELISA is accordingly not the
correct tool to identify artemisinin resistance. Nevertheless does, considering
the results from Borrmann, S. et al. (2013), the approach via the HRP2 assay
allow identification of artemisinin drug susceptibility phenotypes. In
consideration of the recent developments regarding artemisinin drug tolerance
the role of the results and the concluded need for further surveillance will be
underlined.
6.1 Artemisinin drug susceptibility in vivo
Parameters such as parasite clearance time, parasite reduction ratio and
parasite prevalence rate can indicate the effectiveness of a drug applied in
vivo by providing values to compare how fast parasites fall under the
microscopic threshold after initiation of treatment.

81
In 2009, the first artemisinin-resistant malaria episodes were reported in
Cambodia (Dondorp, A. M. et al. 2009) with a prolonged mean parasite
clearance time of 84 hours in Pailin, Cambodia and of 50 hours in Wang Pha,
Thailand. Following that the longitudinal study by Borrmann, S. et al. (2011) in
the coast of Kenya showed a rise in mean PCT from 37.8 (2005 – 2006) to 46.0
(2007 – 2008) hours after treatment with DHA-PPQ and from 45.0
(2005 – 2006) to 49.8 (2007 – 2008) hours after treatment with ART-LUM. Here,
after treatment with the single drug AS at a dose of 2 mg / kg body weight, the
mean PCT was 30.5 hours at the same study site.
The PCT is mostly determined by microscopic evaluations of blood smears and
therefore, limited by the microscopically detectable parasite biomass,
(≤ 108 parasites). A patient might be declared parasite-free when actually
parasitaemia was just reduced below that threshold. In this case the efficacy of
the drug would be overestimated, leading to wrong implications for further drug
usage. The determination of parasitaemia in the field using an average
leukocyte count of 8,000 / µl (refer to 4.2.3) leads to inaccuracy. Especially in
children the leukocyte counts can vary within a wide range, often depending on
the age. Here the white blood cell count had a median of about 8,600 / µl (range
2,900 – 21,700 / µl). The average leukocyte count of 8,000 / µl as an overall
value was, thus, close to the median, but an underestimation of parasitaemia in
patients with higher leukocytes and overestimation in the ones with lower white
blood cell count have to be considered and the possibility of inaccurate
clearance and reduction ratios kept in mind. Besides microscopic threshold and
counting errors, the PCT has been shown to be influenced by factors such as
initial parasitaemia, the stage of development of the parasite, the frequency of
sampling and host defence (immunity and, therefore, also the age of the patient
in high transmission areas) (White, N. J. 2011). Also do different drugs act at
different stages during the parasite life cycle (refer to 2.5). A drug that is not
exactly administered at the point of highest vulnerability of the parasite might
suggest a PCT and PRR that are prolonged or reduced. This might also lead to
falsely drawn conclusions regarding drug efficacy.
82
Parasite clearance is regarded as a first-order-process; higher initial
parasitaemia, consequently, lead to longer clearance times. The PCT did show
a correlation with the initial parasitaemia (Fig. 11, p < 0.0001). About half of the
patients (52 %) had a parasitaemia at enrolment below 105 parasites / µl, the
other half (48 %) above. For the first group the PCT was 30 hours, for the
second 36 hours (p = 0.001). Comparing the results of this study with the
previous study by Borrmann, S. et al. (2011) CATMAP enrolled patients with
initial asexual parasitaemia between 10,000 – 300,000 / µl; the previous study
included patients with lower parasitaemia (2,000 – 200,000 / µl).
Median asexual P. falciparum density was lower in the last study
(34,600 – 57,600 parasites / µl); here the median parasitaemia was
95,200 parasites / µl. Therefore, in comparison to PCTs of 38 and 50 hours in
2005 – 2008, for now no further indication for a decline of responsiveness in
vivo to artemisinin could be found.
Another confounder often mentioned is the immunity of the patient against
malaria acquired in high transmission areas. The age group most at risk for
severe infections are children up to 5 years of age. After that, they are
considered to have built up a level of immunity. Hence, age can be used as an
indicator for immunity. However, no correlation was seen between the patients’
age and the PCT in this study. It is possible that due to a general decline in
malaria transmission in the area (O´Meara, W. P. et al. 2008) the level of
immunity has decreased, thus, not showing a correlation here.
The parasite prevalence rate on the first day after initiation of treatment (PPRD1)
with an ACT is mainly determined by the artemisinin partner (White, N.J. 2004).
From 2005 – 2006 to 2007 – 2008, an increase in the PPRD1 from 55 % to 87 %
in patients receiving treatment with DHA-PPQ and from 81 % to 95 % in the AL
group was noted, meaning that after initiation of treatment with an ACT the
number of patients with remaining parasitaemia 24 hours later rose in both
study arms. The hypothesis drawn from this drop in early treatment response
was a declined sensitivity to the artemisinin-derivate as the fast acting
83
component of the ACT. Comparison of the PPRD1 of 70 % (117 / 168) as
observed after monotherapy with AS in CATMAP shows a faster clinical
response than to ART-LUM. The PPRD1 here also places itself in between the
2005 – 2006 and 2007 – 2008 recorded values for DHA-PPQ. This again did
not raise further concerns of overall reduced drug susceptibility to artemisinins
at the time CATMAP was carried out. Moreover, when comparing the parameter
for patients that still had detectable parasitaemia on the second day after
initiation of treatment (PPRD2), it was much lower (2 %) than the
4 % (DHA-PPQ) / 7 % (ART-LUM) in 2005 / 2006 and the
5 % (DHA-PPQ) / 13 % (ART-LUM) in 2007 / 2008 in the same study area.
Another parameter, the parasite reduction ratio is defined as the factor by which
parasitaemia declines over time and is, therefore, describing how fast the
antimalarial agent reduces parasite burden. Median parasite reduction ratio on
the first day (PRRH24) for DHA-PPQ fell from 2.5 to 1.8 and for AM-LUM from
1.9 to 1.4 in the previous study in Kenya- thus, resembling the observed incline
in detectable parasitaemia on Day 1. Here the median PRRH24 was fairly high
with 2.5. Parasite reduction rates increased quickly within 6 – 12 hours after
each treatment dose, whereas the parasite reduction rate rose from 0.03 / hour
to 0.14 / hour between hour 6 and 12. After the second treatment dose this
reduction rate increased even further within the same time span
(from 0.08 / hour to 0.55 / hour). Also this clinical parameter still indicates a high
susceptibility to Artemisinins with rapid onset of parasite reduction.
Due to multiple potential confounders of the PCT, a new method, the PCE, was
proposed (Flegg, J. A. et al. 2011). In summary, there is only one segment in the
parasite clearance curve which is robust against the above mentioned
confounder. The PCE excludes the two segments that are easily influenced, the
lag phase and the tail, and also identifies outliers. From the robust segment the
parasite clearance values are calculated. Here, for wider comparison with the
results from different studies from regions in artemisinin resistant areas as well
as the study by Borrmann, S. et al. (2011) which used different methods, PCE
and PCT values were shown.
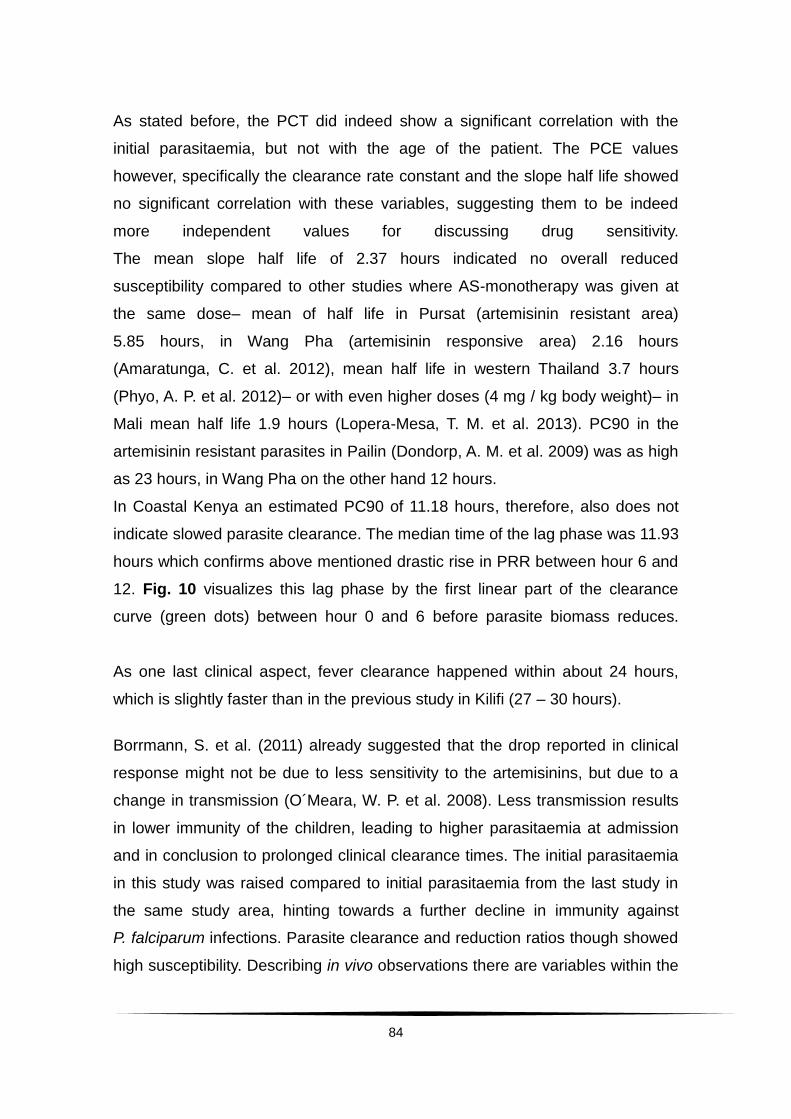
84
As stated before, the PCT did indeed show a significant correlation with the
initial parasitaemia, but not with the age of the patient. The PCE values
however, specifically the clearance rate constant and the slope half life showed
no significant correlation with these variables, suggesting them to be indeed
more independent values for discussing drug sensitivity.
The mean slope half life of 2.37 hours indicated no overall reduced
susceptibility compared to other studies where AS-monotherapy was given at
the same dose– mean of half life in Pursat (artemisinin resistant area)
5.85 hours, in Wang Pha (artemisinin responsive area) 2.16 hours
(Amaratunga, C. et al. 2012), mean half life in western Thailand 3.7 hours
(Phyo, A. P. et al. 2012)– or with even higher doses (4 mg / kg body weight)– in
Mali mean half life 1.9 hours (Lopera-Mesa, T. M. et al. 2013). PC90 in the
artemisinin resistant parasites in Pailin (Dondorp, A. M. et al. 2009) was as high
as 23 hours, in Wang Pha on the other hand 12 hours.
In Coastal Kenya an estimated PC90 of 11.18 hours, therefore, also does not
indicate slowed parasite clearance. The median time of the lag phase was 11.93
hours which confirms above mentioned drastic rise in PRR between hour 6 and
12. Fig. 10 visualizes this lag phase by the first linear part of the clearance
curve (green dots) between hour 0 and 6 before parasite biomass reduces.
As one last clinical aspect, fever clearance happened within about 24 hours,
which is slightly faster than in the previous study in Kilifi (27 – 30 hours).
Borrmann, S. et al. (2011) already suggested that the drop reported in clinical
response might not be due to less sensitivity to the artemisinins, but due to a
change in transmission (O´Meara, W. P. et al. 2008). Less transmission results
in lower immunity of the children, leading to higher parasitaemia at admission
and in conclusion to prolonged clinical clearance times. The initial parasitaemia
in this study was raised compared to initial parasitaemia from the last study in
the same study area, hinting towards a further decline in immunity against
P. falciparum infections. Parasite clearance and reduction ratios though showed
high susceptibility. Describing in vivo observations there are variables within the
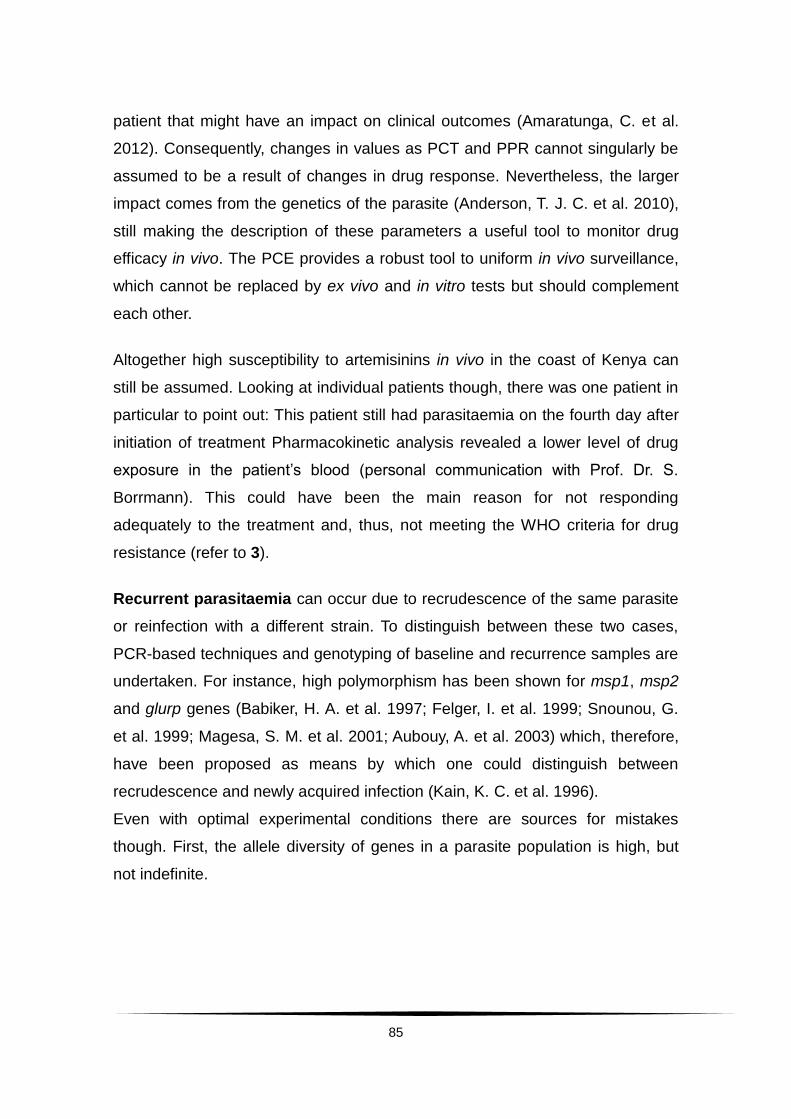
85
patient that might have an impact on clinical outcomes (Amaratunga, C. et al.
2012). Consequently, changes in values as PCT and PPR cannot singularly be
assumed to be a result of changes in drug response. Nevertheless, the larger
impact comes from the genetics of the parasite (Anderson, T. J. C. et al. 2010),
still making the description of these parameters a useful tool to monitor drug
efficacy in vivo. The PCE provides a robust tool to uniform in vivo surveillance,
which cannot be replaced by ex vivo and in vitro tests but should complement
each other.
Altogether high susceptibility to artemisinins in vivo in the coast of Kenya can
still be assumed. Looking at individual patients though, there was one patient in
particular to point out: This patient still had parasitaemia on the fourth day after
initiation of treatment Pharmacokinetic analysis revealed a lower level of drug
exposure in the patient’s blood (personal communication with Prof. Dr. S.
Borrmann). This could have been the main reason for not responding
adequately to the treatment and, thus, not meeting the WHO criteria for drug
resistance (refer to 3).
Recurrent parasitaemia can occur due to recrudescence of the same parasite
or reinfection with a different strain. To distinguish between these two cases,
PCR-based techniques and genotyping of baseline and recurrence samples are
undertaken. For instance, high polymorphism has been shown for msp1, msp2
and glurp genes (Babiker, H. A. et al. 1997; Felger, I. et al. 1999; Snounou, G.
et al. 1999; Magesa, S. M. et al. 2001; Aubouy, A. et al. 2003) which, therefore,
have been proposed as means by which one could distinguish between
recrudescence and newly acquired infection (Kain, K. C. et al. 1996).
Even with optimal experimental conditions there are sources for mistakes
though. First, the allele diversity of genes in a parasite population is high, but
not indefinite.
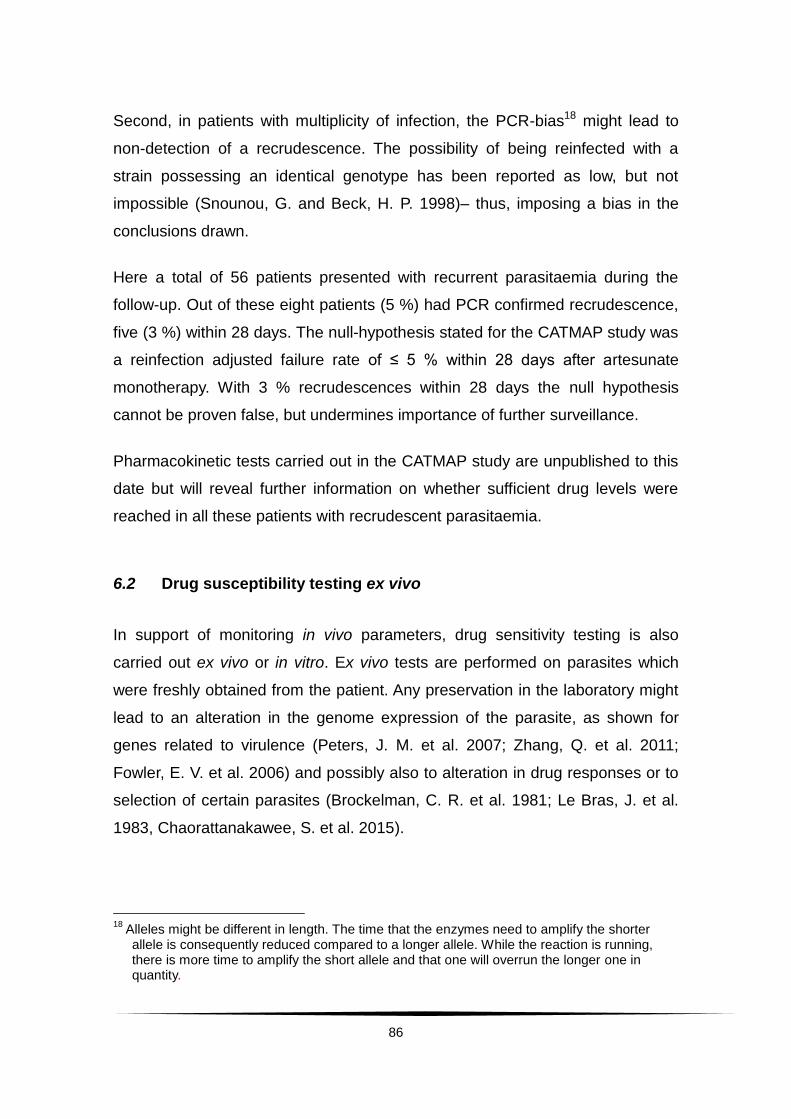
86
Second, in patients with multiplicity of infection, the PCR-bias18 might lead to
non-detection of a recrudescence. The possibility of being reinfected with a
strain possessing an identical genotype has been reported as low, but not
impossible (Snounou, G. and Beck, H. P. 1998)– thus, imposing a bias in the
conclusions drawn.
Here a total of 56 patients presented with recurrent parasitaemia during the
follow-up. Out of these eight patients (5 %) had PCR confirmed recrudescence,
five (3 %) within 28 days. The null-hypothesis stated for the CATMAP study was
a reinfection adjusted failure rate of ≤ 5 % within 28 days after artesunate
monotherapy. With 3 % recrudescences within 28 days the null hypothesis
cannot be proven false, but undermines importance of further surveillance.
Pharmacokinetic tests carried out in the CATMAP study are unpublished to this
date but will reveal further information on whether sufficient drug levels were
reached in all these patients with recrudescent parasitaemia.
6.2 Drug susceptibility testing ex vivo
In support of monitoring in vivo parameters, drug sensitivity testing is also
carried out ex vivo or in vitro. Ex vivo tests are performed on parasites which
were freshly obtained from the patient. Any preservation in the laboratory might
lead to an alteration in the genome expression of the parasite, as shown for
genes related to virulence (Peters, J. M. et al. 2007; Zhang, Q. et al. 2011;
Fowler, E. V. et al. 2006) and possibly also to alteration in drug responses or to
selection of certain parasites (Brockelman, C. R. et al. 1981; Le Bras, J. et al.
1983, Chaorattanakawee, S. et al. 2015).
18
Alleles might be different in length. The time that the enzymes need to amplify the shorter allele is consequently reduced compared to a longer allele. While the reaction is running, there is more time to amplify the short allele and that one will overrun the longer one in quantity.
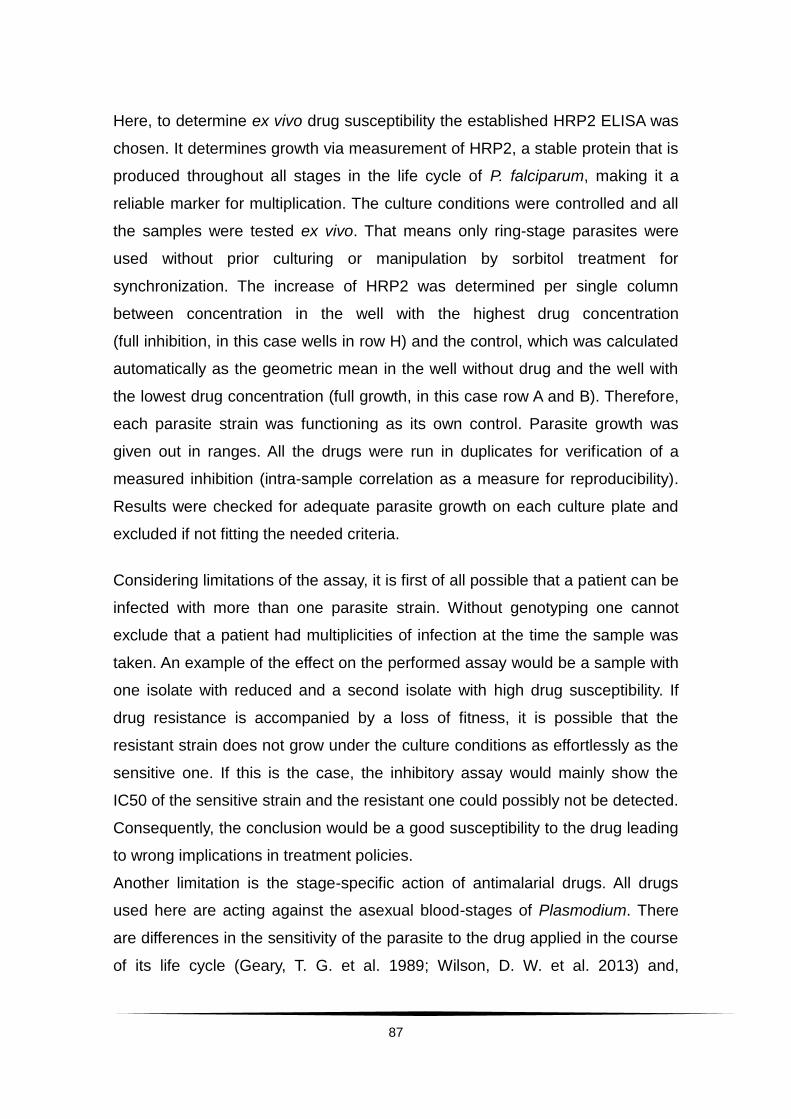
87
Here, to determine ex vivo drug susceptibility the established HRP2 ELISA was
chosen. It determines growth via measurement of HRP2, a stable protein that is
produced throughout all stages in the life cycle of P. falciparum, making it a
reliable marker for multiplication. The culture conditions were controlled and all
the samples were tested ex vivo. That means only ring-stage parasites were
used without prior culturing or manipulation by sorbitol treatment for
synchronization. The increase of HRP2 was determined per single column
between concentration in the well with the highest drug concentration
(full inhibition, in this case wells in row H) and the control, which was calculated
automatically as the geometric mean in the well without drug and the well with
the lowest drug concentration (full growth, in this case row A and B). Therefore,
each parasite strain was functioning as its own control. Parasite growth was
given out in ranges. All the drugs were run in duplicates for verification of a
measured inhibition (intra-sample correlation as a measure for reproducibility).
Results were checked for adequate parasite growth on each culture plate and
excluded if not fitting the needed criteria.
Considering limitations of the assay, it is first of all possible that a patient can be
infected with more than one parasite strain. Without genotyping one cannot
exclude that a patient had multiplicities of infection at the time the sample was
taken. An example of the effect on the performed assay would be a sample with
one isolate with reduced and a second isolate with high drug susceptibility. If
drug resistance is accompanied by a loss of fitness, it is possible that the
resistant strain does not grow under the culture conditions as effortlessly as the
sensitive one. If this is the case, the inhibitory assay would mainly show the
IC50 of the sensitive strain and the resistant one could possibly not be detected.
Consequently, the conclusion would be a good susceptibility to the drug leading
to wrong implications in treatment policies.
Another limitation is the stage-specific action of antimalarial drugs. All drugs
used here are acting against the asexual blood-stages of Plasmodium. There
are differences in the sensitivity of the parasite to the drug applied in the course
of its life cycle (Geary, T. G. et al. 1989; Wilson, D. W. et al. 2013) and,
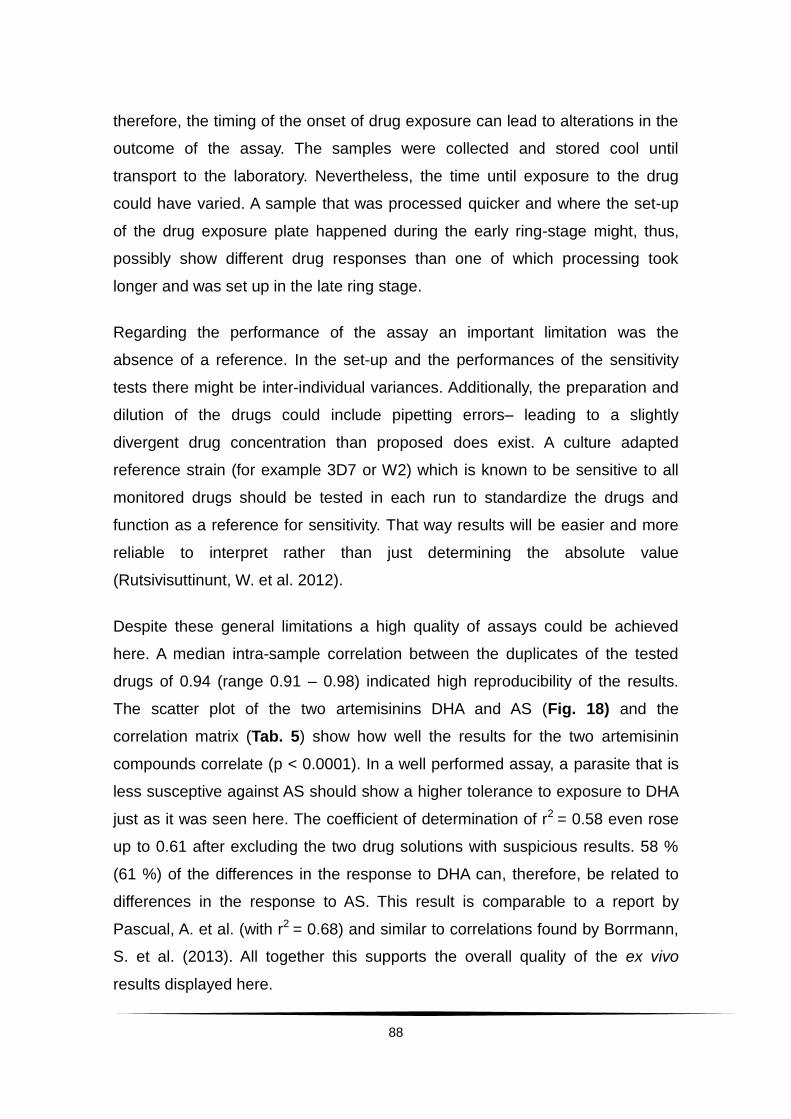
88
therefore, the timing of the onset of drug exposure can lead to alterations in the
outcome of the assay. The samples were collected and stored cool until
transport to the laboratory. Nevertheless, the time until exposure to the drug
could have varied. A sample that was processed quicker and where the set-up
of the drug exposure plate happened during the early ring-stage might, thus,
possibly show different drug responses than one of which processing took
longer and was set up in the late ring stage.
Regarding the performance of the assay an important limitation was the
absence of a reference. In the set-up and the performances of the sensitivity
tests there might be inter-individual variances. Additionally, the preparation and
dilution of the drugs could include pipetting errors– leading to a slightly
divergent drug concentration than proposed does exist. A culture adapted
reference strain (for example 3D7 or W2) which is known to be sensitive to all
monitored drugs should be tested in each run to standardize the drugs and
function as a reference for sensitivity. That way results will be easier and more
reliable to interpret rather than just determining the absolute value
(Rutsivisuttinunt, W. et al. 2012).
Despite these general limitations a high quality of assays could be achieved
here. A median intra-sample correlation between the duplicates of the tested
drugs of 0.94 (range 0.91 – 0.98) indicated high reproducibility of the results.
The scatter plot of the two artemisinins DHA and AS (Fig. 18) and the
correlation matrix (Tab. 5) show how well the results for the two artemisinin
compounds correlate (p < 0.0001). In a well performed assay, a parasite that is
less susceptive against AS should show a higher tolerance to exposure to DHA
just as it was seen here. The coefficient of determination of r2 = 0.58 even rose
up to 0.61 after excluding the two drug solutions with suspicious results. 58 %
(61 %) of the differences in the response to DHA can, therefore, be related to
differences in the response to AS. This result is comparable to a report by
Pascual, A. et al. (with r2 = 0.68) and similar to correlations found by Borrmann,
S. et al. (2013). All together this supports the overall quality of the ex vivo
results displayed here.
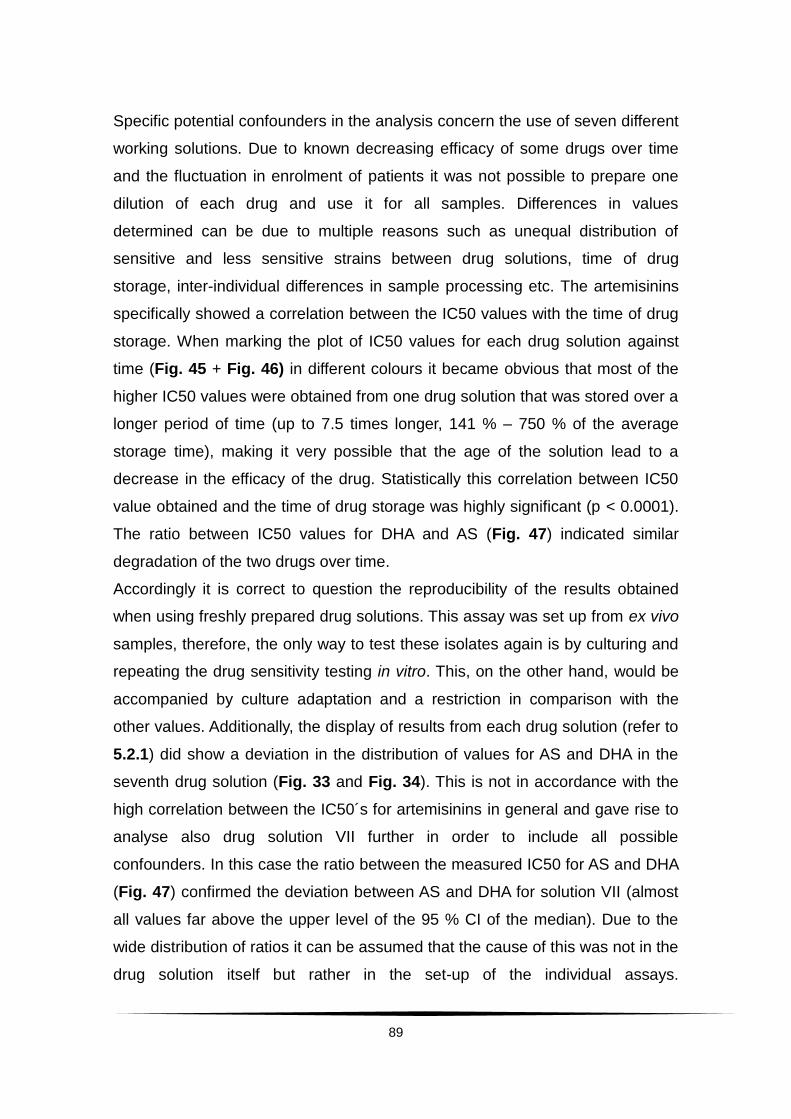
89
Specific potential confounders in the analysis concern the use of seven different
working solutions. Due to known decreasing efficacy of some drugs over time
and the fluctuation in enrolment of patients it was not possible to prepare one
dilution of each drug and use it for all samples. Differences in values
determined can be due to multiple reasons such as unequal distribution of
sensitive and less sensitive strains between drug solutions, time of drug
storage, inter-individual differences in sample processing etc. The artemisinins
specifically showed a correlation between the IC50 values with the time of drug
storage. When marking the plot of IC50 values for each drug solution against
time (Fig. 45 + Fig. 46) in different colours it became obvious that most of the
higher IC50 values were obtained from one drug solution that was stored over a
longer period of time (up to 7.5 times longer, 141 % – 750 % of the average
storage time), making it very possible that the age of the solution lead to a
decrease in the efficacy of the drug. Statistically this correlation between IC50
value obtained and the time of drug storage was highly significant (p < 0.0001).
The ratio between IC50 values for DHA and AS (Fig. 47) indicated similar
degradation of the two drugs over time.
Accordingly it is correct to question the reproducibility of the results obtained
when using freshly prepared drug solutions. This assay was set up from ex vivo
samples, therefore, the only way to test these isolates again is by culturing and
repeating the drug sensitivity testing in vitro. This, on the other hand, would be
accompanied by culture adaptation and a restriction in comparison with the
other values. Additionally, the display of results from each drug solution (refer to
5.2.1) did show a deviation in the distribution of values for AS and DHA in the
seventh drug solution (Fig. 33 and Fig. 34). This is not in accordance with the
high correlation between the IC50´s for artemisinins in general and gave rise to
analyse also drug solution VII further in order to include all possible
confounders. In this case the ratio between the measured IC50 for AS and DHA
(Fig. 47) confirmed the deviation between AS and DHA for solution VII (almost
all values far above the upper level of the 95 % CI of the median). Due to the
wide distribution of ratios it can be assumed that the cause of this was not in the
drug solution itself but rather in the set-up of the individual assays.
90
An analysis excluding these suspicious results (refer to 5.2.3) however did not
reveal a significant influence of these confounders on the overall results. The
median IC50 of DHA did change from 4.52 nM (geometric mean 4.84 nM,
95 % CI 4.10 – 5.70 nM) to 4.17 nM (geometric mean 4.04 nM,
95 % CI 3.41 – 4.71 nM) (p = 0.23) and for AS from 6.59 nM (geometric mean
5.82 nM, 95 % CI 4.77 – 7.12 nM) to 6.26 nM (geometric mean 5.89 nM,
95 % CI 5.06 – 6.86 nM) (p = 0.72) when excluding both drug solutions. When
only excluding the sixth solution with a definite reason for degradation, AS
differed slightly significant (p = 0.04) and DHA showed the trend to significance
(p = 0.08). All together this does imply a trend of higher IC50 values over time of
drug storage and the high importance of controlling for this confounder.
An overall slightly higher value for AS could possibly be explained by
hydrolyzation of AS into DHA, the active metabolite, and succinic acid in
aqueous solutions (Rutvisuttinunt, W. et al. 2012), whereas DHA already is an
active metabolite.
When testing isolates from patients with recurrent parasitaemia, drug selection
did not lead to elevated IC50 values (Fig. 49).
In comparison with previous studies in the same study population (Borrmann, S.
et al. 2011 and 2013), the IC50 for DHA now is statistically significantly higher
(p < 0.001) but remains on a low level. Another study by Borrmann, S. et al.
(2013) showed a median IC50 of 2 nM (range 0.5 – 4 nM) for DHA. In these
studies the 3H-hypoxanthine uptake assay (Desjardins, R. E. et al. 1979) was
used to test drug susceptibility. Thus, it can be argued, that the difference is
caused by inter-test variability. The HRP2 ELISA though has been shown to
produce similar results when compared directly to other assays, including the
isotopic method (Noedl, H. 2002a).
New developments in the research field of artemisinin resistance also have to
be taken into account. Though, considering recent reports as Witkowski, B.
et al. (2013a), the results obtained here are not qualified to detect artemisinin
resistance, they do show the various phenotypes of artemisinin drug responses
in P. falciparum in Coastal Kenya. Fig. 17 displays the variety in artemisinin
91
susceptibility in all isolates. Different phenotypes like these have been
connected to SNPs by Borrmann et al. 2013, including SNPs on chromosome
13. This is of particular interest since chromosome 13 has been discussed
before in the context of artemisinin susceptibility (Cheeseman, I. H. et al. 2012)
and remains a candidate of high attentiveness (Ariey, F. et al. 2014; Mbengue,
A. et al. 2015, Straimer, J. et al. 2015, Mita, T. et al. 2016). Since artemisinin
susceptibility phenotypes have been correlated in Kenya with chromosome 13
despite no reports of artemisinin resistance in this area it is crucial to carry out
further drug surveillance and to investigate the importance of already existing
molecular markers and possibly even identify others. Borrmann, S. et al. (2013)
argued, that the molecular markers might not show signatures of recent positive
selection since by that time artemisinins were only introduced 2 – 3 years
before the sampling started. The development of this finding has to be followed
over time of artemisinin usage and connected with clinical treatment responses.
Equally important is the RSA testing in the area to investigate a correlation with
parasite clearance in this area and identify its importance in further surveillance
in Kenya.
Apart from artemisinin susceptibility it is of interest, since treatment guidelines
nowadays abandon the use of monotherapies in P. falciparum malaria, to take a
closer look at the drug susceptibility to the ACT partner drugs. The combination
of AL is the first line-treatment for malaria in Kenya, DHA-PPQ the second line-
treatment (Ministry of Public Health and Sanitation, National Guidelines for the
Diagnosis, Treatment and Prevention of Malaria in Kenya, 2010). Median IC50
values for LUM were 13.71 nM (geometric mean 12.10 nM, 95 % CI 10.31 –
14.20 nM) and for PPQ 7.88 nM (geometric mean 8.03 nM, 95 % CI 6.91 – 9.34
nM). Both did not show any indication for a decrease in efficacy ex vivo since
the last studies (Borrmann, S. et al. 2011 and 2013– where LUM IC 50 median
was 42.04 nM and 69.67 nM (2011) as well as 17 nM (2013), PPQ 27.83 nM
and 19.67 nM (2011) as well as 49 nM (2013)). Both drugs can, consequently,
as far as ex vivo data is concerned, be considered a safe choice as partner in
artemisinin combination therapy.
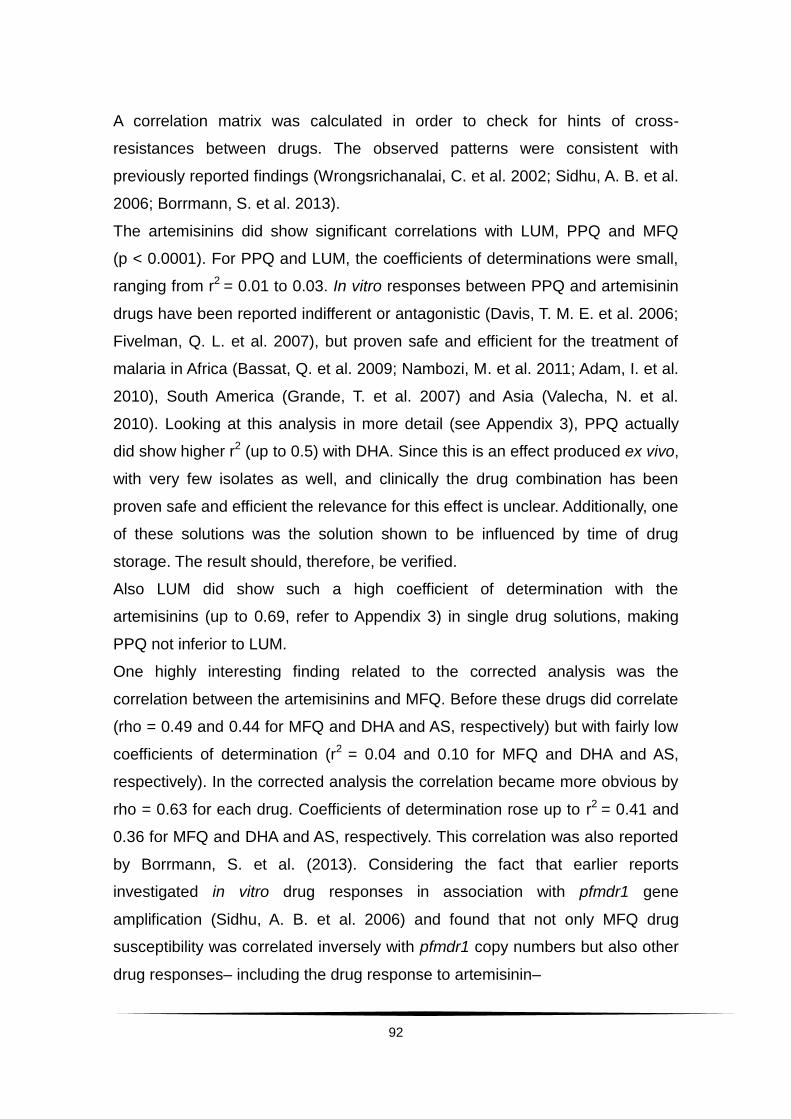
92
A correlation matrix was calculated in order to check for hints of cross-
resistances between drugs. The observed patterns were consistent with
previously reported findings (Wrongsrichanalai, C. et al. 2002; Sidhu, A. B. et al.
2006; Borrmann, S. et al. 2013).
The artemisinins did show significant correlations with LUM, PPQ and MFQ
(p < 0.0001). For PPQ and LUM, the coefficients of determinations were small,
ranging from r2 = 0.01 to 0.03. In vitro responses between PPQ and artemisinin
drugs have been reported indifferent or antagonistic (Davis, T. M. E. et al. 2006;
Fivelman, Q. L. et al. 2007), but proven safe and efficient for the treatment of
malaria in Africa (Bassat, Q. et al. 2009; Nambozi, M. et al. 2011; Adam, I. et al.
2010), South America (Grande, T. et al. 2007) and Asia (Valecha, N. et al.
2010). Looking at this analysis in more detail (see Appendix 3), PPQ actually
did show higher r2 (up to 0.5) with DHA. Since this is an effect produced ex vivo,
with very few isolates as well, and clinically the drug combination has been
proven safe and efficient the relevance for this effect is unclear. Additionally, one
of these solutions was the solution shown to be influenced by time of drug
storage. The result should, therefore, be verified.
Also LUM did show such a high coefficient of determination with the
artemisinins (up to 0.69, refer to Appendix 3) in single drug solutions, making
PPQ not inferior to LUM.
One highly interesting finding related to the corrected analysis was the
correlation between the artemisinins and MFQ. Before these drugs did correlate
(rho = 0.49 and 0.44 for MFQ and DHA and AS, respectively) but with fairly low
coefficients of determination (r2 = 0.04 and 0.10 for MFQ and DHA and AS,
respectively). In the corrected analysis the correlation became more obvious by
rho = 0.63 for each drug. Coefficients of determination rose up to r2 = 0.41 and
0.36 for MFQ and DHA and AS, respectively. This correlation was also reported
by Borrmann, S. et al. (2013). Considering the fact that earlier reports
investigated in vitro drug responses in association with pfmdr1 gene
amplification (Sidhu, A. B. et al. 2006) and found that not only MFQ drug
susceptibility was correlated inversely with pfmdr1 copy numbers but also other
drug responses– including the drug response to artemisinin–
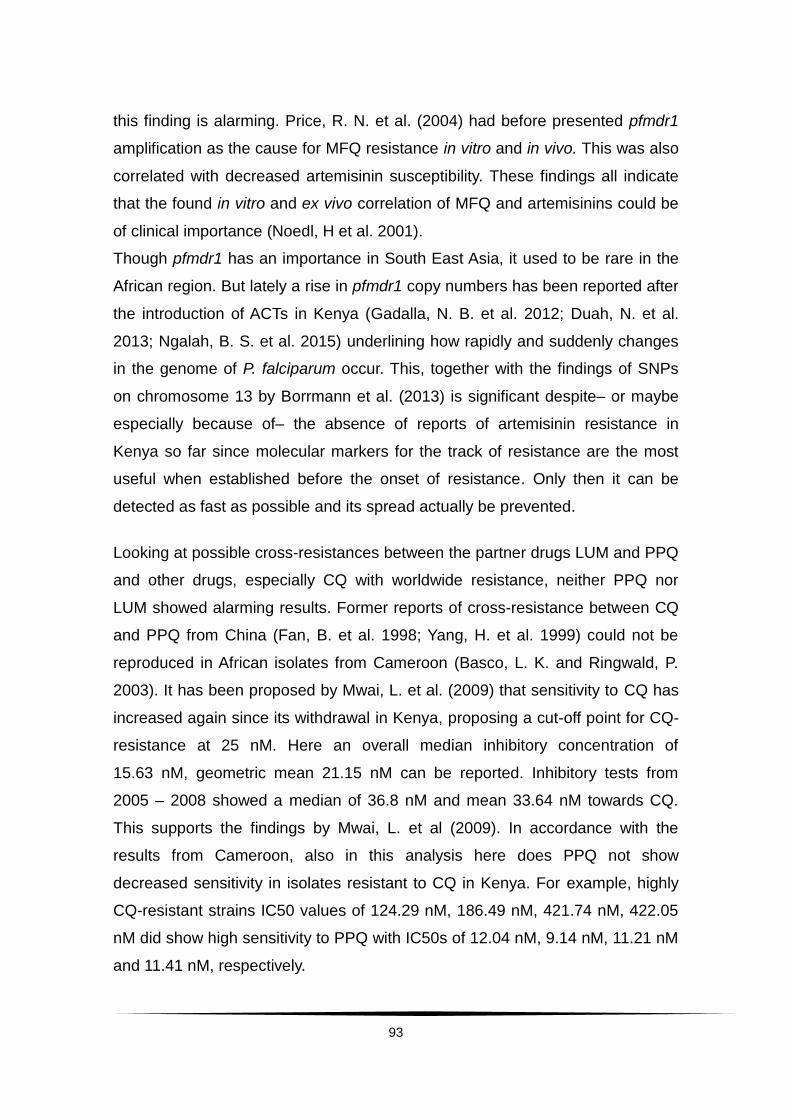
93
this finding is alarming. Price, R. N. et al. (2004) had before presented pfmdr1
amplification as the cause for MFQ resistance in vitro and in vivo. This was also
correlated with decreased artemisinin susceptibility. These findings all indicate
that the found in vitro and ex vivo correlation of MFQ and artemisinins could be
of clinical importance (Noedl, H et al. 2001).
Though pfmdr1 has an importance in South East Asia, it used to be rare in the
African region. But lately a rise in pfmdr1 copy numbers has been reported after
the introduction of ACTs in Kenya (Gadalla, N. B. et al. 2012; Duah, N. et al.
2013; Ngalah, B. S. et al. 2015) underlining how rapidly and suddenly changes
in the genome of P. falciparum occur. This, together with the findings of SNPs
on chromosome 13 by Borrmann et al. (2013) is significant despite– or maybe
especially because of– the absence of reports of artemisinin resistance in
Kenya so far since molecular markers for the track of resistance are the most
useful when established before the onset of resistance. Only then it can be
detected as fast as possible and its spread actually be prevented.
Looking at possible cross-resistances between the partner drugs LUM and PPQ
and other drugs, especially CQ with worldwide resistance, neither PPQ nor
LUM showed alarming results. Former reports of cross-resistance between CQ
and PPQ from China (Fan, B. et al. 1998; Yang, H. et al. 1999) could not be
reproduced in African isolates from Cameroon (Basco, L. K. and Ringwald, P.
2003). It has been proposed by Mwai, L. et al. (2009) that sensitivity to CQ has
increased again since its withdrawal in Kenya, proposing a cut-off point for CQ-
resistance at 25 nM. Here an overall median inhibitory concentration of
15.63 nM, geometric mean 21.15 nM can be reported. Inhibitory tests from
2005 – 2008 showed a median of 36.8 nM and mean 33.64 nM towards CQ.
This supports the findings by Mwai, L. et al (2009). In accordance with the
results from Cameroon, also in this analysis here does PPQ not show
decreased sensitivity in isolates resistant to CQ in Kenya. For example, highly
CQ-resistant strains IC50 values of 124.29 nM, 186.49 nM, 421.74 nM, 422.05
nM did show high sensitivity to PPQ with IC50s of 12.04 nM, 9.14 nM, 11.21 nM
and 11.41 nM, respectively.
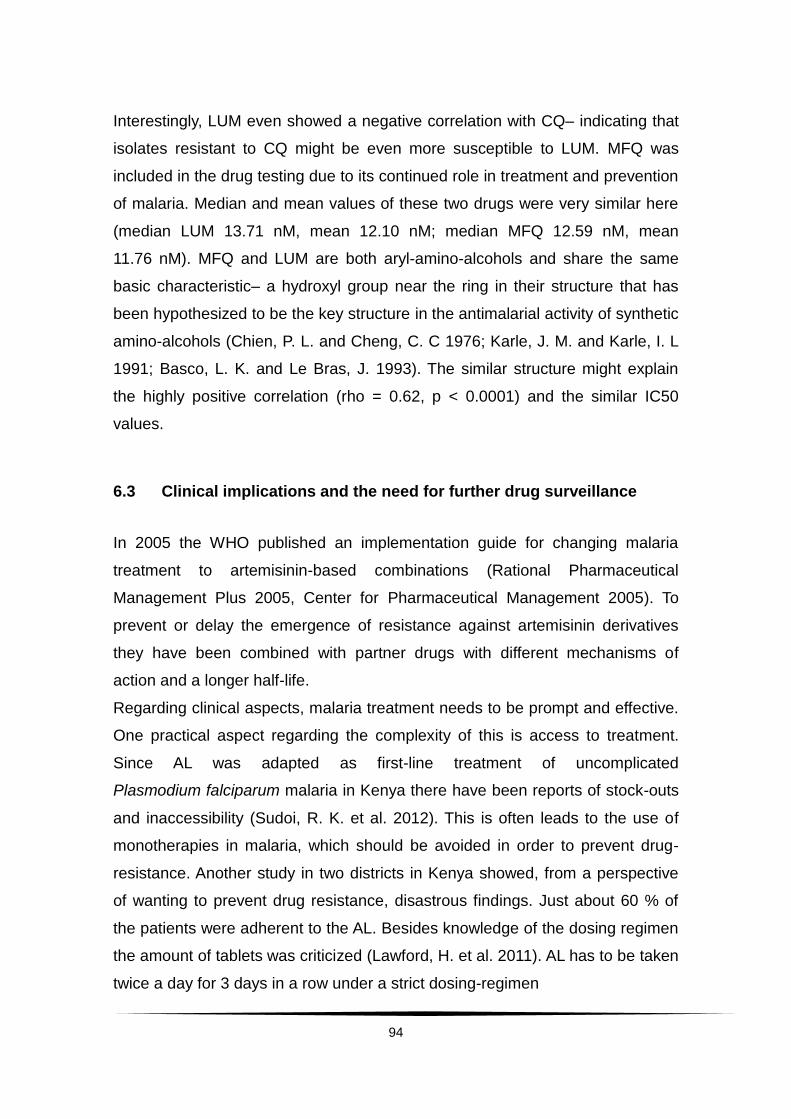
94
Interestingly, LUM even showed a negative correlation with CQ– indicating that
isolates resistant to CQ might be even more susceptible to LUM. MFQ was
included in the drug testing due to its continued role in treatment and prevention
of malaria. Median and mean values of these two drugs were very similar here
(median LUM 13.71 nM, mean 12.10 nM; median MFQ 12.59 nM, mean
11.76 nM). MFQ and LUM are both aryl-amino-alcohols and share the same
basic characteristic– a hydroxyl group near the ring in their structure that has
been hypothesized to be the key structure in the antimalarial activity of synthetic
amino-alcohols (Chien, P. L. and Cheng, C. C 1976; Karle, J. M. and Karle, I. L
1991; Basco, L. K. and Le Bras, J. 1993). The similar structure might explain
the highly positive correlation (rho = 0.62, p < 0.0001) and the similar IC50
values.
6.3 Clinical implications and the need for further drug surveillance
In 2005 the WHO published an implementation guide for changing malaria
treatment to artemisinin-based combinations (Rational Pharmaceutical
Management Plus 2005, Center for Pharmaceutical Management 2005). To
prevent or delay the emergence of resistance against artemisinin derivatives
they have been combined with partner drugs with different mechanisms of
action and a longer half-life.
Regarding clinical aspects, malaria treatment needs to be prompt and effective.
One practical aspect regarding the complexity of this is access to treatment.
Since AL was adapted as first-line treatment of uncomplicated
Plasmodium falciparum malaria in Kenya there have been reports of stock-outs
and inaccessibility (Sudoi, R. K. et al. 2012). This is often leads to the use of
monotherapies in malaria, which should be avoided in order to prevent drug-
resistance. Another study in two districts in Kenya showed, from a perspective
of wanting to prevent drug resistance, disastrous findings. Just about 60 % of
the patients were adherent to the AL. Besides knowledge of the dosing regimen
the amount of tablets was criticized (Lawford, H. et al. 2011). AL has to be taken
twice a day for 3 days in a row under a strict dosing-regimen
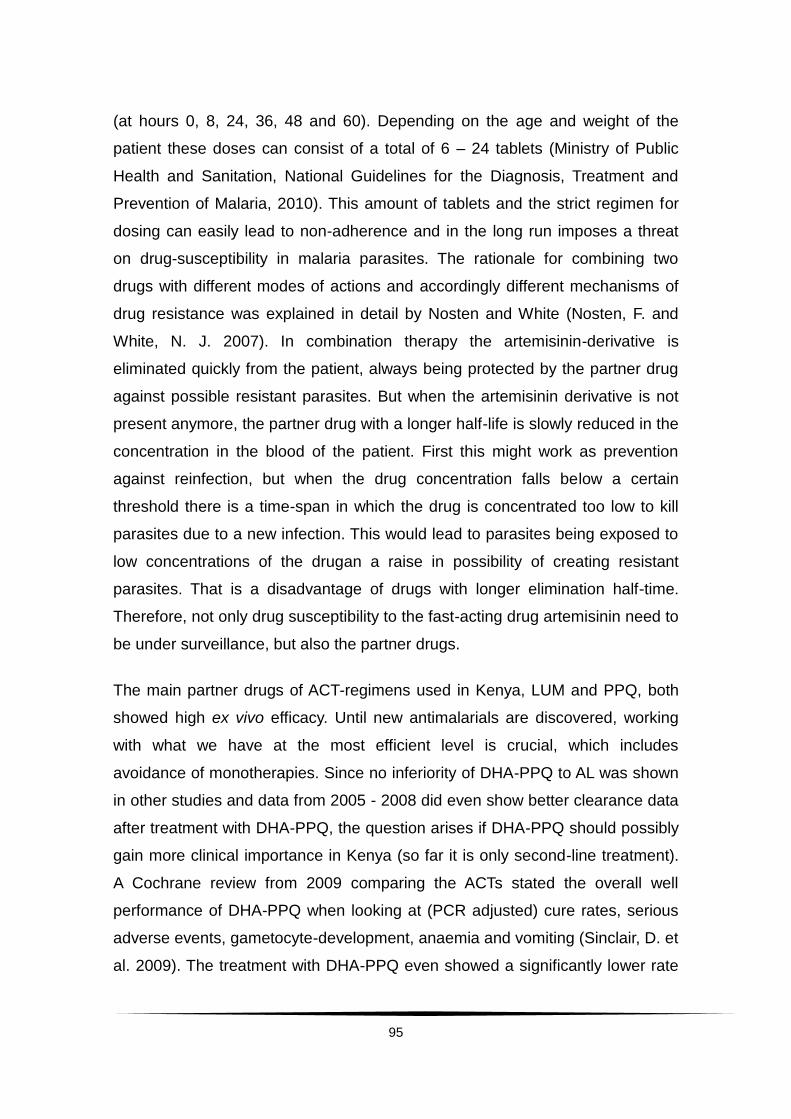
95
(at hours 0, 8, 24, 36, 48 and 60). Depending on the age and weight of the
patient these doses can consist of a total of 6 – 24 tablets (Ministry of Public
Health and Sanitation, National Guidelines for the Diagnosis, Treatment and
Prevention of Malaria, 2010). This amount of tablets and the strict regimen for
dosing can easily lead to non-adherence and in the long run imposes a threat
on drug-susceptibility in malaria parasites. The rationale for combining two
drugs with different modes of actions and accordingly different mechanisms of
drug resistance was explained in detail by Nosten and White (Nosten, F. and
White, N. J. 2007). In combination therapy the artemisinin-derivative is
eliminated quickly from the patient, always being protected by the partner drug
against possible resistant parasites. But when the artemisinin derivative is not
present anymore, the partner drug with a longer half-life is slowly reduced in the
concentration in the blood of the patient. First this might work as prevention
against reinfection, but when the drug concentration falls below a certain
threshold there is a time-span in which the drug is concentrated too low to kill
parasites due to a new infection. This would lead to parasites being exposed to
low concentrations of the drugan a raise in possibility of creating resistant
parasites. That is a disadvantage of drugs with longer elimination half-time.
Therefore, not only drug susceptibility to the fast-acting drug artemisinin need to
be under surveillance, but also the partner drugs.
The main partner drugs of ACT-regimens used in Kenya, LUM and PPQ, both
showed high ex vivo efficacy. Until new antimalarials are discovered, working
with what we have at the most efficient level is crucial, which includes
avoidance of monotherapies. Since no inferiority of DHA-PPQ to AL was shown
in other studies and data from 2005 - 2008 did even show better clearance data
after treatment with DHA-PPQ, the question arises if DHA-PPQ should possibly
gain more clinical importance in Kenya (so far it is only second-line treatment).
A Cochrane review from 2009 comparing the ACTs stated the overall well
performance of DHA-PPQ when looking at (PCR adjusted) cure rates, serious
adverse events, gametocyte-development, anaemia and vomiting (Sinclair, D. et
al. 2009). The treatment with DHA-PPQ even showed a significantly lower rate
96
of new infections over the 42-day follow up period, which demonstrates the
good post-treatment prophylactic effect of PPQ due to its long elimination half
time (Bassat, Q. et al. 2009). Several clinical studies have reported non-
inferiority of DHA-PPQ compared to AL in multiple African countries such as
Zambia (Nambozi, M. et al. 2011), Uganda (Yeka, A. et al. 2008) in a
multicentre-trial carried out in Cameroon, Côte d´Ivoire and Senegal (Yavo, W.
et al. 2011) and in Kenya (Bassat, Q. et al. 2009).
This study has presented data which overall did not confirm a decreased in vivo
responsiveness towards artemisinins in the area as reported before. Ex vivo
drug responses identified different artemisinin susceptibility phenotypes and
indicated cross-resistances with so far mainly unclear clinical importance.
Especially MFQ could possibly impact artemisinin susceptibility in high
transmission areas (Noedl, H. et al. 2001), and the shown correlation in this
analysis together with previous works underlines the necessity for surveillance
of drug usage and susceptibility. Recent studies showed much progress
regarding drug susceptibility surveillance via the RSA (Witkowski, B. et al.
2013a and b). This assay also needs to be implemented for surveillance in
Africa. Molecular markers for resistance like the K13-propeller polymorphism
and pfmdr1 have to be under observation and / or other markers for the African
region have to be established.
Apart from these treatment considerations, the main and most important
conclusion drawn from this work though has to be the need for further
continuous drug surveillance. Both aspects, in vivo as well as ex vivo / in vitro
susceptibility have to be monitored to detect any changes in parasite drug
susceptibility in appropriate time. At the beginning of this work it was stated that
the first onset of upcoming resistance is often overlooked by clinicians since
patients first appear to improve clinically. Fever clearance remains quick and
patients are considered to be cured. In the case of detection of recurrent
parasitaemia within 28 days after a malaria treatment though, clinicians have to
be alarmed. Also during the initial treatment parameters such as parasite
reduction ratios can easily be calculated in order to check whether parasites

97
clear the patients´ blood as expected or if treatment response is inadequate
(e.g. no adequate parasite reduction after 12 hours, since PRR here increased
highly per hour between hour 6 and 12). Besides the attention of each clinician
treating malaria patients, there is a high need for sentinel sites across Africa in
order to monitor drug susceptibility continuously. The major public health
importance of malaria explained in the beginning of this work in addition to the
history of previous emergence of antimalarial resistance justifies and requires
continuous supervision of antimalarial treatment. The responsibility lies with
national as well as international facilities. Sentinel sites are usually able to
obtain data of higher quality and in more detail, but each health facility should
feel responsible to monitor drug susceptibility, inform patients on the importance
of therapy adherence and report suspicious events. Drug efficiency has to be
transparent, for example through an open database. In addition to selected
sentinel sites at areas of high transmission and with many malaria cases,
studies like CATMAP with preferably a standard protocol at different study sites
can function as additional support to the continuous drug surveillance. They can
however not replace it since changes might be detected too late and resistance
spreads fast once established.
All together it can be said that artemisinins for now remain highly effective
against P. falciparum malaria in Coastal Kenya. In vivo data suggested fast
overall parasite clearance after treatment with artesunate. Ex vivo drug
susceptibility tests identified different phenotypes but need to be investigated
further, e.g. correlation with molecular markers and RSA testing. A high need for
continuous drug surveillance in Kenya as well as the whole African region is
given due to the enormous public health importance of malaria, the
spontaneous occurrence of drug resistance and its fast spread.
98
7. Summary
7.1 English
Background: Malaria remains one of the major causes of morbidity and
mortality worldwide. Artemisinin-based combination therapies are used as first-
line treatment in all endemic countries for uncomplicated P. falciparum malaria.
artemether-lumefantrine was introduced as first-line treatment in Kenya in 2006.
Since the first report of artemisinin-resistant P. falciparum malaria in 2009 on
the Thai-Cambodian border, concerns about declining responsiveness to
artemisinins have also been expressed in Kenya, stressing the need for
continued drug-surveillance studies.
Methods: In a single-armed trial children between the ages of 6 months and
10 years with microscopically detected P. falciparum malaria were treated with a
7-day artesunate monotherapy regimen (2 mg / kg per body weight per day as a
single dose) and followed up for 42 days. Data on parasite clearance
parameters was used in order to either substantiate or refute the previously
reported decline in artemisinin responses. Additionally, susceptibility to
lumefantrine and piperaquine, the two most commonly prescribed artemisinin-
based combination therapy partner drugs in Kenya, was tested ex vivo via
Histidine-rich protein 2 Enzyme-linked-immunosorbent-assay. To distinguish
between reinfection and recrudescence, Merozoite-surface-protein 2 -
genotyping was carried out.
Results: 175 patients were recruited between April and December 2011. Mean
overall parasite clearance times were 30.5 hours and median slope half life was
2.4 hours, with a median clearance rate constant of 0.29 / hour. The highest
reduction in parasites took place between hour 6 and hour 12 after initiation of
treatment (parasite reduction ratio increased from 0.03 / hour to 0.15 / hour).
Ex vivo drug susceptibility showed geometric means of 3.8 nM and 4.2 nM for
dihydroartemisinin and artesunate, respectively.
99
Geometric mean IC50 for lumefantrine and piperaquine were 12.1 nM and
8.0 nM, respectively. An indication for cross-resistance between artemisinins
and mefloquine was found (r2 = 0.41 and 0.38 p < 0.0001 for each value). Out of
a total of 56 (33 %) total recurrent parasitaemia cases, 32 (19 %) happened
within 28 days after initiation of treatment. Eight patients had PCR-confirmed
recrudescence (5 %), 5 of those (3 %) within 28 days. Tested recurrence
samples did almost exceptionally not differ significantly from baseline values
regarding their IC50 (0.02 ≤ p ≥ 0.96).
Conclusion: For now overall artemisinin susceptibility in Kenya remains high,
clinically as well as when testing ex vivo. In order to prevent resistance and to
respond adequately in the case of it, new drugs and combinations have to be
studied. PPQ proved to be highly efficient ex vivo. This suggests a high
importance as alternative to the first-line combination therapy in Kenya. All
together it is inevitable to further continue close drug surveillance. High drug
pressure is present due to the frequent use of artemether-lumefantrine in Kenya
and mutations that could affect drug susceptibility arise spontaneously. By
closely monitoring drug effectiveness, a decline in response of P. falciparum
towards artemisinins can be detected and contained early.
Maria Rebekka Marschallek Prof. Dr. med. Steffen Borrmann
100
7.2 German
Hintergrund: Malaria stellt weltweit noch immer eine wesentliche Ursache für
Morbidität und Mortalität dar. Kombinationstherapien mit Artemisinin-Derivaten
sind seit einigen Jahren in allen endemischen Gebieten als Goldstandard
etabliert. Artemether-Lumefantrin bildet in Kenia seit 2006 den Grundstein der
Therapie. Seit dem ersten Report über Artemisinin-resistente P. falciparum
Malaria an der thailändisch-kambodschanischen Grenze im Jahr 2009 wird
auch aus Kenia über abnehmende Sensibilität gegenüber Artemisinin berichtet.
Daraus resultiert die Dringlichkeit weiterer Studien zur Medikamentensensitvität
von P. falciparum in diesem Land.
Methoden: In einer einarmigen Studie wurden im Kinder zwischen 6 Monaten
und 10 Jahren mit mikroskopisch verifizierter P. falciparum Malaria mit einer
7-tägigen Artesunat Monotherapie (2 mg / kg Körpergewicht) behandelt und
über einen 42-tägigen Zeitraum beobachtet. Parasiten Eliminations-Parameter
und ex vivo Medikamentensensitivität dienten als Indikatoren um eine zuvor
publizierte abnehmende Wirksamkeit von Artemisinin in Kenia zu verifizieren
oder zu widerlegen. Die ex vivo Medikamentensensitivität wurde anhand eines
antikörperbasierten Nachweisverfahrens von Histidin-reichem-Protein 2
bestimmt. Zusätzlich wurden die ex vivo Sensitivitäten von Lumefantrin und
Piperaquin, den beiden am häufgsten genutzten Kombinationspartnern der
Artemisinine, getestet. Um zwischen einer Rekrudeszenz und einer Reinfektion
zu unterscheiden, wurde eine Genotypisierung anhand des Merozoiten-
Oberflächen-Proteins 2 durchgeführt.
Resultate: 175 Patienten wurden zwischen April und Dezember 2011 rekrutiert.
Die mittlere Parasiten Eliminations-Zeit betrug 30,5 Stunden, mediane
Steigungs-Halbzeit 2,37 Stunden. Die höchste Parasitenreduktion fand
zwischen 6 und 12 Stunden nach der ersten Medikamenteneinnahme statt
(Anstieg der Rate von 0.03 / Stunde auf 0.15 / Stunde). Die ex vivo-
Inhibitionskonzentration betrug im geometrischen Mittel 3,8 nM gegenüber
Dihydroartemisinin und 4,2 nM gegenüber Artesunat. Gegenüber Lumefantrin
101
und Piperaquin wurden Werte von 12,1 nM und 8,0 nM bestimmt. Statistisch
gab es durch Errechnung des Determinationskoeffizienten r2 Hinweise auf
Kreuzresistenz zwischen den Artemisinen und Mefloquin (r2 = 0.41 und 0.38,
p jeweils < 0.0001). Von insgesamt 56 (33 %) wiederkehrenden Parasitämie-
Fällen traten 32 (19 %) innerhalb von 28 Tagen nach Beginn der Therapie mit
Artesunat auf. 8 Patienten hatten PCR- bestätigte Rekrudeszenz (5 %), 5 davon
(3 %) innerhalb von 28 Tagen nach Therapiebeginn. Die
Inhibitionskonzentrationen bei wiederkehrender Parasitämie unterschieden sich
nahezu ausschließlich nicht signifikant von denen vor Behandlungsbeginn
(0.02 ≤ p ≥ 0.96).
Schlussfolgerung: Die Artemisinin-Wirksamkeit gegenüber P. falciparum in
Kenia erweist sich klinisch und auch ex vivo als noch immer hoch. Um
Resistenzen zu verhindern und gegebenenfalls rasch und adäquat handeln zu
können, sind Untersuchungen neuer Medikamente und Kombinationen
unabdingbar. PPQ zeigt eine hohe Effektivität ex vivo und könnte daher eine
Alterative zum Goldstandard in Kenia darstellen. Trotzdem ist es unerlässlich
weiterhin kontinuierlich Medikamentenwirksamkeitsstudien durchzuführen. Die
häufige Verwendung von Artemether-Lumefantrin bedingt einen hohen
Selektionsdruck der Parasiten. Zudem treten Mutationen, welche die
Medikamentensensitivität beeinflussen können, sehr spontan auf. Durch
engmaschige Kontrollen der Medikamentenwirksamkeit lässt sich deren
Abnahme früh detektieren und ihre weitere Ausbreitung eindämmen.
Maria Rebekka Marschallek Prof. Dr. med. Steffen Borrmann
102
8. References
1. Abdulla, S.; Sagara, I., Borrmann, S.; Allesandro, U., González, R.; Hamel, M., Ogutu, B.; Mårtensson, A.; Lyimo, J.; Maiga, H.; Sasi, P.; Nahum, A.; Bassat, Q.; Juma, E., Otieno, L.; Björkman, A.; Beck, H. P.; Andriano, K.; Cousin, M., Lefèvre, G.; Ubben, D.; Prmji, Z. (2008): Efficacy and safety of artemether-lumefantrine dispersible tablets compared with crushed commercial tablets in African infants and children with uncomplicated malaria: a randomised, single-blind, multicentre-trial. In: Lancet 372 (9652), pp. 1819 – 1827.
2. Adam, I.; Salah, M. T.; Eltahir, H. G.;Elhassan, A. H.; Elmardi, K. A., Malik, E. M. (2010): Dihydroartemisinin-piperaquine versus artemether-lumefantrine, in the treatment of uncomplicated Plasmodium falciparum malaria in central Sudan. In: Ann. Trop. Med. Parasitol. 104 (4), pp. 319 – 326.
3. Aly, A. S. I.; Vaughan, A. M; Kappe, S. H. I (2009): Malaria parasite Development in the Mosquito and Infection of the Mammalian Host. In: Microbiol. Mol. Biol. Rev. 63, pp. 195 – 221.
4. Amaratunga, C.; Sreng, S.; Suon, S.; Phelps, E. S:, Stepniewska, K.; Lim, P.; Zhou, C.; Mao, S.; Anderson, J. M.; Lindegardh, N.; Jiang, H.; Song, J.; Su, X. Z.; White, N. J.; Dondorp, A. M.; Anderson, T. J.; Fay, M. P.; Mu, J.; Duong, S.; Fairhurst, R. M. (2012): Artemisinin-resistant Plasmodium falciparum in Pursat province, western Cambodia: a parasite clearance rate study. In: Lancet Infect. Dis. 12 (11), pp. 851 – 858.
5. Anderson, T. J. C.; Nair, S.; Nkhoma, S.; Williams, J. T.; Imwong, M.; Yi, P.; Socheat, D.; Das, D.; Chotivanich, K.; Day, N. P.; White, N. J.; Dondorp, A. M. (2010): High heritability of malaria parasite clearance rate indicates a genetic basis for artemisinin resistance in western Cambodia. In: J. Infect. Dis. 201 (9), pp. 1326 – 1330.
6. Ariey, F.; Witkowski, B.; Amaratunga, C.; Beghain, J.; Langlois, A.-C.; Khim, N.; Kim, S.; Duru, V.; Bouchier, C.; Ma, L.; Lim, P.; Leang, R.; Duong, S.; Sreng, S.; Suon, S.; Chuor, C. M.; Bout, D.M.; Ménard, S.; Rogers, W. O.; Genton, B.; Fandeur, T.; Miotto, O.; Ringwald, P.; Le Bras, J.; Berry A.; Barale, J.-C.; Fairhurst, R. M.; Benoit-Vical, F.; Mercereau-Puijalon, O., Ménard, D. (2014): A molecular marker of artemisinin-resistant Plasmodium falciparum malaria. In: Nature, 505, pp. 50 – 55.
7. Aubouy, A.; Migot-Nabias, F.; Deloron, P. (2003): Polymorphism in two merozoite surface proteins of Plasmodium falciparum isolates from Gabon. In: Malar. J. 2:12.
103
8. Babiker, H. A.; Lines, J.; Hill, W. G.; Walliker, D. (1997): Population structure of Plasmodium falciparum in villages with different malaria endemicity in east Africa. In: Am. J. Trop. Med. Hyg. 56 (2), pp. 141 – 147.
9. Basco L. K.; Le Bras J. (1993): In vitro activity of artemisinin derivatives against African isolates and clones of Plasmodium falciparum. In: Am. J. Trop. Med. Hyg. 49 (3), pp. 301 – 307.
10. Basco, L. K.; Bickii, J.; Ringwald, P. (1998): In vitro activity of lumefantrine (benflumetol) against clinical isolates of Plasmodium falciparum in Yaoundé, Cameroon. In: Antimicrob. Agents Chemother. 42 (9), pp. 2347 – 2351.
11. Basco, L. K.; Ringwald, P. (2003): In vitro activities of piperaquine and other 4-aminoquinolines against clinical isolates of Plasmodium falciparum in Cameroon. In: Antimicrob. Agents Chemother. 47 (4), pp. 1391 – 1394.
12. Bassat, Q.; Mulenga, M.; Tinto, H.; Piola, P.; Borrmann, S.; Menéndez, C.; Nambozi, M.; Nabasuma, C.; Sasi, P.; Bacchieri, A.; Corsi, M.; Ubben, D.; Talisuna, A.; D’Allesandro, U. (2009): Dihydroartemisinin-Piperaquine and Artemether-Lumefantrine for Treating Uncomplicated Malaria in African Children: A Randomised, Non-Inferiority Trial. In: PLoS ONE 4 (11), e7871.
13. Batty, K. T.; Thu L. T.; Davis T. M.; Ilett, K. F.; Mai, T. X.; Hung, N. C.; Tien, N. P.; Powell, S. M., Thien, H. V.; Binh, T. Q.; Kim, N. V. (1998): A pharmacokinetic and pharmacodynamic study of intravenous vs oral artesunate in uncomplicated falciparum malaria. In: Br. J. Clin. Pharmacol. 45 (2), pp. 123 – 129.
14. Bejon, P.; William, T. N.; Nyundo, C.; Hay, S. I.; Benz, D.; Gething, P. W.; Otiende, M.; Peshu, J.; Bashraeil, M.; Greenhouse, B.; Bousema, T.; Bauni, E.; Marsh, K:; Smith, D. L.; Borrmann, S. (2014): A micro-epidemiological analysis of febrile malaria in Coastal Kenya showing hotspots within hotspots. In: eLife, 3, e02130.
15. Billker, O.; Lindo, V.; Panico, M.; Etienne, A. E.; Paxton, T.; Dell, A.; Rogers, M.; Sinden, R. E.; Morris, H. R. (1998): Identification of xanthurenic acid as the putative inducer of malaria development in the mosquito. In: Nature 392 (6673), pp. 289 – 292.
16. Billker, O.; Shaw, M. K.; Margos, G.; Sinden, R. E. (1997): The roles of temperature, pH and mosquito factors as triggers of male and female gametogenesis of Plasmodium berghei in vitro. In: Parasitology 115 (Pt 1), pp. 1 – 7.

104
17. Borrmann, S.; Sasi P.; Mwai, L.; Bashraheil, M.; Abdallah, A.; Muriithi, S.; Frühauf, H.; Schaub, B.; Pfeil, J.; Peshu, J.; Hanpithakpong, W.; Rippert, A.; Juma, E.; Tsofa, B.; Mosobo, M.; Lowe, B.; Osier, F.; Fegan, G.; Lindegårdh, N.; Nzila, A.; Peshu, N.; Mackinnon, M.; Marsh, K. (2011): Declining Responsiveness of Plasmodium falciparum Infections to Artemisinin-Based Combination Treatments on the Kenyan Coast. In: PLoS ONE 6 (11), e26005.
18. Borrmann, S.; Straimer, J.; Mwai, L.; Abdi, A.; Rippert, A.; Okombo, J.; Muriithi, S.; Sasi, P.; Kortok, M.M.; Lowe, B.; Campino, S.; Assefa, S.; Manske, M.; Maslen, G.; Peshu, N.; Kwiatkowski, D.P.; Marsh, K.; Nzila, A.; Clark, T.G. (2013): Genome-wide screen identifies new candidate genes associated with artemisinin susceptibility in Plasmodium falciparum in Kenya. In: Nature Sci. Rep. 3:3318.
19. Boyd, M. F.; Kitchen S. F. (1939): The Demonstration of Sporozoites in Human Tissues. In: Am. J. Trop. Med. Hyg. 19, pp. 27 – 31.
20. Brockelman, C. R.; Monkolkeha, S.; Tanariya, P. (1981): Decrease in susceptibility of Plasmodium falciparum to mefloquine in continuous culture. In: Bull. World Health Organ. 59 (2), pp. 249 – 252.
21. Chaorattanakawee, S.; Tyner, S. D.; Lon, C.; Yingyuen, K.; Ruttvisutinunt, W.; Sundrakes, S.; Sai-gnam, P.; Johnson, J. D.; Walsh, D. S.; Saunders, D. L.; Lanteri, C.A. (2013): Direct comparison of the histidine-rich protein-2 enzyme-linked immunosorbent assay (HRP-2 ELISA) and malaria SYBR green I fluorescence (MSF) drug sensitivity tests in Plasmodium falciparum reference clones and fresh ex vivo field isolates from Cambodia. In: Malar. J. 12:239.
22. Chaorattanakawee, S.; Lanteri, C. A.; Sundrakes, S.; Yingyuen,K.; Gosi, P.; Chanarat, N.; Wongarunkochakorn, S.; Buathong, N.; Chann, S.; Kuntawunginn, W.; Arsanok, M.; Lin, J. Z.; , Juliano, J. J.; Tyner, S.D.; Char, M.; Lon, C.; Saunders, D. L. (2015): Attentuation of Plasmodium falciparum in vitro drug resistance phenotype following culture adaptation compared to fresh clinical isolates in Combodia. In: Malar. J. 14:486.
23. Cheeseman, I. H.; Miller, B. A.; Nair, S.; Nkhome, S.; Tan, A.; Tan, J.C.; Saai, S. A.; Phyo, A. P.; Moo, C. L.; Lwin, K.M.; McGready, R.; Ashley, E.; Imwong, M.; Stepniewska, K.; Yi, P.; Dondorp, A. M.; Mayxay, M.; Newton, P. N.; White, N. J.; Nosten, F.; Ferdig, M. T.; Anderson, T. J. C. (2012): A major genome region underlying artemisinin resistance in malaria. In: Science 336 (6077), pp. 79 – 82.
24. Chen L.; Qu F. Y.; Zhou Y. C. (1982): Field observations on the antimalarial piperaquine. In: Chin. Med. J. 95 (4), pp. 281 – 286.
https://www.ncbi.nlm.nih.gov/pubmed/?term=Yingyuen%20K%5BAuthor%5D&cauthor=true&cauthor_uid=26626127
https://www.ncbi.nlm.nih.gov/pubmed/?term=Chanarat%20N%5BAuthor%5D&cauthor=true&cauthor_uid=26626127
https://www.ncbi.nlm.nih.gov/pubmed/?term=Buathong%20N%5BAuthor%5D&cauthor=true&cauthor_uid=26626127
105
25. Chien P. L.; Cheng C. C (1976): Difference in antimalarial activity between certain amino alcohol diastereomers. In: J. Med. Chem. 19 (1), pp. 170 – 172.
26. Chou A. A.; Fitch C. D. (1992): Heme Polymerase Modulation by Chloroquine Treatment of a Rodent Malaria. In: Life Sci. 51, pp. 2073 – 2078.
27. Conway D.J.; Fanello C.; Lloyd J. M.; Al-Joubori, B. M.; Baloch, A. H.; Somanath, S. D.; Roper, C.; Oduola, A. M.; Mulder, B.; Povoa, M. M., Singh, B.; Thoma, A. W. (2000): Origin of Plasmodium falciparum malaria is traced by mitochondrial DNA. In: Mol. Biochem. Parasitol. (111), pp. 163 – 171.
28. Cowman, A. F.; Crabb, B. S (2006): Invasion of Red Blood Cells by Malaria Parasites. In: Cell 124 (4), pp. 755 – 766.
29. Cox-Singh, J.; Davis, T. M. E.; Lee, K.-S.; Shamsul, S. S. G.; Matusop, A.; Ratnam, S.; Rahman, H. A.; Conway, D. J.; Singh, B. (2008): Plasmodium knowlesi malaria in humans is widely distributed and potentially life- threatening. In: Clin. Infect. Dis. 46 (2), pp. 165 – 171.
30. Crabb, B. S.; Cooke, B. M.; Reeder, J. C.; Waller, R. F.; Caruana, S. R.; Davern, K. M.; Wickham, M.E.; Brown, G. V.; Coppel, R. L.; Cowman, A. F. (1997): Targeted gene disruption shows that knobs enable malaria-infected red cells to cytoadhere under physiological shear stress. In: Cell 89 (2), pp.287 – 296.
31. Davis, T. M. E.; Hamzah, J.; Ilett, K. F.; Karunajeewa, H. A.; Reeder, J. C.; Batty, K. T.; Hackett, S; Barrett, P. H. R. (2006): In vitro interactions between piperaquine, dihydroartemisinin, and other conventional and novel antimalarial drugs. In: Antimicrob. Agents Chemother. 50 (8), pp. 2883 – 2885.
32. Deitsch, K. W.; Wellems, T. E. (1996): Membrane modifications in erythrocytes parasitized by Plasmodium falciparum. In: Mol. Biochem. Parasitol. 76 (1-2), pp. 1 – 10.
33. Desjardins, R. E.; Canfield, C. J.; Haynes, J. D.; Chulay, J. D. (1979): Quantitative assessment of antimalarial activity in vitro by a semiautomated microdilution technique. In: Antimicrob. Agents Chemother. 16 (6), pp. 710 – 718.
106
34. Dondorp, A. M.; Fanello, C. I.; Hendriksen, I. C. E.; Gomes, E.; Seni, A.; Chhaganlal, K. D.; Bojang, K.; Olaosebikan, R.; Anunobi, N.; Maitland, K.; Kivaya, E.; Agbenyega, T.; Nguah, S. B.; Evans, J.; Gesase, S.; Kahabuka, C.; Mtove, G.; Nadjm, B.; Deen, J.; Mwanga-Amumpaire, J.; Nansumba J.; Karema, C.; Umulisa, N.; Uwimana, A.; Mokuolu, O. A.; Adedoyin, O. T.; Johnson, W. B. R.; Tshefu, A. K.; Onyamboko, M. A.; Sakulthaew, T.; Ngum, W. P.; Silamut, K.; Stepniewska, K.; Woodrow, C. J.; Bethell, D.; Wills, B.; Oneko, M.; Peto, T. E.; von Seidlein, L.; Day, N. P. J.; White, N. J. for the AQUAMAT group (2010): Artesunate versus quinine in the treatment of severe falciparum malaria in African children (AQUAMAT): an open-label, randomised trial. In: Lancet, 376, pp.1647 – 1657.
35. Dondorp, A.; Nosten, F.; Stepniewska, K.; Day, N.; White, N.; South East Asian Quinine Artesunate Malaria Trial (SEAQUAMAT) group (2005): Artesunate versus quinine for the treatment of severe falciarum malaria: randomised trial. In: Lancet 376 (9487), pp. 717 – 725.
36. Dondorp, A. M.; Nosten, F.; Yi, P.; Das, D.; Phyo, A. P.; Tarning, J.; Lwin, K. M.; Ariey, F.; Hanpthakpong, W.; Lee, S. J.; Ringwald, P.; Silamut, K.; Imwong, M.; Choivanich, K.; Lim, P.; Herdman, T.; An, S. S.; Yeung, S.; Singhasivanon, P.; Day, N. P.; Lindegardh, N.; Socheat, D.; White, N. J. (2009): Artemisinin Resistance in Plasmodium falciparum Malaria. In: N. Engl. J. Med. 361 (5), pp. 455 – 467.
37. Duah, N. O.; Matrevi, S. A.; de Souza, D. K.; Binnah, D. D.; Tamakloe, M. M.; Opoku, V. S.; Onwona, C. O.; Narh, C. A.; Quashie, N. B.; Abuaka, B.; Duplessis, C.; Kronmann, K. C.; Koram, K. A. (2013): Increased pfmdr1 gene copy number and the decline in pfcrt and pfmdr1 resistance alleles in Ghanian Plasmodium falciparum isolates after the change of anti-malarial treatment policy. In: Malar. J. 12:377.
38. Edgcomb, J. H.; Arnold, J; Yount, E. H. jr.; Alving, A. S.; Eichelberger, L.; Jeffery, G. M.; Eyles, D.; Young, M. D. (1950): Primaquine, SN13272, a new curative agent in vivax malaria, a preliminary report. In: J. Natl. Malar. Soc. 9 (4), pp. 285 – 292.
39. Editorial (1992): Rediscovering wormwood: qinghaosu for malaria. In: Lancet 339 (8794), pp. 649 – 651.
40. Escalante, A. A.; Ayala, F. J (1994): Phylogeny of the malarial genus Plasmodium, derived from rRNA gene sequences. In: Proc. Natl. Acad. Sci. 91, pp. 11373 – 11377.
41. Ezzet, F.; Mull, R.; Karbwang, J. (1998): Population pharmacokinetics and therapeutic response of CGP 56697 (artemether + benflumetol) in malaria patients. In: Brit. J. Clin. Pharmacol. 46 (6), pp. 553 – 561.
107
42. Ezzet, F.; van Vugt, M.; Nosten, F.; Looareesuwan, S.; White, N. J. (2000): Pharmacokinetics and pharmacodynamics of lumefantrine (benflumetol) in acute falciparum malaria. In: Antimicrob. Agents Chemother. 44 (3), pp. 697 – 704.
43. Falade C.; Makanga, M.; Premji, Z.; Ortmann, C. E.; Stockmeyer, M.; de Palacios, P. I. (2005): Efficacy and safety of artemether-lumefantrine (Coartem®) tablets (six-dose-regimen) in African infants and children with acute, uncomplicated malaria. In: Trans. R. Soc. Trop. Med. Hyg. 99, pp. 459 – 467.
44. Fan, B.; Zhao, W.; Ma, X; Huang, Z.; Wen, Y.; Yang, J.; Yang, Z. (1998): In vitro sensitivity of Plasmodium falciparum to chloroquine, piperaquine, pyronaridine and artesunate in Yuxi prefecture of Yunnan province. In: Zhongguo Ji Sheng Chong Xue Yu Ji Sheng Chong Bing Za Zhi 16 (6), pp. 460 – 462.
45. Felger, I.; Smith, T.; Edoh, D.; Kitua, A.; Alonso, P.; Tanner, M.; Beck, H. P. (1999): Multiple Plasmodium falciparum infections in Tanzanian infants. In: Trans. R. Soc. Trop. Med. Hyg. 93 Suppl 1, pp. 29 – 34.
46. Fidock D. A.; Nomura T.; Talley A. K.; Cooper, R. A.; Dzekunov, S. M.; Ferdig, M..; Ursos, L. M.; Sidhu, A. B.; Naudé, B.; Deitsch, K. W.; Su, X. Z.; Wootton, J. C., Roepe, P. D.; Wellems, T. E. (2000): Mutations in the P.falciparum Digestive Vacuole Transmembrane Protein PfCRT and Evidence for Their Role in Chloroquine Resistance. In: Mol. Cell 6 (4), pp. 861 – 871.
47. Fivelman, Q. L.; Adagu, I. S.; Warhurst, D. C. (2007): Effects of piperaquine, chloroquine, and amodiaquine on drug uptake and of these in combination with dihydroartemisinin against drug-sensitive and -resistant Plasmodium falciparum strains. In: Antimicrob. Agents Chemother. 51 (6), pp. 2265 – 2267.
48. Flegg, J. A.; Guerin, P. J.; White, N. J.; Stepniewska, K. (2011): Standardizing the measurement of parasite clearance in falciparum malaria: the parasite clearance estimator. In: Malar. J. 10:339.
49. Foley, M.; Tilley, L. (1998): Quinoline antimalarials: mechanisms of action and resistance and prospects for new agents // Quinoline antimalarials: mechanisms of action and resistance and prospects for new agents. In: Pharmacol. Ther. 79 (1), pp. 55 – 87.
50. Fowler, E. V.; Chavchich, M.; Chen, N.; Peters, J. M.; Kyle, D. E.; Gatton, M. L.; Cheng, Q. (2006): Physical linkage to drug resistance genes results in conservation of var genes among West Pacific Plasmodium falciparum isolates. In: J. Infect. Dis. 194 (7), pp. 939 – 948.
108
51. Frederich, M.; Dogne, J.-M.; Angenot, L.; De Mol, P. (2002): New Trends in Anti- Malarial Agents. In: Curr. Med. Chem. 9 (15), pp. 1435 – 1456.
52. Gadalla, N. B.; Adam, I.; Elzaki, S. E.; Bashir, S.; Mukhtar, I.; Oquike, M.; Gadall, A.; Mansour, F.; Warhurst, D.; El-Sayed, B. B.; Sutherland, C. J. (2011): Increased pfmdr1 copy number and sequence polymorphisms in Plasmodium falciparum isolates from Sudanese malaria patients treated with artemether-lumefantrine. Antimicrob Agents Chemother 55, pp. 5408 – 5411.
53. Galinski, M. R.; Barnwell, J. W (2009): Monkey malaria kills four humans. In: Trends Parasitol. 25 (5), pp. 200 – 204.
54. Geary, T. G; Divo, A. A.; Jensen, J. B. (1989): Stage specific actions of antimalarial drugs on falciparum in culture. In: Am. J. Trop. Med. Hyg. 40 (3), pp. 240 – 244.
55. Geary, T. G.; Jensen, J. B. (1983): Lack of cross- resistance to 4- aminoquinolines in chloroquine- resistant Plasmodium falciparum in vitro. In: J. Parasitol. 69 (1), pp. 97 – 105.
56. Ginsburg, H. (2005): Should chloroquine be laid to rest? In: Acta Tropica 96 (1), pp. 16 – 23.
57. Grande, T.; Bernasconi, A.; Erhart, A.; Gamboa, D.; Casapia, M.; Delgado, C.; Torres, K.; Fanello, C.; Llanos-Cuentas, A.; D’Alessandro, U. (2007): A randomised controlled trial to assess the efficacy of dihydroartemisinin-piperaquine for the treatment of uncomplicated falciparum malaria in Peru. In: PLoS ONE 2 (10), e1101.
58. Grewal, R. S. (1981): Pharmacology of 8- aminoquinolines. In: Bull. World Health Organ. 59 (3), pp. 397 – 406.
59. Hall, A. J.; Chappell, M. J.; Aston, J. A. D.; Ward, S. A. (2013): Pharmacokinetic modelling of the anti-malarial drug artesunate and ist active metabolite dihydroartemisinin. In: Comput. Meth. Prog. Bio. 112 (1), pp. 1 – 15.
60. Hien, T. T.; White, N. J. (1993): Qinghaosu. In: Lancet 341, pp. 603 – 608.
61. Howard, R. J.; Uni, S.; Aikawa, M.; Aley, S. B.; Leech, J. H.; Lew, A. M.; Wellems, T. E.; Rener, J.; Taylor, D. W. (1986): Secretion of a malarial histidine-rich protein (Pf HRP II) from Plasmodium falciparum-infected erythrocytes. In: J. Cell Biol. 103 (4), pp. 1269 – 1277.
109
62. Hume, J. C. C.; Lyons, E. J.; Day, K. P (2003): Human migration, mosquitoes and the evolution of Plasmodium falciparum. In: Trends Parasitol. 19 (3), pp. 144 – 149.
63. Hutagalung, R.; Paiphun, L.; Ashley, E. A.; McGready, R.; Brockman, A.; Thwai, K.L.; Singhasivanon, P.; Jelinek, T.; White, N. J.; Nosten, F. H. (2005): A randomized trial of artemether-lumefantrine versus mefloquine-artesunate for the treatment of uncomplicated multi-drug resistant Plasmodium falciparum on the western border of Thailand. In: Malar. J. 4:46.
64. Joiner, K. A.; Dubremetz, J. F. (1993): Toxoplasma gondii: a protozoan for the nineties. In: Infect Immun. 61 (4), pp. 1169 – 1172.
65. Kain, K. C.; Craig, A. A.; Ohrt, C. (1996): Single-strand conformational polymorphism analysis differentiates Plasmodium falciparum treatment failures from re-infections. In: Mol. Biochem. Parasitol. 79 (2), pp. 167 – 175.
66. Kamau, E.; Campino, S.; Amenga-Etego, L.; Drury, E.; Ishengoma, D.; Johnson, K.; Mumba, D.; Kekre, M.; Yavo, W.; Mead, D.; Bouyou-Akotet, M.; Apinjoh, T.; Golassa, L.; Randrianarivelojosia, M.; Andagalu, B.; Maiga-Ascafare, O.; Amambbua-Ngwa, A.; Tindana, P.; Ghansa, A.; McInnis, B.; wiatkowski, D.; Djimde, A. A. (2015): K13-Propeller Polymorphisms in Plasmodium falciparum Parasites From Sub-Saharan Africa. In: J. Infect. Dis., 211 (8), pp.1352 – 1355.
67. Karle, J. M.; Karle, I. L. (1991): Crystal structure and molecular structure of mefloquine methylsulfonate monohydrate: implications for a malaria receptor. In: Antimicrob. Agents Chemother. 35 (11), pp. 2238 – 2245.
68. Kaur, K.; Jain, M.; Reddy, R. P.; Jain, R. (2010): Quinolines and structurally related heterocycles as antimalarials. In: Eur. J. Med. Chem. 45 (8), pp. 3245 – 3264.
69. Knowles, R. M.; Das Gupta, B. (1932): A study of monkey–malaria and its experimental transmission to man. In: Ind. Med. Gaz. 67, pp. 301 – 320.
70. Krief, S.; Escalante, A.A.; Pacheco, M. A.; Mugish, L.; André, C.; Halbwax, M.; Fischer, A.; Krief, J. A.; Kasenene, J. M.; Crandfield, M.; Cornejo, O. E.; Chavatte, J.-M.; Lin, C.; Letourneur, F.; Grüner, A. C.; McCutchan, T. F.; Rénia, L.; Snounou, G. (2010): On the Diversity of Malaria Parasites in African Apes and the Origin of Plasmodium falciparum from Bonobos. In: PLoS Pathog. 6 (2), e1000765.
110
71. Kumar, N.; Zheng, H. (1990): Stage-specific gametocytocidal effect in vitro of the antimalarial drug qinghaosu on Plasmodium falciparum. In: Parasitol. Res.76 (3), pp. 214 – 218.
72. Lan, C. X.; Lin, X.; Huang, Z. S.; Chen, Y. S.; Guo, R. N (1989): In vivo sensitivity of Plasmodium falciparum to piperaquine phosphate assayed in Linshui and Baisha counties, Hainan Province. In: Zhongguo Ji Sheng Chong Xue Yu Ji Sheng Chong Bing Za Zhi 7 (3), pp. 163 – 165.
73. Lawford, H.; Zurovac, D.; O´Reilly, L.; Hoibak, S.; Cowley, A.; Munga, S.; Vulule, J.; Juma, E.; Snow, R. W.; Allan, R. (2011): Adherence to prescribed artemisinin-based combination therapy in Garissa and Bunyala districts, Kenya. In: Malar. J. 10:281.
74. Le Bras, J.; Deloron, P.; Ricour, A.; Andriueu, B.; Savel, J.; Coulad, J. P. (1983): Plasmodium falciparum: drug sensitivity in vitro of isolates before and after adaptation to continuous culture. In: Exp. Parasitol. 56 (1), pp. 9 – 14.
75. Lee, K.-S.; Cox-Singh, J.; Brooke, G.; Matusop, A.; Singh, B. (2009): Plasmodium knowlesi from archival blood films: Further evidence that human infections are widely distributed and not newly emergent in Malaysian Borneo. In: Int. J. Parasitol. 39 (10), pp. 1125 – 1128.
76. Liu, W.; Li, Y.; Learn, G.; Rudicell, R. S.; Robertson, J. D.; Keele, B. F.; Ndjango, J.-B. N., Sanz, C. M.; Morgan, D. B.; Locatelli, S.; Gonder, M. L.; Kranzusch, P. J.; Walsh, P. D.; Delaporte, E.; Mpoudi-Ngole, E.; Georgiev, A. V.; Muller, M. N.; Shaw, G. M.; Peeters, M.; Sharp, P. M.; Rayner, J. C.; Hahn, B. H. (2010): Origin of the human malaria parasite Plasmodium falciparum in gorillas. In: Nature 467 (7314), pp. 420 – 425.
77. Lopera-Mesa, T. M.; Doumbia, S.; Chiang, S.; Zeituni, A. E.; Konate, D. S.; Doumbouya, M.; Keita, A. S.; Stepniewska, K.; Traore, K.; Diakite, S. A.; Ndiaye, D.; Sa, J. M.; Fay, M. P.; Long, C. A.; Diakite, M.; Fairhurst, R. M. (2013): Plasmodium falciparum clearance rates in response to artesunate in Malian children with malaria: effect of acquired immunity. In: J. Infect. Dis. 207 (11), pp. 1655 – 1663.
78. Magesa, S. M.; Mdira, K. Y.; Farnert, A.; Simonsen, P. E.; Bygbjerg, I. C.; Jakobsen, P. H. (2001): Distinguishing Plasmodium falciparum treatment failures from re-infections by using polymerase chain reaction genotyping in a holoendemic area in northeastern Tanzania. In: Am. J. Trop. Med. Hyg. 65 (5), pp. 477 – 483.
111
79. Martinsen, E. S.; Perkins, S. L.; Schall, J. J. (2008): A three-genome phylogeny of malaria parasites (Plasmodium and closely related genera): Evolution of life-history traits and host switches. In: Mol Phylogenet. Evol. 47 (1), pp. 261 – 273.
80. Matsuoka, H.; Yoshida, S.; Hirai, M.; Ishii, A. (2002): A rodent malaria, Plasmodium berghei, is experimentally transmitted to mice by merely probing of infective mosquito, Anopheles stephensi. In: Parasitol. Int. 51 (1), pp. 17 – 23.
81. Mbengue, A.; Bhattacharjee, S.; Pandharkar, T.; Liu, H.; Estiu, G.; Stahelin, R. V.; Rizk, S.; Njimoh, D. L.; Ryan, Y.; Chotivanich, K.; Nguon, C.; Ghorbal, M.; Lopez-Rubio, J.-J.; Pfrender, M.; Emrich, S.; Mohandas, N.; Dondorp, A. M.; Wiest, O.; Haldar, K. (2015): A molecular machanism off artemisinin resistance in Plasmodium falciparum malaria. In: Nature, 520 (7549), pp. 683 – 687.
82. Mbogo C. M.; Mwangangi J. M.; Nzovu J.; Gu, W.; Yan, G.; Gunter, J. T.; Swalm, C.; Keating, J.; Regens, J. L.; Shililu, J. I.; Beier, J. C. (2003): Spatial and Temporal Heterogeneity of Anopheles Mosquitoes and Plasmodium Falciparum Transmission along the Kenyan Coast. In: Am. J. Trop. Med. Hyg. 68 (6), pp. 734 – 742.
83. Meshnick, S. R. (2002): Artemisinin: mechanisms of action, resistance and toxicity. In: Int. J. Parasitol. 32 (13), pp. 1655 – 1660.
84. Ministry of Public Health and Sanitation (2010): National Guidelines for the Diagnosis, Treatment and Prevention of Malaria in Kenya. Third Edition.
85. Mita, T.; Culleton, R.; Takahashi, N.; Nakamura, M.; Tsukahara, T.; Hunja, C. W.; Win, Z. Z.; Htike, W. W.; Marma, A. A.; Dysoley, L.; Ndounga, M.; Dzodzomenyo, M.; Akhwale, W. S.; Kobayashi, J.; Uemura, H.; Kaneko, A.; Hombinhanje, F.; Ferreira, M. U.; Björkman, A.; Endo, H.; Ohashi, J. (2016): Little Polymorphism at the K13 propeller Locus in Worldwide Plasmodium falciparum Populations Prior to the Introduction of Artemisinin Combination Therapies. In: Antimicrob. Agents Chemother., 60 (6), pp. 3340 – 3347.
86. Mitchell, G. H.; Bannister, L. H. (1988): Malaria parasite invasion: interactions with the red cell membrane. In: Crit. Rev. Oncol. Hematol. 8 (4), pp. 225 – 310.

112
87. Mok, S.; Ashley, E. A.; Fereira, P. E.; Zhu, L.; Lin, Z.; Yeo, T.; Chotivanich, K.; Imwong, M.; Pukrittayakamee, S.; Dhorda, M.; Nguon, C.; Lim, P.; Amaratunga, C.; Suon, S.; Hien, T. T.; Faiz, M. A.; Onyamboko, M. A.; Mayxay, M.; Newton, P. N.; Tripura, R.; Woodrow, C. J.; Miotto, O.; Kwiatkowski, D. P.; Nosten, F.; Day, N. P. J.; Preiser, P. R.; White, N. J.; Dondorp, A. M.; Fairhurst, R. M.; Bozdech, Z. (2015): Population transcriptomics of human malaria parasites reveals the mechanism of artemisinin resistance. In: Science, 347 (6220), pp.431 – 435.
88. Morris, C. A.; Duparc, S.; Borghini-Fuhrer, I.; Jung, D.; Shin, C. S.; Fleckenstein, L. (2011): Review of the clinical pharmacokinetics of artesunate and its active metabolite dihydroartemisinin following intravenous, intramuscular, oral or rectal administration. In: Malar. J. 10:263.
89. Mwai, L.; Ochong, E.; Abdirahman, A.; Kiara, S.M.; Ward, S.; Kokwaro, G.; Sasi, P.; Marsh, K.; Borrmann, S.; MacKinnon, M.; Nzila, A. (2009): Chloroquine resistance before and after its withdrawal in Kenya. In: Malar. J. 8:106.
90. Myint, H. Y; Ashley E. A.; Day N. P. J.; Nosten F.; White N. J (2007): Efficacy and safety of dihydroartemisinin-piperaquine. In: Trans. R. Soc. Trop. Med. Hyg. 101 (9), pp. 858 – 866.
91. Ngalah, B. S.; Ingasia, L. A.; Cheruiyot, A. C.; Chebon, L. J.; Juma, D. W.; Muiruri, P.; Onyango, I.; Ogony, J.; Yeda, R. A.; Cheruiyot, J.; Mbuba, E.; Mwangoka, G.; Achieng, A. O.; Ng’ang’a, Z.; Andagalu, B.; Akala, H. M.; Kamau, E. (2015): Analysis of Major Genome Loci Underlying Artemisinin Resistance and pfmdr1 Copy Number in pre- and post- ACTs in Western Kenya. In: Sci. Rep. 5:8308.
92. Nambozi, M.; Geertruyden, J.-P.; Hachizovu, S.; Chaponda, M.; Mukwamataba, D.; Mulenga, M.; Ubben, D.; D’Alessandro, U. (2011): Safety and efficacy of dihydroartemisinin-piperaquine versus artemether-lumefantrine in the treatment of uncomplicated Plasmodium falciparum malaria in Zambian children. In: Malar. J. 10:50.
93. Navaratnam, V.; Mansor, S. M.; Sit, N. W.; Grace, J.; Li, Q.; Olliaro, P. (2000): Pharmacokinetics of artemisinin-type compounds. In: Clin. Pharmacokinet. 39 (4), pp. 255 – 270.
94. Noedl, H.; Wernsdorfer, W. H.; Krudsood, S.; Wilairatana, P.; Kollaritsch, H.; Wiedermann, G.; Looareesun, S. (2001): In Vivo–In Vitro Model For The Assessment Of Clinically Relevant Antimalarial Cross Resistance. In: Am. J. Trop. Med. Hyg. 65 (6), pp. 696 – 699.
113
95. Noedl, H.; Wernsdorfer, W. H.; Miller, R. S.; Wongsrichanalai, C. (2002): Histidine-Rich Protein II: a Novel Approach to Malaria Drug Sensitivity Testing. In: Antimicrob. Agents Chemother. 46 (6), pp. 1658 – 1664.
96. Noedl, H.; Wongsrichanalai, C.; Miller, R. S.; Myint, K. S.; Looareesuwan, S.; Sukthana, Y.; Wongchotigul, V.; Kollaritsch, H.; Wiedermann, G.; Wernsdorfer, W. H. (2002): Plasmodium falciparum: effect of anti-malarial drugs on the production and secretion characteristics of histidine-rich protein II. In: Exp. Parasitol. 102 (3 - 4), pp. 157 – 163.
97. Noedl, H.; Wongsrichanalai, C.; Wernsdorfer, W. H. (2003): Malaria drug-sensitivity testing: new assays, new perspectives. In: Trends Parasitol. 19 (4), pp. 175 – 181.
98. Noor, A. M.; Gething P. W.; Alegana V. A.; Patil, A. P.; Hay, S. I.; Muchiri, E.; Juma, E.; Snow, R. W. (2009): The risks of malaria infection in Kenya in 2009. In: BMC Infect. Dis. 9 (1), p. 180.
99. Nosten, F.; White, N. J. (2007): Artemisinin-based combination treatment of falciparum malaria. In: Am. J. Trop. Med. Hyg. 77 (6 Suppl), pp. 181 – 192.
100. O´Meara, W. P.; Bejon, P.; Mwangi, T. W.; Okiro, E. A.; Peshu, N.; Snow, R. W.; Newton, C. R.; Marsh, K. (2008): Effect of a fall in malaria transmission on morbidity and mortality in Kilifi, Kenya. In: Lancet 372 (9649), pp. 1555 – 1562.
101. Okell, L.; Drakeley, C. J.; Ghani, A. C.; Bousema, T.; Sutherland, C. J. (2008): Reduction of transmission from malaria patients by artemisinin combination therapies: a pooled analysis of six randomized trials. In: Malar. J. 7:125.
102. Olliaro, P. L.; Nair, N. K.; Sathasivam, K.; Mansor, S. M.; Navaratnam, V. (2001): Pharmacokinetics of artesunate after single oral administration to rats. In: BMC Pharmacol. 1:12.
103. Outtara, A.; Kone, A.; Adams, M.; Fofana, B.; Maiga, A. W.; Hampton, S.; Coulibaly, D.; Thera, M. A.; Diallo, N.; Dara, A.; Sagara, I.; Gil, J. P.; Bjorkman, A.; Tkala-Harrison, S.; Doumbo, O. K.; Plowe, C. V.; Djimde, A. A. (2015): Polymorphisms in the K13-Propeller Gene in Artemisnin-Susceptible Plasmodium falciparum Parasites from Bougala-Hameau and Bandiagara, Mali. In: Am. J. Trop. Med. Hyg., 92 (6), pp. 1202 – 1206.

114
104. Pascual, A.; Parola, P.; Benoit-Vical, F.; Simon, F.; Malvy, D.; Picot, S.; Delaunay, P.; Basset, D.; Maubon, D.; Faugère, B.; Ménard, G.; Bourgeois, N.; Oeuvray, C.; Didillon, E.; Rogier, C.; Pradines, B. (2012): Ex vivo activity of the ACT new components pyronaridine and piperaquine in comparison with conventional ACT drugs against isolates of Plasmodium falciparum. In: Malar. J. 11:45.
105. Peters, J. M.; Fowler, E. V.; Krause, D. R.; Cheng, Q.; Gatton, M. L. (2007): Differential changes in Plasmodium falciparum var transcription during adaptation to culture. In: J. Infect. Dis. 195 (5), pp. 748 – 755.
106. Phyo, A. P.; Nkhoma, S.; Stepniewska, K.; Ashley, E. A.; Nair, S.; McGready, R.; Moo, C. l.; Al-Saai, S.; Dondorp, A. M.; Lwin, K. M.; Singhasivanon, P.; Day, P. J.; White, N. J.; Anderson, T. J. C.; Nosten, F. (2012): Emergence of artemisinin-resistant malaria on the western border of Thailand: a longitudinal study. In: Lancet 379 (9830), pp. 1960 – 1966.
107. Piper, R.; Lebras, J.; Wentworth, L.; Hunt-Cooke, A.; Houzé, S.; Chiodini, P.; Makler, M. (1999): Immunocapture diagnostic assays for malaria using Plasmodium lactate dehydrogenase (pLDH). In: Am. J. Trop. Med. Hyg. 60 (1), pp. 109 – 118.
108. Portugal, S.; Drakesmith, H.; Mota, M. M. (2011): Superinfection in malaria: Plasmodium shows its iron will. In: EMBO Rep. 12 (12), pp. 1233 – 1242.
109. Price, R. N.; Nosten, F.; Luxemburger, C.; ter Kuile, F. O.; Paiphun, L.; Chongsuphajaisiddhi, T.; White, N. J. (1996): Effects of artemisinin derivatives on malaria transmissibility. In: Lancet 347, pp. 1654 – 1658.
110. Price, R. N.; Uhlemann, A. C.; Rockman, A.; McGready, R.; Ashley, E.; Phaipun, L.; Patel, R.; Laing, K.; Looreesuwan, S.; White, N. J.; Nosten, F.; Krishna, S. (2004): Mefloquine resistance in Plasmodium falciparum and increased pfmdr1 gene copy number. In: Lancet 364 (9432): pp. 438 – 447.
111. Prugnolle, F.; Durand, P.; Ollomo, B.; Duval, L.; Ariey, F.; Arnathau, C.; Gonzalez, J.-P.; Leroy, E.; Renaud, F. (2011): A Fresh Look at the Origin of Plasmodium falciparum, the Most Malignant Malaria Agent. In: PLoS Pathog 7 (2), e1001283.
112. Qinghaosu Antimalaria CoordinatiTeg Research Group (1979): Antimalaria studies on Qinghaosu (1979). In: Chin. Med. J. 92 (12), pp. 811 – 816.
115
113. Rational Pharmaceutical Management Plus, Center for Pharmaceutical Management (Hg.) (2005): Changing Malaria Treatment Policy to Artemisinin- Based Combinations. An Implementation Guide.
114. Rich, S. M.; Leendertz, F. H.; Xu, G.; LeBreton, M.; Djoko, C. F.; Aminake, M. N.; Takang, E. E.; Diffo, J. L. D.; Pike, B. L.; Rosenthal, B. M.; Formenty, P; Boesch, C.; Ayala, F. J.; Wolfe, N. D. (2009): The origin of malignant malaria. In: Proc. Natl. Acad. Sci. 106 (35), pp. 14902 – 14907.
115. Ridley, R. G.; Hofheinz, W.; Matile, H.; Jaquet, C.; Dorn, A.; Masciadri, R.; Jolidon, S.; Richter, W. F.; Guenzi; A.; Giromatta, M. A.; Urwyler, H.; Huber, W.; Thaithong, S.; Peters, W. (1996): 4-aminoquinoline analogs of chloroquine with shortened side chains retain activity against chloroquine-resistant Plasmodium falciparum. In: Antimicrob. Agents Chemother. 40 (8), pp. 1846 – 1854.
116. Rutvisuttinunt, W.; Chaorattanakawee, S.; Tyner, S. D.; Teja-Isavadharm, P.; Se, Y.; Yingyuen, K.; Chaichana, P.; Bethell, D.; Walsh, D. S.; Lon, C.; Fukuda, M.; Socheat, D.; Noedl, H.; Schaecher, K, Saunders, D. L. (2012): Optimizing the HRP-2 in vitro malaria drug susceptibility assay using a reference clone to improve comparisons of Plasmodium falciparum field isolates. In: Malar. J. 11:325.
117. Rock, E. P.; Marsh, K.; Saul, A. J.; Wellems, T. E.; Taylor, D. W.; Maloy, W. L.; Howard, R. J. (1987): Comparative analysis of the Plasmodium falciparum histidine-rich proteins HRP-I, HRP-II and HRP-III in malaria parasites of diverse origin. In: Parasitology 95 (Pt 2), pp. 209 – 227.
118. Roestenberg, M.; McCall, M.; Hopman, J.; Wiersma, J.; Luty, A.J.; van Gemert, G. J.; van de Vegte-Bolmer, M.; van Schaijk, B.; Teelen, K.; Arens, T.; Spaarman, L.; de Mast, Q.; Roeffen, W:; Snounou, G.; Rénia, L.; van der Ven, A.; Hermsen, C. C.; Sauerwein, R. (2009): Protection against a malaria challenge by sporozoite inoculation. In: N. Engl. J. Med. 361 (5), pp. 468 – 477.
119. Sam-Yellowe, T. Y. (1996): Rhoptry organelles of the apicomplexa: Their role in host cell invasion and intracellular survival. In: Parasitol. Today 12 (8), pp. 308 – 316.
120. Schlitzer, M. (2007): Malaria Chemotherapeutics Part I: History of Antimalarial Drug Development, Currently Used Therapeutics, and Drugs in Clinical Development. In: ChemMedChem 2 (7), pp. 944 – 986.
116
121. Sidhu, A. B.; Uhlemann, A. C.; Valderramos, S. G.; Valderramos, S. G.; Krishna, S.; Fidock, D. A. (2006): Decreasing pfmdr1 copy number in plasmodium falciparum malaria heightens susceptibility to mefloquine, lumefantrine, halofantrine, quinine, and artemisinin. In: J. Infect. Dis. 194 (4), pp. 528 – 535.
122. Seder, R. A.; Chang, L.-J.; Enama, M. E.; Zephir, K. L.; Sarwar, U. N.; Gordon, I. J.; Holman, L. A.; James, E. R.; Billingsley, P. F.; Gunasekera, A.; Richman, A.; Chakravarty, S.; Manoj, A.; Velmurugan, S.; Li, M.; Ruben, A. J.; Li, T.; Eappen, A. G.; Stafford, R. E.; Plummer, S. H.; Hendel, C. S.; Novik, L.; Costner, P. J.; Mendoza, F. H.; Saunders, J. G.; Nason, M. C.; Richardson, J. H.; Murphy, J.; Davidson, S. A.; Richie, T. L.; Sedegah, M.; Sutamihardja, A.; Fahle, G. A.; Lyke, K. E.; Laurens, M. B.; Roederer, M.; Tewari, K.; Epstein, J. E.; Sim, B. K.; Ledgerwood, J. E.; Graham, B. S.; Hoffman, S. L.; VRC 312 Study Team (2013): Protection Against Malaria by Intravenous Immunization with a Nonreplicating Sporozoite Vaccine. In: Science 341 (6152), pp. 1359 – 1365.
123. Shen, J. X. (1989): Antimalarial drug development in China. In: Beijing: National Institute of Pharmaceutical Research and Development. http://www.who.int/iris/handle/10665/38624#sthash.5hcklOoL.dpuf (May 11th, 2014).
124. Simpson, J. A.; Aarons, L.; Collins, W. E.; Jeffery, G. M.; White, N. J. (2002): Population dynamics of untreated Plasmodium falciparum malaria within the adult human host during the expansion phase of the infection. In: Parasitology 124 (Pt 3), pp. 247 – 263.
125. Sinclair, D.; Zani, B.; Donegan, S.; Olliaro, P.; Garner, P., The Cochrane Library (2009), Issue 4: Artemisinin-based combination therapy for treating uncomplicated malaria.
126. Singh, B.; Kim, S. L.; Matusop, A.; Radhakrishnan, A.; Shamsul, S. S.; Cox-Singh, J.; Thomas, A.; Conway, D. J. (2004): A large focus of naturally acquired Plasmodium knowlesi infections in human beings. In: The Lancet 363 (9414), pp. 1017 – 1024.
127. Snounou, G.; Beck, H. P. (1998): The use of PCR genotyping in the assessment of recrudescence or reinfection after antimalarial drug treatment. In: Parasitol. Today (Regul. Ed.) 14 (11), pp. 462 – 467.
128. Snounou, G.; Zhu, X.; Siripoon, N.; Jarra, W.; Thaithong, S.; Brown, K. N.; Viriyakosol, S. (1999): Biased distribution of msp1 and msp2 allelic variants in Plasmodium falciparum populations in Thailand. In: Trans. R. Soc. Trop. Med. Hyg. 93 (4), pp. 369 – 374.
http://www.ncbi.nlm.nih.gov/pubmed/?term=Stafford%20RE%5BAuthor%5D&cauthor=true&cauthor_uid=23929949
http://www.ncbi.nlm.nih.gov/pubmed/?term=Saunders%20JG%5BAuthor%5D&cauthor=true&cauthor_uid=23929949
http://www.ncbi.nlm.nih.gov/pubmed/?term=Saunders%20JG%5BAuthor%5D&cauthor=true&cauthor_uid=23929949
117
129. Snow, R. W.; Guerra C. A.; Noor A. M.; Myint, H. Y.; Hay, S. I. (2005): The global distribution of clinical episodes of Plasmodium falciparum malaria. In: Nature 434 (7030), pp. 214 – 217.
130. Straimer, J.; Gnädig, N.; Witkowski, B.; Amaratunga, C.; Duru, V.; Ramadani, A. P.; Dacheux, M.; Khim, N.; Zhang, L.; Lam, S.; Gregory, P. D.; Urnov, F. D.; Mercereau-Puijalon, O.; Benoit-Vical, F.; Fairhurst, R. M.; Ménard, D.; Fidock, D. A. (2015): K13-propeller mutations confer artemisinin resistance in Plasmodium falciparum clinical isolates. In: Science 347 (6220), pp. 428 – 431.
131. Sturm, A.; Amino, R.; van de Sand, C.; Regen, T.; Retzlaff, S.; Rennenberg, A.; Krueger, A.; Pollok, J. M.; Menard, R.; Heussler, V. T. (2006): Manipulation of Host Hepatocytes by the Malaria Parasite for Delivery into Liver Sinusoids. In: Science 313 (5791), pp. 1287 – 1290.
132. Sudoi, R. K.; Githinji, S.; Nyandigisi, A.; Muturi, A.; Snow, R. W.; Zurovac, D. (2012): The magnitude and trend of artemether-lumefantrine stock-outs at public health facilities in Kenya. In: Malar. J. 11:37.
133. Sullivan, D. J.; Gluzman, I. Y.; Goldberg, D. E. (1996): Plasmodium hemozoin formation mediated by histidine-rich proteins. In: Science 271 (5246), pp. 219 – 222.
134. Sullivan, D. J.; Gluzman, I. Y.; Russell, D. G.; Goldberg, D. E. (1996): On the molecular mechanism of chloroquine's antimalarial action. In: Proc. Natl. Acad. Sci. 93 (21), pp. 11865 – 11870.
135. Teja-Isavadharm, P.; Nosten, F.; Kyle, D. E.; Luxemburger, C.; Ter Kuile, F.; Peggins, J. O.; Brewer, T. G.; White, N. J. (1996): Comparative bioavailability of oral, rectal, and intramuscular artemether in healthy subjects: use of simultaneous measurement by high performance liquid chromatography and bioassay. In: Br. J. Clin. Pharmacol. 42 (5), pp. 599 – 604.
136. The RTS, S. Clinical Trials Partnership (2012): A Phase 3 Trial of RTS, S/AS01 Malaria Vaccine in African Infants. In: N. England J. Med. 367 (24), pp. 2284 – 2295.
137. The RTS, S Clinical Trials Partnership (2015): Efficacy and safety of RTS, S/AS01 malaria vaccine with or without a booster dose in infants and children in Africa: final results of a phase 3, individually randomised, controlld trial. In: Lancet 386 (9988), pp. 31 – 45.
138. Tritten, L.; Matile, H.; Brun, R.; Wittlin, S. (2009): A new double-antibody sandwich ELISA targeting Plasmodium falciparum aldolase to evaluate anti-malarial drug sensitivity. In: Malar. J. 8:226.
118
139. Valecha, N.; Phyo, A. P.; Mayxay, M.; Newton, P. N.; Krudsood, S.; Keomany, S.; Khanthvong, M.; Pongvongsa, T.; Ruangveerayuth, R.; Uthaisil, C.; Ubben, D.; Duparc, S.; Bacchieri, A.; Corsi, M.; Rao, B. H. K.; Bhattacharya, P.C.; Dubhashi, N.; Ghosh, S.K.; Dev, V.; Kumar, A.; Pukittayakamee, S. (2010): An Open-Label, Randomised Study of Dihydroartemisinin-Piperaquine Versus Artesunate-Mefloquine for Falciparum Malaria in Asia. In: PLoS ONE 5 (7), e11880.
140. van Vugt, M.; Looareesuwan, S.; Wilairatana, P.; McGready, R.; Villegas, L.; Gathmann, I.; Mull, R.; Brockman, A.; White, N. J.; Nosten, F. (2000): Artemether-lumefantrine for the treatment of multidrug-resistant falciparum malaria. In: Trans. R. Soc. Trop. Med. Hyg. 94 (5), pp. 545 – 548.
141. Verhage, D .F.; Telgt, D. S.; Bousema, J. T.; Hermsen, C. C.; van Gemert, G. J.; van der Meer, J. W.; Sauerwein, R. W. (2005): Clinical outcome of experimental human malaria induced by Plasmodium falciparum- infected mosquitoes. In: Neth. J. Med. 63 (2), pp.52 – 58.
142. Vossen, M. G.; Pferschy, S.; Chiba, P.; Noedl, H. (2010): The SYBR Green I malaria drug sensitivity assay: performance in low parasitemia samples. In: Am. J. Trop. Med. Hyg. 82 (3), pp. 398 – 401.
143. Warhurst, D. C.; Craig, J. C.; Adagu, I. S.; Guy, R. K.; Madrid, P. B.; Fivelman, Q. L. (2007): Activity of piperaquine and other 4- aminoquinoline antiplasmodial drugs against chloroquine- sensitive and resistant blood- stages of Plasmodium Falciparum. Role of beta-heamatin inhibition and drug concentration in vacuolar water- and lipid-phases. In: Biochem. Pharmacol. 73 (12), pp. 1910 – 1926.
144. Waters, A. P.; Higgins, D. G.; McCutchan, T. F (1991): Plasmodium falciparum appears to have arisen as a result of lateral transfer between avian and human hosts. In: Proc. Natl. Acad. Sci. 88, pp. 3140 – 3144.
145. Werk, R. (1985): How does Toxoplasma gondii enter host cells? In: Rev. Infect. Dis. 7 (4), pp. 449 – 457.
146. White, N. J.: Manson´s Tropical Diseases, 21st edition (2003). Section 10, Chapter 71: Malaria. In: Cook G. C.; Zumla, A., pp. 1226 – 1229.
147. White, N. J. (2011): The parasite clearance curve. In: Malar. J. 10 : 278.
148. White, N. J. (1997): Assessment of the Pharmacodynamic Properties of Antimalarial Drugs in vivo. In: Antimicrob. Agents Chemother. 41 (7), pp. 1413 – 1422.

119
149. White, N. J. (1999): Delaying antimalarial drug resistance with combination chemotherapy. In: Parassitologia 41 (1 – 3), pp. 301 – 308.
150. White, N.J (2004): Antimalarial drug resistance. In: J. Clin. Invest. 113 (8), pp. 1084 – 1092.
151. Wilson, D. W.; Langer, C.; Goodman, C. G., McFadden, G. I.; Beeson, J. G (2013): Defining the Timing of Action on Antimalarial Drugs against Plasmodium falciparum. In: Antimicrob. Agents Chemother. 57 (3), pp. 1455 – 1467.
152. Wilson, R. J. M.; Williamson, D. H (1997): Extrachromosomal DNA in the Apicomplexa. In: Microbiol. Mol. Biol. Rev. 61 (1), pp. 1 – 16.
153. Witkowski, B.; Amaratunga, C.; Khim, N.; Sreng, S.; Chim, P.; Kim, S.; Lim, P.; Mao, S.; Sopha, C.; Sam, B.; Anderson, J. M., Duong, S.; Chuor, C. M.; Taylor, W. A. J.; Suon, S.; Mercerau-Puijalon, O.; Fairhurst, R. M.; Menard, D. (2013a): Novel phenotypic assays for the detection of artemisinin-resistant Plasmodium falciparum malaria in Cambodia: in-vitro and ex vivo drug-response studies. In: Lancet Infect. Dis., 13, pp. 1043 – 1049.
154. Witkowski, B.; Khim, N.; Chim, P.; Kim, S.; Ke, S.; Kloeung, N.; Chy, S.; Duong, S.; Leang, R.; Ringwald, P.; Dondorp, A. M.; Tripura, R.; Benoit-Vical, F.; Berry, A.; Gorgette, O., Ariey, F.; Barale, J.-C., Mercerau-Puijalon, O.; Menard, D. (2013b): Reduced Artemisinin Susceptibility of Plasmodium falciparum Ring Stages in Western Cambodia. In: Antimicrob. Agents Chemother. 57 (2), pp. 914 – 923.
155. Woerdenbag, H. J.; Pras, N.; van Uden, W.; Wallart, T. E.; Beekmann, A. C.; Lugt, C. B. (1994): Progress in the research of artemisinin-related antimalarials: An update. In: Pharm World Sci 16, pp.169 – 180.
156. Woodrow, C. J.; Haynes, R. K.; Krishna, S. (2005): Artemisinins. In: Postgrad. Med. J. 81 (952), pp. 71 – 78.
157. World Health Organization (2015): Guidelines for the treatment of malaria. Third edition. Switzerland, p. 32 and pp. 112 – 113.
158. World Health Organization (2016): World Malaria Report 2016, Switzerland, pp. xii - xvii and p. 3.
159. Wrongsrichanalai, C.; Pickard, A. L.; Wernsdorfer, W. H.; Meshnick, S.R. (2002): Epidemiolog of drug-resistant malaria. In: Lancet Infect. Dis. 2: pp. 209 – 218.
120
160. Yang, H.; Liu, D.; Huang, K.; Yang, Y.; Yang, P.; Liao, M.; Zhang, C. (1999): [Assay of sensitivity of Plasmodium falciparum to chloroquine, amodiaquine, piperaquine, mefloquine and quinine in Yunnan province]. In: Zhongguo Ji Sheng Chong Xue Yu Ji Sheng Chong Bing Za Zhi 17 (1), pp. 43 – 45.
161. Yavo, W.; Faye, B.; Kuete, T.; Djohan, V.; Oga, S. A.; Kassi, R.R.; Diatta, M.; Ama, M. V.; Tine, R.; Ndiaye, J. L.; Evi, J.-B.; Same-Ekobo, A.; Faye, O.; Koné, M. (2011): Multicentric assessment of the efficacy and tolerability of dihydroartemisinin-piperaquine compared to artemether-lumefantrine in the treatment of uncomplicated Plasmodium falciparum malaria in sub-Saharan Africa. In: Malar. J. 10:198.
162. Yeka, A.; Dorsey, G.; Kamya, M.R.; Talisuna, A.; Lugemwa, M.; Rwakimari, J. B.; Staedtke, S. G.; Rosenthal, P. J.; Wabwire-Mangen, F.; Bukirwa, H. (2008): Artemether-Lumefantrine versus Dihydroartemisinin-Piperaquine for Treating Uncomplicated Malaria: A Randomized Trial to Guide Policy in Uganda. In: PLoS ONE 3 (6), e2390.
163. Zhang, Q.; Zhang, Y.; Huang, Y.; Xue, X.; Yan, H.; Sun, X.; Wang, J.; McCutchan, T. F.; Pan, W. (2011): From In vivo to In Vitro: Dynamic Analysis of Plasmodium falciparum var Gene Expression Patterns of Patient Isolates during Adaptation to Culture. In: PLoS ONE 6 (6), e20591.
Website:
Nobel Media AB 2016, The 2015 Nobel Prize in Physiology or Medicine- Press Release, available from https://www.nobelprize.org/nobel_prizes/medicine/laureates/2015/press.html, accessed June 21st, 2016.
121
9. Ehrenerklärung
Ich erkläre, dass ich die der Medizinischen Fakultät der Eberhard Karls
Universität Tübingen zur Promotion eingereichte Dissertation mit dem Titel
“Surveillance of artemisinin and partner drug efficacy in uncomplicated
Plasmodium falciparum malaria in Coastal Kenya” im Kenya Medical Research
Institute (KEMRI, Kilifi) mit Unterstützung der Arbeitsgemeinschaft um
Prof. Dr. med. Steffen Borrmann (damals Universität Heidelberg) ohne sonstige
Hilfe durchgeführt und bei der Abfassung der Dissertation keine anderen als die
aufgeführten Hilfsmittel benutzt habe.
Die Studie wurde durch Herrn Prof. Dr. med. Steffen Borrmann konzipiert,
welcher ebenso die Betreuung der Versuche und der gesamten Arbeit
übernommen hat. Die HRP2 Versuche wurden durch mich, Maria Rebekka
Marschallek, durchgeführt und teilweise durch einen weiteren Doktoranden der
Universität Heidelberg, Paul Wettzel, ergänzt. Die PCR Genotypisierungen
wurden einmal durch mich in Kenia durchgeführt und im Anschluss
vervollständigt und verifiziert durch die Arbeitsgemeinschaft Borrmann an der
Universität Heidelberg. Die klinischen Daten der CATMAP Studie wurden durch
das Studienteam in Kenia gesammelt. Die hier aufgeführte Recherche erfolgte
ausschließlich durch mich, ebenso die statistische Analyse.
Bei der Abfassung der Dissertation sind Rechte Dritter nicht verletzt worden.
Ich habe diese Dissertation bisher an keiner in– oder ausländischen
Hochschule zur Promotion eingereicht.
Neubrandenburg, den 19. Januar 2017
Maria Rebekka Marschallek

122
10. Danksagung
Ein großes Dankeschön gilt den kleinen Patienten, ohne die diese Studie nicht
hätte durchgeführt werden können. Zudem gilt mein Dank meinem Betreuer,
Prof. Dr. med. Steffen Borrmann, der es mir ermöglicht hat an diesem Projekt
mitzuarbeiten. Außerdem den Mitgliedern seiner Arbeitsgruppe in Heidelberg,
die mich tatkräftig unterstützt haben. Ebenso Herrn apl. Prof. Dr. Jude
Przyborski und seinen Mitarbeitern in Marburg für die Starthilfe bei der
Laborarbeit. Und natürlich allen Mitarbeitern in KEMRI, die immer ein offenes
Ohr für meine Anliegen hatten.
Ich danke jedem einzelnen meiner Geschwister für die gezeigte Geduld und
meinen Eltern, die mir immer wieder die Welt zu Füßen legen, damit ich sie
erobern kann.
123
11. Appendices 1 – 4
Appendix 119
Criteria for inclusion:
Age between 6 months to 10 years, inclusive
Mono-infection with P. falciparum detected by microscopy
Parasitaemia of 10,000 – 300,000 / µl asexual forms
Presence of axillary temperature ≥ 37.5 °C or history of fever during the
past 24 hrs
Ability to swallow oral medication
Ability and willingness to comply with the study protocol for the duration
of the study and to comply with the study visit schedule
Informed consent from a parent or guardian
Criteria for exclusion:
Presence of clinical danger signs: not able to drink or breast-feed,
vomiting (> twice in 24 hrs), recent history of convulsions (> 1 in 24 hrs),
unconscious state, unable to sit or stand
Mixed or mono-infection with another Plasmodium species detected by
microscopy
Presence of severe acute malnutrition defined as weight for height
< 70 % of the median National Center for Health Statistics / WHO
Presence of febrile conditions due to diseases other than malaria (e.g.
measles, acute lower respiratory tract infection, severe diarrhoea with
dehydration) or other known underlying chronic or severe diseases (e.g.
cardiac, renal and hepatic diseases, Human Immunodeficiency Virus /
Aquired Immune Deficiency Syndrome)
Regular medication, which may interfere with antimalarial
pharmacokinetics or pharmacodynamic assessments (e.g., antibiotics
with known antimalarial activity)
History of hypersensitivity reactions or contraindications to any of the
medicine(s) being tested or used as alternative treatment(s)
19
CATMAP study protocol v1.3, 2011

124
Appendix 2
The absorbance read during the performance oft he HRP2 ELISA resulted in
OD values which were transferred into the HN-NonLin V1.1 sheet to calculate
IC50 values (ng / ml). The IC50 values were transferred into nM by using an
excel sheet containing the needed formula for each drug.
AS nM =
(ng / ml)*1000 / 284.3
CQ nM =
(ng / ml)*1000 / 515.87
DHA nM =
(ng / ml)*1000 / 284.3
LUM nM =
(ng / ml)*1000 / 528.939
MFQ nM =
(ng / ml)*1000 / 414.77
PPQ nM =
(ng / ml)*1000 / 927.5
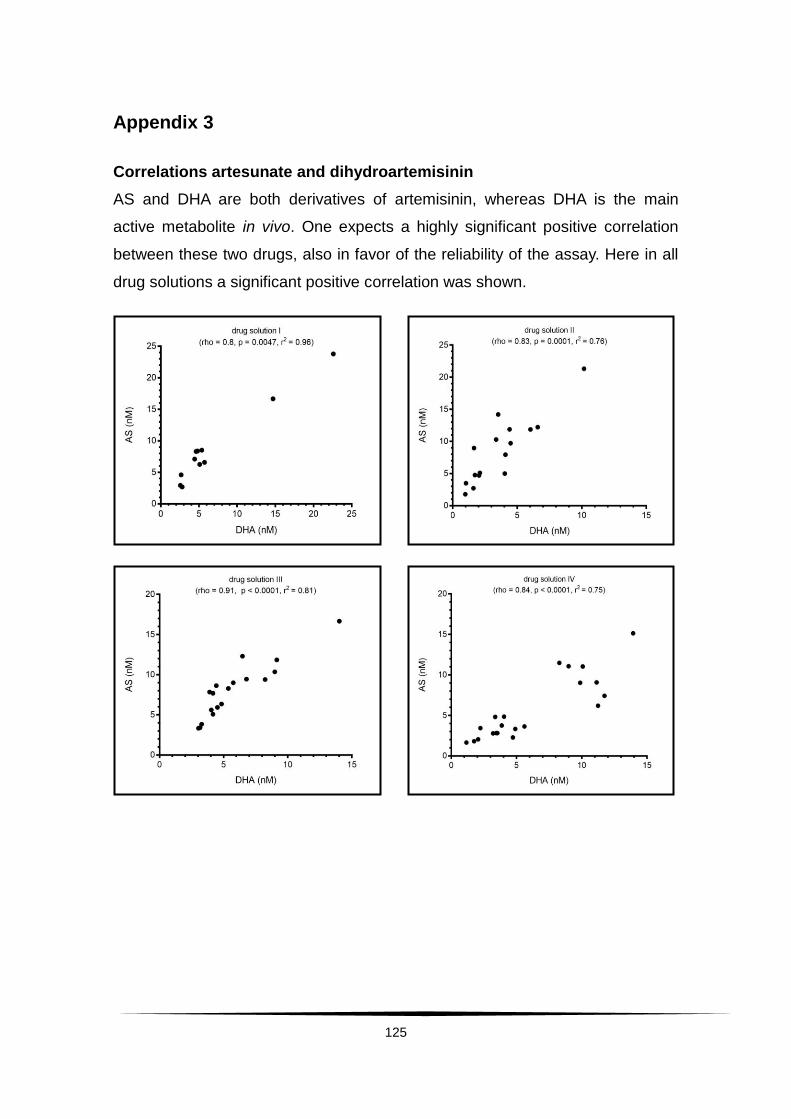
125
Appendix 3
Correlations artesunate and dihydroartemisinin
AS and DHA are both derivatives of artemisinin, whereas DHA is the main
active metabolite in vivo. One expects a highly significant positive correlation
between these two drugs, also in favor of the reliability of the assay. Here in all
drug solutions a significant positive correlation was shown.
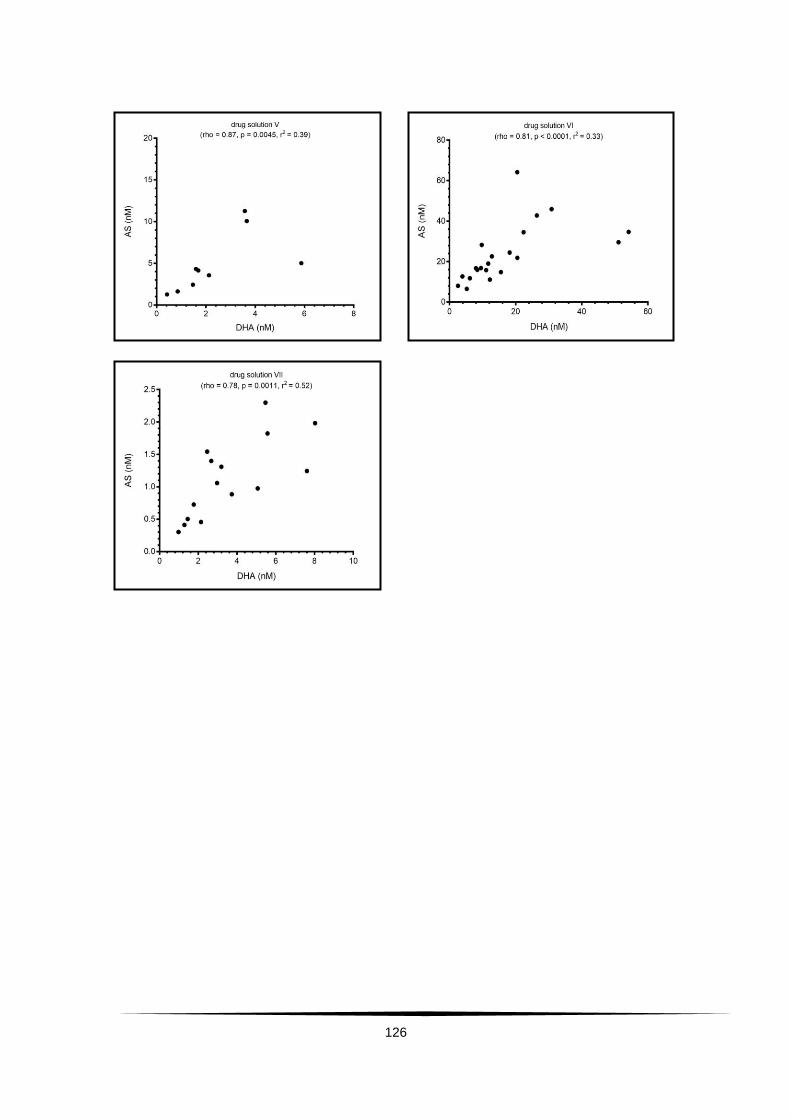
126

127
Correlations dihydroartemisinin and piperaquine
In the analysis including all drug solutions a positive significant correlation
between DHA and PPQ was found. When analyzing drug solutions separately,
two out of the seven solutions did show a significant positive correlation
between those two drugs.
Correlations artesunate and piperaquine
Between AS and PPQ there were two working solutions that showed significant
positive correlations [(rho=0.6821, p=0.0064, r2=0.4919), (rho= 0.8162,
p=0.0001, r2=0.5017)]. Those were the same two drug solutions that also
showed a significant correlation between DHA and PPQ, the coefficient of
determination was much higher though.

128
Correlations dihydroartemisinin and lumefantrine
The analysis among all drug solutions showed a significant positive correlation
between DHA and LUM. When analyzing this again for each single drug
solution the correlation was found in three drug solutions.
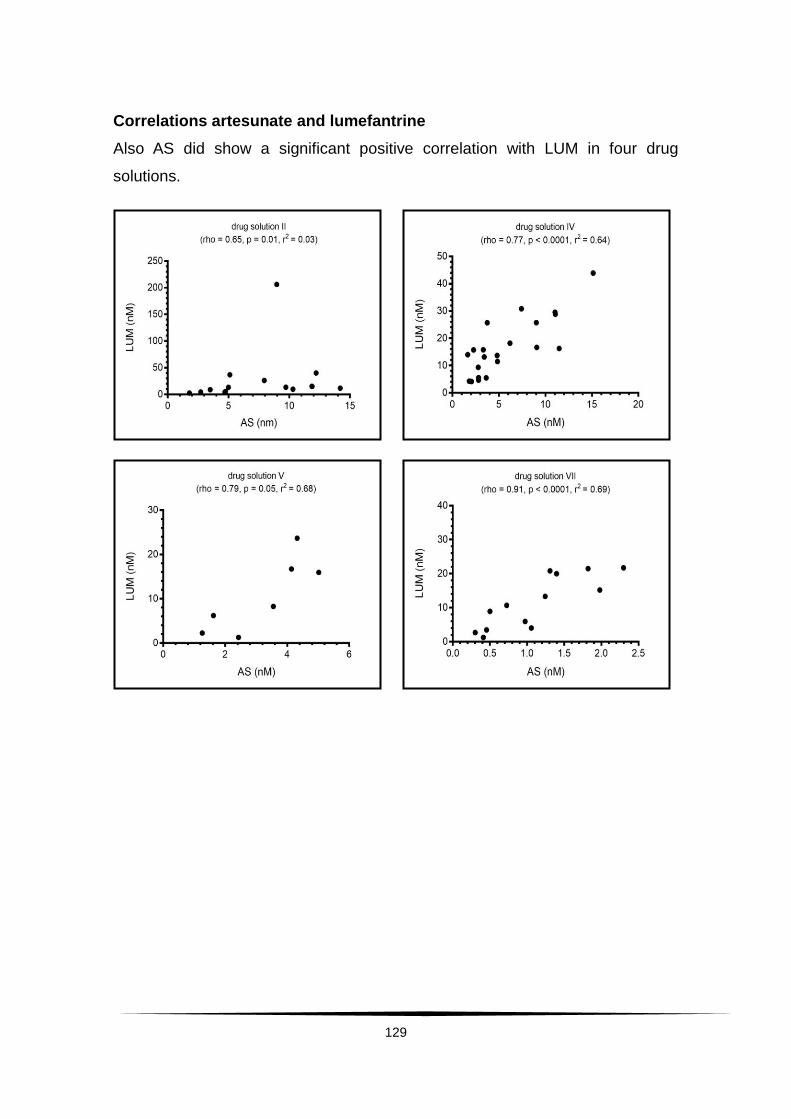
129
Correlations artesunate and lumefantrine
Also AS did show a significant positive correlation with LUM in four drug
solutions.
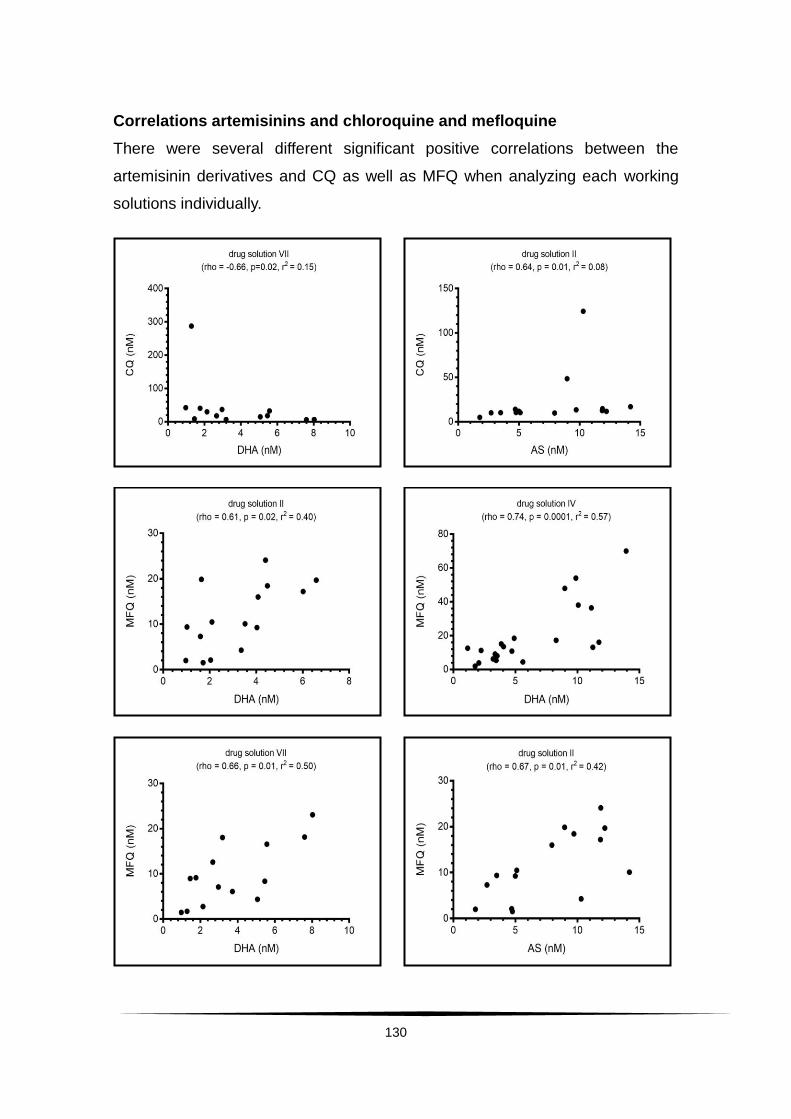
130
Correlations artemisinins and chloroquine and mefloquine
There were several different significant positive correlations between the
artemisinin derivatives and CQ as well as MFQ when analyzing each working
solutions individually.
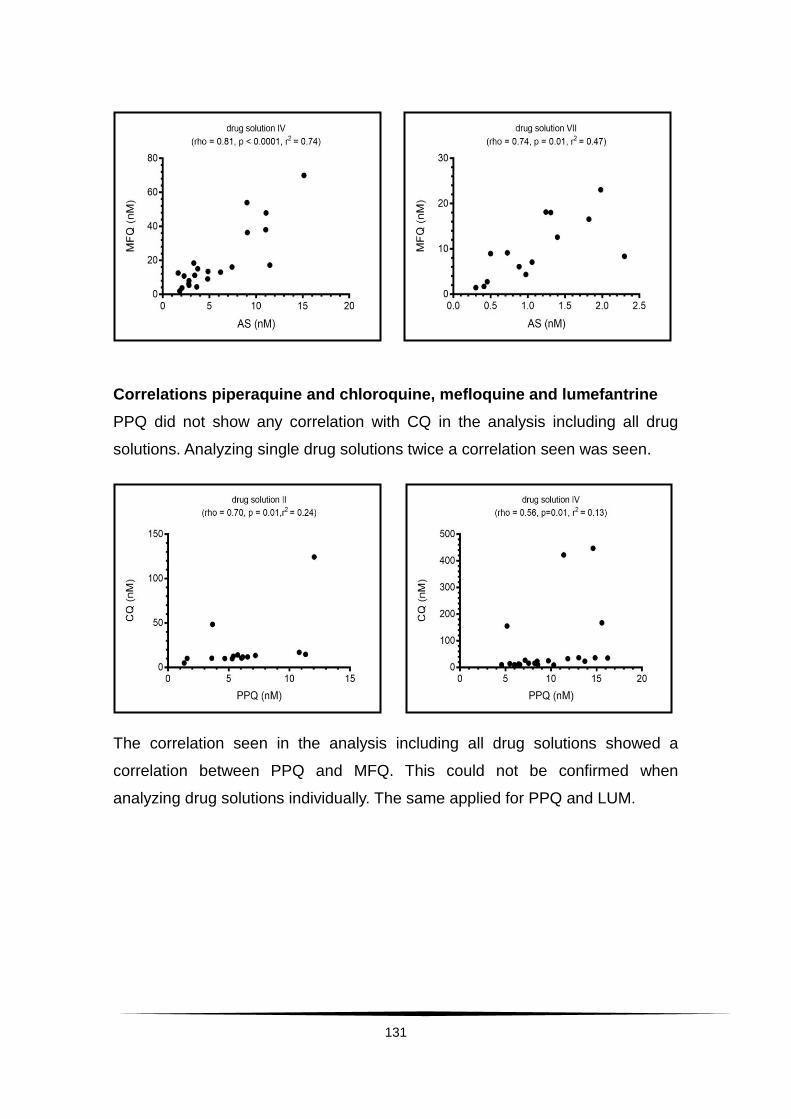
131
Correlations piperaquine and chloroquine, mefloquine and lumefantrine
PPQ did not show any correlation with CQ in the analysis including all drug
solutions. Analyzing single drug solutions twice a correlation seen was seen.
The correlation seen in the analysis including all drug solutions showed a
correlation between PPQ and MFQ. This could not be confirmed when
analyzing drug solutions individually. The same applied for PPQ and LUM.

132
Correlations lumefantrine and chloroquine and mefloquine
LUM showed a significant negative correlation with CQ in the analysis among
all drug solutions. Analyzing single drug solutions, once a significant negative
correlation between LUM and CQ was seen.
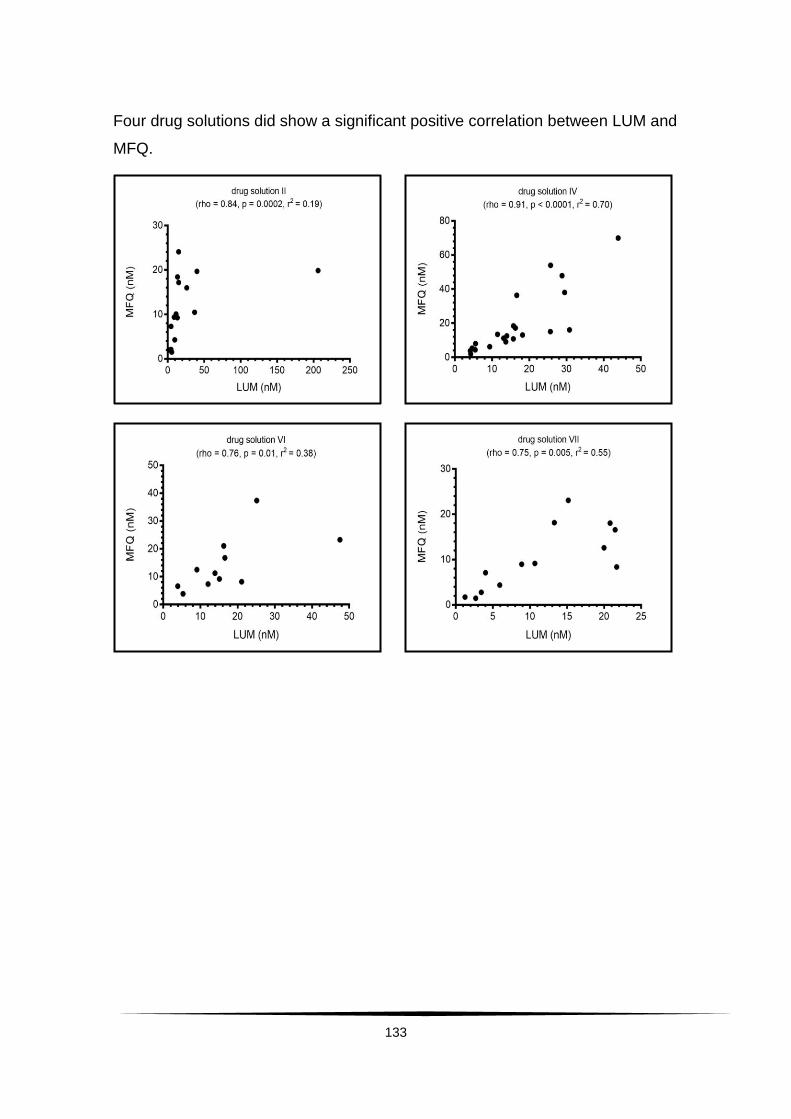
133
Four drug solutions did show a significant positive correlation between LUM and
MFQ.
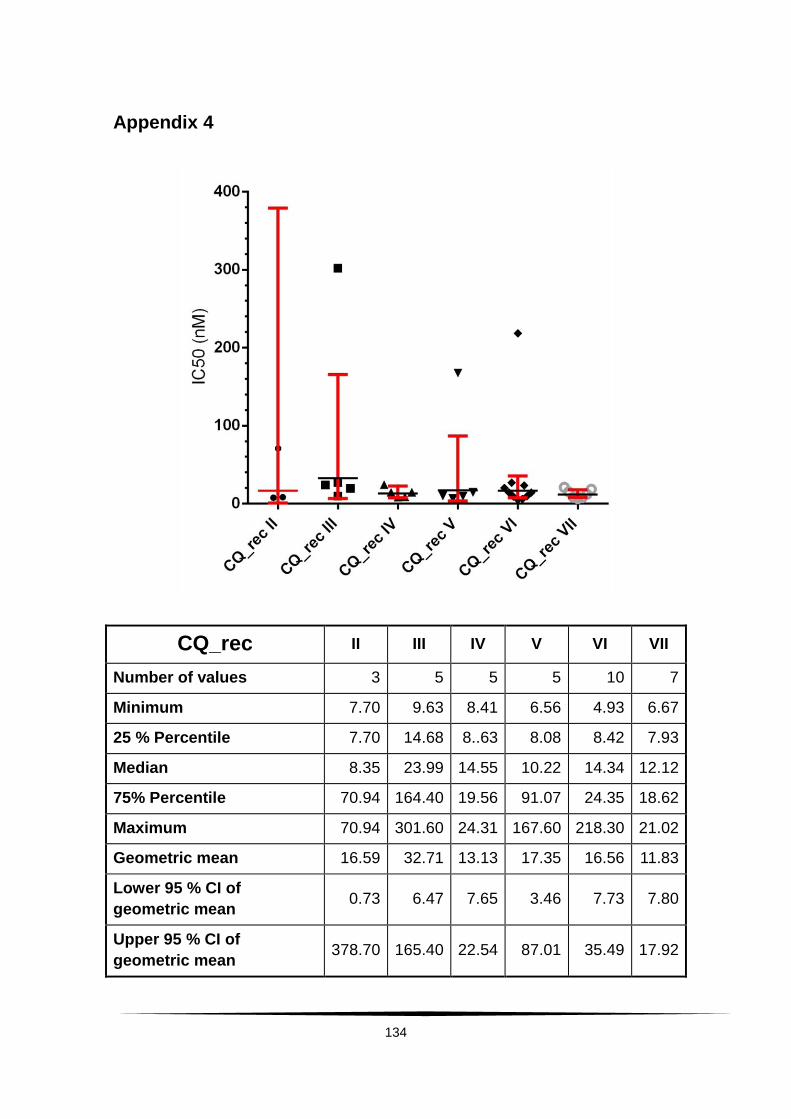
134
Appendix 4
CQ_rec II III IV V VI VII
Number of values 3 5 5 5 10 7
Minimum 7.70 9.63 8.41 6.56 4.93 6.67
25 % Percentile 7.70 14.68 8..63 8.08 8.42 7.93
Median 8.35 23.99 14.55 10.22 14.34 12.12
75% Percentile 70.94 164.40 19.56 91.07 24.35 18.62
Maximum 70.94 301.60 24.31 167.60 218.30 21.02
Geometric mean 16.59 32.71 13.13 17.35 16.56 11.83
Lower 95 % CI of
geometric mean 0.73 6.47 7.65 3.46 7.73 7.80
Upper 95 % CI of
geometric mean 378.70 165.40 22.54 87.01 35.49 17.92

135
MFQ_rec II III IV V VI VII
Number of values 3 5 5 5 10 7
Minimum 5.68 3.63 2.75 1.19 5.35 1.40
25 % Percentile 5.68 9.15 5.37 1.73 8.79 4.83
Median 13.15 14.87 11.79 3.86 16.09 34.99
75 % Percentile 13.94 31.40 34.31 15.54 25.15 38.99
Maximum 13.94 47.47 47.99 20.64 34.15 44.22
Geometric mean 10.13 14.19 12.07 4.68 14.12 17.32
Lower 95 % CI of geometric
mean 2.91 4.57 3.21 1.13 8.91 4.98
Upper 95 % CI of geometric
mean 35.31 44.03 45.38 19.48 22.37 60.28
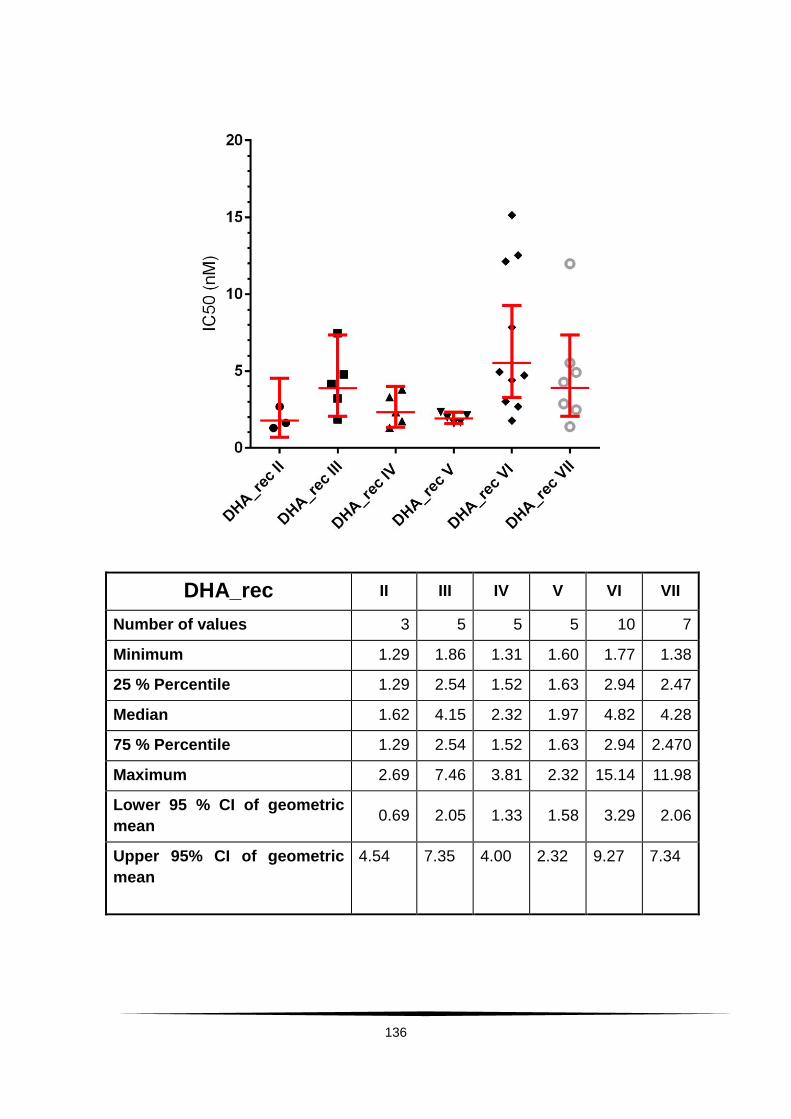
136
DHA_rec II III IV V VI VII
Number of values 3 5 5 5 10 7
Minimum 1.29 1.86 1.31 1.60 1.77 1.38
25 % Percentile 1.29 2.54 1.52 1.63 2.94 2.47
Median 1.62 4.15 2.32 1.97 4.82 4.28
75 % Percentile 1.29 2.54 1.52 1.63 2.94 2.470
Maximum 2.69 7.46 3.81 2.32 15.14 11.98
Lower 95 % CI of geometric
mean 0.69 2.05 1.33 1.58 3.29 2.06
Upper 95% CI of geometric
mean
4.54 7.35 4.00 2.32 9.27 7.34
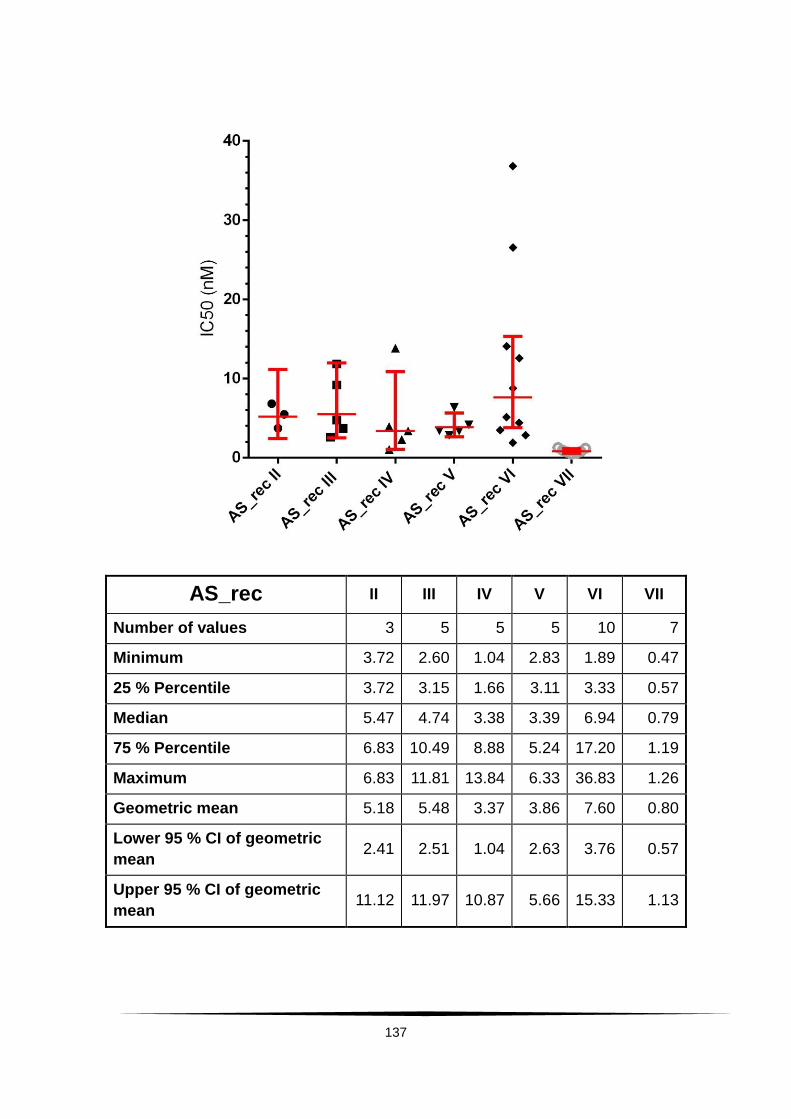
137
AS_rec II III IV V VI VII
Number of values 3 5 5 5 10 7
Minimum 3.72 2.60 1.04 2.83 1.89 0.47
25 % Percentile 3.72 3.15 1.66 3.11 3.33 0.57
Median 5.47 4.74 3.38 3.39 6.94 0.79
75 % Percentile 6.83 10.49 8.88 5.24 17.20 1.19
Maximum 6.83 11.81 13.84 6.33 36.83 1.26
Geometric mean 5.18 5.48 3.37 3.86 7.60 0.80
Lower 95 % CI of geometric
mean 2.41 2.51 1.04 2.63 3.76 0.57
Upper 95 % CI of geometric
mean 11.12 11.97 10.87 5.66 15.33 1.13
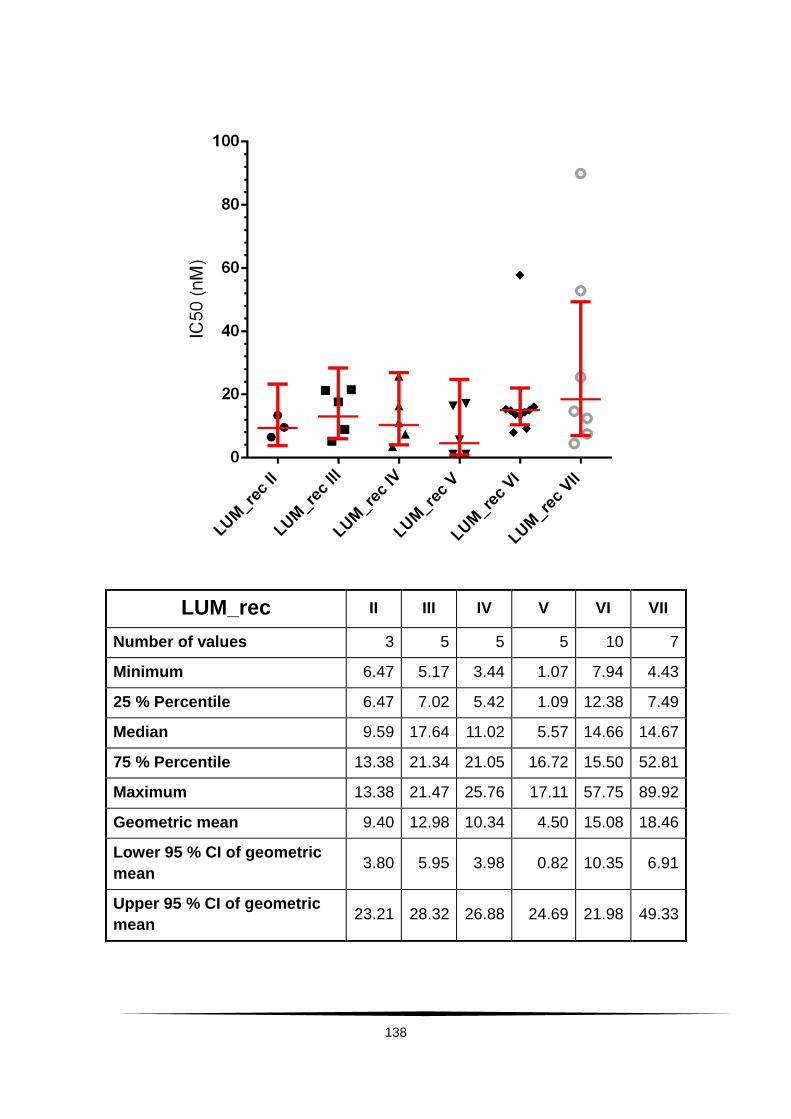
138
LUM_rec II III IV V VI VII
Number of values 3 5 5 5 10 7
Minimum 6.47 5.17 3.44 1.07 7.94 4.43
25 % Percentile 6.47 7.02 5.42 1.09 12.38 7.49
Median 9.59 17.64 11.02 5.57 14.66 14.67
75 % Percentile 13.38 21.34 21.05 16.72 15.50 52.81
Maximum 13.38 21.47 25.76 17.11 57.75 89.92
Geometric mean 9.40 12.98 10.34 4.50 15.08 18.46
Lower 95 % CI of geometric
mean 3.80 5.95 3.98 0.82 10.35 6.91
Upper 95 % CI of geometric
mean 23.21 28.32 26.88 24.69 21.98 49.33
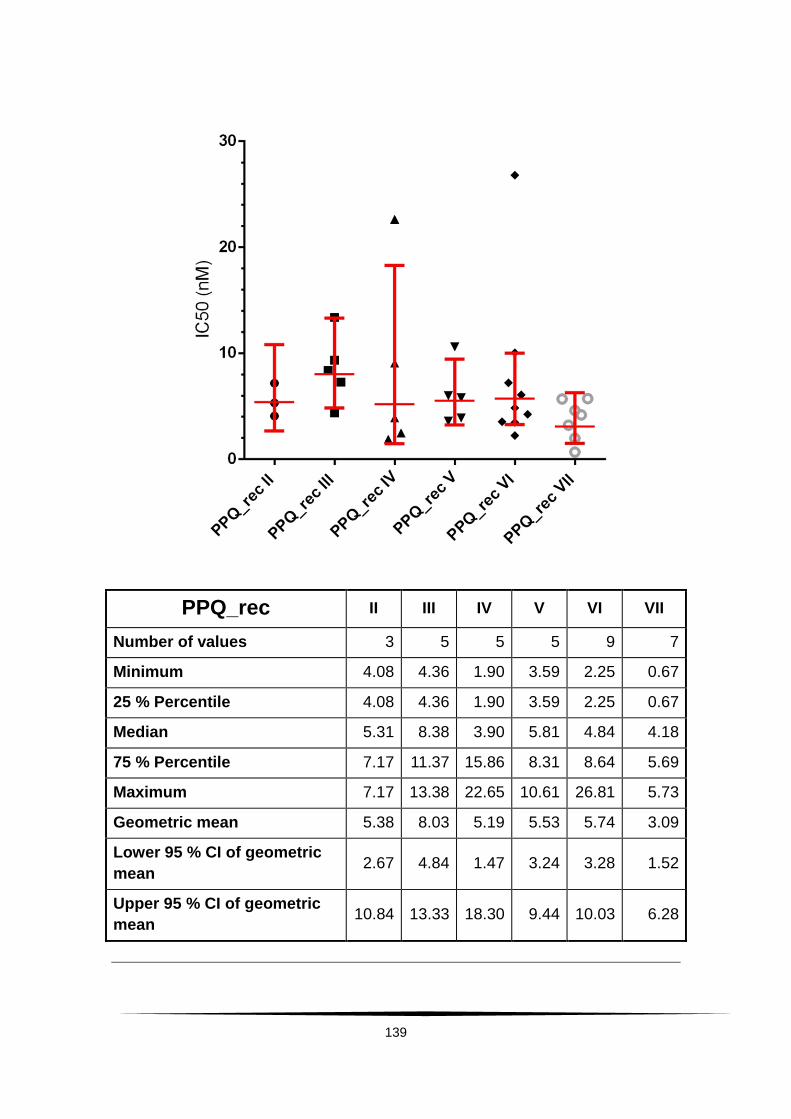
139
PPQ_rec II III IV V VI VII
Number of values 3 5 5 5 9 7
Minimum 4.08 4.36 1.90 3.59 2.25 0.67
25 % Percentile 4.08 4.36 1.90 3.59 2.25 0.67
Median 5.31 8.38 3.90 5.81 4.84 4.18
75 % Percentile 7.17 11.37 15.86 8.31 8.64 5.69
Maximum 7.17 13.38 22.65 10.61 26.81 5.73
Geometric mean 5.38 8.03 5.19 5.53 5.74 3.09
Lower 95 % CI of geometric
mean 2.67 4.84 1.47 3.24 3.28 1.52
Upper 95 % CI of geometric
mean 10.84 13.33 18.30 9.44 10.03 6.28