Eastern Coalfields Limited (A subsidiary of Coal India Ltd.)
Upload
mgmahavidyalayaCategory
view
0download
0
ISSN: 0974 - 0376
AN INTERNATIONAL QUARTERLY JOURNAL OF ENV RONIVENTAL SCIENCES
www. theecoscan. in
SURFACE WATER QUALITY ASSESSMENT OF ABANDONEDOPENCAST COAL PIT.LAKES IN RANIGANJ COALFIELDS AREA,INDIA
Sandipan Pal et al.,
Opencrrt cdal pitilakes
Srurface waterr'quql ity
Seasonal.variation .
Eqological rcondirit:n
Hydrochemical rfacies
Proceedings of tnternational Conference onHarmony with Nature in Context of
Ecotechnological lntervention and Climate Change(HARMONY - 2O13)
November 11 - 13, 2013, CorakhPur,organ ized by
Department ol ZoologY,Biotechnology and Environmental Sciences
DDU, Corakhpur University, Corakhpurin association with
N,q.rrou,r.r- ENvrpoNltpNTALrsrs AssocrerroN, INor,cwww.neaindia.org
-.-:i,Xi#i:-^--otfk! Y!::::,;\ a;-^ (-
t?i|ffi# J-h*,9,***-,***^
SANDIPAN PAL"b, ALOKE KUMAR MUKHTRJEE", TARAKESHWAR SENAPATI"/ PALAS SAMANTA", SUBINOY MONDAL"AND APURBA RATAN CHOSH"*
oDepartment of Environmental Science, The University of Burdwan, Colapbag,Burdwan 713104, West Bengal, INDIA
bDepartment of Environmental Science, Aghorekamini Prakashchandra Mahavidyalaya,Subhasnagar, Bengai 71 2611, Hooghly, West Bengal, INDIA
E-mail: [email protected] (A. R. Chosh)
Ecological status and seasonal variatinn. ofsurface water pararfteters of opencast coal pitlakes in Ranigani Coalfield area were assessed.Distinct geasonal variations among the differentparameters such as, temperdture, pH, electricalconductivity, total hardness, Mg1 , Na , K ,
HCO., POj'',total iron were mar.imum insurnmer but were minimum fol totalsuspended solids, HCO, in rainy season andtotal hardness,.Mg?* and total alkalinity in postrai ny season. Hydrochemical analyses revealedthal the water is of inland origin, fresh, soft tomoderately hard and alkaline in nature.Chemical properties of water were dominatedby major cations in order of Na > Ca2 )K' > Mg > Fe and major anions HCO> Cl > SO,'> CO,') No, > PO.'.Piper diagram revealed the four major waterclasses viz., Nao-Kt-HCOr', mixed Ca2*-Na*-HCO' Na -HCO,'and Ca']--HCO, indicatingthe dominan< e of alkali elements. The Cibbs'plot showed lhe dominance of rock-weatheringndture. Occurrence of zooplanktoniccornmuniqy (4.0 I 1.0 U Lr) was low bu[ thenet primary productivity (310 t 110 mg C m': hrl) was satisfactory, So, suitability of OCPwater usages for drinking, irrigation andaquacultural purposes was ascertained.
INTRODUCTION
The opencast coal extraction method is one of the best and appropriate in them ining ind ustries of lndia resu lting into a void or pit wh ich is eventually filled up bysurface runoff and groundwater seepage becoming a pit-lake, the potential waterreservoir (Chosh, 2012). ln lndia, coal is a major resource and most importantprimary source of energy. Although, coal mining and its associated activities canimbrue the different sectors of our environment, viz., societal condition, ecology,atmosphere, land and/or water system. The major environmental impacts on thesurrounding areas and on human health are well documented by several authorsin different times (Dhar, 1993; Ripley et al., 1996; Peplow and Edmonds,2OO2;Younger, 2004).
Several studies on Raniganj Coalfield (RCF) area revealed that it is free from AcidMine Drainage (AMD) (Chosh et al., 1984; Tiwary and Dhar, 1994; Chosh et a1.,
2005). Different studies on Iimnological parameters depicted the high conductivity,total suspended solids (TSS), total dissolved solids (TDS), biochemical oxygendemand (BOD), chemical oxygen demand (COD), sulphates (SOo)etc., in minewater of this area (Chosh, 1990; Tiwary and Dhar, 1994; Singh et a/., 2009; Singhet al ., 2010). Few records are availab le on assessment of water q ual ity and seasonalvariationsof the lndian coal pit-lakes (Chosh etal.,2OO5; Singh eta/.,2009; Singhet a|.,2010).
The major sources of surface water in the RCF area is Damodar, Ajay and Barakarrivers which are rain fed; and acute shortage of drinking water occurs in summerseason mainly due to withdrawing and discharging resulting from undergroundm in ing activity. Ongoing opencast mining activity, causing permanent flow of waterinto the mine also disturbs the aquifers and water table (Tiwary and Dhar, 1994).Therefore, it can cause groundwater pollution in this area. So, the present study is
aimed to characterise the h id rob iological status of the OCP water for estab I ish mentof its suitability for drinking, irrigation and aquaculture purposes that can improvethe socio-economic condition of the common people in and around the RCF area.
Study area
Raniganj Coalfield (RCF) which is the birth place of lndian coal mine covers an areaof about 1,530 sq. km containing about 13.1 0 sq. km of direct coal bearing land.RCF area is spread over Burdwan, Birbhum, Bankura and Purulia districts in WestBengal and Dhanbad district in jharkhand. There are about 78 old opencast coalpits (OCPs) which encompass 260 hectares of surface area containing total volumeof 4,41 ,17,700 m3 which are now converted into pit-lakes or void becoming a
potential water resource for this area.
Geology
Top soil-cover of the RCF area is of alluvial type. A coal-bearing Condwana Superstratum lies beneath this soil-cover. The area is mostly surrounded by the Archean
SURFACE \(/ATER QUALITY ASSESSMENT OF ABANDONED OPENCAST COAL PIT-LAKES
rocks. The rocks of this area are consisted of fine to mediumgrained buff coloured sandstone, grayish to greenishmicaceous shale, coal seams and siltstones.
Climatic condition
The climatic condition of the study area is tropical andexperiences four main seasons which are summer/ rainy, postrainy and winter. Average annual rainfall is about 1200 to1400 mm and the rainy season generally lasts from July toSeptember. March to May is dry summer intervened by tropicalcyclones. Winter season starts from middle of November andcontinues till the beginning of February. While October andearly November is post rainy season and a very small spring(post winter) is in February.
Description of the selected OCPs
For this study four old OCPs viz., Millenium OCP [M OCP]and Kumardihi A OCP [K OCP] under Bankola area andPurusattampur East OCP [P OCP (E)] and Purusattampur WestOCP [P OCP (W)] underJhanjra area are selected. Longitudinaland latitudinal positions of M OCP, K OCP, P OCP(E) and P
OCP(W) are 23o40'11.93" N and 87o14'04.55. E,
23"40'1 1.09" N and B7o15'29.10' E,23o41'39.56" N and87o17'02.92" E and 23"41'43.00" N and 87"16'57.76' E
respectively (Fig. 1). Total area of M OCP, K OCP, P OCP(E)and P OCP(W) are 2.76,0.50, 0.08, 0.40 km'? respectively.Maximum depth of these OCPs are within 35 - 36 m. Year ofdeclaration of abandonment of M OCP, K OCP, P OCP (E) andP OCP (W) were 1999, 1981 , 1986 and 1981 respectively.
Sampling and analysis
Sampling was carried out for three consecutive years (2005-'06, 2006-'07 and 2007-'08) on regular basis seasonally andseasonally and thirty (30) physicochemical parameters wereanalysed. Surface water was collected from different markedlocations of each OCPs and mixed thoroughly and werebrought to the laboratory and preserved before analysis as
mentioned in APHA (1998). Parameters like temperature, pH,electrical conductivity, free carbon dioxide, dissolved oxygenand primary productivity were analysed on time in the field.Total alkalinity, hydroxide, carbonate and bicarbonate ionconcentration were analysed after following the methods ofSaxena (1998) and zooplankton by Canton (1982), whereas,other parameters were analysed as per APHA (1998). For theanalysis of metal concentration, 1 L of water samples weretaken from all OCPs, and digested by using a mixture of nitricacid-perchloric acid following the methods mentioned inAPHA (1998). Correlation statistics was performed by using
SPSS statistical software version 16.0.
RESUTTSAND
General hydrogeochemistry and limnobiology
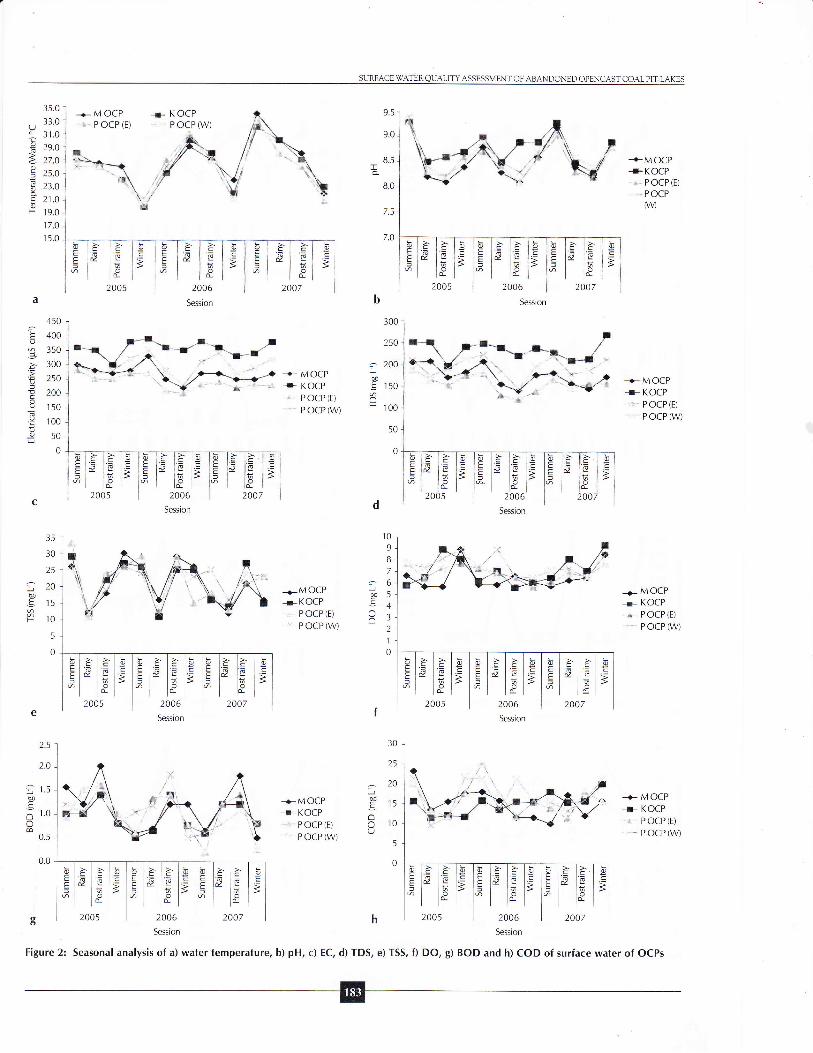
The surface water temperatures varied from 20.0 to 34.0oC(average, 26.0 x 3.60'C). Maximum temperature wasrecorded during summer and/or rainy seasons and minimumin winter season (Fig. 2.a). Rise of water temperature duringsummer season was due to overall increasing trend inatmospheric temperature (Narsimha Rao and Jaya Raju, 200'l ).pH of water samples estimated between 8.1 and 9.4 (average,
8.63 t 0.37). Maximum pH was recorded during summer
season (Fig.2.b). It may be due to high evaporation thatincreased the different ionic concentrations. Electricalconductivity (EC) values ranged from 200 to 390 pS cm-l(average, 290 1 51.2 /rS cm']). Maximum EC values wererecorded during summer and/or winter seasons (Fig. 2.c). Highevaporation during summer and winter seasons increased theconcentration of dissolved solids in the form of acids, baseand salts which may increase the water conductivity (Kataria
and Jain, .l 995). Amount of the total dissolved solids (TDS)
varied between 120 and 270 mg L'] (average, 190 1 35.8 mgL'l). TDS was lower as observed during rainy and/or post rainyseasons (Fig. 2.d), this may be due to dilution of water byprecipitation. Whereas, estimated concentrations of totalsuspended solids (TSS) were observed between 1 1.0 and 33.0mg L'1 (average, 21 .O x 6.25 mg L-'). Low TSS concentrationwas found during rainy season (Fig.2.e) as because of dilutionby rain water as well as due to halting of mining activity in thisseason resulting in decrease of dust fall. The free carbondioxide (COr) concentrations ranged from non-detectable lirnitIo 2.20 mg L-' (average, 0.30 1 0.69 mg L-'). The dissolvedoxygen (DO) concentrations varied between 5.64 and 9.32mg Lr(average,7.03 + 1.03 mg L-') without showing anytrend of seasonal variation (FiS. 2.f). High DO value wasobserved due to vast and stretched water body allowing a
huge mixing of atmospheric oxygen. Concentrations ofbiochemical oxygen demand (BOD) were observed between0.20 and 2.03 mg L'l (average, 1.04 + O.42 mg L1) (Fig. 2.g).This indicated the presence of low amount of microbialpopulation in the OCP water. Maximum values were usuallyrecorded during post rainy season. lt may be due to increaseof pollution load through surface runoff during rainy season.The chemical oxygen demand (COD) was observed in therange of 9.6 Io 25.4 mg L1 (average, 15.8 x 3.67 mg Lr), butthe trend of seasonal change was not so distinct (FiS.2.h).Lowered COD value of the OCP water indicated the lesscontamination by chemical pollutants. Values of total hardnesswere found in the range of 28.0 mg L'r to 130 mg L'r (average,
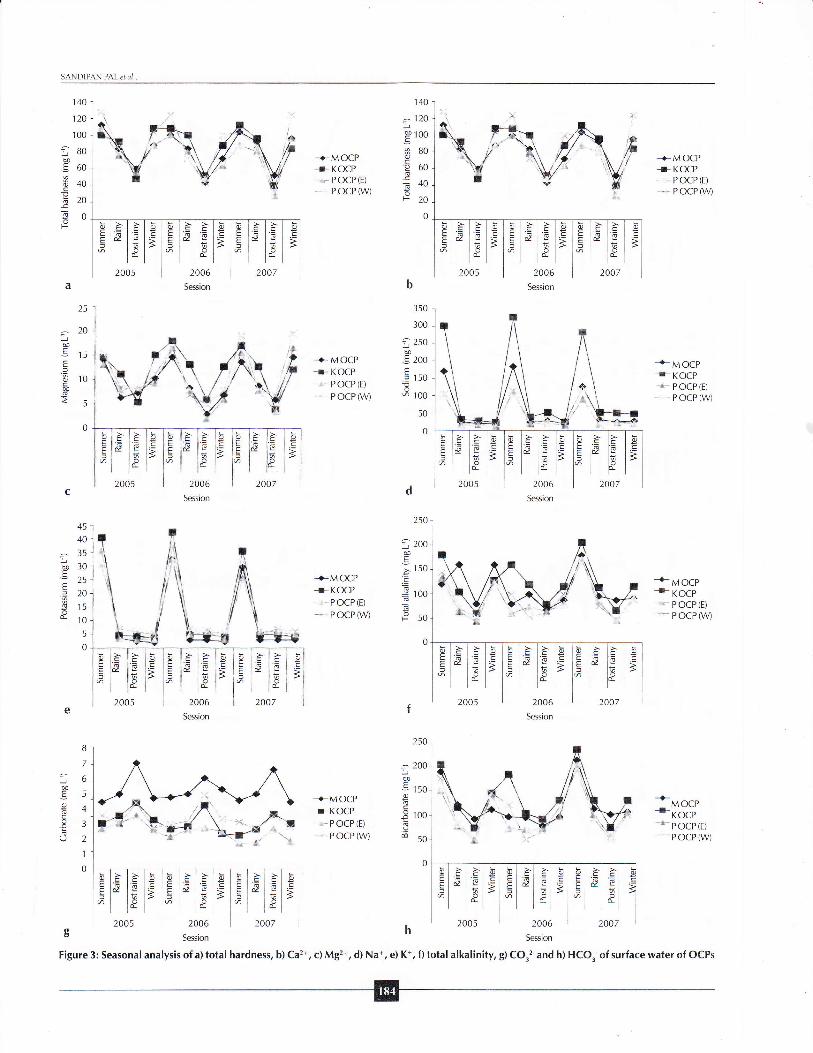
83.1 t 25.3 mg L'). Higher concentrations were recordedmostly during the summer and/or winter seasons, and lowervalues were observed during post rainy season (Fig. 3.a). Thismay be due to increase of evaporation rate at high temperaturecausing the increase of ionic concentrations like Ca2*, Mg2*,Fe2* etc. Calcium ion (Ca2*) concentrations in the OCP watervaried in the range of 1.6 to 27.3 mg L'r (average, 16.7 t 5.19mg L-'). Cenerally, minimum amount of calcium was recordedin the post rainy season (Fig. 3.b). Magnesium ions (Mg'7*) inthe OCP water were found in the range of 1 .94 to 1 9.4 mg L-]
(average, 10.4 t 4.64 mg L''). ln most of the cases, maximummagnesium concentrations were recorded during summerseasons and minimum during rainy or post rainy seasons (Fig.
3.c). Sodium concentrations (Na.) ranged between I I.3 and330 mg L-r(average, 62.2 1 76.1 mg L'l). High concentrationof sodium was observed during summer season (Fig. 3.d) thatmay be due to the high evaporation rate during this seasoncaused an enhancement in the sodium concentration.Potassium (K*) was estimated in the range of 2.01 to 42.4 mgL'] (average, 11.9 t 13.4 mg L'1). Higher concentrations ofpotassium were determined during the summer season (Fig.
3.e) may also be due to high evaporation during thisseason.Total alkalinity values varied is the range of 44.0 to
SANDIPAN PAL er al
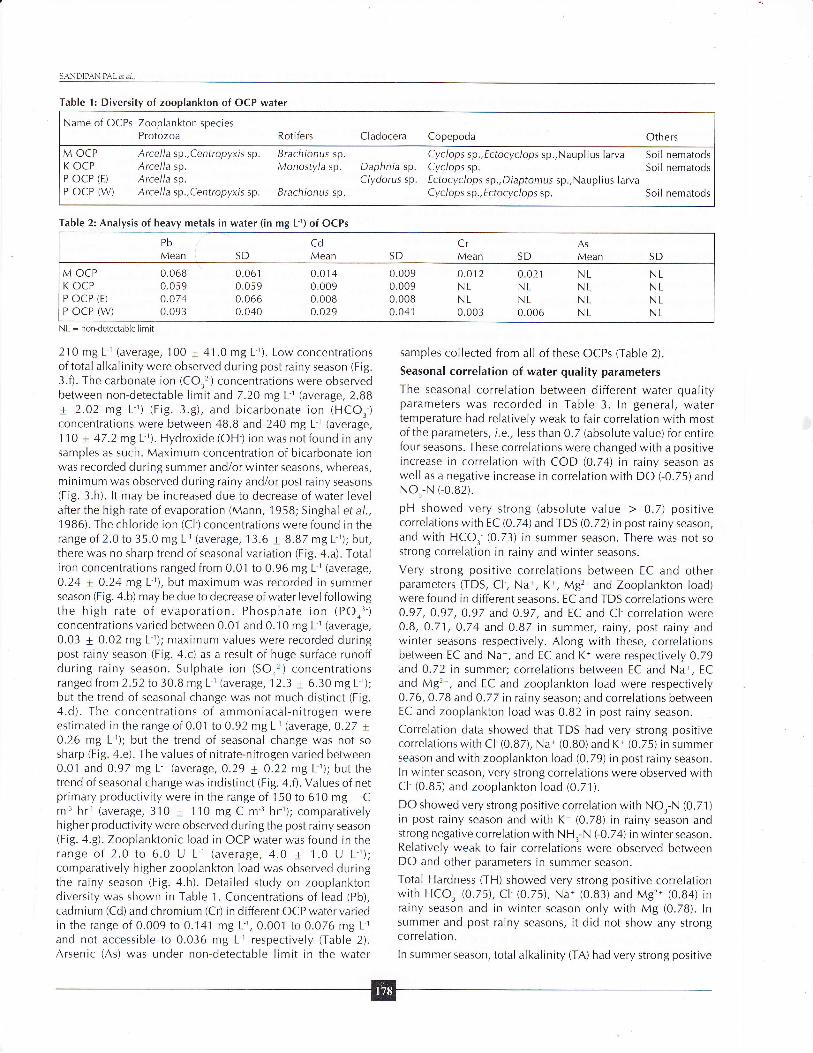
Table 1: Diversity of zooplankton of OCP water
Name of OCPs Zooplankton speciesProtozoa
Arce I I a sp., Ce ntropyxi s sp.Arcella sp.Arcella sp.Arce I I a sp.,Centropyxi s sp.
Rotifers Cladocera Copepoda Others
M OCPK OCPP OCP (E)
P OCP (W)
Brachionus sp.Monostyla sp. Daphnia sp.
Clydorus sp.Brachionus sp.
Cyclops sp.,Ectocyclopssp.,Nauplius larva Soil nematodsCyclops sp. Soil nematodsE ctocy cl o p s sp., D i apto m u s sp., N au p I i us I arvaCyclops sp.,fctocyclops sp. Soil nematods
Table 2: Analysis of heavy metals in water (in mg Lr) of OCPs
Pb
Mean
0.0680.0s90.0740.093
SD
0.0610.0590.0660.040
Cd
Mean
0.0 r40.0090.0080.o29
SD
0.0090.0090.0080.041
CrMean
o.012NLNL0.003
SDAs
Mean
NLNLNLNL
SD
NLNLNLNL
M OCPK OCPP OCP (E)
P OCP (W)
0.o21NLNL0.006
NL : nondetectable limit
210 mg L'] (average, 100 t 41.0 mg L'1). Low concentrationsof total alkalinity were observed during post rainy season (Fig.
3.fl. The carbonate ion (COr'?-) concentrations were observedbetween non-detectable limit and 7.20 mg L'1 (average, 2.BB
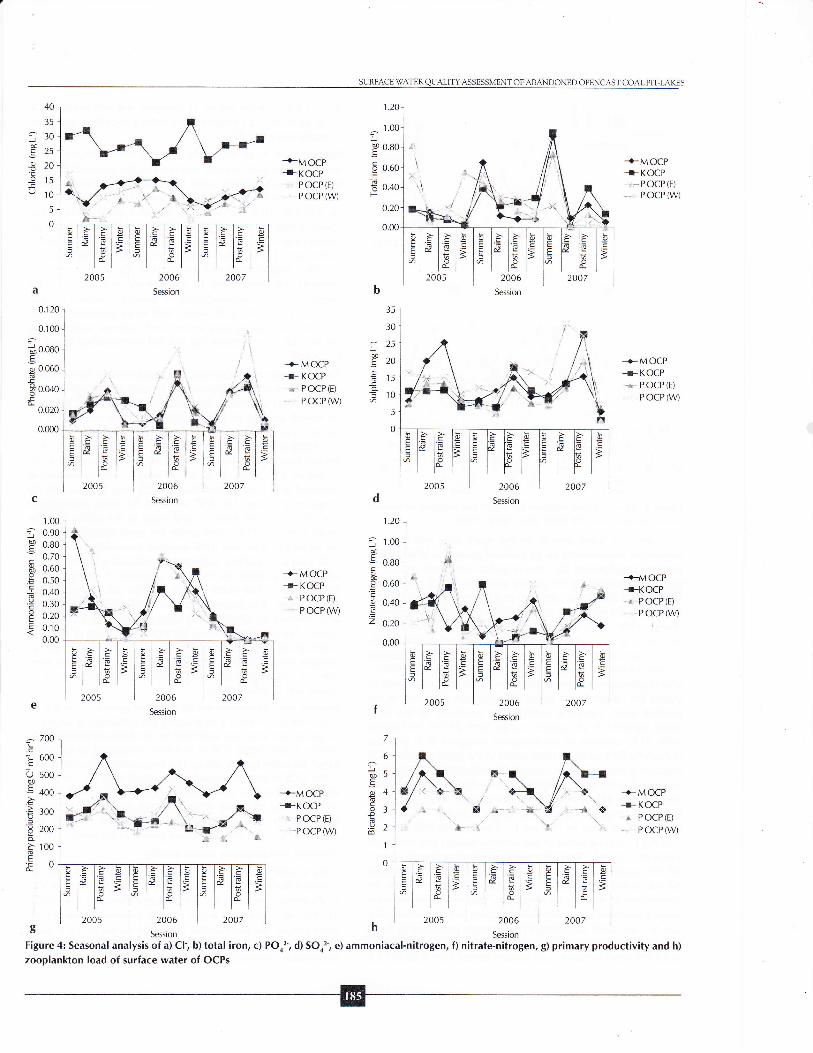
t 2.02 mg L-') (Fig. 3.g), and bicarbonate ion (HCO3')concentrations were between 48.B and 240 mg L-r (average,110 t 47.2 mg L''). Hydroxide (OH-) ion was notfound in anysamples as such. Maximum concentration of bicarbonate ionwas recorded during summer and/or winter seasons/ whereas,minimum was observed during rainy and/or post rainy seasons(Fig. 3.h). It may be increased due to decrease of water levelafter the high rate of evaporation (Mann, 1958; Singhal et a/.,1986). The chloride ion (Cl ) concentrations were found in therange of 2.0 to 35.0 mg L1 (average,13.6 t B.B7 mg L-l); but,there was no sharp trend of seasonal variation (Fig. 4.a). Totaliron concentrations ranged from 0.01 to 0.96 mg L-l (average,0.24 x 0.24 mg L-l), but maximum was recorded in summerseason (Fig. 4.b) may be due to decrease of water level followingthe high rate of evaporation. Phosphate ion (POo3 )
concentrations varied between 0.01 and 0.10 mg L-l (average,0.03 t 0.02 mg L'l); maximum values were recorded duringpost rainy season (Fig.4.c) as a result of huge surface runoffduring rainy season. Sulphate ion (SOr'?') concentrationsranged from 2.52 to 30.8 mg L'] (average, 12.3 t 6.30 mg L'');but the trend of seasonal change was not much distinct (Fig.
4.d). The concentrations of ammoniacal-nitrogen wereestimated in the range of 0.01 to 0.92 mg L1 (average, 0.27 +0.26 mg L'1); but the trend of seasonal change was not sosharp (Fig. 4.e). The values of nitrate-nitrogen varied between0.01 and 0.97 mg L'l (average, 0.29 t 0.22 mg L'r); but thetrend of seasonal change was indistinct (Fig. a.fl. Values of netprimary productivity were in the range of .1
50 to 6'l 0 mg Cmr hrr(average, 310 t 110 mg C mr hrl); comparativelyhigher productivity were observed during the post rainy season(Fig. a.g). Zooplanktonic load in OCP water was {ound in therange of 2.0 to 6.0 U L-1 (average, 4.0 t 1.0 U L'1);comparatively higher zooplankton load was observed duringthe rainy season (Fig. 4.h). Detailed study on zooplanktondiversity was shown in Table 1. Concentrations of lead (Pb),
cadmium (Cd) and chromium (Cr) in different OCP water variedin the range of 0.009 to 0.141 mg 1r,0.001 to 0.076 mg L']
and not accessible to 0.036 mg Lr respectively (Table 2).Arsenic (As) was under non-detectable limit in the water
samples collected from all of these OCPs (Table 2).
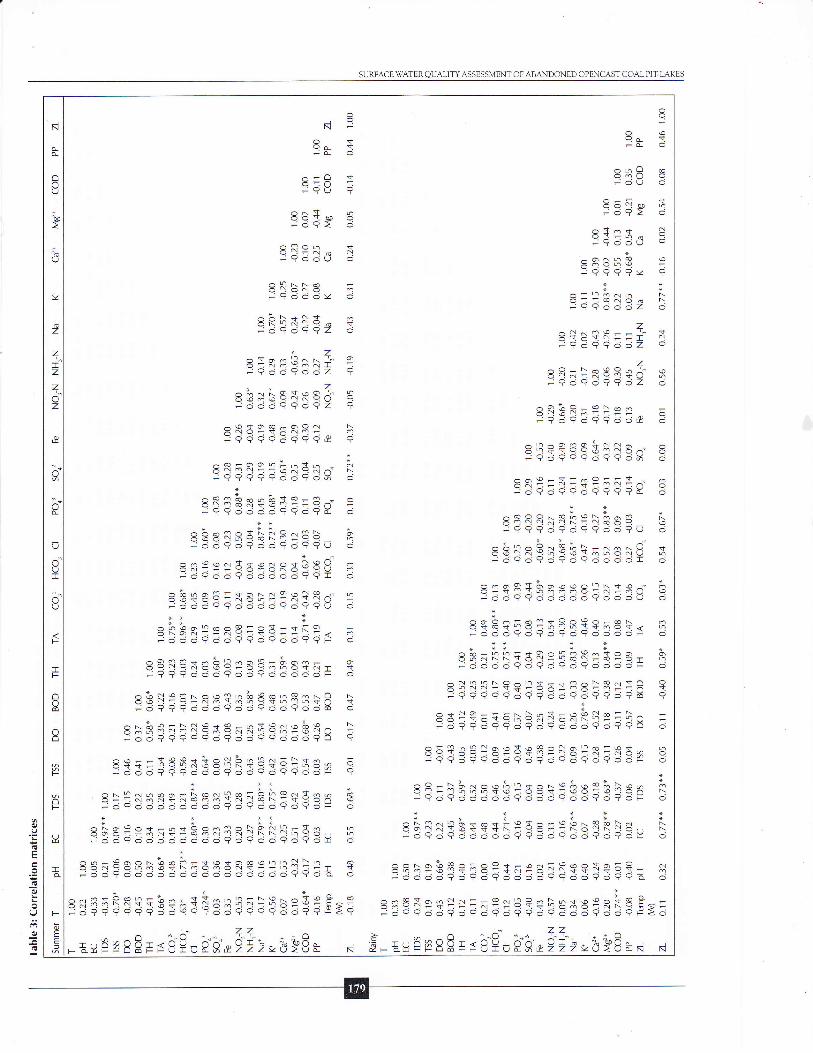
Seasonal correlation of water quality parameters
The seasonal correlation between different water qualityparameters was recorded in Table 3. ln general, watertemperature had relatively weak to fair correlation with mostof the parameters, i.e., less than 0.7 (absolute value) for entirefour seasons. These correlations were changed with a positiveincrease in correlation with COD (0.74) in rainy season aswell as a negative increase in correlation with DO G0.75) andNO3-N (-0.82).
pH showed very strong (absolute value ) 0.7) positivecorrelations with EC (0.74) and TDS (0.72) in post rainy season,and with HCO3 (0.73) in summer season. There was not sostrong correlation in rainy and winter seasons.
Very strong positive correlations between EC and otherparameters (TDS, CI-, Na*, K*, Mg2* and Zooplankton load)were found in different seasons. EC and TDS correlations were0.97, 0.97, 0.97 and 0.97, and EC and Cl' correlation were0.8, O.71, 0.74 and 0.87 in summer, rainy, post rainy andwinter seasons respectively. Along with these, correlationsbetween EC and Na*, and EC and K* were respectively 0.79and 0.72 in summer; correlations between EC and Na*, EC
and Mg2*, and EC and zooplankton load were respectively0.76, O.7B and 0.77 in rainy season; and correlations betweenEC and zooplankton load was 0.82 in post rainy season.
Correlation data showed that TDS had very strong positivecorrelations with Cl-(0.87), Na. (0.80) and K. (0.75) in summerseason and with zooplankton Ioad (0.79) in post rainy season.ln winter season, very strong correlations were observed withCl (0.85) and zooplankton load (0.71).
DO showed very strong positive correlation with NOr-N (0.71)in post rainy season and with K. (0.78) in rainy season andstrong negative correlation with NH3-N (-0,7a)in winter season.Relatively weak to fair correlations were observed betweenDO and other parameters in summer season.
Total Hardness (TH) showed very strong positive correlationwith HCO,' (0.75), Cl'(0.75), Na* (0.83) and Mg,. (0.84) inrainy season and in winter season only with Mg (0.78). lnsummer and post rainy seasons, it did not show any strongcorrelation.
ln summer season, total alkalinity (TA) had very strong positive
SURFACE \UATER QUALITY ASSESSMENT OF ABANDONED OPENCAST COAL PIT,LAKES
oq
OAQu <:-L O
^6Nh@ @
Yrrr: :
o-hdN6 N6II@NO d N-9Qdddz o
z.jQd?gooz ?
z5.1N-&q"1+O 6-?d?aq?oz d
-ioYoY:oo!I o
^h^6ooLrr^;?O??VOY?O- O
aNhhNo^r9-+-^N@^,t^ oj?????oY?oo?oYYOYo Y
E$:iE^E?h^DnIaXeI::Iq ;_OYVO.?YOYOYOOOYOYYU O
BB h s h E e a s ? + x s B r E 3 ? N s E q- il-cjcjdoqoq o9oood?? o o ? o ? ?-o o
8sq{P+l:isE: €?+hsssEakq F.=.j dq q od9o9oqo??d q do o ? oo ?tj > o
O,ON-
oN
?
cq:rp-OY2
LL
ooU
"So
aaO-$-6OF-$ -6\-:-1:s':^11-al d.jd?o??o?Q??E o
^OOOx@nOxl,o91 i5'111N1N':.1@6q '(j.j???d?o9?oo?O o
ob!-ro?r*L\-r-xQ $o@tlNY6:o\.-6o1u n-io?o?o?o?ooodr o
8:+i{nrge8:\rso i-do??ooooo?ooo. o
oo6-=@-+Qo9o-oxo$@$"1 O!:h('t n\.$-O$/ 6'_odoQo?o?o?odoo; o
r-+q^Lr-e-$OO O6JirxN=td^1=i"q1 .e .Qr j:,idodd9oqd?oocidoo= d
sEEB€lssEsfreNaIsiRs* Bj?9o??oo?o?dQo9o9odl d
s3=hhaashqss+EhsEhnsn hj?oooodooqcidoqooqo?dtr d
aLnrEb+++*eE8i{Pbryk\s, Rjdq dQdciddd ?q dd a d d ? d ?oE o
sble6>asTshsssq;58- d ? q ? d d ct ? ci d Q o o ?ci d 6
ooQq'! u
.je.i.itJ
F- e, E p s H E s I 9. tt,.??vu t: Y0 r <
o!lNN@ Fo.l o N o -
O N "lN ) Y 6 $-.iQciQQZ d
8iR3et\r iFYOOlOOZ Y
zO O 6 @ Y'] d Y U YFOOO?9O?Z Y
sbsilseLlE:Qb s.jdo?d?dd?d??O o
ooeorAsororlQQ -On----.OtO1O:iU -jci?ooiodddd??r o
N
oN
A-^:-h-N1o-6 ,:*8:.hR-5AH1)t:l?n?r^,-oo?Q??"oeoo?adcid?o
-oF-{99+!o"f bnPrI\r- - =5+ + i-'1an ir S6u1n $--?r Y -hoLa v: ddoC C ? odd?dcj ?d??dol ?
I > q R q K $ { u S q e t 1s R i +$ S n bj d ? d d d d d o o d C o ? o o ? o ? o tr o
osYL
^-o +5r- .:
ON] 6oo\.@ o
olloh s
^o+o@-6oN NxNO-s;iN-FYYYYOVYYE -f
^@-ooo)^,^s,^ :.:+e+ee;ii"JB i
O:-!@@h@:!w-^ . OY: ]:': \. : A: : UFYYOOOOYYOYL O
ob--l:<-oxsgoJP^- hoo<oY:NOro:1\,:l()-dcid??ooddid??i] o
8R3Ri=S8:?3=:Ii- ;:ooo?oo??o?dd'??- o
oq:1as-6n-oP-b'--- o-Y('jYNOoq-OY-6O$NT s-qqQodo?oo?ooocjd= d
sLs€3s&+:hsnnR\hln;Es, fl-oo?oodoodddqo9oo9oidE d
on-gooxlo-L-oeYo@omrf \n o-oNYOh-O$N*O-C)N$--h :lFT $-dd?dooddooooodooooq?oA d
s r I I E ry ! I 3 + I ^+ * e n ^n I ^: ^E E ? I i t: i-o??????dd99fooC???oo??F:"
^ - - 4<-=.sFP8H=sgV" ?.9,ti22-J g0& s
FoEE=
zrzzoz
e
d
cL
U
oUI
OJU
l!E
o
Ucv')
{J
F

SANDIPAN PAL et ai.
;oEo
oEo;IOEc6Eo:cOo
c
cI'-@
.9CoEE
g.9E.g
!c
Oq
N
o
qo
ect?N
oo
o
o$,)@-6
-OYOOOZ
z^toN--^,-5.'iqqr).15r":??gq?oz
zo9ornr-xl-O':--oooo(J-?ooaaaoz
N
o
Io
N..jo
+
oN
"oao
.1O
qO
No
oIo
oQo
^mOX6^io-
oxPc..jf€e-OYz
oilN6
-YOOU
ooo€9q"1 nn:--OOOYY
o,ON-
3& 3a=Q \
F@ 6IN M OYoe o
YOU O
ci?v e
^@HQ o NaqZ o
Oq
^No'l
-?a6Oo \.'),j?Q
O O - O'l
\.ooh\.OAAAO
d?o?d
]66NI\. O F N']Qdoo?
ONOI:NF o N'l-AAAQA
b6r'I'1::AOO
^,N-aO:rdr&ryc,d?d?
$9€N€FYCF6o?ooo'
-il*ol^-
6.:":ahoQQoci
Q.1+i;+YY?OO
HN=EoQcjQoo
9&oSo
q 6 N:]Nq o o'l 6
NON':-ooo?o
zIhYN"]zoaal
z r,J>
q?
o+
od
hOA Nddi6 d
d9E a
?OU O
€Ld $vou $
R:;' P-.':v Y
..IA N
O
No
shqBlSebPxq+38.jd?o?cidcjoo?ood
skRss{€sN>t?=si-oood??oQoo?ooq
otrcN6S\.1 .lOO
o(JL
sPEqsi$?rsLxss\q-oYYoYYYOOOOOOOY
^ -; 4-
-r-HEr8H=sgYoPg=e?
z.1.1oqqz
zOFIaaZ
x!!dQE
n@oQA
oq
^6
osoQOONY]AAO
5.?"-+c'j
^6 ^60^ o*6Xt:N-iimAN aj?o??o?o?fg qe
EI?h1Irl?is \-oYoyooyYo(- cj
^*+$+r,.aV@NX:i1;,).,v;+-<:^"-OYYOYOOYYOL -O
oo-!-rl.lx=1N€o-'lwo$n-$:Y:--o- :u-OOOOYY-/OOOOY;
853:qsidsiiSlS-'-OOYYOYYOYYO.?OJ
abilsBss=Esis8=r--ooo9oo?qdeo?ooa
on-6---n=\st-oo?O-ONNOO I:\.ON$N6 ]T-ooocicid???oodooQ-
oN.
od
L!dN
?d?
n.:.:aee
o\lbxFYO6:OAA
666-1
zz>r)t
5^!c! 5.1 :b5n+ij-.jQQciQodd?dd?O
s
mxO @
6N- =VYU O
8ff8=B$'.o?od?
3$;$E:=1"
3=35i33soooool'!9oxo++mo": roo--dddciaQddi
ehn=s\ei:S-oodoqcj9oQ
^N-AFh^@+F-5-iia.:tX.lS':i\-?dQQ?d9?90
^hAO---R -N*nE-u1.tqqq,:qrdrR.j???99?d9Qo?
o:l69lo+++6wN6N-:]F:]ooooa.':+N--?d?ociocro?ddo
o€No^ 51x+155:n^iX-nqRcpi 6-?oooodoo?o9??q?oE
EiEsxs{i^qEl{?rEqE50833RiasSRsefr3\Es3i3,j ddd ood odcidq o ?q ddq oi-
85+>sBilLhqqaiei;lxsEn-OOOOOOooYYovOOO YOoYF
oi. - *6@6-il o- N - + -x P ooQO C - N --6h\O@ - - O.-] ; hN - 1 - V,,-doooooddddodaddd ?doCts
.101dQ?d
Y-O
EYs
NA
-O^F-O^+:6XV:,*XO
Ej.'1.:;j.1a,+uloQ?o?9o?
!Q,-aH- -n'Y!6YUJ<V=
ao
qO
oo-ONJA
I
EU
0)
SURFACE \flATERQUALITY ASSESSMENT OF ABANDONED OPENCAST COAL PIT:LAKES
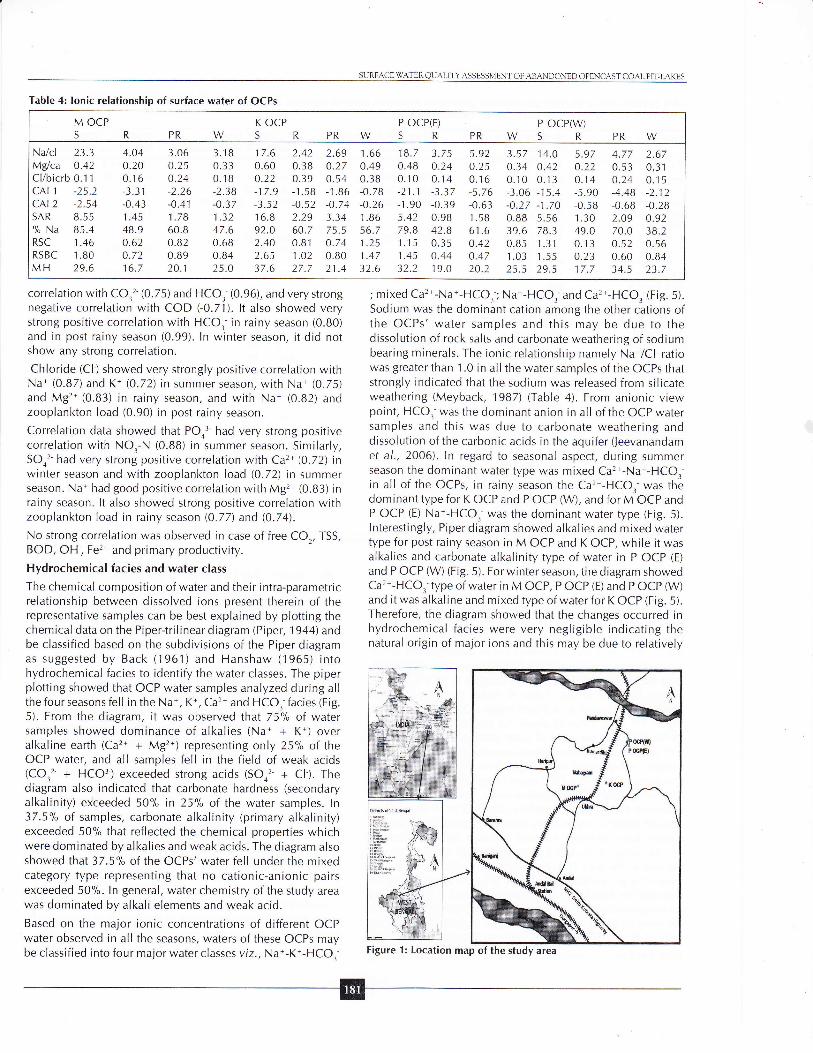
Table 4: Ionic relationship of surface water of OCPs
M OCPSR
Na/cl 23.3 4.O4Mg/ca 0.42 0.20Cllbicrb 0.1 'l 0. 1 6
cAt 1 -25.2 -3.31c{l 2 -2.54 -O.43
sAR 8.55 1.45% Na 85.4 48.9RSC 1.46 0.62RSBC 1.80 0.72M H 29.6 16.7
PRW3.06 3.180.2s 0.330.24 0.1 8-2.26 -2.38-0.41 -0.371.78 1 .3260.8 47.60.82 0.680.89 0.8420.1 25.O
K OCPSR17.6 2.420.60 0.380.22 0.39-17 .9 -1 .58-3.52 -0.5216.8 2.2992.O 60.72.40 0.812.65 1.0237.6 27.7
PRW2.69 1.660.27 0.490.54 0.38-1 .86 -O.78-0.74 -O.26
3.34 1.8675.5 56.70.74 1.250.80 1.4721 .4 32.6
18.7 3 .7 5
0.48 0.240.10 0.14-21 .1 -3.37-1.90 -0.395.42 0.9879.8 42.81 .1 5 0.351.45 0.4432.2 19.0
PRWS5.92 3.57 14.O
o.25 0.34 0.420.16 0.10 0.13-5.76 -3.06 -15.4-0.63 -O.27 -1 .701.58 0.88 s.5661 .6 39 .6 78.30.42 0.85 r.310.47 1.03 1.5520.2 25.s 29,5
RPRW5.97 4.77 2.670.22 0.53 0.31o.14 0.24 0. 1 5
-5.90 -4.48 -2.12-0.58 -0.68 -0.28'l .30 2.09 0.9249.0 70.O 38.20.13 0.52 0.56o.23 0.60 0.8417.7 34.5 23.7
P OCP(E)CD
P OCP(W)
correlation with CO32-(0.75) and HCO3-(0.96), and very strongnegative correlation with COD (-0.71). lt also showed verystrong positive correlation with HCO,- in rainy season (0.80)and in post rainy season (0.99). ln winter season, it did notshow any strong correlation.
Chloride (Cl ) showed very strongly positive correlation withNa. (0.87) and K* (0.72) in summer season, with Na. (0.75)and Mg'7* (0.83) in rainy season, and with Na. (0.82) andzooplankton load (0.90) in post rainy season.
Correlation data showed that POo3' had very strong positivecorrelation with NOr-N (0.88) in summer season. Similarly,SO,2 had very strong positive correlation with Ca2* (0.72) inwinter season and with zooplankton load (0.72) in summerseason. Na* had good positive correlation with Mg2* (0.83) inrainy season. lt also showed strong positive correlation withzooplankton load in rainy season (0.77) and (0.74.No strong correlation was observed in case of free COr, TSS,
BOD, OH-, Fe2* and primary productivity.
Hydrochemical facies and water class
The chemical composition of water and their intra-parametricrelationship between dissolved ions present therein of therepresentative samples can be best explained by plotting thechemical data on the Pipertrilinear diagram (Piper, 1 944) andbe classified based on the subdivisions of the Piper diagramas suggested by Back (1961) and Hanshaw (1965) intohydrochemical facies to identify the water classes. The piperplotting showed that OCP water samples analyzed during allthe four seasons fell in the Na*, K*, Ca2* and HCOr- facies (Fig.
5). From the diagram, it was observed that 75ik of watersamples showed dominance of alkalies (Na* + K*) overalkaline earth (Ca2* + Mg2*) representing only 25% of theOCP water, and all samples fell in the field of weak acids(COr2' + HCO3) exceeded strong acids (SOrl + Cl-). Thediagram also indicated that carbonate hardness (secondaryalkalinity) exceeded 50% in 25"1. of the water samples. ln37.5'k of samples, carbonate alkalinity (primary alkalinity)exceeded 50% that reflected the chemical properties whichwere dominated by alkalies and weak acids. The diagram alsoshowed that 37.5% of the OCPs' water fell under the mixedcategory type representing that no cationic-anionic pairsexceeded 50%. In general, water chemistry of the study areawas dominated by alkali elements and weak acid.
Based on the major ionic concentrations of different OCPwater observed in all the seasons, waters of these OCPs maybe classified into four major water classes vlz., Na*-K*-HCOr'
; mixed Ca2*-Na*-HCOr-; Na.-HCOr'and Car*-HCO, (FiS. 5).Sodium was the dominant cation among the other cations ofthe OCPs'water samples and this may be due to thedissolution of rock salts and carbonate weathering of sodiumbearing minerals. The ionic relationship namely Na*/CI' ratiowas Breater than 1.0 in all the water samples of the OCPs thatstrongly indicated that the sodium was released from silicateweathering (Meyback, 1987) (Table 4). From anionic viewpoint, HCO,'was the dominant anion in all of the OCP watersamples and this was due to carbonate weathering anddissolution of the carbonic acids in the aquifer fleevanandamet al., 2006). ln regard to seasonal aspect, during summerseason the dominant water type was mixed Ca2*-Na*-HCO3-in all of the OCPs, in rainy season the Ca2*-HCO3-was thedominant type for K OCP and P OCP (W), and for M OCP andP OCP (E) Na.-HCO, was the dominant water type (Fig. 5).lnterestingly, Piper diagram showed alkalies and mixed watertype for post rainy season in M OCP and K OCP, while it wasalkalies and carbonate alkalinity type of water in P OCP (E)
and P OCP (W) (Fig. 5). For winter season, the diagram showedCa'?--HCO,'type of water in M OCP, P OCP (E) and P OCP (W)and it was alkaline and mixed type of water for K OCP (Fig. 5).Therefore, the diagram showed that the changes occurred inhydrochemical facies were very negligible indicating thenatural origin of major ions and this may be due to relatively
wA.*)*.. N
'.a;i:#:il;*M
."",I]'
Figure 1: Location map

SANDIPAN PAL et ai.
Table 5: Evaluation of physical and chemical parameters of surface water ofthe study area for drinking and aquaculture purposes [based onWHO (1997), lS 10500 (1995) and lS 13891 (1994) standardsl
Parameters
Trc)pH
EC (pS cm-l)F CO, (mg L-1)
TSS (mg L-l)
TDS (mg L1)
DO (mg L-1)
BOD (mg/ Lr)TA (mg L'r)
OH- (mg Lr)COrL (mg L'])
HCO, (mg Lr)Cl- (mg L't;TH (mg L'1)
Car. (mg L.r)
Mg'?. (mg L-r)
51u* 1mg L_r)
K+ (mg L-1)
Fe (mg Lr)POrl (mg L'1)
SO,l (mg/l)
NHr-N (mg L-l)
NO,-N (mg L-1)
COD (mg L'1)
PP(mgCm3hrr)ZL (U 1.1)
Pb (mg Li)Cd (mg Lr)Cr (mg L1)
Water of OCPs(in Range)
2o.o - 34n8.'10 - 9.40
200 - 390ND - 2.201 1.0 - 33.0120 - 2705.64 - 9.320.20 - 2.o244.0 - 210NDND - 14.448.8 - 2402.00 - 35.028.0 - 1301 .60 - 27.31.94 - 19.41 1.3 - 3302.01 - 42.40.01 - 1.000.001 - 0.102.52 - 30.80.00s - 0.920.01 - 0.979.60 - 25.4150 - 6102.00 - 6.000.009 - 0.1410.001 - 0.076ND - 0.036ND
WHO (1997) DrinkingWater Standard
7.00 - 8.50 (HD),6.50 - 9.20 (MP)
250 - 1500
ioo - , ooo
lS 10500 : 1995Drinking Water Standard
7.00 - 8.s0 (HD),6.50 - 9.20 (MP)
s00 (HD), 2000 (MP)
ioo - ,ooo5.00 (D)
200 - 600
600 (D)
250 - 1000300 - 60075.O - 20030.0 - .t
00
0.30 - 1.00
200 - 400
lS 13891 : 1994Aquaculture Standard
2n0 - 35"06.50 - 8.50
12 (MP)
4.00 (MR)
100 - 300
2.00 (MP)
1.50 (MP)
2.00 (MP)
300 (D)
250 - 500150 - 50075.0 - 20050.0 - 150120 - 40012.0(D)0.30 - 1.00
200 - 400
',0.0 - ou.o
0.010.0030.050.01
0.050.010.050.0sAs (me L'1)
HD : Highlydesirable, MP : Maximum permissible, D : Desirable, MR : Minimum required, ND : Notdetectable
slight insolubility of the igneous rock compassing during thewaterflow.
The Mg'?./Ca2*, Cl-lHCO3' ratio was analyzed to know thesalinity of the water of the OCPs along with origin; andchloroalkaline index (CAl-1 and CAI-2) of Schoeller (1965,1967, 1977) was also calculated for an interpretation of theion-exchange reaction occurred in the area. The Mg2*/Ca':*ratio values of all the OCP water samples in all the seasons
ranged from 0.2 to 0.6 (Table 4) which was less than '1 .0indicating that water is of inland origin as marine water haveMgz+/quz+ ratio value of about 5.0 (Sarma and Krishnaiah,1976). CI|HCO, values of all water samples were varied from0.01 to 0.54 and all these values prevailed in the inland watercategory value which was ranged from 0.1 to 5.0 (Table 4)
and again support that OCP water samples is of inland origin(Custodio, 1987). Chloroalkaline index, both CAI-1 and CAI-2 showed that all water samples of the OCP in all the seasonsshowed negative index ratios which indicating that they hadindirect base exchange reaction meaning that there was noion exchange of Na and K from water with magnesium andcalcium in the rock (Table 4). Schoeller index revealed thation-exchange reaction of the study area were predominantlyregulated by Base Exchange reactions instead ofcation-anionexchanBe reactions. Higher the HCOr'values than alkali-earthelements in all the water samples also suggested that waterswere of base exchange-hardened type (Handa, 1 969).
Total hardness classification scheme of Sawyer and Mccarty
(.1 967) showed that 75% of the water samples were soft andremaining 25% samples were moderately hard. On the basisof total dissolved solids content in water, Todd (1980) classifiedwater into different categories such as fresh, saline, brackish,brine water etc., and water of the present study area areconsidered as freshwater because of its TDS value i.e., less
than 1000 mg L'].
Mechanism of controlling water chemistry
The mechanism of controlling surface water chemistry in
regard to dissolved ions present in water as evaporation-crystallization dominance, rock-weathering dominance andatmospheric-precipitation dominance can be understood byCibbs' plotting of log TDS vs. Na*/(Na* + Ca2*) and log TDSvs. CI/(Cl + HCO.-) ratio scatterdiagram (Cibbs, 1970). TheCibbs' plot (Fig. 6) both cationic and anionic indices markedthat all surface water samples of all OCPs in all the seasons fellin the rock-weathering dominance area and this rockdominance was caused due to interaction between the aquiferrocks and water. The diagrams also depicted that carbonateweathering of the rock was the main dominant process whichcontributed to the ions into the waterthan silicate weathering.ln general, chemical composition of the surface water is
controlled by climate of the area, geomorphology and natureof the parental rocks prevailing in the area, and waters weredominated by sodium and bicarbonate as dominant ions.
lrrigation water quality
SURFACE \X,'ATER QUALiTY ASSESSMENT OF ABANDONED OPENCAST COAL PI}LAKES
-r- KOCPP OCP (W)
35.0
33.0Uo 31.0cLonZ zz.o
= 25.0
H 23.0p zr.ooF 19.0
17.0
15.0
+MOCP,I P OCP (E)
9.5
9.0
8.5:Ca
8.0
7.5
7.O
b
300
250
- 200J@
€ tsooF 100
50
0
30
25
20
15
'10
5
o
.I. I*-{ -r'. r'.1'-t-r*a /\,)€* Y /'\'-a=r=-f,
):i )l
450
E +oo
6 350
! :oo'! zso-E 20o
-? rso.3 tooEo500
0
+ MOCP'T- KOCP.' POCP (E)
POCP(W)
. MOCP*r-KOCP;, POCP(E)
P OCP (W)
--r-MOCP-r-KOCP,;, POCP (E)
P OCP &V)
--.-MOCP.I-KOCP.i. POCP(E)
POCP
0^4
-i- MOCP-r- KOCP
,;. POCP(E)
P OCP (W)
. MOCP
{_ KOCP
,;, POCP(E)
P OCP (W)
--.- MOCP-r- KOCP-,i'POCP(E)'. .POCP(W)
35
30
25
,20@
5 t5
Pro5
0
10
98
76
2.0
-! l5@
E,o 1.0
oo0.5
mE
ooU
Session Session
Session
Figure 2: Seasonal analysis of a) water temperature, b) pH, c) EC, d) TDS, e) TSS, f) DO, g) BOD and h) COD of surface water of OCPs
SANDIPAN PAL et al.,
140
- 120J
10 100E
i' aoocE60EE40o-20
0
'140
120
100
iBo@
960a4uC
E820tEo,o-
--._MOCP-T_ KOCP
,,:, POCP(E)POCP(W)
.*. MOCP
.{* KOCP,,, POCP(E)
POCP (W)
.._MOCP-,T*KOCP-,:'- POCP(E)
P OCP (W)
--.-MOCP-r-KOCP
,r. POCP(E)
P OCP (W)
--+-MOCP.I* KOCP
:;, POCP(E)POCP(W)
+MOCP.I* KOCP
,r.- P OCP (E)
P OCP (W)
+MocP+ rocp",r-POCP(E)
POCP(W)
MOCP*KocP.,,
PoCP(E). POCP(W)
^20ac
Ef'E
roE@d>s
0
b
350
300
i 2s0uEzootr
= 1505o6 100
50
0
25045
40
^35-* ,oFe25E." 20
* t0
5
0
8
7
jb@
€4cOl6O2
1
0
,2oomE
E rso,E
-* roo
E.! 1t,
oEE=
)elo
2005
>lh
:20O!@C5 150gC
! roo
.9t50
0
o.=
I
200
C
t
oL
5
oL
Sssion
E.e
lola
2005
-'6u
2
t:t3lL
005
o.E
Session
cE
I7
i l> > i
E lP E r!60 ]L
Figure 3: Seasonal analysis of a) total hardness, b) Ca2*, c) Mg2*, d) Na*, e) K*, f) total alkalinity, g) CO.'z- and h) HCO.-of surface water of OCPs
SURFACE WATER QUALITY ASSESSMENT OF ABANDONED OPENCAST COAL PIT-LAKES
40
35
i30m__
fro,Co 15
cuto5
0
-;o.oao€o 0.060
!
$o.o+oL
0.020
0.000
.t.00
i o.eogo 0.80C
; 0.70
8o 0.60
.E o.so
i o.+o
: o.3o
I o.zo
! o.ro0.00
: 7oo
-e 600C-U
SOOutre 400
't :oo=: 2ooa. 100tr'=o
d-
+MocP.T-KOCP
,1' POCP(E)POCP(W)
"-.- MOCP.} KOCP
r POCP(E)
POCP(W)
--}MOCP-r- KOCP,,, PoCP(E)
POCPW)
-.-MOCP*3-KOCP. .; P OCP (E)
P OCP (W)
X .;:'
,iilr ' :;l:l'
-.-MOCP'*,"KOCP, ,,,, - P OCP (E)
P OCP 0,^/)
...MOCP-r- KOCP
,,i. POCP(E)
POCP(W)
-+-MOCP_I_KOCP
- lir"P OCP (E)
,,POCP(VV)
-._MOCP-T- KOCP
r POCP(E), POCP(w)
1.20
^ 1.00-!Po 0.80
! o.u,
I o.+oF
b
35
30
t "sc)oE,,so=10
5
0
1.20
I 1.oomFe 0.80ComI 0.60cd o.+osz o.2o
0.00
0.20
0.00
0.1 20
0.'100
7
6
!_m5€a4c
!-d
1
0
|.'/rl// \*("2
200s 2006 I zoot I 200s I 2006 ) 2007c ---- " ,__ ho Session " Session
Figure 4: Seasonal analysis of a) Cl, b) total iron, c) POo2-, d) SOn'-, e) ammoniacal-nitrogen, f) nitrate-nitrogen, g) primary productivity and h)
zooplankton load of surface water of OCPs
\
C
!
oL
Session
:-1olql
=i
t-;T-;llctcltSlElI tolJr"l2007
I;:;i E
lE g S,1t j
2006 l
Session
-t-o.a
)2
I
.9ca
o.q

SANDIPAN PAL et al..
I & W&&* I 80i!'* 6
..:.......;:.,....\1. .. tr 8 *o s . -8 so\^| .o.
.a" - to,,, s,!' T. aL
S''B 40 * -' .e 40{ &c
X€t""""o s_ooooo ooeoCa' 20 44 6 80 L *a m 40 so !o CI
Ca[ois " Aniong
Figure 5: Piper-trilinear diagram for major ion analyses of surfacewater samples from the study area (Piper, 1944)
Evaluation of water quality of the study area was done todetermine its suitability for agricultural purposes. Water is theprimary requirement for crop irrigation and their growth interms of productivity for getting optimum yield. Cenerally,factors such as salinity, sodicity and toxicity are consider forevaluating the suitability of OCP water for irrigation purposes(Todd, 1980; Shainberg and Oster, 1976). Parameters suchas electrical conductivity (EC), total dissolved solids (TDS),
sodium adsorption ratio (SAR), percent sodium (% Na), residualsodium carbonate (RSC), residual sodium bicarbonate (RSBC),
and magnesium hazard (MH) were generally considered toassess the suitability of water for irrigation purposes in thepresent study. Electrical conductivity values of all the OCPwater samples in all seasons varied from 230 to 380 gSlcmwith 25% samples in an excellent category (Cl) and theremaining 75% samples were under in the good category (C2)
indicating that water was suitable for irrigation purposes. Theincreased value of TDS affects the soil efficiency and growth,and yield of plants that should not exceed 2000 mg L-] forlong term irrigation conditions, ranged between 140 and 240mg L-rwith a mean of 190 mg L'r. The highestTDS value of210 mg L-l was recorded in the summer season and minimumvalue of 170 mg L-l was observed in post rainy season. Hence,all the samples were generally less than 1000 mg L'l and arefalling under the best water quality category and can be
considered as suitable for irrigation. Sodium adsorption ratioplays a vital role in soil physical structure and its permeabilitycan be calculated according to the formula proposed by Karlaand Maynard (1991) in terms of alkali hazard. The SARvaluesof al I the water samples in al I seasons varied from 0.BB to I 6.8
and 93.8% samples fell in S1 cateSory and remaining 6.2"ksamples in the S2 category representing excellent and goodcategory respectively.
Percent sodium, an important factor to study sodium hazardmay stunt the plant growth and reduces the permeability dueto high sodium content (Joshi et a|.,2009). Water samples ofthe study area were classed as good (20.0 - 40.0% Na),permissible (40.0 - 60.0% Na), doubtful (60.0 - 80.0% Na)and unsuitable category (80.0 - 100% Na). Percent sodiumvalues ranged from38.2 1o92.0. Here, mostof the samples ofwater falling under the doubtful (43.8"L) and permissible(3 1 .2"1") category wh i le two samples (1 2.5"1.) were under goodcategory and remaining 12.5ok sample fell in unsuitablecategory but no representation in excellent category. Highcontent of sodium in the water tend to be absorbed by clayparticles, displacing magnesium and calcium ions causingdeflocculating and impairing the soil permeability (Singh etal.,2O0B).
Residual sodium carbonate is considered as bicarbonatecontent of water and increase of it leads to precipitation ofcalcium and magnesium ions which ultimately resulting in anincreased amount of sodium content in the soil. Based onEaton's classification, water having RSC was calculatedaccord ing to the formu la of Eaton ( 1 950) and Raghunath (1 987)greater than +2.50 meq L-] was considered as unsuitable forirrigation, RSC of + l.25 to +2.50 meq L'] was considered as
marginal and a value less than +1.25 meq L'l was safe forirrigation purpose. The RSC value of the study area rangedfrom 0.131o 2.40 meq L'1, and most of the water samples(approximately 75"1") were under the good category and safe
for irrigation, and only 25% samples exceeded the value of1.25 meq L-l but below 2.50 meq L-l indicating that water wasmoderately suitable for irrigation purposes. High content ofbicarbonate in the water caused to high pH and ultimatelyresulted into dissolution of organic matter which made theland infertile by affecting the uptake of mineral nutrients ofplants. The residual sodium bicarbonate values of all OCPwaters in all seasons varied from 0.23 to 2.65 meq L'r and allsamples were less than 5.0 meq L'r indicating that they weresafe for irrigation purposes according to the criteria set byCupta and Cupta {1987).
Magnesium adsorption ratio or simply magnesium hazard, animportant parameter for evaluating the suitability of water forirrigation purpose was analyzed by the formula proposed bySzabolcs and Darab (.l964) and was considered as a basis ofirrigation water quality rating. The magnesium adsorption ratioof the OCP waters in present study varied from 16.7 to 37.6okindicating that they were below the acceptable limit of 50%and were suitable for irrigation and not harmful due tomaintenance of a state of balance between calcium andmagnesium to the irrigated crops grown in the fields.
Drinking and domestic water quality
Surface water quality of the OCPs was compared with thedifferent standards of WHO (1997) and lS 10500 (1995) toevaluate the suitability for drinking and domestic uses (Table
5). All the considered water quality parameters except pHwere below the permissible limit. pH values in l0% casesexceeded only in summer season as compared to thepermissible limit recommended by WHO (1997) and lS 10500
mE Eqa60aov-hF I -
I!1E8mr"rFr
S.al6offtanttst q &
80' ,... ,. l|
t.sv
-i |-U*
81et ,"' , .,.' ', .,'
I Summer
I nainy
I Postrainy
I winter
fiuoceSn Orocp
', ,'aoar,r,v4
$ ;l '; PocP (w)
s0"^tb"

SURFACE I(/ATER QUALITY ASSESSMENT OF ABANDONED OPENCAST COAL PIT.LAKES
Nal(Na'+Ca")
fsr..u,f nuiny p eost rain{ winter
L, M ocP u K ocPJ P ocP (EI,,..rP ocP (w)
Cl'licliHCo,)
Figure 6: Cibbs diagram showing the controlling mechanism ofsurface water quality, a, cationic b. anionic (Cibbs, 1970)
(l995). Electrical conductivity of all the samples depicted lowerconcentration than the maximum permissible Iimit of WHO(1997) and lS 10500 (1995). TDS, HCO3-, Cl-, total hardness,Ca2*, Mg2* and POo3-values of all the samples were below thedesirable limit. DO of all water samples were found above thedesirable limit of lS 10500 (1995), only 3% sample (here onesample only) showed the value of total alkalinity within thedesirable limit of I5 10500 (1995), others were below thedesirable Iimit. ln case of sodium concentration , 19ok o{samples contained desirable concentration recommended byWHO (1997), olher samples contained Iower amount ofsodium. Here, 33% of water samples showed potassiumconcentration was above the desirable limit of WHO (1997).
Some samples showed higher concentrations of lead andcadmium, but chromium and arsenic concentrations werelowerthan the permissible limit of WHO (1997) and l5 10500(1995). Based on this comparison, it can be suggested thatwater of this OCPs are su itable for drinking purpose consideringa minimum treatment. Here, according to TDS concentration,water was classified into four classes: fresh (< 1,000 mg L'l),brackish ('l ,000 - 10,000 mg L''), saline (10,000 - 100,000mg L-r) and brine (> 100,000 m8 L'r) (Carroll,1962). Samplesof these OCPs were fresh water in nature. Sawyer and McCarty(1967) classified the water as soft (< 75 mg L1), moderatelyhard (75.0 - 150 mg L'1), hard (150 - 300 mg L-l) and very hard(>300 mg L''). ln case of OCPs water, total hardness datainferred that 39% of the samples were soft, and others weremoderately soft in nature. Concentrations of metals were belowthe permissible limit recommended by WHO (1997) and lS
10s00 (.r99s).
Aquaculture uses
Considering the suitability of water for aquaculture, theparameters of OCP water were compared with lS 1 3891 (1994)
standard (Table 5) and it revealed that except pH of somesamples, concentrations of all the parameters were under lowervalues than the prescribed maximum permissible limit. This
indicated that the water of these OCPs is suitable foraq uacu ltu re.
Primary productivity of an aquatic ecosystem is the estimationof net yield of new biomass during a specific time byphotosynthesizers which are present at the base line of a foodchain in an ecosystem. lt indicates the phytoplanktonicpopulation and ecological condition of an aquatic ecosystemindirectly. ln an aquatic ecosystem zooplankton communityform an important link in the food chain from primary to tertiarylevels. Fish production is also dependent on zooplanktonIoad. Diversity and number of zooplankton indicated the waterquality and ecological status of this water body. Values ofprimary productivity were in the range of 150 to 610 mg Cm'3 hr1 (average 310 + 110 mg C mr hr'); higher productivityvalues were observed during the post rainy seasons (Fig. a.g).Zooplanktonic Ioad in OCP water was found in the range of2.0 to 6.0 U L'l (average 4.0 t 1.0 U L-l); comparatively higherzooplankton load was observed during the rainy seasons (Fig.
4.h). Several workers (Canton and Ward, 1981; Canton ,1982;Slusarczyk, 2003; Kosik et al., 201 1) reported about the less
abundance of the zooplankton load in mine pit-lake.
CONCLUSION :: :,, rr:::,
Detailed seasonal study for the consecutive three yearsrevealed that surface water quality of these abandoned OCPsin Raniganj Coalfield area is alkaline, soft to moderately hardand fresh in nature. Most of the water parameters varyseasonally. Water is of inland origin, and mostly dominatedby Na* and HCOr-. Both the cationic and anionic inciicesindicate that rock-weathering is prevalent in this area.Limnological analysis of the different ions, metallicconcentrations and other parameters indicate suitability fordrinking, irrigation and aquaculture purposes after anapplication of appropriate management practices. It isconcluded that the OCP-lakes, can be considered as thepotential water reservoirs and its above mentioned uses canboost up the socio-economic condition of the core group ofpeople, in and around the RCF mine regions, as well as othermine areas of international importance.
ACKNowtEDGEMENT-.:,.::..:,;i:l:;::1:1::;i{;:f{ff#W
This research work was funded by University CrantsCommission (UCC) and Eastern Coalfields Ltd. (ECL) given thenecessary permission to do this field work. Authors wouldlike to acknowledge the Department of Environmental Science,The University of Burdwan, lndia for providing the laboratoryfacilities during this research.
APHA, AWWA and WEF .1998. Standard methods for the examinationof water and waste water. 20th ed. American Public Health Association,Washington.
Back, W. 't961. Techniques for mapping of hydrochemical facies.USCS Prof Pap. 424D:380-382.
Canton, S. P. 1982, Comparative limnology and biota of mine spoilsponds in Colorado. Southwest Nat.27(1): 33-42.
Canton, S. P. and Ward, J. V. 1 981 . Benthos and zooplankton of coalstrip mine ponds in the mountains of northwestern Colorado, U.S.A.
10i0
,ants
10,

SANDIPAN PAL et al.,
Hydrobiologia. 85(1): 2331.
Carroll, D. 1962. Rainwater as a chemical agent of geological processes-
a review. USCS water supply paper/ Washington DC, USA.1535-G.
Custodio, E.1987. Croundwater problems in coastal areas. ln: Studiesand reports in hydrology. UNESCO, Paris.
Dhar, B. B. 1993. Environmental scenario in lndian mining industry.ln: Environmental Management, Ceo-Water and Engineering Aspects,R. N. Chowdhury and S. M. Shivkumar (Eds.). Balkema, Rotterdam.pp.615-619.
Eaton, F. M. 1950. Significance of carbonate in irrigation water. 5oi/Sci. 69(2): 123-133.
Ghosh, A. K. 1990. Mining in 2000 A.D. - challenges for India. /.lnst. Eng.39(ii): 1-l 1.
Ghosh, A. R. 2012. Coal mining and climate change: an environmentalvista. ln: Climate change-man and environment, C.K. Saha (Ed.).
Daya publishing house, New Delhi, pp. 56-64.
Chosh, A. R., Pal, S. and Mukherjee, A. K.2005. Sustainabilityopportunity for potential aquaculture in OCPS as a post-mining landuse for rural economic development in Raniganj Coalfield areas. ln:Recent advances in water resources development and management,D. Khare, S.K. Mishra, S.K. Tripathi, C. Chauhan and N. Sharma,(Eds.). Vol.'z. Allied Publishers, New Delhi, pp. 140-155.
Ghosh, S. K., Singh, T. P. N. and Tiwary, R. K. 1984. Quality of minewaters in Jharia coalfield. IAWPC TECH ANNUAL. Xl: 25-28.
Gibbs, R. l. 1970. Mechanism controlling world water chemistry.Science. 17: 1088-1090.
Gupta, S. K. and Cupta, l. C. 1987. Management of saline soils andwater. Oxford and IBH Publication Co, New Delhi. p. 399.
Handa, B. K. 1969. Description and classification of media for hydro-geochemical investigations. ln: Symposium on ground water studiesin arid and semiarid regions, Roorkee.
Hanshaw, B. B. 1965. Chemical geohydrology ln: Advances inhydroscience, Academic Press, New York.
lndian Standard 1994. Quality tolerances for freshwater for fishculture. lS I3891.
lndian Standard 1995. Drinking water specification. lS 10500.
Jeevanandam, M., Kannan, R., Srinivasalu, S. and Rammohan, V.2006. Hydrogeochemistry and groundwater quality assessment oflower part of the Ponnaiyar River Basin, Cuddalore district, Southlndia. Envlron Monit Assess. 132(1): 263-274.
foshi, D. M., Kumar, A. and Agrawal, N. 2009. Assessment of theirrigation water quality of River Canga in Haridwar District lndia. /.Chem.2(2): 285-292.
Kalra, Y. P. and Maynard, D, G. 1991. Methods manual for forestsoil and plant analysis. Information report NOR-X-319. ForestryCanada, Northwest Region, Northern Forestry Centte, Canada.
Kataria, H. C. and Jain, O. P. 1995. Physico-chemical analysis ofriver Ajhar. lndian J. Environ Prot. 5: 569-571.
Kosik, M,, Cadkova,Z., Prikryl, 1., Seda, J., Pechar, L. and Pecharova,E. 201 1. ln itial succession of zooplankton and zoobenthos assemblagesin newly formed quarry lake medard (sokolov, czech republic). ln:Mine water - managing the challenges, T.R. Riide, A. Freund and C.Wolkersdorfer (Eds.). Proceedings of 11th lnternational Mine WaterAssociation Congress. pp. 517-521.
Mann, K. H. 1958. Annual fluctuations in sulphate and bicarbonatehardness in ponds. Limnol and Oceanogr.3: 418-422.
Meyback, M. 1987. Clobal chemical weathering of surficial rocksestimated from river dissolved loads. Am J Sci.2B7:401-428.
Narsimha Rao, P. and Jaya Raju, P. B. 2001. Limnological investigationand diversity of plankton in sewage fed fish culture pond at Namburnear Cuntur (A.P.) l. Aqua. Bio. 16(1 and 2): 11-14.
Peplow, D. and Edmonds, R,2002. The effect of mine wastecontamination on fish and wildlife habitat at multiple levels ofbiological organitation, Mathow river, Washington. Project No. 1998-03501 (BPA report DOE/BP-000047 1 0-2).
Piper, A. M. 1944. A geographic procedure in the geochemicalinterpretation of water analysis. Trans. Am. Ceophysical Union.25:914-923.
Raghunath, I. l. M. 1987. Croundwater. 2"ded. Wiley Eastern Ltd,New Delhi. pp. 344-369.
Ripley, E. A. Redmann, R. E. and Crowder A. A. 1996, Environmentaleffects of mining. 5t. lucie Press, Delray Beach.
Sarma, V. V. f, and Krishnaiah N. 1976. Quality of groundwater inthe coastal aquifer near Visakhapatriam, lndia. Cround Water.14(15):290-295.
Sawyer, C. N. and McCarty, D. L. 1967. Chemistry of sanitaryengineers. 2nd ed. McCraw Hill, New York, p. 518.
Saxena, M. M. I998, Environmental analysis water, soil and air. AgroBotanica, lndia.
Schoeller, H. 1965. Qualitative evaluation of groundwater resources.ln: Methods and techniques of groundwater investigations anddevelopment. Water Resources Serles No. 33. UNESCO, Paris, pp.54-83.
Schoeller, H. 1967. Ceochemistry of groundwater-An internationalguide for research and practice. UNESCQ Paris, pp. 1-18.
Schoeller, H. 1977. Ceochemistry of groundwater. ln: Croundwaterstudies-An international guide for research and practice. UNESCO,Paris. pp. 1-.1 8.
Shainberg, l. and Oster, ). D. 1976. Quality of irrigation water. 2nd
edn. lllC publication, lsrael.
Singh, A. K., Mahato, M. K., Neogi, B. and Singh, K. K.2010.Quality assessment of mine water in the Raniganj Coalfield area,India. Mine Watet Environ.2g(4): 248-262.
Singh, A. K., Mondal, G. C., Kumar, S., Singh, T. 8., Tewary, B. K.and Sinha, A. 2008. Major ion chemistry, weathering processes andwater quality assessment in upper catchment of Damodar River basin,lndia. [nviron Ceo/. 54: 745-758.
Singh, A. K., Mondal, C, C., Tewary, B. K. and Sinha, A. 2009. Majorion chemistry, solute acquisition processes and quality assessment ofmine water in Damodar Valley Coalfields, lndia. Abstracts of theinternational mine water conference 19th - 23rd October 2009,Proceedings ISBN Number 978-0-9802623-5-3. DocumentTransformation Technologies, Pretoria. 267-276.
Singhal, R. N., feet, S. and Davis, R. W. 1986. The Physico-Chemicalenvironment and the plankton of managed ponds in Haryana, lndia.Proc. lndian Acad. Sci. (Sec. B).95: 253-263.
Slusarczyk, A. 2003. Limnological study of a Iake formed in limestonequarry (Krak6w, Poland). l. Zooplankton Community. Polish l.Env i ronmental Studies. 12(4): 489-493.
Szabolcs, l. and Darab, C. 1964. The influence of irrigation water ofhigh sodium carbonate content ofsoils. Proceedings of 8tt'lnternationalCongress of lsss Trans. ll: 803-81 2.
Tiwary, R. K. and Dhar, B. R. 1994. Environmental pollution fromcoal mining activity in Damodar River Basin, lndia. Mine WaterEnviron. l3: 1-10.
Todd, D. K. 1980. Croundwater Hydrology. 2"d edn. J. Wiley andSons lnc., New York, pp.315.WHO 1997. Cuidelines for drinking-water quality. Vol 1. WorldHealth Organisation, Ceneva, pp. 1-4.
Younger, P. L. 2004. Environmental impacts of coal mining andassociated wastes: A geochemical perspective. Ceological Society,London 236l. 169-209.
Copyright © 2022 FDOKUMEN