Surface-enhanced resonance Raman spectra of free base 5,10,15,20-tetrakis(4-carboxyphenyl)porphyrin...
11
J. Phys. Chem. 1993,97, 9719-9729 9719 Surface-Enhanced Resonance Raman Spectra of Free Base 5,10,15,20-Tetrakis( 4-carboxypheny1)porphyrin and Its Silver Complex in Systems with Silver Colloid: Direct Adsorption in Comparison to Adsorption via Molecular Spacer Blanka VlEkovB,' Pave1 Mat&jka, Jindfigka SimonovB, and Katefina Cerm4kovB Department of Physical and Macromolecular Chemistry, Faculty of Science, Charles University, Hlavova 2030, CS-12840 Prague 2, Czech Republic Petr PaniiOgka Department of Chemical Physics, Faculty of Mathematics and Physics, Charles University, Ke Karlovu 3, CS- I21 16 Prague 2, Czech Republic VladimIr Baumruk Institute of Physics, Charles University, Ke Karlovu 5, CS-12116 Prague 2, Czech Republic Received: January 12, 1993; In Final Form: June 18, 1993e Surface-enhanced resonance Raman scattering (SERRS) spectra of free base 5,10,15,20-tetrakis(4-carbox- ypheny1)porphyrin (TPPC4) and of its silver complex, Ag(II)TPPC4, have been investigated under conditions of (I) the direct adsorption of the porphyrin on the surface of Ag colloid and (11) the attachment of the porphyrin to the surface of Ag colloid via a nonionic surfactant, Triton X-100 (p-( 1,1,3,3-tetramethylbutyl)phenylply- (oxyethylene)), functioning as a molecular spacer. For both types of porphyrin adsorption, the mechanisms of the SERS-active system formation have been elucidated. In the former case (I), the system is formed by a two-step process involving (1) preaggregation of Ag colloid by adsorption of phosphate introduced to the system by phosphate buffer and (2) elimination of phosphate from the surface by chemisorption of free base TPPC4. Step 2 of the process is effectively accomplished provided that the concentration of free base (f.b.) TPPC4 in the system is higher than 5 X lo-' M. Formation of theAg(II)TPPC4surface complex by chemisorption of f.b. TPPC4 on the surface of Ag colloid was proven by SERRS and UV-vis absorption spectroscopy. For the synthetically prepared Ag(II)TPPC4, the second step of the SERS-active system formation is absent, and the SERRS spectrum of the metalloporphyrin is not obtained. In contrast to that, high-quality SERRS spectra of both the free base TPPC4 and Ag(1I)TPPCd were obtained by the spectral study of organized Ag colloid/ Triton X-100/porphyrin systems (11) assembled by a different type of the two-step adsorption process: (1) adsorption of Triton X-100 on the surface of Ag colloid by its hydrophilic part and (2) attractive, hydrophobic interaction between the hydrophobic part of adsorbed Triton X-100 and the porphyrin. SERRS spectra of Ag(II)TPPC4 surface complex, of Ag(II)TPPC4 (synthetic), and of free base TPPC4 were interpreted. The observed coincidence of the vibrational frequencies of Ag(I1)TPPCs surface complex with those of its synthetically prepared analogue signifies a mutual structural equivalence of the porphyrin core parts of the two species. The minor differences in relative band intensities originate from the effect of the surface on the orientation of phenyl rings with respect to the porphyrin macrocycle as well as on the electronic structure of the surface complex. Introduction Surfaceenhancement of Raman scattering isobserved whenever a scattering species (molecule, ion, radical) is located at (or in the vicinity of) a roughened surface (electrode, colloid, island film, etc.) of silver,copper, or gold.12 In thecaseof metalcolloids, the SERS-active surface is formed by aggregationof the colloidal particlesz4 induced by the adsorption of either the scattering species itself or a preaggregating agent.'.* For several types of species which commonly appear as ligands in transition metal complexes, e.g., ~ y r i d i n e , ~ bipyridine,1° and thiocyanate anion," the vibrational frequency changes accom- panying their adsorption on silver surface closely resemble those observed upon their coordination to the Ag+ metal ion in solution. Interaction of the "ligand" with the "atomic scale active sites", Le., Agn+ cluster~,~~J~ of the surface results in surface complex formation. Investigation of the analogy between the surface complexes and the synthetically prepared ones may provide a deeper insight into mechanisms of catalytic processes on metal * To whom correspondenceshould be addressed. *Abstract published in Aduunce ACS Abstracts, August 15, 1993. 0022-3654/93/2097-97 19$04.00 f 0 surfaces,14 into the structure-function relationship in photo- chemical devices,15 and into the interaction of biomolecules with metallic surfaces.16 On the other hand, whenever structural information regarding the unperturbed adsorbate is required, formation of the surface complex must be prevented. Prevention of the surface complex formation can come into effect when a semiconductor,17 ionic,lg or m0lecular~~.*0 layer separates the adsorbate from the surface. In these systems, the adsorbate molecules have been shown to experience an enhancement of Raman scattering at least up to the 10-nm distance from the surface.17 For biomolecules in general and porphyrin speciesin particular, vibrational spectral data concerningtheir interaction with metal surfacesand their structure in the native, chemically unperturbed form are subjects of interest. Up to now, the majority of the SERRS spectral information obtained has concerned porphyrins directly adsorbedon metal Under these conditions, porphyrins in the free base (f.b.) form have been shown to incorporate silver. The efficiency of f.b. porphyrin metallation by silver appears to be affected both by the functional groups attached to the porphyrin macrocycle and by the morphology of 0 1993 American Chemical Society
Transcript of Surface-enhanced resonance Raman spectra of free base 5,10,15,20-tetrakis(4-carboxyphenyl)porphyrin...
J. Phys. Chem. 1993,97, 9719-9729 9719
Surface-Enhanced Resonance Raman Spectra of Free Base 5,10,15,20-Tetrakis( 4-carboxypheny1)porphyrin and Its Silver Complex in Systems with Silver Colloid: Direct Adsorption in Comparison to Adsorption via Molecular Spacer
Blanka VlEkovB,' Pave1 Mat&jka, Jindfigka SimonovB, and Katefina Cerm4kovB Department of Physical and Macromolecular Chemistry, Faculty of Science, Charles University, Hlavova 2030, CS-12840 Prague 2, Czech Republic
Petr PaniiOgka Department of Chemical Physics, Faculty of Mathematics and Physics, Charles University, Ke Karlovu 3, CS- I21 16 Prague 2, Czech Republic
VladimIr Baumruk Institute of Physics, Charles University, Ke Karlovu 5, CS-12116 Prague 2, Czech Republic
Received: January 12, 1993; In Final Form: June 18, 1993e
Surface-enhanced resonance Raman scattering (SERRS) spectra of free base 5,10,15,20-tetrakis(4-carbox- ypheny1)porphyrin (TPPC4) and of its silver complex, Ag(II)TPPC4, have been investigated under conditions of (I) the direct adsorption of the porphyrin on the surface of Ag colloid and (11) the attachment of the porphyrin to the surface of Ag colloid via a nonionic surfactant, Triton X-100 (p-( 1,1,3,3-tetramethylbutyl)phenylply- (oxyethylene)), functioning as a molecular spacer. For both types of porphyrin adsorption, the mechanisms of the SERS-active system formation have been elucidated. In the former case (I), the system is formed by a two-step process involving (1) preaggregation of Ag colloid by adsorption of phosphate introduced to the system by phosphate buffer and (2) elimination of phosphate from the surface by chemisorption of free base TPPC4. Step 2 of the process is effectively accomplished provided that the concentration of free base (f.b.) TPPC4 in the system is higher than 5 X lo-' M. Formation of theAg(II)TPPC4 surface complex by chemisorption of f.b. TPPC4 on the surface of Ag colloid was proven by SERRS and UV-vis absorption spectroscopy. For the synthetically prepared Ag(II)TPPC4, the second step of the SERS-active system formation is absent, and the SERRS spectrum of the metalloporphyrin is not obtained. In contrast to that, high-quality SERRS spectra of both the free base TPPC4 and Ag(1I)TPPCd were obtained by the spectral study of organized Ag colloid/ Triton X-100/porphyrin systems (11) assembled by a different type of the two-step adsorption process: (1) adsorption of Triton X-100 on the surface of Ag colloid by its hydrophilic part and (2) attractive, hydrophobic interaction between the hydrophobic part of adsorbed Triton X-100 and the porphyrin. SERRS spectra of Ag(II)TPPC4 surface complex, of Ag(II)TPPC4 (synthetic), and of free base TPPC4 were interpreted. The observed coincidence of the vibrational frequencies of Ag(I1)TPPCs surface complex with those of its synthetically prepared analogue signifies a mutual structural equivalence of the porphyrin core parts of the two species. The minor differences in relative band intensities originate from the effect of the surface on the orientation of phenyl rings with respect to the porphyrin macrocycle as well as on the electronic structure of the surface complex.
Introduction
Surface enhancement of Raman scattering isobserved whenever a scattering species (molecule, ion, radical) is located at (or in the vicinity of) a roughened surface (electrode, colloid, island film, etc.) of silver, copper, or gold.12 In thecaseof metalcolloids, the SERS-active surface is formed by aggregation of the colloidal particlesz4 induced by the adsorption of either the scattering species itself or a preaggregating agent.'.*
For several types of species which commonly appear as ligands in transition metal complexes, e.g., ~yr id ine ,~ bipyridine,1° and thiocyanate anion," the vibrational frequency changes accom- panying their adsorption on silver surface closely resemble those observed upon their coordination to the Ag+ metal ion in solution. Interaction of the "ligand" with the "atomic scale active sites", Le., Agn+ c l u s t e r ~ , ~ ~ J ~ of the surface results in surface complex formation. Investigation of the analogy between the surface complexes and the synthetically prepared ones may provide a deeper insight into mechanisms of catalytic processes on metal
* To whom correspondence should be addressed. *Abstract published in Aduunce ACS Abstracts, August 15, 1993.
0022-3654/93/2097-97 19$04.00 f 0
surfaces,14 into the structure-function relationship in photo- chemical devices,15 and into the interaction of biomolecules with metallic surfaces.16 On the other hand, whenever structural information regarding the unperturbed adsorbate is required, formation of the surface complex must be prevented. Prevention of the surface complex formation can come into effect when a semiconductor,17 ionic,lg or m0lecular~~.*0 layer separates the adsorbate from the surface. In these systems, the adsorbate molecules have been shown to experience an enhancement of Raman scattering at least up to the 10-nm distance from the surface.17
For biomolecules in general and porphyrin species in particular, vibrational spectral data concerning their interaction with metal surfaces and their structure in the native, chemically unperturbed form are subjects of interest. Up to now, the majority of the SERRS spectral information obtained has concerned porphyrins directly adsorbed on metal Under these conditions, porphyrins in the free base (f.b.) form have been shown to incorporate silver. The efficiency of f.b. porphyrin metallation by silver appears to be affected both by the functional groups attached to the porphyrin macrocycle and by the morphology of
0 1993 American Chemical Society

9120
the particular silver surface.2”28 By contrast, the possibilities of preventing the f.b. porphyrin metallation in the course of the SERRS experiment have been explored only marginally.20J
In this paper, we demonstrate how a SERS spectral study of free base 5,10,15,20-tetrakis(4-carboxyphenyl)porphyrin (TP- PC4) in systems containing the borohydride-reduced silver colloid can be designed to provide selectively information on either the unperturbed, free base form of the porphyrin or its surface complex.
In the first part, we compare the SERRS as well as the electronic absorption spectra of the Ag colloid/f.b. TPPC4 system to those of a synthetically prepared Ag(II)TPPC4, aiming at obtaining unambiguous proof that a Ag(II)TPPC4 surface complex is formed in the system and that it is the only form of the porphyrin present at the surface of Ag colloid. We also investigate in detail the mechanism of the formation of the Ag colloid/Ag(ZI) TPPG surface complex SERS-active system.
In thesecond part, weelucidatethemechanismof the formation of the SERS-active systems in which either the f.b. TPPC4 or the synthetically prepared Ag(I1)TPPCd is attached to the surface via a nonionic surfactant (Triton X-100) which functions as a molecular spacer20.21 between theporphyrin and the metal surface.
Finally, we present an assignment of the SERRS-active vibrational modes of Ag(II)TPPC4 species (both the surface complex and the synthetically prepared metalloporphyrin) as well as of the free base TPPC4. The spectral interpretation gives a more detailed insight into the structure of the scattering species and their orientation with respect to the metal surface together with information about the contributions of both the surface and the resonance enhancement of Raman scattering29 to the SERRS spectral patterns obtained.
The Journal of Physical Chemistry, Vol. 97, No. 38, 19
Experimental Section
Materials. Analytical gradechemicals and redistilled deionized water were used for all sample preparations. The 5,10,15,20- tetrakis(4-carboxypheny1)porphyrin (TPPC4) and its silver com- plex, Ag(II)TPPC4, were synthesized according to ref 30. Triton X-100 (for scintillation technique, SERVA, Feinbiochimica) was used without purification. The above chemicals were charac- terized by mass and IR spectra. Phosphate buffer (2 X M, pH = 7.3) was used as solvent for both TPPC4 and Ag(I1)- TPPC4. The2.5 X lW-lO-5M solutionsofTPPC4and 10-4-10-5 M solutions of Ag(II)TPPC4 in the phosphate buffer were prepared along with the 10-4 M solutions of both species in 4 X 10⁻⁴ M NaOH.
Preparation Procedures. 1. Preparation of Ag Colloids. Ag colloids were prepared by reduction of AgN03 by NaBH4 following partially the procedure described in ref 3 1. TheNaBH4 to AgNO3 ratio was optimized for each type of SERS-active system.
( i ) Ag Colloid (I) for Ag ColloidlPhosphate Buffer, Ag Colloid/ TPPC4, and Ag Colloid/Ag(II) TPPC4 Systems. A solution of 3.5 mg of NaBH4 in 75 mL of redistilled deionized water was cooled to 4 OC. To this solution, 7.5 mL of 2.2 X l t 3 M aqueous solution of AgN03 (precooled to - 12 “C) was added dropwise(-30pL/s)withconstant stirring (-100rpm). Stirring was continued without interruption for 45 min. The resulting silver colloid was bright yellow with the X, of the surface plasmon absorption at 390 nm.
(i i) Ag Colloid ( I I ) for Ag ColloidlTriton X-lOO/f.b. TPPC4 and Ag Colloid/ Triton X- 1 OOIAg(II) TPPC, Systems. The same preparation protocol as for Ag colloid (I) was followed except for the addition of 9 mL of 2.2 X 10⁻³ M AgNO3 solution instead of 7.5 mL. 2. Preparation of SERS-Active Systems. ( i ) Ag Colloid/
Phosphate Buffer. To 4 mL of Ag colloid (I) aged for 24 h, 80 pL of 2 X 10⁻³ M phosphate buffer was added. The system was shaken for 1 h. SERS-active system formed within 24 h.
’93 SERRS Investigations of Porphyrins
(i i) Ag Colloidlf.6. TPPCrPhosphate Buffer (System 1 ) . The experimental conditions under which a good-quality SERS spectrum of TPPC4 is obtained were investigated systematically. In set 1, to 4 mL of Ag colloid (I) were added equal volumes (80 pL) of 2.5 X 10⁻⁴ M, 10-4 M, 5 X 10⁻⁵ M, and 10-5 M solutions of TPPC4 in 2 X 10⁻² M phosphate buffer. In set 2, varying volumes (40,80,200,400 pL of le5 M solution of the porphyrin in 2 X 10⁻² M phosphate buffer) were added to 4 mL of Ag colloid (I). Formation of both sets of the SERS-active systems was followed by UV-vis absorption as well as Raman spectroscopy. The results which are shown and discussed in detail below lead to the formulation of the following optimized preparation protocol:
To 4 mL of Ag colloid (I) aged for 24 h, 40 pL of 10-4 M solution of TPPC4 in 2 X M phosphate buffer was added, and the resulting system was shaken for 2 h. The SERS-active system formed in the dark at laboratory temperature for 1-2 days. The system is stable and maintains its SERS activity for at least 2 months. The preparation protocol described above was used for the preparation of analogous systems to which porphyrin was added as the 10-4 M solution in 4 X 10⁻⁴ M NaOH (instead of in the phosphate buffer). In that case, the SERS-active system was not formed.
(iii) Ag Colloid/Ag(II) TPPCrPhosphate Buffer (System 2) . Preparation of this SERS-active system followed the preparation protocol of system 1. Addition of 40-pL and/or 80-pL volumes of 1 V M and/or 5 X les M solution of Ag(II)TPPC4 in 2 X
(iv) Ag Colloid/ Triton X-100/f.b. TPPCcPhosphate Buffer (System3). To4mLofAgcolloid(II),40pLof 10-2Maqueous solution of Triton X-100 was added 2 h after Ag colloid preparation. The SERS-active system was formed for 3 days and tested for SERS of Triton X-10020 with a positive result. To this system, 40 pL of 10-4 M solution of f.b. TPPC, in 2 X M phosphate buffer was added. SERS spectra of system 3 were measured 2 h after addition of the porphyrin.
(v) AgColloid/TritonX-lOO fAg(Il)TPPC+-PhosphateBuffer (System 4 ) . The preparation protocol of system 4 was identical with that of system 3, except that Ag(1I)TPPCd was used instead
instrumentation. Raman spectra were measured with a modular spectrometer consisting of a high-resolution monochro- mator THR 1500 (Jobin-Yvon), an additional compact 118 monochromator (Oriel), a photon counting system assembled from NIM modules (Tennelec and Ortec), and an IBM- compatible PC.32 Spectra were accumulated with spectral slit widths of 6 cm-I, with 1-cm-* steps and an accumulation time of 1 s per spectral point. Excitation was provided with several lines of an argon ion laser (Carl Zeiss Jena). Raman spectra at 584- nm excitation were measured using a Dilor XY multichannel Raman spectrometer coupled with an argon ion laser (Spectra Physics) pumping a dye laser (Spectra Physics) filled with Rhodamin 6G. UV-vis absorption spectra were recorded on a Specord M 40 (Carl Zeiss Jena) spectrometer using 0.2-cmquartz cells.
M phosphate buffer was tested.
of f.b. TPPC4.
Results and Discussion
Direct Adsorption of Porphyrins on the Surface of Ag Colloid. 1 . Characterization of Ag(II) TPPC4 Surface Complex by Comparison toItsSynthetically Prepared Analogue. ( i ) SERRS Spectra. SERRS spectra of a synthetically prepared Ag(I1)- TPPC, metalloporphyrin were investigated first in a system formed by addition of a metalloporphyrin solution in phosphate buffer to Ag colloid (system 2). Only broad bands not attributable to the porphyrin macrocycle were observed in the spectrum (not shown here). The bands were later identified as spectral features of the phosphate. The silver metalloporphyrin is evidently not adsorbed on Ag colloid in this system.

VlEkov6 et al. The Journal of Physical Chemistry, Vol. 97, No. 38, 1993 9721
1500 1000 500
Ramon shift [ cm- '1 Figure 1. SE(R)RS spectra measured at 514.5-nm excitation. Spectrum A: Ag(I1)TPPCd (synth) in Ag colloid (4 mL)/Triton X-100 (40 pL of 10-2 M aqueous solution)/Ag(II)TPPC4 (synth) (40 pL of l ( r M solution in 2 X M phosphate buffer). Spectrum B: Ag(I1)TPPCd surface complex formed in Ag colloid (4 mL)/f.b. TPPC4 (40 pL of l(r M solution in 2 X M phosphate buffer).
In a second attempt, we studied the SERS spectra of the Ag colloid/Triton X-l00/Ag(II)TPPC4 system (system 4). The high-quality SERRS spectrum of Ag(II)TPPC4 (synth) thus obtained (Figure 1, spectrum A) is compared with the SERRS spectrum of system 1 in which the free base TPPC4 is directly adsorbed on the surface of Ag colloid (spectrum B). The number of spectral bands and the vibrational frequencies in spectrum A are virtually identical with those in spectrum B. The scattering species in system 1 is thus unambiguously identified as Ag(I1)-
(i i) Electronic Absorption Spectra. Electronic absorption spectra of the SERS-active system 1 as well as of aqueous phosphate buffer solutions of both Ag(II)TPPC4 (synth) and f.b. TPPC4are shown in Figure 2. Although the electronic absorption spectrum of the porphyrin in the SERS-active system is partially masked by the surface plasmon absorption of the aggregated Ag colloid, the Soret band is sufficiently intense to be clearly observed as a distinct peak on the smooth surface plasmon absorption curve (Figure 2, curve a). The position of the maximum of the Soret band at 423 nm corresponds very well to the position of the Soret band at 421 nm in the electronic absorption spectrum of Ag- (II)TPPC, (synth) in solution (Figure 2, curve b) but clearly differs from the maximum of the Soret band at 414 nm in the electronic absorption spectrum of the f.b. TPPC4 in solution (Figure 2, curve c). Electronic absorption spectra thus provide yet another proof of the formation of the Ag(1I)TPPCd species in the Ag colloid/f.b. TPPC4 system.
Besides the identification of the scattering species in system 1 as Ag(II)TPPC4, a proof should be given that this species is really formed as the surface complex, i.e., that the porphyrin is metallated on the surface of Ag colloid and not in solution. We now have two convincing arguments against the alternative explanation that the metallation of the f.b. TPPC4 occurs in solution by some residual Ag+ ions and is consequently adsorbed as of Ag(I1)TPPCd on the surface. First, Ag(1I)TPPCd (synth) is not adsorbed on the surface of Ag colloid in system 2, as no spectral features typical for a silver metalloporphyrin were
TPPC4.
A 423 f \ ,-,,' ',
/ \
I 30 25 20 15
v C1o3cm.'I Figure 2. Absorption spectra. Curve a: Ag colloid (4 mL)/f.b. TPPC4 (80 pL of 2.5 X l(r M solution in 2 X 10-* M phosphate buffer) system (system 1) in which Ag(I1)TPPCd surface complex is form&, maximum of Soret band is observed at 423 nm. Curve b: l(r M solution of Ag- (1I)TPPCd (synth) in 2 X 10⁻² M phosphate buffer; maximum of Soret band is observed at 421 nm. Curve c: l(r M solution of free base TPPC4 in 2 X lW2 M phosphate buffer; maximum of Soret band is observed at 414 nm. observed. The good-quality SERRS spectra of Ag(1I)TPPCd provided by the Ag colloid/TPPC4 system (e.g., Figure 1, spectrum B) thus cannot result from the adsorption of the already metallated Ag(1I)TPPCd species present in solution and evidently do originate from metallation of the f.b. form of the porphyrin directly on the surface. Second, assuming that the f.b. porphyrin was metallated in solution, it would adsorb on the Triton X- 100 modified surface of silver colloid as Ag(I1)TPPCd. In that case, spectral features

9722 The Journal of Physical Chemistry, Vol. 97, No. 38, 1993 SERRS Investigations of Porphyrins
1500 1000 500
R a m o n shif t [cm-' ] Figure 3, SE(R)RS spectra. Spectrum A: Ag colloid (4 mL)/phosphate buffer (80 pL of 2 X M solution). Spectrum B: Ag(1I)TPPCd surface complex and phosphate in the Ag colloid/phosphate buffer/free base TPPC4 system; concentration of f.b. TPPC4 is 2 X lt7 M in the system. Spectrum C: Ag(1I)TPPCd surface complex and phosphate in the Ag colloid/phospbate buffer/free base TPPC4 system; concentration of f.b. TPPC4 is 5 X 10⁻⁷ M. Spectrum D: Ag(II)TPPC4 surface complex in the Ag colloid/phosphate buffer/free base TPPC4 system; concentration of f.b. TPPC4 is 1W M. Concentration of phosphate is 4 X 10-I M in all systems. Analogous SE(R)RS spectra of the Ag(1I)TPPCd surface complex were obtained also for 2 X 10⁻⁶ and 5 X 10⁻⁶ M concentrations of f.b. TPPC, in the system.
of Ag(1I)TPPCs would be observed as dominant in the SERRS spectrum of the Ag colloid/Triton X-lOO/f.b. TPPC4 system (system 3). This is in contrast with the spectra observed (Figure 7), which are dominated by spectral bands of f.b. TPPC4.
We thus conclude that a Ag(II)TPPC4 surface complex, virtually identical with its synthetically prepared analogue, is formed by direct adsorption of f.b. TPPC, on the surface of "borohydride-reduced" silver colloid.
2. Formation of the Ag Colloid/Ag(II)TPPC4 (Surface Complex) SERS-Actiue System. Both the SE(R)RS spectra (Figure 3) and the surface plasmon absorption curves (Figure 4) of system 1 were found to be strongly dependent on the initial concentration of free base TPPC4. SE(R)RS spectra of systems with porphyrin concentrations lower than 5 X lt7 M show only weak spectral features of Ag(II)TPPC4 which are accompanied by broad bands at 265, 445, 569, 932, and 1082 cm-l. Their frequencies roughly correspond to the vibrational frequencies of the Raman-active bands of phosphate (420,567,938, and 1017 cm-l for free phosphate; the 265-cm-l band probably belongs to the Ag+-O mode of adsorbed phosphate). The appearance of the same bands in the SERS spectrum of the Ag colloid/phosphate buffer system (Figure 3, spectrum A) definitely confirms their assignment to phosphate. The phosphate buffer used for dissolving both the free base TPPC4 and Ag(II)TPPC4 in water thus has to be considered as another adsorbate, and the initial form of system 1 is denoted as Ag colloid/phosphate/f.b. TPPC4.
The importance of phosphate for the SERS activity of the initial Ag colloid/TPPC4 system (system 1) is further confirmed by the following experiment: A system analogous to system 1 was prepared using a solution of TPPC4 in 4 X 10⁻⁴ M aqueous NaOH instead of that in phosphate buffer. In this case, the
A
v rlO3c"l Figure 4. Absorption spectra. Curve a: Ag colloid (4 mL)/phosphate buffer (40pLof 2 X 1 t 2 M solution). Curvcsb-f Ag colloid/phosphate buffer/free base TPPC4 system. The concentration of f.b. TPPC4 in the system varies: b, 2 X M; c, 5 X lo" M; d, 10-6 M; e, 2 X 1W M; f, 5 X l e M; concentration of phosphate, 4 X lo" M.
aggregation of Ag colloid did not occur and no SERS spectrum could be obtained.
The dependence of both the SE(R)RS spectra and the surface plasmon absorption curves of system 1 on varying concentrations of f.b. TPPC4 and/or phosphate buffer was investigated. The concentration of porphyrin was identified as the experimental variable responsible for the spectral changes in both the SERRS (Figure 3) and the surface plasmon absorption spectra (Figure 4).
The results of the study are summarized as follows: (1) For concentrations (c) of TPPC4 in the system c < 5 X le7 M, (i)
VlEkov4 et al. The Journal of Physical Chemistry, Vol. 97, No. 38, 1993 9123
SE(R)RS spectra of the SERS-active systems show spectral features of both Ag(II)TPPC4 surface complex and phosphate (Figure 3, spectra B,C). Their mutual intensity ratiodepends on the initial concentration of TPPC4 in the system. (ii) Surface plasmon absorption curves of the SERS-active systems (Figure 4, curves b,c) show a maximum at 590 nm (curve b) and at 570 nm (curve c). Thus, the shapes of curves b and c resemble the shape of the surface plasmon absorption curve of the Ag colloid/ phosphate buffer with a maximum at 605 nm (Figure 4, curve a). The maximum appears to shift to shorter wavelengths with an increasing concentration of TPPC4 in the system. (iii) SERS- active systems are formed rapidly within 12-24 h. (2) For concentrations (c) of TPPC4, c > 5 X le7 M, (i) SERRS spectra show only the spectral features of the Ag(II)TPPC4 surface complex (Figure 3, spectrum D). The spectral features of phosphate are almost missing, with the possible exception of a broad spectral feature at 560 cm-1. (ii) Surface plasmon absorption curves (Figure 4, curves d,e) do not show any distinct maximum (in contrast to curves b and c). Curve f (for the highest concentration of TPPC4 in the system, 5 X 10⁻⁶ M), however, shows a broad maximum at 540 nm. (iii) The formation of the SERS-active system is slower than for systems with porphyrin concentration c < 5 X le7 M and is achieved within 1-3 days. Systems with c = 5 X 10⁻⁶ M are formed more rapidly than those with c = 10-6 M and c = 2 X 10⁻⁶ M.
The following conclusions can be drawn from the above results: (1) For the initial concentrations of TPPC4 in the systems c < 5 X le7 M, two species are coadsorbed on the Ag surface: Ag- (II)TPPC4 surface complex and phosphate. The intensity ratio of their SERS signal depends on the porphyrin concentration. However, when the concentration c > 10-6 M, only Ag(I1)TPPCd is present on the surface of the Ag colloid. This means that in the concentration range 5 X lC7-10-6 M, there is a limit at which all the SERS-active surface is covered entirely by the Ag(I1)- TPPC4 surface complex. A simple calculation (details presented in ref 33) shows that the minimum initial concentration of the f.b. TPPC4 which is required for complete coverage of the Ag colloidal surface by porphyrin molecules in system 1 is 3.7 X le7 M. However, as the adsorption-desorption equilibrium was neglected in the calculation and all the porphyrin molecules are thus considered to be adsorbed, the real value of the concentration required is actually higher and fits well within the 5 X lP7-10-6 M interval established experimentally. (2) It must be emphasized that even at the early stages of the SERS activity of the systems no spectral features of the free base form of TPPC4 have been observed. Furthermore, we have not identified any spectral features which would correspond to a “SAT” (“sitting atop”) intermediate described for f.b. TPPS4 (TPPS4 = 5,10,15,20- tetrakis(4-s~lfonatophenyl)porphyrin).2~ The only form of the porphyrin present on the surface is thus the Ag(I1)TPPCd surface complex. These facts indicate that adsorption of the f.b. TPPC4 on the surface and its metallation have to proceed simultaneously and represent, in fact, a single process of f.b. porphyrin chemisorption or, more precisely, coordination to the surface.
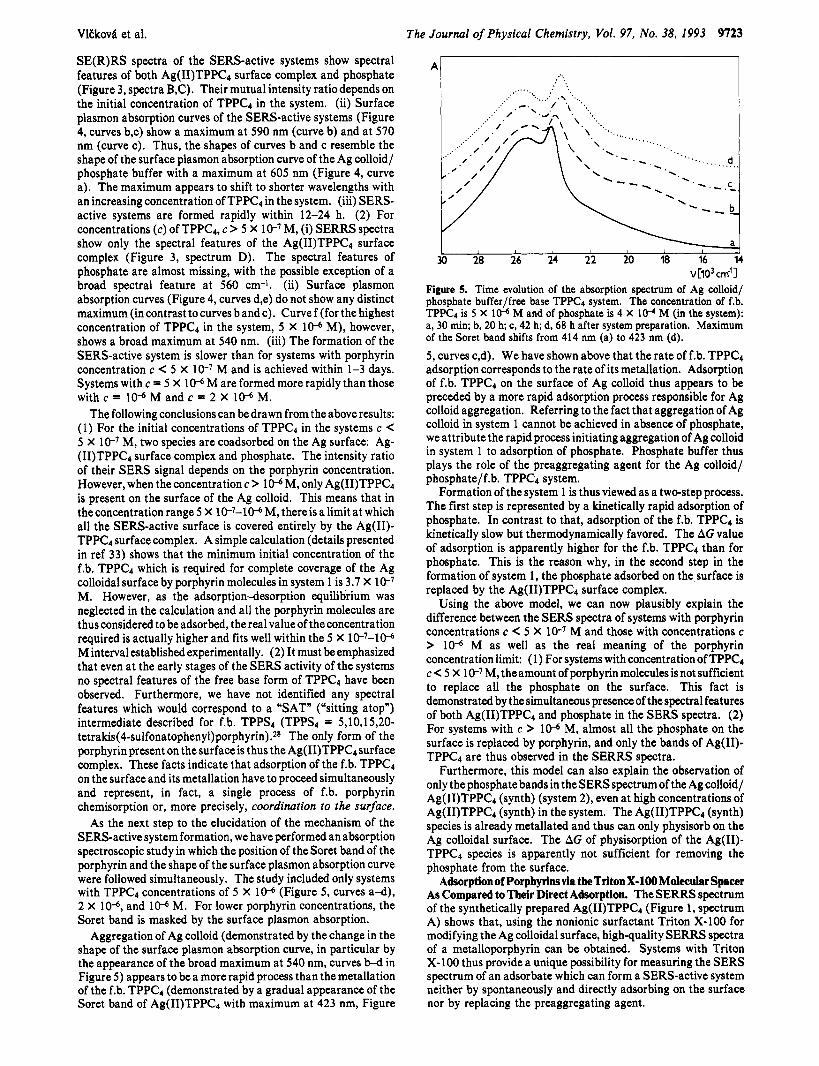
As the next step to the elucidation of the mechanism of the SERS-active system formation, we have performed an absorption spectroscopic study in which the position of the Soret band of the porphyrin and the shape of the surface plasmon absorption curve were followed simultaneously. The study included only systems with TPPC4 concentrations of 5 X 10⁻⁶ (Figure 5, curves a-d), 2 X 10⁻⁶, and 10-6 M. For lower porphyrin concentrations, the Soret band is masked by the surface plasmon absorption.
Aggregation of Ag colloid (demonstrated by the change in the shape of the surface plasmon absorption curve, in particular by the appearance of the broad maximum at 540 nm, curves b-d in Figure 5) appears to be a more rapid process than the metallation of the f.b. TPPC, (demonstrated by a gradual appearance of the Soret band of Ag(1I)TPPCd with maximum at 423 nm, Figure
A ! ..:
I . . . . ...... , , .. . . , . .. .... :,A, ’. ..,,
, C . : , . . \ ‘. I
a
v [io3 cm-‘ 1
I I
30 28 26 24 22 20 i a 16 14
Figure 5. Time evolution of the absorption spectrum of Ag colloid/ phosphate buffer/free base TPPC, system. The concentration of f.b. TPPC, is 5 X 1od M and of phosphate is 4 X l ( r M (in the system): a, 30 min; b, 20 h; c, 42 h; d, 68 h after system preparation. Maximum of the Soret band shifts from 414 nm (a) to 423 nm (d). 5, curves c,d). We have shown above that the rate of f.b. TPPC4 adsorption corresponds to the rate of its metallation. Adsorption of f.b. TPPC4 on the surface of Ag colloid thus appears to be preceded by a more rapid adsorption process responsible for Ag colloid aggregation. Referring to the fact that aggregation of Ag colloid in system 1 cannot be achieved in absence of phosphate, we attribute the rapid process initiating aggregation of Ag colloid in system 1 to adsorption of phosphate. Phosphate buffer thus plays the role of the preaggregating agent for the Ag colloid/ phosphate/f.b. TPPC4 system.
Formation of the system 1 is thus viewed as a two-step process. The first step is represented by a kinetically rapid adsorption of phosphate. In contrast to that, adsorption of the f.b. TPPC4 is kinetically slow but thermodynamically favored. The AG value of adsorption is apparently higher for the f.b. TPPC, than for phosphate. This is the reason why, in the second step in the formation of system 1, the phosphate adsorbed on the surface is replaced by the Ag(1I)TPPCd surface complex.
Using the above model, we can now plausibly explain the difference between the SERS spectra of systems with porphyrin concentrations c < 5 X le7 M and those with concentrations c > 10-6 M as well as the real meaning of the porphyrin concentration limit: (1) For systems with concentration of TPPC4 c < 5 X le7 M, the amount of porphyrin molecules is not sufficient to replace all the phosphate on the surface. This fact is demonstrated by the simultaneous presence of the spectral features of both Ag(II)TPPC4 and phosphate in the SERS spectra. (2) For systems with c > 10-6 M, almost all the phosphate on the surface is replaced by porphyrin, and only the bands of Ag(I1)- TPPC4 are thus observed in the SERRS spectra.
Furthermore, this model can also explain the observation of only the phosphate bands in the SERS spectrum of the Ag colloid/ Ag(II)TPPC4 (synth) (system 2), even at high concentrations of Ag(II)TPPC4 (synth) in the system. The Ag(1I)TPPCd (synth) species is already metallated and thus can only physisorb on the Ag colloidal surface. The AG of physisorption of the Ag(I1)- TPPC4 species is apparently not sufficient for removing the phosphate from the surface.
Adsorption of Porphyrins via the Triton X- 100 Molecular Spacer As Compared to Their Direct Adsorption. The SERRS spectrum of the synthetically prepared Ag(1I)TPPCd (Figure 1, spectrum A) shows that, using the nonionic surfactant Triton X-100 for modifying the Ag colloidal surface, high-quality SERRS spectra of a metalloporphyrin can be obtained. Systems with Triton X-100 thus provide a unique possibility for measuring the SERS spectrum of an adsorbate which can form a SERS-active system neither by spontaneously and directly adsorbing on the surface nor by replacing the preaggregating agent.

9124 The Journal of Physical Chemistry, Vol. 97, No. 38, 1993 SERRS Investigations of Porphyrins
1500 1000 500
Ramon shift [ c m - ' 1 Figure 6. As in Figure 1, but with 488-nm excitation.
To elucidate the function of Triton X-100 in SERS-active systems with borohydride-reduced silver colloid and porphyrins, we compare here the Ag colloid/porphyrin SERS-active systems (systems 1 and 2) to the Ag colloid/Triton X-lOO/porphyrin systems (systems 3 and 4) with respect to the mechanism of their formation and of the fixation of the porphyrin at the surface.
Formation of the Ag colloid/Triton X- 1 OO/porphyrin SERS- active system is accomplished in a two-step process. In the first step, the SERS-active system Ag colloid/Triton X-100 is formed (within 3 days) by the spontaneous adsorption of Triton X-100 on the surface of Ag colloid. We have provenZo that the SERS spectrum of Triton X-100 consists of spectral bands belonging to the hydrophilic part of the Triton X-100 molecule, Le., to the poly(ethy1ene glycol) chain, which is coordinated to the surface of Ag colloid via the lone electron pairs of the oxygen atoms. The role of Triton X-100 in the first stage of the SERS-active system formation is thus simply analogous to that of a preaggregating agent, e.g., phosphate.
In the second step, the porphyrin is added to the Ag colloid/ Triton X- 100 system, and the SE(R)RS spectrum of the resulting Ag colloid/Triton X-lOO/porphyrin system can be measured within 1 h. Both the SERRS spectra of system 3 (Figure 7) and of system 4 (Figure 1, spectrum A; Figure 6, spectrum A) are dominated, respectively, by the spectral features of f.b. TPPC4 and Ag(II)TPPCd, while almost no spectral features of Triton X- 100 are observed. However, Triton X- 100 must evidently be present at the surface, otherwise the f.b. TPPC4 would be adsorbed directly on the surface in the form of Ag(II)TPPC4 while Ag- (1I)TPPCd (synth) would not be adsorbed at all. The decrease of the SERS signal of Triton X-100 in systems with porphyrins can be explained by the absorption of both the incoming and the scattered radiation by the porphyrin molecules and by the substantially higher intensity of Raman scattering by porphyrins in comparison to Triton X-100 stemming from the contribution of the resonance enhancement of Raman scattering.
The fundamental differences between the SERRS spectra of system 1 (Figures 1 and 6, spectra B) and system 3 (Figure 7) containing the free base TPPC4, as well as between the SE(R)RS spectra of system 2 (not shown but analogous to Figure 3, spectrum
A) and system 4 (Figures 1 and 6, spectra A) involving the Ag- (II)TPPC, (synth), clearly demonstrate that both the second step of formation and the structure of the resulting SERS-active systems must be markedly different for systems 3 and 4 in comparison to systems 1 and 2. For systems 1 and 2, the final form of the SERS-active system is a result of the competitive adsorption-desorption process involving the porphyrin and the phosphate. The surface is thus covered by the more strongly binding species. When its concentration is not sufficient to cover the entire surface, coadsorption of a second component is observed. In systems 3 and 4, Triton X-100 and the porphyrin are also simultaneously present at the surface. However, in this case, only the surfactant is directly bound to the surface, while the porphyrin does not show any perturbation by a direct chemical interaction with the surface, as is most clearly demonstrated for the free base TPPC4 (Figure 7). In the SERS-active system involving Triton X- 100, the porphyrins are not bonded directly to the surface but still experience a strong enhancement of the Raman scattering.
The only plausible explanation of this observation emerges when we consider systems 3 and 4 to be organized molecular systems in which Triton X-100 molecules form a spacer between the surface of the Ag colloid and the porphyrin molecules. The molecules of Triton X-100 thus possess a distinct structure functional characteristic which is not possessed by phosphate. The experimental results so far obtained indicate that this particular characteristic is the ability to attract porphyrin molecules. We have shown previously2O that the hydrophobic part of the Triton X-100 molecule is engaged in the interaction of Triton X-100 with f.b. TPPC4. Further evidence in favor of the hydrophobic interaction between the hydrophobic part of Triton X-100 and the porphyrin macrocycle is now provided by the fact that system 4 is formed by the same mechanism as system 3 and that both the free base and the metallated porphyrins interact with Triton X-100 in the same manner.
Furthermore, a series of experiments which will be described in detail elsewhere3' has shown that the SERRS spectra of systems formed by the simultaneous addition of Triton X-100 and the f.b. TPPC4 to Ag colloid differ substantially from those of system 3,

VlEkovA et al. The Journal of Physical Chemistry, Vol. 97, No. 38, 1993 9725
1500 1000 500
Roman shi f t [cm- '1
Figure 7. Comparison of the SE(R)RS spectra of free base TPPC4 in Ag colloid/Triton X-lOO/f.b. TPPC4 system excited with (A) 514.5 nm and (B) 488 nm.
as they consist dominantly of spectral features of the metallated form of the porphyrin. The second condition necessary for the formationof the Ag colloid/Triton X-l00/porphyrin SERS-active system as an organized, supramolecular assembly is thus em- ployment of the two-step prepration process described in detail above.
The first step of organization is the chemisorption of all the Triton X- 100 molecules via their poly(ethy1ene glycol) chains and the formation of an organized matrix of oriented Triton X- 100 molecules on the surface. In the second stage, the porphyrin molecules added to the system are attracted from solution to the other, hydrophobic part of the assembly of oriented Triton X- 100 molecules and attached to it by hydrophobic interactions.
Finally, thedistinct advantages of the system withTriton X-100 for chemical analysis must be emphasized. The principal drawbacks of systems with directly adsorbed porphyrins in prospective analytical applications are (i) the coadsorption of f.b. porphyrin and phosphate for porphyrin concentrations c < 5 X lo-' M and (ii) the dependence of the state of aggregation of the system (demonstrated by surface plasmon absorption curve) and, consequently, of the SERS enhancement factor on the porphyrin concentration. The intensity of the SERS signal thus becomes a rather complicated function of the porphyrin concentration and cannot, therefore, be used in quantitative analysis. In contrast to this, the Ag colloid/Triton X-lOO/porphyrin system is formed by the adsorption of Triton X-100, and its surface plasmon absorption is not substantially affected by the concentration of the porphyrin added to the system. The problem of the dependence of the SERS enhancement factor on the analytical concentration of the porphyrin can thus be successfully overcome in the SERS- active systems with Triton X-100. Moreover, the detection limit of f.b. TPPC4 in the system with Triton X-100 is 500 fmol for the detection of the porphyrin by its most intense spectral band at 327 cm-1 and 4 pmol for obtaining the complete SERRS spectrum (514.5-nmexcitation, single scan). This detection limit can by no means be achieved in the system with f.b. TPPC4 adsorbed directly on the surface. Analytical application of systems with TritonX-100is currentlybeinginvestigatedinour laboratory.
Assignment of the SEW-Active Vibrational Modes of A g (II)TPPC, and Free Base TPPCb Analogues of all the RR- active spectral bands of Ag(I1)TPP (at 457.9-nm excitation)23 are observed as the most intense bands in the SERRS spectra of both the Ag(I1)TPPCd surface species (measured at excitations of 454.5,488, 514.5, and 584 nm-Figures lB, 6B) and of Ag- (II)TPPC, (synth) (obtained with the 488- and 514.5-nm excitations-Figures 1 A, 6A). Furthermore, the vibrational frequencies of the SERRS-active modes of Ag(II)TPPC, species correspond very well to the frequencies of the AI, modes of the porphyrin macrocycle in the RR spectra of NiTPP.35 The latter analogy prompted us to use the correspondence between the vibrational frequencies calculated for NiTPP by Spiro et al.35 and those obtained from the SERRS spectra of Ag(II)TPPC4 as the basis for the assignment of spectral bands of Ag(II)TPPC,. It should be mentioned that the NCAcalc~lat ion~~ was performed for the NiTPP molecule of D4h molecular symmetry in which the phenyl rings adopt the perpendicular orientation with respect to the porphyrin macrocycle.
The assignment of bands of AI, porphyrin core modes in the SERRS spectra of Ag(II)TPPC* species (Figures 1 and 6) is presented in Table I. The assignment of the other spectral bands is somewhat complicated by a close frequency match between the non-totally-symmetric porphyrin core modes and the phenyl ring mode~,3~ as demonstrated by the following discussion. The resulting tentative assignment is listed in Table I (together with the discussed alternatives in brackets).
1. Phenyl Ring In-Plane Modes. The 1605-cm-l band is observed in the SERRS spectra of both Ag(II)TPPC4 species at all the excitation wavelengths listed above, showing an apparent intensity gain when the excitation wavelength is moved to the blue spectral region (Figure 6). The frequency of this vibration is close both to that of the 44 phenyl in-plane mode (calcd 1607, 1599,1605 cm-1) and to that of the YIO (BI,) porphyrin core mode (calcd 1607 cm-I) in the NCA of NiTPP.35 Analogous bands are observed in both the RR22 and SERRS spectra of f.b. TPPC4 (Figure 7) at 1609 and 1605 cm-', respectively. Thevibrational frequency of this mode in the free base porphyrin is thus nearly

9726 The Journal of Physical Chemistry, Vol. 97, No. 38, 19
TABLE I: Assi ent of Bands Observed in the SER(R)S Spectra of Ag(IIKPC4 (Both the Surface Complex and the Synthetically Prepared One) Using Assignment of RR Spectra of NiTPP in Ref 35 as a Guideline
in-plane modes (AI.) out-of-plane modes (E.) Porphyrin Core
1538 v2
1344 v4 1237 V I
1078 v9
894 u7 390 vg
732 YZS [YZS (A2g)l 1494 u3 567 7 2 1
1011 U6
Phenyl Ring 1605 04 [VIO ( B ~ g ) l 967 TI 1490 $5 837 ~2 1183 06 [u34 (B1g)1 707 r 3
659 415 US
646 09 68 1
375 phenyl400- mode 1142
0 Wavenumbers in cm-l.
identical to that in the corresponding metalloporphyrin. This observation disfavors the assignment of this band to the v10 mode, for which a significant frequency difference between the met- allated and free base form of the porphyrin is generally observed.37 On the other hand, the frequencies of the phenyl in-plane mode in the RR spectra of Ag(I1)TPP and f.b. TPP23 are very close, the bands being positioned at 1597 and 1599 cm-l, respectively. Due to this analogy, the 1605-cm-1 band of Ag(I1)TPPCd is tentatively assigned to the 44 phenyl in-plane mode.
The frequency of the 1183-cm-I mode of Ag(II)TPPC4 approaches both that of the 46 phenyl ring in-plane mode of NiTPP (calcd 1199, 1200, 1199 cm-l) and that of the u34 (Bz,) porphyrin core mode (calcd 1169 cm-l, observed 1190 cm-l). No analogue of this band is observed in the RR spectrum of Ag- (II)TPP, while a very weak band is observed in its SERRS spectrum.23 On the other hand, while the band is observed in the RR spectrum of f.b. TPPCdZ2 at 1183 cm-I, it is absent in the SERRS spectrum of f.b. TPPC, (Figure 7). Should the band belong to the v34 mode (BI) of f.b. TPPC4, which can be resonance enhanced only by the B-term mechanism upon excitation into the Q-electronic absorption band, it would not appear in the RR spectrum excited at 457.9 nm.22 Theassignment of the 11 83-cm-1 band to the 46 phenyl mode is thus favored.
The frequencies of the two weak, but clearly distinguished, bands at 646 and 659 cm-l in Figures 1 and 6 are close to that of the 49 phenyl in-plane mode of NiTPP (calcd 619,631,650; observed 639 cm-I). This mode is supposed to gain intensity via vibrational coupling with the u7 porphyrin core in-plane mode at 894 cm-1. The large frequency difference between 49 and v7 is the result of their strong vibrational coupling.35 The activation of the 646- and 659-cm-I bands via the vibrational coupling of v7 to 49 is witnessed by comparison to the SERRS spectrum of f.b. TPPC, (Figure 7), in which the substantial intensity decrease of v7 is accompanied by disappearance of both 646- and 659-cm-l bands.
2. Phenyl Ring Out-ofplane Modes. A very weak band at 967 cm-I is observed in the SERRS spectrum of Ag(II)TPPC4 (synth) in the system with the Triton X-100 spacer (Figure 6, spectrum A). This band becomes substantially more intense in theSERRS spectrum of f.b. TPPC4 attached to the Triton X- 100 spacer (Figure 7) and appears also in the RR spectrum of f.b. TPPCd22 at 965 cm-1. The frequency of the corresponding vibrational mode is nearly coincident with the calculated fre- quencies of the x1 phenyl ring out-of-plane mode of NiTPP:35 964,961,962 cm-l. We thus attribute the 967- (965-) cm-1 band to the xl phenyl ring out-of-plane mode.
‘93 SERRS Investigations of Porphyrins
The 837-cm-1 band appears in the SERRS spectra of Ag- (II)TPPC4at both 514.5- and 488-nmexcitations. An analogous band is observed in both the RRZ2 and the SERRS spectrum (Figure 7) 0ff.b. TPPC4at 822 cm-l. This frequencycorresponds well to the calculated frequencies of the x2 modes of NiTPP: 823, 850, 827 cm-l.35
The two bands at 707 and 681 cm-l shown in Figures 1 and 6 have corresponding counterparts at 701 and 684 cm-’ in the RR spectrum of NiTPPaS5 Accordingly, they are assigned to the x3 out-of-plane phenyl mode (calcd 718 ~ m - l ) . ~ ~ Only one band at 701 cm-1 is observed for the f.b. TPPC4 in Figure 7 without any counterpart in the RR spectrumaZ2
The frequency of the 496-cm-I band which appears selectively in the SERRS spectrum of f.b. TPPC4 matches well that of the x4 mode of NiTPP observed at 498 cm-1 (calcd 474,441, 430).35
The a5 mode (calcd 388,384,391) is observed at 390 cm-l for NiTPP.35 We assume that the two bands at 415 and 375 cm-l in the SERRS spectra of both Ag(II)TPPC4 and f.b. TPPC4 could possibly belong to this mode.
3. Porphyrin Core Out-ofplane (oop) Modes. For the 732-cm-1 band observed in SERRS of Ag(II)TPPC4 species (Figures 1 and 6), the only suitable counterpart which can be found in the NCA interpretation of the RR spectra of NiTPP35v36 is the 737-cm-1 band attributed to the yzs (EB) porphyrin core out-of-plane (oop) mode. Another candidate for the oop mode band is that at 567 cm-I observed specifically in SERRS of Ag- (II)TPPC4 surface complex (Figures 1 and 6, spectra B). This band can correspond to the 552-cm-I band of the 7 2 1 (E,) mode of NiTPP.35
All the oop porphyrin core modes can become resonance Raman active only upon lowering the D4h molecular symmetry of the metalloporphyrin. However, the oop modes of E, symmetry are normal Raman active in the D4h point group and can thus be observed due to the surface enhancement of Raman scattering by the electromagnetic mechanism.
The 1140-cm-l band does not have any suitable counterpart in the NCA of NiTPP.35 Moreover, this band appears to be typical for the TPPC4 species, both free base and metallated. It is observed in the SERRS of all of the TPPC4 species investigated (Figures 1,6, and 7) and also in the RR spectrum of f.b. TPPC422 (at 1132 cm-I), but it is absent in the SERRS as well as the RR spectra of both TPP and Ag(II)TPP.23 We suggest that the band might belong to the p h e n y l 4 0 0 stretching mode.
Structure and Orientation of the Scattering Porphyrin Species and the Mechanisms of the Enhancement of Raman Scattering As Determined from the SERRS Spectra. 1 . SERRS Spectra of Ag(Il) TPPC4 andf.6. TPPC4 Compared to Their RR Spectra. Beside the bands of porphyrin core in-plane modes and of the 44 modeat 1605 cm-I, theSERRS spectraofAg(II)TPPC4 (Figures 1 and 6) also contain additional bands which do not have clearly distinguishable counterparts in the RR spectrum of Ag(I1)TPP.z’ On the other hand, analogues of several of these additional bands areobserved in theSERRSspectrumof Ag(I1)TPPin thelayered str~cture.~’ In particular, the 681-, 707-cm-l bands of the x3 mode correspond to the 704-cm-1 band; the 646-, 659-cm-l bands of 99 to the 639-cm-I band, and the 567-cm-I band of 7 2 s to the 561-cm-I band. Thus, all three categories of additional bands observed in SERRS of Ag(II)TPPC4 are present also in SERRS of Ag(I1)TPP.
Comparison of the SERRS spectra of the f.b. TPPC4 (Figure 7) to the RR spectraz2 shows that all the bands reported for the RR spectrum are observed in the SERRS spectrum, with the only exception being the 1183-cm-I band of 96 which is absent. On the other hand, two additional bands of phenyl out-of-plane modes are observed in the SERRS spectrum: ~3 at 701 cm-I and a 4 at 496 cm-I. This comparison confirms that by using the Triton X- 100 molecular spacer we obtain a high-quality surface- enhanced resonance Raman spectrum of the unperturbed f.b.

VlEkovi et a]. The Journal of Physical Chemistry, Vol. 97, No. 38, 1993 9121
originates from the effect of the surface on the electronic structure of the surface complex. Two possibilities for such effect can be envisaged: either the existence of a charge-transfer transition between the Ag(1I)TPPCd surface complex and the surface itself (represented, possibly, by residual Ag,l+ clusters) or a broadening of the Soret band of the metalloporphyrin (reported, e.g., in ref 38). Nevertheless, a detailed investigation of the SERRS excitation profile would be necessary to get a more detailed insight into the problem.
(4) The relative intensities of the bands of the vz mode at 1538 cm-l and of the 4 4 mode at 1605 cm-l in the SERRS spectra of the surface complex (spectra B in Figures 1 and 6) show a markedly different dependence on the excitation wavelength in comparison to the spectra of synthetic species (spectra A in Figures 1 and 6). At 514.5-nm excitation, the 1538-cm-I band of v2 shows the relative intensity decrease, while the relative intensity of the 1605-cm-l band of 44 increases. At 488-nm excitation, for which the overall intensity increase of the SERRS signal is observed for the surface complex, both bands show an apparent intensity increase.
According to ref 35, there is the vibrational coupling between the v2 totally symmetric porphyrin core in-plane mode and the 44 phenyl in-plane mode from which the resonance Raman activity of the phenyl ring mode stems. We consider the observed wavelength-dependent differences in relative band intensities of these two modes to originate from a difference in the orientation of phenyl rings in the surface complex and in its synthetic analogue. For perpendicular orientations of phenyl rings with respect to the porphyrin macrocycle, which is assumed in the NCA for NiTPP,35 the 44 in-plane phenyl ring mode can gain its RR intensity entirely via the vibrational coupling with the neighboring porphyrin core in-plane mode of AI, symmetry, Le., v2. The perpendicular orientation of phenyl rings, however, can hardly be anticipated for the surface complex. The close proximity of the surface will tend to orient the phenyl rings into the coplanar orientation with the surface and thus, consequently, also with respect to the porphyrin macrocycle. Nevertheless, the ideal coplanarity of the phenyl rings and the porphyrin macrocycle cannot be achieved due to steric hindrance. We assume that in the surface complex the phenyl rings will adopt fixed positions characterized by a general angle with respect to the porphyrin macrocycle plane, the value of which will be a compromise between the orienting effect of the surface and the molecular steric hindrance effect. In that case, the mutual interaction between the electronic energy levels of the porphyrin macrocycle and the phenyl rings may be possible. In the surface complex, the phenyl ring modes can thus, presumably, gain RR intensity also directly via participation of phenyl coordinates in the potential energy surface of the resonant excited state.
3. Ag Colloid/ Triton X-lOOIAg(II) TPPC4 (synth) System As Compared to the Ag ColloidlTriton X-lOO/f.b. TPPC4 System. SERRS spectra of two chemically different species investigated in the analogous SERS-active systems with Triton X-100 as a molecular spacer are compared. As the surface plasmon absorption curves are similar for both systems and the scattering species are located at the same distance from the surface given by the dimensions of the molecular spacer, similar values ofthesurfaceenhancement factor can beexpected for both species. The spectroscopically most relevant difference between the two porphyrin species is their molecular symmetry, which is D4h for Ag(II)TPPC4 and D2h for f.b. TPPC,. This difference affects the symmetry properties of both molecular vibrations and electronic transitions and results in the different conditions of the resonance enhancement of Raman scattering for each of the species. Consequently, while the 5 14.5-nm excitation line is quite far removed from the maximum of the Q-band of Ag(II)TPPC4 at 542 nm, it is quite close to the maximum of the Q-band of f.b. TPPC4 at 521 nm. On the other hand, the 488-nm excitation is
TPPC4 species. Unfortunately, we are not able to determine the surface enhancement factor, as we have not succeeded in obtaining the RR spectrum of f.b. TPPC, in solution. Nevertheless, the 5oO-fmol detection limit of f.b. TPPC4 in the system with Triton X-100 signifies a surface enhancement of about 5 orders of magnitude.
2. Ag Colloid/Ag(Il) TPPC4 (Surface Complex) System As Compared to the Ag Colloid/ TritonX-1 OO/Ag(Il) TPPC4 (synth) System. The SERRS spectra of the same species, i.e., Ag(I1)- TTPC4, are compared in two different types of SERS-active system. While the same contribution of the resonance enhance- ment of Raman scattering is expected, the contribution of the surface enhancement of Raman scattering is different in both systems due to the difference in the surface plasmon absorption of the respective SERS-active systems at a given excitation wavelength, as well as due to the difference in the distance of the scattering species from the surface. The spectra of both the Ag- (II)TPPC4 species obtained at 5 14.5-nm excitation are compared in Figure 1A,B and those excited at 488 nm in Figure 6A,B.
The intensities of bands in each spectrum have been related to that of the 1342-cm-l band of v4 chosen as an internal intensity standard. This band is not affected by changes in the position of the central Ag atom with respect to the porphyrin macrocycle plane upon aging of the Ag colloid/Ag(II)TPPC4 (surface complex) system2] (system 1) and is not coupled to any of the phenyl modes.35
The results of the comparison are summarized as follows: (1) The differences between the SERRS spectra of the surface
complex and the synthesized species are reduced to minor relative intensity changes. The matching frequencies of the vibrational modes signify that the two species possess the same ground-state structures of the porphyrin core units. This explanation is further confirmed by comparing the mutual intensity ratios of the 390- and 1345-cm-1 bands observed in their SERRS spectra. This intensity ratio is considered to be a sensitive indicator of minor changes of the position of the Ag central atom with respect to the porphyrin macrocycle plane, which are characteristic, e.g., of the "aging" of system 1 .*l The values of this ratio are equal for spectrum A and spectrum B in Figure 1 as well as for spectra A and B in Figure 6. The position of the Ag central atom with respect to the porphyrin macrocycle in the aged form of the surface complex is thus identical with that in the synthetically prepared silver metalloporphyrin. Consequently, the process of aging of system 1 is interpreted as the formation of the equilibrium form of the surface complex.
(2) With 514.5-nmexcitation,all the bandsattributed tophenyl ring in-plane (@), phenyl ring out-of-plane (T), and porphyrin core oop modes (7) are relatively more intense in the SERRS spectrum of the surface complex (Figure 1, spectrum B) than in SERRS of the synthetic species (Figure 1, spectrum A) which is distanced from the surface by the molecular spacer. Thus, the close proximity of the surface causes an increase in the enhance- ment of the above modes as a result of the electromagnetic mechanism.
(3) In the SERRS spectra measured with 488-nm excitation (Figure 6), the trends in relative band intensities originating from the close proximity of the Ag(I1)TPPCd species to the surface are similar to those observed with 514.5-nm excitation (Figure 1). In the former case, however, an approximate 1.5-fold increase in the absolute band intensities is observed for the surface complex (spectrum B in Figure 6) as compared to the synthetic species (spectrum A in Figure 6). This intensity increase evidently does not originate from the changes in the surface plasmon absorption of the two SERS-active systems at this wavelength, as a steeper increase of the surface plasmon absorption curve from 514.5 nm to 488 nm is observed for the synthetic species in the system containing Triton X-100 than for the surface complex. We suggest that the increase of the spectral intensity
9728 The Journal of Physical Chemistry, Vol. 97, No. 38, 1993 SERRS Investigations of Porphyrins
quite far from the Soret band of both species positioned at 421 nm for Ag(II)TPPC4 and at 414 nm for f.b. TPPC4.
SERRS spectra of Ag(I1)TPPCd (Figures 1 and 6) and f.b. TPPC4 (Figure 7) provide a good opportunity for vibrational spectroscopic comparison between a metalloporphyrin and the corresponding free base porphyrin. The differences observed have their origin in two effects:
(i) Metallation/Demetallation Effect. Instead of the 390- (vg) and 1342-cm-1 (v4) bands characteristic for the metallopor- phyrin, a sharp band at 327 cm-1 and a doublet at 1331 and 1362 cm-l are observed for the free base form. The 1538-cm-l (UZ) band of the metalloporphyrin is shifted to 1555 cm-’.
(ii) IncreaselDecrease of Molecular Symmetry. Lowering of molecular symmetry from D4h of Ag(1I)TPPCd to Dzh of f.b. TPPC4 is projected into the SERRS spectra by the following spectral changes: the very weak band at 1440 cm-l in Ag(I1)- TPPC, gains intensity and actually splits into a doublet (1440, 1458 cm-I). This band may belong to the v11 (B1, in the NCA of NiTPP’S) which, in D2h symmetry of the free base porphyrin, becomes totally symmetric (A,). The other typical features are the development of the 965-cm-l band of ul and the 496-cm-l band of u4. As the bands of 12,u3, and 1 ~ 5 are also observed at 822,701, and 415 cm-l, respectively, the SERRS spectra of f.b. TPPC4 (Figure 7) contain a complete set of phenyl ring out-of- plane phenyl modes calculated by the NCA for NiTPP.35 On the other hand, the bands attributed to phenyl ring in-plane modes (4) are either missing (the 1183-cm-l band of 4.5 and the 646-, 659-cm-1 bands of 49) or show a substantial intensity decrease (the 1605-cm-’ band of 44) in the SERRS of the f.b. TPPC4. Loss of intensity is observed also for the 890-cm-’ band of u7 porphyrin core in-plane mode (AI, symmetry, 43% of phenyl in-plane coordinates in the NCA of NiTPP3*J6), which actually splits into a weak doublet at 890 and 874 cm-1. The second component of the doublet may belong to the U1.5 porphyrin core in-plane mode which is of A, symmetry in the DZh point group.
The most prominent feature in the SERRS spectrum of f.b. TPPC4 in comparison to that of Ag(I1)TPPCd is thus the intensity gain of the phenyl out-of-plane modes and intensity loss of the phenyl in-plane modes. This effect can be understood as a consequence of the lowering of molecular symmetry. In the DZh point group, the original AI, components of the phenyl ring in- plane modes and the B1, components of the out-of-plane phenyl ring modes can no longer be distinguished, as both types of phenyl ring modes now contain the totally symmetric A, component. Consequently, both the in-plane and out-of-plane phenyl ring modes can gain their intensity via vibrational coupling to totally symmetric porphyrin core modes in the f.b. porphyrin molecule. Changes in the relative band intensities of the in-plane and out- of-plane phenyl modes can be observed also in the RR spectra of f.b. TPP and Ag(II)TPP.23 Nevertheless, the effect observed in theSERRSspectra0ff.b. TPPC4andAg(II)TPPC4isevidently more pronounced.
Conclusions Two alternative approaches to the SERRS spectral investigation
of both the free base TPPCd and Ag(I1)TPPCd porphyrins in systems with the borohydride-reduced Ag colloid as the SERS- active surface are compared. The investigations carried out under the conditions of direct adsorption of porphyrins show that the SERS-active systems are not formed by the direct adsorption of a porphyrin but by preaggregation of silver colloid by phosphate anions introduced to the system as a phosphate buffer. Obser- vation of the SERRS spectrum of the porphyrin is conditioned by the replacement of the phosphate on the surface of Ag colloid by the porphyrin. This step is accomplished provided that the AG value of adsorption of the porphyrin is higher than that of the phosphate. The condition is evidently fulfilled for the f.b. TPPC4, for which the high value of AG of adsorption originates
from chemisorption, Le., from formation of the Ag(II)TPPC4 surface complex. The formation of the surface complex was proven by SERRS and UV-vis absorption spectra. On the other hand, the condition is not fulfilled for the Ag(I1)TPPCd met- alloporphyrin synthetically prepared, which could only physisorb on the silver surface. Furthermore, it is shown that the complete replacement of phosphate on the surface is possible only when the concentration of the f.b. TPPC4 in the system is higher than the minimum concentration necessary for covering the entire surfaceof Agcolloid by porphyrin molecules which wasestimated as 3.8 X l C 7 M (in approximation of 100% adsorption).33 This estimate corresponds quite well to the 5 X IC7 M value of the experimentally established limiting concentration of f.b. TPPC4, above which only theSERRS signalof thef.b. porphyrin (without interference of phosphate) is observed. The results indicate that a rather drastic change in the adsorbate structure, Le., metallation of a free base porphyrin, is required to achieve the direct adsorption of the adsorbate on the surface of silver colloid in systems formed by the preaggregation mechanism.
In contrast to that, in systems with a molecular spacer the adsorption ability of a porphyrin molecule with respect to the Ag surface and/or the alteration of its structure by chemical interaction with the surface no longer represent a problem, as only the mutual attractive interaction between the spacer and the adsorbate together with the two-step procedure of the organized SERS-active system formation is important for obtaining high- quality SERRS spectra of the unperturbed porphyrins. The existence of an adsorbate-spacer attractive interaction represents the principal difference between a molecular spacer (e.g., Triton X-100) and a preaggregating agent (e.g., phosphate). Weak, nonspecific spacer-adsorbate interactions (as, e.g., the hydro- phobic interaction between Triton X-100 and porphyrin) are preferred, as only weak, nonspecific changes (analogous to physisorption) are thus induced in the adsorbate molecule. This fact is demonstrated by the analogy between the SERRS spectra of f.b. TPPC4 and Ag(1I)TPPCd obtained in the Ag colloid/ Triton X-lOO/porphyrin system and their RR spectra pub- li~hed.~2.23
Furthermore, the distinct advantage of the Ag colloid/Triton X- 1 OO/porphyrin SERS-active systems is their defined and reproducible formation without a pronounced dependence on the porphyrin concentration and without interference of the solvent, Le., the phosphate buffer. These characteristics together with the very low detection limits (500 fmol for detection of f.b. TPPC,, 4 pmol for its complete SERRS spectrum in single spectral scan) make systems with molecular spacers generally attractive for analytical applications of SERS and SERRS spectroscopies.
Finally, the SERRS spectra of the Ag(II)TPPC4 surface complex in comparison to those of its synthetically prepared analogue (1) demonstrate thestructural identity of the porphyrin core parts of both species, (2) suggest possible surface-induced differences in the orientations of the phenyl rings with respect to the porphyrin macrocycle, and (3) indicate a more pronounced effect of the surface on the electronic structure of the Ag(I1)- TPPCd surface complex (located directly on the surface) in comparison to the Ag(II)TPPC4 synthetic species distanced from the surface by the Triton X-100 molecular spacer.
In conclusion, introduction of molecular spacers eliminates the crucial problem of SERS and SERRS spectroscopies of biomolecules represented by the possibility of an alteration of the structure and the function of a biomolecule by the chemical interaction with the surface. The systematic investigation and development of molecular spacers tailored specifically for the particular chemical type of adsorbate can thus be envisaged as a new, prospective direction in SERS and SERRS spectroscopies of systems with metal colloids.
Acknowledgment. We thank Dr. Vladimfr Krll of the Institute of Organic Chemistry and Biochemistry, Prague, for the synthesis
VlEkov6 et al. The Journal of Physical Chemistry, Vol. 97, No. 38, 1993 9729
of both the free base TPPC, and Ag(II)TPPC4, and we thank Prof. D. J. Stukens of Universiteit van Amsterdam for the use of his spectral facilities for the measurement of the SERRS spectrum of Ag(1I)TPPCd surface complex at the 584-nm excitation.
References and Notes ( 1 ) Moskovits, M. Rev. Mod. Phys. 1985, 57, 783. (2) Creighton, J. A. In SpectroscopyofSurfaces; Clark, R. J. H., Hater,
(3) Creighton, J. A.; Blatchford, C. G.; Albrecht, M. G. J. Chem. Soc.,
(4) Moskovits, M. J . Chem. Phys. 1978, 69, 4159. ( 5 ) Fornasiero, D.; Grieser, F. J . Chem. Phys. 1987, 87, 3213. (6) Moskovits, M.; Suh, J. S . J . Phys. Chem. 1984,88, 5526. (7) Laserna, J. J.; Torres, E. L.; Winefordner, J. D. Anal. Chim. Acta
(8) Heard, S. M.; Grieser, F.; Barraclough, C. G. Chem. Phys. Lerr.
R. E., Eds.; John Wiley & Sons: New York, 1988; p 37.
Faraday Trans. 2 1979, 75,790.
1987, 200, 469.
m j , 9 5 , 154. (9) Roy, D. E.; Furtak, T. E. Chem. Phys. Lett. 1986, 124, 299.
(10) Watanabe, T.; Kawanami, 0.; Honda, K. Chem. Phys. Lett. 1983, 102. 565.
m j , 9 5 , 154. (9) Roy, D. E.; Furtak, T. E. Chem. Phys. Lett. 1986, 124, 299.
(10) Watanabe, T.; Kawanami, 0.; Honda, K. Chem. Phys. Lett. 1983, 102. 565.
( 1 1) Creighton, J. A. Surf. Sci. 1983, 124, 209. (12) Kim, M.; Itoh, K. J. Electroanal. Chem. 1985, 188, 137. (13) Dornhaus, R.; Long, M. B.; Benner, R. E.; Chang, R. K. Surf. Sci.
(14) Suh, J. S.; Michaelian, K. H. J . Phys. Chem. 1987, 91, 598. (15) Lehn, J. M. Angew. Chem. h r . Ed. Engl. 1988, 27, 89. (16) Cotton, T. M. In Spectroscopy ofsurfaces; Clark, R. J. H., Hater,
R. E., Eds.; John Wiley & Sons: New York, 1988; p 91. (17) Murayama, A.; Oka, Y.; Fujisaki, H. Surf. Sci. 1985, 158, 222. (18) Weaver, M. J.; Gao, P.; Gosztola, G.; Patterson, M. I.; Tadayyoni,
M. A. In Excited States and Reactive Intermediates; Lever, A. B. P., Ed.; ACS Symposium Series; American Chemical Society: Washington, DC, 1986; p 135 and refs therein.
1980, 93, 240.
(19) Rospendowski, B. N.; Schlegel, V. L.; Holt, R. L.; Cotton, T. M. In Charge and Field Effects in Biosystems-2; Allen, M. J., Cleary, S. F., Hawkridge, F. M., Eds.; Plenum, 1989; p 43.
(20) Matgjka, P.; VIEkovB, B.; Vohlldal, J.; PanWka, P.; Baumruk, V. J . Phvs. Chem. 1992.96. 1361. . .
(21) VlEkovB, B.; Matgjka, P.; PanWka, P.; Baumruk, V.; KrB1, V. Inorg.
(22) Cotton, T. M.; Schultz, S. G.; van Duyne, R. P. J. Am. Chem. SOC. Chem. 1991,30,4103.
1982,104, 6528. (23) (a) Kobayashi, Y.; Itoh, K. J. Phys. Chem. 1985, 89, 5174. (b)
Shoji, K.; Kobayashi, Y.; Itoh, K. Chem. Phys. Lerr . 1983, 102, 179. (24) Itabashi, M.; Kato, K.; Itoh, K. Chem. Phys. Lett. 1983, 97, 528. (25) Itabashi, M.; Masuda, T.; Itoh, K. J. Electroanal. Chem. 1984,165,
(26) Itoh, K.; Sugii, T.; Kim, M. J. Phys. Chem. 1988.92, 1568. (27) Kim, M.; Tsujimo, T.; Itoh, K. Chem. Phys. Lett. 1986, 125, 364.
265.
(28) Mou, Ch.; Chen, D.; Wang, X.; Zhang, B.; He, T.; Xin, H.; Liu, F. Chem. Phys. Lett. 1991,179,237.
(29) Spiro, T. G.; Czemuszewitz, R. S.; Li, X.-Y. Coord. Chem. Rev.
(30) Longo, F. R.;Sinarelli, M. G.; Kim, J. B. J . Heterocycl. Chem. 1969,
(31) Ahern, A. M.; Garrell, R. L. Anal. Chem. 1987, 59, 2816. (32) Bok, J.; Praus, P.; Stiphek, J.; Baumruk, V. Computer Phys.
(33) Simonov6, J. MSc. Thesis, Charles University, Prague, 1991. (34) Mat6jka, P.; VIEkovd, B.; Baumruk, V. Manuscript in preparation. (35) Li, X.-Y.; Czernuszewitz, R. S.; Kincaid, J. R.; Su, 0.; Spiro, T. G.
(36) Li, X.-Y.; Czernuszewitz, R. S.; Kincaid, J. R.; Spiro, T. G. J . Am.
(37) Li, X.-Y.; Zgierski, M. Z. J. Phys. Chem. 1991, 95, 4268. (38) PanEollka, P.; Urbanova, M.; BednBrovB, L.; Vacek, K.; Paschenko,
V. Z.; Vasiliev, S.; Maloil, P.; KrB1, V. Chem. Phys. 1990, 147, 401.
1990,100, 541.
6, 927.
Commun. 1988,50, 225.
J. Phys. Chem. 1990,94, 31.
Chem. Soc. 1989,111,7012.