Supply Chain Networks and Electronic Commerce: A Theoretical Perspective
47
Supply Chain Networks and Electronic Commerce: A Theoretical Perspective Anna Nagurney and Jon Loo Department of Finance and Operations Management Isenberg School of Management University of Massachusetts Amherst, Massachusetts 01003 June Dong and Ding Zhang Department of Management and Marketing College of Business SUNY at Oswego Oswego, New York 13126 April 2001; revised April 2002 Appears in Netnomics 4 (2002), pp. 187-220. Abstract: In this paper, we develop a framework for the formulation, analysis, and compu- tation of solutions to supply chain network problems in the presence of electronic commerce. Specifically, we consider manufacturers who are involved in the production of a homogeneous product and can now sell and have delivered the product not only to retailers but also directly to consumers. In addition, the manufacturers can transact with the retailers electronically. We assume that both the manufacturers and the retailers seek to maximize their profits, whereas the consumers take both the prices charged by the retailers and the manufacturers, along with the associated transaction costs, in making their consumption decisions. We identify the network structure of the problem, derive the equilibrium conditions, and es- tablish the finite-dimensional variational inequality formulation. We then utilize variational inequality theory to obtain qualitative properties of the equilibrium pattern. In addition, we propose a continuous time adjustment process for the study of the disequilibrium dynamics and establish that the set of stationary points of the resulting projected dynamical system coincides with the set of solutions of the variational inequality problem. Finally, we apply an algorithm for the determination of equilibrium prices and product shipments in several supply chain examples. This paper synthesizes Business-to-Consumer (B2C) and Business- to-Business (B2B) decision-making in a supply chain context within the same framework. 1
Transcript of Supply Chain Networks and Electronic Commerce: A Theoretical Perspective

Supply Chain Networks and Electronic Commerce: A Theoretical Perspective
Anna Nagurney and Jon Loo
Department of Finance and Operations Management
Isenberg School of Management
University of Massachusetts
Amherst, Massachusetts 01003
June Dong and Ding Zhang
Department of Management and Marketing
College of Business
SUNY at Oswego
Oswego, New York 13126
April 2001; revised April 2002
Appears in Netnomics 4 (2002), pp. 187-220.
Abstract: In this paper, we develop a framework for the formulation, analysis, and compu-
tation of solutions to supply chain network problems in the presence of electronic commerce.
Specifically, we consider manufacturers who are involved in the production of a homogeneous
product and can now sell and have delivered the product not only to retailers but also directly
to consumers. In addition, the manufacturers can transact with the retailers electronically.
We assume that both the manufacturers and the retailers seek to maximize their profits,
whereas the consumers take both the prices charged by the retailers and the manufacturers,
along with the associated transaction costs, in making their consumption decisions. We
identify the network structure of the problem, derive the equilibrium conditions, and es-
tablish the finite-dimensional variational inequality formulation. We then utilize variational
inequality theory to obtain qualitative properties of the equilibrium pattern. In addition, we
propose a continuous time adjustment process for the study of the disequilibrium dynamics
and establish that the set of stationary points of the resulting projected dynamical system
coincides with the set of solutions of the variational inequality problem. Finally, we apply
an algorithm for the determination of equilibrium prices and product shipments in several
supply chain examples. This paper synthesizes Business-to-Consumer (B2C) and Business-
to-Business (B2B) decision-making in a supply chain context within the same framework.
1

1. Introduction
Electronic commerce (e-commerce), with the advent of the Internet Age, has had an
immense effect on the manner in which businesses, as well as, consumers order goods and
have them transported. The major portion of e-commerce transactions is in the form of
business-to-business (B2B) with estimates ranging from approximately .1 trillion dollars to
1 trillion dollars in 1998 and with forecasts reaching as high as $4.8 trillion dollars in 2003
in the United States (see Federal Highway Administration (2000), Southworth (2000)). The
business-to-consumer (B2C) component, on the other hand, has seen tremendous growth in
recent years but its impact on the US retail activity is still relatively small. Nevertheless,
this segment should grow to $80 billion per year (Southworth (2000)).
As noted by Handfield and Nichols (1999) and by the National Research Council (2000),
the principal effect of business-to-business (B2B) commerce, estimated to be 90% of all e-
commerce by value and volume, is in the creation of new and more profitable supply chain
networks. Recall that a supply chain is a chain of relationships which synthesizes and
integrates the movement of goods between suppliers, manufacturers, distributors, retailers,
and consumers.
The topic of supply chain analysis is multidisciplinary by nature since it involves aspects
of manufacturing, transportation and logistics, retailing/marketing, as well as economics. It
has been the subject of a growing body of literature with researchers focusing both on the
conceptualization of the underlying problems (see, e.g., Poirier (1996, 1999), Mentzer (2000),
Bovet (2000)), due to the complexity of the problem and the numerous decision-makers, such
as producers, retailers, or consumers involved in the transactions, as well as on the analytics
(cf. Bramel and Simchi-Levi (1997), Stadtler and Kilger (2000), and Miller (2001) and the
references therein).
The introduction of e-commerce has unveiled new opportunities in terms of research and
practice in supply chain analysis and management (see, e.g., Kuglin and Rosenbaum (2001)).
Indeed, the primary benefit of the Internet for business is its open access to potential suppliers
and customers both within a particular country and past national boundaries. Consumers,
on the other hand, may obtain goods, which they physically could not locate otherwise.
2
In this paper, we propose a theoretical framework for the study of supply chain networks
with electronic commerce in the form of B2C and B2B transactions. The framework is suf-
ficiently general to allow for the modeling, analysis, and computation of solutions to such
problems. Our perspective is based on Network Economics (cf. Nagurney (1999)) in that
we focus on the network interactions of the underlying decision-makers and on the underly-
ing competitive processes. Moreover, we emphasize the equilibrium aspects of the problems
rather than, simply, the optimization ones. Of course, we, nevertheless, assume that the
decision-makers in the supply chain behave in some optimal fashion. The equilibrium per-
spective provides a valuable benchmark against which existing prices and product shipments
can be compared against. For background on the economics of electronic commerce, see
Whinston, Stahl, and Choi (1997).
We consider manufacturers who are involved in the production of a homogeneous product
which can then be shipped to the retailers or the consumers directly or both. The manu-
facturers obtain a price for the product (which is endogenous) and seek to determine their
optimal production and shipment quantities, given the production costs as well as the trans-
action costs associated with conducting business with the different retailers and demand
markets. Note that we consider a transaction cost to be sufficiently general, for example, to
include the transportation/shipping cost. On the other hand, in the case of an e-commerce
link, the transaction costs can include the cost associated with the use of such a link, the
congestion, etc.
The retailers, in turn, must agree with the manufacturers on the volume of shipments,
either ordered physically or through the Internet, since they are faced with the handling cost
associated with having the product in their retail outlet. In addition, they seek to maximize
their profits with the price that the consumers being willing to pay for the product being
endogenous.
Finally, in this supply chain, the consumers provide the “pull” in that, given the demand
functions at the various demand markets, they determine their optimal consumption levels
from the various retailers and manufacturers, subject both to the prices charged for the
product as well as the cost of conducting the transaction (which, of course, may include
the cost of transportation associated with obtaining the product from the manufacturer or
3

retailer).
We establish that, in equilibrium, at which the manufacturers, the retailers, as well as
the consumers, have reached optimality, given the competition, the structure of the supply
chain network is that of a three-tiered network, with additional links connecting the top tier
(the manufacturers) with the bottom tier (the demand markets) to represent e-commerce
links and additional links from the top tier to the middle tier (the retailers) to also rep-
resent the e-commerce links. We then utilize the variational inequality formulation of the
governing equilibrium conditions to obtain qualitative properties of the equilibrium pattern.
In addition, we propose a continuous time adjustment process, formulate it as a projected
dynamical system (see Nagurney and Zhang (1996)), and establish that the set of station-
ary points coincides with the set of solutions to the variational inequality problem. The
dynamical system provides a means of studying the disequilibrium dynamics.
The paper is organized as follows. In Section 2, we present the supply chain network
model with electronic commerce, derive the optimality conditions for each set of network
agents or decision-makers, and then present the governing equilibrium conditions. We also
derive the finite-dimensional variational inequality formulation of the problem. The model
is an extension of the recently introduced supply chain network model of Nagurney, Dong,
and Zhang (2002) to the case of e-commerce with B2C and B2B transactions.
In Section 3, we provide qualitative properties of the equilibrium pattern and establish
the properties needed for proving convergence of the algorithm used for the numerical exam-
ples. In Section 4, we propose the projected dynamical system which describes the dynamic
adjustment process associated with the various decision-makers. In Section 5, we outline
the computational procedure, along with convergence results. The algorithm resolves the
network problem into subproblems, each of which can be solved exactly and in closed form.
In Section 6, we apply the algorithm to numerical supply chain examples in order to
determine the equilibrium product shipments and prices. We conclude the paper with a
summary and suggestions for future research in Section 7.
4

InternetLink
����1 ����
· · · j · · · ����n Retailers
����1 ����
· · · i · · · ����m
Physical Links
����1 ����
· · · k · · · ����o
?
@@
@@
@@R
PPPPPPPPPPPPPPPPq
��
��
�� ?
HHHHHHHHHHHj
���������������������9
����������������)
��
��
��
?
@@
@@
@@R
XXXXXXXXXXXXXXXXXXXXXz
��
��
�� ?
PPPPPPPPPPPPPPPPq
����������������)
������������
@@
@@
@@R
InternetLink
Physical
Link
Manufacturers
Demand Markets
Figure 1: The Multitiered Network Structure of the Supply Chain with E-Commerce atEquilibrium
2. The Supply Chain Network Model with Electronic Commerce
In this Section, we develop the supply chain network model with manufacturers, retailers,
and consumers in which the manufacturers can sell directly to the consumers at the demand
markets through the Internet and can also conduct their business transactions with the
retailers through the Internet. The depiction of the supply chain network at equilibrium,
which we establish in this Section, is as depicted in Figure 1.
Specifically, we consider m manufacturers involved in the production of a homogeneous
product which can then be purchased by n retailers and/or directly by the consumers located
at the o demand markets. We denote a typical manufacturer by i, a typical retailer by j,
and a typical demand market by k. Note that the manufacturers are located at the top tier
of nodes of the network, the retailers at the middle tier, and the demand markets at the
third or bottom tier of nodes.
The links in the supply chain network in Figure 1 include classical physical links as well
as Internet links to allow for e-commerce.
5

Note that the introduction of e-commerce allows for “connections” that were, heretofore,
not possible, such as allowing, for example, consumers to purchase a product directly from
manufacturers. In order to conceptualize this B2C type of transaction, we construct a direct
link from each top tier node to each bottom tier node. In addition, we consider the situation
in which the manufacturers can now transact not only with the consumers directly but also
with the retailers through the Internet. Hence, we also add an additional link between each
top tier node and each middle tier node to reflect the possibility of Internet transactions
between the manufacturers and the retailers. Thus, a manufacturer may now transact with
a retailer through either a physical link or through an Internet link, or both.
We now describe the behavior of the various economic decision-makers represented by
the three tiers of nodes in Figure 1. We first focus on the manufacturers. We then turn to
the retailers and, subsequently, to the consumers.
The Behavior of the Manufacturers and their Optimality Conditions
Let qi denote the nonnegative production output by manufacturer i. We group the
production outputs of all manufacturers into the column vector q ∈ Rm+ . We assume that
each manufacturer i is faced with a production cost function fi, which can depend, in general,
on the entire vector of production outputs, that is,
fi = fi(q), ∀i. (1)
In order to depict the allowable transactions of a typical manufacturer i with the con-
sumers at the demand markets and with the retailers, we provide a graphical depiction in
Figure 2. A manufacturer may transact with a retailer via a physical link, and/or via an
Internet link. We denote the transaction cost associated with manufacturer i transacting
with retailer j via link (also referred to as mode) l, where l = 1 denotes a physical link and
l = 2 denotes an Internet link, by cijl. We denote the product shipment associated with
manufacturer i, retailer j, and mode of transaction l by qijl, and we group these product
shipments into the column vector Q1 ∈ R2mn+ . In addition, a manufacturer i may transact
directly with consumers located at a demand market k with this transaction cost associated
with the Internet transaction denoted by cik and the associated product shipment from man-
6

Internet
Link ����1 ����
· · · j · · · ����n
Retailers
����i
����1 ����
· · · k · · · ����o
� � j
? ?
Internet
Link
Manufacturer
Demand Markets
Figure 2: Network Structure of Manufacturer i’s Transactions
ufacturer i to demand market k by qik. We group these product shipments into the column
vector Q2 ∈ Rmo+ .
We consider the situation in which the transaction cost between a manufacturer and retail
pair as well as the transaction cost between a manufacturer and consumers at a demand
market may depend upon the volume of transactions between each such pair, that is:
cijl = cijl(qijl), ∀i, j, l, (2a)
and
cik = cik(qik), ∀i, k. (2b)
The quantity of the product produced by manufacturer i must satisfy the following con-
servation of flow equation:
qi =n∑
j=1
2∑
l=1
qijl +o∑
k=1
qik, (3)
which states that the quantity produced by manufacturer i is equal to the sum of the quan-
tities shipped from the manufacturer to all retailers and to all demand markets.
7

The total costs incurred by a manufacturer i, thus, are equal to the sum of the manufac-
turer’s production cost plus the total transaction costs. His revenue, in turn, is equal to the
price that the manufacturer charges for the product (and the consumers are willing to pay)
times the total quantity obtained/purchased of the product from the manufacturer by all
the retail outlets and consumers at all demand markets. Let ρ∗1ijl denote the price charged
for the product by manufacturer i to retailer j who has transacted using mode l, and let ρ∗1ik
denote the price charged by manufacturer i for the product to consumers at demand market
k. We, later, discuss how these prices are arrived at.
Noting the conservation of flow equations (3), we can express the criterion of profit
maximization for manufacturer i as:
Maximizen∑
j=1
2∑
l=1
ρ∗1ijlqijl − fi(Q
1, Q2) −n∑
j=1
2∑
l=1
cijl(qijl) −o∑
k=1
cik(qik) −o∑
k=1
ρ∗1ikqik, (4)
subject to qijl ≥ 0, for all j, l, and qik ≥ 0, for all k.
We assume that the manufacturers compete in a noncooperative fashion. Also, we assume
that the production cost functions and the transaction cost functions for each manufacturer
are continuous and convex. Given that the governing optimization/equilibrium concept
underlying noncooperative behavior is that of Nash (1950, 1951), which states that each
manufacturer will determine its optimal production quantity and shipments, given the opti-
mal ones of the competitors, the optimality conditions for all manufacturers simultaneously
can be expressed as the following inequality (cf. Bazaraa, Sherali, and Shetty (1996), Gabay
and Moulin (1980); see also Dafermos and Nagurney (1987) and Nagurney (1999)):
m∑
i=1
n∑
j=1
2∑
l=1
[∂fi(Q
1∗, Q2∗)
∂qijl+
∂cijl(q∗ijl)
∂qijl− ρ∗
1ijl
]×
[qijl − q∗ijl
]
+m∑
i=1
o∑
k=1
[∂fi(Q
1∗, Q2∗)
∂qik+
∂cik(q∗ik)
∂qik− ρ∗
1ik
]×[qik − q∗ik] ≥ 0, ∀Q1 ∈ R2mn
+ , ∀Q2 ∈ Rmo+ . (5)
The inequality (5), which is a variational inequality (cf. Nagurney (1999)) has a nice
economic interpretation. In particular, from the first term we can infer that, if there is a
positive shipment of the product transacted either in a classical manner or via the Internet
from a manufacturer to a retailer, then the marginal cost of production plus the marginal
8

����1 ����
i · · · ����m
Physical
Link ����j
Internet
LinkRetailer
����1 ����
k · · · ����o
HHHHHHHHHHHj
@@
@@
@@R
������������
������������
��
��
��
HHHHHHHHHHHjPhysical Links
Manufacturers
Demand Markets
Figure 3: Network Structure of Retailer j’s Transactions
cost of transacting must be equal to the price that the retailer is willing to pay for the
product. If the marginal cost of production plus the marginal cost of transacting exceeds
that price, then there will be zero volume of flow of the product on that link. The second
term in (5) has a similar interpretation; in particular, there will be a positive volume of flow
of the product from a manufacturer to a demand market if the marginal cost of production
of the manufacturer plus the cost of transacting via the Internet for the manufacturer with
the consumers is equal to the price the consumers are willing to pay for the product at the
demand market.
The Behavior of the Retailers and their Optimality Conditions
The retailers, in turn, are involved in transactions both with the manufacturers since they
wish to obtain the product for their retail outlets, as well as with the consumers, who are
the ultimate purchasers of the product. Thus, a retailer conducts transactions both with the
manufacturers as well as with the consumers. Refer to Figure 3 for a graphical depiction.
A retailer j is faced with what we term a handling cost, which may include, for example,
the display and storage cost associated with the product. We denote this cost by cj and, in
9

the simplest case, we would have that cj is a function of∑m
i=1
∑2l=1 qijl, that is, the holding
cost of a retailer is a function of how much of the product he has obtained from the various
producers via the two different modes of transacting. However, for the sake of generality,
and to enhance the modeling of competition, we allow the function to, in general, depend
also on the amounts of the product held by other retailers and, therefore, we may write:
cj = cj(Q1), ∀j. (6)
The retailers, in turn, also have associated transaction costs in regards to transacting with
the manufacturers via either modal alternative. We denote the transaction cost associated
with retailer j transacting with manufacturer i using mode l by cijl and we assume that the
function can depend upon the manufacturer/retailer pair product shipment, that is,
cijl = cijl(qijl), ∀i, j, l. (7)
Let qjk denote the amount of the product purchased/consumed by consumers located at
demand market k from retailer j. We group these consumption quantities into the column
vector Q3 ∈ Rno+ .
The retailers associate a price with the product at their retail outlet, which is denoted
by ρ∗2j , for retailer j. This price, as we will show, will also be endogenously determined in
the model. Assuming, as mentioned in the Introduction, that the retailers are also profit-
maximizers, the optimization problem of a retailer j is given by:
Maximize ρ∗2j
o∑
k=1
qjk − cj(Q1) −
m∑
i=1
2∑
l=1
cijl(qijl) −m∑
i=1
2∑
l=1
ρ∗1ijlqijl (8)
subject to:o∑
k=1
qjk ≤m∑
i=1
2∑
l=1
qijl, (9)
and the nonnegativity constraints: qijl ≥ 0, and qjk ≥ 0, for all i, l and k. Objective function
(8) expresses that the difference between the revenues minus the handling cost plus the
transaction costs and the payout to the manufacturers should be maximized. Constraint (9)
simply expresses that consumers cannot purchase more from a retailer than is held in stock.
10

We now consider the optimality conditions of the retailers assuming that each retailer is
faced with the optimization problem (8), subject to (9), and the nonnegativity assumption
on the variables. Here we also assume that the retailers compete in a noncooperative manner
so that each maximizes his profits, given the actions of the other retailers. Note that, at this
point, we consider that retailers seek to determine not only the optimal amounts purchased
by the consumers from their specific retail outlet but, also, the amount that they wish
to obtain from the manufacturers. In equilibrium, all the shipments between the tiers of
network decision-makers will have to coincide.
Assuming that the handling cost for each retailer is continuous and convex as are the
transaction costs, the optimality conditions for all the retailers satisfy the variational in-
equality:
m∑
i=1
n∑
j=1
2∑
l=1
[∂cj(Q
1∗)
∂qijl+ ρ∗
1ijl +∂cijl(q
∗ijl)
∂qijl− γ∗
j
]×
[qijl − q∗ijl
]+
n∑
j=1
o∑
k=1
[−ρ∗
2j + γ∗j
]×
[qjk − q∗jk
]
+n∑
j=1
[m∑
i=1
2∑
l=1
q∗ijl −o∑
k=1
q∗jk
]×
[γj − γ∗
j
]≥ 0, ∀Q1 ∈ R2mn
+ , ∀Q2 ∈ Rno+ , ∀γ ∈ Rn
+. (10)
Note that γj is the Lagrange multiplier associated with constraint (9) for retailer j and
γ the column vector of all the retailers’ multipliers. For further background on such a
derivation, see Bertsekas and Tsitsiklis (1992). In this derivation, as in the derivation of
inequality (5), we have not had the prices charged be variables. They become endogenous
variables in the complete equilibrium model.
We now highlight the economic interpretation of the retailers’ optimality conditions. From
the second term in inequality (10), we have that, if consumers at demand market k purchase
the product from a particular retailer j, that is, if the q∗jk is positive, then the price charged
by retailer j, ρ∗2j, is precisely equal to γ∗
j , which, from the third term in the inequality, serves
as the price to clear the market from retailer j. Also, note that, from the second term, we
see that if no product is sold by a particular retailer, then the price associated with holding
the product can exceed the price charged to the consumers. Furthermore, from the first
term in inequality (10), we can infer that, if a manufacturer transacts with a retailer via a
particular mode resulting in a positive flow of the product between the two, then the price
11

����1 ����
j · · · ����n
Retailers
����k
����1 ����
i · · · ����m
QQs
AAAAAAU
��
��
��
��+
Internet Links
PhysicalLink
Manufacturers
Demand Market
Figure 4: Network Structure of Consumers’ Transactions at Demand Market k
γ∗j is precisely equal to the retailer j’s payment to the manufacturer, ρ∗
1ijl, plus his marginal
cost of handling the product plus the retailer’s marginal cost of transaction associated with
transacting with the particular manufacturer.
The Consumers at the Demand Markets and the Equilibrium Conditions
We now describe the consumers located at the demand markets. The consumers take into
account in making their consumption decisions not only the price charged for the product by
the retailers and the manufacturers but also their transaction costs associated with obtaining
the product. The consumers at the demand markets can transact either directly with the
manufacturers through the Internet or physically with the retailers. A graphical depiction
of consumers at a typical demand market k is given in Figure 4.
We let cjk denote the transaction cost associated with obtaining the product by consumers
at demand market k from retailer j and recall that qjk is the amount of the product puchased
(or flowing) between retailer j and consumers at demand market k. We assume that the
12

transaction cost is continuous and of the general form:
cjk = cjk(Q2, Q3), ∀j, k. (11)
Also, we let cik denote the transaction cost, from the perspective of the consumers at demand
market k, associated with manufacturer i. Here we assume that
cik = cik(Q2, Q3), ∀i, k, (12)
Hence, the cost of conducting a transaction with a manufacturer via the Internet can depend,
in general, upon the volume of the product obtained via the Internet as well as the amount
purchased from the retailers.
Let now ρ3k denote the generalized price of the product as perceived by the consumers
at demand market k. Further, denote the demand for the product at demand market k by
dk and assume, as given, the continuous demand functions:
dk = dk(ρ3), ∀k, (13)
where ρ3 is the o-dimensional column vector of generalized prices. Thus, according to (13),
the demand of consumers for the product at a demand market depends, in general, not only
on the price of the product at that demand market but also on the prices of the product at
the other demand markets. Consequently, consumers at a demand market, in a sense, also
compete with consumers at other demand markets.
The consumers take the price charged by the retailers for the product, which, recall
was denoted by ρ∗2j for retailer j, plus the transaction cost associated with obtaining the
product, in making their consumption decisions. In addition, they take the price charged by
a producer, ρ∗1ik, plus that associated transaction cost into consideration.
The equilibrium conditions for consumers at demand market k, thus, take the form: for
all retailers: j; j = 1, . . . , n:
ρ∗2j + cjk(Q
2∗, Q3∗)
{= ρ∗
3k, if q∗jk > 0≥ ρ∗
3k, if q∗jk = 0,(14)
for all manufacturers i; i = 1, . . . , m:
ρ∗1ik + cik(Q
2∗, Q3∗)
{= ρ∗
3k, if q∗ik > 0≥ ρ∗
3k, if q∗ik = 0,(15)
13

and
dk(ρ∗3)
=n∑
j=1
q∗jk +m∑
i=1
q∗ik, if ρ∗3k > 0
≤n∑
j=1
q∗jk +m∑
i=1
q∗ik, if ρ∗3k = 0.
(16)
Conditions (14) state that consumers at demand market k will purchase the product
from retailer j, if the price charged by the retailer for the product plus the transaction cost
(from the perspective of the consumers) does not exceed the price that the consumers are
willing to pay for the product. Conditions (15) state the analogue for the manufacturers and
demand market. Condition (16), on the other hand, states that, if the price the consumers
are will to pay for the product at a demand market is positive, then the quantity consumed
by the consumers at the demand market is precisely equal to the demand. These conditions
correspond to the well-known spatial price equilibrium conditions (cf. Samuelson (195),
Takayama and Judge (1971), and Nagurney (1999) and the references therein).
In equilibrium, conditions (14), (15), and (16) will have to hold for all demand markets
k, and these, in turn, can also be expressed as a variational inequality problem akin to (5)
and (10) and given by: determine (Q2∗, Q3∗, ρ∗3) ∈ Rmo+no+n, such that
n∑
j=1
o∑
k=1
[ρ∗
2j + cjk(Q2∗, Q3∗) − ρ∗
3k
]×
[qjkl − q∗jkl
]
+m∑
i=1
n∑
k=1
[ρ∗
1ik + cik(Q2∗, Q3∗) − ρ∗
3k
]× [qik − q∗ik]
+o∑
k=1
n∑
j=1
q∗jk +m∑
i=1
q∗ik − dk(ρ∗3)
× [ρ3k − ρ∗
3k] ≥ 0, ∀(Q2, Q3, ρ3) ∈ Rmo+no+n+ . (17)
Note that, in the context of the consumption decisions, we have utilized demand functions,
rather than utility functions, as was the case for the manufacturers and the retailers, who were
assumed to be faced with profit functions, which correspond to utility functions. Of course,
demand functions can be derived from utility functions (cf. Arrow and Intrilligator (1982)).
We expect the number of consumers to be much greater than that of the manufacturers and
retailers and, hence, believe that the above formulation is the more natural and tractable
one.
14

The Equilibrium Conditions of the Supply Chain
In equilibrium, the shipments of the product that the manufacturers ship to the retailers
must be equal to the shipments that the retailers accept from the manufacturers. In addition
the amounts of the product purchased by the consumers must be equal to the amounts sold
by the retailers and directly to the consumers by the manufacturers. Furthermore, the
equilibrium shipment and price pattern must satisfy the sum of the optimality conditions
(5) and (10), and the conditions (17), in order to formalize the agreements between the tiers
of the supply chain network.
We now state this formally.
Definition 1: Supply Chain Network Equilibrium with E-Commerce
The equilibrium state of the supply chain with electronic commerce is one where the flows
between the tiers of the supply chain network coincide and the product shipments and prices
satisfy the sum of the optimality conditions (5) and (10) and the equilibrium conditions (17).
We now establish the following:
Theorem 1: Variational Inequality Formulation
The equilibrium conditions governing the supply chain network model with electronic com-
merce are equivalent to the solution of the variational inequality problem given by:
m∑
i=1
n∑
j=1
2∑
l=1
[∂fi(Q
1∗, Q2∗)
∂qijl
+∂cijl(q
∗ijl)
∂qijl
+∂cj(Q
1∗)
∂qijl
+∂cijl(q
∗ijl)
∂qijl
− γ∗j
]×
[qijl − q∗ijl
]
+m∑
i=1
o∑
k=1
[∂fi(Q
1∗, Q2∗)
∂qik+
∂cik(q∗ik)
∂qik+ cik(Q
2∗, Q3∗) − ρ∗3k
]× [qik − q∗ik]
+n∑
j=1
o∑
k=1
[cjk(Q
2∗, Q3∗) + γ∗j − ρ∗
3k
]×
[qjk − q∗jk
]+
n∑
j=1
[m∑
i=1
2∑
l=1
q∗ijl −o∑
k=1
q∗jk
]×
[γj − γ∗
j
]
+o∑
k=1
n∑
j=1
q∗jk +m∑
i=1
q∗ik − dk(ρ∗3)
× [ρ3k − ρ∗
3k] ≥ 0, ∀(Q1, Q2, Q3, γ, ρ3) ∈ R2mn+mo+no+n+o+ .
(18)
15

Proof:
We first establish that the equilibrium conditions imply variational inequality (18). In-
deed, the summation of inequalities (5), (10), and (17) yields, after algebraic simplification,
the variational inequality (18).
We now establish the converse, that is, that a solution to variational inequality (18)
satisfies conditions (5), (10), and (17) and is, hence, an equilibrium according to Definition
1.
To inequality (18), add the term: ρ∗1ijl + ρ∗
1ijl to the term in the first set of brackets,
preceding the multiplication sign. Similarly, add the term: −ρ∗1ik +ρ∗
1ik to the term preceding
the second multiplication sign, and, finally, add the term: −ρ∗2j + ρ∗
2j to the term preceding
the third multiplication sign. Such “terms” do not change the value of the inequality since
they are identically equal to zero, with the resulting inequality of the form:
m∑
i=1
n∑
j=1
2∑
l=1
[∂fi(Q
1∗, Q2∗)
∂qijl
+∂cijl(q
∗ijl)
∂qijl
+∂cj(Q
1∗)
∂qijl
+∂cijl(q
∗ijl)
∂qijl
− γ∗j − ρ∗
1ijl + ρ∗1ijl
]×
[qijl − q∗ijl
]
+m∑
i=1
o∑
k=1
[∂fi(Q
1∗, Q2∗)
∂qik
+∂cik(q
∗ik)
∂qik
+ cik(Q2∗, Q3∗) − ρ∗
3k − ρ∗1ik + ρ∗
1ik
]× [qik − q∗ik]
+n∑
j=1
o∑
k=1
[cjk(Q
2∗, Q3∗) + γ∗j − ρ∗
3k − ρ∗2j + ρ∗
2j
]×
[qjk − q∗jk
]+
n∑
j=1
[m∑
i=1
2∑
l=1
q∗ijl −o∑
k=1
q∗jk
]
×[γj − γ∗
j
]≥ 0, ∀(Q1, Q2, Q3, γ) ∈ R2mn+mo+no+n
+ , (19)
which, in turn, can be rewritten as:
m∑
i=1
n∑
j=1
2∑
l=1
[∂fi(Q
1∗, Q2∗)
∂qijl+
∂cijl(q∗ijl)
∂qijl− ρ∗
1ijl
]×
[qijl − q∗ijl
]
+m∑
i=1
o∑
k=1
[∂fi(Q
1∗, Q2∗)
∂qik+
∂cik(q∗ik)
∂qik− ρ∗
1ik
]× [qik − q∗ik]
m∑
i=1
n∑
j=1
2∑
l=1
[∂cj(Q
1∗)
∂qijl+ ρ∗
1ijl +∂cijl(q
∗ijl)
∂qijl− γ∗
j
]×
[qijl − q∗ijl
]+
n∑
j=1
o∑
k=1
[−ρ∗
2j + γ∗j
]×
[qjk − q∗jk
]
16

+n∑
j=1
[m∑
i=1
2∑
l=1
q∗ijl −o∑
k=1
q∗jk
]×
[γj − γ∗
j
]
+n∑
j=1
o∑
k=1
[ρ∗
2j + cjk(Q2∗, Q3∗) − ρ∗
3k
]×
[qjk − q∗jk
]
+m∑
i=1
o∑
k=1
[ρ∗
1ik + cik(Q2∗, Q3∗) − ρ∗
3k
]× [qik − q∗ik] ≥ 0, ∀(Q1, Q2, Q3, γ) ∈ R2mn+mo+no+n
+ .
(20)
But inequality (20) is equivalent to the price and product shipment pattern satisfying the
sum of the conditions (5), (10), and (17). The proof is complete. 2
For easy reference in the subsequent sections, variational inequality problem (18) can be
rewritten in standard variational inequality form (cf. Nagurney (1999)) as follows:
〈F (X∗)T , X − X∗〉 ≥ 0, ∀X ∈ K ≡ R2mn+mo+no+n+o+ , (21)
where X ≡ (Q1, Q2, Q3, γ, ρ3), and F (X) ≡ (Fijl, Fik, Fjk, Fj, Fk)i=1,...,m;j=1,...,n;l=1,2;k=1,...,o,
and the specific components of F given by the functional terms preceding the multiplica-
tion signs in (18), respectively. The term 〈·, ·〉 denotes the inner product in N -dimensional
Euclidean space.
We now discuss how to recover the prices ρ∗1ijl, for all i, j, l, and ρ∗
2j, for all j, from the
solution of variational inequality (18). (In Section 5 we describe an algorithm for computing
the solution.) Recall that, in the preceding discussions, we have noted that if q∗jk > 0, for
some k and j, then ρ∗2j is precisely equal to γ∗
j , which can be obtained from the solution of
(18). The prices ρ∗1ijl, in turn (cf. also (20)), can be obtained by finding a q∗ijl > 0, and then
setting ρ∗1ijl =
[∂f(Q1∗,Q2∗)
∂qijl+
∂cijl(q∗ijl
)
∂qijl
], or, equivalently, to
[γ∗
j −∂cj(Q
1∗)
∂qijl− ∂cijl(q
∗ijl
)
∂qijl
], for all
such i, j, l. The prices ρ∗1ik, on the other hand, can be obtained by finding a q∗ik > 0 and
setting ρ∗1ik =
[∂fi(Q
1∗,Q2∗)∂qik
+∂cik(q∗ik)
∂qik
], or, equivalently, to
[ρ∗
3k − cik(Q2∗, Q3∗)
], for all such
i, k.
We now construct the supply chain network in equilibrium (cf. Figure 1), using, as build-
ing blocks, the previously drawn networks in Figures 2 thorugh 4 corresponding, respectively,
to the transactions of the manufacturers, the retailers, and the consumers. First, however,
we need to establish the result that, in equilibrium, the sum of the product shipments to each
17

retailer is equal to the sum of the product shipments out. Hence, the corresponding γ∗j s will
all be positive. This means that each retailer, assuming profit-maximization, only purchases
from the producers the amount of the product that is actually consumed by the consumers.
In order to establish this result, we utilize variational inequality (18). Clearly, we know that,
if γ∗j > 0, then the “market clears” for that retailer, that is,
∑mi=1
∑2l=1 q∗ijl =
∑ok=1 q∗jk. Let
us now consider the case where γ∗j = 0 for some retailer j. From the first term in inequality
(18), since the production cost functions, and the transaction cost functions and handling
cost functions have been assumed to be convex, and assuming further, which is not unrea-
sonable, that either the marginal cost of production or the marginal transaction costs or the
marginal holding cost for each manufacturer/mode/retailer combination is strictly positive
at equilibrium, then we know that ∂fi(Q1∗,Q2∗)
∂qijl+
∂cijl(q∗ijl)
∂qijl+
∂cj(Q1∗)
∂qijl+
∂cijl(q∗ijl)
∂qijl> 0, which
implies that q∗ijl = 0, and this holds for all i, j, l. It follows then from the third term in (18),
that∑o
k=1 q∗jk = 0, and, hence, the market clears also in this case since the flow into a retailer
is equal to the flow out and equal to zero. We have thus, established the following:
Corollary 1
The market for the product clears for each retailer in the supply chain network with e-
commerce at equilibrium.
In Figure 1, we depict the structure of the supply chain network in equilibrium, consisting
of all the manufacturers, all the retailers, and all the demand markets. Hence, we replicate
Figure 2 for all manufacturers, Figure 3, for all retailers, and Figure 4 for all demand markets.
These resulting networks represent the possible transactions of all the economic decision-
makers. In addition, since there must be agreement between/among the transactors at
equilibrium, the analogous links (and equilibrium flows on them) must coincide, yielding the
network structure given in Figure 1.
Clearly, the special cases of our model in which there is only B2B commerce or only B2C
commerce can be studied in our framework as well with a suitable reduction of the links and
associated transaction costs and product shipments.
In this Section, we have proposed an equilibrium framework for the formulation of sup-
ply chain network problems with electronic commerce since we believe that the concept of
18

equilibrium provides a valuable benchmark against which existing product shipments be-
tween tiers and prices at different tiers of the supply chain can be compared. In Section
4, we propose a dynamic adjustment process, which is then formulated as a projected dy-
namical system, whose set of stationary points coincides with the set of solutions to the
variational inequality problem (18). The dynamical system provides a means of addressing
the disequilibrium dynamics associated with a supply chain with multiple tiers.
19

3. Qualitative Properties
In this Section, we provide some qualitative properties of the solution to variational
inequality (18). In particular, we derive existence and uniqueness results. We also investigate
properties of the function F (cf. (21)) that enters the variational inequality of interest here.
Since the feasible set is not compact we cannot derive existence simply from the assump-
tion of continuity of the functions. Nevertheless, we can impose a rather weak condition to
guarantee existence of a solution pattern. Let
Kb = {(Q1, Q2, Q3, γ, ρ3)|0 ≤ Q1 ≤ b1; 0 ≤ Q2 ≤ b2; 0 ≤ Q3 ≤ b3; 0 ≤ γ ≤ b4; 0 ≤ ρ3 ≤ b5},(22)
where b = (b1, b2, b3, b4, b5) ≥ 0 and Q1 ≤ b1; Q2 ≤ b2; Q
3 ≤ b3; γ ≤ b4; ρ3 ≤ b5 means that
qijl ≤ b1; qik ≤ b2; qjk ≤ b3; γj ≤ b4; and ρ3k ≤ b5 for all i, j, l, k. Then Kb is a bounded
closed convex subset of R2mn+mo+no+n+o. Thus, the following variational inequality
〈F (Xb)T , X − Xb〉 ≥ 0, ∀Xb ∈ Kb, (23)
admits at least one solution Xb ∈ Kb, from the standard theory of variational inequalities,
since Kb is compact and F is continuous. Following Kinderlehrer and Stampacchia (1980)
(see also Theorem 1.5 in Nagurney (1999)), we then have:
Theorem 2
Variational inequality (18) admits a solution if and only if there exists a b > 0, such that
variational inequality (23) admits a solution in Kb with
Q1b < b1, Q2b < b2, Q3b < b3, γb < b4, ρb3 < b5. (24)
Theorem 3: Existence
Suppose that there exist positive constants M , N , R with R > 0, such that:
∂fi(Q1, Q2)
∂qijl+
∂cijl(qijl)
∂qijl+
∂cj(Q1)
∂qijl+
∂cijl(qijl)
∂qijl≥ M, ∀Q1 with qijl ≥ N, ∀i, j, l, (25)
20

∂fi(Q1, Q2)
∂qik
+∂cik(qik)
∂qik
+ cik(Q2, Q3) ≥ M, ∀Q2 with qik ≥ N, ∀i, k,
cjk(Q2, Q3) ≥ M, ∀Q3 with qjk ≥ N, ∀j, k,
dk(ρ∗3) ≤ N, ∀ρ with ρ3k > R, ∀k. (26)
Then variational inequality (18); equivalently, variational inequality (21), admits at least
one solution.
Proof: Follows using analogous arguments as the proof of existence for Proposition 1 in
Nagurney and Zhao (1993) (see also existence proof in Nagurney, Dong, and Zhang (2000)).
2
Assumptions (25) and (26) are reasonable from an economics perspective, since when
the product shipment between a manufacturer and demand market pair or a manufacturer
and retailer is large, we can expect the corresponding sum of the associated marginal costs
of production, handling, and transaction from either the manufacturer’s or the retailer’s
perspectives as well as the transaction cost associated with the consumers, to exceed a
positive lower bound. Moreover, in the case where the generalized price of the product as
perceived by consumers at a demand market is high, we can expect that the demand for the
product at the demand market to not exceed a positive bound.
We now recall the definition of an additive production cost introduced in Zhang and
Nagurney (1996), which we will utilize as an assumption for establishing additional qualita-
tive properties.
Definition 2: Additive Production Cost
Suppose that for each manufacturer i, the production cost fi is additive, that is,
fi(q) = f 1i (qi) + f 2
i (qi), (27)
where f 1i (qi) is the internal production cost that depends solely on the manufacturer’s own
output level qi, which may include the production operation and the facility maintenance,
etc., and f 2i (qi) is the interdependent part of the production cost that is a function of all the
21

other manufacturers’ output levels qi = (q1, · · · , qi−1, qi+1, · · · , qm) and reflects the impact of
the other manufacturers’ production patterns on manufacturer i’s cost. This interdependent
part of the production cost may describe the competition for the resources, consumption of
the homogeneous raw materials, etc.
We now establish additional qualitative properties both of the function F that enters the
variational inequality problem (cf. (21) and (18)), as well as uniqueness of the equilibrium
pattern. Monotonicity and Lipschitz continuity of F will be utilized in Section 5 for proving
convergence of the algorithmic scheme. Since the proofs of Theorems 4 and 5 are similar
to the analogous proofs in Nagurney, Dong, and Zhang (2002) for the supply chain network
model without e-commerce, they are omitted here.
Theorem 4: Monotonicity
Suppose that the production cost functions fi; i = 1, ..., m, are additive, as defined in Def-
inition 2, and that the f 1i ; i = 1, ..., m, are convex functions. If the cijl, cj, and cijl, and
cik functions are convex; the cjk and the cik functions are monotone increasing, and the dk
functions are monotone decreasing functions of the generalized prices, for all i, l, j, k, then
the vector function F that enters the variational inequality (21) is monotone, that is,
〈(F (X ′) − F (X ′′))T , X ′ − X ′′〉 ≥ 0, ∀X ′, X ′′ ∈ R2mn+mo+no+n+o+ . (28)
Theorem 5: Strict Monotonicity
Assume all the conditions of Theorem 4. In addition, suppose that one of the families of
convex functions f 1i ; i = 1, ..., m, cijl; i = 1, ..., m; j = 1, ..., n; l = 1, 2; cj; j = 1, ..., n; cijl;
i = 1, . . . , m; j = 1, . . . , n; l = 1, 2; and cik; i = 1, . . . , m; k = 1, . . . , o, is a family of strictly
convex functions. Suppose also that cik; i = 1, . . . , m; k = 1, . . . , o; cjk; j = 1, ..., n; k =
1, ..., o, and -dk; k = 1, ..., o, are strictly monotone. Then, the vector function F that enters
the variational inequality (21) is strictly monotone, with respect to (Q1, Q2, Q3, ρ3), that is,
for any two X ′, X ′′ with (Q1′ , Q2′ , Q3′, ρ′3) 6= (Q1′′ , Q2′′ , Q3′′ , ρ3
′′)
〈(F (X ′) − F (X ′′))T , X ′ − X ′′〉 > 0. (29)
22
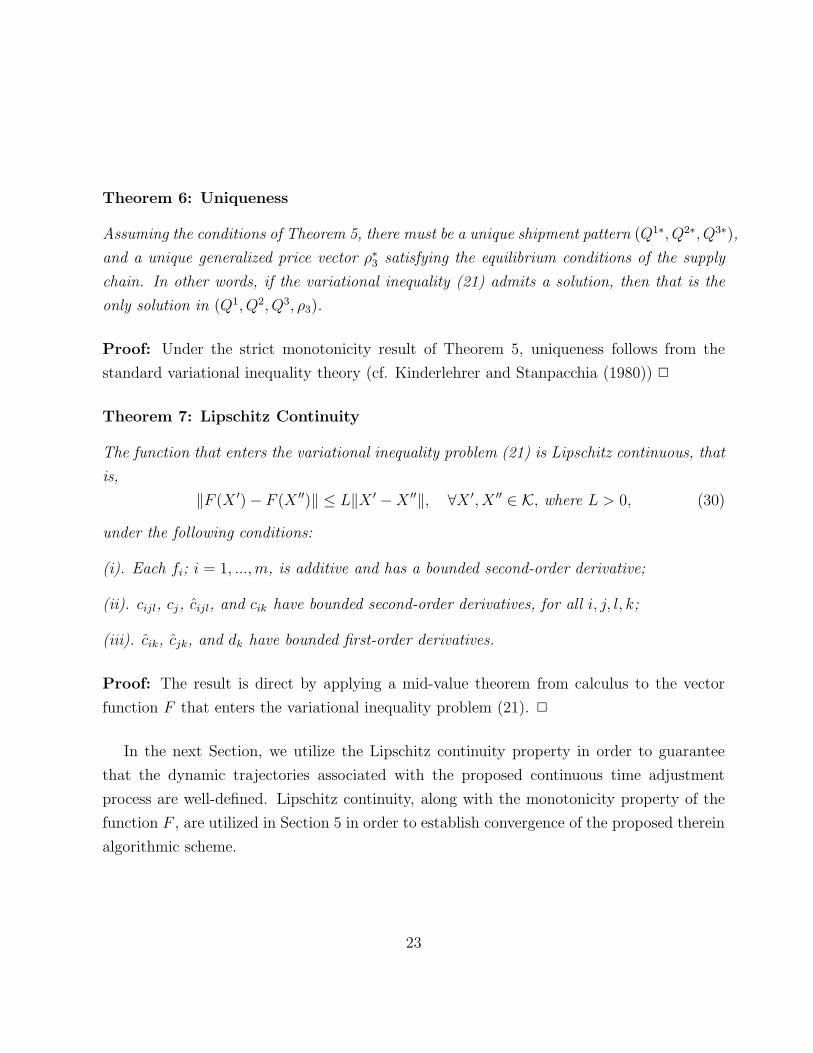
Theorem 6: Uniqueness
Assuming the conditions of Theorem 5, there must be a unique shipment pattern (Q1∗, Q2∗, Q3∗),
and a unique generalized price vector ρ∗3 satisfying the equilibrium conditions of the supply
chain. In other words, if the variational inequality (21) admits a solution, then that is the
only solution in (Q1, Q2, Q3, ρ3).
Proof: Under the strict monotonicity result of Theorem 5, uniqueness follows from the
standard variational inequality theory (cf. Kinderlehrer and Stanpacchia (1980)) 2
Theorem 7: Lipschitz Continuity
The function that enters the variational inequality problem (21) is Lipschitz continuous, that
is,
‖F (X ′) − F (X ′′)‖ ≤ L‖X ′ − X ′′‖, ∀X ′, X ′′ ∈ K, where L > 0, (30)
under the following conditions:
(i). Each fi; i = 1, ..., m, is additive and has a bounded second-order derivative;
(ii). cijl, cj, cijl, and cik have bounded second-order derivatives, for all i, j, l, k;
(iii). cik, cjk, and dk have bounded first-order derivatives.
Proof: The result is direct by applying a mid-value theorem from calculus to the vector
function F that enters the variational inequality problem (21). 2
In the next Section, we utilize the Lipschitz continuity property in order to guarantee
that the dynamic trajectories associated with the proposed continuous time adjustment
process are well-defined. Lipschitz continuity, along with the monotonicity property of the
function F , are utilized in Section 5 in order to establish convergence of the proposed therein
algorithmic scheme.
23

4. The Dynamics
In this Section, we propose a dynamic adjustment process, formulated as a projected
dynamical system. We then establish that the set of stationary points of the projected dy-
namical system coincides with the set of solutions of variational inequality (21), equivalently,
variational inequality (18).
In particular, we now turn to describing the dynamics by which the manufacturers adjust
their product shipments over time, the consumers adjust their consumption amounts based
on the prices of the product at the demand markets, and the retailers operate between the
two, except in the case of electronic commerece when the consumers at the demand markets
can deal with the manufacturers directly. We also describe the dynamics by which the prices
adjust over time. The dynamics are derived from the bottom tier of nodes on up since it is
the demand for the product (and the corresponding prices) that actually drives the supply
chain dynamics.
The Demand Market Price Dynamics
We begin by describing the dynamics underlying the prices of the product associated with
the demand markets. Assume that the rate of change of the price ρ3k, denoted by ρ3k, is
equal to the difference between the demand at the demand market k, as a function of the
demand market prices, and the amount available from the retailers and the manufacturers
at the demand market. Hence, if the demand for the product at the demand market (at
an instant in time) exceeds the amount available, the price at that demand market will
increase; if the amount available exceeds the demand at the price, then the price at the
demand market will decrease. Furthermore, it is guaranteed that the prices do not become
negative. Consequently, the dynamics of the price ρ3k associated with the product at demand
market k can be expressed as:
ρ3k =
{dk(ρ3) −
∑nj=1 qjk −
∑mi=1 qik, if ρ3k > 0
max{0, dk(ρ3) −∑n
j=1 qjk −∑m
i=1 qik}, if ρ3k = 0.(31)
24

The Dynamics of the Product Shipments between the Retailers and the Demand
Markets
The dynamics of the product shipments over the links joining the retailers to the demand
markets are now described. Recall that there is a unit transaction cost cjk associated with
transacting between retailer j and the consumers at demand market k, where cjk is given by
(11) and can depend upon, in general, all the product shipments to all the demand markets.
The rate of change of the product shipment qjk is assumed to be equal to the difference
between the price the consumers are willing to pay for the product at demand market k
minus the unit transaction cost and the price charged for the product at the retail outlet.
Note that here, without loss of generality, we refer to γj as a “price” associated with retailer
j. This is not unreasonable since if there is any consumption at any demand market from
retailer j, then we know (cf. (10)) that γ∗j = ρ∗
2j. Moreover, in the variational inequality
(18) it is the γs that appear as the variables.
Of course, one also must guarantee that these product shipments do not become negative.
Hence, one may write:
qjk =
{ρ3k − cjk(Q
2, Q3) − γj, if qjk > 0max{0, ρ3k − cjk(Q
2, Q3) − γj}, if qjk = 0,(32)
where qjk denotes the rate of change of the product shipment qjk.
Thus, according to (32), if the price the consumers are willing to pay for the product at
a demand market exceeds the price the retailers charge for the product at the outlet plus
the unit transaction cost (at an instant in time), then the volume of the product between
that retail and demand market pair will increase; if the price charged by the retailer plus
the transaction cost exceeds the price the consumers are willing to pay, then the volume of
flow of the product between that pair will decrease.
The Dynamics of the Product Shipments between the Manufacturers and the
Demand Markets
In Section 2, it was assumed that each manufacturer i is faced with a production cost fi, which
can depend, in general, upon all the product shipments from all the manufacturers to the
25
retailers and demand markets. In addition, recall that cik is the transaction cost associated
with manufacturer i transacting with demand market k, with the function being given by
(2b). The consumers at the demand markets, in turn, are also faced with a transaction cost
associated with transacting with a manufacturer directly. For manufacturer/demand market
pair (i, k), this function is denoted by cik and, as in (12), can depend, in general, upon all
the product shipments to all the demand markets from all the manufacturers or retailers.
Since each manufacturer is assumed to be a profit-maximizer according to (4), a fair price
to charge the consumers at a demand market who have transacted directly via a manufacturer
through an Internet link is to charge the manufacturer’s marginal production cost plus its
marginal transaction cost, which for a pair (i, k) would be equal to: ∂fi(Q1,Q2)
∂qik+ ∂cik(qik)
∂qik. The
consumers at demand market k also incur a unit transaction cost associated with transacting
with manufacturer i. Thus, the following rate of change for the product shipments between
the top tier of nodes and the bottom tier of nodes in the logistical network is proposed:
qik =
ρ3k − ∂fi(Q1,Q2)∂qik
− ∂cik(qik)∂qik
− cik(Q2, Q3), if qik > 0
max{0, ρ3k − ∂fi(Q1,Q2)∂qik
− ∂cik(qik)∂qik
− cik(Q2, Q3)}, if qik = 0,
(33)
where qik denotes the rate of change of the product shipment qik.
Hence, according to (33), if the demand price at a demand market exceeds the marginal
production cost plus the marginal transaction cost of the manufacturer associated with trans-
acting via the Internet directly with the consumers and the consumers’ transaction cost, then
the volume of the product transacted via the Internet between the manufacturer/demand
market pair will increase; if the demand price at the demand market is less than the above
described marginal and unit costs, then the volume of product shipment between the pair
will decrease.
The Dynamics of the Prices at the Retail Outlets
The prices for the product at the retail outlets, in turn, must reflect supply and demand
conditions as well. In particular, assume that the price for the product associated with retail
outlet j, γj, evolves over time according to:
γj =
{ ∑ok=1 qjk −
∑mi=1
∑2l=1 qijl, if γj > 0
max{0, ∑ok=1 qjk −
∑mi=1
∑2l=1 qijl}, if γj = 0,
(34)
26
where γj denotes the rate of change of the price γj. Hence, if the amount of the product
desired to be transacted by the consumers (at an instant in time) exceeds that available at
the retail outlet, then the price at the retail outlet will increase; if the amount available is
greater than that desired by the consumers, then the price at the retail outlet will decrease.
The Dynamics of Product Shipments between Manufacturers and Retailers
The dynamics underlying the product shipments between the manufacturers and the retailers
are now described. As already noted, each manufacturer is faced with a production cost and
transaction costs. Recall that the transaction cost associated with manufacturer i and retailer
j transacting via mode l is denoted by cijl and is of the form (2a).
As noted in Section 2, the total costs incurred by a manufacturer i, thus, are equal to the
sum of the manufacturer’s production cost plus the total transaction costs. His revenue, in
turn, with regard to the transactions associated with the retailers, is equal to the price that
the manufacturer charges for the product to the retailers (and the retailers are willing to pay)
times the quantity of the product obtained/purchased from the manufacturer by the retail
outlets and by the consumers directly. Hence, a fair price for the product associated with a
given manufacturer/retailer pair and transacted via a mode is equal to the manufacturer’s
corresponding marginal costs of production and transacting, that is to: ∂fi(Q1,Q2)∂qijl
+∂cijl(qijl)
∂qijl.
Recall that a retailer j, in turn, is faced with a handling cost given by (6). A retailer j,
on the other hand, ideally, would accept a product shipment from manufacturer i at a price
that is equal to the price charged at the retail outlet for the product (and that the consumers
are willing to pay) minus its marginal cost associated with handling the product. Now, since
the product shipments sent from the manufacturers must be accepted by the retailers in
order for the transactions to take place in the supply chain, we propose the following rate of
change for the product shipments between the top tier of nodes and the middle tier:
qijl =
γj − ∂fi(Q1,Q2)
∂qijl− ∂cijl(qijl)
∂qijl− ∂cj(Q1)
∂qijl− ∂cijl(qijl)
∂qijl, if qijl > 0
max {0,γj − ∂fi(Q1,Q2)
∂qijl− ∂cijl(qijl)
∂qijl− ∂cj(Q
1)
∂qijl− ∂cijl(qijl)
∂qijl
}, if qijl = 0,
(35)
where qijl denote the rate of change of the product shipment between manufacturer i and
retailer j transacted via mode l.
27

Following the above discussion, (35) states that the product shipment between a manu-
facturer/retailer pair via a transaction mode evolves according to the difference between the
price charged for the product by the retailer and its marginal costs, and the price charged
by the manufacturer (which, recall, assuming profit-maximizing behavior, was set to the
marginal cost of production plus its marginal cost of transacting with the retailer via the
mode). Here it is also guaranteed that the product shipments do not become negative as
they evolve over time.
The Projected Dynamical System
Consider now the dynamic model in which the demand prices evolve according to (31) for
all demand market prices k, the retail/demand market product shipments evolve accord-
ing to (32) for all retailers/demand markets j, k, and the product shipments between the
manufacturers and the demand markets evolve according to (33). The prices associated
with the retailers, in turn, evolve according to (34) for all retailers j, and the product ship-
ments between the manufacturers and retailers evolve over time according to (35) for all
manufacturer/retailer/mode combinations i, j, l.
Let X and F (X) be defined as following (21).
Then the dynamic model described by (35), (33), (32), (34), and (31) for all k, i, j, l can
be rewritten as the projected dynamical system (PDS) (cf. Nagurney and Zhang (1996))
defined by the following initial value problem:
X = ΠK(X,−F (X)), X(0) = X0, (36)
where ΠK is the projection operator of −F (X) onto K at X and X0 = (Q10, Q20
, Q30, γ0, ρ0
3)
is the initial point corresponding to the initial product shipments between the manufacturers
and the retailers and the demand markets; the initial product shipments between the retailers
and the demand markets; and the initial retailers’ prices and the demand prices. Since the
feasible set K underlying the dynamic supply chain is simply the nonnegative orthant, the
projection operation is very simple. Indeed, it simply guarantees, through the use of the
“max” term (cf. (31)–(35)), that the dynamic trajectory never yields negative values for the
product flows and prices.
28

The dynamical system (36) is non-classical in that the right-hand side is discontinuous
in order to guarantee that the constraints, which in the context of the above model are
nonnegativity constraints on the variables, are not violated. Such dynamical systems were
introduced by Dupuis and Nagurney (1993) and to date have been used to model a variety of
applications ranging from dynamic traffic network problems to dynamic oligopoly problems
(cf. Nagurney and Zhang (1996) and the references therein).
Stationary/Equilibrium Points
The following theorem states that the projected dynamical system evolves until it reaches
a stationary point, that is, X = 0, in which there is no change in the product shipments
and prices, and that the stationary point coincides with the equilibrium point of the supply
chain network model according to Definition 1. The notation “∗” is utilized here to denote
an equilibrium point, as was also done in Section 2, as well as a stationary point, since these
are shown to be equivalent in Theorem 8 below.
Theorem 8: The Set of Stationary Points Coincides with the Set of Equilibrium
Points
The set of stationary points of the projected dynamical system (36) coincides with the set
of equilibrium points defined by Definition 1.
Proof: According to Dupuis and Nagurney (1993), the necessary and sufficient condition
for X∗ to be a stationary point of the PDS (36), that is, to satisfy:
X = 0 = ΠK(X∗,−F (X∗)), (37)
is that X∗ ∈ K solves the variational inequality problem:
〈F (X∗)T , X − X∗〉 ≥ 0, ∀X ∈ K, (38)
where, in our problem, F (X), X, and K are as defined following (21). Writing out (38)
explicitly, we have that
m∑
i=1
n∑
j=1
2∑
l=1
[∂fi(Q
1∗, Q2∗)
∂qijl+
∂cijl(q∗ijl)
∂qijl+
∂cj(Q1∗)
∂qijl+
∂cijl(q∗ijl)
∂qijl− γ∗
j
]
29

×[qijl − q∗ijl
]
+m∑
i=1
o∑
k=1
[∂fi(Q
1∗, Q2∗)
∂qik
+∂cik(q
∗ik)
∂qik
+ cik(Q2∗, Q3∗) − ρ∗
3k
]× [qik − q∗ik]
+n∑
j=1
o∑
k=1
2∑
l=1
[γ∗
j + cjk(Q2∗, Q3∗) − ρ∗
3k
]×
[qjk − q∗jk
]
+n∑
j=1
[m∑
i=1
2∑
l=1
q∗ijl −o∑
k=1
q∗jk
]×
[γj − γ∗
j
]
+o∑
k=1
n∑
j=1
q∗jk +m∑
i=1
q∗ik − dk(ρ∗3)
× [ρ3k − ρ∗
3k] ≥ 0, (39)
∀(Q1, Q2, Q3, γ, ρ3) ∈ K = R2mn+mo+no+n+o+ .
But variational inequality (39) is precisely the variational inequality (18) (and their cor-
responding F (·)s, Xs, and Ks are one and the same), which, in turn, according to Theorem
1 coincides with (Q1∗, Q2∗, Q3∗, γ∗, ρ∗3) being an equilibrium pattern according to Definition
1. The proof is complete. 2
Hence, Theorem 8 establishes the linkage between the solution to the variational inequal-
ity problem (18) governing the static supply chain network model with e-commerce described
in Section 2, and the stationary points of the dynamic supply chain model described by the
projected dynamical system (36). Indeed, it shows that they are one and the same. Thus,
once a stationary point of the dynamic supply chain model has been achieved, that point
satisfies the equilibrium conditions, at which the manufacturers, retailers, and consumers
have formalized their agreements and the shipments between the tiers coincide.
We now state the following theorem.
Theorem 9: Existence and Uniqueness of a Solution to the Initial Value Problem
Assume the conditions of Theorem 7. Then, for any X0 ∈ K, there exists a unique solution
X0(t) to the initial value problem (36).
Proof: Lipschitz continuity of the function F is sufficient for the conclusion based on The-
orem 2.5 in Nagurney and Zhang (1996).
30

Theorem 9 guarantees that, if the Lipschitz property is satisfied, then the disequilibrium
dynamics associated with the proposed projected dynamical system model of the supply
chain are well-defined. In other words, given an initial product shipment and price pattern,
there exists a unique trajectory associated with (36). Note that this existence and uniqueness
result is not the same as those given in Theorems 3 and 6, respectively, since the latter results
are for the equilibrium or stationary point, rather than for the dynamic trajectories.
31

5. The Algorithm
In this Section, we consider the computation of solutions to variational inequality (18);
equivalently, the stationary points of the projected dynamical system (36). The algorithm
that we propose is the modified projection method of Korpelevich (1977), which is guaranteed
to solve any variational inequality problem in standard form (see (21)), that is:
Determine X∗ ∈ K, satisfying:
〈F (X∗)T , X − X∗〉 ≥ 0, ∀X ∈ K,
provided that the function F that enters the variational inequality is monotone and Lipschitz
continuous (and that a solution exists).
The statement of the modified projection method is as follows, where T denotes an
iteration counter:
Modified Projection Method
Step 0: Initialization
Set X0 ∈ K. Let T = 1 and let α be a scalar such that 0 < α ≤ 1L, where L is the Lipschitz
continuity constant (cf. Korpelevich (1977)) (see (30)).
Step 1: Computation
Compute XT by solving the variational inequality subproblem:
〈(XT + αF (XT −1) − XT −1)T , X − XT 〉 ≥ 0, ∀X ∈ K. (40)
Step 2: Adaptation
Compute XT by solving the variational inequality subproblem:
〈(XT + αF (XT ) − XT −1)T , X − XT 〉 ≥ 0, ∀X ∈ K. (41)
32

Step 3: Convergence Verification
If max |XTl − XT −1
l | ≤ ε, for all l, with ε > 0, a prespecified tolerance, then stop; else, set
T =: T + 1, and go to Step 1.
We now give an explicit statement of the modified projection method for the solution
of variational inequality problem (18) for the supply chain network equilibrium model with
electronic commerce.
Modified Projection Method for the Solution of Variational Inequality (18)
Step 0: Initialization
Set (Q10, Q20
, Q30, γ0, ρ0
3) ∈ K. Let T = 1 and set α such that 0 < α ≤ 1L, where L is the
Lipschitz constant for the problem.
Step 1: Computation
Compute (Q1T , Q2T , Q3T , γT , ρT3 ) ∈ K by solving the variational inequality subproblem:
m∑
i=1
n∑
j=1
2∑
l=1
qTijl + α(
∂fi(Q1T −1
, Q2T −1)
∂qijl+
∂cijl(qT −1ijl )
∂qijl+
∂cj(Q1T −1
)
∂qijl+
∂cijl(qT −1ijl )
∂qijl− γT −1
j )
−qT −1ijl
]×
[qijl − qTijl
]
m∑
i=1
o∑
k=1
qTik + α(
∂fi(Q1T −1
, Q2T −1)
∂qik+
∂cik(qT −1ik )
∂qik+ cik(Q
2T −1, Q3T −1
) − ρT −13k ) − qT −1
ik
×[qik − qTik
]
+n∑
j=1
o∑
k=1
[qTjk + α(cjk(Q
2T −1, Q3T −1
) + γT −1j − ρT −1
3k ) − qT −1jk
]×
[qjk − qTjk
]
+n∑
j=1
[γT
j + α(m∑
i=1
2∑
l=1
qT −1ijl −
o∑
k=1
qT −1jk ) − γT −1
j
]×
[γj − γT
j
]
+o∑
k=1
ρT
3k + α(n∑
j=1
qT −1jk +
m∑
i=1
qT −1ik − dk(ρ
T −13 )) − ρT −1
3k
×
[ρ3k − ρT
3k
]≥ 0,
33

∀(Q1, Q2, Q3, γ, ρ3) ∈ K. (42)
Step 2: Adaptation
Compute (Q1T , Q2T , Q3T , γT , ρT3 ) ∈ K by solving the variational inequality subproblem:
m∑
i=1
n∑
j=1
2∑
l=1
[qTijl + α(
∂fi(Q1T , Q2T )
∂qijl+
∂cijl(qTijl)
∂qijl+
∂cj(Q1T )
∂qijl+
∂cijl(qTijl)
∂qijl− γT
j ) − qT −1ijl
]
×[qijl − qTijl
]
m∑
i=1
0∑
k=1
[qTik + α(
∂fi(Q1T , Q2T )
∂qik+
∂cik(qTik)
∂qik+ cik(Q
2T , Q3T ) − ρT3k) − qT −1
ik
]
×[qik − qTik
]
+n∑
j=1
o∑
k=1
[qTjk + α(cjk(Q
2T , Q3T ) + γTj − ρT
3k) − qT −1jk
]×
[qjk − qTjk
]
+n∑
j=1
[γT
j + α(m∑
i=1
2∑
l=1
qTijl −o∑
k=1
qTjk) − γT −1j
]×
[γj − γT
j
]
+o∑
k=1
ρT
3k + α(n∑
j=1
qTjk +m∑
i=1
qTik − dk(ρT3 )) − ρT −1
3k
×
[ρ3k − ρT
3k
]≥ 0,
∀(Q1, Q2, Q3, γ, ρ3) ∈ K. (43)
Step 3: Convergence Verification
If |qTijl − qT −1ijl | ≤ ε, |qTik − qT −1
ik | ≤ ε, |qTjk − qT −1jk | ≤ ε, |γT
j −γT −1j | ≤ ε, |ρT
3k −ρT −13k | ≤ ε, for all
i = 1, · · · , m; j = 1, · · · , n; l = 1, 2; k = 1, · · · , o, with ε > 0, a pre-specified tolerance, then
stop; otherwise, set T := T + 1, and go to Step 1.
Note that the variational inequality subproblems (42) and (43) can be solved explicitly
and in closed form since the feasible set is that of the nonnegative orthant. Indeed, they
yield subproblems in the qijl, qik, qjk, γj and ρ3k variables ∀i, j, l, k.
We now state the convergence result for the modified projection method for this model.
34

Theorem 10: Convergence
Assume that the function that enters the variational inequality (18) (or (21)) has at least
one solution and satisfies the conditions in Theorem 4 and in Theorem 7. Then the modified
projection method described above converges to the solution of the variational inequality (18)
or (21).
Proof: According to Korpelevich (1977), the modified projection method converges to the
solution of the variational inequality problem of the form (18), provided that the function
F that enters the variational inequality is monotone and Lipschitz continuous and that
a solution exists. Existence of a solution follows from Theorem 3. Monotonicity follows
Theorem 4. Lipschitz continuity, in turn, follows from Theorem 7. 2
35

Manufacturers
����1 ����
2
����1 ����
2
����1 ����
2
? ?
HHHHHHHHHHHj
������������
? ?
HHHHHHHHHHHj
������������
Retailers
Demand Markets
Figure 5: Supply Chain Network Structure for the Numerical Examples
6. Numerical Examples
In this Section, we apply the modified projection method to several numerical examples.
The modified projection method was implemented in FORTRAN and the computer system
used was a DEC Alpha system located at the University of Massachusetts at Amherst. The
convergence criterion used was that the absolute value of the flows and prices between two
successive iterations differed by no more than 10−4. For the examples, α was set to .01 in
the algorithm. The numerical examples had the network structure depicted in Figure 5 and
consisted of two manufacturers, two retailers, and two demand markets, with both B2B and
B2C transactions permitted.
Example 1
The data for the first example were constructed for easy interpretation purposes. The
production cost functions for the manufacturers were given by:
f1(q) = 2.5q21 + q1q2 + 2q1, f2(q) = 2.5q2
2 + q1q2 + 2q2.
The transaction cost functions faced by the manufacturers and associated with transacting
36

with the retailers using the physical link, that is, mode 1, were given by:
c111(q111) = .5q2111 + 3.5q111, c121(q121) = .5q2
121 + 3.5q121,
c211(q211) = .5q2211 + 3.5q211, c221(q221) = .5q2
221 + 3.5q221,
whereas the analogous transaction costs, but for mode 2, were given by:
c112(q112) = 1.5q2112 + 3q112, c122(q122) = 1.5q2
122 + 3q122,
c212(q212) = 1.5q2212 + 3q212, c222(q222) = 1.5q2
222 + 3q222,
The transaction costs of the manufacturers associated with dealing with the consumers
at the demand markets via the Internet were given by:
c11(q11) = q211 + 2q11, c12(q12) = q2
12 + 2q12,
c21(q21) = q221 + 2q21, c22(q22) = q2
22 + 2q22.
The handling costs of the retailers, in turn, were given by:
c1(Q1) = .5(
2∑
i=1
2∑
l=1
qi1)2, c2(Q
1) = .5(2∑
i=1
2∑
l=1
qi2)2.
The transaction costs of the retailers associated with transacting with the manufacturers
via mode 1 and mode 2 were, respectively, given by:
c111(q111) = 1.5q2111 + 3q111, c121(q121) = 1.5q2
121 + 3q121,
c211(q211) = 1.5q2211 + 3q211, c221(q221) = 1.5q2
221 + 3q221,
c112(q112) = 1.5q2112 + 3q112, c122(q122) = 1.5q2
122 + 3q122,
c212(q212) = 1.5q2212 + 3q212, c222(q222) = 1.5q2
222 + 3q222.
The demand functions at the demand markets were:
d1(ρ3) = −2ρ31 − 1.5ρ32 + 1000, d2(ρ3) = −2ρ32 − 1.5ρ31 + 1000,
37

and the transaction costs between the retailers and the consumers at the demand markets
(denoted for a typical pair by cjk with the associated shipment by qjk were given by:
c11(Q2, Q3) = q11+5, c12(Q
2, Q3) = q12 +5, c21(Q2, Q3) = q21+5, c22(Q
2, Q3) = q22+5,
whereas the transaction costs associated with transacting via the Internet for the consumers
at the demand markets (denoted for a typical such pair by cik with the associated shipment
of qik) were given by:
c11(Q2, Q3) = q11+1, c12(Q
2, Q3) = q12 +1, c21(Q2, Q3) = q21+1, c22(Q
2, Q3) = q22+1.
The modified projection method converged and yielded the following equilibrium pattern:
the product shipments between the two manufacturers and the two retailers associated with
the physical links, and with the Internet links, respectively, that is, with transacting via
mode 1 and mode 2 were:
Q1∗ := q∗111 = q∗121 = q∗211 = q∗221 = 3.4611,
q∗112 = q∗122 = q∗212 = q∗222 = 2.3907.
The product shipments between the two manufacturers and the two demand markets
with transactions conducted through the Internet were:
Q2∗ := q∗11 = q∗12 = q∗21 = q∗22 = 13.3033.
The product shipments (consumption volumes) between the two retailers and the two
demand markets were:
Q3∗ := q∗11 = q∗12 = q∗21 = q∗22 = 5.8513.
The vector γ∗, which was equal to the prices charged by the retailers ρ∗2, had components:
γ∗1 = γ∗
2 = 263.9088,
and the demand prices at the demand markets were:
ρ∗31 = ρ∗
32 = 274.7701.
38

It is easy to verify that the optimality/equilibrium conditions were satisfied with good
accuracy.
The prices charged by the manufacturers were as follows and were recovered according to
the discussion following variational inequality (25). The ρ∗1ijls were as follows for l = 1 and
for l = 2, respectively: All ρ∗1ij1s= 238.8218 and all ρ∗
1ij2s= 242.0329. All the ρ∗1iks were equal
to 260.4673. These values were obtained in both ways as discussed following (21) and either
manner yielded the same value for the corresponding price. Note that the price charged by
the manufacturers to the consumers at the demand markets, approximately 260, was higher
than the price charged to the retailers, regardless of the mode of transacting. The price
charged to the retailers for the product transacted via the Internet, in turn, exceeded that
charged using the classical physical manner.
Example 2: Variant of Example 1
We then modified Example 1 as follows: The production cost function for manufacturer
1 was now given by:
f1(q) = 2.5q21 + q1q2 + 12q1,
whereas the transaction costs for manufacturer 1 were now given by:
c11(q11) = q211 + 3.5q11, c12(q12) = q2
12 + 3.5q12.
The remainder of the data was as in Example 1. Hence, both the production costs and
the transaction costs increased for manufacturer 1.
The modified projection method converged and yielded the following equilibrium pattern:
the product shipments between the two manufacturers and the two retailers associated with
the physical links, and with the Internet links, respectively, that is, with transacting via
mode 1 and mode 2 were:
Q1∗ := q∗111 = q∗121 = 3.3265, q∗211 = q∗221 = 3.5408,
q∗112 = q∗122 = 2.3010, q∗212 = q∗222 = 2.4438.
39

The product shipments between the two manufacturers and the two demand markets
with transactions conducted through the Internet were:
Q2∗ := q∗11 = q∗12 = 12.5781, q∗21 = q∗22 = 13.3638.
The product shipments (consumption volumes) between the two retailers and the two
demand markets were:
Q3∗ := q∗11 = q∗12 = q∗21 = q∗22 = 5.8056.
The vector γ∗ had components:
γ∗1 = γ∗
2 = 264.1706,
and the demand prices at the demand markets were:
ρ∗31 = ρ∗
32 = 274.9861.
The optimality/equilibrium conditions were, again, satisfied at the desired accuracy.
The ρ∗1ijls were as follows for l = 1 and for l = 2, respectively: The ρ∗
11j1s= 239.5789 for
both j and the ρ∗11j2s= 242.6553 for both j. For firm 2, on the other hand, ρ∗
12j1 = 238.9360
for both j, whereas ρ∗12j2 = 242.268 for both j. The ρ∗
11ks were equal to 261.4085, for
both k, whereas the ρ∗12ks were equal to 260.6223 for both k. Note that these values were
obtained in both ways as discussed following (21) and either manner yielded the same value
for the corresponding price. Note that, again, the prices charged by the manufacturers to
the consumers at the demand markets were higher than the prices charged to the retailers.
Of course, the generalized demand price was, nevertheless, equal for all consumers at a
given demand market. In fact, both in this and in the preceding example the equilibrium
generalized demand prices were the same for each demand market.
Hence, manufacturer 1 now produced less than it did in Example 1, whereas manufacturer
2 increased its production output. The prices charged by the retailers to the consumers
increased, as did the generalized price at the demand markets, with a decrease in the incurred
demand.
40

Example 3: Variant of Example 2
We then modified Example 2 as follows: The data were identical to that in Example 2
except that we increased the demand function for demand market 1 as follows:
d1(ρ3) = −2ρ31 − 1.5ρ32 + 2000.
The modified projection method converged and yielded the following equilibrium pattern:
the product shipments between the two manufacturers and the two retailers associated with
the physical links, and with the Internet links, respectively, that is, with transacting via
mode 1 and mode 2 were:
Q1∗ := q∗111 = q∗121 = 16.1444, q∗211 = q∗221 = 16.4974,
q∗112 = q∗122 = 10.8463, q∗212 = q∗222 = 11.0816.
The product shipments between the two manufacturers and the two demand markets
with transactions conducted through the Internet were:
Q2∗ := q∗11 = 60.2397, q∗12 = 0.0000, q∗21 = 61.2103, q∗22 = 0.0000.
The product shipments (consumption volumes) between the two retailers and the two
demand markets were:
Q3∗ := q∗11 = 54.5788, q∗12 = 0.0000, q∗21 = 54.5788, q∗22 = 0.0000,
the vector γ∗, which was equal to the prices charged by the retailers ρ∗2, had components:
γ∗1 = γ∗
2 = 825.1216,
and the demand prices at the demand markets were:
ρ∗31 = 884.694, ρ∗
32 = 0.0000.
It is easy to verify that the optimality/equilibrium conditions were satisfied with good
accuracy.
41
The prices charged by the manufacturers were as follows and were, again, recovered
according to the discussion following variational inequality (21).
The ρ∗1ijls were as follows for l = 1 and for l = 2, respectively: ρ∗
1111 = 719.1185 = ρ∗1121,
ρ∗1211 = 718.0597 = ρ∗
1221, ρ∗1112 = ρ∗
1122 = 735.019, ρ∗1212 = ρ∗
1222 = 734.3071. The ρ∗111s was
equal to 823.4536, whereas the ρ∗121 was equal to 822.4830.
In this example, only the consumers at demand market 1 consume a positive amount.
Indeed, there is no consumption of the product by consumers located at demand market 2.
42

7. Summary and Conclusions
In this paper, we have proposed a framework for the formulation, analysis, and compu-
tation of solutions to supply chain problems in the presence of electronic commerce in the
form of B2B and B2C transactions. Specifically, we have proposed an equilibrium framework
in which the prices associated with the manufacturers, the retailers, and the consumers are
endogenous, as are the production, shipment, and consumption flows.
We formulated the optimization problems facing the manufacturers and the retailers,
and identified the network structure of their transactions. We also established the network
structure of the supply chain network in which the manufacturers’ product shipments to
the retailers must be in agreement with the shipments that the retailers accept. Moreover,
the amounts purchased by the consumers must be in agreement with the amounts that
the retailers accept from the manufacturers and that the manufacturers transact with the
consumers directly through the Internet.
The methodology used for the formulation, qualitative analysis, as well as computation
of the equilibrium prices and product shipments was that of finite-dimensional variational
inequality theory. We established existence of an equilibrium pattern and also provided
uniqueness results.
We then turned to the study of the of the disequilibrium dynamics and proposed a
continuous time adjustment process, which was formulated as a projected dynamical system.
We subsequently proved that the set of stationary points of the dynamical system coincides
with the set of solutions of the variational inequality problem. We also showed that, under
reasonable conditions, the trajectories of the dynamical system are well-defined.
Of course, there are many additional interesting questions that arise in regards to the
study of the dynamics of supply chain interactions but, nevertheless, we hope that the work
in this paper provides part of the foundation.
An algorithm was also proposed for computational purposes and convergence results
given. Finally, we applied the computational procedure to several illustrative supply chain
network examples.
43
Although we considered a supply chain consisting of manufacturers, retailers, and con-
sumers at demand markets, the approach here should also be applicable to the case where
distribution centers are included and with, suitable modifications, and/or where raw material
suppliers are also incorporated. We plan to address such modeling issues in future research.
Acknowledgments
The authors are grateful to the anonymous referee for helpful comments and suggestions.
The research of the first and second authors was supported, in part, by NSF Grant No.:
IIS-0002647 and, in part, by NSF Grant No.: CMS-0085720. The research of the third
author was also supported by the former grant. This support is gratefully acknowledged.
References
K. J. Arrow and M. D. Intrilligator, editors, Handbook of Mathematical Economics,
Elsevier Science Publishers, New York, 1982.
M. S. Bazaraa, H. D. Sherali, C. M. Shetty, Nonlinear Programming: Theory and
Algorithms, John Wiley & Sons, New York, 1993.
D. P. Bertsekas and J. N. Tsitsiklis, Parallel and Distributed Computation - Numer-
ical Methods, Prentice Hall, Englewood Cliffs, New Jersey, 1989.
D. Bovet, Value Nets: Breaking the Supply Chain to Unlock Hidden Profits, John
Wiley & Sons, New York, 2000.
J. Bramel and D. Simchi-Levi, The Logic of Logistics: Theory, Algorithms and Ap-
plications for Logistics Management, Springer-Verlag, New York, 1997.
A. A. Cournot, Researches into the Mathematical Principles of the Theory of
Wealth, English translation, MacMillan, England, 1838.
S. Dafermos and A. Nagurney, Oligopolistic and Competitive Behavior of Spatially Separated
Markets, Regional Science and Urban Economics 17 (1987), 245-254.
44

P. Dupuis and A. Nagurney, Dynamical Systems and Variational Inequalities, Annals of
Operations Research 44 (1993), 9-42.
Federal Highway Administration, E-Commerce Trends in the Market for Freight. Task 3
Freight Trends Scans, Draft, Multimodal Freight Analysis Framework, Office of Freight Man-
agement and Operations, Washington, DC, 2000.
D. Gabay and H. Moulin, On the Uniqueness and Stability of Nash Equilibria in Noncoopera-
tive Games, A. Bensoussan, P. Kleindorfer, and C. S. Tapiero, editors, Applied Stochastic
Control of Econometrics and Management Science, North-Holland. Amsterdam, The
Netherlands, 1980.
R. B. Handfield and E. L. Nichols, Jr. Introduction to Supply Chain Management,
Prentice Hall, New Jersey, 1999
D. Kinderlehrer and G. Stampacchia, An Introduction to Variational Inequalities and
Their Application, Academic Press, New York, 1980.
G. M. Korpelevich, The Extragradient Method for Finding Saddle Points and Other Prob-
lems, Matekon 13 (1977) 35-49.
F. A. Kuglin and B. A. Rosenbaum, The Supply Chain Network @ Internet Speed,
American Management Association, New York, 2001.
J. T. Mentzer, editor, Supply Chain Management, Sage Publishers, Thousand Oaks,
California, 2001.
T. C. Miller, Hierarchical Operations and Supply Chain Planning, Springer-Verlag,
London, England, 2001.
A. Nagurney, Network Economics: A Variational Inequality Approach, second and
revised edition, Kluwer Academic Publishers, Dordrecht, The Netherlands, 1999.
A. Nagurney, J. Dong, and D. Zhang, Multicriteria Spatial Price Networks: Statics and
Dynamics, to appear in Equilibrium Problems and Variational Models, P. Daniele,
45

A. Maugeri, and F. Giannessi, editors, Kluwer Academic Publishers, 2000.
A. Nagurney, J. Dong, and D. Zhang, A Supply Chain Network Equilibrium Model (2002),
Transportation Research E , in press.
A. Nagurney and D. Zhang, Projected Dynamical Systems and Variational Inequal-
ities with Applications, Kuwer Academic Publishers, Boston, Massachusetts, 1996.
A. Nagurney and L. Zhao, Networks and Variational Inequalities in the Formulation and
Computation of Market Disequilibria: the Case of Direct Demand Functions, Transportation
Science 27 (1993) 4-15.
J. F. Nash, Equilibrium Points in N-Person Games, in Proceedings of the National Academy
of Sciences, USA 36 (1950) 48-49.
J. F. Nash, Noncooperative Games, Annals of Mathematics 54 (1951) 286-298.
National Research Council, Surviving Supply Chain Integration: Strategies for Small
Manufacturers, Committee on Supply Chain Integration, Board on Manufacturing and
Engineering Design, Commission on Engineering and Technical Systems, Washington, DC,
2000.
C. C. Poirier, Supply Chain Optimization: Building a Total Business Network,
Berrett-Kochler Publishers, San Francisco, California, 1996.
C. C. Poirier, Advanced Supply Chain Management: How to Build a Sustained
Competitive Advantage, Berrett-Kochler Publishers, San Francisco, California, 1999.
P. A. Samuelson, Spatial Price Equilibrium and Linear Programming, American Economic
Review 42 (1952) 293-303.
F. Southworth, E-Commerce: Implications for Freight, Oak Ridge National Lavoratory, Oak
Ridge, Tennessee, 2000.
H. Stadtler and C. Kilger, editors, Supply Chain Management and Advanced Plan-
ning, Springer-Verlag, Berlin, Germany, 2000.
46

T. Takayama and G. G. Judge, Spatial and Temporal Price and Allocation Models,
North-Holland, Amsterdam, The Netherlands.
A. B. Whinston, D. O. Stahl, and S.-Y. Choi, The Economics of Electronic Commerce,
Macmillan Technical Publications, Indianapolis, Indiana, 1997.
D. Zhang and A. Nagurney, Stability Analysis of an Adjustment Process for Oligopolistic
Market Equilibrium Modeled as a Projected Dynamical Systems, Optimization 36 (1996)
263-285.
47