Suppliers Evaluation and Selection: A Comprehensive Model ...
191
University of Tennessee, Knoxville University of Tennessee, Knoxville TRACE: Tennessee Research and Creative TRACE: Tennessee Research and Creative Exchange Exchange Doctoral Dissertations Graduate School 12-2005 Suppliers Evaluation and Selection: A Comprehensive Model to Suppliers Evaluation and Selection: A Comprehensive Model to Minimize the Risk Associated with Quality and Delivery Minimize the Risk Associated with Quality and Delivery Ammar Mohamed Aamer University of Tennessee - Knoxville Follow this and additional works at: https://trace.tennessee.edu/utk_graddiss Part of the Engineering Commons Recommended Citation Recommended Citation Aamer, Ammar Mohamed, "Suppliers Evaluation and Selection: A Comprehensive Model to Minimize the Risk Associated with Quality and Delivery. " PhD diss., University of Tennessee, 2005. https://trace.tennessee.edu/utk_graddiss/1676 This Dissertation is brought to you for free and open access by the Graduate School at TRACE: Tennessee Research and Creative Exchange. It has been accepted for inclusion in Doctoral Dissertations by an authorized administrator of TRACE: Tennessee Research and Creative Exchange. For more information, please contact [email protected].
-
Upload
khangminh22 -
Category
Documents
-
view
0 -
download
0
Transcript of Suppliers Evaluation and Selection: A Comprehensive Model ...

University of Tennessee, Knoxville University of Tennessee, Knoxville
TRACE: Tennessee Research and Creative TRACE: Tennessee Research and Creative
Exchange Exchange
Doctoral Dissertations Graduate School
12-2005
Suppliers Evaluation and Selection: A Comprehensive Model to Suppliers Evaluation and Selection: A Comprehensive Model to
Minimize the Risk Associated with Quality and Delivery Minimize the Risk Associated with Quality and Delivery
Ammar Mohamed Aamer University of Tennessee - Knoxville
Follow this and additional works at: https://trace.tennessee.edu/utk_graddiss
Part of the Engineering Commons
Recommended Citation Recommended Citation Aamer, Ammar Mohamed, "Suppliers Evaluation and Selection: A Comprehensive Model to Minimize the Risk Associated with Quality and Delivery. " PhD diss., University of Tennessee, 2005. https://trace.tennessee.edu/utk_graddiss/1676
This Dissertation is brought to you for free and open access by the Graduate School at TRACE: Tennessee Research and Creative Exchange. It has been accepted for inclusion in Doctoral Dissertations by an authorized administrator of TRACE: Tennessee Research and Creative Exchange. For more information, please contact [email protected].

To the Graduate Council:
I am submitting herewith a dissertation written by Ammar Mohamed Aamer entitled "Suppliers
Evaluation and Selection: A Comprehensive Model to Minimize the Risk Associated with Quality
and Delivery." I have examined the final electronic copy of this dissertation for form and content
and recommend that it be accepted in partial fulfillment of the requirements for the degree of
Doctor of Philosophy, with a major in Industrial Engineering.
Rapinder Sawhney, Major Professor
We have read this dissertation and recommend its acceptance:
Kenneth Kirby, Dukwon Kim, Ramón V. León
Accepted for the Council:
Carolyn R. Hodges
Vice Provost and Dean of the Graduate School
(Original signatures are on file with official student records.)

To the Graduate Council: I am submitting herewith a dissertation written by Ammar Mohamed Aamer entitled “Suppliers Evaluation and Selection: A Comprehensive Model to Minimize the Risk Associated with Quality and Delivery.” I have examined the final electronic copy of this dissertation for form and content and recommend that it be accepted in partial fulfillment of the requirements for the degree of Doctor of Philosophy, with a major in Industrial Engineering. Rapinder Sawhney Major Professor We have read this dissertation and recommend its acceptance:
Kenneth Kirby Dukwon Kim Ramón V. León
Accepted for the Council: Anne Mayhew Vice Chancellor and Dean of Graduate Studies (Original signatures are on file with official student records.)
SUPPLIERS EVALUATION AND SELECTION: A COMPREHENSIVE MODELTO MINIMIZE THE RISK
ASSOCIATED WITH QUALITY AND DELIVERY
A Dissertation Presented For the Doctor of Philosophy Degree
The University of Tennessee, Knoxville
Ammar Mohamed Aamer December 2005

ii
DEDICATION To My Wife,
Nesrine Abdulah El-Zine

iii
Copyright © 2005 by Ammar Mohamed Aamer All rights reserved.

iv
ACKNOWLEDGMENTS
I wish to thank Dr. Rapinder Sawhney for being my committee chairman as well
as my advisor throughout my graduate work. I also wish to thank my committee
members, Dr. Ken Kirby, Dr. Dukwon Kim, and Dr. Ramón León, who offered
valued advice and guidance. I also wish to thank Dr. Badiru, the Industrial and
Information Engineering department head, for his continuous support and
encouragements.
I also want to thank everyone who contributed directly or indirectly to this study.
The final acknowledgement is reserved for my wife, son, and family.
v
ABSTRACT
This research focuses on one of the main steps in outsourcing, supplier
evaluation and selection. The main contributions of this research were twofold.
First, best practices in the supplier’s value stream were identified that directly or
indirectly impact a supplier’s quality and delivery. Second, a comprehensive
supplier evaluation and selection model was developed based on the value
stream concept to minimize the risk associated with two very critical supplier-
selection factors, quality and on-time delivery.
A survey was conducted to identify best practices. The outcome of the survey
was used to develop a computer based supplier evaluation model, which could
be used in conjunction with other existing supplier selection factors, such as price
and others, to select suppliers.
vi
TABLE OF CONTENTS CHAPTER Page 1. INTRODUCTION ...................................................................................1
Introduction to the Study ..................................................................1 The Background of the Study ......................................................... 1 Supplier Evaluation and Selection ..................................................4 Problem Statement .........................................................................7 Professional Significance of the Study ............................................8 Organization of the Study ............................................................... 9 Summary ........................................................................................9
2. OVERVIEW OF SUPPLIER EVALUATION AND SELECTION ...........11
Search Process ............................................................................11 Empirical Research .......................................................................11 Supplier Selection Methods ..........................................................13 Literature Review Summary ..........................................................32
3. RESEARCH METHODOLOGY………………… ………………………. 40
General Approach .........................................................................40 Methodology .................................................................................48 Data Collection ............................................................................. 55 Research Hypotheses ...................................................................58 Data Analysis................................................................................ 62
4. RESULTS AND DISCUSSION ............................................................ 64
Descriptive Analysis...................................................................... 64 Relation between Suppliers’ Quality Conformance and Best Practices........................................................................ 67 Relation between Supplier’s On-time Conformance and Best Practices........................................................................ 78 The Proposed Model .................................................................... 89 Application of the Proposed Model ............................................... 93
5. SUMMARY, CONCLUSIONS, AND RECOMMENDATIONS .............. 97
Summary and Conclusion of the Research ...................................97 Study Limitations ..........................................................................99 Recommendations for Research ................................................ 100
BIBLIOGRAPHY.................................................................................... 102 APPENDICES .......................................................................................111
Appendix A: Solicitation and Follow-up E-mails ..........................112
vii
Appendix B: List of the Best Practices .......................................115 Appendix C: Test Statistics Tables ............................................ 136 Appendix D: Details of the Proposed-Model Calculations ...........149 Appendix E: Responses Reliability and Validity Test...................155 Appendix F: Model Weights Calculation .....................................159 Appendix G: Statistical Test Results for the Proposed Model Application ..............................................................171
VITA ................................................................................................. 178

viii
LIST OF TABLES
TABLE PAGE 1 Dickson 23 Supplier Evaluation Criteria ......................................6 2 Chronological Summary of the Literature Review .....................29 3 Academic and Practitioners’ Literature Sources .......................45 4 The 7 Value Stream Elements and their Sub-elements .............47 5 Example List of Possible Customer Service/Sales Best Practices ....................................................................................49 6 Combined Best Practices ..........................................................50 7 Summary of Hypotheses, Variables, and Statistical Tests .........59 8 Breakdown of the Independent Variables .................................61 9 Frequency of Respondents by Quality Conformance Grouping ...................................................................................65 10 Frequency of Respondents by Delivery Conformance Grouping ...................................................................................65 11 Frequency of Respondents by Location.....................................66 12 Randomly Selected Suppliers’ Responses ..............................156 13 Kruskal-Wallis Test for Best-practices’ Sub-elements across the Value Stream by Quality Grouping ...........................68 14 Average Ranks of Best-practices’ Sub-elements by Quality Grouping ....................................................................................69 15 Rerun of the Kruskal-Wallis Test for Best-practices’ Sub-elements across the Value Stream by Quality Grouping .....................................................................137 16 Rerun Average Ranks of Best-practices’ Sub-elements by Quality Grouping ................................................................138 17 Kruskal-Wallis Test for Best-practices’ Sub-elements across the Value Stream by Suppliers’ Delivery Grouping (initial run) ................................................................143 18 Rerun of Kruskal-Wallis Test for Best-practices’ Sub-elements across the Value Stream by Suppliers’ Delivery Grouping (4 Groupings) ............................................................80 19 Average Ranks of Best-practices’ Sub-elements by Delivery Grouping (4 Groupings)...........................................81 20 Rerun of Kruskal-Wallis Test for Best-practices’ Sub-elements across the Value Stream by Suppliers’ Delivery Grouping (3 groupings) ............................................................144 21 Rerun Average Ranks of Best-practices’ Sub-elements by Delivery Grouping (3 groupings) .........................................145 22 Comparison between suppliers Quality Using Traditional and Proposed Model ................................................................172
ix
23 Comparison between Suppliers Delivery Using Traditional and Proposed Model ................................................................174

x
LIST OF FIGURES FIGURE PAGE
1 Ratio of Electronics Manufacturing Outsourced vs. In-House for 2000 & 2004....................................................... 4 2 Roadmap of the Study ................................................................ 10 3 Supplier Selection Categories .................................................... 12 4 General Approach of the Study .................................................. 41 5 Example of a Value Stream Map ................................................ 43 6 Example of a Control Stream Map .............................................. 43 7 Survey Likert Scale ..................................................................... 58 8 Overview of the Main Components of the Quality Evaluation Model ........................................................................ 90 9 Overview of the Main Components of the On-time Evaluation Model ........................................................................ 90 10 Overview of the Calculation for the Main Components of the Quality Evaluation Model .................................................. 92

1
CHAPTER 1
INTRODUCTION
Introduction to the Study
This research focuses on outsourcing in Supply Chain Management (SCM).
Specifically, the research addresses one of the main steps in outsourcing,
supplier evaluation and selection. The main contributions of this research were
twofold. First, best practices in the supplier’s value stream were identified that
directly or indirectly impact a supplier’s quality and delivery. Second, a
comprehensive supplier evaluation and selection model was developed based on
the value stream concept to minimize the risk associated with two very critical
supplier-selection factors, quality and on-time delivery. The outcome of the
proposed model could be used in conjunction with other existing supplier
selection factors, such as price and others, to select among suppliers. The first
chapter of this study presents the background of the study, specifies the problem
of the study, and describes its significance.
The Background of the Study
A common strategy in today’s business is to continue doing what you do best
then outsource what you do worst or know least about. This is called the core
competency. Making a strategic outsourcing decision is no easy task. There are
several factors, parameters, and considerations a company has to take into

2
account to ensure that outsourcing is the right decision. Outsourcing is defined
as the strategic use of outside resources, such as human resources, to perform
activities traditionally handled by internal staff and resource [67]. Outsourcing has
actually been practiced for years. Different business processes have been
outsourced such as Human Resources, Maintenance activities, and most
recently Information Technology.
A recent study by Maurice F. Greaver II [59] demonstrated that the outsourcing
trend has started in the automobile industry. In the early ages of car
manufacturing, mass production dictated that manufacturers produce their own
components, but it became difficult for manufacturers to be flexible enough to
keep up with the tremendous variation in customer requirements without relying
on outside sources.
However, after the Toyota innovation of Just in Time concepts and the increasing
customer requirements, the outsourcing trend increased exponentially. Japanese
manufacturers had to seek alternatives, such as outsourcing the production of
non-core components to their suppliers, to meet the customer demand variation
[59]. A non-core component could be a component that other manufacturers
have succeeded in producing with better quality and lower cost.

3
The Japanese competition in the automobile industry drove the American
companies to react and follow a similar strategy. A recent study by Croon et al.
examined how American car manufacturers responded in the seventies and
eighties. The Big Three (Chrysler Corporation, Ford and General Motors)
switched to long-term contracts with preferred suppliers and forged supplier
relationships that valued more than just the lowest bid [60].
Following this trend, the American textile industry has heavily embraced
production outsourcing. According to an American Textile Manufacturers Institute
study, 257 US textile plants have closed from 1997 to 2003 [65]. Similarly, the
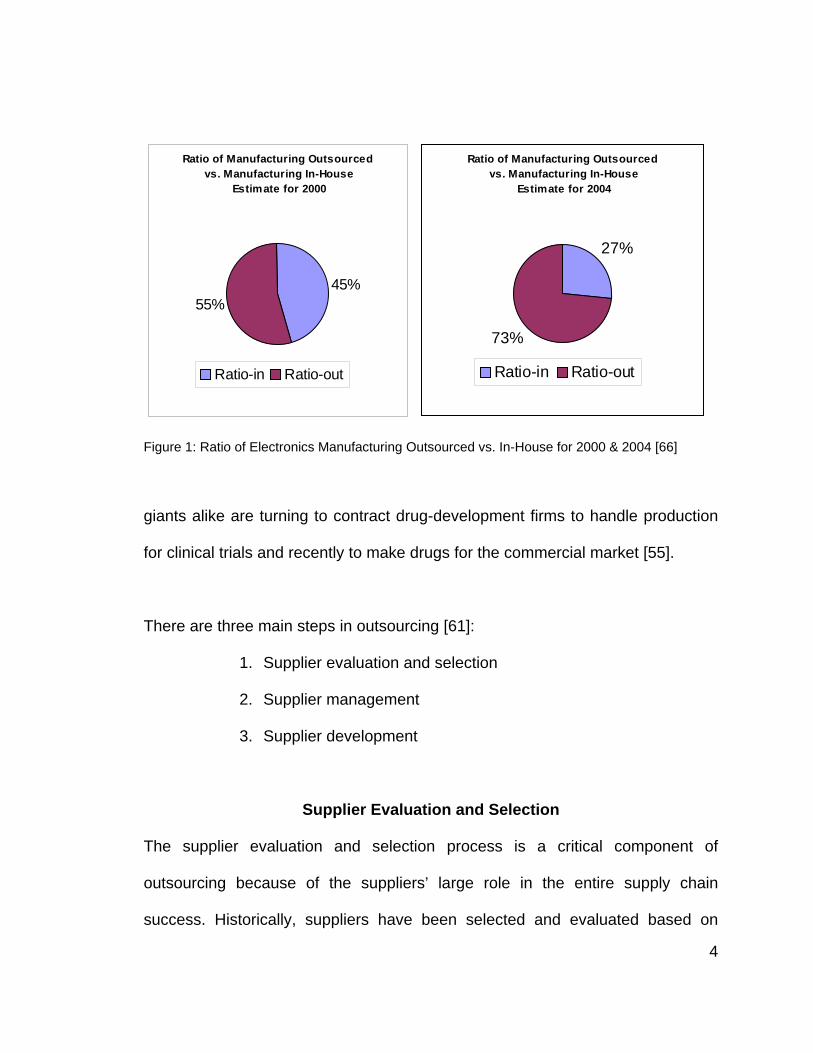
electronics Original Equipment Manufacturers (OEM) have been placing a great
deal of emphasis on outsourcing production. A recent study by the Electronics
Industry Market Research and Knowledge Network examined the electronics
industry, and its $104.95 billion dollar market. Researchers estimate 55% of the
industry uses outsource manufacturing, compared to 45% that uses in-house
manufacturing. These numbers are expected to diverge even further for 2004, to
73% outsource manufacturing, and only 27% in-house manufacturing as
depicted in Figure 1.
A number of other industries, such as the pharmaceutical and biotechnology
industries, have embraced the idea of production outsourcing for strategic and
economical reasons. Industry Week reports that start-ups and pharmaceutical
4
Ratio of Manufacturing Outsourced vs. Manufacturing In-House
Estimate for 2000
45%55%
Ratio-in Ratio-out
Ratio of Manufacturing Outsourced vs. Manufacturing In-House
Estimate for 2004
73%
27%
Ratio-in Ratio-out
Figure 1: Ratio of Electronics Manufacturing Outsourced vs. In-House for 2000 & 2004 [66]
giants alike are turning to contract drug-development firms to handle production
for clinical trials and recently to make drugs for the commercial market [55].
There are three main steps in outsourcing [61]:
1. Supplier evaluation and selection
2. Supplier management
3. Supplier development
Supplier Evaluation and Selection
The supplier evaluation and selection process is a critical component of
outsourcing because of the suppliers’ large role in the entire supply chain
success. Historically, suppliers have been selected and evaluated based on

5
multiple criteria that reported in the history of purchasing management. These
criteria could be broken into different categories related to the supplier’s overall
performance. Some of the main categories, as reported by Ellram, are financial
issues, organizational culture and strategy issues, and technology issues [62].
There have been some studies that presented multiple criteria in selecting
suppliers such as Dickson’s 23 criteria, which are widely used in supplier
selection. Table1 presents Dickson’s supplier selection evaluation criteria.
In most cases, production outsourcing has helped organizations reduce cost and
increase efficiency. However, if not executed appropriately, production
outsourcing could undermine an organizations’ productivity: “once you start
transferring production lines to a contract manufacturer, there is often little or no
time to respond to unforeseen issues, such as quality problems, supplier
shortages or inflexible lead times around the world” [57]. In the short run,
production outsourcing may seem to be a very economical and cost effective
decision, but production outsourcing could potentially do a company more harm
than good, especially if the extremely important suppliers’ criteria are overlooked,
such as quality and on-time delivery. For instance, Boeing lost over 1 billion US
dollars because of part shortages in the production of Boeing’s 747 and 737
airplanes [109].

6
Table 1: Dickson 23 Supplier Evaluation Criteria [63]
Rank Factor Mean Rating
Evaluation
1 Quality 3.508 Extreme Importance 2 Delivery 3.417 3 Performance history 2.998 4 Warranties and claim policies 2.849 5 Production facilities and capacity 2.775 Considerable importance 6 Price 2.758 7 Technical capability 2.545 8 Financial position 2.514 9 Procedural compliance 2.488 10 Communication system 2.426 11 Reputation and position in
industry 2.412
12 Desire for business 2.256 13 Management and organization 2.216 14 Operating controls 2.211 15 Repair service 2.187 Average importance 16 Attitude 2.120 17 Impression 2.054 18 Packaging ability 2.009 19 Labor relations record 2.003 20 Geographical location 1.872 21 Amount of past business 1.597 22 Training aids 1.537 23 Reciprocal arrangements .610 Slight importance
7
It is very critical, for a purchasing company, to be able to predict the unexpected
outsourcing issues of quality and on-time delivery. According to the popular
press, there have been some indications that production outsourcing
organizations are faced with unexpected outsourcing issues in the long run such
as quality and on-time delivery problems. After great success in the short run,
“companies that have been most aggressive in ridding themselves of their
factories have been confronted with a host of unpredicted problems...This wasn't
supposed to happen, say analysts with Booz-Allen & Hamilton's Global
Operations Practice based in San Francisco " [56].
The primary question a buying company should ask is what the potential
operational risks of production outsourcing in the long run are. The more reliable
the supplier is the less negative effects on the production system there are. Thus,
supplier evaluation and selection is a critical step in production outsourcing.
Reliable suppliers equal reliable production flow. Presumably, in production
outsourcing a company’s production system is at the mercy of its supplier:
“Because of increased dependence, how key suppliers perform in terms of
quality, delivery, costs, and service affects the buying company’s performance”
[109].
Problem Statement
More often than not, a supplier selection is based on the lowest bid, and in some
cases on unsystematic and incomprehensive subjective evaluation and

8
interviews. Therefore, it becomes too late to proactively avoid supplier issues or
divest production flow of their symptoms. If causes of the suppliers’ quality and
delivery issues are accounted for early in the supplier evaluation and selection
process, the associated risk could be minimized. The general question this study
attempts to answer is this: is there a more comprehensive and effective supplier
evaluation and selection model that minimizes the risk associated with quality
and delivery? The general question subsumes several related questions:
1. What are the best practices in the supplier’s value stream that affect
suppliers’ quality?
2. What are the best practices in the supplier’s value stream that affect
suppliers’ on-time delivery?
3. Which best practices contribute the most to the suppliers’ quality
conformance?
4. Which best practices contribute the most to the suppliers’ on-time delivery
conformance?
Professional Significance of the Study
It is hoped that this research would make a contribution to the existing knowledge
of supplier evaluation and selection models and provide results of value to
practitioners. Although there have been many supplier evaluation and selection
models reported in the literature, there have been no models reported in the

9
literature that comprehensively evaluate suppliers’ factors from a value stream
perspective.
Organization of the Study
This study is organized into 5 chapters including the introduction--Chapter 1.
Chapter 2 presents a thorough analysis of the supplier evaluation and selection
literature. It also explains the difference between this study and the literature.
Chapter 3 presents the methodology used in this study. Chapter 4 presents the
results and the discussion of the study. It also presents the proposed model and
its implementation. Chapter 5 concludes the study and its limitations with future
research recommendations.
Summary
Overall, evaluating and selecting suppliers based only on purchasing ratings can
lead to a poor decision. This study develops a more comprehensive supplier
evaluation and selection model that takes into account the best practices that are
related to the most critical supplier selection factors in the supplier’s value
stream, quality and on-time delivery. The comprehensive model deals with
supplier selection and evaluation from a supply chain perspective not a
purchasing perspective. Figure 2 summarizes the focus of this study, as it relates
to SCM.

10
Figure 2: Roadmap of the Study
Supplier Evaluation and Selection
Supplier Development
Supplier Management
Quality
Delivery
Outsourcing
SCM

11
CHAPTER 2
OVERVIEW OF SUPPLIER EVALUATION AND SELECTION
A large body of literature on supplier evaluation and selection provides a basis
for the present study. This chapter explains and summarizes the extensive
search process in reviewing the supplier evaluation and selection methods in the
literature. The main focus of this chapter is to present what has been done and
what has not been done in the literature. It is left up to the reader to seek further
details of each study.
Search Process
The following review was developed through a systematic approach. Studies
were selected from previous literature searches such as Boer et al., who
conducted the most recent search in 2001 [68]. Additionally, more up to date
studies were reviewed.
Empirical Research
This study categorizes the supplier evaluation and selection empirical studies
into three main categories based solely on each study’s content: rating,
mathematical, and hybrid methods. Figure 3 depicts the categorization of the
supplier evaluation and selection methods. If it focuses on a supplier

12
Figure 3: Supplier Selection Categories
performance evaluation, the study is listed under the rating methods; otherwise it
is listed under the mathematical methods. However, if it integrates both the
performance evaluation and criteria tradeoffs, the study is listed under the hybrid
methods.
Rating methods encompasses two subcategories, criteria ranking and cost
methods. The mathematical category encompasses four subcategories:
operation research, linear weighting, statistical, and artificial Intelligence
methods. This chapter lists each of the supplier selection and evaluation studies
chronologically as they relate to each category and subcategory.
Supplier Selection Methods
Mathematical Methods Focus: Factors Tradeoff
Hybrid Methods
Rating methods Focus: Factors Evaluation
Artificial Intelligent
Factors Ranking
Factors Cost Estimating
Operation Research
Linear Weighting
Statistical
13
Supplier Selection Methods
This section presents the three main supplier selection categories and their
subcategories.
1. Rating Methods
Rating methods employ subjective weights or dollar values to evaluate and select
suppliers. Factors such as quality and delivery are subjectively evaluated, rated,
and ranked. A supplier, then, is compared to other suppliers and selected. Rating
methods are broken into two subcategories: criteria ranking and cost methods.
1.1. Factors Ranking
Factors ranking subjectively weights and ranks suppliers’ selection factors. The
main strength of subjective weighting of factors is its capability to evaluate
suppliers’ performance through an unsophisticated evaluation process. Factors
ranking methods are generally conducted through different mechanisms such as
plant visits, interviews, and audits. For example, a buying company team
member subjectively evaluates and rate supplier’s performance factors. After
basic mathematical calculations, a number is assigned to each supplier.
Accordingly, the buying company team ranks each supplier from high to low.
Factors ranking is the most popular method in supplier evaluation and selection.
Authors have differed on how to apply factors ranking. Some of the studies rate

14
factors by assigning simple subjective weights to each factor. For instance,
Gregory used a simple weighted factor matrix approach to select suppliers.
Gregory identified five major evaluation criteria and their subjective weight:
proposal responsiveness, technical, quality, cost, and general. Logically the
supplier with a higher score would be selected over others [1]. Similarly,
Timmerman presented a simple approach to evaluate suppliers through the use
of linear averaging, which is based on assigning weight to different suppliers’
selection criteria such as quality and delivery [2].
Taking the factors ranking a step further, Thompson presented a modified
traditional weighted supplier evaluation model. Unlike previous models, this
model addresses the uncertainty associated with supplier factors through the use
of Monte Carlo simulation. In essence, a purchaser has to determine high and
low values for each supplier, and the computer will generate random numbers.
Then the model calculates the sum of the weighted numbers. This number would
be replicated thousands of times to form a frequency distribution for each vendor
to be used as a base to compare suppliers [3, 4].
Several authors have improved the suppliers’ factors ranking by using new
techniques. Ghobadian et al. proposed a computerized model for suppliers’
rating based on existing and developed methods in the area of a supplier’s
rating. The model breaks down the rating techniques into two categories:
15
qualitative techniques and quantitative techniques [5]. By the same token,
Vokurka et al. presented a new method to rate suppliers based on an expert
system [36].
More comprehensive approaches to evaluate and rank suppliers were presented
in the literature, which evaluates the supplier’s capability in different business
areas. Barbarosoglu presented suppliers’ assessment with an addition of new
rating factors. The approach delineates the assessment criteria into three
categories. The first category is performance assessment, which includes quality,
cost, and delivery. The second category is business structure and manufacturing
capability assessment, which looks at financial and technical capability. The third
category is quality system assessment, which is a subjective supplier quality
assessment that addresses various quality issues in a manufacturing plant. After
assigning an importance rating to each category and subcategory, a supplier is
evaluated and selected based on the highest score [7].
Moreover, Muralidharan et al [13] elaborated on the two most critical factors,
quality and delivery. Authors rate quality based on inspection methods,
percentage rejections, following TQM and JIT practices, and product
performance. Also, the authors rate delivery based on speed, dependability,
transport cost, and flexibility in delivery schedules. However, Garriz et al. [15]
presented a more comprehensive ranking method. The evaluation process takes
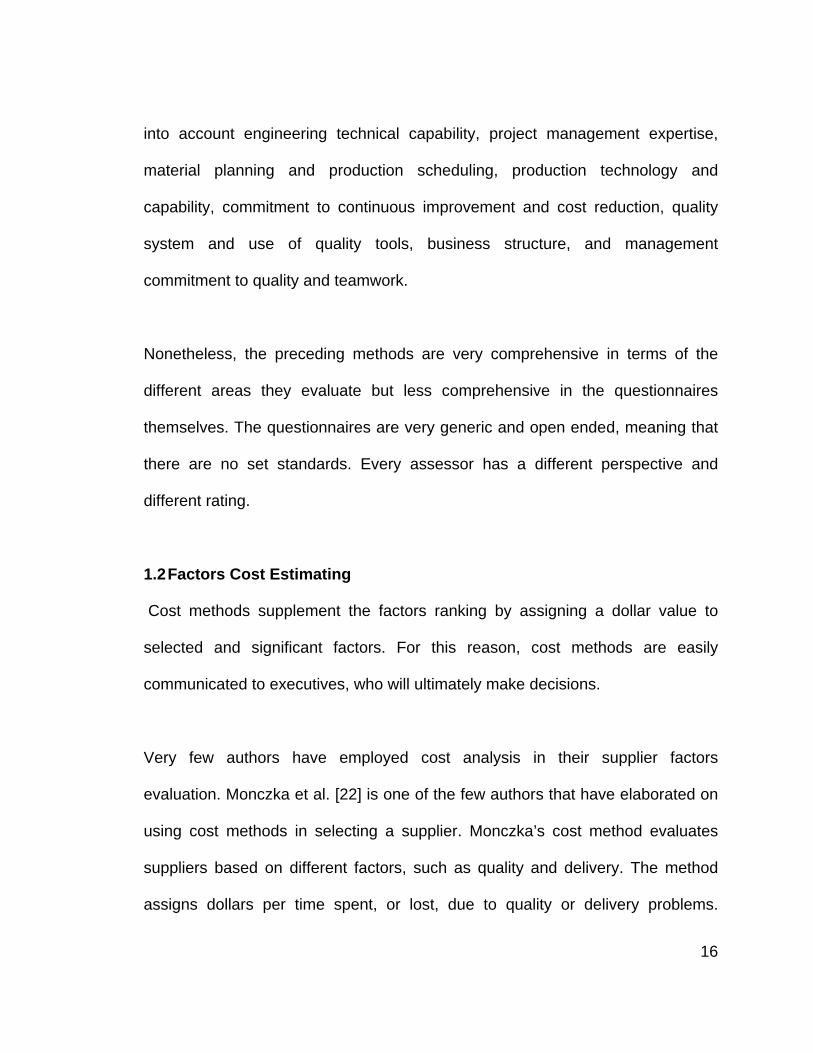
16
into account engineering technical capability, project management expertise,
material planning and production scheduling, production technology and
capability, commitment to continuous improvement and cost reduction, quality
system and use of quality tools, business structure, and management
commitment to quality and teamwork.
Nonetheless, the preceding methods are very comprehensive in terms of the
different areas they evaluate but less comprehensive in the questionnaires
themselves. The questionnaires are very generic and open ended, meaning that
there are no set standards. Every assessor has a different perspective and
different rating.
1.2 Factors Cost Estimating
Cost methods supplement the factors ranking by assigning a dollar value to
selected and significant factors. For this reason, cost methods are easily
communicated to executives, who will ultimately make decisions.
Very few authors have employed cost analysis in their supplier factors
evaluation. Monczka et al. [22] is one of the few authors that have elaborated on
using cost methods in selecting a supplier. Monczka’s cost method evaluates
suppliers based on different factors, such as quality and delivery. The method
assigns dollars per time spent, or lost, due to quality or delivery problems.

17
However, Smytka et al. [6] presented a more in depth analysis of the cost of
suppliers’ quality than Monczka. Smytka’s model decomposes the cost of a
supplier’s quality into more appropriate subcategories such as rejects, shutdown,
rework, and scrap. Also, Chen et al. [12] presented a different cost model, which
bases the supplier selection on the critical factor of quality. Chen’s model
allocates costs to the defective shipments and the cost of quality. The model
tracks the cost of quality in the entire organization from purchasing, production,
design engineering, production supporting, and sales.
Another approach to the factors cost estimating is Activity Based Costing
analysis (ABC). ABC accounts for all direct and indirect activities’ cost. Degraeve
et al. [8, 9] focuses on selecting an optimal number of qualified suppliers using
ABC information. Similarly Dogan et al. [93] presented a supplier selection model
using an ABC methodology, but considered fuzzy factors. Both models use the
purchasing process costs to minimize the total cost of ownership (TCO).
According to Degraeve, TCO quantifies all costs associated with the purchasing
processes throughout the entire value chain of the firm. Compared to other cost
methods, Degraeve’s approach goes beyond the purchasing price to consider all
costs over each item’s entire life, such as costs related to service, quality,
delivery, administration, communication, failure, maintenance, and others.

18
Most of the cost studies consider the cost of quality but at an aggregate level.
For example, a production quality cost is calculated by considering the average
amount of lost time due to a quality problem. There is not an emphasis on the
detailed cost of quality issue as it relates to the entire organization value stream.
The majority of the cost methods presented in this section measure performance
cost and do not predict performance cost.
Overall, rating methods have evolved significantly. Despite their popularity, they
are still biased methods because of the subjectivity involved in the evaluation
process. The majority of the presented rating methods fail to adequately evaluate
and predict suppliers’ quantitative factors such as quality and delivery. There are
other subtle activities and functions that contribute to quality and delivery. This
study attempts to define these latent activities and functions in the entire supplier
value stream to adequately evaluate or predict quality and delivery.
2. Mathematical Methods
Studies under mathematical methods do not incorporate performance evaluation,
but they examine suppliers’ criteria interactions and tradeoffs. There are 4
mathematical subcategories in this study; operation research, linear weighting,
statistical, and artificial intelligence methods.

19
2.1. Operation Research
Operation Research (OR) methods optimize the interactions and tradeoffs
among different factors of interest, which allow the buyer to make an effective
supplier-selection decision. Several optimization methods such as goal
programming, linear programming, heuristic, mixed integer and data
envelopment analysis have been applied in the area of supplier evaluation and
selection. The following sections present the different supplier evaluation and
selection studies as they relate to each OR-method subcategory.
Goal Programming:
Few authors have applied the goal programming methods in the supplier
evaluation and selection area. Bufa et al. [19] and Karpak et al. [42] presented
models that schedule purchases from several suppliers based on goal
programming. One of the fallbacks of goal programming is its lack to consider
qualitative factors. To overcome this issue Cebi et al. [80] integrated goal
programming and the Analytical Hierarchy Process (AHP), which considers both
qualitative and quantitative factors.
Linear Programming:
A few linear programming studies exist in the supplier selection literature. Pan
[23] presented a simple linear model to select among suppliers. However,
Ghoudsypour et al. [41] presented a more comprehensive model, which

20
integrates AHP and linear programming. Ghoudsypour considers the AHP
method to incorporate the tangible and intangible supplier selection factors in the
model. A similar approach was taken by Subramanian et al. [48] when they
integrated the Multi Attribute Utility Theory (MAUT) with linear programming to
account for the uncertainty in the suppliers’ performance.
Heuristic Programming:
Heuristic programming is another OR area that is used in the supplier selection
literature. Benton [24] presented a simple heuristic programming model. The
model considers quantity discounts for multiple items, multiple suppliers and
resource limitations. Akinc [29] presented another heuristic model that reduces
the number of suppliers, and considers cost, delivery, and quality. Tempelmeier
[49] presented a heuristic solution method for the dynamic order sizing and
supplier selection problem. Ganeshan et al. [43] presented a more
comprehensive approach yet simple heuristic model.
Mixed Integer Programming:
The majority of the studies presented in the supplier evaluation and selection
literature use mixed integer programming. Weber et al. [26] presented a Multi-
Objective-Program (MOP) method based on the mixed integer programming.
Weber’s model looks at the tradeoffs between different factors, but in a just in
time (JIT) environment. The model establishes the appropriate order quantities.

21
A different approach was taken by Chaudhry [27] when the author presented a
linear and mixed binary integer-programming model. Chaudhry’s model presents
a price break for a single product over a single planning period. Rosenthal et al.
[35] illustrated an extended pure purchasing method. Rosenthal’s model
presented a mixed integer linear program method to minimize total purchasing
cost. The strength of Rosenthal’s method lies in considering buying from different
suppliers with different discounted order quantity, different quality level, and
different capacity levels.
To strengthen the mixed-integer models even more, authors integrated
approaches to supplier selection using other research areas. For example,
Degraeve et al. [11] integrated a mixed integer programming with the activity
based costing (ABC). Degraeve’ s model uses multi period, multi item, and multi-
vendor mathematical model [11]. Kumara et al. [72] integrated the fuzzy theory
with mixed integer programming. Kumara’s model considers some of the
parameters being fuzzy. Also, Feng et al. [81] presented a stochastic integer
programming model. Feng integrated the Tagouchi’s loss function and process
capability indices with mixed integrate model. Feng’s model is one of the very
few models that address the quality problems from a production perspective.
Recent mixed integer programming studies in the literature consider more
complex constraints in the models such as inventory, lot sizes, and quantity

22
discount. For instance, Basnet et al. [87] presented a mixed integer programming
model taking into consideration a multi-period inventory lot sizing scenario;
Crama et al. [89] presented a mixed integer model taking into consideration total
quantity discounts and alternative product recipes; Ghodsypour et al. [94]
presented a mixed-integer nonlinear programming model to select suppliers and
assign appropriate quantity to each selected suppliers with additional constraints
of multiple sourcing, multiple criteria, and suppliers capacity; and Dahel et al. [97]
presented a multi-objective mixed integer model that considers the quantity to
allocate to each selected supplier in a multiple product, discounts, and multiple-
supplier competitive sourcing. These models only differ in the factors considered
in the analysis, but they are still similar to the preceding models in terms of the
use of mixed integer programming.
Data Envelopment Analysis:
One of the most recent OR areas that is used in the supplier selection studies is
Data Envelopment Analysis (DEA). Weber et al. [37] demonstrated the use of
DEA for measuring vendor performance and efficiency. Weber’s model presents
a graphical analysis to help buyers choose among different suppliers. A few
years later, Weber et al. [40, 46] integrated a mathematical model with DEA to
select between suppliers. Liu et al. [44] extended Weber’s research and
evaluated different suppliers for an individual product using DEA. Liu’s model

23
estimates the overall performance of suppliers in order to be able to reduce the
number of suppliers.
Besides, Zhu [82] presented a supplier selection model based on the DEA, which
is similar to Talluri’s model [76] with an objective to maximize efficiency rather
than minimizing efficiency. Also, models are presented in the supplier selection
literature by Current et al. [33] and Dulmin et al. [92]. Current presented a model
to demonstrate the similarity between supplier selection models and facility
location problems. Current’s model reduces the number of existing suppliers [33].
Dulmin’s model ranks alternatives and analyzes relationships between factors.
2.2. Linear Weighting
Linear weighting methods utilize simple weighting algorithms to rank suppliers
performance factors subjectively, such as quality and delivery. Linear weighting
studies are characterized in this research as mathematical because they do not
evaluate factors but weight factors. Many studies use linear weighting methods in
the supplier selection process because of their uncomplicated execution process
and the use of both qualitative and quantitative factors.
One of the most applied weighting methods is Analytical Hierarchy Process
(AHP). Narasimhan [18] and Nydick et al. [25] demonstrated the applicability of
AHP when selecting suppliers. Finnman et al. [50] applied AHP based on

24
supplier chain risk management. The model integrates decision tree analysis and
AHP, which selects the lowest risk suppliers.
Vendor performance rating is another application area of the linear weighting
methods. Vendor permanence methods evaluate and rate suppliers’ factors.
Soukup [20] presented a vendor performance matrix methodology to compare a
vendor’s performance based on different scenarios. Also, Grando et al. [38]
presented another vendor performance matrix to evaluate suppliers based on
services, quality, cost, and availability. Grando et al. uses a weighting system to
assign criteria values, and then constructs a service vendor rating (SVR) to
select suppliers [38]. However, Li et al. [39] proposed an alternative to the vendor
performance index used in supplier selection. Li et al. proposes a fuzzy bag
method and a new measure called standardized unit-less unit (SUR) to select
between suppliers. Additionally, Willis et al. [30] presented a modified version of
the dimensional analysis model. Basically, the model compares the criteria ratio,
such as quality, between two suppliers, and then the company selects a high
ratio supplier based on the model.
Even though many organizations and researchers use linear weighting methods,
linear weighting methods are still considered biased because of their excessive
subjectivity. The linear weighting methods process relies heavily on human
judgment to weight different suppliers’ factors.

25
2.3. Statistical
Statistical studies incorporate uncertainty; there are not many articles in the
literature that utilize statistics in the supplier selection process. This study’s
comprehensive-literature search reveals three studies only of supplier evaluation
and selection that use statistical methods.
The very first statistical study in the literature is presented by Hinkle et al. [17].
Hinkle et al. presented an overview of using cluster analysis when selecting
suppliers. The method basically clusters suppliers’ factors, and then selects the
best supplier. A different statistical model was presented by Ronen et al. [21].
Ronen used statistical distributions to develop a decision support system (DSS).
The DSS focuses on lead-time management. The model optimizes the order time
for each supplied item, and then chooses the supplier whose minimal cost is the
global minimum for a specific item. The decision support system is management
of when to order items from suppliers in order to meet a due date. The third
study is presented by Petroni et al. [45]. Petroni et al. presented a multivariate-
statistical method. The method evaluates existing suppliers’ performance,
meaning that a company keeps the supplier that meets the company’s
requirement.

26
2.4. Artificial Intelligence
Artificial Intelligence [AI] methods incorporate the ‘if’ scenario when dealing with
different factors. Very few researchers have applied artificial inelegance to the
area of supplier selection.
Siying et al. [77] and Choy et al. [47] presented intelligent supplier selection
models based on Neural Network [NN]. Subsequently, Choy et al. [73, 74, and
75] presented a series of studies dealing with supplier selection using the
application of AI techniques. In particular, the authors used an AI technique
called Critical Based Reasoning (CBR). CBR is a subset of an AI application
Knowledge-based management (KBS), which utilizes past experience to solve
problems. Similarly, Humphreys et al. [96] presented a supplier selection model
using CBR, which takes into account environmental factors. Valluri [78]
presented an AI model that employed an agent based modeling to select
suppliers.
The AI methods presented in this section are constrained to qualitative factors.
That is, if a supplier’s evaluation contain quantitative factor, such as percentage
of defects, a different method would have to be integrated with AI to address the
quantitative factors. AI methods incorporate very generic criteria such as
technical capability, quality assessment, and organization profile.
27
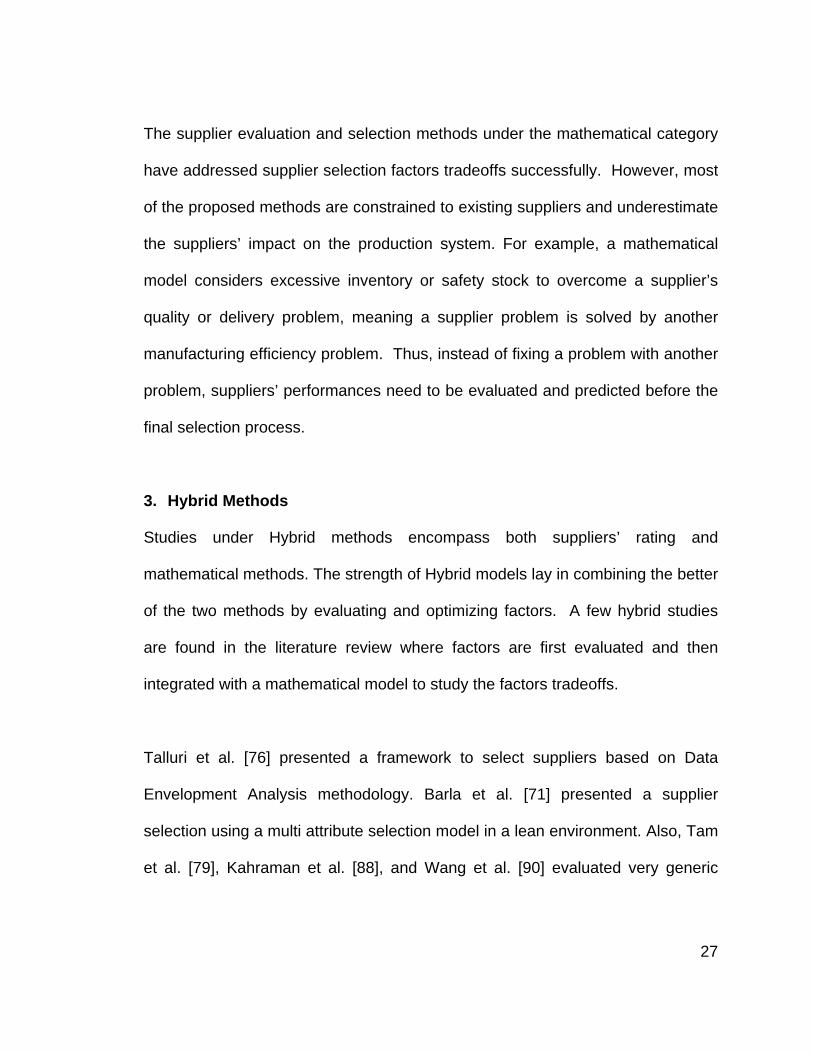
The supplier evaluation and selection methods under the mathematical category
have addressed supplier selection factors tradeoffs successfully. However, most
of the proposed methods are constrained to existing suppliers and underestimate
the suppliers’ impact on the production system. For example, a mathematical
model considers excessive inventory or safety stock to overcome a supplier’s
quality or delivery problem, meaning a supplier problem is solved by another
manufacturing efficiency problem. Thus, instead of fixing a problem with another
problem, suppliers’ performances need to be evaluated and predicted before the
final selection process.
3. Hybrid Methods
Studies under Hybrid methods encompass both suppliers’ rating and
mathematical methods. The strength of Hybrid models lay in combining the better
of the two methods by evaluating and optimizing factors. A few hybrid studies
are found in the literature review where factors are first evaluated and then
integrated with a mathematical model to study the factors tradeoffs.
Talluri et al. [76] presented a framework to select suppliers based on Data
Envelopment Analysis methodology. Barla et al. [71] presented a supplier
selection using a multi attribute selection model in a lean environment. Also, Tam
et al. [79], Kahraman et al. [88], and Wang et al. [90] evaluated very generic

28
factors (such as delivery reliability, flexibility & responsiveness, cost, and assets)
and employed the AHP method.
Other authors such as Kwong et al. [83] and Choy et al. [84, 85, 86] used AI as
their mathematical models and extended the suppliers’ evaluation to incorporate
other functions of the value stream such as delivery, shipment quality, product
price, customer service, quality, development, and organizational culture. A
different approach was taken by Degraeve et al. [11, 95], who presented a mixed
integer model based on data collected from the total cost of ownership. The
authors evaluated and quantified suppliers’ factors then examined the factors
tradeoffs.
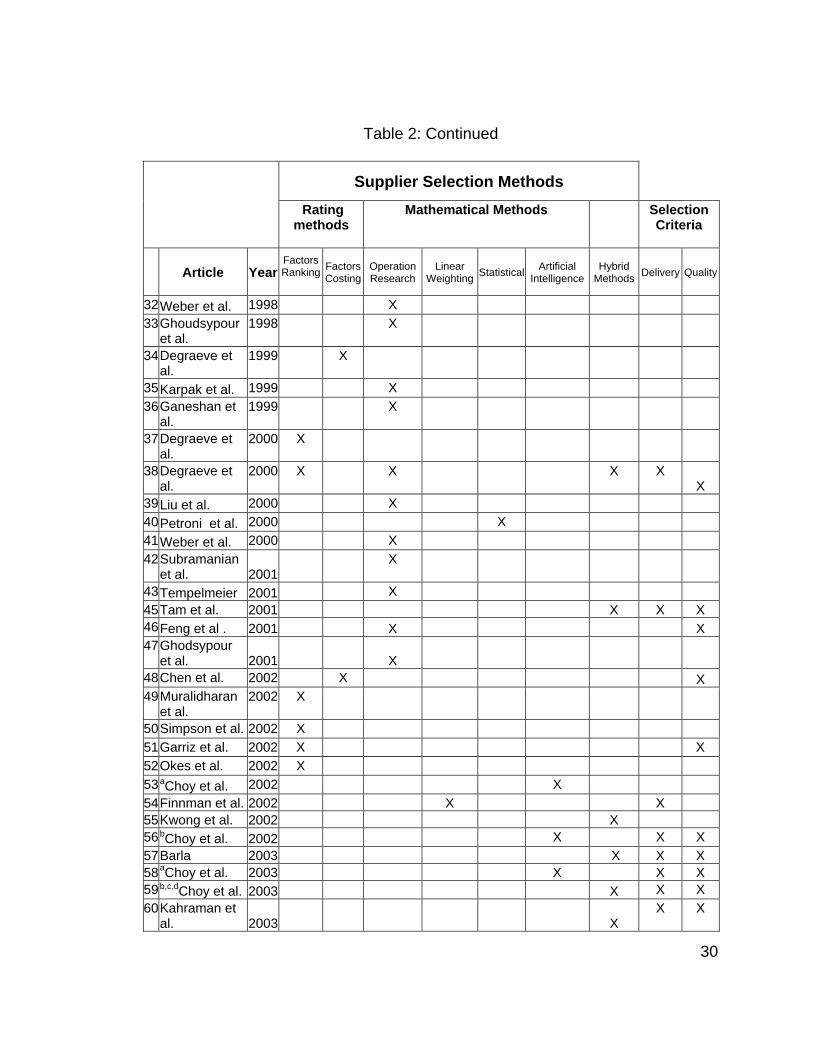
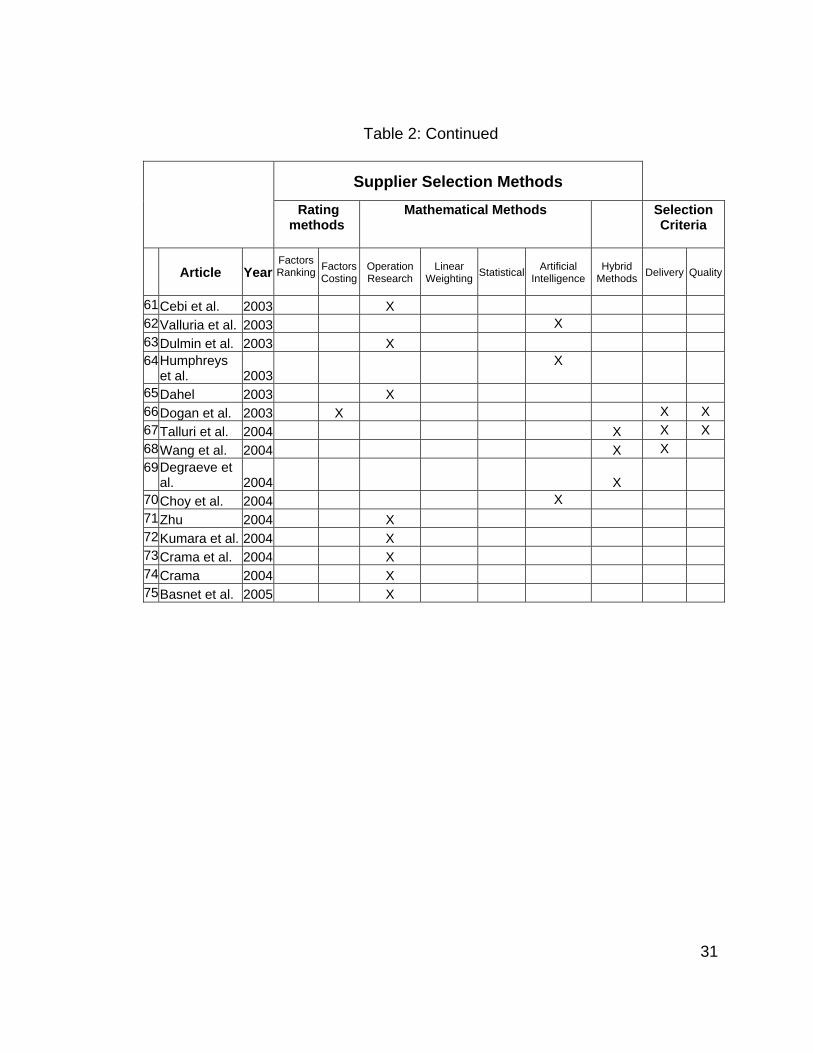
The studies presented in this section were very generic for the two critical
factors, quality and on time delivery. Table 2 references the supplier evaluation
and selection studies presented in this chapter. Also, Table 2 references the
studies that included evaluation of quality or/and delivery in their models. The
following section discusses the shortcoming of the presented studies in terms of
quality and delivery evaluation.

29
Table 2: Chronological Summary of the Literature Review
Supplier Selection Methods
Rating
methods
Mathematical Methods
Selection Criteria
Article Year
Factors Ranking
FactorsCosting
Operation Research
Linear Weighting Statistical Artificial
Intelligence Hybrid
Methods Delivery Quality
1 Hinkle et al. 1969 X 2 Narasimhan 1983 X 3 Bufa et al. 1983 X 4 Gregory, R.E. 1986 X 5 Timmerman 1986 X 6 Soukup 1987 X 7 Ronen et al. 1988 X X 8 Monczka 1988 X X X 9 Pan 1989 X 10Thompson, K. 1990 X 11Thompson, K. 1991 X 12Benton 1991 X 13Nydick et al. 1992 X 14Ghobadian et
al. 1993 X
15Smytka et al. 1993 X X X 16Weber et al. 1993 X 17Chaudhry 1993 X 18Weber et al. 1993 X 19Akinc 1993 X 20Willis et al. 1993 X 21Sadrian et al. 1994 X 22Current et al. 1994 X 23Min 1994 X 24Rosenthal et
al. 1995
X
25Vokurka et al. 1996 X 26Weber et al. 1996 X 27Grando et al. 1996 X X X 28Barbarosoglu
et al. 1997 X X
X 29Li et al. 1997 X 30Siying et al. 1997 X 31Degraeve et
al. 1998
X
30
Table 2: Continued
Supplier Selection Methods
Rating
methods
Mathematical Methods
Selection Criteria
Article Year
Factors Ranking
FactorsCosting
Operation Research
Linear Weighting Statistical Artificial
Intelligence Hybrid
Methods Delivery Quality
32 Weber et al. 1998 X 33 Ghoudsypour
et al. 1998
X
34 Degraeve et
al. 1999
X
35 Karpak et al. 1999 X 36 Ganeshan et
al. 1999
X
37 Degraeve et
al. 2000 X
38 Degraeve et
al. 2000 X X X X
X 39 Liu et al. 2000 X 40 Petroni et al. 2000 X 41 Weber et al. 2000 X 42 Subramanian
et al. 2001 X
43 Tempelmeier 2001 X 45 Tam et al. 2001 X X X 46 Feng et al . 2001 X X 47 Ghodsypour
et al. 2001 X
48 Chen et al. 2002 X X 49 Muralidharan
et al. 2002 X
50 Simpson et al. 2002 X 51 Garriz et al. 2002 X X 52 Okes et al. 2002 X 53 aChoy et al. 2002 X 54 Finnman et al. 2002 X X 55 Kwong et al. 2002 X 56 bChoy et al. 2002 X X X 57 Barla 2003 X X X 58 aChoy et al. 2003 X X X 59 b,c,dChoy et al. 2003 X X X 60 Kahraman et
al. 2003
X X X
31
Table 2: Continued
Supplier Selection Methods
Rating
methods
Mathematical Methods
Selection Criteria
Article Year
Factors Ranking
FactorsCosting
Operation Research
Linear Weighting Statistical Artificial
Intelligence Hybrid
Methods Delivery Quality
61Cebi et al. 2003 X 62Valluria et al. 2003 X 63Dulmin et al. 2003 X 64Humphreys
et al. 2003 X
65Dahel 2003 X 66Dogan et al. 2003 X X X 67Talluri et al. 2004 X X X 68Wang et al. 2004 X X 69Degraeve et
al. 2004
X
70Choy et al. 2004 X 71Zhu 2004 X 72Kumara et al. 2004 X 73Crama et al. 2004 X 74Crama 2004 X 75Basnet et al. 2005 X
32
Literature Review Summary
This section discusses the studies that are related to two of the most critical
suppliers’ selection criteria, quality and delivery. The majority of the studies
presented in the supplier evaluation & selection literature focused on the
selection and overlooked the evaluation of suppliers. The presented studies
occasionally focused on how to better evaluate and measure the suppliers’
criteria. Table 2 references the studies that addressed quality and delivery.
According to Table 2, only 19 out of 75 reviewed studies touched on either
supplier’s quality or delivery. However, the studies that considered either quality
or delivery or even both utilized pre-evaluated values. For example, a study used
percent of defective parts or on time delivery values without presenting how
these values were evaluated. The following section presents the quality related
studies, delivery related studies, and both quality and delivery related studies as
they were listed in Table 2.
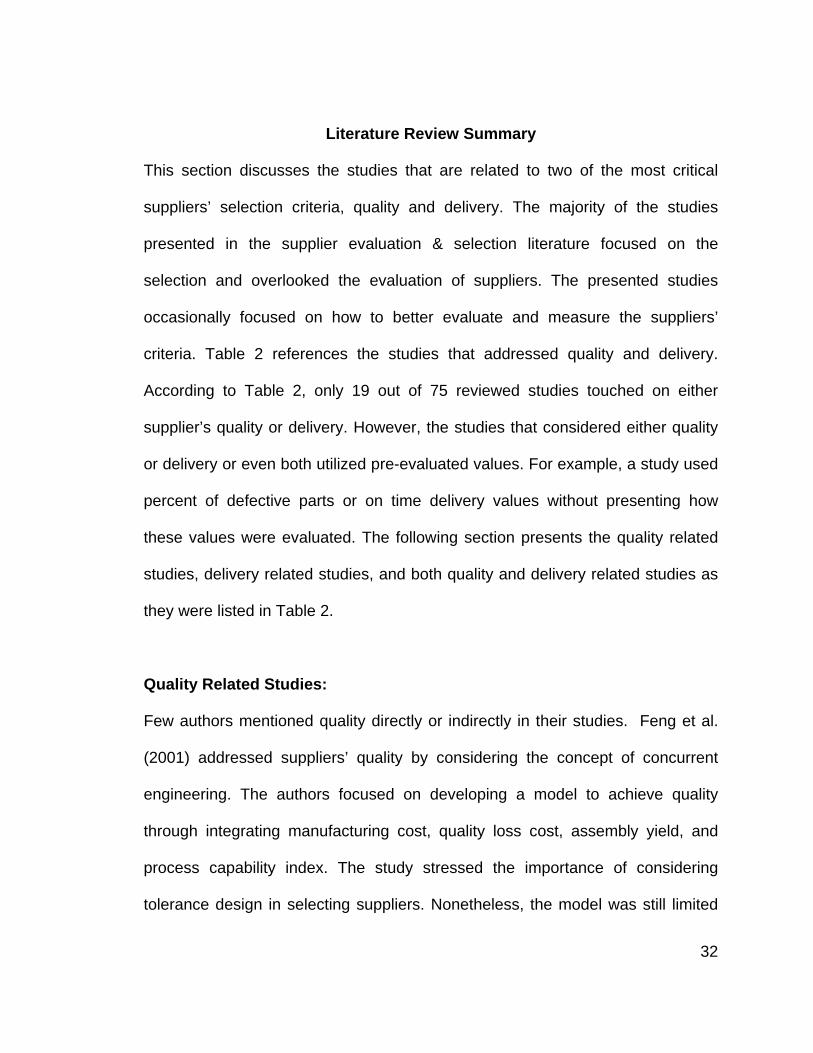
Quality Related Studies:
Few authors mentioned quality directly or indirectly in their studies. Feng et al.
(2001) addressed suppliers’ quality by considering the concept of concurrent
engineering. The authors focused on developing a model to achieve quality
through integrating manufacturing cost, quality loss cost, assembly yield, and
process capability index. The study stressed the importance of considering
tolerance design in selecting suppliers. Nonetheless, the model was still limited

33
to design tolerances to achieve good quality. It did not present how to evaluate
suppliers’ quality.
Chen et al. (2002) evaluated quality from a cost of quality perspective. The
authors used five costs of quality categories: prevention cost, appraisal cost,
internal failure cost, external failure cost, and consequential costs of failure.
These costs were tracked throughout a supplier’s entire organization:
purchasing, production, design engineering, production supporting, and sales.
This model looked at evaluating the cost of suppliers’ quality not the quality of
suppliers.
Gariz et al. (2002) presented more detailed suppliers’ criteria evaluation than
other presented studies. The study touched on several value stream elements
but from a macro level. The authors presented questionnaires to evaluate
suppliers based on engineering technical capability, project management
expertise, material planning and production scheduling, production technology
and capability, commitment to continuous improvement and cost reduction, use
of quality tools, business structure, and management commitment to quality and
teamwork. Clearly, the quality evaluation focused more on the management
aspect of suppliers’ quality rather than conformance to quality.

34
Delivery Related Studies:
Three of the presented studies focused on the suppliers’ delivery criteria. Ronen
et al. (1988) assumed known lead-time in their model based on historical data.
The study focused on determining when to place orders to hit the due date.
Hence, no delivery evaluation was presented.
Finnman (2002) developed a supplier selection model considering the risk of
several parameters. One of the parameters in the model was the suppliers’
logistics complexity, which was described as a poor optimization of the suppliers’
logistic network. The study focused on the selection model development rather
than the suppliers’ delivery evaluation.
Wang et al. (2004) presented very general parameters to evaluate delivery:
delivery performance, fill rate, order fulfilment lead-time, and perfect order
fulfilment. Similarly, the study focused on the selection rather than the evaluation
of suppliers.
Quality and Delivery Related Studies:
More studies focused on both quality and delivery. Monczka et al. (1988)
assigned cost to suppliers’ performance parameters. Quality and delivery were
among the parameters in the model. The authors used very simple evaluation
measurements for both quality and delivery. Quality was evaluated by number of
scraped parts. Meanwhile, delivery was evaluated by on-time delivery, where 5
days early and two days beyond deadline were considered on-time. No specific
35
details were presented in how to evaluate each factor. The study focused more
on how to select a supplier given the quality and delivery values.
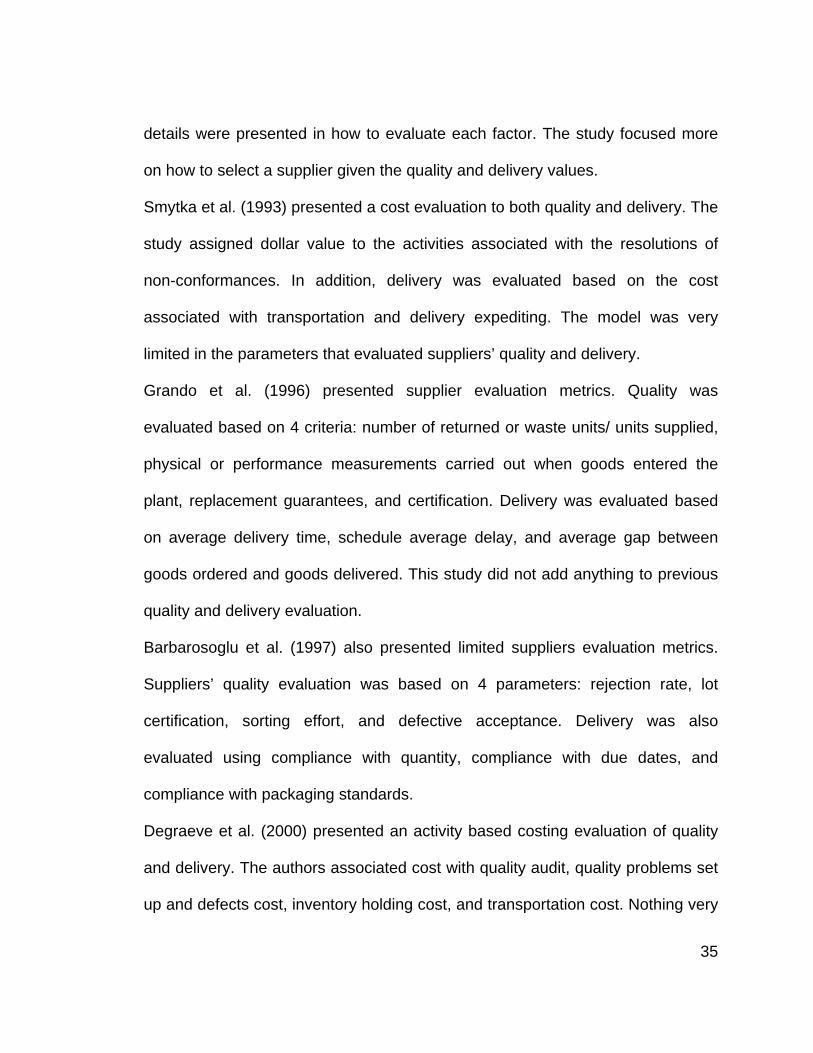
Smytka et al. (1993) presented a cost evaluation to both quality and delivery. The
study assigned dollar value to the activities associated with the resolutions of
non-conformances. In addition, delivery was evaluated based on the cost
associated with transportation and delivery expediting. The model was very
limited in the parameters that evaluated suppliers’ quality and delivery.
Grando et al. (1996) presented supplier evaluation metrics. Quality was
evaluated based on 4 criteria: number of returned or waste units/ units supplied,
physical or performance measurements carried out when goods entered the
plant, replacement guarantees, and certification. Delivery was evaluated based
on average delivery time, schedule average delay, and average gap between
goods ordered and goods delivered. This study did not add anything to previous
quality and delivery evaluation.
Barbarosoglu et al. (1997) also presented limited suppliers evaluation metrics.
Suppliers’ quality evaluation was based on 4 parameters: rejection rate, lot
certification, sorting effort, and defective acceptance. Delivery was also
evaluated using compliance with quantity, compliance with due dates, and
compliance with packaging standards.
Degraeve et al. (2000) presented an activity based costing evaluation of quality
and delivery. The authors associated cost with quality audit, quality problems set
up and defects cost, inventory holding cost, and transportation cost. Nothing very
36
specific was presented on how to evaluate rather than capturing the cost of both
quality and transportation.
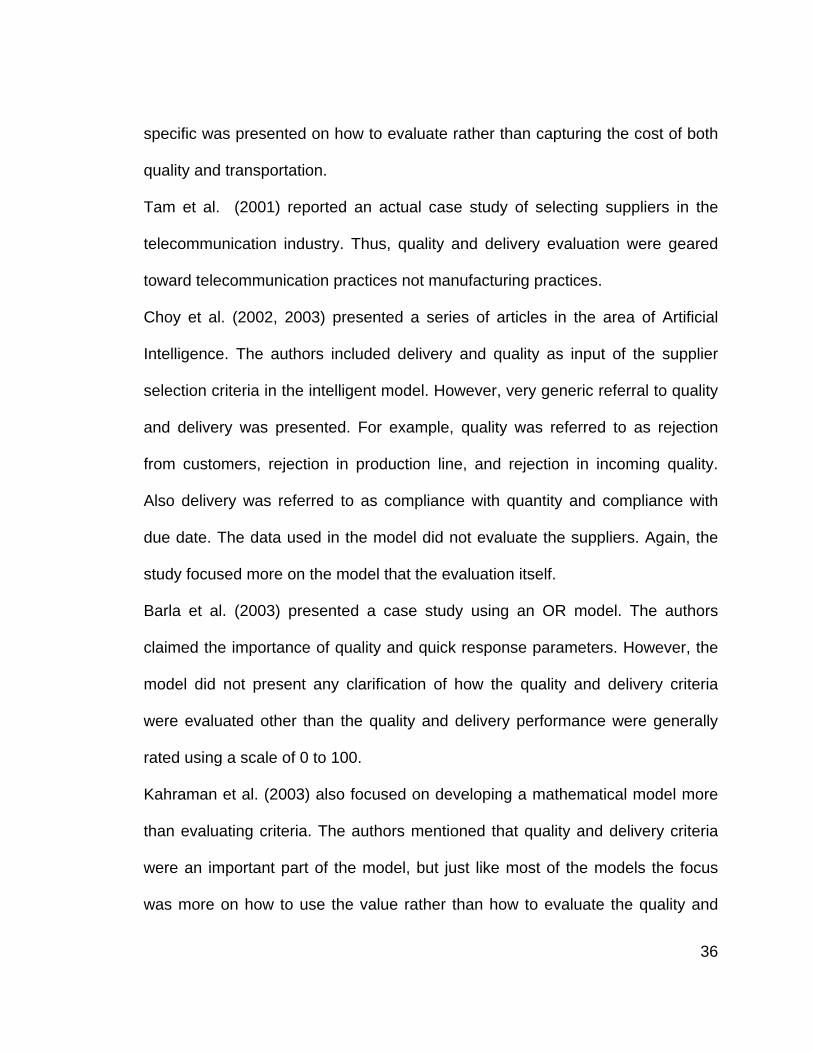
Tam et al. (2001) reported an actual case study of selecting suppliers in the
telecommunication industry. Thus, quality and delivery evaluation were geared
toward telecommunication practices not manufacturing practices.
Choy et al. (2002, 2003) presented a series of articles in the area of Artificial
Intelligence. The authors included delivery and quality as input of the supplier
selection criteria in the intelligent model. However, very generic referral to quality
and delivery was presented. For example, quality was referred to as rejection
from customers, rejection in production line, and rejection in incoming quality.
Also delivery was referred to as compliance with quantity and compliance with
due date. The data used in the model did not evaluate the suppliers. Again, the
study focused more on the model that the evaluation itself.
Barla et al. (2003) presented a case study using an OR model. The authors
claimed the importance of quality and quick response parameters. However, the
model did not present any clarification of how the quality and delivery criteria
were evaluated other than the quality and delivery performance were generally
rated using a scale of 0 to 100.
Kahraman et al. (2003) also focused on developing a mathematical model more
than evaluating criteria. The authors mentioned that quality and delivery criteria
were an important part of the model, but just like most of the models the focus
was more on how to use the value rather than how to evaluate the quality and

37
delivery. Very general statements were made about quality being measured by
ISO 9000 and end user criteria.
Dogan et al. (2003) used value such as delayed delivery and quality trouble in
the model. No specific details on how to evaluate. The study used predetermined
values and implemented a fuzzy logic and ABC costing.
Talluri et al. (2004) presented a framework to select suppliers. The study
presented steps of categories for suppliers’ evaluation. Questionnaires were sent
to suppliers to rate themselves between 0 and 1. Not enough details were
presented in terms of what types of questionnaires were asked to evaluate both
quality and delivery.
The studies presented here did not elaborate on the evaluation steps. Most of
them were very generic in evaluating quality and delivery. Gariz’s assessment
was the only study to address suppliers’ selection from a value stream
perspective. However, the assessment was not geared toward quality and
delivery criteria. It was an overall evaluation to the suppliers and it was still very
limited in the parameters and the areas it assessed. The most common
parameters found in Gariz’s assessment and the reviewed literatures fall under
the following quality and delivery categories:
• Quality management system [ISO 9000]
• Quality planning and assurance processes
• Quality performance [such as PPM, Cpk]

38
• Quality reliability [warranty cost, failure frequency, customer compliant and
serviceability]
• Quality problem solving methods
• Quality safety parts management
• Logistics system evaluation
• Delivery precision [on-time percentage]
However, the literature lack an effective and comprehensive model for suppliers’
quality and delivery evaluation that takes into account the entire supplier value
stream practices. Simpson et al. presented a result of survey to find the different
evaluation methods or factors considered across industry. The survey proved the
lack of predictive measures of suppliers’ selection process [14]. The majority of
the presented methods in the literature fall short to adequately and
comprehensively evaluate suppliers’ quantitative factors such as quality and
delivery. Only a few direct practices of the two factors quality and delivery are
considered in the evaluation models. Indeed, there are other subtle direct and
indirect activities that contribute to quality and delivery conformance. This study
attempted to define these latent activities in the entire supplier value stream to
ultimately minimize the risk associated with suppliers’ quality and delivery.
In more details, this study addressed the risk associated with underestimating the
two most critical factors. To overcome this issue and minimize the associated

39
risk, this study considered a holistic approach to evaluating suppliers’ quality and
delivery conformance. The study addressed the possible practices in the entire
organization to examine their impact on products’ conformance.
The rationale of this study was that the preceding most common evaluation
practices overlooked the latent quality and delivery activities, which could have
tremendous impact on a product conformance. For instance, how the purchasing
department selects vendors has to do tremendously with a product quality and
delivery conformance. If defective materials are bought, scraps and defects are
produced. This study attempts to reveal the most overlooked value stream
practices and prove their implication on quality and delivery conformance, and
apply the practices into a model to evaluate suppliers’ quality and delivery to
minimize the risk associated when selecting suppliers.

40
CHAPTER 3
RESEARCH METHODOLOGY
This chapter explains the method used in conducting the study. The method was
broken down into four main phases: general approach, methodology, data
collection, and data analysis.
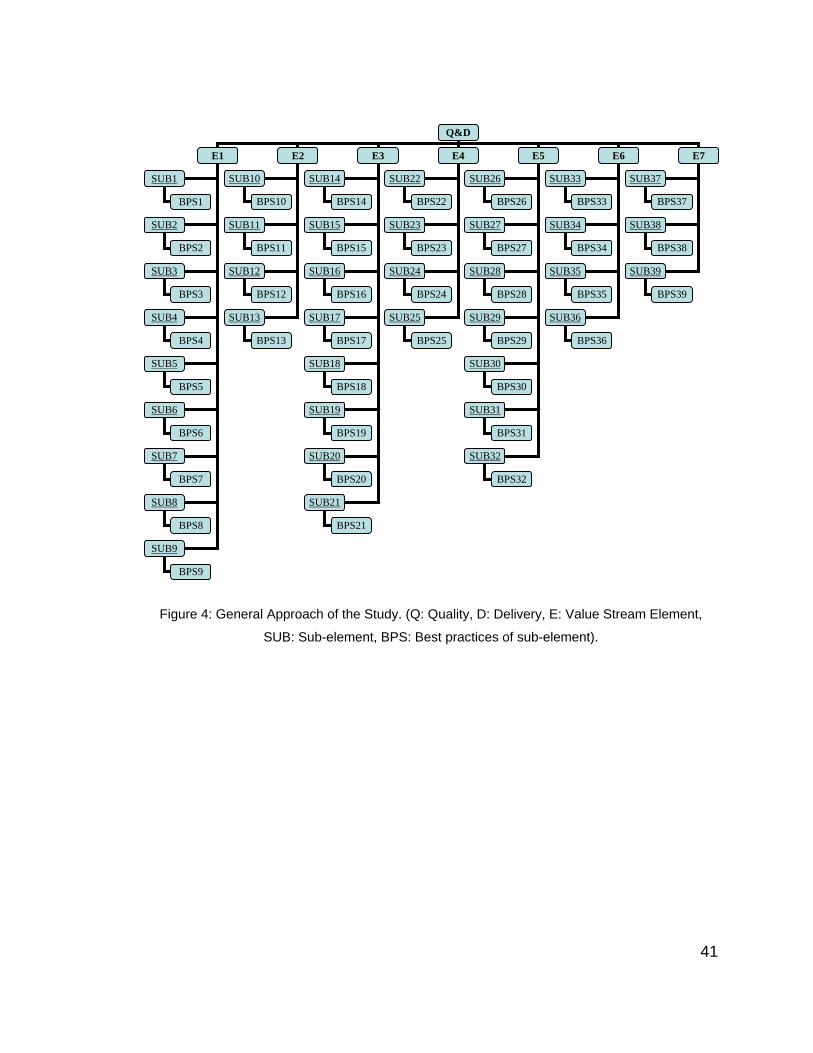
General Approach
The general approach of this study was based on the suppliers’ product value
stream. Figure 4 depicts the overall approach to this study where quality and
delivery were evaluated and predicted based on 7 value stream elements, 39
sub-elements and their associated 205 best practices. The following section
explains the general approach in detail.
To answer the research questions of what best practices in the supplier’s value
stream affected and contributed to the suppliers’ quality and on-time delivery
conformance, an examination of the supplier value stream was required. To
examine a supplier value stream and identify direct and indirect activities
associated with a product quality and delivery, a product was tracked throughout
the value stream. A product went through several transformations from receiving
the raw material all the way to shipping the final product to customers.
41
Figure 4: General Approach of the Study. (Q: Quality, D: Delivery, E: Value Stream Element,
SUB: Sub-element, BPS: Best practices of sub-element).
Q&D
E1 E2 E3 E4 E5 E6 E7
SUB1
SUB2
SUB3
SUB4
SUB5
SUB6
SUB7
SUB8
SUB9
SUB10
SUB11
SUB12
SUB13
SUB14
SUB15
SUB16
SUB17
SUB18
SUB19
SUB20
SUB21
SUB22
SUB23
SUB24
SUB25
SUB26
SUB27
SUB28
SUB29
SUB30
SUB31
SUB32
SUB33
SUB34
SUB35
SUB36
SUB37
SUB38
SUB39
BPS1
BPS2
BPS3
BPS4
BPS5
BPS6
BPS7
BPS8
BPS9
BPS10
BPS11
BPS12
BPS13
BPS14
BPS15
BPS16
BPS17
BPS18
BPS19
BPS20
BPS21
BPS22
BPS23
BPS24
BPS25
BPS26
BPS27
BPS28
BPS29
BPS30
BPS31
BPS32
BPS33
BPS34
BPS35
BPS36
BPS37
BPS38
BPS39

42
Each step of the product flow had associated activities that impacted the final
product’s quality and delivery. The product order flow encompassed material and
information flow as illustrated in Figures 5&6. Figure 5 depicts an example of a
typical value stream map. A value stream map is a visual tool that helps one to
see and understand the flow of material and information as a product makes its
way through the value stream [100]. A value stream map places more emphasis
on the production process activities. Meanwhile, what we call a control stream
map places more emphasis on the supporting functions activities, such as
purchasing and customer service activities. Figure 6 depicts an example of a
control stream map, where a detailed breakdown of a product order flow activities
are illustrated as an order made its way through the sales and the engineering
department. According to the literature, a typical manufacturer value stream
consists of the following 7 major elements [100]:
1. Customer service/sales
2. Purchasing
3. Production planning and control
4. Manufacturing engineering
5. Shop floor and quality control
6. Receiving
7. Shipping

43
Figure 5: Example of a Value Stream Map [100]
Figure 6: Example of a Control Stream Map

44
Each one of the 7 value stream elements contributed to the product’s quality and
delivery because every product had to pass through them directly or indirectly.
Some of the elements had direct and clear contribution to quality and delivery
conformance while others had indirect contribution. For example, in Figures 5& 6
a time delay in customer service/sales paper work processing caused a delay in
the product’s release. Also, a miscommunication of product specifications
impacted product quality. In Purchasing, inaccurate records of parts inventory
affected the time to release a product. Also, purchasing low quality raw material
impacted the final product quality. In Production planning and control,
miscalculation of customers’ requirements and executing the orders contributed
to product’s quality and delivery. In manufacturing and engineering, poor design
contributed to poor quality and delivery. In shop floor and quality control, poor
flow and poor quality practices resulted in poor quality and delayed product
release. In receiving, poor handling and misallocation of received parts
contributed to low quality and delivery conformance. In Shipping, packing and
packaging affected the products quality and delivery.
There are several subtle value stream practices and activities that contributed to
the suppliers’ quality and delivery. A regressive search approach was conducted
to compile a list of possible best practices within each of the 7 value stream
elements. Several practical and academic sources were used to gather and
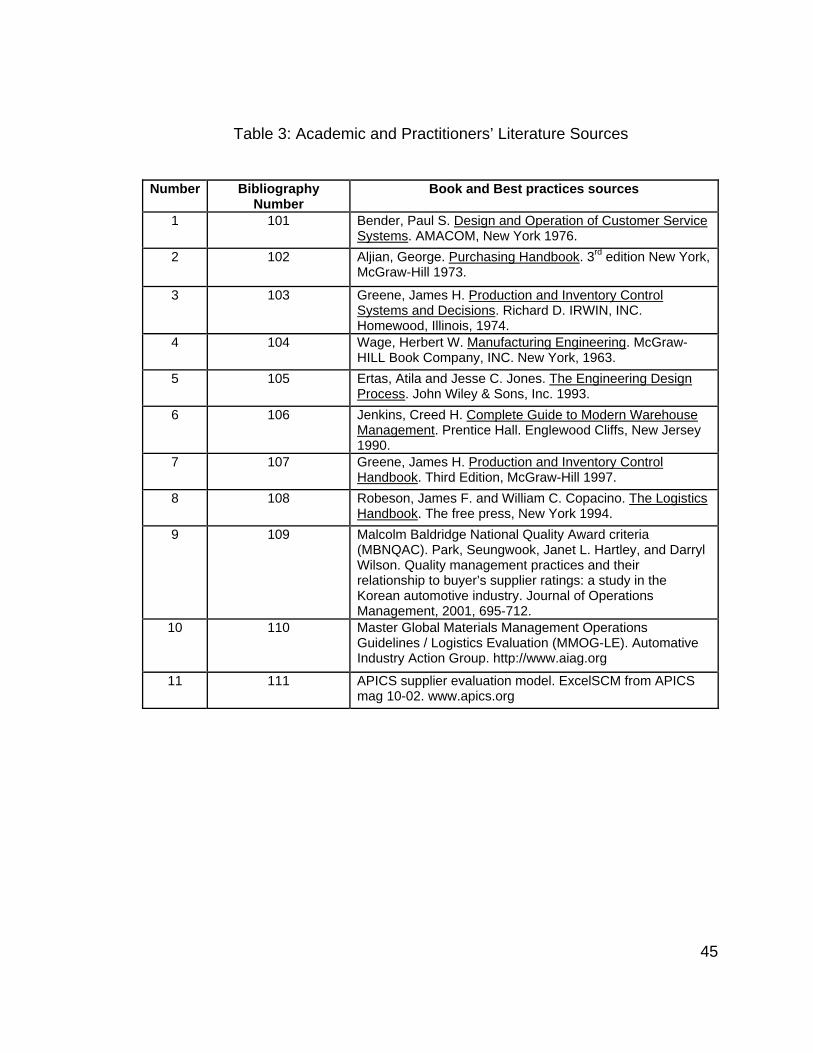
categorize the best practices. Table 3 reports the different academic and
45
Table 3: Academic and Practitioners’ Literature Sources
Number Bibliography Number
Book and Best practices sources
1 101 Bender, Paul S. Design and Operation of Customer Service Systems. AMACOM, New York 1976.
2 102 Aljian, George. Purchasing Handbook. 3rd edition New York, McGraw-Hill 1973.
3 103 Greene, James H. Production and Inventory Control Systems and Decisions. Richard D. IRWIN, INC. Homewood, Illinois, 1974.
4 104 Wage, Herbert W. Manufacturing Engineering. McGraw-HILL Book Company, INC. New York, 1963.
5 105 Ertas, Atila and Jesse C. Jones. The Engineering Design Process. John Wiley & Sons, Inc. 1993.
6 106 Jenkins, Creed H. Complete Guide to Modern Warehouse Management. Prentice Hall. Englewood Cliffs, New Jersey 1990.
7 107 Greene, James H. Production and Inventory Control Handbook. Third Edition, McGraw-Hill 1997.
8 108 Robeson, James F. and William C. Copacino. The Logistics Handbook. The free press, New York 1994.
9 109 Malcolm Baldridge National Quality Award criteria (MBNQAC). Park, Seungwook, Janet L. Hartley, and Darryl Wilson. Quality management practices and their relationship to buyer’s supplier ratings: a study in the Korean automotive industry. Journal of Operations Management, 2001, 695-712.
10 110 Master Global Materials Management Operations Guidelines / Logistics Evaluation (MMOG-LE). Automative Industry Action Group. http://www.aiag.org
11 111 APICS supplier evaluation model. ExcelSCM from APICS mag 10-02. www.apics.org

46
practitioners’ literature sources for the value stream elements, sub-elements and
their associated best practices.
Each academic and practitioner source was examined thoroughly. Consequently,
a list of sub-elements for each value stream element was created. There were a
total of 39 sub-elements. For instance, customer service/sales was broken down
into 6 sub-elements: order processing, information, exchange, technical services,
customer service planning, after delivery services, and reliability. Table 4 reports
the sub-elements as they relate to the 7 value stream elements.
Sources were also examined thoroughly to extract best practices within each
sub-element. Initial examination of the sources revealed a total of 350 best
practices. However, not every single one of the best practice was very important
to either quality or delivery. Hence, the compiled list was sent to 7 different value
stream mangers to screen and confirm the classification of each sub-element
and best practices. A rating scale from 1 to 10 was used to indicate whether
managers think that the listed best practice contributed to quality or delivery. One
means that the practice was not important and 10 means the practice was
extremely important to the value stream mangers. After refining the data
received from the managers, 145 best practices were excluded from the list
because of their weak association with quality or delivery. Best practices with a
rating lower than a cutting point of 3 were excluded from the list. Consequently,
the list of best practices for all the 7 value stream elements was reduced from

47
Table 4: The 7 Value Stream Elements and their Sub-elements Value Stream Element Sub-Elements
1 Customer Service/Sales 1.1. Order Processing 1.2. Information Exchange 1.3. Technical Services 1.4. Customer Services Planning 1.5. After Delivery Services 1.6. Reliability 1.7. Sales Forecasting 1.8. Order Entry 1.9. Claims and Credits 2 Purchasing 2.1. Database 2.2. Procurement Process 2.3. Material management 2.4. Procurement Decision 3 Production Planning and Control 3.1. Engineering Data control 3.2. Inventory control 3.3. Requirements planning 3.4. Capacity planning 3.5 .Operation scheduling 3.6 .Shop floor control 3.7. Purchasing 3.8. Quality Management 4 Manufacturing Engineering Department 4.1. Production Planning 4.2.Product Design 4.3.Tooling Design 4.4. Documentation 5 Shop Floor and Quality Control 5.1. Order Review and release 5.2. Detailed scheduling (Lean Manufacturing) 5.3. Maintenance 5.4. Quality/Prevention 5.5. Quality/Appraisal 5.6. Quality/Failure 5.7. Efficiency 6 Receiving 6.1. Receiving 6.2. Storing 6.3. Incoming Material Inspection 6.4. Space Planning 7 Shipping 7.1. Picking/Packaging and labeling 7.2. Shipping 7.3. Transportation

48
305 to 205 best practices. Table 5 presents a detailed example of the best
practices under each of the customer service’s sub-element. There are two
separate lists of practices for both quality and on-time delivery (See appendix B
for a detailed list of the best practices).
Methodology
Because this study was empirical, a survey was the most appropriate empirical
data collection method. However, a single survey with 205 best practices
related questions would have been highly unlikely filled out by any one of the
suppliers. Such survey would have required the suppliers to spend hours to fill
out. Hence, a fewer number of questions were sought. Hence the 205 best
practices were combined into 39 different categories. Each category represents a
value stream sub-element. Table 6 reports the combined best practices into their
39 sub-elements.
Criteria for Combining Best Practices:
The list of the 205 best practices was given to 7 practitioners in each value
stream area separately. Then, it was determined that to ensure a valid response
rate and get a generalized rating on all value stream elements, a combined list of
best practices under their sub-element was sufficient. Hence the 205 best
practices were combined into 39 different categories. Each category represents a
value stream sub-element. Table 6 reports the combined best practices into their
39 sub-elements.

49
Table 5: Example List of Possible Customer Service/Sales Best Practices
1- Customer Service/ Sales Sub-Elements Best Practices 1.1. Order processing Adequate procedure exists to generate order
assembly and shipping documents Customer Service monitor the performance of
production planning and inventory control operations
Customer Service Manage the quality control operations
When expediting customer orders, Customer Service supervises the proper execution of special customer requirements, such as periodic deliveries and packaging requirements
Procedure exist for editing customer orders Customer Service monitor the performance of
warehousing and transportation operations 1.2. Information exchange Procedures exist to communicate products
specifications with customers and production collect performance feedback data from customer 1.3. Technical services Customer Service offers technical assistance to
customers Customer Service offers testing and laboratory
services 1.4. Customer service planning and control
Customer Service identifies deviations between standards and actual and their causes
Customer Service initiates corrective actions to minimize deviations between standards and actual
1.5. After delivery services Customer Service manages preventive inspection operations
Customer Service monitors the maintenance and repair operations for customers
1.6. Reliability A positive trend exists concerning the following reliability problems:
Warranty Cost Failure Frequency Customer complaints
Serviceability

50
Table 6: Combined Best Practices
Value Stream Element
Sub-element Combined Best Practices
1. Sales /Customer Service
ORDERP ROCESSING Generate assembly and shipping documents; execute special customer requirements, and monitor the performance of warehousing and transportation operations
INFORMATION EXCHANGE Communicate product specification and performance feedback with customers and production
TECHNICAL SERVICES Provide technical assistance to customers ( testing and laboratory services)
CUSTOMER SERVICE PLANNING AND CONTROL
Identify deviations between standards and actual and their causes, and initiate corrective actions to minimize deviations between standards and actual
AFTER DELIVERY SERVICES Monitor the maintenance and repair operations for customers
RELIABILITY Track Warranty Cost, Customer complaints, Serviceability
SALES FORECASTING Forecast short-term sales ORDER ENTRY Standardize procedures to enter and trace
orders CLAIMS AND CREDITS Handle credit and claim efficiently 2. Purchasing DATABASE Ensure availability of parts-history records,
specifications files, standards files, and vendor records
PROCUREMENT PROCESS Study suppliers capability of meeting all specifications; evaluate suppliers according to the quality control and delivery standards
MATERIAL MANAGEMENT Control transferring materials; minimize excess stock and obsolescence; improve inventory turnover; standardize packages and containers, and report material commitments periodically
PROCUREMENT DECISION Conduct make-buy analyses based on quality and delivery; visit supplier plants; consider long term relationships with suppliers, and consider involving suppliers in new product development
3. Production Planning and Control
ENGINEERING DATA CONTROL
Continuously update Engineering drawings changes, production specifications changes, and standard routings work center sequences.
INVENTORY CONTROL Maintain accurate Bill of Material (BOM) records; compare inventory to schedule, and supply information to all appropriate persons.

51
Table 6: Continued
Value Stream Element
Sub-element Combined Best Practices
REQUIREMENTS PLANNING Receive the expected customer requirements daily for production operating plans; plan components requirements accurately, and utilize efficient lot size policy.
CAPACITY PLANNING Plan load and load leveling of work orders efficiently; review and compare resources versus customer requirements.
OPERATION SCHEDULING Estimate manpower and machine requirements based on schedules; run operations based on rate based order management*; assign start and finish job dates accurately; assign priority rules, and analyze queue time
SHOP FLOOR CONTROL Control shortage in labor, and standardize procedure to expedite orders
PURCHASING Communicate with suppliers regarding orders and delivery requirements
QUALITY MANAGEMENT Comply with ISO/QS 9000
4. Manufacturing Engineering
PRODUCTION PLANNING Reproduce and forward complete drawings and Bills of Material (BOM) to production control; determine raw material accurately, and associate finishing route sheets with every work order
PRODUCT DESIGN Utilize the Design for Manufacturability (DFM) and Design for Assembly (DFA) concepts when designing a product
TOOLING DESIGN Plan for new products and tool availability, and track tool's lifecycle
DOCUMENTATION Document review process for proposed engineering changes, physical material flow, and delivery
5. Shop Floor and Quality Control
ORDER REVIEW AND RELEASE
Associate routing sheets with items including: how to machine and/or fabricate the item, description of the activity or process, sequence of the work, tooling required for each operation, type of labor required, and where the work is to be performed.
DETAILED SCHEDULING Apply lean production system: 5S, standard work flow, method sheet, mistake proofing, flow cells, visual control, mixed model production, pull production scheduling, and cross training.

52
Table 6: Continued
Value Stream Element
Sub-element Combined Best Practices
MAINTENANCE Schedule lubrication and inspection; periodic overhaul of tools and equipment; measure the OEE; track breakdown production losses, and plan maintenance activities.
QUALITYP REVENTION Validate design using failure prevention analysis; test and calibrate; use SPC; conduct capability analysis; track PPM, and train operators on quality and reliability.
QUALITY APPRAISAL Conduct Inspection & testing of incoming materials and final products; audit quality, and calibrate & gauge equipments.
QUALITY FAILURE Control internal scrap and rework. EFFICIENCY Calculate and track contact time versus lead
time. 6. Receiving RECEIVING Utilize visual controls, un-palletize or
containerize incoming materials appropriately; unload in a logical and orderly fashion, and compare shipping documents with actual goods received
STORING Utilize efficient material tracking system; control the storage environment; ensure parts have sufficient protection; record inventory for all materials until they are released for shipment, and minimize handling and transportation
INCOMING MATERIAL INSPECTION
Identify unacceptable goods upon receipt; track discrepancies of incoming material, and identify all storage locations accurately
SPACE PLANNING Clear doorways, passageways, and ramps to allow ease of movement of the product handled; utilize the right material handling equipments for the right products
7. Shipping PICKING PACKAGING AND LABELING
Locate materials easily for packaging; define standard packaging; allocate and monitor all packing material, and consider engineering problems in packaging
SHIPPING Ensure what is being shipped is what the customer ordered; optimize transportation, and dock operations; detect discrepancies automatically in quantity shipped
TRANSPORTATION Follow-up transportation quality and delivery issues; select logistics provider based on flexibility and quality parameters; ensure the product is delivered to the customer damage-free; supply the scheduling function with information on in-bound transportation modes and associated transit times

53
Each sub-element had a list of best practices. The main contents of the best
practices were combined into a single question, which revolved around how to
lower the negative impact of each sub-element on a product quality and delivery.
For example, information exchange was originally evaluated using the following 2
best practices:
1. Procedures exist to communicate product specifications with customers
and production
2. Customer Service/Sales collects performance feedback data from
customer.
The preceding 2 best practices were then combined into a single question
without losing their underlined contexts. One question was asked instead of
asking 2 different questions about information exchange: “Communicate product
specification and performance feedback with customers and production”.
Similarly, after delivery services had 2 best practices:
1. Customer Service manages preventive inspection operations
2. Customer Service monitors the maintenance and repair operations for
customers
These 2 best practices were also combined into one question without losing their
underlined contexts: “Monitor the maintenance and repair operations for
customers”
54
Nonetheless, there are some instances where there could be a conflicting
response for a specified sub-element. For example, in Production planning and
control, requirements planning sub-element included three related best-practices,
where the rating could be 7 for one best practice and 1 for the other two:
1. Receive the expected customer requirements daily for production
operating plans
2. Plan components requirements accurately
3. Utilize efficient lot size policy
We assumed here that the respondents did not rate this sub-element as a high
emphasis but rather as an average emphasis of the three best practices. For
instance, if the respondents rating for “Receive the expected customer
requirements daily for production operating plans;” was 7, and the rating for “plan
components requirements accurately” was 1, and the rating for “utilize efficient lot
size policy” was 1, then the respondent used the generalized assessment of the
level of emphasis for this question, which was the average of the three ratings
(7+1+1/3 = 3).
This issue does not impact the main objective of this research since the
proposed model considered only the generalized average of the three best
practices rather than each single practice rating.
55
In addition, the following guidelines were considered in combining the best
practices and writing the questions to maximize the survey reliability and validity
before the data was initially collected [112]:
The respondents should consistently understand the questions.
The questions should consistently be administered to respondents.
A respondent should understand what an adequate answer is to a
question.
All respondents should have access to the information needed to
answer accurately.
Validity focuses on whether a question actually measures what it is supposed to
measure [113]. Validity of the survey was tested using the internal consistency
approach, which focuses on measuring several indicators of similar phenomena
and evaluating their consistency. SPSS Data Entry 4.0 was used to create the
survey, which provided the reliability procedure to estimate internal consistency
reliability. In addition, a pre-testing of the survey was conducted to correct any
possible mistakes prior to the data collection process.
Data Collection
A survey was conducted and administered over the Internet. The internet was
used to expedite the process of collecting the data. According to the literature,
surveys have associated advantages and disadvantages. The survey advantage

56
lies in its ability to validate empirical studies. Unlike face to face interviews,
surveys might have low response rate, which could be remedied by using a good
communication language and persuasion techniques. Also, survey respondents
may tend to interpret questions out of their contextual information, and it would
be impossible to have verbal exchange with the respondents [98, 99, and 114].
A few approaches may be used to overcome the disadvantages such as
encouraging, language, clear explanation of terms and open line of
communication through emails.
To ensure its legibility and contents, the survey was tested by 20 industry
practitioners and academic participants. The participants were given the survey’s
web link and were asked to fill it out. As a result of the initial test, some
modifications were made to the survey. Modifications were cosmetics, definition
of terms, and moving of best practices around.
The survey was distributed through e-mails to a number of suppliers for a
construction equipment manufacturer. The entire first tier suppliers to a major
construction equipment manufacturer represented the population of this study. A
total of 369 active suppliers were solicited for responses. The survey was
communicated to all suppliers through an email. Detailed directions to complete
the survey were provided to participants (see appendix A for a copy of the email).
57
To ensure a sound and valid feedback from the suppliers, a few critical steps
were taken into consideration:
1. The email was sent by the manufacturer’s supplier development and
control manager.
2. An incentive to fill out the survey was communicated to the suppliers by
sending the survey results to them.
3. A weekly follow up email was sent (see appendix A for a copy).
4. Ensured that the suppliers knew their answers were protected. The
answers of the survey were protected by sending the responses directly
to the University of Tennessee for the analyses. The manufacturer had no
control over the data.
The email targeted quality and logistics mangers, and general mangers. For each
question, the survey participants were asked to rate the degree of emphasis
placed on the best practices in the 7 value stream element and their sub-
elements. Likert scale of 1-7, as illustrated in Figure 7, was used because scales
of five points or more are reasonably reliable. As the number of categories
increases, the use of these techniques is more justified [113].
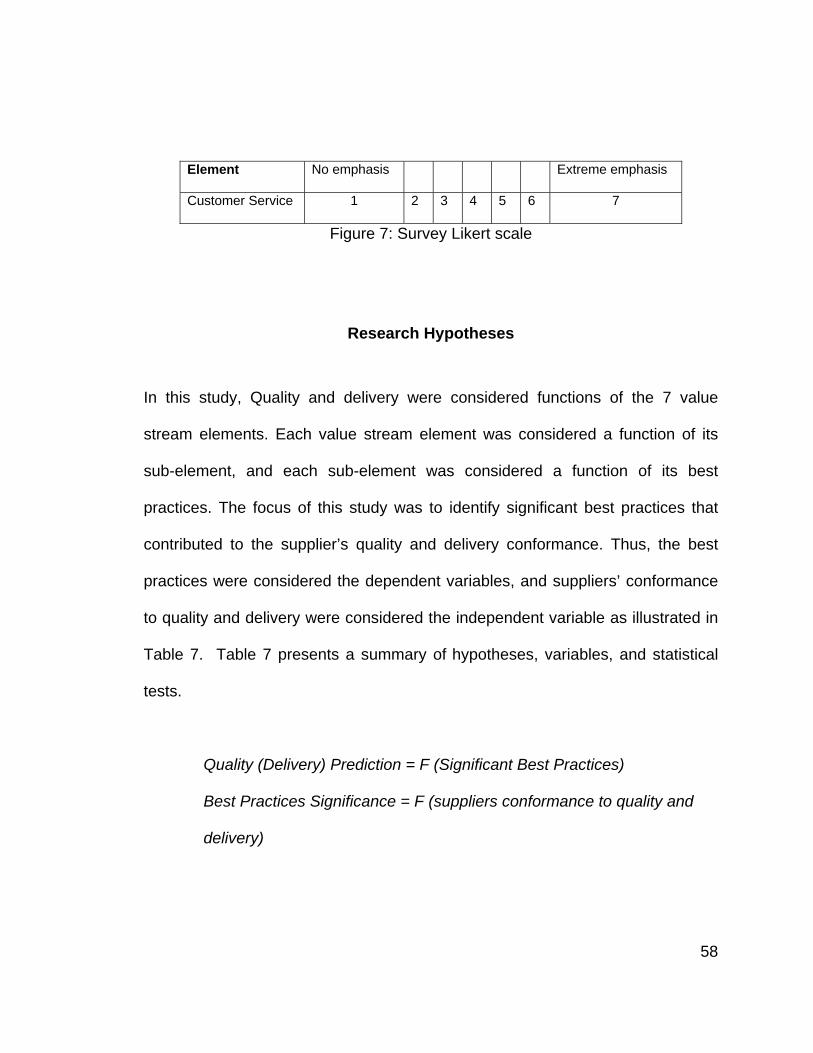
58
Element No emphasis Extreme emphasis
Customer Service 1 2 3 4 5 6 7
Figure 7: Survey Likert scale
Research Hypotheses
In this study, Quality and delivery were considered functions of the 7 value
stream elements. Each value stream element was considered a function of its
sub-element, and each sub-element was considered a function of its best
practices. The focus of this study was to identify significant best practices that
contributed to the supplier’s quality and delivery conformance. Thus, the best
practices were considered the dependent variables, and suppliers’ conformance
to quality and delivery were considered the independent variable as illustrated in
Table 7. Table 7 presents a summary of hypotheses, variables, and statistical
tests.
Quality (Delivery) Prediction = F (Significant Best Practices)
Best Practices Significance = F (suppliers conformance to quality and
delivery)

59
Table 7: Summary of Hypotheses, Variables, and Statistical Tests
Hypotheses Dependent Variables
Independent Variables
Analytical Techniques
Classification of suppliers’ quality conformance suggests significant
practices across the value stream
Classification of Suppliers
conformance to quality
High quality conformance
suppliers place more emphasis on significant
best practices than medium and low quality conformance suppliers.
Classification of Suppliers
conformance to quality
Classification of suppliers’ on-time conformance suggests significant
practices across the value stream
Classification of Suppliers
conformance to delivery
High on-time conformance suppliers
place more emphasis on significant best practices
than medium and low quality conformance
suppliers.
39 combined practices (sub-
elements) across the
product value stream
Classification of Suppliers
conformance to delivery
Kruskal-Wallis non-parametric test.
60
The heavy construction equipment assembler collected suppliers’ data for both
quality and delivery performances. Quality performance data included the
number of received parts not approved in part per million, and after sales
defective parts. Delivery performance data included percent of total number of
orders delivered in right time, percent of total number of order delivered earlier or
later than dispatch data, percent of the total orders delivered with the right or
partial quantity.
To group this study’s independent variables (classification of suppliers’
conformance), the supplier process development and control manager at the
heavy equipment manufacturer was asked to classify the suppliers into different
groups based on the company’s record. A one year worth of suppliers quality and
delivery performance data was collected from the company’s database. The
suppliers’ performance data suggested 4 groupings for each of the quality and
delivery performance: Excellent, High, Acceptable, and Low. Excellent suppliers’
quality and delivery conformance represented the top 25% of all the suppliers.
Meanwhile, High, Acceptable and Low suppliers quality and delivery
conformance represented Less than the top 25% and more than the lower 50%,
less than the top 50% and more than the lower 25% of the suppliers, and bottom
25% of the suppliers respectively. Table 8 illustrates the breakdown of the
independent variables.

61
Table 8: Breakdown of the Independent Variables
Independent variable Grouping Criteria Conformance to quality Excellent conformance
to quality Top 25% of the suppliers
High conformance to quality
Less than the top 25% and more than the lower 50% of the suppliers
Acceptable conformance to quality
Less than the top 50% and more than the lower 25% of the suppliers
Low conformance to quality
Bottom 25% of the suppliers
Conformance to delivery Excellent conformance to delivery
Top 25% of the suppliers
High conformance to delivery
Less than the top 25% and more than the lower 50% of the suppliers
Medium conformance to delivery
Less than the top 50% and more than the lower 25% of the suppliers
Low conformance to delivery
Bottom 25% of the suppliers

62
Data Analysis
Since the survey responses were based on a Likert scale, the responses were
considered ordinal scale. The response scale measured the degree of difference
not the amount of difference. For example, the interval of 1 between 3 and 4 or 5
and 6 is not necessary the same across all the participants responses.
Furthermore, to compare multiple samples, the appropriate method would have
been the analysis of variance (ANOVA). However, because the data collected
was ordinal scaled, the normality assumption was not met. Therefore, it was
recommended to use Kruskal-Wallis nonparametric test for the ordinal scale data
(115,116).
Kruskal-Wallis nonparametric test is used to compare multiple independent
samples to determine whether or not the variables of interest differ between two
or more groups when the analysis of variance (ANOVA) assumption of normality
is not met. In this study, variables of interests were the 39 sub-elements and their
combined best practices, and the groups were the classifications of suppliers’
quality and delivery performances.
The Kruskal-Wallis test statistics is represented by the following equation (116),
where ni (i = 1, 2, ..., k) represent the sample sizes for each of the k groups and
Ri = the sum of the ranks for group i:
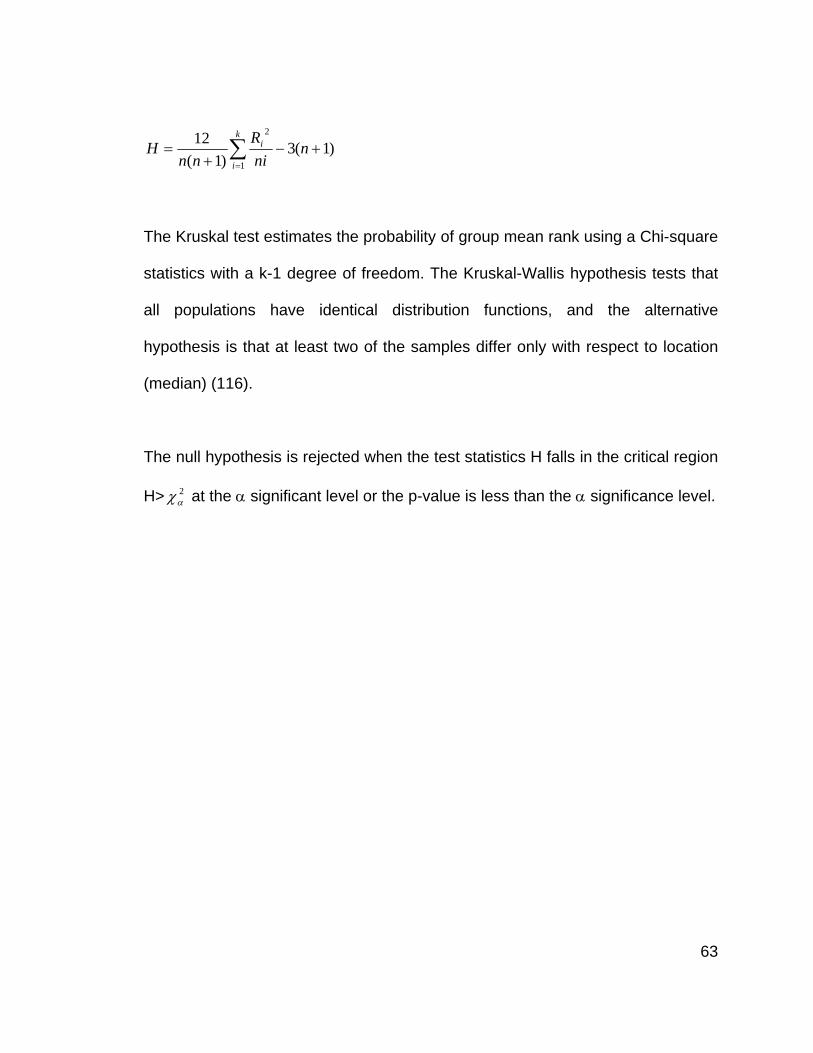
63
)1(3)1(
121
2
+−+
= ∑=
nniR
nnH
k
i
i
The Kruskal test estimates the probability of group mean rank using a Chi-square
statistics with a k-1 degree of freedom. The Kruskal-Wallis hypothesis tests that
all populations have identical distribution functions, and the alternative
hypothesis is that at least two of the samples differ only with respect to location
(median) (116).
The null hypothesis is rejected when the test statistics H falls in the critical region
H> 2αχ at the α significant level or the p-value is less than the α significance level.

64
CHAPTER 4
RESULTS AND DISCUSSION
As stated in chapter one, the study reported here identified the significant best
practices that affect both suppliers’ quality and delivery conformance. The
significant best practices were used to develop a model to minimize the risk
associated in selecting suppliers. This chapter is organized in terms of the four
hypotheses listed in the third chapter. It reports the results of the conducted
statistical analyses. First, it presents a descriptive statistics about the survey
results; then, it discuses the hypotheses analyses. Finally, it presents the
proposed model and its application.
Descriptive Analysis A total of 175 survey responses were received, which accounted for a 47.4 %
response rate. This rate is compared highly to similar empirical studies (109, 117,
118, 119, and 114). However, thirteen responses were excluded form the
analysis because they lacked complete suppliers information. The company’s
name and location were needed to cross reference the suppliers name with the
quality and delivery performance in the company’s database.
Table 9 reports the number of respondents by quality grouping. Fifty four of the
respondents were excellent conformance suppliers. High, Acceptable, and Low
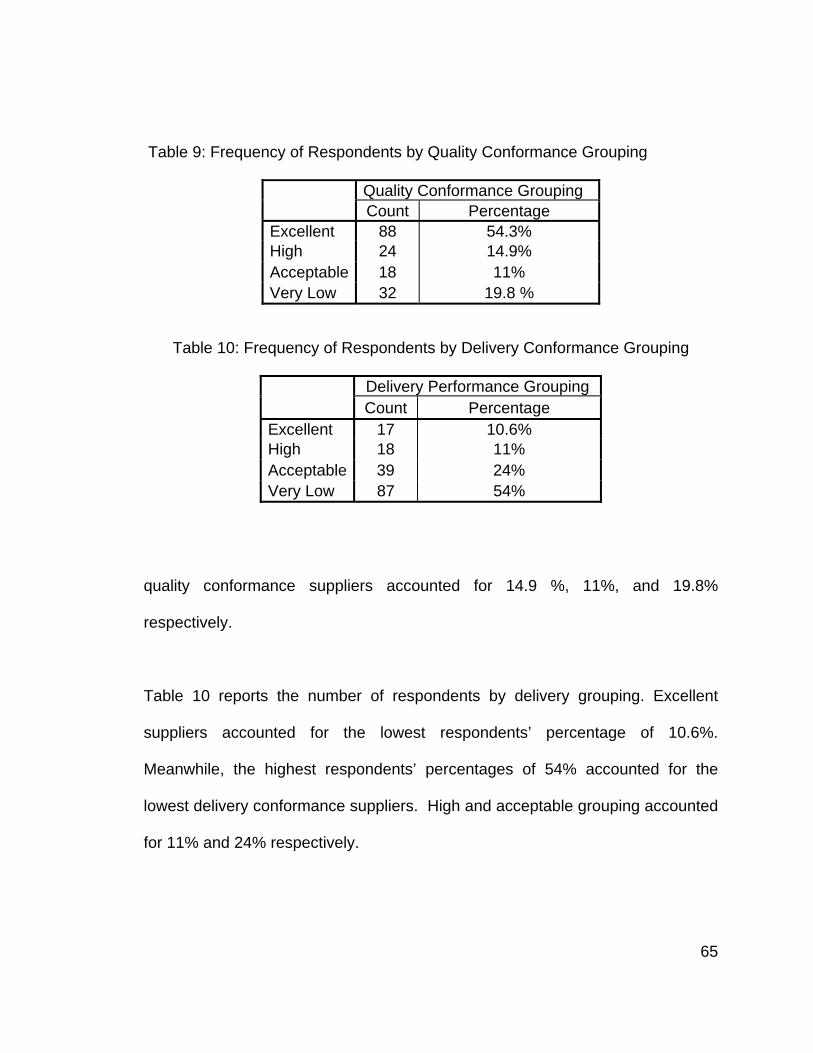
65
Table 9: Frequency of Respondents by Quality Conformance Grouping
Quality Conformance Grouping Count Percentage
Excellent 88 54.3% High 24 14.9% Acceptable 18 11% Very Low 32 19.8 %
Table 10: Frequency of Respondents by Delivery Conformance Grouping
Delivery Performance Grouping Count Percentage
Excellent 17 10.6% High 18 11% Acceptable 39 24% Very Low 87 54%
quality conformance suppliers accounted for 14.9 %, 11%, and 19.8%
respectively.
Table 10 reports the number of respondents by delivery grouping. Excellent
suppliers accounted for the lowest respondents’ percentage of 10.6%.
Meanwhile, the highest respondents’ percentages of 54% accounted for the
lowest delivery conformance suppliers. High and acceptable grouping accounted
for 11% and 24% respectively.

66
Table 11: Frequency of Respondents by Location
Location Count Percentage
USA/Canada 86 53% International 76 47%
Table 11 reports the number of respondents by location. Forty seven percent of
the respondents were international suppliers from different continents such as
South America, Asia, and Europe. The rest of the respondents were North
American suppliers, which accounted for the higher percentage of 53%.
It is important to note that the low percentage of excellent delivery conformance
compared to high quality conformance. This difference was due to the long
shipment lead time. Forty seven percent of the suppliers were foreigner
suppliers; this contributed to the low percentage of excellent suppliers due to
shipment issues and new USA custom regulations.
Table 12 in Appendix E reports the actual survey responses for randomly
selected suppliers. A total of 5 suppliers were selected randomly to respond to
the survey twice by two different people. This random selection was conducted to
test the responses’ reliability and validity. Comparison of the 5 randomly selected
suppliers showed a strong consensus, which justifies the selection of only 5
suppliers. Appendix E presents the analysis results for the selected responses.

67
Two samples Paired t-test was conducted to compare the suppliers’ responses.
In all five cases, the P-value was significantly higher than 5 %. This result
indicated that there was no significant difference between both of the same
supplier’s responses for each of the five randomly selected suppliers. This
affirms the responses reliability and validity.
Relation between Suppliers’ Quality Conformance and Best Practices
H1: Classification of suppliers’ quality conformance suggests significant
best practices across the value stream
H2: High quality conformance suppliers place more emphasis on best
practices than low quality conformance suppliers
Kruskal-Wallis test was used to test the first hypothesis (H1) as well as the
second hypothesis (H2). Tables 13 and 14 report the initial Kruskal-Wallis test
output for H1 and H2. Table 13 presents the Chi-Square value, degrees of
freedom (df), and the P-values (Asymp. Sig.) for each best practice sub-element
by quality grouping. Each significant sub-element with a P-value less than 5%
was highlighted in all the proceeding Kruskal-Wallis tables. Recall from chapter 3
that the best practices were combined into 39 survey questionnaires. Each
question was categorized by one of the 39 value stream sub-elements. For
instance, order processing was a sub-element of the customer service element in
the supplier value stream, which encompassed a compilation of several order-

68
Table 13: Kruskal-Wallis Test for Best-practices’ Sub-elements across the Value Stream by Quality Grouping
Test Statistics a,b
Chi-Square df Asymp. Sig. ORDERP ROCESSING 1.856 3 0.6028 INFORMATION EXCHANGE 12.075 3 0.0071 TECHNICAL SERVICES 5.32 3 0.1498 CUSTOMER SERVICE PLANNING ANDCONTROL 10.739 3 0.0132 AFTERDELIVERYSERVICES 11.748 3 0.0083 RELIABILITY 16.009 3 0.0011 DATABASE 4.106 3 0.2502 PROCUREMENT PROCESS 15.983 3 0.0011 MATERIAL MANAGEMENT 9.385 3 0.0246 PROCUREMENT DECISION 8.561 3 0.0357 ENGINEERING DATA CONTROL 9.987 3 0.0187 INVENTORY CONTROL 15.524 3 0.0014 REQUIREMENTS PLANNING 16.379 3 0.0009 CAPACITY PLANNING 16.96 3 0.0007 OPERATION SCHEDULING 8.598 3 0.0351 SHOP FLOOR CONTROL 4.212 3 0.2395 PURCHASING 2.686 3 0.4426 QUALITY MANAGEMENT 7.318 3 0.0624 PRODUCTION PLANNING 6.256 3 0.0998 PRODUCT DESIGN 3.479 3 0.3235 TOOLING DESIGN 7.071 3 0.0697 DOCUMENTATION 5.839 3 0.1197 ORDER REVIEW AND RELEASE 3.371 3 0.3378 DETAILED SCHEDULING 11.204 3 0.0107 MAINTENANCE 7.174 3 0.0666 QUALITYP REVENTION 6.771 3 0.0796 QUALITY APPRAISAL 3.738 3 0.2911 RECEIVING 10.683 3 0.0136 STORING 16.795 3 0.0008 INCOMING MATERIAL INSPECTION 10.174 3 0.0171 SPACE PLANNING 3.503 3 0.3204 PICKING PACKAGING AND LABELING 10.929 3 0.0121 SHIPPING 5.054 3 0.1679 TRANSPORTATION 8.321 3 0.0398
a. Kruskal Wallis Test b. Grouping Variable: Quality Grouping

69
Table 14: Average Ranks of Best-practices’ Sub-elements by Quality Grouping
Quality Level N Mean Rank ORDERP ROCESSING Very Low 30 76.92 Acceptable 18 81.81 High 24 91.04 Excellent 87 77.64 Total 159 INFORMATION EXCHANGE Very Low 30 82.87 Acceptable 18 94.17 High 24 102.04 Excellent 87 70 Total 159 TECHNICAL SERVICES Very Low 30 77.13 Acceptable 18 99.44 High 24 87.85 Excellent 87 74.8 Total 159 CUSTOMERSERVICEPLANNINGANDCONTROL Very Low 30 64.47 Acceptable 18 96.08 High 24 98.77 Excellent 86 75.9 Total 158 AFTER DELIVERY SERVICES Very Low 30 56.4 Acceptable 18 95.5 High 24 90.92 Excellent 86 81.02 Total 158 RELIABILITY Very Low 30 58.3 Acceptable 18 108.11 High 24 92.17 Excellent 86 77.37 Total 158 DATABASE Very Low 29 69.38 Acceptable 18 95.81 High 24 83.27 Excellent 87 78.46 Total 158

70
Table 14: Continued
Quality Level N Mean Rank PROCUREMENT PROCESS Very Low 29 70.31 Acceptable 18 107.64 High 24 98.94 Excellent 87 71.38 Total 158 MATERIAL MANAGEMENT Very Low 29 70.34 Acceptable 18 106.47 High 24 86.81 Excellent 87 74.95 Total 158 PROCUREMENT DECISION Very Low 29 70.1 Acceptable 18 80.67 High 24 102.52 Excellent 86 75.09 Total 157 ENGINEERING DATA CONTROL Very Low
29 59.76 Acceptable 18 98.83 High 24 87.9 Excellent 86 78.85 Total 157 INVENTORY CONTROL Very Low 29 62.83 Acceptable 18 112.75 High 24 88.19 Excellent 87 75.78 Total 158 REQUIREMENTS PLANNING Very Low 29 81.47 Acceptable 18 106.33 High 24 96.42 Excellent 86 67.59 Total 157 CAPACITY PLANNING Very Low 28 79.29 Acceptable 18 104.89 High 24 99.88 Excellent 87 67.79 Total 157

71
Table 14: Continued
Quality Level N Mean Rank OPERATION SCHEDULING Very Low 29 77.69 Acceptable 18 94.78 High 24 96.46 Excellent 86 71.27 Total 157 SHOP FLOOR CONTROL Very Low 29 67.81 Acceptable 18 92.83 High 24 86.75 Excellent 87 78.64 Total 158 PURCHASING Very Low 28 71.07 Acceptable 18 73.14 High 24 89.92 Excellent 87 79.75 Total 157 QUALITY MANAGEMENT Very Low 30 70.82 Acceptable 18 100.17 High 24 86.94 Excellent 84 74.19 Total 156 PRODUCTION PLANNING Very Low 30 69.3 Acceptable 18 99.33 High 23 86.72 Excellent 86 76.06 Total 157 PRODUCT DESIGN Very Low 29 68.72 Acceptable 18 79.5 High 24 88.88 Excellent 79 73.01 Total 150 TOOLING DESIGN Very Low 30 88.33 Acceptable 18 85.06 High 24 94.25 Excellent 86 71.14 Total 158

72
Table 14: Continued
Quality Level N Mean Rank DOCUMENTATION Very Low 30 76.57 Acceptable 17 97.29 High 24 89.81 Excellent 86 73.22 Total 157 ORDER REVIEW AND RELEASE Very Low
31 66.73 Acceptable 17 85.21 High 24 85.54 Excellent 86 81.29 Total 158 DETAILED SCHEDULING Very Low 31 80.35 Acceptable 17 87.35 High 24 103.21 Excellent 85 70 Total 157 MAINTENANCE Very Low 31 64.6 Acceptable 16 95.88 High 24 90.58 Excellent 86 77.82 Total 157 QUALITYP REVENTION Very Low 31 79.48 Acceptable 17 98.09 High 24 91.52 Excellent 86 72.48 Total 158 QUALITY APPRAISAL Very Low 31 71.19 Acceptable 17 96.24 High 24 75.77 Excellent 84 78.39 Total 156 RECEIVING Very Low 30 61.8 Acceptable 18 104.33 High 24 84.81 Excellent 86 78.99 Total 158
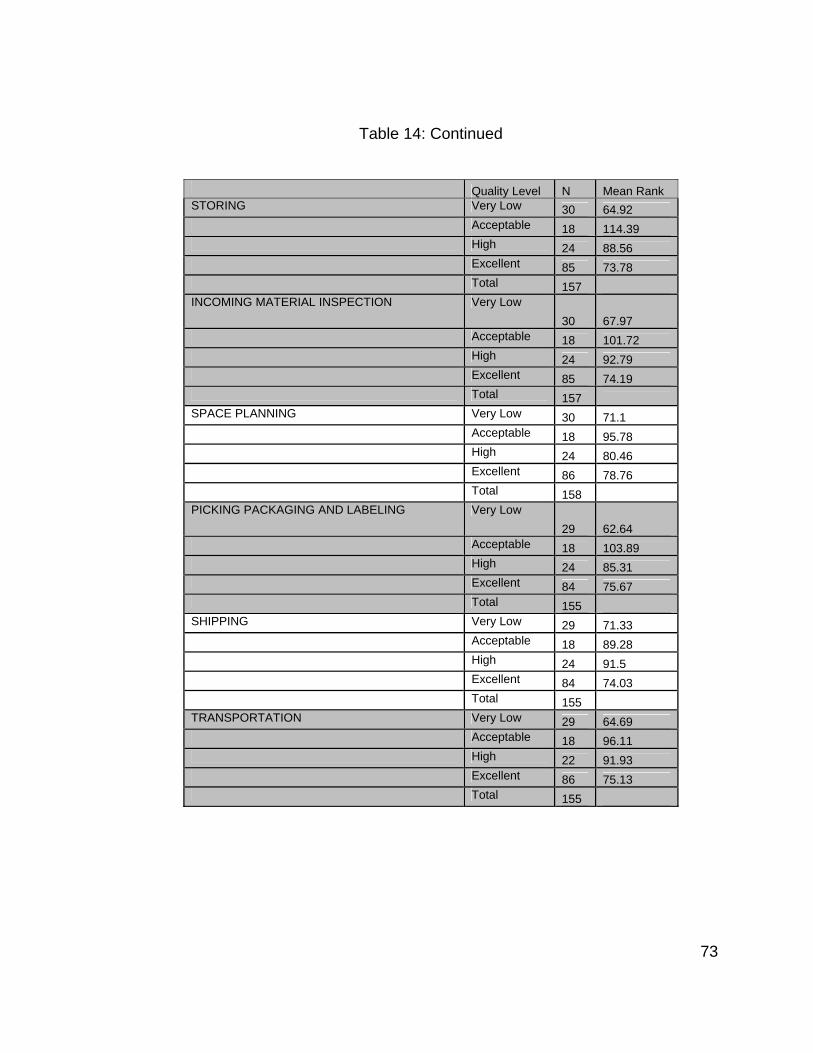
73
Table 14: Continued
Quality Level N Mean Rank STORING Very Low 30 64.92 Acceptable 18 114.39 High 24 88.56 Excellent 85 73.78 Total 157 INCOMING MATERIAL INSPECTION Very Low
30 67.97 Acceptable 18 101.72 High 24 92.79 Excellent 85 74.19 Total 157 SPACE PLANNING Very Low 30 71.1 Acceptable 18 95.78 High 24 80.46 Excellent 86 78.76 Total 158 PICKING PACKAGING AND LABELING Very Low
29 62.64 Acceptable 18 103.89 High 24 85.31 Excellent 84 75.67 Total 155 SHIPPING Very Low 29 71.33 Acceptable 18 89.28 High 24 91.5 Excellent 84 74.03 Total 155 TRANSPORTATION Very Low 29 64.69 Acceptable 18 96.11 High 22 91.93 Excellent 86 75.13 Total 155
74
processing best practices. See Appendix B for a detailed list of the best practices
underneath the elements and sub-elements of the supplier value stream.
A total of 34 quality related sub-elements were analyzed. According to Table 13,
a total of 23 quality sub-elements were found statistically significant. Significant
sub-elements were highlighted in all the tables. Meanwhile, Table 14 presents
the mean rank for each quality grouping. The mean rank adjusts for the
difference in the number of samples in all quality grouping. Thus, the mean rank
should be equal for all quality grouping by sub-element if and only if the groups
were only randomly different. However, when testing the mean rank for each
sub-element, excellent-quality suppliers were found to place less emphasis than
high quality but both place higher emphasis than low quality suppliers. The main
reason for such output was how the manufacturer’s database recorded the
suppliers’ quality data. It was found out that some suppliers were classified as
excellent suppliers because there were no defective parts received during the
selected time period of this study. It appeared that these suppliers did not supply
at all or supplied very insignificant number of orders. Hence, these suppliers
were excluded from the analysis and a rerun of the data was conducted.
It is worth noting here that because the way defective Parts Per Million (PPM)
was calculated, different suppliers could end up with the same PPM value for a
specific time period (i.e. one year). PPM was calculated by dividing the total

75
number of defective parts received by the total number of parts received, and
then multiplied the resulted ratio by one million. However, having the same PPM
for two or more suppliers does not necessarily mean that the two suppliers have
similar quality conformance.
Table 15 and 16 in Appendix C present the results for the data rerun. Table 15
reports the rerun for the Kruskal-Wallis test for the quality sub-elements. Twenty
two out of the 34 quality sub-elements were found significant across the value
stream with a P-value less than 5%. Also, Table 16 shows that higher quality
conformance mean rank is greater than low quality conformance mean rank,
which indicated that high quality conformance suppliers placed more emphasis
on best practices than low quality conformance suppliers.
Discussion of the Results:
According to the survey analysis results, 22 quality sub-elements of combined
best practices were significantly different among suppliers (P<5%). The following
quality sub-elements were found insignificant:
Order processing
Information exchange
Technical services
Requirements planning
Capacity planning
76
Operation scheduling
Production design
Tooling design
Documentation
Detailed scheduling
Quality prevention
However, insignificant sub-elements only meant that all the surveyed suppliers
placed close or similar emphasis on these best practices. Only the listed
significant best practices’ sub-elements distinguished a high quality supplier from
unacceptable supplier.
Based on the Kruskal-Wallis test, the two Hypotheses 1 and 2 were proved to be
true. Significant practices were found among suppliers. Also, the test proved that
higher quality suppliers placed more emphasis on the best practices than low
quality suppliers. The following is a list of the significant sub-elements as they
relate to each of the 7 value stream elements. A detailed list of each category
and sub-element best practices is presented in Appendix B:
1- Customer Service/ Sales
Customer service planning and control
After delivery services
Reliability

77
2- Purchasing
Database
Procurement Process
Material management
Procurement Decision
3- Production Planning and Control
Engineering Data control
Inventory control
Shop floor control
Purchasing
Quality Management
4- Manufacturing Engineering Department
Production Planning
5- Shop Floor & Quality Control
Order Review and release
Maintenance
Quality/Appraisal
6- Receiving

78
Receiving
Storing
Incoming Material Inspection
Space Planning
7- Shipping
Picking/Packaging and labeling
Shipping
Transportation
Relation between Suppliers’ On-time Conformance and Best Practices
H3: Classification of suppliers’ on-time conformance suggests significant practices across the value stream
H4: High on-time conformance suppliers place more emphasis on best
practices than low quality conformance suppliers.
Kruskal-Wallis test was also used to test the third (H3) and fourth (H4)
hypotheses. Table 17 in Appendix C reports the output of the initial Kruskal-
Wallis test for H3. It presents the P-values for the delivery sub-elements.
Expectedly, only three sub-elements were found to be significant. As previously
stated, suppliers who did not deliver or deliver very insignificant amount of
products were removed from the analysis and the Kruskal-Wallis test was
conducted again.

79
Table 18 reports the results of the rerun of the Kruskal-Wallis test. A total of 37
delivery related sub-elements were analyzed. According to Table 18, a total of 34
sub-elements were found very significant with an alpha significant level of less
than 5%. Meanwhile, Table 19 presents the mean ranks for each delivery
grouping. The mean rank adjust for the difference in the number of samples in all
delivery groups. Thus, the mean rank should be equal for all delivery groups by
best-practices sub-element if and only if the groups were only randomly different.
However, when testing the mean rank for sub-element, as shown in Table 19,
excellent delivery placed more emphasis than low delivery because higher
delivery conformance mean rank was higher than low delivery conformance
mean rank. This indicated that high delivery conformance suppliers placed more
emphasis on best practices than low delivery conformance suppliers.
Nonetheless, because of the low sample size in the two higher delivery
categories (excellent and high), it was determined to reclassify the suppliers into
three categories only to balance out the sample size and vary the outcome of the
significant practices. Tables 20 and 21 in Appendix C present the results of the
analysis with only 3 delivery groupings: high, acceptable, and very low. Table 20
confirmed the results of Table 18 that a total of 34 best-practices categories were
found very significant. Also, Table 21 confirmed the finding of Table 19 that
excellent delivery suppliers’ placed more emphasis than low delivery because

80
Table 18: Rerun of Kruskal-Wallis Test for Best-practices’ Sub-elements across the Value Stream by Suppliers’ Delivery Grouping (4 Groupings)
Test Statisticsa,b
Chi-Square df Asymp. Sig. ORDERP ROCESSING 17.8526 3 0.00047 INFORMATION EXCHANGE 11.64974 3 0.00868 TECHNICAL SERVICES 16.77474 3 0.00079 CUSTOMER SERVICE PLANNING AND CONTROL 9.109419 3 0.02787 AFTERDELIVERYSERVICES 8.837877 3 0.03153 SALES FORECASTING 4.836465 3 0.18417 ORDER ENTRY 18.02278 3 0.00044 CLAIMS AND CREDITS 23.5982 3 0.00003 DATABASE 11.85019 3 0.00791 PROCUREMENT PROCESS 9.902659 3 0.01941 MATERIAL MANAGEMENT 22.35346 3 0.00006 PROCUREMENT DECISION 10.94876 3 0.01201 ENGINEERING DATA CONTROL 14.38621 3 0.00242 INVENTORY CONTROL 9.359713 3 0.02487 REQUIREMENTS PLANNING 11.68812 3 0.00853 CAPACITY PLANNING 18.06021 3 0.00043 OPERATION SCHEDULING 13.96134 3 0.00296 SHOP FLOOR CONTROL 8.312775 3 0.03997 PURCHASING 10.53792 3 0.01451 PRODUCTION PLANNING 3.451429 3 0.32712 PRODUCT DESIGN 12.23498 3 0.00662 TOOLING DESIGN 16.28269 3 0.00099 DOCUMENTATION 14.04738 3 0.00284 ORDER REVIEW AND RELEASE 9.976038 3 0.01877 DETAILED SCHEDULING 9.708777 3 0.02121 MAINTENANCE 14.9557 3 0.00185 QUALITYP REVENTION 13.69822 3 0.00335 QUALITY APPRAISAL 7.880365 3 0.04855 QUALITY FAILURE 10.74837 3 0.01317 EFFICIENCY 4.608665 3 0.20280 RECEIVING 13.20437 3 0.00421 STORING 17.88268 3 0.00047 INCOMING MATERIAL INSPECTION 10.05543 3 0.01810 SPACE PLANNING 18.59176 3 0.00033 PICKING PACKAGING AND LABELING 22.84288 3 0.00004 SHIPPING 19.31386 3 0.00024 TRANSPORTATION 16.85667 3 0.00076
a. Kruskal Wallis Test b. Grouping Variable: Delivery Grouping

81
Table 19: Average Ranks of Best-practices’ Sub-elements by Delivery Grouping (4 Groupings)
Delivery Level N Mean Rank ORDERP ROCESSING Very Low 41 39.94 Acceptable 38 55.78 High 15 72.8 Excellent 12 68.5 Total 106 INFORMATION EXCHANGE Very Low 41 43.48 Acceptable 38 53.88 High 15 71.9 Excellent 12 63.54 Total 106 TECHNICAL SERVICES Very Low 41 41.46 Acceptable 38 56.3 High 15 78.03 Excellent 12 55.08 Total 106 CUSTOMER SERVICE PLANNING AND CONTROL Very Low 41 44.12 Acceptable 38 54.24 High 15 66.33 Excellent 12 67.17 Total 106 AFTERDELIVERYSERVICES Very Low 41 44.17 Acceptable 38 62.58 High 15 61.17 Excellent 12 47.04 Total 106 SALES FORECASTING Very Low 41 46.48 Acceptable 38 57.61 High 15 52.6 Excellent 12 65.63 Total 106 ORDER ENTRY Very Low 41 44.11 Acceptable 38 49.24 High 15 78.97 Excellent 12 67.25 Total 106
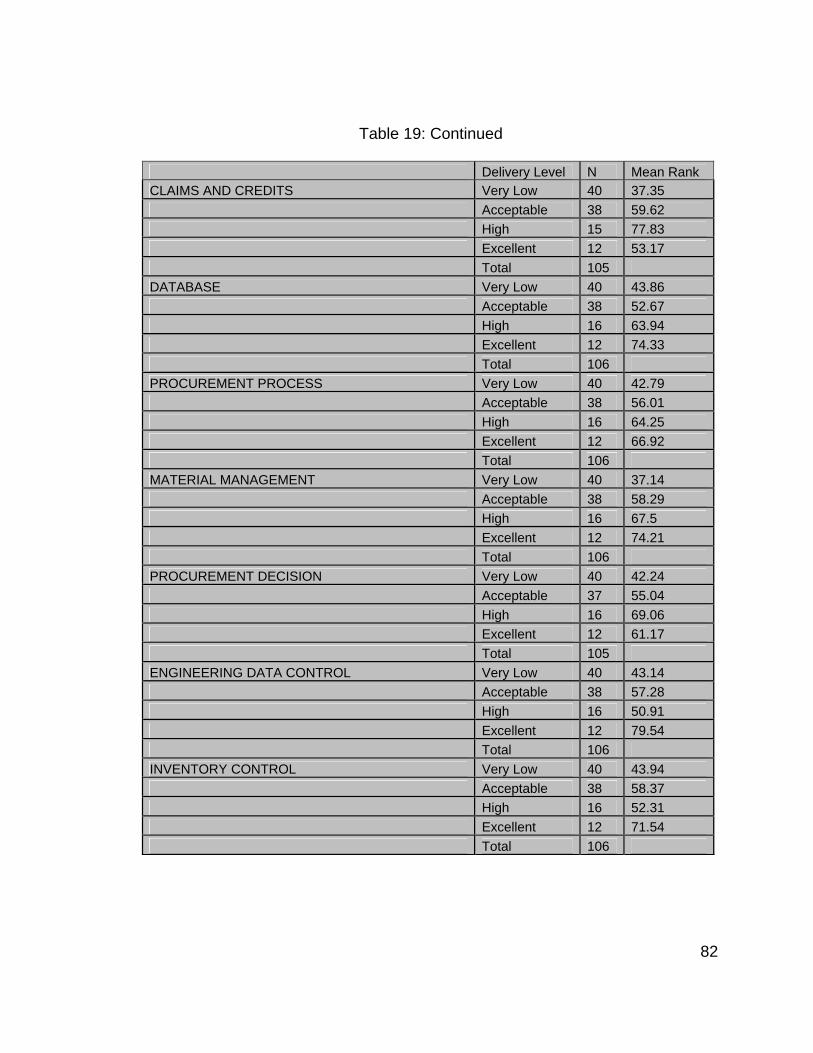
82
Table 19: Continued Delivery Level N Mean Rank CLAIMS AND CREDITS Very Low 40 37.35 Acceptable 38 59.62 High 15 77.83 Excellent 12 53.17 Total 105 DATABASE Very Low 40 43.86 Acceptable 38 52.67 High 16 63.94 Excellent 12 74.33 Total 106 PROCUREMENT PROCESS Very Low 40 42.79 Acceptable 38 56.01 High 16 64.25 Excellent 12 66.92 Total 106 MATERIAL MANAGEMENT Very Low 40 37.14 Acceptable 38 58.29 High 16 67.5 Excellent 12 74.21 Total 106 PROCUREMENT DECISION Very Low 40 42.24 Acceptable 37 55.04 High 16 69.06 Excellent 12 61.17 Total 105 ENGINEERING DATA CONTROL Very Low 40 43.14 Acceptable 38 57.28 High 16 50.91 Excellent 12 79.54 Total 106 INVENTORY CONTROL Very Low 40 43.94 Acceptable 38 58.37 High 16 52.31 Excellent 12 71.54 Total 106

83
Table 19: Continued Delivery Level N Mean Rank REQUIREMENTS PLANNING Very Low 40 41.18 Acceptable 38 56.63 High 16 65.97 Excellent 11 64.59 Total 105 CAPACITY PLANNING Very Low 40 40.34 Acceptable 37 52.72 High 16 71.88 Excellent 12 70.92 Total 105 OPERATION SCHEDULING Very Low 40 39.86 Acceptable 38 57.66 High 15 67.8 Excellent 12 63.54 Total 105 SHOP FLOOR CONTROL Very Low 40 44.74 Acceptable 38 55.22 High 16 57.41 Excellent 12 72.04 Total 106 PURCHASING Very Low 40 44.79 Acceptable 38 51.71 High 16 66.69 Excellent 12 70.63 Total 106 PRODUCTION PLANNING Very Low 41 48.15 Acceptable 38 54.54 High 16 60.56 Excellent 12 63.54 Total 107 PRODUCT DESIGN Very Low 40 39.59 Acceptable 34 62.07 High 16 50.22 Excellent 11 59.41 Total 101

84
Table 19: Continued Delivery Level N Mean Rank TOOLING DESIGN Very Low 41 41.71 Acceptable 38 54.8 High 16 74.66 Excellent 12 65.92 Total 107 DOCUMENTATION Very Low 41 42.2 Acceptable 38 55.29 High 16 72.56 Excellent 12 65.5 Total 107 ORDER REVIEW AND RELEASE Very Low 41 45.74 Acceptable 37 54.39 High 16 53.78 Excellent 12 76.88 Total 106 DETAILED SCHEDULING Very Low 41 42.85 Acceptable 37 55.16 High 16 66.25 Excellent 11 64.27 Total 105 MAINTENANCE Very Low 41 42.82 Acceptable 37 55.86 High 16 55.19 Excellent 12 80.46 Total 106 QUALITYP REVENTION Very Low 41 40.85 Acceptable 37 57.12 High 16 66.03 Excellent 12 68.83 Total 106 QUALITY APPRAISAL Very Low 40 48.75 Acceptable 37 48.14 High 16 56.94 Excellent 11 74.36 Total 104

85
Table 19: Continued
QUALITY FAILURE Very Low 40 43.58 Acceptable 37 52.89 High 16 62.03 Excellent 12 72.71 Total 105 EFFICIENCY Very Low 40 46.16 Acceptable 37 54.96 High 16 55.84 Excellent 12 65.96 Total 105 RECEIVING Very Low 40 44.56 Acceptable 38 51.68 High 16 61.19 Excellent 12 78.79 Total 106 STORING Very Low 40 39.15 Acceptable 38 56.54 High 16 62.94 Excellent 11 76.68 Total 105 INCOMING MATERIAL INSPECTION Very Low 40 42.03 Acceptable 37 56.59 High 16 62.94 Excellent 12 65.25 Total 105 SPACE PLANNING Very Low 40 38.05 Acceptable 38 60.18 High 16 62.19 Excellent 12 72.25 Total 106 PICKING PACKAGING AND LABELING Very Low 39 35.82 Acceptable 38 62.24 High 16 55.38 Excellent 11 73.82 Total 104
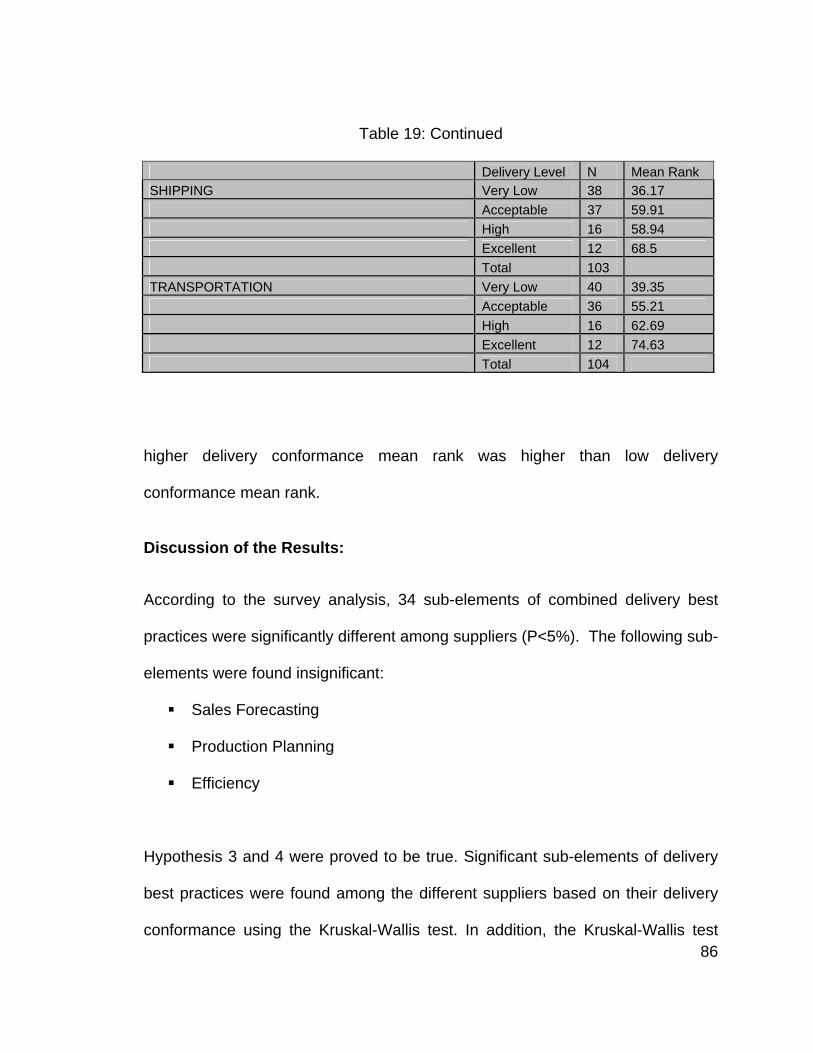
86
Table 19: Continued Delivery Level N Mean Rank SHIPPING Very Low 38 36.17 Acceptable 37 59.91 High 16 58.94 Excellent 12 68.5 Total 103 TRANSPORTATION Very Low 40 39.35 Acceptable 36 55.21 High 16 62.69 Excellent 12 74.63 Total 104
higher delivery conformance mean rank was higher than low delivery
conformance mean rank.
Discussion of the Results: According to the survey analysis, 34 sub-elements of combined delivery best
practices were significantly different among suppliers (P<5%). The following sub-
elements were found insignificant:
Sales Forecasting
Production Planning
Efficiency
Hypothesis 3 and 4 were proved to be true. Significant sub-elements of delivery
best practices were found among the different suppliers based on their delivery
conformance using the Kruskal-Wallis test. In addition, the Kruskal-Wallis test

87
proved that higher delivery performance suppliers placed significant emphasis on
the majority of the best practices. The following is a list of the sub-element of the
significant best practices that distinguish a high delivery performance supplier
from a low delivery performance supplier. A detailed list of each category and
sub-element best practices is presented in Appendix B:
1- Customer Service/ Sales
Order processing
Order entry
Information exchange
Claims and credits
Technical services
Customer service planning and control
After delivery services
2- Purchasing
Database
Procurement Process
Material management
Procurement Decision
3- Production Planning and Control
Engineering Data control
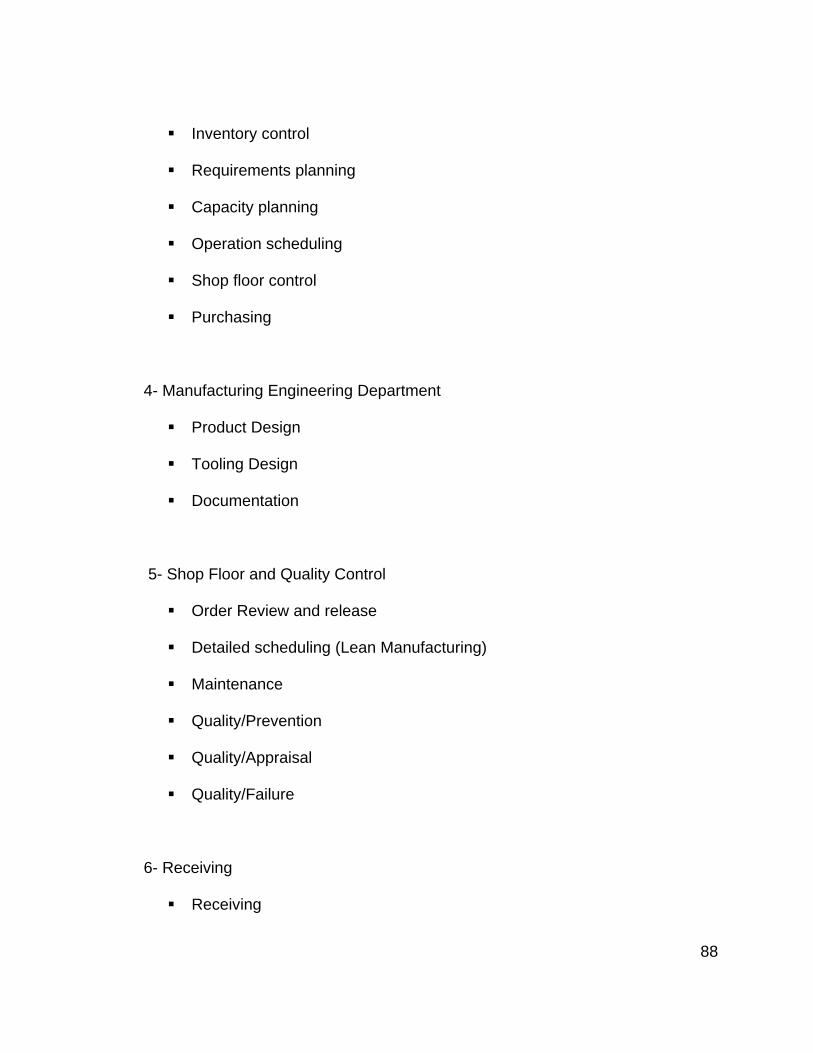
88
Inventory control
Requirements planning
Capacity planning
Operation scheduling
Shop floor control
Purchasing
4- Manufacturing Engineering Department
Product Design
Tooling Design
Documentation
5- Shop Floor and Quality Control
Order Review and release
Detailed scheduling (Lean Manufacturing)
Maintenance
Quality/Prevention
Quality/Appraisal
Quality/Failure
6- Receiving
Receiving
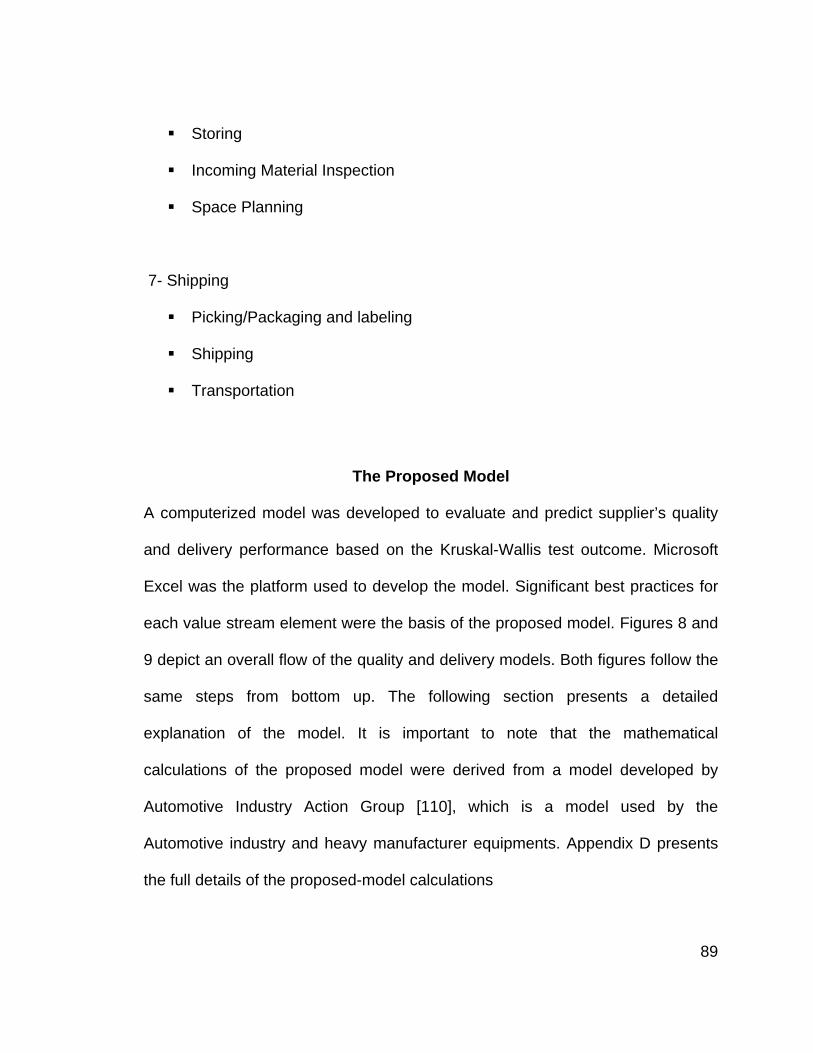
89
Storing
Incoming Material Inspection
Space Planning
7- Shipping
Picking/Packaging and labeling
Shipping
Transportation
The Proposed Model
A computerized model was developed to evaluate and predict supplier’s quality
and delivery performance based on the Kruskal-Wallis test outcome. Microsoft
Excel was the platform used to develop the model. Significant best practices for
each value stream element were the basis of the proposed model. Figures 8 and
9 depict an overall flow of the quality and delivery models. Both figures follow the
same steps from bottom up. The following section presents a detailed
explanation of the model. It is important to note that the mathematical
calculations of the proposed model were derived from a model developed by
Automotive Industry Action Group [110], which is a model used by the
Automotive industry and heavy manufacturer equipments. Appendix D presents
the full details of the proposed-model calculations

90
Figure 8: Overview of the Main Components of the Quality Evaluation Model
Figure 9: Overview of the Main Components of the On-time Evaluation Model
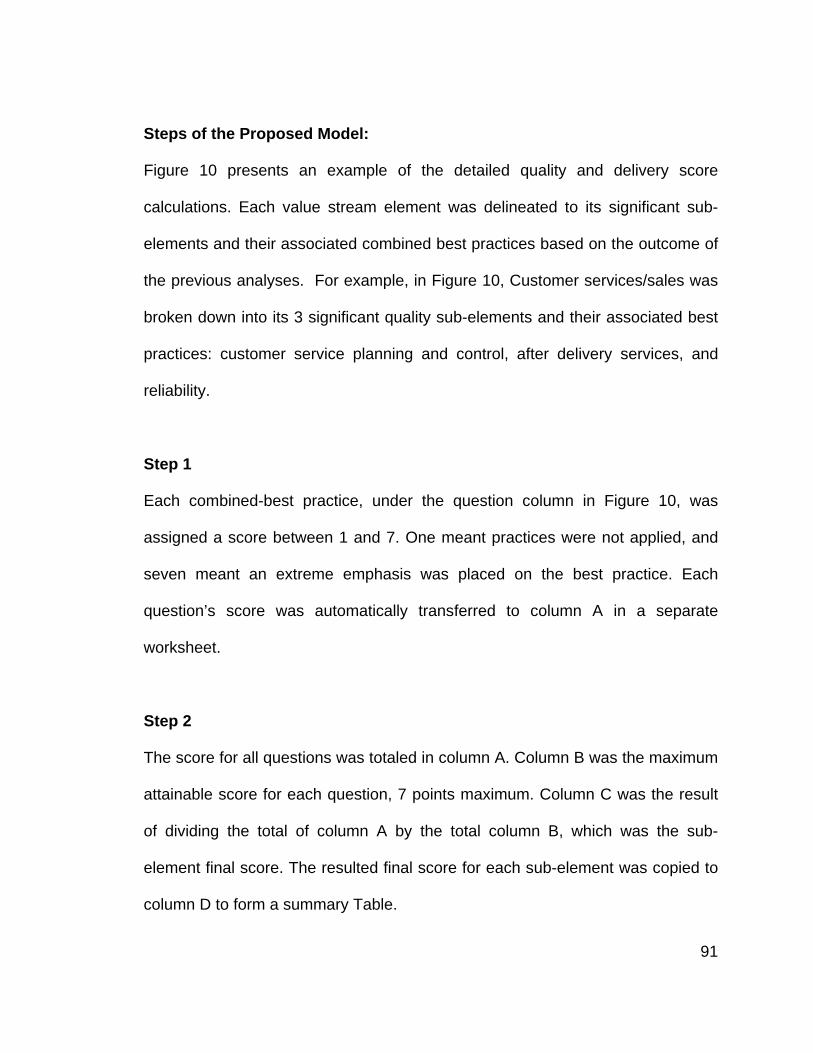
91
Steps of the Proposed Model:
Figure 10 presents an example of the detailed quality and delivery score
calculations. Each value stream element was delineated to its significant sub-
elements and their associated combined best practices based on the outcome of
the previous analyses. For example, in Figure 10, Customer services/sales was
broken down into its 3 significant quality sub-elements and their associated best
practices: customer service planning and control, after delivery services, and
reliability.
Step 1
Each combined-best practice, under the question column in Figure 10, was
assigned a score between 1 and 7. One meant practices were not applied, and
seven meant an extreme emphasis was placed on the best practice. Each
question’s score was automatically transferred to column A in a separate
worksheet.
Step 2
The score for all questions was totaled in column A. Column B was the maximum
attainable score for each question, 7 points maximum. Column C was the result
of dividing the total of column A by the total column B, which was the sub-
element final score. The resulted final score for each sub-element was copied to
column D to form a summary Table.

92
Score Summary
Element
(D) Score
(E) Weight (100)
(F) Element
Final Score
1 Customer Service/Sales 57.14% 13.2 7.54 2 Purchasing 82.14% 13.5 11.09
3 Production Planning and Control 77.14% 14.6 11.26
4 Manufacturing Engineering Department 71.43% 13.6 9.71
5 Shop Floor & Quality Control 95.24% 15.1 14.38 6 Receiving/ Warehouse 100.00% 15.2 15.20 7 Shipping/ warehouse 95.24% 14.8 14.10
Quality Score (Out of 100) 83.29
Element Sub-Element
(A) Questions
Score (1-7)
(B) Max.
Score
(C) Element Score
1 Customer Service/Sales 1.4. Customer Services Planning 6 7 57.14%
1.5. After Delivery Services 1 7
1.6. Reliability 5 7 Total 12 21
Value Stream Element
Sub-element Question Score (1-7)
1. Sales /Customer Service
1.4. Customer Services Planning
Identify deviations between standards and actual and their causes, and initiate corrective actions to minimize deviations between standards and actual
6
1.5. After Delivery Services
Monitor the maintenance and repair operations for customers 1
1.6. Reliability Track Warranty Cost, Customer complaints, Serviceability 5
Figure 10: Overview of the Calculation for the Main Components of the Quality Evaluation Model
Step 3
Step 1
Step 2

93
Step 3
Each value stream element was weighted for its important as it related to either
quality or on-time delivery in column E. For example, production planning and
control was not equally important as customer service/sales or purchasing to
quality. Similarly, shipping was more important than customer service/sales to
on-time delivery. Each value stream element was weighed out of 100 based on
its importance to either quality or delivery. In this study, the Kruskal-Wallis test
average mean rank results was used to calculate the weights based on the level
of emphasis placed on each element as it related to either quality or delivery,
See Appendix F for the weights calculation. Finally, column F was the result of
multiplying column D and column E to get the weighted score for each value
stream element and ultimately get the final quality and delivery score out of 100.
Application of the Proposed Model
The Heavy Equipment Manufacturer Company (HEMC) like other companies had
its own supplier evaluation and selection model. Hence, every supplier was
evaluated and selected based on the company’s specific metrics. Quality and
delivery were two of the metrics used in the company’s evaluation model. A
score was calculated for each metric including quality and delivery for each
potential supplier. The company used the most common quality and delivery
evaluation format or questionnaires as follow:
Quality management system [ISO 9000]

94
Quality planning and assurance processes
Quality performance [ such as PPM, CpK]
Quality reliability [warranty cost, failure frequency, customer
compliant and serviceability]
Quality problem solving methods
Quality safety parts management
Logistics system evaluation
Delivery precision [ on time percentage]
Only 65 of the surveyed suppliers had their quality scores reported and 60 had
their delivery score reported on the company’s database. Tables 22 and 23 in
Appendix G report the HEMC initial quality and delivery evaluation scores for the
selected suppliers as well as the actual performance. Clearly, there was a
discrepancy between the initial evaluation and the performance of each supplier
due to the misevaluation of quality and delivery in the first place. Both Tables
also include the proposed model score of quality and delivery for each selected
supplier.
The proposed model was applied to each of the 65 suppliers. Each value stream
element was evaluated by rating the significant best practices. A score between
1 and 7 was assigned to each supplier based on their responses. Table 22

95
presents the actual quality performance in PPM, HEMC model quality score, and
the proposed model quality score.
Since the actual quality performance had a different measurement unit than the
HEMC and the proposed model, it was recommended to conduct a correlation
test on the HEMC column and a 2-saplme t test on the 2 columns. A correlation
test was conducted between the first two columns of Table 22 to test whether the
HEMC model score was representative of the actual suppliers’ performance. If
the HEMC evaluation model score was representative, one would expect a
strong negative correlation between both actual performance and the score. As
the score increased the quality performance increased and the PPM score
should have decreased. The correlation test revealed insignificant correlation
between the two columns. The correlation test resulted in “r” value of -0.083 and
a Pearson correlation P-Value of 0.511 indicating a poor correlation. However, a
much stronger correlation was found between the suppliers’ actual performance
and the proposed model. The correlation test resulted in a better “r” value of -
0.378 and a Pearson correlation P-Value of 0.002 indicting that there was
enough statistical data to reject the hypothesis of no correlation exist. In addition,
a 2-sample t test was conducted between HEMC model and the proposed model.
The test indicated a significant difference between both columns with a P-Value
of 0.005 indicating strong statistical evidence to reject the hypothesis of equal
means. Thus, the proposed model was proven to be much closer to the actual
96
performance and better than the HEMC model (traditional model), see Appendix
G for the analyses results.
Table 23 compares both HEMC and proposed models results and the actual
delivery performance. Since all the three columns had the same measurement
units, it was recommended to conduct a 2-saplme t test on the 3 columns. First, a
2-sample t test was run between actual delivery performance and HEMC model
score. The test revealed a significant different between both columns with a P-
value of 0.0001. Second, a 2-sample t test was conducted between the proposed
model scores and the actual suppliers’ performance. The t-test resulted in a P-
value of 0.084.The results indicated that both columns are not statistically
different. However, when both traditional and proposed model were compared
using also a 2-sample t test, a P-value of 0.002 resulted indicating a statistical
significant difference between both columns. All in all, the statistical results
proved that the proposed model was much closer than the HEMC (traditional
model) to the actual suppliers’ delivery performance. See appendix G for the test
results.
97
CHAPTER 5
SUMMARY, CONCLUSIONS, AND RECOMMENDATIONS This chapter restates the research problem and reviews the major methods used
in the study. The major section of this chapter summarizes the results, discusses
the study limitations, and recommends future research.
Summary and Conclusion of the Research
The main purpose of this research was to develop a comprehensive and effective
supplier evaluation and selection model. Several questions were answered to
achieve the research goal. These questions as stated in the first chapter were as
follow:
What are the best practices in the supplier’s value stream that affect
suppliers’ quality?
What are the best practices in the supplier’s value stream that affect
suppliers’ on-time delivery?
Which best practices contribute the most to the suppliers’ quality
conformance?
Which best practices contribute the most to the suppliers’ on-time
delivery conformance?
A survey instrument was developed to address the preceding questions. The
survey encompassed best practices that impacted the suppliers’ quality and
98
delivery performance. A compiled list of 39 questions was sent to 369 heavy
equipment manufacturer first tier suppliers. The survey was solicited through an
email sent by the supplier product development and control manager. A weekly
follow up email was also sent to ensure a high response rate. A high response
rate of 43.7% was attained.
Four hypotheses were tested: Classification of suppliers’ quality conformance
suggests significant practices across the value stream (H1), High quality
conformance suppliers place more emphasis on significant best practices than
medium and low quality conformance suppliers (H2), Classification of suppliers’
on-time conformance suggests significant practices across the value stream
(H3), and High on-time conformance suppliers place more emphasis on
significant best practices than medium and low quality conformance suppliers
(H4).
All the hypotheses were statistically proved to be true. The nonparametric test of
Kruskal-Wallis was used to test the 4 hypotheses. The hypotheses stated that
suppliers place different emphasis on the value stream best practices, which
denoted best practices across the value stream. Also, the hypotheses state that
higher quality and delivery suppliers placed more emphasis on the best practices
than lower quality and delivery suppliers.
99
Twenty two sub-elements of the quality best practices were found to be very
significant where higher quality suppliers placed more emphasis on the best
practices. Also, a total of 34 Delivery sub-elements of best practices were found
to be very significant where higher delivery suppliers placed more emphasis on
the best practices.
Two quality and delivery models were developed and applied. The statistical
results revealed that the proposed models were a better evaluation tool than the
traditional models and much closer to the actual suppliers’ performance.
In conclusion, the main value of this study was not only to identify the best
practices within the supplier value stream but to apply them. The identified best
practices within their sub-elements were the platform for the proposed model.
This proposed model will serve as a tool to practitioners to evaluate the two most
critical factors, quality and delivery, more effectively. This tool will minimize the
risk associated with selecting suppliers by reducing the uncertainty of suppliers’
performance.
Study Limitations
There were some limitations to this study. One limitation was the scope of the
study. The study focused mainly on the heavy manufacturer industry. However,
one can claim that the proposed model can be applied in the automotive industry

100
because of the similarities in the heavy manufacturers and automotive industry
supply chain.
Another limitation of this study was communication. As stated in chapter four that
47% of the suppliers were from other contents such as South America, Asia, and
Europe. The assumption was that the survey was filled by people who are fluent
in English, which was the language of the survey.
In addition, a limitation was in reducing the number of best practices in the
survey from 204 to 39. It was determined that to ensure a valid response rate
and get a generalized rating on all value stream elements, a combined list of best
practices under their sub-element was sufficient. Hence the 205 best practices
were combined into 39 different categories.
Recommendations for Research This study provides a general feedback of the best practice within each element
and sub-element by combining sub-element’s practices into one survey. Even
though this study provided a valuable insight into the significant impact of value
stream activities on the suppliers’ quality and delivery conformance, a further
research is needed in. A study is needed to identify best practices at a lower
level than the sub-elements level. That is to have several surveys designated to
each value stream element. For example, a separate survey is needed for

101
purchasing with 29 questions. Each question is related to a single best practice.
This will provide more in depth analysis of the best practices in the value stream
that impact quality and delivery.
Further research is also needed to investigate the significant best practices that
impact quality and delivery in industries other than heavy equipments
manufacturers. With variant supply chains variant best practices exist. However,
the main elements of the heavy equipment manufacturers’ value stream might be
similar to other industries. Thus, the only differences are in the daily activities.
In addition, a study is needed to consider the suppliers’ effect on the customer
production system to not only react but predict suppliers’ conformance issues. To
move toward becoming a world-class manufacturer, an organization ought to
address the supplier’s exacerbated impact on the production system before
selecting a supplier. No clear evidence has shown any sign of addressing a
supplier’s impact on the production system. In particular, production-system data
mining techniques could be utilized to identify factors such as productivity, asset
utilization, inventory, set ups, lead time, lay out, quality, and schedule deviation.

102
BIBLIOGRAPHY

103
Bibliography
1. Gregory, R.E., 1986. Source selection: a matrix approach. Journal of
Purchasing and Materials Management 22 (2), 24-29. 2. Timmerman, E., 1986. An approach to vendor performance evaluation.
Journal of Purchasing and Supply Management 1, 27-32. 3. Thompson, K., 1990. Vendor profile analysis. Journal of Purchasing and
Materials Management 26 (1), 11-18. 4. Thompson, K., 1991. Scaling evaluative criteria and supplier performance
estimates in weighted pint pre-purchase decision models. International Journal of Purchasing and Materials Management 27 (1), 27-36.
5. Ghobadian, A., A. Stainer, J. Liu, and T. Kiss, 1993. A computerized Vendor Rating System. Proceedings of the International Symposium on Logistics. The University of Nottingham.
6. Smytka, D.L., Clemens, M.W., 1993. Total cost supplier selection model: a case study. International Journal of Purchasing and Materials Management 29 (1), 42-49.
7. Barbarosoglu, G., Yazgac, T., 1997. An application of the analytic hierarchy process to the supplier selection problem. Production and Inventory Management Journal 1st quarter, 14-21.
8. Degraeve, Z., and F. Roodhooft, 1998. Determining sourcing strategies: a decision model based on activity and cost driver information. Journal of the Operational Research Society 49 (8), 781-789.
9. Degraeve, Z., and F. Roodhooft, 1999. Improving the efficiency of the purchasing process using total cost of ownership information: the case of heating electrodes at Cockerill Sambre S. A. European Journal of Operational Research 112 (1), 42-53.
10. Degraeve, Z., E. Labro, and F. Roodhooft, 2000. An evaluation of supplier selection methods from a Total Cost of Ownership perspective. European Journal of Operational Research 125 (1), 34-59.
11. Degraeve, Zeger, and F. Roodhooft, 2000. A Mathematical Programming Approach for Procurement Using Activity Based Costing. Journal of Business Finance & Accounting, 27(1) & (2).
12. Chen, Chee-Cheng, and Ching-Chow Yang, 2002. Cost Effective Based Performance Evaluation for Suppliers and Operations. ASQ, 59-73.
13. Muralidharan, C., N. Anantharaman, and S.G. Deshmukh, 2002. A Multi-Criteria Group Decision making Model for Supplier Rating. The journal of Supply Chain Management.
14. Simpson, Penny, Judy Siguaw, and Susan White, 2002. Measuring the performance of Suppliers: An Analysis of Evaluation Process. The journal of Supply Chain Management.
15. Garriz, Linda, George Phillips, and Brian Fitzgerald, 2002. Strategic Supplier Selection. American Society for Quality.

104
16. Kes, Duke, 2002. CHANGING THE BOUNDARIES OF SUPPLIER AUDITS. American Society for Quality.
17. Hinkle, C.L., P. J. Robinson, and P. E. Green, 1969. Vendor evaluation using clusters analysis. Journal of Purchasing 5 (3), 49-58.
18. Narasimhan, R., 1983. An analytic approach to supplier selection. Journal of Purchasing and Supply Management 1, 27-32.
19. Bufa, F.P., and W.M. Jackson, 1983. A goal programming model for purchase planning. Journal of Purchasing and Materials Management 19 (3), 27-34.
20. Soukup, W.R., 1987. Supplier selection strategies. Journal of Purchasing and Materials Management 23 (3), 7-12.
21. Ronen, B., and D. Trietsch, 1988. A decision support system for purchasing management of large projects. Operations Research 36 (6), 882-890.
22. Monczka, R.M., and S.J. Trecha, 1988. Cost-based supplier performance evaluation. Journal of Purchasing and Materials Management 24 (2), 2-7.
23. Pan, A.C., 1989. Allocation of order quantities among suppliers. Journal of Purchasing and Materials Management 25 (2), 36-39.
24. Benton, W.C., 1991. Quantity discounts decisions under conditions of multiple items: multiple suppliers and resource limitations. International Journal of Production Research 29 (10), 1953-1961.
25. Nydick, R.L., and R.P. Hill, 1992. Using the Analytic Hierarchy Process to structure the supplier selection procedure. International Journal of Purchasing and Materials Management 28 (2), 31-36.
26. Weber, Charles, and Lisa Ellram, 1993. Supplier Selection Using Multi-objective programming: A decision Support System Approach. International Journal of Physical Distribution & Logistics Management 23 (2), 3-14.
27. Chaudhry, S.S., F.G. Forst, and J.L. Zydiak, 1993. Vendor selection with price breaks. European Journal of Operational Research 70, 52-66.
28. Weber, Charles, and John Current, 1993. A multiobjective approach to vendor selection. European Journal of Operational Research 68, 173-184.
29. Akinc, U., 1993. Selecting a set of vendors in a manufacturing environment. Journal of Operations Management 11, 107-122.
30. Willis, T.H., C.R. Huston, F. Pohlkamp, 1993. Evaluation measures of just-in-time supplier performance. Production and Inventory Management Journal 2nd quarter, 1-5.
31. Sadrian, A.A., and Y.S. Yoon, 1994. A procurement decision support system in business volume discount environments. Operations Research 42 (1), 14-23.
32. Mandal, A., S.G. Deshmukh, 1994. Vendor selection using Interpretive Structural Modeling (ISM). International Journal of Operations and Production Management 14 (6), 52-59.

105
33. Current, John, and Charles Weber, 1994. Application of facility location modeling constructs to vendor selection problems. European Journal of Operational Research 76, 387-392.
34. Min, H., 1994. International supplier selection: a multi-attribute utility approach. International Journal of Physical Distribution & Logistics Management 24 (5), 24-33.
35. Rosenthal, E.C., J.L. Zydiak, and S.S. Chaudhry, 1995. Vendor selection with bundling. Decision Sciences 26 (1), 35-48.
36. Vokurka, R.J., J. Choobineh, L. Vadi, 1996. A prototype expert system for the evaluation and selection of potential suppliers. International Journal of Operations and Production Management 16 (12), 106-127.
37. Weber, C.A., A. Desai, 1996. Determination of paths to vendor market efficiency using parallel co-ordinates representation: a negotiation tool for buyers. European Journal of Operational Research 90, 142-155.
38. Grando, A., A. Sianesi, 1996. Supply management: a vendor rating assessment. CEMS Business Review 1, 199-212.
39. Li, C.C., Y.P. Fun, and J.S. Hung, 1997. A new measure for supplier performance evaluation. IIE Transactions on Operations Engineering 29, 753-758.
40. Weber, Charles, John Current, and Anand Desai, 1998. Non-cooperative negotiation strategies for vendor selection. European Journal of Operational Research 108, 208-223]
41. Ghoudsypour, S.H., C.O. O'Brien, 1998. A decision support system for supplier selection using an integrated analytic hierarchy process and linear programming. International Journal of Production Economics 56-57 (1-3), 199-212.
42. Karpak, B., E. Kumcu, and R. Kasuganti, 1999. An application of visual interactive goal programming: a case in vendor selection decisions. Journal of Multi-Criteria Decision Analysis 8, 93-105.
43. Ganeshan, R., J.E. Tyworth, and Y. Guo, 1999. Dual sourced supply chains: the discount supplier option. Transportation Research Part E 35, 11-23.
44. Liu, Fian, Fong-yuen Ding, and Vinod Lall, 2000. Using data envelopment analysis to compare suppliers for supplier selection and performance improvements. Supply Chain Management: An International Journal 5 (3), 143-150.
45. Petroni, A., M. Braglia, 2000. Vendor selection using principal component analysis. The Journal of Supply Chain Management: A Global Review of Purchasing and Supply 36 (2), 63-69.
46. Weber, C.A., J.R. Current, A. Desai, 2000. An optimization approach to determining the number of vendors to employ. Supply Chain Management: an International Journal 5 (2), 90-98.

106
47. Choy, K.L., W. B. Lee, and Victor Lo, 2002. An intelligent supplier management tool for benchmarking suppliers in outsource manufacturing. Expert System with Applications 22, 213-224.
48. Subramanian, Muthu, S. Hossein Cheraghi, and Larry Whitman, 2001. A Methodology for Supplier Selection. Proceedings of the 10th Industrial Engineering Research Conference.
49. Tempelmeier, Horst, 2001. A Simple Heuristic for Dynamic Order Sizing and Supplier Selection with Time-Varying Data. Universitat zu Koln. Cologne, http://www.uni-koeln.de/wiso-fak/spw/.
50. Finnman, Fredrik, 2002. Supplier Selection when Considering Risks for Disturbances in the Inbound Flow to Scania: A model for the Supply Chain Risk Management. Department of Industrial Management and Logistics. Division of Engineering Logistics. Lund Institute of Technology. Lund, Sweden.
51. Nicholas, John. Competitive Manufacturing Management Book. Irwin-McGraw-Hill, Boston, 1998.]
52. Branddes, Henrik. Johan Lilliecreutz, and Staffan Brege, 1997. Outsourcing- Success or Failure? European Journal of Purchasing & supply Management 3 (2), 63-75.
53. Vonderembse, M.A., M. Tracey, 1999. The impact of supplier selection criteria and supplier involvement on manufacturing performance. The Journal of Supply Chain Management: a Global Review of Purchasing and Supply 35 (3), 33-39.
54. Tracey, Michael, and Mark A. Vonderembse, 2000. Building Supply Chains: A Key to Enhancing Manufacturing Performance. Mid-American Journal of Business 15 (2).
55. Royal, Weld, 1999. Contract Manufacturing: Perils and Profits. Industryweek.com.
56. Manufacturing & Technology publication dated July 31, 2001 volume 8, No. 14.
57. Contract Manufacturing on the Rise. Assembly Magazine. Issue Date: September 2002, Posted on: 9/6/2002.
58. Anderson, David, Frank Britt, and Donavon Favre, 1997. The Seven Principles of SCM. Supply Chain Management Review, 31-41.
59. Greaver II, Maurice F, 1999. Strategic Outsourcing - A Structured Approach to Outsourcing Decisions and Initiatives. AMACOM.
60. Croon, Hans, Roelwim de Graaf, and Guido de Nobel. The BPO CardTM : The Decision Tool on Strategic Sourcing Decisions.
61. Montabon, Frank. Supplier Evaluation and Selection. TrLog 563X. http://www.bus.iastate.edu/montabon/TrLog_563X.asp.
62. Ellram, Lisa, 1990. The Supplier Selection Decision in Strategic Partnerships. Journal of Purchasing and Material Management.

107
63. Weber, C.A., J.R. Current, A. Desai, 2000. An optimization approach to determining the number of vendors to employ. Supply Chain Management: an International Journal 5 (2), 90-98.
64. The Ohio State University/University of North Florida Global Supply Chain Forum.
65. Johnson, Cass, 2004. Crisis in U.S. Textiles. The American Textile Manufacturers Institute. http://www.atmi.org/TheTextileCrisis/index.asp
66. Electronics.ca Publications (http://www.electronics.ca/) 67. http://www.outsourcing.com/ 68. Boer, Luitzen, Eva Labro, and Pierangela Morlacch, 2001. A review of
methods supporting supplier selection. European Journal of Purchasing & Supply Management 7, 75-89.
69. Korngold, Jacob, and Tony Luscher, 2000. Rensselaer Polytechnic Institute.
70. Hopp, Wallace, and Mark Spearman, 2000. Factory Physics. Second Edition. Irwin McGraw-Hill.
71. Barla, Semra Birg, 2003. A case study of supplier selection for lean supply by using a mathematical model. Logistics Information Management 16 (6), 451-459.
72. Kumara, Manoj, Prem Vratb, and R. Shankarc, 2004. A fuzzy goal programming approach for vendor selection problem in a supply chain. Computers & Industrial Engineering 46, 69–85
73. Choy, K.L., and W.B. Lee, 2002. A generic tool for the selection and management of supplier relationships in an outsourced manufacturing environment: the application of case based reasoning. Logistics Information Management 15 (4). 235-253.
74. Choy, K.L., and W.B. Lee, 2003. A generic supplier management tool for outsourcing manufacturing Supply Chain Management: An International Journal 8 (2), 140-154.
75. Choy, K.L., W.B. Lee, Henry C.W. Lau, and L.C. Choy, 2004. A knowledge-based supplier intelligence retrieval system for outsource manufacturing. Knowledge-Based Systems.
76. Talluri, Srinivas, and Ram Narasimhan, 2004. A methodology for strategic sourcing. European Journal of Operational Research 154, 236–250.
77. Siying, W., Jinlong, Z., Zhicheng, L., 1997. A supplier-selecting system using a neural network 1997 IEEE International Conference on Intelligent Processing Systems, IEEE, New York, NY, 468–471.
78. Valluria, Annapurna, and David C. Croson, 2003. Agent learning in supplier selection models. Decision Support Systems.
79. Tam, Maggie C.Y., and V.M. Rao Tummala, 2001. An application of the AHP in vendor selection of a telecommunications system. Omega 29, 171-182.
80. Cebi, Ferhan, and Demet Bayraktar, 2003. An integrated approach for supplier selection. Logistics Information Management 16 (6), 395-400.
108
81. Feng, Chang-Xeng, Jin Wang, and Jin-Song Wang, 2001. An optimization model for concurrent selection of tolerances and suppliers. Computer & Industrial Engineering 40, 15-33.
82. Zhu, Joe, 2004. A buyer–seller game model for selection and negotiation of purchasing bids: Extensions and new models. European Journal of Operational Research 154, 150–156.
83. Kwong, C.K., W.H. LP, and J.W.K. Chan, 2002. Combining scoring method and fuzzy expert systems approach to supplier assessment: a case study. Integrated Manufacturing Systems 13 (7), 512-519.
84. Choy, K.L., W.B. Lee, and Victor Lob, 2003. Design of a case based intelligent supplier relationship management system—the integration of supplier rating system and product coding system. Expert Systems with Applications 25, 87–100.
85. Choy, K.L., W.B Lee, and V. Lo. Design of an intelligent supplier relationship management system: a hybrid case based neural network approach. Expert Systems with Applications 24 (2003) 225–237.
86. Choy, K.L., Kenny K.H. Fan, and Victor Lo. Development of an intelligent customer-supplier relationship management system: the application of case-based reasoning.
87. Basnet, Chuda, and Janny M.Y. Leung, 2005. Inventory lot-sizing with supplier selection. Computers & Operations Research 32, 1–14.
88. Kahraman, Cengiz, Ufuk Cebeci, and Ziya Ulukan, 2003. Multi-criteria supplier selection using fuzzy AHP. Logistics Information Management 16 (6), 382-394.
89. Crama, Y., R. Pascual J., and A. Torres, 2004. Optimal procurement decisions in the presence of total quantity discounts and alternative product recipes. European Journal of Operational Research 159, 364–378
90. Wang, Ge, Samuel H. Huang, and John P. Dismukes, 2004. Product-driven supply chain selection using integrated multi-criteria decision-ma king methodology. Int. J. Production Economics 91, 1–15.
91. Bhutta, Khurrum S, and Faizul Huq, 2002. Supplier selection problem: a comparison of the total cost of ownership and analytic hierarchy process approaches. Supply Chain Management: An International Journal 7 (3), 126-135
92. Dulmin, Riccardo, and Valeria Mininno. Supplier selection using a multi-criteria decision aid method. Journal of Purchasing & Supply Management 9, 177–187.
93. Dogan, Ibrahim and Ugur Sahin, 2003. Supplier selection using activity-based costing and fuzzy present worth techniques. Logistics Information Management 16 (6), 420-426.
94. Ghodsypour, S.H., and C. O'Brien. The total cost of logistics in supplier selection, under conditions of multiple sourcing, multiple criteria and capacity constraint. Int. J. Production Economics 73, 15-27.
109
95. Degraeve, Zeger, Eva Labro, and Filip Roodhooft, 2004. Total cost of ownership purchasing of a service: The case of airline selection at Alcatel Bell. European Journal of Operational Research 156, 23–40.
96. Humphreys, Paul, Ronan McIvor, and Felix Cha, 2003. Using case-based reasoning to evaluate supplier environmental management performance. Expert Systems with Applications 25, 141–153.
97. Dahel, Nasr-Eddine, 2003. Vendor selection and order quantity allocation in volume discount environments. Supply Chain Management: An International Journal 8 (4), 335-342.
98. Birnberg J., M. Shields, and S. M. Young, 1990. The Case for Multiple Methods in Empirical Management Accounting Research, Journal of Management Accounting Research, 33-66.
99. Runkel, Philip J., and Joseph E. McGrath, 1972. Research on human behavior: A systematic guide to method. Holt, Rinehart and Winston (New York).
100. Rother, Mike, John Shook, Jim Womack, and Dan Jones, 2003. Learning to See. Lean Enterprise Institute.
101. Bender, Paul S., 1976. Design and Operation of Customer Service Systems. AMACOM, New York.
102. Aljian, George, 1973. Purchasing Handbook. 3rd edition New York, McGraw-Hill.
103. Greene, James H., 1974. Production and Inventory Control Systems and Decisions. Richard D. IRWIN, INC. Homewood, Illinois.
104. Wage, Herbert W., 1963. Manufacturing Engineering. McGraw-HILL Book Company, INC. New York.
105. Ertas, Atila and Jesse C. Jones, 1993. The Engineering Design Process. John Wiley & Sons, Inc.
106. Jenkins, Creed H., 1990. Complete Guide to Modern Warehouse Management. Prentice Hall. Englewood Cliffs, New Jersey.
107. Greene, James H., 1997. Production and Inventory Control Handbook. Third Edition, McGraw-Hill.
108. Robeson, James F. and William C. Copacino, 1994. The Logistics Handbook. The free press, New York.
109. Park, Seungwook, Janet L. Hartley, and Darryl Wilson, 2001. Quality management practices and their relationship to buyer’s supplier ratings: a study in the Korean automotive industry. Journal of Operations Management, 695-712.
110. Automotive Industry Action Group. http://www.aiag.org 111. ExcelSCM from APICS mag 10-02. www.apics.org 112. Fowler, Floyd, Jr. 1993. Survey Research Methods. 2nd ed. Newbury
Park, CA: Sage. 113. The SPSS Online Course Guide Library. http://www.spss.com 114. Greene, Bradley M., 2002. A TAXONOMY OF THE ADOPTION OF
LEAN PRODUCTION TOOLS AND TECHNIQUES. A Dissertation

110
Presented For the Doctor of Philosophy Degree, The University of Tennessee, Knoxville.
115. American Psychological Association. Publication manual of the American Psychological Association (4th ed.). Washington, DC.
116. Walpole, Ronald E., Raymond H. Myers, Sharon L. Myers, Keying Ye, and Keying Yee, 2002. Probability and Statistics for Engineers and Scientists. Prentice Hall; 7 ed.
117. Flynn, B.B., Schroeder, R., Sakakibara, S., 1995. Determinants of quality performance in high and low quality plants. Quality Management Journal 2 (winter), 8-25.
118. Powell, T.C., 1995. Total quality management as competitive advantage: a review and empirical study. Strategic Management Journal 16, 15-37.
119. Saraph, J.V., Benson, P.G., Schroeder, R.G., 1989. An instrument for measuring the critical factors of quality management. Decision Science Journal 20 (4), 810-829.

111
APPENDICES

112
Appendix A: Solicitation and Follow-up Emails

113
Initial Solicitation Email Dear XYZ Vendors, Please find below a link to a value stream survey from XYZ Group and the University of Tennessee. We would like you to take 10 to 15 minutes out of your time and answer the questionnaires to help us understand what impacts the quality and delivery of a product. The survey is broken up into 7 different value stream areas: Sales /Customer Service, Purchasing, Production Planning and Control, Manufacturing Engineering, Shop Floor and Quality Control, Receiving, and Shipping. Each value stream area has a list of practices, and you are asked to rate each area by indicating the level of emphasis placed on each practice. Research question: what practices contribute the most to a product quality and delivery conformance? Ammar Aamer is a Doctorial student who is the main coordinator of the survey. The main purpose of the survey is helping both XYZ and the Vendors pinpoint areas for improvements. Your response to the survey is strictly confidential. The data collection and the analysis will be conducted by the University of Tennessee. In return, you will receive a report of the research outcome when it is complete. To complete the survey, please click on the web address below. If that does not work, please copy and paste the entire web address into the address field of your browser. http://surveys.utk.edu/aamer/index.htm I strongly encourage you to take a few minutes out of your time to fill out the survey. Your feedback is very important to us. Thank you for your input and support of this research. Sincerely, XXXXXXXX Supplier Development Process and Control Manager

114
Follow-up Email Dear XYZ Vendors, This is a friendly reminder to please take a few minutes to fill out the value stream survey from XYZ Group and the University of Tennessee. Our records indicate that you have not filled out the survey yet. When you fill out the survey, please make sure to click on the “Company Name” field and type your company’s name, so we can remove your email address from future reminders. Your feedback is very important to us. If you have any questions, please contact me by email [email protected] or call (865) 974-9943. Here's the survey link: http://surveys.utk.edu/aamer/index.htm Sincerely, Ammar Aamer The University of Tennessee Coordinator of the value stream survey

115
Appendix B: List of the Best Practices

116
A. Quality Best Practices: 1- Customer Service/ Sales Sub-Element Best Practices 1.1. Order processing
Adequate procedure exists to generate order assembly and shipping documents?
Customer Service monitor the performance of production planning and inventory control operations
Customer Service Manage the quality control operations When expediting customer orders, Customer Service supervises the
proper execution of special customer requirements, such as periodic deliveries and packaging requirements
Procedure exist for editing customer orders Customer Service monitor the performance of warehousing and
transportation operations 1.2. Information exchange
Procedures exist to communicate products specifications with customers and production
collect performance feedback data from customer 1.3. Technical services
Customer Service offers technical assistance to customers
Customer Service offers testing and laboratory services 1.4. Customer service planning and control
Customer Service identifies deviations between standards and actual and their causes
Customer Service initiates corrective actions to minimize deviations between standards and actual
1.5. After delivery services
Customer Service manages preventive inspection operations
Customer Service monitors the maintenance and repair operations for customers
1.6. Reliability A positive trend exists concerning the following reliability problems: Warranty Cost Failure Frequency Customer complaints Serviceability
2- Purchasing Sub-Element Best Practices 2.1. Database Parts history records are available Specifications files are available Standards files are available Vendor records, including financial and performance are available 2.2.Procurement Process Suppliers are capable of meeting all specification requirements Vendor specifications are established
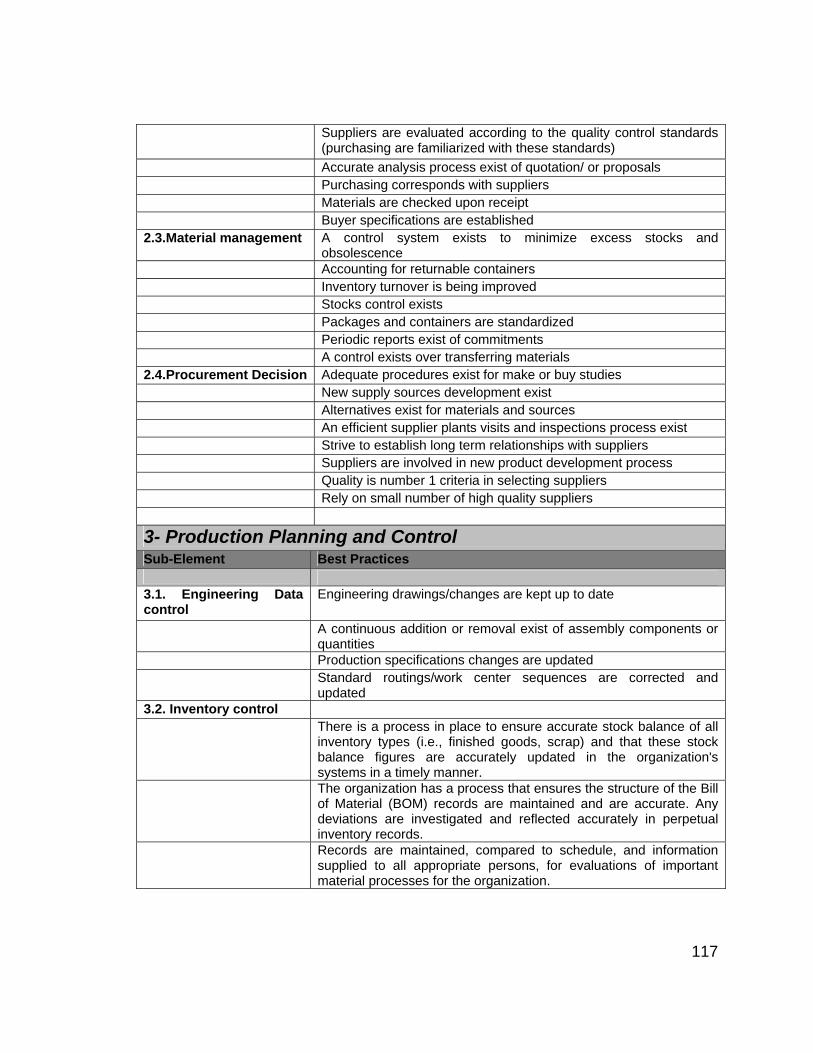
117
Suppliers are evaluated according to the quality control standards (purchasing are familiarized with these standards)
Accurate analysis process exist of quotation/ or proposals Purchasing corresponds with suppliers Materials are checked upon receipt Buyer specifications are established 2.3.Material management A control system exists to minimize excess stocks and
obsolescence Accounting for returnable containers Inventory turnover is being improved Stocks control exists Packages and containers are standardized Periodic reports exist of commitments A control exists over transferring materials 2.4.Procurement Decision Adequate procedures exist for make or buy studies New supply sources development exist Alternatives exist for materials and sources An efficient supplier plants visits and inspections process exist Strive to establish long term relationships with suppliers Suppliers are involved in new product development process Quality is number 1 criteria in selecting suppliers Rely on small number of high quality suppliers
3- Production Planning and Control Sub-Element Best Practices 3.1. Engineering Data control
Engineering drawings/changes are kept up to date
A continuous addition or removal exist of assembly components or quantities
Production specifications changes are updated Standard routings/work center sequences are corrected and
updated 3.2. Inventory control There is a process in place to ensure accurate stock balance of all
inventory types (i.e., finished goods, scrap) and that these stock balance figures are accurately updated in the organization's systems in a timely manner.
The organization has a process that ensures the structure of the Bill of Material (BOM) records are maintained and are accurate. Any deviations are investigated and reflected accurately in perpetual inventory records.
Records are maintained, compared to schedule, and information supplied to all appropriate persons, for evaluations of important material processes for the organization.

118
The organization has a process to ensure physical inventory counts, when performed, are done accurately and reported in inventory records. These inventory counts are performed with an adequate frequency for every part, depending on volume value, waste percentage, etc.
The organization has, and periodically evaluates, error reduction tools (i.e., visual controls, bar coding, elimination of manual entry), for part storage, part movement and accurate inventory records.
3.3.Requirements planning
Components requirements are planned correctly An efficient lot size policy exist 3.4. Capacity planning An efficient planned load and load leveling exist of work orders 3.5 Operation scheduling
Manpower and machine requirements are estimated from schedules
3.6 .Shop floor control Control of shortage in labor exists A systematic and efficient process exist to assign jobs to men and
machines A standardized procedure exist to expedite orders 3.7. Purchasing The order preparation process is error proofed An efficient internal transportations of material exist A good communication exists with suppliers regarding orders and
delivery requirements No delay in purchase requisitions issuance 3.8. Quality Management A good quality management system exists to coordinate planning
and production management is committed to quality ISO/QS 9000 complied
4- Manufacturing Engineering Department Sub-Element Best Practices 4.1. Production Planning Complete drawings and bills of materials are being reproduces and
forwarded to production control Needed raw material are being determined accurately Manufacturing Engineering studies the design, the manufacturing
phases, the necessary drawings, and the bills of materials Clear prints from customer, and finishing route sheets are
associated with every work order Necessary test specifications and operating instructions are
submitted to the quality control 4.2.Product Design A good communication exist of quotation request from contract
administrator Definite procedures exist for the design of the of the product under
consideration Designed similar product before

119
4.3.Tooling Design A good planning exist for new products and tool availability There is a documented, implemented and periodically evaluated
process, which tracks a tool's lifecycle (i.e., current status, rework history, ownership, authorizations, and BOM item link).
4.4. Documentation There is a formal review process for proposed engineering changes to evaluate the impact on manufacturing operations, physical material flow and delivery.
Process documents are associated with work orders A good database exist for starter blank to build router sheet in
database for new items
5- Shop Floor & Quality Control Sub-Element Best Practices 5.1. Order Review and release
Routing sheets are associated with items produced and include the following:
How to machine and/or fabricate the item and a description of the activity or process
Sequence of the work Tooling required for each operation Type of labor required Where the work is to be performed 5.2. Detailed scheduling (Lean Manufacturing)
An efficient process layout exist:
5S standard work flow method sheet mistake proofing cells visual control mixed model production pull production scheduling cross training 5.3. Maintenance Scheduled lubrication and inspection exist Periodic overhaul exist of tools and equipment A good system exist to replace used parts with new or refurbished
parts Measurement of the OEE exist: 80-85% (World Class) 50-70% (Typical) Breakdown production losses are tracked: < 1-2% (World Class) 5-10% (Typical) Planned Maintenance: >90% (World Class) 50-70% (Typical) Reactive Maintenance: <10% (World Class)

120
45-55% (Typical) 5.4. Quality/Prevention Is the design Validated using the following: Failure prevention analysis Field tests Prototype build Design review Release and validation Failure mode analysis Test and calibration procedures Calibration equipment Product testing-design Product testing-production processes Inspect processes, prototype, and 1st art Analytical analysis SPC is used to control the production process Production processes are capable: >2 (World Class) >1.33 (Typical) PPM: 50-100 PPM (World Class) 500-5000 PPM (Typical) Waste/Scrap as a percentage of manufacturing cost: 0.1-0.2% (World Class) 1-3% (Typical) Quality problem are well managed via the following: Scrap/rework reduction Feedback of Q/R and failure information Warranty reduction Warranty charge back communication Products are properly packed and handled Operators are trained on quality and reliability 5.5. Quality/Appraisal Inspection & testing exist: Inspection direct 100% Inspect direct less 100% Quality audits Material for inspection & test Receiving inspection & storage Lab accept testing receiving inspection Lab accept testing production area Outside lab services Field testing Reliability testing Inspection indirect Review test & inspection date Tools and equipments are calibrated and gauged continuously

121
6- Receiving Sub-Element Best Practices 6.1. Receiving Incoming materials are appropriately unpalletized or containerized Unloading mechanization exist Unloading occur in a logical and orderly fashion A planning function exists to allocate resources to ensure adequate
capacity (personnel, equipment, maintenance and layout/space). All variables that affect the receiving activities are considered to
balance the utilization of the docks and space (i.e., scheduling, fixed time slots).
A procedure exists for the correction and follow-up of any discrepancies in the receipt of material (i.e., quality and quantity verification [including packaging]). The organization ensures that each receiving transaction has a unique identifier to support problem resolution.
6.2. Storing Materials are properly stored An efficient tracking system exist for the location of the materials at all
times The storage environment is appropriately controlled for material on
hand, ensuring that all parts have sufficient protection. The organization has a process to safeguard easily damaged material
and high theft material. Accurate inventory records exist for all materials until they are
released for shipment 6.3. Incoming Material Inspection
Unacceptable goods are identified by quality control upon receipt
6.4. Space Planning An efficient and safe layout exist The right material handling equipments are used for the right products
7- Shipping Sub-Element Best Practices 7.1. Order Processing A process exist for special loading and/or shipping instructions 7.2. Picking/Packaging and labeling
A sound storage function with good materials location system exist
Inventory records are updated periodically A good information system exist Engineering Problems are considered in packaging: Compression strength for hard to store products Cushioning for fragile products shelf life for sensitive products Impact and vibration of filling packages packaging operations configurations

122
A documented control system exists for the procurement, allocation and monitoring of all packing material (i.e., standard packaging & back-up packaging) and the responsibilities are clearly defined between partners.
There is a documented procedure to control the return of empty packaging in quality and quantity.
Packing material is considered and optimized as a part of the total Materials Planning and Logistics costs.
7.3. Shipping Materials are consolidated and containerized appropriately A standardized procedure exist to ensure what is being shipped is
what the customer ordered 7.4. Space Planning An efficient plan exist for material handling maneuvering Doorways, passageways, and ramps allow ease of movement of the
product handled Product storage methods exist to prevent product crushing and
products falls Compatibility is investigated of material to be stored close together Products are properly protected from moisture, severe temperature,
leakage, and staining 7.5. Transportation
Documented procedures for the follow-up of transportation issues relating to quality (damages), cost (normal, premium freight and detention/demurrage costs), and delivery (ordering and on-time performance) exists.
A procedure exists for the correction and follow-up of any discrepancies in the receipt of material (i.e., quality and quantity verification [including packaging]). The organization ensures that each receiving transaction has a unique identifier to support problem resolution.
A documented control system exists for the procurement, allocation and monitoring of all packing material (i.e., returnable containers, expendable packaging, dunnage, spacers).
A documented and implemented process exists to ensure that returnable container inventory and their availability in quantity and quality is adequate to cover customer requirements.
A documented, customer approved process exists in case of missing, damaged, dirty or otherwise unsuitable packaging.
There is a process to notify the customer for each shipment when alternative or back-up packaging is used.
A documented process for the storage of customer-supplied packaging is available and followed (i.e., suitable storage and cleaning facilities for returnable containers).
For organization managed transportation the carrier/Lead Logistics Provider is selected and shall be assessed regarding logistics, flexibility and quality parameters.
Appropriate equipment (i.e., bracing, banding) is used to ensure the product is delivered to the customer damage-free.

123
Transportation planning is included from beginning of the products life cycle and the carrier/Lead Logistics Provider is involved as early as possible (i.e., product development process).
The organization has a process to plan transportation capacity together with the carrier/Lead Logistics Provider in line with its own processes and their capacities.
The organization has established documented contingency plans in the event of failure of transport, including quantified alternative methods of transport.

124
B. On-time Delivery Best Practices: 1- Customer Service/ Sales Sub-Element Best Practices 1.1. Order processing Adequate procedure exists to generate order assembly and
shipping documents? Customer Service monitor the performance of production
planning and inventory control operations When expediting customer orders, Customer Service
supervises the proper execution of special customer requirements, such as periodic deliveries and packaging requirements
Customer Service monitor the performance of warehousing and transportation operations
1.2. Sales forecasting A good short-term sales forecast exists
1.3. Order entry
Standardized procedures exist to trace orders
1.4. Information exchange Sales and delivery terms are communicated with customer
Procedures exist to communicate products specifications with customers and production
There are agreed contingency plans established between both parties to maintain permanent communication during bottle-neck situations.
The customers' goals regarding Materials Planning and Logistics performance are clearly defined (i.e., Customer delivery instructions/schedules), visualized and followed-up by the organization.
A contact list exists containing name, function, method of communication (i.e., phone number, fax number, e-mail address, language spoken, etc…), hours of availability and deputies/back-ups for each Materials Planning and Logistics function from its customers.
Electronically communicated delivery forecasts shall be received and processed without manual entry.
Electronically communicated call off's (i.e., shipping schedules, sequenced shipping schedules) shall be received and processed without manual entry.
1.5. Claims and credits Efficient Credit handling and claim are in place
1.6. Technical services Customer Service offers technical assistance to customers
Customer Service offers testing and laboratory services
1.7. Customer service planning and control
Customer Service identifies deviations between standards and actual and their causes
Customer Service initiates corrective actions to minimize deviations between standards and actual
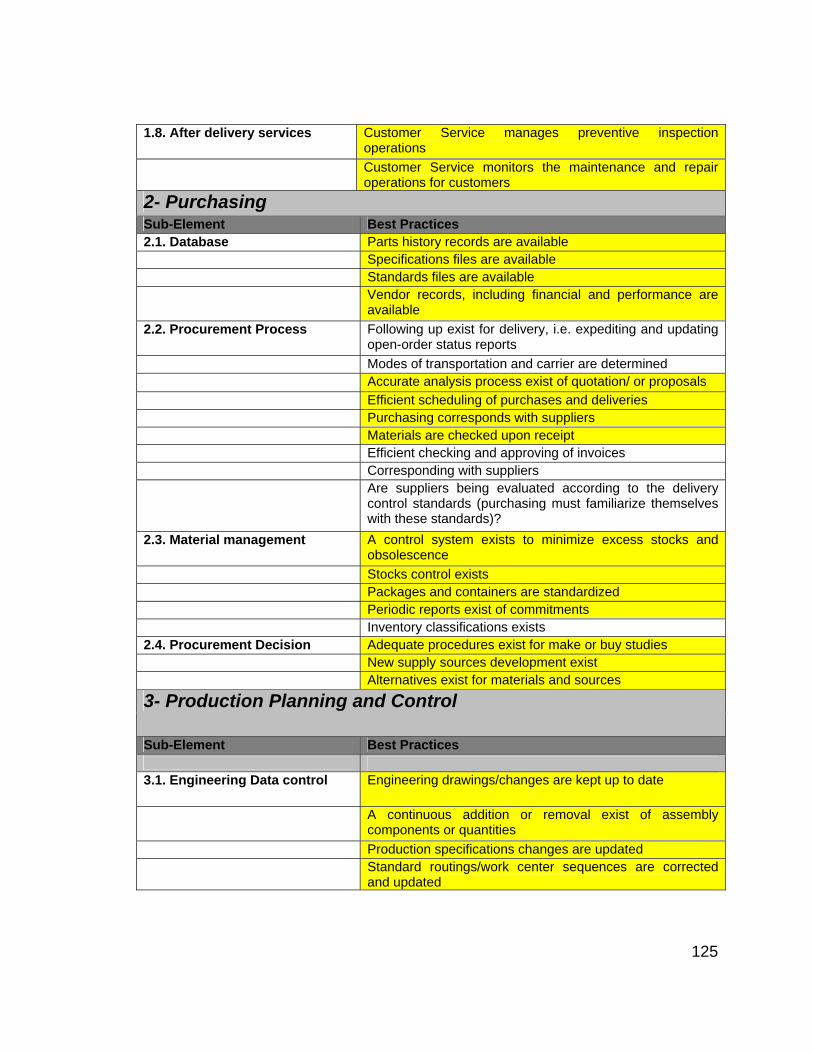
125
1.8. After delivery services Customer Service manages preventive inspection operations
Customer Service monitors the maintenance and repair operations for customers
2- Purchasing Sub-Element Best Practices 2.1. Database Parts history records are available Specifications files are available Standards files are available Vendor records, including financial and performance are
available 2.2. Procurement Process Following up exist for delivery, i.e. expediting and updating
open-order status reports Modes of transportation and carrier are determined Accurate analysis process exist of quotation/ or proposals Efficient scheduling of purchases and deliveries Purchasing corresponds with suppliers Materials are checked upon receipt Efficient checking and approving of invoices Corresponding with suppliers Are suppliers being evaluated according to the delivery
control standards (purchasing must familiarize themselves with these standards)?
2.3. Material management A control system exists to minimize excess stocks and obsolescence
Stocks control exists Packages and containers are standardized Periodic reports exist of commitments Inventory classifications exists 2.4. Procurement Decision Adequate procedures exist for make or buy studies New supply sources development exist Alternatives exist for materials and sources
3- Production Planning and Control
Sub-Element Best Practices 3.1. Engineering Data control Engineering drawings/changes are kept up to date
A continuous addition or removal exist of assembly components or quantities
Production specifications changes are updated Standard routings/work center sequences are corrected
and updated

126
3.2. Inventory control There is a process in place to ensure accurate stock balance of all inventory types (i.e., finished goods, scrap) and that these stock balance figures are accurately updated in the organization's systems in a timely manner.
Efficient order policy exists The organization has a process that ensures the structure
of the Bill of Material (BOM) records are maintained and are accurate. Any deviations are investigated and reflected accurately in perpetual inventory records.
Records are maintained, compared to schedule, and information supplied to all appropriate persons, for evaluations of important material processes for the organization.
The organization has a process to ensure physical inventory counts, when performed, are done accurately and reported in inventory records. These inventory counts are performed with an adequate frequency for every part, depending on volume value, waste percentage, etc.
The organization has, and periodically evaluates, error reduction tools (i.e., visual controls, bar coding, elimination of manual entry), for part storage, part movement and accurate inventory records.
3.3. Sales forecast Accurate sales forecast exists 3.4. Requirements planning Components requirements are planned correctly
An efficient lot size policy exist Customer schedule information shall be automatically
integrated into the organization's releasing system to avoid manual transference of data
MRP receives the expected customer requirements prior to the actual MRP run to calculate daily production operating plans.
3.5. Capacity planning An efficient planned load and load leveling exist of work
orders Accurate start dates calculations Comparison of resources versus customer requirements
shall be reviewed upon receipt of forecast requirements, comparing every week of the forecast (i.e., from week 3 to month 6 of the planning horizon) sent by customers.
Resources versus customer requirements shall be reviewed upon receipt of shipping requirements, comparing daily ship requirement (usually current week and week 2) sent by customers.
There shall be a process in place to notify customers of any significant resource limitations in meeting the requirements.
3.6. Operation scheduling Operations are run based on rate based order management
Accurate assignment of start and finish job dates

127
Priority rules exist Queue time analysis exists Tools are controlled Efficient planning of schedules and minimizing planning
failures Manpower and machine requirements are estimated from
schedules The scheduling system shall consider customer
requirements when generating production schedules. 3.7. Shop floor control Control of shortage in labor exists
A systematic and efficient process exist to assign jobs to men and machines
A standardized procedure exist to expedite orders 3.8. Purchasing The order preparation process is error proofed An efficient internal transportations of material exist No delay in purchase requisitions issuance
4- Manufacturing Engineering Department Sub-Element Best Practices 4.1. Production Planning Complete drawings and bills of materials are being
reproduces and forwarded to production control Needed raw material are being determined accurately Manufacturing Engineering studies the design, the
manufacturing phases, the necessary drawings, and the bills of materials
Clear prints from customer, and finishing route sheets are associated with every work order
Necessary test specifications and operating instructions are submitted to the quality control
4.2. Product Design A good communication exist of quotation request from contract administrator
Definite procedures exist for the design of the of the product under consideration
4.3. Tooling Design A good planning exist for new products and tool availability There is a documented, implemented and periodically
evaluated process, which tracks a tool's lifecycle (i.e., current status, rework history, ownership, authorizations, BOM item link).
There is a sub-process for evaluating tool disposition when related to past models or inactive parts.
There is a sub-process, which tracks customer authorizations for reworking or disposing of tools.
4.4. Documentation Process documents are associated with work orders A good database exist for starter blank to build router
sheet in database for new items

128
A formal engineering change/sign-off review shall exist to ensure that all changes which affect the materials planning and Logistics process are planned, performed and communicated in a synchronized manner, (i.e., process sign-off sheet with Bill of Material (BOM) review, routing changes, effective dates, notification to suppliers, scheduling, and shipping).
There is a formal review process for proposed engineering changes to evaluate the impact on manufacturing operations, physical material flow and delivery.
All affected parties are represented in the review (i.e., Materials, Engineering, Suppliers, and Customer) and the results are communicated to all affected parties.
All affected personnel understand engineering change procedures internally, and at the supplier and customer facilities. These procedures are reviewed on a regular basis for effectiveness and potential process improvements.
There is a process for ensuring that inbound material has adequate revision control, including labels with revision level if applicable, and all material personnel understand the process.
5- Shop Floor & Quality Control Sub-Element Best Practices 5.1. Order Review and release Routing sheets are associated with items produced and
include the following: How to machine and/or fabricate the item and a description
of the activity or process How much time is required to perform each operation Sequence of the work Tooling required for each operation Type of labor required Where the work is to be performed 5.2. Detailed scheduling (Lean Manufacturing)
An efficient process layout exist:
5S standard work flow method sheet mistake proofing cells visual control mixed model production pull production scheduling cross training 5.3. Maintenance Scheduled lubrication and inspection exist Periodic overhaul exist of tools and equipment

129
A good system exist to replace used parts with new or refurbished parts
Measurement of the OEE exist: 80-85% (World Class) 50-70% (Typical) Breakdown production losses are tracked: < 1-2% (World Class) 5-10% (Typical) Planned Maintenance: >90% (World Class) 50-70% (Typical) Reactive Maintenance: <10% (World Class) 45-55% (Typical) 5.4. Quality/Prevention Is the design Validated using the following: Failure prevention analysis Field tests Prototype build Design review Release and validation Failure mode analysis Test and calibration procedures Calibration equipment Product testing-design Product testing-production processes Inspect processes, prototype, and 1st art Analytical analysis SPC is used to control the production process Production processes are capable: >2 (World Class) >1.33 (Typical) PPM: 50-100 PPM (World Class) 500-5000 PPM (Typical) Waste/Scrap as a percentage of manufacturing cost: 0.1-0.2% (World Class) 1-3% (Typical) Quality problem are well managed via the following: Scrap/rework reduction Feedback of Q/R and failure information Warranty reduction Warranty charge back communication Products are properly packed and handled Operators are trained on quality and reliability 5.5. Quality/Appraisal Inspection & testing exist: Inspection direct 100%

130
Inspect direct less 100% Quality audits Material for inspection & test Receiving inspection & storage Lab accept testing receiving inspection Lab accept testing production area Outside lab services Field testing Reliability testing Inspection indirect Review test & inspection date Tools and equipments are calibrated and gauged
continuously 5.6 Quality/Failure Internal/Scrap: Vendor responsible Re-inspection Internal/Rework: Direct labor sorting Division responsible Vendor responsible External: Customer complaints User complaints Scrap-division responsible at assembly plant Salaries related to product reliability Product liability costs Field service Civil penalty for lack of due care Returned material process and repair Management and engineering Management and engineering 5.6 Efficiency Contact Time / cycle time
6- Receiving Sub-Element Best Practices 6.1. Receiving Choices of receiving dock bays are specified in the
purchase order Incoming materials are appropriately unpalletized or
containerized Unloading mechanization exist Unloading occur in a logical and orderly fashion A planning function exists to allocate resources to ensure
adequate capacity (personnel, equipment, maintenance and layout/space).
All variables that affect the receiving activities are considered to balance the utilization of the docks and space (i.e., scheduling, fixed time slots).
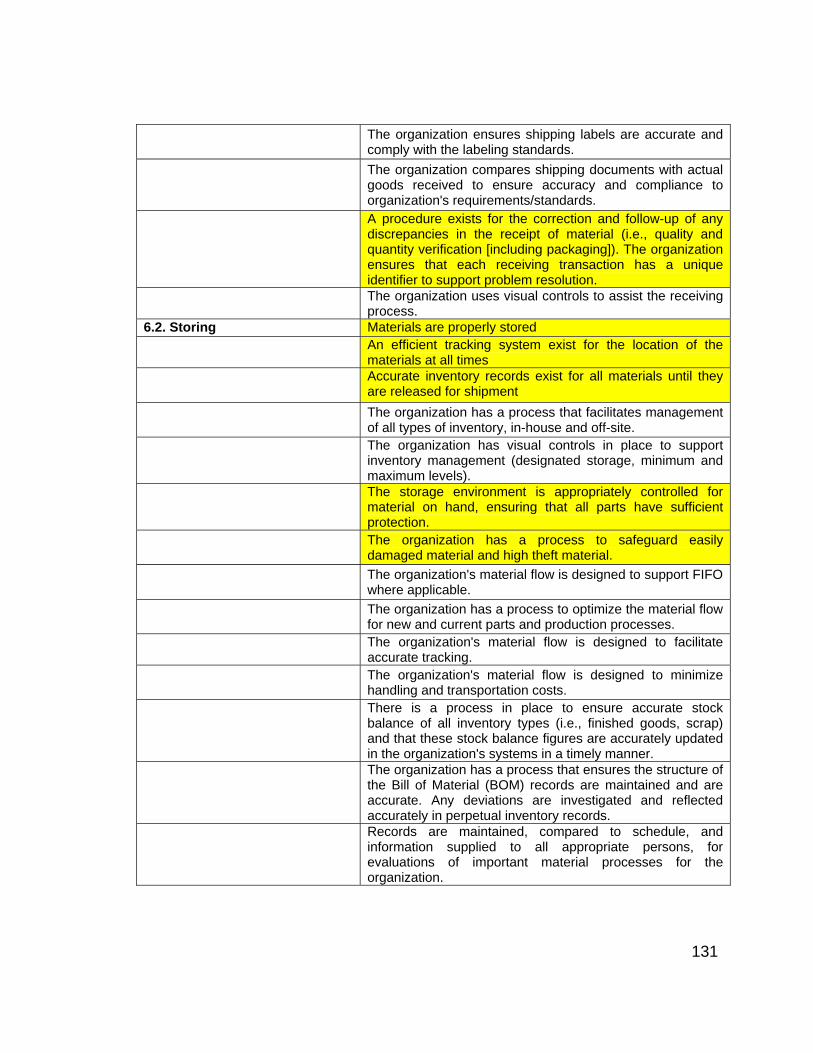
131
The organization ensures shipping labels are accurate and comply with the labeling standards.
The organization compares shipping documents with actual goods received to ensure accuracy and compliance to organization's requirements/standards.
A procedure exists for the correction and follow-up of any discrepancies in the receipt of material (i.e., quality and quantity verification [including packaging]). The organization ensures that each receiving transaction has a unique identifier to support problem resolution.
The organization uses visual controls to assist the receiving process.
6.2. Storing Materials are properly stored An efficient tracking system exist for the location of the
materials at all times Accurate inventory records exist for all materials until they
are released for shipment The organization has a process that facilitates management
of all types of inventory, in-house and off-site. The organization has visual controls in place to support
inventory management (designated storage, minimum and maximum levels).
The storage environment is appropriately controlled for material on hand, ensuring that all parts have sufficient protection.
The organization has a process to safeguard easily damaged material and high theft material.
The organization's material flow is designed to support FIFO where applicable.
The organization has a process to optimize the material flow for new and current parts and production processes.
The organization's material flow is designed to facilitate accurate tracking.
The organization's material flow is designed to minimize handling and transportation costs.
There is a process in place to ensure accurate stock balance of all inventory types (i.e., finished goods, scrap) and that these stock balance figures are accurately updated in the organization's systems in a timely manner.
The organization has a process that ensures the structure of the Bill of Material (BOM) records are maintained and are accurate. Any deviations are investigated and reflected accurately in perpetual inventory records.
Records are maintained, compared to schedule, and information supplied to all appropriate persons, for evaluations of important material processes for the organization.

132
The organization has a process to ensure physical inventory counts, when performed, are done accurately and reported in inventory records. These inventory counts are performed with an adequate frequency for every part, depending on volume value, waste percentage, etc.
The organization has, and periodically evaluates, error reduction tools (i.e., visual controls, bar coding, elimination of manual entry), for part storage, part movement and accurate inventory records.
The organization shall archive material records for the appropriate length of time (retention requirements). These records must be retrievable and readable.
6.3. Incoming Material Inspection Unacceptable goods are identified by quality control upon receipt
Discrepancies are tracked in the receiving tally against the carrier’s bill of lading, the vendors packing list, and the purchase order recorded?
Unacceptable goods are identified by quality control? The organization shall have a process to correctly identify all
material, including in-process material and including direct marking when needed.
The organization shall have a process to ensure part's labels are available at the appropriate time and are applied correctly.
The organization shall have a process to clearly identify all storage locations accurately.
The organization shall have a process to assure the appropriate identification of all unusable or damaged material (scrap, returns, rejections, etc…).
Bar codes are used to identify and trace material where appropriate.
6.4. Space Planning An efficient and safe layout exist The right material handling equipments are used for the
right products 7- Shipping
Sub-Element Best Practices 7.1. Order Processing Credit limit/terms are set Procedures to acknowledge receipt of customer orders exist A process is in place for special loading and/or shipping
instructions Process exists to check the Compliance of warehouse with
customer due dates? A process exists for releasing stocking locations and
standard handling times to schedule picking and shipping 7.2. Picking/Packaging and labeling
A process exist for special loading and/or shipping instructions
A sound storage function with good materials location
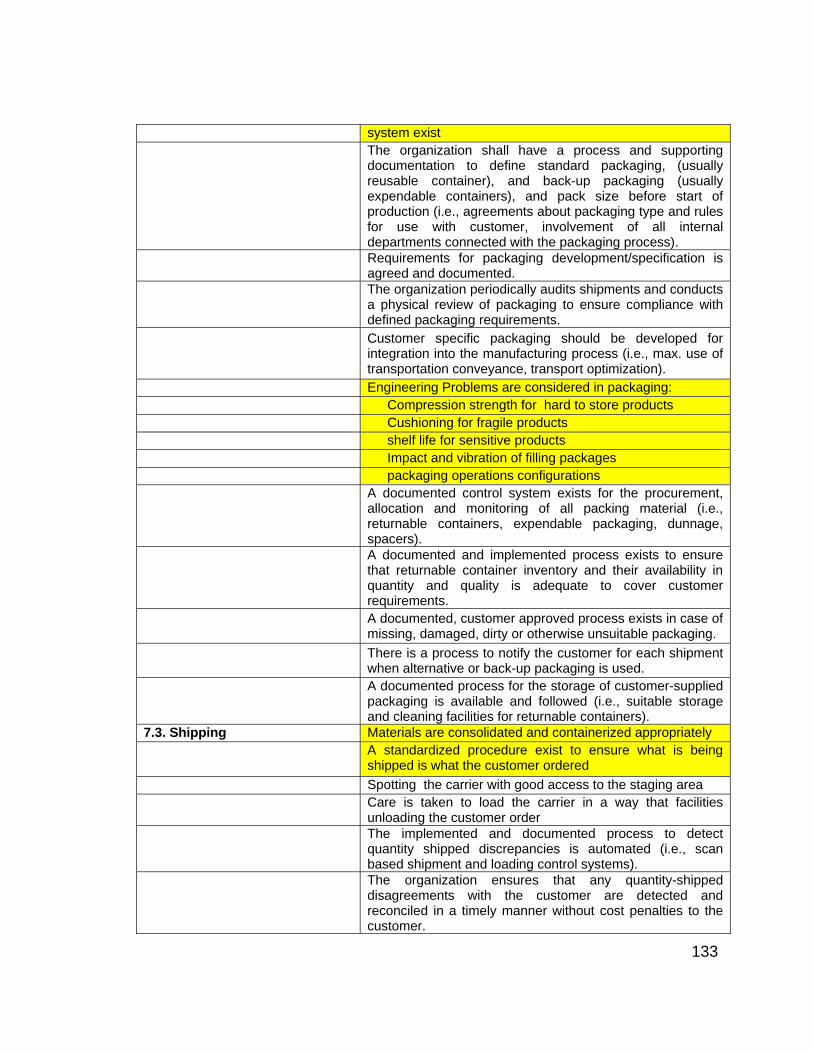
133
system exist The organization shall have a process and supporting
documentation to define standard packaging, (usually reusable container), and back-up packaging (usually expendable containers), and pack size before start of production (i.e., agreements about packaging type and rules for use with customer, involvement of all internal departments connected with the packaging process).
Requirements for packaging development/specification is agreed and documented.
The organization periodically audits shipments and conducts a physical review of packaging to ensure compliance with defined packaging requirements.
Customer specific packaging should be developed for integration into the manufacturing process (i.e., max. use of transportation conveyance, transport optimization).
Engineering Problems are considered in packaging: Compression strength for hard to store products Cushioning for fragile products shelf life for sensitive products Impact and vibration of filling packages packaging operations configurations A documented control system exists for the procurement,
allocation and monitoring of all packing material (i.e., returnable containers, expendable packaging, dunnage, spacers).
A documented and implemented process exists to ensure that returnable container inventory and their availability in quantity and quality is adequate to cover customer requirements.
A documented, customer approved process exists in case of missing, damaged, dirty or otherwise unsuitable packaging.
There is a process to notify the customer for each shipment when alternative or back-up packaging is used.
A documented process for the storage of customer-supplied packaging is available and followed (i.e., suitable storage and cleaning facilities for returnable containers).
7.3. Shipping Materials are consolidated and containerized appropriately A standardized procedure exist to ensure what is being
shipped is what the customer ordered Spotting the carrier with good access to the staging area Care is taken to load the carrier in a way that facilities
unloading the customer order The implemented and documented process to detect
quantity shipped discrepancies is automated (i.e., scan based shipment and loading control systems).
The organization ensures that any quantity-shipped disagreements with the customer are detected and reconciled in a timely manner without cost penalties to the customer.

134
Dock operations (i.e., capacity of preparation areas, loading bays, limits of loading and unloading, rules of freight capacity, schedule of dispatch handling) are optimized, using scheduled window times and carrier on-time performance is tracked.
The organization shall verify the data contents of shipping labels, (the use of electronic based support systems such as RFID or scanning is mandatory for some customers), to assure consistency between container content, labels and documentation.
The organization shall ensure that the data content of all ASN's is complete and accurate in accordance with customer requirements.
All shipments, including documentation and labeling, shall be prepared to customer, industry and government standards and requirements (i.e., customs handling) including carrier routings.
The shipment process shall ensure that each ASN is transmitted at the time of conveyance departure.
There is a procedure describing the proper use of shipment quantity-determination equipment (i.e., scales, counters).
All quantity-determination equipment is calibrated to a recognized standard at planned intervals.
The inspection status and date for all quantity-determination equipment is clearly displayed on the equipment.
An inspection schedule is created and one person has the responsibility of equipment calibration.
Design and development responsibility is agreed between partners; packaging design requirements (i.e., standard packaging, pack size, back-up packaging) are documented in a detailed procedure and communicated to the supplier before the start of production and covers the entire product life cycle.
Existing standards are used; returnable, reusable or recyclable containers are considered as a part of environmental guidelines.
Optimization of transport, variety of packaging, material receiving, and handling until point of use is considered.
A documented control system exists for the procurement, allocation and monitoring of all packing material (i.e., standard packaging & back-up packaging) and the responsibilities are clearly defined between partners.
There is a documented procedure to control the return of empty packaging in quality and quantity.
Packing material is considered and optimized as a part of the total Materials Planning and Logistics costs.
7.4. Space Planning An efficient plan exist for material handling maneuvering Doorways, passageways, and ramps allow ease of
movement of the product handled Product storage methods exist to prevent product crushing

135
and products falls Compatibility is investigated of material to be stored close
together Products are properly protected from moisture, severe
temperature, leakage, and staining 7.5. Transportation Transportation set-up is considered as part of the product
development process, including transportation specification, (i.e., lead time), optimization and environmental consideration together with carriers and Lead Logistics providers.
Documented procedures for the follow-up of transportation issues relating to quality (damages), cost (normal, premium freight and detention/demurrage costs), and delivery (ordering and on-time performance) exists.
The organization tracks and traces in-bound material from time of supplier shipment through to receipt of material.
Transportation function supplies the scheduling function with information on in-bound transportation modes and associated transit times (i.e., lead-time, window times).
For organization managed transportation the carrier/Lead Logistics Provider is selected and shall be assessed regarding logistics, flexibility and quality parameters.
Appropriate equipment (i.e., bracing, banding) is used to ensure the product is delivered to the customer damage-free.
Transportation planning is included from beginning of the products life cycle and the carrier/Lead Logistics Provider is involved as early as possible (i.e., product development process).
The organization has a process to plan transportation capacity together with the carrier/Lead Logistics Provider in line with its own processes and their capacities.
The organization has established documented contingency plans in the event of failure of transport, including quantified alternative methods of transport.
The organization regularly explores opportunities to reload inbound conveyances with outbound product.
Disposition of all empty transportation capacities (both inbound and outbound) should be done on a daily basis to ensure that FIFO is occurring to minimize detention and demurrage related charges.
The organization tracks and traces in-bound material from time of supplier shipment through to receipt of material.
The organization ensures shipping labels are accurate and comply with the labeling standards.

136
Appendix C: Test Statistics Tables

137
Table 15: Rerun of the Kruskal-Wallis Test for Best-practices’ Sub-elements across the Value Stream by Quality Grouping
Test Statisticsa,b
Chi-Square df Asymp. Sig. ORDERP ROCESSING 5.159619 3 0.1605 INFORMATION EXCHANGE 3.469083 3 0.3248 TECHNICAL SERVICES 4.190828 3 0.2416 CUSTOMERSERVICEPLANNINGANDCONTROL 9.806157 3 0.0203 AFTERDELIVERYSERVICES 11.07373 3 0.0113 RELIABILITY 14.03162 3 0.0029 DATABASE 8.835216 3 0.0316 PROCUREMENT PROCESS 10.89372 3 0.0123 MATERIAL MANAGEMENT 12.14413 3 0.0069 PROCUREMENT DECISION 10.64562 3 0.0138 ENGINEERING DATA CONTROL 15.42948 3 0.0015 INVENTORY CONTROL 13.22498 3 0.0042 REQUIREMENTS PLANNING 3.255252 3 0.3539 CAPACITY PLANNING 4.428092 3 0.2188 OPERATION SCHEDULING 3.508903 3 0.3196 SHOP FLOOR CONTROL 10.28769 3 0.0163 PURCHASING 11.72131 3 0.0084 QUALITY MANAGEMENT 10.79536 3 0.0129 PRODUCTION PLANNING 8.4117 3 0.0382 PRODUCT DESIGN 4.313038 3 0.2296 TOOLING DESIGN 0.970969 3 0.8083 DOCUMENTATION 5.958344 3 0.1137 ORDER REVIEW AND RELEASE 15.5416 3 0.0014 DETAILED SCHEDULING 3.812448 3 0.2824 MAINTENANCE 9.21542 3 0.0266 QUALITYP REVENTION 3.226182 3 0.3580 QUALITY APPRAISAL 14.61725 3 0.0022 RECEIVING 25.05511 3 0.0000 STORING 23.98327 3 0.0000 INCOMING MATERIAL INSPECTION 18.6078 3 0.0003 SPACE PLANNING 19.79814 3 0.0002 PICKING PACKAGING AND LABELING 16.56032 3 0.0009 SHIPPING 10.0078 3 0.0185 TRANSPORTATION 13.61114 3 0.0035
a. Kruskal Wallis Test b. Grouping Variable: Quality Grouping

138
Table 16: Rerun Average Ranks of Best-practices’ Sub-elements by Quality Grouping
Quality Level N Mean Rank ORDERP ROCESSING Very Low 30 45.13 Acceptable 18 50.39 High 24 54.71 Excellent 34 61.68 Total 106 INFORMATION EXCHANGE Very Low 30 47.52 Acceptable 18 57.67 High 24 61.17 Excellent 34 51.16 Total 106 TECHNICAL SERVICES Very Low 30 45.52 Acceptable 18 59.47 High 24 51.13 Excellent 34 59.06 Total 106 CUSTOMERSERVICEPLANNINGANDCONTROL Very Low 30 38.97 Acceptable 18 59.64 High 24 59.96 Excellent 34 58.51 Total 106 AFTERDELIVERYSERVICES Very Low 30 38.00 Acceptable 18 61.64 High 24 58.35 Excellent 34 59.44 Total 106 RELIABILITY Very Low 30 37.03 Acceptable 18 67.72 High 24 57.48 Excellent 34 57.69 Total 106 DATABASE Very Low 29 41.12 Acceptable 18 60.14 High 24 51.13 Excellent 35 61.97 Total 106 PROCUREMENT PROCESS Very Low 29 39.90 Acceptable 18 66.25 High 24 60.69 Excellent 35 53.29 Total 106

139
Table 16: Continued Quality Level N Mean Rank MATERIAL MANAGEMENT Very Low 29 39.52 Acceptable 18 64.75 High 24 49.88 Excellent 35 61.79 Total 106 PROCUREMENT DECISION Very Low 29 39.98 Acceptable 18 47.81 High 24 62.98 Excellent 34 59.81 Total 105 ENGINEERING DATA CONTROL Very Low 29 36.52 Acceptable 18 59.19 High 24 51.73 Excellent 34 64.68 Total 105 INVENTORY CONTROL Very Low 29 38.47 Acceptable 18 67.06 High 24 51.69 Excellent 35 60.23 Total 106 REQUIREMENTS PLANNING Very Low 29 46.22 Acceptable 18 61.33 High 24 56.33 Excellent 35 53.56 Total 106 CAPACITY PLANNING Very Low 28 44.05 Acceptable 18 61.06 High 24 57.13 Excellent 35 53.19 Total 105 OPERATION SCHEDULING Very Low 29 44.31 Acceptable 18 57.06 High 24 56.77 Excellent 34 55.60 Total 105 SHOP FLOOR CONTROL Very Low 29 40.52 Acceptable 18 56.00 High 24 51.48 Excellent 35 64.36 Total 106

140
Table 16: Continued Quality Level N Mean Rank PURCHASING Very Low 28 42.34 Acceptable 18 43.50 High 24 54.63 Excellent 35 65.30 Total 105 QUALITY MANAGEMENT Very Low 30 40.45 Acceptable 18 60.89 High 24 50.98 Excellent 33 61.58 Total 105 PRODUCTION PLANNING Very Low 30 41.03 Acceptable 18 61.83 High 23 53.22 Excellent 35 60.09 Total 106 PRODUCT DESIGN Very Low 29 43.29 Acceptable 18 50.25 High 24 56.06 Excellent 32 57.83 Total 103 TOOLING DESIGN Very Low 30 51.12 Acceptable 18 50.39 High 24 55.94 Excellent 35 57.00 Total 107 DOCUMENTATION Very Low 30 43.20 Acceptable 17 58.18 High 24 52.85 Excellent 35 60.50 Total 106 ORDER REVIEW AND RELEASE Very Low 31 40.29 Acceptable 17 52.79 High 24 50.71 Excellent 35 68.99 Total 107 DETAILED SCHEDULING Very Low 31 46.89 Acceptable 17 50.50 High 24 61.79 Excellent 35 56.66 Total 107

141
Table 16: Continued Quality Level N Mean Rank MAINTENANCE Very Low 31 40.08 Acceptable 16 60.38 High 24 55.31 Excellent 35 61.00 Total 106 QUALITYP REVENTION Very Low 31 46.37 Acceptable 17 59.79 High 24 54.00 Excellent 35 57.94 Total 107 QUALITY APPRAISAL Very Low 31 42.92 Acceptable 17 58.44 High 24 45.21 Excellent 35 67.69 Total 107 RECEIVING Very Low 30 33.75 Acceptable 18 64.06 High 24 50.17 Excellent 35 68.81 Total 107 STORING Very Low 30 34.30 Acceptable 18 69.75 High 24 50.19 Excellent 35 65.40 Total 107 INCOMING MATERIAL INSPECTION Very Low 30 35.75 Acceptable 18 59.47 High 24 53.63 Excellent 34 65.91 Total 106 SPACE PLANNING Very Low 30 40.13 Acceptable 18 54.44 High 24 46.23 Excellent 35 70.99 Total 107 PICKING PACKAGING AND LABELING Very Low 29 36.69 Acceptable 18 64.25 High 24 50.54 Excellent 35 63.93 Total 106

142
Table 16: Continued Quality Level N Mean Rank SHIPPING Very Low 29 40.88 Acceptable 18 52.50 High 24 54.02 Excellent 34 62.88 Total 105 TRANSPORTATION Very Low 29 37.19 Acceptable 18 56.31 High 22 51.70 Excellent 35 63.73 Total 104

143
Table 17: Kruskal-Wallis Test for Best-practices’ Sub-elements across the Value Stream by Suppliers’ Delivery Grouping (initial run)
Test Statisticsa,b
Chi-Square df Asymp. Sig. ORDERP ROCESSING 4.96642 3 0.1743 INFORMATION EXCHANGE 3.553956 3 0.3138 TECHNICAL SERVICES 6.522866 3 0.0888 CUSTOMERSERVICEPLANNINGANDCONTROL 0.832015 3 0.8418 AFTERDELIVERYSERVICES 3.287925 3 0.3493 SALES FORECASTING 0.800153 3 0.8494 ORDER ENTRY 7.194551 3 0.0659 CLAIMS AND CREDITS 7.674639 3 0.0532 DATABASE 1.604774 3 0.6583 PROCUREMENT PROCESS 0.640483 3 0.8871 MATERIAL MANAGEMENT 1.170213 3 0.7602 PROCUREMENT DECISION 3.160324 3 0.3676 ENGINEERING DATA CONTROL 2.767744 3 0.4288 INVENTORY CONTROL 1.625214 3 0.6537 REQUIREMENTS PLANNING 0.725733 3 0.8671 CAPACITY PLANNING 3.501531 3 0.3206 OPERATION SCHEDULING 1.657338 3 0.6465 SHOP FLOOR CONTROL 0.534516 3 0.9112 PURCHASING 2.802893 3 0.4230 PRODUCTION PLANNING 0.894706 3 0.8267 PRODUCT DESIGN 5.16501 3 0.1601 TOOLING DESIGN 4.381634 3 0.2231 DOCUMENTATION 2.277813 3 0.5168 ORDER REVIEW AND RELEASE 3.206586 3 0.3609 DETAILED SCHEDULING 0.709496 3 0.8710 MAINTENANCE 4.186867 3 0.2420 QUALITYP REVENTION 1.03537 3 0.7927 QUALITY APPRAISAL 4.829784 3 0.1847 QUALITY FAILURE 3.897983 3 0.2727 EFFICIENCY 0.819153 3 0.8449 RECEIVING 3.347785 3 0.3410 STORING 1.018904 3 0.7967 INCOMING MATERIAL INSPECTION 1.221175 3 0.7479 SPACE PLANNING 0.463492 3 0.9268 PICKING PACKAGING AND LABELING 3.132228 3 0.3717 SHIPPING 2.555701 3 0.4653 TRANSPORTATION 1.047106 3 0.7899
a. Kruskal Wallis Test b. Grouping Variable: Delivery Grouping

144
Table 20: Rerun of Kruskal-Wallis Test for Best-practices’ Sub-elements across the Value Stream by Suppliers’ Delivery Grouping (3 groupings)
Chi-Square df Asymp. Sig. ORDERP ROCESSING 17.71527 2 0.00014 INFORMATION EXCHANGE 11.12873 2 0.00383 TECHNICAL SERVICES 12.92415 2 0.00156 CUSTOMERSERVICEPLANNINGANDCONTROL 9.104361 2 0.01054 AFTERDELIVERYSERVICES 7.38353 2 0.02493 SALES FORECASTING 3.604409 2 0.16493 ORDER ENTRY 17.01103 2 0.00020 CLAIMS AND CREDITS 18.9767 2 0.00008 DATABASE 11.0289 2 0.00403 PROCUREMENT PROCESS 9.848031 2 0.00727 MATERIAL MANAGEMENT 22.00618 2 0.00002 PROCUREMENT DECISION 10.46701 2 0.00533 ENGINEERING DATA CONTROL 8.203266 2 0.01655 INVENTORY CONTROL 6.563452 2 0.03756 REQUIREMENTS PLANNING 11.67403 2 0.00292 CAPACITY PLANNING 18.05308 2 0.00012 OPERATION SCHEDULING 13.82464 2 0.00100 SHOP FLOOR CONTROL 6.696435 2 0.03515 PURCHASING 10.41949 2 0.00546 PRODUCTION PLANNING 3.385736 2 0.18399 PRODUCT DESIGN 11.5724 2 0.00307 TOOLING DESIGN 15.70456 2 0.00039 DOCUMENTATION 13.67426 2 0.00107 ORDER REVIEW AND RELEASE 5.946473 2 0.05114 DETAILED SCHEDULING 9.680008 2 0.00791 MAINTENANCE 10.15867 2 0.00622 QUALITYP REVENTION 13.63863 2 0.00109 QUALITY APPRAISAL 5.600037 2 0.06081 QUALITY FAILURE 9.865758 2 0.00721 EFFICIENCY 3.830837 2 0.14728 RECEIVING 10.85466 2 0.00439 STORING 16.49758 2 0.00026 INCOMING MATERIAL INSPECTION 10.01294 2 0.00669 SPACE PLANNING 17.8175 2 0.00014 PICKING PACKAGING AND LABELING 20.25664 2 0.00004 SHIPPING 18.55079 2 0.00009 TRANSPORTATION 15.73734 2 0.00038
a. Kruskal Wallis Test b. Grouping Variable: Delivery Grouping

145
Table 21: Rerun Average Ranks of Best-practices’ Sub-elements by Delivery Grouping (3 groupings)
Delivery Level N Mean Rank ORDERP ROCESSING Very Low 41 39.94 Acceptable 38 55.78 High 27 70.89 Total 106 INFORMATION EXCHANGE Very Low 41 43.48 Acceptable 38 53.88 High 27 68.19 Total 106 TECHNICAL SERVICES Very Low 41 41.46 Acceptable 38 56.3 High 27 67.83 Total 106 CUSTOMERSERVICEPLANNINGANDCONTROL Very Low 41 44.12 Acceptable 38 54.24 High 27 66.7 Total 106 AFTERDELIVERYSERVICES Very Low 41 44.17 Acceptable 38 62.58 High 27 54.89 Total 106 SALES FORECASTING Very Low 41 46.48 Acceptable 38 57.61 High 27 58.39 Total 106 ORDER ENTRY Very Low 41 44.11 Acceptable 38 49.24 High 27 73.76 Total 106 CLAIMS AND CREDITS Very Low 40 37.35 Acceptable 38 59.62 High 27 66.87 Total 105 DATABASE Very Low 40 43.86 Acceptable 38 52.67 High 28 68.39 Total 106

146
Table 21: Continued Delivery Level N Mean Rank PROCUREMENT PROCESS Very Low 40 42.79 Acceptable 38 56.01 High 28 65.39 Total 106 MATERIAL MANAGEMENT Very Low 40 37.14 Acceptable 38 58.29 High 28 70.38 Total 106 PROCUREMENT DECISION Very Low 40 42.24 Acceptable 37 55.04 High 28 65.68 Total 105 ENGINEERING DATA CONTROL Very Low 40 43.14 Acceptable 38 57.28 High 28 63.18 Total 106 INVENTORY CONTROL Very Low 40 43.94 Acceptable 38 58.37 High 28 60.55 Total 106 REQUIREMENTS PLANNING Very Low 40 41.18 Acceptable 38 56.63 High 27 65.41 Total 105 CAPACITY PLANNING Very Low 40 40.34 Acceptable 37 52.72 High 28 71.46 Total 105 OPERATION SCHEDULING Very Low 40 39.86 Acceptable 38 57.66 High 27 65.91 Total 105 SHOP FLOOR CONTROL Very Low 40 44.74 Acceptable 38 55.22 High 28 63.68 Total 106
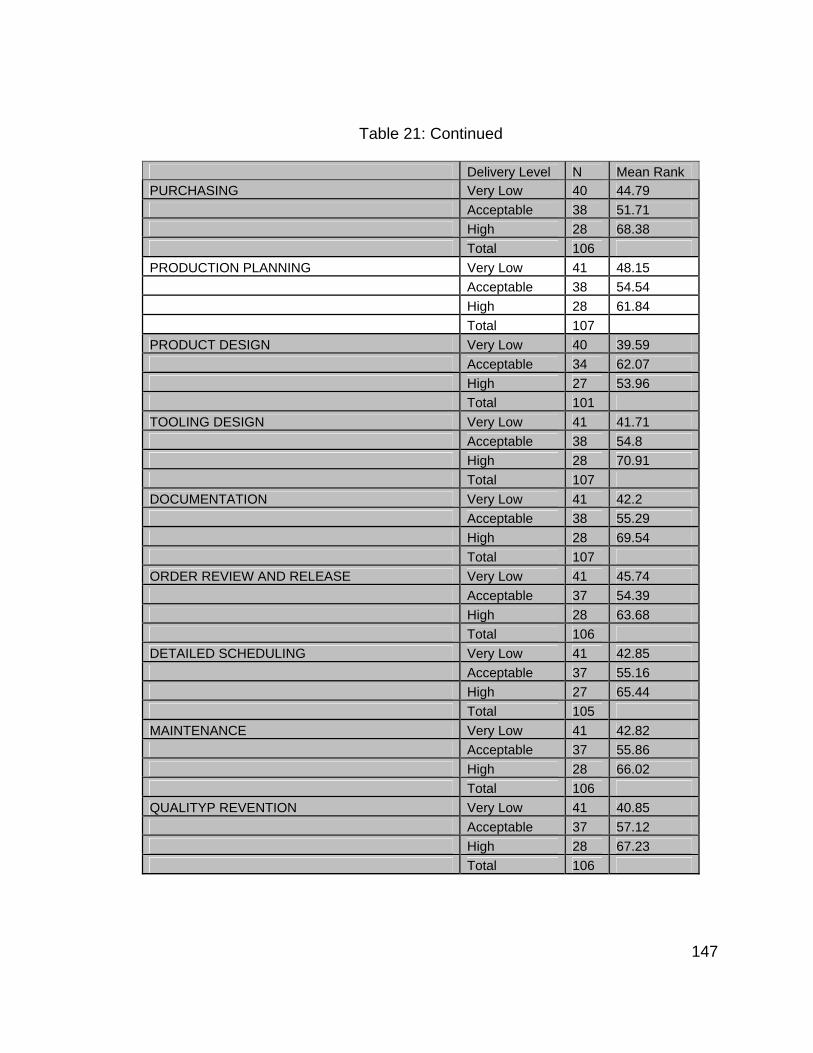
147
Table 21: Continued Delivery Level N Mean Rank PURCHASING Very Low 40 44.79 Acceptable 38 51.71 High 28 68.38 Total 106 PRODUCTION PLANNING Very Low 41 48.15 Acceptable 38 54.54 High 28 61.84 Total 107 PRODUCT DESIGN Very Low 40 39.59 Acceptable 34 62.07 High 27 53.96 Total 101 TOOLING DESIGN Very Low 41 41.71 Acceptable 38 54.8 High 28 70.91 Total 107 DOCUMENTATION Very Low 41 42.2 Acceptable 38 55.29 High 28 69.54 Total 107 ORDER REVIEW AND RELEASE Very Low 41 45.74 Acceptable 37 54.39 High 28 63.68 Total 106 DETAILED SCHEDULING Very Low 41 42.85 Acceptable 37 55.16 High 27 65.44 Total 105 MAINTENANCE Very Low 41 42.82 Acceptable 37 55.86 High 28 66.02 Total 106 QUALITYP REVENTION Very Low 41 40.85 Acceptable 37 57.12 High 28 67.23 Total 106

148
Table 21: Continued Delivery Level N Mean Rank QUALITY APPRAISAL Very Low 40 48.75 Acceptable 37 48.14 High 27 64.04 Total 104 QUALITY FAILURE Very Low 40 43.58 Acceptable 37 52.89 High 28 66.61 Total 105 EFFICIENCY Very Low 40 46.16 Acceptable 37 54.96 High 28 60.18 Total 105 RECEIVING Very Low 40 44.56 Acceptable 38 51.68 High 28 68.73 Total 106 STORING Very Low 40 39.15 Acceptable 38 56.54 High 27 68.54 Total 105 INCOMING MATERIAL INSPECTION Very Low 40 42.03 Acceptable 37 56.59 High 28 63.93 Total 105 SPACE PLANNING Very Low 40 38.05 Acceptable 38 60.18 High 28 66.5 Total 106 PICKING PACKAGING AND LABELING Very Low 39 35.82 Acceptable 38 62.24 High 27 62.89 Total 104 SHIPPING Very Low 38 36.17 Acceptable 37 59.91 High 28 63.04 Total 103 TRANSPORTATION Very Low 40 39.35 Acceptable 36 55.21 High 28 67.8 Total 104

149
Appendix D: Details of the Proposed-Model Calculations

150
A. Details of the quality model: Score Summary
Element Score Weight (100)
Element Final Score
1 Customer Service/Sales 57.14% 13.2 7.54 2 Purchasing 82.14% 13.5 11.09
3 Production Planning and Control 77.14% 14.6 11.26
4 Manufacturing Engineering Department 71.43% 13.6 9.71
5 Shop Floor & Quality Control 95.24% 15.1 14.38
6 Receiving/ Warehouse 100.00% 15.2 15.20 7 Shipping/ warehouse 95.24% 14.8 14.10
Quality Score (Out of 100) 83.29
Element Sub-Element Questions Score (1-7)
Max. Score
Element Score
1 Customer Service/Sales 1.4. Customer Services Planning 6 7 57.14%
1.5. After Delivery Services 1 7
1.6. Reliability 5 7 Total 12 21
Element Sub-Element Questions Score (1-7)
Max. Score
Element Score
2 Purchasing 2.1. Database 5 7 82.14%
2.2. Procurement Process 6 7
2.3. Material management 6 7
2.4. Procurement Decision 6 7
Total 23 28
Element Sub-Element Questions Score (1-7)
Max. Score
Element Score
3 Production Planning and Control
3.1. Engineering Data control 5 7 77.14%
3.2. Inventory control 5 7
3.6 .Shop floor control 5 7

151
3.7. Purchasing 5 7
3.8. Quality Management 7 7
Total 27 35
Element Sub-Element Questions Score (1-7)
Max. Score
Element Score
4 Manufacturing
Engineering Department 4.1. Production Planning 5 7 71.43%
Total 5 7
Element Sub-Element Questions Score (1-7)
Max. Score
Element Score
5 Shop Floor & Quality Control
5.1. Order Review and release 7 7 95.24%
5.3. Maintenance 6 7
5.5. Quality/Appraisal 7 7
Total 20 21
Element Sub-Element Questions Score (1-7)
Max. Score
Element Score
6 Receiving 6.1. Receiving 7 7 100.00% 6.2. Storing 7 7
6.3. Incoming Material Inspection 7 7
6.4. Space Planning 7 7 Total 28 28
Element Sub-Element Questions Score (1-7)
Max. Score
Element Score
7 Shipping
7.2. Picking/Packaging and labeling 7 7 95.24%
7.3. Shipping 7 7 7.5. Transportation 6 7 Total 20 21

152
B. Details of the on-time delivery prediction model: Score Summary
Element Score Weight (100)
Element Final Score
1 Customer Service/Sales 57.14% 14.4 8.23
2 Purchasing 39.29% 14.5 5.70
3 Production Planning and Control 38.78% 14.2 5.51
4 Manufacturing Engineering Department 42.86% 14.0 6.00
5 Shop Floor & Quality Control 50.00% 14.2 7.10
6 Receiving/ Warehouse 46.43% 14.5 6.73
7 Shipping/ warehouse 47.62% 14.2 6.76
Delivery Score (Out of 100) 46.03
Element Sub-Element Questions
Score (1-7) Max.
Score Element Score
1 Customer Service/Sales 1.1. Order Processing 4 7 57.14%
1.3. Order entry 4 7
1.4. Information exchange 5 7
1.5. Claims and credits 3 7
1.6. Technical services 5 7
1.7. Customer service planning and control 4 7
1.8. After delivery services 3 7
Total 28 49
Element Sub-Element Questions
Score (1-7) Max.
Score Element Score
2 Purchasing 2.1. Database
3 7 39.29%
2.2. Procurement Process
3 7
2.3. Material management
2 7
2.4. Procurement Decision
3 7
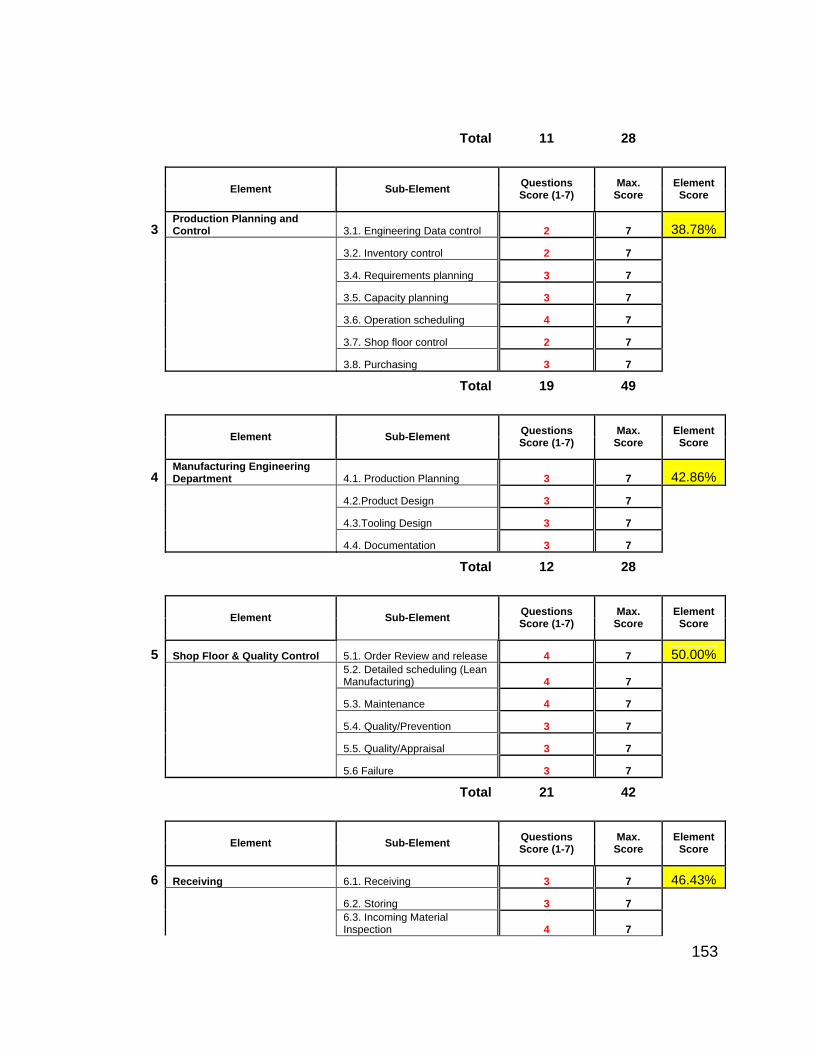
153
Total 11 28
Element Sub-Element Questions
Score (1-7) Max.
Score Element Score
3 Production Planning and Control 3.1. Engineering Data control 2 7 38.78%
3.2. Inventory control 2 7
3.4. Requirements planning 3 7
3.5. Capacity planning 3 7
3.6. Operation scheduling 4 7
3.7. Shop floor control 2 7
3.8. Purchasing 3 7
Total 19 49
Element Sub-Element Questions
Score (1-7) Max.
Score Element Score
4 Manufacturing Engineering Department 4.1. Production Planning 3 7 42.86%
4.2.Product Design 3 7
4.3.Tooling Design 3 7
4.4. Documentation 3 7
Total 12 28
Element Sub-Element Questions
Score (1-7) Max.
Score Element Score
5 Shop Floor & Quality Control 5.1. Order Review and release 4 7 50.00%
5.2. Detailed scheduling (Lean Manufacturing) 4 7
5.3. Maintenance 4 7
5.4. Quality/Prevention 3 7
5.5. Quality/Appraisal 3 7
5.6 Failure 3 7
Total 21 42
Element Sub-Element Questions
Score (1-7) Max.
Score Element Score
6 Receiving 6.1. Receiving 3 7 46.43%
6.2. Storing 3 7
6.3. Incoming Material Inspection 4 7

154
6.4. Space Planning 3 7
Total 13 28
Element Sub-Element Questions
Score (1-7) Max.
Score Element Score
7 Shipping 7.2. Picking/Packaging and labeling 3 7 47.62%
7.3. Shipping 4 7
7.5. Transportation 3 7
Total 10 21

155
Appendix E: Responses Reliability and Validity Test

156
Table 12: Randomly Selected Suppliers’ Responses
Supp.1 A
Supp.1 B
Supp. 2 A
Supp. 2 B
Supp. 3 A
Supp. 3 B
Supp. 4 A
Supp. 4 B
Supp. 5 A
Supp. 5 B
4 4 7 7 4 4 7 7 6 4 6 5 7 7 2 4 5 5 6 6 4 4 5 4 4 6 5 3 5 6 5 5 7 1 3 3 7 6 5 6 4 2 5 7 3 2 6 1 5 5 6 5 7 7 2 3 6 5 6 5 5 4 7 7 3 2 4 6 5 4 4 5 7 7 3 4 6 7 5 5 4 5 7 7 3 3 6 5 5 5 4 5 7 7 3 4 5 5 5 5 3 4 7 7 4 4 5 6 6 6 4 5 7 6 5 5 5 6 6 5 4 4 6 7 5 5 6 6 4 5 5 5 7 7 3 4 5 5 4 5 4 4 7 7 3 4 6 5 5 4 5 5 6 7 4 5 5 6 7 5 4 4 6 7 4 5 5 5 6 4 4 3 7 7 5 6 6 5 6 5 4 4 7 7 4 3 6 5 5 5 4 5 6 1 5 4 6 5 6 5 6 4 7 7 7 4 6 7 6 7 4 4 7 7 4 3 5 5 5 5 4 4 6 7 3 3 5 4 4 5 4 4 6 4 5 4 4 4 5 5 5 5 7 7 4 5 5 4 5 4 5 6 7 7 4 4 6 7 5 4 4 3 6 6 4 5 5 6 6 6 5 3 7 7 4 4 5 6 5 5 5 4 7 7 6 5 6 7 5 6 5 5 7 7 6 6 5 7 4 5 5 4 7 7 6 5 6 5 4 6 4 4 7 6 5 3 1 4 4 5 4 4 7 7 5 6 5 7 5 5 4 4 7 7 4 7 6 7 6 5 4 3 7 7 5 6 6 7 6 5 4 4 7 7 4 5 6 7 5 4 5 4 7 7 5 5 6 7 6 4 4 4 7 7 6 7 7 7 7 5 5 5 6 7 5 6 6 6 5 5

157
Paired T-Test and CI: Supp.1 A, Supp.1 B Paired T for Supp.1 A - Supp.1 B N Mean StDev SE Mean Supp.1 A 39 4.43590 0.68036 0.10894 Supp.1 B 39 4.23077 0.77668 0.12437 Difference 39 0.205128 0.832861 0.133364 95% CI for mean difference: (-0.064854, 0.475110) T-Test of mean difference = 0 (vs not = 0): T-Value = 1.54 P-Value = 0.132 Paired T-Test and CI: Supp. 2 A, Supp. 2 B Paired T for Supp. 2 A - Supp. 2 B N Mean StDev SE Mean Supp. 2 A 39 6.69231 0.56911 0.09113 Supp. 2 B 39 6.46154 1.46622 0.23478 Difference 39 0.230769 1.404158 0.224845 95% CI for mean difference: (-0.224406, 0.685945) T-Test of mean difference = 0 (vs not = 0): T-Value = 1.03 P-Value = 0.311 Paired T-Test and CI: Supp. 3 A, Supp. 3 B Paired T for Supp. 3 A - Supp. 3 B N Mean StDev SE Mean Supp. 3 A 39 4.20513 1.15119 0.18434 Supp. 3 B 39 4.43590 1.25226 0.20052 Difference 39 -0.230769 1.157619 0.185367 95% CI for mean difference: (-0.606026, 0.144487) T-Test of mean difference = 0 (vs not = 0): T-Value = -1.24 P-Value = 0.221 Paired T-Test and CI: Supp. 4 A, Supp. 4 B Paired T for Supp. 4 A - Supp. 4 B N Mean StDev SE Mean Supp. 4 A 39 5.46154 1.02202 0.16365 Supp. 4 B 39 5.58974 1.33215 0.21332 Difference 39 -0.128205 1.379922 0.220964 95% CI for mean difference: (-0.575524, 0.319114) T-Test of mean difference = 0 (vs not = 0): T-Value = -0.58 P-Value = 0.565 Paired T-Test and CI: Supp. 5 A, Supp. 5 B

158
Paired T for Supp. 5 A - Supp. 5 B N Mean StDev SE Mean Supp. 5 A 39 5.28205 0.79302 0.12698 Supp. 5 B 39 5.02564 0.70663 0.11315 Difference 39 0.256410 1.044231 0.167211 95% CI for mean difference: (-0.082090, 0.594911) T-Test of mean difference = 0 (vs not = 0): T-Value = 1.53 P-Value = 0.133
159
Appendix F: Model Weights Calculation
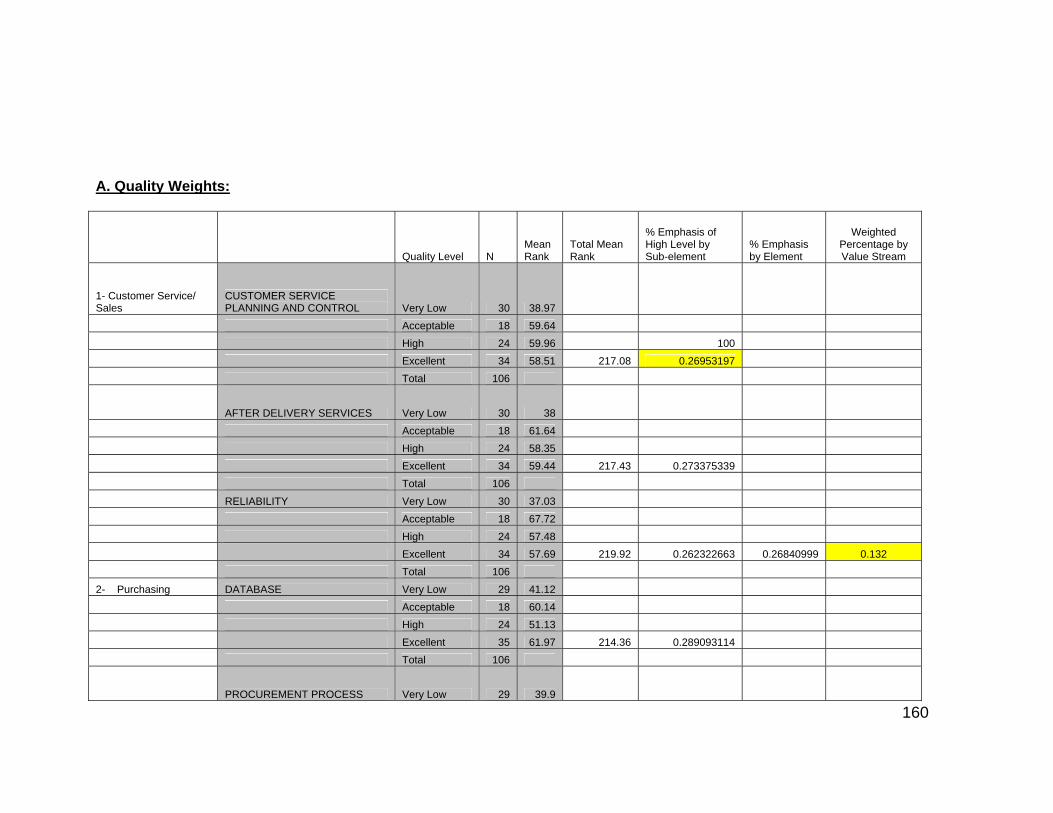
160
A. Quality Weights:
Quality Level N Mean Rank
Total Mean Rank
% Emphasis of High Level by Sub-element
% Emphasis by Element
Weighted Percentage by Value Stream
1- Customer Service/ Sales
CUSTOMER SERVICE PLANNING AND CONTROL Very Low 30 38.97
Acceptable 18 59.64 High 24 59.96 100 Excellent 34 58.51 217.08 0.26953197 Total 106
AFTER DELIVERY SERVICES Very Low 30 38
Acceptable 18 61.64 High 24 58.35 Excellent 34 59.44 217.43 0.273375339 Total 106 RELIABILITY Very Low 30 37.03 Acceptable 18 67.72 High 24 57.48 Excellent 34 57.69 219.92 0.262322663 0.26840999 0.132 Total 106 2- Purchasing DATABASE Very Low 29 41.12 Acceptable 18 60.14 High 24 51.13 Excellent 35 61.97 214.36 0.289093114 Total 106
PROCUREMENT PROCESS Very Low 29 39.9

161
Acceptable 18 66.25 High 24 60.69 Excellent 35 53.29 220.13 0.242084223 Total 106
MATERIAL MANAGEMENT Very Low 29 39.52
Acceptable 18 64.75 High 24 49.88 Excellent 35 61.79 215.94 0.286144299 Total 106
PROCUREMENT DECISION Very Low 29 39.98 Acceptable 18 47.81 High 24 62.98 Excellent 34 59.81 210.58 0.284025074 0.27533668 0.135 Total 105
3- Production Planning and Control ENGINEERING DATA CONTROL Very Low 29 36.52 Acceptable 18 59.19 High 24 51.73 Excellent 34 64.68 212.12 0.304921742 Total 105
INVENTORY CONTROL Very Low 29 38.47 Acceptable 18 67.06 High 24 51.69 Excellent 35 60.23 217.45 0.276983215 Total 106
SHOP FLOOR CONTROL Very Low 29 40.52

162
Acceptable 18 56 High 24 51.48 Excellent 35 64.36 212.36 0.303070258 Total 106 PURCHASING Very Low 28 42.34 Acceptable 18 43.5 High 24 54.63 Excellent 35 65.3 205.77 0.317344608 Total 105
QUALITY MANAGEMENT Very Low 30 40.45 Acceptable 18 60.89 High 24 50.98 Excellent 33 61.58 213.9 0.287891538 0.29804227 0.146 Total 105
4- Manufacturing Engineering Department PRODUCTION PLANNING Very Low 30 41.03 Acceptable 18 61.83 High 23 53.22 Excellent 35 60.09 216.17 0.277975667 0.27797567 0.136 Total 106
5- Shop Floor & Quality Control ORDER REVIEW AND RELEASE Very Low 31 40.29
Acceptable 17 52.79 High 24 50.71 Excellent 35 68.99 212.78 0.324231601 Total 107 MAINTENANCE Very Low 31 40.08 Acceptable 16 60.38 High 24 55.31
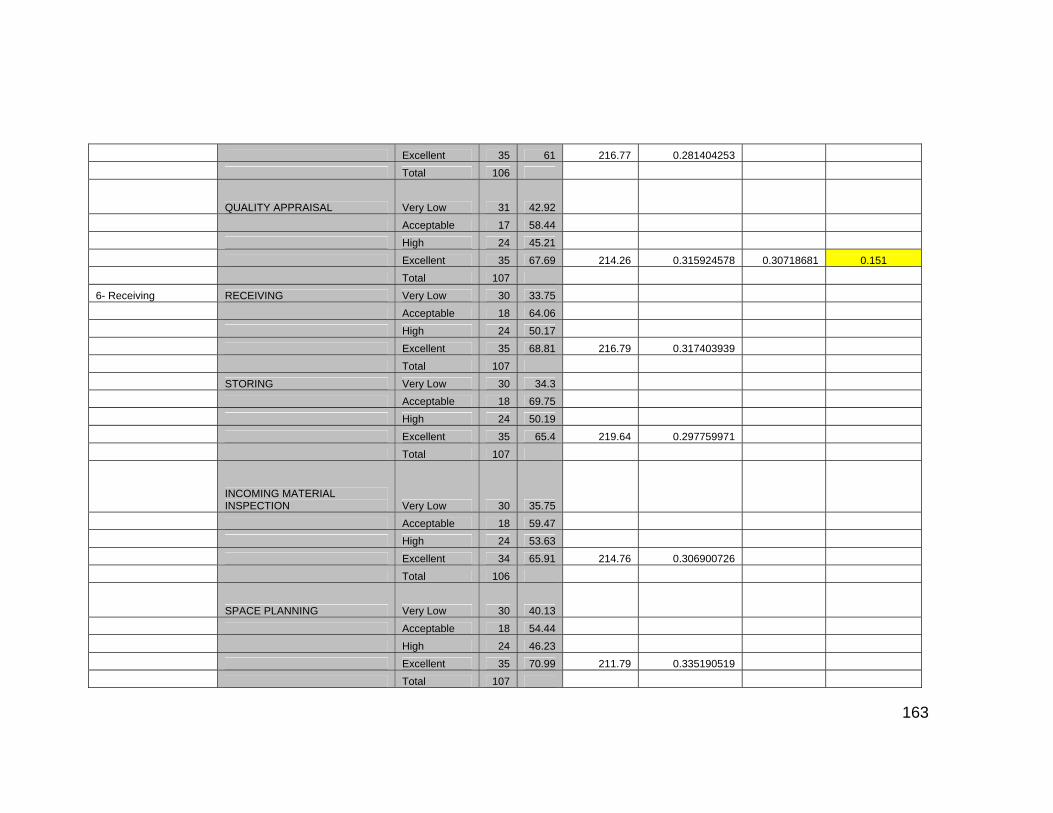
163
Excellent 35 61 216.77 0.281404253 Total 106
QUALITY APPRAISAL Very Low 31 42.92 Acceptable 17 58.44 High 24 45.21 Excellent 35 67.69 214.26 0.315924578 0.30718681 0.151 Total 107 6- Receiving RECEIVING Very Low 30 33.75 Acceptable 18 64.06 High 24 50.17 Excellent 35 68.81 216.79 0.317403939 Total 107 STORING Very Low 30 34.3 Acceptable 18 69.75 High 24 50.19 Excellent 35 65.4 219.64 0.297759971 Total 107
INCOMING MATERIAL INSPECTION Very Low 30 35.75
Acceptable 18 59.47 High 24 53.63 Excellent 34 65.91 214.76 0.306900726 Total 106
SPACE PLANNING Very Low 30 40.13 Acceptable 18 54.44 High 24 46.23 Excellent 35 70.99 211.79 0.335190519 Total 107
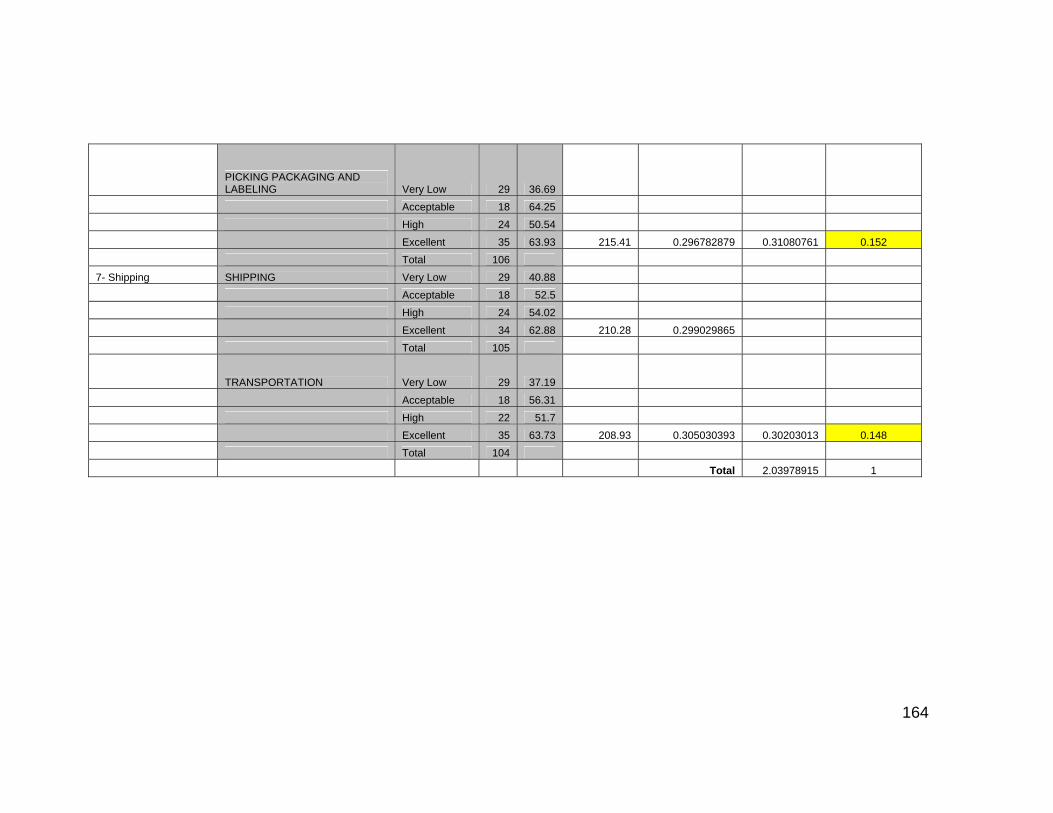
164
PICKING PACKAGING AND LABELING Very Low 29 36.69
Acceptable 18 64.25 High 24 50.54 Excellent 35 63.93 215.41 0.296782879 0.31080761 0.152 Total 106 7- Shipping SHIPPING Very Low 29 40.88 Acceptable 18 52.5 High 24 54.02 Excellent 34 62.88 210.28 0.299029865 Total 105
TRANSPORTATION Very Low 29 37.19
Acceptable 18 56.31 High 22 51.7 Excellent 35 63.73 208.93 0.305030393 0.30203013 0.148 Total 104 Total 2.03978915 1

165
B. Delivery Weights:
Delivery Level N Mean Rank
Total Mean Rank
% Emphasis of High Level by Sub-element
% Emphasis by Element
Weighted Percentage by Value Stream
1- Customer Service/ Sales ORDERP ROCESSING Very Low 41 39.94 Acceptable 38 55.78 High 27 70.89 166.61 0.425484665 Total 106
INFORMATION EXCHANGE Very Low 41 43.48 Acceptable 38 53.88 High 27 68.19 165.55 0.411899728 Total 106 TECHNICAL SERVICES Very Low 41 41.46 Acceptable 38 56.3 High 27 67.83 165.59 0.409626185 Total 106
CUSTOMERSERVICEPLANNINGANDCONTROL Very Low 41 44.12
Acceptable 38 54.24 High 27 66.7 165.06 0.40409548 Total 106
AFTERDELIVERYSERVICES Very Low 41 44.17 Acceptable 38 62.58 High 27 54.89 161.64 0.339581787 Total 106

166
ORDER ENTRY Very Low 41 44.11 Acceptable 38 49.24 High 27 73.76 167.11 0.441385913 Total 106 CLAIMS AND CREDITS Very Low 40 37.35 Acceptable 38 59.62 High 27 66.87 163.84 0.40814209 0.40574512 0.143818787 Total 105 2- Purchasing DATABASE Very Low 40 43.86 Acceptable 38 52.67 High 28 68.39 164.92 0.414685908 Total 106
PROCUREMENT PROCESS Very Low 40 42.79 Acceptable 38 56.01 High 28 65.39 164.19 0.398258116 Total 106
MATERIAL MANAGEMENT Very Low 40 37.14 Acceptable 38 58.29 High 28 70.38 165.81 0.424461733 Total 106
PROCUREMENT DECISION Very Low 40 42.24 Acceptable 37 55.04 High 28 65.68 162.96 0.403043692 0.41011236 0.145366782 Total 105
3- Production Planning and Control ENGINEERING DATA CONTROL Very Low 40 43.14 Acceptable 38 57.28 High 28 63.18 163.6 0.386185819
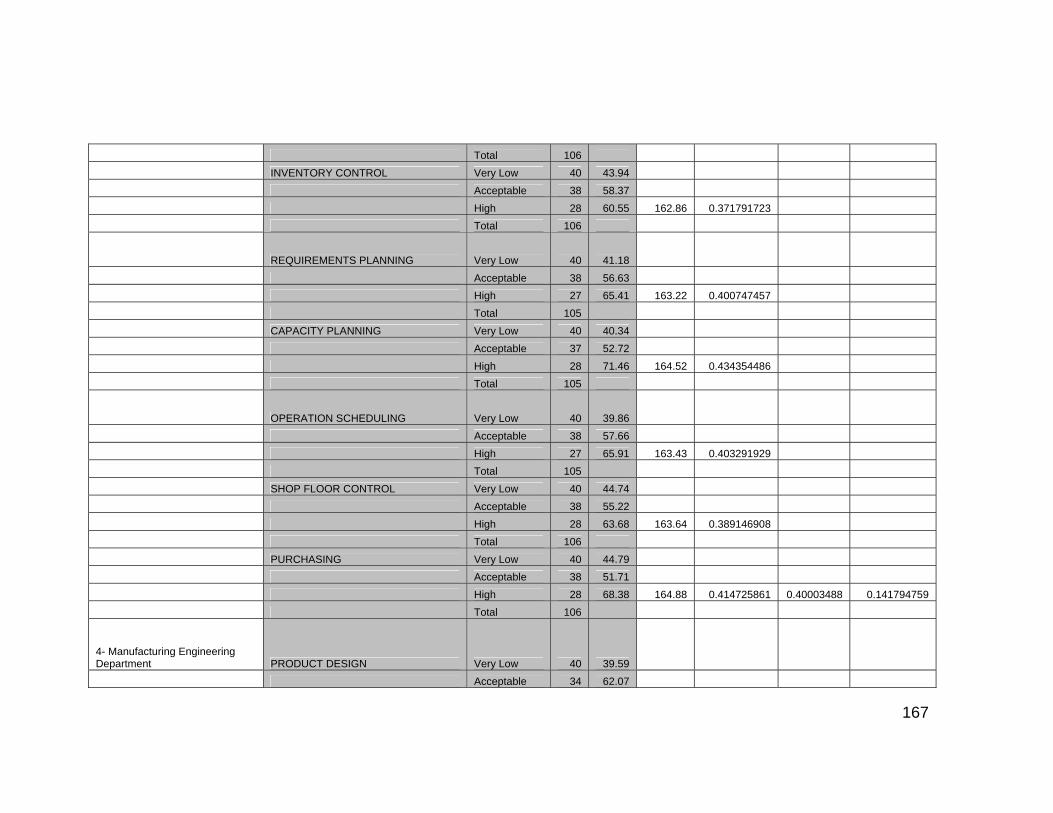
167
Total 106 INVENTORY CONTROL Very Low 40 43.94 Acceptable 38 58.37 High 28 60.55 162.86 0.371791723 Total 106
REQUIREMENTS PLANNING Very Low 40 41.18
Acceptable 38 56.63 High 27 65.41 163.22 0.400747457 Total 105 CAPACITY PLANNING Very Low 40 40.34 Acceptable 37 52.72 High 28 71.46 164.52 0.434354486 Total 105
OPERATION SCHEDULING Very Low 40 39.86
Acceptable 38 57.66 High 27 65.91 163.43 0.403291929 Total 105 SHOP FLOOR CONTROL Very Low 40 44.74 Acceptable 38 55.22 High 28 63.68 163.64 0.389146908 Total 106 PURCHASING Very Low 40 44.79 Acceptable 38 51.71 High 28 68.38 164.88 0.414725861 0.40003488 0.141794759 Total 106
4- Manufacturing Engineering Department PRODUCT DESIGN Very Low 40 39.59 Acceptable 34 62.07

168
High 27 53.96 155.62 0.346742064 Total 101 TOOLING DESIGN Very Low 41 41.71 Acceptable 38 54.8 High 28 70.91 167.42 0.423545574 Total 107 DOCUMENTATION Very Low 41 42.2 Acceptable 38 55.29 High 28 69.54 167.03 0.416332395 0.39554001 0.140201525 Total 107
5- Shop Floor & Quality Control ORDER REVIEW AND RELEASE Very Low 41 45.74
Acceptable 37 54.39 High 28 63.68 163.81 0.388743056 Total 106 DETAILED SCHEDULING Very Low 41 42.85 Acceptable 37 55.16 High 27 65.44 163.45 0.400367085 Total 105 MAINTENANCE Very Low 41 42.82 Acceptable 37 55.86 High 28 66.02 164.7 0.40085003 Total 106 QUALITYP REVENTION Very Low 41 40.85 Acceptable 37 57.12 High 28 67.23 165.2 0.406961259 Total 106 QUALITY APPRAISAL Very Low 40 48.75 Acceptable 37 48.14 High 27 64.04 160.93 0.397936991 Total 104

169
QUALITY FAILURE Very Low 40 43.58 Acceptable 37 52.89 High 28 66.61 163.08 0.408449841 0.40055138 0.141977833 Total 105 6- Receiving RECEIVING Very Low 40 44.56 Acceptable 38 51.68 High 28 68.73 164.97 0.416621204 Total 106 STORING Very Low 40 39.15 Acceptable 38 56.54 High 27 68.54 164.23 0.417341533 Total 105
INCOMING MATERIAL INSPECTION Very Low 40 42.03 Acceptable 37 56.59 High 28 63.93 162.55 0.393294371 Total 105 SPACE PLANNING Very Low 40 38.05 Acceptable 38 60.18 High 28 66.5 164.73 0.403690888 0.407737 0.14452482 Total 106
7- Shipping PICKING PACKAGING AND LABELING Very Low 39 35.82
Acceptable 38 62.24 High 27 62.89 160.95 0.390742467 Total 104 SHIPPING Very Low 38 36.17 Acceptable 37 59.91 High 28 63.04 159.12 0.396178984 Total 103 TRANSPORTATION Very Low 40 39.35
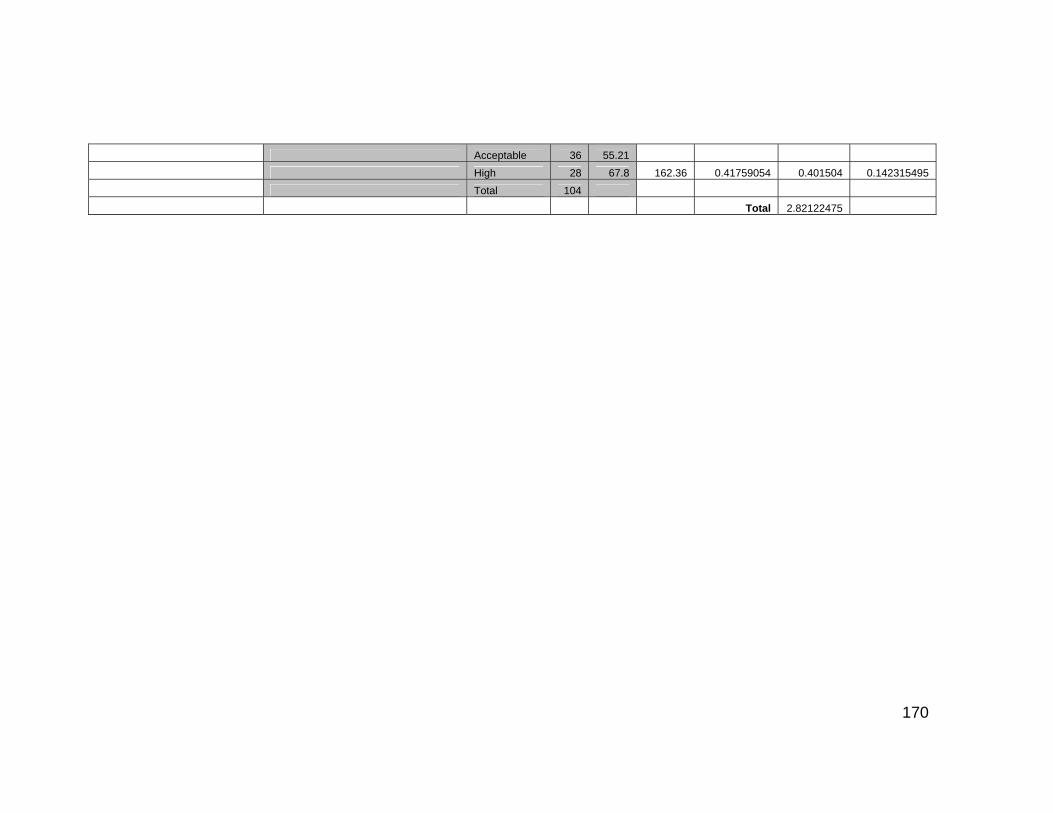
170
Acceptable 36 55.21 High 28 67.8 162.36 0.41759054 0.401504 0.142315495 Total 104 Total 2.82122475

171
Appendix G: Statistical Test Results for the Proposed Model Application

172
Table 22: Comparison between Suppliers Quality Using Traditional and Proposed Model
Supplier Actual Performance
(PPM) Traditional (Company) Model
Score Proposed Model
Score 1 6548 25 57.47 2 91408 40 81.1 3 33973 44 83.81 4 18214 53 80.96 5 333333 58 49.28 6 7617 60 61.01 7 22084 67 89.91 8 14048 67 64.91 9 26316 67 62.43 10 74074 72 49.02 11 74074 72 49.02 12 74074 72 49.02 13 74074 72 49.02 14 74074 72 49.02 15 74074 72 49.02 16 74074 72 49.02 17 13505 75 23.94 18 13505 75 23.94 19 13505 75 23.94 20 6539 78 80.86 21 699 53 71.71 22 2851 56 96.35 23 2851 56 92.32 24 1009 58 57.97 25 1461 62 78.51 26 1461 62 78.51 27 1461 62 78.51 28 3401 72 87.15 29 1641 80 91.14 30 1641 80 91.14 31 1653 80 54.66 32 670 83 86.74 33 3746 83 85.02 34 566 42 88.33 35 19 47 87.23 36 547 53 84.27 37 224 62 83.21 38 307 63 79.4 39 102 67 57.07 40 256 67 89.21

173
Table 22: Continued
Supplier Actual Performance
(PPM) Traditional (Company) Model
Score Proposed Model
Score 41 529 67 64.87 42 77 67 58.8 43 77 67 63.28 44 77 67 95.14 45 73 69 41.85 46 18 72 100 47 18 72 100 48 18 72 100 49 18 72 100 50 206 80 71.09 51 461 83 85.63 52 0 56 88.43 53 0 58 89.83 54 0 58 92.18 55 0 58 82.29 56 0 58 90.95 57 0 59 62.1 58 0 61 100 59 0 64 96.41 60 0 67 83.53 61 0 70 86.31 62 0 78 94.66 63 0 78 98.73 64 0 89 80.31 65 0 89 81.72

174
Table 23: Comparison between Suppliers Delivery Using Traditional and Proposed Model
Supplier Actual Delivery Performance Traditional (Company)
Model Score Proposed Model
Score 1 99 67 91.03 2 91 56 90.4 3 100 58 77.43 4 100 64 95.76 5 100 69 72.32 6 100 70 81.3 7 97 72 99.33 8 97 72 99.33 9 97 72 99.33 10 90 72 82.61 11 97 42 61.27 12 90 42 61.27 13 90 42 61.27 14 90 42 61.27 15 90 42 61.27 16 90 42 61.27 17 90 42 61.27 18 100 67 98.47 19 94 100 85.24 20 93 33 85.6 21 83 67 86.55 22 81 67 85.47 23 86 56 78.27 24 88 100 58.99 25 88 58 54.38 26 88 58 54.38 27 88 58 54.38 28 88 58 54.38 29 83 0 73.35 30 82 33 72.72 31 88 78 94.44 32 82 33 87.54 33 89 89 79.3 34 89 89 82 35 44 0 54.5 36 76 50 65.17 37 55 67 39.47 38 71 33 69.93 39 52 58 57.14 40 75 58 81.3

175
Table 23: Continued
Supplier Actual Delivery Performance Traditional (Company)
Model Score Proposed Model
Score 41 58 33 89.44 42 52 59 61.13 43 50 62 86.85 44 68 100 83.58 45 68 67 92.47 46 70 67 73.14 47 55 33 59.4 48 55 33 62.04 49 35 33 68.9 50 66 69 43.33 51 55 42 61.27 52 51 67 22.79 53 51 67 22.79 54 51 67 22.79 55 55 76 56.96 56 55 76 74.89 57 66 33 67.99 58 49 82 42.86 59 39 67 66.94 60 27 67 47.12
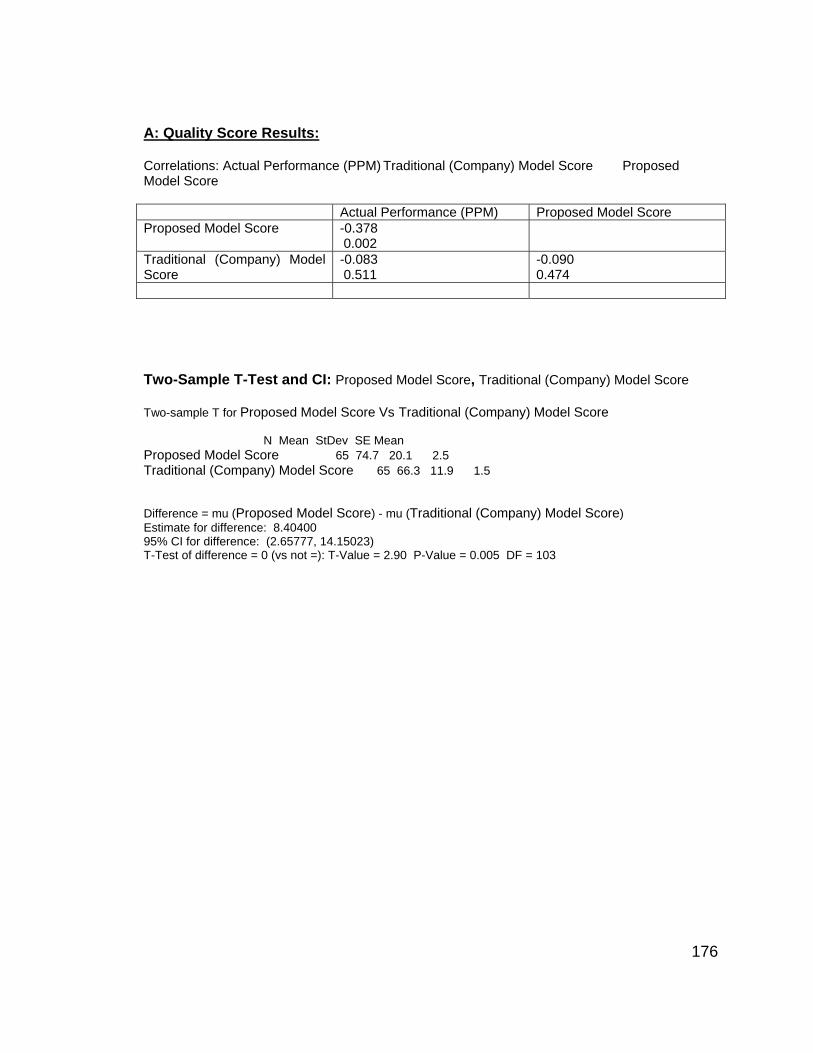
176
A: Quality Score Results: Correlations: Actual Performance (PPM) Traditional (Company) Model Score Proposed Model Score Actual Performance (PPM) Proposed Model Score Proposed Model Score -0.378
0.002
Traditional (Company) Model Score
-0.083 0.511
-0.090 0.474
Two-Sample T-Test and CI: Proposed Model Score, Traditional (Company) Model Score Two-sample T for Proposed Model Score Vs Traditional (Company) Model Score N Mean StDev SE Mean Proposed Model Score 65 74.7 20.1 2.5 Traditional (Company) Model Score 65 66.3 11.9 1.5 Difference = mu (Proposed Model Score) - mu (Traditional (Company) Model Score) Estimate for difference: 8.40400 95% CI for difference: (2.65777, 14.15023) T-Test of difference = 0 (vs not =): T-Value = 2.90 P-Value = 0.005 DF = 103

177
A: Delivery Score Results: Two-Sample T-Test and CI: Actual Delivery Performance, Traditional Model Score Two-sample T for Actual Delivery Performance vs Traditional Model Score N Mean StDev SE Mean Actual Delivery Performance 60 75.8 19.8 2.6 Traditional Model Score 60 57.9 20.8 2.7 Difference = mu (Actual Delivery Performance) - mu (Traditional Model Score) Estimate for difference: 17.8500 95% CI for difference: (10.5082, 25.1918) T-Test of difference = 0 (vs not =): T-Value = 4.82 P-Value = 0.000 DF = 117 Two-Sample T-Test and CI: Actual Delivery Performance , Proposed Model Two-sample T for Actual Delivery Performance vs Proposed Model N Mean StDev SE Mean Actual Delivery Performance 60 75.8 19.8 2.6 Proposed Model 60 69.6 18.9 2.4 Difference = mu (Actual Delivery Performance) - mu (Proposed Model) Estimate for difference: 6.16033 95% CI for difference: (-0.84436, 13.16503) T-Test of difference = 0 (vs not =): T-Value = 1.74 P-Value = 0.084 DF = 117 Two-Sample T-Test and CI: Traditional Model Score, Proposed Model Two-sample T for Traditional Model Score vs. Proposed Model N Mean StDev SE Mean Traditional Model Score 60 57.9 20.8 2.7 Proposed Model 60 69.6 18.9 2.4 Difference = mu (Traditional Model Score ) - mu (Proposed Model) Estimate for difference: -11.6897 95% CI for difference: (-18.8794, -4.5000) T-Test of difference = 0 (vs not =): T-Value = -3.22 P-Value = 0.002 DF = 116

178
VITA
Ammar Mohamed Aamer was born in Sana’a, Yemen. He attended high school
in Yemen, where he graduated from Alahlia high School in 1992. Aamer came to
the United States of America in 1994 to pursue his education. He completed his
Bachelor’s in 1998 and his Master’s of Science in 1999 with a concentration in
Industrial Engineering at the University of Tennessee. From 1998-2003, Aamer
worked as a student consultant during his graduate studies. He consulted with
more than 26 different companies. He also developed training materials and
trained in the areas of Len Enterprise and Six Sigma.
From 2003-2005, Aamer was hired as an Instructor in the Industrial Engineering
department at the University of Tennessee. He taught 2 junior level courses
(Simulation Modeling, and Engineering Data Analysis & Process Improvement)
and one senior level course (Process Improvement through Planned
Experimentation).
Aamer is presently completing his doctorate of philosophy in Industrial
Engineering at the University of Tennessee.