Superfund Problems Can Be Solved... - Princeton University
228
Coming Clean: Superfund Problems Can Be Solved... October 1989 NTIS order #PB90-142209
-
Upload
khangminh22 -
Category
Documents
-
view
0 -
download
0
Transcript of Superfund Problems Can Be Solved... - Princeton University

Coming Clean: Superfund Problems CanBe Solved...
October 1989
NTIS order #PB90-142209

Recommended Citation:
U.S. Congress, Office of Technology Assessment, Coming Clean: Super fund’s Problems CanBe Solved ..., OTA-ITE-433 (Washington, DC: U.S. Government Printing Office, October1989).
Library of Congress Catalog Card Number 89-600751
For sale by the Superintendent of DocumentsU.S. Government Printing Office, Washington, DC 20402-9325
(order form can be found in the back of this report)

Foreword
This report, which responds to requests from the House Committee on Public Works andTransportation and the House Committee on Energy and Commerce, examines theimplementation of the Superfund Amendments and Reauthorization Act of 1986. Anadditional request was received from the Senate Subcommittee on Superfund, Ocean andWater Protection. Before the currnt assessment, OTA had responded to a number of othercongressional requests to examine various aspects of the Superfund program. Previous OTAworks on Superfund include Technologies and Management Strategies for Hazardous WasteControl (March 1983), Habitability of the Love Canal Area (technical memorandum, June1983), Superfund Strategy (April 1985), and a number of special responses on specificSuperfund sites. OTA has also published two earlier documents as part of this assessment: AreWe Cleaning Up.’) 10 Superfund Case Studies (special report. June 1988); and AssessingContractor Use in Superfund (background paper, January 1989);
OTA recognizes the enormous challenge posed by the Nation’s commitment to clean upuncontrolled toxic waste sites. The challenge is to our scientific knowledge about properties,environmental transport, and health effects of toxic substances; to our technologicalcapabilities to manage hazardous waste and cleanups; to our national workforce which, priorto Superfund, had little experience in site cleanup; to the government institutions charged withimplementing Superfund, notably the U.S. Environmental Protection Agency; and last, butcertainly not least, to everyone’s patience.
From its beginning. controversy has surrounded Superfund, and the program has had tocope with an unusually high level of public scrutiny, criticism, and debate. OTA is sensitiveto the frustrations of many hard-working people trying to meet the Superfund challenge andrecognizes that people are still learning. And a great deal has been accomplished, although itis easy to lose sight of the accomplishments amidst all the criticism. For example. hundredsof emergency responses have been successfully carried out, an enormous amount ofcontamination of land and groundwater has been carefully documented. and the major.near-term threats at many sites have been eliminated. Yet most of the national cleanup job liesahead of us and the need to get increasing effectiveness per dollar spent is bound to grow.
In this report, OTA concludes that there is ample reason to be optimistic about thepotential of the Superfund program and presents a number of possible strategic initiatives andincremental program changes in some detail. As difficult as the national cleanup job is, thereare many ways to build a better balance between health and environmental needs and thelimitations that technology, experience, and economics will always impose. OTA thanks theproject’s advisory panel members for their invaluable assistance and appreciates thecontributions made by all the other reviewers of the drafts of this report. But the contents ofthis report are solely OTA’s responsibility.
Ill

Assessment on Superfund ImplementationAdvisory Panel
David Marks, ChairmanMassachusetts Institute of Technology
Kirk BrownTexas A&M University
Richard BrownellMalcolm Pirnie, Inc.
William ChildIllinois Environmental Protection Agency
Henry ColeClean Water Action and National Campaign Against
Toxic Hazards
E. William ColglazierWaste Management InstituteUniversity of Tennessee
William B, DeVilleLouisiana Department of Environmental Quality
Deborah HankinsGeneral Electric Corp.
Bob HarrisENVIRON Corp.
William N. HedemanBeveridge & Diamond, P.C.
Robert G. KissellE.I. du Pont de Nemours & Co., Inc.
Steve LesterCitizens Clearinghouse for Hazardous Waste
William LibrizziNew Jersey Institute of Technology
George MuhlebachCiba-Geigy Corp.
Robert N. OggCH2M Hill
Robert B. PojasekChemCycle Corp.
Frank J. Veale, Jr.Texas Instruments, Inc.
James N. Welshformerly with Shirco
NOTE: OTA appreciates and is grateful for the valuable assistance and thoughtful critiques provided by the advisory panel members.The panel does not, however, necessarily approve, disapprove, or endorse this report. OTA assumes full responsibility for thereport and the accuracy of its contents.
iv

OTA Project Staff-Coming Clean: Superfund Problems Can Be Solved . . .
Lionel S. Johns, Assistant Director, OTAEnergy, Materials, and lnternational Security Division
Audrey B. Buyrn, Managerlndustry, Technology, and Employment Program
Joel S. Hirschhorn, Project Director
Kirsten U. Oldenburg, Deputy Project Director
Karen L. Jordan, Research Assistant
Vickie B. Boesch, Analyst
David A. Dorau, Analyst
Contractors
Apogee Research, Inc.
ENVIRON Corporation
Frank R. Wolle
William J. Lacy
Jeffrey P. Per l
Lynn M. Powers
David Sheridan
Administrative Staff
Christopher N. Clary, Administrative Assistant
Diane D. White, Administrative Secretary

Contents
Page
CHAPTER 1. Summary, Introduction, and Policy Options . . . . . . . . . . . . . . . . . . . . . . . . . . . . . . . 3OVERVIEW . . . . . . . . . . . . . . . . . . . . . . . . . . . . . . . . . . . . . . . . . . . . . . . . . . . . . . . . . . . . . . . . . . . . . 3BACKGROUND . . . . . . . . . . . . . . . . . . . . . . . . . . . . . . . . . . . . . . . . . . . . . . . . . . . . . . . . . . . . . . . . . . 6SUMMARY OF OTA’s FINDINGS . . . . . . . . . . . . . . . . . . . . . . . . . . . . . . . . . . . . . . . . . . . . . . . 9THE BACKGROUND FOR PUBLIC POLICY DEVELOPMENT . . . . . . . . . . . . . . . . . . . . 18POLICY OPTIONS TO IMPROVE SUPERFUND . . . . . . . . . . . . . . . . . . . . . . . . . . . . . . . . . . 27
CHAPTER 2. The Front End of Superfund: Site Discovery and Evaluation . . . . . . . . . . . . . . . . 85INTRODUCTION . . . . . . . . . . . . . . . . . . . . . . . . . . . . . . . . . . . . . . . . . . . . . . . . . . . . . . . . . . . . . . . . 85SITE DISCOVERY AND INVENTORIES . . . . . . . . . . . . . . . . . . . . . . . . . . . . . . . . . . . . . . . . . 86SITE EVALUATION . . . . . . . . . . . . . . . . . . . . . . . . . . . . . . . . . . . . . . . . . . . . . . . . . . . . . . . . . . . . . 101APPENDIX 2A A HEALTH CARE MODEL FOR SUPERFUND SCREENING . . . . . 130
CHAPTER 3. Cleanups and Cleanup Technology . . . . . . . . . . . . . . . . . . . . . . . . . . . . . . . . . . . . . . . 13910 KEY ISSUES . . . . . . . . . . . . . . . . . . . . . . . . . . . . . . . . . . . . . . . . . . . . . . . . . . . . . . . . . . . . . . . . 139
CHAPTER 4. Other Cleanup Programs and Superfund. . . . . . . . . . . . . . . . . . . . . . . . . . . . . . . . . . . . 193introduction . . . . . . . . . . . . . . . . . . . . . . . . . . . . . . . . . . . . . . . . . . . . . . . . . . . . . . . . . . . . . . . 193A PYRAMID . . . . . . . . . . . . . . . . . . . . . . . . . . . . . . . . . . . . . . . . . . . . . . . . . . . . . . . . . . . . . . . . . . . 193SHRINKING SUPERFUND . . . . . . . . . . . . . . . . . . . . . . . . . . . . . . . . . . . . . . . . . . . . . . . . . . . . . . . 195SUPERFUND STANDS ALONE . . . . . . . . . . . . . . . . . . . . . . . . . . . . . . . . . . . . . . . . . . . . . . . . . . 198ARE OTHER PROGRAMS THE SOLUTION? . . . . . . . . . . . . . . . . . . . . . . . . . . . . . . . . . . . . . 200CONCLUSIONS . . . . . . . . . . . . . . . . . . . . . . . . . . . . . . . . . . . . . . . . . . . . . . . . . . . . . . . . . . . . . . . . . 217
INDEX . . . . . . . . . . . . . . . . . . . . . . . . . . . . . . . . . . . . . . . . . . . . . . . . . . . . . . . . . . . . . . . . . . . . . . . . . . . . . . . 221
vi

Chapter 1
Summary, Introduction, andPolicy Options

CONTENTSPage
OVERVIEW . . . . . . . . . . . . . . . . . . . . . . . . . . . . . . . . . . . . . . . . . . . . . . . . . . . . . . . . . . . . . . . . 3Health and Environmental Priorities and Goals . . . . . . . . . . . . . . . . . . . . . . . . . . . . . . . . . . . 4
. . . . .
Workers and Technology . . . . . . . . . . . . . . . . . . . . . . . . . . . . . . .. . . . . . . . . . . . . . . . . . . . 4Government Management
. . . . .... ... ... ... ... .**. ... ... ... ... ... ..c. o**. $o. ... o* coo. .o 5
Conclusion of This Report . . . . . . . . . . . . . . . . . . . . . . . . . . . . . . . . . . . . . . . . . . . . . . . . . . . . . . 6BACKGROUND . . . . . . . . . . . . . . . . . . . . . . . . . . .. . . . . . . . . . . . . . . . . . . . . . . . . . . . . . . . . . . . . . . 6
Key Superfund Questions . . . . . . . . . . . . . . . . . . . . . . . . . . . . . . . . . . . . 6Public Demand for Cleanup
. . . . . . . . . . . . . . . . . . .. . . . . . . . . . . . . . . . . . . . . . . . . . . . . . . . . . . . . 7
Regaining Public Confidence . . . . . . . . . . . . . . . . . .. . . . . . . . . . . . . . . .
. . . . . . . . . . . . . . . . . . . . . . . . . . . . . . . . . 8SUMMARY OF OTA’s FINDINGS . . . . . . . . . . . . . . . . . . . . . . . . . . . . . . . . . . . . . . . . . . . . . . . . 9
General Conclusions . . . . . . . . . . . . . . . . . . . . . . . . . . . .. . . . . . . . . . . . . . . . . . . . . . 9Specific Problems and Findings
. . . . . . . . . . .● . . . . . . . . . . . . . . . . . . . . . . . . . . . . . . . . . . . . . . . . . . . . . . . . . 10
THE BACKGROUND FOR PUBLIC POLICY DEVELOPMENT . . . . . . . . . . . . . . . . . . . . 18Breaking Out of the Superfund Syndrome . . . . . . . . . . . . . . . . . . . . . . . . . . . . . . . . . . . . . . . . 18Do Superfund Sites Pose Significant Health Risks? . . . . . . . . . . . . . . . . . . . . . . . . . . . . . . . . 22Strategy v. Spending . . . . . . . . . . . . . . . . . . . . . . . . . . . . . . . . . . . . . . . . . . . . . . . . . . . 26Different Perspectives on Fixing Superfimd . . . . . . . . . . . . . . . . . . . . . . . . . . . . . . . . . . . . . . . 27
. . . . . . . .
POLICY OPTIONS TO IMPROVE SUPERFUND . . . . . . . . . . . . . . . . . . . . . . . . . . . . . . . . . . 27Summary Policy Overview in Three Key Areas . . . . . . . . . . . . . . . . . . . . . . . . . . . . . . . . . . . 27Policy Options . . . . . . . . . . . . . . . . . . . . . . . . . . . . . . . . . . . . . . . . . . . . . . . . . . . . . . . . . . . . . 30PART I: Strategic Initiatives . . . . . . . . . . . . . . . . . . . . . . . . . . . . . . . . . . . . . . . . . . . . . . . . . . . . . 31
. . . .
PART II Program Changes . . . . . . . . . . . . . . . . . . . . . . . . . . . . . . . . . . . . . . . . . . . . . . . . . . . . . 63
BoxesBox Pagel-A. How Does Superfund Operate? . . . . . . . . . . . . . . . . . . . . . . . . . . . . . . . . . . . . . . . . . . . . . . . 7l-B. How a State Cleanup Can Differ Substantially From a Superfund Cleanup . . . . . . . . 14l-C. Three Kinds of Inefficient Superfund Spending . . . . . . . . . . . . . . . . . . . . . . . . . . . . . . . . . 28l-D. Questions and Answers About Policy Option 1 . . . . . . . . . . . . . . . . . . . . . . . . . . . . . . . . . 32l-E. Examples of Using Current v. Future Risk in Cleanup Decisions . . . . . . . . . . . . . . . . . 33l-F. A Hierarchy of Preferred Cleanup Technologies and Methods . . . . . . . . . . . . . . . . . . . . 45
FiguresFigure Page1-1. CERCLIS Inventory and National Priorities List Sites . . . . . . . . . . . . . . . . . . . . . . . . . . . 111-2. Approximate Reductions in Risk and Cost for Different Types of
Cleanup Actions . . . . . . . . . . . . . . . . . . . . . . . . . . . . . . . . . . . . . . . . . . . . . . . . . . . . . . . . . . . . . 75
TablesTable Page1-1. Policy Options . . . . . . . . . . . . . . . . . . . . . . . . . . . . . . . . . . . . . . . . . . . . . . . . . . . . . . . . . . . . . . . 51-2. Summaries of Results of Some Epidemiologic Studies for Toxic Waste Sites . . . . . . 231-3. Examples of Use of Risk Assessment to Justify Superfund Cleanups . . . . . . . . . . . . . . 24

Chapter 1
Summary, Introduction, and Policy Options
OVERVIEW
Superfund started out in 1980 as a short-termcrash cleanup effort. By 1985, when Congressdebated reauthorizing Superfund for a second 5years, it had become controversial and confronta-tional. It has remained so. Superfund still lacks:
10
2.
3.
a carefully crafted strategy with implementa-tion policies to spell out environmentalpriorities and goals;an effective partnership among govern-ment, site communities, and private sectorparties responsible for cleanup; anda unified national infrastructure of educa-tion, training, databases, research, anddevelopment.
Superfund has not yet balanced protection ofpublic health and environment against con-straints of information, technology, time, andmoney very well.
Unless serious consideration is soon given tomaking fundamental changes in the structureand policies of the Superfund program throughstrategic initiatives, OTA’s assessment is thatsignificant risks to public health and environ-ment will remain poorly managed, public expec-tations will remain unmet, and public confi-dence will worsen. Fine-tuning or incrementalprogram changes are feasible and necessary too,but they alone will probably not suffice.
Another general OTA finding is that reducingexcessive flexibility in Superfund implementa-tion is critical to reducing the constant confron-tation among nearly everyone affected by andworking in the program. OTA calls the currentadversarial condition the Superfund syndrome.Public fears of toxic waste and toxic chemicalsset high expectations for Superfund; site com-munities perceive substantial risks to theirhealth and environment and they want effectiveand stringent cleanups from the EnvironmentalProtection Agency (EPA), regardless of cost;
but communities have experienced slow, incom-plete, and uncertain cleanups. EPA tries to limitfund-financed cleanups by getting parties heldliable for sites to voluntarily pay for cleanups.However, responsible parties often believe thattheir liabilities are largely unfair, that risks arenot as bad as communities think they are, thatcleanup objectives are unnecessarily stringent,and, therefore, that they must work hard tominimize their cleanup costs. Unless everyonebreaks out of the Superfund syndrome, mostcleanups will seem to do too little or too much.Billions more dollars will be spent. Hardlyanyone will be satisfied. Hardly anyone will feeltreated fairly. Hardly anyone will seem incontrol.
Another general OTA finding is that Super-fund’s environmental mission is being under-mined because of inefficient spending. OTAestimates that between 50 and 70 percent ofspending by government and industry is ineffi-cient because:
1. about 50 percent of cleanups addressspeculative future risks which preemptsspending to identify and reduce currentrisks at many other sites;
2. about 75 percent of cleanups are unlikelyto work over the long term; and
3. there are many unnecessarily high oravoidable administrative, study, and trans-action (negotiation and litigation) costs.
OTA has found that many of the problemsplaguing the Superfund program can be groupedin three areas: health and environmental protec-tion priorities and goals; workers and technol-ogy; and government management. A three-point restructuring of the program focusing onthese areas is possible. We summarize belowour detailed findings in these areas. Later in thischapter, we discuss 38 policy options that,separately or in combination, Congress maywish to consider to improve the Superfund
-3 -

4 ● Coming Clean: Superfund Problems Can Be Solved . . .
program. There are so many options because theproblems identified by OTA in Superfundimplementation are numerous and complex. The38 policy options have been divided into twocategories: strategic initiatives, which would bemajor new directions in the program, anysignificant number of which would result inprogram restructuring; and program changes,which are more modest in scope and whichcould be integrated into the existing program.Table 1-1 lists the 38 options within the twocategories and three problem areas.
Health and Environmental Priorities and Goals
Clearer priorities and less maneuvering roomin environmental goals can make the Superfundsystem work better, fairer, and faster. By notsetting clear priorities, government has fedunrealistic public expectations, making man-agement of Superfund with limited resources athankless task. Government has largely ignoredthe front-end of Superfund; for example, there isno Federal site discovery program. New Na-tional Priorities List (NPL) sites are no lesshazardous than sites discovered earlier, accord-ing to EPA data. But sites in the program maywait years for significant attention. The size ofthe NPL is a policy choice, and cleanups arechanneled from Superfund to other less strin-gent cleanup programs in the shadow of Super-fund. Thus, Superfund may increasingly be-come a re-cleanup program.
A central conclusion of OTA’s 1985 reportSuperfund Strategy was the critical need fortaking faster, but limited, actions at all sitesnationwide to reduce immediate threats andreduce the spread of contamination.l Today, thecritical question is: Which expensive finalcleanups are truly necessary now? The distinc-tion between significant, current threats v.
speculative, potential ones could be used toanswer this tough question. Prudent use of thecurrent-future risk distinction could get moresites into and through the system faster, at leastthrough site stabilization to reduce current risks.Although, permanent cleanups would have towait at sites where only future risks existed. Thecurrent large backlog of sites at the front andmiddle of the Superfund process could be tradedfor a backlog at the end, producing more rapidrisk reduction for more people.
Workers and Technology
The relatively young and inexperienced na-tional cleanup workforce requires better man-agement, information, and technical assistance.Long-term government support is needed forbasic research, R&D on critical problems, andeducation programs to improve and expand thenational workforce. Frontline Superfund work-ers need more stringent policies on technologyevaluation and selection, more information onwhat is and is not working in cleanups, and moreaccess to technical experts. EPA needs morestaff, to reduce its dependence on contractors,but it faces recruitment problems. The enormouspotential size of the cleanup business hastouched off a ferment of R&D and the emer-gence of hundreds of new companies withadvanced cleanup technologies. But use ofbetter, but often more expensive technologies, islimited by decisionmakers who are overlycautious, have poor information, or are primar-ily interested in minimizing front-end costs. It isequally important to recognize that some con-tamination problems do not yet have goodsolutions. For large contaminated aquifers, pump-ing and treating contaminated groundwater isless effective than previously believed. For largelandfills, capping is an impermanent solution.
l~d ~ ~u~uenl, ~~~ rep~s Are We cie~ing Up? 10 Superjioui Case Studies (June 1988) and Assessing Cmfmcfor use in SWeCfU~(January 1989), as well as in testimony at a number of congressional hearings OTA identified many implementation problems, particularly at thefiont+nd of the program. However, nearly all public attention on Supxfund still pertains (o remedial cleanup and the backlog at the front-end ofSuperfund remains.

Chapter 1--Summary, Introduction, and Policy Options ● 5
Table 1 -l—Policy Options
STRATEGIC INITIATIVESSetting Cleanup Priorities and Goals
1. Set Priorities on Basis of Current or Future Risks2. Establish a Federal Site Discovery Program3. Use Environmental Criteria to Eliminate Sites at PA and S1
Screening Stages4. Remove Range of Acceptable Risk Objectives5. Establish National Minimum Cleanup Standards6. Define and Limit Meaning of Permanent Cleanup
Developing Workers and Technologies7. Reduce Dependency on Contractors, Expand EPA Workforce8. Establish a Hierarchy of Cleanup Technologies and Methods9. Restrict Use of Groundwater Cleanup Technology
10. Establish Generic Site Assistance Program, Including ExpertSystems
11. Establish Technologies Assistance Program12. Better Define Mission of SITE Technology Demonstration
Program
Improving Government Management13:14.15.
16.
17.18.
19.
Use Generic Site ClassificationLimit Responsible Parties to Implementation of RemediesReexamine Financing and Enforcement of Liabilities toImprove Environmental PerformanceStrengthen EPA Headquarters Direction and Oversight ofRegional ImplementationCommit to a Permanent Superfund ProgramEstablish an All Inclusive List of Cleanup Sites in the UnitedStatesBegin Examination of Moving Superfund ImplementationOutside of EPA
Government Management
By clarifying statutory requirements andimproving EPA’s compliance with them, publicpolicy, statutory requirements, regulations, fund-ing, and program administration could worktogether with less confrontation and friction.Congress, EPA, and States can find commonground in providing protection of health andenvironment without threatening the publicwelfare economically. Many of EPA’s actions,such as its interpretation of cost-effectiveness,seem inconsistent with statute. Many statutoryprovisions provide insufficient direction to EPAon how to resolve competing goals; for example,
PROGRAM CHANGESSetting Cleanup Priorities and Goals20. Use Hazard Ranking System in More Limited Way21. Reassess and Limit Use of Indicator Chemicals for Site
Studies, Risk Assessments22, Clarify and Strengthen Cost-Effectiveness Requirement for
Remedy Selection, Reject Use of Cost-Benefit Analysis23. Better Integrate Community Perspective Into Enforcement
Site Decisions
Developing Workers and Technologies24. Make Site Managers Responsible for Sites From the Front-
End of the Program Through Final Disposition25. Establish Program for Certified Public Environmental Audi-
tors26. Strengthen Effort to Offset Current Limitations of the Govern-
ment and Contractor Workforce27. Establish a Bureau of Mines Superfund Support Program28. Establish a Superfund Support Program at the U.S. Geologi-
cal Survey29. Increase R& Depending, With Focus on Groundwater Cleanup
Improving Government Management30.
31.
32.
33.
34.
35.
36.
37.
38.
Combine Preliminary Assessment, Site Inspection, HRSScoring, and Remedial Investigation Phases into Single SiteEvaluation ProgramCombine Removal and Remedial Programs Into Single SiteCleanup ProgramReexamine Current Statutorily Required Program Perform-ance SchedulesFor Records of Decision, Require a Statement of inconsis-tency for Selected RemedyReduce Need for Formal Regulatory Compliance for OnsiteCleanupEstablish a Formal Evaluation Program for Completed SiteCleanups and Long Term Ones in ProgressEstablish Formal Measures of the Program’s EnvironmentalProgressAddress Conflicts of Interest Associated With TechnologySelectionReauthorize Superfund for 10 Years
what is a permanent remedy and when doesfund-balancing identify excessively costly fund-financed cleanups?
The tension between obtaining more clean-ups and industry’s interest in minimizingcosts has not been resolved satisfactorily.Allowing responsible parties to conduct siteinvestigations and feasibility studies, whichguide cleanup decisions, poses a conflict ofinterest between minimizing costs and assuringeffective protection; it gives an advantage toresponsible parties over communities. Super-fund site communities want as much influenceas the companies found liable for cleanup costs.

6 ● Coming clean: Superfund problems Can Be Solved . . .
Responsible parties are paying for over 50percent of site studies and cleanups throughvoluntary settlements; EPA wants to increasethis contribution. OTA’s analysis shows,though, that many of those cleanups are lessstringent than government-paid ones. In fiscalyear 1988, for example, 75 percent of remediesbased on land disposal were for enforcementRecords of Decisions (RODS) which are likelyto lead to responsible party cleanups; 78 percentof remedies based on waste destruction technol-ogy were for fund RODS, which are likely tolead to fund-financed cleanups. These andother OTA findings show a pattern of EPAselecting less stringent cleanup technologiesto obtain voluntary or negotiated settlementswith responsible parties. Excessively flexiblegovernment policies and rules allow signifi-cantly different cleanups at similar sites. Butan affected community cares more about gettingeffective cleanups than whether the governmentor responsible parties pay.
Conclusion of This Report
The task facing Superfund is formidable—cleaning up over 1,200 toxic waste sites cur-rently on the NPL as well as another 900 sites(EPA’s estimate) to 9,000 sites (OTA’s esti-mate) which could be added over the next 10years+ specially in light of tight Federal budg-ets and shortages of technologies and experi-enced workers. Fortunately, though, opportuni-ties exist for making both the strategic andincremental changes in the program that wouldallow it to fulfill its mission. Making Superfunda permanent program would be a logical firststep in this effort because achieving complete,rapid, and permanent cleanups everywhere in adecade or two is impossible. Over many dec-ades, spending by all parties on cleaning uptoxic waste sites could total $500 billion, unlessthere are major technological innovations thatbring the costs of permanent remedies down.
BACKGROUND
Key Superfund Questions
As the time approaches for Congress toreauthorize Superfund a second time, after adecade of experience, there is ample reason toask: Can Superfund perform effectively—notperfectly-to address the environmental prob-lem of uncontrolled toxic waste sites? Can wedevelop a strategy consistent with time, money,and technology constraints? Can Superfund earnpublic confidence? OTA’s findings supportpositive, optimistic answers to these questions.
The Superfund system is complex (see boxl-A) and it is easy to lose sight of the basictechnical driving forces. Which sites requirecleanup? How much cleanup is necessary? Whatcleanup technologies can do the job? Theanswers to these questions determine the humanand financial resources and time for cleanup.But there are few unequivocal, scientific right orwrong answers for the Superfund program, andoften few (if any) precise answers for individualcontaminated sites much less for all sites. Theneed for judgment is constant. Consensus andtrusted answers are scarce. Are procedures andsystems for site evaluations as effective as theycould be? If not, are sites being rejected whichtruly need attention? Yes, they are. Has thedilemma of spending a lot quickly on a few siteswhile many more sites wait long times beenresolved? No, the backlog of sites waiting to beevaluated in a preliminary way remains substan-tial.
Bringing more sites into the program, follow-ing statutory cleanup standards, and usingeffective technology would require a lot moremoney. More payments by responsible partiesseem necessary. But will more enforcementmean a faster, more complete national cleanupeffort? Not necessarily. Determining who paysfor cleanup and building a strong legal casetakes time and the legal and administrativetransaction costs are high. And building asuccessful legal case is not necessarily consis-

Chapter l-Summary, Introduction, and Policy Options ● 7
Box l-A-How Does Superfund Operate?
The Superfund system is complex. Sites are identified and enter an inventory because they may require acleanup. At this point, or at any time, a site may receive a Removal Action because of emergency conditions thatrequire fast action or because the site could get a lot worse before a remedial cleanup could be implemented. (Mostof SARA’s requirements for remedial cleanups do not apply to removal actions, even though removal actions cancost several million dollars and resemble a cleanup.) In the preremedial process, sites receive a PreliminaryAssessment (PA); some then go forward to a Site Inspection (SI), with some of those sites scored by the HazardRanking System (HRS). If the score is high enough, the site is placed on the National Priorities List (NPL) andbecomes eligible for a remedial cleanup paid for by the government, if necessary, or by responsible parties identifiedas having contributed to creating the uncontrolled toxic waste site. Undercurrent procedures, only about 10 percentof sites which enter the system are likely to be placed on the NPL. Some States have their own lists of sites whichrequire cleanup; these often contain sites not on the NPL.
NPL sites receive a Remedial Investigation and Feasibility Study (RIFS) to define contamination andenvironmental problems and to evaluate cleanup alternatives. The public is given an opportunity to comment onthe RIFS and EPA’s preferred cleanup alternative. Then, EPA issues a Record of Decision (ROD) which says whatremedy the government has chosen and the reasons for doing so; the decision may be that no cleanup is necessary.A ROD may only deal with part of a site’s cleanup and several RODS maybe necessary for a site. The ROD alsocontains a summary of EPA’s responses to public comments. EPA chooses the cleanup goals and technology in theROD. In actual fact a number of actions involving different technologies are likely to be chosen for any but thesimplest sites. The ROD is like a contract in which the government makes a commitment to actions which will renderthe site safe. If responsible parties agree to clean up the site, they sign a negotiated consent decree with thegovernment; this stipulates the exact details of how the responsible parties will proceed. If the cleanup usesSuperfund money, the State must agree to pay 10 percent of the cleanup cost.
In the post-ROD process, the site receives a Remedial Design (RD) study to provide details on how the chosenremedy will be engineered and constructed. The whole process ends with the Remedial Action (RA), the actualimplementation of the selected remedy. Many cleanups include long-term monitoring to determine whether thecleanup is effective and if more cleanup is necessary. A ROD may be reopened and amended because of newinformation discovered or difficulties encountered during the design and remedial action. When a cleanup is deemedcomplete and effective, the site can be delisted by EPA from the NPL.
SOURCE: U.S. CmgtwM, OffIcc of Technology Assessment, Are We Cleanutg Up? 10 Smpqftud Cuw Mu&s, OTA-lTE-362 (Wsshingtcm, DC: U.S. Govcmmctu* Ofli=, kc 19ss).
tent with engineering a good cleanup solution. trols to offset the limitations of a largelyObtaining settlements with responsible partiestests EPA’s resistance to compromising envi-ronmental goals and incurs high oversight costs.
Even if we had enough money and technol-ogy, experienced and expert technical people ingovernment and in the contracting pool are inshort supply. Are special efforts needed toincrease and strengthen the national cleanupworkforce, especially at EPA where turnover ishigh? OTA’s 1989 report on contractor useshowed how important this problem is, and anumber of the policy options in this reportaddress this issue. In the short term, can we useinformation technology, special teams of ex-perts, and stronger, central management con-
inexperienced workforce? In theory, yes, -butnew programs must be created.
Public Demand for Cleanup
Without intense public demand for cleanup,there would be no Superfund program. But thegeneral public and Superfund site communities,for the most part, have little confidence in theSuperfund program.
As a new, large, technically complex programborn in a crisis atmosphere in 1980, Superfundfaced many difficulties under the pressure ofhigh public expectations and intense fears abouttoxic waste. Public expectations have remainedhigh. But the issue is not perfection. The public

8 ● Coming Clean: Superfund Problems Can Be Solved . . .
wants open and honest communication andinformation, opportunities to participate, andenvironmental results. The public is not thecause of Superfund’s poor performance todate. OTA’s research finds that the governmenthas not yet balanced necessary environmentalgoals with real world constraints of money,information, technology, and time.
Sometimes the public must be-and is—toldthat their expectations exceed technical oreconomic resources. The issue is the credibilityof government reasons for not providing themost stringent cleanups. Should the communitybe content to wait for an indefinite period forreliable site information and for a complete,permanent cleanup? Or with full information,might the community consent to accept aninterim action which greatly reduced immediatethreats, even though that meant waiting forsomething more complete later on? Understand-ing this choice and participating in its resolutionrequires complete and timely information andparticipatory opportunities. The government hasnot yet achieved these routinely. Sometimes theneed and choice seems clear to the commu-nity and to others; it is the government thatseems reluctant to do what is environmen-tally necessary and feasible.
Regaining Public Confidence
How the government identities and communi-cates cleanup needs and solutions shapes publicconfidence. Superfund implementation needscommonsense practices. Analyses which makesense only to technical experts do not breedpublic confidence. When Superfund’s managersdepend solely on risk assessments, cost-benefitand other technical analyses to defend theirpolicies and actions they do not succeed. SomeSuperfund managers do not speak in plainEnglish. They justify their actions in terms ofbureaucratic schedules and arcane regulationsrather than environmental goals. Of course,within Superfund there are government peoplesaying and doing the right things. But it is
difficult for government workers to look (orfeel) good when the public criticizes the pro-gram they work in.
What does a permanent cleanup mean to anordinary person? It means that more studies,tests, and cleanup will not be needed, unless themost unexpected and unpredictable event oc-curs. In terms of safety, permanence means thatpeople living near Superfund sites do not haveto worry about exposure to toxic chemicals leftin their community. People understand thatsome sites are very complicated and that newinformation obtained during the cleanup processmay force significant changes. But peoplerightly lose confidence when they are told it issafe and effective to leave toxic waste in theground and cover it up with soil, or to buryuntreated toxic chemicals in a landfill, or to letgroundwater slowly flush contaminants into ariver.
Can a community accept a higher residuallevel of contamination compared to anothercommunity? Not if the real explanation seems tobe who is paying for cleanup. People living nearSuperfund sites can understand that some legiti-mate technical factors (like a difference in routeof exposure or the presence of a sensitive groupof people or animal species) explain differentcleanup standards. But understanding complextechnical factors requires good information andeffective dialog.
Do people who live near a Superfund sitewant their toxic waste shipped to a landfill insome other community? Based on what peoplehave said during open discussions about remedyselection, for the most part the answer is no.When they do, they may be poorly informedabout the feasibility and safety of onsite wastetreatment, which the law prefers, but which maybe under attack because of higher costs.
Lack of public confidence in Superfund andcriticism of Superfund may cause some peopleto discount the real environmental problem andabandon the effort. With billions of dollars at

Chapter I--Summary, Introduction, and Policy Options ● 9
stake and widespread concern about com-peting environmental problems and harm toAmerican industries, building public confi-dence in Superfund is more necessary thanever.
SUMMARY OF OTA’S FINDINGS
Superfund’s primary purpose is not to punishguilty parties, not to sustain a cleanup industry,and not to respond to people’s fears about toxicchemicals. Superfund’s essential mission is toclean up land and water that are so contaminatedthat they constitute threats to human health andthe environment. Therefore, OTA has examinedSuperfund from technical and environmentalperspectives. However, OTA finds that thewidespread interest in stronger enforcement toget more financing of cleanups by ‘ ‘responsibleparties’ must be addressed because settlementswith these parties are affecting some cleanupdecisions adversely. Therefore, this dimensionof the enforcement issue is important in thisstudy.
There are three other chapters in this reportand OTA urges the reader to examine thembecause only a small fraction of the detailedinformation and analysis in them t’s given inchapter 1.
Chapter 2 presents OTA’s research resultson the front-end stages of the Superfundsystem, starting with site discovery, in-cluding several levels of site screening andinvestigation, and ending with the listing ofsome sites on the National Priorities List(NPL). Even though the Superfund pro-gram has received so much attention, fewpeople know much about the preremedialpart of the program, yet it is critical tounderstanding the issue of setting prioritiesfor the program and understanding poten-tial resource needs.
Chapter 3 covers cleanups and cleanuptechnologies. A number of key issues areexamined, including the meaning of per-manent cleanup and distinctions amongdifferent kinds of cleanup technologies,and obstacles to using new cleanup tech-nology. There is also an extensive analysisof recent cleanup decisions which identi-fies the impact of settlements with respon-sible parties.Chapter 4 presents information on thewhole national cleanup system and themany different cleanup programs in it,focusing on potential significant impactson Superfund implementation and futureresource needs.
General Conclusions
Accomplishments and startup problems notwith-standing, Superfund’s overall poor performanceis not a result of inadequate funding,2 lack ofcost-effective technology, inadequate legal au-thority for the government to get responsibleparties to pay for cleanups, insufficient policydirection from Congress, or low public support.Superfund has not been neglected, ignored, orshort-changed. OTA finds two root causes forSuperfund’s current low level of performance:1) ineffective management of the Superfundprogram by EPA; and 2) unsuccessful congres-sional actions.
The closer one gets to Superfund’s implementa-tion the more that many cleanups look likedecisionmaking has worked backwards, that is:1) on the basis of some rough measures of thesite’s problem an amount of money for a sitecleanup was determined, based on what respon-sible parties or the government were willing tospend; 2) some set of technologies and re-sponses were chosen; 3) the combination of thefirst two determined the targeted level ofcleanup. Of course this overstates and oversimplifies the process. But money and bureau-

10 ● Coming Clean: Superfund Problems Can Be Solved . . .
cratic imperatives to show that something isbeing done seem to dominate Superfund, insteadof independent scientific assessment of sites,cleanup objectives based on health or environ-mental effects, and engineering analysis ofcleanup options.
This study has identified options for a three-point restructuring of Superfund:
1.
2.
3.
The
Health and Environmental Prioritiesand Goals: Establish general and sitepriorities explicitly based on environ-mental goals so that money is spent torapidly reduce the greatest and most immi-nent risks at the greatest number ofplaces; 3
Workers and Technology: Improve thequality of work and reduce costs byimproving the government and contractorworkforce and the technologies and proce-dures it works with; andGovernment Management: Clarify stat-utory requirements and congressional in-tent and improve compliance with them byEPA policy and program management.
38 policy options presented in the lastsection of this chapter could be used to imple-ment this restructuring, separately or in combi-nation, if Congress chooses to do so.
Specific Problems and Findings
In each of the three areas described above, weidentify first EPA’s and then Congress’ contri-bution to OTA’s identification of particularproblems. Then, we briefly discuss OTA’s keyfindings.
Health and Environmental Priorities and Goals
Problem: Loss of the first priority, Superfund'senvironmental mission.
EPA—It has subordinated the environmentalmission of the program to short-term fiscal andadministrative objectives by, for example, limit-ing the number of sites placed on the NationalPriorities List and using an accounting approachto measure program performance instead ofenvironmental accomplishments.
Congress—Some statutory directives haveled to actions which are counterproductive toenvironmental goals---ego, non-environmentalperformance schedules—which drive EPA to anaccounting measure of success. Such statutoryrequirements provide incentives to artificiallyshrink the size of the cleanup problem or toshorten and undermine the quality of studies.
OTA Findings—Limiting program sizethrough controlling site discovery. Current EPAdata on how many sites require cleanup underSuperfund underestimate the true scope of thenational problem. But, as figure 1-1 shows,looking at the past rate of increase in Superfundinventory sites and National Priorities List sitesconveys a key message. Cleanup is a growthbusiness. This is despite the fact that EPA hasnot carried out a comprehensive and systematicsite discovery program nationwide, even thoughthey have developed and, to some extent,verified such a program in a few parts of thecountry. Sites are also kept out of the inventory,because once in it, they must be processedwithin certain times.
Eliminating sites which really require cleanup.EPA’s screening procedures for determiningwhether sites require remedial cleanup underSuperfund incorrectly eliminate some sites whichreally do require cleanup. EPA has not estimatedthe magnitude of these false negative decisions,but OTA has. From 240 to 2,000 false negativedecisions may exist. The criterion for decidingwhether a site qualifies for detailed examination
q~e su~rf~d ~endment5 and Reau~orization Act (SARA) of 1986 strengthened EPA’s abdity to perform linuted cleanup aCtiOfls under ltSremoval program. But there is no evidence that the program has shifted its focus substantially to faster, partml remedies, even taking into account theuse of operable unhs in the remtxlial program. Moreover, EPA current public discussions of setting priorities so that the worst sites get addressed firstdoes not include consideration of carrying out site discovery, moving all sites entered into Superfund mentor-y through preremedial evaluation quickly,or being concerned about incorrectly eliminating sites during preremedial evaluahon which really req.ure cleanup.

. .
Chapter 1- Summary, Introduction, and Policy Options ● 11
Figure 1-14 ERCLIS Inventory and National Priorities List Sites
I 31,522
k
541 857 887 1,174 1,224
1 1
80 81 82 83 84 85 86 87 88 89(9 months)
Fiscal year
SOURCE Office of Technology Assessment, 1989.
has changed significantly. Originally, there wasa strict, but simple environmental criterionapplied at the earliest screening stage (thePreliminary Assessment): Does it look like thesite may require cleanup? Lately, the criterionhas changed to: Is the site contaminated badenough to warrant cleanup under Superfund?Indeed, the Hazard Ranking System (HRS) wasoriginally applied as the third and last screeningstep. Now, the HRS is applied at the beginningof the preremedial process when informationabout a site is weakest. The question should norbe: Do we know enough to keep the site inSuperfund? And, the response should not be toeliminate it if we do not. The question should be:Do we know enough to eliminate it fromSuperfund? And, the response should be to keep
it in if we do not. The percent of inventory sitesexamined in the preremedial process that madeit to the National priorities List sites started outat over 20 percent, decreased in the past fewyears to less than 10 percent, and must decreasefurther if EPA is not to exceed its estimate of a2,100 site NPL by the year 2000.4 A differentchoice is possible. With site discovery, withimproved procedures for examining andselecting sites, and without massive deferralof cleanups to other programs, particularlyState programs, the NPL could ultimatelyreach 10,000 sites or more, conceivably by theyear 2000 with a full-throttle effort. The sizeof the NPL is a policy choice which controlsthe distribution of cleanups among Super-fund and other cleanup programs.
4MY invcntov sites, however, r~eive removal actions prior to or instead of placement on the NPL. However, there is little public Xcountabilityfor removal actions and EPA now defers them to responsible parties and State and local government agencies before it considers performing them.

12 ● Coming Clean: Superfund Problems Can Be Solved . . .
Problem: Luck of setting clear, environmentallybased program priorities.
EPA—It has not made sharp enough distinc-tions between sites that really require majorcleanup in the near term and those that can wait,nor has it used alternatives to actions that cannotprovide permanent, cost-effective cleanups. Thereis too much bureaucratic separation betweenpreremedial and remedial activities.
Congress—It has not adequately establishedprogram priorities. Conflicting goals have oftenbeen compromised as EPA tries to do a little bittoward meeting them all.
OTA Findings—Permanent clogged prere-medial pipeline. Under current procedures,the program will never eliminate its largebacklog of unassessed sites which still requirea Site Inspection and possibly application ofthe HRS. For example, it could take 10 years tomove all currently known sites through thepreremedial stages and then there would beanother 10 years of backlogged sites because ofnewly discovered sites. At times it has beensuggested that the backlog is not that significantbecause the Nation’s worst sites have alreadybeen identified and are on the NPL.
However, OTA'S analysis of HRS sitescores shows that newly identified Superfundsites pose about the same level of environ-mental threat as older ones. Letting sites waitfor years before they receive significant exami-nation and attention, therefore, can be a seriousproblem. To illustrate current delays, OTAexamined the 229 June 1988 additions to theNPL; from the time of initial site discovery,one-third of sites waited 8 years or more,
one-third waited between 4 and 7 years, andone-third waited 3 years or less to get proposedfor the NPL. Analysis of the 47 April 1989additions to EPA’s site inventory database (i.e.,sites with completed site inspections) foundthat, from the time of initial site discovery, over50 percent of sites waited 8 years or more whilefewer than 20 percent waited 3 years or less.
All risks considered equal when they are not,With few exceptions, EPA has not made adistinction between estimated risks which arereal and current versus those which are morespeculative and contingent on uncertain futureuses of contaminated land or water or uncertainmigration of contaminants. If it did so, EPAwould have an important way to establishpriorities and postpone major spending. (How-ever, this would complicate attempts to getvoluntary settlements with responsible parties.)
From examining several hundred cleanupdecisions over several years, OTA concludedthat as many as 50 percent of cleanup decisions(some sites have more than one) addressedfuture, uncertain risks. Confirmation of thisobservation comes from a study by Oak RidgeNational Laboratory; it found that two-thirds ofgroundwater cleanups and one-third of soilcleanups were for sites without current risks(considering both cleanup categories, the aver-age was 50 percent cleanups for sites withoutcurrent risk).5 At the same time, EPA hasimplicitly or explicitly deferred actions at sitesthat pose significant, more certain, and nearerterm risks.6
There are limits to speeding up cleanups, butroom for improvement. Detailed data on how a
5c.B. My and C,C. Travis, ‘‘The Superfund Remedial Action Decision Process’ draft, undated; received by OTA on May 30, 1989; 50 out of 74fiscal year 1987 RODS were examined; this is the same set of RODS from which OTA selected 6 positive and 10 negative examples for its June 1988-. (Rele* as ORNJJN1-780, September 1989)
me following conclusion supports the importance of this issue and this finding: “The most important policy need is to develop realistic criteriafor making remediation decisions. We need to find a balance between technical and economic criteria, Identify statutory constraints on what remediescan be implemented and what cleanup standards, if any, limit the selection of remedies, . . .[G]ream attention should be focused on developing criteriato guide the decisions concerning whether to undertake remediation and when to stop remediation. Glen D. Anderson, WhutNeeds To Be Done ~ A PolicyPerspective on Ground Waterund Soil Rernediurion, presented at Researching Ground Water and Soil Contamination: Are Science, Pohcy, and PublicPerception Compatible?--+ colloquium by the National Research Council, March 1989, Washington, DC.

Chapter I--Summary, Introduction, and Policy Options ● 13
site moves through the entire Superfund system(given in OTA’s 1988 report) show that between4 and 5 years pass from when a site is firstidentified until the Remedial Investigation andFeasibility Study at a site is started; a completecleanup can take 10 years or more. But very fastcomplete cleanups at complex sites would oftenbe inconsistent with technically sound cleanups.No one should underestimate the technicaldifficulties in fully understanding a site’s prob-lem(s) and selecting a cleanup remedy.7 How-ever, a major way to speed up overall protectionof health and environment is to move sitesthrough the early stages of Superfund faster.And EPA’s preference for eliminating sitesfrom Superfund, incomplete and impermanentcleanups, and unstringent cleanup standardshelp produce statistical progress instead ofmeasured environmental performance. No goodmeasures of environmental performance eitherat the site or program level are currently used.
Other cleanup programs exist but offer lessstringency. A myth has developed that Super-fund is the national cleanup program for toxicwaste and other types of chemically contamin-ated sites. It is not. Superfund is just the visibletip of an expanding national pyramid of cleanupprograms. All cleanup programs draw on thesame national workforce and technologies. Someof the most important aspects of Superfund aremissing in other cleanup programs; for example,in other cleanup efforts there typically is nopreference for permanent cleanups, less oppor-tunity for effective public participation in theentire cleanup process, less attention to allsignificant risks to both health and environment,and less public accountability.
Implementation of other cleanup programsare uncertain. By ignoring site discovery and
controlling the preremedial process and the sizeof the NPL, EPA diverts increasingly moreremovals and remedial cleanups to other pro-grams, especially to State programs. But fewStates have effective cleanup programs. Currentinformation indicates that State programs relyextensively on land disposal and containmentremedies, which ultimately will prove to beimpermanent.
Information on several major State programs(e.g., California, Minnesota, and New York)indicate that about 80 percent of cleanups, notcounting groundwater cleanup, bury or coverhazardous site material already buried, com-pared to 26 percent for Superfund’s remedialprogram. However, the figure for land disposaland containment is close to 90 percent forSuperfund’s removal program, in which smaller,more urgent actions are taken (one-third areclassic emergency responses). In other words,State cleanups are more like smaller Superfundremoval actions (both are likely to cost severalhundred thousand dollars, rather than tens ofmillions of dollars for remedial cleanups). Seebox 1-B for an example of a State cleanup whichis inconsistent with current Superfund practice.
Because Superfund is the most stringentcleanup program, there is more and moreshopping around for alternatives to Superfund.The flight from Superfund can be viewed as asignificant national problem to the extent thatcleanups outside of Superfund are less compre-hensive, effective, or permanent environmentalsolutions. Ironically, Superfund may increas-ingly be required to fix poor cleanups of thepast from other programs, just as it wasoriginally conceived to address poor pastwaste disposal practices.
_Jfi@en@ su~~~d ca~W[or ~ofesslon~s have o~~~: “using current site investigation and remediation technologies, it IS not possibleto locate all significant contamination, nor can anyone accurately predict contaminant movement, fate, exposure, effects, or remedial technologyperformamx.” William A. Wallace and David R. Lincoln, How Scientuts Make Decisions About Groundwater and Soil Remedi@ion, paper presentedat Remediating Ground Water and Soil Contamination: Are Science, Policy, and Public Perception Compatible?--+ colloquium of the National ResearchCcxmcil, April 1989, Washington, DC.

14 ● Coming Clean: Superfund Problems Can Be Solved , . .
Box l-B—How a State Cleanup Can Differ Substantially From a Superfund Cleanup
In May 1989, the Minnesota Pollution Control Agency released its proposed cleanup plan for the Ashland Oilsite in Cottage Grove. As an industrial site where a variety of wastes were land disposed, the site is typical of manySuperfund sites. At the request of the State, the responsible party conducted the Remedial Investigation andFeasibility Study, and it has indicated that it will implement the cleanup. It took about 5 years to reach the site studystage, after the site was first identified as possibly requiring cleanup. Different levels of soil contamination, lowlevels of groundwater contamination, and buried drums were found. Contaminants include various asphalt and oilwastes as well as some volatile organic chemicals. Ten cleanup alternatives were examined, including no action.The cleanup plan selected by the State has three components: 1) offsite disposal of excavated drums; 2) excavationand consolidation of contaminated soils under a hazardous waste cap onsite; and 3) regular groundwater monitoringto detect any significant increase in contamination. The cost of the selected remedy is estimated at $500,000.
The Minnesota cleanup program has generally received high marks and a lot of attention because it emphasizessettlements with responsible parties. This cleanup seems representative of others in Minnesota and other States.Compared to Superfund, however, a number of concerns can be raised:
. Not one of the cleanup alternatives considered involved the use of treatment technology to permanentlydestroy hazardous material, unlike normal Superfund practice for a feasibility study. The type of chemicalcontamination at the site could be so treated.
● The selected remedy is based on OffSite and onsite land disposal, the least preferred type of Superfundremedy. The Superfund preference for a permanent remedy was not met. The source of potential increasedcontamination of the groundwater, for the most part, remains onsite. No hazardous waste landfill liner wasselected, which would offer another level of protection against migration of buried contaminants intogroundwater.
. The proposed remedy plan does not tell the public of any specific risks to health or environment posed bythe site, nor any specific cleanup standards, unlike normal Superfund practice. It does acknowledge a current(pre-cleanup) risk as human skin exposure for people entering the site without protective clothing. Themis uncertainty about what level of detected increases in groundwater contamination would trigger furthercleanup action.
This example shows that successful settlements with responsible parties for State cleanups, like someSuperfund sites, can result in cleanups which are inconsistent with Superfund goals and requirements. Cleanup ofthis site under current Superfund rules, without the influence of settlement, would have likely involved substantialuse of onsite treatment, such as incineration, increasing the cost to several million dollars. Even with a land disposalapproach, cleanup under Superfund would probably have required a hazardous waste landfill liner, especiallybecause of the evidence of groundwater contamination and because the site is along the Mississippi River. Thiswould have increased the cost significantly. In fact, this site was scored with EPA’s Hazard Ranking System andwas scored high enough to qualify for placement on the National Priorities List. But many States retain sites for theirown cleanup programs.
Workers and Technology Congress—It has appropriated enormous
Problem: Decentralized decisions by aninexperienced workforce.
EPA--Superfund’s managers have not effec-tively addressed organizational and workforceproblems, such as the need to closely monitoractivities by 10 EPA regional offices and toprovide a young, inexperienced government andcontractor workforce with better informationand technical assistance, more explicit policies,and closer supervision.
amounts of money quickly and put manypressures on EPA to spend that money. Therehas been little anticipatory concern about ineffi-cient implementation resulting from excessivedemand for contractors, technical informationand methodologies, and cleanup technologies.
OTA Findings—Regionalized management.Demand has outstripped the ability of govern-ment to respond efficiently, especially in EPA’s10 regions. EPA Regional Administrators have
Chapter I--Summary, Introduction, and Policy Options ● 15
been granted extraordinary autonomy to imple-ment Superfund. EPA headquarters has donelittle to assure that regional cleanup decisionsmeet high standards and are consistent onkey issues like cleanup goals and technolo-gies. Nor do EPA regions learn effectively fromeach other’s experiences, both positive andnegative. Regionalized management has alsostood in the way of developing effective nationaldatabases and developing major support fromkey Federal technical agencies.
[nexperienced Superfund workforce. The Super-fund workforce in EPA, States, and contractorshas been given enormous responsibilities in ahigh-pressure environment that demands quicksolutions to new and complex technical prob-lems. But as already noted, the Superfundworkforce is largely inexperienced, untrained,and poorly supervised. There is insufficienttechnical oversight of critical studies, analyses,and decisions. There is insufficient access to anduse of the latest, reliable information on cleanuptechnologies and past cleanup failures andsuccesses.8
Poor site studies and questionable cleanupdecisions. The costly and lengthy studies of siteproblems—a scientific pursuit of knowledge—and cleanup alternatives—an engineering analy-sis on how to construct a remedy—all too oftenare riddled with inaccurate and incompletetechnical information and analyses (see OTA’s1988 study). Poor studies help to explain whythe government does not routinely select themost advanced, permanent, and cost-effectivecleanup technologies. EPA’s data on remedyselection, for example, show that in fiscal year1987 and fiscal year 1988 only about 25 percentof source control RODS chose permanent reme-dies, using OTA’s criterion of destruction or
recovery of hazardous material. The Oak RidgeNational Laboratory study mentioned aboveconcluded that 19 percent of remedy selectionscould be interpreted to offer a permanentremedy; it also found that nearly 50 percent ofsoil cleanup decisions lacked specific cleanupgoals and that RODS and backup studies do notprovide discussions or rationales to support theselection of remedy based on a cost-effectiveness criterion.
Heavy use of contractors. Nearly all Super-fund activities are performed by contractors,including some that should not be, such asp o l i c y - r e l a t e d w o r k ( s e e O T A ’ se x e r t e n o r m o u sinfluence over Superfund policies and pro-grams, because government depends on themnot merely for carrying out engineering andconstruction, but for the core technical exper-tise, information, and analysis which form thebackbone of Superfund policies, programs, anddecisions. Contractors frequently work both forthe government and for companies the govern-ment is regulating and trying to get to pay forcleanups.
High spending levels cause inefficiency. Therapid demand for Superfund contractor serviceshas been caused by the rapid escalation ofspending demanded by many groups and pro-vided by Congress. Moreover, at the same time,other cleanup programs have also geared up.The result is predicted by classic economics.Excessive demand creates a market whichprovides easy entry for inexperienced firms andtoo many jobs for inexperienced people as oldercompanies expand. This contributes to lowproductivities and efficiencies, and it causeswidespread and rapid turnover of the relativelyfew experienced workers and escalation of
ah imp~m[ obsemation a~u( tie workforce problem and environmental performance has been made by MI cxperlcnccd cnvlronrnentalprofessional: “The Superfund program suffers from a combination of a shortage of human resources and extraordumnly stringent environmentalobjectives. On the one hand the nation is faced with a shortage of trained and experienced environmental scientists capable of’ cvaluat]ng complex riskand exposure models at Superfund sites. On the other hand, the system has dclcgatcd to these same overworked and relauvely mcxperlenccd people tieresponsibdity for makmg risk balancing decisions wluch the [EPA] Adrmrustrator has frequently been unable or unwilling to make. Walter C. Barber,Environmentuf LegIslan”on und Regufa!ory Pracnce, paper prepared for Envlronmentai Quahty and Industrial Cornpetitivencss workshop, AmericanAcademy of Environmental Engineers, April 1989, Baltimore.

16 ● Coming Clean: Superfund Problems Can Be Solved . . .
salaries. Expertise has been drained away fromgovernment to higher paying industry jobs.Currently, the government provides too fewincentives for quality work, too little manage-ment control and auditing of contractors, and toolittle attention to layers of contractors andsubcontractors with high overhead costs.
Government Management
Problem: Conflicts between the statute and itsadministration.
EPA—The agency often seems ambivalentabout implementing statutory policies and direc-tives, such as the goal of minimizing imperma-nent remedies based on containment and landdisposal, and making technical assistance grantsto communities. Interpretations which are in-consistent with congressional intent are a prob-lem, such as converting cost-effectiveness intocost-benefit decisionmaking.
Congress—Some statutory provisions lackclarity, especially on resolving competitionamong objectives, or provide what gives, inretrospect, too much flexibility to EPA—such asthe preference for permanent remedies whichdoes not define what permanent means norwhich treatment technologies are preferred.
OTA Findings—Mixed results from the re-moval program. Most actions are sound emer-gency and site stabilization responses to imme-diate threats, but some large removals circum-vent statutory requirements for remedial clean-ups. Removals frequently use offsite land dis-posal. EPA frost tries to defer actions to respon-sible parties and States. There is little easilyaccessible public information on removal ac-tions. EPA’s Inspector General recently re-ported not being able to find valid documenta-tion for 30 percent of removal activities inRegions’ files.9
Key remedial cleanup decisions inconsistentwith statute. With too few exceptions, EPA’s
key remedial cleanup decisions—Records ofDecision (RODs) are inconsistent with statu-tory requirements. They often are assertions orexpectations instead of closely reasoned deci-sions supported by data and thorough analysis.Various kinds of environmental risks may beignored or discounted. Consequently, it is notclear how the cleanups will be implemented orhow effective they will be. Descriptions ofdecisions and remedies are frequently mislead-ing (see OTA’s 1988 report). For example, aROD might say a cleanup is permanent, eventhough the cleanup relies on land disposal, oruncertain institutional measures such as deedrestriction on future land use, or the uncertainoutcomes of future tests, studies, and monitor-ing. The study by Oak Ridge National Labora-tory mentioned above found that 68 percent offinal remedial RODS required additional studiesto confirm the extent of contamination, effec-tiveness of a technology, or applicability of theselected remedy to the site conditions. A RODmight say treatment technology will be used,when in fact land disposal will be used for mostor much of the sites contaminants. For exam-ple, the cleanup at the Brown Wood Preservingsite in Florida consisted of sending 94 percent ofthe carcinogenic contaminants to a landfill inAlabama, leaving 6 percent for a biologicalonsite treatment whose effectiveness is uncer-tain.
The cost-effectiveness criterion turned intocost-benefit. Everyone knows that cleanup costhas to be considered. However, EPA has trans-formed the statutory directive to minimize cost,after cleanup objectives are identified, into acost-benefit approach which can reduce cleanupobjectives to reduce cleanup cost. Cost-benefitthinking allows nearly any kind of cleanupdecision to be rationalized and underminesthe environmental goals of Superfund. Cost-benefit reasoning backs up the selection ofimpermanent remedies because of excessive
W.S, Environmental Rotection Agency, Progress Toward Irqulementing S~erjimd-Fiscal Year 1987-Report @ Congress, April 1989.

Chapter 1--Summary, Introduction, and Policy Options ● 17
flexibility in cleanup goals. RODS comparecleanup alternatives which do not offer compa-rable environmental protection and, on the basisof cost-benefit analysis, select low-cost reme-dies because a judgment has been made that theyprovide enough of a cleanup.10 Communitiesoften want more environmentally stringent rem-edies which, however, cost more money than theones preferred by EPA, States, and responsibleparties.
Problem: Conflict between enforcement andenvironmental protection.
EPA—It has not emphasized using the strongenforcement tools provided by statute and,therefore, has relied on making voluntary ornegotiated settlements with responsible partieswhich sometimes are less stringent and lesscostly than fund-financed cleanups at siteswhere settlement is not feasible.
Congress-Congress has paid little attentionto the intrinsic conflict of interest EPA faces asit pursues enforcement and settlement (to mini-mize cleanups paid for by the trust fund) whiletrying to uphold its environmental mission andadhere to strict statutory environmental provi-sions.11
OTA Findings-Cleanup decisions affectedby desire for settlement with responsible par-ties. The selection of remedy as embodied in theROD should be, but often is not, disconnectedfrom enforcement and funding considerations .12For example, RODS from the enforcementdivision show substantially greater use of con-tainment and less use of permanent treatmentremedies than do RODS from the fund financedpart of the program. In fiscal year 1988, 14percent of enforcement RODS (backed up byresponsible party studies) selected treatmenttechnologies which permanently destroy toxicwaste (chiefly incineration and biological treat-ment); 44 percent of fund-financed studies andRODS selected destruction technology. Cleanupstandards at sites where settlement with respon-sible parties is a factor are frequently substan-tially less stringent than at sites with fund-fina.need cleanups. An extreme example is fortwo similar wood preserving sites, one inFlorida and one in Maryland. The cleanupstandard agreed to for the enforcement site inFlorida was 100 times higher (i.e., less strin-gent) than the standard for the fund site inMaryland. Based on its analysis of fiscal year
l~c Oak Ridge Na~on~ Lahr@~ study mentioned above found that 34 percent of RODS selected either no action or the least cost iIkIMUVeother than no action; only 8 percent selected the most costly remdy. OTA June 1988 report said ‘‘The average estrmated cost of the cleanups in thesix good RODS. . was $20 million. In contrast, the average estimated cost of not-so-good cleanups in the 10 case studies. . was $12 million.
1 l’rhls ob~mation supports this prs~tive: ‘‘In some respects, Congress has never explicitly resolved the policy issue as to whether the Superfundprogram is basically a public works program (through the Fund-financed cleanups), a public health program, or a regulatory/enforcement program,though SARA tips the balance more toward the latter. A consequence of a regulatory/enforcement focus is the demand for technical information youcan go into court with, thus leading to more intensive site studies to provide ‘enforcement quality’ data. . . this may be one of the root cm.ses, at leasthorn a policy perspective, for the slow progress toward actual cleanups. ’ Glenn Paulson, Tools and Resources Av&”lable Policy Issues, paper presentedat Remediating Ground Water and Soil Contamination: Are Science, Policy, and Public Perception Compatible?---+ colloquium of the National ResearchCouncil, April 1989, Washington, DC.
12A ~ent public statement of ths pdk’t’I was: c ‘The problem arises precisely because the risk assessment model has resulted m a further downturnin the Superfhnd program credibility with waste site communities, which cumulaavely include millions of Americans. .[T]hese fears boil down toa conviction that the government is more interested in justifying partial cleanups which do not offend the pocketbooks of industry than it is in havingan honest dialogue with affected citizens. ” Rena I. Steinzor, Decbions Based on Public Policies and Perceptwm, paper presented at RemediatingGround Water and Soil Contamination: Are Science, Policy, and Public Perception Compatible?—a colloquium of the National Research Council, April1989, Washington, DC. A study of EPA RODS noted that how closely a cleanup approaches legal mandates can be influenced by responsible parties:‘‘when the PRP [potentially responsible party] plays an active role (provided that public acceptance is possible), the EPA may be willing to negotiateand accommodate. Negotiation allows the EPA to gain PRP participation and financial resources where the alternative would likely be htigazion., . . ‘clean’ becomes whatever can be done at a reasonable cost with the technology available and that will be accepted by the public. ’ C.F. Baes 111 andG. Marhtnd, Evaluation of Cleanup Levels for Remedial Action at CERCLA Sites Based on a Review of EPA Rtxords of Decision, Oak Ridge NationalLaborato~, January 1989.

18 ● Coming Clean: Superfund problems Can Be Solved . . .
1988 RODS, OTA concludes that responsibleparties may eventually save as much as 50percent or as much as $1 billion for thoseactions, compared to more stringent remedies.
With settlements and consent decrees, muchcan happen after a ROD is issued. For the RoseTownship site in Michigan, EPA changed theselected remedy after the ROD in order to obtaina settlement with responsible parties. Thechange will reduce the cleanup cost by $19million to $24 million. However, in EPA’sproposed settlement plan and explanation ofsignificant differences it did not inform thepublic that the settlement involved more thanreplacing some incineration of contaminatedsoil with soil flushing to remove volatile organicchemicals. (Soil flushing had been consideredoriginally by EPA but not selected.) In fact, astringent numerical cleanup goal in the originalROD was dropped and the consent decreeallows the responsible parties to propose cleanupstandards during the implementation of thecleanup.
Several conflicts of interest risk the environ-mental performance of Superfund actions. Respon-sible parties have a conflict between minimizingtheir costs and providing the public with environ-mental protection. In accordance with the basiccongressional strategy of restricting fund-financed cleanups, EPA has decided to empha-size the tactic of shifting workloads and deci-sions to responsible parties. But letting respon-sible parties exercise control over the definitionof contamination problems, the selection ofremedies, and the implementation of remediesrequires closer, effective government oversight.Increasingly, there is also a conflict between aresponsible party using its own cleanup technol-ogy or business versus someone else’s tech-nology or services that might be more effectiveenvironmentally.
THE BACKGROUND FOR PUBLICPOLICY DEVELOPMENT
Breaking Out of the Superfund Syndrome
After examining Superfund implementationsince its beginning, OTA has found it instructiveto define a condition it calls the “Superfundsyndrome’ which can help us understand per-ceptions and problems of this program, as wellas the adversarial nature of Superfund implem-entation. A syndrome is a set of complexsymptoms of an undesirable condition. ForSuperfund, the undesirable condition is constantconfrontation among nearly everyone affectedby and working in the program. Mutuallyreinforcing but opposing values, interests, andobjectives make program management and pro-gram improvements exceedingly difficult. Forexample, there are community-government dis-putes over technical issues and cleanup objec-tives; there are responsible party-governmentdisputes about technical issues and cleanupcosts. The Superfund syndrome forestalls con-sensus on identifying key issues and resolvingthem. “Analysis breeds paralysis” as stake-holders with different perceptions of risk anddifferent priorities fight data with data. Contrac-tors keep busy, reports pile up, contaminationspreads into soil and groundwater, many siteswait to get into the system. It is very difficult tobreak gridlock situations by invoking explicitpolicy direction, and litigation waits in theshadows. The syndrome slows improving pro-gram effectiveness and efficiency through up-ward movement on a learning curve.
OTA has identified two causes of the syn-drome: 1) opposing views of risks to publichealth and environment and, therefore, of neces-sary cleanup costs; and 2) excessive flexibilityin the statutory structure and implementationpolicies of the program. The first factor has nonear-term solution, but the second cause does.The result of these two factors is a system inwhich competing interests find too many oppor-tunities to achieve their objectives at too great an

Chapter 1 Summary, Introduction, and Policy Options ● 19
expense to their adversaries. Site-specific cir-cumstances and variations among communities,responsible parties, and government officialsdetermine who ‘‘wins’ and who ‘‘loses. ’ Withthe Superfund syndrome, the system tears itselfapart as it overresponds or underresponds atsites. Only rarely do cleanup decisions satisfyall parties and meet the full range of statutorypreferences and requirements.
First, consider the root causes of the opposingviews on cleanup risks and costs. One one side,there are people who are primarily concernedabout risks to health and environment: thegeneral public who knows Superfund indirectlythrough news media coverage and people inaffected communities who have had directexperience with Superfund implementation. Re-peated sharp visual images of leaking drums oftoxic waste, pools of foul liquid waste, discol-ored streams and creeks, and abandoned homesnear Superfund sites have etched permanentimpressions in the minds of most Americans.Superfund’s implementation has documentedmuch chemical contamination of land and waternationwide. For years, the public has heard asteady stream of disturbing information aboutpolitical scandals related to Superfund, criminalbehavior of some toxic waste companies, con-tinued conflicts between Congress and execu-tive agencies over Superfund implementation,and slow, patch-work, and ineffective govern-ment actions documented in many reports byOTA, GAO, congressional committees, andenvironmental organizations. After a decade ofsuch indirect experiences based on many sourcesof information, the American public has a lot offear and anxiety about toxic waste sites.
At the community level, experience with thegovernment’s ineffective implementation of Super-fund, as well as feelings about involuntary andcatastrophic risk, cause outrage and distrust,dread, fear, and confusion. Again and again,people living near sites say they feel victimized;they face risks to health, environment, jobs, andhome values; they feel left out of key decisionsaffecting their lives.13 These experiences andemotions have increased people’s perception ofrisks posed by toxic waste sites and madecleanup costs a secondary issue compared toobtaining effective protection of health andenvironment. 14
Pressures from responsible parties push in theopposite direction. These pressures result, inpart, from a perception that the toxic wasteproblem has been blown out of proportion andhas caused an expensive over-reaction by gov-ernment. In fact, the actual health effects ofmany chemicals are questionable or unknown,although many have known dangers. Naturalprocesses of dispersion, dilution, and degrada-tion can sometimes reduce health and environ-mental effects of released site contaminants, butthis cannot be assumed. And chemical contami-nation of land and water does not necessarilytranslate to exposures to those chemicals and,hence, significant health or environmental risksor effects. For some people, therefore, perceivedrisk from toxic waste sites seems small com-pared to other environmental problems and toosmall to justify the large amounts of moneybeing drained from specific companies and thegeneral economy.
Many responsible parties believe that theyhave much more than money to contribute to
IJEpA’s rout~c com~ty relations effo~s are insufficlcn[ to prevent discontent in communities t.hOUgh early public participation and earlychssemination of information. For sites managed under EF’A’s enforcement prot?~, eff~tive public p~cipation is limlt~ by tie government ‘S inter~tin building a strong legal cax.
140TA hw fo~d it CfitiC~ly impo~t to underst~d an important ~uding of risk communication: risk = hazard + outrage. (see peter M. Sandman,‘‘Hazard Versus Outrage in the Public Perception of Risk, ‘‘ in Effective Risk Communicafwn, Vincent T. Covello et al. (eds. ), (New York, NY: PlenumPress 1989), pp. 45-49. Hazard reflects scientific information about chemical contaminants, their health effects, and exposures to them. The outrage factoris a result of dwerse experiences and feelings; for toxic waste it is higher than for other environmental problems, This explains why many Americansview toxic waste sites as more threatening than other environmental problems, even though more people are afftxtd by other environmental problems(e.g., w pollution and radon contamination of homes), which pose high health risks.

20 ● Coming Clean: Superfund Problems Can Be Solved . . .
Superfund’s implementation, including techni-cal expertise, project management experience,and more interest in trying innovative cleanuptechnologies than government. An expensivecleanup is not necessarily a truly effectivecleanup, they argue and, as OTA’s reviews ofcleanup decisions have verified, that is oftencorrect. As much as community people feel leftout of the decisionmaking process, so do manyresponsible parties. Moreover, as much ascommunity people may feel like victims be-cause of threats from toxic waste, many respon-sible parties feel like victims because theliability imposed on them is not related to pastviolations of laws or regulations then in place.
Economics affects risk perception. For thosebeing asked to pay cleanup costs, perceived riskis usually lower than it is seen to be in Superfundcommunities. (This lower perceived risk oftenchanges when responsible parties become mem-bers of an affected community.) If risk isunderestimated, then there is a potential forunderresponses by the cleanup program. Moreo-ver, this economic perturbation of risk some-times occurs with EPA officials who, likeresponsible parties, place high value on mini-mizing individual cleanup costs in order tospread Federal money around to more sites. Andthey too may believe that risks are not as high asaffected citizens believe them to be. Indeed,EPA has said this officially.ls
Next, consider the causes and characteristicsof excessive program flexibility. Normally,flexibility is valuable. Indeed, at the beginningof the program, flexibility was critically needed.Superfund was a new government program andcleaning up toxic waste sites was a new andlargely unknown challenge. There was a true
need for flexibility because there was littlereliable information or experience to fine-tunepolicies and objectives. Today, after nearly adecade of experience and a lot of information,the flexibility in the program seems excessive,and seems to the public like a way to minimizecosts by lowering protection.16 There are toomany opportunities for opposing interests—including the public—to achieve their objec-tives at too great an expense to others. Govern-ment officials have too much room to makedifferent kinds of decisions, and often contradic-tory ones at different sites, depending oncircumstances and bureaucratic goals, suchas obtaining settlements with responsibleparties.
Excessive flexibility means that there are fewsafeguards against underestimating risk andcleanup needs, and designing cleanups accord-ingly. This ultimately increases public concerns,which results in the public seeing more risk.Increased perception of risk leads to greaterpublic demands, making it harder for govern-ment to satisfy expectations. But, excessiveflexibility also allows over responses to height-ened perceptions of risk. Selecting an overlystringent cleanup at a site or giving high priorityto what seems like a less serious situation oftenprompts responsible parties and some govern-ment officials to fight the desired remedy or toreduce costs at other sites. And in some cases,there are several community groups expressingdiametrically opposite views on cleanup objec-tives and remedies. This contributes to gridlockat the site level. If responsible parties refuse togo along with a stringent cleanup and EPAcannot compromise because of strong commu-nity positions, then the State may become the
15u.3 ~v~wmt~ Ra=um Agency, u~n~~d Business: A Comparative Assessment of Environmental Problem, Febm~ 1987.
161*~b~ ~ ‘mulmm flexibility/yninimum ~co~~illty’ ~proach by community grOUpS living wound the dump sites, this approach dlOWS
EPA to take into account numerous variables, most notably cost, in addition to the need to protea human health and the environment when cleaningup sites. . . [T]k major objection that environmental and community groups have about the current EPA approach is that it does not guarantee a minimumlevel of protection to citizens across tk country; rather, a number of factors, many of which are never quantified or explicitly discussed, appear todetermine the amount of contamination that will remain at the site after cleanup. ” Linda E. Grtzr, “How Clean is Clean? An Environmentalistperspective,” Hazardaus Wurte Site Management: Water Quality /ssues, Report on a Colloquium Sponsored by the Water and Tkdnology Board(W-, ~: Nadortd hi(ktly hSS, 1988).

Chapter 1-Summary, introduction, and Policy options ● 21
controlling factor because it may not provide therequired 10 percent matching funds for what itconsiders an overly expensive fund-financedcleanup. The Superfund syndrome is sustained.
Excessive program flexibility entails:
a great deal of EPA regional autonomy,permitting different interpretations of stat-ute and EPA headquarters’ policies (i.e.,how much protection from toxic waste aperson receives depends on where in theUnited States that person happens to live);a widespread belief among EPA staff thatevery cleanup is unique;a broad range of acceptable risk for settingcleanup objectives;no official definition for permanent cleanup;little distinction among the environmentalresults of very different cleanup technolo-gies and methods;using cost-benefit instead of cost-effectiveness to justify selected remedies;using public opposition to an expensivetreatment cleanup alternative to help rejectit, but ignoring public opposition to alow-cost, land disposal alternative in orderto select it;no specific criteria for using the statutoryfund-balancing provision to reject high-cost cleanup alternatives; andselective use of different enforcement mech-anisms.
Theoretically, responsible party concerns aboutcleanup cost might balance the demands formore stringent and effective cleanups by peopleat risk. But instead of opposing prioritiescreating optimum cleanups, the Superfund sys-tem often creates site decisions that individuallyoverrespond or underrespond to site hazards.Site outcomes depend on the relative strengthsof affected citizens and responsible parties at
specific sites and often the views of the State.Without viable responsible parties, articulatecommunity groups may obtain overly stringentcleanups. Without well-organized communitygroups, settlement cleanups may be weak. Atthose sites where there are both strong, unitedcommunity and responsible party interests,gridlock is likely. 17
In addition to the general public and affectedcommunities, there are tens of thousands ofpeople implementing Superfund, both govern-ment employees and contractors, who think thatthey have done the best they could with animpossible situation. Some people in Congressthink that no matter what they do the programremains deeply troubled. Nearly everyone isfrustrated, but nearly everyone has learned tofind opportunities within the system excessiveflexibility to achieve their goals, at least some ofthe time, or to prevent remedies they oppose, orto make implementation of them difficult.Cleanup decisions can be reopened or changedconsiderably during their implementation.
There is another complication. Spendingbillions of dollars has created a new industry. Alegal, consulting, technology, and site andlaboratory services industry thrives on Super-fund and other cleanup programs. Nationalcleanup spending is between $2 billion and $3billion annually—and growing at a high rate,probably 20 to 40 percent for most companies inthe business of cleanup. Changing Superfundinevitably affects the financial interests of thiscleanup industry as a whole and, in a morecomplicated way, the relative competitive inter-ests of different companies. Of course thisindustry is filled with people who genuinely careabout the cleanup problem and about doing agood job. They too have to live with Superfundimplementation problems, and they would like
I T~e eff=tlveorg~zatlm of community intere5~ into a single set of well-articulated demands and acti vities to achieve them s=ms to be determmedby several factors. For example, the clearer and more imminent the threat to public health, the more likely it IS that the community WIII rally around aparticular set of cleanup objectives and remedies. Another factor is whether the community is able to lap the reso~ces of a nationaJ environmental orpublic interest organization or local tezhrucal experts, such as engineering faculty. in some cases there may be a strong relationship with the primeresponsible party which also IS the commumty chief’ source of employment.

11 ● Coming Clean: Superfund Problems Can Be Solved . . .
to see them solved. But, overall, the cleanupindustry pays little penalty for Superfund’sineffectiveness and inefficiency. Nor does itreceive much incentive from the government forimproved performance. Because of strong pub-lic support for Superfund, a backlash effectwhich would diminish cleanup activity hasseemed unlikely. And the cleanup industry hasbenefited from other, growing cleanup pro-grams. For the most part, this industry is viewedwith distrust by communities because it worksfor the government and responsible partieswhich, as discussed above, are seen to havedifferent priorities than communities.
Do Superfund Sites Pose SignificantHealth Risks?
Superfund was not created on the basis oflengthy, detailed studies which made the casefor its need. Sup-fund was born out of some-thing close to public hysteria, news stories aboutleaking toxic waste sites, vivid pictures of sites,and first-person accounts of health effects. Douncontrolled toxic waste sites in fact pose aproblem that justifies a multibillion dollarprogram? The evidence available now indi-cates to OTA the answer is yes.
First, mainly because of hundreds of Super-fund studies (and the availability of advancedanalytical techniques to detect smaller andsmaller amounts of contaminants), there ismassive documentation of substantial contami-nation of air, land, surface water, and groundwa-ter in virtually every part of the United States.For many of the prevalent contaminants, there isundisputed information on adverse health andenvironmental effects.
Second, adverse health effects in populationsexposed to releases of contaminants from cleanupsites have been documented (and some effectshave not) through a few epidemiologic studieswhich, however, are almost always viewed bymany professionals to have serious shortcom-ings. Examples of these are summarized in table1-2; nearly all of them are controversial. Suchstudies are difficult and costly to conduct.Proving the contribution of past exposures tocurrently identifiable health effects, havingmany other possible causes, and in a mobilepopulation is very difficult.
Third, Superfund has produced many expo-sure and risk assessments. These have docu-mented past, current, and future exposures andrisks through a variety of routes of exposure,including ingestion, inhalation, and dermal ab-sorption, and for different types of people,including workers, residents, and occasionalvisitors. Risk assessment methodology has majorlimitations, often yields imprecise estimates,and produces numbers that very much dependon who does the work.18 Using seemingly thesame methodology, people working for thegovernment or a responsible party can analyzea site and produce estimates of risk differing bya factor of 10 or 100, or even more. But the pointis that many of Superfund’s assessments haveyielded undisputed high estimated current riskslike 1 in 10 or 1 in 100 excess cancer deaths.19
EPA’s decision document for the cleanup of theRose Township site in Michigan noted an excesscancer risk as high as 0.7 (i.e., 70 percent ofexposed population dying of cancer) for con-sumption of groundwater contaminated princi-pally with PCBs, vinyl chloride, and arsenic;and a non-carcinogenic risk as high as over 100times the safe value, arising principally from
lg~e ~ of EpA’s SWe@~ f~lic Health Evaluation Manual does not eliminate these problems. Also see Joel S. Hirschhom et al., ‘ ‘Ustig RiskConcepts m Superfund,’ Supe@nd ’87, proceedings of November 1987 conference, Hazardous Materials Research Institute, Silver Spring, MD.
lg~r C]emups are jmtifi~ only on me basis of estimated and, to a large degree, hypothethized future exposures and risks. Will residences be builton the land, groundwater be used as drinking water, or institutional controls such as fences and deed restrictions always be effective? The uncertainlyfor future, potential rtiks is tnevitubly larger than for curreru rhk. But the statute requires cleanups for potcnual as well as current risks. And thisrequirement demands thinking through what mighr happen at a site. However, EPA has not routinely made an explicit distinction between future potentialrisks and significant currenl risks.

Chapter I--Summary, introduction, and Policy Options . 23
Table l-2--Summaries of Results of Some Epidemiologic Studies for Toxic Waste Sites
Hardeman County, Tennessee By 1977, 5 years after burial of pesticideproduction wastes had stopped, local residents were complaining ofbad-tasting, smelly well water and were reporting health problems.Groundwater testing confirmed that a variety of chlorinated solventshad leached from the site, including carbon tetrachloride, chloroform,methylene chloride, and tetrachloroethylene. Providing a new watersupply for some residents resulted in the disappearance of acutesymptoms, such as nausea, diarrhea, skin and eye irritation, and upperrespiratory infections But persisting problems were identified 2 yearslater, including enlarged livers and eye problems. Eleven countyresidents were hospitalized with a variety of symptoms. A limitedhealth survey by the University of Cincinnati found evidence of liverdysfunction.
San Jose, California A water supply had been contaminated by leakagefrom an underground storage tank; 1,1,1-trichloroethane and 1,1-dichloroethylene were found in a municipal well. A study by theCalifornia Department of Health Services in 1980 and 1981 docu-mented a doubled rate of spontaneous abortions in the exposed areaas compared to a control area. The study also found a nearly four-foldincrease in all birth defects combined. After the well was closed, a1986 follow-up study found no excess malformations. In a differentstudy, the rates of cardiac defects in the affected area were comparedagainst the rest of the county. An excess number of major cardiacdefects occurred in babies born to residents in the affected area for1981. In May 1988 the State sad, that the leak, was an “unlikely”cause of the observed health problems, but also that “it probably willnever be possible to determine conclusively what the role the leakplayed .“
Love Canal, New York In the 1970s there was ample evidence to residentsof leaking toxic waste from the former disposal site. Testing confirmed
SOURCE. Contractor work for OTA by ENVIRON Corp 1989
chlorobenzene in the groundwater. But theserisks were for a ‘‘hypothetical exposure’ not acurrent exposure to the contaminated groundwa-ter.
Table 1-3 gives a summary of descriptions ofsignificant estimated risks at seven Superfundsites, based on EPA site documents. Theseexamples illustrate the kind of results beingobtained at Superfund sites, including sites forwhich cleanup has been justified only or partlyon the basis of future potential risks. However,many times, actions are taken on the basis ofinformation obtained about current releases ofcontaminants, likely exposures to them, andpossible health effects. For example, NewJersey recently decided that it had to recontrol86 sites contaminated with chromium by cover-
heavy contamination in air, water, and soil, Beginning in 1976, localresidents began reporting elevated incidence of a variety of healthsymptoms, Residents reported elevated incidences of miscarriagesand children with multiple birth defects, severe asthma, and congenitalheart defects, A 1978 preliminary health survey of over 100 residentsby the Love Canal Home Owner’s Association showed an increase inhealth problems; these included urinary tract problems, centralnervous system disorders, and adverse reproductive outcomes suchas miscarriages, stillbirths, and birth defects In August 1978 the Statedeclared a health emergency.
Woburn, Massachusetts Drinking water was found to be contaminatedwith solvents at concentrations one-tenth of those in San Jose,California. Some residents were supplied with contaminated water toa much greater degree than others. In 1984, a team from HarvardUniversity conducted a study The study groups were women whoreceived less than 20 percent or more than 20 percent of their drinkingwater from contaminated wells. Relative risks were found to beelevated for eye and ear birth defects and for birth defects generallyconsidered associated with environmental exposures, such as spinabifida, central nervous system problems, and cleft palate During the3 years after use of the contaminated wells was discontinued, therelative risks of perinatal death and birth defects among exposedmothers were comparable to those in other parts of the community,Also, the incidence of childhood Ieukemla was Increased In Woburn,especially in the areas receiving almost all water from the contami-nated wells. Childhood leukemia continues to be studied In exposedadults in Woburn, neurological damage, immunologic problems, andcardiac arrhythmias persisted for at least 5 years
ing them with asphalt for perhaps 2 years untila final remedy is selected. Monitoring had foundhigh levels of chromium in dust in a school.20
Controlling windblown chromium dust to mini-mize health risks was the stated goal.
Other Reasons for Cleaning Up Sites
As important as health risks are, there areother reasons for cleaning up sites. Protectingthe environment is important in itself. Also,damage to sensitive parts of the environment cansignal future damage to human health for tworeasons. First, toxic chemicals may enter ourfood chain, but take long times to manifestthemselves as a cause of human health prob-lems. Second, environmental damage may hap-pen at low concentration levels, but contami-
The New York Times, July 26, 1989.

24 ● coming clean: Superfund Problems Can Be Solved . . .
Table l-3-Examples of Use of Risk Assessment to Justify Superfund Cleanups
Baird and McGuire site, Massachusetts Future risk. Out of 102contaminants, 53 critical contaminants were selected using methodssuggested by EPA; they included 26 carcinogens, 11 noncarcinogens,and many suspected carcinogens. Because the site is not homogene-ous in its geology, hydrology, and contamination, it was divided into10 zones. The risk assessment focused on potential risks underhypothetical future conditions, because groundwater was not beingused, a fence prevents direct contact with soil and surface water, therewas no current fishing or recreational uses of the area. All the zoneswere found to have at least one pathway for exposure with theestimated incremental lifetime cancer risk greater than 1 in 10,000 andseveral pathways pose risks greater than 1 in 100. Moreover, all buttwo of the zones have at least one pathway with the Hazard Index fornoncarcinogenic substances greater than the cutoff of one. Thepathway showing the greatest potential risks was groundwateringestion by adults.
Price Landfill site, New Jersey Future risk. Major groundwater contami-nation exists. The primary route of exposure was found to be ingestionof contaminated groundwater. Past and current exposures wereevaluated for municipal and private water supply users. Actualconcentrations of volatile organic chemicals in the groundwatersupply wells were used. Although past risks were high for themunicipal water users, current risks were low, even if it was assumedthat the wells had not been taken out of production, which they hadbeen. Risks for the private well users had in some cases been as highas 4 in 10,000 cancer risk, but the homes had been connected topublic wells. A major groundwater cleanup was selected for the site,presumably because of potential future use of the groundwater. Aqualitative risk assessment showed that ingestion of soil inorganiccontaminants by children posed a significant risk which justified sitecapping and fencing.
Tinkam’s Garage, Now Hampshire Future risk. Indicator contaminantswere chosen based on concentrations of volatile organic chemicalsfound in groundwater, surface water, and soil, and their toxicity; therewere 10 carcinogens and 10 noncarcinogens. Future risks wereestimated on the assumption that an alternative water supply had notbeen installed, and residents continued to consume contaminatedgroundwater under two scenarios: either at the levels measured insupply wells, or at the maximum concentrations measured in sitemonitoring wells. The latter produced estimated cumulative cancerrisk of 2 in 100 compared to 3 in 10,000 for the lower concentrationsat the well point. For the noncarcinogens, the Hazard Index was over30 for the higher site concentrations and 2 for the well concentrations.Two scenarios for children with oral and dermal routes of exposure tocontaminated soil were used: a worst-case scenario assumedcontaminant concentrations equal to the maximum measured values;a more-likely scenario assumed contaminant concentrations equal tothe average measured values. The worst-case produced a cumulativecancer risk of 1 in 1,000 and the more-likely scenario 5 in 100,000. Fornoncarcinogens the Hazard Index was 1.7 for the worst-case and lessthan the cutoff of one for the more-likely case.
Summit Nationai site, Ohio Current and future risks. Studies showed thepresence of more than 100 chemicals in different media on and offsite.Indicator chemicals were selected for groundwater, soil, and sedi-ment, Under current use of the site and surrounding area, theseexposure pathways were of concern: ingestion of site soils bytrespassers, ingestion of offsite soils by residents and workers, andingestion of sediments, Ingestion of groundwater under the currentuse scenario was not considered because onsite wells were not being
used and local residential wells had not been found to be contami-nated. For current use, the worst case cancer risks were in the 1 in10,000 to 1 in 1 million range but the average exposures did notwarrant cleanup using a cutoff of 1 in 1 million; nearly all of the HazardIndices were below 1. The potential future use scenario consideredingestion of groundwater and soils by onsite workers and residents.An average (based on geometric mean contaminant concentration)and worst case (based on maximum detected value of contaminant)exposure were calculated. For future use, both the average and worstcase scenarios could justify cleanup, with the worst case risks beingas high as the 1 in 10 and 1 in 100 levels for the groundwater ingestionroute; the Hazard Indices were very high for the worst casegroundwater route, as much as 400.
Leetown Pesticide site, West Virginia Current and future risks. Riskswere determined for exposure to most of the pesticides detected andarsenic. Ail major site contaminants were considered carcinogens.The current exposure route was ingestion of milk by local residentsfrom cows fed silage grown in areas of soil contamination, assumingeither all milk drunk was contaminated or that the daily mixedcontaminated milk with noncontaminated milk. Only under theall-contaminated milk scenario was the risk significant enough tojustify cleanup; it was at the 1 in 10,000 level. The future exposureswere inhalation of contaminated dust and dermal exposure tocontaminated soil by farmers tilling fields; this scenario assumed thatthe former orchards, then used mostly for pasture, might change tomore intensive agriculture. Site sampling did not indicate groundwatercontamination. Cumulative cancer risks for different areas were basedon average contaminant concentration. For nearly all areas and forboth inhalation and dermal exposure, the risks were high enough tojustify cleanup, with inhalation risks being much higher and rangingfrom the 1 in 100 to 1 in 1,000 levels in four areas out of six.
Wildcat Landfill site, Delaware Current and future risks. Of 80contaminants of heavy metals, PCBs, and other organic chemicals, 60were used in the risk assessment. Current exposure pathwaysexamined were: ingestion of groundwater by off site residents,incidental ingestion of surface waster from nearby river by occasionalsite users, ingestion of contaminated fish from river by occasionalusers, and direct contact with soil and surface Ieachate by occasionalusers. High excess lifetime cancer risk was estimated for current siteusers through inadvertent ingestion of contaminated soil (1 in 1,000)and through surface water (8 in 100,000). The cancer risk for currentoffsite groundwater users was 1 in 1 million. Future use exposurescenarios examined were: ingestion of groundwater by future onsiteand offsite residents, and direct contact of soil and Ieachate by futuresite residents. The future potential risk for onsite residents consumingcontaminated groundwater produced the highest lifetime cancer risk(4 in 1,000) and noncarcinogenic hazard index (104).
Sol Lynn/Industrial Transformer site, Texas Current risk. Site investigat-ions found PCB and TCE in soil, plus several other organiccontaminants. Risks were estimated for soil under current usescenarios. Only the risk of exposure to PCB through ingestion anddermal absorption was estimated. Due to the proximity of peoplewithin one mile (the Houston area) of the contaminated soil, exposureconcentrations for PCB were assumed to equal maximum concentra-tions. The exposed population included workers, trespassers, andclientele of the businesses which currently operate at the site. Excesslifetime cancer risk associated with exposure to PCBs at the site wasestimated to be 1 in 1,000.
SOURCE: Contractor work for OTA by Environ Corp., 1989.

Chapter 1--Summary, Introduction, and Policy Options ● 25
nants may later be concentrated to high enoughlevels in food chains to affect human health.
Another reason for cleaning up chemicalcontamination of land and water is ethical.Many Americans believe that they, as individu-als and as a society, have a moral obligation asguardian, steward, or conservator of the planetto keep our environment inhabitable-and topass on to future generations an environmentwhich is in as good or better shape than when weinherited it. They believe that cleaning up sitesis important even without quantified certaintyabout health or environmental risk, or even if thecosts of cleanup seem high relative to thebenefits. American society does many things inthe name of this environmental ethic, some ofthem expensive, which are not justified strictlyon the basis of specific health benefits. Publicconcern about littering is a manifestation of theethic. Superfund cleans up chemical litteringwhich is as visible in people’s minds as street orhighway litter is to their eyes.
It seems that the moral or social reason forcleanup has a lot to do with the public’s desirefor permanent cleanups and for waste reductionat its source. Even after early cleanup actionshave removed immediate health or environ-mental risks, going back to a site is important, inthis view. For instance, addressing residual soilcontamination or buried toxic waste (which mayseem relatively immobile) fulfills the responsi-bility to leave the earth to future generations
without our chemical litter. This moral valuestands in contrast to a more materialistic per-spective. Government officials are inclined tojustify spending money on cleanups only whenrisk assessment and cost-benefit analysis sup-
21 Ethical considerations do not lendport it. It.themselves to quantification.
Is Superfund Worth the Costs?
Inevitably, some people will focus on risk andcost information for cleanups to decide whetherthe costs and benefits of Superfund seemreasonable compared to other environmentalprograms, or even to very different governmentprograms. In 1987, EPA’s Administrator had astudy done on risks from different environ-mental problems that concluded Superfund wasan area of high agency priority and spending butlow to medium health and environmental risks.22
But EPA’s conclusion about risks was notsupported by analysis. 2 3 A n o t h e r C o r n p a r a t i v e
examination concluded that ‘‘reduced lifetimecancer incidence is often very small forSuperfund cleanups and, compared to a problemlike radon contamination of homes, the Super-fund program seems clearly misdirected.24
In fact, cleaning up uncontrolled hazardouswaste sites is expensive and will remain so. ForSuperfund, OTA estimates that the average costper life saved, the commonly used programevaluation criterion, varies greatly from site tosite, but at a rough average is $5 million, if only
ZIMX mu~n~ co~s t. ~hicve ~n=ncy and stringency are supported---demanded-by the public, because publlc cIcanup demand = utility(protection) + morality. [See Amitai Etzioni, The A40ralDimenswn The Free Press, 1988.] But Superfund managers focus on utdity, leaving some publicexpectations stemming from moral considerations unsatisfkl. This conrnbutes to the Superfund syndrome.
~u.s. ~vlronmen~ ~oLWtlon A~ncy, U@nished Business.’ A Comparative Assessmetu of Environmental Problerm, February 1987. EPA ‘S viewthat “total health unpacts do not appear to match public concerrs in most areas’ sets up an adversarial relationsiup between commumties and EPA onthe key issue of different perceptions of risk and cleanup needs.
230TA*S Cxmlnation of ~s s~dy fomd sever~ is~es, including: tie me~odology WaS b~ on “inforrn~ judgmen~’ and ‘‘ex~~ OplniOrl, ’rather than objective and quantitative analysis, from about 75 EPA managers and experts, only 2 of which were directly involved in Supedundimplementation; there was no systematic compilation, presentation, and analysis of data from Superfund risk assessments or health effects stuches; andthe report acknowledged considerable uncertainty’ for cancer risks because it considered only 6 chemicals and extrapolated information on 35 sitmto a universe of 25,000 sites.
mPauI R. Portney, “Reforming Environmental Regulation: Threz Modest Proposals, ’ Issues in Sc[ence and Technology, Winter 1988.

26 ● Coming Clean: Superfund Problems Can Be Solved . .
cancer risks are considered.2s Superfund costsare not absurdly high. To the contrary, they arecomparable to those of other government pro-grams, especially if about half of the spending isallocated to health, environmental, and socialbenefits other than preventing cancer deaths.These can be significant for many sites.26 Thelarger issue is that unless Superfund’s perform-ance is improved, cleanup costs may increaseand benefits may decrease, making the programseem economically irrational relative to othernational needs.
Strategy v. Spending
Few people question cleaning up chemicallycontaminated land and water, both for our ownsake and for the sake of future generations. Thetough question is: How much cleanup is reallynecessary? Insisting on perfect, quick and cer-tain solutions, and ignoring resource limits candefeat cleanups of specific sites and threaten thenational program. Conversely, insisting on low-cost cleanups can compromise protection ofhealth and environment. The unsuccessful at-tempt to balance Superfund’s environmentalgoals against technical and economic resourceshas revealed the lack of a well-crafted, long-term strategy in statute or implementation.
Much of the past policy debate focused onSuperfund funding levels and who pays, and notabout strategy and priorities. Ideally, Superfundwould eliminate all significant risks at alluncontrolled sites through permanent cleanups.In reality, however, limited financial, human,and technical resources make this ideal unattain-able in the short term. The question, therefore,arises: what is the most efficient means ofallocating Superfund’s limited resources toachieve maximum protection of the public andenvironment? The answer to this question lies inhow the spending is to be distributed withrespect to sites and time. In other words,strategy, not just spending, has to be consid-ered.27
Currently, spending is focused on relativelyfew sites and on complete, defensible cleanupsat those sites, which are often, nonetheless, hotlydebated. Many sites—both known and as yetundiscovered—remain largely unattended. Intrying to deal with resource constraints, ahost of largely ad hoc policies minimize: 1)the number of sites entering the program; 2)the number of sites deemed to require clean-ups under Superfund; 3) sometimes the levelof site cleanup; 4) often the cost of sitecleanup through remedy selection; and 5)expenditures from the fund through settle-
~h comp~50n, he study mention~ m footnote 22 calculated a cost of onfy $2,500 per lifetime case of lung cancer prevented by radon remedation.The OTA estimate of $5 milllon per fatal cancer prevented from Supcrfund sites is based on the figures: 2,000 sltcs with a total of 10 million peopleat risk, a cancer rmk reduction from 1 m 1,000 to 1 m 1,000,000, and an average cleanup cost of $25 milllon. The average exposed populauon of 5,000people per site is consistent with EPA figures. (EPA, “Extent of the Hazardous Release problem and Future Funding Needs--< ERCLA SectIon301(a)(l)(C) Study, December 1984. Mean populations exposed were 5,00(1 for groundwater and 3,600 for surface water; since HRS scorey have notchanged significantly, these figures still seem applicable. ) However, because of uncertainties about risks and cleanup costs as well as large variationsin site risks and cleanup costs, the cost per cancer death prevented probably vanes plus or minus a factor of 10, from about $500,()()0 w $50 mllhon percancer death prevented. Sites at the h@ end result from complex contaminauon, requiring expensive cleanup, bu( posing low health risks or affectingrelatively few people, or both; however, other benefits for such sites may be signficam.
~Work for ~c ~p~enl of Energy ‘S cleanup of hazardous waste sites uses a value of $5 mdlion as Consistent With preventing a fatallty. (~leyW. Merkhofer et al., “A Program Optimization System for Aiding Decisions to Fund the Cleanup of Hazardous Waste Sites at Department of EnergyDefense Facilities, ” Superfi.tnd ’88, proceedings of November 1988 conference, Hazardous Materials Research institute, Silver Spring, MD.,) Otherbenefits include preventing or minimizing non-cancer health problems, loss of home values, and loss of a community’s economic activity anddevelopment. Moreover, addressing environmental problems could be significant; for example, in 1984 EPA estimated that about half of NPL sites posedthreats to sensitwe environments such as freshwater wetlands, coastal wetlands, and critical habitats. Cument EPA guidance suggests that a regulationis warranted if the cost per hfe saved is less than $1.5 milllon, Most Federal agencies regulate vigorously if the cost per life saved is about $2 millionor less.
~SupPfi~g ~ls ~rwtive is he following comment by Tom GrumblY, President of Clean Sites ~c.: ‘ ‘The EPA has a history of lurching fromone tactic to another without having developed an ovcrafl strategy. . Although 1‘m sympathetic to the wew that some of the Supcrfund commentaryhas been negauve, criticism can be traced back to EPA’s failure to articulate a definite strategy. ” Environmental Bumess Journul, May 1989.

Chapter 1 Summuryt Introduction, and Policy Option-s . 27
ments with responsible parties. Such actionserode public confidence in Superfund, makingmanaging it even more difficult,
Two facts about the Superfund program areworth recalling. First, even after nearly adecade, Superfund is still in its experimentalstages. It is an evolving program which hasprovided some benefits. For example, enormousamounts of toxic waste and contaminated soiland water have been identified and many siteswhich posed significant immediate threats tohealth and environment have been addressedthrough emergency and removal actions. But theNation has probably spent only about 1 or 2percent of what ultimately might be spent byall parties to clean up chemically contami-nated sites—now roughly estimated by OTAat $500 billion over 50 years.
Second, although the program seems largelyineffective and inefficient in meeting its objec-tives, most attention has focused on specificevents, sites, decisions, and narrow policies.This has blocked seeing the whole, complicatedSuperfund program and examining broad policyand implementation issues. After the originalstatute was passed in 1980, the accumulation ofmany administrative and legislative decisions(in the 1986 Superfund Amendments and Reau-thorization Act—SARA) have shaped andreshaped Superfund. Congress, EPA, and thepublic have not had the benefit of a major policydiscussion of where Superfund has come from,where it is today, and where it might go duringthe next 10 years and during the decadesthereafter.
Different Perspectives on Fixing Superfund
Among those who see a need for change, thereare fundamentally different perspectives on howto fix Superfund. Can incremental fine-tuningwork or are fundamental changes necessary? Inthis report, both types of improvements areidentified and discussed. Incremental changes(called program changes in this report) tendto be easier to implement in the near term
and are useful, but OTA’s assessment is thatfundamental changes (called strategic initia-tives in this report) will be necessary for aneffective long-term program.
Many people see Superfund mostly in termsof its financial and legal dimensions and believethat how Superfund is financed, how muchmoney it gets, how it is enforced, and how itimposes liabilities are key. For these people,some changes in these areas seem justified. Butit is Superfund’s environmental mission whichis its reason for being, and environmental andcommunity groups work hard to keep attentionfocused on that mission. All other issues pale incomparison. Stressing non-environmental goals(e.g., numbers of cleanup decisions and ac-tions, dollars obtained from responsible par-ties) polarizes environmental and communityinterests against those of industry and gov-ernment, and it encourages EPA officials tolose sight of their mission.
Moreover, there are clear links betweencertain groups and non-environmental issues;for example, major parts of American industry,which face paying for cleanups, and Superfundcontractors would like changes in Superfund’sliability provisions; by virtue of their trainingand interests, many people in the legal world andgovernment are inclined to see enforcement asthe key issue; industrial and insurance groupsfocus on level of funding and how the money israised through taxes and fees. It is important tosee whether, and if so how, addressing non-environmental issues affects the environmentalperformance of the Superfund program.
POLICY OPTIONS TO IMPROVESUPERFUND
Summary Policy Overview in Three Key Areas
Health and Environmental Priorities and Goals
Expensive cleanup actions could be post-poned when: 1) risks are not current, or 2)selected remedies are not to likely produce a

28 ● Coming Clean: Superfund Problems Can Be Solved . . .
Box l-C—Three Kinds of Inefficient Superfund Spending1
(OTA estimates that between 50 and 70 percent of current Superfund program spending is inefficient and undermines theenvironmental mission of the program. We discuss below three kinds of inefficient spending and explain how we arrive at theestimate of 50 to 70 percent. At any one site, some or all types of inefficient spending may occur. Many of OTA’s policy optionsare meant to address one or more of the three areas.
L Spending to address uncertain future exposures to hazardous substances released into the environment orremaining onsite and, therefore, speculative future risks to health and environment. OTA’s examination of FY87 and FY88RODS and a study by Oak Ridge National Laboratory of FY87 RODS
2 found that, overall, EPA finds about 50 percent of cleanupsnecessary primarily or, in many cases, solely because of hypothetical, speculative, and uncertain future exposures and risks. (Seetable 1-3 and discussion of policy option 1.) OTA analysis of data in the ORNL report substantiates that the percent of cleanupcosts attributable to uncertain future risks is about the same as the percent of cleanup decisions. Therefore, about 50 percent ofcleanup costs (whether paid by government or industry) are likely directed to reducing hypothetical risks which may notmaterialize. OTA calls such spending inefficient because of the opportunity costs, including: inadequate spending on sitediscovery and early site assessment, inspection, and ranking (i.e., EPA’s preremedial activities); delayed cleanup of sites whichpose current exposures and risks, and whose cleanup costs may escalate as contamination spreads into soil or groundwater; andthe deferral of cleanups from Superfund to other, often less effective cleanup programs (e.g., States), motivated in part by theneed to save Superfund money.
2. Spending on cleanup remedies which are unlikely to be permanent, leading to more spending in the long term forre-cleanups and perhaps posing expodures, risks, and damage to health and environment. OTA considers that a site hasbeen permanently cleaned up when the contamination that was the cause of high enough risk to warrant cleanup (either currentor future risk) is rendered irreversibly harmless through destruction (e.g., incineration or biological treatment) or recovery andmuse of the hazardous substances (e.g., recovery of lead from contaminated soil and buried battery casings). Using this definitionof a permanent cleanup, about 75 percent of FY87 and FY88 RODS selected impermanent remedies for cleanup of onsitehazardous waste and contaminated soiloul (see ch. 3). (An even higher percent of removal actions use impermanent remedies.) Also,about 75 percent of groundwater cleanups use technology that experience is now showing to be unreliable in practice, even thoughit seemed to be permanent in theory. (See ch. 3’s discussion of pump and treat for groundwater cleanup.) For these cases, therelationship between percent of decisions and percent of spending has not been assessed quantitatively. But on the basis of itsexamination of FY87 and FY88 RODS, OTA concludes that impermanent remedies contribute substantially to inefficientspending on cleanups, even though impermanent remedies usually cost less than permanent ones (see OTA’s 1988 case studyreport and ch. 3). For example, if impermanent remedies on average cost one-third as much as permanent ones, and three-quartersof decisions are for impermanent remedies, then half of total spending is for impermanent remedies, and is inefficient. OTA callssuch spending inefficient, because impermanent remedies provide uncertain long-tan pmection of health and environment andmay lead to substantial future re-cleanup costs.
Now assume, in line with Point #l, above, that spending on impermanent remedies is distributed 50/50 between cleanupsjustified primarily or solely by future risks and those with current risks. Then, avoiding double counting of inefficient spending,75 percent of spending is for impermanent remedies and future risks. And looking at the extremes, we see that, atone extreme,if all impermanent remedies are for future risk sites, then the total of inefficient spending is still 50 percent; at the other extreme,if all impermanent remedies are for current risk sites, then the total of inefficient spending is 100 percent. OTA concludes thatprobably 75 percent of the money spent on cleanups is inefficient because of the reasons discussed in Points #1 and #2. Fortypercent (or $1.7 billion) out of EPA’s Superfund total spending (of $4.4 billion) from FY86 through FY89 is for cleanup3 andtherefore, 30 percent of total program spending is probably inefficient because of the two reasons we have just discussed. Wediscuss the other 60 percent of program spending in Point #3, below.
3. Spending on the administration and management of the program, extensive site studies, and prolongednegotiations and litigation between government and industry (responsible parties) which is either unnecessarily high oravoidable with different policies and program management. From FY86 through FY89, about 16 percent (or $7(K) million)of EPA’s Superfund total spending (of S4.4 billion) was for site studies and 44 percent (or $1.9 billion) was for all types ofadministration and management activities.
Examples of unnecessarily high or avoidable study costs are: 1) RIFSs which have been of such low quality that furtherstudies by responsible parties, or work in the design phase or even work during actual cleanup has revealed the need to redo theEPA work; 2) RIFSs that have not made effective use of information from preremedial site studies, from removal actions, orearlier studies by responsible parties; 3) redundant, concurrent RIFSs by EPA and responsible parties motivated by distrust ofthe accuracy or completeness of the other’s work; 4) RIFSs for site problems that could have been judged on the basis of priorinformation to pose only future risks and, therefore, which could have been deferred; and 5) many policies and programrequirements which lead to excessive or ineffective analysis of cleanup al ternatives. (See OTA’s policy options on, for example,
Chapter I-Summa ry, Introduction, and Policy Options ● 29
defining and limiting permanent cleanup, hierarchy of cleanup methods, using site generic classification, and using technicalassistance experts in generic types of sites and technologies.)
Two examples of unnecessarily high or avoidable administrative and management costs are particularly important. The firstconcerns the large and complex system of contracts by which EPA spends about 90 percent of its funds. As we discussed in ourbackground paper,4 this contracting system has not been structured to achieve efficient spending nor has it been managedefficiently. s Secondly, the high level of autonomy given to EPA Regions, coupled with ineffective central management oversightand control by EPA headquarters mean that cleanup decisions are often vulnerable to challenge because they are inconsistentwith EPA policies or statutory requirements.
In OTA’s judgment, a major cause of unnecessarily high or avoidable costs for prolonged negotiations and litigation is theexcessive flexibility inherent in the current program (see discussion at beginning of this chapter). As a consequence of excessiveflexibility, there are many points of conflict or disagreement about cleanup objectives, about remedy selection, about enforcementof liability. These disagreements become the basis for prolonged and expensive negotiations and litigation between thegovernment and responsible parties (and often among responsible parties). In turn, confrontational negotiations and litigationlead to excessive and overly defensive studies and analyses to bolster the positions of adversaries.
OTA sees no possibility for precise quantitative analysis of the linkage between these areas and spending. However, it isOTA’s judgment that a substantial fraction of current spending on studies, administration, management, negotiation, andlitigation is inefficient, Support for this view exists. EPA has recently said that it wants to reduce RIFS costs by about 32 percent,and a number of EPA Inspector General and GAO reports have documented wasteful spending in the Superfund program.Moreover, the Army Corps of Engineers, which carries out large, complex engineering projects, spends only about 10 percentof its total budget (which is about twice that of Superfund) on administration and management compared to Superfund’s 44Percent.6 If we assume a range of one-third to perhaps two-thirds for inefficient spending, and apply it to the 60 percent of totalprogram spending covering these efforts, then from 20 to 40 percent of total program spending is inefficient because of the reasonsdiscussed here in Point #3. OTA defines as inefficient those administrative, management, study, and transaction costs that donot contribute to timely and effective cleanups. Unnecessary and avoidable spending outside of actual cleanups preemptsspending time and money on identifying and solving significant current health and environmental problems.
Conclusion---Combining the 30 percent from Points #1 and #2 with the range of 20 to 40 percent for Point #3, we estimatethat 50 to 70 percent of spending in the Superfund program is inefficient. This range probably also applies to private sectorspending on Superfund activities. Responsible parties perform about half of current site studies and cleanups and many of theiractivities and problems mirror EPA’s. For example, they also bear high administrative, management, and transaction costs. Butthe mix of private sector spending in the latter area is probably different than for EPA. Responsible parties are probably spendingmuch more, proportionately, on litigation than on studies, administration, and management. In addition to negotiation andlitigation with the government, responsible parties are in negotiation and litigation with other responsible parties, insurancecompanies, and private citizens and community groups. One recent review of Superfund concluded that ‘of the total funds spentsince 1980 . . . something between 30 and 60 percent has gone for legal expenses.”7 Of course, not all legal expenses areunnecessarily high or avoidable, but, here too, OTA believes it is fair to estimate that a significant portion of legal spending isunnecessarily high or avoidable and, therefore, inefficient.
INot all inMcimt speding iss complete waste, much of it produces something of value butt& qxmding is eit&r suboptitxul relative to pmgrsrn priorities(of wM t& public Ihinks tiy dmuld be) or it pmeulpts mom productive spending.
karolyn B. thy and W C. Travis, The Snpetjiuui Remedial Actwn Decuwn froces~, ~ contmcl wak pctfomd for EPA. Fifty out ofseventy-four RODs w~e cxamimd
3W ~ mA’g amlysis of EPA bud- ~.
4LJ.S. GXIm, offkc of Ttiogy Aswmnmt, Assessing CotUroctor Use in Supe @41d-Backgrotuld Puper, oTA-BP-tTE-51 (Washington, Ix!: Us.oov~ Printing Ofrm, Iuluuy 1989).
sNor has uxttr=t~ - -~ l=f~ ovorsight been suffkiem to idatt@ md prevent fmud wute, and ● buse. Sea EPA’s tmpectcx~ m m SUprfIKKJ in Much KUJ Scptanbcs 1988, ad a number of GAO rcpcm a Supafund contracts.
% conlp8rison Mwcm Supcrftmd and the Cqs is approximate; for example, the Corps tk$ not have expenses for cost recovery, but it faces costs forsitin# facilities, and tbc WY off8ct exh otk.
7~ticc R. -LKXg, “To ClearI Up the Residue of tigress, A NtioMI ~v~ ml Trust ~“ Financ’to have baa tnuk for both govcsmnent d priv8tc Sxxor spmding.
w, April 1989. % observation ~
permanent remedy. Box 1-C presents a discus- another on impermanent remedies. That spend-sion of the kinds of inefficient spending, one of ing could be used to bring more critical sites intowhich is spending to address future risks and and through the Superfund system, receiving

30 ● Coming Clean: Superfund Problems Can Be Solved . . .
fast interim attention and major—but not neces-sarily complete—risk reduction. Only whenexpensive thorough cleanups are necessary toaddress current risks would they be used, unlessresponsible parties wanted to finance cleanupsfor future risks. The cost for faster and morewidely distributed near-term protection on themost hazardous sites is that many less hazardoussites would be waiting for their final cleanup.Essentially, with this strategy, the current back-log at the front-end and in the middle phases ofSuperfund would be exchanged for a backlog atthe back-end of the program.
There are other components to the overallstrategy. Another kind of inefficient spending isfor umecessarily high or avoidable administra-tive, transaction, and study costs. This is thethird factor discussed in box l-C.
Workers and Technology:
1. Improve quality of government and con-tractor work to reduce costs of making andfixing mistakes in studies and actions.
2. Develop and use technologies and meth-ods which reduce unit costs for siteinvestigation and cleanup and providebetter information for decisionmaking.
Government Management:
1.
2.
3.
Through improved technical capabilities,make the system more efficient by reduc-ing time and cost for necessary tasks,particularly site studies for a larger num-ber of sites moved into the system, and byeliminating unnecessary tasks.Reduce unnecessary and unproductive trans-action costs and delays related to enforce-ment, lack of public confidence, andpolicy conflicts.Provide clearer program needs, goals, andpriorities to the private sector, and pro-mote competition among private sectorproviders of services.
Policy options
There are many near- and long-term ways toimprove the environmental effectiveness andeconomic efficiency of Superfund. The 38policy options described below are comprehen-sive but not exhaustive. They are diverse—someare broad, substantial changes in the direction ofthe program and have been called strategicinitiatives. Implementation of a significant num-ber of the strategic initiatives would result in arestructuring of the program. By their nature, thestrategic initiatives will engender strong supportor opposition from different interest groups.Other policy options are called program changes,and these could be integrated into the currentprogram. Each option has the potential toimprove Superfund. They are not mutuallyexclusive or mutually dependent; each optionstands on its own. All or some of the optionscould be implemented although, as discussedbelow, some of them are strongly related toothers.
Although some of the following policy op-tions might be implemented solely by EPA, thefocus is on congressional actions. And evenwhen an option might, theoretically, be imple-mented by EPA alone, considering the history ofSuperfund, it may be beneficial for Congress toexpress itself. When OTA’s assessment hadbeen nearly completed, EPA released its reportA Management Review of the Super-fund Pro-gram (June 1989); it was the result of a limited90-day EPA review of the Superfund program.OTA has not presented a detailed comparisonbetween EPA’s intended actions and OTA’sfindings and policy options. A follow-up EPAreport will provide the necessary details on howEPA’s recommendations will be implemented.28
EPA’s report announced “a new long-termstrategy for Superfund" and presented 50 recom-mendations for improving Superfund. In gen-eral, there is some agreement between EPA’s
2SmC HOW commltt= on ApprOpria@ns Said $ ‘~]e the repo~ pf tie $)()-day management rewew contains many thoughtful rezornmendations,h remains to be seen what decisions will be made and what actions will bc taken to make these reforms a reality. Report 101-150, July 17, 1989,

Chapter I-Summary, introduction, and Policy Options ● 31
and OTA's identification of major problems andissues. The EPA report offers an importantrecognition of problems in the Superfundprogram, and its specific recommendationsfor improving the program are significantwithin the effort’s attempt to fine-tune theprogram and not make major changes in it.Many of the specific issues addressed by OTAand its policy options, however, are not similarto those in EPAs report, including, for example:site discovery, preremedial site evaluation, se-lection of remedy, permanent cleanup, cost-effectiveness, variable cleanup objectives, im-pact of settlements on cleanup decisions, andinconsistencies with statutory preferences andrequirements.
Below, the basis and nature of each OTAoption is discussed, then its benefits, and thenimplementation issues, including concerns, prob-lems, and costs. Linkages to other options andchapters in the report are also made. Beforereading all 38 policy option sections, the readerwill probably find it useful to peruse table 1-1 toget some sense of their scope and diversity.
PART I: Strategic Initiatives
Setting Cleanup Priorities and Goals
OPTION 1: Set Priorities on Basis of Currentor Future Risks
There is a desperate need to find an environmen-tally sound way of setting priorities and makinghard choices. Current implementation is tooinfluenced by non-environmental factors, suchas the willingness of a responsible party to payfor cleanup, or the ability of communities to getpolitical and news media attention as well assupport from national organizations—whichdepends more on a community’s affluence oreducation, than on environmental needs. Withthis option, a critical distinction would be madebetween current and future health and environ-
mental risks posed by sites on the NPL. Thatdecision could be made in an official EPAdecision document, including the supportingfacts and analysis, or it might be included as partof a site’s initial proposal for the NPL or as partof an initial ROD. Box 1 -D presents questionslikely to be raised about this option and OTA’sresponses to them.
Cleanup actions based solely or primarily onfuture potential risks would no longer competeon an equal standing with actions justified on thebasis of current risks or damage to sensitiveenvironments. For example, Class I sites wouldpose current risks to health or environmentaldamage and Class II sites would pose futurepotential health risks or environmental damage.However, the delayed cleanups for Class II siteswould not replace the priority assigned tointerim recontrol actions necessary to preventsites from becoming worse through the spreadof contaminants into the environment. Moreo-ver, assignment to either Class would not berigid; new information about a site or actions ata site could justify reclassification.
Major decisions and allocation of resourceswithin all Superfund implementation phaseswould automatically put Class II sites into asecond, lower priority state; within Classespriorities might be based on chronological orderof initial site discovery or identification (whichwould serve as a worthwhile incentive for earlysite discovery), and/or relative levels of assessedrisks.29 Classification could change over time,as actions (what EPA now calls removals andoperable units) are taken at a site to mitigaterisks. The default option when too little informa-tion exists for making a judgment about currentv. future risk would be a Class I designation.
Exposure and risk assessment are by natureimprecise and produce uncertain results whichare dependent on who does the work. Neverthe-
29@c ~pro=h ~ou]d & [0 ~~~ll~h high, m~m, ad low r~gcs o f risks wi[hin cl-s I ~d 11, For ex~ple, for Cmcinogenic risks, High = greaterthan 1 m 1,000, I.mw = less than 1 in 1, O(X),000, MedIurn = the range between H@r and LcIw; for use of the H~ard Index for non carcinogenic materials,High = greater than 50, Imw = less than 2, and Medmrn = the range in between.

32 ● Coming Clean: Super-fund Problems Can Be Solved . . .
Box I-D-Questions and Answers About Policy Option 1Is This Idea Inconsistent With Current Law And Program?
The law requires a consideration of present and potential threats to health, welfare, and environment. From thevery beginning of Superfund, it was recognized that some threats are imminent, even emergencies sometimes. Thus,the need for the removal part of the program. However, in the most expensive part of the program--remedialcleanups-an explicit distinction between current and future risks has not been made. If the scope of the nationalcleanup problem were small, it would not be important to make this distinction. But with so many sites requiringcleanup, not making this distinction means that some sites which pose risks in the near term may not get cleanupsin the near term, while other sites which might pose some risk in the future will get cleanups in the near term.
Is This Idea Just a Way To Reduce Superfund Spending?This option has no bearing necessarily on increasing or decreasing total Superfund spending. This option only
provides away to decide priorities and to decide exactly how whatever money is appropriated or otherwise madeavailable is spent.
How Do We Know Whether a Site Poses Current or Future Risks?The key to moving beyond information about site contamination with hazardous substances to risks is to
evaluate specific paths of exposures. Exposure pathways will be based on some current condition, such as peoplehaving contaminated groundwater as their only source of drinking water, or some possible future condition, suchas people using a site for recreation or housing and children possibly eating contaminated soil. Cleanup may bewholly or mostly justified on the basis of current or future exposure, or some portion of a site may be assessed topose current exposure and another only future exposure.
If Risk Assessment Has So Many Problem% How Can We Confidently Assess Current v. Future Risks?Exposure assessment combines qualitative information about a site’s contamination and human and ecological
receptors which can contact the contamination. Formal, quantitative risk assessment, based on detaileddose-response relationships, has more uncertainty and is not necessary.
Will Addressing Current Risks First Mean Using More Low Cost Actions Like Land Disposal?Placing the highest priority on addressing current risks may entail using recontrol and interim actions to reduce
current risks to safe levels. Those actions may use permanent technology which is practical and cost-effective orthey may use other kinds of treatment technology, land disposal or containment, and institutional controls. But nosite would be considered finally and completely cleaned up--and delisted from the NPL-unless permanent cleanuptechnology had achieved a final cleanup.
Will Sites Ever Get Permanent, Final Cleanups?Sites will get their current risks addressed, possibly with permanent cleanup technologies, but may have to wait
for a final cleanup which addresses future risks. But eventually the government must provide such sites with finalremedies which use permanent cleanup technologies to the maximum extent practical.
If Future Risks Are Not Worth Addressing Now, Why Spend a Lot of Money Lateron Expensive Permanent Cleanups?
This option does not change the current law or national policy. The government is just as obligated topermanently clean up sites which pose potential risks as ones which pose current risks. The issue addressed by thisoption is the timing of final, permanent cleanups. The Nation has already decided that it is worth cleaning up sitesto protect health, welfare, and environment. But since we cannot do everything at once, some environmentallysensible way of allocating scarce resources is necessary.
less, the uncertainty about future potential risks cleanups are based on hypothesized scenarios,is intrinsically different qualitatively. Study of such as possible future use of land or groundwa-past Superfund site decisions shows that many ter (see box l-E). Indeed, EPA sometimes has

Chspter 1-Summary, Introduction, and Policy Options ● 33
Box 1-E—Example of Using Current v. Future Risk in Cleanup Decisions
The approach in Policy Option 1, of using the distinction between current and future risk as a primary way todecide whether to clean up a site, is used currently, to some extent. The Record of Decision for the first operableunit of remedial cleanup for the Arkansas City Dump site in Arkansas City, Kansas was signed in September 1988.
A key part of the decision was that there was only one current risk which required near-term attention. Thatrisk was direct exposure by onsite workers to acid sludge; workers might get burned if they came into contact withthe 47,000 tons of the sludge onsite.
However, the groundwater under the site was found to be heavily contaminated with arsenic, beryllium, anda group of polynuclear aromatic hydrocarbons. The total carcinogenic risk resulting from long-term ingestion ofthe groundwater was said to be greater than 1 in 1,000 (actually, the figures in the ROD suggest a risk in the orderof 1 in 100, which is very high). Testing of offsite groundwater did not find contamination from the site.
The ROD said: “It must be remembered, however, that the risk of cancer is present only if consumption ofground water from contaminated aquifers were to occur based on a 70-kilogram adult over a 70-year lifetime. Atthe present time there is no known consumption of onsite ground water, and consumption of offsite water poses norisk. ‘‘
With this reasoning, EPA elected to postpone consideration of groundwater cleanup until a second operableunit ROD. However, from a discussion OTA staff had with the site’s remedial project manager, it appears that EPAmay not pursue groundwater cleanup. Indeed, on the basis of the absence of current risk and lack of evidence thatcontaminants are causing a problem in surrounding groundwater or the nearby Arkansas River, EPA could maintainthe same reasoning used in the first operable unit ROD. The only complication is that EPA invoked the formalwaiver provision of SARA in order to postpone groundwater cleanup in the first ROD. This was necessary becausethe groundwater contamination was found to exceed State and Federal drinking water standards. The issue for thefuture becomes whether EPA can postpone groundwater cleanup on the basis of no current risk and, if that is thecase, also postpone addressing the source of the groundwater problem. The latter seems to be a large amount ofsubsurface petroleum material and buried metallic waste.
The estimated cost of the remedy selected in the frost ROD is less than $1 million; it is based on in situneutralization of the acid sludge and a soil cover. If complete source control and groundwater cleanup were pursued,cleanup would probably cost from $20 million to $40 million.
With OTA’s Policy Option 1, deferral of this groundwater cleanup and full source control would be acceptable,but the site would not be considered permanently cleaned up, it would not be delisted from the NPL, and there wouldbe continued monitoring of the surrounding groundwater offsite as well as institutional controls prohibiting use ofonsite groundwater. As the above figures show for this example, a relatively large amount of money would becomeavailable to address current risks at other sites. This example, however, also shows the difficulty of postponingexpensive cleanup, for addressing future risks, under current statutory requirements.
sOmcE: office of lbchnology ANesmUm, 1989.
applied this option, as illustrated in box l-E. actions, as resources become available. ThisThis example shows the considerable potentialfor shifting spending with this option.
Benefits: It is sound environmental thinkingto defer actions when risks are future, potential,and highly uncertain. The chief benefit would bechanneling Superfund resources where they aremost needed. At many sites, limited cleanupactions may effectively deal with current risks,while leaving future uncertain risks for future
means that site studies would be smaller andfaster, because whole final remedies requiremuch more study. (Other options presentedbelow would help reduce studies.) Interimremedial actions would be easier to define andimplement.
The cost of not delaying final remedialcleanups is to postpone attending to sites withmore certain current risks. Postponement means

34 ● Coming Clean: Superfund Problems Can Be Solved . . .
that people suffer health effects, sensitive partsof our ecology are damaged, and sites get worsefrom the spread of contamination.
Another benefit is that criticism of manycleanups would be reduced; what often nowappears to be an inconsistent or ineffective finalremedy may be a compromise remedy becausethe site only poses a future, uncertain risk.Currently, instead of not acting (or using arecontrol approach), a lower cost, less stringentfinal cleanup is chosen, in part because responsi-ble parties and government officials want toreach closure on sites.30
Finally, delaying final cleanup probably in-crease the chances that an innovative treatmenttechnology leading to better cleanup will beavailable.
Implementation: The current statute requiresEPA to address future potential risks; it doesnot, however, preclude EPA from implementingthis option. However, because this option wouldhave major impacts, congressional action seemsnecessary. This option could be implementedalong with the currently used Hazard RankingSystem. With current site study and risk assess-ment practices it is possible to identify the
difference between current and future risks, andto distinguish current or potential environmentaldamage. For example, consistent with OTA’sobservations, the Oak Ridge National Labora-tory study was able to distinguish betweencurrent and future risks in all but 4 of the 50RODS it examined.
The State of Missouri uses a site classificationsystem which makes the kind of distinctiondiscussed here. The State notes that:
The relative need for action at each site is basedsolely upon the potential impact of the site on publichealth and the environment. The type of actionrequired, the feasibility of such an action, and its costbenefit are not the primary factors in decidingwhether the action is needed.31
The Missouri experience demonstrates an im-portant aspect of current-future risk classifica-tion: it does not require detailed, quantitativerisk assessment. Qualitative analysis of a siteand exposure routes can be sufficient to identifythe presence of future risks for all or part of asite. New Jersey has recently found it necessaryto distinguish between ‘proximate risk and longterm priorities ‘‘ in order to ‘‘ensure work on the‘worst’ cases first’ and to ‘‘allocate resourcesto high priorities. A proximate risk remedy or
30A g~ exmp~e of~ls is ~e FY88 ROD for tie Coshocton City Landfill site in Ohio (discussed in ch. 3). The responsible ptiies con~st~ EPA’s
P- containment remedy s ttcc.essfully and a less stringent cont. “ammcnt cleanup was obtained. The responsible parties said: ‘‘Gwen the negliblepresent risk and speculative future risk, the remedy would not seem to meet any kind of test for cost-effectiveness. . . In the absence of any significantpresent threat to human health and the environment, EPA appears to rely on the potential threat of future releases and their postulated impact on humanhealth and the environment as a justification for requiring corrective action at the site. EPA admitted that potential threat of future releases was a‘ ‘majorfactor’ in its original remedy Seldon. OTA’S point is that, with this option, EPA could have defended a mxd for a recontrol action-perhaps as stringentas its original containment remdy+d eventually had a strong case for a stringent final remediat cleanup. With the current ROD, there is considerableuncertainty about how future cleanup needs will be addressd after the likely settlement is obtained, and public accountability is mmimat after the ROD.Similarly, the remedy selected in the fiscal year 1987 ROD for the large Bayou Sorrel sne in Imuisiana, which gets flooded periochcatly, essentially gavethe responsible parties the containm em remedy that they wanted in order to agree to a settlement, but which had been opposed by most of the comm unityand others. In an internal memorandum urging approval of the remedy, EPA staff noted that ‘‘the endangerment posed by the site is questionable andthe risk assessment for the site is not well prepared. With this option, the containm ent action would be considered a recontrol, interim remedy requiringclose monitoring, rather than the final cleanup with delisting from the NPL. [t also has become clear, since the completion of the Feasibility Study inearly 1986, that the cost of the rejected onsite incineration option has become much lower than the one estimated originally.
3 I Briefly, WsWfi cl~s I si~s pose imminent tiger and require immediate action; this IS like EPA current emergency and, possibly, removalactions. Class II sites pose significant threat and require action; this is Ilke EPA’s current remedial cleanup program. But Class 111 sites are such thataction may be deferred. Here are some examples of statements for specific Missouri sites which illustrate the nature of Class III sites, conflnn thefeasibility of identi~ing future risks, and show the consistency with the approach of this policy option: ‘ ‘There are no known environmental problemsat the present time, but there is the potential for surface and groundwater contamination at the site due to the leachable nature of the wastes. ‘‘Followingremedial actions at the site, residual contamination remains in the soil and groundwater. Groundwater in the area is not used for drinking. ‘‘. . . thepotential does exist for soil and surface water contamination If drums deteriorate. “ “NO environmental problem exists at this site unless it is disturbedby construction and/or drilling. ” “ There is some possibility for contamination of groundwater due to permeability of the soils. Surface watercontaminadon from erosion is also a possibility. Missouri Department of Natural Resources, Division of Environmental Quality, “ConfirmedAbandoned or Uncontrolled Hazardous Waste DisposaJ Sites in Missoui--Fiscat Year 1987 Annual Report. ”

Chapter 1-Summary, Introduction, and Policy Options ● 35
interim action addresses “areas of immediateenvironmental concern, in which it is possibleand necessary to control the contaminant sourceand reduce or eliminate the threat to the potentialreceptors." 32
An immediate question to raise is: What iscurrent? A legitimate environmental concern ispotential abuse of the current-future risk distinc-tion by an over-zealous placement of sites intoClass II. Functionally, the need is to definewhether a cleanup action is necessary in the nearterm or whether it can wait for some years. Theplanning horizon for site cleanup is about 5years, from serious site study to serious implem-entation of the selected remedy. Therefore, if anexposure currently exists or is likely withinabout 5 years, the risk could be consideredcurrent. If this period is increased (i.e., movingfrom what exposure is likely to what maypossibly occur), then the intended benefits ofmaking a distinction between current and futurerisks would be reduced.
A legitimate concern is whether the timewould ever come when resources would beavailable for Class 11 sites. Would, for example,the continued discovery of Class I sites alwayspreempt taking actions at Class II sites? Wouldpolitical will and funding diminish for secondpriority actions’? Would the whole system moveback to using impermanent remedies, convert-ing current risks to future risks? These uncer-tainties cannot be completely removed. How-ever, they should be compared with the proba-bility that unless this risk distinction is made, theSuperfund syndrome presented earlier will getworse and many sites will get worse fromcomplete inattention. Honoring the nationalcommitment to address Class 11 sites can beaccomplished institutionally, for example, bykeeping Class 11 sites on the NPL (not delistingthem) or otherwise removing their visibility.Moreover, this option presumes site recontrol
(controlling current exposures and preventingsites from getting worse) for Class 11 sites andthat interim remedial actions (addressing currentrisks) for them fulfill the statutory preference forusing treatment technologies.
On a more technical level, implementationcould be made difficult by the quality ofinformation and analysis during the history of asite. Site investigation is a continuing processwhich starts with the first evaluation of a site andcontinues throughout a site history until com-plete, final remedial cleanup is attained. Site riskclassification must always be a professionaljudgment because qualitative or quantitativerisk assessment is not a precise science, nomatter who practices it. But it would be usefulfor successful implementation of this option ifEPA provided more refined guidance for theconduct of risk assessments and made theanalytic procedure more consistent by users inorder to reduce variations in risk estimates (thisis also important for Option 4).
Another potential problem is that communi-ties might insist on more and more site investi-gations to prove a site would be safe as a ClassII, thus effectively keeping sites in Class I. EPAneeds to document its case for Class II designa-tion with care. Conversely, certain safeguardsfrom a community perspective are necessary.For example, assignment to Class II in EPA’sofficial decision document could be subject toan appeal process. Moreover, assignment toClass II would not preclude a community fromreceiving a Technical Assistance Grant underSuperfund. And there could be a formal proce-dure for petitioning reclassification to Class Ionthe basis of new information obtained by partiesother than EPA.
As information increases and becomes morecomplete and accurate, the assessment of whetherthe chief risks are current or future may change.Moreover, many factors not directly associated
32NCW Jer~y ~lvl~]on of Wakr Re~ur~e~ HUardOUS Wawe Programs Case Management Commllwc, L’dsr Munagemenz .$rrareg)’ MunuuL daft,May 1989.

36 ● Corning Clean: Superfund Problems Can Be Solved . . .
with the site, but which affect exposures—suchas nearby residential development—and, there-fore, risks may also change over time. These toomust be a basis for reassessing site risk classifi-cation. 33
Another implementation issue is whether thisoption would pose a serious obstacle to thegovernment’s obtaining complete payment ofcleanup costs from responsible parties. Actionwould not have to be deferred because of futurerisk classification if one or more responsibleparties are able and willing to pay for thenecessary cleanup. But communities could seethis penalizing fund financed deferred cleanups.Payment of an upfront cash premium to coverfuture costs for deferred cleanups is also possi-ble (see Option 15).
Implementation could be thwarted becausethe States have the power to withhold the legallyrequired 10 percent match for fund-financedcleanups. For example, a State could makecleanup of a Class I site impossible, even thoughEPA deemed it a high priority, and could offermatching funds for a Class II site for which EPAdetermined a sound basis for deferring action.This potential problem could probably be han-dled in most cases by negotiation between EPAand the highest levels of State government, if thepublic were kept informed. An example of thisState authority being used in association withfuture risk recently occurred for the SacoTannery Waste Pits site in Maine. The basis forEPA’s original cleanup decision was future riskin the event of residential development. But,without viable responsible parties, the Statewanted to reduce its cost. It convinced the EPAto switch from a $33.5 million cleanup based onchemical fixation of hazardous material to a $10million one based on containment of the site, so
it could save $2.35 million. The State mustassure that no one will develop the site. EPA willavoid spending $21 million to address the futurerisk at the site.
OPTION 2: Establish a Federal SiteDiscovery Program
The Federal Government could establish asite discovery program whose mission was toidentify chemically contaminated sites whichmay require cleanup, including those whichmight not be managed within the Superfundprogram. A number of different approacheshave been used on a limited basis with resultsgood enough to justify full-scale national appli-cation. In particular, there is a large inventory ofhistorical aerial photographs and procedures foranalyzing them can identify likely chemicalwaste sites which are no longer readily apparent.
Benefits: It is in the national interest to knowthe full scope of the cleanup problem as soon aspossible. Only in this way can effective andefficient national strategies, policies, and pro-grams be conceived and implemented. Settingsharper and more useful cleanup prioritiesrequires that program managers understandwhat their current and future workload really isor will likely be. Moreover, the laws of nature—principally entropy—mean that undiscoveredcontaminated sites will become more difficult toclean up over time. Contaminants will leavetheir original containers or places of disposal,spread into the environment, increasing the sizeand complexity of cleanup. Money spent on sitediscovery would be relatively small compared toalmost all other Superfund activities. For exam-ple, a site discovery program that started at $5million per year and increased to say $25 millionper year over 5 years pales in comparison to site
qq~e ~p]e may view this witi aIarm because, for example, it suggests that a developer might intentionally locate a new residential communitynear a Class II site in order to obtain a Class I rating and a permanent cleanup which removes a disadvantage of the loath (and increases its marketvalue). Given the time and uncertainties for achieving complete cleanups, this is not likely to be a significant problem. Moreover, the government couldtake the position that until the new exposure situation existd the site remained Class 11; this would make it difficult to initiate and implement the newdevelopment. But it can also be argued that providing this kind of incentive for final remedial cleanup (or removing the disincentive for worthwile useof the land) is not without merit.

Chapter I-Summary, Introduction, and Policy Options ● 37
study and cleanup costs. Moreover, identifyinga few serious sites a year and taking earlycleanup action could pay for the entire programseveral times over in reduced cleanup costs.
Implementation: Current cleanup staffs resistsite discovery for different reasons. Addingmore sites to the program makes achievingsuccess and meeting performance goals seemmore difficult; and discovering new seriouscleanup sites also challenges conventional wis-dom that the worst sites are already known(which OTA shows to be incorrect in ch. 2).EPA has resisted a formal site discovery pro-gram in part because sites would be identifiedwhich would not necessarily qualify for cleanupby Superfund. However, this should not block asite discovery program, because knowing whatthe appropriate cleanup program is cannot bedetermined until the sites are identified andassessed. This option requires congressional andEPA commitment, consistent with a long-termnational cleanup program.
OPTION 3: Use Environmental Criteria toEliminate Sites at PA and SI ScreeningStages
Bureaucratic criteria now being used to con-trol the flow of sites into and through theprogram, in order to achieve performance goalsand meet resource constraints, would be re-placed by environmental criteria. Instead of asite being judged-on the basis of very sparseinformation-to be contaminated enough tomerit attention by Superfund, the critical deci-sion would be whether or not the site appearedto require cleanup. There is no information oranalysis to support the contention that siteseliminated from the Superfund program thatmay require some degree of cleanup willreceive adequate attention from other cleanupprograms. The presumption in this option isthat a site eliminated from Superfund is notassured of cleanup elsewhere. Indeed, getting
cleanup attention elsewhere is made difficult by:1) the stigma of being eliminated from theSuperfund program, and 2) the demand forresources in other programs to address the manysites which do make it through the Superfundsystem and on to the NPL. (For example, Statesmust provide matching funds for government-financed cleanups and may have insufficientfunds to carry out all other cleanups; responsibleparties and Federal agencies would naturallydevote resources to required cleanups.)
Benefits: Improving public confidence inSuperfund and reducing public outrage requiresthat key program decisions be based on soundenvironmental thinking. Over time, by creatingexcessive flexibility, Superfund’s managementhas met resource constraints, in part, by bureau-cratically controlling the workload of the pro-gram. If Superfund is primarily a public healthprogram, then it ought to employ standardthinking used in health screening. This meanshaving as much, if not more concern, for falsenegative findings in the earliest stages ofSuperfund than for false positive ones. That is,making certain that sites which really do requirecleanup are not eliminated should be of para-mount concern to the government. Letting sitesthrough which really do not require cleanup isimportant because money could be wasted,perhaps preventing action at sites which reallyrequire cleanup. However, subsequent site workcan and sometimes does reveal the false positiveproblem. But a site falsely eliminated fromSuperfund may never be rediscovered—until,that is, the problem becomes evident throughdamage to health or environment.
Implementation: This option probably re-quires statutory direction to EPA. The key issueis the need to let sites proceed through thesystem until reliable information and its analysiscan be used to make an environmentally sounddecision about the need for cleanup.
38 ● Coming Clean: Superfund Problems Can Be Solved . . .
OPTION 4: Remove Range of AcceptableRisk Objectives
Because environmental standards currentlyexist for only a tiny fraction of cleanup situa-tions, especially for safe limits of contaminantsin soil, EPA has appropriately used risk assess-ment as a means to set cleanup levels. However,the current broad range of acceptable risk(expressed as above normal deaths in a popula-tion), from 1 in 10,000 to 1 in 10 million posesopportunities to compromise environmental pro-tection at sites and to have inconsistent cleanupsnationwide. 34 With this option, the range wouldbe replaced by a single value.35
What that value should be deserves attentionbeyond the scope of this study; however, itappears that a value of 1 in 1 million with avariance procedure is most consistent withcurrent decisions. Moreover, the inherent limitsto current practice (e.g., examining only indica-tor contaminants for which health effects dataexist), and the need for a margin of safetyrelative to the considerable uncertainties of riskassessment support this level of risk. Yetanother reason for a margin of safety is thatwhatever a cleanup objective is set at, corre-sponding to a risk of 1 in 1 million (e.g.,concentration of contaminants in soil), theactual cleanup will have some statistical spreadaround that target. Some people may believethat this level of risk is overly stringent, but the
popular belief that risk assessment is intrinsi-cally overly conservative has recently beenshown to be inaccurate.36
It should also be understood that the riskconsidered here refers to individual risk, nottotal population risk. This option presumes, ofcourse, that explicit cleanup goals or standardsfor a site are set. But, in fact, this is not the casefor many sites. One problem is that manycleanups are implicitly based on cleanup tech-nology performance, for whatever cleanup tech-nology is selected, which most of the time is notone based on destruction of hazardous material.Another way of seeing this current form ofimplementation is that there often is no explicitrisk reduction identified as the goal of cleanup.
Benefits: Removing environmental protec-tion as a variable in cleanup decisions canimprove public confidence in Superfund. Cur-rent excessive flexibility would be reduced.From a long-term perspective, reducing cleanupcosts through lowering of cleanup levels is notconsistent with the basic environmental missionof Superfund. When circumstances exist to usea higher level of acceptable risk, then theyshould be articulated by the government anddefended on technical or fund-balancinggrounds. Using a single acceptable level of riskalso offers an opportunity for more certainty inthe operation of Superfund. It removes one issueover which there sometimes is considerable
34A ~nt exarnination of cleanup levels said, ‘4. . . if the allowable level of risk is not held constant, “How Clean Is Clean?’ levels become ‘movingtargets’ and the probability that they will be applied inconsistently increases significantly. D. Killian, “‘How Clean Is Clean?’ contaminant remrxdiationlevels in soil,” in Managewwuof Hazardow Materialr aria’ Wastes: Treatment, Minimization and Environmental lrrpacts. Edited by S.K. Majumdar,E.W. Miller and R.F. Schrnalz, 1989, The Pcmsylvania Academy of Science.
ss~rdingto EPA, ith~not USCXIt,he lowest end oftie risk range (i.e., 1 in 10 million). Moreover, in defending why the range should not be narrowedby reducing the lowest risk by a factor of 10 (to 1 in 1 million), as desired by the Office of Management and Budget to prevent higher cost ckamqmEPA also noted that its risk range “has not been a point of contention” with responsible parties. (EPA internal memorandum, identified as the notesOf famer Assistant Adnum“ “strator J. Winston Porter, Sept. 30, 1988, in Committee Print 101-B, Subcommittee on Oversight and Investigations, Hou=Committee on Energy and Commerce, March 1989.) Why was EPA successful in convincing OMB to keep the original risk range? EPA told OMB thatranovingthe Iowestrisk, which it had not used, would, however, lead to a ‘” !irestorm’ which might ‘destroy much of [its] flexibility. But the flexibilityreferred to by EPA was at the opposite end of the risk range; that is, higher risks (i.e., Ies than 1 in 1 million) have been used by EPA and sometimeshave been important in aelecting mnedics with lower costs which have facilitated settlements with responsible parties. Selecting higher risk levels hasbca a point of contention with site canmunities.
~John C. Bailar, 1~, et ~.. “One-Hit Models of Carci.nogenesis: Conservative or Not?” Risk Analysis, vol. 8, No. 4, 1988. The study found thatmkmstimation of risk occurs in about 2.5 to 4 percent of the cases, and overe stimates occur in about 5 to 7 percent of the cases. This paper has beeninstrumental in supporting the position that risk assessments of chemicat hazards are not nczasarily substantially conservative. Ln the case of vinylchloride, for example, standard risk asaessm ent methodology underestimatcxi risk by a factor of 9.

Chapter 1--Summary, Introduction, and Policy Options ● 39
confrontation and costly delay. This option,however, offers no benefits relative to cleanupdecisions for sites posing threats from sub-stances which cause health effects other thancancer and threats which are not now describedin terms of numerical risks, such as threats tosensitive environments.
Implementation: Action by Congress seemsnecessary for such a critical policy change.Because of the sensitivity of the issue of not onlyselecting a specific level of risk, but of selectingwhat that risk is, it might be useful to begin withan independent study. The study would examinethe issue and provide a recommendation for anational risk level for cleanup based on healthand environmental protection criteria only. TheNational Research Council has performed anumber of relevant studies in the past, such as onrisk assessment and the Oak Ridge NationalLaboratory has performed very detailed work onthe use of risk assessment in Superfund.
A major concern about this option, espe-cially from responsible parties and govern-ment officials, is the inevitable loss of flexibil-ity in determining site cleanup objectives.But to people living near Superfund sites,flexibility has meant the ability to legallyreduce the stringency of cleanup in order tosecure funding from either the governmentor responsible parties. In other words, thecurrent range of acceptable risk automaticallymakes it legal to offer varying degrees ofprotection to people without explicitly explain-ing why that is appropriate or necessary. Thepublic is especially sensitive to less stringentcleanups based on higher than normal (forSuperfund) risk levels, because normally nobenefits to the community are lost by demand-ing the most stringent cleanup. (One exception,which has occurred at several Superfund sites, iswhen a responsible party is also a majoremployer in a community.)
Another potential problem is that the inherentlack of precision in risk assessment and its
susceptibility to subtle manipulation could makethe use of a single value of acceptable riskineffective. Refining guidance on risk assess-ment methodology to tighten its application,therefore, should be part of any study on thisoption.
Some consideration should also probably begiven to the question of whether estimating risksat Superfund sites should take into accountexposures to similar hazardous substances fromnearby sources. For example, there may be othercleanup sites nearby. Or the government ToxicRelease Inventory database obtained under TitleIII of SARA could be used to factor in exposuresfrom industrial operations. It is difficult, from ahealth protection perspective, to judge cleanupneed or extent in isolation, ignoring otherexposures which, in some cases, might make thecritical difference between cleanup or no cleanup,or affect cleanup standards significantly. Thisoption does not preclude following the currentstatutory requirement to use applicable or rele-vant and appropriate regulations (ARARs),which, however, do not cover many contamin-ants and exposure routes at Superfund sites.Finally, the use of national cleanup standards,particularly for soil cleanup, is another way toachieve certainty and efficiency by steppingoutside of the risk assessment methodology (seeOption 5).
OPTION 5: Establish National MinimumCleanup Standards
All cleanups of chemically contaminatedsites, performed by any public or private entity,would have to comply with minimum Federalrequirements comparable to those of Superfund.All available information indicates that verydifferent procedures, actions, and results areoccurring in different Federal, State, and privatecleanup programs. For example, the use of landdisposal is far more prevalent outside of Super-fund (see ch. 4), the influence of those paying forcleanup on decisions about the scope and levelof cleanup appears more significant in programs

40 ● Coming Clean: Superfund Problems Can Be Solved . . .
outside Superfund, and substantially differentlevels of residual contamination in soil andwater pervade the national cleanup system.Federal requirements could include, for exam-ple: compliance with existing Federal numericalstandards for safe levels of contamination in air,water, and soil when they exist, unless morestringent standards have been set by the State;setting numerical standards for cleanup goals ofmajor types of contaminants unless a waiver wasgranted in response to a detailed environmentaljustification for so doing (e.g., acceptable resid-ual levels in soil of lead, PCBs, and creosotechemicals); use of standard exposure and riskassessment methodology and acceptable level(s)or risk to establish cleanup objectives; thepreference for permanent onsite treatment reme-dies; use of a Superfund hierarchy of cleanuptechnologies and methods; use of cost-effectiveness analysis as a means to minimizesite cleanup costs after determination of sitecleanup goals; full public participation fromstart to finish of the cleanup process; and 5-yearreviews of sites where contamination remains.
Benefits: National standards would introduceconsistency and certainty into the nationalcleanup effort. Excessive flexibility would bereduced. The flight from Superfund wouldlargely be stopped and, therefore, sites deferredout of Superfund would not be penalized byreceiving less stringent cleanups; this wouldalso reduce future Superfund needs.37 Thosepaying for cleanups, including all types ofgovernment agencies and companies, wouldhave: 1) less incentive to shop around for acleanup program which posed the least stringentrequirements and, hence, minimized their costs,and 2) less trouble and costs dealing withdifferent cleanup programs with different cleanup
standards or procedures in obtaining them. Thecurrent inequality and inconsistency in thearray of cleanups nationwide, often provid-ing uncertain, incomplete, and ineffectiveprotection of health and environment wouldlargely be eliminated. Many studies, particu-larly risk assessments, could be eliminatedbecause fixed cleanup standards could be used.Conversely, national standards could also re-duce excessive cleanups, as well as reducingtransaction costs by reducing confrontation overcleanup goals at sites and shifting of sites amongdifferent cleanup programs (see ch. 4).
Eventually, this option would make it morefeasible to shift implementation of Superfund toStates (see Option 19), because of the assurancethat their programs would provide comparableprotection. State officials have concluded:
The lack of development of cleanup standards orgoals has been a major impediment in achieving amore rapid remediation of hazardous waste sitesthroughout the country. The ARAR concept is good,but States have looked to EPA for guidance in thedevelopment of national standards or models for theestablishment of site specific cleanup goals withoutreceiving much meaningful assistance. The NationalSuperfund Program Strategy must include a commit-ment by EPA to develop, in conjunction with theStates, tools to generically answer the question“How Clean is Clean?” . . . The overall goal ofdeveloping cleanup standards, models, and criteriashould be to assure a consistent approach to thecleanup of hazardous waste sites.38
Implementation: This option requires statu-tory enactment. Many parties would find thisoption objectionable because of, for example:losing flexibility, facing increased costs, andfacing the need to make initial changes inexisting State statutes, regulations, and pro-grams. In other words, implementation wouldbe difficult and opposition to the option substan-
sTAt a Scnu hearing on June 15, 1989 the WA ~“ ‘srrator indicated that the agency would not pursue at that time its deferral proposal as partof the new NCP. The reasoning was that cleanups for sites deferred to other programs could not be axmred to offer the same kind of remedies, standards,and procedures found in Supedtmd. Response of William K. Reilly to question km Senator Lautenbcrg; Superfund oversight hearing, SenateSubcmnmittee on Superfund, Ocean and Water Protection, June 15, 1989.
38-l~m of Swm ~d ~rn~ri~ Solid Wme ~agemcnt of fici~s, w-n, DC., position p-r ‘ ‘ N ~ o n ~ SUprfund h-
Strategy+tting More Done With Limited Public Funds,” Apr. 28, 1989.

Chapter ISummary, Introduction, and Policy Options ● 41
tial, as any such Federal environmental legisla-tion has historically been. Actual implementa-tion problems and costs would depend on theexact requirements, their enforcement, and onpenalties for noncompliance, as well as incen-tives which might be used to motivate compli-ance. Analysis of these details is beyond thescope of this study, but implementation prob-lems could be minimized by keeping require-ments as simple as possible. OTA concludesthat the potential environmental and eco-nomic benefits justify serious considerationof this option for a permanent nationalcleanup effort. A first step by Congress mightbe to have a l-year independent study of thisoption by, for example, the National Academyof Sciences or a university with experience inthe cleanup area, such as the federally sponsoredprogram at the Center for Environmental Man-agement at Tufts University. One issue requir-ing study is the extent to which numericalcleanup standards for soils would define a verylarge universe of potential cleanup sites (e.g.,areas near highways with heavy metal contaminat-ion).
OPTION 6: Define and Limit Meaning ofPermanent Cleanup
Superfund is necessary because of past short-sighted waste management practices. The ideaof achieving a permanent cleanup has intrin-sic merit. But “permanent cleanup" is notnow well defined by statute or EPA policy.However, EPA has recently explained the roleof treatment technology, which according toOTA is the means of achieving permanence,versus containment technology, which accord-ing to OTA is not a permanent remedy. EPA saidthat treatment technology “will be used mostoften for highly toxic, highly mobile waste,whereas containment is generally reserved for
low concentrations of toxic materials or rela-tively immobile wastes. ’39
This position makescontainment an acceptable remedy for manytypes of sites, especially ones with soil contami-nation and low levels of groundwater contami-nation. (Moreover, EPA’s application of theland disposal restrictions under the RCRAregulatory program to Superfund essentiallypromotes leaving hazardous site material inplace and capping it, instead of treating thehazardous material or even containing it in aRCRA hazardous waste landfill with liners andleachate collection.40) In fact, EPA has indi-rectly defined sites for which the statutorypreference for permanent remedy applies andsites for which it does not, a distinction thestatute does not make. If permanence is not anoverarching cleanup goal, then lower cost,impermanent remedies are likely to prevail; inthe past 2 years at least 75 percent of selectedremedies are impermanent, according to OTA’sdefinition of permanent remedy (i.e., destruc-tion or recovery of hazardous material). (See ch.3.)
With this option, permanence would meanthat cleanup objectives are achieved withoutfurther action at the original site or at anyother site which has become a part of thecleanup, such as an offsite landfill thatreceives cleanup waste. People living near siteswant to feel confident that there are not enoughtoxic chemicals left in land or water to threatentheir health. Conversely, impermanent cleanupmeans--or should mean-permanent contamina-tion of land or water, because hazardous sub-stances remain hazardous and a potential threatthrough uncontrolled release or exposure. (Un-like radioactive materials, there is no naturalpredictable decay of the hazardous characteris-tics of chemical waste.)
39EPA Memor~d~, ‘‘Advancing the Use of Treatment ‘Mmologies for Supcrfund Remedies, OSWER Directive No. 9355.0-26, Feb. 21, 1989.
@Environmental Protection Agency, ‘‘Policy for Supcrfimd Compliance With the RCRA Land Disposal Restrictions, ’ OSWER Directive 9347.1-02,Apr. 17, 1989 and “Land Dipmal Restrictions as Relevant and Appropriate Requirements for CERCLA contaminated Soil and Debris, ” OSWERDirective No, 9347.2-01, June 5, 1989. SCC discussion inch. 3.
42 ● Coming Clean: Superfund Problems Can Be Solved . . .
Without definite cleanup goals it is impossi-ble to know whether any action is permanent.Permanence does not imply reaching zero con-tamination or zero risk. Cleanup standards thatare less protective of public health and environ-ment make it easier to achieve permanence. Butcertain kinds of action are inconsistent withpermanence, including any form of land dis-posal or containment, and any use of engineer-ing or institutional controls, including long termmonitoring for releases. All of these mean: 1)site hazardous material remains hazardous; 2)there is uncertainty about releases of hazardousmaterial and, therefore, risks to health andenvironment; and 3) there are a host of uncon-trollable possible future events which mightcompromise the effectiveness of the protection.Some important examples of problems are: deedrestrictions which later are forgotten, ignored oroverturned; physical failure of caps on buriedwaste which goes undetected or, even if knownabout, is not effectively and expeditiously dealtwith by repair or replacement because of lack ofmoney or confusion over who has responsibil-ity; new commercial or residential uses of landor water which were not anticipated and whichcannot be blocked legally; natural catastrophes,such as flooding of a capped landflll or alightening hit on a leachate treatment system;monitoring systems which may fail, may not beoperated properly, may not be properly main-tained with required sensitivities, and may notbe responded to with fast and effective remedialaction.
OTA concludes that it is not technicallycorrect to convert the concept of permanenceinto a variable parameter. That is, OTA disa-grees with the notion that land disposal orengineering or institutional controls providea “degree of permanence.” What varies is thelevel of protection provided by different cleanuptechnologies and methods, not the degree ofpermanence. To tell the public that a remedy ispermanent for perhaps a decade does not buildpublic confidence. However, impermanent
actions have an important role to play indecontrolling sites to reduce or even eliminatecurrent risks without, necessarily, producinga complete and permanent cleanup.
Benefits: Current statutory provisions are tooambiguous and lack the clarity necessary foreffective program management. With this op-tion Congress could establish a clear policy forSuperfund management and reduce excessiveflexibility, that now is enjoyed by EPA staff.OTA concludes that there is a net benefit tofocusing on achieving permanence throughreduction of the cause of the intrinsic hazard,such as toxicity, compared to current statu-tory attention to reducing mobility and vol-ume. Scientifically, reducing mobility is notachievable through techniques which offer cer-tain long-term effectiveness on a par withdestruction; reducing volume of hazardous ma-terial usually results from application of atechnology which concentrates the truly hazard-ous component of some larger volume of soil orwater or non-hazardous waste and, therefore, isnot on a par environmentally with reducinghazard through destruction or recovery of valua-ble material.
The public intuitively understands the environ-mental, economic, and psychological benefits ofa permanent cleanup. Permanent cleanups offermore certain and more effective environmentalprotection and can prevent future cleanup costs.But many cleanups have not and cannot, withavailable technology and resources, completelyeliminate the source of the problem. Still, publicconfidence in Superfund and EPA’s implemen-tation of it would benefit substantially from acommitment to achieving permanent remedies.And the public can understand that achievingpermanence for all Superfund sites (currentlyknown and yet to be identified) is not technicallyor economically feasible in the near or evenmid-term.
Under current statute, 5-year reviews arenecessary when hazardous material remains
Chapter I--Summary, Introduction, and Policy Options ● 43
onsite and many RODS acknowledge that futurerequirement. Whenever that requirement is in-voked, the remedy is not permanent. (Nor is aremedy necessarily permanent if this provisionis not invoked. ) Current policy, however, meanssuch sites can be delisted from the NPL. Withthis option such delisting would not occur.
Implementation: EPA could implement partof this option through revised policy and, if thecurrent proposed NCP becomes final, through aregulatory change. However, because of thewide difference between past congressionalactions and EPA interpretations, congressionalaction may be advisable. It would be difficult forEPA to implement this option without thor-oughly revising its nine criteria for remedyselection. Moreover, current statutory lan-guage about reducing toxicity, volume, ormobility through treatment as a cleanuppreference must be addressed for completeimplementation of this option.
There would be major impacts on remedyselection and delisting which would raise con-cerns about implementation of this approach(see Option 22). The trend of moving away fromland disposal to treatment would become stronger,and the diverse set of treatment technologieswould take on a different meaning. Only sometreatment technologies offer permanence (seech. 3). Costs might increase significantly in theshort term. But R&D, technology demonstra-tion, and competition would probably reducecosts in the longer term.41 Increasing competi-tion among an increasing number of destructiontechnologies and, for example, mobile incin-erators, have already reduced costs. More effec-tive separation technologies, which concentratehazardous material for recovery or treatment bydestruction technology, have also emerged rap-idly and will continue to expand.
Implementation of this option could be madedifficult because of the power States have inwithholding their legally required 10 percentmatch for fund-financed cleanups, EPA maywant to use a permanent but more expensiveremedy at a site, but the State may only providetheir matching funds for a lower cost, imperma-nent remedy. Indeed, this has happened already.One solution is for senior EPA officials to makethis situation known to the public and to appealsuch actions to the highest State officials.
Finally, this option can make use of theconcept of Option 1, current versus future,uncertain risk. If there is an identifiable future,uncertain risk, the cleanup achieved to date maynot be fully complete, even though a permanenttreatment technology has been used. In such acases, the remedy might be classified as aninterim action and a permanent remedy might—
be needed later.or might not—
Developing Workers and TechnologiesOPTION 7: Reduce Dependency on
Contractors, Expand EPA Workforce
Superfund implementation will always makeextensive use of private sector contractors. Butthe current degree of dependence on contractorsseems too high and, with this option, would bereduced. Too much dependence on contractorsmeans a lack of independent technical expertiseand information in government. Improvedpublic confidence in Superfund is contingenton the public believing that governmentworkers, working in the public interest, knowenough to solve cleanup problems. The previ-ous option as well as several others above alsoaddress this problem. Another aspect of contrac-tor dependency is the use of contractors forinherently governmental work, particularly pol-icy development and program implementation.Inevitably, reducing contractor dependence means
41 EPA Currently uses figures which indicate that total site cleanup costs, including EPA’s administration of the program, total ahout $30 million onaverage. OTA believes that implementation of this and some other options discussed in this report might increase the average site cleanup cost to $50million, although variations among sites would remain very large. But this is really a worst-case scenario, because technological innovations and programrestructuring, as discussed in the policy options of fhis report, could prevent such a large increase in average site cleanup cost.
20-011 0 - 89 - 2 : QL 3
44 ● Coming Clean: Superfund Problems Can Be Solved . . .
recognizing that Superfund is a permanentprogram and, therefore, accepting the necessityto increase EPA’s workforce at headquartersand in its regional offices. There is also a needto increase Superfund activities in EPA’s In-spector General’s office, a need presented inOTA’s 1989 Background Paper on contractoruse.
Benefits: The effectiveness and efficiency ofSuperfund in the near term depends, in somesignificant measure, on building up EPA’sworkforce and reducing the dependence oncontractors. This option recognizes the absolute,permanent need to use private contractors inSuperfund implementation. With this option,however, balance would be restored between theroles of government and private sector workers.Some of the dependency on private contractorscould also be reduced if EPA would makegreater use of other Federal agencies, includingthe U.S. Geological Survey, the Bureau ofMines, and the National laboratories (see Op-tions 27 and 28).
Implementation: EPA could implement thisoption with congressional support for shiftingfunds from contracting to building up thepermanent EPA staff. This option does notimply a net increase in funding.
OPTION 8: Establish a Hierarchy ofCleanup Technologies and Methods
A possible hierarchy is given in box l-F.Using a hierarchy is meant to introduce anenvironmentally sound logic into the identifica-tion and evaluation of cleanup alternatives. Forremedy selection decisions it means that itwould be necessary to demonstrate that alterna-tives higher on the hierarchy than the oneselected had been carefully considered, and thereasons for their elimination provided. It does
not imply that specific cleanup technologies ormethods would be required by the government,nor does it rule out combinations of technolo-gies and methods which taken together mayprovide an effective site remedy. The hierarchywould establish destruction and recoverytechnology at the top of the hierarchy; thismeans that it is the most preferred, usingpermanence of remedy (or permanent riskreduction) and certainty of that outcome asthe ranking criteria.42 For combinations oftechnologies and methods, the one lowest on thehierarchy is key. For instance, reduced certaintyplaces separation plus destruction lower on thehierarchy than just destruction. When separationtechnology is used first, its effectiveness deter-mines the overall achievement of permanence;however, the combination of separation anddestruction technologies can achieve a perma-nent site remedy. Lower on the hierarchy is landdisposal, containment, and other engineeringcontrols, followed by institutional controls,including ongoing monitoring and provision ofalternate water. Relying on natural conditions(e.g., biodegradation in a contaminated aquifer)usually offers far more uncertainty than acontrolled treatment process and can correctlybe considered a form of no action. In someinstances, separation technology alone mayoffer a permanent remedy because the collectedand released hazardous material may be so lowin concentration (after dispersion) that destruc-tion technology is unnecessary environmentallyand impractical (e.g., air emission of very smallamounts of volatile organic chemicals fromgroundwater air stripping). But this variation isbest characterized by a combination of separa-tion and natural treatment.
Benefits: It would be helpful to achieve abetter understanding of the functional differ-
42~c ~plc m~~ thti tec.hnologi~ and methods which reduce mobility or exposure (and therefore risk) without destroying or recoving a site’shazardous substances offcx comparable protition. OTA’S finding, as discussed in ch. 3, however, is that the long-term certainty of protection ismaximized what hazardous substances are destroyed or recovered. With other technologies and methods, the duration of effectiveness cannot be assuredand they are impermanent remedies, but in some cws they maybe the only feasible options, and they are espxidly important for emergency, rwontrol,and inwim cleanup Wtkms,

—
C h a p t e r 1 Summary, introduction, and Policy Options ● 45
Box I-F--A Hierarchy of Preferred Cleanup Technologies and MethodsPurpcme-The hierarchy recognizes the environmental preference for some outcomes and types of
uncertainties over others. “ Primarily, onsite permanent destruction or recovery of hazardous substances is favored.Note that SARA’s use of “or” with regard to reducing toxicity, mobility or volume is inconsistent with a hierarchyof preferred environmental benefits. The hierarchy does not guarantee that the highest level of technology is usedat a specific site because other factors must enter into the analysis, especially the type of action (e.g., recontrol v.final remedy). But the hierarchy provides a consistent framework for studies and decisions. The following is apossible hierarchy of Preferred cleanup technologies and methods:
Clam I: Destruction or Recovery-Actual destruction of hazardous organic substances to irreversiblyeliminate the source of the problem. Examples: thermal, biological, and some chemical treatments (e.g.,dechlrination). Recovery of pure metals or chemicals suitable for commercial use.
Class II: Separation Followed by Destruction--Technologies which separate hazardous from non-hazardous materials. Examples: extraction or stripping of volatile chemicals from soil or groundwater, gas venting,soil washing and flushing, precipitation, and carbon absorption of contaminants from groundwater.
Class 111: Stabilization-Any form of chemical fixation, stabilization, and solidification which cannot assureactual destruction of all hazardous components. There are numerous commercial forms which vary according to thematerials mixed with the hazardous material. In some cases there are claims that organic molecules are permanentlyaltered by the process, but this has not been well documented scientifically.l Effectiveness and reliability for toxicmetals are well proven.
Class IV: Engineering Controls-A variety of methods can restrict the movement of contaminants orexposure to them. Although such methods are not permanent, they can recontrol a site by: 1) imposing physicalbarriers (e.g., slurry walls, landfill caps and liners, leachate or groundwater pumping); 2) keeping water away fromhazardous material (e.g., diversion ditches, soil and plastic covers, storage vaults); and 3) keeping people away fromhazardous material (e.g., fences, caps, and soil covers). Techniques in this class must be assessed routinely for failureor deterioration of materials. Repair and maintenance, as well as less than 100 percent effectiveness, poseunavoidable uncertainties. Onsite re-disposal of hazardous material, followed by engineering controls, providesmore reliability than applying controls to hazardous material in their original condition (e.g., buried waste or
taminated soil).Class V: Institutional Controls--These depend on people and organizatons to deal indirectly with hazardous
contaminants by controlling exposures to them or by detecting the need for further action (e.g., restrictive deeds;alternate water supplies; relocation of residents; periodic monitoring, testing, or inspection). Unavoidableuncertaintiesrcsult from: l)potential failures of people or institutions to adequately fund or implement the controls,and 2) possible changes in the original cleanup objectives without public accountability.
Class VI: Natural Treatment-Any onsite or no-action approach which depends on a natural form oftreatment being effective over the long-term (comparable to time over which hazardous properties persist) forexpected but inevitably uncertaain site conditions and future land and water use. Includes: natural biodegradation,chemical breakdown or decay of hazardous molecules, adsorption to soil. Dilution and dispersion of hazardous
which produce "safe" concentrations maybe considered by some people as naturalSubstances into the environmenttreatment or attenuation.
l b ~~ ~ h likely to Ml illm Ihi9 ~ bocuuo Ooulplue rbxnal ~ Cama be assured (EPA’s SITE. . pgmn places it in hednhm$alcatosuy).N- Rr CIMSOS I-IIL the tlrst pmfamma is m#it8 m4m=tC 9ocCm4 in situ Uoslxmaq ~ UaupLm mxl Ofhita tmummt.
~: Ofh8 aflbcbldogy Ama9um@ 19s9.
ences among waste treatment technologies. Past excessive program flexibility, introduce efficien-effort has focused on the distinction-between cies into studies, help compliance with statu-treatment technology and land disposal and tory requirements, help the public bettercontainment. The hierarchy would reduce understand analysis and selection of remedy,

46 ● Coming Clean: Superfund Problems Can Be Solved . . .
help channel government R&D and privatesector technology R&D and commercializa-tion into the most productive areas, andmotivate technology developers to providebetter data. In particular, in too many pastFeasibility Studies, significant options high upon the hierarchy have not been thoroughlyconsidered; this has blunted compliance withstatutory preferences and requirements and ithas caused community people to fight selectedremedies which they correctly perceived to offerlower levels of protection.
Implementation: There is no statutory obsta-cle to EPA’s implementation of this option.Alternatively, Congress could define the hierar-chy and require EPA to implement the hierarchyin all implementation efforts. Although there arebound to be legitimate concerns, there seem tobe no major obstacles to implementation. Butquestions may arise as to whether a technologydestroys hazardous material, or how a technol-ogy gets classified when it destroys only somehazardous substances at a site, or about thelabeling of a technology which destroys somehazardous material but produces new hazardousbyproducts.
Destruction can be dealt with through scien-tific enquiry; proponents of a technology shouldhave the burden of demonstrating scientifically,through experimental results, that hazardoussubstances have been rendered nonhazardouswithout the production of hazardous bypro-ducts. (The rendering to a nonhazardous statedoes not necessarily imply the loss of originalchemical identity; for example, some metals areonly significantly toxic in one electronic valencestate which can be changed through treatment.)Currently, without a good distinction betweendestruction or recovery and other types oftreatment technologies, some companies aremaking unsubstantiated claims of permanence.
With regard to partial destruction or recoveryof site materials by a particular technology, thefirst scientific principle should be that n o
destruction technology can destroy or recoverall conceivable hazardous substances. There-fore every destruction technology has limits; forexample, incineration cannot destroy toxic met-als. The second scientific principle is that noprocess can operate with 100-percent” efficiency.That is, every destruction technology inevitablymust provide information about hazardous emis-sions and residuals due to incomplete destruc-tion. The third principle is that any destructionor recovery technology may produce new haz-ardous substances; this is a well-known aspectof incineration but an often neglected issue forother technologies, such as biological treatment.
The question of incomplete site contaminantdestruction is another matter; it requires ad-dressing the use of destruction technologyrelative to the quantity of all hazardous sitematerial and the use of other cleanup technolo-gies. Information should be presented on therelative contribution of different site cleanuptechnologies when they are intended to be usedat roughly the same time; for example, at a siteat which incineration and land disposal is used,information should reveal what fraction of thehazardous material-the actual hazardous sub-stances, not the total volume of soil or waterwhich may contain the hazardous substances—has been destroyed, versus the fraction landdisposed. The degree of site contaminant de-struction may often be maximized by using acombination of destruction technologies, or bya combination of separation and destructiontechnologies. Using separation first can reducetotal costs substantially because destructiontechnologies are usually more expensive per tonprocessed than separation technologies.
Another issue is whether a natural form oftreatment qualifies as destruction technology, oras presented here as the lowest, most uncertainoption on the hierarchy. Here too, scientificanalysis must be used. For example, it may beargued that natural adsorption of a chemical tosite soil is treatment; perhaps, but that treatmentis not destruction, it is a form of separation

Chapter 1-Summary, Introduction, and Policy Options ● 47
technology. Moreover, it intrinsically has uncer-tainty, because soil conditions might change andreduce the adsorption, releasing the hazardoussubstance. Another important example, becauseit is frequently invoked in cleanups, is naturalflushing. This means that water infiltratingcontaminated soil removes contaminants andtransports them away, typically into groundwa-ter which may release the contaminants into ariver. This too is a case of separation technol-ogy, with uncertain cleanup effectiveness anduncertain environmental effects due to subse-quent exposures; natural or solar evaporation ofvolatile chemicals is similar. An example ofnatural destruction is biological destruction ofan organic contaminant by naturally occurringmicrobes, in soil or groundwater, without,however, engineering controls to ensure contin-ued effectiveness. Natural treatment may some-times be used to make no-action seem more thanit really is.
Adoption of the hierarchy does not imposeoptions, but it does make it more difficult tochoose an option low on the hierarchy with-out careful explanation of why ones above ithave not been used. It is important torecognize that for some cleanup actions lowerlevel options are appropriate, especially foremergency and recontrol actions.
Lastly, the impact of the hierarchy on treata-bility testing may raise concerns. Althoughtreatability testing is critical to the maximumuse of newer treatment technologies, the selec-tion of specific technologies for evaluationremains an issue. The hierarchy would guideproject managers in thinking about which tech-nologies should be targeted for treatabilitytesting. It is important to have representation oftechnologies from top to bottom, in case themost desirable one(s) are not found successful.In this way, the public can understand thetechnical basis of why more preferred technolo-gies have not been selected.
OPTION 9: Restrict Use of GroundwaterCleanup Technology
The most common form of groundwatercleanup (other than providing alternate water) ispumping contaminated water to the surface andtreating it through a variety of technologies,with the aim of rendering it suitable for use,discharge, or reinfection into the ground. Butexactly when the program has substantiallyincreased its use of pump and treat, researchresults and analyses have concluded that currentpractice does not offer predictable performanceand success (see ch. 3) for complicated clean-ups. Moreover, most decisions to clean upgroundwater are for sites for which the govern-ment’s analysis has shown no current risks, thesource of the contamination has not beenbrought under control, and the undergroundaquifer is not yet well understood. Althoughpump and treat can remove some contami-nants, there is major uncertainty about theultimate levels of contaminant reduction andthe time to reach them. But this uncertaintyis not communicated in RODS. Over a yearago, a senior EPA official said:
. . . a recent analysis by EPA’s own Office ofResearch and Development strongly indicates thatthe groundwater pump and treat systems, which theagency has been selecting to control groundwatercontamination, will not achieve the levels of cleanuprequired by agency standards in less than tens,perhaps hundreds, of years, ., . [T]his new dataillustrates that there is still a great deal to learn abouthow to remediate some of the problems at theseSites.43
With this option, Superfund managementwould reassess the current selection of pumpand treat as a proven, predictable, and effectivegroundwater cleanup remedy for nearly allsituations. This means examining ways to im-prove the practice of pump and treat, andalternatives to pump and treat, including point-of-use treatment, hydraulic containment of theplume, in situ biological treatment and other
43Gtmc A. Lucero, “&m of Supcrfimd,” The Envirotvnend Forum, March/April 1989.

48 ● Coming Clean: Superfund Problems Can Be Solved. . .
new treatments, and natural attenuation andbiodegradation. This issue also highlights theneed to pay more attention to identifying andeliminating the source of groundwater contami-nation at a site. The greater the difficulty ofcleaning up groundwater, the greater theurgency to remove the source of groundwatercontamination.
Benefits: The public’s demand for action bySuperfund is not well served in the long term byusing an unreliable cleanup method. An enormousamount of money might better be spent on othersites, providing the public with more protection.Indeed, the current approach may be counterpro-ductive environmentally. Expensive pump andtreat cleanups may eventually be stopped be-cause either the cleanup level is thought to beattained when in fact it has not been (e.g.,because chemicals de-adsorb from subsurfacesoil), or because cleanup will be judged com-plete even though cleanup standards cannot bemet (i.e., health effects standard is replaced bya technology performance standard). With thisoption, there would be more limited use of pumpand treat, and more explicit institutional com-mitment to near-term monitoring and recontrolwhich, however, does not imply permanentcleanup.
Implementation: EPA could act on this optionthrough, for example, a special high level taskforce study. Alternatively, Congress could re-quire an independent study (perhaps by the U.S.Geological Survey which has developed im-proved pump and treat practices) which inte-grated the current state of scientific knowledgeand the performance of current pump and treatpractices at cleanup sites. The congressionalroute may be advisable, because EPA has shownlittle interest in addressing this issue, in partbecause of a natural tension between the Super-fund program, with its primary interest in takingaction, and the R&D program at EPA, with itsprimary interest in better understanding technol-ogy and its limits. Indeed, facing heavy public
demand for action, it would be difficult for EPAon its own to shift away from the pump and treatapproach, using it only when its effectivenesscan be well substantiated (e.g., for contamina-tion of a simple, well understood, and relativelysmall aquifer by only one chemical or a fewsimilar contaminants).
Some people are concerned about underreac-tion to groundwater problems. But if spend-ing large amounts of money on pump andtreat at complicated sites is going to proveultimately wasteful, then the public needs tounderstand that. If pump and treat is not areliable permanent remedy for many types ofsites, then it would be better to focus onrecontrol actions to address current risks fromgroundwater contamination, careful monitoringof the problem, and the need for a major R&Dprogram (see Policy Option 29). Moreover, it ispossible to increase the chances for success ofpump and treat by improving the technicalmethods used (see ch. 3), which mean increasedcosts.
OPTION 10: EstablishAssistance Program,Systems
Generic SiteIncluding Expert
Groups of experts in generic types of cleanupsites (e.g., PCB, wood preserving, lead battery,municipal landfills) would be established atEPA headquarters. This means expertise cen-tered around site problems rather than aroundcleanup technology (see following option). Thekey functions of the groups would be to: 1)provide technical assistance to front-line Super-fund staff in EPA regional offices, Federal andState agencies, and contractors through tele-phone assistance, site visits, reviews of techni-cal documents, and special reports; 2) developand update expert systems (to replace or supple-ment technical guidance documents) for imple-menters to use on their own from the earliest siteevaluations through assessment of the effective-

Chapter 1-Summary, Introduction, and Policy Options ● 49
ness of a permanent remedy;44 and 3) provideformal peer review of RODS prior to theirregional approval and release.
Benefits: This option would provide an effi-cient way to use the greatest technical expertisepresent in the Superfund system, improvingtechnical work and information transfer. Lowquality and unnecessary site study work couldbe cut substantially because of the expert helpand systems; indeed, with this option it becomesfeasible in many cases for EPA to performRemedial Investigations and Feasibility Studieson its own. The impact on the program offront-line staff turnover would be reduced,because there would be a stable core of technicalexpertise for site managers to draw on. Thisgroup of experts would also provide the mecha-nism for transferring information and technol-ogy from R&D efforts into the field. The publicwould be better assured that the best availablecleanup technology was being selected by thegovernment. Expert systems compensate forinexperience; they could also be very useful foreducating members of the community, makingtheir public participation more effective. Theplacement of this effort within the Superfundoffice and not EPA’s Office of Research ‘andDevelopment is important. This effort is envi-sioned as operational, not research. Current useof ORD personnel for operational supportdetracts from ORD’s primary mission.
An important benefit would be to provide acapability within government to assess thecredibility and importance of technical informa-tion obtained by responsible parties. Currently,government spends a substantial amount ofmoney on contractor work to duplicate siteanalyses or cleanup technology evaluationsperformed by responsible parties. This oftenmeans delay in cleanup and, very often, thegovernment contractor work provides no new ordifferent information.
Implementation: Either EPA or Congresscould implement this option. The key to suc-cessful implementation is having the Nation’sbest technical experts, more so in science thanengineering. This means people with majorexperience in investigating and cleaning upcertain types of sites. OTA believes that manyqualified experts already work for different EPAprograms, such as in some of EPA’s regionaloffices where they have accumulated manyyears of experience. Others are in universities,consulting firms, and some technology develop-ment companies. Work in this program could beseen as a rotating assignment, for EPA staff andfor those in universities and elsewhere. Thelevel of effort envisioned here is about 20 to 40professionals administering this program; totalannual spending would probably be in the rangeof $3 million to $5 million. But about $10million might be necessary initially for develop-ment of several expert systems.
OPTION 11: Establish TechnologiesAssistance Program
Groups of experts in generic technologieswould be established at EPA headquarters; forexample, incineration, biotechnology for soilcleanup, chemical fixation, low temperature soilstripping of organics, vacuum extraction oforganics, groundwater cleanup. The groups ofexperts would provide operational assistance tosite managers and staff by phone, personalvisits, and quick reports in all phases of theprogram. The technology experts would be ableto interpret new R&D results, as well as helpdesign and interpret the results of site treatabil-ity tests (i.e., testing of site materials to evaluateeffectiveness of a particular technology). Theywould stay abreast of all commercial develop-ments and data, and provide an independentevaluation of vendor information. During de-sign and implementation, they would also beavailable as consultants and trouble-shooters;
ti~e Cxwfl ~s~m w~d & ~~r=tive computer SOfiWSR program which should also be made available to commtities, mwnsible Pfies~and the consulting engineering cmnrmmity.

50 ● Corning Clean: Superfund Problems Can Be Solved. . .
they would also collect and analyze perform-ance data from cleanup implementation. Theexperts would be the key instruments in transfer-ring information from all government andindustrial efforts to the front-line people imple-menting Superfund. Teams of experts couldhelp regional site managers and staff resolve thedifficult issue of what technologies or whatcombination of technologies could best be usedat a site. This group would also provide anotherlevel of formal peer review of RODS prior totheir regional approval and release.
Benefits: This option would improve the rateat which the best, most innovative, and cost-effective cleanup technologies were implemented.It would give the government much neededindependent expertise cost-effectively, becauseit is impossible for site managers and staff inregional offices to be experts on a large numberof very different, rapidly changing technologies.Moreover, OTA’s research has shown thatSuperfund staff need to be less dependent on theexpertise of vendors, contractors, and responsi-ble parties. This option would help EPA conductsome of its own Feasibility Studies. Conflicts ofinterest which may affect key technology choiceswould be minimized. More consistency inSuperfund implementation would also result,and the successes and failures of technologieswould be quickly integrated into program im-plementation.
Implementation: The key to successful implemen-tation by EPA is to assure that the highestcaliber, experienced professionals are chosenfor this critical task, more in engineering thanscience. OTA believes that many qualifiedexperts already work for different EPA pro-grams, such as in some of EPA’s laboratorieswhere they have accumulated many years ofexperience. Others are in universities, consult-ing fins, and some technology developmentcompanies. Work in this program could be arotating assignment, for EPA staff and for thosein universities and elsewhere. A key need is forobjective, critical analysis and evaluation of
information. In this regard, it is important thatEPA personnel be totally committed to thiswork, as compared to current practice wheresome EPA experts provide technical assistanceto Superfund staff on a part-time basis from theircurrent home bases, such as in ORD. The levelof effort envisioned here is about 20 to 40professionals administering this program; totalannual spending would probably in the range of$2 million to $4 million.
OPTION 12: Better Define Mission of SITETechnology Demonstration Program
This option would not change the basicpremise of the SITE program; the need for theprogram remains. What appears necessary, how-ever, is to make the program perform faster, bemore user friendly, and be less bureaucratic.Moreover, the program needs a better focus onthe demonstration of truly innovative technolo-gies which seem too risky or uncertain for theprivate marketplace. This probably requiresmore sharing of cost and risk by the government.Too many of the technologies in the SITEprogram (21 out of the 30 technologies cur-rently) have already had extensive private sectoruse and support. Attention would also be givento the need to say that a technology has notworked when it hasn’t, and to minimize the useof SITE participation as a marketing tool,especially when SITE results do not fullysupport the claims of a vendor. Moreover,technology companies not in the SITE programshould not be penalized by, for example, receiv-ing less attention or support from EPA andSuperfund staff. This option first means anindependent evaluation of the SITE program by,for example, EPA’s Science Advisory Board orthe National Research Council. A short 6-monthstudy would provide specific recommendationson how to improve the program.
Benefits: For a long-term cleanup programthere are enormous benefits from the demonstra-tion of innovative technologies which offer truebreakthroughs in solving particularly difficult

—
Chapter 1~Summary, Introduction, and Policy Options • 51
and important cleanup problems, and also toproduce substantial and even dramatic reduc-tions in unit cleanup costs. Incremental techno-logical improvements are well handled by theprivate sector, particularly because the cleanupmarket is so large and competition among andwithin generic technologies so intense. So themission of the SITE program should be topush the frontiers of cleanup technology. Thebenefits, however, are questionable if the pro-gram competes with private sector efforts inpromoting the demonstration and diffusion ofmore modest incremental technical improve-ments. With this option, current or anticipatedspending levels for the SITE program might bedecreased, because so much of the program’sactivities now have little to do with cutting edge,innovative technologies.
Implementation: EPA or Congress couldrequire the study and specify its scope andobjectives. The study should make use ofdetailed interviews with companies that havealready participated in the program, with expertsin cleanup implementation who are able toevaluate the types of technologies chosen for theprogram, and with academic experts in the areasof technological innovation and diffusion. Spe-cial attention should also be given to how siteshave been selected for the program and whetherthe SITE technologies met a need that could notbe satisfied by any currently available commer-cial technology.
Improving Government Management
OPTION 13: Use Generic Site Classification
A site classification system could be estab-lished and all existing sites and each siteentering the Superfund system classified ac-cording to the best applicable generic descrip-tion. A relatively small number of site classesis possible; the types would focus on theorigin and nature of site contamination.
Some feasible site classes are: wood preserving,pesticide, lead battery recycling, complex indus-trial manufacturing facility, PCB cleanup, mu-nicipal landfill, industrial landfill, solvent con-taminated well field, asbestos, mixed heavymetals, and mining waste. All Superfund re-cords, documents, and public notices wouldshow a site’s classification on a level ofimportance comparable to the site’s name andlocation (e.g., site name, location, a municipallandfill).45
Benefits: This is a way to simplify theSuperfund program and introduce managementefficiencies. It also offers an opportunity formore certainty in the operation of Superfund byreducing excessive flexibility in key decision-making. For too long, EPA has chosen to seeevery cleanup site as unique. While every site,like every person, may differ from others, itis also possible to see the important common-ality within certain classes of sites. Classifica-tion becomes critical for a large and growingcleanup program; it is based on the principle thatmuch is learned over time about certain classesof sites and that transferring this expertiseprevents unnecessary, redundant, and inconsis-tent work. Major amounts of repetitive contrac-tor study work (particularly in the FS) could beeliminated, speeding up cleanups and reducingstudy costs; major regional inconsistencies forselection of cleanup standards and technologiescould be eliminated. It is feasible to have genericprotocols for all program activities based on siteclassification. Early classification of a site couldalso speed up removal and interim cleanupactions.
Implementation: Congress could statutorilyrequire EPA to devise and implement a siteclassification system, or Congress could itselfestablish site classes. There are no majorimplementation obstacles; all current sitesshould be classified as well as new, incoming

52 ● Coming Clean: Superfund Problems Can Be Solved. . .
sites. One class would have to be something like“No Generic Classification” for sites whichcannot be accurately fit into a generic category.When a site is first discovered or identified littleinformation may exist and it might automati-cally be assigned NGC. But site classificationshould not be a rigid decision; as information ona site increases, its classification may change.The workload to apply a classification system toexisting sites is relatively small; experiencedEPA staff should take no more than 2 months toclassify NPL sites and perhaps 1 year for allother sites in the system.
OPTION 14: Limit Responsible Parties toImplementation of Remedies
This option involves a major change inpolicy. EPA has sought and achieved substantialincreases in the number of site studies (RIFSs)performed by responsible parties (actually bycontractors they hire). More than half of sitestudies are being done by responsible partieswith government oversight provided chieflythrough government contractors (under EPA’sTechnical Enforcement Support contracts). One-third of all fiscal year 1988 RODS were for sitesat which responsible parties conducted RIFSs.From June 1988 to June 1989, information fromEPA indicates that there was about a 50-percentincrease in the fraction of RIFSs conducted byresponsible parties.46 EPA has said that it wantsto give responsible parties a larger role indefining site problems and evaluating cleanupalternatives. This approach offers the benefit ofreducing the need for fund-financed studies and,to the extent that studies performed by responsi-ble parties also promotes settlements with them
to perform cleanups, also the benefit of reducingthe need for fund-financed cleanups.
A study on the RIFS process done for EPAconcluded that “Many of the RPMs [sitemanagers] believe that the PRPs [potentiallyresponsible parties] often seek the least expen-sive, rather than the best, clean-up techniquesand are willing to expend considerable amountsof money in attempts to establish justificationfor the less expensive clean-up procedures. ”47
An earlier EPA headquarters study that exam-ined the concern about risk assessments beingdifferent in enforcement actions, but which didnot evaluate individual risk assessments, cameto several pertinent conclusions: EPA regionalstaff believed that there was no differencebetween risk assessments prepared by EPA orresponsible parties; about half the EPA regions‘‘recognizing PRPs’ biased perspective and the‘malleability’ of a risk assessment. . . have theircontractors prepare all risk assessments, even if’PRPs are conducting the rest of the site investi-gation; and because of ineffective oversightEPA headquarters ‘‘would not necessarily knowif differences between Fund and Enforcementassessments are occurring. ’ ’48
With regard to the use of innovative cleanuptechnology, EPA has said that ‘Difficult negotia-tions [with potentially responsible parties] aremost likely where innovative technologies areproposed for sites where containment remediesare consistent with CERCLA mandates. PRPconcerns generally focus on continued liabilityin the event of remedy failure, implementabilityproblems, and cost. ”49 Thus EPA recognizesthe tendency for responsible parties to favorcontainment remedies (see Option 6 and discus-
%s change appears to be related to EPA’s desire to meet the congressional requirement in SARA for starting 275 RIFSS by oetober 1989 as wellas the desire to reduce the demand on fund financed studies and cleanups. Another factor often brought up is that the more studies and cleanups performedby responsible parties the less the fund itself is used, making more money available from the fund for other cleanups. But it has also km noted thatthere has consistently kn unused M money which offsets the Ftxleral deficit.
47Research Triangle Institute, Ourreach initiative on SWerfund Remedial lnvestigationlFeasibiluy Study (R1/FS), Summer 1988.
UEPA, Ev&Wn of the Pre~r&n of Risk Assessments for Enforcement Activities, September 1987.
49EPA M~orandum, 1‘Advancing the Use of Treatment Rdmologies fOr Superfund Remedies, ’ OSWER Dirwtive No. 9355,0-26, February21,1989.

Chapter Z-Summary, Introduction, and Policy Options ● 53
sions in ch. 3). Also, EPA seems to acknowledgethat the effectiveness of protection of health andenvironment is not a primary concern of respon-sible parties, but is the responsibility of thegovernment.
In November 1988 a senior EPA enforcementofficial said:
I am getting anecdotal information from a numberof regions that some work being done by PRPs onRI/FSs is of substandard quality and is not beingcompleted in a timely manner. . . . The mostsensitive portion of the PRP work and the area thatEPA must pay particular attention to is the remedialalternatives and the endangerment [risk] assessmentportions of the RI/FS.50
More recently, EPA has acknowledged publicconcerns about this issue and has said thefollowing:
According to nearly all Regional managers andstaff interviewed on this topic, many PRPs try toeconomize and propose only the most minimalremedial action. Some variations exist, of course;this characterization certainly does not apply to allPRPs. Nonetheless, EPA’s basic approach to over-sight must first assume that PRPs will try to conductRI/FSs geared to their interests alone. . . . There wasbroad consensus among EPA managers and staff thatthe Agency needs to put more effort and resourcesinto oversight of RI/FS performed by PRPs. . . . Inlight of the increasing number of PRP leads to beconducted in the coming months and the generalconcerns raised during this study . . . the task groupbelieves that EPA must act quickly to upgradecurrent oversight practices and, in particular, involvecitizens in this process.51
Responsible parties play a major role in manycleanups being conducted under the jurisdictionof States; the sites are not Superfund NPL sites,although many of them might qualify. A forth-coming GAO report on State cleanups says,“When private responsible parties clean up anon-NPL site, the state role in remedy selectionis normally limited to reviewing and accepting
or modifying a cleanup plan proposed by theresponsible party. The state does not normallyevaluate other alternatives or cost-effective-ness. ” OTA agrees with the GAO assessment,State cleanups are not likely to offer environ-mental protection comparable to that requiredunder Superfund. This is significant because theresponsible party community has an interest inmoving the Federal Superfund program in thedirection of this type of interaction betweenresponsible parties and government. The currentrapid increase in the number of site studies andcleanups performed by responsible parties inSuperfund stresses EPA’s capabilities to exer-cise independent control over data acquisition,analyses, and cleanup actions.
The current policy, with its emphasis onhaving responsible parties conduct site stud-ies, does not promote public confidence inSuperfund for several reasons:
1.
2.
3.
4.
there is an intrinsic, potential conflict ofinterest because responsible parties havestrong reasons to give as high or higherpriority to minimizing study and cleanupcosts than to stringency of cleanup;responsible parties have an advantage overcommunity groups in the pre-ROD stagesof cleanup and can have greater impact onEPA RODs;the current EPA oversight process, basednearly entirely on contractors and con-strained by EPA’s lack of experiencedpersonnel and high workload, lacks publicaccountability and provides nearly noinformation to affected communities (e.g.,critiques of responsible party contractorwork);there is so much inherent flexibility inEPA’s policies and requirements as wellas in many statutory preferences and
50Bruee M. Diamond, ‘‘Tightening Up on Enforcement, ’ paper presented at Superfund ’88 conference, Washington, DC, November 1988.51EpA, A ~mgemnr ReV1w ~ft~ ,$we~~ Progrm, J~e 1989, This s~dy consider~ but &d no( endorse disallowing responsible parties from
conducting site studies. The rtxommendation was for closer oversight of private party studies, but improved overs@t could be more expensive thanthe approach of OTA’S opuon.

54 ● Coming Clean: Superfund Problems Can Be Solved. . .
5.
requirements that it is well within legallydefined boundaries to select cleanup ob-jectives and remedies at the low end ofhealth and environmental protection; and
there is statistical and site-specific evi-dence (see ch. 3) that key EPA decisionson cleanup objectives and remedies aresometimes less stringent for sites whensettlement with responsible parties is pos-sible and sought by EPA as compared togovernment-paid site studies and clean-ups.
The first two factors cannot be easilychanged, but the last three factors could, theoret-ically, be removed with substantial improve-ments to EPA’s workforce, policies, and re-quirements, as well as statutory changes (assuggested in many of the options in this report).Accomplishing the latter would take time, andonly their successful implementation over timemight create enough improvement in the Super-fund system to restore public confidence andovercome public concerns about the first twofactors. That is, the intrinsic potential forconflict of interest might become unimportant ifthe government’s set of rules for studying sites,examining cleanup alternatives, and making keycleanup decisions, as well as its own technicalexpertise, reduced the risk of responsible partiesbiasing cleanup decisions to minimize cleanupcosts. And the advantage of responsible partiesover communities might in time be offset by animproved Technical Assistance Grants programand improved public participation activities byEPA. As it now stands, however, OTA con-cludes that this option is one of the mostimportant in this report for the Congress toconsider. Congress might also wish to considerlimiting its implementation to perhaps 5 years,at which time Congress could assess whether itwas still needed.
Responsible parties strongly oppose thisoption. They believe it critically important thatthey have the opportunity to conduct RIFSs.Responsible parties maintain that they havetechnical and project management expertise,often superior to and more stable than that of thegovernment. And sometimes they do. They alsomaintain that they follow EPA guidance andregulations as well as statutory preferences andrequirements. But, as discussed previously,excessive flexibility blunts the significance ofcompliance with government rules. They pointto low-quality site studies done for the govern-ment and questionable cleanup decisions—which OTA has also identified-and maintainthat they can do better work or ensure bettercontractor work for themselves. Moreover, theymaintain that EPA provides significant over-sight and retains the ultimate authority to makethe key cleanup decisions in RODS.52 Overall,responsible parties believe that they are ready toaccept the responsibility assigned to them by thegovernment and that responsibility should notbe limited to providing money for or doing thecleanup. Nearly everyone acknowledges thatproviding responsible parties the opportunity toconduct site studies helps get settlements withthem to perform post-ROD design studies andremedial actions.
With this option, responsible parties would nolonger conduct site investigations or feasibilitystudies, and there would no longer be anyremedial cleanup effort under the jurisdiction ofan enforcement office.53 Until the governmentitself concluded what problems had to beaddressed and what remedies would be used,there would be no settlements with responsibleparties for cleanup implementation, or formal orinformal negotiations for settlements whichdiscussed cleanup standards or remedies asnegotiable issues.
5aAb obwrvd, IWWCVCX, thti EPA’s RODS often contain verbatim excerpts from responsible party study documents and fiequendy depend uponM data obtained in those studies. In other cases, EPA’s contractors redo work performed for responsible parties.
S3R_ible @= aISO incl~e Fedcr~ agencies and States for some Superfund slh%+.

Chapter 1--Summary, Introduction, and Policy Options ● 55
A key goal of this option is to balance theparticipation by responsible parties prior toRODS with that of site communities. That is,this option does not preclude responsible partyactivity at a site prior to the ROD, but it doestransfer the official RIFS activity to the govern-ment. Responsible parties would still have theright to conduct their own studies if they desiredand to contribute, as communities do, to the EPAsite study and cleanup decision process. EPAsite managers could consider information pro-vided by responsible parties and use that infor-mation in significant ways, but the governmentwould retain the principal responsibility for siteinvestigation and evaluation of remedies.
With this option, the government would stillretain its authorities to recover the costs of sitestudies from responsible parties or even toobtain agreements to pay such costs.
Benefits: This option would definitely im-prove public confidence in Superfund. What-ever the problems in having the governmentconduct site studies, with this option all suchwork would have public accountability andvisibility. It seems as if, to some degree, EPAhas addressed its workforce, contractor, andfunding issues by privatizing site studies. Butultimately those issues must be addressed by thegovernment without yielding its responsibilitiesto responsible parties and contractors.
If the contractor workforce is available toresponsible parties to conduct studies, then it isalso available to the government. The largeamounts of money spent on oversight of respon-sible party studies-which can be as great as thecosts of the studies themselves-would instead
be spent on conducting the studies themselves.54
There is considerable potential to reduce a lot ofredundant contractor work in the current system.In its research on site studies and RODS,OTA has not found any consistently higherlevel of technical quality in studies performedby or for responsible parties. Although thatmay have been the case at one time, the recentgrowth of responsible party studies has met thesame problems faced by EPA because of theexplosive growth of Superfund. With this op-tion, there is an opportunity for a net reductionin all contractor studies. This in turn couldremove some of the pressure on the contractorworkforce which now contributes to low-qualitywork and high costs.
A subtle benefit of this option is associatedwith another use of site studies. Completelyobjective and comprehensive RIFSs provide thepublic with an invaluable source of detailedinformation about a site which may contribute tothe public’s ability to pursue legal actions undercommon law because of personal injury orproperty damage. If a responsible party con-ducts an RIFS, certain kinds of information maynot be obtained or may not be given in publicdocuments. For example, the following advicewas given to the responsible party community inthe context of managing environmental claims:
If a company believes that it could be susceptibleto third-party suits either because data exist to showeffects on neighboring wells or because there is alikelihood that the contamination could affect theneighboring wells in the future, further investigationmay be an undesirable strategy. Action is called for,and any actions must fit in with the other aspectsinvolved in overall claims management.ss
WS& tie OveBl@t Cmt is ge~r~ly @d for by responsible parties as agreed to in consent decrees, there could be a saving for responsible partiesif they only pay for government studies, assuming that, under this option, the government would not pay more than the current tod for responsible partycontractor studies plus government contractor overs@t work. A recent news story described two cases with higb oversight study costs: the A.Y.Mcllcmald Manufacturing Co. of Dubuque Iowa paid $279,000 for EPA’s oversight contractor which was almost m much as the company paid for theckanup, and the John Deere Dubuque Works paid more than $1 million for an EPA contractor to contlrrn that the $8 CI0,0(XI cleanup wm woriung. NormBrewer, “Another Iowa Buaincwxnan Raps ‘Ridiculous’ EPA Cleanup Costs, ’ The Des Moines Regtiter, June 15, 1989.
Michael J. Murphy and Richard E. Freudcnbergcr, ‘‘Environmental Claims Management: A Case Study of 7kdmical Support, in /nrwance Cluinufor ~nvtionmcntaf Damages (New York, NY: Executive Enterprises Publications, 1989),
56 ● Coming Clean: Superfund Problems Can Be Solved . . .
In other words, the responsible party’s interestin minimizing cleanup costs also extends tominimizing or avoiding other costs as well.
Implementation: Considering EPA’s highinterest in having more responsible party stud-ies, this option would probably not be imple-mented without congressional action. A newstatutory provision to override current languagecould preclude responsible parties from con-ducting site studies and limit settlements toimplementation of government cleanup deci-sions, from design studies through implementa-tion. Cost recovery for government studieswould still be encouraged. Clearly a currentinducement for responsible parties to enter intovoluntary or negotiated settlements with EPA isthe opportunity to conduct RIFSs. Adopting thisoption, therefore, would make it all the moreimportant for EPA to use the full array of strongenforcement tools provided it by statute. Moreo-ver, if EPA provides effective participation inthe pre-ROD process for responsible parties (asfor communities) then the negative impact ofthis option on post-ROD settlements will bereduced. However, in the short term, this optionwould increase the need for spending signifi-cantly more fund money on RIFSs, but eventu-ally these costs could be recovered.
A negative impact of this option on theduration of site studies and cleanups does notseem likely. OTA examined fiscal year 1988RODS on a regional basis and found that in fiveregions fund sites moved faster from placementon the NPL to issuance of a ROD, and in fiveregions enforcement sites moved faster.56 Na-
tionwide, the average for enforcement sites was4.0 years and for fund sites 3.9 years. OTA alsoanalyzed EPA’s data on RIFSs and remedialaction projects in progress, which presented dataon schedule performance from January 1,1987through September 30, 1987;57 189 activitiesdesignated as responsible party lead averaged adelay of 1.7 quarters and 68 designated asfund-enforcement averaged 1.6 quarters, com-pared to an average delay of 1.1 quarters for 163activities designated fund-financed.58 For mini-mizing delays, these data indicate a potentialadvantage for shifting work from responsibleparties to EPA.
However, the recent study Coalition onSuperfund Research Report (September 1989)presented ‘ ‘intriguing interim trends and con-clusions’ but cautioned against drawing broadnational conclusions; 21 sites in Region 5 wereexamined, including 7 pre-SARA sites from1984 and 1985. The study concluded that RIFSsperformed by responsible parties were of equalquality to those by EPA, that sites move fasterthrough the Superfund process when responsi-ble parties conduct studies, and that cleanupstandards are similar for the same type of sitesfor government financed and responsible partyfinanced cleanups. All three conclusions areopposite to those of OTA’s, which are based onexamination of national data as well as a largernumber of specific case studies in a number ofEPA regions, all for 1987 or 1988. In theCoalition study, of the 6 sites that responsibleparties performed the RIFS, 3 were from 1984or 1985. Because Region 5 is large, the sites
5~e mo~ s~~g ~fferenca were: Region 6 where fired sites were 1 year faster; Region 7 where fund sites were 1.6 years faster; Region 10 whereenforcement sites were 1 year fmter. Nationwide, for enforcement sites, Regions 2 and 7 had the longest times (4.8 years) and Regions 3 and 6 the shortes~times (3.4 and 3.5 years); for fund sites, Regions 1, 2,4, 8, and 10 had the longest times (4.6 to 4.8 years) and Region 6 the shortest time (2.5 years).
57~s is a ~tab~ over t.hrw ties luger than FY88 RODS; 85 percent of the data covered over 450 RIFSS in progress and, therefore, these datasuggest the possibility of discernible differences betwcxm fund and enforcement RODS released after FY88. EPA, ‘‘Progress Toward ImplementingSuperfund: Fiscal Year 1987 Report to Congress-Appendix D Status of Active Remedial Investigations/Feasibility Studies and Remedial Actions inProgress on Sept. 30, 1987, ” April 1989 [statutorily, the report was due on Jan. 1, 1988]. ‘l%edatapresente ddonot reveal delays which may have occurredprior to Jan. 1, 1987,
5J3Nom~Iy, ~~~ble p~ 14 ~tivities wodd be plac~ in the enforcement category, We think that fund-enforcement ~tivlties mean thatresponsible pan.ies have been identified and that the site is slatd for enforcement action to subsequently obtain settlement for future work and costrecovery for work financed with the fund. Responsible party lead activities probably mean that responsible parties are conducting work agreed to as arcauh of a settlement and consent deuec.

Chapter 1--Summary, Introduction, and Policy Options . 57
evaluated in the Coalition study are a smallfraction of that region’s output.
Overall, the key to successful implementa-tion is improved EPA capabilities and proce-dures which would assure that its site studieswill be more effective, efficient, and consis-tent than they have been. (A number of policyoptions identified in this report could assist thatgoal.) As noted above, implementation of thisoption could be for a limited time, perhaps 5years, with the expectation that sufficient im-provements in the program might make responsi-ble party conduct of site studies less contentious.
OPTION 15: Reexamine Financing andEnforcement of Liabilities to ImproveEnvironmental Performance
Superfund’s environmental performance isaffected by its financing and enforcement ofstatutory liabilities. To limit the amount ofmoney for fund-financed studies and cleanups,Congress imposed very strict liabilities whichwould set the stage for major financing ofcleanups by responsible parties. A number ofstrong enforcement powers were given to EPAand the Justice Department to ensure thatresponsible parties, if they could be identified,would pay for cleanups either before or after thefact. In large measure, the basic congressionalstrategy has worked, because responsible partieshave probably provided several billion dollarsfor studies and cleanups. OTA has not in-cluded 100 percent public financing (as for apublic works program) without liabilities asan alternative to this basic congressionalstrategy. One of the more important reasonsis that Superfund liabilities have been seen bynearly everyone as a powerful incentive topromote industrial waste reduction and im-proved waste management.
But success has had several undesirableimpacts: delayed studies and cleanups, addedadministrative and transaction costs for thegovernment and responsible parties, and com-
promised environmental quality at some sites.These effects are an inevitable consequence ofthe natural confrontation between governmentgoal of maximizing spending by responsibleparties and responsible parties’ goal of minimiz-ing their costs. Delay and added administrativeand transaction costs have also resulted from thereluctance of many responsible parties to ac-tively participate and negotiate with the govern-ment. This, in turn, has resulted, in largemeasure, because EPA has not used some of thestrongest enforcement powers given it by stat-ute. That is, uncooperative responsible partiesare not necessarily penalized. But some of theproblem has to do with the difficulty of makinga strong legal case. Thus EPAs preference forvoluntary or negotiated settlements which isonly one of several tactics given it by statute toimplement the basic congressional strategy.Settlements have been promoted through: 1)allowing responsible parties to conduct RIFSs,and 2) implicitly or explicitly reducing the scopeor extent of cleanup and selecting less perma-nent remedies to reduce costs at some sites.
With this option, Congress would reexaminehow the mix of statutory tactics can best be usedto implement the original congressional strategy(i.e., maximizing financing of cleanups byresponsible parties) and obtaining stringentcleanups comparable to fund-financed ones.Principally, this means exploring: 1 ) using moregovernment funds to act quickly at sites—implying increasing current special taxes orestablishing new ones initially-followed byincreased cost recovery; 2) using the strongerenforcement tools provided by statute to compelmore responsible parties to pay for stringentcleanups; and 3) developing more effectiveincentives for voluntary settlements so that it isnot necessary for EPA to compromise environ-mental goals.
For the first two tactical approaches, OTA’sresearch has not yielded any new technicalinsights and congressional discussion of themwill largely center on legal, financial, and

58 ● Coming Clean: Superfund Problems Can Be Solved . . .
implementation issues. However, for the thirdtactical approach there is an idea debated, butrejected by Congress in 1986, which meritsreexamination. Responsible parties have arguedthat giving them complete and final closure tothe government’s claim on them at a specific sitewould get more voluntary settlements and getthem more expeditiously. Obtaining quick andcertain closure has monetary value. The govern-ment could provide this settlement incentive:If the responsible party or parties pay apremium to the government—above the near-term estimated cost for cleanup--then thegovernment will irreversibly close its case.59
(EPA sometimes uses this approach today withde minimus responsible parties; i.e., thoseassigned a small fraction of a site’s cleanupcost.) To lower its monetary risk with broadapplication, the government would have to havea good sense of what the ultimate completecleanup might be and cost, taking into accountuncertainties about site contamination, risks,cleanup objectives, and cleanup technologies.This may, however, not be feasible at all sites.
Benefits; Improving Superfund implementa-tion requires the examination of all aspects ofthe program and, especially, their interactions.Giving the public the kind and amount ofenvironmental protection it demands expedi-tiously is, inevitably, linked to Superfund’scomponents relating to financing and enforce-ment of liabilities. Past and current tactics haveprovided some key financial benefits, but theyhave come at some environmental and monetarycosts. OTA believes that there is no intrinsicconflict between the twin goals of obtainingexpedient, comprehensive, and permanentenvironmental protection and making re-sponsible parties pay for cleanup. The issue
really is what mix of tactics best achieves bothgoals.
implementation: Congressional action is re-quired. Although CERCLA already gives EPAsome of the necessary statutory authority (e.g.,enforcement tools and cost recovery), historyhas shown how contentious and difficult it is todeal with financing and enforcement of liabilityissues. The idea of responsible parties paying apremium to quickly reach complete and finalclosure at a site is actually an extension ofsomething already implemented by EPA in alimited way. However, the release from futureliability does not cover the discovery of newconditions or other extraordinary circumstances.These are not improbable events. Thus, theresponsible party cannot obtain total protectionfrom future liability. However, for completeelimination of future liability as considered inthis option, Section 122(f) of the CERCLA/SARA statute would have to be changed. Acritical policy issue for implementation of thepremium option is: Would the public interest beserved by giving responsible parties completeand total release from future payments andliability if they pay a special one-time premium?
The answer, of course, may depend on howwell the government can identify what thatpremium should be. In 1986 making this deter-mination was viewed as infeasible and the ideaof allowing responsible parties to pay for acomplete release was rejected. OTA’s examina-tion of many cleanup decisions and the develop-ment of new information at many sites duringtheir cleanup leads us to conclude that it wouldbe difficult to calculate a premium but not asinfeasible at most sites as it seemed in 1986.Much experience has been gained throughhundreds of remedy selections, remedial de-
sg~4~e Em ‘risk Premlw payment’ refers to a risk apportionment device similar to insurance premiums, under which the risk taken by thegovernrmmt for providing PRPs with a broader release from liability is offset by a payment in excess of the projected cost to complete the remedy, ‘I%epremium should be sufficient to compensate EPA for taking the risks associated with contingent future costs, such as cost overruns in completing theseleaxi runedy or future costs that may be incurred if the selected remedy is not adequately protective of human health and the environment. RobertJ. Mason and Mark F. Johnson, “Structured Settlements: A New Settlement Incentive, ” SWe@md ’88, proceedings of November 1988 conference,Hazardous Materials Re=arch Institute, Silver Spring, MD.

Chapter I--Summary, Introduction, and Policy Options ● 59
signs, and remedial actions. A study could showthe relationships between estimated costs inRODS and actual costs of implementing reme-dies (and some such work is underway). Thedistinction between current and future risksdiscussed above might also aid this effort. Theexample given in the discussion of PolicyOption 1 (box l-D) is also instructive here.Although only a small amount of money wouldbe associated with the immediate cleanup, amuch larger sum would be necessary to addresscomplete source control and groundwater cleanupin the future.
OTA believes that it is possible to estimate(with reasonable but not complete certainty) thecosts of future cleanup at most sites and factorin the delay before future actions might takeplace. High eventual costs would be often offsetby longer times before action is necessary, if atall, and low costs would usually be offset by aneed to take action fairly soon. Too low apremium would result from higher than antici-pated cleanup costs and/or costs that becamenecessary faster than anticipated; too high apremium would result from a lower than antici-pated remedy cost and/or one more delayed thananticipated. (The premium situation describedhere is not unlike that facing insurance compa-nies in setting life insurance premiums.)
Implementation of some of the other policyoptions presented in this report would help EPAestimate premiums, these include: site classifi-cation, defining permanence, using a hierarchyof cleanup methods, the site technical assistanceprogram, and the technology technical assis-tance program. Uncertainty about future cleanupcosts cannot be eliminated, but it can be reducedto reasonable levels for many sites and trans-lated into risk premiums.
In terms of economic principles, there is abenefit for the government to get significant
money upfront. In effect, premiums are likemini-trust funds for individual sites, coveringfuture cleanup contingencies, and building valueover time before they are needed. They are likelife insurance premiums used by companies toearn money before payment is necessary. Thegovernment also might pay less for administra-tive and transaction costs when negotiatingbecause a one-time premium may reduce thelength and complexity of the settlement processor other, sometimes multiple, enforcement ac-tions.
OPTION 16: Strengthen EPA HeadquartersDirection and Oversight of RegionalImplementation
There is little dispute that Superfund actionsand program performance vary widely amongEPA regions (see OTA’s 1988 case study reportand ch. 2). In its recent management review,EPA said that nearly 80 percent of fiscal year1988 RODS, for example, used the agency’srequired nine criteria for selecting remedies. Butthe fact that over 20 percent of RODS did not usethe agency’s method for remedy selection indi-cates excessive regional autonomy. In checkingthe accuracy of information provided by EPA inits first report to Congress on Superfund im-plementation, EPA’s Inspector General recentlyfound “30 percent of removal activities and 13percent of remedial activities claimed by theRegions were not supported by valid documen-tation in the Regions’ files."60 A recent study ofSuperfund examined this issue and concluded:
In reality, the Administrator has little time to“manage” the Regional Administrators. As a result,they operate with considerable autonomy and, itappears, frequently without close adherence tonational policy. [There is] a lack of clearly definedresponsibility, authority and accountability betweenthe Regions and Headquarters.61
%33% Progress Toward implementing Supe@nd Fiscal Year 1987-Ueport to Congress, A@l 1989.
blcl~ Siks hc., Ma&ng Supe@md Work, JiiLNMXY 1989.

60 ● Coming Clean: Superfund Problems Can Be Solved . . .
The flexibility regions want competes withnational consistency. With this option, EPAregional offices would still maintain primaryimplementation responsibility, but they wouldhave less flexibility in interpreting or ignoringEPA policy and guidance. EPA headquarterswould have a primary goal of national consis-tency for Superfund implementation. Therewould be routine examination of RODS andstudies for inconsistent regional decisions, espe-cially for cleanup standards and remedy selec-tion. 62 ROD bunching at the end of the fiscalyear and ROD inconsistencies for substance andformat would be given special public attention.Deviations from program policy would beidentified, such as using design studies tocircumvent the need for treatability studies onalternative cleanup technologies during thepre-ROD study phase.
Benefits: This is a way to reduce excessiveflexibility in program management, restore pub-lic confidence in the program, and strengthenenvironmental performance. There is no basisin law or policy for environmental protectiondepending on what region a Superfund site isin. It is also a critical way to reduce unnecessar-ily high administrative and transaction costs forthe government and the responsible party commu-nity. Reducing regional variation in the imple-mentation of Superfund is key to having asingle, truly national cleanup program. There isno inherent contradiction between the desire forcentral national policy and management versusthe desire for regionalized implementation.Regions could identify regional, State, and sitespecific conditions which merit special attentionor different responses from the national norm.
Implementation: Regional managers a n dstaff’s are likely to resist this option. Findinga middle ground between the need for re-gional flexibility and central national control,however, is necessary if Superfund's per-formance is to be improved. Theoretically,
EPA could implement this option. But, consid-ering the historical relationship between EPAheadquarters and EPA regional offices, it maybe advisable for Congress to explicitly requireaction by the EPA Administrator. For example,all key summary information on Superfund’sperformance could be required to be presentedon a regional basis. The Administrator wouldidentify significant differences among regions,the environmental impacts of those differences,and actions to address those differences andimpacts. Special attention should be given to theimpact of State laws and actions on regionaldepartures from agency policies. Explicit andpublic evaluation of regional performance againstnationwide, program objectives would also berequired. Programs designed to rotate key re-gional people among regions to bring thepoorest performing regions up to the level of thebest performing regions might be required.
OPTION 17: Commit to a PermanentSuperfund Program
As a matter of public policy, Sup-fundwould be acknowledged to be a permanentprogram, requiring a national infrastructure andinstitutional delivery system. This means, forexample, establishing: university programs tosupport a well-educated, stable workforce ingovernment and the contracting industry; acontinuing R&D effort; well-defined policiesfor short- and long-term priorities; effectiveinter-agency and Federal-State relationships;and central, national information systems. As afirst step, Congress could consider requiring anindependent study to: 1 ) assess whether and, ifso, how current Superfund activities have beenbased on detailed long-term program needs andstrategic objectives, and 2) identify specificpolicies, programs, and funding requirements toestablish an effective national infrastructure fora permanent cleanup effort. The study wouldproduce a long-range strategic plan for Super-
Wther program components, such as site evaluation, also need headquarters oversight snd periodic assessment.

Chapter 1-Summary, Introduction, and Policy Options ● 61
fund, identifying and discussing issues, needs,and policy options beyond the scope of thisOTA study.
Benefits: Public confidence in Superfundwould be improved by the government takingspecific steps to ensure an effective long-termdelivery system. It would help make publicexpectations for Superfund more realistic, and itwould help the private sector in making efficientand effective contributions to the governmenteffort.
Implementation: Congressional action is re-quired. It could take the form of both a statutorypolicy statement and a series of specific programspending authorizations and appropriations. Broadpublic support is likely because it is in virtuallyeveryone’s interests to minimize future uncer-tainties.
OPTION 18: Establish an All Inclusive Listof Cleanup Sites in the United States
The new list might be called the NationalCleanup List and a new NCL office would beestablished at EPA to be a central, nationalclearinghouse for key information about sitesfor which some governmental agency had deter-mined that cleanup was probably necessary.63
This corresponds to the Superfund’s NationalPriorities List. All cleanups of chemically con-taminated sites would be tracked through thenew NCL; Superfund sites would be a subset ofthe NCL and they could be designated asbelonging to the National Priorities List. Twicea year, the office would issue a revised NCLdocument, made freely available to the public.By using a set of simple symbols, for example,the following important information could bepresented for each site: what cleanup programthe site was being managed in (e.g., Superfund,RCRA corrective action, a State program, a
Federal agency); when the site first was recog-nized as requiring cleanup; what actions havebeen taken at the site (i.e., site investigation,emergency action, recontrol, interim or finalcleanup) and when those actions were com-pleted. Appendices in the report could providenames and telephone numbers of key govern-ment cleanup offices, and a list of sites whichhave received complete cleanups.
Benefits: Cleanup in America has not onlygrown, it has become increasingly fragmentedamong many different programs, making itincreasingly difficult for anyone in or outside ofgovernment to have a good sense of the overalleffort. This option would greatly improve publicaccountability. A chief use of the NPL is toprovide information to the public, but thecurrent NPL covers only a small fraction ofcleanup sites in America. This option wouldinform the public about the relative contributionof Superfund compared to other cleanup pro-grams. And from the perspective that sites inother cleanup programs may ultimately becomeSuperfund sites because of less complete or lessstringent cleanups than in Superfund, this optionis important for a long-term Superfund program.
Moreover, there is relatively little informa-tion in the current NPL which really helpspeople understand what is going on at sites.With this option, the NCL would be become aquick-reference report card for cleanup sites.The NCL would become the key instrument fordisseminating the results of a national clearing-house for centrally collecting key facts aboutcleanup sites. The NCL office would also havethe capability to provide important summaryinformation to Congress and others about cleanupin America. Environmentally, there is bound tobe increasing attention to cumulative exposuresand risks; contaminated sites in different cleanup
63~1~ is ~ ~onh~t t. ~ list of inventow si~s; hat is, sites which have ~n identifi~ ss possibly ~~mg cleanup but which require someaswwmcmt, inspection, and evaluation before dcterrninadon of the need for cleanup. The number of inventory sites is much larger than the number ofsites eventually determined to likely require cleanup. In Superfurtd, about 10 percent of examined inventory sites have become NPL sites. But 10 to 20percent of the inventoried sites become the responsibility of other cleanup programs. Some estimates of the potential number of Superfund invento~sites reach hundreds of thousands of sites.

62 ● Coming Clean: Superfund Problems Can Be Solved . . .
programs may be close enough to affect thesame people. Determining safe levels of residualcontamination in land or water may requireaccurate information on multiple cleanup sitesas well as other sources of toxic chemicals, suchas operating industries reporting information tothe Toxic Release Inventory maintained by EPAunder Title III of SARA.
Implementation: This option requires statu-tory action by Congress, possibly includingauthority to obtain key information from ailcleanup programs in the nation. Implementationof this option would not in any way affectcurrent statutory requirements for NPL sites.Establishing this new effort means more peopleand money. But the effort would be relativelysmall, probably no more than 10 to 20 peoplecould carry out this function; EPA alreadycommits some resources to the administration ofthe NPL. Procedures would be established toreceive information in a routine, periodic wayfrom all cleanup programs. Total annual costwould be probably be in the range of $1 millionto $2 million, including publishing and mailingNCL reports (the report could also be madeavailable electronically). This cost would bebalanced against the potential benefits of im-proving public information and confidence, aswell as the help it could give to managers of allcleanup programs and companies in the cleanupbusiness. A few States, such as Florida, nowprovide the kind of comprehensive and informa-tive listing of sites considered in this option.
OPTION 19: Begin Examination of MovingSuperfund Implementation Outside of EPA
Direct implementation of such a large-scalefield activity is not, theoretically, what a regula-tory agency is supposed to do. Moreover,Superfund implementation pits the environ-mental standard setting role of EPA againstEPA’s compliance with environmental stan-dards. It is similar to asking EPA to build andoperate, for example, hazardous waste landfillsor incinerators. In fact, this fundamental prob-
lem helps account for the trend in EPA’smanagement of Superfund to privatize theprogram as much as possible, through both theextensive use of private contractors andsettlements with responsible parties. But thereare other strategies to shift Superfund implem-entation away from EPA, leaving it to concen-trate on setting cleanup standards and goals andensuring compliance with them by all partieswhich perform cleanups.
Two main alternatives seem worth detailedexamination, which is beyond the scope of thisOTA study. First, Superfund implementationmight be transferred to the States. A number ofother EPA efforts have taken this route. On theplus side, the States are closest to the problemand, for the most part, want as much responsibil-ity as they can get in implementing environ-mental programs, although that is usually con-tingent on obtaining substantial financial sup-port from the Federal Government. On thenegative side, State implementation of environ-mental programs has had mixed results, and theState participation in current Superfund im-plementation (through site specific cooperativeagreements) also has not been especially suc-cessful. Moreover, although many States havesignificant cleanup programs of their own, thereis very little detailed information to support ageneral conclusion that State implementationhas been better than EPA’s of Superfund. Still,State implementation of Superfund could be alonger term strategy, perhaps in about 10 yearsor more.
Second, Superfund implementation might betransferred to a new quasi-Federal agency,designed especially to carry out the nationalcleanup effort-perhaps including many othercleanup programs. The Federal Government hasestablished new agencies in the past to imple-ment a major national technical effort (e.g.,National Aeronautics and Space Administra-tion). Indeed, neither OTA nor others have beenable to make a good case for using an existingFederal agency other than EPA for Superfund

Chapter I-Summary, Introduction, and Policy Options ● 63
implementation, even though, in theory, severalof them seem qualified. The chief problemseems to be a lack of public confidence in thoseexisting agencies to move beyond their currentmissions and undertake a major hazardous wastecleanup program (e.g., the Army Corps ofEngineers, the Bureau of Reclamation) or therelatively small size and limited scope of thecurrent organization (e.g., U.S. Geological Sur-vey). Moreover, there are unique benefits ofestablishing a new quasi-Federal agency. Inparticular, it is a way to overcome manypersonnel constraints, especially the cap onFederal salaries for technical professionals inshort supply.
Benefits: If Superfund is accepted to be apermanent program, then there are enoughtheoretical benefits for shifting implementationaway from EPA to warrant a serious study of theoption.
lmplementation: This option requires congres-sional action. The frost step would be a special,independent study delivered to Congress. Itwould focus on the costs and benefits of specificoptions, paying special attention to identifyingtransition problems and their solutions. Such astudy could be done by a major universitygovernment or public policy center with someexperience in the environmental area, and couldtake about 2 years. Another early action could beproviding grants to States which submit propos-als on how they would develop their resourcesin order to implement the Superfund program inthe way EPA regional offices now do.
PART II: Program Changes
Setting Cleanup Priorities and Goals
OPTION 20: Use Hazard Ranking System inMore Limited Way
The HRS (in its present or revised form)would no longer be seen as yielding numbersaccurate to two decimal places and scores wouldno longer be assigned to NPL sites for theirentire history. Instead, the HRS would be used
as a binary decision tool: either a site poses asignificant environmental problem which mayrequire cleanup, or it does not. Years of researchand analysis of the HRS has found that it cannotreliably make fine distinctions from site to site(see ch. 2). Its appropriate use is as an aid toearly site decisions based on limited informa-tion. Instead of the current cutoff score of 28.50for placement on the NPL, which was set onnonenvironmental grounds, two scores wouldbe used: a high score above which a sitecertainly merits detailed examination and possi-ble remedial cleanup, and a low score belowwhich there is little chance of the site having asignificant environmental problem. For siteswith scores between these two critical scores, apanel of experts would make a consensusprofessional judgment as to whether the sitedoes or does not get placed onto the NPL, on thebasis of the information prepared for the site.
Benefits: This new use of the HRS would savea lot of effort and money which now goes intothe determination, review, revision, and use ofscores, which, in fact, serve little purpose. Forexample, in the shift from proposed to finalstatus, scores are often changed very smallamounts-amounts which make little sense interms of the accuracy of the methodology nor interms of how the scores are used. There is noevidence that EPA regions make importantdecisions about sites because of their precisescores. The chief priority-setting accomplishedby the NPL is to distinguish between sites on theNPL and sites not on it. Site scores, however,have not set priorities among sites on the NPL.EPA’s practice of changing site rankings on thegrowing NPL, based on site scores, serves nouseful function. The extensive quality assurance/quality control efforts by government and con-tractor staffs is largely misdirected to achieve afalse and unnecessary precision. Moreover, theuse of a single score for the entire history of anNPL site doesn’t mean much technically orenvironmentally. The score is determined wheninformation on the site is at its early and worst

64 ● Coming Clean: Superfund Problems Can Be Solved. . .
stage; the score is never changed on the basis ofnew and improved information, such as theeventual risk assessment, nor is it changed toreflect the environmental consequences of emer-gency, removal, or remedial cleanup actions atthe site. To its credit, the Department of Defenseupdates its site scores to reflect changes in sites.
With this option, sites which may not now geton the NPL because of deficiencies in the HRSmethodology would have a better chance ofbeing placed on the NPL.
Implementation: EPA could do this on itsown or Congress could direct it to make thesechanges through statute. There are no significantobstacles to implementation. Unnecessary workby government and contractor staff could bestopped. Some effort would be necessary todetermine the two new high-low score bounda-ries. This could be done by EPA’s ScienceAdvisory Board, which has already done workon the HRS. This study could be done within 6months; it should also recommend a standardform which would be filled out by the technicalreview panel in explaining its decision on a site.
The composition of the panel of technicalreview experts to make the decisions for siteswith scores between the high-low boundariesshould not be difficult. To make the applicationof the HRS efficient and timely, this groupshould be a permanent staff function at EPAheadquarters (not a contractor activity). Fromthree to six of EPA’s most senior, experiencedtechnical staff should be selected for thisimportant function. The review panel shouldprepare its standard brief report on a site within1 month of receiving the job; the panel shouldhave the right to visit a site. Currently, regula-tory rulemaking is used for site placement on theNPL, which carries with it many legal andprocedural burdens, including challenges toHRS scores. However, this option would notrequire changing that procedure. Sites would beproposed on the basis of a score which exceededthe high-boundary score or the judgment of the
review panel. Challenging EPA’s decision wouldremain essentially the same as it is now.
OPTION 21: Reassess and Limit Use ofIndicator Chemicals for Site Studies, RiskAssessments
The selection of indicator chemicals to studyrisks at sites merits more attention and publicscrutiny. The purposes and technical appropri-ateness, in theory, of using indicator chemicalsneeds policy clarification. For example, the OakRidge National Laboratory study mentionedearlier found that 54 percent of RODS used noformal screening procedure for selection ofindicator chemicals. This option would requirean independent examination of current policyand procedure, and a detailed analysis of howindicator chemicals have been selected and usedin critical site cleanup decisions. As a means ofsimplification and study cost reduction, using ashort-list of representative site contaminantsstands on its own merits. The problem lies inimplementation of the concept, especially byrelatively inexperienced people, and unintendeduses of the short-list.
First, indicator chemicals used in risk assess-ment may not produce accurate risks becausetoo many site contaminants are left out. Theextent of this problem is linked to what conceptof risk is employed. If risk assessment iscentered around possible worst case individualrisk, as it is currently, then using a short-list isless problematic, as long as the worst sitecontaminants in terms of health effects arechosen. However, if the risk concept is popula-tion risk, reflecting actual or likely total risks toa whole exposure group, then using a short-listof contaminants could greatly underestimatetotal estimated risk and the total benefits fromrisk reduction. The latter is favored by peoplewho want to have cleanups justified by cost-benefit analysis. But using only indicator con-taminants inevitably means underestimatingtotal risk and total benefits (or total riskreduction) from cleanup.

——
Chapter 1--Summary, introduction, and Policy Options . 65
A second major problem is that indicatorchemicals are used for technology evaluationand implementation. But selection of indicatorchemicals because of their documented healtheffects is not necessarily consistent with differ-ences among site contaminants with regard totheir chemical and physical properties which arecritical to cleanup. Therefore, decisions regard-ing remedy selection, design of remedy, and—most critically—measurement of cleanup suc-cess may be seriously affected by the originallyselected indicator chemicals. For example, it isquite conceivable that a cleanup could be judgedto be successful on the basis of cleanup levels forindicator chemicals. But such a cleanup couldleave a site contaminated with other contami-nants which, in their own right, pose unac-ceptable levels of risk to health or-especially—environment, because environmental effects arenot used on a par with health effects in theselection of indicator chemicals. Or site contam-inants which are not indicator chemicals mightseriously reduce the effectiveness of chosencleanup technologies.
Benefits: More effective and consistent clean-ups could be achieved, as well as fewer surprisesarising in the later stages of the cleanup processthat often mean increases in cleanup costs.Applying more public scrutiny as well astechnical expertise early on in the selection ofindicator chemicals could, in the longer term,make the entire cleanup process more efficientand effective.
Implementation: Either EPA or Congresscould initiate a study which implemented thisoption. Such a study should be possible to
complete in about 1 year by a universityprogram with experience in chemistry, healtheffects, and environmental engineering. Thestudy should include a detailed examination ofsites within a few generic categories (e.g, woodpreserving sites) to see if past practice has usedconsistent types of indicator chemicals. And thestudy should examine the performance of somerecently completed cleanups to see the extent, ifany, of problems arising because of the use ofindicator chemicals.
OPTION 22: Clarify and Strengthen Cost-Effectiveness Requirement for RemedySelection, Reject Use of Cost-BenefitAnalysis
Major policy attention is necessary if we areto clarify what cost-effectiveness means, howthe goal is achieved by the remedy selectionprocess, and how it is different from cost-benefitanalysis. This option embodies a policy commit-ment to cost-effectiveness as the way to meetnational and site environmental objectives withlimited resources. The keystone of this commit-ment is using health and environmentalcriteria to decide on the extent of cleanup(risk reduction) first. Then, the lowest costalternative able to reliably provide the se-lected level(s) of cleanup is selected.64
This option requires a reexamination of thecurrent framework for remedy selection, whichuses nine criteria. One of these is cost—notcost-effectiveness. 6s The nine criteria have pro-vided enormous flexibility to Superfund manag-ers, enough to select virtually any kind ofremedy and maintain that it is consistent with
~~e me~~ of sttmg cle~up obj~tlves ftr~ and then detenmmng the cost- effective remedy has been expressed by Congrc\s ‘‘The term‘cost-effective’ means that in determining the appropriate level of cleanup the President first determutes the appropriate level of cnvironrnental and healthprotection to be achieved and then selects a cost-effective means of achieving that goal. ” Conference Report 10 accompany HR. 2005, SupcrfundAmendments and Reauthorization Act of 1986, U.S. House of Representatives, 99th Congress, 2d session, Report No. W-962, p, 245. In the debate onthe conference report, Senator Mitchell said ‘‘An amdysis of cost effectiveness begins only after a remedial action has been selected m compliance withthe health and environmental protection requirements, permanent treatment requirements, and other standards, requiremen~, critcri a or Iimitat]onsimposed under the law. Congressional Record [dai!y cd,], 99th Cong,, 2d SCSS., Oct. 3, 1986, at S14913.
65~e other ei@[ ~. ovc~l ~o~~tl~n of hum~ he~~ and tie environment; compll~~e witi applicable or relevant and appropriate requirementsof other statutes (’ ‘ARARS ‘); long-term effectiveness, reduction of toxicity, mobility or volume; short-tern effectiveness; implemcntabihty; Stateacceptance; and community acceptance.

66 ● Coming Clean: Super-fund Problem Can Be Solved . .
statutory requirements and effective environ-mental protection. A recent study of Superfundconcluded:
EPA has not clearly defined each of the criterianor how they are to be applied. , , . The Agency’scurrent remedy-selection policy, in that it treats allthe criteria equally, does not provide EPA staff,States, PRPs and concerned citizens with a frame-work that clarifies how tradeoffs are to be madeamong the different criteria in selecting a remedy.66
The current nine EPA criteria might be reducedto two essential steps after the precise cleanupobjectives (based on existing environmentalstandards, risk assessment, and perhaps specialcleanup standards) are determined: 1) analyzingeach alternative for its ability to meet thosecleanup objectives, and 2) estimating the fullcosts for each cleanup alternative (includingfactors which are now in some of the ninecriteria, such as implementability and less thancomplete permanence). Then, with this option,the lowest cost alternative able to meet thecleanup objectives would be selected.
The goal of selecting a cost-effective remedyis not the same as cost minimization, which, inlarge measure, is the current practice. Nor doescurrent practice define or use specific detailedcleanup objectives to examine cleanup alterna-tives and to justify the one selected.b7 Whenusing cost-effectiveness, minimization of costoccurs after a remedy is selected, consistent withthe cleanup objectives originally selected.
Superfund managers have a number of waysto minimize cleanup costs, starting with decid-ing as early as possible which are current risksand which are future, possible risks. Similarly,early recontrol and interim cleanup actions canreduce final cleanup costs because they preventsites from becoming worse. Analysis of alterna-
tive technologies, including value engineeringand full short- and long-term costs is alsocritical. More generally, costs will be minimizedthrough: R&D and technology transfer; designoptimization; pilot testing; new informationabout contamination or exposures which canreduce cleanup needs; competition among pro-viders of cleanup services; and effective govern-ment procurement procedures and oversight ofcontractors.
Current Superfund practice has largelyreplaced the statutorily required cost-effectiveness approach with cost-benefit anal-ysis. This option would explicitly reject the useof site cost-benefit analysis to justify cleanup, toset the extent of cleanup, or to select a remedy;it would prevent the changing of cleanupobjectives with little public scrutiny. As anexample of a conclusion based on cost-benefitanalysis, a recent ROD said: ‘‘The selectedremedy provides overall effectiveness commen-surate to its costs such that it represents areasonable value for the money."68 EPA’sproposed National Contingency Plan has similarlanguage, which would make current practiceofficial policy.
The chief attribute of cost-benefit analysis,and its apparent attraction, is to considerenvironmental protection goals as variable.The chief presumption of the approach is theability to accurately quantify both costs andbenefits, even though experience demonstratesthe inability to do either. Indeed, research showsthat cleanup costs have more impact on remedyselection than any other factor, even thoughcosts are nearly always underestimated at everystage of Superfund before cleanup is actuallycompleted. Cleanup happens or stops whencosts seem appropriate relative to estimated
~lean Sites Inc., Mti”ng Sq@knd Work, January 1989.67~e O* R1d~ N~m~ ~~r~~ mtiy m~ti~ abOVC found that only 12 pcreent of cleanup decisions were b- on a qumtittiivc ~ysis
of the degree of risk reduction provided by different cleanup ahematives. Even though some form of cleanup goals were also identified, the study notedthat “few sites incorporated the cleanup goals into the evaluation of alternatives. ”
MEPA Re@on III, R~d of D&ision, Ambler Aslxstos Piles site, Ambler, PA., Sept. 30.1988.

Chapter I-Summary, Introduction, and Policy Options ● 67
benefits. A recent analysis disclosed that chang-ing the current statutory structure for Superfund(i.e., risk-based decisions, for the most part,followed by cost-effectiveness analysis) to thecost-benefit approach would exacerbate currentproblems. According to the analysis, replacingthe statutory approach with cost-benefit deci-sionmaking would, on the negative side, reducerisk reduction and equity from high to low,public accountability from high to very low, andadministrative simplicity from high to low. Onthe positive side, the change would increaseefficiency from low to very high.69
Some inevitable consequences of the cost-benefit approach include the following exam-ples:
1.
2.
3.
4.
5.
6.
not cleaning up identically contaminatedsites because at one, in a rural area, thereare relatively few people potentially af-fected and other short- or long-term envi-ronmental benefits are ignored;not cleaning up a site at all because thereare no quantifiable current benefits andfuture benefits are discounted;not using available cleanup technologywhich offers a truly permanent remedybecause it is more expensive than anotherone, which is based on containment oftoxic waste and not its destruction;cleaning up only part of a site, whichaccounts for most of the risk to health,which can be quantified, but not the partwhich might pose some uncertain risk toenvironment;stopping cleanup, even though originalcleanup standards have not been met,because the marginal cleanup costs arehigh relative to the incremental benefitsobtained, leaving, contamination in ground-water or soil above the cleanup standards;having very different levels of cleanupamong sites for specific contaminants insoil or water.
Benefits: This is a way to reduce excessiveflexibility in remedy selection and, therefore,ensure that environmental protection is notcompromised in order to minimize spending bythe government or responsible parties. It is alsoa way to ensure that all approaches to reduce thecost of a cleanup with specified environmentalobjectives are examined and used where appro-priate. Current flexibility is reduced in order tocomply with statute and to obtain nationalconsistency. By stressing proper use of cost-effectiveness, program managers would also berequired to formulate specific environmental,risk reduction cleanup goals, something that isnot now commonly done.
Implementation: This option requires congres-sional reaffirmation of the cost-effectivenessapproach to Superfund management. Explicitstatutory language would give the meaning anduse of cost-effectiveness as well as the preclu-sion of implicit or explicit cost-benefit analysis.This would likely be opposed by those valuingmaximum flexibility. Support would likelycome from community and public interestgroups.
Lastly, the statute has provided EPA a way toreject some fund-financed cleanup alternativessimply because their costs are too high. Thefund-balancing provision is based on the legiti-mate environmental position that a very expen-sive fund-financed cleanup could consume somuch money that the action would preempt asubstantial number of other fund-financed clean-ups. However, EPA has rarely used this statu-tory provision to reject cleanup alternatives withrelatively high costs. If Congress provided moreguidance on what level of spending could triggeruse of this provision, it would make it possiblefor EPA to move outside of the cost-effectiveness approach discussed here in excep-tional fund-financed cleanups. However, thereis now no statutory basis for rejecting high costresponsible party-financed cleanups obtained
@kstcr B. Lave and Eric H. Males, “At Risk: The Framework for Regulaung Toxic Substances, ” Env. Sri. & Tech., vol. 23, No. 4, 1989.

67 ● Coming Clean: Superfund Problems Can Be Solved . . .
directly through a settlement (i.e., not subse-quent to a fund-financed cleanup followed by acost recovery action).
OPTION 23: Better Integrate CommunityPerspective Into Enforcement and SiteDecisions
It was the perceived lack of public confidencein Superfund implementation which motivatedCongress to enact the Technical AssistanceGrants program in 1986. (OTA suggested thisoption in its 1985 report Super-rid Strategy.)Since 1986, implementation of the TAG pro-gram has been slow and interpretation ofstatutory provisions has resulted in complex,burdensome procedures and requirements forcommunity groups. This option would providemajor policy direction for the TAG program andits integration into Superfund implementation.Another trend since 1986 has been the expandedrole of responsible parties in Superfund implem-entation, mainly because EPA has emphasizedthe settlement route to enforcement. Therefore,an emerging issue is whether EPA has bal-anced its enforcement of the polluter paysprinciple with concerns about victim’s rights.(Victim may be a strong word, but it is importantto acknowledge that community members are atrisk; they perceive themselves as actual orpotential victims, either because of health oreconomic effects.)
The presumption of this option is that vic-tim’s rights have become overshadowed by thedesire by EPA to shift cleanup spending fromSuperfund to responsible parties primarilythrough voluntary or negotiated settlements.With this option, better balance between the twoconcerns would be sought. For example, EPAcould be required to:
1. include community representation duringits settlement negotiations and provideopportunity to comment on consent de-crees and other formal instruments imple-menting settlements or carrying out en-
2.
3.
4.
5.
forcement actions for anything other thanpayment;solicit formal community comments aboutkey cleanup decisions;provide more than perfunctory responsesto community comments in its RODS;instruct site managers to maintain ongoingcommunication with community groupsduring the entire time a site is within theSuperfund program; andrequire responsible parties implementingcleanups to maintain ongoing communica-tion with community groups and to notifythem of any new information which re-veals changes in perceived site problemsand problems in the performance of theselected remedy.
Benefits: This option would help balance therole of communities and responsible parties. Ifthe emphasis on enforcement continues, thisoption becomes more important in improvingpublic confidence in Superfund.
Implementation: Congress would provide statu-tory direction to EPA. A major implementationconcern would be whether this option wouldresult in delays in key cleanup decisions andactions. It seems that the best way of minimizingthis problem is for government site managers toinform communities that their actions may havenegative impacts. After all, it is not in thecommunity’s self-interest to cause unneces-sary delays. But delays in the pursuit ofimproved environmental protection are justifia-ble. A site manager who concluded that commu-nity activity was causing a loss in environmentalprotection has an obligation to tell the commu-nity that and to take action to mitigate thatimpact. Another concern would probably be thatthe option would interfere with enforcementobjectives. But enforcement should take secondplace to environmental protection and to thepublic’s confidence in the government’s sincer-ity and ability to provide that protection. Theincrease in program administrative costs toimplement this option are uncertain. Congressional

Chapter 1---Summary, Introduction, and Policy Options . 69
oversight could give special attention to theeffectiveness of this option and make changes ifnecessary.
Developing Workers and Technologies
OPTION 24: Make Site ManagersResponsible for Sites From the Front-Endof the Program Through Final Disposition
One person would have operational manage-ment responsibility for a site from the time itenters the Superfund system until the time itleaves it. The Superfund site manager optionwould apply the concept of project managementin engineering or a case worker in socialservices. Indeed, the site manager has manyengineering responsibilities and, moreover, crit-ical responsibilities for dealing with affectedcommunities, local officials, and responsibleparties. The latter would look to the site manageras the person providing environmental serviceson behalf of the government. The site managerwould have total responsibility for seeing thatthe site is handled efficiently, fairly, andconsistently under law and EPA policies, andcompared to other sites in the program. Thesite manager would draw on a broad array ofexperts to support his or her efforts, includingexperts in the areas of: technology, contracts,conflict resolution, policy, law, and health.
Benefits: Cleaning up sites is a complexprocess whose management could be mademore efficient by having one person responsiblefrom beginning to end. Many human endeavorsfall into the project management category andhistorically everyone has acknowledged thevirtue of having a single point of managementresponsibility to provide continuity over time.Accountability is improved by having a singleoverview of diverse activities carried out bymany different people, including contractorsand government staff. A site manager could bekey in preventing unnecessary, redundant siteefforts which now occur as different site activi-ties are handled in different bureaucratic stages.
Implementation: This is a management op-tion for EPA, but Congress could, throughoversight or legislation, support or not supportthis approach. An obvious concern about thisoption is that EPA is currently having majorproblems retaining remedial project managers.Some people may believe that this option isinfeasible because of this problem. But one ofthe ways to improve the status, importance, andpay for these key front-line people is to expandtheir role. Superfund site managers wouldbecome an elite corp of professionals; theywould have the most comprehensive knowledgeof the entire program, from one end to the other.People working in other parts of the programwould aspire to become site managers. Havingassistant site managers could provide on-the-jobtraining under experienced EPA staff, as well assupport for the site managers. The workload ofsite managers would be balanced by providingnew site responsibility, for a site entering thesystem, as other sites near the end of theSuperfund process.
OPTION 25: Establish Program forCertified Public Environmental Auditors
This option would require EPA to establish anew program to certify people who could attestto the quality of site and cleanup data and reports(i.e., for onsite investigation and engineeringactivities outside of analysis and studies whichrequire no onsite activity). Responsible partystudies and cleanups would have to use certifiedpublic environmental auditors. Governmentagencies and groups receiving EPA Techni-cal Assistance Grants would also be requiredto use certified public environmental audi-tors to the extent that the work was con-ducted by non-governmental contractors foronsite investigation and engineering activi-ties. The basis for certification would be meet-ing a set of criteria established by EPA afterdiscussions with a number of organizationsrepresenting professional engineers, consultingengineers, hazardous waste professionals, and

70 ● Coming Clean: Superfund Problems Can Be Solved . . .
EPA’s Science Advisory Board. Such criteriawould pertain to minimum cleanup experience,level of science or engineering education, andprofessional certification. EPA would make listsof certified individuals available to the public.
Benefits: Certification of experts would aidgovernment oversight. This approach wouldimprove the quality of contractor work, whichseems critically needed because of the explosivegrowth of the industry and the rapid entry ofmany new companies. It would also help buildpublic trust in contractor work for responsibleparties.
Implementation: Congress could direct EPAto establish a certification program expedi-tiously. Certification could be implementedeffectively through a concerted effort by EPAwith the help of other groups in perhaps 1 year.Comments and ideas should be solicited fromabout a dozen engineering, professional, andtrade organizations. Out of this activity wouldcome a set of criteria and procedures forcertification. Within EPA, certification could bemanaged by the procurement and contractsmanagement office. Recertification could beevery 5 years. To offset the cost to the govern-ment of administering this option, certificationand recertification would require a fee, whichwould be paid into the trust fund in the same waythat the primary fees are.
OPTION 26: Strengthen Effort to OffsetCurrent Limitations of the Governmentand Contractor Workforce
The rapid expansion of Superfund created theconditions for workforce problems. It is axio-matic that the more inexperienced theworkforce, the greater the need for strongmanagement. In the case of Superfund, thesituation was exacerbated by the enormousamount of money spent on contractors, resultingin a steady loss of government workers, keepingthe government workforce inexperienced. Andthe growth of spending on contractors (from
Superfund and other cleanup programs) hasforced companies to hire more and more inexpe-rienced people, despite siphoning away govern-ment workers. If Superfund implementation isto improve for the long term, then the govern-ment must give high priority to identifyingweaknesses in the workforce and ways to offsetthem. With this option, EPA would have apermanent activity within its Superfund officeto improve the performance of the nationalcleanup workforce. For example, continuingeducation and training, intensive technical assis-tance, improved administrative support, ex-panded use of electronic support (e.g., data-bases, expert systems), and more opportunity toattend technical conferences. Moreover, EPAcould establish special programs with contrac-tors, State programs, universities, research labo-ratories, other Federal agencies, professionaland trade associations, and responsible parties tomeet the objectives of this option. A specialposition would be established under the directorof the Superfund office to carry out theseresponsibilities.
Benefits: For long-term success, the Super-fund program must provide assurance to thepublic that the government is doing everythingpossible to make the cleanup workforce firstrate.
Implementation: EPA could implement thisoption, but congressional support for increasedspending seems necessary. Annual spending forthis effort might be in the $5 million to $10million range, which is small compared tocleanup costs.
OPTION 27: Establish a Bureau of MinesSuperfund Support Program
Many Superfund sites are contaminated withtoxic metals, such as lead, arsenic, and chro-mium. Achieving a permanent remedy for suchcontamination means recovering and using themetal. The Bureau of Mines is the FederalGovernment’s major source of expertise appro-

Chapter 1 Summary, Introduction, and Policy Options ● 71
priate to accomplishing this goal. The Bureauhas already performed some important work ata few sites for some regional offices, but theSuperfund program has not fully optimized itsuse of the Bureau.70 This option would requirea long-term commitment of funds to support theBureau’s continuing involvement, particularlyfor developing techniques applicable to genericcategories with many sites, such as lead batterysites. Moreover, some sites have a combinationof organic and metal contamination, and there isan opportunity to integrate metal recoverytechniques into a series of cleanup steps forcontaminated soils to achieve a permanentremedy. The Bureaus Superfund support pro-gram would include R&D, site treatability andfeasibility studies, site demonstrations, techni-cal assistance to site program managers andothers implementing cleanups, and possiblymanaging some cleanups instead of contractors.
Benefits: This would be an efficient way togreatly improve the technologies used to cleanup hundreds of current and future NPL sitescontaminated with toxic metals. Very littlerecovery of metal site contaminants is currentlyused to achieve permanent remedies. The gov-ernment has already invested millions of dollarsover many years in creating the Bureau of Minesand its technical expertise is undisputed. TheBureau also is well positioned to network withexperts in the academic and industrial communi-ties. Developing techniques to clean up sitesmight also provide an opportunity to developnew mining techniques. The kind of expertisethe Bureau has does not exist within EPA or thetechnical environmental consulting communitynow providing major support for Superfundimplementation.
lmplementation: Although EPA could imple-ment this option, congressional action seemsappropriate to establish a significant program,
probably at the level of $10 million to $20million annually initially. This is particularlyimportant if EPA is to move beyond the currentlimited use of the Bureau by its regional officestoward a national program with some long-termcertainty to facilitate internal development ofresources by the Bureau. One concern may bethat pursuit of the recovery approach for metalcleanup will be expensive compared to currentapproaches. First, current approaches usuallyconsist of: 1 ) offsite land disposal which is nota permanent remedy; or 2) onsite containment(i.e., capping of a site) which is not a permanentremedy; or 3) chemical fixation or stabilizationtreatment technologies whose permanence oververy long times is uncertain. Moreover, thelimited work to date with recovery and recyclingdoes not suggest exorbitant cleanup costs. Tothe contrary, because there are large numbers ofrelatively similar metal-contaminated sites, it islikely that generic cleanup techniques can bedeveloped and applied at many sites, bringingcleanup costs down. Moreover, the sale ofrecovered metal could reduce cleanup costs. Therecently completed cleanup of the JibboomJunkyard Superfund site in Sacramento, Califor-nia ended up costing about $400 per ton toexcavate and ship lead-contaminated soil to alandfill in Utah. But a decision to use a recoverytechnology developed by the Bureau for apermanent remedy at the United Lead Super-fund site in Ohio involves a cost of about halfthat land disposal rate.
OPTION 28: Establish a Superfund SupportProgram at the U.S. Geological Survey
The USGS is one of the most respectedtechnical Federal agencies; it has extraordinaryinformation and expertise about groundwater.But to date the Superfund program has maderelatively little use of USGS. With this option,a formal and stronger supportive role of USGS
7~is ~m ~ ~ but ~m ~~am@~ of ~ gener~ su~glc choice exercl~ e~]y in Supfind’s hls~~; ~al is, it was &ci&d to emphasizt @Yatt3
sector contractors for Superfund implementation and not immediately avadable and potential resources of Federal agencies, The one exception is theArmy’s Corps of Engineers at the back-end of Superfund.
72 ● coming clean: Superfund Problems Can Be Solved . . .
for Superfimd implementation would be cre-ated. For example, USGS could:
●
●
●
●
●
assist R&D efforts to identify and developeffective groundwater cleanup technology;provide assistance in evaluating technicalinformation provided by responsible par-ties concerning groundwater problems andcleanup;conduct parts of or all site investigation andfeasibility efforts at sites where groundwa-ter is the major problem, or review contrac-tor studies;provide independent evaluation of the per-formance of groundwater containment andcleanup efforts at Superfund sites; andperhaps manage the cleanup of some particu-larly complex groundwater contamination.
Benefits; This option would improve theenvironmental performance of Superfund byusing an existing Federal resource. It alsocompensates for the shortage of highly experi-enced technical personnel in EPA and contract-ing fins.
Implementation: There is no significant ob-stacle to implementation. EPA, however, hasnot used USGS effectively, and, therefore,congressional direction to do so may be advisa-ble. This option seems feasible and valuablebecause for the past several years USGS hassignificant y and successful y carried out techni-cal support for the U.S. Air Force’s site cleanupprogram. Moreover, it is OTA’s understandingthat EPA’s Inspector General’s office has usedUSGS in the past to review Superfund studiesand actions. Currently, USGS is working on siteinvestigations and feasibility studies for about20 to 25 Air Force sites, at an annual spendinglevel of about $10 million. This is the type ofSuperfund activity currently performed by con-tractors. The level of activity envisioned for thisoption is annual spending of perhaps $20million initially. USGS was able to develop itsAir Force effort within its existing resources andstaff; it is not clear how quickly it could commit
to implementing this option. But USGS hassome competitive advantage, relative to EPA, inattracting first rate technical specialists. More-over, in its Air Force work, USGS has success-fully expanded its capabilities through the use ofcertain types of contractors (e.g., site drillingand laboratory analysis) and, most interestingly,by using the experienced staff of some otherFederal agencies such as the Bureau of Recla-mation. There is also probably substantial op-portunity for USGS effort in the R&D area.
OPTION 29: Increase R&D Spending, WithFocus on Groundwater Cleanup
A long-term national cleanup program re-quires a stronger R&D program to develop moreeffective and lower cost cleanup technologiesfor the most prevalent and difficult cleanupproblems. This option would frost consist of anindependent study, for example by the NationalResearch Council or EPA’s Science AdvisoryBoard. The basic objective is to define the exacttargets for increased R&D spending within andoutside EPA. A national research agenda iscritical for avoiding unproductive and redundantresearch efforts. For example, improved ground-water cleanup technology is a critical need, as ispermanent cleanup of large landfills throughsome type of treatment technology, but withoutlarge-scale excavation. Major attention to thepotential use of in situ biological cleanup ofgroundwater seems critical. Even without astudy, a major increase in the outstandinggroundwater program at EPA’s Robert S. KerrEnvironmental Research Laboratory seems crit-ically needed. There are also needs outside ofcleanup technology; for example, more andbetter non-intrusive and non-invasive site inves-tigation technologies to determine hot spots ofunderground contamination. Moreover, if cleanupin America is a permanent effort, then muchmore support of basic research is criticallynecessary.
Benefits: To the extent that there is a need fora wider range of technologies to effectively run
Chapter l-Summary, Introduction, and Policy Options ● 73
along-term cleanup program and to find innova-tive ways to reduce costs, a stronger commit-ment to R&D stands on its own merits. More-over, a strong R&D program which inevitablymeans more university activity helps address thelong-term need for greater education to improvethe national workforce.
Implementation: This option requires actionby Congress and support by EPA and OMB.Considering the enormous future spending onthe national cleanup effort, a major increase incleanup R&D spending is in a special class. Thekey issue is determining how much money tospend on R&D. It seems useful and appropriateto see annual R&D spending relative to totalgovernment and private sector cleanup spend-ing. The latter is probably in the range of $2billion to $4 billion currently by all parties.Spending say 5 percent on R&D suggests atarget of $200 million annually; this seemsnecessary because the national cleanup effortis still in its infancy, and because there is acritical need to reduce costs and come up withnew, effective solutions. This figure is proba-bly about three times larger than currentpublic spending on R&D related to cleanupof chemically contaminated sites. In particu-lar, a several-fold increase in annual spendingfor EPA’s Robert S. Kerr laboratory and for theSuperfund Basic Research and Training GrantsProgram of the National Institute of Environ-mental Health Services would probably yield anenormous payoff in the years ahead. Together,current annual spending on these two programsis less than what is often spent on a single majorsite cleanup. Another important target for in-creased funding is the University HazardousSubstance Research Centers established byCongress in 1986.
Improving Government Management
OPTION 30: Combine PreliminaryAssessment, Site Inspection, HRS Scoring,and Remedial Investigation Phases IntoSingle Site Evaluation Program
Three technical activities now make up thepreremedial part of the Superfund program:preliminary assessment, site inspection, andHRS scoring. The Remedial Investigation isnow part of the remedial program. This optionwould combine all four EPA staff activities intoone organizational unit at the headquarters andregional levels. The premise of this option is thatunderstanding the hazards posed by a site is acontinuing learning experience based on gettingmore and better information about a site overtime. All four activities constitute site evalua-tion. Use of the four current individual activitiescould be retained with this option, but theywould be parts of a unified process and a singlebureaucratic operation.
Benefits: Improved program efficiency andprobably improved environmental performancewould result from this organizational streamlin-ing. Currently separate, often redundant activi-ties would be combined in a simpler operation.Bureaucratic disconnects would be eliminated.Moreover, the front-end of Superfund would,through this consolidation, become more visibleand important. Currently, relatively junior peo-ple perform the earliest, but, in a critical sense,the efforts with the largest long-term impacts.More senior and experienced technical peoplewould be more likely to be attracted to theseactivities because of the greater scope of respon-sibility.
This option is particularly important in overcom-ing the currently popular view that cleaning upsites is a straightforward engineering job. Infact, however, the ‘ ‘specifications’ for cleanupare not fixed quantities, easily determined at oneparticular time. As complexity of contamination(e.g., types, amounts, and distribution) andnatural site conditions (e.g., geology, hydrol-ogy, soil parameters, etc. ) increases, site evalua-tion increasingly takes on the character of anevolving investigation instead of a one-timeevent producing correct answers. With complexsites, new information leads to new probes aboutthe site and its problems. Moreover, as site

74 ● Coming Clean: Superfund Problems Can Be Solved . . .
complexity increases, more discrete types ofactions are taken at the site (e.g., emergency,removal, interim or operable unit actions, ground-water cleanup, soil cleanup, final remedialcleanup) and when these are implemented newinformation often arises which leads to unfore-seen needs for new and different site investiga-tion.
Finally, separating site investigation fromcurrent feasibility study activity could offerbenefits. The feasibility study is supposed totake information about the site and its problemsand determine possible cleanup solutions. Thisis a very different technical activity than siteinvestigation. In fact, site investigation is funda-mentally a scientific endeavor, seeking knowl-edge to define the problem (i.e., the cleanupspecifications)-the demand side of cleanup. Afeasibility study in conjunction with cleanupactions themselves, is fundamentally an engineer-ing operation, in which a solution to the problemis conceived, designed, and constructed-thesupply side of cleanup in which cost is explicitlyfactored into remedy selection. By keeping theactivities separate—but with effective, continu-ing communication between the two-the integ-rity of the two different functions could be bettermaintained. This is in contrast to the currentsituation, where sometimes the definition of thecleanup problem and cleanup goals are compro-mised to fit what engineers (working for thegovernment or responsible parties) say is feasi-ble, desirable, effective, or low cost. In otherwords, by separating site investigation fromthe remediation function, environmental needswill drive engineering solutions instead of theother way around.
Implementation: This is a management improve-ment that could be implemented by EPA.However, current separate bureaucratic activi-ties and different contracts pose a seriousimplementation problem. Unification of sepa-rate activities is never easy. However, from along-term perspective, the ultimate benefits ofbringing together essentially the same technical
activities may be worth overcoming bureaucraticobstacles in the near term. Congressional actionmight be necessary to overcome bureaucraticinertia.
OPTION 31: Combine Removal andRemedial Programs Into Single SiteCleanup Program
This option would recognize and institution-alize the relationship over time of different typesof cleanup actions. The sharp distinction be-tween emergency/removal actions and remedialactions would cease. Instead, Superfund man-agement would recognize a continuum of cleanupactions over time: emergency, recontrol, interim(currently called operable unit), and final.
Total risk reduction decreases over time (seefigure 1-2) as extent and cost of studies andactions increase over time. In other words, inmoving from emergency response to finalremedy, the marginal costs on average in-crease, producing less environmental benefitper dollar over time. This progression of costmotivates aiming for initial cleanup actionsat as many sites as possible, instead of aimingfor final cleanups at relatively few sites.Postponement of the final remedy (as withOption 1) is a way to optimize the entireSuperfund system.
This option provides an explicit definition toeach of these four types of cleanup action:
●
●
Emergency response is self-evident: animmediate, urgent, and certain threat isaddressed and is more important thanprocedure or policy preferences regardinganalysis of the problem (Site Investigation)or selection and implementation of rem-edy. Emergency responses in this optionwould be essentially the same as emer-gency responses are now and applicable tonon-NPL sites.Recontrol stresses preventing the spread ofcontamination into the environment aside

Chapter 1 Summary, Introduction, and Policy Options . 75
Figure l-2—Approxlmate Reductions In Risk and Coatfor Dlfferent Types of Cleanup Actions
Emergency Recontrol Interim Final
Type of action
&XRCE: Offioa of Technology Asaeaament, 1989
from addressing risks.71 Recontrol alsomeans addressing near-term risks to healthor environment because of current, certainexposures to hazardous material. Studiesshould be minimal for recontrol actions.Decontrolling a site may mean activelymaintaining effectiveness through expedi-ent engineering or institutional controls.That is, a service or continuing activity
may be required to implement the action,such as monitoring, maintenance, and peri-odic repair. Recontrol measures usually: 1)impose physical or institutional barriersbetween the contamination and its environ-ment, such as a cap on contaminated soil orburied waste, a slurry wall between buriedwaste and groundwater, above-ground stor-age of hazardous waste or contaminatedsoil, groundwater extraction wells whichprevent a plume of contamination fromspreading, fencing to prevent human expo-sure to contaminated soil, restrictions onuse of contaminated groundwater, provi-sion of new supply of water, relocation ofhomes etc.; or 2) use treatment technolo-gies which leave residual contamination.With recontrol actions which leave hazard-ous material onsite, the need for a perma-nent remedy eventually is acknowledged.The proclivity to send hazardous waste toa landfill in the current removal programwould be replaced by a policy to eitherstore waste temporarily or send it to atreatment facility. Recontrol actions wouldbe applicable to non-NPL sites, as withcurrent removal actions.
An interim remedial action achieves apartial remedy by addressing current risksto health or environment, leaving eitherfuture, uncertain risks to address or currentrisks for which no current technologyoffers a permanently effective remedy.That is, in contrast to recent.rol actions,there would be a preference for perman-ently effective technologies. Part of asite’s problem may be addressed throughan interim action, such as a soil or ground-water cleanup, or surface soil cleanup but
TiM~@ ~m is ~me s~lM~ ~tmn reC~UOI and removal (in the current program), this option could lead to a much larger use of KZOIIIIO1.Removal actions do not stress reamtrolling sites when spreading contamination does not pose immediate risks. For example, EPA said ‘‘States generallyme going to have to be rmpmsible for ncm-time-critical removals where there is not an immediate danger but the site is deteriorating in a way such that~g needs to be done over the next year or two. ” In general, EPA has acknowledged that its conduct of the removal program stresses limitingremoval actions by defering actions to responsible parties and State or local government agencies, and non-NPL sites have tie lowest priority. It is notclear that EPA provides significant oversight of actions taken by other parties. Limiting spending on the removal program has dictated the scope andnumber of actions. (Karen Burgan et al., “Setting Removal Program Prionues,’ Superfund ’88, proctxxiings of November 1988 conference, HazardousM#riais Research Institute, Silver Spring, MD,)

74 ● Coming Clean: Superfund Problems Can Be Solved . . .
●
not subsurface soil cleanup; several interimactions at a site may be necessary.A final remedial action would address allremaining current or future risks throughtechnology which irreversibly renders haz-ardous site material nonhazardous. Delist-ing of a site from the NPL would onlyoccur after completion and confirmation ofa permanent final remedy.
Transfer of a site from Class I to Class II, asdescribed in Option 1, could occur after emer-gency, recontrol or interim actions.
Organizationally, EPA would combine allcleanup activities into one unit, Site Cleanup,because all are fundamentally engineering solu-tions to a contamination problem, employingsimilar methods and technologies. Use of re-moval and operable unit terminology, which hasnot conveyed useful notions to the public, wouldcease. With this option EPA would formally berequired to issue Records of Decision for everysite cleanup action, except that an emergencyaction would not be held up for its ROD. Foremergency actions a post-action ROD would beacceptable to establish a public record of whatoccurred. Currently, RODS are only issued forremedial actions, including operable units.
Benefits: This option would provide a techni-cally rational framework for a range of complexsite actions. Some current practices which seemto circumvent statutory requirements would beeliminated, such as performing remedial clean-ups as removal actions. There has been confu-sion about the nature and purpose of removalactions. Neither public opinion or public policysupports removal in a literal sense, wherebytoxic waste or contaminated material is removedfrom a site to a landfill, for example. The firstchoice is removal to a treatment or storagefacility, although sometimes landfilling may benecessary. With this option, recontrol actionswould be integrated into the full remediation ofa site; currently, removal actions are not necessar-ily matched well with remedial actions.
Another benefit might be reduced studies,because recontrol and interim actions should notrequire extensive studies as are now being donefor nearly all remedial actions and some largerremoval actions. Public understanding of thetrue, complex nature of site cleanup would beimproved and, hence, public confidence in theprogram could improve. The requirement thatEPA issue RODS for every cleanup action wouldalso improve public accountability and publicconfidence. Currently, there is virtually noaccessible information to the general public orCongress which provides substantive informa-tion on what emergency or removal actions haveconsisted of, accomplished, or cost. All RODSshould reference earlier RODS at the site in orderto help people understand the history of siteactions.
Implementation; This option requires statu-tory action. Definitions and limits for all fourcategories would replace current statutory dis- ,tinctions for removals and remedial cleanups.An immediate issue is how current statutoryprovisions would apply to this framework.Therefore, there would have to be an explicitassignment of critical statutory requirements tothe four types of actions. For example, currentremedy selection and cleanup standards provi-sions, or modifications of them, might onlyapply to interim and permanent actions. Currentspending constraints on removal actions couldbe applied to recontrol actions. Within EPA,there will be some resistance to this kind ofconceptual and organizational change. Overtime, competition has developed between theremoval part of the program and the remedialpart. Problems with existing contracting mecha-nisms would not be affected too much. Contrac-tor services for emergency responses remain aunique kind of need. However, current distinc-tions between contract support for removal v.remedial actions would cease.

Chapter 1-Summary, Introduction, and Policy Options ● 77
OPTION 32: Reexamine Current StatutorilyRequired Program PerformanceSchedules
Congress established a number of programperformance schedules in 1986. However, insetting performance goals for the program,unintended impacts, such as eliminating orreducing environmental criteria for key deci-sions have occurred. EPA has said ‘‘Achievingtargets can mean trade-offs with achievingenvironmental results. Targets are numericalgoals that do not measure quality, timeliness orrisk reduction. ’72 A recent study of Superfundsaid ‘‘Time pressures sometimes reduce oppor-tunities to involve all the affected parties(including the community) early in the remedy-selection process to promote consensus. ’73
OTA agrees with these views. With this option,either the performance schedules would bedropped or they would be supplemented byexplicitly directing EPA to assure that compli-ance was obtained without environmentalcompromises.
Benefits: Subtle but negative impacts onenvironmental performance would be elimi-nated by removing pressures on EPA to meettimetables which have little to do with effectivecleanup. Mandated schedules direct EPA’s at-tention away from satisfying requirements oncleanup objectives and remedy selection.
Implementation: Congressional action is re-quired. This option requires rethinking thebenefits of imposing performance schedulesagainst the negative impacts they have onenvironmental performance. EPA is facingalmost a Catch-22 situation: either it com-promises environmental goals to comply withschedules or it maintains environmental stan-dards and fails to comply. Either way, theagency draws public criticism. For the most
part, EPA has done the former. But because ofthe complexity of the Superfund program, it hasreceived relatively little criticism thus far formost of its environmental compromises, such asrestricting the inflow of sites into Superfund.But such compromises are bound to havesignificant negative effects in the longer term.
OPTION 33: For Records of Decision,Require a Statement of Inconsistency forSelected Remedy
All RODS would be required to have aseparate section for a statement of inconsis-tency, or a statement that none has been foundnecessary. This statement would force a routineconsideration by site managers and their super-iors of any significant inconsistencies betweenthe cleanup action, particularly its cleanupstandards and remedy selection, and statutory orEPA policy requirements, as well as withgeneral practices (e.g., a deviance from agenerally standard type of remedy selection fora generic type of site, or a postponement of atreatability study until after the ROD).74 Theinconsistencies would have to be identified andthe environmental justification of them fullypresented. Use of a new, innovative technologyor a technology demonstration would be de-scribed and explained.
Benefit: This option would improve publicaccountability and, hence, public confidence inSuperfund. It would reduce current inter-siteand EPA regional inconsistencies. It wouldprovide an incentive for effective use by Super-fund staff of technical assistance resources andinformation transfer programs. EPA headquar-ters control of regional efforts would be en-hanced. Congressional oversight would be im-proved.
Tz~vlrmenM Protwtion Agency, A Management Revitnv of the Superfum.i Program, JU.IIC 1989, PP. 1-6.
73CIa Siks kc. Mahng Superjimd Work, J~uiuY 1989.TWA hu &n told ~a[ ~UCh ~[alemenLS we sometimes a pm of tie adminls~a(ive r~ord or b~kup informtiion to a ROD,

78 ● Coming Clean: Superfund Problems Can Be Solved . . .
Implementation: Either EPA or Congresscould implement this option. More effort wouldbe required in ROD preparation by regionaloffices and another responsibility is placed onsite managers, increasing administrative costs.But the cost seems marginally small both in anabsolute sense and relative to potential benefits.
OPTION 34: Reduce Need for FormalRegulatory Compliance for OnsiteCleanups
In meeting the goals of simplification andspeeding up cleanups it seems appropriate toeliminate regulatory requirements for permits—not health or environmental effects based stand-ards-if their environmental objectives can bemet more simply. The objective is to eliminateintensive time, labor, and paperwork require-ments for regulatory compliance. On the as-sumption that a government agency wants tosatisfy the functional requirements of environ-mental regulations, and that the need for expedi-tious cleanups has intrinsic environmental im-peratives, elimination of formal, regulatorycompliance is unlikely to jeopardize environ-mental goals. This option would go beyond thecurrent statutory provision that eliminates for-mal compliance with Federal permitting re-quirements for onsite cleanups. With this op-tion, all Federal, State, and local regulatoryrequirements for obtaining a license or permit tooperate, or substantiating compliance with aregulatory requirement through documentation,would automatically be waived. The only re-quirement would be that EPA would have topublicly identify which requirements it was notplanning to formally comply with and how itwas achieving the same environmental objec-tives of the regulations. This would be done ina separate section of the Record of Decision.
Benefits: Cleanups would be speeded up andadministrative costs reduced substantially.
Implementation: Congressional action is re-quired. As a form of Federal preemption, this
option poses certain traditional issues. How-ever, many regulatory requirements would stillpertain to Superfund cleanups, including, forexample, all health or environmental effectbased standards for acceptable levels of contam-ination in environmental media, regulatory defi-nitions of hazardous wastes and substances, andregulatory bans against land disposal. Success-ful implementation without sacrificing environ-mental protection is contingent on the motivesand capabilities of key Superfund staff, princi-pally site managers. As long as only governmentpersonnel are entrusted with the power to bypassformal regulatory compliance, as compared tocontractors or responsible parties, the risks ofcompromising environmental protection can beminimized. It might be useful, nevertheless, toalso provide through statute the legal right ofany governmental authority with regulatorypowers or member of the public to petition theEPA Administrator within say 30 days after aROD is issued for reconsideration because ofsome basis for believing that the intendednoncompliance would likely lead to adverseenvironmental consequences (noncompliancebecause of emergency responses would not fallunder this provision). OTA recognizes thatsome State agencies and regulations have beencritical to achieving improved cleanups and thisoption is not meant to reduce the positiveinfluence of stringent State programs.
OPTION 35: Establish a Formal EvaluationProgram for Completed Site Cleanups andLong-Term Ones in Progress
There is a critical need for independentevaluation of the environmental and economicperformance of Superfund actions. With thisoption, an ongoing performance evaluationeffort would be established outside of EPA.Some sampling of sites in generic classes wouldyield critically needed information on how welltechnologies are performing in the field in anabsolute sense and relative to estimates andprojections made by the government or respon-

C h a p t e r 1 -Summary, Introduction, and Policy Options ● 79
sible parties. It is important to discover theextent to which technologies are succeeding andfailing, and the extent to which originallychosen cleanup objectives or requirements iden-tified in RODS and consent decrees are beingmet or not met.
For example, for the Pepper’s Steel & Alloyssite in Florida, for which the responsible partywas successful in gaining EPA approval for afirst time, large-scale application of new tech-nology, the cleanup has recently been com-pleted. However, the responsible party, whichnow markets the cleanup technology, has re-quested EPA to do more than delist the site fromthe NPL because the remedy is successfullycompleted. It has also asked for ‘‘unrestricteduse of the affected property’ and in its discus-sion of its implementation of groundwatermonitoring has said:
If [the presence of the constituent above the targetlevel] is confirmed, then, if appropriate, an effort todetermine the source of the constituent, or someother action consistent with the facts presented,might be undertaken. 75
The latter is not a strong commitment for takingremedial action in the event that monitoringfinds that the chemical fixation technology usedat the site, contaminated in large part with PCBs,does not perform as expected. Indeed, the longterm effectiveness of this technology for PCBshas been a major issue. The ROD had said:
the action will require monitoring and institutionalcontrols on future land use to ensure the continuedeffectiveness of the remedy. These activities will beconsidered part of the approved action.
Yet, immediately after the onsite treatment, theresponsible party has reached a high level ofcertainty about the cleanup’s effectiveness onthe basis of laboratory testing and wants toremove the institutional controls on land use.Industrial use of the site, as desired, would alsocomplicate interpretation of monitoring results
with regard to responsibility for groundwatercontamination.
With this option, if information was obtainedwhich could immediately impact current deci-sions and program implementation, the programwould issue some form of alert notice to EPAheadquarters and regional offices, as well asother programs which are part of Superfundimplementation (such as the efforts in Options10, 11, 27, and 28). Otherwise, semiannualcollections of site evaluations could be releasedto these groups and the general public.
Benefits: In a program as technically complexas Superfund and one in which there have beenmajor problems with implementation, quality ofwork, and public confidence, there are benefitsfrom having an independent performance re-view effort. Both the environmental perform-ance and economic efficiency of Superfundwould be improved, because there would bemore use of the most effective technologies andless use of ineffective ones. Moreover, therewould be improved information transferthrough the system, improving the expertise andperformance of the workforce. Public accounta-bility would be improved. There is a particularneed to build public confidence for less visiblepost-ROD activities, especially because of in-creasing implementation of remedies by respon-sible parties. There are also a lot of selectedremedies which include institutional and engi-neering controls. This option would help in theimplementation of the current statutory require-ment for 5-year reviews when contaminationremains onsite.
Implementation: Congressional action is neces-sary. This would be a new activity requiringadditional funding. As envisioned here, the levelof effort would be perhaps $5 million annually;that is, it seems feasible to examine about 25 to50 sites annually, assuming a site evaluationcost of from $100,000 to $200,000. Although
ls~orida POWW & L@ CO,, Final Report on Rcmedkd Actiom+epper’s Steel & AlJoys Supe@tnd Site, Medley, FIOridtI, J~e 1989.

80 ● Coming Clean: Superfund Problems Can Be Solved . . .
this effort would not have to be permanent, itseems useful to see it extending over the next 5to 10 years. The most difficult implementationissue is the selection of the group to perform theindependent analysis. Having a lot of experi-enced and expert professionals seems at oddswith having true independence of the Superfundprogram, because nearly everyone associatedwith cleanup may have some involvement inSuperfund. One possibility would be to createsomething like a Superfund Evaluation Boardadministered by the National Research Council;it could have a small core staff (such as recentlyretired, experienced government cleanup profes-sionals) supplemented by consulting academicsand others who would only examine sites forwhich they had no conflict of interest. Statutorydirection to EPA to supply all requested infor-mation to the Board would be useful. It mightalso be beneficial, as with peer review ofscientific journal articles, to maintain the ano-nymity of the professionals evaluating a site.The impact of cleanup reviews on Superfundimplementation by EPA would be a priority ofcongressional oversight, if this option wasadopted.
OPTION 36: Establish Formal Measures ofthe Program’s Environmental Progress
Improving Superfund implementation for thelong term requires developing meaningful meas-ures of the program’s environmental success.With this option, the current practice ofusing bureaucratic outputs, such as numbersof studies and actions started and completedper quarter, number and dollar value ofenforcement actions, numbers of differenttypes of technologies used, and speed o fpassing through program stages would bereplaced (or supplemented) by environmentaloutcomes. There are two fundamental areaswhich, theoretically, could form the basis forformal measurements. First, some measure ofhow well professionals understand site contamin-ation and conditions could be defined. Second,
some measure of how much site cleanup hasoccurred over a given time could be derived; forexample, whether current risks have been fullyaddressed, but not future risks (in terms ofOption 1), and the extent of risk reduction orcontaminant reduction. The goal in developingformal measures should be simplicity and agood analog is the use of technology perform-ance standards, as, for example, the percentageof input hazardous material destroyed by anincinerator. For environmental performance at asite, therefore, we might want a comprehensivepercentage to indicate how well the site isunderstood and a reduction percentage to indi-cate how much the site’s contamination (or totalrisk) has been reduced. A special notation wouldindicate whether all current risks have beenaddressed permanently. Performance at theregional and national levels could be presentedby some type of averaging of site performancefigures over the appropriate population of sites.
Benefits: In the past, in other areas, ap-proaches by EPA or others have been effective;for example, percent reductions in atmosphericor surface water pollution, or percent reductionsin the amount of toxic chemicals in people’sblood. If the American public can get a semi-quantitative sense of the percent of the nation’scontamination being destroyed, for example, itsconfidence in Superfund will be improved.Moreover, EPA itself needs to measure environ-mental results to assess its staff and regionaloffices.
Implementation: Congress could direct EPAto develop some formal measures of environ-mental performance. There are significant im-plementation problems. Designing specific fac-tors to measure environmental progress is noteasy. This is something that EPA’s ScienceAdvisory Board or a university might be able tohelp with over a 6-month period. Anotherproblem is that the Superfund base is continu-ally increasing, in terms of numbers of sites andinformation about sites moving through thesystem. One way to overcome this problem

—.
Chapter 1 Summary, Introduction, and Policy Options ● 81
might be to present figures only for individualsites. For program performance it might makesense to have an annual report which basedperformance on what was known to EPA at thebeginning of the year; another way might be tobase performance on a set of NPL sites. Adetailed approach is beyond the scope of thisOTA study, but the potential benefits justifyserious attention to this basic need. Lastly,implementing this option will be made difficultby poor quality information on sites and by thefrequent lack of specific cleanup standards.
OPTION 37: Address Conflicts of InterestAssociated With Technology Selection
The selection of cleanup technologies inRODS is a primary determinant of future spend-ing and, therefore, affects the economic interestsof many responsible parties, cleanup companies,and technology developers. The chief potentialproblem is a selection of remedy which does notassure the best environmental results. Secondar-ily, decisions which are influenced by specificcommercial interests interfere with market com-petition and can impede the introduction ofnewer technologies. For example, some of themajor engineering firms working as Superfundor responsible party contractors own specificcleanup technologies. And a number of largecorporations who are responsible parties atmany Superfund sites have gone into the cleanupbusiness, often by developing a particular newtechnology. 76 Therefore, there is a need forexplicit attention to the potential for conflicts ofinterest which may affect critical cleanup deci-sions (see OTA’s 1989 report on contractor useand a GAO report77). With this option, RODSwould be required to have a statement thatcertified that all parties who have been involvedin the execution of site studies or who have
provided significant information on the site orits potential cleanup have been examined forconflicts of interest. A finding of no conflicts orof business interests which exist but which havenot affected the site’s decisions would berequired.
Benefits: There would be more assurance thatthe best cleanup technologies for effective andminimal cost cleanups have been selected.Competition among cleanup technologies, par-ticularly newer ones, would be safeguarded. Theinfluence of responsible parties on remedyselection which compromise environmental pro-tection would be reduced.
Implementation: EPA could implement thisoption. This option requires more staff activity,places another responsibility on site managers,and increases administrative costs. However,these additional requirements seem to be out-weighed by the potential benefits. This option islikely to engender strong opposition from somefirms and people.
OPTION 38: Reauthorize Superfund for 10Years
Consistent with Superfund being a long-termprogram, the period of the second reauthoriza-tion would be increased from 5 to 10 years. This,of course, does not preempt congressionalaction, should the need arise, for changingstatutory provisions.
Benefits: Considering both the past, difficulthistory of Superfund and the possibility, asenvisioned in this report, of making fundamen-tal as well as incremental changes in theprogram, providing stability and certainty ap-pears highly desirable. This option would makeprogram management and implementation by
76Fm ~xap]e, me che-n]c~ fix~lon tw~ology ~1~~ for tie c]e~up of tie pep~r’s S@] & A]]oys site in Norida WZLS one developed and now
commercialize by the responsible party; EPA staff expreswi some concerns about using the technology for cleanup of PCBS. For the cleanup of anumber of PCB sites in Indiana, the government .seJectd a novel but unproven type of incineration, which the responsible party could also developcommercially; there have been many objections to using this technology and cleanup has been delaycxl.
T7GA0, SWe#~ contru~, EPA)S Proceduesfor Prevennng Conjlicts of Interest Need Strengthening, Feb. 17, 1989.

82 ● Coming Clean: Superfund Problems Can Be Solved . . .
EPA easier, and it would also help everyone delay in finalizing the new National Contin-else, such as affected communities, public gency Plan to reflect statutory changes.interest groups, responsible parties, and technol-ogy developers. It is significant that EPA has Implementation: Committees with legislativehad great difficulty implementing SARA within jurisdiction would have to act. Appropriations5 years; for example, there has been a substantial actions do not have to change.

Chapter 2
The Front End of Super fund:Site Discovery and Evaluation

CONTENTSPage
INTRODUCTION *.**, ****. ... .* * * * *, * * . * * * * * * * * * * . * . * . . . . . . * . . . * * *, . . . . . . . . . . . . .National Site Discovery Through Technology . . . . . . . . . . . . . . . . . . . . . . . . . . . . . . . . . . . .Site Evaluation: A Management or Environmental Decision? . . . . . . . . . . . . . . . . . . . . .
SITE DISCOVERY AND INVENTORIES ● . . e . * * . o . * . , * . , . . . * . * * e , , * . . e , , * . * o . , . .
Why Should We Want to Know? . . . . . . . . . . . . . . . . . . . . . . . . . . . . . . . . . . . . . . . . . . . . . . . .What Have We Done So Far? * * . , * * . * . . . , * * e . . * * . * " . * . . . o o * * . . . * . . * . . . o * . . . . . , .
Comprehensive, Active Site Discovery . . . . . . . . . . . . . . . . . . . . . . . . . . . . . . . . . . . . . . . . . .Inventories, Lists, and Estimates . . . . . . . . . . . . . . . . . . . . . . . . . . . . . . . . . . . . . . . . . . . . . . .
SITE EVALUATION **. ***** *.*** ... ..**. *.. , ********e.**,.*,*****..*,.*.*.,,*,Environmental Fulcrum Shift *.. ,*. .*. .*, ... *o. *,, .,, .*. ,*, .,. o.. .*. ... .. *e,..*A Better Environmental Priorities Initiative . . . . . . . . . . . . . . . . . . . . . . . . . . . . . . . . . . . . . .The Changing PA **. *.. ***** ..*. ..**. .**. .*. ..*. .. e......*..**...**.*......*.*Two SIs and a Deferral Point .o*. .,. .***. ,.. ... .., *.. *.*. **. . . . . . . . . . . . . . . . . . . .
False Negatives and Regional Comparability . . . . . . . . . . . . . . . . . . . . . . . . . . . . . . . . . . . . .
The HRS and the NPL . . . . . . . . . . . . . . . . . . . . . . . . . . . . . . . . . . . . . . . . . . . . . . . . . . . . . . . .The NPL Grows . . . . * * . o * . * . . * * . * . . . . . * . * . . . . . . o . . . . . * . * . * . . . . . * . . . e * . * e . . . . * *
APPENDIX 2A A HEALTH CARE MODEL FOR SUPERFUND SCREENING . . . . .Introduction . . . . . . . . . . . . . . . . . . . . . . . . . . . . . . . . . . . . . . . . . . . . . . . . . . . . . . . . . . . . . . . . . .False Positives and False Negatives in Superfund . . . . . . . . . .*.**.***.. .*. . . . . . .**.A Model of Superfund Screening .*. ..ee*** ***. *6. ..e6. . . . . . . . . . . . . . . . . . . . . . . . . . .
Accuracy in SuperfundPrecision in SuperfundConclusion . . . . . . . . . . .
Screening . . . . . . . . . . . . . . . . . . . . . . . . . . . . . . . . . . . . . . . . . . . . . . .Screening . . . . . . . . . . . . . . . . . . . . . . . . . . . . . . . . . . . . . . . . . . . . . .. . . . . . . . . . . . . . . . . . . . . . . . . . . . . . . . . . . . . . . . . . . . . . . . . . . . . . . .
BoxesBox2-A. Historical Axial Photography and Site Discovery . . . . . . . . . . . . . . . . . . . . . . . . . . . . . .2-B. Historical Aerial Photography (HAP)--Project Summaries . . . . . . . . . . . . . . . . . . . . .2-C. From NFA to NFRAP ... .. ........*.**.*.**...*...*.*.***............*.***.2-D. How Many False Negative Decisions? . . . . . . . . . . . . . . . . . . . . . . . . . . . . . . . . . . . . . . . .
2-E. SARA and the Hazard Ranking System . . . . . . . . . . . . . . . . . . . . . . . . . . . . . . . . . . . . . . . .2-F. The Office of Technology Assessment’s 1985 Comments on the
Hazard Ranking system . . . . . . . . . . . . . . . . . . . . . . . . . . . . . . . . . . . . . . . . . . . . . . . . . . . . . .2-G. Summary of EPA’s Science Advisory Board Hazard Ranking
System Recommendations .**. ..*. .*. ... .*. *.. *.. . e * . . . . . . . . . . . . . . . . . . . . . . . . . .
Figure
8585868686879199
101101102103106111115124130130131131135135135
9096
103113116
122
122
Figure Page2-1. Land Disposal in the 1950s Hidden by Land Use in the 1970s . . . . . . . . . . . . . . . . . 922-2. Revised EPA Preremedial Process -. . . . . . . . . . . . . . . . . . . . . . . . . . . . . . . . . . . . . . . . . . . 1102-3. National Priorities List Actions$ Fiscal Years 1983-89 . . . . . . . . . . . . . . . . . . . . . . . . 1192-4. EPA Panel’s Ranking of Sites v. HRS Score . . . . . . . . . . . . . . . . . . . . . . . . . . . . . . . . . 1202-5 Growth of the National Priorities List . . . . . . . . . . . . . . . . . . . . . . . . . . . . . . . . . . . . . . . 1252-6. HRS Scores of NPL Sites . . . . . . . . . . . . . . . . . . . . . . . . . . . . . . . . . . . . . . . . . . . . . . . . . . . 126
2A-1. Estimation of True/False Positives and Negatives . . .***.*.. . .*. . . . . . .*.*. ,*. . 132
TableTable Page2-1. Pre-RemediaI Program Accomplishments . . . . . . . . . . . . . . . . . . . . . . . . . . . . . . . . . . . . . 108

Chapter 2
The Front End of Superfund: Site Discovery and Evaluation
INTRODUCTIONBefore major site studies are done and long before
cleanups start, uncontrolled sites spend 5 or moreyears in the front end of the Superfund pipeline. Firstsomeone has to discover a potential site, then othersevaluate it to determine whether or not the Federalprogram will take action.
In this chapter OTA reviews both the site discov-ery and evaluation aspects of the Superfund pro-gram; how site discovery has remained the same andsite evaluation changed during the first 8 years ofSuperfund, and the consequences for the future.OTA concludes that Superfund’s environmentalmission could be measurably enhanced by theaddition of a national site discovery program andthe revamping of the evaluation process. Bothchanges will involve spending more money at thefront end of Superfund but can mean saving moremoney over the long run. The upfront costs of havingbetter information sooner and making sounderenvironmental decisions, instead of expedient man-agement choices, are small, compared to the cost ofa few Superfund cleanups.
National Site Discovery Through Technology
Almost a decade after obvious problems like LoveCanal drove the Federal Government to get activelyinvolved in cleaning up environmental damage, westill do not really know how many sites needattention. As Russell Train, former administrator ofEPA, said in 1987 in answer to the question, Howserious is the problem? “Distressingly little isknown, in fact, about the number of toxic waste sitesand how serious a risk each site poses.
We do not know how many sites there are becausethere has been no comprehensive or systematicsearch for them. The sites that have been discoveredare listed on various Federal and State inventoriesfor which there are no listing criteria nor attempts toavoid duplications among lists.
Despite haphazard and passive site discovery,over 31,000 sites have been reported to EPA’sCERCLA Information System (CERCLIS) inven-
tory of sites that potentially require cleanup. Overthe years of the program, 1,274 of these sites havebeen proposed for the National Priorities List (NPL);the list now includes 1,224 sites. All sites on theNPL qualify for cleanup funding under the Super-fund program, except the 115 sites belonging toFederal agencies.
For some years EPA has maintained that amaximum of about 2,000 sites will ultimately beSuperfund’s responsibility. Those estimates havealways been constrained by the choices that EPA hasmade about the Superfund program. OTA said in1985 that ultimately 10,000 sites might be on theNPL. That estimate, still valid, assumed that EPAwould have an active site discovery program andwould apply environmental criteria to the siteevaluation process. It did not take EPA’s deferral ofcleanups to other programs into account. Today’sCERCLIS inventory and its growth rate--despitepassive site discovery-imply that over 4,000 sitescould be on the NPL by the year 2000.
Enough sites to keep the Superfund programchallenged? Of course, but the real question ought tobe: Have we found them all? OTA and many othersdon’t think so, and data from the Superfund programshows that the worst sites are not necessarilyaccounted for. Both site discovery and the way sitesare inventoried can be improved—and the costs ofdoing so contained-by the use of technology.
Active, comprehensive, and systematic site dis-covery could be built around a method such ashistorical aerial photography analysis. A nationalprogram could be supplemented by State effortsusing traditional site discovery methods. Withfunding assistance from the Federal Governmentand in combination with improved preremedial siteanalysis, this could move the Nation quickly tofinally knowing with more certainty the true size ofthe cleanup problem. But the history of the Super-fund program so far tells us that a comprehensivesite discovery program will not occur unlessCongress gives explicit direction to EPA, or someother authority, to proceed.
IRussell Train, ‘ ‘Big Questions Facing the Cleanup, ” EPA Journai, JanuaryiFebruary 1987, p. 8.
-85-

84 ● Coming Clean: Superfund Problems Can Be Solved . . .
Site Evaluation: A Management orEnvironmental Decision?
Most observers express great concern with onepoint in Superfund’s site evaluation process: theon/off NPL decision, whether or not a site is on theNPL. Few, however, seem to care about whathappens before that point. OTA concludes that thereare many reasons to suspect that the entire siteevaluation process is biased against making soundenvironmental decisions.
Should the Superfund program bear the burden ofdetermining whether or not discovered sites arepotential environmental threats, even though theprogram may not have the authority or resources torespond to all those threats? Or, should the Super-fund program’s site evaluation process be restrictedto only finding potential Superfund sites? If so, howearly in the process is it reasonable to make thatdecision? When it is made, how can the public bestbe notified when a site is rejected for managementreasons even though it poses a threat to public healthand the environment?
There is evidence that past Superfund site evalua-tions have produced many false negative decisions.That means that sites have been rejected when theyreally require cleanup. OTA estimates that from240 to 2,000 false negatives may exist so far.Recent changes in the process-meant to cope withdemands to work faster-are likely to aggravate thisproblem. Another characteristic of site evaluation isregional inconsistency; across the Nation widedifferences exist in the efficiency and apparentenvironmental effectiveness of site evaluation.
SITE DISCOVERY ANDINVENTORIES
This section sums up what the Nation knows anddoes not know about potential sites; how many sitesmight need to be cleaned up? The ad hoc nature ofEPA and State searches and reporting systems is aresult of EPA (and Congress) not having paid muchattention to (or spent much money on) site discoverysince the Superfund program began in 1981. In theinterim and without knowing the full extent of thepotential universe, EPA (and Congress) have con-centrated on evaluating sites that are known.
Further, what we do know about the potential sizeof the national problem is confused by a multiplicityof site inventories. OTA has identified other nationalinventories, besides the well-known CERCLIS andNPL lists associated with the Superfund program, Inaddition, each State has some kind of list or lists.Today, there is no way to know the extent of overlapof these lists. This situation will be exacerbated ifEPA’s proposed deferral policy (see ch. 4) forSuperfund sites goes into effect. Increased deferralof sites out of the Superfund program and into otherprograms will create dynamic lists of sites as theauthority for cleanup changes and sites are movedback and forth among programs. Accountability atthe national level will become more difficult. Somesites deferred to other programs will essentiallydisappear. Not only are the other cleanup programsless visible to Congress and the public than isSuperfund, but few of their site inventory systemsare as available. Some programs do not have formalinventories.
Why Should We Want to Know?
The major, longstanding bureaucratic argu-ment against site discovery has been that weknow enough without it to keep us busy for years.But this argument ignores the environmental mis-sion of the Superfund program. And it perpetuatesthe crisis atmosphere around Superfund. Without astrategy to decide which sites get attention first,newly discovered sites that engender a lot ofpublicity tend to push existing work aside.
The number of sites potentially requiring any kindof cleanup defines the magnitude of the nationalproblem, its ultimate cost and length. The number ofsites actually needing cleanup will always be lessthan any inventory of known potential sites, such asCERCLIS. But, all potential sites consume nationalresources because they all require some type ofevaluation to separate out duplicate and obviouslynonhazardous sites from hazardous sites requiringsome kind of attention.
From a policy perspective, knowledge of theoutside bounds of site cleanup determines thenecessary scope and, therefore, acceptable pace andfinancial impact of a national program. Unrealisti-cally low estimates of potential sites lead to underes-timates of sites requiring cleanup and low estimates

Chapter 2—The Front End of Superfund: Site Discovery and Evaluation ● 87
of resource needs. If a site is a problem today, it willprobably be a worse problem tomorrow. Ignoringpotential sites only saves resources in the shortterm and decreases protection of human healthand the environment. Overestimates of the size ofthe national problem that overwhelm systems andresources result in an unnecessarily slow pace ofcleanup.
A relatively small number of potentiai sites maymean that limited funds can be used quickly to cleanup the universe of sites, but a small number devaluesthe importance of a priority system for determiningwhich sites get attention sooner. The larger thenumber of potential sites becomes, more care mustbe taken in assigning priorities to sites and managinglimited funds. Issues of environmental protectionand cost-effectiveness become more difficult tobalance; thoughtful development of a long-termstrategy becomes critical.
What Have We Done So Far?
In 1982, the General Accounting Office (GAO)stated that ‘‘a national hazardous waste site inven-tory does not exist. ”2 In 1985, GAO stated, “Acomplete inventory of hazardous waste sites doesnot exis t . And, in late 1987, GAO said, “Whilestill not fully understood, the extent of the nation’spotential hazardous waste problem appears to bemuch larger than is indicated by EPA’s inventory ofs i t e s .
These statements are not surprising since an EPAofficial stated in 1981 that a comprehensive searchfor sites needing cleanup was “against EPA pol-icy. ‘‘5 This attitude was still policy in 1985 when thethen director of the Superfund program said:
There is no national policy that says go out andaggressively look at sites. I’m not sure, if we had
such a policy, that we would have more to deal withthen we currently do, however. The national inven-tory (not the NPL) has grown about 3000 sites a year.It is growing faster than we have the resources toassess and inspect those that come to our attention,I’m not sure, frankly, what more we could do. Orhow one would go about actively investigating forthe presence of new sites ...6
Congressional Direction and Funding
Congress has been largely silent on site discovery.In CERCLA, little attention is paid to site discoveryexcept to say that the NCP shall include ‘‘methodsfor discovering and investigating facilities. ”7 GAOand OTA analyses at the time of Superfund reauthor-ization concluded that the ‘methods’ being used byEPA were not producing comprehensive informa-tion. But site discovery was not art issue duringreauthorization and nothing was added in the Super-fund Amendments and Reauthorization Act of 1986(SARA) to prompt more action from EPA.
Sufficient site discovery funding levels have beenauthorized under the Resource Conservation andRecovery Act (RCRA) since 1980 but Congress hasonly appropriated the funds once,8 When theauthorized level was $20 million, Congress appro-priated $10 million for fiscal year 1983 for State siteinventory programs. Subsequently, Congress raisedthe authorized level to $25 million per year for fiscalyears 1985 through 1988. None of that money wasever appropriated. If it had been appropriated anddirected toward site discovery, the question of howlarge the potential universe is might have beenanswered by now.
The fiscal year 1983 funds were actually drawnfrom the Superfund trust fund. They were earmarked
2U3, ~ner~ ACCoUINi21g Oft%% “Environmcntat Protection Agency’s Progrcw in Implementing the Superfund Program, ’ GAO/CED-82-91.SU.S, ~ner~ ~comting ~fi=, EPA’S /nvemoV of poce~~/ Hazardous Wastes Sites IS Incomplete, GAO/RCED/-85-75 (Gmthcrsburg, MD: U.S.
General Account.tng Office, Mar. 26, 1985).dust Gewr~ ~comung offiu, SWeflu~: Ex[e~ of NanOn’S polenti~ Ha~r&~ Waste Problem Stili Unknown, GAO/RCED/-88-44
(Gaithersburg, MD: U.S. General Accounting Office, Ikember 1987).SMorW K~@m, hen EpA ~p~ller, m nod in [el~hone log of Vem Webb, then direztor, Envlrommmld photowaphlc ~nlerprelatlon center,
Aug. 25, 1981.6W11ha N H~man, Jr., ~ quo~ in ‘‘s~rf~d ~ef @~ines Svategy on HaZM&)US WaStC C] CaIIUpS, ’ Chenucal & Engineering News, June
3, 1985, p. 17.7CIZRCLA Section 105(1).
8RCRA Section 3012, Hazardous Waste Site Inventory

88 ● Coming Clean: Superfund Problems Can Be Solved . . .
for site discovery and evaluation. Congress referredto that appropriation as a “one time event. ’
There was no followup accounting by EPA (orexamination by Congress) to ascertain how usefulthe funding was for site discovery purposes. How-ever, EPA has said that activities were funded “. . .in the following order of priority: preliminaryassessments, site inspections, responsible party searches,discovery, and site inspection follow-up” [empha-sis added].10 Given such low priority, little of the $10million was likely spent on site discovery.
EPA and Site Discovery
EPA has never requested funds from Congress forsite discovery. EPA has no site discovery program,has no budget for site discovery, and does not allowStates to spend Superfund monies for site discovery.Instead, EPA has relied on varied State-fundedefforts and a few regional investigations to identifypotential sites.
Traditionally, EPA officials give two reasons whythe program devotes no effort to site discovery. First,there is no need for a site discovery program becausethe extent of the problem is known; the worst siteshave been found already. Second, the Superfundprogram has enough to do just evaluating the knownsites. Discovering more would simply choke thesystem.
EPA has implied that some kind of a sitediscovery program once existed. In 1984, EPA toldCongress that it had shifted the emphasis in theSuperfund program away from site discovery. ‘Thesechanges reflect EPA’s belief that many of the sitesposing more serious problems have been identifiedand EPA resources should increasingly focus onfurther assessment and inspection of these sites. ”11Today, EPA’s policy is the same even though it
has abandoned the idea that the extent of theproblem is known. GAO reported in 1987:
EPA officials now recognize that many morehazardous waste sites may exist, [but] they believe ahigher priority is to meet the deadlines imposed bySARA for assessing and evaluating those sitesalready included in the CERCLIS inventory .12
In other words, resources and SARA schedulesare determining the size of the inventory ratherthan the inventory size establishing the fundinglevel. This management, rather than environmental,perspective of the CERCLIS inventory ignores thehigher future costs (both resources and public healthand environmental damage) of not fully understand-ing the extent of the problem today. Moreover,limiting the size of the inventory and the NPLdiminishes the need to develop a strategy fordistinguishing between near- and long-term reme-dial actions.
EPA reported on the extent of site discovery toCongress in 1984 with a list of site discoverymethods in use: 13
1.
2.
3.
4.
5.
required reporting under CERCLA Section103 of known sites (following enactment ofCERCLA) or subsequent releases;government investigation under CERCLA re-sponse authority;reporting by permit holders under other stat-utes when required;inventory efforts (i.e., RCRA Section 3012) orrandom observations and reports; and‘‘other sources, ‘‘ including formal analysis ofvarious industries.
EPA said the one-time reporting requirement ofSection 103 (#1 above) had been a major source ofinitial site discoveries. Since then, EPA said it was
9HOW of Rep~n~tivcs, ~fcmce Re@ [appropriations for HUD and Independent Agencies for fiscat year 1983], H.Rep. 97-891, Sept. 29,1982.
IUU.S. Environmental protection Agency, ‘‘The Effeztivcness of the Superfund Program, CERmA Smtion 301(4(1)(A) st~yt’ D~em~r 1984)p. 1-14. According to Frank Wolle, who was then with EPA’s Environmental Photographic Interpretation Center, the funds were actually used to redoRCRA inventories conducted in 1976 and 1980 that were considered to be invalid. llms, the monies were not spent on gathering any new information.
llIbid., p. 1-13.IZU.S. ~er~ ~co~~g ~fice, fjWe~ Extew of the Nation’s polenti~ Hamra’ou ware Problem Still Unknown, op. cit., footnok 4, p. 28.
In a rare public statement, an EPA officiaJ from Region 2 lamented on national TV in July 1989 that just as we think we know where all the sites areanother one becomes known.
13uts. ~v~ment~ Protection Agency, ‘‘The Effectiveness of the Superfund Program, CERCLA !ktion 301(a)(l)(A) Study,’ op. cit., footnote10. These “methods” are the same as those listed by EPA in the National Contingency Plan.

Chapter 2—The Front End of Superfund: Site Discovery and Evaluation ● 89
relying on inventory efforts (#4) and other sources(#5) for discovery. For the future, EPA said it was:
. , . currently developing a method to systematicallyevaluate various industries to determine categoriesof waste generators which are more likely to involvehazardous release problems that require Superfundaction. 14
The new method may have been developed, butindustries have not been systematically evaluated byEPA since 1984. OTA could locate only oneindustry study: “U.S. Production of ManufacturedGases: Assessment of Past Disposal Practices, ”completed in 1988.
EPA did contract with Booz-Allen & Hamilton toconduct a study on site discovery. The results arecontained in a 1987 draft report, which begins:
To date, discovery and identification of releases orthreatened releases of hazardous waste have beenreported to the EPA through a wide variety ofuncoordinated channels . . . The magnitude of thehazardous waste problem on a national level remainsunknown and EPA is unable to forecast the resourcesrequired to understand and mediate this problem. Anactive site discovery program is needed to betterforecast future EPA resources and schedules inwhich Superfund’s overall objectives may be met. 15
The study remains in draft form; the needexpressed in it for an ‘‘active site discovery pro-gram’ is not EPA policy and does not reflect officialEPA thinking. Two followup studies mentioned inthe report-to develop management options andguidance for a site discovery program-were notdone. Followup work was confined to reviewingdiscovery techniques and drafting some guidance.
The Aborted 200 Cities Plan
There were some technical people in EPA in theearly days of the Superfund program who saw valuein site discovery. EPA’s Environmental Photo-graphic Interpretation Center (EPIC) had a compre-hensive site discovery program-the 200 CitiesHazardous Waste Site Discovery Plan-underwayin 1980. It lasted barely a year; in August 1981,
EPA’s comptroller told the laboratory to cancel theproject because “we already have more sites thanthere is money for so we do not need more.16 EPICasked the Superfund program in March 1982 tosupport its $850,000 request for funding the project.According to the director of EPIC, the Superfundprogram director told him that there was not to be a200 Cities project.
There was some initial support for the EPICproject within EPA’s Office of Research and Devel-opment (ORD). EPIC had $161,500 in fiscal year1981 for a pilot program and received guidelinesfrom ORD for an expanded program in June 1981.The guideline document called for the 200 citysearch to be completed and 50 sites analyzed by1985. An accelerated program was also outlined inwhich 100 of the most serious sites found wouldreceive detailed analysis. Total funding throughfiscal year 1986 was estimated at $6.4 million fordiscovery and site analysis. Of the four city invento-ries selected for the pilot project, two were finished.
The 200 Cities plan was based on EPIC’s experi-ences since 1973 in developing the use of historicalaerial photography for environmental purposes. Bythe late 1970s, it was an established technique forsite characterization. One intent of the initial 200Cities pilot project was to demonstrate the practical-ity of using the technique to conduct a site discoveryprogram and to determine if the criteria for selectingthe 200 cities were valid (see box 2-A). Figure 2-1shows how a series of aerial photographs, the basisfor HAP analysis, can uncover past disposal prac-tices no longer visible.
State Site Discovery
State site discovery efforts are funded by States.States have become, by default, fully responsible forcollecting national data. But EPA does not allowStates to use Cooperative Agreement (CA) moneyfor site discovery, because CERCLA Section 104bconfines its planning authority to only site-specificactions. Thus, since site discovery actions-by theirvery nature--cannot be site specific, EPA reasonsthat States cannot use CA funds for site discovery
141bid., p. 1-8.151J.s. ~v~omcn~ prottxtion Agency, Office of Solid Waste and hncrgemy RMPOKW) “CERCLA Site hscovery Program Evaluation, ” draft
~~ by BOOZ, A1len & ~ikon. Inc.. Mar. 5, 1987, p. 1. EPA told OTA that the report never went from &aft to finat form because of resourceeonarramts in the preremedial program.
16Morgm K~@m, hen WA compVoller, ~ not~ in telephone 1og of Vem Webb, hen EPIC dirwtor, Aug. 25, 1981.

90 ● Coming Clean: Superfund Problems Can Be Solved . . .
Box 2-A Historical Aerial Photography and Site DiscoverySite discovery using historical aerial photographs allows a trained analyst to peel back layers of construction
and vegetation in a particular area that have occurred over time and hide past practices and to review those practices.This process of looking back in time uncovers sites where wastes have been dumped. The technique cannot confirmthat hazardous constituents are present at a site. Instead, a probability of their presence is inferred from activitiesobserved or if the site has remained scarred over a long period of time and does not support vegetation.
Historical Aerial Views of the United StatesThe United States has been extensively photographed from the air since at least the 1920s and especially after
1938. The photographs have been taken primarily for mapmaking and soil survey purposes. After World War II,aerial photography increased with the availability of surplus military reconnaissance equipment and pilots andcrewman trained in the technique during the war. For maps, a series of overlapping photographs are taken of theterrain as an aircraft progresses along a straight flight path. The photographs are taken from a height of 12,000 feetand each one covers an area 11.5 square miles. Viewed through a stereoscopic microscope, a three-dimensional viewof the terrain is obtained. Towns and cities undergoing the greatest development and expansion have been the mostrecoded areas, generally on a three-to-five-year cycle.
The collection of historical aerial photography (HAP) is now stored in five government archives: the NationalArchives in Washington, DC; the Earth Resources Observation System in Sioux Falls, South Dakota; the USDA’sAgricultural Conservation and Stabilization Service in Salt Lake City, Utah; the National Atmospheric and OceanicAdministration in Rockville, Maryland; and the Tennessee Wiley Authority’s Mapping Services Branch inChattanooga, Tennessee. Additional photos and index services are sold through commercial firms. In the past, somecommercial negatives have been destroyed to reclaim the silver value. For instance, during the speculation of silverby the Hunt brothers in the late 1970s, the value of the silver in film rose ten-fold and millions of feet of commercialphotographic records were lost. An unknown amount of aerial photographic film was destroyed as well.
The use of historical aerial photography for purposes other than mapmaking is not new. In the past, it has beenused to:
● analyze coastline erosion or change over time;● note changes in watersheds following darn construction;● collect evidence for litigation involving land change, such as wetlands; and locate historical landmarks, such as Civil War fortifications.
When EPA’s Environmental Photographic Interpretation Center (EPIC) was established in 1973 part of itscharter was to develop techniques and methods for the extraction of environmental information from the historicalaerial photographic libraries of other Federal agencies. At the time, many people considered historical aerialphotography to be of no value in addressing environmental problems. Instead, the prevalent belief was that aerialphotographs could be used to record current environmenal events such as oil spills, fires, and agricultural practicesrather than uncover practices of the past. Work at EPIC has proven the value of HAP analysis as a site discoverytechnique.
Using Historical Aerial Photography for Site DiscoveryThe process of using aerial photographs to locate unknown hazardous waste disposal sites involves: 1)
selecting an area of high probability; 2) acquiring a historical series of aerial photographs of the area; 3) analyzingthe time series of photographs for indicators of hazardous waste activities; and 4) for any area where indicators arefour@ following up the analysis with ground investigations to ascertain whether hazardous substances are present.
Areas of High Probability-For the 200 Cities project at EPIC, a number of criteria were used to select areaswith the highest potential of having abandoned hazardous wastes. Criteria included: 1) knowledge of wherehazardous waste had been generated through manufacturing, 2) knowledge of traditional waste disposal areas, 3)consideration of transportation methods and corridors between the 1930s and 1960s, and 4) cancer incidence rates.Four cities (one each in EPA Regions 1,2,3, and 4) were selected for the pilot project: Worcester, Massachusetts;Buffalo, New York; Charleston, West Virginia; and Chattanooga, Tennessee. They were chosen because of theirpopulation density, concentration of chemical manufacturers or users, and health data.

Chapter 2—The Front End of Superfund: Site Discovery and Evaluation ● 91
Selection of Photographs-A time series of photographs, usually in 4-to-5-year increments, is selected andprinted from negative transparencies. A current aerial photograph may have to be taken.
Analysis of Photo Series--A photo analyst, using a backlighted table and magnifying stereo optics, scans eachtransparency for indicators of hazardous waste activities, such as ground scars, indiscriminate dumping, wasteponds, landfills, quarries, ground stains, junk yards, etc. By viewing successive years of photographs, an analystcan see changes that have occured over time and are no longer visible on the surface.
Ground Investigations--Like all discovery methods, once a suspect site is located through photo analysis,the site must be investigated on the ground. For instance, all sites placed in the CERCLIS inventory must undergoa Preliminary Assessment to determine if there is any evidence of an environmental problem and to assure that thesite reported is not a duplicate of another one in CERCLIS. In the case of sites discovered through HAP, the sameprocess must occur. However, HAP sites also provide information not available through other discovery methods,such as the exact location and extent of the possible contamination.
purposes. But EPA has not invoked this interpreta-tion to explain its own lack of attention to sitediscovery, and there is no reason to believe that, ifEPA allowed States to use CA funds for sitediscovery, anyone—including Congress-would beconcerned.
EPA also does not allow States to use CoreProgram Cooperative Agreement (CPCA) funds—money that is explicitly not site specific-for sitediscovery. In this case, EPA reasoned:
Site discovery is not eligible for funding at thistime. It is OERR’s [Office of Emergency andRemedial Response] opinion that all sites presentlylisted in CERCLIS should be addressed prior to anyfunding for site discovery under the CPCA. 17
This decision by EPA was made despite admit-ting, in the same memorandum, that CPCAs are aresult of congressional “intent to increase the scopeof Cooperative Agreements. ’ ’18 The congressionalSARA Conference Report mentions “site inventoryand assessment efforts” as a class of activity thatmay be included in these expanded CooperativeAgreements.19
The consequence of delegating site discovery andfunding to States is that there are 50 different sitediscovery programs. According to the 1987 Booz-Allen/EPA study:
[State] discovery efforts have not been consistent.They range from minimal efforts with little interestfor change to an active state effort based on state“Superfund” legislation, which may result in sitelists larger than CERCLIS.20
Eighteen out of fifty States surveyed by Booz-Allen claimed to have an active, as opposed to apassive, program. Booz-Allen’s review of the sitediscovery methods used by States, however, showsthat passive methods predominate. Citizen com-plaints topped the list of methods (47 States) withreferrals from other programs second (38 States).Third on the list (22 States) was some kind of surveyreview (e.g., a records search), which, of the threemost used methods, is the only active one. Otheractive methods (e.g., aerial photography, propertytransfer regulations, and special studies) were usedby less than a quarter of the States.
Comprehensive, Active Site Discovery
The existing structure for site discovery andlisting of sites that may need cleanup is largely adisconnected maze. Various authorities (Federal andState) seek out sites. The degree of effort andcomprehensiveness each applies to the task varieswidely; each approach lies along a spectrum frompassive to somewhat aggressive. Once discovered,knowledge about potential sites is handled in many
Im,s. EJNiKIMIa~ Protection Agency, “Final Guidance on State Core Program Funding Cooperative @eanents,” Directive 9375.2-01, Dw.18, 1987, transmittal memorandum, p. 3.
%id.. p. 1.lgH_ of RePre~mtive, ~~e~u Re~ [on ~endmen~ ~ mRCLA], H.R. Rep. 99-%2, p. 195.
W1.s. Env”won.mental Protection Agency, “CERCLA Site Discovery Program Evaluation, ” op. cit., footnote 15, p. 26. OTA found in a review ofmany Stale programs’ annuat reports that site discovery efforts were rarely mentioned. The topic, thus, appears to be of little interest at the State level.
20-011 0 - 8!3 - 3 : OL 3

92 ● Coming clean: Superfund Problems Can Be Solved . . .
Figure 2-l--Land Disposal In the 19509 Hidden by Land Use In the 1970s
1948
1952

—
Chapter 2—The Front End of Superfund: Site Discovery and Evaluation ● 93
These three photographs are from a larger series of historical aerial photographs of one end ofNeville Island in the Ohio River near Pittsburgh, PA. A number of chemical plants are located at theopposite end of the island. Across from t he island are industrial plants. A 1938 photograph (not included)shows that before the war the island was a large farm. Over time, land use on the island changed to amix of residential, l ight and heavy industrial, and recreation.
Even viewing the photographs without the aid of a stereoscopic microscope, as is done in HAPanalysis, it is possible to see activity taking place overtime t hat eventually created a need for a cleanup.In the first photograph-taken in April 1948--victory gradens from WWll still remain the dominatefeature, although at the tip of the island (circled area) t he gardens have been destroyed and t he surfaceappears disrupted. It may indicate the beginning of land disposal. In the second photograph—April1952—farming here has ceased and this portion of the island has become a disposal site for solid andIiquid wastes.
By October 1973 (the third photograph), however, visual evidence of dumping has almostdisappeared. Vegetation has returned to most of the area, although in the circled area (where Iiquiddumping has taken place) the soil does not support much vegetation. By 1979 the area had b e e ndonated to the local community for a park. Cabins, roads, trails, and a parking lot further obscured pastwaste disposal practices.
1973

94 ● Coming Clean: Superfund Problem Can Be Solved . . .
ways, from entering the information into a databasein a timely manner to letting the information sit in afile drawer for years. Communication among allthese discovery and inventory systems ranges fromnonexistent to formal handoffs. Thus, sites discov-ered in one system but judged not eligible may beofficially turned over to another authority or may besimply ignored, even though some cleanup mayappear necessary.
Often site discovery methods do not respectregulatory or legal boundaries. Historical aerialphotography (HAP), for instance, discovers sites onevidence of land use over time. HAP does notnecessarily distinguish between underground tanksthat store a nonhazardous or hazardous material.HAP does not distinguish between a RCRA hazard-ous waste and a CERCLA hazardous substance.HAP also does not tell whether the private or publicsector is responsible for creating a problem orwhether or not the owner of the property has had aRCRA permit or not. It does, instead, provide someenvironmental evidence of a problem.
The undiscriminating nature of many sitediscovery methods suggests that it is better tothink of site discovery not as the responsibility ofSuperfund or RCRA or some other program butas a national responsibility. A national sitediscovery program, whether solely a Federalfunction or in cooperation with States, couldproduce inventories of potential sites to feed intoa variety of cleanup programs.
A comprehensive, active site discovery programwill, of course, cost money. But, as discussed above,such a program can be cost-effective in the long run,and the costs seem small compared to what isroutinely spent to study and clean up individualsites. From among a variety of methods used in thepast to discover sites, some could be part of an activeprogram, and existing technology can be adopted tominimize the immediate program costs. OTA hasestimated, for instance, that resurrecting and re-targeting the 200 Cities plan today would cost about$100 million over a 5-year period. The cost includes
detailed analysis of an estimated 7,500 foundsites—part of the work now done by EPA during thepreliminary assessment (PA) phase of site evalua-tion.
Once sites are discovered, the information foundneeds to be aggregated to make the necessaryfollowup efficient and to avoid duplication by EPAand others. One solution is to develop a nationallyconsistent listing system or compatible ones that canbe used by all cleanup authorities (see later discus-sion). Once sites have been evaluated as needingsome cleanup, OTA has suggested (see ch. 1, option18) that a national cleanup list be maintained.
Technical Options for Comprehensive Searches
In heavily populated areas, it may be true thatobvious uncontrolled sites have been found. Peoplehave smelled them or seen them leaking. 21 T odiscover those sites not yet emitting odors or liquids,techniques can be applied that sweep large geo-graphic areas and collect information about whatmay be occurring under the surface. Such waysinclude using knowledge about contaminatedground and surface waters as indicators and peelingback layers of earth through historical aerial photoanalysls. 22 California has conducted studies in twocounties using the contaminated water technique.EPA and others have used historical aerial photoanalysis. OTA has chosen to review the latter for itspotential as a cornerstone for a national site discov-ery program.
HAPPI: A Historical Aerial PhotographyProgram Initiative
Despite the halt of the original EPIC pilot projectto initiate the proposed 200 Cities plan in 1981, EPAand others have used historical aerial photography(HAP) to discover, verify, and characterize hazard-ous waste sites. The technique has not been usedcomprehensively for site discovery, however, In-stead, various government authorities (i.e., the U.S.Army, some EPA regions, and some State govern-ments) have used the method on an occasional basisor for special projects.
21~, have fol]ow~ up ~me ~t~tion This hap~n~ in %lin@on, VA, in 1989 when a pime of industrial property was being reviewed fOr Sde tOthe U.S. Navy. Testing based on suspicion proved that PCBS had been disposd on the land, presumably by a metal rcxycling fmn that had leased thePVW.
22Rem~~ ~m~g by s~llltc is ofien t.hou@I of as ~otier way, however, the technique has shortcomings such as poor KSOIUtiOn md he in*ilitYto view subsurface conditions.

Chapter 2—The Front End of Superfund: Site Discovery and Evaluation ● 95
OTA has evaluated some of the projects andfound that most evidence suggests the technique,when properly applied, is a very useful tool. Becauseof past inattention and lack of follow up evaluation,a new pilot program is advisable, especially one thatcarries sites through at least a PA type of evaluation.Ultimately, the best use for HAP would probably bein examining areas with the highest probability ofhaving abandoned hazardous wastes since costprohibits and logic denies a blanket examination ofthe entire country. HAP is one of the few methods ofsite discovery that can systematically analyze agiven area for unknown and abandoned sites. Oneanalyst says, ‘‘Historical aerial photographs may bethe only source of reliable information for identify-ing active and inactive landfills. ’ ’23 Another expertcalls HAP the most ‘‘impersonally recorded docu-ment available’ for conducting inventories.24
Other methods tend to be biased and limited bythe information used for discovery. For instance,surveys are limited by the accuracy and complete-ness of responses, historical document searches arelimited by how well records were kept and have beenmaintained, and property transfer regulations arelimited by the types of property (usually existingcommercial or industrial) included in the regulationsand only are triggered if property is sold.
Historical aerial photography analysis is limitedby the extent of the availability of historical photo-graphs and trained analysts. As long as the existingarchives of aerial photographs are preserved andmaintained, there does not appear to be any shortageof photographs. Trained analysts are another matter;in the initial stages of a major government program,demand could outstrip supply.
If the pilot phase had been completed before the200 Cities plan had been canceled, a wealth of datawould be available today to analyze its potential infull. Since the termination of the 200 Cities plan,EPIC has used aerial photography analysis almostexclusively (about 90 percent of its work) for sitecharacterization for EPA’s RCRA and Superfundprograms. Still, site discovery work has not beentotally abandoned, and OTA has based its analysison available information. We have included in our
analysis: 1) existing results from the 200 Citiesproject; 2) the U.S. Army’s Toxics and HazardousMaterials Agency work under the Facilities Restora-tion Program; 3) a Monroe County, New York,project; 4) a Memphis, Tennessee, emergency re-sponse project; 5) an EPIC inventory of Love Canal,New York; and 6) several inventories conducted forEPA Regions 2, 3 and 4. Brief summaries of theprojects are presented in box 2-B.
These projects show that the HAP method locatessites found through other discovery methods andadds sites to existing inventories generated throughother methods. In other words, HAP could replacemany commonly used site discovery methods.There is no information available to determinewhether the HAP method generates any more orfewer false positive sites (sites that do not need to becleaned up) than any other site discovery method.This void exists because followup on HAP hasseldom been done, or, if done, records have not beenkept, so that determinations of false positive ratescannot be made. Similarly, no records have beenkept on the false positive rates of other methods.
Although information is available on the cost ofvarious HAP projects, there is little cost dataavailable on conducting site discovery through othermethods, Cost comparisons should be made on thebasis of the costs of discovering true hazardouswaste sites. There is, however, no informationavailable on the costs of discovering true hazardouswaste sites through HAP or any other means.
Another aspect of site discovery is the timerequired to complete a project. A State of Californiaproject using traditional methods took 33 months tosearch for sites in two agricultural counties; 9 siteswere located. The time and cost of the U.S. Armysearches of military installations depend on the sizeof the installation; some have been ongoing since theearly 1980s. In comparison, the duration of the 10HAP Re-Look projects reviewed by OTA were allless than a year,
Pros and Cons of HAP-No one questionsHAP’s viability as a site discovery technique. Itslack of use is a consequence of site discovery being
~~omfi L. Erb et al., “Analysis of Landfills With Historic Airphotos, ” Phdogramme tric Engineering and Remote Sensing, vol. 47, No. 9,Sqmxnber 1981, p. 1364.
~Fr~ R wol]e, fomer]y ~1~ EPA’s fivlromen~ photo~aphic 1nte~retauon Gnter, prsonal conversation, January 1988.

96 ● Coming Clean: Superfund Problems Can Be Solved . . .
Box 2-B-Historical Aerial Photography (HAP)-Project Summaries
EPA Region 3:84 sites Added to CERCLIS; Other projects Await ScreeningTwo of the four inventories planned by the 200 Cities pilot project were done. The HAP inventory of Buffalo,
New York has not had a followup to verify the results. The inventory of Charleston, West Virginia was releasedto EPA Region 3 in 1983 but was not used until the Bhopal, India, chemical release incident in 1984 heightenedconcern about a similar plant near Charleston. Field teams then checked the 74 areas identified in the report, manyof which had multiple sites. As a result of the followup, 84 sites were added to the 56 Buffalo sites already in theCERCLIS inventory. Acceding to Region 3, about 25 percent of the HAP sites required an Site Inspection (SI) andfour sites may receive a listing SI. In other words, 5 percent of the 84 sites may end up on the NPL.
The value of the inventory convinced Region 3 officials to fund two more inventories (southwesternPennsylvania and the Elizabeth River watershed). Because of resource constraints, the new inventories were notfinished by EPIC until 1987. As of April 1989, Region 3 had not done the followup on the southwesternPennsylvania inventory because it has a lower priority than getting normal preremedial work accomplished. l
The Elizabeth River inventory covering 1937 through 1985 turned up 650 potential problem areas. Over halfwere eliminated as potential Superfund sites; the scope of the inventory had been purposefully broad, including suchareas as grain storage systems, gas and petroleum storage facilities, and other pollution sources that do not qualifyfor the program. Almost 300 potential Superfund sites have, as of April 1989, not been added to CERCLIS becausethe necessary field investigations have been delayed due to funding priorities.
U.S. Army Re-Look Project: HAP Equals and Betters Other Site Discovery MethodsThe U.S. Army’s site discovery program has evaluated hundreds of Army installations using HAP as well as
methods such as exhaustive record searches and interviews with current and former employees. The Army considersits search and interview methods possible of yielding a 90 percent discovery rate because of its penchant forrecordkeeping and a stable workforceo
In a program called Re-Look, the Army asked EPIC to verify the site discovery program’s accuracy using HAP.In a random sample of 10 (one-third) of the Re-Look projects, HAP added 25 new sites to the Army’s inventory.HAP was particularly useful in finding errors in the previous searches at large installations; at some smallinstallations HAP found all the known sites (i.e., had an equal discovery rate). At three large installations, 23previously unknown sites were discovered. Eleven sites were later confirmed as hazardous waste sites; others wereplaced in a lower priority for additional screening.
Monroe County: HAP Project Added 33 Sites to Existing InventoryIn Monroe County, New York, record searches, interviews of residents, and an advertising campaign
requesting citizen reports had produced a list of 10 landfills for a RCRA inventory. In a 1981 project to test HAPas a site discovery method, nine of the 10 reported landfills were identified and 33 additional sites were found. Theone landfill not found by HAP was an incorrect entry in the inventory.
Of the 42 sites, the HAP process classified 12 sites as dumps or landfills, 19 as possible dumps or landfills,and 11 as unspecified sites. After followup interviews and field inspections, 22 sites were confirmed as dumps orlandfills, 11 were classified as possible dumps or landfills, and six remained unspecified. Three sites were eliminatedfrom the inventory because they contained clean fill.
Region 4: Eight Percent of HAP Sites with Sampling HazardousA HAP project, initiated for emergency response planning, discovered 350 potential sites in and around
Memphis, Tennessee, in 1980. Field investigation of the sites was limited to visual observations samples at 44 siteswere subsequently taken, and 29 sites were found to pose some degree of hazard.
Despite some prescreening, all 350 sites were entered into CERCLIS, at least doubling the number ofTennessee sites in the inventory at that time. Since all PAs have been done for sites entered into CERCLIS priorto October 1986, PAs have been done on all the HAP sites. This set of data of sites with PAs could be used tocompare the false negative/positive rate of the HAP process v. other discovery methods. Unfortunately, once in

.
Chapter 2—The Front End of Superfund: Site Discovery and Evaluation ● 97
CERCLIS the HAP sites cannot be distinguished from all other entries. And Region 4 has misplaced the EPIC mapsheets with overlays so that it is not possible to separately identify the HAP sites.
Love Canal, New York: HAP Confirms Known Sites and Adds 55 More SitesAs a part of the EPA investigation at Love Canal in 1980, HAP was used to verify 107 sites identified by a
task force. EPIC located and confirmed 46 of the 107 sites as potential hazardous waste sites. In addition, 55 siteswere discovered that the task force has missed. Of the61 task force sites that HAP did not confirm, some were wereinside buildings and thus invisible. Others HAP confirmed as negative findings by the task force. For instance, forone very large disposal area in the task force inventory, HAP could not find any sign from 1938 to the present thatany dumping had occured.
Regions 2 and 4: HAP Inventories Not UsedEPA Regions 2 and 4 have engaged EPIC to do nine inventories since 1981. However, no followup work has
been done in the regions, so it is not possible to ascertain the accuracy of the HAP analysis. The inventories havenot been used as sources of potential sites.
Three inventories done for Region 2 found 1,341 potential sites. A removal action was later taken on one sitewhen buried drums-identified by HAP but ignored—were uncovered during subsequent housing construction.Instead of using the inventories as intended, the region considers them as a source of supplemental information onsites discovered by other means. (The New York State cleanup program, which has a site discovery project, wasnot aware of the availability of the inventories until OTA happened to contact a State official asking questions aboutits status.)
EPIC HAP analysis for Region 4 located 2,076 potential hazardous waste sites, of which 873 are sitescontaining liquids. OTA could not locate anyone in Region 4 with any knowledge of how the inventories have beenused or whether any followup has been conducted
IRegiond pcrformsncc is uaaacd on wbetk a not targets (i.e., numbers of PA and Sls) arc muf. Ddng the followup on an EPIC invcmtay, despite its-~sipiftcamx, wdd W coutlf. Tqccs arc WI bed cm numbers of situ shady in the CERCLIS invcutory.
a low priority in the Superfund program and being of The following statement is representative oflittle concern to Congress or public interest groups.
Most of those who have used HAP to assist in sitediscovery work see its value; no one disputes itsability to comprehensively and efficiently survey anarea and uncover valuable environmental informa-tion. The major argument against its use is its drainon resources; finding hundreds of potential sites ina given area means that hundreds of sites have to bechecked out. But the same argument is used againstactive site discovery, in general. Hundreds ofpotential sites will need hundreds of assessmentstoday but assessments today can save millions ofdollars tomorrow if finding truly hazardous sitessooner rather than later means that the cost ofcleaning them up is minimized. Identifying haz-ardous sites faster also means that protection ofhuman health and the environment is enhanced.
several that OTA received from EPA and otherofficials who have used HAP. The same kind ofstatement could be made about any site discoverymethod:
The major drawback is that historical analysis[is] only a screen tool. A completed, historical aerialphotography study does not define potential CER-CLA hazardous waste sites exclusively. As a result,a significant amount of follow-up work is necessaryto define the true number of potential CERCLAhazardous waste sites. This additional work includesscreening out obvious non-CERCLA sites, filesearch, mapping, cross-referencing other environ-mental data bases, and offsite reconnaissances.These subsequent activities are both time andresource intensive.25
Like all other discovery methods, the HAPmethod locates potential sites that may or may not betrue hazardous waste sites. HAP and other methods
nsk~a WmWmug, ~tor, -do~ Wwe Management Division, EPA Region 3, letter to O’rA, Fe~MY 1988,
98 ● Coming Clean: Superfund Problems Can Be Solved . . .
will discover sites regardless of their appropriatecleanup authority. Because of the comprehensivesweep of an area that is possible using HAP and theresultant large numbers of discovered potential sites,its use may require that more resources be devotedin the field to verify sites than would be necessarywith other methods. One analyst has estimated thatcompeting the 200 Cities project could add another30,000 potential sites to CERCLIS, doubling theinventory. It took EPA, under current policies, 7years to complete the PAs for 24,185 sites, a task thatwas accomplished only because Congress mandatedEPA to do SO by January 1988.
It is important to note that thousands of HAPdiscovered sites would not be added to the CER-CLIS inventory overnight. They would be addedover 5 to 10 years. Under the current passive sitediscovery program, the inventory grows at a rateof 2,000 sites per year. An active site discoveryprogram, using HAP and other methods, could atleast double the rate of growth. Thus, EPA couldrequire twice as many resources as are currentlydevoted to preremedial work (about $50 million peryear) to keep up with the discovery rate. However,some of this need for additional resources could beoffset by adopting a more efficient site evaluationprocess (see later discussion and app. 2A).
Other drawbacks of HAP mentioned to OTAinclude:
"6. . . it is only cost effective in highly industrial
areas or areas where many sites are clusteredtogether. ’26
“EPA has no dedicated resources to verifycritical information such as street addresses formany of these sites. ’ ’27
The first problem is resolved by carefully selectingthe areas in which to use HAP, such as was doneunder the 200 Cities proposal. The second problemof identification is one aspect of ground proofingunique to HAP. HAP discovered sites are identified
by map coordinates; sites are listed in CERCLIS bystreet address (and assigned code number). Todayoff-the-shelf commercial computer programs areavailable that will match coordinates (latitude/longitude) with street addresses.28
Beyond its site discovery capabilities, HAP canprovide additional valuable information, not availa-ble from other site discovery methods, that ispertinent in later stages of site cleanup analysis.Some of this information is available directly fromthe site discovery work, other information can beprovided with additional photo analysis. For in-stance, U.S. Army documents say that, even in caseswhere HAP projects did not locate additional sites,“the study was very useful in confirming theexistence and a real extent of various potential sitesidentified in the initial assessment report."29
One expert has classified the information about alandfill derivable from HAP as: 1) existence (i.e., thelocation, extent, and possible nature of a landfill), 2)general or detailed temporal land use and land coverinformation, and 3) physical environmental aspects(i.e., the geology, soils, and surface and subsurfacedrainage). The expert says,
In general, [HAP] can provide the most efficient,complete source of information regarding the physi-cal environment, particularly, in the absence of soilsurvey or surficial geology reports.30
The original EPIC inventory done for EPARegion 3 (as part of the aborted 200 Cities project)was later used for other projects in the Charleston,West Virginia, area. For the Kanawha ValleyIntegrated Environmental Management Project, thestudy provided spatial relationships of potential andactual hazardous waste sites and of productionfacilities to populated areas. In another study onconcentrations of dioxin in fish, the inventoryprovided valuable information for developing asampling plan of river sediments by pinpointingareas of high potential sources of contamination.
~B~b~a Mc~ger, EPA Region 2, letter to OTA, January 1988.
27N~~ M. Kumar, EPA Region 4, letter to OTA, May 1988.
‘Mapping Information Systems Corp. (MAPINFO) offers one that covers 330 metropolitan areas.Z9U.S. ~y Tbxic and Hazardous Materials Agency, “Update of the Initial Installation Assessment of Green River Launch Complex, UT, ” Nov.
12, 1987.3~rb et al, op. cit., fOOtnOte *3.

-..
Chapter 2—The Front End of Superfund: Site Discovery and Evaluation ● 99
Inventories, Lists, and Estimates
Once sites are discovered, the information needsto be put somewhere. The Superfund CERCLISinventory is perceived as the national list, but it isnot. The CERCLIS inventory is, more accurately,the Superfund remedial list. There is also theEmergency Response Notification System (ERNS),the Federal Facilities Hazardous Waste ComplianceDocket, and various inventories associated withother Federal cleanup programs, such as RCRAcorrective action.type of inventorythese inventoriespendently of onewith CERCLIS.
n addition, most States have somemany have multiple lists. All of
or lists have been created inde-another and few are compatible
Sometimes a site is included in more than oneinventory. For example, there are Leaking Under-ground Storage Tank (LUST), RCRA, and Federalfacility sites in CERCLIS. But, not all RCRA,LUST, and Federal facility sites are in CERCLIS.While all known potential Federal sites are includedin the Federal docket, EPA does not have, as yet, anoperational RCRA correction action database andhas no plans to create a national LUST inventory.
National Lists
CERCLIS was originally created by combiningthree separate databases (13,392 sites) in 1982 anda group of sites reported by States in 1983 thatbrought the total to over 15,000 sites .31 This list nowgrows at a steady rate of about 2,000 sites per year(see figure 1-1 in ch. 1) despite the lack of an activenational discovery program or any consistency onhow and when reporting occurs.
To be evaluated by the Federal Superfund pro-gram, a site is supposed to be placed in CERCLIS.32
Actual site entry into CERCLIS is the responsibilityof EPA regional offices. But, how the information
flows to that point is dependent on who discovers theinformation and how it is reported. There is nonational criteria or guidance on the timeliness ofentering a site into CERCLIS or if any prescreen-ing should take place. The Booz-Allen/EPA reporton site discovery identified a number of States (e.g.,California, Florida, Wisconsin, Ohio, West Virginia,and New Jersey) that prescreen sites prior to turningthem over to EPA for placement in CERCLIS.
GAO investigations of just five States in 1985showed that 837 sites on State lists were not inCERCLIS. By 1988, a followup report confirmedthat 494 of those 837 were still not in CERCLIS.33
States do not report all potential sites for variousreasons, Some States claim that not reporting sites toCERCLIS gives them an edge in negotiating to getpotentially responsible parties to clean up sites.Sometimes States do not report sites they feel willnever qualify for the NPL, Florida, according to theBooz-Allen/EPA report, ‘‘only adds sites to CER-CLIS if the State believes that the site will require [aSite Inspection]."34 California, according to thesame report, only submits those sites ‘‘it wants toaddress through a CERCLA cooperative agree-ment. ’35
Lack of listing guidance has backfired in a wayprobably not intended by Congress when it man-dated (through SARA in 1986) schedules for thepreremedial process. EPA subsequently added apolicy that all sites must have a PA within a year ofentry into CERCLIS. The nature of CERCLIS as alist of all reported potential sites is changing. Sitesare now sometimes held outside of CERCLIS untilregions have some confidence that resources are
available for a PA within a year. An example is theEPA decision to move some 3,000 potential RCRAcorrective action sites through the Superfund PA/SIprocess. Since this move requires the entry ofthousands of sites into CERCLIS, the sites are being
31CER~IS Ww C~I~ ERRIS ~tll the mid- 1980s. h be law few years. CERCLIS has become much more than simply an lnvento~ of polentldSuperfund sites. It is now THE database of the Superfund program and contains the data for tracking NPL and non-NPL sites through the program.
32Convenuon~ ~sdom is hat a ~1~ ~ ~ & ~ CERCL]S ~ move In[~ AC Supe-d program. This is not necessarily wue, [n 1984 EPA identifial19 California sites that had been submitted directty for HRS evaluation without having been placed in CERCLIS. [U.S. Env]ronmcnul ProtectIonAgency, “Extent of the Hazardous Release Problem and Future Funding Needs, CERCLA Section 301(a)(l)(C) Study, ” December 1984, p 4-.?, ) Also,in an analysis of the time it took to move a set of sites from discovery to proposal for the NPL in June 1988, OTA could not find about a dozen of theNPL sites in CERCLIS.
33u, s. Ge~r~ ~omting Office, t?%A’s Inven[oq of Poterrrrd Hazardous Waste Sites IS l?t@?@ete, Op. cit.. foomole 3; ad s~efluti Exteti ofNanon’s Potennal Hazardom Waste Problem Still Unknown, op. cit., fcmtnotc 12.
34u.s. Environmen~ Protection Agency, ‘‘CERCLA Site Discovery Program Evaluation, ’ op. cit., footnote 15, p. 5.
Js[bid., p. 10,

100 ● Coming Clean: Super-fund Problems Can Be Solved . . .
phased in to relieve the pressure caused by theone-year policy. Thus, RCRA sites are beingprescreened prior to entry; high priority sites werescheduled to be entered in fiscal year 1989 andmedium and low priority sites in fiscal years 1990and 1991.36 This cautious approach to CERCLISentry appears to duplicate workload; one outcome ofthe PA done once a site is in CERCLIS is to givesites priority labels. In another example, an inven-tory of potential sites was discovered throughhistorical aerial photography and given to EPARegion 3 in 1987. As of April 1989, the data was stillbeing held outside of CERCLIS until it can beprescreened prior to entry. Again, the bureaucraticreason is to avoid creating a workload for whichthere are no resources within the required one-yeart imeline.
Holding sites outside of CERCLIS has severaleffects. From a management perspective, it helpsmeet SARA targets and conserves existing re-sources. If, however, the preremedial program hasmore work than it can handle, which is justifiedenvironmentally, another approach is for EPA to askCongress for an increase in funding. Otherwise, thepractice of circumventing congressional intent ofspeedy PAs serves to avoid rather than solvepotential problems. The practice devalues CERCLISas a timely inventory and source of knowledge of thenational extent of the problem. Delays in entry willartificially cause the growth of CERCLIS todecline, falsely implying that site discovery haspeaked.
Other Lists or Estimates
CERCLIS is the largest single Federal inventory,but it is not the only source of potential Superfundsites. Other Federal and State inventories, lists, orestimates include:
● Federal Facilities Hazardous Waste Compli-ance Docket. The docket lists Federal facilitiesor sites that may require cleanup. Reporting isrequired under CERCLA every 6 months.Reporting is on a facilities basis (except forsites belonging to the Department of theInterior (DOI)); each listed facility may have
●
●
●
●
one, a few, or hundreds of sites. The Depart-ment of Defense’s (DOD’s) Rocky MountainArsenal, for instance, has 165 sites, As ofNovember 1988, the last update, the docketcontains 1,170 facilities; 115 sites are on theNPL.GAO Review of Civilian Agencies. This Sep-tember 1986 report reviewed agency data andidentified 1,882 potential sites (excluding some7,000 sites believed to be DOD’s responsibil-ity). The study implies that over half of thecivilian agency sites (about 1,000) will needsome cleanup.37
Individual Agency Estimates. Federal agen-cies are required to report to Congress annually(under CERCLA) on the status of their cleanupprograms. Data from those reports is morerecent than the GAO report data. In fiscal year1988 reports DOD listed 8,139 sites; DOE,1,700 sites; and DOI 254.RCRA Corrective Action. A formal nationalinventory does not yet exist. There may beanywhere from 2,000 to 5,000 RCRA sitesrequiring some kind of cleanup; differingestimates depend on the counting scheme. A1989 EPA document accounts for 5,081 knownRCRA facilities. Using a 1987 GAO estimate,at least one unit in 52 percent of the facilities,or 2,626 facilities, will need remediation. InNovember 1988, EPA estimated that 29 percentof 80,000 units in RCRA facilities, or 23,066units, will need to be cleaned up. A unit (calleda Solid Waste Management Unit in regulatoryjargon) can range from a small tank to a largelandfill. Another EPA document says that closeto 5,000 closing RCRA facilities are potentialsites. None of the above accounts for thethousands of municipal landfills that mayrequire cleanup and for which there is nonational listing.Mining Sites. The DOI’S Abandoned MineLands Remediation Program has not invento-ried noncoal mines needing cleanup. GAOestimated in 1987 that there could be 22,339hazardous waste sites at mines and processingfacilities, over 90 percent of them located at
WJ.S. ~vlro~cn~ pro~tim Agency, Office of Solid Waste and Emergency Response, ‘‘Annual Report, Fiscal Year 1988. ’ EPA/68-01-7X9,November 1989, p, 31. The sites scheduled for entry and PAs in fiscxd year 1989 had not been entered by July 1989.
37u,s, Ge~r~ ~cowting Office, SWe~& clvll~n Federal Agencies Slow to C!e~ w H~~do~ Wrote, GA OIRCED-87-15.3 (Gaithemburg,MD: U.S. General Accounting Office, July 1987).

Chapter 2—The Front End of Superfund: Site Discovery and Evaluation ● 101
closed or abandoned mines.38 Of the 24 sites inthe Uranium Mill Tailings remediation pro-gram, 22 have yet to be cleaned up.
. Leaking Underground Storage Tanks. Theestimated number of potential leaking under-ground storage tanks ranges from 300,000 to400,000. Discovery and development of inven-tories has been left to State programs. (Whenwriting Underground Storage Tank regula-tions, EPA rejected a suggestion that activediscovery be required.)
. Asbestos Abatement. EPA has estimated thatover 44,000 public schools contain asbestosthat may need attention. Between 300,000 and700,000 public and commercial buildings haveasbestos that may have to be removed. Thishazardous material gets deposited primarily inmunicipal landfills (see ch. 4).
● State Lists. Many States have inventories;usually a State list (or lists) contains more sitesthan the number of that State’s sites in CER-CLIS. The results of an Association of Stateand Territorial Solid Waste Management Offi-cials (ASTSWMO) survey taken in July 1986reported a total of 31,910 confirmed andsuspected sites in 45 States and Puerto Rico.39
This number compares with 24,544 sites listedin CERCLIS, as of October 1986, for thosesame States and Puerto Rico. If the sameState/CERCLIS ratio holds today, States haveover 40,000 sites inventoried. State inventoriesvary widely in content (types of sites listed), inknowledge level on sites (confirmed or onlysuspected problems), and whether or not theyinclude sites that are also in CERCLIS.
It does not have to be this way. New Jersey hasrecognized that because of multiple and incompati-ble lists, “the actual number of sites requiringremediation [by the State] is unknown."40 As part ofa new strategy to coordinate various State cleanupprograms, a computer database-a ComprehensiveSite List—has been established. Data input will bedone by and be accessible to individual programs.
The central database replaces individual programinventories that caused overlap or duplicate count-ing and collection of data.
SITE EVALUATIONSite evaluation in the Superfund program starts
with a preliminary assessment (PA) and doesn‘treally end until a remedial investigation/feasibilitystudy (RIFS) has been completed. (But, to someextent, site evaluation continues through remedialdesign and implementation, especially for complexsites, ) This section reviews the conduct, status, andoutcomes of preremedial Superfund site evalua-tions; the PA and site inspection (SI) stages and theuse of the Hazard Ranking System (HRS) to scoresites for the NPL on/off decision. Along the wayfrom a PA to scoring, the majority of sites inCERCLIS get rejected; only 10 percent make theNPL. Those few sites, however, are not the only onesthat pose threats to public health and the environ-ment. They are also not necessarily the worst sites .41OTA has estimated that from 240 to 2,000 sites mayhave missed being placed on the NFL because offalse decisions made during preremedial screening.
Environmental Fulcrum Shift
The goal of preremedial site evaluation hasalways been—and still is—to ultimately decidewhich sites belong in the Superfund program. Overtime, early decisionmaking has shifted from anenvironmental bias (’‘Does the site need cleanup’?’to a management bias (’Will the site qualify for theNPL?"). A site no longer moves beyond the firstscreening step unless a case can be made that it maywarrant Federal attention (i.e., has a probable HRSscore of at least 28.50). A PA no longer simplydetermines whether or not a site is a threat or not.
The shift, part of the narrowing of Superfunddiscussed in chapter 4, has occurred quietly withoutany public discussion. There has been little publicnotice of the shift because the public doesn’t paymuch attention to preremedial activities andbecause public statements by EPA imply that
J81bid,, p. 16.J$’A~lafiOn of State and ~rnton~ Solid Waste M~agcment offi~la]>, ‘ ‘State Programs for Hazardous Waste Site ASwswllcn[\ wd Rcmedlal
Actions, ” June 1987, p. 1.40 New Jcr~y &p~Cn[ of Eirvironmental ~o~tlon, “Case Managcmcnt Strategy Manual, ” draf[, May 1989.41~e km ~or~f ~tfe~ Is rwcly &fined, [t cm mem a ~mpllcat~ Sl[e, a si[e hat IS expensive to clean up, or one that poses high nks to the s~o~~n~
camnumty. It could also mean a s]te that poses current risks as opposed [u a wte that only poses potenwd future risks.

102 . Coming Clean: Superfund Problems Can Be Solved . . .
nothing has changed. The shift may have beenoccurring before SARA was passed in 1986 but wascertainly enhanced by congressionally mandatedactivity levels for site evaluation.
The management bias means that the Superfundprogram has fewer sites to deal with not only duringthe preremedial process but in all following stages ofSuperfund. The shift saves money for the Superfundprogram and makes it easier for EPA to meet targetsmandated by SARA. In 1988, EPA stated:
A key management initiative in fiscal year 1987was a strategy designed to expedite the pre-remedialprocess by focusing attention on early decisions toensure that fewer low priority sites reach theresource-intensive stages of the pre-remedial process[emphasis added] .42
The environmental consequence is that, as thekinds and numbers of sites rejected early by EPAgrows, increasing numbers of those sites proba-bly truly need attention. The earlier they arerejected, the less anyone will know about them. Ifignored, the future costs of cleaning up those that doneed cleanup will probably be greater than theywould be today and, in the interim, protection ofpublic health and the environment has been reduced.
The Superfund site evaluation process is what thehealth care field calls screening. Screening generatestwo kinds of correct (true) and incorrect (false)outcomes. True positive and true negative decisionsare the desired information. But, there is always aprobability of making false positive and falsenegative decisions. For Superfund and in a strictenvironmental sense, false positive sites are thosethat do not pose a threat but are judged to be threats.False negative sites are sites that are a threat but arejudged not to be.43 EPA worries more about whethera site is judged a problem, when it is not, thanwhether a site is judged not a problem, when it is.False positives mean that money is spent unneces-sarily in site analysis. False negatives may causeharm to human health and the environment untilsites eventually resurface for attention, and thencleanup costs will be higher. False negatives alsocan downplay the extent of the cleanup problem to
Congress and the public by underestimating thenumber of sites requiring cleanup.
Screening in Superfund is done in a series: PA, SI,HRS scoring, RIFS. Series processes tend to gener-ate more false negatives than false positives (seeapp. 2A). Despite this inherent bias in the Superfundprocess, EPA assumes that false negative outcomesare minimal. EPA has never assessed the 8-yearuniverse of rejects from its process to determinehow well it performs, environmentally. On theother hand, EPA has spent time and effort to assurethe lowest possible numbers of false positive out-comes.
A Better Environmental Priorities Initiative
EPA’s Environmental Priorities Initiative (EPI) isa minor adjustment in the Superfund site evaluationprocess, It is a good example of a move by EPA tointegrate two cleanup programs (see ch. 4). EPI doesnot appear to have the environmental significancethat its name implies or EPA claims, however. But,a broader initiative with true environmental focuscould have.
As it now stands, EPI partially integrates theRCRA and Superfund programs by evaluating underthe existing Superfund preremedial system thosesites covered by either program. At a point duringthe SI stage, a management decision is made aboutwhether Superfund or RCRA has responsibility fora site.
In combination with a national site discoveryprogram, this kind of integration could encompassall cleanup programs. To regain art environmentalfocus, the PA would need to be returned to itsoriginal threat/no threat role and sites would be keptin the system until a case could be made that a threatdoes not exist. At the decision point, sequentialdecisions would be made: Is it a threat or not? If not,a site would be tagged no further action (NFA). Ifyes, which program has the authority to act? Then,a formal notification would send the site to theproper authority and the appropriate indicationwould be entered into the CERCLIS database so thattracking would be feasible.
42u.s. ~vlromen~ ~ot~[ion Agency, Office of Solid Waste and Emergency Response, ‘‘Superfund AdvisoV, Winter 1988. P. 1.
431f & intmt IS m find NIL sites, hen fatse negatives are sites that qualify for the NPL but haw ~n rcjwti.

Chapter 2—The Front End of Superfund: Site Discovery and Evacuation . 103
Just where the environmental/management deci-sion point should be assigned is a key element of abetter EPI. What may be required is to throw out thePA/SI concept, to view site evaluation as a contin-uum rather than two distinct steps. Instead of asystem that says that at a specific point sufficientinformation is always available to make a binarydecision, a better system could be built around theprinciple that when enough information is availablea decision will be made. Unlike the current Super-fund evaluation process, this system would requirethe development and use of experts as decision-makers.
State programs, if they had sufficient resources todo so, might be inclined to make better judgmentsabout whether a site is a threat or not. States, unlikeEPA, have no one to defer sites to. If a site is aproblem and does not qualify for the Superfundprogram, the State itself will eventually clean it up.
The Changing PA
It is primarily at the PA stage and to some degreeat the SI stage where the environment-to-management shift has occurred in the Superfundprogram. The change has crept in with changes in thedefinition of a PA and its outcome and with the useof the HRS to prescore a site. That a change hasoccurred is obvious by the change in the languageused to tag a site that is rejected during thepreremedial process (see box 2-C). No longer doesa PA simply say whether or not a problem poten-tially exists, leaving it up to the more extensiveinformation of the SI stage to make a judgment aboutNPL qualification. The PA now concludes whetheror not a site may qualify for the NPL. With littlechange in the information available, EPA has castthe PA in a new role for which it is inappropriate.
According to the 1982 National Contingency Plan(NCP), the PA originally was a method for theremoval program to assess whether: 1 ) no threat waspresent at a site, 2) a threat required immediateattention, or 2) a potential threat should be turnedover to the remedial program. This concept is similarto that in the medical field where a process calledtriage separates patients into three categories: noattention, immediate attention, and later attention.
Box 2-C—From NFA to NFRAPConcurrent with the changes in the PA have been
changes in the nomenclature for sites rejected by thepreremedial process. The original no further action(NFA) was changed around 1986 to no furtherremedial action planned (NFRAP).
An NFA had an environmental meaning: nothreat was present at the site. The current NFRAP ismore a policy statement and can mean, according toa 1988 EPA documental
1. sites that never received CERCLA hazardoussubstances;
2. sites where the CERCLA hazardous sub-stances are clearly not releasing, and have nopotential to release, into the environment andno removal action is required;
3. sites where EPA is not legally authorized torespond to the release; and
4. sites with no reasonable potential to score28.5 or higher upon application of the currentHRS at the end of an SI.
EPA further explained in another 1988 docu-ment: “Note that the NFRAP designation does notmean that there are no environmental hazards at thesite. There may be hazards but these hazards maynot be of sufficient magnitude for NPL listingpurposes."2 A 1989 EPA document is more suc-cinct; it defines NFRAP as “those sites with noreasonable potential to score above the HRScutoff. ‘‘3
lu.s# ~vuonmcntd protection Agcmy, Office of Solid Wawe andEmugulcy R=%== ‘ ‘*l- Asaessanem GuI-, Fiscal Year1988,” directive 9345.0-01, January 1988.
2U,5. ~~MI protection Agcmcy, Office of Solid Waste ad~=yk3$p01MC, “P’rc-RcmcdialS matcgyfor hnplemen ting SARA,”dimctivo934S.2-01, Feb. 12q 1988, p. 5.
3U,5. fi”’~ Pnwctiori Agcwy, Offkc of Solid Waste adEmergency Rcqonsc, “RcgionaJ h-remedial P!wgrarn objectives forFY 89 and Fii Qtmta of FY 90,” dinxtive 9345.242, Mar. 10, 1989,p. 3.
By 1985, the PA had become the province of theremedial program, but the triage concept remained.That year the NCP listed three purposes of a PA: 1)to eliminate nonthreatening sites from further con-sideration [no attention], 2) to determine any poten-tial need for removal action [immediate attention],and 3) to establish priorities among sites requiringSite Inspections (SIs) [later attention].44
4450 F~r~ Re~ster 47972, NOV. 20, 1985
✑✐✔ ● Coming Clean: Superfund Problems Can Be Solved ., .
As late as April 1987, the PA still retained thetriage concept. EPA stated in a training manual thenin use:
A PA is not intended to give a full or completepicture of a site and its associated problems. A PA isby design, a relatively quick, low-cost review ofrelevant available data to determine whether the sitepotentially poses a problem and, if so, what type offollow-up work should be undertaken to furtherassess the site.45
And, in public documents, EPA said that an SIproceeded ‘‘if a preliminary assessment turns upevidence that a site may pose a threat . . .‘ ’46
Thus, the official use of the PA has been todetermine whether a site needs emergency attention,whether it should move on to the second screeningstep (an SI), or whether it is dropped from furtherconsideration because the site does not pose aproblem. In a 1984 report to Congress, EPA definedsites rejected by the PA—no further action sites—assites that ‘‘pose no threat to public health or theenvironment, and thus warrant no further investiga-tion or remediation. ’47 Examples of such sites aresites reported to the CERCLIS that do not actuallyexist, have already been identified under a differentname, and demonstrably contain no hazardoussubstances. Dropping such narrowly defined typesof sites early is environmentally appropriate andcost-effective.
Under December 1988 proposed rules for theNCP, the PA appears to be unchanged, except that,in the preamble and a section called ‘‘Point ofClarification, ’ EPA is explicit about the entirepreremedial process being one to determine whetheror not sites ‘‘warrant remedial action, ” The phrase‘‘warrant remedial action’ clearly means whether ornot a site qualifies for the NPL, whether it will attainan HRS score of 28.50 or greater and will not bedeferred to another authority (e.g., is not a RCRA
site). No longer is a potential threat sufficient causeto keep a site in the evaluation process. Only if a siteshows evidence of a significant threat may it moveto the SI stage of site evaluation, according to theproposed NCP.
Today’s PA (and SI) appear to be the result ofstudies such as one done for EPA in 1987 byEcology & Environment, Inc. The study, “Work-load and Resource Requirements for PreliminaryAssessments, Site Inspections, and Hazard RankingSystem Evaluations Under SARA,” was funded byEPA after SARA mandated EPA to meet specifictarget dates and objectives.48 This document, likeother similar EPA documents, does not discuss ormention the possible environmental effects of chang-ing the preremedial process.
At the time that such internal EPA documentswere changing the concept of the PA, publicstatements were projecting the original environ-mental image of a PA (and SI). EPA told Congressin 1988 that the information collected for a PA:
. . . is then evaluated to determine whether the sitehas handled hazardous substances and if thosesubstances have the potential to affect human healthor the environment . . . If a PA indicates that theremay be a release of hazardous substances that maythreaten human health or the environment, EPA thenrecommends a site inspection (SI) to better under-stand the problem. On completion of the SI, if the sitestill poses a potential threat, it is scored . , .[emphasis added] .49
Compare the above “potential to affect humanhealth or the environment’ determination that keepsa site in the screening system with a March 1989directive to EPA regional offices that says, at the endof a PA (and a screening SI), sites ‘ ‘with noreasonable potential to score above the HRS cutoffwill be rejected from the system.50
45u,s, fivlromen~ ~o~um Agency, H~~dous site Ev~uation D i v i s i o n , ‘ ‘ s u p - f ~ d pA/sJ Tr~ning COUW, ‘ s~tion 1,], undat~ but USCXJ
in training sessions on Apr. 22-24, 1987.
‘i’’ Steps in Cleaning Up a Superfund Site, ” EPA Journuf, January/February 1987, p. 17.4TU.S. fivirolnen@ pro~tion Agency, Office of Emergency and Remedird Res@nse. ‘‘The Effectiveness of the Superfund Rogram-CERCLA
Section 301(a)(l)(A) Study, ” December 1984, p. 1-9.48s= SARA Sections 105 and 116.49 LJ,s, Environrnent~ protection Agency, ‘‘ Superfund Advisory, ’ op. cil., fOOtMMe 42. pp. 5-6.SOU.S. fiviromen(~ Pmtectim Agency, Office of Solid Waste and Emergency ResinSe, ‘‘Regional Pm-remedial program Objectives for Fiscal
Year 1989 and First Quarter of FY90,” chrecuve 9345.2-02, Mar. 10, 1989, p. 3,

Chapter 2—The Front End of Superfund: Site Discovery and Evaluation ● 105
HRS Prescoring
The Hazard Ranking System (HRS) was designedto score a site with data collected from the SI stageof the preremedial process; the score is used to makethe on/off NPL site decision. Even this documented,quality assured set of information does not (and wasnever intended to) fully characterize a site and therisks it poses. That occurs later during a RemedialInvestigation (RI).
Now, EPA has moved the HRS up to the PA stage.The HRS is being used to prescore (or, estimate theHRS score for) a site when most of the availableinformation comes from existing records. There isno site sampling done for a PA. EPA has defined twotypes of prescores. A preliminary HRS score is aminimum value; missing data is assigned a zero. Aprojected score is a possible score with missing dataestimated by the evaluator. The PA guidance docu-ment says that the prescore will “be used to assigna priority to the site for an SI or to eliminate the sitefrom CERCLA remedial activity. ”5l Clearly, thePA has changed from being a threat/no threatdecision to being a method to eliminate sites asearly as possible from the Superfund program.
To make the ruling of significant threat to movea site from a PA to an SI, agencies conducting the PAhave been told, through the proposed NCP, that they‘‘may use a combination of a preliminary HRS scoreand best professional judgment. The latter tool—professional judgment—is, however, only to be asupplement ‘‘to the preliminary score in makingdecisions about whether or not to proceed to the nextphase of evaluation. ”5z EPA’s Preliminary Assess-ment Guidance Fiscal Year 1988 requires the use of
preliminary and projected HRS scores as a basis forsite decisions. Thus, the NCP proposal is not onlycodifying the use of prescoring but appears to bemaking it more difficult than does the guidance tomove a site forward.
Adding a quantitative measure and, perhaps,professional judgment to the PA evaluation appearsto be a step toward objectivity. And, EPA isdesigning a computer program to standardize andreduce the workload. However, the numerical out-come of the HRS--even when used after an SI—isbased on subjective decisions, and because theinformation available at the PA stage is the poorest,the HRS prescore is most uncertain. Since the PArelies on existing information, evidence of contami-nation may not be uncovered without sampling,which does not occur until an SIq.53 Confirming this,a memorandum from two EPA officials said: ‘‘Oftenit is difficult at the PA stage to recommend no furtheraction without field visits and sampling. ’54 PA datacollections and evaluations are done by entry-levelemployees, adding uncertainty both in the applica-tion of the HRS and the use of professionaljudgment.
Another point is that getting HRS scores highenough to qualify for the NPL is sometimes an art.It is not an uncommon practice to recalculate HRSscores repeatedly until a sufficiently high score isobtained so that a decision can be made to proceedwith formal scoring.55 One regional official toldOTA that it is “always possible” to get the crew togo back to the site and get more information to raisethe score. This is an overstatement because scoresfrom repeated attempts would eventually approacha ceiling. However, the practice points out that the
51 us, EnvU~~ent~ %o~tion Agency, Office of Energency and Rcmedial Response, Prehrruna~ Assessment Guidime ~L\( df ~k~ 19~~,Dir(xtIve 9345.0-01, January 1988, p. 14.
SZS3 F&r~ Register 51394, N. 21, 1988, p. 51413.Sqsmpllng Is not ~ways done fm ~ SI el~er. ~ EPA InspWtor General report cited several instances where samphng dld not occur In onc au~t
of State work that had not received adequate Region oversight, the [G sad, ‘ ‘The most common deficiency was the fadure m perform the necessarysampling during the S1 process. [U.S. Environmental Protection Agency, “Capping Report on EPA, Office of the Inspector General Audits ofSuperfimd Cooperative Agrwments for Fiscal Years 1985 through 1987, ” Mar. 29, 1988.] Also an EPA contractor stud> found that samplmg was notdone and no pre-existing analytical data was available for 22 percent of 212 sites that had received SIS. [U.S. Envlronnlenml F’rotcctmn Agency,“preliminary Assessment and Site Inspection Program Quality Assurance Review, ” draft, Sept. 11, 1987. ]
54 LJ.s. Envumrnema] Protection Agency, “Guldarrce on Prellminq Assessments and Site Inspections Under CERCLA, ’. draft. no date, sent to theall EPA Regions on Sept. 8, 1987, by Gene Lucero (Office of Waste programs Enforcement) and Henry bngest (Office of Emergency and RemcxhalRcqxmse), p. 10. In the past, sne visits were not an official part of a PA. Now, they might occur. Under the proposed NCP: “A PA shall . mcludcan off-site ruorumssance as appropriate. A PA may Include an on-s]tc reconmssance where appropriate. [53 Federal Register 51502, Dec. 21, 198X ]
s5An EpA ~SWtor (jener~ rewfl &L~ M~~h 1 ~~~ doc~len(~ ~Veral examples, s~le progr~ officl~s ~so gave OT’,4 numerous f2X&UT@tX Of’
multiple sampling to finally obtain the necessary data. For instance, W}lliam De Vine, Louisiana Department of Environmental Quality, swd that m wassampled numerous umes al the Dutchtown site m Lows]ana before a rclcasc could be documented.

106 ● Coming Clean: Superfund Problems Can Be Solved . . .
aggressiveness with which information is collectedand the comprehensiveness of the information af-fects the ultimate HRS score. Using an HRSprescore before most of the information is collectedcan prematurely bias the ultimate fate of a site.
This is not to say that prescoring does not havevalue during a PA. As a tool, it can help focus futuredata collection and sampling efforts. For example, ifprescoring indicates that no information is knownabout contaminant migration paths, the SI can bedesigned to look specifically for them. EPA’scontractor in Region 5 has been using prescoringexpressly for this purpose since mid-1984. Prescor-ing can also be used as an indicator of environmentalthreat to help decide which sites with PAs should getSIs first,
What prescoring cannot do is make a definitivedetermination of the possible environmentalthreat of a site nor does it necessarily forecast asite’s ability to make the NPL. A preliminaryscore, as a minimum score, can tell whether a siteappears to be a significant threat, if the informationis valid. In an environmentally biased system, thedefault option would be to always move sitesforward unless a case can be made that a site isnot a threat. That decision would require an HRSprescore that is maximized and still shows nothreat. 56
Focusing so narrowly and early in the process ononly the data needed for HRS scoring also detractsfrom a positive step EPA may be trying to take andthat OTA has suggested as a policy option. That is,to link the site evaluation process with the RI toavoid the current duplication of effort that occurs assites move from the preremedial to the remedialphase of evaluation.
Two SIs and a Deferral Point
EPA now has two SIs: a screening SI (SSI) and alisting SI (LSI). The goal is to flush out Superfund
false positive sites that have managed to get beyondthe PA stage (i.e., have received a high or mediumpriority rating when in fact they will not qualify fora Superfund remedial action). From EPA’s manage-ment perspective, there is no point in spendingresources on collecting more data for these sites. Ifthey need to be cleaned up, Superfund won’t bedoing it.
Introducing a new screening stage does provide anopportunity to find false positive sites that havegotten through the previous stage and to preventthem from moving to a more expensive stage. It alsomeans that additional false negative decisions willbe made because all screening stages make bothtypes of false decisions. Under the old one-SIsystem, all sites that made it through the PA stagegot a full SI, lessening the chances of making falsenegative decisions.
Now, under an SSI all sites get a ‘‘refined” I-IRSprescore. In conducting an SSI, the ‘‘rigorous ILSI]data quality objectives (DQOs)” do not have to bemet.57 Thus, like during the PA, the incompletenessof the data for the prescore may bias the outcome.Not having to adhere to DQOs, however, savesresources. Based primarily on the new prescore, siteswith SSIs will either be rejected (get an NFRAPdesignation), be recommended for an LSI, or getdeferred to another authority. EPA says that deferralat this point ‘‘indicates that the site has the potentialto score above the cutoff score for NPL listing butthe release could be more effectively addressed byanother statute or authority. ”58 For now, this is aCERCLA/RCRA decision point. However, it isdesigned to accommodate more extensive deferrals,if a comprehensive deferral policy is implemented(see ch. 4).
What Are the Outcomes?
Over the last few years, the budgets for siteevaluation have increased some. For fiscal year1990, EPA has requested almost $47 million to pay
%~ me of a series of p~rs prepw~ for the Massachusetts Contingency Plan, the question of proper bias was discussed as: ‘‘. whether theDepartment should assume, when little information is available, that a substantial hazard exists or whether it should designate a site as a priority disposalsite only when available information indicates a substantial hazardous exists. [’‘Site Classification System, Mussachusefrs Conn”ngency Plan,Discussion Papers, December 1987.] NW that not included is the Superfund program concept that when httle information exists a site can be classifiedas not hazardous.
5TU.S. ~v~omen~ protution Agency, Office of Solid Waste and Emergency Response, “Pre-Remdial Strategy for Implementing SARA,”Directive 9345.2-01, Feb. 12, 1988, p. 8.
S8U.S. ~vuoment~ protwtion Agency, Office of Solid Waste and Emergency Response, ‘‘Regional Pre-remedial Program Objectives for FY 89and First Quarter of FY 90, ” Directive 9345,2-02, Mar, 10, 1989, p, 5,
Chapter 2—The Front End of Super fund: Site Discovery and Evaluation ● 107
contractors for PAs, SIs, and HRS scoring work; infiscal year 1987, $34 million was appropriated.59
Still, the annual cost of site evaluation is comparableto cleaning up one large site, and taking sites froma PA to the NPL consumes only about 3 percent ofthe annual Superfund budget. And, the budgetincreases for preremedial work may not be keepingpace with an increasing effort required.60
At the regional offices, the internal EPAworkforce in terms of numbers of full-time equiva-lents (FTEs) is very small. It has decreased from ahigh of 47 FTEs in fiscal year 1988 to 41 FTEs infiscal years 1989 and 1990.61 The near leveling ofPA/SI funding and decrease in staffing may reflectEPA’s goal to change the process to reduce theoverall workload, i.e., evaluate fewer sites.
Site evaluation is not done by EPA staff. Staffsupervise the work of Field Investigation Team(FIT) contractors and State government agencies,whose employees or contractors do site evaluations.EPA’s FIT contracts have been held throughout thehistory of the program by two firms: Ecology &Environment, Inc., and NUS Corp. The currentcontracts run for 5 years from November 1986 toOctober 1991 and are valued at $154 million and$130 million, respectively.
Like the other portions of the Superfund program,the accomplishments of site evaluation are recordedas numbers of PAs, SIs, and NPL listings completedper fiscal year. These numbers are not only used toshow the progress of the program to the outsideworld but also internally as regional performancemeasures. Table 2-1 shows the numbers from fiscalyears 1980 through 1988.
Additionally, since SARA imposed mandatoryactivity levels in 1986, EPA’s performance has beenjudged on whether or not those schedules are met.The first requirement, that PAs be completed for all
sites in CERCLIS as of the date of enactment ofSARA, was met on schedule by January 1988.Within that same year, however, EPA had stated thatthe other deadlines—all necessary SIs and HRSscores by January 1989 and October 1990-respectively, could not be met. Actually, EPARegions 6 and 10 did complete the SIs on all theirpre-SARA sites by the deadline. Those two regionshad only 6 percent of the total backlog. Thus, 94percent of the SIs were not done as required bySARA.
Congress also placed continuing pressure bysaying EPA should complete all necessary HRSscores within 4 years for sites entered into CERCLISafter SARA was enacted. EPA told the HouseAppropriations Committee in early 1987, that itwould be able to meet that goal.62 Historically, EPAtold the committee, to go from CERCLIS entrythrough HRS scoring may take as little as 2 years oras long as 5 years. The conclusion from an OTAanalysis differs. OTA reviewed all 229 sites pro-posed for the NPL on June 24, 1988. The averagetime from discovery date to proposal was 5.5 years.For 54 percent of the sites it took 6 to 10 years. Whilefor 20 percent of the sites it took 3 years to completethe process, an equal number took 8 years.
The new PA/SSI/LSI/HRS scoring screening willbe more time-consuming than the old PA/SI/HRSscoring screening was. To shorten the time it takesto move a site through the process, EPA couldreduce the time a site sits between stages.63
The Persistent SI Backlog—Meeting the initialSI and HRS deadlines has been impossible due to apersistent backlog of sites awaiting SIs and anapparent unwillingness or inability on EPA’s part tofund SIs at the level needed to resolve the backlog.Even if full funding were available, a questionremains as to whether or not the technical expertise
S% fi=~ yw IWO rque~ is $1 million more than the estimated budget for fiscal year 1989.60tiHW ~lam~ hat EPA’s prereme~~ Prmess has chang~ over he put several years and has bexome more time-consuming The effect for
Mimesota is a reduction in the number of sites identified for placement on the NPL. [’ ‘Minnesota pollution con~ol Agency’s Report on the Use of theEnvironmcntat Response, Compensation and Compliance Fund During Fiscal Year 1988,” November 1988, p. 4.]
61~ ~mp~Son, at EPA he+u~ers fie Sik Eval~[ion Division of the Office of Emergency and Remediat Response (OERR) has over 30professional positions in three branches.
624 *A RePfi m tie Commltt= on Approp~ations, us, Hou~~ of Repre~cntafives, on tie Statm of tie Environrnentd Protwtion Agency ‘S Su@hndprogram,” March 1988, Appendix I, p. 31.
63~rd~g m EpA data, tie ~t~ ~o~t of time to do tie work to complete a pA, S1, and ms Scoring has averagd abut 4 months. Thus, a site
that made it through the process in the average 5.5 years sits around m the pqx4ine for over 5 years.

108 ● Coming Clean: Superfund Problems Can Be Solved . . .
Table 2-1—Pre-Remedlal Program Accomplishments (numbers of sites)
Fiscal year:Sites in CERCLIS . . . . . . . . . . . . . . . . . . . .PA completions’
Fiscal year total . . . . . . . . . . . . . . . . . . . .Cummulative total . . . . . . . . . . . . . . . . .
Fraction of CERCLIS with PAs . . . . . . . . .SI completions’
Fiscal year total . . . . . . . . . . . . . . . . . . . .Cumulative total . . . . . . . . . . . . . . . . . .
Fraction of SIs required . . . . . . . . . . . . . . .Number of SIs requiredb. . . . . . . . . . . . . . .SI backlogb . . . . . . . . . . . . . . . . . . . . . . . . .Percent of sites with PAs
that require Slsb c . . . . . . . . . . . . . . . . . .
19808,000
198110,500
198213,386
198316,309
198418,884
1985 1986 198722,621 25,194 27,571
198829,987
2,2042,2040.276
1,0723,2760.312
1,2094,4850.335
1,8096,2940.386
4,44710,7410.569
5,181 4,262 4,00115,922 20,184 24,1850.704 0.801 0.877
2,95326,913
0.897
613613
0.3481,7611.148
4281,0410.3972,6221,581
5661,6070.4483,5871,980
6422,2490.4475,0312,782
1,3083,5570.4148,5925,035
1,618 1,267 1 ,3435,175 6,442 7,7850.406 0.399 0.402
12,746 16,145 19,3667,571 9,703 11,581
1,2589,0480.562
16,1007,052
80 80 80 80 80 80 80 80 60a~l sfles in CERCLIS must have PA; Sites with NFA after PA do not get an S1hkulated by OTA from EPA data in rows aboveWne explanation fort ha same, constant percent over 7 years and a reduced percent for FY88 is that the EPA numbers for S1s were generated using 80 percent
FY80-87 and 60 percent In FY88.
SOURCE: offim of Technology Assessment, 1989; using EPA data.
would be available, as well.64 The situation iscompounded by the fact that EPA is already over oneyear behind the SARA date of April 1988 infinishing the development of the new HRS.65 Thescope of the HRS determines the data collectionneeds for the SI, and although sites scored prior tothe availability of the new HRS do not have to berescored using the new HRS, there will have to be aphase-in period.
So far, the program has cumulatively completed56 percent of the SIs necessary. That rate jumpedfrom 40 percent at the end of 1987 because of a PAreassessment conducted in 1988 during which some3,000 sites were reclassified as not requiring SIs (seelater discussion).67 Before the reassessment, EPAhad over 11,500 sites awaiting SIs; that is, almost4,000 more sites awaiting SIs than had beencompleted in the previous 8 years of the program!
Now, there may be over 7,000 sites in the SIbacklog. And, it may start growing again becauseEPA’s projections for SIs do not appear to take thebacklog into account. For fiscal years 1989 and1990, EPA expects to complete 1,325 SIs eachyear. 68 At that rate, if 1,600 SIs are required a year,EPA will be adding 275 sites to the backlog eachyear. If EPA is estimating that only 66 percent ofsites with PAs will require SIs, the backlog willpersist at the current level. Even if only 50 percentof the incoming sites per year require SIs, only 325of the backlogged SIs could be done each year.69At
Since the CERCLIS list grows at a rate of about2,000 sites per year, EPA must complete about 2,000PAs per year to comply with its own policy ofcompleting PAs within one year of CERCLISentry. 66 EPA’s performance, budgets, and projec-tions clearly show that it can complete those PAs.Historically, the program has rejected 20 percent ofthe sites for which PAs are completed, Thus, 80percent of all PAs have needed SIs. To keep up, EPAshould have been doing about 1,600 SIs (80 percentof 2,000) per year. Only in 1985 has this happened(see table 2-l).
*- ~T ~n~X~r in Re@on 5 estimated in 1987 tiat m additional 2(N techmcxd staff (tripling their staff level at that time) would & n~ed toget the S1s required by SARA done in time. [Ecology & Environment, Inc., 4 ‘Analysis of and Solutions to Problems Related to the Completion of theSARA Man&red Site Inspection Goal, ” Jan. 26, 1987. ]
tiRu16 W- prom December 1988; final rules are expected in February 1990.
%ongress, through SARA, has required EPA to complete a PA petition (a citizen’s request for a PA) within one year. EPA has made that one-yewrule a policy for afl PAs.
67As @le 2.1 shows, he reassessment also reduced the cumulative percentage of sites rquiring S1s from 80 to 60 percent of PAs completed
‘U.S. Env ironrnental Protection Agency, ‘‘Justification of Appropnaiions Estimates for Committee on Appropriations, Fiscal Year 1990, ” Other,internal EPA documents show the fiscal year 1990 S1 target to be 1,250 sites.
%PA’s workload report calculated that 1,211 S1s would have to be done each year to meet SARA’s requirement of 5 years. This assumes that only60 percent of the sites with PAs—instead of the historical 80 percent-would need S1s.

Chapter 2—The Front End of Superfund: Site Discovery and Evaluation ● 109
that rate, it would take 21 years to eliminate thebacklog.
The reality is that to eliminate the SI backlog in,say, 5 years while handling the normal flow ofrequired SIs from the PA stage, EPA needs sufficientresources to complete about 3,000 SIs per year.Assuming that no cost efficiencies could be found inconducting SIs, doubling the number of SIs per yearamounts to a doubling of the current SI funding levelto over $70 million per year for 5 years.
If Not By Adding Resources, How?—Not havingasked for or been given budget levels and staffing torapidly reduce the SI backlog, EPA is trying tomanage away the problem of a mismatch betweenthe numbers of sites to evaluate and schedulesimposed by Congress.
70 EPA says it has developed
a strategy that “reduces the overall pre-remedialworkload while increasing resources available forthe highest priority sites. ”71 The PA/SI processoutlined in the proposed NCP is the result of thisstrategy. Figure 2-2 is OTA’s version of the newflow for site evaluations.
The necessary program changes are, according toEPA’s preremedial strategy document, to:
1. More effectively screening out sites that do notrequire SI through improved PA procedures.
2. Adjusting the way we conduct SIs so that we aremore efficient in applying resources appropriately.
3. Increasing the resources available to do PAs, SIs,and HRS scoring packages .72
The first change, ‘‘improved PA procedures, ’ hasbeen made by changing the criteria for rejecting sitesat the PA stage, and the second change, ‘‘adjusting. . . S1s,’ ‘ means splitting the SI into two stages.While the third change, ‘‘increasing. . . resources,”
implies increased budgets (and they have beenincreased), according to the preremedial strategydocument, EPA planned to reduce FIT contractors’overhead by 10 percent and to ‘‘exercise future FIT[contractor levels of effort] options now’ to increaseavailable funds up to 25 percent, nationally .73 Fundswere also to be made available by discouraging theuse of FIT resources for non-preremedial work.
The EPA analysis assumed that the current levelsof effort allowed for the PAs and SIs were appropri-ate and that if new work was added, the levels ofeffort would have to be increased.74 However, addedworkload because of increased pace does not neces-sarily require increased resources. Efficiencies mighthave been found by evaluating the validity of theestablished levels of effort for PAs and SIs. OneState official has disputed EPA’s assumption of aneed for increased levels of effort. A bureau chief inIowa’s Department of Natural Resources claims thathis staff can complete PAs in about 40 (instead of100) hours and SIs in 240 (instead of 400) hours.And, EPA could have searched for cost efficienciesby reconsidering the PA/SI process itself. But thatoption might have been foreclosed by SARA, whichby establishing schedules effectively codified theexisting process.
One tactic EPA has employed is a one-shotattempt at reducing the level of need for SIs. To cutdown the SI backlog, EPA had the regionsretroactively apply the new PA-to-SI rules to sitesthat had already received PAs. Many of those siteshad been evaluated in the days when the PA decisionwas a threat/no threat decision. In 1987, EPAidentified over 8,000 sites awaiting SIs and in aserious of documents, asked or required the regions
70~~rding t. he Hou.w ApprOpfi~lO~ cwnxnlttw rcpw cited earlier, in one fiscal year EPA’s rUIUCSt fOr i.ncread funding was denied by theOffice of Management and Budget.
71U.S. Environrnent~ Protection Agency, ‘‘Pre-RemediaI Strategy for Implementing SARA, ” op. cit,, footnote 57, p. 3.
721bid., p. 3.73~s Option ~m suueq~ by EPA’S cm~xt study on workload needs. Although it appears in the EpA’s lamr premm~~ s~ategy docwent, it
was apparently imtially rejected by EPA bemuse ‘‘a shortage of experienced staff exists. IEzology & Environment, inc., ‘‘Workload and ResourceRqwrements for Preliminary Assessments, Site Inspections, and Hu.ard Rarkng System EvaIuatlons Under SARA, prepard for EPA, October 1987,p. 21.]
741t is ~lew from comp~ng tie fiolofl & Environment repn for EpA wl~ tie prerem~~ Suategy doc~ent ~a[ EPA relied heavily on Lht?
contractor’s conclusions to make demions about how to fmd the resources with the curretu program to increase the workload

110 ● Coming Clean: Superfund Problems Can Be Solved . . .
CERCLIS
(ail sites)
1
1
M H
1 TNFRAP
Screeningsite
Inspection
NFRAP
evaluation
Figure 2-2-Revised EPA Preremedial Process
I I
Otherprograms Listing
site
NFRAP
M (medium priority SI) = HRS prescoreindicates potential toscore above 28.50
H (high priority) = HRS prescoreindicates site likely toscore above 28.50
●✝ same as H
(a) =(b) =(c) =(d) =(e) =
Initial HRS score >25.0QA’d initial score <28.50Region adjusted score >= 28.50Proposed score >28.50Final score >= 28.50
Back to region for more/betterdata; HRS score adjusted
1A A
(b) (c)
NFRAP Other Finalprograms NPL
site
NFRAP (no further remedial action planned) = sites with no reasonable potential to score above 28.50
SOURCE: Office of Technology Assesment, 1989.

Chapter 2—The Front End of Superfund: Site Discovery and Evaluation . 111
to reevaluate these sites.75 In August 1987, forinstance, EPA said:
A new criterion applies to this re-evaluation.Those sites which do not have a reasonable chancefor scoring high enough to be listed should be ratedas ‘ ‘no further action This differs from the pasttendency to designate ‘‘no further action’ only ifthere was no hazard potential. The remaining sitesshould be designated as “medium’ or “high’priority based on their preliminary HRS score.76
In a later document, EPA said that although the8,000 sites already had been given low, medium, andhigh priority ratings, they must be reassessed“against the new criteria’ and given NFRAP,medium priority, or high priority .77 Regions weregiven the option of simply reclassifying low prioritysites as NFRAP sites without any reassessment.
The reassessment was highlighted in the OSWERAnnual Report, Fiscal Year 1988 as having beennecessary to ‘‘more accurately assess the future SIworkload. Out of approximately 5,000 low priorityPAs re-evaluated, it was determined, said EPA,‘‘that no further action was necessary at approxi-mately 3,000 sites, ’ saving ‘‘substantial resourcesfor use at more serious sites. ’78 What this means isthat the Superfund program is no longer responsi-ble for 3,000 sites. While the Superfund programmay have saved 1.4 million hours of contractortime by avoiding SIs, someone else (State pro-grams, probably) will have to spend a portion ofthat time and the money to discover which sitesare problems.79
False Negatives and Regional Comparability
With SARA, EPA was forced to review the siteevaluation process. As discussed above, the reviewshave all focused on how to match increased work-load needs with available resources. There has beenno assessment of the environmental effects of theprocess or how a speeded up program might affectenvironmental outcomes, In particular, EPA has notasked the question: How many false negativedecisions are we generating?
In any screening process, some false positive andfalse negative decisions are unavoidable but mecha-nisms can be built in to minimize these errors. (SeeOTA’s comparison of the Superfund screeningprocess to a health care model in appendix 2A.) TheEPA process in use today is biased toward findingfalse positives rather than false negatives for tworeasons, First, false positives in any serial screeningprocess stay in the universe being evaluated, provid-ing further chances to find them. But false negativesare shunted out of the universe being evaluated andjoin true negative sites in a universe that receiveslittle, if any, attention. Second, EPA tries to mini-mize false positives to save unnecessary costs to thetrust fund.
No one knows the real frequency of false deci-sions because EPA has not kept records. But EPAapparently assumes that false positives exist at alevel that needs to be reduced. One contractor reportfor EPA looked at the feasibility of spending moreresources during SIs to reduce the number of falsepositives; the issue of false negatives was notraised. 8o In the 1987 workload report (see above),false negatives were mentioned once:
T5~m is ~ obvious di=repmcy ~1 we have not tin able to resolve between EPA’s 1987 b~klog number of 8,000 si[es and OTA’S earliercalculation, based on EPA data (see table 2-1) of over 11300 sites, as of the end of fiscal year 1987. To add to the discrepancy, EPA workload report,dated October 1987, said that there were 13,719 sites m CERCLIS awaiting S1s. And a 1989 EPA documem says there were 7,150 backlogged S1s asof October 1988. Since this date is after the PA r easse.wment was completed and 3,000 sites had been eliminated, it implies that 10,150 sites, rather than8,000 sites awaited S1s.
76u.s. Environmental Prottxtion Agency, ‘‘Attached Dra.fl Pre-Remcdud Strategy for Implementing SARA, ’ memorandum from Stephen A. Lingle,director, Hazardous Site Evaluation Division, to Superfund Branch Chefs, Regions I-X, Aug. 14, 1987.
77u.s, Environmental protection Agency, “Pre-Remedial Strategy for Implementing SARA, ” op. cit., footnote 57, p. 5.78us. Environmental protection Agency, “Office of Solid Waste and Emergency Response, Annual Report, Fiscal Year 1988, ” EPA/68-01-7256,
November 1988, p. 9.Tg~A’s wmklo~ rem jn 1987 es~at~ ~ jt wo~d t*e 20 ho~s to re~ss a site PA versus 500 ho~s to pU_fOml aII S1 for a sltc. Thus, If these
=timates are valid. Supcrfund spent 100,000 hours on 5JXKI reassessments and quatified 2.000 sites for SIS (w~ch will take 1 million hours to do) insteadof spending 2.5 million hours on S1s for all 5,000 sites. [Ecology & Enwronment, Inc., “Workload ~d Resource Requirements for %.)uninq
Assessments, Site Inspections, and Hazard Ranking System Evaluations Under SARA, ’ op. cit., footnote 72, p. 19.1Mstm ~us (~~ COT.), ‘‘~~ysls of tie ~pWt on Supfid Rogm cow of ~rea Expenditures for Site inspections, &tit, &t. 28,
1986,

112 ● Coming Clean: Superfund Problems Can Be Solved. . .
It is assumed that the EPA Regional offices tendto err on the side of caution, and that the incidenceof false-negatives is rare [emphasis added] .81
Later, in response to congressional questioning,EPA agreed that there was a statistical possibility offalse negative decisions but, reiterated that they wereminimized by a‘ ‘conservative approach’ to makingNFA decisions. EPA further minimized the impactof errors by stating that sites are not precluded from“reentering our system if new information indicatesa mistake was made” earlier.82 This ignores thepossible added costs of getting a site under controllater rather than sooner.
What Is the Rate of False Negatives?
Many people working in EPA and State programscan provide anecdotal information about false nega-tives. OTA’s comparison of a common screeningmodel used in the health care field and Superfund’ssite evaluation process shows the inevitability offalse decisions (see app. 2A). And, OTA’s analysisof the changes in the preremedial process raisesquestions about the potential for making more falsedecisions.
While there have been no records kept on falsenegatives in Superfund, OTA has found someinformation about false negatives in EPA contractorstudies. Using these studies and other information,OTA has estimated that between 240 and 2,000 falsenegative decisions may have been made so far (seebox 2-D).
Evidence From Studies-In a paper assessinghow Region 5 could meet the SARA SI goal byJanuary 1989, EPA’s FIT contractor tested theassumption that a PA conclusion is predictive of asite’s ultimate HRS score.83 The point of theexercise was not to calculate false decisions but tomake a case for changing the way SI workloads wereassigned. The PA conclusions (low, medium, highpriorities) for 308 sites were compared with eachsite’s eventual HRS score, The correlation was poor
and indicated a problem with both false positivesand false negatives. Only 30 percent of the 104 siteswith a high priority rating after the PA ended up withan HRS score of at least 28.50. Viewed another way,70 percent of high priority PAs missed the NPL; the46 percent (48 sites) that got HRS scores of zerowere clearly false positives at the PA and SI stagesbut were eventually caught by HRS scoring.
At the other end of the spectrum, while 57 percentof the 30 low priority PAs had HRS scores of zero,10 percent of them received HRS scores higher thanthe NPL cutoff of 28.50. These sites managed tomake the NPL because, for some reason, they stayedin the screening process long enough to be amongthe 308 sites that got scored, Under the newpreremedial process, HRS prescores would elimin-ate them from further consideration at the PA stage.The study did not consider sites that got dropped out(NFAs) before being scored.
The same contractor stated, in another study:‘‘False-negatives are those sites that are erroneouslyclassified as NFA or low-priority sites after the PA’[emphasis added].84 This is simply a statement ofgeneral reality in the program at the time, that lowpriority sites often did not move beyond the PAstage. (EPA made this practice explicit policy byeliminating the low priority category in 1988 and, asdiscussed above, suggested to regions that lowpriority PAs when reassessed could be simplydesignated as NFRAP sites.)
Thus, it is not unreasonable to assume that upto 10 percent of the sites judged as NFAs, inaddition to low priority sites, might have madethe NPL. With 26,913 PAs completed through fiscalyear 1988 and a historical NFA rate of 20 percent, atleast 538 sites (2 percent of PAs completed) may befalse negatives. This estimate would be higher if dataon low priority PAs were available.
There is other evidence that some NFAs might befalse negatives. A Booz-Allen contract study re-
SIECO]OU & Environment, he., ‘‘Workload and Resource Reqturements for Preliminary Assessments, Site Inspections, and Hazard Ranking SystemEvaluations Under SARA, ” op. cit., foomote 72, p. 18.
82HWX of Represenwtivesl ‘‘preliminary Findings of OTA Report on Superfund, ’ hearing before the Subcommittee on investigations and Oversightof the Committee on Public Works and Transportation, Apr. 20, 1988, p. 270.
E3~Io0 & Environment, hc., “Analysis of and Solution to Problems Related to the Completion of the SARA Mandated Site Inspection Goal,”Jan. 26, 1987. The contractor used all HRS packages that it had completed over a 15-month period for which PA priorities were available.
~Eco]oa & Environment, Lnc., ‘‘Workload and Resource Requirements for Preliminary Assessments, Site Inspections, and Hazard Ranking SystemEvaluations Under SARA,” op. cit., footnote 72, p. 18.

Chapter 2—The Front End of Superfund: Site Discovery and Evaluation ● 113
Box 2-D-How Many False Negative Decisions?From 240 to 2,000 false negative site decisions may have been made so far in the Superfund program.
OTA used several sources of information to arrive at these estimates. Each source covers a different set of theSuperfund three-stage screening process. Each provides a different estimate. The first two estimates are based onexisting studies which used actual data from the program. The third is a model; the numbers used are similar to thenumber of sites that have passed through the screening process. The fourth estimate is based on known errors caughtduring the quality assurance for assigning HRS scores to potential NPL sites.
1) A study by an EPA preremedial contractor in Region 5 covered the PA stage only. OTA’S extrapolation fromthat study gives an estimate of 538 false negative decisions, or 2 percent of the PAs completed through fiscal year1988.
2) A study done for EPA by Booz-Allen & Hamilton covered both PA and SI stages. OTA’s use of that studydata provides an estimate of 2,056 false negative decisions for PAs and SIs completed through fiscal year 1988.
3) An OTA comparison of the preremedial process with a health care field screening model covered all threestages (through the RIFS). The model using conservative assumptions estimates that, for 10,000 sites evaluated (ofwhich 1,200 are problems and would qualify for the NPL), 240 false negative decisions would be made.
4) OTA review of two different data sets of sites with SIs moving through the HRS scoring phase of evaluationreveals an 18-20 percent error rate in calculating scores (see pp. 34-36). EPA data implies that, through fiscal year1988, just over 7,000 sites have received NFAs after an SI. A 5 to 10 percent error rate in underestimatingpreliminary HRS scores for these sites would produce 350 to 700 false negatives. This assumes the error rate is loweror the same for these sites. Actually, the error rate could be higher since the data can be weaker and less attentionmay be paid to fine tuning preliminary scorns.
viewed PA and SI files in eight EPA regions to mates of the national count of possible falseassess how well regional work-reflected headquar-ters guidance.85 In each region, a random set of PAand SI files was selected for evaluation. As part ofthe study, Booz-Allen checked to see if NFAs werejustified by data in the files. In 406 PA files, 19percent had NFA recommendations, and Booz-Allen concluded that 28 percent of those decisions(22 out of 79) were not supported by PA filecontents. Thus, 5 percent of the PAs completedmay be false negatives. Regionally, the percentageof possible false negatives, out of PAs completed,ranged from zero to 16 percent. Out of a total of 212SIs reviewed, 31 percent of the 49 NFAs, or 8percent of the SIS completed were possible falsenegatives. For SIs the range of possible falsenegatives across the regions was larger than that forPAs; from zero to 30 percent.
If the Booz-Allen data is extrapolated to the totalnumbers of Superfund PA and SI decisions, esti-
negatives can be made. As of the end of fiscal year1986, the period when the Booz-Allen study ended,EPA says it had completed 20,184 PAs and 6,442SIs. Using the Booz-Allen rates, 1,009 PAs and515SIs could be false negatives. Between then and now,another 556 false negative decisions may have beenmade for a total of 2,056 sites. This does notnecessarily mean that over 2,000 sites might beadded to the NPL but that 2,000 problem sites maybe hidden among the universe of sites rejected by theSuperfund program through fiscal year 1986. Someof them may qualify for the NPL,
Anecdotal Information-Every region, everyState can provide examples of false conclusions.Anecdotes, however, are only possible when sitesonce judged no problem become evident as prob-lems. In other words, until they resurface, falsenegative sites are unknowns. Known turnaroundsinclude:
~Booz-Allen & Hamilton Inc., “U.S. I%vironmental Protection Agency Preliminary Assessment and Site Inspection Program Quality AssuranceReview,” draft, Sept. 11, 1987. The study did not include Regions 4 and 9.

114 ● Coming Clean: Superfund Problems Can Be Solved . . .
●
●
●
●
The Illinois Environmental Protection Agencyprovided OTA with a list of 12 sites that hadbeen tagged after the PA with a low priority orNFA designation. Two sites (one low priorityand one NFA) are now on the NPL; the balanceare being cleaned up under the State program.In Region 8, the Martin Marietta (DenverAerospace) site had a PA/SI completed early inthe Superfund program that did not involve anysampling. Contamination was later discoveredwhen monitoring wells were required underRCRA. After a second SI was completed, thesite was proposed for the NPL in 1985 with anHRS score of 46.01.The California State program told OTA of a SanDiego site that was evaluated using existingcounty information and determined to be nothreat. Later, when the property was sold andconstruction began, an old incinerator wasfound and a cleanup is now required.In a survey prompted by SARA, EPA regionalstaff identified a dozen sites that they feltshould be on the NPL but were not because theyhad not qualified.
Why Regional Differences?—The wide variancein NFA rates by EPA region, reported in variousEPA documents, may indicate that regions getdistinctly different kinds of sites to evaluate. Thewide ranges of unsupported NFAs in the Booz-Allenstudy, however, indicate that it is more likely that thedifferences are a product of varying regional andcontractor staffing problems and the fact that, untilJanuary 1988 an official PA guidance document didnot exist. (The SI guidance document awaits the newHRS.) The first directive covering site evaluationwas issued in February 1988, 7 years after theprogram began to evaluate sites. The consequence isthat where you live may determine how many sitesare being ignored.
Turnover and lack of skills, as reported in OTA’sAssessing Contractor Use in Superfund,86 willcertainly decrease the accuracy and reproducibilityof PA, SI, and HRS decisions. A MITRE official, forinstance, told OTA that turnover in the EPA regions
severely affects their ability to assure that properlytrained employees do HRS scoring packages.87
For the first 8 years of Superfund, EPA regionshad some direction from a State participationmanual issued in 1985 and in some training manuals.FIT contracts also provide some written detail onPAs and SIs. EPA did issue PA and SI forms for useby the regions that could have provided someconsistency, but not all regions used the forms andrevised forms have been ignored in some cases. TheBooz-Allen study found that only one of eightregions used a form on all PAs, Region 9, which wasnot included in the Booz-Allen study, told OTA thatthe FIT contractor does not use a form in reportingPAs.
Issuance of the recent documents may improvethe consistency across regions or it may not.Comments made to OTA by an EPA headquartersofficial in the Hazardous Site Evaluation Divisionindicated that while headquarters would prefer allregions to conduct their work in a consistent manner,EPA is unwilling to require them to do so. Guidancedocuments do not assure consistency unless they arefollowed. Assuring national consistency may re-quire periodic evaluations of regional performance.
Where Do False Negatives Go?—False negativesites from Superfund end up in the universe of sitesrejected by the site evaluation process. The universeincludes NFA (now NFRAP) sites as a result of PAsand SIs; sites rejected when their official HRS scoresfall below 28.50, either before being proposed forthe NPL or afterwards when MITRE Corp. does thequality assurance; and sites that EPA has decided—on a policy basis-do not belong in the Superfundprogram.
Since an estimated 90 percent of the sites inCERCLIS don’t make the NPL, the universe ofrejects is now approximately 17,000 sites. OTA hascalculated (see above) that the false negatives withinthis universe may total over 2,000 sites. Currently,there is no easy way to track the fate of these sites.In the CERCLIS database an NFA entry indicatesthe site decision. In the early years, when sites wererejected primarily because no environmental threat
S6U.S. Congess, Office of khnOIog Assessment, Assessing (lonmxtor Use m Supetii, OTA-BP-ITE-51 (Washington. ~: us. Governm~tPrinting Office, January 1989).
87~~ iS ~e fim that deve]o~ be HRS ~ holds he con~~( from EPA to do tie quality sur~e on ~ I-IRS scoring packages completedby regional offices (see later discussion).

Chapter 2—The Front End of Superfund: Site Discovery and Evaluation ● 115
existed, there was no need to develop any kind of anotification system other than the CERCLIS entry.But, as EPA’s own statements show, today’s NFRAPis not an indication of lack of hazard. Although 1988EPA documents tell the regions that they shouldnotify States of sites that are rejected, there has neverbeen, nor is there anticipated to be, a formal nationalnotification process.88
In the last couple of years, States have increas-ingly taken on more of the task of site evaluation.When States do the PAs and SIs, they know whensites are rejected and presumably assume responsi-bility for those sites that are problems. But, once asite is judged NFA or NFRAP by EPA, funding bySuperfund effectively dries up.89 For the sitesrejected in years prior to State involvement, anyState has two choices: 1) to verify all EPA decisions(i.e., search for false negatives), or 2) to assume EPAdecisions are correct and focus on the more obviousproblem sites—those that have moved through thepreremedial process and have at least acquired anestimated HRS score.
While State cleanup resources vary widely, theyare often extremely limited. Taking the first path—reevaluation-is most unlikely. Louisiana, for in-stance, has 297 sites that EPA has tagged as NFAs.While the State cleanup program admits that anunknown number of those sites may require someattention, there are 209 sites yet to receive evalua-tion. Louisiana is a State program with few re-sources; a 1989 report poses the question: ‘‘wherewill the necessary resources be found?"90 Initiating209 site evaluations for which Superfund funding isavailable has a higher priority than reevaluating 297NFA sites for possible false negatives. Conversely,the New Jersey State program’s strategy documentstates that no site should be listed as NFA ‘‘withoutfile documentation and sampling to justify noaction."91 This is a recognition that a State does not
really have the option to defer sites away to someoneelse.
The HRS and the NPL
The HRS score calculated for a site determineswhether or not it will go on the NPL. Being on theNPL (a score of 28.50 or more) means that trust fundmoney may be spent for remedial action. Being offthe NPL (less than 28.50) means trust fund moneycannot be spent for remedial action. The NPL alsohas informational significance; NPL sites receiveconsiderably more public attention than non-NPLsites. The critical on/off decision is an EPA policyenunciated in the NCP. Congress, through SARA,expressed concern about the HRS and its use byrequiring EPA to examine several questionableeffects of the HRS and to revise it by October 1988(See box 2-E).
Scoring
Once a site has received an SI, the EPA regionprepares an HRS scoring package. For those sitesscoring at least 25.00, the package may be submittedto EPA headquarters, which turns it over to theMITRE Corp. for quality assurance (QA).92 I fverified at 28.50 or greater the site is eligible forproposal for the NPL. Sites get returned to regionsif the QA determines that the score is less than 28.50or if the information does not support the score. Sitescan also get returned to regions if EPA determinesthat the site does not qualify for the Superfundprogram (i.e., is exempt by the statute or policy).
Once formally proposed for the NPL, a site issubject to public comment, which may push thescore, up or down. If adjusted below 28.50, the siteis removed from the proposed list. If not, sites areeventually placed on the final list.
EPA says the HRS process currently costs anaverage of almost $60,000 per site, including the PA
88A lg89 EpA d~~en( says hat EPA wt notify Sta@s when a site is given an =Ap after a PA and shadd inform states when a site is givenan NFRAP tier an SS1.
89 Not officl~Iy, hOwever, ~~W tie N~ m]e is hat supe~~d monies c~ot be U.MXJ for re~diaf UCfk)?I ~ non-NPL sites. That means that, legally,States could apply for funding to continue site evacuation when EPA stops doing so.
%uisiana Department of Environmental Quality, Progress and Problem: Cleaning Up Louisiana’s Inactive and Abandoned Hazardous WasteSties, A Report to the Louisiana bgislature, April 1989, p. 1.
gl~went of Environmental ~o~tionl “New Jersey’s Case Management Strategy for Hazardous Waste Programs Reme&d Actions, ” June1987.
‘?ZRevlew of ~TRE dala indicates hat only 12 sites submitted for QA slnu 1984 M scores iess t.h 28.50.
116 ● Coming Clean: Superfund Problems Can Be Solved. . .
Box 2-E--SARA and the Hazard RakingSystem
In The Statute:● Section 105 (c)(l): “.. . assure, to the maxi-
mum extent feasible, that the hazard rankingsystem accurately assesses the relative degreeof risk to human health and the environmentposed by sites and facilities subject to m-View”
● Section 105 (c)(2) :”... ensure that the humanhealth risks associated with the contaminati“onor potential contamination. . . of surface water[used for recreation or potable water consump-tion] are appropriately assessed. . .“
● Also, in Section 125, EPA was ased to revise
the HRS to “assure appropriate considera-tion” of specific site characteristics of facili-ties that generate wastes such as fly ash,bottom ash, and slag and that emit flue gases.
In the Conference Report, Congress asked EPAto determine:
● the “effect of establishing a threshold value of28.5 for facilities to be included on the[NPL],” and
. “whether a new threshold value should beestablished.” 1
l s ~ ~ ~ p p . m - m .
and SI.m EPA pays up to $4 million per year for theMITRE QA services. Based on the average numberof sites processed each year, QA alone may cost over$12,000 per site.
At Least 28.50!
The cutoff score of 28.50 has no technical basis.It is an arbitrary number; or, as EPA calls it, amanagement tool.94 The number was selected in
1982 to come as close as possible to the ‘at least 400sites” required by CERCLA for the first list.95 Inessence, then, the hazard level of the first set of sitesfrom which the initial 418 NPL sites came serves asthe basis for inclusion on the NPL of all sites thathave followed. If the hazard level of that collectionhad been lower, then some sites subsequentlyrejected for the NPL would be on the NPL.
The cutoff score is often reported as 28.5 insteadof its real value: 28.50. The zero plays a major roleand implies a certain numerical precision eventhough there is no possible technical rationale fortaking the number to the hundredths, or eventenths.% Using two decimal places means that a sitewith a score between 28.45 and 28.49 does not getrounded up to 28.5 and get on the NPL.
EPA is aware of the HRS score’s lack of precisionbut has not used that information to convert thecutoff score to a whole number or a range. In a studyprepared after SARA, EPA commented: “becauseof the uncertainties associated with the HRS, it ispossible that a site scoring 35, for example, is morehazardous in terms of absolute risk than a sitescoring 36."97 If so, then there maybe no differencebetween a site at 29 and one at 28. Furthermore, EPAgroups the sites on the NPL instead of listing themby HRS score ‘‘to emphasize that minor differencesin scores do not necessarily indicate significantlydifferent levels of risk. ”98
Once calculated, the HRS score does not serveany official function other than to make the NPLdecision. EPA repeatedly states that the HRS onlymeasures relative risk and that the score is not usedas a way of making priority cleanup decisions.However, OTA showed in its 1985 report, SuperfundStrategy, that, even if the method works, theresultant score is not a measure of relative risk
9353 F- Register 51%2, DCC. 23, 1988.
%~ a Report tO congress, EPA stated t.luu the cutoff score was not chosen because ‘‘. . . it represents any threshold in the significance of the riskspresented by sites. ” [U.S. Environmental Protection Agency, Office of Solid Waste and Emergency Response, Progress Toward Irnpfemen/lngS~erfund, Fiscal Year 1987, Report to Congress, EPA 540/8 -89~3, April 1989, p. 27.]
9SE.PA M a 11~ Slb M h~ been SCord. Using 28.50 as the cutoff score generated a proposed list Of418 SikS.%~y m~em~ici~, ~i~is~, or @~r kIIOWS t.hti k solution to any calculation Can Ofdy CUfkd to M many decimal pl=es m tie lem a~~~
number for any data used in the calculation. Many numbers used in the HRS calculation are whole numbers, i.e., 3 or 5.97U.S. En””wonmental Rotection Agency, “HRS Revisions Support: SARA Studies on HRS Scores and Remedial Actions, HRS Scores and Potential
Dangers, and the Effect of the 28.5 Cutoff Score,” November 1987, p. 9.9853 F~c~ Re@~ms 1%2, ~. 23, lgg& p, s IQ&$. &h group h~ so sl~s; -h time IMW sites w added to the NPL, the sites are reordered into
new groups of 50.

Chapter 2—The Front End of Superfund: Site Discovery and Evaluation ● 117
because not all sites receive complete scores.99 HRSscores are a combination of three possible routes ofexposure--groundwater, surface water, and air. Airsubscores are frequently not calculated if the twowater routes or even one of them provides enoughinformation to push a site score over 28.50.
For this report, OTA reviewed the sites submittedto MITRE for QA since 1984. Ninety-four percent ofsites were submitted without air subscores and 97percent of the sites with final HRS scores did nothave air subscores. Conversely, 98 percent of thefinal sites do have groundwater subscores. Thus, theresultant HRS score says, at the most, somethingabout the relative risks of sites due to contaminatedgroundwater.
It is true, however, that the HRS score does not setpriorities. 100 Higher ranking sites do not necessar-
ily move through the system first or faster. On thewhole, there is no discernible relationship betweena site’s HRS score and, say, the start of its RIFS. Itis, in fact, possible to find cases where an inverserelationship exists, such as occurred with three sitesRegion 7 proposed for the NPL in April 1985.
Despite its lack of technical foundation andusefulness after the fact, the cutoff score has takenon serious meaning within the context of its use.Regions, States, public interest groups, industry, andothers are at times keenly interested in making surethat a particular site gets on the list or stays off.States with few resources or without an enforcementprogram to clean up sites on their own may prefer tohave as many sites as possible on the NPL so thatthey only have to pay the CERCLA 10 percentmatch rather than the full cost of cleanup. SomeStates, like California, make decisions in advanceabout whether or not they want a site on the NPL andin the Superfund program. If not, they intentionallykeep sites off the CERCLIS, which eliminates them
from consideration and scoring, Having a site on theNPL projects a negative image to the public, and acompany may have a strong interest in not having itsproperty listed.l0l Communities have been known topress to keep a site off the list because of the stigmaand possible negative affect on their economicwelfare. Congress can intervene; through SARA theSilver Creek Tailings site in Park City, Utah, waseffectively removed from the proposed list. 102
This jostling to be on or off the NPL position addsinefficiency to and detracts from Superfund’s envi-ronmental role. As discussed previously, calculat-ing an HRS score is not a science. When scores areclose to the cutoff, it is not uncommon for regionaloffices or State agencies to seek out more informa-tion to move the score above the cutoff. A KansasState official, who was formerly with the New JerseyState program, told OTA that he got 65 sites on theNPL by sampling judicious). 103 There is no way tocalculate the national costs of pushing sites over28.50, because the data to do so is spread among filesin 50 States and 10 regional offices. It could besignificant if each entity spends extra money andtime on just a few sites each year.
Because the setting of an HRS score on a site hasbeen made a regulatory procedure, the score must beproposed for public comment. This can causereworking of the number and has led to an officialchange of at least 224 site scores. Twenty-three ofthose sites were removed from the proposed listbecause their revised score was below 28.50. For 66of the 224 (30 percent), the difference between theproposed and revised scores was less than 1 pointand ranged from 0.01 to 0.99, up or down. In noneof these cases did the reworked score affect the site’sNPL status. Obviously, the level of effort required torework scores varies, but EPA was unable to give
IWU,S. Congcss, ~fice of ~hnoIoW A~ssment, S~e@md Strategy, OTA-ITE-252 (Springfield, VA: Nauonal lkhnical Information Service,April 1985), p. 163.
Im~ c~lfofia it does: ‘‘. . cleanup priorities are now generally established based on the HRS migration score . . .‘ ICalifomla State Departmentof Health Services, Expenditure Plan for the Hazardous Substance Cleanup Bond Act of 1984, revised Januw 1988, p. 51.1 In Louisiana, priorities areba.sd on whether or not a PRP exists. In Minnesota, sites in the cleanup pipeline have precedence over sites that have not yet started the process.
10INot ~~g 1lst~ d~s not Prohlblt WA from ~ing CERCLA enforcement action, however.
IOzS~A, Srxtion 118(P) SW al~t ‘ ‘Selection for Superfund List Puts Utah Resort in Dumps: As EPA Reconsiders, Property Wlues Plunge, ”Washington Post, Mar. 2, 1987, p. Al.
lm~, aS a New JerXy document StateS: ‘‘Since the criteria for placement (HRS) was relatively undefined, NPL placement wa.. easily accomplished.[Department of Env~onmentat Protection, “New Jersey’s Case Management Strategy for Hazardous Waste Programs Remedial Actions, ” June 1987. ]

118 ● Coming Clean: Superfund Problems Can Be Solved. . .
OTA a rough estimate of the cost and staff time (foreither EPA or MITRE).l04
What Are the Results?
So far, almost 2,000 sites have gone through theHRS scoring QA system. As of July 1989, 1,274sites have been proposed for the NPL. Accountingfor removals and deletions from the list, the NPLstands at 1,224 proposed and final sites. Figure 2-3shows NPL actions by EPA from fiscal year 1983through 11 months of fiscal year 1989.
CERCLA requires EPA to update the NPL at leastonce a year. Since 1983 there has been at least oneupdate a year for the proposed or final list.105 Inaddition, at irregular intervals sites have beenremoved (from the proposed list) or deleted (fromthe final list). NPL removals are part of the HRSscoring process, while deletions occur after remedialactions have been completed. Deletions can alsohappen because the Remedial Investigation/Feasibility Study (RIFS) shows that no remedialaction is necessary.
There are a number of aspects of HRS scoring thatdeserve some attention. The managerial significancebut questionable relevance of the cutoff score hasalready been discussed. Another aspect is thereworking of scores. This is driven by the cutoffscore and the need to calculate THE score for a site.MITRE checks the region’s work before a site isproposed and then, as discussed above, scores can bealtered between proposed and final listings. When ascore is revised, it is because some kind of error hasoccurred. It could be caused by poor math, improperuse of the HRS, or inaccurate or incomplete informa-tion. While the two revision points catch thoseerrors, examination of some data raises questionsabout why regional work varies so much and whatthe errors and the variances mean regarding sites thatdo not make it to the first or second revision point.
The difference between the number of sitessubmitted for QA ( 1,970) and sites proposed ( 1,223)through early 1989 says that almost 40 percent of thesites submitted by regions have not been proposed.Some were rejected for policy reasons. Some havenot yet been verified. These two categories mayrepresent up to half of the nonproposed sites.l06
Then, almost 400 of the submitted sites may havebeen rejected because of errors in the regionaloffices. QA determined that their scores were below28.50 or there was not proper documentation backup.If 20 percent of the submitted sites have errors,for how many sites that do not get submitted (i.e.,judged NFRAP after an SI or PA) are errorsmade? Remember that there is less documentationfor and attention paid to these sites for which HRSscores are only estimated.
The fact that the 224 scores discussed earliercould be changed between proposed and finallistings is indicative of the lack of precision to anHRS score. More information and reevaluated informa-tion can change an HRS score, up or down, by aslittle as 0.01 and as much as 31.57 points. In termsof the on/off NPL decision, all of these errors aresignificant since 0.01 can make the differencebetween 28.49 (off the NPL) and 28.50 (on theNPL). From a risk perspective, however, because 79percent of the errors are between 0.01 and 10.0, theerrors may be insignificant. Should the Superfundprogram be spending money looking for and adjust-ing site scores, especially when they have norelevance afterwards?
While the 224 changes represent a national errorrate of 18 percent in proposed scores, the rate rangesfrom 8 to 37 percent by region. Nationally, most ofthe errors (54 percent) are on the plus side (i.e., theproposed score is higher than the final score), butthey range from 37 to 66 percent on a regionalbasis. l07 Four regions have higher minus than plus
IMEPA did provi~ OTA with detail on five score revisions. Obviously, the amount of time and resources ncxessary to respond tO public mmmentsis proportional to the complexity of the comments rather than to the eventual score chmge. Of the five scores, two were each changed 0.01 points (onewent up, the other down) because of rounding errors discovered while considering comments. The other thrcz were revised (maximum, 0.14 points)because of comments received regarding the surface water subscores.
lm~ ~rv~ llw~g may ~ mme ~W~t ~m a fi~ llsting. EPA does not necessarily wait until a site gains final status to ~~ the R~S or thesearch for PRPs.
l-s is a ~ev comm~ve ~um~e. For ~~ce, las ~~ 4 ~rcent of the sites ~bmitti for QA in 1988 and 1989 still wait to b ~OpOstd.
lU7~s “~on~ ~nd for over~~at~g sores may & ~nfm~ by ~~ data on ~1 initi~ (SS submitted by regions for QA), proposed, and finalsite scores. On average, as sites move through the QA process, they systematically decline. It may be, however, that score depression is a product oftbe QA process, rather than regional tendencies to overestimate initial scores, especially since score depression occurs between proposed and final scoresaim.

Chapter 2—The Front End of Superfund: Site Discovery and Evaluation ● 119
Figure 2-3-National Priorities List Actions, Fiscal Years 1983-89
560—
TB
4(
R FFYa3
316.
132
D P R F DI= Y&l
P =R =F =D =
170
P R F D P R F D P R F DFY85 FY86 FY 87
NOTE: SFwtmg Indcatea that more than one update occurred in a fd year.
SOURCE: Offioe of Technology Aaaesament, 1989; baaed on EPA data.
error rates which means they are more likely tounderestimate HRS scores. Finally, if 18 percent ofproposed scores are in error, that strongly sug-gests a significant error rate on sites that don’tmake it that far.
False Negatives and False Positives
The error rates discussed above suggest that falsedecisions (both positive and negative) can persist
proposed siteremoved from proposed listfinal sitedeleted from final list
2!
F’ (88 FY 89 (11 r-no,)
through the HRS scoring stage. EPA does not knowhow many false negatives scoring has created in 7years of use but does know for sure that at least threefalse positives exist because three sites have beendeleted from the NPL after an RIFS was com-pleted. l08 While EPA is “concerned that loweringthe [cutoff score] might substantially increase thenumber of [false positives] . . .,” the agency has notexpressed a corresponding concern about falsenegatives.
10E53 F-dRe@~r51962, ~. 23, 1988, p. 519M, ~em may ~ mom ~ ~~ f~~ psitives. OTA mview~ all RODs issued ti the program.At least nine sites have M deleted because no remedial action was rezornmendcxl in the ROD.

120 ● Coming Clean: Superfund Problems Can Be Solved. . .
EPA’s Science Advisory Board (SAB) assumesboth types of false decisions have been made and hassuggested that EPA establish a review process:
Screening models like the HRS must be simple.They do not have much resolving power andtherefore, some false positives and false negativesare inevitable. Because of this limitation, HRSscorns should not be overemphasized. A processshould be established either to review sites subject toscoring or to review HRS scores in an attempt to spotfake positives and negatives.l09
Some studies and certain aspects of the HRS pointto the possibility of false decisions. In one study,EPA compared current HRS scores with potentialdangers at 32 sites using a risk assessment methodol-ogy. The results showed poor correlation betweenthe HRS score and the potential danger at a site. Thestudy concluded:
Based on the sites used in this study, potentialfalse-negative results (sites that pose potentiallysignificant risks, but receive HRS scores below thecutoff) are more common than false-positive results(sites that receive HRS scores above the cutoff, butdo not pose potentially significant risks). *10
For another study, EPA’s Office of Policy Plan-ning and Evaluation (OPPE) assembled a panel ofEPA experts from the various disciplines involved insite evaluation. The panel studied documentation ona set of Superfund sites, developed its own rankingmethodology, and scored the sites by consensusalong a spectrum from high risk to no problem.lll
When the panel’s ranking of sites is comparedwith the sites’ HRS scores, the HRS is shown notonly to be a poor predictor of risk-as judged byexperts-but also to be source of many falsenegative decisions, As figure 2-4 shows, 6 of 18 sites(33 percent) with scores at or below the cutoff werejudged by the panel as medium or high risk. Anotherconclusion is that the HRS underestimates risk asmost of the panel’s decisions placed the sites abovethe diagonal line that represents concurrence be-tween the panel and the HRS.
Figure 2-4-EPA Panel’s Ranking of Sites v.HRS score
● 0a ● *
Relativelylowrisk
“Noproblem”
1 i 1 i i I 1 I i20 40 60 8o 100
HRS score
SOURCE: Environmental Protection Agency.
On the NPL are three examples of the HRS as apoor predictor of risk. Under CERCLA, each Stateis allowed to place one site on the NPL regardless ofhow it scores. Three such sites, with scores of 5.49,8.27, and 17.68, have moved through the system andreceived RIFSs, and RODS have been issued. In allthree cases, EPA has decided that a remedial actionis necessary. If the sites did not present a risk, EPAcould have decided that no action was necessary anddeleted them from the NPL. While the cost ofcleaning up these sites ranges from $1 to $2 millionand is below the average for Superfund sites, thesites are not dissimilar to many sites that qualify forthe NPL on the basis of higher scores.
Two other problems with the current HRS, whichmay be corrected by the pending new HRS, are alsocreating false negatives. When there is not enoughinformation to assign a number to a factor, a default
[email protected]. ~v~wen~ Roteaion Agency, Office of the Mmitistrator, Science Axivisory Board, ‘Review of t-be Superknd Hazard Ranking Sy*m, ’s~-~-88~8, hllUIUy 1988, p. 6.
I IW,S. fi~men~ Rotection Agency, ‘‘HIM Revisions Support: SARA Studies on HRS Scores and Remedial Actions, HRS Scores and PotentialDangers, and the Effect of the 28.5 Cutoff Score,” op. cit., footnote 97, p. 50.
11 IA@~ ~ision AllalySis, k., “A Site-Ranking Panel Evaluation of the Relative Risk Posed by Twenty Superfund Sites, ” draft, July 14, 1987,pp. 44-45.

Chapter 2—The Front End of Superfund: Site Discovery and Evaluation ● 121
value has been used.112 In 1982, EPA advisedscorers to assign a default value of zero, 113 The resultfor toxicity is, according to an EPA scientist:
A default value of zero would enhance thepossibility of false negatives in the absence oftoxicity data, while a default value of 5 would tendto enhance the possibility of false positives, Amid-range default value of 3 in the absence ofappropriate toxicity information would reduce anydirectional bias toward either false positives or falsenegatives.114
In the proposed HRS, some default values havebeen adjusted. For example, a default value of 3 (amidpoint in the toxicity scale) has been proposed fora pathway’s toxicity factor value when ‘appropriatetoxicity data for scoring does not exist for anyhazardous substance relevant to that pathway .’’l15
Under the current HRS, when a site appears tohave only a direct contact threat, the site will notmake the NPL.l16 But, two EPA contractor studieshave shown that a threat of direct contact is a majorrationale for remedial action. EPA has in the pastadded two sites to the NPL, using provisions inCERCLA other than the HRS, when their scoreswere below the cutoff, because of their direct contactthreat. 117 If direct contact is added as a new pathwayin the proposed HRS, these kinds of sites may havea better chance of being on the NPL. However,among the universe of sites scored under the currentHRS, they are false negatives. Some, but notnecessarily all, may have been cleaned up byremoval actions.
How Will the New HRS Change Superfund?
Many concerns had been raised about the efficacyand fairness of the HRS. Box 2-E lists the concernsexpressed by Congress in SARA. A summary of
major problems with the HRS from OTA’s Super-fund Strategy are included in box 2-F. Box 2-Gcontains a summary of recommendations made byEPA’s Science Advisory Board (SBA).
Has EPA Resolved the Concerns ?-For thisreport, OTA could not do a comprehensive analysisof the new HRS because the new HRS does not yetexist. EPA proposed the new HRS in December1988 but does not plan final action on the rules untilFebruary 1990 (almost 2 years beyond the promul-gation date that SARA specified).ll8 And, so far,EPA has not tackled a major issue—the algorithm—cited by the SAB:
The Subcommittee places special emphasis on thealgorithm issue because it is impossible to review thecomponents of the HRS without considering how thecomponents fit together.l19
In the proposed rules, EPA recognized SAB’sconcern and said about suggested changes:
EPA is planning to evaluate and possibly test suchchanges in the algorithm prior to promulgating arevised FIRS,120
The SAB was concerned about the algorithmbecause it is the basic logic of the model. The boardimplied that the way the current HRS was designedmay have been a backwards approach. A better way,according to the SAB, is a risk assessment approachthat begins with an understanding of how to list sitesquantitatively if all needed information and re-sources were available. This risk assessment modelis then transformed into a scoring system andsimplified to operate at reasonable cost and withsparse information. 121
Despite outside concern and advice, EPA haspostponed consideration of the basic logic of the. -
112A fw~r in tie HRs is a point ~ Which a number is assimed based on the judgment of the person doing the scoring package. For instance, a factoru)tdd translate toxicity data mto a numerical value for calculation purposes.
11347 F~r~ Regi~er 31222, July 16, 1982.114~s &Row, chief, EpA ~emlc~ ~xtwes Aswssment Branch, letter ~ Scott Parrish, acting chief, I-kard Ranking ~d Listing Branch, sept.
22, 1987.115u.s. Envlro~ent~ ~o~tion Agency, preamble to me HRS propo~d rule, drti, Ca. February 1988, p. 40.
116A &at ~onwzt ~e~ mems w a ~rson co~d come into direct con~t wim K)xic substances at the site.
1 ]7~ slta ad ~ores we L~~me R~atlon Q&, pA (20.32) ~d Q~l R~, Mo (21.19).
I18SMA Swtion Ios(c)( 1 ) rqul~ (he new HRS t. & promulgat~ by April 1988 and m b in effect by October 1988.
1 lw.s, Environmental Protection Agency, “Review of the Superfund Hazard Ranking System, ” op. cit., foomote 109, p. 5.lzo53 F~er~ Register 51%2, k. 23, 1988. p. 51970.
IZI sa, U.S. Enwronmentd Protection Agency, “Review of the Superfund Hazard Ranking System, ” op. cit., footnote 109, Appmdix A5.

122 ● Coming Clean: Superfund Problems Can Be Solved. . .
Box 2-F—The Office of TechnologyAssessment’s 1985 Comments on the
Hazard Ranking Systeml
OTA summarized other criticisms of the Hits atthat time. Problems identified were that the HRS:
. had a bias toward human exposure at theexpense of the environment
● had a bias against low density populations;● required documentation for air releases but
none for water;● scores were based on site contaminantt rather
than known or potential released contami-nants;
. averaged route scores creating a bias against asite with only one route score greater thanzero; and
● considered only waste quantity rather thanquantity and distribution.
kl.s. ~, Oracc of -Iw A$@@==@l s#@+@#Swawgy, (YTA-lTE-2S2 (S@ngfbkJ Vk N@mal Tbctmical lufamm-tioo SmJkXl? A@ 19ss).
HRS. Meanwhile, the proposed HRS is replete withthe “fine tuning” that the SAB thought to be lessimportant than the algorithm. These changes appar-ently will result in “vast new data requirements’that also concerned SAB. EPA says that the newHRS will cost almost $150,000 per site; that is,two and a half times ($90,000 more than) thecurrent HRS costs. EPA expects the new HRS toadd $56 million in total costs to the program.122
EPA says it “expects that the changes will resultin increased accuracy in assessing the relative degreeof risks to public health and the environment forcertain sites [emphasis added].’’123 EPA also saysthat “at this point, it is impossible to predict whetherthe revised HRS would result in more or fewer sitesbeing included on the NPL. ” Unanswered is Con-gress’ concern that the HRS accurately as possibleassess the relative degree of risk posed by sites.
EPA did not, according to the SAB, properlyassess the current HRS prior to proceeding withchanges. Also, EPA has apparently not tested the
Box 2-G-Summary of EPA’s ScienceAdvisory Board Hazard Ranking System
RecommendationsWhen the Superfund program requested the
Science Advisory Board (SAB) to review the HRS,only three specific issues were posed: types oftoxicity to address and how, relevant distance froma site for air pollutants, and large volume wastes andwaste concentrations. On these issues, SAB recom-mended that:
1. the toxicity rating scale in use be replaced bymultiple measures of toxicity and exposuremeasures to be improved;
2. since a potential for air release seemedappropriate and possible, a scoring systemweighing population exposure in concentricrings be employed; and
3. although applying the HRS to mining (largevolume) sites has not treated them withsystematic error, it does have the potential todo so and could be improved with theadoption of several factors.
But, the SAB subcommittee that studied the HRSchose to also address some fundamental issues. Forinstance, the SAB said: “Improving the algorithmcould potentially do more to improve the HRS thanfine-tuning individual Components.”1
IUOS, “Emmmmaltal Frotcc.tian Agency, Sciemc Mviaoey Bo8rd,“Rsviow of b Su@und Hawd Rx system,” SAB-EC-SS-OOS,Jmnlsry 1!MS, p. m.
proposed HRS to assess its impact (other than costof using it). EPA’s request of the SAB was madeafter an advance notice of a proposed rule on theHRS had been published (April 1987) and publiccomments received. That is, the process of revisingthe HRS was well underway at the time of SAB’sinvolvement. Thus, SAB made suggestions abouthow to better proceed with the next revision. On thetop of its list was the need for an ‘‘empiricalretrospective evaluation of how successfully theFIRS predicts risk . . . based on an in-depth technicalreview.” 124 What SAB had in mind was a reviewcomparing sites’ HRS scores with the knowledgegained as a result of their RIFSs. In other words,
IM53 F~r~ Register 51%2, Dec. 23, 1988, p. S*ME
l~Ibid., p. 51966.IUI_J,S. Enviroment~ Protection Agency, “Review of the Superfund Hazard Ranking System, ” op. cit., foomote 109, p. A6-1.

Chapter 2—The Front End of Superfund: Site Discovery and Evaluation ● 123
EPA should ask the question “How does it err inpractice?” before trying to fix it.
The copious proposed changes in the kinds of dataused and how used to calculate an HRS score havebeen backed up with a plethora of contractor studies.But, the algorithm remains the same and there hasbeen no analysis of the combined affect of thechanges. The debate will continue as to whether ornot the HRS can provide an appropriate or accuratemeasure of relative risk among sites. As the SABsaid:
Each step in this process affects the final scoreand, therefore, how well the HRS discriminatesbetween sites of greater and lesser risk to humanhealth and the environment. {x
As to the steps, EPA appears to have adoptedsome of the SAB’s recommendations regardingtoxicity, air releases, large volume sites, and wasteconcentrations. The proposed HRS has four insteadof three pathways: surface water, groundwater, air,and onsite exposure. The new onsite (or directcontact) pathway may improve one shortcoming ofthe current HRS, as discussed earlier. Currently,direct contact is only used to determine whether ornot a site needs a removal action.
In the HRS, current and proposed, each pathwayis made up of three categories (release, wastecharacteristics, and targets) and each category has anumber of factors. As described by the SAB:
After a numerical value is assigned to each factor,it is multiplied by a weight to obtain a factor score.Factor scores within the same category are added.Scores for the categories are multiplied together.This procedure yields a score for the pathway. Thepathways are then combined through a methodcalled quadratic averaging. 126
Most of the fine tuning of the HRS has involvedchanging factors or how to obtain the numerical
value assigned. The structure of the groundwater andair migration pathways are unchanged althoughsome of the factors of the three categories have beenchanged. A mobility factor has been added to bothpathways to account for exposure. Potential releasesare now calculated for the air pathway, and thedistance to sensitive environments has been in-creased. The surface water pathway has been sub-stantially expanded and now consists of four threats:drinking water, human food chain, recreational, andenvironmental. Under food chain, bioaccumulationand fishery use are considered for the first time.127
A New Cutoff?--In response to congressionalconcerns about the cutoff score, EPA says that astudy did ‘‘indicate that some sites with scoresbelow the cutoff can also pose potential dangers tohuman health and the environment’ [emphasisadded]. 128 This is in contrast to EPA’s strongerstatement in 1984 to Congress: “Many of the sitesthat score below the 28.5 HRS cutoff still pose somethreat to human health” [emphasis added],129
Review of State programs yields information that“some sites’ is a major understatement. In reality,many sites with scores well below the cutoff dopose current or potential dangers. For instance,Minnesota uses the HRS to score all sites, whetherfor the Superfund program or its own program. Thescores for 118 sites in the State program run from 2to 51.130 Illinois also uses the HRS to score all sites;sites with scores greater than or equal to 10 gainplacement on the State Remedial Action PriorityList. The list currently has sites with scores from 10to 28.16. Further, the State acknowledges that siteswith scores less than 10 may ‘‘present immediatethreats’ and are handled through removal actions. 131
EPA has proposed that the revised HRS have acutoff that is “functionally equivalent” to 28.50because ‘‘EPA believes that the current cutoff score
l~Ibid., p. 10.l~tbid., p, 10.127~s new dam may m~e it ~ier for m~ne ~lment si~s 10 gain NPL status. Until such sitis are scored under the new HRS, however, it is not
possible to know for sure.12853 F~er~ Register 51%2, Ik. 23, 1988, p. 51966.
INu.s. Env~onment~ Protection Agency, Office of Solid Waste and Emergency Response, ‘‘Extent of the Hazardous Release Problem and FutureFunding N~ERCJ_A Section 301(a)(l )(C) Study,” December 1984, p. 2-2.
130A ~neW~ officl~ told OTA mat ~me of tie sites wl~ ~ores over ~~,50 m the State pro~~ were m~icip~ l~dfi]ls ~d hti not been submittedto EPA txxause at the urne the pohcy was to reject smch sites regardless of their scores.
1.311111nol~ Environmen~ ~o~tlon Agency, Dlvis~on of L~d pollutlOn con~ol, C/eting ///1/10 is, Apfi] 1988, p, 15.

124 ● Coming Clean: Superfund Problems Can Be Solved . . .
has been a useful management tool” [emphasisadded].132 But, EPA has not determined the currentHRS’ false positive/negative rates, dealt with thealgorithm, or evaluated how sites will fare under thenew HRS. Thus, an equivalent cutoff maybe a usefulmanagement tool, but its environmental implica-tions are not at all clear. Two of EPA’s threesuggested ways of determining equivalency aredesigned to produce an NPL of the same size thatwould be produced under the current HRS. The thirdway would attempt to produce the same level ofquantitative risks for sites evaluated with the old andnew HRS.
EPA has not grasped the nettle of the improbabil-ity of ever finding a single point (especially one withtwo decimal places) above which sites can be judgedto present substantially more risk than those below.It may, however, be possible to design a moreequitable system with two points (see OTA’s option20 in ch. 1).
Effects of the Delay-Congress specifically ex-empted EPA from having to reevaluate sites thathave been listed on the NPL prior to the effectivedate of the new HRS, which Congress set at October17, 1988. It may have been that the SARA schedulefor revision was unrealistic, but the fact remains thatthe delay in issuing the new rules is causingproblems in scheduling SIs. Further, while themethod chosen by EPA to switch to the new HRSappears designed to save money, it may generatefalse positives.
SI data collection is dependent on the data needsof the HRS. The new HRS will require the collectionof different information (and, perhaps, more infor-mation) than the current HRS does. This means thatat some point EPA has to define and start new SI datacollection. To avoid having a period during which noSIs and scoring packages are done, EPA has deviseda phase-in of the new HRS. It is biased against lowscoring sites and toward finding false positives.
EPA is assuming that a non-NPL site under thecurrent HRS will be a non-NPL site under the newone but that some NPL-bound sites under the current
HRS will be rejected by the new HRS. Sites thatscore below 25.0 during the transition will not bereevaluated. An exception is allowed for sites thathave an element (e.g., direct contact pathway) thatmight allow them to score high enough for the NPLunder the revised HRS. These exceptions ‘‘shouldbe infrequent” according to EPA. 133 However, sitesthat do score at least 25.0 (i.e., could be submittedfor QA) are to be reevaluated using the new HRS.Thus, positive sites under the old HRS have to passanother screening and be judged positive under thenew HRS, as well, to make the NPL.
Instead of just 2 years after SARA of current HRSevaluations, EPA will have had almost 4 years, if thenew HRS is effective in February 1990. BetweenSARA’s enactment and mid-1989, 458 more siteshave entered the MITRE QA system and 355 siteshave been proposed for the NPL using the existingHRS. The NPL updates in May and July 1989 wouldhave been under the new HRS if EPA had finishedit on schedule.134 Because of the uncertainty of theeffect of the new HRS, it is unknown whether moreor fewer than 62 sites would have been proposed ifthe new HRS was used.
The NPL Grows
The NPL’s annual growth and its eventual sizedepend on how thorough EPA is in discovering sites,maintaining inventories, and evaluating potentialsites. So far, site discovery has been ad hoc,inventories incomplete and incompatible, and evalu-ation has been driven toward limiting the growth ofSuperfund. Still, the NPL continues to grow, propor-tionally increasing the responsibilities of Superfund.
NPL growth is also affected by the rate at whichEPA moves sites through the HRS scoring stage,primarily by the numbers of sites proposed (seefigure 2-3). The total number of sites on the NPL atany one time is the sum of the proposed and finalsites less those that have been removed or deleted,Figure 2-5 shows NPL growth from fiscal year 1983(546 sites) through 11 months of fiscal year 1989
13253 F~a,l Regiwer 51%2, M. 23, 1988, p. 51966.133U.S. fi””wonrnental Protection Ageney, “Pre-Remedial Strategy for Implementing SARA,” op. cit., footnote 57, p. 6.134~t~]y, Cve@ng iS ~~d. me J~y 1989 u~e had ~n ~h~~~ f~ emly 1$)89, and a IXX Up&UC was to happen in the summer of 1989
but, by mid-September, had not.

Chapter 2—The Front End of Superfubd: Site Discovery and Evaluation ● 125
Figure 2-5 Growth of the National Priorities List
1
1
1
SOURCE: Office of Technology Assessment, 1969; baaed on EPA data.
(1,224 sites).135 Although the growth has beenuneven and sporadic, EPA has complied with theCERCLA requirement to update the list annually butdid not add enough sites to meet the 1,600 to 2,000level by January 1988 suggested by the SARAConference report.
Another way to analyze the NPL is by the qualityof the sites. EPA claims that HRS scores are ameasure of relative risk among sites. EPA has alsolong maintained that the worst sites have been found.If so, one would expect the HRS scores to declineover time. OTA has averaged the scores of sitesproposed in each fiscal year.136 Figure 2-6 showsthat the average score declined somewhat from 1983to 1986 but from 1986 to 1989 has increased. Thechanges-up and down—are all within a 6-pointspread that is probably insignificant for the HRS. Itis not possible to conclude-if HRS scores are avalid measure--that sites now coming throughthe system pose less (or more) threat than those inprevious years.
OTA also looked at the spread of HRS scores (seefigure 2-6) and the distribution of scores in eachfiscal year. These data suggest that the HRS scoresmay be approaching an equilibrium. The spread inscores (minimum to maximum score) shows a trendsimilar to the average scores. The spread com-pressed between 1983 and 1986 and then expandedbetween 1986 and 1988.137 In 1989, the spreadcompressed again although the average is up,slightly. The distribution of scores is roughly similarfor all years except the first year (1983). In 1983,44percent of the scores were between 28.50 and 40.00.For all other years, from 60 to 73 percent of thescores were in that range. Conversely, 27 percent ofthe scores were greater than 50.00 in 1983; for allother years, 7 to 15 percent were greater than 50.00.
It is important to note that the changes in HRSscores averages, spread, and distribution over timedo not necessarily reflect differences in the characterof the sites. They can be the result of changes inpolicy (e.g., for a number of years EPA discouragedRegions from submitting landfill sites) or otherfactors. While the highest scoring sites (scoresgreater than 70.00) were all proposed in the first 2years, all nine of these sites have high air subscores.As discussed earlier, 97 percent of the NPL sitesprocessed by MITRE since 1984 have air subscoresof zero. A zero air subscore may mean that airmigration is not a problem or that an air score wasnot necessary to push a site score over 28.50.138
Estimates for the Future
Looking to the future, it appears that-if theenvironmental mission of the Superfund program isregained-the size of the NPL should increasesubstantially. OTA, GAO, and EPA data all pointtoward growth. Today’s CERCLIS inventory andits growth rate implies an NPL of over 4,000 sitesby the year 2000. Ultimately, with a national sitediscovery program, minimal deferrals, and aneed for secondary cleanups, over 10,000 sitescould qualify for cleanup under Superfund.

126 ● Coming Clean: Superfurnd Problems Can Be Solved. . .
Figure 2-6HRS Scores of NPL Sites (averages and minimum/maximum)
80
00 060 - 0 00
A
40 “
A A A A A
20 “
I I I I I I
~ Average O Maximumscore
SOURCE: Offim of Taehnology Aaaeawnant, 1989; baaed on EPA data
EPA’s Projections-The Superfund program’sprojections do not agree with OTA’s conclusionsabout the future size of the NPL. EPA makes itsprojections based on the choices it has made for theprogram. Those choices include no active sitediscovery, deciding that the preremedial programshould make management rather than environmentaldecisions, and explicit or implicit deferral of clean-ups to other programs. For instance, EPA toldCongress in 1988 that it was not possible to give anestimate for the future size of the NPL because“future changes in the preremedial program. . . willlikely revise [the traditional] percentage” of CER-CLIS sites that make the NPL.139
The Superfund program estimate of the NPL hasalways hovered around 2,000 sites despite a growingCERCLIS inventory. An assessment in 1983 pro-jected an eventual CERCLIS inventory of 22,000sites and an NPL of 1,400. Uncertainty about typesof sites to be included in the NPL in the futureproduced an upper bound estimate of 2,200 sites.
Today, EPA says that, with an inventory of 31,000sites, there will be 2,100 NPL sites by the year 2000.
EPA says that about 5 percent of the evaluatedsites end up on the NPL. How EPA arrived athistorical average of 5 percent of evaluated sites isunclear since at the same time EPA presented datashowing that the rate stood at 11 percent by 1986 and7 percent by 1989.140
CERCLIS and the NPL--Using the size ofCERCLIS to estimate the NPL is problematic, Notonly do changing site evaluation and listing policieschange historical averages but there is the pipelineeffect. It can take 5 years or more for a site to movefrom CERCLIS entry to the NPL. Additionally,CERCLIS is not the master list of potential sites forthe Superfund program. But, most importantly, asthe Superfund program’s long adherence to an NPLof about 2,000 sites shows, the size of the NPL is aproduct of choices made about how large the NPLshould become. Thus, a choice of whether or not to
139Hw of RcpIWCIN@W “Prelimhmry Findings of OTA Report on Superfund,” op. cit., foomotc 81, p. 270.
1~.s. Environmental Protection AgcMy, “A Management Review of the Superfund Program,” June 1989, p. 1-6,

Chapter 2—The Front End of Superfund: Site Discovery and Evaluation ● 127
conduct a site discovery program alters the size ofthe NPL.
OTA calculated a cumulative rate of 9 percent ofCERCLIS sites making the NPL from 1983 through1988 (using EPA data from table 2-1). OTA took thenumbers of sites evaluated each year and comparedit with the NPL of the following year to take intoaccount some of the time lag between evaluation andfinal placement on the NPL. On a noncumulativebasis, the initial rate was 22 percent in 1983 (the firstNPL year) and for 1988 was 11 percent. Thus,historically-by either measure-a declining per-centage of CERCLIS sites have become NPL sites,but the EPA average rate of 5 percent has not yetbeen encountered. 141
OTA estimates that 10 percent of the sites onCERCLIS, or over 4,000 sites, could be on theNPL by the year 2000. The 10 percent rate assumesthat the preremedial process is improved such thatsites are evaluated on an environmental rather thanmanagement basis and that cleanup deferrals areminimal. Thus, if the CERCLIS could be frozen at31,000 sites, the NPL could grow to at least 3,100sites by the year 2000. But, a CERCLIS growing by2,000 new sites each year will eventually contributeanother 200 NPL sites per year. Taking evaluationtime into account, 1,000 of those sites (or, 5 yearsworth) could be on the NPL by the year 2000. Anational site discovery program could add severalthousand more sites to the NPL.
CERCLIS may becoming an increasingly poorindicator of the potential size of the Superfundprogram. First, EPA plans-under the Environ-mental Priorities Initiative—to enter some 3,000sites the agency clearly intends to defer to the RCRAcorrective action program. That action, however,will broaden the concept of the CERCLIS inventoryand move it toward being more of a nationalinventory. Second, as discussed earlier, the bureau-cratic response to the policy to complete a site’s PAwithin a year of its entry into CERCLIS has been tohold up site entry. The result may be a decline in the2,000 sites per year growth rate.
Calculations based only on known CERCLIS/NPL data can underestimate the future size of theSuperfund program (and national cleanup needs),Despite the move to add RCRA sites, CERCLIS isnot a master list. But, using combinations of lists canresult in overestimates. As previous discussionsshow, lists of potential sites abound and no crosschecks have been made for double counting eitheramong these lists or between each list and CER-CLIS.
Further, when and if cleanups fail in other cleanupprograms, they may become a new source of NPLsites: secondary cleanups (see ch. 4). OTA estimatesthat failures from other cleanup programs could addover 1,000 sites to the NPL. This estimate assumesthat, while 10 percent of CERCLIS sites becomeNPL sites, an additional 20 to 30 percent actuallyrequire cleanup.
142 A failure rate of only 5 to 10percent of those cleanups, could add 410 to 1,230sites to the Superfund program.
Ultimately, An NPL of 10,000 Sites or More?—OTA’s 1985 estimate of 10,000 or more Superfundsites remains valid. It assumes that the Superfundprogram has an improved preremedial process,active site discovery, and minimal deferrals. In termsof the national cleanup problem, the 10,000 siteprojection is a major underestimate (see ch. 4).
The original OTA estimate was based on aconservative analysis of only three categories ofpotentiai sites. It produced a total of 8,000 sites: 1)solid waste facilities (5,000 sites), 2) groundwaterproblems created by RCRA Subtitle C hazardouswaste facilities (1,000), and 3) an improved siteanalysis and selection process for the NPL (2,000).EPA’s own estimate at the time of a maximum 2,000sites, which did not include the OTA categories, wasadded to the 8,000 figure to arrive at a total estimateof 10,000 sites.
Since 1985, when the OTA analysis was done, theOTA categories still remain as potential problemsfor the Superfund program:
● For solid waste facilities (active and closedmunicipal and industrial landfills and surface
141 ~1 ,s ~~~lb~c t. ~,biwn ~ ~mulatlve rate of 3 or Q percent by ~ompwlrlg tic number of NPL si~cs in onc yew Witi the cERCLIs sites irI the same
year but that lgnorcs the evaluation and t]mc lag cl fccI.1421n 1985 OTA Prcwnlcd Sta[c da~a [hat ~ ~s[lmatc~ 40 pcrCCn[ of po[Cn[lal sl[es would rcqulre a ~lc~up, see, OTA’S .$~e?fund Strategy, Op. Cll,
Also, DOD data for fiscal year 1988 shows tlw 30 percent of’ that agcnc} potential sltcs will rcqulrc a cleanup.

128 ● Coming Clean: Superfund Problems Can Be Solved . . .
●
●
impoundments), there has been no comprehen-sive study, subsequent to OTA’s, to identifyproblem sites. In fact, municipal landfills wereactively kept off the NPL (and thus notevaluated) by EPA until external pressurecaused a policy reversal in August 1987. Evenso, few landfills have been added to the NPLsince the policy was changed. 143 A more recent,proposed policy is to defer such sites to StateSubtitle D correction action programs. Pro-posed Federal rules for those cleanups, how-ever, only cover new and existing landfills;closed landfills and other types of solid wastefacilities would still, presumably, qualify forthe Superfund program.Estimates for hazardous waste RCRA Subti-tle C cleanups range from 2,000 to 5,000 sitesnow, but those sites are being actively deferredby EPA to the RCRA corrective action pro-gram. Since 1983, EPA has designated about 80sites proposed for the NPL as possible RCRAcorrective action sites; about a dozen havemade the final list. In June 1988 EPA proposedto officially designate 30 proposed NPL sites asRCRA Subtitle C corrective action sites and 15as NPL sites.l44 For all future sites movingthrough Superfund site evaluation, EPA willdecide whether or not they qualify for theRCRA program. If so, they will become RCRArather than Superfund sites. GAO estimated in1987 that 818 sites would fail to get cleaned upunder RCRA corrective action and end up in theSuperfund program.The selection process for the NPL remains thesame. Site analysis has actually been adjustedsuch that fewer, instead of more, sites should beexpected to move far enough through theprocess to receive NPL evaluation. OTA con-cluded in 1985 that if EPA paid more attentionto environmental factors, more sites would endup on the NPL. Congress has required EPA to
revise the HRS, but those new procedures willnot be effective until February 1990, or later.As the discussion on the proposed HRS hasshown, whether or not the new HRS wiliimprove environmental decisionmaking is un-known.
OTA has identified two new categories of sitesthat could add work to the Superfund program: 1)newly created sites, and 2) secondary cleanups.Illegal dumping still occurs.145 California recentlycited its Transportation Department for dumpingtoxic and other waste materials into a pit at amaintenance yard for 10 years. The practice onlyceased in May 1989. Firms that legally operateoutside of the regulatory system are also creatingnew sites. One example is bankrupt firms that haveused hazardous substances but were not required tohave a RCRA permit because they did not store,treat, or dispose of hazardous wastes and, thus,received no enforcement actions while in operation.The need for secondary cleanups will occur whenimpermanent cleanups done by programs other thanSuperfund fail.
Uncertain Future--The maximum number ofpotential sites, from which eventually come CER-CLIS and then NPL sites, is approaching 500,000.Ten years ago, the maximum base number was50,000. It was estimated by an EPA contractor whoconcluded that from 30,000 to 50,000 hazardoussubstance sites existed.146 The report was roundlycriticized at the time as an inflated estimate. Then,in 1984, EPA said in its Report to Congress thatsystematic investigation efforts could expand theuniverse of problem sites and thus increase theresponse needs of the Superfund program. EPAestimated those “problem sites” to be between131,000 and 379,000 from a larger universe ofknown sites in five categories: RCRA Subtitle CTSD facilities, municipal landfills, industriallandfills, mining waste sites, and leaking under-
14qAsof May ]986, 184 rn~c]p~ solid waste landfills were on NPL according to the Subtitle D regulations proposed Aug. 30, 1988. CERCIJS damas of July 1988, classifies 220 NPL sites as landfills.
14.4Even ~ou@ tie 15 sl~s t. remfi on tie NPL h~ &n on fhe NpL for a num~r of ye~, EPA chow to repropo~ them. They now wtit againto become final sites.
14SD~ from me remov~ ~rogm shows ~ incre~ ~ 1987 over 1986 in remov~ actions at illegal dump sites. [U.S. E n v i r o n m e n t a l ProtecUon
Agency, Progress Toward Implementing Supefind Ftical Year 1987, Report to Congress, op. cit., footnote 94. ] Also, New York City Envuonment.alPolice tit has a 22-member force working fulltime to seek out illegal dumps. [“Toxic Avengers, ” Discover, August 1989. ]
146F~ C, H~, kc., “Preiirninary Assessment of Cleanup Costs for National Hazardous Waste Problem, ” Feb. 19, 1979, as cited in EPA’s “Extentof the Hazardous Release Problem and Future Funding Needs, CERCLA (301)(a)(l)(C) Study, ’ op. cit., footnote 32, p. 1-2.

Chapter 2—The Front End of Superfund: Site Discovery and Evaluation ● 129
ground storage tanks.147 EPA did not estimate howmany of these sites would eventually require cleanup;only that ‘‘some subset would require more inten-sive investigation, and a subset of those couldrequire removal or remedial response by Super-fund. 148
In 1987, using EPA data, GAO recalculated thenumber of potential sites and arrived at a new rangeof 130,000 to 425,000. This group includes: RCRASubtitle C and D facilities, mining waste sites,underground leaking storage tanks (non-petroleum),pesticide-contaminated sites, Federal facilities, radi-oactive releases, underground injection wells, towngas facilities, and wood preserving plants. 149 Again,no estimate was attempted of how many of thesesites would actually require any cleanup. They are,however, classes of sites which currently are han-dled by the Superfund program. The estimate doesnot include classes of sites that are the exclusivepurview of other cleanup programs, such as LUSTSwith petroleum. Federal agency sites are included onthe list. Although the Superfund trust fund is notused to pay for those cleanups, EPA incurs relatedcosts due to its responsibility for oversight ofFederal agency cleanups. 150
OTA has updated two categories of the 1987 GAOestimates for a new upper bound of at least 439,000potential sites. GAO’s estimate for LUSTS contain-ing hazardous substances was 10,820 in 1987; using1988 data from the Office of USTS that estimateshould be about 20,000 tanks. Federal facilities now
contain over 10,000 known sites, instead of the5.800 estimated by GAO.
If 10 percent of these potential sites do requirecleanup, the Superfund program could be facing atotal NPL of from 13,000 to 43,900 sites. If only 5percent, then from 6,500 to 21,950 sites. These arenot necessarily the worst case national scenariosbecause they do not account for any sites currentlyresigned to other cleanup programs-such as LUST—some of which could eventually become Superfundsites (see ch. 4).
Comments on the RCRA corrective action pro-gram by the General Accounting Office in a 1989discussion paper make clear why sites in otherprograms may eventually have to be redone by theSuperfund program:
Preliminary indications are that over half of the5,000 operating hazardous waste facilities are leak-ing and causing contamination . . the pace ofcleanups has been slow. in part because there is nooverall strategy to deal with the problem . . . theagency has not been able to devote sufficientresources towards its corrective action program . . .remedy selection has often been conflicting andinconsistent, with no clear criteria for selecting aremedy that is most protective of- human healthand/or the environment . . . The longer these prob-lems persist and remain unresolved, the greater thelikelihood that operators will be unable to takecorrective action and that the facilities will becomeSuperfund sites. ‘5*
147u.s. Environmental Protection Agency, “Extent of the Hazardous Rclcmc Problem and Future Funding Needs: CERCLA Sccuon 301 (a){ 1 )(C)Study, ” op. cit., footnote 32, p, 5-3.
1481 b]d., p. 5-2.149GA0 only incjud~ those RCRA Subtit]e C facllltles hey fell would cnd up in tie su~fiund, ralhcr than RCRA L. OrrCCIIVC W’IIOTI, p r o g r a m .
150]n ~ reswnw t. ~uestlons ~sed by the How commlt~~ on publlC Works and Transportation, EPA stated in 1 !)88 that [hc maximum number ofPotential sites m the 1987 GAO study should be 84,000. EPA argued that the count for three categories should be decreased not bccausc the sites mightnot be contaminated but bezause-bureaucratically -+hey should not be Ilstcd m CERCLIS. EPA subtracted RCRA Subtltlc D 1 tic 11 } ucs on the ba.wsof a Supctfund pohcy that had been reJectcd by EPA m 1987. EPA ObJe~tcd to GAO’s count of Federal sires rather thmfac’//irtrs bccauw the NPL list~Federat facilities. However, Federal agencies inventory numbers of potcntd sites not facilities, EPA eliminated the bulk of lnjectlon wells countcci byGAO because they are ‘‘non-hazardous by definmon.’ GAO Justlficd the inclusion of these WCIIS bccauw of cwdcnce that (lass 5 wcll~ have a low[o high probablll~y of bclng contaminated. [‘‘Prcllmlnag Findings of OTA Report on Supcrfund, ’ op. CII., footnote 81, p. 269. J
151 L’s, con~css, General .AccounUng OffiCC, “?ktajor Ektvuomenlal Issues. 1991- 1994, ” dlsusslon papers, Scptcmbcr 1989.

130 ● Coming Clean: Superfund Problems Can Be Solved . . .
APPENDIX 2AA HEALTH CARE MODEL FOR
SUPERFUND SCREENING
Introduction
Because the Superfund program does not collectthe proper data, OTA cannot make a definitiveanalysis of the environmental effectiveness of itsscreening process. Analogies are possible, however,with the health care field where screening tests areroutinely used to detect the presence of illness (e.g.,mammography for breast cancer) or risk factors(e.g., high cholesterol levels) that may requiretreatment. The efficacy of medical screening testsreceives a lot of attention and making improvementsis often high priority research. In addition, cutoffsare set with explicit consideration of the costs ofmissing cases and of incorrectly labelling a healthyperson as diseased. The Superfund program, whichjustifies cleanup decisions on protection of humanhealth, has not sought the same high standards in itsapproach to screening sites and setting a cutoff.
A potential Superfund site must pass three levelsof screening prior to site cleanup: 1) the preliminaryassessment (PA), 2) the site inspection (SI) and HRSscoring, and 3) the remedial investigation andfeasibility study (RIFS) and Record of Decision(ROD). Starting with the PA, screening is simple(only existing information is used), but at each of thetwo higher levels, increasingly more and betterinformation is used. A site must be judged positiveat each screening stage in order to enter the nextscreening stage and, finally, to receive a cleanup.
At each stage, some sites are eliminated andlabeled NFA—No Further Action. * Eliminationdoes not necessarily mean that a site is free frompublic health or environmental problems. First,because no screening process is perfect, some sitesare judged negative-not requiring cleanup-whenin fact they are positive. Second, sites are eliminatedbecause it is estimated or shown that they will notscore at least 28.50 using the HRS. Third, sites areeliminated because, for statutory or policy reasons,they are not covered by the Superfund program. All
of these classes of rejected sites have been lumpedtogether in the universe of sites that don’t needcleanup.
Based on a health care model, two characteristicsand two outcomes can be used to assess how well thethree Superfund screening stages perform, bothindependently and collectively:2
●
●
●
●
Sensitivity—What is the probability that screen-ing will identify the true positive sites, i.e.,those sites requiring cleanup? This is the validhit rate of the screening method.Specificity-What is the probability that thescreening method will identify the true nega-tive sites, i.e., nonproblem sites that do notrequire cleanup? This is the valid reject rate.Accuracy—What is the probability that adecision made by the screening is correct?Accuracy is a dependent variable. It is affectedby sensitivity, specificity, and the fraction ofsites needing cleanup,Precision-Is the screening decision reproduce -ble if different people or offices examine thesame site?
Embodied in sensitivity and specificity are twofundamental pitfalls: making false positive and falsenegative decisions. It is critical to understand that ascreening test is not necessarily equal in its abilitiesto detect problems and nonproblems; sensitivitiesand specificities may differ widely.
For example, using x-ray examination (mammo-gram) to screen for breast cancer may have arelatively high sensitivity (find a high fraction ofcancers) but a lower specificity (identify manynoncancers as cancers). Although such false posi-tives present many problems, in this case it may bebetter to have false positives than to have falsenegatives. Any positive finding can be followed upwith more sophisticated testing. But a negativefinding leaves the system without a second chance,and its true nature only becomes apparent if symp-toms appear later when cure (remediation) is moredifficult. Another form of medical examination mayhave greater accuracy because, for example, it candetect smaller size cancers. High precision would
1’IIE term now used IS NFRAP, no further remedial action planned.2S=, for immce, R.M, ~omer md Q.R, Rernek, ~rinci@les and Procedures m the Evaluation of Screening for Duease, Rbllc Heal~ Mono@@
No. 67, Mily 1967,

131 ● Coming Clean: Superfund Problems Can Be Solved . . .
mean the test would detect the same cancer ifperformed by different people at different times andunder different conditions.
False Positives and False Negatives inSuperfund
In Superfund, a false positive is a site that isselected for cleanup but really does not need one.Money is wasted and an opportunity cost may bepaid because other sites do not get the cleanupattention they require in a timely way. A falsenegative is a site that is eliminated from the systemeven though it really needs cleanup. In this case,near-term costs are avoided but long-term costs,including environmental damages, are very likely togrow.
Improving the environmental performance ofSuperfund screening process means reducing falsenegatives, It is necessary to find out at what level,where, and why the process produces false nega-tives. When the problems are found, ways to solvethem must also be found and then resources must bedevoted to do the job. Management must want toevaluate and improve system performance, butcurrent pressures are to meet numerical quotas withfairly constant budgets. There are no allowances forreassessing what has been done,
The result for Superfund is that there has beenalmost no critical examination of the efficiency andaccuracy of screening procedures nor of alternativescreening strategies. Some effort has been made atdetermining false positives but not false negatives.
By nature, the system responds to positive testresults and not negative ones; the system has severalchances to detect a false positive (because it stays inthe system), but not a false negative (because itdeparts). But to detect a false negative (and tomeasure sensitivity and specificity) requires thatmoney be spent on evaluating the successive levelsof screening and, perhaps, the ultimate remediationto assess whether sites labeled as negatives andpositives are really so. Clearly, no system wouldexpend such effort on all findings because thatwould eliminate the reason for conducting screeningtests, whose costs are supposed to be small relativeto the final cleanup, In the health care field, researchis conducted on smaller numbers of subjects in order
to establish the sensitivity, specificity, accuracy, andprecision of screening tests. The results are com-pared with some “gold standard, ” usually a defini-tive diagnostic test or the closest thing to it. Thecosts and benefits of improving the efficiency andaccuracy of a test are dealt with explicitly.
A Model of Superfund Screening
The percentage of false positives and false nega-tives for each screening stage can be calculated whenthree things are known: the true incidence rate(percentage of sites in the inventory of possiblecleanup sites that actually require cleanup) and thesensitivity and specificity of each stage. Eitherspecial tests must be done or some reliable historicalinformation must be used to obtain these figures; itis not possible to get them from current Superfundrecords. OTA has assumed values to gain insightinto the nature of the current system, to illustratepossible problems, and to suggest strategies to solvethe problems.
With the model shown in figure 2A-1, the threeserial screening stages in Superfund allow forcalculations-analogous to a mass balance-totrack the disposition of sites as they move throughthe system. Positives from one stage pass on to thenext, while negatives leave the system. As with anymodel, some details and richness of the real case aresimplified or ignored. For example, OTA hascombined the SI and HRS scoring into one stage,because for the most part the same information hasbeen used for both, although in reality some sites areeliminated after the SI. Now, with two SIs (ascreening and a listing SI) the level of the informa-tion is different and EPA has added another rejectionpoint.
It is important to emphasize that there is no onecorrect result from the model. Numbers are assumedfor key variables. For figure 2A-1, OTA assumed aCERCLIS inventory of 10,000 evaluated sites and atrue incidence rate of 12 percent, or that 1,200 sitesreally require cleanup. We assumed that at the PAstage the sensitivity is good, but not exceptionallyhigh, and resigned it a value of 0.85 (i.e., a 15percent miss rate on the true problem sites) and thespecificity is rather low, a value of 0.25 (i.e., 75
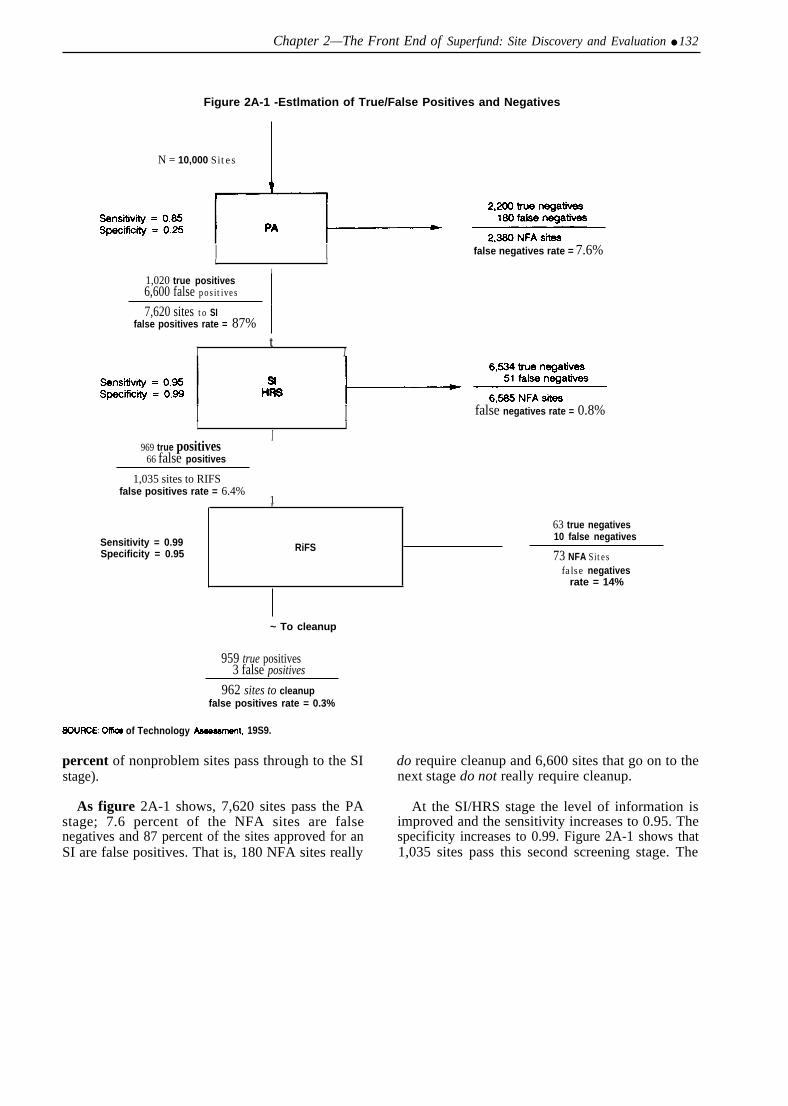
Chapter 2—The Front End of Superfund: Site Discovery and Evaluation ● 132
Figure 2A-1 -Estlmation of True/False Positives and Negatives
N = 10,000 Sites
I I false negatives rate = 7.6%L I
I1,020 true positives6,600 false positives
7,620 sites to SIfalse positives rate = 87%
tI 1
I I false negatives rate = 0.8%I I
I969 true positives
66 false positives
1,035 sites to RIFSfalse positives rate = 6.4%
1w
63 true negatives
Sensitivity = 0.99 10 false negatives
Specificity = 0.95RiFS
73 NFA Sitesfalse negatives
rate = 14%
~ To cleanup
959 true positives3 false positives
962 sites to cleanupfalse positives rate = 0.3%
80URCE: Offkx of Technology Awe8wnenl, 19S9.
percent of nonproblem sites pass through to the SI do require cleanup and 6,600 sites that go on to thestage). next stage do not really require cleanup.
As figure 2A-1 shows, 7,620 sites pass the PA At the SI/HRS stage the level of information isstage; 7.6 percent of the NFA sites are false improved and the sensitivity increases to 0.95. Thenegatives and 87 percent of the sites approved for an specificity increases to 0.99. Figure 2A-1 shows thatSI are false positives. That is, 180 NFA sites really 1,035 sites pass this second screening stage. The

133 ● Coming Clean: Superfund Problems Can Be Solved . . .
false negatives are 0.8 percent, and the falsepositives are 6.4 percent. The number of trueproblem sites missed (false negatives) is 51.
At the RIFS/ROD stage, the quantity and qualityof information are greatly improved. OTA assumedthat the sensitivity increases to 0.99 and the specific-ity is 0.95. The specificity was decreased somewhatto reflect the likelihood that investigators wouldhave some reluctance to reject a site at this last levelof screening after so much investment has beenmade in the site. Figure 2A-1 shows that 962 sitespass through the RIFS/ROD stage to actual cleanup;14 percent of the negatives are false and 0.3 percentof the positives are false. Ten more true problemsites (false negatives) are missed.
Overall, out of the 1,200 true problem sites, 959are detected and 241 sites are missed. The number ofunnecessary cleanups is three. A total of 9,038 sitesare eliminated. It is only the number of falsepositives at the last screening stage that results inunnecessary cleanups. But false negatives dropout at each screening stage and accumulate. Thus,for the three-stage process, 0.3 percent of thepositives are false while 2.7 percent of the negativesare false. The overall sensitivity for detecting trueproblem sites is 0.80, less than for any of theindividual stages. Thus, out of 1,200 true problemsites, 20 percent (241 sites) are missed because of thecumulative effect, The specificity is very high at99.97 percent (i.e., nearly all the nonproblem sitesare rejected); only 3 false positives get through thelast stage.
Applying Results to Superfund
The model and the numbers assumed and calcu-lated simulate current Superfund results. About thesame size NPL is created (roughly 1,000 sites) fromabout the same universe of inventory sites and sitesexamined through the three screening stages. Avail-able data show that the historical NFA rate at the firstscreening stage (the PA) has been about 20 percent(24 percent in the model) and that the NFA rate at thelast screening stage is about 8 percent (7 percent inthe model). Other numbers might lead to the sameoverall performance; therefore, the model showsseveral important things about the possible behaviorof the current Superfund screening system:
●
●
●
●
It probably does a good job of minimizing falsepositives; that is, very few totally unnecessarycleanups result, although responsible partiesasked to pay for cleanups sometimes believeotherwise.It may do a poor job of minimizing falsenegatives; that is, a rather large number of sitesthat require cleanup can be missed with noindication that they exist; they are buried withina large number of true nonproblem sites. Whilesome State programs may do a good job atdetecting which are problems, not all can (seechs. 2 and 4).It is impossible for the second two screeningstages, with their higher levels of sensitivity, toovercome or offset the inefficiency of the firstscreening stage where 180 out of the total of241 false negatives are created; only 10 falsenegatives stem from the last screening stage.Most false positives come from the first stageand very few from the second two screeningstages.
Ways to Minimize False Negatives
The results of the model suggest two fundamentalstrategies to cut down the number of false negativesand their attendant problems of high future cleanupcosts and damage to human health and the environ-ment. A High Risk Site Strategy creates a paralleltrack of sites and a Better Information Strategyresults in a two-stage process,
High Risk Site Strategy-A case can be made tocircumvent the three-stage screening system and itsinherently lower overall sensitivity and very longevaluation time by going directly to the third stage.In the health care field a subpopulation with a higherincidence of a certain disease is identified, and thishigh risk groups is sent directly to a more advancedstage of screening. The key is to use preexistinginformation to define the subpopulation.
This strategy offers Superfund a parallel route tocleanup for some sites with a higher incidence ofrisk. Example subpopulations include: 1) sites thathave been identified through historical aerial photo-graphs, analysis of which clearly shows past hazard-ous waste management practices that lead to con-tamination; and 2) sites that have received emer-gency or other removal actions and that profession-als who have worked onsite believe need a cleanup.
Chapter 2—The Front End of Superfund: Site Discovery and Evaluation ● 134
A high percentage of such sites are apt to requirecleanup, perhaps 70 to over 90 percent. They couldbe skipped directly to the third screening stagewhere the very high sensitivity would confirmalmost all of them. For example, for 1,600 such siteswith an incidence rate of 75 percent (i.e., 1,200 trueproblem sites, the same as in figure 2A-l), 1,188sites would be correctly detected, and 12 sites wouldbe missed. This strategy results in a 1 percent missrate rather than the 20 percent miss rate for thecurrent system.
Better Information Strategy--lt is conceivablethat the first screening stage, where most falsenegatives are created, can be improved to raise itssensitivity. This approach runs counter to the basisof the current three-stage screening process which issimple and low-cost (typically days or weeks and afew thousand dollars) at the first stage and gets muchmore costly and longer (typically a few years andseveral hundred thousand dollars) at the third stage.Improving the first screening stage means spendingmore money on a very large number of sites—anactivity that could make subsequent stages redun-dant. This redundancy seems to be happening now;for example, pushing the use of the HRS into the PAstage. But, the current use of the HRS at the PA stagedoes not include using better information.
Making a significant improvement in PA screen-ing so that its sensitivity increases is worth consider-ing. For example, if its sensitivity is increased from0.85 to 0.95, the PA and SI/HRS stages can becombined into a new, more efficient first stage withthe benefits of the current second stages That is, thisstrategy uses the second and third stages of theoriginal model. The result is that, after the thirdstage, 71 true problem sites are missed and there are4 false positives in the total of 1,133 going tocleanup.
Instead of missing 241 sites in the current systemand 12 sites in the High Risk Site strategy, 71 sitesare missed in the Better Information strategy. Thesensitivity for the Better Information strategy is 94percent (as compared to 99 percent in the High RiskSite strategy and 80 percent in the current system).However, the basis for comparison is not quite thesame for all three cases, even though there are 1,200
true problem sites in each. Although the currentsystem and the Better Information strategy could beused on the same group of randomly selected siteswithin the entire Superfund inventory, the High RiskSite strategy is used on a selected group of sites forwhich it is known that the percentage of sitesneeding cleanup is high. The advantage of the HighRisk Site strategy, therefore, depends on havinginformation which reliably predicts that a site is atrue problem requiring cleanup.
Comparison With EPA AttemptsTo Improve Screening
One of the paradoxes of Superfund is that the PA,the first screening stage traditionally gets the leastattention, uses the least and probably worst informa-tion, and probably is implemented by the mostjunior, inexperienced people. This condition meansthat the sensitivity and specificity are probably low,as reflected in OTA’s modeling of the current systemabove. EPA’s interest (as detailed in ch. 2) is toreduce the workload of the SI/HRS, the second,more expensive screening stage. Thus the drive is toimprove the specificity (i.e., finding nonproblemsites) of the PA rather than the sensitivity (i.e.,finding problem sites). But, it is the sensitivity thatdetermines how many false negatives are created.
The model helps to assess the effects of EPA’sexpansion of PA screening to reduce the workload atthe SI/HRS stage; that is, to reduce as early aspossible false positives. The subtlety is that it ispossible to increase the specificity without increas-ing the sensitivity; that is, by increasing the specific-ity the number of false positives is decreased, but notthe number of false negatives. If something is doneto better detect true nonproblem sites, such as usingcrude field sampling and analysis to show nocontamination, a specificity of 0.75 instead of 0.25(as in the current system model) for the firstscreening step could be assumed. This reduces thenumber of false positives from 6,600 to 2,200. Thenumber of sites going on to the SI/HRS stage-theworkload-decreases from 7,620 to 3,220 sites, a 58percent reduction. The false positive rate drops from87 to 68 percent. The false negative rate decreasesfrom 7.6 to 2.7 percent even though the actual
3This is s~llw ~ ~ ~W=@-I in ch. 2 mat wreening be a continuum rather than one in which at a specific point, say the PA stage, it is tlssumedthat enough information exists u make a site decision.
135 ● Coming Clean: Superfund Problems Can Be Solved. . .
number of false negative sites remains constant(because a larger NFA base is created).
However, the real danger is that whatever actionis used to increase the specificity also affects thescreening’s sensitivity. In fact, the likelihood is verygreat that the sensitivity would decrease, therebyincreasing the rate of false negatives. For example.in a modified PA, using crude sampling and analysiswith high detection limits and very few samples peracre could miss major contamination. Similarly, asis currently the situation, application of the HRSscoring at a time when very little reliable informa-tion exists could reduce the sensitivity as much asthe specificity is increased.
Reducing the sensitivity, such that more falsenegatives are created, has an apparent effect of alsoincreasing the number of sites eliminated andreducing the workload for the next screening level.If the sensitivity decreases from 0.85 to 0.80 at thePA stage, then an additional 60 false negatives arecreated (240 as compared to 180 in the currentsystem).
Accuracy in Superfund Screening
The degree to which screening decisions areaccurate is yet another problem. In Superfund, theincreasingly critical factor is the use of the HRS. Justas in some medical tests, a cutoff score is used todecide whether a site is “bad” enough to meritcleanup. As discussed in chapter 2, the HRS hasbeen criticized for many years by many people. Noavailable evidence has established a valid relation-ship between the score—and certainly not thearbitrary cutoff value of 28.50--and the actual threatto human health and environment.
It is not clear that there is any one cutoff scorethat would accurately indicate that a significantenvironmental threat exists or does not exist. Ifthere is one point of uncertainty below which nocleanup problem probably exists and another pointabove which there is almost certainly a need forcleanup, these points among HRS scores has notbeen determined. If such points were determined,then the policy decision would be whether or nor toconsider sites between the points as positives ornegatives.
Precision in Superfund Screening
The higher the precision of screening tests, thegreater their reproducibility. No matter who appliedthe screen, or when, the result would be the same. InSuperfund, good precision would mean that it wouldnot make any difference, with regard to whether asite is judged to require cleanup, what EPA region asite is in, nor what contractor or State officeperformed the work, nor which people did the work,nor when the work was done. Unfortunately, nospecific attempts (such as having some sites evalu-ated by different offices) have been made to evaluatethe precision of the three-stage screening processand, especially, the HRS. What data exist, however,suggest a substantial level of inconsistent results inevery aspect of Superfund implementation (see chs.2 and 3). Thus, the probability is high that a sitewhich is judged to be positive or negative couldreceive just the opposite label if it was examined ata different time by different people in a differentoffice.
Conclusion
The examination of sensitivity and specificity incombination with an overview of problems withaccuracy and precision in Superfund’s screeningsteps leads to an unsettling conclusion. No detaileddata have ever been intentionally gathered that couldrate the worth of Superfund’s screening steps.However, whatever analysis can be done with themeager information available leads one to suspectthat current screening efforts may miss substantialnumbers of sites that really require cleanup. But thesystem is much less likely to result in cleanups thatare really unnecessary.
In fact, for every one unnecessary cleanup, themodel used here suggests 80 sites are not cleaned upthat should be. The costs of better or extra screeningdesigned to minimize false negative sites seem smallcompared to the higher costs of delayed cleanup.Doubling preremedial costs, for instance, to 6percent of the Superfund budget would add about$40 million to screening. That is comparable totoday’s average cost of cleaning up a site, $30million. If improved screening found most of the 80sites, it is possible that hundreds of millions in futureclean up costs could be saved.

Chapter 2—The Front End of Superfund: Site Discovery and Evaluation ● 136
When the problems of poor accuracy and the model used here. On the other hand, errors mayprecision are also taken into account, then it is clear be systematic, not random. Indeed, some actionsthat the margin of error in any estimate of false have been discussed that bias results, and thenegatives and false positives is probably very large, pressures on Superfund point to a predilection toeven as much as plus or minus 100 percent. This ignore false negatives while attempting to minimizemeans that if all errors were random there may be no false positives. Short-term costs are being mini-significant problem of false negatives or the ratemight be twice as large as the estimates made with mized at the expense of higher long-term costs.

Chapter 3
Cleanups and Cleanup Technology

CONTENTSPage
10 KEY ISSUES . . . . . . . . . . . . . . . . . . . . . . . . . . . . . . . . . . . . . . . . . . . . . . . . . . . . . . . . . . . . . . . . 139Issue 1: Is there now available a full range of proven, safe, and cost-effective cleanup
technologies so that land disposal and containment can be largely avoided? . . . . . . 139Issue 2: Is the Superfund system using proven cleanup treatment technologies—
preferably permanent ones-where and when they are applicable and feasible?.. 142Issue 3: Is the current enforcement emphasis on obtaining settlements with
responsible parties affecting remedy selection? . . . . . . . . . . . . . . . . . . . . . . . . . . . . . . . . . 161Issue 4: Are analyses and selections of cleanup technologies inconsistent and, if so,
does it matter? .*. ... ***. ... *.. ... *.. ... ...0. *.. ..*. ... .*. **. ..$. ... .*. *.e 4*.. 174Issue 5: Are there incentives built into the Superfund program for making broad use
of improved cleanup technologies? . . . . . . . . . . . . . . . . . . . . . . . . . . . . . . . . . . . . . . . . . . . . 177Issue 6: Will using permanently effective cleanup technologies mean that cleanup
costs will skyrocket? . . . . . . . . . . . . . . . . . . . . . . . . . . . . . . . . . . . . . . . . . . . . . . . . . . . . . . . . 178Issue 7: Are research and development producing a steady stream of more
cost-effective cleanup technologies? . . . . . . . . . . . . . . . . . . . . . . . . . . . . . . . . . . . . . . . . . . 180Issue 8: Are the rules clear on what constitutes proof of cleanup effectiveness for
new technologies? . . . . . . . . . . . . . . . . . . . . . . . . . . . . . . . . . . . . . . . . . . . . . . . . . . . . . . . . . . . 183Issue 9: Is poor information affecting the use of better cleanup technologies? . . . . . . . 187Issue 10: Is experience leading to easier, faster, and less expensive analyses and
decisions on cleanup technologies? . . . . . . . . . . . . . . . . . . . . . . . . . . . . . . . . . . . . . . . . . . . 189
BoxesBOX Page3-A. 10 Case Study Sites With Capsule Findings . . . . . . . . . . . . . . . . . . . . . . . . . . . . . . . . . . . 1453-B. Key Issues for Onsite Incineration . . . . . . . . . . . . . . . . . . . . . . . . . . . . . . . . . . . . . . . . . . . 1463-C. Key Issues for Biological Treatment . . . . * *, * . . . . . . . . . . . . . . . . . . . . . . . . . . . . . . . . . . 1473-D. Key Issues for Separation Technologies ● . . . . . . . . . . . . . . . . . . . . . . . . . . . . . . . . . . . . . 1483-E. Key Issues for Chemical Fixation . . . . . . . . . . . . . . . . . . . . . . . . . . . . . . . . . . . . . . . . . . . . . 1493-F. How a Technical Assistance Grant Analysis Concluded That a Pump-And-Treat
Approach Did Not Offer a Reliable Cleanup of Groundwater . . . . . . . . . . . . . . . . . . . 1573-G. Summaries of Eight FY88 Region 5 Decisions Selecting Containment/Land
Disposal . . . . . . . . . . . . . . . . . . . . . . . . . . . . . . . . . . . . . . . . . . . . . . . . . . . . . . . . . . . . . . . . . . . .172
FiguresFigure Page3-1. Possible Restoration Scenarios When Evaluating Performance Data . . . . . . . . . . . . . 1543-2. Conceptualization of the Trade-offs Between Investigation and Cleanup Costs as a
Function of the Sophistication of Site Characterization Efforts . . . . . . . . . . . . . . . . . . 155
TalksTable Page3-1. Comparison of Mobile/Transportable Incineration Technologies . . . . . . . . . . . . . . . . 1443-2. Site Characterization . . . . . . . . . . . . . . . . . . . . . . . . . . . . . . . . . . . . . . . . . . . . . . . . . . . . . . . . . 156

Chapter 3
Cleanups and Cleanup Technology
What is a permanently effective treatment tech-nology? The Superfund Administration and Reau-thorization Act of 1986 (SARA) strongly supportsits development, demonstration, and use for sitecleanup, but the statute does not say exactly what“permanent,” “effective,” or “treatment” mean.The resulting ambiguity for Superfund has fueledpublic criticism of specific cleanups and clashesbetween statutory requirements and implementa-tion. Some flexibility is necessary for the peopletrying to find cleanup solutions to complex sites.The challenge is finding an approach which followsstatutory requirements and preferences, uses thelatest understanding of science and engineering, andalso allows enough flexibility for front-line peopleto solve tough problems.
OTA’s analysis of site cleanup in this chapterfocus on how well technology is evaluated andselected to solve contamination problems and tomeet cleanup objectives. Ten key issues are identi-fied and discussed.
This chapter is not a treatise on Superfundprocedures and cleanup technologies. While manypeople want to know details about cleanup technolo-gies, especially newer ones, the technology area isevolving rapidly and detailed descriptions of spe-cific technologies are quickly out-of-date. 1 Also, theobjectivity and reliability of available informationcannot be guaranteed because so much of it comesfrom technology developers themselves. Moreover,engineering specifications have limited value topolicymakers charged with making the Superfundprogram work more effectively and efficiently.
OTA’s analysis is meant to provide a backgroundfor the discussion of policy options to improveSuperfund implementation. Accordingly, generalscientific and engineering principles and trends areset out, in somewhat of a tutorial style, which shouldbe of particular use to the non-specialist in cleanupscience and technology. Given the paucity of exactinformation, examples of site decisions also play animportant role in OTA’s analysis.
10 KEY ISSUES
Issue 1: Is there now available a full range ofproven, safe, and cost-effective cleanup technol-ogies so that land disposal and containmentcan be largely avoided?
In large measure, the answer is yes, Perhaps thebest proof is the current smorgasbord of treatmenttechnologies for different kinds of Superfund sitesfrom hundreds of technology vendors. But landdisposal and containment are still needed andparticular treatment technologies accomplish differ-ent things.
Nor can cost-effectiveness be separated fromcleanup objectives. That is, no cleanup technologyis intrinsically cheap or exorbitantly expensive. Therange of cleanup applications is very broad, andcost-effectiveness depends on what the cleanup needis, including what the contamination and site con-ditions are. Claims that a technology is intrinsicallycost-effective are misleading. Yet, some technolo-gies commonly used for generic applications earnthe engineering label “proven.” Assessment of theavailability of treatment alternatives to land dis-posal, therefore, is linked to general cleanup goals(e.g., permanence, cost-effectiveness), specific sitecleanup objectives (e.g., levels of residual contami-nation for specific contaminants to attain riskreduction objectives, compliance with regulatorystandards), and an understanding of different genericcleanup applications.
Because not all treatments are the same, thegeneral availability of all treatment technologies thatare lumped together can be misleading. Sometreatments are preferred over others, and if somecleanup problems have no good treatment solutions(e.g., very large municipal landfills).
The mere label of “treatment’ for a technologycan be misleading. The government has not estab-lished a clear hierarchy of preferred treatments andpreferred environmental outcomes. One possible
1 In its 1985 ~cp~ swe~~ s~~eO., OTA ll~t~ s~lfic t~hnology vendors with some dl~ussion Of the~ new tedlnologles. TO a kge degree,
the information quickly became outdated; it was also unintentionally unfair to fms not llsted. At this time, there is no convenient single source of thelatest information on new cleanup technologies.
-139–
20–01 1 0 – 89 – 4 : QL 3

140 . Coming Clean: Superfund Problems Can Be Solved . . .
hierarchy is given in box l-F, chapter 1. Treatmenttechnologies, such as thermal destruction (incinera-tion) and biological treatment, which actually de-stroy or detoxify hazardous substances, and technol-ogies that recover contaminants for reuse are themost desirable; OTA concludes that such treatmentsoffer permanent remedies. EPA has said thatpermanent remedy “has not been strictly defined. ”2
Permanence is at one end of the performancespectrum for treatment technologies. At the otherend, for example, are simple treatments that extractwater from a sludge type of waste, reducing volumebut leaving the hazardous substances in their origi-nal chemical form and quantity. For environmentalprotection, treatment that permanently renders haz-ardous substances harmless is most preferred. Thereason is simple. To the extent that the treatment ismaximally effective, there are no uncertainties: thesource of hazard is removed, not merely reduced,separated, or contained. Permanent treatment pro-vides maximum risk reduction, especially if it can bedone for all of a site’s contaminants. Russell E.Train, former EPA Administrator, stated the impor-tance of permanent cleanups: ‘‘Haunting Superfundis the nightmare of spending millions to clean up asite, then discovering the cleanup is far frompermanent. ’
Some treatments, however, only reduce mobility,such as chemical fixation, stabilization, and so-lidification; these also generally increase volume.Some are only separation technologies (e.g., soilwashing, solvent extraction from soils, carbonadsorption, and precipitation of contaminants ingroundwater) which may reduce volume but actuallyproduce a more concentrated hazardous waste thatmust be treated or landfilled. Some separationtechnologies can (and often do) release hazardousmaterials directly into the environment (e.g., airstripping of contaminated water, soil aeration, andextraction of volatile chemicals from soil) unless
contaminants are collected and some form of de-struction technology is also used.4
Treatment and Permanence-To begin with, theword ‘‘treatment is not especially informativetechnically. At best, treatment as applied to hazard-ous waste problems has come to mean anythingother than land disposal of hazardous waste. Byitself, treatment does not convey what happens to thehazardous waste. In particular, treatment does notimply a permanent transformation of hazardousmaterial to harmless material.
Cleanup permanence may also be seen as a formof pollution prevention. A permanent treatmenttechnology removes the source of future pollution.Other types of treatment leave hazardous material asan uncertain threat, which may require action later.In contrast to primary pollution prevention forindustrial hazardous waste generation, cleanups startout with hazardous waste already created. It is onlythrough destruction or recovery that source reduc-tion can be applied to cleanup; this application mightbe called secondary pollution prevention.
Theoretically, every hazardous substance andcontaminated material can be permanently treated torender it irreversibly harmless. Engineering, econom-ics, and the ability to apply such technology to allsite contaminants are another matter. Organic haz-ardous substances can be destroyed by supplyingenough energy to break chemical bonds, such asthrough incineration or biological activity, andthrough chemical reactions, such as dechlorination,ultraviolet photolysis, wet air oxidation, and super-critical water oxidation. Materials containing toxicmetals can be treated to recover the metals, convert-ing them back into their original commerciallyvaluable form. Even some organic hazardous sub-stances can be recovered and sold commercially;recovery of oil from refinery waste sludges andcontaminated soils is commercially available
ZRc~Ww 10 question, in pre/lmMV fi-l~ings oj” (YKA Report on Superfund, Committee Report on Hearing ~fore the subcommi~~ onInvestigauons and Overs@t, Comrmttee on Public Works and Transportation, U.S. House of Representatives, Apr. 20, 1988, p, 273.
sRussell E. Train, ‘ ‘Big Questions Facing Lhe Cleanup, ” EPA Journul, January/February 1987.
q[ncre~smgly, separation t~hnology is used m Conjunction with a destruction technology, but litde allenf.iOn may be given to the enviromentd
release of contaminants from the. separation technology. For example, air ~tnpping of contaminated groundwatermay be used prior to biological treatmentin a reactor; a case study which described a groundwater cleanup of such a combination provided no information on the relatlve contribution of the airstripping to cleanup versus actual dest.rwmon of orgarnc contaminants by microbes. Robert Sanford and Donald Smallbeck, ‘‘Startup of aPhysical/Biological Treatment Plant to Treat Groundwater Contarmnated With Chlorinated Hydrocarbons and Soluble Orgarucs, ” proceedings ofHaztech International Conference, St. I.muis, MO, August 1987.

Chapter 3--Cleanups and Cleanup Technology . 141
through various solvent extraction processes, Acidicor alkaline wastes can be chemically neutralized.Asbestos can be classified. Therefore, in terms ofscientific principles, destruction, recovery, or someform of chemical conversion are treatment ap-proaches that produce permanent cleanups. Inassessing commercial availability of alternativetreatment technologies, therefore, it is useful to fistdistinguish between those that offer permanence, ina scientific sense, and those that do not. Not alltreatment technologies can meet environmentalgoals.
Reducing the volume or mobility of hazardoussubstances offers some environmental benefits rel-ative to the goals of controlling the release ofhazardous material into the environment and mini-mizing exposures to hazardous substances. Suchtreatment technologies may play an important roleprior to using a permanent treatment technology.But, in themselves, reducing volume and mobility(or reducing exposure by encapsulating a toxicsubstance) does not produce the kind of certainenvironmental benefit that destruction or recoverydo (even with less than perfect performance) be-cause the source of chemical hazard remains.
Current EPA thinking on the various outcomes ofcleanup approaches is different from OTA thinking.For example, under the heading of ‘‘programprinciples/expectations, at a technical informationforum for Superfund personnel, EPA said:5
●
●
‘‘Protwtion can be achieved by the destructionor immobilization of waste through treatmentor by preventing exposure through engineeringand institutional controls. ” (Although engi-neering and institutional controls must be usedat times, this statement can be interpreted tomean that a Record of Decision (ROD) couldconsider land disposal and deed restrictions ascomparable to incineration.)“Expect most remedies will involve a combi-nation of treatment and containment technol-ogies. ” (Although this statement is true to alarge degree and there is a role for containmenttechnologies, this statement does not tell front-
●
line personnel that treatment is to be maxi-mized and containment minimized; see thediscussion below on extent of permanence anddifferent types of cleanup actions.)‘‘Highly toxic, highly mobile waste (waste thatcan be contained reliably with engineeringcontrols, e.g., containment, capping) generallywill not need treatment. ’ (The problem is thelimited information on and in the interpretationof what is highly toxic and highly mobile; theinterpretation suggests to personnel a rationalefor not selecting treatment.)
Is it useful to think of degrees of permanence? No,not for what a particular technology accomplishes.Superfund implementation, thus far, has shown thatit is important to keep the distinction betweenpermanence and volume or mobility reduction clear.Otherwise, too many treatments are credited withpermanence. However, EPA has favored use of thedegree of permanence concept and this practicehas been important in providing the flexibility—which OTA considers being excessive—to equatedifferent cleanup alternatives as equally satisfy-ing the goal of obtaining permanent remedies. Forexample, former Assistant Administrator J. WinstonPorter said: “. ., There are degrees of permanence,. . . Certainly digging everything up and burning it isabout as permanent as you can get. On the otherhand, if you take just putting a cap over it andwalking away, that’s about as least permanent as youcan get. Then there is a gradation. . . . Certainlythings like solidification, I would say, is not aspermanent in the sense as some destruction tech-niques. . . . When we put a cap on or when we putmonitoring wells in or we do in situ (in-place)solidification or various other things, we do it withthe understanding that we hope that will workpermanently, not in geologic time . . . but for somefinite time period we expect that to work. ’
In OTA’s view, working for a finite time maymean months or years. What varies is not the degreeof permanence but the degree of environmentalprotection provided by the treatment or containmenttechnology. Indeed, even land disposal and contain-
5(-J.fj. fivfimen~ protection A~ncy, materials distributed at EPA’s Technical Information F~. Arlington, VA, Feb. 22-23, 1989.6Rc~pm t. ~ue~on, in p~~i~’~ Fi~ings Of OT,A Report on s~e~~, op. cit., foo~ow 2, PP. 189, 191.

142 ● Coming Clean: Superfund Problems Can Be Solved. . .
ment have sometimes been described as giving adegree of permanence.7
A related issue is the extent of use of a permanenttechnology at a site. It is not always possible to applypermanent treatment technology to all of a site’scontaminants. When more than one technology isused for a cleanup, including technologies andmethods other than destruction and recovery, onlypart of a site’s contamination may receive permanenttreatment. Therefore, if at all possible, the percent ofhazardous site material rendered harmless throughdestruction or recovery should be calculated todescribe the extent that permanent treatment tech-nology is used. Maximizing the extent of such use tosatisfy statutory preferences and requirements is thegoal.
Three Limiting Principles for Permanent Treat-mets--Unless proven inapplicable, there are threefundamental limits to any destruction or recoverytechnology. First, no destruction or recovery tech-nology can work on all conceivable hazardoussubstances. For example, incineration does notdestroy toxic metals, and biological treatment isvery chemical-specific. This limitation implies theneed for effective pollution controls to deal withuntreated substances.
Second, no process is 100 percent efficient.Incomplete destruction or recovery must be care-fully examined and measured. EPA currently re-quires an efficiency of 99.99 percent for incineration(and even more for polychlorinated biphenyls (PCBs).If this requirement was applied to other treatmenttechnologies, few would currently pass muster. Thisdeficiency too implies the need for effective pollu-tion controls to deal with untreated material. Thedeficiency also implies the need to set acceptablelevels of residual un-destroyed or un-recoveredcontaminants at a site on the basis of insignificanthealth or environmental effects.
Third, a treatment may produce new hazardoussubstances as byproducts of chemical reactions.
Testing for toxic byproducts takes special effort.While the problem is well known for incineration, itis an often neglected issue for other technologies,such as biological treatment. Also, a treatmentprocess may use chemicals which themselves posesome problem, such as additives to make in situbiological or chemical fixation work effectively.
Conclusions—The market for cleanup technolo-gies is rapidly changing, Over the past several yearsmany new technology companies have entered themarketplace. Technology availability has increased,but evaluating different technologies has gottenmore difficult. Increasingly, the competition will notbe between containment/land disposal and treatmentbut among different generic treatment technologies-especially permanent ones—and among differentoptions within generic categories. Although perma-nence is a key goal of final remedial actions, cleanuptechnologies which do not offer permanence have animportant role to play in emergency responses,attempts to recontrol sites, and interim remedialactions. But there it is important not to blur thedistinction between technologies which offer perma-nence and those which do not.
Issue 2: Is the Superfund system using provencleanup treatment technologies-preferablypermanent ones-where and when they areapplicable and feasible?
Types of Cleanup--This question cannot befairly answered unless it is understood that there arefour types of cleanup actions. First, there is emer-gency action, for which any type of fast responsenecessary to reduce the immediate danger is appropri-ate. There is no requirement to choose treatmenttechnology and, indeed, there would rarely be timeto pursue treatment.
Second, there is what is now called removalaction. Both emergency and removal actions can betaken on any site, without the requirement of the sitebeing selected for the National Priorities List (NPL).Originally, removal action was supposed to deal
7A ~fitiquc of ~ EpA s~dy @ a ~n~~tor working for responsible parties at a si~: “.. c The FS [feasibility study] incorrectly eliminates from&tailed consideration those alternatives, such as capping with groundwater renovation, which permanently reduce the mobility and volume of hazardoussubstances and which arc more cost-effective than the alternatives considered by EPA. (’‘Review Comments on the Re-Solve Site, Dartmouth,Massachuxm, Draft Feasibility Study and U.S. EPA Preferred Alternative, ’ ERT Company, August 1987,) No mention of reducing toxicity is made.Accurding to the contractor, leaving hazardous materials in the ground is a permanent remedy. It should be understood that EPA and its contractors havemade similar arguments in their work. l%e Re-SoIve site decision is one of the cases cited by OTA in its 1988 report as an example of SUperfind at itsbest becu of h treatment cleanup technology sclwted (i.e., dechlorination).

Chapter 3--Cleanups and Cleanup Technology ● 143
with imminent threats of release or exposure and wasdone relatively quickly and simply, prior to theremedial cleanup, often by removing hazardousmaterial to a landfill. The amounts of such materialscan be larger than the amounts treated subsequentlyduring a remedial cleanup. Data from EPA indicatesthat less than 10 percent of removal actions usedsome kind of treatment technology (about half ofthese used destruction technology);8 the vast ma-jority of removals--over 90 percent—used landdisposal and engineering or institutional controls.
But over time some removal actions have come tolook like major cleanups, sometimes using treatmenttechnology. Indeed, SARA increased the time andspending limits for removals. A number of multimillion-dollar removals examined by OTA are no differentthan major cleanups. For the period of fiscal year1987 and about half of fiscal year 1988, EPA saidthat there were 22 removals for which it waived the12-month/$2 million limit of SARA; the averagecost for those removals was just over $4 million.9
However, such multimillion-dollar removals areoutside the stringent cleanup standards of SARAwhich apply to remedial cleanups,
Third, there is an interim remedial action, nowcalled by EPA an operable unit, which is a partialremedial cleanup, in terms of part of a site or fractionof contamination targeted. Unlike the previous twocategories, interim remedial action requires majorsite investigation and a feasibility study of cleanupoptions. Also, EPA issues a Record of Decisionwhich describes the selected remedy and cleanupobjectives.
Fourth, there is a final remedial cleanup which,as with an interim effort, requires major site studyand a ROD and is covered by the stringent cleanupstandards of SARA; that is, in these two remedialcategories there is a clear statutory preference forusing permanent treatment technology. A finalremedial cleanup would set the conditions necessaryfor delisting a site from the NPL.
The Record on Technology Use—First, it isimportant to recognize that, contrary to some pop-
ular beliefs, SARA does not require EPA to selectpermanent solutions and alternative treatment tech-nologies but only to give them preference and to usethem “to the maximum extent practicable. ” Thestatutory requirements are vague and permit manydifferent interpretations. There is no governmentguidance to remove the ambiguities and inconsisten-cies. Considerable progress toward using moretreatment technology has been made, but all toooften it is not used. This was a major lesson fromOTA’s case studies, many of which either used nopermanent treatment technology or no other type oftreatment technology, or selected unproven anduntested treatment technologies (see box 3-A for asummary from the 1988 report).
Second, there are many technical application andimplementation issues for any generic cleanuptechnology; see box 3-B for an overview of suchissues for incineration, and see table 3-1 for asummary comparison of the many types and sourcesof mobile and transportable incinerators availabletoday. Over the past few years, there has been asubstantial expansion, nationwide, of the mobile/transportable incinerator business. This competitivemarket has brought down prices. The key differencebetween mobile and transportable is that transporta-ble units require significant effort to dismantle, setup, and move while mobile units do not. See boxes3-C, 3-D, and 3-E for overviews of application andimplementation issues for biological treatment, sep-aration, and chemical fixation technologies.
All of these application and implementationissues illustrate the complexity of remedy selection.Despite increasing experience with cleanups and theintroduction of more treatment options, the cleanupworkforce has found remedy selection to be morecomplicated. The need for narrowing down cleanupalternatives as early as possible without, however,foreclosing on important options has become greater,But narrowing down requires in-depth experienceand insight about generic types of sites and recenttechnology developments and experiences, so thattruly infeasible or impractical cleanup alternativescan be eliminated while retaining important options.
8U,S. Envir-ent~ ~o~tlon Agency, ~, ~lt,, f~mo~ 5, me flg~e of less ~aII 10 percent for ~ea~ent Cornpm ~ just under 70 perCent fOrremdird actions in fiscal year 1988, but the data for removals is cumulative, covering all actions since the beginning of the program; the comparablecumulative figure for remedial actions would be much lower than 70 percent, but significantly higher than 10 percent.
9R=WW t. question, in prel~”~ Fi~ings of OTA Report on SUpe?@d, op. cit.. foomote 2V P 200.

Table 3-l-Comparison of Mobile/Transportable Incineration Technologies
Rotary kiln Infrared furnace Circulating bed Electric pyrolysis Plasma arc torch
Operating Temperature . . . . . . . . . .
Residence Timesolids . . . . . . . . . . . . . . . . . . . . . .
Gases . . . . . . . . . . . . . . . . . . . . . .Waste Form. . . . . . . . . . . . . . . . . . .
Estimated Throughput . . . . . . . . . . .
Energy Recovery . . . . . . . . . . . . . .Estimated Cost . . . . . . . . . . . . . . . .
Availability . . . . . . . . . . . . . . . . . . . .
Movability . . . . . . . . . . . . . . . . . . . . .
Startup Time. . . . . . . . . . . . . . . . . . .
Vendors . . . . . . . . . . . . . . . . . . . . . .
1,200-1,800”F primarychamber
Up to several hours
1-2 secondssolid, sludges, Iiquid
1-5 tons/hour (mobile)5-20tons/hour (trans-portable)
Yes, for some units$100-$500/ton
Commercial
MobileTransportable24 hours (mobile) 4-6
Week (transportable)(Mobile)M & S Systems, Broad
Brook, CTENSCO Environmental
Services, Little Rock,AR
Thermal Dynamics,Mt. Kisco, NY
Vesta Technology,Ft. Lauderdale, FL
Roy F. Weston, WestChester, PA
Incinerex, Houston, TX(Transportable)ChemicalWasteManage
ment, Oak Brook, ILENSCO Environmental
Services, Little Rock,AR
Envirite Field Services,Atlanta, GA
lnternationalTechndogyCorp., Torrance, CA
600-1,900'F primarychamber
10-180 minutes
2 secondsSolids, sludges, Iiquid
adaptable80-210 tons/day (tpd)
Commercial
Mobile
1-2 weeks
Envi ronmental Treatment&Technologiescorp.,Findlay, OH
Reidel EnvironmentalServices, Portland,OR
Westinghouse Environ-mental Services,Pittsburgh, PA
1,500*F
About 30 minutes
2 secondssolids, sludges, Iiquids
4 tons/hour
Yes$100-$400/ton
Commercial
Transportable
3 weeks, not includingsite preparation
Ogden Environmentalservices, San Diego,CA
3,000-3,200 oF
Variable from minutesto hours
2 secondssolids, sludges, Iiquids
5-10 tpd, pilot 100 tpd,proposed Commercial
$300-$400/ton, pilot(preliminary)
Pilot. Commercial in 1year
Mobile
l-2 weeks, proposed com-mercial
Westinghouse Environ-mental Services,Pittsburgh, PA
Over 10,OOO”F plasmaplume
500 milliseconds, plasmaplume
Liquids, certain Iiquifiedsludges
2.5-3 gallons/minute; 1(on/hour
No$800-$2,000/ton
(preliminary)Commercial unit in final
testing; available bymid-1989
Mobile
1 week
Westinghouse Environ-ment Services,Pittsburgh, PA
SOURCE: Adapted from B. Rey de Castro, “SIX Burn Technolqes Roll Onto !Mes,” Waste Age, February 1989; and Paul N Cheremisinoff, ‘M&Me, Tranqortable and Package TreatmentSystems,” PoHti”on Ew”neering, April 1989.

—
Chapter 3--Cleanups and Cleanup Technology ● 145
Box 3-A—1O Case Study Sites WitA Capsule Findings
Case Study I
Chemical Control Corp., E:llxill)t>th, New, jersey~;~)l~ 1<1’gloll ~: Nl)l, r a n k 223 out o f 77(I
f{~llmatwl cost: $7. LI million
(Jnprtjtcrl solidification (f. h[!nlical fixation) technologyw,is selt!ctml to treat i n situ highly contaminated subsur-I;i(,c w)I1, whlf.h ~)r[:viou~ r~!m[)~al actions had left belowt ho wdt er t at)le ,Int{ [.l)~er(;d up with gravel. No treatabilit ySt u(iv \~’ii\ utfxl, ‘1’h I: (.mt of ]ncinerat ion was overestimated.‘1’h~! [,]f:anu[~ 1%’lli ]e,iv~! LI ntr(!i]td contaminat ion orrsite.
Case Study zCompass Industries, ‘[’l]l~i) (hunty, Oklahoma~:[~lf R{:glorl f): N})l. rilr]k 483177(JF;st imiitf!d ( [)sI $12 mllli(jn
( ;ai)l)t n~ (Lorlt,1 inmf; nt) of ~.ti]st(! was chosen ov[!r inclnt!r-at ion. (LI pp i n~ wci~ (Iilll(!d a (.f)st-(~ffc(;ti~~(:, permanent clean-u [) [!v[!n though it (lo~;s not provide perma n[!nt protection(.() rn pd rdblt: t t) i n(. I nerd t ion. .N() corn m i I ment was made tot rl?iit (’onti] m I Il:ltfXl gr{)l] ndwatf:r.
Case Studv 3Conservation Chemical Co., K,lnsas ( ;it}f, MissouriFIPA Regl{)n 7; N 1’1. ri]r)k i)cn(lln~E;st Imatf:d (()~t $2 k rn Illlon
(;ii[)pir)g {If th[! s]t[: ii n(l ii bydriluli(; (x)ntainnwnt systt!rnto pu rn[) a n(i t rf!iit sunlf> cl)rltiinrl nated ground wrater werechoserl (1~’(!r t?~(:d~ri]t I n~ ,1 nd treat ing COntam inat~!d SOi] andburied wastes, which was r[!commcnded in an EPA stildyand by the Stiitf). Wi]t(:r treiitment cannot remo~e all the(Iii’t’rsc (.ont am iniints i]t the site. The ROD said that no esti-m,it[; ~ ~)uld hc m,}dc for the rfurat ion of t h~! clc~nup.
Case Study 4Crystal City Airport, (;rystal (;it}, TtIxasE P A Region 6: NPI, #(j39/770b;stirnated cost” $ 1 . 6 m i l l i o n
~;~(.ci~ilt Ion of contilminated soils and wastes (which wereburiwf in a previous ri!rnot’al action) and their disposal inan urrl ined landfill with a cap over it were selected overincirleratioll. No treatability study supported the conclu-sion that the selected remedy is permanent on the basis(If the adsorption of diverse contain inants to site soi]. Ma-jor failure modes for the landfill were not examined.
Case Study 5Industrial Excess Landfill, Uniontown, Ohio~;pA Region 5; NP1, #164/770Estimated cost: $2 million
Providing i]lterna!t} water to houses that have or are likelyto have contaminated wells was a satisfactory interim re-medial action. Howe\(er, actions to address the source ofcontaminant ion and to stop and treat contain inated ground-watt~r are long nverdue.
Case Study 6Pristine, Inc., Reading, OhioEPA Region 5; NPL #531/770Estimated cost: $22 million
[n situ vitrification was developed originally for rildi[)-act ive soils, but its use for chemical}. contarn i n,ited sitesis still unproven. In situ kfitrification was selecttx - wit bouttreatability test results—chiefly because its estimated costwas about half that of onsite incineration. Rut the est imate(icost for incineration is probably high by ir factor of Z. I rl -cineration offers more certainty and probably would costno more than the chosen remedy. Ground water will bepumped and treated by air stripping and carbon adsorption.
Case Study 7Renora, Inc., Edison Township, New ]erseyEPA Region 2: NPL #378/770Estimated cost: $1.4 million
The sefected remedy makes use of of fsite land fiiiing forsoils contaminated with PCBS. Also, biological treatmentwas selected for soils contaminated with diverse organ iccompounds and toxic metals and for contain inatecf groun{i-water, but no treatabil it y study su pportcd its selection.
Case Study 8Sand Springs Petrochemical ComplexTulsa County, OklahomaEPA Region 6; NPI. #761/770Estimated cost: $45 rniflion
EPA originally said that solidification technology wasineffective for the high organic content wastes and thatonsite incineration was effective. EPA then reversed itselfand selected solidification for most of the cleanup, whichthe responsible party had claimed effective based on itstreatability study. Incineration is to be used if solidifica-tion technology is not successfully demonstrated or failsafter sol id i fied material is I and filled on the floodplain site,but criteria for failure are unspecified.
Case Study 9Schmalz Dump Site, Harrison, WisconsinEPA Region 5; NPL #190/770Estimated cost: $800,000
A simple compacted earth cover over the soil contami-nated with lead and chromium w a s s(!lected. Sol idifica-tion/stabilization treatment was rejer-ted, although this wasa textbook example of appropriate use of the technology.Voluntary well abandonment and monitoring was chost!nover pumping and treat ing contaminated grou ndwater.
Case Study 10Tacoma Tar Pits, Tacoma, WashingtonEPA Region 10; NPL #347/770Estimated cost: $3.4 million
NO treatability study results supportwf th(! s~!lcct ion ofchemical stabilization. Significant amnu nts of u ntrwatedcontaminants as well as the treated materials will be ]t?ftonsite. The effectiveness of the treatment i> LI n(:f)rti] i n. In-cinerat ion was said to offer no better protection and wasrejected because of its higher cost.
SOURCE: U.S. Congress, OfticcofTrchoniogy~ Are We Cleaning Up? 10 Snpe@md Cme Stndies, OTA-H’E-362 (Wash@uq* -J- 19ss), p. 9.
DC: Us. GOWWDCu

146 ● Coming Clean: Superfund Problems Can Be Solved. .,
Box 3-Key Issues for Onsite IncinerationExtra Cost Variables-Wastes or soils with: 1)
high water content or large inert objects (e.g., buriedautomobiles, large rocks), 2) high levels of corro-sive chemicals (e.g., chlorine), or 3).high levels oftoxic metals require costly materials handling,special construction, or additional pollution controltechnology, respectively. Materials with low heatvalue (low organic content) require more externalfuel or energy, increasing costs. Such needs do noteliminate the intrinsic advantage of incineration:the ability to destroy organic hazardous substances.
Unit Costs==Unit costs for mobile incinerationdepend on volume of treated treated becasue thereis significant economy of scale. Smaller cleanupsare proportionately higher in cost because of highmobilization“on, set up, and testing costs. For very highvolumes, unit cost is substantially lower, but totalsite cleanup cost remains relatively high (e.g., for alarge landfill).
Environtmental Risk--General concerns aboutenvironmental risks of incineration (e.g., air pollu-tion, no standards for toxic air emissions) canincrease costs (e.g., permits, tests) and publicopposition which itself results in incereased costsand delay because more data and assurances ofsafety must be provided.
Imcinerator Market-An inCreasing diversityof mobile incinerators, differing in: 1) size, design,and type of heating (e.g., rotary kiln, infrared,fluidized bed, plasma-arc); and 2) the degree of pastexperience and proven reliability, requires moreanalysis prior to selection of remedy and causesgreater variables in estimated costs.
souRcB: Omc80r l=l=@Y~ 19s9.
EPA’s data for source control RODS (excludingno further action and groundwater cleanup deci-sions) for fiscal years 1987 and 1988 indicates:
. use of land disposal/containment in 52 percentof RODS in fiscal year 1987, down to 26percent in fiscal year 1988;
. destruction treatment (incineration and biologi-cal) in 21 percent in fiscal year 1987, which
●
●
improved to 30 percent in fiscal year 1988; and
separation technology in 7 percent in fiscal year1987, which increased to 21 percent in fiscalyear 1988;
various types of chemical fixation or stabiliza-tion techniques in 13 percent in fiscal year1987, which increased to 17 percent in fiscalyear 1988.
Note that some RODS used more than onetechnology and that some technologies were notcategorized. Separation technologies were not nec-essarily followed by destruction.l0
In understanding the selection of treatment tech-nologies, it is necessary to take into account cost, siteconditions (e.g., hydrogeology, climate, geochemis-try), Complexity and widely varying levels ofcontamination, and other factors that may rule outtechnology that otherwise appears technically feasi-ble from a more scientific perspective. But nearlyalways there is more than one technically feasibletreatment option and increasingly the options are foronsite treatment in mobile or transportable equip-ment or, to a lesser extent, for in situ application toundisturbed soil or groundwater. Onsite treatmentoffers the advantage of eliminating the costs andrisks of transporting hazardous materials and, in-creasingly, the high costs and limited availability ofsome waste treatment technologies at commercialfacilities. Moreover, different treatment technolo-gies can be combined or even used in conjunctionwith land disposal/containment approaches; forexample, only hot spots of contamination may beexcavated and treated when there are truly enormousamounts of buried materials.
Different forms of a generic technology may varyso much in terms of equipment, cost, mechanism ofhazard reduction, environmental safety, and otherfactors that Feasibility Studies and selections ofcleanup technology may have to go beyond genericcategories. This situation is definitely the case forforms of thermal and biological destruction that varygreatly. Serious problems result because greaterexpertise and analysis is required, which can lead tolonger and more costly studies.
l~os. ~“”worm.wntal Prutcctiom A-y, ‘‘Solid and Hazardous Wsste Report for Fiscal Years 1987 and 1988,” and informal corrections providedto OTA.

Chapter 3--Cleanups and Cleanup Technology ● 147
BOX 3--Key Issues for Biological Treatment
Lack Of Field Experience--The enormous promise of biological treatment, as a destruction technology fororganic hazardous subtances and for the conversion or recovery of some toxic metals, is impeded by the lack ofdocumented field experience in meeting stringent (low residual contaminant level) cleanup standards. This problemis exacerbated by aggressive marketing by an increasing number of vendors with little, if any, experience. Muchvendor experience has been for confidential clients, which limits detailed public information.
Chemical Specificity-Biological effectiveness is chemical-specific, meaning that sites with diversecontaminants are difficult and require more testing, verification, and process monitoring. Even variations of a typeof chemical can be very significant; e.g., PCB molecules with higher numbers of chlorine ions are difficult todegrade.
Sustaining Performance--Very low and very high contaminant concentrations pose problems for sustainingbiological performance. Hazardous material is both a food source and at high concentrations, potentially, a poisonto microbes, depending on many factors in addition to concentration.
In Situ Problems--In situ application (i.e., leaving wastes where they are) is more difficult than usingabove-ground engineered equipment (i.e., bringing wastes to the biological process) because: 1) degree and speedof effectiveness depend on controlling critical variables such as oxygen and nutrients to sustain biological activity,2) natural soil or aquifer conditions can inhibit effectiveness (i.e., bacteria may not be able to reach contaminantsbecause of low permeability subsurface soil or slow moving groundwater), and 3) variations in contaminantconcentrations and unexpected contamination can drastically reduce effectiveness which is difficult to detect.
Correlations of Effectiveness--Varying degrees and rates of effectiveness have not been well correlated withvarious waste and site characteristics. This limits learning about technology and extrapolation of results to othersites.
Uncertain Choices--A very high level of R&D is underway and substantial new or different approachesintroduce uncertainty into applicability and remedy evaluation; e.g., aerobic v. anaerobic bacteria fungi v. bacterianatumily occurring site bacteria v. proprietary microbes and genetically engineered bacteria; i.e., acceptance orrejection of the generic approach requires an increasing amount of treatability testing and analysis of specifictechniques, requiring more cost and time prior to critical remedy selection decisions. This problem is exacerbatedby a generally low level of microbiological literacy in the cleanup workforce, especially those who examine andselect cleanup remedies.
Costs-Although there is, theoretically, an intrinsic economic advantage for biological treatment (particularlywith thermal destruction technologies), because of low capital, energy, and materials costs, claims of comparativecost advantages for biological cleanups discount offsetting factors, including: high testing costs, the need for usingother technologies before or after biological treatment high contingency costs to account for encountering upsetconditions (sudden occurrences which cause treatment systems to crash-i.e., stop performing according tospecifications), sometimes long processing times, and similar costs for competing generic technologies (eventhough they might not be permanent treatment technologies) or combinations of technologies, such as low-costseparation technology followed by incineration.
P roof o f Des t ruc t ion Above Ground-Above-ground processing may suggest contaminant destructionwhich actually is contaminant transfer to the air or water. Data to substantiate contaminant destruction is oftenlacking, and this issue is complicated by the use of other treatment technologies (e.g., air stripping of groundwater)in a site cleanup.
Toxic Byprod ucts--There is very little information on production of toxic byproducts.Process Controls--Process controls may not reflect detailed determination of failure points; i.e.,
combinations of loading and engineering control parameters that cause biological treatment systems to exhibitsudden effluent deterioration and failure.
Biodegradability-Lists of chemicals that say whether or not they are biodegradable reflect scientificknowledge more than engineering information and field experience.
SOURCE: on%= of lkclmology Aswsmc@ 19s9.

148 ● Coming Clean: Superfund Problems Can Be Solved. . .
Box 3-D--Key Issues for SeparationTechnologies 1 2
Identifying Contaminants--The disposition ofthe separated contaminant (s) requires precise iden-tification. Sometimes a contaminant is released intothe air or disposed of in a landfill, although it isalways feasibIe to destroy organic material throughSome form of incineration or to recover toxicmetals.
Concentration Levels--The effectiveness andefficiency of many techniques are sensitive to theconcentration of contaminants; some techniqueswork cost-effectively within certain“ concentrationranges.
Many Contaminants Need Extra Treatment—When many diverse contaminants are present, anysingle technology is unlikely to be fully effective onall of them. Use of several technologies can meetstringent cleanup objectives but adds significantnew costs, whose avoidance may compromiseCleanup objectives. Detailed treatability testing ofsite material“ s and onsite demonstrati“on of systemare critical.
In Situ Effectiveness--For in situ techniques,soil conditions, depth of contaminati“on, and watercan drastically reduce effectiveness. Complex siteconditions increase costs substantially and increasethe need to show, in site demonstration, that thetechnology works.
1~~ ~,. ..McmmlexUUaKm“ d dr a H 91ripp@ d VdUile agmic~ k sait (in simk•h~J~“ fmul d (m 8inl Or m ~
● soil flq m Wabiug (m situ ff m y ylnlll?mk● SdveatoxUMXim dmib (in ~ qupmem “● Ak9Uippiq , ~ ~ ~ *WV w~ of ~ in w- (m ~ oq9ip
Ilmnt).~aMpUUianmdXmbgy an beumdfa~~ (- ~~X)- al k$ sbilky topru&ceP - ~ mitabb far ~ -. In ambbUim Wililtkructb=~ ~t ~‘ ~-~~W===-”
SOURCE: CMfbeof ‘MmotaW ~ IW.
Use of Land Disposal and Containment--Noone should jump to the conclusion that land disposal/containment options are no longer being selected, or
that they will not be selected in the future. Althoughthere are some kinds of sites for which containmentremains an appropriate action, the issue is whetherto call such actions permanent remedial cleanups.There are still sites where treatment technologies areruled out, sometimes in a preliminary screening ofalternatives and sometimes on the basis of poorinformation and evaluation, as OTA’s case studieshave shown.ll In many cases, containment/landdisposal options are being used unnecessarily. Thereis more experience in rejecting treatment technolo-gies than in selecting them. Here are (in no specialorder) 23 generic explanations for rejection oftreatment technology, which OTA has found areoften used singly or in combination in studies forSuperfund sites:
10
2.
3.
4.
5.
6.
7.
8.
9.
10.
110
12.
13.
Land disposal or containment provide com-parable environmental protection.There is too little hazardous material tojustify treatment.There is too much hazardous material to treatcost-effectively.Treatment technology provides unnecessaryrisk reduction at excessive cost.Excavating material would pose unaccepta-ble short-term risks because, for example, ofvolatile chemicals or explosive materials.There is no treatment technology with enoughreliability and implementability to use.The treatment technology used elsewherewill not work for this site, because of itsuniqueness.Future land use restrictions are sufficient andthe waste can be left in the ground.Natural dilution of contaminated water willbe enough.No one is using the contaminated ground-water.An alternative source of water has alreadybeen provided.If treatment was used, the clean materialwould only get re-contaminated because ofother sources of contamination.Information on the true extent of contamina-tion and risk exposure is still incomplete andmore studies are necessary.
Ilu$s. cmw~~, ~lw of ~~loa ~sment, Are we clea~”ng fJp? 10 s~e~~ c~e Sti’cs, OTA-ITE-362 (Wd@tOU, ~: U .S .
Oovunmcnt Printing Office, June 1988).

Chapter 3-Cleanups and Cleanup Technology ● 149
14.
15.
16.
17.
18.
19.
20.
21.
22.
23.
o f
No test results show that the technologyworks for this site’s problem.The costs of the treatment technology cannotbe estimated.The local community does not want uncer-tain, innovative treatment technology to beused.If incineration is selected, some commercialoperation will begin after cleanup and otherpeople’s wastes will be treated on-site.Regulatory permits cannot be obtained expe-ditiously.The residues of the treatment are hazardousand will have to be disposed of at a permittedhazardous facility at great cost.The law does not say that treatment technol-ogy must be selected, only that it be examinedand given preference.The technology will not treat all the contamin-ants at the site.If the technology is used, then some othertreatment technology will also have to beused afterwards for residues.Natural treatment will take place through, forexample, biodegradation, adsorption to soil,or release to the environment.
course, sometimes such explanations forrejection are valid. But when this is so it is necessaryto give a well-documented technical case or logicalanalysis rather than mere assertion. Moreover, manytimes an obstacle could be effectively overcome if adecisionmaker has the will to do so. For example,poor information can be corrected and tests can beconducted.
Last, there is the emerging issue of how newlydeveloping land disposal restrictions for hazardouswaste under the Resource Conservation and Recov-ery Act (RCRA) affect Superfund cleanup decisionsin response to the SARA statutory requirement tocomply with current government regulatory stand-ards. Briefly, EPA’s current guidance to peopleimplementing Superfund suggests several ways tojustify using land disposal by evading land disposalrestrictions, particularly treatment requirements: *2
. The cleanup waste must be placed, but place-ment does not include: waste capped in place,
Box 3-E—Key Issues for Chemical FixationPermanency-Although there are increasing
claims of permanency for new and advanced formsof fixation, there is very little scientific evidence toverify irreversible molecular change for organiccontaminants or chemical bonding for toxic metalatoms. Any such evidence cannot be extrapolatedfrom one contaminant to another. Solidification(forming a hard solid) does not necessarily meanthat the material is resistant to leaching-out ofcontaminants.
Contaminant Compatibility-There is too lit-tle recognition that using the technology for siteswith diverse contaminants requires extensive fine-tuning of formulations. Incompatible contaminantscan reduce effectiveness substantially.
Long-Term Effectiveness-Long-term effec-tiveness cannot be proven experimentally (unless
permanency is demonstrated) and modeling hasinherent uncertainties. For example, changing envi-ronmental conditions (e.g., acidity, chemistry, tempera-ture) might cause increased leachability of contamin-ants from solidified/treated material.
Air Releases--Processing and mixing of materi-als can release volatile contaminants into the air.
Volume Increase—Often, there is a large vol-ume increase which may complicate onsite dis-posal.
Dangers of Private Formulas-An increasingnumber of vendors offer proprietary formulations,leaving users with significant uncertainties, such asquestions about worker health and safety, toxicbyproducts, and patent infringement.
SOURCE: Office of ‘l&.hnoIogy ~t, 1989.
waste consolidated within a cleanup unit, wastetreated in situ, waste processed within the unitto improve its structural stability for closure orfor movement of equipment over the area.
● The cleanup waste may not be a RCRAhazardous waste and is not sufficiently similarto a known RCRA waste.
. The cleanup waste may not be restricted in aregulatory sense.
12U.S. &“uwnfncntal Protection Agency, op. cit., footnote 5.

150 . Coming Clean: Superfund Problems Can Be Solved. . .
. If treatment standards cannot be met: apply fora no-migration petition; apply for a case-by-case extension; apply for an equivalent treat-ment method petition; delist the waste; or applyfor treatability variance through rulemaking oradministrative permission, particularly for soiland debris cleanup wastes.
It seems, therefore, that expectations that theRCRA land disposal restrictions might promotemore use of treatment technology in cleanups shouldbe tempered by the many ways such requirementsmay be circumvented. For example, many cleanupsconsist of capping waste in place or consolidatingsite wastes within a cleanup site.
New Technologies--Though more sites are usingpermanent cleanup technologies, new technologiesstill face difficulties. It may seem to some peoplethat progress is being made because, for example,rotary kiln incineration and not land disposal ischosen for a cleanup. However, some other perma-nent technology, such as a newer form of thermaldestruction or a type of biological treatment, mightoffer cost, environmental, or technical advantagesbut has not even been considered and evaluated.Although nearly everyone working within the Su-perfund system understands the congressional intentto shift to permanently effective cleanup technolo-gies and acknowledges the public’s support of thatpolicy, numerous factors account for its slow anduneven implementation.13
One recent survey concluded, “The array oftechnological tools available for treatment of haz-ardous waste streams and site remediation continuesto grow at an ever faster pace . . . In fact, technolog-ical advance is in many ways outpacing the rate atwhich treatment choices made by regulatory agen-cies can be put into action. . . . The regulatory pushtoward permanent solutions that can be accomplishedonsite and that avoid present and future risk liability
is likely to spawn many more new technologies ofvarying applicability. ’ ’14
A study by Tufts University concluded that “. . .there are elements which result in a bias against theuse of innovative treatment technologies. . . Limiteddata on cost and operational history has resulted inscreening out innovative technologies early in theevaluation process. Because of the liability fordamages resulting from failure of the technologies,contractors, potentially responsible parties, and gov-ernment alike are reluctant to recommend the use ofinnovative technologies that have not been fullydemonstrated to remedy hazardous waste prob-lems. ”15
The frustration of technology developers is wide-spread. This is what one developer said at acongressional hearing: ‘‘The Remedial Division, thegroup which should be performing cleanups asdictated by the principles of SARA, appears sowedded to A&E (architecture and engineering) firmsfor their Records of Decision that it appears virtuallyimpossible to get a new technology accepted in anyreasonable time."16 EPA has made progress inovercoming obstacles to using treatment alternativesto land disposal and has recently clarified its policyobjectives,
17 but use of new treatment technologiesstill faces major obstacles (see following issues).
There is a significant lag not only betweenresearch and development and demonstration butalso between successful demonstration--consideredhere as enough onsite work with site materials toestablish technical effectiveness and reliability—and full-scale application. This lag tends to push theexpanding national cleanup effort toward oldertechnologies rather than toward the risk and uncertainty—but the chance for bigger payoff--of newer technolo-gies. Furthermore, the public may have little pa-tience with delays in Superfund cleanups. In otherwords, insecurities inside the Superfund system andpressures from outside cause the adoption of newer
13s= OTA*S 1988 report and following issues.
14Jim Bishop, “Treatment TMmologies,” Hazmu Worfd, June 1989.lscen~r for Environmental Management, ‘lhh University, “The Use of Innovative Treatment Technologies at SuperfUnd Sites, ” Environment.d
hnpuctAsseswnenf Review, vol. 8, 1988, pp. 181-191.16paul s. McGou@, ~ument m~e at h~ng, Su&om.mittee on Transportation, Tourism, artd Hazardous Matiri~s* comrnitt~ on ficr8Y ad
Gxnmeree, U.S. House of Representatives, Hoboken, NJ, Dec. 7, 1987.17u.sC ~vlromen~ ~otatim Agency, Office of Solid Waste and Emergency Response memorandum, ‘‘Advmcing tie UX of Tr~~ent
lldmologies for Superfund Remedies,” OSWER Directive No. 9355.0-26, Feb. 21, 1989.

Chapter 3--Cleanups and Cleanup Technology ● 151
technologies to be slow even as the need for them isincreasing,
Information transfer and communication are keyproblems too. For both the general public andmembers of the Superfund workforce, it is difficultto cope with the flood of scientific and technologicaldata and details, which is increasing at a rapid rateas more vendors enter the market. But technologydevelopment and selection of new technologies arecrucial to making Superfund work more effectivelyand efficiently.
The SpeciaI Case of Pump and Treat forGroundwater-Cleaning up contaminated ground-water increasingly means using the pump-and-treatapproach, which means that contaminated ground-water is pumped up to the surface and treated insome manner. The treated water may then bepumped back into the ground (through injectionwells), sent to a municipal water treatment plant forfurther treatment, or discharged to a river. Theincreasing use of pump and treat is in response to thepublic demand for cleanup of contaminated ground-water. However, over the past few years, there hasbeen increasing discussion in the technical com-munity (particularly from EPA’s Robert S, KerrLaboratory, Ada, Oklahoma) of the uncertainty andprobably ineffectiveness of pump and treat. Somekey thinking and findings on this issue are excerptedbelow:
●
●
‘‘ [U]nless the hydrology and contaminant char-acteristics at the site are adequately understood,the perceived success of pump-and-treat tech-nology can be misleading. A failure to under-stand the processes controlling contaminanttransport can result in extremely long pumpingperiods and consequently, costly and ineffi-cient remediation." 18
‘‘Using current site investigation and remedia-tion technologies, it is not possible to locate allsignificant contamination, nor can anyone ac-curately predict contaminant movement, fate,
●
●
exposure, effects, or remedial technology per-formance. 19
“[T]here are two principal phenomena ofsubsurface contaminant movement that limitthe effectiveness of pump-and-treat remedia-tion. One is the hydrologic effects of subsurfaceheterogeneity. In the real world, ground waterflows through preferential pathways; that is,through zones of higher permeability . . . Thepractical effect on pump-and-treat remedia-tions is that it may take much longer to flush outor exchange the water in zones of finer grainedmaterials than is estimated from traditionalmathematical models that average flow ratesover the thickness of the aquifer. The result isthe long tailing effect on (contaminant) recov-ery curves. . , This effect increases with the ageof the contamination because of more time forthe pollutants to diffuse into the finer grainedsubsurface materials.
“The second phenomenon concerns thechemical and physical forces that retard themovement of contaminants in relation to watermovement. Most contaminants sorb onto andinto aquifer materials and ‘partition’ betweenthe solid and liquid phases, Many commoncontaminants also have a vapor phase in thesubsurface. . . . [T]he amount of contaminantsin each of these phases is a function of thecharacteristics of the subsurface material andthe chemical properties of the contaminant. Ifonly samples of groundwater are used toestimate the amount of contaminants to beremoved by pumping, that amount will often begreatly underestimated because, in general,most of the contamination will be associatedwith the solid phase. Slow contaminant transferfrom geologic material to water, where it can beextracted by pumping, is further exacerbatedwhen immiscible fluids are present."20
“An analysis of the mechanisms that controlseparate phase migration and dissolution re-veals that groundwater extraction as a cleanup
lgcl~~n W. H~, ‘‘practical Lfiits to Pump-and-Treat lkchnology for Aquifer Remediation, ’ Hazardous iUaterials Technical Center Newsletter,hdy 1988.
15WiIIjm A W~I= and David R. L~co]n, 1‘ HOW scienti~s Make Deaslons About Groundwa[er and S011 Remediation, ’ PreWI(Cd at NatlmdResearch Council Colloquium Remediating Ground Water and Soil Conmtnmatwn: Are Science, Policy, and Public Perception Compatible?
%linton W. Hall (Director of EPA’s Robert S. Kerr Environmental Research Laboratory), letter to OTA, Sept. 6, 1988.

152 ● Coming Clean: Superfund Problems Can Be Solved . . .
●
technology is very inefficient-Petroleum hydrocar-bon and organic solvent liquids are trappedwithin porous media as ganglia and lenses dueto air-liquid and water-liquid interracial surfacetensions.21 Water table fluctuations, either re-gionally or locally, can emplace lighter-than-water liquids below the water table as lenses.Under conditions encountered in aquifers, theseganglia and lenses cannot be mobilized bygroundwater extraction. . . . The time requiredfor separate phase contaminant dissolution intogroundwater is on the order of decades andproduces a dilute waste stream that is expensiveto treat. The low boiling points of these liquidsindicate that steam injection could mobilize thetrapped contaminant phase. A series of experi-ments has demonstrated the inadequacy ofgroundwater pumping and the feasibility ofsteam injection for complete recovery of sepa-rate phase liquid contaminants. ’22
‘‘Depending upon the nature of the subsurfaceterrain and the composition of the contaminantspresent, remediation may be relatively easy orvirtually impossible. . . . [T]here needs to be arecognition that there are many existing sites ofcontamination that, if not entirely beyond ourability for rectification in an environmentallysatisfactory way, may at least require manyyears to remediate, may involve enormoussums of money, and may create other environ-mental and social problems that may be equalto or greater than that posed by the contamina-tion itself. Because of the great diversity of theproblem sites, setting criteria and priorities forcleanup is not a simple task. An easy solutionis not likely to be found. Even the effectivenessof proposed solutions is often quite uncertain
●
●
because of the many unknowns inherent in sitecharacterization and the absence of proventechnologies for remediation. ’ ’23
“New models have been developed that arepotentially sophisticated enough to deal withalmost any geologic or hydrologic setting. Theproblem now lies in our continuing inability tocollect sufficient subsurface information to usein the models. Because of the nature of thesubsurface, the uncertainties can never beresolved with today’s investigation technology.
" . . . [T]he hazardous waste engineer mightreasonably want to know in which direction aplume of dense, pure-phase TCE (trichloroeth-ylene) might flow along the base of an aquiferand whether or not it would be possible tofollow it to a low point and extract it through awell.
" . . . [T]he answer to the hazardous wasteengineer’s question is just not obtainable, and,therefore, the pure-phase TCE can neither belocated, if it exists at all, nor extracted duringthe cleanup.
“There is not now, nor will there soon be,quantitative guidance or standards to go by indesigning hazardous waste site investigations.(Best judgment) will occasionally result inerrors: unnecessary samples will be taken; dataof the wrong quality will be collected and willhave to be collected again; and other errors willoccur." 24
‘‘For NAPLs (non-aqueous phase liquids) suchas benzene and other petroleum products,which tend to float on groundwater, there havebeen successes in pumping a significant frac-tion of the NAPL to the surface. Yet for others
21T& i=u of whe~er con~iu~ sink or float in groundwater is very important. In general, petroleum-based materials are lighter than water, andchloMated chemicals are heavier than water. Volubility in water also determines the physical state of contaminants in groundwater. Dense chlorinatedsolvents, for example, are not very soluble in water either; therefore, they will tend to sink in aquifers until stopped by the solid aquifer material, andthen they may spread laterally. Over time, more of the contaminant may dissolve in the groundwater, particularly if the water is moving, exposing cleanerwater to the contaminant. Lighter-than-water contaminants float on the surface of underground water. Essentially pure, discrete forms of insoluble liquidcontaminants in an aquifer are just like above ground or subsurface soil sources of contamination, which enter the groundwater because of vezticaldownward motion, perhaps with the help of water entering the site and moving into the aquifer.
22J== R. Hunt et id., “Organic Solvents and Petroleum Hydrocarbons in the Subsurface: Transport and Cleanup,” University of California,Berkeley, Sam’tary Engineering and Environmental Health Research Laboratory Report No. 86-11, August 1986. Note that steam injection faces manyof the same problems as pump and treat and it has not yet reached commercial availability.
‘Perxy L. McCarty, “Scientific Limits to Remediation of Contaminated Soils and Ground Water, ” presented at National Research CouncilColloquium, Remediating Ground Wattr and Soil Contamkuion: Are Science, Policy, and Public Perception Compatible? April 1989.
24 HUdoU WNW ~tion CoWtion, ~e~cm Consulting Enginwrs council, Tk i-faz~do~ Waste Practice-Technica/ and Legal Environment1988, 1989.
Chapter 3--Cleanups and Cleanup Technology . 153
more dense than water (e.g., chlorinated sol-vents, creosote, and PCB-rich oils), very littlesuccess has been achieved in even locating thesubsurface NAPL sources, let alone removingthem.
" . . . [E]ven after exceptionally detailed siteinvestigations are conducted, it is normally notpossible to predict reliably where these (dense)NAPL pools are, Not knowing the size andlocation of (dense) NAPL pools and zones ofresidual (dense) NAPL makes it impossible topredict how long a pump-and-treat programmust operate in order to clean the aquifer.
‘‘The mass of NAPL at or below the watertable is not known with sufficient detail at mostsites to make reliable predictions of the timenecessary for cleanup by pump-and-treat pro-grams. In general, it is appropriate to view suchapproaches as remediation in perpetuity [em-phasis added]. ”2s (In contrast to this viewabout NAPLs, EPA’s view seems overly opti-mistic. *6)
. “Complex groundwater flow patterns presentgreat technical challenges in terms of charac-terization and manipulation (management) ofthe associated contaminant transport pathways.. . . One result is that certain parts of the aquiferare flushed quite well and others are remediatedrelatively poorly. Another result is that thosepreviously uncontaminated portions of theaquifer that form the peripheral bounds of thecontaminant plume may become contaminatedby the operation of an extraction well that islocated too close to the plume boundary,because the flowline pattern extends down-gradient of the well. The latter is not a trivialsituation that can be avoided without repercus-sions by simply locating the extraction well farenough inside the plume boundary so that its
flowline pattern does not extend beyond thedowngradient edge of the plume, because doingso results in very poor cleansing of the aquiferbetween the location of the extraction well andthe downgradient plume boundary.
“It is not possible to determine preciselywhere the various flowlines generated by apump-and-treat operation are located, unlessdetailed field evaluations are made duringremediation. Consequently, there is a need formore data to be generated during the remedia-tion (esp., inside the boundaries of the contamin-ation plume) than were generated during theentire RI/FS process at a site, and for interpreta-tions of those data to require much moresophisticated tools. ’27
“Originally, we were confident long-term ground-water remediation (i.e., pump-and-treat) couldbe accomplished in approximately 20 years.Now, with our present knowledge and ex-perience, many professionals suggest theseactions may take much longer, in some cases upto 100 years. , . . Is it cost-effective to continu-ally remediate ground water or should weaccept wellhead (point-of-use) treatment andrely on natural attenuation for the aquifer? If wedo, then what will be the long- and short-termimpacts on surface water and the environ-ment? ’28
“Complex fate and transport mechanisms ofcontaminated ground water often make it diffi-cult to predict accurately the performance ofground water remedial action, . . . To illustratethis principle, figure 3-1 presents three possiblesituations that may occur after several years ofa groundwater response action. In the firstscenario (case A), the target concentration willbe reached within the desired time period. Inthe second scenario (case B), the target concentra-
Mmuglm M. Mcby ~d John A. men-y, ‘‘Groundwater Contammauon: Pump-and-Treat Remechation, ’ Environmental S~lenc e and Techologj,vol. 23, No. 6, 1989.
MU.S. fivuomen~ ~otauon Agency, Guldame onl?e~dialActu)~f~r Contaminated Ground Water at S~erfund Site.\. Dcccmbcr 1988. EPA’sview is: ‘‘The presence of dense non-aqueous phzw liquids (DNAPLs) also may affect the extent to which contaminants can be removed from the groundwater; points of accumulation are difficult to Identify, and, unless the well screen IS located in the non-aqueous l]quid phase. the contaminant will onlybe extracted slowly as it dissolves in[o the groundwater. ’
27 Joseph F. Keeiy, ‘ ‘Performance Evaluations of Pump-And-Treat Rcmcd]atlons, draft of EPA Supcrfund Groundwater Issue Paper. SW foilowmgdiscussion on the observational method.
Zgstephen R. Wassrsug and Christopher J. Corbetl, ‘ ‘Policy AspecIs of Currcn~ Practices and Appllca(]ons, presented al National Research CouncilColloqwum Remediatvrg Ground Water and SOJ[ Contamination Are .~~lence, Policy, and Public Perceptwn Compatible? April 1989.
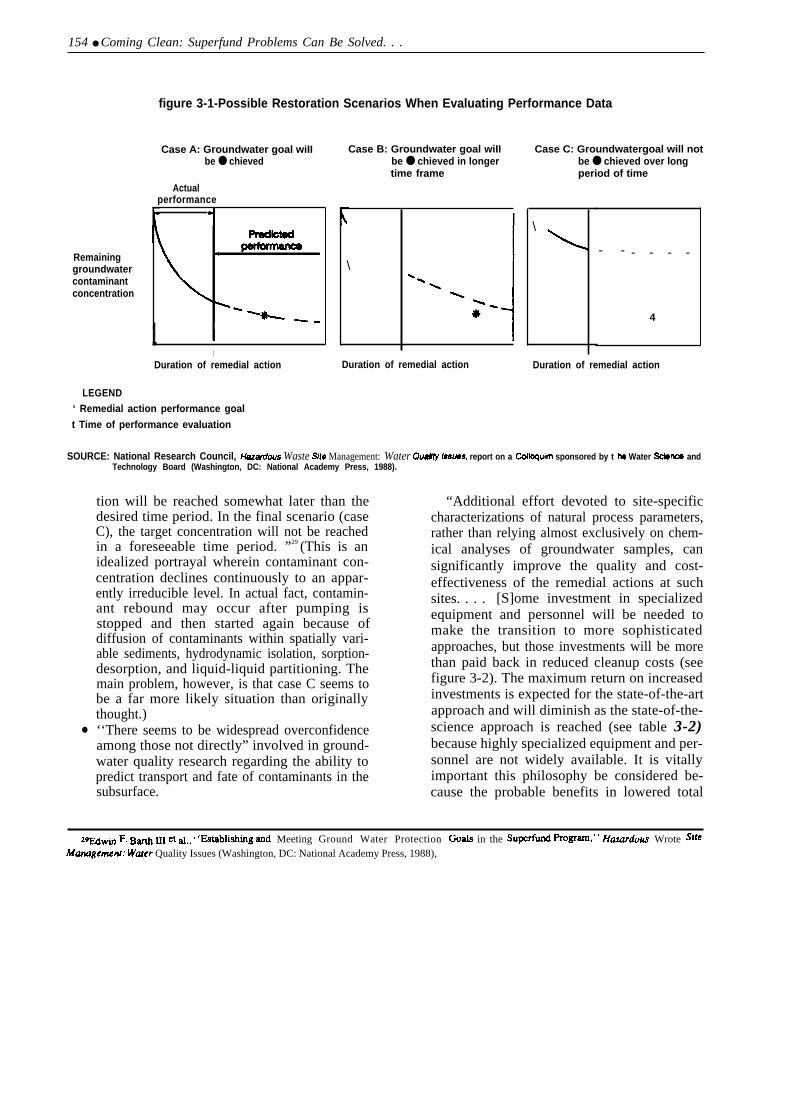
154 ● Coming Clean: Superfund Problems Can Be Solved. . .
figure 3-1-Possible Restoration Scenarios When Evaluating Performance Data
Case A: Groundwater goal wiIIbe ● chieved
Actualperformance
Case B: Groundwater goal wiIIbe ● chieved in longertime frame
Case C: Groundwatergoal will notbe ● chieved over longperiod of time
Remaininggroundwatercontaminantconcentration
1I
Duration of remedial action
LEGEND‘ Remedial action performance goal
t Time of performance evaluation
\
\
- - - - - -
4
Duration of remedial action Duration of remedial action
SOURCE: National Research Council, Hazadous Waste We Management: Water @a#ty ksues, report on a Cdloquim sponsored by t ha Water Science andTechnology Board (Washington, DC: National Academy Press, 1988).
●
tion will be reached somewhat later than thedesired time period. In the final scenario (caseC), the target concentration will not be reachedin a foreseeable time period. ”29 (This is anidealized portrayal wherein contaminant con-centration declines continuously to an appar-ently irreducible level. In actual fact, contamin-ant rebound may occur after pumping isstopped and then started again because ofdiffusion of contaminants within spatially vari-able sediments, hydrodynamic isolation, sorption-desorption, and liquid-liquid partitioning. Themain problem, however, is that case C seems tobe a far more likely situation than originallythought.)‘‘There seems to be widespread overconfidence
“Additional effort devoted to site-specificcharacterizations of natural process parameters,rather than relying almost exclusively on chem-ical analyses of groundwater samples, cansignificantly improve the quality and cost-effectiveness of the remedial actions at suchsites. . . . [S]ome investment in specializedequipment and personnel will be needed tomake the transition to more sophisticatedapproaches, but those investments will be morethan paid back in reduced cleanup costs (seefigure 3-2). The maximum return on increasedinvestments is expected for the state-of-the-artapproach and will diminish as the state-of-the-science approach is reached (see table 3-2)
among those not directly” involved in ground- because highly specialized equipment and per-water quality research regarding the ability to sonnel are not widely available. It is vitallypredict transport and fate of contaminants in the important this philosophy be considered be-subsurface. cause the probable benefits in lowered total
2f93-j~ F. B~ UI et ~., c ‘Es~bli~ing and Meeting Ground Water Protection Goals in the SuPCrfund b~~,’ * H~r~~ Wrote SfieManugewunt: Wuter Quality Issues (Washington, DC: National Academy Press, 1988),
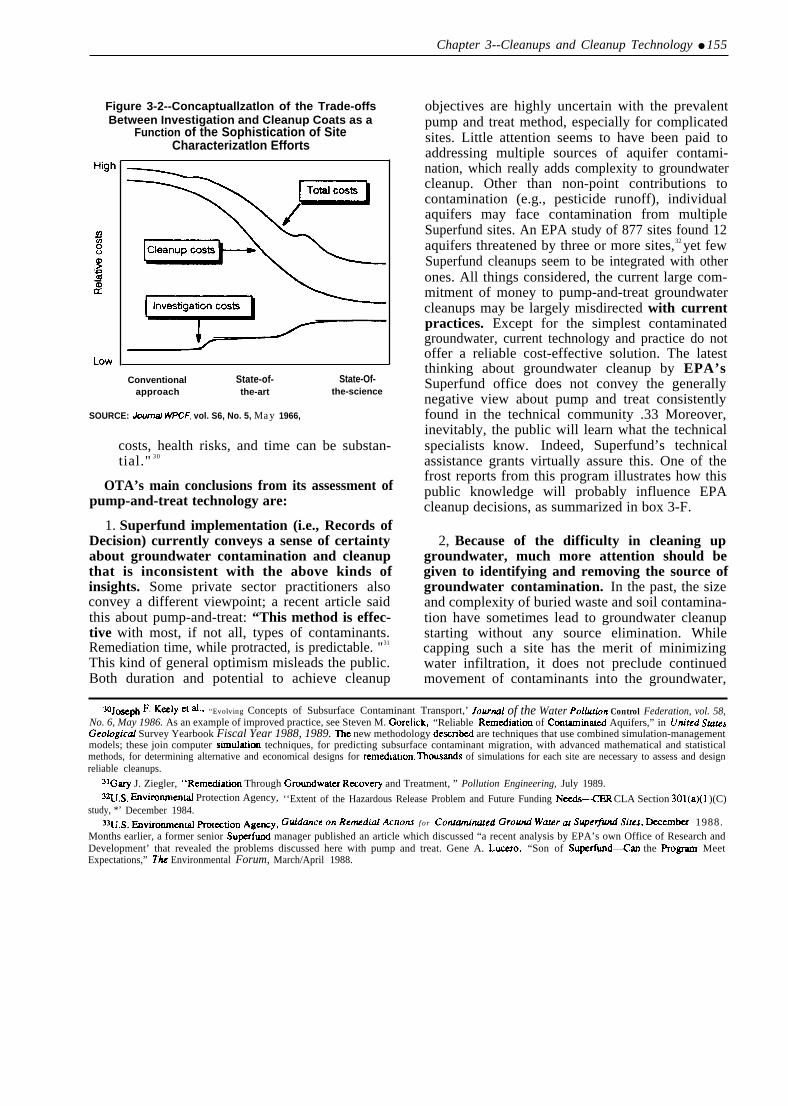
Chapter 3--Cleanups and Cleanup Technology ● 155
Figure 3-2--Concaptuallzatlon of the Trade-offsBetween Investigation and Cleanup Coats as a
Function of the Sophistication of SiteCharacterizatlon Efforts
Conventional State-of- State-Of-approach the-art the-science
SOURCE: Journa/ WPCF, vol. S6, No. 5, May 1966,
costs, health risks, and time can be substan-tial." 30
OTA’s main conclusions from its assessment ofpump-and-treat technology are:
1. Superfund implementation (i.e., Records ofDecision) currently conveys a sense of certaintyabout groundwater contamination and cleanupthat is inconsistent with the above kinds ofinsights. Some private sector practitioners alsoconvey a different viewpoint; a recent article saidthis about pump-and-treat: “This method is effec-tive with most, if not all, types of contaminants.Remediation time, while protracted, is predictable. "31
This kind of general optimism misleads the public.Both duration and potential to achieve cleanup
objectives are highly uncertain with the prevalentpump and treat method, especially for complicatedsites. Little attention seems to have been paid toaddressing multiple sources of aquifer contami-nation, which really adds complexity to groundwatercleanup. Other than non-point contributions tocontamination (e.g., pesticide runoff), individualaquifers may face contamination from multipleSuperfund sites. An EPA study of 877 sites found 12aquifers threatened by three or more sites,32 yet fewSuperfund cleanups seem to be integrated with otherones. All things considered, the current large com-mitment of money to pump-and-treat groundwatercleanups may be largely misdirected with currentpractices. Except for the simplest contaminatedgroundwater, current technology and practice do notoffer a reliable cost-effective solution. The latestthinking about groundwater cleanup by EPA’sSuperfund office does not convey the generallynegative view about pump and treat consistentlyfound in the technical community .33 Moreover,inevitably, the public will learn what the technicalspecialists know. Indeed, Superfund’s technicalassistance grants virtually assure this. One of thefrost reports from this program illustrates how thispublic knowledge will probably influence EPAcleanup decisions, as summarized in box 3-F.
2, Because of the difficulty in cleaning upgroundwater, much more attention should begiven to identifying and removing the source ofgroundwater contamination. In the past, the sizeand complexity of buried waste and soil contamina-tion have sometimes lead to groundwater cleanupstarting without any source elimination. Whilecapping such a site has the merit of minimizingwater infiltration, it does not preclude continuedmovement of contaminants into the groundwater,
30J~@ F. Kee]y et id., ‘‘Evolving Concepts of Subsurface Contaminant Transport,’ JOIUM1 of the Water Poilutwn Control Federation, vol. 58,No. 6, May 1986. As an example of improved practice, see Steven M. Gorelick, “Reliable Remediation of Coatarninated Aquifers,” in Um”ted sumGeofogicaJ Survey Yearbook Fiscal Year 1988, 1989. ‘I%e new methodology describexi are techniques that use combined simulation-managementmodels; these join computer simulatim techniques, for predicting subsurface contaminant migration, with advanced mathematical and statisticalmethods, for determining alternative and economical designs for remediation. llmusands of simulations for each site are necessary to assess and designreliable cleanups.
31Gary J. Ziegler, “Remediation Through Groundwater Recove~ and Treatment, ” Pollution Engineering, July 1989.3ZU.S. Ertvironmenud Protection Agency, ‘‘Extent of the Hazardous Release Problem and Future Funding Needs—CER CLA Section 301(a)(l )(C)
study, *’ December 1984.33U$S+ ~v~mm~ ~uon Age~y, G&_e on Re~di~ Acno~ for co~~’~ed Gro& water a s~e~ Sites, kemk 1988.
Months earlier, a former senior Supet-fimd manager published an article which discussed “a recent analysis by EPA’s own Office of Research andDevelopment’ that revealed the problems discussed here with pump and treat. Gene A. Lucero, “Son of Superfund<an the PrOgriUn MeetExpectations,” The Environmental Forum, March/April 1988.

156 ● Coming Clean: Superfund Problems Can Be Solved. . .
Table 3-2-Site Characterization
Conventional approach State-of-the-art approach State-of-the science approach
Actions typically tokenInstall a few dozen shallow monitoring wells
Sample and analyze numerous times for129+ pollutants
Define geology primarily by driller’s log andcuttings
Evaluate hydrology with water level mapsonly
Possibly obtain soil and core samples(chemical extractions)
BenefitsRapid screening of problem
Moderate costs involved
Field and lab techniques standardized
Data analysis relatively straightforward
Tentative identification of remedial optionspossible
ShortcomingsTrue extent of problem often misunder-
stoodSelected remedial alternative may not be
appropriateOptimization of remedial actions not possi-
bleCleanup costs unpredictable and excas-
siveVerification of compliance uncertain and
difficult
Recommended actionsInstall depth-specific well clusters
Sample and analyze for 129+ pollutantsinitially
Analyze selected contaminants in subse-quent samplings
Define geology by extensive coring/split-spoon samples
Evaluate hydrology with well clusters andgeohydraulic tests
Perform limited tests on solids (grain size,clay contents)
Conduct limited geophysial surveys (resistiv-ity soundings)
BenefltsConceptual understanding of problem more
completeBetter prospect for optimization of remedial
actionsPredictability of remediation effectiveness
increasedCleanup costs lowered, estimates improved
Verification of compliance more soundlybased
ShortcomingsCharacterization costs somewhat higher
Detailed understanding of problem stilldifficult
Full optimization of remedial actions notlikely
Field tests may create secondary problems
Demand for specialists increased
Idealizes approachAssume state-of-the-art approach as start-
ing pointConduct tracer-tests and borehole geo-
physical surveysDetermine percent organic carbon, ex-
change capacity, and other other proper-ties of solids
Measure redox potential, pH, dissolvedoxygen, and other properties of fluids
Evaluate sorption-desorption behavior usingselect cores
Identify bacteria and assess potential forbiotransformation
BenefitsThorough conceptual understanding of prob-
lem obtainedFull optimization of remedial actions possi-
blePredictability of remediation effectiveness
maximizedCleanup costs lowered significantly, esti-
mates reliableVerification of compliance assured
ShortcomingsCharacterization costs significantly higher
Few previous field applications of advancedtheories
Field and laboratory techniques not yetstandardized
Availability of specialized equipment low
Demand for specialists dramatically in-creased
SOURCE: J- F. Keely et al., “Evolving Concepts of Subsurface Contaminant Trmsport,” Journal WPCF, vol. 5S, No. 5, May 1966.
resulting from subsurface groundwater flow throughthe site’s contamination or possibly the sinking ofdense liquids. Nor is the long-term effectiveness ofcaps assured; many current Superfund cleanups putnew caps on older ones which evidently were noteffective. (The intrinsic problems of pump and treatshould be borne in mind for soil cleanup based onflushing, because the same subsurface problemspertain.)
3. Making pump and treat more predictableand effective requires improved practices whichwill tax the current workforce and may increasecosts substantially. Still, development of improved
pump-and-treat practices is important. However,more strategic thinking and economic analysisshould go to two other primary options:
a. Point-of-use treatment: “Serious considerationshould be given to point-of-use treatment for con-taminated groundwater rather than attempting toreverse the random movement of organic moleculesat tremendous pumping and treatment expense. Thepumping and treatment of billions of gallons ofgroundwater to recover a few pounds of spilledsolvent requires serious rethinking. Technologydevelopment should focus on how to economicallyand consistently surpass low part-per-billion treat-

—.
Chapter .3-Cleanups and Cleanup Technology ● 157
Box3-F--How a TecbnicalAssistance Grant1 Analysis Concluded That a Pump-And-Treat ApproachDid Not Offer a Reliable Cleanup of Groundwater
The following excerpts illustrate how an understanding of the limits of pump and treat can affect a community’sperception of a remedy proposed by EPA, in this case one largely based on site containment and pump and treat.The community and its technical advisers, of course, wanted the groundwater cleaned up. But their insights into thelimits of pump and treat led them to other alternatives, including obtaining the kind and quantity of informationnecessary to make pump and treat work effectively and giving higher priority to effective source control of thecontaminants in the landfill (through identification of hot spots for excavation and treatment, for example). Thisparticular experience also illustrates how the U.S. Geological Survey can perform analyses of use to Superfund siteinvestigations and selection of remedies; their work was not integrated into EPA’s efforts.
“. . . [T]here are too few wells, particularly to the south and west of the landfill, to define the full extent of thecontaminant plume or to understand the complex pattern of groundwater flow. The U.S. Geological Survey hasreached the same conclusion. Furthermore, the EPA used inappropriately low flow rates to estimate the area of thepotentially contaminated groundwater.
" . . . [A] groundwater punp and-treatment system based on ERA’s current understanding of flow may begrossly inadequate to prevent the continued offsite contamination of groundwater. If potent NAPL [non-aqueousphase liquid] pools are present they may be drawn into the extraction wells and overwhelm the treatment systemdesigned for much lower contaminant levels. Another possibility is that lowering the groundwater under the landfill(resulting from groundwater extraction) may actually dislodge NAPLs and thus aggravate groundwatercontamination problems.
“An evaluation of the site remedy selected by EPA in the Feasibility Study is not possible at this time becausethe database defined by the RI is insufficient to evaluate the effect or the efficacy of the proposed pump-and-treatsystem.
" . , . the USGS report prepared for ATSDR (Agency for Toxic Substances and Disease Registry) evaluatedthe hydraulic characteristics of the flow system over an area encompassing 4 square miles. This large-scale viewallowed them to place the IEL site in a proper regional context and led to conclusions which are at odds with thosereached by EPA.
“The approaches selected do little, if anything, to remove or even stabilize the potentially large amounts oftoxins in the landfill. This is exactly what one would expect since they based the selection of the proposed remedieson a lack of data on what is in the landfill. ”
(It should be noted that EPA’s Proposed Plan for the site (December 1988) offers no information on risk orrisk reduction or any specific information on the objectives of the groundwater cleanup. Nor does it say anythingabout the limits to or uncertainty of pump and treat. The Feasibility Study for the site speaks of meeting MCLs andpreventing a lifetime cancer risk of from 1 in 10,000 to 1 in 10 million (i.e., the broadest risk range used by EPA),but gives no specifics.)
1~ .Aumauce Oramww@e@AMiSM w Caqmu m SARA m $uim WIXXUWS in-lK@aOOIMqKalkm -d emSOURCE: “Comumm on EPA’s Pmfaxcd kmxiial Alwnauva“ for * IIKiustrid Excem LamlfW Superfuad Site in Uniaumvn, Ohio,” pmpwect for ‘k
Cumermd C&mu ofhke T- by Tho Clam Water I%@ Diqocal Safcq be., ad The Ham@nre‘ Rueal’eh Institute, May 31, 19s9.
ment levels with a margin of safety required for gation techniques. Some form of enhanced in situpotable water supplies. ”34 biological treatment is particularly desirable, but
other approaches, such as injection of steam orb. Other aquifer cleanup methods: There is a clear surfactants, also need more support. The in situ
need for a focused R&D effort to find more reliable biological approach is probably the most importantgroundwater cleanup methods, including site investi- option and it is currently receiving much attention
34~@~ c. Downey! ‘ ‘Applying New llxhnologies: A Scientific Perspective, ’ presented at National Research Council Colloquium, RemediatingGround Water and Soil ContaMmtion: Are Science, Policy, and Public Perceptwn Cotnpasible? April 1989.

158 ● Coming Clean: Superfund Problems Can Be Solved. . .
and some use. But the advice of two groundwaterexperts should be heeded: “Laboratory studies andsmall-scale field prototype trials are likely to yieldoveroptimistic expectations for the application andefficiency of these (new) technologies. ’ ’35
Another important view is: “In situ biodegrationis frequently among the remediation options recom-mended for soil and groundwater decontamination.. . . Our experience has shown that a 250-milliliterflask has little or nothing in common with thecontaminated subsurface and its response to nutrientand hydrogen peroxide (oxygen) additions. Permea-bility problems and rapid decomposition of hydro-gen peroxide have both been documented in the fieldwith little warning from laboratory experiments.While microbiologists have proven the principles ofbiodegradation in the laboratory, engineers arehaving less success achieving a uniform reaction inheterogeneous aquifers. ”36 An independent reviewof experiences with biological groundwater clean-ups came to generally negative conclusions abouttheir proven effectiveness, including: “While seed-ing of an acclimated or mutant microbial populationholds a great deal of potential . . . results fromprevious attempts have not proven it to be responsi-ble for the removal of contaminants. Further workneeds to be done to demonstrate that seedingmicrobes is a viable technique for the restoration ofcontaminated aquifers. “37 One of the more detailedcase studies for a Superfund site concluded”. . . thelarge volume of ground water that has flowedthrough the contaminated zone has failed to produceappreciable removal of the sorbed contamination.
. IB]iodegradative processes were a major meansof dissolved contaminant removal [emphasis added].’A study of anaerobic biodegradation of groundwaterat a Superfund site confirmed that trichloroetheneresulted in the production of vinyl chloride as a toxicbyproduct.39
4. Cleanups using pump and treat may bestopped because data on pumped groundwaterindicates that contaminant concentration hasreached a stable low level, but in fact subsequenttesting (or testing in different locations) mightshow that contaminant levels have increased orrebounded. Original cleanup objectives should notbe foregone (or changed to whatever the technologyhas been able to deliver) until there is convincingevidence that equilibrium has been achieved (case Cin figure 3-1) and that no other cleanup options exist.Current EPA thinking on this issue is to favor a“flexible decision process” that includes usingperformance information to change the cleanupobjectives. 40
Moreover, there is some indirect indication thatEPA is already adjusting its cleanup objectives forsites to reflect, in some way, the problems withpump and treat. For example, the cleanup level forcarcinogens in groundwater at the Seymour Recy-cling site (which was assessed to pose a relativelyhigh aggregate risk of 4 in 10,000) is an aggregaterisk of 1 in 100,000 in addition to meeting individualMCLs (maximum contamination levels under theSafe “Drinking Water Act), One of the reasons givento justify this cleanup level (which is less stringentthan the more typical 1 in 1 million risk level) was“low levels of contaminants will continue to mi-grate when the extraction system is terminated. ”41
In other words, the more typical, more stringentcleanup level would be difficult to attain.
5. There is a distinct possibility that, for somesites, natural attenuation, including biodegradation,of contamination within the aquifer might produceessentially the same cleanup results as lengthy andcostly pump and treat. Research on biodegradationis ongoing and some results are very positive, but itis not yet a reliable cleanup alternative. Indeed, arecent study of a site for which natural attenuation
gs~kay ~d chc~, op. cit., f~ote 25, 1989.36@mey, OP. cit., fOOtllO@ ~.
3?L,W. Cmwr ~d R.C. ~ox, Grow Waler Po/i~ion Conmo/ (Chel=a, w: bwi.s Publishers, 1986).
3SRo~fi ~yle and Michael Piotrowski, “In-situ Bioremediation at a Superfund Site,” The Second Annual Hazardous Materials ManagementCoqferencelCentral, procdings of conference March 1989, ‘Ibwer Conference Management Co., Glen Ellyn, IL.
s~yle R. Silh d ~U@S A. ‘~len’ “Observed Rates of Biotransformation of Chlorinated Aliphatics in Groundwater,” Supe@md ’88,P~“ gs of November 1988 conference, Hazardous Materials Research Institute, Silver Spring, MD.
W.S. Environmental Protea.ion Agency, op. cit., footnote 33.dl~A, “GuidmW on Rem~~ ~tims for con~in~~ Grolmd Water at Suprfud Sites, ’ December 1988.

Chapter 3--Cleanups and Cleanup Technology ● 159
was selected concluded that site conditions favora-ble to natural attenuation ‘‘are not going to be foundat a large number of sites, due primarily to complexhydrogeologic conditions and significant exposurepotentials. ’42 Augmentation of natural biodegrada-tion by supplying dissolved oxygen, for example,has possibilities, but success depends on a variety offactors, such as the soil permeability and groundwa-ter flow rates being high enough.
6. It should be understood that there are appropri-ate uses of pumping groundwater to contain themovement of a plume of contamination and to treatrelatively simple, well understood aquifers andrelatively simple and well identified types of con-tamination. Indeed, beginning pump and treat veryearly at a site may be important as a recontrolmeasure. Improved practices are needed to makethese applications more cost-effective. However,pumping contaminated groundwater and reinfectingit upgradient in order to prevent plume migrationand contamination from entering a sensitive area(e.g., a withdrawal well for a municipal watersupply, a river) is also uncertain. For example, onemodeling study showed that the effect of pumpingand injection was “to reduce the total amount ofcontaminant entering the river at the onset of theoperation and to spread contaminant flow into theriver at later times. ’ ’43 The point is that the methodreduced the average concentration of the con-taminant entering the river over many years, buteventually all the contamination reached the river.
Comments on the Observational Method-TheHazardous Waste Action Coalition, a trade associa-tion of hazardous waste technical consulting firms,has endorsed what it calls the observational methodas appropriate for hazardous waste site investi-gation, assessment, and remediation design andimplementation. 44 In addition to hypothesized envi-ronmental benefits from improved recognition andresolution of the inevitable uncertainty about a site’scontamination, reduction of contractor liability is agoal in adopting the observational method. The
observational method seems to be especially rele-vant to the problems of groundwater contaminationdiscussed above, The method is based on the correctbelief that no amount of site study can eliminate alluncertainties about the site’s problem(s) and theeffectiveness of the selected remedy (ies). However,after examining the main points of the observationalmethod, OTA concludes that in addition to itspotential benefits there are significant implemen-tation issues and problems, as discussed below underthe five key contributions defined by the coalition.After this discussion, two alternatives or supple-ments to the observational method are presented.
1. “The site remediation design is based on themost probable site conditions. ’ Remediation designfollows the formal government decision on cleanupobjectives and remedy selection. Remedy design iscurrently based on the best understanding of thesite’s contamination and conditions. Therefore, thiscontribution does not say anything different thancurrent and necessary practice. The implication thatcurrent practice presumes complete and certainunderstanding of a site’s cleanup problems andnatural conditions might have been true for somepeople early in the cleanup business; but mostpeople are now skeptical about obtaining siteinformation in the Remedial Investigation which isthe last word. The need is only to obtain enoughgood information to select a cleanup strategy, thedetails of which will be worked out in the designphase.
2. “Reasonable deviations from these conditionsare formally identified and accounted for. Thisapproach seems beneficial. Presumably, the formalremedy design, performed by an engineering con-sulting firm, would identify potential deviationsconcerning site contamination and natural condi-tions which might arise from new information aboutthe site. But there are typically a lot of possibilitieswhich could be identified. This approach, therefore,might add significant new costs to the design part ofthe process. There is a potential for unnecessary
42Rlchard L. Hebert et al., “Case Study of Factors Favoring Natural Attenuation as the Prefertd Ahemauve for Aqwfcr Rcstorauon, ” Supe@und’88, procecxhngs of conference November 1988, Hazardous Materials Control Research Lnstitute, Silver Spring, MD.
43R.W. Nelmn, 1‘me N~ t. U@a~ Gro~dwater pollution con~o] S~ategles--A ~hnicat Basis and Historical perspcc[lve, ’ Proccedmgs of theInternational Conference on Advances in Groundwater Hydrology, Tampa, FL, November 1988.
44~e Bead of Duwtors of tie HU~dou~ Wrote ~tion coall~on of tic Amefi~an Consdting ~ngti~rs COUCI1 endorsed Ihc obsemational method
on Mar. 16, 1989, and the coalition’s members cumcntly advocate this approach in pubhcatlons, testimony, and presentations. The coa.lltion’s fumsrepremt most of the major Superfund contractors.

160 . Coming Clean: Superfund Problems Can Be Solved . . .
contractor work. Moreover, presumably a reallyfirst-rate Remedial Investigation and FeasibilityStudy would do this under current practice, accord-ing to the degree of understanding about theuncertainty of the site’s contamination and condi-tions.
3. "Parameters are identified for further obser-vation in order to detect deviations. ’ Another partof the design study would presumably designcontinuing site investigation efforts to verify whetherthe remedy is working and whether previouslyidentified potential deviations are occurring. Thereis a potential for continuing site investigation aftera ROD and as part of remedy implementation. Incurrent practice, most experts recognize that duringremedy implementation new site information mayarise, especially because information is obtained onthe remedy’s performance. But this situation isdifferent than a directed effort to obtain newinformation about the site which might alter theselected remedy, except that an interim action(operable unit) already implies that key decisionshave not yet been made about some part of the site.Remedial investigations now can proceed while aninterim action is being implemented.
4. “Contingency plans for each deviation areincorporated into the remediation design. ” Thedesign study report would also presumably presentdetailed contingency plans (akin to a feasibilitystudy) if such deviations became documented.However, contingency planning means that changesin the originally selected remedy might be made.OTA has expressed concerns about remedies chang-ing after a ROD is issued, when public participationis minimal. Significant new information about a siteafter a ROD is now recognized as a possibility, andthere is a procedure to amend a ROD or issue a newone without compromising public participation andaccountability.
5. “Post-remedial monitoring is established as anessential component of hazardous waste site remedi-a t i on . There is potential for more monitoring toreplace action and closure to a cleanup. The lawcurrently requires such monitoring if hazardous
waste remains onsite, and EPA normally requiressignificant monitoring when there is potential ground-water contamination or when impermanent remediesare used.
Overall, the observational method changes theprocess of study and cleanup. This method may havetechnical benefits, but it also might complicatepublic accountability of the critical cleanup deci-sions for a site, although its proponents say it wouldimprove communication and accountability. Byfocusing on uncertainties, the method may alsoproduce increased uncertainty about remedy imple-mentation, and health-based cleanup objectives maybe transformed into technology performance ones(especially when pump and treat is used). A sintended, contractor liability might be reducedbecause the cleanup process would become tentativeand be maintained longer, and produce increasedinformation to reduce the possibility that a selectedremedy is ineffective; this last point is clearly abenefit. But considerably more contractor workmight be created and there would be more relianceon the engineering judgments of contractor staff andthe responses to them by either the government (forfund-financed cleanups) or responsible party (forsettlements which give the responsible party im-plementation authority). Indeed, the people whohave devised the observation method said “Theparty responsible for operating the remedial actionwill have to have the judgment required to determineif a deviation has occurred and which response totake. . . . In cases where more than one response ispossible to a deviation, considerable judgment maybe required to select the most appropriate re-sponse. ’45 To some degree, EPA appears to haveaccepted the observational method.%
Two alternatives or supplements to the observa-tional method are: 1) improving the technicalmethods and practices used in site assessment andcleanup design to reduce and better understanduncertainties about a site, and 2) changing the kindsof cleanup decisions made to reduce the negativeimpacts of imperfect information on decisions. First,as discussed in the previous groundwater section,
4sstM M. Brow ~1 ~., ,@pli~~i~n~f & Ob~erv&io~Me~d @ Remedi~ion OfHam&w Waste Sites (Bellevue, WA: cI-i2~i]], Apd 1989).
.WFor exmp]e, In its guidance for groundwater clmup. EpA said: “Data to reduce the uncertainty of important variables should be collectedthroughout the remexhal selection [presumably pre-RODl, design, and construction phases to refine and modify the remedy.” U.S. EnvironmcntalProtection Agency, op. cit., foomote 33.
———
Chapter 3--Cleanups and Cleanup Technology ● 161
shifting from the conventional to the state-of-the-artapproach for site investigation (table 3-2 and figure3-2) offers environmental and cost benefits. Thisshift recognizes the problem that the engineeringcommunity, to a large extent, is not using the bestavailable techniques for site investigation. Althoughbetter techniques (e.g., the simulation-managementmodel developed at the U.S. Geological Survey)require more skilled personnel, may take more time,and cost more money, they ultimately lead to morecost-effective cleanups, greater reliability, and fewerfailures. In fact, even now there are wide differencesin the capabilities and practices of firms working ongroundwater cleanup. With the observational method,conventional techniques may remain dominant andchange slowly as the more conservative, analysis-intensive process attempts to reduce errors andfailures.
Second, key cleanup decisions can change toreflect an improved understanding of the complexityof site investigation and cleanup. The optionsinclude: 1 ) stressing the distinction between actionsnecessary because of current risks and actions thatcan be postponed because of uncertain, future risks;2) emphasizing different types of remedial actionsover time (i.e., emergency, recontrol, interim reme-dial, and final permanent); 3) refraining from callinga remedy complete and permanent when imperma-nent technologies or highly uncertain ones (e.g.,pump and treat for groundwater) are used; and 4)avoiding making critical cleanup decisions after theROD unless there is full public participation andaccountability. For groundwater cleanup, for exam-ple, the alternative would be making a differentdecision about the groundwater cleanup, including:continuing the site investigation before committingto pump and treat or postponing cleanup if no
significant current risk exists, trying a differentcleanup method (e.g., in situ bioreclamation), orimplementing a recontrol approach based on plumecontainment but not aquifer restoration. With theobservational method, the increased use of pumpand treat would probably continue and changes inthe original cleanup objectives might be unknown tocommunities and other interested parties who are notdirectly implementing the cleanup (see followingdiscussions of landfill cleanup decisions).
Issue 3: Is the current enforcement emphasis onobtaining settlements with responsible partiesaffecting remedy selection?
After examining nearly all fiscal year 1988 RODS,summary statistics on them, and studying someRODS in detail, OTA arrived at a number of findingsabout how settlements with responsible partiesinfluence selection of cleanup technologies andstandards, and about other major issues .47 The mostimportant findings for the settlement impact issueare summarized first:
● Cleanup standards, the extent of cleanup, thepermanency of cleanup, and the selection ofcleanup technology are often compromised informal or informal negotiations to obtain set-tlements with responsible parties. What respon-sible parties are willing to pay, together withthe flexibility inherent in the current system,can lead to less stringent cleanups. Indeed, aformer administrator of EPA said, “We do notbelieve it is wise to select a remedy that cannotbe implemented because of . . . unwillingnessof the responsible parties to agree to a settle-ment. ’48 Of course, when responsible partiesare successful in obtaining remedies theybelieve more cost-effective, they correctly main-
dT~ ~t~l~discussion under I.S,WW 3 of RODs from fiscal year 1988 supplements OTA’S 1988 case study report, Are We Cfeunmg Up 710 SupecfundCare Studies which examined fiscal year 1987 RODS. A number of observations in the discussion here pertain to general IMUCS concemmg Superfundimplementation, such as conflicts betw-n statutory requirements and cleanup decisions.
48fipW~ ~~lmony of ~ M. ~om~, in Pre[ti~ Ftndings of OZA Report on Supe?fund, COtIUIUttCC RCPOII on Hcanng before theSubcommittee on Invesugattons and Oversight, Committee on Publlc Works and Transportation, U.S. House of Representmves, Apr. 20, 1988, p. 99.At the hearing, EPA’s former Assistant Administrator J. Winston Porter aJso testifhxi, “Let me tell you the worst result in Superfund, and that 1s If 1get in a bind where the State won’t pay the 10 percent-+hat means we can’t move ahead with the fund-nor will potential responsible parties {PRPs)_ @do it?” P. 189 AIso, in EpA’s remov~ program “re@onaJ offices must agwssively PWSW cleanup by tie potentially responsible party (PRP)before initiating any Fund-financed removat action. ” (Karen Burgan et al., ‘ ‘Setting Removal Program Priorities, ” Supe@nd ‘6’8, proc~ings ofNovember 1988 conference, Hazardous Materials Research Institute, Silver Spring, MD. Ixgally, EPA may not be able to perform a fund-i_mancedremedial action without State agreement to pay the matching 10 percent, and if responsible parties will not settle and if EPA does not wam 10 delay cleanupuntd successful legal enforcement action, then again act]on becomes conungent on State agreement to pay the 10 percent. One way out of this dependencyon State cooperation might be for EPA to take a removaJ or, m duscussed in this repxt, a rezontrol acuon which would not require State agrmmtmt.

162 ● Coming Clean: Superfund Problems Can Be Solved. . .
tain that the government has affirmed theiradequacy to protect health and environment.49
. The decisions for 12 sites discussed below, forwhich the desire for settlement is probablyimportant may save responsible parties about$400 million, compared to estimated costs ofmore stringent remedies in the sites’ RODS orin matched-site RODS. Roughly, that seems torepresent about a 50-percent saving overall. Infiscal year 1988, OTA estimates that there mayhave been 50 to 70 decisions affected by thedesire for and pursuit of settlement.50 Throughthe decisions documented in these RODS,responsible parties may eventually save manyhundreds of millions of dollars, perhaps asmuch as $1 billion. If all these settlements leadto permanent, complete cleanups, the savingsare laudable. But will in fact those cost-savingremedies work effectively in the long term?Only time, effective environmental site moni-toring, and effective government oversight willprovide conclusive answers. But science, com-mon sense, and experience suggest that, even-tually, major follow-up cleanups may be neces-sary. And if some of these cleanups proveineffective, then damage to public health andthe environment may result.
. Cleanup standards, such as the acceptable levelof residual soil contamination at a site aftercleanup, are sometimes substantially less strin-gent at sites where decisions seem influencedby the government’s desire to obtain a volun-tary settlement with responsible parties—compared to sites where settlement is not anissue. These differences cannot be explainedtechnically, for example on the basis of majordifferences in site conditions. While currentrisk assessment methods can easily lead todifferent results for the same conditions (be-cause many somewhat arbitrary assumptionshave to be made, and because it is not alwaysclear just what data should be used), sometimeshigher levels of residual contamination (less
cleanup) result from using high levels ofacceptable risk.
. When sites are in EPA’s enforcement programand when responsible parties perform thecritical Remedial Investigation and FeasibilityStudy (RIFS),51 cleanup actions are much morelikely to use land disposal and containmenttechniques rather than waste destruction technol-ogies. For fiscal year 1988 RODS, 78 percent ofRODS using waste destruction technologieswere in the fund program, and 75 percent of theRODS using containment/land disposal wereenforcement RODS. Some Superfund cleanupwaste is still being sent to commercial landfills.And EPA’s statistics on use of treatmentcleanup technologies may present an overop-timistic picture, because many of the treatmentsdo not destroy toxic material and sometimesdeal with a very small portion of site contamin-ation.
. In enforcement cases, low-cost cleanups thatfacilitate settlement are sometimes based onrelatively speculative or unproven treatment(but not destruction) technologies.52 They aretested for their effectiveness on site materialsafter the government has selected them andduring Remedial Design, which is much lessvisible to the public than the pre-ROD activi-ties. Assurances that consent decrees providefor the contingency of ineffective test resultsare not entirely satisfactory. Who will interpretthe post-ROD test results? How much moretime will be added to the already lengthy sitecleanup process if another remedy has to beselected? Moreover, an important issue iswhether specific cleanup standards committedto by the government in the ROD may bechanged years later to accept the limitedaccomplishments of the selected technology.That is, health-based cleanup objectives may bereplaced by technology performance standards,especially for groundwater cleanup. The way topromote use of innovative technologies is

—
Chapter 3-Cleanups and Cleanup Technology ● 163
through pre-ROD treatability studies whichprovide a basis for confidence in the technologyselection for a particular site.
. For about the last 2 years, EPA has used aframework for evaluating cleanup alternatives(and the one in EPA’s proposed NationalContingency Plan) that permits virtually anykind of decision to be rationalized. This ex-cessive flexibility affects settlements with re-sponsible parties. EPA uses cost-benefit analy-sis of alternative cleanup approaches, in whichthe level of environmental protection is avariable. EPA’s instruction to personnel imple-menting Superfund is, ‘‘Make final determina-tion of which alternatives provide overalleffectiveness proportionate to costs ”53 [em-phasis added]. But the statute requires a cost-effectiveness technique, which first sets spe-cific environmental objectives of a cleanup andthen finds ways to minimize costs. Alternativesthat offer far less certain and effective pro-tection of health and environment are some-times given the same ratings as better tech-niques, making it appear that cleanup goalshave not been compromised.
Research-OTA examined summary statistics onremedy selection provided by EPA for RODSclassified either as enforcement or fund. In addition,OTA examined pairs of sites in three genericcategories (wood preserving, PCB contamination,and lead battery); that is, sets very similarly contami-nated sites whose RODS were issued in fiscal year1988, one or more sites involving settlement, andone or more which did not. Sites were chosen solelyon the basis of finding matches in the nature of sitecontamination and on the basis that there were nosite condition variables that could explain substan-tially different cleanup decisions, Nine cases arediscussed below.
Third, OTA examined all the fiscal year 1988RODS in Region 5 for which containment/landdisposal was selected. All these sites were landfillsof various types. Five were enforcement RODS andthree were fund RODS, but one of the latter said that
EPA was negotiating with responsible parties forremedy implementation.
Statistical Patterns--From EPA’s summary sta-tistics, we conclude that there is a substantialdifference in cleanup technology for sites in theenforcement program compared to sites in the fundprogram. For example, in fiscal year 1988, theenforcement program selected land disposal orcontainment actions in 42 percent of its sourcecontrol (these exclude groundwater action RODS),compared to only 12 percent for the fimd-fma.needprogram. Between fiscal years 1987 and 1988, thefund program substantially decreased its use of landdisposal from 44 to 12 percent, but the enforcementprogram showed a smaller decrease from 64 to 42percent. There has been wide agreement for sometime that land disposal and containment are notpermanent remedies, are bound to fail eventually,and pose uncertain long-term costs and threats tohealth and environment, Indeed, many of EPA’sRODS that have rejected land disposal and contain-ment cite these reasons for doing so. Moreover, thelaw expresses a particular policy against sendinghazardous waste from Superfund cleanup sites tooffsite landfills. In the past 2 years, 83 percent of theremedial action cases using offsite landfills were inthe enforcement program.
Conversely, in fiscal year 1988, the enforcementprogram selected those kinds of treatment technolo-gies (chiefly incineration and biological treatment)that permanently destroy toxic waste in 14 percent ofits source control RODS; the fund program selectedpermanent treatment in 44 percent of its sourcecontrol RODS. Between fiscal years 1987 and 1988,the fund program substantially increased its use ofdestruction technology from 26 to 44 percent, but theenforcement program’s usage remained constant at14 percent. The law explicitly expresses a preferencefor permanent treatment remedies over land disposaland containment.54 Sometimes, treatment technol-ogy, for example at a very large landfill or miningwaste site, could be rejected by invoking thestatute’s fund-balancing provisions for fund-financed cleanups; in such cases there may be no
53u.s. EJI~mmM Praeetion Agency, op. cit., footnote 5.54T-en[ [w~Ok@=.~ ~a[ o~y ~we Volme or rnobili~ of h~~do~ w~e do not ~~t~ Wrm~ence, but hey are alSO preferred over l~d
disposal and containment. SARA does not explicitly favor destruction tecbnolo~es over other forms of treatment. EPA has not provided a technical-Won of permanence the way OTA has.

]64 ● Coming Clean: Superfund Problems Can Be Solved . . .
other choice with current technology but a much lesscostly containment approach. But the nine examplesgiven below are not such cases.
EPA’s data on remedy costs shows that enforce-ment costs are less likely to be at the high range(above $20 million) and more likely to be at the lowrange (below $5 million) as compared to funddecisions. In fiscal year 1988, only 7 percent ofenforcement costs were above $20 million but 16percent of fund decisions were; also, 51 percent ofenforcement costs were below $5 million, while 64percent, of fund decisions were in this range. Oneplausible explanation is that, to encourage settle-ments, the enforcement effort selects containmentremedies for source control (and possibly justifiestaking no action for groundwater contamination) forrelatively large sites in order to arrive at a costacceptable to responsible parties. However, in orderto balance this bias for using containment, relative tothe need to be responsive to the statutory preferencefor treatment-based remedies which assure perma-nence, the enforcement effort selects treatment-based remedies for smaller sites. Because of smallervolumes of hazardous waste for treatment, the costsremain low enough to facilitate settlement.
For fund program RODS, having proportionatelymore remedies with costs at the low and high ends,a plausible explanation is that containment is morelikely to be used for relatively smaller, simple sitesand destruction technology for larger, more complexsites. In other words, this interpretation suggests thatresponsible parties for smaller sites pay more forcleanup than the government spends for similarsites, and responsible parties for larger sites pay lessfor cleanup than the government spends for similarsites.
Nine Cases
Four Wood Preserving Sites
These four Superfund sites have similar historiesand similar contamination. The contamination is
principally from the use of creosote, which consistsof many toxic chemicals, including a number ofknown carcinogens.
The first site is the Brown Wood Preserving sitein Florida, an enforcement program site. The Brownsite may be the clearest example we have found ofthe environmental consequences where settlement isthe goal. Responsible parties contracted for theRIFS. The ROD did not use EPA’s required ninecriteria for evaluating remedial alternatives. Most ofthe hazardous material from this site was sent to theNation’s largest hazardous waste landfill in Emelle,Alabama, in a removal action several months beforethe ROD was signed in April 1988. (Landfilling wasrejected in the three other wood preserving siteexamples. ) A total of 16,500 tons of the site’s mostcontaminated sludge and soil was sent offsite. Tenthousand tons of less contaminated soil was leftonsite for biological treatment which, however, hadnot yet been proven effective for the whole range ofchemicals at this kind of cleanup.55 A backgrounddocument for the Brown site reveals that 840 tons ofthe carcinogenic chemicals (in the soil) werelandfilled offsite and 50 tons were left onsite forbiological treatment; that is, 94 percent of thecarcinogenic contaminants were landfilled off-site. 56 The cleanup level for contaminants was 100parts per million (ppm) carcinogenic chemicals inthe soil. (With exactly the same exposure route ofsoil ingestion for residents and acceptable risk of 1in 1 million excess cancer deaths, the correspondingvalue for the Southern Maryland site in Maryland,discussed below, was 2.2 ppm, and for the L.A.Clarke & Son site in Virginia, discussed below, 0.08ppm.) The ROD said that cleanup standards hadbeen changed from the original risk assessment butdid not say what the changes were.
In its explanation for the removal action, EPA’sROD said that it “contributed to the acceleration ofthe site along the Superfund enforcement processtrack. The ROD also said that the responsibleparties “have been very cooperative in furthering
55A ~enl ~~c~ ~Wr on biologic~ ~ea~ent no{~ some problenls with the kinds of chemicals found at sites WrIt_fflatd by crwsote. F~st*the rate of degradal.ion of larger polyaromadc hydrocarbons decreases with increasing molecule size and decreasing volubility. Second, if the creosoteis ~nt as small droplets within pores of soil, the degradation process will be inhibited. Gaylen R. Brubaker, $ ‘Screcmng Criteria for In situBioreclamation of Cmmtrninated Aquifers, ” The Second Annual Hazardous Materiak Management Conference/Central, proceedings, TbwerConference Management Co., Glen Ellyn, IL, March 1989.
-s cleanup illustrates how important it is to have data that can be used to identify the contribution of different twhnologies to the overall cleanup.For example, EPA credits this site with using biological treatment, even though it addressed only 6 percent of the contamination,

Chapter 3--Cleanups and Cleanup Technology . 165
the cleanup of the site. ” The timing of the removalwas significant. At a public meeting in October1987, an EPA official explained that the RCRA landdisposal bans imposed by Congress were going tomake it impossible to landfill the site’s toxicmaterial and that he ‘‘was told by Headquarterswithin the last couple of days that virtually all thistype of waste will eventually have to be incineratedonsite or offsite. The type of land disposal wherebyexcavation and removal were accomplished will bea thing of the past. Therefore, the governmentcooperated in circumventing the congressional in-tent to prohibit land disposal of certain toxicmaterials.
The remedy approved by EPA was estimated inthe ROD to cost $2.4 million (apparently $1.9million for the landfilling and $0.5 million for thebiological treatment), while the use of onsite mobileincineration was estimated to cost $5.4 million.EPA’s analysis of cleanup alternatives acknowl-edged that onsite incineration would provide greaterenvironmental protection, was more consistent withstatutory requirements, and would take significantlyless time to fully implement than the remedyselected. There was no explicit acknowledgment ofthe inconsistency between the selected remedy andstatutory requirements and preferences.
Second, consider the June 1988 ROD for theSouthern Maryland Wood Treating site in Maryland,a fund program site, EPA selected onsite mobileincineration for treating over 100,000 cubic yards ofcontaminated materials at an estimated cost of $38million, including groundwater cleanup. There is noapparent viable responsible party to settle with. Anearly attempt by the responsible party at usingbiological cleanup at the site had failed. The RODspecifically rejected the use of a hazardous wastelandfill at $23 million and biological treatment at$31 million; for landfilling, the ROD said thatpotential leaks and leachate migration made “thepermanence of this option . . . dependent upon theexpected life of the landfill, ” and for biologicaltreatment it said that it had ‘‘a higher risk of remedyfailure than thermal treatment. ” In contrast to theBrown site in Florida, the Southern Maryland RODpresented extensive data on contamination, risks,and cleanup standards. The key cleanup objectiveselected was 1 ppm carcinogenic chemicals insubsurface soil necessary to protect groundwater—
i.e., 1 percent of the 100 ppm standard for the Floridasite. (In both cases the risk level was said to be 1 in1 million excess cancer deaths. ) The cleanup stan-dard for surface soil was 2,2 ppm.
At a third site, an enforcement ROD was issuedfor the Brodenck Wood Products Co. site inColorado. Most of the RIFS work has been done byresponsible party contractors. A small amount ofsurface impoundment material (4,000 cubic yards ofsludge and oil) will be incinerated onsite. Except forvisibly contaminated soils beneath surface impound-ments, the ROD commits to using onsite incinera-tion only if the volume of soil is less than 2,500 cubicyards. If, as is likely, the volume is greater than 2,500cubic yards-and it may be as much as 30,700 cubicyards-the material will be stored onsite for furtherstudy and, it appears, may not be incinerated, Thereis no technical or environmental reason why thelarger amount of contaminated soil could not beincinerated, except that it would of course costmore—an estimated $11 million for the largeramount of incineration, instead of $1 million foreither the small amount of incineration or thestockpiling.
The Brodenck ROD presents no actual cleanupstandard for soils beneath impoundments, other thanthe somewhat subjective identification of visiblecontamination. Soils can be quite contaminatedwithout being visibly contaminated. The moreroutine ROD requirement is a specific level ofresidual contamination above which soil would haveto be excavated and remediated. Moreover, data inthe ROD suggests that soil beneath the impoundmentsmay be contaminated with dioxins, because rel-atively high levels were found in some impound-ment sludges. This situation argues for using onsiteincineration, sooner rather than later. (The presenceof dioxins was also a factor in the decision for usingincineration at the Southern Maryland site; dioxincontamination at wood preserving sites is likelywhen, in addition to creosote, pentachlorophenolwas used, as was the case for the Brodenck site. )
A fourth wood preserving site—the L.A. Clarke &Son site in Virginia—illustrates a general problemfacing analyses of Superfund implementation. Somesite RODS that EPA classifies as a fund programmay, nevertheless, reflect the consequences of apreference for and pursuit of voluntary settlement, a

166 ● Coming Clean: Superfund Problems Can Be Solved . . .
process that often begins before the ROD is issued.The L.A. Clarke & Son site is a sister site of theSouthern Maryland Wood Treating site discussedearlier. Both sites are in EPA Region 3, L.A. Clarke& Son operated both facilities, and the estimatedvolume of contaminated material was nearly thesame for both sites (the volume of material requiringcleanup at the L.A. Clarke & Son site was said to be119,000 cubic yards). But the ROD for the Virginiasite selected a combination of soil flushing, biologi-cal treatment (i.e., a combination of in situ biorecla-mation, biotreatment in tanks, and land farming),and landfilling of an unspecified amounts of mate-rial which are not effectively treated by the in situflushing and biological treatment.57 The selectedremedy would have to be proved effective byextensive post-ROD testing. (Biological treatmentwas selected in two of these examples [Broderickand L.A. Clarke& Son] and rejected in the other two[Brown and Southern Maryland], and its effective-ness for this cleanup is uncertain.58) The site’scontamination is complex, including a layer of densecreosote that lies on top of a clay layer beneath anupper aquifer, which raises serious concerns aboutthe selected remedy’s ability to be effective. Theflushing component would probably generate haz-ardous waste for land disposal.
Moreover, the L.A. Clarke & Son site RODselected an acceptable concentration for soil for astandard group of carcinogenic chemicals of 10.3ppm for protection of groundwater (correspondingto a risk level of 1 in 100,000 excess cancer deathsand 10 times higher than corresponding figure forthe Southern Maryland site). Onsite incineration wasnot evaluated as a cleanup alternative and noexplanation was given, but an offsite incinerationoption was estimated to cost $76 million. Cleanup ofcontaminated groundwater was deferred to a later
ROD. The estimated cost for the L.A. Clarke& Sonsite cleanup was about half that for the SouthernMaryland site, a difference of about $20 million.EPA has indicated that if a cleanup goal of 1 in 1million risk had been used “the only feasibleremedy would have been incineration, ”59 A fewmonths after EPA issued the ROD, based on its ownRIFS, a complete settlement was reached with aresponsible party for implementation of the selectedremedy; the ROD had identified the responsibleparty and said that negotiation with it was intended,and the responsible party had submitted extensivecomments to EPA on its RIFS and proposed remedy.The ROD provides strong indication that the desireto allow the industrial facility to keep operating wasa significant factor in remedy selection. To imple-ment incineration, it would be necessary to removethe site’s buildings because of the extensive contam-ination below them. The ROD noted that “manyresidents are skeptical of the treatment technologyproposed in the preferred alternative and are un-happy with the length of time projected for thecleanup (the longest of the alternatives ).’ The desireof some residents to shut down the facility was alsonoted.
The L.A. Clarke & Son site decision is actuallymore indicative of environmental compromise andless protective than it first appears. The safe soilcleanup level was determined to be 0.08 ppm foringestion (compared to 2.2 ppm for the SouthernMaryland site), but the ROD used the figure for soilof 10.3 ppm for protection of groundwater based ona lower risk level of 1 in 100,000 instead of 1 in 1million (compared to 1 ppm for the Maryland site).To justify replacing the 0.08 ppm figure for surfacesoil with a cleanup objective over 100 times higher,the ROD said, “To achieve surface soil levelsprotective of direct contact exposure, the site will be
5TNo~g ~K1~ ~ tie ROD p~ludcs a rnajof amount of the site’s contaminated materiidS from being lartdfilled.
5SOTA exmln~ tie resu]~ of a prelimin~ fe~ibi]ity study on the potential for indigenous microbes to destroy the site’s polynuclear aromatichydrocarbons reported to EPA’s RIFS contractor for this site in October 1986. There were 51 laboratory results for percent destruction of four chemicalsin soil and surface water samples horn different locations. Only 29 pmcent of the results were vety successful (i.e., % to 99 percent reduction ofcontaminants), nearly half of the results were zero or close to zero percent reduction, and the other 20 percent were partially successful but not sufficientfor effective cleanup. The results are particularly important because they indicate a potential problem for achieving effective in situ bioreclamationselected for subsurface soils. But a report which designed a formal treatability study, issued in March 1987 by an EPA contractor, described those initialresults as finding that “indigenous microbes were capable of degrading” the four chemicals tested. Apparently the 8-month $70,400 treatability studywas not cxxtducted prior to completion of the RIFS and ROD about a year later.
59~ ~ ~~~ ~km~ ~A Region 3 memo provid~ ~ (_JTA$ The memo ~SCI refers to a cost of incineration of $125 million which d~s not a-with the ROD, and says that the soil volume needing treatment was twice as much as at the Maryland site, which also does not agree with RODinformation.

Chapter 3--Cleanups and Cleanup Technology ● 167
covered with 1.5 feet of seeded topsoil. This moveis not standard EPA practice, especially as noinstitutional controls on future land use were im-posed by the ROD for this containment solution.Indeed, the industrial facility is still active. In otherwords, cleanup costs were also reduced by replacingsome biological treatment with crude capping; thatis, soil cover and not an engineered hazardous wastelandfill cap.
Three PCB Sites
Technologically, the cleanup of PCB contamina-tion illustrates the availability of competing perma-nent treatment techniques, mostly incineration andto a lesser degree chemical dechlorination andbiological treatment. The enforcement ROD for theMGM Brakes site in California, however, selectedoffsite landfilling of over 10,000 cubic yards ofcontaminated soils. The cleanup standard for soil of10 ppm PCBs was for a risk level of 1 in 100,000excess cancer deaths and not the more typical 1 in 1million risk level. The estimated cost of the selectedremedy is $5.3 million.
A previous Feasibility Study had selected onsiteincineration at a cost of $8.4 million, but in responseto public opposition EPA issued a revised FS andchanged the remedy to offsite landfilling. The MGMBrakes site is still a major operating industrialfacility and is a prime employer in the community.This fact may explain why, according to the ROD,community opposition focused on ‘‘the economicand health risks’ of onsite incineration. The RODnoted that there was no public opposition to theselected remedy of offsite Iandfilling. (Landfillingwas rejected in the next two PCB cleanup exam-pies.m)
The ROD for MGM Brakes noted that sometesting of PCB dechlorination technology, whichEPA has selected elsewhere for a Superfund PCBcleanup, had been done in 1987, but the ROD saidthat ‘it was deemed impractical due to the nature of
site soils’ and because of “process control prob-lems. ” However, the ROD did not support thisinterpretation with specific technical data. Chemicalfixation, which EPA has used elsewhere for aSuperfund PCB cleanup, was rejected in part be-cause it would not destroy the PCBs and would notoffer a permanent solution (consistent with OTA’sviews on permanence), and also because treatedmaterials would have to be landfilled which wouldrequire institutional controls such as deed and landuse restrictions, The ROD said that ‘‘EPA also doesnot have well-developed administrative capabilitiesto oversee and enforce institutional controls,"61 Butthe selected remedy of offsite landfilling also has thedisadvantages of impermanence and uncertainty,
But the most significant issue is the cleanup’sapparent violation of the statutory requirement tocomply with applicable or relevant and appropriateregulatory requirements. Regulations promulgatedunder the Toxic Substances Control Act (40 CFR761.60) require that PCBs in concentrations greaterthan 500 ppm must be disposed of by incineration.The MGM Brakes ROD said, Soil sampling resultsshowed a significant percentage of samples withPCBs in excess of (milligrams per kilogram) 1,000mg/kg (1,000 ppm). ’ The ROD referred only to aregulatory requirement that concentrations over 50ppm be incinerated or disposed of in an approvedlandfill, Actually, the regulations speak of the rangebetween 50 and 500 ppm for the option of landdisposal or incineration.
Next, consider the fund program ROD for theLaSalle Electrical Utilities site in Illinois, The fiscalyear 1988 ROD selected onsite incineration at a costof $28.6 million for 23,600 cubic yards of soil andsediment. There is no viable responsible party tosettle with. The cleanup standard is 5 ppm down toone foot and 10 ppm beneath one foot of soil; theROD said that a soil concentration of 0.03 to 3 ppmof PCBs corresponds to a risk of 1 in 100,000 excesscancer deaths (indicating a relatively high residual
~owever, landfWing of PCB cleanup waste has been practiced elsewhere; for example, the cleanup of the Geneva Industries site in Tkxas is basedon sending 47,000 tons of PCB-contarninated soil to the commercial hazardous waste landfdl in Ernelle, Alabama.
61~s ~t~ment is p~c~wly Si@ficmt ~a~ m~y Superfund RODS rely on institutional controls m pm Of tie *lt%ted remdy. It ~so is a goodexample of regional autonomy, because EPA headquarters has not expressed this view and probably would not as policy or guidance because H frequentlyendorses institutional Contiols.

168 . Coming Clean: Superfund Problems Can Be Solved . . .
risk for the cleanup levels selected).62 The leastcostly option of landfilling at about $3.5 million wasrejected because of the “difficulty in assuring thelong-term integrity of hazardous waste landfills. ”The options of biological treatment and dechlorina-tion were rejected initially on the basis of uncertaineffectiveness and implementation times. A 1986ROD for the LaSalle site had selected onsiteincineration for contaminated soils in a residentialarea offsite. The 1988 ROD noted that costs for theearlier selected incineration cleanup, started in early1988, had been 45 percent less than the originalestimate ($15 million instead of $27 million) be-cause of ‘the current competitive atmosphere in thethermal destruction business. ”63
Another fiscal year 1988 ROD labeled as fundprogram (like the L.A. Clarke site in Virginia) wasthat for the French Limited site in Texas, for whichPCBs are a major contaminant in about 150,000cubic yards of sludges, sediments, and soils. How-ever, responsible parties have been very active at thesite; they conducted a multimillion-dollar technol-ogy demonstration for in situ biological treatmentand have produced a supplemental Remedial Inves-tigation, which EPA said it used. Indeed, EPAoverturned its original selection of incineration andselected in situ biological treatment in its ROD.(Biological treatment was not selected in the abovetwo PCB site examples.) The estimated cost for theselected biological remedy was $47 million ascompared to the ROD’s estimated $120 million forthe rejected onsite incineration option; the biologi-cal alternative was the second lowest cost treatmentoption (a containment option at $42 million was
rejected). A few months after EPA issued the RODa complete settlement was reached with responsibleparties for implementation of the selected remedy.64
The French Limited cleanup standard was 23 ppmfor PCBs which the ROD said corresponds to a riskof 1 in 100,000 excess cancer deaths. (This is arelatively high risk and a high level for PCB cleanup,which in the previous two PCB examples was 5 to 10ppm,) The site study conducted by the responsibleparties, as noted by EPA in its ROD, found thatPCBs were not reduced to below the relatively highallowable PCB level of 23 ppm, and that somesecondary chemical fixation treatment would benecessary. The ROD acknowledged that the pilotstudy had presented “no data . . . to show whatportion of the decrease is specifically attributable todegradation. In other words, some of the apparentdecrease in measured PCB contamination levelsmight not have resulted from molecular destructionby microbes but may have resulted from a transfer ofPCBs to another medium, such as air or water. Thecurrent scientific literature on biological treatmentof PCBs does not show that all PCB molecules(higher chlorine types) can be destroyed biologicallyto low residual levels.65 A professional paper bypeople working for the responsible parties whichdescribed the remedy selection made no mention ofthe issue of PCB destruction.66
Moreover, the French Limited ROD also notedthat “some degradation of the water quality in theupper aquifer did occur during the pilot study. ’Furthermore, “Recovery and treatment of the shal-low aquifer is necessary to control any groundwaterdegradation which may occur during implementation
‘In other words, it seems that a trade-off was made, increasing the risk to reduce the amount of soil rtquiring incineration; however, the 5 and 10ppm levels for PCBS are typicat of many PCB cleanups. The risk assessment may have been overly conservative or a mistake may have been made (Wdiscussion on risk assessment in ch. 1).
ISmS o~atim su~~ OTA’S conclusion that com~tition among generic cleanup technologies and within classes of technologies has reducedunit cleanup costs, preventing permanent remedies from becoming exorbitant, as some people feared would happen as a result of SARA.
am estim~ WQ fm iM&r~lon ~ms hi@; using the unit cost from the LaSalle cleanup would suggest a cost of $90 million md a still lowercost is likely-perhaps S60 million--beeause of the much larger (six times) volume of materiat at French Limited and there are significanteconomy-of-scale effem for incinmtion.
6s~ effativenew of biological treatment of soil contaminated with PCBS remains a controversial issue and there is a large literature on the subject.(see EPA, Technology Screening GuMe for Treatment of CERCLA Soils and Sludges, September 1988; and S. Niaki, “Treatment Tedmologies forPCB-Contaminated Soils,” conference proceedings Hazt.wh International, St. Imuis, Missouri, August 1987) EPA concluded that with more than 5chlorines per molecule bacteriat degradation was not readily observed. (EPA, Microbial Decotquosition of ChforinasedAroma.rlc Compounds, September1986.) Some commercial vendors of biological cleanup technology say that they are effective on PCB-contaminated soil, but little detaikl data areavailable. professor John Waid of La Trobe University in Australia has informed OTA of promising results of a field test in the United States using hismethod, based on white rot fungus and landfarming techniques, to destroy PCBS in soil.
‘Richard L. Sloan et al., ‘The French, Ltd. PrOJCCt: A Gse study, supetiund ’88, proceedings of conference Novemkr 1988, HUudOus Mwri~sItescmch hmitute, silver S*8, ~.

Chapter 3--Cleanups and Cleanup Technology . 169
of the biotreatment remedy. ” Based on our exten-sive study of RODS, such uncertainty about effec-tiveness and implementation problems would typi-cally rule out an alternative. However, the ROD’sevaluation of alternatives gave the selected remedythe same ratings for effectiveness and irnplementabilityas incineration, But the ROD acknowledged thatincineration ‘offers destruction of all of the contam-inants to levels below the health-based criteria’whereas biological treatment would require stabili-zation for PCBs and that the stabilization would notdestroy the PCBs. Chemical fixation had beenevaluated and rejected in the MGM Brakes siteROD, which said that it ‘‘would not provide apermanent solution for the site. ” For most of themany commercially available forms of chemicalfixation, effectiveness on PCBs is unproven.67
Two Battery Recycling Facilities
Lead is the principal contaminant of concern attwo very similar battery recycling facility Superfundsites. Unlike organic contaminants (e.g., creosoteand PCBs) discussed earlier, toxic metals cannot bedestroyed by treatment technology; however, thestatutory goal of recycling when it is feasible is thekey issue for metals. It is through recovery and thenrecycling of toxic metals that a truly permanentremedy can be obtained. At both sites presentedhere, the chief problems are battery casings andcontaminated soil, both surface and subsurface.
The enforcement ROD for the Gould site inOregon selected a cleanup standard for surface soilsof 1,000 ppm of lead; the standard for subsurface soiland the unrecyclable materials was the failure ofEPA’s EP Toxicity test. Twenty-nine-thousand cubicyards of contaminated soils will be treated bychemical stabilization and backfilled onsite. (OTAnotes that the estimated volume appears to be based
on the responsible party RIFS which used a 3,000ppm level for lead [which EPA apparently rejected]and, therefore, underestimates the volume based onthe selected standard of 1,000 ppm.) It was estimatedthat about 25 percent of the lead in the casings wouldbe recycled, plus some other materials. Contami-nated unrecyclable battery casing materials, from atotal of 81,000 cubic yards of casings, will be sent toan offsite hazardous waste landfill. Estimated costfor the selected remedy at the Gould site is $21million, but this figure does not count any incomefrom sale of recycled material.
The fund program ROD for the United Scrap Leadsite in Ohio selected a cleanup standard for 45,000cubic yards of surface soils of 500 ppm of lead-one-half of the value for the Gould site—and the failureof EPA’s EP Toxicity test for subsurface soils(unestimated volume, but could be two to three timessurface volume) and 55,000 cubic yards of residualbattery casing materials, Contaminated soils andbattery casings will be treated using a chemicalprocess developed by the Bureau of Mines, and thesafe residuals of treatment will be replaced onsite.This treatment process uses fluosilicic acid toremove and purify lead for recycling. Similar totechnology currently used in the mining industry,the process was evaluated in laboratory treatabililytests and was found to successfully reduce leadcontent of soils and battery casings below thecleanup standards. Further tests and a pilot studywill be conducted as part of the design phase tooptimize the process. For the United Scrap site, theROD noted that “the 500 ppm level was chosen inorder to assure protectiveness. It is also the levelchosen at other CERCLA sites nearby . . . Soilscontaminated with lead at or above 500 ppm levelrepresent a health threat. ” Consistent with OTA’sperspective on permanence, the ROD also said that
LV~ ~IWtim of chefic~ fix~on for tie pep~r’s Steel & Alloys site in Florida was an unusual dezision. In addition to PCB contamination, thesite also had very high levels of toxic metals which posed a problem for incineration. The site decision was based on test work and analysis by theresponsible party which developed and now sells the chemical fixation technology. A fidl settlement was reached for this SIIC. Significant uncertaintyabout long-term effectiveness remains. Indeed, about one month before the ROD was sigrd, EPA’s expert on chemical fixauon m Its Office of Researchand Development said, “’l%e subject report [responsible party’s] does not provide conclusive evidence that soil from the waste wte can be treated toprovide a solid that will be harmless to the environment. The waste would appear to be capable of leaching unacceptably high levels of lead mto a h@dyused aquifer system. ” A few weeks earlier, a professor at Lm.usiana State University submittcxi a report as a consultant to EPA’s contrac~or; the reportraised a number of issues about the limits of the testing done by the responsible pany. Afl.er the responsible party began the cleanup, EPA said:“SolidificatkmM.abilization costs less than the other alternatives. It is also more likely to perform as expected. . A extmwve tesnng program wascmducted by EPA and Florida Power & Light to make sure that the stabilmd and solidified materials would meet the goal of isolating the waste fromthe environment over an extendd period of time. ” About 2 ‘/2 years after the ROD and before the remedy was complete, ~ EPA Region 4 memo onthe cleanup said, ‘ ‘Time will tell if the remedy mcwts our expectations. . . . Umversally accepted tests to characterize either short- or long-termperformance did not and still do not exist.

170 ● Coming Clean: Superfund Problems Can Be Solved . . .
‘‘since the contaminants are removed and recycled,the possibility of future actions is eliminated. ” Theestimated cost for the selected remedy is $27million, which accounts for sale of recycled ma-terial.
These two RODS illustrate:
●
●
●
A surface soil cleanup standard for lead at theenforcement site half as stringent as thatselected for the fund program site; this differ-ence cannot be explained on the basis offundamentally different exposure or risk fac-tors. The consensus in the technical literature isthat a cleanup level of 1,000 ppm for lead insurface soil could pose a significant healththreat to children who might come into contactwith such soil.68
A selected remedy at the enforcement sitewhich, in part, uses a treatment technology(stabilization) for soil that does not recoverlead, whereas the treatment technology at thefund program site does. Institutional controlsfor the enforcement site are an important part ofthe remedy because lead will remain onsite.The ROD for the fund program site, whichrejected chemical stabilization, said, “Sincecontaminants are contained rather than re-moved, the possibility for future remedialactions at the (cleanup) site or at the offsitelandfill site will remain. ” This position agreeswith OTA’s concerns about the uncertaintiesand impermanence of chemical fixation, com-pared to recovery of metal.The recovery of lead from casings at theenforcement site relies on a less- effectivemechanical separation technique (a grindingand physical separation operation); the one atthe fund program site uses a chemical tech-
*
nique, which is likely to remove more of thelead, producing, therefore, a permanent rem-edy. Therefore, for the enforcement site, signif-icant quantities of hazardous material will besent offsite for landfilling, but for the fundprogram site safe treatment residuals will bebackfilled onsite.It is difficult to compare costs for the two sites.About 80 percent of the cost for the enforce-ment site is operation and maintenance (mostlyfor offsite landfilling); the cost for the fundprogram site consists almost entirely of capitalcosts for the more sophisticated chemicalrecovery treatment facility (10 times morecapital cost than for the enforcement RODcleanup); the cost also accounts for revenue ofabout $4 million from selling recovered metal.Still, if the enforcement ROD had used thecleanup standard of the fund program ROD andits cleanup technology, then it might have costperhaps as much as another $10 million.69
Eight Landfills
Sites at which wastes were buried initially varygreatly, some were used only for industrial wastesbut many were municipal or mixed waste landfills.But there are also significant similarities from acleanup perspective. For example, the cleanup oflandfills nearly always is based on leaving thewastes buried, capping them, and, if necessary,addressing groundwater contamination, which isvery common around such sites. The assumption isnearly always that the volume of buried waste is toolarge to consider excavation and treatment; littleattention is normally given to identifying hot-spotsof contamin ation amenable to excavation. In manycases these sites already have caps on them, but they
@At a majm Su@und site in Michigan (Rose Township), the cleanup standard for lead in soil was 70 ppm, which is quite low for lead d illu~wsthe benefit of having uniform cleanup standards for common contaminants in soil, which for lead would probably be higher than 70 ppm. lltis site cleanupwas also a settlement with originally stringent cleanup objectives. However, subsequently, as asked for by the responsi le parties, a portion of theincineration was replaced with less expensive soil flushing for volatile organic chemicals, and EPA’s usual cleanup standard was dropped, with a newom to be determined by the responsible parties during post-ROD work. This suggests that a technology performance standard might replace ahealth-based one. The Natural Resources I.kfense Council testified that “The Rose Township reversal is a sobering reminder of the power wielded byPRPs, and of the numerous means by which a protective remedy can be undermined. Donald S. Strait and Jacqueline M. Warren, testimony beforeSenate Subcommitttx on Supxfund, Ocean and Water Protection, June 15, 1989. The reduction of cleanup cost issue was described recently: ‘“It wasSrnct.ly a money thing, ’ said Kevin Adler, tbe EPA’s project manager. The maximum the companies would pay voluntarily was $14 million; any moreand they’d take the EPA to court. Newsweek, July 24, 1989 The situation at the Rose Tbwnship site also illustrates the potential significance ofdistinguishing between cunent and future risk (see discussion in ch. 1 of policy option 1) because much of the justification for cleanup was baaed onspeculative future risks. This appears to weaken EPA’s position in obtaining stringent cleanups by responsible parties.
69~t~}y, ~ estim~ cql~ cost fm the B~eau of ~nes tre~ent p}~t W* probdly ovemtti because the equipment could be ud u other
Superfund sites and the capital costs distributed over several cleanup projects.

Chapter 3-Cleanups and Cleanup Technology ● 171
have not prevented the need for further action which,ironically, is often to use another cap.
Instead of matching a small number of similarsites, as in the previous sections, all the fiscal year1988 RODS in Region 5 for which containment/landdisposal was selected were examined to determine ifthere were effects from settlements with responsibleparties. Summary findings are given in box 3-GThree of the eight RODS were labeled by EPA asfund and five were designated enforcement. That is,62 percent of the containment/land disposal RODSwere enforcement, compared to a national average of71 percent. Region 5 is a large but representativeEPA region.
The general conclusion is that enforcement con-tainment RODS had significantly more issues relatedto effects from settlements or the conduct of RIFSsby responsible parties. Issues include the reductionof cleanup costs by: selecting simpler caps, consis-tent with municipal instead of hazardous wastelandfill regulations; rejecting the use of incinerationfor small amounts of hazardous material (with costssimilar to typical cleanup costs) or for large amounts(with costs which are high-perhaps $50 million to$100 million-but not necessarily infeasible);70
avoiding or minimizing groundwater cleanup.
The total costs of the five enforcement RODS andthe one fund ROD which EPA said it was negotiat-ing with responsible parties (Belvidere) is $44.2million compared to costs which might have totaled$283.6 million if more stringent cleanups consideredin the RODS had been selected.
Conclusions
There is nothing intrinsically wrong with EPA’sdesire to maximize settlements which reduce theneed for fund-financed remedies. OTA’s researchshows that EPA’s emphasis on using negotiatedsettlements as its chief enforcement tool, however,is linked to EPA’s ability to reduce cleanup costs to
levels attractive to responsible parties by compro-mising environmental objectives. However, there isnothing illegal about this, because there is currentlya lot of flexibility in statute and EPA’s implementa-tion of it to allow different kinds of remedies andlevels of protection for similar sites. This conclusionsuggests the need for routine EPA examination ofremedy selection and cleanup objectives in RODSand, perhaps, a policy about enforcement whichassures consistent levels of environmental pro-tection, regardless of whether a cleanup is fund-financed or responsible party-financed.
But it is also important to note that there areexamples of responsible parties showing greatinterest in performing first-rate cleanups, sometimesmore consistent with statutory provisions thanEPA’s selected remedies. For example, at theTyson’s Superfund site in Pennsylvania the respon-sible party did its own technology demonstrationand convinced EPA to change its ROD, replacingmajor offsite landfilling with onsite vacuum extrac-tion and destruction of volatile organic chemicals, iffurther testing confirms its effectiveness.
OTA’s analysis also shows that technical work inSuperfund looks better when enforcement site deci-sions, in which non-technical considerations stronglyaffect outcomes, are separated from fund site deci-sions.
EPA spends hundreds of millions of dollars on itsTechnical Enforcement Support contractors. A majorjob for them is oversight of responsible partycontractor work and supplemental work at enforce-ment sites. But this extensive EPA contractoractivity is not preventing EPA decisions that some-times compromise environmental protection. Giventhis and the increasing rate of settlements, the keyquestion is: Will future government oversight, fromthe same system, reveal whether or not settlementcleanups performed by responsible parties are com-
701t is cmvatlo~ ~~om w for 1~ge lan~l]ls it is ~onomical]y infeasible to employ expensive cleanup technologies, such as incineration. Butthere has been no attention by EPA or others to exactly what level of cleanup cost is unacceptable or prohibitive. The statute gwes EPA a way to rejectvery expensive jimd-finunced cleanups; it is called fund-balancing, which means that when costs for a cleanup get so high as to seriously reduce thegovernment capability to address other Superfund sites, the expensive cleanup can be rejected on economic grounds, even though it might be the bestenvironmental sohmion for the site. EPA, however, rarely invokes the fund-balancing provision when it rejects high cost alternatives for fund-fiiancecleanups. How much money is too much for a site? At enforcement sites where responsible parties-which for landillls often include localgovernment---could pay a high cleanup cost, should high cost alternatives be dismissed automatically? The issue of whether the lower cost containmentremedies being selected are permanent is also important, and whether settlements and consent decrees hold responsible pames hable for future majorScc41ndary cleanup actions
172 ● Coming Clean: Superfund Problems Can Be Solved. .
Box 3-G--Summarie s of Eight FY88 Region 5 Decisions Selecting Containment/Land Disposal
Belvidere Municipall No. 1 Landfill, Belvidere, Illinois: fund ROD, EPA did RIFS.The ROD did not give specific groundwater cleanup levels, but extensive details from the site’s risk assessment
were given. The cap selected is consistent with that required for a hazardous waste landfill, even though the limitedamount of hazardous waste was disposed before 1980. ((Men, EPA defends using a solid (municipal) waste landfillcap when there is documentation that hazardous waste disposal was prior to 1980.) The ROD rejected an incinerationoption for 790,(X)0 cubic yards at a cost of $127.6 million [which is low but realistic in today’s market] chieflybecause it was “so much more costly. ” No fired-balancing argument was given, Environmental benefits for theincineration option were not given. The selected remedy’s estimated cost was $7.9 million. The ROD said that EPAwas negotiating with responsible parties to implement the ROD.
Kummer Sanitary Landflll, Northern Township, Minnesota: fund ROD, State did RIPS.The ROD rejected a hazardous waste landfill cap, but justified it correctly on the basis of no documented
disposal of hazardous waste and an estimate of the small increased protection over using the State’s requiredmunicipal landfill cap, which is stringent. Incineration of the 1.3 million cubic yards in the landfill was eliminatedearly on because of short-term problems and “excessive cost” and because it was “cost-prohibitive.” No explicituse of the fund-balancing provision was made. The selected remedy’s estimated cost was $6.9 million to $12.5million. A 1985 ROD had selected an alternative water supply: a future ROD will address groundwater cleanup.The case for deferring a decision on groundwater cleanup was well discussed
Oak Grove Sanitary Landfill Site, Oak Grove Township, Minnesota: fired ROD, State did RIFS.The ROD acknowledged documented disposal of hazardous waste, but rejected using a hazardous waste
landfill cap because only about 0.1 percent of the 2.5 million cubic yards of landfilled waste is hazardous was* andit is dispersed throughout the landfill. Using the hazardous waste cap had an estimated cost of $7.4 million to $14.6million compared to the selected remedy’s estimated cost of $5.1 million to $10.7 million. Incineration w a seliminated early on because of cost and short-term risks. The deferral of the decision on groundwater cleanup waswell presented
Cashocton City Landfill, Coshocton, Ohio: enforcement ROD, EPA did RIFS.The originally proposed remedy (at $17.5 million) was changed because of comments by responsible parties
primarily a lower cost option (at $8.9 million) was selected. Cost was reduced by eliminating a leachatetreatment system and a system to vent landfill gases, but these were to be considered in the design
of the remedy. Although groundwater contamination on and signficant risks were documented in the ROD, nogroundwater cleanup was selected; monitoring was selected instead. Even though there was documentation that 6.4million pounds of hazardous waste were disposed in the landfill, a cap for a municipal and not a hazardous wastelandfill (as was proposed initially) was selected. The ROD acknowledged that the responsible parties want an evenless stringent cap and that waivers are possible later. The ROD contained candid discussions of the desire by theresponsible parties to minimize immolate costs, even though EPA thinks that they risk higher long-term costs dueto eventual cleanup needs. But clearly EPA gave the responsible parties what they wanted. From the ROD: “ThePRPs’ proposal suggests a remedy which is less costly, initially, but which could be substantially more expensiveshould the monitoring system detect changed conditions... . The PRPs. . . have expressed a preference for a lesscomprehensive (and less costly) initial containment option, with the understanding that should said initial actionnot be sufficient, the ensuing remedy could be more costly. While it may not be appropriate for the federalgovernment to ‘gamble’ in this way, if financially viable private entities agree to undertake the remedy and arewilling to enter into an enforceable court order by which they would be obligated to quickly act in response toc h a n g e d t h e g o vernment maybe willing to consider a remedy by which the PRPs explicitly assume sucha risk.” How well this arrangement does not jeopardize public health and environment depends on effective EPAoversight of post-ROD activities and fast responses by responsible parties should they be necessary.

——— . . — — -
Chapter 3--Cleanups and Cleanup Technology ● 173
Republic Steel Quarry Site, Elyria, Ohio: enforcement ROD, EPA did RIFS.The decision not to pursue groundwater and sediment cleanup was well supported. The ROD gave good details
from the site’s risk assessment. However, the ROD selected offsite Iandfilling for 100 cubic yards of contaminatedsoil at an estimated cost of $63,2(M). The alternative to use offsite incineration at an estimated cost of $279,700 wasrejected because of its higher cost.
Mason County Landfill, Mason County, Michigan: enforcement ROD, EPA did RIFS.To its credit the ROD selected a cap consistent with a hazardous waste landfill because industrial slurry and
sludge wastes had been disposed there (prior to 1978). The ROD gave good details on the site’s risk assessmentresults and the case for deferring a decision on groundwater cleanup was well presented. An alternative of usingchemical fixation for excavated material at a cost of $43 million was rejected on sound technical grounds.Incineration for the relatively small landfill (140,000 cubic yards) was rejected without detailed examination, butits cost might be about $50 million. The selected remedy’s estimated cost was $2.8 million.
Allied Chemical/Ironton Coke Site, Ironton, Ohio: enforcement ROD, responsible parties did RIFS.Cleanup levels for groundwater cleanup were given in the ROD. However, numerous statements indicate that
the pump and treat method is not likely to reach those levels, will be stopped when “technical unfeasibility isdemonstrated” during cleanup, and a formal waiver from regulatory requirements for contaminant concentrationswill then be implemented. The ROD had few details from the site’s risk assessment. Options to excavate most andall of the site’s hazardous materials and incinerate them were seriously examined. But they were rejected becausethe overall environmental protection was not rated higher than capping the landfill, and because of high costs ($92.2million and $218 million). The ROD acknowledged the difficulty of the selected remedy being effective for the layerof dense non-aqueous contaminants which have settled at the bottom of the site. The higher cost incineration optionwhich would treat all 456,000 cubic yards of site hazardous material was actually overestimated in cost by closeto $100 million, based on current costs for onsite incineration. The ROD referred to the high cost incineration optionas “cost prohibitive” and offering advantages “not commensurate with the costs. ” To its credit, the ROD selecteda hazardous waste landfill cap; hazardous waste disposal had stopped in 1977. The estimated cost of the selectedremedy, which also includes a slurry wall around the disposal area was $13.1 million. The ROD included adiscussion about comments from the Department of Interior: “DOI asserted that the major advantage of the selectedremedy is cost, and without reviewing the cost assumptions, asserted that future operation and maintenance of thepreferred alternative will meet or exceed the cost of the most expensive alternative [incineration of all site hazardousmaterial]. DOI also raised concern about the source of money for continued long-term operation and maintenance,and the future environmental consequences if long-term operation and maintenance% is not conducted. ”
Waste Disposal Engineering, Andover, Minnesota: enforcement ROD, responsible parties did RIFS.The ROD lacked details from the site’s risk assessment and specific cleanup objectives for the groundwater
cleanup. Optimism about the pump and treat groundwater cleanup was contradicted by other ROD statements: “Theextraction system will effectively intercept all [emphasis added] contaminated ground water migrating from the Sitein the Upper Sand aquifer and currently entering Coon Creek. . . . The extraction system will be active indefinitely,and will greatly reduce, if not eliminate, any loadings to Coon Creek, . .“ Serious attention was given to excavatingand incinerating a confirmed hot-spot called the Pit. But it was not selected, even though only 5,500 cubic yardswas estimated to cost $6.3 million. The argument was that only 10 percent of the site hazardous waste was in thePit. But this position is undermined by many statements in the ROD which refer to the Pit as the “major,”“dominant,” and “most serious” source of groundwater contamination. There is no mention of the benefit of
permanently removing such a major confirmed source of groundwater contamination. Moreover, the cost for theincineration is overestimated by about 100 percent and the issue of ‘severe safety risks’ from excavation seemsoverstated because a test excavation in 1986 did not result in safety problems. To its credit, the ROD selected ahazardous waste landfill cap, even though disposal had stopped in 1974. The selected remedy’s estimated cost was$11.4 million, which includes a slurry wall around the Pit and pumping from within it.
sOuKE: Omcc of Tbdnlology ~, 19S9: based on exmninuion of EPA RODS.

174 ● Coming Clean: Superfund Problems Can Be Solved. . .
parable environmentally to fund-financed cleanupsand SARA’s stringent cleanup requirements?
The issue that seems important for future Super-fund implementation is: Is there a better way to getresponsible parties to pay for cleanups withoutcompromising environmental goals? After all, SAM’Scleanup requirements do not distinguish betweenenforcement and fund-financed cleanups. EPA couldmaintain uniformly high environmental standardsfor all Superfund cleanups and make cleanupdecisions independent of who pays for cleanup. EPAcould use the tough enforcement tools given to it bystatute to get those responsible for creating Super-fund sites to pay for environmentally effectivecleanups that are consistent with statute and con-gressional intent. The more EPA uses strong en-forcement tools, the stronger its position in reachingvoluntary settlements which do not require compro-mising environmental goals. However, it should benoted that responsible parties believe that settlementcleanups are effective environmentally and satisfystatutory requirements. Indeed, there generally isenough flexibility or ambiguity in key statutoryrequirements to permit some widely different inter-pretations. Moreover, EPA’s implementation hasalready included so many different types of cleanupsfor essentially the same types of sites that responsi-ble parties can easily point to the least stringentcleanups as precedents for cleanups providing effec-tive environmental protection. (See several policyoptions in ch. 1)
Finally, OTA’s findings on effects of settlementsshould also be examined with regard to othercleanup programs into which potential Superfundsites may be deferred, especially programs in whichresponsible parties routinely select and implementcleanups (e.g., EPA’s corrective action programwithin its RCRA hazardous waste regulatory pro-gram, the leaking underground storage tank pro-gram, and many State cleanup programs). Suchcleanup programs include many more sites than inSuperfund and influence Superfund in several ways(see ch. 4).
Issue 4: Are analyses and selections of cleanuptechnologies inconsistent and, if so, does itmatter?
OTA’s 1988 case studies have documented sub-stantial cleanup inconsistencies among and withinthe 10 EPA Regions and EPA headquarters. Theinconsistencies are for critical decisions about cleanupobjectives and remedy selection. The situation canbe credited to excessive regional autonomy—thereliterally are 11 different EPA and Superfund pro-grams.
An environmentalist’s 1987 analysis of 10 post-SARA RODS is consistent with OTA’s case studies:
Our review of the 10 RODS reveals a disorgan-ized, confused bureaucracy making seat-of-the-pants, poorly documented decisions that fail toprotect public health and violate the law. Seven yearsinto the program, we have not progressed beyond adhoc and inconsistent process that was the hallmark ofSuperfund’s grim first few years. [The] Superfundprogram . . . continues to make bad and inconsistentcleanups the rule and the reality. The inconsistentapproaches taken in the 10 RODS underscore theurgent need for the agency to develop specificnational policies for its regional offices to use inmaking such decisions.71
A rarely addressed consequence of inconsistentdecisions was also noted:
In short, the agency’s erratic, inconsistent ap-proach to cleanup standards today could compro-mise the fiscal integrity of the fund years into thefuture. 72
A study by Washington State University andBattelle’s Pacific Northwest Laboratory on im-proving site study methodologies said:
Although EPA has provided general guidance forconducting an RI, EA (endangerment assessment),and FS, detailed procedures are not readily availableto implement these guidelines; as such, analyses tendto be inconsistent from site to site, and the qualityand quantity of documentation varies.73
Another recent observation was that:
71 A.Fj. &ly, ~s~ony &fom the %nti Subcommittee on Supdmd and Environmental Oversight, June 2S, 1987.~fiid.TsKe~~ E. H- ~ Gene Wilson, ‘“~As ~d ~As Mc~odOIOgieS ss hqga~ hto the R~~s PKXX?SS,’ supt?rjid ’88, PKWX!&XlgS
of cmfenmce November 1988, Hazardous Materials Research Institute, Silver Spring, MD.

Chapter 3-Cleanups and Cleanup Technology ● 175
The ROD process, occurring in ten EPA regionsas well as at headquarters, results in wildly in-consistent remedies and sometimes conflicting ra-tionales,74
Why is there so much inconsistency? Differentinformation is used. For example, the unit cost of atechnology such as mobile incineration may vary by100 percent or more (see OTA’s 1988 case studies).The problem is caused, in large part, by having manydifferent contractors working on sites for 10 EPAregions that are responsible for selecting remedies.At the Pristine site in Ohio, incineration was rejectedbecause it w as estimated to cost twice as much as theselected remedy (in situ vitrification). In fact, its costwas overestimated by a factor of 2, according todetailed incineration costs contained in two feasibil-ity studies on other sites by the same contractor, butat a different regional office of the contractor.
Different technical criteria and different struc-tures for analysis are used in feasibility studies andRODS. Some RODS have analyses that really do helpa reader understand why the remedy selected isbetter than the others. But, more often, the analysescan be used to justify any remedy selection becauseeither they are superficial and qualitative, or they arelengthy and redundant with no sharp distinctions. AState official summed up his view of EPA’s methodto evaluate cleanup alternatives and select a remedy:
Sometimes it seems that “guidance” is followedso faithfully that common sense is neglected. Flexi-bility is a crucial missing component when remedialalternatives are developed and evaluated, but it isoverutilized in actual remedy selection. In our viewit is best to consider a wide, variable range ofalternatives and allow the best one to emerge.Instead, EPA does a rigid evaluation of genericremedies, only to be confronted with a choicebetween several square solutions for a round prob-lem. At that point flexibility is too late.7s
Variable interpretation of SARA’s provisions onremedy selection is also important in understandingthe presence of inconsistent Superfund implementa-tion. EPA has tacitly encouraged subjective, varia-ble, and inconsistent interpretations of statutory
language. No attempt has been made to clarify themeaning of terms such as treatment, permanence,reduction in toxicity, cost-effectiveness, and futurefailure modes. Nor has there been any attempt toestablish hierarchies for types of treatment technolo-gies and their outcomes. The current use of ninedifferent criteria-apparently with equal importanceand no hierarchy-to evaluate cleanup alternativesdoes not help to make clearly understood, sharpdistinctions. Regions and specific remedial projectmanagers emphasize whatever criteria they chooseto.
Some of the nine criteria could have been simplerequirements to be met by a selected remedy ratherthan criteria for which alternatives have differentlevels of performance (e.g., compliance with regula-tory standards, long-term effectiveness, communityreaction, State support). Also, the overlapping andambiguity of some of the environmental criteria(e.g., short-term effectiveness, reduction of toxicity,mobility or volume, implementability, overall pro-tection of human health and the environment) fostersan analysis that can be made to support any decision.
The inclusion of cost (but not cost-effectiveness)has also facilitated ruling out alternatives early in thescreening process and in combination with theflexibility of the preceding environmental criteriafacilitates a cost-benefit kind of analysis. All of thisis compounded by the lack of detailed analysis,including references to the technical literature,scientific principles, and actual data. In its place isqualitative assertion and cost-benefit reasoning.
As OTA’s case studies have documented, use ofany treatment technology and, in some cases, evenuse of land disposal or containment are interpretedas meeting SARA’s requirements and preferencesconcerning the examination and selection of reme-dial cleanup technologies. Confirmation of this OTAconclusion comes from a study of fiscal year 1987RODS which concluded, “The degree to whichselected alternatives are cost-effective cannot bedetermined based on the limited discussions and
74Roger J. Marzulla, ‘‘Superfund 199 1: How Insurance Companies Can Help Clean Up the Nation Hazardous Waste, paper presented to InsuranceInformation Institute, Washington, DC, June 13, 1989.
75 Mic&l J. Bti, Dir~tor of New Mexico’s Environmental Improvement Division, letter to OTA, July 5, 1988.

176 ● Coming Clean: Superfund Problems Can Be Solved . . .
rationales provided in the documents reviewed."76
This conclusion is all the more significant becausethe study also concluded that:
. . . cost was the most significant factor in theselection of remedial alternatives in the decisionsreviewed. Thirty-four percent of RODS reviewedselected either no action or the least costly alternativeother than no action; 8 percent selected the mostcostly alternative evaluated. In 40 percent of RODS,more protective alternatives not selected cost at leastan additional $10 million; some of these remediescost an additional $100 million or more. . . . [C]ostappeared to play a more significant role in theselection of remedial alternatives than did risk.77
This work supports our previously discussed findingconcerning money saved by responsible parties as aresult of settlement-impacted RODS, and the con-clusion that cost-effectiveness has given way tocost-benefit thinking which leads to selection oflow-cost remedies and rejection of higher costremedies which, however, offer higher levels ofenvironmental protection. In other words, not usingthe statutorily required cost-effectiveness form ofdecisionmaking has lead to inconsistent cleanupdecisions in Superfund.
In addition to the case studies, a few moreexamples from RODS illustrate the diversity of waysto comply with the statutory requirements:
●
●
For the Powersville Landfill site in Georgia, theselected remedy consists of capping thelandfill, grading of the surface, groundwatermonitoring, providing alternate drinking water,and restricting the site deed. The 1987 RODsaid: ‘‘This remedy satisfies the preference fora treatment that reduces toxicity, mobility, orvolume as a principal element. . . . [T]heremedy utilizes permanent treatment technolo-gies to the maximum extent practicable. ”For the NW 58th Street Landfill in Florida, theselected remedy closes the landfill in accor-dance with regulatory requirements, includingleachate control and probably capping, groundwa-ter monitoring, and providing municipal waterto some private well users. The 1987 ROD said:“The statutory preference for treatment is not
satisfied because treatment was found to beimpracticable due to the magnitude of waste tobe treated (estimated 27 million cubic yards). ’Treatment of contaminated groundwater wasrejected because the contamination is toowidespread; a 1985 ROD selected air strippingat the water treatment plants, The ROD alsonoted that: “The present worth estimate of thecost of excavation alone is $439 million, Sincethis is two orders of magnitude higher than theother alternatives that would provide compara-ble protection, this alternative is rejected on thebasis of cost [emphasis added], ” But if treat-ment offers better protection, then the selectedremedy does not offer comparable protectionand is not cost-effective. The fund-balancingprovision of the statute, which provides a wayto avoid spending so much at any one site thatcleanups at other sites would be jeopardized,could have been used, but was not, to justifyrejection of excavation and treatment.
For the Tri-City Oil Conservationist Corp. sitein Florida, the selected remedy was no furtheraction. The 1987 ROD said: “The statutorypreference for treatment is not satisfied becausetreatment was found to be impracticable. Treat-ments which reduce toxicity, mobility, orvolume of wastes would not have been cost-effective at this site because of the smallvolume (850 cubic yards) of wastes present.The ROD also said “. . . the remedy utilizespermanent treatment technologies to the maxi-mum extent practicable given the small volumeof contaminated materials. ” In fact, the 850cubic yards had been removed and landfilled in1985 and, therefore, the volume present that theROD actually addressed was zero.
For the Vega Alta Public Supply Wells site inPuerto Rico, the selected groundwater remedywas treatment of some well waters and shut-down of some others with connections toanother source of water. The 1987 ROD said:‘‘The statutory preference for treatment, whilenot fully satisfied in that the sources still needto be considered, is partially addressed in that
7~uo]yn B. Doty and Curtis C. Travis, ‘‘The Superfund Remedial Action Decision Process’ draft, Oak Ridge Nationat Laboratory, undated, racivedby OTA in May 1989. The study was done for EPA and &d not analyze the effect of responsible parties on cleanup decisions.
‘Ibid.

Chapter 3-&lean ups and Cleanup Technology ● 177
●
●
●
●
●
●
the groundwater treatment system reduces thetoxicity and volume of contaminants.For the Presque Isle site in Pennsylvania, theselected remedy was no further action, The1987 ROD Said: “This remedy satisfies thepreference for treatment that reduces toxicity,mobility, or volume as a principal element.Finally, it is determined that this remedyutilizes permanent solutions and alternativetreatment (or resource recovery) technologiesto the maximum extent practicable. ” All thedeep well-injected wastes will be left onsite.
EPA has examined the presence and cause ofinconsistent Superfund implementation withregard to risk assessments, an important part ofthe RIFS process that leads to setting cleanupgoals which cleanup technologies must thenmeet. Some of the EPA report’s findingssubstantiate an organization and managementstructure that also explains inconsistent tech-nology analysis and selection like this:“The current guidance, Regional review, andHQ oversight systems will not necessarilydetect or prevent inconsistencies. ”“Guidance cannot ensure consistency. Unre-solved technical and policy issues and thecontinuing need for judgment leave room fordifferences to emerge. ”" . . . [N]o one group. , . has a broad view of allrisk assessments, limiting HQ’s ability toidentify inconsistencies between sites or Re-gions."‘ ‘Regions, intent on their own work, know littleabout the actions of other Regions.
". . . [N]o one really knows the extent ofinconsistency. As the number of assessmentsgrows, it becomes increasingly likely that somesignificant inconsistencies will go undetected. ’78
The report omits the possibility that non-EPAactivities might elucidate the presence and sig-nificance of inconsistent Superfund implementation,including congressional oversight, studies by publicinterest groups, and news media coverage. Instead,staying within its own perspective and system, EPAconcluded that no major new actions were necessarybut that existing activities could be strengthened.
OTA doesSuperfundreasonable
A morealso found
not concur. The level of inconsistentimplementation is so high that it is
to seek new ways to remedy the situation.
recent study of fiscal year 1987 RODSmany problems in the processes leading—
up to RODS.79
Summary--Inconsistency is not necessarily bad.But similar Superfund sites and cleanup problemshave received different cleanups with different,uncertain, and sometimes relatively low levels ofenvironmental protection. Variable environmentalprotection is the central problem with inconsis-tent Superfund implementation. Counter to stat-utory requirements and preference, non-treatment,impermanent remedies based on land disposal,containment of wastes, or wait-and-see monitoringare often selected. ROD selections of untested anduncertain treatment technologies also occur. Particu-lar treatment technologies have become favorites ofsome EPA Regions and are ignored by others.Moreover, as said earlier, some treatments do notdestroy or detoxify site contaminants and cart crowdout more effective treatments, which may be morecostly. Inconsistency makes the marketplace verydifficult for technology developers, creating majoruncertainties that have little to do with the merits ofthe technologies.
Issue 5: Are there incentives built into theSuperfund program for making broad use ofimproved cleanup technologies?
There are nearly none.
SARA does, of course, provide a basic nationalpolicy framework that favors improved treatmenttechnologies, and public opinion helps, But thispolicy can be responded to superficially, ignored,and misinterpreted. There are far more penalties thanrewards for going with new solutions over olderones, even though the older ones may not offerreliable, permanent long-term protection.
All those who bear costs generally see treatmentalternatives as more expensive in the near term thanconventional containment/land disposal and monitor-ing options. Those who pay include responsible
78u s fiv~omen~ ~otwtlon Agency, Ev~utlon of ~c ~epwatlon Of RI* As~s~en~ for Enforcement &tivities, September 1987.. .T!?~ty ~d Travis, op. cit., footnote 76,
178 ● Coming Clean: Superfund Problems Can Be Solved . . .
parties, States, and EPA. EPA also is driven by adesire to distribute funds over as many sites aspossible and by its interest in facilitating agreementswith responsible parties so that they pay for cleanup.Responsible parties may worry about the long-termuncertainty and liability of newer cleanup tech-niques. Engineering consulting companies worry agreat deal about liability for ineffective work orwork that is judged later by different standards.Inevitably, engineers see less risk with favoring useof ‘standard’ off-the-shelf technologies. Few peo-ple want to be the first to use a new technology ona major scale. The view of professional consultingengineers is this:
Engineers incorporating unproven technologies intheir designs are gambling with their clients’ money.If the gamble backfires, the engineering firm couldbe held liable. Thus, engineers are not like] y to oftenmake use of unproven technologies in remedialdesigns. This results in an impasse: engineers do notwant to use unproven technologies, but technologiescannot reach commercial status unless they areused.w
Within government, there are also bureaucraticpressures on people to finish reports and RODS,pressure that goes against what could be a morelengthy and costly examination of alternative treat-ment technologies.
There is an important exception regarding incen-tives. Some responsible parties have been veryaggressive in examining and selecting newer treat-ment technologies, chiefly because they see areduction in cost over some other alternate-oftenanother older, more expensive treatment technology.Moreover, responsible parties want to minimizetheir future liabilities and, therefore, sometimeswork very hard to have a permanent remedyselected. Indeed, some EPA decisions to use landdisposal have been changed because of responsibleparty work that demonstrated the effectiveness oftreatment technology; this happened at the Tyson’ssite in Pennsylvania.
Last, an important disincentive built into thecurrent system is the need to obtain a regulatorydelisting of the residue of a treatment operation if thematerial is to go offsite after treatment. The RCRA
regulatory program has considerable inefficiencies.If delistings cannot be obtained quickly, then thecost of using a treatment technology escalates,because the residue is automatically consideredhazardous unless found otherwise through the delist-ing process. This situation means that the residuemust go to a permitted hazardous waste facility orthat one must be built onsite, instead of a lower costsolid waste one or just backfilling the material intothe site. Uncertainty about delisting and high cost ofresidue management can block adoption of effectivetreatment technology.
issue 6: Will using permanently effective cleanuptechnologies mean that cleanup costs willskyrocket?
No one seriously believes that American societycan afford Superfund cleanups at any cost, regard-less of who is paying for the cleanup. But discus-sions on cost and, eventually, where the moneycomes from, and liability issues have obscured somebasic points about technology which, after all, is thetool with which cleanups are accomplished, Thesame is true about discussions of cleanup standardsand goals that ignore the means of meeting expecta-tions.
Better cleanup technology is not the enemy of costreduction. In the long-term, permanently effectivetechnologies avoid uncertain and possibly highfuture repeated cleanup costs. Certainly in thelong-term and probably in the short-term, techno-logical innovation and development will reducecosts as well as increase technical effectiveness tomeet stringent cleanup goals. These gains are clearlyhappening for some cleanup technologies already.Competition among more vendors and more availa-ble treatment capacity is also helping to reducecosts. In several areas, such as thermal destructionand removal of volatile organic chemicals fromcontaminated soil, unit cleanup costs for permanentremedies have decreased in the past few years.
Combinations of newer technologies at complexsites can also reduce total long-term costs, particu-larly use of separation technologies to reduce the useof more expensive destruction technology such as
~azardous Waste Action Coalition, American Consulting Engineers Council, The Hazardous Wa.we Practice-Technical and Qgaf Environment1988.1989,

Chapter 3--Cleanups and Cleanup Technology ● 179
incineration, For example, a variety of in situtechniques can remove volatile organic chemicalsfrom soil which can then be burned, thus avoidingthe high cost of excavating the contaminated soil andburning a largely inert, uncontaminated mass.
More reliable comparative data on costs ofdifferent permanent and containment/land disposaltechnologies are needed. In particular, it is criticalthat actual cleanup costs be collected, analyzed, anddisseminated to compare with data from vendors andwith estimated costs in feasibility studies. Onepreliminary study of 30 completed Superfund clean-ups found that cost estimates tend to be less thanactual costs at all stages of the projects (i.e.,feasibility study, ROD, design, and contract pro-curement). The study noted, ‘‘Even at late projectstages the estimates do not ‘hone in’ accurately onactual costs. ‘ ’81
OTA’s 1988 case studies show an average cost of$20 million for a cleanup considered consistent withSARA and $10 million for one which can bequestioned, but some of these costs are only for partsof a site’s total cleanup.
On the one hand, EPA said: ‘‘More permanentremedies are not necessarily slower or more expen-sive remedies. ’ ’82 But EPA’s Assistant Administra-tor J. Winston Porter had said earlier: ‘ ‘There’sprobably not enough money in the world to clean upall the sites permanently. ”83
OTA has examined EPA’s official figures forestimating the average cost of a remedial cleanup inits regulatory impact analyses, as published in theFederal Register. In 1984 and 1986, EPA said aremedial cleanup would cost $7.2 million in 1984dollars. In 1987 and 1988, the figure was adjustedupward to $8.6 million, but only to reflect the earliercost in 1986 dollars (no real change). In 1989, thefigure became $13.5 million in 1988 dollars, the first
real increase since 1984 and after SARA. (Interest-ingly, the net present value of operation andmaintenance over 30 years at a 10 percent discountrate remained exactly the same at $3.77 million in1984, 1986, and 1988 dollars, If these calculationsare not mistaken, then such costs are decreasing inreal terms.)84 More recently, EPA said that theaverage construction cost per site is $25 million,which with study and administrative costs mighttotal $30 million. In other words, EPA’s dataindicates that some increase in remedial cleanupcosts has been foreseen because of the morestringent requirements in SARA, but not what wouldbe described as skyrocketing costs. However citingan average cleanup cost is not especially instructive,because costs vary enormously (from several hun-dred thousand dollars to the $50 million to $100million range) and because a number of site actionsmay be taken over some years at a particular site.
However, there has been a lot of rhetoric aboutskyrocketing cleanup costs. A view from the respon-sible party community is: ‘‘, . . SARA includes astrong bias in favor of permanent remedies andonsite remedies and requires that applicable orrelevant and appropriate State and Federal standardsbe applied. , . . SARA has created a cleanup processwith great potential for inflating costs. EPA hasestimated that the cleanup requirements in SARAwould drive the cost of a Superfund cleanup from itspresent average of about $8 million-$9 million persite to between $25 million and $30 million persite. ’85 The major cause of the shift in cleanup costshas been the shift away from impermanent remediesbased on containment and landfilling. Indeed, astudy for the Chemical Manufacturers Associationestimated high post-SARA costs of over $60 millionfor using incineration, This compared to $27 millionfor using incineration for hot spots and onsitecontainment which was called modified perma-nence. 86 However, the scenario based on using
gl~xdent Project Analysis, Inc., “Bener Cost and Schedule Estimates for Hazardous Waste Cleanup,” background package, Great Falls, VA,January 1989.
SZEPA JOIVA, 13 (1), January/February 1987.
gJEnviro~nt Reporter Curreti Developmetis, Sept. 26, 1986, P. 778.U- fiWes ~e from he fouowlng F&r~ Register notices: Sept. z 1, 19~; J~e 10, 1986; Jm. 22, 1987; June 24, 1988; Mw. 31, 1989.
85~M, He~mm ~d DA, H~wk~s, in H&@&~ Wrote site &fmgeme~ w~er QwIL~ Issues (wmhin~on, m: Nauonal Academy Press, 1988),pp. 98-119.
s%u~ Fullerton et d., “Irnpaet Analysis of SARA on the CERCLA Remediadon Program, ’ Supefind ’88, proceedings of November 1988conference, Hazardous Materiats Research Insutute, Silver Spring, MD.

180 ● Coming Clean: Superfund Problems Can Be Solved . . .
incineration pervasively for Superfund cleanupsoverstated costs for achieving permanent remedies,because incineration is more expensive than someother technical approaches, unit costs for incinera-tion have decreased, and it would not be used forvery large landfills.
Sites with large amounts of landfilled materialdefinitely pose a particularly difficult problem forusing excavation-treatment approaches. Consider avolume of 1 million to 10 million cubic yards. Theremay be hundreds of sites in this range, typically oldmunicipal and industrial landfllls whose leachate ishazardous. Though the actual amount of hazardoussubstances in the landfill may be very small, they aredistributed within a large mass. At a low cost of $200per cubic yard, the cleanup cost would range from$200 million to $2 billion-both costs are beyondthe routine capabilities of Superfund for fund-financed cleanups. It is not a question of cost-effectiveness, because containment does not offercomparable protection to treatment. Large landfillsillustrate an appropriate use of the fund-balancingprovision of Superfund. That is, cleanup at too manyother sites might be blocked because of enormousindividual site cleanup costs. But the containmentremedy should not be called permanent. Very lowcost in situ permanent treatments or clever ways ofidentifying hot spots of contamination for excava-tion and treatment are needed. Otherwise, traditionalcontainment approaches will prevail.
Another major problem is that decisions are madewith unreliable cost estimates. As one insightfulanalysis concluded: “It is difficult enough to esti-mate costs at this early (screening) stage of thefeasibility study when ‘old’ technologies are in-volved; it is hardly prudent to try to estimate thecosts of innovative technologies before a much moredetailed analysis (not to mention extensive pilottesting) is performed. ”87 OTA’s case studies haverevealed major under-and over-estimates of cost.While it is generally recognized that a desire tominimize cleanup costs might be influencing deci-sions, it is another matter that estimated cleanup
costs can easily be manipulated to create theappearance of too high a cost for a treatmentalternative (that allows cost-effectiveness to rule itout) or too low a cost (that makes it appear that costis not the main reason for rejecting it).
Finally, there will be increasing debate over howmuch contaminated material will be treated in acleanup and to what levels of residual contamin-ation. The shift to treatment technologies is beingcompromised by limiting the extent of treatment inorder to reduce costs while still getting credit forusing treatment. Some cleanups may use treatmentfor very small fractions of site-contaminated materi-als. A good example of this issue is a study done bytwo national environmental organizations for acommunity group concerned about the selection ofremedy for a Superfund site in New Hampshire. Thereport concluded:
The community-based plan would provide perma-nent treatment for a much greater volume of soil,would destroy nearly all PCB’s and would clean upgroundwater to a cancer-risk level that is 100 timeslower than EPA’s cleanup, Equally important, thecommunity-backed alternative is cost-effective. . . .[A]ll of the above benefits can be achieved for a totalcost that is less than 13 percent higher than EPA’ssubstandard cleanup. The new Superfund clearlyindicates that such increases are warranted wherethey bring about large benefits.88
Note that the remedy selected by EPA did includeincineration.
Another example is the complaint for the BayouBonfouca site in Louisiana:
Although the remedy selected by the agencyinvolves the excavation and incineration of somecontaminated sludges, 20,000 cubic yards of contamin-ated soil will be left onsite and covered with a capto keep out rainfall. The entire area is characterizedby standing water and saturated surface soil,89
Issue 7: Are research and development produc-ing a steady stream of more cost-effectivecleanup technologies?
STD. T~tt md J. C~dwcll, ‘Evaluation of Innovative Waste Treatment T@mologies, ‘‘ Waste Management Conference-Focus on the West, ColoradoState University, June 1987.
88H. ~lc et ~,, *’The Ottari and GoasKlreat Lakes Container Corporation Cleanup Dwision: A Bad Precedent for the New Superfund, ” NationalCampaign Against lbxic Hazards and Clean Water Action, June 1987.
89~1y, op. Ci[., footnok 71‘

—— . . . . .
Chapter 3--Cleanups and Cleanup Technology ● 181
The answer is yes. The cleanup market is enormousand private sector funds so available, because of theperceived volume of business, that extensive R&Dis constantly producing new and improved cleanuptechnologies. Government spending and universityactivities have also increased, some with the help ofSARA programs. The activity in separation andbiological treatment technologies is particularlyintensive and productive.
Of particular importance is the rapid emergence ofin situ cleanup technologies; these have the advan-tage of eliminating the need to excavate con-taminated soil or to extract groundwater, which addexpense, and sometimes cause concern over siteworker safety (for soil) or releases of contaminantsinto the environment (for soil and groundwater).Moreover, testing and demonstration of cleanuptechnologies at cleanup sites are taking place at anincreasingly rapid pace because of actions byresponsible parties, EPA Regional offices, States,and the formal SITE program (discussed below)established by Congress. Still, this technical activityis not necessarily reflected by program decisions andcommitments at actual sites.
The main problem continues to be a “cloggedpipeline. ” That is, R&D efforts are driven bycontinued optimism about the number of cleanups,the availability of government cleanup funds, andthe availability of venture capital. But the cleanupmarket rarely meets the expectations of technologydevelopers. Enormous amounts of money can bespent in ways that do not create business forcompanies selling newer cleanup technologies. Para-doxically, the rapid growth of Superfund and thepublic pressures on the government to produce morecleanups as fast as possible do not necessarilypromote the adoption of newer, innovative cleanuptechnologies. Already one company with anew formof thermal destruction, which had received a lot ofattention and had passed several site demonstrationssuccessfully, has gone bankrupt. Some biologicaltreatment companies have failed. Moreover, thecompetition is constantly increasing so that availa-ble business and opportunities for site demonstrationare being distributed over more technology compa-nies. Small market share can limit company successand continuing technology development.
Government agencies themselves that spend lotsof time and resources developing a technology mayinterfere with fair competition among other, pri-vately developed technologies. For example, EPAdeveloped its own mobile incinerator and gave itpreferential treatment, publicity, and work overprivately developed mobile incinerators, But theEPA incinerator offered no significant technologicaladvance. Indeed, EPA’s interest in incineration hasdwarfed its interest in biotechnology, although theagency has tried to offset this imbalance in the pastyear. New York State with some EPA assistance hasspent substantial time developing a plasma thermaldestruction unit without the same level of success ofsome private enterprises. Such government ac-tivities make sense to the extent that private industryis not already doing similar development and if theydo not remove comparable testing, demonstration,and application opportunities from private technol-ogy developers. In the cleanup area, there is somebasis for believing that direct financial developmentof cleanup technology by government agencies hasnot been adequately justified. Nor is there anyevidence that the government efforts have beencost-effective.
The EPA SITE Program—in 1985 and 1986,Congress had discussed the need for a joint governmentindustry effort to aid the introduction of innovativetechnologies into the Superfund program during itsinitial authorization period, and later Congresscreated the SITE program in SARA. Thus far, theSITE program has had mixed results. A few corpo-rate participants in the program commented on itrecently:90
●
●
●
“Those hoping involvement in SITE will turnquick profits in the short-term may be disap-pointed. ” (Carl Brassow, Soliditech, a subsidi-ary of United Resource Recovery.)
“[SITE was] very slow moving.” (Mark Zwecker,American Combustion Inc.)
“The analytical expense that the EPA went towas close to $1 million. We could have cleanedup the entire site for less than half thatamount.” (James Malot, Terra Vac Inc.)
A recent survey of the program found that:
~Envlromer@ Business Journal, May 1989

182 ● Coming Clean: Superfund Problems Can Be Solved. . .
Nearly one-third of the interviewed companyofficials (28 technology developers) claimed that thecontractors hired by EPA to sample, test, and analyzedata were unsatisfactory.. . . Some industry represen-tatives felt the contractors were slow, inexperienced,and generated irrelevant data. . . . One officialcommented that contractors continue to analyze andre-analyze the same data, making more money forthemselves and taking away dollars from bothindustry and EPA,91
In this same study, of the five technology compa-nies that had completed their demonstrations, fourhad problems with EPA’s contractors that promptedthe study to note, “Future demonstrations may behindered unless the contracting system is improvedin the future. ”
An issue that merits more attention is the degreeto which participating technology developers inSITE are sometimes making public statements toadvance their commercial interests, despite the lackof SITE results to back up those claims. Moreover,sometimes EPA officials seem to be cooperating insuch efforts. For example, a report by EPA’sInspector General documented several instanceswhere publications spoke about a successful testwithin SITE “despite a lack of successful opera-tions. ’ ’92 Indeed, EPA’s published results on theB.E.S.T. process,93 which portray test results assuccessful, are in disagreement with the results ofthe Inspector General’s office. A broader issue,therefore, is whether there is an inclination withinthe SITE program to emphasize positive findingsand to discount negative results. Similarly, for anincineration technology, the Inspector General’sreport said that “PCBs and particulate (mainlylead) were released into the air and thousands ofgallons of wastewater containing lead were sent tothe local wastewater treatment plant. ” But EPA’sSITE program said, ‘[Lead] remained in the ash andwas not transferred to the scrubber water or emitted
to the atmosphere.”% The SITE program literaturedoes not explicitly point out that the test results showthat the stringent requirements of the Toxic Sub-stances Control Act for PCB destruction were notmet.
In an article in a technical magazine, the presidentof a participating company said, ‘‘The EPA’s PaulDePercin, project manager for the HAZCON SITEfield evaluation, stated the test ‘. , , was an unquali-fied success in stabilization of heavy metals andPCBs in the presence of 25 percent by weight of oilsand grease. ”95 In fact, some months later, EPA’sDemonstration Bulletin in March 1989 said thatvolatile organics were primarily released to theenvironment during processing, and that test datashowed that base neutral/acid extractable organicswere higher in the treated samples than the untreatedones. No data to support effective stabilization ofPCBs was obtained. The only clear positive resultwas the lack of toxic metals in leachate for treatedmaterials. But this result is what is expected ofcommercially available chemical fixation technolo-gies. To its credit, the SITE program also publishesApplication Analysis Reports which give a broaderand more interpretive presentation of a demonstratedtechnology; the one for the HAZCON technology(almost 2 years after the site demonstration) said:“Data shows immobilization of organics in a fewinstances but not in most. . , . It can be concludedthat immobilization of volatile and semivolatileorganics does not usually occur. ’96 While thisofficial EPA work does not rule out the technologyfor Superfund cleanups involving organics, EPAdefinitely shifts the burden of proving effectivenessto detailed site-specific treatability and demon-stration tests.
In the June 1989 issue of Chemical EngineeringProgress, Gee-Con said in an advertisement: “DeepSoil Mixing and its sister technique, Shallow Soil
91J. c~~e~ et ~., ‘‘An Evaluation of the EPA SITE Demonstration Program, ’ Worcester Polytechnic Institute, Washington, DC, Project Center,December 1988.
w~=mr~na~, U.S. Environmental Rotection Agency, ‘‘Review of Region 4’s Management of Significant Superfund Removal Actions,’ Sept.26, 1988.
93u.s. ~v~onment~ Protection Agency, Hojwt summwt “Evaluation of the B. E.S.T. (TM) Solvent Extraction Sludge Treatment ‘IkchnologyTwenty-Four-Hour T@t, ” November 1988.
Muos. ~v~ment~ ~t=tim Agency, &mon~atim bu]ktin, ‘‘EIw~c kfi~d kineration, ’ A@l 1989.
gsRay Funderburk, “EPA’s SITE ‘I&t of Solidification,” Poilution Engineering, December 1988.XU.S. Environmentid protection Agency, “HAZCON Solidification Process, Douglassville, Pennsylvania, ” April 1989.
Chapter 3-Cleanups and Cleanup Technology ● 183
Mixing, have been proven effective in the U.S.EPA’s Superfund Innovative Technology Evalua-tion (Sites) program at Hialeah, FL, where PCB-contaminated soil was stabilized in place. ’ But atthat time no report had been issued by EPA on thedemonstration.
A critical concern about the SITE program is thatit has never focused on truly innovative technolo-gies, ones that would make major breakthroughs inparticularly difficult cleanup applications and onesfor which prior R&D has justified field dem-onstration. Some of the technologies in EPA’s SITEprogram are variations of well-known, commercialtechnologies and have been demonstrated severaltimes already or have even been used for an actualcleanup. It appears that the SITE program hasbecome a public relations opportunity for compa-nies. OTA’s examination of the 30 technologies andfirms in the SITE97 program indicates that at least 21technologies have been commercially available forsome time, used in cleanups, and cannot be inter-preted to be innovations. Four other technologies arevariations of existing, commercially used technol-ogy. An EPA spinoff program is the EmergingTechnologies Program to develop “cutting-edgetechnologies. The goal is to prepare technologiesfor demonstration; direct financial assistance isavailable to support R&D. Of the seven technologiesin the program, two are known commercial technolo-gies,
One company has told OTA: “Three years ago theTerra Vac process was being labeled as ‘unproven’technology even though the process was initiallydeveloped over six years ago at a Superfund site.Terra Vac’s independent application of the technol-ogy at more than 60 sites across the country has donemore to promote the technology than the reams ofdata collected during the demonstration and stillawaiting final evaluation. Instead of paying (TerraVac) for worthwhile services rendered while par-tially cleaning up a Superfund site during a demon-stration, EPA paid five times as much for asubcontractor (who is one of our competitors andnow offering our technology to clients) to learn theprocess from Terra Vac. “98
To some extent, the SITE demonstration programlooks redundant or like a formality that EPAimposes on technology companies, and it may beimpeding development and adoption of truly inno-vative technology. In most cases thus far, severalyears or many months have passed before the resultsof demonstrations have been completely analyzedand presented to the public. Meanwhile, somecompanies can complete actual cleanups and mayhave enough data to convince others that thetechnology merits adoption. Waiting for ‘‘proof’from a SITE demonstration may only maintain thestigma of being ‘‘unproven’ and ‘‘innovative. Anadded complexity, in the case of thermal destructiontechnologies, is that some companies have alsocarried out test burns at sites in order to meet variousgovernment requirements, The results of these arejust as important as those from formal demonstra-tions.
Issue 8: Are the rules clear on what constitutesproof of cleanup effectiveness for new technolo-gies?
The answer is no. There seems to be muchdisagreement on how to prove that newer cleanuptechnologies work. Inconsistent cleanup technologyselections are being made because there is no clear,generally accepted understanding of what amountand type of information are reasonable proof ofeffectiveness and reliability. Moreover, the en-gineering side of technology selection can obscurefundamental environmental protection goals, withthe result being the rejection of environmentallymore effective cleanup technologies.
The key problem is how to bridge the gap betweentechnology selection decisions and laboratory re-sults or very limited use of a newer technology. Theproblem is compounded by rapidly changing andincreasing data and experience as well as byincreasing numbers of companies and individualsimplementing Superfund.
There are at least three types of inquiry whereactual Superfund site materials are tested; in order of
mu.!j. EnvirOnrnental Protection Agency, ‘ ‘The Superfund Innovation Technology Evaluation Program-Progress and Accomplishments Fiscal Year1988,;; March 1989.
ggjme~ ~ot, Resident of ~rra %c, personal communication, Wing 1989.

184 ● Coming Clean: Superfund Problems Can Be Solved . . .
increasing cost they are: treatability studies, pilotstudies, and site demonstrations.
Non-site materials (prepared to simulate actualsite waste) are generally used in laboratory ex-periments carried out as part of R&D programs or bytechnology developers. In these cases, the materialsare typically very simple chemically compared tocomplex mixtures of contaminants at many Super-fund sites. The unavoidable risk is that field testsmay not be successful even though laboratory testswere. This risk is greatest for in situ techniqueswhere actual site conditions and not just the chemi-cal nature of the contaminants are important.
Overall, it is not clear to everyone implementingSuperfund just how these various types of tests differor what has to be done to satisfy EPA in reaching aconclusion, which itself is currently informal, that agiven new technology can be considered as provenfor some types of Superfund cleanups.
Treatability Studies--Increasing attention is beinggiven to treatability studies in which actual sitematerials and newer treatment technologies areevaluated in offsite laboratory facilities. Treatabilityrefers to the ability of treatment to work effectivelyon site hazardous material. Relatively few treatabil-ity studies are currently being done before RODS; anEPA survey of fiscal year 1988 RODS found thatonly 4 of 50 source control RODS examineddiscussed treatability studies.99 A key issue is whensuch studies are done; another is with what technolo-gies they are done. OTA’s 1988 case studies showedthat treatability testing of technologies was oftendelayed until the post-ROD Design Phase, which isnot subject to much public scrutiny. It is difficult toaccept the legitimacy of selecting a remedy beforetests show that the selected remedy can work unless,of course, the technology has been widely used onsimilar problems successfully. For example, a pre-ROD test of commonly used forms of incineration isprobably unnecessary for most cleanups. Yet, if testsare delayed, then negative post-ROD test results alsomean major delays because it is necessary to go backto the study stage; such a delay happened at theConservation Chemical Co. site in Missouri, and atthe Re-Solve site in Massachusetts. Clean Sites, Inc.,
has described two of its sites. At one, a post-RODtreatability study will “likely indicate that theselected remedy will not be effective’ and delay islikely. At the other site, the treatability study is beingconducted 3 years after completion of the feasibilitystudy. 100
Considering its historic lack of confidence inSuperfund, the public is likely to be suspicious ofexactly how post-ROD test results will be verifiedand what criteria will be used to conclude that thetest results are positive enough to proceed with theremedy’s implementation. This suspicion is particu-larly true for remedies implemented by responsibleparties. The danger is that cleanup objectives canshift from health-based to technology performance.
If the basic purpose of treatability testing is toprovide data on the feasibility of a cleanuptechnology for site materials, then it must be doneduring the RIFS and before the ROD. Otherwise,it is possible to rule out or select technologieswithout enough credible technical data to supportthe ROD analysis and decision. For post-RODtreatability tests with negative results, there areincentives and pressures to avoid re-opening theROD, carrying out another feasibility study, andpossibly performing another treatability test.
On the other hand, if the purpose of the test is toget more detailed data to implement the DesignPhase, then it could be done at the beginning of thestage. A pilot study definitely fits into this legitimateneed to obtain refined engineering data for reliabledesign of the cleanup.
Selection of technologies and test laboratories isanother issue. Based on their technical expertise,innovative technology developers (and not Super-fund contractors) should perform treatability stud-ies. Their self-interests requires detailed documenta-tion of results and careful review by government andindependent experts. Another problem is fairness inensuring that all interested and qualified parties haveequal access to laboratory results. Very often onlyone treatment technology or company has theadvantage of a treatability test. Remedy selectionand establishing of site cleanup objectives may be
!wswe~~ Report, July 5, 1989.
lfJWWI sites, tnc., Making Supe@tnd Work, JanuarY 1989.

Chapter 3--Cleanups and Cleanup Technology . 185
biased in favor of a particular technology within ageneric class.
Engineering consulting firms that perform Reme-dial Investigation and Feasibility Studies are notnecessarily expert enough about new cleanup technolog-ies to conduct treatability studies. There may be aconflict of interest if treatability testing is done bycompanies that also perform RIFSs or by responsibleparties, both of which may have a financial interestin certain technologies remedy selection. The pointis not to legally prohibit such practices, but to raisethe conflict-of-interest issue. EPA has a responsibil-ity to ensure fairness in order to ensure that the most
effective cleanup solutions are found.
Another issue is: Is the technology consideredproven from a scientific perspective? If so, is itsappropriateness for a specific site to be demonstratedthrough a treatability study? In most cases theanswer should be yes. If the range and levels of sitecontaminants are different from a previous demon-stration, it is necessary to perform a treatabilitystudy.
Alternatively, can an innovative technology thathas not been tested very much at the laboratory stagenor considered proven by EPA be adopted for use onthe basis of a positive treatability test result? Unlessthe answer to this question is yes, doing treatabilitystudies (which increase as more new technologiesenter the picture) as part of the RIFS process may bea waste of considerable money because they can beexpensive, from tens to hundreds of thousands ofdollars. But, on the other hand, allowing a treatabil-ity study to be sufficient for remedy selectionshortcuts the R&D process. Such a shortcut is likelyto sidestep obtaining data on the more subtle aspectsof performance, including production of toxic bypro-ducts and the dependence of effectiveness oncontaminant concentration.
Pilot Studies-A valid reason for a site pilot studyor small-scale test (including incinerator test bums)is that laboratory results cannot take into accountactual site conditions. For example, even treatabilitystudies on site materials do not necessarily encom-pass site climatic, hydrological, or biological condi-tions. Nor do they address materials handling
problems found in the field. Pilot studies areessential for evaluating in situ techniques such assoil washing or flushing, biological treatment, chem-ical stabilization, vitrification, and extraction ofvolatile chemicals. It is unlikely that a treatabilitystudy would provide a sufficient technical databasefor full-scale use of an in situ treatment technology,and this deficiency is often true for relativelyconventional above-ground technologies that treatcontaminated groundwater, for example. Anothertechnical problem is highly variable concentrationsof contaminants which are not likely to be properlyassessed in offsite treatability studies.
Often the issue of scale-up is also pertinent; thatis, either an onsite or offsite pilot study (which mayalso be called a treatability study) is needed toexamine feasibility on a larger scale than can bedone in laboratory tests. Trying to determine therelationship between scale of use (e.g., volume) ofwaste and cost is, however, difficult and expensive.Some pilot studies, however, could probably beextensive enough to accomplish smaller cleanups,because the concept of scale-up does not have itstraditional engineering significance for cleanups.There is no standard size or type of cleanup. Forexample, quantities of contaminated soil to becleaned can range from hundreds of tons to hundredsof thousands of tons at a site, and volumes ofcontaminated surface and ground waters vary greatly.Sometimes, a small unit or several small modularunits or combinations of smaller units of differenttechnologies may be quite feasible for a cleanup.Moreover, there is some flexibility for cleanupduration because imminent dangers rarely exist bythe time a remedial cleanup is done. Many recentpilot studies have been nearly complete cleanups ofrelatively small sites. For example, a 3-month pilotstudy of in situ bioreclamation, based on supplyingnutrients and oxygen to the aquifer to promotedegradation of gasoline by indigenous organisms,cleaned up 90 percent of the groundwater contamin-ation. The study noted that it would have takenconventional pump and treat 7 years to achieve sucha result.lo1
Site Demonstrations-There is probably nothingmore convincing to skeptics than the successful
IolEdww(j A. Radedi et d., “Enhanced Natural Degrada~on of a Shallow Hydrocarbon Contammati Aquifer, ’ m proceedings of HaztechInterna&Ional Conference, St. Louis, MO, August 1987.

186 ● Coming Clean: Superfund Problems Can Be Solved . . .
results of a technology demonstration that success-fully cleans up part or all of an actual site. Thisreaction is especially true for in situ techniques. Still,there are many uncertainties yet to address. Sitecontaminants and conditions vary substantially, andone or more successful demonstrations may not beadequate to select the technology at a significantlydifferent site. Who has conducted the demonstrationand the accuracy and reliability of the data are alsoimportant factors. Many times technology develop-ers speak of their successful demonstrations atcleanup sites, often without EPA or any governmentagency being formally revolved. EPA and othersmay not recognize those tests as acceptable demon-strations, for good reason. In a great many cases, thetechnology company and the site owner make verylittle technical data available to substantiate theirclaims.
General Comments-Frustration on the part oftechnology developers and controversy about theselection of cost-effective permanent technologiesare explained by insufficient rules for the burden ofproof that EPA requires before newer technologiescan be selected. Equally important is the poordissemination of information to an increasinglylarge number of people and organizations imple-menting Superfund and other cleanup programs.
Moreover, there is evidence of inconsistencyabout remedy selection in the history of the Su-perfund program (see OTA’s 1988 case study report)which sends confusing signals to technology compa-nies and raises the issue of fairness. While sometechnology companies are being made to jumpnumerous high hurdles, others are being treatedquite deferentially. Other than government person-nel, people in the engineering consulting firms thatwork for government and industry as well as forresponsible parties can help technology companiessubstantially if they choose to do so. An enthusiasticsupporter of a technology can get treatability orother tests done and can even build a case for RODselection without test data. Conversely, consultantscan also easily kill a cleanup alternative without anydetailed data.
Although the frequently heard complaint is thatnew technologies cannot get tested or used at
Superfund sites, in fact many treatment technologiesare being selected without any significant technicaldata to support the decision. For example, anextensive study by EPA’s Inspector General for tworemoval actions said:
Region 4 funded commercial testing and develop-ment of two hazardous waste treatment prototypes:SHIRCO’s infrared incinerator and Resources Con-servation Company’s Basic Extraction Sludge Treat-ment (BEST) unit. To fund the tests, the Regionsidestepped several internal controls; such as permit-ting, delisting, and contracting regulations. Region4’s selection of the two technologies was speculativeand unsupported by scientific or engineering fact.Nevertheless, both prototypes were used to conductfull-scale operations at removal sites prior to evi-dence that the manufacturer’s performance claimswere true.102
Several examples were also given in OTA’s 1988case studies, including the Chemical Control site inNew Jersey and the Sand Springs site in Oklahoma.We have two other examples to add.
At the Lipari Landfill site in New Jersey, forexample, a positive treatability study for biotreat-ment was ignored, but a cleanup approach based onsoil flushing was adopted for the site cleanup eventhough the technique had never been documented tobe successful at a similar site. The long duration ofsoil flushing was a major point noted by a number ofparties unhappy with the selection of soil flushing atLipari. A major factor of concern was the diversetypes of contaminants at Lipari, some of which wereshown to be difficult to remove by water flushing.For several PCB-contaminated sites in Indiana anovel incineration approach based on burning bothmunicipal solid waste and site-contaminated materi-als was selected. But it had not been tested or usedelsewhere. In both cases, there has been considerablecommunity opposition to the selected remedy be-cause of the lack of convincing data on technologyfeasibility.
Finally, the situation is made even more complexand ambiguous because there is no evidence thatinformation from various types of testing done bymany different parties involved in the nationalcleanup effort, inside and outside of the Superfundprogram, comes together in some central way for
l~~wwr General, op. cit., f~~ote 92.

Chapter 3--Cleanups and Cleanup Technology ● 187
analysis and transfer. Testing protocols are absentand there may be redundancy and technical in-consistencies among treatability testing, pilot stud-ies, and demonstrations on the same technologies.While EPA has made progress in addressing thisproblem, there is now no effective Federal effort toprovide independent professional review and expedi-tious distribution of validated information nation-wide.
Issue 9: Is poor information affecting the use ofbetter cleanup technologies?
The latest technical information on generic andspecific cleanup technologies, their costs, and theirperformance and implementation at sites does nottravel far. Similarly, the considerable experiencefrom private, State, RCRA corrective action, andnon-EPA Federal agency studies and cleanups maygo untapped, along with the expanding reservoir ofcleanup-related R&D, including university work.Theoretically, much of this activity could have apositive impact on Superfund, including making itmore efficient and effective.
A particularly striking example of poor communi-cation about cleanup technology with EPA hap-pened for the Crystal City site in Texas (one of thecase studies in OTA’s 1988 report and a cleanupdecision that has been criticized by the localcommunity, State and national environmentalgroups, and Members of Congress). In defense ofEPA’s selected remedy which was based on landdisposal, the Region 6 Administrator testified that“No technology was found that could effectivelyremove (arsenic) from the soils. . . . Arsenic, aprinciple pollutant of concern at this site, cannot beeffectively removed from the solids by alternatetreatment technologies. ’’103 In a ROD that wassigned at the same time that the Crystal City RODwas signed in September 1987, “on-site flushing ofsoil with an acidic water solution to remove arsenicwas selected for the Palmetto Wood Preserving Sitein South Carolina. A month before the Crystal CityROD, EPA had formally acknowledged in regu-lations for the RCRA program that chemical fixationwas proven, available technology for waste with
arsenic; and the ROD for the French Limited site inthe same State and region (and signed by theRegional Administrator a month before the testi-mony on Crystal City) also acknowledged theapplicability of chemical fixation for arsenic.
Some poor information transfer is unavoidablebecause of the rapid rate of growth and in change.But most of the problem is probably due toinsufficiently focused EPA activities, arising fromthe highly decentralized, fragmented nature of theSuperfund program and-just as importantly-thewhole national cleanup effort. OTA has examined anumber of documents that EPA uses in its technol-ogy transfer activities. Often only a superficial levelof information is being reported. A person wouldstill have to expend considerable time and energy toobtain the detail necessary for a good technologyevaluation. A remedial project manager with littleexperience and a heavy workload is not likely to beable to do this research. In other cases, highlydetailed voluminous studies are prepared at considera-ble expense, but hardly anyone seems to be usingthese documents (from EPA’s Office of Researchand Development) because it would take so muchtime to use them effectively. They are meant forresearchers and experts, not practitioners at thefrontline of Superfund.
Some part of the problem of poor information mayalso result from insufficient attention to the problemby contractors. OTA agrees with the perspective ofa technology developer: “The REMS and ARCScontractors (types of contracts for the remedialprogram) are at best six months behind on individualtechnology development programs, and more fre-quently 18-to-30 months. ” The developer, there-fore, believes that bringing technology developersinto the RIFS process through the conduct oftreatability studies ‘‘is a way for EPA to effectivelyhelp the technology transfer from the developers totheir contractors. ’ 104
Another problem is the generally inexperiencedand, therefore, cautious workforce. There is apreponderance of civil engineers and hydrologistsworking in the cleanup, but these people are likely
lmR~~fi E, Lay~n, m~~ony at he~g~ ~fore tie How su~omln= on Envir~ent, Energy, and Natural Resourees, Apr. 11, 1988.
104Jme~ A. Hel~ et ~., “Remediation and Treatment of RCRA Hazardous Wastes by Freeze Crystallization, ” presented at EPA’s Forum onInnovative Hazardous Waste Treatment Tlxhnologies: Domestic and International, June 1989.
20-011 0 - 89 - 5 : QL 3

188 . Coming Clean: Superfund Problems Can Be Solved. . .
to lack the expertise and experience necessary tounderstand many new forms of cleanup technologiesbased, for example, on complex chemical engineer-ing or biological treatment. Moreover, the rapidexpansion of cleanup technologies has resulted inincreasingly exotic and sophisticated technologieswhich only a few people implementing Superfundunderstand. A judgment that a newer technology isproven, reliable, and applicable-or unproven, unre-liable, and inapplicable-may depend on the limitedand recent experiences of the contractor company(or really, individuals within the company) insteadof the accumulated experiences of all parties withinthe national cleanup system, within and outside ofSuperfund.
Technology loyalty, instead of an open mind, canalso be a problem when organizations other thantechnology developers exercise it. First, as Super-fund contractors have diversified, some of themhave a stake in the adoption of a particular technol-ogy that they own. For example, at least onecontractor owns an incinerator, several have devel-oped techniques to physically remove volatile or-ganic chemicals from contaminated soil, and one’sparent company sells raw materials to a technologyvendor. This problem is compounded by the fact thatsometimes the identity of the company performinga Superfund study is not revealed. The more onelooks carefully, the more one finds Superfundcontractors, their parent companies, or their subsidi-aries involved with the ownership of cleanup equip-ment and technology.
Technology companies themselves are a problembecause of the limited information they provide.They sometimes may not make necessary informa-tion available because they cannot afford to get it ordo not want to get it. The waste treatment industryhas long been frustrated with the slow adoption oftreatment technologies. While the treatment industryfosters the appropriate use of newer treatmenttechnologies, it sometimes contributes to prematureselections and inappropriate use as discussed inOTA’s 1988 case studies. It is just as unwise toselect an untested and unproven technology as it isto reject a risky, innovative one with real promise tosolve a difficult problem. Both actions can lead to an
ineffective cleanup that wastes money, increasesenvironmental risks, and creates a worse cleanupproblem for the future.
Limited information from technology companiesis an especially important problem for emergingbiotechnologies. People knowledgeable about thisarea said,
Past attempts at bioremediation have failed toestablish conclusively biodegradation of chlorinatedaromatic compounds in large-scale systems and havenot yielded information useful for other systems,even those similarly designed. . . . Failure to con-sider testing and evaluation of bioremedial processescan lead to a credibility crisis. Left on its own, therace to market environmental biotechnology withinthe entrepreneurial private sector may not onlyprevent the effective technical development of thistechnology, but may also lead to market failure. Theinability to analyze and correct failures and toenhance successes leads to a perception of unreliabil-ity and a major erosion of confidence. 105
Technology companies may sometimes want tokeep information confidential or may have to, in thecase of cleanups on sites unknown to governmentofficials. Technology companies may also be wor-ried about giving information to RIFS contractorswhich may compete against them for field work orwhich may have a competing technology.
The overselling of a technology is a real problem.Providing detailed available data often is in conflictwith marketing efforts because the data reveals thelimits of the testing or application to date. Oversellis especially prevalent because usually few contamin-ants have been worked on successfully relative tothe enormous variety of contaminants found atSuperfund sites. Too many technology developersextrapolate successful test results to other chemicalsor site conditions without a valid theoretical basis fordoing so. They ignore or underestimate the im-portance of technology specificity. For example,biological treatment which works for one chemicalmay not work for others present at a site; siteconditions such as the soil chemistry and porositymay require significant changes in the design of abioreactor or the materials that are added to assureeffective microbial destruction.
la~mes= ~ley Authority, Center for Environmental Biotechnical Applications (University of Tkmnessee); and EPA, “A propOSd for theDevelopment and Application of PCB Bioremediation Twhnology for the Tkxas Eastern Sites,” September 1988.

Chapter 3--Cleanups and Cleanup Technology ● 189
One more factor is the often confused need forFederal and State regulatory permits for onsitecleanup activities (there is no uncertainty about theneed for using permitted offsite waste treatment ordisposal facilities, although their regulatory com-pliance status remains an issue). A need for permitsincreases information requirements significantly.Debate persists on the need for permits for onsitework—by law, none are needed for work onSuperfund sites—but sometimes States have exer-cised their prerogative to require State environ-mental permits under their existing regulatory pro-grams. The problem is that many cleanup technolo-gies are not now regulated by existing programs,especially hazardous waste programs. If no specificregulatory standards exist, it can be difficult to getagencies to issue permits. Another issue is the needto get permits for mobile equipment, with technol-ogy companies and other parties wanting to reducethe complexity, costs, and delays associated withpermitting.
Issue 10: Is experience leading to easier, faster,and less expensive analyses and decisions oncleanup technologies?
Just the opposite appears the case. Even thoughsome individuals may be moving up a learningcurve, the program does not appear to be gainingsubstantial efficiency. There are three key problems,
First, not many people see past the conventionalwisdom that every cleanup site is unique, with theimplication that every site decision must be on acase-by-case basis. Although there is as much truthto this as there is that every person is unique, sitescan be grouped by important commonalities of siteconditions and problems. Overly stressing the unique-ness of every site does not necessarily make thesystem worse as it expands, but it does hinder aglobal view. It also promotes unnecessary sitestudies, which add more cost and delay thanproviding truly useful information. Belief in siteuniqueness stands in the way of using cleanupobjectives and technologies selected at similar sites,because site differences currently obscure site simi-larities.
Another part of this problem is that there has beenreluctance by EPA staff to admit and openlycommunicate the failures of cleanups at sites, even
though this could substantially affect other deci-sions. OTA’s examination of RODS indicates thatmost failures are for containment and land disposalapproaches and, less frequently, simple forms oftreatment such as chemical stabilization. There oftenseems to be an attitude that maybe the technologycan be made to work at other sites or that other EPAregions have the right to make their own decisionsand mistakes. Moreover, public criticism of Super-fund makes it difficult for EPA officials to acknowl-edge cleanup failures.
Each site study and decision has the potential forbeing made in isolation. To the extent this is true,then the more sites and cleanup technology options,the worse the situation. Indeed, there are so fewcentral management controls imposed on the pro-gram that it is difficult to see Superfund as learningand maturing from its own experiences, and less sofrom other cleanup programs. Instead, disparateworking elements of the program act independently,too free of central oversight and control which wouldhelp the elements learn from each other’s positiveand negative experiences.
Second, the increasing numbers of generic andspecific cleanup technologies outpace the trans-formation of information into wisdom, They in-crease the amount of information ideally obtained inthe RIFS and place difficult demands on theworkforce. Considerable information on exact siteand contaminant conditions is necessary to rule outor to defend the selection of particular technologies.There are fundamentally different constraints todifferent generic technologies, such as thermal v.biological treatment. Increasing numbers of technol-ogies also means that increasing combinations ofthem can be assembled, at least theoretically, toclean up complex sites.
Technology specificity, where effectiveness var-ies for different hazardous substances, takes on moreimportance as the range of cleanup technologiesexpands, because for many of them no theoretical orscientific case can be made for non-specificity.Although specificity has been a problem even forcontainment techniques (e.g., effect of some chemi-cals on slurry wall permeability), it is less relevantfor older incineration techniques. Generally, technol-ogy specificity has not been adequately dealt with.In fact, the frequent practice of using short lists of

190 ● Coming Clean: Superfund Problems Can Be Solved. . .
indicator contaminants, instead of the full array ofchemicals present at a site, to reduce the RIFSworkload conflicts with evaluating and using di-verse permanent cleanup technologies. Indicatorcontaminants might make sense for simplifying riskassessment. But physical and chemical propertiesthat affect cleanup technology feasibility may varysubstantially from health effects.
Specificity can be a problem with treatabilitystudies because they too may rely on indicatorchemicals to evaluate a technology’s performance.The ultimate risk is the use of cleanup technologythought to be generally proven effective and foundto be applicable through a site treatability study butthat, nevertheless, does not work effectively on thefull range and often wildly fluctuating concen-trations of contaminants at a complex site.
Moreover, analyses and decisions themselves arecoming under more scrutiny. The increasing num-bers of technology companies mean that moreparties want their technologies fairly and carefullyconsidered in cleanup decisions. Technical as-sistance grants to communities are supposed to helpthe affected public make sure that the best technolo-gies are used. Grants may also provide anotheropportunity for technology developers to enter thesystem. Responsible parties want to free themselvesof future liabilities and to cut unnecessary costs.They can introduce new cleanup alternatives into theprocess. All of these concerns mean that the time andcost of “defensible’ RIFSs and RODs are likely toescalate--competing with full-scale cleanups them-selves-and thus the introduction and adoption ofnewer technologies may suffer. Increased overheadcosts due to more extensive studies--often severalhundred thousand dollars-at a large number of sitesmight offset cost savings from using improvedtechnologies at a much smaller number of sites.Delays alone can be sufficient to stymie technology
companies at a critical point in their development. Away to address this problem is to use the mostexperienced and expert people, with certain types ofsites or technologies, to screen alternatives andreduce the number of alternatives studied.
Third, the general level of inexperience in techni-cal and management areas of the national cleanupworkforce in government and industry is a majorproblem on its own. The rapid expansion of activitycoupled with a steady stream of new technologiesrequires major efforts to prevent delays and poorwork. As the role of contractors has grown, it usesgovernment programs as breeding grounds for itsworkforce. The constant shift of people from gov-ernment to the private sector, because of substan-tially higher salaries and probably better workingconditions and potential for promotion, keeps thegovernment workforce inexperienced. This makeseffective government oversight and management ofcontractor activities difficult, if not impossible. Oneobserver recently summed up the current contractorsystem as being ‘‘wasteful, disorganized and in-efficient."106 On top of this, there is also a highdegree of mobility of the most experienced peopleamong contractors as contractors compete to main-tain or increase market share or business volume.Some of those with the most technical expertise gointo management.
The result is a national cleanup workforcewhich is expanding rapidly, which is in constantmotion, with few people having institutionalmemories or loyalties, for whom informationtransfer and education through working withexperienced people is minimal, with no substan-tial improvement in average level of experience,and where labor costs are increasing. Theseproblems will not cease without effective organiza-tion and management controls and clear and explicitpolicies.
1~Roger J. MarzuJla, ‘‘Superfund 1991: How Insurance Companies Can Help Clean Up The Nation’s Hazardous Waste,’ paper presented to InsuranceInformation Institute, WaaMngton, DC, June 13, 1989. Also see U.S. Congress, Office of ‘lkdmology Assessment, Assessing Constructor Use inSupe@d, OTA-BP-ITE-51 (Wash@on, DC: U.S. Government Printing Office, January 1989).

Chapter 4
Other Cleanup Programsand Superfund

C O N T E N T S
INTRODUCTION . . . . . . . . . . . . . . . . . . . . . . . . . . . . . . . . . . . . . . . . . . . . . . . . . . . . . . . . . . . . . . . .A PYRAMID . . . . . . . . . . . . . . . . . . . . . . . . . . . . . . . . . . . . . . . . . . . . . . . . . . . . . . . . . . . . . . . . . . . .
SHRINKING SUPERFUND . . . . . . . . . . . . . . . . . . . . . . . . . . . . . . . . . . . . . . . . . . . . . . . . . . . . .Limiting Through the NPL . . . . . . . . . . . . . . . . . . . . . . . . . . . . . . . . . . . . . . . . . . . . . . . . . . . . . .Limiting Through Management . . . . . . . . . . . . . . . . . . . . . . . . . . . . . . . . . . . . . . . . . . . . . . . .Deferring Cleanups Elsewhere . . . . . . . . . . . . . . . . . . . . . . . . . . . . . . . . . . . . . . . . . . . . . . . . . .
SUPERFUND STANDS ALONE . . . . . . . . . . . . . . . . . . . . . . . . . . . . . . . . . . . . . . . . . . . . . . . . .Contracting Links All Programs . . . . . . . . . . . . . . . . . . . . . . . . . . . . . . . . . . . . . . . . . . . . . . . . .
Programs Proliferate . . . . . . . . . . . . . . . . . . . . . . . . . . . . . . . . . . . . . . . . . . . . . . . . . . . . . . . . . .
ARE OTHER PROGRAMS THE SOLUTION? . . . . . . . . . . . . . . . . . . . . . . . . . . . . . . . . . . .The National Costs of Cleanup . . . . . . . . . . . . . . . . . . . . . . . . . . . . . . . . . . . . . . . . . . . . . . . . .Comparative Costs, Availability of Funding . . . . . . . . . . . . . . . . . . . . . . . . . . . . . . . . . . . . .Limited Technical Expertise . . . . . . . . . . . . . . . . . . . . . . . . . . . . . . . . . . . . . . . . . . . . . . . . . . . .Confusion Among Overlapping Programs . . . . . . . . . . . . . . . . . . . . . . . . . . . . . . .Different Programs, Different Cleanups
● *. . . . . . .. . . . . . . . . . . . . . . . . . . . . . . . . . . . . . . . . . . . . . . . . .
Other Programs Are Also Slow . . . . . . . . . . . . . . . . . . . . . . . . . . . . . . . . . . . . . . . . . . . . . . . .Not Enough Public Participation . . . . . . . . . . . . . . . . . . . . . . . . . . . . . . . . . . . . . . . . . . . . . . . .Information Tough ~ Get . . . . . . . . . . . . . . . . . . . . . . . . . . . . . . . . . . . . . . . . . . . . . . . . . . . . .
CONCLUSIONS . . . . . . . . . . . . . . . . . . . . . . . . . . . . . . . . . . . . . . . . . . . . . . . . . . . . . . . . . . . . . . . .
Page
1931931951951%1961981991992002(X)201202203206214215216217
BoxesBox Page4-A. From RCRA to the State to Superfund: Vertac Site, Arkansas . . . . . . . . . . . . . . . . . .4-B. CERCLA v. RCRA: Basin Fat Rocky Mountain Arsenal . . .
Superfund to the State: The Colorado Tailings4-C0 From AML to. . . . . . . . . . . . . . . . . . .Site . . . . . . . . . . . . . . .
207208213
Figure4-1. The
Table
Figure
Effort . . . . . . . . . . . . . . . . . . . . . . . . . . . . . . . . . . . . . . . . . . . . . . . . . 204Page
TablePage
4-1. Other Cleanup Programs . . . . . . . . . . . . . . . . . . . . . . . . . . . . . . . . . . . . . . . . . . . . . . . . . . . . . . 194

—
Chapter 4
Other Cleanup Programs and Superfund
INTRODUCTIONTo most observers, the Federal Superfund pro-
gram is the Nation’s environmental cleanup pro-gram. In reality it is but one—the most visible—partof a complex, not necessarily comprehensive, frag-mented and generally uncoordinated national effortto clean up chemically contaminated sites.
Besides the Superfund program, the nationaleffort consists of separate programs for hazardouswaste facilities and underground storage tanks;programs to remediate sites with mine wastes andmill tailings and to close old mine shafts and pits;programs that clean up specific materials, such asPCBs and asbestos; and individual Federal agencyand State cleanup programs. When the national costof this system is added up, the current annualSuperfund budget of about $1.5 billion is matchedby an estimated $1.7 billion spent by the otherprograms. Spending by private parties increases thiscost by perhaps $1 billion.
Actions, or inaction, by these other cleanupprograms affect how the Superfund program works,what the Superfund program accomplishes, futuredemands on the program, and, just as importantly,people’s perceptions of the program. Depending onthe goals of the Superfund program, it may beimportant for Congress to consider ways to limitsome interactions and enhance others. A particular,important long-term issue for Superfund is whetherimpermanent or incomplete cleanups from otherprograms might someday become Superfund sites.In a broader context, Congress may wish to considerwhether a set of separate, overlapping and parallelprograms is the wisest way to clean up the environ-ment.
OTA’s review of other programs shows that theysuggest ways to improve Superfund; many examplesare used throughout this report. Overall, however,many effects of other programs are less positive.This chapter discusses those impacts, which lead to:
. underestimates of Superfund needs, because: 1 )the movement of sites among programs may
delay effective cleanups under Superfund, and2) cleanups in other programs, rather thanpreventing the growth in numbers of Superfundsites, can create future Superfund sites as aresult of incomplete, or less stringent cleanupsin other programs;]overestimates of the needs of Superfund whensites that qualify for and at one time might havebeen placed in the Superfund program areshifted to other programs; andimplementation problems because Superfundmust share the available national workforce andsupply of technology with other programs.
Some details on the national cleanup effortsurrounding Superfund are provided in table 4-1.OTA has not done a comprehensive assessment ofevery Federal cleanup program and has not been ableto obtain details on all State programs. In all cases,OTA sought only the kind of information that couldshed light on the interaction of the programs withSuperfund. Federal programs were chosen becauseof their obvious connection to Superfund. Includedwere Federal agency cleanups, which are partiallycovered by the Comprehensive Environmental Re-sponse, Compensation, and Liability Act (CER-CLA) and are overseen by EPA, and Federal cleanupprograms that EPA has designated as current orfuture homes for sites deferred from Superfund. Toreduce the analytical burden of 50 State cleanupprograms, OTA has chosen to focus on programs,such as California, Illinois, New York, and Minne-sota, that are highly regarded by most people.California and Illinois, for instance, have reputationsfor advancing treatment technology; Minnesota isalways used as an example of the benefits of usingenforcement to clean up sites.
A PYRAMIDThe national cleanup effort may best be likened to
a dynamic pyramid with the Superfund programoccupying the pinnacle, the most visible portion ofthe pyramid. The height of the pyramid is growingas most cleanups occur and new sites are addedbelow the pinnacle. The bottom of the pyramid
] If ~ Suwrfid ~rogm hw t. ~wc ju~[ ]0 ~rcen[ of tie ~le~up~ [low Me responsibility of o~cr progrms, it could dd $24 to $61 billion
to the cost of the Superfund program (see table 4-1).
–193–
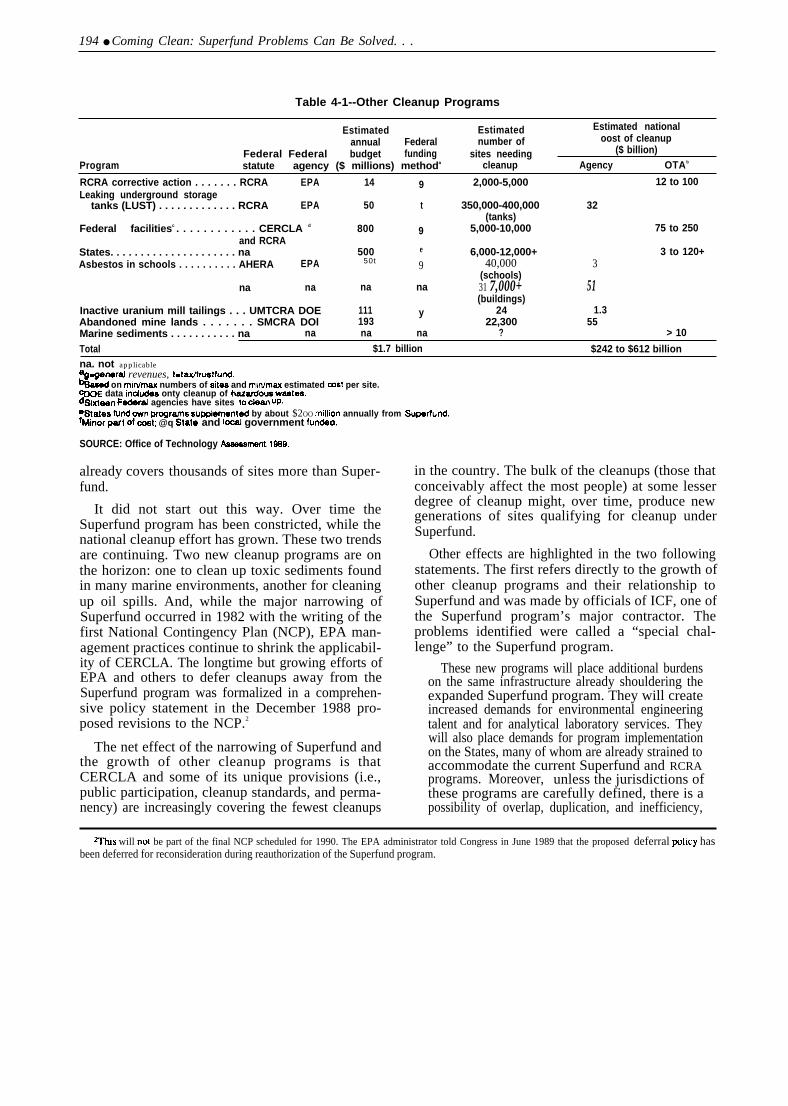
194 ● Coming Clean: Superfund Problems Can Be Solved. . .
Table 4-1--Other Cleanup Programs
Estimated Estimated Estimated nationalannual Federal number of oost of cleanup
Federal Federal budget funding sites needing ($ billion)Program statute agency ($ millions) methoda cleanup Agency OTAb
RCRA corrective action . . . . . . . RCRA EPA 14 9 2,000-5,000 12 to 100Leaking underground storage
tanks (LUST) . . . . . . . . . . . . . RCRA EPA 50 t 350,000-400,000 32(tanks)
Federal facilitiesc . . . . . . . . . . . . CERCLA d 800 9 5,000-10,000 75 to 250and RCRA
States. . . . . . . . . . . . . . . . . . . . . na 500 e 6,000-12,000+ 3 to 120+Asbestos in schools . . . . . . . . . . AHERA EPA 50t 9 40,000 3
(schools)na na na na 31 7,000+ 51
(buildings)Inactive uranium mill tailings . . . UMTCRA DOE 111 y 24 1.3Abandoned mine lands . . . . . . . SMCRA DOl 193 22,300 55Marine sediments . . . . . . . . . . . na na na na ? > 10
Total $1.7 billion $242 to $612 billionna. not applicable+genwd revenues, t-tadtrustfund.%ased on min/max numbers of sites and min/max estimated eat per site.CDOE data Indtis onty cleanup of h=dous Mfutes.dslxt~n F~r~ agencies have sites to cle~ uP.e~ates futi own prWra8 su~iementect by about $2OO million annually from Superfund.f~nor pat of -t; @q State’ and Ioeal government fu~.
SOURCE: Office of Technology lbaessment, 10S9.
already covers thousands of sites more than Super-fund.
It did not start out this way. Over time theSuperfund program has been constricted, while thenational cleanup effort has grown. These two trendsare continuing. Two new cleanup programs are onthe horizon: one to clean up toxic sediments foundin many marine environments, another for cleaningup oil spills. And, while the major narrowing ofSuperfund occurred in 1982 with the writing of thefirst National Contingency Plan (NCP), EPA man-agement practices continue to shrink the applicabil-ity of CERCLA. The longtime but growing efforts ofEPA and others to defer cleanups away from theSuperfund program was formalized in a comprehen-sive policy statement in the December 1988 pro-posed revisions to the NCP.2
The net effect of the narrowing of Superfund andthe growth of other cleanup programs is thatCERCLA and some of its unique provisions (i.e.,public participation, cleanup standards, and perma-nency) are increasingly covering the fewest cleanups
in the country. The bulk of the cleanups (those thatconceivably affect the most people) at some lesserdegree of cleanup might, over time, produce newgenerations of sites qualifying for cleanup underSuperfund.
Other effects are highlighted in the two followingstatements. The first refers directly to the growth ofother cleanup programs and their relationship toSuperfund and was made by officials of ICF, one ofthe Superfund program’s major contractor. Theproblems identified were called a “special chal-lenge” to the Superfund program.
These new programs will place additional burdenson the same infrastructure already shouldering theexpanded Superfund program. They will createincreased demands for environmental engineeringtalent and for analytical laboratory services. Theywill also place demands for program implementationon the States, many of whom are already strained toaccommodate the current Superfund and RCRAprograms. Moreover, unless the jurisdictions ofthese programs are carefully defined, there is apossibility of overlap, duplication, and inefficiency,
Ws will not be part of the final NCP scheduled for 1990. The EPA administrator told Congress in June 1989 that the proposed deferral plicy hasbeen deferred for reconsideration during reauthorization of the Superfund program.

Chapter 4-Other Cleanup Programs and Superfund . 195
with deleterious consequences for the objectivesthese programs are intended to serve.3
The second statement refers to complications of amultitude of programs within one State-NewJersey:
Thus ‘‘major’ cleanups are being conducted bydifferent programs through different statutes pre-senting the problems of inconsistency on everytopic, from public to private remediation, fromregulated units to whole site, from in-house guidanceon soils to ground water standards . . . overlap waspresumed to be high. In a Department with limitedresources and an enormous number of sites toaddress, overlap could not be afforded.4
As a result of these kinds of findings, New Jersey isimplementing a new strategy to assure that sites ofsimilar complexity be cleaned up using “the sametechnical standards and approaches . . . By develop-ing a cohesive strategy, duplicate and inefficientactions will be minimized in achieving comprehen-sive and consistent management actions.
SHRINKING SUPERFUNDAs a statute, CERCLA conveys broad coverage.5
It begins with the statement:
To provide for liability, compensation, cleanup,and emergency response for hazardous substancesreleased into the environment and the cleanup ofinactive hazardous waste disposal sites.
The definitions of “hazardous substance” and‘‘release’ and the restrictions on the use of the trustfund provide some limits. For instance, petroleumand various forms of natural gas used as fuel havebeen excluded from the definition of hazardoussubstance. A release has been defined very broadlybut specifically excludes: workplace exposures,engine exhaust emissions, nuclear materials coveredby other statutes, and the normal application of
fertilizer. In general, the fund is to be used forgovernment response costs taken for removal andremedial actions and the investigations that proceedthem. It cannot be used for response actions atFederal agency facilities.
Limiting Through the NPL
The major restrictions on CERCLA coveragehave been accomplished through the NCP, and theNational Priorities List (NPL) is the device throughwhich EPA first restricted coverage. While the NCPrestrictions have been written by EPA and beenapproved by the administration, Congress has nottotally accepted them. For instance, the SuperfundAmendments and Reauthorization Act (SARA)requires EPA to revise the Hazardous RankingSystem (HRS) and reconsider the cutoff score (seech. 2).
In 1980, under CERCLA, Congress asked for a“criteria for determining priorities among releases. , . “ and for EPA to use the criteria to create a listof ‘‘national priorities."6 EPA developed the HRSand proposed an initial 418 NPL sites in response toCongress asking for at least 400 sites initially. EPAimplied program restrictions in the first NCP andthen clearly stated in a revised version in 1985:‘‘Fund-financed remedial action is available only forsites on the NPL.
One way to interpret the original request byCongress for criteria and a priorities list is that it setup some way for a new program to determine whichsites to start cleaning up frost. Reliable informationwas scarce in 1980. There were thousands ofsuspected sites in the country and there was a dangerthat the program could be quickly overwhelmed.The 1980 conference report on CERCLA says thatthe NPL was to serve “primarily informationalpurposes identifying for the States and the public
3Jamcs R. Janis and Edwin Berk, ICF hC., “Superfund: Significant Accomplishments, ” proceedings of Anutomy of Supe@ui, 8th Nationat GroundWater Quality Symposium, September 1986, Kansas City, MO.
dNew Jer~y, Division of Wakr Reso~ces and Hazardous Waste Programs, ‘‘Case Management s~ategy Manualt’ draft! May 19~9
5~ere Wm discussion d~ng tie deba~ over C~CLA in 19~ about placing limits on the program. h amendment by Congressman Dave Stockmanwould have restricted cleanup under CERCLA to only those sites posing only ‘‘a significant threat to human health. It was reyxted by the Housecommittee. During the floor vote in the House, another amendment was submitted to restrict EPA from cleaning up ‘‘any dump site m the country ‘‘It, too, was rej~ted. [1980 Congressional Quurterly AkUIMC, p. 588, ]
WERCLA, S e c t i o n l o a n d ( B )750 F~r~ Register 5862, Feb. 12, 1985, P. 5867.
20-011 0 - 89 - 6 : QL 3

196 . Coming Clean: Superfund Problems Can Be Solved . . .
those. . . sites . . . which appear to warrant remediala c t i o n s .
EPA made the HRS and the NPL a way to limitFederal responsibility under CERCLA. EPAdecided that a‘ ‘national priority’ was not just a sitethat might require early attention but the onlycategory of site requiting CERCLA attention. Fromthe language in the NCP, the decision was clearlytaken to conserve the trust fund, which was seen atthat time as a finite, one-time allocation. Explainingthe agency’s 1982 decision, EPA said:
The purpose of this restriction was to ensure thatthe limited Fund monies were only used for remedialaction at NPL sites.9
And, by labeling NPL sites as those “posing thegreatest potential threats to human health and theenvironment, ’ EPA fostered the concept of theSuperfund program as one to remediate the worstsites. 10
Limiting Through ManagementLimiting the size and duration of the program has
been an overriding objective of the managers of theSuperfund program. The attempt to hold the size ofthe NPL to the original 418 sites is well known nowas the “there will be no Son of Superfund” strategy.Since 1983, when congressional action promptedwholesale changes in Superfund managers, programcost has still been the driving force. For example, theevolution of the preremedial part of the Superfundprogram (discussed inch. 2) and its effect on the sizeof the program may be as effective as the originalstrategy but more subtle.
Limiting program size (and, therefore, cost) hasbeen carried out primarily by holding down the
number of Superfund sites: by not going out andactively looking for potential sites, by not placing allknown potential sites in the official inventory, byeliminating sites at high rates as they proceedthrough evaluation stages, and by deferring sites outof the program. The program is also constricted bydelaying actions, by reducing the extent of cleanups,and by using low-cost remedies. All of these tacticsand their effect on the environmental mission of theSuperfund program, which EPA does not explicitlyaddress when using them, are discussed elsewhere inthis report.
Deferring Cleanups Elsewhere
Deferral moves sites qualifying for the NPL out ofthe Superfund program. EPA offered for consider-ation a deferral policy in the December 1988proposed NCP. Even though near-term implementa-tion of that comprehensive policy has been halted bypublic opposition, deferral has been occurring since1982. Then, EPA stated that active RCRA facilitieswould not be placed on the NPL and asked forcomments about its policy, at that time, of includingmining sites.11
Less well known are deferrals practiced by theremoval program. According to a 1988 paper, it isEPA policy that when time permits the regionaloffice must “aggressively pursue cleanup’ by aPotentially Responsible Party (PRP) or State or localgovernment before initiating Superfund cleanups.12
EPA has justified deferral, not on an environ-mental basis, but on the basis that, because anothercleanup authority exists, it is appropriate to defer tothat authority. EPA does not determine a site willreceive a quicker, better, or even comparable
SU.S. Congess, Semte Rep No. %848, 198(I, p. 60. Pos!-CERCLA and with the development of the NPL, the term ‘remdi~ ~tion’ has ~~on a legal definition. It is no longer just a reference to an environmentally needed cleanup but is a cleanup that qualifies for the Superfimd program underCERCLA.
950 F&r~ Regis~r 5862, Feb. 12, 1985, p. 5867.IOwo~ S1- is ~ ~upt ~mly &fi~. To some ~le it mc~ ~mplex si@s; ~ o~~s, Sites t.ha( we Cxpnsivc to Ckxm up. Wors Cm also imply
greater risks although when applied to NPL sites makes unfounded a.munptions about the accuracy of HRS scoring. The worst sites can also be sitesthat pose cument risks v. sites that pose future, speculative risks.
1147 ~r~ Re@~r 58476, M. 30, 1982, p. 58478.lzK=n BWg~ ad B~ce figel~fl, U.S. Envlronment~ fio~tion Agency, ad Vema Montgome~, BOOZ, Mien & Hamilton, hlC., ‘ ‘Setting
Removal Program Priorities,’ proceedings but Superfutui ’88, 9th National Conference and Exhibition, Washington, DC, November 1988, pp. 32-34,

Chapter 4--Other Cleanup Programs and Superfund ● 197
cleanup if the cleanup is deferred to another pro-gram. According to several public interest groups:
. . . the [deferral] proposal is also devoid of anyanalysis of the likely environmental effects ofdeferral. 13
Individual proponents of deferral do often assumethat by scattering cleanups among more authoritiesand by avoiding the CERCLA process and proce-dures, the pace of cleanups will quicken. 14 Thatconclusion, however, ignores the limited nationalsupply of technical resources and assumes that theprocess and procedures do not contribute to thedesired CERCLA outcome and that other programshave the people and funding to handle additionalwork.
The real significance of avoiding CERCLA maybe to encourage deferrals. EPA has reasoned thatrequiring States to “strictly conform to NCP re-quirements might result in fewer States choosing toundertake a site remediation that could be de-ferred. 15 As part of EPA’s discussions with theDepartment of the Interior (DOI) to gain acceptancefor the deferral of mine sites to DOI’s AbandonedMine Lands Reclamation (AMLR) program, a Su-perfund official said:
EPA’s position is that States choosing to useAMLR funds to clean up non-coal sites would not besubject to the standards and procedures prescribed inthe National Continence Plan (NCP) [emphasisadded] .16
In the December 1988 proposed deferral policy,EPA reasoned that expanding deferral of sites shouldbe done because it ‘‘may be appropriate’ and
because it will conserve CERCLA effort and fundsfor sites where “remedial action cannot be achievedby other means. ”17 Logically, this implies that, tothe extent that other cleanup programs offer lessstringent cleanups than Superfund, sites moving toother programs (or their communities) are penalized.EPA proposed to
. . . view the non-Federal [agency] section of theNPL merely as a list for informing the public ofhazardous waste sites that appear to warrant CER-CLA funding for remedial action through CER-CLA funding alone [emphasis added].l8
This shrinks the CERCLA program (and, perhaps,applicability) down to only those sites that cannot bedeferred to other programs. It also appears to
eliminate the listing of CERCLA enforcement sites(EPA suggests formally deferring those to responsi-ble parties) since they would not be paid for withCERCLA funding.
The comprehensive deferral policy would turn theSuperfund program into the “court of last Federalresort, ’ which is not the same as saying thatSuperfund handles the worst sites. That is, a worstsite (i.e., one with an HRS score of 28.50 or more)would be moved to another program if it qualifiesunder another program. Once there, however, it mayreceive a less stringent cleanup than if it were inSuperfund, the public may get less of an opportunityto participate and could not obtain Technical Assis-tance Grants (TAGs), the Agency for Toxic Sub-stances and Disease Registry health assessmentswould not be done, and cost recovery on sites that
13$ c~mats of Nat~~ Rc~ces ~fen~ Council, U.S. Public Interest Research Group, and National Audubon Society on L’.S. EnwrmmentalProtm.icm Agency’s Proposed Rule for NationaJ Oil and Hazardous Substances Pollution Contingency Plan, ” Mar. 23, 1989, p. 5.
Mh Ietkm t. OTA supp~ng clemup ~fem~s tO s~es, both tie National Governor’s Asmciation and the Association of State and Territorial SohdWaste Management Officials say that foregoing the procedural requirements of the NCP will hasten cleanup actions but not Jeopardize the mtegrhy ofti cleanup itself.
1553 F~r~ Register, Dec. 21, 1988, p.5 1418.i6u, s. Envuoment~ ~o~tlon Agency, offiW of Solid Waste ~d Emergency RespnW, letter from J. Winston porter to Jcd O. Christensen,
dirtxtor, Office of Surface Mining, Department of the Interior, Jan. 20, 1988.1753 F~r~ Re@~er 51394, ~. 21, 1988, p, 51415. s= ‘ ‘Cements of Nalm~ R~urces Defense Council, U.S. Publlc htteres[ Research Group,
and National Audubon Society on U.S. EnvironrnentaJ Protection Agency Proposed Rule for National Oil and Hazardous Substances PollutlonContingency Plan,” op. cit., foomote 13, for counter arguments to EPA’s use of the “appropriate factors” clause of CERCLA to support the proposeddeferral policy. These organizations say that EPA’s interpretation ‘‘ignores the clear thrust of the legislative history, and subverts CERCLA carefullystncturexl program to expeditiously identify, list, and remedy the worst sites in the country according to natiomdly uniform, protective standards’ [p.13].
ls5’j F&r~ Regtster 5 13%, Dec. 21, 1988, p. 51416.

198 ● Coming Clean: Super-fund Problems Can Be Solved . . .
return to the Superfund program could be compro-mised. l9
SUPERFUND STANDS ALONENational programs to clean up the environment
and protect the public have been a growth area eversince the 1970s. The Clean Water Act was enactedin 1972. Its premise was that, by slowing the rate atwhich contaminants were added to the Nation’ssurface waters, natural attenuation would eventuallyproduce clean water. The same perspective was thebasis of the Clean Air Act in 1970. The Clean WaterAct also contains a provision allowing the FederalGovernment to act in emergency situations whenpetroleum products are spilled in waterways.
Superfund is unique because it is the first-andonly—program designed expressly for environ-mental cleanup and for all media. Amendmentsunder SARA in 1986 added sections on cleanupstandards, which included a call for permanentremedies, and public participation, which providesfor technical assistance grants. These are featuresthat no other cleanup program has.
Other cleanup programs are not as stringentlyguided by statute or by current regulations.20 Mostother statutes have the kind of flexibility of theoriginal Superfund statute (later rejected by Con-gress in SARA) that allow site-by-site decisions onthe meaning of protection of human health and theenvironment. Public participation is mentioned inother statutes but not to the extent that it is inCERCLA.
Programmatically, most other programs-again,unlike Superfund-have dual roles. They set andenforce management regulations for active facilitieswhile at the same time setting and enforcing cleanup
regulations and procedures. Examples are the RCRAand Underground Storage Tank (UST) programs andthose implemented by DOI under the SurfaceMining Control and Reclamation Act (SMCRA) andthe Department of Energy (DOE) under the UraniumMill Tailings Radiation Control Act (UMTRCA).21
For dual programs, cleanup goals may clash withother program goals. For example, the RCRAprogram has identified the preservation of adequatewaste management capacity as a critical item ofConcern. 22 Thus, at active RCRA sites EPA (andStates) must balance their regulatory responsibilitiesto compel cleanup with their goal to keep sufficienttreatment and disposal facilities open. Additionalpressure arises from the congressional requirementin SARA that States provide assurance that capacitywill exist to manage hazardous wastes or face theloss of Superfund cleanup funding.23
One stated mission of the management side ofmany dual programs is to ‘‘prevent Superfundsites. ” The phrase implies either preventing uncon-trolled sites from being abandoned or from becom-ing expensive, complicated sites, or both, FutureSuperfund sites are also prevented by proper man-agement practices and, more fundamentally by notgenerating hazardous substances that need to bemanaged. 24 Thus, a major contribution to the na-tional cleanup effort each regulatory system couldprovide is to encourage pollution prevention and toprovide early warning and site discovery. The latterentails having both effective inspection and enforce-ment, which is often lacking,25 Under the LeakingUnderground Storage Tank (LUST) regulations,EPA rejected, as too costly, a requirement thatimplementing agencies actively seek out tanks thathave been abandoned.
19EpA ~w~ in tie prow~ ~licy tit Provisions could be made to retain these features but they Wotdd tid to the costs of cle~ups.
~Alone ~ong tie F&r~ pro~~s OTA reviewed, RCRA corrective action~ eventufd~ have regulations or guidance that is Similw to su~tid.However, the program has been undenvay for 4 years without regulations and very minor guidance, allowing for maximum flexibility. Meanwhile, sitesare being studied, remedies are being selected, and cleanups are occurring.
ZIBo~ tie ~1 ad DOE pro~ms de~ wl~ mine w~~ problems. Most of tie info~ation in tis chapter on the DOE ~d DOI programs relat~to the cleanup of muctive sites. Under SMCRA, the DOI’S Abandoned Mine Lands (AML) program remediates both coal and noncoal mine areas. TheDOE program is narrow; it only has authority over uranium mill tailings that are a consequence of processing uranium mine ores,
22U.S. EnvUonment~ Protection Agency, The Hazardow Waste Management SYstem, 1987.%3ARA, Section 104(k).24s= OTA*5 Serlou Re&tion of HU~dO~ w~tes ~d From p~i[~ion tO Prevention: An Update on Waste Reductwn.
~Sw, for instmW, Gener~ ~cout~g office, Hu2~&w Waste Facility lmpectiom Are Not Thorough and complete, GAQRCED-~8-20.November 1987,

Chapter 4---Other Cleanup Programs and Superfund ● 199
Cleanup programs differ among themselves inother ways. For example, the UMTRCA inactiveuranium mill tailings and AML mine cleanupprograms are like Superfund in that the governmentis responsible for evaluating sites, making remedydecisions, and doing the actual cleanups. Others arepurely enforcement programs in which the govern-ment role is to coerce others, through administrativeor court orders or negotiation, to evaluate and cleanup sites. Usually, in the latter case, the governmentholds an oversight role but, as OTA’s work on theSuperfund program has shown, oversight is depend-ent on having sufficient resources and expertise,Like Superfund, “but unlike other programs, theLUST program does have a trust fund to handlecleanups it cannot get done through enforcement,The AML program is a hybrid. It has no enforcementprovisions and is funded by taxes collected from thecoal industry. AML funds cannot be used for acleanup if a responsible party is known. Thus, oncea PRP search is successful under Superfund, amining site becomes ineligible for the AML pro-gram.
Contracting Links All Programs
In all of the programs, including Superfund,consultants and contractors are heavily relied on todo some or all of the study and field work. The SouthCarolina State program, for instance, has three majorcontracts that consume most of the available re-sources: 1) a remedial activities (physical cleanupwork) contract, 2) an RIFS study contract, and 3) anemergency response contract.26
By and large the contractors hired for otherprograms are the same firms that Superfund hires.For instance, NUS has a contract to survey DOE’sfacilities; Ebasco Services, Inc., won NASA’s siteevaluation contract; and Roy F. Weston has a DOEand several U.S. Army contracts. The UMTCRAprogram at DOE is contracted out to a joint ventureof Jacobs Engineering and Roy F. Weston. InCalifornia, of seven State remedial contracts, fivewith a total value of $23.5 million were held in 1988by Superfund contractors.27 As discussed later, this
expanding but largely inexperienced workforce addsstresses to Superfund, as well as the other programs,
Programs Proliferate
Despite its unique role, Superfund has not beenused to incorporate new cleanup efforts. Three othercleanup programs were created prior to 1980 whenCERCLA was enacted; the other programs werecreated since then. Instead of building a comprehen-sive cleanup effort by adding newly recognizedproblems to existing programs, Congress has filledthe gaps by building new, separate programs.
The growth of cleanup programs has followed theNation’s traditional structure of single media envi-ronmental programs and the existing authority formining issues. That is, as knowledge about a newcleanup problem has become available, its solutionhas been crafted within the confines of existingstructure. As each separate program is developed, itsauthority excludes that given to existing programs.Thus, CERCLA prevents the Superfund programfrom handling certain uranium mill tailing cleanupsalready handled under UMTCRA and the LUSTprogram cannot clean up hazardous wastes releasedby underground storage tanks regulated by RCRA.The Superfund program has spawned new programs.Most State programs were created or existing onesenhanced to handle sites excluded by Superfundpolicy decisions. Widely held views that Superfundrequirements are too stringent or costly and that itsimplementation is too burdensome and slow hassupported political pressures to exclude certaintypes of facilities or substances from CERCLA.
Two cleanup problems—marine sediments andoil spills—not adequately covered by Superfund orother existing authority are being discussed; eithercould end up as separate programs or be closelylinked to or subsumed into Superfund. The Super-fund trust fund is excluded by statute from beingused to clean up petroleum products, whetherreleased on land or discharged into the Nation’swaters. Under the NCP, however, the Superfundremoval program or the Coast Guard responds to oilspill emergencies covered by section 311 of the
~SOuti Carolina Dep~en( of Health and Environmental Control, ‘ ‘Report to the South Carolina General Assembly, Hazardous Waste Cent.mgencyFund Activities, July 1, 1986- June 30, 1987, p. 14. ASTSWMO found m 1987 that 33 out of44 States had a total of $258 million available for contractors.
2WC1UM were Metcalf and Eddy, CH2MHill, Dames and Moore, Tetra Tech, and Ecology and Envkonment.

200 ● Coming Clean: Superfund Problems Can Be Solved . . .
Clean Water Act. Incidents such as the March 1989spill in Valdez, Alaska, and the Ashland Oil spill inJanuary 1988 have pointed out deficiencies. Forinstance, critical time delays can occur because of apresumption that, even in an emergency, the FederalGovernment should allow the responsible party totake initial action. Low funding has also limitedFederal response capabilities. Congress is nowconsidering legislation that would broaden Federalpowers. 28
Toxic marine sediments can be cleaned up underSuperfund but, because few of the potential hun-dreds of sites are, a comprehensive, separate pro-gram is being advanced by advocates of an Aq-uafund. The majority of known sites are not in theSuperfund program because current HRS scoringdoes not account for sediments as a unique media orfor their biological impacts .29 Thus, an alternative tocreating a separate program is to make relativelysimple adjustments in Superfund. This would greatlyincrease the size and cost of the Superfund programbut bring technically similar problems under thesame authority. A National Academy of Sciencereport says that contaminated marine sediments arewidespread throughout U.S. coastal waters, Prelimi-nary estimated costs of cleaning up just 10 of 30known contaminated areas in the Great Lakes rangefrom $2.9 to $3.4 billion.30
ARE OTHER PROGRAMS THESOLUTION?
All of the actions taken and being taken to limitthe Superfund program can be rationalized. They donot, however, necessarily assure that Superfund’senvironmental or public health benefits will remainintact. Limiting the Superfund program’s scope andworkload, however, might allow the Superfundprogram to improve its public image, Or, as some
public interest groups say, “. . . maintain an illusionof progress on the NPL. ’ ’31 Indeed, that objectiveseems to have overridden concerns about the poten-tial for a reduction in environmental protectionbecause of less stringent cleanups outside of Super-fund.
The National Costs of Cleanup
The policy of reducing Superfund’s work does notlimit national costs. It just shifts costs around and inthe process might even increase overall costs. Ifcleanups are necessary, someone pays and notalways under the Superfund principle of “polluterpays. ” Superfund monies come mostly from indus-try with a relatively small contribution from generalrevenues. All of the Federal programs-even thosethat rely on enforcement for cleanup-receive somefunding from general revenues to pay for developingprogram rules and regulations and for oversight,monitoring, and enforcement costs.
Table 4-1 shows that the annual budgets of theprograms, excluding Superfund, add up to at least$1.7 billion per year. Estimates for future nationalcosts are very uncertain but may be greater than $600billion. Comprehensive data on the current cost of allthe State cleanup programs is not readily available.The Association of State and Territorial Solid WasteOfficials (ASTSWMO) reported data on State fund-ing mechanisms in 1988. Out of 50 States, 39collected an average total of almost $300 million perfiscal year to pay for cleanups. Based on available,current budget data, OTA has estimated that Statesare spending about $500 million of their own fundsfor cleanups.32
The real issue is how well these other programs arefunded and how good our knowledge is about futureresource needs. If the other programs are under-funded they will have difficulties handling their own
213ForcXmple, tie Senae pd s.bstj in AUgUS( 1989 mat would create a $1 billion cleanup fund and provide for timely F~er~ emergencY resPonse,This bill would not necessarily set up a separate response capability but could, instead, enhance the existing structure.
29EXWP1= of Sites tit ~ve ~o~ hi@ enou@ to get on he NpL we waukeg~ Harbor (Outbowd Marine), Sheboygan H~bor, ad Ashtabula(Fields Brook) in Region 5.
3~tie ~ger, Northeast. Midwest ktitute! ‘‘Cleaning up Great Lakes Toxics Hotspots: How Much Will It Cost; How Can h Be Paid For?’ September1989.
31* ‘coment~ of Natu~ Resources ~feme co~cll, us ~b]lc ~terest Rese~ch Group, and National Audubon Society on U.S. EnvironmentalProtection Agency’s Proposed Rule for National Oil and Hazardous Subsmnces Pollution Contingency Plan, ” op. cit., footnote 13, p. 6.
32~y Smtcs Supplement ~eu reWWces wl~ F~er~ Suprfud momes. EPA su~rf~d budget includes about $200 million each yew for States,which are granted through Cooperative Agreements and CORE funding. Kansas, for instance, has been getting $300,tXKl pr year; New Jersey, about$2 million. Minnesota pays for 31 staff with Federal funds.

Chapter 4---0ther Cleanup Programs and Superfund ● 201
problems. This would create two problems forSuperfund. First, other programs may be unable totake deferrals from Superfund. And, if resourceneeds for Superfund are based on deferrals that willnot occur, then Superfund has underestimated itsneeds. Second, underfunded programs may be underpressure to compromise extent of cleanup. Sites withincomplete cleanups could eventually become Su-perfund problems. This ultimate outcome can alsooccur as the result of programs that are structuredand funded as enforcement programs, for whichcurrent government costs are relatively low. AsOTA has shown in chapter 3, enforcement cleanupsthat are the result of negotiated settlements tend tocompromise cleanup goals.
If estimates about the future are based on poorinformation that causes underestimates, then theSuperfund system will be in periodic, perpetualcrisis. It appears that the Superfund program, al-though it frequently doesn’t use it, has some of thebest information available with which to predict thefuture need for cleanups. All cleanup programs tendto collect, with varying degrees of effort, their ownlist of potential or known sites needing cleanup.There is no coordination among lists, no commondefinitions, no understanding of possible duplica-tions. These multiple, noncomparable lists severelycomplicate the Nation’s ability to understand the fullnature and extent of its cleanup needs (see ch. 2).
Comparative Costs, Availability of Funding
There is no evidence to suggest that programsother than Superfund are more efficient, i.e., providequality cleanups at lower cost to the public. Asdiscussed below, many cleanups outside of Super-fund are less stringent than ones inside it, Nor isthere evidence that other programs have the fundingavailable to support deferred cleanups from theSuperfund program. In some cases the programs donot have the resources to handle their own problems.State programs that emphasize enforcement do not
do so because of the quality of site cleanup receivedbut because it means that more sites can getattention. In other words, States rely on enforcementto expand their constrained resource base.33
Some States do assert that their programs, unen-cumbered by the “cumbersome bureaucratic/administrative practices under CERCLA are moreefficient, but there are no statistics to show whetherState transaction costs are higher or lower than thoseof Superfund.34 Available data on State averagecosts per site are considerably less than Superfund’s(at $30 million per site) .35 California, among Stateprograms, may have the highest average cost per siteat $2.7 million; most States appear (o pay between$200,000 and $500,000 per site. These average costsare much lower than Superfund's because low costcontainment and disposal options are often chosenby State programs and because States have a higherproportion of smaller sites to clean up than doesSuperfund. In fact, State cleanup spending is morecomparable to the Superfund removal program.
The RCRA corrective action program reliestotally on enforcement to get sites cleaned up. Eventhen, it has a budget that seems unrealistic, espe-cially since that it may rival Superfund in number ofsites needing remediation. For fiscal year 1989, EPArequested $14 million for this national program, anamount equal to 1 percent of the annual Superfundbudget. The effect of low budgets is that Regions,which implement the program, either have to delayissuing orders to owners to clean up sites or toprovide less oversight than necessary, or both. Eitherway, public health and the environment can suffer.36
The Federal UMTCRA program appears to be lessefficient than Superfund. It has spent $474 million inits 10 years, through fiscal year 1988, and claims tohave remediated 2 of the 24 sites in the program. Theprogram projections are that another $500 millionwill be spent to finish remediation of all the sites,excluding contaminated groundwater. Funds forcleaning up groundwater, estimated at $800 million,
JJ@er 80 ~rcent of all Stak Clemum Me enforcement, Wcording to a 1988 statement made by J. Winston Porter, then EPA a-wistant administratorin charge of Superfund.
sd~mem~ ~nds 65 ~ment of its ~u~ budget on administrative costs, half of which is to stxure commitments from responsible parues. OTAhas found (WZ ch. 1) that EPA spends 44 percent of the Superfund budget on administration and management activities.
qs~ord~g t. F~cr~ Regl~@r notices, ~wenl su~fimd tot~ c]e~up cos~ are about $2f) million, mcluting capl~~ and ]ong-term operalmg ~dmaintenance costs. EPA’s June 1989 ‘‘Management Rewew of the Supcrfund Program report stales that COSLS are higher, about $30 rndhon per s]te.
36~w finding ~d tie= kinds of consequences are discussed in an EPA document, ‘ ‘Draft Corrccuve Aclion Outyear Strategy, ’ that reflects theviews of EPA headquarters and regional staff expressed during workshops held in early 1989,

202 ● Coming Clean: Superfund: Problems Can Be Solved . . .
are not yet budgeted. At $1.8 billion for 24 sites, theprogram is projected to cost over twice as much per
site ($74 million) than the Superfund program.Although UMTCRA sites are large, they are allsimilar to one another (i.e., uranium mill tailings)and do not each present radically different engineer-ing challenges. The standard remedy in theUMTCRA program is the relatively cheap option ofearthen containment, which, even for large sites, isrelatively low cost.
While a few States have managed to stretch theiravailable Federal AML funds to cover needed minecleanups, nationally the program has long beenrecognized as one that is underfunded. Given theprogram’s tax rate (its source of funding) and theshort time that is left under its authorization, DOIestimates-based on the numbers of projects re-maining that qualify for AML funds—show thatthere may beat least a $2 billion shortfall. The futureviability of the program will be determined bywhether or not and how Congress extends SMCRAtaxing authority beyond 1992.
Limited Technical Expertise
When EPA defers cleanups from the Superfundprogram, the agency does not consider whether theprograms to which the sites are deferred haveadequate resources. All the cleanup programs are, infact, linked together by the national pool of technicalexpertise and technology. Cleanups, whether they beasbestos from schools or mine wastes or toxicwastes, all require the same basic technical expertiseand often the same technologies. People are neededto collect relevant site information, analyze the data,develop remedial alternatives, perform tests, andcarry out remedial action. Similarly, the samecommercial treatment and disposal facilities are theultimate receivers of wastes from Superfund, Fed-eral agency, and State cleanup sites.
Private contractors aggressively compete for ex-pertise among themselves and with Federal andState agencies. A real possibility is that the expan-sion of other cleanup programs will only exacerbatethe workforce and contractor problems felt by
Superfund. The burgeoning growth of cleanupprograms is causing the supply of expertise to beoutstripped by the demand. For all programs, thiswill drive up the cost of cleanup (i.e., as wages arepushed up) but lower the quality of the work (as thepool of expertise is stretched thin).
The evidence of talent constraints is compelling.Staff in the RCRA corrective program say that EPAis at a disadvantage in negotiating cleanups withowners and operators of RCRA facilities. Not onlydo industrial representatives have better technicalbackgrounds and experience, they also have greaterknowledge of EPA and its operations. As soon asEPA’s people gain experience and skills, they arerecruited by private industry and contractors andmove to the other side of the table.
State programs always seem to be the mostdisadvantaged. Arizona, according to the assistantdirector of Arizona’s waste programs, has a 36percent personnel turnover rate; most leave for“better-paying jobs in industry. ”37 The New Yorkprogram has identified “shortage of experiencedstaff’ as one its major issues. The consequences area slowdown in progress at State sites and reductionin the oversight of PRP field work. The latter will‘‘increase the risk that responsible party and othercleanups will be improperly performed and willrequire additional work in the future. ’ ’38 New Yorkclaims that it is having to compete for qualifiedpersonnel with the Federal Government, otherStates, and consulting fins.
For two of the Federal cleanup programs—Superfund and asbestos in schools—the problemscaused by the mismatch between supply and demandhave been detailed. OTA’s report, Assessing Con-tractor Use in Super-fund (and work by the GeneralAccounting Office, EPA’s Inspector General, andenvironmental groups), concluded that poor techni-cal performance has been a problem in the Super-fund program, not all of the time, but all toofrequent.ly. As OTA said:
Much of this results from the rapid initiation andexpansion of the program and the enormous pres-sures imposed by the public and Congress to perform
3TN_ wel~~, ~sitiml d~~t~ for wm~ pro~~s, fizona ~p~~en( of EnvUonment~ @~i~, a.s quot~ in tie Phoenix New Times, Mu. 15,1989.
38Ncw York state, Department of Environmental Conservation, ‘‘New York State Inactive Hazardous Waste Site Remedial Plan Update and StatusReport,” Oct. 30, 1987, p. vii.

Chapter 4--Other Cleanup Programs and Super-red . 203
quickly. The limited number, limited experience,and high turnover of EPA’s staff has made it verydifficult for EPA to assure the environmental per-formance and economic efficiency of Superfund’scontractors all of the time. And the problem iscompounded by the inexperience and high turnoverof workers for contractors, resulting from the explo-sive growth of that industry .39
The asbestos in schools program [under theAsbestos Hazard Emergency Response Act (AHERA)]has also shown the negative effect of expansivegrowth. Not only has demand for contractors in-creased but it appears that the expertise does notexist to properly oversee their work. Various busi-ness analysts have estimated that the demand forasbestos evaluation and cleanup has caused thecreation of some 2,000 new firms in the past fewyears. The market is expected to grow from a current$2 billion per year to $6 or $7 billion in a few yearsand to $100 billion in 20 years.@ During congres-sional hearings in 1988, a member of a school boardin New York State told Congress:
. . . a serious problem exists concerning the qualityof work being performed by consulting and contract-ing companies . . . AHERA has set up a situationwhere the group that is calling the shots is the newlycreated group of asbestos consultants and removalcontractors. These people are, by and large, not at alldriven by health and safety considerations, but byeconomic considerations. And it is their economicself-interest, not the school districts’, which con-cerns them most.41
The EPA Inspector General reported at the samehearings that proper asbestos work practices wereexpensive thus the incentive to circumvent them wasgreat and results in large profits for contractors,42
Additionally, EPA, which is responsible fortraining and certifying asbestos abatement fins,doubts that the supply of trained asbestos profes-sionals will be sufficient to meet the time frames set
out in AHERA. The agency has used this inadequateinfrastructure of accredited personnel and enforce-ment staff’ as one of its major arguments againstextending asbestos regulations to public and com-mercial buildings.43
On the plus side, the set of national cleanupprograms offers an opportunity for sharing oftechnical expertise and knowledge that could im-prove the performance of all programs. This kind oftechnical transfer is difficult because each programhas its own regulations and procedures that cancause individuals in one program to view the workor knowledge gained in other programs as irrelevantor inappropriate. Even within the Superfund pro-gram, OTA has found examples of poor technologytransfer among regions, headquarters, and EPA’sown Office of Research and Development. Althoughcertain individuals may seek outside information,mechanisms have to be created to facilitate thesharing of information for the benefit to accruesystemwide.
Confusion Among Overlapping Programs
As the venn diagram in figure 4-1 shows, whilesome programs pick up where another leaves off,many have overlapping jurisdictions. At the sametime, there are sites that remain outside the existingstructure, such as marine sediments. While theproblem of sites without cleanup authority is obvi-ous, overlapping jurisdictions don’t just double thecoverage but cause competition for control of a site
44 It is overlappingand can increase expenditures.jurisdictions that makes the deferral of Superfundsites possible.
Overlapping jurisdictions are not necessarily in-tentional but are often caused by differing bases forprograms, For instance, Superfund coverage is basedon the presence of a hazardous substance. (Hazard-ous substances are a collection of pollutants defined
WU.S. Con=ess, (jfficc of TwhnoIo~ Asxssment, Assessing Contractor Use in [email protected], OTA-BP-lTE-51 (Washington, DC’: U.S. GovcmmcmPrinting Office, January 1989).
~See, for instance, “Why Throw Money at Asbestos, ” Fortune, June 6, 1988, and “Cleanup Dollar Flow Like Water Bu( industry Is Awash InProblems,” ENR Special Report, Mar. 9, 1989.
41B111 ~~hen, mem~r of tie Joh~to~, N, Y., ~h~l bo~d, he~ngs &fore (& Envtionment, Energy, and Natural Resources Subcommlttw of theCommittee on Government @rations, House of Representatives, June 1, 1988.
qz~n~d E. K~kdend~], &puty ~~tor General, U.S. Environmental protection Agency, June 1. 1988.
4354 F~r~ Register 13632, Apr. 4, 1989. p. 13636..t4Sttiup costs ~cre= natlon~ ~os~, ~ tie first z yews of tie LL’ST program, 50 percent of tie f~d money dls~ibut~ LO States was spent for
administrative costs to develop programs.

204 ● Coming Clean: Superfund Problems Can Be Solved . .
Figure 4-l-The National Cleanup Effort
/
\
—
SOURCE: Offica of Technology Assessment, 1969.

—
Chapter 4--Other Cleanup Programs and Superfund ● 20..
by other environmental statutes or regulations, lessthose substances that Congress has explicitly ex-cluded from program authority.) The discovery of ahazardous substance, which has been released and isuncontrolled, any where in the Nation, can be reme-diated by the Superfund program.
RCRA and LUST corrective action programs, onthe other hand, are based on a community ofregulated facilities. In the case of RCRA, Subtitle Cregulations cover the management of hazardouswastes by treatment, storage, and disposal facilities(TSDFs). Because all hazardous wastes are hazard-ous substances, all RCRA corrective actions could,theoretically, be included under Superfund. Onlysome are because EPA has decided-through itsNPL policy—to keep cleanups in the RCRA fold tothe maximum extent possible.45
Included in the LUST program are regulatedunderground storage tanks (USTs) that containeither petroleum products or hazardous substances(except those hazardous substances that are at thesame time hazardous wastes). Because the Super-fund statute excludes petroleum products from thedefinition of hazardous substances and most USTsstore petroleum products, the Superfund programcan only handle a minor portion of the problemscaused by USTs. And, because of the exemption ofhazardous wastes in the LUST statute, USTs withhazardous wastes fall into the RCRA program. Thus,cleanups resulting from leaking underground stor-age tanks can be (and are) handled by Superfund,RCRA, or LUST programs.
EPA’s deferrals map the overlaps between Super-fund and other programs. EPA has and is deferringcleanups to RCRA (Subtitle C facilities) andUMTRCA programs and would have been to theAML program except that restrictions on thatprogram have prevented deferrals. But, one AMLsite--Colorado Tailings-has moved into the Su-perfund program. Pending deferrals are to theFederal Insecticide, Fungicide, and Rodenticide Act(FIFRA), RCRA (operating Subtitle D landfills),LUST, and States.4b (EPA has also proposed defer-
ring cleanups to PRPs, which would move cleanupsoutside of the government and into the privatesector, )
Early in Superfund’s history, EPA made openattempts to exclude mine site cleanups from theprogram. Those attempts were thwarted by courtrulings and congressional action. Current policy is todefer mine waste cleanups to the AML andUMTRCA programs in the cases where thoseprograms are broad enough to have authority.UMTRCA cleanup of tailing sites belonging toinac[ive mills is restricted to 22 sites identifiedspecifically by statute, plus 2 sites added by DOE;CERCLA excludes these sites from Superfund.Superfund deferrals are made to the active millscleanup program. The AML program for noncoalsites is restricted by the fact that any State has tocleanup its coal sites before it can proceed withnoncoal problems, unless the Governor declares anemergency. So far, only Wyoming is reaching theend of its coal cleanups and is the only State that mayin the near future be able to use AML funds forcleanups deferred from Superfund.
Except for those to the RCRA Subtitle C correc-tive action program, relatively few official deferralshave occurred from Superfund. It is the future thatEPA may be most concerned about. For instance,OTA estimated in 1985 that 5,000 municipallandfills may require cleanup. EPA data indicatesthat, as of July 1988, only 220 landfills were on theNPL. While this is only 4 percent of a large universe,it is a significant fraction of the NPL (almost 20percent) and represents a growth rate of about 10percent per year since 1986.
Overlaps in program authority cause situations inwhich a particular site is simultaneously or sequen-tially handled by different programs. The decision ofwhich authority prevails is sometimes made by theSuperfund deferral policy but not always. ForFederal agency NPL sites a negotiated agreementbetween EPA, the agency, and the State determinethe cleanup authority. Under the UST regulations,EPA has made the UST implementing agency
45EpA ~llcy on ~lemmg up RCRA Subutle C sl[es under Superfund is b~ on criteria outlined in the Federal Rcg]stcr on June 24, 1988, pp.23978-23986. Basically, a finding must be made that site owners are bankrupt or otherwise lack fmartcial capability or have shown unwllmgess topr- with a RCRA comznve z~on.
46~FRA hm n. ~omwtlve ~tion Provlslons, ~d he pro~~ Subtllle D ~~rr~tlve ~tlon IU]CS address ~oundwatcr ord)I with no at tent ion tO
contaxmnated soil, surface water, or au.

206 ● Coming Clean: Superfund Problems Can Be Solved. . .
(which can be a State or local agency) the determina-tor of whether it or CERCLA will govern a cleanupqualifying for either program. And, States caneffectively defer cleanups to themselves by notentering sites in EPA’s CERCLIS inventory data-base.
Complying with a varying set of rules can befrustrating. At an Air Force installation where EPAand the State were pushing for an InteragencyAgreement (IAG), a RCRA permit, and a Stateaction, the base commander was quoted by acongressional report as saying:
, . . the use of these three separate proceduralframeworks to address the same problem places theAF in an untenable if not impossible situation,questions of efficiency aside. Compliance with oneset of procedures may or may not satisfy therequirements of the other’s procedures. It is entirelyconceivable that compliance with one set mayviolate another’s, especially in the area of schedulingof activities and prioritization of sites.47
Two of the many sites with overlapping authori-ties are detailed in boxes 4-A and 4-B. The firstcovers a private sector site in Arkansas; the second,a controversy over Basin F, a part of the huge RockyMountain Arsenal site in Colorado.
There have been a few attempts to officiallycoordinate or integrate the various cleanup programsor the flows of sites between them. One recentexample is EPA’s “Environmental Priorities Initia-tive. ” This plan routes potential RCRA correctiveaction sites through the existing Superfund pro-gram’s preremedial site evaluation process. EPAargued that this initiative will ‘‘enable the Agencyand the States to identify and cleanup first those sitesthat present the greatest threat to human health andthe environment. ’ Since the system being used toevaluate RCRA sites is the system currently in usein the Superfund program and since, as OTA hasshown in chapter 2, it does not necessarily accom-plish that goal for Superfund sites very well, itshould not be expected to do so for RCRA sites.
Nevertheless, there may be gains from this initiativethrough the reduction in RCRA program costs byusing art existing system, rather than developing anew one exclusively for RCRA, and because of thetime saved by not having to wait for the developmentof a separate evaluation system. However, delayshave occurred in implementation; the high prioritysites that were to get preliminary assessments infiscal year 1989 had not, as of July 1989, beenentered into the CERCLIS inventory, a step thatprecedes evaluation.
Different Programs, Different Cleanups
If cleanups conducted by other programs are aspermanent as Superfund cleanups are supposed tobe, there should be no future impact on the Super-fund program. Unfortunately, most evidence showsthat other programs tend to choose containmentonsite or removal of contaminants to commercial orespecially designed land disposal sites. The Super-fund program had the same focus before SARA waspassed in 1986; its enforcement side still has.
Superfund is the only Federal cleanup programthat has a statutory basis for cleanup standards(’‘applicable or relevant and appropriate’ standards,called ARARs) and has been pushed by Congresstoward permanent remedies through the use oftreatment technology. Both the basis for standardsand the cleanup preference came with the 1986reauthorization of, and were reactions to deficien-cies in, the Superfund program. All of the otherFederal cleanup programs-by statute and regulations-leave the definition of protection of health and theenvironment pretty much up to individual sitedecisions. While this, by itself, does not necessarilymean that site cleanups will be inconsistent aroundthe country, it does mean that there is no guaranteethat they will be consistent with Superfund clean-ups.49 As for State cleanup programs, J. WinstonPorter, then EPA’s assistant administrator responsi-ble for the Superfund program, said in 1988: “Thereis some concern about cleanup standards-whether
47U.S. Congress, “A Report to the Committee on Appropriations, U.S. House of Representatives, on the Department of Defense EnvironmentalRestoration Fund,” August 1987, p. 23.
4SU.S. ~vlroma~ protection Agency, Office of Solid Waste and Emergency R~wxt “Annual Report, Fiscal Year 1988, ” EPA/68-01-7259,November 1989.
@~ng ~ Senw ~ba~ on tie SARA amendments, Senator Chafee stressed hat the Superfund standards were the minimum allowable forSuperfund cleanups and that ‘compliance with standards promulgated under the authority of other laws will not necessarily assure compliance with thisgenerat standard. ” [132 Congressional Record S14925, Oct. 3, 1986. ]

Chapter 4-Other Cleanup Programs and Superfund ● 207
Box 4-A—From RCRA to the State to Superfund: Vertac Site, ArkansasThe Vertac site is an example of a RCRA enforcement site that turned into a State site and a Superfund site.
A cleanup delay of almost 2 years, so far, has occurred because enforcement failed and the State did not havesufficient funds to contract for the necessary work. Now, Superfund is involved in supporting the State cleanupaction and has taken on the responsibility to finish the extensive cleanup remaining for the site. And, if animpermanent initial action done by the responsible party fails, Superfund may have to redo that work.
Vertac Inc., was still operating a chemical plant on the property when it became a Superfund site in 1983 withan HRS score of 65.46. Also in 1983 a RCRA consent order was signed; Vertac agreed to set aside $10.7 million(a trust fund plus a letter of credit) for necessary cleanup and to handle an initial cleanup that consisted of onsitedisposal of contaminated liquids and solids. Although both the State and EPA objected to the way Vertac proceededwith the work, the judge on the case ruled that Vertac was complying with the order.
In January 1987, Vertac abandoned the property and subsequently filed for bankruptcy. That left the State withthe job of finding a treatment company to incinerate over 27,000 drums of materials contaminated with dioxins andchlorinated phenols that had been found onsite. Meanwhile, the trust fund had become caught up in litigation bythe shareholders of Vertac, and questions were raised as to whether there were sufficient funds to cover incineration.Negotiations with the first company selected by the State for the incineration job failed because IT COrp. asked for$15 million, which the State could not afford. As of June 1989, the State has found one company-MRK-whohas agreed to incinerate the drums and material for the available $10 million.
But, more cleanup remains. The Region 6 Superfund program tried in early 1988 to obtain approval for fundsto supplement the incineration project (including an air monitoring plan, ash disposal, and a delisting petition) andto proceed with an RIFS to cover the remaining contamination onsite, which includes the plant, buildings, tanks,and surrounding areas. The funds were denied in fiscal year 1988. Region 6 has now completed a plan for an interimaction, costing $2 million, to support the incineration job, and those funds are available. The region is also innegotiation with Hercules Corp., who owned the plant prior to Vertac, to do an RIFS for the additional work neededonsite. There are also offsite problems involving contaminated creeks, a sewage treatment plant with contaminatedsewer lines, and a stream with contaminated sediment yet to be studied.
Although site cleanup appears to be finally underway, there is future uncertainty about the initial onsitedisposal facility completed under RCRA in 1986. It is leaking and a more permanent solution-a secondcleanup may be necessary for “Mt. Vertac” as the initial cleanup is known locally.
cleanup levels are equivalent [to Superfund], and so reason to assume that any program will follow rulesforth. ’ ’50
Federal Programs and Their Regulations
EPA has acknowledged a difference betweenSuperfund and other Federal program cleanups.Under the proposed deferral policy, EPA said otherFederal programs”. . . do not necessarily present thesame level of assurance of remediation that meet theenvironmental protection standards of CERCLA’ ’51
A partial review of the basis for some programs’cleanups provides insight into the varieties ofcleanups that are to be expected, since there is no
other than its own:
● For the LUST program, EPA decided to allowa site-specific approach to standards that it sayswill “adequately protect human health and theenvironment. ’52 Earlier EPA suggested threeoptions: 1) national standards, 2) site-specificstandards, or 3) a combination of both depend-ent on groundwater classification schemes.Site-specific standards were chosen not fortheir environmental strengths but because theywould accommodate existing State programs,minimize the overall regulatory impact on
wJ. Wkston po~er, s~h at S~er@d ’88, 9th National Conference and Exhibition, NOV. 28, 1988.
5153 F~r~ Ftegimer 51394, De.c. 21, 1988, p. 51418.
5253 F~r~ Register 37082, Sept. 23, 1988. p. 37174.

208 ● Coming Clean: Superfund Problems Can Be Solved . . .
Box 4-B-CERCLA v. RCRA: Basin F at Rocky Mountain ArsenalFederal agencies often find themselves caught between EPA and CERCLA and States and RCRA. CERCLA
gives States only a consultant role in Federal agency cleanups. States view this role as inadequate and theenforcement relationship of EPA, the Department of Justice, and Federal agencies as one with a high potential forconflict of interest. Thus, States with RCRA authority generally prefer that Federal agency cleanups be conductedunder RCRA giving States greater leverage. Portions of Federal agency NPL site cleanups are officially placedunder RCRA corrective action through an interagency agreement drawn up on sites.
The cleanup of Basin F, part of the Rocky Mountain Arsenal site in Colorado, has been caught up in thisCERCLA/RCRA issue. The dispute between the State and the Army involves which authority takes precedence andultimately what kind of cleanup will occur and how fast. Basin F has also been affected by changing EPA deferralpolicy.
Basin F was added to the existing Rocky Mountain Arsenal NPL site in March 1989. It had been originallyexcluded when Rocky Mountain was proposed for the NPL because EPA believed that Basin F would be subjectto RCRA corrective action and thus, under the agency’s RCRA deferral policy of September 1983, might beappropriate for deferral. Subsequently, EPA decided that Federal agency facilities that qualify for RCRA correctiveaction will not be deferred from listing (as is done for non-Federal sites).1 That changed policy meant that BasinF should be included instead of excluded.
The U.S. Army constructed Basin Fin 1956 to store and dispose of contaminated liquid wastes; Shell Oil alsocontributed wastes. Approximately 240 million gallons of hazardous liquids and an estimated half a million cubicyards of contaminated soils resulted. The Army has projected the cost of cleaning up Basin F to be about $42 million;a ROD is scheduled for 1993.
The Army implemented a two-part strategy; an interim action has been taken to reduce existing migrationpending the decision on a final, permanent remedy. The liquids were moved to holding tanks and surfaceimpoundments and the soil was excavated and placed in a double-lined waste pile. The State and local citizens havebeen against the Army taking the interim action, preferring that the contaminated materials be removed from BasinF and disposed of elsewhere. They have subsequently criticized the effectiveness of the interim solutions. The caseof Basin F went to court over whether or not CERCLA can preempt the State’s ability to enforce its own regulationsand RCRA corrective action. The judge issued a memorandum of opinion that the State of Colorado has authorityover the Basin. Thus, the legal answer here seems to be that CERCLA does not preempt RCRA. According to theruling:
I t i snot inappropriate that the present and future victims of this poison legacy, left in their midst by the Army and Shell,should have a meaningful voice in its cleanup. In RCRA, Congress has plainly provided them that voice throughrepresentation by the State. I hold that RCRA enforcement by the State is not precluded by CERCLA in the circumstanceshere presented.2
11~ ~ ~~ 13296, M#r. 31, 19s9.
2“~ @inkm ad -,” iucoiordo v. the U.S Army, U.S. District Court, ~, CO, Feb. W, 19s9.
small businesses, and reduce the cost of com-pliance for all owners.53
. When cleanups of PCBs occur under the ToxicSubstance Control Act (TSCA), the cleanuplevels are based on the standards in the regula-tions but can vary, as occured in the TexasEastern Pipeline case (see later).
. Cleanup rules for uranium mill tailings differdepending on whether the cleanup is of an
active or inactive mill. For active sites, RCRAcorrective action regulations apply and coverboth radioactive substances and hazardouswastes; for tailings at inactive sites onlyradioactive substances are covered. EPA statedin proposed groundwater standards that inor-ganic and organic hazardous constituentsshould be assessed rather than stating they mustdespite the conclusion that the “concentrations
5352 ~r~ Re@~r 12662, Apr. 17, 1988, p. 12681. EPA asserted that national standards would not necessarily assure national consistency.

Chapter 4-Other Cleanup Programs and Superfund . 209
of (nonradioactive) materials vary from pile topile, ranging from 2 to more than 100 timesapplicable standards. ’ ’54
For the AML program, neither SMCRA nor theresultant regulations require the use of anyspecific methods or application of specificcleanup standards. Implementing agencies aredirected, instead, to a guidance documentwritten in 1980, which suggests that contain-ment methods be used for toxic materials.55 ANational Academy of Sciences report thatreviewed the program in 1986 supports thatapproach and suggests covering the materialswith ‘‘impermeable clay or capping them withsynthetic materials. ”56 There is no require-ment for groundwater cleanup.
For the RCRA corrective action program, nocleanup regulations have yet been issued. EPA hasmade a number of statements that the RCRA rules.when published, will be similar to Superfund’s. Intestimony before Congress in 1987, the head ofEPA’s Superfund program claimed that ‘the level ofenvironmental protection provided by a cleanupproceeding under RCRA authority should be thesame as that under CERCLA. ’ ’57 Meanwhile, clean-ups underway are based on existing regulations (thatonly cover groundwater contamination) and a guid-ance document, ‘‘National RCRA Corrective ActionStrategy,’ issued in 1986. The only advice in thatdocument about cleanup standards is: ‘‘. . . finalremedies will . . . be required to meet applicablehealth and environmental standards promulgatedunder RCRA and other laws’ [emphasis added] .5xThere is no statement about preference for perma-nent cleanups.
Currently, differences do exist between Super-fund and RCRA as a report released by the HouseCommittee on Appropriations on DOD’s Environ-mental Restoration Fund pointed out. The report
says that ‘‘generally RCRA remedial actions tend tofavor containment as a technical solution, whileSARA remedial actions are mandated to favorpermanence of remedy for treatment technolo-gies. ”59 In an example covering one potentialcleanup, the report said an EPA RCRA programmanager stated that he would approve a remedy thatconsisted of containment with monitoring for metal-contaminated soils. The CERCLA program managerstated that he would not approve of containment andthat perhaps soil washing combined with otheremerging technologies would be required.
How closely RCRA cleanups eventually resembleSuperfund cleanups and avoid being Superfundproblems some day may await the outcome ofnegotiations between EPA, who has drafted pro-posed rules, and the office of Management andBudget (OMB) who has taken over 7 months so farto review them. OMB apparently does not agree withEPA’s rules for permanence, for not allowingfacilities to postpone cleanup until groundwateroutside its property is contaminated, and for setting
cleanup targets in the same range as Superfund’s,OMB also wants only direct contact by the public totrigger a RCRA cleanup. Conversely, the HRS thatidentifies Superfund sites uses various indirectpathways, and direct contact will be an addedSuperfund pathway if the new HRS is approved.
RCRA corrective action is an enforcement pro-gram and whatever the rules, RCRA cleanups mayeventually be similar to and have the same problemsas Superfund enforcement cleanups. One differencewill persist, however. EPA has no backup fundingunder RCRA corrective action as it does with theSuperfund trust fund. Thus, when an owner oroperator of a RCRA facility is intransigent, acleanup waits resolution. In some instances, clean upwill await transfer of sites to the Superfund programfor attention,
5452 F&r~ Register, “Standards for Remedial Actions at Inactive Uramum processing Sites, ” Sept. 24, 1987, p. 36001.55A GAO rew~ in 1988 (Su~~e Ml~’~g. l~o~tion on the LJp&t~~ Abandoned Mine hnd Inventory) quoted one State official as comp]a.ming
because the Office of Surface Mining had never provided any policy gwdance on acceptable reclamation methods.56N~on~ Re~~~h Comcll, Aba~onedJfine ~nds. A M~-course Review of the National Reclamation prografnfor Cixd, November 1986, p. 26,
JTJ. w~~ton poner, fomer ~l~mt fillfis~ator, U.S. Envkonmental Protwtion Agency, statement before the Envwonmcntal Rcs[oration Panelof the Readiness Subeommittm of the Committee on Armed Sewices, No\. 19, 1987.
58 LI.s. ~vironmen~ Protection Agency, “National RCRA Correctlvc Action Strategy, ’ p, 13.
59U.S. Congress, ‘‘A Report to the Committee on Appropnamms, U S. House of Rcprcscnta[lves, on the Department of Defense EnwronmentalRestoration Fund, ” August 1987, p. 26.

210 ● Coming Clean: Superfund Problems Can Be Solved . . .
Actual Cleanups Differ
Another, better way to assess the differencebetween Superfund and other program cleanups is toobtain information on what has actually happened.Unfortunately, little of this information is availableat the national level and some not even at the Statelevel.
Federal Agency Programs—For Federal agencycleanups CERCLA provisions only apply to NPLsites. Out of the thousands of potential cleanups,only 115 so far are on the NPL. Thus, most agencycleanups will take place under States laws or otherFederal corrective action programs, such as RCRAor LUST Even some NPL sites or portions of NPLsites will be cleaned up under RCRA correctiveaction rather than CERCLA.60 Still, it may be tooearly to make comparisons based on actions. Agencyprograms are, in general, behind most other pro-grams. The U.S. Department of Energy (DOE)program indicates in its fiscal year 1988 report thatall NPL sites are still in the site evaluation stage; thereport has no information on non-NPL sites.6l
DOD seems to be furthest along, but littlepermanency has been achieved. Its annual report forfiscal year 1989 says that 36 NPL sites have hadsome kind of interim action and one has a finalremedy completed.62 Although the report claimssome action underway at over 1,000 sites, it onlyprovides details on types of remedies selected for theinterim actions. Forty-one percent were waste re-movals (i.e., contaminated soils or liquids weretransported off site for disposal) and 28 percent wereclassified as site treatment/remediation. (The lattercategory might more properly be titled ‘ ‘miscellane-ous. According to information DOD supplied OTAon the individual remedies, none used treatmenttechnology.) The balance of the interim actions
involved providing alternative water supplies (13percent), groundwater treatment (6 percent), long-term monitoring (9 percent), or decontamination ofmunitions (3 percent). At one site, explosive con-taminated soil is being incinerated.
State Programs—For State cleanup programs,information on actual remedy selection varies fromnonexistent to comprehensive:
●
●
●
●
The Illinois State program has a reputation forchoosing incineration, and officials told OTAthat mobile incineration has been used at foursites of the 45 sites cleaned up so far. Detailsabout what remedies were selected for the other41 sites are unknown by the State office.63
Little specific information is available at theState level in Florida; the program is independ-ently implemented by six districts. The Statedoes produce an annual “The Sites List” thatgives the status of hundreds of Florida sitesunder various kinds of cleanup programs, butinformation on remedy selection is not in-cluded.
A Kansas State report for 1988 provides manystatistics on site cleanups including the statusof sites. The only information in the report onremedies is a statement that remediation mayinvolve removal, onsite detoxification, or con-tainment. No weight or preference is given tothe three options.64
New York State included a breakdown ofremedies in a 1986 report but has not done thesame in successive annual reports. The 1986data shows that (for 129 projects) 62 percent ofthe actions taken were onsite containment, 15percent were removals of soils for offsitedisposal, and 33 percent involved treatment of
WA has left this determination to be made on a site-be-site basis in the interagency agreement signed between an agency, EPA, and the State.61u.s. Department of Energy, “Annual Report to Congress for Fiscal Year 1988, ’ December 1988. Under CERCLA Section 120, all Federal agencies
are required to report annually to Congress on the status of their cleanup programs. Of the 16 agencies with sites in the Federal Docket, OTA could onlylocate reports from 6 agencies.
szof tie ~~ 8,139 sites identifi~ by tie agency, more than half (4,435 sites) are expected to need an RIFS and 96 percent of those have a completedRIFS or one underway. For the 2,486 sites expected to need a remedial design or action, 60 percent (1 ,482 sites) have had or are undergoing a removalor an interim remedial action or longt.emn monitoring.
GJ1llinois’ annual report .S+’S: ‘‘The Agency now requests the use of alternative treatment technologies such as incineration, and is less dependent onlandfill disposal of hazardous wastes generated from cleanup operations. [Illinois Environmental protection Agency, ‘Cleaning Illinois, ’ Spring 1988,p. 8] For sites discussed in the report for which sufficient detail was given, OTA found that onsite containment was used at five sites, contaminated soilsfrom six were sent to offsite landfills. incineration was chosen at one site, and soil flushing wa.. used at one site.
~Kansas Department of Health and Environment, “ 1988 Summary of Bureau of Environmental Remediation Sites in Kansas, ” January 1989, p, 3.

Chapter 4--Other Cleanup Programs and Superfund ● 211
groundwater,65 The 1987 report stated that NewYork was inconsistent with the Federal Super-fund program, and the 1988 report listed a goalto establish policies and regulations to increaseconsistency in site cleanups.
. In South Carolina, 5 remedial actions wereconducted between July 1986 and June 1987.All contaminated soils were taken to commer-cial landfills; liquids were incinerated.66
. A 1988 report on the Tennessee State Super-fund program says that many of the 24 cleanupsaccomplished are of “dubious effectiveness”because of inadequate attention to groundwa-ter, use of clay caps over buried wastes, and nolong-term monitoring.67
OTA was able to obtain more comprehensive,up-to-date information from California, Minnesota,and New Jersey. California’s report for 1988 says:‘‘State law and (agency) policy . . . support the useof cleanup solutions other than excavation andredisposai of untreated waste. “68 And, the Statedoes have an extensive program to test alternativetechnologies. Still, California data show that 80percent of actions in 1987 and 79 percent in 1988involved moving soil offsite to landfills. Incinera-tion was used for one action in 1988 and in each yearone action consisted of soil bioremediation.
In New Jersey, there are four separate Stateprograms that have cleaned up or overseen thecleanup of almost 40 sites. Ten cleanups in oneprogram consisted primarily of groundwater pump-ing and treating or monitoring. OTA was told thatwhen contaminated soil was involved it was usuallyland disposed (in some other State). In one case,PCBs were incinerated. Three cleanups in anotherprogram involved sending most contaminated soils
and materials to landfills, liquids were usuallyincinerated or, in one instance, sent through amunicipal water treatment plant. The enforcementprogram under the State’s Environmental CleanupResponsibility Act is credited with the most com-pleted cleanups (about 20), New Jersey was unableto supply OTA with information on remedy selec-tions, however.
The Minnesota Superfund program has completed38 NPL and non-NPL cleanups since 1983 and “isrecognized nationally as being very effective atinsuring the cleanup of hazardous waste sites. ”69
Out of 27 completions for which information wasprovided to OTA, soil treatment (of some unknownkind) occurred at two sites. The balance of remedieswere: containment onsite, excavation and transportto landfills offsite, monitoring of wells, and provid-ing alternate water supplies. Extensive groundwaterpumping and treating is done in Minnesota.70 Box1-B (ch. 1) discusses in detail one recent cleanupdecision made by Minnesota authorities. Given thestatistics available on the program, that decisionseems to be representative of the overall trend ofcleanups in Minnesota.
Federal Programs-OTA contacted severalStates that have used the Federal AML program toclean up mine wastes. A Montana State official saidthat cleanup standards are chosen on a site-by-sitebasis; they rely on their consulting engineers foradvice. 71 In Wyoming, State disposal standards ‘n
materials similar to those found in mine wastes arethe guide to cleanup levels. The usual option is tomove contaminated materials to a land disposal cellwhere natural materials are used to protect againstfuture migration. Copper tailings, for instance, havebeen moved from a river bed site and disposed in a
fiNew York State, ~p~ent of Environrnenm Conservation, Divisions of Solid and H=ardous Wask, ‘ ‘New York State inactive Hazardous WasteSite Remulial Plan,” Oct. 15, 1986, p. V-5.
%e South Carolina Department of Health and Environmental Control, ‘ ‘Report to the South Carolina General Assembly-Hazardous WasteContingency Fund Activu.ies-July 1, 1986 to June 30, 1987, op. cit., footnote 27.
67 Kirsten Dow et al., “lkrmessee Superfund After Four Years: A Critical Appraisal, ” May 6, 1988. The report was sponsorti by the LegalEnvironmental Assistance Foundation and the lknnessee Environmental Council.
~c~lfomia Dep-ent of Health Services, “Expenditure P1an for the Hazardous Substance Cleanup Bond Act of 1984, ’ revised Januay 1988, p.13.
~“Minnesota Pollution Control Agency’s Report on the Use of tbe Envmonmental Response, Compensation and Comphance Fund During Fi~atYear 1988,” November 1988, p. 15.
70~ ~ 1988 repfi, he ~meWta po]]utlon Conmol Agency s~d ~a[ site-sWific g-o~dwater cleanup goaJs were king established. Meanwhile,
‘‘targets for soil contamination will be developed later. ’ [“Minnesota Pollution Control Agency’s Report on the Use of the Environrnentat Response,Compensation and Compliance Fund During Fiscal Year 1988, ” November 1988, p. 14.]
71 Ben Mundie, Montana AML program, ~rsonal conversation, APT1l 1989.

212 ● Corning Clean: Superfund Problems Can Be Solved. . .
cell above the water table. Monitoring is ongoing toevaluate any leachate. Tailings from a gold miningsite contaminated with mercury and arsenic will besimilarly disposed. Clay materials are used tostabilize metals in mine pits, and contamination ingroundwater is left to naturally attenuate aftersources have been cleaned up.
In some programs, especially those covering minewastes, the use of containment can often be justifiedbecause of the huge volumes of contaminatedmaterial. Still there is fiction between Superfundand other programs regarding the appropriate kind ofcontainment to use and whether the materials shouldbe treated frost. One case, the Colorado Tailingsmining site in Montana, has been caught between theAML program and Superfund (see box 4-C).
In the UMTCRA program, most cleanup planscall for containing the tailings in place or somewhereonsite or offsite, using natural materials and noleachate collection systems. The UMTCRA choiceis driven by a requirement in the regulations that aremedy be effective up to 1,000 years and at least200 years.72 No one can, of course, assure that aremedy that does not destroy contaminants will last200, much less 1,000 years. The DOE program hasdecided that-since radioactive materials cannot bedestroyed-the best way to approach that require-ment is to construct simple earthen containmentsystems that have no mechanical components toavoid the need for human intervention over 200years.
An EPA publication for the Superfund programon radioactive sites, Technological Approaches tothe Cleanup of Radiologically Contaminated Super-fund Sites, offers many treatment alternatives tocontainment. 73 The publication says that excavationand containment in ‘‘either permanent or temporaryabove-ground containment facilities” has been thechoice in most remedial decisions and that the 1,000year requirement is applicable to uranium milltailings only and thus is not necessarily “applicableor relevant and appropriate” (a SARA phrase) forSuperfund site cleanups. It also points out that‘‘some Superfund (radioactive) sites contain various
types of hazardous wastes, and the radioactiveportion may pose a relatively minor problem, ”
This difference between UMTCRA and Super-fund suggests that better interactions between theprograms on a technical level might change the waysboth are doing their job, if regulations allowedchanges. From one perspective, the kind of contain-ment remedies the UMTCRA program is selectinghave been abandoned as inappropriate for hazardoussubstances. However, the 1,000 year requirement isbased on the UMTCRA perspective that it is theradioactive emissions from the materials that harmhuman health and that over a period of time thoseemissions will decay, resolving the problem. Metalsthat are hazardous substances, however, have intrin-sic toxicity that does not decay and are toxic forever.Thus, the RCRA requirement-used in Superfund—for containment with a 30-year lifetime for materialsthat never decay may not be an improvement.74
However, the simpler UMTRCA solution may notretain its integrity longer than 30 years, much less200 to 1,000 years.
Classifications Create Problems
Cleanups can also differ because of the wayssubstances are classified. When they do differ,especially when they are inconsistent with CER-CLA, future Superfund cleanup costs and problemsmay be increased.
RCRA hazardous wastes area subset of CERCLAhazardous substances so that a cleanup under RCRAcovers fewer substances. However, the differencesmay not be profound. Mine wastes and radionu-clides, for instance, are not hazardous wastes, butthey are only infrequently found in the TSDFs thatRCRA corrective actions cover. And, while minewastes are not classified as hazardous wastes, someof their constituents, such as heavy metals, are.
Asbestos is an example of a hazardous substance,the cleanup of which under AHERA, State, andSuperfund programs may lead to future Superfundsites. Under current law and regulations, asbestoscan be considered dangerous enough to be removedfrom schools—and from Superfund sites—but safe
7240 Code of Federal Regtdafions 192.02(a)(1).73u.s, Enviro~ent~ Wotwtim Agency, Office of Re~~ch ~d Development, Techn&gl’caJ Approac&s to the Cleanup of Radiologically
Contanunated Supe@uui Sites, EPA/540t2-88rW2, August 1988.T.tR~A ~y~tems, doub]e-l~~ ~1~ s~~etic matefi~s, have le~ha~e co]]ection ~wems for which periodic monitoring is necessary.

——— . . . .
Chapter 4--Other Cleanup Programs and Superfund ● 213
Box 4-C-From AML to Superfund to the State: The Colorado Tailings SiteColorado Tailings in Butte, Montana is part of the Silverbow Creek site, which was placed on NPL in 1982.
As early as 1979, however, the Montana AML program was involved in the Colorado Tailings site. Now, despiteits NPL status, State negotiations may settle on the basis of State, rather than CERCLA, cleanup provisions.
The initial AML cleanup plan for the tailings contaminated with heavy metals was estimated to cost $1 million,but Montana was denied the funding by DOI's Office of Surface Mining Reclamation and Enforcement. In fiscalyear 1984 Congress appropriated the money as a special line item in the budget for the AML program. Because thesite was by that time on the NPL, the State AML office worked with EPA on the cleanup plan. Both agencies agreedon a land disposal option for the tailings but disagreed on its extent. EPA’s version was estimated at $3 million andincluded multiple liners and a monitoring system; the AML program wanted a lesser $1 million cleanup. The Statewas told by EPA that if it did the Colorado Tailings cleanup it could become liable (a PRP) if the cleanup adverselyaffected the Silverbow Creek site. According to a current Montana AML official, this liability issue, more so thanthe disagreement over the cleanup method led to the State declining to handle the cleanup.1 However, a former Stateofficial told OTA that the project was rejected because of the $3 million cost and the belief that the imposition ofEPA performance standards were unnecessary, as well as the question of liability.2
The project reverted to the Superfund program in 1984. Colorado Tailings is now part of one operable unit ofthe Silverbow Creek NPL site. The feasibility study was completed in October 1986. As of early 1989, no cleanupdecision had been made. Meanwhile, the State-which has the lead on the site-was under negotiation with thePRPs for settlement. A State official told OTA that they would not necessarily settle under provisions of Superfundeven though the site is on the NPL because CERCLA does not take precedence over State laws.
1~ M@G, M~ AML prq p6maasl Cummtion, April 19s9.2~~ Ju~, f~ Bumxu chief, Malt8us AML program, persoast cmversadom October 19ss.
enough to end up in a municipal solid waste landfill. been that RCRA rules are meant to protect ground-Under EPA’s offsite policy there is now someprotection against hazardous substances ending upin an out-of-compliance landfill at a subtitle Cfacility. That policy does not cover subtitle Dfacilities. Thus, it is possible to move asbestos froma Superfund site (or a school under AHERA) to anymunicipal landfill, including ones that are alreadycontaminating groundwater and may have to becleaned up.75 The Sup-fund removal program hastaken asbestos from over 30 sites. OTA was told thatonly when State laws require it is this material sentto a hazardous waste landfill.
This movement is legal because asbestos, al-though a hazardous substance under CERCLA, isnot a hazardous waste under RCRA. Air emissionsof asbestos are considered the primary source ofharm to public health and the environment. Thereasoning for not listing asbestos under RCRA has
water and, since asbestos tends to bind to soils, itwill not leach from landfills into groundwater. (Datafrom one Superfund site—Asbestos Dump, whereasbestos has been found in groundwater—mayrefute this theory, but it is being ignored at that site,and it is doubtful that the information is beingtransferred elsewhere. ) Although asbestos can betreated and the fibers that cause harm destroyed,treatment is rarely the option of choice in theSuperfund or AHERA program.76
The way asbestos waste is managed suggests thatonce placed in a landfill it may cause or help alandfill to qualify for the Superfund program andthus have to be moved again. The general manage-ment practice for asbestos is to wet the materials andplace them in plastic bags prior to disposal. Once ata landfill, they may be segregated from other wastes(although no Federal regulation requires segrega-
7S~c ~omt of ~~.to~ ha may & deposit~ ~ landfills ~au~ of tie A HERA program is not trivial. One rural county in Ca.lifomia has esumatedthat it must resctve landfill space for 50 tons of asbestos. A conservauve csfimate is that about 5MMKN tons of asbestos will be placed m the Natmn’sLandfills.
~s~ tie ROD fm k AS~Sm ~p--Mil]in@n SIIC in New Jersey treatability studies are included in the post-ROD remdial design ph~.However, EPA and the PRPs are negotiating over whether or not the conclusions from the treatability Studies will change the ultimate cleanup, scheduledto be onsite containment.

214 ● Coming Clean: Superfund Problems Can Be Solved. .
tion), placed in a specially dug trench, and coveredwith soil. These practices can vary if State or countyregulations differ from Federal regulations. Theyalso vary because of poor enforcement. According toan EPA IG report and EPA’s own statement, “manyasbestos removals and the subsequent waste dis-posal operations are performed out of compliancewith [the existing regulations]. ’ ’77 The IG alsoreported that inspections and enforcement are weakand penalties for violations are inadequate.78 AsEPA administrator William K. Reilly has said:
I still fear where it goes [when asbestos is removedfrom buildings], whether it really is disposed of in aplace where we can trust that it’s been put to rest andit won’t come back again in the future.79
Sites containing PCBs are cleaned up underSuperfund and TSCA. When PCBs are cleaned upunder TSCA only the PCB contamination is consid-ered even though a site may contain other hazardoussubstances as well. This occurred when TexasEastern Pipeline Co. agreed to pay a $15 million fineand cleanup costs (estimated at $400 million) forareas contaminated by PCBs (89 sites in 14 States)along its 10,000-mile natural gas pipeline. Thecleanup agreement did not cover any substancesother than PCBs and Superfund cleanup standardswere not invoked. The agreement also did notrequire offsite or groundwater cleanup nor does it setany compliance schedule for the company to meet.PCB levels of cleanup were based on Federal PCBstandards and varied depending on the area beingcleaned up (. . . pits, surrounding soil, etc.) and threerankings of sites. The agreement requires the com-pany to test for other hazardous substances but doesnot set any cleanup requirements for them if found.While it does not foreclose EPA or States frommoving under Superfund to handle such eventuali-ties, doing so will require that new cases are broughtagainst the company. For Superfund to use trust
funds to clean up any of these 89 sites, they wouldfirst have to be individually taken through the NPLlisting process.
OTA was unable to obtain details on actual LUSTcleanups, which mostly deal with petroleum liquidsand contaminated soils. Although petroleum prod-ucts are relatively easily destroyed by incinerationand are amenable to microbial biodegradation, anOUST handbook, Cleanup of Releases From Petro-leum USTs: Selected Technologies, says that exca-vation and disposal of contaminated soil is the“most widely used corrective action. ”8° Soil con-taminated with petroleum is not a RCRA hazardouswaste, but some States regulate it as hazardous. InStates that do not regulate it, contaminated soilsremoved from petroleum tank sites can be put inlow-cost municipal landfills. In some cases, it ischeaper to pay shipping costs and transport exca-vated soils from a State that considers them hazard-ous to a State that does not.81 Once petroleum wastesare put in a landfill, they can--depending on theactual substance--qualify as hazardous substancesand secondary cleanup under Superfund.
Other Programs Are Also Slow
Assessing the pace of cleanup is, to most observ-ers, the relevant way to determine program effective-ness. Thus, many argue that a benefit of using othercleanup programs is that cleanups can be donequicker because they are not encumbered with theinflexible process and procedures of CERCLA andthe NCP. But, some other cleanup programs areexperiencing delays in getting down to cleanup.Meanwhile, the cleanups assigned to them wait.
Some State data does show that State enforcementcleanups are quicker than State-funded cleanups.82
But, State-funded cleanups appear to take the sametime as CERCLA-funded cleanups. Conclusionsfrom a 1987 ASTSWO survey show that, on
7754 F~~ Register 912. Jan 10, 1989, P. 915.
78U.S. Envi ronrnentd Protection Agency, Office of the Inspector General, ‘‘Consolidated Report on EPA’s Administration of the Asbestos NationalEmission Standard for Hazardous Air Pollutants, ” Mar. 24, 1988.
79A8 quottxi in “Good Riddance?” Nacional Jourtual, July 29, 1989, p. 1930.
~.S. Environmental Protection Agency, Office of Underground Storage Tanks, Cleanup of Releases From Petroleum USTS: Selected Technologies,EP~53~ST-88/001, April 1988, p. ix.
gl~e OUST hmdbook, cit~ ~ve, cites a ‘ ‘reasonable $12 per square yard’ for soils senl [0 nonhazardous landfills and ‘‘up to $160 per Wweyard if the soit is considered hazardous” [p. ix].
820TA ~omp~ ~1 Sumd si~s which g~n~ a ROD in fisc~ yew 1988. There was no difference between enforcement and find sites in theaverage time it took the program to move them from placement on the NPL to ROD completion.

Chapter 4-Other Cleanup Programs and Superfund ● 215
average, State staff have to work a little harder onNPL sites than non-NPL sites but that the elapsedtime is about the same.83 Data from California showsthat an RIFS on a State-funded site takes from 11 to42 months compared to EPA’s 21 to 38 months foran RIFS.84 That is, an RIFS in California canconsume less or more time than a Superfund one. InNew York State the average time for an RIFS is 24months v. EPA’s average 32 months, as determinedby OTA in Are We Cleaning Up? In another exampleof pace, New York State said in a 1987 report thatonly 2 of the 15 planned starts ( 13 percent) for theState program actually were initiated while 12 of the22 planned starts (54 percent) under the Superfundprogram in the State were initiated. The identifiedcauses of the difference were: 1 ) resources shifted tooversee work by responsible parties, 2) lengthycontract procurement procedures, 3) a shortage ofexperienced staff, and 4) a liability insurance prob-lem.85 This performance measure improved thefollowing year. The reason may have been that staffhad been added to the State program.
Under RCRA, some cleanup regulations havebeen in place since 1983, but EPA’s authority wasgreatly expanded in 1984. Five years later, severalthousand sites are just beginning the initial assess-ment process, the new regulations covering cleanuphave not been proposed, and OTA was only able toidentify 12 sites with completed Corrective Meas-ures Studies (CMSs).86 Although some cleanupsmay have been completed as part of permits in theRCRA program, information on progress is notavailable. Out of some 5,000 RCRA facilities in thecountry, initial site evaluations have been done at1,372 facilities. Of the 1,122 of those facilitiesdetermined to need further evaluations, EPA regionshave formally required owners to proceed with 499of them, either through orders or as part of permits.
For other Federal programs, the pace varies. TheUMTRCA inactive mills program has been author-ized for 10 years and by the end of fiscal year 1988had only claimed to have completed the cleanup of2 out of 24 sites.87 On the other hand, the LUSTprogram, whose statutory authority dates from 1984and 1986, appears to be moving briskly. A recentannual report claims that responsible parties arebeginning cleanups at “thousands of sites’ and thatmore than 155 corrective actions have begun usingfund monies.88 But over 300,000 tanks may needattention, so the program’s pace is an unknown. TheAML program has moved fairly aggressively on coalmine cleanups, but substantial work is left to be doneat noncoal mines because they are the third priorityof the program.
Not Enough Public Participation
Congress has not, for other cleanup programs,given nearly as much attention to public participa-tion as it has under CERCLA, where an entiresection outlines the scope of public participation.Lack of statutory direction does not necessarilymean that public participation will not be as broadunder other programs. But the level of complaintabout how public participation slows the process inSuperfund suggests otherwise. However, Super-fund’s public participation has been a significantfactor in moving Superfund implementation towardmore compliance with statutory requirements. Whenother cleanup programs have less public participa-tion, the prospect for less stringent cleanup (andpotential for creating future Superfund sites) in-creases.
Not everyone agrees that EPA allows the public toadequately participate in the Superfund program andcertainly not to the extent that PRPs do, ButCERCLA does encourage public participation at anearly stage and throughout the cleanup process, and.
83~~ work effon rw~r~ of Stae st~f is 4.5 work yews on a State-lead NPL site and 3.4 years On a non-mL si~. me average time elaPs~ Wrsite is 5.5 years on an EPA-lead NPL site, 5.6 years on a State-lead NPL site, and 4.7 years on a non-NPL site. [Association of State and Ta_ritorial SolidWaste Management Ofi3cials, “State Programs for Hazardous Waste Silc Assessments and Remedial Actions, ’ June 1987. ]
gdc~ifo~a data from ‘ ‘Expenditure plm for tie Hazardous Substance Cleanup Bond Act of 1984, Revised January 1988, ’ op. cit. footnote 69. Dataon EPA from OTA’S Are We Cleaning Up?
SSNewYork Dep~ent of Environmental Conservation, ‘‘New York Mate inactive Hazardous Waste Site Remedial Plan Update and Status Report, ”Oct. 30, 1987.
86A R~A ~m=tlve ~tim CMS is comp~able to a superf~d RIFS, bu( it includes tie f~ili~ owner’s suggested remedy.
870TA did not review active mill cleanups.
811J.s. mvironment~ I%mxtion Agency, Office of Solid Waste and Emergency Responw, ‘ ‘Annual Report, Fiscal Year 1988, ” op. cit., footnote48.

216 . Coming Clean: Superfund Problems Can Be Solved . . .
participation is set up to be active, rather thanpassive. For remedial actions, the regional commu-nity relations program is supposed to establishcontact with local citizens before any action isplanned or undertaken and follow up with notice ofproposed and final remedial actions. Once a prelimi-nary decision has been made on the selected siteremedy, the public has an opportunity to commentand EPA must respond to those comments. Forremoval actions, an onsite public coordinator isassigned to answer any questions the public mayhave. In addition, under CERCLA the public hasbeen given the right to sue to enforce the law.
Unique to Superfund is the provision for awardingtechnical assistance grants to public citizen groups.TAGs were meant to assist the affected communityat sites at understanding and evaluating the problemsposed and to help assure that cleanups were chosenin accordance with SARA. However, the concepthas not necessarily been well implemented by EPA.Criticism has been raised by Congress and publicinterest groups about the way EPA translatedstatutory language into practice. For instance, onecongressional survey found the system so complexand cumbersome that it tended to discourage groupsto participate.89 Still, groups who have obtainedTAGs have been helped (see box 3-F in chapter 3).
Despite the implementation flaws, public partici-pation with the Superfund program is supposed to bevery broad. TSCA has no provisions for publicparticipation and since cleanups under TSCA areenforcement cases, the public may have no knowl-edge of how their interests are being protected untila court settlement has been completed and avenuesfor changes are essentially closed. The same kind ofpublic closeout occurs in the Superfund program atenforcement sites. When EPA wrote the regulationsfor the UST program, provisions for public partici-pation were included only for the last of six possiblephases prior to actual cleanup. When a confirmedrelease requires a cleanup plan, the implementingagency must notify the public and release informa-tion but has the option to decide whether or not tohold a public meeting to discuss the plan.
Under RCRA the public must be notified whenEPA intends to issue a permit (which may includecleanup requirements) and hold a hearing. Under anenforcement order, citizens only become involvedafter a facility has completed its investigation andrecommended a cleanup plan. As in the LUSTprogram, a public hearing is only held if theauthorities decide there is enough interest to meritone.
Information Tough To Get
Most other programs receive less public scrutinythan Superfund and even Federal ones are largelyimplemented at the State level. This can makegathering information to understand what is happen-ing in these programs difficult and time-consuming.For those programs that rely on enforcement,information is even less available because of itsnegotiation value.
It is possible to track progress at most Superfundsites by examining a copy of the Superfund Compre-hensive Assessments Plan. No such national data-base exists for any of the other programs, althoughthe RCRA program is attempting to put one together.So far, not all information originally designed for thesystem is maintained and regions have been incon-sistent in entering data. Thus, to make sure howmany CMSs have been finished under RCRA, OTAhad to call 10 EPA regional offices. For the LUSTprogram, most relevant information resides at theState or local level. OTA was not able to, forinstance, obtain from the EPA headquarters officeany specific information about sites that have beencleaned up under the LUST program. If one wants toknow about a LUST site, it is necessary to first findthe relevant agency in charge. Because of theflexibility that EPA has built into the UST programs,the mix of responsible agencies is broad. Accordingto a 1987 report, five were in ‘‘the State FireMarshall’s Office, one in the State CorporationCommission, about eight in the water program andthe remainder in the hazardous waste program. ”90
Specific sites deferred from the Superfund pro-gram are discussed in the Federal Register when
s~.s. How of Re~sen~ives, ltepre~nlatives Edwwd J. Markey (D-MA) and James J. Flono (D-NJ), ‘ ‘EPA’s Superfund TAG Game, A Reporton the Implementation of the Superfund Tkchnical Asslwtnce Grant Program by the U.S. Environmental Protection Agency, ’ Mar. 2, 1989.
%J.S. Environmental Protection Agency, Office of Solid Waste and Erncrgency Response, ‘ ‘Solid and Hazardous Waste Report for Fuscal Year1987,” November 1987, p. 3-2.

Chapter 4--Other Cleanup Programs and Superfund . 217
EPA makes a decision. For instance, in 1988 EPAannounced and listed the names and location of 30sites on the NPL to be moved from Superfund toRCRA and 15 to be retained. For those gone fromSuperfund, the public tracking system disappears.EPA’s proposed policy in December 1988 discussesthe relevance of the NPL as a source of publicinformation but claims that reducing the numbers ofsites qualifying for the NPL will “. . . provide moremeaningful information to the public and theStates” [emphasis added].91 What EPA may mean isthat with an NPL confined to sites actually beingcleaned up by the Superfund program, the publicwill not get confused about who is responsible. Tokeep the public informed about sites that have beendeferred, EPA discusses various alternatives, such asnotices in local newspapers or letting States handlenotification.
The way information about non-Superfundcleanups is diffused throughout the Nation makesit all the more difficult to ascertain the extent towhich cleanups in other programs may eventu-ally produce new work for Superfund.
CONCLUSIONSThe job of cleaning up past mismanaged hazard-
ous wastes has only just begun. While it is clear thatthe Superfund program needs to get its own house inorder, there are compelling reasons to worry that
cleanups occurring outside of Superfund mayone day provide it with a whole new class ofsites-sites for which cleanup has been misman-aged. This is not occurring-like past mistakesdid—because we do not understand the conse-quences or do not have enough information to dothings better. It is happening because we havecreated one premier cleanup program that gets all theattention, while the others operate in the shadows.
Given the large estimates for numbers of potentialsites for each program, it is impractical to suggestthat there ought to be ONE cleanup program. But,there are ways to coordinate actions among thecleanup programs so as to minimize failures andtheir impacts. As discussed in chapter 1, a set ofnational cleanup standards is one option. Withcleanups so widely dispersed, better program cleanuptracking systems (and ones that are compatible witheach other) would help Congress and the publicknow what is happening so that when cleanupfailures occur they could be corrected early. Theprograms could be partially integrated and long-termsavings accrue to all through a national site discov-ery program (see ch. 2). Solutions for the technicalresource stresses of the Superfund program, if notviewed from the perspective of the ongoing nationalcleanup effort, might be only a partial or patchworkaffair. And, mechanisms could be constructed toencourage sharing of technical knowledge.
91s3 F~r~ Re@ster 51394, k. 21, 1988, p. 51416.

Index
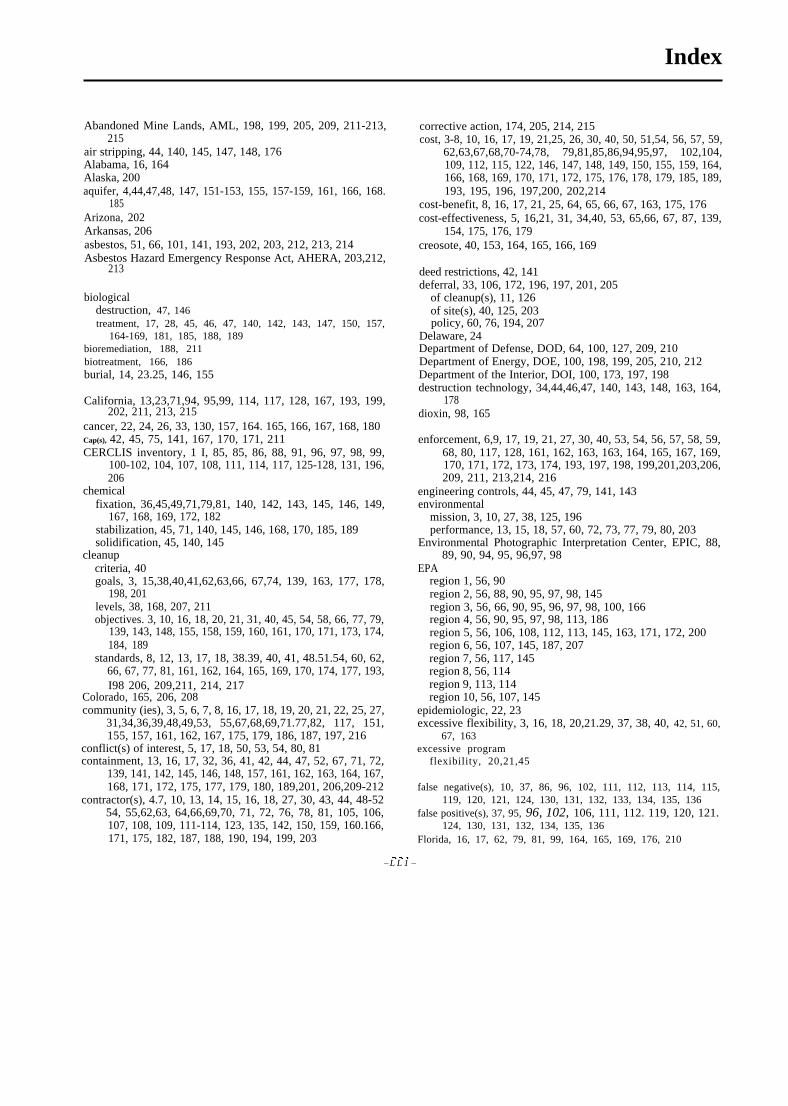
—
Index
Abandoned Mine Lands, AML, 198, 199, 205, 209, 211-213,215
air stripping, 44, 140, 145, 147, 148, 176Alabama, 16, 164Alaska, 200aquifer, 4,44,47,48, 147, 151-153, 155, 157-159, 161, 166, 168.
185Arizona, 202Arkansas, 206asbestos, 51, 66, 101, 141, 193, 202, 203, 212, 213, 214Asbestos Hazard Emergency Response Act, AHERA, 203,212,
213
biologicaldestruction, 47, 146treatment, 17, 28, 45, 46, 47, 140, 142, 143, 147, 150, 157,
164-169, 181, 185, 188, 189bioremediation, 188, 211biotreatment, 166, 186burial, 14, 23.25, 146, 155
California, 13,23,71,94, 95,99, 114, 117, 128, 167, 193, 199,202, 211, 213, 215
cancer, 22, 24, 26, 33, 130, 157, 164. 165, 166, 167, 168, 180Cap(s), 42, 45, 75, 141, 167, 170, 171, 211CERCLIS inventory, 1 I, 85, 85, 86, 88, 91, 96, 97, 98, 99,
100-102, 104, 107, 108, 111, 114, 117, 125-128, 131, 196,206
chemicalfixation, 36,45,49,71,79,81, 140, 142, 143, 145, 146, 149,
167, 168, 169, 172, 182stabilization, 45, 71, 140, 145, 146, 168, 170, 185, 189solidification, 45, 140, 145
cleanupcriteria, 40goals, 3, 15,38,40,41,62,63,66, 67,74, 139, 163, 177, 178,
198, 201levels, 38, 168, 207, 211objectives. 3, 10, 16, 18, 20, 21, 31, 40, 45, 54, 58, 66, 77, 79,
139, 143, 148, 155, 158, 159, 160, 161, 170, 171, 173, 174,184, 189
standards, 8, 12, 13, 17, 18, 38.39, 40, 41, 48.51.54, 60, 62,66, 67, 77, 81, 161, 162, 164, 165, 169, 170, 174, 177, 193,I98 206, 209,211, 214, 217
Colorado, 165, 206, 208community (ies), 3, 5, 6, 7, 8, 16, 17, 18, 19, 20, 21, 22, 25, 27,
31,34,36,39,48,49,53, 55,67,68,69,71.77,82, 117, 151,155, 157, 161, 162, 167, 175, 179, 186, 187, 197, 216
conflict(s) of interest, 5, 17, 18, 50, 53, 54, 80, 81containment, 13, 16, 17, 32, 36, 41, 42, 44, 47, 52, 67, 71, 72,
139, 141, 142, 145, 146, 148, 157, 161, 162, 163, 164, 167,168, 171, 172, 175, 177, 179, 180, 189,201, 206,209-212
contractor(s), 4.7, 10, 13, 14, 15, 16, 18, 27, 30, 43, 44, 48-5254, 55,62,63, 64,66,69,70, 71, 72, 76, 78, 81, 105, 106,107, 108, 109, 111-114, 123, 135, 142, 150, 159, 160.166,171, 175, 182, 187, 188, 190, 194, 199, 203
corrective action, 174, 205, 214, 215cost, 3-8, 10, 16, 17, 19, 21,25, 26, 30, 40, 50, 51,54, 56, 57, 59,
62,63,67,68,70-74,78, 79,81,85,86,94,95,97, 102,104,109, 112, 115, 122, 146, 147, 148, 149, 150, 155, 159, 164,166, 168, 169, 170, 171, 172, 175, 176, 178, 179, 185, 189,193, 195, 196, 197,200, 202,214
cost-benefit, 8, 16, 17, 21, 25, 64, 65, 66, 67, 163, 175, 176cost-effectiveness, 5, 16,21, 31, 34,40, 53, 65,66, 67, 87, 139,
154, 175, 176, 179creosote, 40, 153, 164, 165, 166, 169
deed restrictions, 42, 141deferral, 33, 106, 172, 196, 197, 201, 205
of cleanup(s), 11, 126of site(s), 40, 125, 203policy, 60, 76, 194, 207
Delaware, 24Department of Defense, DOD, 64, 100, 127, 209, 210Department of Energy, DOE, 100, 198, 199, 205, 210, 212Department of the Interior, DOI, 100, 173, 197, 198destruction technology, 34,44,46,47, 140, 143, 148, 163, 164,
178dioxin, 98, 165
enforcement, 6,9, 17, 19, 21, 27, 30, 40, 53, 54, 56, 57, 58, 59,68, 80, 117, 128, 161, 162, 163, 163, 164, 165, 167, 169,170, 171, 172, 173, 174, 193, 197, 198, 199,201,203,206,209, 211, 213,214, 216
engineering controls, 44, 45, 47, 79, 141, 143environmental
mission, 3, 10, 27, 38, 125, 196performance, 13, 15, 18, 57, 60, 72, 73, 77, 79, 80, 203
Environmental Photographic Interpretation Center, EPIC, 88,89, 90, 94, 95, 96,97, 98
EPAregion 1, 56, 90region 2, 56, 88, 90, 95, 97, 98, 145region 3, 56, 66, 90, 95, 96, 97, 98, 100, 166region 4, 56, 90, 95, 97, 98, 113, 186region 5, 56, 106, 108, 112, 113, 145, 163, 171, 172, 200region 6, 56, 107, 145, 187, 207region 7, 56, 117, 145region 8, 56, 114region 9, 113, 114region 10, 56, 107, 145
epidemiologic, 22, 23excessive flexibility, 3, 16, 18, 20,21.29, 37, 38, 40, 42, 51, 60,
67, 163excessive program
flexibility, 20,21,45
false negative(s), 10, 37, 86, 96, 102, 111, 112, 113, 114, 115,119, 120, 121, 124, 130, 131, 132, 133, 134, 135, 136
false positive(s), 37, 95, 96, 102, 106, 111, 112. 119, 120, 121.124, 130, 131, 132, 134, 135, 136
Florida, 16, 17, 62, 79, 81, 99, 164, 165, 169, 176, 210
–LL1–

222 ● Coming Clean: Superfund Problems Can Be Solved . . .
Georgia, 176groundwater, 4,8, 12, 13, 14, 18,22,23,24,26,28,32, 33,34,
41,44,45,47,48,49,59, 67,71,72,74,75,79, 117, 123,127, 140, 145-148, 151-161, 163-166, 168, 170-173, 176,180, 181, 185, 195,201,205,207-214
Hazard Ranking System (HRS), HRS score, 7,11,12, 14,26,34,63, 64,73,99, 101-109, 111-126, 128, 130-132, 134, 135,195, 196, 197, 200,207,209
health, health effects, 3,4,5,9, 10, 13,18-23,25,27,28,31, 32,34,37,38,39,40,42,48, 53,54,64-69,75,78,86, 87,88,97, 102, 104, 111, 115, 122, 123, 133, 142, 155, 160, 162,163, 169, 170, 172, 174, 175, 184, 195, 196, 197, 198,201,206,207,209,212,213
heavy metals, 51, 182hierarchy of cleanup remedies or technologies, 40, 59historical aerial photography, HAP, HAP analysis, 85, 89, 90,
91,93,94,95,96,97, 100, 133
Illinois, 114, 123, 172, 193, 210impermanent cleanup, 13, 41impermanent remedy, 4, 13, 16,28,35,41,44,75, 140, 160, 177,
179impermanent technology, 161incineration, 14, 17, 18,28,46,49, 140, 141, 142, 143, 145, 146,
147, 148,149, 150, 163, 165, 166, 167,168, 169, 171, 172,173, 175, 179, 180, 181, 182, 184, 186,210,214
Indiana, 81, 186indicator chemical(s), 64, 65information transfer, 79, 151, 187innovation, 51, 178, 183innovative technology, 6, 77, 183, 184, 185institutional controls, 42, 44, 75, 79, 143, 167, 170inventory (ies) (of sites), 10, 11, 61, 86, 87, 89, 91, 94, 96, 100,
124Iowa, 55, 109
Kansas, 33, 117,200, 210
land disposal, 4,6, 13, 14, 16,21,32,39,41,42,43, 44,46,71,78, 139, 140, 141, 142, 143, 145, 146, 148, 149, 150, 162,163, 165, 166, 167, 171, 175, 177, 187, 189,206,216
landfill(s), 8, 14,41,42,45,48,51,62, 71,72,75,76,95,96,98,100, 101, 123, 128, 139, 140, 143, 145, 146, 148, 157, 161,163,164, 165, 167, 168, 169,170,171,172, 173, 175, 180,205,210,211,213,214
lead, 40,48, 51,70,71, 163, 170leaking underground storage tanks, LUST, 99, 101, 128, 129,
174, 198, 199,205,207,210,214, 215,216liability (ies), 3,20,27,52,57,58, 150, 159, 160, 178, 195,215Louisiana, 34, 105, 115, 117, 169, 180
marine sediment(s), 123, 199, 200, 203Maryland, 17,90, 164, 165, 166Massachusetts, 23,24,90, 106, 184Michigan, 18,22, 170Minnesota 13, 14, 107, 117, 123, 172, 173, 193,200,201,211Missouri, 34, 145, 184Montana, 211, 212,213
National Contingency Plan, NCP, 42,66,82, 103, 104,109, 115,163, 194, 195, 196, 197, 199,214
National priorities List, NPL, 4,6, 7,9, 10, 11, 12, 13, 14, 26,31,32,33,34,35,37,43, 51,53,56,61,62,63,64, 71,76,81, 85, 86, 87, 88, 96,99, 101, 102, 103, 105, 106, 107,112-120, 123-129, 133, 142, 143, 195, 196,200,205,208,210,214,215,216
New Hampshire, 24, 180New Jersey, 23,24,99, 101, 115, 117, 145, 186, 195,200, 211,
213New York, 13, 23,90,95,96,97, 181, 193, 202,203,211, 215new technology, 79, 81, 139, 142, 150, 178, 184
Ohio, 24, 71,99, 145, 169, 172, 173, 175Oklahoma, 145, 151, 162, 186operable unit(s), 31, 74, 76, 143, 150Oregon, 169oversight, 15, 18, 52, 53, 54, 55, 59, 60, 66, 69, 70, 75, 77, 80,
162, 171, 177, 189, 190, 199, 202
Polychlorinated biphenyls, PCB(S), 22,24,40,48,51,79,81, 94,142, 147, 153, 163, 167, 168, 169, 180, 182, 183, 188, 193,214
Pennsylvania, 96, 171, 177, 178permanent cleanup, 6,8,9,12, 16,21,26,31,32,41,42, 48,60,
141, 148, 162,209permanent remedy, 5,6, 15, 16,17,27,40,41,42,43, 44,48,49,
57,67,70,71,76, 141, 142, 148, 163, 168, 169, 170, 178,179, 180
permanent technology, 15, 16,32, 140, 141, 142, 143, 147, 150,161, 163, 176, 186
potentially responsible party (ies), PRP(s), 17, 19,20,21,22,29,52, 53, 58, 66, 68,99, 118, 150, 161, 168, 169, 172, 173,181, 196, 199,202,205,215
preliminary assessment, PA, 7,11,73,88,94,95,96,97, 99, 101,102, 103, 104, 105, 106, 107, 108, 109, 111, 112, 113, 114,115, 118, 130, 132, 133, 134,206, 213
preremedial, site screening, 9, 10, 11, 13, 85, 101Public
confidence, 6, 8, 9, 30, 38, 42, 43, 53, 54, 55, 61, 62, 68, 76,77,79
outrage, 19participation, 13, 19,40,49,54, 160, 161, 194, 198,215,216
pump-and-treat, 4,47,48, 151, 153, 155, 156, 157
recontrol, 23, 31, 32, 34, 35, 44,47,48, 61, 66, 74, 75, 76, 142,159, 161
Record of Decision(s), ROD(s), 6,7, 12, 15, 16, 17, 18,28,29,31,33,34,42,47,49,50, 53,54,55,56,58,59,60, 64,66,68,76,77,78,79,80,81, 119,120,130, 132, 133,141, 143,145, 146, 155, 160-172, 174-179, 184, 189,213,214
recovery, 28,41.42,43,44,45,46, 56, 57,58,71, 140, 141, 142,148, 152, 169, 170, 177, 197
recycling, 28, 71, 94, 169Remedial Investigation Feasibility Study, RIFS(s), RI/FS(s), 7,
13, 14, 28, 29, 48, 52, 53, 54, 55, 56, 57, 101, 102, 113,117-120, 130, 132, 133, 153, 162, 164-166, 169, 171-173,177, 184, 185, 187, 188, 189, 190, 199,210, 215
remedial program managers, 69, 71

Index ● 223
remedy selection, nine criteria, 8, 12, 15, 43, 44, 58, 59, 60, 65,66, 67, 74, 76, 77, 81, 143, 147, 159, 171, 174, 175, 210,211,216
removal, 13, 16,31,64,75,76, 103, 143, 158, 165, 186, 195, 196,199, 201, 206, 210, 213
removal action, 7, 11, 13, 16, 27,28, 34,51,59,74,75,76, 103,123, 128, 142, 143, 164, 216
removal emergency, 64, 74, 76research and development, R&D, 45, 47-49, 60, 66, 71, 72, 73,
147, 150, 157, 180, 181, 183, 184, 187responsible party (ies), 3, 5, 6, 7,9, 12, 18,27, 28,29, 34, 36, 37,
38,49,50,52,53,54,55, 56,57,58,62,69,70,72, 78,79,81,82,88, 133, 145, 160, 162,163,164, 165,166,167, 168,170-172, 174, 176, 178, 179, 184, 186, 199, 200, 207
Resource Conservation and Recovery Act, RCRA, 41, 87, 88,94,95,96, 100, 102, 104, 106, 114, 128,128, 129, 149, 150,165, 174, 178, 194, 196, 198,202,204,206,207, 208,209,210, 212, 213, 214,215, 216, 217
RCRA corrective action, 61, 99, 100, 127, 129, 187, 198, 201,205, 206, 208, 209, 210, 212,213, 215
Risk(s), 3,4, 12, 16, 17, 19,20,21,22,23,24,25, 26,27,28,30,31, 33,34,35, 36, 38,39,43,44,50,58,61, 65,67,74,75,77, 101, 120, 123, 124, 125, 130, 146, 148, 150, 155, 157,165, 166, 170, 176, 184, 188, 190, 202
current risk, 4, 12, 14, 22, 24, 28, 30-35,42, 47, 59, 80, 101,161, 170
future risk, 4,22, 23, 24,28,29, 30-36, 59,66,80, 101, 150,161, 170
risk assessment(s), 8, 52,53,63,64, 121, 162, 167, 168, 172, 177risk communication, 19
Science Advisory Board, SAB, 50,64,70,72,80, 120, 121, 123separation technologies, 140, 146, 148, 178settlement(s), 6, 7, 9, 12, 14, 17, 18, 20, 21, 26, 31, 34, 52, 54,
56, 57,59, 62, 68, 160, 161, 162, 163, 164, 165, 166, 168,170, 171, 174, 176, 201, 216
site classification, 29, 35, 51, 52site discovery, 4,9, 10, 11, 13, 31, 85, 86, 88, 89,90,91,92,95,
96,97, 98, 99, 102, 124, 126, 127, 217site inspection, SI, 7, 12,28,72,73,88,96,97,99, 102, 103, 104,
105, 106, 107, 108, 109, 111-116, 118, 124, 130, 131, 132,134
site managers, 69, 77, 78, 81soil, 8, 12, 14, 15, 18, 28, 32, 34, 38-42, 45-47, 67, 70, 71, 73,
74,75,76,98, 140, 145, 146, 147, 149, 150, 155, 156, 158,159, 164, 165, 166, 167, 169, 170, 179, 180, 181, 185, 187,188, 195, 205, 209,210, 211, 213, 214
soil cover(s), 45South Carolina, 199,210South Dakota, 90spending, Superfund spending, 3, 6, 12, 15, 21. 25, 26, 28, 29,
33,36,48-51,56,57,60, 67,68,70,72,73,81,85, 181, 193,200,201
strategy, 6,26,30,40,55,57,62, 86,88, 101, 102, 133, 134, 157,159, 195, 196
Superfund Innovative Technology Evaluation, SITE, 50-51, 183
technical assistance, 4, 14, 29, 48, 50, 59, 70, 71, 77technical assistance grants, 16,35,54,68.69, 157, 197, 198.216technology demonstration, 43, 77, 171, 186Tennessee, 23,90, 95, 211Texas, 24, 145, 168, 187, 188thermal destruction, 45, 140, 146, 150, 168, 178, 181, 183toxic metals, 46, 70, 71, 140, 142, 145, 148, 149, 169Toxic Substances Control Act, TSCA 167, 182, 208, 214, 216training, 3, 27, 69, 104, 114, 203treatability study (ies), 60, 77, 163, 184, 185, 187, 190
underground storage tanks, UST, 23, 101, 129, 1981204, 205,214, 216
Uranium Mill Tailings Radiation Control Act, UMTRCA, 198,199, 205,212, 215
Utah, 71, 117
vacuum extraction, 49, 148, 171Virginia, 164, 165, 166, 168volatile organic chemicals, VOC(s), 18, 44, 148, 170, 178, 179,
188
Washington (State), 145West Virginia, 24,90,96,98,99Wisconsin, 99, 145wood preserving, 17, 51, 65, 129, 163, 164workforce, 4,7, 10, 13, 14, 15,43, 44, 54, 55,60,70,73,79,96,
107, 143, 147, 151, 156, 187, 190, 193, 199Wyoming, 205, 211

Other Related OTA Reports
Assessing Contractor Use in Superfund—Background Paper. Describes how the Super-fundprogram uses contractors, and what their role is rela-tive to that of’ EPA staff’. The history and extent ofcontractor use in Superfund are described, as well aswhy the original masons for EPA’s heavy dependenceon contractors may no longer be valid. The paper alsogives some ideas for improving the environmentalperformance and economic efficiency of Superfundover the long term. BP-ITE-51 , 1/89; 52 p.
GPO stock #052-003-01 147-6; $2.50NTIS order #PB 89-154 116A/S
Are We Cleaning Up? 10 Superfund Case Studies—Special Report. Analyzes 10 case studies of recentSuper-fund decisions, based on surveying 100 recentcleanup decisions, that represent a broad range ofcontaminant ion problems and cleanup technologies.ITE-362, 6/88; 84 p.
GPO stock #052-003-01 122-1 ; $3.7.5NTIS order #PB 89-139 018/AS
Serious Reduction of Hazardous Waste. Examinesand reviews the technical options to substantiallyreduce the amount and hazardous nature of indus-trial hazardous waste and pollutants; identifies andanalyzes current efforts in waste reduction and ex-amines the full range of technical, economic, and in-stitutional impediments facing industry in theseefforts; analyzes Federal and State policies and pro-grams which affect waste and nonregulatory options.ITE-317, 9/86; 264 p.
Free summary available.NTIS order #PB 87-139 622/AS
From Pollution to Prevention: A Progress Reporton Waste Reduction—Special Report. Examinesopt ions for reducing the generation of all hazardouswastes and environmental pollutants; the effective-ness of Federal actions taken so far; and summarizeswhat industry and State and local governments havedone to implement waste reduction. ITE-347, 6/87;64 p.
(;PO stock #052-003-0107 1-2; $2.75NTIS order #PB 87-208062
Superfund Strategy. Examines future Superfundneeds and how permanent cleanups can be accom-plished in a cost-effective manner for diverse typesof sites; describes the interactions among many com-ponents of the complex Superfund system; and ana-
●
●
●
lyzes the consequences of pursuing different strategiesfor implementing the program. ITE-252, 4/85; 292 p.
Free summary available.NTIS order #PB 86-120 425/AS
Technologies and Management Strategies for Haz-ardous Waste Control. Assesses the criteria for defin-ing hazardous waste and for judging the relativehealth and environmental hazards of a given waste;evaluates technologies for cleaning up current wastedisposal sites that are hazardous to health and the en-vironment; assesses technologies and approaches forthe safe treatment, storage, or disposal of hazardouswaste; and examines technologies and approaches forreducing the volume of hazardous waste. M- 196,3183; 408 p.
NTIS order #PB 83-189241
Habitability of the Love Canal Area: An Analysisof the Technical Basis for the Decision on theHabitability of the Emergency Declaration Area—A Technical Memorandum. Based on a reportpublished by the LT. S. Environmental ProtectionAgency which was reviewed by a multidisciplinaryteam of consultants for several Federal agencies, theU.S. Department of Health and Human Servicesjudged the Love Canal, N. Y., to be as habitable asthe control areas with which it was compared.. OTAcritically reviewed EPA’s habitability decision. TM-M-13, 6/83; 60 p.
NTIS order #PB 84-114917
Nonnuclear Industrial Wastes: Classifying forHazards Management—A Technical Memoran-dum. Addresses basic issues surrounding a degree-of-hazard classification approach; the potential for in-corporating a degree-of-hazard concept through clas-sification in the Resource Conservation and RecoveryAct regulations; and examines various methods of ap-plying a degree-of-hazard classification system. TM-M-9, 11/81 ; 36 p.
NTIS order #PB 82-134305
NOTE: Reports are available through the U.S. GovernmentPrinting Office, Superintendent of Documents,Washington, DC 20401-9325, (202) 783-3238; and/orthe’ National Technical Information Service, 5285Port Royal Road, Springfield. VA 22161-0001, (703)487-4650.