summary-report-bss-kerala-india-2001.pdf - AIDS Data Hub
43
-
Upload
khangminh22 -
Category
Documents
-
view
3 -
download
0
Transcript of summary-report-bss-kerala-india-2001.pdf - AIDS Data Hub


This report is part of a series of baseline surveys conducted to monitor the impact ofHIV/STI prevention programmes in five states of India: Andhra Pradesh, Gujarat,Kerala, Orissa, West Bengal and in the Healthy Highways Project. The surveysconducted include behavioural surveillance surveys (BSS), STI/HIV prevalence surveysand health care providers surveys. Together these surveys follow the methods outlinedby UNAIDS/WHO for evaluation and monitoring of large scale HIV/STI preventionprogrammes.
Surveys in each state were implemented by a variety of research organizations, NGOs,medical colleges and laboratories, in collaboration with the respective State AIDSControl Societies. Family Health International provided technical assistance in theimplementation of these surveys with funding from the UK Department forInternational Development.
This report was compiled in 2001
For more information on the Behaviouarl Surveillance Survey in Kerala, contact:
Kerala State AIDS Control Society State Management AgencyRed Cross Road, Trivandrum T. C. IX/453, Jawahar NagarKerala 695 037. Trivandrum 695 041
Department for International Development Family Health InternationalB-28, Tara Crescent, Opposite Convention HallQutab Institutional Area Hotel Ashok, ChanakyapuriNew Delhi 110 016 New Delhi 110 021
“This document is an output from a project funded by UK Department forInternational Development for the benefit of developing countries. The views
expressed are not necessarily those of DFID or FHI”

SUMMARY REPORTBehavioural Surveillance
Survey in Kerala,India
A study Implemented by Taylor Nelson Sofres Mode (TNS Mode)under the guidance of Kerala State AIDS Control Society, with
technical assistance from Family Health International
Funded by UK Department for International Development


MESSAGE
I am glad to note that the Impact Assessment Project is drawing to a close and is nowready to disseminate the findings of its work. The Impact Assessment Project , supportedby DFID was carried out under the guidance of NACO and the State AIDS ControlSocieties in the states of Orissa, West Bengal , Kerala, Gujarat , Andhra Pradesh andamong highway populations. The studies, which include behavioural surveillancesurveys, STI prevalence studies and health care provider survey’s, provide a mine ofinformation for the planning, design, implementation and monitoring and evaluationof HIV/AIDS control programmes.
I must record here my appreciation for the technical support provided by the FamilyHealth International and their constant efforts to maintain very high standards ofquality. I would also like to thank NACO and the State AIDS Control Societies for
source of information for all people working in the field of HIV/ AIDS prevention inIndia and the world at large.
Senior Health Adviser
http//www.dfid.gov.uk
their ungrudging support throughout this exercise. I hope this report will be a valuable
(91 11) 652 9123(91 11) 652 9296
Tel:
Email:
Fax:
New Delhi 110 016Qutab Institutional AreaB28, Tara Crescent
British High CommissionDFID India
DFIDDevelopmentInternat iona lDepartment for
DFID is responsible for the British G overnment’s contribution to international development
Tim Martineau


Kerala State AIDS Control SocietyRed Cross Road, Thiruvananthapuram -695037
Phone : 0471-304882, 305183, Fax : 305193, E-mail : [email protected]
FOREWORD
Sexually transmitted infections (STI) and Human Immunodeficiency Virus (HIV) infectionhave emerged as an important public health problem in India in recent times. STI/HIVis not only a public health problem but also an important developmental challenge.
A number of activities are being implemented as a part of the National AIDS ControlProgramme under the leadership of National AIDS Control Organization in the state ofKerala for the prevention of HIV/STI. Activities include awareness generation, behaviourchange communication, condom promotion, management of STIs, training of healthcare providers etc. Activities are also directed towards monitoring and evaluation (includingimpact assessment) of the programme.
Impact Assessment Project implemented in the state under the overall guidance of KeralaState AIDS Control Society (KSACS) with technical assistance of Family HealthInternational (FHI) and funding from Department for International Development (DFID)is an important step for tracking the trend of sexual behaviour (behavioural surveillancesurveys, BSS), sexually transmitted infections (STI prevalence studies) and STI casemanagement practices of health care providers [health care providers survey (HCPS)]. STIprevalence studies among female sex workers (FSWs) were implemented by different NGOs(1. SOMA in Thiruvanthapuram, 2. CSRD in Calicut and 3. ACS in Trissur); BSS wasimplemented by TNS MODE in the whole state; and HCPS was implemented by C-GRAF, Department of Futures Studies, University of Kerala in the whole state.
All these surveys provided useful insight into the prevalence of STIs among FSWs, thebehaviour of some of the important groups in the state (like FSWs and clients,

plantation workers etc. and the way STI patients are managed in the health care settings.For instance, BSS showed that the level of risk behaviour of some of the groups weresubstantially different from what was estimated before the survey. In the case of Autorickshaw drivers, while the estimated measurement was 25%, the actual measurement was13.8%, for Plantation workers it was 20% and 4.8% respectively.
It will be important to repeat these studies at periodic interval to see the change in theseparameters over time.
We thank DFID for providing the financial support to this project.
It is expected that these reports will also be useful for agencies and individuals involved inthe fight against STI/HIV/AIDS elsewhere in the country.
Thiruvananthapuram Dr. D. Thangam Additional Project Director
Kerala State AIDS Control Society (KSACS) Red Cross Road, Thiruvanthapuram, Kerala.

ContentsContents
Executive summary 1
Introduction 5
Key findings 10
Discussion 28
Annex: BSS indicators at a glance, baseline wave, Kerala, 1999 30

Acronyms and AbbreviationsAcronyms and Abbreviations
AIDS Acquired immunodeficiency syndromeBSS Behavioural Surveillance SurveyDFID Department for International DevelopmentEP Equal probabilityFHI Family Health InternationalFSW Female sex workersHIV Human immunodeficiency virusKSACS Kerala State AIDS Control SocietyMARD Male auto rickshaw driversMC Male clients of female sex workersMPW Male plantation workersMUS Male university studentsNGO Non governmental organizationPPS Probability proportional to sizePSH Partnership in sexual healthSMA State Management AgencySTI Sexually transmitted infectionWHO World Health Organization

1
Executive summary
This report is a summary of the methodology and findings of the Kerala HIV RiskBehavioural Surveillance Survey (BSS). This survey was part of the impact assessment
project of HIV prevention activities in Kerala and was conducted in late 1999 for theKerala State AIDS Control Society (KSACS). Taylor Nelson Sofres Mode (TNS Mode)had implemented the survey.
The BSS in Kerala was intended to track trends in HIV/AIDS related knowledge, attitudesand behaviours in sub-populations in Kerala, especially those at high-risk of acquiringHIV infection. It was also intended to contribute to the larger monitoring and evaluationefforts of the KSACS. The measurements of indicators obtained in this survey served as abaseline from which future trends could be measured. The core indicators on which datawere collected included (a) behaviour indicators and (b) knowledge indicators.
The secondary indicators provided information on, among others, prevalence of STIsymptoms, treatment-seeking behaviour, messages recalled on HIV and sources ofinformation on issues concerning HIV and practices related to condom use. These indicatorswere based on those recommended by WHO/UNAIDS for monitoring and evaluationlarge scale AIDS programmes.
Sampling
The sub-population groups sampled ranged from those with known high-risk behaviourssuch as female sex workers (FSW) and male clients of female sex workers (MC) to otherswith varying estimates of high-risk behaviours such as those having sexual intercoursewith a non-regular partner. Representatives from KSACS, State Management Agency (SMA),officials from the state health department and other local experts had collectively prepareda list of possible groups that could be included in the survey. Based on available research

2 Kerala Behavioural Surveillance Survey (1999)
findings, anecdotal information and reports from NGOs about the groups included inthis list, the risk behaviour of each group was estimated and three sub-populations werefinally selected for the study. These included male plantation workers (MPW), male autorickshaw drivers (MARD) and male university students (MUS).
The BSS sampling universe consisted of areas in the state where major concentrations ofthe selected groups were located. The seven places where the survey was implementedcovered cities and some districts. The sample sizes were decided based on the estimatedlevel of key risk behaviours and the degree of confidence (95%) required to detect a significantchange (15%) in behaviour over time. The sampling frame was constructed with theassistance of NGOs and individuals working with the specific sub-populations and throughmapping exercises. A two stage systematic random sampling procedure was used to selectrespondents. Clusters were selected in the first stage and respondents were randomly selectedin the second stage. Depending on the nature of the group, the clusters were selected witheither probability proportional to size (PPS) or equal probability (EP).
Implementation
Qualitative exploratory research was first conducted to facilitate exposure to the targetgroups and to gain information that would contribute to development of the questionnaire.The standardised BSS questionnaires were adapted for use in Malayalam following intensivepre-testing. The implementation team received training in data collection methods,HIV/AIDS, sex and sexuality, etc. Many NGO partners from the PSH project assistedTNS Mode to understand the socio dynamics of the sex industry and also in the designand implementation of training of field workers. A supervisory team closely monitoredthe quality. The data was analysed using SPSS. The questionnaires were administered afterinformed consent was obtained, either by an interviewer or as in the case of students,through self-administration.
Key Findings
Profile of respondents
Female sex workers: The mean age of the female sex workers was 32.6 years. A total of48% of them were reported to be married once but were divorced/separated/widowed or

3
not living with their husbands at the time of the survey. Only 15% of the sex workers saidthat they were illiterate.
Clients of female sex workers: The mean age of the clients of female sex workers was 31.3years. Only 2% respondents of this group were illiterate. A high proportion (81%) of themsaid that they were married and were living with their wives. Their occupational profileincluded skilled and unskilled categories such as auto-rickshaw or taxi drivers (21%), unskilledlabourers (29%) and self-employed or in businesses (18%).
Other male sub-population groups: The mean age of the auto rickshaw drivers was 31.4years. All of them were literate and 98% were reported to be married and living with theirwives. The mean age of the plantation workers was 34.4 years. Only 2% of them wereilliterate and 97% said that they were married and were living with their wives. The meanage of the university students living in hostels was 20.8 years.
Measurement of indicators
Female sex workers and condom use: Ninety-nine percent female sex workers reportedhaving one-time clients and 45% said that they also had regular clients. Eighty nine percentof the sex workers who had reported having one-time clients said that such clients hadused a condom during the last sexual intercourse with them. The corresponding figurefor regular clients was 67%.
Male sub-population groups and non-regular partners: Percentage of respondents whoreported having sexual intercourse with any non-regular partner (including commercialpartners, non-regular, non-commercial partners and male partners) was 13.8% amongauto rickshaw drivers, 9.3% among the university students and 4.8% among the plantationworkers. Six percent auto rickshaw drivers, 2% plantation workers and 3% university studentshad also reported having paid sex or sexual intercourse with a FSW.
Condom use by male sub-population groups: Among the respondents who said thatthey had sex with a female sex worker, 91% auto rickshaw drivers, 58% plantation workersand 66% students said that they had used condom during their last sexual intercourse witha female sex worker. Eighty percent of the clients of female sex workers had reportedcondom use during last sexual intercourse with such a partner.
Executive summary

4 Kerala Behavioural Surveillance Survey (1999)
Other findings
University students: A total of 15.6% students reported ever having sexual intercourse.The median age at first sexual intercourse for the students was 17 years. A total of 9.5% ofthe students said that they had sexual intercourse in the last twelve months. While3.2% of the students stated that they had sexual intercourse with one partner, 6.3% reportedhaving sexual intercourse with more than one partner during the preceding 12 months.Only 3.8% of the students reported having more than 4 partners. The median number ofsex partners reported by the students was 3.
Other male sub-population groups: The median age at first sexual intercourse for maleclients of female sex workers was 21 years, for male plantation workers it was 23 years, formale auto rickshaw drivers it was 24 years and for the female sex worker, it was 18 years.

5
Introduction
HIV/AIDS in Kerala
The first HIV positive person in Kerala was identified in 1987. Since then the epidemicin the State has been growing gradually. Infections were initially reported to have
been acquired from outside the state. Subsequently, however, more infections were said tohave been acquired within the state. The sentinel surveys had shown an HIV prevalence of3.5% among STI clinic attendees and 0.2% among pregnant women in Kerala during1999.
Prevention activities by the State AIDS Control Society
The State AIDS Cell was established towards the end of 1993 to prevent and control thespread of HIV infection in the state. The initial activities included ensuring blood safety inthe state, training public sector health care providers in the syndromic management ofsexually transmitted infections, strengthening public STI clinics and provisionof counselling services in these clinics. In order to create general awareness aboutHIV/AIDS, campaigns were conducted using TV, radio, print media and folk art forms.Students in schools and colleges and young school dropouts were being reached througha variety of programmes. The thrust of the programme however subsequently shifted fromawareness creation to changing behaviour through interventions in populations at high-risk of contracting and spreading HIV/AIDS in the general community.
Partners
The Department for International Development (DFID) of the UK government had beenproviding supplementary funds to the Kerala State AIDS Control Society through theNational AIDS Control Organisation for carrying out targeted interventions among certainsub-population groups. The groups at high-risk of HIV infection such as female sex

6 Kerala Behavioural Surveillance Survey (1999)
workers, men having sex with men, injecting drug users, street children, prisoners, truckdrivers, migrant labourer etc. were identified and a multi-pronged strategy was used toreduce their risk.
The activities of targeted interventions included intensive behaviour change communicationmainly through peer educators, provision of STI treatment services, condoms andcounselling wherever necessary. The targeted interventions were implemented by non-governmental organizations (NGOs) since they would win the trust of the marginalisedgroups of people and develop a better rapport with them. At the time of the survey, therewere 40 such interventions in all the districts of Kerala. Since most of the HIV infectedpeople in Kerala had acquired the infection outside the state, a cross border initiative hadbeen started with neighbouring states and with the city of Mumbai to control the epidemicin Kerala more effectively.
Behavioural Surveillance Surveys (BSS)
The BSS is a monitoring and evaluation tool designed to track trends in HIV/AIDSrelated knowledge, attitudes and behaviours in sub-populations at particular risk of HIVinfection. The BSS findings provide indicators of success or failure of prevention activities,highlight persistent problem areas, identify appropriate target populations, identify specificbehaviours in need of change, function as a policy and advocacy tool and supply comparativedata concerning behavioural risks.
Objective
The objective of the BSS in Kerala was to measure HIV-related risk behaviours in selectedpopulation sub-groups. The measurements presented in this report serve as a baselinefrom which future trends could be measured.
Methodology
Indicators
Behavioural surveillance consists of repeated cross-sectional surveys in selected populationgroups, which provide measurements on certain indicators. In the baseline wave in Kerala,

7
data were collected on two main indicators: (a) behaviour indicators and (b) knowledgeindicators. In addition, there were secondary indicators such as incidence of STI symptoms,treatment-seeking behaviour, practices related to condom use and main sources ofinformation for messages on prevention of STI and HIV/AIDS. The list of indicatorsand the total responses for each were as included in the Annex.
The measurements of the core indicators provided information on the proportion of thetotal respondents who had reported a particular behaviour or knowledge.
Study Population
In Kerala, the subpopulations surveyed included those with known high-risk behavioursand others with varying estimates of risk behaviours. Representatives from KSACS, StateManagement Agency (SMA), officials from the state health departments and other localexperts had collectively prepared a list of possible groups that could be included in thesurvey. Information on the risk behaviour among these groups was complied based onavailable research findings, anecdotal information and reports from NGOs. Based on thisinformation, the groups with relatively higher risk behaviour were purposefully selectedfor the study. Table 1 lists the sub-populations surveyed in Kerala BSS.
Introduction
Table 1: Sub-populations surveyed in the Kerala BSS
Sub-populations DefinitionsFemale sex workers (FSW) Women aged 18 years and above reporting having
sold sex for money or gifts during the past yearMale clients of FSW (MC) Men aged 18 years and above reporting having
bought sex from FSW in the past yearMale plantation workers Men aged 18-49 years working on plantations(MPW)Male auto-rickshaw drivers Men aged 18-49 years working as auto-rickshaw(MARD) driversMale university students Male students, aged 18 years and above residing in(MUS) hostels who are at least second year students of
designated universities and colleges

8 Kerala Behavioural Surveillance Survey (1999)
Sampling design and sample sizes
The sampling frame was constructed with the assistance of NGOs and individuals workingwith the specific sub-populations and through mapping exercises. A two stage samplingprocedure was used to select respondents. The clusters were selected in the first stage ofsampling by using either probability proportional to size (PPS) or equal probability (EP)and respondents were randomly selected in the second stage.
The sample sizes were chosen based on the measurement of change on a given indicator.This is based on various factors such as the estimated baseline level of the indicator, amagnitude of change (15%) that can be detected reliably, using a desired level of significanceand power as well as the percent of the population that is eligible to be considered for theindicator.
Table 2: BSS sites and sample sizes
FSW MC MARD MPW MUSSample size 400 400 1000 1200 2500Thiruvananthapuram ü ü ü ü
Ernakulam ü ü ü ü
Kozhikode ü ü ü ü
Trissur ü ü ü
Kollam ü
Pathanamthitta ü
Kottayam ü
Study Sites
The expert group that had met to decide on the sub-population groups for the KeralaBSS had also listed out the locations where these groups were found in the state. Based onavailable information on the concentration of these groups in the short-listed locations,the places with highest concentration of these groups were chosen. These sites includedlarge and smaller towns and rural areas in districts such as Pathanamthitta. The study siteswere as listed in Table 2.
9
Issues in behavioural data collection –Validity of self reported data on sexual behaviour
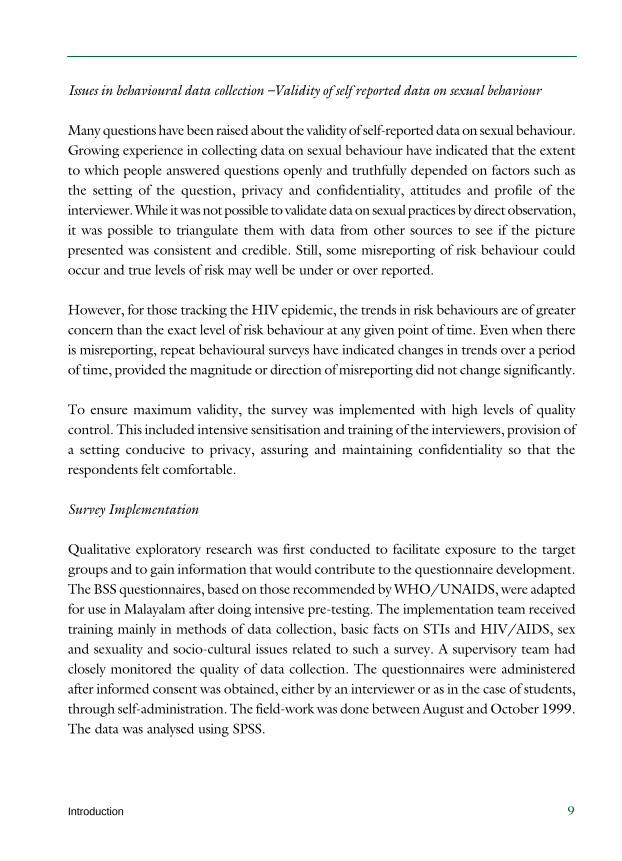
Many questions have been raised about the validity of self-reported data on sexual behaviour.Growing experience in collecting data on sexual behaviour have indicated that the extentto which people answered questions openly and truthfully depended on factors such asthe setting of the question, privacy and confidentiality, attitudes and profile of theinterviewer. While it was not possible to validate data on sexual practices by direct observation,it was possible to triangulate them with data from other sources to see if the picturepresented was consistent and credible. Still, some misreporting of risk behaviour couldoccur and true levels of risk may well be under or over reported.
However, for those tracking the HIV epidemic, the trends in risk behaviours are of greaterconcern than the exact level of risk behaviour at any given point of time. Even when thereis misreporting, repeat behavioural surveys have indicated changes in trends over a periodof time, provided the magnitude or direction of misreporting did not change significantly.
To ensure maximum validity, the survey was implemented with high levels of qualitycontrol. This included intensive sensitisation and training of the interviewers, provision ofa setting conducive to privacy, assuring and maintaining confidentiality so that therespondents felt comfortable.
Survey Implementation
Qualitative exploratory research was first conducted to facilitate exposure to the targetgroups and to gain information that would contribute to the questionnaire development.The BSS questionnaires, based on those recommended by WHO/UNAIDS, were adaptedfor use in Malayalam after doing intensive pre-testing. The implementation team receivedtraining mainly in methods of data collection, basic facts on STIs and HIV/AIDS, sexand sexuality and socio-cultural issues related to such a survey. A supervisory team hadclosely monitored the quality of data collection. The questionnaires were administeredafter informed consent was obtained, either by an interviewer or as in the case of students,through self-administration. The field-work was done between August and October 1999.The data was analysed using SPSS.
Introduction

10 Kerala Behavioural Surveillance Survey (1999)
Key findings
Key findings described briefly in this section mainly focus on demographic profile and knowledge and behaviour indicators in various sub-population groups included in
the study.
Female Sex Workers
Key demographics
The mean age of the female sex workers was 32.6 years. While 15% of the sex workers wereilliterate, rest 85% were literate (Figure 1).

11
Thirty seven percent FSWs had said that they were unmarried or had never married. Only15% of them had stated that they were married and were living with their husbands. Atotal of 29% respondents were reported to be married but were not living with theirhusbands and 19% of them were either divorced/separated or widowed (Figure 2).
Behavioural indicators
Ninety-nine percent sex workers reported that they had sexual intercourse with one-timeclient during the preceding month. Forty five percent had stated that they had sex with aregular partner and 33% reported having sex with spouse or cohabitating partner duringthe same period.
Condom use
The study indicated that percentage of respondents who had reported consistent condomuse was lower than the reported condom use during the last sex as shown in Figure 3.Consistent condom use with one-time clients during the preceding 12 months was reportedby 52% FSWs, which was not significantly higher than the reported consistent condomuse with regular clients (44%).
Key findings

12 Kerala Behavioural Surveillance Survey (1999)
Two percent FSWs had said that they had never used a condom with one-time clientsduring the previous 12 months. This proportion was less than the reported non-use ofcondoms with regular partners, which was 8%.
Number of clients on last working day
About 84% sex workers reported having between 1 and 3 one-time clients on the lastworking day before the survey. Only two percent of them said that they had six differentpartners on the same day. A total of 73% FSWs had also said that they had between 1 and3 regular clients on the last working day. More than 25% respondents reported that theydid not have sex with a regular client on the last working day.
Knowledge indicators
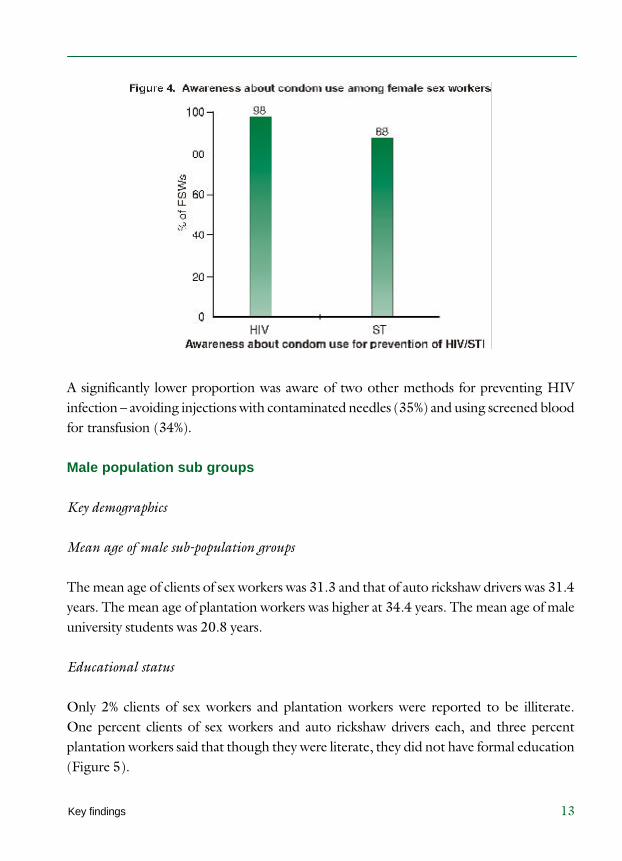
Almost all sex workers (98%) were aware that condom use could prevent HIV infection. Atotal of 88% of them had said that consistent condom use could prevent STIs, thusindicating that the knowledge about condoms use to prevent HIV infection was greaterthan the knowledge of condoms for preventing STIs (Figure 4). About 30% FSWs hadsaid that avoiding sex with a person with STIs would prevent them from acquiring thedisease.
13
A significantly lower proportion was aware of two other methods for preventing HIVinfection – avoiding injections with contaminated needles (35%) and using screened bloodfor transfusion (34%).
Male population sub groups
Key demographics
Mean age of male sub-population groups
The mean age of clients of sex workers was 31.3 and that of auto rickshaw drivers was 31.4years. The mean age of plantation workers was higher at 34.4 years. The mean age of maleuniversity students was 20.8 years.
Educational status
Only 2% clients of sex workers and plantation workers were reported to be illiterate.One percent clients of sex workers and auto rickshaw drivers each, and three percentplantation workers said that though they were literate, they did not have formal education(Figure 5).
Key findings

14 Kerala Behavioural Surveillance Survey (1999)
Higher levels of education were reported among the male clients and auto rickshaw driversthan the plantation workers. 48% clients and 43% auto rickshaw drivers were reported tohave studied at least up to Class X while only 23% of the plantation workers had studiedup to the same level.
Marital status
Almost all male auto rickshaw drivers and plantation workers were married (Figure 6).

15
The proportion of male clients who were married and not living with their wives washigher (12%) when compared to auto rickshaw drivers (1%) and plantation workers (2%).
Behavioural indicators
Male subpopulation groups reporting sexual intercourse with different types of partners in thepast one-year
Female sex worker: Six percent auto rickshaw drivers and 2% plantation workers and 3%male university students had reported having had sexual intercourse with a femalecommercial partner during the preceding year (Figure 7).
Female non-regular non-commercial partner (does not include female sex worker):Apart from having commercial partners, nearly half (47.2%) the male clients of sex workerssaid that they also had sex with non-regular partners during the previous year.
In total 4.6% male plantation workers and 9.8% auto rickshaw drivers said that they hadsex with non-regular partners during the preceding year (Figure 8). This difference wassimilar to the difference observed for the number of respondents who had sex with acommercial partners. The female non-regular partners of male university students includedfriends, relatives, neighbours and acquaintances.
Key findings

16 Kerala Behavioural Surveillance Survey (1999)
Male partner: In addition to reported sex with commercial and non-regular female partners,7% male clients and 2% male university students had said that they had anal sex with a malepartner during the preceding year (Figure 9).

17
Condom use with last partner
Condom use during last sexual intercourse with a female sex worker was highest amongmale auto rickshaw drivers (91%) followed by male clients (80%). It was lowest amongmale plantation workers (58%) and was not significantly higher among male universitystudents (66%) (Figure 10).
The proportion of respondents who had reported condom use during their last sexualintercourse with a female non-regular partner was low. It was 44% among male autorickshaw drivers and 41% among male clients. Condom use was reported to be lowestamong male plantation workers, which as 26%. The difference between condom use witha FSW and non-regular partner was least among university students (16%) and highestamong auto rickshaw drivers (47%). Most respondents had said that non-regular partnersmainly included neighbours, relatives or casual friends. Plantation workers had also reportedco-workers as non-regular partners. The proportion of respondents who reported condomuse during their last sexual intercourse with male partner was lower than the condom usefor other corresponding groups. It was 31% for male university students and 14% for maleclients.
Key findings

18 Kerala Behavioural Surveillance Survey (1999)
Consistent condom use
The reported consistent condom use during the preceding year by all the groups wasconsiderably lower than the reported condom use during their last sexual intercourse.
The pattern for consistent condom use was similar to the pattern reported on condom useduring last sexual intercourse. The group that had highest proportion of reported consistentcondom use with female sex worker during the last year was male auto rickshaw drivers(55%) followed by male clients (48%) and male university students (43%) (Figure 11).
The reported consistent condom was lowest among male plantation workers (26%). Justas in the previous section, consistent condom use with non-regular partners was lowerthan that with female sex workers.
Knowledge indicators
Knowledge of methods to prevent transmission of HIV
A total of 90% male clients said that condom use could prevent HIV infection. However,knowledge about the role of mutual monogamy and abstinence for prevention of

19
HIV infection was low. For example, 72% and 58% auto rickshaw drivers had said thatcondom use and being in a mutually faithful relationship respectively could prevent HIVinfection. On the other hand, 85% plantation workers had said that mutual monogamyprevented HIV as compared to 55% of them who had listed condom use a way to preventHIV infection (Table 3).
Ninety one percent male university students were aware that consistent use of condomsprevented HIV infection. Although only 16% of them had reported ever having hadsexual contact, 25% students has listed abstinence a way to prevent HIV infection.
STI Knowledge – that consistent condom use can prevent STIs
Just as with knowledge about HIV prevention, the knowledge that condom use couldprevent STI was highest among students (91%) and male clients (85%). Sixty seven percentauto rickshaw drivers and less than half the plantation workers had the same knowledge(Figure 12). A total of 60% plantation workers and 39% auto rickshaw drivers said that amutually faithful relationship prevented STIs. This number of was higher than that of theresponse for condom use as a method to prevent STIs.
Other findings
Age at first sexual intercourse
The mean age at first sexual intercourse ranged from 18 among FSWs to 21 among clientsof FSWs. It was 23, 24 and 17 years for plantation workers, auto rickshaw drivers anduniversity students respectively. About 5% female sex workers had said that their age at first
Key findings
Response Sub-groups(Figures in %) MC MARD MPW MUSUse condoms 90 72 55 91Mutual monogamy between HIVnegative partnersNo sex at all 4 3 2 25
Table 3: Knowledge of methods to prevent transmission of HIV
34 58 85 82

20 Kerala Behavioural Surveillance Survey (1999)
sexual intercourse was below 15 years. A total of 76% of them, however, reported thattheir age at first sexual intercourse was between 15-20 years (Figure 13).
Thirty two percent male clients stated that their first sexual intercourse was between theage of 18-20. About a third of the auto rickshaw drivers and plantation workers had theirfirst sexual intercourse between 24 to 26 years. Of the students that had reported to have

21
ever had sex, 10% had said that their first sexual experience was before the age of15 years and 35% had said it was between 15 and 17 years of age. A total of 23% studentssaid that they could not recall their age at first sex.
Age at first commercial sex
About 53% and 40% FSWs had said that their age at first commercial sex was after 23 yearsand between 17-22 years respectively (Table 4). The mean age at first commercial sex was23.5 years for FSWs and 24.5 years for male clients.
About 60% clients of sex workers reported that their first commercial sex was between theages of 20-25 years. About 15% of the clients reported first commercial sex before 19 yearsof age and 25% at age 26 and above.
Number of partners
The average number of commercial partners during the preceding 12 months were fourfor clients of sex workers, two for male auto rickshaw drivers, one for male plantationworker and four for male university students. The average number of non-regular, non-commercial partners during the preceding 12 months were two for male clients of FSWs,one each for male auto rickshaw drivers and male plantation workers and three for maleuniversity students.
Age in years % reporting16 and below 717-19 1820-22 2323-25 1826-28 1429 and above 20
Table 4: Age of FSWs at first
commercial sexual intercourse
Key findings

22 Kerala Behavioural Surveillance Survey (1999)
Occupational Profile
Clients of sex workers
The occupation of clients of sex workers presented a mixed picture. About a fifth were autoor taxi drivers. There were almost as many unskilled workers (18%) and skilled workers(20%). A total of 17% respondents had said that they were self-employed, a tenth said thatthey had white collared jobs and 7% were reportedly working as manual labourers (Table 5).
Secondary occupation of sex workers
A total of 26% sex workers were reported to have a secondary occupation. Nine percent ofthe sex workers worked as housemaids and 7% worked in trade, for example, as shop girls,as door-to-door salesgirls or as street vendors. Six percent were reported to be working insmall companies (Table 6).
Table 6: Secondary occupation of sex workersJob %Housemaid/Household job 9Working in small companies 6Sales woman in shop 3Street Vendors 2Sales Personnel - Door to Door 2Others 4
Occupation %Drivers (auto, taxi) 21Skilled worker 20Unskilled worker 18Self employed/Business/Trade 17Clerical/salesman 10Manual labourer 7Cultivation/agriculture labour 3Supervisory level/officer/executive 2Others 2
Table 5: Occupation of clients of sexworkers

23
Media and messages
Study findings indicated that the habit of watching TV daily was highest among maleplantation workers (58%) and lowest among the male university students (14%) duringthe preceding month (Figure 14). The proportion of male university students who saidthat they listened to radio was 61%, which was higher than the same habit among othergroups.
The practice of listening to the radio or watching TV was comparatively low among sexworkers. Apart from plantation workers, the number of respondents who had not listenedto the radio during the preceding 4 weeks was higher than the number that had notwatched the television.
Four most frequently cited sources of HIV/AIDS information
All the groups, except sex workers, had said that newspapers/magazines was the mainsource of information on HIV/AIDS. The main source of information for sex workerswas reported to be cinema (Table 7). The other two common sources of information weretelevision and radio.
Key findings

24 Kerala Behavioural Surveillance Survey (1999)
Posters were also cited as another common source of information on HIV/AIDS. Morethan 50% of the students had listed 9 sources of information, which were different fromthose mentioned above. These sources included lecturers, fellow students, friends, relativesand documentary films. Sex workers had listed least number of sources of information,which included cinema, newspapers, posters and television. Less than 50% FSWs were ableto list any one source of information.
Three most commonly recalled messages on HIV/AIDS
The most commonly recalled message among all sub-population groups was ‘Usecondoms/Nirodh’ (Table 8). ‘Be faithful to one partner/single sex partner’ was a less
Sources Sub-groups(Figures in %) FSW MC MARD MPW MUSNewspaper/Magazine 44 85 95 91 91Radio – 55 60 88 62Television 38 73 78 62 93Cinema 49 55 – – –Poster 41 61 59 42 72
Table 7: Sources of information on HIV/AIDS
Messages Sub-groups(Figures in %) FSW MC MARD MPW MUSUse condoms/Nirodh 33 34 26 22 30Be faithful to one partner/single sex partnerAIDS is a great disaster/dangerous diseasesIf infected you can live onlyseven yearsBeware of AIDS – – – – 9No casual sex – – 27 – –No sex with other girls/women – – – 16 –Recall no particular message 56 46 39 51 45
Table 8: Messages recalled on HIV/AIDS
3 10 16 – 10
5 9 – – –
– – – 27 –

25
recalled message. Auto rickshaw drivers also cited ‘No casual sex’ and male plantationworkers had recalled ‘If infected, you can live only seven years’ as other messages. However,large percentage sub-population groups could not recall any specific message.
Reported incidence of genital ulcer/discharge and first step taken after onset ofsymptoms
Twelve percent of the sex workers, nine percent male clients and two percent auto rickshawdrivers and students each had reported having genital ulcer/discharge during the previousyear. The responses of the sex workers regarding the first step taken after onset of symptomsvaried between the use of once procured prescriptions, treatment from a qualified privatedoctor, a practitioner of other systems of medicine and to a lesser extent, a qualifieddoctor in a government facility.
Condoms
Almost all the respondents in the survey had heard about condoms except for one percentsex workers, half a percent of the male plantation workers and five percent of the maleuniversity students. The two most common places cited for procuring condoms weremedical and petty shops (Table 9). Another site, though less mentioned, was thedepartmental store. Among male university students, after medical shops, a high proportion(64%) had cited a government hospital or family planning centre as a place from wherethey could get condoms.
Table 9: Three most commonly cited places where condoms can be obtainedPlaces Sub-groups(figures in %) FSW MC MARD MPW MUSBunk/petty shop 88 82 63 61 –Medical shop/Pharmacy 77 91 83 52 84Departmental store/Market 39 33 – – 48Hospital – – 41 41 –Govt. Hospital/Family planning center – – – – 64
Key findings

26 Kerala Behavioural Surveillance Survey (1999)
Time taken for obtaining a condom
A total of 94% auto rickshaw drivers and male clients each had said that they could get acondom in less than an hour, less than three fourth students and half the plantationworkers felt they could do so within the hour (Figure 15). Less than half the plantationworkers and about one-tenth male university students had said that they needed betweenan hour to a day to get condoms.
Alcohol and drug consumption
A total of 18% male clients had said that they consumed alcohol everyday, which was ahigher proportion than the reported alcohol use in other groups (2-4%). Consumptionof alcohol once a week was reported by about one tenth of the students and plantationworkers, one fifth sex workers and drivers, and half the clients of sex workers (Figure 16).

27Key findings

28 Kerala Behavioural Surveillance Survey (1999)
Discussion
Interpretation and Implications of findings
The findings of this survey contributed to the baseline measurements of behaviourand knowledge indicators against which trends could be tracked over time. The
results of this wave of the BSS also provided useful and actionable information regardingHIV related risk behaviours and knowledge prevalent at that point of time in Kerala.Some of these are discussed below.
Ø In order to calculate the sample sizes required for the survey, the proportion ofeach sub-population group that would report sexual intercourse with a non-regular partner (which included female commercial partners, male partners andnon-regular non-commercial partners) in the past year was estimated. The resultsof the baseline wave of the BSS had shown that there is a difference between theestimate and the actual measurement of the indicator. For example, in the case ofauto rickshaw drivers, while the estimated measurement was 25%, the actualmeasurement was 13.8%. Similarly, for plantation workers although the estimatedmeasurement was 20%, its actual measurement was 4.8%. In the case of Universitystudents living in hostels, the estimate of 10% was closer to the actual measurementof 9.3%.
Ø The study indicated that the proportions of male university students reportingsex with a female sex worker and a male partner was not very different (3% and2%). Students reporting sexual intercourse with only female non-regular partnerswas 8.3%, and with inclusion of male partners, the proportion becomes 9.3%.However, consistent condom use with the female sex worker partner (43%) washigher than with the male partner (15%).

29
Ø The reported condom use during last sex was relatively high for all subpopulationgroups with female sex worker and female non-regular partners (Range 26% to91%). However, the reported consistent condom use was relatively lower (rangefrom 13% to 52%).
Ø Female sex workers reported lower last time as well as consistent condom use withregular clients (a difference of 23%) than with one time clients (a difference of37%).
Ø More clients of sex workers had reported non-regular partners (both noncommercial female and male) than any other male sub-population group.
Ø While print media was the most frequently cited source of HIV/AIDS information,there was a wide disparity between different groups. For example, 44% of the sexworkers had reported hearing about HIV/AIDS through newspapers andmagazines as compared to 85% to 95% among other groups for the same sourceof information.
Discussion

30 Kerala Behavioural Surveillance Survey (1999)
Annex: BSS indicators at a glance, Baseline wave,Kerala, 1999
MC MARD MPW MUS FSW
Sample Size (N) 400 1000 1200 2500 400
% % % % %
Knowledge of HIV Prevention Methods
Consistent condom use 90 72 55 91 98
Mutual monogamy between HIV negative 34 58 85 82
partners
Abstinence from sex 4 3 2 25
Respondents who had sex with non regular, 189 98 44 193
non commercial partners in the past 12
months (N1)
Had sex with non regular, non commercial 47.2 9.8 4.6 7.7
partners in the past 12 months
Average number of non regular, non 2 1 1 3
commercial partners in the past 12 months
Condom use at last sex with non regular, non 41 44 26 50
commercial partner (% of N1)
Consistent condom use with non regular, non 28 24 14 27
commercial partner in the past 12 months
(% of N1)
C.I of 95% 22-34 15-32 4-24 21-33
Respondents who had commercial sex in 400 64 19 79
the past 12 months (N2)
Had commercial sex in the past 12 months 100 6 2 3
Average number of commercial partners in 4 2 1 4
the past 12 months
Condom use at last sex with commercial 80 91 58 66
partner (% of N2)
Consistent condom use with commercial 48 55 26 43
partner in the past 12 months (% of N2)
C.I of 95% 43-52 42-67 7-46 32-54

31
MC MARD MPW MUS FSW
Sample Size (N) 400 1000 1200 2500 400
% % % % %
FSWs having sex with regular client in the 181
past one month (N1)Have regular clients in past one month 45(% of N)
Average number of regular client in the 3past one monthCondom use at last sex with regular client 67
(% of N1)Consistent condom use with regular client 44 in the past 12 months (% of N1)
C.I of 95% 37-51FSWs having sex with one time client 396in the past one month (N2)
Have one time clients in past one month 99(% of N)Average number of one time client in the 21
past one monthCondom use at last sex with one time client 89(% of N2)
Consistent condom use with one time client 52in past 12 months (% of N2) C.I of 95% 47-57
Respondents who had anal sex with male 30 3 0 59partner in the past 12 months (N3)Had and sex with male partner in the past 7 0 0 2
12 monthsAverage number of anal sex partners in past 3 0 0 512 months
Condom use at last anal sex with male 14 0 0 31partner (% of N3)Consistent condom use with male partner 14 0 0 15
during anal sex in the past 12 months (% of N3) C.I of 95% 1-26 6-24
BSS indicators at a glance

32 Kerala Behavioural Surveillance Survey (1999)
MC MARD MPW MUS FSW
Sample Size (N) 400 1000 1200 2500 400
% % % % %
Incidence of Genital Discharge/Ulcer
in the past 12 months
Suffered from discharge from genitals or 9 2 2 12
ulcers in genitals in the past 12 months
MC – Male Clients of Female Sex Workers; MARD – Male Auto Rickshaw Drivers;MPW – Male Plantation Workers; MUS – Male University Students living in hostels;FSW – Female Sex Workers
Some definitions
• Regular partner: Spouse or cohabiting partner• Commercial sexual partner: Partner with whom respondent had sex in exchange
for money or payment in kind.• Non regular partner: Non spousal/cohabiting, non commercial partner• For all male groups, the above are considered to be female partners, for female
groups, they are considered to be male. Indicators related to anal sex by malerespondent groups with male partners have also been measured.
• For the purposes of this survey, sex is defined as either vaginal or anal sex.• Consistent condom use is defined as condom used every time.