
Sultan Haitham Bin Tariq Al Said - Bank Dhofar
328
-
Upload
khangminh22 -
Category
Documents
-
view
2 -
download
0
Transcript of Sultan Haitham Bin Tariq Al Said - Bank Dhofar


His Majesty
Sultan Haitham Bin Tariq Al Said

TABLE OFCONTENTS

DISCLOSURE REQUIREMENTSUNDER PILLAR-III OF BASEL II & III
72
CORPORATE GOVERNANCE REPORT
22BOARD OFDIRECTORS’ REPORT
12
FINANCIAL HIGHLIGHTS OF LAST FIVE YEARS
65MANAGEMENT DISCUSSION AND ANALYSIS REPORT
43
INDEPENDENT AUDITOR’S REPORT AND FINANCIAL STATEMENTS
116
MAISARAH ISLAMIC BANKING SERVICESANNUAL REPORT 2019
211NOTES TO THE FINANCIAL STATEMENTS 2019
130

Throughout our “Together 2020” journey, we were keen to be the best bank in customer experience, through providing innovative products and services, and creative solutions through our customer touch-points.

9Annual Report 2019
Unparalled experience with traditional Omani culture of hospitality
Personalized and unique banking experience for Al Riadah Priority Banking customers
Corporate Centre provides tailored services, products, and financial solutions for corporate customers

Banking services for your family
The best Mobile Banking App
The first bank in the Sultanate to provideDrive Thru Banking Services
Annual Report 201910
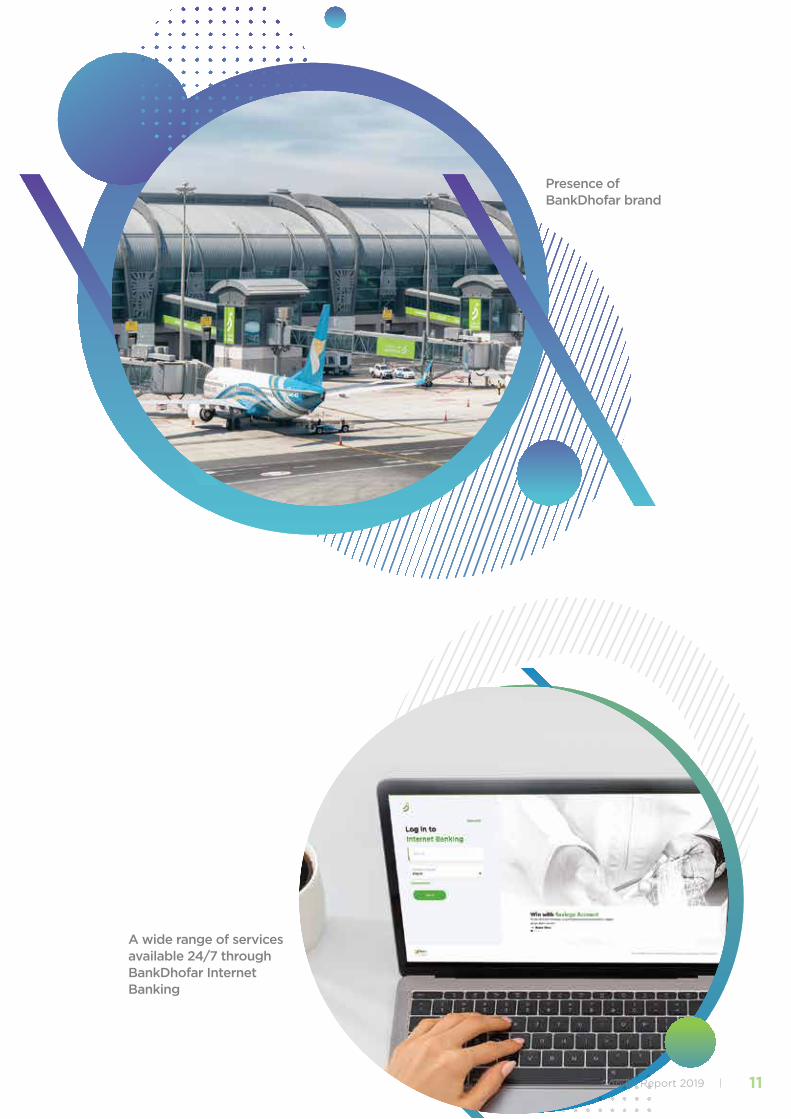
Presence of BankDhofar brand
A wide range of services available 24/7 through BankDhofar Internet Banking
11Annual Report 2019

THE BOARD OF DIRECTORS’ REPORTFOR THE FINANCIAL YEAR ENDED31st DECEMBER 2019

13Annual Report 2019
Dear Shareholders,
At the outset, on behalf of the Board of Directors of
Bank Dhofar, we would like to express our sincerest
congratulations and best wishes to His Majesty Sultan
Haitham Bin Tariq of good health, happiness and
success and leading the Omani people towards further
progress and prosperity.
On behalf of the Board of Directors of Bank Dhofar
S.A.O.G., I am pleased to present you the Bank’s
Financial Statements and the Auditors’ Report for the
financial year ended 31st December 2019.
Financial overview in year 2019
In the midst of current challenging economic and
financial situation driven by volatile oil prices and rising
interest rates in the local market, the bank reported a
net profit of OMR 30.24 million (USD 78.55 million) for
the year-to-date (YTD) 31st December 2019 compared
to RO 50.28 million (USD 130.60 million) achieved
during similar period of last year, a year-on-year decline
of 39.86%. This decline is resulting from increase in net
provisions by OMR 15.74 million (USD 40.88 million) from
classification of certain large exposures (reflecting the
current economic environment). Bank’s Islamic Banking
Window, Maisarah Islamic Banking Services reports
strong Profits before tax growth of 17.36% reaching RO
6.98 million (USD 18.13 million) in 2019 compared to RO
5.94 million (USD 15.43 million) in 2018. Total assets of
the Bank reached RO 4.33 billion (USD 11.25 billion) in
December 2019 as compared to RO 4.21 billion (USD
10.94 billion) at end of 2018, 2.85% increase. The Net
Loans, Advances and Financing to customers reached
RO 3.06 billion (USD 7.95 billion) at December 2019,
compared to RO 3.16 billion (USD 8.21 billion) at the
end of 2018, 3.16% decline year-on-year, continuing the
cautious approach on increasing the loan and financing
book and focusing on credit quality. Customer deposits,
including Islamic deposits increased by 0.68% from RO
2.92 billion (USD 7.58 billion) at the end of 2018 to reach
RO 2.94 billion (USD 7.64 billion) at the end of 2019.
The Net Interest Income and income from Islamic
Financing activities earned were RO 94.83 million
(USD 246.31 million) for the year 2019 as compared
to RO 97.43 million (USD 253.06 million) during 2018,
a decrease of 2.67%. However, Non-funded income
increased by 2.03% year-on-year reaching RO 35.13
million (USD 91.25 million) in 2019 as against RO
34.43 million (USD 89.43 million) for 2018. The total
operating income is RO 129.96 million (USD 337.56
million) for the year 2019 as compared to RO 131.85
million (USD 342.47 million) for the year 2018, year-on-
year decrease of 1.43%.
Total Operating Expenses increased to RO 71.47 million
(USD 185.64 million) for the year 2019 as compared to
RO 65.46 million (USD 170.03 million) for the year 2018,
9.18%. This resulted in increase of the cost to income
ratio to 55% in 2019 from 50% in 2018.
Net provisions (Expected Credit Loss ‘ECL’) increased
by OMR 15.74 million (USD 40.88 million) from RO
6.65 million reported in 2018 to RO 22.39 million for
the year 2019, this includes classification of certain
large exposures (reflecting the current economic
environment), as stated above. Correspondingly, gross
NPL (Non-performing loans) increased to 4.67% as at
31st December 2019 from 3.68% as at 31st December
2018. Net NPL, net of interest reserve is 3.91% at 31
December 2019 vs. 1.99% at 31 December 2018; Net
NPL, net of interest reserve and ECL provision is
2.14% as at 31 December 2019 compared to 0.74%
at 31 December 2018. NPL is based on funded non-
performing exposure over total funded exposure.
Annual Report 201914
Maisarah- Islamic Banking Services
Bank’s Islamic Banking Window, Maisarah Islamic Banking Services has achieved a remarkable growth in profitability during 2019. For the year 2019, Maisarah Islamic Banking Services posted a profit before tax of RO 6.97 million (USD 18.10 million) compared to RO 5.94 million (USD 15.43 million) earned in 2018, reflecting strong 17.34%, year-on-year growth.
Maisarah key financial metrics showed significant growth compared to the previous year. The gross income from Financing, Placement and Investment increased by 11.66% to RO 26.24 million (USD 68.16 million) in 2019 from RO 23.50 million (USD 61.04 million) reported in 2018. The net financing income (after cost of funds) increased by 8.47%, to RO 12.42 million (USD 32.26 million) for 2019 as compared to RO 11.45 million (USD 29.74 million) reported in 2018. Non-Funded income increased significantly by 41.67% to RO 2.38 million (USD 6.18 million) in 2019 from RO 1.68 million (USD 4.36 million) in 2018. Cost to income ratio continue to improve and reduced to 47.92% for 2019 from 50.83% last year. Maisarah net provisions (ECL including bad debts) for 2019 is RO 0.737 million compared to RO 0.516 million for 2018, an increase of 42.83%
Maisarah gross financing portfolio has grown 12.44% to RO 451.44 million (USD 1.17 billion) at 31 December 2019 from RO 401.49 million (USD 1.04 billion) at 31 December 2018. The Sukuk investment portfolio increased by 48.28% from RO 42.15 million (USD 109.48 million) as at 31 December 2018 to RO 62.50 million (USD 162.34 million) as at 31 December 2019.
The total customer deposits of Maisarah increased to RO 405.22 million (USD 1.05 billion), registering a growth of 14.67% compared to OMR 353.39 million (USD 0.92 billion) at 31 December 2018, to support the strong financing growth. Maisharah total assets increased by 14.15% to OMR 584.93 million (USD 1.52 billion) at December 2019 from OMR 512.43 million (USD 1.33 billion) at 31 December 2018.
Funding and Capital Raising initiatives
In continuation of its capital augmentation to strengthen the capital base, the Bank has approved the issue of, subject to Regulatory approval, Tier 1 Capital instrument (Additional Tier 1 perpetual bonds (AT-1)) in an indicative amount of USD 300 Million or equivalent in OMR 115.5 Million for the next five years to be listed Euronext Dublin or in the Muscat Securities Market. Country’s debut issuance of AT-1 Bond in the international market in May 2015 is coming up for first call date in May 2020.
Bank’s Core Equity Tier-1 (CET-1) Ratio has strengthened and increased from 11.88% at 31 December 2018 to 12.59% as at 31 December 2019; Tier 1 is at 16.40%
31 December 2019 vs. 15.52% last year; total capital adequacy ratio (CAR) is 17.86% at 31 December 2019 vs. 17.33% last year. The Regulatory minimum requirements are a) 9.5% CET-1, 11.5% Tier 1 and 13.5% CAR as at 31 December 2019.
Top Management Changes
As part of Bank’s long term strategy, the following senior management changes took place during the year 2019:
In the Annual General Meeting of shareholders held on 27 March 2019 following members are elected to the new Board for a term of three years:
• Sheikh Tariq Salim Al Mashani
• Sheikh Khalid Said Al Wahaibi
• Appointments of banks top team management
• Dr Tariq Taha is appointed as Deputy General Manager and Chief Digital Banking and information officer in July 2019.
• Appointment of Mr. Ali Al-Alawi as Assistant General Manager & Head of Compliance in May 2019.
• Resignation of top team management:
Resignation of DGM and Chief Risk Officer Mr Jose in August 2019 and currently the Risk management division is headed by Mr Praveen Bokolia as Acting Head of Risk.
Corporate Governance
The Bank has fully complied with all directives of the Code of Corporate Governance issued by the Capital Market Authority. The Bank has also assessed and reviewed the internal control procedures of the Bank during the year 2019.
In compliance with Article (197) of the Commercial Companies Law No. 4/1974 and its amendments, the Board of Directors would like to disclose that the total amount received in 2019 as sitting fees was RO 84,800 and the proposed remuneration & sitting fees is RO 115,200 complying with total cap of RO 200,000.
Distributed & Proposed Dividends
The Board of Directors in their meeting held on 28th January 2020 proposed a total cash dividend of 7% (RO 20.98 million) for the year 2019 (2018: 10%, RO 28 million), made up of a) 3% (amounting to RO 8.99 million) from the Retained Earnings and b) 4% (amounting to RO 11.99 million) from the Special Reserve Account and nil bonus shares issue for year 2019 (2018: 7%). (2018: 196,022,991 shares) of RO 0.100 each, subject to the approval of Central Bank of Oman and shareholders.

15Annual Report 2019
Corporate Social Responsibility (CSR) Initiatives
During the year 2019 Bank Dhofar continued to focus on supporting the community contributed RO 19,300 as Bank’s support to the citizens to various campaigns including various social programs and other CSR initiatives. In 2018, the board of directors donated OMR 1 Million in Dhofar and Wusta governorates to support the repair and restoration efforts for the damages caused by Cyclone Mekunu that hit southern part of Oman.
Awards and Accolades during 2019
Bank Dhofar won the following rewards during the year 2019 and those awards are testimony to the continued efforts put in by the Bank:
• Best Corporate Advisory - Oman 2019” award by Global Business Awards
• Best Islamic bank in Oman - Maisarah Islamic Banking Services at the Middle East Banking Awards 2018 (EMEA Finance)
• Best Customer Experience Transformation Strategy Award – by Customer Experience - Middle East Awards 2019
• Customer Delight Awards by MENAA Awards - 2018
• Best CEO in GCC’s Banking Industry by Business Worldwide 2018 Global Corporate Excellence Awards
• Corporate & Investment Bank of the Year – Oman by the ABF Corporate & Investment Banking Awards 2019
• Equity Deal of the Year – Oman by the ABF Corporate & Investment Banking Awards 2019
• Best Mobile Banking Application Oman 2019 by Global Banking & Finance Review Awards
• Excellence Award for CSR initiatives and programs by the Arab Organization for Social Responsibility
The Year Ahead (2020)
The Financial Year 2020 Oman budget represents the final year of the Ninth Five-Year Development Plan (2016-2020) and paves the way for the Tenth Five-Year Development Plan (2021-2025) which underpin the
Oman Vision 2040 development objectives. The budget sets a prudent and measured tone in both its revenue and expenditure projections with a resultant deficit of OMR 2.5 billion. Revenue is budgeted to increase by 6% to OMR 10.7 billion (cf. FY19 OMR 10.1 billion), with oil & gas revenue representing c.72% (OMR 7.7 billion). The FY20 revenue forecast assumes a precautionary average oil price of $58 per barrel, which was also used as the basis for the FY19 budget, despite the fact that actual realized oil price in FY19 was $65 per barrel. Expenditure is budgeted to increase by 2% to OMR 13.2 billion (cf. FY19 OMR 12.9 billion), with a commitment to complete a number of strategic infrastructure projects to help incentivize economic growth. There is continued focus on the need to enhance the contribution of non-oil revenue, and the budget includes allocations for the five sectors identified by the National Program for Enhancing Economic Diversification (Tanfeedh): manufacturing, logistics, tourism, fisheries and mining. The Government acknowledges that revenues from these sectors depend significantly on private sector investment, and is committed to improving the business environment to facilitate this. In addition, the Government appears keen to outsource other services and projects to the private sector to further ease expenditure and with the aim of bringing improved efficiency and cost savings. GDP grew by 2% in 2019 and is expected to grow by 3% in 2020. Inflation for the period January to November 2019 stood at 2% and is expected to remain low during 2020.
Acknowledgment
On behalf of the Board, I would like to thank our valuable customers for their patronage and confidence they have reposed in the Board of Directors and the Executive Management. Also I thank the shareholders for their continuous support and Chairman, members of Sharia Supervisory Board of Maisarah Islamic Banking Services, Management and Staff for their efforts and contributions in the year 2019.
The Board of Directors also wishes to thank the Central Bank of Oman the Capital Market Authority for its valuable guidance to the local banking sector.
Eng. Abdul Hafidh Salim Rajab Al-Aujaili
Chairman
The percentage of dividends distributed to the Shareholders in the last five years is as follows:
Year 2014 2015 2016 2017 2018
Cash Dividends 5% 15% 13.5% 12% 10%
Bonus Shares 15% 10% 7.5% 8% 7%

Annual Report 201916
THE BOARDOF DIRECTORS
17Annual Report 2019
Name of Director: Mr. Ahmed Said Mohammed Al Mahrezi
Basis of Membership: Vice-Chairman Non-executive Independent Non-shareholder Director
No. of other directorships held: 1
Name of Director: Mr. Mohammed Yousuf Alawi Al Ibrahim
Basis of Membership: Member Non-executive Non-Independent Representative Shareholder Director
No. of other directorships held: 1
Name of Director: Mr. Tarik Abdul Hafidh Salim Al Aujaili
Basis of Membership: Member Non-executive Non-Independent Representative Shareholder Director
No. of other directorships held: 3
Name of Director: Mr. Zakariya Mubarak Ismail Al-Zidjali
Basis of Membership: Member Non-executive Non-Independent Non-shareholder Director
No. of other directorships held: 0
Name of Director: Mr. Hamdan Abdul Hafidh Al Farsi
Basis of Membership: Member Non-executive Independent Non-shareholder Director
No. of other directorships held: 1
Name of Director: Mr. Faisal Mohammed Moosa Al Yousef
Basis of Membership: Member Non-executive Independent Representative Shareholder Director
No. of other directorships held: 0
Name of Director: Sheikh Khalid Said Salim Al Wahaibi
Basis of Membership: Member Non-executive Independent Representative Shareholder Director
No. of other directorships held: 0
Name of Director: Sheikh Tariq Salim Mustahil Al Mashani
Basis of Membership: Member Non-executive Independent Representative Shareholder Director
No. of other directorships held: 1
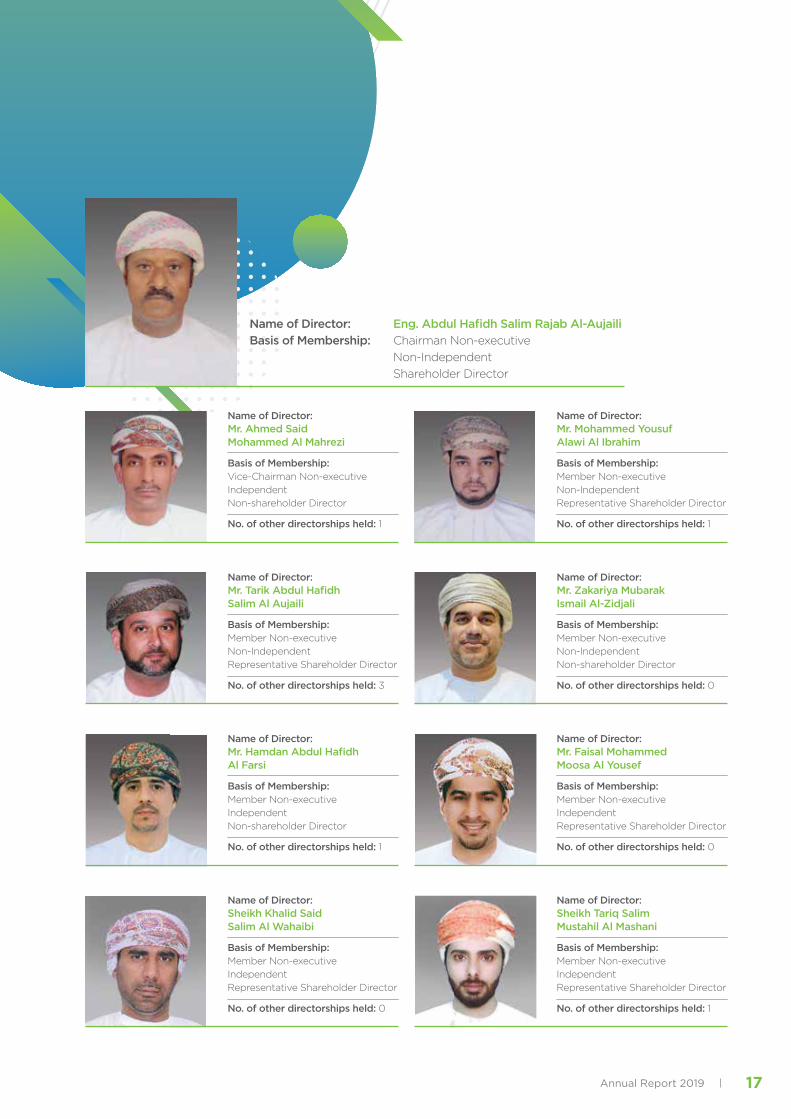
Name of Director: Eng. Abdul Hafidh Salim Rajab Al-AujailiBasis of Membership: Chairman Non-executive Non-Independent Shareholder Director

Annual Report 201918
THEEXECUTIVE TEAM
Abdul Hakeem Omar Al OjailiChief Executive Officer
THEEXECUTIVE TEAM
Kamal Hassan Al MurazzaGeneral Manager &
Chief Wholesale Banking Officer
Ahmed Said Al IbrahimGeneral Manager &
Chief Corporate Services Officer
Faisal Hamad Al WahaibiGeneral Manager &
Chief Strategic Business Officer
Shankar Krishnan SharmaChief Financial Officer
Mohammed Hilal Al ReyamiDGM & Head of Internal Audit

19Annual Report 2019
Tariq Saleh TahaDGM & Chief Digital Banking &
Information Officer
Sohail NiaziChief Executive
Maisarah Islamic Banking Services
Shaleen ChughDGM & Head of Corporate Banking
Nasser Said Al BahantahChief Human Resources Officer
Tariq Saleh TahaDGM & Chief Digital Banking &
Information Officer

Annual Report 201920
THEEXECUTIVE TEAMTHEEXECUTIVE TEAM
Mohammed Iqbal Al BalushiAGM & Head of Retail Banking Division
Hussain Ali Al LawatiActing DGM - Retail & SME Banking
Osama Fathi Al MansoorDGM & Head of Transformation
Duraid Al JamaliDGM & Head of Legal

21Annual Report 2019
Amina Nasser Al FalahiAGM & Head of Government Relations
Ali Mohamed Al AlawiAGM & Head of Compliance
Bashir Said Al SubhiAGM & Head of Treasury &
Financial Institutions
Hani Habib MackiAGM & Head of Strategy & Planning

CORPORATEGOVERNANCE REPORT FOR THE YEAR ENDED31st DECEMBER 2019


Annual Report 201924
Report on Corporate Governance
Part One
1. Corporate Governance Philosophy:
Corporate Governance is an essential element in attaining, enhancing and retaining confidence of the Bank’s stakeholders. Corporate governance lays down the relationship and responsibilities between shareholders, Board of directors and senior management of the Bank through the structure of setting objectives, formulating strategies, controlling and monitoring performance while ensuring compliance with regulations in letter and spirit and promoting a culture of transparency through disclosures and commitment to highest ethical standards.
The Board of Directors of Bank Dhofar SAOG (the Bank) bears the principal responsibility of establishing Corporate Governance as appropriate to the Bank within the broad framework laid down by the Central Bank of Oman (CBO) and the Capital Market Authority (CMA).
Decision-making within the Bank has been broadly divided into two levels. The Board of Directors (the Board) at the top level, as trustees of the shareholders, bears the responsibility of strategic supervision of the Bank, apart from fulfilling statutory obligations. Some of the major responsibilities of the Board are discharged through four sub-committees, viz. the Board Executive Committee, the Board Audit Committee, the Board Risk Management Committee and the Board Nomination & Remuneration Committee. These sub-committees which operate under the Board approved charters have been meeting regularly and have contributed significantly to the effective functioning of the code of corporate governance. The charters of these committees meet all the requirements as laid down in the Code of Corporate Governance. In addition, the Board carries the responsibility of approving the strategic plans and internal policies to institute adequate controls for achievement of the set objectives and compliance with rules and regulations. The executive management of the Bank comprises of the Senior Members headed by the Chief Executive Officer.
Through this two-tiered interlinked governance process, an appropriate balance has been created between the need for focus and executive freedom, and the need for supervision, control and checks and balances of all activities and transactions.
The formal Code of Corporate Governance prescribes the highest ethical standards in the conduct of the Bank’s business. The Senior Members of the Bank are fully cognizant of their responsibilities in setting personal examples so that the code is internalized within the Bank and becomes part of its culture.
2. Board of Directors
The Responsibilities of the Board of Directors
The Board has the full authority to perform all acts required for managing the Bank and protecting and growing the shareholders’ interests pursuant to its objectives besides securing the interests of other stakeholders. Such authority is not limited or restricted except as provided by the law, the Articles of Association or resolutions of the General Meetings. However, such authority is not extended to the operational matters and day-to-day affairs of the Bank which remains a responsibility of the Senior Management.
The responsibilities and functions of the Board include the following:
- Charting the overall strategic direction of the Bank and reviewing and approving the annual business and strategic plans.
- Monitoring the Bank’s performance and evaluating whether the business is properly managed in accordance with the Bank’s set plans.
- Approving the interim and annual financial statements and providing accurate information at the right time to the shareholders, in accordance with the guidelines of the Capital Market Authority.
- Forming various Board sub-committees, approving their charters and reviewing the functions of these committees.

25Annual Report 2019
- Adopting internal regulations and bylaws pertinent to steering and management of the affairs of the Bank.
- Reviewing all audit reports submitted by internal and external auditors and statutory agencies.
- Ensuring that the Bank conducts its operations in an ethical and transparent manner.
- Assessing and approving the proper delegation of authorities to executive management.
- Appointing and evaluating the functions and the performance of the Chief Executive Officer and other key employees.
Further, the Board exercises objective independent judgment on corporate affairs after having access to accurate, relevant and timely information.
Size and Terms of the Board
The Board consists of nine (9) non-executive directors who are elected by the shareholders at the Annual General Meeting. The term of office of the Board of Directors is three years and each Director can be re-elected for a similar period. The term of office of the current Board expires in March 2022.
Composition and selection of the Board
Members of the Board of Directors are elected from among the Bank’s shareholders or non-shareholders provided that a shareholder candidate holds not less than 50,000 shares of the Bank’s share capital. All members of the Board of Directors are non-executive Directors.
A minimum of one-third of the Board members shall be independent Directors, meeting the definition of independent director, as defined in the new Code of Corporate Governance issued in July 2015, which states that a director shall be deemed non-independent in the following cases:
(a) Holding ten per cent (10%) or more of the company shares, its parent company, or any of its subsidiary or associate companies.
(b) Representing a juristic person who holds ten per cent (10%) or more of the company shares, its parent company, or any of its subsidiary or associate companies.
(c) Had been, during the two years preceding candidacy or nomination to the board, a senior executive of the company, its parent company or any of its subsidiary or associate companies.
(d) Being a first degree relative of any of the directors of the company, its parent company or any of its subsidiary or associate companies.
(e) Being a first degree relative of any of the senior executives of the company, its parent company or any of its subsidiary or associate companies.
(f) Being a director of the parent company or any of the subsidiary or associate companies of the company being nominated for its board membership.
(g) Being, during the two years preceding candidacy or nomination to the board, an employee of any parties contractually engaged with the company (including external auditors, major suppliers or civil society organizations (“CSO”) where the latter received a support in excess of 25% of the annual budget of such CSOs).
(h) Being, during the two years preceding candidacy or nomination to the board, an employee of the parent company or any of its subsidiary or associate companies.
(i) Holding about 20% of the shares of any of the above mentioned parties during the two years preceding candidacy or nomination to the board.
Annual Report 201926
The nomination of Board members is according to the rules and condition of the election of directors as issued by CMA. The election process is through direct secret ballot whereby each shareholder shall have a number of votes equivalent to the number of shares he/she holds. Every shareholder shall have the right to vote for one candidate or more provided the total number of votes in the voting form is equivalent to the number of shares he/she holds.
At present all the directors of the Board are non-executive, four are non- Independent and five are Independent within the scope of the definition of independence laid down by the CMA Code of Corporate Governance.
Board Committees
The Board has the following four Board Committees, whose objectives, powers and procedures are governed by the charters of the respective Committees, which are approved by the Board:
1. Board Executive Committee
2. Board Audit Committee
3. Board Risk Management Committee
4. Board Nomination & Remuneration Committee
Additional committees may be established from time to time based on business needs. Each committee has access to the information and resources it requires, including direct access to staff and consultants. The Board has selected the committee members based on their professional backgrounds, skills and other qualities they bring to the committees.
Sharia Supervisory Board
Sharia Supervisory Board was formed in the year 2012 for the Islamic Banking operations of the Bank’s window, Maisarah Islamic Banking Services (Maisarah).
3. Profiles of Members of Board of Directors
H.E. Eng. Abdul Hafidh Salim Rajab Al Aujaili - Chairman
H.E. Eng. Abdul Hafidh Salim Rajab Al Aujaili is currently the Chairman of Bank Dhofar. He is the Chairman of the
Board Executive Committee. He is a promoter shareholder of well-established institutions in Oman such as Bank
Dhofar, Dhofar International Development & Investment Holding Co. SAOG, Dhofar Power Company SAOC and
Oman Aviation Services Co. (SAOG). He holds Master Degree in Mechanical Engineering.
Mr. Ahmed Said Al Mahrezi- Deputy Chairman
Mr. Ahmed Said Al Mahrezi is a member of the Board of Directors. He is also the Vice Chairman, the Chairman of
the Board Nomination & Remuneration Committee, a member of the Board Risk Management Committee and
a member of the Board Audit Committee. He is a Director of Hotel Management Co. International SAOG. He has
extensive experience in the public sector in Law, Finance, Investment & Administration, extending over a period of
more than 26 years. Mr. Ahmed holds a Master of International Commercial Law and a Bachelor of Law.
Mr. Mohammed Yousuf Al Ibrahim - Director
Mr. Mohammed bin Yousuf Al Ibrahim is a member of the Board of Directors. He is also a member of the Board
Executive Committee, a member of the Board Risk Management Committee and a member of the Board
Nomination & Remuneration Committee. He has extensive experience in directorship of private and public
companies. His diverse portfolio includes being Shareholder, Executive & Managing Director of various private
companies & Establishments. He is a Director of Dhofar University. Mr. Mohammed holds a Bachelor of Business Administration.

27Annual Report 2019
Mr. Tariq Abdul Hafidh Al Aujaili - Director
Mr. Tariq Abdul Hafidh Al Aujaili is a member of the Board of Directors. He is also the Chairman of the Board Risk
Management Committee and a member of the Board Nomination & Remuneration Committee. He has extensive
experience of public companies’ directorship. Other positions held by him include Vice Chairman of Dhofar Int.
Development & Investment Holding Co. SAOG, Vice Chairman of Dhofar Insurance Co SAOG and Vice Chairman
of Oman Investment & Finance Co SAOG. Mr. Tariq holds a Bachelor of Accountancy & Finance.
Mr. Zakariya Mubarak Al Zadjali - Director
Mr. Zakariya Mubarak Al Zadjali is a member of the Board of Directors. He is a member of the Board Audit Committee.
He has over 26 years’ experience in financial management, sourcing logistics, supply chain management and
vendor development. Presently he holds the position of Budget Controller at the Ministry of Defence. Mr. Zakariya
holds a Bachelor of Science in Military Sciences.
Mr. Hamdan Abdul Al Hafidh Farsi - Director
Mr. Hamdan Abdul Al Hafidh Farsi is a member of the Board of Directors. He is also the Chairman of the Board
Audit Committee. He currently holds the position of Director of Risk Management at the Public Authority for
Social Insurance (PASI). He is a director of National Gas Co SAOG. He has a wealth of experience extending for 24
years in Finance, Internal Audit and Risk Management. Mr. Hamdan Al Farsi holds a bachelor and a Master degree
in Accountancy.
Mr. Faisal Mohamed Moosa Al Yousef - Director
Mr. Faisal Mohamed Moosa Al Yousef is a member of the Board of Directors, a member of the Board Executive
Committee and a member of the Board Nomination & Remuneration Committee. He is the Chairman of Muscat
Finance Co SAOG and a member of the Board of Directors of Dhofar Int. Development and Investment Holding
Co SAOG. He is the Chief Operating Officer of Al Yousef Group. Mr. Mr. Faisal holds a bachelor of Economics and
is a fellow of Chartered Certified Accountant, U.K.
Sheikh Khalid Said Salim Al Wahaibi - Director
Sheikh Khalid Said Salim Al Wahaibi is a member of the Board of Directors, a member of the Board Executive
Committee and a member of the Board Audit Committee. He is the Chairman of Al Omaniya Financial Services
Co SAOG and Vice Chairman of National Gas Co SAOG. He has a wealth of experience extending over 23 years
as a Director and Managing Director of Assarain Group of Companies. Sheikh Khalid holds a Bachelor of Business
Administration.
Sheikh Tariq Salim Mustahil Al Mashani - Director
Sheikh Tariq Salim Mustahil Al Mashani is a member of the Board of Directors and a member of the Board Executive
Committee a. He is a Director of Al Omaniya Financial Services Co SAOG and Director of Dhofar University. a. He
has extensive experience in directorship of private companies. His diverse portfolio includes being Shareholder,
Chairman and Director of various private companies & establishments. Sheikh Tariq holds a Bachelor of Business
Management.
Annual Report 201928
Part Two
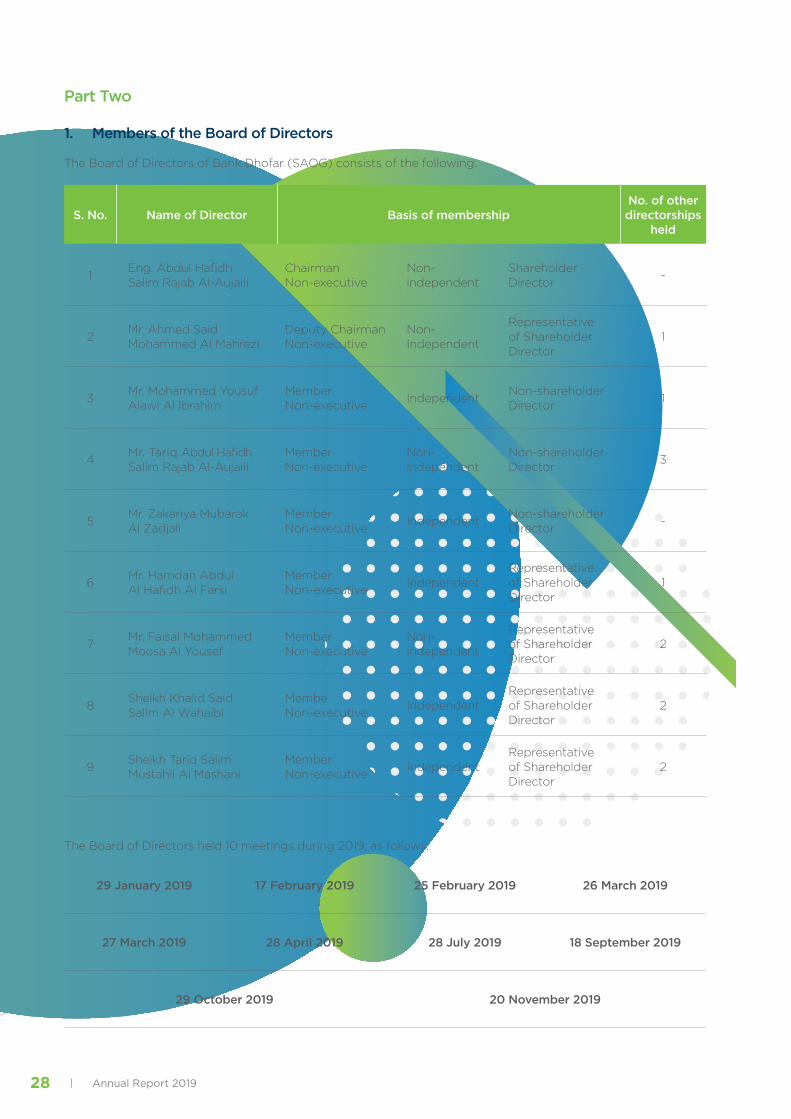
1. Members of the Board of Directors
The Board of Directors of Bank Dhofar (SAOG) consists of the following:
S. No. Name of Director Basis of membershipNo. of other directorships
held
1Eng. Abdul Hafidh Salim Rajab Al-Aujaili
Chairman Non-executive
Non- independent
Shareholder Director
-
2Mr. Ahmed Said Mohammed Al Mahrezi
Deputy Chairman Non-executive
Non- Independent
Representative of Shareholder Director
1
3Mr. Mohammed Yousuf Alawi Al Ibrahim
Member Non-executive
IndependentNon-shareholder Director
1
4Mr. Tariq Abdul Hafidh Salim Rajab Al-Aujaili
Member Non-executive
Non- independent
Non-shareholder Director
3
5Mr. Zakariya Mubarak Al Zadjali
Member Non-executive
IndependentNon-shareholder Director
-
6Mr. Hamdan Abdul Al Hafidh Al Farsi
Member Non-executive
IndependentRepresentative of Shareholder Director
1
7Mr. Faisal Mohammed Moosa Al Yousef
Member Non-executive
Non- independent
Representative of Shareholder Director
2
8Sheikh Khalid Said Salim Al Wahaibi
Membe Non-executive
IndependentRepresentative of Shareholder Director
2
9Sheikh Tariq Salim Mustahil Al Mashani
Member Non-executive
IndependentRepresentative of Shareholder Director
2
The Board of Directors held 10 meetings during 2019, as follows:
29 January 2019 17 February 2019 25 February 2019 26 March 2019
27 March 2019 28 April 2019 28 July 2019 18 September 2019
29 October 2019 20 November 2019

29Annual Report 2019
Details of meetings and remuneration of the Board of Directors of Bank Dhofar (SAOG) are as follows:
S. No. Name of Director No. of meetings attended
Directors’ benefits (Amount in OMR)
Sitting Fees
PaidRemuneration
Proposed
1 Eng. Abdul Hafidh Salim Rajab Al-Aujaili 10 10,000 14,964
2 Mr. Ahmed Said Mohammed Al Mahrezi 10 10,000 13,467
3 Mr. Mohammed Yousuf Alawi Al Ibrahim 9 10,000 11,967
4 Mr. Tariq Abdul Hafidh Salim Rajab Al-Aujaili 8 10,000 13,467
5 Mr. Zakaria bin Mubarak Al Zadjali 9 9,400 11,967
6 Mr. Hamdan Abdul Al Hafidh Al Farsi 10 10,000 13,467
7 Mr. Faisal Mohammed Moosa Al Yousef 9 9,800 11,967
8 Sheikh Khalid Said Salim Al Wahaibi* 6 7,600 9,147
9 Sheikh Tariq Salim Mustahil Al Mashani* 4 4,400 9,147
10 Sheikh. Hamoud Mustahail Ahmed Al Mashani** - - 2,820
11 Eng. Abdul Sattar Mohammed Abdullah Al Murshidi** 4 3,600 2,820
Total 84,800 115,200
* Sheikh Khalid Said Salim Al Wahaibi and Sheikh Tariq Salim Mustahil Al Mashani were elected as members of the Board of
Directors at the Annual General Meeting on 27 March 2019.
** Sheikh. Hamood Mustahail Ahmed Al Mashani, and Eng. Abdul Sattar Mohammed Abdullah Al Murshidi did not nominate
themselves for the Board new term of office at the Annual General Meeting on 27 March 2019.

Annual Report 201930
2. Sharia Supervisory Board (SSB)
The SSB consists of five members. The objectives of SSB include:
• To provide the Sharia rulings in all activities of the Islamic Banking Window (IBW)
• To supervise the compliance of the IBW with Islamic Sharia rules
• To enhance the IBW contribution in spreading the awareness and contribute in development of the Islamic
banking. The Sharia Supervisory Board has held 4 meetings in 2019.
S. No. Name of SSB Members DesignationNo. of
Meetings Attended
Honorarium(Amount in OMR)
Fees Paid Remuneration Proposed
1Sheikh Dr. Salim bin Ali bin Ahmed Al Dhahab
Chairman 4 2,400 9,000
2 Sheikh Dr. Abdullah bin Mubarak Al AbriDeputy
Chairman4 2,200 7,500
3Sheikh. Ahmed bin Awadh bin Abdul-Rahman Al-Hassaan
Member 4 2,000 7,000
4Sheikh Dr. Mohammed bin Ali bin Mahmoud Al Lawati
Member 4 2,000 7,000
5 Sheikh Dr. Mohammad Ameen Ali QattanMember
(Non-Voting)4 2,000 7,000
3. Board Executive Committee (BEC)
The BEC comprises five members of the Board of Directors and meets as and when there is a business need. The Board Executive committee (BEC) is entrusted to guide the Bank management on three key strategic areas:
1. Approval of credit proposals - The BEC is responsible for approving certain credit proposals and overseeing the Bank’s credit policy framework. The responsibilities of the BEC include reviewing and approving specific transactions up to the Bank’s permitted risk limits, in particular those which exceed the authority of the senior management.
2. Strategy, Merger, Information & Transformation - The committee oversees matters pertaining to Strategy, Information Technology (IT), Transformation and Merger/s. Review major projects handled by Enterprise Project Management Office. Review IT Strategy and major decisions relating to IT. Consider matters raised in Management’s Information Technology Committee meetings and update the BOD as appropriate. The committee is to review and set the direction on the Bank’s potential merger/s on behalf of the Board of Directors of the Bank in compliance with CBO, CMA and MOCI and other regulators guidelines and regulations. To conduct and finalize negotiations in relation to the potential merger on behalf of the Board of Directors of the Bank and also to oversee the steps of the merger to its final potential conclusion.
3. Capital, Funding & Bank Proprietary Book Investments - The Committee is tasked with reviewing and setting the direction on the capital and funding requirements of the Bank to ensure compliance with the CBO and Basel guidelines. It is also responsible for reviewing and setting the direction of the non-capital long-term funding requirements of the Bank, which are typically issued and listed on international or local markets, in addition to overseeing capital requirements. The Committee also oversees the management practices on investment matters. It monitors the Bank’s investments and ensures that the Bank complies with its policies and regulatory requirements

31Annual Report 2019
The Members of the Board Executive (BEC) Committee are:
S. No. Name of Director Designation No. of Meetings Attended
1 Eng. Abdul Hafidh Salim Rajab Al AujailiChairman of the Board Executive Committee
7
2 Mr. Mohammed Yousuf Alawi Al Ibrahim Member 6
3 Mr. Faisal Mohammed Moosa Al Yousef Member 6
4 Sheikh Khalid Said Salim Al Wahaibi* Member 3
5 Sheikh Tariq Salim Mustahil Al Mashani* Member 3
6 Sheikh. Hamoud Mustahail Ahmed Al Mashani** Member -
7 Eng. Abdul Sattar Mohd Abdullah Al Murshidi** Member 3
* Sheikh Khalid Said Salim Al Wahaibi and Sheikh Tariq Salim Mustahil Al Mashani were appointed as members of the Board Executive Committee at the Board Meeting on 27 March 2019.
** Sheikh. Hamood Mustahail Ahmed Al Mashani, and Eng. Abdul Sattar Mohammed Abdullah Al Murshidi did not nominate themselves for the Board new term of office at the Annual General Meeting on 27 March 2019. Hence their membership of the
Board Executive committee lasted only till 26 March 2019.
The BEC held 7 meetings in 2019.
4. Board Audit Committee (BAC)
The Board Audit Committee (BAC) was formed by the Board of Directors with the following main objectives and responsibilities:
- To focus the attention of the Board and top management of the Bank on the importance of strong internal controls over financial reporting and sound risk management and governance practices.
- To review the adequacy and effectiveness of internal controls in the Bank and to recommend appropriate steps to improve them where required.
- To review the effectiveness of the system for monitoring the Bank’s compliance with legal and regulatory provisions, Bank’s articles of association, charters, by-laws and internal policies and procedures established by the Board of Directors.
- To review the effectiveness of the internal audit function and approve the risk based internal audit plan as well as the availability of adequate resources and informational access.
- To recommend to the Board of Directors the appointment of the external auditors, their termination and remuneration and determine and review their terms of engagement.
- To meet the External Auditors and hear their views before forwarding the annual financial statements to the Board for approval.
- To report and bring to the attention of the Board any matters of concern with regard to the foregoing and any material accounting or auditing concerns identified as a result of the external or internal audits, or examination by supervisory authorities.

Annual Report 201932
The Members of the Board Audit Committee (BAC) are:
S. No. Name of Director Designation No. of Meetings Attended
1 Mr. Hamdan Abdul Hafidh Al FarsiChairman of the Audit Committee
10
2 Mr. Ahmed Said Mohammed Al Mahrezi Member 9
3 Mr. Zakariya Mubarak Al Zadjali Member 10
4 Sheikh Khalid Said Salim Al Wahaibi* Member 7
* Sheikh Khalid Said Salim Al Wahaibi was appointed a member of the Board Audit Committee at the Board Meeting on 27 March 2019.
The (BAC) held 10 meetings in 2019.
5. Board Risk Management Committee (BRMC):The Board Risk Management Committee (BRMC) was formed by the Board of Directors to focus on issues relating to Risk
Management policies and procedures on a Bank-wide basis by arriving at a judicious policy decision collectively.
Roles and Responsibilities:
- To understand the risks undertaken by the Bank and ensure that they are appropriately managed.
- To develop risk policies, limits and procedures after assessment of the Bank’s risk bearing capacity.
- To identify, monitor and measure the overall risk profile of the Bank.
- To verify models used for pricing complex products and transfer pricing.
- To review the risk models as development takes place in the markets and also identify new risks.
- To ensure that the risk policies developed clearly spell out the quantitative prudential limits on various segments of Bank’s operations.
- To build stress scenarios and measure the impact of unusual market conditions and monitor variance between the actual volatility in portfolio values and those predicted by the risk measures.
- To monitor compliance with various risk parameters by business lines.
- To hold the line management accountable for the risks under their control.
- Apprise the Board of Directors on significant issues affecting Risk Management in a timely manner.
- To oversee and ensure the implementation of CBO’s guidelines on risk management systems in Banks.

33Annual Report 2019
The members of the Board Risk Management Committee (BRMC): are:
S. No. Name of Director Designation No. of Meetings Attended
1 Mr. Tariq Abdul Hafidh Salim Al Aujaili Chairman of the Board
Risk Management Committee
9
2 Mr. Ahmed Said Mohammed Al Mahrezi Member 8
3 Mr. Mohammed Yousuf Alawi Al-Ibrahim Member 5
4 Sheikh Tariq Salim Mustahil Al Mashani* Member 2
* Sheikh Tariq Salim Mustahil Al Mashani was appointed a member of the Board Risk Management Committee at the Board
Meeting on 27 March 2019. He resigned from this committee on 18 September 2019.
The (BRMC) held 9 meetings in 2019.
6. Board Nomination and Remuneration Committee (BNRC):
The Board Nomination and Remuneration Committee (BNRC) is formed by the Board to ensure that the overall human resources developments at Board of Directors and executive management levels are as per the strategic direction of the Bank.
At a strategic level, the Committee is responsible for reviewing and monitoring the following:
- Nominate qualified persons to assume senior executive management positions for Board of Directors approval.
- Provide succession and development plans for the executive management.
- Develop succession policy/plan for the Board of Directors, at least for the Chairman.
- Prepare detailed job descriptions for the Chairman and Directors.
- Nominate qualified persons to act as interim Directors on the Board in the event of any seat becomes vacant.
- Prepare and review compensation policy of executive management.
- Endorse compensation package (salary, increment, promotion, & bonus) of executive management for Board of Directors approval.
The members of the Board Nomination and Remuneration (BNRC) Committee are: *
S. No. Name of Director Designation No. of Meetings Attended
1 Mr. Ahmed Said Mohammed Al MahreziChairman of the Board
NR Committee6
2 Mr. Mohammed Yousuf Alawi Al-Ibrahim Member 5
3 Mr. Tariq Abdul Hafidh Salim Rajab Al Aujaili Member 6
4 Mr. Faisal Mohammed Moosa Al Yousef* Member 4
* Mr. Faisal Mohammed Moosa Al Yousef was appointed a member of the Board Nomination and Remuneration Committee at
the Board Meeting on 27 March 2019.
The (BNRC) held 6 meetings in 2019.

Annual Report 201934
7. Board Merger Committee (BMC)
The BMC was formed as a temporary committee for the proposed merger with National Bank of Oman. The Board Merger Committee was tasked only with the negotiation and finalization of the proposed merger with National Bank of Oman, following which this specific-purpose Board Merger Committee was dissolved.
The members of the Board Merger Committee are:
S. No. Name of Director Designation No. of Meetings Attended
1 Mr. Ahmed Said Mohammed Al MahreziChairman of the Board
Merger Committee2
2 Mr. Tariq Abdul Hafidh Salim Al Aujaili Member 1
3 Mr. Faisal Mohammed Moosa Al Yousef. Member 1
The (BMC) held 2 meetings in 2019.
8. Directors’ Remuneration and Executives Pay
As all members of the Board are non-executive directors, no fixed salary or performance-linked incentives are applicable. The non-executive directors are paid an annual remuneration and sitting fees for attending the Board / Committee meetings. Directors’ proposed remuneration and sitting fees paid during 2019 are as follows:
Proposed Remuneration
OMR
Sitting Fees Paid
OMR
TotalOMR
Chairman of the Board 14,964 10,000 24,964
Board Members 100,236 74,800 175,036
Total 115,200 84,800 200,000
The Bank’s top five executives are Chief Executive Officer, Chief Retail Banking Officer, Chief Wholesale Banking Officer, Chief Corporate Services Officer and Chief Human Resources Officer have received the following compensation in 2019:
Salaries , Performance Bonus & Others (OMR)
Top five Executives 1,739,988
Incentives other than the fixed payments are linked to the performance. Performance is measured against the preset objective for contribution towards achievement of Bank’s overall goals. The period of services contract for expatriate executives is two years while the notice period for the top executives is three months.
9. Compliance with Regulatory and Control Requirements
The Bank adhered to and complied with all relevant regulatory requirements in the last three years. No penalties were imposed in 2017, 2018 &2019.
Also the Bank complied with all provisions of the Code of Corporate Governance issued by the Capital Market Authority.
35Annual Report 2019
10. Communication with Shareholders and Investors
All financial and non-financial information are disseminated in a timely manner. The management provides regular updates to the market on the Bank’s performance and new developments, besides detailed disclosures in accordance with regulatory requirements and international standards. The management discussion and Analysis Report form part of the annual report.
As part of enhancing Bank Dhofar’s investors’ relations image, the Bank has taken the following steps:
1. The Bank has created a separate section under its website “investors’ relations” where all the relevant information, links, and documents of investors’ interest and relevance are gathered under this section.
2. The Bank has created an email ID: [email protected], which is available on Bank Dhofar’s website under “investors’ relations” section for further communication ensuring attending investors’ and other external stakeholders’ queries on timely basis. The bank receives various queries from external financial institutions and investors’ from time to time.
The Bank publishes its unaudited quarterly and audited annual financial statements and also hosts these and other relevant information on its website (www.bankdhofar.com) and Muscat Securities Market (MSM) website (www.msm.gov.om). The quarterly and annual results are also published in two local newspapers in Arabic and English. These results remain available for the shareholders of the Bank. Bank’s all official news releases are displayed on the Bank’s website.
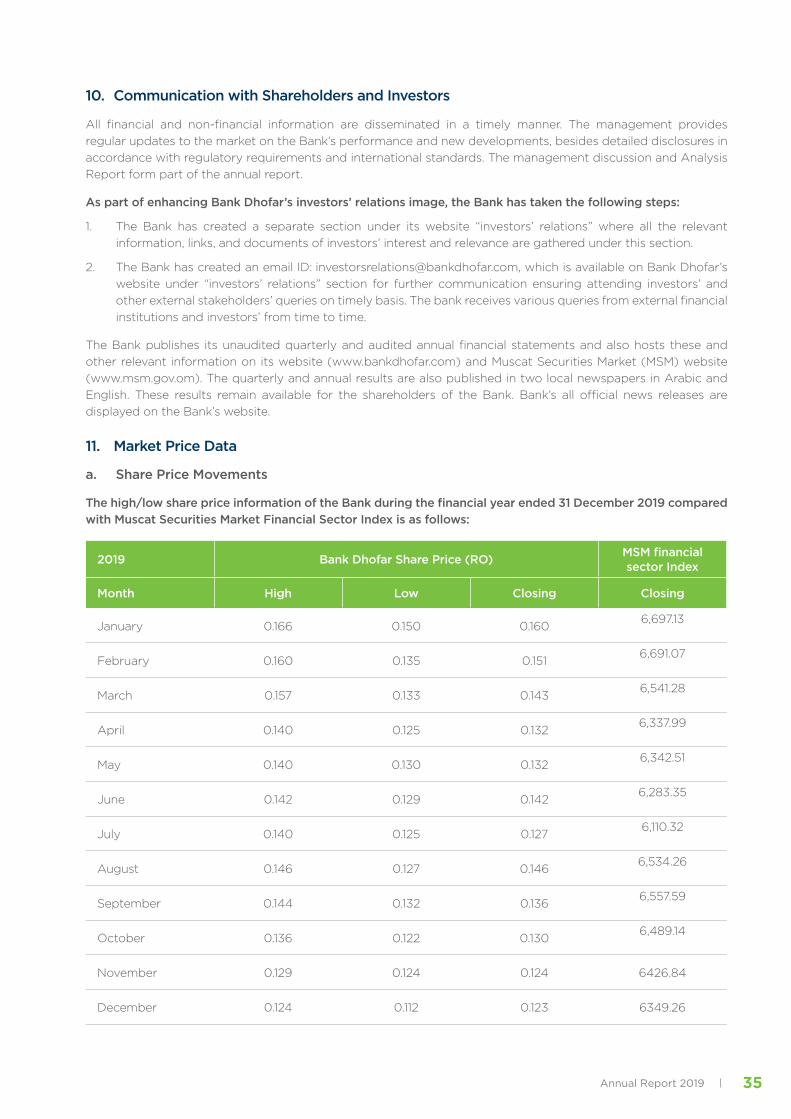
11. Market Price Data
a. Share Price Movements
The high/low share price information of the Bank during the financial year ended 31 December 2019 compared with Muscat Securities Market Financial Sector Index is as follows:
2019 Bank Dhofar Share Price (RO) MSM financial sector Index
Month High Low Closing Closing
January 0.166 0.150 0.1606,697.13
February 0.160 0.135 0.1516,691.07
March 0.157 0.133 0.1436,541.28
April 0.140 0.125 0.1326,337.99
May 0.140 0.130 0.1326,342.51
June 0.142 0.129 0.1426,283.35
July 0.140 0.125 0.1276,110.32
August 0.146 0.127 0.1466,534.26
September 0.144 0.132 0.1366,557.59
October 0.136 0.122 0.1306,489.14
November 0.129 0.124 0.124 6426.84
December 0.124 0.112 0.123 6349.26

Annual Report 201936
b. Major Shareholders
The following are the major shareholders who own more than 5% of the outstanding shares as at 31 December 2019:
Sr.No. Shareholder Percentage of Ownership
1Dhofar International Development & Investment Holding Company (SAOG)
24.38 %
2Eng. Abdul Hafidh Salim Rajab Al Aujaili & his companies
23.45 %
3 Civil Service Pension Fund 10.49 %
4H.E. Yousuf bin Alawi bin Abdullah & his Companies
9.80 %
5 Public Authority of Social Insurance 8.78 %
6 Qais Omani Establishment LLC 6.98%
7 Ministry of Defense Pension Fund 5.25 %
8 Others 10.87%
Total 100.00%
12. Profile of the Statutory Auditors
Pricewaterhouse Coopers (PwC) is a global network of firms operating in 157 countries with more than 276,000 people who are committed to delivering quality in assurance, tax and advisory services. PwC also provides corporate training and professional financial qualifications through PwC’s Academy.
Established in the Middle East for over 40 years, PwC Middle East has firms in Bahrain, Egypt, Iraq, Jordan, Kuwait, Lebanon, Libya, Oman, the Palestinian territories, Qatar, Saudi Arabia and the United Arab Emirates, with around 5,600 people. (www.pwc.com/me).
PwC has been established in Oman for over 40 years and the Firm comprises seven partners, including one Omani national, and over 180 professionals and support staff. Our experts in assurance, tax and advisory professionals are able to combine internationally acquired specialist consulting and technical skills with relevant local experience.
PwC refers to the PwC network and/or one or more of its member firms, each of which is a separate legal entity. Please see www.pwc.com/structure for further details.
The Professional fees paid or payable to auditors for the financial year 2019 is OMR 171,050. This amount represents OMR 100,700 paid or payable for audit services and OMR 70,350 paid for permitted non-audit services. The total audit services fees of OMR 100,700 include an amount of OMR 19,080 paid or payable, as Audit fees and Sharia fees relating to the Bank’s Islamic Banking Window, Maisarah Islamic Banking Services.
13. Other Matters
The last Annual General Meeting was held on 27 March 2019. The meeting was conducted as per statutory requirements and attended by the Chairman, Eng. Abdul Hafidh Salim Rajab Al AujailI and the following members of the Board of Directors: Mr. Ahmed Said Mohammed Al Mahrezi, Mr. Mohammed Yousuf Alawi Al Ibrahim, Mr. Tariq Abdul Hafidh Salim Al Aujaili Mr. Zakariya Mubarak Al Zadjali and Mr. Hamdan Abdul Hafidh Al Farsi & Mr. Faisal Mohammed Moosa Al Yousef.
14. Subordinated Loan (Outstanding and movements during 2019)
1. In May 2017, the Bank availed RO 35 million unsecured subordinated loan for a tenor of 66 months. These facilities carries a fixed rate of interest payable half yearly with principal being repaid on maturity.
2. In September 2014, the Bank availed USD 75 million (RO 28.875 million) unsecured subordinated loan for a tenor of 66 months. This facility carries a fixed rate of interest payable half yearly, with principal being repaid on maturity.
3. Details regarding subordinated loan reserve are set out in note 18(b) in the Notes of the financial statements.

37Annual Report 2019
15. Perpetual Tier 1 Capital Securities
On 27 May 2015, the Bank issued Perpetual Tier 1 USD Capital Securities (the “Tier 1 USD Securities”), amounting to USD 300,000,000. This Tier 1 USD Securities is listed in Irish Stock Exchange (now traded as Euronext Dublin).
The Tier 1 USD Securities constitute direct, unconditional, subordinated and unsecured obligations of the Bank and are classified as equity in accordance with IAS 32: Financial Instruments – Classification. The Tier 1 USD Securities do not have a fixed or final maturity date. They are redeemable by the Bank at its discretion on 27 May 2020 (the “First Call Date”) or on any interest payment date thereafter subject to the prior consent of the regulatory authority.
The Tier 1 USD Securities bear interest on their nominal amount from the issue date to the First Call Date at a fixed annual rate of 6.85%. Thereafter the interest rate will be reset at five year intervals. Interest will be payable semi-annually in arrears and treated as deduction from equity.
On 27 December 2018, the Bank issued Perpetual Tier 1 OMR Capital Securities (the “Tier 1 OMR Securities”), amounting to OMR 40,000,000, denominated in OMR. This Tier 1 OMR Securities is listed in Muscat Securities Market.
The Tier 1 OMR Securities constitute direct, unconditional, subordinated and unsecured obligations of the Bank and are classified as equity in accordance with IAS 32: Financial Instruments – Classification. The Tier 1 OMR Securities do not have a fixed or final maturity date. They are redeemable by the Bank at its discretion on 27 December 2023 (the “First Call Date”) or on any interest payment date thereafter subject to the prior consent of the regulatory authority.
The Tier 1 OMR Securities bear interest on their nominal amount from the issue date to the First Call Date at a fixed annual rate of 7.50%. Thereafter the interest rate will be reset at five year intervals. Interest will be payable semi-annually in arrears and treated as deduction from equity
The Bank at its sole discretion may elect not to distribute interest and this is not considered an event of default. If the Bank does not pay interest on the Tier 1 USD Securities and/or Tier 1 OMR Securities, on a scheduled interest payment date (for whatever reason), then the Bank must not make any other distribution or payment on or with respect to its ordinary shares or any of its Other Common Equity Tier 1 Instruments or securities, ranking junior to or pari passu with the Tier 1 USD Securities and Tier 1 OMR Securities unless and until it has paid one interest payment in full on the Tier 1 USD Securities and Tier 1 OMR Securities. The Tier 1 USD Securities and Tier 1 OMR Securities also allow the Bank to write-down (in whole or in part) any amounts due to the holders of the Securities in certain circumstances.
These securities form part of Tier 1 Capital of the Bank and comply with Basel-3 and Central Bank of Oman Regulations (BM-1114).
16. Acknowledgment
The Board of Directors confirms the following:
- Its responsibility for the preparation of the financial statements in accordance with the applicable standards and rules.
- It has reviewed the efficiency and adequacy of internal control systems of the Bank and that it complies with rules and regulations and internal policies.
- There are no material matters that affect the continuation of the Bank and its ability to continue its operations during the next financial year.
Eng. Abdul Hafidh Salim Rajab Al OjailiChairman

Annual Report 201938
Profiles of theTop 5 Executives
Abdul Hakeem Omar Al OjailiChief Executive Officer
With 30 years of progressive experience in all aspects of banking operations and a strong track record of successful and inspirational leadership, Abdul Hakeem Al Ojaili was appointed as the Chief Executive Officer of BankDhofar in April 2017 to lead the bank through a comprehensive restructure and transformation journey towards achieving an ambitious strategic vision to become the Best Bank in the Gulf.
During his tenure, BankDhofar witnessed constant growth of business and reached remarkable milestones across all units and functions, including Corporate Banking, Retail Banking, Operations Management, Information Technology, Core Banking Systems, Corporate Support Services and Human Resources Development.
Abdul Hakeem heads a number of committees within the bank, including Executive Management Committee, Assets & Liability Committee, Management Credit Committee, Management Risk Committee, Information Technology Committee and Investment Management Committee.
Abdul Hakeem holds a Master’s Degree in Banking Management from the University of Exeter in the UK and a Bachelor’s Degree in Business Administration, Marketing & Management from New England College in the USA. He is also an alumnus of both Harvard and London Business Schools’ Executive Education Programs, and he was cross-posted to work on key assignments with a number of international banks.

39Annual Report 2019
Ahmed Said Al IbrahimGeneral Manager & Chief Corporate Services Officer
Ahmed Al Ibrahim brings in a wealth of experience accumulated throughout over 25 years in the banking and finance industry. Prior to his appointment as BankDhofar’s General Manager & Chief Corporate Services Officer, he has been mandated with various key assignments across different functions and business units including Management, Sales and Marketing, Government Banking, Quality Assurance, Investment Banking and Priority Banking.
Ahmed is the head of the Bank’s Asset & Liability Committee, Executive Management Committee, Investment Management Committee and he is the Chairman of the Purchase Committee.
Ahmed holds an MBA from the University of Hull in the UK and a Bachelor’s Degree in Mass Communication from Sultan Qaboos University. He also attended the Executive Leadership Programs at the London Business School and several other programs in Management, Business and Banking.

Annual Report 201940
Faisal Hamad Al WahaibiGeneral Manager - Strategic Business Officer
Faisal Al Wahaibi is the General Manager & Chief Strategic Business Officer at BankDhofar.
Faisal has more than 26 years of experience in Strategic Planning, Relationship Management, Customer Experience, Budgeting, Planning, Funding, Regulatory Affairs, Outsourcing and Restructuring, Cost Control and Reduction, Sales, Marketing, Distribution, Staff Development, telecommunications, Operations, Retail and Accounts. He is a member of the Bank’s Asset & Liability Committee, Executive Committee and the Projects Steering Group Committee.
Faisal holds a Bachelor’s Degree in Marketing from the University of Missouri, USA. He is also an alumnus of Harvard Business School, having completed the Advanced Management Program 192. He is listed in the list of Leading Practitioners in Financial Services Industry by the Asian Banker Excellence in Retail Financial Services Council and is certified in Risk Management by IIR Middle East.

41Annual Report 2019
Kamal Hassan Al MurazzaGeneral Manager & Chief Wholesale Banking Officer
Kamal Al Marazza is an experienced banker with over 19 years of experience in Corporate Banking, Relationship Management, Sales and Marketing, Risk Management and Business Strategy. Prior to joining BankDhofar, he served in a couple of banks and financial institutions across Oman, including HSBC and Bank Sohar.
In addition to his post as the General Manager & Chief Wholesale Banking Officer, Kamal heads the Disciplinary Committee and he is a member of a number of committees within the bank including Assets & Liability Committee, Management HR Committee, Management Credit Committee and Management Risk Committee.
Kamal holds a Bachelor’s degree in Marketing from Saint Louis University in USA, and he attended Harvard Advanced Management Program, in addition to several specialized banking programs locally and internationally.
Annual Report 201942
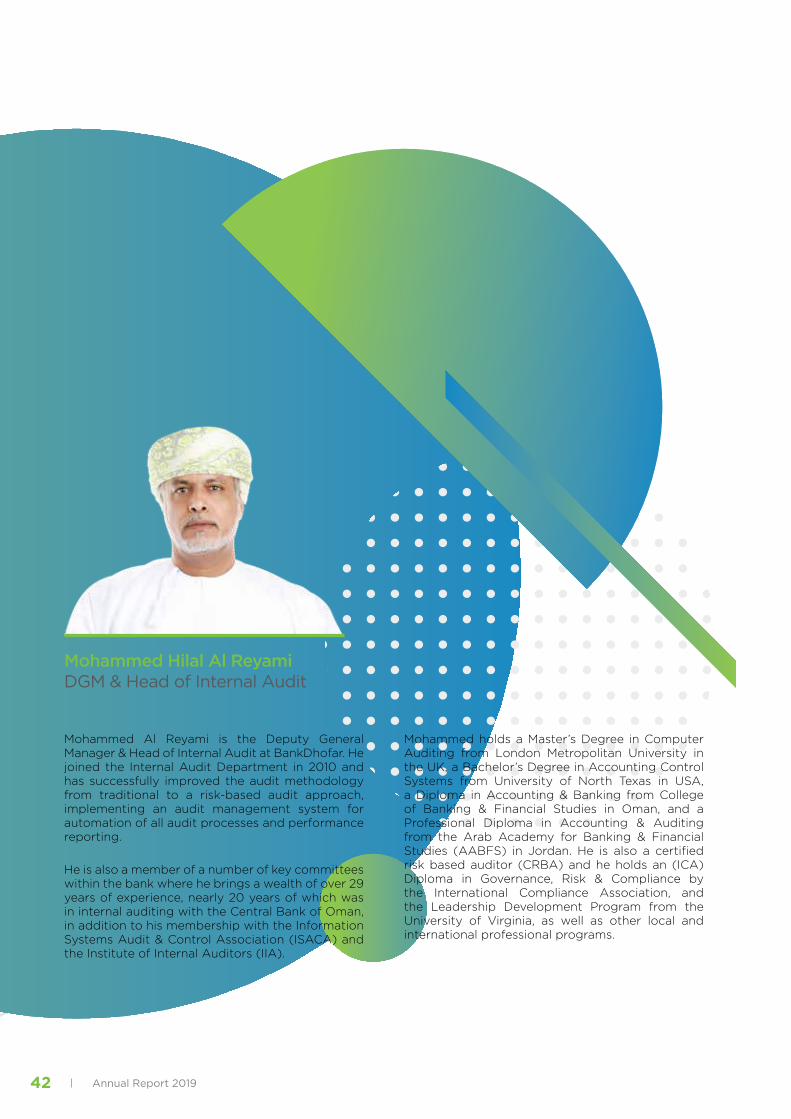
Mohammed Hilal Al ReyamiDGM & Head of Internal Audit
Mohammed Al Reyami is the Deputy General Manager & Head of Internal Audit at BankDhofar. He joined the Internal Audit Department in 2010 and has successfully improved the audit methodology from traditional to a risk-based audit approach, implementing an audit management system for automation of all audit processes and performance reporting.
He is also a member of a number of key committees within the bank where he brings a wealth of over 29 years of experience, nearly 20 years of which was in internal auditing with the Central Bank of Oman, in addition to his membership with the Information Systems Audit & Control Association (ISACA) and the Institute of Internal Auditors (IIA).
Mohammed holds a Master’s Degree in Computer Auditing from London Metropolitan University in the UK, a Bachelor’s Degree in Accounting Control Systems from University of North Texas in USA, a Diploma in Accounting & Banking from College of Banking & Financial Studies in Oman, and a Professional Diploma in Accounting & Auditing from the Arab Academy for Banking & Financial Studies (AABFS) in Jordan. He is also a certified risk based auditor (CRBA) and he holds an (ICA) Diploma in Governance, Risk & Compliance by the International Compliance Association, and the Leadership Development Program from the University of Virginia, as well as other local and international professional programs.

MANAGEMENT DISCUSSION& ANALYSIS REPORT FOR THE YEAR ENDED31st DECEMBER 2019

Annual Report 201944
Economic Scenario and Outlook
The Financial Year 2020 Oman budget represents the final year of the Ninth Five-Year Development Plan (2016-2020) and paves the way for the Tenth Five-Year Development Plan (2021-2025) which underpin the Oman Vision 2040 development objectives. The budget sets a prudent and measured tone in both its revenue and expenditure projections with a resultant deficit of OMR 2.5 billion. Revenue is budgeted to increase by 6% to OMR 10.7 billion (cf. FY19 OMR 10.1 billion), with oil & gas revenue representing c.72% (OMR 7.7 billion). The FY20 revenue forecast assumes a precautionary average oil price of $58 per barrel, which was also used as the basis for the FY19 budget, despite the fact that actual realized oil price in FY19 was $65 per barrel. Expenditure is budgeted to increase by 2% to OMR 13.2 billion (cf. FY19 OMR 12.9 billion), with a commitment to complete a number of strategic infrastructure projects to help incentivize economic growth. There is continued focus on the need to enhance the contribution of non-oil revenue, and the budget includes allocations for the five sectors identified by the National Program for Enhancing Economic Diversification (Tanfeedh): manufacturing, logistics, tourism, fisheries and mining. The Government acknowledges that revenues from these sectors depend significantly on private sector investment and is committed to improving the business environment to facilitate this. In addition, the Government appears keen to outsource other services and projects to the private sector to further ease expenditure and with the aim of bringing improved efficiency and cost savings. GDP grew by 2% in 2019 and is expected to grow by 3% in 2020. Inflation for the period January to November 2019 stood at 2% and is expected to remain low during 2020.
Wholesale Banking Group
BankDhofar provides wide range of customized products & services to its customers. The Bank endeavors to be the most preferred, professional and reliable corporate financing bank in Oman. The Bank’s aim is to deliver superior service to customers, through a team of experienced professionals. Wholesale Banking department continued its transformation journey with core values of “Transparency”, “Innovation” and “service excellence” in line with Bank’s commitment to be the Best Bank in Gulf.
Wholesale Banking Group (WBG) consists of the following departments/units:
(1) Corporate Banking
(2) Business Banking & Payment and Cash Management Services
(3) Corporate Advisory & Investment Banking
(4) Treasury & Financial Institutions
(5) Government Banking
(6) Wholesale Banking -Projects & MIS
Wholesale Banking department always undertake new initiatives with customer centric approach and strive to provide Best in Class Service. Wholesale banking deparment’s initiatives on digital transformation and incorporation of new technologies for corporate finance & trade finance solutions intended to offer more products of better quality with excellent user experience.
Corporate Banking Department
Corporate Banking Department plays a vital role in Wholesale banking Group by focusing on specific segments of emerging Corporates and well established businesses. Project finance and syndications department forms part of Corporate banking and has a dedicated team of professionals to arrange, syndicate and participate in various infrastructure and industrial projects like “Power & water projects, Oil & Gas industry, Roads, Petro chemical projects etc.”. The corporate customers are serviced through dedicated and experienced relationship teams.
With the growing importance of Small & Medium Enterprises (SME) for a vibrant economy, BankDhofar has formulated strategic initiatives for SME sector. The customers in this segment are serviced by dedicated business relationship managers to provide appropriate financing solutions. Bank is extending services by spreading out its delivery channels and by leveraging the technology in reaching out to SME customers across the country.
BankDhofar’s extensive range of wholesale banking products and services helps to manage the liquidity of businesses efficiently.

45Annual Report 2019
Business Banking Payments & Cash Management Services Department
Payments & Cash Management Services is part of Business Banking department and provide cash management services designed for the management of incoming and outgoing cash flows. Such services includes “collection of revenue, disbursement of expenses/ payables, tracking as well as investment of surplus funds etc.”
Corporate Advisory & Investment Banking Department
Corporate Advisory & Investment banking department offers specialized services of strategic advisory to various industry sectors in the country viz., Oil & Gas, Telecom, Financial Institutions, Steel, Power & Utilities, Textiles and SMEs by providing tailor-made solutions & products. The products on offer includes “corporate and asset level organic and inorganic growth/exit strategies, mergers, acquisitions, distressed debt restructuring advisory, management buy-outs/buy-ins, capital raising, capital structure, private placements, start-ups, joint ventures and business re-engineering”. The department also has been providing clients with brokerage related services for dealing in investment securities (both equities & bonds) listed on the Muscat Securities Market (MSM) along with other services like EZ Trade (a service which allows clients to trade MSM securities online).
Treasury & Financial Institutions Department
Treasury & Financial Institutions Department offers specialized services to corporate customers to meet their forex requirements and cross border financial needs. Treasury department is one of the leading market makers in local currency and swaps. The business solutions includes “Hedging solutions, Market research, Money market and Financial Institutions”.
The bank’s corporate and retail clients have access to the world, through a wide network of leading correspondent banks. The Treasury & Financial Institutions department actively assists the bank’s corporate customers in meeting their global trade finance related requirements.
Government Banking Department
Government Banking Department within wholesale banking group offers all banking products and services to Government / Quasi-Government clients through dedicated resources as a separate channel. This ensures providing quick customer service and meeting unique requirements of Government customers & Ministries with varied financial service needs.
Thus, the bank offers a suite of products to meet the various business needs of all the Bank’s customers.

Annual Report 201946
Retail Banking Division
The Retail Banking Division (RBD) at BankDhofar continued providing value-added products and services to
the customers.
During the year 2019 as part of BankDhofar’s “Together 2020” journey the Bank renovated and relocated few
branches ensuring that the design is standardized across branches network and aiming to enrich customer
experience at the branches. The Bank also introduced extended banking hours in key branches to serve customer in
best possible manners beyond normal banking hours. BankDhofar introduced first of its kind “Drive Thru Banking”
in Oman at Seeb branch, unique experience for the customers. BankDhofar has wide distribution network across
Sultanate of Oman with an aim of making banking services available to all customer segments across the country.
The network includes 70 branches and 1 corporate center, 61 conventional banking branches and 10 Maisarah
Islamic Banking.
In 2019, Bankdhofar provided a special offering to the employees of targeted organizations. The bank continued
providing best customer service in Oman and ensuring quick turnaround time for loans transactions, customers
campaign continued to own new home within 5 days at competitive and affordable pricing in housing loan
category. In January, the new saving scheme was launched. BankDhofar offered a daily prize; where 1 customer/
per day won OMR 1,000, weekly prizes where 10 customers/ per week got the chance to win OMR 1,000 each,
and one lucky customer/ per month got the chance to win OMR 10,000 in the monthly prize, in addition to the
grand prize worth OMR 50,000 for one winner. For the special occasion prizes, 5 customers got the chance to win
OMR 1,000 each in the Omani Women’s Day prize draw, 5 customers got the chance to win OMR 1,000 each in
the Renaissance Day prize draw, 10 customers got the chance to win OMR 1,000 each in the Back to School prize
draw and one lucky customer got the chance to win OMR 49,000 the National Day prize draw. As for Al Riadah
customers, one customer won in each of the monthly draw worth OMR 25,000, quarterly (3 quarters/ 3 winners
per year) worth OMR 100,000 and grand prize draw worth OMR 250,000.
BankDhofar launched the saving plans scheme for education and retirement to encourage customers to deposit
for their kids’ education and their retirement on attractive rates.
BankDhofar continued to offer a diverse selection of insurance packages such as Personal Accident insurance
and Motor insurance. The bank functions here as an insurance agency and provides these services to meet
customers’ needs.
Corporate Services Division
The Corporate Service Division is the backbone of the Bank, and looks into all the operations aspects, which
supports the business units. The division ensures the best customer service experience towards the internal and
external customers. Under this Divisions, are various other departments who foresees various service excellence
in a consistent way.
The departments under Corporate Service are:
• Marketing and Corporate Communications (M&CC)
• Transformation Department
• Digital Banking and Information Department
• Logistics, Procurement and Premises Department
• Operations & Support Services
These Departments have further been divided into units who look into specific functions catering to the Best
Customer Service Experience. As stated a short brief has been given about the various departments and units,
explaining about their services, achievements and any new units added.
Marketing and Corporate Communications (M&CC
47Annual Report 2019
Marketing and Corporate Communications (M&CC)
Marketing and Corporate Communications Department looks into bringing the visibility of BankDhofar brand through events, activities and campaigns.
- With the aim of enhancing the presence of BankDhofar brand, Marketing and Corporate Communication Department conducted a number of campaigns that aimed at brand visibility, including; national celebrations with the public, along with social media campaigns.
- Additionally, M&CC department maintained the strong presence of BankDhofar brand in Muscat International Airport and Salalah Airport through the jet bridges.
- To keep up with the brand visibility, the department oversaw the renovation of branches network to ensure standardized design across all branches of BankDhofar.
- M&CC conducted awareness campaigns for BankDhofar and Maisarah customers. These campaigns aimed at raising the awareness among customers about the state-of-the-art products, services and financial solutions provided by the Bank. The campaigns targeted customers through various touch points including social media and digital channels, and events
- The department conducted comprehensive Savings Account Scheme and Prize Account Scheme campings, through digital and social media channels as well as through organizing various prize draw events. The campaigns aimed at instilling saving habit among different segments of the society.
- A comprehensive Digital Banking Campaign was conducted digitally. The campaign aimed at informing the customers about the cutting edge digital services of BankDhofar.
- M&CC department also looks into the corporate social responsibility events and initiatives, as BankDhofar strives to ensure that its contributions are carefully planned in order to diversify and reach out to the maximum number of people, especially those in need of it to make a meaningful change in the society. In 2019, the Bank provided support to a number of charitable organizations.
- To further extend its social involvement and community outreach, the Mujtamaie volunteer team from BankDhofar visited inpatient children at the Royal Hospital, Sohar Hospital and Sultan Qaboos Hospital Salalah. The team handed over toys and presents for the inpatient children to lift up their spirit.
The department also foresees the overall communication strategy, media relation and internal communication. In order to enhance its internal communication strategy and ensure circulate effective messages to employees, the department continued internal campaigns including “Go Green” with Lean process campaign. Additionally, in order to keep the staff updated with the initiatives the department continued sharing the updates of various achievements and event coverages through Internal Announcement communication and BankDhofar Whatsapp. M&CC continued sharing quarterly updates through BD TV initiative. Marketing and Corporate Communications Department provides required support to other business units.
Financial Inclusion Initiatives
1. BankDhofar
As part of Financial inclusion initiatives, Marketing and Corporate Communications has taken the responsibility to communicate to all individuals and businesses owners various retail products and services that meet their needs and are delivered in responsible and sustainable ways such as; awareness campaigns (segment-wise), sponsorship events, newspapers’ press releases and advertisements, social media coverage …etc.
M&CC has also optimized its spending verses exposure and focused on being visible in big way especially in high traffic areas, main high ways, most visited spots in order to enhance BankDhofar brand visibility and ensure customer recall. The M&CC backed this strategy up with the strategic tie-up with Muscat and Salalah International airports where BankDhofar will have the highest exposure in these two important avenues in addition to selecting the best and highly visible outdoor locations across the sultanate in order to attract population to the bank.
Annual Report 201948
Social Media channels were essential in promoting products and services and different offerings in addition
to utilizing corporate communications tools in highlighting BankDhofar’s news and updates. The awareness
campaigns don’t only target existing customer base, but they cover general population to encourage public to
join BankDhofar.
In addition to the awareness campaigns related to products & services, the bank has continued supporting
community related social top-notch events such as; Muscat Festival, Salalah Tourism Festival, Sports events and
supporting SMEs exhibitions in order to make financial products and services accessible and affordable to all
individuals and businesses.
BankDhofar has a branch network of 59 branches (designed appropriately to entertain disabled customers) across
Oman to cover all demographics for customer banking ease. Key branches have extended hours till 9:00pm to
meet customers banking requirements after normal banking hours.
Apart from the current customer segments, the bank has introduced benefits to different segments to attract
more customers to the bank.
In order to assure higher consumer engagements and retention, BankDhofar has one of the best mobile banking
application which is 24/7 accessible for real time multiple transactions to migrate customer to mobile banking
platform.
The Bank is in the process of introducing CRM platform across its branch network to help the Bank focus on
customer acquisition and encouraging more customer to bank while offering the best customer experience and
better cross-sell to the existing ones.
Finally, the staff are trained regularly on multiple aspects of banking specially on selling skills and products available
for each segment to ensure effective customer acquisition.
2. Maisarah Islamic Banking Initiatives
Maisarah constantly works on various awareness campaigns to increase the knowledge of Islamic banking in
general and Maisarah in specific, which will help us to get more customers on board as well as working with
entities and promoting conferences whereby special focus on Islamic banking is being created in the market.
They are continuing “did you know” posts on social media to increase the awareness on Islamic banking products
in the market as well as having intensive mobile banking app campaign to bring in more customers to the mobile
banking channel.
Furthermore, they launched the annual Prize Account Scheme and conducts the prize draws in various locations
every month thereby increasing the awareness of Maisarah’s products to the population. These draws are
announced via social media and press releases periodically to assure awareness of the product.
Additionally, various projects are in progress and in different stages such as remittances, POS, Corporate Cards,
which will surely bring in more customers to Maisarah.
Maisarah’s staff members are continuously trained and encouraged to market and cross-sell its products, thereby
increasing the customer base of Maisarah.
Maisarah is in the process of rolling out branches as well as relocating some of the existing branches, open kiosk
and commission mobile branch. This will help us to increase the foot print in locations where the Bank do not have
presence or further penetrate into the market which will be contributing to reaching out to potential customers.
They are in discussion with Awqaf to help set up a process which is expected to bring in more than 40,000
beneficiaries of zakah to the banking system which includes banking system beneficiaries.

49Annual Report 2019
Digital Banking & Information Department
‘Digital Banking & Information’ Group comprises of
- Information Technology
- Alternate Delivery Channels
- Cards Centre
- e-Payments
- Centre of Innovation and Information
- Information security
The Information Technology at the bank owns the technology strategy, application systems, digital channel
systems and infrastructure; delivering services to support the bank’s operations, growth and transformation.
As part of BankDhofar’s transformation journey, the Bank restructured the division in 2019 aligning with the
enterprise strategy and in order to spearhead the strategic transformation initiatives for realizing BankDhofar’s
vision to be the best bank in the gulf. The Bank has organized highly focused departments covering technology
transformation, operations and infrastructure.
There have been a number of major technology initiatives in 2019 encompassing the implementation of:
• New business systems,
• Digital transformation programs
• Renewals and enhancements of several critical applications.
The bank continued its technology leadership by pioneering digital transformation and customer experience
programs resulting in a number of international and national recognitions and awards in the areas of digital
transformation, customer experience design and business process automation.
The bank continued its focus on digital transformation and innovation that helped in further enhancing the services
on digital channels as well as introduce latest technologies.
1. BankDhofar became the first bank in Oman and among the first in the region to partner with an international
Fintech to offer instant cross border remittances leveraging the blockchain based platform.
2. The bank became the first in the world to offer cardless ATM services to its customers using mobile number,
besides being the first bank in Oman to have contactless ATM services for Visa cardholders from Oman and
around the world. Contactless acquiring terminals were also rolled out to point of sale merchants through
implementation of a new in-house POS system.
3. Some of the other initiatives during the 2019 year included the:
• Roll-out of advanced Multi-function kiosks (MFK) for self-service,
• Introduction of new services such as cheque book printing,
• QR code-based payments and transfer through mobile, based on the CBO’s new services launched on the
MPclear switch.
4. In addition, the bank implemented an advanced Omni Channel platform to redefine the digital channel experience
for customers. During 2019, the bank also undertook the implementation of a new strategic initiatives including:
• CRM application to support the customer relationship management strategy
• Oracle Enterprise Resource Planning (ERP) platform to support Finance and Procurement transformation
initiatives.

Annual Report 201950
• The implementation of the enhanced business process automation platform iBPS to support the lean
operational excellence initiatives
• Rollout of several new modules and automated processes resulting in enhanced customer service, reduced
turnaround times and at the same time improving controls and process transparency.
• The Initiation of Core Banking Upgrade
• Regulatory technology was another focus area during 2019 with the implementation of an advanced IFRS 9
system and upgrade of systems for enhanced asset-liability management and funds transfer pricing capabilities.
There are a number of other technology initiatives currently in progress aligned to the transformation goals and vision.
In 2018, the bank set up the centre of innovation to lead identification, qualification and prioritization of new
innovative ideas for implementation by leveraging internal ideations, external partnerships as well as crowdsourcing.
Alternative Delivery Channels
Alternative Delivery Channels enable BankDhofar customers to access banking services easily via new, convenient
and innovative electronic channels (e-channels) which are available 24/7.
In 2019, Alternative Delivery Channels have successfully enhanced BankDhofar Mobile Banking App to be more
user friendly with added features including; cardless ATM services through mobile banking, Fibre net payment for
(Awsar) users.
Additionally, the team has upgraded Maisarah Islamic Mobile Banking Services with unique services for customers,
new upgrade to the mobile wallet system which provide services to the banked and non-banked customers.
Maisarah Mobile Banking App enables customers to conduct a number of services including:
• Tasded bill payment.
• Transfer funds within their accounts and third party’s accounts in Maisarah
• Instantly transfer funds to a valid ATM card number of another local bank within Oman
• Cardless cash
• Mobile top-up (OmanTel, Ooreedoo, Friendi and Renna).
The App also offers:
• Prayer timings
• Locate the Qibla direction.
In translation of its efforts to provide best customer experience through BankDhofar e-channels the unit received
a number of international and regional awards including;
• Best Mobile Banking Application in Oman 2016 at the World Finance Digital Banking Awards.
• Best Digital Bank in Oman 2016 at the World Finance Digital Banking Awards.
• Best Mobile Banking Application Oman 2019
BankDhofar has launched a new platform which is an updated core banking system (Omni Channel) as this is an
upgraded core banking channel will be able to link all channels in one platform with a new look and feel for the
customer and new experience for BankDhofar customers.
The Bank has also launched cardless banking service through ATMs. The first-of-its-kind service in the world,
enables customers to conduct ATM transactions easily by only using BankDhofar Mobile Banking App.

51Annual Report 2019
Other units within the departments have seen a number of achievements during 2019, including:
Contact Center
1. Preparation and Approval for the Transformation Journey Roadmap, Organization Chart, Job Descriptions,
KPI and Location Design
The Basic Critical Steps are prepared and the approval is received to generate profits, deliver superior cx,
and work efficiently including self service
2. Preparation and Approval for Outbound and Retention Pilots
Initiate the basic steps for sales and profit focus
3. Establishment of the Antifraud Team, Digital RM concept with OCH off line requests, POS Helpline Support,
Mobile Wallet, CRM Implementation Contribution
Initiated solid actions to add additional activities
4. Employee Engagement and Investment in Skillset Development Activities to increase the employee morale
which in turn impacts the customer service
Investment in employee engagement activities like monthly celebrations, public appreciation, off-site team
building activities, revisiting all the employee experience points
Training staff on LSS and starting the projects, Rotation, Digital RM and other initiatives.
5. Very Good Rating from Internal Audit Department
6. Follow up and completion of CRs in Collection, IVR, Queu Management
E-payments unit was set up in 2018 to focus on capitalizing and building on existing payments services as well as
leveraging digital payments opportunities. In 2019, the unit has achieved the following:
1. Sign Oman Air as an eCommerce Merchant
2. Sign the Godoba travel company as an eCommerce merchant.
3. Develop a partnership with Sale (now known as Channels) see them transfer c. OMR 3 million company
funds to the bank.
4. Signing of an MOU with TelyPay, a local Fintech supported by the Oman Technology Fund.
5. Develop partnerships with Sohar University and Thawani.
6. Initiate Data Analytics pilot with AFS to gain a better understanding of BankDhofar Credit card portfolio
Information security
Achieved the re-certification & compliance with latest version of PCI-DSSv3.2 information & cyber security
standard. Completed PCI-DSS security testing activities including external & internal vulnerability assessment
scans, external & internal penetration testing, web application penetration testing, network segmentation testing,
card tipper scans and Wi-Fi access scans.
Achieved the re-certification & compliance with latest version of ISO 27001:2013 information & cyber security
standard. Ensured continuous compliance of ISMS documentation & implementation of ISO 27001:2013 standard
covering 14 information security domains and 114 information security controls (viz. technical, process, people,
management, etc).
Completed comprehensive annual IT-cyber security assessment exercise for Bank’s IT infrastructure covering
external vulnerability assessment & penetration testing, internal vulnerability assessment & penetration testing,
web application penetration testing, technical security review – security testing of ATMs/CDMs/POSs, network
security architecture review, configuration review of network/security devices and social engineering testing.

Annual Report 201952
Completed security assessment and testing activities for bank-wide new transformation projects/systems in coordination with EPMO & IT teams including OCH internet banking system, ERP system, CRM system, iMal core upgrade system, IFRS system, BD career website and treasury system.
Implemented real-time 24x7 anti-phishing & brand monitoring services covering anti-phishing monitoring for internet banking, mobile application monitoring, social media monitoring
Central Operation Division (COD)
Central Operations Department (COD) plays a major role in handling back-end operations, thus enabling the branches and business units to focus on customer service and business development. The volume of transactions processed at COD continues to grow in line with the Bank’s overall business growth. Continuous efforts are being made to redesign and simplify the processes by implementing lean sigma concepts, effective utilisation of technological solutions and thus increasing the staff productivity.
Key Projects Implemented by COD in 2019:
Enhancement of Cheque Return System. CBO has enhanced the process of reporting cheques return data in the Cheques Return System.
As a part of the digital initiative of the Bank, uploading of Cheques Return data, have been automated through Robotics application.
Many staff in COD have successfully completed Lean Sigma Yellow Belt projects, related to COD functions, thus simplifying the daily operations. Some staff have taken up Green Belt projects, which will be implemented in the year 2020.
Summary of initiatives completed during the year is given below:
Summary of Initiatives Completed in 2019 Number
Processes Automated 4
Processes Re-engineered 8
Business Continuity Management (BCM)
In terms of regulatory requirements, Bank has in place Business Continuity and Disaster Recovery Planning aiming at continued operations and customers services at all times. Bank undertakes reviews and methods to ensure its capability to meet the contingency arising out of any unforeseen disasters, technological failures and various other threats. In this regard, the Bank has taken number of measures to strengthen the BCM implementation in the Bank. The key initiatives include:
• An exclusive Business Continuity Management (BCM) Department has been set up under Risk Management Division to deal with such as identification, assessment of risks, reporting of BCP activities, conducting BCP testing, organizing BCM awareness programmes, issuing alert staff during adverse weather conditions, maintaining updated BCP document, conducting quarterly BCM Committee meetings, addresses regulatory and compliance /audit issues etc.
• Risk Assessment exercise is undertaken on annual basis to review the BCP related risks and mitigation requirements. Business Impact Analysis (BIA) exercise is conducted on half yearly basis to identify and assess BCP back-up requirements by interacting with nominated Business continuity coordinators.
• Bank has set up an exclusive BCP Steering Committee, entrusted with the responsibility of overseeing BCM implementation and maintaining a sound BCP for the Bank. The Committee is reporting to Board Risk Management Committee (BMRC). The Committee is meeting on quarterly basis to review that BCP formulated across the Bank are implemented and tested.
• Bank has set up state-of-art an alternate BCP site at Knowledge Oasis Oman (KOM) campus for resuming critical business activities in emergent scenarios. In the same location, Bank has also set up secondary Data Back- Up Center as part of Bank DR Plan.

53Annual Report 2019
• Various BCP testing are adopted to ensure that the Business Continuity Plan is logical and practically feasible.
As part of this testing plan, Bank undertakes two major types of testing 1. BCP Simulation testing under partial
disruption scenario (what if current work location is not available) and 2. IT DR Drill under full disruption scenario
(Primary data centre not accessible / unavailable scenario). During the year under review, Bank has conducted
annual BCP Simulation testing (Oct 2019) and Disaster Recovery drill testing (Dec 2019) at the newly set up
BCP Site, to test check people, systems and other capabilities are working expected levels.
• Besides this, Bank conducts several other types of BCP testing such as Database back up testing, Back Up
branches testing, etc. to test the adequacy of systems and business resumption procedures in various disruption
scenarios. And also the Tabletop testing exercise is conducted to cross verify the preparedness of Business
continuity leaders.
• In terms of disaster recovery and safety measures, fire drills are conducted to test the preparedness of the staff and
to improve the recovery capabilities in line with the recovery strategies. Floor leaders /Fire wardens are nominated
and trained in fire prevention and important procedures that need to be followed in the event of an emergency.
• Staff are provided periodical training on BCM aspects. Different programmes are customized to cater to the
different target groups. Importantly, during the period under review, customized specialized BCM Training
Programmes have been organized for Board members, Senior Management, Heads of Department and Business
Continuity Leaders. Also BCM e-module has also been launched to benefit all end users to undergo mandatory
BCM programmes at their convenience either at office or at home. Also, as part of promoting BCM Awareness,
new innovations are introduced such screensavers containing BCM Messages and BCM Gifts with embossing
BCM contents.
• Bank is in the process of obtaining BCM – ISO 22301 Quality Certification. Currently Gap analysis along with
Corrective Action plan are implemented to strengthen the BCM capabilities, prior to obtaining Certification.
• The communication numbers of key persons are provided to all the staff so that they can contact the relevant
person in case of emergency. The contact detail of key officials are provided below:
Position Contact information(+968 prefix)
Head of BCM Steering Committee – Acting AGM and Head of Ops & Support Services
24 790 466 - Ext:215 GSM: 9923 5197
Acting Head of Risk Management24 790 466 Ext: 752, 24797246
GSM: 99645641
Senior Manager - BCM24790466 Ext. 754;
GSM 95763521
Business Continuity Planning (BCP)
Business Continuity Management is the implementation and management of preventative measures, planning
and preparation to ensure the Bank can continue to operate following an incident, significant unplanned event or
major operational disruption. The Bank ensures that its systems and procedures are resilient to ensure business
continuity through potential situations of failure. Bank has adopted Business Continuity / Disaster Recovery Plan
with a view to continue business operations and critical customers services at all times both at Conventional and
Maisarah. The plan addresses employee health and safety, potential disruptions from the unanticipated loss of
services or infrastructure and resumption of business operations in the face of an emergency or disaster. Business
Impact Analysis, Business Continuity/ Disaster Recovery testing, Awareness Programs etc. are conducted in tune
with the regulatory guidelines for meeting any unforeseen circumstances. The key initiatives on the business
continuity readiness included the following:
• Business Continuity Management (BCM) Steering Committee, a Management level committee has been set up
and entrusted with the responsibility of overall supervision for the implementation and maintaining a sound BCM for the Bank. The committee ensures that plans formulated are implemented and tested.

Annual Report 201954
• The Bank maintains an alternate / Business Continuity Plan (BCP) site equipped with redundancy and contingency features to ensure business continuity for resuming critical business activities in emergent scenarios. Bank has strengthened BCP site seating capacity and infrastructure considering various worst case scenarios. Additional workspace has been created for critical business units to resume business services in the event of a disaster.
• The Bank-wide BCP testing exercise and Information Technology Disaster Recovery Drill is conducted to test check the resilience of technical as well as business recovery. Testing was conducted in coordination with business units to test check transaction systems using business test cases and also to test the preparedness, recovery of applications, recovery timings, assembly of key resources, functioning of equipment’s, coordination of business units / branches etc. The testing results along with the gaps and action taken are apprised to the risk committees at the Management and Board level.
• For the cause of human safety and security, fire drill exercises are also conducted in Head Office building. Through fire drills, the preparedness and recovery capabilities of the coordinators /floor leaders /fire wardens are tested and security procedures are reinforced.
• As part of creating awareness, specific as well as comprehensive awareness programme are also conducted to imbibe the importance of BCP amongst staff.
• The communication numbers of key persons are provided to all the staff so that they can contact the relevant person in case of emergency.
Credit Administration Department
Credit Administration Department “CAD” is the backbone for the lending related operations of the Bank. CAD department structure is formulated in a manner to accommodate post sanction operational process. This pertains to limit maintenance & disbursements, controlling of facilities & collateral documentation, pricing management & lodgment of security documents etc. These activities are carried under specific units allocated for Large Corporate Division, Business Banking and Retail Banking. Each of the units comprises of portfolios handled by portfolio holders and team leaders who are managed by a specialized unit manager.
These units are entrusted with the tasks to carry out the post sanction activities such as identifying the borrowers legal structure and validate and review the KYC documents , Identify, value, and prudently classify and record the collateral, attach Bank’s security interest in the collateral module and perfect the lien position in the collateral and also managing legal agreements , preparation of Covenant Compliance Reports, Key Risk Indicator monitoring and other monitoring tools to manage the loan portfolio. An additional CAD support unit was formed in the newly established Corporate Centre in Azaiba in providing swift services to the clients in order to reduce the turnaround time for many CAD related transactions.
As a key support procedure for the business segments of Retail and Wholesale Banking, CAD has an established unit for PRO activities, which handles mortgages/joint registrations in Ministry of Housing (MOH), Ministry of Commerce and Industries (MOCI) & Royal Oman Police (ROP) & the unit in coordination with CAD WSB unit liaise with Muscat Security Market for the creation of pledge and release of shares. Additionally, the unit carries in out the preparation of Arabic letters to the external authorities for various requirements such as No Objection Certificates etc.
The Housing Loan Documentation Unit which is allocated under the CAD Retail Segment, carries out custodian services for original housing loan documents and periodical revaluation for the purpose of MIS reporting for Capital Adequacy computation.
CAD has a Branch Support Unit which manages day to day activities which are centralized at the department. The system rights to handle these activities are solely entrusted with CAD. These activities include lien management, classification/de classification end process, blocking/de blocking end process as well as loan rescheduling and pricing related activities pertaining to the retail segment.

55Annual Report 2019
Compliance and MIS
Another key activity handled by CAD is the role as the focal point and carries out the administration of the Oman
Credit and Financial Information Centre (OCFIC) activities previously known as the Banking Credit Statistics
Bureau (BCSB) of the Central Bank of Oman. This unit coordinates reporting, exception management, access
control, complaint management as well as MIS/Regulatory reporting pertaining to the Senior Management of the
Bank. This BCSB unit directs the other related periodical regulatory reporting with the prudent coordination of
divisions such as Business, Finance and Compliance. CAD plays an active role in the CBO’s initiative of establishing
the new Oman Credit Bureau (OCB). The unit is also entrusted with formulating the CAD policies and standard
operating procedures (SOPs).
Personal Development & the future
As a stepping stone for a self-development, CAD originated a intra departmental staff learning & development
section where staff members are given a choice to conduct their own periodical presentations and training programs
to share the knowledge of their respective areas as well as their learnt skills. By initiating this CAD ensures there is
a prudent transformation of knowledge as well as to enhance the presentation skills of the staff member.
As a vision for the future and the rapidly changing business environment, CAD has embarked on re-engineering
and developing of the unit and the processes through Lean Six Sigma and 5s concepts using tools such as Robotic
Process Automation (RPA) and Intelligent Business Process System (IBPS).
Recovery Department
Recoveries Department is established under Corporate Services Division, and is specialized and primarily responsible
in handling and monitoring all Non-Performing Assets. The department is mandated to ensure the implementation
of policies / instructions of the Bank pertaining to the recovery of overdue under all loan and advances.
The main objective of the department is to maximize the recovery by adopting various methods such as;
• Independently validate the grades of classification and adequacy of the provisioning.
• Close follow up with the customers for recovery of past dues before initiating legal action.
• Negotiating for mutually acceptable settlements.
• Re-structuring the classified accounts with definite source of repayments.
• De-classification of accounts in terms of the Bank’s extant instruction and CBO’s regulation in place from time
to time.
• Liaison with Legal Department for demand notices and taking legal action for recovery.
• Regularly monitoring the progress of legal cases with the Bank’s external lawyers.
• Coordinating with Royal Oman Police (ROP) and regulatory bodies to expedite various legal processes and
execution of decrees and court orders.
• Providing information to Court Appointed Experts for the legal action initiated by us.
• Gathering and maintaining market information on assets and investment of defaulters.
• Handling Asset Classification, monitoring security/ valuation of mortgaged assets.
• Validating/ maintaining provisions for Loan Loss Reserve/ Interest Reserve as per CBO/ IFRS9 norms.
• Maintaining effective MIS system.
• Regulatory Reporting – Internal/ External Auditors, CBO Examiners, Internal Departments/ Control functions.
Due to vigorous follow up and timely actions, the department has successfully recovered substantial amount of
non- performing assets during the year and achieved the target despite difficult market conditions.

Annual Report 201956
Policies and Procedures Department
Policies & Procedures department (PPD) continues to maintain an integrated model for linking strategies with
everyday business processes & decision making at every level.
The maintenance of above stated integrated model brought together, standardized and systematized all risk,
control, compliance and governance processes. Further, it helped in improving efficiency of the operational
framework.
PPD mainly undertakes following activities
• Act as nodal department and work closely with Management, Business, Operations, and Others to maintain and
improvise internal governance & control framework of the Bank.
• Ensure that documents are designed to support business strategy & operations and promote sound working
practices.
• Ensure that documents are accurate, clear-cut, presented consistently & uniformly, and easily identifiable &
accessible.
• Ensure that documents are periodically reviewed for accuracy and applicability to address changing business
dynamics.
• Ensure proper review mechanism/approvals are obtained and kept on record.
• Ensure that respective staff of units are provided with updated document through common shared folders
and/or suitable mode of sharing and updated regularly & on timely manner as ongoing process.
Apart from the core activities of developing and reviewing policies & procedures, PPD serves as member to
Management Risk Committee, and continues to contribute significantly in successful implementation of various
projects assigned time to time.
Legal Department
The Legal Department provides legal support and advice to all of the Bank’s departments and branches in
order to safeguard the Bank’s interests and prevent breaches. This is achieved by coordinating with the Bank’s
departments and branches to ensure correct implementation and interpretation of laws, regulations, circulars and
internal policies.
• The Legal Department has grown, and the team includes lawyers and paralegals. Work is streamlined between
the team members to increase turnaround time and quality of the work.
• There has been an increase in the number of case settlements with customers and quicker responses to claims.
• The Legal Department conducts majority of the review and drafting of contracts in-house to protect the Bank’s
interests and minimize risks while also improving quality and turnaround time.
• The Bank’s policies and terms and conditions for both existing and new products are reviewed and updated in
coordination with relevant departments.
• Various committees include participation of the Legal Department.
• The Legal Department coordinates with the Central Bank of Oman, Capital Market Authority, Royal Oman
Police, Public Prosecution and other authorities as required.

57Annual Report 2019
Compliance Division
Compliance activities in the Bank are guided by Central Bank of Oman (CBO) guidelines, local and applicable
international statutory guidelines/ obligations, applicable capital market guidelines & international best practices.
The Board of Directors have established an effective compliance function in the Bank and enforce its activities
through a set of Board approved policies and procedures. While, the first line, guided by Senior Management,
ensures day to day operational management of compliance risk; at the same time, Compliance Division is entrusted
to independently look after effective management of compliance risk in the Bank by conducting periodical
compliance testing, monitoring of regulatory limits, conducting gap analysis with applicable regulatory guidelines,
transaction monitoring, transactions screening, screening of customers, etc. The Board approved Compliance
Charter empowers Compliance Division to have direct access to the Board of Directors. However, for routine
compliance risk related issues, Compliance reports directly to the Board Risk Management Committee (BRMC)
for necessary guidance.
Considering BankDhofar’s “Together 2020” vision, the Bank has undertaken fundamental restructuring of its
Compliance function, aiming to be the best amongst its peers. In the last 3 years, compliance operational landscape
has shifted to maintain ‘zero’ level compliance risk in the Bank. In 2018-19, Bank engaged an external consultant of
international repute to review the Compliance activities within the Bank. The final report, accepted by the Board
Risk Management Committee, is being implemented through a separate time bound Compliance project, titled
FATF AML Compliance Design & Implementation Program. The primary objective of the program is to ensure on-
going compliance with regulatory guidelines and relevant international standards and practices in letter and spirit.
The Bank strictly follows regulatory mandates and Financial Action Task Force (FATF) recommendations on Know
Your Customers (KYC)/ Customer Due Diligence (CDD), Anti-money laundering (AML)/Combating Financing of
Terrorism (CFT) as well as sanctions resolutions passed by United Nations Security Council (UNSC). Customers
of the Bank are risk rated, periodically reviewed and screened from the sanctions database and STRs are raised in
case of suspicious transactions as per legal and regulatory requirements in Oman. The Bank relies on state of art
IT systems of international specifications to monitor transactions for AML and Anti-Fraud. Moreover, system has
been operationalized to screen SWIFT transactions/messages real time from the sanctions database and screen
customers from database of sanctions, PEPs, adverse media etc. BankDhofar is registered as Participating Foreign
Financial Institution (PFFI) with Internal Revenue Service (IRS), Treasury Department, U.S. for Foreign Account
Tax Compliance Act (FATCA) Regulations. Bank has also successfully implemented regulations based on OECD
Common Reporting Standard (CRS).
To promote value based compliance culture and set the right tone at the top, Bank has conducted Compliance
related training for Board members and Senior Management. Through the year, dedicated programs were carried
out for staff training and development, including retention testing of previously trained staff. In addition to specific
classroom trainings, mandatory e-Learning courses have also been adopted in the Bank for all staff. Relevant
staff in Compliance Division were trained in their operational areas. Compliance officials have coveted CAMS
certification from ACAMS, in addition to the International Diploma in Governance, Risk and Compliance and
Advanced Certificate in Managing Sanctions Risk examination by International Compliance Association (ICA) and
are fully geared to face the emerging issues/ challenges on account of growing profile of the Bank.
Anti-Fraud Unit (AFU) falls within the ambit of Compliance Division. AFU reviews processes, procedures, and
products from fraud perspective, and recommends fraud preventive measures. AFU also monitors, reviews, and
reports any suspicious activities, transactions and data by utilizing appropriate analytical techniques and data
mining tools. It also reports fraud transactions to Central Bank of Oman and Royal Oman Policy (ROP) as per
regulatory requirements.
Annual Report 201958
Risk Management Division
1. Risk Management Structure
The primary responsibility of understanding the risks assumed by the Bank and ensuring that these risks are appropriately managed is vested with the Board of Directors of the Bank. The Board has set risk policies, limits and procedures by assessing the risk bearing capacity of the Bank.
The overall risk management has been delegated to an independent Board Risk Management Committee (BRMC) of the Board of Directors of the Bank, which monitors and controls the overall risk profile (including Maisarah Islamic Banking Services). The BRMC reports to the full Board, on matters of significance and keeps the Board continuously updated with the Risk Management process in the Bank. In this task, BRMC relies on an independent Risk Management Division within the Bank.
The Bank has a well-established Risk Management Division (RMD) with a team of highly competent and experienced professionals. The primary responsibility of the RMD is to ensure, on a continuous basis, that an effective risk management framework exists and that the various divisions of the Bank, including Maisarah Islamic Banking Services, function within this framework. RMD also functions as an interface between the Management and the Board in defining appropriate risk tolerance levels for various business lines and operating divisions of the Bank and in ensuring that policies and procedures are tailored to the defined tolerance levels.
The Bank’s risk management strategy statement is expressed as follows:
a. Compliance with regulatory capital requirements;
b. Ensuring balanced performance across business units;
c. Placing emphasis on the diversity, quality and stability of earnings;
d. Making disciplined and selective strategic investments;
e. Maintaining adequate capital adequacy;
f. Providing qualitative and quantitative benchmarks to gauge broad alignment between initiatives and risk appetite;
g. Stable funding and strategic liquidity management allowing for business planning within the liquidity risk tolerance and regulatory requirements.
The Bank defines risk strategy and risk appetite on the basis of the strategic plan to ensure alignment of risk, capital and performance targets. The risk strategy of the Bank includes the Risk Appetite and Capital Plan, which allow the Bank to:
• Review the capital adequacy requirement goals with respect to risk, considering Bank’s strategic focus and business plans;
• Assess risk-bearing capacity with regard to internal and external requirements;
• Apply stress testing to assess the impact on the capital base and liquidity position.
2. Management of various Risks
A brief account on the various identifiable risks and their risk management process is given below:
1) Credit Risk
• Credit risk is defined as the possibility that a borrower or counterparty may fail to meet its obligation in accordance with agreed terms in relation to lending, trading, hedging, settlement and other financial transactions. This risk is primarily managed by proper assessment of inherent risks in credit proposals and ensuring a balanced portfolio of customers meeting the risk appetite of the Bank. The Bank also ensures dealing with customers of good credit standing, a thorough and professional credit assessment process, obtaining collaterals to mitigate risks and continuous monitoring of the accounts. The Bank has taken the following measures to mitigate credit risk:

59Annual Report 2019
• Credit Risk Policy addresses credit risk emanating from lending to corporates and individuals. The policy also
provides broad criteria for retail loans in a structured manner and is reviewed / updated on regular basis. The
policy has been defined for both Conventional Banking and Islamic Banking separately. The policies of the
Bank encompasses organizational responsibilities, prudential limits, credit risk rating standards, risk pricing
standards, loan review mechanism, delinquent account management and portfolio management.
• Policy on Country and Counterparty Bank credit risk addresses credit risk emanating from exposure to banks
as counterparties as well as countries. The maximum exposure that can be taken on a counterparty bank is
specified by an internally developed model.
• The Bank has credit risk rating system and a risk grade is assigned objectively to a borrower based on the single
point score provided by the rating model. The grade is assigned to the Standard category of borrowers on a
scale of 7. The rating models have been duly validated by the Bank through independent third party.
• Various credit risk models are used to assess the obligor risk as well as the facility risk and while assessing the
credit risk of the borrower, both probability of default and loss given default is estimated.
• Risk Adjusted Return on Capital (RAROC) is computed to assess the risk based pricing of each facility, which
facilitates in informed decision making.
• The Bank conducts stress tests to assess the impact of credit risk on capital adequacy and profitability under
stress situations.
• All the corporate credit proposals from both conventional banking and Maisarah are reviewed by the RMD
to assess the risk factors and suggest mitigates. The observations of RMD form an important input in credit
decision making.
The Bank employs experienced and competent staff in the areas of corporate banking and provides them with
regular training to upgrade and hone their credit skills. Detailed credit policies and procedures, strict adherence
to the segregation of duties, elaborate and well defined authority levels, periodical audit and examination by the
internal auditors ensure that the culture of risk permeates through the business divisions supported by a rigorous
environment of checks and balances.
2) Liquidity Risk
Liquidity Risk is the potential inability of the Bank to meet its maturing obligations to counterparty. Liquidity
planning and management are necessary to ensure that the Bank has the ability to fund its liquidity requirement
effectively and to meet current and future potential obligations such as loan commitments, contingent liquidity
commitments and unexpected deposit outflows.
The Bank has constituted an Asset-Liability Management Committee (ALCO), which is responsible for setting the
broad framework for managing the liquidity risk effectively for both the conventional banking and Maisarah. The
responsibility of managing the liquidity risk of the Bank, within this framework, lies with the Treasury Department
of both the entities; conventional banking and Maisarah, which discharges this function with the assistance of
other business divisions of the Bank.
The Bank has Board approved policy for both the entities on liquidity management which encompasses assessment
of liquidity gaps through cash flow and static approach, reserve against deposits, lending ratio, mitigation of
liquidity risk and contingency measures. The Bank has set up Middle office within RMD to ensure that the Treasury
Departments of both the entities operate within these guidelines.
The Middle office regularly monitors the liquidity position of the Bank and helps in managing the liquidity gaps,
well in time. It also conducts liquidity risk stress test periodically and Treasury Department ensures that sufficient
liquid assets are available with the Bank all the time, to meet any business exigency.

Annual Report 201960
3) Market Risk
Market risk is the risk of loss arising from unexpected changes in financial prices arising out of changes in interest
rates, exchange rates, bonds, equity and commodity prices. The Bank has major exposure in currency, equity and
interest rate risk.
ALM Policy and Investment Management Policy addresses all the aspects of the market risk. The ALM Policy
addresses foreign exchange risk and interest rate risk whereas the Investment Management Policy addresses the
equity risk.
The major foreign currency in which the Bank deals on a regular basis is United States Dollar (USD). The established
parity between US Dollar and Omani Rial (OMR) substantially reduces this risk. However, in order to control
currency exposure risk, limits for intraday and overnight positions have been set up in addition to currency wise
stop loss limits. Limit on net open position has been placed to restrict the Treasury department to take undue
currency exposure as per prudential norm set by the Central Bank of Oman (CBO). All these limits are monitored
by the Middle office of the Bank.
BankDhofar manages the interest rate risk by matching the re-pricing of assets and liabilities and operating within
the set gap limits. The Middle office in RMD regularly monitors the impact of adverse movement in interest rate on
profitability and economic value of equity in Conventional entity.
Maisarah is also vulnerable to rate of return risk (profit rate risk) and Asset Liability Management (ALM) Policy
of Maisarah addresses this risk. Rate of Return risk arises because of unexpected changes in the market rate of
return, which adversely affect a firm’s earnings. The profit distribution to Investment Account Holders (IAHs) is
based on profit sharing agreements and thus, Maisarah should not be subject to any significant rate of return risk.
However, in order to meet customer’s expectations and to remain competitive with the market, Maisarah may
forego part or all of its Mudarib share of profit on funds managed on behalf of IAHs, in order to increase return
to the IAHs. This absorption of additional risk by the Mudarib is known as Displaced Commercial Risk. Maisarah
seeks to mitigate this risk through prudential reserve accounts such as Profit Equalization Reserve (PER) and
Investment Risk Reserve (IRR).
Middle office monitors equity portfolio through daily reporting and assess the risk inherent in the quoted domestic
equity portfolio through Value at Risk (VaR) approach. Various limits like stop loss limit, transaction deal limit and
realized loss limit are in place to manage the equity risk. All the investment proposals are reviewed by RMD to
provide independent view on the risks associated with them.
Middle office also conducts stress tests periodically to assess the impact of adverse movement of market variables
on capital adequacy and places the same to the Board Risk Management Committee.
4) Operational Risk
Operational risk is the risk of loss resulting from inadequate or failed internal systems, processes, people or external
events. The Bank has detailed policies and procedures that are regularly updated to ensure that a sound internal
control environment exists. Management Risk Committee (MRC), comprising of the Executive Management of the
Bank, precedes RMC in reviewing, evaluating and monitoring of operational risk. Business Units are responsible
for management of operational risks within their respective scope of duties. In the financial year 2019, the Bank’s
operational risks were well controlled and losses from operational risks were kept at low level. Trained and
competent staff oversee the various operational functions of the Bank.
The Bank has developed a comprehensive operational risk management framework comprising of the Operational
Risk Management (ORM) policy, Risk Control and Self-Assessment, Key Risk Indicator, Loss Data Management
(LDM) Framework. The ORM policy of the Bank provides the ORM framework which includes ORM components,
management process, measurement process and governance, roles and responsibilities. Continuing the task of
improvement in existing systems and processes, the management system and tools for operational risks were
further strengthened during the year.

61Annual Report 2019
The Risk Control and Self-Assessment (RCSA) framework enables the Bank to identify the operational weaknesses in the process and procedures by conducting self-assessment workshops. A team of experts in various departments assess the operational weaknesses in various processes and its likely impact on the Bank. During the RCSA exercise, processes in various departments were reviewed from operational risk point of view and wherever high risk events were identified, the existing controls were reviewed. With the completion of the RCSA exercise, risk register has been created, which inter-alia includes inherent risk events, control effectiveness and residual risks.
The Key Risk Indicator (KRI) framework enables the Bank to identify and monitor the key risks at various levels. KRIs of all the departments have been identified and are being monitored on a monthly basis. Loss Data Management framework lays down the procedure to identify, record and report the internal and external loss events. The data on operational loss is collated on a regular basis and is presented to the Management and Board level committees. In order to avoid unexpected shocks to the financial position of the Bank, a reporting system on ‘Potential Losses’ has also been introduced. Potential Loss can be defined as an operational event that has not actually crystallized into actual loss but has a potential of adversely impacting the Bank’s bottom-line.
Operational Risk Unit in RMD is responsible for implementation, development and coordination of all the operational risk activities of the Bank, while working towards achievement of stated goals and objectives. Risk Management Division conducts regular training programs for staff at various levels to inculcate ‘risk awareness’ and to spread the general ‘risk management culture’ in the Bank. Professional training in diversified forms is also imparted to improve the employees’ risk management skills.
5) Country Risk
Country risk arises from changes in the value of foreign exposure due to country specific conditions, which may result from economic, social, political or natural events and may relate to factors such as exchange controls, currency devaluations, nationalization or expropriation of assets among others.
Country & Counterparty Bank Credit Risk policy addresses the country risk that may arise due to cross border exposure, in a structured manner. The Bank has in place a country risk assessment methodology which grades each country based on their risk profile. Suitable limits are assigned to undertake the business based on the internal risk rating grade of the countries.
The Middle office in association with the Financial Institution department monitors the country risk and takes suitable steps in event of any downgrade or change in the economic activity of any country.
Internal Capital Adequacy Assessment process
The Bank’s Internal Capital Adequacy Assessment Process (ICAAP) is an integrated enterprise-wide process that encompasses the governance, management, and control of risk and capital functions within the Bank. It provides a framework for ensuring an appropriate relationship between the risk profile and the capital held by the Bank, both in absolute terms and in terms of composition (Tier I & Tier II). This alignment between the capital and risks makes for better risk management.
The ICAAP cover assessment of risks under Pillar 1 and Pillar 2 risks, viz. interest rate risk in the banking book, concentration risk, business risk, reputation, legal and strategic risk. The ICAAP is facilitated by Risk Management and is supported by numerous functional areas which together help determine the Bank’s internal capital adequacy assessment.
A Separate Working Group on Capital Planning under ALCO, monitors the overall adequacy of the Bank’s available capital in relation to both internal and regulatory capital requirements.
Human Resources Division (HRD)In line with BankDhofar’s Transformation Journey “Together 2020”, the Human Resources Division had played an instrumental role in the organization, in collaboration with the leadership team and the Board, the department has been able to drive and deliver corporate HR Transformation Programs and Projects, that were developed with the strategic intent and objective to create strong Performance Culture. The Bank has successfully implemented more than 50 Programs and Projects under the HR Transformation Journey; creating and building the right Culture, People, Processes and Systems
BankDhofar, believes that people are the key competitor advantage and biggest differentiator, and that this
transformation journey can be only be achieved by having committed, engaged and motivated talent who will
continue driving sustained performance.

Annual Report 201962
The department will continue to develop and invest in people at all levels of the organization, starting with the
Board of the Directors all the way to staff in the Branches, providing them with clear, vision & mission, values and more importantly purpose to align all stakeholders objectives, goals and aspirations.
HRD will continue to drive performance culture which is one of the key pillars of the Together 2020 transformation journey. The primary objective of the HR strategy is enhance individual, team and organizational performance by developing people capabilities in terms of knowledge, skills and abilities while providing key talent opportunities to grow by creating an environment that supports and fosters high performance.
HRD will also continue to support “Together 2020” Transformation Journey, as the Bank is seeing the results and outcomes of this journey; creating the Bank of the future that delivers the best customer experience in the Gulf.
Talent Development & Retention
HRD is in the talent business delivering financial solutions, the department will continue to focus on talent development and retention by developing and implementing career development programs, career opportunities management, and by implementing competitive total rewards and recognition programs.
The Bank will continue to harness the talent and ensure that all high performance individuals and teams will have the right career development opportunities to grow and achieve their potential and career aspirations. As a result of these programs, BankDhofar has been able to achieve 93.7% Omanization and achieved an attrition rate of less than 5% being one the lowest in the Omani Banking Sector.
Talent Management
Human Resources has continued implementing Talent Development Programs for different talent segments in the Bank. In this program, talent goes through talent identification, assessment and development. These programs are based on both structured learning programs delivered by the Performance Academy in coloration with the learning & development partners. These programs also may involve participation of real time projects which will enable the talent to improve their functional competencies.
During the year the Bank has conducted various programs targeting different talent segments such as the Board Members, Top Team, Middle Managers and Junior Managers to develop their specific development needs and to cater for the succession planning needs. Bank has also taken steps to assess various staff on identifying competency gaps and training them to improve their performance.
Learning & Development
Though the Performance Academy, the Bank developed and implemented various ambitious projects aiming at improving the employee performance, productivity, and career development. The Bank continues to innovate the learning and development programs by designing and delivering the required learning & development programs and objectives across all business functions.
To align with the Banks Transformation strategy and journey, during the year 2019, Performance Academy continued to cascade the Lean Transformation programs across the Bank and built professional lean practitioners who will be Lean Champions for their respective businesses and operating units to achieve the Lean Operating Model
The Bank has also launched a Learning Management System (LMS) to assist staff “Anytime Anywhere Learning”. As a part of this initiative, various eLearning programs have been launched during the year which covers Lean Six Sigma and most of the regulatory programs including Anti Money Laundering, Anti-Fraud and Information Security Awareness.
In order to further build Omani staff skills and competencies, the Bank has also implemented specialized Banking programs including various Master Class Program through internationally recognized training providers. Bank has also initiated Secondment programs to other Banks across the globe to build the right capability for high potential Omani talent. This program has given the seconded staff exposure to best practices and professional way of
managing business in global Banks. In 2019 the Bank has sent 10 staff to overseas Banks from Retail, Wholesale,
Information Technology, Islamic Banking and Compliance.

63Annual Report 2019
Digital People Program
As an integral part of the digital people strategy, BankDhofar has automated all employee services and benefits
and the Bank is now able to provide all banking services to the members online. Further, the Bank is in the
process of implementing talent management, career & succession planning, onboarding/off-boarding, and people
analytics systems to provide all people and talent management processes in a digital platform.
In addition to establishing HR Contact Center to better serve the staff.
Financial Performance
In the midst of current challenging economic and financial situation driven by volatile oil prices and rising interest
rates in the local market, the bank reported a net profit of OMR 30.24 million (USD 78.55 million) for the year-to-
date (YTD) 31st December 2019 compared to RO 50.28 million (USD 130.60 million) achieved during similar period
of last year, a year-on-year decline of 39.86%. This decline is resulting from increase in net provisions by OMR
15.74 million (USD 40.88 million) from classification of certain large exposures (reflecting the current economic
environment). Bank’s Islamic Banking Window, Maisarah Islamic Banking Services reports strong Profits before
tax growth of 17.36% reaching RO 6.98 million (USD 18.13 million) in 2019 compared to RO 5.94 million (USD 15.43
million) in 2018. Total assets of the Bank reached RO 4.33 billion (USD 11.25 billion) in December 2019 as compared
to RO 4.21 billion (USD 10.94 billion) at end of 2018, 2.85% increase. The Net Loans, Advances and Financing to
customers reached RO 3.06 billion (USD 7.95 billion) at December 2019, compared to RO 3.16 billion (USD 8.21
billion) at the end of 2018, 3.16% decline year-on-year, continuing the cautious approach on increasing the loan and
financing book and focusing on credit quality.
An analysis of key gross loan portfolio by segment is tabulated below:
Description (RO 000) 31-Dec-19 31-Dec-18 Growth %
Gross Loans/Financing 3,181,597 3,293,945 -3.41%
Retail Loans/ Financing 1,286,585 1,375,140 -6.44%
WSB Loans/Financing 1,895,012 1,918,805 -1.24%
Analysis of Loan portfolio by product is tabulated below:
Loans, advances and financing to customers (RO 000) 31-Dec-19 31-Dec-18 Growth%
Overdrafts 137,827 165,880 -16.91%
Loans 2,425,730 2,547,049 -4.76%
Loans against trust receipts 109,865 99,393 10.54%
Bills discounted 46,898 70,969 -33.92%
Advance against credit cards 9,450 8,921 5.93%
Islamic Banking Window financing 451,827 401,733 12.47%
Gross loans, advances and financing 3,181,597 3,293,945 -3.41%
Less: Impairment allowance (118,247) (135,101) 12.48%
Net loans, advances and financing 3,063,350 3,158,844 -3.02%
Customer deposits, including Islamic deposits increased by 0.68% from RO 2.92 billion (USD 7.58 billion) at the
end of 2018 to reach RO 2.94 billion (USD 7.64 billion) at the end of 2019.
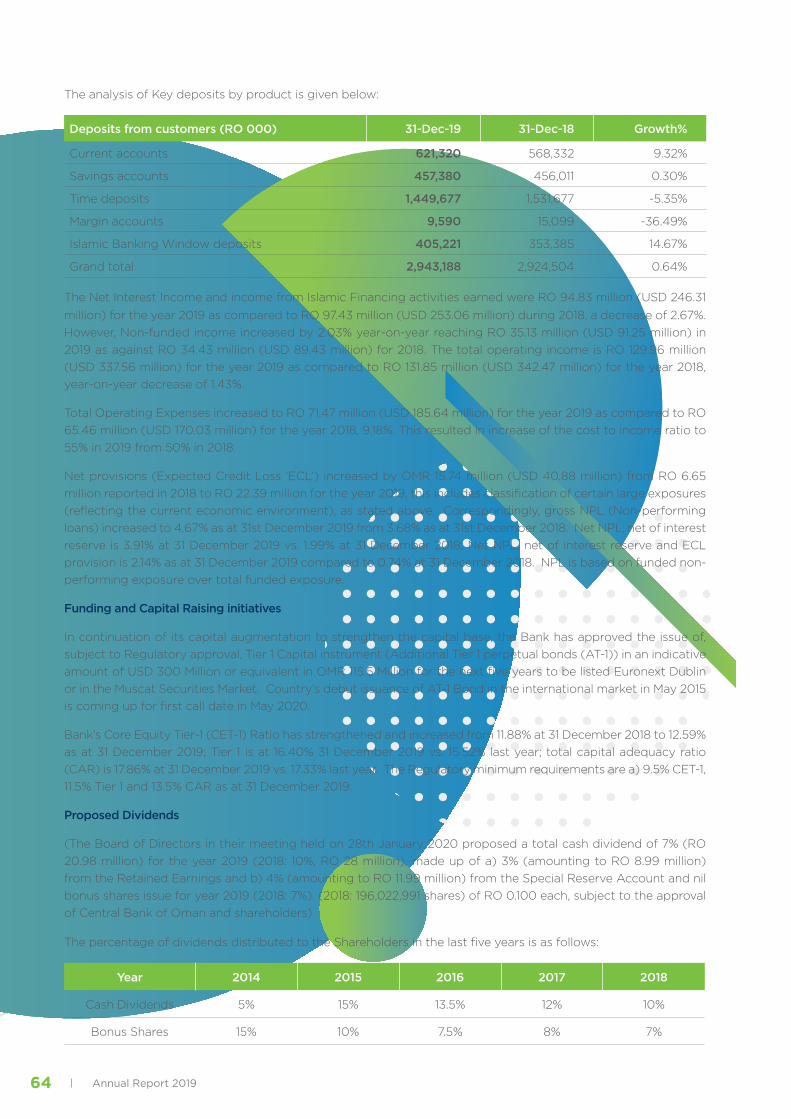
Annual Report 201964
The analysis of Key deposits by product is given below:
Deposits from customers (RO 000) 31-Dec-19 31-Dec-18 Growth%
Current accounts 621,320 568,332 9.32%
Savings accounts 457,380 456,011 0.30%
Time deposits 1,449,677 1,531,677 -5.35%
Margin accounts 9,590 15,099 -36.49%
Islamic Banking Window deposits 405,221 353,385 14.67%
Grand total 2,943,188 2,924,504 0.64%
The Net Interest Income and income from Islamic Financing activities earned were RO 94.83 million (USD 246.31 million) for the year 2019 as compared to RO 97.43 million (USD 253.06 million) during 2018, a decrease of 2.67%. However, Non-funded income increased by 2.03% year-on-year reaching RO 35.13 million (USD 91.25 million) in 2019 as against RO 34.43 million (USD 89.43 million) for 2018. The total operating income is RO 129.96 million (USD 337.56 million) for the year 2019 as compared to RO 131.85 million (USD 342.47 million) for the year 2018, year-on-year decrease of 1.43%.
Total Operating Expenses increased to RO 71.47 million (USD 185.64 million) for the year 2019 as compared to RO 65.46 million (USD 170.03 million) for the year 2018, 9.18%. This resulted in increase of the cost to income ratio to 55% in 2019 from 50% in 2018.
Net provisions (Expected Credit Loss ‘ECL’) increased by OMR 15.74 million (USD 40.88 million) from RO 6.65 million reported in 2018 to RO 22.39 million for the year 2019, this includes classification of certain large exposures (reflecting the current economic environment), as stated above. Correspondingly, gross NPL (Non-performing loans) increased to 4.67% as at 31st December 2019 from 3.68% as at 31st December 2018. Net NPL, net of interest reserve is 3.91% at 31 December 2019 vs. 1.99% at 31 December 2018; Net NPL, net of interest reserve and ECL provision is 2.14% as at 31 December 2019 compared to 0.74% at 31 December 2018. NPL is based on funded non-performing exposure over total funded exposure.
Funding and Capital Raising initiatives
In continuation of its capital augmentation to strengthen the capital base, the Bank has approved the issue of, subject to Regulatory approval, Tier 1 Capital instrument (Additional Tier 1 perpetual bonds (AT-1)) in an indicative amount of USD 300 Million or equivalent in OMR 115.5 Million for the next five years to be listed Euronext Dublin or in the Muscat Securities Market. Country’s debut issuance of AT-1 Bond in the international market in May 2015 is coming up for first call date in May 2020.
Bank’s Core Equity Tier-1 (CET-1) Ratio has strengthened and increased from 11.88% at 31 December 2018 to 12.59% as at 31 December 2019; Tier 1 is at 16.40% 31 December 2019 vs. 15.52% last year; total capital adequacy ratio (CAR) is 17.86% at 31 December 2019 vs. 17.33% last year. The Regulatory minimum requirements are a) 9.5% CET-1, 11.5% Tier 1 and 13.5% CAR as at 31 December 2019.
Proposed Dividends
(The Board of Directors in their meeting held on 28th January 2020 proposed a total cash dividend of 7% (RO 20.98 million) for the year 2019 (2018: 10%, RO 28 million), made up of a) 3% (amounting to RO 8.99 million) from the Retained Earnings and b) 4% (amounting to RO 11.99 million) from the Special Reserve Account and nil bonus shares issue for year 2019 (2018: 7%). (2018: 196,022,991 shares) of RO 0.100 each, subject to the approval of Central Bank of Oman and shareholders)
The percentage of dividends distributed to the Shareholders in the last five years is as follows:
Year 2014 2015 2016 2017 2018
Cash Dividends 5% 15% 13.5% 12% 10%
Bonus Shares 15% 10% 7.5% 8% 7%
FINANCIAL HIGHLIGHTS OF LAST FIVE YEARS

Annual Report 201966
FINANCIAL HIGHLIGHTS OF LAST FIVE YEARS
(OMR’000) 2019 2018 2017 2016 2015
NET INTEREST INCOME (CONVENTIONAL)
84,649 87,918 84,605 90,786 84,478
NET INCOME FROM ISLAMIC FINANCING AND INVESTMENT ACTIVITIES
10,182 9,509 8,521 6,874 5,729
NON INTEREST INCOME 35,133 34,426 33,801 29,691 25,019
OPERATING COSTS 71,474 65,456 58,994 56,767 51,199
PROFIT FROM OPERATIONS 36,092 59,743 56,031 54,429 52,501
NET PROFIT FOR THE YEAR 30,244 50,281 47,627 47,622 46,765
At year-end
TOTAL ASSETS 4,325,845 4,213,490 4,246,710 3,952,043 3,593,061
NET LOANS, ADVANCES AND FINANCING
3,063,350 3,158,844 3,248,873 2,988,592 2,729,306
CUSTOMER DEPOSITS 2,943,188 2,924,504 3,068,409 2,885,189 2,592,371
TOTAL EQUITY 686,155 698,162 587,007 534,000 476,529
SHARE CAPITAL 299,635 280,033 225,786 189,920 154,473
FULL SERVICE BRANCHES 71 71 69 68 67
ATMs / CDMs / FFMs/ MFKs 194 190 179 180 187
STAFF 1,586 1,600 1,514 1,478 1,371

FINANCIAL RATIOSOF LAST FIVE YEARS

Annual Report 201968
Financial Ratios of Last Five Years
As at 31 December
2019
As at 31 December
2018
As at 31 December
2017
As at 31 December
2016
As at 31 December
2015
1. PROFITABILITY
Return on Weighted Average Total Equity (including AT1)
7.26% 7.82% 8.50% 9.42% 11.66%
Return on Weighted Average Shareholders Equity
9.37% 9.92% 10.70% 12.22% 13.63%
Return on Weighted Average Paid-up Capital
17.35% 19.88% 22.91% 27.66% 32.39%
Return on Average Assets 0.71% 1.19% 1.16% 1.26% 1.38%
Non-Interest Income to Operating Income
27.03% 25.67% 26.63% 23.31% 21.71%
Operating Expenses to Operating Income
55.00% 50.50% 46.48% 44.58% 44.43%
2. LIQUIDITY
Net Loans to Total Deposits 89.22% 95.91% 94.00% 92.36% 94.07%
Total Customer Deposits to Total Deposits*
85.72% 88.80% 88.78% 89.17% 89.35%
3. ASSET QUALITY RATIOS
Loan Loss Provisions to Total Loans
3.72% 4.10% 4.07% 3.83% 3.49%
Non-Performing Loans to Total Loans
4.67% 3.68% 3.11% 2.68% 2.30%
Non-Performing Loans Net of Interest Reserve to Total Loans **
3.91% 1.99% 1.72% 1.41% 1.10%
Loan Loss Provisions to Total Non-Performing Loans
79.58% 111.38% 130.93% 142.66% 151.88%
4. CAPITAL ADEQUACY
Common Equity Tier 1 Ratio 12.59% 11.88% 10.53% 9.85% 9.43%
Tier 1 capital ratio 16.40% 15.52% 13.29% 12.77% 12.68%
Total Capital Adequacy Ratio 17.86% 17.33% 15.44% 14.41% 14.70%
Shareholder’s Equity/ Total Assets
12.27% 12.88% 11.10% 10.59% 10.05%
* Net Loan to Customers Deposits is 104.08%.
** Net NPL for 2019 is 2.14% based on NPA less interest reserve and IFRS-9 Stage 3 ECL over gross loans.

69Annual Report 2019
Branch Network
BRANCH TEL. NO. FAX NO.
MUSCAT NORTH AREA
Al Khoudh Dir/ 2427 6000 - 24276001 - 24276002 24 545 268
Seeb Town Dir/ 24425851 - 24425852 - 24424434 - 24423373 24425627
Ghala Dir/ 24216001 - 24216002 24216006
Muscat International Airport Dir/ 24510537 - 24510101 - 24 510102 24510468
Mabellah Dir/ 24451520 - 24451540 - 24451539 24451542
New Muscat International Airport Dir/ 24356999 - 24356995 - 24356997 24 216 600
Muscat Center Area
Muscat Grand Mall Dir/ 24216666 24216600
Qurum Dir/ 24568351 - 24567671 - 24567673 24567679
New Bausher Dir/ 24614768 - 24614786 24614764
Amarat Dir/ 24877838 - 24876580 - 24876120 24875829
Bausher Polyclinic Dir/ 24502606 - 24596994 24595323
Al Khuwair Ministry Dir/ 24694710 - 24694725-24694715 24694730
MUSCAT SOUTH AREA
MBD Dir/ 24750516 - 24790466 24798621
Muscat Dir/ 24 737865 - 24736614 - 24736606 - 24 737066 24739166
Muttrah Dir/ 24712970 - 24714452 - 24 714279 24713556
Quriyat Dir/ 24845195 - 24845193 - 24845192 24845173
Ruwi Dir/ 24831090 - 24835854 24831892
Wadi Kabir Dir/ 24814127 - 24814126 24814128
BATINAH SOUTH AREA
Barka Dir/ 26884423 - 26884428 26884451
Rustaq Dir/ 26876039 - 26875117 26875591
Suwaiq Dir/ 26862001 - 26862010 26862102
Muladdah Dir/ 26868544 - 26868553 26868549
Khadhra Dir/ 26714164 - 26714162 26714163
BATINAH NORTH AREA
Sohar Dir/ 26943400 – 26943401-26943402 26943444
Khaboura Dir/ 26801028-26801686 26805130
Saham Dir/ 26854400 - 26856699 26855277
Hafeet Dir/ 26817646 - 26817991 - 26817992 26817993
Falaj Al Qabail Dir/ 26949962 - 26949812 - 26949813 26750891
Shinas Dir/ 26748302 - 26748306-26748308 26748304

Annual Report 201970
DAKHLYAH AREA
Nizwa 25410234 - 25411370 25411234
Sumail 25350543 - 25351188 25350094
Izki 25340089 - 25341016 25340204
Bahla 25420021 - 25420292 25420387
Bid Bid 25369044 - 25369033 25369055
Adam 25215001 25215050
BURAIMI & DHAHIRA AREA
Al Buraimi Dir/ 25652224 - 25652227 25 651 115
Buraimi Industrial Area Dir/ 25669821 – 25669822 – 25669823 - 25669824 25669825
Yanqul 25672018 - 25672031 25672041
Ibri 25689341 - 25689685 25690341
SHARQYAH NORTH AREA
Ibra Dir/ 25571632 - 25571631 - 25571632 25570646
Sinaw Dir/ 25524663 - 25524367 25524823
Samad A’Shan Dir/ 25526736 - 25526529 25526574
Al Muntrib Dir/ 25583853 - 25584049 25583510
Mudhaibi Dir/ 25578110 - 25578113 25578114
SHARQYAH SOUTH & WOSTA AREA
Sur Dir/ 25546677 - 25541255 - 25540256 25540615
J. B. B. Ali Dir/ 25553414 - 25553440 25553446
J. B. B. Hassan Dir/ 25551020 - 25551025 25551181
kamil Al Wafi Dir/ 25557134 - 25557501 25557962
Al Duqum Dir/ 25215801 - 25215800 25215888
DHOFAR EAST AREA
Salalah Dir/ 23290644 - 23292299 - 23294863 - 23291631 23295291
Saada Dir/ 23227177 - 23 225463 - 23225409 23225179
Taqa Dir/ 23258108 - 23258113 23258366
Mirbat Dir/ 23268007 - 23268038 23268080
Dhofar University Booth Dir/ 23237789 - 23237785 - 23237782 23237745
DHOFAR WEST AREA
Salalah Gardens Mall Dir/ 233818200 - 23381201 23381222
Salalah commercial District Dir/ 23380700 - 23380719 - 23380721 23202761
Salalah-Al Gharbiah Dir/ 23298046 - 23297526 - 23297536 23295084
Raysut Dir/ 23219219 - 23219262 - 23219216 23219197
BRANCH TEL. NO. FAX NO.
Al Riadah Prestige Opera Galleria 24647070 24647007
BRANCH TEL. NO. FAX NO.
Corporate Centre 22520001 22520002

71Annual Report 2019
Maisarah Islamic Banking Services Branch Network
BRANCH TEL. NO. FAX NO.
Azaiba 24212544 24212521
Salalah 23211100 23211186
Sohar 26840929 26840818
Birkat Al Mouz 25443365 / 25443462
Al Hail 24287777 / 24287788
Greater Muttrah 24793297 / 24707959 24706103
Al Khuwair 24484880 / 24480008 24483366
Sur 25545867 / 25541912 25543710
Al Araqi 25694126 / 25695071 25695047
New Salalah 23297492 / 23296158 23294263

DISCLOSUREREQUIREMENTS UNDERPILLAR-III OF BASEL II & III

73Annual Report 2019

Annual Report 201974
1. Introduction
The following detailed qualitative and quantitative public disclosures are provided in accordance with Central Bank of Oman (CBO) rules and regulations on capital adequacy standards issued through circular BM 1009 on Guidelines on Basel II, Islamic Banking Regulatory Framework and BM 1114 on Regulatory Capital and Composition of Capital Disclosure Requirement under Basel III. The purpose of these requirements is to complement the capital adequacy requirements and the Pillar II – Supervisory review process. These disclosures are intended for market participants to assess key information about the Bank’s exposure to various risks and to provide a consistent and understandable disclosure framework for easy comparison among banks operating in the market.
The major highlights of the Central Bank of Oman (CBO) regulations on capital adequacy are:
a. To maintain capital adequacy ratio (CAR) at a minimum of 11% effective from 01.04.2018. Previously the minimum CAR requirement was 12%;
b. The predominant form of capital shall be Tier 1 capital of which Common Equity Tier (CET1) will form the major component.
c. To maintain capital adequacy ratio (CAR) at a minimum of 13.5% (including capital conservation buffer) effective from 01.01.2019
d. The Bank is required to maintain at all times, the following minimum capital adequacy ratios:
• Within the overall requirement of 13.50% CAR (including capital conservation buffer), Tier 1 ratio is to be maintained at a minimum of 11.50%,
• Within the minimum Tier 1 ratio of 11.50%, minimum CET 1 ratio is to be maintained at 9.50%,
• Further, within the minimum overall capital ratio of 1 1% (excluding capital conservation buffer), Tier 2 capital can be admitted up to a maximum of 2% of Risk Weighted Assets (RWA) of the Bank.
e. To adopt the Basel II standardized approach for credit risk, using national discretion for:
• Adopting the credit rating agencies as external credit assessment institutions (ECAI) for claims on sovereigns and Banks;
• Adopting simple/comprehensive approach for Credit Risk Mitigants (CRM)
• Treating all corporate exposures as unrated and assign 100% risk weight.
f. To adopt standardized approach for market risk and basic indicator approach for operational risk.
g. Capital Adequacy returns are submitted to CBO on a quarterly basis and the Bank’s external auditors review capital adequacy returns on an annual basis.
As per Islamic Banking Regulatory Framework:
Islamic Windows of domestic conventional banks shall have and at all times maintain an allocated capital of not less than OMR 10 million or such higher amount as may be determined from time to time by the Central Bank.
Islamic windows are also required to maintain the minimum capital adequacy ratio of 11% of the RWA at all times. Within 11% Capital adequacy ratio, Islamic Window need to maintain minimum of 9% of RWA as Tier 1 Capital ratio. The capital buffer requirement is imposed at the consolidated level and thus, is not applicable at the Islamic window level.
2. Scope of Application
The Bank has no subsidiaries or significant investments. However, Bank has introduced Islamic Banking through an Islamic window named as “Maisarah”. Accordingly, the information in the document pertains to the consolidated entity i.e., for both conventional banking & Islamic window (Maisarah). The disclosure pertaining to Maisarah is provided separately.
BankDhofar
DISCLOSURE REQUIREMENTS UNDER PILLAR – III OF BASEL II & III.For the year ended 31 December 2019

75Annual Report 2019
3. Basel II & III Disclosures
3.1 Capital Adequacy Norms
The Bank has calculated its Common Equity Tier 1 (CET1), Tier 1 and Total Capital Ratios in the following manner:
1. CET1 Capital Ratio = Common Equity Tier 1 Capital/ Total RWA
2. Tier 1 Capital Ratio= Tier 1 Capital/ Total RWA
3. Total Capital Ratio = Total Capital/ Total RWA
Tier 1 Capital is the sum of CET1 Capital and Additional Tier 1 Capital (AT1) and Total Capital is the sum of Tier 1 Capital and Tier 2 Capital.
The denominator, viz., Total risk-weighted assets (RWA) is calculated as the sum of credit risk weighted assets, market risk-weighted assets, and operational risk-weighted assets, as provided for in CBO circular BM-1009 and Islamic Banking Regulatory Framework. In the case of Islamic banks, CBO has provided an adjustment factor of alpha at 30% in the RWA in the manner stipulated under Article 2.3.1 of title 5 of IBRF relating to Capital adequacy. However, as per communication received from CBO, for the time being no adjustment is applicable in the computation of RWA.
Based on the presently prescribed level of capital adequacy, banks operating in the Sultanate will be required to maintain at all times, the following minimum capital adequacy ratios:
With effect from 01.01.2019
CET 1 Capital Ratio: 9.5% of risk weighted assets
Tier 1 Capital Ratio: 11.5% of risk weighted assets (Going concern capital)
Total Capital Ratio: 13.5% of risk weighted assets (Gone concern capital)
With effect from 01-01-2016, Capital Conservation Buffer (CCB) has been implemented in a phased manner. The CCB is 2.5% of the total RWA and every year the buffer was to be enhanced by 0.625%, thereby reached a level of 2.5% in 2019. Further, CBO has also finalised Countercyclical Capital Buffer, which is intended to protect the banking sector as a whole from systemic risk that is often developed during an economic upswing, when there is a tendency towards excessive aggregate credit growth. The Countercyclical Capital Buffer lies between 0% and 2.5% of the total RWA; however presently the countercyclical capital buffer is not imposed. The capital buffer requirements shall be imposed at consolidated level but will not be applied at the Islamic Banking Window level. Thus from 2019 onwards, assuming a zero countercyclical capital buffer, banks shall operate above CET1, Tier 1 and Total Capital levels of 9.5%, 11.5% and 13.5% respectively.
Based on the Basel III requirement, the capital structure of the Bank (as a consolidated entity) is presented as per Annexure I. A reference is invited to paragraph 91 of the Basel III rules, which states that banks should disclose “a full reconciliation of all regulatory capital elements back to the balance sheet in the audited financial statements”. The reconciliation process laid down is aimed at addressing the issues of disconnect between the numbers disclosed for the calculation of regulatory capital and the numbers used in the published financial statements. However, there is no difference between the regulatory consolidation and the accounting consolidation. The components used in the definition of capital disclosure template are provided as per Annexure IIa and the same are mapped to the composition of capital disclosure template as per Annexure IIb.
Basel II, Pillar 3 guidance note states that banks should provide qualitative disclosure that sets out “Summary information on the terms and conditions of the main features of all capital instruments, especially in the case of innovative, complex or hybrid capital instruments.” Banks are required to disclose a description of the main features of regulatory capital instruments along with the full terms and conditions of the regulatory capital instruments issued by them. Bank presently has three types of capital instruments viz., Common Shares, Perpetual bonds in the form of Additional Tier 1 Capital and Subordinated Debt. The summary disclosure for these regulatory capital instrument issued by the Bank is provided at Annexure III.
BankDhofar
DISCLOSURE REQUIREMENTS UNDER PILLAR – III OF BASEL II & III.For the year ended 31 December 2019

Annual Report 201976
3. Basel II & III Disclosures (Continued)3.2. Capital Structure
The capital base for complying with capital standards is quite distinct from accounting capital. The regulatory capital is broadly classified into two categories – Tier I and Tier II. Bank’s capital structure also consists of Tier I capital and Tier II capital.
Tier I capital includes paid up capital, share premium, Additional Tier I capital instruments, legal and general reserves and other disclosed free reserves, including subordinated loan reserves, non-cumulative perpetual preferred stocks and retained earnings (available on a long term basis) less regulatory adjustments like cumulative losses of financial instruments classified as Fair Value through Other Comprehensive income (FVOCI), goodwill & other intangibles.
Tier II (Supplementary capital) consists of undisclosed reserves, revaluation reserves/cumulative fair value gains on FVOCI instruments, general loan loss provision/ general loan loss reserve in capital and subordinated term debt subject to certain conditions. Tier II capital of the Bank also includes 45% of Investment revaluation reserve and general provisions to the extent of total Stage 1 and permitted Stage 2 provision subject to ceiling of 1.25% of credit risk weighted assets or total general provisions amount taken by Bank for Tier2 capital as on 31st December 2017. However, stage 2 provisions would be phased out over a period of four years.
The details of capital structure are provided as under:
CAPITAL STRUCTURE : RO’000Amount
Paid up capital 299,635
Legal reserve 58,966
Share premium 95,656
Special reserve 18,488
Subordinated loan reserve 42,875
Retained earnings 1,447
Proposed bonus shares -
Common Equity Tier (CET) I capital 517,067
Deferred Tax Assets (1,028)
Less Goodwill (397)
Cumulative unrealized losses recognized directly in equity (2,245)
CET I Capital – Regulatory Adjustments (3,670)
Total CET I capital 513,397
Additional Tier I Capital 155,500
Total Tier I Capital 668,897
Investment revaluation reserve (45% only ) 370
General provision (Sum of Stage 1 and permitted Stage 2 provision subject to max of 1.25% of credit RWA or General provision amount held under Tier2 capital as on 31/12/2017 ) 38,315
Subordinated loans 21,000
Total Tier II capital 59,685
Total eligible capital (Tier I + Tier II Capital) 728,582
BankDhofar
DISCLOSURE REQUIREMENTS UNDER PILLAR – III OF BASEL II & III.For the year ended 31 December 2019

77Annual Report 2019
3. Basel II & III Disclosures (Continued)3.3 Capital Adequacy Ratio
The Bank has adopted Standardized Approach (SA) for computation of capital charge for credit risk and market risk and Basic Indicator Approach (BIA) for operational risk. Under Standardized approach for credit risk, the Bank has adopted simple approach for recognizing collaterals in the Banking Book and for risk weighting the claims on Sovereigns and Banks, credit ratings of external credit assessment institutions is used. Assessment of capital adequacy is carried out in conjunction with the capital adequacy reporting to the CBO.
The Bank’s capital adequacy ratio is 17.86% as against the CBO requirement of 13.50% as at 31st December 2019. The Bank’s policy is to manage and maintain its capital with the objective of maintaining strong capital ratio and high rating. The Bank maintains capital levels that are sufficient to absorb all material risks the Bank is exposed to and provides market return to the shareholders. The Bank also ensures that the capital levels comply with regulatory requirements and satisfy the external rating agencies and other stakeholders including depositors and senior creditors. The whole objective of the capital management process in the Bank is to ensure that the Bank remains adequately capitalized at all times.
The Bank has in place Internal Capital Adequacy Assessment Process (ICAAP) for assessing Bank’s capital adequacy in relation to the risk profiles as well as a strategy for maintaining the capital level. The objective of ICAAP document is to explain the Risk policies adopted, Target risk structure and Capital planning, the process of assessing the capital adequacy for credit, market and operational risk, Specific assessment procedures for risks not covered under Pillar I, process of Internal Control Mechanism and stress testing methodologies adopted by the Bank.
Bank has also formed working group on capital planning which meets periodically and assess the capital adequacy to support projected asset growth. The capital adequacy ratio is periodically assessed and reported to the Board Risk Management Committee (RMC). The composition of capital in terms of Common Equity Tier I, Additional Tier I, Total Tier I and Tier II are also analyzed to ensure capital stability and to reduce volatility in the capital structure.
1) Position of Risk weighted Assets is presented as under:
S. No DetailsGross Balances(Book Value)
RO’000
Net Balances(Book Value)*
RO’000
Risk Weighted Assets
RO’000
1 On balance sheet items 4,515,059 4,410,807 3,145,469
2 Off balance sheet items 541,787 506,583 502,814
3 Derivatives 1,301,118 1,301,118 23,137
4 Total Credit Risk 6,357,964 6,218,508 3,671,420
5 Market Risk - - 143,412
6 Operational Risk - - 263,487
7 Total Risk Weighted Assets - - 4,078,319
* Net of provisions and, reserve interest
BankDhofar
DISCLOSURE REQUIREMENTS UNDER PILLAR – III OF BASEL II & III.For the year ended 31 December 2019

Annual Report 201978
3. Basel II & III Disclosures (Continued)3.3 Capital Adequacy Ratio (Continued)
2) Detail of Capital Adequacy:
S.No. Details RO’000
1 Common Equity Capital 513,397
Tier 1 Capital 668,897
2 Tier 2 Capital 59,685
3 Tier 3 Capital -
4 Total eligible capital 728,582
5 Capital Requirement for Credit Risk 3,671,420
6 Capital Requirement for Market Risk 143,412
7 Capital Requirement for Operational Risk 263,487
8 Total Required Capital 4,078,319
9 Common Equity Capital Ratio 12.59%
10 Tier 1 Capital Ratio 16.40%
Total Capital Adequacy Ratio 17.86%
3.4 Risk Exposure and Assessment
The risks to which banks are exposed to and the techniques that banks use to identify, measure, monitor and
control those risks are important factors that market participants consider in their assessment of an institution. In
this section, several key banking risks are considered: credit risk, market risk, interest rate risk in the banking book
and operational risk. For each separate risk area (e.g. credit, market, operational, banking book interest rate risk)
the Bank describes its risk management objectives and policies, including scope and nature of risk reporting and/
or measurement systems and risk mitigation strategies.
BankDhofar
DISCLOSURE REQUIREMENTS UNDER PILLAR – III OF BASEL II & III.For the year ended 31 December 2019

79Annual Report 2019
3. Basel II & III Disclosures (Continued)3.4 Risk Exposure and Assessment (Continued)3.4.1 Credit Risk
Credit risk is defined as the possibility that a borrower or counterparty will fail to meet its obligations in accordance with agreed terms. Credit risk, therefore, arises from the Bank’s dealings with or lending to a corporate, individual, another bank, financial institution or a country. The objective of credit risk management is to minimize the probable losses and maintaining credit risk exposure within acceptable parameters.
The Bank has well established credit risk policy duly approved by the Board which establishes prudent standards, practices in managing credit risk and setting up prudent bench marks, limits for management of credit risks. Continuous review of the credit risk policy is done to adapt to the business environment and regulatory requirements at all times.
The Board of Directors delegate credit approval powers for Wholesale Banking and Retail Banking functional areas, which are clearly defined in Authorities Matrix contained in the Manual on Delegation of Authority. All concerned executives are responsible to ensure that they exercise their delegated powers in terms of the approved Authorities Matrix and seek appropriate special approvals wherever required.
Board Executive Committee is the topmost credit approving authority of the Bank which is mainly responsible for approving all credit proposals beyond the authority level of the management. The senior management executives are also empowered with certain loan approving limits beyond which the credit proposals shall be considered by the Management Credit Committee (MCC) which is empowered to consider all credit related issues up to certain limits.
Credit risk is managed by the Risk Management Division (RMD) through a system of independent risk assessment of all the Corporate, Business Banking and Project Finance credit proposals before they are considered by the appropriate approving authorities. The borrowers in the Standard Category are assigned a risk rating on a scale of 7 grades based on quantitative as well as qualitative parameters. All accounts reflecting weakness in financials or operations as defined by CBO are assigned grade 8 (Special Mention category) for closer monitoring. RMD approves the risk grade of the borrower and also identifies the risk factors in the credit proposal and suggests suitable mitigation. This facilitates the approving authorities in making informed credit decision. In addition, RMD reviews grading of obligors and conducts regular analysis of the credit portfolio. Every corporate account is reviewed annually and in case of accounts graded as 6, 7 and 8 (Special Mentioned category); reviews are conducted at higher frequency.
The Bank has also established Credit Control department which looks after Loan Review Mechanism (LRM). LRM helps in ensuring credit compliance with the post-sanction processes/ procedures laid down by the Bank from time to time. It involves taking up independent account-specific reviews of individual credit exposures as per the Board approved LRM Policy. Credit Control department also monitors various credit concentration limits. Counterparty/group exposures are limited to 15% of the Bank’s networth as stipulated by CBO and where a higher limit is required for projects of national importance, prior approval of CBO is obtained. The credit control department also undertakes monitoring of the retail loans.
Retail lending is in accordance with the CBO guidelines. The Bank uses a score card as a selection tool for the personal loans in conventional banking. Bank has also implemented Loan Origination System (LOS) which has automated the workflow of retail loan credit proposals in conventional banking. In Maisarah, retail financing is mainly in auto and housing finance category.
In addition to these, the Bank also undertakes business with other banks. The maximum exposures to these banks are defined through internally developed model and the total exposure to such counterparty banks is linked to the net worth of the Bank and regulatory ceiling. The Bank has also implemented country risk limits approved by the Board to ensure portfolio diversification in terms of sovereign and geographical exposure. Specific country risk limits have been set up based on the internal risk rating grades assigned to various countries and these limits are reviewed on half yearly basis. In addition to the internal limits, the Bank also adheres to the limits for countries and counterparty banks prescribed by CBO strictly.
In the absence of acceptable external credit rating agency in the Sultanate of Oman, the Bank has obtained approval of the CBO to treat all corporate exposures as unrated and accordingly assign risk weight of 100% for computing capital requirements under Basel II. The same convention has also been applied to Maisarah financing.
Past dues and impaired exposures are defined in accordance with the relevant CBO regulations. Bank has adopted the International Financial Reporting Standards (IFRS) 9 guidelines for estimation of Expected Credit Loss as per International Accounting Standards Board (IASB) and CBO guidelines on International Financial Reporting Standards (IFRS) 9 on Financial Instruments, effective from 1st January 2018.
Credit Risk exposure of the Consolidated entity (i.e. both Conventional banking & Maisarah)
BankDhofar
DISCLOSURE REQUIREMENTS UNDER PILLAR – III OF BASEL II & III.For the year ended 31 December 2019

Annual Report 201980
3. Basel II & III Disclosures (Continued)3.4 Risk Exposure and Assessment (Continued)3.4.1 Credit Risk (Continued)
1) Analysis of gross credit exposures, plus average gross exposure over the period broken down by major types of credit exposure:
S. No. Type of Credit Exposure
Average Gross exposure Total Gross exposures
RO’000 RO’000 RO’000 RO’000
Conventional 2019 2018 2019 2018
1 Overdrafts 158,227 177,624 137,827 165,880
2 Loans 2,448,399 2,549,067 2,425,730 2,547,049
3 Loans against trust receipts 101,088 119,580 109,865 99,393
4 Other 49,146 59,346 36,564 59,331
5 Bills purchased /discounted 10,747 11,426 10,334 11,638
6 Advance against credit cards 9,207 8,833 9,450 8,921
Total 2,776,814 2,925,876 2,729,770 2,892,212
Islamic
7 Murabaha Receivables 22,100 22,370 19,686 24,625
8 Mudaraba Financing 21,955 21,601 18,897 26,585
9 Ijarah Assets 45,812 45,301 46,028 46,002
10 Wakala Financing 30,961 - 40,011 18,762
11 Diminishing Musharaka Financing 303,040 291,868 327,205 285,759
12 Total Islamic 423,868 381,140 451,827 401,733
Total 3,200,682 3,307,016 3,181,597 3,293,945
BankDhofar
DISCLOSURE REQUIREMENTS UNDER PILLAR – III OF BASEL II & III.For the year ended 31 December 2019

81Annual Report 2019
3. Basel II & III Disclosures (Continued)3.4 Risk Exposure and Assessment (Continued)3.4.1 Credit Risk (Continued)
2) Geographic distribution of exposures, broken down in significant areas by major types of credit exposure:
S.No
Type of Credit Exposure
Oman RO’000
Other GCC
Countries RO’000
*OECDCountries RO’000
India RO’000
Pakistan RO’000
Other RO’000
Total RO’000
1 2 3 4 5 6 7
1 Overdrafts 137,827 - - - - - 137,827
2 Personal Loans 1,286,585 - - - - - 1,286,585
3 Loans against trustReceipts 109,865 - - - - - 109,865
4 Other Loans 1,139,145 - - - - - 1,139,145
5 Bills Purchased / negotiated 10,334 - - - - - 10,334
6 Advance against credit cards 9,450 - - - - - 9,450
7 Any other 36,564 - - - - - 36,564
Total 2,729,770 - - - - - 2,729,770
Islamic
8 Murabaha Receivables 19,686 - - - - - 19,686
9 Mudaraba Financing 18,897 - - - - - 18,897
10 Ijarah Assets 46,028 - - - - - 46,028
11 Wakala Financing 40,011 - - - - - 40,011
12
Diminishing Musharaka Financing
327,205 - - - - - 327,205
13 Total Islamic 451,827 - - - - - 451,827
Total 3,181,597 - - - - - 3,181,597
Overdrafts and others includes in Personal loans and others
*excluding countries included in column 2
BankDhofar
DISCLOSURE REQUIREMENTS UNDER PILLAR – III OF BASEL II & III.For the year ended 31 December 2019

Annual Report 201982
3. Basel II & III Disclosures (Continued)3.4 Risk Exposure and Assessment (Continued)3.4.1 Credit Risk (Continued)
3) Industry or counterparty type distribution of exposures broken down by major types of credit exposures:
S.No Economic Sector Overdraft RO’000
Loans & Financing RO’000
Bills RO’000
purchased
Others RO’000
Total RO’000
Off balance sheet
exposure RO’000
1 Import trade 10,972 79,776 - 12,588 103,336 25,662
2 Export trade 188 121 - 5 314 59
3 Wholesale/retail trade 4,821 21,008 - 2,349 28,178 21,661
4 Mining and quarrying 1,859 16,723 162 13 18,757 619
5 Construction 53,015 399,072 4,683 77,871 534,641 379,395
6 Manufacturing 16,933 121,123 3,527 42,789 184,372 44,491
7Electricity, gas and water
715 161,826 - 169 162,710 14,675
8Transport and Communication 1,048 1,455 - 556 3,059 5,047
9 Financial institutions 1,248 143,728 1,940 - 146,916 236,531
10 Services 25,200 149,100 - 2,015 176,315 31,339
11 Personal loans 1,625 1,276,017 - 8,943 1,286,585 3,875
12Agriculture and alliedActivities 4,022 4,543 22 1,782 10,369 813
13 Government - 248,739 - 3 248,742 18,446
14 Non-resident lending - - - - - -
15 Others 16,181 254,326 - 6,796 277,303 28,317
Total (1 to 15) 137,827 2,877,557 10,334 155,879 3,181,597 810,930
4) Residual contractual maturity breakdown of the whole portfolio, broken down by major types of credit exposure:
S.No. Time Band Overdrafts
RO’000
Loans & Financing RO’000
Bills purchased/ Discounted
RO’000
Others RO’000
Total RO’000
Off-balance
sheet exp. RO’000
1 Upto 1 month 6,891 51,811 - 515 59,217 315,851
2 1 - 3 months 6,891 158,971 10,334 4,990 181,186 56,590
3 3 - 6 months 6,891 61,202 - 7,071 75,164 26,778
4 6 - 9 months 6,891 9,800 - 8,572 25,263 14,209
5 9 - 12 months 6,891 15,582 - 6,183 28,656 16,895
6 1 - 3 years 34,457 84,680 - 25,049 144,186 138,904
7 3 – 5 years 34,457 143,763 - 27,699 205,919 153,797
8 Over 5 years 34,458 2,351,748 - 75,800 2,462,006 87,906
Total 137,827 2,877,557 10,334 155,879 3,181,597 810,930
BankDhofar
DISCLOSURE REQUIREMENTS UNDER PILLAR – III OF BASEL II & III.For the year ended 31 December 2019

83Annual Report 2019
3. Basel II & III Disclosures (Continued)3.4 Risk Exposure and Assessment (Continued)3.4.1 Credit Risk (Continued)
5) Analysis of loan & financing book by major industry or counterparty type:
S.No.
Economic Sector
Performing loans
RO’000
Non-performing
loans RO’000
Expected Credit Loss
for Stage 1 & 2 Exposure RO’000
Expected Credit Loss for Stage 3 Exposure RO’000
Interest reserve
RO’000
Stage 3 Expected
Credit Loss during the
year RO’000
Advances written off during the
year RO’000
1 Import trade 96,476 6,860 786 1,369 4,080 515 1,0592 Export trade 308 6 20 3 3 - -
3 Wholesale/retail trade 19,067 9,112 2,547 3,564 337 3,777 4,908
4 Mining and quarrying 18,745 12 578 6 7 3 -
5 Construction 510,681 23,960 5,481 8,066 1,764 7,320 -6 Manufacturing 183,671 701 1,541 221 256 203 -
7 Electricity, gas and water 162,671 39 1,230 9 4 - -
8 Transport and communication 2,400 659 286 269 80 394 -
9 Financial institutions 146,916 - 944 - - - -
10 Services 174,526 1,789 1,195 697 468 223 -11 Personal loans 1,222,275 64,310 13,414 28,669 14,199 10,546 2,174
12 Agriculture and allied activities 10,359 10 40 5 4 - -
13 Government 248,742 - 8 - - -
14 Non-resident lending - - - - - 49 4,429
15 Others 236,178 41,124 9,573 13,557 2,967 12,571 -
Total (1 to 15) 3,033,015 148,582 37,643 56,435 24,169 35,601 12,570
* Represents only on balance sheet NPLs.
6) Geographical distribution of amount of impaired loans:
S.No Countries
Exposure to Stage 1 & 2
RO’000
Exposure to Stage 3 RO’000
Stage 1 & 2 ECL
RO’000
Stage3 `ECL
RO’000
Interest reserve RO’000
Stage 3 ECL made during the
year RO’000
Advances written off during the
year RO’000
1 Oman 3,033,015 148,582 37,643 56,435 24,169 35,601 8,141
2 Other GCC countries - - - - - - 4,429
3 OECD countries* - - - - - - -
4 India - - - - - - -
5 Pakistan - - - - - - -
6 Others - - - - - - -
7 Total 3,033,015 148,582 37,643 56,435 24,169 35,601 12,570
*excluding countries included in row 2
BankDhofar
DISCLOSURE REQUIREMENTS UNDER PILLAR – III OF BASEL II & III.For the year ended 31 December 2019

Annual Report 201984
3. Basel II & III Disclosures (Continued)3.4 Risk Exposure and Assessment (Continued)3.4.1 Credit Risk (Continued)
7) Movement of Gross Loans/Financing:(OR in 000’s)
S.No.
Stage 1RO’000
Stage 2RO’000
Stage 3RO’000
TotalRO’000
1 Opening Balance 2,506,380 666,266 121,299 3,293,945
2 Migration/changes (+/-) (142,818) 66,879 75,939 -
3 New Loans 473,261 214,579 11,927 699,767
4 Recovery from Loans (633,757) (117,775) (5,493) (757,025)
5 Loans written off - - (55,090) (55,090)
6 Closing Balance 2,203,066 829,949 148,582 3,181,597
7 Total Provisions 11,586 26,057 56,435 94,078
3.4.2 Credit Risk: Disclosures for portfolios subject to the Standardized Approach
1) The Bank has obtained CBO approval vide its letter dated December 11, 2006 to use the ratings of Moody’s, Standard & Poor (S&P) or Fitch for risk weighting claims on sovereigns and banks. However, as mentioned earlier, the Bank has obtained CBO approval to treat all corporate exposures as unrated and assign 100% risk weight on all of them. Similar convention has been applied for Maisarah as well.
2) The Bank is adopting the simplified approach for collateral recognition under the standardized approach, where 0% risk weight is assigned for the exposures covered by cash collateral. The total exposure covered by cash collateral, which attracts 0% risk weight is RO 139.456 million All other credit exposures of Corporate and Retail are assigned 100% risk weight (except mortgage loans, where valuation of the mortgaged house property is not older than 3 years, are assigned 35% risk weight and 75% for SME borrowers).
Quantitative Disclosure
The net exposure after risk mitigation subject to Standardized Approach as at 31.12.2019 is as follows:
S. No Risk bucket 0% 1% 5% 20% 35% 50% 75% 100% 150% 300% Total
RO 000 RO’000 RO’ 000 RO’ 000 RO’ 000 RO’ 000 RO’ 000 RO’ 000 RO’ 000 RO’ 000 RO’ 000
1 Sovereigns (Rated) 641,808 - - - - - - - - - 641,808
2 Banks(Rated) - - - 120,895 - 264,720 - 86,792 4 - 472,411
3 Corporate 102,395 - - - - - - - - - 102,395
4 SME - - - - - - 50,555 1,638,516 - 18,897 1,707,968
5 Retail 1,857 - - - - - - 669,008 - - 670,865
6Claims secured by residential property
- - - - 522,809 - - 28,587 - - 551,396
7 Past due loans - - - - - - - 148,582 - - 148,582
8 Other assets - - - - - - - 93,309 - - 93,309
9 Un-drawn exposure - - - - - - 607 223,937 - 485 225,029
10 Derivative - 1,082,617 217,042 - - - - 1,459 - - 1,301,118
11 Non funded- Bank - - - - - - - 107,632 - - 107,632
12 Non funded- Customers 35,204 - - 647 - 224,228 - 71,603 - - 331,682
13 Non funded- Sovereign 3,769 - - - - - - - - - 3,769
Total 785,033 1,082,617 217,042 121,542 522,809 488,948 51,162 3,069,425 4 19,382 6,357,964
3) The Bank also conducts stress tests on portfolio basis at regular intervals to assess the impact of movement in the staging on its profitability and capital adequacy. The same is placed before the Board Risk Management Committee.
BankDhofar
DISCLOSURE REQUIREMENTS UNDER PILLAR – III OF BASEL II & III.For the year ended 31 December 2019

85Annual Report 2019
3. Basel II & III Disclosures (Continued)3.4 Risk Exposure and Assessment (Continued)3.4.3 Credit Risk Mitigation (CRM): Disclosures for Standardized approaches
The Bank has adopted the simple approach for credit risk mitigation and no offsetting of the collaterals is done to calculate the capital requirement. However, the main CRM techniques followed by the Bank are based on collaterals which the Bank endeavors to obtain for its exposures, as far as commercially practicable. The collaterals mainly consist of real estate properties, shares listed on the Muscat Securities Market (MSM), government bonds, unlisted shares and Bank fixed deposits. However, the Bank’s predominant form of eligible collateral as defined by CBO in its guidelines and for capital adequacy computation purposes is in the form of cash, acceptable Bank guarantees and shares listed on the MSM main index.
The Bank has credit risk rating framework comprising of Risk Rating system which is a single point indicator of diverse risk factors of a Borrower and assists in taking credit decisions in a consistent manner. The risk rating framework is having 8 performing loan grades (including special mention) and 3 non-performing loan grades. The rating grade indicates the default probability of the borrower’s obligation. The Bank has also implemented the facility rating system based on Basel II foundation approach which considers the collateral support, seniority and other structural aspects of the facilities provided.
Bank has also implemented model on Risk Adjusted Return on Capital (RAROC) for conventional banking, which provides the risk based pricing, which refers to a process of identifying risks, understanding them and subsequently pricing them appropriately. It is an important aspect of prudent credit risk management and is essential for maintaining financial discipline while giving loans. It helps in not only identifying, but also understanding the risk and pricing it appropriately. The RAROC system provides a competitive edge to the Bank in improving the quality of the portfolio and also covers the cost of doing business in the form of pricing.
The Bank has strengthened its existing credit risk management systems and is committed to improve it further.
3.4.4 Counterparty Credit Risk
Counterparty Credit Risk (CCR) is the possibility that a customer or trading counterparty will fail to fulfill contractual obligations, and such failure may result in the termination or replacement of the transaction at a loss to the Bank. Such exposures arise primarily in relation to over-the-counter (OTC) derivatives. The majority of CCR exposure is incurred in transactions designed to help our clients manage their interest rate and currency risks.
To measure RWA, Bank Dhofar uses the Current Exposure Method (CEM), which is the sum of current credit exposure (CCE) and the potential future exposure (PFE). The CCE is the sum of net positive fair values and the PFE is an estimate of the maximum amount of the exposure that could occur over a one year horizon. BankDhofar has a total notional amount of RO 83.244 Mn in OTC derivatives (such as currency option, interest rate swap and forward interest rate agreement) and risk weighted assets of RO 1.459 Mn as at 31 Dec 2019.
3.4.5 Market Risk
Market Risk is the risk to the Bank’s earnings and capital due to changes in the interest rates, profit rates or prices of securities, foreign exchange and equities. The Bank for International Settlements (BIS) defines market risk as “the risk that the value of ‘on’ or ‘off’ balance sheet positions will be adversely affected by movements in equity and interest rate markets, currency exchange rates and commodity prices”. Market Risk has been categorized into interest rate risk, profit rate risk, foreign exchange risk, commodity price risk and equity price risk.
Bank has a comprehensive Asset Liability Management (ALM) Policy for conventional entity and Islamic banking and Investment Management Policy for conventional banking which encompasses assessment, monitoring and management of all the above market risks. Bank has defined various internal limits to monitor market risk and is computing the capital requirement as per Standardized approach of Basel II.
Details of various market risks faced by the Bank are set out below:
1) Interest Rate Risk (IRR) for conventional banking:
Interest rate risk is the risk where changes in market interest rates might adversely affect a Bank’s financial condition. The immediate impact (up to one year) of changes in interest rates is on the Net Interest Income (NII) and a long term impact (more than one year) of changing interest rates is on the Bank’s networth.
BankDhofar
DISCLOSURE REQUIREMENTS UNDER PILLAR – III OF BASEL II & III.For the year ended 31 December 2019

Annual Report 201986
3. Basel II & III Disclosures (Continued)3.4 Risk Exposure and Assessment (Continued)3.4.5 Market Risk (Continued)
The responsibility of interest rate risk management rests with the Bank’s Asset and Liability Management Committee (ALCO). Bank periodically computes the IRR on the Banking book that arises due to re-pricing mismatches in interest rate sensitive assets and liabilities. The impact of IRR on the earnings of the Bank is computed and placed to ALCO on monthly basis. An internal limit has been set up to monitor the impact of Interest rate risk on NII. Similarly, Bank has developed a model to assess the impact of IRR on the Bank’s net worth based on duration gap analysis method and an internal limit has also been fixed for the same.
Details relating to re-pricing mismatches and the interest rate risk thereon is monitored by ALCO on periodic basis. In addition, scenario analysis assuming a 200 basis point parallel shift in interest rates and its impact on the interest income and net profit of the Bank are assessed on a quarterly basis and placed to Risk Management Committee of the Board with proposals for corrective action if necessary.
Impact on earnings and economic value of equity due to adverse movement of 100 bps and 200 bps in interest rate in conventional banking is provided as under:
(RO in 000’s)
Position as at 31.12.2019Impact on + or – 1% + or – 2%
Earnings 11.06 22.12
Economic Value of Equity 37,235 74,471
Impact on earning as a % of NII 10.41% 20.83%
Impact as a % of Bank’s Net worth 5.56% 11.12%
2) Profit Rate Risk (PRR):
Profit rate risk is the risk that Maisarah will incur a financial loss as a result of mismatch in the Profit rates on assets & Investment Account Holder (IAH). The profit distribution to IAH is based on Profit Sharing Agreements. Therefore, Maisarah is not subject to any significant PRR. However, the profit sharing agreements will result in displaced commercial risk when Maisarah result does not allow it to distribute profits in line with the market rates.
Maisarah has a Profit Distribution Policy in place which details the process and management of Profit Distribution, including setting up of Profit Equalization & Investment Risk Reserve. The responsibility of profit rate risk management rests with the Bank’s Asset and Liability Management Committee (ALCO). Maisarah periodically computes the PRR on the Banking book.
3) Foreign Exchange Risk:
Foreign Exchange Risk maybe defined as the risk that a Bank may suffer losses as a result of adverse exchange rate movements during a period in which it has an open position, either spot or forward, or a combination of the two, in an individual foreign currency.
The responsibility of management of foreign exchange risk rests with the Treasury department. The Bank has set up internal limit to monitor foreign exchange open positions. Most of the foreign exchange transactions are conducted for corporate customers and mostly are on back to back basis. Bank has also defined various limits for foreign currency borrowing and lending.
The Bank also conducts stress tests to assess the impact of foreign exchange risk on capital adequacy and the same is placed to Board Risk Management Committee of Board of Directors on regular basis.
4) Commodity Risk:
Commodity Risk occurs due to volatility in the prices of the commodities. Presently the Bank has no exposure to the commodity market.
BankDhofar
DISCLOSURE REQUIREMENTS UNDER PILLAR – III OF BASEL II & III.For the year ended 31 December 2019

87Annual Report 2019
3. Basel II & III Disclosures (Continued)3.4 Risk Exposure and Assessment (Continued)3.4.5 Market Risk (Continued)
5) Equity Position Risk:
Equity Position risk occurs due to change in the market value of the Bank’s portfolio as a result of diminution in the market value of the equity securities. The responsibility of management of equity position risk rests with the Investment Management Department of the Bank. The Bank does not hold trading position in equities in conventional banking and does not hold any position in equities in Maisarah. The Bank’s portfolio is marked to market on regular basis and the difference in the book value and market value are adjusted against revaluation reserve. The Bank also conducts regular stress test on equity position risk and assesses its impact on profitability and capital adequacy.
Bank has introduced the Value at Risk (VaR) method in conventional banking for the domestic quoted equity portfolio. Out of total quoted equity portfolio of OMR 2.92 million as on 31.12.2019, VaR works out to OMR 340K at 99% confidence level and 11.63% of the domestic quoted equity portfolio.
6) The Capital Charges:
The capital charge for the entire market risk exposure is computed as per the standardized approach using the duration method and in accordance with the guidelines issued by CBO in its circular BM 1009. The Bank adopts duration method in measuring interest rate risk in respect of debt securities held in trading book. The Bank does not hold any trading position in equities and in commodities necessitating capital charge to cover the market risk. Foreign exchange risk capital charge is computed on the three month average of the sum of net short positions or net long positions, whichever is higher of the foreign currency positions held by the Bank. The capital charge for various components of market risk is presented below:
Type of risk RO’000Amount
Interest Rate Risk -Equity Position Risk -Commodities Position risk -Foreign Exchange position risk 11,473Total 11,473
3.4.6 Liquidity Risk
Liquidity risk is the potential inability to meet the liabilities as they become due. It arises when the banks are unable to generate cash to cope with a decline in deposits or increase in assets.
The Bank’s Liquidity Risk Management is governed by the ALM Policy document approved by the Board of Directors as well as the provisions of relevant CBO guidelines on liquidity risk management. The ALM policy also incorporates contingency funding plans and measures, so as to be in a position to meet all maturing liabilities as well as to fund asset growth and business operations. The contingency funding plan includes effective monitoring of the cash flows on a day to day basis, holding of tradable high quality liquid assets, which may be readily disposed off in sizeable amount etc.
The Bank monitors its liquidity risk through cash flow approach and stock approach. Under cash flow approach the Bank generates Maturity of Assets and Liabilities (MAL) report which captures all the maturing assets and liabilities into various pre-set time buckets ranging from one month to above five years. The mismatches in various time buckets indicate liquidity gap and the Bank strictly adheres to the CBO set limit of 15% of cumulative liabilities (outflows) on mismatches (liquidity gaps) in time buckets up to one year. In addition, the Bank has also set up internal limit on mismatches in time buckets beyond one year. Under stock approach, the Bank monitors the liquidity risk through liquidity ratios, which portrays the liquidity stored in the balance sheet.
Treasury department of the Bank controls and monitors the liquidity risk and ensures that the Bank is not exposed to undue liquidity risk and at the same time makes optimum use of its funds. Middle office in Risk Management Division also monitors the liquidity position of the Bank and provides the liquidity gap positions to Treasury Department to manage it.
Middle office also undertakes regular stress test that provides the requirement of liquidity over a given time horizon.
The Bank has reconciled the statement of Maturity of Assets and Liabilities with the discussions under IFRS (Refer item no. 32 of the notes to financial statements).
BankDhofar
DISCLOSURE REQUIREMENTS UNDER PILLAR – III OF BASEL II & III.For the year ended 31 December 2019

Annual Report 201988
3. Basel II & III Disclosures (Continued)3.4 Risk Exposure and Assessment (Continued)3.4.7 Operational Risk
Basel Committee on Banking Supervision has defined operational risk as “the risk of loss resulting from inadequate or failed internal processes, people and systems or from external events.” This definition includes legal risk, but excludes strategic and reputational risk. Legal risk includes, but is not limited to, exposure to fines, penalties, punitive damages resulting from supervisory actions, as well as private settlements.
Bank has a well-defined Operational Risk Management (ORM) policy which inter-alia includes Operational Risk Events, Operational Risk losses and ORM process. Business and Functional units are primarily responsible for taking and managing Operational Risk on a day-to-day basis. Risk Management Division provides guidance and assistance in the identification of risk and in the ongoing operational risk management process. Bank has set up Operational Risk Management Committee to identify, manage, measure, monitor, mitigate and report operational risks. Bank has also formulated a framework for reporting red flags to the Management and to the Board.
Basel II has provided three different approaches viz., Basic Indicator approach (BIA), The standardized approach (TSA) and Advanced measurement approach to compute the capital charge of Operational Risk. The Bank has adopted the BIA for computing the capital charge for Operational Risk as per CBO guidelines. The approach requires the Bank to provide 15% of the average gross income for the last three years as capital charge for operational risk.
Bank uses various operational risk tools like loss data management (LDM), Key Risk Indicators (KRI), Risk Control and Self-Assessment (RCSA) for effective operational risk management. The system of collecting and collating data on operational risk events has been improved further to build a strong loss data base and to improve control effectiveness. The loss data are being captured using Operational Risk Management System and complete history of the loss data is maintained.
Bank undertakes Risk Control and Self-Assessment exercise by which the inherent risk in various processes of each business unit is identified and control against these risks are assessed for their design and effectiveness. The residual risk (i.e. inherent risk after controls) provides the potential loss amount and based on residual risk, the controls are improved further.
Bank is also identifying and monitoring the Key Risk Indicators (KRIs) for each business unit. Each KRI has a defined threshold limit and an escalation criterion is also attached to it. A breach in threshold of the KRI escalates the risk to the higher authority. All the Operational Risk Management tools are configured in Operational Risk Management System.
4. Liquidity Standards
Bank has adopted Basel III liquidity standards and is reporting the liquidity coverage ratio and net stable funding ratio to CBO with effect from March 2014.
4.1 Liquidity Coverage Ratio (LCR)
This ratio aims to ensure that a bank maintains an adequate level of unencumbered, high-quality liquid assets that can be converted into cash to meet its liquidity needs for a 30 calendar day time horizon under a significantly severe liquidity stress scenario. The ratio is calculated as follows:
LCR = Stock of High Quality Liquid Assets / Total Net Cash Outflows over the next 30 calendar days
As per guidelines, the value of the LCR should be minimum 100% on an ongoing basis with effect from 01.01.2019. The Bank is meeting the regulatory limit of LCR as at 31st December 2019 on a consolidated basis.
BankDhofar
DISCLOSURE REQUIREMENTS UNDER PILLAR – III OF BASEL II & III.For the year ended 31 December 2019

89Annual Report 2019
4. Liquidity Standards (Continued)4.2 Net Stable Funding Ratio (NSFR)
The net stable funding ratio is designed to ensure that banks rely more on long term funding and they maintain a sound funding structure over a horizon of one year to withstand Bank specific stress events. The ratio aims to reduce over-reliance on short term funding to create long term assets, especially during times of volatile liquidity conditions. The ratio is calculated as follows
Net Stable Funding Ratio = Available Stable Funding (ASF) / Required Stable
Funding (RSF) *100
In terms of CBO guidelines, the standard for NSFR has become effective from 1st January 2018, with a minimum ratio of 100%. Presently, the Bank is meeting the regulatory limit of NSFR as at 31st December 2019.
5. Basel III Leverage Ratio
As per CBO guidelines on Leverage Ratio standards, Bank is expected to maintain a leverage ratio of 4.5%. The leverage ratio standard is not applicable to Islamic Banking Window. The Bank’s leverage ratio, calculated in accordance with the CBO guidelines for the consolidated entity is as follows:
(All amounts in OMR’000)
Table 1: Summary comparison of accounting assets vs leverage ratio exposure measure
S.No ItemAs at 31st December
2019
As at 31st December
2018
1 Total consolidated assets as per published financial statements 4,325,845 4,010,454
2Adjustment for investments in banking, financial, insurance or commercial entities that are consolidated for accounting purposes but outside the scope of regulatory consolidation
3Adjustment for fiduciary assets recognised on the balance sheet pursuant to the operative accounting framework but excluded from the leverage ratio exposure measure
4 Adjustments for derivative financial instruments 13,701 13,574
5 Adjustment for securities financing transactions (i.e., repos and similar secured lending)
6 Adjustment for off-balance sheet items (i.e., conversion to credit equivalent amounts of off-balance sheet exposures) 423,124 448,750
7 Other adjustments
8 Leverage ratio exposure 4,762,670 4,472,778
BankDhofar
DISCLOSURE REQUIREMENTS UNDER PILLAR – III OF BASEL II & III.For the year ended 31 December 2019

Annual Report 201990
Table 2: Leverage ratio common disclosure template
S. No ItemAs at 31st December
2019
As at 31st December
2018
1 On-balance sheet items (excluding derivatives and SFTs, but including collateral) 4,325,845 4,010,454
2 (Asset amounts deducted in determining Basel III Tier 1 capital)
3 Total on-balance sheet exposures (excluding derivatives and SFTs) (sum of lines 1 and 2) 4,325,845 4,010,454
Derivative Exposures
4 Replacement cost associated with all derivatives transactions (i.e., net of eligible cash variation margin)
5 Add-on amounts for PFE associated with all derivatives transactions 13,701 13,574
6Gross-up for derivatives collateral provided where deducted from the balance sheet assets pursuant to the operative accounting framework
- -
7 (Deductions of receivables assets for cash variation margin provided in derivatives transactions) - -
8 (Exempted CCP leg of client-cleared trade exposures) - -
9 Adjusted effective notional amount of written credit derivatives - -
10 (Adjusted effective notional offsets and add-on deductions for written credit derivatives) - -
11 Total derivative exposures (sum of lines 4 to 10) 13,701 13,574
Securities financing transaction exposures
12 Gross SFT assets (with no recognition of netting), after adjusting for sale accounting transactions -
13 (Netted amounts of cash payables and cash receivables of gross SFT assets) -
14 CCR exposure for SFT assets -
15 Agent transaction exposures
16 Total securities financing transaction exposures (sum of lines 12 to 15) - -
Other Off-balance sheet exposures
17 Off-balance sheet exposure at gross notional amount 810,930 848,120
18 (Adjustments for conversion to credit equivalent amounts) (387,806) (399,370)
19 Off-balance sheet items (sum of lines 17 and 18) 423,124 448,750
Capital and total exposures
20 Tier 1 capital 668,489 653,977
21 Total exposures (sum of lines 3, 11, 16 and 19) 4,762,670 4,472,778
Leverage Ratio
22 Basel III leverage ratio (%) 14.0 14.6
BankDhofar
DISCLOSURE REQUIREMENTS UNDER PILLAR – III OF BASEL II & III.For the year ended 31 December 2019
5. Basel III Leverage Ratio (Continued)

91Annual Report 2019
Annexure I
Basel III Capital Disclosure Template 31st/12/2019
S.No Basel III common disclosure template to be used during the transition of regulatory adjustments
Amount Subject to Pre-Basel III
treatment
(RO ‘000)
Common Equity Tier 1 Capital: Instruments and reserves
1 Directly issued qualifying common share capital (and equivalent for non-joint stock companies) plus related stock surplus 395,291.00
2 Retained Earnings 1,447.00
3 Accumulated other comprehensive income (and other reserves) 120,329.00
4 Directly issued capital subject to phase out from CET1 (only applicable to non-joint stock companies) -
Public Sector capital injections grandfathered until 1 January 2018 -
5 Common share capital issued by subsidiaries and held by third parties (amount allowed in group CET 1) -
6 Common Equity Tier 1 Capital before regulatory adjustments 517,067.00
Common Equity Tier 1 Capital: Regulatory Adjustments
7 Prudential valuation adjustments 2,245.00
8 Goodwill (net of related tax liability)* 397.00
9 Other intangibles other than mortgage-servicing rights (net of related tax liability)* -
10 Deferred tax assets that rely on future profitability excluding those arising from temporary differences (net of related tax liability) 1,028.00
11 Cash Flow hedge reserve -
12 Shortfall of provisions to expected loss -
13 Securitization gain on sale (as set out in para 14.9 of CP-1) -
14 Gains and losses due to changes in own credit risk on fair valued liabilities -
15 Defined benefit pension fund net assets -
16 Investments in own shares (if not already netted off paid-in capital on reported balance sheet) -
17 Reciprocal cross holdings in common equity -
18
Investments in the capital of banking, financial, insurance and takaful entities that are outside the scope of regulatory consolidation, net of eligible short positions, where the bank does not own more than 10% of the issued share capital (amount above 10% threshold)
-
19Significant investments in the common stock of banking, financial, insurance and takaful entities that are outside the scope of regulatory consolidation, net of eligible short positions (amount above 10% threshold)
-
20 Mortgage servicing rights (amount above 10% threshold) -
21 Deferred tax assets arising from temporary differences (amount above 10% threshold, net of related tax liability) -
22 Amount exceeding the 15% threshold) -
BankDhofar
DISCLOSURE REQUIREMENTS UNDER PILLAR – III OF BASEL II & III.For the year ended 31 December 2019

Annual Report 201992
S.No Basel III common disclosure template to be used during the transition of regulatory adjustments
Amount Subject to Pre-Basel III
treatment
23 of which: significant investments in the common stock of financials -
24 of which: mortgage servicing rights -
25 of which: deferred tax assets arising from temporary differences -
26 National specific regulatory adjustments -
Regulatory adjustments applied to common equity Tier 1 in respect of amount subject to pre-basel III treatment -
of which: (insert name of adjustment) -
of which: (insert name of adjustment) -
of which: (insert name of adjustment) -
27 Regulatory adjustments applied to common equity Tier 1 due to insufficient Additional Tier 1 and Tier 2 to cover deductions -
28 Total regulatory adjustments to common equity Tier 1 3,670.00
29 Common Equity Tier 1 capital (CET 1) 513,397.00
Additional Tier 1 Capital: Instruments
30 Directly issued qualifying Additional Tier 1 instruments plus related stock surplus 155,500.00
31 of which: classified as equity under applicable accounting standards 155,500.00
32 of which: classified as liabilities under applicable accounting standards
33 Directly issued capital instruments subject to phase out from Additional Tier 1
34 Additional Tier 1 instruments (and CET 1 instruments not included in row 5) issued by subsidiaries and held by third parties (amount allowed in group AT 1)
35 of which: instruments issued by subsidiaries subject to phase out
36 Additional Tier 1 capital before regulatory adjustments 155,500.00
Additional Tier 1 Capital: Regulatory Adjustments
37 Investments in own Additional Tier 1 instruments -
38 Reciprocal cross holdings in Additional Tier 1 instruments -
39
Investments in the capital of banking, financial, insurance and takaful entities that are outside the scope of regulatory consolidation, net of eligible short positions, where the bank does not own more than 10% of the issued common share capital of the entity (amount above 10% threshold)
-
40Significant investments in the capital of banking, financial, insurance and takaful entities that are outside the scope of regulatory consolidation (net of eligible short positions)
-
41 National specific regulatory adjustments -
Regulatory adjustments applied to Additional Tier 1 in respect of amount subject to pre-basel III treatment -
of which: (insert name of adjustment) -
of which: (insert name of adjustment) -
of which: (insert name of adjustment) -
42 Regulatory adjustments applied to Additional Tier 1 due to insufficient Tier 2 to cover deductions -
43 Total regulatory adjustments to Additional Tier 1 -
44 Additional Tier 1 capital (CET 1) 155,500.00
45 Tier 1 capital (T1 = CET 1 + AT 1) 668,897.00
BankDhofar
DISCLOSURE REQUIREMENTS UNDER PILLAR – III OF BASEL II & III.For the year ended 31 December 2019

93Annual Report 2019
S.No Basel III common disclosure template to be used during the transition of regulatory adjustments
Amount Subject to Pre-Basel III
treatment
Tier 2 capital: Instruments and provisions
46 Directly issued qualifying Tier 2 instruments plus related stock surplus 21,000.00
47 Directly issued capital instruments subject to phase out from Tier 2
48 Tier 2 instruments (and CET 1 and AT 1 instruments not included in rows 5 or 34) issued by subsidiaries and held by third parties (amount allowed in group Tier 2)
49 of which: instruments issued by subsidiaries subject to phase out
50 Provisions and Cumulative fair value gains on available for sale instruments 38,685.00
51 Tier 2 capital before regulatory adjustments 59,685.00
Tier 2 capital: Regulatory Adjustments
52 Investments in own Tier 2 instruments -
53 Reciprocal cross holdings in Tier 2 instruments -
54
Investments in the capital of banking, financial, insurance and takaful entities that are outside the scope of regulatory consolidation, net of eligible short positions, where the bank does not own more than 10% of the issued common share capital of the entity (amount above 10% threshold)
-
55Significant investments in the capital of banking, financial, insurance and takaful entities that are outside the scope of regulatory consolidation (net of eligible short positions)
-
56 National specific regulatory adjustments -
Regulatory adjustments applied to Tier 2 in respect of amount subject to pre-basel III treatment
-
of which: (insert name of adjustment) -
of which: (insert name of adjustment) -
of which: (insert name of adjustment) -
57 Total Regulatory Adjustments to Tier 2 capital -
58 Tier 2 Capital (T 2) 59,685.00
59 Total Capital (TC = T 1 + T 2) 728,582.00
Risk Weighted Assets in respect of amounts subject to pre-Basel III treatment
of which: (insert name of adjustment)
of which: (insert name of adjustment)
60 Total Risk Weighted Assets (60a + 60b + 60c) 4,078,319.00
60a of which: Credit Risk Weighted Assets 3,671,420.00
60b of which: Market Risk Weighted Assets 143,412.00
BankDhofar
DISCLOSURE REQUIREMENTS UNDER PILLAR – III OF BASEL II & III.For the year ended 31 December 2019

Annual Report 201994
S.No Basel III common disclosure template to be used during the transition of regulatory adjustments
Amount Subject to Pre-Basel III
treatment
60c of which: Operational Risk Weighted Assets 263,487.00
Capital Ratios
61 Common Equity Tier 1 (as a percentage of risk weighted assets) 12.59%
62 Tier 1 (as a percentage of risk weighted assets) 16.40%
63 Total capital (as a percentage of risk weighted assets) 17.86%
64Institution specific buffer requirement (minimum CET 1 requirement plus capital conservation buffer plus countercyclical buffer requirements plus G-SIB/ D-SIB buffer requirements expressed as a percentage of risk weighted assets) 9.50%
65 of which: capital conservation buffer requirement 2.50%
66 of which: bank specific countercyclical buffer requirement 0.00%
67 of which: D-SIB/ G-SIB buffer requirements 0.00%
68 Common Equity Tier 1 available to meet buffers (as a percentage of risk weighted assets) 3.09%
National Minima (if different from Basel 3)
69 National common equity Tier 1 minimum ratio (if different from Basel III minimum) NA
70 National Tier 1 minimum ratio (if different from Basel III minimum) NA
71 National total capital minimum ratio (if different from Basel III minimum) NA
Amounts below the thresholds for deduction (before risk weighting)
72 Non-significant investments in the capital of other financials -
73 Significant investments in the common stock of financials -
74 Mortgage servicing rights (net of related tax liability) -
75 Deferred tax assets arising from temporary differences (net of related tax liability) -
Applicable caps on the inclusion of provisions in Tier 2
76 Provisions eligible for inclusion in Tier 2 in respect of exposures subject to standardized approach (prior to application of cap) 38,685.00
77 Cap on inclusion of provisions in Tier 2 under standardized approach 45,892.75
78 Provisions eligible for inclusion in Tier 2 in respect of exposures subject to internal ratings based approach (prior to application of cap) -
79 Cap for inclusion of provisions in Tier 2 under internal ratings based approach -
Capital instruments subject to phase-out arrangements (only applicable between 1 Jan 2018 and 1 Jan 2022)
80 Current cap on CET 1 instruments subject to phase out arrangements NA
81 Amount excluded from CET 1 due to cap (excess over cap after redemptions and maturities) NA
82 Current cap on AT 1 instruments subject to phase out arrangements NA
83 Amount excluded from AT 1 due to cap (excess over cap after redemptions and maturities) NA
84 Current cap on T 2 instruments subject to phase out arrangements NA
85 Amount excluded from T 2 due to cap (excess over cap after redemptions and maturities) NA
BankDhofar
DISCLOSURE REQUIREMENTS UNDER PILLAR – III OF BASEL II & III.For the year ended 31 December 2019

95Annual Report 2019
CA Report 1 (For CBO Use only)
S.No CA Report 1 (For CBO Use only)
1 Common Equity Tier 1 Capital (CET1) before Regulatory Adjustments 517,067
2 Regulatory Adjustments to CET1 3,670
3 CET1 513,397
4 Additional Tier 1 Capital (AT1) before Regulatory Adjustments 155,500
5 Regulatory Adjustments to AT1 -
6 AT1 155,500
7 Tier 1 Capital (7=3+6) (minimum at 0.625%) 668,897
8 Tier 2 Capital before Regulatory Adjustments 59,685
9 Regulatory Adjustments to Tier 2 Capital -
10 Tier 2 Capital (T2) 59,685
11 Total Capital (11=7+10) 728,582
12 Total Risk Weighted Assets (TRWA) (12=13+14+15) 4,078,319
13 Credit Risk Weighted Assets 3,671,420
14 Market Risk Weighted Assets 143,412
15 Operational Risk Weighted Assets 263,487
16 CET1 (as a percentage of TRWA) (in %) 7.625% 12.59
17 Tier 1 (as a percentage of TRWA) (in %) 9.625% 16.40
18 Total capital (as a percentage of TRWA) (in %) 12.625% 17.86
BankDhofar
DISCLOSURE REQUIREMENTS UNDER PILLAR – III OF BASEL II & III.For the year ended 31 December 2019

Annual Report 201996
Basel III common
Capital Adequacy Disclosure
S.No Details 31st December 2019
Amount RO ‘ 000
1 Common Equity Tier 1 capital (CET 1) 513,397
2 Tier I Capital (after supervisory deductions) 668,897
3 Tier II capital (after supervisory deductions & upto eligible limits) 59,685
4 Tier III Capital ( upto a limit where Tier II & Tier III does not exceed Tier I)
5 Of which, Total Eligible Tier III Capital 0
6 Risk Weighted Assets – Banking Book 3,671,420
7 Risk Weighted Assets – Operational Risk 263,487
8 Total Risk Weighted Assets – Banking Book + Operational Risk 3,934,907
9 Minimum required capital to support RWAs of banking book & operational risk 472,189
1) Minimum required Tier I Capital for banking book & operational risk 412,504
2) Tier II Capital required for banking book & operational risk 59,685
10 Tier I capital available for supporting Trading Book 256,393
11 Tier II capital available for supporting Trading Book 0
12 Risk Weighted Assets – Trading Book 143,412
13 Total capital required to support Trading Book 17,209
14 Minimum Tier I capital required for supporting Trading Book 4,905
15 Used Eligible Tier III Capital 0
16 Total Regulatory Capital 728,582
17 Total Risk Weighted Assets – Whole bank 4,078,319
18 Common Equity Tier 1 Ratio 12.59%
19 Tier 1 Ratio 16.40%
20 Total Capital Adequacy Ratio 17.86%
21 Unused but eligible Tier III Capital
Common Equity Tier 1 available to meet buffers (as a percentage of risk weighted assets 3.09%
BankDhofar
DISCLOSURE REQUIREMENTS UNDER PILLAR – III OF BASEL II & III.For the year ended 31 December 2019

97Annual Report 2019
Capital Adequacy Disclosure OMR ‘ 000 Exposure with CRM OMR ‘ 000
Details Drawn Exposure
Undrawn Exposure
Repo Style
OTC Derivative Other OBS Total
Exposure Unsecured Pre mitigation
Post mitigation
Net Exposure
RWAs - Standardized
ApproachI. Banking Book
1) Soverign
carrying 0% 641,808 - - - 3,769 645,577 - - - 645,577 -
carrying 20%
carrying 50%
carrying 100%
carrying 150%
Unrated 100%
2) MDBs Carrying 0%
3) Banks
carrying 0%
Placement carrying 20% 120,895 - - - - 120,895 - - - 120,895 24,179
carrying 50% 264,720 - - - - 264,720 - - - 264,720 132,360
carrying 100% 86,792 - - - 107,632 194,424 - - - 194,424 194,424
carrying 150% 4 - - - - 4 - - - 4 6
Unrated 50%
4) Corporate
carrying 0% 102,395 - - - 35,204 137,599 - 137,599 137,599 137,599 -
carrying 20% - - - - 647 647 - - - - 647
carrying 50% - - - - 224,228 224,228 - - - - 224,228
carrying 75%
SME carrying 75% 50,555 607 - - - 51,162 51,162 - - 51,162 38,372
carrying 100% 98,704 - - 170,307 170,307 170,307 - - 170,307 170,307
Unrated 100% 1,638,516 70,723 - - - 1,709,239 1,709,239 - - 1,709,239 1,709,239
(Mudaraba) SME carrying 300% 201 - - - - 201 201 - - 201 603
(Mudaraba) carrying 300% 18,696 485 - - - 19,181 - - - 19,181 57,543
5) Retail carrying 0% 1,857 - - - - 1,857 - 1,857 1,857 1,857 -
carrying 20%
carrying 50%
carrying 75%
carrying 100% 669,008 54,510 - - - 723,518 - - - 723,518 723,518
6) Claims secured by residential property
carrying 0%
carrying 20%
carrying 35% 522,809 - - - - 522,809 - - - 522,809 182,983
carrying 100% 28,587 - - - - 28,587 - - - 28,587 28,587
7) Claims secured by commercial property
carrying 0%
carrying 20%
carrying 100%
8) Past Due Loans
carrying 0%
carrying 20%
carrying 150%
carrying 100% 148,582 - - - - 148,582 - (80,604) 67,978 67,978 67,978
net prov for past due loans carrying 50%
9) Other Assets
carrying 0%
carrying 20%
other assets/investment/fixed assets carrying 100% 93,309 - - - - 93,309 - - - 93,309 93,309
carrying 150%
10) High Risk Assets
Securitization tranches rated between BB+ and BB- - 350%
Venture Capital & Private Equity Investments - 150%
11) Off-balance Sheet Items
Forward Bank and Customer carrying 0%
Less than 1 Year carrying 1% - - - 1,082,617 - 1,082,617 - - - 1,082,617 10,826
Above 1 Year carrying 5% - - - 217,042 - 217,042 - - - 217,042 10,852
carrying 7.5%
carrying 100% - - - 1,459 - 1,459 - - - 1,459 1,459
12) Failed transactions (para 88)
From 5 to 15 days after the agreed settlement date (100% RWA)
From 16 to 30 days after the agreed settlement date (625% RWA)
From 31 to 45 days after the agreed settlement date (937.5% RWA)
46 days or more after the agreed settlement date (1250% RWA)
Total Banking Book 4,388,734 225,029 0 1,301,118 541,787 6,357,964 2,155,784 58,852 207,434 6,052,485 3,671,420
BankDhofar
DISCLOSURE REQUIREMENTS UNDER PILLAR – III OF BASEL II & III.For the year ended 31 December 2019

Annual Report 201998
Capital Adequacy Disclosure
S.No Details 31st December 2019 Amount in OMR ,000
Common Equity Tier 1 Capital: Instruments and reserves
Local Banks
1 Paid - up Capital 299,635
2 Share Premium 95,656
3 Legal reserves 58,966
4 General Reserves (Special Reserve) 18,488
5 Sub-ordinated Loan Reserve 42,875
6 Stock Dividend -
7 Retained Earnings 1,447
8 Non -cumulative perpetual preferred stock
9 Other non-distributable Reserve
Foreign Banks
10 Assigned Capital
11 Capital Deposit
12 Retained Earnings
13
Interest free funds from HOCommon Equity Tier 1 Capital before regulatory adjustmentsCommon Equity Tier 1 Capital : Regulatory AdjustmentsDeductions
517,067
14 Goodwill (397)
15 Deferred Tax Asset (1,028)
*16 Intangible Assets, including losses, cumulativeunrealized losses recognized directly in equity (1,536)
17 Reciprocal crossholding of bank capital, artificially (709)
designed to inflate the capital position of the banks
Total regulatory adjustments to common equity Tier 1 (3,670)
18 Tier I capital after the above deductions
1950% of investments in capital of banks andother financial entities, other than reciprocal crossholding of bank capital
20
50% of Significant minority and majority 5% of the bank’s net worth for individual significantinvestments and 20% of the banks’ net worth foraggregate of such investments
21 50% of shortfall in t he regulatory capitalrequirements in the un-consolidated entities
22
50% of Investments in unconsolidated bankingand financial subsidiary companies associates oraffiliates, etcsub-total
-
23 Common Equity Tier 1 capital (CET 1) 513,397
Pepercual Capital Tier 1 Capital 155,500
BankDhofar
DISCLOSURE REQUIREMENTS UNDER PILLAR – III OF BASEL II & III.For the year ended 31 December 2019

99Annual Report 2019
S.No Details 31st December 2019 Amount in OMR ,000
Total Tier 1 Capital (T1=CET1+AT1) 668,897
Tier II Capital: Instruments and Provisions
Directly issued qualifying Tier 2 instruments plus related stock surplus
Directly issued capital instruments subject to phase out from Tier 2
24 Undisclosed reserves
25 Revaluation Reserves / Cumulative fair value gains 370
or losses on available for sale instruments
26 General Loan Loss Provisions / General Loan Loss 38,315
Reserve
27 Sub-ordinated Debt 21,000
28 Hybrid Debt Capital Instruments
29 Total Tier II Capital before Regulatory adjustment 59,685
Tier II capital Regulatory Adjustments
30 Tier III Capital
31 Total Regulatory Capital 728,582
S. No. Details – Risk Weighted Assets – Trading Book
1 Capital Charge on Specific Risk -
1) On interest rate related instruments -
2) On Equities -
2 Capital charge on general market risk -
1) On interest rate related instruments -
2) On Equity -
3) On foreign exchange & Gold position 11,473
4) On Commodities position -
3 Total Capital Charge for market risks 11,473
4 Total Risk Weighted Assets – Trading Book 143,412
S. No. Details – Risk Weighted Assets – Operational Risk
1 Capital Charge for Operational Risk under Basic Indicator Approach 21,079
2 Total Risk Weighted Assets - Operational Risk 263,487
BankDhofar
DISCLOSURE REQUIREMENTS UNDER PILLAR – III OF BASEL II & III.For the year ended 31 December 2019

Annual Report 2019100
Statement IIA
The components used in the definition of capital disclosure template are provided below:
Rec onciliation of reported balance sheet and the regulatory scope of consolidation
Balance Sheet as in Published
Financial Statement
Under regulatory scope of
consolidationReference
As at Period End As at Period end
Assets
Cash & Balances with CBO 300,405.00
Balances with bank and money at call and short notice 471,158.00
Investments: 378,551.00
Of which Held to Maturity
Out of investments in Held to Maturity:
Investments in Subsidiaries
Investments in Associates & Joint Ventures
Of which Available for Sale
Out of investments in Available for Sale:
Investments in Subsidiaries
Investments in Associates & Joint Ventures
Of which Held for Trading
Loans & Advances - Conventional 2,617,345.00
Of which,
Loans & Advances to domestic banks
Loans & Advances to Non Resident Banks - Net
Loans & Advances to domestic customers
Loans & Advances to Non Resident Customers for domestic operations
Loans & Advances to Non Resident Customers for operations abroad
Loans & Advances to SMEs
Financing from Islamic Banking Window 446,005.00
Fixed Assets 19,172.00
Other Asset 92,812.00
Of which,
Goodwill & Intangible Assets 397.00 a
Out of which
Goodwill
Other Intangibles (excluding MSRs)
Deferred Tax Assets
BankDhofar
DISCLOSURE REQUIREMENTS UNDER PILLAR – III OF BASEL II & III.For the year ended 31 December 2019
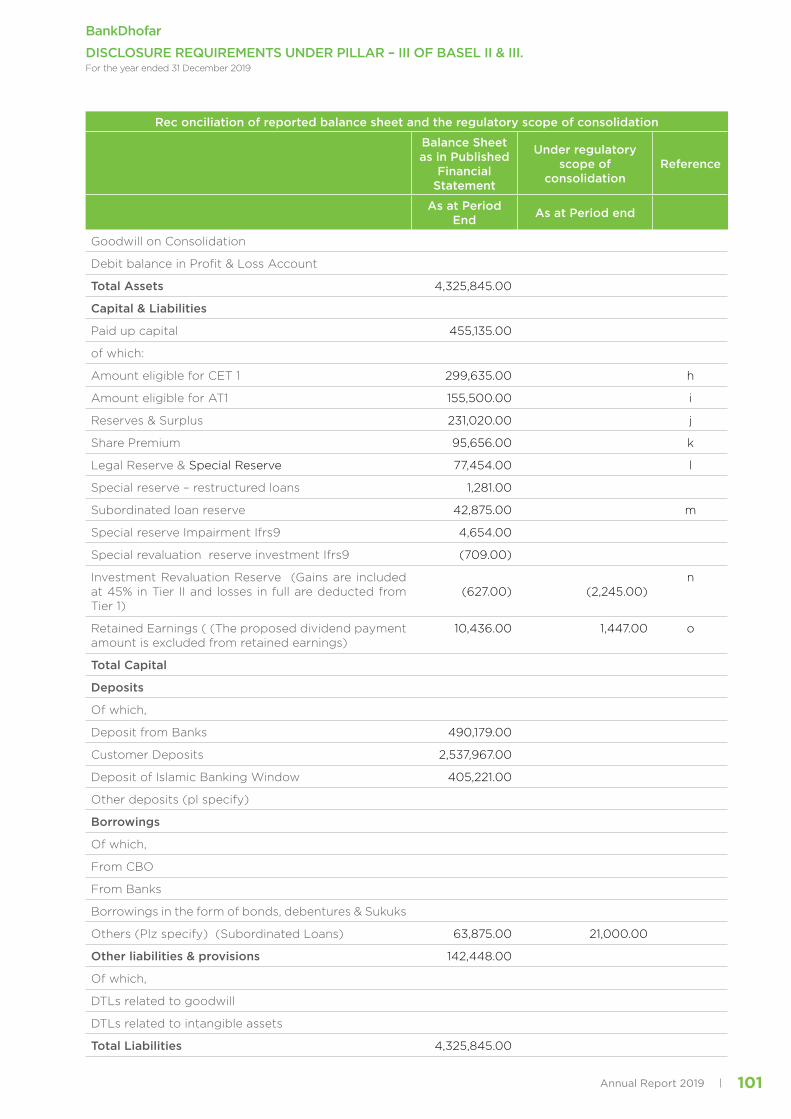
101Annual Report 2019
Rec onciliation of reported balance sheet and the regulatory scope of consolidation
Balance Sheet as in Published
Financial Statement
Under regulatory scope of
consolidationReference
As at Period End As at Period end
Goodwill on Consolidation
Debit balance in Profit & Loss Account
Total Assets 4,325,845.00
Capital & Liabilities
Paid up capital 455,135.00
of which:
Amount eligible for CET 1 299,635.00 h
Amount eligible for AT1 155,500.00 i
Reserves & Surplus 231,020.00 j
Share Premium 95,656.00 k
Legal Reserve & Special Reserve 77,454.00 l
Special reserve – restructured loans 1,281.00
Subordinated loan reserve 42,875.00 m
Special reserve Impairment Ifrs9 4,654.00
Special revaluation reserve investment Ifrs9 (709.00)
Investment Revaluation Reserve (Gains are included at 45% in Tier II and losses in full are deducted from Tier 1)
(627.00) (2,245.00)n
Retained Earnings ( (The proposed dividend payment amount is excluded from retained earnings)
10,436.00 1,447.00 o
Total Capital
Deposits
Of which,
Deposit from Banks 490,179.00
Customer Deposits 2,537,967.00
Deposit of Islamic Banking Window 405,221.00
Other deposits (pl specify)
Borrowings
Of which,
From CBO
From Banks
Borrowings in the form of bonds, debentures & Sukuks
Others (Plz specify) (Subordinated Loans) 63,875.00 21,000.00
Other liabilities & provisions 142,448.00
Of which,
DTLs related to goodwill
DTLs related to intangible assets
Total Liabilities 4,325,845.00
BankDhofar
DISCLOSURE REQUIREMENTS UNDER PILLAR – III OF BASEL II & III.For the year ended 31 December 2019

Annual Report 2019102
Statement IIB
The components mentioned in above table are mapped to the composition of capital disclosure template, which is provided below:
Table 2c: Common Equity Tier 1 capital: instruments and reserves
S. No. Component of
regulatory capital reported by bank
Source based on reference numbers/letters of the balance
sheet under the regulatory scope of consolidation from step 2
1
Directly issued qualifying common share (and equivalent for non-joint stock companies) capital plus related stock surplus
299,635.00 h
2 Retained earnings 1,447.00
3 Accumulated other comprehensive income (and other reserves) 215,985.00 k,l,m,o
4Directly issued capital subject to phase out from CET1 (only applicable to non-joint stock companies)
5Common share capital issued by subsidiaries and held by third parties (amount allowed in group CET1)
6 Common Equity Tier 1 capital before regulatory adjustments 517,067.00
7 Prudential valuation adjustments 2,245.00 n
8 Goodwill (net of related tax liability) 397.00 a
BankDhofar
DISCLOSURE REQUIREMENTS UNDER PILLAR – III OF BASEL II & III.For the year ended 31 December 2019
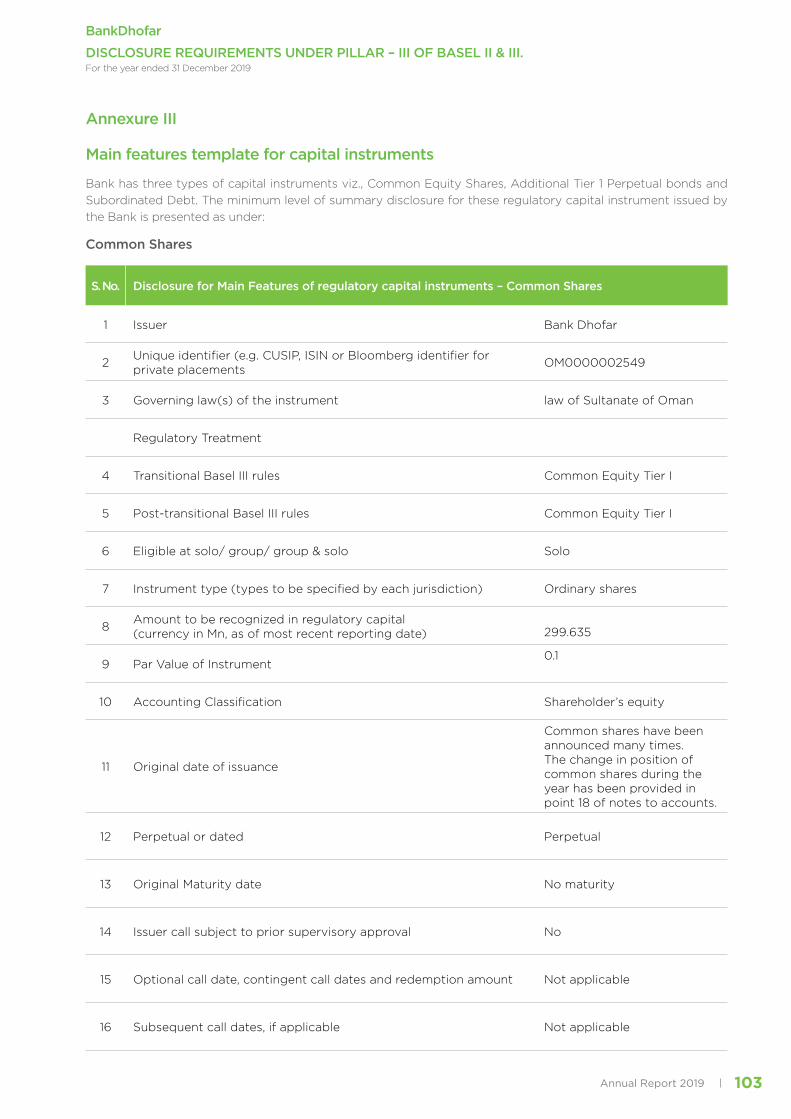
103Annual Report 2019
Annexure III
Main features template for capital instruments
Bank has three types of capital instruments viz., Common Equity Shares, Additional Tier 1 Perpetual bonds and Subordinated Debt. The minimum level of summary disclosure for these regulatory capital instrument issued by the Bank is presented as under:
Common Shares
S. No. Disclosure for Main Features of regulatory capital instruments – Common Shares
1 Issuer Bank Dhofar
2 Unique identifier (e.g. CUSIP, ISIN or Bloomberg identifier for private placements OM0000002549
3 Governing law(s) of the instrument law of Sultanate of Oman
Regulatory Treatment
4 Transitional Basel III rules Common Equity Tier I
5 Post-transitional Basel III rules Common Equity Tier I
6 Eligible at solo/ group/ group & solo Solo
7 Instrument type (types to be specified by each jurisdiction) Ordinary shares
8 Amount to be recognized in regulatory capital (currency in Mn, as of most recent reporting date) 299.635
9 Par Value of Instrument0.1
10 Accounting Classification Shareholder’s equity
11 Original date of issuance
Common shares have been announced many times. The change in position of common shares during the year has been provided in point 18 of notes to accounts.
12 Perpetual or dated Perpetual
13 Original Maturity date No maturity
14 Issuer call subject to prior supervisory approval No
15 Optional call date, contingent call dates and redemption amount Not applicable
16 Subsequent call dates, if applicable Not applicable
BankDhofar
DISCLOSURE REQUIREMENTS UNDER PILLAR – III OF BASEL II & III.For the year ended 31 December 2019

Annual Report 2019104
S. No. Disclosure for Main Features of regulatory capital instruments – Common Shares
Coupons / Dividends
17 Fixed or floating dividend coupon No coupon
18 Coupon rate & any related index Not applicable
19 Existence of a dividend stopper Yes
20 Fully discretionary, partially discretionary or mandatory Fully discretionary
21 Existence of step up or other incentive to redeem No
22 Non-cumulative or cumulative Non-cumulative
23 Convertible or non-convertible Non-convertible
24 If convertible, conversion trigger(s) Not applicable
25 If convertible, fully or partially Not applicable
26 If convertible, conversion rate Not applicable
27 If convertible, mandatory or optional conversion Not applicable
28 If convertible, specify instrument type convertible into Not applicable
29 If convertible, specify issuer of instrument it converts into Not applicable
30 Write down features Yes
31 If Write down, write down triggers Non viability
32 If Write down, full or partial Full
33 If Write down, permanent or temporary Permanent
34 If temporary write down, description of write up mechanism Not applicable
35 Position in subordination hierarchy in liquidation (specify instrument type immediately senior to instrument)
Fully subordinated (Subordinated debt are senior to ordinary shares)
36 Non-compliant transitioned features No
37 If yes, specify non complaint features Not applicable
BankDhofar
DISCLOSURE REQUIREMENTS UNDER PILLAR – III OF BASEL II & III.For the year ended 31 December 2019

105Annual Report 2019
Subordinated Loan 1
S. No. Disclosure for Main Features of regulatory capital instruments – Subordinated debt
1 Issuer BankDhofar
2 Unique identifier (e.g. CUSIP, ISIN or Bloomberg identifier for private placements Not applicable
3 Governing law(s) of the instrument law of Sultanate of Oman
Regulatory Treatment
4 Transitional Basel III rules Tier II
5 Post-transitional Basel III rules Tier II
6 Eligible at solo/ group/ group & solo Solo
7 Instrument type (types to be specified by each jurisdiction) Subordinated Loan
8 Amount to be recognized in regulatory capital (currency in Mn, as of most recent reporting date) USD 75 Mn
9 Par Value of Instrument USD 75 Mn
10 Accounting Classification Subordinated Loan
11 Original date of issuance 16-Sep-14
12 Perpetual or dated Dated
13 Original Maturity date 16-Mar-20
14 Issuer call subject to prior supervisory approval No
15 Optional call date, contingent call dates and redemption amount Not applicable
16 Subsequent call dates, if applicable Not applicable
Coupons / Dividends
17 Fixed or floating dividend coupon Fixed
18 Coupon rate & any related index 4.75% p.a.
19 Existence of a dividend stopper No
20 Fully discretionary, partially discretionary or mandatory Mandatory
21 Existence of step up or other incentive to redeem No
BankDhofar
DISCLOSURE REQUIREMENTS UNDER PILLAR – III OF BASEL II & III.For the year ended 31 December 2019

Annual Report 2019106
S. No. Disclosure for Main Features of regulatory capital instruments – Subordinated debt
22 Non-cumulative or cumulative Non-cumulative
23 Convertible or non-convertible Non-convertible
24 If convertible, conversion trigger(s) Not applicable
25 If convertible, fully or partially Not applicable
26 If convertible, conversion rate Not applicable
27 If convertible, mandatory or optional conversion Not applicable
28 If convertible, specify instrument type convertible into Not applicable
29 If convertible, specify issuer of instrument it converts into Not applicable
30 Write down features Yes
31 If Write down, write down triggers
Trigger Event” means the earlier of:(a) a notification to the Bank
in writing by the Central Bank of Oman that the Central Bank of Oman is of the opinion that a write-off of the Facility is necessary without which the Borrower shall become non-viable; or
(b) A decision is taken to make a public sector injection of capital, or equivalent support, without which the Borrower would have become non-viable.
32 If Write down, full or partial Full
33 If Write down, permanent or temporary Permanent
34 If temporary write down, description of write up mechanism Not applicable
35 Position in subordination hierarchy in liquidation (specify instrument type immediately senior to instrument)
All the depositors & General Creditors
36 Non-compliant transitioned features No
37 If yes, specify non complaint features Not applicable
BankDhofar
DISCLOSURE REQUIREMENTS UNDER PILLAR – III OF BASEL II & III.For the year ended 31 December 2019

107Annual Report 2019
Subordinated Loan 2
S. No. Disclosure for Main Features of regulatory capital instruments – Subordinated debt
1 Issuer BankDhofar
2 Unique identifier (e.g. CUSIP, ISIN or Bloomberg identifier for private placements Not applicable
3 Governing law(s) of the instrument law of Sultanate of Oman
Regulatory Treatment
4 Transitional Basel III rules Tier II
5 Post-transitional Basel III rules Tier II
6 Eligible at solo/ group/ group & solo Solo
7 (Instrument type (types to be specified by each jurisdiction Subordinated Loan
8 Amount to be recognized in regulatory capital (currency in Mn, as(of most recent reporting date RO 35 Mn
9 Par Value of Instrument RO 35 Mn
10 Accounting Classification Subordinated Loan
11 Original date of issuance 15-May-17
12 Perpetual or dated Dated
13 Original Maturity date 15-Nov-22
14 Issuer call subject to prior supervisory approval No
15 Optional call date, contingent call dates and redemption amount Not applicable
16 Subsequent call dates, if applicable Not applicable
Coupons / Dividends
17 Fixed or floating dividend coupon Fixed
18 Coupon rate & any related index 6.25% p.a.
19 Existence of a dividend stopper No
20 Fully discretionary, partially discretionary or mandatory Mandatory
BankDhofar
DISCLOSURE REQUIREMENTS UNDER PILLAR – III OF BASEL II & III.For the year ended 31 December 2019

Annual Report 2019108
S. No. Disclosure for Main Features of regulatory capital instruments – Subordinated debt
21 Existence of step up or other incentive to redeem No
22 Non-cumulative or cumulative Non-cumulative
23 Convertible or non-convertible Non-convertible
24 (If convertible, conversion trigger(s Not applicable
25 If convertible, fully or partially Not applicable
26 If convertible, conversion rate Not applicable
27 If convertible, mandatory or optional conversion Not applicable
28 If convertible, specify instrument type convertible into Not applicable
29 If convertible, specify issuer of instrument it converts into Not applicable
30 Write down features Yes
31 If Write down, write down triggers
Trigger even means earlier of:(a) a notification to the
Bank in writing by the Central Bank of Oman that the Central Bank is of the opinion that a write-off of the Facility is necessary without which the Borrower shall become non-viable; or
(b) a decision is taken to make a public sector injection of capital, or equivalent support, without which the borrower would have become non-viable.
32 If Write down, full or partial Full
33 If Write down, permanent or temporary Permanent
34 If temporary write down, description of write up mechanism Not applicable
35 Position in subordination hierarchy in liquidation (specify instrument type immediately senior to instrument)
All the depositors & GeneralCreditors
36 Non-compliant transitioned features No
37 If yes, specify non complaint features (20.4 (2) of CP1 of CBO(guidelines Not applicable
BankDhofar
DISCLOSURE REQUIREMENTS UNDER PILLAR – III OF BASEL II & III.For the year ended 31 December 2019

109Annual Report 2019
Subordinated Loan 3
S. No. Disclosure for Main Features of regulatory capital instruments – Perpetual Tier I Capital Securities
1 Issuer Bank Dhofar
2 Unique identifier (e.g. CUSIP, ISIN or Bloomberg identifier for private placements XS1233710380
3 Governing law(s) of the instrument
The Capital Securities (except for Condition on Subordination of the Capital Securities) and any non-contractual obligations arising out of or in connection with the Capital Securities will be governed by the English law. Subordination of the Capital Securities will be governed by the laws of Oman.
Regulatory Treatment
4 Transitional Basel III rules Additional Tier I
5 Post-transitional Basel III rules Additional Tier I
6 Eligible at solo/ group/ group & solo Group & Solo
7 Instrument type (types to be specified by each jurisdiction) Perpetual Tier I Capital Securities
8 Amount to be recognized in regulatory capital (currency in Mn, as of most recent reporting date) USD 300 Mn
9 Par Value of Instrument USD 300 Mn
10 Accounting Classification Equity
11 Original date of issuance 27-May-15
12 Perpetual or dated Perpetual
13 Original Maturity date No maturity
14 Issuer call subject to prior supervisory approval Yes
15 Optional call date, contingent call dates and redemption amount
Redeemable by the Bank at its discretion on 27 May 2020 or on any interest payment date thereafter subject to the prior consent of the regulatory authority
16 Subsequent call dates, if applicable
Any interest payment date occuring after 27 May 2020, means each 27 May and 27 November in each year, starting on (and including 27 November 2020
Coupons / Dividends
17 Fixed or floating dividend coupon Floating
BankDhofar
DISCLOSURE REQUIREMENTS UNDER PILLAR – III OF BASEL II & III.For the year ended 31 December 2019

Annual Report 2019110
S. No. Disclosure for Main Features of regulatory capital instruments – Perpetual Tier I Capital Securities
18 Coupon rate & any related index
Coupon is determined by adding a fixed margin of 5.128 % p.a. over the mid-swap rate. It has resulted into a rate of 6.850 per cent on the date of issue. The mid-swap rate will be reset every 5 years. The mid-swap rate for U.S. dollar swap transactions with a maturity of 5 years displayed on Reuters 3000 page ‘‘ISDAFIX1’’ at or around 11.00 a.m. (New York time) on the Determination Date, which will be 3 days prior to 27 May 2020 and every fifth anniversary thereafter.
19 Existence of a dividend stopper Yes
20 Fully discretionary, partially discretionary or mandatory Fully discretionary
21 Existence of step up or other incentive to redeem No
22 Non-cumulative or cumulative Non-cumulative
23 Convertible or non-convertible Non-convertible
24 If convertible, conversion trigger(s) Not applicable
25 If convertible, fully or partially Not applicable
26 If convertible, conversion rate Not applicable
27 If convertible, mandatory or optional conversion Not applicable
28 If convertible, specify instrument type convertible into Not applicable
29 If convertible, specify issuer of instrument it converts into Not applicable
30 Write down features Yes
31 If Write down, write down triggers
Write down will take place in case of a non-viability event that means:(a) a notification to the
Bank in writing by the Central Bank of Oman that the Central Bank has determined that the Bank will become non-viable without a write-down; or
(b) a decision is taken to make a public sector injection of capital, or equivalent support, without which the Bank will become non-viable.
32 If Write down, full or partial Full
33 If Write down, permanent or temporary Permanent
34 If temporary write down, description of write up mechanism Not applicable
35 Position in subordination hierarchy in liquidation (specify instrument type immediately senior to instrument)
Senior to ordinary shares and subordinate to Tier II instruments like Subordinated Debt
36 Non-compliant transitioned features No
37 If yes, specify non complaint features Not applicable
BankDhofar
DISCLOSURE REQUIREMENTS UNDER PILLAR – III OF BASEL II & III.For the year ended 31 December 2019

111Annual Report 2019
Subordinated Loan 4
S. No. Disclosure for Main Features of regulatory capital instruments – Perpetual Tier I Capital Securities
1 Issuer Bank Dhofar
2Unique identifier e.g. CUSIP, ISIN or Bloomberg identifier for private placements)
OM0000007548
3 Governing law(s) of the instrument
The Capital Securities (except for Condition on Subordination of the Capital Securities) and any non-contractual obligations arising out of or in connection with the Capital Securities will.be governed by the Oman law
Regulatory Treatment
4 Transitional Basel III rules Additional Tier I
5 Post-transitional Basel III rules Additional Tier I
6 Eligible at solo/ group/ group & solo Group & Solo
7 (Instrument type (types to be specified by each jurisdiction Perpetual Tier I CapitalSecurities
8 Amount to be recognized in regulatory capital (currency in Mn, as of(most recent reporting date
OMR 40 Mn
9 Par Value of Instrument OMR 40 Mn
10 Accounting Classification Equity
11 Original date of issuance 27-Dec-18
12 Perpetual or dated Perpetual
13 Original Maturity date No maturity
14 Issuer call subject to prior supervisory approval Yes
15 Optional call date, contingent call dates and redemption amount
Redeemable by the Bank at its discretion on 27 Dec 2023 or on any interest payment date thereafter subject to the prior consent of the regulatory authority and after givingsuitable notice
16 Subsequent call dates, if applicable
Any interest payment date occurring after 27 Dec 2023, means each 27 June and 27 December thereafter, at the.option of the Bank
Coupons / Dividends
17 Fixed or floating dividend coupon Floating
BankDhofar
DISCLOSURE REQUIREMENTS UNDER PILLAR – III OF BASEL II & III.For the year ended 31 December 2019

Annual Report 2019112
S. No. Disclosure for Main Features of regulatory capital instruments – Perpetual Tier I Capital Securities
18 Coupon rate & any related index
The Bonds shall bear interest from (and including) the Issue Date to (but excluding) the First Call Date at a rate of 7.5% per annum (Initial Interest Rate) on the outstanding principal amount of the Bonds. The Bonds shall bear interest from each Reset Date to the next Reset Date at the then Relevant 5 Year Reset Rate. Reset date is the First Call Date and every fifth anniversary thereafter.
19 Existence of a dividend stopper Yes
20 Fully discretionary, partially discretionary or mandatory Fully discretionary
21 Existence of step up or other incentive to redeem No
22 Non-cumulative or cumulative Non-cumulative
23 Convertible or non-convertible Non-convertible
24 (If convertible, conversion trigger(s Not applicable
25 If convertible, fully or partially Not applicable
26 If convertible, conversion rate Not applicable
27 If convertible, mandatory or optional conversion Not applicable
28 If convertible, specify instrument type convertibel into Not applicable
29 If convertibe, specify issuer of instrument it converts into Not applicable
30 Write down features Yes
31 If Write down, write down triggers
Write down will take place in case of a non-viability event:that means
a) a notification to the Bank in) writing by the Central Bank of Oman that the Central Bank has determined that the Bank will become non-viable without awrite-down; or
b) a decision is taken to make a) public sector injection of capital, or equivalent support, without which the Bank will become.non-viable
32 If Write down, full or partial Full
33 If Write down, permanent or temporary Permanent
34 If temporary write down, description of write up mechanism Not applicable
35 Position in subordination hierarchy in liquidation (specify instrument(type immediately senior to instrument
Senior to ordinary shares and subordinate to Tier II instrumentslike Subordinated Debt
36 Non-compliant transitioned features No
37 If yes, specify non complaint features Not applicable
BankDhofar
DISCLOSURE REQUIREMENTS UNDER PILLAR – III OF BASEL II & III.For the year ended 31 December 2019

113Annual Report 2019
DISCLOSURE UNDER BASEL III LIQUIDITY STANDARDS
Liquidity Coverage Ratio:
Bank has adopted Basel III liquidity standards and is reporting the liquidity coverage ratio (LCR) to the Central Bank of Oman (CBO) with effect from March 2013. The LCR is defined as the proportion of high quality liquid assets to total net cash outflows over the next 30 days. The high quality liquid assets include cash; reserves held with CBO; investment in CBO Certificate of Deposits, CBO Treasury Bills, Government Development Bonds; Sovereign Treasury Bills; and investment in equity listed on Muscat Securities Market. LCR is a measure of adequacy of liquid assets that will enable the Bank to survive an acute stress scenario lasting for 30 days.
As per CBO guidelines, the LCR is to be maintained at a minimum of 100% from 01.01.2019. In compliance with the CBO guidelines, the Bank is meeting the regulatory limit of LCR as at 31 December 2019.
The disclosure for Liquidity Coverage Ratio for Bank Dhofar consolidated (i.e. conventional entity + Islamic Window entity) is as follows:
Bank Dhofar Consolidated Entity LCR Common Disclosure Template for the period ending: Dec-19
Maisarah Islamic Banking Services (MIBS) LCR Disclosure for the quarter ended December 2019
Total Unweighted Value (average)
OMR ‘000
Total Weighted Value (average)
OMR ‘000
High Quality Liquid Assets
1 Total High Quality Liquid Assets (HQLA) 447,974.20
Cash Outflows
2 Retail deposits and deposits from small business customers, of which: 600,675.27 43,351.30
3 Stable deposits 317,675.65 15,051.34
4 Less stable deposits 282,999.62 28,299.96
5 Unsecured wholesale funding, of which: 768,499.80 418,257.53
6 Operational deposits (all counterparties) and deposits in networks of cooperative banks
7 Non-operational deposits (all counterparties) 768,499.80 418,257.53
8 Unsecured debt
9 Secured wholesale funding
10 Additional requirements, of which 463,628.02 33,000.66
11 Outflows related to derivative exposures and other collateral requirements
12 Outflows related to loss of funding on debt products
13 Credit and liquidity facilities 463,628.02 33,000.66
14 Other contractual funding obligations 34,653.25 34,653.25
15 Other contingent funding obligations 167,619.87 8,380.99
16 TOTAL CASH OUTFLOWS 537,643.73
Cash Inflows
17 Secured lending (e.g. reverse repos)
18 Inflows from fully performing exposures 590,718.84 319,919.88
19 Other cash inflows 20,826.70 20,826.70
20 TOTAL CASH INFLOWS 611,545.55 340,746.58
Total Adjusted Value
21 TOTAL HQLA 448,074.67
22 TOTAL NET CASH OUTFLOWS 196,897.15
23 LIQUIDITY COVERAGE RATIO (%) 227.57 The above disclosed values for high quality liquid assets, cash outflows and cash inflows are the arithmetic average of the values for the last four quarters.
LCR is computed on a monthly basis and year end position for LCR is 340% as at 31.12.2019 (227% as at 31.12.2018).
BankDhofar
DISCLOSURE REQUIREMENTS UNDER PILLAR – III OF BASEL II & III.For the year ended 31 December 2019

Annual Report 2019114
Net Stability Funding Ratio (NSFR):
The Net Stable Funding Ratio (NSFR) is a longer term structural ratio designed to address liquidity mismatches and reduce funding risk over a one-year horizon. It is effective January 2018, with a minimum ratio of 100% as per the regulatory guidance.
The disclosure for Net Stability Funding Ratio for Bank Dhofar consolidated (i.e. conventional entity + Islamic Window entity) is as follows:
The above disclosed values for required stable funding and the available stable funding are the arithmetic average of the values for the last four quarters reflecting average during the year 2019.
NSFR is computed on a monthly basis and year end position of NSFR for Bank Dhofar (consolidated entity) was at 115% as at 31.12.2019 (116% as at 31.12.2018).
NSFR disclosures Year ended: Dec-19
Bank: Dhofar (Consolidated) (RO ‘000)
Unweighted value by residual maturity
ASF Item No maturity
< 6 months
6 months to < 1yr > 1yr Weighted
value
1 Capital: 1,906,339.96 1,906,339.96 - - 1,906,339.96
2 Regulatory capital 913,180.51 913,180.51
3 Other capital instruments 993,159.45 993,159.45
4 Retail deposits and deposits from small business customers 574,772.62 44,720.68 48,090.30 - 667,583.60
5 Stable deposits 322,049.15 1,948.91 2,663.75 326,661.81
6 Less stable deposits 252,723.47 42,771.77 45,426.54 340,921.78
7 Wholesale funding: 1,546.39 - 1,280,386.22 640,193.11 640,966.31
8 Operational deposits 1,546.39 773.19
9 Other wholesale funding 1,280,386.22 640,193.11
10 Liabilities with matching interdependent assets -
11 Other liabilities:
12 NSFR derivative liabilities
13 All other liabilities and equity not included in above categories 450,150.17 -
14 Total ASF 3,214,889.86
RSF Item
15 Total NSFR high-quality liquid assets (HQLA) 12,412.95
16Deposits held at other financial institutions for operational purposes
23,141.95 11,570.98
17 Performing loans and securities: - 413,197.48 866,424.87 1,979,561.79 2,344,303.20
BankDhofar
DISCLOSURE REQUIREMENTS UNDER PILLAR – III OF BASEL II & III.For the year ended 31 December 2019

115Annual Report 2019
NSFR disclosures Year ended: Dec-19
Bank: Dhofar (Consolidated) (RO ‘000)
Unweighted value by residual maturity
ASF Item No maturity
< 6 months
6 months to < 1yr > 1yr Weighted
value
18Performing loans to financial institutions secured by Level 1 HQLA
- -
19
Performing loans to financial institutions secured by non- Level 1 HQLA and unsecured performing loans to financial institutions
60,129.54 30,064.77
20
Performing loans to non-financial corporate clients,loans to retail and small business customers, and loans to sovereigns, central banks and PSEs, of which
413,197.48 806,295.33 466,288.26
21
-With a risk weight of less than or equal to 35% under the Basel II Standardised approach for credit risk
22. Performing residential mortgages, of which: 1,964,138.52 1,669,517.75
23
With a risk weight of less than or equal to 35% under the Basel II Standardised Approach for credit risk
254,342.53 165,322.64
24Securities that are not in default and do not qualify as HQLA, including exchange-traded equities
15,423.27 13,109.78
25 Assets with matching interdependent liabilities
26 Other Assets: - - 196,729.52 196,729.52
27 Physical traded commodities, including gold -
28
Assets posted as initial margin for derivative contracts and contributions to default funds of CCPs
29 NSFR derivative assets -
30NSFR derivative liabilities before deduction of variation margin posted
-
31 All other assets not included in the above categories 196,729.52 196,729.52
32 Off-balance sheet items 66,529.87
33 TOTAL RSF 2,631,546.51
34 NET STABLE FUNDING RATIO (%) 122.17%
BankDhofar
DISCLOSURE REQUIREMENTS UNDER PILLAR – III OF BASEL II & III.For the year ended 31 December 2019

INDEPENDENTAUDITOR’S REPORTAND FINANCIALSTATEMENTS31st DECEMBER 2019


Annual Report 2019122
Statement of Financial PositionAs at 31 December 2019
2019 USD’000
2018 USD’000
Notes2019
RO’0002018
RO’000
Assets 780,273 783,130 Cash and balances with Central Bank of Oman 5 300,405 301,505
983,249 790,473 Investment securities 8 378,551 304,332
1,223,787 854,699 Loans, advances and financing to banks 6 471,158 329,059
6,798,299 7,173,402 Loans, advances and financing to customers (conventional) 7 2,617,345 2,761,760
1,158,454 1,031,387 Islamic financing receivables 7 446,005 397,084
241,070 270,231 Other assets 11 92,812 104,039
1,031 2,062 Intangible asset 9 397 794
49,797 38,745 Property and equipment 10 19,172 14,917
11,235,960 10,944,129 Total assets 4,325,845 4,213,490
Liabilities and equity
Liabilities
1,273,192 958,398 Due to banks 12 490,179 368,983
6,592,122 6,678,231 Deposits from customers (conventional) 13 2,537,967 2,571,119
1,052,522 917,883 Islamic customers deposits 13 405,221 353,385
340,501 374,431 Other liabilities 14 131,093 144,156
29,494 35,870 Tax Liabilities 24 (e) 11,355 13,810
165,909 165,909 Subordinated loans 15 63,875 63,875
9,453,740 9,130,722 Total liabilities 3,639,690 3,515,328
Equity
Shareholders’ equity
778,273 727,358 Share capital 16(a) 299,635 280,033
248,457 248,457 Share premium 17 95,656 95,656
153,159 145,138 Legal reserve 18(a) 58,966 55,878
48,021 48,021 Special reserve 18(d) 18,488 18,488
3,327 3,327 Special reserve for restructured loans 18(e) 1,281 1,281
12,088 11,849 Special Impairment reserve 18(f) 4,654 4,562
(1,842) (1,842) Special revaluation reserve – Investment 18(g) (709) (709)
111,364 78,182 Subordinated loan reserve 18(b) 42,875 30,100
(1,629) (4,647) Investment revaluation reserve 18(c) (627) (1,789)
27,106 153,668 Retained earnings 19 10,436 59,162
1,378,324 1,409,511 Total equity attributable to the equity holders of the Bank 530,655 542,662
403,896 403,896 Perpetual Tier 1 capital securities 16 (b) 155,500 155,500
1,782,220 1,813,407 Total equity 686,155 698,162
11,235,960 10,944,129 Total liabilities and equity 4,325,845 4,213,490
2,106,312 2,625,491 Net assets per share (Rial Omani) 20 0.177 0.194
0.46 0.50 Contingent liabilities and commitments 28 810,930 1,010,814
The financial statements including notes and other explanatory information on pages 130 to 210 were approved and authorised for issue by the Board of Directors on 28 January 2020 and were signed on their behalf by:
Eng. Abdul Hafidh Salim Rajab Al-Ojai Chairman
Abdul Hakeem Omar Al OjailiChief Executive Officer
Independent auditor’s report - pages 117 to 121
BankDhofar

123Annual Report 2019
Statement of Comprehensive IncomeFor the year ended 31 December 2019
2019 USD’000
2018 USD’000
Notes2019
RO’0002018
RO’000
441,906 453,938 Interest income 21 170,134 174,766
(222,039) (225,579) Interest expense 22 (85,485) (86,848)
219,868 228,359 Net interest income 21 84,649 87,918
62,348 55,990 Income from Islamic financing / Investments 21 24,004 21,556
(35,901) (31,291)Unrestricted investment account holders’ share of profit and profit expense
22 (13,822) (12,047)
26,447 24,699 Net income from Islamic financing and investment activities
10,182 9,509
47,787 53,514 Fees and commission income 18,398 20,603
(10,834) (12,984) Fees and commission expense (4,171) (4,999)
36,953 40,530 Net fees and commission income 29 14,227 15,604
54,301 48,888 Other operating income 22 20,906 18,822
337,569 342,476 Operating income 129,964 131,853
(170,852) (160,488) Staff and administrative costs 23 (65,778) (61,788)
(14,795) (9,527) Depreciation 10 (5,696) (3,668)
(185,647) (170,015) Operating expenses (71,474) (65,456)
(58,166) (17,273) Net impairment losses on financial assets 7 (22,394) (6,650)
(10) (10) Bad debts written-off (4) (4)
93,746 155,178 Profit before taxation 36,092 59,743
(15,190) (24,577) Income tax expense 24 (5,848) (9,462)
78,556 130,602 Profit for the year 30,244 50,281
Other comprehensive income:
Items that will not be reclassified to profit or loss
(1,252) (1,971)Movement in fair value reserve (FVOCI equity instrument)
18(d) (482) (759)
Items that are or may be reclassified to profit or loss in subsequent periods:
4,270 (3,992)Movement in fair value reservesFVOCI debt instruments
18(d) 1,644 (1,537)
3,018 (5,963)Other comprehensive income / (loss) for the year
1,162 (2,296)
81,574 124,639 Total comprehensive income for the year 31,406 47,985
0.02 0.04 Earnings per share (basic and diluted) (Rial Omani)
25 0.006 0.016
The notes on pages 130 to 210 are an integral part of these financial statements.
Independent auditor’s report - pages 117 to 121
BankDhofar

Annual Report 2019124
Statement of changes in equityFor the year ended 31 December 2019
Not
es
Shar
e ca
pita
l R
O’0
00
Shar
e pr
emiu
m
RO
’00
0
Lega
l res
erve
R
O’0
00
Spec
ial r
eser
ve
RO
’00
0
Spec
ial r
eser
ve
rest
ruct
ured
loan
R
O’0
00
Spec
ial i
mpa
irmen
t re
serv
e R
O’0
00
Spec
ial r
eval
uatio
n re
serv
e R
O’0
00
Subo
rdin
ated
loan
s re
serv
e R
O’0
00
Inve
stm
ent
reva
luat
ion
rese
rve
RO
’00
0
Ret
aine
d ea
rnin
gs
RO
’00
0
Tota
l R
O’0
00
Perp
etua
l Tie
r 1
capi
tal s
ecur
ities
R
O’0
00
Tota
l equ
ity
RO
’00
0
Balance at 1 January 2019 280,033 95,656 55,878 18,488 1,281 4,562 (709) 30,100 (1,789) 59,162 542,662 155,500 698,162
Profit for the year - - - - - - - - - 30,244 30,244 - 30,244
Other comprehensive income for the year:
Net changes in fair value reserveFVOCI equity instrument
18(c) - - - - - - - - (482) - (482) - (482)
FVOCI debt instruments 18(c) - - - - - - - - 1,644 - 1,644 - 1,644
Total comprehensive income for the year - - - - - - - - 1,162 30,244 31,406 - 31,406
Reversal of specialimpairment reserve to IFRS 9 provision (Net Tax)
18(f) - - - - - (4,562) - - - - (4,562) - (4,562)
Transfer to special impairment reserve IFRS 9
18(f) - - - - - 4,654 - - - (4,654) - - -
Transfer to legal reserve 18(a) - - 3,024 - - - - - - (3,024) - - -
Excess of receipts over right issue expenses
18(a) - - 64 - - - - - - - 64 - 64
Transfer to subordinated loan reserve
- - - - - - - 12,775 - (12,775) - - -
Transfer to sub-loan reserve 18(b) - - - - - - - - - - - - -
Perpetual Tier 1 capital securities:
Proceeds from issuance - - - - - - - - - - - - -
Issuance cost - - - - - - - - - - - - -
Payment towards perpetual additional Tier 1 coupon
- - - - - - - - - (10,912) (10,912) - (10,912)
Transactions with owners recorded directly in equity
Issue of right shares - - - - - - - - - - - - -
Dividendpaid 35 - - - - - - - - - (28,003) (28,003) - (28,003)
Bonus shares issued 35 19,602 - - - - - - - - (19,602) - - -
Balances as at 31 December 2019 299,635 95,656 58,966 18,488 1,281 4,654 (709) 42,875 (627) 10,436 530,655 155,500 686,155
The notes on pages 130 to 210 are an integral part of these financial statements.
Independent auditor’s report - pages 117 to 121
BankDhofar

125Annual Report 2019
Statement of changes in equityFor the year ended 31 December 2018
Not
es
Shar
e ca
pita
l R
O’0
00
Shar
e pr
emiu
m
RO
’00
0
Lega
l res
erve
R
O’0
00
Spec
ial r
eser
ve
RO
’00
0
Spec
ial r
eser
ve
rest
ruct
ured
loan
R
O’0
00
Spec
ial i
mpa
irmen
t re
serv
e R
O’0
00
Spec
ial r
eval
uatio
n re
serv
e R
O’0
00
Subo
rdin
ated
loan
s re
serv
e R
O’0
00
Inve
stm
ent
reva
luat
ion
rese
rve
RO
’00
0
Ret
aine
d ea
rnin
gs
RO
’00
0
Tota
l R
O’0
00
Perp
etua
l Tie
r 1
capi
tal s
ecur
ities
R
O’0
00
Tota
l equ
ity
RO
’00
0
Balances as at 1 January 2018 225,786 77,564 50,254 18,488 1,281 - - 42,325 507 55,302 471,507 115,500 587,007
Adjustment on initial application of IFRS 9, net of tax
2.7 - - - - - 3,527 (709) - - 709 3,527 - 3,527
Restated balance on 1 January 2018 225,786 77,564 50,254 18,488 1,281 3,527 (709) 42,325 507 56,011 475,034 115,500 590,534
Profit for the year - - - - - - - - - 50,281 50,281 - 50,281
Other comprehensive income for the year:
Net changes in fair value reserve
FVOCI equity instrument 18(c) - - - - - - - - (759) - (759) - (759)
FVOCI debt instruments 18(c) - - - - - - - - (1,537) - (1,537) - (1,537)
Total comprehensive income for the year - - - - - - - - (2,296) 50,281 47,985 - 47,985
Transfer to special impairment reserve IFRS 9
18(f) - - - - - 1,035 - - - (1,035) - - -
Transfer to legal reserve 18(a) - - 5,028 - - - - - - (5,028) - - -
Excess of receipts over right issue expenses
18(a) - - 596 - - - - - - - 596 - 596
Transfer to subordinated loan reserve
- - - - - - - 12,775 - (12,775) - - -
Transfer to retained earnings 18(b) - - - - - - - (25,000) - 25,000 - - -
Perpetual Tier 1 capital securities:
Proceeds from issuance - - - - - - - - - - - 40,000 40,000
Issuance cost - - - - - - - - - (223) (223) - (223)
Payment towards perpetual additional Tier 1 coupon
- - - - - - - - - (7,912) (7,912) - (7,912)
Transactions with owners recorded directly in equity
Issue of right shares 36,184 18,092 - - - - - - - - 54,276 - 54,276
Dividendfor 2017 35 - - - - - - - - - (27,094) (27,094) - (27,094)
Bonus shares issued for 2017 35 18,063 - - - - - - - - (18,063) - - -
Balances as at 31 December 2018 280,033 95,656 55,878 18,488 1,281 4,562 (709) 30,100 (1,789) 59,162 542,662 155,500 698,162
The notes on pages 130 to 210 are an integral part of these financial statements.
Independent auditor’s report - pages 117 to 121
BankDhofar
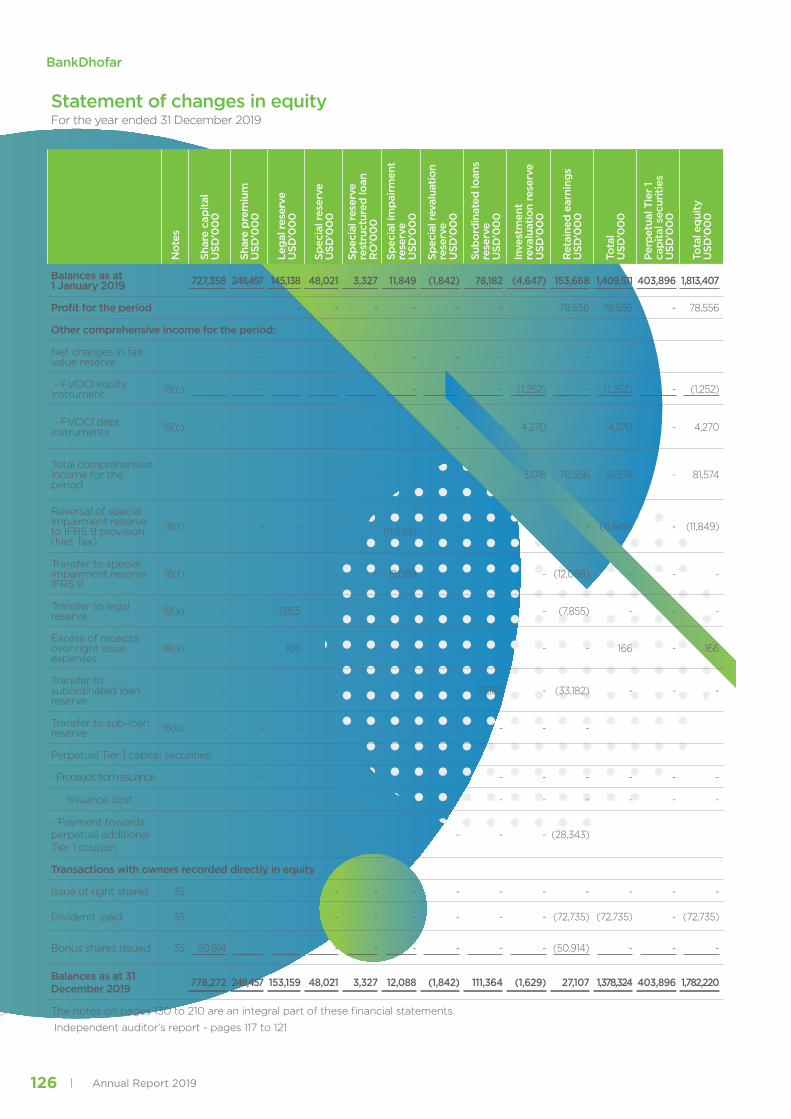
Annual Report 2019126
Statement of changes in equityFor the year ended 31 December 2019
Not
es
Shar
e ca
pita
l U
SD’0
00
Shar
e pr
emiu
m
USD
’00
0
Lega
l res
erve
U
SD’0
00
Spec
ial r
eser
ve
USD
’00
0
Spec
ial r
eser
ve
rest
ruct
ured
loan
R
O’0
00
Spec
ial i
mpa
irmen
t re
serv
e U
SD’0
00
Spec
ial r
eval
uatio
n re
serv
e U
SD’0
00
Subo
rdin
ated
loan
s re
serv
e U
SD’0
00
Inve
stm
ent
reva
luat
ion
rese
rve
USD
’00
0
Ret
aine
d ea
rnin
gs
USD
’00
0
Tota
l U
SD’0
00
Perp
etua
l Tie
r 1
capi
tal s
ecur
ities
U
SD’0
00
Tota
l equ
ity
USD
’00
0
Balances as at 1 January 2019 727,358 248,457 145,138 48,021 3,327 11,849 (1,842) 78,182 (4,647) 153,668 1,409,511 403,896 1,813,407
Profit for the period - - - - - - - - - 78,556 78,556 - 78,556
Other comprehensive income for the period:
Net changes in fair value reserve - - - - - - - - - - -
- FVOCI equity instrument 18(c) - - - - - - - - (1,252) - (1,252) - (1,252)
- FVOCI debt instruments 18(c) - - - - - - - - 4,270 - 4,270 - 4,270
Total comprehensive income for the period
- - - - - - - - 3,018 78,556 81,574 - 81,574
Reversal of special impairment reserve to IFRS 9 provision (Net Tax)
18(f) - - - - - (11,849) - - - - (11,849) - (11,849)
Transfer to special impairment reserve IFRS 9
18(f) - - - - - 12,088 - - - (12,088) - - -
Transfer to legal reserve 18(a) - - 7,855 - - - - - - (7,855) - - -
Excess of receipts over right issue expenses
18(a) - - 166 - - - - - - - 166 - 166
Transfer to subordinated loan reserve
- - - - - - - 33,182 - (33,182) - - -
Transfer to sub-loan reserve 18(b) - - - - - - - - - -
Perpetual Tier 1 capital securities:
- Proceeds from issuance - - - - - - - - - - - - -
- Issuance cost - - - - - - - - - - - - -
- Payment towards perpetual additional Tier 1 coupon
- - - - - - - - - (28,343)
Transactions with owners recorded directly in equity
Issue of right shares 35 - - - - - - - - - - - - -
Dividend paid 35 - - - - - - - - - (72,735) (72,735) - (72,735)
Bonus shares issued 35 50,914 - - - - - - - - (50,914) - - -
Balances as at 31 December 2019 778,272 248,457 153,159 48,021 3,327 12,088 (1,842) 111,364 (1,629) 27,107 1,378,324 403,896 1,782,220
The notes on pages 130 to 210 are an integral part of these financial statements.
Independent auditor’s report - pages 117 to 121
BankDhofar

127Annual Report 2019
Statement of changes in equityFor the year ended 31 December 2018
Not
es
Shar
e ca
pita
l U
SD’0
00
Shar
e pr
emiu
m
USD
’00
0
Lega
l res
erve
U
SD’0
00
Spec
ial r
eser
ve
USD
’00
0
Spec
ial r
eser
ve
rest
ruct
ured
loan
U
SD’0
00
Spec
ial i
mpa
irmen
t re
serv
e U
SD’0
00
Spec
ial r
eval
uatio
n re
serv
e U
SD’0
00
Subo
rdin
ated
loan
s re
serv
e U
SD’0
00
Inve
stm
ent
reva
luat
ion
rese
rve
USD
’00
0
Ret
aine
d ea
rnin
gs
USD
’00
0
Tota
l U
SD’0
00
Perp
etua
l Tie
r 1
capi
tal s
ecur
ities
U
SD’0
00
Tota
l equ
ity
USD
’00
0
Balances as at 1 January 2018 586,457 201,465 130,530 48,021 3,327 - - 109,935 1,317 143,642 1,224,694 300,000 1,524,694
Adjustment on initial application of IFRS 9, net of tax
2.7 - - - - - 9,161 (1,842) - - 1,842 9,161 - 9,161
Restated balance on 1 January 2018 586,457 201,465 130,530 48,021 3,327 9,161 (1,842) 109,935 1,317 145,484 1,233,855 300,000 1,533,855
Profit for the period - - - - - - - - - 130,600 130,600 - 130,600
Other comprehensive income for the period:
Net changes in fair value reserve
- FVOCI equity instrument 18(c) - - - - - - - - (1,971) - (1,971) - (1,971)
- FVOCI debt instruments 18(c) - - - - - - - - (3,992) - (3,992) - (3,992)
Total comprehensive income for the period - - - - - - - - (5,963) 130,600 124,637 - 124,637
Transfer to special impairment reserve IFRS 9
18(f) - - - - - 2,688 - - - (2,688) - - -
Transfer to legal reserve 18(a) - - 13,060 - - - - - - (13,060) - - -
Excess of receipts over right issue expenses 18(a) - - 1,548 - - - - - - - 1,548 - 1,548
Transfer to subordinated loan reserve
- - - - - - - 33,182 - (33,182) - - -
Transfer to retained earnings 18(b) - - - - - - -
(64,935) - 64,935 - - -
Perpetual Tier 1 capital securities:
- Proceeds from issuance - - - - - - - - - - - 103,896 103,896
- Issuance cost - - - - - - - - - (579) (579) - (579)
- Payment towards perpetual additional Tier 1 coupon
- - - - - - - - - (20,551) (20,551) - (20,551)
Transactions with owners recorded directly in equity
Issue of right shares 93,984 46,992 - - - - - - - - 140,976 - 140,976
Dividend for 2017 35 - - - - - - - - - (70,374) (70,374) - (70,374)
Bonus shares issued for 2017 35 46,917 - - - - - - - - (46,917) - - -
Balances as at 31 December 2018 727,358 248,457 145,138 48,021 3,327 11,849 (1,842) 78,182 (4,646) 153,668 1,409,512 403,896 1,813,408
The notes on pages 130 to 210 are an integral part of these financial statements.
Independent auditor’s report - pages 117 to 121
BankDhofar

Annual Report 2019128
Statement of cash flows For the year ended 31 December 2019
2019 USD’000
2018 USD’000
2019 RO’000
2018 RO’000
CASH FLOWS FROM OPERATING ACTIVITIES
93,745 155,177 Profit for the year before taxation 36,092 59,743
Adjustment for:
15,826 10,558 Depreciation and amortisation 6,093 4,065
58,177 17,273 Net impairment on financial asset 22,398 6,650
(751) (743) Dividend Income (289) (286)
777 862 End of service benefits provision for the year 299 332
(16) (119) Gain on disposal of property and equipment (6) (46)
9,294 9,439 Interest Expense on Subordinated Loans 3,578 3,634
(403) 777 (Gain) / loss on sale of investments (155) 299
176,649 193,224 Operating profit before working capital changes 68,010 74,391
Change in working capital:
315,197 (48,418) Due to banks 121,351 (18,641)
(335,519) 22,361 Due from banks (129,175) 8,609
178,974 227,348 Loans & advances and financing 68,905 87,529
29,242 (87,068) Other assets 11,258 (33,521)
48,530 (373,779) Customer deposits 18,684 (143,905)
(34,148) 102,917 Other liabilities (13,147) 39,623
378,925 36,585 Cash generated from operations before tax and end of service benefits 145,886 14,085
(19,951) (19,109) Taxes paid (7,681) (7,357)
(558) (935) End of service benefits paid (215) (360)
358,416 16,541 Net cash generated fromoperating activities 137,990 6,368
CASH FLOWS FROM INVESTING ACTIVITIES
(26,397) (23,535) Purchase of property and equipment (10,163) (9,061)
751 743 Dividends received from investment securities 289 286
(597,197) (641,696) Purchase of investments (229,921) (247,053)
404,101 599,951 Proceeds from sale/maturities of investments 155,579 230,981
566 119 Proceeds from sale of property and equipment 218 46
(218,176) (64,418) Net cash used in investing activities (83,998) (24,801)
CASH FLOWS FROM FINANCING ACTIVITIES
0 (64,935) (Repayment) of subordinated loans - (25,000)
(72,735) (70,374) Dividend paid (28,003) (27,094)
0 103,896 Proceeds from Tier 1 perpetual subordinated bond - 40,000
0 (579) Perpetual Tier 1 capital securities issuance cost - (223)
0 142,525 Proceeds from rights issue of share capital, net of expense - 54,872
(28,343) (20,551) Interest on Tier 1 perpetual subordinated bond (10,912) (7,912)
(9,294) (9,439) Interest expense on subordinated loans (3,578) (3,634)
166 0 Excess of Rights Issue Receipt 64 -
BankDhofar

129Annual Report 2019
Statement of cash flows For the year ended 31 December 2019
2019 USD’000
2018 USD’000
2019 RO’000
2018 RO’000
(110,206) 80,543 Net cash (used in) /generated from financing activities (42,429) 31,009
30,034 32,665 NET CHANGE IN CASH AND CASH EQUIVALENTS 11,563 12,576
1,110,273 1,077,608 Cash and cash equivalents at 1 January 427,455 414,879
1,140,307 1,110,273 Cash and cash equivalents at 31 December 439,018 427,455
Cash and cash equivalent comprises of:
780,273 783,130 Cash and balances with Central Bank of Oman 300,405 301,505
(1,299) (1,299) Capital deposit with Central Bank of Oman (500) (500)
362,143 329,655 Due from banks 139,425 126,917
(810) (1,213) Due to banks (312) (467)
1,140,307 1,110,273 439,018 427,455
Reconciliation of liabilities and equity arising from financing activities:
Subordinated loan
165,909 230,844 Balance at beginning of the period 63,875 88,875
0 (64,935) Cash flows - (25,000)
165,909 165,909 Balance at end of the period 63,875 63,875
Retained earnings
153,668 143,642 Balance at beginning of the period 59,162 55,302
0 1,842 Changes on initial application of IFRS 9 - 709
78,556 130,600 Profit for the year 30,244 50,281
(7,855) (13,060) Transfer to legal reserve (3,024) (5,028)
(33,182) (33,182) Transfer to subordinate reserve (12,775) (12,775)
0 64,935 Transfer from subordinated loans to retained earning - 25,000
(28,343) (20,551) Additional Tier 1 coupon (10,912) (7,912)
0 (579) Perpetual tier 1 capital securities issuance cost - (223)
(12,088) (2,688) Transfer to special reserve (IFRS 9) (4,654) (1,035)
(50,914) (46,917) Bonus shares issued (19,602) (18,063)
(72,735) (70,374) Dividend transfer (28,003) (27,094)
27,107 153,668 Balance at end of the period 10,436 59,162
Non cash Transaction
The principal non-cash transactions for the year ended 31 December 2019 consist mainly of the following:
- Impact of the application of IFRS 16 amounting to RO 2.03 million that has been charged to right-of-use assets (note 3).
- Impact of bonus shares issued for 2018 amounting to RO 19.60 million that has been deducted from retained earnings (note 14).
The notes on pages 130 to 210 are an integral part of these financial statements.Independent auditor’s report - pages 117 to 121
BankDhofar

Annual Report 2019130
1. LEGAL STATUS AND PRINCIPAL ACTIVITIES
Bank Dhofar SAOG (the “Bank”) is incorporated in the Sultanate of Oman as a public joint stock company and is principally engaged in corporate, retail and investment banking activities. The Bank’s Islamic Banking Window, “Maisarah Islamic Banking services” has an allocated capital of RO 55 million from the core paid up capital of the shareholders. The Bank has a primary listing of its ordinary shares on the Muscat Securities Market (“MSM”), and the Bank’s Additional Tier I Perpetual Bonds are listed on the Irish Stock Exchange (‘ISE”) and Muscat Securities Market (“MSM”). The Bank’s principal place of business is its Head Office located at Central Business District (“CBD”), Muscat, Sultanate of Oman.
2. BASIS OF PREPARATION
2.1 Statement of compliance
The financial statements have been prepared in accordance with International Financial Reporting Standards (IFRSs) as issued by International Accounting Standards Board (IASB), the requirements of the Commercial Companies Law of 1974, as amended, the disclosure requirements of the Capital Market Authority of the Sultanate of Oman and the applicable regulations of the Central Bank of Oman (“CBO”).
The Bank also prepares a separate set of financial statements for its Islamic Banking Window (IBW) in accordance with the requirements of Section 1.2 of Title 3 of the Islamic Banking Regulatory Framework (“IBRF”) issued by the CBO. The separate set of financial statements of its IBW are prepared in accordance with Financial Accounting Standards (“FAS”) issued by Accounting and Auditing Organisation for Islamic Financial Institutions (“AAOIFI”), the Sharia Rules and Principles as determined by the Sharia Supervisory Board of the Islamic Window (the “SSB”) and other applicable requirements of the CBO. The IBWs financial statements are then converted into International Financial Reporting Standards (IFRS) compliant financial statements and included in these financial statements. All balances and transactions between Bank and IBW are eliminated in these financial statements.
2.2 Basis of measurement
The financial statements have been prepared under the historical cost convention except for derivative financial instruments, financial instruments at fair value through profit or loss (FVTPL) and financial instruments at fair value through other comprehensive income (FVOCI).
This is the first set of the Bank’s annual financial statements in which IFRS 16 “Leases” have been applied. The statement of financial position is presented in descending order of liquidity as this presentation is more appropriate to the Bank’s operations.
2.3 Functional and presentation currency
The financial statements are presented in Rial Omani (“RO”), which is the Bank’s functional (currency of primary economic environment in which the Bank operates) and presentation currency, rounded to the nearest thousand unless otherwise stated.
2.4 Use of estimates and judgements
The preparation of financial statements in conformity with IFRSs requires management to make judgements estimates and assumptions that effect the application of accounting policies and the reported amounts of assets, liabilities, income and expenses. Actual results may differ from these estimates.
Estimates and underlying assumptions are reviewed on an on-going basis. Revisions to accounting estimates are recognised in the period in which the estimate is revised and in any future periods affected.
Information about significant areas of uncertainty and critical judgements in applying accounting policies that have the most significant effect on the amounts recognised in the financial statements are described in note 4.
Notes to the financial statementsFor the year ended 31 December 2019

131Annual Report 2019
2. BASIS OF PREPARATION (CONTINUED)
2.5 Standards, amendments and interpretations to IFRS effective in 2019 and relevant for the Bank’s operation.
For the year ended 31 December 2019, the Bank has adopted applicable all the new and revised standards and interpretations issued by the International Accounting Standards Board (IASB) and the International Financial Reporting Interpretations Committee (IFRIC) of the IASB that are relevant to its operations and effective for periods beginning on 1 January 2019.
The Bank has applied the following standards and amendments for the first time for their annual reporting period commencing 1 January 2019:
• IFRS 16 Leases
• Prepayment Features with Negative Compensation - Amendments to IFRS 9
• Annual Improvements to IFRS Standards 2015 - 2017 Cycle
• Interpretation 23 Uncertainty over Income Tax Treatments
• Definition of Material - Amendments to IAS 1 and IAS 8.
Bank also elected to adopt the following amendments early:
• Interest Rate Benchmark Reform amendment to IFRS 9 and IFRS 7
The Bank had to change its accounting policies as a result of adopting IFRS 16. The Bank elected to adopt the new rules but has not restated comparatives for the 2018 reporting period. This is disclosed in note 2.7. The other amendments listed above did not have any impact on the amounts recognised in prior periods and are not expected to significantly affect the current or future periods.
2.6 The following new standards and amendments have been issued by the International Accounting Standards Board (IASB) but are not yet mandatory for the year ended 31 December 2019:
There are no relevant applicable new standards and amendments to published standards or IFRIC interpretations that have been issued but are not effective for the first time for the Bank’s financial year beginning on 1 January 2019 that would be expected to have a material impact on the financial statements of the Bank.
2.7 Changes in accounting policies
A. IFRS 16 Leases
The Bank has adopted IFRS 16 from 1 January 2019, but has not restated comparatives for the 2018 reporting period, as permitted under the specific transitional provisions in the standard. The reclassifications and the adjustments arising from the new leasing rules are therefore recognized in the opening statement of financial position on 1 January 2019. The new accounting policies are disclosed in note 36.
Adjustments recognized on adoption of IFRS 16
On adoption of IFRS 16, the Bank recognized lease liabilities in relation to leases which had previously been classified as ‘operating leases’ under the principles of IAS 17 Leases. These liabilities were measured at the present value of the remaining lease payments, discounted using the lessee’s incremental borrowing rate as of 1 January 2019. The weighted average lessee’s incremental borrowing rate applied to the lease liabilities on 1 January 2019 was 5.5%.
(1) Practical expedients applied
In applying IFRS 16 for the first time, the Bank has used the following practical expedients permitted by the standard:
- applying a single discount rate to a portfolio of leases with reasonably similar characteristics- the accounting for operating leases with a remaining lease term of less than 12 months as at 1 January 2019
as short-term leases- the exclusion of initial direct costs for the measurement of the right-of-use asset at the date of initial
application, and
- the use of hindsight in determining the lease term where the contract contains options to extend or terminate the lease.
Notes to the financial statementsFor the year ended 31 December 2019
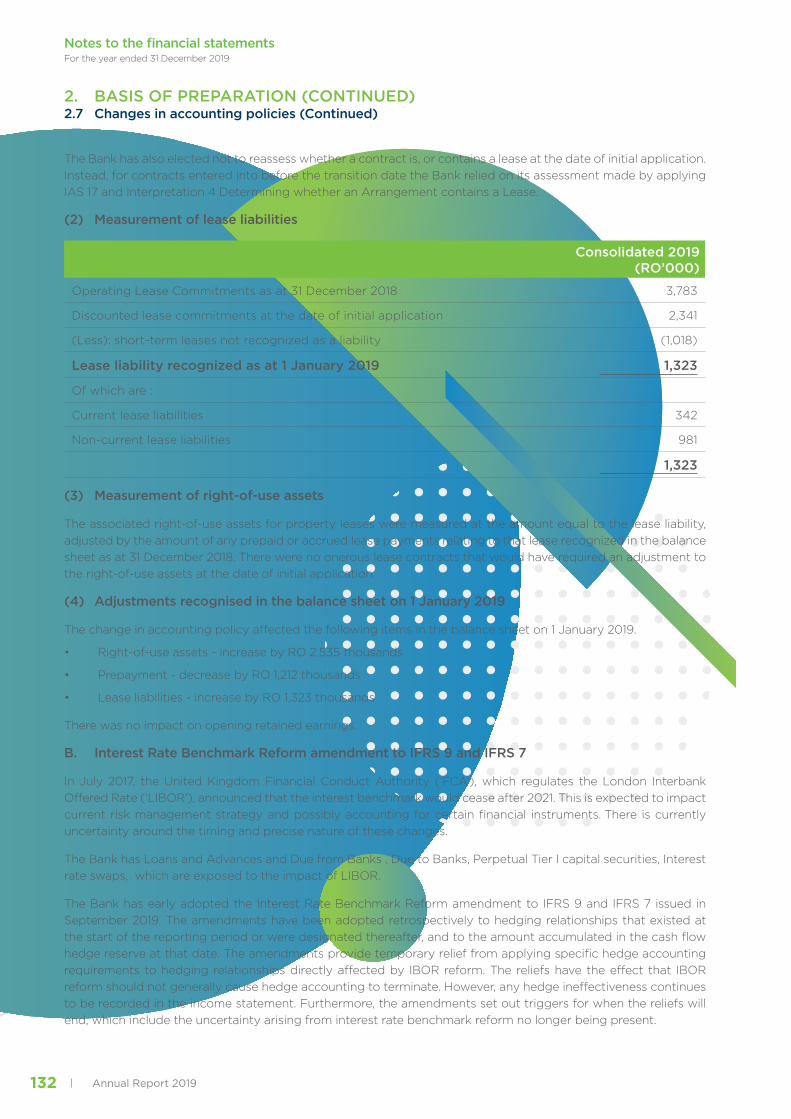
Annual Report 2019132
2. BASIS OF PREPARATION (CONTINUED)2.7 Changes in accounting policies (Continued)
The Bank has also elected not to reassess whether a contract is, or contains a lease at the date of initial application. Instead, for contracts entered into before the transition date the Bank relied on its assessment made by applying IAS 17 and Interpretation 4 Determining whether an Arrangement contains a Lease.
(2) Measurement of lease liabilities
Consolidated 2019(RO’000)
Operating Lease Commitments as at 31 December 2018 3,783
Discounted lease commitments at the date of initial application 2,341
(Less): short-term leases not recognized as a liability (1,018)
Lease liability recognized as at 1 January 2019 1,323
Of which are :
Current lease liabilities 342
Non-current lease liabilities 981
1,323
(3) Measurement of right-of-use assets
The associated right-of-use assets for property leases were measured at the amount equal to the lease liability, adjusted by the amount of any prepaid or accrued lease payments relating to that lease recognized in the balance sheet as at 31 December 2018. There were no onerous lease contracts that would have required an adjustment to the right-of-use assets at the date of initial application.
(4) Adjustments recognised in the balance sheet on 1 January 2019
The change in accounting policy affected the following items in the balance sheet on 1 January 2019.
• Right-of-use assets - increase by RO 2,535 thousands
• Prepayment - decrease by RO 1,212 thousands
• Lease liabilities - increase by RO 1,323 thousands
There was no impact on opening retained earnings.
B. Interest Rate Benchmark Reform amendment to IFRS 9 and IFRS 7
In July 2017, the United Kingdom Financial Conduct Authority (‘FCA’), which regulates the London Interbank Offered Rate (‘LIBOR’), announced that the interest benchmark would cease after 2021. This is expected to impact current risk management strategy and possibly accounting for certain financial instruments. There is currently uncertainty around the timing and precise nature of these changes.
The Bank has Loans and Advances and Due from Banks , Due to Banks, Perpetual Tier I capital securities, Interest rate swaps, which are exposed to the impact of LIBOR.
The Bank has early adopted the Interest Rate Benchmark Reform amendment to IFRS 9 and IFRS 7 issued in September 2019. The amendments have been adopted retrospectively to hedging relationships that existed at the start of the reporting period or were designated thereafter, and to the amount accumulated in the cash flow hedge reserve at that date. The amendments provide temporary relief from applying specific hedge accounting requirements to hedging relationships directly affected by IBOR reform. The reliefs have the effect that IBOR reform should not generally cause hedge accounting to terminate. However, any hedge ineffectiveness continues to be recorded in the income statement. Furthermore, the amendments set out triggers for when the reliefs will end, which include the uncertainty arising from interest rate benchmark reform no longer being present.
Notes to the financial statementsFor the year ended 31 December 2019

133Annual Report 2019
3. SIGNIFICANT ACCOUNTING POLICIES
3.1 Foreign currency transactions
Transactions in foreign currencies are translated into the respective functional currency using the exchange rates at the dates of the transactions.
Monetary assets and liabilities denominated in foreign currencies are translated into the functional currency at the rate of exchange at the reporting date. Any resulting exchange differences are included in ‘other income’ in the statement of comprehensive income.
The non-monetary assets and liabilities denominated in foreign currencies that are measured at fair value are retranslated into the functional currency at the spot exchange rate at the date the fair value is determined. Foreign exchange differences arising on translation are recognised in the statement of comprehensive income, except for non-monetary financial assets, such as equities held at fair value through profit or loss are recognised in profit or loss as part of the fair value gain or loss.
Translation differences on non-monetary financial assets, such as equities classified as FVOCI, are included in other comprehensive income. Non-monetary assets and liabilities that are measured in terms of historical cost in a foreign currency are translated using the exchange rate at the date of the transaction.
3.2 Financial assets and liabilities
3.2.1 Recognition and initial measurement
The Bank initially recognises loans and advances, deposits, debt securities issued and subordinated liabilities on the date on which they are originated. All other financial instruments (including regular-way purchases and sales of financial assets) are recognised on the trade date, which is the date on which the Bank becomes a party to the contractual provisions of the instrument.
A financial asset or financial liability is measured initially at fair value plus, for an item not at FVTPL, transaction costs that are directly attributable to its acquisition or issue.
3.2.2 Classification
(a) Financial assets
IFRS 9 contains three principal classification categories for financial assets: measured at amortized cost, fair value through other comprehensive income (FVOCI) and fair value through profit or loss (FVTPL)
On initial recognition, a financial asset is classified as measured at; amortised cost, FVOCI or FVTPL.
Financial assets measured at amortised cos
A financial asset is measured at amortised cost if it meets both of the following conditions and is not designated as at FVTPL:
• the asset is held within business model whose objective is to hold assets to collect contractual cash flows; and the contractual terms of the financial asset give rise on specified dates to cash flows that are solely payments of principal and interest (SPPI) on the principal amount outstanding.
• It is initially recognised at fair value plus directly attributable transaction costs and subsequently measured at amortised cost less impairment.
Financial assets measured at fair value through other comprehensive income
1) Debt Instruments
• Investment in debt instrument is measured at FVOCI only if it meets both of the following conditions and is not designated as FVTPL;
• The asset is held within business model whose objective is achieved by both collecting contractual cash flows and selling financial assets; and
• the contractual terms of the financial asset give rise on specified dates to cash flows that are solely payments of principal and interest on the principal amount outstanding.
These debt instruments are initially recognised at fair value plus directly attributable transaction costs and subsequently measured at fair value. Gains and losses arising from changes in fair value are included in other comprehensive income within a separate component of equity.
Notes to the financial statementsFor the year ended 31 December 2019

Annual Report 2019134
3. SIGNIFICANT ACCOUNTING POLICIES (CONTINUED)3.2 Financial assets and liabilities (Continued)
2) Equity Instruments
For an equity instrument that is not held for trading, the Bank may elect at initial recognition to irrevocably designate those instruments under FVOCI. This election is made on an investment on investment basis. Amounts presented in other comprehensive income are not subsequently transferred to the statement of profit or loss.
Financial assets measured at fair value through profit or loss
Financial assets at fair value through profit or loss comprises of investments held for trading and designated as FVTPL on initial recognition. It is initially recognised at fair value with transaction costs recognised in the statement of profit or loss as incurred. Subsequently, they are measured at fair value and any gains or losses are recognised in the statement of profit or loss.
Business model assessment
Business model assessment involves determining how financial assets are managed in order to generate cash flows. The Bank’s business model assessment is based on the following categories:
• Held to collect: The objective of the business model is to hold assets and collect contractual cash flows. Any sales of the asset are incidental to the objective of the model.
• Held to collect and for sale: Both collecting contractual cash flows and sales are integral to achieving the objectives of the business model.
• Other business model: The business model is neither held-to-collect nor held-to-collect and for sale.
• The Bank makes an assessment of the objective of a business model in which an asset is held at a portfolio level because this best reflects the way the business is managed and information is provided to management. The information considered includes:
• The stated policies and objectives for the portfolio and the operation of those policies in practice. In particular, whether management’s strategy focuses on earning contractual interest revenue, maintaining a particular interest rate profile, matching the duration of the financial assets to the duration of the liabilities that are funding those assets or realising cash flows through the sale of the assets;
• How the performance of the portfolio is evaluated and reported to the Bank’s management;
• The risks that affect the performance of the business model (and the financial assets held within that business model) and how those risks are managed;
• How managers of the business are compensated – e.g. whether compensation is based on the fair value of the assets managed or the contractual cash flows collected; and
• The frequency, volume and timing of sales in prior periods, the reasons for such sales and its expectations about future sales activity. However, information about sales activity is not considered in isolation, but as part of an overall assessment of how the Bank’s stated objective for managing the financial assets is achieved and how cash flows are realised.
Financial assets that are held for trading or managed and whose performance is evaluated on a fair value basis are measured at FVTPL because they are neither held to collect contractual cash flows nor held both to collect contractual cash flows and to sell financial assets.
Assessment whether contractual cash flows are solely payments of principal and interest
For the purposes of this assessment, ‘principal’ is defined as the fair value of the financial asset on initial recognition. ‘Interest’ is defined as consideration for the time value of money and for the credit risk associated with the principal amount outstanding during a particular period of time and for other basic lending risks and costs (e.g. liquidity risk and administrative costs), as well as profit margin.
Notes to the financial statementsFor the year ended 31 December 2019

135Annual Report 2019
3. SIGNIFICANT ACCOUNTING POLICIES (CONTINUED)3.2 Financial assets and liabilities (Continued)
In assessing whether the contractual cash flows are solely payments of principal and interest, the Bank considers the contractual terms of the instrument. This includes assessing whether the financial asset contains a contractual term that could change the timing or amount of contractual cash flows such that it would not meet this condition.
Modifications of financial assets
If the cash flows of the modified asset carried at amortised cost are not substantially different, then the modification does not result in de-recognition of the financial asset. In this case, the Bank recalculates the gross carrying amount of the financial asset and recognises the amount arising from adjusting the gross carrying amount as a modification gain or loss in profit or loss.
The risk of default of such assets after modification is assessed at the reporting date and compared with the risk under the original terms at initial recognition, when the modification is not substantial and so does not result in derecognition of the original asset. The Bank monitors the subsequent performance of modified assets. The Bank may determine that the credit risk has significantly improved after restructuring, so that the assets are moved from Stage 3 (Lifetime ECL) to Stage 2 (Lifetime ECL) or Stage 1 (12-month ECL). This is only the case for assets which have performed in accordance with the new terms for twelve consecutive months or more.
The Bank continues to monitor if there is a subsequent significant increase in credit risk in relation to such assets.
Financial guarantee contracts and loan commitments
For financial guarantee contracts and loan commitments, the loss allowance is recognised as impairment as described in note 3.3. The Bank has issued no loan commitment that are measured at FVTPL. Impairment arising from financial guarantee and loan commitments are included within impairment allowance under other liabilities in statement of financial position.
Loans & advances and financing receivables
Loans & advances and financing receivables are initially recognised at fair value which is the cash consideration to originate or purchase the loan including any transaction costs and measured subsequently at amortised cost using the effective interest method less allowance for impairment losses which are recognised in the statement of profit or loss.
3.2.3 Recognition
The Bank initially recognises loans, advances and financing to customers, deposits from customers, debt securities issued and subordinated liabilities on the date that they are originated. All other financial assets and liabilities are initially recognised on the trade date at which the Bank becomes a party to the contractual provisions of the instrument.
3.2.4 De-recognition
Financial assets
The Bank derecognises a financial asset when the contractual rights to the cash flows from the financial asset expire, or it transfers the rights to receive the contractual cash flows in a transaction in which substantially all of the risks and rewards of ownership of the financial asset are transferred or in which the Bank neither transfers nor retains substantially all of the risks and rewards of ownership and it does not retain control of the financial asset.
On de-recognition of a financial asset, the difference between the carrying amount of the asset (or the carrying amount allocated to the portion of the asset derecognised) and the sum of (1) the consideration received (including any new asset obtained less any new liability assumed) and (2) any cumulative gain or loss that had been recognised in OCI is recognised in profit or loss.
Any cumulative gain/loss recognised in OCI in respect of equity investment securities designated as at FVOCI is not recognised in profit or loss on de-recognition of such securities. Any interest in transferred financial assets that qualify for de-recognition that is created or retained by the Bank is recognised as a separate asset or liability.
Financial liabilities
The Bank derecognises a financial liability when its contractual obligations are discharged or cancelled, or expire.
Notes to the financial statementsFor the year ended 31 December 2019

Annual Report 2019136
3. SIGNIFICANT ACCOUNTING POLICIES (CONTINUED)3.2 Financial assets and liabilities (Continued)
3.2.5 Modifications of financial assets and financial liabilities
Financial assets
If the terms of a financial asset are modified or an existing financial asset is replaced with a new one, an assessment is made to determine if the existing financial asset should be derecognized. Where a modification does not result in de-recognition, the date of origination continues to be used to determine significant increase in credit risk (SICR). Where a modification results in de-recognition, the new financial asset is recognized at its fair value on the modification date. The modification date is also the date of origination for this new asset.
The Bank may modify the contractual terms of loans for either commercial or credit reasons. The terms of a loan in good standing may be modified for commercial reasons to provide competitive pricing to borrowers. Loans are also modified for credit reasons where the contractual terms are modified to grant a concession to a borrower that may be experiencing financial difficulty.
For all financial assets modifications of the contractual terms may result in de-recognition of the original asset when the changes to the terms of the loans are considered substantial. These terms include interest rate, authorized amount, term, or type of underlying collateral. The original loan is derecognized and the new loan is recognized at its fair value. The difference between the carrying value of the derecognized asset and the fair value of the new asset is recognized in the statement of profit or loss.
For all loans, performing and credit-impaired, where the modification of terms did not result in the de-recognition of the loan, the gross carrying amount of the modified loan is recalculated based on the present value of the modified cash flows discounted at the original effective interest rate and any gain or loss from the modification is recorded in the provision for credit losses line in the statement of profit or loss.
Financial liabilities
The Bank derecognises a financial liability when its terms are modified and the cash flows of the modified liability are substantially different. In this case, a new financial liability based on the modified terms is recognised at fair value. The difference between the carrying amount of the financial liability derecognised and consideration paid is recognised in profit or loss. Consideration paid includes non-financial assets transferred, if any, and the assumption of liabilities, including the new modified financial liability.
If the modification of a financial liability is not accounted for as de-recognition, then the amortised cost of the liability is recalculated by discounting the modified cash flows at the original effective interest rate and the resulting gain or loss is recognised in profit or loss. For floating-rate financial liabilities, the original effective interest rate used to calculate the modification gain or loss is adjusted to reflect current market terms at the time of the modification. Any costs and fees incurred are recognised as an adjustment to the carrying amount of the liability and amortised over the remaining term of the modified financial liability by re-computing the effective interest rate on the instrument.
3.2.6 Offsetting
Financial assets and financial liabilities are offset and the net amount presented in the statement of financial position when, and only when, the Bank currently has a legally enforceable right to set off the amounts and it intends either to settle them on a net basis or to realise the asset and settle the liability simultaneously.
Income and expenses are presented on a net basis only when permitted under IFRS, or for gains and losses arising from a group of similar transactions such as in the Bank’s trading activity.
The amortised cost of a financial asset or liability is the amount at which the financial asset or liability is measured at initial recognition, minus principal repayments, plus or minus the cumulative amortisation using the EIR of any difference between the initial amount recognised and the maturity amount, minus any reduction for impairment.
Notes to the financial statementsFor the year ended 31 December 2019

137Annual Report 2019
3. SIGNIFICANT ACCOUNTING POLICIES (CONTINUED)3.2 Financial assets and liabilities (Continued)
3.2.8 Fair value measurement
A number of the Bank’s accounting policies and disclosures require the determination of fair value, for both financial and non-financial assets and liabilities. Fair values have been determined for measurement and/or disclosure purposes based on a number of accounting policies and methods. Where applicable, information about the assumptions made in determining fair values is disclosed in the notes specific to that asset or liability. Details are set out in note 31.
Fair value is the price that would be received to sell an asset or paid to transfer a liability in an orderly transaction between market participants at the measurement date. The fair value measurement is based on the presumption that the transaction to sell the asset or transfer the liability takes place either:
• In the principal market for the asset or liability, or
• In the absence of a principal market, in the most advantageous market for the asset or liability
The principal or the most advantageous market must be accessible to the Bank.
The fair value of an asset or a liability is measured using the assumptions that market participants would use when pricing the asset or liability, assuming that market participants act in their economic best interest.
A fair value measurement of a non-financial asset takes into account a market participant’s ability to generate economic benefits by using the asset in its highest and best use or by selling it to another market participant that would use the asset in its highest and best use.
The Bank uses valuation techniques that are appropriate in the circumstances and for which sufficient data are available to measure fair value, maximising the use of relevant observable inputs and minimising the use of unobservable inputs.
3.2.9 Designation at fair value through profit or loss
Financial assets
At initial recognition, the Bank designate certain financial assets as at FVTPL because this designation eliminates or significantly reduces an accounting mismatch, which would otherwise arise.
Financial liabilitiesThe Bank designates certain financial liabilities as at FVTPL in either of the following circumstances:
- the liabilities are managed, evaluated and reported internally on a fair value basis; or
- the designation eliminates or significantly reduces an accounting mismatch that would otherwise arise.
3.3 Impairment
The Bank recognises loss allowances for expected credit losses (ECL) on the following financial instruments that are not measured at FVTPL:• Balances with banks• Due from banks• Debt investment securities• Loans, advances & financings to customers• Loan commitment• Financial guarantee• Other assets (acceptances and interest receivables)
No impairment loss is recognised on equity investments.
The Bank measures loss allowances at an amount equal to lifetime ECL, except for the following, for which they are measured at 12-month ECL:
- debt investment securities that are determined to have low credit risk at the reporting date; and
- other financial instruments on which credit risk has not increased significantly since their initial recognition.
Notes to the financial statementsFor the year ended 31 December 2019

Annual Report 2019138
3. SIGNIFICANT ACCOUNTING POLICIES (CONTINUED)3.3 Impairment (Continued)
The Bank considers a debt investment security to have low credit risk when its credit risk rating is equivalent to the globally understood definition of ‘investment grade’. The Bank does not apply the low credit risk exemption to any other financial instruments.
12-month ECL are the portion of ECL that result from default events on a financial instrument that are possible within the 12 months after the reporting date. Financial instruments for which a 12-month ECL is recognised are referred to as ‘Stage 1 financial instruments’.
Life-time ECL are the ECL that result from all possible default events over the expected life of the financial instrument. Financial instruments for which a lifetime ECL is recognised but which are not credit-impaired are referred to as ‘Stage 2 financial instruments’.
Impairment allowances are measured using a three-stage approach based on the extent of credit deterioration since origination:
• Stage 1 – Where there has not been a significant increase in credit risk (SICR) since initial recognition of a financial instrument, an amount equal to 12 months expected credit loss is recorded. The expected credit loss is computed using a probability of default occurring over the next 12 months. For those instruments with a remaining maturity of less than 12 months, a probability of default corresponding to remaining term to maturity is used.
• Stage 2 – When a financial instrument experiences a SICR subsequent to origination but is not considered to be in default, it is included in Stage 2. This requires the computation of expected credit loss based on the probability of default over the remaining estimated life of the financial instrument.
• Stage 3 – Financial instruments that are considered to be in default are included in this stage. Similar to Stage 2, the allowance for credit losses captures the lifetime expected credit losses.
The key inputs into the measurement of ECL are the term structure of the following variables:
• Probability of default (PD);
• Loss given default (LGD); and
• Exposure at default (EAD).
Details of these statistical parameters/inputs are as follows:
• PD – The probability of default is an estimate of the likelihood that the borrower of a loan or debt will not be able to make the necessary scheduled repayments and defaults over a given time horizon. Bank has developed PD models for various portfolios reflecting the existing state of the environment in which the bank operates and in line with a forward looking view. The PD models are built to capture the changing risk of default of clients over a long period of time and Bank has used its own internal data to develop such models. PD is assessed for pool of borrowers falling under each rating grade using statistical tools, which represents the average expected default probability within future 12 months horizons.While the ratings itself incorporate forward looking parameters to a certain extent, the models are structured in a way to produce average PD estimates in line with historical long-run averages including forward looking information.
• EAD – The exposure at default computed is the expected amount owed to the bank, expressed as an amount, at the time the client defaults, or is expected to default. The exposure can be distinguish between those amounts forming part of (1) revolving (2) non-revolvingand (3) off-balance sheet exposures to the bank, as special considerations have been taken in treating each case. For all non revolving exposures, the amount outstanding as on reporting date has been treated as EAD. For all revolving exposure, EAD shall be the sum of the amount outstanding and likely amount that will be utilised by the borrower from the unavailed limit before the default. The off balance sheet items are converted into credit exposure equivalent through credit conversion factor (or CCF) and accordingly, EAD is estimated.
• LGD – The loss given default is an estimate of the loss arising in the case where a default occurs at a given time. It is based on the difference between the contractual cash flows due and those that the lender would expect to receive, including from the realization of any collateral. It is usually expressed as a percentage of the EAD. The Bank has adopted different approaches for estimation of LGD depending on the portfolio. The Bank has used internal data reflecting Bank’s own loss experience for development of model, however wherever the Bank lacked internal loss experience, external loss benchmarks are adopted.
Notes to the financial statementsFor the year ended 31 December 2019
139Annual Report 2019
3. SIGNIFICANT ACCOUNTING POLICIES (CONTINUED)3.3 Impairment (Continued)
(a) Measurement of ECL
ECL are a probability-weighted estimate of credit losses. They are measured as follows:
- financial assets that are not credit-impaired at the reporting date: as the present value of all cash shortfalls (i.e. the difference between the cash flows due to the entity in accordance with the contract and the cash flows that the Bank expects to receive); and
- financial assets that are credit-impaired at the reporting date: as the difference between the gross carrying amount and the present value of estimated future cash flows.
However for unfunded exposures, ECL is measured as follows:
- undrawn loan commitments: at the present value of the difference between the contractual cash flows that are due to the Bank if the commitment is drawn down and the cash flows that the Bank expects to receive; and
- financial guarantee contracts: the expected payments to reimburse the holder less any amounts that the Bank expects to recover.
(b) Restructured financial assets
If the terms of a financial asset are renegotiated or modified or an existing financial asset is replaced with a new one due to financial difficulties of the borrower, then an assessment is made of whether the financial asset should be derecognised and ECL are measured as follows:
- If the expected restructuring will not result in de-recognition of the existing asset, then the expected cash flows arising from the modified financial asset are included in calculating the cash shortfalls from the existing asset.
- If the expected restructuring will result in de-recognition of the existing asset, then the expected fair value of the new asset is treated as the final cash flow from the existing financial asset at the time of its de-recognition. This amount is included in calculating the cash shortfalls from the existing financial asset that are discounted from the expected date of de-recognition to the reporting date using the original effective interest rate of the existing financial asset.
(c) Credit-impaired financial assets
At each reporting date, the Bank assesses whether financial assets carried at amortised cost and debt securities carried at FVOCI are credit-impaired.
A financial asset is ‘credit-impaired’ when one or more events that have a detrimental impact on the estimated future cash flows of the financial asset have occurred. Credit impaired financial assets are referred to as Stage 3 assets. Evidence of credit-impairment includes observable data regarding the following events:
- significant financial difficulty of the borrower or issuer;
- a breach of contract such as a default or past due event;
- the restructuring of a loan or advance by the Bank on terms that the Bank would not consider otherwise; or
- it is becoming probable that the borrower will enter bankruptcy or other financial reorganisation.
It may not be possible to identify a single discrete event—instead, the combined effect of several events may have caused financial assets to become credit-impaired. The Bank assesses whether debt instruments that are financial assets measured at amortised cost or FVOCI are credit-impaired at each reporting date. To assess if sovereign and corporate debt instruments are credit impaired, the Bank considers the following factors:
- The market’s assessment of creditworthiness as reflected in the bond yields;
- The rating agencies’ assessments of creditworthiness;
- The country’s ability to access the capital markets for new debt issuance; and
- The probability of debt being restructured, resulting in holders suffering losses through voluntary or mandatory debt forgiveness.
Notes to the financial statementsFor the year ended 31 December 2019

Annual Report 2019140
3. SIGNIFICANT ACCOUNTING POLICIES (CONTINUED)3.3 Impairment (Continued)
A loan is considered credit-impaired when a concession is granted to the borrower due to a deterioration in the borrower’s financial condition, unless there is an evidence that as a result of granting the concession the risk of not receiving the contractual cash flows has reduced significantly and there are no other indicators of impairment.
For financial assets where concessions are contemplated but not granted, the asset is deemed credit impaired when there is observable evidence of credit-impairment including meeting the definition of default. The definition of default (refer note 3.3 (g)) includes unlikeliness to pay indicators and a backstop if amounts are overdue for 90 days or more.
(d) Forward-looking information
The measurement of expected credit losses for each stage and the assessment of significant increases in credit risk considers information about past events and current conditions as well as reasonable and supportable forecasts of future events and economic conditions. The estimation and application of forward-looking information requires significant judgement.
(e) Macroeconomic factors
In impairment models, the Bank relies on a broad range of forward looking information as economic inputs, such as: real gross domestic product (GDP) growth and oil revenue (as % of GDP). The inputs and models used for calculating expected credit losses may not always capture all characteristics of the market at the reporting date. To reflect this, qualitative adjustments or overlays are made as temporary adjustments using expert credit judgement.
(f) Assessment of significant increase in credit risk
The Bank assesses whether there has been a significant increase in credit risk for exposures since initial recognition by comparing the risk of default occurring over the remaining expected life from the reporting date and the date of initial recognition. The assessment considers counterparty quantitative and qualitative information without consideration of collateral, and the impact of forward-looking macroeconomic factors.
The common assessments for SICR on financial assets include macroeconomic outlook, management judgement, and delinquency and monitoring. Forward-looking macroeconomic factors are a key component of the macroeconomic outlook. The importance and relevance of each specific macroeconomic factor depends on the type of product, characteristics of the financial instruments and the counterparty and the geographical region. Quantitative models may not always be able to capture all reasonable and supportable information that may indicate a significant increase in credit risk. Qualitative factors may be assessed to supplement the gap. Examples of situations include changes in adjudication criteria for a particular group of counterparties; changes in portfolio composition; and natural disasters impacting certain portfolios. With regards to delinquency and monitoring, there is a presumption that the credit risk of the financial instrument has increased since initial recognition when contractual payments are more than 30 days overdue.
(g) Definition of default
The Bank considers a financial asset to be in default when:
• The counterparty is unlikely to pay its credit obligations to the Bank in full without recourse by the Bank to actions such as realising security held (if any); or
• The counterparty is past due more than 90 days on any material credit obligation to the Bank.
Overdrafts are considered as being in default if the outstanding balance remains continuously in excess of 10% of the sanctioned / authorized limit or in cases where there are not enough credits in the account to cover the interest charged or unauthorized drawings have frequently been allowed.
In assessing whether a borrower is in default, the Bank considers indicators that are:
• Qualitative – e.g. breaches of covenant;
• Quantitative – e.g. overdue status and non-payment on another obligation of the same issuer to the Bank; and
• based on data developed internally and obtained from external sources.
Inputs into the assessment of whether a financial instrument is in default and their significance may vary over time to reflect changes in circumstances.
The Bank follows the definition of default as stipulated in CBO guidelines (BM 977 and subsequent).
Notes to the financial statementsFor the year ended 31 December 2019

141Annual Report 2019
3. SIGNIFICANT ACCOUNTING POLICIES (CONTINUED)3.3 Impairment (Continued)
Loss allowances for ECL are presented in the statement of financial position as follows:
- Financial assets measured at amortized cost: as a reduction from the gross carrying amount of the financial assets;
- Debt instruments measured at FVOCI: no loss allowance is recognised in the statement of financial position because the carrying amount of these assets is their fair value. However, the loss allowance is disclosed and is recognised in the fair value reserve; and
- Off-balance sheet credit risks include undrawn lending commitments, letters of credit and letters of guarantee: as an impairment allowance on off-balance sheet items on other liabilities.
Where modelling of a parameter is carried out on a collective basis, the financial instruments are grouped on the basis of shared risk characteristics that include:
- Instrument type;
- Credit risk grading;
- Collateral type;
- Loan to value (LT5) ratio for retail mortgages;
- Date of initial recognition; - Remaining term to maturity; and
- Industry.
The groupings are subject to regular review to ensure that exposures within a particular group remain appropriately homogeneous.
(i) Write-off
Loans & advances and financing receivables together with the associated allowance are written off when there is no realistic prospect of future recovery and all collateral has been realised or has been transferred to the Bank. If, in a subsequent year, the amount of the estimated impairment loss increases or decreases because of an event occurring after the impairment was recognised, the previously recognised impairment loss is increased or reduced by adjusting the financing impairment account. If a write-off is later recovered, the recovery is credited to the statement of profit or loss. The policy on write off’s remains unchanged.
The Bank still seeks to recover amounts it is legally owed in full, but which have been partially written off due to no reasonable expectation of full recovery.
(j) Hedge accounting
IFRS 9 introduces a new hedge accounting model that expands the scope of hedged items and risks eligible for hedge accounting and aligns hedge accounting more closely with risk management objectives and strategy with more qualitative approach to assess hedge effectiveness. IFRS 9 also introduces new requirements on rebalancing hedge relationships and prohibiting voluntary discontinuation of hedge accounting.
The types of hedge accounting relationships that the Bank currently designates meet the requirements of IFRS 9 and are aligned with the Bank’s risk management strategy and objective.
Based on the Bank’s assessment, there is no impact from the adoption of new standard on hedge accounting.
3.4 Cash and cash equivalents
Cash and cash equivalents consist of cash in hand and balance with CBO, balances with Bank, treasury bills, money market placements and deposits with original maturity of less than three months. Cash and cash equivalents are carried at amortised cost in the statement of financial position.
3.5 Due from banks
These are stated at amortised cost, less any amounts written off and provisions for impairment. Due from banks includes nostro balances, placements and loans to banks.
Notes to the financial statementsFor the year ended 31 December 2019
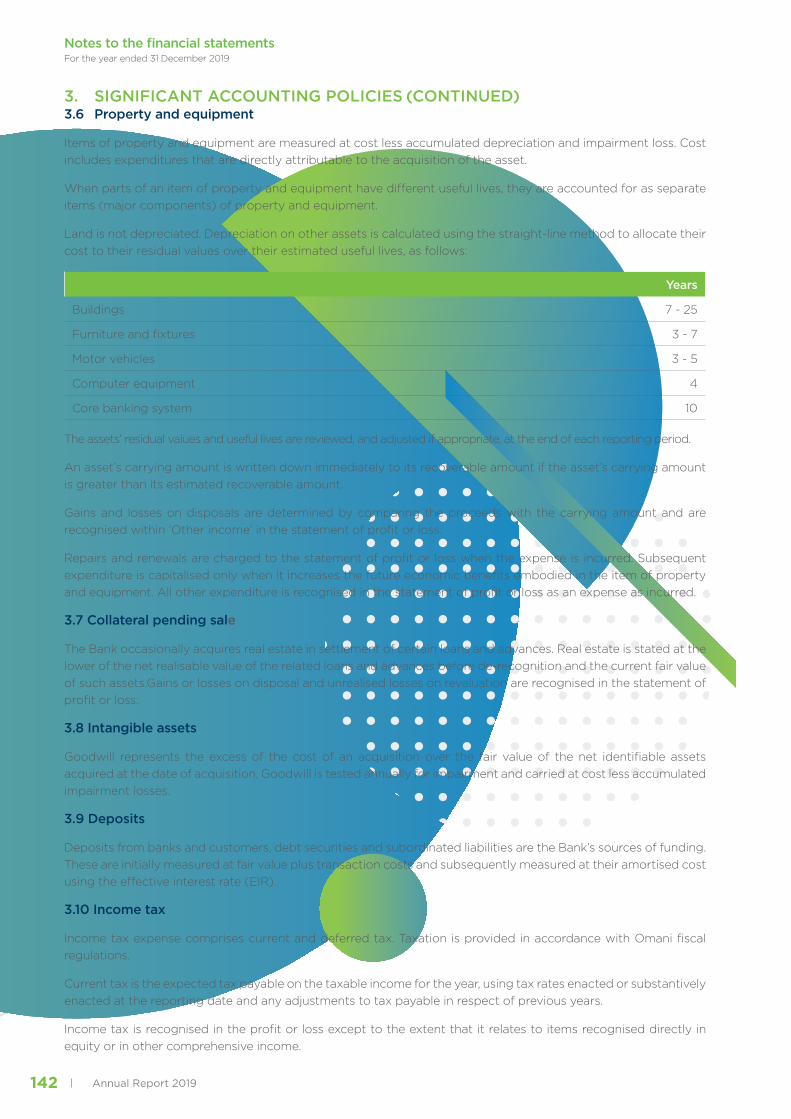
Annual Report 2019142
3. SIGNIFICANT ACCOUNTING POLICIES (CONTINUED)3.6 Property and equipment
Items of property and equipment are measured at cost less accumulated depreciation and impairment loss. Cost includes expenditures that are directly attributable to the acquisition of the asset.
When parts of an item of property and equipment have different useful lives, they are accounted for as separate items (major components) of property and equipment.
Land is not depreciated. Depreciation on other assets is calculated using the straight-line method to allocate their cost to their residual values over their estimated useful lives, as follows:
Years
Buildings 7 - 25
Furniture and fixtures 3 - 7
Motor vehicles 3 - 5
Computer equipment 4
Core banking system 10
The assets’ residual values and useful lives are reviewed, and adjusted if appropriate, at the end of each reporting period.
An asset’s carrying amount is written down immediately to its recoverable amount if the asset’s carrying amount is greater than its estimated recoverable amount.
Gains and losses on disposals are determined by comparing the proceeds with the carrying amount and are recognised within ‘Other income’ in the statement of profit or loss.
Repairs and renewals are charged to the statement of profit or loss when the expense is incurred. Subsequent expenditure is capitalised only when it increases the future economic benefits embodied in the item of property and equipment. All other expenditure is recognised in the statement of profit or loss as an expense as incurred.
3.7 Collateral pending sale
The Bank occasionally acquires real estate in settlement of certain loans and advances. Real estate is stated at the lower of the net realisable value of the related loans and advances before de-recognition and the current fair value of such assets.Gains or losses on disposal and unrealised losses on revaluation are recognised in the statement of profit or loss.
3.8 Intangible assets
Goodwill represents the excess of the cost of an acquisition over the fair value of the net identifiable assets acquired at the date of acquisition. Goodwill is tested annually for impairment and carried at cost less accumulated impairment losses.
3.9 Deposits
Deposits from banks and customers, debt securities and subordinated liabilities are the Bank’s sources of funding. These are initially measured at fair value plus transaction costs and subsequently measured at their amortised cost using the effective interest rate (EIR).
3.10 Income tax
Income tax expense comprises current and deferred tax. Taxation is provided in accordance with Omani fiscal regulations.
Current tax is the expected tax payable on the taxable income for the year, using tax rates enacted or substantively enacted at the reporting date and any adjustments to tax payable in respect of previous years.
Income tax is recognised in the profit or loss except to the extent that it relates to items recognised directly in equity or in other comprehensive income.
Notes to the financial statementsFor the year ended 31 December 2019

143Annual Report 2019
3. SIGNIFICANT ACCOUNTING POLICIES (CONTINUED)
3.10 Income tax (Continued)
Deferred tax assets/liabilities are calculated using the balance sheet method, providing for temporary differences between the carrying amounts of assets and liabilities for financial reporting purposes and the amounts used for taxation purposes.The amount of deferred tax provided is based on the expected manner of realisation or settlement of the carrying amount of assets and liabilities, using tax rates enacted or substantially enacted at the reporting date.
The carrying amount of deferred income tax assets/liabilities is reviewed at each reporting date and reduced to the extent that it is no longer probable that sufficient taxable profit will be available to allow all or part of the deferred income tax asset to be utilised.
3.11 Fiduciary assets
Assets held in trust or in a fiduciary capacity are not treated as assets of the Bank in the statement of financial position.
3.12 Acceptances
Acceptances are disclosed on the statement of financial position under other assets with corresponding liability disclosed under other liabilities. Therefore, there is no off-balance sheet commitment for acceptances.
3.13 Sale and repurchase agreements
Securities sold subject to repurchase agreements (repos) are reclassified in the financial statements as pledged assets when the transferee has the right by contract or custom to sell or re-pledge the collateral; the counterparty liability is included in amounts due to other banks, deposits from banks, other deposits or deposits due to customers, as appropriate.Securities purchased under agreements to resell (reverse repos) are recorded as loans and advances to other banks or customers, as appropriate.The difference between sale and repurchase price is treated as interest and accrued over the life of the agreements using the effective interest method.Securities lent to counterparties are also retained in the financial statements.
Securities borrowed are not recognised in the financial statements, unless these are sold to third parties, in which case the purchase and sale are recorded with the gain or loss included in trading income.
3.14 Derivative financial instruments and hedging activities
Derivatives are initially recognised at fair value on the date derivative contracts are entered into and are subsequently re- measured at their fair value. The method of recognising the resulting gain or loss depends on whether the derivative is designated as a hedging instrument, and if so, the nature of the item being hedged. The Bank designates certain derivatives as either:
- hedges of the fair value of recognised assets or liabilities or a firm commitment (fair value hedge);
- hedges of a particular risk associated with a recognised asset or liability or a highly probable forecast transaction (cash flow hedge).
On initial designation of the derivative as hedging instrument, the Bank formally documents the relationship between the hedging instrument and hedged item, including risk management objectives and strategy in undertaking the hedge transaction and the hedged risk, together with the method to assess the effectiveness of the hedging relationship. The Bank makes an assessment, both at the inception of the hedging relationship as well as ongoing basis, of whether the hedging instrument are expected to be highly effective in offsetting the changes in fair value or cash flows of the respective hedged items attributable to the hedge risk.
Notes to the financial statementsFor the year ended 31 December 2019
Annual Report 2019144
3. SIGNIFICANT ACCOUNTING POLICIES (CONTINUED)
3.14 Derivative financial instruments and hedging activities (Continued)
In relation to cash flow hedges, the gain or loss on hedging instruments is recognised initially in other comprehensive income to the extent that the hedge is effective and is transferred to the profit or loss in the period in which the hedged transaction impacts the profit or loss.If the hedged transaction is no longer expected to occur, the net cumulative gain or loss recognised in other comprehensive income is transferred to profit or loss.
The Bank does not have any derivatives designated as hedging instruments.
3.15 Leases
As explained in note 2.7, the Bank has changed its accounting policy for leases where the Bank is the lessee. The new policy is described in note 36 and the impact of the change in note 2.7.
Until 31 December 2018, leases in which a significant portion of the risks and rewards of ownership were not transferred to the Bank as lessee were classified as operating leases (note 18). Payments made under operating leases (net of any incentives received from the lessor) were charged to profit or loss on a straight-line basis over the period of the lease.
3.16 Employee benefits
End of service benefits are accrued in accordance with the terms of employment of the Bank’s employees at the reporting date, having regard to the requirements of the Oman Labour Law. Employee entitlements to annual leave and leave passage are recognised when they accrue to employees and an accrual is made for the estimated liability arising as a result of services rendered by employees up to the reporting date.
Contributions to a defined contribution retirement plan and occupational hazard insurance for Omani employees in accordance with the Omani Social Insurances Law of 1991 and its subsequent amendments are recognised as an expense in the statement of profit or loss as incurred.
The Bank’s obligation in respect of non-Omani end of service benefits, which is an unfunded defined benefit retirement plan, is the amount of future benefit that such employees have earned in return for their service in current and prior periods.
The obligation is calculated using the projected unit credit method and is discounted to its present value.
3.17 Financial guarantees contracts
Financial guarantees are contracts that require the issuer to make specified payments to reimburse the beneficiary for a loss incurred because the debtor fails to make payments when due, in accordance with the terms of the debt. Such guarantees are given to Banks, financial institutions or other entities on behalf of the customers.
Financial guarantees are initially recognised in the financial statements at fair value on the date the guarantee was issued. Subsequent to initial recognition, the Bank’s liabilities under such guarantees are measured at the higher of initial measurement, less amortisation calculated to recognise in the statement of profit or loss the fee income earned on the straight line basis over the life of the guarantee and the best estimate of the expenditure required to settle any financial obligation arising at the reporting date. These estimates are determined based on experience of similar transactions and history of past losses, supplemented by the judgment of management. Any increase in the liability relating to guarantees is taken to the statement of comprehensive income.
3.18 Borrowings
Borrowings are recognised initially at fair value, being their issue proceeds (fair value of consideration received) net of transaction costs incurred. Borrowings are subsequently stated at amortised cost; any difference between proceeds net of transaction costs and the redemption value is recognised in the statement of comprehensive income over the period of the borrowings using the effective interest rate method.
Fees paid on the establishment of loan facilities are recognised as transaction costs of the loan to the extent that it is probable that some or all of the facility will be drawn. In this case, the fee is deferred until the draw-down occurs. To the extent there is no evidence that it is probable that some or all of the facility will be drawn, the fee is capitalised as a pre-payment for liquidity services and amortised over the period of the facility to which it relates.
Notes to the financial statementsFor the year ended 31 December 2019

145Annual Report 2019
3. SIGNIFICANT ACCOUNTING POLICIES (CONTINUED)
3.19 Dividend on ordinary shares
Dividends on ordinary shares are recognised as a liability and deducted from equity when they are approved by the regulators and shareholders. Interim dividends are deducted from equity when they are paid.
Dividends for the year that are approved after the reporting date are dealt with as an event after the reporting date.
3.20 Directors’ remuneration
The Board of Directors’ remuneration is accrued within the limits specified by the Capital Market Authority and the requirements of the Commercial Companies Law of the Sultanate of Oman.
3.21 Revenue and expense recognition
1. Interest income and expense
Interest income and expense is recognised in the statement of profit or loss using the effective interest rate method. The effective interest rate is the rate that exactly discounts the estimated future cash payments or receipts through the expected life of the financial asset or liability (or, where appropriate, a shorter period) to the gross carrying amount or the amortised cost of the financial asset or liability. The calculation of effective interest rate includes transaction costs and fees paid/ received that are an integral part of effective interest rate. Transaction costs includes incremental costs that are directly attributable to the acquisition or issue of a financial asset or financial liability.
The amortized cost is the amount at which the financial asset or financial liability is measured at initial recognition minus the principle repayments, plus or minus the cumulative amortization using the effective interest rate method of any difference between that initial amount and the maturity amount and, for financial assets, adjusted for loss allowance.
The gross carrying amount of a financial asset is the amortised cost of a financial asset before adjusting for any expected credit loss allowance.
Interest income and expense presented in the statement of comprehensive income include:
(1) Interest on financial assets and liabilities at amortised cost on an effective interest rate basis;nd
(2) Interest on debt investment securities on an effective interest rate basis.
Interest income which is doubtful of recovery is included in loan impairment and excluded from income until it is received in cash.
2. Fees and commission income
Fees and commission income and expenses that are integral to the effective interest rate on a financial asset or liability are included in the measurement of the effective interest rate.
Other fees and commission income include account servicing fees, credit related fees, administration fees and other management fees, sales commission, placement fees, advisory fees and syndication fees. Fees and commission income is measured based on the consideration specified in the contract with the customers. The Bank satisfies its performance obligation upon completion of the related services as mentioned in the contract and revenue is recognised accordingly.
3.22 Dividends
Dividend income is recognised in the statement of profit or loss in ‘Other income’, when the Bank’s right to receive income is established.
3.23 Provisions
A provision is recognised if, as a result of past event, the Bank has a present legal or constructive obligation that can be estimated reliably and it is probable that an outflow of economic benefits will be required to settle the obligations. Provisions are determined by discounting the expected future cash flows at a pre-tax rate that reflects current market assessments of the time value of money and the risk specific to the liability.
Notes to the financial statementsFor the year ended 31 December 2019

Annual Report 2019146
3. SIGNIFICANT ACCOUNTING POLICIES (CONTINUED)3.24 Segment reporting
A segment is a distinguishable component of the Bank that is engaged either in providing products or services (business segment), or in providing products or services within a particular economic environment (geographical segment), which is subject to risks and rewards that are different from those of other segments.The Bank currently operates only in the Sultanate of Oman. The Bank’s primary format for reporting segmental information is business segments, based upon management and internal reporting structure which are regularly reviewed by the Bank’s chief operating decision maker (CODM). The Bank’s main business segments are corporate, retail banking, Treasury and Investment. Segmental information pertaining to Islamic Banking Window is also disclosed in note 34.
3.25 Earnings per share
The Bank presents basic and diluted earnings per share (EPS) data for its ordinary shares. Basic EPS is calculated by dividing the profit or loss attributable to ordinary shareholders by the weighted average number of ordinary shares outstanding during the period. Diluted EPS is determined by adjusting the profit or loss attributable to ordinary shareholders and the weighted average number of ordinary shares outstanding for the effects of all dilutive potential ordinary shares, which comprises convertible notes.
3.26 Perpetual Tier 1 capital securities
Perpetual Tier 1 Capital Securities of the Bank are recognised under equity and the corresponding distribution on those instruments are accounted as a debit to retained earnings. The Tier 1 securities constitute direct, unconditional, subordinated and unsecured obligations of the Bank and are classified as equity in accordance with IFRS 9: Financial Instruments. The Tier 1 securities do not have a fixed redemption or final maturity date and is redeemable by the Bank at its sole discretion on the first call date or thereafter on any interest payment date.
4. CRITICAL ACCOUNTING JUDGMENTS AND KEY SOURCES OF ESTIMATION UNCERTAINTY
In preparing these financial statements, management has made judgments, estimates and assumptions that affect the application of accounting policies and the reported amounts of assets and liabilities, income and expense. Actual results may differ from these estimates.
The significant judgments made by management in applying the Bank’s accounting policies and the key sources of estimation uncertainty were the same as those that applied to the financial statements as at and for the year ended 31 December 2018, except for new significant judgments and key sources of estimation uncertainty related to the application of IFRS 16, which is described in Note 3.
4.1 Impairment of Loans and Advances
The Bank uses various models and assumptions in estimating ECL. Judgement is applied in identifying the mostappropriate model for each type of asset, as well as for determining the assumptions used in these models, including assumptions that relate to key drivers of credit risk. ECL is measured as an allowance equal to 12-month ECL for Stage 1 assets, or lifetime ECL assets for Stage 2 or Stage 3 assets. An asset moves to Stage 2 when its credit risk has increased significantly since initial recognition. IFRS 9 does not define what constitutes a significant increase in credit risk. In assessing whether the credit risk of an asset has significantly increased the Bank takes into account qualitative and quantitative reasonable and supportable forward looking information.
4.2 Taxes
Uncertainties exist with respect to the interpretation of tax regulations and the amount and timing of future taxable income. The Bank establishes provisions, based on reasonable estimates, for possible consequences of finalisation of tax assessments of the Bank. The amount of such provisions is based on various factors, such as experience of previous tax assessments and differing interpretations of tax regulations by the Bank and the relevant tax authority.
Notes to the financial statementsFor the year ended 31 December 2019

147Annual Report 2019
4. CRITICAL ACCOUNTING JUDGMENTS AND KEY SOURCES OF ESTIMATION UNCERTAINTY (CONTINUED)
4.3 Classification of the Equity Tier 1 instrument under IAS 32
The Bank has issued Perpetual Tier 1 Securities listed on the Euronext Dublin (formerly trading as Irish Stock Exchange) and Muscat Securities Market, which have been classified as equity in accordance with IAS 32: Financial Instruments – Classification. The key features of the instruments are as follows:
• no fixed date of maturity;
• payment of interest and/or capital is solely at the discretion of the Bank
• the instruments are deeply subordinated and rank just above the ordinary shareholders
• these securities also allow the Bank to write-down (in whole or in part) any amounts due to the holders in the event of non-viability with the approval of the Central Bank of Oman.
The determination of equity classification of these instruments requires significant judgement as certain Clauses, particularly the “Events of Default”, require interpretation. The Directors, after factoring in the clauses relating to the write-down, non-payment and subordination in the instrument offering document consider that the Bank will not reach the point of insolvency before a write-down is affected due to a non-viability event.. Accordingly, such clauses were assessed by the Directors as not being substantive for the purpose of determining the debt vs equity classification. The Directors have considered appropriate independent legal advice in forming their judgement around this matter.
4.4 Determination of lease term under IFRS 16
In determining the lease term, the Bank considers all facts and circumstances. Extension options (or periods after termination options) are only included in the lease term if the lease is reasonably certain to be extended (or not terminated). The Bank considers the nature and enforceability of extension clause in the lease agreement, the value of leasehold improvements, penalties on termination, costs and business disruption required to replace the leased premises as factors to determine the lease term. Lease agreements for premises occupied by the Bank may contain an extension option, where the Group has not considered extension options after analysing above factors.
Lease term is reassessed if an option is actually exercised (or not exercised) or the Bank becomes obliged to exercise (or not exercise) it. The assessment is only revised if a significant event or a significant change in circumstances occurs which affects this assessment and that is within the control of the Bank. During the financial year, the Bank has not revised its assessment of lease term as no significant events or changes occurred.
4.5 Key sources of estimation uncertainty
The following are key estimations that have been used in the process of applying the Bank’s accounting policies:
• Establishing the number and relative weightings of forward-looking scenarios for each type of product and determining the forward looking information relevant to each scenario: When measuring ECL the Bank uses reasonable and supportable forward looking information, which is based on assumptions for the future movement of different economic drivers and how these drivers will affect each other.
• Probability of default: PD constitutes a key input in measuring ECL. PD is an estimate of the likelihood of default over a given time horizon, the calculation of which includes historical data, assumptions and expectations of future conditions.
• Loss Given Default: LGD is an estimate of the loss arising on default. It is based on the difference between the contractual cash flows due and those that the lender would expect to receive, taking into account cash flows from collateral and integral credit enhancements.
Notes to the financial statementsFor the year ended 31 December 2019

Annual Report 2019148
5. CASH AND BALANCES WITH CENTRAL BANK OF OMAN
2019RO’000
2018RO’000
Cash in hand 31,223 31,422
Balances with the Central Bank of Oman 171,007 126,863
Placements with Central Bank of Oman 98,175 143,220
300,405 301,505
Balances with CBO includes capital deposit of RO 500,000 (2018: RO 500,000). This is not available for day to day operations of the Bank and cannot be withdrawn without the Central Bank of Oman approval. During the year, the average minimum balance to be kept with Central Banks as statutory reserves is RO 85.77 million (2018: RO 92.49 million)
6. LOANS, ADVANCES AND FINANCING TO BANKS
At Amortised Cost 2019
RO’0002018
RO’000
Syndicated loans to other banks 86,662 81,104
Placements with other banks 343,997 230,060
Current clearing accounts 41,752 18,732
472,411 329,896
Less: impairment allowance (1,253) (837)
471,158 329,059
At 31 December 2019, No placement with any bank individually represented 20% or more of the Bank’s placements (2018: One local bank - 30.3%).
Movement of the impairment allowance is analysed below:2019
RO’0002018
RO’000
Opening balance as on 1 January 837 409
IFRS 9 transition impact - 495
Charge for the year 416
Less: Reversal during the year - (67)
Closing balance as on 31 December 1,253 837
7. LOANS, ADVANCES AND FINANCING TO CUSTOMERS – CONVENTIONAL BANKING
2019RO’000
2018RO’000
(a) Conventional Banking
Loans 2,425,730 2,547,049
Overdrafts 137,827 165,880
Loans against trust receipts 109,865 99,393
Bills discounted 46,898 70,969
Advance against credit cards 9,450 8,921
Gross loans, advances and financing to customers 2,729,770 2,892,212
Less: Impairment allowance including reserved interest (112,425) (130,452)
Net Loans, advances and financing to customers 2,617,345 2,761,760
Notes to the financial statementsFor the year ended 31 December 2019

149Annual Report 2019
2019RO’000
2018RO’000
(b) Islamic Banking Window Financing
Housing finance 162,731 158,610
Corporate finance 276,851 232,301
Consumer finance 12,245 10,822
451,827 401,733
Less: Impairment allowance (5,822) (4,649)
Net financing to customers 446,005 397,084
Impairment allowance includes the amount of profit reserve of RO 392 thousand and RO 249 thousand for 2019 and 2018 respectively.
(c) The movement in the impairment allowance is analysed below:
(1) Allowance for loan impairment (conventional and Islamic)
1 January 79,308 90,740
IFRS 9 transition impact, - (16,370)
Reversal of special impairment reserve to IFRS 9 provision 5,185 -
Allowance for the year 30,151 11,320
Released to profit or loss during the year (7,996) (6,354)
Written off during the year (12,570) (28)
31 December 94,078 79,308
(2) Reserved interest
1 January 55,793 47,212
Reserved during the year 12,519 10,146
Recoveriesto profit or loss during the year (1,623) (1,398)
Written-off during the year (42,520) (167)
31 December 24,169 55,793
Total impairment allowance 118,247 135,101
As of 31 December 2019, loans and advances on which contractual interest is not being accrued or has not been recognised amounted to RO 6.86 million(2018: RO 3.13 million). Contractual interest reserved and recovery thereof is shown under net interest income and income from Islamic financing in the statement of comprehensive income.
In 2019, the Bank has written off RO 51.78 million which includes RO 12.51 million of principal amount and RO 39.36 million of reserve interest (2018 - Nil) as technical write off.
In accordance with CBO requirements, where the aggregate provision on portfolio & specific basis computed as per CBO norms is higher than the impairment allowance computed under IFRS 9, the difference, net of the impact of taxation, is transferred to an impairment reserve as an appropriation from the retained earnings.
(3) Comparison of provision held as per IFRS 9 and required as per CBO norms
Disclosure requirements containing the risk classification –wise gross and net amount outstanding, provision required as per CBO norms, allowance made as per IFRS 9, interest recognized as per IFRS 9 and reserve interest required as per CBO are given below based on CBO circular BM 1149.
In accordance with CBO circular BM 1149 Banks should continue to maintain and update the risk classification (i.e. standard, special mention, substandard, etc.) of accounts as per the extant CBO norms, including those on restructuring of loans accounts for regulatory reporting purposes.
Notes to the financial statementsFor the year ended 31 December 2019
7. LOANS, ADVANCES AND FINANCING TO CUSTOMERS CONVENTIONAL BANKING (CONTINUED)

Annual Report 2019150
At 31 December 2019 RO’000
Asset Classification as per CBO Norms A
sset
C
lass
ifica
tio
n as
per
IFR
S 9
Gro
ssA
mo
unt
Pro
visi
on
req
uire
d
as p
er C
BO
No
rms
Pro
visi
on
held
as
per
IFR
S 9
Diff
eren
ce
bet
wee
n C
BO
p
rovi
sio
n re
qui
red
an
d p
rovi
sio
n he
ld
Net
Am
oun
t as
p
er C
BO
no
rms*
Net
Am
oun
t as
p
er IF
RS
9
Inte
rest
re
cog
nise
d in
P&
L as
per
IFR
S 9
Res
erve
inte
rest
as
per
CB
O n
orm
s
(1) (2) (3) (4) (5) (6) = (4)-(5) (7)=(3)-(4)-(10)
(8) = (3)-(5) (9) (10)
Standard Stage 1 2,211,386 27,109 11,586 15,523 2,184,277 2,199,800 - -
Stage 2 581,389 7,668 8,281 (613) 573,721 573,108 - -
Stage 3 - - - - - - - -
Subtotal 2,792,775 34,777 19,867 14,910 2,757,998 2,772,908 - -
Special Mention Stage 1 - - - - - - - -
Stage 2 240,240 5,194 17,776 (12,582) 235,046 222,464 - -
Stage 3 - - - - - - - -
Subtotal 240,240 5,194 17,776 (12,582) 235,046 222,464 - -
Substandard Stage 1 - - - - - - - -
Stage 2 - - - - - - - -
Stage 3 19,899 5,245 8,723 (3,478) 13,905 11,176 - 749
Subtotal 19,899 5,245 8,723 (3,478) 13,905 11,176 - 749
Doubtful Stage 1 - - - - - - - -
Stage 2 - - - - - - - -
Stage 3 57,340 24,413 18,313 6,100 29,579 39,027 - 3,348
Subtotal 57,340 24,413 18,313 6,100 29,579 39,027 - 3,348
Loss Stage 1 - - - - - -
Stage 2 - - - - - -
Stage 3 71,343 43,227 29,399 13,828 8,044 41,944 20,072
Subtotal 71,343 43,227 29,399 13,828 8,044 41,944 - 20,072 Total loans and advances 3,181,597 112,856 94,078 18,778 3,044,572 3,087,519 - 24,169
Other items not covered under CBO circular BM 977 and related instructions
Stage 1 1,722,430 428 5,909 (5,481) 1,722,002 1,716,521 - -
Stage 2 423,510 - 8,643 (8,643) 423,510 414,867 - -
Stage 3 2,452 - - - 2,452 2,452 - - Subtotal 2,148,392 428 14,552 (14,124) 2,147,964 2,133,840 - - Total (31stDecember 2019) Stage 1 3,933,816 27,537 17,495 10,042 3,906,279 3,916,321 - -
Stage 2 1,245,139 12,862 34,700 (21,838) 1,232,277 1,210,439 - -
Stage 3 151,034 72,885 56,435 16,450 53,980 94,599 - 24,169
Total 5,329,989 113,284 108,630 4,654 5,192,536 5,221,359 - 24,169
* Net of provision and reserve interest as per CBO norms.
Notes to the financial statementsFor the year ended 31 December 2019
7. LOANS, ADVANCES AND FINANCING TO CUSTOMERS CONVENTIONAL BANKING (CONTINUED)

151Annual Report 2019
At 31 December 2018 RO’000
Asset Classification as per CBO Norms A
sset
Cla
ssifi
catio
n as
per
IFR
S 9
Gro
ssA
mou
nt
Pro
visi
on r
equi
red
as
per
CB
O N
orm
s
Pro
visi
on h
eld
as
per
IFR
S 9
Diff
eren
ce b
etw
een
CB
O p
rovi
sion
re
qui
red
and
p
rovi
sion
hel
d
Net
Am
ount
as
per
CB
O n
orm
s*
Net
Am
ount
as
per
IFR
S 9
Inte
rest
rec
ogni
sed
in
P&
L as
per
IFR
S 9
Res
erve
inte
rest
as
per
CB
O n
orm
s
(1) (2) (3) (4) (5) (6) = (4)-(5) (7)=(3)-(4)-(10)
(8) = (3)-(5) (9) (10)
Standard Stage 1 2,506,302 28,268 13,349 14,919 2,478,034 2,492,953 - -
Stage 2 411,703 4,868 5,859 (991) 406,637 405,844 - 198
Stage 3 - - - - - - - -
Subtotal 2,918,005 33,136 19,208 13,928 2,884,671 2,898,797 - 198
Special Mention Stage 1 78 2 1 1 76 77 - -
Stage 2 254,563 7,037 18,699 (11,662) 247,526 235,864 - -
Stage 3 - - - - - - - -
Subtotal 254,641 7,039 18,700 (11,661) 247,602 235,941 - -
Substandard Stage 1 - - - - - - - -
Stage 2 - - - - - - - -
Stage 3 9,611 2,515 3,936 (1,421) 6,748 5,675 - 348
Subtotal 9,611 2,515 3,936 (1,421) 6,748 5,675 - 348
Doubtful Stage 1 - - - - - -
Stage 2 - - - - - - - -
Stage 3 7,835 3,159 2,952 207 4,017 4,883 - 659
Subtotal 7,835 3,159 2,952 207 4,017 4,883 - 659
Loss Stage 1 - - - - - - - -
Stage 2 - - - - - -
Stage 3 103,853 45,104 34,512 10,592 4,161 69,341 - 54,588
Subtotal 103,853 45,104 34,512 10,592 4,161 69,341 - 54,588
Total loans and advances 3,293,945 90,953 79,308 11,645 3,147,199 3,214,637 - 55,793
Other items not covered under CBO circular BM 977 and related instructions
Stage 1 1,923,599 493 5,857 (5,364) 1,923,106 1,917,742 - -
Stage 2 375,270 - 8,456 (8,456) 375,270 366,814 - -
Stage 3 790 - - - 790 790 - -
Subtotal 2,299,659 493 14,313 (13,820) 2,299,166 2,285,346 - -
Total (31stDecember 2018) Stage 1 4,429,979 28,763 19,207 9,556 4,401,216 4,410,772 - -
Stage 2 1,041,536 11,905 33,014 (21,109) 1,029,433 1,008,522 - 198
Stage 3 122,089 50,778 41,400 9,378 15,716 80,689 - 55,595
Total 5,593,604 91,446 93,621 (2,175) 5,446,365 5,499,983 - 55,793
* Net of provision and reserve interest as per CBO norms.
Notes to the financial statementsFor the year ended 31 December 2019
7. LOANS, ADVANCES AND FINANCING TO CUSTOMERS CONVENTIONAL BANKING (CONTINUED)
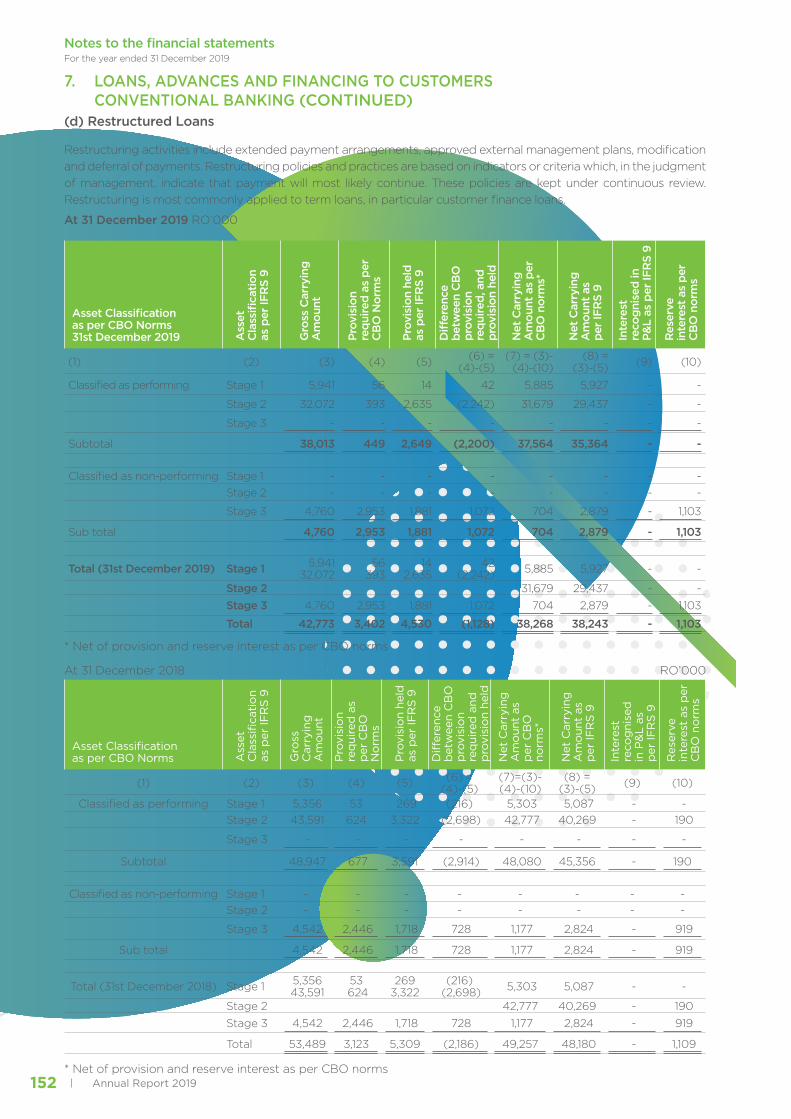
Annual Report 2019152
(d) Restructured Loans
Restructuring activities include extended payment arrangements, approved external management plans, modification and deferral of payments. Restructuring policies and practices are based on indicators or criteria which, in the judgment of management, indicate that payment will most likely continue. These policies are kept under continuous review. Restructuring is most commonly applied to term loans, in particular customer finance loans.
At 31 December 2019 RO’000
Asset Classification as per CBO Norms31st December 2019 A
sset
C
lass
ifica
tion
as p
er IF
RS
9
Gro
ss C
arry
ing
A
mou
nt
Prov
isio
n re
quire
d as
per
C
BO
Nor
ms
Prov
isio
n he
ld
as p
er IF
RS
9
Diff
eren
ce
betw
een
CB
O
prov
isio
n re
quire
d, a
nd
prov
isio
n he
ld
Net
Car
ryin
g
Am
ount
as
per
CB
O n
orm
s*
Net
Car
ryin
g
Am
ount
as
per
IFR
S 9
Inte
rest
re
cogn
ised
in
P&L
as p
er IF
RS
9
Res
erve
in
tere
st a
s pe
r C
BO
nor
ms
(1) (2) (3) (4) (5) (6) = (4)-(5)
(7) = (3)-(4)-(10)
(8) = (3)-(5) (9) (10)
Classified as performing Stage 1 5,941 56 14 42 5,885 5,927 - -
Stage 2 32,072 393 2,635 (2,242) 31,679 29,437 - -
Stage 3 - - - - - - - -
Subtotal 38,013 449 2,649 (2,200) 37,564 35,364 - - Classified as non-performing Stage 1 - - - - - - - -
Stage 2 - - - - - - - -
Stage 3 4,760 2,953 1,881 1,072 704 2,879 - 1,103
Sub total 4,760 2,953 1,881 1,072 704 2,879 - 1,103
Total (31st December 2019) Stage 1 5,941 32,072
56 393
14 2,635
42 (2,242) 5,885 5,927 - -
Stage 2 31,679 29,437 - -
Stage 3 4,760 2,953 1,881 1,072 704 2,879 - 1,103
Total 42,773 3,402 4,530 (1,128) 38,268 38,243 - 1,103
* Net of provision and reserve interest as per CBO norms
At 31 December 2018 RO’000
Asset Classification as per CBO Norms A
sset
C
lass
ifica
tio
n as
per
IFR
S 9
Gro
ss
Car
ryin
g
Am
oun
t
Pro
visi
on
req
uire
d a
s p
er C
BO
N
orm
s
Pro
visi
on
held
as
per
IFR
S 9
Diff
eren
ce
bet
wee
n C
BO
p
rovi
sio
n re
qui
red
and
p
rovi
sio
n he
ld
Net
Car
ryin
g
Am
oun
t as
p
er C
BO
no
rms*
Net
Car
ryin
g
Am
oun
t as
p
er IF
RS
9
Inte
rest
re
cog
nise
d
in P
&L
as
per
IFR
S 9
Res
erve
in
tere
st a
s p
er
CB
O n
orm
s
(1) (2) (3) (4) (5) (6) = (4)-(5)
(7)=(3)-(4)-(10)
(8) = (3)-(5) (9) (10)
Classified as performing Stage 1 5,356 53 269 (216) 5,303 5,087 - - Stage 2 43,591 624 3,322 (2,698) 42,777 40,269 - 190
Stage 3 - - - - - - - -
Subtotal 48,947 677 3,591 (2,914) 48,080 45,356 - 190
Classified as non-performing Stage 1 - - - - - - - -
Stage 2 - - - - - - - -
Stage 3 4,542 2,446 1,718 728 1,177 2,824 - 919
Sub total 4,542 2,446 1,718 728 1,177 2,824 - 919
Total (31st December 2018) Stage 1 5,356 43,591
53 624
2693,322
(216) (2,698) 5,303 5,087 - -
Stage 2 42,777 40,269 - 190
Stage 3 4,542 2,446 1,718 728 1,177 2,824 - 919
Total 53,489 3,123 5,309 (2,186) 49,257 48,180 - 1,109
* Net of provision and reserve interest as per CBO norms
Notes to the financial statementsFor the year ended 31 December 2019
7. LOANS, ADVANCES AND FINANCING TO CUSTOMERS CONVENTIONAL BANKING (CONTINUED)

153Annual Report 2019
(5) Impairment charge and provisions held 2019
As per CBO Norms
As per IFRS 9 Difference
RO’000 RO’000 RO’000
Impairment loss charged to profit and loss account (net of recoveries) - 22,394 (22,394)
Provisions required as per CBO – BM 977/ held as per IFRS 9 (Note 1) 113,284 108,630 4,654
Gross NPL ratio 4.67% 4.67% -
Net NPL ratio 1.62% 2.14% (0.52%)
Gross NPL (Non-performing Loans) is 4.67% and Net NPL is 2.14% based on funded non-performing exposure over funded exposure (Net NPL exclude interest reserve and ECL Provision).
Note 1 : Excluding Interest Reserve of RO 24,169 thousand.
5(a) Special impairment reserve
During 2019 certain adjustments were made including transfer from retained earnings resulting in 31 December 2019 balance amounts to RO 4,654 thousand under the special impairment reserve as per IFRS 9 representing the difference of provisions required as per CBO – BM977 of RO 113,284 thousand and provisions held as per IFRS 9 of RO 108,630 thousands.
Impairment charge and provisions held 2018
As per CBO Norms As per IFRS 9 Difference
RO’000 RO’000 RO’000
Impairment loss charged to profit and loss account (net of recoveries)
- 6,650 (6,650)
Provisions required as per CBO – BM 977/ held as per IFRS 9 (Note 1)
91,446 93,621 (2,175)
Gross NPL ratio 3.68% 3.68% -
Net NPL ratio 0.45% 0.74% (0.29%)
Gross NPL (Non-performing Loans) is 3.68% and Net NPL is 0.74% based on funded non-performing exposure over funded exposure (Net NPL exclude interest reserve and ECL Provision).
Note 1: Excluding Interest Reserve of RO 55,793 thousand.
Notes to the financial statementsFor the year ended 31 December 2019
7. LOANS, ADVANCES AND FINANCING TO CUSTOMERS CONVENTIONAL BANKING (CONTINUED)

Annual Report 2019154
The following table discloses the stage-wise gross exposure, impairment and net exposure of only those financial assets that are tested for impairment under IFRS 9 as at 31 December 2019:
RO’000
Gross exposure Stage 1 Stage 2 Stage 3 Total Central Bank balances 131,583 - - 131,583
Due from Banks 472,411 - - 472,411
Sovereign 196,415 - - 196,415 Investment Securities at amortized cost
20,927 - - 20,927
Investment Securities at FVOCI 60,545 - - 60,545
Loans and advances 2,211,386 821,629 148,582 3,181,597
Accrued profit 13,535 4,690 - 18,225
Total funded gross exposure 3,106,802 826,319 148,582 4,081,703Letters of credit/guarantee 524,725 283,753 2,452 810,930
Acceptances 44,675 10,892 - 55,567
Loan commitment / unutilised limits 257,614 124,175 - 381,789
Total non-funded gross exposure 827,014 418,820 2,452 1,248,286Total gross exposure 3,933,816 1,245,139 151,034 5,329,989ImpairmentCentral Bank balances - - - -
Due from Banks 1,253 - - 1,253
Sovereign - - - - Investment Securities at amortized cost
- - - -
Investment Securities at FVOCI 186 - - 186
Loans and advances 11,586 26,057 56,435 94,078
Accrued profit 59 136 - 195
Total funded impairment 13,084 26,193 56,435 95,712Letters of credit/guarantee 2,442 7,297 - 9,739
Acceptances 78 18 - 96
Loan commitment/unutilised limits 1,891 1,192 - 3,083
Total non-funded impairment 4,411 8,507 - 12,918Total impairment 17,495 34,700 56,435 108,630Net exposureCentral Bank balances 131,583 - - 131,583
Due from Banks 471,158 - - 471,158
Sovereign 196,415 - - 196,415 Investment Securities at amortized Cost
20,927 - - 20,927
Investment Securities at FVOCI 60,359 - - 60,359
Loans and advances 2,199,800 795,572 92,147 3,087,519
Accrued Profit 13,476 4,554 - 18,030
Total funded net exposure 3,093,718 800,126 92,147 3,985,991Letter of credit/guarantee 522,283 276,456 2,452 801,191
Acceptances 44,597 10,874 - 55,471
Loan commitment / unutilised limits 255,723 122,983 - 378,706
Total net non-funded exposure 822,603 410,313 2,452 1,235,368Total net exposure 3,916,321 1,210,439 94,599 5,221,359
Gross exposure of loans and advances of RO 148,582 thousands under stage 3 includes reserved interest of RO 24,168 thousand. Accordingly, the principal outstanding of RO 65,506 was subject to ECL.
Notes to the financial statementsFor the year ended 31 December 2019
7. LOANS, ADVANCES AND FINANCING TO CUSTOMERS CONVENTIONAL BANKING (CONTINUED)

155Annual Report 2019
The following table discloses the stage-wise gross exposure, impairment and net exposure of only those financial assets that are tested for impairment under IFRS 9 as at 31 December 2018:
RO’000
Gross exposure Stage 1 Stage 2 Stage 3 Total Central Bank balances 143,220 - - 143,220
Due from Banks 329,857 - - 329,857
Sovereign 237,520 - - 237,520Investment Securities at amortized cost
917 - - 917
Investment Securities at FVOCI 55,412 - - 55,412
Loans and advances 2,506,380 666,266 121,299 3,293,945
Accrued profit 13,405 2,951 - 16,356
Total funded gross exposure 3,286,711 669,217 121,299 4,077,227Letters of credit/guarantee 800,612 209,412 790 1,010,814
Acceptances 61,116 13,473 - 74,589
Loan commitment / unutilised limits 281,540 149,434 - 430,974
Total non-funded gross exposure 1,143,268 372,319 790 1,516,377Total gross exposure 4,429,979 1,041,536 122,089 5,593,604ImpairmentCentral Bank balances - - - -
Due from Banks 837 - - 837
Sovereign - - - -Investment Securities at amortized cost
- - - -
Investment Securities at FVOCI 266 - - 266
Loans and advances 13,350 24,558 41,400 79,308
Accrued profit 61 103 - 164
Total funded impairment 14,514 24,661 41,400 80,575Letters of credit/guarantee 3,258 6,722 - 9,980
Acceptances 92 35 - 127
Loan commitment/unutilised limits 1,343 1,596 - 2,939
Total non-funded impairment 4,693 8,353 - 13,046Total impairment 19,207 33,014 41,400 93,621Net exposureCentral Bank balances 143,220 - - 143,220
Due from Banks 329,020 - - 329,020
Sovereign 237,520 - - 237,520Investment Securities at amortized Cost
917 - - 917
Investment Securities at FVOCI 55,146 - - 55,146
Loans and advances 2,493,030 641,708 79,899 3,214,637
Accrued Profit 13,344 2,848 - 16,192
Total funded net exposure 3,272,197 644,556 79,899 3,996,652Letter of credit/guarantee 797,354 202,690 790 1,000,834
Acceptances 61,024 13,438 - 74,462
Loan commitment / unutilised limits 280,197 147,838 - 428,035
Total net non-funded exposure 1,138,575 363,966 790 1,503,331Total net exposure 4,410,772 1,008,522 80,689 5,499,983
Notes to the financial statementsFor the year ended 31 December 2019
7. LOANS, ADVANCES AND FINANCING TO CUSTOMERS CONVENTIONAL BANKING (CONTINUED)
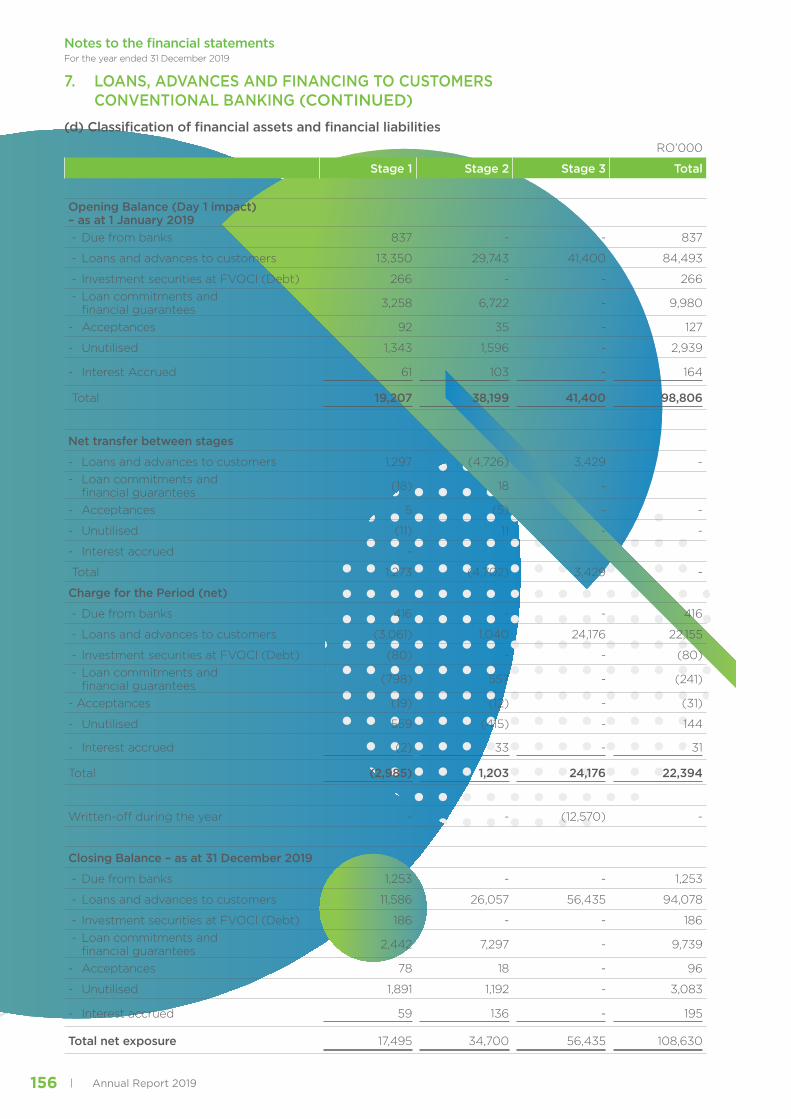
Annual Report 2019156
(d) Classification of financial assets and financial liabilitiesRO’000
Stage 1 Stage 2 Stage 3 Total
Opening Balance (Day 1 impact) – as at 1 January 2019 - Due from banks 837 - - 837
- Loans and advances to customers 13,350 29,743 41,400 84,493
- Investment securities at FVOCI (Debt) 266 - - 266 - Loan commitments and
financial guarantees 3,258 6,722 - 9,980
- Acceptances 92 35 - 127
- Unutilised 1,343 1,596 - 2,939
- Interest Accrued 61 103 - 164
Total 19,207 38,199 41,400 98,806
Net transfer between stages
- Loans and advances to customers 1,297 (4,726) 3,429 -- Loan commitments and
financial guarantees (18) 18 -
- Acceptances 5 (5) - -
- Unutilised (11) 11 - -
- Interest accrued -
Total 1,273 (4,702) 3,429 -
Charge for the Period (net)
- Due from banks 416 - - 416
- Loans and advances to customers (3,061) 1,040 24,176 22,155
- Investment securities at FVOCI (Debt) (80) - - (80) - Loan commitments and
financial guarantees (798) 557 - (241)
- Acceptances (19) (12) - (31)
- Unutilised 559 (415) - 144
- Interest accrued (2) 33 - 31
Total (2,985) 1,203 24,176 22,394
Written-off during the year - - (12,570) -
Closing Balance – as at 31 December 2019
- Due from banks 1,253 - - 1,253
- Loans and advances to customers 11,586 26,057 56,435 94,078
- Investment securities at FVOCI (Debt) 186 - - 186 - Loan commitments and
financial guarantees 2,442 7,297 - 9,739
- Acceptances 78 18 - 96
- Unutilised 1,891 1,192 - 3,083
- Interest accrued 59 136 - 195
Total net exposure 17,495 34,700 56,435 108,630
Notes to the financial statementsFor the year ended 31 December 2019
7. LOANS, ADVANCES AND FINANCING TO CUSTOMERS CONVENTIONAL BANKING (CONTINUED)
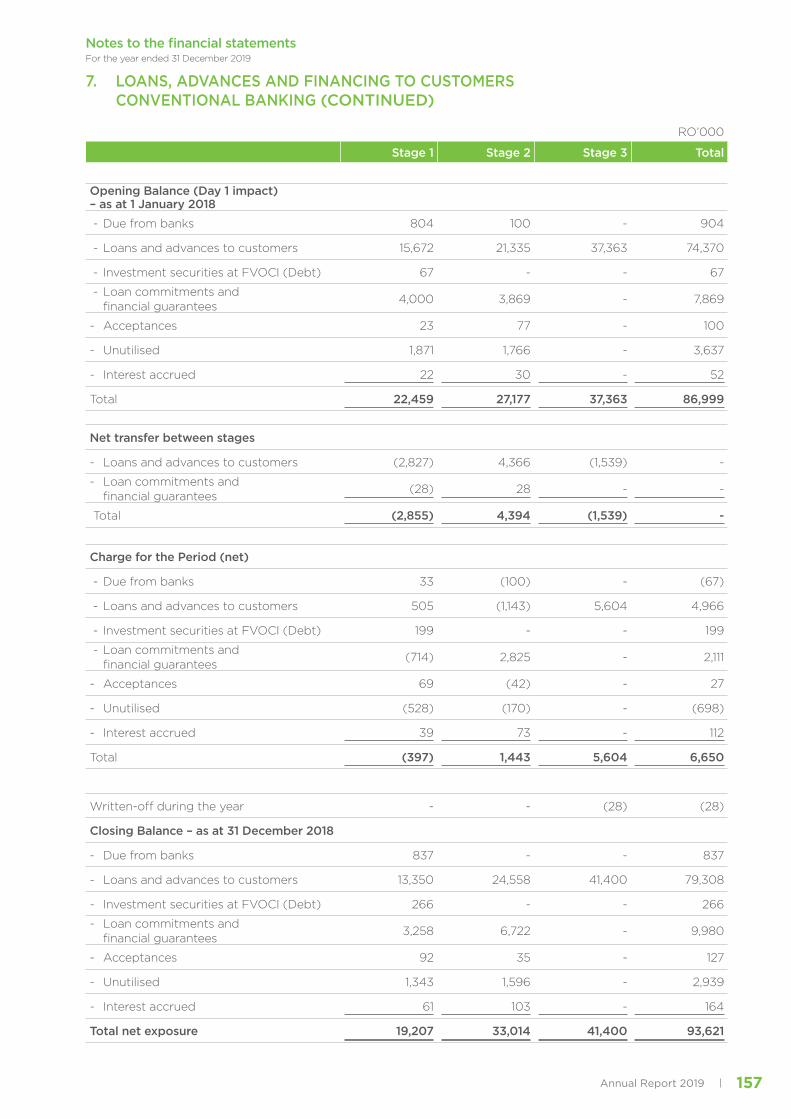
157Annual Report 2019
RO’000
Stage 1 Stage 2 Stage 3 Total
Opening Balance (Day 1 impact) – as at 1 January 2018
- Due from banks 804 100 - 904
- Loans and advances to customers 15,672 21,335 37,363 74,370
- Investment securities at FVOCI (Debt) 67 - - 67
- Loan commitments and financial guarantees
4,000 3,869 - 7,869
- Acceptances 23 77 - 100
- Unutilised 1,871 1,766 - 3,637
- Interest accrued 22 30 - 52
Total 22,459 27,177 37,363 86,999
Net transfer between stages
- Loans and advances to customers (2,827) 4,366 (1,539) -
- Loan commitments and financial guarantees
(28) 28 - -
Total (2,855) 4,394 (1,539) -
Charge for the Period (net)
- Due from banks 33 (100) - (67)
- Loans and advances to customers 505 (1,143) 5,604 4,966
- Investment securities at FVOCI (Debt) 199 - - 199
- Loan commitments and financial guarantees
(714) 2,825 - 2,111
- Acceptances 69 (42) - 27
- Unutilised (528) (170) - (698)
- Interest accrued 39 73 - 112
Total (397) 1,443 5,604 6,650
Written-off during the year - - (28) (28)
Closing Balance – as at 31 December 2018
- Due from banks 837 - - 837
- Loans and advances to customers 13,350 24,558 41,400 79,308
- Investment securities at FVOCI (Debt) 266 - - 266
- Loan commitments and financial guarantees
3,258 6,722 - 9,980
- Acceptances 92 35 - 127
- Unutilised 1,343 1,596 - 2,939
- Interest accrued 61 103 - 164
Total net exposure 19,207 33,014 41,400 93,621
Notes to the financial statementsFor the year ended 31 December 2019
7. LOANS, ADVANCES AND FINANCING TO CUSTOMERS CONVENTIONAL BANKING (CONTINUED)

Annual Report 2019158
(e) Classification of financial assets and financial liabilities
The following table provides a reconciliation between line items in the statement of financial position and categories of financial instruments:
RO’000
31 December 2019 Notes FVTPLFVOCI – debt
instruments
FVOCI – equity
instrument
Amortised cost
Total carrying amount
Cash and balances with CBO
5 - - - 300,405 300,405
Loans and advances to banks
6 - - - 471,158 471,158
Loans and advances to customers
7 - - - 3,063,350 3,063,350
Investment securities 8 4,263 3,643 70,370 300,275 378,551
Other assets 11 1,435 - - 88,834 90,269
5,698 3,643 70,370 4,224,022 4,303,733
Due to banks 12 - - - 490,179 490,179
Deposits from customers 13 - - - 2,943,188 2,943,188
Subordinated liabilities 15 - - - 63,875 63,875
Other liabilities 14 - - - 116,649 116,649
- - - 3,613,891 3,613,891
Other assets include RO 1,435 thousand of derivatives financial instruments mandatorily measured at FVPTL.
RO’000
31 December 2018 Notes FVTPLFVOCI – debt
instruments
FVOCI – equity
instrument
Amortised cost
Total carrying amount
Cash and balances with CBO
5 - - - 301,505 301,505
Loans and advances to banks
6 - - - 329,059 329,059
Loans and advances to customers
7 - - - 3,158,844 3,158,844
Investment securities 8 4,140 45,147 4,118 250,927 304,332
Other assets 11 642 - - 99,271 99,913
4,782 45,147 4,118 4,139,606 4,193,653
Due to banks 12 - - - 368,893 368,893
Deposits from customers 13 - - - 2,924,504 2,924,504
Subordinated liabilities 15 - - - 63,875 63,875
Other liabilities 14 - - - 129,474 129,474
- - - 3,486,746 3,486,746
Other assets includes RO 642 thousands of derivatives financial instruments mandatorily measured at FVPTL.
Notes to the financial statementsFor the year ended 31 December 2019
7. LOANS, ADVANCES AND FINANCING TO CUSTOMERS CONVENTIONAL BANKING (CONTINUED)

159Annual Report 2019
8. INVESTMENT SECURITIES
2019RO’000
2018RO’000
Equity investments:
Measured at FVTPL 1,884 1,882
Measured at FVOCI 3,643 4,118
Gross equity investments 5,527 6,000
Less: Impairment losses on investments - -
Net equity investments 5,527 6,000
Debt investments:
Designated at FVTPL 2,379 2,258
Measured at FVOCI 70,556 45,413
Measured at amortized cost 300,275 250,927
Gross debt investments 373,210 298,598
Total investment securities 378,737 304,598
Less: Impairment loss allowance (186) (266)
Total investment securities 378,551 304,332
Investment securities measure as at FVTPL 4,263 4,140
Investment securities measured at FVOCI 74,013 49,265
Debt investments measured at amortised cost 300,275 250,927
378,551 304,332
The movement of investment securities is summarised as below page 46 and 48.
Notes to the financial statementsFor the year ended 31 December 2019

Annual Report 2019160
8. INVESTMENT SECURITIES (CONTINUED)8. 1 Categories of investments by measurement
As at 31 December 2019 FVTPLRO’000
FVOCIRO’000
Amortized cost
RO’000
TotalRO’000
Quoted Equities:
Other services sector - 1,082 1,082
Unit funds 153 - - 153
Financial services sector - 155 - 155
Industrial sector - 1,685 - 1,685
153 2,922 - 3,075
Unquoted Equities:
Local securities - 721 - 721
Unit funds 1,731 - - 1,731
1,731 721 - 2,452
Gross Equity investments 1,884 3,643 - 5,527
Quoted Debt:
Government Bonds and sukuk - 41,127 269,358 310,485
Foreign Bonds 2,379 393 - 2,772
Local bonds and sukuks - 29,036 917 29,953
Treasury Bills - - 30,000 30,000
Gross debt investments 2,379 70,556 300,275 373,210
Total Investment Securities 4,263 74,199 300,275 378,737
Less: Impairment losses on investments - (186) - (186)
4,263 74,013 300,275 378,551
Government Development Bonds represents Oman Government Bonds having face value of RO 256.89million (2018: RO 237.52 million) at average coupon rate of 4.82% maturing between 2020 and 2029.
Omani Treasury bills represents RO 30 Mil average yield of 1.99%.
The movements in investment securities are summarised as follows:
FVOCI Debt instrumentsRO 000’s
FVOCI Equity investmentRO 000’s
Amortised cost
RO 000’sFVTPL
RO 000’sTotal
RO 000’s
At 1 January 2019 45,413 4,118 250,927 4,140 304,598
Additions 50,418 7 179,371 88 229,884
Disposals and redemption (26,948) (130,023) (77) (157,048)
Gain /(loss) from change in fair value 1,681 (482) - 112 1,311
Realised gains on sale (8) - - - (8)
At 31 December 2019 70,556 3,643 300,275 4,263 378,737
Less: Impairment losses on investments (186) - - - (186)
31 December 2019 70,370 3,643 300,275 4,263 378,551
Notes to the financial statementsFor the year ended 31 December 2019

161Annual Report 2019
8. INVESTMENT SECURITIES (CONTINUED)
As at 31 December 2018 FVTPLRO’000
FVOCIRO’000
Amortized cost
RO’000
TotalRO’000
Quoted Equities:
Other services sector - 1,170 - 1,170
Unit funds 220 - - 220
Financial services sector - 323 - 323
Industrial sector - - 1,904 - 1,904
220 3,397 - 3,617
Unquoted Equities:
Local securities - 721 - 721
Unit funds 1,662 - - 1,662
1,662 721 - 2,383
Gross Equity investments 1,882 4,118 - 6,000
Quoted Debt:
Government Bonds and sukuk - 12,570 250,010 262,580
Foreign Bonds 2,258 12,819 - 15,077
Local bonds and sukuks - 20,024 917 20,941
Gross debt investments 2,258 45,413 250,927 298,598
Total Investment Securities 4,140 49,531 250,927 304,598
Less: Impairment losses on investments - (266) - (266)
4,140 49,265 250,927 304,332
The Bank has designated some investments in equity instruments at FVOCI as these are investments that the bank plans to hold in the long-term for strategic reasons.
The movements in investment securities are summarised as follows:
FVOCI Debt instruments
RO 000’s
FVOCI Equity investments
RO 000’s
Amortised cost
RO 000’s
FVTPLRO 000’s
TotalRO 000’s
At 1 January 2018 29,529 6,283 255,043 - 290,855
Reclassification on transition to IFRS 9
(3,092) (1,733) - 4,825 -
At 1 January (reclassified) 26,437 4,550 255,043 4,825 290,855
Additions 30,840 - 215,917 - 246,757
Disposals and redemption (10,011) (19) (220,033) (86) (230,149)
Loss from change in fair value
(1,853) (413) - (599) (2,865)
At 31 December 2018 45,413 4,118 250,927 4,140 304,598
ECL (266) - - - (266)
Total 45,147 4,118 250,927 4,140 304,332
Notes to the financial statementsFor the year ended 31 December 2019

Annual Report 2019162
9. INTANGIBLE ASSET
2019RO’000
2018RO’000
1 January 794 1,191
Impaired during the year (397) (397)
31 December 397 794
Intangible asset represents goodwill which resulted from the acquisition of branches of the Commercial Bank of Oman during 2001 and merger with Majan International Bank during 2003. Goodwill is tested for impairment each year. An assessment has been made to establish projected future cash flows associated with the cash generating unit (CGU) by using discount rate equivalent to cost of funds of the Bank. An impairment change of RO 397 thousand (2018: 397 thousand) was recognised during the year.
10. PROPERTY AND EQUIPMENT
31 December 2019 Freeholdland Buildings
Furnitureand
fixturesMotor
vehiclesComputer
equipmentCapital
work-in-progress
Right use ofAsset
Total
RO’000 RO’000 RO’000 RO’000 RO’000 RO’000 RO’000 RO’000
Cost
1 January 2019 140 1,573 15,248 1,326 27,970 4,650 2,535 53,442
Additions - - 2,633 35 7,908 (3,053) 105 7,628
Disposals - - (716) (35) (334) - - (1,085)
31 December 2019 140 1,573 17,165 1,326 35,544 1,597 2,640 59,985
Depreciation
1 January 2019 - 1,292 12,318 1,059 21,321 - - 35,990
Charge for the year - 59 1,307 145 3,368 - 817 5,696
Disposals - - (678) (35) (160) - - (873)
31 December 2019 - 1,351 12,947 1,169 24,529 - 817 40,813
Carrying value 31 December 2019 140 222 4,218 157 11,015 1,597 1,823 19,172
Notes to the financial statementsFor the year ended 31 December 2019

163Annual Report 2019
10. PROPERTY AND EQUIPMENT (CONTINUED)
31 December 2018Freehold
land BuildingsFurniture
andfixtures
Motorvehicles
Computerequipment
Capitalwork-in-progress
Total
RO’000 RO’000 RO’000 RO’000 RO’000 RO’000 RO’000
Cost
1 January 2018 140 1,573 14,138 1,308 23,726 1,612 42,497
Additions - - 1,466 212 4,345 3,038 9,061
Disposals - - (356) (194) (101) - (651)
31 December 2018 140 1,573 15,248 1,326 27,970 4,650 50,907
Depreciation
1 January 2018 - 1,234 11,455 1,112 19,172 - 32,973
Charge for the year - 58 1,219 141 2,250 - 3,668
Disposals - - (356) (194) (101) - (651)
31 December 2018 - 1,292 12,318 1,059 21,321 - 35,990
Carrying value 31 December 2018
140 281 2,930 267 6,649 4,650 14,917
As of 31 December 2019, cost of Computer and includes acquired software of RO 21.71 Million (31 December 2018: RO 16.39 Million). Accumulated depreciation against these software is RO 13.66 Million (31 December 2018: RO 11.36 Million).
11. OTHER ASSETS
2019RO’000
2018RO’000
Acceptances 55,567 74,590
Interest receivable 18,794 16,575
Prepaid expenses 1,710 3,262
Positive fair value of derivatives (note 30) 1,435 642
Deferred tax assets (note 24) 1,028 1,028
Other receivables 14,473 8,106
Less: impairment allowance (195) (164)
92,812 104,039
Notes to the financial statementsFor the year ended 31 December 2019

Annual Report 2019164
12. DUE TO BANKS
2019RO’000
2018RO’000
Syndicated Inter bank borrowings 192,500 201,041
Inter bank borrowings 297,368 167,475
Payable on demand 311 467
490,179 368,983
At 31 December 2019, Inter bank borrowings includes Islamic Banking Window’s inter bank borrowings with other banks of RO 38.88 million (2018: RO 38.88 million). The bank has complied with the financial covenant of its borrowing facilities during the year 2019 and 2018.
At 31 December 2019, inter bank borrowings with one bank individually represented 20%of the Inter bank’s borrowings (2018: one bank, 39%). The Bank has not had any defaults of principal, interest or other breaches during the year on its borrowed funds.
13. DEPOSITS FROM CUSTOMERS – CONVENTIONAL BANKING
2019RO’000
2018RO’000
Current accounts 621,320 568,332
Savings accounts 457,380 456,011
Time and certificate of deposits 1,449,677 1,531,677
Margin accounts 9,590 15,099
2,537,967 2,571,119
Deposits from customers - Islamic Banking window
Current accounts 112,498 56,040
Savings accounts 39,319 34,026
Time deposits 253,404 263,319
405,221 353,385
Current accounts and time deposits include deposits from the Government of the Sultanate of Oman and its entities amounting to RO 1,160.6 million as at 31 December 2019 (2018: RO 1,180.1 million).
Notes to the financial statementsFor the year ended 31 December 2019
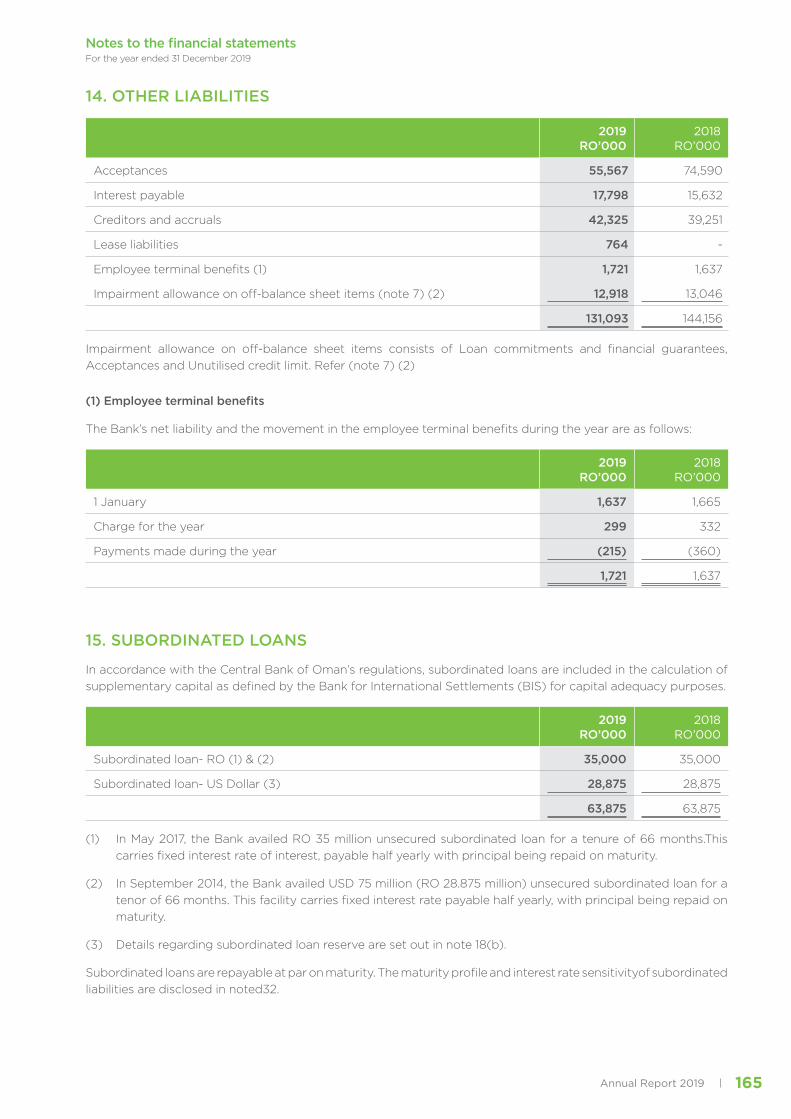
165Annual Report 2019
14. OTHER LIABILITIES
2019RO’000
2018RO’000
Acceptances 55,567 74,590
Interest payable 17,798 15,632
Creditors and accruals 42,325 39,251
Lease liabilities 764 -
Employee terminal benefits (1) 1,721 1,637
Impairment allowance on off-balance sheet items (note 7) (2) 12,918 13,046
131,093 144,156
Impairment allowance on off-balance sheet items consists of Loan commitments and financial guarantees, Acceptances and Unutilised credit limit. Refer (note 7) (2)
(1) Employee terminal benefits
The Bank’s net liability and the movement in the employee terminal benefits during the year are as follows:
2019RO’000
2018RO’000
1 January 1,637 1,665
Charge for the year 299 332
Payments made during the year (215) (360)
1,721 1,637
15. SUBORDINATED LOANS
In accordance with the Central Bank of Oman’s regulations, subordinated loans are included in the calculation of supplementary capital as defined by the Bank for International Settlements (BIS) for capital adequacy purposes.
2019RO’000
2018RO’000
Subordinated loan- RO (1) & (2) 35,000 35,000
Subordinated loan- US Dollar (3) 28,875 28,875
63,875 63,875
(1) In May 2017, the Bank availed RO 35 million unsecured subordinated loan for a tenure of 66 months.This carries fixed interest rate of interest, payable half yearly with principal being repaid on maturity.
(2) In September 2014, the Bank availed USD 75 million (RO 28.875 million) unsecured subordinated loan for a tenor of 66 months. This facility carries fixed interest rate payable half yearly, with principal being repaid on maturity.
(3) Details regarding subordinated loan reserve are set out in note 18(b).
Subordinated loans are repayable at par on maturity. The maturity profile and interest rate sensitivityof subordinated liabilities are disclosed in noted32.
Notes to the financial statementsFor the year ended 31 December 2019
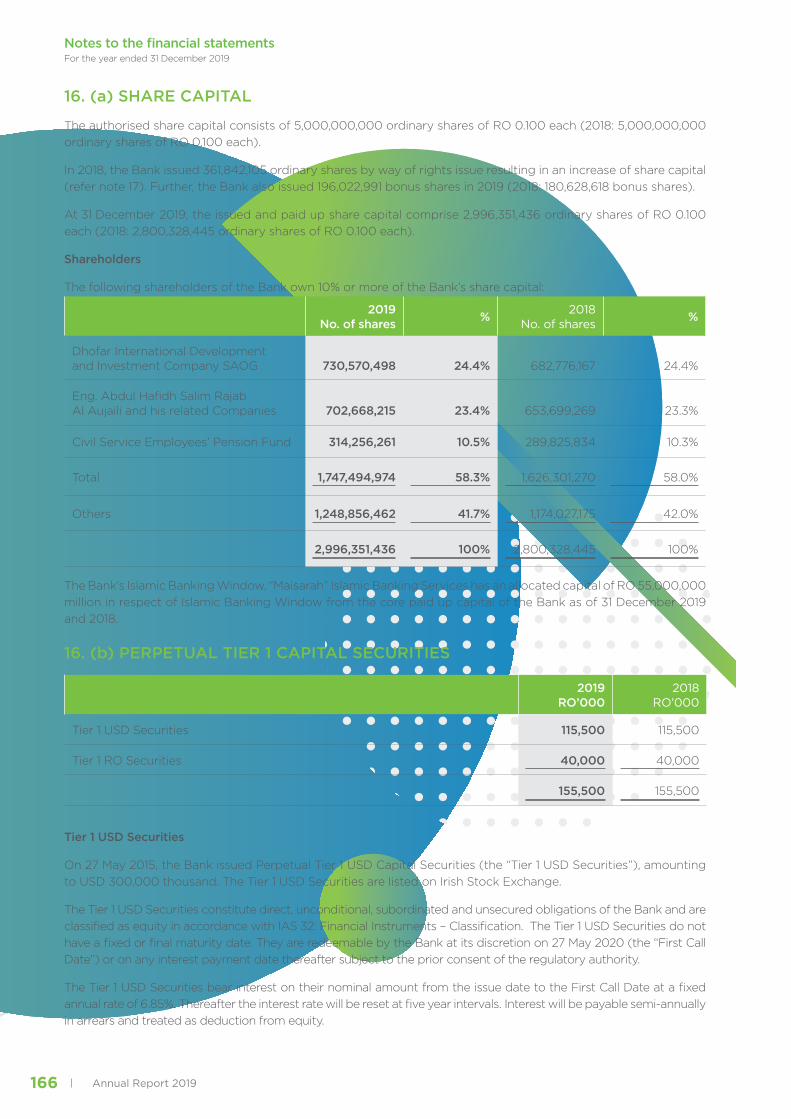
Annual Report 2019166
16. (a) SHARE CAPITAL
The authorised share capital consists of 5,000,000,000 ordinary shares of RO 0.100 each (2018: 5,000,000,000 ordinary shares of RO 0.100 each).
In 2018, the Bank issued 361,842,105 ordinary shares by way of rights issue resulting in an increase of share capital (refer note 17). Further, the Bank also issued 196,022,991 bonus shares in 2019 (2018: 180,628,618 bonus shares).
At 31 December 2019, the issued and paid up share capital comprise 2,996,351,436 ordinary shares of RO 0.100 each (2018: 2,800,328,445 ordinary shares of RO 0.100 each).
Shareholders
The following shareholders of the Bank own 10% or more of the Bank’s share capital:
2019 No. of shares % 2018
No. of shares %
Dhofar International Developmentand Investment Company SAOG 730,570,498 24.4% 682,776,167 24.4%
Eng. Abdul Hafidh Salim Rajab Al Aujaili and his related Companies 702,668,215 23.4% 653,699,269 23.3%
Civil Service Employees’ Pension Fund 314,256,261 10.5% 289,825,834 10.3%
Total 1,747,494,974 58.3% 1,626,301,270 58.0%
Others 1,248,856,462 41.7% 1,174,027,175 42.0%
2,996,351,436 100% 2,800,328,445 100%
The Bank’s Islamic Banking Window, “Maisarah” Islamic Banking Services has an allocated capital of RO 55,000,000 million in respect of Islamic Banking Window from the core paid up capital of the Bank as of 31 December 2019 and 2018.
16. (b) PERPETUAL TIER 1 CAPITAL SECURITIES
2019RO’000
2018RO’000
Tier 1 USD Securities 115,500 115,500
Tier 1 RO Securities 40,000 40,000
155,500 155,500
Tier 1 USD Securities
On 27 May 2015, the Bank issued Perpetual Tier 1 USD Capital Securities (the “Tier 1 USD Securities”), amounting to USD 300,000 thousand. The Tier 1 USD Securities are listed on Irish Stock Exchange.
The Tier 1 USD Securities constitute direct, unconditional, subordinated and unsecured obligations of the Bank and are classified as equity in accordance with IAS 32: Financial Instruments – Classification. The Tier 1 USD Securities do not have a fixed or final maturity date. They are redeemable by the Bank at its discretion on 27 May 2020 (the “First Call Date”) or on any interest payment date thereafter subject to the prior consent of the regulatory authority.
The Tier 1 USD Securities bear interest on their nominal amount from the issue date to the First Call Date at a fixed annual rate of 6.85%. Thereafter the interest rate will be reset at five year intervals. Interest will be payable semi-annually in arrears and treated as deduction from equity.
Notes to the financial statementsFor the year ended 31 December 2019

167Annual Report 2019
16. (b) PERPETUAL TIER 1 CAPITAL SECURITIES (CONTINUED)Tier 1 RO Securities
On 27 December 2018, the Bank issued additional Perpetual Tier 1 Capital Securities (the “Tier 1 RO Securities”), amounting to RO 40,000 thousand. The Tier 1 RO Securities are listed on Muscat Securities Market.
The Tier 1 RO Securities constitute direct, unconditional, subordinated and unsecured obligations of the Bank and are classified as equity in accordance with IAS 32: Financial Instruments – Classification. The Tier 1 RO Securities do not have a fixed or final maturity date. They are redeemable by the Bank at its discretion on 27 December 2023 (the “First Call Date”) or on any interest payment date thereafter subject to the prior consent of the regulatory authority.
The Tier 1 RO Securities bear interest on their nominal amount from the issue date to the First Call Date at a fixed annual rate of 7.50%. Thereafter the interest rate will be reset at five year intervals. Interest is payable semi-annually in arrears and treated as deduction from equity
The Bank at its sole discretion may elect not to distribute interest on both perpetual Tier 1 capital securities and this is not considered an event of default. If the Bank does not pay interest on the Tier 1 USD Securities and/or Tier 1 RO Securities, on a scheduled interest payment date (for whatever reason), then the Bank must not make any other distribution or payment on or with respect to its ordinary shares or any of its Other Common Equity Tier 1 Instruments or securities, ranking junior to or pari passu with the Tier 1 USD Securities and Tier 1 RO Securities unless and until it has paid one interest payment in full on the Tier 1 USD Securities and Tier 1 RO Securities. The Tier 1 USD Securities and Tier 1 RO Securities also allow the Bank to write-down (in whole or in part) any amounts due to the holders of the Securities in certain circumstances.
These securities form part of Tier 1 Capital of the Bank and comply with Basel-3 and Central Bank of Oman regulations (BM 1114).
Refer to the Critical Accounting Judgments and Key Sources Of Estimation Uncertainty in note 4.3
17. SHARE PREMIUM
In 2018, the Bank issued 361,842,105 ordinary shares by way of rights issue, a share premium of RO 0.050 per share, resulting in an increase of share capital and share premium by RO 36,184 thousand and RO 18,092 thousand, respectively.
In 2017, the Bank issued 216,216,216 shares by way of rights issue at a premium of RO 0.083 resulting in increase of share capital and share premium by RO 21,622 thousand and RO 17,946 thousand, respectively.
In 2016, the Bank issued 200,000,000 shares by way of rights issue at a premium of RO. 0.098 resulting in increase of share capital and share premium by RO 20,000 thousand and RO 19,600 thousand, respectively.
In 2013, the shareholders of the Bank in the annual general meeting approved the issuance of 15% bonus shares amounting to RO 13,311 thousand (133,114,993 shares of par value RO 0.100 each) from the share premium account.
In 2008, the Bank issued 176,921,306 shares by way of rights issue at a premium of RO 0.300 resulting in increase of share capital and share premium by RO 17,692 thousand and RO 53,076 thousand, respectively.
Notes to the financial statementsFor the year ended 31 December 2019
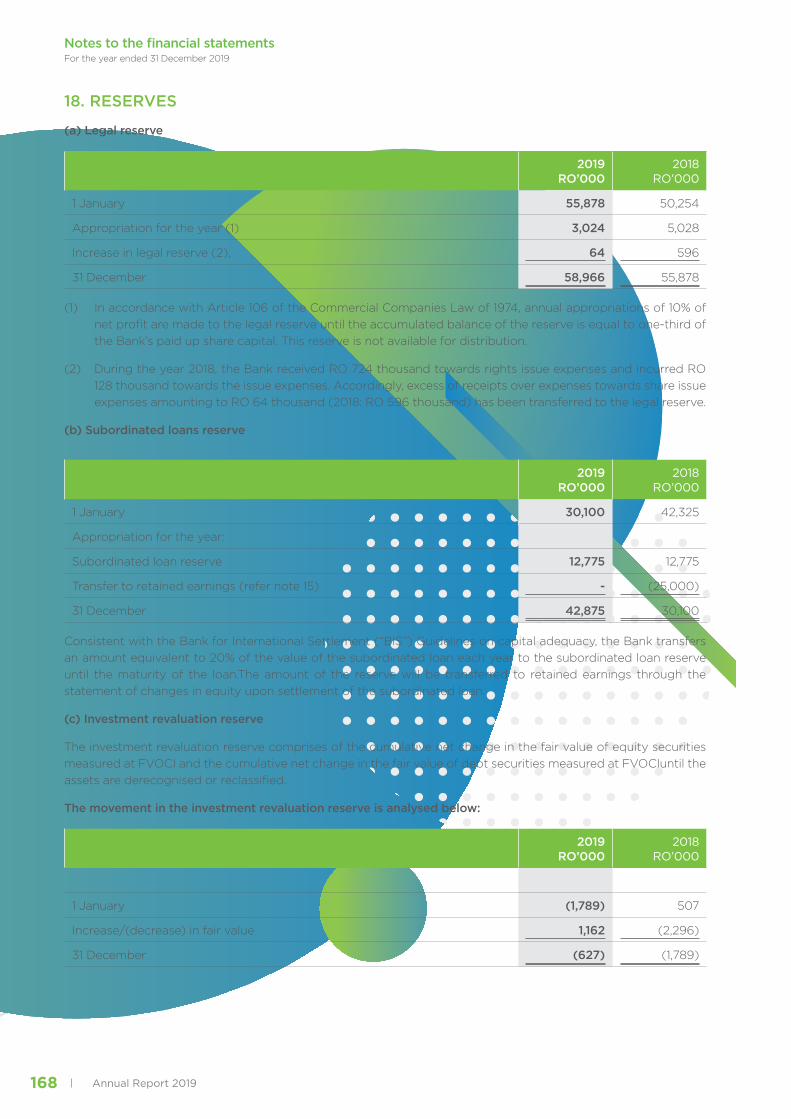
Annual Report 2019168
18. RESERVES
(a) Legal reserve
2019RO’000
2018RO’000
1 January 55,878 50,254
Appropriation for the year (1) 3,024 5,028
Increase in legal reserve (2), 64 596
31 December 58,966 55,878
(1) In accordance with Article 106 of the Commercial Companies Law of 1974, annual appropriations of 10% of net profit are made to the legal reserve until the accumulated balance of the reserve is equal to one-third of the Bank’s paid up share capital. This reserve is not available for distribution.
(2) During the year 2018, the Bank received RO 724 thousand towards rights issue expenses and incurred RO 128 thousand towards the issue expenses. Accordingly, excess of receipts over expenses towards share issue expenses amounting to RO 64 thousand (2018: RO 596 thousand) has been transferred to the legal reserve.
(b) Subordinated loans reserve
2019RO’000
2018RO’000
1 January 30,100 42,325
Appropriation for the year:
Subordinated loan reserve 12,775 12,775
Transfer to retained earnings (refer note 15) - (25,000)
31 December 42,875 30,100
Consistent with the Bank for International Settlement (“BIS”) Guidelines on capital adequacy, the Bank transfers an amount equivalent to 20% of the value of the subordinated loan each year to the subordinated loan reserve until the maturity of the loan.The amount of the reserve will be transferred to retained earnings through the statement of changes in equity upon settlement of the subordinated loan.
(c) Investment revaluation reserve
The investment revaluation reserve comprises of the cumulative net change in the fair value of equity securities measured at FVOCI and the cumulative net change in the fair value of debt securities measured at FVOCIuntil the assets are derecognised or reclassified.
The movement in the investment revaluation reserve is analysed below:
2019RO’000
2018RO’000
1 January (1,789) 507
Increase/(decrease) in fair value 1,162 (2,296)
31 December (627) (1,789)
Notes to the financial statementsFor the year ended 31 December 2019

169Annual Report 2019
18. RESERVES (CONTINUED)
(d) Special reserve
During 2013, the Bank recognised in profit or loss, recovery from a legal case of RO 26.1 million, out of which, the Bank allocated RO 18.49 million (equivalent amount that was used from share premium account for issuance of bonus shares, and which was approved by the Shareholders in the annual general meeting held on 28 March 2012) to a special reserve to strengthen its capital. Prior approval of CBO is required for any distribution from this ‘special reserve account’.
(e) Special reserve – restructured loans
In accordance with Central Bank of Oman circular BSD/2018/BKUP/Bank and FLC’s/467 dated 20 June 2018, the banks are required to create a special reserve of 15% for all restructured financing after the date of circular. The amount is computed as an appropriation from net profit and is not eligible to be considered for the purpose of regulatory capital and dividend distribution.
Requirement to create special reserve at 15% has been dispensed on immediate effect based on Central Bank of Oman circular BSD/CB/FLC/2019/15 dated 18 November 2018.
(f) Special Impairment reserve IFRS 9
CBO circular BM 1149 requires the Bank to create a reserve for the difference between provisions under CBO norms and IFRS 9 provisions, under CBO normsare higher than IFRS 9 provisions.
(g) Special investment revaluation reserve IFRS 9
From 1 January 2018, the Bank classified its portfolio of equity investments as FVOCI (elected). Certain investments were previously impaired, with the impairment allowance of RO 709 thousand charged to statement of profit or loss. A one off adjustment was recorded on 1 January 2018 to retained earnings to account this as part of transition adjustments of the Bank under IFRS 9. This reserve will be released to retained earnings on disposal of investments.
19. RETAINED EARNINGS
Retained earnings represent the undistributed profits generated by the Bank since incorporation.
20. NET ASSETS PER SHARE
Net assets per share are calculated by dividing net assets attributable to equity holders of the Bank at the year-end by the number of shares outstanding at 31 December as follows:
2019RO’000
2018RO’000
Net assets (RO) 530,655,000 542,662,000
Number of shares outstanding at 31 December 2,996,351,436 2,800,328,445
Net assets per share (RO) 0.177 0.194
Notes to the financial statementsFor the year ended 31 December 2019

Annual Report 2019170
21. NET INTEREST INCOME
Conventional Banking 2019 RO’000
2018 RO’000
Loans and advances 153,126 162,274
Due from banks 16,534 12,128
Investments 474 364
Total 170,134 174,766
Islamic Banking 2019RO’000
2018RO’000
Islamic financing receivables 23,851 21,255
Islamic due from banks 153 301
Total 24,004 21,556
22.INTEREST EXPENSE / DISTRIBUTION TO DEPOSITORS
Conventional Banking 2019 RO’000
2018 RO’000
Customers’ deposits 69,468 72,413
Subordinated liabilities / mandatory convertible bonds 3,578 3,634
Bank borrowings 12,439 10,801
Total 85,485 86,848
Islamic Banking 2019 RO’000
2018 RO’000
Customer Deposits 12,343 11,428
Islamic bank borrowings 1,479 619
Total 13,822 12,047
Included in interest expenses on deposits from customers and related parties is interest on subordinated loan against related parties and customer of RO 3,578 thousand (2018: RO 3,634 thousand). Interest expense on customer’s deposits include cost of prize schemes of RO 1,800 thousands belong to conventional bank and Islamic Bank of RO 662 thousands (2018: RO 1,811.thousand and Islamic Bank RO 460 thousands offered by the Bank to its saving deposit holders).
Notes to the financial statementsFor the year ended 31 December 2019
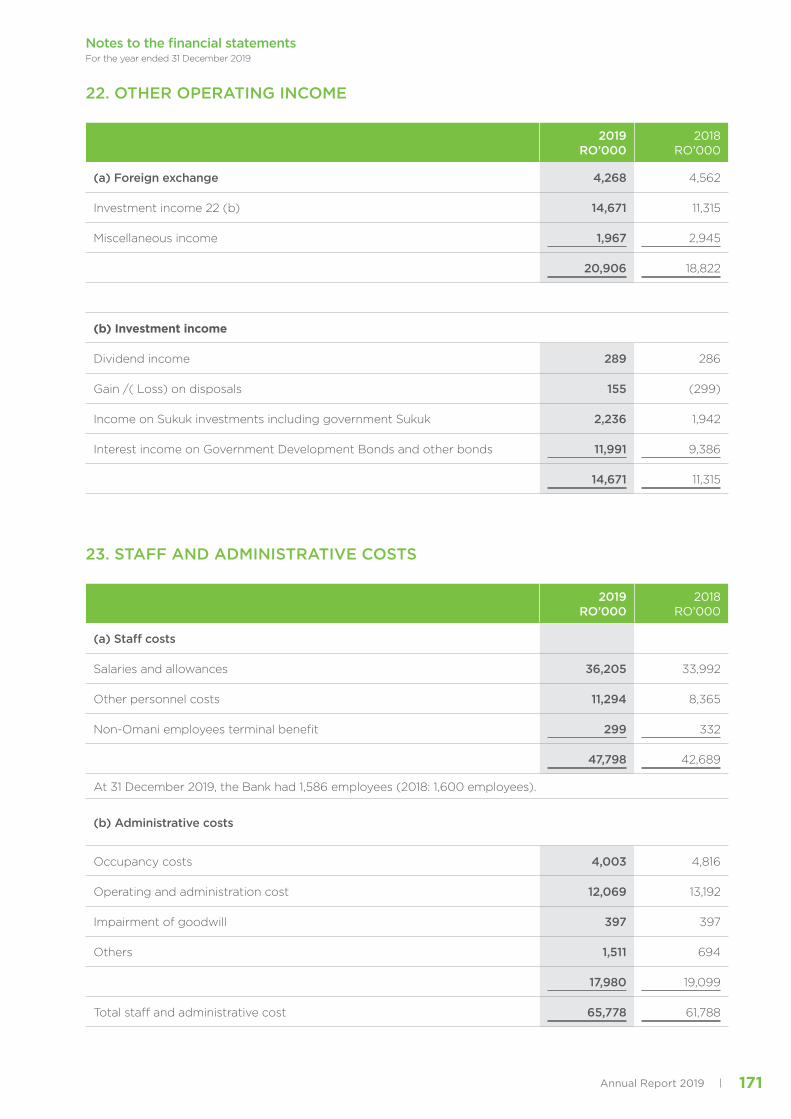
171Annual Report 2019
22. OTHER OPERATING INCOME
2019 RO’000
2018 RO’000
(a) Foreign exchange 4,268 4,562
Investment income 22 (b) 14,671 11,315
Miscellaneous income 1,967 2,945
20,906 18,822
(b) Investment income
Dividend income 289 286
Gain /( Loss) on disposals 155 (299)
Income on Sukuk investments including government Sukuk 2,236 1,942
Interest income on Government Development Bonds and other bonds 11,991 9,386
14,671 11,315
23. STAFF AND ADMINISTRATIVE COSTS
2019 RO’000
2018 RO’000
(a) Staff costs
Salaries and allowances 36,205 33,992
Other personnel costs 11,294 8,365
Non-Omani employees terminal benefit 299 332
47,798 42,689
At 31 December 2019, the Bank had 1,586 employees (2018: 1,600 employees).
(b) Administrative costs
Occupancy costs 4,003 4,816
Operating and administration cost 12,069 13,192
Impairment of goodwill 397 397
Others 1,511 694
17,980 19,099
Total staff and administrative cost 65,778 61,788
Notes to the financial statementsFor the year ended 31 December 2019

Annual Report 2019172
24. INCOME TAX
2019 RO’000
2018 RO’000
(a) Income tax expense:
Current tax
Current year charge 4,895 9,436
Prior years 331 1,615
5,226 11,051
Deferred tax
Current year 609 (153)
Prior years 13 (1,436)
622 (1,589)
Tax expense for the year 5,848 9,462
Interest on Additional Tier 1 Securities is reflected in the statement of changes in equity for the years ended 31 December 2015 to 31 December 2019. The Bank sought confirmation from the Secretariat General for Taxation (SGT) of the Bank’s position on the deductibility of interest expense in Additional Tier1 securities. However, in view of no confirmation received from the SGT in this regard, the Bank has created a current tax provision against the disallowance of the interest on Additional Tier 1 Securities.
The tax rate applicable to the Bankis 15%(2018: 15%). For the purpose of determining the tax expense for the year, the accounting profit has been adjusted for tax purposes. Adjustments for tax purposes include items relating to both income and expense. After giving effect to these adjustments, the average effective tax rate is estimated to be 16.20% (2018: 15.84%).
The difference between the applicable tax rate of 15 % (2018: 15%) and effective tax rate of 16.20 % (2018: 15.84%) arises due to tax effect of income not considered to be taxable and expenses not considered to be deductible. The adjustments are based on the current understanding of the existing tax laws, regulations and practices.
(b) The reconciliation of taxation on the accounting profit before tax for the year at RO 36.1 million (2018: RO 59.7 million) and the taxation charge in the consolidated financial statements is as follows:
2019 RO’000
2018 RO’000
Profit before tax 36,092 59,743
Income tax as per rates mentioned above 5,414 8,961
Tax exempt revenue (43) (43)
Non-deductible expenses 146 365
Prior years 331 179
Tax expense for the year 5,848 9,462
The deferred tax asset/liability has been recognised at the effective tax rate of 15% (2018 - 15%).
Notes to the financial statementsFor the year ended 31 December 2019

173Annual Report 2019
24. INCOME TAX (CONTINUED)(c) Deferred tax asset / (liability) in the statement of financial position and the deferred tax credit / (charge)
in the statement of comprehensive income relates to the tax effect of provisions, Impairment allowance on financial instruments, change in fair value of FVOCI investment and derivatives, accelerated depreciation and expenses disallowed which give rise to deferred tax liability are as follows:
Particulars 2019 RO ‘000
Recognised in SCI
Recognised in SOCI
2019 RO ‘000
Property and equipment (294) (202) - (496)
Impairment allowance on financial instruments
1,920 (720) - 1,200
Investment revaluation reserve (Non listed) 121 - - 121
Fair value derivatives (96) - - (96)
Specialimpairment reservefor loan loss IFRS 9
(623) - 622 (1)
Provision for legal claim - 375 - 375
Right of Use Asset and Finance Liability - (75) - (75)
Net deferred tax asset/(liability) 1,028 (622) 622 1,028
Particulars 2018 RO ‘000
Recognised in SCI
Recognised in SOCI
2018 RO ‘000
Property and equipment (461) 167 - (294)
Impairment allowance on financial instruments
523 1,397 - 1,920
Investment revaluation reserve (Non listed) - 121 - 121
Fair value derivatives - (96) - (96)
Specialimpairment reservefor loan loss IFRS 9
- (623) (623)
Net deferred tax asset/(liability) 62 1,589 (623) 1,028
(d) Status of previous year returns:
The tax returns of the Bank for the years 2014 to 2018 have not yet been agreed with the Secretariat General for Taxation at the Ministry of Finance.
The Board of Directors are of the opinion that additional taxes, if any, related to the open tax years would not be significant to the Bank’s financial position as at 31 December 2019.
(e) tax liability
The movement in the income tax liability is summarised as follows:
2019 RO’000
2018 RO’000
At 1 January 13,810 10,116
Charge for the year 5,226 11,051
Payments during the year (7,681) (7,357)
At 31 December 11,355 13,810
Notes to the financial statementsFor the year ended 31 December 2019

Annual Report 2019174
25. EARNINGS PER SHARE (BASIC AND DILUTED)
The calculation of basic and diluted earnings per share is based on profit for the year attributable to ordinary shareholders as follows:
2019 RO’000
2018 RO’000
Profit for the year (RO) 30,244,000 50,281,000
Less : Additional Tier 1 Coupon (10,912,000) (7,912,000)
Profit for the period attributable to equity holders of the Bank 19,332,000 42,369,000
Weighted average number of shares outstanding during the year 2,996,351,436 2,706,910,285
Earnings per share basic and diluted (RO) 0.006 0.016
Earnings per share (basic and diluted) have been derived by dividing the profit for the year attributable to the shareholders by the weighted average number of shares outstanding. As there are no dilutive potential shares, the diluted earnings per share is identical to the basic earnings per share.
For the purpose of earning per share calculation, the Bank has restated the previous year weighted average number of shares outstanding, to include 7% bonus shares and bonus element (196,022,991 shares) in respect of bonus shares issued during the year.
26. RELATED PARTIES TRANSACTIONS
In the ordinary course of business, the Bank conducts certain transactions on mutually agreed terms with its Directors, shareholders and companies over which they are able to exert significant influence. The aggregate amounts of balances with such related parties are as follows:
2019 RO’000
2018 RO’000
Loans and advances
Directors and shareholders holding 10% or more interest in the Bank 42,445 35,993
Other related parties 25,755 26,055
68,200 62,048
Subordinated loans
Directors and shareholders holding 10% or more interest in the Bank 23,663 23,663
Other related parties 19,775 19,775
43,438 43,438
Deposits and other accounts
Directors and shareholders holding 10% or moreinterestin the Bank 125,597 143,240
Other related parties 213,739 161,701
339,336 304,941
Contingent liabilities and commitments
Directors and shareholders holding 10% or more interest in the Bank
3,305 562
Other related parties 5,201 6,203
8,506 6,765
Notes to the financial statementsFor the year ended 31 December 2019

175Annual Report 2019
2019 RO’000
2018 RO’000
Remuneration paid to Directors
Chairman
– remuneration paid 15 16
– sitting fees paid 10 10
OtherDirectors
– remuneration paid 100 108
– sitting fees paid 75 66
200 200
Other transactions
Rental payment to related parties 564 486
Other transactions 2,894 3,288
Remuneration and fees proposed to Sharia’ Board of Islamic Banking Window
48 43
Key management compensation
salaries and other short-term benefits 1,740 1,612
The Bank conducts certain transactions with its Directors, the interest rates on loan and advances start ranges from 2.75% to 7%. and for Deposits the interest rates ranges from0% to 4.85%.
27. SINGLE BORROWER AND SENIOR MEMBERS
2019 RO’000
2018 RO’000
(a) Single borrower
Total direct exposure 157,798 157,162
Number of members 4 4
(b) Senior members
Total exposure:
Direct 74,534 67,434
Indirect 8,507 6,764
83,041 74,198
Number of members 47 44
Notes to the financial statementsFor the year ended 31 December 2019
26. RELATED PARTIES TRANSACTIONS (CONTINUED)
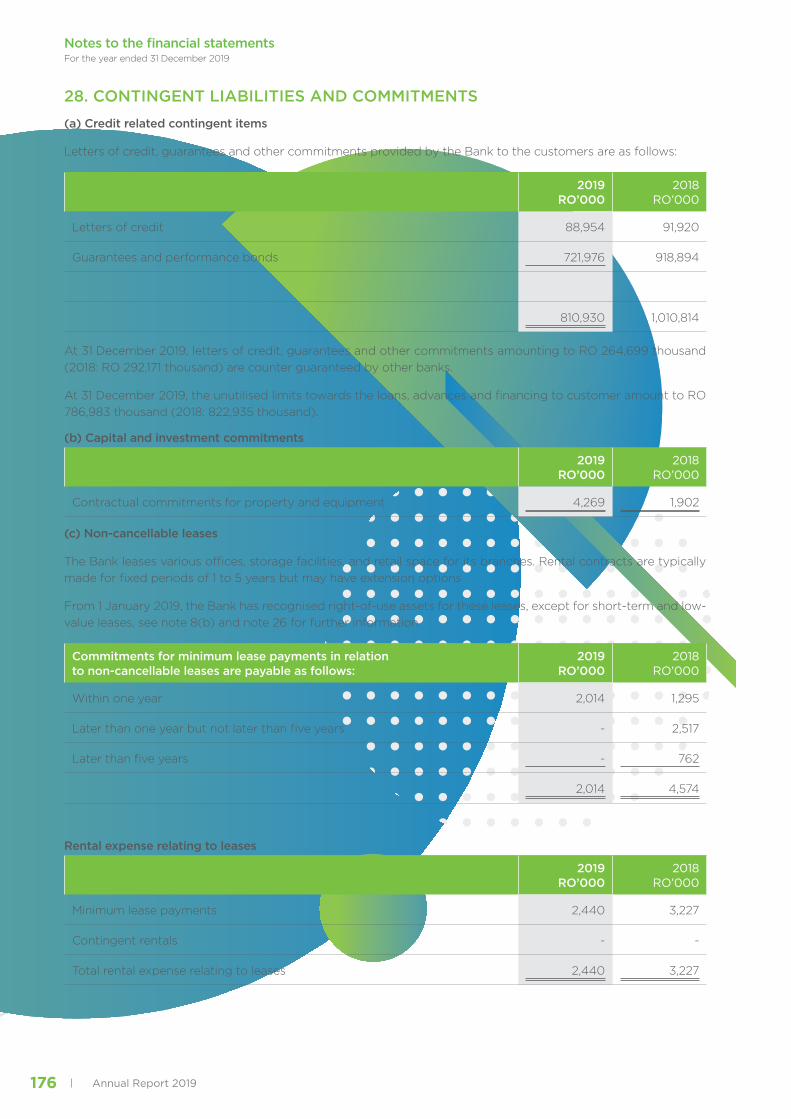
Annual Report 2019176
28. CONTINGENT LIABILITIES AND COMMITMENTS
(a) Credit related contingent items
Letters of credit, guarantees and other commitments provided by the Bank to the customers are as follows:
2019 RO’000
2018 RO’000
Letters of credit 88,954 91,920
Guarantees and performance bonds 721,976 918,894
810,930 1,010,814
At 31 December 2019, letters of credit, guarantees and other commitments amounting to RO 264,699 thousand (2018: RO 292,171 thousand) are counter guaranteed by other banks.
At 31 December 2019, the unutilised limits towards the loans, advances and financing to customer amount to RO 786,983 thousand (2018: 822,935 thousand).
(b) Capital and investment commitments
2019 RO’000
2018 RO’000
Contractual commitments for property and equipment 4,269 1,902
(c) Non-cancellable leases
The Bank leases various offices, storage facilities, and retail space for its branches. Rental contracts are typically made for fixed periods of 1 to 5 years but may have extension options
From 1 January 2019, the Bank has recognised right-of-use assets for these leases, except for short-term and low-value leases, see note 8(b) and note 26 for further information.
Commitments for minimum lease payments in relation to non-cancellable leases are payable as follows:
2019 RO’000
2018 RO’000
Within one year 2,014 1,295
Later than one year but not later than five years - 2,517
Later than five years - 762
2,014 4,574
Rental expense relating to leases
2019 RO’000
2018 RO’000
Minimum lease payments 2,440 3,227
Contingent rentals - -
Total rental expense relating to leases 2,440 3,227
Notes to the financial statementsFor the year ended 31 December 2019

177Annual Report 2019
29. DISAGGREGATION OF NET FEES AND COMMISSION INCOME 2019
Retail bankingRO’000
Corporate bankingRO’000
Treasury and investment
bankingRO’000
TotalRO’000
Transactional services 3,400 - 62 3,462Trade services 13 8,130 279 8,422
Syndication and other financing related services
862 2,608 202 3,672
Advisory and asset management services - 263 209 472Net fee and commission income 4,275 11,001 752 16,028
The total of RO 16,028 thousands includes service charges income of RO 1,801 thousand included under other income as miscellaneous income (note 22). The reversal of long outstanding provision & written back of other assets is RO 159 thousands.
Disaggregation of net fees and commission income 2018
Retail banking
Corporate banking
Treasury and investment
bankingTotal
RO’000 RO’000 RO’000 RO’000
Transactional services 3,506 4,141 108 7,755Trade services - 6,446 146 6,592Syndication and other financing related services
1,232 1,908 168 3,308
Advisory and asset management services - 474 354 828Net fee and commission income 4,738 12,969 776 18,483
The total of RO 18,483 thousands includes service charges income of RO 2,879 thousand included under other income as miscellaneous income (note 22). The reversal of long outstanding provision & written back of other assets is RO 66 thousands.
30. DERIVATIVE FINANCIAL INSTRUMENTS
The Bank uses the following derivative instruments for non-hedging purposes:
Currency forwards represent commitments to purchase foreign and domestic currency, including undelivered spot transactions. Currency swaps are commitments to exchange one set of cash flows for another.Swaps result in an economic exchange of currencies.No exchange of principal takes place, except for certain currency swaps.The Bank’s credit risk represents the potential cost to replace the swap contracts if counterparties fail to perform their obligation.This risk is monitored on an ongoing basis with reference to the current fair value, a proportion of the notional amount of the contracts and the liquidity of the market. To control the level of credit risk taken, the Bank assesses counterparties using the same techniques as for its lending activities.
The notional amounts of certain types of financial instruments provide a basis for comparison with instruments recognised on the statement of financial position but do not necessarily indicate the amounts of future cash flows involved or the current fair value of the instruments and, therefore, do not indicate the Bank’s exposure to credit or price risks. The derivative instruments become favourable (assets) or unfavourable (liabilities) as a result of fluctuations in market interest rates or foreign exchange rates relative to their terms.The aggregate contractual or notionalamount of derivative financial instruments on hand, the extent to which instruments are favourable or unfavourable, and thus the aggregate fair values of derivative financial assets and liabilities shown within other assets and other liabilities, can fluctuate significantly from time to time.The fair values of derivative instruments held are set out below:
Notes to the financial statementsFor the year ended 31 December 2019

Annual Report 2019178
30. DERIVATIVE FINANCIAL INSTRUMENTS (CONTINUED)
The table on the following page shows the positive and negative fair values of derivative financial instruments, which are equivalent to the market values, together with the notional amounts analysed by the term to maturity. The notional amount is the amount of a derivative’s underlying asset, reference rate or index and is the basis upon which changes in the value of derivatives are measured.
31 December 2019 RO 000’s
Positive
fair value
NegativeFair
Value
Notionalamount
total
Notional amounts by term to maturity
within 3 months 4-12 months > 12 months
Derivatives:
Interest rate swaps - 3,419 83,244 - - 83,244
IRS customer 3,419 - 83,244 - - 83,244
Currency options bought - - - 321 - -
Currency options sold - - - 321 - -
Forward purchase contracts 3,150 - - 587,197 495,420 217,042
Forward sales contracts - 1,715 - 586,747 491,890 213,490
Total 6,569 5,134 166,488 1,174,586 987,310 597,020
31 December 2018 RO 000’s
Positive
fair value
NegativeFair
Value
Notionalamount
total
Notional amounts by term to maturity
within 3 months 4-12 months > 12 months
Derivatives:
Fair value hedge - - - - - -
Cash flow hedge - - - - - -
Interest rate swaps Purchase 652 - 41,609 - - 41,609
Interest rate Swaps Contract
- 652 41,609 - - 41,609
Forward purchase contracts 1,095 - - 518,127 516,773 1,217,263
Forward sales contracts - 453 - 518,043 513,131 1,209,823
Total 1,747 1,105 83,218 1,036,170 1,029,904 2,510,304
The following table indicates the positive fair values of derivatives (net)associated with derivatives that are recognised in the statement of comprehensive income.
Assets Liabilities
2019RO’000
2018RO’000
2019RO’000
2018RO’000
Expected cash flows 1,435 642 - -
Notes to the financial statementsFor the year ended 31 December 2019
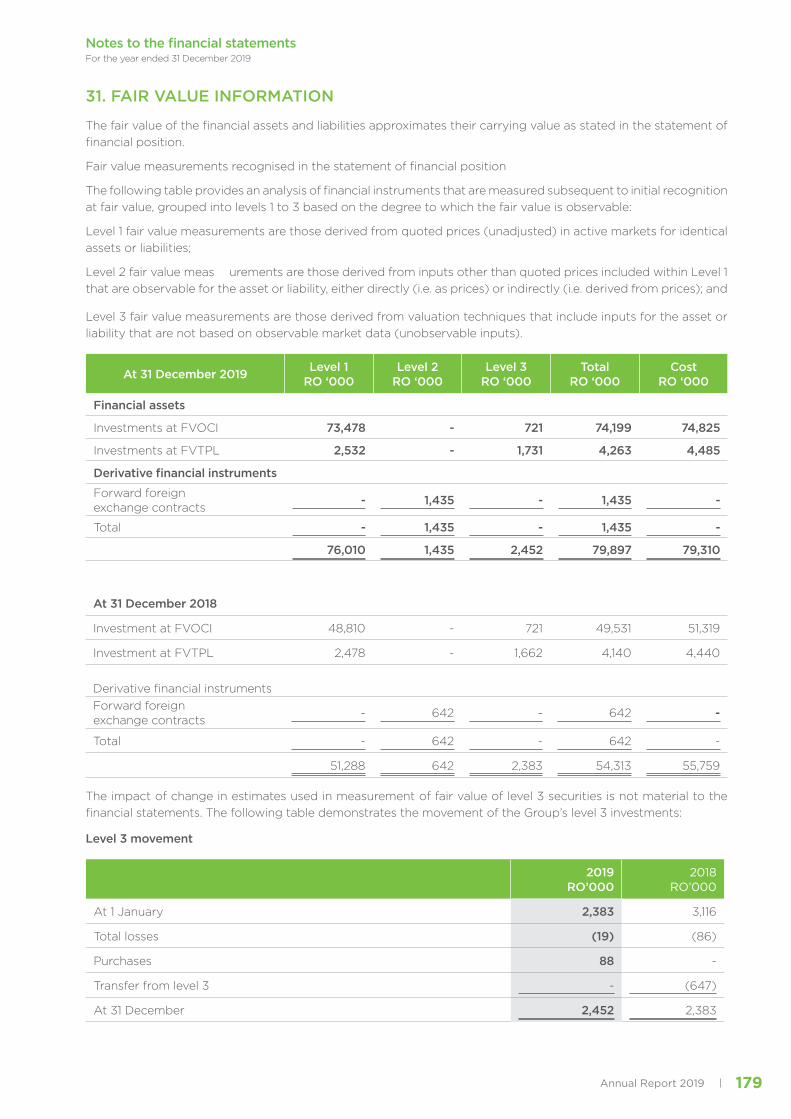
179Annual Report 2019
31. FAIR VALUE INFORMATION
The fair value of the financial assets and liabilities approximates their carrying value as stated in the statement of financial position.
Fair value measurements recognised in the statement of financial position
The following table provides an analysis of financial instruments that are measured subsequent to initial recognition at fair value, grouped into levels 1 to 3 based on the degree to which the fair value is observable:
Level 1 fair value measurements are those derived from quoted prices (unadjusted) in active markets for identical assets or liabilities;
Level 2 fair value meas urements are those derived from inputs other than quoted prices included within Level 1 that are observable for the asset or liability, either directly (i.e. as prices) or indirectly (i.e. derived from prices); and
Level 3 fair value measurements are those derived from valuation techniques that include inputs for the asset or liability that are not based on observable market data (unobservable inputs).
At 31 December 2019 Level 1RO ‘000
Level 2RO ‘000
Level 3RO ‘000
TotalRO ‘000
CostRO ‘000
Financial assets
Investments at FVOCI 73,478 - 721 74,199 74,825
Investments at FVTPL 2,532 - 1,731 4,263 4,485
Derivative financial instruments
Forward foreign exchange contracts
- 1,435 - 1,435 -
Total - 1,435 - 1,435 -
76,010 1,435 2,452 79,897 79,310
At 31 December 2018
Investment at FVOCI 48,810 - 721 49,531 51,319
Investment at FVTPL 2,478 - 1,662 4,140 4,440
Derivative financial instrumentsForward foreign exchange contracts
- 642 - 642 -
Total - 642 - 642 -
51,288 642 2,383 54,313 55,759
The impact of change in estimates used in measurement of fair value of level 3 securities is not material to the financial statements. The following table demonstrates the movement of the Group’s level 3 investments:
Level 3 movement
2019 RO’000
2018 RO’000
At 1 January 2,383 3,116
Total losses (19) (86)
Purchases 88 -
Transfer from level 3 - (647)
At 31 December 2,452 2,383
Notes to the financial statementsFor the year ended 31 December 2019

Annual Report 2019180
31. FAIR VALUE INFORMATION (CONTINUED)
Valuation techniques include net present value and discounted cash flow models, comparison with similar instruments for which market observable prices exist and other valuation models. Assumptions and inputs used in valuation techniques include risk-free and benchmark interest rates, credit spreads and other premia used in estimating discount rates, bond and equity prices, foreign currency exchange rates, equity and equity index process and expected price volatilities and correlations.
Observable prices or model inputs are usually available in the market for listed debt and equity securities, exchange-traded derivatives and simple over-the-counter derivatives such as interest rate swaps. Availability of observable market prices and model inputs reduces the need for management judgment and estimation and also reduces the uncertainty associated with determining fair values. Availability of observable market prices and inputs varies depending on the products and markets and is prone to changes based on specific events and general conditions in the financial markets.
Transfer between level 1 and level 2
There were no transfers between level 1 and level 2 of the fair value hierarchy during the year.
32. FINANCIAL RISK MANAGEMENT
The important types of financial risks to which the Bank is exposed are credit risk, liquidity risk and market risk. The risk management division of the Bank is an independent and dedicated unit reporting directly to the Risk Management Committee (“RMC”) of the Board. The division’s primary responsibility is to assess, monitor and recommend strategies for control of credit, market and operational risk. The absence of any direct or indirect reporting lines and permanent membership in all the Bank’s committees are among the factors which reflect the independence of the Risk Management Divisions (RMD) working and the key role it plays within the Bank.
The risk management framework is pivoted on a host of committees involving the executive management and the Board of Directors (“the Board”) for approval and reporting purposes. The Board has the overall authority for approval of strategies and policies, which it exercises through its various sub-committees. The Risk Management Committee of the Board is responsible for reviewing and recommending to the full Board for approval of all risk policies and procedures. RMC also reviews the risk profile of the Bank as presented to it by the RMD and appraises the full Board in its periodic meeting.
A. Credit Risk
Credit risk is the risk of financial loss to the Bank if a customer or counterparty to a financial instrument fails to meet its contractual obligations arising principally from the loans, advances and Islamic financing, amounts due from banks and investment in debt securities. Bank has an independent credit risk management function which identifies, assess and manages the credit risk at an individual or entity level. All the Corporate credit proposals are assessed independently by RMD before they are considered by the appropriate approving authorities. Bank has defined various levels of authorities for credit approval with Board Executive Committee being the final credit approving authority of the Bank and mainly responsible for approving all credit proposals beyond the authority level set for the management. This committee is also the final authority for approving investments beyond the set authority of the management. The Management Credit Committee (“MCC”) is the credit decision making body at the management level which is empowered to consider all credit related issues up to certain limit.
Bank has established robust credit risk management policies and procedures and a risk grading system for analysing the risk associated with credit. This facilitates the approving authorities in making their credit decision. In addition, RMD assists/ reviews grading of obligors, conducts regular macro analysis of the credit portfolio and monitors credit concentration limits.
Maximum counterparty/Bank exposures are limited to 15% of the Bank’s capital base as stipulated by CBO and where a higher limit is required for projects of national importance prior CBO approval is obtained. Individual country limits using leading external rating agencies have also been set up to ensure portfolio diversification in terms of sovereign risk ratings and geographical exposure. These limits are approved by the Board. Retail lending is strictly in accordance with the CBO guidelines.
Notes to the financial statementsFor the year ended 31 December 2019

181Annual Report 2019
32. FINANCIAL RISK MANAGEMENT (CONTINUED)1. Credit Exposure
The following table informs about the Credit Exposure to customers of the Bank:
(1) Geographical concentrations
Assets Liabilities
Gross loans,
advances and
financing to banks
Gross loans,
advances and
financing to
customersInvestment securities
Deposits from
customersDue to banks
Contingent liabilities
RO’000 RO’000 RO’000 RO’000 RO’000 RO’000
31 December 2019
Sultanate of Oman 87,202 3,181,597 375,965 2,941,485 85,704 688,744
Other GCC countries 209,776 - 2,076 1,390 352,692 32,321
Europe and North America
103,914 - - 4 26,950 56,858
Africa and Asia 71,519 - 696 309 24,833 33,007
472,411 3,181,597 378,737 2,943,188 490,179 810,930
31 December 2018
Sultanate of Oman 87,610 3,287,406 299,531 2,922,039 51,855 883,964
Other GCC countries 102,311 5,664 1,555 2,024 253,940 40,622
Europe and North America
80,415 875 2,809 4 40,280 58,029
Africa and Asia 59,560 - 703 437 22,908 28,199
329,896 3,293,945 304,598 2,924,504 368,983 1,010,814
Other assets and liabilities are predominately concentrated in the Sultanate of Oman.
(2) Customer concentrations
Assets Liabilities
Gross loans,
Advances and
financing to banks
Gross Loans,
Advances and
financing to
customers
Investment Securities
Deposits from
customersDue to banks
Contingent liabilities
RO’000 RO’000 RO’000 RO’000 RO’000 RO’000
31 December 2019
Personal - 1,286,585 - 641,452 - 3,875
Corporate 472,411 1,646,270 37,335 1,141,100 490,179 788,609
Government - 248,742 341,402 1,160,636 - 18,446
472,411 3,181,597 378,737 2,943,188 490,179 810,930
31 December 2018
Personal - 1,375,140 - 625,887 - 174
Corporate 329,896 1,650,688 48,101 1,118,535 368,983 999,970
Government - 268,117 256,497 1,180,082 - 10,670
329,896 3,293,945 304,598 2,924,504 368,983 1,010,814
Notes to the financial statementsFor the year ended 31 December 2019

Annual Report 2019182
32. FINANCIAL RISK MANAGEMENT (CONTINUED)1. Credit Exposure (CONTINUED)
(3) Economic sector concentrations
Assets Liabilities
Gross loans, advances and financing to
customers
Deposits from customers Contingent Liabilities
RO’000 RO’000 RO’000
31 December 2019
Personal 1,286,585 641,452 3,875
International trade 103,650 69,642 25,662
Construction 534,641 179,670 379,395
Manufacturing 184,372 42,017 44,491
Wholesale and retail trade 28,178 13,298 21,661
Communication and utilities
165,769 59,668 19,722
Financial services 146,916 89,089 236,531
Government 248,742 1,160,636 18,446
Other services 176,315 128,099 31,339
Others 306,429 559,617 29,808
3,181,597 2,943,188 810,930
Assets Liabilities
Gross loans, advances and financing to
customers
Deposits from customers Contingent Liabilities
RO’000 RO’000 RO’000
31 December 2018
Personal 1,375,140 625,887 174
International trade 107,375 51,174 35,718
Construction 496,901 172,005 465,775
Manufacturing 213,220 39,277 49,235
Wholesale and retail trade 60,798 22,248 32,727
Communication and utilities
144,420 20,044 100,138
Financial services 140,850 89,281 248,862
Government 268,117 1,180,082 10,670
Other services 199,183 169,101 38,319
Others 287,941 555,405 29,196
3,293,945 2,924,504 1,010,814
Notes to the financial statementsFor the year ended 31 December 2019

183Annual Report 2019
32. FINANCIAL RISK MANAGEMENT (CONTINUED)1. Credit Exposure (CONTINUED)
(4) Gross credit exposure
Total gross exposure Monthly average gross exposure
2019RO’000
2018RO’000
2019RO’000
2018RO’000
Overdrafts 137,827 165,880 158,227 177,624
Loans 2,425,730 2,547,049 2,448,399 2,549,067
Loans against trust receipts 109,865 99,393 101,088 119,580
Bills discounted 46,898 70,969 59,893 70,772
Advance against credit cards 9,450 8,921 9,207 8,833
Islamic Banking Window financing
451,827 401,733 423,868 381,140
Total 3,181,597 3,293,945 3,200,682 3,307,016
(5) Geographical distribution of exposures:
31 December 2019 Sultanate of OmanRO’000
Other countriesRO’000
TotalRO’000
Overdrafts 137,827 - 137,827
Loans 2,425,730 - 2,425,730
Loans against trust receipts 109,865 - 109,865
Bills discounted 10,334 - 10,334
Advance against credit cards 9,450 - 9,450
Others 36,564 - 36,564
Islamic Banking Window financing 451,827 - 451,827
3,181,597 - 3,181,597
31 December 2018
Overdrafts 165,880 165,880
Loans 2,541,596 5,453 2,547,049
Loans against trust receipts 99,393 - 99,393
Bills discounted 10,552 1,086 11,638
Advance against credit cards 8,921 - 8,921
Others 59,331 - 59,331
Islamic Banking Window financing 401,733 - 401,733
3,287,406 6,539 3,293,945
Notes to the financial statementsFor the year ended 31 December 2019

Annual Report 2019184
32. FINANCIAL RISK MANAGEMENT (CONTINUED)1. Credit Exposure (CONTINUED)
(6) Industry type distribution of exposures by major types of credit exposures:
OverdraftsRO’000
Loans including Islamic
financingRO’000
Bills discounted
RO’000Others
RO’000Total
RO’000
Off balance sheet
exposureRO’000
31 December 2019
Import trade 10,972 79,776 - 12,588 103,336 25,662
Export trade 188 121 - 5 314 59
Wholesale/retail trade 4,821 21,008 - 2,349 28,178 21,661
Mining and quarrying 1,859 16,723 162 13 18,757 619
Construction 53,015 399,072 4,683 77,871 534,641 379,395
Manufacturing 16,933 121,123 3,527 42,789 184,372 44,491
Electricity, gas and water 715 161,826 - 169 162,710 14,675
Transportand Communication
1,048 1,455 - 556 3,059 5,047
Financial institutions 1,248 143,728 1,940 - 146,916 236,531
Services 25,200 149,100 - 2,015 176,315 31,339
Personal loans 1,625 1,276,017 - 8,943 1,286,585 3,875
Agriculture and allied Activities
4,022 4,543 22 1,782 10,369 813
Government - 248,739 - 3 248,742 18,446
Non-resident lending - - - - -
Others 16,181 254,326 - 6,796 277,303 28,317
137,827 2,877,557 10,334 155,879 3,181,597 810,930
31 December 2018
Import trade 15,573 76,260 - 15,314 107,147 29,026
Export trade 172 51 - 5 228 6,692
Wholesale/retail trade 13,086 44,356 - 3,356 60,798 32,727
Mining and quarrying 5,722 30,481 1,930 1,612 39,745 1,719
Construction 62,741 338,266 6,598 89,296 496,901 465,775
Manufacturing 21,372 161,416 1,307 29,125 213,220 48,994
Electricity, gas and water 586 137,917 - - 138,503 92,763
Transport andCommunication
2,420 3,114 - 383 5,917
7,375
Financial institutions 1,987 138,606 257 - 140,850 248,862
Services 24,845 171,743 - 2,595 199,183 38,319
Personal loans 1,045 1,365,684 - 8,411 1,375,140 174
Agriculture and allied Activities
4,004 6,231 - 1,888 12,123 696
Government - 268,114 - 3 268,117 10,670
Non-resident lending - 5,453 1,086 - 6,539 241
Others 12,327 201,090 460 15,657 229,534 26,781
165,880 2,948,782 11,638 167,645 3,293,945 1,010,814
Notes to the financial statementsFor the year ended 31 December 2019

185Annual Report 2019
32. FINANCIAL RISK MANAGEMENT (CONTINUED)1. Credit Exposure (CONTINUED)
(7) Maximum exposure to credit risk (net of impairment) without consideration of collateral held:
2019 2018
RO’ 000 RO’ 000
Treasury bill 30,000 -
Loans, advances and financing to banks 471,158 329,059
Loan, advances and financing to customers 3,063,350 3,158,844
Government development bonds and Sukuk 310,485 262,580
Foreign bonds 2,772 15,077
Local bonds and sukuks 29,953 20,941
3,907,718 3,786,501
Off-balance sheet items
Financial guarantees 721,976 918,894
4,629,694 4,705,395
As at 31 December 2019, Bank has total gross impaired loans of RO 148,582 (RO 121,299) thousand which includes interest reserved of RO 24,169 (2018: RO 55,594) thousand against principal outstanding of RO 124,413 (2018: RO 65,705 ) expected credit losses of RO 56,435 (2018: RO 41,400 ) thousands have been carried.
(8) Credit Quality Analysis
The financial assets have been segregated into various portfolios like exposure to Banks, Sovereign, Wholesale Banking and Retail customers. Exposure to Retail customer includes personal loans, housing loans and credit cards. Exposure to Wholesale Banking customer includes exposure other than retail and bank exposure.
The following table sets out information about the credit quality of financial assets measured at amortised cost and FVOCI debt investments. Unless specifically indicated, for financial assets, the amounts in the table represent gross carrying amounts.
Explanation of the terms ‘Stage 1’, ‘Stage 2’ and ‘Stage 3’ is included in note 3.3. The following table provides the exposure to non-trading financial assets measured at amortized cost & FVOCI. Exposure to financial asset includes outstanding as at 31 December 2019
Stage 1 Stage 2 Stage 3 Total
RO’000 RO’000 RO’000 RO’000
31 December 2019
Exposure
Banks 734,029 3,080 - 737,109
Sovereigns 370,575 - - 370,575
Wholesale banking 1,594,293 1,209,117 89,178 2,892,588
Retail banking 1,196,023 32,942 61,856 1,290,821
Investments 38,896 - - 38,896
Total 3,933,816 1,245,139 151,034 5,329,989
Provision for expected credit losses 17,495 34,700 56,435 108,630
Notes to the financial statementsFor the year ended 31 December 2019

Annual Report 2019186
32. FINANCIAL RISK MANAGEMENT (CONTINUED)1. Credit Exposure (CONTINUED)
(8) Credit Quality Analysis (Continued)
Explanation of the terms ‘Stage 1’, ‘Stage 2’ and ‘Stage 3’ is included in note 3.3. The following table provides the exposure to non-trading financial assets measured at amortized cost & FVOCI. Exposure to financial asset includes outstanding as at 31 December 2018
Stage 1 Stage 2 Stage 3 Total
RO’000 RO’000 RO’000 RO’000
31 December 2018
Exposure
Banks 767,020 1,028 - 768,048
Sovereigns 239,384 - - 239,384
Wholesale banking 2,084,903 1,001,862 63,099 3,149,864
Retail banking 1,282,342 38,646 58,990 1,379,978
Investments 56,330 - - 56,330
Total 4,429,979 1,041,536 122,089 5,593,604
Provision for Expected credit losses 19,207 33,014 41,400 93,621
(9) Inputs, assumptions and techniques used for estimating impairment
a. Significant increase in credit risk (SICR)
The assessment of SICR since origination of a financial asset considers borrower-specific quantitative and qualitative information without consideration of collateral, and the impact of forward-looking information. Quantitative models may not always be able to capture all reasonable and supportable information that may indicate a significant increase in credit risk. Qualitative factors may be assessed to supplement the gap.
For retail exposures, a significant increase in credit risk cannot be assessed using forward looking information at an individual account level. Therefore, the assessment is done at the segment level. Segment migration thresholds exist for each PD model by product which considers the proportionate change in PD as well as the absolute change in PD. The thresholds used for PD migration are reviewed and assessed at least annually, unless there is a significant change in credit risk management practices in which case the review is brought forward.
For non-retail exposures the Bank uses an internal risk rating scale (IG codes) for its non-retail exposures. All non-retail exposures have an IG code assigned that reflects the probability of default of the borrower. Both borrower specific and non-borrower specific (i.e. macroeconomic) forward looking information is considered and reflected in the IG rating. Significant increase in credit risk is evaluated based on the migration of the exposures among IG codes.
Incorporation of forward looking information
The Bank incorporates forward-looking information into both the assessment of whether the credit risk of an instrument has increased significantly since its initial recognition and the measurement of ECL. The Bank formulates three economic scenarios: a base case, which is the median scenario assigned a 50% probability of occurring, and two less likely scenarios, one upside and one downside, each assigned a 25% probability of occurring. External information considered includes economic data and forecasts published by monetary authorities and selected private-sector forecasters. A comprehensive review is performed at least annually on the design of the scenarios by the Bank’s senior management.
Notes to the financial statementsFor the year ended 31 December 2019

187Annual Report 2019
32. FINANCIAL RISK MANAGEMENT (CONTINUED)1. Credit Exposure (CONTINUED)
b. Economic variable assumptionsThe Bank uses the macroeconomic forecast to convert the Through the Cycle (TTC) PD into Point in Time (PIT) PD. Real GDP growth rate and Oil Revenue to GDP are considered for establishing the relationship with historical non-performing loans (NPLs) data of the banking system, as they were observed to be more statistically significant parameters reflecting the state of economy. The forecast of macro-economic indicators are considered for next 3 years with time lag of 1 year. The macroeconomic indicators used as at 31 December 2019 including the projections used is presented as under:
31st December 2019
Real GDP growth (%)
Present 2.10%
Oil revenue (%GDP)
Present 31.08%Year 1 Projection
1.10%Year 1 Projection
27.07%
Year 2 Projection
6.20%Year 2 Projection
25.43%
Year 3 Projection
2.80%Year 3 Projection
27.74%
Predicted relationships between the macroeconomic indicators, default and loss rates on various portfolios of financial assets have been developed based on analysing historical data over the past 15 years.
1 January 2019
Real GDP growth (%)
Present 2.0%
Oil revenue (%GDP)
Present 21.1%
Year 1 Projection
2.0% Year 1 Projection 24.3%
Year 2 Projection
3.6% Year 2 Projection 24.7%
Year 3 Projection
1.9%Year 3 Projection
23.8%
The following tables shows estimate of the ECL on non-impaired financial assets (Stages 1 and 2) under IFRS 9 as at December 31, 2019, with 100% probability of happening each scenario.
Sensitivity of ECL estimates on non-impaired loans (excluding ECL on unutilised loans and interest receivables) ECL (RO’ 000)
Impact on ECL due to Sensitivity
(RO 000)
Scenario weighted ECL under IFRS 9 (Actual Estimate)** 48,917
Sensitivity:
ECL if only Upside case happens - 100% probability 27,176 (21,740)
ECL if only Base case happens - 100% probability 45,835 (3,082)
ECL if only Downside case happens - 100% probability 58,745 9,828
** for computation of ECL (ie actual estimates), Bank considers three scenario viz. base case, upside case and downside case with
weightage of 50%, 25% & 25% respectively.
c. Sensitivity analysis
The most significant assumptions affecting the ECL allowance are as follows:
Retail portfolios
(1) GDP, given the significant impact it has on mortgage collateral valuations; and
(2) Oil price index, given its impact on secured and unsecured borrowers’ ability to meet their contractual repayments.
Wholesale portfolios
(1) GDP, given the significant impact on companies’ performance and collateral valuations; and
(2) Oil Price Index, given its impact on companies’ likelihood of default.
Notes to the financial statementsFor the year ended 31 December 2019
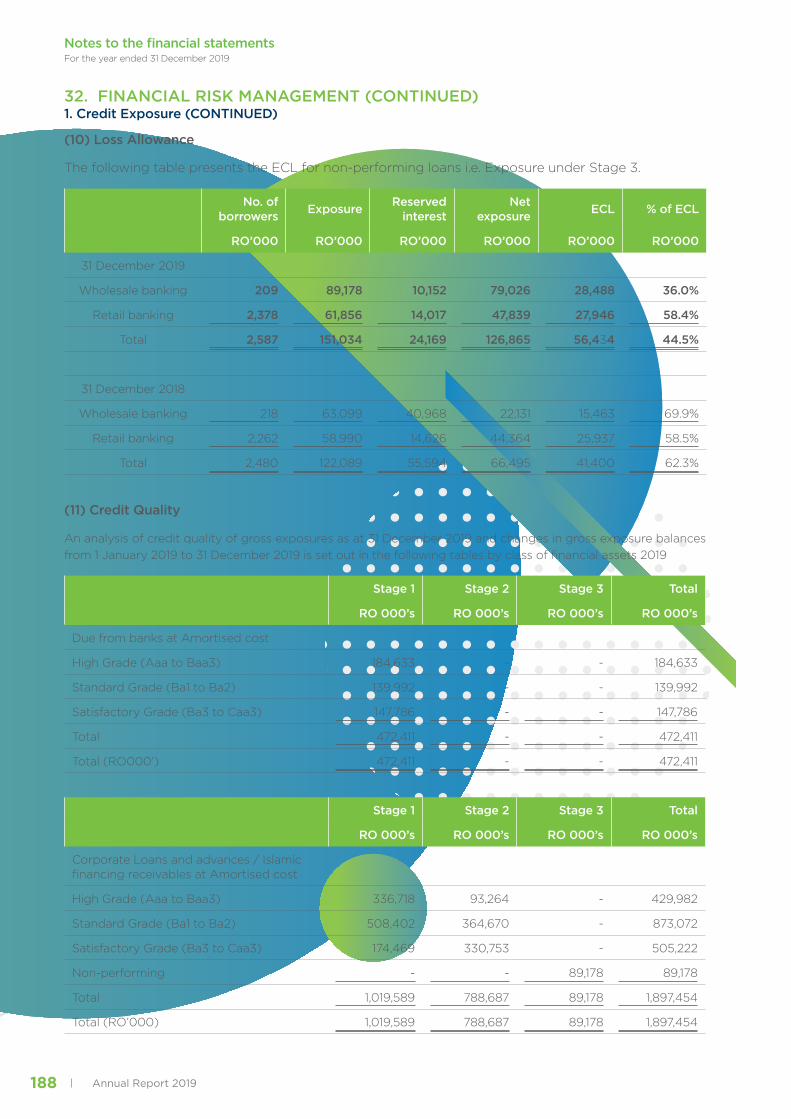
Annual Report 2019188
32. FINANCIAL RISK MANAGEMENT (CONTINUED)1. Credit Exposure (CONTINUED)
(10) Loss Allowance
The following table presents the ECL for non-performing loans i.e. Exposure under Stage 3.
No. of borrowers Exposure Reserved
interestNet
exposure ECL % of ECL
RO’000 RO’000 RO’000 RO’000 RO’000 RO’000
31 December 2019
Wholesale banking 209 89,178 10,152 79,026 28,488 36.0%
Retail banking 2,378 61,856 14,017 47,839 27,946 58.4%
Total 2,587 151,034 24,169 126,865 56,434 44.5%
31 December 2018
Wholesale banking 218 63,099 40,968 22,131 15,463 69.9%
Retail banking 2,262 58,990 14,626 44,364 25,937 58.5%
Total 2,480 122,089 55,594 66,495 41,400 62.3%
(11) Credit Quality
An analysis of credit quality of gross exposures as at 31 December 2019 and changes in gross exposure balances from 1 January 2019 to 31 December 2019 is set out in the following tables by class of financial assets 2019
Stage 1 Stage 2 Stage 3 Total
RO 000’s RO 000’s RO 000’s RO 000’s
Due from banks at Amortised cost
High Grade (Aaa to Baa3) 184,633 - - 184,633
Standard Grade (Ba1 to Ba2) 139,992 - - 139,992
Satisfactory Grade (Ba3 to Caa3) 147,786 - - 147,786
Total 472,411 - - 472,411
Total (RO000’) 472,411 - - 472,411
Stage 1 Stage 2 Stage 3 Total
RO 000’s RO 000’s RO 000’s RO 000’s
Corporate Loans and advances / Islamic financing receivables at Amortised cost
High Grade (Aaa to Baa3) 336,718 93,264 - 429,982
Standard Grade (Ba1 to Ba2) 508,402 364,670 - 873,072
Satisfactory Grade (Ba3 to Caa3) 174,469 330,753 - 505,222
Non-performing - - 89,178 89,178
Total 1,019,589 788,687 89,178 1,897,454
Total (RO’000) 1,019,589 788,687 89,178 1,897,454
Notes to the financial statementsFor the year ended 31 December 2019

189Annual Report 2019
32. FINANCIAL RISK MANAGEMENT (CONTINUED)1. Credit Exposure (CONTINUED)
Stage 1 Stage 2 Stage 3 Total
RO 000’s RO 000’s RO 000’s RO 000’s
Retail Loans and advances / Islamic financing receivables at Amortised cost*
High Grade (Aaa to Baa3) 539,913 - - 539,913
Standard Grade (Ba1 to Ba2) 626,381 7,603 - 633,984
Satisfactory Grade (Ba3 to Caa3) 25,504 25,339 - 50,843
Non-performing - - 61,856 61,856
Total 1,191,798 32,942 61,856 1,286,596
Total (RO’000) 1,191,798 32,942 61,856 1,286,596
* includes Housing Loans, Personal Loans Credit Cards and Retail Overdrafts
Stage 1 Stage 2 Stage 3 Total
RO 000’s RO 000’s RO 000’s RO 000’s
Investment
High Grade (Aaa to Baa3) 9,861 - - 9,861
Standard Grade (Ba1 to Ba2) 29,010 - - 29,010
Satisfactory Grade (Ba3 to Caa3) 25 - - 25
Non-performing - - - -
Total 38,896 - - 38,896
Total (RO’000) 38,896 - - 38,896
Stage 1 Stage 2 Stage 3 Total
RO 000’s RO 000’s RO 000’s RO 000’s
Debt investment securities at FVOCI
High Grade (Aaa to Baa3) 70,556 - - 70,556
Standard Grade (Ba1 to Ba2) - - - -
Satisfactory Grade (Ba3 to Caa3) - - - -
Total 70,556 - - 70,556
Total (RO’000) 70,556 - - 70,556
Stage 1 Stage 2 Stage 3 Total
RO 000’s RO 000’s RO 000’s RO 000’s
Debt investment securities at Amortised cost
High Grade (Aaa to Baa3) 300,275 - - 300,275
Standard Grade (Ba1 to Ba2) - - - -
Satisfactory Grade (Ba3 to Caa3) - - - -
Total 300,275 - - 300,275
Total (RO’000) 300,275 - - 300,275
Notes to the financial statementsFor the year ended 31 December 2019

Annual Report 2019190
32. FINANCIAL RISK MANAGEMENT (CONTINUED)1. Credit Exposure (CONTINUED)
Stage 1 Stage 2 Stage 3 Total
RO 000’s RO 000’s RO 000’s RO 000’s
Acceptances at Amortised cost
High Grade (Aaa to Baa3) 15,145 1,702 - 16,847
Standard Grade (Ba1 to Ba2) 15,909 6,523 - 22,432
Satisfactory Grade (Ba3 to Caa3) 12,965 2,458 - 15,423
Sub Standard - - - -
Total 44,019 10,683 - 54,702
Total (RO’000) 44,019 10,683 - 54,702
Stage 1 Stage 2 Stage 3 Total
RO 000’s RO 000’s RO 000’s RO 000’s
Unutilized / Amortised cost
High Grade (Aaa to Baa3) 257,614 124,175 - 381,789
Standard Grade (Ba1 to Ba2) - - - -
Satisfactory Grade (Ba3 to Caa3) - - - -
Total 257,614 124,175 - 381,789
Total (RO’000) 257,614 124,175 - 381,789
Stage 1 Stage 2 Stage 3 Total
RO 000’s RO 000’s RO 000’s RO 000’s
Letter of credit guarantee - Amortised cost*
High Grade (Aaa to Baa3) 524,725 283,753 2,452 810,930
Standard Grade (Ba1 to Ba2) - - - -
Satisfactory Grade (Ba3 to Caa3) - - - -
Non-performing - - - -
Total 524,725 283,753 2,452 810,930
Total (RO’000) 524,725 283,753 2,452 810,930
* includes Corporate & SME , Retail and Banks
Stage 1 Stage 2 Stage 3 Total
RO 000’s RO 000’s RO 000’s RO 000’s
Accrued Profit- Amortised cost*
High Grade (Aaa to Baa3) 13,535 4,690 - 18,225
Standard Grade (Ba1 to Ba2) - - - -
Satisfactory Grade (Ba3 to Caa3) - - - -
Non-performing - - - -
Total 13,535 4,690 - 18,225
Total (RO’000) 13,535 4,690 - 18,225
* includes Corporate & SME , Retail and Banks
Notes to the financial statementsFor the year ended 31 December 2019

191Annual Report 2019
32. FINANCIAL RISK MANAGEMENT (CONTINUED)1. Credit Exposure (CONTINUED)2018:
Stage 1 Stage 2 Stage 3 Total
RO 000’s RO 000’s RO 000’s RO 000’s
Due from banks at Amortised cost
High Grade (Aaa to Baa3) 214,348 - - 214,348
Standard Grade (Ba1 to Ba2) 194,734 - - 194,734
Satisfactory Grade (Ba3 to Caa3) 65,338 - - 65,338
Total 474,420 - - 474,420
Total (RO000’) 474,420 - - 474,420
Stage 1 Stage 2 Stage 3 Total
RO 000’s RO 000’s RO 000’s RO 000’s
Corporate Loans and advances / Islamic financing receivables at Amortised cost
High Grade (Aaa to Baa3) 421,893 41,723 - 463,616
Standard Grade (Ba1 to Ba2) 629,506 256,535 - 886,041
Satisfactory Grade (Ba3 to Caa3) 175,987 329,507 - 505,494
Non-performing - - 62,309 62,309
Total 1,227,386 627,765 62,309 1,917,460
Total (RO’000) 1,227,386 627,765 62,309 1,917,460
Stage 1 Stage 2 Stage 3 Total
RO 000’s RO 000’s RO 000’s RO 000’s
Retail Loans and advances / Islamic financing receivables at Amortised cost*
High Grade (Aaa to Baa3) 604,230 - - 604,230
Standard Grade (Ba1 to Ba2) 643,117 8,085 - 651,202
Satisfactory Grade (Ba3 to Caa3) 30,303 30,416 - 60,719
Non-performing - - 58,990 58,990
Total 1,277,650 38,501 58,990 1,375,141
Total (RO’000) 1,277,650 38,501 58,990 1,345,141
* includes Housing Loans, Personal Loans Credit Cards and Retail Overdrafts
Stage 1 Stage 2 Stage 3 Total
RO 000’s RO 000’s RO 000’s RO 000’s
Investment
High Grade (Aaa to Baa3) 26,295 - - 26,295
Standard Grade (Ba1 to Ba2) 30,010 - - 30,010
Satisfactory Grade (Ba3 to Caa3) 24 - - 24
Non-performing - - - -
Total 56,329 - - 56,329
Total (RO’000) 56,329 - - 56,329
Notes to the financial statementsFor the year ended 31 December 2019

Annual Report 2019192
32. FINANCIAL RISK MANAGEMENT (CONTINUED)1. Credit Exposure (CONTINUED)
Stage 1 Stage 2 Stage 3 Total
RO 000’s RO 000’s RO 000’s RO 000’s
Debt investment securities at FVOCI
High Grade (Aaa to Baa3) 45,413 - - 45,413
Standard Grade (Ba1 to Ba2) - - - -
Satisfactory Grade (Ba3 to Caa3) - - - -
Total 45,413 - - 45,413
Total (RO’000) 45,413 - - 45,413
Stage 1 Stage 2 Stage 3 Total
RO 000’s RO 000’s RO 000’s RO 000’s
Debt investment securities at Amortised cost
High Grade (Aaa to Baa3) 250,927 - - 250,927
Standard Grade (Ba1 to Ba2) - - - -
Satisfactory Grade (Ba3 to Caa3) - - - -
Total 250,927 - - 250,927
Total (RO’000) 250,927 - - 290,927
Stage 1 Stage 2 Stage 3 Total
RO 000’s RO 000’s RO 000’s RO 000’s
Acceptances at Amortised cost
High Grade (Aaa to Baa3) 5,341 1,764 - 7,105
Standard Grade (Ba1 to Ba2) 42,795 2,138 - 44,933
Satisfactory Grade (Ba3 to Caa3) 12,750 9,265 - 22,015
Sub Standard - - - -
Total 60,886 13,167 - 74,053
Total (RO’000) 60,886 13,167 - 74,053
Stage 1 Stage 2 Stage 3 Total
RO 000’s RO 000’s RO 000’s RO 000’s
Unutilized / Amortised cost
High Grade (Aaa to Baa3) 281,539 149,434 - 430,973
Standard Grade (Ba1 to Ba2) - - - -
Satisfactory Grade (Ba3 to Caa3) - - - -
Total 281,539 149,434 - 430,973
Total (RO’000) 281,539 149,434 - 430,973
Notes to the financial statementsFor the year ended 31 December 2019

193Annual Report 2019
32. FINANCIAL RISK MANAGEMENT (CONTINUED)1. Credit Exposure (CONTINUED)
Stage 1 Stage 2 Stage 3 Total
RO 000’s RO 000’s RO 000’s RO 000’s
Letter of credit guarantee - Amortised cost*
High Grade (Aaa to Baa3) 313,454 44,011 790 358,255
Standard Grade (Ba1 to Ba2) 331,026 67,027 - 398,053
Satisfactory Grade (Ba3 to Caa3) 156,363 98,681 - 255,044
Non-performing - - - -
Total 800,843 209,719 790 1,011,352
Total (RO’000) 800,843 209,719 790 1,011,352
* includes Corporate & SME , Retail and Banks
Stage 1 Stage 2 Stage 3 Total
RO 000’s RO 000’s RO 000’s RO 000’s
Accrued Profit- Amortised cost*
High Grade (Aaa to Baa3) 13,405 2,951 - 16,356
Standard Grade (Ba1 to Ba2) - - - -
Satisfactory Grade (Ba3 to Caa3) - - - -
Non-performing - - - -
Total 13,405 2,951 - 16,356
Total (RO’000) 13,405 2,951 - 16,356
* includes Corporate & SME , Retail and Banks
Notes to the financial statementsFor the year ended 31 December 2019

Annual Report 2019194
32. FINANCIAL RISK MANAGEMENT (CONTINUED)1. Credit Exposure (CONTINUED)(12) Distribution of impaired loans
The following table presents the distribution of impaired loans, past due and not past due loans by type of industry:
Per
form
ing
lo
ans
No
n-p
erfo
rmin
g
loan
s
Exp
ecte
d
Cre
dit
Lo
ss fo
r St
age
1 &
2
Exp
osu
re
Exp
ecte
d
Cre
dit
Lo
ss
for
Stag
e 3
Exp
osu
re
Inte
rest
re
serv
e
Stag
e 3
Expe
cted
C
redi
t Los
s du
ring
th
e ye
ar
Ad
vanc
es
wri
tten
o
ff d
urin
g
the
year
RO’000 RO’000 RO’000 RO’000 RO’000 RO’000 RO’000
31 December 2019
Import trade 96,476 6,860 786 1,369 4,080 515 1,059
Export trade 308 6 20 3 3 - -
Wholesale/retail trade 19,067 9,112 2,547 3,564 337 3,777 4,908
Mining and quarrying 18,745 12 578 6 7 3 -
Construction 510,681 23,960 5,481 8,066 1,764 7,320 -
Manufacturing 183,671 701 1,541 221 256 203 -
Electricity, gas and water 162,671 39 1,230 9 4 - -
Transport and communication
2,400 659 286 269 80 394 -
Financial institutions 146,916 - 944 - - - -
Services 174,526 1,789 1,195 697 468 223 -
Personal loans 1,222,275 64,310 13,414 28,669 14,199 10,546 2,174
Agriculture and allied activities 10,359
10 40 5 4 - -
Government 248,742 - 8 - - -
Non-resident lending - - - - - 49 4,429
Others 236,178 41,124 9,573 13,557 2,967 12,571 -
3,033,015 148,582 37,643 56,435 24,169 35,601 12,570
31 December 2018
Import trade 94,488 12,659 871 1,743 10,548 596 1
Export trade 222 6 17 4 3 2 -
Wholesale/retail trade 30,598 30,200 230 4,906 25,045 (90) -
Mining and quarrying 39,735 10 689 3 5 (37) -
Construction 488,548 8,353 5,907 2,416 3,253 1,519 1
Manufacturing 213,039 181 1,175 31 141 16 -
Electricity, gas and water 138,467 36 761 9 1 8 -
Transport and communication 5,709
208 202 84 6 108 -
Financial institutions 140,850 - 310 - - 10 -
Services 197,750 1,433 797 537 306 - -
Personal loans 1,316,151 58,989 16,885 25,937 14,625 8,252 26
Agriculture and allied activities 12,114
9 43 5 4 - -
Government 268,117 - 234 - - - -
Non-resident lending 1,086 5,453 1 4,380 1,027 - -
Others 225,772 3,762 9,786 1,345 829 35 -
3,172,646 121,299 37,908 41,400 55,793 10,419 28
Notes to the financial statementsFor the year ended 31 December 2019

195Annual Report 2019
32. FINANCIAL RISK MANAGEMENT (CONTINUED)1. Credit Exposure (CONTINUED)The following table presents the distribution of impaired loans and gross loans by geographical distribution:
Exposure to Stage
1 & 2
Exposure to Stage 3
Stage 1 & 2 ECL
Stage 3 `ECL
Interest reserve
Stage 3 ECL during
the year
Advances written
off during the year
RO’000 RO’000 RO’000 RO’000 RO’000 RO’000 RO’000
31 December 2019Sultanate of Oman
3,033,015 148,582 37,643 56,435 24,169 35,601 8,141
Other countries
- - - - - - 4,429
3,033,015 148,582 37,643 56,435 24,169 35,601 12,57031 December 2018Sultanate of Oman
3,171,560 115,846 37,907 37,020 54,766 10,419 28
Other countries
1,086 5,453 1 4,380 1,027 - -
3,172,646 121,299 37,908 41,400 55,793 10,419 28
Analysis of impairment and collateral
A. An estimate of the fair value of collateral and other security enhancements held against financial assets is shown below:
2019RO 000’s
2018RO 000’s
Against individually impaired
Property 37,996 18,483
Equities - -
Others 869 17
38,865 18,500
B. Liquidity risk
Liquidity risk is the potential inability to meet the Bank’s liabilities that are settled by delivering cash or another financial asset as they become due.It arises when the Bank is unable to generate cash to cope with a decline in deposits or increase in assets.
Bank’s Liquidity Risk Management is governed by the Treasury Risk Policy document approved by the Board of Directors as well as the provisions of relevant CBO guidelines on liquidity risk management. The Treasury risk policy also incorporates contingency plans and measures so as the Bank is always in a position to meet all maturing liabilities as well as to fund asset growth and business operations. The contingency funding plan includes effective monitoring of the cash flows on a day to day basis, holding of tradable high quality liquid assets, which may be readily disposed off in sizeable amount etc. The Bank also has in place adequate lines of credit from both local and international Banks to meet any unforeseen liquidity requirements.
The Bank monitors its liquidity risk through cash flow approach and stock approach. Under cash flow approach Bank generates Maturity of Assets and Liabilities (MAL) report which captures all the maturing assets and liabilities into various pre-set time buckets ranging from one month to five years. The mismatches in various time buckets indicate liquidity gap and Bank strictly adheres to the CBO set limit of 15%, 20% and 25% of cumulative liabilities (outflows) on mismatches (liquidity gaps) in time buckets up to one year. In addition, the Bank has also set up internal limit on mismatches in time buckets beyond one year.Under stock approach, Bank monitors the liquidity risk through liquidity ratios, which portrays the liquidity available at the reporting date.
Treasury department of the Bank controls and monitors the liquidity risk and ensures that the Bank is not exposed to undue liquidity risk and at the same time make optimum use of its funds. Middle office in Risk Management Division also monitors the liquidity position of the Bank and provide the liquidity gap to Treasury Department to meet liquidity gaps.
Notes to the financial statementsFor the year ended 31 December 2019

Annual Report 2019196
32. FINANCIAL RISK MANAGEMENT (CONTINUED)1. Credit Exposure (CONTINUED)
Maturity profile of assets and liabilities
Due on demand
and up to 30 days RO’000
More than 1 month to 6 months RO’000
More than 6 months
to 12 months RO’000
More than 1 year to 5 years RO’000
Over 5 years RO’000
Total RO’000
31 December 2019
Cash and balances with Central Bank of Oman
299,905 - - - 500 300,405
Loan and advances to customer
248,200 347,818 165,902 791,902 1,509,528 3,063,350
Loans and advances to banks 224,416 181,404 39,126 26,212 - 471,158
Investments FVTPL - - 4,263 - 4,263
Investments FVOCI Equity - - 3,643 - 3,643
Investments FVOCI-Debt Instrument
- - - 34,245 36,125 70,370
Investments at amortized cost
79,844 10,074 57,681 75,691 76,985 300,275
Intangible asset - - - - 397 397
Property and equipment - - - - 19,172 19,172
Other assets 18,943 50,955 4,462 - 18,452 92,812
Total Assets Funded 871,308 590,251 275,077 928,050 1,661,159 4,325,845
Total Assets Non Funded (Forward, Option and Commitments)
503,635 426,548 277,717 217,042 - 1,424,942
Total Assets Funded and Non Funded 1,374,943 1,016,799 552,794 1,145,092 1,661,159 5,750,787
Due to banks 239,929 77,000 - 173,250 - 490,179
Deposits from customers 235,674 681,756 567,155 908,479 550,124 2,943,188
Other liabilities 55,419 57,448 5,107 7,974 16,500 142,448
Subordinated loans - 28,875 - 35,000 - 63,875
Total equity** - - - - 686,155 686,155
Total liabilities and shareholders’ equity 531,022 845,079 572,262 1,124,703 1,252,779 4,325,845
Total Liabilities Non Funded (Forward , Unutilized) 387,764 432,218 276,688 338,615 - 1,435,285
Total Liabilities Funded and Non Funded 918,786 1,277,297 848,950 1,463,318 408,380 5,761,130
Cumulative Liabilities 918,786 1,277,297 848,950 1,463,318 408,380
Gap 456,157 (260,492) (296,150) (318,226) 1,252,779
Cumulative Gap 456,157 195,659 (100,497) (418,723) 834,056
** Including Perpetual Tier 1 capital securities
Notes to the financial statementsFor the year ended 31 December 2019

197Annual Report 2019
Due on demand
and up to 30 days RO’000
More than 1 month to 6 months RO’000
More than 6 months
to 12 months RO’000
More than 1 year to 5 years RO’000
Over 5 years RO’000
Total RO’000
31 December 2018
Cash and balances with Central Bank of Oman
301,005- - -
500 301,505
Loan and advances to customer
305,432 333,556 139,074 834,571 1,546,211 3,158,844
Loans and advances to banks
105,474 179,559 23,041 20,985 - 329,059
Investments FVTPL - - 4,140 - - 4,140
Investments FVOCI Equity - - 4,118 - - 4,118
Investments FVOCI-Debt Instrument
- - - 26,585 18,562 45,147
Investments at amortized cost
- 22,989 21,791 126,109 80,038 250,927
Intangible asset - - - - 794 794
Property and equipment - - - - 14,917 14,917
Other assets 16,662 63,024 12,166 280 11,907 104,039
Total assets Funded 728,573 599,128 204,330 1,008,530 1,672,929 4,213,490
Total Assets Non Funded (Forward, Option and Commitments)
542,131 260,406 436,418 182,363 - 1,421,318
Total Assets Funded and Non Funded
1,270,704 859,534 640,748 1,190,893 1,672,929 5,634,808
Due to banks 213,250 59,483 - 96,250 - 368,983
Deposits from customers 225,298 530,666 380,152 960,549 827,839 2,924,504
Other liabilities 48,936 73,785 12,842 8,466 13,937 157,966
Subordinated loans - - - 63,875 - 63,875
Total equity** - - - - 698,162 698,162
Total liabilities and shareholders’ equity
487,484 663,934 392,994 1,129,140 1,539,938 4,213,490
Total Liabilities Non Funded (Forward, Unutilized)
387,819 268,421 434,292 344,199 - 1,434,731
Total Liabilities Funded and Non Funded
875,303 932,355 827,286 1,473,339 1,539,938 5,648,221
Cumulative Liabilities 875,303 932,355 827,286 1,473,339 1,539,938
Gap 395,401 (72,821) (186,538) (282,446) 132,991
Cumulative Gap 395,401 322,580 136,042 (146,404) (13,413)
** Including Perpetual Tier 1 capital securities
Notes to the financial statementsFor the year ended 31 December 2019
32. FINANCIAL RISK MANAGEMENT (CONTINUED)1. Credit Exposure (CONTINUED)

Annual Report 2019198
32. FINANCIAL RISK MANAGEMENT (CONTINUED)1. Credit Exposure (CONTINUED)
C. Market risk
Market risk includes currency risk, interest rate risk and equity price risk.
Currency risk
The Bank is exposed to currency risk through its transactions in foreign currencies. The major foreign currency to which the Bank is exposed is the US Dollar which is effectively pegged to Rial Omani. The Bank finances a significant portion of its financial assets in the same currencies as the relevant measurement currencies to mitigate its foreign currency risk.
The Bank’s transactional exposures give rise to foreign currency gains and losses that are recognised in the statement of comprehensive income. The Bank ensures that its net exposure is kept to an acceptable level by buying and selling foreign currencies at spot rates when considered appropriate. Foreign exchange risk is computed on the average of the sum of net short positions or net long positions, whichever is higher of the foreign currency positions held by the Bank. The foreign currency exposures are given below:
Foreign currency exposures
2019RO 000’s
2018RO 000’s
Net assets denominated in US Dollars 94,327 163,412
Net assets denominated in UAE Dirham (AED) 278 14,020
Net assets denominated in other foreign currencies 1,327 1,320
95,932 178,752
Interest rate risk
The Bank’s operations are subject to the risk of interest rate fluctuations to the extent that interest-earning assets and interest-bearing liabilities are reset at different times. Risk management activities are aimed at optimising net interest income, given market interest rate levels, consistent with the Bank’s business strategies. The Bank manages mismatches by following policy guidelines and reduces risk by matching the repricing of assets and liabilities. Details relating to re-pricing mismatches and the interest rate risk thereon are placed to the ALCO in its regular meetings and also to the Risk Management Committee of the Board.Impact on earnings due to interest rate risk in the banking book is as follows:
Impact on earnings due to interest rate risk in the banking book
+ or – 1% + or – 2%
2019RO 000’s
2018RO 000’s
2019RO 000’s
2018RO 000’s
Omani Rials 7,825 8,859 15,649 17,718
US Dollars 3,948 4,083 7,896 8,165
Others currencies 537 232 1,075 464
12,310 13,174 24,620 26,347
The impact of statement in changes of equitydue to interest rate risk in the banking book is not material to the financial statements
Notes to the financial statementsFor the year ended 31 December 2019

199Annual Report 2019
32. FINANCIAL RISK MANAGEMENT (CONTINUED)1. Credit Exposure (CONTINUED)
D. Interest rate sensitivity gap
Sensitivity to interest rates arises from mismatches in the period to repricing of assets and that of the corresponding liability. The Bank manages these mismatches by following policy guidelines and reduces risk by matching the repricing of assets and liabilities.
Effective average interest
rate
Due on demand
and within
30 days
Due within 1 to 6
months
Due within 7 to 12 months
Due within 1 to 5 years
Due after 5 years
Non-interest bearing
Total
% RO’000 RO’000 RO’000 RO’000 RO’000 RO’000 RO’000
31 December 2019
Cash and balances with Central Bank of Oman
1.2% 98,175- - -
500 201,730 300,405
Loans, advances and financingto banks
3.8% 224,162 181,404 39,128 26,212252
471,158
Loans, advances and financing tocustomers
5.7% 512,781 1,204,195 113,202 659,603 573,569 - 3,063,350
Investments - FVTPL - - 4,263 - - - 4,263
Investment – FVOCI Equity
- - 3,643 - - - 3,643
Investment FVOCI – Debt Instrument
6.4% - - - 34,245 36,125 - 70,370
Investments at amortized cost
4.1% 79,844 2,167 48,656 105,066 56,635 7,907 300,275
Intangible asset - - - - - 397 397
Property and equipment
- - - - - 19,172 19,172
Other assets - - - - - 92,812 92,812
Total assets 914,962 1,387,766 208,892 825,126 666,829 322,270 4,325,845
Due to banks 3.3% 239,928 77,000 - 173,251 - - 490,179
Deposits from customers
2.9% 179,059 579,517 965,017 644,302 101,390 473,903 2,943,188
Other liabilities - - - - - 142,448 142,448
Subordinated loan 5.6% - 28,875 - 35,000 - - 63,875
Shareholders’ equity - 145,744 - 40,000 - 500,411 686,155
Total liabilities and Equity** 418,987 831,136 965,017 892,553 101,390 1,116,762 4,385,845
On-balance sheet gap 495,975 556,630 (756,125) (67,427) 565,438 (794,492) -
Cumulative interest sensitivity gap 495,975 1,052,605 296,480 229,053 794,492 - -
** Including Perpetual Tier 1 capital securities
Notes to the financial statementsFor the year ended 31 December 2019
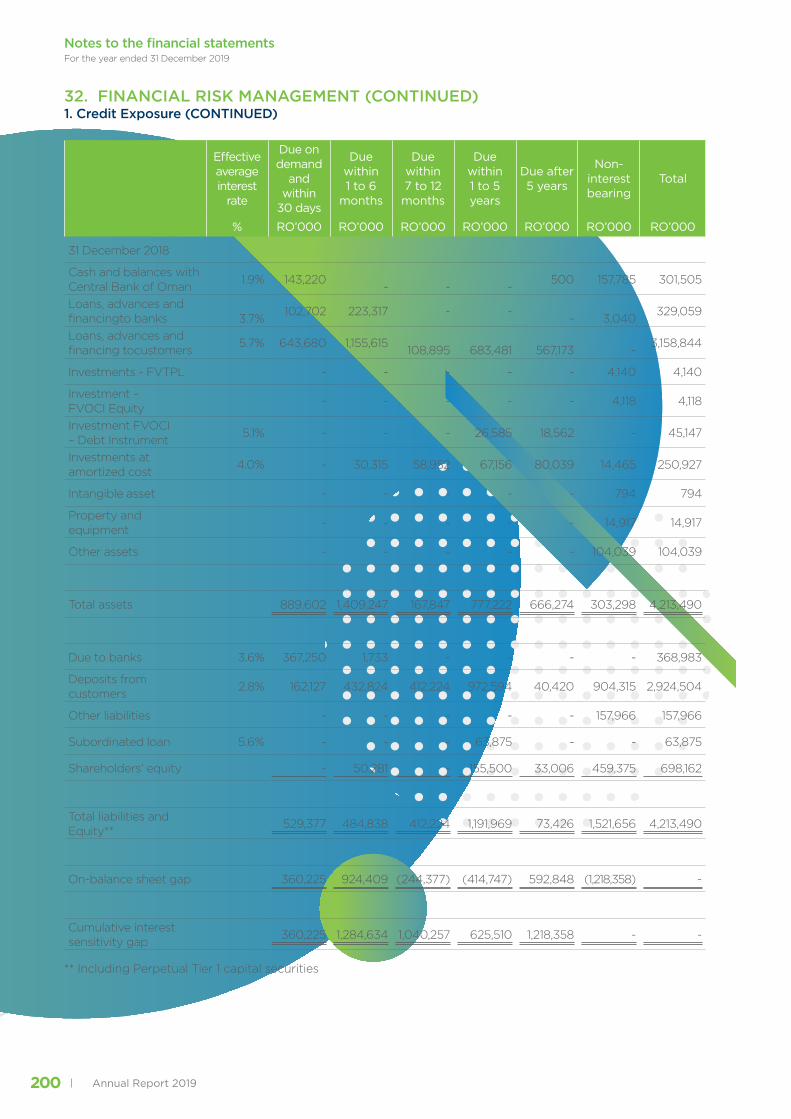
Annual Report 2019200
32. FINANCIAL RISK MANAGEMENT (CONTINUED)1. Credit Exposure (CONTINUED)
Effective average interest
rate
Due on demand
and within
30 days
Due within 1 to 6
months
Due within 7 to 12 months
Due within 1 to 5 years
Due after 5 years
Non-interest bearing
Total
% RO’000 RO’000 RO’000 RO’000 RO’000 RO’000 RO’000
31 December 2018
Cash and balances with Central Bank of Oman
1.9% 143,220- - -
500 157,785 301,505
Loans, advances and financingto banks 3.7%
102,702 223,317 - -- 3,040
329,059
Loans, advances and financing tocustomers
5.7% 643,680 1,155,615108,895 683,481 567,173 -
3,158,844
Investments - FVTPL - - - - - 4,140 4,140
Investment – FVOCI Equity
- - - - - 4,118 4,118
Investment FVOCI – Debt Instrument
5.1% - - - 26,585 18,562 - 45,147
Investments at amortized cost
4.0% - 30,315 58,952 67,156 80,039 14,465 250,927
Intangible asset - - - - - 794 794
Property and equipment
- - - - - 14,917 14,917
Other assets - - - - - 104,039 104,039
Total assets 889,602 1,409,247 167,847 777,222 666,274 303,298 4,213,490
Due to banks 3.6% 367,250 1,733 - - - - 368,983
Deposits from customers
2.8% 162,127 432,824 412,224 972,594 40,420 904,315 2,924,504
Other liabilities - - - - - 157,966 157,966
Subordinated loan 5.6% - - - 63,875 - - 63,875
Shareholders’ equity - 50,281 - 155,500 33,006 459,375 698,162
Total liabilities and Equity**
529,377 484,838 412,224 1,191,969 73,426 1,521,656 4,213,490
On-balance sheet gap 360,225 924,409 (244,377) (414,747) 592,848 (1,218,358) -
Cumulative interest sensitivity gap
360,225 1,284,634 1,040,257 625,510 1,218,358 - -
** Including Perpetual Tier 1 capital securities
Notes to the financial statementsFor the year ended 31 December 2019
201Annual Report 2019
32. FINANCIAL RISK MANAGEMENT (CONTINUED)1. Credit Exposure (CONTINUED)
(e) Investment Pricerisk
Bank is exposed to the volatility in the prices of the securities held under equity and debt portfolio. Equity and debt investments held are for strategic/long term rather than for trading purposes and hence, the Bank does not hold trading positions in equity and debt investments. However the Bank’s portfolio is marked to market on regular basis and the difference in the book value and market value are adjusted against investment revaluation reserve in shareholder’s equity and for impaired investments.
Further, Bank also conducts stress testing and sensitivity analysis to take an informed decision on equity and debt risk exposure.
If there is adverse impact of 5% on Level 1 portfolio, the value of the portfolio may decrease by RO 1,045 thousand (2018: decrease by RO 906 thousand).
If price for unlisted equity and debt instruments had been 5% lower:
The financial statements include holdings in unlisted shares and bonds which are measured at fair value. Fair value is estimated using either Net Asset Value (NA5) provided by the fund managers or book value per share of the investee company. If the estimation were 5% lower / higher while all other variables were held constant, the carrying amount of the unlisted shares and bonds would decrease / increase by RO 36,030 thousand (2018: decrease / increase by RO 36,029 thousand).
D. Operational risk
Operational risk is the deficiencies in information systems/internal controls or uncontrollable external events leading to financial/ non-financial losses for the Bank. The risk is associated with human error, systems failure and inadequate procedures or control and external causes. As per the Basel Committee on Banking Supervision (BCBS), operational risk is the risk of losses resulting from inadequate or failed internal processes, people and systems or from external events. Operational risk includes legal risk but excludes strategic and reputational risk.
The Bank has detailed policies and procedures that are regularly updated to ensure that a sound internal control environment exists. Risk Management Committee (RMC), a sub-committee of the Board, drives the implementation of the risk management framework, approved by the Board, at the apex level. The RMC ensure that the risk policies developed clearly spell out the quantitative prudential limits on various segments of the Bank’s operations and also ensures implementation of Central Bank of Oman’s guidelines on Risk Management/Basel II/Basel III and internationally accepted best practices in the area of risk management including Operational risk management. Management Risk Committee (MRC), comprising of Senior Management of the Bank, precedes RMC in reviewing, evaluating and monitoring of operational risk. Business Units are responsible for management of operational risks within their respective scope of duties. In the financial year 2019, the Bank’s operational risks were well controlled and losses from operational risks were kept at low level. Trained and competent staff oversees the various operational functions of the Bank.
Taking the New Capital Accord Implementation as an opportunity, the Bank has developed a comprehensive operational risk management framework comprising of the Operational Risk Management (ORM) policy, Risk Control and Self-Assessment, Key Risk Indicator, Loss Data Management (LDM) Framework. The ORM policy of the Bank provides the ORM framework which includes ORM components, management process, measurement process and governance, roles and responsibilities. The Bank has also set up Operational Risk Management Software to aid assessment of operational risk as well as collection and analysis of operational losses and key risk
indicators.
The Risk Control and Self-Assessment (RCSA) framework enables the Bank to identify the operational weaknesses in the process and procedures by conducting self-assessment workshops. A team of experts in various departments assess the operational weaknesses in various processes and its likely impact. RMD in association with business units has been able to complete the RCSA exercise for all the departments and branches of the conventional banking. During RCSA exercise, processes in various departments were reviewed from operational risk point of view and wherever high risk events were identified, the extant controls were reviewed. With the completion of the RCSA exercise, risk register has been created, which inter-alia includes inherent risk events, control effectiveness and residual risks.
Notes to the financial statementsFor the year ended 31 December 2019

Annual Report 2019202
32. FINANCIAL RISK MANAGEMENT (CONTINUED)1. Credit Exposure (CONTINUED)
The Key Risk Indicator (KRI) framework enables the Bank to identify and monitor the key risks. KRIs of all the departments in conventional banking have been identified and are being monitored on a monthly basis. Loss Data Management framework lays down the procedure to identify, record and report the internal and external loss events. The data on operational loss is collated on a regular basis and is presented to the Management and Board level committees. In order to avoid unexpected shocks to the financial position of the Bank, a reporting system on “Potential Losses” has also been introduced.Potential Loss can be defined as an operational event that has not actually crystallized into actual loss but has a potential of adversely impacting Bank’s bottom-line.
Operational Risk Unit (ORU) in RMD is responsible for implementation, development and coordination of all the operational risk activities of the Bank, while working towards achievement of stated goals and objectives. Risk Management Division (RMD) conducts regular training programs for staff at various levels to inculcate ‘risk awareness’ and to spread the general ‘risk management culture’ in the Bank. Professional training in diversified forms is also imparted to improve the employees’ risk management skills.
Business Continuity Planning (BCP)
Business Continuity Management is the implementation and management of preventative measures, planning and preparation to ensure the Bank can continue to operate following an incident, significant unplanned event or major operational disruption. The Bank ensures that its systems and procedures are resilient to ensure business continuity through potential situations of failure. Bank has adopted Business Continuity / Disaster Recovery Plan with a view to continue business operations and critical customers services at all times both at Conventional and Maisarah. The plan addresses employee health and safety, potential disruptions from the unanticipated loss of services or infrastructure and resumption of business operations in the face of an emergency or disaster. Business Impact Analysis, Business Continuity/ Disaster Recovery testing, Awareness Programs etc. are conducted in tune with the regulatory guidelines for meeting any unforeseen circumstances. The key initiatives on the business continuity readiness included the following:
Business Continuity Management (BCM) Steering Committee, a Management level committee has been set up and entrusted with the responsibility of overall supervision for the implementation and maintaining a sound BCM for the Bank. The committee ensures that plans formulated are implemented and tested.
The Bank maintains an alternate / Business Continuity Plan (BCP) site equipped with redundancy and contingency features to ensure business continuity for resuming critical business activities in emergent scenarios. Bank has strengthened BCP site seating capacity and infrastructure considering various worst case scenarios. Additional workspace has been created for critical business units to resume business services in the event of a disaster.
The Bank-wide BCP testing exercise and Information Technology Disaster Recovery Drill is conducted to test check the resilience of technical as well as business recovery. Testing was conducted in coordination with business units to test check transaction systems using business test cases and also to test the preparedness, recovery of applications, recovery timings, assembly of key resources, functioning of equipment’s, coordination of business units / branches etc. The testing results along with the gaps and action taken are apprised to the risk committees at the Management and Board level.
For the cause of human safety and security, fire drill exercises are also conducted in Head Office building. Through fire drills, the preparedness and recovery capabilities of the coordinators /floor leaders /fire wardens are tested and security procedures are reinforced.
As part of creating awareness, specific as well as comprehensive awareness programme are also conducted to imbibe the importance of BCP amongst staff.
The communication numbers of key persons are provided to all the staff so that they can contact the relevant person in case of emergency.
Notes to the financial statementsFor the year ended 31 December 2019
203Annual Report 2019
32. FINANCIAL RISK MANAGEMENT (CONTINUED)1. Credit Exposure (CONTINUED)
Internal Capital Adequacy Assessment Process (ICAAP):
The Bank has put in place Internal Capital Adequacy Assessment Process (ICAAP)with an objective to explain the Risk policies adopted, Risk policy principles, Target risk structure and Capital planning, the process of assessing the capital adequacy for all the three risks viz., Credit Risk, Market Risk and Operational Risk, Specific assessment procedures for all material risks like interest rate risk in banking book, reputational risk, credit concentration risk etc, the process of Internal Control Mechanism and the stress testing methodologies adopted by the Bank.
As a part of capital planning process, ICAAP provides a detailed assessment of its current capital adequacy, and also project future capital requirement to meet the regulatory capital adequacy ratios in line with approved business plans. The process covers a forward looking plan for the next 3 years. The overall framework has introduced a structured methodology for a comprehensive forward-looking assessment of capital based on the Bank’s risk profile. It is also expected that the establishment of ICAAP in the Bank will facilitate the awareness for risk sensitive topics when it comes to strategic decisions like acquisitions, launch of new products or organic growth targets.ICAAP is approved by the Board of Directors through Board Risk Committee. On a quarterly basis, reporting is done to the Board on the adequacy of capital. The Bank believes that its current and foreseen capital endowment is suitable to support its business strategy in a soothing market environment. The capital planning is reviewed on half yearly basis and the entire ICAAP document is updated at least annually for a forward-looking planning period of 3 years.
In order to determine the Bank’s capability to withstand adverse conditions, in addition to the base case, scenario and sensitivity analysis is also carried out. The scenario analysis entails boom in the economy & rise in oil prices, Decline in GDP due to economic downturn or due to decline in oil prices and capital adequacy sensitivity due to increase & decrease in growth of loans and advances. Besides this, Bank also conducts stress testing to assess the potential impact of the stress situations on the Bank’s earnings & capital position and enable the Bank to understand its risk profile & adjusting it in accordance with the risk appetite.
33. CAPITAL RISK MANAGEMENT
The Bank manages its capital to ensure that it will be able to continue as a going concern while maximising the return to shareholders within acceptable risk return framework. The Bank’s overall strategy remains unchanged from prior year. As per CBO guidelines, the Bank needs to maintain capital adequacy ratio (CAR) at a minimum of 12.875% (including the capital conservation buffer) as at 31 December 2019 and with effect from 1 January 2019, to maintain minimum capital adequacy ratio of 13.5% (including capital conservation buffer).
The capital base of the Bank consists of debt, which includes borrowings disclosed in note 15, and equity attributable to shareholders of the Bank comprising issued share capital, share premium, reserves and retained earnings and Perpetual Tier I Capital securities, as disclosed in notes 16 to 19
Notes to the financial statementsFor the year ended 31 December 2019

Annual Report 2019204
33. CAPITAL RISK MANAGEMENT (CONTINUED)
Capital adequacy
The ratio of equity to risk weighted assets, as formulated by the Basel II and Basel III, for the year ended 31 December 2019 is 17.86% (2018: 17.33%).
Capital structure 2019RO 000’s
2018RO 000’s
Common Equity Tier (CET) I/ TIERI CAPITALPaid up capital 299,635 280,033
Legal reserve 58,966 55,878
Share premium 95,656 95,656
Special reserve 18,488 18,488
Subordinated loan reserve 42,875 30,100
Retained earnings 1,447 11,557
Proposed bonus shares - 19,602
CET I/Tier I Capital 517,067 511,314
Additional Tier I regulatory adjustments:
Deferred tax assets (1,028) (1,029)
Goodwill (397) (794)
Negative investment revaluation reserve (2,245) (2,271)
Total CET 1capital 513,397 507,220
Additional Tier I capital ( AT1) 155,500 155,500
Total Tier 1 Capital (T1=CET1+AT1) 668,897 662,720
TIERII CAPITAL
Investment revaluation reserve 370 134
General provision 38,315 43,606
Subordinated loan 21,000 33,775
Total Tier II capital 59,685 77,515
Total eligible capital 728,582 740,235
Risk weighted assets
Banking book 3,671,420 3,936,646
Trading book 143,412 75,779
Operational risk 263,487 258,086
Total 4,078,319 4,270,511
Total Tier 1 Capital (T1=CET1+AT1) 668,897 662,720
Tier II capital 59,685 77,515
Total regulatory capital 728,582 740,235
Common Equity Tier 1 ratio 12.59% 11.88%
Tier I capital ratio 16.40% 15.52%
Totalcapital ratio 17.86% 17.33%
Notes to the financial statementsFor the year ended 31 December 2019

205Annual Report 2019
34. SEGMENTAL INFORMATION
The Bank is organised into three main business segments:
Retail banking – incorporating, private customer current accounts, savings, deposits, investment savings products, custody, credit and debit cards, consumer loans and mortgages;
Corporate banking – incorporating direct debit facilities, current accounts, deposits, overdrafts, loan and other credit facilities, foreign currency and derivative products; and
Treasury and investments
Other operations comprise investment management and institutional finance neither of which constitutes a separately reportable segment which are included in “Treasury and investments” segment.
Transactions between the business segments are on normal commercial terms and conditions.Funds are ordinarily allocated between segments, resulting in funding cost transfers disclosed in operating income.Interest charged for these funds is based on the Bank’s cost of capital. There are no other material items of income or expense between the business segments.
Segment assets and liabilities comprise operating assets and liabilities, being the majority of the statement of financial position, but exclude items such as taxation and borrowings.
Internal charges and transfer pricing adjustments have been reflected in the performance of each business.Revenue sharing agreements are used to allocate external customer revenues to a business segment on a reasonable basis.
At 31 December 2019Retail
bankingRO’000
Corporate bankingRO’000
Treasury and investments
RO’000
TotalRO’000
Segment operating revenues 75,988 100,989 17,161 194,138
Other revenues (net of commission expense)
4,279 11,160 19,694 35,133
Total 80,267 112,149 36,855 229,271
Interest, Islamic Window Deposit expenses
(30,205) (51,089) (18,013) (99,307)
Net operating income 50,062 61,060 18,842 129,964
Segment cost
Operating expenses including depreciation (35,867) (30,130) (5,477) (71,474)
Impairment for loans and investment net recoveries from allowance for loans impairment
(719) (21,424) (251) (22,394)
Bad Debts Written (4) - - (4)
Profit from operations after provision 13,472 9,506 13,114 36,092
Income tax expenses (2,183) (1,540) (2,125) (5,848)
Net profit for the year 11,289 7,966 10,989 30,244
Segment assets 1,376,470 2,071,420 997,836 4,445,726
Less: Impairment allowance 56,332 62,110 1,439 119,881
Total segment assets 1,320,138 2,009,310 996,397 4,325,845
Segment liabilities 675,099 2,385,730 565,943 3,626,772
Add: Impairment allowance 124 11,898 896 12,918
Segment liabilities 675,223 2,397,628 566,839 3,639,690
Notes to the financial statementsFor the year ended 31 December 2019

Annual Report 2019206
34. SEGMENTAL INFORMATION (CONTINUED)
At 31 December 2018Retail
bankingRO’000
Corporate bankingRO’000
Treasury and investments
RO’000
TotalRO’000
Segment operating revenues 82,641 100,746 12,935 196,322
Other revenues (net of commission expense)
4,738 12,991 16,697 34,426
Total 87,379 113,737 29,632 230,748
Interest, Islamic Window Deposit expenses
(37,490) (56,264) (5,141) (98,895)
Net operating income 49,889 57,473 24,491 131,853
Segment cost
Operating expenses including depreciation
(31,119) (29,168) (5,169) (64,456)
Impairment for loans and investment net recoveries from allowance for loans impairment
(6,650) 349 (353) (6,654)
Profit from operations after provision 12,120 28,654 18,969 59,743
Income tax expenses (1,920) (4,538) (3,004) (9,462)
Net profit for the year 10,200 24,116 15,965 50,281
Segment assets 1,444,926 2,086,191 818,742 4,349,859
Less: Impairment allowance (57,590) (77,676) (1,103) (136,369)
Total segment assets 1,387,336 2,008,515 817,639 4,213,490
Segment liabilities 659,296 2,408,677 434,309 3,502,282
Add: Impairment allowance 9 12,023 1,014 13,046
Segment liabilities 659,305 2,420,700 435,323 3,515,328
Islamic Banking Window
At 31 December 2019Retail
bankingRO’000
Corporate bankingRO’000
Treasury and investments
RO’000
TotalRO’000
Segment operating revenues 9,073 14,778 153 24,004
Other revenues 223 1,465 2,929 4,617
Total 9,296 16,243 3,082 28,621Unrestricted investment account holders’ share of profit and profit expense
(1,777) (10,566) (1,479) (13,822)
Net operating income 7,519 5,677 1603 14,799
Segment cost
Operating expenses including depreciation (3,676) (2,446) (970) (7,092)
Impairment allowance (58) (737) 61 (734)
Bad Debts Written (3) - - (3)
Profit before tax 3,782 2,494 694 6,970
Segment assets 175,792 282,850 132,286 590,928
Less: Impairment allowance (456) (5,413) (127) (5,996)
Total segment assets 175,336 277,437 132,159 584,932
Segment liabilities 63,995 350,385 36,327 450,707
Add: Impairment allowance 1 268 - 269
Segment liabilities 63,996 350,653 36,327 450,976
Notes to the financial statementsFor the year ended 31 December 2019

207Annual Report 2019
34. SEGMENTAL INFORMATION (CONTINUED)
At 31 December 2018Retail
bankingRO’000
Corporate bankingRO’000
Treasury and investments
RO’000
TotalRO’000
Segment operating revenues 8,531 12,724 301 21,556
Other revenues 234 786 2,600 3,620
Total 8,765 13,510 2,901 25,176
Unrestricted investment account holders’ share of profit and profit expense
(1,047) (10,381) (619) (12,047)
Net operating income 7,718 3,129 2,282 13,129
Segment cost
Operating expenses including depreciation
(2,633) (3,114) (927) (6,674)
Impairment allowance (133) (242) (141) (516)
Profit before tax 4,952 (227) 1,214 5,939
Segment assets 170,063 235,315 111,659 517,037
Less: Impairment allowance(382) (4,040) (188) (4,610)
Total segment assets 169,681 231,275 111,471 512,427
Segment liabilities 28,432 299,472 82,884 410,788
Add: Impairment allowance 3 528 - 531
Segment liabilities 28,435 300,000 82,884 411,319
35. DIVIDENDS – PROPOSED AND DECLARED
The Board of Directors in their meeting held on 28th January 2020 proposed a total cash dividend of 7% (RO
20.98 million) for the year 2019 (2018: 10%, RO 28 million), made up of a) 3% (amounting to RO 8.99 million)
from the Retained Earnings and b) 4% (amounting to RO 11.99 million) from the Special Reserve Account and nil
bonus shares issue for year 2019 (2018: 7%). (2018: 196,022,991 shares) of RO 0.100 each, subject to the approval
of Central Bank of Oman and shareholders. The Bank received Central Bank of Oman approval for a total cash
dividend of 3% (RO 8.99 million) against the proposal of total cash dividend of 7% (RO 20.98 million). A resolution
to approve these distributions will be presented to the shareholders at the Annual General Meeting to be held
on 23 March 2020. Board of Directors in their meeting held on 28 January 2020 approved a distribution of RO
15 million from Maisarah Islamic Banking Services, Bank’s Islamic Banking Window to the Head Office and also
approved increase in paid up capital from Bank’s core capital to Maisarah Islamic Banking Services an amount RO
15 million.
During the year, unclaimed dividend amounting to RO 3,864 (2018: RO 22,449) was transferred to the Investor’s
Trust Fund account as per the guidelines issued by the Capital Market Authority of Oman.
The shareholders of the Bank in the annual general meeting held during March 2019 approved the issuance of
7% bonus shares comprising 196,022,991 shares of par value RO 0.100 each (2018: 180,628,618 shares of par value
RO 0.100 each) and 10% (2018 – 12%) as cash dividend of the paid share capital of the Bank amounting to RO
28 million for the year ended 31 December 2018 (2017 – RO 27.09. million for the year ended 31 December 2017).
Notes to the financial statementsFor the year ended 31 December 2019

Annual Report 2019208
36. LEASES
This note provides information for leases where the Bank is a lessee.
Amounts recognised in the statement of financial position
The balance sheet shows the following amounts relating to leases:
2019RO 000’s
2018RO 000’s
Right-of-use assets
Leased Premises 1,823 2,535
Lease liabilities
Current 26 552
Non-current 738 771
764 1,323
Additions to the right-of-use assets during the 2019 financial year were RO 105 thousands.
Amounts recognised in the statement of profit or loss
The statement of profit or loss shows the following amounts relating to leases:
2019RO 000’s
2018RO 000’s
Depreciation charge of right-of-use assets
Leased Premises 817 -
Interest expense (included in finance costs) 56 -
Expense relating to short-term leases 1,929 -
The total cash outflow for leases in 2019 was RO 2,151 thousand.
The Bank’s leasing activities and how these are accounted for
The Bank leases various offices, storage facilities, and retail space for its branches. Rental contracts are typically made for fixed periods of 1 to 5 years but may have extension options as described in (4) below.
Contracts may contain both lease and non-lease components. The Bank allocates the consideration in the contract to the lease and non-lease components based on their relative stand-alone prices. However, for leases of real estate for which the Bank is a lessee, it has elected not to separate lease and non-lease components and instead accounts for these as a single lease component.
Lease terms are negotiated on an individual basis and contain a wide range of different terms and conditions. The lease agreements do not impose any covenants, but leased assets may not be used as security for borrowing purposes.
Until the 2018 financial year, leases of property were classified as operating leases. Payments made under operating leases (net of any incentives received from the lessor) were charged to profit or loss on a straight-line basis over the period of the lease.
From 1 January 2019, leases are recognized as a right-of-use asset and a corresponding liability at the date at which the leased asset is available for use by the Bank.
Notes to the financial statementsFor the year ended 31 December 2019

209Annual Report 2019
36. LEASES (CONTINUED)
Assets and liabilities arising from a lease are initially measured on a present value basis. Lease liabilities include the net present value of the fixed payments (including in-substance fixed payments), less any lease incentives receivable.
Lease payments to be made under reasonably certain extension options are also included in the measurement of the liability.
The lease payments are discounted using the lessee’s incremental borrowing rate is used, being the rate that the individual lessee would have to pay to borrow the funds necessary to obtain an asset of similar value in a similar economic environment with similar terms and conditions.
To determine the incremental borrowing rate, the Bank:
• where possible, uses recent third-party financing received by the individual lessee as a starting point, adjusted to reflect changes in financing conditions since third party financing was received
• uses a build-up approach that starts with a risk-free interest rate adjusted for credit risk for leases held by the Bank, which does not have recent third party financing, and
• makes adjustments specific to the lease, for exam ple term, country, currency and security.
Each lease payment is allocated between principle and finance cost. The finance cost is charged to profit or loss over the lease period so as to produce a constant periodic rate of interest on the remaining balance of the liability for each period.
Right-of-use assets are measured at cost comprising the following:
• the amount of the initial measurement of lease liability
• any lease payments made at or before the commencement date less any lease incentives received
• any initial direct costs, and
• any restoration costs.
The right-of-use assets are generally depreciated over the shorter of the asset’s useful life and the lease term on a straight-line basis.
Payments associated with short-term leases and leases of low-value assets are recognized on a straight-line basis as an expense in profit or loss. Short-term leases are leases with a lease term of 12 months or less. The Bank does not have any Low-value assets as of the respective reporting date.
Extension and termination options
Extension and termination options are included in a number of property and equipment leases across the Bank. These terms are used to maximize operational flexibility in terms of managing contracts. The majority of extension and termination options held are exercisable by the Bank and by the respective lessor. Extension options are not included in the lease term because it is not reasonably certain that the leases will be extended or not terminated.
Critical judgements in determining the lease term
In determining the lease term, management considers all facts and circumstances that create an economic incentive to exercise an extension option, or not exercise a termination option. Extension options (or periods after termination options) are only included in the lease term if the lease is reasonably certain to be extended (or not terminated).
• For leases of premises, the following factors are normally the most relevant:
• If there are significant penalties to terminate (or not extend), the Bank is typically reasonably certain to extend (or not terminate).
Notes to the financial statementsFor the year ended 31 December 2019
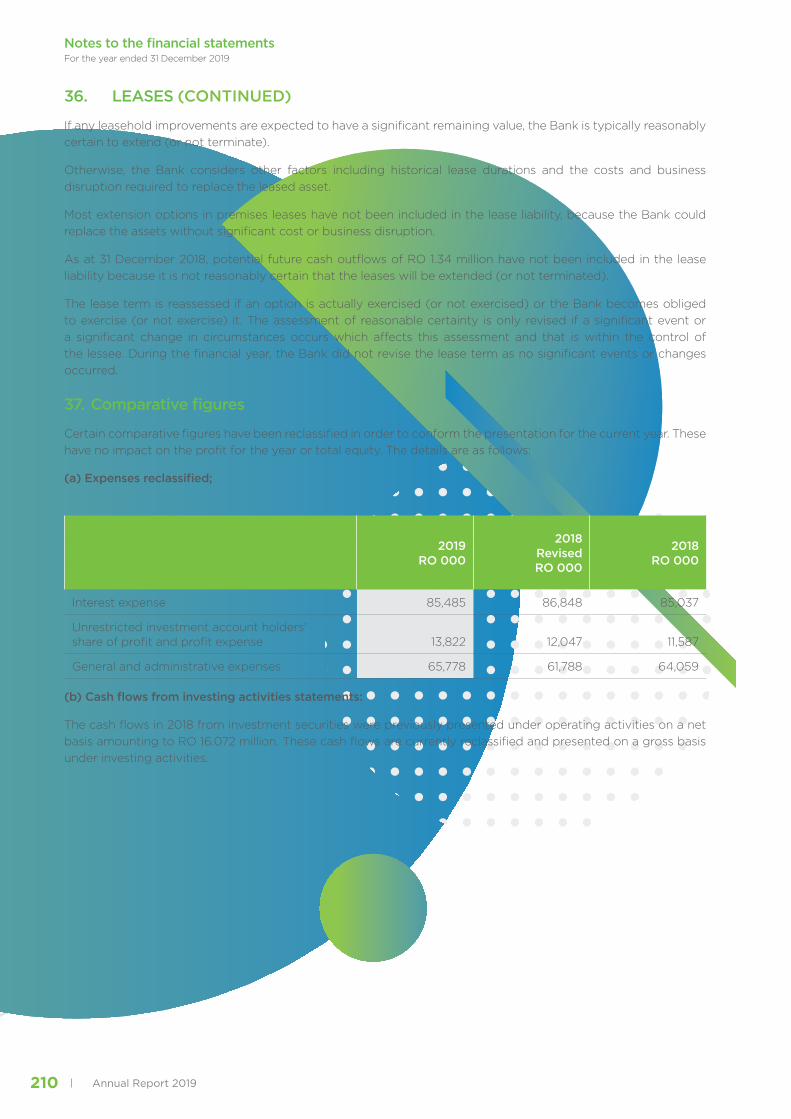
Annual Report 2019210
36. LEASES (CONTINUED)
If any leasehold improvements are expected to have a significant remaining value, the Bank is typically reasonably certain to extend (or not terminate).
Otherwise, the Bank considers other factors including historical lease durations and the costs and business disruption required to replace the leased asset.
Most extension options in premises leases have not been included in the lease liability, because the Bank could replace the assets without significant cost or business disruption.
As at 31 December 2018, potential future cash outflows of RO 1.34 million have not been included in the lease liability because it is not reasonably certain that the leases will be extended (or not terminated).
The lease term is reassessed if an option is actually exercised (or not exercised) or the Bank becomes obliged to exercise (or not exercise) it. The assessment of reasonable certainty is only revised if a significant event or a significant change in circumstances occurs which affects this assessment and that is within the control of the lessee. During the financial year, the Bank did not revise the lease term as no significant events or changes occurred.
37. Comparative figures
Certain comparative figures have been reclassified in order to conform the presentation for the current year. These have no impact on the profit for the year or total equity. The details are as follows:
(a) Expenses reclassified;
2019RO 000
2018RevisedRO 000
2018RO 000
Interest expense 85,485 86,848 85,037
Unrestricted investment account holders’ share of profit and profit expense 13,822 12,047 11,587
General and administrative expenses 65,778 61,788 64,059
(b) Cash flows from investing activities statements:
The cash flows in 2018 from investment securities were previously presented under operating activities on a net basis amounting to RO 16.072 million. These cash flows are currently reclassified and presented on a gross basis under investing activities.
Notes to the financial statementsFor the year ended 31 December 2019

MAISARAH ISLAMICBANKING SERVICES

Annual Report 2019212
TABLE OFCONTENTS

213Annual Report 2019
2019 DISCLOSUREREQUIREMENTS UNDERPILLAR-III OF BASEL II
228
MANAGEMENT DISCUSSIONAND ANALYSIS REPORT
222ANNUAL REPORT OFSHARI’A SUPERVISORYBOARD
214
FINANCIAL STATEMENTSFOR THE YEAR ENDED 31STDECEMBER 2018
264
NOTES
272
MAISARAH ISLAMICBANKING SERVICESWINDOW OFBANKDHOFAR SAOGAnnual Report 2019

ANNUAL REPORT OFSHARI’A SUPERVISORYBOARD31st DECEMBER 2019

215Annual Report 2019
Report of Shari’a Supervisory Board
To: General Assembly and Board of Directors of Maisarah Islamic Banking Services – Bank Dhofar (S.A.O.G)
Assalam Alaikum Wa Rahmat Allah Wa Barakatuh
All perfect praise be to Allah; and may Allah send blessing and peace upon the noblest of Messengers, our Prophet Muhammad, sallallahu ‘alayhi wa sallam, his family and companions.
In compliance with the letter of appointment, we are required to submit the following report for the year ended 31/12/2019:
We have reviewed the principles and the contracts relating to the transactions and applications introduced by Maisarah Islamic Banking Services (MIBS) during the year ended on 31/12/2019. We have also conducted our review to form an opinion as to whether the MIBS has complied with Sharia principles and also with the specific Fatawa, rulings and guidelines issued by us.
Maisarah’s management is responsible for ensuring that the Maisarah conducts its business in accordance with Sharia principle. It is our responsibility to form an independent opinion, based on our review of the operations of Maisarah, and report to you.
We conducted our review which included examining, on a test basis, of each type of transaction, the relevant documentation and procedure adopted by Maisarah.
We planned and performed our review so as to obtain all the information and explanations which we consider necessary in order to provide us with sufficient evidence to give reasonable assurance that the Maisarah has not violated Sharia principles.
In our opinion:
a) The affairs of Maisarah have been carried out in accordance with the rules and principles of Sharia, Central Bank’s regulations and guidelines related to Sharia compliance and other rules as well as with specific Fatwa and rulings issued by the SSB from time to time;
b) The contacts, transactions and dealings entered into by the Maisarah during the year ended 2019 that we have reviewed are in compliance with Sharia principles;
c) The allocation of profit and charging of losses relating to investment accounts conform to the basis that had been approved by us in accordance with Sharia principles;
d) Earnings that have been realized from sources or by means prohibited by Shari’a principles have been identified and segregated for disposal to charity.
We have identified the following areas where we believe there is room for further improvement by the management of Maisarah in order to follow truly the letter and spirit of the Sharia and to enhance the public’s confidence in Islamic banking in general and the Maisarah in particular:
a) Although Maisarah has focused on training and development of human resources in 2019, however more focus is required for training of new and existing staff in 2020;
b) Public awareness programs and seminars should be conducted to create awareness of Islamic banking;
c) As MIBS operations are expected to increase in 2020, therefore, management should further focus on ensuring highest standard of Sharia compliance;
d) The SSB advises MIBS to actively participate in Sharia compliant social and community activities to fulfill its corporate responsibilities.
We beg Allah the almighty to grant us all the success and straight-forwardness.
Wassalam Alaikum Wa Rahmat Allah Wa Barakatuh
Sheikh Dr. Salim Bin Ali Bin Ahmed Al DhahabChairman
Sheikh Ahmed bin Awadh bin Abdul-Rahman Al-HassaanMember
Sheikh Dr. Abdullah bin Mubarak Al AbriVice Chairman
Sheikh Dr. Mohammed bin Ali bin Mahmoud Al LawatiMember
Sheikh Dr. Mohammad Ameen Ali QattanMember
Date : 29th January 2020Place : Muscat, Sultanate of Oman

Annual Report 2019216
Fatwa: Advance Rental
The Sharia Supervisory Board (SSB) of Maisarah Islamic Banking Services has discussed the treatment of Advance Rental during construction/ assembling period and gives the following Fatwa:
Sharia Query Submitted to Sharia Supervisory Board:
MIBS is financing the construction cases mainly under Diminishing Musharakah (Construction). The Rental Agreement under Diminishing Musharakah (Construction) is based on the concept of Ijarah Mausufa Fi Al Zimma. Under DM structure, MIBS appoints the customer as an agent of MIBS through an independent agreement for arranging/ managing the construction/ assembling of DM asset on behalf of MIBS.
In this regard, following mechanism of income recognition during the construction/ assembling period is adopted.
1. Advance Rentals received from the customer during the construction/ assembling period is treated as an income of Maisarah Islamic Banking Services (MIBS) and distributed to stakeholders including the depositors.
2. In-case any of the assets under construction/ assembling of DM is not completed due to negligence of the customer, consultant or construction project manager, MIBS will request the said parties to compensate for any negligence, taking into account the rights of the customer being agent and partner.
3. In-case any of the assets under construction/ assembling of DM is not completed without the negligence of customer, consultant or construction project manager, MIBS will return the advance rental to the customer from its share of profit i.e. Mudarib share.
The management of Maisarah Islamic Banking Services seeks the Sharia Supervisory Board opinion on the above mentioned treatment of Advance Rent under Diminishing Musharakah (DM) and Ijarah.
Sharia Supervisory Board Fatwa
In-case Maisarah wants to take the advance rent as income of the bank during the construction/ assembling period and distribute it to all the stakeholder including the depositors, Maisarah may do so, provided that Maisarah takes full responsibility to fulfill the contractual commitment with the customer i.e. to ensure that the usufruct of the DM/ Ijarah asset is delivered to the customer as per the terms and condition agreed with the customer under the DM/ Ijarah agreements. In-case the usufruct of the DM/ Ijarah asset is not delivered to the customer without the negligence/ breach of the contractual obligation by the customer or due to the act of Allah i.e. natural disaster etc. then Maisarah will be responsible to return the advance rent to customer from its own sources i.e. Mudarib share.
Once the asset is constructed/ assembled the advance rent may become the part of rent for post completion of construction/ assembling period.
In this context, it is necessary that Maisarah should have a mechanism in place to record and monitor the advance rental received during the construction/ assembling period of DM/ Ijarah asset.
Shari’ah Supervisory Board hereby approves the above practice and pronounces that the same is in conformity with the provisions of Shari’ah.
We seek Allah guidance and Allah knows the best.
Sheikh Dr. Salim Bin Ali Bin Ahmed Al DhahabChairman
Sheikh Ahmed bin Awadh bin Abdul-Rahman Al-HassaanMember
Sheikh Dr. Abdullah bin Mubarak Al AbriVice Chairman
Sheikh Dr. Mohammed bin Ali bin Mahmoud Al LawatiMember
Sheikh Dr. Mohammad Ameen Ali QattanMember

217Annual Report 2019
Fatwa Business Account:
The Sharia Supervisory Board (SSB) of Maisarah Islamic Banking Services has reviewed the subject Product and its related documents and gives the following Fatwa:
First: Product Concept and Shari’ah Basis:
This product is a combination of two accounts i.e. saving and current. The saving account is based on the Islamic principle of Wakala, wherein customer will be Muwakil (Principal) while MIBS will be Wakil (investment agent) while current account will be based on the concept of Qard.
The business account will be having a sweep facility allowing the customer’s balance maintained in current account to be swept (or transferred) to the Business Account and vice versa. If a customer’s financial instrument is presented for clearing from current account and the current account is not having the required balance, then the remaining amount from business account will be swept to current account to clear customer’s financial instrument provided that there is enough balance available in the business account.
Second: The Agreements
1. Business Account – Special Conditions
The Shari’ah Supervisory Board hereby approves the above product and pronounces that Business account product is in conformity with the provisions of Islamic Shari’ah.
We seek Allah guidance and Allah knows the best.
Sheikh Dr. Salim Bin Ali Bin Ahmed Al DhahabChairman
Sheikh Ahmed bin Awadh bin Abdul-Rahman Al-HassaanMember
Sheikh Dr. Abdullah bin Mubarak Al AbriVice Chairman
Sheikh Dr. Mohammed bin Ali bin Mahmoud Al LawatiMember
Sheikh Dr. Mohammad Ameen Ali QattanMember
Annual Report 2019218
Fatwa Profit Calculation in Wakala Financing
The Sharia Supervisory Board (SSB) of Maisarah Islamic Banking Services has reviewed the profit calculation method of Wakala finance product and gives the following Fatwa:
First: Product Concept and Shari’ah Basis:
The subject product is based on Wakala contract (Investment Agency) that is defined as follows:
Wakala (Investment Agency)
Wakala (investment agency) means appointing another person to invest and grow one’s wealth with or without a fee.
Under the subject product, Maisarah Islamic Banking Services (Principal) will appoint Customer as its agent (investment agent) for investing the funds provided by Maisarah Islamic Banking Services in its (agent’s) Sharia Compliant business to generate an anticipated profit based on the actual performance of the business. Maisarah will pay a fee to customer for providing the services as an agent. Any profit generated over and above the anticipated profit rate will be held in the profit reserve account. At the end of the Wakala tenure this profit can be paid to the customer as an incentive provided that facility is not renewed. The anticipated profit of the Wakala will be calculated as following:
The profit will be calculated at the end of the agreed Wakalah period for each Wakala transaction/ facility and will take into account the final Wakalah accounts presented by the customer, the actual gross profit generated by the customer’s business, the customer’s current assets and the amount of funds utilized by the customer for the Wakalah during the Wakalah period.
Wakala profit = customer’s business turnover- total cost of sales as agreed and documented between Bank and the customer
Where the total cost of sales will be the direct costs attributable to the goods manufactured/traded by the customer including transport and insurance but excluding any amounts incurred in respect of financing costs, costs attributable to fixed assets, payroll, administration costs, depreciation and profit tax as agreed and documented between Bank and the customer.
The Shari’ah Supervisory Board hereby approves the above method for calculating the profit of Wakala Financing product and is of the opinion that same is in conformity with the provisions of Islamic Shari’ah.
We seek Allah guidance and Allah knows the best.
Sheikh Dr. Salim Bin Ali Bin Ahmed Al DhahabChairman
Sheikh Ahmed bin Awadh bin Abdul-Rahman Al-HassaanMember
Sheikh Dr. Abdullah bin Mubarak Al AbriVice Chairman
Sheikh Dr. Mohammed bin Ali bin Mahmoud Al LawatiMember
Sheikh Dr. Mohammad Ameen Ali QattanMember

219Annual Report 2019
Fatwa Salam Financing:
The Sharia Supervisory Board (SSB) of Maisarah Islamic Banking Services has reviewed the subject Product and its related documents and gives the following Fatwa:
First: Product Concept and Shari’ah Basis:
The subject product is based on Islamic concept of Salam that is defined as follows:
Salam is a kind of sale whereby the seller undertakes to deliver specified goods to a buyer at a future date in consideration of a price fully paid in advance at the time the contract of Salam sale is executed. Salam is permitted for fungible goods.
The specifications, quality, quantity, delivery date and place of delivery of the goods must be determined at the time of Salam sale to avoid any ambiguity which could become a cause of dispute between buyer and seller.
Under this product Maisarah Islamic Banking service (buyer) will purchase the specified goods from the customer (seller) through Salam sale wherein Maisarah Islamic Banking Services will pay the price in advance to the customer (seller) at the time of executing the Salam contract and customer (seller) will give the delivery of the goods at a deferred date as mutually agreed between Maisarah Islamic Banking Services and Customer. Maisarah Islamic Banking Services after taking the possession (physical or constructive) will sell the goods to a third party either directly or through its appointed agent.
Second: The Agreements
1. Master Salam Agreement
2. Agency Agreement
3. Independent Corporate Guarantee
The Shari’ah Supervisory Board hereby approves the above product and pronounces that Salam Financing product is in conformity with the provisions of Islamic Shari’ah.
We seek Allah guidance and Allah knows the best.
Sheikh Dr. Salim Bin Ali Bin Ahmed Al DhahabChairman
Sheikh Ahmed bin Awadh bin Abdul-Rahman Al-HassaanMember
Sheikh Dr. Abdullah bin Mubarak Al AbriVice Chairman
Sheikh Dr. Mohammed bin Ali bin Mahmoud Al LawatiMember
Sheikh Dr. Mohammad Ameen Ali QattanMember
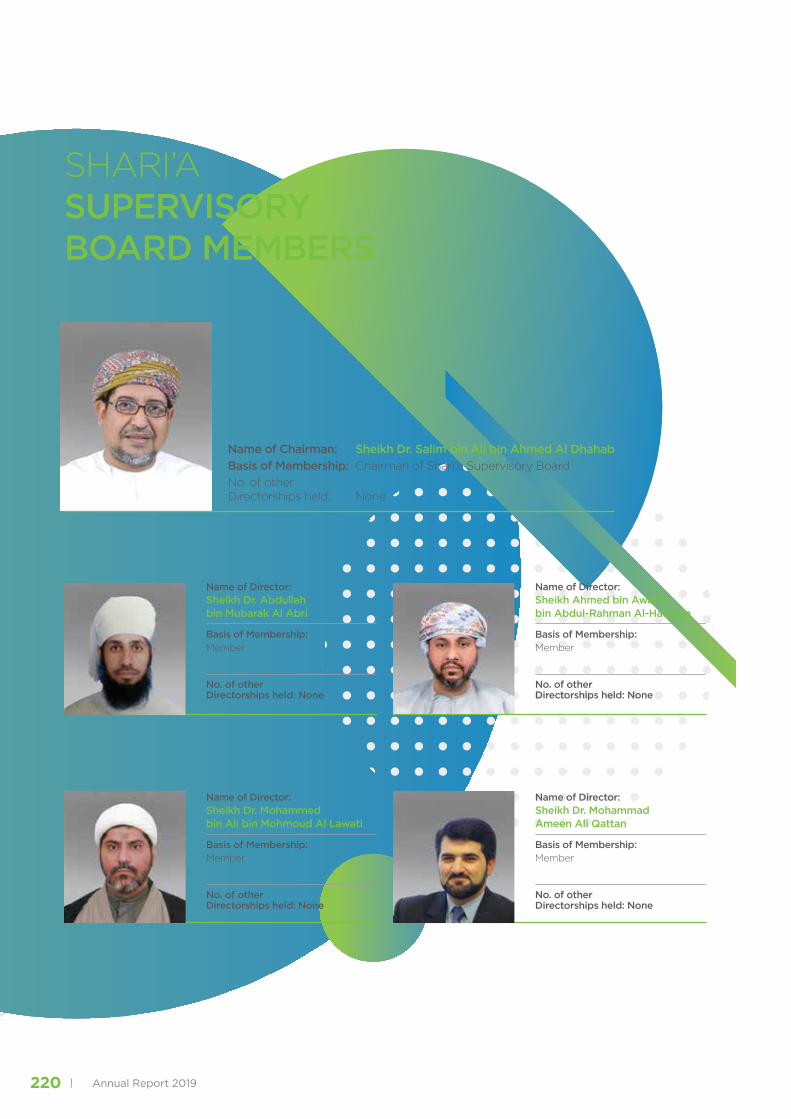
Annual Report 2019220
SHARI’A SUPERVISORY BOARD MEMBERS
Name of Director: Sheikh Dr. Abdullah bin Mubarak Al Abri
Basis of Membership: Member
No. of otherDirectorships held: None
Name of Director: Sheikh Dr. Mohammed bin Ali bin Mohmoud Al Lawati
Basis of Membership: Member
No. of otherDirectorships held: None
Name of Director: Sheikh Ahmed bin Awadh bin Abdul-Rahman Al-Hassaan
Basis of Membership: Member
No. of otherDirectorships held: None
Name of Director: Sheikh Dr. Mohammad Ameen Ali Qattan
Basis of Membership: Member
No. of otherDirectorships held: None
Name of Chairman: Sheikh Dr. Salim bin Ali bin Ahmed Al DhahabBasis of Membership: Chairman of Shari’a Supervisory BoardNo. of other Directorships held: None

221Annual Report 2019
Yahya Mohamed Ahmed Al SharaiqiHead of Treasury
Fawaz Rajab Al OjailiHead of Corporate Banking
Jamsheed HamzaHead of Retail
Mohsin ShaikHead Of Investment Banking& Capital Markets
Ismail Jama Ismail Bait IshaqChief Operating Officer
Sohail NiaziChief Executive
MANAGEMENT TEAM

MANAGEMENT DISCUSSION& ANALYSIS REPORT31st DECEMBER 2019

223Annual Report 2019
Maisarah Islamic Banking Services
The Islamic banking window of BankDhofar, Maisarah Islamic Banking Services was launched in 2013 offering superior Islamic banking experience and a wide range of Shariah compliant range of products and services. Maisarah has grown tremendously over the years due to its continued commitment to provide exceptional Islamic banking services to its customers and fulfillment of long term goals of its all stakeholders. Maisarah started with 1 branch in 2013 and now operates with network of 10 branches strategically located across Sultanate of Oman.
The major units operating under Maisarah and Maisarah Financial performance as at December 2019 is highlighted below:
MAISARAH WHOLESALE BANKING GROUP
In order to provide focused financial solutions to its clienteles, Maisarah Wholesale Banking (MIBS WSB) is divided into two segments, i.e. Corporate Banking and SME. Each of these segments is managed by a dedicated team of highly trained and qualified business professionals.
MIBS WSB offers a wide range of innovative products, financial solutions and services stemming out of the financial needs of clients operating in different sectors, in a Sharia compliant manner. The spectrum of the products and services is not limited to the market known Working Capital requirements, Term Finance, Project Finance and Trade Finance, but it also spans over financial advisory and syndicate arrangements as well. MIBS WSB products have been developed and managed by specialized professionals with extensive experience and expertise in the field, through which MIBS was able to have competitive edge in its offering to clients in public and private sector companies, governments and quasi-governmental entities, and HNWI.
MIBS WSB continues to strengthening its market position and recorded strong performance during 2019, despite the prevailing economic challenges during the year, where it has successfully grow its corporate financing portfolio by a remarkable 19.1% during the year, at the same time was able to keep focused on the quality and healthiness of the portfolio.
The strategy for the year was to continue diversifying the portfolio through increased geographic coverage and availability of additional products. Diversification was achieved through financing clients in Food industries, Logistics, Environmental and Recycling industries, Hotels & Tourism, Education, Quarry & Mining, Trading, Health, oil and gas, contracting and Manufacturing Sectors. The trusted experienced team of professionals and the vast branches network and the dedicated full-fledged Corporate Offices in Muscat, Salalah and the dedicated presence in Batinah Region were among the top critical success factors for MIBS WSB.
The market response and demand has been so encouraging, that MIBS WSB plans to introduce new products and services designed with specific consideration of the Omani market and business requirements. These products will provide further options and flexibility to the existing and potential clientele including Corporate, SME and even Individual entrepreneurs. We optimistically look at 2020 as a year of economy rejuvenation and stabilization to mark another year of business success and growth for MIBS WSB.
MAISARAH RETAIL BANKING SERVICES
Maisarah Retail Banking division continued its business with the existing network of 10 branches across Oman which include Azaiba, Salalah, Sohar, Birkat Al Mouz, Al Hail, New Salalah, Araqi, Sur, Greater Muttrah and Al Khuwair. During 2019 the products and services were enhanced with optimizing the product process as well as introducing new products to meet customer demand. With these strengths in hand in addition to the well acceptance that Maisarah received amongst the customers, Retail portfolio registered a growth of 3.27% in Assets and 3.22% in liabilities in spite of the challenging market conditions.
During the year many initiatives were kicked off and rolled out to enhance the Mobile Banking Application, segmentation and Prize Account for customers. Maisarah introduced contact less cards were to the customers which help customer to tap and complete transaction on POS and ATMs where the option is enabled.
Maisarah continued to put its focus on excellence in service and to meet the same staff members went through intensive training programs on products, sharia and soft skills.
To complement the efforts and as part of Maisarah efforts to increase the awareness of Islamic banking, many programs for customers, social media awareness programs as well as various Islamic banking conference initiatives were sponsored and supported. Furthermore, VIP gathering events were conducted in various parts of Oman, where the dignitaries from the locality was invited and Islamic banking awareness given for better understanding and soliciting relationship.

Annual Report 2019224
In addition, Maisarah Prize Account was also one of the key product that Maisarah has and which was well accepted amongst the customers. During the year, the transformation and digitalization was also given focus to improve the customer experience as well as improve user experience at the same time. To enhance the customer experience and further elevate the digital journey, the upgrading of the core banking took place during the year.
In 2020, Maisarah is poised to reach out to more customers. More attractive prize scheme, financial inclusion plans, branch and kiosk roll outs are all initiated to meet the demand. The team is also being structured more to focus on business as well as operations thereby enhancing the customer experience and differentiating with the service we offer.
INVESTMENT & CAPITAL MARKETS
Investment Banking and Capital Markets focus besides investments is to create and distribute Shariah compliant investment products in both equity and debt markets. This department provides comprehensive range of services such as financial advisory, corporate finance, deal structuring mainly in Sukuk and private equity placements.
In 2019, Maisarah’s Investment Banking & Capital Market was engaged as the sole Issue Manager and Lead Manager for a family office based in Salalah on a sukuk deal. Furthermore, the department has been engaged to advise on Real Estate Investment Fund for a leading real estate development company in Oman. In 2019, Maisarah also won the “Sukuk Deal of the Year” by Islamic Finance Network for advising the USD denominated sukuk for Tilal Development Company in 2018.
As a step forward, Maisarah’s Investment banking & Capital Market will play an important role in the growth of Maisarah and also to enhance the investment banking platform in Oman from the Shariah compliant space.
MAISARAH – TREASURY
Maisarah Treasury continued to operate with a clear vision and mission that is in line with the overall Bank’s strategy and commitment to be the Best Bank in Gulf. Maisarah Treasury demonstrated an impressive financial and operational performance that is driven by admirable customer experience, enhancing value for employees by building a high performance work environment and to diversify revenue streams by exploring new and innovative business opportunities. The department contributed towards the completion and implementation of several IT infrastructures based projects including Maisarah’s Banking system upgrade. This has helped Maisarah retain its position as one of the leading Islamic Banking Entity in the Sultanate of Oman.
Maisarah Treasury is one of the main drivers of wholesale and government deposit base with the objective to strengthen and diversify core funding sources that supported the overall asset growth. Maisarah’s client base continued to broaden which was instrumental in making additional wholesale/retail financing and investments in order to meet the overall business budget.
Maisarah Treasury strives to maintain a strong balance sheet position and regulatory ratios that comfortably exceed threshold. The department constantly endeavors to hold a certain amount of liquidity along with a portfolio of liquid and marketable securities for unexpected events and economic uncertainties. In addition, Maisarah Treasury inducted new offshore counterparties by signing interbank Money Market agreements that helped the Bank in developing a contingency funding plan to ensure business continuity under stressful market conditions.
Maisarah Treasury also participated in the latest Omani Rial based sovereign Sukuk in order to support the successful close of the issuance and to contribute positively towards the economy. Furthermore, the department continued its approach towards managing long and short term cash flows along with its foreign currency exposures in line with the growing financing, investment and trade business volume to contribute towards achieving the planned targets for the year 2020.
SHARIA SUPERVISORY BOARD
Maisarah’s Sharia Supervisory Board (SSB) is the highest authority in Maisarah to decide on the Sharia related matters. SSB, with the aim of upholding the highest Sharia standards held 4 meetings during the year under the Chairmanship of Sheikh Dr. Salim bin Ali bin Ahmed Al Dhahab, and membership of Sheikh Dr. Abdullah bin Mubarak Al Abri, Sheikh Dr. Mohammed bin Ali bin Mahmoud Al Lawati, Sheikh Ahmed bin Awadh bin Abdul-Rahman Al-Hassaan, Sheikh Dr. Mohammad Ameen Ali Qattan.

225Annual Report 2019
The SSB reviewed and approved all new products, services, policies, procedures, manuals and amendments in the existing products and services to ensure ongoing Sharia compliance and supervisory guidance. The SSB has been fulfilling its responsibility of playing an important role in ensuring Sharia governance in line with CBO Islamic Banking Regulatory Framework (IBRF) and industry best practices with the help of Sharia Compliance and the Audit Department.
SHARIA COMPLIANCE AND AUDIT DEPARTMENT
A full-fledged Sharia Compliance and Audit Department is working under the supervision of Sharia Supervisory Board (SSB), in order to ensure that all the business operations conducted by Maisarah are in-line with the Sharia principles and as per the Sharia Governance framework mentioned in Islamic Banking Regulatory Framework (IBRF) of Central Bank of Oman comprises of Sharia Compliance Unit and Sharia Audit Unit.
To implement Sharia controls and ensure highest standards of Sharia compliance, the Sharia Department works closely with all departments and management within Maisarah to ensure all activities, operations and transactions are conducted in accordance with Sharia rules, principles and IBRF guidelines.
As a part of its role, the Sharia Department monitors and audits all branches, business units and control functions of Maisarah. The service level agreements and profit distribution with BankDhofar are also reviewed and audited by the Sharia Compliance and Audit Department.
Furthermore, Maisarah has entered into an engagement with an External Sharia Auditor that conducted a third party independent Sharia audit and review to ensure highest standards of Sharia compliance are maintained within Maisarah. The Sharia Compliance Department is actively involved in Islamic banking and product related training of staff, management and other stakeholders.
MAISARAH CORPORATE SERVICES
Maisarah Corporate Services comprising of Maisarah Operations & Support Services (MO&SS), Policies & Procedures, Product Development, Projects & IT, and Learning & Development departments provides infrastructure support for efficient functioning of Maisarah Islamic Banking Services. This group is working under the supervision of Chief Operating Officer Maisarah.
MAISARAH OPERATIONS & SUPPORT SERVICES
Maisarah Operations & Support Services MO&SS consist of following departments;
• Centralized Operations
• Credit Administration• Trade Finance• General Admin Services
• Remedial and Recovery
MO&SS facilitates all operations of Maisarah to allow business units to offer best and efficient services to customers, and continuously works on streamlining and re-engineering the processes to ensure that operational risks are minimized while enhancing the operational efficiencies to execute and process the transactions on day to day basis. Similarly with the addition of Maisarah Remedial and recovery department bank has improved its recovery of bad debts and minimize provisioning for the year. MO&SS also plays an important role in the implementation of systems and procedures to automate its activities to fulfill its goal of providing best customer experience through state of the art infrastructure support.
PRODUCT DEVELOPMENT
As a part of the core strategy for providing complete range of Sharia compliant products and services, Maisarah has established a dedicated product development department that focuses on creatively developing new and innovative product along with enhancing the existing products through continuous research and customer feedback. The main objective of product development is to design product structures that meets the customer requirements in the best possible manner, whilst helping Maisarah expand its business.
During the year Product Development department has successfully launched Prize Scheme for 2019 under Prize Account product for its retail customers based on the Sharia structure of Mudarabah, allows the customer a chance to win periodic prizes, which are paid from shareholder’s funds. Additional prize draws were also launched for Prize Account customers during the year.

Annual Report 2019226
Product development efforts will continue to play an important role in providing best customer experience through development and launch of innovative products and services.
MAISARAH PROJECTS, POLICIES AND PROCEDURES
Under Corporate Services the Maisarah Project department in coordination with Maisarah Policies & Procedures Department has achieved several milestones within this year to enhance customer services by delivering the following key projects among many other initiatives:
• Core Banking Upgrade from R12.8 to R14.1
• ERP
• Mobile Wallet Service
The department plays an important role in enabling Maisarah to continue its remarkable growth by building the state-of-the art infrastructure and developing the organizational structure for future success.
MAISARAH - FINANCIAL PERFORMANCE
Maisarah Islamic Banking Services has achieved a remarkable growth in profitability during 2019. For the year 2019, Maisarah Islamic Banking Services posted a profit before tax of OMR 6.97 million compared to OMR 5.94 million earned in 2018, reflecting strong 17.34%, year-on-year growth.
Maisarah key financial metrics showed significant growth compared to the previous year. The gross income from Financing, Placement and Investment increased by 11.66% to OMR 26.24 million in 2019 from OMR 23.50 million reported in 2018. The net financing income (after cost of funds) increased by 8.47%, to OMR 12.42 million for 2019 as compared to OMR 11.45 million reported in 2018. Non-Funded income increased significantly by 41.67% to OMR 2.38 million in 2019 from OMR 1.68 million in 2018. Cost to income ratio continue to improve and reduced to 47.92% for 2019 from 50.83% last year. Maisarah net provisions (ECL) including bad debts for 2019 is OMR 0.737 million compared to OMR 0.516 million for 2018, an increase of 42.83%
ParticularsOMR in Million
2019 2018
Gross Profit income 26.24 23.50
Net Financing income (after cost of fund) 12.42 11.45
Fees, commissions & other income 2.38 1.68
Total Operating Income 14.8 13.13
Total operating costs (7.09) (6.67)
Net operating profit / (loss) 7.71 6.46
Impairment allowance (net) (0.74) (0.52)
Net profit / (loss) before tax 6.97 5.94
Maisarah gross financing portfolio has grown 12.44% to OMR 451.44 million at 31 December 2019 from OMR 401.49 million at 31 December 2018. The Sukuk investment portfolio increased by 48.28% from OMR 42.15 million as at 31 December 2018 to OMR 62.50 million as at 31 December 2019.
The total customer deposits of Maisarah increased to OMR 405.22 million, registering a growth of 14.67% compared to OMR 353.39 million at 31 December 2018, to support the strong financing growth. Maisarah total assets increased by 14.15% to OMR 584.93 million at December 2019 from OMR 512.43 million at 31 December 2018.

227Annual Report 2019
A brief analysis of diverse financing portfolio as at December 31, 2019 is as follows:
ParticularsOMR in Million
2019 2018
Murabaha & Other receivables 19.09 24.18
Mudaraba financing 18.90 26.59
Diminishing Musharaka financing 326.82 285.52
Ijarah Muntahia Bittamleek 46.02 46.00
Credit Card receivable 0.60 0.44
Wakala Finance 40.01 18.76
Gross Financing to customers 451.44 401.49
Less: Allowance for impairment (5.43) (4.40)
Net Financing 446.01 397.09
Customer deposits of Maisarah as at December 31, 2019 comprises of the following:
ParticularsOMR in Million
2019 2018
Current accounts 112.50 56.04
Equity of investment account holders 39.32 34.03
Wakala Deposits 253.40 263.32
Total customer deposits 405.22 353.39
MAISARAH GOALS & PLANS
Maisarah shall continue to stay focused on providing superior customer services, increase market share, enhance business growth and create value for its shareholders.
The key area of focus and initiatives for 2020 include:
• Reach out to more customers, segments and regions by expanding branch network across the country.
• Roll out new products and services to cater to ever growing customer needs.
• Investing in technology and operational infrastructure to stream line internal process and reduce operational risks.
• Improve and optimize current product and services to minimize the turnaround times.
• Organize seminars and corporate events locally and internationally to promote awareness of Maisarah Islamic banking products and services.
• Introducing more innovative channels and E platforms to customers for banking transactions.
• Develop stronger relationships with its existing and new customer and all other stakeholders by getting closer to them through regular meetups and workshops.

DISCLOSUREREQUIREMENTS UNDERPILLAR-III OF BASEL II & III

229Annual Report 2019

Annual Report 2019230
1. SCOPE OF APPLICATION
1.1. QUALITATIVE DISCLOSURE
1. Maisarah Islamic Banking Services (Maisarah) is an Islamic Window of Bank Dhofar SAOG (the Bank), established after obtaining license from the Central Bank of Oman (CBO). The principal activities of the Maisarah include taking saving, investment accounts, providing Shari’a Compliant forms of financings as well as managing investor’s money on the basis of Mudaraba or Wakala, providing commercial banking services and other investment activities.
2. A complete set of financial statements of Maisarah is included under Notes in the consolidated financial statements of the Bank. The disclosures in this document have been prepared in accordance with the CBO requirements outlined in the Islamic Banking Regulatory Framework (IBRF), Title 5: Capital Adequacy.
3. There is no restriction on the transfer of funds from the Bank towards Maisarah. However, under the IBRF, Title 9, section 1.10.2, transfer of funds from Maisarah to the Bank is not permissible.
1.2. QUANTITATIVE DISCLOSURE
1. Maisarah does not own any interest in any entities including Takaful company.
2. CAPITAL STRUCTURE
2.1. QUALITATIVE DISCLOSURE
1. Islamic Windows of domestic conventional banks shall have and at all times maintain an allocated capital of not less than RO 10 million or such higher amount as may be determined from time to time by CBO. Islamic windows are also required to maintain the minimum capital adequacy ratio of 11% of the RWA at all times. The capital buffer requirement as per Basel III is imposed at the consolidated level and thus, is not applicable at the Islamic window level.
Maisarah’s regulatory capital is calculated as per the guidelines issued by the CBO. The regulatory capital is broadly classified into two categories – Tier I and Tier II capital. Maisarah’s capital structure mainly consists of Tier I capital. Tier I capital includes paid up capital, retained earnings (available on a long-term basis) and reduced by unrealized losses on investments categorized as fair value through other comprehensive income. Within 11% Capital adequacy ratio, Islamic Window need to maintain minimum of 9% of Risk Weighted Assets (RWA) as Tier 1 Capital ratio.
Tier II (supplementary capital) consists of undisclosed reserves, revaluation reserves / cumulative fair value gains on instruments classified as other comprehensive income and impairment provision subject to certain conditions.
Deposits of Unrestricted Investment Account Holders (URIA) is not considered as part of regulatory capital and Maisarah is not reducing its risk weighted assets for jointly financed assets.
Maisarah Islamic Banking Services – Window of BankDhofar
DISCLOSURE REQUIREMENTS UNDER PILLAR – III OF BASEL II & III.For the year ended 31 December 2019

231Annual Report 2019
2. CAPITAL STRUCTURE (CONTINUED)
2.2. QUANTITATIVE DISCLOSURE
1. The details of capital structure are provided as under:
ELEMENTS OF CAPITAL RO 000
Common Equity Tier I Capital (CET1)
Paid up capital 55,000
Share Premium -
Legal Reserve -
Subordinated Debt Reserve -
Retained earnings 19,587
Proposed Stock Dividend -
Common Equity Tier I Capital (CET1) 74,587
Prudential valuation adjustments -
Additional Tier I Capital (AT1) -
Total Tier I Capital (TI=CET1+AT1) 74,587
Tier 2 Capital (T2): Instruments and provisions
Subordinated Debt -
Impairment provision (upto 1.25% of risk-weighted assets) * 3,501
Profit Equalization Reserve (PER) & Investment Risk Reserve (IRR) 20
Total Tier 2 Capital (T2) 3,521
TOTAL REGULATORY CAPITAL (TC=CET1+AT1+ T2) 78,108
* As per CBO Circular BSD/CB/FLC/2018/17 dated 26 November 2018, Expected Credit Loss under Stage 1 and 60% of Stage 2 (2019: RO 3,501k) shall be considered for Tier II capital provided such amount should not exceed 1.25% of the credit risk weighted assets or the general provision considered for Tier 2 capital as on 31 December 2017 (RO 3,747k).
2. The elements of equity of Unrestricted Investment Account Holders (URIA) are provided as under:
ELEMENTS OF EQUITY OF URIA RO 000
Total URIA Funds 39,319
Profit Equalization Reserve (PER) - Shareholders’ Component 8
Profit Equalization Reserve (PER) - Investment Account Holders’ Component) 8
Investment Risk Reserve (IRR) 4
Maisarah Islamic Banking Services – Window of BankDhofar
DISCLOSURE REQUIREMENTS UNDER PILLAR – III OF BASEL II & III.For the year ended 31 December 2019

Annual Report 2019232
3. CAPITAL ADEQUACY
3.1. QUALITATIVE DISCLOSURE
1. The Bank has adopted Standardized Approach (SA) for computation of capital charge for credit risk and market risk, and Basic Indicator Approach (BIA) for operational risk. Under Standardized approach for credit risk, the Bank has adopted simple approach for recognizing collaterals in the Banking Book and for risk weighting the claims on Sovereigns and Banks, credit ratings from external credit assessment institutions is used. Assessment of capital adequacy is carried out in conjunction with the capital adequacy reporting to the CBO.
Maisarah capital adequacy ratio is 15.13% as against the CBO requirement of 11%. The Bank’s policy is to manage and maintain its window’s capital with the objective of maintaining strong capital ratio and high rating. Maisarah maintains capital levels that are sufficient to absorb all material risks to which it is exposed to and provides market return to the shareholders. Maisarah also ensures that the capital levels comply with regulatory requirements. The whole objective of the capital management process in Maisarah is to ensure that it always remains adequately capitalized.
2. In principle, Risk weighted assets (RWA) financed by Profit Sharing Investment Accounts (PSIA), in principle, are excluded in the calculation of the denominator of the capital ratio, insofar as the commercial risk of these assets do not affect the capital of the shareholders. However, as per communication received from CBO, RWA shall be computed in the same way as in conventional banking, therefore, PSIA is not deducted. Assets funded by PSIA are also assigned same risk weights as the assets funded by own equity.
3.2. QUANTITATIVE DISCLOSURE
1. Capital Requirement
DetailsRisk Weighted
AssetsRO 000
Capital Requirements *
RO 000
Credit Risk 447,345 49,208Market Risk 18,625 2,049Operational Risk 50,340 5,537Total Risk Weighted Assets 516,310 56,794
* calculated as 11% of risk weighted assets as per the CBO requirement.
2. Capital Adequacy Ratio
Sr. No. Details RO 000
1 Tier I Capital (after supervisory deductions) 74,5872 Tier II Capital (after supervisory deductions and up to eligible limits) 3,5213 Of which, Total Eligible Tier III Capital -4 Risk weighted assets – banking book 447,3455 Risk weighted assets – operational risk 50,3406 Total risk weighted assets – Banking Book + Operational risk 497,6857 Minimum required capital to support RWAs of banking book and operational risk 54,7457 (1) Minimum required Tier I capital for banking book and operational risk 51,2247 (2) Tier II capital required for banking book and operational risk 3,5218 Tier I capital available for supporting trading book 23,3639 Tier II capital available for supporting trading book -10 Risk weighted assets – trading book 18,62511 Total capital required to support trading book 2,04912 Minimum Tier I capital required for supporting trading book 58413 Used Eligible Tier III Capital -14 Total regulatory capital 78,10815 Total risk weighted assets 516,31016 BIS capital adequacy ratio 15.13%
Maisarah Islamic Banking Services – Window of BankDhofar
DISCLOSURE REQUIREMENTS UNDER PILLAR – III OF BASEL II & III.For the year ended 31 December 2019

233Annual Report 2019
3. CAPITAL ADEQUACY (CONTINUED)3.2. QUANTITATIVE DISCLOSURE (CONTINUED)
3. Ratio of Total and Tier I Capital to RWA
Details RO 000
Tier I capital 74,587
Total capital 78,108
Total RWA 516,310
Ratio of total capital to RWA (%) 15.13%
Ratio of tier I capital to RWA (%) 14.45%
4. Ratio of Total Capital to Total Assets
Details RO 000
Total capital 78,108
Total assets 584,932
Ratio of total capital to total assets (%) 13.35%
5. Capital Requirement for Each Category of Shari’a Compliant Financing Contracts
DetailsCredit Risk Market Risk
RWA Capital Requirement RWA Capital
Requirement
RO 000 RO 000 RO 000 RO 000
Murabaha and other Receivables 19,845 2,183 - -
Mudaraba Financings 58,145 6,396 - -
Ijarah Assets 17,533 1,929 - -
Diminishing Musharaka Financing 261,556 28,771 - -
Wakala Financing 40,013 4,401 - -
Total 397,092 43,680 - -
6. Disclosure of Displaced Commercial Risk
Details RO 000
Total profits available for distribution 26,240
Profit sharing
- Shareholders 25,104
- IAH’s 1,136
Mudarib fee charged by Maisarah (232)
Profits for IAH’s before smoothening 904
Amount adjustment for profit smoothening (6)
Profits paid out to IAH after smoothening 898
Maisarah Islamic Banking Services – Window of BankDhofar
DISCLOSURE REQUIREMENTS UNDER PILLAR – III OF BASEL II & III.For the year ended 31 December 2019
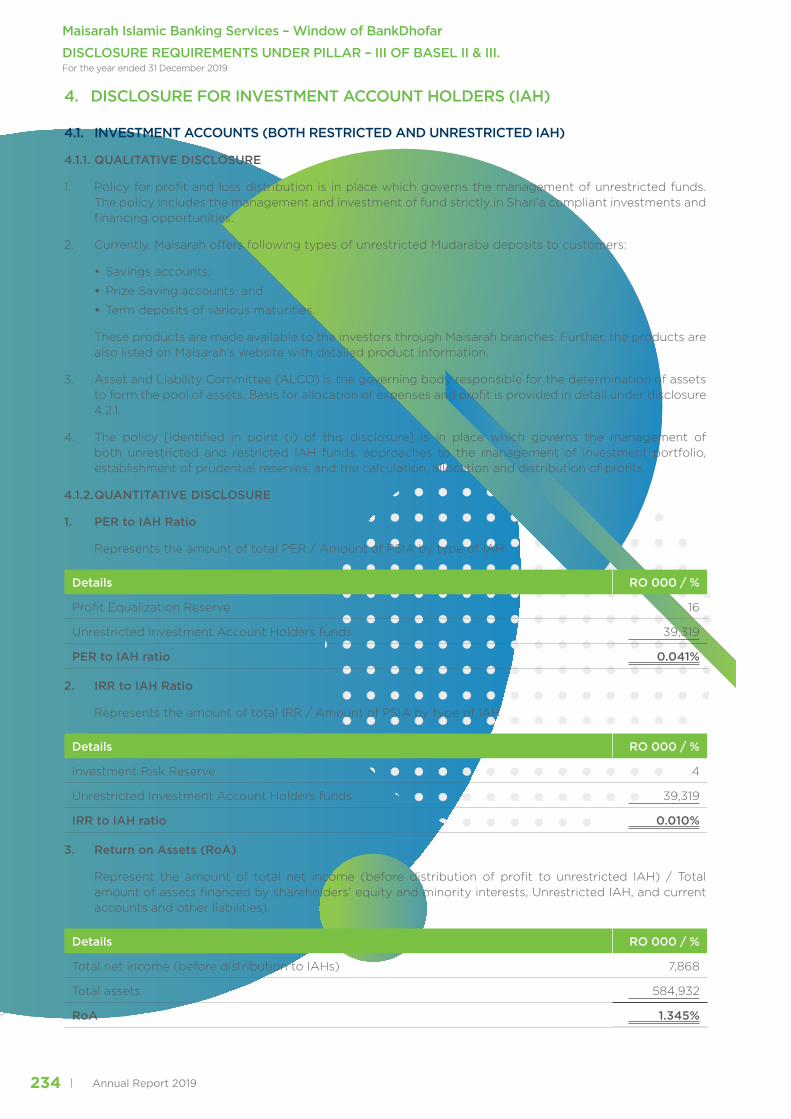
Annual Report 2019234
4. DISCLOSURE FOR INVESTMENT ACCOUNT HOLDERS (IAH)
4.1. INVESTMENT ACCOUNTS (BOTH RESTRICTED AND UNRESTRICTED IAH)
4.1.1. QUALITATIVE DISCLOSURE
1. Policy for profit and loss distribution is in place which governs the management of unrestricted funds. The policy includes the management and investment of fund strictly in Shari’a compliant investments and financing opportunities.
2. Currently, Maisarah offers following types of unrestricted Mudaraba deposits to customers:
• Savings accounts;
• Prize Saving accounts; and
• Term deposits of various maturities.
These products are made available to the investors through Maisarah branches. Further, the products are also listed on Maisarah’s website with detailed product information.
3. Asset and Liability Committee (ALCO) is the governing body responsible for the determination of assets to form the pool of assets. Basis for allocation of expenses and profit is provided in detail under disclosure 4.2.1.
4. The policy [identified in point (i) of this disclosure] is in place which governs the management of both unrestricted and restricted IAH funds, approaches to the management of investment portfolio, establishment of prudential reserves, and the calculation, allocation and distribution of profits.
4.1.2. QUANTITATIVE DISCLOSURE
1. PER to IAH Ratio
Represents the amount of total PER / Amount of PSIA by type of IAH
Details RO 000 / %
Profit Equalization Reserve 16
Unrestricted Investment Account Holders funds 39,319
PER to IAH ratio 0.041%
2. IRR to IAH Ratio
Represents the amount of total IRR / Amount of PSIA by type of IAH
Details RO 000 / %
Investment Risk Reserve 4
Unrestricted Investment Account Holders funds 39,319
IRR to IAH ratio 0.010%
3. Return on Assets (RoA)
Represent the amount of total net income (before distribution of profit to unrestricted IAH) / Total amount of assets financed by shareholders’ equity and minority interests, Unrestricted IAH, and current accounts and other liabilities).
Details RO 000 / %
Total net income (before distribution to IAHs) 7,868
Total assets 584,932
RoA 1.345%
Maisarah Islamic Banking Services – Window of BankDhofar
DISCLOSURE REQUIREMENTS UNDER PILLAR – III OF BASEL II & III.For the year ended 31 December 2019

235Annual Report 2019
4. DISCLOSURE FOR INVESTMENT ACCOUNT HOLDERS (IAH) (CONTINUED)4.1. INVESTMENT ACCOUNTS (BOTH RESTRICTED AND UNRESTRICTED IAH) (CONTINUED)4.1.2. QUANTITATIVE DISCLOSURE (CONTINUED)
4. Return on Equity (RoE)
Represents the amount of total net income (after distribution of profit to IAH) / Amount of shareholders’ equity.
Details RO 000 / %
Total net income (after distribution to IAHs) 6,970
Total shareholder’s equity 74,675
RoE 9.334%
5. Ratios of Profit Distributed to PSIA by type of IAH
Details %
Savings deposit 100
Term deposit -
Total 100
6. Ratios of Financing to PSIA by type of IAH
Details RO 000 / Ratio
Total Financing 450,841
Saving deposits 39,319
Financing to PSIA 11.47
4.2. UNRESTRICTED INVESTMENT ACCOUNTS
4.2.1. QUALITATIVE DISCLOSURE
1. During the current year, there was no major change in the investment strategy of Maisarah which affects the investment accounts. Maisarah continued the commingling of IAH’s funds with its own funds or with the funds which Maisarah has right to use.
2. Income from Mudaraba pool, comprising of Shari’a compliant assets, is reduced by direct expenses. PER is appropriated from the net income before allocating the Mudarib’s share of income. Thereafter, Mudarib’s fee is charged which shall not exceed 80% of the profit earned by Maisarah. IRR is deducted from investment accountholders share after allocating the Mudarib’s share of profit. Net distributable income is distributed to different classes of investment accountholders in accordance with the weightages based on amount and tenor.
3. PER is the amount Maisarah appropriates in excess of the profit to be distributed to equity of investment accountholders before allocating the Mudarib’s share of income to maintain a certain level of return. PER will revert to owner’s equity and equity of investment accountholders as per terms and condition of Mudaraba contract. IRR is deducted from investment accountholders share after allocating the Mudarib’s share of profit as per the approved policy in order to cater against future losses of equity of investment accountholders. Investment risk reserve will revert to the investment accountholders as per terms and conditions of Mudaraba contract.
4. ALCO determines the category of expenses that should be deducted from the total return (gross returns) of the investment pools as direct expenses. Direct expenses such as depreciation, pre-paid expenses, commission of direct investments (such as Sukuk) or any other direct related expenses shall be charged to the relevant pool. Maisarah does not charge any operating expenses against the profits from the joint pool other than the aforementioned direct expenses.
5. The administration expenses are only charged to Maisarah.
Maisarah Islamic Banking Services – Window of BankDhofar
DISCLOSURE REQUIREMENTS UNDER PILLAR – III OF BASEL II & III.For the year ended 31 December 2019

Annual Report 2019236
4. DISCLOSURE FOR INVESTMENT ACCOUNT HOLDERS (IAH) (CONTINUED)4.2. UNRESTRICTED INVESTMENT ACCOUNTS (CONTINUED)
4.2.2. QUANTITATIVE DISCLOSURE
1. Unrestricted IAH Funds and Sub-Total by Asset Category
Details RO 000
Assets
- Murabaha 1,399
- Diminishing Musharaka 23,951
- Ijarah Muntahia Bittamleek 3,373
- Wakala financing 2,932
- Mudaraba financing 1,385
- Investment in Sukuk 4,587
- Wakala placement 1,693
Total Unrestricted IAH Funds (allocated based on proportion) 39,319
2. Share of Profit to IAH before and after transfer of funds
Details RO 000 %
Share of profit of IAHs before PER and IRR for the year 904 2.30%
Transfers To:
PER (5) -0.01%
IRR (1) -0.00%
Share of profit of IAHs after PER and IRR for the year 898 2.29%
3. Movement of PER and IRR
Details PER IRR
RO 000 RO 000
Balance as at 1 January 2019 11 3
Add: Amount apportioned from income allocated 5 1
Less: Amount utilized during the year - -
Balance as at 31 December 2019 16 4
4. Utilization of PER and IRR
PER and IRR has not been utilized during the year.
5. 5 Years Profits Earned and Profits Paid
Deposit Category Average rate over 5 years
Position as at
Dec 2019 Dec 2018 Dec 2017 Dec 2016 Dec 2015
Saving accounts (RO) 0.97% 0.60% 0.66% 0.95% 1.67% 0.98%
Saving accounts (USD) 0.58% 0.22% 0.19% 1.03% 0.89%
Prize Saving Account 0.83% 0.61% 0.64% 0.99% 0.0106
Mudaraba 3-M 1.18% 1.25% 1.10%
Mudaraba 12-M 1.48% 1.48%
Maisarah Islamic Banking Services – Window of BankDhofar
DISCLOSURE REQUIREMENTS UNDER PILLAR – III OF BASEL II & III.For the year ended 31 December 2019

237Annual Report 2019
4. DISCLOSURE FOR INVESTMENT ACCOUNT HOLDERS (IAH) (CONTINUED)4.2. UNRESTRICTED INVESTMENT ACCOUNTS (CONTINUED)4.2.2. QUANTITATIVE DISCLOSURE (CONTINUED)
6. Administrative Expenses
Maisarah does not charge any administrative expenses to unrestricted IAH.
7. Asset Allocation During Last Six Months
There have been no material changes in asset allocation during the last six months.
8. Off Balance Sheet Exposures
No off-balance sheet exposure is allocated to the pool.
9. Limits Imposed on Investment Amount
Maisarah has not imposed any limits on the amount that can be invested in any one type of asset.
4.3. RESTRICTED INVESTMENT ACCOUNTS
1. The Bank does not have any restricted investment accounts as at the reporting date.
5. RETAIL INVESTOR-ORIENTED DISCLOSURES FOR IAH
Disclosures for IAHs, mentioned in section 4, is equally applicable for the retail investors. Below are some of the salient features for retails investors:
1. The deposits being accepted by the Bank under URIA are structured according to Mudaraba contracts. Under the Mudaraba, the Bank acts as a Manager (Mudarib) of the depositor / Investor (Rab ul Maal).
2. Under the arrangement of URIA, the Bank is authorized to invest the IAHs’ funds strictly in Shari’a compliant investment and financing opportunities. Under this arrangement, the Bank can mix the IAHs funds with its own funds. Accordingly, IAHs, and the Bank share in the returns on the invested funds in proportion to their respective investments.
3. Different categories of deposits are assigned variable weights / utilization rates based on the investment amount and tenor. The higher the investment amount and the longer the investment tenor, the higher shall be the weights / utilization rates.
4. In case of premature withdrawals, the bank may apply a lower weights / utilization rate. Where a deposit is withdrawn by the IAH before the completion of its term, the effective weight / utilization rate for the highest tenor completed by the investment shall be applied on the actual investment days for profit calculation.
5. Profit on the investment jointly financed by the Bank and IAHs, shall be allocated between them according to their respective investment portions. Any loss due to negligence or misconduct on the part of the Bank shall be deducted from the Bank’s share in the profits of the jointly financed investment.
6. The profit from URIA accounts shall be calculated and allocated based on the profit calculation frequency and the weights / utilization rates assigned to each category of deposits.
7. The banks shall charge only direct expense to the pool income such as depreciation on Ijarah assets; and will not deduct any indirect expenses such as salary, admin costs etc.
8. To cater the situation where actual profit rate is less than the market rate (known as Displaced Commercial Risk) and to cater the future losses, the Bank maintains a certain percentage of profits as Profit Equalization Reserve and Investment Risk Reserve respectively.
Maisarah Islamic Banking Services – Window of BankDhofar
DISCLOSURE REQUIREMENTS UNDER PILLAR – III OF BASEL II & III.For the year ended 31 December 2019

Annual Report 2019238
6. RISK MANAGEMENT, RISK EXPOSURES AND RISK MITIGATION
6.1. GENERAL DISCLOSURE
6.1.1. QUALITATIVE DISCLOSURE
1. Bank has well established risk management function which commonly serves the Conventional and Islamic window entity. The objective of the risk management function is to identify, measure, monitor and manage its risk exposures to ensure that:
• risks are understood;
• risks are within tolerances set by the Board of Directors;
• decisions having inherent risks are consistent with strategic business objectives;
• risk taking decisions are explicit and clear;
• the expected return compensates for the risk taken; and
• bank’s performance incentives are aligned with risk tolerances or risk reward relationship.
Risk management is a continuous, forward-looking process that should address issues that could endanger achievement of critical objectives. A continuous risk management approach is applied to effectively anticipate and mitigate the risks that have critical impact on the business.
Bank’s risk management strategy statement has been provided under Chapter on Management Discussion and Analysis. Bank has formulated various policies in various areas of operations of the Bank which are duly approved by the Board of Directors. Bank also has developed various procedures for smooth functioning and mitigating/ controlling risks.
2. The overall risk management has been delegated to an independent Board Risk Management Committee (BRMC) of the Board of Directors of the Bank, which monitors and controls the overall risk profile (including Maisarah Islamic Banking Services). The BRMC reports to the full Board, on matters of significance and keeps the Board continuously updated with the Risk Management process in the Bank. In this task, BRMC relies on an independent Risk Management Division within the Bank.
The Bank has a well-established Risk Management Division (RMD) with a team of highly competent and experienced professionals. The primary responsibility of the RMD is to ensure, on a continuous basis, that an effective risk management framework exists and that the various divisions of the Bank, including Maisarah Islamic Banking Services, function within this framework. RMD also functions as an interface between the Management and the Board in defining appropriate risk tolerance levels for various business lines and operating divisions of the Bank and in ensuring that policies and procedures are tailored to the defined tolerance levels.
3. Depending on the type of risk, Bank has placed internal systems and models to measure various risks. The risk measurement system has been made effective by strengthening the Management Information System (MIS) to report about various to Senior Management and Board on periodical basis. The measurement of risk takes into account the nature of the risk, exposure, profile, existence of mitigants and the impact.
4. Bank has defined various policies to define the collaterals and processes to mitigate various risks. A continuous risk management approach is applied to effectively anticipate and mitigate the risks that have critical impact on the business. Bank has defined three lines of defense system for monitoring the risks. The Three Lines of Defense Framework defines roles and responsibilities of various entities in the Bank in addressing risks and controls; the aspect for which each entity is accountable, and how the efforts between entities are coordinated at the Bank-wide level. The framework addresses how specific duties related to risk and control could be assigned and coordinated within an organization and monitors the implementation of effective risk management practices.
6.1.2. QUANTITATIVE DISCLOSURE
1. Risks Measures for Restricted IAH Funds and Assets Funded by Restricted IAH
The Bank does not have any restricted investment accounts as at the reporting date.
2. Assets Financed by Unrestricted IAH in RWA Calculation
Maisarah applies same treatment for calculation of RWA for assets financed by unrestricted IAH and shareholders.
Maisarah Islamic Banking Services – Window of BankDhofar
DISCLOSURE REQUIREMENTS UNDER PILLAR – III OF BASEL II & III.For the year ended 31 December 2019

239Annual Report 2019
6. RISK MANAGEMENT, RISK EXPOSURES AND RISK MITIGATION (CONTINUED)6.1. GENERAL DISCLOSURE (CONTINUED)6.1.2. QUANTITATIVE DISCLOSURE (CONTINUED)
3. Financing by Contract Type
Details RO 000%age of total
financing
Murabaha and other receivables 19,686 4.36%Mudaraba Financings 18,896 4.19%Ijarah Assets 46,021 10.19%Diminishing Musharaka Financing 326,824 72.40%Wakala Financing 40,010 8.86%Total 451,437 100.00%
4. Financing by Counterparty Category
Details RO 000 %age of total financing
Corporate and SME 276,476 61.24%
Retail 174,961 38.76%
Total 451,437 100.00%
5. Assets Pledged as Collateral
As of the reporting date, Maisarah has not pledged any of its assets as collateral (2018: no assets were pledged).
6. Guarantees or Pledges by Islamic Window
As of the reporting date, Maisarah has not extended any guarantees or pledges (2018: no guarantees or pledges).
6.2. CREDIT RISK
6.2.1. QUALITATIVE DISCLOSURE
1. Credit risk is defined as the possibility that a customer or counterparty will fail to meet its obligations in accordance with agreed terms. Credit risk, therefore, arises from Maisarah’s dealings with or financing to a corporate, individual, another bank or financial institution. The objective of credit risk management is to minimize the probable losses and maintaining credit risk exposure within acceptable parameters.
2. Maisarah has well established credit risk policy duly approved by the Board which establishes prudent standards, practices in managing credit risk and setting up prudent benchmarks, limits for management of credit risks. The Board of Directors delegate credit approval powers for functional areas, which are clearly defined in Authorities Matrix contained in the Manual on Delegation of Authority. All concerned executives are responsible to ensure that they exercise their delegated powers in terms of the approved Authorities Matrix and seek appropriate special approvals wherever required.
Board Executive Committee is the topmost credit approving authority of the Bank which is mainly responsible for approving all credit proposals beyond the authority level of the management. The senior management executives are also empowered with certain finance approving limits beyond which the credit proposals shall be considered by the Management Credit Committee (MCC) which is empowered to consider all credit related issues up to certain limits.
Credit risk is managed by the Risk Management Division (RMD) through a system of independent risk assessment of all the credit corporate proposals before they are considered by the appropriate approving authorities. The customer in the Standard Category are assigned a risk rating on a scale of 7 grades based on quantitative as well as qualitative parameters. All accounts reflecting weakness in financials or operations as defined by CBO are assigned the grade 8 (Special Mention category) for closer monitoring.
Maisarah Islamic Banking Services – Window of BankDhofar
DISCLOSURE REQUIREMENTS UNDER PILLAR – III OF BASEL II & III.For the year ended 31 December 2019

Annual Report 2019240
6. RISK MANAGEMENT, RISK EXPOSURES AND RISK MITIGATION (CONTINUED)6.2. CREDIT RISK (CONTINUED)6.2.1. QUALITATIVE DISCLOSURE (CONTINUED)
RMD approves the risk grade of the customer and also identifies the risk factors in the credit proposal and suggests suitable mitigation. This facilitates the approving authorities in making informed credit decision. In addition, RMD reviews grading of obligors, and conducts regular analysis of the credit portfolio. Every corporate account is reviewed annually and in case of accounts graded as 6, 7 and 8 (Special Mentioned category accounts), reviews have been prescribed at higher frequency. However, the customers who do not publish audited financials are treated as unrated.
Retail financing is strictly in accordance with the CBO guidelines.
In addition to these, Maisarah also undertakes business with other banks. The maximum exposures to these banks are defined in the policy on exposure to non-resident borrowers and restrictions are put in place on the total exposure to such counterparty banks. Maisarah has also implemented country risk limits approved by the Board to ensure portfolio diversification in terms of sovereign and geographical exposure. Specific country risk limits have been set up based on the internal risk rating grades assigned to various countries and these limits are reviewed on half yearly basis.
3. In the absence of acceptable external credit rating agency in the Sultanate of Oman, the Bank has obtained approval of the CBO to treat all corporate exposures as unrated and accordingly assign risk weight of 100% for computing capital requirements under Basel II. The same convention is used for Maisarah as well.
The Bank’s conventional entity has obtained CBO approval vide its letter dated December 11, 2006 to use the ratings of Moody’s, Standard & Poor (S&P) or Fitch for risk weighting claims on sovereigns and banks. However, as mentioned earlier, the Bank has obtained CBO approval to treat all corporate exposures as unrated and assign 100% risk weight on all of them. The same convention has been adopted for Maisarah as well.
The Bank is adopting the simplified approach for collateral recognition under the standardized approach, where 0% risk weight is assigned for the exposures covered by cash collateral. The total exposure covered by cash collateral, which attracts 0% risk weight is NIL. All other credit exposures of Corporate and Retail (except house finance, where valuation of the property is not older than 3 years; have a maximum of 2 dwelling units per borrower; and LTV is less than or equal to 80%, are assigned 35% risk weight and 75% for SME borrowers) are assigned 100% risk weight.
4. Past dues and impaired exposures are defined in accordance with the relevant CBO regulations. Bank has adopted the International Financial Reporting Standards (IFRS) 9 guidelines for estimation of Expected Credit Loss as per International Accounting Standards Board (IASB) and CBO guidelines on International Financial Reporting Standards (IFRS) 9 on Financial Instruments, effective from 01 January 2018.
6.2.2. QUANTITATIVE DISCLOSURE
1. Total Gross Credit and Average Gross Credit Exposure
31 December 2019Total Gross
CreditRO 000
Average Gross Credit
RO 000
Murabaha and other receivables 19,686 22,100Mudaraba financing 18,896 21,955Diminishing Musharaka financing 326,824 302,720Wakala financing 40,010 30,960
Ijarah Muntahia Bittamleek 46,021 45,806
Total 451,437 423,541
31 December 2018Total Gross
CreditRO 000
Average Gross Credit
RO 000
Murabaha and other receivables 24,625 22,370Mudaraba financing 26,585 21,601Diminishing Musharaka financing 285,515 282,678Wakala financing 18,762 8,990Ijarah Muntahia Bittamleek 45,998 45,301Total 401,485 380,940
Maisarah Islamic Banking Services – Window of BankDhofar
DISCLOSURE REQUIREMENTS UNDER PILLAR – III OF BASEL II & III.For the year ended 31 December 2019

241Annual Report 2019
6. RISK MANAGEMENT, RISK EXPOSURES AND RISK MITIGATION (CONTINUED)6.2. CREDIT RISK (CONTINUED)6.2.2. QUANTITATIVE DISCLOSURE (CONTINUED)
Murabaha and other receivable includes Credit Card receivables which are funded exclusively by shareholders while all other financing exposures are funded jointly by shareholders and IAH. Percentage of funding of financing assets as at 31 December 2019 is as below:
Shareholders 91.29%IAH 8.71%
2. Total Gross Credit Exposure – Geographical Area
DetailsMurabaha and other
receivablesRO 000
Mudaraba financingRO 000
Diminishing Musharaka
financingRO 000
Wakala financingRO 000
Ijarah Muntahia
BittamleekRO 000
TotalRO 000
Sultanate of Oman 19,686 18,896 326,824 40,010 46,021 451,437Other GCC Countries - - - - - -Europe and North America - - - - - -Africa and Asia - - - - - -Total 19,686 18,896 326,824 40,010 46,021 451,437
3. Total Gross Credit Exposure – Counterparty
Details
Murabaha and other
receivablesRO 000
Mudaraba financingRO 000
Diminishing Musharaka
financingRO 000
Wakala financingRO 000
Ijarah Muntahia
BittamleekRO 000
TotalRO 000
Corporate & SME 7,441 18,896 209,895 40,010 234 276,476Retail 12,245 - 116,929 - 45,787 174,961Total 19,686 18,896 326,824 40,010 46,021 451,437
4. Total Gross Credit Exposure – Industry
Details
Murabaha and other
receivablesRO 000
Mudaraba financingRO 000
Diminishing Musharaka
financingRO 000
Wakala financingRO 000
Ijarah Muntahia
BittamleekRO 000
TotalRO 000
Retail personal finances 12,245 - 116,929 - 45,787 174,961Construction 2,672 7,648 142,022 11,525 - 163,867Manufacturing 2,093 6,789 7,345 8,744 - 24,971Services - 43 45,410 2,486 - 47,939Others 2,676 4,416 15,118 17,255 234 39,699Total 19,686 18,896 326,824 40,010 46,021 451,437
5. Total Gross Credit Exposure – Residual Contractual Maturity
Details
Murabaha and other
receivablesRO 000
Mudaraba financingRO 000
Diminishing Musharaka
financingRO 000
Wakala financingRO 000
Ijarah Muntahia
BittamleekRO 000
TotalRO 000
Upto 1 month 1,080 18,896 41 4,251 - 24,2681 – 3 months 681 - 39 10,279 1 11,0003 – 6 months 2,199 - 107 21,355 10 23,6716 – 9 months 134 - 370 4,125 3 4,6329 – 12 months 74 - 168 - 7 2491 – 3 years 874 - 6,776 - 163 7,8133 – 5 years 1,833 - 26,892 - 459 29,184Over 5 years 12,811 - 292,431 - 45,378 350,620Total 19,686 18,896 326,824 40,010 46,021 451,437
Maisarah Islamic Banking Services – Window of BankDhofar
DISCLOSURE REQUIREMENTS UNDER PILLAR – III OF BASEL II & III.For the year ended 31 December 2019

Annual Report 2019242
6. RISK MANAGEMENT, RISK EXPOSURES AND RISK MITIGATION (CONTINUED)6.2. CREDIT RISK (CONTINUED)6.2.2. QUANTITATIVE DISCLOSURE (CONTINUED)
6. Total Gross Credit Exposure – Rating Category
Ratings 2019 2018
RO 000 RO 000
Rating grade 1 – 3 243,889 92,671
Rating grade 4 – 5 151,227 270,437
Rating grade 6 – 7 53,443 36,373
Non – performing financing 2,878 2,004
Total Financing 451,437 401,485
7. Total Gross Credit Exposure – Equity Based Financing
Equity based financing
31 December 2019 31 December 2018
Total Gross Credit
Average Gross Credit
Total Gross Credit
Average Gross Credit
RO 000 RO 000 RO 000 RO 000
Mudaraba financing 18,896 21,955 26,585 21,601
Wakala financing 40,010 30,960 18,762 8,990
Total 58,906 52,915 45,347 30,591
8. Past Due and Impaired Financing Assets – Counterparty
DetailsMurabaha and other
receivables
Mudaraba financing
Diminishing Musharaka financing
Wakala financing
Ijarah Muntahia
BittamleekTotal
RO 000 RO 000 RO 000 RO 000 RO 000 RO 000
Corporate & SME
- Neither past due nor impaired
7,047 18,896 143,255 39,391 234 208,823
- Past due but not impaired
387 - 64,063 549 - 64,999
- Non-performing 7 - 2,577 70 - 2,654
- Total financing 7,441 18,896 209,895 40,010 234 276,476
- Stage 1 & 2 ECL 41 181 3,876 73 2 4,173
- Stage 3 ECL 2 - 795 18 - 815
- Total ECL 43 181 4,671 91 2 4,988
Retail
- Neither past due nor impaired
11,943 - 114,630 - 44,403 170,976
- Past due but not impaired
272 - 2,185 - 1,304 3,761
- Non-performing 30 - 114 - 80 224
- Total financing 12,245 - 116,929 - 45,787 174,961
- Stage 1 & 2 ECL 68 - 170 - 93 331
- Stage 3 ECL 14 - 54 - 43 111
- Total ECL 82 - 224 - 136 442
Maisarah Islamic Banking Services – Window of BankDhofar
DISCLOSURE REQUIREMENTS UNDER PILLAR – III OF BASEL II & III.For the year ended 31 December 2019

243Annual Report 2019
6. RISK MANAGEMENT, RISK EXPOSURES AND RISK MITIGATION (CONTINUED)6.2. CREDIT RISK (CONTINUED)6.2.2. QUANTITATIVE DISCLOSURE (CONTINUED)
9. Past Due and Impaired Financing Assets – Industry
Details
Murabaha and other
receivablesRO 000
Mudaraba financingRO 000
Diminishing Musharaka
financingRO 000
Wakala financingRO 000
Ijarah Muntahia
BittamleekRO 000
TotalRO 000
Retail personal finances- Neither past due norimpaired 11,943 - 114,630 - 44,403 170,976 - Past due but not impaired 272 - 2,185 - 1,304 3,761 - Non-performing 30 - 114 - 80 224 - Total financing 12,245 - 116,929 - 45,787 174,961 - Stage 1 & 2 ECL 68 - 170 - 93 331 - Stage 3 ECL 14 - 54 - 43 111 - Total ECL 82 - 224 - 136 442 Construction- Neither past due nor impaired 2,370 7,648 104,539 11,150 - 125,707 - Past due but not impaired 302 - 35,648 375 - 36,325 - Non-performing - - 1,835 - - 1,835 - Total financing 2,672 7,648 142,022 11,525 - 163,867 - Stage 1 & 2 ECL 11 100 3,299 27 - 3,437 - Stage 3 ECL - - 610 - - 610 - Total ECL 11 100 3,909 27 - 4,047 Manufacturing- Neither past due nor impaired 2,093 6,789 4,624 8,744 - 22,250 - Past due but not impaired - - 2,721 - - 2,721 - Non-performing - - - - - - - Total financing 2,093 6,789 7,345 8,744 - 24,971 - Stage 1 & 2 ECL 10 48 155 8 - 221 - Stage 3 ECL - - - - - - - Total ECL 10 48 155 8 - 221 Services- Neither past due nor impaired - 43 24,308 2,486 - 26,837 - Past due but not impaired - - 21,102 - - 21,102 - Non-performing - - - - - - - Total financing - 43 45,410 2,486 - 47,939 - Stage 1 & 2 ECL - - 286 4 - 290 - Stage 3 ECL - - - - - - - Total ECL - - 286 4 - 290 Others- Neither past due nor impaired 2,584 4,416 9,784 17,011 234 34,029 - Past due but not impaired 85 - 4,592 174 - 4,851 - Non-performing 7 - 742 70 - 819 - Total financing 2,676 4,416 15,118 17,255 234 39,699 - Stage 1 & 2 ECL 21 32 137 35 2 227 - Stage 3 ECL 2 - 185 18 - 205 - Total ECL 23 32 322 53 2 432
Maisarah Islamic Banking Services – Window of BankDhofar
DISCLOSURE REQUIREMENTS UNDER PILLAR – III OF BASEL II & III.For the year ended 31 December 2019

Annual Report 2019244
6. RISK MANAGEMENT, RISK EXPOSURES AND RISK MITIGATION (CONTINUED)6.2. CREDIT RISK (CONTINUED)6.2.2. QUANTITATIVE DISCLOSURE (CONTINUED)
10. Past Due and Impaired Financing Assets – Geographical Area
DetailsMurabaha and other
receivablesRO 000
Mudaraba financingRO 000
Diminishing Musharaka
financingRO 000
Wakala financingRO 000
Ijarah Muntahia
BittamleekRO 000
TotalRO 000
Sultanate of Oman
- Neither past due nor impaired 18,990 18,896 257,885 39,391 44,637 379,799
- Past due but not impaired 659 - 66,248 549 1,304 68,760
- Non-performing 37 - 2,691 70 80 2,878
- Total financing 19,686 18,896 326,824 40,010 46,021 451,437
- Stage 1 & 2 ECL 109 181 4,046 73 95 4,504
- Stage 3 ECL 16 - 849 18 43 926
- Total ECL 125 181 4,895 91 138 5,430
11. Loss Provisions
Details Stage 1RO 000
Stage 2RO 000
Stage 3RO 000
As at 1 January 2019 1,255 3,228 907
Provided / Added during the year 75 391 466
Written back during the year - - (55)
Written off during the year - - -
As at 31 December 2019 1,330 3,619 1,318
12. Penalties on Customers and Donation Payment
Details RO 000
Undistributed charity funds as at 1 January 2019 17
Shari’a non-compliant income 5
Disposition of charity funds (17)
Undistributed charity funds as at 31 December 2019 5
6.3. CREDIT RISK MITIGATION
6.3.1. QUALITATIVE DISCLOSURE
1. Assets leased under Ijarah Muntahiyah Bittamleek is governed by the relevant product schemes of Corporate Ijarah and Home Finance. Asset under Ijarah is owned by Maisarah by registering it in its name throughout the period of Ijarah. Further, the asset is also secured through Takaful (Islamic Insurance), to cover Maisarah’s exposure in case of loss.
2. Hamish Jiddiyah / Urbun is a down payment is taken from the customer as part of his contribution in the asset. With respect to pledge of asset, an asset in case of Ijarah remains in Maisarah’s ownership during the term of financing, however, in case of Diminishing Musharaka the pledge is a primary collateral.
3. Maisarah has well defined policies in place for the valuation and re-valuation of the collateral and it’s enforceability. It is principally governed through the Credit Risk Policy, combined with related product schemes such as Corporate Ijarah, Corporate Diminishing Musharaka, Home Finance and Property Finance. Further to this the mechanism of disposing of such assets is also discussed in the policy and Instruction Manual Wholesale Banking and Instruction Manual Credit Administration.
Maisarah Islamic Banking Services – Window of BankDhofar
DISCLOSURE REQUIREMENTS UNDER PILLAR – III OF BASEL II & III.For the year ended 31 December 2019

245Annual Report 2019
6. RISK MANAGEMENT, RISK EXPOSURES AND RISK MITIGATION (CONTINUED)6.3. CREDIT RISK MITIGATION (CONTINUED)6.3.1. QUALITATIVE DISCLOSURE (CONTINUED)
4. The Bank has adopted the simple approach for credit risk mitigation and no offsetting of the collaterals is done to calculate the capital requirement. However, the main CRM techniques followed by the Bank are based on collaterals which the Bank endeavors to obtain for its exposures, as far as commercially practicable. The collaterals mainly consist of real estate properties.
The Bank has credit risk rating framework comprising of Risk Rating system which is a single point indicator of diverse risk factors of a Customer and assists in taking credit decisions in a consistent manner. The risk rating framework is having 8 performing assets grades (including special mention) and 3 non-performing assets grades. The rating grade indicates the default probability of the customer’s obligation. The same rating framework has been adopted by Maisarah as well.
Bank has also implemented Risk Adjusted Return on Capital (RAROC) methodology for Maisarah which provides the risk-based pricing. The RAROC system enables Maisarah to price its facilities after considering the cost and risk involved in a facility.
6.3.2. QUANTITATIVE DISCLOSURE
1. Total Carrying Amount by Type of Collateral
Total carrying amounts of collateral of non-performing corporate assets by type of collateral held by the window is as follows:
Collateral Type Collateral Value
Haircut Applied
Total Collateral
After Haircut Applied
RO 000 RO 000 RO 000
Mortgage 1,000 25% 750
Mortgage 2,725 35% 1,771
Total 3,725 2,521
2. Assets Owned and Leased under Ijarah Muntahiyah Bittamleek
Carrying amount of assets under Ijarah Muntahia Bittamleek as of 31 December 2019 is RO (000) 46,021/-.
6.4. LIQUIDITY RISK
6.4.1. QUALITATIVE DISCLOSURE
1. Maisarah’s Liquidity Risk Management is governed by the Asset Liability Management Policy document approved by the Board of Directors as well as the provisions of relevant CBO guidelines on liquidity risk management.
Overall, Bank follows CBO circular BM955 for liquidity risk management of Current Accounts and URIA, which requires the monitoring and managing based on the cashflow approach for liquidity risk profile. Maisarah monitors its liquidity risk through cash flow approach. Under cash flow approach Maisarah generates Maturity of Assets and Liabilities (MAL) report which captures all the maturing assets and liabilities into various pre-set time buckets ranging from one month to above five years. The mismatches in various time buckets indicate liquidity gap and Maisarah strictly adheres to the CBO set limit of 15% of cumulative liabilities (outflows) on mismatches (liquidity gaps) in time buckets up to one year. In addition, Maisarah has also set up internal limit on mismatches in time buckets beyond one year.
Treasury department of Maisarah controls and monitors the liquidity risk and ensures that the Bank is not exposed to undue liquidity risk and at the same time makes optimum use of its funds. Middle office in Risk Management Division also monitors the liquidity position of Maisarah.
Maisarah Islamic Banking Services – Window of BankDhofar
DISCLOSURE REQUIREMENTS UNDER PILLAR – III OF BASEL II & III.For the year ended 31 December 2019
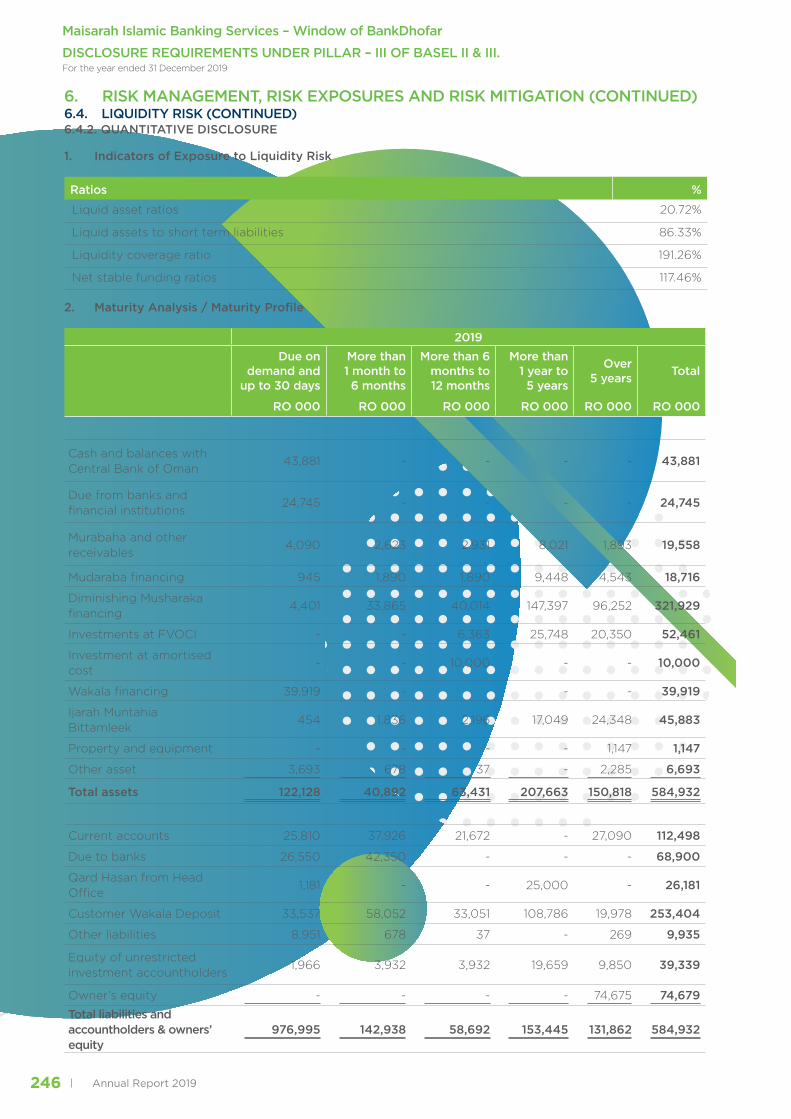
Annual Report 2019246
6. RISK MANAGEMENT, RISK EXPOSURES AND RISK MITIGATION (CONTINUED)6.4. LIQUIDITY RISK (CONTINUED)6.4.2. QUANTITATIVE DISCLOSURE
1. Indicators of Exposure to Liquidity Risk
Ratios %
Liquid asset ratios 20.72%
Liquid assets to short term liabilities 86.33%
Liquidity coverage ratio 191.26%
Net stable funding ratios 117.46%
2. Maturity Analysis / Maturity Profile
2019Due on
demand and up to 30 days
More than 1 month to6 months
More than 6 months to12 months
More than1 year to 5 years
Over5 years Total
RO 000 RO 000 RO 000 RO 000 RO 000 RO 000
Cash and balances with Central Bank of Oman
43,881 - - - - 43,881
Due from banks and financial institutions
24,745 - - - - 24,745
Murabaha and other receivables
4,090 2,623 2,931 8,021 1,893 19,558
Mudaraba financing 945 1,890 1,890 9,448 4,543 18,716
Diminishing Musharaka financing
4,401 33,865 40,014 147,397 96,252 321,929
Investments at FVOCI - - 6,363 25,748 20,350 52,461
Investment at amortised cost
- - 10,000 - - 10,000
Wakala financing 39,919 - - - - 39,919
Ijarah Muntahia Bittamleek
454 1,836 2,196 17,049 24,348 45,883
Property and equipment - - - - 1,147 1,147
Other asset 3,693 678 37 - 2,285 6,693
Total assets 122,128 40,892 63,431 207,663 150,818 584,932
Current accounts 25,810 37,926 21,672 - 27,090 112,498
Due to banks 26,550 42,350 - - - 68,900
Qard Hasan from Head Office
1,181 - - 25,000 - 26,181
Customer Wakala Deposit 33,537 58,052 33,051 108,786 19,978 253,404
Other liabilities 8,951 678 37 - 269 9,935
Equity of unrestricted investment accountholders
1,966 3,932 3,932 19,659 9,850 39,339
Owner’s equity - - - - 74,675 74,679Total liabilities and accountholders & owners’ equity
976,995 142,938 58,692 153,445 131,862 584,932
Maisarah Islamic Banking Services – Window of BankDhofar
DISCLOSURE REQUIREMENTS UNDER PILLAR – III OF BASEL II & III.For the year ended 31 December 2019

247Annual Report 2019
6. RISK MANAGEMENT, RISK EXPOSURES AND RISK MITIGATION (CONTINUED)6.5. MARKET RISK6.5.1. QUALITATIVE DISCLOSURE
1. Market Risk is the risk to the Bank’s earnings and capital due to changes in the profit rates or prices of securities, foreign exchange and equities, as well as the volatilities of those changes. The Bank for International Settlements (BIS) defines market risk as “the risk that the value of ‘on’ or ‘off’ balance sheet positions will be adversely affected by movements in equity and interest rate markets, currency exchange rates and commodity prices”. Market Risk has been categorized into profit rate risk, foreign exchange risk, commodity price risk and equity price risk.
Maisarah has a comprehensive Asset Liability Management Policy which encompasses assessment, monitoring and management of all the above market risks. Bank has defined various internal limits to monitor market risk and is computing the capital requirement as per standardized approach of Basel II.
6.5.2. QUANTITATIVE DISCLOSURE
1. Breakdown of Market Risk RWA
Details RWA RO 000
Profit rate related instrument -Equity -Foreign exchange & gold position 18,625Commodities position -Total 18,625
2. Foreign Exchange Net Open Positions to Capital
Details RWA RO 000
Foreign exchange net open position 2,440Total capital 78,108Foreign exchange net open position to total capital 0.031
99.71% of the net open position is in pegged currencies.
3. Commodity Net Open Positions to Capital
As at reporting date, Maisarah does not have an exposure to commodity positions.
4. Equity Net Open Positions to Capital
As at reporting date, Maisarah does not have an exposure to equity positions.
5. Assets Subject to Market Risk by Type of Assets
Type of Assets Gross Amount RO 000
Total Sukuk 62,586Net open position foreign currency 2,440
6. Sensitivity analysis for different types of Market Risk
Impact on earnings due to profit rate risk in the banking book is as follows:
Currencies + or – 1% + or – 2%2019 2018 2019 2018
RO 000 RO 000 RO 000 RO 000
Omani Rials 0.915 0.957 1.83 1.915US Dollars 0.533 0.156 1.06 0.311Other currencies - - - -
Impact on earnings due to foreign exchange risk:
Impact of 10% valuation, on earnings due to foreign exchange risk in the banking book is RO (000) 244.
Maisarah Islamic Banking Services – Window of BankDhofar
DISCLOSURE REQUIREMENTS UNDER PILLAR – III OF BASEL II & III.For the year ended 31 December 2019

Annual Report 2019248
6. RISK MANAGEMENT, RISK EXPOSURES AND RISK MITIGATION (CONTINUED)6.6. OPERATIONAL RISK6.6.1. QUALITATIVE DISCLOSURE
1. The Operational risk policy of the Bank sets out the loss mitigation tools. Bank has established a disaster comprehensive recovery and business continuity plan, considering various plausible scenarios in accordance with the ‘Business Continuity Plan (BCP). Bank has implemented IT Security Policy and guidelines to mitigate the information technology security related risks.
The Bank has developed a comprehensive operational risk management framework comprising of the Risk Control and Self-Assessment, Key Risk Indicator and Loss Data Management (LDM) Framework. The Risk Control and Self-Assessment (RCSA) framework enables the Bank to identify the operational weaknesses in the process and procedures by conducting self-assessment workshops. A team of experts in various departments assess the operational weaknesses in various processes and its likely impact on the Bank. Bank has created a comprehensive risk register which includes inherent risk events, control effectiveness and residual risks. The Key Risk Indicator (KRI) framework enables the Bank to identify and monitor the key risks at various levels. KRIs of all the departments have been identified and are being monitored on a monthly basis. Loss Data Management framework lays down the procedure to identify, record and report the internal and external loss events. The data on operational loss is collated on a regular basis and is presented to the Management and Board level committees.
2. Bank has set up Management Risk Committee to identify, manage, measure, monitor, mitigate and report operational risks.
Bank has the process of collecting and collating data on operational risk events to build a strong loss data base and to improve the control effectiveness. The loss data are being captured using Operational Risk Management system. Further, other operational risk tools like Risk Control & Self-Assessment (RCSA) and Key Risk Indicators (KRIs) are also implemented.
Basel II has provided three different approaches viz., Basic Indicator approach (BIA), The standardized approach (TSA) and Advanced measurement approach to compute the capital charge of Operational Risk. The Bank has adopted the BIA for computing the capital charge for Operational Risk as per CBO guidelines.
3. Maisarah has in place the policies and procedures to increase the banking as well as the Islamic financing knowledge within its staff. During the year, Maisarah has conducted 50 training programs including both in-house as well as external training programs. These programs were conducted mainly in the areas of concepts of Islamic banking and the products and services of Islamic banking.
6.6.2. QUANTITATIVE DISCLOSURE
1. RWA Equivalent for Quantitative Operational Risk
Details RWA RO 000
Operational risk 50,340
2. Gross Income
Details 2019 2018 2017 Total
RO 000 RO 000 RO 000 RO 000
Gross income 30,946 26,877 22,721 80,544
3. Amount of Shari’a Non-Compliant Income
Amount of Shari’a non-compliant income transferred to charity was RO(000) 5.
Maisarah Islamic Banking Services – Window of BankDhofar
DISCLOSURE REQUIREMENTS UNDER PILLAR – III OF BASEL II & III.For the year ended 31 December 2019

249Annual Report 2019
6. RISK MANAGEMENT, RISK EXPOSURES AND RISK MITIGATION (CONTINUED)6.7. RATE OF RETURN RISK6.7.1. QUALITATIVE DISCLOSURE
1. Rate of return risk refers to the possible impact on the net income of Maisarah arising from the impact of changes in market rates and relevant benchmark rates on the return on assets and on the returns payable on funding. An increase in benchmark rates may result in IAH’s having expectation of a higher rate of return, while the returns on assets may be adjusting more slowly due to longer maturities, thereby affecting the net income of Maisarah.
2. The profit distribution to Investment Accounts is based on profit sharing agreements. Therefore, Maisarah is not subject to any significant profit rate risk. However, the profit-sharing agreements will result in Displaced Commercial Risk (DCR) when Maisarah results do not allow to distribute profits in line with the market rates. To cater against DCR, Maisarah creates Profit Equalisation Reserve as explained in section 4.2.1.
6.7.2. QUANTITATIVE DISCLOSURE
1. Indicators of exposures to rate of return risk
31 December 2019Effective average
profit rate
Due on demand
and within 30 days
Due wmarket
riskithin 1 to 6 months
Due within 7 to 12
months
Due within 1
to 5 years
Due after 5
years
Non-profit
bearingTotal
RO 000 RO 000 RO 000 RO 000 RO 000 RO 000 RO 000
Cash and balances with Central Bank of Oman
- - - - - - 43,881 43,881
Due from banks and financial institutions
2.85% 23,098 - - - - 1,647 24,745
Murabaha and other receivables
5.84% 3,494 2,623 2,931 8,021 1,893 596 19,558
Mudaraba financing 5.96% 18,716 - - - - - 18,716Diminishing Musharaka Financing
5.71% 4,401 33,865 40,014 147,397 96,252 - 321,929
Investments at FVOCI 5.28% - - 6,363 25,748 20,350 - 52,461Investment at amortised cost
3.50% - - 10,000 - - - 10,000
Wakala financing 5.62% 39,919 - - - - - 39,919Ijara Muntahia Bittamleek 5.30% 454 1,836 2,196 17,049 24,348 - 45,883Property and equipment - - - - - 1,147 1,147Other asset - - - - - 6,693 6,693Total assets 90,082 38,324 61,504 198,215 142,843 53,964 584,932
Current accounts 4.30% 18,263 31,960 9,132 9,132 22,829 21,182 112,498Due to banks 2.75% 26,550 42,350 - - - - 68,900Qard Hasan from Head office
- - - - - 26,181 26,181
Customer Wakala deposit 4.30% 33,537 58,052 33,051 108,786 19,978 - 253,404Other liabilities - - - - - 9,935 9,935Equity of unrestricted investment accountholders
2.43% 39,919 - - - - 20 39,339
Owner’s equity - - - - - 74,675 74,675Equity of accountholders & Total liabilities and shareholders’ equity
117,669 132,362 42,183 117,918 42,807 131,993 584,932
On-balance sheet gap (27,587) (94,038) 19,321 80,297 100,036 (78,029) -Cumulative profit sensitivity gap (27,587) (121,625) (102,304) (22,007) 78,029 - -
2. Sensitivity Analysis The sensitivity analysis profit rate movement by 200 basis points on the rate sensitive assets and liabilities
reflect a negative impact, on overall currencies, on the income of Maisarah by RO (000) 2,176.
Maisarah Islamic Banking Services – Window of BankDhofar
DISCLOSURE REQUIREMENTS UNDER PILLAR – III OF BASEL II & III.For the year ended 31 December 2019

Annual Report 2019250
6. RISK MANAGEMENT, RISK EXPOSURES AND RISK MITIGATION (CONTINUED)6.8. DISPLACED COMMERCIAL RISK6.8.1. QUALITATIVE DISCLOSURE
1. Displaced Commercial Risk (DCR) refers to the market pressure to pay returns which exceed the rate that has been actually earned on each category of deposit. Reason may be underperforming assets as compared to market rates or commitment to retain customers by giving higher returns. To cater for DCR, to avoid fluctuations in the profits and to cater the risk of future losses, Maisarah maintains a certain percentage of the profits as PER and IRR in accordance with the detailed profit and loss distribution policy.
6.8.2. QUANTITATIVE DISCLOSURE
1. Disclosure of Historical Data Over the Past Years
DetailsPosition as at
Dec 2019 Dec 2018 Dec 2017 Dec 2016 Dec 2015
RO 000 RO 000 RO 000 RO 000 RO 000
Total profits available for sharing 26,240 23,498 20,070 13,857 8,283
Profit available for IAH before smoothing 1,136 405 376 200 139
Profit paid to IAH after smoothing 898 202 201 119 83
DetailsPosition as at
Dec 2019 Dec 2018 Dec 2017 Dec 2016 Dec 2015
RO 000 RO 000 RO 000 RO 000 RO 000
PER 16 11 7 4 2
IRR 4 3 2 1 -
2. Five-Year Comparison of Historical Rate of Return with Market Benchmark Rate
No market benchmark rate is available for comparison purpose.
3. Five-Year Comparison Between Return to IAHs and Return to Shareholders
Deposit CategoryPosition as at
Dec 2019 Dec 2018 Dec 2017 Dec 2016 Dec 2015
Investment Account Holders
Saving accounts (RO) 0.60% 0.66% 0.95% 1.67% 0.98%
Saving accounts (USD) 0.22% 0.19% 1.03% 0.89%
Prize Saving Account 0.61% 0.64% 0.99% 1.06%
Mudaraba 1-M
Mudaraba 3-M 1.25% 1.10%
Mudaraba 6-M
Mudaraba 12-M 1.48%
Equity 5.82% 5.90% 4.23% 4.89% 4.31%
4. Profit Appropriated to PER and IRR
Appropriation of profit to PER and IRR is provided under disclosure (ii) of 4.2.2.
Maisarah Islamic Banking Services – Window of BankDhofar
DISCLOSURE REQUIREMENTS UNDER PILLAR – III OF BASEL II & III.For the year ended 31 December 2019

251Annual Report 2019
6. RISK MANAGEMENT, RISK EXPOSURES AND RISK MITIGATION (CONTINUED)6.8. DISPLACED COMMERCIAL RISK (CONTINUED)6.8.1. QUALITATIVE DISCLOSURE (CONTINUED)
5. Analysis of difference between aggregate Mudaraba earned profits and profits distributed
Details RO 000
Total profits available for distribution to IAH 1,136
- Mudarib fee charged by Maisarah (232)
- PER (5)
- IRR (1)
Profit distributed to IAH 898
6. Analysis of the proportion of the RWA funded by IAH
Details RWA RO 000
RWA %
Assets
- Murabaha 1,403 4.55%
- Diminishing Musharaka 19,168 62.13%
- Ijarah Muntahia Bittamleek 1,285 4.16%
- Wakala financing 2,932 9.50%
- Mudaraba financing 4,261 13.81%
- Investment in Sukuk 1,466 4.75%
- Wakala placement 339 1.10%
Total assets funded by IAH (allocated based on proportion) 30,854 100%
6.9. CONTRACT-SPECIFIC RISKS
6.9.1. QUALITATIVE DISCLOSURE
1. For the purpose of various types of Shari’a compliant financing contracts, the Bank assigns the risk-weightage based on the purpose of financing as well as the risk profile of the customer as prescribed in IBRF.
6.9.2. QUANTITATIVE DISCLOSURE
1. RWA Classified by Shari’a Compliant Financing Contracts
Sr. Details RWA RO 000
1 Murabaha and other receivables 19,845
2 Mudaraba Financings 58,145
3 Ijarah Assets 17,533
4 Diminishing Musharaka Financing 261,556
5 Wakala Financing 40,013
Total 397,092
Maisarah Islamic Banking Services – Window of BankDhofar
DISCLOSURE REQUIREMENTS UNDER PILLAR – III OF BASEL II & III.For the year ended 31 December 2019

Annual Report 2019252
7. GENERAL GOVERNANCE AND SHARI’A GOVERNANCE DISCLOSURES7.1. GENERAL GOVERNANCE DISCLOSURES7.1.1. QUALITATIVE DISCLOSURE
1. Maisarah follows Financial Accounting Standard issued by Accounting and Auditing Organization for Islamic Financial Institutions (AAOIFI) as required by the regulations of the Central Bank of Oman. There had been no departure from the financial reporting framework of AAOIFI during the year.
2. Being the Islamic window operation of the Bank, Maisarah is managed under the same governance structure as the Bank. The details of which are disclosed in the main Pillar III document of the Bank. In addition, Maisarah’s operations are governed and monitored by the Shari’a Supervisory Board (SSB) details of which is provided under disclosure 7.2.
3. In the ordinary course of business, Maisarah conducts transactions with some of its Directors, members of Shari’a Supervisory Board, shareholders and companies over which they are able to exert significant influence. The aggregate amounts of balances with such related parties are as follows:
Related parties’ transactions 2019RO 000
2018RO 000
Finances
Directors, members of Shari’a Supervisory Board and shareholders holding 10% or more interest in the Bank
822 664
Deposits and other accountsDirectors, members of Shari’a Supervisory Board and shareholders holding 10% or more interest in the Bank
35,463 43,930
Other transactionsRental payment to a related party 306 237Income from finance to related parties 37 25Profit expense on deposits from related parties 1,811 2,007
Key management compensationSalaries and other benefits 267 261
End of service benefits 10 9
4. During the year Maisarah has conducted following investor / consumer education programs on Islamic banking principles and Maisarah products:
· VIP gathering in Muscat Hayat Regency Hotel.
· VIP gathering in Salalah Millennium Hotel.
· Awareness program in Free Zone Company, Salalah.
· Awareness program in Sohar University.
· Participating in banks exhibition at Daleel petroleum company.
· Participating in banks exhibition at British Petroleum company.
5. Complaint management of Maisarah customers is handled at the parent entity level through the Guest Relation Department. The department has a written procedures and process whereby it handles the complaints receive through branches, emails, call centers. The complaints are lodged and a proper resolution mechanism in place including escalations as well as follow up with concerned departments and customers.
6. During the year, Maisarah has played an important role in fulfilling its responsibility towards the society by having events such as visiting hospitals, conducting Quran recitation events, and extending support for local events. During the year, four (4) events were organized.
Maisarah Islamic Banking Services – Window of BankDhofar
DISCLOSURE REQUIREMENTS UNDER PILLAR – III OF BASEL II & III.For the year ended 31 December 2019

253Annual Report 2019
7. GENERAL GOVERNANCE AND SHARI’A GOVERNANCE DISCLOSURES (CONTINUED)7.2. SHARI’A GOVERNANCE DISCLOSURES7.2.1. QUALITATIVE DISCLOSURE
1. The most distinct feature of any Islamic bank is its compliance with the principles of Shari’a in all its activities, operations, transactions and investments. To ensure compliance with the rules and principles of Shari’a, Maisarah has a fully independent setup of Shari’a Governance system.
The Shari’a Compliance and Audit Department have been setup with the purpose of examination and assessment of the extent to which the Institution is observing Shari’a Principles, Fatwas, guidelines and instructions issued by the Shari’a Supervisory Board (SSB) of Maisarah. It also ensures a proper segregation exists between Maisarah and the parent bank with regards to services, products, funds and investments. During 2019, the department has conducted 16 audits as compared to the target of 15. The Unit comes under the direct supervision of SSB. The SSB met 5 times (including 1 meeting with Board of Directors) in the year 2019.
2. Maisarah is committed to contributing to charity any income generated from non-Islamic sources. Accordingly, any earning prohibited by Shari’a is credited to charity funds to be used for social welfare purposes.
3. Shari’a rulings issued by the Shari’a Supervisory Board is binding on Maisarah.
7.2.2. QUANTITATIVE DISCLOSURE
1. Violation of Shari’a Compliance During the Year
During the year, Maisarah recorded and transferred to charity the Non Shari’a compliant income of RO 5k in respect of rebate received on nostro accounts, late payments from customers and income from placement with Central Bank.
2. Zakat Contributions of the Islamic Window
In accordance with the Policy of Maisarah, the responsibility to pay Zakat is on the shareholders & IAH.
3. Remuneration of Shari’a Board Members
Details 2019 2018
RO 000 RO 000
Chairman
- Remuneration proposed 9 8
- Sitting fees paid 2 2
Other Members
- Remuneration proposed 29 24
- Sitting fees paid 8 6
Maisarah Islamic Banking Services – Window of BankDhofar
DISCLOSURE REQUIREMENTS UNDER PILLAR – III OF BASEL II & III.For the year ended 31 December 2019

Annual Report 2019254
8. BASEL III
Bank has adopted Basel III liquidity standards and is reporting the liquidity coverage ratio and net stable
funding ratio to CBO with effect from March 2014.
8.1. CAPITAL DISCLOSURE
Basel III common disclosure template to be used during the transition of regulatory adjustments (RO ‘000)
Amount Subject to
Pre-Basel III treatment
Common Equity Tier 1 Capital: Instruments and reserves
1Directly issued qualifying common share capital (and equivalent for non-joint stock companies) plus related stock surplus [Note 1] 55,000
2 Retained Earnings 19,587
3 Accumulated other comprehensive income (and other reserves) -
4Directly issued capital subject to phase out from CET1 (only applicable to non-joint stock companies)
-
Public Sector capital injections grandfathered until 1 January 2018 -
5Common share capital issued by subsidiaries and held by third parties (amount allowed in group CET 1)
-
6 Common Equity Tier 1 Capital before regulatory adjustments 74,587
Common Equity Tier 1 Capital: Regulatory Adjustments
7 Prudential valuation adjustments -
8 Goodwill (net of related tax liability) * -
9Other intangibles other than mortgage-servicing rights (net of related tax liability) *
-
10Deferred tax assets that rely on future profitability excluding those arising from temporary differences (net of related tax liability)
-
11 Cash Flow hedge reserve -
12 Shortfall of provisions to expected loss -
13 Securitization gain on sale (as set out in para 14.9 of CP-1) -
14 Gains and losses due to changes in own credit risk on fair valued liabilities -
15 Defined benefit pension fund net assets -
16Investments in own shares (if not already netted off paid-in capital on reported balance sheet)
-
17 Reciprocal cross holdings in common equity -
18
Investments in the capital of banking, financial, insurance and takaful entities that are outside the scope of regulatory consolidation, net of eligible short positions, where the bank does not own more than 10% of the issued share capital (amount above 10% threshold)
-
19Significant investments in the common stock of banking, financial, insurance and takaful entities that are outside the scope of regulatory consolidation, net of eligible short positions (amount above 10% threshold)
-
20 Mortgage servicing rights (amount above 10% threshold) -
Maisarah Islamic Banking Services – Window of BankDhofar
DISCLOSURE REQUIREMENTS UNDER PILLAR – III OF BASEL II & III.For the year ended 31 December 2019
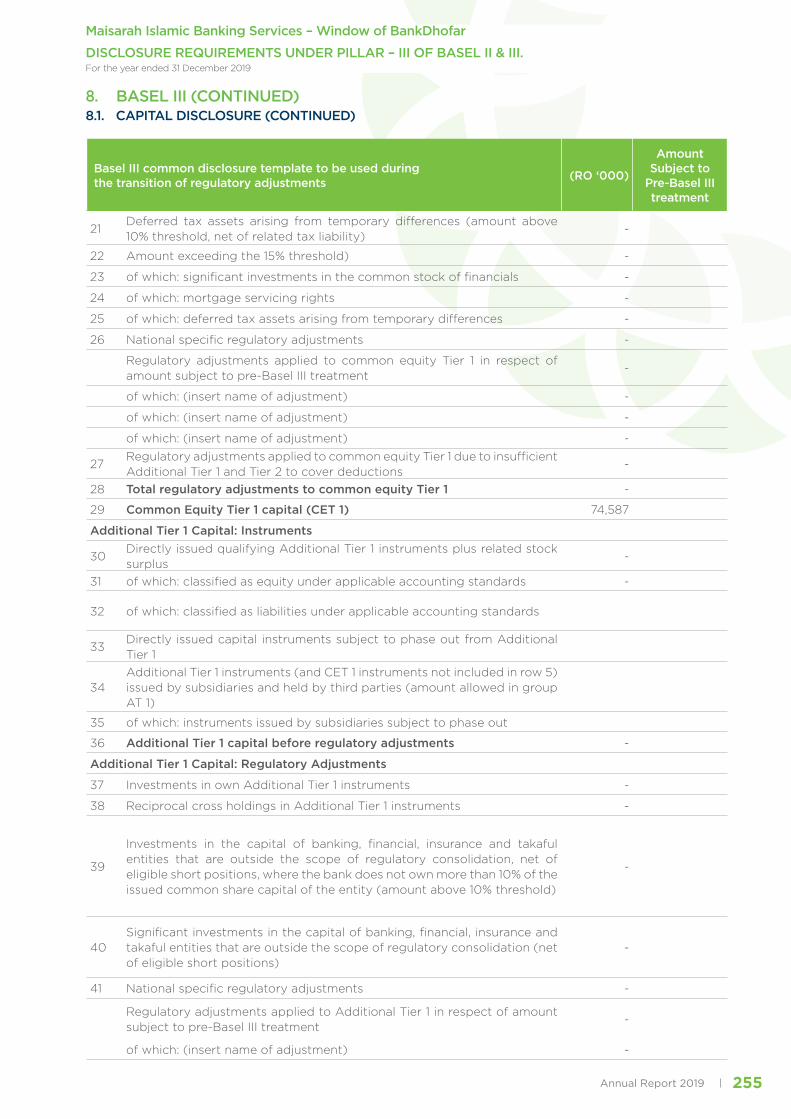
255Annual Report 2019
Basel III common disclosure template to be used during the transition of regulatory adjustments (RO ‘000)
Amount Subject to
Pre-Basel III treatment
21Deferred tax assets arising from temporary differences (amount above 10% threshold, net of related tax liability)
-
22 Amount exceeding the 15% threshold) -
23 of which: significant investments in the common stock of financials -
24 of which: mortgage servicing rights -
25 of which: deferred tax assets arising from temporary differences -
26 National specific regulatory adjustments -
Regulatory adjustments applied to common equity Tier 1 in respect of amount subject to pre-Basel III treatment
-
of which: (insert name of adjustment) -
of which: (insert name of adjustment) -
of which: (insert name of adjustment) -
27Regulatory adjustments applied to common equity Tier 1 due to insufficient Additional Tier 1 and Tier 2 to cover deductions
-
28 Total regulatory adjustments to common equity Tier 1 -
29 Common Equity Tier 1 capital (CET 1) 74,587
Additional Tier 1 Capital: Instruments
30Directly issued qualifying Additional Tier 1 instruments plus related stock surplus
-
31 of which: classified as equity under applicable accounting standards -
32 of which: classified as liabilities under applicable accounting standards
33Directly issued capital instruments subject to phase out from Additional Tier 1
34Additional Tier 1 instruments (and CET 1 instruments not included in row 5) issued by subsidiaries and held by third parties (amount allowed in group AT 1)
35 of which: instruments issued by subsidiaries subject to phase out
36 Additional Tier 1 capital before regulatory adjustments -
Additional Tier 1 Capital: Regulatory Adjustments
37 Investments in own Additional Tier 1 instruments -
38 Reciprocal cross holdings in Additional Tier 1 instruments -
39
Investments in the capital of banking, financial, insurance and takaful entities that are outside the scope of regulatory consolidation, net of eligible short positions, where the bank does not own more than 10% of the issued common share capital of the entity (amount above 10% threshold)
-
40Significant investments in the capital of banking, financial, insurance and takaful entities that are outside the scope of regulatory consolidation (net of eligible short positions)
-
41 National specific regulatory adjustments -
Regulatory adjustments applied to Additional Tier 1 in respect of amount subject to pre-Basel III treatment
-
of which: (insert name of adjustment) -
8. BASEL III (CONTINUED)8.1. CAPITAL DISCLOSURE (CONTINUED)
Maisarah Islamic Banking Services – Window of BankDhofar
DISCLOSURE REQUIREMENTS UNDER PILLAR – III OF BASEL II & III.For the year ended 31 December 2019

Annual Report 2019256
Basel III common disclosure template to be used during the transition of regulatory adjustments (RO ‘000)
Amount Subject to
Pre-Basel III treatment
of which: (insert name of adjustment) -
of which: (insert name of adjustment) -
42Regulatory adjustments applied to Additional Tier 1 due to insufficient Tier 2 to cover deductions
-
43 Total regulatory adjustments to Additional Tier 1 -
44 Additional Tier 1 capital (CET 1) -
45 Tier 1 capital (T1 = CET 1 + AT 1) 74,587
Tier 2 capital: Instruments and provisions
46 Directly issued qualifying Tier 2 instruments plus related stock surplus -
47 Directly issued capital instruments subject to phase out from Tier 2 -
48Tier 2 instruments (and CET 1 and AT 1 instruments not included in rows 5 or 34) issued by subsidiaries and held by third parties (amount allowed in group Tier 2)
-
49 of which: instruments issued by subsidiaries subject to phase out
50Provisions and Cumulative fair value gains on available for sale instruments
3,521
51 Tier 2 capital before regulatory adjustments 3,521
Tier 2 capital: Regulatory Adjustments
52 Investments in own Tier 2 instruments -
53 Reciprocal cross holdings in Tier 2 instruments -
54
Investments in the capital of banking, financial, insurance and takaful entities that are outside the scope of regulatory consolidation, net of eligible short positions, where the bank does not own more than 10% of the issued common share capital of the entity (amount above 10% threshold)
-
55Significant investments in the capital of banking, financial, insurance and takaful entities that are outside the scope of regulatory consolidation (net of eligible short positions)
-
56 National specific regulatory adjustments -
Regulatory adjustments applied to Tier 2 in respect of amount subject to pre-Basel III treatment
-
of which: (insert name of adjustment) -
of which: (insert name of adjustment) -
of which: (insert name of adjustment) -
57 Total Regulatory Adjustments to Tier 2 capital -
58 Tier 2 Capital (T 2) 3,521
59 Total Capital (TC = T 1 + T 2) 78,108
Risk Weighted Assets in respect of amounts subject to pre-Basel III treatment
of which: (insert name of adjustment)
of which: (insert name of adjustment)
60 Total Risk Weighted Assets (60a + 60b + 60c) 516,310
60a of which: Credit Risk Weighted Assets 447,345
60b of which: Market Risk Weighted Assets 18,625
60c of which: Operational Risk Weighted Assets 50,340
Capital Ratios
61 Common Equity Tier 1 (as a percentage of risk weighted assets) 14.45%
8. BASEL III (CONTINUED)8.1. CAPITAL DISCLOSURE (CONTINUED)
Maisarah Islamic Banking Services – Window of BankDhofar
DISCLOSURE REQUIREMENTS UNDER PILLAR – III OF BASEL II & III.For the year ended 31 December 2019
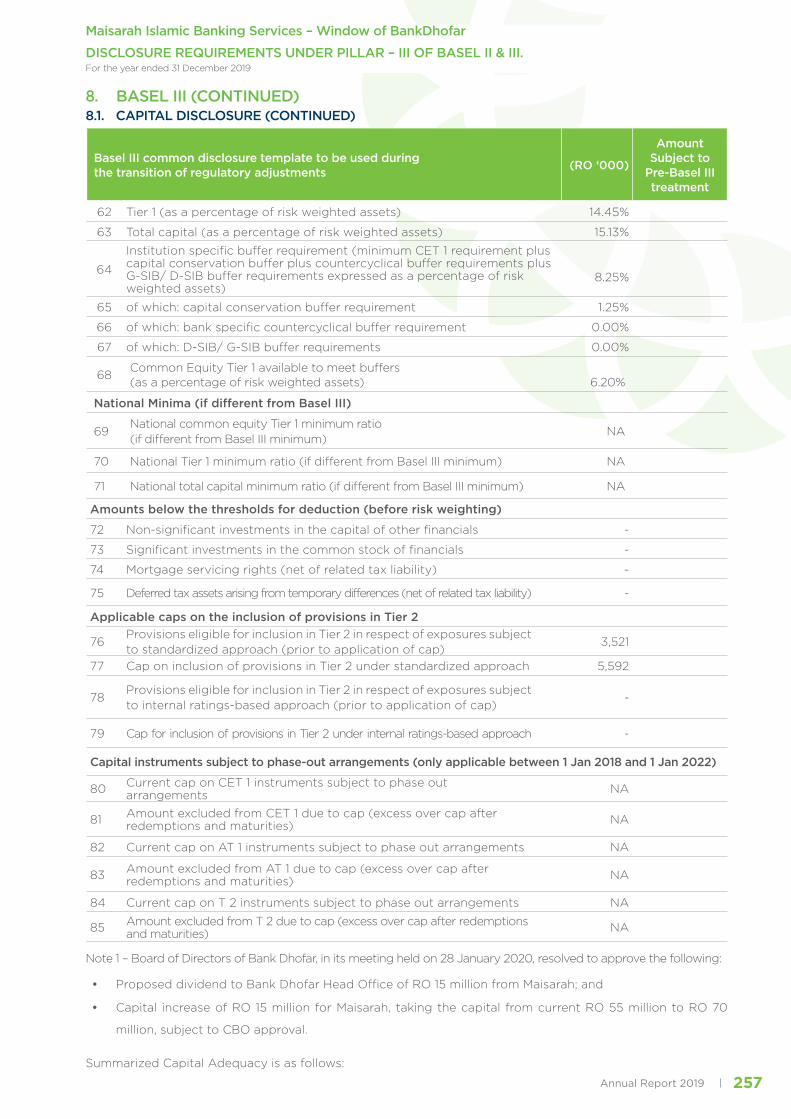
257Annual Report 2019
Basel III common disclosure template to be used during the transition of regulatory adjustments (RO ‘000)
Amount Subject to
Pre-Basel III treatment
62 Tier 1 (as a percentage of risk weighted assets) 14.45%
63 Total capital (as a percentage of risk weighted assets) 15.13%
64
Institution specific buffer requirement (minimum CET 1 requirement plus capital conservation buffer plus countercyclical buffer requirements plus G-SIB/ D-SIB buffer requirements expressed as a percentage of risk weighted assets)
8.25%
65 of which: capital conservation buffer requirement 1.25%
66 of which: bank specific countercyclical buffer requirement 0.00%
67 of which: D-SIB/ G-SIB buffer requirements 0.00%
68Common Equity Tier 1 available to meet buffers (as a percentage of risk weighted assets) 6.20%
National Minima (if different from Basel III)
69National common equity Tier 1 minimum ratio (if different from Basel III minimum)
NA
70 National Tier 1 minimum ratio (if different from Basel III minimum) NA
71 National total capital minimum ratio (if different from Basel III minimum) NA
Amounts below the thresholds for deduction (before risk weighting)
72 Non-significant investments in the capital of other financials -
73 Significant investments in the common stock of financials -
74 Mortgage servicing rights (net of related tax liability) -
75 Deferred tax assets arising from temporary differences (net of related tax liability) -
Applicable caps on the inclusion of provisions in Tier 2
76Provisions eligible for inclusion in Tier 2 in respect of exposures subject to standardized approach (prior to application of cap)
3,521
77 Cap on inclusion of provisions in Tier 2 under standardized approach 5,592
78Provisions eligible for inclusion in Tier 2 in respect of exposures subject to internal ratings-based approach (prior to application of cap)
-
79 Cap for inclusion of provisions in Tier 2 under internal ratings-based approach -
Capital instruments subject to phase-out arrangements (only applicable between 1 Jan 2018 and 1 Jan 2022)
80 Current cap on CET 1 instruments subject to phase out arrangements NA
81 Amount excluded from CET 1 due to cap (excess over cap after redemptions and maturities) NA
82 Current cap on AT 1 instruments subject to phase out arrangements NA
83 Amount excluded from AT 1 due to cap (excess over cap after redemptions and maturities) NA
84 Current cap on T 2 instruments subject to phase out arrangements NA
85 Amount excluded from T 2 due to cap (excess over cap after redemptions and maturities) NA
Note 1 – Board of Directors of Bank Dhofar, in its meeting held on 28 January 2020, resolved to approve the following:
• Proposed dividend to Bank Dhofar Head Office of RO 15 million from Maisarah; and
• Capital increase of RO 15 million for Maisarah, taking the capital from current RO 55 million to RO 70
million, subject to CBO approval.
Summarized Capital Adequacy is as follows:
8. BASEL III (CONTINUED)8.1. CAPITAL DISCLOSURE (CONTINUED)
Maisarah Islamic Banking Services – Window of BankDhofar
DISCLOSURE REQUIREMENTS UNDER PILLAR – III OF BASEL II & III.For the year ended 31 December 2019

Annual Report 2019258
Sr. No. CA Report 1 (For CBO Use only) RO 000
1 Common Equity Tier 1 Capital (CET1) before Regulatory Adjustments 74,587
2 Regulatory Adjustments to CET1 -
3 CET1 74,587
4 Additional Tier 1 Capital (AT1) before Regulatory Adjustments -
5 Regulatory Adjustments to AT1 -
6 AT1 -
7 Tier 1 Capital (7=3+6) (minimum at 0.625%) 74,587
8 Tier 2 Capital before Regulatory Adjustments 3,521
9 Regulatory Adjustments to Tier 2 Capital -
10 Tier 2 Capital (T2) 3,521
11 Total Capital (11=7+10) 78,108
12 Total Risk Weighted Assets (TRWA) (12=13+14+15) 516,310
13 Credit Risk Weighted Assets 447,345
14 Market Risk Weighted Assets 18,625
15 Operational Risk Weighted Assets 50,340
16 CET1 (as a percentage of TRWA) (in %) 14.45
17 Tier 1 (as a percentage of TRWA) (in %) 14.45
18 Total capital (as a percentage of TRWA) (in %) 15.13
Reconciliation of reported balance sheet and the regulatory scope of consolidation:
Balance Sheet
as in Published Financial
Statement
Under regulatory
scope of consolidation
Reference
As at Period End - 31.12.2019
As at Period End -
31.12.2019
Assets
Cash & Balances with CBO 43,881
Balances with bank and money at call and short notice 24,747
Investments: 62,586
Of which Held to Maturity 10,000
Out of investments in Held to Maturity:
Investments in Subsidiaries
Investments in Associates & Joint Ventures
Of which Available for Sale 52,586
Out of investments in Available for Sale:
Investments in Subsidiaries
Investments in Associates & Joint Ventures
8. BASEL III (CONTINUED)8.1. CAPITAL DISCLOSURE (CONTINUED)
Maisarah Islamic Banking Services – Window of BankDhofar
DISCLOSURE REQUIREMENTS UNDER PILLAR – III OF BASEL II & III.For the year ended 31 December 2019

259Annual Report 2019
Balance Sheet
as in Published Financial
Statement
Under regulatory
scope of consolidation
Reference
As at Period End - 31.12.2019
As at Period End -
31.12.2019
Of which Held for Trading
Loans & Advances 451,437
Of which,
Loans & Advances to domestic banks
Loans & Advances to Non-Resident Banks
Loans & Advances to domestic customers 437,495
Loans & Advances to Non-Resident Customers for domestic operations
Loans & Advances to Non-Resident Customers for operations abroad
Loans & Advances to SMEs 13,942
Financing from Islamic Banking Window
Fixed Assets 1,147
Other Asset 7,132
Of which,
Goodwill & Intangible Assets a
Out of which
Goodwill
Other Intangibles (excluding MSRs)
Deferred Tax Assets
Goodwill on Consolidation
Debit balance in Profit & Loss Account
Total Assets 590,930 -
Capital & Liabilities
Paid up capital 55,000
of which:
Amount eligible for CET 1 55,000 h
Amount eligible for AT1 - if
Reserves & Surplus j
Share Premium - k
Legal Reserve - l
Subordinated loan reserve - m
Investment Revaluation Reserve (Gains are included at 45% in Tier II and losses in full are deducted from Tier I)
88
- n
Retained Earnings (The proposed dividend payment amount is excluded from retained earnings)
19,587 19,587 o
Total Capital 74,675
Deposits 405,221
Of which,
8. BASEL III (CONTINUED)8.1. CAPITAL DISCLOSURE (CONTINUED)
Maisarah Islamic Banking Services – Window of BankDhofar
DISCLOSURE REQUIREMENTS UNDER PILLAR – III OF BASEL II & III.For the year ended 31 December 2019

Annual Report 2019260
Balance Sheet
as in Published Financial
Statement
Under regulatory
scope of consolidation
Reference
As at Period End - 31.12.2019
As at Period End -
31.12.2019Deposit from Banks
Customer Deposits 405,221
Deposit of Islamic Banking Window -
Other deposits - (Please specify)
Borrowings 95,081
Of which,
From CBO
From Banks (includes borrowing from HO) 95,081
From other Institutions & Agencies
Borrowings in the form of bonds, debentures & Sukuks
Others (Please specify) (Subordinated Loans)
Other liabilities & provisions 15,953
Of which,
DTLs related to goodwill
DTLs related to intangible assets
Total Liabilities 590,930 19,587
Common Equity Tier 1 capital: instruments and reserves
Sr. No.
Component of regulatory capital reported by bank
Source based on reference numbers/
letters of the balance sheet under the
regulatory scope of consolidation
from step 2
1
Directly issued qualifying common share (and equivalent for non-joint stock companies) capital plus related stock surplus ‘Allocated Capital to Window from Core Capital’
55,000 h
2 Retained earnings 19,587 k,l,m,o
3Accumulated other comprehensive income (and other reserves)
4Directly issued capital subject to phase out from CET1 (only applicable to non-joint stock companies)
5Common share capital issued by subsidiaries and held by third parties (amount allowed in group CET1)
6Common Equity Tier 1 capital before regulatory adjustments
74,587
7 Prudential valuation adjustments
- n
8 Goodwill (net of related tax liability)
- a
8. BASEL III (CONTINUED)8.1. CAPITAL DISCLOSURE (CONTINUED)
Maisarah Islamic Banking Services – Window of BankDhofar
DISCLOSURE REQUIREMENTS UNDER PILLAR – III OF BASEL II & III.For the year ended 31 December 2019
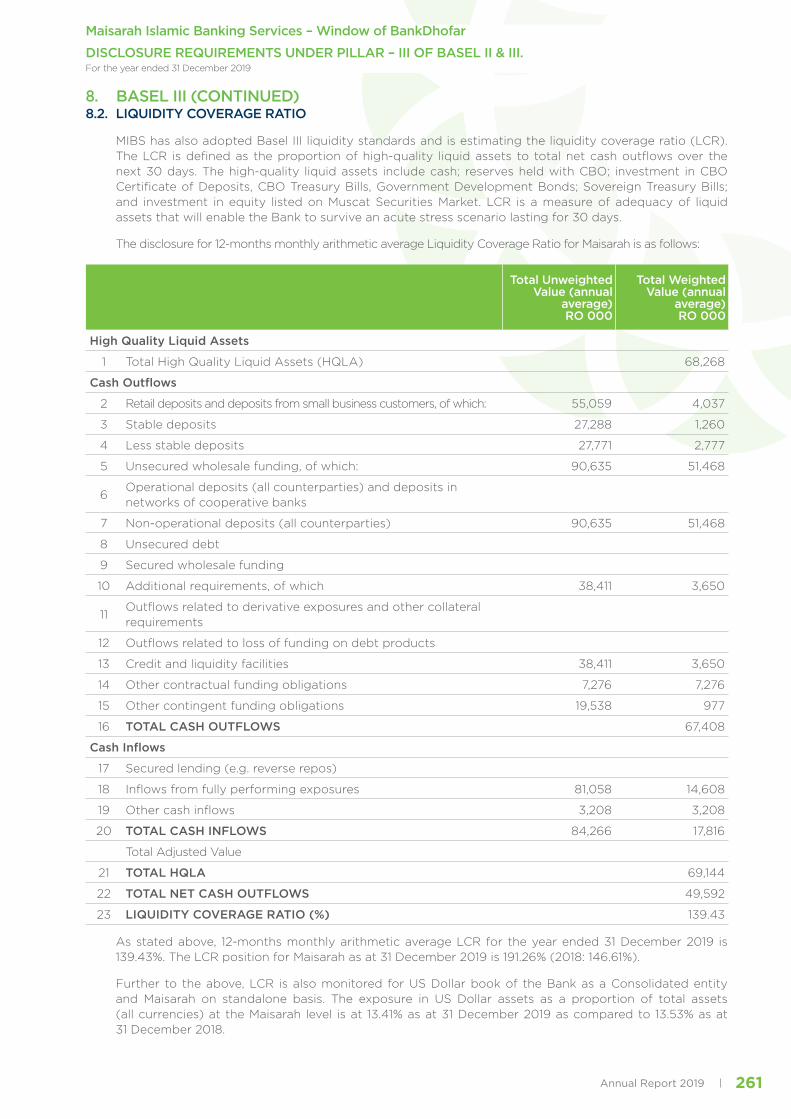
261Annual Report 2019
8. BASEL III (CONTINUED)8.2. LIQUIDITY COVERAGE RATIO
MIBS has also adopted Basel III liquidity standards and is estimating the liquidity coverage ratio (LCR). The LCR is defined as the proportion of high-quality liquid assets to total net cash outflows over the next 30 days. The high-quality liquid assets include cash; reserves held with CBO; investment in CBO Certificate of Deposits, CBO Treasury Bills, Government Development Bonds; Sovereign Treasury Bills; and investment in equity listed on Muscat Securities Market. LCR is a measure of adequacy of liquid assets that will enable the Bank to survive an acute stress scenario lasting for 30 days.
The disclosure for 12-months monthly arithmetic average Liquidity Coverage Ratio for Maisarah is as follows:
Total Unweighted Value (annual
average) RO 000
Total Weighted Value (annual
average) RO 000
High Quality Liquid Assets
1 Total High Quality Liquid Assets (HQLA) 68,268
Cash Outflows
2 Retail deposits and deposits from small business customers, of which: 55,059 4,037
3 Stable deposits 27,288 1,260
4 Less stable deposits 27,771 2,777
5 Unsecured wholesale funding, of which: 90,635 51,468
6Operational deposits (all counterparties) and deposits in networks of cooperative banks
7 Non-operational deposits (all counterparties) 90,635 51,468
8 Unsecured debt
9 Secured wholesale funding
10 Additional requirements, of which 38,411 3,650
11Outflows related to derivative exposures and other collateral requirements
12 Outflows related to loss of funding on debt products
13 Credit and liquidity facilities 38,411 3,650
14 Other contractual funding obligations 7,276 7,276
15 Other contingent funding obligations 19,538 977
16 TOTAL CASH OUTFLOWS 67,408
Cash Inflows
17 Secured lending (e.g. reverse repos)
18 Inflows from fully performing exposures 81,058 14,608
19 Other cash inflows 3,208 3,208
20 TOTAL CASH INFLOWS 84,266 17,816
Total Adjusted Value
21 TOTAL HQLA 69,144
22 TOTAL NET CASH OUTFLOWS 49,592
23 LIQUIDITY COVERAGE RATIO (%) 139.43
As stated above, 12-months monthly arithmetic average LCR for the year ended 31 December 2019 is 139.43%. The LCR position for Maisarah as at 31 December 2019 is 191.26% (2018: 146.61%).
Further to the above, LCR is also monitored for US Dollar book of the Bank as a Consolidated entity and Maisarah on standalone basis. The exposure in US Dollar assets as a proportion of total assets (all currencies) at the Maisarah level is at 13.41% as at 31 December 2019 as compared to 13.53% as at 31 December 2018.
Maisarah Islamic Banking Services – Window of BankDhofar
DISCLOSURE REQUIREMENTS UNDER PILLAR – III OF BASEL II & III.For the year ended 31 December 2019
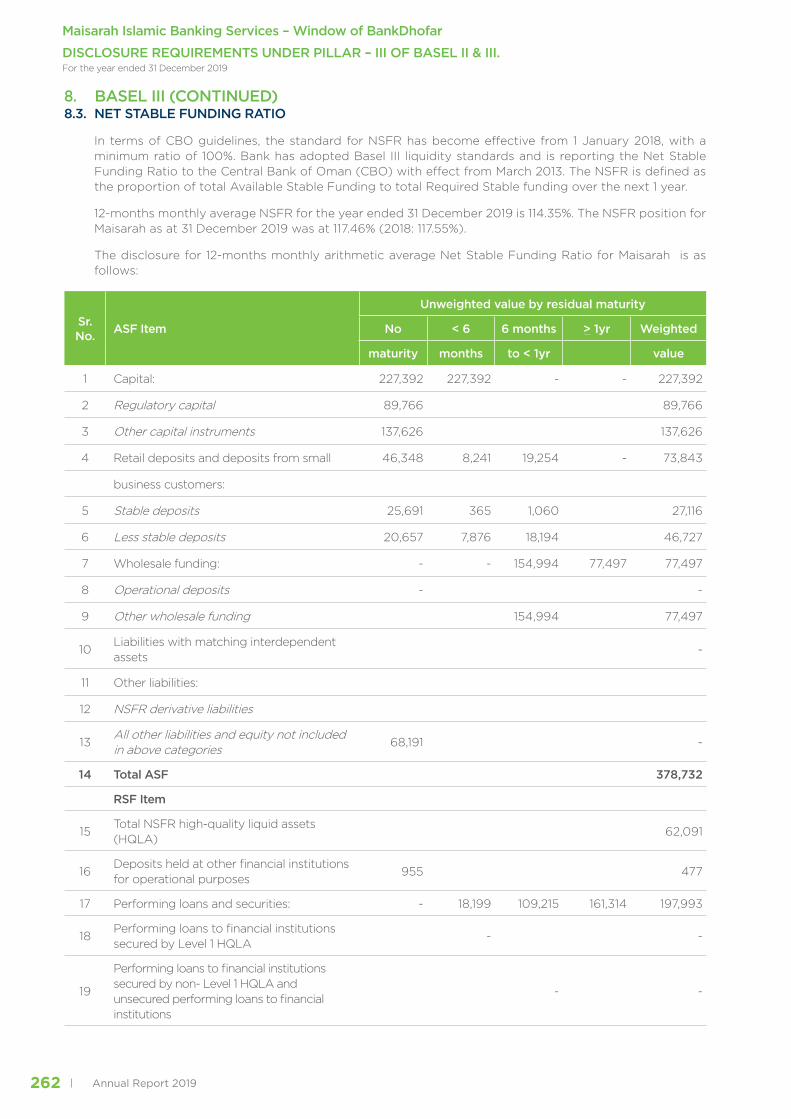
Annual Report 2019262
8. BASEL III (CONTINUED)8.3. NET STABLE FUNDING RATIO
In terms of CBO guidelines, the standard for NSFR has become effective from 1 January 2018, with a minimum ratio of 100%. Bank has adopted Basel III liquidity standards and is reporting the Net Stable Funding Ratio to the Central Bank of Oman (CBO) with effect from March 2013. The NSFR is defined as the proportion of total Available Stable Funding to total Required Stable funding over the next 1 year.
12-months monthly average NSFR for the year ended 31 December 2019 is 114.35%. The NSFR position for Maisarah as at 31 December 2019 was at 117.46% (2018: 117.55%).
The disclosure for 12-months monthly arithmetic average Net Stable Funding Ratio for Maisarah is as follows:
Sr. No. ASF Item
Unweighted value by residual maturity
No < 6 6 months > 1yr Weighted
maturity months to < 1yr value
1 Capital: 227,392 227,392 - - 227,392
2 Regulatory capital 89,766 89,766
3 Other capital instruments 137,626 137,626
4 Retail deposits and deposits from small 46,348 8,241 19,254 - 73,843
business customers:
5 Stable deposits 25,691 365 1,060 27,116
6 Less stable deposits 20,657 7,876 18,194 46,727
7 Wholesale funding: - - 154,994 77,497 77,497
8 Operational deposits - -
9 Other wholesale funding 154,994 77,497
10Liabilities with matching interdependent assets
-
11 Other liabilities:
12 NSFR derivative liabilities
13All other liabilities and equity not included in above categories
68,191 -
14 Total ASF 378,732
RSF Item
15Total NSFR high-quality liquid assets (HQLA)
62,091
16Deposits held at other financial institutions for operational purposes
955 477
17 Performing loans and securities: - 18,199 109,215 161,314 197,993
18Performing loans to financial institutions secured by Level 1 HQLA
- -
19
Performing loans to financial institutions secured by non- Level 1 HQLA and unsecured performing loans to financial institutions
- -
Maisarah Islamic Banking Services – Window of BankDhofar
DISCLOSURE REQUIREMENTS UNDER PILLAR – III OF BASEL II & III.For the year ended 31 December 2019

263Annual Report 2019
Sr. No. ASF Item
Unweighted value by residual maturity
No < 6 6 months > 1yr Weighted
maturity months to < 1yr value
20
Performing loans to non-financial corporate clients, loans to retail and small business customers, and loans to sovereigns, central banks and PSEs, of which
18,199 109,215 60,876
21-With a risk weight of less than or equal to 35% under the Basel II Standardised approach for credit risk
22. Performing residential mortgages, of which: 161,314 137,117
23With a risk weight of less than or equal to 35% under the Basel II Standardised Approach for credit risk
151,765 98,647
24Securities that are not in default and do not qualify as HQLA, including exchange-traded equities
- -
25Assets with matching interdependent liabilities
26 Other Assets: - - 7,722 7,722
27 Physical traded commodities, including gold -
28Assets posted as initial margin for derivative contracts and contributions to default funds of CCPs
29 NSFR derivative assets -
30NSFR derivative liabilities before deduction of variation margin posted
-
31All other assets not included in the above categories
7,722 7,722
32 Off-balance sheet items 62,916
33 TOTAL RSF 331,199
34 NET STABLE FUNDING RATIO (%) 114.35%
8. BASEL III (CONTINUED)8.3. NET STABLE FUNDING RATIO (CONTINUED)
Maisarah Islamic Banking Services – Window of BankDhofar
DISCLOSURE REQUIREMENTS UNDER PILLAR – III OF BASEL II & III.For the year ended 31 December 2019

MAISARAHINDEPENDENTAUDITOR’S REPORTAND FINANCIALSTATEMENTS31st DECEMBER 2019
265Annual Report 2019

Annual Report 2019266
Statement of Financial Position at 31 December 2019
2019USD 000
2018USD 000 Note 2019
RO 000 2018
RO 000
Assets
113,977 100,805 Cash and balances with Central Bank of Oman 5 43,881 38,810
64,273 78,860 Due from banks and financial institutions 6 24,745 30,361
50,800 63,670 Murabaha and other receivables 7 19,558 24,513
48,613 68,314 Mudaraba financing 8 18,716 26,301
836,179 731,556 Diminishing Musharaka financing 9 321,929 281,649
136,262 81,623 Investments 10 52,461 31,425
25,974 25,974 Investment at amortised cost 11 10,000 10,000
103,686 48,657 Wakala financing 12 39,919 18,733
119,177 119,190 Ijarah Muntahia Bittamleek 13 45,883 45,888
2,979 3,400 Property and equipment 14 1,147 1,309
17,384 8,930 Other assets 15 6,693 3,438
1,519,304 1,330,979 Total assets 584,932 512,427
Liabilities, equity of investment accountholders and owners’ equity
Liabilities
292,203 145,558 Current accounts 112,498 56,040
178,961 146,558 Due to banks 16 68,900 56,425
68,003 67,922 Qard Hasan from Head office 17 26,181 26,150
658,192 683,946 Customer Wakala deposits 253,404 263,319
25,805 24,377 Other liabilities 18 9,935 9,385
1,223,164 1,068,361 Total liabilities 470,918 411,319
102,179 88,416 Equity of investment accountholders 19 39,339 34,040
Owners’ equity
142,857 142,857 Allocated share capital 20 55,000 55,000
229 (1,426) Investment revaluation reserve 88 (549)
50,875 32,771 Retained earnings 19,587 12,617
193,961 174,202 Total owners’ equity 74,675 67,068
Total liabilities, equity of investment
1,519,304 1,330,979 Accountholders and owners’ equity 584,932 512,427
69,140 43,042 Contingent liabilities and commitments 28 26,619 16,571
The financial statements were approved by the Board of Directors on 28 January 2020 for issue in accordance with a resolution of Board of Directors and signed on their behalf by
Chairman Chief Executive Islamic Banking
The attached notes on pages 272 to 325 form an integral part of these financial statements.Independent auditors report – Page 265
Maisarah Islamic Banking Services – Window of BankDhofar

267Annual Report 2019
Statement of Comprehensive Income For the year ended 31 December 2019
2019 USD 000
2018 USD 000 Note 2019
RO 0002018
RO 000
Income
67,759 60,252 Income from Islamic finances and investments 22 26,087 23,197
397 782 Income on Wakala placements 153 301
68,156 61,034 26,240 23,498
Less:
(2,935) (2,234) Return on equity of investment accountholders before Maisarah’s share as Mudarib (1,130) (860)
603 515 Maisarah’s share as Mudarib 232 198
(29,727) (27,964) Return on customer Wakala deposits 23 (11,445) (10,766)
(3,842) (1,608) Return on inter bank Wakala deposit (1,479) (619)
(35,901) (31,291) (13,822) (12,047)
Maisarah’s share in income from investment as a Mudarib and Rabul Maal 12,418 11,451
4,696 3,670 Revenue from banking services 1,808 1,413
1,075 628 Foreign exchange gain – net 414 242
413 60 Other revenues 159 23
38,439 34,101 Total revenue 14,799 13,129
(12,821) (12,060) Staff costs 24 (4,936) (4,643)
(4,306) (4,080) General and administrative expenses 25 (1,658) (1,571)
(1,294) (1,195) Depreciation 14 (498) (460)
(18,421) (17,335) Total expenses (7,092) (6,674)
(1,906) (1,340) Net impairment on financial instruments (734) (516)
(8) - Bad debts written off (3) -
18,104 15,426 Profit for the year 6,970 5,939
Other comprehensive income / (loss) for the year
Items that are or may not be reclassified to profit or loss
1,655 (1,956) Gain / (loss) from change in fair value of Debt instrument at FVOCI 10 637 (753)
1,655 (1,956) Other comprehensive income / (loss) for the year 637 (753)
19,759 13,470 Total comprehensive income for the year 7,607 5,186
The attached notes on pages 272 to 325 form an integral part of these financial statements.
Independent auditors report – Page 265.
Maisarah Islamic Banking Services – Window of BankDhofar

Annual Report 2019268
Statement of changes in owners’ equity For the year ended 31 December 2019
31 December 2019
Allocated share capital
RO 000
Investment revaluation
reserveRO 000
Retained earnings RO 000
TotalRO 000
Balance at 31 December 2018 55,000 (549) 12,617 67,068
Total comprehensive income for the year
Net profit for the year - - 6,970 6,970
Other comprehensive income for the year
Fair value change on FVOCI debt investments - 637 - 637
Total comprehensive income - 637 6,970 7,607
Balance as at 31 December 2019 55,000 88 19,587 74,675
31 December 2019
Allocated share capital
USD 000
Investment revaluation
reserveUSD 000
Retained earnings
USD 000Total
USD 000
Balance at 31 December 2018 142,857 (1,426) 32,771 174,202
Total comprehensive income for the year
Net profit for the year - - 18,104 18,104
Other comprehensive income for the year
Fair value change on FVOCI debt investments - 1,655 - 1,655
Total comprehensive income - 1,655 18,104 19,759
Balance as at 31 December 2019 142,857 229 50,875 193,961
Maisarah Islamic Banking Services – Window of BankDhofar
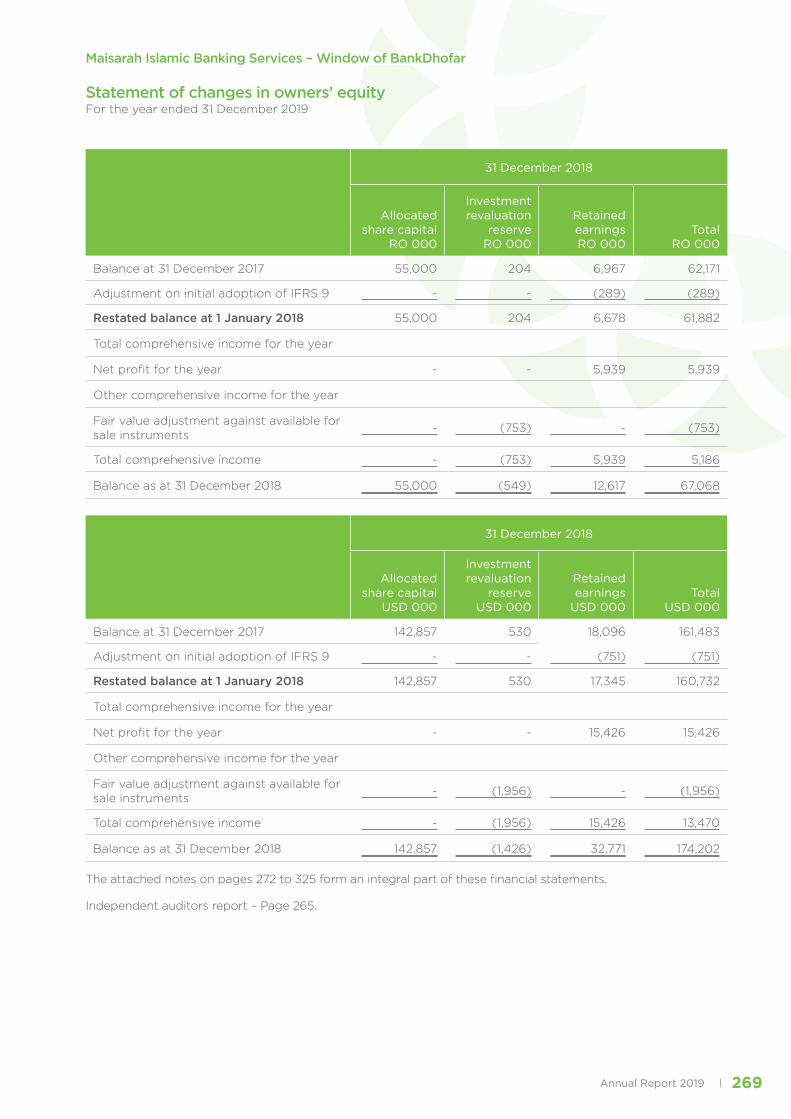
269Annual Report 2019
Statement of changes in owners’ equity For the year ended 31 December 2019
31 December 2018
Allocated share capital
RO 000
Investment revaluation
reserveRO 000
Retained earnings RO 000
TotalRO 000
Balance at 31 December 2017 55,000 204 6,967 62,171
Adjustment on initial adoption of IFRS 9 - - (289) (289)
Restated balance at 1 January 2018 55,000 204 6,678 61,882
Total comprehensive income for the year
Net profit for the year - - 5,939 5,939
Other comprehensive income for the year
Fair value adjustment against available for sale instruments - (753) - (753)
Total comprehensive income - (753) 5,939 5,186
Balance as at 31 December 2018 55,000 (549) 12,617 67,068
31 December 2018
Allocated share capital
USD 000
Investment revaluation
reserveUSD 000
Retained earnings
USD 000Total
USD 000
Balance at 31 December 2017 142,857 530 18,096 161,483
Adjustment on initial adoption of IFRS 9 - - (751) (751)
Restated balance at 1 January 2018 142,857 530 17,345 160,732
Total comprehensive income for the year
Net profit for the year - - 15,426 15,426
Other comprehensive income for the year
Fair value adjustment against available for sale instruments - (1,956) - (1,956)
Total comprehensive income - (1,956) 15,426 13,470
Balance as at 31 December 2018 142,857 (1,426) 32,771 174,202
The attached notes on pages 272 to 325 form an integral part of these financial statements.
Independent auditors report – Page 265.
Maisarah Islamic Banking Services – Window of BankDhofar

Annual Report 2019270
Statement of sources and uses of charity fund For the year ended 31 December 2019
2019USD 000
2018USD 000
2019RO 000
2018RO 000
Sources of charity funds
43 521 Undistributed charity funds at beginning of the year 17 201
13 43 Shari’a non-compliant income 5 17
56 564 Total sources of funds during the year 22 218
Uses of charity funds
(43) (521) Distributed to charity organizations (17) (201)
(43) (521) Total uses of funds during the year (17) (201)
13 43 Undistributed charity funds at end of the year 5 17
The attached notes on pages 272 to 325 form an integral part of these financial statements.
Independent auditors report – Page 265.
Maisarah Islamic Banking Services – Window of BankDhofar

271Annual Report 2019
Statement of cash flowsFor the year ended 31 December 2019
2019 2018 2019 2018
USD 000 USD 000 RO 000 RO 000
18,104 15,426 Profit for the year 6,970 5,939
Adjustments for:1,294 1,195 Depreciation 498 4608,727 4,969 Depreciation on Ijarah assets 3,360 1,913
- (8) Gain on sale of property and equipment - (3)1,906 1,340 Net impairment on financial instruments 734 516
8 - Bad debts written off 3 -21 - Amortisation of premium on investment 8 -16 13 Profit equalisation reserve and Investment risk reserve 6 5
30,076 22,935 Operating profit before changes in operating assets and liabilities 11,579 8,830
Operating assets and liabilities:12,831 6,784 Murabaha and other receivables 4,940 2,612
(9,281) (10,886) Ijarah Muntahia Bittamleek assets (3,573) (4,191)494 1,592 Proceeds from sale of Ijarah Muntahia Bittamleek assets 190 613
(107,296) 18,743 Diminishing Musharaka financing (41,309) 7,21619,971 (8,062) Mudaraba financing 7,689 (3,104)
(55,190) (48,732) Wakala financing (21,248) (18,762)(7,774) (553) Other asset (2,993) (213)
1,258 1,278 Other liabilities 484 492
(699) 4,210 Qard Hasan from Head Office (269) 1,621
(115,610) (12,691) Net cash used in operating activities (44,510) (4,886)
Cash flows from investing activities(112,987) (51,974) Purchase of investments (43,500) (20,010)
60,109 25,974 Sale proceed from maturity of investments at FVOCI 23,142 10,000
(52,878) (26,000) Net cash used in investing activities (20,358) (10,010)
Cash flows from financing activities146,644 (41,857) Current account 56,458 (16,115)110,000 - Due to banks 42,350 -(25,753) (39,042) Customer Wakala deposit (9,915) (15,031)
13,748 20,125 Unrestricted investment accountholders 5,293 7,748
244,639 (60,774) Net cash generated from / used in financing activities 94,186 (23,398)76,151 (99,465) Increase / (Decrease) in cash and cash equivalents 29,318 (38,294)33,143 132,608 Cash and cash equivalents at the beginning of the year 12,760 51,054
109,294 33,143 Cash and cash equivalents at the end of the year 42,078 12,760Cash and cash equivalents at the end of the year comprise:
113,977 100,805 Cash and balances with CBO 43,881 38,81064,278 78,896 Due from banks and financial institutions 24,747 30,375
(68,961) (146,558) Due to banks (26,550) (56,425)
109,294 33,143 42,078 12,760
The attached notes on pages 272 to 325 form an integral part of these financial statements.
Independent auditors report – Page 265.
Maisarah Islamic Banking Services – Window of BankDhofar
Annual Report 2019272
Notes to the financial statements For the year ended 31 December 2019
1. LEGAL STATUS AND PRINCIPAL ACTIVITIES
Maisarah Islamic Banking Services (“Maisarah”) was established in the Sultanate of Oman as window of Bank Dhofar SAOG (“the Bank”). Maisarah’s operations commenced on 3 March 2013 and it currently operates through 10 (2018: 10) branches in the Sultanate under the license issued by the Central Bank of Oman on 27 February 2013.
The principle activities of Maisarah is taking Shari’a compliant demand, saving and time deposit accounts, providing Murabaha finance, Ijarah financing and other Shari’a compliant forms of financing as well as managing investor’s money on the basis of Mudaraba or agency for a fee, providing commercial banking services and other investment activities.
Maisarah’s activities are regulated by the Central Bank of Oman (“CBO”) and supervised by Shari’a Supervisory Board (“SSB”) comprising of five members.
The window is not a separate legal entity. The assets and liabilities presented within the window remain the assets and liabilities of the Bank and are not legally separable from the Bank’s other assets and liabilities. As such legally, the assets of the window may be available to the other claims of the Bank. The separate financial statements of Islamic Banking Window have been prepared to comply with the requirements of Articles 1.5.1.2 to 1.5.1.4 of Title 2 ‘General Obligations and Governance’ of Islamic Banking Regulatory Framework issued by CBO.
2. BASIS OF PREPARATION
2.1 STATEMENT OF COMPLIANCE
In accordance with the requirements of Section 1.2 of Title 3 of the IBRF issued by CBO, the financial statements of Maisarah Islamic Banking Services are prepared in accordance with the Financial Accounting Standards (“FAS”) issued by the Accounting and Auditing Organization for Financial Institutions (“AAOIFI”), the Shari’a rules and principles as determined by the SSB of Maisarah and the applicable laws and regulations issued by the CBO.
Maisarah complies with the requirements of AAOIFI, for matters for which no AAOIFI standards exist, Maisarah uses the relevant International Financial Reporting Standards (“IFRS”) or International Accounting Standards (“IAS”) as issued by International Accounting Standards Board (“IASB”).
These financial statements pertains to the Maisarah operations only and do not include financial results of the Bank. Statement of changes in restricted investment amount, statement of sources of funds in zakah and statement of sources and uses of funds in Qard Fund have not been presented as these are not applicable / relevant to Maisarah’s operations. Complete set of financial statements of the Bank is presented separately.
2.2 BASIS OF MEASUREMENT
The financial statements are prepared on a historical cost basis, except for certain investments carried at fair value through other comprehensive income.
2.3 FUNCTIONAL AND PRESENTATION CURRENCY
Items included in Maisarah’s financial statements are presented and measured using Rials Omani (“RO”) which is the currency of the primary economic environment in which Maisarah operates. All financial information presented in Rial Omani has been rounded to the nearest thousands, unless mentioned otherwise.
2.4 USE OF ESTIMATES AND JUDGEMENTS
The preparation of financial statements in conformity with AAOIFI and IFRS requires management to make judgments, estimates and assumptions that effect the application of accounting policies and the reported amounts of assets, liabilities, income and expenses. Actual results may differ from these estimates.
Estimates and underlying assumptions are reviewed on an ongoing basis. Revisions to accounting estimates are recognised in the period in which the estimate is revised and in any future periods affected.
Information about significant areas of uncertainty and critical judgments in applying accounting policies that have the most significant effect on the amounts recognized in the financial statements are described in note 4.
Maisarah Islamic Banking Services – Window of BankDhofar

273Annual Report 2019
Notes to the financial statements For the year ended 31 December 2019
2. BASIS OF PREPARATION (CONTINUED)
2.5 CHANGE IN ACCOUNTING POLICY
The accounting policies applied in these financial statements are the same as those applied in the last financial statements.
2.6 NEW STANDARDS, INTERPRETATIONS AND AMENDMENTS
For the year ended 31 December 2019, the Islamic window has adopted all of the amendments in standards issued by the AAOIFI that are relevant to its operations and effective for periods beginning on 1 January 2019.
The adoption of these standards has not resulted in changes to the Islamic Window accounting policy and has not affected the amounts reported for the current and prior periods.
Standards issued and effective from 01 January 2019
FAS 28 Murabaha and Other Deferred Payment Sales
AAOIFI has issued FAS 28 Murabaha and Other Deferred Payment Sales in 2017. FAS 28 supersedes the earlier FAS No. 2 “Murabaha and Murabaha to the Purchase Orderer” and FAS No. 20 “Deferred Payment Sale”. The objective of this standard is to prescribe the appropriate accounting and reporting principles for recognition, measurement and disclosures in relation to Murabaha and other deferred payment sales transactions for the sellers and buyers, for such transactions. This standard is effective for the financial periods beginning on or after 1 January 2019 with early adoption permitted.
Maisarah has applied the standard prospectively from its mandatory adoption date, and the impact is immaterial on the financial information of Maisarah.
Standards issued but not effective from 01 January 2019
FAS 30 Impairment, Credit losses and onerous commitments
AAOIFI has issued FAS 30 Impairment, Credit losses and onerous commitments (FAS 30) in 2017. The objective of this standard is to establish the principles of accounting and financial reporting for the impairment and credit losses on various Islamic financing, investment and certain other assets of Islamic financial institutions (the institutions), and provisions against onerous commitments enabling in particular the users of financial statements to fairly assess the amounts, timing and uncertainties with regard to the future cash flows associated with such assets and transactions.
The standard will be effective from financial periods beginning on or after 1 January 2020 with early adoption permitted.
CBO earlier issued its circular 1149 dated 13 April 2017 governing implementation of IFRS 9 Financial Instruments Standard (IFRS 9) for all the banks, which also applies to Islamic banks / windows subject to any specific instructions by the Central Bank for Islamic Banking entities on IFRS 9 if, as and when instructions are issued . Maisarah had adopted the IFRS 9, which are similar to FAS 30, with effect from 1 January 2018 and as permitted by IFRS 9, Maisarah elected not to restate comparative figures. Adjustments to the carrying amounts of financial assets and liabilities at the date of transition were recognised in the opening retained earnings and non-controlling interests of the current period.
Since the window already has applied IFRS 9 for impairment and credit losses, management believes that adoption of FAS 30 in 2020 is not expected to result in significant changes.
FAS 31 Investment Agency (Al-Wakala Bi Al-lstithmar)
AAOIFI has issued FAS 31 Investment Agency (Al-Wakala Bi Al-lstithmar) in 2018. The objective of this standard is to establish the principles of accounting and financial reporting for the investment agency (Al-Wakala Bi Al- Istithmar) instruments and the related assets and obligations from both the principal (investor) and the agent perspectives. The standard requires the liabilities under Wakala contract to be treated as off-balance sheet for the agent. The standard will be effective from the financial periods beginning on or after 1 January 2020 with earlier adoption being permitted. The standard is not expected to have a material impact on the on Maisarah’s financial statements.
Maisarah Islamic Banking Services – Window of BankDhofar

Annual Report 2019274
Notes to the financial statements For the year ended 31 December 2019
2. BASIS OF PREPARATION (CONTINUED)2.6 NEW STANDARDS, INTERPRETATIONS AND AMENDMENTS (CONTINUED)
FAS 32 Ijara
AAOIFI has issued FAS 32 Ijara in 2020. The objective of this standard is to establish the set-out principles for the classification, recognition, measurement, presentation and disclosures of Ijarah transactions including their different forms entered into by the Islamic financial institutions in the capacity of both the lessor and lessee. This standard brings a fundamental shift in the accounting approach for Ijarah transactions, particularly, in the hand of the lessee in contrast to the earlier approach of the off-balance sheet accounting for Ijarah. The standard will be effective from the financial periods beginning on or after 1 January 2021 with earlier adoption being permitted.
Maisarah is currently evaluating the impact of this standard.
FAS 33 Investment in Sukuk, shares and similar instruments
AAOIFI has issued FAS 33 Investment in Sukuk, shares and similar instruments in 2019. FAS 33 supersedes the earlier FAS 25 “Investment in Sukuks, shares and similar instruments”. The objective of this standard is to set out improved principles for classification, recognition, measurement, presentation and disclosure of investments in Sukuk, shares and other similar instruments of investment made by Islamic Financial Institutions in line with Shari’a principles. It defines the key types of instruments of Shari’a compliant investments and defines the primary accounting treatments commensurate to the characteristics and business model of the institution under which the investments are made, managed and held. This standard shall be effective for the financial periods beginning on or after 1 January 2020 with early adoption permitted.
Maisarah is currently evaluating the impact of this standard.
FAS 34 Financial reporting for Sukuk-holders
AAOIFI has issued FAS 34 Financial reporting for Sukuk-holders in 2019. The objective of this standard is to establish the principles of accounting and financial reporting for assets and business underlying the Sukuk to ensure transparent and fair reporting for all stakeholders particularly Sukuk-holders. This standard shall be effective for the financial periods beginning on or after 1 January 2020 with early adoption permitted.
Maisarah is currently evaluating the impact of this standard.
FAS 35 Risk Reserves
AAOIFI has issued FAS 35 “Risk Reserves” in 2018. This standard along with FAS 30 ‘Impairment, Credit losses and onerous commitments’ supersede the earlier FAS 11 “Provisions and reserves”.
The objective of this standard is to establish the principles of accounting and financial reporting for risk reserves established to mitigate various risks faced by stakeholders, mainly the profit and loss taking investors, of Islamic financial institutions (IFIs / the institutions). The standard defines the accounting principles for risk reserves in line with the best practices of financial reporting and risk management. The standard encourages maintaining adequate risk reserves to safeguarding the interest of profit and loss stakeholders particularly against various risks including credit, market, equity investment risks, as well as, the rate of return risk including displaces commercial risk. This standard shall be effective for the financial periods beginning on or after 1 January 2021 with early adoption permitted only if the Bank early adopts FAS 30 “Impairment, Credit losses and onerous commitments”.
Maisarah is currently evaluating the impact of this standard.
Maisarah Islamic Banking Services – Window of BankDhofar

275Annual Report 2019
Notes to the financial statements For the year ended 31 December 2019
3. SIGNIFICANT ACCOUNTING POLICIES
The accounting policies set below have been consistently applied in dealing with items that are considered material in relation to Maisarah’s financial statements to the period presented.
3.1 FOREIGN CURRENCY TRANSLATIONS
Foreign currency transactions are translated into the functional currency using the exchange rates prevailing at the dates of the transactions. Foreign exchange gains and losses resulting from the settlement of such transactions and from the translation at period-end exchange rates of monetary assets and liabilities denominated in foreign currencies are recognised in statement of profit or loss.
3.2 CASH AND CASH EQUIVALENTS
Cash and cash equivalents consist of cash in hand, balances with Central Bank of Oman, due from and due to banks and highly liquid financial assets with original maturities of up to three months, which are subject to insignificant risk of changes in their fair value, and are used by the Maisarah in management of its short term commitments. Cash and cash equivalents are carried at amortised cost in the statement of financial position.
3.3 OFFSETTING
Financial assets and liabilities are offset and the net amount is reported in the statement of financial position when there is a legally enforceable or religious right to set off the recognised amounts and there is an intention to settle on a net basis, or realise the asset and settle the liability simultaneously in accordance with Shari’a principles and guidelines.
Income and expenses are presented on a net basis only for permitted transactions.
3.4 MURABAHA AND OTHER RECEIVABLES
Murabaha receivables are stated net of deferred profits, any amounts written off and provision for expected credit losses, if any.
In Murabaha transactions, the Bank purchases the goods and after taking the possession, sells them to the customer on cost plus profit basis.
Murabaha receivables are sales on deferred payment terms. The Bank arranges a Murabaha transaction by buying goods (which represents the object of the Murabaha) and then sells these goods to Customer (beneficiary) after computing a margin of profit over cost. The sale price (cost plus the profit margin) is paid in instalments by the Customer over the agreed period. (Promise made in the Murabaha to the purchase orderer is not obligatory upon the customer or the Bank considers promise made in the Murabaha to the purchase orderer as obligatory).
Other receivables include credit card receivable which is based on the Islamic financial principle of profit-free Qard Hasan, and travel and education finance which is based on the on Islamic financial principle of Ujrah.
3.5 MUDARABA
Mudaraba is stated at the fair value of consideration given less any expected credit losses.
Mudaraba is a partnership in profit whereby one party provides capital (Rab al-maal) and the other party provides labour (Mudarib).
In case Mudaraba capital is lost or damaged without misconduct or negligence on the part of Mudarib, then such losses are deducted from Mudaraba capital and are treated as loss to the Bank. In case of termination or liquidation, unpaid portion by Mudarib is recognised as receivable due from Mudarib.
3.6 DIMINISHING MUSHARAKA
Diminishing Musharaka is a contract, based on Shirkat-ul-Mulk, between the Bank and a customer for joint ownership of a fixed asset (e.g. house, land, plant or machinery). The Bank divides its share in the fixed asset into units and gradually transfers the ownership of these units to a customer (at carrying value). The use of Bank’s share to the customer is based on an Ijarah agreement. Diminishing Musharaka is stated at the fair value of the consideration given, less any expected credit losses.
Maisarah Islamic Banking Services – Window of BankDhofar

Annual Report 2019276
Notes to the financial statements For the year ended 31 December 2019
3. SIGNIFICANT ACCOUNTING POLICIES (CONTINUED)3.7 WAKALA
Wakala is a contract where the Bank (the Muwakil) will enter into Wakala Agreement with the customer (the Wakil) and will establish a contractual and commercial relations between the parties by providing Wakala capital (Ras al Mal) to be utilized in customer’s core business. The Wakil provides specialist work using its skills to manage the business.
3.8 IJARAH MUNTAHIA BITTAMLEEK ASSETS
Ijarah Muntahia Bittamleek assets are initially recorded at cost. Ijarah Muntahia Bittamleek is a lease whereby the legal title of the leased asset passes to the lessee at the end of the Ijarah (lease term), provided that all Ijarah instalments are settled.
Depreciation is calculated as per Equal Monthly Instalment (EMI) method as per the terms agreed with customer.
3.9 IFRS 9 – FINANCIAL INSTRUMENTS
Classification and measurement of financial assets and financial liabilitiesFinancial assets are classified into one of the following three categories:
• Amortised cost;
• Fair value through other comprehensive income (FVOCI); and
• Fair value through profit or loss (FVTPL).
Financial liabilities are classified into one of the following two categories:
• Amortised cost; and
• Fair value through profit or loss (FVTPL).
Business model assessment
Business model assessment involves determining how financial assets are managed in order to generate cash flows. The Islamic window’s business model assessment is based on the following categories:
• Held to collect: The objective of the business model is to hold assets and collect contractual cash flows. Any sales of the asset are incidental to the objective of the model.
• Held to collect and for sale: Both collecting contractual cash flows and sales are integral to achieving the objectives of the business model.
• Other business model: The business model is neither held-to-collect nor held-to-collect and for sale.
Maisarah makes an assessment of the objective of a business model in which an asset is held at a portfolio level because this best reflects the way the business is managed and information is provided to management. The information considered includes:
• The stated policies and objectives for the portfolio and the operation of those policies in practice. In particular, whether management’s strategy focuses on earning contractual profit revenue, maintaining a particular profit rate profile, matching the duration of the financial assets to the duration of the liabilities that are funding those assets or realising cash flows through the sale of the assets;
• How the performance of the portfolio is evaluated and reported to the Islamic window’s management;
• The risks that affect the performance of the business model (and the financial assets held within that business model) and how those risks are managed;
• How managers of the business are compensated – e.g. whether compensation is based on the fair value of the assets managed or the contractual cash flows collected; and
• The frequency, volume and timing of sales in prior periods, the reasons for such sales and its expectations about future sales activity. However, information about sales activity is not considered in isolation, but as part of an overall assessment of how the Islamic window’s stated objective for managing the financial assets is achieved and how cash flows are realised.
Financial assets that are held for trading or managed and whose performance is evaluated on a fair value basis are measured at FVTPL because they are neither held to collect contractual cash flows nor held both to collect contractual cash flows and to sell financial assets.
Maisarah Islamic Banking Services – Window of BankDhofar

277Annual Report 2019
Notes to the financial statements For the year ended 31 December 2019
3. SIGNIFICANT ACCOUNTING POLICIES (CONTINUED)3.9 IFRS 9 – FINANCIAL INSTRUMENTS (CONTINUED)
Assessment whether contractual cash flows are solely payments of principal and profit
For the purposes of this assessment, ‘principal’ is defined as the fair value of the financial asset on initial recognition. ‘Profit’ is defined as consideration for the time value of money and for the credit risk associated with the principal amount outstanding during a particular period of time and for other basic financing risks and costs (e.g. liquidity risk and administrative costs), as well as profit margin.
In assessing whether the contractual cash flows are solely payments of principal and profit, the Islamic window considers the contractual terms of the instrument. This includes assessing whether the financial asset contains a contractual term that could change the timing or amount of contractual cash flows such that it would not meet this condition.
Modifications of financial assets
If the cash flows of the modified asset carried at amortised cost are not substantially different, then the modification does not result in derecognition of the financial asset. In this case, the Islamic window recalculates the gross carrying amount of the financial asset and recognises the amount arising from adjusting the gross carrying amount as a modification gain or loss in profit or loss.
Fair Value
Fair value is determined for each financial asset individually in accordance with the valuation policies set out below:
• For quoted investments that are traded in organised financial markets, fair value is determined by reference to the quoted market bid prices prevailing on the statement of financial position date.
• For unquoted investments, fair value is determined by reference to recent significant buy or sell transaction with third parties that are either completed or are in progress. Where no recent significant transactions have been completed or are in progress, fair value is determined by reference to the current market value of similar investments. For others, the fair value is based on the net present value of estimated future cash flows, or other relevant valuation methods.
• For investments that have fixed or determinable cash flows, fair value is based on the net present value of estimated future cash flows determined by the Islamic window using current profit rates. For investments with similar terms and risk characteristics.
• Investments which cannot be remeasured to fair value using any of the above techniques are carried at cost, less impairment loss, if any.
Impairment
The Islamic window recognises impairment provision for Expected Credit Loss (ECL) on the following financial instruments that are not measured at FVTPL:
• Balances with Central Bank of Oman
• Bue from banks
• Financial assets that are debt-type instruments;
• Financing receivables;
• Financial guarantee contracts issued
• Financing commitments issued; and
• Other assets (acceptances and accrued profit).
No impairment loss is recognised on equity investments.
The Islamic window measures impairment provision at an amount equal to lifetime ECL, except for the following, for which they are measured as 12-month ECL:
• Debt investment securities that are determined to have low credit risk at the reporting date; and
• Other financial instruments (other than lease receivables) on which credit risk has not increased significantly since their initial recognition.
Maisarah Islamic Banking Services – Window of BankDhofar

Annual Report 2019278
Notes to the financial statements For the year ended 31 December 2019
3. SIGNIFICANT ACCOUNTING POLICIES (CONTINUED)3.9 IFRS 9 – FINANCIAL INSTRUMENTS (CONTINUED)
The Islamic window considers a debt security to have low credit risk when their credit risk rating is equivalent to the globally understood definition of ‘investment grade’. The Islamic window does not apply the low credit risk exemption to any other financial instruments.
12-month ECL is the portion of ECL that result from default events on a financial instrument that are possible within the 12 months after the reporting date. Financial instruments for which a 12-month ECL is recognised are referred to as ‘Stage 1 financial instruments’.
Life-time ECL are the ECL that result from all possible default events over the expected life of the financial instrument. Financial instruments for which a lifetime ECL is recognised but which are not credit-impaired are referred to as ‘Stage 2 financial instruments’.
Impairment provision is measured using a three-stage approach based on the extent of credit deterioration since origination:
• Stage 1 – Where there has not been a significant increase in credit risk (SICR) since initial recognition of a financial instrument, an amount equal to 12 months expected credit loss is recorded. The expected credit loss is computed using a probability of default occurring over the next 12 months. For those instruments with a remaining maturity of less than 12 months, a probability of default corresponding to remaining term to maturity is used.
• Stage 2 – When a financial instrument experiences a SICR subsequent to origination but is not considered to be in default, it is included in Stage 2. This requires the computation of expected credit loss based on the probability of default over the remaining estimated life of the financial instrument.
• Stage 3 – Financial instruments that are considered to be in default are included in this stage. Similar to Stage 2, the allowance for credit losses captures the lifetime expected credit losses.
The key inputs into the measurement of ECL are the term structure of the following variables:
• Probability of default (PD);
• Loss given default (LGD); and
• Exposure at default (EAD)
These parameters are generally derived from internally developed statistical models and other historical data. They are adjusted to reflect forward-looking information.
Details of these statistical parameters / inputs are as follows:
• PD – The probability of default is an estimate of the likelihood of default over a given time horizon.
• EAD – The exposure at default is an estimate of the exposure at a future default date, taking into account expected changes in the exposure after the reporting date.
• LGD – The loss given default is an estimate of the loss arising in the case where a default occurs at a given time. It is based on the difference between the contractual cash flows due and those that the lender would expect to receive, including from the realization of any collateral. It is usually expressed as a percentage of the EAD.
Measurement of ECL
ECL are a probability-weighted estimate of credit losses. They are measured as follows:
• financial assets that are not credit-impaired at the reporting date: as the present value of all cash shortfalls (i.e. the difference between the cash flows due to the entity in accordance with the contract and the cash flows that the Maisarah expects to receive); and
• financial assets that are credit-impaired at the reporting date: as the difference between the gross carrying amount and the present value of estimated future cash flows.
However, for unfunded exposures, ECL is measured as follows:
• undrawn financing commitments: at the present value of the difference between the contractual cash flows that are due to the Maisarah if the commitment is drawn down and the cash flows that the Islamic window expects to receive; and
• financial guarantee contracts: the expected payments to reimburse the holder less any amounts that the Maisarah expects to recover.
Maisarah Islamic Banking Services – Window of BankDhofar

279Annual Report 2019
Notes to the financial statements For the year ended 31 December 2019
3. SIGNIFICANT ACCOUNTING POLICIES (CONTINUED)3.9 IFRS 9 – FINANCIAL INSTRUMENTS (CONTINUED)
Restructured financial assets
If the terms of a financial asset are renegotiated or modified or an existing financial asset is replaced with a new one due to financial difficulties of the customer, then an assessment is made of whether the financial asset should be derecognised and ECL are measured as follows:
• If the expected restructuring will not result in de-recognition of the existing asset, then the expected cash flows arising from the modified financial asset are included in calculating the cash shortfalls from the existing asset.
• If the expected restructuring will result in de-recognition of the existing asset, then the expected fair value of the new asset is treated as the final cash flow from the existing financial asset at the time of its de-recognition. This amount is included in calculating the cash shortfalls from the existing financial asset that are discounted from the expected date of de-recognition to the reporting date using the original effective interest rate of the existing financial asset.
Credit impaired financial assets
At each reporting date, Maisarah assesses whether financial assets carried at amortised cost and debt securities carried at FVOCI are credit-impaired.
A financial asset is ‘credit-impaired’ when one or more events that have a detrimental impact on the estimated future cash flows of the financial asset have occurred. Credit impaired financial assets are referred to as Stage 3 assets. Evidence of credit-impairment includes observable data regarding the following events:
• significant financial difficulty of the customer or issuer;
• a breach of contract such as a default or past due event;
• the restructuring of a financing by Maisarah on terms that Maisarah would not consider otherwise; or
• it is becoming probable that the customer will enter bankruptcy or other financial reorganisation.
It may not be possible to identify a single discrete event – instead, the combined effect of several events may have caused financial assets to become credit-impaired. Maisarah assesses whether debt instruments that are financial assets measured at amortised cost or FVOCI are credit-impaired at each reporting date. To assess if sovereign and corporate debt instruments are credit impaired, Maisarah considers the following factors:
• The market’s assessment of creditworthiness as reflected in the bond yields;
• The rating agencies’ assessments of creditworthiness;
• The country’s ability to access the capital markets for new debt issuance; and
• The probability of debt being restructured, resulting in holders suffering losses through voluntary or mandatory debt forgiveness.
A financing is considered credit-impaired when a concession is granted to the customer due to a deterioration in the customer’s financial condition, unless there is an evidence that as a result of granting the concession the risk of not receiving the contractual cash flows has reduced significantly and there are no other indicators of impairment.
For financial assets where concessions are contemplated but not granted, the asset is deemed credit impaired when there is observable evidence of credit-impairment including meeting the definition of default. The definition of default (refer below) includes unlikeliness to pay indicators and a backstop if amounts are overdue for 90 days or more.
Forward-looking information
The measurement of expected credit losses for each stage and the assessment of significant increases in credit risk considers information about past events and current conditions as well as reasonable and supportable forecasts of future events and economic conditions. The estimation and application of forward-looking information requires significant judgement.
Maisarah Islamic Banking Services – Window of BankDhofar

Annual Report 2019280
Notes to the financial statements For the year ended 31 December 2019
3. SIGNIFICANT ACCOUNTING POLICIES (CONTINUED)3.9 IFRS 9 – FINANCIAL INSTRUMENTS (CONTINUED)
Macroeconomic factors
In its models, the Islamic window relies on a broad range of forward-looking information as economic inputs, such as: real gross domestic product (GDP) growth and oil revenue (as % of GDP). The inputs and models used for calculating expected credit losses may not always capture all characteristics of the market at the date of the financial statements. To reflect this, qualitative adjustments or overlays are made as temporary adjustments using expert credit judgement.
Assessment of significant increase in credit risk
Maisarah assesses whether there has been a significant increase in credit risk for exposures since initial recognition by comparing the risk of default occurring over the remaining expected life from the reporting date and the date of initial recognition. The assessment considers counterparty-specific quantitative and qualitative information without consideration of collateral, and the impact of forward-looking macroeconomic factors.
The common assessments for SICR on financial assets include macroeconomic outlook, management judgement, and delinquency and monitoring. Forward-looking macroeconomic factors is a key component of the macroeconomic outlook. The importance and relevance of each specific macroeconomic factor depends on the type of product, characteristics of the financial instruments and the counterparty and the geographical region. Quantitative models may not always be able to capture all reasonable and supportable information that may indicate a significant increase in credit risk. Qualitative factors may be assessed to supplement the gap. Examples of situations include changes in adjudication criteria for a particular group of counterparties; changes in portfolio composition; and natural disasters impacting certain portfolios. With regards to delinquency and monitoring, there is a rebuttable presumption that the credit risk of the financial instrument has increased since initial recognition when contractual payments are more than 30 days overdue.
Presentation of allowance for ECL in the statement of financial position
Allowance for ECL are presented in the statement of financial position as follows:
• Financial assets measured at amortized cost: as a deduction from the gross carrying amount of the financial assets;
• Debt instruments measured at fair value through other comprehensive income: no provision is recognized in the Statement of Financial Position because the carrying value of these assets is their fair value. However, the provision determined is disclosed and recognised in the fair value reserve; and
• Off-balance sheet credit risks include undrawn financing commitments, letters of credit and letters of guarantee: as a provision in other liabilities.
Definition of default
Maisarah considers a financial asset to be in default when:
• The counterparty is unlikely to pay its credit obligations to the Islamic window in full without recourse by the Islamic window to actions such as realising security held (if any); or
• The counterparty is past due more than 90 days on any material credit obligation to the Islamic window.
Credit facilities like overdrafts, line of credit etc. where no definite repayments are pre-determined are treated as past due if the outstanding balance remains continuously in excess of 10% of the sanctioned / authorized limit or in cases where the outstanding balance in the principal operating account is less than the sanctioned / authorized limit, but there are not enough credits in the account to cover the profit charged or unauthorized drawings have frequently been allowed.
In assessing whether a counterparty is in default, the Islamic window considers indicators that are:
• Qualitative – e.g. breaches of covenant;
• Quantitative – e.g. overdue status and non-payment on another obligation of the same issuer to the Islamic window; and
• Based on data developed internally and obtained from external sources.
Inputs into the assessment of whether a financial instrument is in default and their significance may vary over time to reflect changes in circumstances.
The Islamic window follows the definition of default as stipulated in CBO guidelines (BM 977 and subsequent).
Maisarah Islamic Banking Services – Window of BankDhofar

281Annual Report 2019
Notes to the financial statements For the year ended 31 December 2019
3. SIGNIFICANT ACCOUNTING POLICIES (CONTINUED)3.10 PROPERTY AND EQUIPMENT
Items of property and equipment are stated at cost less accumulated depreciation and impairment loss. Depreciation is calculated so as to write-off the cost of property and equipment, other than freehold land and capital work-in-progress, on straight line basis over their estimated useful lives from the date the asset is brought into use. The estimated useful lives are as follows:
Years
Furniture, fixtures and equipment 3 - 7
Motor vehicles 3 - 5
Computer equipment 4
Core banking system 10
The assets’ residual values and useful lives are reviewed, and adjusted if appropriate, at each reporting date. An asset’s carrying amount is written down immediately to its recoverable amount if the asset’s carrying amount is greater than its estimated recoverable amount. The recoverable amount is the higher of the asset’s fair value less costs to sell and value in use.
Gains and losses on disposal of property and equipment are determined by reference to their carrying amount and are taken into account in determining operating profit. Repairs and renewals are charged to statement of profit or loss when the expense is incurred. Subsequent expenditure is capitalised only when it increases the future economic benefits embodied in the item of property and equipment. All other expenditure is recognized in statement of profit or loss as an expense when incurred.
3.11 EQUITY OF INVESTMENT ACCOUNTHOLDERS
Equity of investment accountholders are carried at cost plus profit and related reserves less amounts settled.
Equity of investment accountholders’ share of income is calculated based on the income generated from investment accounts after deducting Mudarib’s share. Operating expenses are charged to shareholders’ funds and not included in the calculation.
The basis applied by Maisarah in arriving at the equity of investment accountholders’ share of income is total income from jointly financed Islamic assets less shareholders’ income. Pre-agreed profit share generated from equity of investment accountholders is deducted as Mudarib’s share after deducting profit equalisation reserve and the remaining amount is distributed to the equity of investment accountholders after deducting investment risk reserve.
3.12 PROFIT EQUALISATION RESERVE
Maisarah appropriates certain amount in excess of the profit to be distributed to equity of investment accounts before taking into consideration the Mudarib share of income. This will be used to maintain a certain level of return on investment for equity of investment accountholders.
3.13 INVESTMENT RISK RESERVE
Investment risk reserves are amounts appropriated out of the income of equity of investment accountholders, after allocating the Mudarib’s share, to cater against future losses for equity of investment accountholders.
3.14 PROVISIONS
A provision is recognised in the statement of financial position when Maisarah has a legal or constructive obligation as a result of a past event, and it is probable that an outflow of economic benefits will be required to settle the obligation and the amount has been reliably estimated.
Maisarah Islamic Banking Services – Window of BankDhofar

Annual Report 2019282
Notes to the financial statements For the year ended 31 December 2019
3. SIGNIFICANT ACCOUNTING POLICIES (CONTINUED)3.15 EARNINGS PROHIBITED BY SHARI’A
All the funds mobilised and income earned by Maisarah is from Islamic sources. Maisarah is committed to avoid recognizing any income generated from non-Shari’a compliant sources. Accordingly, all non-Islamic income is credited to a charity account where Maisarah uses these funds for social welfare activities. It includes but not limited to cases/transactions classified by Shari’a as non-compliant income and approved by the SSB to be forfeited, interest paid by other banks on Nostro accounts, late payment fee received from the customer in financing and investment transaction.
3.16 ZAKAH
The responsibility of payment of zakah is on individual shareholders and investment accountholders.
3.17 JOINT AND SELF-FINANCED
Investments, financing and receivables that are jointly owned by Maisarah and the equity of investment accounts holders are classified under the caption “jointly financed” in the financial statements. Investments, financing and receivables that are financed solely by Maisarah are classified under “self-financed”.
3.18 FUNDS FOR MAISARAH
Maisarah functions with funds specifically available for Islamic Banking activities and there is no commingling of funds with conventional banking financial business.
3.19 REVENUE RECOGNITION
3.19.1 Murabaha and Musawama receivables
Profit from Murabaha and Musawama receivables are recognised on time apportioned basis from the date of contract. Income related to non-performing accounts is excluded from statement of profit or loss.
3.19.2 Diminishing Musharaka (DM) Financing
Income from Diminishing Musharaka is recognised when Bank’s right to receive payment is established. The right to receive payment is established when a customer enters into an Ijarah agreement for acquiring Bank’s ownership in the fixed asset. Income related to non-performing accounts is excluded from statement of profit or loss.
3.19.3 Mudaraba financing
Income on Murdaraba financing is recognised when the right to receive payment is established or on distribution by the Mudarib, whereas the losses are charged to statement of profit or loss on declaration by the Mudarib. Income related to non-performing accounts is excluded from statement of profit or loss.
3.19.4 Ijarah Muntahia Bittamleek
Income from Ijarah Muntahia Bittamleek assets is recognised on a time-apportioned basis over the lease term, net of depreciation. Income related to non-performing Ijarah Muntahia Bittamleek assets is excluded from statement of profit or loss.
3.19.5 Wakala financing
Wakala profit is estimated reliably and recognized on time-apportioned basis so as to yield the expected rate of return based on the Wakala capital outstanding. In case of default, negligence or violation of any of the terms and conditions of Wakala agreement, the Wakil would bear the loss, otherwise the loss would be borne by the Muwakil.
3.19.6 Dividends
Dividends are recognised when the right to receive payment is established.
3.19.7 Fee and Commission income
Fee and commission income is recognised when earned.
Maisarah Islamic Banking Services – Window of BankDhofar
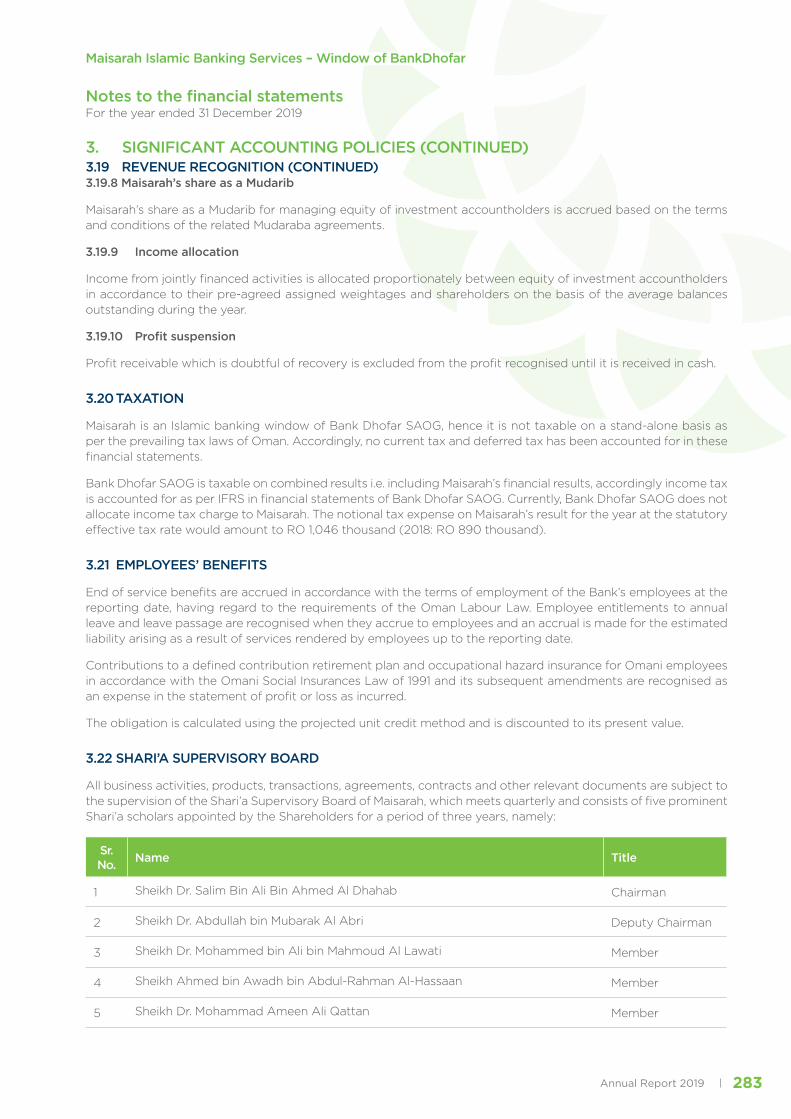
283Annual Report 2019
Notes to the financial statements For the year ended 31 December 2019
3. SIGNIFICANT ACCOUNTING POLICIES (CONTINUED)3.19 REVENUE RECOGNITION (CONTINUED)3.19.8 Maisarah’s share as a Mudarib
Maisarah’s share as a Mudarib for managing equity of investment accountholders is accrued based on the terms and conditions of the related Mudaraba agreements.
3.19.9 Income allocation
Income from jointly financed activities is allocated proportionately between equity of investment accountholders in accordance to their pre-agreed assigned weightages and shareholders on the basis of the average balances outstanding during the year.
3.19.10 Profit suspension
Profit receivable which is doubtful of recovery is excluded from the profit recognised until it is received in cash.
3.20 TAXATION
Maisarah is an Islamic banking window of Bank Dhofar SAOG, hence it is not taxable on a stand-alone basis as per the prevailing tax laws of Oman. Accordingly, no current tax and deferred tax has been accounted for in these financial statements.
Bank Dhofar SAOG is taxable on combined results i.e. including Maisarah’s financial results, accordingly income tax is accounted for as per IFRS in financial statements of Bank Dhofar SAOG. Currently, Bank Dhofar SAOG does not allocate income tax charge to Maisarah. The notional tax expense on Maisarah’s result for the year at the statutory effective tax rate would amount to RO 1,046 thousand (2018: RO 890 thousand).
3.21 EMPLOYEES’ BENEFITS
End of service benefits are accrued in accordance with the terms of employment of the Bank’s employees at the reporting date, having regard to the requirements of the Oman Labour Law. Employee entitlements to annual leave and leave passage are recognised when they accrue to employees and an accrual is made for the estimated liability arising as a result of services rendered by employees up to the reporting date.
Contributions to a defined contribution retirement plan and occupational hazard insurance for Omani employees in accordance with the Omani Social Insurances Law of 1991 and its subsequent amendments are recognised as an expense in the statement of profit or loss as incurred.
The obligation is calculated using the projected unit credit method and is discounted to its present value.
3.22 SHARI’A SUPERVISORY BOARD
All business activities, products, transactions, agreements, contracts and other relevant documents are subject to the supervision of the Shari’a Supervisory Board of Maisarah, which meets quarterly and consists of five prominent Shari’a scholars appointed by the Shareholders for a period of three years, namely:
Sr. No. Name Title
1 Sheikh Dr. Salim Bin Ali Bin Ahmed Al Dhahab Chairman
2 Sheikh Dr. Abdullah bin Mubarak Al Abri Deputy Chairman
3 Sheikh Dr. Mohammed bin Ali bin Mahmoud Al Lawati Member
4 Sheikh Ahmed bin Awadh bin Abdul-Rahman Al-Hassaan Member
5 Sheikh Dr. Mohammad Ameen Ali Qattan Member
Maisarah Islamic Banking Services – Window of BankDhofar

Annual Report 2019284
Notes to the financial statements For the year ended 31 December 2019
3. SIGNIFICANT ACCOUNTING POLICIES (CONTINUED)3.23 TRADE DATE ACCOUNTING
All “regular way” purchases and sales of financial assets are recognised on the trade date, i.e. that date Maisarah commits to purchase or sell the assets. Regular way purchases or sales are purchases or sales of financial assets that require delivery of assets within the time frame generally established by regulations or convention in the market place.
3.24 SEGMENT REPORTING
A segment is a distinguishable component of Maisarah that is engaged either in providing products or services (business segment), or in providing products or services within a particular economic environment (geographical segment), which is subject to risks and rewards that are different from those of other segments.
Maisarah currently operates only in the Sultanate of Oman. Maisarah’s primary format for reporting segmental information is business segments, based upon management and internal reporting structure which are regularly reviewed by the Bank’s chief operating decision maker (CODM). Maisarah’s main business segments are retail banking, corporate banking, treasury and investments.
3.25 FIDUCIARY ASSETS
Assets held in trust or in a fiduciary capacity are not treated as assets of Maisarah in the statement of financial position.
4. Critical Accounting Judgment and Key Sources Of Estimation Uncertainty
(a) Significant increase in credit risk
ECL is measured as an allowance equal to 12-month ECL for Stage 1 assets, or lifetime ECL assets for Stage 2 or Stage 3 assets. An asset moves to Stage 2 when its credit risk has increased significantly since initial recognition. IFRS 9 does not define what constitutes a significant increase in credit risk. In assessing whether the credit risk of an asset has significantly increased the Bank takes into account qualitative and quantitative reasonable and supportable forward-looking information.
(b) Establishing Groups of assets with similar credit risk characteristics
When ECLs are measured on a collective basis, the financial instruments are grouped on the basis of shared risk characteristics. The Bank monitors the appropriateness of the credit risk characteristics on an ongoing basis to assess whether they continue to be similar. This is required in order to ensure that should credit risk characteristics change there is appropriate re-segmentation of the assets. This may result in new portfolios being created or assets moving to an existing portfolio that better reflects the similar credit risk characteristics of that group of assets. Resegmentation of portfolios and movement between portfolios is more common when there is a significant increase in credit risk (or when that significant increase reverses) and so assets move from 12-month to lifetime ECLs, or vice versa, but it can also occur within portfolios that continue to be measured on the same basis of 12month or lifetime ECLs but the amount of ECL changes because the credit risk of the portfolios differ.
(c) Models and assumptions used
The Bank uses various models and assumptions in measuring fair value of financial assets as well as in estimating ECL. Judgment is applied in identifying the most appropriate model for each type of asset, as well as for determining the assumptions used in these models, including assumptions that relate to key drivers of credit risk.
Maisarah Islamic Banking Services – Window of BankDhofar

285Annual Report 2019
Notes to the financial statements For the year ended 31 December 2019
4. Critical Accounting Judgment and Key Sources Of Estimation Uncertainty (CONTINUED)
(d) Key sources of estimation uncertainty
The following are key estimations that have been used in the process of applying the Islamic window’s accounting policies:
• Establishing the number and relative weightings of forward-looking scenarios for each type of product / market and determining the forward-looking information relevant to each scenario: When measuring ECL the Bank uses reasonable and supportable forward-looking information, which is based on assumptions for the future movement of different economic drivers and how these drivers will affect each other.
• Probability of default (PD): constitutes a key input in measuring ECL. PD is an estimate of the likelihood of default over a given time horizon, the calculation of which includes historical data, assumptions and expectations of future conditions.
• Loss Given Default (LGD): is an estimate of the loss arising on default. It is based on the difference between the contractual cash flows due and those that the lender would expect to receive, taking into account cash flows from collateral and integral credit enhancements.
• Fair value measurement and valuation process: In estimating the fair value of a financial asset or a liability, the Islamic window uses market-observable data to the extent it is available. Where such Level 1 inputs are not available the Islamic window uses valuation models to determine the fair value of its financial instruments.
(e) Useful life of property and equipment and Ijarah Muntahia Bittamleek
Depreciation is charged so as to write off the cost of assets over their estimated useful lives. The calculation of useful lives is based on management’s assessment of various factors such as the operating cycles, the maintenance programs, and normal wear and tear using its best estimates.
5. Cash and balances with Central Bank of Oman
2019 2018RO 000 RO 000
Cash in hand 2,773 2,356Balances with Central Bank of Oman 41,108 36,454
43,881 38,810
6. Due from banks and financial institutions
2019RO 000
2018RO 000
Wakala placement – jointly financed 23,100 27,335Current clearing account – self financed 1,647 3,040
24,747 30,375
Less: Impairment allowance for ECL (note 26) (2) (14)
24,745 30,361
At 31 December 2019, placement with two overseas banks individually represented 20% or more of the Islamic window’s placements (2018: Three banks represented 20%).
Maisarah Islamic Banking Services – Window of BankDhofar
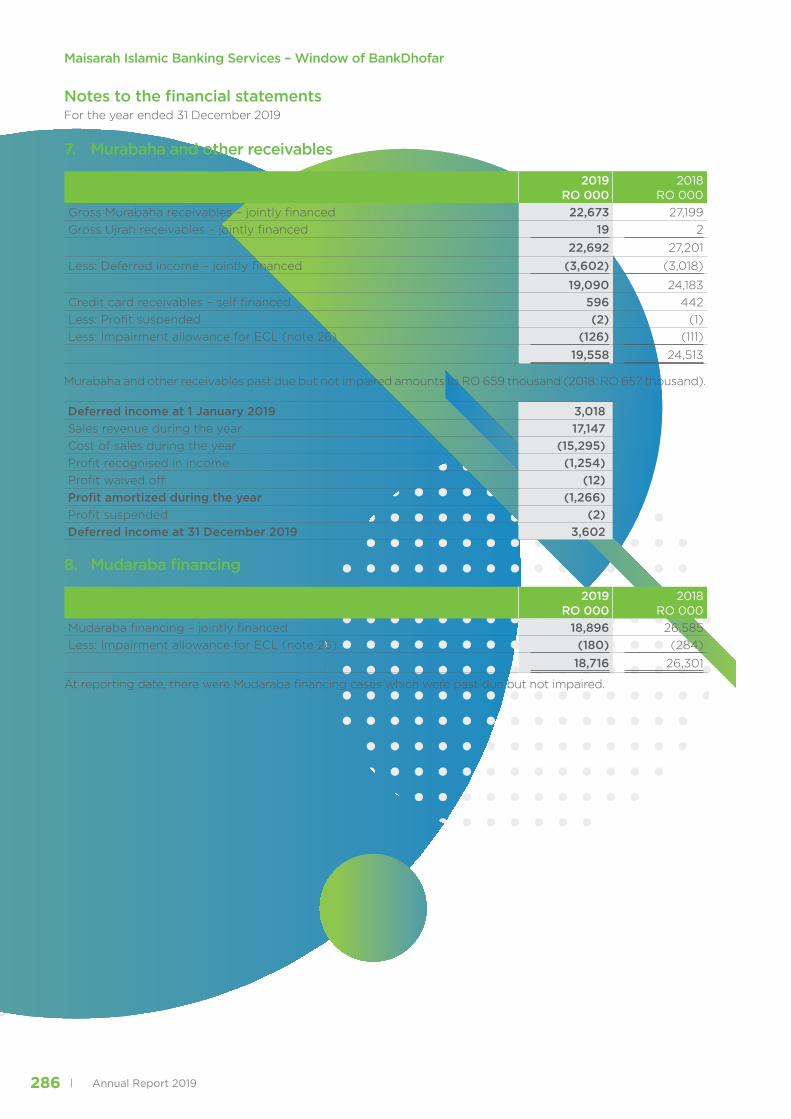
Annual Report 2019286
Notes to the financial statements For the year ended 31 December 2019
7. Murabaha and other receivables
2019RO 000
2018RO 000
Gross Murabaha receivables – jointly financed 22,673 27,199Gross Ujrah receivables – jointly financed 19 2
22,692 27,201
Less: Deferred income – jointly financed (3,602) (3,018)
19,090 24,183Credit card receivables – self financed 596 442Less: Profit suspended (2) (1)Less: Impairment allowance for ECL (note 26) (126) (111)
19,558 24,513
Murabaha and other receivables past due but not impaired amounts to RO 659 thousand (2018: RO 657 thousand).
Deferred income at 1 January 2019 3,018Sales revenue during the year 17,147Cost of sales during the year (15,295)Profit recognised in income (1,254)Profit waived off (12)Profit amortized during the year (1,266)Profit suspended (2)Deferred income at 31 December 2019 3,602
8. Mudaraba financing
2019RO 000
2018RO 000
Mudaraba financing – jointly financed 18,896 26,585Less: Impairment allowance for ECL (note 26) (180) (284)
18,716 26,301
At reporting date, there were Mudaraba financing cases which were past due but not impaired.
Maisarah Islamic Banking Services – Window of BankDhofar

287Annual Report 2019
Notes to the financial statements For the year ended 31 December 2019
9. Diminishing Musharaka financing
2019RO 000
2018RO 000
Diminishing Musharaka – jointly financed 326,824 285,515
Less: Impairment allowance for ECL (note 26) (4,895) (3,866)
321,929 281,649
Diminishing Musharaka past due but not impaired amounts to RO 66,248 thousand (2018: RO 36,567 thousand).
Fair value of collaterals
Upon initial recognition of Diminishing Musharaka, the fair value of collateral is based on valuation techniques commonly used for the corresponding assets. In subsequent periods, the fair value is updated by reference to market price or indexes of similar assets.
10. Investments
2019RO 000
2018RO 000
Fair value through other comprehensive income:
Local listed Sukuk – jointly financed 10,000 10,000
International listed Sukuk – jointly financed 15,873 10,010
Sovereign Sukuk – jointly financed 26,713 11,589
52,586 31,599
Less: Impairment provision for ECL (note 26) (125) (174)
Total Sukuk – jointly financed 52,461 31,425
During the year movement in investments at fair value through other comprehensive income:
2019RO 000
2018RO 000
Debt type instruments
At 1 January 31,599 22,342
Additions 43,500 20,010
Disposals and redemptions (23,142) (10,000)
Gain / (Loss) from change in fair value 637 (753)
Amortisation of discount / premium (8) -
At 31 December 52,586 31,599
11. Investment at amortised cost
2019RO 000
2018RO 000
Sovereign Sukuk – jointly financed 10,000 10,000
Being Sovereign Sukuk, no impairment allowance for ECL has been recognised.
Maisarah Islamic Banking Services – Window of BankDhofar

Annual Report 2019288
Notes to the financial statements For the year ended 31 December 2019
12. Wakala financing
2019RO 000
2018RO 000
Wakala financing – jointly financed 40,010 18,762
Less: Impairment allowance for ECL (note 26) (91) (29)
39,919 18,733
Wakala financing past due but not impaired amounts to RO 549 thousand (2018: RO Nil).
13. Ijarah Muntahia Bittamleek
2019RO 000
2018RO 000
Cost – jointly financed
at 1 January 52,766 49,622
Additions 3,573 4,191
Disposals (1,762) (1,047)
at 31 December 54,577 52,766
Accumulated depreciation – jointly financed
at 1 January 6,768 5,289
Charge for the period 3,360 1,913
Disposals (1,572) (434)
at 31 December 8,556 6,768
Net book value at 31 December 46,021 45,998
Less: Impairment allowance for ECL (note 26) (138) (110)
Net Ijarah Muntahia Bittamleek 45,883 45,888
Ijarah Muntahia Bittamleek past due but not impaired amounts to RO 1,304 thousand (2018: RO 994 thousand).
Maisarah Islamic Banking Services – Window of BankDhofar

289Annual Report 2019
Notes to the financial statements For the year ended 31 December 2019
14. Property and equipment
2019Furniture, fixtures &
equipmentRO 000
Motor vehiclesRO 000
Computer equipment
RO 000
Capital work in progress
RO 000Total
RO 000
Cost
at 1 January 1,224 78 1,817 2 3,121Additions 81 - 186 120 387Disposals / Transfers (25) - - (51) (76)at 31 December 1,280 78 2,003 71 3,432Accumulated depreciation
at 1 January (702) (60) (1,050) - (1,812)Charge for the year (196) (10) (292) - (498)Disposal 25 - - - 25at 31 December (873) (70) (1,342) - (2,285)Net book amount at 31 December 407 8 661 71 1,147
2018Furniture, fixtures &
equipmentRO 000
Motor vehiclesRO 000
Computer equipment
RO 000
Capital work in progress
RO 000
TotalRO 000
Cost
at 1 January 1,039 61 1,600 55 2,755Additions 187 17 217 204 625Disposals / Transfers (2) - - (257) (259)at 31 December 1,224 78 1,817 2 3,121
Accumulated depreciation
at 1 January (522) (47) (785) - (1,354)Charge for the year (182) (13) (265) - (460)Reversal of depreciation 2 - - - 2at 31 December (702) (60) (1,050) - (1,812)Net book amount at 31 December 522 18 767 2 1,309
As of 31 December 2019, cost of computer equipment includes software cost of RO 1,651 thousand (31 December 2018: RO 1,520 thousand). Accumulated depreciation against these software is RO 1,076 thousand (31 December 2018: RO 835 thousand).
15. Other assets
2019RO 000
2018RO 000
Ijarah rental receivables 64 84Other profit receivables 3,918 1,933Prepayments 314 350Murabaha and Musawama inventory 946 -Advances 909 713Others 116 171Acceptances 865 537
7,132 3,788Less: Reserve for suspended profit (note 26) (390) (248)Less: Allowance against other assets - (80)Less: Impairment allowance for ECL on accrued profit (note 26) (49) (22)Total 6,693 3,438
Maisarah Islamic Banking Services – Window of BankDhofar

Annual Report 2019290
Notes to the financial statements For the year ended 31 December 2019
16. Due to banks
2019RO 000
2018RO 000
Due to the Bank (Bank Dhofar SAOG) 33,100 17,550Due to banks 35,800 38,875Total 68,900 56,425
Due to Head Office and banks comprises of Wakala deposits.
At 31 December 2019, inter bank borrowings with 2 banks including Bank Dhofar SAOG individually represented 20% or more of the Islamic window’s due to banks (2018: Three banks including Bank Dhofar SAOG represented 20%).
17. Qard Hasan from Head Office
2019RO 000
2018RO 000
Qard Hasan from Head Office (17.1) 25,000 25,000Current clearing account (17.2) 1,181 1,150Total 26,181 26,150
17.1 This amount represents profit-free Qard Hasan facility obtained on real need basis from Head Office for a specific period as part of Maisarah’s liquidity management.
17.2 This amount represents the vostro account of Head Office opened with Maisarah.
18. Other liabilities
2019RO 000
2018RO 000
Payables 518 939Accrued expenses 1,277 1,118Profit payables 6,960 6,215Others 41 28Charity payable 5 17Acceptances 865 537Impairment allowance for ECL on non-funded exposure (note 26) 269 531Total 9,935 9,385
19. Equity of investment accountholders
2019RO 000
2018RO 000
Saving account 39,319 34,026Profit equalisation reserve 16 11Investment risk reserve 4 3Total 39,339 34,040
There is no restricted investment at reporting date.
Basis of distribution of the profit between owners’ equity and equity of investment accountholders
The investment profits are distributed between owners’ equity and equity of investment accountholders for the period ended 31 December 2019 and 2018 as follows:
2019 2018Equity of investment accountholders share 50% 50%Mudarib’s share 50% 50%
Maisarah Islamic Banking Services – Window of BankDhofar

291Annual Report 2019
Notes to the financial statements For the year ended 31 December 2019
19. Equity of investment accountholders (CONTINUED)
The investment risk reserve is deducted from investment accountholders share after allocating the Mudarib’s share of profit as per the approved policy in order to cater against future losses of equity of investment accountholders. Investment risk reserve will revert to the investment accountholders as per terms and conditions of Mudaraba contract.
The profit equalisation reserve is the amount Maisarah appropriates in excess of the profit to be distributed to equity of investment accountholders before allocating the Mudarib share of income to maintain a certain level of return. Profit equalisation reserve will revert to owner’s equity and equity of investment accountholders as per terms and condition of Mudaraba contract. Equity of investment accountholders funds are commingled with Maisarah’s funds for investment, no priority is granted to any party for the purpose of investments and distribution of profits. The administration expenses are only charged to Maisarah.
19.1 MOVEMENT IN PROFIT EQUALISATION RESERVE
2019RO 000
2018RO 000
Balance as at 1 January 11 7
Apportioned during the year 5 4
Balance as at 31 December 16 11
19.2 MOVEMENT IN INVESTMENT RISK RESERVE
2019RO 000
2018RO 000
Balance as at 1 January 3 2
Apportioned during the year 1 1
Balance as at 31 December 4 3
20. Allocated share capital
During 2018 and 2019, there was no increase in assigned capital to Maisarah from the core paid up capital of the shareholders.
21. Fiduciary assets
At reporting date, there were no funds under management with Maisarah.
22. Income from Islamic finances and investments
2019RO 000
2018RO 000
Murabaha receivables 1,254 1,278Mudaraba 1,333 1,351Ijarah muntahia bittamleek – net* 2,429 2,395Diminishing Musharaka 17,110 15,769Wakala financing 1,707 462Musawama 17 -Ujrah fees 1 -Profit on investments at FVOCI 1,886 1,592Profit on investment at amortised cost 350 350
26,087 23,197
* Depreciation on Ijarah Muntahia Bitamleek amounts to RO 3,360 thousand (2018: RO 1,913 thousand).
Maisarah Islamic Banking Services – Window of BankDhofar
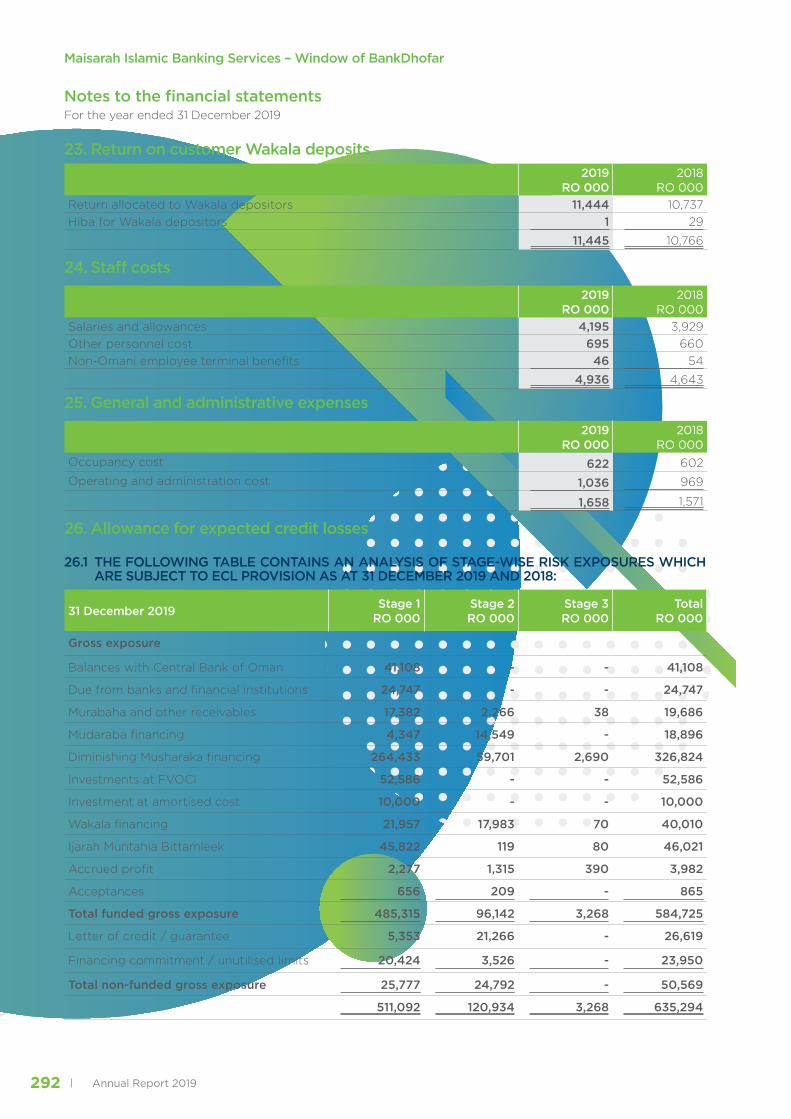
Annual Report 2019292
Notes to the financial statements For the year ended 31 December 2019
23. Return on customer Wakala deposits2019
RO 0002018
RO 000Return allocated to Wakala depositors 11,444 10,737Hiba for Wakala depositors 1 29
11,445 10,766
24. Staff costs
2019RO 000
2018RO 000
Salaries and allowances 4,195 3,929Other personnel cost 695 660Non-Omani employee terminal benefits 46 54
4,936 4,643
25. General and administrative expenses
2019RO 000
2018RO 000
Occupancy cost 622 602Operating and administration cost 1,036 969
1,658 1,571
26. Allowance for expected credit losses
26.1 THE FOLLOWING TABLE CONTAINS AN ANALYSIS OF STAGE-WISE RISK EXPOSURES WHICH ARE SUBJECT TO ECL PROVISION AS AT 31 DECEMBER 2019 AND 2018:
31 December 2019 Stage 1RO 000
Stage 2RO 000
Stage 3RO 000
TotalRO 000
Gross exposure
Balances with Central Bank of Oman 41,108 - - 41,108
Due from banks and financial institutions 24,747 - - 24,747
Murabaha and other receivables 17,382 2,266 38 19,686
Mudaraba financing 4,347 14,549 - 18,896
Diminishing Musharaka financing 264,433 59,701 2,690 326,824
Investments at FVOCI 52,586 - - 52,586
Investment at amortised cost 10,000 - - 10,000
Wakala financing 21,957 17,983 70 40,010
Ijarah Muntahia Bittamleek 45,822 119 80 46,021
Accrued profit 2,277 1,315 390 3,982
Acceptances 656 209 - 865
Total funded gross exposure 485,315 96,142 3,268 584,725
Letter of credit / guarantee 5,353 21,266 - 26,619
Financing commitment / unutilised limits 20,424 3,526 - 23,950
Total non-funded gross exposure 25,777 24,792 - 50,569
511,092 120,934 3,268 635,294
Maisarah Islamic Banking Services – Window of BankDhofar

293Annual Report 2019
Notes to the financial statements For the year ended 31 December 2019
26. Allowance for expected credit losses (CONTINUED)26.1 THE FOLLOWING TABLE CONTAINS AN ANALYSIS OF STAGE-WISE RISK EXPOSURES WHICH
ARE SUBJECT TO ECL PROVISION AS AT 31 DECEMBER 2019 AND 2018 (CONTINUED)
31 December 2019 (continued) Stage 1RO 000
Stage 2RO 000
Stage 3RO 000
TotalRO 000
Allowance for ECL & profit suspended
Balances with Central Bank of Oman - - - -
Due from banks and financial institutions (2) - - (2)
Murabaha and other receivables (88) (22) (18) (128)
Mudaraba financing (24) (156) - (180)
Diminishing Musharaka financing (846) (3,200) (849) (4,895)
Investments at FVOCI (125) - - (125)
Investment at amortised cost - - - -
Wakala financing (36) (37) (18) (91)
Ijarah Muntahia Bittamleek (73) (22) (43) (138)
Accrued profit (9) (40) (390) (439)
Acceptances - (1) - (1)
Total funded (1,203) (3,478) (1,318) (5,999)
Letter of credit / guarantee (18) (93) - (111)
Financing commitment / unutilised limits (109) (48) - (157)
Total non-funded (127) (141) - (268)
(1,330) (3,619) (1,318) (6,267)
Net exposure
Balances with Central Bank of Oman 41,108 - - 41,108
Due from banks and financial institutions 24,745 - - 24,745
Murabaha and other receivables 17,294 2,244 20 19,558
Mudaraba financing 4,323 14,393 - 18,716
Diminishing Musharaka financing 263,587 56,501 1,841 321,929
Investments at FVOCI 52,461 - - 52,461
Investment at amortised cost 10,000 - - 10,000
Wakala financing 21,921 17,946 52 39,919
Ijarah Muntahia Bittamleek 45,749 97 37 45,883
Accrued profit 2,268 1,275 - 3,543
Acceptances 656 208 - 864
Total funded net exposure 484,112 92,664 1,950 578,726
Letter of credit / guarantee 5,335 21,173 - 26,508
Financing Commitment / unutilised limits 20,315 3,478 - 23,793
Total non-funded net exposure 25,650 24,651 - 50,301
509,762 117,315 1,950 629,027
Maisarah Islamic Banking Services – Window of BankDhofar

Annual Report 2019294
Notes to the financial statements For the year ended 31 December 2019
26. Allowance for expected credit losses (CONTINUED)26.1 THE FOLLOWING TABLE CONTAINS AN ANALYSIS OF STAGE-WISE RISK EXPOSURES WHICH
ARE SUBJECT TO ECL PROVISION AS AT 31 DECEMBER 2019 AND 2018 (CONTINUED)
31 December 2018 Stage 1RO 000
Stage 2RO 000
Stage 3RO 000
TotalRO 000
Gross exposure
Balances with Central Bank of Oman 36,454 - - 36,454
Due from banks and financial institutions 30,375 - - 30,375
Murabaha and other receivables 23,990 605 30 24,625
Mudaraba financing 13,472 13,113 - 26,585
Diminishing Musharaka financing 239,823 43,799 1,893 285,515
Investments at FVOCI 31,599 - - 31,599
Investment at amortised cost 10,000 - - 10,000
Wakala financing 12,287 6,475 - 18,762
Ijarah Muntahia Bittamleek 45,720 197 81 45,998
Accrued profit 1,238 531 248 2,017
Acceptances 230 307 - 537
Total funded gross exposure 445,188 65,027 2,252 512,467
Letter of credit / guarantee 7,682 8,889 - 16,571
Financing commitment / unutilised limits 39,603 9,849 - 49,452
Total non-funded gross exposure 47,285 18,738 - 66,023
492,473 83,765 2,252 578,490
Allowance for ECL & profit suspended
Balances with Central Bank of Oman - - - -
Due from banks and financial institutions (14) - - (14)
Murabaha and other receivables (77) (19) (16) (112)
Mudaraba financing (39) (245) - (284)
Diminishing Musharaka financing (660) (2,601) (605) (3,866)
Investments at FVOCI (174) - - (174)
Investment at amortised cost - - - -
Wakala financing (10) (19) - (29)
Ijarah Muntahia Bittamleek (50) (22) (38) (110)
Accrued profit (5) (17) (248) (270)
Acceptances - (2) - (2)
Total funded (1,029) (2,925) (907) (4,861)
Letter of credit / guarantee (36) (68) - (104)
Financing commitment / unutilised limits (190) (235) - (425)
Total non-funded (226) (303) - (529)
(1,255) (3,228) (907) (5,390)
Maisarah Islamic Banking Services – Window of BankDhofar

295Annual Report 2019
Notes to the financial statements For the year ended 31 December 2019
26. Allowance for expected credit losses (CONTINUED)26.1 THE FOLLOWING TABLE CONTAINS AN ANALYSIS OF STAGE-WISE RISK EXPOSURES WHICH
ARE SUBJECT TO ECL PROVISION AS AT 31 DECEMBER 2019 AND 2018 (CONTINUED)
31 December 2018 (continued) Stage 1RO 000
Stage 2RO 000
Stage 3RO 000
TotalRO 000
Net exposure
Balances with Central Bank of Oman 36,454 - - 36,454
Due from banks and financial institutions 30,361 - - 30,361
Murabaha and other receivables 23,913 586 14 24,513
Mudaraba financing 13,433 12,868 - 26,301
Diminishing Musharaka financing 239,163 41,198 1,288 281,649
Investments at FVOCI 31,425 - - 31,425
Investment at amortised cost 10,000 - - 10,000
Wakala financing 12,277 6,456 - 18,733
Ijarah Muntahia Bittamleek 45,670 175 43 45,888
Accrued profit 1,233 514 - 1,747
Acceptances 230 305 - 535
Total funded net exposure 444,159 62,102 1,345 507,606
Letter of credit / guarantee 7,646 8,821 - 16,467
Financing Commitment / unutilised limits 39,413 9,614 - 49,027
Total non-funded net exposure 47,059 18,435 - 65,494
491,218 80,537 1,345 573,100
26.2 In accordance with CBO circular BM 1149 Banks should continue to maintain and update the risk classification (i.e. standard, special mention, substandard, etc.) of accounts as per the extant of CBO norms, including those on restructuring of accounts for regulatory reporting purposes.
Maisarah Islamic Banking Services – Window of BankDhofar

Annual Report 2019296
Notes to the financial statements For the year ended 31 December 2019
26. Allowance for expected credit losses (CONTINUED)26.2.1 COMPARISON OF PROVISIONS HELD AS PER IFRS 9 AND REQUIRED AS PER CBO NORMS
Disclosure requirements containing the risk classification-wise gross and net amount outstanding, provision required as per CBO norms, allowance made as per IFRS 9, and reserve profit required as per CBO are given below based on CBO circular BM 1149:
31 December 2019
Asset Classification as per CBO Norms
Asset Classification as per IFRS 9
Gross Amount
Provision required as per CBO Norms
Provision held as per IFRS 9
Difference between CBO provision required and provision held
Net Amount as per CBO norms*
Net Amount as per IFRS 9
Profit recognized as per IFRS 9
Reserve profit as per CBO norms
RO 000 RO 000 RO 000 RO 000 RO 000 RO 000 RO 000 RO 000
(1) (2) (3) (4) (5) (6) = 4-5 (7)= 3-4-10 (8)=3-5 (9) (10)
Standard
Stage 1 353,941 3,691 1,067 2,624 350,250 352,874 - -
Stage 2 52,507 524 939 (415) 51,983 51,568 - -
Stage 3 - - - - - - - -
Subtotal 406,448 4,215 2,006 2,209 402,233 404,442 - -
Special Mention
Stage 1 - - - - - - - -
Stage 2 42,111 417 2,498 (2,081) 41,694 39,613 - -
Stage 3 - - - - - - - -
Subtotal 42,111 417 2,498 (2,081) 41,694 39,613 - -
Substandard
Stage 1 - - - - - - - -
Stage 2 - - - - - - - -
Stage 3 58 14 19 (5) 44 39 - -
Subtotal 58 14 19 (5) 44 39 - -
Doubtful
Stage 1 - - - - - - - -
Stage 2 - - - - - - - -
Stage 3 154 45 59 (14) 107 95 - 2
Subtotal 154 45 59 (14) 107 95 - 2
Loss
Stage 1 - - - - - - - -
Stage 2 - - - - - - - -
Stage 3 2,666 1,008 850 158 1,658 1,816 - -
Subtotal 2,666 1,008 850 158 1,658 1,816 - -
Other items
Stage 1 157,151 - 263 (263) 157,151 156,888 - -
Stage 2 26,316 - 182 (182) 26,316 26,134 - -
Stage 3 390 - 390 (390) - - - 390
Subtotal 183,857 - 835 (835) 183,467 182,022 - 390
Total
Stage 1 511,092 3,691 1,330 2,361 507,401 509,762 - -
Stage 2 120,934 941 3,619 (2,678) 119,993 117,315 - -
Stage 3 3,268 1,067 1,318 (251) 1,809 1,950 - 392
Total 635,294 5,699 6,267 (568) 629,203 629,027 - 392
Maisarah Islamic Banking Services – Window of BankDhofar

297Annual Report 2019
Notes to the financial statements For the year ended 31 December 2019
26. Allowance for expected credit losses (CONTINUED)26.2.1 COMPARISON OF PROVISIONS HELD AS PER IFRS 9 AND REQUIRED AS PER CBO NORMS (CONTINUED)
31 December 2018
Asset Classification as per CBO Norms
Asset Classification as per IFRS 9
Gross Amount
Provision required as per CBO Norms
Provision held as per IFRS 9
Difference between CBO provision required and provision held
Net Amount as per CBO norms*
Net Amount as per IFRS 9
Profit recognized as per IFRS 9
Reserve profit as per CBO norms
RO 000 RO 000 RO 000 RO 000 RO 000 RO 000 RO 000 RO 000
(1) (2) (3) (4) (5) (6) = 4-5 (7)=3-4-10 (8)=3-5 (9) (10)
Standard
Stage 1 335,214 3,454 835 2,619 331,760 334,379 - -
Stage 2 47,344 468 1,410 (942) 46,876 45,934 - -
Stage 3 - - - - - - - -
Subtotal 382,558 3,922 2,245 1,677 378,636 380,313 - -
Special Mention
Stage 1 78 2 1 1 76 77 - -
Stage 2 16,845 156 1,496 (1,340) 16,689 15,349 - -
Stage 3 - - - - - - - -
Subtotal 16,923 158 1,497 (1,339) 16,765 15,426 - -
Substandard
Stage 1 - - - - - - - -
Stage 2 - - - - - - - -
Stage 3 53 13 18 (5) 40 35 - -
Subtotal 53 13 18 (5) 40 35 - -
Doubtful
Stage 1 - - - - - - - -
Stage 2 - - - - - - - -
Stage 3 82 27 43 (16) 54 39 - 1
Subtotal 82 27 43 (16) 54 39 - 1
Loss
Stage 1 - - - - - - - -
Stage 2 - - - - - - - -
Stage 3 1,869 794 598 (196) 1,075 1,271 - -
Subtotal 1,869 794 598 (196) 1,075 1,271 - -
Other items
Stage 1 157,181 - 419 (419) 157,181 156,762 - -
Stage 2 19,576 - 322 (322) 19,576 19,254 - -
Stage 3 248 - 248 (248) - - - 248
Subtotal 177,005 - 989 (989) 176,757 176,016 - 248
Total
Stage 1 492,473 3,456 1,255 2,201 489,017 491,218 - -
Stage 2 83,765 624 3,228 (2,604) 83,141 80,537 - -
Stage 3 2,252 834 907 (73) 1,169 1,345 - 249
Total 578,490 4,914 5,390 (476) 573,327 573,100 - 249
Other items disclosed above includes exposure which are not subjected to provision under BM 977 and related instructions. This represents outstanding and respective provisions held against letter of credit and guarantee, financing commitments / unutilised limits, investments at FVOCI and other assets.
Maisarah Islamic Banking Services – Window of BankDhofar

Annual Report 2019298
Notes to the financial statements For the year ended 31 December 2019
26. Allowance for expected credit losses (CONTINUED)26.2.2 RESTRUCTURED FINANCING
31 December 2019
Asset Classification as per CBO Norms
Asset Classification as per IFRS 9
Gross Amount
Provision required as per CBO Norms
Provision held as per IFRS 9
Difference between CBO provision required and provision held
Net Amount as pe r CBO norms*
Net Amount as per IFRS 9
Profit recognized as per IFRS
Reserve profit as per CBO norms
RO 000 RO 000 RO 000 RO 000 RO 000 RO 000 RO 000 RO 000(1) (2) (3) (4) (5) (6) = 4-5 (7)=3-4-10 (8)=3-5 (9) (10)
Classified as performing
Stage 1 526 3 12 (9) 523 514 - -
Stage 2 14,785 141 1,251 (1,110) 14,644 13,534 - -
Stage 3 - - - - - - - -
Subtotal 15,311 144 1,263 (1,119) 15,167 14,048 - -
Classified as non-performing
Stage 1 - - - - - - - -
Stage 2 - - - - - - - -
Stage 3 - - - - - - - -
Subtotal - - - - - - - -
Total
Stage 1 526 3 12 (9) 523 514 - -
Stage 2 14,785 141 1,251 (1,110) 14,644 13,534 - -
Stage 3 - - - - - - - -
Total 15,311 144 1,263 (1,119) 15,167 14,048 - -
31 December 2018
Asset Classification as per CBO Norms
Asset Classification as per IFRS 9
Gross Amount
Provision required as per CBO Norms
Provision held as per IFRS 9
Difference between CBO provision required and provision held
Net Amount as per CBO norms*
Net Amount as per IFRS 9
Profit recognized as per IFRS
Reserve profit as per CBO norms
RO 000 RO 000 RO 000 RO 000 RO 000 RO 000 RO 000 RO 000
(1) (2) (3) (4) (5) (6) = 4-5 (7)=3-4-10 (8)=3-5 (9) (10)
Classified as performing
Stage 1 - - - - - - - -
Stage 2 480 2 93 (91) 478 387 - -
Stage 3 - - - - - - - -
Subtotal 480 2 93 (91) 478 387 - -
Classified as non-performing
Stage 1 - - - - - - - -
Stage 2 - - - - - - - -
Stage 3 - - - - - - - -
Subtotal - - - - - - - -
Total
Stage 1 - - - - - - - -
Stage 2 480 2 93 (91) 478 387 - -
Stage 3 - - - - - - - -
Total 480 2 93 (91) 478 387 - -
* Net of provisions and reserve profit as per CBO norms.
Maisarah Islamic Banking Services – Window of BankDhofar

299Annual Report 2019
Notes to the financial statements For the year ended 31 December 2019
26. Allowance for expected credit losses (CONTINUED)26.2.2 RESTRUCTURED FINANCING (CONTINUED)
31 December 2019
Asset Classification as per IFRS 9 As per CBO Norms As per IFRS 9 Difference
RO 000 RO 000 RO 000Impairment loss charged to statement of profit or loss 785 734 51Provision required as per CBO norms including reserve profit/held as per IFRS 9 6,091 6,267 (176)
Gross non-performing financing (percentage) 0.64% 0.64% 0.00%Net non-performing financing (percentage) 0.40% 0.43% 0.03%
31 December 2018
Asset Classification as per IFRS 9 As per CBO Norms As per IFRS 9 Difference
RO 000 RO 000 RO 000Impairment loss charged to statement of profit or loss 578 516 62Provision required as per CBO norms including reserve profit/held as per IFRS 9 5,163 5,390 (227)
Gross non-performing financing (percentage) 0.50% 0.50% 0.00%Net non-performing financing (percentage) 0.29% 0.34% 0.05%
27. Related parties transactionsIn the ordinary course of business, Maisarah conducts transactions with certain of its Directors, members of Shari’a Supervisory Board, shareholders and companies over which they are able to exert significant influence. The aggregate amounts of balances with such related parties are as follows:
2019RO 000
2018RO 000
FinancesDirectors, members of Shari’a Supervisory Board and shareholders holding 10% or more interest in the Bank 822 664Deposits and other accountsDirectors, members of Shari’a Supervisory Board and shareholders holding 10% or more interest in the Bank 35,463 43,930Remuneration paid to Shari’a Board members & Shari’a SupervisorChairman – remuneration proposed 9 8 – sitting fees paid 2 2Other Members – remuneration proposed 29 24 – sitting fees paid 8 6
48 40
Other transactionsRental payment to a related party 306 237Income from finance to related parties 37 25Profit expense on deposits from related parties 1,811 2,007
Key management compensationSalaries and other benefits 267 261End of service benefits 10 9
277 270
At 31 December 2019, profit rate for finances range from 2.00% to 5.50% (2018: 2.00% to 5.25%), and profit rate for deposits range from 0.0% to 4.5% (2018: 0.00% to 4.25%).
Maisarah Islamic Banking Services – Window of BankDhofar

Annual Report 2019300
Notes to the financial statements For the year ended 31 December 2019
28. Contingent liabilities and commitments
(a) Credit related contingent items
Letters of credit and other commitments for which there are corresponding customer liabilities:
2019RO 000
2018RO 000
Letters of credit 10,532 5,678
Guarantees 16,087 10,893
Total 26,619 16,571
(b) Capital and investment commitments
2019RO 000
2018RO 000
Contractual commitments for property and equipment 73 19
(c) The unutilised limits of Maisarah’s funded and non-funded exposure for the year ended 31 December 2019 amounts to RO 45,631 thousand (2018: 90,004 thousand).
29. Islamic financial derivatives
Forward exchange contracts represent commitments to purchase foreign and domestic currency, including undelivered spot transactions. The values of the derivative instruments held are set out as below:
Contract / Notional Amount2019
RO 0002018
RO 000
Forward exchange contracts
Currency forward - purchase contracts 38,500 38,635
Currency forward - sale contracts 38,511 38,505
During 2018 and 2019, all the foreign exchange contracts have a maturity of less than one month.
30. Fair value information
Fair value is an amount for which an asset could be exchanged, or a liability settled, between knowledgeable, willing parties in an arm’s length transaction. Consequently, differences can arise between the carrying value and fair value estimates. As at the reporting date the fair values of Maisarah’s financial instruments are not significantly different from their carrying values.
The following table provides an analysis of financial instruments that are measured subsequent to initial recognition at fair value, grouped into levels 1 to 3 based on the degree to which the fair value is observable:
• Level 1 fair value measurements are those derived from quoted prices (unadjusted) in active markets for identical assets or liabilities;
• Level 2 fair value measurements are those derived from inputs other than quoted prices included within Level 1 that are observable for the asset or liability, either directly (i.e. as prices) or indirectly (i.e. derived from prices); and
• Level 3 fair value measurements are those derived from valuation techniques that include inputs for the asset or liability that are not based on observable market data (unobservable inputs).
Maisarah Islamic Banking Services – Window of BankDhofar

301Annual Report 2019
Notes to the financial statements For the year ended 31 December
30. Fair value information (Continued)
2019
Fair value information Level 1 Level 2 Level 3 Total
RO 000 RO 000 RO 000 RO 000
Investments at FVOCI 52,586 - - 52,586
Fair value information
2018
Level 1 Level 2 Level 3 Total
RO 000 RO 000 RO 000 RO 000
Investments at FVOCI 31,599 - - 31,599
31. Financial risk management
The important types of financial risks to which Maisarah is exposed are credit risk, liquidity risk and market risk. The risk management division of Maisarah is an independent and dedicated unit reporting directly to the Risk Management Committee (“RMC”) of the Board. The division’s primary responsibility is to assess, monitor and recommend strategies for control of credit, market and operational risk. The absence of any direct or indirect reporting lines and permanent membership in all Maisarah’s committees are among the factors which reflect the independence of the Risk Management Division’s working and the key role it plays within Maisarah.
The risk management framework is pivoted on a host of committees involving the executive management and the Board of Directors (“the Board”) for approval and reporting purposes. The Board has the overall authority for approval of strategies and policies, which it exercises through its various sub-committees. RMC of the Board is responsible for reviewing and recommending to the full Board, approval risk policies and procedures. RMC also reviews the risk profile of Maisarah as presented to it by the Risk Management Division and appraises the full Board in its periodic meetings.
Credit risk
The most important risk to which Maisarah is exposed is credit risk. To manage the level of credit risk, Maisarah deals with counter-parties of good credit. Board Executive Committee is the final credit approving authority of Maisarah which is mainly responsible for approving all credit proposals beyond the authority level of the management. RMC is the management decision making body which is empowered to consider all credit related issues upto certain limits.
Credit risk is managed by the Risk Management Division (“RMD”) through a system of independent risk assessment in credit proposals before they are considered by the appropriate approving authorities. Maisarah has in place a risk grading system for analysing the risk associated with credit. This facilitates the approving authorities in making their credit decision. Maximum counterparty/group exposures are limited to 15% of the Bank’s capital base as stipulated by CBO and where a higher limit is required for projects of national importance prior CBO approval is obtained. Individual country limits using Moody’s, S&P and Fitch ratings have also been set up to ensure portfolio diversification in terms of sovereign risk ratings and geographical exposure. These limits are approved by the Board. Retail financing is strictly in accordance with the CBO guidelines. The analysis of credit portfolio is provided below.
Maisarah Islamic Banking Services – Window of BankDhofar
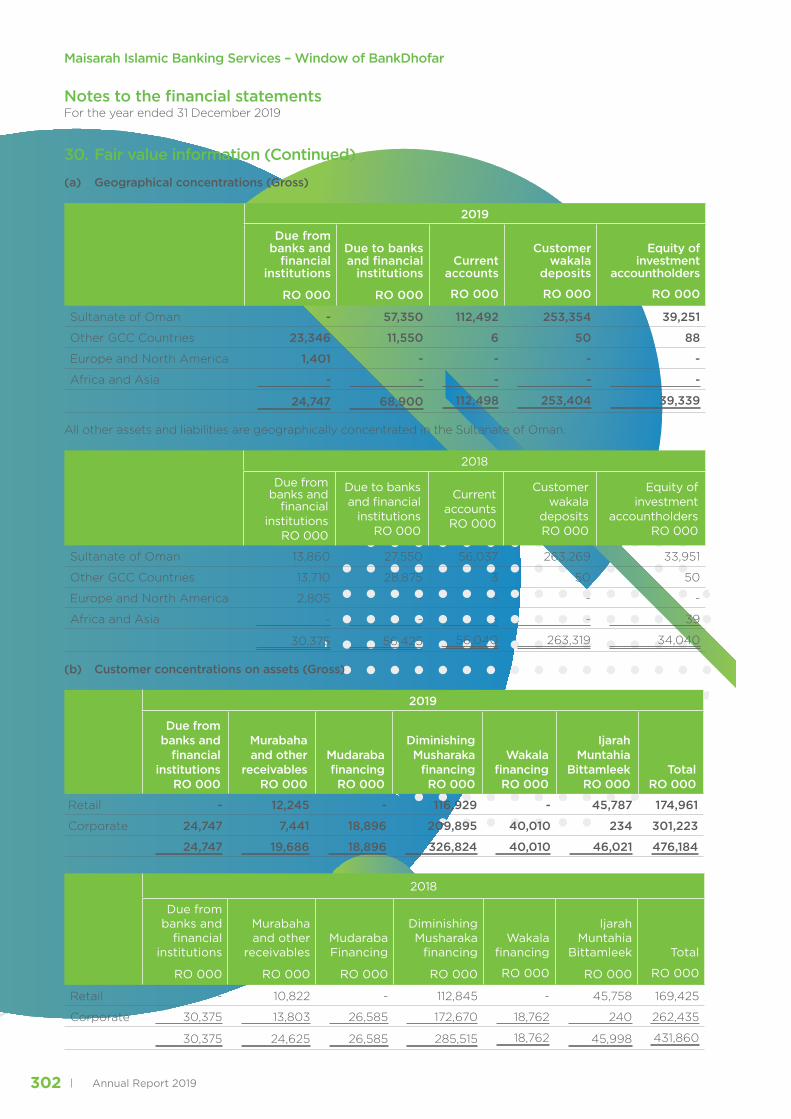
Annual Report 2019302
Notes to the financial statements For the year ended 31 December 2019
30. Fair value information (Continued)
(a) Geographical concentrations (Gross)
2019
Due from banks and
financial institutions
Due to banks and financial
institutionsCurrent
accounts
Customer wakala
deposits
Equity of investment
accountholders
RO 000 RO 000 RO 000 RO 000 RO 000
Sultanate of Oman - 57,350 112,492 253,354 39,251
Other GCC Countries 23,346 11,550 6 50 88
Europe and North America 1,401 - - - -
Africa and Asia - - - - -
24,747 68,900 112,498 253,404 39,339
All other assets and liabilities are geographically concentrated in the Sultanate of Oman.
2018
Due from banks and
financial institutions
RO 000
Due to banks and financial
institutionsRO 000
Current accountsRO 000
Customer wakala
depositsRO 000
Equity of investment
accountholdersRO 000
Sultanate of Oman 13,860 27,550 56,037 263,269 33,951
Other GCC Countries 13,710 28,875 3 50 50
Europe and North America 2,805 - - - -
Africa and Asia - - - - 39
30,375 56,425 56,040 263,319 34,040
(b) Customer concentrations on assets (Gross)
2019
Due from banks and
financial institutions
RO 000
Murabaha and other
receivablesRO 000
Mudaraba financingRO 000
Diminishing Musharaka
financingRO 000
Wakala financingRO 000
Ijarah Muntahia
Bittamleek RO 000
TotalRO 000
Retail - 12,245 - 116,929 - 45,787 174,961
Corporate 24,747 7,441 18,896 209,895 40,010 234 301,223
24,747 19,686 18,896 326,824 40,010 46,021 476,184
2018
Due from banks and
financial institutions
Murabaha and other
receivablesMudaraba Financing
Diminishing Musharaka
financingWakala
financing
Ijarah Muntahia
Bittamleek Total
RO 000 RO 000 RO 000 RO 000 RO 000 RO 000 RO 000
Retail - 10,822 - 112,845 - 45,758 169,425
Corporate 30,375 13,803 26,585 172,670 18,762 240 262,435
30,375 24,625 26,585 285,515 18,762 45,998 431,860
Maisarah Islamic Banking Services – Window of BankDhofar

303Annual Report 2019
Notes to the financial statements For the year ended 31 December 2019
30. Fair value information (Continued)
(c) Industry type distribution of exposures by major types of credit exposures:
2019
Murabaha and other
receivablesMudaraba financing
Diminishing Musharaka Financing
Wakala financing
Ijarah Muntahia
BittamleekTotal
financing
Off balance sheet
exposures
RO 000 RO 000 RO 000 RO 000 RO 000 RO 000 RO 000
Import trade 415 973 2,660 12,667 - 16,715 664Wholesale & retail trade 2,177 856 2,130 695 - 5,858 558
Mining & quarrying - 648 1,146 2,864 - 4,658 -Construction 2,672 7,648 142,022 11,525 - 163,867 12,351Manufacturing 2,093 6,789 7,345 8,744 - 24,971 12,174Electricity,gas and water - - 1,823 - - 1,823 -
Transport & communication 84 - 124 - - 208 -
Financial institutions - 985 - - - 985 -Services - 43 45,410 2,486 - 47,939 58Retail 12,245 - 116,929 - 45,787 174,961 361Agriculture and allied Activites - 954 - 1,029 - 1,983 -
Others - - 7,235 - 234 7,469 45319,686 18,896 326,824 40,010 46,021 451,437 26,619
2018
Murabaha and other
receivables
Mudaraba financing
Diminishing Musharaka Financing
Wakala financing
Ijarah Muntahia
Bittamleek
Total financing
Off balance sheet
exposures
RO 000 RO 000 RO 000 RO 000 RO 000 RO 000 RO 000
Import trade 5,579 780 1,283 9,509 - 17,151 6,649Wholesale & retail trade 2,242 775 3,039 31 - 6,087 1
Mining & quarrying - 2,840 861 418 - 4,119 -Construction 2,924 10,743 109,416 5,934 240 129,257 5,438Manufacturing 2,952 9,478 6,590 1,514 - 20,534 3,649Electricity, gas and water - - 513 - - 513 -
Transport & communication 106 - 221 - - 327 -
Financial institutions - 981 - - - 981 -Services - 35 45,757 1,356 - 47,148 727Retail 10,822 - 112,845 - 45,758 169,425 -Agriculture and allied Activities - 953 - - - 953 -
Others - - 4,990 - - 4,990 107
24,625 26,585 285,515 18,762 45,998 401,485 16,571
Maisarah Islamic Banking Services – Window of BankDhofar

Annual Report 2019304
Notes to the financial statements For the year ended 31 December 2019
30. Fair value information (Continued)
(d) Residual contractual maturities of the portfolio by major types of credit exposures:
2019
Murabaha and other
receivablesMudaraba financing
Diminishing Musharaka Financing
Wakala financing
Ijarah Muntahia
Bittamleek Total
financing
Off Balance sheet
exposures
RO 000 RO 000 RO 000 RO 000 RO 000 RO 000 RO 000
Upto 1 month 1,080 18,896 41 4,251 - 24,268 4,284
1 - 3 months 681 - 39 10,279 1 11,000 15,670
3 - 6 months 2,199 - 107 21,355 10 23,671 1,317
6 - 9 months 134 - 370 4,125 3 4,632 2,432
9 - 12 months 74 - 168 - 7 249 857
1 - 3 years 874 - 6,776 - 163 7,813 2,059
3 – 5 years 1,833 - 26,892 - 459 29,184 -
Over 5 years 12,811 - 292,431 - 45,378 350,620 -
19,686 18,896 326,824 40,010 46,021 451,437 26,619
2018
Murabaha and other
receivablesMudaraba financing
Diminishing Musharaka Financing
Wakala financing
Ijarah Muntahia
Bittamleek Total
financing
Off Balance sheet
exposures
RO 000 RO 000 RO 000 RO 000 RO 000 RO 000 RO 000
Upto 1 month 1,646 26,585 1 394 - 28,626 1,169
1 - 3 months 4,847 - 83 3,051 - 7,981 7,482
3 - 6 months 4,434 - 5 11,364 - 15,803 1,926
6 - 9 months 894 - 209 3,953 9 5,065 1,806
9 - 12 months 37 - 784 - - 821 817
1 - 3 years 807 - 10,565 - 107 11,479 2,896
3 – 5 years 1,480 - 18,338 - 419 20,237 475
Over 5 years 10,480 - 255,530 - 45,463 311,473 -
24,625 26,585 285,515 18,762 45,998 401,485 16,571
(e) Maximum exposure to credit risk without consideration of collateral held:
2019 RO 000
2018 RO 000
Due from banks and financial institutions (Gross) 24,747 30,375
Maisarah Islamic Banking Services – Window of BankDhofar

305Annual Report 2019
Notes to the financial statements For the year ended 31 December 2019
30. Fair value information (Continued)
(f) Amounts arising from Expected Credit Loss (ECL)
Inputs, assumptions and techniques used for estimating impairment
Significant increase in credit risk (SICR)
The assessment of SICR since origination of a financial asset considers customer-specific quantitative and qualitative information without consideration of collateral, and the impact of forward-looking information. Quantitative models may not always be able to capture all reasonable and supportable information that may indicate a significant increase in credit risk. Qualitative factors may be assessed to supplement the gap.
For retail exposures, a significant increase in credit risk cannot be assessed using forward-looking information at an individual account level. Therefore, the assessment is done at the segment level. Segment migration thresholds exist for each PD model by product which considers the proportionate change in PD as well as the absolute change in PD. The thresholds used for PD migration are reviewed and assessed at least annually, unless there is a significant change in credit risk management practices in which case the review is brought forward.
For non-retail exposures the Bank uses an internal risk rating scale (IG codes) for its non-retail exposures. All non-retail exposures have an IG code assigned that reflects the probability of default of the customer. Both customer specific and non-customer specific (i.e. macroeconomic) forward-looking information is considered and reflected in the IG rating. Significant increase in credit risk is evaluated based on the migration of the exposures among IG codes.
Incorporation of forward-looking information
The Bank incorporates forward-looking information into both the assessment of whether the credit risk of an instrument has increased significantly since its initial recognition and the measurement of ECL. The Bank formulates three economic scenarios: a base case, which is the median scenario assigned a 50% probability of occurring, and two less likely scenarios, one upside and one downside, each assigned a 25% probability of occurring. External information considered includes economic data and forecasts published by monetary authorities and selected private-sector forecasters. A comprehensive review is performed at least annually on the design of the scenarios by the Bank’s senior management.
Economic variable assumptions
The Bank uses the macroeconomic forecast to convert the Through the Cycle (TTC) PD into Point in Time (PIT) PD. Real GDP growth rate and Oil Revenue to GDP are considered for establishing the relationship with historical non-performing financing (NPFs) data of the banking system, as they were observed to be more statistically significant parameters reflecting the state of economy. The forecast of macro-economic indicators are considered for next 3 years with time lag of 1 year. The macroeconomic indicators used as at 31 December 2019 including the projections used is presented as under:
Real GDP growth (%)
2019 2018
Oil revenue (%GDP)
2019 2018
Present 2.10% 2.0% Present 31.08% 21.1%
Year 1 Projection 1.10% 2.0% Year 1 Projection 27.07% 24.3%
Year 2 Projection 6.20% 3.6% Year 2 Projection 25.43% 24.7%
Year 3 Projection 2.80% 1.9% Year 3 Projection 27.74% 23.8%
Predicted relationships between the macroeconomic indicators, default and loss rates on various portfolios of financial assets have been developed based on analysing historical data over the past 15 years.
Maisarah Islamic Banking Services – Window of BankDhofar

Annual Report 2019306
Notes to the financial statements For the year ended 31 December 2019
30. Fair value information (Continued)(f) Amounts arising from Expected Credit Loss (ECL) (Continued)
31 December 2019Stage 1 Stage 2 Stage 3 Total
ECL Exposure ECL Exposure ECL Exposure ECL ExposureRO 000 RO 000 RO 000 RO 000 RO 000 RO 000 RO 000 RO 000
Balances with CBOHigh investment grade - 41,108 - - - - - 41,108Moderate investment grade - - - - - - - -
Sub investment grade - - - - - - - - Non-performing - - - - - - - - Total - 41,108 - - - - - 41,108
BanksHigh investment grade 2 24,747 - - - - 2 24,747Moderate investment grade - - - - - - - -
Sub investment grade - - - - - - - -Non-performing - - - - - - - - Total 2 24,747 - - - - 2 24,747
Financing to customersCorporate and SMEHigh investment grade 115 52,523 91 17,114 - - 206 69,637Moderate investment grade 634 125,619 494 25,177 - - 1,128 150,796
Sub investment grade 12 1,218 2,827 52,171 - - 2,839 53,389Non-performing - - - - 815 2,654 815 2,654Total 761 179,360 3,412 94,462 815 2,654 4,988 276,476
Retail (Personal)High investment grade 55 11,257 - - - - 55 11,257Moderate investment grade 5 329 1 29 - - 6 358
Sub investment grade - - 2 8 - - 2 8Non-performing - - - - 16 30 16 30Total 60 11,586 3 37 16 30 79 11,653
Retail (Housing and credit card receivables)High investment grade 246 162,995 - - - - 246 162,995Moderate investment grade - - 9 73 - - 9 73
Sub investment grade - - 13 46 - - 13 46Non-performing - - - - 97 194 97 194Total 246 162,995 22 119 97 194 365 163,308
Total financing 1,067 353,941 3,437 94,618 928 2,878 5,432 451,437
InvestmentsHigh investment grade - 42,576 - - - - - 42,576Moderate investment grade 125 20,010 - - - - 125 20,010
Sub investment grade - - - - - - - -Non-performing - - - - - - - -Total 125 62,586 - - - - 125 62,586
Maisarah Islamic Banking Services – Window of BankDhofar
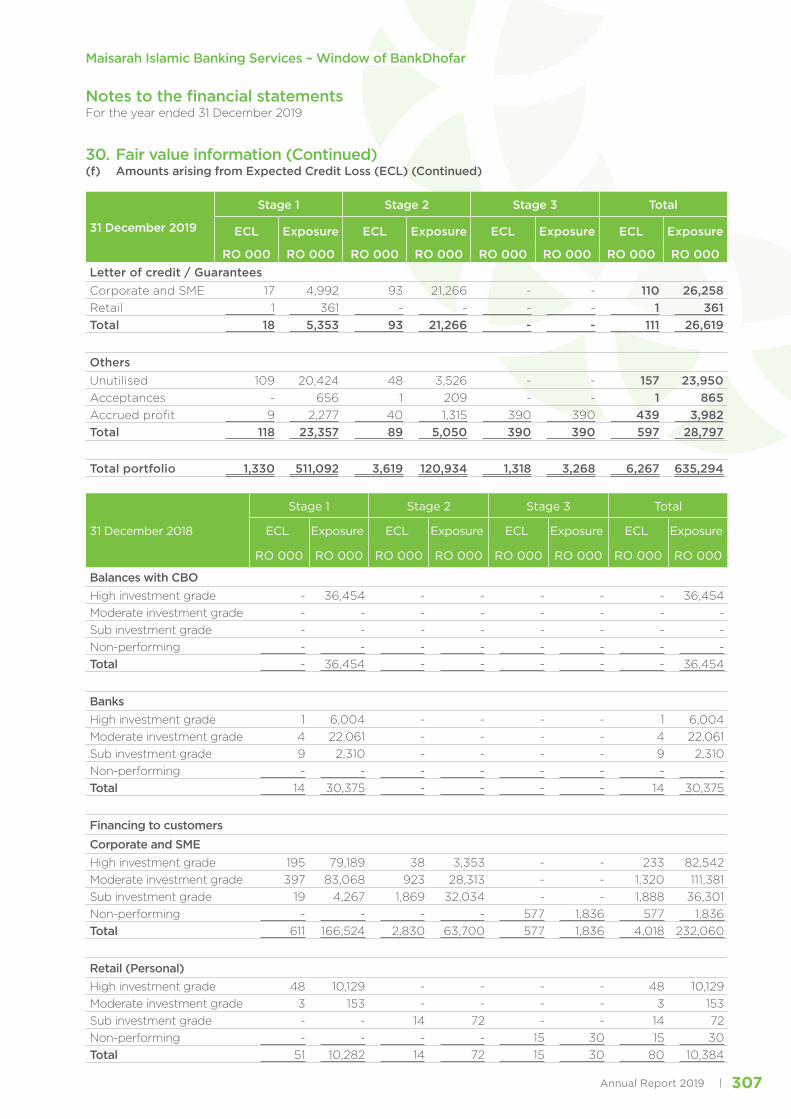
307Annual Report 2019
Notes to the financial statements For the year ended 31 December 2019
30. Fair value information (Continued)(f) Amounts arising from Expected Credit Loss (ECL) (Continued)
31 December 2019
Stage 1 Stage 2 Stage 3 Total
ECL Exposure ECL Exposure ECL Exposure ECL Exposure
RO 000 RO 000 RO 000 RO 000 RO 000 RO 000 RO 000 RO 000Letter of credit / GuaranteesCorporate and SME 17 4,992 93 21,266 - - 110 26,258Retail 1 361 - - - - 1 361Total 18 5,353 93 21,266 - - 111 26,619
OthersUnutilised 109 20,424 48 3,526 - - 157 23,950Acceptances - 656 1 209 - - 1 865Accrued profit 9 2,277 40 1,315 390 390 439 3,982Total 118 23,357 89 5,050 390 390 597 28,797
Total portfolio 1,330 511,092 3,619 120,934 1,318 3,268 6,267 635,294
31 December 2018
Stage 1 Stage 2 Stage 3 Total
ECL Exposure ECL Exposure ECL Exposure ECL Exposure
RO 000 RO 000 RO 000 RO 000 RO 000 RO 000 RO 000 RO 000
Balances with CBOHigh investment grade - 36,454 - - - - - 36,454Moderate investment grade - - - - - - - - Sub investment grade - - - - - - - - Non-performing - - - - - - - - Total - 36,454 - - - - - 36,454
BanksHigh investment grade 1 6,004 - - - - 1 6,004 Moderate investment grade 4 22,061 - - - - 4 22,061 Sub investment grade 9 2,310 - - - - 9 2,310 Non-performing - - - - - - - - Total 14 30,375 - - - - 14 30,375
Financing to customersCorporate and SMEHigh investment grade 195 79,189 38 3,353 - - 233 82,542Moderate investment grade 397 83,068 923 28,313 - - 1,320 111,381Sub investment grade 19 4,267 1,869 32,034 - - 1,888 36,301Non-performing - - - - 577 1,836 577 1,836Total 611 166,524 2,830 63,700 577 1,836 4,018 232,060
Retail (Personal)High investment grade 48 10,129 - - - - 48 10,129Moderate investment grade 3 153 - - - - 3 153Sub investment grade - - 14 72 - - 14 72Non-performing - - - - 15 30 15 30Total 51 10,282 14 72 15 30 80 10,384
Maisarah Islamic Banking Services – Window of BankDhofar

Annual Report 2019308
Notes to the financial statements For the year ended 31 December 2019
30. Fair value information (Continued)(f) Amounts arising from Expected Credit Loss (ECL) (Continued)
31 December 2018
Stage 1 Stage 2 Stage 3 Total
ECL Exposure ECL Exposure ECL Exposure ECL Exposure
RO 000 RO 000 RO 000 RO 000 RO 000 RO 000 RO 000 RO 000
Retail (Housing and credit card receivables)
High investment grade - - - - - - - -
Moderate investment grade 174 158,486 62 417 - - 236 158,903
Sub investment grade - - - - - - - -
Non-performing - - - - 67 138 67 138
Total 174 158,486 62 417 67 138 303 159,041
Total financing 836 335,292 2,906 64,189 659 2,004 4,401 401,485
Investments
High investment grade - 21,589 - - - - - 21,589
Moderate investment grade 174 20,010 - - - - 174 20,010
Sub investment grade - - - - - - - -
Non-performing - - - - - - - -
Total 174 41,599 - - - - 174 41,599
Letter of credit / Guarantees
Corporate and SME 33 7,228 68 8,889 - - 101 16,117
Retail 3 454 - - - - 3 454
Total 36 7,682 68 8,889 - - 104 16,571
Others
Unutilised 190 39,603 235 9,849 - - 425 49,452
Acceptances - 230 2 307 - - 2 537
Accrued profit 5 1,238 17 531 248 248 270 2,017
Total 195 41,071 254 10,687 248 248 697 52,006
Total portfolio 1,255 492,473 3,228 83,765 907 2,252 5,390 578,490
Retail related housing and credit card receivable portfolio is not rated and currently it is categorized based on days past due bucket.
The gross exposure of the financial assets as at 31 December 2019 along with reconciliations from the opening to the closing balance by class of financial instruments are as follows:
Maisarah Islamic Banking Services – Window of BankDhofar

309Annual Report 2019
Notes to the financial statements For the year ended 31 December 2019
30. Fair value information (Continued)(f) Amounts arising from Expected Credit Loss (ECL) (Continued)
31 December 2019Stage 1 Stage 2 Stage 3 Total
ECL Exposure ECL Exposure ECL Exposure ECL ExposureRO 000 RO 000 RO 000 RO 000 RO 000 RO 000 RO 000 RO 000
Balances with CBOOpening balance - 36,454 - - - - - 36,454Transfer between stages
- Transfer to Stage 1 - - - - - - - -- Transfer to Stage 2 - - - - - - - -- Transfer to Stage 3 - - - - - - - -
- - - - - - - -Re-measurement of - (3,046) - - - - - (3,046)outstanding
Financial asset originated - 7,700 - - - - - 7,700during the year
Financial asset matured - - - - - - - -during the year
Closing balance - 41,108 - - - - - 41,108
BanksOpening balance 14 30,375 - - - - 14 30,375Transfer between stages
- Transfer to Stage 1 - - - - - - - -- Transfer to Stage 2 - - - - - - - -- Transfer to Stage 3 - - - - - - - -
- - - - - - - -Re-measurement of (13) (17,178) - - - - (13) (17,178)outstanding
Financial asset originated 1 11,550 - - - - 1 11,550during the year
Financial asset matured - - - - - - - -during the year
Closing balance 2 24,747 - - - - 2 24,747
Total financingOpening balance 836 335,292 2,906 64,189 658 2,004 4,400 401,485Transfer between stages
- Transfer to Stage 1 218 2,173 (218) (2,173) - - - -- Transfer to Stage 2 (110) (28,280) 110 28,280 - - - -- Transfer to Stage 3 - (76) (23) (742) 23 818 - -
108 26,183 (131) 25,365 23 818 - -Re-measurement of (173) (8,314) (3) (13,372) 227 (14) 51 (21,700)outstanding
Financial asset originated 373 87,234 2,070 51,324 18 70 2,461 138,628during the year
Financial asset matured (77) (34,088) (1,405) (32,888) - - (1,482) (66,976)during the year
Closing balance 1,067 353,941 3,437 94,618 926 2,878 5,430 451,437
Maisarah Islamic Banking Services – Window of BankDhofar
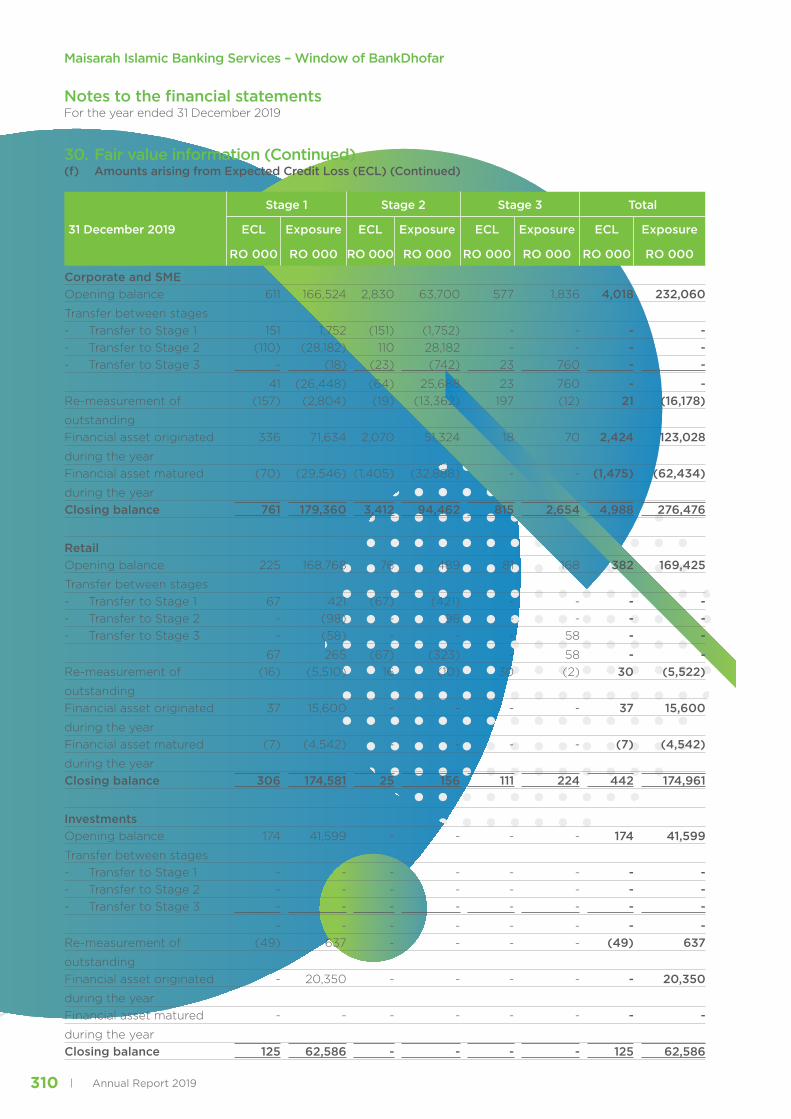
Annual Report 2019310
Notes to the financial statements For the year ended 31 December 2019
30. Fair value information (Continued)(f) Amounts arising from Expected Credit Loss (ECL) (Continued)
31 December 2019
Stage 1 Stage 2 Stage 3 Total
ECL Exposure ECL Exposure ECL Exposure ECL Exposure
RO 000 RO 000 RO 000 RO 000 RO 000 RO 000 RO 000 RO 000
Corporate and SMEOpening balance 611 166,524 2,830 63,700 577 1,836 4,018 232,060 Transfer between stages- Transfer to Stage 1 151 1,752 (151) (1,752) - - - - - Transfer to Stage 2 (110) (28,182) 110 28,182 - - - - - Transfer to Stage 3 - (18) (23) (742) 23 760 - -
41 (26,448) (64) 25,688 23 760 - -Re-measurement of (157) (2,804) (19) (13,362) 197 (12) 21 (16,178)outstandingFinancial asset originated 336 71,634 2,070 51,324 18 70 2,424 123,028 during the yearFinancial asset matured (70) (29,546) (1,405) (32,888) - - (1,475) (62,434)during the yearClosing balance 761 179,360 3,412 94,462 815 2,654 4,988 276,476
RetailOpening balance 225 168,768 76 489 81 168 382 169,425 Transfer between stages- Transfer to Stage 1 67 421 (67) (421) - - - - - Transfer to Stage 2 - (98) - 98 - - - - - Transfer to Stage 3 - (58) - - - 58 - -
67 265 (67) (323) - 58 - -Re-measurement of (16) (5,510) 16 (10) 30 (2) 30 (5,522)outstandingFinancial asset originated 37 15,600 - - - - 37 15,600 during the yearFinancial asset matured (7) (4,542) - - - - (7) (4,542)during the yearClosing balance 306 174,581 25 156 111 224 442 174,961
InvestmentsOpening balance 174 41,599 - - - - 174 41,599Transfer between stages- Transfer to Stage 1 - - - - - - - -- Transfer to Stage 2 - - - - - - - -- Transfer to Stage 3 - - - - - - - -
- - - - - - - -Re-measurement of (49) 637 - - - - (49) 637outstandingFinancial asset originated - 20,350 - - - - - 20,350during the yearFinancial asset matured - - - - - - - -during the yearClosing balance 125 62,586 - - - - 125 62,586
Maisarah Islamic Banking Services – Window of BankDhofar

311Annual Report 2019
Notes to the financial statements For the year ended 31 December 2019
30. Fair value information (Continued)(f) Amounts arising from Expected Credit Loss (ECL) (Continued)
31 December 2019
Stage 1 Stage 2 Stage 3 Total
ECL Exposure ECL Exposure ECL Exposure ECL Exposure
RO 000 RO 000 RO 000 RO 000 RO 000 RO 000 RO 000 RO 000
Letter of credit / GuaranteesOpening balance 36 7,682 68 8,889 - - 104 16,571Transfer between stages- Transfer to Stage 1 - 194 - (194) - - - - - Transfer to Stage 2 (2) (235) 2 235 - - - - - Transfer to Stage 3 - - - - - - - -
(2) (41) 2 41 - - - -Re-measurement of (13) (1,182) (28) (224) - - (41) (1,406)outstandingFinancial asset originated 12 2,464 63 15,326 - - 75 17,790 during the yearFinancial asset matured (15) (3,570) (12) (2,766) - - (27) (6,336)during the yearClosing balance 18 5,353 93 21,266 - - 111 26,619
AcceptancesOpening balance - 230 2 307 - - 2 537 Transfer between stages- Transfer to Stage 1 - - - - - - - - - Transfer to Stage 2 - - - - - - - - - Transfer to Stage 3 - - - - - - - -
- - - - - - - -Re-measurement of - - - - - - - -outstandingFinancial asset originated - 656 1 209 - - 1 865 during the yearFinancial asset matured - (230) (2) (307) - - (2) (537)during the yearClosing balance - 656 1 209 - - 1 865
Unutilised limitsOpening balance 190 39,603 235 9,849 - - 425 49,452 Transfer between stages- Transfer to Stage 1 - - - - - - - - - Transfer to Stage 2 - 181 - (181) - - - - - Transfer to Stage 3 (11) (6,798) 11 6,798 - - - -
(11) (6,617) 11 6,617 - - - -Re-measurement of 26 1,106 (12) (6,521) - - 14 (5,415)outstandingFinancial asset originated 49 9,753 - 1 - - 49 9,754 during the yearFinancial asset matured (145) (23,421) (186) (6,420) - - (331) (29,841)during the yearClosing balance 109 20,424 48 3,526 - - 157 23,950
Maisarah Islamic Banking Services – Window of BankDhofar

Annual Report 2019312
Notes to the financial statements For the year ended 31 December 2019
30. Fair value information (Continued)(f) Amounts arising from Expected Credit Loss (ECL) (Continued)
31 December 2019
Stage 1 Stage 2 Stage 3 Total
ECL Exposure ECL Exposure ECL Exposure ECL Exposure
RO 000 RO 000 RO 000 RO 000 RO 000 RO 000 RO 000 RO 000
Accrued profit
Opening balance 5 1,238 17 531 248 248 270 2,017
Transfer between stages
- Transfer to Stage 1 - - - - - - - -
- Transfer to Stage 2 - - - - - - - -
- Transfer to Stage 3 - - (14) (14) 14 14 - -
- - (14) (14) 14 14 - -
Re-measurement of 4 1,039 37 798 128 128 169 1,965
outstanding
Financial asset originated - - - - - - - -
during the year
Financial asset matured - - - - - - - -
during the year
Closing balance 9 2,277 40 1,315 390 390 439 3,982
31 December 2018Stage 1 Stage 2 Stage 3 Total
ECL Exposure ECL Exposure ECL Exposure ECL Exposure
Balances with CBO
Opening balance - 79,374 - - - - - 79,374
Transfer between stages
- Transfer to Stage 1 - - - - - - - -
- Transfer to Stage 2 - - - - - - - -
- Transfer to Stage 3 - - - - - - - -
- - - - - - - -
Re-measurement of - (42,920) - - - - - (42,920)
outstanding
Financial asset originated - - - - - - - -
during the year
Financial asset matured - - - - - - - -
during the year
Closing balance - 36,454 - - - - - 36,454
Maisarah Islamic Banking Services – Window of BankDhofar

313Annual Report 2019
Notes to the financial statements For the year ended 31 December 2019
30. Fair value information (Continued)(f) Amounts arising from Expected Credit Loss (ECL) (Continued)
31 December 2018
Stage 1 Stage 2 Stage 3 Total
ECL Exposure ECL Exposure ECL Exposure ECL Exposure
RO 000 RO 000 RO 000 RO 000 RO 000 RO 000 RO 000 RO 000
BanksOpening balance 47 8,881 - - - - 47 8,881 Transfer between stages
- Transfer to Stage 1 - - - - - - - -- Transfer to Stage 2 - - - - - - - -- Transfer to Stage 3 - - - - - - - -
- - - - - - - -Re-measurement of - - - - - - - -outstanding
Financial asset originated 14 30,375 - - - - 14 30,375 during the year
Financial asset matured (47) (8,881) - - - - (47) (8,881)during the year
Closing balance 14 30,375 - - - - 14 30,375
Total financingOpening balance 2,051 345,144 2,010 40,708 451 1,929 4,512 387,781Transfer between stages
- Transfer to Stage 1 216 3,571 (216) (3,571) - - - -- Transfer to Stage 2 (485) (24,196) 485 24,196 - - - -- Transfer to Stage 3 - (76) - - - 76 - -
(269) (20,701) 269 20,625 - 76 - -Re-measurement of (932) (2,285) 170 (6,190) 205 (6) (557) (8,481)outstanding
Financial asset originated 187 67,869 531 11,282 2 5 720 79,156 during the year
Financial asset matured (201) (54,735) (74) (2,236) - - (275) (56,971)during the year
Closing balance 836 335,292 2,906 64,189 658 2,004 4,400 401,485
Corporate and SMEOpening balance 1,827 188,306 1,989 40,367 443 1,838 4,259 230,511 Transfer between stages
- Transfer to Stage 1 198 3,277 (198) (3,277) - - - - - Transfer to Stage 2 (483) (23,765) 483 23,765 - - - - - Transfer to Stage 3 - - - - - - - -
(285) (20,488) 285 20,488 - - - -
Re-measurement of (890) 597 103 (6,180) 134 (2) (653) (5,585)outstanding
Financial asset originated 153 49,055 527 11,261 - - 680 60,316 during the year
Financial asset matured (194) (50,946) (74) (2,236) - - (268) (53,182)during the year
Closing balance 611 166,524 2,830 63,700 577 1,836 4,018 232,060
Maisarah Islamic Banking Services – Window of BankDhofar

Annual Report 2019314
Notes to the financial statements For the year ended 31 December 2019
30. Fair value information (Continued)(f) Amounts arising from Expected Credit Loss (ECL) (Continued)
31 December 2018
Stage 1 Stage 2 Stage 3 Total
ECL Exposure ECL Exposure ECL Exposure ECL Exposure
RO 000 RO 000 RO 000 RO 000 RO 000 RO 000 RO 000 RO 000
RetailOpening balance 224 156,838 21 341 8 91 253 157,270 Transfer between stages
- Transfer to Stage 1 18 294 (18) (294) - - - - - Transfer to Stage 2 (2) (431) 2 431 - - - - - Transfer to Stage 3 - (76) - - - 76 - -
16 (213) (16) 137 - 76 - -Re-measurement of (42) (2,882) 67 (10) 71 (4) 96 (2,896)outstanding
Financial asset originated 34 18,814 4 21 2 5 40 18,840 during the year
Financial asset matured (7) (3,789) - - - - (7) (3,789)during the year
Closing balance 225 168,768 76 489 81 168 382 169,425
InvestmentsOpening balance - - - - - - - -Transfer between stages
- Transfer to Stage 1 - - - - - - - -- Transfer to Stage 2 - - - - - - - -- Transfer to Stage 3 - - - - - - - -
- - - - - - - -Re-measurement of - - - - - - - -outstanding
Financial asset originated 174 41,599 - - - - 174 41,599 during the year
Financial asset matured - - - - - - - -during the year
Closing balance 174 41,599 - - - - 174 41,599
Letter of credit / GuaranteesOpening balance 63 12,682 1 98 - - 64 12,780 Transfer between stages
- Transfer to Stage 1 - - - - - - - - - Transfer to Stage 2 (14) (5,758) 14 5,758 - - - - - Transfer to Stage 3 - - - - - - - -
(14) (5,758) 14 5,758 - - - - Re-measurement of (25) 3,229 50 2,452 - - 25 5,681 outstanding
Financial asset originated 22 2,903 3 616 - - 25 3,519 during the year
Financial asset matured (10) (5,374) - (35) - - (10) (5,409)during the year
Closing balance 36 7,682 68 8,889 - - 104 16,571
Maisarah Islamic Banking Services – Window of BankDhofar
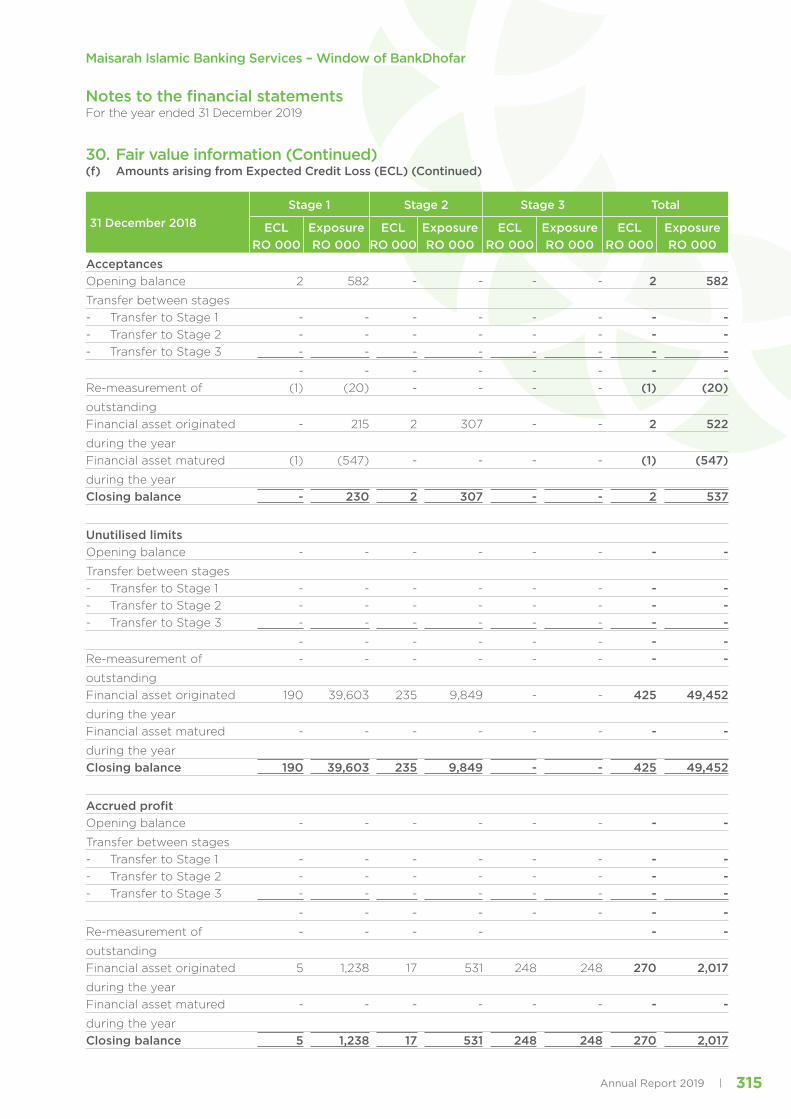
315Annual Report 2019
Notes to the financial statements For the year ended 31 December 2019
30. Fair value information (Continued)(f) Amounts arising from Expected Credit Loss (ECL) (Continued)
31 December 2018Stage 1 Stage 2 Stage 3 Total
ECL Exposure ECL Exposure ECL Exposure ECL ExposureRO 000 RO 000 RO 000 RO 000 RO 000 RO 000 RO 000 RO 000
AcceptancesOpening balance 2 582 - - - - 2 582 Transfer between stages- Transfer to Stage 1 - - - - - - - -- Transfer to Stage 2 - - - - - - - -- Transfer to Stage 3 - - - - - - - -
- - - - - - - -Re-measurement of (1) (20) - - - - (1) (20)outstandingFinancial asset originated - 215 2 307 - - 2 522 during the yearFinancial asset matured (1) (547) - - - - (1) (547)during the yearClosing balance - 230 2 307 - - 2 537
Unutilised limitsOpening balance - - - - - - - -Transfer between stages- Transfer to Stage 1 - - - - - - - -- Transfer to Stage 2 - - - - - - - -- Transfer to Stage 3 - - - - - - - -
- - - - - - - -Re-measurement of - - - - - - - -outstandingFinancial asset originated 190 39,603 235 9,849 - - 425 49,452 during the yearFinancial asset matured - - - - - - - -during the yearClosing balance 190 39,603 235 9,849 - - 425 49,452
Accrued profitOpening balance - - - - - - - -Transfer between stages- Transfer to Stage 1 - - - - - - - -- Transfer to Stage 2 - - - - - - - -- Transfer to Stage 3 - - - - - - - -
- - - - - - - -Re-measurement of - - - - - -outstandingFinancial asset originated 5 1,238 17 531 248 248 270 2,017during the yearFinancial asset matured - - - - - - - -during the yearClosing balance 5 1,238 17 531 248 248 270 2,017
Maisarah Islamic Banking Services – Window of BankDhofar

Annual Report 2019316
Notes to the financial statements For the year ended 31 December 2019
30. Fair value information (Continued)(g) Distribution of performing and non-performing financing by type of industry:
2019
Performing Murabaha and other
receivables
Performing Mudaraba Financing
Performing Diminishing Musharaka Financing
Performing Wakala
financing
Performing Ijarah
Muntahia Bittamleek
Non-performing
FinancingTotal
financing
Stage 1&2 ECL as of Year End
Stage 3 ECL as of Year End
RO 000 RO 000 RO 000 RO 000 RO 000 RO 000 RO 000 RO 000 RO 000Import trade 415 973 2,660 12,667 - - 16,715 (91) -Wholesale & retail trade 2,169 856 1,389 625 - 819 5,858 (32) (205)
Mining & quarrying - 648 1,146 2,864 - - 4,658 (10) -
Construction 2,672 7,648 140,187 11,525 - 1,835 163,867 (3,437) (610)Manufacturing 2,093 6,789 7,345 8,744 - - 24,971 (221) -Electricity,gas and water - - 1,823 - - - 1,823 (6) -
Transport & communication 84 - 124 - - - 208 (7) -
Financial institutions - 985 - - - - 985 (5) -
Services - 43 45,410 2,486 - - 47,939 (290) -Retail 12,215 - 116,815 - 45,707 224 174,961 (331) (111)Agriculture and allied activities - 954 - 1,029 - - 1,983 (2) -
Others - - 7,235 - 234 - 7,469 (72) -19,648 18,896 324,134 39,940 45,941 2,878 451,437 (4,504) (926)
2018
Performing
Murabaha and other
receivables
Performing Mudaraba Financing
Performing Diminishing Musharaka Financing
Performing Wakala
financing
Performing Ijarah
Muntahia Bittamleek
Non-performing
FinancingTotal
financing
Stage 1&2 ECL as of Year End
Stage 3 ECL as of Year End
RO 000 RO 000 RO 000 RO 000 RO 000 RO 000 RO 000 RO 000 RO 000
Import trade 5,579 780 1,283 9,509 - - 17,151 (80) -Wholesale & retail trade 2,242 775 3,039 31 - - 6,087 (64) -
Mining & quarrying - 2,840 861 418 - - 4,119 (9) -
Construction 2,924 10,743 107,580 5,934 240 1,836 129,257 (2,855) (577)Manufacturing 2,952 9,478 6,590 1,514 - - 20,534 (173) -Electricity,gas and water - - 513 - - - 513 (2) -
Transport & communication 106 - 221 - - - 327 (3) -
Financial institutions - 981 - - - - 981 (2) -
Services - 35 45,757 1,356 - - 47,148 (223) -Retail 10,791 - 112,789 - 45,677 168 169,425 (301) (81)Agriculture and allied activities - 953 - - - - 953 (1) -
Others - - 4,990 - - - 4,990 (29) -
24,594 26,585 283,623 18,762 45,917 2,004 401,485 (3,742) (658)
Maisarah Islamic Banking Services – Window of BankDhofar
317Annual Report 2019
Notes to the financial statements For the year ended 31 December 2019
30. Fair value information (Continued)(g) Distribution of performing and non-performing financing by type of industry: (Continued)
Liquidity risk
Liquidity risk is the potential inability to meet Maisarah’s liabilities as they become due, because of the difficulty in liquidating assets (market liquidity risk) or in obtaining adequate funding (funding liquidity risk). It arises when Maisarah is unable to generate cash to cope with a decline in deposits or increase in assets.
Maisarah’s liquidity risk management is governed by the treasury risk policy document approved by the Board of Directors as well as the provisions of relevant CBO guidelines on liquidity risk management. Maisarah monitors its liquidity risk through cash flow approach. Under cash flow approach Maisarah generates Maturity of Assets and Liabilities (MAL) report which captures all the maturing assets and liabilities into various pre-set time buckets ranging from one month to five years. The mismatches in various time buckets indicate liquidity gap and Maisarah strictly adheres to the CBO set limit of 15% of cumulative liabilities (outflows) on mismatches (liquidity gaps) in time buckets upto one year. In addition, Maisarah has also set up internal limit on mismatches in time buckets beyond one year.
Treasury department of Maisarah controls and monitors the liquidity risk and ensures that the window is not exposed to undue liquidity risk and at the same time makes optimum use of its funds. Middle office in Risk Management Division also monitors the liquidity position of Maisarah.
Maisarah Islamic Banking Services – Window of BankDhofar

Annual Report 2019318
Notes to the financial statements For the year ended 31 December 2019
30. Fair value information (Continued)(g) Distribution of performing and non-performing financing by type of industry: (Continued)
Maturity profile of assets (net of impairment allowance for ECL) and liabilities
2019
Due on demand
and up to 30 days
More than 1 month to6 months
More than 6 months to12 months
More than1 year to
5 yearsOver
5 years Total
RO 000 RO 000 RO 000 RO 000 RO 000 RO 000
Cash and balances with Central Bank of Oman 43,881 - - - - 43,881
Due from banks and financial institutions 24,745 - - - - 24,745
Murabaha and other receivables 4,090 2,623 2,931 8,021 1,893 19,558
Mudaraba financing 945 1,890 1,890 9,448 4,543 18,716Diminishing Musharaka financing 4,401 33,865 40,014 147,397 96,252 321,929
Investments at FVOCI - - 6,363 25,748 20,350 52,461Investment at amortised cost - - 10,000 - - 10,000Wakala financing 39,919 - - - - 39,919Ijarah Muntahia Bittamleek 454 1,836 2,196 17,049 24,348 45,883Property and equipment - - - - 1,147 1,147
Other asset 3,693 678 37 - 2,285 6,693
Total assets – funded 122,128 40,892 63,431 207,663 150,818 584,932
Total assets – non funded (Forwards) 38,500 - - - - 38,500
Total assets – funded and non funded 160,628 40,892 63,431 207,663 150,818 623,432
Future profit cash inflows 1,893 13,933 14,814 60,035 35,526 126,201
Current accounts 25,810 37,926 21,672 - 27,090 112,498Due to banks 26,550 42,350 - - - 68,900Qard Hasan from Head Office 1,181 - - 25,000 - 26,181Customer Wakala Deposit 33,537 58,052 33,051 108,786 19,978 253,404Other liabilities 8,951 678 37 - 269 9,935Equity of unrestricted investment accountholders 1,966 3,932 3,932 19,659 9,850 39,339
Owner’s equity - - - - 74,675 74,679
Total liabilities and accountholders & owners’ equity 97,995 142,938 58,692 153,445 131,862 584,932
Total liabilities non funded(Forwards) 38,511 - - - - 38,511
Total liabilities funded and non funded; and accountholders & owners’ equity
136,506 142,938 58,692 153,445 131,862 623,443
Future profit cash outflows 2,458 5,621 4,015 8,113 - 20,207
Gap 24,122 (102,046) 4,739 54,218 18,956 (11)
Cumulative gap 24,122 (77,924) (73,185) (18,967) (11) -
Maisarah Islamic Banking Services – Window of BankDhofar

319Annual Report 2019
Notes to the financial statements For the year ended 31 December 2019
30. Fair value information (Continued)(g) Distribution of performing and non-performing financing by type of industry: (Continued)
2018
Due on demand
and up to 30 days
More than 1 month to6 months
More than 6 months to12 months
More than1 year to 5 years
Over5 years Total
RO 000 RO 000 RO 000 RO 000 RO 000 RO 000Cash and balances with Central Bank of Oman 38,810 - - - - 38,810
Due from banks and financial institutions 30,361 - - - - 30,361
Murabaha and other receivables 12,086 1,773 2,009 6,990 1,655 24,513
Mudaraba financing 1,329 2,658 2,658 13,293 6,363 26,301Diminishing Musharaka financing 4,354 27,713 31,805 129,405 88,372 281,649
Investments at fair value through equity - - - 16,277 15,148 31,425
Investment at amortised cost - - - 10,000 - 10,000Wakala financing 18,733 - - - - 18,733Ijarah Muntahia Bittamleek 518 1,782 2,143 16,620 24,825 45,888Property and equipment - - - - 1,309 1,309Other asset 1,834 403 47 - 1,154 3,438
Total assets 108,025 34,329 38,662 192,585 138,826 512,427
Total assets – non funded (Forwards) 19,250 - 19,385 - - 38,635
Total assets – funded and non funded 127,275 34,329 58,047 192,585 138,826 551,062
Current accounts 12,833 18,902 10,801 - 13,504 56,040Due to banks 56,425 - - - - 56,425Qard Hasan from Head Office 1,150 - - 25,000 - 26,150
Customer Wakala Deposit 38,794 65,039 45,331 66,194 47,961 263,319Other liabilities 8,404 403 47 - 531 9,385Equity of unrestricted investment accountholders 1,701 3,403 3,403 17,013 8,520 34,040
Owner’s equity - - - - 67,068 67,068Total liabilities and accountholders & owners’ equity
119,307 87,747 59,582 108,207 137,584 512,427
Total liabilities non funded(Forwards) 19,255 - 19,250 - - 38,505
Total liabilities funded and non funded; and accountholders & owners’ equity
138,562 87,747 78,832 108,207 137,584 550,932
Gap (11,287) (53,418) (20,785) 84,378 1,242 130
Cumulative gap (11,287) (64,705) (85,490) (1,112) 130 -
Maisarah Islamic Banking Services – Window of BankDhofar
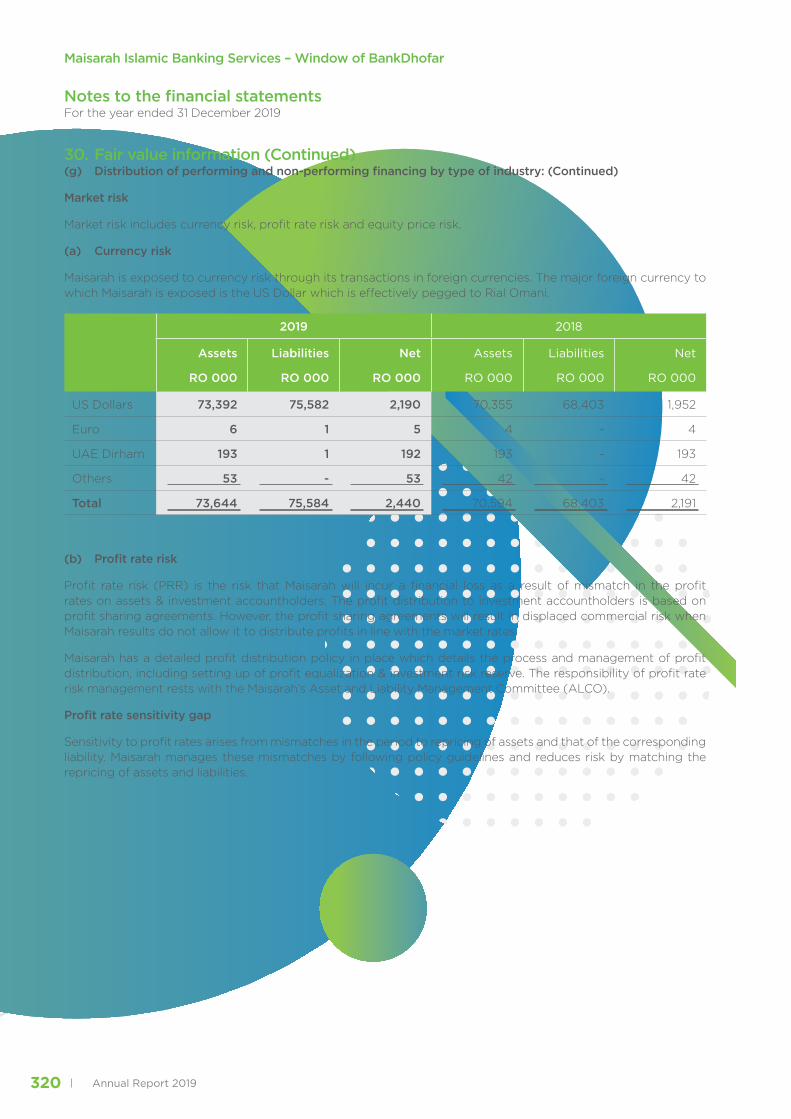
Annual Report 2019320
Notes to the financial statements For the year ended 31 December 2019
30. Fair value information (Continued)(g) Distribution of performing and non-performing financing by type of industry: (Continued)
Market risk
Market risk includes currency risk, profit rate risk and equity price risk.
(a) Currency risk
Maisarah is exposed to currency risk through its transactions in foreign currencies. The major foreign currency to which Maisarah is exposed is the US Dollar which is effectively pegged to Rial Omani.
2019 2018
Assets Liabilities Net Assets Liabilities Net
RO 000 RO 000 RO 000 RO 000 RO 000 RO 000
US Dollars 73,392 75,582 2,190 70,355 68,403 1,952
Euro 6 1 5 4 - 4
UAE Dirham 193 1 192 193 - 193
Others 53 - 53 42 - 42
Total 73,644 75,584 2,440 70,594 68,403 2,191
(b) Profit rate risk
Profit rate risk (PRR) is the risk that Maisarah will incur a financial loss as a result of mismatch in the profit rates on assets & investment accountholders. The profit distribution to investment accountholders is based on profit sharing agreements. However, the profit sharing agreements will result in displaced commercial risk when Maisarah results do not allow it to distribute profits in line with the market rates.
Maisarah has a detailed profit distribution policy in place which details the process and management of profit distribution, including setting up of profit equalization & investment risk reserve. The responsibility of profit rate risk management rests with the Maisarah’s Asset and Liability Management Committee (ALCO).
Profit rate sensitivity gap
Sensitivity to profit rates arises from mismatches in the period to repricing of assets and that of the corresponding liability. Maisarah manages these mismatches by following policy guidelines and reduces risk by matching the repricing of assets and liabilities.
Maisarah Islamic Banking Services – Window of BankDhofar

321Annual Report 2019
Notes to the financial statements For the year ended 31 December 2019
30. Fair value information (Continued)(g) Distribution of performing and non-performing financing by type of industry: (Continued)
Market risk (Continued)(b) Profit rate risk (Continued)
2019
Effective average
profit rates
Due on demand
and within
30 days
Due within 1 to 6
months
Due within 7 to 12
months
Due within 1 to 5 years
Due after 5
years
Non-profit
bearing Total
% RO 000 RO 000 RO 000 RO 000 RO 000 RO 000 RO 000
Cash and balances with Central Bank of Oman - - - - - - 43,881 43,881
Due from banks and financial institutions 2.85% 23,098 - - - - 1,647 24,745
Murabaha and other receivables 5.84% 3,494 2,623 2,931 8,021 1,893 596 19,558
Mudaraba financing 5.96% 18,716 - - - - - 18,716Diminishing Musharaka Financing 5.71% 4 ,401 33,865 40,014 147,397 96,252 - 321,929
Investments at FVOCI 5.28% - - 6,363 25,748 20,350 - 52,461Investment at amortised cost 3.50% - - 10,000 - - - 10,000
Wakala financing 5.62% 39,919 - - - - - 39,919Ijara Muntahia Bittamleek 5.30% 454 1,836 2,196 17,049 24,348 - 45,883Property and equipment - - - - - - 1,147 1,147
Other asset - - - - - - 6,693 6,693
Total assets 90,082 38,324 61,504 198,215 142,843 53,964 584,932
Current accounts 4.30% 18,263 31,960 9,132 9,132 22,829 21,182 112,498Due to banks 2.75% 26,550 42,350 - - - - 68,900Qard Hasan from Head office - - - - - 26,181 26,181
Customer Wakala deposit 4.30% 33,537 58,052 33,051 108,786 19,978 - 253,404Other liabilities - - - - - 9,935 9,935Equity of unrestricted investment accountholders
2.43% 39,319 - - - - 20 39,339
Owner’s equity - - - - - - 74,675 74,675
Equity of accountholders & Total liabilities and shareholders’ equity
117,669 132,362 42,183 117,918 42,807 131,993 584,932
On-balance sheet gap (27,587) (94,038) 19,321 80,297 100,036 (78,029) -
Cumulative profit sensitivity gap (27,587) (121,625) (102,304) (22,007) 78,029 - -
Maisarah Islamic Banking Services – Window of BankDhofar

Annual Report 2019322
Notes to the financial statements For the year ended 31 December 2019
2018
Effective average
profit rates
Due on demand
and within 30
days
Due within 1 to 6
months
Due within 7 to 12
months
Due within 1 to 5 years
Due after 5 years
Non-profit
bearing Total
% RO 000 RO 000 RO 000 RO 000 RO 000 RO 000 RO 000
Cash and balances with Central Bank of Oman - - - - - - 38,810 38,810
Due from banks and financial institutions 1.86% 27,322 - - - - 3,039 30,361
Murabaha and other receivables 5.75% 11,644 1,773 2,009 6,990 1,655 442 24,513
Mudaraba financing 6.27% 26,301 - - - - - 26,301Diminishing Musharaka Financing 5.59% 4,354 27,713 31,805 129,405 88,372 - 281,649
Investments at fair value through equity 5.10% - - - 16,277 15,148 - 31,425
Investment at amortised cost 3.50% - - - 10,000 - - 10,000
Wakala financing 5.49% 18,733 - - - - - 18,733Ijara Muntahia Bittamleek 5.28% 518 1,782 2,143 16,620 24,825 - 45,888Property and equipment - - - - - - 1,309 1,309
Other asset - - - - - - 3,438 3,438
Total assets - 88,872 31,268 35,957 179,292 130,000 47,038 512,427
Current accounts 2.47% 5,464 9,562 12,294 - - 28,720 56,040
Due to banks 2.20% 56,425 - - - - - 56,425Qard Hasan from Head office - - - - - - 26,150 26,150
Customer Wakala deposit 3.91% 38,794 65,039 45,331 66,194 47,961 - 263,319Other liabilities - - - - - - 9,385 9,385Equity of unrestricted investment accountholders
0.63% 34,026 - - - - 14 34,040
Owner’s equity - - - - - - 67,068 67,068
Equity of accountholders & Total liabilities and shareholders’ equity
134,709 74,601 57,625 66,194 47,961 131,337 512,427
On-balance sheet gap (45,837) (43,333) (21,668) 113,098 82,039 (84,299) -
Cumulative profit sensitivity gap (45,837) (89,170) (110,838) 2,260 84,299 - -
(c) Equity risk
Presently Maisarah is not exposed to any equity price risk as window does not have any investment in equity instruments.
Operational risk
Maisarah has adopted the Basic Indicator Approach under Basel II for the purpose of measuring capital charge for Operational Risk. The approach requires Maisarah to provide 15% of the average three years gross annual income as capital charge for operational risk.
Maisarah Islamic Banking Services – Window of BankDhofar

323Annual Report 2019
Notes to the financial statements For the year ended 31 December 2019
32. Capital management
CBO sets and monitors capital requirements for the Bank as whole as well as individually for Islamic window. A minimum of 11% ratio of total capital to total risk-weighted assets ratio is required to be maintained by Maisarah. The regulatory capital of Islamic window is analysed into the following tiers:
· Tier I capital, which includes share capital allocated from the Head office; deduction of unrealized loss on investment at fair value through other comprehensive income; and retained earnings; and
· Tier II capital, which includes the impairment provision and PER / IRR.
2019 RO 000
2018 RO 000
Types of capitalTier I capital 74,587 67,068
Tier II capital 3,521 3,761
Total Regulatory Capital 78,108 70,829
Risk weighted assets (RWA)
Credit risk weighted assets 447,345 418,114
Market risk weighted assets 18,625 4,438
Operational risk weighted assets 50,340 41,043
Total risk weighted assets 516,310 463,595
Capital ratios
Tier I capital ratio (%) 14.45% 14.47%
Total capital as a % of RWA 15.13% 15.28%
33. Segmental information
Maisarah is organised into three main business segments:
(1) Retail banking – incorporating private customer current accounts, savings account, term deposits, Murabaha, diminishing musharaka financing and ijarah muntahia bittamleek;
(2) Corporate banking – incorporating current accounts, savings account, term deposits, Murabaha, Mudaraba and diminishing musharaka financing; and
(3) Treasury & investments
Segment assets and liabilities comprise operating assets and liabilities, being the majority of the statement of financial position.
Maisarah Islamic Banking Services – Window of BankDhofar

Annual Report 2019324
Notes to the financial statements For the year ended 31 December 2019
33. Segmental information (Continued)
2019
Retail banking
Corporate banking
Treasury and investments Total
RO 000 RO 000 RO 000 RO 000
Segment operating revenues 9,073 14,778 2,389 26,240
Other revenues 223 1,465 693 2,381
Total segment operating revenues 9,296 16,243 3,082 28,621
Profit expenses (1,777) (10,566) (1,479) (13,822)
Net operating income 7,519 5,677 1,603 14,799
Segment costOperating expenses including depreciation (3,676) (2,446) (970) (7,092)
Provision for impairment (58) (737) 61 (734)
Bad Debts Written (3) - - (3)
Net profit for the year before tax 3,782 2,494 694 6,970
Segment assets 175,778 282,474 132,286 590,538
Less: Provision for impairment (442) (5,037) (127) (5,606)
Total segment assets 175,336 277,437 132,159 584,932
Segment liabilities 25,502 349,808 95,608 470,918
2018
Retail banking
Corporate banking
Treasury and
investmentsTotal
RO 000 RO 000 RO 000 RO 000
Segment operating revenues 8,531 12,724 2,243 23,498
Other revenues 234 786 658 1,678
Total segment operating revenues 8,765 13,510 2,901 25,176
Profit expenses (1,047) (10,381) (619) (12,047)
Net operating income 7,718 3,129 2,282 13,129
Segment cost Operating expenses including depreciation (2,633) (3,114) (927) (6,674)
Provision for impairment (133) (242) (141) (516)
Net profit for the year before tax 4,952 (227) 1,214 5,939
Segment assets 170,063 235,315 111,659 517,037
Less: Provision for impairment (382) (4,040) (188) (4,610)
Total segment assets 169,681 231,275 111,471 512,427
Segment liabilities 28,432 300,004 82,883 411,319
Maisarah Islamic Banking Services – Window of BankDhofar
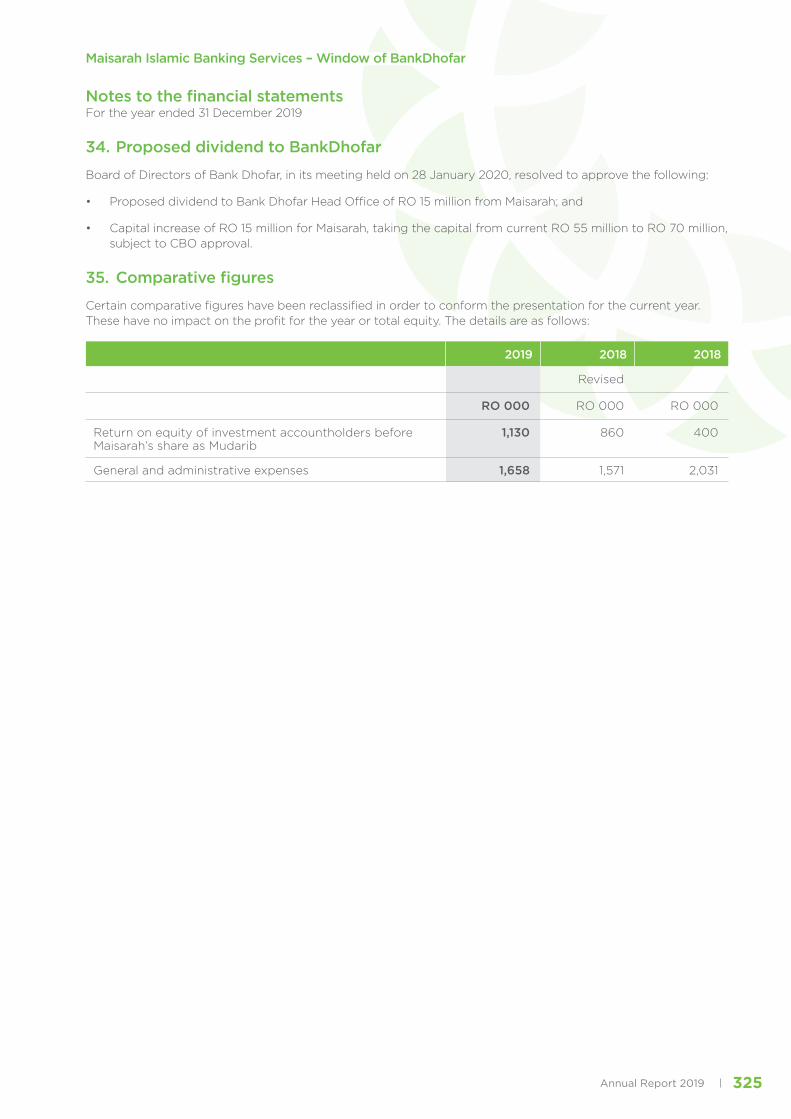
325Annual Report 2019
Notes to the financial statements For the year ended 31 December 2019
34. Proposed dividend to BankDhofar
Board of Directors of Bank Dhofar, in its meeting held on 28 January 2020, resolved to approve the following:
• Proposed dividend to Bank Dhofar Head Office of RO 15 million from Maisarah; and
• Capital increase of RO 15 million for Maisarah, taking the capital from current RO 55 million to RO 70 million, subject to CBO approval.
35. Comparative figures
Certain comparative figures have been reclassified in order to conform the presentation for the current year. These have no impact on the profit for the year or total equity. The details are as follows:
2019 2018 2018
Revised
RO 000 RO 000 RO 000
Return on equity of investment accountholders before Maisarah’s share as Mudarib
1,130 860 400
General and administrative expenses 1,658 1,571 2,031
Maisarah Islamic Banking Services – Window of BankDhofar


Annual Report 2019328
P.O.Box 1507P.C 112, Ruwi Sultanate of Oman