Suffolk Rail Impact Study - Hampton Roads Transportation ...
56
Suffolk Rail Impact Study MAY 2007 T07-03
-
Upload
khangminh22 -
Category
Documents
-
view
2 -
download
0
Transcript of Suffolk Rail Impact Study - Hampton Roads Transportation ...

Suffolk RailImpact Study
MAY 2007 T07-03

HAMPTON ROADS PLANNING DISTRICT COMMISSION CHESAPEAKE NEWPORT NEWS SUFFOLK REBECCA C. W. ADAMS CHARLES C. ALLEN LINDA T. JOHNSON AMAR DWARKANATH * JOE S. FRANK * JAMES G. VACALIS * CLIFTON E. HAYES, JR. RANDY W. HILDEBRANDT
ANNE F. ODELL ELLA P. WARD NORFOLK SURRY
ANTHONY L. BURFOOT * TYRONE W. FRANKLIN FRANKLIN * PAUL D. FRAIM JUDY S. LYTTLE
JOSEPH J. SCISLOWICZ DR. THERESA W. WHIBLEY * ROWLAND L. TAYLOR REGINA V.K. WILLIAMS VIRGINIA BEACH BARCLAY C. WINN HARRY E. DIEZEL GLOUCESTER COUNTY ROBERT M. DYER
JOHN J. ADAMS, SR. POQUOSON BARBARA M. HENLEY * WILLIAM H. WHITLEY * CHARLES W. BURGESS, JR. * LOUIS R. JONES GORDON C. HELSEL, JR. MEYERA E. OBERNDORF HAMPTON JAMES K. SPORE * RANDALL A. GILLILAND PORTSMOUTH JOHN E. UHRIN ROSS A. KEARNEY, II JAMES B. OLIVER, JR. JESSE T. WALLACE, JR. * DOUGLAS L. SMITH WILLIAMSBURG * JACKSON C. TUTTLE, II ISLE OF WIGHT COUNTY SOUTHAMPTON JEANNE ZEIDLER
W. DOUGLAS CASKEY ANITA T. FELTS * STAN D. CLARK * MICHAEL W. JOHNSON YORK COUNTY
* JAMES O. McREYNOLDS JAMES CITY COUNTY THOMAS G. SHEPPERD, JR. * BRUCE C. GOODSON SANFORD B. WANNER
*EXECUTIVE COMMITTEE MEMBER
PROJECT STAFF
ARTHUR L. COLLINS EXECUTIVE DIRECTOR/SECRETARY
DWIGHT L. FARMER DEPUTY EXECUTIVE DIRECTOR, TRANSPORTATION CAMELIA RAVANBAKHT PRINCIPAL TRANSPORTATION ENGINEER NICOLE C. FOX TRANSPORTATION ENGINEER
ROBERT C. JACOBS DIRECTOR OF GRAPHIC & PRINTING SERVICES MICHAEL R. LONG GRAPHIC ARTIST/ILLUSTRATOR TECHNICIAN II BRIAN MILLER GRAPHIC TECHNICIAN II RACHAEL V. PATCHETT REPROGRAPHIC SUPERVISOR

SUFFOLK RAIL IMPACT STUDY
This report was included in the Work Program for Fiscal Year 2006-2007, which was approved by the
Commission and the Metropolitan Planning Organization at their meetings of March 15, 2006.
PREPARED BY:
MAY 2007 T07-03

REPORT DOCUMENTATION
TITLE: Suffolk Rail Impact Study AUTHORS: Nicole C. Fox, P.E. Camelia Ravanbakht, Ph.D. ABSTRACT The City of Suffolk requested that a rail impact study be undertaken to assess the effect of increased rail traffic due to the construction of the new Maersk/APM Terminal and Craney Island Terminal port facilities in Portsmouth, the Commonwealth Railway Mainline Safety Relocation Project (Median Rail Project), and Norfolk Southern’s upgraded Heartland Corridor. Commonwealth Railway, Norfolk Southern, and CSX each run through Suffolk and will experience increases in train volumes from these developments. This study analyzes the impacts to thirty-one (31) at-grade highway-rail crossings in Suffok that will experience an increase in rail traffic due to the new port facilities. Performance measures are used to evaluate the effects of this traffic on the impact areas of mobility and safety. Based on analysis using these performance measures, the crossings are ranked and improvement priority crossings are identified for both impact areas. Each priority crossing is assessed and improvement options are identified.
REPORT DATE: May 2007 GRANT/SPONSORING AGENCY: FHWA/VDOT/LOCAL FUNDS ORGANIZATION NAME, ADDRESS, & TELEPHONE Hampton Roads Planning District Commission 723 Woodlake Drive Chesapeake, Virginia 23320 757.420.8300 http://www.hrpdcva.gov ACKNOWLEDGMENTS This report was prepared by the Hampton Roads Planning District Commission (HRPDC) in cooperation with the City of Suffolk, the Virginia Department of Transportation (VDOT), and the Federal Highway Administration (FHWA). The contents of this report reflect the views of the staff of the Hampton Roads Area Metropolitan Planning Organization (MPO). The MPO staff is responsible for the facts and the accuracy of the data presented herein. The contents do not necessarily reflect the official views or policies of the FHWA, VDOT, or HRPDC. This report does not constitute a standard, specification, or regulation. FHWA or VDOT acceptance of this report as evidence of fulfillment of the objectives of this planning study does not constitute endorsement/approval of the need for any recommended improvements nor does it constitute approval of their location and design or a commitment to fund any such improvements. Additional project level environmental impact assessments and/or studies of alternatives may be necessary.

ii Suffolk Rail Impact Study
Table of Contents Report Documentation...................................................................................................................................................i List of Figures................................................................................................................................................................................iii List of Tables....................................................................................................................................................................................iii List of Maps......................................................................................................................................................................................... iv Introduction .................................................................................................................................................................................. 1 Analysis ....................................................................................................................................................................................................13 Composite Rankings...........................................................................................................................................................30 Conclusions ..................................................................................................................................................................................32 Summary...............................................................................................................................................................................................48

iii Suffolk Rail Impact Study
List of Figures Figure 1: Exposure Index Rankings..................................................................................................................16 Figure 2: Daily Minutes Crossing Blocked Rankings.........................................................19 Figure 3: Minutes of Vehicle Delay Rankings..................................................................................21 Figure 4: Hazard Index Rankings.................................................................................................................. 25 Figure 5: Emergency Services Rankings................................................................................................ 27 Figure 6: Four-Quadrant Gates – Acute Angle..........................................................................35 Figure 7: Four-Quadrant Gates – Obtuse Angle........................................................................38 List of Tables Table 1: Rail Crossing Inventory .......................................................................................................................10 Table 2: Historical Average Weekday Traffic Volumes................................................... 11 Table 3: Projected Average Weekday Traffic Volumes ...................................................13 Table 4: Performance Measures ..........................................................................................................................14 Table 5: Exposure Index ....................................................................................................................................................15 Table 6: Minutes Crossing Blocked Per Train...............................................................................17 Table 7: Daily Minutes Crossing Blocked.............................................................................................18 Table 8: Daily Minutes of Vehicle Delay..................................................................................................20 Table 9: Economic Development Rank.................................................................................................... 22 Table 10: Accident History ......................................................................................................................................... 23

iv Suffolk Rail Impact Study
Table 11: Hazard Index ...................................................................................................................................................... 24 Table 12: Emergency Services Score .............................................................................................................26 Table 13: Daily Minutes Crossing Blocked – Future Projections.....................28 Table 14: Daily Minutes Vehicle Delay – Future Projections.....................................29 Table 15: Composite Mobility Rankings.....................................................................................................30 Table 16: Composite Safety Rankings .............................................................................................................31 Table 17: Summary Table ..................................................................................................................................................48 List of Maps Map 1: Existing & Proposed Southside Port Connections ............................................. 2 Map 2: Study-wide Highway-Rail Crossings.......................................................................................... 3 Map 3: Western Highway-Rail Crossings.................................................................................................. 4 Map 4: Downtown Highway-Rail Crossings....................................................................................... 5 Map 5: Eastern Highway-Rail Crossings....................................................................................................6 Map 6: Marshalling Yard Location................................................................................................................ 7 Map 7: Fairgrounds Redevelopment Project Location...................................................9 Map 8: Mobility & Safety Priorities..................................................................................................................33 Map 9: E Washington Street Crossing......................................................................................................34 Map 10: Finney Avenue Flyover Location...............................................................................................36 Map 11: Liberty Street Crossing (No. 14) ......................................................................................................36 Map 12: S Saratoga Street Crossing .............................................................................................................37

v Suffolk Rail Impact Study
Map 13: Nansemond Parkway 1 Crossing...............................................................................................38 Map 14: Nansemond Parkway Bypass Location.............................................................................39 Map 15: S Main Street Crossing..............................................................................................................................40 Map 16: Wellons Street Crossing........................................................................................................................41 Map 17: N Main Street Crossing............................................................................................................................ 42 Map 18: Shoulders Hill Road Crossing.................................................................................................... 43 Map 19: Nansemond Parkway 2 (Wilroy) Crossing ................................................................ 44 Map 20: Commerce Street Crossing............................................................................................................. 45 Map 21: Liberty Street/Moore Avenue Crossing (No. 40) ..................................................46 Map 22: Sportsman Boulevard Crossing..............................................................................................46

1 Suffolk Rail Impact Study
Introduction
Introduction The City of Suffolk requested that a rail impact study be undertaken to assess the effect of increased rail traffic due to the construction of the new Maersk/APM Terminals and Craney Island port facilities in Portsmouth, the Commonwealth Railway Mainline Safety Relocation Project (Median Rail Project), and Norfolk Southern’s upgraded Heartland Corridor. These projects will benefit the Hampton Roads region by providing new economic opportunities and reducing the percentage of containerized freight shipped by truck on the region’s increasingly congested roadways. Currently, Commonwealth Railway, Norfolk Southern, and CSX each run through Suffolk and will experience increases in train volumes from these developments. These tracks cross many major roadways in Suffolk, including those providing access to commercial business, residences, and industry in downtown Suffolk. Significant increases in the number of trains in addition to increases in roadway congestion may affect the safety and mobility of motorists as well as the ability of the City’s emergency services to provide adequate response times. Additionally, this study will consider options to mitigate any adverse impacts to the safety and mobility of the community. These options may include improving safety protection equipment at crossings, a rail monitoring system, grade separation, or new roadway connections. Purpose of study The goal of the Suffolk Rail Impact Study is to analyze the effects of increasing rail traffic through Suffolk on the mobility and safety of its citizens and to consider and provide the City with options to reduce any impacts. Study area This study includes analysis of forty (40) highway‐rail crossings along three railroad lines in the City of Suffolk. These crossings are located along
Train crossing E Washington Street
Old Myrtle Road

2 Suffolk Rail Impact Study
Introduction
Commonwealth Railway, CSX, and Norfolk Southern lines. The additional traffic from the new port facilities will enter Suffolk on Commonwealth Railway from Chesapeake near the I‐664/Pughsville Road interchange. This location will not change with the completion of the Median Rail project, as it will tie into the existing alignment just east of the Suffolk city line. The rail traffic from the APM Terminal and Craney Island Terminal entering Suffolk on Commonwealth Railway will switch to either CSX or Norfolk Southern mainline tracks just east of downtown. From there, trains will travel west through the city and further on to their ultimate destinations. Only those crossings that will experience increased rail traffic from the new port facilities have been examined in this study. These include every Commonwealth Railway crossing and those crossings of CSX and Norfolk Southern west of their connections to Commonwealth Railway. Norfolk Southern and CSX each have connections to other existing port facilities to the east that are anticipated to generate relatively stable volumes of rail traffic. Commonwealth Railway enters Suffolk from the east in a primarily agricultural, sparsely developed area that will likely experience significant growth in the future as the rapid development in the northern part of the city spreads south. There are already several residential neighborhoods and industry sites near this rail line.
The trains will switch to CSX and Norfolk Southern lines just east of downtown. Both lines travel through the densely settled downtown area, crossing through residential, business, and mixed‐use areas. Beyond downtown, the trains will travel through the rural western section of the city before crossing into Isle of Wight County.
CITNIT
PMT
APM LPCT
0 2 4 6 81Miles
®
Map 1: Existing and Proposed Southside Port Connections
LegendCommonwealth Rail
Norfolk Southern
Median Rail/CI Railway (proposed)
CSX
Other Rail
Roadways
Existing Port
Proposed Port
Isle of Wight
Suffolk
Chesapeake
Norfolk
Portsmouth

3 Suffolk Rail Impact Study
Introduction
ÏÎÏÎ
ÏÎÏÎ
ÏÎ
ÏÎ
ÏÎÏÎÏÎ ÏÎÏÎÏÎÏÎÏÎÏÎÏÎÏÎÏÎÏÎÏÎÏÎÏÎÏÎ
ÏÎÏÎ
ÏÎÏÎ
ÏÎÏÎ
ÏÎÏÎÏÎ ÏÎÏÎÏÎÏÎÏÎÏÎÏÎÏÎ
3031 32
33
343635 37383940
7
65
4
3
2
1
98
29
28
2726
2524
22
23
21
2019
1817
161514
131211
0 1 2 3 40.5Miles
®
Legend
ÏÎ RR Crossings
Commonwealth Rail
CSX
Norfolk Southern
Roadways
Other Rail
Map 2: Study-Wide Highway-Rail Crossings
Crossing No. Street Name Crossing No. Street Name Crossing No. Street Name
1 Old Mill Road 15 N 5th Street/Saul Street 30 Kingsale Rd2 Old Myrtle Road 16 Portsmouth Boulevard 31 Indian Trail3 Kings Fork Road 17 Saunders Drive 32 Buckhorn Dr4 Lake Meade Drive 18 Suburban Drive 33 Kenyon Rd5 Indian Trail 19 Prospect Road 34 Lake Cohoon Rd6 Suffolk Northern Bypass 2 (Holland) 20 Olde Mill Creek Road 35 W Constance Rd7 Holland Road 21 Suffolk Northern Bypass 1 (Wilroy) 36 N Broad Street8 Wellons Street 22 QVC Entrance 37 Pine Street9 S Saratoga Street 23 Progress Road 38 N Main Street10 Main Street Bypass 24 Rodney Lane 39 Pinner Street11 S Main Street 25 Nansemond Parkway 2 (Wilroy) 40 Liberty Street/Moore Ave12 Commerce Street 26 Sportsman Boulevard13 E Washington Street 27 Day Farm Lane14 Liberty Street 28 Nansemond Parkway 1
29 Shoulders Hill Road

4 Suffolk Rail Impact Study
Introduction
ÏÎ
ÏÎ
ÏÎ
ÏÎ
ÏÎÏÎÏÎÏÎÏÎ
ÏÎÏÎÏÎ
DEER PATH RD
US 58
30 3132
3334
76
5
4
3
2
1
BUC
KHO
RN
DR
INDIA
N TR
JOSHUA LN
KINGS FORK RD
OLD
MILL R
D
LAKE
KIL
BY R
D
ASH
BU
RN
RD
LAKE COHOON RD
HOLLAND RD
KIN
GS
ALE
RD
PITCHKETTLE RD
KEN
YON
RD
PRUDEN BLVD
INDIAN TR
INDIAN TR
LAKE MEAD
E DR
LITTLE CREEK RD
KIN
GS
FO
RK
RD
OLD M
YRTLE R
D
TURLINGTON RD
0 1 2 3 40.5Miles
®
Legend
ÏÎ RR Crossings
CSX
Norfolk Southern
Roadways
Other Rail
Map 3: Western Highway-Rail Crossings
Crossing No. Street Name1 Old Mill Road2 Old Myrtle Road3 Kings Fork Road4 Lake Meade Drive5 Indian Trail6 Suffolk Northern Bypass 2 (Holland)7 Holland Road30 Kingsale Rd31 Indian Trail32 Buckhorn Dr33 Kenyon Rd34 Lake Cohoon Rd

5 Suffolk Rail Impact Study
Introduction
ÏÎÏÎ ÏÎÏÎ ÏÎ ÏÎ ÏÎ
ÏÎ
ÏÎ
ÏÎ
ÏÎ ÏÎÏÎ ÏÎ ÏÎÏÎ35
36
37 3839
40
98
17
16
15
14
13121110
KILBY AV
VERMONT AV
PIN
NER
ST
N 5TH
ST
BATTERY AV
PIN
E ST
PITCHKETTLE RD
CAR
OLI
NA
RD
RIV
ER
VIE
W D
R E
FAC
TOR
Y S
T
W
HIT E MARSH RD
CED
AR S
T
CONSTANCE RD W
N D
IVISION
ST
N B
RO
AD
ST
MARYLAND AV
2ND
ST
1ST
ST
S M
AIN
ST
SMITH ST
WIL
ROY RD
MADISON AVN
MA
IN S
T
LIN
DE
N A
V WILSON ST
E WASHINGTON ST
HIL
L ST
FINNEY AV
HIGHLAND AV
E PI
NNER
ST
WE
LLO
NS
ST
BEEC
H S
T
E PIN
NER ST
N M
AIN
ST
SMITH ST
FAC
TOR
Y ST
S SARATO
GA ST
0 0.25 0.5 0.75 10.125Miles
®
Legend
ÏÎ RR Crossings
Commonwealth Rail
CSX
Norfolk Southern
Roadways
Other Rail
Map 4: Downtown Highway-Rail Crossings
Crossing No. Street Name Crossing No. Street Name
8 Wellons Street 35 W Constance Rd9 S Saratoga Street 36 N Broad Street10 Main Street Bypass 37 Pine Street11 S Main Street 38 N Main Street12 Commerce Street 39 Pinner Street13 E Washington Street 40 Liberty Street/Moore Ave14 Liberty Street15 N 5th Street/Saul Street16 Portsmouth Boulevard17 Saunders Drive

6 Suffolk Rail Impact Study
Introduction
ÏÎ
ÏÎ
ÏÎÏÎ
ÏÎÏÎ
ÏÎ
ÏÎ
ÏÎ
ÏÎ
ÏÎ
ÏÎ29
28
27
26
25
24
22
23
21
20
19
18
WIL
ROY
RD
KINGS HWY
DAY FAR
M LN
BOB WHITE LN
LO
NG POINT LNN
ANS
EM
ON
D P
KW
Y
LITTLE JOHN RD
DR
IVER LN
UPTON LN
BARON BLVD
0 0.75 1.5 2.25 30.375Miles
®
Legend
ÏÎ RR Crossings
Commonwealth Rail
Roadways
Other Rail
Map 5: Eastern Highway-Rail CrossingsCrossing No. Street Name
18 Suburban Drive19 Prospect Road20 Olde Mill Creek Road21 Suffolk Northern Bypass 1 (Wilroy)22 QVC Entrance23 Progress Road24 Rodney Lane25 Nansemond Parkway 2 (Wilroy)26 Sportsman Boulevard27 Day Farm Lane28 Nansemond Parkway 129 Shoulders Hill Road

7 Suffolk Rail Impact Study
Introduction
Background Commonwealth Railway Currently Commonwealth Railway operates approximately one to two 300‐foot long trains per day. These trains primarily serve the BASF plant on the Elizabeth River in Portsmouth, which will be closing in 2008. This will leave negligible baseline traffic on Commonwealth’s tracks for the study years of 2010 and 20171.
Commonwealth Railway’s tracks are currently rated for train speeds up to 10 mph only. The tracks are currently being upgraded in anticipation of the increased traffic due to the new port facilities. Following these upgrades, trains will be able to safely travel at 20 mph2. In addition, a marshalling yard has been constructed along Commonwealth Railway parallel to Nansemond Parkway north of Wilroy Road. This marshalling yard will be used to assemble short trains (3,500 feet long) coming from the APM facility 1 Gregory Richards, “Big changes ahead on Commonwealth Railway’s short line,” The Virginian-Pilot, September 10, 2006 2 William Jasper (Commonwealth Railway), personal communication, September 11, 2006
into longer trains (up to 7,500 feet long) for long distance travel westward. The shorter trains will be used to reduce the delay caused by a single train crossing at at‐grade highway rail crossings in Portsmouth, Chesapeake, and eastern Suffolk. Because the location of the marshalling yard will be east of downtown Suffolk, most of the at‐grade crossings in Suffolk will not benefit from the shorter trains. The marshalling yard will be used to assemble longer trains until the completion of the Commonwealth Railway Mainline Safety Relocation Project (Median Rail Project) by the end of 2009, at which time the longer trains will be assembled at the APM port facility when its internal rail yard has been completed. The Median Rail Project will relocate
Commonwealth Railway at Shoulders Hill Road
© William Grimes, courtesy of rrpicturearchives.net
ÏÎ
ÏÎ
ÏÎ
ÏÎ27
26
25
24
WIL
ROY
RD
NANSEMOND PKWY
LITTLE JOHN RD
SHERWOOD PL
UPTON LN
0 0.25 0.5 0.75 10.125Miles
®
LegendÏÎ RR Crossings
Commonwealth Rail
Roadways
Marshalling Yard Location
Crossing No. Street Name24 Rodney Lane25 Nansemond Parkway 2 (Wilroy)26 Sportsman Boulevard27 Day Farm Lane
Map 6: Marshalling Yard Location

8 Suffolk Rail Impact Study
Introduction
Commonwealth Railway’s tracks to the medians of the Western Freeway (VA Route 164) and Interstate 664, removing the at‐grade conflicts in Portsmouth and Chesapeake. The relocated tracks will connect to the existing alignment just east of the Chesapeake‐Suffolk city line.
Using Rail Enhancement Funds, Commonwealth Railway has purchased 12 miles of track it previously leased from Norfolk Southern and will construct a switch connection to the CSX tracks that cross near downtown Suffolk3. This connection will make it possible for CSX to carry some of the freight from new port facilities. Norfolk Southern
Norfolk Southern’s tracks in Suffolk carry significant existing rail traffic. The existing traffic level consists of twenty (20) daily trains with an average length of 7500 feet. These trains travel at speeds between 20 and 40 mph. Norfolk Southern anticipates adding another two trains per day in 2007 to
3 Gregory Richards, “Big changes ahead”
and from Chesapeake that have been included in this study’s base traffic assumptions4.
Norfolk Southern is in the process of upgrading its Heartland Corridor between Portsmouth and the Midwest to allow the passage of trains double‐stacked with shipping containers. The project will reduce the trip double‐stacked trains travel between Hampton Roads and Chicago by more than 250 miles, or one day, over the existing route5. CSX
The Federal Railroad Administration indicates that five (5) trains per day pass through Suffolk on CSX tracks. The trains on CSX tracks travel at the same speed, but are shorter than Norfolk Southern trains, with an average length of 5000 feet6.
4 Robert Siik (Norfolk Southern Corporation), email message, October 30, 2006 5 Gregory Richards, “Rail project to cut miles to Midwest due by 2009,” The Virginian-Pilot, February 16, 2006
Norfolk Southern in Suffolk
© William Grimes, courtesy of rrpicturearchives.net
CSX in Suffolk
© William Grimes, courtesy of rrpicturearchives.net

9 Suffolk Rail Impact Study
Introduction
It is expected that the traffic on CSX’s tracks will be relatively stable in the next ten years. CSX anticipates growth in demand at a rate of 5.0% per year during the study period7. This anticipated growth is in addition to any increase in demand due to the new port facilities.
Fairgrounds Redevelopment Project The City of Suffolk is completing the Fairgrounds Redevelopment Project, a significant revitalization project in downtown. The Fairgrounds project is bounded on the north by Hall Avenue and E Washington Street, to the east and west by County Street and S Main Street, and on the south by the Planters Peanuts Factory. This project will bring 170 new residential units
6 Jay Westbrook (CSX Corporation), personal communication, December 5, 2006
along with additional commercial uses to an existing industrial and commercial area. The City commissioned a traffic study for this project and its results were incorporated into the traffic projections for the affected rail crossings.
7 Jay Westbrook, pers. comm., December 5, 2006
ÏÎ ÏÎ ÏÎ ÏÎÏÎ
ÏÎ
CE
DAR
ST
S M
AIN
ST
CU
LLO
DE
N S
TP
INN
ER
ST BANK ST
MAIN
ST B
YP
MADISON AV
TYN
ES
ST
CA
RO
LIN
A R
D
MO
RG
AN
ST
E WASHINGTON ST
HALL AV
LIBE
RTY
ST
FAC
TORY
ST
CO
UN
TY
ST
SMITH ST
JOHNSON AV
S M
AIN
ST
HALL AV
S M
AIN
ST
0 0.06 0.12 0.18 0.240.03Miles
®
LegendFairgrounds Project
ÏÎ RR Crossings
Roadways
Commonwealth Rail
CSX
Norfolk Southern
Other Rail
Map 7: Fairgrounds Redevelopment Project Location
Source: Urban Design Associates
Fairgrounds Redevelopment Project
10 Suffolk Rail Impact Study
Introduction
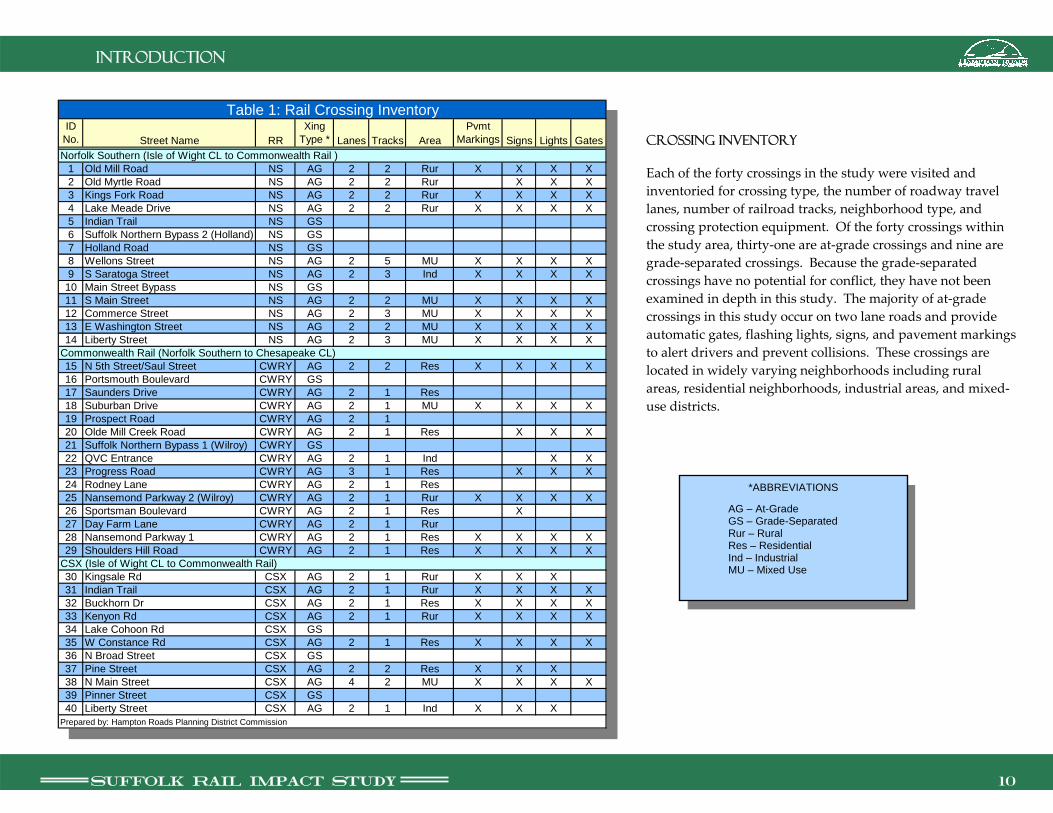
Crossing Inventory Each of the forty crossings in the study were visited and inventoried for crossing type, the number of roadway travel lanes, number of railroad tracks, neighborhood type, and crossing protection equipment. Of the forty crossings within the study area, thirty‐one are at‐grade crossings and nine are grade‐separated crossings. Because the grade‐separated crossings have no potential for conflict, they have not been examined in depth in this study. The majority of at‐grade crossings in this study occur on two lane roads and provide automatic gates, flashing lights, signs, and pavement markings to alert drivers and prevent collisions. These crossings are located in widely varying neighborhoods including rural areas, residential neighborhoods, industrial areas, and mixed‐use districts.
*ABBREVIATIONS
AG – At-Grade GS – Grade-Separated Rur – Rural Res – Residential Ind – Industrial MU – Mixed Use
ID No. Street Name RR
Xing Type * Lanes Tracks Area
Pvmt Markings Signs Lights Gates
1 Old Mill Road NS AG 2 2 Rur X X X X2 Old Myrtle Road NS AG 2 2 Rur X X X3 Kings Fork Road NS AG 2 2 Rur X X X X4 Lake Meade Drive NS AG 2 2 Rur X X X X5 Indian Trail NS GS6 Suffolk Northern Bypass 2 (Holland) NS GS7 Holland Road NS GS8 Wellons Street NS AG 2 5 MU X X X X9 S Saratoga Street NS AG 2 3 Ind X X X X
10 Main Street Bypass NS GS11 S Main Street NS AG 2 2 MU X X X X12 Commerce Street NS AG 2 3 MU X X X X13 E Washington Street NS AG 2 2 MU X X X X14 Liberty Street NS AG 2 3 MU X X X X
15 N 5th Street/Saul Street CWRY AG 2 2 Res X X X X16 Portsmouth Boulevard CWRY GS17 Saunders Drive CWRY AG 2 1 Res18 Suburban Drive CWRY AG 2 1 MU X X X X19 Prospect Road CWRY AG 2 120 Olde Mill Creek Road CWRY AG 2 1 Res X X X21 Suffolk Northern Bypass 1 (Wilroy) CWRY GS22 QVC Entrance CWRY AG 2 1 Ind X X23 Progress Road CWRY AG 3 1 Res X X X24 Rodney Lane CWRY AG 2 1 Res25 Nansemond Parkway 2 (Wilroy) CWRY AG 2 1 Rur X X X X26 Sportsman Boulevard CWRY AG 2 1 Res X27 Day Farm Lane CWRY AG 2 1 Rur28 Nansemond Parkway 1 CWRY AG 2 1 Res X X X X29 Shoulders Hill Road CWRY AG 2 1 Res X X X X
30 Kingsale Rd CSX AG 2 1 Rur X X X31 Indian Trail CSX AG 2 1 Rur X X X X32 Buckhorn Dr CSX AG 2 1 Res X X X X33 Kenyon Rd CSX AG 2 1 Rur X X X X34 Lake Cohoon Rd CSX GS35 W Constance Rd CSX AG 2 1 Res X X X X36 N Broad Street CSX GS37 Pine Street CSX AG 2 2 Res X X X38 N Main Street CSX AG 4 2 MU X X X X39 Pinner Street CSX GS40 Liberty Street CSX AG 2 1 Ind X X X
Prepared by: Hampton Roads Planning District Commission
Table 1: Rail Crossing Inventory
Norfolk Southern (Isle of Wight CL to Commonwealth Rail )
Commonwealth Rail (Norfolk Southern to Chesapeake CL)
CSX (Isle of Wight CL to Commonwealth Rail)

11 Suffolk Rail Impact Study
Introduction
Data collection Historical Average Weekday Traffic Volumes were collected from the Virginia Department of Transportation’s (VDOT’s) Traffic Monitoring System database. Several count year volumes were considered because arterials and collector streets are counted every three years, but local roads are counted on a less frequent cycle. In a few cases, VDOT’s database did not contain traffic counts for minor local roads. The traffic volumes for those streets were obtained from Federal Railroad Administration (FRA) data.
Existing train traffic characteristics were collected from each of the railroads potentially affected by the proposed port‐generated rail traffic: Commonwealth Railway, Norfolk Southern, and CSX. The data included the number of trains per day as well as length and speed. In addition, any expected changes in this traffic not associated with the new port facilities was also collected. The Virginia Port Authority (VPA) provided, through its consultant, the train traffic volumes anticipated to be generated by the APM Terminals and Craney Island port facilities. The data provided assumed that the APM Terminals facility will open in 2007 at 1.0 million Twenty‐foot Equivalent Units (TEUs), open a second phase in 2010 with 1.3 million TEUs, and reach its full capacity of 2.1 million TEU in 2017. VPA also provided projections for Craney Island; the 2017 opening year capacity will be 0.8 million TEUs with full capacity being reached in 2032 with 2.5 million TEUs8. VPA has also supplied data suggesting a future expansion of Craney Island to 5.0 million TEUs at an unspecified time in the future beyond 20329. The volumes of containers were converted to train traffic by making the following assumptions suggested by VPA: the intermodal split between trucks and trains is assumed to be
8 Michael Crist (Moffatt & Nichol), email message, September 20, 2006 9 Michael Crist (Moffatt & Nichol), email message, December 1, 2006
1993-1994 1999 2002 2005
Norfolk Southern1 Old Mill Road 161 256 2712 Old Myrtle Road 417 452 4613 Kings Fork Road 506 487 569 4614 Lake Meade Drive 222 4038 Wellons Street 1,954 2,284 2,0289 S Saratoga Street 4,289 3,894 4,466 4,401
11 S Main Street* 3,16512 Commerce Street* 1,50013 E Washington Street 12,909 19,685 13,981 8,98814 Liberty Street 7,232 6,057 5,663 2,935
Commonwealth Rail15 N 5th Street/Saul Street 2,54717 Saunders Drive***18 Suburban Drive 2,520 2,72019 Prospect Road 9420 Olde Mill Creek Road 36822 QVC Entrance**23 Progress Road 2,395 3,76024 Rodney Lane* 025 Nansemond Parkway 2 (Wilroy) 4,461 4,93626 Sportsman Boulevard 75 6827 Day Farm Lane**28 Nansemond Parkway 1 10,664 10,819 11,171 13,11929 Shoulders Hill Road 3,072 3,489 4,727 6,787
CSX30 Kingsale Rd 476 602 58131 Indian Trail 195 203 22132 Buckhorn Dr 329 457 45333 Kenyon Rd 2,075 89335 W Constance Rd 10,685 9,779 9,964 9,67337 Pine Street* 1,65638 N Main Street 17,002 20,943 21,500 21,15440 Liberty Street/Moore Ave 7,232 6,057 5,663 2,935
Table 2: Historical Average Weekday Traffic Volumes
ID No. Street Name
Source: VDOT, FRA where noted with *, Private Crossing no data available where noted with **
Average Weekday Volumes

12 Suffolk Rail Impact Study
Introduction
70%/30%10and each train will be approximately 7500 feet long and double‐stacked with containers. Various analyses have been conducted for years 2007, 2010, and 2017, however, due to a limited ability to accurately project distant vehicular traffic volumes, it is not prudent to provide analysis for horizon years more than twenty‐five years in the future. Therefore, complete analyses based on the train traffic generated by Craney Island capacities of 2.5 million in 2032 and 5.0 million TEUs at an undetermined date were not completed. It is recognized that these future volumes of containerized freight may produce more significant impacts and, for that reason, a limited analysis of the train traffic generated at full capacity and future expansion using the 2017 vehicular traffic volumes was completed. This analysis will not show the full effects of the full capacity and future expansion of the Craney Island Terminal as it is likely that vehicular traffic will also have increased significantly in the time between 2017 and those milestones.
10 Michael Crist (Moffatt & Nichol), email message, September 20, 2006
Highway‐rail crossing accident inventory data was collected from the FRA Office of Safety Analysis website11 for the period from 1996 through 2006. These accident reports listed any injuries or fatalities, the cause of the accident, and other data. Several City departments provided data and input that contributed to the analysis of the highway‐rail crossings in this study. The Department of Public Works provided guidance and information about both existing roadways and proposed infrastructure projects. The GIS Department provided mapping of emergency services dispatch locations and districts. The Department of Economic Development supplied information on existing and planned development affecting the economic strength of the city. The Office of the Assistant City Manager provided information regarding the Fairgrounds project including projected traffic volumes.
11 ”Highway-Rail Crossing Inventory & Accidents Page” Federal Railroad Administration Office of Safety Analysis. <http://safetydata.fra.dot.gov/OfficeofSafety/NewCrossing/>
Commonwealth Railway near Shoulders Hill Road
© William Grimes, courtesy of rrpicturearchives.net
Commonwealth Railway near Norfolk Southern switch

13 Suffolk Rail Impact Study
Analysis
Analysis Roadway Traffic projections Future daily traffic volumes for 2007, 2010, and 2017 were projected based on the historic average daily traffic volumes. For regionally significant routes, the HRPDC 2026 Long Range Plan12 was to obtain traffic growth rates. Where long‐range plan data was unavailable, VDOT’s 2025 projections were used. For local roads where neither published growth rate was available, an average annual growth rate of 1.0% was assumed. The traffic projections for S Saratoga Street and QVC were provided by the City of Suffolk. Train Traffic Projections Each of the three railroads having crossings analyzed in this study provided train traffic data. This data consists of the existing train traffic and the changes anticipated for 2010 and 2017 that are unrelated to the new APM Terminals and Craney Island ports. Norfolk Southern anticipates stable train traffic from 2007 through 2017. Commonwealth Railway will lose its two existing trains per day by 2010 due to the closing of the BASF plant in Portsmouth. CSX expects growth of 5% per year over the existing traffic it experiences today throughout the study period. The impacts of these trains were calculated separately from the trains related to the new port facilities and are listed under the heading “Baseline”. Tables containing complete calculations can be found in the appendix, included as a separate document. Train traffic estimates for trains originating or terminating at the new APM and Craney Island ports were provided by VPA. In the detailed tables in the appendices, the effects of these trains are calculated under the heading “APM and Craney Island Generated”.
12 Hampton Roads Planning District Commission, Hampton Roads 2026 Regional Transportation Plan, June, 2004
2007 2010 2017Norfolk Southern
1 Old Mill Road 290 300 3002 Old Myrtle Road 490 500 5503 Kings Fork Road 500 550 6004 Lake Meade Drive 425 450 5008 Wellons Street 2,100 2,150 2,3009 S Saratoga Street ** 4,450 4,700 5,400
11 S Main Street* 3,200 3,400 3,60012 Commerce Street* 1,550 1,550 1,60013 E Washington Street 14,250 15,100 16,10014 Liberty Street 5,700 5,700 5,700
Commonwealth Rail15 N 5th Street/Saul Street 2,600 2,750 2,90017 Saunders Drive***18 Suburban Drive 2,800 2,950 3,10019 Prospect Road 100 100 10020 Olde Mill Creek Road 380 400 40022 QVC Entrance** 100 125 15023 Progress Road 3,800 4,100 4,30024 Rodney Lane* 0 0 025 Nansemond Parkway 2 (Wilroy) 5,000 5,200 5,50026 Sportsman Boulevard 75 75 8027 Day Farm Lane***28 Nansemond Parkway 1 13,900 14,900 17,40029 Shoulders Hill Road 7,000 7,400 8,300
CSX30 Kingsale Rd 600 650 70031 Indian Trail 230 250 30032 Buckhorn Dr 470 475 50033 Kenyon Rd 950 1,000 1,10035 W Constance Rd 9,710 9,800 9,90037 Pine Street* 1,700 1,700 1,70038 N Main Street 21,705 22,550 24,50040 Liberty Street/Moore Ave 5,700 5,700 5,700
Table 3: Projected Average Weekday Traffic VolumesID No. Street Name
Source: VDOT, FRA where noted with *, City of Suffolk where noted with **, Private Crossing no data available where noted with ***
Projected Weekday Volumes

14 Suffolk Rail Impact Study
Analysis
Performance measures Several parameters were established to compare the effects of rail traffic on the mobility and safety of vehicular traffic at railroad crossings within the study corridors. Each crossing was analyzed for each of the performance measures for the three years of consideration, 2007, 2010, and 2017, with the exception of Economic Development Priorities, Accident History, and Emergency Services Access. The Economic Development Priorities performance measure accounts for economic issues that are not easily quantified. Accident History by nature cannot be easily projected to the future, so accident records were inventoried for the ten‐year period between 1996 and 2006. Emergency Services Access is a more subjective measure, where the locations of important infrastructure and alternative routes were compared and specific areas for concern were identified.
The performance measures were split into the two impact areas of mobility and safety for separate analysis. Mobility and safety are both very important issues which warrant consideration independent of one another. The analyses of these impact areas will generate different results and require different types of solutions. Portsmouth Boulevard
Nansemond Parkway at Wilroy Road
Measure Impact AreaExposure Index MobilityDaily Minutes Crossing Blocked MobilityDaily Hours of Vehicle Delay MobilityEconomic Development Priorities MobilityAccident History SafetyHazard Index SafetyEmergency Services Access Safety
Historical vehicle/train accident recordsExposure Index and protection factorEmergency services locations, minutes crossing blocked, alternative access routes
Economic Development Priorities
Table 4: Performance Measures
Daily number of trains and daily roadway trafficDaily number of trains, length of trains, and speed of trainsDaily minutes crossing blocked and daily roadway traffic
Function of

15 Suffolk Rail Impact Study
Analysis
Exposure index
Exposure Index is a comparative measure commonly used to quantify the interaction between railroad and roadway traffic. It is not a refined measure, but the Exposure Index can be used to rank intersections with high levels of conflicting traffic and higher potential for adverse impacts related to those conflicts.
The Exposure Index formula multiplies the roadway vehicular traffic by the train traffic on the railroad tracks for each crossing. The Total Exposure Index for each study year was determined by calculating a baseline Exposure Index and an APM and Craney Island generated Exposure Index and summing them. The APM and Craney Island generated Exposure Index includes only those trains originating at or destined for the new port facilities and the baseline Exposure Index includes all other train traffic. At right are the Total Exposure Index values for each study crossing in each study year and, for comparison, the Exposure Index for existing conditions. The Exposure Index values for Norfolk Southern track crossings are generally much higher than those of CSX and Commonwealth Railway because Norfolk Southern has a much higher level of baseline train traffic. As discussed in the Existing Conditions section of this report, Norfolk Southern has a total of twenty‐two trains per day of base traffic compared to five for CSX and two for Commonwealth Railway. The APM and Craney Island generated train traffic will originate to the east and travel on Commonwealth Railway before switching off to either Norfolk Southern or CSX, with the majority switching to Norfolk
Southern. As a result, crossings of Commonwealth Railway have the largest increases in Exposure Index, but not large enough to overcome the more significant baseline traffic of Norfolk Southern.
Exposure Index (EI)=(V)(T) Where: V – Average daily traffic on roadway T – Daily number of trains
ID No. Crossing EI Exist EI 2007 EI 2010 EI 2017Norfolk Southern
1 Old Mill Road 6,380 6,960 7,500 8,4002 Old Myrtle Road 10,780 11,760 12,500 15,4003 Kings Fork Road 11,000 12,000 13,750 16,8004 Lake Meade Drive 9,350 10,200 11,250 14,0008 Wellons Street 46,200 50,400 53,750 64,4009 S Saratoga Street 97,900 106,800 117,500 151,200
11 S Main Street 70,400 76,800 85,000 100,80012 Commerce Street 34,100 37,200 38,750 44,80013 E Washington Street 313,500 342,000 377,500 450,80014 Liberty Street 125,400 136,800 142,500 159,600
Commonwealth Rail15 N 5th Street/Saul Street 5,200 11,700 9,625 21,75017 Saunders Drive 0 0 0 018 Suburban Drive 5,600 12,600 10,325 23,25019 Prospect Road 200 450 350 75020 Olde Mill Creek Road 760 1,710 1,400 3,00022 QVC Entrance 200 450 438 1,12523 Progress Road 7,600 17,100 14,350 32,25024 Rodney Lane 0 0 0 025 Nansemond Parkway 2 (Wilroy) 10,000 22,500 18,200 41,25026 Sportsman Boulevard 150 338 263 60027 Day Farm Lane 0 0 0 028 Nansemond Parkway 1 27,800 62,550 52,150 130,50029 Shoulders Hill Road 14,000 31,500 25,900 62,250
CSX 30 Kingsale Rd 3,000 3,300 4,225 6,65031 Indian Trail 1,150 1,265 1,625 2,85032 Buckhorn Dr 2,350 2,585 3,088 4,75033 Kenyon Rd 4,750 5,225 6,500 10,45035 W Constance Rd 48,550 53,405 63,700 94,05037 Pine Street 8,500 9,350 11,050 16,15038 N Main Street 108,525 119,378 146,575 232,75040 Liberty Street/Moore Ave 28,500 31,350 37,050 54,150
Crossings 5, 6, 7, 10, 16, 21, 34, 36, 39 are grade-separated and have been excluded from analysis
Prepared by: Hampton Roads Planning District Commission
Table 5: Exposure Index

16 Suffolk Rail Impact Study
Analysis
The crossings were ranked based on this measure and the ten (10) highest crossings for the three study years are shown below. E. Washington Street has the highest Exposure Index in each study year meaning that it has the largest potential for conflict for the duration of the study period. While this does not indicate the need for improvements specifically, it should be considered in conjunction with other performance measures.
E Washington Street
N Main Street
Figure 1: Exposure Index ‐ Top Ten Crossings
0
50,000
100,000
150,000
200,000
250,000
300,000
350,000
400,000
450,000
500,000
EW
ashi
ngto
nS
treet
N M
ain
Stre
et
Libe
rty S
treet
S S
arat
oga
Stre
et
S M
ain
Stre
et
Nan
sem
ond
Par
kway
1
W C
onst
ance
Rd
Wel
lons
Stre
et
Libe
rtyS
treet
/Moo
reA
ve
Com
mer
ceS
treet
13 38 14 9 11 28 35 8 40 12
Exp
osur
e In
dex
200720102017
Xing ID No.

17 Suffolk Rail Impact Study
Analysis
Daily minutes crossing blocked The amount of time that a roadway‐rail crossing is blocked on an average day is a measure of the mobility of roadway users. It is indicative of the likelihood that a given roadway user will be stopped for a train. This measure is calculated based on the properties of the railroad traffic including the number of trains, their speeds and lengths, and warning time plus time for the train to clear the intersection. 13 Train speeds were assumed to be 30 mph in rural areas and 20 mph in developed areas. Until the completion of the Median Rail project in 2010, trains will only be able to travel at 10 mph on Commonwealth Railway. It was assumed that all APM generated trains in the downtown area would travel at 10 mph in 2007 because they will be
13 Korve Engineering, San Gabriel Valley Grade Crossing Study, January, 1997
Daily Minutes Blocked (B) = T (W+(L/S)) Where: T – Daily Number of Trains W – Warning/Clearance Time Per Train (see below) L – Average Length of Trains (ft) S – Speed of Trains (ft/min)
Warning/Clearance Time13 (W) = X+C+R Where: X –advanced warning time & time to lower gates – 30s C – time to clear intersection – (width of road + 50ft)/S R – time to raise gates – 8s
ID No. Crossing
B Exist (min)
B 2007 (min)
B 2010 (min)
B 2017 (min)
Norfolk Southern 1 Old Mill Road 3.5 3.5 3.5 3.52 Old Myrtle Road 3.5 3.5 3.5 3.53 Kings Fork Road 3.5 3.5 3.5 3.54 Lake Meade Drive 3.5 3.5 3.5 3.58 Wellons Street 4.9 9.2 4.9 4.99 S Saratoga Street 4.9 9.2 4.9 4.9
11 S Main Street 4.9 9.2 4.9 4.912 Commerce Street 4.9 9.2 4.9 4.913 E Washington Street 4.9 9.2 4.9 4.914 Liberty Street 4.9 9.2 4.9 4.9
Commonwealth Rail15 N 5th Street/Saul Street 1.1 9.2 4.9 4.917 Saunders Drive 1.1 9.2 4.9 4.918 Suburban Drive 1.1 9.2 4.9 4.919 Prospect Road 1.1 9.2 4.9 4.920 Olde Mill Creek Road 1.1 9.2 4.9 4.922 QVC Entrance 1.1 9.2 4.9 4.923 Progress Road 1.1 9.3 4.9 4.924 Rodney Lane 1.1 9.2 4.9 4.925 Nansemond Parkway 2 (Wilroy) 1.1 9.2 4.9 4.926 Sportsman Boulevard 1.1 9.2 4.9 4.927 Day Farm Lane 1.1 9.2 4.9 4.928 Nansemond Parkway 1 1.1 9.2 4.9 4.929 Shoulders Hill Road 1.1 9.2 4.9 4.9
CSX30 Kingsale Rd 2.6 3.5 3.5 3.531 Indian Trail 2.6 3.5 3.5 3.532 Buckhorn Dr 2.6 3.5 3.5 3.533 Kenyon Rd 2.6 3.5 3.5 3.535 W Constance Rd 3.5 9.2 4.9 4.937 Pine Street 3.5 9.2 4.9 4.938 N Main Street 3.5 9.3 5.0 5.040 Liberty Street/Moore Ave 3.5 9.2 4.9 4.9
Table 6: Minutes Crossing Blocked Per Train
Crossings 5, 6, 7, 10, 16, 21, 34, 36, 39 are grade-separated and have been excluded from analysis
Prepared by: Hampton Roads Planning District Commission

18 Suffolk Rail Impact Study
Analysis
switching from Commonwealth Railway just beyond the marshalling yard where train speeds will be very low. Empirical data collected for the Motorist Delay at Public Highway‐Rail Grade Crossings in Northeastern Illinois Study by the Illinois Commerce Commission14 show that the value of L/S will increase by a factor of 1.65 for crossings within one‐half mile of a rail yard. The only crossings within that range of the proposed marshalling yard are Nansemond Pkwy 2 (Wilroy) and Sportsman Boulevard; because the marshalling yard will only be used prior to the opening of the Median Rail Project, this effect will only exist for study year 2007.
The number of minutes that a crossing is blocked each day is only dependent on the characteristics of train traffic and the width of the road being crossed and is not related to vehicular traffic flow. Because of this several crossings will be blocked for the same amount of time each day,
14 Illinois Commerce Commission, Motorist Delay at Public Highway-Rail Grade Crossings in Northeastern Illinois, July, 2002
Wellons Street
ID No. Crossing
B Exist (min)
B 2007 (min)
B 2010 (min)
B 2017 (min)
Norfolk Southern 1 Old Mill Road 77.1 84.1 87.6 98.12 Old Myrtle Road 77.1 84.1 87.6 98.13 Kings Fork Road 77.1 84.1 87.6 98.14 Lake Meade Drive 77.1 84.1 87.6 98.18 Wellons Street 108.6 127.1 123.4 138.29 S Saratoga Street 108.6 127.1 123.4 138.2
11 S Main Street 108.6 127.1 123.4 138.212 Commerce Street 108.6 127.1 123.4 138.213 E Washington Street 108.6 127.1 123.4 138.214 Liberty Street 108.6 127.1 123.4 138.2
Commonwealth Rail15 N 5th Street/Saul Street 2.1 25.2 17.3 37.017 Saunders Drive 2.1 25.2 17.3 37.018 Suburban Drive 2.1 25.2 17.3 37.019 Prospect Road 2.1 25.2 17.3 37.020 Olde Mill Creek Road 2.1 25.2 17.3 37.022 QVC Entrance 2.1 25.2 17.3 37.023 Progress Road 2.1 25.3 17.3 37.124 Rodney Lane 2.1 25.2 17.3 37.025 Nansemond Parkway 2 (Wilroy) 2.1 40.2 17.3 37.026 Sportsman Boulevard 2.1 40.2 17.3 37.027 Day Farm Lane 2.1 25.2 17.3 37.028 Nansemond Parkway 1 2.1 25.2 17.3 37.029 Shoulders Hill Road 2.1 25.2 17.3 37.0
CSX30 Kingsale Rd 12.8 14.5 17.1 25.731 Indian Trail 12.8 14.5 17.1 25.732 Buckhorn Dr 12.8 14.5 17.1 25.733 Kenyon Rd 12.8 14.5 17.1 25.735 W Constance Rd 17.6 22.2 23.6 35.537 Pine Street 17.6 22.2 23.6 35.538 N Main Street 17.6 22.2 23.6 35.640 Liberty Street/Moore Ave 17.6 22.2 23.6 35.5
Table 7: Daily Minutes Crossing Blocked
Crossings 5, 6, 7, 10, 16, 21, 34, 36, 39 are grade-separated and have been excluded from analysis
Prepared by: Hampton Roads Planning District Commission

19 Suffolk Rail Impact Study
Analysis
and their speed cause the largest differences in total daily time blocked. In the chart above, note that the first six crossings will experience a decrease in blockage time from 2007 to 2010. This is largely due to an increase in train travel speeds following the completion of the Median Rail Project.
S Saratoga Street
Commerce Street
Figure 2: Daily Minutes Crossing Blocked ‐ Top Ten
0.0
20.0
40.0
60.0
80.0
100.0
120.0
140.0
160.0
Wel
lons
Stre
et
S S
arat
oga
Stre
et
S M
ain
Stre
et
Com
mer
ceS
treet
EW
ashi
ngto
nS
treet
Libe
rtyS
treet
Old
Mill
Roa
d
Old
Myr
tleR
oad
Kin
gs F
ork
Roa
d
Lake
Mea
deD
rive
8 9 11 12 13 14 1 2 3 4
Dai
ly M
inut
es C
ross
ing
Bloc
ked 2007
20102017
Xing ID No.

20 Suffolk Rail Impact Study
Analysis
Daily Hours of Vehicle Delay
Daily Hours of Vehicle Delay is the most comprehensive measure of mobility considered for this study because it includes both the volume of vehicles and the number of minutes the crossing is blocked. One minute of delay is calculated as one vehicle waiting for one minute, therefore, the total minutes is a cumulative value for all vehicles encountering a blocked crossing during a twenty‐four hour period. The daily minutes of vehicle delay have been converted to hours for evaluation. For calculation purposes, it was assumed that vehicular traffic arrives at a given crossing at a constant rate throughout the twenty‐four hour period. While it would be possible to estimate vehicular traffic volumes at a given time of day, it is not possible to know what time of day future trains will pass through Suffolk. Due to this fact, assuming a constant rate of traffic is the best approximation available despite the fact that it underestimates the impacts of trains arriving during peak hours and overestimates the impact of trains arriving in the overnight hours. Additionally, it was assumed that because vehicles arrive at a constant rate, on average, each vehicle stopped by the passing train would wait for one‐half the time for the train to cross and clear the intersection.
Daily Hours of Vehicle Delay (D) =(Vmin*B)(0.5B)/60 Where: Vmin – Vehicles/Minute approaching the crossing B – Daily Minutes Crossing Blocked
ID No. Crossing
D Exist (hr)
D 2007 (hr)
D 2010 (hr)
D 2017 (hr)
Norfolk Southern1 Old Mill Road 10.0 10.0 10.5 11.12 Old Myrtle Road 16.8 17.0 17.5 20.33 Kings Fork Road 17.2 17.3 19.2 22.14 Lake Meade Drive 14.6 14.7 15.7 18.58 Wellons Street 143.4 147.5 149.5 168.79 S Saratoga Street 303.8 312.6 326.8 396.0
11 S Main Street 218.4 224.8 236.4 264.012 Commerce Street 105.8 108.9 107.8 117.313 E Washington Street 972.7 1,000.9 1,049.9 1,180.814 Liberty Street 389.1 400.4 396.3 418.0
Commonwealth Rail15 N 5th Street/Saul Street 0.1 8.1 4.8 23.017 Saunders Drive 0.0 0.0 0.0 0.018 Suburban Drive 0.1 8.7 5.1 24.619 Prospect Road 0.0 0.3 0.2 0.820 Olde Mill Creek Road 0.0 1.2 0.7 3.222 QVC Entrance 0.0 0.3 0.2 1.223 Progress Road 0.1 11.9 7.1 34.224 Rodney Lane 0.0 0.0 0.0 0.025 Nansemond Parkway 2 (Wilroy) 0.1 42.2 9.0 43.626 Sportsman Boulevard 0.0 0.6 0.1 0.627 Day Farm Lane 0.0 0.0 0.0 0.028 Nansemond Parkway 1 0.4 43.3 25.7 138.029 Shoulders Hill Road 0.2 21.8 12.8 65.8
CSX 30 Kingsale Rd 0.6 0.6 0.7 1.231 Indian Trail 0.2 0.2 0.3 0.532 Buckhorn Dr 0.4 0.5 0.5 0.833 Kenyon Rd 0.9 0.9 1.2 1.835 W Constance Rd 17.4 18.6 21.4 31.537 Pine Street 3.0 3.3 3.7 5.438 N Main Street 38.8 41.5 49.2 77.940 Liberty Street/Moore Ave 10.2 10.9 12.4 18.1
Table 8: Daily Hours of Vehicle Delay
Crossings 5, 6, 7, 10, 16, 21, 34, 36, 39 are grade-separated and have been excluded from analysis
Prepared by: Hampton Roads Planning District Commission

21 Suffolk Rail Impact Study
Analysis
E Washington Street has, by far, the largest number of hours of delay for all the crossings considered in this study for each year of evaluation. In fact, the top six crossings for daily hours of delay occur at crossings of Norfolk Southern due to its high level of baseline rail traffic. In contrast, Commonwealth Railway carries all of the new port generated rail traffic, but has very little baseline traffic and there are only three crossings of Commonwealth Railway in the top ten.
E Washington Street
Liberty Street
Figure 3: Daily Hours of Vehicle Delay ‐ Top Ten
0
200
400
600
800
1,000
1,200
1,400
EW
ashi
ngto
nS
treet
Libe
rtyS
treet
S S
arat
oga
Stre
et
S M
ain
Stre
et
Wel
lons
Stre
et
Com
mer
ceS
treet
Nan
sem
ond
Par
kway
1
N M
ain
Stre
et
Sho
ulde
rsH
ill R
oad
Nan
sem
ond
Par
kway
2(W
ilroy
)
13 14 9 11 8 12 28 38 29 25
Dai
ly H
ours
of V
ehic
le D
elay 2007
20102017
Xing ID No.

22 Suffolk Rail Impact Study
Analysis
Economic Development Priorities The Suffolk Department of Economic Development provided a ranking of the rail crossings that reflects mobility priorities that it feels may not be accounted for in other measures. These rankings take into consideration existing and planned development and investments that affect the economic strength of the City. This ranking is provided below.
QVC Entrance
Progress Road
ID No. Crossing Rank22 QVC Entrance 123 Progress Road 128 Nansemond Parkway 1 129 Shoulders Hill Road 133 Kenyon Rd 138 N Main Street 140 Liberty Street/Moore Ave 113 E Washington Street 525 Nansemond Parkway 2 (Wilroy) 535 W Constance Rd 537 Pine Street 515 N 5th Street/Saul Street 1017 Saunders Drive 1020 Olde Mill Creek Road 1024 Rodney Lane 1026 Sportsman Boulevard 108 Wellons Street 209 S Saratoga Street 20
11 S Main Street 2012 Commerce Street 2014 Liberty Street 2018 Suburban Drive 2019 Prospect Road 2027 Day Farm Lane 201 Old Mill Road 252 Old Myrtle Road 253 Kings Fork Road 254 Lake Meade Drive 25
30 Kingsale Rd 2531 Indian Trail 2532 Buckhorn Dr 25
Crossings 5, 6, 7, 10, 16, 21, 34, 36, 39 are grade-separated and have been excluded from analysis
Source: City of Suffolk
Table 9: Economic Development Rank

23 Suffolk Rail Impact Study
Analysis
Accident History It is difficult to predict future accidents, so this study considered the accident history of each crossing as a measure of past safety. While new developments and projected future traffic might increase potential accidents at other crossings, accident history is a good indication of areas that may already be in need of a safety review. Fourteen (14) accidents between trains and vehicles occurred at the crossings in this study in the period from 1996 through 2006. These accidents were generally minor and resulted in only four personal injuries.
E Washington Street and Liberty Street/Moore Avenue combined had the majority of incidents and all of the personal injuries. Contributing to the number of accidents at the E Washington Street crossing is its complicated horizontal geometry with several roadways coming together on both sides of the crossing as well as its non‐perpendicular crossing angle. The Liberty Street/Moore Avenue crossing is the only significant crossing in the study that does not have automated gates for protection, which likely played a part in the larger number of accidents.
Liberty Street/Moore Avenue
Crossing Accidents Injuries
1 Old Mill Road 0 02 Old Myrtle Road 0 03 Kings Fork Road 0 04 Lake Meade Drive 0 08 Wellons Street 0 09 S Saratoga Street 2 0
11 S Main Street 1 012 Commerce Street 0 013 E Washington Street 0 014 Liberty Street 5 3
15 N 5th Street/Saul Street 0 017 Saunders Drive 0 018 Suburban Drive 0 019 Prospect Road 0 020 Olde Mill Creek Road 0 022 QVC Entrance 0 023 Progress Road 0 024 Rodney Lane 0 025 Nansemond Parkway 2 (Wilroy) 0 026 Sportsman Boulevard 0 027 Day Farm Lane 0 028 Nansemond Parkway 1 0 029 Shoulders Hill Road 0 0
30 Kingsale Rd 0 031 Indian Trail 0 032 Buckhorn Dr 0 033 Kenyon Rd 0 035 W Constance Rd 0 037 Pine Street 0 038 N Main Street 0 040 Liberty Street/Moore Ave 0 0
Total 4 1
No fatalities occurred at any highway-rail crossing in this study between 1996 and 2006
Crossings 5, 6, 7, 10, 16, 21, 34, 36, 39 are grade-separated and have been excluded from analysis
Source: FRA
Table 10: Accident History 1996 - 2006
Commonwealth Rail
CSX
Summary
Norfolk Southern
ID No.
24 Suffolk Rail Impact Study
Analysis
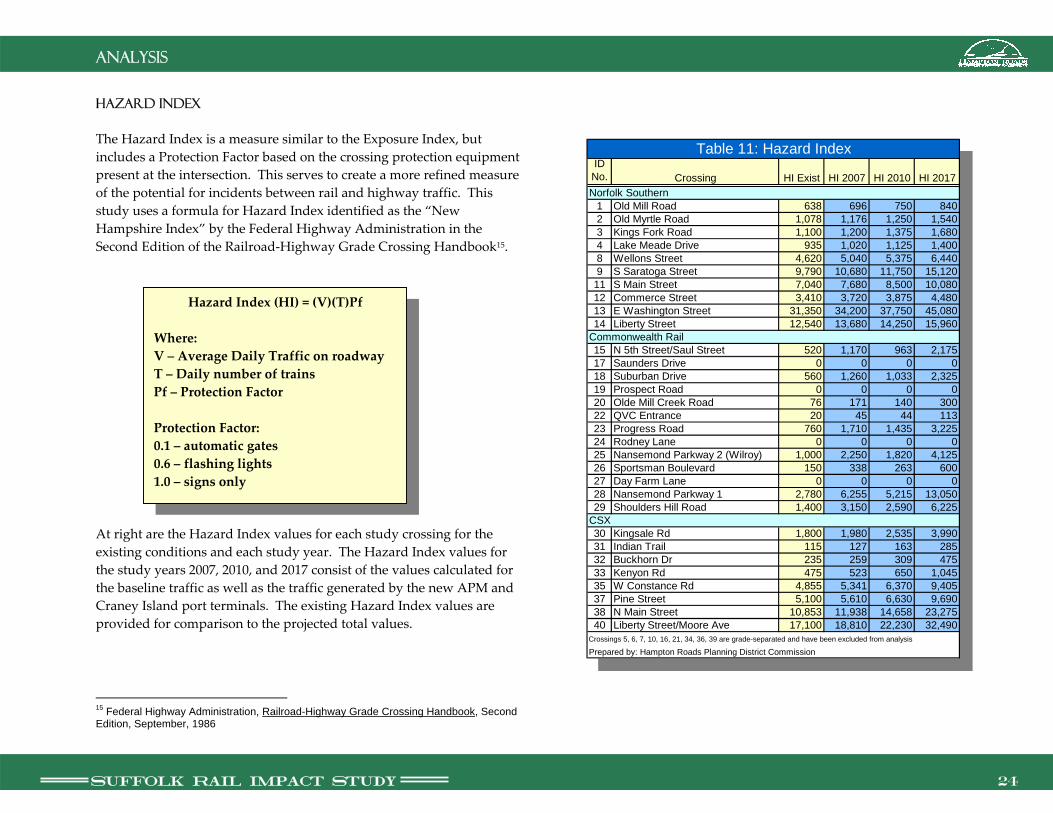
Hazard Index The Hazard Index is a measure similar to the Exposure Index, but includes a Protection Factor based on the crossing protection equipment present at the intersection. This serves to create a more refined measure of the potential for incidents between rail and highway traffic. This study uses a formula for Hazard Index identified as the “New Hampshire Index” by the Federal Highway Administration in the Second Edition of the Railroad‐Highway Grade Crossing Handbook15.
At right are the Hazard Index values for each study crossing for the existing conditions and each study year. The Hazard Index values for the study years 2007, 2010, and 2017 consist of the values calculated for the baseline traffic as well as the traffic generated by the new APM and Craney Island port terminals. The existing Hazard Index values are provided for comparison to the projected total values. 15 Federal Highway Administration, Railroad-Highway Grade Crossing Handbook, Second Edition, September, 1986
Hazard Index (HI) = (V)(T)Pf Where: V – Average Daily Traffic on roadway T – Daily number of trains Pf – Protection Factor Protection Factor: 0.1 – automatic gates 0.6 – flashing lights 1.0 – signs only
ID No. Crossing HI Exist HI 2007 HI 2010 HI 2017Norfolk Southern
1 Old Mill Road 638 696 750 8402 Old Myrtle Road 1,078 1,176 1,250 1,5403 Kings Fork Road 1,100 1,200 1,375 1,6804 Lake Meade Drive 935 1,020 1,125 1,4008 Wellons Street 4,620 5,040 5,375 6,4409 S Saratoga Street 9,790 10,680 11,750 15,120
11 S Main Street 7,040 7,680 8,500 10,08012 Commerce Street 3,410 3,720 3,875 4,48013 E Washington Street 31,350 34,200 37,750 45,08014 Liberty Street 12,540 13,680 14,250 15,960
Commonwealth Rail 15 N 5th Street/Saul Street 520 1,170 963 2,17517 Saunders Drive 0 0 0 018 Suburban Drive 560 1,260 1,033 2,32519 Prospect Road 0 0 0 020 Olde Mill Creek Road 76 171 140 30022 QVC Entrance 20 45 44 11323 Progress Road 760 1,710 1,435 3,22524 Rodney Lane 0 0 0 025 Nansemond Parkway 2 (Wilroy) 1,000 2,250 1,820 4,12526 Sportsman Boulevard 150 338 263 60027 Day Farm Lane 0 0 0 028 Nansemond Parkway 1 2,780 6,255 5,215 13,05029 Shoulders Hill Road 1,400 3,150 2,590 6,225
CSX30 Kingsale Rd 1,800 1,980 2,535 3,99031 Indian Trail 115 127 163 28532 Buckhorn Dr 235 259 309 47533 Kenyon Rd 475 523 650 1,04535 W Constance Rd 4,855 5,341 6,370 9,40537 Pine Street 5,100 5,610 6,630 9,69038 N Main Street 10,853 11,938 14,658 23,27540 Liberty Street/Moore Ave 17,100 18,810 22,230 32,490
Table 11: Hazard Index
Crossings 5, 6, 7, 10, 16, 21, 34, 36, 39 are grade-separated and have been excluded from analysis
Prepared by: Hampton Roads Planning District Commission

25 Suffolk Rail Impact Study
Analysis
Generally, because most crossings analyzed in this study have automatic gates for protection, crossings of Norfolk Southern tracks have higher than average Hazard Index values because of higher levels of train traffic. The Liberty Street/Moore Avenue crossing has the second highest projected value in each study year because it has only flashing lights and signs for protection and a relatively high level of vehicular traffic.
S Main Street
Nansemond Parkway 1
Figure 4: Hazard Index ‐ Top Ten Crossings
05,000
10,00015,00020,00025,00030,00035,00040,00045,00050,000
EW
ashi
ngto
nS
treet
Libe
rtyS
treet
/Moo
reA
ve N M
ain
Stre
et
Libe
rty S
treet
S S
arat
oga
Stre
et
S M
ain
Stre
et
Nan
sem
ond
Par
kway
1
Pin
e S
treet
W C
onst
ance
Rd
Wel
lons
Stre
et
13 40 38 14 9 11 28 37 35 8
Haz
ard
Inde
x
200720102017
Xing ID No.

26 Suffolk Rail Impact Study
Analysis
Emergency Services Access The ability of first responders to reach emergencies in a timely manner is a significant issue when considering the safety effects of increased rail traffic. To estimate the relative importance of the crossings, a scoring system was developed. The scoring categories included availability of alternative routes, evacuation routes, and locations of schools. The locations of hospitals would also be an important factor, but there are no hospitals located near any of the crossings evaluated in this study. The scoring methodology is outlined below.
There are three crossings on residential streets that have no alternative access. The most significant of these is Sportsman Boulevard, which is the only access to an entire residential neighborhood. Rodney Lane and Saunders Drive only provide access to one residence each.
S Main Street
Emergency Services Scoring Access 20 – highest concern, no alternative access 15 – high concern, important corridor crossing 10 – moderate concern, detour of more than 1 mi. 0 – low concern, detour of less than 1 mi. Evacuation Routes 5 – crossing located on evacuation route 0 – crossing not located on evacuation route Schools 5 – crossing located on primary access to school 0 – crossing not located on school access route
Crossing
1 Old Mill Road 102 Old Myrtle Road 103 Kings Fork Road 104 Lake Meade Drive 108 Wellons Street 09 S Saratoga Street 0
11 S Main Street 012 Commerce Street 013 E Washington Street 2014 Liberty Street 0
15 N 5th Street/Saul Street 1017 Saunders Drive 2018 Suburban Drive 019 Prospect Road 020 Olde Mill Creek Road 1022 QVC Entrance 1023 Progress Road 024 Rodney Lane 2025 Nansemond Parkway 2 (Wilroy) 2026 Sportsman Boulevard 2027 Day Farm Lane 028 Nansemond Parkway 1 2029 Shoulders Hill Road 20
30 Kingsale Rd 1031 Indian Trail 1032 Buckhorn Dr 1033 Kenyon Rd 1535 W Constance Rd 537 Pine Street 038 N Main Street 040 Liberty Street/Moore Ave 0
Prepared by: Hampton Roads Planning District CommissionCrossings 5, 6, 7, 10, 16, 21, 34, 36, 39 are grade-separated and have been excluded from analysis
Table 12: Emergency Services Score
Commonwealth Rail
CSX
Norfolk Southern
Composite Score
ID No.

27 Suffolk Rail Impact Study
Analysis
E Washington Street, Nansemond Parkway, and Shoulders Hill Road have some alternative access, but are major roadway corridors through Suffolk and provide access to schools, causing them to score highly as well. The Kenyon Road crossing does not have a convenient alternative route and is located near a school.
Sportsman Boulevard
Saunders Drive
Figure 5: Top Emergency Services Access Scores
0
5
10
15
20
25
EW
ashi
ngto
nS
treet
Saun
ders
Driv
e
Rod
ney
Lane
Nan
sem
ond
Par
kway
2(W
ilroy
)
Spor
tsm
anBo
ulev
ard
Nan
sem
ond
Par
kway
1
Shou
lder
sH
ill R
oad
Keny
on R
d
13 17 24 25 26 28 29 33
Scor
e
Xing ID No.
28 Suffolk Rail Impact Study
Analysis
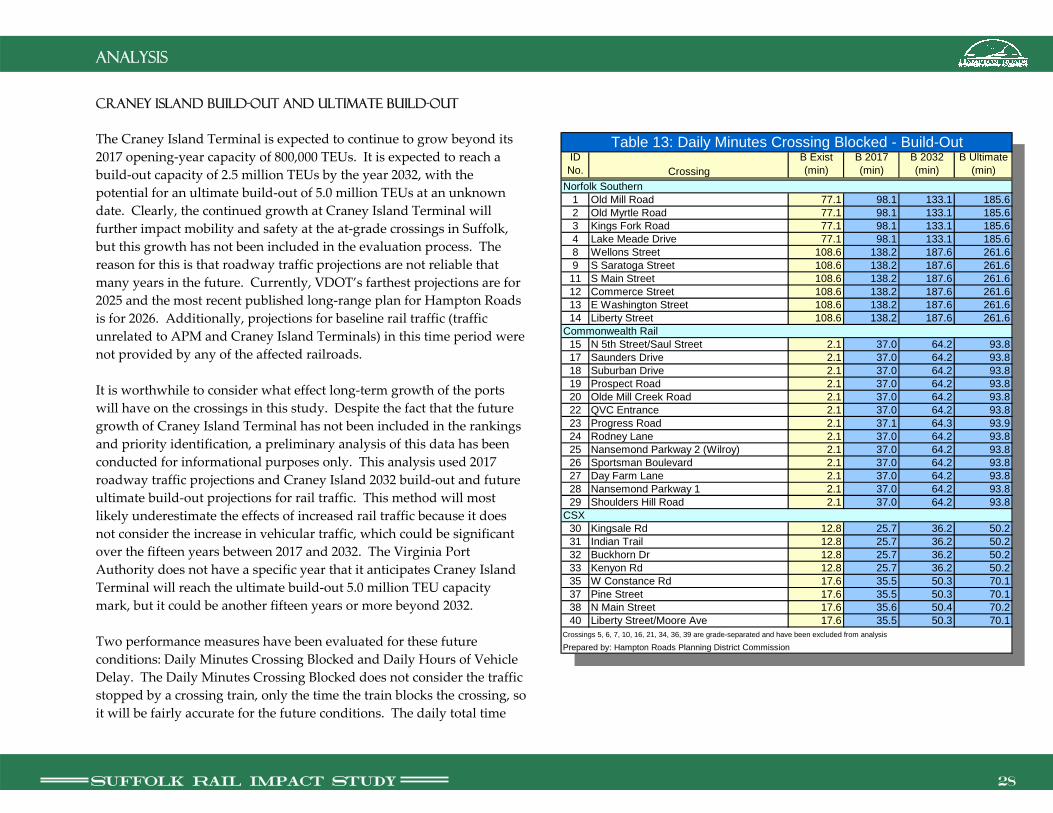
Craney Island Build-out and Ultimate Build-out The Craney Island Terminal is expected to continue to grow beyond its 2017 opening‐year capacity of 800,000 TEUs. It is expected to reach a build‐out capacity of 2.5 million TEUs by the year 2032, with the potential for an ultimate build‐out of 5.0 million TEUs at an unknown date. Clearly, the continued growth at Craney Island Terminal will further impact mobility and safety at the at‐grade crossings in Suffolk, but this growth has not been included in the evaluation process. The reason for this is that roadway traffic projections are not reliable that many years in the future. Currently, VDOT’s farthest projections are for 2025 and the most recent published long‐range plan for Hampton Roads is for 2026. Additionally, projections for baseline rail traffic (traffic unrelated to APM and Craney Island Terminals) in this time period were not provided by any of the affected railroads. It is worthwhile to consider what effect long‐term growth of the ports will have on the crossings in this study. Despite the fact that the future growth of Craney Island Terminal has not been included in the rankings and priority identification, a preliminary analysis of this data has been conducted for informational purposes only. This analysis used 2017 roadway traffic projections and Craney Island 2032 build‐out and future ultimate build‐out projections for rail traffic. This method will most likely underestimate the effects of increased rail traffic because it does not consider the increase in vehicular traffic, which could be significant over the fifteen years between 2017 and 2032. The Virginia Port Authority does not have a specific year that it anticipates Craney Island Terminal will reach the ultimate build‐out 5.0 million TEU capacity mark, but it could be another fifteen years or more beyond 2032. Two performance measures have been evaluated for these future conditions: Daily Minutes Crossing Blocked and Daily Hours of Vehicle Delay. The Daily Minutes Crossing Blocked does not consider the traffic stopped by a crossing train, only the time the train blocks the crossing, so it will be fairly accurate for the future conditions. The daily total time
ID No. Crossing
B Exist (min)
B 2017 (min)
B 2032 (min)
B Ultimate (min)
Norfolk Southern 1 Old Mill Road 77.1 98.1 133.1 185.62 Old Myrtle Road 77.1 98.1 133.1 185.63 Kings Fork Road 77.1 98.1 133.1 185.64 Lake Meade Drive 77.1 98.1 133.1 185.68 Wellons Street 108.6 138.2 187.6 261.69 S Saratoga Street 108.6 138.2 187.6 261.6
11 S Main Street 108.6 138.2 187.6 261.612 Commerce Street 108.6 138.2 187.6 261.613 E Washington Street 108.6 138.2 187.6 261.614 Liberty Street 108.6 138.2 187.6 261.6
Commonwealth Rail15 N 5th Street/Saul Street 2.1 37.0 64.2 93.817 Saunders Drive 2.1 37.0 64.2 93.818 Suburban Drive 2.1 37.0 64.2 93.819 Prospect Road 2.1 37.0 64.2 93.820 Olde Mill Creek Road 2.1 37.0 64.2 93.822 QVC Entrance 2.1 37.0 64.2 93.823 Progress Road 2.1 37.1 64.3 93.924 Rodney Lane 2.1 37.0 64.2 93.825 Nansemond Parkway 2 (Wilroy) 2.1 37.0 64.2 93.826 Sportsman Boulevard 2.1 37.0 64.2 93.827 Day Farm Lane 2.1 37.0 64.2 93.828 Nansemond Parkway 1 2.1 37.0 64.2 93.829 Shoulders Hill Road 2.1 37.0 64.2 93.8
CSX30 Kingsale Rd 12.8 25.7 36.2 50.231 Indian Trail 12.8 25.7 36.2 50.232 Buckhorn Dr 12.8 25.7 36.2 50.233 Kenyon Rd 12.8 25.7 36.2 50.235 W Constance Rd 17.6 35.5 50.3 70.137 Pine Street 17.6 35.5 50.3 70.138 N Main Street 17.6 35.6 50.4 70.240 Liberty Street/Moore Ave 17.6 35.5 50.3 70.1
Table 13: Daily Minutes Crossing Blocked - Build-Out
Crossings 5, 6, 7, 10, 16, 21, 34, 36, 39 are grade-separated and have been excluded from analysis
Prepared by: Hampton Roads Planning District Commission

29 Suffolk Rail Impact Study
Analysis
the crossings are anticipated to be blocked will increase significantly as Craney Island Terminal expands. For years 2007 through 2017, Norfolk Southern crossings will experience the largest blockage times, but Commonwealth Railway crossings will be blocked nearly three times more per day in the future condition over 2017. Crossings of CSX will see blockage times double in the future condition over 2017 projections. The future projections for Daily Hours of Vehicle Delay also predict large increases over 2017 projections. Because this performance measure includes roadway traffic, these delay estimates are probably quite low for some roadways. E Washington Street is expected to see more than 1600 hours of cumulative daily delay for motorists at completion of the future expansion of Craney Island Terminal. A more than 500% increase in delay over 2017 is projected for the crossings of Commonwealth Railway. The estimates generated by this analysis provide an indication of things to come for Suffolk, but may not necessarily supply accurate predictions of future conditions. The City will undoubtedly experience increases in roadway traffic that could not be accounted for in this analysis that will contribute to increased impacts. The effects of increased rail traffic through Suffolk will not resolve on their own and will continue to grow as the ports grow.
ID No. Crossing
D Exist (hr)
D 2017 (hr)
D 2032 (hr)
D Ultimate (hr)
Norfolk Southern1 Old Mill Road 10.0 11.1 12.4 15.12 Old Myrtle Road 16.8 20.3 22.8 27.73 Kings Fork Road 17.2 22.1 24.9 30.24 Lake Meade Drive 14.6 18.5 20.7 25.28 Wellons Street 143.4 168.7 189.4 230.09 S Saratoga Street 303.8 396.0 444.8 540.0
11 S Main Street 218.4 264.0 296.5 360.012 Commerce Street 105.8 117.3 131.8 160.013 E Washington Street 972.7 1,180.8 1,326.1 1,609.914 Liberty Street 389.1 418.0 469.5 570.0
Commonwealth Rail15 N 5th Street/Saul Street 0.1 23.0 69.1 147.717 Saunders Drive 0.0 0.0 0.0 0.018 Suburban Drive 0.1 24.6 73.9 157.819 Prospect Road 0.0 0.8 2.4 5.120 Olde Mill Creek Road 0.0 3.2 9.5 20.422 QVC Entrance 0.0 1.2 3.6 7.623 Progress Road 0.1 34.2 102.8 219.524 Rodney Lane 0.0 0.0 0.0 0.025 Nansemond Parkway 2 (Wilroy) 0.1 43.6 131.1 280.026 Sportsman Boulevard 0.0 0.6 1.9 4.127 Day Farm Lane 0.0 0.0 0.0 0.028 Nansemond Parkway 1 0.4 138.0 414.7 885.929 Shoulders Hill Road 0.2 65.8 197.8 422.6
CSX 30 Kingsale Rd 0.6 1.2 1.5 1.931 Indian Trail 0.2 0.5 0.6 0.832 Buckhorn Dr 0.4 0.8 1.1 1.333 Kenyon Rd 0.9 1.8 2.4 2.935 W Constance Rd 17.4 31.5 40.9 50.737 Pine Street 3.0 5.4 7.0 8.738 N Main Street 38.8 77.9 101.4 125.740 Liberty Street/Moore Ave 10.2 18.1 23.5 29.2
Table 14: Daily Hours Vehicle Delay - Build-Out
Crossings 5, 6, 7, 10, 16, 21, 34, 36, 39 are grade-separated and have been excluded from analysis
Prepared by: Hampton Roads Planning District Commission

30 Suffolk Rail Impact Study
Analysis
Composite rankings Mobility Rankings Composite mobility rankings were computed to determine the crossings most affected by rail traffic across all of the mobility performance measures. To determine the composite rank of a given highway‐rail crossing, its ranking for each mobility performance measure was summed and then ranked among all studied crossings. For example, in 2007 E Washington Street had a ranking of one (1) for the performance measures exposure index, minutes crossing blocked, and hours of delay and a ranking of five (5) in the category of economic development priorities. Its sum of rankings is 8 (1+1+1+5) and compared to the sums of all other crossings’ rankings this is the smallest sum, giving E Washington Street a composite rank of one (1). Seven highway‐rail crossings appear in the top ten for all three study years. These crossings are highlighted in the tables at right. E Washington Street is ranked first in each list indicating that
mobility at this crossing will be most affected by rail traffic throughout the study period. Of the seven crossings that appear in the top ten for all three years, five are crossings of Norfolk Southern, one is a crossing of Commonwealth Railway, and one is a crossing of CSX. This is not surprising considering Norfolk Southern has a significantly higher level of baseline traffic (unrelated to APM Terminals and Craney Island) utilizing its tracks.
Table 15: Composite Mobility Rankings
ID No. Crossing
Composite Ranking
ID No. Crossing
Composite Ranking
ID No. Crossing
Composite Ranking
13 E Washington Street 1 13 E Washington Street 1 13 E Washington Street 114 Liberty Street 2 38 N Main Street 2 28 Nansemond Parkway 1 29 S Saratoga Street 3 14 Liberty Street 3 14 Liberty Street 311 S Main Street 4 9 S Saratoga Street 4 9 S Saratoga Street 428 Nansemond Parkway 1 4 11 S Main Street 5 29 Shoulders Hill Road 58 Wellons Street 6 35 W Constance Rd 6 11 S Main Street 612 Commerce Street 7 28 Nansemond Parkway 1 7 8 Wellons Street 729 Shoulders Hill Road 7 8 Wellons Street 8 38 N Main Street 825 Nansemond Parkway 2 (Wilroy) 9 12 Commerce Street 9 23 Progress Road 938 N Main Street 10 40 Liberty Street/Moore Ave 9 25 Nansemond Parkway 2 (Wilroy) 1023 Progress Road 11 29 Shoulders Hill Road 11 12 Commerce Street 1135 W Constance Rd 12 23 Progress Road 12 35 W Constance Rd 1240 Liberty Street/Moore Ave 13 25 Nansemond Parkway 2 (Wilroy) 13 15 N 5th Street/Saul Street 133 Kings Fork Road 14 37 Pine Street 14 40 Liberty Street/Moore Ave 142 Old Myrtle Road 15 3 Kings Fork Road 15 18 Suburban Drive 154 Lake Meade Drive 16 2 Old Myrtle Road 16 22 QVC Entrance 1615 N 5th Street/Saul Street 17 33 Kenyon Rd 16 3 Kings Fork Road 1737 Pine Street 18 4 Lake Meade Drive 18 2 Old Myrtle Road 181 Old Mill Road 19 15 N 5th Street/Saul Street 19 20 Olde Mill Creek Road 1818 Suburban Drive 19 1 Old Mill Road 20 37 Pine Street 1820 Olde Mill Creek Road 19 22 QVC Entrance 21 4 Lake Meade Drive 2122 QVC Entrance 22 18 Suburban Drive 22 33 Kenyon Rd 2226 Sportsman Boulevard 23 20 Olde Mill Creek Road 23 1 Old Mill Road 2333 Kenyon Rd 24 26 Sportsman Boulevard 24 26 Sportsman Boulevard 2417 Saunders Drive 25 17 Saunders Drive 25 17 Saunders Drive 2524 Rodney Lane 25 24 Rodney Lane 25 24 Rodney Lane 2519 Prospect Road 27 30 Kingsale Rd 27 19 Prospect Road 2727 Day Farm Lane 28 32 Buckhorn Dr 28 27 Day Farm Lane 2830 Kingsale Rd 29 19 Prospect Road 29 30 Kingsale Rd 2932 Buckhorn Dr 30 31 Indian Trail 29 32 Buckhorn Dr 3031 Indian Trail 31 27 Day Farm Lane 31 31 Indian Trail 31
2007 Composite Mobility Ranking
2010 Composite Mobility Ranking
2017 Composite Mobility Ranking

31 Suffolk Rail Impact Study
Analysis
Safety Rankings Like the composite mobility rankings, composite safety rankings were computed to determine the crossings most affected by rail traffic as gauged by the safety performance measures. To determine the composite rank of a given highway‐rail crossing, its ranking for each safety performance measure was summed and then ranked among all studied crossings. For example, in 2007 E Washington Street had a ranking of one (1) for all three safety performance measures of Accident History, Hazard Index, and Emergency Services Access. The sum of these rankings is 3 (1+1+1) and compared to the sums of all other crossings’ rankings this is the smallest sum, giving E Washington Street a composite rank of one (1). Ten highway‐rail crossings appear in the top ten for all three study years. There are several crossings with a rank of ten (10) in 2007 and 2010. The safety composite rankings are very consistent, with the first six crossings are in the same order all three years. Because the safety
performance measures are not as closely related to the traffic volumes on the roadways or railroads, the crossings in the top ten are more evenly distributed among the three railroads.
Table 16: Composite Safety Rankings
ID No. Crossing
Composite Ranking
ID No. Crossing
Composite Ranking
ID No. Crossing
Composite Ranking
13 E Washington Street 1 13 E Washington Street 1 13 E Washington Street 128 Nansemond Parkway 1 2 28 Nansemond Parkway 1 2 28 Nansemond Parkway 1 229 Shoulders Hill Road 3 29 Shoulders Hill Road 3 29 Shoulders Hill Road 325 Nansemond Parkway 2 (Wilroy) 4 25 Nansemond Parkway 2 (Wilroy) 4 25 Nansemond Parkway 2 (Wilroy) 440 Liberty Street/Moore Ave 5 40 Liberty Street/Moore Ave 5 40 Liberty Street/Moore Ave 514 Liberty Street 6 14 Liberty Street 6 14 Liberty Street 626 Sportsman Boulevard 7 9 S Saratoga Street 7 26 Sportsman Boulevard 79 S Saratoga Street 8 26 Sportsman Boulevard 7 9 S Saratoga Street 88 Wellons Street 9 8 Wellons Street 9 8 Wellons Street 9
17 Saunders Drive 10 30 Kingsale Rd 10 38 N Main Street 924 Rodney Lane 10 35 W Constance Rd 10 17 Saunders Drive 1130 Kingsale Rd 10 38 N Main Street 10 24 Rodney Lane 1135 W Constance Rd 10 17 Saunders Drive 13 30 Kingsale Rd 1138 N Main Street 10 24 Rodney Lane 13 35 W Constance Rd 1111 S Main Street 15 3 Kings Fork Road 15 33 Kenyon Rd 153 Kings Fork Road 16 11 S Main Street 15 11 S Main Street 16
33 Kenyon Rd 16 2 Old Myrtle Road 17 15 N 5th Street/Saul Street 162 Old Myrtle Road 18 33 Kenyon Rd 17 3 Kings Fork Road 18
37 Pine Street 18 37 Pine Street 17 37 Pine Street 1815 N 5th Street/Saul Street 20 4 Lake Meade Drive 20 2 Old Myrtle Road 204 Lake Meade Drive 21 15 N 5th Street/Saul Street 21 4 Lake Meade Drive 211 Old Mill Road 22 1 Old Mill Road 22 1 Old Mill Road 22
12 Commerce Street 22 12 Commerce Street 22 12 Commerce Street 2232 Buckhorn Dr 24 32 Buckhorn Dr 24 32 Buckhorn Dr 2420 Olde Mill Creek Road 25 23 Progress Road 25 20 Olde Mill Creek Road 2523 Progress Road 25 31 Indian Trail 25 23 Progress Road 2518 Suburban Drive 27 20 Olde Mill Creek Road 27 18 Suburban Drive 2731 Indian Trail 27 22 QVC Entrance 28 31 Indian Trail 2722 QVC Entrance 29 18 Suburban Drive 29 22 QVC Entrance 2919 Prospect Road 30 19 Prospect Road 30 19 Prospect Road 3027 Day Farm Lane 30 27 Day Farm Lane 30 27 Day Farm Lane 30
2007 Composite Safety Ranking
2010 Composite Safety Ranking
2017 Composite Safety Ranking

32 Suffolk Rail Impact Study
Conclusions
Conclusions Mobility Priorities Mobility improvement priorities were identified based on the Composite Mobility Rankings for 2007, 2010, and 2017. Seven crossings appear in the top ten for all three study years and these crossings have been included in the mobility priority list. The remaining three crossings have been selected because they appear in the top ten for two of the three study years. These priorities are meant to represent a starting point for consideration of improvements and are not a complete list of the at‐grade crossings that may warrant mobility improvements. The complete mobility analyses can be found in the technical appendix.
Safety Priorities Similarly, safety improvement priorities were identified based on the Composite Safety Rankings for 2007, 2010, and 2017. The composite safety rankings experience very little change over the ten‐year study period and the Safety Improvement Priorities selected were all ranked in the top ten for each study year. These priorities are meant to represent a starting point for consideration of improvements and are not a complete list of the at‐grade crossings that may warrant safety improvements. The complete safety analyses can be found in the technical appendix.
Mobility Improvement Priorities
1. E Washington Street 2. Liberty Street (14) 3. S Saratoga Street 4. Nansemond Parkway 1 5. S Main Street 6. Wellons Street 7. N Main Street 8. Shoulders Hill Road 9. Nansemond Parkway 2 (Wilroy)10. Commerce Street
Safety Improvement Priorities
1. E Washington Street 2. Nansemond Parkway 1 3. Shoulders Hill Road 4. Nansemond Parkway 2 (Wilroy)5. Liberty Street/Moore Ave (40) 6. Liberty Street (14) 7. Sportsman Boulevard 8. S Saratoga Street 9. Wellons Street 10. N Main Street

33 Suffolk Rail Impact Study
Conclusions
ÏÎÏÎ ÏÎÏÎ
ÏÎ
ÏÎÏÎ
ÏÎÏÎÏÎ
ÏÎ
ÏÎ
98
38
29
28
25
141312
11
26
40
WIL
ROY
RD
KINGS HWY
PROSPECT RD
DAY FA
RM
LN
BOB WHITE LN
SUBURBAN DR
HOLLAND RD
LAK
E KI
LBY
RD
NAN
SEM
ON
D P
KW
YVERMONT AV
LITTLE JOHN RD
WIL
RO
Y R
D
NAN
SEMOND PKW
Y
0 0.9 1.8 2.7 3.60.45Miles
®
Legend
ÏÎ Mobility & Safety Priority
ÏÎ Mobility Priority
ÏÎ Safety Priority
Commonwealth Rail
Norfolk Southern
CSX
Roadways
Map 8: Mobility & Safety PrioritiesCrossing No. Street Name Priority Type
8 Wellons Street Mobility & Safety9 S Saratoga Street Mobility & Safety11 S Main Street Mobility12 Commerce Street Mobility13 E Washington Street Mobility & Safety14 Liberty Street Mobility & Safety25 Nansemond Parkway 2 (Wilroy) Mobility & Safety26 Sportsman Boulevard Safety28 Nansemond Parkway 1 Mobility & Safety29 Shoulders Hill Road Mobility & Safety38 N Main Street Mobility & Safety40 Liberty Street/Moore Avenue Safety

34 Suffolk Rail Impact Study
Conclusions
Options Each of the highway‐rail crossings identified as an improvement priority has a unique set of conditions. These conditions both contribute to the need for improvement and provide opportunities to reduce that need. Near‐term, intermediate‐term, and long‐term solutions have been considered to address these priorities. Several crossings appear on both the mobility and safety improvement priority lists. In many cases, a solution to a mobility problem will resolve a safety problem or vice versa, but that is not always the case and recommendations have been made to resolve issues affecting both impact areas. Citywide Improvements It is important to consider options that can create system‐wide or citywide improvements in addition to options to improve individual highway‐rail crossings. These improvements will not resolve the need for improvement at any individual location, but can, by degrees, improve the efficiency and overall safety of all crossings in the study area. One simple option that could have a significant impact on mobility would be coordination between the City, ports, and railroad companies to schedule trains to avoid peak travel periods. If the majority of trains can be scheduled to travel at night, the effects of increased rail traffic on mobility could be considerably reduced. Implementation of a railroad grade crossing monitoring system would allow emergency responders to track the location and speeds of trains to avoid delay at at‐grade rail crossings. Trains could be monitored at a central location and the information could be transmitted to responders in the field. There are different systems available, but the Texas Transportation Institute compared transponder and radar
systems and found that systems using Doppler radar were the most accurate, did not require equipment be placed in railroad right‐of‐way, and were less expensive to implement16. Building on the concept of a train monitoring system, the information collected for first responders could be used to alert motorists of the presence of crossing trains to allow them to use an alternative route. This information could be relayed to motorists using ITS (Intelligent Transportation Systems) technologies and variable message signs. There are commercially available systems designed for this purpose. E Washington Street E Washington Street is the highest priority crossing from both safety and mobility standpoints; it is also the crossing where it is most
16 Texas Transportation Institute, Railroad Grade Crossing Monitoring System, August, 2003
E Washington Street
Map 9: E Washington Street Crossing

35 Suffolk Rail Impact Study
Conclusions
difficult to implement improvements. E Washington Street has several challenging aspects. Holladay Street and Pinner Street intersect E Washington Street approximately 100 feet west of the crossing and Culloden Street/Hall Avenue intersect E Washington Street about 100 feet east of the crossing. The Norfolk Southern tracks themselves cross E Washington Street at an acute angle. Additionally, this crossing is located in the downtown area where historic buildings are located very close to the street and where the City is in the process of
constructing a large redevelopment project just south of this crossing. As part of this Fairgrounds Redevelopment Project, a large water main has recently been laid under E Washington Street close to this crossing. This crossing experiences daily vehicular delay well above the forty‐hour threshold for consideration of grade separation outlined in the Guidance on Traffic Control at Highway‐Rail Grade Crossings published by the Federal Highway Administration17. While this
17 Highway/Rail Grade Crossing Technical Working Group (TWG), Guidance on Traffic Control at Highway-Rail Grade Crossings, Federal Highway Administration, November, 2002
crossing certainly warrants consideration of grade‐separation, because of the nearby intersections, historic buildings, and utility crossings, it would be nearly impossible and prohibitively expensive to construct either an overpass or an underpass of the railroad at this location. The City of Suffolk has a project in the early stages of development that would help ease the mobility issues anticipated at E Washington Street. This project, known as the Finney Avenue flyover, would connect Factory Street to Finney Avenue by overpassing Norfolk Southern and Commonwealth Railway tracks east of the E Washington Street crossing. This connection will provide an alternate route for travelers on E Washington Street and would be most effective in combination with a rail monitoring system and variable message signs to redirect traffic. While the Finney Avenue flyover will reduce the challenges to mobility at E Washington Street, there remains important safety concerns at this crossing. There were more accidents recorded at this location than at any other crossing in the study between 1996 and 2006.
E Washington Street
Source: MUTCD, 2003 Ed.
Figure 6: Four-Quadrant Gates –Acute Angle

36 Suffolk Rail Impact Study
Conclusions
According to FRA accident reports, these accidents occurred when vehicles stopped on the tracks or drove around the gates. To address stopped vehicles, signing instructing drivers not to stop on the tracks can be installed in the near term and, if deemed necessary upon further study, traffic signals can be installed to ensure the tracks are cleared for approaching trains. Four‐quadrant crossing gates can be installed in conjunction with medians to prevent motorists from driving around gates and attempting to “beat” an oncoming train. Figure 6 illustrates a configuration of four‐quadrant gates and medians for a crossing with similar geometry to E Washington Street. Liberty Street (Crossing No. 14) Liberty Street is the second highest mobility priority and the sixth highest safety priority in this study. Like E Washington Street, it crosses Norfolk Southern’s tracks, which already have significant
levels of train traffic. In fact, the existing levels of vehicular and train traffic create enough delay daily to meet FRA’s threshold to consider grade‐separation18. Also like E Washington Street, the conditions near this crossing would make grade‐separation difficult. Bank Street intersects Liberty Street approximately 200 feet north of the rail crossing. There are buildings very close to the roadway roughly 200 feet south of the crossing. The distance to the Bank Street intersection is much too short for an overpass of the railroad. The roadway would have to be elevated to allow trains double‐stacked with containers, requiring vertical clearance of 21 feet, and an additional five feet for the structure of the bridge. Assuming a five percent grade on the roadway, this means that an overpass of the railroad would require at least 550 feet on either side of the tracks. An underpass of the railroad would require less clear distance from the crossing, but it would need more than the
18 TWG, Guidance on Traffic Control at Highway-Grade Crossings
Map 11: Liberty Street Crossing (No. 14)
Map 10: Finney Avenue Flyover Location
ÏÎÏÎ
PIN
NE
R S
T
N 5T
H S
T
MO
OR
E A
V
N D
IVIS
ION
ST
CU
LLO
DE
N S
T
BANK ST
TYN
ES
ST
FINNEY AV
LIBE
RTY
ST
CO
UN
TY
ST
BEEC
H S
T
FAC
TOR
Y S
T
CLARYS DR
E WASHINGTON ST
HALL AV
0 0.05 0.1 0.15 0.20.025Miles
®
Legend
ÏÎ RR Crossings
Finney Ave Flyover
Commonwealth Rail
Norfolk Southern
Roadways
Other Rail

37 Suffolk Rail Impact Study
Conclusions
distance available. The height of roadway clearance is much less than that for trains, requiring only 14 feet. Additional clearance to allow for the depth of the bridge structure would be the same as for an overpass. With a roadway slope of five percent, an underpass would require at least 400 feet on either side of the tracks. The Finney Avenue flyover in conjunction with a variable message sign system would help reduce the mobility concerns at this crossing as well as at E Washington Street.
The safety concerns at this crossing relate to its accident history and potential for future accidents as measured by the hazard index. FRA’s accident reports indicate that both accidents occurring during the ten years considered were due to vehicles stopped on the tracks. There are no obvious indications why vehicles would stop at this location. Because Bank Street is stop‐controlled, it is unlikely that traffic would back up from that intersection. Installation of signing instructing vehicles not to stop on the tracks may help raise drivers’ awareness of the crossing. Additionally, moving the flashing lights from the roadside to an overhead structure will also make motorists more aware of the crossing.
S Saratoga Street S Saratoga Street is the third highest mobility priority and the eighth highest safety priority. This street, like Liberty Street and E Washington Street, crosses Norfolk Southern’s tracks and experiences high enough levels of train traffic today to warrant consideration of grade‐separation19. Also like the two previously discussed crossings, the location of the S Saratoga Street crossing realistically eliminates this possibility. Hall Avenue and Caroline Avenue intersect S Saratoga Street less than 100 feet south of the crossing and Smith Street intersects S Saratoga Street 200 feet north of the rail crossing.
19 TWG, Guidance on Traffic Control at Highway-Grade Crossings
Liberty Street
Map 12: S Saratoga Street Crossing

38 Suffolk Rail Impact Study
Conclusions
Fortunately, S Saratoga Street is one block away from the Main Street Bypass, which overpasses the railroad, and has convenient connections to the bypass. Mobility at this crossing would benefit greatly from a variable message sign system giving advance warning of an impending train crossing and directing motorists to use the bypass. The single accident recorded in the ten years examined occurred when a driver drove around the crossing gates. The railroad tracks cross S Saratoga Street at an obtuse angle, which makes it easier for drivers to circumvent the crossing gates. Four‐quadrant gates combined with median islands (see right) that effectively block the entire crossing could be installed to prevent this behavior.
Nansemond Parkway 1 The Nansemond Parkway 1 rail crossing, located near Shoulders Hill Road, is the second highest safety priority and the fourth highest mobility priority. Nansemond Parkway is crossed by Commonwealth Railway tracks, which will experience significant growth above existing train traffic from the operation of the new port facilities. Nansemond Parkway is an important corridor through Suffolk with high levels of vehicular traffic. A project to widen it from two to four lanes is the City’s highest priority roadway project. In 2007 and 2017, vehicles at this crossing are expected to experience high enough levels of delay to justify consideration of grade separation20. The delay drops in 2010 due to the Median Rail project, but the increase in rail traffic from the Craney Island Terminal in 2017 pushes the delay well above the forty‐hour mark.
20 TWG, Guidance on Traffic Control at Highway-Grade Crossings S Saratoga Street
Map 13: Nansemond Parkway 1 Crossing
Source: MUTCD, 2003 Ed. Figure 7: Four-Quadrant Gates – Obtuse Angle

39 Suffolk Rail Impact Study
Conclusions
There is one private driveway 200 feet east of this crossing and the intersection of Nansemond Parkway and the main entrance to a residential neighborhood, Suffolk Meadows Boulevard, is about 200 feet west of the rail crossing. This neighborhood has another entrance off of Shoulders Hill Road, although that entrance is located very close to the Shoulders Hill Road rail crossing. It would not be possible to relocate the intersection of Suffolk Meadows Boulevard far enough west to allow a grade‐separated crossing without the acquisition of several residences. It would be possible, although probably unpopular, to simply dead‐end this entrance. The private entrance east of the crossing also poses an obstacle to grade separation. It is impossible to determine without further engineering study whether it is feasible to relocate the entrance or whether property acquisition would be necessary. An underpass of the railroad tracks would have fewer property impacts than an overpass, but there are several considerations that must be examined. The depth of the water table is a very important
issue because low roadway crossings can be flood‐prone. Nansemond Parkway is an arterial corridor with economic significance and would not be well served by removing closures due to trains and creating closures due to flooding. Further study of the advantages and disadvantages of grade‐separation at this location is recommended. Another option to help alleviate some of the disruption to traffic and emergency services would be to construct an alternative route that would avoid the rail crossing. There is a possibility to build such a roadway connecting Shoulders Hill Road (north of its crossing of Commonwealth Railway) to Nansemond Parkway near the village of Driver. This route follows a discontinued railroad alignment where the City is currently planning a recreational trail. This route would not prevent through traffic on Nansemond Parkway from being delayed by crossing trains, but would help motorists traveling on Nansemond
Nansemond Parkway 1
ÏÎ
ÏÎ
ÏÎ
DA
Y FARM LN
BOB WHITE LN
SH
OU
LDE
RS
HIL
L R
D
NA
NS
EM
ON
D P
KW
Y
DR
IVE
R LN
BARON BLVD
DUTCHESS WY
BER
WY
N W
YNANSEMOND PKWY
0 0.2 0.4 0.6 0.80.1Miles
®
Legend
ÏÎ RR Crossings
Commonwealth Rail
Roadways
Nansemond Bypass
Map 14: Nansemond Parkway Bypass Location

40 Suffolk Rail Impact Study
Conclusions
Parkway to or from Shoulders Hill Road. This detour connects to Nansemond Parkway approximately one mile west of the railroad crossing and to Shoulders Hill Road nearly a mile north of its rail crossing and would, therefore, work most effectively in combination with a train monitoring system and variable message signs to alert motorists to the presence of a train early enough that they may use the detour. There is no recent history of accidents at this crossing. The crossing gates at this location appear to be effective at separating railroad and roadway traffic. Due to the large increase of train traffic over the existing condition, monitoring of motorist compliance with warning gates is recommended. This crossing is at an acute angle and if it is observed that vehicles are bypassing the gates, long‐arm gates that block seventy‐five percent of the roadway or four‐quadrant gates should be installed to prevent that behavior. S Main Street S Main Street is the fifth highest mobility priority, but is not among the top safety priorities. This crossing of Norfolk Southern’s tracks has
more than sufficient traffic to consider grade‐separation based on daily hours of vehicle delay21. Hall Avenue intersects S Main Street about 50 feet south of the crossing and there are several buildings located very close to S Main Street just north of the crossing. It is located one block east of the Main Street Bypass and has convenient connections to that grade‐separated crossing. This crossing is not a good candidate for grade‐separation due to the adjacent buildings, the Hall Avenue intersection, and proximity to the Main Street Bypass. Mobility at this crossing would benefit greatly from implementation of a rail monitoring system and variable message sign system giving advance warning of an impending train crossing and directing motorists to the bypass.
21 TWG, Guidance on Traffic Control at Highway-Grade Crossings S Main Street
Map 15: S Main Street Crossing

41 Suffolk Rail Impact Study
Conclusions
Wellons Street The Wellons Street crossing is ranked as the sixth highest mobility priority and the ninth highest safety priority. Like other crossings of Norfolk Southern, Wellons Street experiences more than forty hours of vehicle delay daily in the existing condition, justifying consideration of grade separation22. However, also like other crossings of Norfolk Southern, the area surrounding the crossing would make that difficult. There are residences and industry located immediately adjacent to the
crossing. The industrial buildings located adjacent to the crossing are part of a much larger complex that would probably be prohibitively expensive to acquire. Fortunately, this crossing is located about a half a mile from the Main Street Bypass and has convenient connections to that grade‐separated crossing. The use of a rail monitoring system in
22 TWG, Guidance on Traffic Control at Highway-Grade Crossings
conjunction with a variable message sign system would significantly improve mobility at this crossing. This crossing is also a safety priority. Wellons Street had two accidents recorded between 1996 and 2006; these were attributed to motorists stopping on the tracks. A visibility problem could be contributing to accidents at this crossing. The industrial building at the southeast corner of the crossing is close enough to the railroad tracks that it may block motorists’ views of approaching trains. Additional advanced warning signs could reduce the likelihood of future incidents. A variable message sign system would reduce this issue as well, by providing additional, eye‐catching advanced warning. Installation of long‐arm gates would reduce the possibility of vehicles circumventing the shorter gates at this angled crossing. N Main Street The at‐grade crossing of N Main Street and CSX is the seventh highest mobility priority and the tenth highest safety priority. This crossing is
Wellons Street
Map 16: Wellons Street Crossing
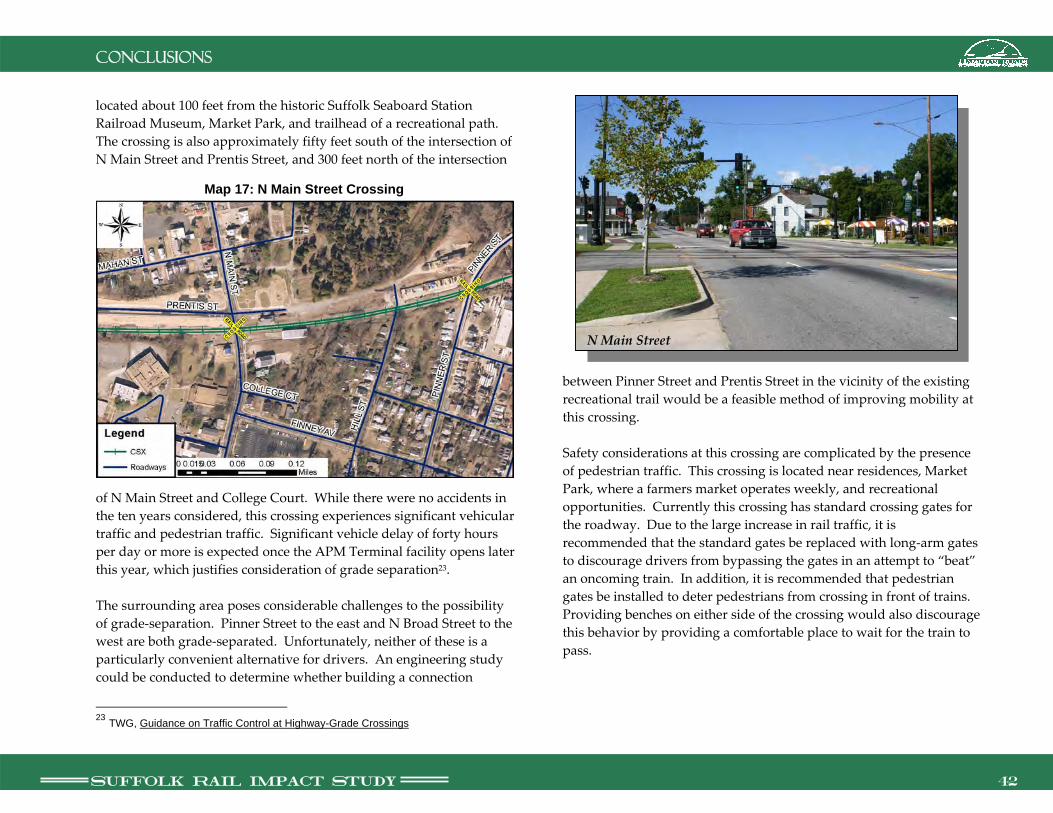
42 Suffolk Rail Impact Study
Conclusions
located about 100 feet from the historic Suffolk Seaboard Station Railroad Museum, Market Park, and trailhead of a recreational path. The crossing is also approximately fifty feet south of the intersection of N Main Street and Prentis Street, and 300 feet north of the intersection
of N Main Street and College Court. While there were no accidents in the ten years considered, this crossing experiences significant vehicular traffic and pedestrian traffic. Significant vehicle delay of forty hours per day or more is expected once the APM Terminal facility opens later this year, which justifies consideration of grade separation23. The surrounding area poses considerable challenges to the possibility of grade‐separation. Pinner Street to the east and N Broad Street to the west are both grade‐separated. Unfortunately, neither of these is a particularly convenient alternative for drivers. An engineering study could be conducted to determine whether building a connection
23 TWG, Guidance on Traffic Control at Highway-Grade Crossings
between Pinner Street and Prentis Street in the vicinity of the existing recreational trail would be a feasible method of improving mobility at this crossing. Safety considerations at this crossing are complicated by the presence of pedestrian traffic. This crossing is located near residences, Market Park, where a farmers market operates weekly, and recreational opportunities. Currently this crossing has standard crossing gates for the roadway. Due to the large increase in rail traffic, it is recommended that the standard gates be replaced with long‐arm gates to discourage drivers from bypassing the gates in an attempt to “beat” an oncoming train. In addition, it is recommended that pedestrian gates be installed to deter pedestrians from crossing in front of trains. Providing benches on either side of the crossing would also discourage this behavior by providing a comfortable place to wait for the train to pass.
N Main Street
Map 17: N Main Street Crossing
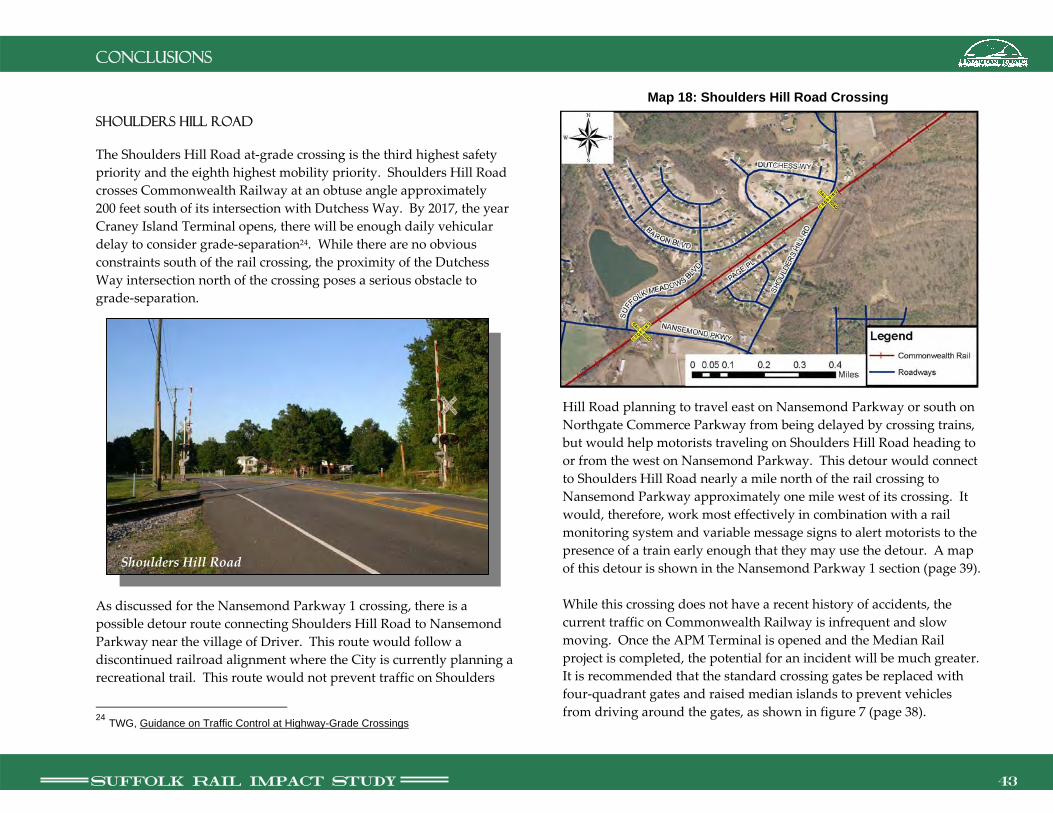
43 Suffolk Rail Impact Study
Conclusions
Shoulders Hill Road The Shoulders Hill Road at‐grade crossing is the third highest safety priority and the eighth highest mobility priority. Shoulders Hill Road crosses Commonwealth Railway at an obtuse angle approximately 200 feet south of its intersection with Dutchess Way. By 2017, the year Craney Island Terminal opens, there will be enough daily vehicular delay to consider grade‐separation24. While there are no obvious constraints south of the rail crossing, the proximity of the Dutchess Way intersection north of the crossing poses a serious obstacle to grade‐separation.
As discussed for the Nansemond Parkway 1 crossing, there is a possible detour route connecting Shoulders Hill Road to Nansemond Parkway near the village of Driver. This route would follow a discontinued railroad alignment where the City is currently planning a recreational trail. This route would not prevent traffic on Shoulders
24 TWG, Guidance on Traffic Control at Highway-Grade Crossings
Hill Road planning to travel east on Nansemond Parkway or south on Northgate Commerce Parkway from being delayed by crossing trains, but would help motorists traveling on Shoulders Hill Road heading to or from the west on Nansemond Parkway. This detour would connect to Shoulders Hill Road nearly a mile north of the rail crossing to Nansemond Parkway approximately one mile west of its crossing. It would, therefore, work most effectively in combination with a rail monitoring system and variable message signs to alert motorists to the presence of a train early enough that they may use the detour. A map of this detour is shown in the Nansemond Parkway 1 section (page 39). While this crossing does not have a recent history of accidents, the current traffic on Commonwealth Railway is infrequent and slow moving. Once the APM Terminal is opened and the Median Rail project is completed, the potential for an incident will be much greater. It is recommended that the standard crossing gates be replaced with four‐quadrant gates and raised median islands to prevent vehicles from driving around the gates, as shown in figure 7 (page 38).
Shoulders Hill Road
Map 18: Shoulders Hill Road Crossing

44 Suffolk Rail Impact Study
Conclusions
Nansemond Parkway 2 (Wilroy) The Nansemond Parkway 2 crossing of Commonwealth Railway is the fourth highest safety priority and the ninth highest mobility priority. This crossing, like Nansemond Parkway 1, will have enough combined vehicular and rail traffic in 2007, following the opening of the APM Terminal, and 2017 to warrant consideration of grade‐separation25. Wilroy Road intersects Nansemond Parkway only 25 feet from the crossing, making grade separation problematic. The traffic volume on Nansemond Parkway drops significantly south of Wilroy Road because the majority of traffic north of the crossing on Nansemond Parkway turns right onto Wilroy Road; that traffic is unaffected by the railroad crossing. Because the surrounding area is largely undeveloped, it may be possible to configure an overpass of both the railroad crossing and Wilroy Road. Ramps could be constructed to
25 TWG, Guidance on Traffic Control at Highway-Grade Crossings
provide access to/from Wilroy Road. There is no opportunity to provide drivers with an alternate route once they are northbound on Nansemond Parkway, so while the rail monitoring system would be helpful to emergency responders, it would do little to help motorists avoid delays. Due to the significant increase in rail traffic on Commonwealth Railway, drivers will have to wait far longer for trains to pass once the new port facilities open and may be tempted to avoid the crossing gates. One of the gates at this crossing is already the long‐arm type and it is recommended that the other gate be replaced with a long‐arm gate as well. Commerce Street Commerce Street is the tenth highest mobility priority. Like the other mobility priority crossings of Norfolk Southern, motorists on Commerce Street currently experience more than forty hours of daily
Nansemond Parkway 2 (Wilroy)
Map 19: Nansemond Parkway 2 (Wilroy) Crossing

45 Suffolk Rail Impact Study
Conclusions
vehicle delay, which is the threshold to consider grade separation26. Hall Avenue intersects Commerce Street approximately 50 feet south of the crossing, a commercial building is located very close to Commerce Street just north of the crossing, and the crossing is two blocks from the Main Street Bypass. The location of Hall Avenue, an adjacent building, and its proximity to the Main Street Bypass cause Commerce Street to be a poor candidate for grade separation. Because this crossing is only two blocks from the Main Street Bypass, traffic could easily be diverted using variable message signs activated by a rail monitoring system to reduce delay at this crossing. Liberty Street/Moore Avenue (Crossing no. 40) The Liberty Street/Moore Avenue crossing is the fifth highest safety priority. This crossing of CSX tracks is located about 200 feet south of
26TWG, Guidance on Traffic Control at Highway-Grade Crossings
Commerce Street
Liberty Street/Moore Avenue
Map 20: Commerce Street Crossing

46 Suffolk Rail Impact Study
Conclusions
the Moore Avenue/Pinner Street intersection and approximately 100 feet north of the entrance to the Producers Peanut Company site. A large complex of warehouses, Commonwealth Storage Buildings, is also located about 200 feet south of the crossing. This crossing does not experience enough combined vehicular and rail traffic to consider grade separation27. There were four accidents at this location, one with injuries, recorded in the period between 1996 and 2006. A likely contributing factor is the absence of crossing gates at this location. It is recommended that long‐arm crossing gates be installed at this location to protect vehicles from passing trains. The installation of variable message signs used with a rail monitoring system would alert drivers to the presence of a train and allow them to use Pinner Street, which is grade‐separated. This would improve safety by diverting them to a crossing with no potential for conflict with train traffic.
27 TWG, Guidance on Traffic Control at Highway-Grade Crossings
Sportsman Boulevard Sportsman Boulevard is the seventh highest safety priority and the sole access point for the Wonderland Forest residential neighborhood. This crossing of Commonwealth Railway is adjacent to the marshalling yard currently under construction (see map page 7). There are driveways for two residences about 200 feet south of the rail crossing and undeveloped land north of the crossing.
There are two primary safety concerns at this highway‐rail crossing. While there were no accidents recorded at this crossing in the time period examined, it remains a concern that this crossing does not have gates to separate roadway traffic from rail traffic. Considering the large increase in length and number of trains that will cross this roadway, the installation of long‐arm crossing gates is recommended for protection of roadway traffic.
Map 21: Liberty Street/Moore Avenue Crossing (No. 40)
Map 22: Sportsman Boulevard Crossing

47 Suffolk Rail Impact Study
Conclusions
Additionally, there is an emergency services access issue at this crossing because Sportsman Boulevard is the only entrance into the Wonderland Forest neighborhood. A rail monitoring system would not alleviate this problem because no alternate route can be used. This neighborhood is in an isolated location and a new roadway connection would need to be more than a mile long to avoid another highway‐rail crossing. Because of the residential driveways just south of the crossing, it would be difficult to grade‐separate this crossing. The lot sizes of those two residences are large enough that it might be possible to relocate them far enough south that an underpass of the railroad would be possible. There are other factors to consider with an underpass, including depth of the water table, which would need to be considered in an engineering study before a conclusion can be reached.
Sportsman Boulevard

48 Suffolk Rail Impact Study
Conclusions
Summary Railroad traffic through the City of Suffolk will increase dramatically due to regional growth as well as the construction of the new APM and Craney Island Terminals. These new port facilities will have important positive economic effects for Hampton Roads and surrounding regions, but safety and mobility in Suffolk will be negatively impacted. Four mobility performance measures and three safety performance measures were used to evaluate the severity of those impacts. Based on that analysis, ten mobility and ten safety priority crossings were identified. Eight priority crossings appeared on both the mobility and safety lists, resulting in further assessment of a total of twelve crossings. Each priority crossing was evaluated based on its unique characteristics and options for improvement were identified to address the particular challenges at each location. These options included near‐term, intermediate‐term, and long‐term solutions. Many of the safety improvements recommended lend themselves to quick
implementation, such as installation of gates and signing which can be completed quickly and with relatively little cost. Most of the mobility improvements recommended require extensive planning and design with potentially high right‐of‐way and construction costs, which cause them to be long‐term solutions. Citywide solutions were also considered to alleviate safety and mobility issues. City coordination with the railroads and ports to schedule as many trains at off‐peak travel times could dramatically reduce the effects of increased rail traffic. A Doppler radar based rail monitoring system to track the presence, location, and speeds of trains is also recommended to assist emergency responders. This system can be expanded to activate variable message signs (VMS) alerting motorists to blocked crossings and suggesting alternate routes. The study recommendations and planning‐level costs are provided below for informational purposes. Decisions to implement any recommendations will be made by the City of Suffolk based on further study and the availability of funding.
Crossing Priority Type Possible Solution Planning Cost* Possible Solution Planning Cost* Possible Solution Planning Cost*
13 E Washington Street Mobility & SafetyFour-quadrant gates w/ medians & signing $170,000 Rail Monitoring System w/ VMS $3 million Finney Avenue Flyover $30 million
14 Liberty Street Mobility & Safety Signing & overhead lights $130,000 Rail Monitoring System w/ VMS $3 million Finney Avenue Flyover $30 million
9 S Saratoga Street Mobility & SafetyFour-quadrant gates w/ medians $170,000 Rail Monitoring System w/ VMS $3 million
28 Nansemond Parkway 1 Mobility & Safety Long-arm gates $130,000 Rail Monitoring System w/ VMS $3 millionBypass Road or Underpass
$20 million $50 million
11 S Main Street Mobility Rail Monitoring System w/ VMS $3 million8 Wellons Street Mobility & Safety Signing & long-arm gates $135,000 Rail Monitoring System w/ VMS $3 million
38 N Main Street Mobility & SafetyLong-arm gates, pedestrian gates, & benches $200,000 Rail Monitoring System w/ VMS $3 million Connection to Pinner Street $15 million
29 Shoulders Hill Road Mobility & SafetyFour-quadrant gates w/ medians $170,000 Rail Monitoring System w/ VMS $3 million Bypass Road $20 million
25 Nansemond Parkway 2 (Wilroy) Mobility & Safety Long-arm gate (1) $70,000 Rail Monitoring System w/ VMS $3 million Overpass $60 million12 Commerce Street Mobility Rail Monitoring System w/ VMS $3 million40 Liberty Street/Moore Ave Safety Long-arm gates $130,000 Rail Monitoring System w/ VMS $3 million26 Sportsman Boulevard Safety Long-arm gates $130,000 Rail Monitoring System w/ VMS $3 million Underpass $35 million
Table 17 - Summary Table
Prepared by: Hampton Roads Planning District Commission
Near-Term Options Intermediate-Term Options Long-Term Options
* Planning costs shown for each crossing represent the cost to implement the entire solution and not the share of the project related to each crossing.
ID No.