
Sudeep Tanwar Sudhanshu Tyagi Neeraj Kumar Editors
477
Intelligent Systems Reference Library 163 Sudeep Tanwar Sudhanshu Tyagi Neeraj Kumar Editors Multimedia Big Data Computing for IoT Applications Concepts, Paradigms and Solutions
-
Upload
khangminh22 -
Category
Documents
-
view
0 -
download
0
Transcript of Sudeep Tanwar Sudhanshu Tyagi Neeraj Kumar Editors

Intelligent Systems Reference Library 163
Sudeep TanwarSudhanshu TyagiNeeraj Kumar Editors
Multimedia Big Data Computing for IoT ApplicationsConcepts, Paradigms and Solutions

Intelligent Systems Reference Library
Volume 163
Series Editors
Janusz Kacprzyk, Polish Academy of Sciences, Warsaw, Poland
Lakhmi C. Jain, Faculty of Engineering and Information Technology, Centre for
Artificial Intelligence, University of Technology, Sydney, NSW, Australia;
Faculty of Science, Technology and Mathematics, University of Canberra,
Canberra, ACT, Australia;
KES International, Shoreham-by-Sea, UK;
Liverpool Hope University, Liverpool, UK

The aim of this series is to publish a Reference Library, including novel advances
and developments in all aspects of Intelligent Systems in an easily accessible and
well structured form. The series includes reference works, handbooks, compendia,
textbooks, well-structured monographs, dictionaries, and encyclopedias. It contains
well integrated knowledge and current information in the field of Intelligent
Systems. The series covers the theory, applications, and design methods of
Intelligent Systems. Virtually all disciplines such as engineering, computer science,
avionics, business, e-commerce, environment, healthcare, physics and life science
are included. The list of topics spans all the areas of modern intelligent systems
such as: Ambient intelligence, Computational intelligence, Social intelligence,
Computational neuroscience, Artificial life, Virtual society, Cognitive systems,
DNA and immunity-based systems, e-Learning and teaching, Human-centred
computing and Machine ethics, Intelligent control, Intelligent data analysis,
Knowledge-based paradigms, Knowledge management, Intelligent agents,
Intelligent decision making, Intelligent network security, Interactive entertainment,
Learning paradigms, Recommender systems, Robotics and Mechatronics including
human-machine teaming, Self-organizing and adaptive systems, Soft computing
including Neural systems, Fuzzy systems, Evolutionary computing and the Fusion
of these paradigms, Perception and Vision, Web intelligence and Multimedia.
** Indexing: The books of this series are submitted to ISI Web of Science,
SCOPUS, DBLP and Springerlink.
More information about this series at http://www.springer.com/series/8578

Sudeep Tanwar • Sudhanshu Tyagi •
Neeraj KumarEditors
Multimedia Big DataComputing for IoTApplications
Concepts, Paradigms and Solutions
123

Editors
Sudeep TanwarDepartment of Computer Scienceand EngineeringInstitute of Technology, Nirma UniversityAhmedabad, Gujarat, India
Sudhanshu TyagiDepartment of Electronicsand Communication EngineeringThapar Institute of Engineeringand Technology, Deemed UniversityPatiala, Punjab, India
Neeraj KumarDepartment of Computer Scienceand EngineeringThapar Institute of Engineeringand Technology, Deemed UniversityPatiala, Punjab, India
ISSN 1868-4394 ISSN 1868-4408 (electronic)Intelligent Systems Reference LibraryISBN 978-981-13-8758-6 ISBN 978-981-13-8759-3 (eBook)https://doi.org/10.1007/978-981-13-8759-3
© Springer Nature Singapore Pte Ltd. 2020This work is subject to copyright. All rights are reserved by the Publisher, whether the whole or partof the material is concerned, specifically the rights of translation, reprinting, reuse of illustrations,recitation, broadcasting, reproduction on microfilms or in any other physical way, and transmissionor information storage and retrieval, electronic adaptation, computer software, or by similar or dissimilar
methodology now known or hereafter developed.The use of general descriptive names, registered names, trademarks, service marks, etc. in thispublication does not imply, even in the absence of a specific statement, that such names are exempt fromthe relevant protective laws and regulations and therefore free for general use.The publisher, the authors and the editors are safe to assume that the advice and information in thisbook are believed to be true and accurate at the date of publication. Neither the publisher nor the
authors or the editors give a warranty, expressed or implied, with respect to the material containedherein or for any errors or omissions that may have been made. The publisher remains neutral with regardto jurisdictional claims in published maps and institutional affiliations.
This Springer imprint is published by the registered company Springer Nature Singapore Pte Ltd.The registered company address is: 152 Beach Road, #21-01/04 Gateway East, Singapore 189721,
Singapore

Preface
With an exponential increase in the provisioning of multimedia devices over the
Internet of Things (IoT), a significant amount of multimedia big data has been
generated from different devices located across the globe. Current proposals in the
literature mainly focus on scalar sensor data with less emphasis on the streaming
multimedia big data generated from different devices. This textbook examines the
unique nature and complexity of MMBD computing for IoT applications and
provides unique characteristics and applications divided into different chapters for
MMBD over IoT. A number of research challenges are associated with MMBD,
such as scalability, accessibility, reliability, heterogeneity, and quality-of-service
(QoS) requirements. This textbook is the first-ever “how-to” guide addressing one
of the most overlooked practical, methodological, and moral questions in any
nations’ journeys to handle the massive amount of multimedia big data being
generated from IoT devices’ interactions: For example, how to handle the com-
plexity of facilitating MMBD over IoT? How to organize the unstructured and
heterogeneous data? How to deal with cognition and understand complexity
associated with MMBD? How to address the real-time and quality-of-service
requirements for MMBD applications? How to ensure scalability and computing
efficiency.
The book is organized into four parts. Part I is focused on technological
development, which includes five chapters. Part II discussed the multimedia big
data analytics, which has five chapters. Part III illustrates the societal impact of
multimedia big data with well-structured four chapters. Finally, Part IV highlights
the application environments for multimedia big data analytics with four chapters.
Part I Technological Developments
Chapter “Introduction to Multimedia Big Data Computing for IoT” presents an
introduction to the multimedia big data computing for IoT applications. This
chapter addresses the gap between multimedia big data challenges in IoT and
v

multimedia big data solutions by offering the present multimedia big data frame-
work, their advantages and limitations of the existing techniques, and the potential
applications in IoT. It also presents a comprehensive overview of the multimedia
big data computing for IoT applications, fundamental challenges, and research
openings for multimedia big data era.
Chapter “Energy Conservation in Multimedia Big Data Computing and the
Internet of Things—A Challenge” highlights various ways to achieve energy
conservation in the MMBD IoT environment. The authors have focused on the
investigation of the existing technologies and mechanisms in the above domains.
The authors have first presented the need for energy conservation briefly and then
discuss the key points of the existing solutions for saving energy in IoT commu-
nications. At the end of the paper, the authors have summarized the findings to
describe the advantages and limitations of the existing mechanisms and provide
insights into possible research directions.
Chapter “Deep Learning for Multimedia Data in IoT” highlights the importance
and convergence of deep learning techniques with IoT. Emphasis is laid on the
classification of IoT data using deep learning and the essential fine-tuning of
parameters. A virtual sensor device implemented in Python is used for simulation.
An account of protocols used for communication of IoT devices is briefly dis-
cussed. A case study is also provided regarding the classification of Air Quality
Dataset using deep learning techniques. Later in this chapter, the challenges faced
by IoT are discussed, and deep learning is explained in detail. At the end, the future
research directions are discussed.
Chapter “Random Forest-Based Sarcastic Tweet Classification Using Multiple
Feature Collection” proposes a model with an accuracy slightly higher than 84%,
which depicts a clear improvement in comparison with the existing models. The
authors have used random forest-based classification model which outperformed all
other candidates deployed under the experiment. Through simulations, the authors
have obtained an accuracy of 84.7%, which outperforms the SVM (78.6%), KNN
(73.1%), and maximum entropy (80.5%).
Part II Multimedia Big Data Analytics
Chapter “Peak-to-Average Power Ratio Reduction in FBMC Using SLM and PTS
Techniques” presents an overview of a novel selective mapping (SLM) and partial
transmit sequence (PTS) PAPR reduction technique which is suggested for FBMC.
The authors have proposed a technique which was implemented by using an ele-
mentary successive optimization technique that upsurges the PAPR performance
and ensures the design difficulty is taken low. PAPR and bit error rate
(BER) parameters are analyzed and simulated for the proposed and conventional
PAPR reduction techniques. The authors have performed simulation which shows
that the SLM and PTS accomplished an excellent PAPR reduction up to 2.8 dB and
4.8 dB as compared to other peak power minimization techniques.
vi Preface

Chapter “Intelligent Personality Analysis on Indicators in IoT-MMBD-Enabled
Environment” enlightens the use of personality detection test in academics, job
placement, group interaction, and self-reflection. It provides the use of multimedia
and IoT to detect the personality and to analyze the different human behaviors. It
also includes the concept of big data for the storage and processing of the data
which will be generated while analyzing the personality through IoT. In this
chapter, authors have used supervised learning. Algorithms like Linear Regression,
Multiple Linear Regression, Decision Tree and Random Forest to build the model
for personality detection test.
Chapter “Data Reduction in MMBD Computing” provides an overarching view
of data compression challenges related to big data and IoT environment. The
authors have provided an overview of the various data compression techniques
employed for multimedia big data computing, such as run-length coding, Huffman
coding, arithmetic coding, delta modulation, discrete cosine transform, fast Fourier
transform, Joint Photographic Experts Group, Moving Picture Experts Group, and
H.261, including the essential theory, the taxonomy, necessary algorithmic details,
mathematical foundations, and their relative benefits and disadvantages.
Chapter “Large-Scale MMBD Management and Retrieval” introduces the basics
of multimedia data and the emergence of big data in multimedia. Then, the
requirements that are essential for a Multimedia Database Management System to
function properly and produce efficient results are discussed. Further, this chapter
covers the annotation and indexing techniques that help manage a large amount of
multimedia data. Finally, a detailed description of the databases can be put to use
for storing, managing, and retrieving the multimedia big data.
Chapter “Data Reduction Technique for Capsule Endoscopy” explores data
reduction techniques with the aim of maximizing the information gain. This tech-
nique exhibits high variance and low correlation to achieve this task. The proposed
data reduction technique reduces the feature vector which is fed to a
computer-based diagnosis system in order to detect ulcer in the gastrointestinal
tract. The proposed data reduction technique reduces the feature set to 98.34%.
Part III Societal Impact of Multimedia Big Data
Chapter “Multimedia Social Big Data: Mining” presents an extensive and organized
overview of the multimedia social big data mining. A comprehensive coverage
of the taxonomy, types, and techniques of multimedia social big data mining is put
forward. Then, a SWOT analysis is done to understand the feasibility and scope of
social multimedia content and big data analytics is also illustrated. They concluded
with the future research direction to validate and endorse the correlation of mul-
timedia to big data for mining social data.
Chapter “Advertisement Prediction in Social Media Environment Using Big
Data Framework” describes an advertisement prediction framework which uses
prediction approaches on big data platforms. In addition, social media platforms are
Preface vii

used to collect data that is based on user interest. The authors have performed
experiments on real-time data that is collected from social media platforms. Finally,
the proposed framework can be served as a benchmark for business companies to
send the appropriate advertisement to the individuals.
Chapter “MMBD Sharing on Data Analytics Platform” explores the field of
multimedia big data sharing on data analytics platform. Multimedia data is a major
contributor to the big data bubble. The authors have discussed various ways of data
sharing. Further, this chapter covers cloud services as a recently developed area for
storage and computation. Impacts of social media giants like Facebook and Twitter
along with Google Drive have been discussed. Finally, this chapter ends with a
brief mention of the security of online data and analysis of the MMBD.
Chapter “Legal/Regulatory Issues for MMBD in IoT” details the fundamental
issues related to the use of MMBD in IoT applications and also presents a sys-
tematic discussion of some emerging questions regarding the transfer and use of
data across the Internet. Thus, strict penalties are needed to be imposed on the
offenders and misusers of MMBD, and an adequate legal framework is discussed in
this chapter which addresses the regulatory and legal issues for MMBD in IoT that
are required.
Part IV Application Environments
Chapter “Recent Advancements in Multimedia Big Data Computing for IoT
Applications in Precision Agriculture: Opportunities, Issues, and Challenges” pre-
sents a survey on the existing techniques and architectures of MMBD computing
for IoT applications in precision agriculture, along with the opportunities, issues,
and challenges it poses in the context. As a consequence of the digital revolution
and ease of availability of electronic devices, a massive amount of data is being
acquired from a variety of sources. Moreover, this chapter focuses on major agri-
cultural applications, cyber-physical systems for smart farming, multimedia data
collection approaches, and various IoT sensors along with wireless communication
technologies, employed in the field of precision agriculture.
Chapter “Applications of Machine Learning in Improving Learning
Environment” presents various machine learning approaches that help educators
to make the teaching and learning environment more fun and challenging with the
aid of intelligent technologies and take our education to new heights, as soon as
education system implements the machine learning concept in their curriculums.
Chapter “Network-Based Applications of Multimedia Big Data Computing in
IoT Environment” gives a brief introduction on IoT with its structure. Then, dif-
ferent technologies are discussed in the field of IoT. The authors have described
various application areas of IoT. Finally, big data and the importance of IoT-based
sensor devises in big data are presented.
Chapter “Evolution in Big Data Analytics on Internet of Things: Applications
and Future Plan” discusses some applications and explains the utilization of big
viii Preface

data and IoT in brief. Secondly, the deficiencies are also the matter of concern in
this chapter. The desired solutions to overcome the drawbacks of the big data and
Internet of Things are also discussed. The authors also have presented the devel-
opment in the subject of big data on the Internet of things applications.
The editors are very thankful to all the members of Springer (India) Private
Limited, especially Mr. Aninda Bose, for the given opportunity to edit this book.
Ahmedabad, Gujarat, India Dr. Sudeep Tanwar
Patiala, Punjab, India Dr. Sudhanshu Tyagi
Patiala, Punjab, India Dr. Neeraj Kumar
Preface ix

Contents
Part I Technological Developments
Introduction to Multimedia Big Data Computing for IoT . . . . . . . . . . . 3
Sharmila, Dhananjay Kumar, Pramod Kumar and Alaknanda Ashok
Energy Conservation in Multimedia Big Data Computing
and the Internet of Things—A Challenge . . . . . . . . . . . . . . . . . . . . . . . 37
Pimal Khanpara and Kruti Lavingia
An Architecture for the Real-Time Data Stream Monitoring
in IoT . . . . . . . . . . . . . . . . . . . . . . . . . . . . . . . . . . . . . . . . . . . . . . . . . . . 59
Mario José Diván and María Laura Sánchez Reynoso
Deep Learning for Multimedia Data in IoT . . . . . . . . . . . . . . . . . . . . . . 101
Srinidhi Hiriyannaiah, B. S. Akanksh, A. S. Koushik, G. M. Siddesh
and K. G. Srinivasa
Random Forest-Based Sarcastic Tweet Classification Using Multiple
Feature Collection . . . . . . . . . . . . . . . . . . . . . . . . . . . . . . . . . . . . . . . . . 131
Rajeev Kumar and Jasandeep Kaur
Part II Multimedia Big Data Analytics
Peak-to-Average Power Ratio Reduction in FBMC Using SLM
and PTS Techniques . . . . . . . . . . . . . . . . . . . . . . . . . . . . . . . . . . . . . . . 163
Arun Kumar and Manisha Gupta
Intelligent Personality Analysis on Indicators in IoT-MMBD-Enabled
Environment . . . . . . . . . . . . . . . . . . . . . . . . . . . . . . . . . . . . . . . . . . . . . 185
Rohit Rastogi, D. K. Chaturvedi, Santosh Satya, Navneet Arora,
Piyush Trivedi, Akshay Kr. Singh, Amit Kr. Sharma and Ambuj Singh
Data Reduction in MMBD Computing . . . . . . . . . . . . . . . . . . . . . . . . . . 217
Yosef Hasan Jbara
xi

Large-Scale MMBD Management and Retrieval . . . . . . . . . . . . . . . . . . 247
Manish Devgan and Deepak Kumar Sharma
Data Reduction Technique for Capsule Endoscopy . . . . . . . . . . . . . . . . 269
Kuntesh Jani and Rajeev Srivastava
Part III Societal Impact of Multimedia Big Data
Multimedia Social Big Data: Mining . . . . . . . . . . . . . . . . . . . . . . . . . . . 289
Akshi Kumar, Saurabh Raj Sangwan and Anand Nayyar
Advertisement Prediction in Social Media Environment Using Big
Data Framework . . . . . . . . . . . . . . . . . . . . . . . . . . . . . . . . . . . . . . . . . . 323
Krishna Kumar Mohbey, Sunil Kumar and Vartika Koolwal
MMBD Sharing on Data Analytics Platform . . . . . . . . . . . . . . . . . . . . . 343
Manish Devgan and Deepak Kumar Sharma
Legal/Regulatory Issues for MMBD in IoT . . . . . . . . . . . . . . . . . . . . . . 367
Prateek Pandey and Ratnesh Litoriya
Part IV Application Environments
Recent Advancements in Multimedia Big Data Computing for IoT
Applications in Precision Agriculture: Opportunities, Issues,
and Challenges . . . . . . . . . . . . . . . . . . . . . . . . . . . . . . . . . . . . . . . . . . . . 391
Shradha Verma, Anshul Bhatia, Anuradha Chug and Amit Prakash Singh
Applications of Machine Learning in Improving Learning
Environment . . . . . . . . . . . . . . . . . . . . . . . . . . . . . . . . . . . . . . . . . . . . . 417
Pallavi Asthana and Bramah Hazela
Network-Based Applications of Multimedia Big Data Computing
in IoT Environment . . . . . . . . . . . . . . . . . . . . . . . . . . . . . . . . . . . . . . . . 435
Anupam Singh and Satyasundara Mahapatra
Evolution in Big Data Analytics on Internet of Things: Applications
and Future Plan . . . . . . . . . . . . . . . . . . . . . . . . . . . . . . . . . . . . . . . . . . . 453
Rohit Sharma, Pankaj Agarwal and Rajendra Prasad Mahapatra
xii Contents

About the Editors
Sudeep Tanwar is an Associate Professor in the Computer Science and
Engineering Department at the Institute of Technology of Nirma University,
Ahmedabad, India. He is invited as a Visiting Professor by the Jan Wyzykowski
University Polkowice, Polkowice, Poland and University of Pitesti, Pitesti,
Romania. He received his Ph.D. in 2016 from the Faculty of Engineering and
Technology, Mewar University, India, with a specialization in Wireless Sensor
Networks. His research interests include routing issues in WSN, Network Security,
Blockchain Technology, and Fog Computing. He has authored four books: Energy
Conservation for IoT Devices: Concepts, Paradigms and Solutions (ISBN:
978-981-13-7398-5), Routing in Heterogeneous Wireless Sensor Networks (ISBN:
978-3-330-02892-0), Big Data Analytics (ISBN: 978-93-83992-25-8), and Mobile
Computing (ISBN: 978-93-83992-25-6). He is an associate editor of the Security
and Privacy Journal, and is a member of the IAENG, ISTE, and CSTA.
Dr. Sudhanshu Tyagi is an Assistant Professor in the Department of Electronics
and Communication Engineering, Thapar Institute of Engineering and Technology,
Deemed University, India. He is invited as a Visiting Professor by the Jan
Wyzykowski University Polkowice, Polkowice, Poland. He received his Ph.D. in
2016 from the Faculty of Engineering and Technology, Mewar University, India,
with a specialization in Wireless Sensor Networks; and a Master’s degree in
Technology with honors in Electronics & Communication Engineering in 2005
from the National Institute of Technology, Kurukshetra, India. His research focuses
on wireless sensor networks and body area sensor networks. He has co-authored
two books: Big Data Analytics (ISBN: 978-93-83992-25-8), and Mobile
Computing (ISBN: 978-93-83992-25-6). He is an associate editor of the Security
and Privacy Journal, and is a member of the IEEE, IAENG, ISTE, and CSTA.
xiii

Dr. Neeraj Kumar is currently an Associate Professor in the Department of
Computer Science and Engineering, Thapar Institute of Engineering and
Technology, Deemed University, India. He received his Ph.D. degree in Computer
Science and Engineering from Shri Mata Vaishno Devi University, India, in 2009.
He was then a Postdoctoral Research Fellow at Coventry University, U.K. His
research focuses on distributed systems, security and cryptography and body area
networks. He is on the editorial board of the Journal of Network and Computer
Applications and the International Journal of Communication Systems. He has
published more than 200 research papers in leading journals and conferences in the
areas of communications, security and cryptography. He is also a member of the
IEEE and IEEE ComSoc.
xiv About the Editors

Part I
Technological Developments
Introduction to Multimedia Big Data
Computing for IoT
Sharmila, Dhananjay Kumar, Pramod Kumar and Alaknanda Ashok
Abstract The headway of new technology, the Internet of Things (IoT) assumes
an active and central role in smart homes, wearable gadgets, agricultural machinery,
retail analytics, engagement on energy resources, and healthcare. The boom of the
internet and mobility support this proliferation in all these smart things, and massive
production of multimedia big data of different formats (such as images, videos, and
audios) daily. Multimedia applications and services provide more opportunities to
compute multimedia big data. Most of the data generated from IoT devices such as
a sensor in the devices, actuators, home appliances, and social media. In the near
future, IoT will have a significant impact in broader domains such as healthcare, smart
energy grids and smart cities in the name of IoT big data applications. More research
work has been carried out in the multimedia big data in the different aspects such as
acquisition of data, storage, mining, security, and retrieval of data. However, a few
research work offers a comprehensive survey of the multimedia big data computing
for IoT. This chapter addresses the gap between multimedia big data challenges
in IoT, and multimedia big data solutions by offering the present multimedia big
data framework, their advantages, and limitations of the existing techniques, and
the potential applications in IoT. It also presents a comprehensive overview of the
multimedia big data computing for IoT applications, fundamental challenges, and
research openings for multimedia big data era.
Sharmila (B) · D. Kumar · P. Kumar
Department of Computer Science Engineering, Krishna Engineering College, Ghaziabad 201007,
Uttar Pradesh, India
e-mail: [email protected]
D. Kumar
e-mail: [email protected]
P. Kumar
e-mail: [email protected]
A. Ashok
Women Institue of Technology, Dehradun, Uttarakhand Technical University, Dehradun,
Uttarakhand, India
e-mail: [email protected]
© Springer Nature Singapore Pte Ltd. 2020
S. Tanwar et al. (eds.), Multimedia Big Data Computing
for IoT Applications, Intelligent Systems Reference Library 163,
https://doi.org/10.1007/978-981-13-8759-3_1
3

4 Sharmila et al.
Keywords Big data · Internet of things · Multimedia data · Unstructured data ·
Data computing
1 Introduction
Regular ascend in new technologies and their accessibility coupled with the avail-
ability of multimedia sources, the rapid and extensive use of multimedia data such as
videos, audios, images, and text have been increasing day by day. Currently, sources
of multimedia big data are YouTube, Facebook, Flickr, iCloud, Instagram, Twitter,
etc. For example, every minute, the people are uploading 100 h of videos in YouTube,
per day the user send approximately 500 million of messages in Twitter; nearly, 20
billion photos are in Instagram [1]. The statistical analysis illustrates that due to the
multimedia data sharing over the internet has reached nearly 6,130 PB every month
in the year 2016. In 2020, the digital data rate surpasses 40ZB [2]. From this analysis,
each person in the world generates nearly 5,200 GB of data.
Due to the advancement in the technology, the people spend most of the time on
the internet and social networks to share and communicate their information in the
form of multimedia data [3] such as audio, videos, text, images, etc. Multimedia big
data is considered as a large volume of the information. Such multimedia big data
is characterized in terms of its massive volume, diverse Variety, and rapid velocity.
These data are mostly unstructured and may contain much noisy information. The
processing and analyzing of these data becomes difficult using the traditional data
handling and analytic tools because the traditional datasets, which consist of text
and number. Therefore, the multimedia big data requires more extensive and sophis-
ticated solutions to handle the large volume of unstructured data [4]. The major
problem which needs to be analyzed efficiently and effectively by multimedia big
data analytics such as data handling, data mining, visualizing, and understanding the
different datasets generated by multimedia sources to handle real-time challenges.
Multimedia applications and services provide more opportunities to compute mul-
timedia big data. By 2020, it is anticipated that 4 × 10ˆ24 bytes may be generated.
Studies lead by CISCO, and IBM states that 2.5 quintillions of data are generated
each day making it equivalent to 5200 GB per person in the universe. Most of the
data is generated from IoT devices such as a sensor in the devices, actuators, home
appliances, and social media. Internet of Things (IoT) also offers new challenges
to multimedia big data owing to the mobility of IoT devices, data gathering from
omnipresent sensor devices, and Quality of Experience (QoE). In this chapter, an
extensive overview of the multimedia big data challenges, impact of multimedia big
data in IoT, characteristics of multimedia big data computing in 10 V’s perspective,
and further, addressed the opportunities and future research direction of multimedia
big data in IoT.

Introduction to Multimedia Big Data Computing for IoT 5
1.1 Big Data Era
The big data concept is essential to understand the characteristics, challenges, and
opportunities for multimedia big data. The following section provides the dawn of big
data and its challenges. Over the past two decades, the amount of data has increased
in a huge amount in different fields. In 2011, the International Data Corporation
(IDC) studied and revealed that the entire volume of data generated and the size of
data copied has grown ninefold within 5 years worldwide to 01.8 ×〖10〗ˆ21 Bytes
(ZB) of data. Shortly, this numeral twice at least every 2 years [5]. Due to the massive
growth in data globally, big data is predominantly utilized for explaining the huge
amount of datasets. Big data needs much instant analysis as compared to traditional
dataset because of unstructured data. Recently, industries and government agencies
development an interest in this enormous volume of data and declared the first plans
in the direction of research and applications in big data [6]. The big data challenges
and concerns are extensively reported in public media [7–9]. Big data provides novel
opportunities for realizing new values, to gather detailed knowledge about concealed
values and also acquires in what way the data is to organize and manage multimedia
datasets efficiently. At present, a large volume of data is generating rapidly from
the source of Internet. For example, Facebook produces over 10 PB (Petabyte) of
data log per month; Google deals with 100 s of PB of data, for online trading,
Alibaba produces tens of terabyte of data for per day [10]. Advancement of IoT also
contributes significantly to generating a large amount of data rapidly. For example,
in YouTube, people are uploading an average of 72 h of videos per minute [10].
There is no abstract definition for big data. In 2001, Doung Laney addressed the
issues and chances took by enlarged data concerning the 3 V’s model, i.e., Volume,
Velocity, and Variety. IBM [11] and Microsoft research department [12] have been
used 3 V’s model to outline the big data within the subsequent fifteen years. The
3 V’s model represents Velocity, Volume, and Variety [13]. The Volume represents
the large volume of data generation and collection, Velocity represents the speed of
data generation, and Variety means the diverse forms of data which contain struc-
tured, unstructured, and semi-structured data such as text, audio, videos, web pages,
etc. Apache Hadoop well stated the big data as the traditional computers which not
able to process, and analyses the datasets in the year 2010 [14]. In 2011, McKin-
sey & Company defined big data as the succeeding level for the invention, rivalry,
and productivity. In 2011, big data ranged from TB to PB [15]. The key features
addressed by McKinsey & Company include increasingly growing of big data as
well as management of big data.
The traditional database technologies could not manage the big data. Though,
people still have different views, including the most powerful important frontrunner
in the investigation fields of big data is International Data Corporation (IDC). IDC
defines the big data as the new-fangled advancement of technologies and architec-
tures, intended to retrieve the value economically from a huge amount of a diverse
variety of data. Further, the big data considered as 4 V’s such as Volume, Variety,
Velocity, and Value. This characterization addressed the utmost difficult part in big

6 Sharmila et al.
data, which is in what way to extract the values from a large volume of datasets.
The extensive discussions have been carried out by academician and industry on the
characterization of big data [16].
1.2 Big Data Challenges
The big data provides more challenges such as data storage, to manage the data,
data acquisition, and analysis. Traditional Relational Database Management System
(RDBMS) is not suitable for unstructured and semi-structured data. The database
management and analysis relies on RDBMS, which uses more expensive hardware.
The traditional relational database management system could not manage the large
capacity and diversity of big data concerning different types of data and sources.
On a different perspective, the research community has proposed a solution to han-
dle a large volume of big data. For example, distributed file system and NoSQL
[17] databases provide the permanent solution to store and manage the large-scale
chaotic datasets, and the cloud computing provides a solution to satisfy the needs on
infrastructure for big data. Various technologies are developed for the applications
of big data applications. Some author [18] addressed the issues and difficulties of the
big data applications.
Some of the big data challenges are as follows:
• Data Representation: The different levels of big datasets such as structure, seman-
tics, granularity, and openness. The main goal of data representation is that the
data is more significant for computer analysis and user comprehensible. The inap-
propriate way of data representation reduces the originality of data and analysis.
An efficient data representation achieves an efficient data operation on datasets.
• Redundancy reduction and data reduction: Big datasets have a large number
of redundant data. It is an efficient method to decrease the highly redundant data
generated by sensor networks from IoT applications and reduces the cost of the
whole system.
• Analytical mechanism: Within the limited amount of period, the analytical mech-
anisms of big data process the vast volume of heterogeneous data. Traditional
RDBMS has the limitation of scalability and expandability, which could not
encounter the performance requirements. The non-relational databases system
could process the unstructured data. It is the unique advantage of non-relational
databases system; still, some problems are encountered in terms of performance
and specific applications. The best solution to overcome the tradeoff of relational
and non-relational databases for big data is mixed database architecture (Facebook
and Taobao), which integrates the advantages of both.
• Expendability and Scalability: The logical scheme and algorithm for big data
should sustain the current as well as forthcoming datasets and process the enormous
growth of complex data.

Introduction to Multimedia Big Data Computing for IoT 7
• Energy Management: The energy consumption is a significant problem, which
brings the attention of economy of the country. The different operations of multi-
media big data such as acquisition, processing, analysis, storing, and broadcasting
of the huge volume of big data consumes more energy. The system-level power
depletion and managing established to ensure the expandability and accessibility
of big data.
1.3 Big Data Applications in Multimedia Big Data
The multimedia big data management system depends on the big data techniques to
process and manipulate the multimedia big data efficiency.
The application of big data in multimedia big data analytics are as follows,
• Social Networks: Many research works have been performed on social network
big data analysis [19]. Tufeki et al., analyses the challenges of social activities and
behaviors of people on Twitter hashtags, which has a large number of datasets,
visibility, and ease of access. Ma et al. address the new emerging technology called
social recommender system, and it is mainly used in social networks to share
multimedia information. Davidson et al. presented YouTube video framework
activities in which it integrates social information and personalizes videos in a
recommendation system [18].
• Smartphones: Recently, smartphones have overhauled the usage of other elec-
tronic devices such as personal computers, and laptops. The smartphones have
advanced technologies and capabilities such as Bluetooth, Camera, network con-
nection, Global Positioning System (GPS), and high potential Central Processing
Unit (CPU), etc. Using smartphones, the user can manipulate, process, and access
the heterogeneous multimedia data. Mobile sensing issues of smartphones sensors
and data analyses such as data sharing, influence, security, and privacy issues are
addressed by Lane et al. [19]. The other challenges of smartphones are investigated
such as the large volume of data, security, and multimedia cloud computing.
• Surveillance Videos: The significant sources of multimedia big data is surveil-
lance videos. Xu et al. [20] present the dawn of big data innovative solutions for
multimedia big data such as volume, velocity, variety, and value of multimedia
generates from surveillance sources such as traffic control, IoT, and criminal inves-
tigation. Shyu et al. [21] present the concept of how to detect semantic concept
from the surveillance videos. One of the promising applications of multimedia big
data is smart city surveillance.
• Other applications: The applications of multimedia big data can be categorized
as health informatics, smart TVs, Internet of Things (IoT), disaster management
system, etc. The biomedicine data and healthcare data are considered as the
primary origin of the multimedia big data. It consists of variety and a huge size of
data such as patient records, medical images, physician prescription, etc. Kumari
8 Sharmila et al.
et al. [22] examined the part of IoT, fog computing, and cloud computing for
health care service.
2 Definition and Characteristics of Multimedia Big Data
Multimedia big data is the theoretical concept. There is no particular description for
multimedia big data. Multimedia big data concept differs from big data in terms of
heterogeneous, human-centric, different forms of media, and larger size as related to
the typical big data.
Some of the features of multimedia big data are given below:
• Multimedia big data comprises an enormous number of data types as compared to
traditional big data. Multimedia datasets are more understandable by a human as
compared to the machines.
• The multimedia big data is more difficult to processing as compared to traditional
big data becausem which consists of different types of audio, and videos data such
as interactive videos, stereoscopic three-dimensional videos, social videosm and
so forth.
• It is challenging to model and characterize the multimedia big data as these data are
collected from diverse (heterogeneous) sources such as pervasive portable mobile
devices, the sensor-embedded devices, the Internet of Things (IoT), Internet, digital
games, virtual world, and social media.
• It is thought-provoking to analyze the content and context of multimedia big data,
which is not constant over a period of time and space.
• Security of multimedia big data is complicated due to rapid increases in the sen-
sitive video data on communication.
• There is a necessity to process the multimedia big data swiftly and uninterrupt-
edly in order to cope with the transmission speed of the network. For real-time
computing, the multimedia big data is needed to be stored in order to transfer the
enormous amount of data in real time.
From the above discussed characteristics, it is observed that the scientific multime-
dia big data leads to some fundamental challenges such as cognition and understand-
ing complexity, analyzing complex and heterogeneous data, difficult to manage the
security of distributed data, quality of experience, quality of service, detailed require-
ments, and performance restriction that arises from multimedia big data applications.
The abovementioned challenges are associated with processing, storing of multime-
dia big data, transmission, and analysis, which leads to more research directions in
an area of multimedia big data.
Figure 1 shows the diverse sources of multimedia big data. The term big data is
used to refer those datasets, which could be no longer handled by traditional data
processing and analyzing application software because of a large volume of size
and complexity. The massive volume of datasets is both structured and unstructured,
which is very challenging to perform different types of task such as querying, sharing

Introduction to Multimedia Big Data Computing for IoT 9
Fig. 1 Different sources of multimedia big data
of data, transferring, updating, collecting, storing, visualizing, analyzing, security,
and privacy. The unstructured data does not have any fixed row and column for-
mat. Examples of unstructured data are picture files, auditory files, audiovisual files,
webpages, and different kinds of multimedia contents.
It does not fit appropriately into a database. As compared to structured data, the
unstructured data proliferate every second. The two different data of unstructured
dataset are the captured data and user-generated. The captured data is generated
based on users behavior. A user itself generates user-generated data. Examples of
user-generated data are comments, posts, photos, and videos posted by a user on Face-
book (Facebook.com 2016), Twitter (Twitter.com 2016), tweets, re-tweets, YouTube
(Youtube.com 2016), etc. The structured data types refer to that data which has a
static size and organized. It could be managed and stored easily in a database.
2.1 Challenges of Multimedia Big Data
As compared to the traditional big data(text-based big data), the multimedia big data
has more challenges related to basic operations like storing of enormous datasets,
processing, transmission, and analysis of data. Figure 2 depicts the multimedia big
data and its challenges.

10 Sharmila et al.
�
�Data Types: Videos, audio, text, IoTdevices, Social networks, etc.
�Challenges: Volume, real-time,unstructured, noisy, uncertainity, etc.
Multimedia Data
Abstraction
�Data storage: RDBMS, MMDBMS, NoSQL, Graph DBS, ORDBMS, Key value stores, etc.
�Challenges: store, manage, extract/retrive, unstructured data and heterogenous data sets
Multimedia
Database
�Sharing system: Cloud, online file sharing system, wireless data sharing
�Challenges: More storage, Bandwidth, maximum file size, data types, human efforts
Multimedia data
sharing
�Data Processing: Data cleaning, Data transformation, data reduction, etc.
�Feature Analysis: Videos, Audios, textual, motion, spatiotemporal, etc.
�Machine learning: Supervised , unsupervised, semi-structured, etc.
�Challenges: Multimodality data representation, Complexity, noisy, semi-structured data efficiency, real time, accuracy
Multimedia Data
Mining
Fig. 2 Multimedia big data and its challenges
The following points are some of the challenges of multimedia data:
• Real time and quality of experience requirements: The services provided by
multimedia big data is on real time. It is difficult to addresses the problem of
Quality of Experience and its requirements, which needs to perform real-time
streaming online, concurrently process the data for analysis, learning, and mining.
• Unstructured and Multimodal data: The representation of multimedia big data
is challenging to store, and modeling due to unstructured and multimodal data
which is acquired from heterogeneous sources. It is very thought-provoking to

Introduction to Multimedia Big Data Computing for IoT 11
transform unstructured multimedia data into structured data and representation of
multimedia big data due to the data gathering from different sources.
• Perception and understanding complexity: Multimedia data cannot be readily
understood by computer due to the high-level and low-level semantics gap between
semantics. Furthermore, multimedia data vary for time and space.
• Scalability and efficiency: Multimedia big data systems are required to perform
huge computation, so it must enhance communication resources, computation, and
storage resources.
The above fundamental challenges lead to four logical problems as follows:
1. Representation and Modeling: In what way the unstructured data is converted
into structured datasets? How to create representation and modeling for the mul-
timedia data gathered from heterogeneous sources, unstructured data, and mul-
timodal data?
2. Data Computing: How effectively can we can perform data mining and learning
to examine the data?
3. Online Computing: In what way concurrently analyze, process, data mining,
and learn the real-time multimedia data received in a parallel way?
4. Computing, storage, and communication optimization: In what way design a
multimedia architecture to efficiently use storage, processing, and communica-
tion?
3 The Relationship Between IoT and Multimedia Big Data
In the rapid development of the IoT, a huge number of sensors are set into the numer-
ous devices from personal electronics applications to industrial machines, which are
connected to the internet. The embedded sensors are acquired from various kinds
of datasuch as home appliances, environmental data, scientific data, geographical
data, transportation data, medical data, personal human data, mobile equipment data,
public data, and astronomical data. The multimedia big data, which collects from
IoT devices have diverse characteristics as compared with typical big data due to
the diverse characteristics of sources such as heterogeneity, different types of data
(video, audio, and image), unstructured feature, noise, etc.
According to the report by IHS Markit, by 2030, the number of connected IoT
devices can exceed 125 billion, and then an enormous amount of IoT data generated.
Current technologies available to process the multimedia big data is not enough to
face challenges in the future era. Many IoT operators realize that the importance
and advancement of multimedia big data on IoT. It is essential for adopting the
applications of IoT on the development of multimedia big data. The rapid growth
of IoT, an enormous amount of multimedia data provides more openings for the
growth of multimedia big data. These two well-known technological developments
are mutually dependent on each other and should be developed together, which also
provides more openings for the research on IoT.
12 Sharmila et al.
4 Multimedia Big Data Life cycle
The emergence of IoT device is having a more significant impact on multimedia big
data life cycle. The fundamental challenges addressed with the help of multimedia
life cycle stages.
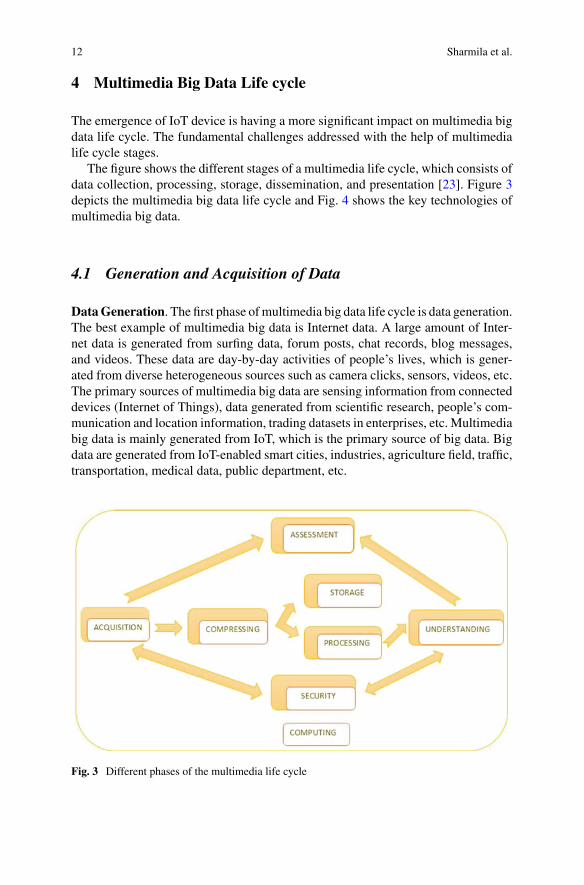
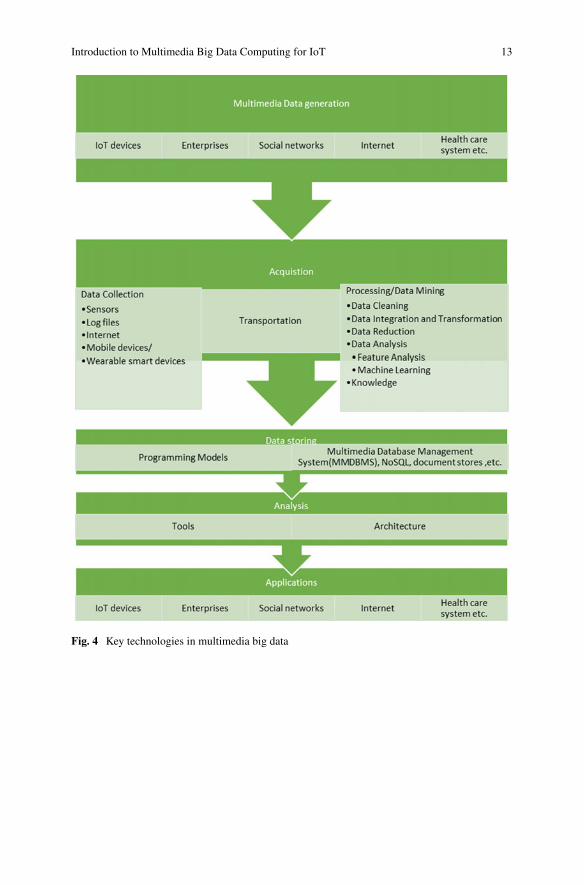
The figure shows the different stages of a multimedia life cycle, which consists of
data collection, processing, storage, dissemination, and presentation [23]. Figure 3
depicts the multimedia big data life cycle and Fig. 4 shows the key technologies of
multimedia big data.
4.1 Generation and Acquisition of Data
Data Generation. The first phase of multimedia big data life cycle is data generation.
The best example of multimedia big data is Internet data. A large amount of Inter-
net data is generated from surfing data, forum posts, chat records, blog messages,
and videos. These data are day-by-day activities of people’s lives, which is gener-
ated from diverse heterogeneous sources such as camera clicks, sensors, videos, etc.
The primary sources of multimedia big data are sensing information from connected
devices (Internet of Things), data generated from scientific research, people’s com-
munication and location information, trading datasets in enterprises, etc. Multimedia
big data is mainly generated from IoT, which is the primary source of big data. Big
data are generated from IoT-enabled smart cities, industries, agriculture field, traffic,
transportation, medical data, public department, etc.
Fig. 3 Different phases of the multimedia life cycle
Introduction to Multimedia Big Data Computing for IoT 13
Fig. 4 Key technologies in multimedia big data

14 Sharmila et al.
Data Acquisition. Acquisition is the first phase of the multimedia life cycle to get
multimedia data from heterogeneous sources, Internet of Things (IoT), sensor, actua-
tor, social media, digital games, etc. Different types of multimedia big data are gener-
ated from the sources such as audio, 2D, 3D virtual worlds, videos from the camera,
online streaming videos, social video, Hypertext Markup Language (HTML), tables,
etc. Recently, researchers proposed many standards for video coding. As compared
to typical big data, it has a high level of difficulty in acquiring data from different
sources due to the unstructured way of data representation. The unstructured datasets
are proliferating regarding volume, size, and quality. These features of multimedia
big data can offer opportunities to design new representation methods to deal with
complex and heterogeneous datasets. Table 1 depicts the comparison of multimedia
big data sets with other datasets such as representative dataset and big data.
IoT Multimedia big data generation and acquiring. To process an acquired
multimedia data from IoT devices and for transmission, the network layer is divided
into different layers such as the physical (sensing) layer, application layer, and the
network layer. The acquisition is carried out by sensing layer, which consists of
sensor networks. The information transmission and processing are carried out by the
network layer. The sensor network is responsible to perform transmission with in
the range and long distance transmission is carried out with the help of internet. The
application services of the Internet of Thing are carried out by the application layer.
The features of data generated from IoT as follows:
• Large-scale multimedia data;
• Heterogeneity;
• A limited amount of data due to noises;
• Robust time and space correlation.
Table 1 Characteristics of multimedia big data, typical datasets, and big data
Characteristics Typical datasets Big data Multimedia
Volume Less Medium Big
Data size Definite Uncertain Uncertain
Inferring video Not at all No Yes
Representation of data Structured data Structured data Unstructured data
Real-Time Not at all Yes Yes
Human-centric Not at all No Yes
Response No No Yes
Data source Centralized Heterogeneous
distributed
Heterogeneous
distributed
Complexity Low Medium High

Introduction to Multimedia Big Data Computing for IoT 15
4.2 Data Compression
The size of multimedia big data decreased to store, communicate, and process the data
efficiently. Multimedia data compression refers to eliminate the redundant data in
the dataset. Redundant data refers to duplications or additional data in the datasets,
which increases the data inconsistency, storage space, data transmission cost and
delay, and reduction of data reliability.
Feature-transformation-based data compression: The numerical data reduc-
tion is carried out by compressive sensing and wavelet transform.
• Cloud-based compression: A large amount of multimedia data is produced today
with the advent of IoT era. In the current scenario, many organizations are moving
toward the cloud to store an enormous volume of multimedia data, which leads to
storage issues in cloud computing. The storage issues are related to space, time,
access control, validation, etc. Facebook has declared that 300 billion pictures are
shared per day. Microsoft has announced that its cloud storage service accommo-
dates approximately 11 billion pictures. Many efficient compressing techniques are
available regarding space and time to store multimedia data efficiently in a cloud.
Subsequently, research on multimedia data compression for cloud computing is
of increasing importance in the computer society.
4.3 Multimedia Data Representation
The multimedia data which received from the different sources and each source
represents the data in different format. For multimodal analysis, it needs a common
representation of data. Multimedia data representation comprises of the following
different methods:
1. Feature-based data representation: Some features of multimedia big data are
standard regarding space or time; feature-based data representation is used to
extract the data among all different combination of features. Currently, many
types of research are being carried on feature vectors to retrieve the content-
based multimedia data. According to the applications, from the audio, video
streams, or image pixels, the features are extracted and combined into vectors.
The application-based approach leads to scalability, and accuracy lack in feature-
based data representation.
2. Learning-based representation: The common feature space extraction is a chal-
lenging task in multimedia big data due to the large volume of data gathered from
different sources. A new representation which used to extract the hidden space
is called learning or machine based representation.
Many learning-based representation approaches have been suggested to signify
multimedia big data. Predominantly, in recent years, deep architectures are exten-
sively applied for data learning representation.

16 Sharmila et al.
4.4 Data Processing and Analysis
Once the data is acquired and stored, the next phase of the life cycle is data processing
and analysis. The raw multimedia data, which is received from different heteroge-
neous sources are unstructured and noisy. The unstructured large-scale multimedia
datasets are not directly suitable for analysis because of sparse, noisy, and diverse
data, which causes troublesome and sometimes unfeasible. The problem as men-
tioned earlier can be alleviated by preprocessing methods. Data preprocessing is the
process of conversion of unusable data into new and cleaned data for further analysis.
After the data preprocessing, the datasets are ready for further higher level analysis.
Multimedia preprocessing of data comprises data cleaning, data transformation,
and data reduction [24] as follows:
Data Cleaning: According to the reports, data scientists are spending almost
60% of the time on data organizing and cleaning. Data organization and cleaning
[23] comprises of noise reduction, acquisition, outlier identification, and avoiding
inconsistencies. Data cleaning can improve the data quality and reduce the discrep-
ancy and faultiness of data. Data imputation methods have been used to handle the
missing data values. To improve the final results, error-aware data mining approach
incorporates the noise information in it. The noisy semi-structured data is converted
into clean data with the help of data manipulation and preprocessing tools.
Data Integration and Transformation: Data integration is the process of com-
bining the heterogeneous sources, as well as, their metadata into a consistent source.
It detects data conflicts and resolves it. Data transformation is another crucial step in
preprocessing. Data transformation includes data formatting, aggregation, and nor-
malization. Recently, extensive research work [25] is going on to develop a common
representation model to transform different data into enhanced, and simplified data.
Data reduction: Recently, many data compression techniques is proposed to
handle a large amount of multimedia data. Researches mainly focused on feature
reduction and instance reduction. In instance reduction technique [26], the quality of
mining model is improved by reducing the original datasets as well as the complexity
of the data without affecting the original data structure and integrity of the data.
• Data Analysis: As multimedia big data research is advanced due to the develop-
ment of IoT, the typical data analysis is a new complication on multimedia big
data processing. A generally big data analysis is narrowed down to the single data
format.
• Feature Analysis: The current explosion of multimedia data increases the com-
plications of data analysis as well. Feature extraction is connected to the gap
between low-level multimedia characteristics into its high-level semantic content.
It is time-consuming task to extract the features from massive datasets, and for that,
the whole process is parallelized and shared among numerous systems. Recently,
the fast feature extraction method is studied [27], and compared the three big data
techniques for multimedia feature extraction such as Apache Hadoop, Apache
Strom, and Apache Spark. Schuller et al. [23] studied how to extract the features
directly from compressed audio data.

Introduction to Multimedia Big Data Computing for IoT 17
• Deep learning Algorithm: Many researchers have been motivated by the pop-
ular Deep Learning toolboxes to extract large-scale features using deep learning
algorithms. Deep learning has mainly focused on unsupervised feature learning
and based on deep learning, a very less amount of work has been carried out on
multimodal features. An audiovisual speech classification framework using three
learning techniques are fusion-based method, a cross-modality, and shared repre-
sentation learning method. In the mid-2000s, feature reduction techniques were
proposed for large scale real time multimedia data. Online feature selection (OFS)
in which an online learner is only allowed to maintain a classifier involved only
a small and fixed number of features. The group and nonlinear feature selection
methods are based on Adaptive feature scaling to increase the performance and
speed of the training process.
• Machine Learning: Machine learning is the procedure of improving the perfor-
mance of computer programs by learning the data automatically through expe-
rience. The main purpose of machine learning is to learn a specific work whose
class tag is unknown. The supervised and unsupervised learning are the classifi-
cations of machine learning. In unsupervised learning, there is no label related to
each data instance input. The Supervised learning use an algorithm to learn the
mapping function from the input to the output.
4.5 Storage and Retrieval of Multimedia Data
The multimedia big data management and recovery are carried out with the help
of annotation due to the unstructured and heterogeneity of data. Annotation [12] is
categorized as the manual and automatic annotation. The manual annotation [28]
is done by users, source providers, and tools. The automatic annotation is carried
out by machine learning algorithms. The automatic annotations are more interest-
ing as compared to manual annotation due to the endlessly growing data. The main
problem of automatic annotation is a semantic gap. From the multimedia text docu-
ments, the semantic data are extracted by using Latent Dirichlet Modeling (LDM).
Currently, the deep learning techniques have been used widely to extract annotations
for videos and pictures. Generally, the Multimedia Database Management System
(MMDBMS) consists of multimedia data and their relationship, which is different
from traditional relational database management system. The characteristics of the
multimedia database are storage, constraints on spatial and temporal, presentation
of data, retrieval, etc.
The main requirements of the multimedia database are traditional database capa-
bilities, data modeling, storage management, retrieval, integration of media, inter-
face, and interactivity, and performance. The multimedia database management sys-
tem requires to satisfy the following requirements to perform the manipulation and
storage efficiency:

18 Sharmila et al.
• Data modeling for multimedia. Even though the various traditional database
modeling is available such as relational modeling, semantic, and network mod-
eling, only few modeling methods proposed for multimedia databases due to the
unstructured nature of multimedia data. For each type of media, the multimedia
data needs an object-oriented data model. The modeling system for the multime-
dia document, which combines the technologies such as Object-Oriented Database
Management System, Natural Language Processing (NLP), etc., to excerpt the vital
information, structure the input documents and offers semantic recovery. The data
modeling is mainly used to extract/retrieve the information.
• High volume storage management. The storage management of multimedia char-
acterized by significant volume and variety which need a hierarchical structure.
The hierarchical storage of multimedia big data increases the storage size and
decreases the performance.
• Query support and retrieval capabilities. Multimedia data needs different
queries such as content and keyword. The multimedia query typically does not
return an exact match; it returns a result which contains an object similar to the
query object. The multimedia consists of different media types, which require
consistent ranking and pruning approaches.
• Media Integration, configuration, and presentation. The integration and con-
figuration play an essential role; once unstructured data are converted into a struc-
tured data format. It ensures the truthfulness and individuality of multimedia data.
The multimedia big data require an efficient and effective presentation to reduce
excessive computation storage.
• Performance. The performance is an essential parameter of multimedia big data,
such as competence, consistency, processing of data on real-time and execution,
Quality of Service (QoS), Quality of Experience (QoE), and guaranteed mul-
timedia presentation. These performances are achieved with the help of cloud
computing and distributed processing.
• Multimedia Indexing. Generally, the traditional RDBMS is not appropriate for
multimedia big data because of unstructured data format. This problem solved with
the help of indexing approaches. The indexing approaches have been proposed to
manage the different data types and queries. Artificial Intelligence (AI) and non-
artificial intelligence are the types of indexing approaches.
4.6 Assessment
Advancements of information technologies and MEMS (Micro Electro Mechanical
Sensor) technologies and its extensive growth in numerous areas resulted in an enor-
mous amount of different data such as videos, audios, and text data. Due to the rapid
development of multimedia data and services, it is vital to provide the Quality of
Experience (QoE) to the users. Either the subjective or objective analysis cis arried
out to test the quality of the videos. The subjective analysis is carried out in a test
center which needs more human resource and expense. Generally, the subjective

Introduction to Multimedia Big Data Computing for IoT 19
Fig. 5 Characteristics of multimedia big data
assessment is not carried out for real-time estimation. The objective test depends on
the standard of Human Visual System (HVS). The objective assessment analysis is
based on subjective assessment test parameters.
4.7 Computing
From the enormous amount of multimedia data, it is a challenging task to organize
and process the multimedia big data. Multimedia big data computing is a novel
paradigm; the data analytics is performed by combining large-scale computation
with mathematical models.
5 Characteristics of Multimedia Big Data
A multimedia is a group of enormous and complicated datasets. Figure 5 shows the
characteristics of multimedia big data. Figure 6 shows the five V’s of multimedia big
data. The following characteristics can describe it,
Volume: In big data, the volume defined as the vast volumes of data generated
through the internet of things, portals, internet, etc. According to Worldometers 2016,
above 7.4 billion people (Worldometers 2016) are in the world, and almost 2 billion
peoples are linked to the internet, and remaining individual people are using various

20 Sharmila et al.
Fig. 6 Five V’s of multimedia big data

Introduction to Multimedia Big Data Computing for IoT 21
portable handheld devices, i.e., mobile devices. As a result of this technological
development, each product produces huge volume of multimedia data through the
growth of Internet technology and the use of various devices. Especially, remote
sensors embedded in the devices produce the heterogeneous data continuously either
in a structured or unstructured format. In the near future, the exponential growth
of multimedia data exceed yottabytes (1024). For example, more than one billion
users (YouTube.com 2016) are daily uploading videos over 300 h/min on YouTube.
The Facebook comprises more than 1.4 billion users, 25 trillion posts as on 2016
(StatisticsBrain 2016), and a total of 74 million Facebook pages. In 2016, 6.2 billion
gigabytes of global mobile traffic is estimated per month. According to the report
of Digital universe study of International Data and EMC Corporation, the data has
been generating tremendously, i.e., 800 EB in 2009–1.8 ZB in 2011, and in near
future, data grow 40 times (40ZB) greater in 2020. It is very challenging to handle
such amount of multimedia big data [26] concerning gathering, storage, analyzing,
preprocessing, sharing, and visualization.
Velocity: The term velocity denotes the rate at which data has been generated,
i.e., how fast the data is coming in. Hendrickson et al. [29], reports that information
proliferates by one order of scale every 5 years. Every day, 5 billion users browse
the internet, tweet, upload, and send both multimedia and standard data. The people
generates 58 million tweets and 2.1 billion queries in tweeter per day. The number of
users using YouTube increased to 40% since March 2014. Almost 50% of Facebook
account holders log into Facebook account every day. Every minute, about 2 million
searches and queries in Google (Google.com 2016) and Google processed 25 PB
every day. The efficient management tools and techniques are required to cope up
with the speed of multimedia big data.
Variety: The term variety refers to the diversity of data [29]. Examples of variety
are emails, voicemails, video message, ECG reading, audio recording, etc. In the age
of multimedia big data, the data gathered from heterogeneous sources are represented
by either images or videos. It contains more information and knowledge. Generally,
sources generate structured and unstructured data. Unstructured data does not have
any fixed format which is very difficult to process. The similar formats and predefined
lengths are referred to as structured data. The unstructured data can be processed with
the help of Hadoop; the clustering method used to process the unstructured data in a
short interval of time. The unstructured multimedia big data brings more challenges
for analyzing, preprocessing, and extracting the valuable data.
Veracity: In multimedia big data, the term veracity denotes the uncertainty of
data, noise, and deviation in data. It is very challenging issues in multimedia big data
to ensure the precision of data which make it as difficult to determine how much data
can be reliable.
Value: Value is the most critical element in multimedia big data. It denotes the
usage and retrieval of the valuable information from these huge volumes and diversity
of data. For the analysis of data, it is essential to filter, sort, and select data.
The other essential V’s of multimedia big data is as follows:

22 Sharmila et al.
• Visualization: The essential challenging characteristics of multimedia big data
are in what way the data is visualized. The technical challenges confronted by
tools available for visualization is due to the limitations of memory, functional-
ity, expandability, and response time. It is not possible to plot a billion of data
points using traditional graphs. The multimedia big data need different methods
of representing data such as data clustering, parallel coordinates, circular network
diagrams, sunbursts, etc.
• Vulnerability: Vulnerability refers to security concerns about multimedia big data.
• Validity: Validity denotes the correctness of the data for its envisioned use.
• Variability: It refers to the number of inconsistencies in the data, as well as, the
speed at which multimedia data loaded into your database.
6 Multimedia Big Data Challenges and Opportunities
With the proliferation of IoT, the world has marched into multimedia big data. The
development of multimedia big data provides a lot of challenges as well as countless
chances for the betterment of IoT applications.
6.1 Acquisition Challenges
Many different types of multimedia are videos, audios, speech, online streaming
videos, documents, graphics, geospatial data, 3D virtual worlds, etc. Multimedia big
data is unstructured data, which have more complexity in an analysis as compared to
typical big data. The unstructured data can be easily understandable by users which
proliferate regarding quantity and quality. It is difficult to understand by the machines.
These are the main challenges of multimedia big data acquisition. Some of the papers
addressed these issues are as follows: the representation and modeling of multimedia
big data is a very challenging task. Most of the studies focused on graph structure
instead of video structure. Generally, the large-scale multimedia big data is acquired
from the source, which contains the data in the form of incompleteness, uncertainty,
communication errors, also affect from malicious attack, data corruptions mainly
ignored the hidden video content and different levels of quality.
In BigKE method presents the knowledge framework to handles disjointed knowl-
edge and E-learning methods which receives the data from heterogeneous sources.
The streams feature is derived from spatial and temporal information. Wu et al. [30]
presents a tag assignments stream clustering for dynamic unstructured data, which
is modeled as a stream to describe the properties and interest of users. Hu et al. [11]
proposed a model to manage the multimedia big data using semantic link network,
which creates the relationship among different multimedia resources.

Introduction to Multimedia Big Data Computing for IoT 23
Table 2 Existing methods of acquisition process
Methods Objectives Limitations
BigKE [30] Knowledge framework to
handles disjointed knowledge
exhibiting and E-learning
methods from numerous
heterogeneous sources
Not addressed IoT
Semantic link network model
[11]
Manage the multimedia data
using semantics
Not addressed issues on IoT
Wang [35], Pouyanfar et al.
[44]
Addressed the review of
multimedia big data
Not addressed issues on IoT
Kumari et al. [31] Addressed the taxonomy and
multimedia big data for IoT
Focused on IoT
Multimedia data acquisition for IoT application is categorized as three parts,
namely, data gathering, compression, and representation [31]. Table 2 shows the
pros and cons of existing acquisition process.
In context of IoT, the multimedia data is often collected from sensors. The data
collection has been carried out from several areas such as forecasting health status
of patient, wireless networks, Internet of Multimedia Things (IoMT), Healthcare
I,ndustrial IoT (Health-IIoT) and personal devices. The multimedia big data collected
from the IoT devices are heterogeneous in nature. The main limitations of the existing
methods are each method has different views and categories. While designing a new
method for data acquisition, the following factors are considered such as unstructured
data, heterogeneous sources, multimodal, dynamic evolution, user’s interest, spatial
and temporal information, semantics, and geographically distributed data.
6.2 Compressing Challenges
The multimedia big data is a massive size of data; it must be compressed before
further processing and storage.
The compression of multimedia big data brings more challenges as compared to
traditional datasets and big data techniques. Due to the limited storage and process-
ing/computational capability, it needs to be compressed effectively with the help of
signal processing and transformation.
Many challenges arise while compressing multimedia big data as follows:
• Multimedia big data is difficult to handle because of unstructured data;
• Due to the large volume of data, it is challenging to compress at a fast speed;
• Data loss is very high due to diverse sources.
The traditional big data reduction approaches for compression are wavelet trans-
form and compressive sensing. Duan et al. [32] proposed the compression technique

24 Sharmila et al.
based on feature descriptor to attain large reduction ratio which depends on different
coding approaches. Bu et al. [22] proposed a deep learning-based feature extraction
context to extract the multilevel three-dimensional shape feature extraction. Xu et al.
[20] proposed a latent intact space learning to acquire abundant data information
by merging multiple views. Herrera et al. [33] proposed an architecture to handle
the data from various multimedia streaming stations such as TV and radio stations
to perform gather, process, analyze, and visualize data. The approaches mentioned
above is mainly focused on high-level integrated features in multiple views. The
effective description techniques are needed to extract high features. Most of the
existing approaches are not focused on the application of IoT. Table 3 shows the pros
and cons of existing methods of data reduction and collection.
6.3 Storage Challenges
Big volume of multimedia big data being is created continuously, and it is essential to
store the large volume of data after compression. The size of multimedia big data is
unlimited and has a variety of media types. With the massive evolution of multimedia
big data, the quality and amount of unstructured data bring more challenges to store
data as compared to typical big data. The storage system of typical big data is based
on the NoSQL. In multimedia big data scenario, it is impossible to store all real-time
streaming multimedia data. The limitation of existing storage methods is given in
Table 4.
The challenges of multimedia big data storage addressed in the new design regard-
ing feasibility and cost. Dede et al. [34] present a pipeline processing to combine
the NoSQL storage with big data processing platform (MapReduce). Wang et al.
[35] presented hybrid stream big data analytic models for multimedia big data to
addresses the data video analysis which contains data preprocessing, classification,
recognition, and big data overload reduction. Table 3 shows the limitations of existing
storage methods.
Liu et al. [20] present a hashing algorithm based on deep learning and shal-
low learning to efficiently store multimedia data, indexing, and retrieval. NoSQL-
based approach is introduced to manage real-time embedded database efficiently. It
is mainly designed to distribute data storage for an enormous amount of data needs,
which takes advantage of scaling. The concept of integrating the IP Multimedia Sub-
system (IMS) with the Hadoop system increases the performance, scalable distributed
storage, and computing system of IP multimedia subsystem service resources. While
designing the storage system for multimedia big data, the following features should
be considered to increase the performance and distributed storage. The boundaries
of IoT and cloud computing should be considered.

Introduction to Multimedia Big Data Computing for IoT 25
Table 3 Existing methods of data collection and reduction
Category Survey Area of Interest Pros Cons
Multimedia
data collection
Gao et al. [39] Machine learning
feature analysis
Outline of
High-
dimensional
multimedia big
data and
machine
learning
techniques
Not focused on
multimedia big
data and its
technical
challenges on
IoT
Hu et al. [11] Retrieval of video An overview on
video indexing
and retrieval
• Limited to
single
multimedia
data type• Lack of
multimedia
big data
challenges
Wang et al. [39] Smart grid A general
overview on
multimedia
wireless sensor
networks and
its application
in smart grid
Limited to
multimedia big
data analytics
Madan et al.
[45]
To predict health
status of the patient
Low costs for
providers
Not addressed
wireless
networks issues
LUSTER [46],
Hossain et al.
[47]
• Environmental
monitoring using
WSN
• Data collected
from Internet
• Data
reliability,
efficient
scalability
• Distributed
and fault
tolerant
storage
Prone to
Security
breaches
Duang et al.
[32]
• Feature
descriptor based
on multimedia
coding
approaches
• High
compression
ratio
Not focused on
multimedia
data on IoT
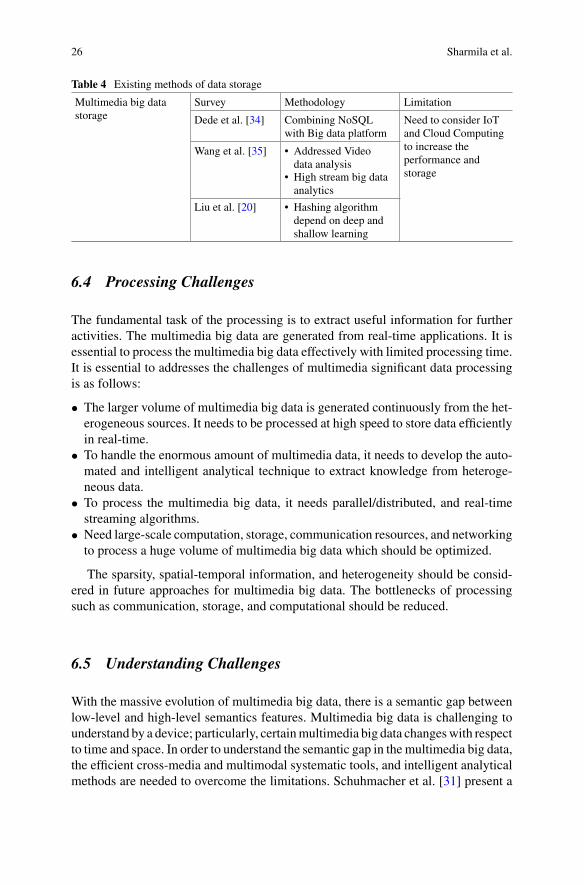
26 Sharmila et al.
Table 4 Existing methods of data storage
Multimedia big data
storage
Survey Methodology Limitation
Dede et al. [34] Combining NoSQL
with Big data platform
Need to consider IoT
and Cloud Computing
to increase the
performance and
storage
Wang et al. [35] • Addressed Video
data analysis
• High stream big data
analytics
Liu et al. [20] • Hashing algorithm
depend on deep and
shallow learning
6.4 Processing Challenges
The fundamental task of the processing is to extract useful information for further
activities. The multimedia big data are generated from real-time applications. It is
essential to process the multimedia big data effectively with limited processing time.
It is essential to addresses the challenges of multimedia significant data processing
is as follows:
• The larger volume of multimedia big data is generated continuously from the het-
erogeneous sources. It needs to be processed at high speed to store data efficiently
in real-time.
• To handle the enormous amount of multimedia data, it needs to develop the auto-
mated and intelligent analytical technique to extract knowledge from heteroge-
neous data.
• To process the multimedia big data, it needs parallel/distributed, and real-time
streaming algorithms.
• Need large-scale computation, storage, communication resources, and networking
to process a huge volume of multimedia big data which should be optimized.
The sparsity, spatial-temporal information, and heterogeneity should be consid-
ered in future approaches for multimedia big data. The bottlenecks of processing
such as communication, storage, and computational should be reduced.
6.5 Understanding Challenges
With the massive evolution of multimedia big data, there is a semantic gap between
low-level and high-level semantics features. Multimedia big data is challenging to
understand by a device; particularly, certain multimedia big data changes with respect
to time and space. In order to understand the semantic gap in the multimedia big data,
the efficient cross-media and multimodal systematic tools, and intelligent analytical
methods are needed to overcome the limitations. Schuhmacher et al. [31] present a

Introduction to Multimedia Big Data Computing for IoT 27
knowledge graph which consists of objects, concepts, and relationships; to extract the
knowledge associations from different heterogeneous data. The concept and entities
reproduce the real-world concepts. The pattern matching methodologies is used to
extract the information from open source before constructing the knowledge graph.
The knowledge graph is used in different applications, such as big data analytics, deep
learning, to search semantic data, etc. Extensive research is needed to construct the
knowledge graph automatically to handle the huge scale of data. Recently, research
works are going on the structured and semi-structured text data. More research is
required on the unstructured knowledge graph to handle the large volume of multi-
media big data.
6.6 Computing Challenges
The multimedia big data is generated from the real-time environment. It is generating
continuously by more number of heterogeneous sources, which requires to process
uninterruptedly to store the data efficiently and time restrictions. Multimedia big data
consists of a wide variety of data and transient in nature. As a result, it is essential
to design the concurrent and instantaneous online streaming processing for scrutiny
of multimedia data. To perform computation on large-scale data, it is necessary to
optimize storage, communication resources, and processing. Due to the development
of communication technology, the multimedia big data travels through the network
at very high sapped; it brings the challenges of GPU computing. The cloud-based
system presented to harvest data from multimedia big data in the global camera
networks. In this method, it receives multimedia data from numerous devices, and
it can be evaluated instantaneously by an application programming interface. The
storage and computing of multimedia big data problem can be addressed by cloud
computing technology.
Sadiq et al. [36] addressed the several challenges of multimedia big data received
from crowded heterogeneous sources. The author presents a framework for spa-
tial multimedia big data and various multimedia sources. It also handled the spatial
queries related to multimedia big data in real-time. Cevher et al. [37] addressed the
bottlenecks in big data such as computational, storage, and communications. It also

28 Sharmila et al.
shows that advances in convex optimization algorithms propose several unconven-
tional computational choices. The synchronization problem in multimedia big data
is addressed to exploit the therapy recorder, which can implement the two-tier syn-
chronization process. It creates the multimedia synchronized therapy session file and
separates the complex media files. Garcia et al. [38] present a pipeline media con-
cept and Platform as a Service (PaaS) scheme. Zhang et al. [28] presents a method to
efficient precision recommendation method to recover the particular image from the
large size image database. The author presents three different types of content-based
imageretrieval, based on the content comparison the relevant image is recovered from
the image database. The authors have been analysed the platform to facilitate the pub-
lic cultural services based on cloud computing and Hadoop system. The fusion of
cloud computing and big data technology need to be considered to reduce computa-
tion time and improve data scalability. The data traffic can be classified based on the
local and structural features to process the data in real-time.
6.7 Security and Privacy Challenges
The multimedia big data consists of different datasets, which include private/personal
videos or sensitive videos [27]. With the explosion of videos, the multimedia big data
must be governed in complete security. It is challenging and essential to trace and
protect the multimedia big data. In order to manage and accesses the multimedia big
data securely, it is essential to study the implementation of a privacy policy. In the
context of IoT devices, the security of multimedia big data provides confidentiality,
integrity, and availability. Due to the huge volume and heterogeneous nature of data,
the security brings more challenges to deal with multimedia big data in IoT. In case
of centralized data, the single point of failure reveals the user’s information which
violates the laws. An outset of data mining in the real world dogged to privacy issue.
The encryption techniques are used to secure the confidentiality of multimedia big
data. At present, the methodologies/technologies available ensure only the privacy
of the static data. The protection of dynamic dataset is a challenging task.
6.8 Assessment Challenges
The Quality of Experience (QoE) plays a significant part in multimedia big data for
video applications. Some of the challenges of multimedia big data assessment are as
follows:
• It is a tedious task to measure and quantify user experience levels.
• In real time, it is complicated to keep track of multimedia big data applications.
• In what way to correlate Quality of Service (QoS) and QoE metrics effectively?
• In what way to obtain a standard for users?

Introduction to Multimedia Big Data Computing for IoT 29
• How efficiently analyses the customers’ experience?
• In what way quickly and accurately measure the QoE under various standards?
Wang et al. [39] present the importance of monitoring and analyzing the net-
work traffic to improve the customer experience and improving resource allocation
of networks. Liu et al. [20] present the methodology to monitor and analyze the
big data traffic with the help of Hadoop. Hadoop is mainly developed for batch
processing, later on, used for large-scale data processing. It is a license-free Java-
based distributed computing platform for big data. Google developed Hadoop for
big data applications. In Hadoop, the Java language is used to write MapReduce
code. The features of Hadoop are cost effective, high efficiency, scalability, tolerate
the fault, and distributed concurrency computing. The significant primary challenge
of Hadoop is tough to adapt it for network measurement. Recently, many research
works have been carried out on QoE problems. Adaboost model presented to achieve
higher accuracy which shows the relationship between the significances of the IPTV
set-up box and QoE. An user-centric QoE prediction methodology depends on var-
ious machine learning algorithms such as artificial neural networks, decision tree,
Gaussian Naïve Bayes classifiers, and vector regression tool. Sun et al. [4] present a
decision tree video to model datasets, which achieves good service and enhance the
users QoE. The main characteristics of this model provide the association between
users QoE and alarming data for IPTV. The cross-layer prediction method was pro-
posed to estimate the mobile video quality without any reference model. Recently,
much research has been carried out on user-centric analysis and a likelihood of QoE
based on a machine learning algorithm.
7 Opportunities
Despite all the challenges faced by the multimedia big data, it still offers considerable
opportunities to the Internet of Multimedia Things (IoMT) to advance the facilities
and applications through the efficient use of multimedia big data. With the prolifera-
tion of MEMS technologies, the IoT is well thought-out as one of the most transitions
in today’s technology. IoT offers more opportunities for multimedia big data analyt-
ics. Some examples of multimedia big data computing for IoT applications are as
follows:
E-Commerce In this era, the growth of multimedia big data is very high as
compared to traditional data. To process the large quantity of data in real time,
the multimedia IoT big data analytics provides well-designed tools for decision-
making. The integration of multimedia big data with IoT provides new challenges
and openings to construct a smart environment.
Social Media Analytics collects the data from social media such as Facebook,
Twitter, Google Plus, blogs, Wikipedia, etc., to analyses/statistics such data to gather
the knowledge. Most of the E-commerce vendors are gathering the social media

30 Sharmila et al.
analytics to gain business values, increase the sales and profits, customer satisfaction,
build companies reputation, and create brand awareness among people.
Smart Cities The development of multimedia big data and evolution of IoT tech-
nologies have played a significant role in the initiatives of smart cities. The integration
of IoT and multimedia big data is a promising new research area that brought more
interesting challenges and opportunities for attaining the goal of future smart cities.
IoT plays an important source for collecting a large amount of multimedia big data,
which needs high-speed processing, analysis, and transmission. Tanwar et al. [40,
41] proposed an advanced security alert system architecture for smart home using
pyroelectric infrared and raspberry pi module.
Healthcare: Big data has a huge potential to alter the healthcare industry. The
smart healthcare devices produce a huge amount of information such as ECG, tem-
perature monitors, sugar level, etc. The healthcare devices monitor real-time health
data of patient, which reduces the overall cost for the prevention and management
of illnesses. From the analysis of health data, the doctor could diagnose and detect
diseases at an early stage. Due to the high-speed access to the internet, many people
have started to utilize mobile applications to manage their health problems. These
mobile applications and smart devices are integrated and act as a Medical Internet
of Thing (MIoT).
The proper use of multimedia big data gathered from IoT increase economics,
productivity and bring new visions to the world. Based on a literature review, the
challenges are identified for multimedia big data analytics in Internet of Things (IoT).
8 Future Research Directions
Many of the organizations have widely acknowledged multimedia big data com-
puting for IoT applications. Still, multimedia big data for IoT is in primary stages.
Many current challenges have been not addressed. This section gives numerous chal-
lenges and its future research directions of multimedia big data computing for IoT
applications.
8.1 Infrastructure
In this era, the amount of data generated from the IoT devices exceeds the computer
resources. To analyze the multimedia big data, the manufacturers have to produce
a high-volume solid hard disk drive to handle a massive volume of data. The solid
disk drive replaced the conventional hard disk storage system. In the near future, a
powerful processor is needed to process an enormous amount of multimedia big data.
The diversity of real-time multimedia big data such as 3D graphics, audios, and videos
are processed by more efficient Central Processing Unit (CPU) virtualization ad I/O
virtualization needed, which reduces cloud computing cost. As already mentioned
Introduction to Multimedia Big Data Computing for IoT 31
that the primary source of generating multimedia data from the internet is IoT, which
would need large data warehouses. Hadoop and Spark techniques would be used
further to explore the data locality and transfer huge volume of big data to computing
units over traditional High-Performance Computing (HPC).
8.2 Data Security and Privacy
Data security and privacy play a significant concern in multimedia big data. Still, most
of the enterprises do not use the cloud to store their multimedia big data due to the
nonexistence of data visibility and privacy in this new infrastructure. As mentioned
earlier, data security and privacy have been a significant problem in the development
of technologies and mobile devices (MIoT). The security storage and management
of big data, privacy on data mining and analysis, access control are the possible
mechanisms for multimedia big data. It does not increase the computational and
processing cost. It should balance between access control and processing ease. The
efficient security mechanism such as encryption of multimedia data is required to
secure the multimedia big data. The privacy plays an significant issue in data mining.
The privacy of data is achieved by encryption, anonymity, and temporary identifica-
tion. Another security issue related to multimedia big data associated with IoT is the
heterogeneity sources used and the nature of different types of data generated. The
authentication of heterogeneous devices could be carried out by assigning a unique
identification to the respective device. The architecture of heterogeneous IoT has
increased the security risks to security professionals. Subsequently, any attack in
IoT architecture compromises the security of the system and cutoff interconnected
devices. The traditional security algorithm is not appropriate for IoT devices due
to a dynamic observation of data. The security problems encountered by IoT big
data are as follows: (a) dynamic updates—challenging to keep system updates, (b)
identifying illegitimate traffic patterns among legitimate ones, (c) interoperability,
(d) and protocol convergence—the application of Ipv4 security rules are not suitable
for currently compatible IPv6.
Currently, these challenges are not addressed to accomplish the privacy and secu-
rity of connected IoT devices. The subsequent strategies can overwhelme these dif-
ficulties such as (1) APIs is essential to evade compatibility and dependability prob-
lems. (2) IoT devices is well guarded while interconnecting with peers. (3) Protected
devices with best-hardcoded security practices to resist against threats.
8.3 Data Mining
Data mining plays a significant part in multimedia big data, which is used to extract
the interesting data for multimedia datasets. Multimedia datasets consist of structured
and unstructured data such as videos, audio, images, speech, text, etc. The multimedia

32 Sharmila et al.
data mining is further categorized as static and dynamic media. Examples of static
media are text and images; dynamic media is audio and videos. The multimedia
data mining mentions that the analysis of a massive amount of multimedia big data
gathered from IoT devices to excerpt the useful information pattern depend on their
statistical relationship.
Data mining methods offer solutions for multimedia big data to generalize for new
data. IoT brought the challenges of data extraction. The main challenges related to
data mining and processing are knowledge discovery, processing, and data. A large
amount of big data faces the challenges due to volume, openness, exactness, and
heterogeneity regarding data sources and data type. The big data sets are more irreg-
ularities and uncertainties in nature, which require additional preprocessing such as
cleansing, reduction, and transmission. Recently, researchers have presented pro-
gramming models based on concurrent, and serial processing and diverse algorithms
are proposed to reduce the response time of query on big data. Researchers have an
opportunity to address the bottlenecks of data mining in big data IoT.
8.4 Visualization
In big data analytics with IoT systems, the visualization plays a vital role in deal-
ing with a large amount of data are generated. Visualization is difficult to process
because of a large amount of data and its different dimensions. It is necessary to work
faultlessly in big data analytics and visualization to obtain better results from IoT
applications. Visualization is a difficult task in big data because of heterogeneous
and various types of data such as structured, unstructured and semi-structured data.
Designing visualization for IoT big data is an arduous task. Wang et al. [42] addressed
the challenges and technology progress of visualization and big data. The visualiza-
tion software is used to visualize the fine-grained dimensions based on the concept of
the locality reference as well as the probability of identifying the correlations, outliers,
and patterns. The concurrency is a thought-provoking task in visualization to man-
age the IoT big data. Most of the visualization tools used for IoT produced deprived
performance regarding scalability, functionality, and response time. Gorodov et al.
[43] addressed real-time analytics for IoT architecture issues of data visualization
concerning the application of big data such as visual noise, information loss, great
image observation, high-performance requirements due to the dynamic generation
of data in an IoT environment.
8.5 Cloud Computing
The advancement of visualization technologies has motivated the development of
cloud computing technologies. The cloud computing technologies characterized by
virtual computers are constructed on top of the computing infrastructure. The main

Introduction to Multimedia Big Data Computing for IoT 33
limitations of cloud computing are cost of the massive amount of data storage, control
over the distributed environment, security, privacy, and transfer. All these limitations
is considered for future research directions.
8.6 Integration
Data integration denotes that the different formats of data can be viewed as uni-
form. Integration offers a single point of view of the data, which is gathered from
heterogeneous sources. Multimedia big data are generated from different sources
continuously. The produced data can be classified into three groups, namely, (1)
structured, (2) unstructured, and (3) semi-structured. It extracts the information from
different datasets. It is a challenging task to integrate different data types, and over-
lapping of the same data increases the scalability, performance, and enable real-time
data access. These challenges related to the integration of data should be addressed
in the near future.
8.7 Multimedia Deep Learning
The application of deep learning in computer vision, NLP, speech processing, etc.,
are growing faster as compared to current research in deep learning on multimedia
big data analysis. The deep learning analysis of multimedia big data is yet in its initial
stage of development. The different modularity of data needs to be analyzed using
multimodal deep learning techniques. The future deep learning research is mainly
focused on dealing with heterogeneous sources, high-dimensional, and un-named
multimedia data. As compared to the traditional machine learning approaches, the
computational efficiency of deep learning is remains a big challenge; because of
the massive amount of resources and more training time is needed. The efficiency
of deep learning techniques can be increased by using clusters of GPU. Lacey et al.
[37] suggested the use of Field-Programmable Gate Arrays (FPGA) on deep learning,
which provides an optimization, the large degree of parallelism and reduces the power
consumption as compared to the GPU.
9 Summary
This chapter has presented the sophisticated approaches developed for multimedia
big data analytics. The emergence of multimedia big data opens opportunities and
draws more attention to researchers. First, introduce the general background of big
data, challenges, and its application in multimedia big data. This chapter provides an
extensive overview of the multimedia big data challenges, the impact of multimedia

34 Sharmila et al.
big data in IoT, and characteristics have been discussed in 10 V’s perspective. The
different phases of multimedia big data such as data generation and acquisition, data
representation, compression, processing and analysis, storage and retrieval, assess-
ment, and computing have been discussed. Further, a comprehensive and organized
framework has been discussed for each stage such as background, technical chal-
lenges, and review the recent updates in the area of multimedia big data. In addition,
a list of opportunities for the multimedia big data has also been provided. In spite of
all the challenges faced by the multimedia big data, it still offers huge opportunities
to the Internet of Multimedia Things (IoMT) to advance the services and applications
through the efficient use of multimedia big data. Many organizations acknowledged
the development of multimedia big data for IoT applications. Multimedia big data
for IoT is in the primary stage. These discussions aim to offer a broad overview,
and perspective to make the significant advances in multimedia big data for IoT that
meets futures requirement.
References
1. R. John et al., Riding the multimedia big data wave, in Proceedings of the 36th International
ACM SIGIR Conference on Research and Development in Information Retrieval (ACM, Dublin,
Ireland) pp. 1–2 (2013)
2. L. Mearian, By 2020, there will be 5,200 GB of data for every person on the
Earth, http://www.computerworld.com/article/2493701/data-center/by-2020-there-will-be-5-
200-gb-of-datafor-every-person-on-earth.html. Accessed 5 Apr 2016
3. E. Adler. Social media engagement: the surprising facts about how much time people spend on
the major social networks (2016), http://www.businessinsider.com/social-media-engagement-
statistics-2013-12
4. Mei-Ling Shyu, Shu-Ching Chen, Qibin Sun, Yu. Heather, Overview and future trends of
multimedia research for content access and distribution. Int. J. Semant. Comput. 1(1), 29–66
(2007)
5. J. Gantz, D. Reinsel, Extracting value from chaos. IDC iView 1–12 (2011)
6. K. Cukier, Data, data everywhere: a special report on managing information (2011)
7. Lohr S, The age of big data. N. Y. Times 11 (2012)
8. V. Mayer-Schonberger, K. Cukier, Big data: a revolution that will transform how we live, work,
and think. EamonDolan/Houghton Mifflin Harcourt (2013)
9. P. Zikopoulos, C. Eaton et al., Understanding big data: analytics for enterprise-class Hadoop
and streaming data. McGraw-Hill Osborne Media (2011)
10. E. Meijer, The world according to LINQ. Commun. ACM. 54(10), 45–51 (2011)
11. C. Hu, Z. Xu, Y. Liu, L. Mei, L. Chen, X. Luo, Semantic link network-based model for
organizing multimedia big data. IEEE Trans. Emerg. Top. Comput. 2(3), 376–387 (2014)
12. M. Beyer, Gartner says solving big data challenge involves more than just managing volumes
of data. Gartner, http://www.gartner.com/it/page.jsp
13. R. Cattell, Scalable SQL and NoSQL data stores. ACM SIGMOD Rec. 39(4), 12–27 (2011)
14. O.R. Team, Big data now: current perspectives from OReilly radar. OReilly Media (2011)
15. A. Labrinidis, H.V. Jagadish, Challenges and opportunities with big data. Proc. VLDB Endow.
5(12), 2032–2033 (2012)
16. R.E. Wilson, S.D. Gosling, L.T. Graham, A review of Facebook research in the social sciences.
Perspect. Psychol. Sci. 7(3), 203–220 (2012)
Introduction to Multimedia Big Data Computing for IoT 35
17. Z. Tufekci, Big questions for social media big data: representativeness, validity and other
methodological pitfalls, in Proceedings of the Eighth International Conference on Weblogs
and Social Media (Michigan, USA, 2014) pp. 505–514
18. D. Agrawal, P. Bernstein, E. Bertino, S. Davidson, U. Dayal, M. Franklin, J. Gehrke, L. Haas,
A. Halevy, J. Han et al., Challenges and opportunities with big data. A community white paper
developed by leading researches across the United States (2012)
19. N.D. Lane, E. Miluzzo, L. Hong, D. Peebles, T. Choudhury, A.T. Campbell, A survey of mobile
phone sensing. IEEE Commun. Mag. 48(9), 140–150 (2010)
20. Xu Zheng, Yunhuai Liu, Lin Mei, Hu Chuanping, Lan Chen, Semantic-based representing and
organizing surveillance big data using video structural description technology. J. Syst. Softw.
102, 217–225 (2015)
21. Mei-Ling Shyu, Zongxing Xie, Min Chen, Shu-Ching Chen, Video semantic event/concept
detection using a subspace-based multimedia data mining framework. IEEE Trans. Multimedia
10(2), 252–259 (2008)
22. A. Kumari, S. Tanwar, S. Tyagi, N. Kumar, Fog computing for healthcare 4.0 environment:
opportunities and challenges, Comput. Electr. Eng. 72, 1–13 (2018)
23. Gerald Schuller, Matthias Gruhne, Tanja Friedric, Fast audio feature extraction from com-
pressed audio data. IEEE J. Select. Top. Sign. Process. 5(6), 1262–1271 (2011)
24. K.R. Malik, T. Ahmad, M. Farhan, M. Aslam, S. Jabbar, S. Khalid, M. Kim, Big-data: trans-
formation from heterogeneous data to semantically-enriched simplified data. Multimed. Tools
Appl. 75(20), 12727–12747 (2016)
25. Y. Jia, E. Shelhamer, J. Donahue, S. Karayev, J. Long, R. Girshick, S. Guadarrama, T. Dar-
rell, Cafe: convolutional architecture for fast feature embedding, in Proceedings of the ACM
International Conference on Multimedia (2014), pp. 675–678
26. N. Khan, I. Yaqoob, I.A.T. Hashem, Z. Inayat, W. Kamaleldin, M. Ali, M. Alam, M. Shiraz,
A. Gani, Big data: survey, technologies, opportunities, and challenges. Sci. World J. 18 (2014)
27. David Mera, Michal Batko, Pavel Zezula, Speeding up the multimedia feature extraction: a
comparative study on the big data approach. Multimed. Tools Appl. 76(5), 7497–7517 (2017)
28. G. Zhang, Y. Yang, X. Zhai, W. Huang, J. Wang, Public cultural big data analysis platform, in
Proceedings of 2016 IEEE Second International Conference on Multimedia Big Data (BigMM)
(Taipei, Taiwan, 2016) pp. 398–403
29. S. Hendrickson, Getting started with Hadoop with Amazon’s Elastic MapReduce
(2010), https://www.slideshare.net/DrSkippy27/amazon-elastic-map-reduce-getting-started-
with-hadoop
30. X. Wu, H. Chen, G. Wu, J. Liu, Q. Zheng, X. He, A. Zhou, Z. Zhao, B. Wei, M. Gao, Y. Li, Q.
Zhang, S. Zhang, R. Lu, N. Zhang, Knowledge engineering with big data. IEEE Intell. Syst.
30(5), 46–55 (2015)
31. M. Schuhmacher, S.P. Ponzetto, Knowledge-based graph document modeling, in Proceedings
of 7th ACM International Conferrrence on Web Search and Data Mining (WSDM’14) (New
York, NY, 2014) pp. 543–552
32. L.-Y. Duan, J. Lin, J. Chen, T. Huang, W. Gao, Compact descriptors for visual search. IEEE
Multimed. 21(3), 30–40 (2014)
33. J. Herrera, G. Molto, Detecting events in streaming multimedia with big data techniques, in
Proceedings of 2016 24th Euromicro International Conference on Parallel, Distributed, and
Network-Based Processing (PDP), (Heraklion Crete, Greece, 2016), pp. 345–349
34. E. Dede, B. Sendir, P. Kuzlu, J. Weachock, M. Govindaraju, L. Ramakrishnan, Processing
Cassandra datasets with Hadoop-Streaming based approaches. IEEE Trans. Serv. Comput.
9(1), 46–58 (2016)
35. Z. Wang, S. Mao, L. Yang, P. Tang, A survey of multimedia big data. China Commun. 15(1),
155–176 (2018)
36. B. Sadiq, F. Ur Rehman, A. Ahmad, A Spatio-temporal multimedia big data framework for a
large crowd, in Proceedings of 2015 IEEE International Conference on Big Data (Santa Clara,
CA, 2015), pp. 2742–2751

36 Sharmila et al.
37. G. Lacey, G.W. Taylor, S. Areibi, Deep learning on FPGAs: past, present, and future. CoRR
abs/1602.04283 (2016). http://arxiv.org/abs/1602.04283
38. B. Garcia, M. Gallego, L. Lopez, G.A. Carella, A. Cheambe, NUBOMEDIA: an elastic PaaS
enabling the convergence of real-time and big data multimedia, in Proceedings of 2016 IEEE
International Conference on Smart Cloud (SmartCloud) (New York, 2016) pp. 45–56
39. X. Wang, L. Gao, S. Mao, BiLoc: bi-modality deep learning for indoor localization with 5 GHz
commodity Wi-Fi. IEEE Access J. 5(1), 4209–4220 (2017)
40. Tanwar et al., An advanced internet of thing based security alert system for smart home, in
International Conference on Computer, Information and Telecommunication Systems (IEEE
CITS-2017), vol. 21(2) (Dalian University, Dalian, China, 2017), pp. 25–29
41. S. Tanwar, S. Tyagi, S. Kumar, The role of internet of things and smart grid for the development
of a smart city, in Intelligent Communication and Computational Technologies, IoT4TD 2017
(Lecture Notes in Networks and Systems: Proceedings of Internet of Things for Technological
Development), vol. 19 (Springer International Publishing, 2017), pp. 23–33
42. L. Lin, G. Ravitz, M.-L. Shyu, S.-C. Chen, Effective feature space reduction with imbalanced
data for semantic concept detection, in Proceedings of the IEEE International Conference on
Sensor Networks, Ubiquitous, and Trustworthy Computing 262–269 (2008)
43. E.Y. Gorodov, V.V. Gubarev, Analytical review of data visualization methods in application to
big data. J. Electr. Comput. Eng. 22 (2013)
44. S. Pouyanfar, Y. Yang, S.-C. Chen, M.-L. Shyu, S.S. Iyengar, Multimedia big data analytics: a
survey. ACM Comput. Surv. 51(1):10:1–10:34 (2018)
45. A. Madan, M. Cebrian, D. Lazer, and A. Pentland. Social sensing for epidemiological behavior
change, in Proceedings of the 12th ACM International Conference on Ubiquitous Computing
(Ubi Comp’10, 2010) pp. 291–300
46. L. Selavo, A. Wood, Q. Cao, T. Sookoor, H. Liu, A. Srinivasan, Y. Wu, W. Kang, J. Stankovic, D.
Young, and J. Porter. Luster: Wireless sensor network for environmental research in Proceed-
ings of the 5th International Conference on Embedded Networked Sensor Systems (SenSys’07,
2007) pp. 103–116
47. M. Shamim Hossain and Ghulam Muhammad. Cloud-assisted industrial internet of things (iiot)
– enabled framework for health monitoring. Computer Networks, 101(Supplement C):192–202
(2016)

Energy Conservation in Multimedia Big
Data Computing and the Internet
of Things—A Challenge
Pimal Khanpara and Kruti Lavingia
Abstract In the recent days, wide-ranging cellular devices and purchaser gadgets
in the Internet of Things (IoT) have created immense multimedia information in
different types of media (for example, content, pictures, video, and sound). Due to
this, there is a great increase in the research challenges for creating strategies and
tools in addressing Multimedia Big Data (MMBD) for future IoT. As the worldwide
framework for the ongoing data society, IoT empowers progressed benefits by inter-
connecting (virtual as well as physical) things dependent on existing and advancing
interoperable data and correspondence advancements. An immense measure of con-
nected objects will be installed universally in a couple of years. In the meantime,
the utilization of MMBD has been developing colossally since recent years, while
organizations are rapidly getting on what they remain to pick up. Actually, these two
advances are affecting and molding one another. In spite of the fact that they emerge
from various application situations, MMBD can be together utilized with machine
learning, AI, factual, and other progressed procedures, models, and techniques to
investigate or locate the profound incentive behind the immense information origi-
nated from IoT. Actually, the registering knowledge, including transformative calcu-
lation, neural systems, and the fuzzy hypothesis, is relied upon to assume a vital job
for these issues. It is as yet one of the most scorching and most challenging fields to
create novel processing knowledge for the reasonable situations concerned with the
MMBD for future IoT. In this paper, we focus on one of the most important research
domains in MMBD IoT, Energy Conservation. IoT devices communicate through the
wireless communication medium and are expected to transmit information whenever
needed. The battery life of IoT devices is an important concern for researchers and
device manufacturers. Many exhaustive efforts have been put by researchers in this
area. Since most IoT devices are usually deployed in remote and hostile environ-
ments out of reach for human users, it may not be possible to charge and recharge
P. Khanpara (B) · K. Lavingia
Department of Computer Science and Engineering, Institute of Technology, Nirma University,
Ahmedabad, India
e-mail: [email protected]
K. Lavingia
e-mail: [email protected]
© Springer Nature Singapore Pte Ltd. 2020
S. Tanwar et al. (eds.), Multimedia Big Data Computing
for IoT Applications, Intelligent Systems Reference Library 163,
https://doi.org/10.1007/978-981-13-8759-3_2
37
38 P. Khanpara and K. Lavingia
batteries frequently. Moreover, in MMBD IoT applications, a large volume of mul-
timedia traffic needs to be processed, which consumes precious network resources
such as bandwidth and energy. Thus, devising protocols for conserving energy of IoT
devices in such environments has become a very interesting topic of research. There
are various ways to achieve energy conservation in the MMBD IoT environment.
Some of the popular research inclinations are designing energy-efficient communi-
cation protocols, developing of mechanisms that enable IoT devices to self-generate,
recycle, store and harvest energy, and modifying underlying protocol stack of com-
munication technologies to support energy efficiency. Our paper mainly focuses on
the investigation of existing technologies and mechanisms in the above domains.
We first present the need for energy conservation briefly and then discuss the key
points of existing solutions for saving energy in IoT communications. At the end of
the paper, we summarize our findings to describe the advantages and limitations of
existing mechanisms and provide insights into possible research directions.
Keywords IoT · MMBD · Energy conservation · IoT nodes · Energy harvesting ·
Energy management · Energy-efficient routing · Green IoT
1 Introduction
In the current era, the application domain of Ubiquitous Computing and IoT has
been quickly increasing as it suggests impending web connectivity for all. IoT is a
system of interrelated processing devices, mechanical and computerized machines,
items, creatures, or individuals that are furnished with Inique Identifiers (UIDs)
and has the capacity to exchange data through a communication network without
expecting human-to-human or human-to-PC connection [1]. The increasing arena of
IoT prompted a technical rebellion to develop intelligent and small-sized devices,
outfitted with constrained storage, energy, and computing abilities. Such advances
empower fabricating huge-scale heterogeneous systems that associate an enormous
number of regular physical devices like intelligent sensors, actuators, cell phones,
watches, healthcare devices, RFID labels, CCITVs, wearable devices, and so on.
These objects are associated with the web through a wired or wireless medium. Wire-
less is the most favored medium to accomplish this extensive range of connectivity.
These intelligent and smart devices can detect the data, gather the data and exchange
the data. The working strategy of these devices relies upon one’s requirements.
IoT has turned into a rising key innovation for forthcoming advancements, in
which a heap of sensors, actuators, and brilliant questions in our dayto-day life
are associated with the internet. These sensors and actuators (e.g., reconnaissance
cameras, home machines, and condition observing sensors) are commonly outfitted
with various types of microcontrollers, handsets, and conventions for correspondence
of detecting and controlling information [2]. These genuine items, either sensors or
actuators, are associated with one another to exchange their detected information to
bring together servers, where data is, on the whole, put away and made accessible for

Energy Conservation in Multimedia Big Data Computing … 39
specific clients with legitimate access privileges. The exchange of information from
one sensor/actuator hub to another sensor/actuator hub or to an IoT server is executed
over another correspondence model termed Machine-Type Communications (MTC)
or Machine to Machine (M2M) [3].
Insights uncover that Internet traffic is moving from non-multimedia information
to interactive media information. This predominant strength connotes the significance
and increment of multimedia use in our everyday undertakings. Consistent synthe-
sis, agreeable detecting, connectivity, and self-sufficiency on the Internet of Mul-
timedia Things (IoMT) framework opens ways to various opportunities to enhance
administrations and applications through productive usage of huge multimedia infor-
mation. Be that as it may, the heterogeneous idea of huge multimedia information
desires versatile and customized recommendation frameworks for effective inves-
tigation of enormous information gathered in situations like reconnaissance, retail,
telemedicine, traffic checking, and disaster management. Recommender frameworks
are the specialized reaction to the way that we as often as possible depend on peo-
ple groups’ involvement, social standards, and provincial conventions when stood
up to with another field of ability, where we don’t have a wide learning all things
considered, or where such learning would surpass the measure of data people can
subjectively manage. This perception, in reality, proposes that recommender frame-
works are a natural and profitable augmentation, permitting both end clients and
multimedia specialist organizations to play a considerably more dynamic job in
choosing semantically important substance and giving significant recommendations.
For example, in smart urban areas, multimedia sensors enable overseers to effectively
screen resources and exercises. Upgrades in the programmed translation of media
huge information can improve the limit of keen city directors via self-governing
responding to crisis circumstances, and suggesting powerful activities, accordingly
decreasing reaction times altogether. Moreover, novel answers for interactive media
information handling and the board in the IoMT biological system can upgrade per-
sonal satisfaction, urban condition, and smart city organization.
Big data processing incorporates data management as well as data analytics. Man-
agement of data requires effective cleaning, learning extraction, and reconciliation
and total techniques. Though, IoMT’s investigation depends on information modeling
and understanding, which is increasingly more regularly performed by manipulating
deep learning models. In a couple of years, blending ordinary and deep learning
procedures, have displayed incredible guarantee in ingesting multimedia big data,
investigating the worldview of exchange learning, predictive analytics, association
rule mining, and so forth.
The key processing elements of an IoT network are shown in Fig. 1. As discussed
above, device-to-device communication between sensors and actuators take place
using the M2M model. The tiny devices involved in the IoT themselves have limited
storage ability and the processing power.
There is a number of IoMT applications, which cover practically all the areas
of our day-to-day life [4]. As shown in Fig. 2, on the basis of their impact on the
environment, the applications can be categorized into domains such as IoT in Health

40 P. Khanpara and K. Lavingia
Fig. 1 Processing elements in IoT systems
Fig. 2 IoT application domains
and Living, Industrial Automation, Habitation Monitoring, Smart city Management,
Energy, Transportation, etc.
IoT in healthcare domain is useful for real-time tracking and identification of
both patients as well as medical equipment in health care and smart data collection.
IoT sensors are real-time health indicators, which in turn help in the diagnosis of
patients. IoT can also be useful for sports domain where people are concerned about
getting the dynamic, real-time information of a game. In the Industrial Automation
field, IoT helps in designing Smart Industrial Plants, M2M as well as Smart Plant

Energy Conservation in Multimedia Big Data Computing … 41
Monitoring. If we look into Habitat monitoring, work is being carried out on Smart
Agriculture, Smart Animals, and Smart Underwater Sensor Networks. To facilitate
urban population growth, IoT has also emerged into applications such as Smart
Buildings, Smart Environment, Smart Streetlight management systems as well as
Smart Waste Management. IoT in energy management includes Smart Grid and
Smart Metering. IoT also plays a vital role in Transportation for Smart Parking,
Smart Traffic Congestion Detection, and Smart Logistics. The list of applications is
never-ending. In all the areas of our routine life, the IoT is emerging at a great speed.
Figure 3 shows the IoT World Forum Reference Model [5]. The multi-layer design
of the IoT World Forum is very intriguing as it outlines the different layers from the
edge as far as possible up to the most vital layer, including Business Processes and
Collaboration. At the bottommost layer, the edge lies the smart IoT devices also
known as the “Things in IoT”. The next layer comprises of the communication and
processing units that are responsible for the connectivity of these IoT devices. The
Edge computing layer carries out Data element analysis and Transformation. The
fourth layer is responsible for the accumulation of data. The fifth Layer carries out
the task of data abstraction, whereas the top two layers involve applications such as
Reporting, Analytics, and Control as well as Collaboration-related activities.
As described in [6], the features of IoMT are almost equal to those of IoT systems
apart from Quality of Service (QoS) and required bandwidth. Therefore, energy-
efficient solutions available for IoT applications can also be applied in IoMT domain.
In this paper, we provide an exhaustive study and analysis of the latest actions to
determine the Energy preservation challenges for resource compelled IoT gadgets
and talk about problems and explanations given in various types of survey works.
This review inspects the writing with a particular spotlight on Energy Management in
Fig. 3 IoT World Forum Reference Model [5]

42 P. Khanpara and K. Lavingia
terms of Efficient Communication, Routing, Self-Generating, and Recycling Energy
and Energy Harvesting and Storing.
1.1 Research Problems in IoMT
The IoMT is still at an initial level of development, and numerous issues/look into
challenges must be resolved before it is extensively accepted. A considerable amount
of these challenges are technological, as well as interoperability, adaptability, and
scalability, as a large number of diverse gadgets will be associated, yet choosing
how to put resources into the IoMT is a test for corporate, and there are additionally
societal, ethical, and legitimate issues, together with privacy and security of data
gathering, which need to be settled.
There is a number of issues of research related to the IoMT. Some of the issues
are well known now, there may be many new to emerge later on. These issues shield
the entire field, comprising the technical ones of outlining, overseeing plus utilizing
a multi-industrial, multinational multi-innovation framework, the commercial diffi-
culties of creating IoMT plans of action, as well as the hierarchical, political, and
societal difficulties of a novel innovation that guarantees to modify the manner of
our living and working style in significant means.
The major research problems of IoMT can be categorized into Design, Scien-
tific/Engineering, and Management/Operations categories. The design would include
the concepts of Architecture, Interoperability, Scalability, Mobility, Security, and
Privacy [7]. Scientific/Engineering domain includes Energy Efficiency, Power Reli-
ability, and Robustness, whereas, Management/operations would include Software
Development Availability, Data Management/Information Fusion, and Cloud Com-
puting Performance [8, 9].
1.2 Importance of Energy Conservation in IoMT
In practical scenarios, the IoMT usage comes across numerous challenges. It is
because of the devices that are comprised in the IoMT, must detect/sense information
constantly [10]. Due to this constant sensing and processing of data, a large amount
of energy gets consumed and hence there is a necessity for enhancing energy. An
enormous number of nodes are involved in the IoMT network, and hence, it devours
additional energy for the entire system [11, 12].
Energy has to be properly managed so that no node moves toward becoming
energy deficient [13]. This would in turn help in making the network operational for
an extensive amount of time. To achieve this, each and every node in the network of
sensors ought to have executed a proficient energy management protocol.
Energy is believed to be the utmost critical asset for a sensor node, particularly if
any sensor node is kept in an environment such as a distributed network and on the off
Energy Conservation in Multimedia Big Data Computing … 43
chance that it isn’t possible to supply extra energy to the sensor node, as soon as the
existing energy gets finished [14]. Hence, an energy management system which can
adjust the demand and supply is expected, to avoid energy deficiency circumstances
in the network [15]. The battery is the main controlling source of a node in sensor
networks which can either be energized by recharging or changed/replaced on the
basis of the environment where it has been deployed [16].
For finding out energy-efficient mechanisms, a lot of research work has been
carried out. Work is being carried out on designing energy-efficient communication
protocols, modifying underlying stack of communication technologies to support
energy efficiency, designing mechanisms for helping the IoT devices to self-generate,
store, recycle, and harvest energy [15, 17].
The main motto of our paper is to inspect the different existing mechanisms for
energy conservation in IoT devices and analyze those mechanisms in terms of their
efficiency. We summarize our findings to describe the advantages and limitations of
existing mechanisms and provide insights into possible research directions.
2 Related Work
The scope of this survey is to first recognize the main research challenges. Numerous
ongoing studies on the IoMT, incorporate an area on exploring difficulties, and we
have endeavored to merge their outcomes for our motivations. This was a troublesome
undertaking because of contrasts in wording by various researchers, the way that the
distinctive research challenges can’t be totally isolated from one another, and the way
that they can be depicted at various levels of detail. For instance, “IoT design” may
be considered as a very high-level research challenge, but this incorporates a various
low level of research issues, for example, “architecture”, “interoperability” as well
as “adaptability” [18, 19]. Every one of these lesser level research difficulties may
incorporate other lower level of research issues, e.g., for an Architectural Structure
for the IoT, IEEE’s Standard incorporates the exploration difficulties of assurance,
security, protection as well as safety. A few writers view IoT Standardization as a
self-imbibed challenge [20, 21]. The views differ from author to author.
Some of the surveys that we have looked upon include the following: Kim and
Kim [22] adjusted an Analytic Hierarchy Procedure exemplary related to three IoT
usages: health-related services, energy management, and logistics, utilizing norms
of innovation, showcase prospective, and regulatory situation. Review information
that was examined utilizing this model demonstrated that marketplace potential was
the most critical paradigm in the model’s principal layer and reasoned that the most
encouraging usage from the ICT specialist’s Technical point of view is the IoT
logistics. Healthcare services need to beat client obstructions and technical depend-
ability requires to be acknowledged. Energy administration necessitates government
bolster (Korean Smart Grid activity). Haghighi et al. [23] utilized a game theory
methodology to deal with streamline dissemination of task and Energy utilization in
the IoT networks. To deal with deciding costs for solving clashes among peers, an

44 P. Khanpara and K. Lavingia
auction-based approach was used. The discrete-event simulation would give off an
impression of being a perfect way to deal with concentrating a significant number of
the outline and designing difficulties for IoT, like the scalability and energy efficiency
can be developed in a situation wherein new ideas can be steadily tried. Researchers
Esmaeili and Jamali [24] connected GA for enhancing energy utilization, which is a
key aspect in the case of IoT networks. The authors here have designed and proposed
a few more algorithms for enhancing energy utilization in the field of WSNs.
3 Methodology: Classification of Existing Energy
Conservation Mechanisms
Research work is being carried out by a number of researchers for finding efficient
solutions for conserving energy for IoT devices [25]. The authors in their literature
have carried out a survey on the basis of different categories.
Musaddiq et al. [26] have provided a review on resource management by taking
IoT Operating Systems into consideration. The authors have carried out a survey on
resource management concepts of Contiki, TinyOS, and FreeRTOS which includes
all the operating system concepts of process organization, memory organization,
energy management, the organization of files, and communication management.
Future research directions and challenges in resource management of IoT OSs are
also provided.
Ryan and Watson [27] in their paper have focused on the methods of Opera-
tions Research (OR) to deal with the research challenges faced by IoT. The authors
first identify the research problems, and then proposes contribution in the means of
solutions where OR can be used to deal with the problem.
Abbas and Yoon [28] in their paper carried out a survey on providing solutions
for energy conservation in resource-constrained IoT devices. Their main focus is on
wireless networking aspects of IoT Energy Conservation. Their survey focuses on
providing energy conservation solutions for devices based on their network archi-
tecture such as Wireless Networking—WWAN, WLAN, and WPAN.
Our paper mainly focuses on a survey of mechanisms that are already proposed
by different researchers. We have categorized these solutions on the basis of the fol-
Fig. 4 Classification of existing energy conservation solutions for IoT applications

Energy Conservation in Multimedia Big Data Computing … 45
lowing categories: Solutions for Energy-Efficient Communication, Energy-Efficient
Routing, Solutions for Self-generating and Recycling Energy/Green IoT and Solu-
tions for Storing and Harvesting energy. This classification is shown in Fig. 4.
4 Solutions for Energy Management
Various techniques for conserving energy in IoT communications have been pro-
posed by researchers [29, 30]. This section provides an overview of such existing
mechanisms. These mechanisms are grouped based on their objectives and key tech-
niques for implementation. The analysis of these mechanisms is presented in the next
section.
4.1 Mechanisms for Energy-Efficient Communication
The authors of [31] have described an energy-efficient management framework for
the IoT environment. The main idea proposed in this paper is to regulate the duty
cycles of IoT sensors considering QoI (Quality of Information) requirements. This
paper also proposes an idea to cover the critical task set to choose sensor services.
This concept is based on QoI-aware sensor-to-task relevance. The advantage of this
proposal is that it can be used with any underlying routing protocols for a variety of
applications to preserve energy in communication. Moreover, the energy manage-
ment decision is taken dynamically to deal with constraints such as service delay and
optimum level of energy. The authors have also considered the latency of process-
ing and signal propagation time and shown the impact of these factors on average
measured delay probability. The proposed algorithm is greedy in nature and exe-
cutes mainly three steps: shutting down sensors which are not perilous to the recent
task; keeping the current status of each sensor for every task and computing the
least energy requirement likelihood for task transitions. The proposed framework is
applicable to certain realistic scenarios.
For energy-efficient and highly scalable IoT, the concept of multihop networking
is presented in [32]. The mechanism uses blind cooperation along with multihop
communications to improve scalability. Power control is necessary to have efficient
blind cooperation. The authors also discuss an uncoordinated power control tech-
nique in conjunction with blind cooperative clustering to be implemented in each
device. As claimed in the paper, this mechanism outperforms the simple point-to-
point routing mechanism. Multihop networking helps reduce the overhead associated
with the underlying routing protocols and enhances scalability. An upper bound for
the mean transmit power level is computed as a function of cluster size. The proposed
mechanism is evaluated based on the normalized transport rate. The performance of
this mechanism is improved when there is a small deviation between the real size
and assessed the size of a cooperative cluster.

46 P. Khanpara and K. Lavingia
According to the authors of [33], Ferroelectric RAM (FRAM) technology can
be used in IoT edge devices to control unreliable power supply. FRAM is a volatile
memory technology and can be treated as a unified memory. FRAM-based solu-
tions offer reliability but they are energy inefficient in comparison of SRAM due to
a greater access latency. In contrast to FRAM-based solutions, SRAM-based solu-
tions provide a high level of energy efficiency but they are not reliable in the face
of power loss. The authors present a hybrid approach which is based on FRAM-
SRAM MCUs and uses shrewd memory mapping to get reliability from FRAM and
efficiency of SRAM-based systems. The memory mapping technique proposed in
this paper is energy-aware and lowers the consumption of energy without affecting
reliability. The proposed technique uses eM-map-based representation to compute
the optimum memory map for the functions which establish programs. This makes
the solution platform-portable and energy-aligned. To enhance energy efficiency and
performance, the solution aligns system’s powered-on time intervals to function exe-
cution bounds. The authors claim a 20% reduction in energy consumption when their
proposed solution is used.
Van et al. [34] propose the use of converged Fi-Wi (Fiber-Wireless) access net-
works to develop a collective communication facility for the Internet of Things.
The paper discusses the applicability and difficulties associated with the design and
implementation of energy-efficient IoT infrastructures in the optical backhaul net-
work. This effort discusses the usage of converged Fi-Wi networks which combine
a capacity-centric OAN backhaul and a coverage-centric multi-RAT front-end net-
work to support the Internet of Things infrastructure. The paper proposes mecha-
nisms for power saving, scalability, energy efficiency, H2H/M2M coexistence and
network integration for IoT deployment scenarios. The Authors state that in small-
scale Fi-Wi-based IoT scenarios, approximately 95% of energy can be preserved by
implementing TDMA-based scheduling. In the large-scale LTE-based IoT setups,
up to 5 years of battery life can be attained by incorporating the suggested DRX
technique.
Suresh et al. [35] describe an energy-efficient mechanism called EEIoT (Energy-
Efficient Internet of Things) for IoT applications. This mechanism is based on the
concept of MECA (Minimum Energy Consumption Algorithm). MECA techniques
are not efficient as they do not consider energy consumption in sensor nodes. The
goal of EEIoT is to control factors that energy consumption in IoT efficiently. EEIoT
has a self-adaptation property and can lower energy harvesting to a great extent in
the IoT environment. Different energy consumption factors have been considered by
the authors to make the implementation of EEIoT effective. The paper also describes
the effective method of dealing with energy efficiency requirements for data streams
in big data platforms. Here, the objective is to maintain connectivity and normal
functionality despite low energy levels. According to the authors, EEIoT outperforms
other traditional methods of energy saving.
Energy Conservation in Multimedia Big Data Computing … 47
4.2 Mechanisms for Energy-Efficient Routing
A hybrid routing protocol for M2M sensor networks for wireless IoT applications has
been proposed in [36]. In this paper, nonuniform energy consumption, scalability of
network and performance degradation issues have been addressed. To handle these
issues, a scalable energy-efficient clustering method is presented. In this approach,
numerous mobile sink nodes have been considered for large-scale M2M sensor net-
works to discover the shortest routing trail to the destination node from the cluster
head. It helps to lengthen the lifespan of the network. The rotation used in the selec-
tion of cluster heads results in a better distribution of energy and traffic among all
sensing nodes in the network. Because of this, the lifetime of the nodes and hence of
the network is increased. It also helps in improving end-to-end delay and through-
put of the communication process. Simulation outcomes indicate that the use of the
suggested clustering procedure and multiple mobile sink nodes enhance the network
lifetime and energy distribution. The authors claim significant improvement in the
routing process compared to the efficiency of the existing routing protocol.
Alkuhlani and Thorat [37] address a trade-off between the privacy of locations
and energy consumption in the IoT environment. The authors of this paper suggest a
secure procedure to preserve the location secrecy of the source node by modifying the
routing procedure, and energy-aware load balancing protocol based on the selection
of random routes to support fair energy consumption with path diversity. In this
method, each packet is forwarded to a random node. To keep the actual route of the
packet confidential and maximize the confidentiality, tunnels of M intermediate hops
are defined. This keeps the location of the source node hidden from the attacks based
on backtracking. The paper explains an energy-aware load balancing RPL-based
protocol which is integrated with multiple random path-finding techniques such that
each packet is forwarded in different directions on a random basis. This idea prevents
attackers to eavesdrop the exact location of the source node using back-tracing and
may reach a different node.
An energy proficient self-organizing multicast routing protocol called ESMR is
presented in [38] for IoT applications. In this protocol, there are two categories of
nodes: network nodes and nonnetwork nodes. The nodes which are present in the
network are treated as network nodes. The other category of nodes, nonnetwork
nodes use Markov process based diverse measurements for computing a network
nodes’ weight. The protocol selects a node with the highest weight as a sink node.
Nonnetwork nodes can enter into the network by sending requests to sink nodes.
This is how a tree-like structure is constructed in the network. The structure of
the network is balanced in stages to control energy levels. Automatic AVL tree
pruning operation is used to prolong the network lifetime. When the network grows
in size, the packet loss proportion does not increase due to pruning and this results in
extending the lifespan of the network. In the AVL tree structure, a node is declared
as a sink node only if can poise child nodes, remaining energy, hop count and the
spatial deviation between the sink node and its child nodes. The height of the tree
is also optimized in ESMR. The topology of the network is changed during data

48 P. Khanpara and K. Lavingia
communication based on the future energy of sink nodes. The authors of this paper
claim that a dependable tree-based network can be built using ESMR which improves
the lifetime of the network and lowers the consumption of energy. The success rate of
packets is shown to be improved in ESMR compared to AODV (Ad hoc On-Demand
Distance Vector Routing), DSDV (Destination Sequence Distance Vector Routing),
and ADMR (Adaptive Demand-Driven Multicast Routing) protocols.
Under many application areas in the IoT, the mobility of nodes and P2P (Pointto-
Point) communication are the basic requirements. Therefore, such applications
should have routing mechanisms that support mobility and discovery of best P2P
paths and focus on energy efficiency as well. According to the authors of [39], the
existing P2P routing protocols for the IoT do not upkeep the movement of nodes.
Hence, they suggest a novel energy-efficient mobility-aware routing protocol titled
MAEER (Mobility-Aware Energy-Efficient Routing) for the IoT scenarios. This pro-
tocol minimizes the total number of partaking nodes in the P2P path-finding process
to lower the ingesting of energy. It also provides a mechanism to facilitate mobility
with improved packet delivery ratio. As stated in this paper, the energy depletion of
MAEER is 24% less compared to P2P-RPL protocol.
Behera et al. [40] describe the altered LEACH (Low Energy Adaptive Clustering
Hierarchy) protocol to decrease the energy ingesting in sensor nodes for IoT appli-
cations. This protocol defines a threshold for selecting cluster heads with simultane-
ously changing the power levels between the nodes. The authors state that their mod-
ified LEACH protocol performs better than the existing LEACH and other energy-
efficient protocols in terms of network lifespan, throughput, and stability period
when used in different scenarios with varying network size, the density of nodes and
available energy.
4.3 Mechanisms for Self-generating and Recycling
Energy/Green IoT
Shaikh et al. [41] describe the efficient deployment of different technologies such as
sensors, Internet, and other smart objects in the IoT environment to make it green
IoT. According to the definition given in this paper, Green IoT is defined as the
IoT which uses either hardware or software-based energy-efficient procedures. The
objective of green IoT is to diminish the effect of the greenhouse effect of IoT
services and applications. The life sequence of green IoT mainly focuses on reducing
the greenhouse effect in the design, production, utilization, and disposal or cycling
processes. The authors of these paper have also considered numerous facets such as
applications, communications, crucial enablers, and services to achieve green IoT.
The survey of various solutions for achieving green IoT is also presented. The paper
provides the list of IoT application areas where it is possible to conserve energy
to have the green environment. The list of key enablers of green IoT and various
methods to implement energy-efficient solutions with respect to these enablers are
Energy Conservation in Multimedia Big Data Computing … 49
also discussed. Domains of green IoT such as service management, heterogeneous
communication, physical environments, and sensor cloud integration are required to
be considered for providing efficient communication among them. Future scope in
existing efforts is highlighted to implement green IoT.
An energy-efficient protocol stack named GREENNET is presented in [42]. This
solution is proposed for IP-enabled wireless sensor networks but can be used in
the IoT environment. The protocol stack executes on a photovoltaic cell energy-
enabled hardware platform. GREENNET integrates different standard mechanisms
and improves the performance of existing protocols to a great extent. It provides a
discovery mechanism that facilitates the adjustment of the duty cycles of harvested
nodes to the remaining energy in the network and leverages network performance.
GREENNET also supports the security of standard operations at the link layer and
data payload. It does not utilize multiple channels to increase the capacity of the net-
work. Robustness and mobility of the nodes are considered in the proposed scheme.
An amended tiered clustering protocol named EH-mulSEP (Energy Harvesting
enabled Multi-level Stable Election Protocol) is given in [43] for green IoT-based het-
erogeneous wireless sensor networks. The authors of this paper discuss the effects
of energy harvesting methods in large-scale IoT systems when a large number of
relay nodes that harvest energy and obtain the accumulated information from the
selected cluster heads. Relay nodes forward this information to the base stations. The
paper also presents a general computation method for multi-level weighted election
possibility which can facilitate up to n levels of heterogeneous nodes with their cor-
responding level of primary energies. More than three types of nodes are considered
for heterogeneity, which provides generic models for higher initial energy levels in
sensor nodes. The major goal of EH-mulSEP is to reduce the energy depletion in
battery-operated sensor nodes in IoT applications and maximize the conservation of
energy by increasing the scalability and lifespan of the network. Using an intermedi-
ary energy harvesting layer between the base stations and cluster heads, EH-mulSEP
improves the performance of the network in terms of throughput, permanence, scala-
bility, network lifespan, and energy consumption in comparison of the other versions
of SEP protocols in similar deployment settings.
4.4 Mechanisms for Storing and Harvesting Energy
IoT systems need sensing, data congregation, storage, handling, and data transmis-
sion capabilities. Real time, as well as virtual sensors, are used to provide these
capabilities. Mahapatra et al. [44] describe robustness in data delivery process and
energy efficiency as the major requirements of IoT communication. The authors of
[44] propose data awareness, cluster head selection using active RFID tags and energy
harvesting in the IoT the environment. The proposed protocol, DAEECI (Data Aware
Energy-Efficient Distributed Clustering protocol for IoT), saves energy involved in
the cluster head selection process. It uses active RFID tags to reduce dispensation
energy by including data awareness factor and enhancing lifespan by infusing RF

50 P. Khanpara and K. Lavingia
energy harvesting. Energy consumption models are formulated in each round and
the same is sent from sensor nodes to BS through gateways. The authors claim a
significant enhancement in network lifetime and data delivery when DAEECI is
deployed.
A novel sensor architecture named EcoSense is presented in [45]. Unlike conven-
tional software-based techniques, EcoSense uses a hardware-based reactive sensing
technique that removes the energy waste generated by a sensor working in either
standby mode or sleep mode. If the target events are available, a sensor is powered
off to reserve energy. When the target events are present, a reactive connection com-
ponent harvests energy from the events and activates the sensor again. Light and
RF-driven sensors are used to sense lights and RF signals and provide fair reac-
tion distances. The reactive connection module is used to control the connections
between the power supply unit and sensors. By default, this module is disabled so no
power is used by the sensors. When a target event takes place, the energy harvester
module stores the energy correlated to the events and enables sensors by linking
them to the power supply. The performance is evaluated based on reaction distance,
reaction times, and working duration. Results state that the suggested mechanism is
applicable only in short-range applications.
A modified routing mechanism for the 802.11 networks is presented in [46]. The
routing protocol proposed in this paper uses energy harvesting data for making path-
finding decisions. The objective of this modified routing protocol is to extend the
network lifetime when it is set up in an energy-constrained scenario. When no viable
energy source is available, network nodes harvest energy from the environment. This
logic is incorporated into the routing activity so that the network operation can exe-
cute without disruptions and harvested energy can be utilized properly. The routing
algorithm determines energy-efficient routes for transmitting messages through the
network. To achieve this, the algorithm maintains energy harvesting information
along with the level of residual energy at each hop in the network. To see the effect
of the proposed routing protocol on energy management, the authors presented the
simulation of the proposed logic with varying energy harvesting conditions. Accord-
ing to the results given in the paper, the proposed protocol can improve network
lifetime by approximately 30% in low energy harvested scenarios. In high energy
harvested conditions, the proposed algorithm is claimed to avert the energy hole
problem successfully.
The infrastructure of the IoT comprises of a big number of battery-driven devices
with restricted lifetime. The manual replacement of their batteries is not feasible in
large-scale deployments. The host stations need to communicate with the distributed
sensor devices and this communication requires a significant amount of energy based
on the physical distance between the host and sensing nodes. An energy-efficient
multi-sensing platform is presented in [47]. This paper addresses long-range device
communication, energy harvesting and self-sustainability of low-power short-range
devices in the network. The idea to design a power-efficient solution and reduce
the quiescent current in the radio devices even when they are always on in the
wireless channel. The proposed platform supports a heterogeneous long and short-
range network architecture to minimize latency and energy consumption during the

Energy Conservation in Multimedia Big Data Computing … 51
listening phase. For better energy management, the architecture combines LoRaTM
and wake up radio. This results in increased communication efficiency and reduced
power consumption.
Yang et al. [48] explore resource distribution for a machine to machine-aided
cellular network to achieve energy efficiency and nonlinear energy harvesting. The
proposed method uses two major access strategies, NOMA (Non-Orthogonal Multi-
ple Access) and TDMA (Time-Division Multiple Access). This method attempts to
reduce the total energy consumption in the network through joint circuit power con-
trol and time allocation. The authors state that both access strategies can be used for
optimal machine communication with minimum energy consumption and improved
throughput. Energy consumption of each machine type communication device is
defined as a convex function with regard to the assigned communication duration.
Using the optimum transmission power conditions of machine type communication
devices, the optimization issue for NOMA can be transformed into an equivalent issue
whose solution can be derived suboptimally. The paper also discusses the transfor-
mation of the original TDMA optimization to an equivalent tractable problem by
considering appropriate variable transformation. This transformed problem can then
be solved iteratively. The authors show that NOMA requires less amount of energy
compared to TDMA with low circuit power control machine type communication
devices. In the case of high circuit power control of machine type communica-
tion devices, TDMA does better than NOMA, in terms of energy efficiency. The
paper also analyses the total energy consumed in NOMA and TDMA policies in
uplink M2M communications. Energy minimization problem is stated in terms of
circuit power consumption, throughput, energy causality, and transmission power
constraints. Either NOMA or TDMA can be used based on the circuit power control
in machine type communication devices.
5 Analysis of Existing Energy Conservation Mechanisms
Table 1 recapitulates the existent energy-conserving mechanism for various IoT
applications with respect to the category of the solution, key technology used, and
approaches. This table also lists the advantages and drawbacks or limitations of these
energy-conserving mechanisms.
6 Conclusions
This paper has presented an inclusive investigation of energy preserving issues and
existing mechanisms for energy-constrained IoT environment. The existing energy
conservation mechanisms are classified based on the techniques used for conserv-
ing energy in battery-operated IoT devices and networks. These mechanisms have
been studied and analyzed based on various aspects such as distributed and het-

52 P. Khanpara and K. Lavingia
Table 1 Existing energy conservation mechanisms for IoT applications
Protocol Category Key
techniques
implemented
Advantages Limitations Approach
[31] Energy-
efficient
communica-
tion
QoI-aware
energy-
efficient
framework
Transparent
and
compatible
with lower
protocols
Applicable
in specific
scenarios
Uses sensor-
to-task
relevancy
and critical
covering set
concepts
GREENNET
[42]
Green IoT Energy-
efficient
protocol
stack for
sensor nodes
Improved
performance
of existing
protocols
Limited
network
capacity
Uses
photovoltaic
cell energy-
enabled
hardware
platform
[41] Green IoT Key enablers
and methods
to implement
green IoT
Integration
of IoT
domains for
smooth
interaction
Discusses
only
theoretical
aspects
Various
application
domains of
green IoT
[32] Energy-
efficient
communica-
tion
Multihop
networking,
blind
cooperative
clustering
Reduced
overhead in
the
underlying
protocol,
improved
scalability
Efficiency
depends on
cluster size
Sets upper
bound for
mean
transmit
power level
[33] Energy-
efficient
communica-
tion
Hybrid
FRAM-
SRAM
MCUs,
energy
alignment
Platform
portability
reduced
power
consumption
Computation
complexity
Uses optimal
memory
maps
DAEECI [44] Energy
harvesting
Data
awareness,
cluster head
selection
using active
RFID tags
Energy
saving
cluster head
selection,
improved
lifetime
None Computes
energy
consumption
models in
each round
[34] Energy-
efficient
communica-
tion
Integrated
capacity-
centric OAN
backhaul and
a coverage-
centric
multi-RAT
front-end
network
Improved
battery life
None Uses
converged
Fi-Wi access
networks
(continued)

Energy Conservation in Multimedia Big Data Computing … 53
Table 1 (continued)
Protocol Category Key
techniques
implemented
Advantages Limitations Approach
EcoSense
[45]
Energy
storage and
harvesting
Hardware
based
on-demand
sensing
technique
Energy
consumption
only for
desired
events
Useful for
only
short-range
applications
Controlled
connection
between
sensors and
the power
supply unit
[46] Energy
storage and
harvesting
Energy-
aware
routing
protocol
Prolonged
network
lifetime,
prevents
energy hole
Cannot be
used with
existing
routing
protocols,
increased
computa-
tional
complexity
Additional
information
needs to be
maintained
at every node
EEIoT [35] Energy-
efficient
communica-
tion
Modified
MECA
algorithm
Self-
adaptation of
energy
harvesting
Specific to
big data
platforms
Based on
MECA
[36] Energy-
efficient
routing
Scalable
energy
efficient
clustering
Fair
distribution
of energy,
prolonged
network
lifetime
None Hybrid
routing
protocol for
M2M sensor
networks
[47] Energy
harvesting
Energy
efficient
multi-
sensing
platform
Reduced
latency, self-
sustainability
None Heterogeneous,
long-range
device com-
munication
[37] Energy-
efficient
secure
routing
Energy-
aware load
balancing
routing
protocol
Location
privacy, fair
energy
consumption
Increased
packet
forwarding
Uses path
diversity
[48] Energy
harvesting
Circuit
power
control
Improved
throughput,
optimal
machine
communica-
tion
Selection of
access
mechanism
is difficult
Considers
NOMA and
TDMA
access
mechanisms
(continued)

54 P. Khanpara and K. Lavingia
Table 1 (continued)
Protocol Category Key
techniques
implemented
Advantages Limitations Approach
ESMR [38] Energy-
efficient
routing
Energy-
efficient
self-
organizing
multicast
routing
Prolonged
network
lifespan,
improved
packet
success rates
None Uses AVL
tree pruning
MAEER [39] Energy-
efficient
routing
Energy-
efficient
mobility-
aware
routing
Supports
mobility,
improved
packet
delivery ratio
High
memory
requirement
Reduces the
number of
participating
nodes for
optimal route
discovery
EH-mulSEP
[43]
Green IoT Energy
harvesting
enabled
multi-level
stable
election
Improved
scalability,
throughput,
network
lifetime
Uses fixed
traffic
patterns
Uses
multi-level
weighted
election
probability
on heteroge-
neous
nodes
Modified
LEACH [40]
Energy-
efficient
routing
Threshold-
based cluster
head
selection
Enhanced
throughput,
network
lifespan
Cannot be
used with
heteroge-
neous
routing
Modification
in LEACH
protocol
erogeneous working environments, adjustment of duty cycles, access control, and
congestion avoidance techniques, sleep time control techniques during inactivity
periods, switch off and standby time of radio, resource management and scheduling,
efficient cluster head selection schemes, prolonged network lifetime, throughput,
scalability, and so on. As features of IoMT and IoT are almost similar, energy con-
servation techniques proposed for IoT systems can be used for IoMT applications to
achieve energy efficiency. The survey presented in this paper evaluates the existing
solutions considering various performance metrics to address energy conservation
issues.

Energy Conservation in Multimedia Big Data Computing … 55
References
1. Y. Agarwal, A.K. Dey, Toward building a safe, secure, and easy-to-use internet of things
infrastructure. IEEE Comput. 49(4), 88–91 (2016)2. A. Sheth, Internet of things to smart iot through semantic, cognitive, and perceptual computing.
IEEE Intell. Syst. 31(2), 108–112 (2016)3. M. Weyrich, C. Ebert, Reference architectures for the internet of things. IEEE Softw. 33(1),
112–116 (2016)4. S.M. Alzahrani, Sensing for the internet of things and its applications, in 2017 IEEE 5th
International Conference on Future Internet of Things and Cloud: Workshops (W-FiCloud)
(IEEE, 2017), pp. 88–925. C. Rostetter, S. Khoshafian, The Adaptive Digital Factory: IoT Reference Architectures (2016),
https://www.pega.com/insights/articles/adaptive-digital-factory-iot-reference-architecture6. S.A. Alvi, B. Afzal, G.A. Shah, L. Atzori, W. Mahmood, Internet of multimedia things: vision
and challenges. Ad Hoc Netw. 33, 87–111 (2015)7. A. Al-Fuqaha, M. Guizani, M. Mohammadi, M. Aledhari, M. Ayyash, Internet of things: a
survey on enabling technologies, protocols, and applications. IEEE Commun. Surv. Tutor.
17(4), 2347–2376 (2015)8. A. Rodriguez, A. Ordóñez, H. Ordoñez, Energy consumption optimization for sensor net-
works in the IoT, in 2015 IEEE Colombian Conference on Communications and Computing
(COLCOM) (IEEE, 2015), pp. 1–69. T. Houret, L. Lizzi, F. Ferrero, C. Danchesi, S. Boudaud, Energy efficient reconfigurable antenna
for ultra-low power IoT devices, in 2017 IEEE International Symposium on Antennas and
Propagation & USNC/URSI National Radio Science Meeting (IEEE, 2017), pp. 1153–115410. T.D. Nguyen, J.Y. Khan, D.T. Ngo, A distributed energy-harvesting-aware routing algorithm
for heterogeneous IoT networks. IEEE Trans. Green Commun. Netw. (2018)11. P.V. Krishna, M.S. Obaidat, D. Nagaraju, V. Saritha, CHSEO: an energy optimization approach
for communication in the internet of things, in GLOBECOM 2017–2017 IEEE Global Com-
munications Conference (IEEE, 2017), pp. 1–612. S. Santiago, L. Arockiam, A novel fuzzy based energy efficient routing for internet of things,
in 2017 International Conference on Algorithms, Methodology, Models and Applications in
Emerging Technologies (ICAMMAET) (IEEE, 2017), pp. 1–413. Z. Sun, C.H. Liu, C. Bisdikian, J.W. Branch, B. Yang, QoI-aware energy management in
internet-of-things sensory environments, in 2012 9th Annual IEEE Communications Society
Conference on Sensor, Mesh and Ad Hoc Communications and Networks (SECON) (IEEE,
2012), pp. 19–2714. S. Mallick, A.Z.S.B. Habib, A.S. Ahmed, S.S. Alam, Performance appraisal of wireless energy
harvesting in IoT, in 2017 3rd International Conference on Electrical Information and Com-
munication Technology (EICT) (IEEE, 2017), pp. 1–615. M.E. Khanouche, Y. Amirat, A. Chibani, M. Kerkar, A. Yachir, Energy-centered and QoS-aware
services selection for internet of things. IEEE Trans. Autom. Sci. Eng. 13(3), 1256–1269 (2016)16. D. Chen, W. Yang, J. Hu, Y. Cai, X. Tang, Energy-efficient secure transmission design for the
internet of things with an untrusted relay. IEEE Access 6, 11862–11870 (2018)17. Q. Ju, H. Li, Y. Zhang, Power management for kinetic energy harvesting IoT. IEEE Sens. J.
18(10), 4336–4345 (2018)18. C.X. Mavromoustakis, J.M. Batalla, G. Mastorakis, E. Markakis, E Pallis, Socially oriented
edge computing for energy awareness in IoT architectures. IEEE Commun. Mag. 56(7),
139–145 (2018)19. T. Wan, Y. Karimi, M. Stanacevic, E. Salman, Energy efficient AC computing methodology
for wirelessly powered IoT devices, in 2017 IEEE International Symposium on Circuits and
Systems (ISCAS) (IEEE, 2017), pp. 1–420. S.S. Prasad, C. Kumar, An energy efficient and reliable internet of things, in 2012 International
Conference on Communication, Information & Computing Technology (ICCICT) (IEEE, 2012),
pp. 1–4

56 P. Khanpara and K. Lavingia
21. C.C. Liao, S.M. Cheng, M. Domb, On designing energy efficient wi-fi P2P connections for
internet of things, in 2017 IEEE 85th Vehicular Technology Conference (VTC Spring) (IEEE,
2017), pp. 1–5
22. S. Kim, S. Kim, A multi-criteria approach toward discovering killer IoT application in Korea.
Technol. Forecast. Soc. Chang. 102, 143–155 (2016)
23. M. Haghighi, K. Maraslis, T. Tryfonas, G. Oikonomou, A. Burrows, P. Woznowski, R.
Piechocki, Game theoretic approach towards optimal multi-tasking and data-distribution in
IoT, in 2015 IEEE 2nd World Forum on Internet of Things (WF-IoT) (IEEE, 2015), pp. 406–411
24. M. Esmaeili, S. Jamali, A survey: optimization of energy consumption by using the genetic
algorithm in WSN based internet of things. CIIT Int. J. Wirel. Commun. (2016)
25. M.H. Asghar, N. Mohammadzadeh, Design and simulation of energy efficiency in node based
on MQTT protocol in internet of things, in 2015 International Conference on Green Computing
and Internet of Things (ICGCIoT) (IEEE, 2015), pp. 1413–1417
26. A. Musaddiq, Y.B. Zikria, O. Hahm, H. Yu, A.K. Bashir, S.W. Kim, A survey on resource
management in IoT operating systems. IEEE Access 6, 8459–8482 (2018)
27. P. Ryan, R. Watson, Research challenges for the internet of things: what role can OR play?
Systems 5(1), 24 (2017)
28. Z. Abbas, W. Yoon, A survey on energy conserving mechanisms for the internet of things:
wireless networking aspects. Sensors 15(10), 24818–24847 (2015)
29. C. Chilipirea, A. Ursache, D.O. Popa, F. Pop, Energy efficiency and robustness for IoT: building
a smart home security system, in 2016 IEEE 12th International Conference on Intelligent
Computer Communication and Processing (ICCP) (IEEE, 2016), pp. 43–48
30. H. Khodr, N. Kouzayha, M. Abdallah, J. Costantine, Z. Dawy, Energy efficient IoT sensor with
RF wake-up and addressing capability. IEEE Sens. Lett. 1(6), 1–4 (2017)
31. C.H. Liu, J. Fan, J. Branch, K. Leung, Towards QoI and energy-efficiency in internet-of-things
sensory environments. IEEE Trans. Emerg. Top. Comput. 1, 1, 2014
32. A. Bader, M.S. Alouini, Blind cooperative routing for scalable and energy-efficient internet of
things, in 2015 IEEE Globecom Workshops (GC Wkshps) (IEEE, 2015), pp. 1–6
33. H. Jayakumar, A. Raha, V. Raghunathan, Energy-aware memory mapping for hybrid FRAM-
SRAM MCUs in IoT edge devices, in 2016 29th International Conference on VLSI Design and
2016 15th International Conference on Embedded Systems (VLSID) (IEEE, 2016), pp. 264–269
34. D.P. Van, B.P. Rimal, J. Chen, P. Monti, L. Wosinska, M. Maier, Power-saving methods for
internet of things over converged fiber-wireless access networks. IEEE Commun. Mag. 54(11),
166–175 (2016)
35. K. Suresh, M. RajasekharaBabu, R. Patan, EEIoT: energy efficient mechanism to leverage
the internet of things (IoT), in International Conference on Emerging Technological Trends
(ICETT) (IEEE, 2016), pp. 1–4
36. B.R. Al-Kaseem, H.S. Al-Raweshidy, Scalable M2M routing protocol for energy efficient
IoT wireless applications, in 2016 8th Computer Science and Electronic Engineering (CEEC)
(IEEE, 2016), pp. 30–35
37. A.M.I. Alkuhlani, S.B. Thorat, Enhanced location privacy and energy saving technique for
sensors in internet of things domain, in 2016 International Conference on Global Trends in
Signal Processing, Information Computing and Communication (ICGTSPICC) (IEEE, 2016),
pp. 122–125
38. S. Nisha, S.P. Balakannan, An energy efficient self organizing multicast routing protocol for
internet of things, in 2017 IEEE International Conference on Intelligent Techniques in Control,
Optimization and Signal Processing (INCOS) (IEEE, 2017), pp. 1–5
39. S.S. Chaudhari, S. Maurya, V.K. Jain, MAEER: mobility aware energy efficient routing protocol
for internet of things
40. T. Behera, U.C. Samal, S. Mohapatra, Energy efficient modified LEACH protocol for IoT
application. IET Wirel. Sens. Syst. (2018)
41. F.K. Shaikh, S. Zeadally, E. Exposito, Enabling technologies for green internet of things. IEEE
Syst. J. 11(2), 983–994 (2017)

Energy Conservation in Multimedia Big Data Computing … 57
42. L.O. Varga, G. Romaniello, M. Vucinic, M. Favre, A. Banciu, R. Guizzetti, C. Planat et al.,
GreenNet: an energy-harvesting IP-enabled wireless sensor network. IEEE Internet Things J.
2(5), 412–426 (2015)
43. A.S.H. Abdul-Qawy, T. Srinivasulu, EH-mulSEP: energy-harvesting enabled multi-level SEP
protocol for IoT-based heterogeneous WSNs, in 2017 3rd International Conference on
Applied and Theoretical Computing and Communication Technology (iCATccT) (IEEE, 2017),
pp. 143–151
44. C. Mahapatra, Z. Sheng, V.C. Leung, Energy-efficient and distributed data-aware clustering
protocol for the internet-of-things, in 2016 IEEE Canadian Conference on Electrical and
Computer Engineering (CCECE) (IEEE, 2016), pp. 1–5
45. Y. Liu, Q. Chen, G. Liu, H. Liu, Q. Yang, EcoSense: a hardware approach to on-demand sensing
in the internet of things. IEEE Commun. Mag. 54(12), 37–43 (2016)
46. L. Rosyidi, R.F. Sari, Energy harvesting aware protocol for 802.11-based internet of things
network, in 2016 IEEE Region 10 Conference (TENCON) (IEEE, 2016), pp. 1325–1328
47. M. Magno, F.A. Aoudia, M. Gautier, O. Berder, L. Benini, WULoRa: an energy efficient
IoT end-node for energy harvesting and heterogeneous communication, in Proceedings of
the Conference on Design, Automation & Test in Europe (European Design and Automation
Association, 2017), pp. 1532–1537
48. Z. Yang, W. Xu, Y. Pan, C. Pan, M. Chen, Energy efficient resource allocation in machine-to-
machine communications with multiple access and energy harvesting for IoT. IEEE Internet
Things J. 1–1, 2017

An Architecture for the Real-Time DataStream Monitoring in IoT
Mario José Diván and María Laura Sánchez Reynoso
Abstract The IoT allows a new kind of monitoring strategy based on the hetero-
geneity of the devices and its lower cost. It implies a challenge in terms of the data
interoperability and the associated semantic when they must support the real-time
decision making. In this chapter, an integrated and interdisciplinary view of the data
processing in the heterogeneous contexts is presented at the light of the Processing
Architecture based on Measurement Metadata (PAbMM). The processing architec-
ture gathers the data stream processing with the batch processing related to the Big
Data repositories under the umbrella of the measurement projects. Thus, the integra-
tion between the measurement and evaluation (M&E) framework and the real-time
processing is detailed. Followed, the interoperability is addressed from the M&E
project definitions and the data interchanging related to PAbMM. The decision-
making support is strengthened by a similarity mechanism which allows looking for
similar experiences when a given situation lack of a specific knowledge. Finally, an
application of the processing architecture based on Arduino technology for the “Bajo
Giuliani” (La Pampa, Argentina) lagoon monitoring is shown.
Keywords Data stream · Measurement · Real-Time processing · Internet of
thing · Big data
1 Introduction
The evolution of the communications and the Internet have allowed the integration
of different kind of services and infrastructures. From the active web pages, passing
through the social networks and mobile devices to the real-time data consuming,
M. J. Diván (B) · M. L. Sánchez Reynoso
Economics and Law School, National University of La Pampa, Coronel Gil 353. 1st Floor,
6300 Santa Rosa, Argentina
e-mail: [email protected]
M. L. Sánchez Reynoso
e-mail: [email protected]
© Springer Nature Singapore Pte Ltd. 2020
S. Tanwar et al. (eds.), Multimedia Big Data Computing
for IoT Applications, Intelligent Systems Reference Library 163,
https://doi.org/10.1007/978-981-13-8759-3_3
59

60 M. J. Diván and M. L. Sánchez Reynoso
they are today the current coin in a world dominated by the communication and the
information systems [1]. In this context, the data are continuously generated under
different kinds of formats and following a specific underlying model.
Nowell, along with the data generation process, it is possible to differentiate at
least between the real-time data and historical data. On the one hand, the real-time
data are consumed as close as possible to the generation instant, and the life cycle
is limited to the arrival of new data (i.e. the new data implies the substitution and
updating of the previous data, allowing describing an updated situation). On the
other hand, the historical data are consumed at any moment and they are oriented to
characterize a given historical situation, conceptualizing the idea of “historical” such
as a captured past event in relation to the current time (e.g. the past five minutes). The
real-time and historical data are useful in its own context, that is to say, the real-time
data are mainly oriented to the active monitoring of an entity under analysis (e.g.
an outpatient, the environment, etc.), while the historical data are associated with
the non-critical information systems in where there exists tolerance in relation to the
answer time and its processing.
In this sense, the data source is understood such as an integrable component
(physical or not) with a given precision and accuracy, able to generate data under a
particular organization from a given entity. The entity represents any concept able to
be analyzed through a set of measurable characteristics (be abstract characteristics or
not). Thus, the idea of data source could be matched with different kinds of physical
sensors, or even a software measuring specific aspects of other software.
The configuration possibilities associated with each data source are very wide
and it depends on the specific application, and for that reason, the likelihood to find
heterogeneous data sources is very high. For example, it could be possible to measure
the water temperature using a digital thermometer, or by mean of a thermometer based
on mercury. In both cases, the measured value could be similar, however, the data
organization for informing the current data, the accuracy and precision could be
different.
Another important aspect in relation to the data sources is its autonomy, that is to
say, each data source sends the captured and observed data from its own entity under
analysis, and no one external entity could affect or interrupt its internal behavior.
Continuing the example of the water temperature, the thermometer informs the value
of the measured temperature from the water following a given technique, but this is
independent of other devices. This is important to highlight because a data processor
is not able to affect or modify the expected behavior from the data sources, it just
can receive and process the sent data from the data source.
Thus, the basic idea of data source could be defined as an integrable component,
heterogeneous, with a given precision and accuracy, susceptible to be calibrated,
autonomous in terms of the measurement technique and the measure production,
with basic interaction capacities limited to the coordinating of the data sending.
The evolution of the data sources converges today in the idea associated with
the Internet of Thing [2]. Before defining it, it is important to say that by “things”
is understood that data source able to interact by wireless connections with other
devices, conforming, integrating or scaling new services. Thus, the Internet of Thing

An Architecture for the Real-Time Data Stream Monitoring in IoT 61
could be defined such as the autonomous capacity related to a set of pervasive “things”
connected through wirelesses, which is able to integrate, extend or support new kind
of services by mean of the interaction among them. In this kind of environment, the
things could be heterogeneous, and for that reason, the data interchanging requires
a common understanding which fosters the interoperability from the syntactic and
semantic point of view.
In this way, the data could be continuously generated from different environments
and any time, which implies a rapid growing of the volume and variety of data. In
the case of the data should be stored, it gives place to a big data repository. In
effect, the three Big Data V’s implies velocity, variety, and volume. The volume of
data is associated with the huge of collected data from the devices which must be
permanently stored. The variety refers to the kind of data to be stored, queried and
processed coming from the devices (e.g. a picture, information geographic, etc.).
Finally, the velocity refers to the growth projection of the Big Data repository in
relation to the incoming data.
The Big Data repositories could be as big as possible, but they are finite. That is
to say, they may incorporate a lot of data, but always the volume is quantifiable and
determined. The last is a key difference in relation to the real-time data collecting
and processing, because, for example, the sensors are permanently sending data, the
data are useful at the generation instant and the volume of the data just could be
estimated but not determined.
In other words, the size of a Big Data repository could be computed, but the size of
a data flow is not limited. This is a key difference between the Big Data and the real-
time data processing approach. For example, it supposes that a user needs to match
their customers with its geographic information for putting the customer information
on a map. Both the customer and the information geographic corresponds with a finite
set, with a given size, in where the sets could be analyzed and processed for obtaining
the wished results. The results can be ordered in absolute terms because the result
set is finite too. However, if the user wants to merge the share prices from New York
with Tokyo for a given stock, the resulting is continuously updated with each new
data and the final size is not determined. Even, the order in which the resulting could
be sent to the user is relative because such order is limited to the currently processed
data.
1.1 The Data Stream Environment
One of the main aspects to consider in this new communicated world is the usefulness
of the data stream and what is the advantage in relation to the persistent data strategy.
In this sense, it is necessary to say that the stored data are inadequate when the data
is oriented to the active monitoring. That is to say, the time for the data retrieving
from a persistent device is upper than the required time for processing them at the
moment in which they arrive. The idea of the data stream is associated with the data

62 M. J. Diván and M. L. Sánchez Reynoso
processing exactly when they have arrived. Thus, they are ideally read one time,
because a new reading would simply lose the opportunity to read the new data.
The data stream could be defined in terms of Chaudhry [3] such as an unbounded
data sequence. In addition, it is important to incorporate that the data sequence could
have a data organization and the order in each sequence is relative only to a given
sequence. For this reason, the definition could be updated and extended saying that
the data stream is an unbounded data sequence in where the data could be structured
under a given data model and the order of each datum is relative to its own sequence.
The real-time data and its associated processing, present key differences in relation
to the data stored in a Big Data repository, which can be synthesized in at least three:
time notion, reliability, and reaction. In the data stream, the data are processed at the
moment in which they arrive, they push the old data (updating them), and the data
are processed as they are, be reliable or not. Even, the data stream incorporates the
notion of time in its own generation chronology. However, a Big Data repository does
not necessarily incorporate the notion of time, the data must be queried, and because
they are able to be analyzed and controlled, they have an upper level of reliability.
The data stream itself could be characterized by Chakravarthy and Jiang [4]:
• The arriving: The data elements arrive in a continuous way, keeping a relative
order to the sequence itself,
• The notion of time: The idea of time is incorporated, be in the underlying data
model or in the sequence,
• The Data Origin: The data source is associated with the data stream (e.g. a
temperature sensor), that is to say, the data origin is unmodifiable by any data
processor,
• The input from the data stream: It is unpredictable in terms of rate or volume
of data,
• The Data Model: Each data stream could have its own underlying data model or
not (e.g. it could be semi-structured such as an XML document, or not structured
like a text file),
• Data Reliability: The data inside of the data stream are processed like they are,
they are not free of errors because depend on the data source and the transited
path,
For boarding the data stream processing, the idea of “window” was proposed.
Basically, a window is a logical concept associated with some kind of partition of
the original data stream for making easier the partial data processing. Synthetically,
it is possible to define a window in terms of a given magnitude of time (physical
window), for example, the window keeps the data related to ten minutes. In addition,
it is possible to define a window in terms of a given quantity of data (logical window),
for example, one hundred messages from the data source. Nowell, when the logical
or physical window implies to keep static the width and update its content based on
a notion of time (the new data replace to the old data), the window is known as a
sliding window. For example, the last five minutes (sliding physical window), the
last one hundred messages (sliding logical window), etc.

An Architecture for the Real-Time Data Stream Monitoring in IoT 63
1.2 The Big Data Environment
The Big Data is a term which describes a huge of data, following a data model,
which continuously overflow with data to the organization. The processing strategy
is thought for batch processing, fostering the parallelization strategy, on the base on
a given requesting (On-demand).
As it was introduced before, the original three “V” of the Big Data is associated
with variety, volume, and velocity. The variety implies that the data contained inside
the repositories are associated with different kinds (e.g. associative, relational, audio,
etc.). The volume refers to the huge of data available in the repository for processing
and analysis. The Velocity concept is associated with the increasing rate of the data
in relation to the repository and its sizing.
Even more, the variability of the provided data is a current concern in the dis-
cipline, because the data coming from independent data sources (such as the data
streams) could incorporate inconsistent data in the repository. In addition, the pro-
cessing complexity is incremented from the heterogeneity of the underlying data
models and the diversity of kind of data.
An additional “V” was proposed in relation to the value of the data and its impor-
tance for the decision-making process. That is to say, the idea of value refers to the
capacity of obtaining new information through some kind of processing from the
stored data in a repository. This gives a start to the idea of data monetization, in other
words, the way to make money by using the data available on the repository [5].
However, the four mentioned “V” are not the only “V” because Khan et al. [6]
proposed another “V” as complement, such as (i) Veracity: it refers to the trust respect
the data when it needs to be used for supporting the decision making, (ii) Viscosity:
it is associated with the level of relationship among complex data (cohesion and
dependence), (iii) Variability: it is related to the inconsistent data flow which takes a
special interest in the measurement projects, (iv) Volatility: it is associated with the
data lifecycle and its necessity of being stored, (v) Viability: it is related which the
time where the data is useful for generating new information, and (vi) Validity: It
refers to the fitted and compatible data for a given application.
The idea associated with the NoSQL database simply refers to “Not only SQL”
in relation to the databases. That is to say, the NoSQL databases are oriented to
implement a different data model to the relational data model. There are at least
four basic NoSQL data model related to the Big Data repositories [7]: (i) The Wide-
Column Data Model: the data are organized in terms of tables, but the columns
become to a column family, being it fully dynamic aspect. The atomicity principle
is not applied here such as the relational model, and for that reason the content is
heterogeneous. Even, the structure between rows (e.g. the quantity of columns) is
not necessarily the same. (ii) The Key-Value Data Model: It looks like a big hash
table where the key allows identifying a position which contains a given value. The
value is a byte flow, and for that reason, it represents anything expressible like byte
stream (e.g. picture, video, etc.), (iii) The Graph Data Model: each node represents
a data unit, and the arcs with a given sense implement the relationships among them,

64 M. J. Diván and M. L. Sánchez Reynoso
and (iv) Document-oriented Data Model: The data are hierarchically organized, and
they are free of a schema. Each stored value is associated with a given key, being
possible to store the data formats such as JSON, XML, among others.
Because the uses and applications of the NoSQL databases do not necessarily have
a transactional target [8], the ACID (Atomicity, Consistency, Isolation, and Dura-
bility) principle is not critical or mandatory to consider. Thus, the BASE (Basically
Available, Soft State, and Eventually Consistent) principle is better fitted in NoSQL
databases [9]. In this sense, basically available implies that the answer is guaranteed
even when the data are obsolete. The Soft State refers to the data are always available
for receiving any kind of changing or updating. Finally, eventually consistent implies
that given the distributed nature of the nodes, the global data as a unit will be in some
instant consistent.
Even when the data stream and the Big Data environment have different kinds
of requirements in terms of the available resources, data organization, processing
strategy and, data analysis, they could be complementary. That is to say, in case of
having that to store a data representative quantity from a data stream, the ideal kind
of repository for managing a massive dump of data is precisely a Big Data repository
because allows keeping the stability and scalability at the same time.
1.3 Main Contributions
As contributions of this chapter: (i) An Integrated and Interdisciplinary View of the
Data Processing in the Heterogeneous Contexts is presented: An integrated perspec-
tive under the figure of a processing architecture based on measurement metadata,
which includes from the heterogeneous data sources (e.g. Internet of things) to the
real-time decision making based on the recommendations (i.e. knowledge and previ-
ous experiences). The fully-updated main processes are detailed using the Business
Process Model and Notation (BPMN)1; (ii) The integration between the measurement
and evaluation framework and the real-time processing is detailed: In a data-driven
decision-making context, the concept monitoring and the real-time data processing
are a key aspect. In this sense, the importance of the measurement and evaluation
project definition in relation to the data processing (be it online or batch) is introduced
and exemplified; (iii) The Interoperability as the axis of the Processing Architec-
ture: Because of the data sources are heterogeneous, the Measurement Interchange
Schema (MIS) is introduced jointly with its associated library, as a strategy for the
data integration of different kinds of devices. Even, the project definition schema
based on the measurement and evaluation framework is highlighted in terms of its
importance for the interoperability among the different measurement systems; and
(iv) The similarity as a recommending strategy improves the decision-making sup-
port: Because of some monitored concept could do not have previous experiences or
knowledge, a strategy oriented to the similarity-based searching is proposed for the
1http://www.bpmn.org.

An Architecture for the Real-Time Data Stream Monitoring in IoT 65
organizational memory. Thus, the idea is found the experiences as close as possible
to a given situation for a complementary recommending. This allows a better support
to the decision-making process in presence of the uncertainty.
1.4 An Outline of the Rest of the Chapter
Thus, having introduced important aspects related to the Big Data Repositories and
NoSQL databases, jointly with the underlying concepts to the data streams and the
Internet of Thing, in the following sections an overview of the proposal for the integral
boarding of the real-time monitoring applied in the measurement and evaluation
area is synthesized. Section 2 presents a synthesis associated with the data stream
management system. Section 3 describes the basic steps for defining a measurement
and evaluation project. Section 4 introduces the measurement interchange schema.
Section 5 outlines the Processing Architecture based on Measurement Metadata.
Section 6 describes the main processes related to the Processing Architecture in
terms of the Business Process Model and Notation (BPMN). Section 7 introduces an
application case for an integral boarding of the measurement and evaluation project.
Section 8 outlines some related works. Finally, Sect. 9 presents some conclusions
and future trends related to the area.
2 The Data Stream Management System
The Data Stream Processing (DSP) could be viewed as a programming paradigm
oriented to the transformation or change in any form of the data continuously arriving
through one or more data sources [10]. Returning to the concept of data stream
introduced before, the data stream is an unbounded data sequence in where the
data could be structured under a given data model and the order of each datum is
relative to its own sequence. Thus, the Data Stream Management System (DSMS)
could be defined as the software responsible for the implementing of the data stream
processing, considering from the data sources, the data transformation to the output
managing.
Each operation applied to a given data on a data stream is defined through an
operator which is able to transform, change and/or replicate in any form the data
stream. The operations applied to the data stream can be pipelined following a given
order defined by an application. This pipeline allows connecting the operations and
their results with the aim of building a global pipelining system of data, connecting
each data source with the expected outputs. Thus, the data stream applications exploit
the parallelism given by the pipelines, taking advantage of the common hardware for
scalability and the infrastructure economy [11].

66 M. J. Diván and M. L. Sánchez Reynoso
Fig. 1 The architectural view of the data stream management system
In this sense and for keeping simple the idea of the data stream management
system, it is possible to see them as responsible for keeping flowing the data inside
each pipeline, avoiding the obstruction and giving the outputs in terms of each con-
nection (the intermediate operations). Figure 1 exposes an architectural view of the
data stream management system, which is organized around five main components:
the stream and query catalog, monitoring and planning engine, persistence manager,
stream receiver, the processor itself, and output manager.
The stream and query catalog (see Fig. 1, on the left lower angle) is basically
responsible for: (i) The data stream structure definition: It is associated with the
structural definition of each data stream to be consumed by the stream receiver; (ii)
The data stream statistics: It represents the collecting of the arrival rate, data volume,
among others aspects necessaries for the query planner and the managing of each
data stream; (iii) The data stream validity: It defines the data stream to be accepted
along with a given time period; (iv) The data stream prioritization: It establishes
the prioritization to be considered for the data stream receiving and processing in
case of the resources are committed; (v) The operation definition: It is responsible
for defining the inputs, the transformation or associated procedure jointly with the
expected operation outputs; (vi) Pipelines definition: It establishes the way in which
the operations and data streams are connected, and (vii) Query Catalog: It registers
the set of the planned queries for the data streams or intermediate results.
The Monitoring and Planning Engine (see Fig. 1, on the middle lower region) is
responsible for: (i) The resources monitoring: The main responsibility is the real-
time monitoring associated with the pipelines, planned queries and ad hoc queries.
This allows warrantying enough resources for generating the expected outputs; (ii)
The Service Queue Manager: It is responsible for the ordering of the operations in
the runtime environment, considering the available resources; (iii) The query plan-
ner: From the statistics related to the data streams, the available resources, and the

An Architecture for the Real-Time Data Stream Monitoring in IoT 67
associated definitions, it is responsible for the organization of the query plan and
its communication to the service queue manager; (iv) The performing coordinator:
From the real-time information provided by the resource monitoring and the query
planner, it is responsible for launching and warrantying the running of each operation
from the beginning to the end.
The Persistence Manager (see Fig. 1, on the right lower angle) is responsible
for the storing of the data following the indicated synthesis strategy, but just when
it is required. That is to say, this component is optional and could be out of the
bundle of a given data stream management system. When the persistence manager
is incorporated as component inside the data stream management system, the main
responsibilities are associated with: (i) The synthesis services: it describes the strategy
for identifying the data to be kept in a persistent way from the real-time data stream,
(ii) The storage services: It is responsible for establishing the necessary channels for
storing and retrieving the data from the external storage unit; and (iii) The historical
data services: This service is responsible for the query plan optimization, retrieving,
and the output organization from a given external query on the historical data.
Thus, the Stream Receiver (see Fig. 1, on the left upper angle) is who determines
whether a data stream is accepted or not, using the defined metadata in the data
stream catalog. In this sense, a data stream could be correctly defined, but its life
period is not valid (e.g. it has expired). All the defined data streams with a valid time
period are monitored for collecting statistics. The statistics are sent for its posterior
use in the planners (e.g. the query planner). Once the statistics were collected, the
data streams pass through a load shedder. The load shedder discards in a selective
way the data, keeping those considered as important in base on its definition. The
use of the load shedding techniques is optional, and they are applicable when the
available resources are near to the maximum limit. Once the data stream has got
out from the load shedder, the output could directly go to an operation, or well, it
could be used in a planned query. In the case of a planned query, the output could be
directly sent to the output manager or even to another operation.
The processor (see Fig. 1, on the middle upper region) is who keep flowing the
data from the data stream, passing through the operations to the output manager [12,
13]. It is responsible for the real-time computing, implementing of the pipelines,
data transformation, and the communication of the results to the output manager.
An interesting thing incorporated on each operation is the idea of the synopsis. The
synopsis is an in-memory materialized operation result who kept the last known
result for the associated operation. This materialized result is useful for continuing
the processing with the posterior operations, even when the inputs of the origin
operation were interrupted.
The Output Manager (see Fig. 1, on the right upper angle) regulates the way
in which the outputs are communicated jointly with its monitoring (e.g. the output
rate). The output (i.e. the result associated with a pipeline, planned query or ad hoc
query) could be replicated to other sites or systems, but also, it could be directly
consumed by mean of a set of users or systems. In this sense and on the one hand,
the replication service is responsible for automatically serving the outputs to the
configured systems or users. On the other hand, the subscription service regulates

68 M. J. Diván and M. L. Sánchez Reynoso
the target associated with the consumers of each stream and the valid life cycle in
which they could consume each output.
The Internet of Thing, Data Streams, Big Data and Data Stream Management
Systems are converging in application joint areas, such as the healthcare [14] among
other areas. That is to say, the Internet of Thing (IoT) allows boarding the data
collection with different kind of devices, communicating they between them and
transmitting different kinds of data (e.g. from information geographic to pictures).
On the one hand, the collected data from the different “Things” could be stored in
case of necessity, which considering that the data streams are potentially unbounded
will give origin to a Big Data Repository. On the other hand, when the data coming
from the “Things” should be processed when they arrive, it is necessary for the
incorporation of the DSMS. Thus, The IoT, Big Data and the DSMS allow the
implementing of the measurement process as a strategy for knowing and monitoring
the current state of some concept under interest [15].
3 The Measurement and Evaluation Project Definition
The way in which the person naturally knows the state or situation of an object is
through the measurement, for example, when a child goes to the periodical medical
visit, the doctor checks its size, height, weight, among other aspects comparing all
of them with the previous medical visit. In this sense, measuring and comparing the
current and past values, the doctor could determine its evolution. Even when this
could seem to be as an elemental thing, the measurement involves a set of details
which are critical at the time in that the values should be obtained, compared and
evaluated.
Figure 2 shows a simple case in where the child and an adult person are walking
in the park. In such a situation, it is necessary to monitor the child temperature for
determining whether the child has a fever or not. The child is considered like the entity
under monitoring, while the park is considered as the context in where the entity is
immersed. Because the presence of fever is related to the corporal temperature, it is
considered as an attribute able to be quantified, and for that reason, to be monitored.
The way in which a given value is obtained for a particular attribute is known as a
metric. In addition, the metric involves the specification of the particular method to
be used, jointly with the unit, scales, etc. Thus, the metric uses a device for obtaining
the measure; that is to say, in this situation the thermometer is used for obtaining the
value (e.g. 38.3 °C). The obtained value is known as the measure. Once the value is
obtained, the measurement reaches to its end, and the next stage is associated with the
value interpretation. There, it is necessary the knowledge from the domain experts,
which is incorporated in the indicators in the form of the decision criteria. Thus, using
the indicators with the incorporated decision criteria, the evaluation could conclude
about the presence of fever or not on the child. What if the next day the corporal
temperature is obtained from the child’s mouth using the same thermometer? The
new measure would not be comparable with the previous temperature because the
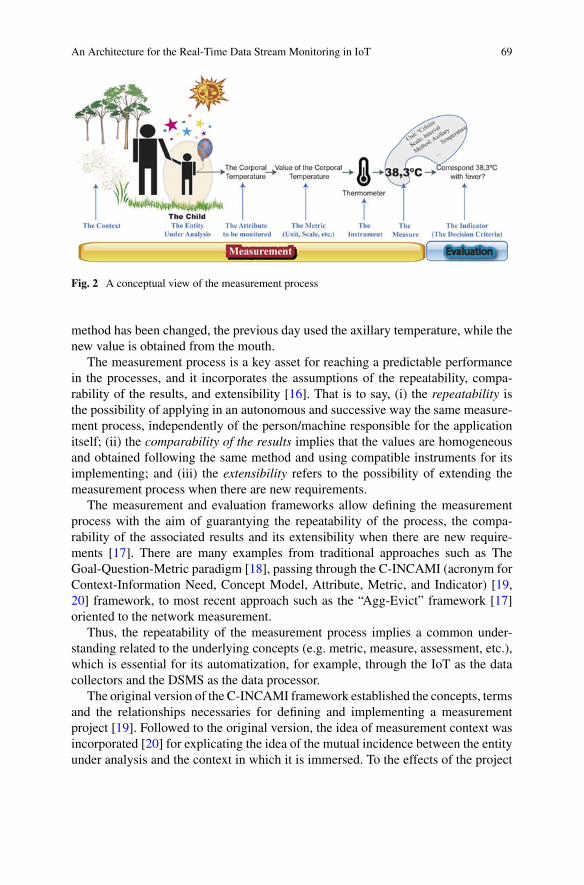
An Architecture for the Real-Time Data Stream Monitoring in IoT 69
Fig. 2 A conceptual view of the measurement process
method has been changed, the previous day used the axillary temperature, while the
new value is obtained from the mouth.
The measurement process is a key asset for reaching a predictable performance
in the processes, and it incorporates the assumptions of the repeatability, compa-
rability of the results, and extensibility [16]. That is to say, (i) the repeatability is
the possibility of applying in an autonomous and successive way the same measure-
ment process, independently of the person/machine responsible for the application
itself; (ii) the comparability of the results implies that the values are homogeneous
and obtained following the same method and using compatible instruments for its
implementing; and (iii) the extensibility refers to the possibility of extending the
measurement process when there are new requirements.
The measurement and evaluation frameworks allow defining the measurement
process with the aim of guarantying the repeatability of the process, the compa-
rability of the associated results and its extensibility when there are new require-
ments [17]. There are many examples from traditional approaches such as The
Goal-Question-Metric paradigm [18], passing through the C-INCAMI (acronym for
Context-Information Need, Concept Model, Attribute, Metric, and Indicator) [19,
20] framework, to most recent approach such as the “Agg-Evict” framework [17]
oriented to the network measurement.
Thus, the repeatability of the measurement process implies a common under-
standing related to the underlying concepts (e.g. metric, measure, assessment, etc.),
which is essential for its automatization, for example, through the IoT as the data
collectors and the DSMS as the data processor.
The original version of the C-INCAMI framework established the concepts, terms
and the relationships necessaries for defining and implementing a measurement
project [19]. Followed to the original version, the idea of measurement context was
incorporated [20] for explicating the idea of the mutual incidence between the entity
under analysis and the context in which it is immersed. To the effects of the project

70 M. J. Diván and M. L. Sánchez Reynoso
definition, this chapter is based on a variant of the C-INCAMI framework [21], which
allows jointly incorporating:
• The idea of estimated and deterministic measure,
• The incorporation of the complementary data related to each measure. The com-
plementary data could be a picture, video, audio, plain text, and/or information
geographic,
• The managing of the data sources and the associated constraints,
• The organization and use of the measurement adapter,
• Diverse ways to check the content integrity (e.g. be it at message or measure level),
and
• The possibility of carrying forward the data traceability,
The C-INCAMI framework is guided by an information need, which allows estab-
lishing the entity under analysis and describing the attributes who characterize it.
Each attribute is associated with a metric, who is responsible for its quantification.
The metric defines the method, scale, unit, the associated instrument (i.e. the data
source) among other aspects for obtaining and comparing the measure. Each metric
could obtain a set of measures. The measure represents a specific value obtained by
mean of the metric, at a specific time. The measure alone does not say much, but
the role of the indicator allows interpreting each measure through the incorporation
of the decision criteria. For example, given a temperature obtained from a metric,
the indicator (through the decision criteria) allows knowing whether a child suffers
fever or not (see Fig. 2).
The way in which a measurement and evaluation project could be formally defined
using the C-INCAMI framework is defined in [22], and just a few basic steps are
requested: (i) The definition of the non-functional requirements: it is responsible for
establishing the information need related to the project and the identification of the
entity category (e.g. a lagoon, a person, etc.), the entity to monitor (e.g. John Doe)
and the attributes for quantifying it; (ii) Designing the Measurement: Once the entity
is defined and their attributes identified, the metric is defined for each attribute jointly
with its association with the data source (e.g. a given sensor in IoT); (iii) Implementing
of the Measurement: The measurement is effectively activated through the different
sensors associated with each metric and the measures start to arrive for its processing;
(iv) Designing the Evaluation: The indicators and the associated decision criteria are
defined for interpreting each measure from the metrics; (v) Implementing of the
Evaluation: The indicators, decision criteria, and the decision-making is effectively
put to work through an automatized process; and (vi) Analyzing and Recommending:
It is responsible for analyzing each decision from the indicators and to give some
recommendations pertinent to the configured situation.
The “Bajo Giuliani” is a lagoon located around 10 km at the south of the Santa
Rosa city, province of La Pampa in Argentina (South-America). On the south shore
of the lagoon, there is a neighborhood named “La Cuesta del Sur”. This lagoon
receives water from the raining and waterways coming from the city. On the lagoon,
the national route number 35 cross it from the north to south. For clarifying the
idea associated with the project definition, the basic steps are exemplified. Thus, the

An Architecture for the Real-Time Data Stream Monitoring in IoT 71
project’s information need could be defined as “Monitor the level of water of the ‘Bajo
Giuliani’ lagoon for avoiding flood on the south shore related to the neighborhood”.
The entity category is defined such as “lagoon located in the province of La Pampa”,
principally considering the particularities of this region and the semi-arid climate.
The entity under analysis or monitoring is limited to the “Bajo Giuliani” lagoon.
Nowell, the attributes to choose should characterize the lagoon in relation to the
defined information need. For that reason, it is chosen: (i) The water temperature: It
allows determining the possibilities of the evaporation in relation to the lagoon; (ii)
The ground moisture: it facilitates identifies the regions in which the water advance
on the south shore and the regions in which the water is retreating; and (iii) The
water level: It allows determining the variation of the water level between the floor
of the national route number 35 (it is crossing the lagoon) and the south shore floor
related to the neighborhood. In relation to the context, the environmental temperature
and humidity are considered for analyzing the effect of the evaporation and the risk
of fog on the national route respectively. Even, a picture would be a good idea
like complementary datum, principally considering the aspects related to the fog,
evaporation, and the environmental temperature.
It is important to highlight that the number of attributes for describing to an entity
under analysis jointly with the number of the context properties for characterizing the
related context is arbitrarily defined by the analyst responsible for the measurement
process. In this case and following the principle of parsimony, these attributes and
context properties are kept for exemplifying the idea and the associated applications
along this chapter.
Once the attributes and context properties are known and clearly limited, the
definition of each metric associated with them is necessary for its quantification. In
this sense, the definition of each metric allows specifying the ID associated with
the metric, the kind of metric, the associated scale (i.e. kind of scale, the domain of
values and the unit), and the associated method. The method describes its name (this
is important when it is standardized), the kind of measurement method (i.e. objective
or not), a brief narrative specification and the instrument to be used for effectively
getting the measure (or value). This step is critical because here it is possible to define
whether the expected measure will be deterministic or not.
Table 1 shows an example of the definition for the metric related to the water
temperature attribute based on the entity under analysis “The Bajo Giuliani Lagoon”.
Because the result associated with a metric is a value or likelihood distribution, the
given name for a metric starts with “Value of …”. Even when the metric gives a
likelihood distribution, the estimated value (e.g. the mathematics expectation) is a
unique value. The defined metric is direct because the value is obtained using an
instrument, and not by derivation from other values of metrics (in this case would
be indirect). The scale associated with temperature is Interval, the domain of values
is numeric, each value belongs to the set of the Reals, and the expected unit is the
Celsius degree. The method describes the way in which each value is effectively
obtained. In this case, the water temperature gets by immersion and contact direct,
using an objective method through the sensor Ds18b20 mounted on the Arduino One
board.

72 M. J. Diván and M. L. Sánchez Reynoso
Table 1 An example of the definition for the metric related to the water temperature attribute
Metric ID: 1 Name: value of the water temperature
Kind Direct metric
Scale • Kind: Interval
• The domain of Values: Numeric, Real
• Unit: ºCelsius
Method • Name: Submerged by direct contact
• Measurement method: objective
• Specification: It takes the water temperature in the specific position where the
monitoring station based on the Arduino One is located. The water temperature is
taken at least around 5 cm under the level of the water surface
• Instrument: Sensor Ds18b20 (Waterproof) mounted on the Arduino One board
• Kind of values: Deterministic
Table 2 An example of the definition for the metric related to the environmental humidity context
property
Metric ID: 2 Name: Value of the environmental humidity
Kind Direct metric
Scale • Kind: Interval
• The domain of Values: Numeric, x ∈ R+0 /x ≤ 100
• Unit: % (Percentage)
Method • Name: Direct exposition to the environment
• Measurement method: objective
• Specification: It takes the environmental humidity in the specific position where
the monitoring station based on the Arduino One is located. The environmental
humidity is taken at least around 2 m above the level of the floor related to the
south shore of the neighborhood
• Instrument: The DHT11 humidity sensor mounted on the Arduino one board
• Kind of values: Deterministic
Table 2 shows an example of the definition for the metric related to the environ-
mental humidity (a context property) for the defined context in relation to the “Bajo
Giuliani Lagoon”. The metric receives the ID 2 for differentiating from other metrics
(i.e. a unique identification) jointly with a specific name “Value of the environmental
humidity”. This metric is direct because it does not depend on the values of other
metrics. The scale is an interval, the domain of values is defined to the set of the real
limited to the closed interval [0; 100], and there is not a unit, because the expected
value is a percentage (i.e. it is relative). The method for getting the value is objective
and based on the direct exposition to the environment. The sensor who obtains the
value is the DHT11 mounted on the Arduino One board, and the expected position
of the sensor is above 2 m above the floor of the neighborhood south shore.
As it is possible to appreciate between Tables 1 and 2, the definition of a metric
has no difference whether it is a context property or an attribute, because the con-
text property is really an attribute. However, the context property is conceptually
specialized for describing a characteristic of the entity context.
An Architecture for the Real-Time Data Stream Monitoring in IoT 73
Thus, the defined metrics for the entity attributes and the context properties allows
obtaining a value, be it deterministic or not. Nowell, the interpretation of each value
is an aspect associated with the indicator definition. In this sense, the conceptual
differentiation between metric and indicator is that the metric obtains the value, and
the indicator interprets each value from a given metric.
Each indicator has an ID which allows its unique identification along the project.
Because the indicators are associated with the interpretation, the common name starts
with “Level of…”, in where the interpreted value is related to one or more metrics. It
is possible to have two kinds of indicators: Elementary or Global. On the one hand,
the elementary indicator allows interpreting in a direct way the value from a formula,
which establishes the relationship among a set of metrics. The global indicator allows
obtaining its value from the values associated with a set of elementary indicators,
and in this case, the weight is used for pondering each elementary indicator value.
Table 3 shows an example of the indicator definition associated with environmental
humidity. The indicator named “Level of the environmental temperature” is identified
by “I2” and it is an elementary indicator. For that reason, the associated metric is in
this case MetricID2 (i.e. The value of the environmental humidity) and the formula
expresses that the decision criteria uses the value such the metric provides (i.e. without
conversion or transformation). Because the number of indicators is not limited, it
is possible to have as many indicators as be necessary. For example, it could be
possible to have an indicator for expressing the level of variation of the environmental
humidity using a formula such as MetricI D2(t)/MetricI D2(t − 1). The conversion
or transformation of the metric value is not mandatory, but many times is used for
expressing transformations or for linking a set of metrics. Thus, once the formula
value is obtained, the decision criteria incorporate the knowledge from the experts
for interpreting each value, and for example, when the value of the environmental
humidity is 96%, the decision criterium using the Table 3 will say “Very High” and
will indicate a specific action to do. The Kind of answer based on the interpretation is
defined as a categoric value and with an ordinal scale limited to the following values
“Very High”, “High”, “Normal”, “Regular”, and “Low” in that order. When some
interpretation has an associated action, the interpreter is responsible for performing
it. It is important to highlight that the action to do is based on the decision criteria
defined by the experts in the specific domain, and it is not related to a particular
consideration of the interpreter.
Following this same mechanic, all the necessary indicators associated with the
“Bajo Giuliani lagoon” can be defined. Thus, on the one hand, the measurement is
implemented through the definitions of the metrics who are responsible for obtaining
the measures (i.e. the values). On the other hand, the evaluation is implemented
through the indicators who are responsible for the interpretation of each value from
the metric and the guiding of their derived actions.
The CINCAMI/Project Definition (synthetically, CINCAMI/PD) [23] is a schema
based on the C-INCAMI extended framework which allows interchanging the defi-
nition of the measurement and evaluation project among different systems. It has an

74 M. J. Diván and M. L. Sánchez Reynoso
Table 3 An example of the definition for the indicator related to the environmental humidity context
property
Indicator ID: I2 Name: Level of the value of the environmental humidity
Kind/weight Elementary indicator Weight: 1
Reference metrics MetricID2 (i.e. Value of the environmental humidity)
Model • Kind: Ordinal
• Domain of values:
x ⊂ {V er y High, High, Normal, Regular, Low}
• Unit: Not applicable
Formula =MetricID2
Decision criteria Interval Interpretation Actions
[95%; 100%] Very high Notify
[80%; 95%) High Notify
[60%; 80%) Normal No action
[40%; 60%) Regular No action
[0%; 40%] Low No action
open source library available on GitHub2 for generating and reading the definitions,
fostering its interoperability along different kind of systems who need to implement
the measurement based on the extended C-INCAMI framework.
Thus, before to board the data stream processing based on the measurement meta-
data, the next section introduces the measurement interchange schema for demon-
strating how the measurement stream can be generated based on the project definition.
4 The Measurement Interchange Schema
Once the Measurement and Evaluation Project is defined, the definition is commu-
nicated to the data processing systems jointly with the measurement adapter. The
measurement adapter is a role associated with the responsibility for translating the
raw data coming from the sensors to a given data format. For example, the data are
obtained from the sensors mounted on the Arduino One. The Arduino One takes
the raw data and transforms them in a message based on the eXtensible Markup
Language (XML)3 or JavaScript Object Notation (JSON)4 to be sent to the data
processor.
As it was shown before, the measurement and evaluation project definition allow
defining the attributes and context properties for an entity, jointly with the associated
2https://github.com/mjdivan/cincamipd.3https://www.w3.org/XML/.4https://www.json.org.

An Architecture for the Real-Time Data Stream Monitoring in IoT 75
metrics. Thus, the measurement adapter and the data processor could interpret a
given message using the definition.
Nowell, when the measurement adapter receives the project definition, it asso-
ciates each sensor value with the expected metric, and in this line, the new messages
will be organized using the project definition known as the metadata. In the same
sense, the data processor will interpret each message coming from the measurement
adapter using the same project definition. This is a key asset because both the sender
and receiver share a common project definition for fostering the data interoperability.
The Measurement Interchange Schema (MIS) [21] is structured following the
underlying concepts, terms and the relationships associated with the extended C-
INCAMI framework, and it is also known under the name of CINCAMI/MIS. The
schema allows the measurement interchanging using as guide the project definition.
Thus, a CINCAMI/MIS message incorporates the data (i.e. the measures) jointly
with the metadata (e.g. the identification of a metric for a given measure) which
allow guiding the real-time data processing.
4.1 The Details About the Measurement Schema
The Measurement Interchange Schema is hierarchically organized through an XML
schema following the concepts, terms, and relationships associated with the mea-
surement and evaluation project definition.
In the hierarchical organization of the schema (see Fig. 3), It is possible to find
three kind of symbols: (a) A: it represents that it is possible to have a set of the lower
tags in any order. For example, under the measurementItemSet tag, it is possible to
find a set of the measurementItem tag in any order; (b) S: it refers to a specific order
in relation to the set of the lower tags. For example, under the measurementItem tag,
it will find the idEntity, Measurement, and context tags in that specific order; (c) C:
it indicates that just one lower tag can be chosen from all the detailed lower tags.
Thus, Fig. 3 outline the highest level related to the measurement interchange
schema. The CINCAMI_MIS tag limits the message for a given measurement adapter.
That is to say, each set of measures coming from the same measurement adapter at a
given time, it will be organized under the same CINCAMI_MIS tag. This tag has two
associated attributes, the version refers to the version of the measurement schema
used in the message, while the dsAdapterID refers to the unique identification of the
measurement adapter which acts as the intermediary between the data sources (i.e.
the sensors) and the data processor.
The measures are grouped through the measurementItemSet tag, which contains
a set of measurementItem tag. The measurementItem tag represents one measure
associated with its contextual information and complementary data. This tag iden-
tifies (1) The data source ID (i.e. the dataSourceID tag) which is the identification
of the data source that acts as the origin of the measures; (2) The original data
format in which the data source provides the measure to the measurement adapter.
For example, and using the Table 1, it would be the data format in that the sensor

76 M. J. Diván and M. L. Sánchez Reynoso
Fig. 3 The upper level of the CINCAMI/MIS message
Ds18b20 informs each measure to the Arduino One in which it is mounted; and (3)
The footprint allows an integrity verification on the informed measure, considering
the measurement itself jointly with the context information. In addition to the mea-
sure and the context information, the measurementItem tag allows identifying the
entity under monitoring, which is useful in case of the load shedding techniques and
data prioritization in the real-time data processing.
The yellow circle with an arrow inside represents a direct access to the definition
for avoiding the redundancy. For example, Fig. 3 indicates that the structure of the
Measurement tag under the measurementItem and Context tags respectively are the
same. Indeed, the Measurement tag is shown in Fig. 4, and it has three associated
tags: datetime, idMetric and Measure. The datetime tag refers to the instant in which
the measure is got. The idMetric tag refers to the metric in the project definition for
the entity under analysis with who the measure is associated. Finally, the Measure
tag describes the structure related to the measure itself.
Under the Measurement tag there exists the description of the quantitative value
jointly with the complementary data. The quantitative value could be estimated or
deterministic and for that reason, just one of the two tags must be chosen. On the one
hand, the deterministic value has a unique value which represents the quantification
of the indicated metric (i.e. idMetric tag) for the given entity (i.e. IdEntity tag) at the
specific time. On the other hand, the likelihood distribution is represented such as a
set of the estimated tags. Thus, each estimated tag is an estimated value described
by the (value, likelihood) pair.
The Measurement tag introduced in Fig. 3 is extended in Fig. 4; while the com-
plementary data introduced in Fig. 4 are detailed in Fig. 5.
Thus, Fig. 5 details the alternatives for the complementary data related to a given
measure. As it is possible to appreciate in Fig. 5, under the complementaryData tag is
possible to find a set of the complementaryDatum tag. Each complementary datum
must be one of five alternatives: (i) A document organized under the Geography

An Architecture for the Real-Time Data Stream Monitoring in IoT 77
Fig. 4 The measurement tag in the CINCAMI/MIS message
Fig. 5 The complementary data organization in the CINCAMI/MIS message

78 M. J. Diván and M. L. Sánchez Reynoso
Markup Language (GML)5; (ii) A picture describing the context or some character-
istic of the entity under analysis; (iii) A plain text which is possible to be associated
with a system log; (iv) An audio track representative of some attribute or context
property related to the entity or its context respectively; and (v) A video file which
could describe some interesting aspect of the region.
Each complementary datum could be associated with a GML document for
describing the specific location. This is useful when the audio, picture or video file
should be related to a particular localization. Moreover, the geographic information
could be linked in relation to a measure without the necessity to have an associated
audio, picture or video file. That is to say, the incorporation of the geographic infor-
mation does not require the mandatory use of the multimedia files to be included as
a complementary datum for a given measure. In this sense, each measure could have
complementary data (i.e. it is optional), and in that case, the set could be integrated
by one or more complementary datum without a specific limit.
In this way, the CINCAMI/Measurement Interchange Schema allows coordinating
the meaning and data organization based on the extended C-INCAMI framework,
jointly with the project definition. This fosters the data interoperability between
the involved processing systems and the data sources, because the data generation,
consuming, and the processing itself are guided by the metadata (i.e. the project
definition). For example, the Arduino One receives the project definition by mean
of a CINCAMI/PD message, and thus, it knows the range of expected values from
the sensor DHT11 (environmental humidity). Then, a value such as 120 could be
detected as not valid in the measurement adapter by mean of the direct contact with
the data source (DHT11 sensor), just using the metric definition (see Table 2). When
this happens, it could be possible to send an alarm to the data processor and discard
the anomalous value avoiding overhead from the source.
4.2 The CINCAMIMIS Library
The CINCAMIMIS library is an open source library, freely available on GitHub6 for
using in any kind of systems which require the measurement automatization based
on the extended C-INCAMI framework. The library was developed in the Java 8
language, using Google gson7 jointly with JAXB libraries.
The library allows generating the measurement streams under the CINCAMI/MIS
for being interchanged among the processing systems, the data sources and the pro-
cessing system, or even the data sources with each other (e.g. in IoT). Thus, the
measurement interchange schema fosters the data interoperability independently of
the processing systems (be it a data consumer or producer) and the software used for
carrying forward the project definition.
5http://www.opengeospatial.org/standards/gml.6https://github.com/mjdivan/cincamimis.7https://github.com/google/gson.

An Architecture for the Real-Time Data Stream Monitoring in IoT 79
Both XML as JSON data formats are supported for making as easy as possible
the data interchanging. Complementarily, the GZIP compression can be used on the
XML/JSON messages for minimizing the interchanged data and the required time
for the communication.
The library implements a translating mechanism which allows transparently
migrating among XML, JSON, the object model in any sense. The Object Model is
completely based on the extended C-INCAMI framework, a reason why the concepts
and terms able to be processed are completely known.
5 An Architectural View for the Measurement Processing
The Processing Architecture based on Measurement Metadata (PAbMM) is a data
stream engine encapsulated inside a Storm Topology. It allows carrying forward
the data-driven decision making based on the real-time monitoring of one or more
measurement and evaluation projects [24].
From the architectural view, it could be analyzed from four functional perspec-
tives: (a) The Definition: It is responsible for the measurement and evaluation project
definition. The result of this perspective is a CINCAMI/PD file used as input in the
architecture; (b) The Data Collecting and Adapting: The Data Collecting and Adapt-
ing: it is responsible to implement from the data collecting on the sensors to the
consolidated data receiving for its central processing; (c) The Analysis and Smooth-
ing: It allows carrying forward a series of statistical analysis on the data stream for
detecting anomalies, deviations or unexpected behavior in terms of the typical data
distribution; and (d) The Decision Making: In case of some situation is detected, it
is responsible for making a decision based on the experience and previous knowl-
edge available on the organizational memory. The four perspectives are synthetically
described through the BPMN notation in the next section.
Initially, each measurement and evaluation project is defined by the domain’s
expert, who establishes the information need, it defined the entity under analysis,
the associated attributes, the context properties, the metrics useful for their quantifi-
cation, among other aspects (see Sect. 3). Once the M&E project is ready, this is
communicated to the PAbMM using the CINCAMI/PD schema and the definition is
incorporated in the organizational memory (see Fig. 6). Thus, when PAbMM receives
the CINCAMI/PD file, it is simultaneously informed to each in-memory component,
being ready for processing a new data stream.
As it is possible to see in Fig. 6, the Measurement Adapter (MA in Fig. 6) has
a morphology like a star. That is to say, each extreme of the star represents a given
data source (e.g. a sensor) communicated with the measurement adapter located on
the center. Each sensor could be heterogeneous, and for that reason, it is possible
that the MA receives the data organized in a different way (a typical aspect in IoT).
Using the project definition file (i.e. the CINCAMI/PD file associated with a given
project) in the configuration stage, the MA identifies and knows each related sensor,

80 M. J. Diván and M. L. Sánchez Reynoso
Fig. 6 The architectural view for the measurement processing
its associated metric, the quantified attribute or context property, and the entity under
analysis.
Synthetically, the MA receives the data organized in a heterogeneous way from
each sensor. From there, this is responsible to identify each sensor, verify the obtained
measure in terms of the project definition (e.g. for detecting miscalibration), and to
make the necessary transformations for sending the measures as a unique CIN-
CAMI/MIS stream.
It is important to remark that each CINCAMI/MIS stream jointly inform the
measures and the associated metadata. Thus, the Gathering Function responsible for
receiving the data streams guides the processing using the metadata and the associated
project definition (e.g. using the CINCAMI/PD file).
The Gathering Function (see Fig. 6) receives the data stream and it applies the
load shedding techniques when it is necessary. The load shedding techniques allow
a selective discard of the data for minimizing the loose when the arrival rate is upper
than the processing rate [25]. Whether the load shedding techniques be applied or
not, the resulting stream organized under the CINCAMI/MIS (i.e. the data orga-
nization coming from the MA) is automatically replicated to (i) The subscribers:
Each one who needs to read the data stream without any kind of modification could
be subscribed it (e.g. it could be made using Apache Kafka8); (ii) The Synthesis
and Storing Functionality: it represents a kind of filter for the data stream, which
acts before to store the content with the aim of synthesizing it. The synthesizes
algorithm is optional, and for that reason, a data stream could be fully stored if no
8https://kafka.apache.org.

An Architecture for the Real-Time Data Stream Monitoring in IoT 81
one algorithm was indicated. For example, in the monitoring of the environmental
temperature related to the “Bajo Giuliani” lagoon, it would be possible to store a
synthesis of the environmental temperature every five minutes (e.g. one value) if no
change in it happens. In terms of storing, it would be an interesting optimization
of its capacity; (iii) The Analysis and Smoothing Function: It is responsible for the
real-time statistical analysis of the data stream.
When the data stream is received in the Analysis and Smoothing Function, it
canalizes the data through a common data bus. From the common data bus a set
of analysis are simultaneously computed: (i) The Kolmogorov-Smirnov through the
Anderson-Darling test [26]: it allows analyzing the data distribution in relation to the
expected behavior (e.g. detecting normality when it is present); (ii) The Principal
Component Analysis: This analysis is useful for detecting the variability source,
mainly thinking in aspects that could get out of control the expected behavior for a
given attribute; (iii) The Correlation Analysis: It is carried forward for analyzing the
dependence and relationships between the involved variables in the entity monitoring
(i.e. a metric could be viewed such as a variable), and (iv) The Descriptive Analysis:
it allows updating the descriptive measures related to each attribute and context
property of each entity. In this way, the last known state is gradually built. Even,
from the last known state, an idea of synopsis could be used for answering in an
approximate way when the data source related to an entity has been interrupted.
As it is possible to see in Fig. 6, some circles have an associated flag but not all.
The circles with an associated flag represent that the related operation can launch an
alarm when some atypical situation is detected (based on the project definition). For
example, when the descriptive analysis is processing the value of the environmental
temperature (i.e. a metric’s value, the measure) in the “Bajo Giuliani” lagoon, a
temperature upper than 50 °C is atypical for the region, and it could be indicating a
fire.
At the same time in which the data are statistically processed, they continue its
travel to the decision-making function. In the decision-making function, a current
classifier (see Ct in Fig. 6) based on the Hoeffding Tree is applied from the known
situations [27]. For example, in the case of the “Bajo Giuliani” lagoon, the known
situations could be the fire, flood, etc. In parallel, the original classifier is incremen-
tally updated with the new data, resulting in a new Tree (see Ct+1 in Fig. 6) for who a
new classification is obtained. Both classifiers are compared based on the area under
the ROC (Receiver Operative Curve) curve [25], and the classifier with the biggest
area will be the new “current classifier”. However, and as it is possible to see in
Fig. 6, the classifiers could launch an alarm when some critical situation is detected
(e.g. a flood). In any case, the alarm receiver is the decision maker component in the
decision-making function.
When the decision maker receives an alarm (be it from the statistical analysis
or the classifiers), it looks in the near history related to the entity under analysis
for similar situations and its associated recommendations. When the situations and
recommendations are found, the recommended actions are performed (e.g. notify
to the fire station). However, it is highly possible that some entity has not a recent
associated story. In such case, a case-based reasoning based on the organizational

82 M. J. Diván and M. L. Sánchez Reynoso
memory is carry forward supported by the structural and behavioral coefficients. On
the one hand, the structural coefficient allows identifying the entities who share the
similar structure for the monitoring. On the other hand, the behavioral coefficient
allows identifying the entities who experiment a similar. Both coefficients, structural
and behavioral, allows filtering the in-memory organizational memory for limiting
the search space and improving the performance of the case-based reasoning.
As it is possible to appreciate, the architectural view considers from the project
definition, passing through the data collecting (i.e. by mean of the IoT sensors)
and adapting (i.e. the measurement adapter) and ending with the real-time decision
making and the associated recommendations. The next section introduces the process
formalization for the Architectural View related to the measurement processing.
6 The Formalization Related to the Architectural View
The Architectural View of the Measurement Processing is substantiated around five
main processes: (i) The configuration and startup: It is responsible for the initial-
ization of the processing architecture, from the loading of each project definition
to the start of the data receiving; (ii) The collecting and adapting: It is oriented to
warranty the data collecting from the sensors, the needed transformations from the
raw data and the delivering to the GF of the data stream; (iii) The Data Gathering: It
is responsible for the data gathering coming from the measurement adapters, jointly
with the data replications and synthesis when it is required; (iv) Data Analysis and
Smoothing: It performs the real-time data analysis based on the M&E project defini-
tion, being responsible for the building and keeping of the synopsis in memory; and
(v) Decision making: It receives the alarms thrown from the different processes, and
it is responsible for determining the necessity of notification based on the priority,
informing the actions and the associated recommendations. Following, each process
is synthetically explained using the BPMN notation for better understanding.
6.1 The Configuration and Startup Process
Before the processing architecture can process anything, the M&E project definition
must be loaded in memory and initialized. As was introduced in Sect. 3, the project
definition establishes the information need, the entity under analysis, the attributes
used for characterizes the entity, the context properties useful for detailing the context
in which the entity is immersed, among other concepts and terms. The loading activity
implies read each CINCAMI/PD content from the files or web services, validate it
and prepared the data structure and buffer for receiving the data.
This process incorporates the capacity of starting-up the processing architecture,
stop its functioning and make the online updating of the project definition (see Fig. 7).
When the startup process of the architecture is initialized, three different threads are

An Architecture for the Real-Time Data Stream Monitoring in IoT 83
Fig. 7 The configuration and startup process using BPMN notation
generated: (i) The project definition loader, (ii) The updating listener, and (iii) The
Power-off performer.
The thread associated with the project definition loader is located in the superior
region of Fig. 7, and it starts with the reading of the project definitions. In the
beginning, the M&E project definitions are read from the organizational memory
related to the PAbMM (see Fig. 6). Each project definition is organized following
the CINCAMI/PD schema, which allows using any kind of software for carrying
forward the project specification.
Once the definitions were read, the architecture counts them and in case of there not
exists definitions, the architecture keeps waiting for new definitions. The waiting time
could be specified as an architecture parameter. However, when at least one definition
is present, it is updated in memory indicating the entity, the expected attributes, and
the associated metrics jointly with the expected values, among other aspects indicated
in the definition. If there is not enough memory during the initialization, a fault is
thrown, and an abnormal end state is reached.
After the project initializing, the data buffers are created and reserved specifically
for the M&E project. Thus, the memory space for the data stream, the synopses and
the partial results derived from the statistical analysis are ready for the processing.
Thus, a message indicating the “Successful” updating is sent to the project director,

84 M. J. Diván and M. L. Sánchez Reynoso
and the architecture finally comes back to the waiting state waiting for new definitions
(be it new projects or updating).
The thread related to the online updating just implies a task continuously waiting
for a message from the project director. When the project director sends a CIN-
CAMI/PD document through a web service to the process by mean of the “Online
Updating” message, the architecture migrates the new definition to the project def-
inition loader for starting its loading as was explained before. In this case, and on
the one hand, when the successful loading of the new definition is made, the project
director receives a message indicating it. On the other hand, and when some memory
failure happens, an error message is communicated to the project director too.
The power-off is simple but quite different because it implies the stopping of the
data processors, the cleaning and freeing of memory. The manager is the only role
able to carry forward the shutdown. Thus, when the manager sends the shutdown
signal, the message is received and immediately the data processors are stopped.
Next, any transitory results are stored on the disk for finally cleaning all the memory
(data structures and buffers). When the cleaning has ended, the architecture sends a
message to the manager committing the shutdown.
It is clear that this process is dependent on the project definition, and for that
reason, there is not any processing in absence of the project definition. This is a key
asset because it allows highlighting the importance of the metadata (i.e. the entity,
attributes, metrics, etc.) at the moment in which each data should be processed.
Having said that, it is possible to highlight that all of the other processes directly
depend on the configuration and startup process.
6.2 The Collecting and Adapting Process
The collecting and adapting process is carried forward on the measurement adapter.
The measurement adapter is a piece of the architecture located on portable devices
(see Fig. 6). This process is responsible for communicating an M&E project definition
to the measurement adapter, for establishing the relationships among the available
sensors and each metric indicated in the project (see Fig. 8).
As it is shown in Fig. 8, the process could carry forward a new project defini-
tion, an updating or even the power-off of the measurement adapter. In this sense, it
is important to highlight that the power-off is specifically limited on one measure-
ment adapter and not all the processing architecture. Thus, a set of sensors could be
interrupted through the power-off of its associated measurement adapter, while other
measurement adapters continue sending data to the gathering function.
The project definition is entered by mean of a CINCAMI/PD definition. The defi-
nition could be obtained from: (a) a file, (b) the organizational memory or, (c) by the
web services related to the architecture (see Fig. 6). In the case of the CINCAMI/PD
definition is locally stored on the measurement adapter, the project loader directly
starts with the loading when power-on the device. Thus, a matching between sensor
and metrics based on the project definition using the metadata (see Tables 1 and 2)

An Architecture for the Real-Time Data Stream Monitoring in IoT 85
Fig. 8 The collecting and adapting process using BPMN notation
is automatically made. In the case of all the metrics are correctly associated with the
sensor, the buffers are initialized, and the data collecting is immediately started.
However, in case of some metric keeps without association, it provokes that the
measurement adapter transits to wait for a new M&E project definition. This allows
defining a norm such as: “A measurement adapter will initialize an M&E project
definition if and only if all the included metrics have an associated sensor in the
measurement adapter, else the definition is not appropriated”. In other words, a
measurement adapter could have more sensors than metrics, but a metric must have
an associated sensor.
In addition, the project director could update the definition sending a new defini-
tion to the measurement adapter. The measurement adapter receives the new defini-
tion, validate it (e.g. the content and the association between sensors and metrics),
starts the new buffers in parallel for instantly replacing the previous definition. Next,
the data collecting is continued based on the new definition.
In this case, just the manager role is able to shut down the measurement adapter.
Because the measurement adapter is a component located on a portable device, the
shutdown implies stop the data collecting thread, clean the memory and power-off
the device. Figure 9 synthetically describes the steps for the data collecting. The
sensors have a passive behavior, due to which the measurement adapter collect the
data from the sensors and put the data inside the data buffer. The data are put in the
buffer in the same way that they were obtained (be it such as a raw data or in the
proprietary data format).
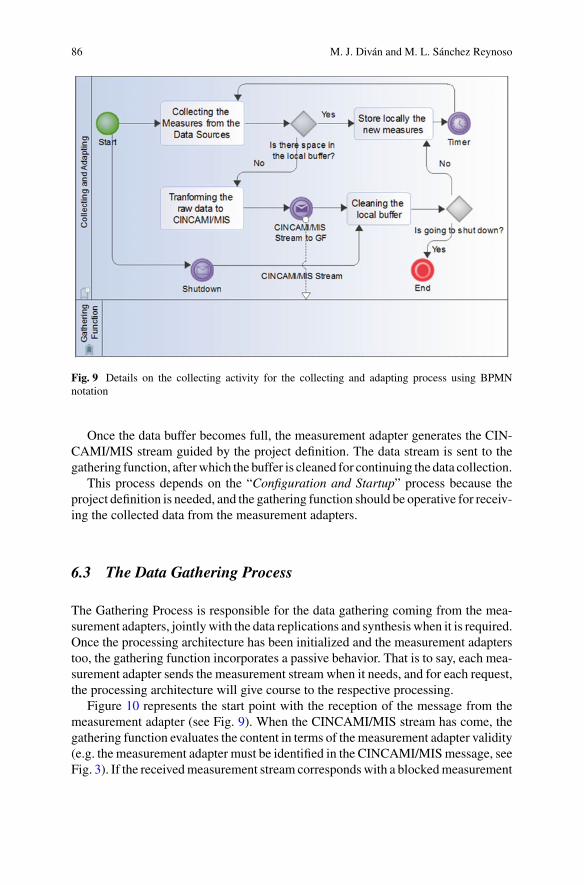
86 M. J. Diván and M. L. Sánchez Reynoso
Fig. 9 Details on the collecting activity for the collecting and adapting process using BPMN
notation
Once the data buffer becomes full, the measurement adapter generates the CIN-
CAMI/MIS stream guided by the project definition. The data stream is sent to the
gathering function, after which the buffer is cleaned for continuing the data collection.
This process depends on the “Configuration and Startup” process because the
project definition is needed, and the gathering function should be operative for receiv-
ing the collected data from the measurement adapters.
6.3 The Data Gathering Process
The Gathering Process is responsible for the data gathering coming from the mea-
surement adapters, jointly with the data replications and synthesis when it is required.
Once the processing architecture has been initialized and the measurement adapters
too, the gathering function incorporates a passive behavior. That is to say, each mea-
surement adapter sends the measurement stream when it needs, and for each request,
the processing architecture will give course to the respective processing.
Figure 10 represents the start point with the reception of the message from the
measurement adapter (see Fig. 9). When the CINCAMI/MIS stream has come, the
gathering function evaluates the content in terms of the measurement adapter validity
(e.g. the measurement adapter must be identified in the CINCAMI/MIS message, see
Fig. 3). If the received measurement stream corresponds with a blocked measurement

An Architecture for the Real-Time Data Stream Monitoring in IoT 87
Fig. 10 The data gathering process using BPMN notation
adapter (i.e. the measurement adapter is kept out from the collecting schema by a
given reason), the message is discarded, and the process instantiation is derived to
the end state, indicating that the message is invalid for its processing.
However, when the informed message from the measurement adapter corresponds
with an active adapter, the next step is associated with the consistency verification
related to the message itself. Thus, the message is effectively read and received, and
then, the schema validation is carried forward. In the case of the stream does not
satisfy the CINCAMI/MIS schema, the process instantiation is derived to the end
state indicated as “Inconsistent Stream”.
Thus, all the streams which satisfying the measurement interchange schema (i.e.
CINCAMI/MIS) are derived for the application of the load shedding techniques. The
load shedding techniques allow a selective discarding based on the content stream
and the M&E project definition. This kind of optional techniques is automatically
activated when the arriving rate is upper to the processing rate. Because the mea-
surement interchange schema is completely based on the M&E project definition, it
is possible to retain in a selective way the priority measures.
Once the measurement stream has passed through the load shedding techniques,
the resulting measures are replicated. The replication happens to four different des-
tinations: (a) The subscribers: It requires a previous registration for continuously
receiving the measurement stream without any modification; (b) The Analysis and
Smoothing Function: a copy of the current measurement stream is sent for the real-
time statistical analysis; (c) The Decision-Making Function: a copy of the current
measurement stream is derived for analyzing whether corresponds with some typical
situation or not (e.g. fire, flood, etc.); and (d) Historical Data: Basically the measure-
ment is directly stored in the organizational memory for future use. However, when
the synthesis data option is enabled, the measurement stream is processed through a
determined synthesis algorithm which internally determines what kind of data must

88 M. J. Diván and M. L. Sánchez Reynoso
be retained and stored. For example, it is possible to continuously receive the tem-
perature data from the “Bajo Giuliani” shore, but maybe, it could be interesting just
keep the temperature’s changes in persistence way.
Thus, when the measurement stream has been derived by mean of the four channels
(i.e. the subscribers, analysis and smoothing function, decision-making function and
the organizational memory), the process comes to its end.
6.4 The Analysis and Smoothing Process
The Analysis and Smoothing Process performs the real-time data analysis based on
the M&E project definition, being responsible for the building and keeping of the
synopsis in memory.
This process performs five statistical analysis in parallel at the moment in which
the measurement streams come from the gathering function (see Fig. 11): (i) The
Descriptive Analysis (DA), (ii) The Principal Component Analysis (PCA), (iii) The
Data Distribution Analysis (DDA), (iv) The Analysis of the Outliers (AO), and (v)
The Correlation Analysis.
The Descriptive Analysis allows checking each measure in terms of the project
definition, and at the same time, carry forward the updating of the descriptive mea-
sures (i.e. mean, variance, etc.) for each metric related to a given entity under analy-
sis. In this sense, when the descriptive analysis obtains a value inconsistent with the
Fig. 11 The analysis and smoothing process using BPMN notation
An Architecture for the Real-Time Data Stream Monitoring in IoT 89
project definition (e.g. an environmental temperature with a value of 200), an alarm
is sent to the Decision Maker. Whether the alarm is thrown or not, the computed
descriptive measures for each metric allows updating the synopsis related to the
entity under monitoring. Thus, by mean of the synopses, the processing architecture
could partially answer the state of an entity in front of a given query, even when the
associated measurement adapter has been interrupted.
The Principal Component Analysis is carried forward for evaluating the contribu-
tion to the system variability of each metric in the context of the M&E project. When
some metric (i.e. or random variable in this context) is identified as big variance
contributor, an alarm is thrown to the decision maker for analyzing it. Whether the
alarm is thrown or not, the PCA analysis allows updating the synopsis related to each
associated entity under monitoring.
The Data Distribution Analysis carries forward the Anderson-Darling test for
analyzing the data distribution in terms of the previous data distribution for the same
metric. When some variation is detected, an alarm is thrown to the decision maker.
Continuously the data distribution information is updated in the synopsis for enabling
the future comparison in terms of the new data arriving.
The Analysis of the Outliers is continuously performed for each metric and entity
under analysis. When some outlier is detected, an alarm is thrown to the decision
maker. The decision maker will determine the importance and priority of each alarm.
The outlier information is continuously updated in the synopsis for comparing the
behavior in relation to the data distribution.
The Correlation Analysis allows analyzing the relationships between the metrics,
be they attributes, or context properties related to a given entity under analysis. Thus,
it is important to verify the independence assumptions among the variables (i.e. the
metrics), but also for possibly detecting new relationships unknown before.
Finally, all the information coming from each analysis is updated in the last
known state by the entity, which allows carrying forward the online computing of the
scoring for the recommendations. That is to say, with each new data coming through
the measurement stream for a given entity, the recommendations are continuously
reordered in terms of the pertinence in relation to the new data. Thus, when some
alarm is thrown for a given entity, the scoring corresponds with the last data situation
for the associated entity. This avoids an additional computation for the decision
making when it needs to incorporate recommendations jointly to the actions for a
given alarm.
6.5 The Decision-Making Process
The Decision-Making Process receives the data and alarms from the different pro-
cesses (i.e. The Gathering Function and Statistical and Smoothing). It is responsible
for determining the necessity of notification based on the priority, informing the
actions and the associated recommendations.

90 M. J. Diván and M. L. Sánchez Reynoso
Fig. 12 The decision-making process using BPMN notation
Figure 12 shows the different kinds of start point related to the process. The
basic start (circle without any image) is started when a new measurement stream
is received from the gathering function. In that situation, if the classifiers are not
trained, then they are trained just one time by the mean of the training set contained
in the organizational memory.
Once the classifiers are trained, each new data is classified by the current classifier.
Next, the classifier is updated with the new data, and the data is reclassified using the
updated classifier. Both classifiers are compared by mean of a ROC curve. When the
updated classifier contains an area under the curve upper than the current classifier,
the updated classifier becomes in the new current classifier, replacing it. It is important
to highlight that in case of the current or updated classifier give a classification related
to a typified situation which is considered critical (e.g. fire, flood, etc.), the process
is directly derived for evaluating the level of criticality.
The rest of the start points of this process correspond with alarms thrown from the
statistical and smoothing function. All the start points related to a message implies
that the anomaly or alarm was detected, and in this process, the criticality analysis
should be made.
The level of the criticality is taken from the decision criteria contained in the
indicators jointly with the organizational memory, who contains the previous expe-
rience and knowledge. Thus, and on the one hand, when the situation is an alarm in
where the notification is not required, it is discarded. On the other hand, when the
alarm requires notification, the search spacing of the organizational memory (a Big
Data Repository) is filtered looking for the associated recommendations, and finally,
the external alarm is sent with the actions and associated recommendations (e.g. the
steps to follow in a given situation).
Because the organizational memory is a big data repository, the strategy is to keep
in memory the most used region. For that reason, the scoring is permanently updated
on each new data. In addition, the structural coefficient allows looking for entities

An Architecture for the Real-Time Data Stream Monitoring in IoT 91
which share attributes for its quantification. However, a most strict limitation could
be carried forward using the entities with a similar structure, but also with similar
behavior for each monitored attribute [28]. In this sense, when there are not recom-
mendations for a given entity, it is possible to find recommendations coming from
similar entities for avoiding send an alarm without recommendations. For example,
the “Bajo Giuliani” lagoon is a new entity under analysis and there is not associated
history. However, in case of fire, the previous experience related to other lagoons,
could be used for driving the steps in an emergency.
7 An Application Case Using the Arduino Technology
In this application case, the processing architecture based on measurement metadata
is applied to the real-time lagoon monitoring. In this case, the application is associated
with the “Bajo Giuliani” lagoon. What is special with the “Bajo Giuliani” Lagoon?
It is a natural reservoir of water, located 10 km at the south of the Santa Rosa city
(the capital of the province of La Pampa, Argentina), in South America. The lagoon
receives the water from the rain and the waterways who bring the derived water from
the Santa Rosa city.
The lagoon is crossed by two routes, the national route number 35 from south
to north, and the provincial route number 14 from west to east. Both routes are
intersected in the middle of the lagoon. Figure 13 allows graphically detailing the
geography related to the lagoon.
On the south coast of the lagoon, there is a neighborhood named “La Cuesta del
Sur”. In this neighborhood, there are one hundred seventy houses and originally, they
were used such as weekend houses. Nowadays, there are one hundred families living
in the neighborhood, which incorporate a constant traffic by the internal streets and
the connection with the routes.
In March of 2017, the volume of fallen water by the rains was excessive for the
region related to the Santa Rosa city. Just in three weeks, the volume of water was
equivalent to one full year [29]. It provoked that the city keeps partially under the
water, generating different kinds of health risks without to enumerate the economic
damages. For this reason and in front of this kind of emergency, the water from the
city was immediately derived through the waterways to the “Bajo Giuliani” lagoon.
Thus, the volume of derived water through the waterways was constant, and it
provoked the incrementing of the level of water related to the lagoon. The concerns
started when the water advanced on the land located on the south coast, of the
neighborhood, flooding it.
This situation gave origin to this project and the associated application. The indi-
cated points on the south coast of the lagoon in Fig. 13, indicate the initial points
established for the installation of the monitoring stations.
Before introducing the monitoring stations, it is important to remark the initial
definition of the measurement and evaluation project associated with the lagoon and
introduced in Sect. 3. The project’s information need could be defined as “Monitor

92 M. J. Diván and M. L. Sánchez Reynoso
Fig. 13 The “Bajo Giuliani” lagoon. A descriptive map for the region. The satellite image was
obtained through Maps 2.0 (Apple Inc.) with data from TomTom and others
the level of water of the ‘Bajo Giuliani’ lagoon for avoiding flood on the south
shore related to the neighborhood”. The entity category is defined such as “lagoon
located in the province of La Pampa. The entity under analysis or monitoring is
limited to the “Bajo Giuliani” lagoon. The attributes chosen for characterizing the
lagoon are (i) The water temperature, (ii) The ground moisture, and (iii) The water
level. The context of the lagoon is described by the following context properties: the
environmental temperature and humidity. In this particular case, the incorporation
of a camera as a complementary datum is an added-value for describing the region
in case of necessity (see Sect. 4.1, Fig. 5).
The Processing Architecture based on Measurement Metadata is located in terms
of physical processing in the region indicated as “Base Station” in Fig. 13. The firsts
monitoring stations were installed from the south-west coast to the south-east region
of the lagoon because the neighborhood is located in a hill, being the south-west
coast the lower region. The slope of the hill goes growing-up from the south-west to
the south-east coast, being the riskiest region the south-west coast of the lagoon.
The monitoring station is completely based on open hardware, with the aim of
an agile reproduction of this kind of experiences. The monitoring station uses the
Arduino One (see Fig. 14, the component with ID 1) in the role of the measurement
adapter (see Sects. 5 and 6.2) who is responsible for the measure collecting from
each sensor. This monitoring station uses the following sensors (i.e. data sources):
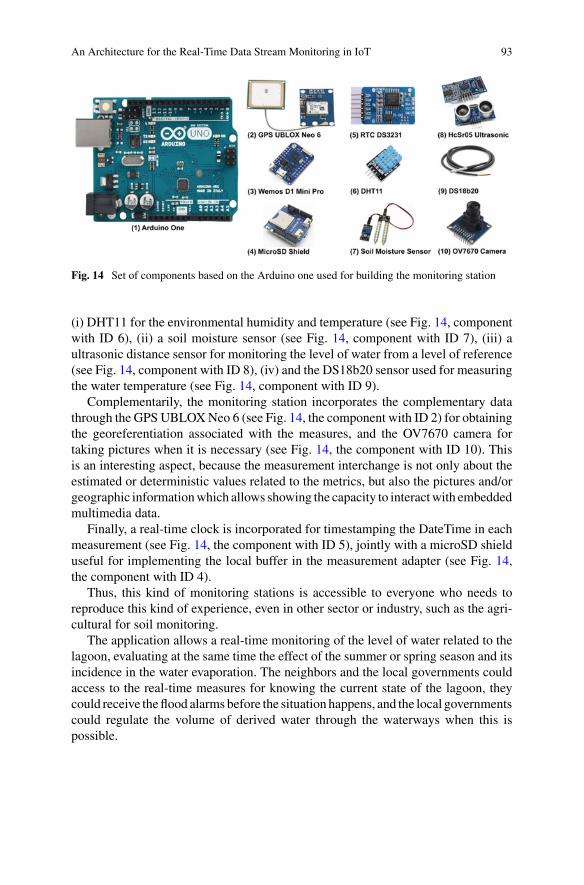
An Architecture for the Real-Time Data Stream Monitoring in IoT 93
Fig. 14 Set of components based on the Arduino one used for building the monitoring station
(i) DHT11 for the environmental humidity and temperature (see Fig. 14, component
with ID 6), (ii) a soil moisture sensor (see Fig. 14, component with ID 7), (iii) a
ultrasonic distance sensor for monitoring the level of water from a level of reference
(see Fig. 14, component with ID 8), (iv) and the DS18b20 sensor used for measuring
the water temperature (see Fig. 14, component with ID 9).
Complementarily, the monitoring station incorporates the complementary data
through the GPS UBLOX Neo 6 (see Fig. 14, the component with ID 2) for obtaining
the georeferentiation associated with the measures, and the OV7670 camera for
taking pictures when it is necessary (see Fig. 14, the component with ID 10). This
is an interesting aspect, because the measurement interchange is not only about the
estimated or deterministic values related to the metrics, but also the pictures and/or
geographic information which allows showing the capacity to interact with embedded
multimedia data.
Finally, a real-time clock is incorporated for timestamping the DateTime in each
measurement (see Fig. 14, the component with ID 5), jointly with a microSD shield
useful for implementing the local buffer in the measurement adapter (see Fig. 14,
the component with ID 4).
Thus, this kind of monitoring stations is accessible to everyone who needs to
reproduce this kind of experience, even in other sector or industry, such as the agri-
cultural for soil monitoring.
The application allows a real-time monitoring of the level of water related to the
lagoon, evaluating at the same time the effect of the summer or spring season and its
incidence in the water evaporation. The neighbors and the local governments could
access to the real-time measures for knowing the current state of the lagoon, they
could receive the flood alarms before the situation happens, and the local governments
could regulate the volume of derived water through the waterways when this is
possible.

94 M. J. Diván and M. L. Sánchez Reynoso
8 Related Works
The idea related to collect data from different kind of data sources is not new, just
that now the technology and the computing power made possible new perspectives,
applications and, data processing alternatives. Ferdoush and Li [30] have proposed
an overall system architecture based on the Raspberry Pi9 and Arduino10 Technol-
ogy. The work presented a wireless sensor network with the aim of environmental
monitoring, which is based on open source hardware platforms for keeping the cost
low and facilitating the maintaining of the devices. Vujovic and Maksimovic [31]
developed an architecture for home automation using the RaspberryPi as a sensor
web node. A comparison among with the similar hardware platforms in relation to
the application case was presented. Both proposals define the data gathering and
its associated processing based on open source hardware, leaving the measurement
definition as an open aspect, which could have some inconvenient in terms of the
result comparisons or when the measurement process should be extended (i.e. the
descendent compatibility). In this sense, PAbMM formalizes each operational pro-
cess, describing through the measurement and evaluation framework, each involved
concept with an entity under analysis.
Stephen et al. [32] described STYX, a stream processing with trustworthy cloud-
based execution. This proposal makes focus on the confidentiality specifically related
to the interchanged data between each device and the data processor in a wireless
sensor network. A proposal in an analogous line is introduced by Ghayyur and others
by mean of the IoT Detective game [33]. This aspect takes a particular importance
when a solution wishes to be generalized satisfying the different kinds of regulations
related to the data interchange along the world. For this reason, the measurement
interchange schema (see Sect. 4) embeds metadata based on the project definition,
which allows knowing the data origin, it keeps the data traceability, it knows the
measurement adapter (the intermediary between the data source and the data proces-
sor), it incorporates the integrity control inside each cincamimis message with the
possibility of protecting its confidentiality.
Andrade et al. [34] present a study in which analyze the behavior of heterogeneous
devices (e.g. IoT devices) in a car (i.e. connected cars) based on radio connectiv-
ity. The underlying idea is to measure the consuming pattern (e.g. mobility) of the
resources on a GSM production network with around one million of the radio con-
nections from the cars. It is an interesting analysis for taking dimension of the data
traffic in a tangible domain related to IoT on road. In this sense, PAbMM incorpo-
rates the mechanism for online monitoring each data stream in terms of the active
projects jointly with the available resources, which takes a particular interest when
the decision must be made in real-time (see Sect. 5).
Carvalho et al. [35] introduce the processing of distributed data streams based
on an architecture oriented to IoT smart grids monitoring. The architecture relation-
ships the IoT with the heterogeneous data sources contained in the sensor networks,
9https://www.raspberrypi.org.10https://www.arduino.cc.

An Architecture for the Real-Time Data Stream Monitoring in IoT 95
making a focus on the smart grid data profiles. In this approach, Apache Kafka11 is
used on the message layer, while the processing layer is based on Spark Streaming.12
It is a similar view in relation to PAbMM, but the main difference is associated with
the way in which the monitoring project is defined, and the data interchange. That
is to say, PAbMM uses a measurement and evaluation framework as the underlying
supporting for the project definition, giving existence to the CINCAMI/Project Def-
inition. Even, the measurement interchange schema (i.e. CINCAMI/MIS) is the way
in which heterogeneous data sources and the data processor carry forward a common
understanding in relation to the data meanings, the associated project, and its entity
under monitoring (e.g. 38.3 is a temperature coming from a sensor monitoring the
child’s corporal temperature in Fig. 2).
The data collecting jointly with the data processing for supporting real-time deci-
sions currently has different kinds of applications, some of them are: (i) the role
of the fog computing, IoT and cloud computing in the healthcare 4.0 for providing
uninterrupted context-aware services [36]; (ii) The role of the IoT and smart grids in
the context of the smart cities [37]; (iii) Aspects related to the security alert systems
for smart home [38]; (iv) The vehicle air pollution monitoring based on IoT devices
[39]; (v) The role of the ontology for the platform scalability in the complex IoT
contexts [40], among others. In addition, the multimedia big data implies the prolif-
eration of the multimedia data in the big data repositories (e.g. audio, video, etc.),
and this aspect was introduced with the complementary data in the measurement
interchange schema (see Sect. 4). In this sense, taxonomies and a model process are
described in [38], addressing different kinds of challenges in the area, such as the
reliability, heterogeneity, etc. In this line, PAbMM has an underlying ontology based
on the measurement and evaluation framework named C-INCAMI, which is used for
the project definition (i.e. CINCAMI/PD) and the measurement interchange schema
(i.e. CINCAMI/MIS). Thus, each actor in the architecture knows the responsible
sensor for an attribute, the associated meaning, the way in which the data should
be processed, and the normal behavior patterns defined by the experts in the project
definition (coming from the organizational memory).
9 Conclusions and Future Works
Nowadays the different kinds of the data sources and its evolution, carry us to a
heterogeneous environment in which each time the components trend to keep a
continuous interaction as a form to self-organizing for satisfying a given objective. In
this environment, the heterogeneity is the norm which rules the different applications,
be it through the sensors or even the kind of the data that need to be processed (i.e.
from the raw data to the information geographic in its different forms). Moreover,
the data sources (i.e. sensors) are permanently generating data for its processing
11https://kafka.apache.org.12https://spark.apache.org/streaming/.

96 M. J. Diván and M. L. Sánchez Reynoso
and consuming. Thus, and when the data should be stored (synthesized or not) the
volume and the associated rate of the data is increased in a significative way falling
in the Big Data environment. Nowell, the online data processing is a very different
context than the Big Data environment, because when in the first the real-time data
processing is a priority, in the second the batch data processing is the rule. This is
important to highlight because the data processing strategies are very different like
the needed resources for carrying forward the processing in its different forms. In
this sense, the chapter introduced an integrated perspective for the data processing in
the heterogeneous contexts, incorporating the process description through BPMN.
The measurement process is a key asset when the monitoring must be carried
forward on a given target. In this sense, the determination about the concept or
object to be monitored jointly with the way in which the measurement is carried
forward constitutes the base for the data-driven decision making. That is to say, the
decision maker must support each decision based on the information and not the
mere intuition.
Thus, before any kind of the data processing for the data coming from the sensors,
it is necessary to warranty the processability and the understandability related to the
data to be processed in terms of the measurement process. For that reason, this chapter
introduced the idea of the measurement and evaluation framework (e.g. C-INCAMI),
like the way in which the measurement process could warranty the comparability
of its results, the repeatability, and extensibility of the process itself. For example,
the C-INCAMI framework allows using the terms, concepts and its relationships for
defining the information need of the project, the entity to be monitored, the descriptive
attributes for the entity, the descriptive context properties for the environment in
which the entity is located, the associated metrics, among other essential aspects
for knowing the way in which each aspect related to an entity under monitoring is
quantified.
In this way, the CINCAMI/Project Definition (PD) schema was presented as the
way in which the M&E project definitions based on the C-INCAMI framework
could be interchanged among different systems, independently of the creator soft-
ware. It is interesting because fosters the interoperability in terms of the project
definitions, avoiding the dependence of a particular or proprietary framework. The
C-INCAMI/PD library which allows the supporting, interchanging and interpreta-
tion of each project definition under this schema are, it is open source and freely
available on the GitHub repository.
In a heterogeneous environment and when it is possible to agree on the way in
which an entity will be monitored, then it is possible to understand the role of each
metric (or variable) in relation to the entity under monitoring jointly with its expected
incidence. Thus, starting from a definition based on the CINCAMI/PD schema, the
chapter introduced the role of the measurement adapter in terms of its relationship
with the sensors who show a passive behavior. The measurement adapter allows car-
rying forward the data collecting, but also the translating of the heterogeneous data
from its proprietary data format to the measurement interchange schema (i.e. CIN-
CAMI/MIS). The measurement interchange schema allows homogenizing the data
interchanging based on the project definition and the underlying concepts and terms

An Architecture for the Real-Time Data Stream Monitoring in IoT 97
coming from the measurement and evaluation framework. This is a key asset because
the data collecting and processing are guided by the metadata and the metadata are
directly associated with the way in which an attribute or context property should be
quantified and interpreted. The measurement interchange schema has an associated
library freely available on the GitHub repository useful for fostering the use and
interchange of the measures based on the project definition. For this reason, Both the
measurement adapter and the processing architecture are able to carry forward the
data collecting and processing respectively because they share a common definition
and communication language. That is to say, in case of the use of the determin-
istic measures or the incorporation of complementary data (e.g. a picture, a video,
etc.), the measurement adapter knows the way in which the association sensor-metric
should be made following the project definition, and in addition, it knows the way in
which the same information should be informed through a CINCAMI/MIS stream.
In an analogous way, the processing architecture knows the way in which each CIN-
CAMI/MIS should be read, and by the use of the project definition, the architecture
knows the role of each attribute or context property in relation to the project’s aim
jointly with the role of the eventually informed complementary data.
The processing architecture incorporates the real-time data processing on the mea-
surement streams, incorporating a detective behavior through the statistical analysis
and the analysis of the project definition, jointly with a predictive behavior based in
the use of the incremental classifiers. The architecture contemplates the possibility
of replication of the measurement streams jointly with the storing of the data, be
it in a direct way or by mean of a synthesis algorithm. In any case, the role of the
processing architecture when some typified situation or alarm happen, is looking
for recommendations for attaching to the notification to send. For this reason, an
organizational memory is used as a guide for capitalizing the previous experience
and the knowledge from the experts, but also for storing the project definitions, the
historical data and the training data set for the initial training of the classifiers.
A real application of the processing architecture was synthesized for the lagoon
monitoring and its incidence in the “La Cuesta del Sur” neighborhood (Santa Rosa,
La Pampa, Argentina). This kind of applications and the positive social impact for the
governments, people and the private organizations allows projecting many kinds of
the business plan and social applications, from the farm monitoring, flood monitoring,
fire monitoring, among a lot of applications, in which the real-time monitoring could
positively increment the benefits and the profits with a minimal cost. That is to say,
the investment related to each monitoring station is minimum (e.g. around 50 dollars
depending the precision, accuracy, and kind of sensors to be used), and the involved
software is open source reason which there is no additional cost.
The semantic similarity related to two or more entity under analysis is an active
researching line. That is to say, the entities are characterized by the attributes in terms
of the C-INCAMI framework. Each metric is directly associated with an attribute
(or context property). The current structural coefficient is used for the in-memory
filtering of the organizational memory looking for the entities that share as many
attributes as possible. Thus, in case of absence of recommendations for an entity,
it is possible to reuse the previous knowledge from other similar entity. However,

98 M. J. Diván and M. L. Sánchez Reynoso
the structural coefficient is based on the attribute comparison by the name, but not
based on its definition (i.e. the meaning). Thus, the active line refers to obtain a
semantic coefficient able to be applied to the Spanish language, for knowing when
two attributes for the same entity correspond to the same concept based on a narrative
definition (i.e. the explanation of the meaning of each attribute given in the project
definition), independently the given name to each attribute.
References
1. J. Zapater, From Web 1.0 to Web 4.0: the evolution of the web, in 7th Euro American Conference
on Telematics and Information Systems (ACM, New York, 2014), pp. 2:1–2:1
2. G. Nedeltcheva, E. Shoikova, Models for innovative IoT ecosystems, in International Confer-
ence on Big Data and Internet of Thing (ACM, New York, 2017), pp. 164–168
3. N. Chaudhry, Introduction to stream data management, in Stream Data Management. Advances
in Database Systems, vol. 30, ed. by N. Chaudhry, K. Shaw, M. Abdelguerfi (Springer-Verlag,
New York, 2005), pp. 1–13
4. S. Chakravarthy, Q. Jiang, Stream Data Processing: A Quality of Service Perspective, Advances
in Database Systems, vol. 36 (Springer Science + Business Media, New York, 2009)
5. D. Laney, Infonomics. How to Monetize, Manage, and Measure Information as an Asset for
Competitive Advantage (Routledge, New York, 2018)
6. N. Khan, M. Alsaqer, H. Shah, G. Badsha, A. Abbasi, S. Salehian, The 10 Vs, issues and
challenges of big data, in International Conference on Big Data and Education (ACM, New
York, 2018), pp. 52–56
7. A. Davoudian, L. Chen, M. Liu, A survey on NoSQL stores. ACM Comput. Surv. (CSUR) 51,
40:1–40:43 (2018)
8. T. Ivanov, R. Singhal, Abench: big data architecture stack benchmark, in ACM/SPEC Interna-
tional Conference on Performance Engineering (ACM, New York, 2018), pp. 13–16
9. F. Gessert, W. Wingerath, S. Friedrich, N. Ritter, NoSQL database systems: a survey and
decision guidance. Comput. Sci. Res. Dev. 32, 353–365 (2017)
10. M. Garofalakis, J. Gehrke, R. Rastogi, Data stream management: a brave new world, in Data
Stream Management. Processing High-Speed Data Streams, Data-Centric Systems and Appli-
cations, edited by M. Garofalakis, J. Gehrke, R. Rastogi (Springer-Verlag, Heidelberg, 2016),
pp. 1–9
11. T. De Matteis, G. Mencagli, Proactive elasticity and energy awareness in data stream processing.
J. Syst. Softw. 127, 302–319 (2017)
12. I. Flouris, N. Giatrakos, A. Deligiannakis, M. Garofalakisa, M. Kamp, M. Mock, Issues in
complex event processing: status and prospects in the Big Data era. J. Syst. Softw. 127, 217–236
(2017)
13. N. Hidalgo, D. Wladdimiro, E. Rosas, Self-adaptive processing graph with operator fission for
elastic stream processing. J. Syst. Softw. 127, 205–216 (2017)
14. P. Tsiachri Renta, S. Sotiriadis, E. Petrakis, Healthcare sensor data management on the cloud,
in Workshop on Adaptive Resource Management and Scheduling for Cloud Computing (ACM,
New York, 2017), pp. 25–30
15. T. Bennett, N. Gans, R. Jafari, Data-driven synchronization for internet-of-things systems.
ACM Trans. Embed. Comput. Syst. (TECS) 16, 69:1–69:24 (2017). Special Issue on Embedded
Computing for IoT, Special Issue on Big Data and Regular Papers
16. A. Meidan, J. Garcia-Garcia, I. Ramos, M. Escalona, Measuring software process: a systematic
mapping study. ACM Comput. Surv. (CSUR) 51, 58:1–58:32 (2018)
17. Y. Zhou, O. Alipourfard, M. Yu, T. Yang, Accelerating network measurement in software.
ACM SIGCOMM Comput. Commun. Rev. 48, 2–12 (2018)

An Architecture for the Real-Time Data Stream Monitoring in IoT 99
18. V. Mandic, V. Basili, L. Harjumaa, M. Oivo, J. Markkula, Utilizing GQM + strategies for
business value analysis: an approach for evaluating business goals, in ACM-IEEE International
Symposium on Empirical Software Engineering and Measurement (ACM, New York, 2010),
pp. 20:1–20:10
19. L. Olsina, F. Papa, H. Molina, How to measure and evaluate web applications in a consistent
way, in Web Engineering: Modelling and Implementing Web Applications, ed. by G. Rossi, O.
Pastor, D. Schwabe, L. Olsina (Springer-Verlag, London, 2008), pp. 385–420
20. H. Molina, L. Olsina, Towards the support of contextual information to a measurement and
evaluation framework, in Quality of Information and Communications Technology (QUATIC)
(IEEE Press, New York, 2007), pp. 154–166
21. M. Diván, M. Martín, Towards a consistent measurement stream processing from heterogeneous
data sources. Int. J. Electric. Comput. Eng. (IJECE) 7, 3164–3175 (2017)
22. P. Becker, Process view of the quality measurement and evaluation integrated strategies. Ph.D.
Thesis, National University of La Plata, La Plata, Argentina (2014)
23. M. Diván, M. Sánchez Reynoso, Fostering the interoperability of the measurement and eval-
uation project definitions in PAbMM, in 7th International Conference on Reliability, Infocom
Technologies and Optimization (ICRITO) (IEEE Press, New York, 2018), pp. 228–234
24. M. Diván, Data-driven decision making., in 1st International Conference on Infocom Tech-
nologies and Unmanned Systems (ICTUS) (IEEE Press, New York, 2017), pp. 50–56
25. L. Dalton, Optimal ROC-based classification and performance analysis under bayesian uncer-
tainty models. IEEE/ACM Trans. Comput. Biol. Bioinformatics 13, 719–729 (2016)
26. N. Razali, Y. Wah, Power comparisons of Shapiro-Wilk, Kolmogorov-Smirnov, Lilliefors and
Anderson-Darling tests. J. Stat. Model. Anal. 2, 21–33 (2011)
27. G. Morales, A. Bifet, SAMOA: scalable advanced massive online analysis. J. Mach. Learn.
Res. 16, 149–153 (2015)
28. M. Diván, M. Sánchez Reynoso, Behavioural similarity analysis for supporting the recommen-
dation in PAbMM. in 1st International Conference on Infocom Technologies and Unmanned
Systems (ICTUS) (IEEE Press, New York, 2017), pp. 133–139
29. B. Dillon, A view of the flood from a flight of the UNLPam’s Geography Institute (original title
in Spanish: La Inundación vista desde un vuelo del Instituto de Geografía de la UNLPam). La
Arena Daily. http://www.laarena.com.ar/la_ciudad-no-podemos-hacer-cargo-a-la-fatalidad-o-
la-naturaleza-1128851-115.html
30. S. Ferdoush, X. Li, System design using Raspberry Pi and Arduino for environmental moni-
toring applications. Proc. Comput. Sci. 34, 103–110 (2014)
31. V. Vujovic, M. Maksimovic, k Raspberry Pi as a Sensor Web node for home automation.
Comput. Electric. Eng. 44, 153–171 (2015)
32. J. Stephen, S. Savvides, V. Sundaram, M. Ardekani, P. Eugster, STYX: stream processing with
trustworthy cloud-based execution, in Seventh ACM Symposium on Cloud Computing (ACM,
California, 2016), pp. 348–360
33. S. Ghayyur, Y. Chen, R. Yus, A. Machanavajjhala, M. Hay, G. Miklau, S. Mehrotra, IoT-
detective: analyzing IoT data under differential privacy, in ACM International Conference on
Management of Data (ACM, Texas, 2018), pp. 1725–1728
34. C. Andrade, S. Byers, V. Gopalakrishnan, E. Halepovic, D. Poole, L. Tran, C. Volinsky, Con-
nected cars in cellular network: a measurement study, in Internet Measurement Conference
(ACM, London, 2017), pp. 1725–1728
35. O. Carvalho, E. Roloff, P. Navaux, A distributed stream processing based architecture for IoT
smart grids monitoring, in 10th International Conference on Utility and Cloud Computing
(ACM, Texas, 2017), pp. 9–14
36. A. Kumari, S. Tanwar, S. Tyagi, N. Kumar, Fog computing for healthcare 4.0 environment:
opportunities and challenges. Comput. Electr. Eng. 72, 1–13 (2018)
37. S. Tanwar, S. Tyagi, S. Kumar, The Role of internet of things and smart grid for the development
of a smart city, in Intelligent Communication and Computational Technologies, LNNS, vol. 19,
ed. by Y. Hu, S. Tiwari, K. Mishra, M. Trivedi (Springer, Singapore, 2018), pp. 23–33

100 M. J. Diván and M. L. Sánchez Reynoso
38. S. Tanwar, P. Patel, K. Patel, S. Tyagi, N. Kumar, M. Obaidat, An advanced internet of thing
based security alert system for smart home, in IEEE International Conference on Computer,
Information and Telecommunication Systems (CITS) (IEEE Press, Dalian 2017), pp. 25–29
39. S. Pal, A. Ghosh, V. Sethi, Vehicle air pollution monitoring using IoTs, in 16th ACM Conference
on Embedded Networked Sensor Systems (ACM, Shenzhen 2018), pp. 400–401
40. J. Teh, V. Choudhary, H. Lim, A smart ontology-driven IoT platform, in 16th ACM Conference
on Embedded Networked Sensor Systems (ACM, Shenzhen 2018), pp. 424–425
41. A. Kumari, S. Tanwar, S. Tyagi, N. Kumar, M. Maasberg, K. Choo, Multimedia big data com-
puting and Internet of Things applications: a taxonomy and process model. J. Netw. Comput.
Appl. 124, 169–195 (2018)

Deep Learning for Multimedia Data
in IoT
Srinidhi Hiriyannaiah, B. S. Akanksh, A. S. Koushik, G. M. Siddesh
and K. G. Srinivasa
Abstract With the advent of Internet leading to proliferation of large amounts ofmultimedia data, the analytics of the aggregated multimedia data is proven to beone of the active areas of research and study. Multimedia data includes audio, video,images associated with applications like similarity searches, entity resolution, andclassification. Visual data mining is now one of the active learning fields that includesurveillance applications for object detection, fraud detection, crime detection, andother applications. Multimedia data mining includes many challenges like data vol-ume, variety, and unstructured nature, nonstationary, and real time. It needs advancedprocessing capabilities to make decisions in near real time. The existing traditionaldatabase systems, data mining techniques cannot be used because of its limitations.Hence, to process such large amounts of data advanced techniques like machinelearning, deep learning methods can be used. Multimedia data also includes sensordata that is widely generated. Most of the healthcare applications include sensorsfor detecting heart rate, blood pressure, and pulse rate. The advancement of thesmartphones has resulted in fitness based applications based on the number of stepswalked, calories count, kilometers ran, etc. All these types of data can be classified asMultimedia data for Internet of Things (IoT). There are many interfacing devices thatare interconnected to each other with backbone as a computer network when sensordata is involved. The main aim of this chapter is to highlight the importance andconvergence of deep learning techniques with IoT. Emphasis is laid on classification
S. Hiriyannaiah (B) · B. S. Akanksh · A. S. Koushik · G. M. SiddeshRamaiah Institute of Technology, Bengaluru, Indiae-mail: [email protected]
B. S. Akankshe-mail: [email protected]
A. S. Koushike-mail: [email protected]
G. M. Siddeshe-mail: [email protected]
K. G. SrinivasaNational Institute of Technical Teacher Training Research, New Delhi, Indiae-mail: [email protected]
© Springer Nature Singapore Pte Ltd. 2020S. Tanwar et al. (eds.), Multimedia Big Data Computing
for IoT Applications, Intelligent Systems Reference Library 163,https://doi.org/10.1007/978-981-13-8759-3_4
101

102 S. Hiriyannaiah et al.
of IoT data using deep learning and the essential fine-tuning of parameters. A virtualsensor device implemented in python is used for simulation. An account of protocolsused for communication of IoT devices is briefly discussed. A case study is providedregarding classification of Air Quality Dataset using deep learning techniques.
Keywords Multimedia data · IoT · Air quality analysis · Deep learning · IoTanalytics
1 Introduction to Multimedia and IoT
Data Mining has gained a greater significance in recent days due to the large amountof data being collected and its availability over the Internet. The significant advancesin the big data technology and tools have lead to the development of analytics andresearch in this area over the years. There is a paradigm shift of data mining tobig data analytics that involves various stages of processing and analysis. Big dataanalytics consists of exploration of data, identifying the relationships among thedifferent features in the data and visualize it. The applications of big data analyt-ics include various multidisciplinary fields such as machine learning, informationretrieval, databases, and visualization. These significant advances have lead to theevolution of multimedia management systems.
Multimedia data includes image, video, audio, and text. Due to the advent ofsmartphones and Internet, this kind of multimedia data has to lead to several applica-tions and sharing platforms [1]. The valuable sources of multimedia data are socialmedia such as Instagram, YouTube, Twitter, and Facebook [2]. The volume of databeing collected at these sites is significantly increasing day by day. For example,in Instagram users have uploaded over 20 billion photos, 100 videos are uploadedevery minute per day on YouTube, 500 million tweets on twitter. Such huge amountof information plays an important source for analyzing different patterns and devel-oping applications. This rich source of information is termed as “Big data”. Big dataposses three essential features namely variety, velocity, and volume. The prolifer-ation of big data in terms of volume, velocity, and variety has reached to differentdomains as shown in Fig. 1. In this chapter, the focus is on IoT applications andmultimedia.
Internet of Things (IoT) is a network of things that are connected to each otherwhich is supported by Internet for communication. Most of the devices nowadaysare sensor based and is connected to one or more usually. It is estimated in mostof the reviews that the total devices that will be connected to each other will 20billion by 2020 [3]. With the increase in the number of devices that are connected toeach other, the generation of multimedia data also increases. The scope of IoT is notlimited to the sensor data alone but also relates to multimedia. For example, CCTVcamera captures the video data for surveillance purposes which can be categorizedas multimedia data. The fingerprint data can also be regarded as the multimedia datasince it is in the form image. The applications of such data are utilized in smart

Deep Learning for Multimedia Data in IoT 103
Fig. 1 Big data and applications
communities such as smart city, smart power, smart grid, etc. [3]. Hence, multimediaanalytics play a crucial role in the field of IoT as well.
Multimedia analytics can be carried out using conventional analytical approachessuch as clustering, decision tree methods. However, a major challenge faced withthe conventional approaches is the scalability of the methods and the execution timerequired to produce the results [4]. In this regard, Deep learning and GPU computingmethods are used for multimedia analytics. Deep learning methods that involve deepforward networks, recurrent networks are used most of the times for multimediaanalytics. The features that are present in the multimedia data need to be extractedso that clear decision can be made. The main challenge of deep learning is featureextraction process involves stages of object recognition, object detection from theedges identified in the image.
Multimedia applications need a different kind of approach for analysis comparedto conventional analytical techniques [4]. The conventional techniques of data anal-ysis such as clustering, regression, naïve bayes classification can be used on thestationary data. Since multimedia data and IoT data is nonstationary, techniques thatare based on streaming analysis are useful. The different types of enabling technolo-gies for multimedia analysis and IoT data classification are discussed in the furthersections.
The focus of this chapter is to introduce the advances in multimedia data, chal-lenges in multimedia analytics and how deep learning methods can be used formultimedia analytics. An illustration regarding communication of IoT devices isprovided. A brief account regarding MQTT protocol and its fundamental operationssuch as publish and subscribe is discussed. In the final section of the chapter, a case

104 S. Hiriyannaiah et al.
study on IoT data classification is presented. The chosen dataset for this purpose isAir Quality dataset. It deals with creating a deep learning model to classify IoT dataalong with the associated code.
2 Advances in Multimedia Data
In the data analytics world, data has been proliferated in different ways. Multimediadata is one of such data that has been recently generated in huge volumes in the Inter-net. It is being captured by various multimedia computing devices like computers,tablets, mobile phones, and cameras [5]. The nature of the data being captured is alsoubiquitous. Initially, started with audio, video it has now reached animations in theform of gifs. The advances in multimedia data are summarized as follows.
• Visual data: The most common form of multimedia data found is the video data.A visual data consists of a sequence of image sequences that has to analyze one-by-one. Most of the unstructured information exists in the form of visual data andcontains very rich information. Visual data analytics process involves extractingmeaningful information from the different image sequences that are present in thevisual data. However, the main challenge lies in the size of the visual data. Recenttechnologies such as cloud computing, high-performance computing have enabledthe visual data and analytics research in areas such as video surveillance systems,autonomous systems, and healthcare. The advances in visual data and analytics arechallenging the human brain and its computation. In [5] one of the competitionsheld, machine outperformed the humans in image classification.
• Audio data: One more type of multimedia data that is mostly used is audio/speechdata. Real-time audio analytical applications are needed in social media, health-care, and industry. Audio analytics involves extracting useful information from thedifferent pieces of the information present in the audio data. Call centers are one ofindustry applications that need audio analytics for interaction with the customerand training the persons involved in the call center. Big data platforms such asSpark, Hadoop, and different libraries are widely used for such audio analyticalapplications.
• Text data: Multimedia data may be embedded in the textual context in the formof web pages, surveys, feeds, and metadata. The analysis of such data helps togain interesting insights. Multimedia data in the form of text can be structuredor unstructured. The structured kind of data can be analyzed with the help oftraditional relational database techniques of query retrieval. However, the multi-media data in the form of feeds are unstructured and needs to be transformed intoa structured format for further analysis [6]. One of the example applications ofmultimedia text analytics is based on a particular situation like election, naturaldisaster, stock market, etc. The emotions behind the text can be analyzed with thehelp of multimedia data analysis. In this way, different kinds of information canbe extracted from different sources of multimedia textual data.

Deep Learning for Multimedia Data in IoT 105
• Sensor data: IoT is playing a significant role nowadays and sensors are presentalmost everywhere. The sensors are equipped with not only capturing the databut also apply analytics in real time [7]. With the advances in the hardware andthe technologies of cloud computing, sensor data are increasing enormously. Itis highly challenging to analyze such data and develop an analytical applicationbased on that. Sensor data applications are highly seen in astronomical sciencesfor meteorological patterns, satellite conditioning, and monitoring. In healthcare,most of the applications are based on sensor data. Therefore, with the advances inthe sensor data, it is highly essential to develop analytical applications based onit.
• Social networks: The main source for multimedia data is social networks. Theadvances in social networking and sharing that started from a normal text havenow reached to image, video, live video, public groups, etc. Recommendationapplications [7] widely use the multimedia content available in the social networksto provide recommendations by analyzing the shared messages, video, audio, andtext. Personalization services are more widely used by the users of smartphonesbased on the subscriptions made by them.
The main characteristic nature of the multimedia data is variety. It exists in differ-ent forms and at various sources. These advances in multimedia data and analyticshave enabled various challenges and technologies for developing different applica-tions. Though, there are various technologies that exist for multimedia analytics thechallenges that are put forth for analysis are more and have to be addressed carefully.In the next section, the different challenges that exist for multimedia analytics arediscussed followed by the enabling technologies for multimedia analytics.
3 Challenges in Multimedia Data
Multimedia data involves the data from various sources such as cameras, socialnetwork, sensors and other that heterogeneous in nature. In order to carry out analyticsfor such data, the heterogeneity nature of such data has to be transformed for analysispurposes. The transformation of the data involves converting the data from differentformats into a singular format for analytics. Some of the challenges that are generallyseen with multimedia analytics are discussed below.
3.1 Data Acquisition and Volume
Multimedia data takes a large amount of storage for analytics and involves the acqui-sition of data from various sources. There are different heterogeneous sources thatare involved such as social media, sensors, mobile devices, cameras, and virtualworlds [4]. The heterogeneous data that are generated from these sources are mul-

106 S. Hiriyannaiah et al.
tistructural and multimodal in nature. Each of the source exhibit different kind ofcharacteristics and highly complex in acquisition both in terms of quantity and qual-ity. New techniques and technologies are needed to understand the varying nature ofthe multimedia data for acquisition [4, 6].
With the unprecedented growth of multimedia data, there is a huge challengeof storage and making it available for multimedia applications. There are manyinvestigations done for addressing this challenge in multimedia data. In [7], a bigdata processing pipeline is introduced along with MapReduce that consists of stagessuch as data preprocessing, data recognition and load reduction. NoSQL databasesplay a significant role in the storage of multimedia data that allows flexibility of theschema involved in the storage. The different enabling technologies that can handlethis issue are addressed in the next section.
3.2 Feature Extraction
Multimedia data such as audio and video includes numerous features. The processof extracting the features from this data plays a significant role in multimedia ana-lytics. The different features of the video can be color, edge, shape, and texture ofthe image sequences in the video. The extraction of features is divided into two cat-egories namely local feature extraction and global feature extraction. Global featureextraction techniques involve obtaining the color histogram of different objects thatare present in the image sequence of the video. The development of color histogramshelps in identifying the edges of the objects to distinguish among them. However, itinvolves a great amount of time since the data will be huge in volume and need to becompressed. In some of the situations, the color histogram may not be successful.Hence, feature extraction is one of the main challenges faced in Multimedia analytics[3]. The different types of techniques for feature extraction are discussed in the nextsection.
3.3 Synchronization and Computing
Multimedia analytics deals with both audio and video. The main challenge of multi-media analytics is in the synchronization of audio and video. For example in health-care systems, 3-D based multimedia data need to be taken care of for analytics [8].A two-tier based synchronization is required for some of the multimedia systems.The research in computing for analytics on multimedia data involves many big datacomputing platforms like Hadoop, Cassandra, and NoSQL databases. Pipelines ofsuch platforms are required for computation and analysis.
The computational methods for multimedia analytics are mostly based on machinelearning techniques like support vector machines (SVM), clustering. However, twoor more techniques are usually combined together for multimedia analytics. GPU

Deep Learning for Multimedia Data in IoT 107
computing is utilized in most of the multimedia analytics since the amount of the datais huge in volume. Parallel computing is carried out for multimedia analytics with theGPU to reduce the time of computation and to deal with the nonstationary multimediadata. However, computational methods that are scalable are still a challenge formultimedia analytics.
3.4 Security
Multimedia analytics involves data that are user-centric and contains some of thesensitive information of the users. The analysis performed on such data should havenecessary techniques to not utilize the user identity information but carry out analysis[3]. For example, in the sentimental analysis of social network data, the user identityshould not be revealed but the textual content can be utilized. Here, the textual contentneeds to be used rather than the identity of the users. However, geospatial analyticsmight reveal the geographical information about the users. In such cases, analyticaltechniques should be careful in revealing the information based on the analysis.
4 Enabling Technologies
Multimedia analytics is analyzing multimedia data such as audio, video, and text toidentify the patterns in data and take decisions based on the patterns found. Thereare various stages of multimedia analytics like data preprocessing, feature extractionand analysis. In each stage, different types of technologies are used for leveraging theanalytics and decision-making process. This section focuses on the different enablingtechnologies and platforms for multimedia analytics. In this regards, multimediadata is categorized into three parts namely text analytics, video analytics, and audioanalytics. The enabling technologies in each of the category are summarized as shownin Table 1.
Table 1 Enablingtechnologies for multimediaanalytics
Enabling technology Language Open source
NLTK Python Yes
Hadoop and Spark Java, Python, Scala Yes
Tableau Java, Python Partially
Graph databases Python Partially
LibROSA Python Yes
OpenCV Python Yes

108 S. Hiriyannaiah et al.
4.1 Text Analytics
The most common form of multimedia data is text. It is highly volatile in naturesince the text written by humans is unstructured and differs from person to person.There are various stages of text analytics such as removal of stop words like “is”,“was”, “this”. For example, in the case of sentimental analysis, the key phrases ofthe text are important for analysis rather than the stop words in the text. Some of theenabling technologies that are available for text analytics are discussed below.
• NLTK
Natural language Toolkit (NLTK) is one of the famous python based tools usedfor natural language processing. Most of the text analytics stages such as prepro-cessing, tokenization, stemming, tagging, parsing, and semantic reasoning can beperformed using various modules that are available within NLTK. Corpus infor-mation is most needed while performing text analytics. For example, in the sce-nario of sentimental analysis a corpus of information that identifies the positiveand negative sentiments are needed. WordNet a corpus is available in NLTK fortext analytics. The main advantage of NKTK is python based that helps in easyunderstanding and analysis [9].
• Deep Learning
The recent hype of Artificial intelligence and robotics has paved the way fordifferent deep learning frameworks. Deep learning platforms such as Pytorch andTensorflow are widely used for text analytics in multimedia systems. The texts thatcannot be captured through the World Wide Web are analyzed using deep learn-ing techniques like CNN and RNN architectures. Some of the examples includedetection of actions in video, identifying disasters in the web crawled datasets.
• Scikit learn
It is one of the scientific tool kits available in Python platform. Most of the machinelearning techniques are provided in the form of APIs that helps in ease of program-ming. In text analytics, a bag of words is required to identify the most significantwords that are present in the text dataset considered. Scikit learn provides suchfunctions like “bag-of-words”, “tf-idf” which are needed for text analytics. Theterm document frequency (TF) is mainly needed to identify the most occurredterms in the text. In this way, Scikit learn is one of the enabling technologies fortext analytics [10].
• Hadoop and Spark
Hadoop is one of the open source platforms that can be used to analyze any formatof data. MapReduce programming is used to extract the data in the form of textpresent in Hadoop file system for analysis. It helps in aggregating the informationthat is present in the form of text. For example, a file containing the users and thechannels subscribed by them can be analyzed with the help of MapReduce to findthe top subscribed channels [11]. Spark is one of the open-source platforms that

Deep Learning for Multimedia Data in IoT 109
provides numerous machine learning libraries in the form of Spark MLib [12] forperforming different types of analytics.
4.2 Video Analytics
Major chunk of the multimedia data is in the form of video. Visual data analyticsis a convoluted process since it involves a number of image sequences [13]. Otherthan the image sequences, visual data can be in the form of graphs and networksof text. There are some enabling technologies that help in visual analytics that aresummarized below.
• Convolution neural networks (CNN) using deep learning
CNN is the widely used technique for video analytics. The applications of CNN tovideo analytics include object detection, crime detection, etc. In CNN, the imagesequence is first divided into various pixels and then brought down to scale forobject detection. The image is first divided into various filters that represents amatrix of values of the image [14]. The filters are convolved into a matrix of lessvalue by product and sum of two matrices. For example, a 2D image convolutionis as shown below.
2-D Image Convolved Feature
1 × 0 1 × 1 1 × 0 0 × 1 0 × 0 2 3 2
0 × 1 1 × 0 1 × 1 1 × 0 0 × 0 2 3 3
0 × 1 0 × 1 1 × 0 1 × 1 1 × 0 2 3 3
0 × 0 0 × 1 1 × 1 1 × 0 0 × 1
0 × 1 1 × 0 1 × 1 0 × 0 0 × 1
Once the convolved feature matrix is obtained, a series of convolution layers arebuilt to obtain the final feature matrix and carry out the object detection.In this way, CNN architectures are used in video analytics.
• Tableau
Multimedia data involves social network data that can be in the form of feedsor tweets. Visualization of such data helps in revealing the interesting patternsabout the data. Tableau is one of such tools that help in understanding the databy visualizing first the data and then to carry out analysis. Tableau is the leadingData Visualization and Business Intelligence tool that helps in creating interactivevisualizations. The visualization tool provides an easy to use interface to createdashboards and help solve complex business problems in a fast and effective way.Tableau also can connect to a vast set of files, databases, data warehouse, etc., tocarry out analysis on the data from multiple sources.

110 S. Hiriyannaiah et al.
• OpenCV
OpenCV is one of the platforms widely used for video analytics. It stands for Opensource computer vision library. It provides the necessary libraries for real-timeobject detection within a video. The applications of OpenCV includes facial recog-nition system, gesture recognition, motion tracking, augmented reality, mobilerobotics [15]. It includes most of the machine learning algorithms like k-meansclustering, Bayesian classification, decision tree learning, random forest classifier,and artificial neural networks.
4.3 Audio Analytics
Multimedia data that is in the form of audio needs extensive computing and time forarriving at results. The data present in the audio format need to be analyzed stage bystage since it differs from time to time. Some of the enabling technologies for audioanalytics are summarized as below.
• LibROSA
It is one of the libraries that is available in python for analysis of various audio files[16]. It helps in the development of various audio applications based on differentformats. It helps in extracting the features of the music files like rhythm, tempo,beats, audio time series, power spectrogram of the audio, roll of frequency, spectralflatness, etc.
• Deep learning
Deep learning is used for audio analysis using the artificial neural networks likeRecurrent Neural Nets (RNN), Convolutional Neural Networks (CNN), and feed-forward networks. Recent developments in the computer science has paved theway for different applications in audio processing using deep learning. One ofsuch experiments has been done in [14] to develop a framework for audio eventrecognition based on the web data. A CNN is developed as a part of the experimentwith five hidden layers. Some of the learning methods are explored in the furthersections.
5 Deep Learning Methods
In any dataset features/attributes play an important role to develop learning algo-rithms. In deep learning methods, these features play an important role in developingappropriate learning algorithms. A feature can be defined as the interesting part ofthe dataset that acts as the starting point for learning. The desirable property of anylearning algorithm is the repetitive process of detecting the features for the datasetthat is not trained. The important features for an image dataset are temporal, spa-tial, and textural. There are three stages in any feature detection algorithm namely

Deep Learning for Multimedia Data in IoT 111
extraction, selection, and classification. The output of the extraction phase is a rep-resentation vector of the dataset/image considered. The representation vectors canbe different for different datasets. It is used for classification purposes using deeplearning methods like CNN, RNN, and feed-forward networks [17, 18].
5.1 Local Feature Extraction Methods
A feature is a function that represents the quantified value of an object/dataset.It represents the significant features of the object such as color, texture, and pixels.Local features of a dataset/image refer to the characteristics of the image that adheresto edge detection, image segmentation, and the features that are calculated on theresults of the subdivision of the image. The most common methods that are used forlocal feature extraction using deep learning are as follows.
• Haris Corner detection
Corner detection is used in the computer vision systems to infer some of theinteresting facts of the image and its corners. It is usually used for applicationslike motion detection, video tracking, 3D modeling, and object recognition. Oneof the methods that are used is Haris corner detection that is based on the intensityof the corners [19]. The basic idea is to observe a large change in appearancewhen there is a shift in the window in any direction. The normal three scenarios ofcorner detection are as shown in Fig. 2. The change in the shift of the intensitysays [u, v] is calculated as shown in the Eq. 1.
• Scale Invariant Feature Transformation (SIFT)
It is used to detect local features in the image for applications such as gesturerecognition, video tracking, 3D modeling, etc. A set of key features in the imageare extracted and stored in a database. For a new image, the features are compared
Flat region
No change
in any
direction
Edge region
No change
in edge
direction
Corner region
Significant
change in all
directions
Fig. 2 Haris corner detection

112 S. Hiriyannaiah et al.
against the existing database to determine the best candidate matching using theEuclidean distance of the feature vectors [20]. In order to filter out the matchingfrom the database, a subset of the keypoints that are matched with location, scale,and orientation are filtered out from the database. The drawback of SIFT is thecomputation involves calculation of pixel patch value based on the histogram ofgradients. Hence, if the image size is large then computation becomes expensive.
E(u, v) =∑
x,y
w(x, y)[I (x + u, y + u) − I (x, y)]2 (1)
• Oriented FAST and Rotated BRIEF(ORB)
ORB is one of the local feature extraction methods that overcomes the drawbackof SIFT and reduces the computation time. It is based on the BRIEF (Binaryrobust independent elementary features) and FAST point detector [21]. The pointsare detected in the image based on the orientation. Initially, the point is locatedat the center of the corner of the image. The orientation of the image is knownfrom this point. The invariance is improved using the circular region of the image.The description of the images is set using the points detected using FAST pointdetector. A matrix S (2 × n) defines the coordinates of the pixels from the featureset. The orientation � found using FAST point rotates the matrix S to a steeredversion S�. A lookup table is first precomputed using the angle 2�/30° to producethe correct set of points S�. A small snippet of the code is as shown below.The image is read initially inputted in grayscale but can be converted to RGB later.The ORB local feature extractor is defined and to specify the number of featuresthat are needed to pick up. Initially, it’s set to the top 1000 features, if left blank iffinds all the possible features. All the points of interest in the image are computedand stored in the variable “kp”. A plot is defined for these feature points stored in“kp” on the original image, these points are marked in a single color as specified inthe parameters list. In the end, output can be viewed using the imshow() functionin matplotlib. The output of a sample image is as shown in Fig. 3.
Input Image ORB features
Fig. 3 ORB sample output

Deep Learning for Multimedia Data in IoT 113
import cv2
import matplotlib.pyplot as plt
filename='5.jpg' #filename of the image
img = cv2.imread('5.jpg',0)
orb = cv2.ORB(nfeatures=1000) #defines how many features
to pick
kp = orb.detect(img,None)
kp, des = orb.compute(img, kp)
img2 = cv2.drawKeypoints(img,kp,color=(255,0,0), flags=0)
#plot all the points of interest on the image
plt.figure(figsize=(16, 16))
plt.title('ORB Interest Points')
plt.imshow(img2) #print image with highlights
plt.show()
5.2 Global Feature Extraction Methods
Once the local features such as edges of the images/dataset are extracted from theimage global features are computed for the entire image. These global features helpin the final classification of the image using the computed elements of the localfeatures. The common methods that are used in extracting global features of thedataset/image are as follows:
• Histogram of Oriented Gradients (HOG)
HOG is used as feature descriptor in image processing and computer vision forobject detection. It is based on the histogram of gradients that acts as a globalfeature for object detection. In local portions of the image, it counts the occurrencesof gradient orientation to produce the histogram. The intensity of the distributionof histograms present in the local object appearances guides the production of thehistograms [22]. Basically, in an image, each pixel is drawn into a group of cells.A histogram of gradients is compiled for each pixel in the cell. A descriptor formsthe concatenation of all these histograms. The different types of gradients that arefollowed in HOG are listed as follows.
– Image gradients
A gradient is a vector quantity that has both magnitude and direction. An imagegradient gives the intensity change at the particular location of the image. Anillustrative image gradient is as shown in Fig. 4.
– Histogram of oriented gradients
When the gradients of the image are oriented, it is called as oriented gradients.A histogram of oriented gradients gives the intensity of the gradients of the

114 S. Hiriyannaiah et al.
Fig. 4 Image gradient
Fig. 5 Histogram of oriented gradients
small portion of the image. It helps to find the probability of a gradient in theparticular portion of the image as shown in Fig. 5.
A small snippet of Histogram of oriented gradients is as shown below. The requiredlibraries are imported, including the HOG detector function from the skimagelibrary. Here, img is the image being read, orientation is the number of directionsfor features in terms of intensity fluctuation, pixels_per_cell divides picture intocells and define the number of pixels per cell, cells_per_block is the number of cellstaken per block for mapping, visualize is to get final image of feature detection,feature_vector is to output the final feature vector, “feat” is the feature set and“im” is the histogram. The output of a sample image is as shown in Fig. 6a–c.

Deep Learning for Multimedia Data in IoT 115
Fig. 6 a Input for HOG b Histogram for HOG sample output c Features for HOG sample output
import cv2
import matplotlib.pyplot as plt
from skimage.feature import hog
img = cv2.imread("7.jpg",0) #read image
feat,im=hog(img,orientations=9,pixels_per_cell=(8,8),cell
s_per_block=(2,2), visualise=True,feature_vector=True)
#img is image being read
#orientation the number of directions for features in
terms of intensity fluctuation
#pixels_per_cell divide picture into cells and define the
pixel density
#cells_per_block number of cells taken per block for
mapping
#visualise get image of feature detection
#feature_vector
plt.plot(im) #plot histogram for detection
plt.show() #show histpgram graph

116 S. Hiriyannaiah et al.
6 Deep Learning for IoT Data Classification
6.1 IoT Data and Its Types
Internet of things is composed of various devices capable of receiving data and may ormay not possess computing power. These devices are interconnected and are usuallyin constant communication with each other. Thus as a natural consequence alwayskeep generating data. The devices participating in an IoT network can be majorlyclassified into two types. The first of them which forms the building blocks of thenetwork are the sensors and second one of them are the devices which consume thedata acquired from the sensors. These devices that consume the data can be furtherdistinguished as ones which perform analysis based on the retrieved data or initiatean action based on the acquired data. On the whole, IoT data that is being generatedby sensors play a major role in powering various kinds of applications.
From the natural understanding of the behavior of devices that participate in IoT,a norm can be derived for classifying IoT data. Thus this basic classification of IoTdata yields two categories namely
1. Data used for analysis purposes (Analysis data)2. Data used to initiate an action (Actuation data or action causing data)
6.1.1 Analysis Data
The volume of data generated from a wide array of sensors provides an excellentplatform to perform analysis. Various kinds of sensor data are available ranging rightfrom trivial data obtained from simple motion sensors to a more sophisticated formof data such as location data obtained from smartphones. The data obtained willusually be in the form of time series data which has a natural consequence of havinga higher volume.
A classical example that can be illustrated in the case of analysis of IoT data is thatof study of meteorological data. It consists of study of atmosphere and its constituentsand various related analysis such as weather patterns, rainfall magnitudes, and so on.Various predictions are also undertaken based on this data which is clearly evident inthe form of weather updates, rainfall predictions, and temperature range suggestions.Another similar example will be the analysis of chemical constituents of air andanalyzing the overall air quality.
Various other domains also provide good scope for data analysis which includesmultimedia sources. This vast domain has a huge disposal of data which exists minvarious forms. This includes real-time traffic data, text, and images from varioussocial media platforms. Another domain which provides a platform to obtain statisticsare the various routers, switches, and other networking devices deployed acrossthe globe. Modern SDN systems have device statistics built into them to enableanalysis and to infer congestion levels and other such parameters. A variety of medical

Deep Learning for Multimedia Data in IoT 117
equipments also participate in generating data such as electrocardiography, blood testreports, x-rays, etc., which can be used for analysis purpose when viewed at a largescale. Call records of mobile phones and the usage times of different applications canalso be considered as a contributor. The insights obtained after performing analysisare usually used for commercial purposes or can be utilized by the government.
6.1.2 Actuation Data or Action Causing Data
Apart from aiding various analytics applications, IoT data is also being used to actuateother devices in order to obtain a desirable action or a mechanism which drives adecision. This form of utility is being exploited in areas such as automation systemsand in networking scenarios, as a solution mechanism for congestion problems.
As an example, in the case of automation systems, a simple home automationsystem serves the purpose of understanding decision driving mechanisms. The heat-ing and illumination systems present in a typical house such as normal light bulb,or a fan can be made alternate between on and off state based on the data collectedby sensors deployed in the house which include motion sensors, thermostats, andrelated sensors.
As an example in the case of networking scenarios, the routing information storedin the edge devices and the records of data or packets passing through the device canbe retrieved. This information can be used to enable rerouting bringing about loadbalancing and thereby enabling congestion control.
6.2 Case Study on IoT Data Classification Using Deep
Learning
6.2.1 IoT Dataset
The dataset chosen for classification purpose is “Air Quality Dataset” [23]. It is afairly sized dataset of 9358 instances. The quality of air is determined by the relativecomposition of its constituent elements. The data collected here can be categorizedas IoT data since it has accumulated by the various sensors. The device used to formthe dataset is an Air Quality Chemical Multisensor Device. It is composed of fivemetal oxide chemical sensors which are arranged to form the device.
Data was gathered on an hourly basis in order to obtain a sizeable dataset andwhich represents adequate variation. The sensor was placed in an Italian city whichwas subject to a relatively higher level of pollution due to the presence of variouspollutants. The duration of data capture ranged from March 2004 to February 2005.This data represents one whole year of recording which is regarded as the longestduration in which chemical sensors were deployed which captured air quality.

118 S. Hiriyannaiah et al.
The dataset consists of the following attributes:
1. Date (DD/MM/YYYY)2. Time (HH.MM.SS)3. True hourly averaged concentration CO in mg/mˆ3 (reference analyzer)4. PT08.S1 (tin oxide) hourly averaged sensor response (nominally CO targeted)5. True hourly averaged overall Non-Metanic HydroCarbons concentration in
microg/mˆ3 (reference analyzer)6. True hourly averaged Benzene concentration in microg/mˆ3 (reference ana-
lyzer)7. PT08.S2 (titania) hourly averaged sensor response (nominally NMHC targeted)8. True hourly averaged NOx concentration in ppb (reference analyzer)9. PT08.S3 (tungsten oxide) hourly averaged sensor response (nominally NOx
targeted)10. True hourly averaged NO2 concentration in microg/mˆ3 (reference analyzer)11. PT08.S4 (tungsten oxide) hourly averaged sensor response (nominally NO2
targeted)12. PT08.S5 (indium oxide) hourly averaged sensor response (nominally O3 tar-
geted)13. Temperature in °C14. Relative Humidity (%)15. AH Absolute Humidity
IoT data most of the times is captured with the help of various sensors. Thesesensors are usually physical which are deployed in sites. They can also be simulatedvia a python script for experimental or analysis purposes. Theses scripts which aredeployed in edge devices act as an interface to simulate different kinds of sensors.The script shown below can be used to pump in sensor data.
The sensors deployed in edge devices need to pump in data to a central database.IoT devices communicate using a lightweight protocol called mqtt protocol. Twobasic operations or functions associated with mqtt protocol are published and sub-scribed. These terms are analogous to write and read of an I/O device. A device ora sensor that needs to pump in data has to publish with a particular type under apredetermined topic. Similarly, devices that need to analyze or read this data needto subscribe to the topic. The mqtt broker plays a vital role or is essentially the heartof the protocol. It is responsible for sending and receiving messages and deliveringit to the clients thereby responsible for the fundamental publish/subscribe model. Inthe script shown below data needs to published and hence associated code has beenincorporated.

Deep Learning for Multimedia Data in IoT 119
import time
import paho.mqtt.client as mqtt import json import ssl import randombroker = "<broker_url here>" port = 8883 topic = "iot-2/evt/test/fmt/json"username = "<username>" password = "<password >"organization = "<org id here>"deviceType = "Python_Client"
mqttc = mqtt.Client("<client id>") print(username+''+password)mqttc.username_pw_set(username,password)mqttc.tls_set_context(context=None)mqttc.tls_insecure_set(False)mqttc.connect(broker,8883,60)for i inrange(0,10):
print('Sending sample key value pairs')msg={'key':i,'value':random.randrange(1,50)}mqttc.publish(topic,json.dumps(msg))time.sleep(1)
The supporting libraries for implementing the mqtt protocol and establishing asecure channel for communication have been imported. A suitable port number anda desired device type has been chosen. Among the various mqtt brokers available, anapt broker according to the application is to be chosen. The above script simulatesa sample sensor and hence accordingly a generic key-value pair is taken as thereading of the sensor and a sample topic name is chosen. The key-value pairs usuallydenote the (time period, sensor value) of a typical sensor. This generic sensor can beconsidered as a temperature gauge, or an accelerometer, in simple terms a gravitysensor which is present on most modern day smartphones. These virtual sensors canbe used for sample analytics purposes and to suit real life requirements, they arereplaced by actual sensors that are deployed in the region of study.
6.2.2 Building Neural Network for Classification
Many problems like Email spam, Handwriting digit recognition, Fraud transactiondetection are important day to day example of Classification problems. Classificationin simple terms, is grouping of things by a common features, characteristics, andqualities. To solve this problem there are many classification algorithms like decisiontree, logistic regression, and k-nearest neighbors. However, Neural Network has fewbenefits when compared to others therefore, it is the most popular choice to handlereal-time big data. The benefits of neural network are:

120 S. Hiriyannaiah et al.
– Normal Machine learning algorithm will reach a plateau, and will not improvemuch with more data after a certain point. However, neural network improveswith more data to train
– Neural Network is a nonlinear model, which helps us to define complex hyperplane, nontrivial decision boundaries for solving convoluted classification prob-lem.
– Neural network is highly adaptive can deal with nonstationary environments.– Neural network has high Fault tolerance. Corruption of few neurons does not
restrict it from generating the output.– Every neuron has a potential to influence every other neuron in the network. There-
fore, Contextual information is dealt naturally.
Due to all the reasons above, artificial neural network is being actively employedin lot of real-world problems like classifying spam emails, Bankruptcy prediction,flagging fraud transaction, etc., and are getting better results than conventional algo-rithms.
6.2.3 Experiment and Results
A sample dataset is as shown in Table 2. Artificial neural network is a network ofneurons. They process the training data one at time and learn by comparing theirclassification predicted with the actual classification. The errors from initial classifi-cation are fed back into the network to correct itself and modify weights for furtheriteration. Therefore, the major difficulty in building neural network is to find themost appropriate grouping of training, learning, and transfer functions to get the bestresult.
Before we can build a network, we have process the dataset by classifying allNO2(GT) columns to two classes. 1 for higher and 0 for lesser than 100 air qualityindex as shown in Table 3.
Table 2 Air quality data set
Date Time CO(GT) PT08.S1(CO)
NMHC(GT) C6H6(GT) PT08.S2(NMHC)
10-03-2004 18.00.00 2.6 1360 150 11.9 1046
10-03-2004 19.00.00 2 1292 112 9.4 955
10-03-2004 20.00.00 2.2 1402 88 9 939
10-03-2004 21.00.00 2.2 1376 80 9.2 948
10-03-2004 22.00.00 1.6 1272 51 6.5 836

Deep Learning for Multimedia Data in IoT 121
Table 3 Preprocessing ofdata
Date Time NO2(GT) T
10-03-2004 18.00.00 1 13.6
10-03-2004 19.00.00 0 13.3
10-03-2004 20.00.00 1 11.9
10-03-2004 21.00.00 1 11.0
10-03-2004 22.00.00 1 11.2
data=df[[’Date’,’Time’,’NO2(GT)’, ’T’]].copy()for i in range(len(data)):
if(data.iloc[i][’NO2(GT)’]<100):
data.at[i,’NO2(GT)’]=0 else:data.at[i,’NO2(GT)’]=1
Next, we need input features like weekday and hour to extract from date and timecolumn as shown in Table 4. We can split the dataset into training set and testing set.
for i in range(len(data)):
time=datetime.datetime.strptime(data.iloc[i]['Date'
]+" "+ data.iloc[i]['Time'], "%d/%m/%Y %H:%M:%S") weekday=time.weekday()
hour=time.hour
data.at[i,'Weekday']=weekday
data.Weekday = data.Weekday.astype(int)
data.hour = data.hour.astype(int)
train, test = train_test_split(data, test_size=0.2)
data.at[i,'hour']=hour
train.to_csv("train.csv",mode="w",index=False)test.to_csv("test.csv",mode="w",index=False)
Table 4 Preprocessing of data with day and hour
Date Time NO2(GT) T Weekday Hour
10-03-2004 18.00.00 1 13.6 2 18
10-03-2004 19.00.00 0 13.3 2 19
10-03-2004 20.00.00 1 11.9 2 20
10-03-2004 21.00.00 1 11.0 2 21
10-03-2004 22.00.00 1 11.2 2 22

122 S. Hiriyannaiah et al.
We will use tensor flow high level API to build a simple neural network with aninput layer (4 nodes) and a output layer. To that, we have to first write a function toextract the training dataset.
def load_traindata(label_name=’NO2(GT)’):train_path="train.csv" # For Training NN model
CSV_COLUMN_NAMES=
['Date','Time','NO2(GT)','T','Weekday','hour']
train = pd.read_csv(filepath_or_buffer=train_path,names=CSV_COLUMN_NAMES, # list of column namesheader=0, # ignore the first row of the CSV file.
skipinitialspace=True,
#skiprows=1
)
train.pop('Time')train.pop('Date')
train['hour'] = train['hour'].astype(str) train.Weekday= train.Weekday.astype(str) train['T']= train['T'].astype(float) train_features,train_label=train,train.pop(label_name)
return (train_features,train_label)
#getting training features and labels
(train_feature,train_label)= load_traindata()
To give a input features to we have to give it in the form of tf.feature column.This feature consist can be categorical (Weekday, hour) or numerical (TemperatureT) also. If two or more input features are closely related, it can be a separate featurein itself. This type of columns is known as crossed column (weekday x_hour), whichis mixture of two or more input features. After deciding the input features we create aSimple DNN classifier with base columns and crossed columns. Hidden unit indicatesthe no of nodes in each layer (for example [3–5] indicates a neural network with inputlayer with 4 nodes, hidden layer with 3 nodes and hidden layer 2 with 2 nodes). Weneed a hidden layer if the data is not linearly separable. Number of input nodesdepends on number of input features and, similarly, number of output nodes dependson number of classes being in output label.

Deep Learning for Multimedia Data in IoT 123
#creating normal features and crossed features for thenn model
Weekday = tf.feature_column.categorical_column_with_vocabulary_list ('Weekday', ['0', '1', '2', '3', '4','5','6'])
hour = tf.feature_column.categorical_column_with_vocabulary_list('hour', [ '0','1','2', '3','4','5','6','7','8','10','12','13','14','15','16','17','18','19','20','21','22','23'])
T=tf.feature_column.numeric_column(key='T',dtype=tf.float64)
base_columns = [
tf.feature_column.indicator_column(Weekday),
tf.feature_column.indicator_column(hour),
T
]
Weekday_x_hour = tf.feature_column.crossed_column( ['Weekday', 'hour'], hash_bucket_size=1000)
crossed_columns = [ tf.feature_column.indicator_column(Weekday_x_hour)
]
# Running Dnn classifer model with the features designed# Above and with and input layer with 4 nodes
tf.estimator.DNNClassifier(feature_columns=
base_columns+crossed_columns,hidden_units=[4],n_
classifier =
classes=2)
We have to train the classifier by passing a train_input function which shuffles theinput training data features. We have to iterate through the process (epoch) until theclassifier reaches its minimum error rate. Here we have chosen to iterate 50 times.
#training the nnmodel
def train_input_fn(features, labels, batch_size):
dataset =tf.data.Dataset.from_tensor_slices((dict(features) ,labels))
dataset=
dataset.shuffle(buffer_size=1000).repeat(count=None
n
).batch(batch_size)
retur
dataset.make_one_shot_iterator().get_next()

124 S. Hiriyannaiah et al.
classifier.train( input_fn=lambda:train_input_fn(train_feature,train_label, 50 ),steps=1000)
Neural Network Training
INFO:tensorflow:Callingmodel_fn.
INFO:tensorflow:Done calling model_fn.
INFO:tensorflow:CreateCheckpointSaverHook.
INFO:tensorflow:Graph was finalized. INFO:tensorflow:Runninglocal_init_op.
INFO:tensorflow:Done running local_init_op. INFO:tensorflow:Saving checkpoints for 1 into C:\Users\Guest\AppData\Local\Temp\tmprvwl47wc\model.ckpt.INFO:tensorflow:step = 1, loss = 42.49231
INFO:tensorflow:global_step/sec: 48.6003
INFO:tensorflow:step = 101, loss = 30.568665 (2.062 sec)
INFO:tensorflow:global_step/sec: 55.7494
INFO:tensorflow:step = 201, loss = 25.75341 (1.793 sec)
INFO:tensorflow:global_step/sec: 57.967
INFO:tensorflow:step = 301, loss = 24.957882 (1.726 sec) INFO:tensorflow:global_step/sec: 57.7436 INFO:tensorflow:step = 401, loss = 29.967522 (1.732
sec) INFO:tensorflow:global_step/sec: 58.4679
INFO:tensorflow:step = 501, loss = 27.571487 (1.711 sec)
INFO:tensorflow:global_step/sec: 53.1789
INFO:tensorflow:step = 601, loss = 25.81527 (1.875 sec)
INFO:tensorflow:global_step/sec: 54.6941
INFO:tensorflow:step = 701, loss = 19.551216 (1.833 sec) INFO:tensorflow:global_step/sec: 56.3506
INFO:tensorflow:step = 801, loss = 27.794727 (1.776 sec) INFO:tensorflow:global_step/sec: 59.6893
INFO:tensorflow:step = 901, loss = 21.918167 (1.673 sec)
INFO:tensorflow:Saving checkpoints for 1000 into
C:\Users\Guest\AppData
\Local\Temp\tmprvwl47wc\model.ckpt.
INFO:tensorflow:Loss for final step: 24.991734.
After training the classifier we can test it by passing it test data input features, ina similar way as we train. We have to pass a function which evaluate_input functionto pass only the input feature to classifier and classifier predicts the output.
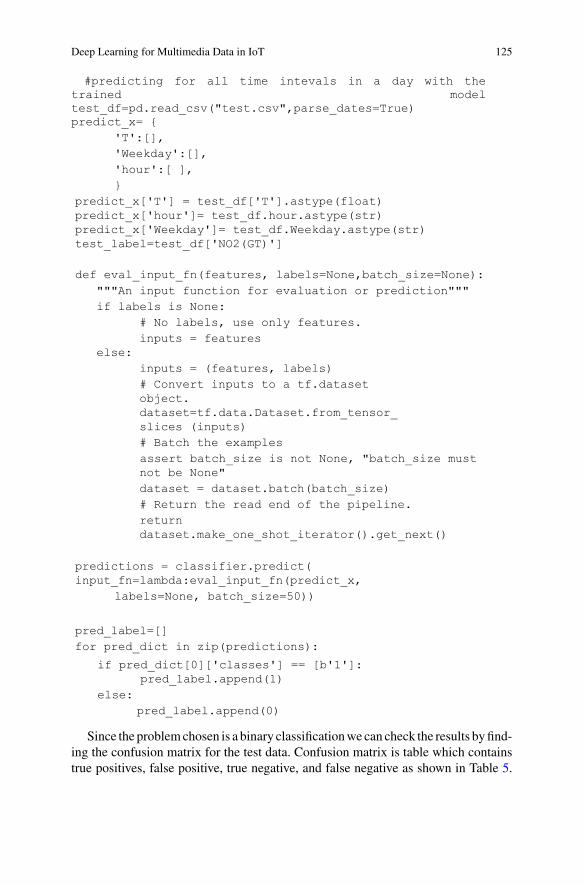
Deep Learning for Multimedia Data in IoT 125
#predicting for all time intevals in a day with theledomdeniart
test_df=pd.read_csv("test.csv",parse_dates=True)predict_x= {
'T':[],
'Weekday':[],
'hour':[ ],
}
predict_x['T'] = test_df['T'].astype(float)predict_x['hour']= test_df.hour.astype(str) predict_x['Weekday']= test_df.Weekday.astype(str) test_label=test_df['NO2(GT)']
def eval_input_fn(features, labels=None,batch_size=None):
"""An input function for evaluation or prediction"""
if labels is None:
# No labels, use only features.
inputs = features else:
inputs = (features, labels)
# Convert inputs to a tf.dataset object.dataset=tf.data.Dataset.from_tensor_slices (inputs)
# Batch the examples
assert batch_size is not None, "batch_size mustnot be None"
dataset = dataset.batch(batch_size)
# Return the read end of the pipeline.
returndataset.make_one_shot_iterator().get_next()
predictions = classifier.predict(input_fn=lambda:eval_input_fn(predict_x,
labels=None, batch_size=50))
pred_label=[]
for pred_dict in zip(predictions):
if pred_dict[0]['classes'] == [b'1']: pred_label.append(1)
else:
pred_label.append(0)
Since the problem chosen is a binary classification we can check the results by find-ing the confusion matrix for the test data. Confusion matrix is table which containstrue positives, false positive, true negative, and false negative as shown in Table 5.

126 S. Hiriyannaiah et al.
Table 5 Confusion matrix Predicted positive Predicted negative
Actual positive 692 303
Actual negative 169 708
We get the sensitivity and specificity with which classifier classifies the test data. Wecan also represent the confusion matrix in the form of a graph as shown in Fig. 7.
#ploting a confusion matrix with the tested data def plot_confusion_matrix(cm, names, title='Confusion matrix', cmap=plt.cm.Blues):
plt.imshow(cm, interpolation='nearest', cmap=cmap)
plt.title(title)
plt.colorbar()
tick_marks = np.arange(len(names))
plt.xticks(tick_marks, names, rotation=45) plt.yticks(tick_marks, names)
plt.tight_layout()plt.ylabel('True label')
plt.xlabel('Predicted label')
con_mat =tf.confusion_matrix(test_label,pred_label) cm=[]
with tf.Session():
cm=tf.Tensor.eval(con_mat,feed_dict=None,
session=None)
Fig. 7 Visual representationof confusion matrix

Deep Learning for Multimedia Data in IoT 127
plt.figure()
diagnosis=["NO2 "] plot_confusion_matrix(cm, diagnosis)
We can also test our results of our classifier using a ROC (Receiver OperatingCharacteristic) curve. ROC curve is a graphical way to show the cutoff betweensensitivity (fraction of true positives) and specificity (fraction of true negatives). Thearea under Roc curve is a measure of usefulness of test, therefore greater AOC meansbetter result as shown in Fig. 8.
# Plot an ROC. pred - the predictions, y - the expectedoutput. def plot_roc(pred,y):
roc_auc = auc(fpr, tpr)
print("Auc of classifer is ")
print(roc_auc)
plt.figure()
plt.plot(fpr, tpr, label='ROC curve (area = %0.2f)'
lt.title('Receiver Operating Characteristic (ROC)')
fpr, tpr, _ = roc_curve(y, pred)
% roc_auc)
plt.plot([0, 1], [0, 1], 'k--') plt.xlim([0.0, 1.0]) plt.ylim([0.0, 1.05])plt.xlabel('False Positive Rate') plt.ylabel('True Positive Rate')
p
plt.legend(loc="lower right") plt.show()
plot_roc(pred_label,test_label)
Fig. 8 Visual representationof ROC curve

128 S. Hiriyannaiah et al.
7 Conclusion
Since IoT devices are increasing day by day multimedia data from different sensorssuch as video, audio, phone, and others need to be processed in real time. If the datagenerated is not collected and analyzed then the value of the data may not be known.Thus, deep learning methods are very essential for analysis of multimedia data andIoT for different applications. In this chapter, a brief introduction to multimedia dataand its types were initially mentioned. The different deep learning methods with localfeature extraction and global feature extraction were discussed with small snippets ofexamples. Finally, a case study on air quality monitoring presented the deep learningmethod of classification and analysis of the data.
References
1. A. Kumari, S. Tanwar, S. Tyagi, N. Kumar, M. Maasberg, K.-K.R. Choo, Multimedia bigdata computing and Internet of Things applications: a taxonomy and process model. J. Netw.Comput Appl. (2018)
2. P.K. Atrey, M. Anwar Hossain, A. El Saddik, M.S. Kankanhalli, Multimodal fusion for multi-media analysis: a survey. Multimed. Syst. 16(6), 345–379 (2010)
3. J. Gubbi, R. Buyya, S. Marusic, M. Palaniswami, Internet of Things (IoT): a vision, architecturalelements, and future directions. Future Gener. Comput. Syst. 29(7), 1645–1660 (2013)
4. C.A. Bhatt, M.S. Kankanhalli, Multimedia data mining: state of the art and challenges. Mul-timed. Tools Appl. 51(1), 35–76 (2011)
5. F. Venter, A. Stein, Images & videos: really big data. Anal. Mag. 14–47 (2012)6. D. Che, M. Safran, Z. Peng, From big data to big data mining: challenges, issues, and oppor-
tunities, in Database Systems for Advanced Applications (Springer, Wuhan, China, 2013),pp. 1–15
7. Z. Wu, M. Zou, An incremental community detection method for social tagging systems usinglocality-sensitive hashing. Neural Netw. 58(1), 12–28 (2014)
8. P.K. Atrey, N.C. Maddage, M.S. Kankanhalli, Audio based event detection for multimediasurveillance, in 2006 IEEE International Conference on Acoustics Speech and Signal Process-
ing Proceedings, vol. 5 (IEEE, 2006)9. NLTK, https://www.nltk.org/
10. Scikit learn, http://scikit-learn.org/11. Hadoop, https://hadoop.apache.org/12. Spark, https://spark.apache.org13. J. Herrera, G. Molto, Detecting events in streaming multimedia with big data techniques, in
2016 Proceedings of 24th Euromicro International Conference on Parallel, Distributed, and
Network-Based Processing (PDP), Heraklion Crete, Greece (2016), pp. 345–34914. S. Hershey, S. Chaudhuri, D.P. Ellis, J.F. Gemmeke, A. Jansen, R.C. Moore, M. Plakal, D.
Platt, R.A. Saurous, B. Seybold et al., CNN architectures for large-scale audio classification,in 2017 IEEE International Conference on Acoustics, Speech and Signal Processing (ICASSP)
(IEEE, 2017), pp. 131–135, https://www.tableau.com/ (14. Tableau)15. OpenCV, https://opencv.org/16. Librosa, https://librosa.github.io/librosa/17. K. Alex, I. Sutskever, E.H. Geoffrey, ImageNet Classification with Deep Convolutional Neural
Networks (2012), pp. 1097–110518. J. Schmidhuber, Deep learning in neural networks: an overview. Neural Netw. 61, 85–117
(2015)

Deep Learning for Multimedia Data in IoT 129
19. C. Harris, M. Stephens, A combined corner and edge detector, in Alvey Vision Conference, vol.15, no. 50 (1988), pp. 10–5244
20. T. Lindeberg, Scale invariant feature transform (2012)21. E. Rublee, V. Rabaud, K. Konolige, G. Bradski, ORB: an efficient alternative to SIFT or
SURF, in 2011 IEEE International Conference on Computer Vision (ICCV) (IEEE, 2011),pp. 2564–2571
22. N. Dalal, B. Triggs, Histograms of oriented gradients for human detection, in IEEE Computer
Society Conference on Computer Vision and Pattern Recognition, 2005, CVPR 2005, vol. 1(IEEE, 2005), pp. 886–893
23. Air quality data, https://archive.ics.uci.edu/ml/datasets/Air+quality

Random Forest-Based Sarcastic Tweet
Classification Using Multiple Feature
Collection
Rajeev Kumar and Jasandeep Kaur
Abstract Sarcasm is primary reason behind the faulty classification of the tweets.
The tweets of sarcastic nature appear in the different compositions, but mainly deflect
the meaning different than their actual composition. This confuses the classification
models and produces false results. In the paper, the primary focus remains upon
the classification of sarcastic tweets, which has been accomplished using the textual
structure. This involves the expressions of speech, part of speech features, punctu-
ations, term sentiment, affection, etc. All of the features are extracted individually
from the target tweet and combined altogether to create the cumulative feature for the
target tweet. The proposed model has been observed with accuracy slightly higher
than 84%, which depicts the clear improvement in comparison with existing models.
The random forest-based classification model has outperformed all other candidates
deployed under the experiment. The random forest classifier is observed with accu-
racy of 84.7, which outperforms the SVM (78.6%), KNN (73.1%), and Maximum
entropy (80.5%).
Keywords Text analytics · Supervised text classification · Sarcasm detection ·Support vector machine · Punctuation features · Affection analysis
1 Introduction
The field of study which focuses on the interactions of human language and com-
puters is natural language processing. NLP mainly focuses on the intersection of
artificial intelligence, computer science, and computational linguistics. To examine,
understand, and conclude importance and definition in a wise manner from human
language, NLP uses computers. By using NLP, knowledge can be structured and
R. Kumar · J. Kaur (B)
DAV Institute of Engineering and Technology, Jalandhar, Punjab, India
e-mail: [email protected]
R. Kumar
e-mail: [email protected]
© Springer Nature Singapore Pte Ltd. 2020
S. Tanwar et al. (eds.), Multimedia Big Data Computing
for IoT Applications, Intelligent Systems Reference Library 163,
https://doi.org/10.1007/978-981-13-8759-3_5
131

132 R. Kumar and J. Kaur
analyzed to do different things like translation, automatic summarization, sentiment
analysis, speech recognition, and topic segmentation. NLP is required to analyze text,
allowing machine to know how human speaks. It is required for machine translation,
automatic question answering, and mining. The exactness in human language is rare
and this is the most difficult problem for NLP in computer science. The connection
between human and machine is required to know its meaning and not by simply
understanding the words. The ill-defined part of language makes NLP a critical task
for computers to master and not the learning of language which is quite easy for indi-
viduals to learn. On machine learning algorithms NLP is developed. NLP can rely
on machine learning than hand-coding big set of rules for automated rule learning
by examining a pair of references such as down to a collection of sentences, a large
corpus etcetera, and make predictions statistically. To infer, more the information is
examined, more the model will be explicit.
1.1 Applications of NLP
• Machine translation
The procedure through which the conversion of source language text to the target
language is done is known as Machine Translation. The pictorial representation below
defines all the stages which define it that is from source text to target text [1].
• Automatic summarization
Information overload becomes a problem when humans require acquiring a specific
and significant detail from a large amount of knowledge base. Therefore, this appli-
cation not only understands the emotional meaning containing in the context but also
conclude the definition, e.g., gathering information from Social Media.
• Sentiment analysis
To search sentiment among several posts or in the same post in which feeling is not
always exhibited clearly, sentiment analysis is used. NLP applications are used by
many companies such as this method to know sentiment and opinions electronically
through computer to assist to know the thinking of the users related to their products or
services. To exemplify, “I love the new Samsung phone” and further wrote “ However,
it does not sometimes operate well” in this example, an individual is mentioning about
the phone along with final benchmarks of its image.
• Text classification
To get the detail which is significant or which can ease few things by permitting
predefined categories to a document and fit them is feasible through this classification
only.
To exemplify: Spam filtering in email.

Random Forest-Based Sarcastic Tweet Classification … 133
• Question answering
For answering the human request, the term of question answering is a capable system
and for its popularity, the major gratitude goes to Siri, OK Google, and Chat boxes.
It provides authenticity and will go long in the upcoming time, therefore this will
remain a challenging task for searching devices and will remain the crucial term of
NLP research.
1.2 Introduction to Sentiment Analysis
Sentiment analysis is a process to obtain valuable information or sentiment from
data. It uses various techniques like text processing, text analysis, natural language,
and computational linguistics to process the data. The motive is to find out polarity
of a document by analysis of data inside the document. The polarity of document is
according to the opinion of the document and that can be either positive or negative
or can be neutral polarity. Sentiment analysis is categorized into 3 main areas which
are mentioned below.
Sentiment analysis faces many challenges and one of them is sarcasm Detection.
As sentiment analysis can be misguided due to the presence of words that have
a strong polarity and used as sarcastically, which intended the opposite polarity.
Sarcasm is a form of speech in which the speakers convey their message in an
implicit way. Sometimes, the naturally uncertain nature of sarcasm makes it hard
for humans to decide whether a sentence is sarcastic or not and also it conveys a
negative opinion using only positive words or intensified positive words. Therefore,
the detection of sarcasm is important for the development and refinement of sentiment
analysis (Fig. 1).
1.3 Introduction to Sarcasm Detection
Sarcasm is a verbal device, with the intention of putting someone down or is an
act of saying one thing while the meaning is opposite. It is mostly used on social
media to make a remark that means the opposite of what they say, in order to hurt
Fig. 1 Different sentiment
analysis levels
Document
level
Sentence level Aspect based
level
Sentiment analysis levels

134 R. Kumar and J. Kaur
someone’s feelings. The polarity of the statement is also transformed by sarcasm
into its opposite. For instance, if someone says, “You have been working hard,” he
said with heavy sarcasm as the person looked at the empty page.
Phases of sarcasm detection:
• Dataset Formation: It is the first step in which dataset can be collected from dif-
ferent sources, e.g., Twitter or posts from Facebook.
• Data Preprocessing: In this case, cleaning of data is performed such as removal of
URLs, hashtags, tags in the form of @user and unnecessary symbols.
• Sarcasm Identification: It involves two different phases, i.e., feature selection and
feature extraction. Feature extraction involves Part of speech (), Term presence,
Term frequency, Inverse document frequency, Negation and opinion expressions
for extracting the features. On the other hand, the lexicon method and statistical
method are used in case of feature selection.
1.4 Sarcasm Classification Approaches
Sarcasm analysis can be implemented using:
i. Machine Learning Approach
ii. Lexicon Based Approach
iii. Hybrid Approach
1.4.1 Machine Learning
It is a field of artificial intelligence that trains the model from the current data in order
to predict future outcomes, trends, and behaviors with the new test data. Machine
Learning is categorized into Supervised and Unsupervised Learning.
Supervised Learning
Supervised Learning is used when there is a finite set of classes. In this method,
labeled data is needed to train classifiers. In a machine learning based classifier, a
training set is used as an automatic classifier to learn the different characteristics
of documents, and a test set is used to validate the performance of the automatic
classifier. Two steps are involved, i.e., training and testing.

Random Forest-Based Sarcastic Tweet Classification … 135
Unsupervised Learning
This method is used when it is hard to find labeled training documents. It does not
depend upon prior training for mine the data. In document level, SA is based on
deciding the semantic orientation (SO) of particular phrase within the document. If
the average semantic orientation of these phrases is above some predefined threshold,
then the document is classified as positive, otherwise it is deemed negative.
1.4.2 Lexicon Based Techniques
One of the unsupervised techniques of sentiment analysis is lexicon based technique.
There has been a lot of work done based on lexicon. In this classification is performed
by comparing the features of a given text in the document against sentiment lexicons.
The sentiment values are determined prior to their use. Basically, the sentiment
lexicon consists of lists of words and expressions that are used to convey people’s
subjective feelings and opinions. Three methods to construct sentiment lexicon are:
Manual Method
In this approach each opinion word, such as nice (adjective), fast (adverb), love
(verb), is selected manually and the corresponding polarity is assigned. This manual
approach is a little time consuming and that is why it is never used alone.
Dictionary Based Method
This approach has three steps. In the first step, opinion words are constructed with
their sentiment orientations manually. Then, in the second step, the seed list is grown
by searching for synonyms and antonyms of seed words in a dictionary that is avail-
able online such as WordNet. The search results are combined with the seed list
with the same polarity as their synonyms in the list or the opposite polarity of their
existing antonyms, and the seeking process is started again until no new word is
found in the dictionary. In the third step, a correction process is done manually to
remove any existent errors. By using machine learning techniques and using addi-
tional information in WordNet such as “hyponym, -, it is possible to generate better
and richer opinion words lists”.
The most important drawback of this simple approach is that it is unable to dis-
tinguish between opinion words with respect to their domains. For example, “quiet”
is expressing positive sentiment in the context of a car but a negative sentiment for
a speakerphone.

136 R. Kumar and J. Kaur
Corpus-Based Method
This method is intended to solve the problem of the dictionary based approach. This
method is intended to solve the problem of the dictionary based approach. It consists
of two steps. The first step is constructing a seed list of opinion words which have
adjective part of speech tags and their polarities. In the second step, a set of linguistic
constraints is introduced to search for additional opinion words from the existing
corpus as well as their sentiment orientations.
These linguistic constraints are based on the idea of “Sentiment Consistency.”
According to sentiment consistency, people usually express the same opinions on
both sides of conjunctions (for instance, “and”) and the opposite opinion around
disjunctions (for instance, “but”). This idea helps to discover new sentiment words
in a collection. For instance, in the sentence “This house is lovely and big.” If we
do not have “big” in our seed list, we can conclude from “lovely” and conjunction
(“and”) that “big” has the same polarity as “lovely.” Therefore, we can extend our
list.
1.4.3 Hybrid Based Techniques
It involves a combination of other approaches namely machine learning and lexical
approaches.
2 Literature Survey
Tanwar et al. [2] presented a huge amount of multimedia data also defined as MMBD
is produced with a rapid incline in the supplying of multimedia devices over the invent
of things in “Multimedia big data computing and Internet of Things applications: A
taxonomy and process model.” In the present time, there research and development
activities do not consider the complexity of MMBD over IoT rather focus on scaler
sensor data. This process model mainly directs a number of challenges related to
research such as accessibility, scalability, QoS, and reliability requirements.
A survey is presented by Jasandeep Kaur et al. on phases of sarcasm detection
and also discusses various approaches based upon the combination of multiple fea-
tures for classifying the text in “Text Analytical Models for Data Collected from
Micro-blogging Portal—A Review”. Moreover, various classification algorithms are
deployed for various text analytics systems, which are shortlisted on the basis of the
feature engineering mechanism and type of data. For the data collected from Twitter,
the Random Forest, SVM, and KNN are used with the punctuation-related, syntax-
based, and other features for the sarcasm detection. The Random forest classifier is
found the best in comparison with other classification models, where it outperforms
the other model by minimum margin of 1.6% from KNN.

Random Forest-Based Sarcastic Tweet Classification … 137
Shubhodip Saha et al. proposed an approach for sarcasm detection in Twitter in
which textblob is used for preprocessing which includes tokenization, part of speech
tagging, parsing, and by using python programming stop words are also removed.
For polarity and subjectivity of tweets, RapidMiner is used and weka tool is used for
calculating the accuracy of tweets using two classifiers, i.e., Naïve Bayes and SVM.
At the end, naïve bayes provides more accuracy as compared to SVM.
A survey is provided by V. Haripriya et al. on various methodologies used to
sarcasm detection in Twitter social media data and also done an analysis of vari-
ous classifiers such as Naïve Bayes, Lexicon Based, and Support Vector Machine.
Sarcasm can be determined efficiently only if the existing approaches can deal with
large data set but most of the existing approaches can deal with only small datasets.
So a deep learning approach is considered as an efficient approach to detect Sarcasm
in case of large datasets.
Aditya Joshi et al. described datasets, approaches, trends, and issues in sarcasm
detection. Datasets are divided into three classes: short text, long text, and other
datasets approach like rule-based, statistical, deep learning-based, shared tasks are
discussed and issues in data, issues with features, dealing with dataset skews are the
issues for sarcasm detection.
Two approaches are presented by Aditya Joshi et al. in “Expect the unexpected:
Harnessing Sentence Completion for Sarcasm Detection” that use sentence com-
pletion for sarcasm detection, one is all-words approach and other is incongruous
words-only approach. Two datasets are used for the evaluation (i) tweets by [3] con-
tains 2278 tweets out of which 506 are sarcastic annotated manually (ii) discussion
forum posts by [4] 752 sarcastic and 752 non-sarcastic tweets manually annotated.
For similarity measures, Word2Vec and WordNet similarities are used. The evaluation
is configured into overall performance and twofold cross-validation. In overall per-
formance, when Word2Vec similarity is used for the all-words approach an F-score
of 54% is obtained but when WordNet is used in Incongruous words-only approach
then F-score is 80.24%. In case of two-fold cross validation, when incongruous
words-only approach and WordNet similarity are used then F-score is 80.28%.
A pattern-based approach is proposed by Mondher Bouazizi et al. for sar-
casm detection on Twitter. They also proposed four different sets of features, i.e.,
Sentiment-related features, Punctuation-related features, Syntactic and Semantic fea-
tures, and Pattern-based features. In this approach, the authors proposed more effi-
cient and reliable patterns, i.e., words are divided into two classes: “CI” and “GFI”
and this approach achieved 83.1% accuracy, 91.1% precision.
Different supervised classification technique is identified by Anandkumar D. Dave
et al. in “A Comprehensive Study of Classification Techniques for Sarcasm Detec-
tion on Textual Data” for sarcasm detection and also train SVM classifier for 10X
validation along simple Bag-of-words as features and use TFIDF for frequency mea-
surement of the feature. Two datasets were collected (Amazon product reviews and
tweets) and preprocessing also done for the removal of noise (spelling mistakes,
slang words, user-defined label, etc.) present in the dataset.
An ensemble approach is introduced by Elisabetta Fersini et al. in “Detecting
Irony and Sarcasm in Microblogs: The Role of Expressive Signals and Ensemble

138 R. Kumar and J. Kaur
Classifiers” in which BMA (Bayesian Model Averaging) along with different classi-
fiers on the basis of their marginal probability predictions and reliabilities. The two
main ensemble approaches, i.e., Majority Voting and Bayesian Model Averaging
are considered to detect sarcasm and irony. In order to evaluate the proposed BMA
approach, Fersini et al. [5] considered baseline classifier the one with the highest
accuracy and four configurations: BOW, PP, POS, PP & POS, and the experimen-
tal result shows the proposed solution outperforms the traditional classifiers for the
well-known Majority Voting mechanism and in this paper sarcasm can be better
characterized by PoS tags or ironic statements are captured by pragmatic particles.
Tomas Ptacek et al. represent the first attempt at sarcasm detection on two different
languages, i.e., Czech and English in “Sarcasm detection on Czech and English twit-
ter.” For this two different datasets collected 140,000 tweets in Czech and 780,000
English tweets from Twitter Search API and Java Language Detection for the eval-
uation and two classifiers were used, i.e., Maximum Entropy and Support Vector
Machine for the classification. Tests were organized in the 5-fold cross-validation
and this approach achieved F-measure of 0.947 and 0.924 on the balanced and imbal-
anced datasets in English. SVM achieved good results, i.e., F-measure 0.582 on the
Czech dataset with the feature set upgraded with patterns.
Two additional features are proposed by Edwin Lunando et al. in “Indonesian
Social Media Sentiment Analysis with Sarcasm Detection” to detect sarcasm, i.e.,
number of interjection words and negativity information, after a common sentiment
analysis is conducted. Three different types of experiments were conducted, i.e.,
experiments on sentiment score, experiments on classification method and experi-
ments for sarcasm detection. In last experiment, the additional features evaluated
in the sarcasm classification accuracy which shows that the additional features are
effective in sarcasm detection.
A novel bootstrapping algorithm is presented by Ellen Riloff et al. in “Sarcasm as
Contrast between a Positive Sentiment and Negative Situation” this naturally learn
record of positive sentiment phrases and negative situation phrases from sarcastic
tweets. Two baseline systems are created and to train SVM classifiers LIBSVM
library is used and 10-fold cross-validation is used to evaluate the classifiers. The
SVM achieved 64% precision and 39% recall with both unigram and bigram features
and the hybrid approach, applying the contrast method with only positive verb phrases
raises the recall from 39 to 42%.
Bruno Ohana et al. present sentiment analysis on film reviews by using hybrid
approach which involves a machine learning algorithm namely support vector
machine (SVM) and a semantic oriented approach namely sentiwordnet. The fea-
tures are extracted from sentiwordnet. Training of support vector machine classifier
is done on these features. Film reviews are classified by support vector machine
afterward. To determine the sentiment orientation of the film reviews, counting of
negative and positive term scores has been done.
Random Forest-Based Sarcastic Tweet Classification … 139
2.1 Research Gaps
1. The word compression method used in the existing model can lower the perfor-
mance of the sentiment analysis by removing the necessary bias and affecting
the total emotion of the text data [6].
2. The existing model offers the accuracy of the nearly 83%, which carries a room
for improvement and can be improved up to the higher level. The accuracy of
the system can be improved by using the various improvements in the existing
model. The system accuracy may be improved by using the above steps [6].
3. The existing model requires high computational power and slower the process of
sentiment analysis. The proposed model can be extended to increase the process
execution speed of the process. The existing model works in the various levels and
uses the multivariate feature descriptors along with the classifier, which includes
the overall elapsed time of the sentiment analytical system [6].
4. Only sentiment and emotion clues, which include the polarity and emoticon
features, are used to detect the sarcasm in the existing scheme. It analyzes the
existence of both positive and negative sentiment-related features, which may
lead to false results in many cases [7].
5. The existing approach is best acceptable for the smaller text datasets, where the
results have been proved to be efficient for Twitter with 140-word tweets. As
Twitter has raised the number of allowed words from 140 to 280, this scheme is
no longer efficient for the Twitter data. It must be improved for the larger text
databases [8].
6. The sarcasm detection is based upon the different levels of sarcastic tweet in
existing scheme. Sarcasm can’t be properly described with the particular pre-
defined set of rules; hence this scheme can’t meet such requirement. A more
generalized model can be a better option for sarcasm detection [9].
3 Proposed Methodology
3.1 To Create a Dataset for Sarcasm Detection
The dataset has been collected fromTwitter using the Rest API, and the tweets are
captured for the different streams, which includes different keywords for sarcasm,
such as #sarcasm #sarcastic, etc. The normal tweets are collected from the natural
discussion threads with keywords, such as #happy, #good, etc. A total of 25000
tweets are extracted from the Twitter API used as training data, and 609 tweets for
testing purpose.

140 R. Kumar and J. Kaur
3.2 Implementation
The proposed work is implemented in Anaconda framework for complete sarcasm
detection model. The configuration of the system is windows 8 (64-bit operating
system) having an Intel i3 processor and 3 GB RAM. A detailed explanation of the
implementation is done in this section.
3.2.1 Feature Comparison Model
The new model is designed for classifying tweet data into various categories, which
involves the tweet data obtained from Twitter containing several tweets includ-
ing non-sarcastic and sarcastic tweets. It is basically based upon the mixture of
knowledge-based sarcasm detection with feature amalgamation to explore the var-
ious aspects of the text in order to recognize the correct type of the tweet. N-gram
analysis techniques are used to extract tokens from the message data. Basically, for
word-level tokenization is occurred. Mainly, the tokenization process relies on simple
heuristics and is distinct from the whitespace characters (such as a space, line breaks)
or by punctuation characters. These whitespace and punctuation can or cannot have
comprised in the developing accrued record of tokens. On the other hand, there are
many cases like hyphenated words, contractions, emoticons, and larger constructs
such as URIs. The sarcasm detection technique is quite based upon the tweet category
database that uses the n-gram analysis for message data. This model is designed in
various components and each component has its own working and design. The new
model contains different modules such as tokenization, feature extraction, classifica-
tion density estimator, stop word filter, etc. Each components have created the final
model of proposed work based on the sarcasm detection using feature engineering
(or amalgamation) using various aspects of the text data.
3.2.2 Tokenization
It is the method to extract the keyword data from the input message string. It also
enables the automatic sarcasm detection algorithms to find the category of the input
tweet data, which gives better results within the lower time and small dictionary as
compared to the complete phase dictionary. The proposed model has been analyzed
under the N-gram model, which is capable of extracting the word combinations with
the higher influence rather than extracting the stag words of less influence.
Algorithm 1: The tokenization method design
1. Acquire the string from the message body
2. Split the string into the word list
3. Count the number of words in the splitted string
4. Load the STOPWORD data

Random Forest-Based Sarcastic Tweet Classification … 141
5. Start the iteration for each word (index)
a. Check the word (index) against the STOPWORD list
b. If the word (index) match return true
i. Filter the word out of the list
c. Otherwise, match the word (index) with the supervised data provided for the
tokenization
d. If the token matches the data in the supervised lists
i. Add to the output token list
e. Check the token relation with the next word against the phrase data
f. If relation found
i. Pair both of the words word (index) and word (index + 1)
g. Otherwise, return the singular word (index)
h. If it’s the last word
i. Return the word list
i. Otherwise GOTO 5(a)
Feature 1 Contrasting features: The first feature is entirely based upon the
contrasting connotations, which is the most prominent factor showing the sarcastic
expressions. The use of the contrasting combinations of emotion or meaning based
words and phrases are mainly used to show sarcasm in the sentences. The example
of the sarcastic expressions such as “I love being robbed during holidays,” or “I
enjoying being cheated by businesses” are the high sarcasm phrases, which are used
to show the most common form of sarcastic sentences. From these combinations,
two primary things are cleared, which involves the affection and sentiment scores.
The sentiment score is calculated by using the following algorithm, which is a kind
of supervised sentiment analysis method.
Algorithm 2: Typical Sentiment analysis model
1. Perform the data acquisition
2. Perform user list extraction over the input data acquired from the social thread
3. Perform the message level extraction from the input data
4. Apply the supervised tokenization with the localized dictionary to extract each
message M out of the total messages N
M = f × (N ,′ extract ′)
5. Apply the STOPWORD filtering over the message data denoted by M
tokens =
∫Remove (M == stopW ord)
6. Apply the polarization method over the filtered message in step 5
polari t y =
∫Score(M == polar W ord)

142 R. Kumar and J. Kaur
7. Return the polarization value to the decision maker method under the proposed
sentiment analysis algorithm
weight =∑
polari t y
8. Classify the message polarity according to the computed weight
a. If the computed weight is lesser than 0
i. mark the message as negative
b. If the weight is higher than 0
i. mark the message as positive
c. If weight equals zero
i. mark message as neutral
To calculate the sentiment score, the dictionary-based sentiment analysis algo-
rithm has been used over the tweet data, where each individual tweet is analyzed
under the lexical chain method. The tri-option analysis, which includes the negative,
neutral, and positive sentiments in the given tweets, where the negative score range
is between −1 and −5 usually, whereas the positive tweet is noticed between 1 and
6 on a majority. The tweets with sentiment score of zero are considered neutral. The
following methods are utilized to determine the affection and sentiment weightage
of the individual terms and in the cumulative form.
A = {a f f ect (w)|w ∈ t} (3.1)
S = {sentiment (w)|w ∈ t} (3.2)
�a f f ect = max(A) − min(A) (3.3)
�sentiment = max(S) − min(S) (3.4)
Here, t denotes text contained in the tweet, whereas the w represents the words in
the tweets. The affect () is the function, which accepts the input of each word one by
one and returns the matching affection in the form of affection weight, also known
as special sentiment weight. The sentiment is computed by using the sentiment ()
function, which works similarly as the affect (). The difference or contrast of the
affection or sentiment is denoted with the symbols of �affect and �sentiment. The
minimum affection score is subtracted from the maximum affection and a similar
step is performed for the sentiment score vector. The contrasting weight is returned
to the program.
Feature 2 Affection analyses: The tweet data evaluation algorithm based upon
the vital combination of above techniques such as sentiment analysis, tokenization,
affection, etc. The new model is designed to collect data directly from online source
or offline data source. The following algorithm explains the design of the affection
model for the proposed model:

Random Forest-Based Sarcastic Tweet Classification … 143
Algorithm 3: Affection analysis method
1. Acquire the dataset and chooses the raw data form of the read CSV file
2. Count number of rows in raw data,
3. Load STOPWORD list
4. Run the iteration for each message in the raw data
a. Extract the current message in the raw data
b. Filter the STOPWORDS from the input message data
c. Extract the tokens from the input messages data
d. Evaluate the affection score of the overall message
e. Return the message score to determine the degree of affection
f. Add to the detected polarity list of positive, negative or neutral
g. If the message is negative
i. Acquire the deep emotion supervised lists
ii. Determine the message under anger module
iii. Determine the message under disgust module
h. Return the deep sentiment results
Feature 3 Punctuation: This feature is the detailed feature, which counts for the
various terms and their individual weights in order to understand the composition of
the sentences in the given tweets. This is considered very important, as there is always
a unique pattern behind each and every kind of phrase or sentence being written.
The composition includes the various terms together such as special characters,
punctuations, verbs, adverbs, etc. The following algorithm is used to determine this
feature in an elaborative way:
Algorithm 4: Sentence composition extraction model
1. Acquire the tweet data obtained from the API
2. Count the rows in the tweet data matrix
3. Iterate for every row in tweet data matrix
a. Read the current tweet from the tweet data matrix
b. Convert the tweet string to lowercase
c. Normalize the string to make it process able through NLP processors
d. Replace the URL with the word “url”
e. Replace the string “@username” with the word “at_user”
f. Remove the hashtags from the string
g. Remove the number values from the input string
h. Remove the special characters from the input string
i. Convert the string to Unicode string
j. Apply the tokenization on the string
k. Replace the internet slangs with the original syntactic replacements in the
tokens array
l. Convert the tokens to the string
m. Reapply the tokenization on the re-prepared string
n. Remove the stopwords from the extracted keywords under N-gram analysis

144 R. Kumar and J. Kaur
o. Extract the subjective words
p. Add the output to the processed array
4. Acquire the training data
5. Process the training data
6. Apply the classification and Return the classification results
7. Compute the classification performance
8. Return the performance parameters.
3.3 Main News Classification Algorithm
Automatic sarcasm detection module is majorly defined to compute the density of
the keywords related to the categories defined in the training model. The sarcasm
detection algorithm is used to return the sentences from the message weight in the
numerical form. The supervised classifier is trained with real tweets for the extraction
of ontology with the goal that it will find hidden dependencies and also use them
for predictions. For classification, supervised learning model and statistical method
both are represented by Bayesian classification and also expect a probabilistic model
which is used to grab uncertainty about the model by certain probabilities of the
outcomes. It can figure out problems of diagnostic and predictive (Fig. 2).
4 Results
The proposed model has been designed for the sarcasm classification using the text
analytical methods over the Twitter dataset. This data contains the various parameters,
which includes various features such as affection, sentiment and punctuation related
features, syntactic features, pattern related features, etc. In this work, the SVM,
Maximum Entropy, KNN, and Random Forest classifiers are applied to the dataset
in order to obtain the results.
Afterward, the data is divided into training and testing dataset, which is done using
random selection by creating the random number series. The cross-validation split
works on the different ratios, such as 10, 20, 30, 40, and 50% for cross-validation,
which divided the testing samples accordingly into random groups of training and
testing signatures under the prepared sub-datasets.
4.1 Performance Parameters
The performance evaluation of the proposed model is evaluated using the following
parameters:

Random Forest-Based Sarcastic Tweet Classification … 145
Fig. 2 Generalized
supervised classification
model for sarcasm detection
Input data acquisition
Data preprocessing
Data preparation
Set input parameters
Apply Bayesian
classification
Result postprocessing
Display results
Stop
Start
4.1.1 Accuracy
The overall accuracy is the analysis of the proposed model in the terms of overall
accuracy, which is computed by dividing the total number of true cases (including
true negative and true positive), by all of the cases.
Accuracy :=T rue Posi tive + T rue Negative
T rue Posi tive + T rue Negative + False Posi tive + False Negative(4.1)

146 R. Kumar and J. Kaur
4.1.2 Recall
Recall is the test of the probability of the accuracy, which indicates the performance
of the proposed model in the presence of the false negative cases. The false negative
cases depict the falsely detected case from the data entries. In recall, the accuracy of
the proposed model has been analyzed in the presence of false negative cases:
Recall :=T rue Posi tive
T rue Posi tive + False Negative(4.2)
4.1.3 Precision
The precision depicts the accuracy of the model in the presence of false positive
cases. The accuracy of the model depicts the overall impact of the false positive
cases, which rejects positive cases. A positive case in our case is when the data entry
contains a certain set of parameters from one of the registered category but returns
the false result for such entries.
Precision :=T rue Posi tive
T rue Posi tive + False Posi tive(4.3)
4.1.4 F1-Measure
The F1-Measure is the cumulative parameter to assess the overall impact of the
precision and recall in the case to study the overall impact of the false positive
and false negative cases over the overall accuracy assessed from the preliminary
statistical parameters. The F1-score value is represented in the range of 0 to 1 or 0 to
100, decided as per the maximum ranges of the precision and recall. The following
equation is utilized to measure the F1-measure.
F1-Measure := 2 ∗(R ∗ p)
R + P(4.4)
where R is recall, and p or P is precision.
4.1.5 True Positive
The true positive reading is observed when the target tweet belongs to the sarcastic
category and classification result also indicates similar after evaluating the tweet text.

Random Forest-Based Sarcastic Tweet Classification … 147
4.1.6 True Negative
The true negative reading is observed when the target tweet is not sarcastic and the
classification also confirms its non-sarcastic nature.
4.1.7 False Positive
The true negative reading is observed when the target tweet is not sarcastic, but the
classification shows it as sarcastic tweet.
4.1.8 False Negative
The true positive reading is observed when the target tweet belongs to the sarcastic
category, but the classification result indicates it as non-sarcastic after evaluating the
tweet text.
4.2 Confusion Matrix
Error matrix is another term for confusion matrix and represents a unique table layout
which confesses mental image of the execution of classifiers, mostly supervised
learning classification. Confusion matrix is a primary kind of contingency table,
having two dimensions, i.e., “actual” and “predicted” and in both dimensions sets
of classes are same. Normally, positive are those which are identified and negative
which are rejected. Therefore, after classification true positive are those which are
correctly identified, false positive are describe incorrectly and also represent type
1 error in which no. of samples are incorrectly marked as positive. On the other
hand, true negative are those which are correctly rejected, false negative represents
incorrectly rejected data and also represent type 2 error in which no. of samples are
marked incorrectly negative (Table 1).
Table 1 Confusion matrix
True condition
Predicted condition True positive False positive
(type 1 error)
False negative
(type 2 error)
True negative
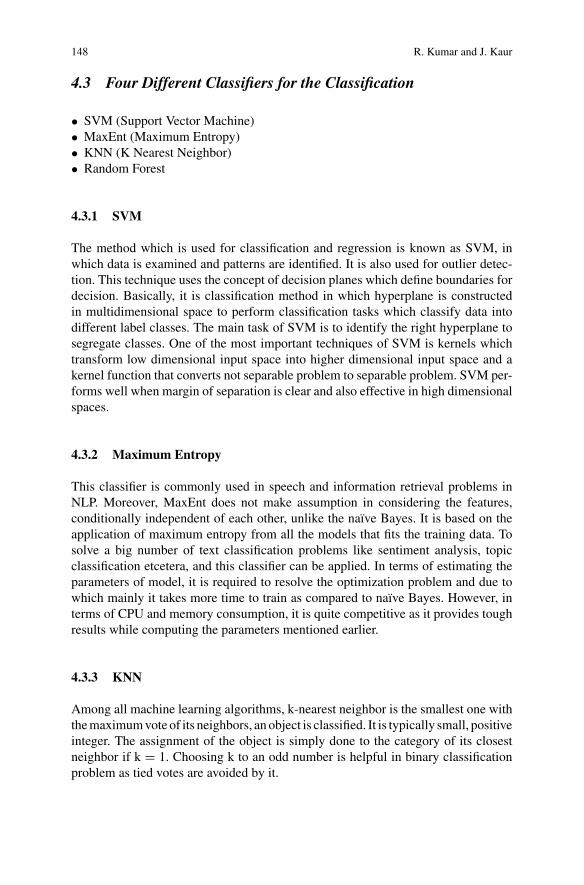
148 R. Kumar and J. Kaur
4.3 Four Different Classifiers for the Classification
• SVM (Support Vector Machine)
• MaxEnt (Maximum Entropy)
• KNN (K Nearest Neighbor)
• Random Forest
4.3.1 SVM
The method which is used for classification and regression is known as SVM, in
which data is examined and patterns are identified. It is also used for outlier detec-
tion. This technique uses the concept of decision planes which define boundaries for
decision. Basically, it is classification method in which hyperplane is constructed
in multidimensional space to perform classification tasks which classify data into
different label classes. The main task of SVM is to identify the right hyperplane to
segregate classes. One of the most important techniques of SVM is kernels which
transform low dimensional input space into higher dimensional input space and a
kernel function that converts not separable problem to separable problem. SVM per-
forms well when margin of separation is clear and also effective in high dimensional
spaces.
4.3.2 Maximum Entropy
This classifier is commonly used in speech and information retrieval problems in
NLP. Moreover, MaxEnt does not make assumption in considering the features,
conditionally independent of each other, unlike the naïve Bayes. It is based on the
application of maximum entropy from all the models that fits the training data. To
solve a big number of text classification problems like sentiment analysis, topic
classification etcetera, and this classifier can be applied. In terms of estimating the
parameters of model, it is required to resolve the optimization problem and due to
which mainly it takes more time to train as compared to naïve Bayes. However, in
terms of CPU and memory consumption, it is quite competitive as it provides tough
results while computing the parameters mentioned earlier.
4.3.3 KNN
Among all machine learning algorithms, k-nearest neighbor is the smallest one with
the maximum vote of its neighbors, an object is classified. It is typically small, positive
integer. The assignment of the object is simply done to the category of its closest
neighbor if k = 1. Choosing k to an odd number is helpful in binary classification
problem as tied votes are avoided by it.

Random Forest-Based Sarcastic Tweet Classification … 149
The method which is used for KNN can be applied to regression by taking the
average value of KNN to be the property value for the object. All the training samples
are stored in instance based or lazy learners, which are nearest neighbor classifiers
and a new sample is required to be categorized without which it cannot build a
classifier. Also, for making projections it can be used.
4.3.4 Random Forest
This [10] was the first paper which brought the concept of ensemble of decision trees
which is known random forest, which is composed by combining multiple decision
trees. While dealing with the single tree classifier there may be the problem of noise
or outliers which may possibly affect the result of the overall classification method,
whereas random forest is a type of classifier which is very much robust to noise
and outliers because of randomness it provides. Random forest classifier provides
two types of randomness, first is with respect to data and second is with respect to
features. Random forest classifier uses the concept of bagging and bootstrapping.
4.4 Result Evaluation
The results of the proposed model are analyzed for the different classifiers, which
includes SVM, maximum entropy, KNN, and random forest algorithms to calculate
the sarcastic sentiment in the given set of tweets. The proposed model is cross-
validated using the different split ratios, which ranges between 10 and 50%. The
results of the simulated are collected in the form of type 1 and 2 errors and statis-
tical accuracy based parameters to calculate overall achievement of work. Table 2
shows statistical accuracy based parameters for the split ratio of 10% with different
classification algorithms:
Table 2 Result analysis of 10% split ratio with statistical accuracy based parameters
Classification algorithms Precision (%) Recall (%) Accuracy (%) F1-measure
(%)
SVM 84.4 77.2 78.6 80.7
MaxEnt 81.0 82.0 80.5 81.5
KNN 77.9 73.1 73.1 75.4
Random forest 78.5 92.3 85.1 84.8
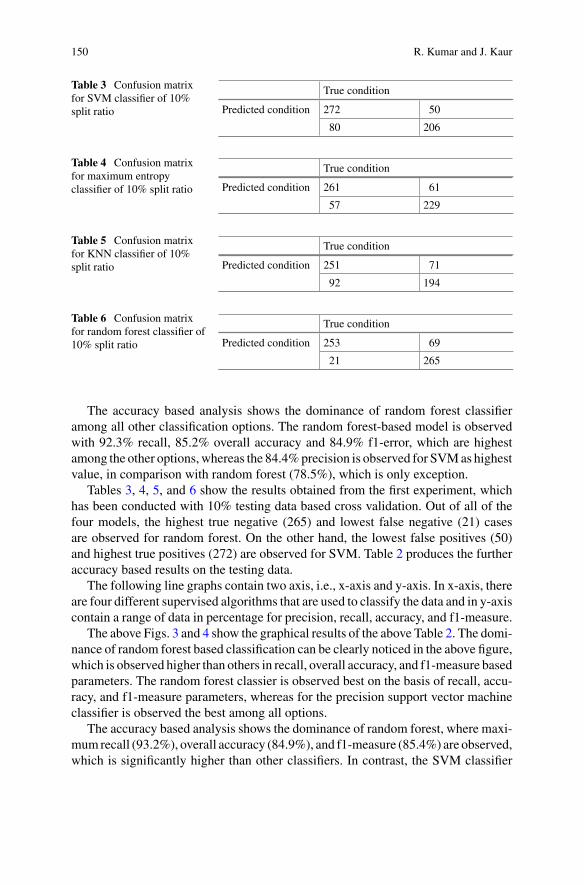
150 R. Kumar and J. Kaur
Table 3 Confusion matrix
for SVM classifier of 10%
split ratio
True condition
Predicted condition 272 50
80 206
Table 4 Confusion matrix
for maximum entropy
classifier of 10% split ratio
True condition
Predicted condition 261 61
57 229
Table 5 Confusion matrix
for KNN classifier of 10%
split ratio
True condition
Predicted condition 251 71
92 194
Table 6 Confusion matrix
for random forest classifier of
10% split ratio
True condition
Predicted condition 253 69
21 265
The accuracy based analysis shows the dominance of random forest classifier
among all other classification options. The random forest-based model is observed
with 92.3% recall, 85.2% overall accuracy and 84.9% f1-error, which are highest
among the other options, whereas the 84.4% precision is observed for SVM as highest
value, in comparison with random forest (78.5%), which is only exception.
Tables 3, 4, 5, and 6 show the results obtained from the first experiment, which
has been conducted with 10% testing data based cross validation. Out of all of the
four models, the highest true negative (265) and lowest false negative (21) cases
are observed for random forest. On the other hand, the lowest false positives (50)
and highest true positives (272) are observed for SVM. Table 2 produces the further
accuracy based results on the testing data.
The following line graphs contain two axis, i.e., x-axis and y-axis. In x-axis, there
are four different supervised algorithms that are used to classify the data and in y-axis
contain a range of data in percentage for precision, recall, accuracy, and f1-measure.
The above Figs. 3 and 4 show the graphical results of the above Table 2. The domi-
nance of random forest based classification can be clearly noticed in the above figure,
which is observed higher than others in recall, overall accuracy, and f1-measure based
parameters. The random forest classier is observed best on the basis of recall, accu-
racy, and f1-measure parameters, whereas for the precision support vector machine
classifier is observed the best among all options.
The accuracy based analysis shows the dominance of random forest, where maxi-
mum recall (93.2%), overall accuracy (84.9%), and f1-measure (85.4%) are observed,
which is significantly higher than other classifiers. In contrast, the SVM classifier

Random Forest-Based Sarcastic Tweet Classification … 151
0
20
40
60
80
100
SVM Maximum
Entropy
KNN Random
Forest
Pre
cisi
on
an
d R
eca
ll
Classifica on Algorithms
Precision
Recall
Fig. 3 Result analysis of 10% split ratio with precision and recall based parameters
Fig. 4 Result analysis of 10% split ratio with accuracy and F1-measure based parameters
Table 7 Result analysis of 20% split ratio with statistical accuracy based parameters
Classification algorithms Precision (%) Recall (%) Accuracy (%) F1-measure
(%)
SVM 83.9 79.1 78.6 81.4
MaxEnt 83.0 85.4 82.6 84.2
KNN 76.1 76.3 73.4 76.2
Random forest 78.7 93.2 84.9 85.3
is observed with 83.9% precision is observed in comparison with random forest
(78.8%).
The results of 20% testing ratio based cross-validation is evaluated with all clas-
sifiers in another experiment. The highest true negatives (497) and minimum false
negatives (39) are observed for random forest among all classifiers. The lowest false
positives (109) and the highest true positives (570) are observed for the SVM clas-
sifier. The overall accuracy based evaluation is shown in Table 7.

152 R. Kumar and J. Kaur
Fig. 5 Result analysis of 20% split ratio with precision and recall based parameters
Fig. 6 Result analysis of 20% split ratio with accuracy and F1-measure based parameters
Table 8 Confusion matrix
for SVM classifier of 20%
split ratio
True condition
Predicted condition 570 109
150 386
Table 9 Confusion matrix
for Maximum Entropy
classifier of 20% split ratio
True condition
Predicted condition 564 115
96 440
In the Figs. 5 and 6 similar to previous figure, random forest classifier is observed
with highest recall (>93%), highest accuracy (approx. 84%), and highest f1-measure
(>85%), which supports the selection of random forest as best classifier in comparison
with other SVM, KNN, and MaxEnt for the sarcasm classification in Twitter data
(Tables 8, 9, 10, 11, and 12).

Random Forest-Based Sarcastic Tweet Classification … 153
Table 10 Confusion matrix for KNN classifier of 20% split ratio
True condition
Predicted condition 517 162
160 376
Table 11 Confusion matrix for Random Forest classifier of 20% split ratio
True condition
Predicted condition 535 144
39 497
Table 12 Result analysis of 30% split ratio with statistical accuracy based parameters
Classification algorithms Precision (%) Recall (%) Accuracy (%) F1-measure
(%)
SVM 83.9 78.7 78.7 81.2
MaxEnt 81.9 85.7 82.6 83.7
KNN 75 74.2 72.0 74.6
Random forest 78.6 93.4 85.2 85.3
Table 13 Confusion matrix for SVM classifier of 30% split ratio
True condition
Predicted condition 839 161
226 597
The accuracy based analysis of the classifiers on cross-validation with 30% testing
data again shows the dominance of random forest classifier, with only exception of
the highest precision in case of SVM. The random forest classifier based model
is observed with highest recall (93.4%), overall accuracy (85.2%), and f1-measure
(85.3%) in comparison with second highest recall (85.7%), accuracy (82.6%), and
f1-measure (83.7%) in case of MAXENT classifier (Tables 13, 14, and 15).
Table 14 Confusion matrix for Maximum Entropy classifier of 30% split ratio
True condition
Predicted condition 819 181
136 687
Table 15 Confusion matrix for KNN classifier of 30% split ratio
True condition
Predicted condition 750 250
260 563

154 R. Kumar and J. Kaur
Table 16 Confusion matrix for Random Forest classifier of 30% split ratio
True condition
Predicted condition 786 214
55 768
Fig. 7 Result analysis of 30% split ratio with precision and recall based parameters
Fig. 8 Result analysis of 30% split ratio with accuracy and F1-measure based parameters
Similarly, as observed from the Table 16, the random forest classifier is also
observed with highest true negatives and lowest false negatives, whereas SVM dom-
inates the lowest false positives and highest true positives as per the result synthesis
of Table 15.
In the above Figs. 7 and 8, the proposed model based upon random forest
is observed with highest recall value (>93%), accuracy (>85%), and f1-measure
(>85%), which proves its best performance among other classification methods,
whereas the value of recall, accuracy and f1-measure are observed for KNN (74.2,
72.0, and 74.6%), MAXENT (85.7, 82.6, and 83.7%), and SVM (78.7, 78.7, and
81.2%). On the contrary, SVM has been observed with significantly higher on the

Random Forest-Based Sarcastic Tweet Classification … 155
Table 17 Result analysis of 40% split ratio with statistical accuracy based parameters
Classification algorithms Precision (%) Recall (%) Accuracy (%) F1-measure
(%)
SVM 84.3 76.7 77.6 80.3
MaxEnt 83.0 84.7 82.7 83.9
KNN 75.2 72.9 71.4 74.0
Random forest 79.1 92.1 85.0 85.1
Table 18 Confusion matrix
for SVM classifier of 40%
split ratio
True condition
Predicted condition 1109 206
336 779
Table 19 Confusion matrix
for maximum Entropy
classifier of 40% split ratio
True condition
Predicted condition 1092 223
196 919
Table 20 Confusion matrix
for KNN classifier of 40%
split ratio
True condition
Predicted condition 989 326
367 748
basis of precision (approx. 84%), which is outperformed by the overall accuracy in
random forest (85%) in comparison with SVM’s 78.7% (Table 17).
The accuracy based analysis shows the dominance of random forest, where maxi-
mum recall (92.1%), overall accuracy (85.0%), and f1-measure (85.1%) are observed,
which is significantly higher than other classifiers. In contrast, the SVM classifier
is observed with 85.3% precision is observed in comparison with random forest
(79.1%).
The results of the simulated are collected in the form of type 1 and 2 errors and
statistical accuracy based parameters to calculate the overall achievement of work.
Above tables (Tables 18, 19, 20 and 21) show the results of type 1 and type 2 errors
and statistical accuracy based parameters for the split ratio of 40% with different
classification algorithms. The random forest dominates for true negatives and false
negatives, whereas SVM dominates for false positives and true positives, which is
similar to the previous result analysis of type 1 and 2 errors.
Table 21 Confusion matrix
for random forest classifier of
40% split ratio
True condition
Predicted condition 1041 274
89 1026
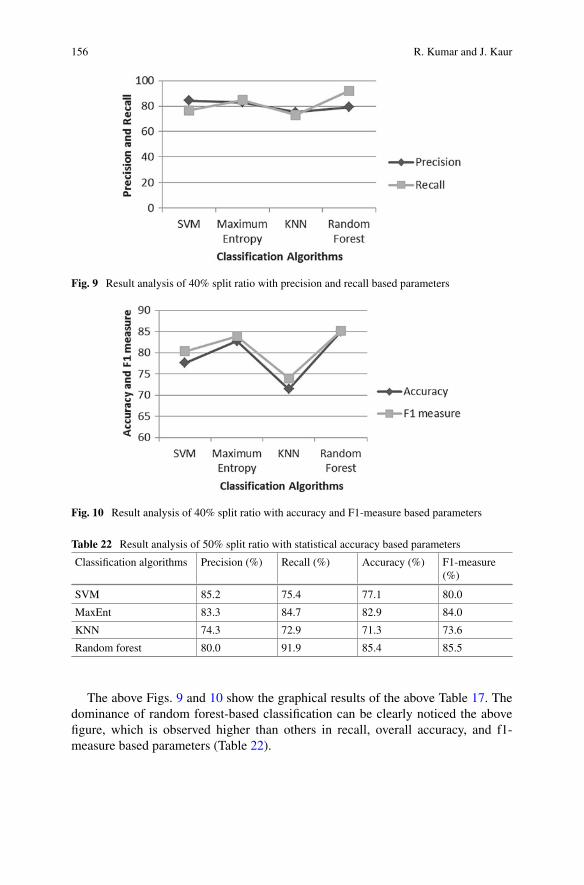
156 R. Kumar and J. Kaur
Fig. 9 Result analysis of 40% split ratio with precision and recall based parameters
Fig. 10 Result analysis of 40% split ratio with accuracy and F1-measure based parameters
Table 22 Result analysis of 50% split ratio with statistical accuracy based parameters
Classification algorithms Precision (%) Recall (%) Accuracy (%) F1-measure
(%)
SVM 85.2 75.4 77.1 80.0
MaxEnt 83.3 84.7 82.9 84.0
KNN 74.3 72.9 71.3 73.6
Random forest 80.0 91.9 85.4 85.5
The above Figs. 9 and 10 show the graphical results of the above Table 17. The
dominance of random forest-based classification can be clearly noticed the above
figure, which is observed higher than others in recall, overall accuracy, and f1-
measure based parameters (Table 22).

Random Forest-Based Sarcastic Tweet Classification … 157
Table 23 Confusion matrix
for SVM classifier of 50%
split ratio
True condition
Predicted condition 1394 242
453 948
Table 24 Confusion matrix
for maximum entropy
classifier of 50% split ratio
True condition
Predicted condition 1363 273
246 1155
Table 25 Confusion matrix
for KNN classifier of 50%
split ratio
True condition
Predicted condition 1216 420
451 950
Table 26 Confusion matrix
for random forest classifier of
50% split ratio
True condition
Predicted condition 786 214
55 768
The accuracy based analysis of the classifiers on cross-validation with 50% testing
data again shows the dominance of random forest classifier, with only exception of
highest precision in case of support vector machine. The random forest classifier
based model is observed with highest recall (91.1%), overall accuracy (85.4%), and
f1-measure (85.5%) in comparison with second highest recall (84.7%), accuracy
(82.9%), and f1-measure (84.0) in case of MaxEnt classifier (Tables 23, 24, and 25).
In the case of Table 26, the highest true negatives (1286) and lowest false negatives
(115) are observed for random forest, whereas the highest true positives (1394) and
lowest false positives (242) for support vector machine. The overall result is worst
in the case of KNN and best in the case of random forest on the basis of observations
in Table 26. Table 22 describes the results of 50% cross-validation obtained in the
form of statistical accuracy based parameters.
In Figs. 11 and 12, the accuracy based analysis shows the dominance of random
forest, where maximum recall (91.9%), overall accuracy (85.4%), and f1-measure
(85.5%) are observed, which is significantly higher than other classifiers. In contrast,
the SVM classifier is observed with 85.2% precision is observed in comparison with
random forest (80.0%).
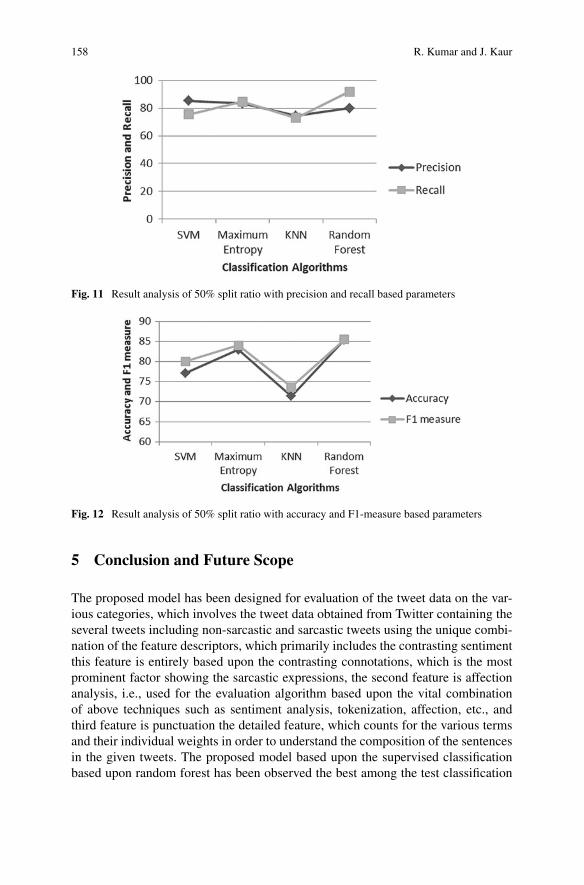
158 R. Kumar and J. Kaur
Fig. 11 Result analysis of 50% split ratio with precision and recall based parameters
Fig. 12 Result analysis of 50% split ratio with accuracy and F1-measure based parameters
5 Conclusion and Future Scope
The proposed model has been designed for evaluation of the tweet data on the var-
ious categories, which involves the tweet data obtained from Twitter containing the
several tweets including non-sarcastic and sarcastic tweets using the unique combi-
nation of the feature descriptors, which primarily includes the contrasting sentiment
this feature is entirely based upon the contrasting connotations, which is the most
prominent factor showing the sarcastic expressions, the second feature is affection
analysis, i.e., used for the evaluation algorithm based upon the vital combination
of above techniques such as sentiment analysis, tokenization, affection, etc., and
third feature is punctuation the detailed feature, which counts for the various terms
and their individual weights in order to understand the composition of the sentences
in the given tweets. The proposed model based upon the supervised classification
based upon random forest has been observed the best among the test classification

Random Forest-Based Sarcastic Tweet Classification … 159
algorithms, where the random forest is observed with (84.7%) of overall accuracy
in comparison with other supervised classification models of SVM (78.6%), logistic
regression (80.5%), and KNN (73.1%).
In the future, the proposed model can be further improved by using the more
advanced and/or compact feature set, which can provide the more specific informa-
tion to the sarcastic expressions than the approach used in this paper. The application
of feature selection based upon effective algorithms like particle swarm optimiza-
tion (PSO), genetic algorithm (GA), etc. will be used to attain higher exactness for
sarcasm detection.
References
1. http://language.worldofcomputing.net/category/machine-translation
2. S. Tanwar et al., Multimedia big data computing and internet of things applications: a taxonomy
and process model. J. Netw. Comput. Appl. (2018)
3. E. Riloff, A. Qadir, P. Surve, L. De Silva, N. Gilbert, R. Huang, Sarcasm as contrast between
a positive sentiment and negative situation, in Proceedings of the Conference on Empirical
Methods in Natural Language Processing (EMNLP) (2013), pp. 704–714
4. M.A. Walker, J.E.F. Tree, P. Anand, R. Abbott, J. King, A corpus for research on deliberation
and debate, in LREC (2012), pp. 812–817
5. E. Fersini, F.A. Pozzi, E. Messina, Detecting irony and sarcasm in microblogs: the role of
expressive signals and ensemble classifiers, in Proceedings of the IEEE Conference on Data
Science and Advanced Analytics, IEEE (2015), pp. 1–8
6. M. Bouazizi, T. Ohtsuki, A pattern-based approach for sarcasm detection on Twitter. IEEE 4,
5477–5488 (2016)
7. S. Poria, E. Cambria, D. Hazarika, P. Vij, A deeper look into sarcastic tweets using deep
convolutional neural networks (2016)
8. A. Joshi, S. Agrawal, P. Bhattacharyya, M. Carman, Expect the unexpected: harnessing sentence
completion for sarcasm detection, in Proceedings of the International Conference of the Pacific
Association for Computational Linguistics (Springer, Singapore, 2017), pp. 275–287
9. S.K. Bharti, R. Pradhan, K.S. Babu, S.K. Jena, Sarcastic sentiment detection based on types of
sarcasm occurring in twitter data. Int. J. Sem. Web Inf. Syst. (IJSWIS) 13, 89–108 (2017)
10. S.K. Bharti, K.S. Babu, S.K. Jena, Parsing-based sarcasm sentiment recognition in twitter data,
in Proceedings of the International Conference on Advances in Social Networks Analysis and
Mining, IEEE/ACM (2015), pp. 1373–1380
11. J. Kaur et al., Text analytical models for data collected from micro-blogging Portal–a review.
J. Emerg. Technol. Innov. Res. (JETIR) 5, 81–86 (2018)
12. M. Khodak, N. Saunshi, K. Vodrahali, A large self-annotated corpus for Sarcasm (2018)
13. S. Saha, J. Yadav, P. Ranjan, Proposed approach for sarcasm detection in Twitter. Indian J. Sci.
Technol. 10 (2017)
14. P. Deshmukh, S. Solanke, Review paper: sarcasm detection and observing user behavioral. Int.
J. Comput. Appl. 166 (2017)
15. V. Haripriya, P.G. Patil, A survey of sarcasm detection in social media. Int. J. Res. Appl. Sci.
Eng. Technol. (IJRASET) (2017)
16. A. Joshi, P. Bhattacharya, M.J. Carman, Automatic sarcasm detection: a survey. ACM Comput.
Surv. (CSUR) 50 (2017)
17. A.D. Dave, N.P. Desai, A comprehensive study of classification techniques for sarcasm detec-
tion on textual data, in Proceedings of the International Conference on Electrical, Electronics
and Optimization Techniques (ICEEOT) (2016), pp. 1985–1991

160 R. Kumar and J. Kaur
18. W. Medhat, A. Hassan, H. Korashy, Sentiment analysis algorithms and applications: a survey.
Eng. J. 5, 1093–1113 (2014)
19. Tomas Ptacek, Ivan Habernal and Jun Hong, “Sarcasm detection on Czech and English twitter”,
Proceedings of the 25th International Conference on Computational Linguistics: Technical
Papers, COLING, pp. 213–223, 2014
20. D. Khurana, A. Koli, K. Khatter, S. Singh, Natural language processing: state of the art, current
trends and challenges (2017)
21. E. Lunando, A. Purwarianti, Indonesian social media sentiment analysis with sarcasm detec-
tion, in Proceedings of the International Conference on Advanced Computer Science and
Information Systems (ICACSIS), IEEE ( 2013), pp. 195–198
22. https://www.google.com/search?q=starting+window+of+spyder&tbm=isch&source=
iu&ictx=1&fir=dlJnEECXUMNvM%253A%252Cf1HkEIjoqWS7zM%252C_&
usg=__3JDt9STOUxjMyHHYZ2UmfpL697k%3D&sa=X&ved=0ahUKEwiUoo2zz_
LaAhVKr48KHcmQDIkQ9QEIajAG#imgrc=dlJnEEC-XUMNvM
23. https://en.wikipedia.org/wiki/Spyder_(software)
24. https://wiki.python.org/moin/BeginnersGuide/Overview
25. D. Dmitry, O. Tsur, A. Rappoport, Enchanced sentiment learning using Twitter hashtags and
smileys, in Proceedings of the 23rd International Conference on Computational Linguistics:
posters (2010), pp. 241–249
26. B. Ohana, B. Tierney, Sentiment classification of reviews using SentiWordNet (2009)
27. S.B. Kotsiantis, I. Zaharakis, P. Pintelas, Supervised machine learning: a review of classification
techniques, in Emerging Artificial Intelligence Applications in Computer Engineering (2007)
28. A. Pak, P. Paroubek, Twitter as a corpus for sentiment analysis and opinion mining. LREC 10,
1320–1326 (2010)

Part II
Multimedia Big Data Analytics

Peak-to-Average Power Ratio Reduction
in FBMC Using SLM and PTS
Techniques
Arun Kumar and Manisha Gupta
Abstract Orthogonal frequency division multiplexing (OFDM) is the advanced
transmission scheme utilized in 4G. Nevertheless, it has several shortcomings like
guard band, peak-to-average power ratio (PAPR), high power consumption, inca-
pable to accommodate various other devices (an IOT application). Hence, OFDM
cannot be considered in 5G due to the several disadvantages mentioned above. Filter
bank multi-carrier (FBMC) is believed to be one of the most promising technolo-
gies which can be used in 5G. FBMC and OFDM are multi-carrier system. It is
obvious that it agonizes from PAPR which hamper the efficiency of the system. The
conventional peak reduction methods utilized in OFDM cannot be used in FBMC
due to the overlapping structure of FBMC. In this work, a novel selective mapping
(SLM) and partial transmit sequence (PTS) PAPR reduction technique is suggested
for FBMC. The proposed techniques are implemented by using an elementary suc-
cessive optimization technique that upsurge the PAPR performance and ensure the
design difficulty is taken low. PAPR and bit error rate (BER) parameters are analyzed
and simulated for the proposed and conventional PAPR reduction techniques. The
simulation results show that the SLM and PTS accomplished an excellent PAPR
reduction up to 2.8 and 4.8 dB as compared to other peak power minimization tech-
niques.
Keywords FBMC · PAPR · SLM · PTS · Clipping
A. Kumar (B)
Department of Electronics and Communication Engineering, JECRC University,
Jaipur 303905, India
e-mail: [email protected]
M. Gupta
Department of Physics, University of Rajasthan, Jaipur 302004, India
e-mail: [email protected]
© Springer Nature Singapore Pte Ltd. 2020
S. Tanwar et al. (eds.), Multimedia Big Data Computing
for IoT Applications, Intelligent Systems Reference Library 163,
https://doi.org/10.1007/978-981-13-8759-3_6
163

164 A. Kumar and M. Gupta
1 Background
In the year 1895, Marconi invented radio which was used to transmit the signal from
one place to another place without the use of wires for which he got the noble prize in
the year 1909. Graham Bell and Charles Sumner Trainers invented telephone in the
year 1980 which was the beginning of telecommunication era. The first commercial
phone was designed and implemented in Bell Lab, USA in 1946. Analog frequency
transmission scheme and high-power transmitter were used in early mobile which
limit the coverage up to 50 km due to which very few customers get the service with
lots of constraint of spectrum. In order to achieve an efficient bandwidth, cellular
model was introduced by Bell Lab which utilized the technique called frequency
reuse to achieve an efficient bandwidth and power consumption was also reduced.
The first-generation mobile phone also known as 1G was consisting of analog system
accessing frequency division multiple access (FDMA) technique. Sensitive to inter-
ference, requirement of high power, and its analog technique were few disadvantages
of 1G mobile. One of the main reasons for failure of analog mobile was usage of
different standards by different countries which were incompatible. To overcome
the issues of 1G, second-generation (2G) mobile were introduced which used digital
technology. Better spectrum utilization due to accessing of advanced modulation
technique, high capacity, introduction of SMS, improved handoff, and good signal-
ing were few advantages of 2G. Among several, most popular 2G mobile phone was
GSM (Global system for mobile communication). Due to rising demands from the
industry and subscribers like high data rate lead to development of third-generation
(3G) mobile communication system. In 3G, CDMA is used as a modulation tech-
nique, where multiple users share the same channel with different codes [1]. Hence,
CDMA is considered as one of the secured communication. ISI, cross talk, and high
power consumption are the disadvantages in CDMA due to which OFDM is con-
sidered in fourth-generation mobile communication system (4G). In the year 1971,
Weinstein and Ebert introduced a new multi-carrier technique whose set of modulator
and demodulator was replaced by using a discrete Fourier transform (DFT). OFDM
as a radio technique is widely used for high data rate wireless communication system
due to its better utilization of the spectrum and immune to fading of signals [2]. For
instance, in OFDM, CP (Cyclic Prefix) is inserted between two symbols to elimi-
nate inter-symbol interference (ISI). However, CP results in wastage of bandwidth.
OFDM cannot be considered adequate for this purpose due to the abovementioned
disadvantages. Hence, next-generation mobile communication is commonly known
as 5G will need a new and improved technological core. A new modulation tech-
nique, such as FBMC, is being explored and experimented upon in hopes that one
of them may become a conceivable option for 5G wireless communication.

Peak-to-Average Power Ratio Reduction in FBMC … 165
1.1 Introduction
FBMC is the most probable modulation techniques that have been able to exhibit
not similar but better performance than OFDM. It does not insert a CP between
the symbols, meaning the availability of extra bandwidth. It is an advanced version
of OFDM, which uses a set of filters at both the transmitter and receiving end to
provide better communication with more prudent bandwidth utilization [3]. OFDM
as a radio technique is widely applied for high data rate wireless communication
system due to its better utilization of the spectrum and immune to fading of signals.
Contrariwise, it has the shortcoming of PAPR and spectral transmission in the wire-
less environment. Combined with the multiple inputs and multiple outputs (MIMO),
MIMO-OFDM plays a significant role in enhancing the capacity and data rate by
reducing a multipath and co-channel interference. MIMO-OFDM includes a large
number of antennas at the transmitter and receiver. Hence, it receives the signals
from the transmitter through different paths. However, high power consumption and
implementation cost are the major disadvantage of MIMO-OFDM [4]. High-speed
data transfer networks are the primary requirement for technology enhanced dig-
ital world for improvement of services and hence the lives of a human being. To
cater the need of large amount of data at higher speed for real-time applications,
next-generation communication systems should be developed. The next-generation
wireless networks known as fifth-generation mobile communication (5G) must be
able to address the capacity constraints and the existing challenges associated with
current communication systems such as network link reliability, coverage and latency,
and energy efficiency. Nevertheless, the principle of OFDM and FBMC is the same
as both are multi-carrier techniques [5]. In multi-carrier methods, the subsequent
result is the assemblage of numerous subcarriers that leads to a situation where peak
power increases in the system [6]. Hence, the operation of the amplifier utilized in
FBMC and OFDM system gets reduced. The peak power reduction techniques uti-
lized in OFDM cannot be considered in proposed FBMC due to their intersecting
structure [7, 8]. Therefore, in that respect is a requirement to study PAPR minimiza-
tion methods for FBMC arrangement [9, 10]. The work presents the implementation
of a novel PTS and SLM peak power reduction techniques for FBMC system. BER,
PAPR measurements were simulated and examined.
2 Conventional SLM
One of the disadvantages of SLM detection is long latency which occurs due to
the serial processing of the signals [11–15]. In this work, SLM detection scheme is
implemented with parallel processing that scales the latency and complexity. One of
the constraint point of this proposed scheme is to detect M transmit signal under N
stages. The proposed method finds rank of X∧(k) to determine channels order. The
second step is to calculated rank T ∧(k) after QR disintegration and QR rearrange-

166 A. Kumar and M. Gupta
Fig. 1 Proposed channel
ranking from an M × T
matrix [24]
ment. The ranking method of channel is indicated by Fig. 1. The power rank of each
column is given by the number of circles which are allocated likewise to all blocks
[16–20]. The numbers of blocks are arranged in downward direction starting from
the right-hand side. The circle of black, white, and gray indicates the comparative
power. The power of black circle is greater than white and gray. In the next step, the
triangular matrix T ∧(k) is converted into staircase matrix. This is achieved by elim-
inating the T ∧(k) by using Gauss-Jordan elimination method [21–23]. The parallel
detection determines the step of staircase matrix. In the other word, staircase matrix
step depends on the number of blocks: For example, when four and two blocks are
used then T ∧(k) is given in Figs. 2 and 3 which are independent of each other. In
this case, An is the nth block.
By utilizing T ∧(k), the parallel detection is achieved to detect the transmitted
signal. The RGB circles are initially detected simultaneously. Hence, the latency of
the suggested method is decreased by 1/Na times as comparing to conventional SLM
method. Second, the diversity rate of the proposed technique is also decreased by the
same order. Hence, the latency and diversity are independent of each other. The gain
Fig. 2 Modified T matrix as
a four block T ∧ [21]
Fig. 3 Modified T matrix as
a two block T ∧ [25]

Peak-to-Average Power Ratio Reduction in FBMC … 167
of the system can be enhanced slightly by increasing the diversity order. Therefore,
it is not desirable to select extreme diversity order. Hence, in this proposed method,
its diversity order is taken as four to obtain the optimum latency [26]. For example,
we select two blocks in 4 × 4 MIMO. The rank of T ∧(k) is given as
⎡
⎢
⎢
⎣
T1,rank(4)(k)T1,rank(1)(k)T1,rank(3)(k)T1,rank(2)(k)
T2,rank(4)(k)T2,rank(1)(k)T2,rank(3)(k)T2,rank(2)(k)
T3,rank(4)(k)T3,rank(1)(k)T3,rank(3)(k)T3,rank(2)(k)
T4,rank(4)(k)T4,rank(1)(k)T4,rank(3)(k)T4,rank(2)(k)
⎤
⎥
⎥
⎦
(1)
Therefore, Y(k) is given as
⎡
⎢
⎢
⎣
Y4(K )
Y1(K )
Y2(K )
Y3(K )
⎤
⎥
⎥
⎦
=
⎡
⎢
⎢
⎣
T11(k) T12(k) T13(k) T14(k)
0 T22(k) T23(k) T24(k)
0 0 T33(k) T34(k)
0 0 0 T44(k)
⎤
⎥
⎥
⎦
⎡
⎢
⎢
⎣
X4(K )
X1(K )
X2(K )
X3(K )
⎤
⎥
⎥
⎦
(2)
Hence, T13(k) and T23(k) are eradicated we select the third row. After T14(k) and
T24(k) are eradicated by the fourth row Y∧(k) is given as
⎡
⎢
⎢
⎣
Y ∧4 (K )
Y ∧1 (K )
Y ∧2 (K )
Y ∧3 (K )
⎤
⎥
⎥
⎦
=
⎡
⎢
⎢
⎣
T11(k) T12(k) 0 0
0 T22(k) 0 0
0 0 T33(k) T34(k)
0 0 0 T44(k)
⎤
⎥
⎥
⎦
⎡
⎢
⎢
⎣
X4(K )
X1(K )
X2(K )
X3(K )
⎤
⎥
⎥
⎦
(3)
where V ∧(k) is the permuted Y(k).
Hence, by using Eq. (3) the detection of X4(K ), X1(K ), X2(K ) and X3(K ) are
independently functioned as
[
Y ∧4 (K )
Y ∧1 (K )
]
=[
T11(k) T12(k)
0 T22(k)
][
X4(K )
X1(K )
]
(4)
[
Y ∧3 (K )
Y ∧2 (K )
]
=[
T33(k) T34(k)
0 T44(k)
][
X2(K )
X3(K )
]
(5)
Hence, the signal X4(K ), X1(K ), X2(K ), and X3(K ) are detected simultaneously
in two step, and in this way the latency and multiplication complexity of the projected
scheme is drastically decrease [27, 28]. The past and present studies are given in
Table 1.

168 A. Kumar and M. Gupta
Table 1 PAPR reduction techniques with outcomes
References Technique System model PAPR (%)
[29] PTS OFDM 4.1
[30] STR and TI OFDM 6
[31] Hybrid clipping OFDM 8, 4
[32] Circular fourier
transformation
4-QAM WPT-OFDM,
FFT-OFDM
7.05 and 4.95
[33] Chiken swarm optimization Coherent Optical-OFDM 5.5
[34] Hybrid and filtering QPSK-OFDM 6.3 and 7.3
[35] Double hybrid, A. hybrid OFDM 6.569, 5.8 and
5.3
[36] I.Noise, clipping, and µ Law OFDM 3.8, 6.6 and
10.2
[37] Improved SLM for PAPR
reduction
OFDM 2.6
[38] Hybrid, M-Hybrid FBMC 6 and 7
[39] DCT-Precoding,
WHT-Precoding, and
MU-Law commanding
FBMC 3.5 and 13.4
[40] ACE, TRACE, and TR
reduction method
FBMC 4, 4.2 and 7
[41] Clipping and filtering FBMC 7 and 6.3
[42] TSLM and MBJO-PTS FBMC 8.2 and 7.4
[43] SLM and W-SLM FBMC 8 and 7.5
[44] Tone injection, companding FBMC 10.5 and 3.7
3 Single Carrier Versus Multi-carrier Modulation
In single carrier systems, a guard band must be placed between each carrier band-
width to provide a space where an adjacent carrier signal can be attenuated to prevent
data loss. But this is wastage of costly bandwidth only. Also, in a multipath prop-
agation environment, a shorter symbol period drives toward greater possibility ISI.
The OFDM, a multi-carrier system, is well capable of addressing these problems
of a single carrier system. Available channel is divided into several narrowband
sub-channels which experience almost flat-fading making equalization very simple.
Orthogonality of subcarriers allows them to overlap each other without interference
which results in saving of bandwidth which is a constraint for wireless commu-
nication. Also, symbols acquiring long symbol duration undergo serial to parallel
conversion which eliminates the ISI and increases the data rates significantly. Dis-
advantage of the single carrier system is when we increase the number of users than
the overall quality of service decrease. Inter-symbol interference and huge power
Peak-to-Average Power Ratio Reduction in FBMC … 169
consumption create a big problem in single carrier system. For a high-frequency
communication, multi-carrier modulation techniques are more efficient [45].
3.1 Orthogonal Frequency Division Multiplexing (OFDM)
OFDM has been recently proposed in many advanced techniques. Also, several pre-
cise methods of OFDM have been suggested for cognitive radio (Cr) systems [46,
47]. A subsection of subcarriers is allotted to each and every user. To overcome inter-
carrier interference (ICI), synchronization between the subcarriers signals need to be
achieved at the receiver input. Bearing on this point, OFDM fits in downlink, where
OFDM signals are transmitted from the identical terminal. Hence, synchronization
can be easily carried out the equivalent Doppler frequency change at each receiver.
On the other hand, in the uplink of an OFDM system, synchronization between
subcarrier signals is difficult to attain. Further, digital algorithm steps have to be
added to reduce interference among the subcarrier from diverse ends. Additional
digital algorithm steps increase the complexity in OFDM receiver [48]. The problem
is increasing in Cr system where both license and non-license users communicate
autonomously and might be centered on different rules. This problem can be over-
come by using a filtering technique that separates the license and non-license user
signals. OFDM with filters introduce large side lobes which result in an outflow of
signal powers between the groups of different users, making it unsuitable. The side
lobes of OFDM with filters are improved by proposed methods. However, the per-
formance of the proposed solutions is limited. For instance, in OFDM, CP (Cyclic
Prefix) is introduced between two symbols to eliminate inter-symbol interference
(ISI). Normally, ISI occurs when channel bandwidth is more than the coherence
bandwidth and noise is greater than received signal. However, use of CP in OFDM
resulted in wastage of bandwidth [49]. OFDM is recognized to be sensitive to the
fast deviation of communication channels. The poor frequency bandwidth of the sub-
carrier signals in OFDM is the main root of difficulties that bound the applicability
of OFDM system. The above difficulties can be overcome by going through filters
that synthesize/investigate the subcarrier signals had trivial side lobes. A motivating,
but apparently not extensively implicit, point is that the first multi-carrier technique
designed before the creation of OFDM used lot of filters for the examination and
synthesis of multi-carrier techniques. These filters can be followed out with low
side lobes and consider to be perfect modulation scheme to Cr and multiple access
schemes as well as broadband signal spread over unprotected wires. FBMC has
diverted a great heap of attention every bit one of the alternates to OFDM, which
also occupy an important role in the cognitive radio application [50]. Consequently,
several peal power minimization techniques are explored for advanced modulation
technique. One of the most challenging issues in a wireless communication system is
to increase the capability of the system. In this work, the channel capacity of FBMC
and OFDM integrated with Cr is discussed and described. The result reveals that the
capacity and gain of FBMC are better than OFDM [50]. In [51] Greedy suboptimal

170 A. Kumar and M. Gupta
algorithm based FBMC cognitive radio performance is discussed and analyzed. The
primary objective of the proposed study was to efficiently apply the bandwidth with-
out causing any hindrance. The mathematical results of BER and SNR were analyzed
to reveal that performance of the FBMC was better than OFDM. In [52] the perfor-
mance of QAM-FBMC and O-QAM FBMC and the effect of time offset (TO) and
carrier frequency offset (CFO) is analyzed and computed. The production of the study
reveals that the effect of ISI is greater for O-QAM FBMC because it includes two
different filters whose orthogonality criteria are not met. QAM-FBMC utilizes two
types of filters whose orthogonality criteria are not satisfied which results in severe
ISI. In [21], FBMC is designed to execute a simple synchronization to access the
fragmented spectrum, which also cuts the physical channel signaling of the scheme.
Additionally, the performance and capacity of OFDM and FBMC are analyzed and
compared. Result reveals that FBMC performs better than OFDM. In [53], a new
radio wave technique called QAM-FBMC is introduced which overcomes the dis-
advantage of CP-OFDM. FBMC does not use CP due to which 10–12% efficiency
in bandwidth is achieved, but interference due to non-orthogonal filter degrades the
BER performance. The work introduced a decision feedback equalization scheme
to overcome the interference problem. Outcome also reveals that the proposed radio
wave scheme is superior to conventional OFDM system. The transmitter and receiver
of OFDM are shown in Fig. 4.
The combination of OFDM with MIMO systems gives tremendous results. It
improves the performance of the system significantly. A very compact description
of MIMO-OFDM system is mentioned here. The MIMO channel can be given as
z(t) = H(0)s(t) + H(1)s(t − 1) + H(2)s(t − 2) + . . . . . . . . .
+ H(L − 1)s(t − L + 1) + n−(t) (6)
where
s−(t) = T x vector at time(t)
s(t − 1) = T x vector at time(t − 1)
Random Signal
S/PIFFT and
modulationCP
P/S
multipathChannel
S/P CP RemovalFFT and De-
modulation OutputP/S
.
. . .
Fig. 4 Block diagram of OFDM transmitter and receiver

Peak-to-Average Power Ratio Reduction in FBMC … 171
H(L) = channel matri x corresponding to tap L .(N x M matri x);and n−(t) = noise
For flat-fading system, the MIMO channel is given as
z−(0) = H(0)s−(0)
z−(1) = H(1)s−(1)
:z(N − 1) = H(M − 1)s−(M − 1) (7)
In general,
z(k) = H(k)s−(k) (8)
where
z(k) = Rx 1 receive vector corresponding to subcarrier(k)
H(k) = f lat f ading channel matri x corresponding to the subcarrier(K )
s(k) = T x 1 transmit vector corresponding to subcarrier(k).
3.2 Filter Bank Multi-carrier Modulation (FBMC)
FBMC is designed by using a PHYDAS filter at the transmitter and receiver of
the system. The filter length is L (L = K * N). Haijian et al. (2010) discussed and
described the channel capacity of FBMC and OFDM integrated with cognitive radio.
Result reveals that the capacity and gain of OFDM are better than FBMC [54]. Won-
suk et al. (2014) evaluates the performance of QAM-FBMC and O-QAM FBMC
and the effect of time offset (TO) and carrier frequency offset (CFO) is analyzed and
computed. The output of the work reveals that the effect of ISI is greater for O-QAM
FBMC because it includes two different filters whose orthogonality criteria are not
satisfied. QAM-FBMC utilizes two types of filters whose orthogonality criteria are
not satisfied which results in severe ISI. Overall, an outcome of the work reveals
that QAM-FBMC performance is better for CFO but sensitive to TO as compared
to O-QAM-FBMC [55]. Greedy suboptimal algorithm based FBMC cognitive radio
performance is discussed and analyzed in this work. The main aim of the proposed
work was to efficiently utilize the bandwidth without causing any interference. The
numerical results of BER and SNR were analyzed to reveal the performance of the
proposed system [56]. Increasing amount of data traffic, capacity, and limited band-
width is the major challenges in the present scenario. It is also estimated that by
the next 4 years, data consumption will increase by 20–30% and presently there are
no technologies to support this. Hence, there is an urgency to find a new radio and
efficient bandwidth utilization techniques. In this regard, FBMC, a new transmission
technique, is the most promising technique for next-generation wireless communi-

172 A. Kumar and M. Gupta
Inputsignal S/P IFFT PHYDAS P/S
Multipath channel
S/P PHYDAS FFT OutputP/S
..
.
..
.
Fig. 5 FBMC block diagram
cation. It includes filters in the transmitter and receiver which motivate to discard the
use of OFDM where more than 10% of bandwidth is wasted due to insertion of CP.
Additionally, CR better utilizes the unused spectrum by allocating it to needy users.
In this work, different spectrum sensing techniques are discussed and described for
FBMC and OFDM system. In this work, FBMC is designed to perform a simple
synchronization to access the fragmented spectrum, which also reduces the physi-
cal channel signaling of the system. Additionally, the performance and capacity of
OFDM and FBMC are analyzed and compared [57]. Presently, CP-OFDM is one
of the most popular radio techniques used in 4G, WLAN, etc. The performance of
OFDM is severely affected by synchronous heterogeneous network environment. A
proposed work described a new radio wave technique called QAM-FBMC which
overcomes the disadvantage of CP-OFDM. FBMC does not use CP due to which
10–12% efficiency in bandwidth is achieved, but interference due to non-orthogonal
filter results in interference which degrade the performance of the system. The work
introduced a decision feedback equalization scheme to overcome the interference
problem as mentioned above. Outcome also reveals that the proposed radio wave
scheme is superior to conventional FBMC system. OFDM-CDMA is designed with
multiplexed space-time block codes (STBC) which results in high-spectral transmis-
sion efficiency and it also enhanced the performance of space/frequency diversity
gain of frequency fading channels. The proposed work is also inexpensive due to the
use of less numbers of receiver antennas as compared to transmitter antennas [58].
The structure of FBMC is shown in Fig. 5.
3.3 PAPR in FBMC
FBMC has an overlapping nature and due to this nature we cannot openly apply it
to PAPR reduction technique to FBMC. The PAPR for FBMC in time duration can
be written as [59]

Peak-to-Average Power Ratio Reduction in FBMC … 173
P AP R(x(t))d B = 10log10
maxmT≤t≤(m+1)T|x(t)|2
E[
|x(t)|2] (9)
i = 0, 1…M + q−1, and E [.] called the expectation.
3.4 PHYDAS Filter
The analytical model of PHYDAS filter in time domain is given by following equa-
tion:
(
1 + 2∑L−1
k=1 ak cos 2π ktLt
)
−LT ≤ t ≤ Lt2
else 0(10)
where L is the length of filter and K is the overlapping factor. Stop band performance
of PYDAS filter is excellent for infinite symbols. The design complexity of filter is
directly proportional to the length of filter. The impulse and magnitude response of
PHYDAS filter are shown below: The impulse response of PHYDAS is not compact
which will make it more prone to noise and frequency fading channel, whereas in
frequency domain, its response is more compact which make it insensitive to nose
and frequency fading channel [60].
3.5 PAPR Reduction Techniques for OFDM
It has several weaknesses, such as CP some part of the system band width is lost,
and BER performance is also decreased. The conventional PAPR minimization tech-
niques mentioned cannot be utilized in the FBMC system because of its different
structure as compared to OFDM [59].
3.5.1 Conventional Partial Transmit Sequence (PTS)
It represents several signal methods. In this technique, the input signal is segregated
into several blocks. These block of signals are converted into time-domain PTS. This
shift can be accomplished with the help of IFFT. The output signals are autonomously
switched by phase aspects to minimize the peak power [61].

174 A. Kumar and M. Gupta
Fig. 6 Selected mapping OFDM system
3.5.2 Conventional Selected Mapping (SLM)
In this scheme, the signal is convolved with each phase series made. And accordingly,
arrangements which transfer the identical data are made. From these data’s, the
reduced PAPR signal is identified for communication [62]. The structure of SLM is
indicated in Fig. 6.
3.5.3 Conventional Tone Rejection (TR)
In this method, the peak power is reduced by adding the time-domain signal and
orthogonal signal. The main motive is to encompass the constellation and therefore
to form the similar signal equivalent to numerous likely constellation [44]. The
structure of TR is indicated in Fig. 7.
3.5.4 Conventional Clipping
It is one of the popular peak minimization techniques for OFDM. It is implemented
usually at the transmitting part of the system. The introduction of noise is one of
the drawbacks of this technique. Table 2 indicates the evaluation of different PAPR
reduction techniques.

Peak-to-Average Power Ratio Reduction in FBMC … 175
IFFT
X(t)+c(t)
0
0
IFFT
X(t)
c(t)
Fig. 7 Block diagram for TR
Table 2 Evaluation of PAPR minimization schemes
PAPR techniques Advantage Disadvantage Operation
prerequisite
Block coding Low noise High power and loss
of data rate
Transmitter:
advanced coding
require
Receiver: advanced
coding require
PTS Low noise and low
power
Loss data rate Transmitter: IDFTs
operation require
Receiver:
information
estimation is require
Clipping and filtering No loss of data rate High noise Transmitter: clipping
Receiver: no clipping
TR Simple to implement High noise, high
power, and loss of
data
3.5.5 Signal-to-Noise Ratio (SNR)
How much quantity of information will be carried out by a communication channel
is decided by the channel bandwidth and the extent of the noise in the channel. The
typical measure of amount of noise present in a system is denoted by SNR. It is
expressed mathematically as
SN R = Ps/Pn (11)

176 A. Kumar and M. Gupta
3.5.6 Bit Error Rate (BER)
In digital communication, bits are changed because of interferences, noise added
by the channel, error of synchronization, and any other distortions. The number
of changed bits received at receiver end is known as bit error. For example, let us
consider a sequence of transmitted bits as 1 1 0 0 1 0 1 0 0 1 and the sequence of
received bits as 0 1 0 0 1 1 10 0 1. The number of bits changed is 2. Therefore, bit
error is 2. The BER is calculated as 2 altered bits divided by total transmitted bits
(10 bits), resulting as 0.2 or 20%.
4 Proposed Partial Transmit Sequence
The structure of P-PTS is shown in Fig. 8. The input signal is modulated and converted
into parallel form. The signals are divided into numbers of block followed by a
precoder and IFFT. Finally, the signals are optimized and summed to generate the
reduced PAPR signal. Let the FBMC input signal is given by
Y = [Y1,Y2,..........YN ]T (12)
y(a) =∑v−1
i=0X i e
j2π f t
T av (13)
=∑v−1
i=0X i e
j2π i t
T av
∑v−1
m=0pi,n yn (14)
y(a) = av
∑v−1
m=0yn
(
∑v−1
i=0Pi,n e
j2π i t
T
)
(15)
The PAPR of PTS is given by
P AP R ≤1
N
(
∑v−1
m=0yn
∣
∣
∣pi,n e
j2π i t
T av
)
∗(
∑v−1
m=0yn
∣
∣
∣pi,n e
j2π i t
T av
)
(16)
Fig. 8 Proposed modified PTS technique

Peak-to-Average Power Ratio Reduction in FBMC … 177
Fig. 9 Proposed SLM technique
4.1 Proposed SLM Technique
The structure of SLM technique is given in Fig. 9. The block of same data is generated
by multiplying an FBMC signal with phase factor U. The different FBMC signals
are accompanied by precoder and modulator. The structure of minimum PAPR is
selected. The multiplication of FBMC input signals and U is given by
Y u = y0α0,y1α1,.............
yN−1αN−1(17)
where U = 1, 2, ………U−1
The precoder output is given by
Xum =
∑N−1
k=0Pn,k Y u
k (18)
Taking IFFT of the above equation:
yuk (t) =
1√
N
∑N−1
n=0Y u
n e j2πn� ft (19)
5 Results and Discussion
In this work, PAPR reduction schemes will be applied for FBMC. This effect in
reduction of power and step-up in capacity. This study will provide fruitful outcomes
for further research and analysis regarding next-generation communication systems.
Matlab-2014 is used as a designing tool. The simulation parameters are indicated in
Table 3.
The performance of conventional and proposed peak power reduction methods
is given in Fig. 10. Original PAPR signal is 10 dB at CCDF of 10−5. For CCDF of
10−5, the PAPR of the Clipping, TR, Conventional PTS, and Conventional SLM is
9, 9, 7, 5.9 dB. For proposed PTS and SLM, the PAPR is reduced to 3.8 and 2.9 dB.

178 A. Kumar and M. Gupta
Table 3 Simulation parameters
S.no Parameters
1. Input symbols: 2048
2. N = 64
3. 64-QAM
4. FBMC system
5. PHYDAS filter
Roll of factor = 1
Overlapped symbols = 2
Fig. 10 Conventional and proposed PAPR techniques
Table 4 PAPR values of PAPR reduction techniques
PAPR >
PAPRo
Original
FBMC
signal
Clipping TR Conventional
PTS
Conventional
SLM
Proposed
PTS
Proposed
SLM
10−5 9.5 dB 9.2 dB 9.3 dB 7 dB 5.3 dB 3.4 dB 2.7 dB
The results reveal that the proposed PTS and SLM method perform better than the
conventional PAPR reduction techniques. It can be also observed that the proposed
SLM technique achieved 1 dB gain as compared to proposed PTS technique. The
PAPR values of different PAPR reduction techniques are given in Table 4.
Figure 11 shows the performance of PAPR reduction technique for U = 4 and U
= 8. It can be seen that SLM (U = 4) achieved 2 dB gain as compared to the original
signal. PTS (U = 4) achieved a gain of 2.2 dB as compared to SLM (U = 4). SLM
(U = 8) achieved a 2 dB gain than PTS (U = 8). The value of SLM and PTS for
different values of U is given in Table 5.

Peak-to-Average Power Ratio Reduction in FBMC … 179
Fig. 11 SLM and PTS for U
Table 5 PAPR values for SLM and PTS for different values of U
PAPR >
PAPRo
Original
FBMC signal
PTS(U = 4) SLM (U = 4) PTS (U = 8) SLM (U = 8)
10−5 10 dB 7.9 dB 5.5 dB 4.6 dB 2.7 dB
Fig. 12 BER performance of SLM and PTS
Figure 12 shows a BER performance of PTS and SLM PAPR reduction techniques.
The output shows that the SLM is superior to PTS.

180 A. Kumar and M. Gupta
6 Conclusion
Though this study focused on FBMC in current and forthcoming communication
systems, the significance and desired structures of OFDM system cannot be ignored.
The purpose is to highlight the point that OFDM, though extensively implemented
in the current engineering, is not the best techniques in several next-generation com-
munication systems, more often than not in cognitive radio networks and multiple
accesses where FBMC is considered to be more promising. We have proposed a
FBMC which do not use CP results in utilization of bandwidth as compared to
OFDM (11% of bandwidth is lost). In the proposed study, novel peak reduction
methods are implemented, namely, SLM and PTS, respectively. The conventional
and proposed PAPR techniques are compared. It was observed that peak power can
be cut by using TR, SLM, and conventional PTS for OFDM system. But when we
utilized these PAPR reduction techniques in FBMC, the performance of the system
degrades because of the overlying arrangement of FBMC. The simulated results
indicate that the proposed SLM and PTS techniques performance is better than the
conventional PAPR reduction techniques. Further, the efficiency of proposed PTS
and SLM is also equated for U = 4 and 8 and the simulated results indicate that the
proposed SLM gives better result than PTS for U = 4 and 8.
6.1 Future Scope of the Proposed Work
• Orthogonal Issue: Due to the structure and internal distortion, FBMC loses its
orthogonality because of waveform overlapping nature in time domain.
• Packet Transmission: The performance of FBMC is excellent for short-range
packet transmission but it is unsuitable for long-range packet transmission. Trans-
mitting the information to a long range results in loss of orthogonality between
the subcarriers.
• Hardware implementation of FBMC-OQAM P-PTS technique.
• Computational complexity reduction.
• The proposed PAPR reduction techniques of FBMC can be used with MIMO
• Minimum latency.
• Complexity: The use of banks of filter at the transmitter and receiver results in the
complexity in the designing of FBMC structure. Further, the use of PAR reduction
techniques also adds the complexity design.
References
1. A. Kumar, M. Gupta, A review on OFDM and PAPR reduction techniques. Am. J. Eng. Appl.
Sci. 8, 202–209 (2015)

Peak-to-Average Power Ratio Reduction in FBMC … 181
2. A. Kumar, M. Gupta, Reduction of PAPR by using clipping and filtering for different modulation
schemes. Am. J. Appl. Sci. 12, 601–605 (2015)
3. A. Kumar, M. Gupta, Design and comparison of MIMO OFDM for different transmission
schemes. Electron. World 121, 16–121 (2015)
4. T. Necmi, K. Adem, Y. Mahmut, Partial transmit sequence for PAPR reduction using parallel
table search algorithm in OFDM systems. IEEE Commun. Lett. 15, 974–976 (2011)
5. T. Jiang, C. Ni, C. Ye, Y. Wu, K. Luo, A novel multi-block tone reservation scheme for PAPR
reduction in OQAM-OFDM systems. IEEE Trans. Broadcast. 61, 717–723 (2015)
6. Y.C. Wang, Z.Q. Luo, Optimized iterative clipping and filtering for PAPR reduction of OFDM
signals. IEEE Trans. Commun. 59, 33–37 (2011)
7. A. Kumar, Design, simulation of MIMO & massive MIMO for 5G mobile communication
system. Int. J. Wirel. Mobile Comput. 14, 197–206 (2018)
8. A. Kumar, M. Gupta, Design of 4:8 MIMO OFDM with MSE equalizer for different modulation
technique. J. Wirel. Pers. Commun. 95, 4535–4560 (2017)
9. S. Ghorpade, S. Sankpal, Behaviour of OFDM system using Matlab simulation. Int. J. Adv.
Comput. Res. 3, 67–71 (2013)
10. W. Murtuza, N. Srivastava, Implementation of OFDM based transreceiver for IEEE802.11a on
FPGA. Int. J. Adv. Res. Comput. Sci. Softw. Eng. 4, 24–28 (2014)
11. Kumari et al., Multimedia big data computing and internet of things applications: a taxonomy
and process model. J. Netw. Comput. Appl. 124, 169–195 (2018)
12. V. Divyatha, B.S. Reddy, Design and BER performance of MIMO-OFDM for wireless broad
band communication. Int. J. Mod. Eng. Res. 3, 1382–1385 (2013)
13. A. Srivastava, Suitability of big data analytics in indian banking sector to increase revenue and
profitability, in 3rd International Conference on Advances in Computing, Communication &
Automation (ICACCA-2017), Tula Institute, Dehradhun, UA, pp. 1–6
14. S. Tanwar, An advanced Internet of Thing based security alert system for smart home, in
International Conference on Computer, Information and Telecommunication Systems (IEEE
CITS-2017), Dalian University, Dalian, China, 21–23 July 2017 (2017), pp. 25–29
15. H. Yan, L. Wan, S. Zhou, Z. Shi, J.H. Cui, J. Huang, H. Zhou, DSP based receiver implemen-
tation for OFDM acoustic modem. Phys. Commun. 5, 22–32 (2012)
16. V.S. Kumar, S. Anuradha, PAPR reduction of FBMC using sliding window tone reservation
active constellation extension technique. J. Electr. Comput. Energ. Electro. Commun. Eng. 8,
1555–1559 (2014)
17. I. Shaheen, A. Zekry, F. Newagy, R. Ibrahim, Combined DHT precoding and A-Law com-
panding for PAPR reduction in FBMC/OQAM signals. Int. J. Comput. Acad. Res. 6, 31–39
(2017)
18. N. Raju, S.S. Pillai, Companding and Pulse shaping technique for PAPR reduction in FBMC
systems, in International Conference on Control, Instrumentation, Communication and Com-
putational Technologies (2015), pp. 265–272
19. A. Kumar, M. Gupta, A Novel modulation technique for 5G mobile communication system.
Am. J. Appl. Sci. 12, 601–605 (2015)
20. R. Gopal, S.K. Patra, Combining tone injection and companding techniques for PAPR reduc-
tion of FBMC-OQAM system, in IEEE Global Conference on Communication Technologies
(GCCT) (2015), pp. 321–326
21. Z. Kollar, P. Horvath, PAPR reduction of FBMC by clipping and its iterative compensation. J.
Comput. Netw. Commun. (2012). https://doi.org/10.1155/2012/382736
22. H. Wang, X. Wang, L. Xu, W. Du, Hybrid PAPR reduction scheme for FBMC/OQAM systems
based on multi data block PTS and TR methods. IEEE Access 4, 4761–4768 (2016)
23. I. Shaheen, A. Zekry, F. Wagy, R. Ibrahim, PAPR reduction for FBMC/OQAM using hybrid
scheme of different precoding transform and mu-law companding. Int. J. Eng. Technol. 6,
154–162 (2017)
24. Z. Kollar, L. Varga, B. Horvath, P. Bakki, J. Bito, Evaluation of clipping based iterative PAPR
reduction techniques for FBMC systems. Sci. World J. (2014). http://dx.doi.org/10.1155/2014/
841680 (Hindawi Publishing Corporation)

182 A. Kumar and M. Gupta
25. S.K. Bulusu, H. Shaiek. D. Roviras, Reducing the PAPR in FBMC-OQAM systems with low-
latency trellis-based SLM technique. EURASIP J. Adv. Signal Process. (2016). https://doi.org/
10.1186/s13634-016-0429-9
26. J. Moon, Y. Nam, E. Choi, B. Chen, J. Kim, Selected data utilization technique for the PAPR
reduction of FBMC-OQAM signals, in ICUFN (2017), pp. 741–743
27. V. Sandeep, S. Anuradha, PAPR reduction of FBMC using sliding window tone reservation
active constellation extension technique. Int. Sch. Sci. Res. Innov. 8, 1555–1559 (2014)
28. R. Shrestha, J. Seo, PAPR reduction in FBMC systems using phase realignment based tech-
niques, in Proceedings of APCC (2015), pp. 647–651
29. L. Yu, X. Zhu, X. Cheng, H. Yu, PAPR reduction for OFDMA systems via Kashin’s represen-
tation, in IEEE International Conference on Computer and Communications (ICCC) (2015),
pp. 285–289
30. T. Wattanasuwakull, W. Benjapolakul, PAPR reduction for OFDM transmission by using a
method of tone reservation and tone injection, in Fifth International Conference on Information,
Communications and Signal Processing (2005), pp. 273–277
31. H. Chen, A. Haimovich, An iterative method to restore the performance of clipped and filtered
OFDM signals, in IEEE International Conference on Communications, ICC 2003 (2003),
pp. 3438–3442
32. Z. Tong, Y. Wang, Z. Guo, The PAPR reduction techniques based on WPT for CO-OFDM
systems, in 15th International Conference on Optical Communications and Networks (ICOCN)
(2006), pp 1–3
33. Z. Yi, J. Liu, S. Wang, X. Zeng, J. Lu, PAPR reduction technology based on CSO algorithm
in a CO-OFDM system, in 15th International Conference on Optical Communications and
Networks (ICOCN) (2016), pp. 1–3
34. M.A. Aboul, E.A. Hagras, E.A.L. EL-Henawy, PAPR reduction for downlink LTE system
based on DCT and Hyperbolic Tangent Companding noise cancellation, in 34th National
Radio Science Conference (NRSC) (2017), pp. 238–245
35. B. Lekouaghet, Y. Himeur, A. Boukabou, A. Senouci, A novel clipping based µ-law com-
panding scheme for PAPR reduction over power line communication, in Seminar on Detection
Systems Architectures and Technologies (DAT) (2017), pp. 1–5
36. N. Van der Neut, B.T. Maharaj, F.H. de Lange, G. Gonzalez, F. Gregorio, J. Cousseau, PAPR
reduction in FBMC systems using a smart gradient-project active constellation extension
method, in 21st International Conference on Telecommunications (ICT) (2014), pp. 134–139
37. W. Lingyin, C. Yewen, Improved SLM for PAPR reduction in OFDM systems, in Intelligent
Systems and Applications, ISA 2009 (2009), pp. 1–4
38. I. Shaheen, A. Zekry, F. Newagy, R. Ibrahim, PAPR reduction for FBMC/OQAM using hybrid
scheme of different Precoding transform and mu-law companding. Int. J. Eng. Technol. 6,
154–162 (2017)
39. K. Fukumizu, F.R. Bach, M.I. Jordan, Kernel dimension reduction in regression. Ann. Stat. 3,
1871–1905 (2009)
40. J. Armstrong, Peak-to-average power reduction for OFDM by repeated clipping and frequency
domain filtering. Electron. Lett. 38, 246–247 (2002)
41. S.K.C. Bulusu, H. Shaiek, D. Roviras, Reducing the PAPR in FBMC-OQAM systems with
low-latency trellis-based SLM technique. EURASIP J. Adv. Signal Process. 16, 132–137 (2016)
42. H. Kim, T. Rautio, Weighted selective mapping algorithm for FBMC-OQAM systems, in IEEE
International Conference on Information and Communication Technology Convergence (ICTC)
(2016), pp. 214–219
43. W. Fang, W. Fei, W. Zhenchao, C. Lixia, A novel sub-optimal PTS algorithm for controlling
PAPR of OFDM signals, in Information Theory and Information Security (ICITIS) (2010),
pp. 728–731
44. R. Gopal, S.K. Patra, Combining tone injection and companding techniques for PAPR reduc-
tion of FBMC-OQAM system, in IEEE Global Conference on Communication Technologies
(GCCT) (2015), pp. 709–713

Peak-to-Average Power Ratio Reduction in FBMC … 183
45. A. Kumar, M. Gupta, Key technologies and problem in deployment of 5G mobile communi-
cation systems. Commun. Appl. Electron. 3, 4–7 (2015)
46. A. Kumar, M. Gupta, Design of OFDM and PAPR reduction using clipping method, in Artificial
Intelligence and Network Security, New Delhi (2015), pp. 221–229
47. S.K.C. Bulusu, H. Shaiek, D. Roviras, The potency of trellis-based SLM over symbol-by-
symbol approach in reducing PAPR for FBMC-OQAM signals, in IEEE International Confer-
ence on Communications (ICC) (2015), pp. 4757–4762
48. L. Wang, J. Liu, Cooperative PTS for PAPR reduction in MIMO-OFDM. Electron. Lett. 47,
1–6 (2011)
49. R. Gopal, S. Patra, Combining tone injection and companding techniques for PAPR reduction
of FBMC-OQAM system, in Global Conference on Communication Technologies (GCCT)
(2015), pp. 1–5
50. K. Liu, J. Hou, P. Zhang, Y. Liu, PAPR reduction for FBMC-OQAM systems using P-PTS
scheme. J. China Univ. Posts Telecommun. 22, 78–85 (2015)
51. N. Irukulapati, V. Chakka, A. Jain, SLM based PAPR reduction of OFDM signal using new
phase sequence. Electron. Lett. 45, 1231–1232
52. H. Wang, X. Wang, L. Xu, W. Du, Hybrid PAPR reduction scheme for FBMC/OQAM systems
based on multi data block PTS and Tr methods, in Special Section on Green Communications
and Networking for 5G Wireless (2016), pp. 4761–4768
53. S.S.K. Bulusu, H. Shaiek, D. Roviras, Reduction of PAPR for FBMC-OQAM systems using
dispersive SLM technique, in Proceedings of the 11th International Conference on Wireless
Communications Systems (ISWCS 2014), Barcelona, Spain (IEEE, USA, 2014), pp. 568–572
54. R. Zakaria, D. Le Ruyet, Intrinsic interference reduction in a filter bank-based multicarrier
using QAM modulation. Phys. Commun. 11, 15–24 (2014)
55. H. Han, H. Kim, N. Kim, H. Park, An enhanced QAM-FBMC scheme with interference miti-
gation. IEEE Commun. Lett. 20, 2237–2240 (2016)
56. L. Dai, Z. Wang, Z. Yang, Next-generation digital television terrestrial broadcasting systems:
key technologies and research trends. IEEE Commun. Mag. 50, 150–158 (2012)
57. D.J.G. Mestdagh, J.L. Gulfo Monsalve, J. Brossier, Green OFDM: a new selected mapping
method for OFDM PAPR reduction. Electron. Lett. 54(7), 449–450 (2018)
58. A. Kumar, S. Bharti, Design and performance analysis of OFDM and FBMC modulation
techniques. Sci. Bull. Electr. Eng. Fac. 17, 30–34 (2017)
59. A. Kumar, H. Rathore, Reduction of PAPR in FBMC system using different reduction tech-
niques. J. Opt. Commun. (2018). https://doi.org/10.1515/joc-2018-0071
60. PHYDYAS Project, http://www.ict-phydyas.org/
61. V. Pooria, M. Borhanuddin, A low complexity partial transmit sequence for peak to average
power ratio reduction in OFDM. Radio Eng. Syst. 20, 677–682 (2011)
62. S. Minkyu, K. Sungyong, S. Jaemin, L. Jaehoon, J. Jichai, DFT-precoded coherent optical
OFDM with hermitian symmetry for fiber nonlinearity mitigation. J. Lightwave Technol. 30,
2757–2763 (2012)

Intelligent Personality Analysis
on Indicators in IoT-MMBD-Enabled
Environment
Rohit Rastogi, D. K. Chaturvedi, Santosh Satya, Navneet Arora,
Piyush Trivedi, Akshay Kr. Singh, Amit Kr. Sharma and Ambuj Singh
Abstract Psychologists seek to measure personality to analyze the human behavior
through a number of methods. As the personality of an individual affects all aspects
of a person’s performances, even how he reacts to situations in his social life, aca-
demics, job, or personal life. The purpose of this research article is to enlighten the
use of personality detection test in an individual’s personal, academics, career, or
social life, and also provide possible methods to perform personality detection test.
One of the possible solutions is to detect the personality, and the study is based on
the individual’s sense of humor. Throughout the twentieth century, psychologists
show an outgoing interest in study of individual’s sense of humor. Since individual
differences in humor and their relation to psychological well-being can be used to
detect the particular personality traits. Machine learning has been used for personality
R. Rastogi (B) · A. Kr. Singh · A. Kr. Sharma · A. Singh
Department of Computer Science and Engineering, ABESEC, Ghaziabad, India
e-mail: [email protected]
A. Kr. Singh
e-mail: [email protected]
A. Kr. Sharma
e-mail: [email protected]
A. Singh
e-mail: [email protected]
D. K. Chaturvedi
Department of Electrical Engineering, DEI, Agra, India
e-mail: [email protected]
S. Satya
Department of Rural Development, IIT-Delhi, Delhi, India
e-mail: [email protected]
N. Arora
Department of Mechanical Engineering, IIT-Roorkee, Roorkee, India
e-mail: [email protected]
P. Trivedi
Centre of Scientific Spirituality, DSVV, Hardwar, India
e-mail: [email protected]
© Springer Nature Singapore Pte Ltd. 2020
S. Tanwar et al. (eds.), Multimedia Big Data Computing
for IoT Applications, Intelligent Systems Reference Library 163,
https://doi.org/10.1007/978-981-13-8759-3_7
185

186 R. Rastogi et al.
detection involves the development and initial validation of questionnaire, which
assesses four dimensions relating to individual differences in the uses of humor.
Which are Self-enhancing (humor used to enhance self), Affiliative (humor used to
enhance the relationship with other), Aggressive (humor used to enhance the self at
the expense of others), and Self-defeating (the humor used to enhance relationships at
the expense of self). Machine learning is gaining importance, nowadays, as it enables
computers to perform self-learning without being programmed for a specific task.
Psychologists seek to measure personality through different methods. Nowadays, the
human being is so much complex that it is difficult to estimate the personality of an
individual manually. The purpose of this chapter is to enlighten the use of personal-
ity detection test in academics, job placement, group interaction, and self-reflection.
This book chapter provides the use of multimedia and IOT to detect the personality
and to analyze the different human behaviors. It also includes the concept of big data
for the storage and processing the data, which will be generated while analyzing the
personality through IOT. We have used one of the supervised learnings called regres-
sion. Algorithms like Linear Regression, Multiple Linear Regression, Decision Tree,
and Random Forest are used here for building the model for personality detection
test. Among the different algorithms used in the project, Linear Regression and Mul-
tiple Linear Regression are proved to be the best so they can be used to implement the
prediction of personality of individuals. Decision tree regression model has achieved
minimum accuracy as in comparison to others so it is not the model, which can be
used for training our model for determining the personality traits of individuals.
Keywords Sense of humor · Personality · Affiliative · Self-enhancing ·
Self-defeating · Aggressive · Python · Anaconda · Machine learning · Regression ·
Linear regression · Multiple linear regression · Decision tree · Random forest
1 Introduction
“Personality” has been taken from the word “Persona”. “Persona” is the characteri-
zation of a person which is different from his real-life character. Personality can be
defined as the sum of characteristics, behavior, and qualities due to which a person
is remarked as different or unique. The personality of a person can be described as
the habitual behavior and emotional pattern of the person, which evolves from the
biological and environmental factors.
The personality of a person can influence the social, personal, and professional
life of an individual, therefore, we can use the personality detection test followed by
some tasks to develop our personality so as to improve ourselves for better social,
personal, and professional life. Personality psychology is the study of the psychology
of personality, which analyses the differences in behavior of an individual.
Many approaches have been taken to studying personality, including learning and
trait-based theories, biological, cognitive-based theories as well as psychodynamic
and humanistic approaches. The possible method we are going to use in this research

Intelligent Personality Analysis on Indicators in IoT-MMBD … 187
article is taking a quiz from individuals and concluding their personality traits on
the basis of result. The questionnaire used in this research article is based on the
difference of sense of humor of person. The sense of humor of a person is the
tendency of an individual to provoke laughter, but the sense of humor or the type of
the humor the person uses can accentuate the personality trait of an individual. For
example, the person can use the humor for sarcasm or to appreciate anyone or to
get attention. Therefore, the sense of humor of a person or their goal for the usage
of humor accentuates the personality trait of the individual. Throughout twentieth
century, psychologists showed an interest in the study of individual differences in
their sense of humor [1].
In the past two decades, researchers interested in detection personality of an
individual since the personality of a person can influence the individual’s social,
professional as well as personal life so to help them to develop their personality
traits.
1.1 Big Data and IOT
Big data is the collection of data set, which is being generated at a tremendous
rate around the world. These data can be structured or unstructured. These data are
so large and complex that it is difficult to process them by using traditional data
processing application. So, to overcome the processing and storage difficulty of big
data, an open-source Hadoop is introduced.
Hadoop is an open-source distributed processing framework that is used to store
a tremendous amount of data, i.e., big data and also for their processing. Big data
has different characteristics which are defined using 4 V’s (Fig. 1) [2].
Internet of Things (abbreviated as IOT) is a system or network, which connects
all physical objects to the internet through routers or network devices to collect and
share the data without manual intervention.
Fig. 1 The characteristics of
big data [8]

188 R. Rastogi et al.
IOT provides a common platform and language for all physical devices to dump
their data and to communicate with each other. Data emitted from various sensors are
securely provided to the IOT platform and is integrated. Now, necessary and valuable
information is extracted. Finally, results are shared with other devices to improve the
efficiency and for better user experience automation.
1.2 Cloud Using Fog Computing with Hadoop Framework [3]
In today’s world as data is growing at an exponential rate, and the need to store data
is also increasingly parallel may be as a memory or as a record. Five–10 years back
data is being stored in the hard disks of computers or in the smart phones. But due to
the increase in number of profiles of individuals, there was a parallel increase in the
data store. This causes to the insufficiency of the storage space, thus forcing more and
more people to store their data onto the cloud. The main features of cloud computing
are flexibility, scalability, efficiency, and multi-portability. Although cloud provides
an excellent option to store the day but still, there are some loopholes in the security
which is restricting the users from using cloud. Therefore, instead of securing the
data only by authentication credentials like user name and password, an approach
of using fog computing that is concoction of user’s profile mapping using various
behavior parameters and decoy data technology that is having a fake file of every
file format, which will be used to launch a disinformation attack in case the user
gets detected as an intruder came into being in order to maintain confidentiality of
data. Thus, by getting large data set, our accuracy on personality in detecting human
behavior will surely get increased.
1.3 Guiding Principles of Mist Computing [4]
Network [5] must provide information but not simply data. The network should
deliver only information that has been requested and only when it has been requested.
Dynamic creation of a system is based on information needs with end devices work-
ing together using a subscriber provider model. Devices must be situation aware,
they must adapt to the information needs and the network configuration. We should
not have static binding’s rules for device and data providers. The devices must
dynamically discover the data providers and execute the application.
Traditional wireless routing protocols are not suitable for routing in mist com-
puting. Here, the routing protocols support device-to-device connectivity. It has
been observed that suboptimal routing paths increase the bandwidth requirements
of the network. Also, in mist, any node should be able to connect to any gateway
eliminating dependence on a specific gateway. In a huge network, sometimes
gateway failures force addition of a new gateway, the nodes near that gateway should
have the ability to connect dynamically to such a node and a new route between itself

Intelligent Personality Analysis on Indicators in IoT-MMBD … 189
and the gateway efficiently established so that the crisis of information unavailability
is solved within the tolerance time [6].
As we can observe in above representation, the mist nodes are responsible to
process the data which has to be handed over to the IOT devices, which include the
sensors and actuators with a physical connection among themselves. The mist node
also monitors the quality of link parameters. At the gateway level, the functionalities
are loading updated application rules and tuning application parameters, monitoring
the health of local nodes, execution of computationally intensive services. Finally,
at the cloud level, new applications can be deployed and applications can be coor-
dinated along with service quality monitoring and monitoring health of the running
applications [7].
1.4 Edge Computing [8]
Almost every use case and every connected device focused on by the Industrial
Internet Consortium (IIC) require some sort of compute capability at its source, at
the edge. Multiple sources define edge computing as “cloud computing systems that
perform data processing at the edge of the network, near the source of the data”.
While this is certainly true, it only scratches the surface of the immense power
and remarkable capabilities that edge computing applications and architectures can
provide to solve industrial internet users toughest challenges. But, as is typical with
any powerful technology, innovative architectures and new terminology are needed
to facilitate implementation, bringing increased complexity with it.
Interviews in corporate, during hiring procedure and ever for selecting the person
in companies, for example, in agile software development methodology, it is very
important to find the right person for the particular job. Personality tests in gov-
ernment organizations, As the jobs like them demands different characteristics and
personality of an individual, for example, the ORQ (officer-like qualities are needed
in defense some special characteristics are needed in IAS officer, that can differ from
the characteristics needed for an IPS officer so in order to find right candidate the
personality detection can be a great help.
It can help the aspirants of such jobs which need a good personality. So, they can
prepare by working on their personality as if they will know the problem than they
can easily find the solution.
This method can be used by the user to develop their personality. This method
can be used in companies also to give appropriate work to appropriate employee
according to their personality (nowadays, it is used in agile methodology of software
development where the attitude of an employee plays a very important role). This
program can be used in selection in defense, as the main requirement in defense is
attitude and personality. This program can be used by the aspirants also to prepare
for particular jobs or exams.

190 R. Rastogi et al.
2 Effect of Personality in Person’s Life
“Personality” has been taken from the word “Persona”. “Persona” is the characteri-
zation of a person which is different from his real life character. Personality can be
defined as the sum of characteristics, behavior, and qualities due to which a person
is remarked as different or unique. The personality of a person can be described as
the habitual behavior and emotional pattern of the person which evolves from the
biological and environmental factors.
The personality of a person can influence the social, personal, and professional
life of an individual, therefore, we can use the personality detection test followed by
some tasks to develop our personality so as to improve ourselves for better social,
personal and professional life. Personality psychology is the study of the psychology
of personality which analyses the differences in behavior of an individual [9].
The personality of a person can influence their social life. Personality of an indi-
vidual influence his behavior, thought process, and actions, which affects the social
life of a person. Personality trait such as aggressive can have a negative impact on
the individual’s life whereas the personality trait such as openness to experience can
have the positive impact on individual’s life. Today is the world of digitalization,
people like to have a interactive and happy civic life or like to pretend in that way,
which can be analyzed from their social networking accounts. People use humor to
hide their feelings, they like to pretend and hide all the sentiments in humor.
The personality of a person can affect their personal life, today, everyone is so
much busy in their careers and pretend to be happy in social networking sites that
they forget to spend time with their closed ones. The personality of an individual
directly influences the priorities of an individual.
How an individual behaves in different situations affects the relationships of an
individual, personality of an individual can either eases the person’s life of a person
or can make it much difficult for that person.
The personality of a person can affect their professional life, in a workplace
environment, the attitude of an individual is important. Someone’s personality can be
cheerful and upbeat. These are the person who fills their surrounding with happiness
and has always positive thinking. Likewise, no one wants to work with those who a
have negative attitude as they make the environment unhealthy. In contrast, people
with a positive attitude bring enthusiasm in workplace. Therefore, personality is very
important in the professional life of an individual [10].
Therefore, we can use the personality detection test to examine our weakness and
strengths so that we can improve our personality to make our social, personal and
professional life better.
Various studies by researchers and psychologists have done to detect the per-
sonality traits of a person through learning and trait-based theories, biological,
cognitive-based theories, and humanistic approaches. One possible method for per-
sonality detection test is to develop a questionnaire based on the basis of the answers
given by the participants, and the personality trait of the individual can be predicted.

Intelligent Personality Analysis on Indicators in IoT-MMBD … 191
Various personality traits are defined by the human characteristics. It can be
Optimistic, Realistic, Leader, Listener, Writer, Enthusiastic, Attentive, Responsible,
Smart Kind, etc. [11].
3 Data Description
For data preparation, (Table 1), dataset is taken from “Martin, R. A., Puhlik-Doris,
P., Larsen, G., Gray, J., & Weir, K. (2003). Individual differences in uses of humor
and their relation to psychological well-being: Development of the Humor Styles
Questionnaire. Journal of Research in Personality, 37(1), 48–75”.
Machine Learning is a study which performs learning without being explicitly pro-
grammed. So, if we want our program to predict the personality, we can run different
machine learning algorithms with data of some previously performed personality
test (Experience) and if learning is successfully done then, it will help in performing
better prediction. We have used one of the supervised learning algorithms called
regression. Regression is a modeling and analyzing technique, which computes the
relationship between target (dependent variables) and predictors (independent vari-
ables). Regression allows comparing the effects of algorithms on variables of dataset.
To make predictions, various kinds of regression techniques are available:
• Linear Regression—One of the most widely used techniques. It establishes the
relation between independent variables (one or more) and dependent variable using
a best-fit regression line. It is represented by an equation
Table 1 Column metadata
Features Feature description Data type
32 set of
questions
These were statements rated on a five-point scale where 1 =
Never or very rarely true, 2 = Rarely true, 3 = Sometimes
true, 4 = Often true, 5 = Very often or always true (−1 =
did not select an answer)
Numeric
Age People of 14–87 years of age group Numeric
Gender Gender defines here the comparison of personality traits (1 =
male, 2 = female, 3 = other)
Numeric
Accuracy It is given by the users revealing that how much predictions
are correct according to them. Scale (0–100)
Numeric
Affiliative Who establish connections easily with others? Scale (1–5) Numeric
Self-
enhancing
Who makes people feel positive about themselves? Scale
(1–5)
Numeric
Aggressive It depicts the emotional distress and person who is likely
ready to attack or confront. Scale (1–5)
Numeric
Self-defeating Who works against himself/herself and unable to achieve the
desired result. Scale (1–5)
Numeric

192 R. Rastogi et al.
Y = b + aX + e (1)
where b is an intercept, a is slope of line and e is error.
• Multiple Linear Regression—It is the most common form of linear regression
analysis. It helps to establish the relationship when dependent variable is not only
dependent on any one independent variable but on multiple independent variables.
It is represented by an equation
Y = a0x0 + a1x1 + a2x2 + . . . . + ak xk + e (2)
where Y is response by k predictor variable x1, x2, x3…. xk; a0, a1, a2….ak are
regression coefficients and e is the error.
It consists of five methods of building models, namely, All in, Backward Elimi-
nation, Forward Selection, Bidirectional Elimination, and Score Comparison.
• Decision Tree Regression—Decision tree algorithms are nonparametric super-
vised learning algorithms that are used for building regression and classification
models, through this algorithm, we try to train our model to predict values of tar-
get variable by learning decision rule inferred from data features. Decision trees
are able to manage both numeric and categorical data and they can also handle
multi-output problems.
• Random Forest Regression—Random forest is like a forest of decision tress, i.e.,
it takes decision based on various decision trees. The final model of this technique
is developed by the base models of various decision trees. It uses averaging for
improving the predictive accuracy and controlling the over fitting. The equation
used in this technique: hx = k0x +k1x +k2x + k3x + … here, hx is final model
and k0x, k1x, k2x, k3x …, are base models.
4 Previous Work Study
In a survey of Personality Computing [12], according to Alessandro Vienciarelli,
Gelareh Mohammadi researches, personality can be explained by a few measur-
able individual characteristics. We can use various technologies (i.e., which can deal
with human personalities) for personality computing approaches, i.e., understand-
ing, prediction and synthesis of the human behavior This paper is a survey of such
approaches and it provides the three main problems indicated in literature, i.e., (1)
Automatic Recognition of personality, (2) Automatic Perception of personality, and
(3) Automatic synthesis of Personality.
In results of Personality Recognition on Social Media with Label Distribution
Learning [13], the main aim of the experiment was to efficiently, reliably, and validly
recognize an individual’s personality. Di Xue, Zheng Hong, and Shize Guo have
stated the traditional ways of personality assessment are interviews, quiz prepared
by the psychologists but these are expensive and not much practical in the social
Intelligent Personality Analysis on Indicators in IoT-MMBD … 193
media domain. It proposes the method of big five Personality Recognitions (PRs)
with a new machine learning paradigm named label distribution learning. Out of
994 features, 113 features were extracted from active profiles and microblogs. Nine
nontrivial conventional machine learning algorithms and eight LDL algorithms are
used to train the personality traits prediction models. Results show that two of the
proposed LDL approaches outperform in predictive ability.
In the development of Agile Person Identification through Personality Test and
k-NN Classification Technique [14] Software methodology is a planning of the devel-
opment of software; agile methodology is one of the most efficient software devel-
opment methods. Agile method requires the cooperation and understanding between
the employees, so this is important for the software project manager to assign the
right work to the right people. Rintaspon Bhannarai, Chartchai Doungsa-ard have
revealed the fact that the researchers provide five personality traits to predict suitable
people for the agile method. A predicting method is done by using k-NN (k-nearest
neighbor) classification technique. The k-NN techniques classify the unknown data
from the known data by comparing the distance calculated between them. The most
common method to calculate the distance between data is using Euclidian Distance.
Using the participants, which involve software developers, testers, managers, etc.,
the pilot study is used to explore this technique that k-NN technique can be explored
to predict the correct people for agile method.
In view to check individual differences in sense of humor and their relation with
psychological well-being [15], the main aim of this survey was to identify the most
common personality traits in males and females and which traits dominate in male
and female. Here, the analysis was done by the quiz which was developed on the basis
of different sense of humors of a person. After collecting the data from candidates, the
analysis was done on the basis of some particular personality traits. Rod A. Martin,
Patricia Puhlik-Doris, Gwen Larsen, Jeanette Gray, and Kelly Weir are the authors of
related work and focused on the difference in individual’s sense of humor and on the
basis of that observation, they characterized the individual in terms of four personality
traits that are aggressive, affiliative, self-enhancing, and self-defeating. The objective
of the experiment was to analyze the proportionality of these personality traits in male
and female.
To understand the product functions and operations, the personality detection test
will predict the personality of an individual on the basis of four personality traits that
are aggressive, affiliative, self-enhancing, self-defeating. It anticipates the personal-
ity of an individual by giving the dominance of each personality trait (aggressive,
affiliative, self-enhancing, and self-defeating) in the range of 0–5. If the particular
personality trait is 0 that means it is least in the particular person and if it reaches
near 5 that means it is a very dominant personality trait in an individual.
The personality development test will first collect the input from the
user/participant, when the user will perform the quiz. The answers collected will be
used as the data, which will be passed to the multiple machine learning algorithms.
The machine learning algorithms will predict the result on the basis of training set
memory constraints—to run a python programs, 2 GB memory is required.

194 R. Rastogi et al.
Operations that will be done by user are 1. The user/participant will perform the
quiz, 2. On the basis of the result, they will try to develop their personality as they
will be aware about their strengths and weaknesses to accomplish a healthy and
successful life.
5 Supervised Learning with Regression Analysis Using
Python Language
Python is a free and open source, simple and interpreted, object-oriented, and exten-
sible language. Python uses NumPy and Pandas, Scikit-learn, Model Evaluation
and Validation, Training and Testing, and Metrics for evaluation in the process of
data analysis and training. It serves several benefits as most appropriate for machine
learning as open source–open software license with GPL compatible. It is proved
highly versatile with Scikit-learn machine learning library. It uses Pandas for data
munging, NumPy for data representation, matplotlib for visualization, and Django
for web application integration. It is faster and easier to develop prototypes. Python
language is supported by for deep learning framework by Google (https://www.
tensorflow.org/), and is used in Hadoop streaming in many industries.
Supervised learning [16] is used to train the model with some examples of a pair
of input and output. Supervised learning algorithms use the training set, which is
a set of data used to train the model. On the basis of the training set of data and
learning of model, the result for other inputs can be inferred. The testing data set is
used to verify the performance of the model or the accuracy of model. The test data
set is some part of initial data set as the output will already be available so that we
will have to compare the original output with inferred output to check the accuracy
of model (Figs. 2 and 3).
Regression analysis and its Gantt Chart (Fig. 4a, b) a are set of statistical pro-
cesses, which are used for estimating the relationship among variables. It provides
many techniques for modeling and analyzing several variables. Regression analysis
mainly focuses on the relationship between dependent variable and one or more
independent variable (or we can call independent variable as predictors). It mainly
focuses to understand how the typical value of the criterion variable (dependent
variable) changes when any one of the predictors is varied and other predictors are
fixed. Prediction and forecasting are the most common application of regression
analysis [17]. The following are the various regression techniques:
Linear Regression, Multiple Regression, Decision tree Regression, and Random
Forest Regression.
The following steps are taken in the process of regression analysis:
1. Raw Dataset: Once the raw dataset is collected and the data is refined for the
analysis. Then, the data is partitioned into train dataset and test dataset. The data
set contains the column of input variables and output variables, which is used to
train the model for predicting the result using regression analysis techniques or

Intelligent Personality Analysis on Indicators in IoT-MMBD … 195
Fig. 2 Methodology of supervised learning [22]
Fig. 3 Iterative process of constructing and applying ML-based prediction models [23]
regression algorithms. Here, the entire dataset is into 80:20 ratio, where training
is done on 80% data and cross-validation is done on 20% data.
2. Train the Model: Here, data processing is done. Train data is used to train different
models. The best model is chosen among them. Data processing involves removal
of nonnumeric data columns, NA, and NAN terms from the data frame. It is done
either by replacing them with 0 or replacing the attribute value with its mean or
median value. Then, individual models are built using different algorithms from
the packages like Caret, rpart, etc., from R and Scikit, sklearn from Python.
3. Get Best Model: After training the model using different regression algorithms,
the comparison between those algorithms is done by finding the accuracy of each

196 R. Rastogi et al.
Fig. 4 a Flowchart of regression analysis. b Gantt chart of activity
model using test data set for validation and calculating the accuracies of each
model. After comparing the accuracies of each model and limitations, the best
model is selected for further predictions.
4. Get prediction of the new dataset: Once the most accurate model is selected and
trained, the new data set can be applied to the model as input and the output can
be predicted using trained model and machine learning algorithms.

Intelligent Personality Analysis on Indicators in IoT-MMBD … 197
6 Study Plot
The dataset consists of the Humor Style Questionnaire [18]. Dimensions of data are
39 attributes and 1071 instances. There are no missing values in the dataset. Now,
while exploring the dataset
Step 1 Apply data ETL operations
i.e., Apply data feature extraction, Data Transformation, Loading of dataset.
[Loop Begins] Till all the dataset is completed.
Step 2 Estimation of summary of each attribute including max, min, mean, count
value and also some percentiles.
Step 3 Check for any null value.
Step 4 Check the data type of various attributes in dataset.
[End of Loop].
For data visualization first, we start with univariate plots that is, the plot of each
variable to get an idea of the distribution (Fig. 5).
7 Algorithm(s) Implementation Results—Graphs
and Tables
The graphs above (Figs. 6, 7, 8, and 9) show the range of different personalities among
individuals. The use of machine language IOT has helped to detect the different
personalities among the people. For detection of each personality, separate graphs
are used, hence the data obtained are large and these tremendous amounts of data
can be handled by the help of big data only.
The next step is data preprocessing where we initially declare dependent and
independent variables. Splitting of the dataset into Training set and Test set. Dataset
is split in ratio of 80:20. In other words, 80% of the data is kept in training set and
20% data is kept in test set. Now, we have a training data in X_train and Y_train
and test data in X_test and Y_test. We are building some ML models by establishing
the correlation between dependent variable and independent variable and once the
correlation estimated then, we will test the model using test data (X_test and Y_test)
that whether it can understand the correlation between the training set on test set.
Prediction is an action performed on the test data to forecast the values that up
to which extent model has learned from the trained data. Predicted values help in
estimating the degree that how much accurate model has learned and able to predict
the values (Figs. 6, 7, 8, and 9).
Building of models enables us to know that which model is best for learning to
perform further computations. As different regression models like Linear Regression
(by Eq. 1), Multiple Linear Regression, Decision Tree Regression, and Random
Forest Regression. Machine learning regressors usually support a single dependent
variable. So, here we create multi-output regressors for Multiple Linear Regression

198 R. Rastogi et al.
Fig. 5 The flowchart of algorithm applied
(by Eq. 2), Decision Tree Regression, and Random Forest Regression. This strategy
consists of fitting one regressor for each target. Prediction and accuracy of multi
output regressor for each model is computed. The graphs below (Figs. 10, 11, 12, 13,
14, 15, 16, 17, 18, 19, 20, 21, and 22) gives the visualization of predicted and tested
values and shows that predicted values are how much close to tested values. Since
accuracy is the most important parameter to decide that which regression technique
is best and the accuracy will be achieved only if these large amounts of data, i.e., big
data are processed and stored properly (Figs. 23, 24, 25, and 26).

Intelligent Personality Analysis on Indicators in IoT-MMBD … 199
Fig. 6 It shows range of affiliative personality among individuals
Fig. 7 It shows the range of self-enhancing personality among individuals

200 R. Rastogi et al.
Fig. 8 It shows the range of aggressiveness personality among individuals
Fig. 9 It shows range of self-defeating personality among individuals
Decision Tree Regression2 and Decision Tree Regression4 achieve almost same
accuracy that is, near to 70%.
Least accurate is Decision Tree Regression3 of 28.75% accuracy. Average accu-
racy of Decision Tree Regression is 64.175%. This method doesn’t give the best
result. Many times, IOT device collects the data but the data are very complex so it
is not able to give good result by this regressions.

Intelligent Personality Analysis on Indicators in IoT-MMBD … 201
Fig. 10 This graph shows the relationship between the tested and predicted values computed from
Linear Regression model. As we can see in the graph, blue color dots are coinciding with each other
and are not scattered in the whole plane because the predicted values are very close to the tested
values. Accuracy achieved is 99.56% with mean square regression loss is 0.00156390272662
Fig. 11 This graph shows the relationship between the tested and predicted values of Multiple
Linear Regression1. The dots are lying very close to each other and are also not scattered in whole
plane so it shows that predicted values are very much accurate with accuracy 99.79%. Mean square
regression loss is 0.00111408573375

202 R. Rastogi et al.
Fig. 12 Visualization of predicted and tested values of Multiple Linear Regression2. This model
also predicts the accurate results and this is clearly visible through scattering of points linearly in a
plane. Accuracy is 99.51% and mean square regression loss is 0.00169502757472
Fig. 13 Visualization of predicted and tested values of Multiple Linear Regression3. This model
also predicts the accurate result but in comparison to Multiple Linear Regression1 and Multiple
Linear Regression2m there is minor difference in accuracy. Accuracy is 99.14% and mean square
regression loss 0.00159577024357

Intelligent Personality Analysis on Indicators in IoT-MMBD … 203
Fig. 14 Visualization of predicted and tested values of Multiple Linear Regression4. This model
predicts the accurate results with accuracy of 99.56% and mean square regression loss is
0.00159151039372
Fig. 15 Visualization of predicted and tested values of Decision Tree Regression1. As we can see
in the graphm all points are scattered in a plane because the prediction is not much accurate as in
case of Linear regression and Multiple Linear Regression. Scattering shows that predicted and test
values are not lying much close to each other. Accuracy is 87.52% and mean square regression loss
is 0.0675178855488

204 R. Rastogi et al.
Fig. 16 Visualization of predicted and tested values of Decision Tree Regression2. In this graph,
the points are much scattered initially that is, lying at some distance. It is a good model but not
accurate model as in comparison to Decision Tree Regression1. Accuracy is 71.48% and mean
square regression loss is 0.0984915683583
Fig. 17 Visualization of predicted and tested values of Decision Tree Regression3. This model
is least accurate as we can see in the graph that points are clustered at various places and are
not scattered linearly. This is model has very less accuracy. Accuracy is 28.75% and mean square
regression loss 0.132380568167

Intelligent Personality Analysis on Indicators in IoT-MMBD … 205
Fig. 18 Visualization of predicted and tested values of Decision Tree Regression4. This is far better
than Decision Tree Regression3 as we can see that points are scattered in the linear form. This is
very much similar to Decision Tree Regression2 in terms of prediction. Accuracy is 72.84% and
mean square regression loss is 0.0982561775804
Fig. 19 Visualization of predicted and tested values of Random ForestRegression1. This is accurate
model as in comparison to Decision Tree Regression where average accuracy is 65.1475%. All points
are scattered linearly in a plane. So, better predictions are obtained. Accuracy is 94.16% and mean
square regression loss is 0.0315995487491
8 Performance Evaluation, Learning and Outcomes,
Product Perspective
Among the different algorithms used in the project, Linear Regression and Multiple
Linear Regression are proved to be the best. Both of them are the best algorithm
that can be used to implement the prediction of personality of individuals. On the
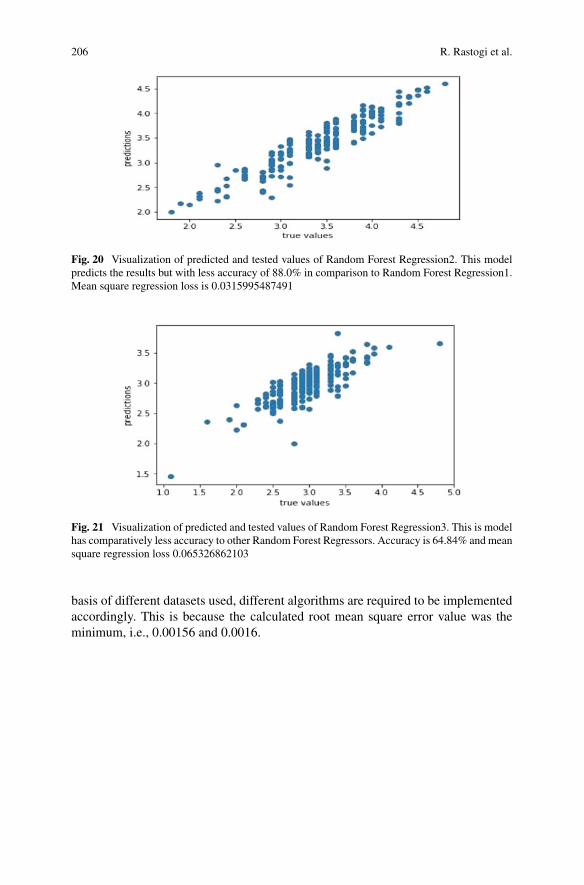
206 R. Rastogi et al.
Fig. 20 Visualization of predicted and tested values of Random Forest Regression2. This model
predicts the results but with less accuracy of 88.0% in comparison to Random Forest Regression1.
Mean square regression loss is 0.0315995487491
Fig. 21 Visualization of predicted and tested values of Random Forest Regression3. This is model
has comparatively less accuracy to other Random Forest Regressors. Accuracy is 64.84% and mean
square regression loss 0.065326862103
basis of different datasets used, different algorithms are required to be implemented
accordingly. This is because the calculated root mean square error value was the
minimum, i.e., 0.00156 and 0.0016.

Intelligent Personality Analysis on Indicators in IoT-MMBD … 207
Fig. 22 Visualization of predicted and tested values of Random Forest Regression4. This model is
performing predictions in same manner as Random Forest Regression2. Graph is almost the same
for both the regressors. Accuracy is 89.35% and mean square regression loss 0.0385353877922
Fig. 23 Comparison of accuracy of different multiple regressions. This graph represents the com-
parison among the accuracies of four regressors of Multiple Linear Regression. All the regressors
are computing almost the same results as there is not much difference in their accuracies. But the
highest accuracy is of Multiple Linear Regression1 that is, 99.79%. Average accuracy of multiple
Linear Regression is 99.5%. By this accurate result, the model is very impressive and this method
compiles all the data that are collected by IOT device, and gives good result

208 R. Rastogi et al.
Fig. 24 Comparison of accuracy of different decision tree regressions. As it is clearly visible
through the graph that Decision Tree Regression1 is having the highest accuracy that is, 87.52%
greatest among all the regressors
Fig. 25 Comparison of accuracy of different Random Forest Regressions. As it is clearly visible
through the graph that Random Forest Regression1 is having the highest accuracy among all the
regressors that is, 94.16%. Random Forest Regression2 and Random Forest Regression4 achieve
almost the same accuracy but Regression3 with accuracy of 64.84%. The comparison between all
the regressors that we have got in this figure using the concept of IOT. Since the data processed
during regression are very large, so the compared data of different regressors are in tremendous
amount which can be processed and stored using big data
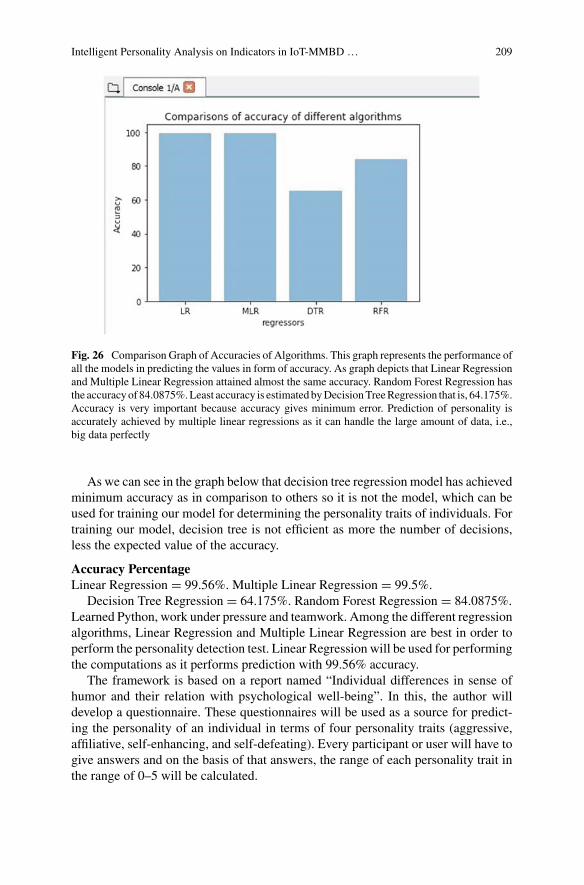
Intelligent Personality Analysis on Indicators in IoT-MMBD … 209
Fig. 26 Comparison Graph of Accuracies of Algorithms. This graph represents the performance of
all the models in predicting the values in form of accuracy. As graph depicts that Linear Regression
and Multiple Linear Regression attained almost the same accuracy. Random Forest Regression has
the accuracy of 84.0875%. Least accuracy is estimated by Decision Tree Regression that is, 64.175%.
Accuracy is very important because accuracy gives minimum error. Prediction of personality is
accurately achieved by multiple linear regressions as it can handle the large amount of data, i.e.,
big data perfectly
As we can see in the graph below that decision tree regression model has achieved
minimum accuracy as in comparison to others so it is not the model, which can be
used for training our model for determining the personality traits of individuals. For
training our model, decision tree is not efficient as more the number of decisions,
less the expected value of the accuracy.
Accuracy Percentage
Linear Regression = 99.56%. Multiple Linear Regression = 99.5%.
Decision Tree Regression = 64.175%. Random Forest Regression = 84.0875%.
Learned Python, work under pressure and teamwork. Among the different regression
algorithms, Linear Regression and Multiple Linear Regression are best in order to
perform the personality detection test. Linear Regression will be used for performing
the computations as it performs prediction with 99.56% accuracy.
The framework is based on a report named “Individual differences in sense of
humor and their relation with psychological well-being”. In this, the author will
develop a questionnaire. These questionnaires will be used as a source for predict-
ing the personality of an individual in terms of four personality traits (aggressive,
affiliative, self-enhancing, and self-defeating). Every participant or user will have to
give answers and on the basis of that answers, the range of each personality trait in
the range of 0–5 will be calculated.

210 R. Rastogi et al.
9 Future Directions, Novelty, and Complexity Analysis
Since the personality of an individual can adversely affect the professional attitude
of a person. All the MNCs and even our defense organization select candidate for
job on the basis of their personality, therefore, they use some procedure to predict
the personality of an individual, which can be done through machine learning and
take IOT data and model result to select the perfect candidate. This experimental
study can be further modified to be used in these organizations to get more efficient
prediction.
Different disciplines and backgrounds of computer science engineering with psy-
chology have been merged to perform the work. Specifically, the author aims to
predict the personality traits of an individual as the personal and professional life of
an individual.
The analysis is performed on the personality detection to get the domination of
some particular personality traits in male or female [19]. The prediction of personality
has been done through k-nearest neighbor classification technique [20]. Personality
detection is less efficient and costly manually so the author has tried to do these
jobs by machine learning. Regression techniques used for the prediction are linear
regression, decision tree, and random forest. An individual can use the predicted
result to develop their personality and improve their personal and professional life.
The work has been done by merging mathematical algorithms and the psychology
and behavior oh human being. Psychologists seek to measure the personality by
analyzing human behavior. This process of analyzing the human behavior can be
done mathematically. The author has used the basic analysis of human behavior
to prepare the questionnaire machine learning algorithms to train the model using
the collected dataset. The author has converted the subjective concept into some
quantitative approach. This analysis can be proved very much beneficial to improve
the personality to accomplish healthy and successful life.
The personality is something, which describes your actions and reactions toward
in any situations or how you will react in particular circumstances. Prediction of
personality traits is not much accurate when performed manually and it is a complex
process too. Using machine learning subjective work can now be performed using
mathematical models. These models are trained with experiences and could easily
perform a personality test, which is much more accurate and fast as in comparison
to manual task.
The human behavior is very different to analyze as human mind along with human
nature is very complex. So, we need some technology, i.e., IOT which may analyze
the person’s personality from very near. The calculated attributes are subjective and
vary from person to person. Also, it is so complex phenomenon that it can be treated
as NP-complete program. The run-time complexity will be high in the program as the
human behavior and thinking are very complex to convert it into some quantitative
calculations.

Intelligent Personality Analysis on Indicators in IoT-MMBD … 211
10 Recommendations, Limitations, Future Scope,
and Possible Applications
The given program or method is used to predict the personality of an individual
in terms of four personality traits (aggressive, affiliative, self-enhancing, and self-
defeating) where we need some technology to handle the big data because all four
personality traits generate abundant data. For processing and storage of data, we use
data processing application software. As the personality of an individual can directly
influence the social, personal, and professional life of an individual. The result of
this technology helps in analyzing the personality traits of an individual and with the
help of this result, the user can develop his or her personality as they will be aware of
their weaknesses and strengths. IOT gives every information about the personality of
a person and may predict that what will be the need of person and constantly watch
their behavior, executes the data by method of multiple regression and with time IOT
makes them smarter.
The method used by the authors is a new way for computing personality detection
test. Machine learning is something which makes the human work easier and gives
more efficient output. As it is a well-known fact that decision-making processes of
human beings are easily affected by the activities and up and downs of human life.
Process of personality test is automated in order to reduce the human error and it’s
done by IOT device, which always connects the person with Internet. This is one of
the reasons that this method is much accurate and preferable in order to predict the
personality of an individual because personality data is very large and by using Big
Data concept processing of this type of large data has become easy and it gives an
accurate result. These tests are better to understand the perception of an individual for
self-reflection and understanding. The result of this technology is helpful to decide
the one’s personality and take important decisions in the field of job placement, group
interaction, drive to learn, and team spirit.
The framework can work for short number of parameters. The personality of an
individual is predicted on the basis of answers collected from the user. The ques-
tionnaire is developed on the basis of difference in someone’s sense of humor and
usage of humor, but there are so many factors which can influence the personality,
which is determined by IOT therefore to obtain the accurate and more precise result,
maximum factors should be covered during the development of questionnaire and
these data are processed using big data and gives more precise result.
The model used for personality detection is Linear Regression. But Linear Regres-
sion is prone to overfitting such that regression begins to model noise in the data along
with the relationship of the variables. This is pretty extrapolation and not necessarily
accurate. Decision Tree Regression is not estimating the good results so we can’t use
this for learning and prediction of personality traits.
Explore yourself from a completely different perspective. To find a successful
career and improve social and personal life by understanding different personality
traits.

212 R. Rastogi et al.
But this is possible when connectivity will improve, data collection will manage
and differentiate for different parameter. Internet of Things will be smarter than
human in the future but for protection, we need some organization to monitor all
data process and identify unethical action.
Collection of data will be larger in the future so if anyone manipulates, then IOT
will not show good result.
To overcome this vulnerability, we need to make some hardware and software to
secure the result and behavior of modal.
Interviews in corporate, during hiring procedure and ever for selecting person
in companies, for example, in agile software development methodology, it is very
important to find the right person for the particular job.
Personality tests in government organizations, As the jobs like them demands
different characteristics and personality of and individual for example the ORQ
(officer like qualities are needed in defense some special characteristics are needed
in IAS officer, that can differ from the characteristics needed for an IPS officer so in
order to find right candidate the personality detection can be a great help.
Can help to the aspirants of such jobs which need good personality. And same
data transfer to other company, organization or government bodies to select good
candidate. So here role of big data will be increase. So, they can prepare by working
on their personality as, if they will know the problem than they can easily find the
solution [21].
This method can be used by the user to develop their personality. This method
can be used in companies also to give appropriate work to appropriate employee
according to their personality (owadays, it is used in agile methodology of software
development where the attitude of an employee plays a very important role). This
program can be used in selection in defense, as the main requirement in defense is
attitude and personality. This program can be used by the aspirants also to prepare
for particular jobs or exams.
11 Motivation
Personality is something that explains the behavior of an individual in different
circumstances. If the people will be aware of their personality than they can improve
their personality, if they want as if we don’t know the disease than how can we find
the accurate medicine to cure the disease. Not only for an individual personality can
detection be used by companies to hire the right person for the right job. As each job
require demands, some unique characteristics to find the person who holds them can
be found by the procedure of personality detection.
Machine learning is getting popular day by day and enable the computers to per-
form computations without being explicitly programmed. Science has made our life
simpler and proved to be boon for solving many complex problems. Many researches
in personality ranges from the study of biological systems to genetic codes in order
to study social, cultural basis of thought, emotions, feelings, and behavior. Issues of

Intelligent Personality Analysis on Indicators in IoT-MMBD … 213
personality appeal to everyone and there are many interesting web sites that can be
visited both inside and outside of academia. So, this is basically an approach that can
be used by any organization during the personality test conducted during the selec-
tion process of any employee. A personality test can give the different characteristics
or features which were not known to us.
Today, everyone wants a better life but instead of focusing on their weakness and
strength, they criticize others and system. Therefore, we need to improve ourselves,
and this test can be proved useful for personality development of an individual.
Interviews in corporate, during hiring procedure and ever for selecting person in
companies, for example, in agile software development methodology, it is very
important to find the right person for the particular job.
Personality tests in government organizations, As the jobs like them demands
different characteristics and personality of and individual for example the ORQ
(officer like qualities are needed in defense some special characteristics are needed
in IAS officer, that can differ from the characteristics needed for an IPS officer so in
order to find right candidate the personality detection can be a great help.
It can help to the aspirants of such jobs which need good personality. So, they can
prepare by working on their personality as, if they will know the problem than they
can easily find the solution.
12 Conclusion
The proposed work will be an effort to utilize the machine intelligent techniques like
Python programming on Spyder framework. Human beings are complex to under-
stand and their personality traits are changed according to the changes in them. So,
we will try to learn more and more about them.
To predict the personality traits of an individual here, the author has implemented
a method that involves the supervised learning. Supervised learning has a subset of
algorithms called regressions. These regressors have provided us with the models
which are trained for learning. Models learned from experiences that is, 80% of train
data and the remaining 20% are used to test the accuracy of prediction. Among the
four models, Linear Regression and Multiple Linear Regression have attained the
best prediction accuracy of 95% about.
Decision Tree Regression has a prediction accuracy of 64.175% which is very
less. So, this model can’t be used for predicting the personality traits using dataset
available with us. Random Forest Regression attained the accuracy of 84.0875%,
which is better than Decision Tree Regression it can also be used as a secondary
model to predict the personality traits.
The difference in an individual’s sense of humor can influence the personality
trait of an individual. Therefore, the sense of humor and usage of humor can be used
to predict the personality of an individual. The personality of an individual affects
their life, therefore, it is very important to develop their personality and anyone
can improve their personality only when they are aware about their weakness and

214 R. Rastogi et al.
strengths. So, to know the weakness and strengths of an individual can be known by
analyzing the personality traits of an individual.
The proposed work is a successful mathematical framework to calculate or predict
human personality traits. Which can help the user to develop their personality to
achieve a healthy and successful life?
This method can be used by the user to develop their personality. This method
can be used in companies also to give appropriate work to appropriate employee
according to their personality (Nowadays, it is used in agile methodology of software
development where the attitude of an employee plays a very important role). This
program can be used in selection in defense, as the main requirement in defense is
attitude and personality. This program can be used by the aspirants also to prepare
for particular jobs or exams.
Acknowledgements The authors are obliged for the guidance of ABES Engineering College staffs
and faculties. Mr. Shubham Sidana, Mr. Abhishek Goyal, Mr. Mayank Gupta of TCS, and evaluation
team of experimental presentation to understand the concept well and for showing the path ahead.
The acknowledgement is to all those forces which inspired us to work hard and to learn something
and to make a difference in society.
References
1. A. Kumari, S. Tanwar, S. Tyagi, N. Kumar, Fog computing for healthcare 4.0 environment:
opportunities and challenges. Comput. Electr. Eng. 72, 1–13 (2018)2. A. Kumari, S. Tanwar, S. Tyagi, N. Kumar, M. Maasberg, K.K.R. Choo, Multimedia big
data computing and Internet of Things applications: a taxonomy and process model. J. Netw.
Comput. Appl. 124, 169–195 (2018)3. K.H.K. Reddy, H. Das, D.S. Roy, A Data Aware Scheme for Scheduling Big-Data Applications
with SAVANNA Hadoop. Futures of Network (CRC Press, 2017)4. H. Das, A.K. Jena, P.K. Rath, B. Muduli, S.R. Das, Grid computing-based performance analysis
of power system: a graph theoretic approach, in Intelligent Computing, Communication and
Devices (Springer, New Delhi, 2015), pp. 259–2665. B.B Mishra, S. Dehuri, B.K. Panigrahi, A.K. Nayak, B.S.P. Mishra, H. Das, Computational
Intelligence in Sensor Networks. Studies in Computational Intelligence, vol. 776 (Springer,
2018)6. S. Tanwar, P. Patel, K. Patel, S. Tyagi, N. Kumar, M.S. Obaidat, An advanced internet of
thing based security alert system for smart home, in International Conference on Computer,
Information and Telecommunication Systems (IEEE CITS-2017), Dalian University, Dalian,
China, 21–23 July 2017, pp. 25–297. A. Srivastava, S.K. Singh, S. Tanwar, S. Tyagi, Suitability of big data analytics in indian banking
sector to increase revenue and profitability, in 3rd International Conference on Advances in
Computing, Communication & Automation (ICACCA-2017), Tula Institute, Dehradhun, UK,
pp. 1–68. I. Kar, R.R. Parida, H. Das, Energy aware scheduling using genetic algorithm in cloud data
centers, in International Conference on Electrical, Electronics, and Optimization Techniques
(ICEEOT), March 2016 (IEEE, 2016), pp. 3545–35509. J. Villena-Roman, J. Garcia-Morera, C. Moreno-Garcia, L. Ferrer-Urefia, S. Lana-Serrano, J.
Carlos Gonzalez-Cristobal, A. Waterski, E. Martinez-Camara, M.A. Umbreras, N1.T. Martin-
Valdivia, L. Alfonso Urefia-Lopez, TASS-Workshop on Sentiment Analysis at SEPLN, Workshop
on Sentiment Analysis. Sociedad Espanola para el Procesamiento del Lenguaje (2012)
Intelligent Personality Analysis on Indicators in IoT-MMBD … 215
10. M. De Juan-Espinosa, Personalidad Artificial: Hacia Una Simulación De Las Diferencias
DePersonalidadEnSituaciones De Interacción (Universidad Autónoma de Madrid, Madrid,
2007)
11. A. Bandura, R.H. Walters, A. Riviere, Aprendizaje social y desarrollo de la personalidad.
Alianza Editorial Sa (2007)
12. N.D. Liver good, Strategic Personality Simulation: A New Strategic Concept. Center for
Strategic Leadership, US Army War College, vol. 3 (1995), pp. 60–93
13. L.J. Francis, L.B. Brown, R. Philipchalk, The development of an abbreviated form of the
Revised Eysenck Personality Questionnaire (EPQR-A): its use among students in England,
Canada, the USA and Australia. Pers. Individ. Differ. 13(4), 443–449 (1992)
14. G. Young, Mapping mayhem: the geography of crime. Computer Age. Google Scholar
171(107) (2003)
15. D.K. Rossmo, Geographic Profiling, vol. 1 (CRC Press, 1999). ISBN-0849381290
16. P. Sarkhel, H. Das, L.K. Vashishtha, Task-scheduling algorithms in cloud environment, in
Computational Intelligence in Data Mining (Springer, Singapore, 2017), pp. 553–562
17. H. Das, A.K. Jena, J. Nayak, B. Naik, H.S. Behera, A novel PSO based back propagation
learning-MLP (PSO-BP-MLP) for classification, in Computational Intelligence in Data
Mining, vol. 2 (Springer, New Delhi, 2015), pp. 461–471
18. T. Polzehl, S. Möller, F. Metze, Automatically assessing acoustic manifestations of personality
in speech, in Spoken Language Technology Workshop (SLT), December 2010 (IEEE, 2010),
pp. 7–12
19. L.R. Goldberg, Language and individual differences: the search for universals in personality
lexicons. Rev. Pers. Soc. Psychol. 2(1), 141–165 (2007)
20. A.V. Ivanov, G. Riccardi, A.J. Sporka, J. Franc, Recognition of personality traits from
human spoken conversations, in Twelfth Annual Conference of the International Speech
Communication Association (2011)
21. A.J. Gill, J. Oberlander, Taking care of the linguistic features of extraversion, in Proceedings
of the Annual Meeting of the Cognitive Science Society, vol. 24, no. 24, January 2002
22. M. De Juan, Personalidad y Criminalidad, Apuntes de Psicología Criminológica. la asignatura
Psicología Criminológica, Universidad Autónoma de Madrid (No publicado) (2005)
23. P.T. Costa, R.R. McCrea, Revised neo personality inventory (NEO PI-R) and neo five-factor
inventory (NEO-FFI) (Psychological Assessment Resources, 2012)
24. H.J. Eysenek, H.J. Eysenck, Dimensions of Personality, vol. 5 (Transaction Publishers, 1950),
pp. 398–423
25. F. Mairesse, M. Walker, Automatic recognition of personality in conversation, in Proceedings
of the Human Language Technology Conference of the NAACL, Companion Volume: Short
Papers. Association for Computational Linguistics, June 2006, pp. 85–88
26. J.W.P.M.E. Francis, R.J. Booth, Linguistic Inquiry and Word Count. Technical Report
(Southern Methodist University, Dallas, TX, 1993)
27. A. Ruiz-Falcó, Instituto de Astrofísica de Andalucía, CSIC. Entiempo real Lenguajes de
Descripción Hardware: Conceptos y Perspectivas (126), 35 (2009)
28. G.V. Caprara, C. Barbaranelli, L. Borgogni, M. Perugini, The “Big Five Questionnaire”: a
new questionnaire to assess the five-factor model. Pers. Individ. Differ. 15(3), 281–288 (2011)

Data Reduction in MMBD Computing
Yosef Hasan Jbara
Abstract Internet of Things technology is emerging very quickly in human facil-
ities of all types, such as smart home and industry, which leads to a large boom in
multimedia big data due to the connection of approximately 50 billion devices to the
internet in 2020. It is really a challenging task to manage the IoT multimedia data
regarding storage and transmission. The only way to handle this complicated storage
and transmission problem is the process of compression techniques. Multimedia data
is compressed by reducing its redundancy. Compression algorithms face numerous
difficulties because of the large size, high streaming rate, and the high quality of the
data, due to their different types and modality of acquisition. This chapter provides
an overarching view of data compression challenges related to big data and IoT envi-
ronment. In this chapter, we provide an overview of the various data compression
techniques employed for multimedia big data computing, such as run-length coding,
Huffman coding, arithmetic coding, delta modulation, discrete cosine transform, fast
Fourier transform, joint photograph expert group, moving picture expert group, and
H.261, including the essential theory, the taxonomy, necessary algorithmic details,
mathematical foundations, and their relative benefits and disadvantages.
Keywords Internet of Things · Multimedia big data · JPEG · MPEG · Quality of
service · CODEC
1 Introduction
The Internet of Things (IoT) will induce a vast influx of big data as a result of the
massive spreading of sensors across almost every industry. The emerging popularity
of IoT-based Internet-friendly low-cost devices and the explosive use of smart device
technology, drive users to generate and transmit multimedia data over the internet.
Y. H. Jbara (B)
Computer Science, College of Engineering and Information Technology,
Buraydha Colleges, Al Qassim, Saudi Arabia
e-mail: [email protected]
© Springer Nature Singapore Pte Ltd. 2020
S. Tanwar et al. (eds.), Multimedia Big Data Computing
for IoT Applications, Intelligent Systems Reference Library 163,
https://doi.org/10.1007/978-981-13-8759-3_8
217

218 Y. H. Jbara
IoT-enabled devices and objects upload tremendous amounts of audio, image, video,
and text data in real time [1]. In 2012, the number of radio-frequency identification
(RFID) tags and IoT-enabled devices in commercial use was 12 million. This quantity
is predicted to increase to 210 billion in 2021. The multimedia data from IoT-enabled
devices belong to big data sets, and this information is typically gathered for analysis
and control. The total turnover of the multimedia big data business was 10.2 billion
dollars in 2011. It grew to 54.3 billion dollars in 2017. There will be a boom in
multimedia big data due to the connection of approximately 50 billion users to the
internet in 2020. Therefore, the two technologies IoT and multimedia big data are
growing in parallel. IoT is a network of smart devices that collect and exchange data.
It has been estimated that trillions of the data will be created every hour by 31 billion
devices in 2020 and 76 billion in 2025 [2].
The substantial amount of multimedia content that is obtainable among IoT com-
ponents contains enormous amounts of text, audio, image, video, and animation data.
These data originate from entry-level IoT products such as Amazon Dash Buttons
to virtual reality (VR) and augmented reality (AR) IoT devices such as Samsung
Gear VR [3]. In this big data era, multimedia data have become a unique type of big
data because of the colossal generation of multimedia datasets and their subsequent
storage, transmission and processing.
The traditional multimedia compression techniques face challenges because of
the characteristics, namely, massive volume and complex structure, of IoT data sets
[4]. Multimedia big data are any combination of large-scale signals such as text,
graphics, art, sound, and video elements, which all are partially unknown complex
structures in nature. All these multimedia component signals have a skeletal resem-
blance and are described in terms of a statistical parameter in time and space, drift
curvature, redundancies, and the quality of experience. Naturally, the modeling and
representation of such unstructured, multimodal and heterogeneous multimedia big
data are complicated processes.
The processing steps of the life cycle of multimedia big data are acquisition, com-
pression, storage, processing, interpretation, assessment, and security. Initially, the
big data are acquired from IoT-enabled devices. Before further storage and process-
ing, the data are compressed and interpreted. The data transfer is subject to security
checks, and the assessment is carried out with acquired data and credible data. These
multimedia big data are compressed to ensure efficient storage and communication,
as their vast volume exceeds the capacity of the transmission channel and the storage
capacities of computing machines. Moreover, multimedia big data face challenges
in achieving fast storage and processing due to their large data volumes [5].
Multimedia data reduction results in two main benefits: reduced memory size
in the local disk and increased speed of data transfer between the network and the
disk. Multimedia big data face substantial problems, after acquisition from sensors,
RFIDs, and interconnected smart devices in storage and processing. Therefore, the
compression of multimedia big data is an inevitable process in IoT applications [6].
The initially acquired data require an effective compression algorithm that uses time
domain or frequency domain methods, to overcome the limitations of the traditional
memory and computational resources. Such compression algorithms face numerous

Data Reduction in MMBD Computing 219
difficulties that are due to the enormous size, faster streaming rate, quality, and
various types and modalities of acquisition of the data. The very fast multimedia big
data reduction techniques must be employed, to manage the large data volume [7].
In a multimedia data reduction technique, an encoding process is applied to
represent that data using fewer bits by utilizing a precise encoding system. Storage,
throughput, and interaction are the fundamental coding requirements for data reduc-
tion techniques. The multimedia data reduction techniques are of high significance
in IoT because of the reduction in disk space for storage, which enhances reading
and writing. The speed of file transfer is also increased with variable dynamic range
and byte order independence via these reduction techniques [8]. Additional disk
space will be needed to store multimedia components such as images and graphics,
audio, videos, and animations. We require 175 kB of memory space to save audio
that has been recorded for one second in stereo quality. A 320 × 240 × 8-bit
grayscale image requires 77 kB memory space, a 1100 × 900 × 24-bit color image
requires 3 MB disk space, and a 640 × 480 × 24 × 30 frames/s video requires
27.6 MB/s of memory. The interaction between the sender and receiver should be
very fast to avoid transmission delays in the multimedia system [9].
Compression methods are broadly classified into lossless and lossy methods. In
a lossless compression technique, the original data are completely recovered from
the compressed data. Every bit of the original data is recovered from the compressed
data. A lossy compression technique reduces the acceptable level of data in the coding
process and rebuilds an estimation of the original data in decoding [10].
The fundamental categories of multimedia data reduction techniques are entropy
coding, source coding, channel coding, and hybrid coding. Methods in the entropy
coding category use run-length coding, Huffman coding, and arithmetic coding.
DPCM and DM are the most widely used prediction techniques in source coding.
Prior to the encoding, the original multimedia data are transformed into a compact
data format to realize more effective coding by employing fast Fourier transform
(FFT) and discrete cosine transform (DCT) transformations [11]. The most widely
used compression models under the hybrid coding category, are Joint Photographic
Experts Group (JPEG), Moving Picture expert group (MPEG), and H.261, which
are utilized for the compression of multimedia such as text, graphics, art, sound, and
video.
The run-length coding technique replaces each repeated value by the length of
its run and its value based on entropy. Compression is realized by eliminating the
redundancy that is due to the continuous occurrence of the same value [12]. The
Huffman coding algorithm uses the shortest code for the most frequently occurring
values and the longest code for the least frequently occurring values based on entropy.
Compression is realized by using variable bit lengths for different values.
In arithmetic coding allows “blending” of bits in a data stream are “blended” and
the total number of required bits is calculated based on the sum of the self-information
using a message interval and a sequence interval. In the differential coding algorithm,
the difference between two continuous data values is encoded instead of the data [13].
In vector quantization, the original data are split into chunks of bytes. Then, each
chunk is encoded with a list of patterns. Lempel–Ziv–Welch (LZW) compression
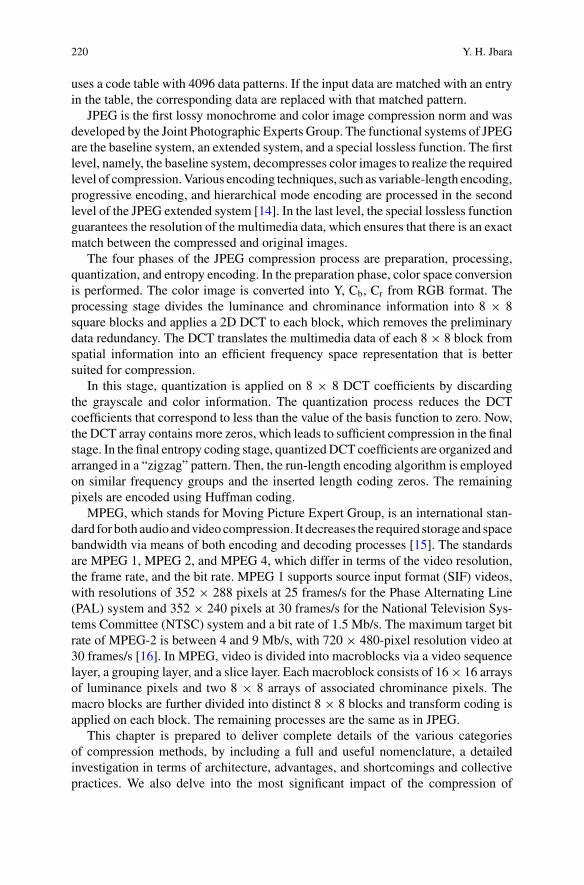
220 Y. H. Jbara
uses a code table with 4096 data patterns. If the input data are matched with an entry
in the table, the corresponding data are replaced with that matched pattern.
JPEG is the first lossy monochrome and color image compression norm and was
developed by the Joint Photographic Experts Group. The functional systems of JPEG
are the baseline system, an extended system, and a special lossless function. The first
level, namely, the baseline system, decompresses color images to realize the required
level of compression. Various encoding techniques, such as variable-length encoding,
progressive encoding, and hierarchical mode encoding are processed in the second
level of the JPEG extended system [14]. In the last level, the special lossless function
guarantees the resolution of the multimedia data, which ensures that there is an exact
match between the compressed and original images.
The four phases of the JPEG compression process are preparation, processing,
quantization, and entropy encoding. In the preparation phase, color space conversion
is performed. The color image is converted into Y, Cb, Cr from RGB format. The
processing stage divides the luminance and chrominance information into 8 × 8
square blocks and applies a 2D DCT to each block, which removes the preliminary
data redundancy. The DCT translates the multimedia data of each 8 × 8 block from
spatial information into an efficient frequency space representation that is better
suited for compression.
In this stage, quantization is applied on 8 × 8 DCT coefficients by discarding
the grayscale and color information. The quantization process reduces the DCT
coefficients that correspond to less than the value of the basis function to zero. Now,
the DCT array contains more zeros, which leads to sufficient compression in the final
stage. In the final entropy coding stage, quantized DCT coefficients are organized and
arranged in a “zigzag” pattern. Then, the run-length encoding algorithm is employed
on similar frequency groups and the inserted length coding zeros. The remaining
pixels are encoded using Huffman coding.
MPEG, which stands for Moving Picture Expert Group, is an international stan-
dard for both audio and video compression. It decreases the required storage and space
bandwidth via means of both encoding and decoding processes [15]. The standards
are MPEG 1, MPEG 2, and MPEG 4, which differ in terms of the video resolution,
the frame rate, and the bit rate. MPEG 1 supports source input format (SIF) videos,
with resolutions of 352 × 288 pixels at 25 frames/s for the Phase Alternating Line
(PAL) system and 352 × 240 pixels at 30 frames/s for the National Television Sys-
tems Committee (NTSC) system and a bit rate of 1.5 Mb/s. The maximum target bit
rate of MPEG-2 is between 4 and 9 Mb/s, with 720 × 480-pixel resolution video at
30 frames/s [16]. In MPEG, video is divided into macroblocks via a video sequence
layer, a grouping layer, and a slice layer. Each macroblock consists of 16 × 16 arrays
of luminance pixels and two 8 × 8 arrays of associated chrominance pixels. The
macro blocks are further divided into distinct 8 × 8 blocks and transform coding is
applied on each block. The remaining processes are the same as in JPEG.
This chapter is prepared to deliver complete details of the various categories
of compression methods, by including a full and useful nomenclature, a detailed
investigation in terms of architecture, advantages, and shortcomings and collective
practices. We also delve into the most significant impact of the compression of

Data Reduction in MMBD Computing 221
multimedia big data, with an excellent and lucid review of the current multimedia
IoT data compression techniques. So we hope this chapter be able to help as a
valuable reference for teachers and researcher involved in IoT data compression and
processing, which has remarkable openings in both education and employment. This
chapter also delivers an instrumental allusion for IoT, multimedia professionals, and
computer scientists. We organized this chapter with five key sections broadly includ-
ing all features of multimedia data compression: Multimedia basics, Elements, and
File Formats, Quality of Service, Principles of Compression Techniques, and Image
Compression Standards. In this chapter, we discuss the most significant impact of the
compression of multimedia big data. We hope this chapter will serve as a valuable
reference for teachers and researchers who are involved in IoT data compression
and processing, which have remarkable applications in both education and research.
The remainder of this chapter is organized into four sections: In Sect. 2, we
describe the multimedia elements, the preliminaries of differential formats and qual-
ity of service. Section 3 reviews several multimedia compression techniques and their
principles. We discuss critical open problems in reference models and protocols and
recent developments along with future directions in Sect. 4. Lastly, Sect. 5 concludes
this chapter with an encapsulated summary of data reduction in multimedia big data
computing.
2 Multimedia Basics
The advancement of IoT has had a large impact on multimedia data. Multimedia is an
interactive form of communication in which multiple types of media data such as text,
audio, graphics, animation, and video, are conveyed. In recent years, with significant
advances in the state-of-the-art semantic web techniques and technologies, IoT has
explored a tremendous amount of multimedia big data [17].
According to a recent survey by Cisco and IBM, every day, IoT-enabled devices,
such as smart consumer appliances and lab instruments, will generate 2560 quintillion
data (1 quintillion = 10 17). They also predicted that this amount of IoT multimedia
data will increase to 40 yottabytes in 2020 (1 yottabyte = 1024 bytes) and every
person will generate 5200 GB per day in the IoT era. Because of this extremely
large volume and the intangible nature of fundamental data formats, IoT multimedia
will encounter substantial problems in storage and transmission. Therefore, it is
essential to understand exclusively the basics of multimedia big data and to have
the ,in-depth knowledge of the file formats and the quality of service of multimedia
big data systems [18]. To handle multimedia data, three fundamental requirements
must be specified for compression, namely, the video frame size, frame rate, and
synchronization of audio and video, along with the encoding and decoding speeds,
end-to-end delay and data retrieval rate.
The data that are collected and exchanged between smart devices are multimedia
data, which are a complex mixture of audio, video, text, image, and animation. It
is challenging to handle this vast amount of data. Big data techniques are used to

222 Y. H. Jbara
manage the large data that have been obtained from IoT devices and other sources.
Since big data are large and complex, it is challenging to store and retrieve the rapidly
increasing volume of multimedia data from smart devices.
For multimedia big data, substantial problems are encountered after acquisition
from sensors, RFIDs, and interconnected smart devices in storage and processing.
Thus, the compression of multimedia big data is an inevitable process in IoT appli-
cations. The initially acquired data require an effective compression algorithm that
uses time domain or frequency domain methods, to overcome the limitations in
the traditional memory and computational resources. These compression algorithms
face numerous difficulties because of the enormous size, high streaming rate and high
quality of the data, which results from the various types and modalities of acquisition.
The challenging task of storing multimedia data is performed by utilizing one of
the most critical signal processing techniques: data compression. Data compression
is a complex process that involves sequences of several operations. An encoding
operation with an appropriate representation technique removes the redundancy in
the data set, which results in an overall reduction in the size of data. However,
multimedia compression uses various types of tools and procedures to decrease the
file sizes for text, audio, image, video and animation formats. In turn, multimedia
compression reduces the amount of memory that is necessary for storing media files
and reduces the amount of bandwidth that is required for the transmission of media
files.
2.1 Elements and File Formats
Multimedia is a complex type of data, with a combination of audio, animation,
graphics, image, text, and video data. Any IoT application consists of any or all the
multimedia elements.
This section discusses the most important data types that are used in multimedia
big data in IoT applications. This basic information provides the reader with the
necessary background knowledge for understanding the compression techniques and
standards of this big data era.
2.1.1 Text
Text and symbols are fundamental data that are important for communication in any
medium. The forms of text information include ASCII/Unicode, HTML, Postscript,
and PDF. The standard file type for text only is TXT and those for text with other
elements are DOC, DOCX, and PDF [19].

Data Reduction in MMBD Computing 223
2.1.2 Graphics and Images
These are important data elements in IoT multimedia big data computation. The main
sources for image data in IoT are digital still cameras and video cameras. All com-
puters and software compatibly support available file formats such as GIF (Graphics
Interchange Format), TIFF (Tagged Image File Format), JPEG (Joint Photographic
Experts Groups), EPS (Encapsulated PostScript), BMP (Bitmap Image File), PNG
(Portable Network Graphics), and RAW [20]. In this section, we present introductory
information of various image and graphics file formats.
TIFF was developed by Aldus and is best-suited for high-quality prints, pro-
fessional publications, and archival copies. This TIFF file format requires a large
memory space for storage because of its large size. An image that is in this format
can be stored in bi-level (black and white), grayscale, palette (indexed), or RGB (true
color). Compression is optional for TIFF images. Huffman and LZW algorithms are
used for compression. After compression, the file is larger compared to GIF and JPEG
files. TIFF images can be displayed by web browsers using inbuilt plug-ins [21].
Microsoft developed the BMP image file format for their Windows operating
system. Like TIFF, BMP images are of high quality, with or without compression
but require more memory space for storage. This file format is device-independent
and can be displayed by any display by Windows operating systems. The bitmap
file format supports monochrome, 16-color, 256-color, and 224-color images. The
default file extension is .bmp [22].
JPEG is a standardized image compression mechanism. It was devised by the Joint
Photographic Experts Group for compressing either full-color or grayscale images
via a lossy encoding technique. It performs well with photographs and artwork. The
size of the image file is small because it stores 24-bit-per-pixel color data instead of
8-bit. In the last entropy coding stage, quantized DCT coefficients are arranged in a
“zigzag” pattern. A run-length encoding algorithm is employed on similar frequency
groups and inserted length coding zeros. The remaining pixels are encoded using
Huffman coding. It can easily realize a 20:1 compression ratio [23].
GIF is a standard file format that was developed by CompuServ for the storage
and transmission of color raster image information. Since it uses lossy compression
encoding techniques, the resulting files are small and portable. It can also be used
to store screenshots, letters, geometric line drawings, sharp images, and flat color
images. It enables the display of high-quality, high-resolution graphics on any display
using graphics hardware. It has unique features such as animation and transparency.
The file extension is .gif.
The PNG image format was developed by Unisys as an alternative to the GIF
format for storing monochrome images with a color depth of 16-bits per pixel, color
images with a color depth of 48-bits per pixel and indexed images with a palette of
256 colors [24]. Royalties should be paid to the proprietor Unisys by the user. Its
compression ratio exceeds that of GIF by 5–25%. It has gamma correction and error
correction mechanisms, which lead to device independence and integrity. The file
extension is .png.

224 Y. H. Jbara
The EPS file extension is used for the Encapsulated PostScript image file type,
which is a vector file model. It was developed for software applications such as
CORELDRAW. Since this image file format contains vector information, no com-
pression technique can be used. Its file extension is .eps.
The RAW file format represents unprocessed “raw” pixels with the intensity values
and spatial coordinates of the pixels, which is the same as film negative, but in
digital form. This “raw” pixel information is obtained directly from image acquisition
devices such as video camera sensors. In this raw image file, each pixel is associated
with an RGB intensity value. These RGB values undergo a demosaicking process.
Modern digital cameras convert this raw file into a JPEG or TIFF file via proper
software processes and store it in the memory card. This image file format is most
suitable for photography without compression. The file extensions are .raw, .cr2, and
.orf [25].
2.1.3 Audio
Audio can enrich information and strengthen concepts that are presented in the form
of graphics or text. The contents of the presentation will be more informative because
of the associated audio files [26]. The audio formats that are available for multimedia
communication are MP3, WAV, WMA, MIDI, RealAudio, AAC, OGG, and MP4.
MIDI stands for Musical Instrument Digital Interface, which is a software interface
between electronic musical instruments and a personal computer through the sound
card. Like other audio file formats, MIDI files contain not only sound information
but also digital notes and are suitable for playing via electronics. This file format
is efficiently handled by both music hardware and computers, but not supported by
internet web browsers. The file extension is midi.
Real Media devised an audio file format, namely, RealAudio, that enables the
streaming of audio with the file extension.ram or.rm. Unfortunately, web browsers
are unable to handle this file type.
Microsoft developed WMA (Windows Media Audio) exclusively for music play-
ers. It is suitable for Windows computers, but not web browsers. The file extension
is .wma.
Similarly, Apple developed an audio file format, namely, Advanced Audio Coding,
for iTunes. It is suitable for Apple computers, but not web browsers. The file extension
is .acc.
The file format OGG is only supported by MTML5 and has file extension .ogg.
The Xiph.Org Foundation, combined with HTML5, developed this file format.
The famous audio format MP3 is an integral part of the MPEG file format. All
music players can access this audio file format effectively. A file of this format has
a high compression ratio and high quality and is supported by all browsers. The file
extension is .mp3. MP4 is used for both audio and video files and has the extension
.mp4.

Data Reduction in MMBD Computing 225
2.1.4 Video
Videos are widely used to carry information, but require high bandwidth for down-
loading. Video file formats combine a container file and a codec file. The container
file contains bearing all the information about the file structure, along with the type
of codec that is being used. The codec contains the entire procedure for coding and
decoding the video data. The more common types of container formats that are avail-
able in the market are MPEG, MPEG4, AVI, WMV, QuickTime, Real Video, Flash,
and WebM [27]; these formats are briefly described below to facilitate understanding
of the IoT multimedia compression techniques and standards that are described in
the next section.
MPEG, which stands for Moving Picture Expert Group, is an international stan-
dard for both audio and video compression, which is used to create downloadable
movies. It supports all web browsers, but not HTML5. It requires less storage and
bandwidth due to its encoding and decoding processes. The standards are MPEG 1,
MPEG 2, and MPEG 4, which differ in terms of video resolution, frame rate, and bit
rate. MPEG 1 supports SIF video, has resolutions of 352 × 240 pixels at 30 frames/s
for the NTSC system and 352 × 288 pixels at 25 frames/s for the PAL system and
a bit rate of 1.5 Mb/s. The maximum target bit rate of MPEG-2 is between 4 and
9 Mb/s, with a video resolution of 720 × 480 at 30 frames/s. It is compatible with
both the Apple QuickTime Player and the Microsoft Windows Media Player. The
file extension is.mpg or.mpeg. MPEG-4 is specially designed to handle movies in
TV and video cameras. It can easily upload audio and video streams online. More-
over, it also supports HTML 5 and YouTube users. In this format, video and audio
compression is achieved via MPEG-4 video encoding and Advance Audio Coding.
The file extension is .mp4.
The Video Interleave audio format was developed by Microsoft for electronic
devices gadgets such as TVs and video cameras. It performs efficiently on Widows-
based PCs but is not supported by internet browsers. It stores audio and video data
after encoding with different codecs and less compression. Therefore, it is widely
used by internet users. It supports all players, including the Apple QuickTime Player,
Microsoft Windows Media Player, VideoLAN VLC media player and Null soft
Winam on both Windows and Mac platforms. The file extension is .avi.
Microsoft also developed another video file format, namely, Windows Media
Video, which has the file extension.wmv for internet streaming applications. Since
electronic devices such as TV and video cameras are also compatible with the Win-
dows Media Video file format, videos are stored in this format. It also performs
efficiently in Windows-based PCs but is not supported by Internet browsers. After
the installation of a plug-in, Mac and UNIX-based computers can also play this
format [28].
The ASF file format was developed by Microsoft for synchronized streaming
videos. It is available as a container file that consists of WMA (Windows Media
Audio) and WMV (Windows Media Video) with copyrights. It is also available with
many other codecs. It supports still image, text, and metadata. The OS-independent

226 Y. H. Jbara
version is used to deliver multimedia across various protocols. Its file extension is.asf,
which stands for Advanced Streaming Format.
QuickTime is a multimedia technology that was developed by Apple Computer
for producing graphics, sound, and movies. It is also used to store such multimedia
content. It has been developed for wide use on both Mac and PC. It is rarely used on
the internet. The file extension is .mov.
The Real Media developed the RealVideo video file format for the internet. It
allows low bandwidth video stream on the internet with a reduced amount of quality.
Web browsers can’t use this file format. The file extension is.ram. The RealNetworks
created another video file format named RealMedia. To stream the media file over
the internet with audio and video content, RealMedia file format is used. RealMedia
is supported by both Mac and Pcs media players with the file extension .rm.
Flash video format is compact, complex and very common in all browsers. Macro-
media has the ownership of this file format. Flash video format works well and good
in Pcs, Mac, and UNIX platforms. Because of its cross-platform usage, it reaches
all users progressively. It supports both progressive and streaming downloads with
compression. The file extension is .flv.
Macromedia developed the Flash movie format with the inclusion of text, graphics,
and animation. It needs flash plug-in to play in web browsers. So, all the latest web
browsers are preinstalled with this flash plug-in. The file extension is .swf.
The 3GP format is exclusively designed to transfer both audio and video data files
among 3G mobile and the internet. In most of the smartphone acquire videos and
transfer in online using this file format. It is accessible by the “Apple QuickTime
Player, Real Networks Real Player, Video LAN VLC media player, M Player MIK-
SOFT, and Mobile 3GP Converter”, both in mac and windows operating systems.
The file extension is .3gp.
The browser developers “Mozilla, Opera, Adobe, and Google” devised the video
file format named WebM to support HTML5. The file extension is.webm. Theora
Ogg is HTML-5 supported file format and Xiph.Org Foundation is the owner of this
file format. The file extension is .ogg.
2.1.5 Animation
Animation is an illustrative concept of moving graphics. The animation effect
depends on the characteristics of the graphic that is used for the animation. Various
tools, such as Authorware, Dreamweaver, Director, and Flash are used to generate
animations. Flash can animate bitmap graphics and vector graphics; vector animation
files are smaller than bitmap animation files. Open-source tools such as pencil and
blender are also used to create simple 2D animations [29].
Data Reduction in MMBD Computing 227
2.2 QoS—Quality of Service
An essential metric in multimedia networks, real-time multimedia systems, and
distributed multimedia is quality of Service (QoS). QoS may be dynamic and its
purpose is to provide an acceptable level of system performance assurance. QoS
may be established for two general aspects: services and traffic. It is essential to set
the QoS level for the system and require the same QoS level for traffic. The capacity
of a multimedia network is measured according to the level of the guarantee for
satisfying the requirements of service and traffic [30].
The variation in the QoS parameter over time complicates the maintenance of
QoS in distributed multimedia systems. Therefore, we have to monitor the QoS level
continuously and maintain the required QoS level by blocking lower priority tasks
when necessary.
The two types of QoS are currently available in multimedia big data systems and
networks: resource reservation QoS (service) and prioritization QoS (traffic) The
objective of service QoS is to allocate system resources according to the network’s
bandwidth management policy. The traffic QoS assigns system resources according
to the broadcast requirements. Since these QoS types are opposite in nature, any
multimedia system must be designed to use these two QoS types in a coordinated
manner to satisfy the network requirements.
The main application functionalities of a multimedia data system are common
consumer gratification and correct demonstration of the hypermedia artifact to the
user. Starting audio 5 s after video and synchronizing rolling text and a voice-over
are examples of application functionalities. QoS depends on both the application and
the network and is subject to negotiation between system components. A video game
and a web page differ in terms of QoS factors, even though they are both multimedia
applications.
The five categories of distributed multimedia QoS parameters are oriented in terms
of performance, format, synchronization, cost, and user. The end-to-end delay, bit
rate, and jitter are the QoS parameter for performance-oriented category. The format-
oriented QoS parameters are the video resolution, frame rate, and storage format.
The skew between the beginnings of sequences is the synchronization-oriented QoS
parameter. The QoS connection and data transmission charge parameter belong to
the cost-oriented category. The QoS parameters that describe the image and sound
quality are user-oriented QoS parameters. The relative significance of these five
parameter types depends heavily on the multimedia application to be distributed.
The significance of the end-to-end delay differs between noninteractive applications
such as “presentation” and interactive applications such as “conversational”.
QoS factor processing involves the following three linked operations in a multi-
media distributed system:
1. Evaluating the QoS factor that corresponds to customer satisfaction with the
execution performance.
2. Relating QoS factors with the evaluation of system outcomes.
3. Modifying system components to satisfy individual requirements.

228 Y. H. Jbara
3 Principles of Compression Techniques
The fundamental categories of data compression techniques are entropy coding,
source coding, channel coding, and hybrid coding. The main principle of entropy
coding is to ignore the semantics of the data, which falls under the category of lossless
compression. Source coding is a lossy compression technique that compresses the
data based on the semantics of the information. In the communication channel, we
adapted the channel coding, which introduced redundancy during encoding. Hybrid
coding combines entropy and source coding. Each category of compression has
a technique for data reduction. The three techniques of entropy coding are run-
length coding, Huffman coding, and arithmetic coding. Source coding uses two types
of prediction technique: DPCM and DM; two types of transformation techniques:
FFT and DCT; and three types of coding techniques: bit position, subsampling,
and subband coding. Vector quantization is another technique in source coding.
JPEG, MPEG, and H.261 are coding techniques in the hybrid coding category of
compression [31].
3.1 Run-Length Coding
Run-length coding is suitable if a data stream has a long sequence of identical sym-
bols, such as “ABCEEEEEEDACBBBBB”. Figure 1 illustrates the algorithm for
RLE.
Fig. 1 Run-length encoding
algorithm

Data Reduction in MMBD Computing 229
3.2 Huffman Coding
Huffman coding is most suitable for compression if the data stream has more occur-
rences of some symbols than others, as in the example that is shown in Fig. 2. The
fundamental principle is to encode the repeatedly occurring symbols with codes of
shorter length. Figure 2 shows the encoding procedure for Huffman coding. The
resultant coded output is 111001101000.
3.3 Adaptive Huffman Coding
The main limitation of Huffman coding is its dependence on the statistical knowledge
of the data. Since statistical knowledge is not available for live video and audio,
adaptive Huffman coding is better suited for compressing live data. The adaptive
Huffman encoding and decoding algorithm is shown in Fig. 3.
Fig. 2 Huffman encoding procedure
Fig. 3 Adaptive Huffman encoding and decoding algorithm

230 Y. H. Jbara
3.4 Arithmetic Coding
The basic principle of arithmetic coding is to encode frequently occurring symbols
with the minimum number of bits and rarely occurring symbols with higher numbers
of bits. Each symbol of the ensemble narrows the interval between 0 and 1 to reduce
the number of bits. Arithmetic coding assumes an explicit probabilistic model of the
source [32, 33]. Arithmetic coding uses the symbol-wise recursive method, in which a
single data symbol is used for each iteration. It estimates the separation of the interval
between 0 and 1. The entire interval is divided according to the probabilities of the
symbols. For each symbol, this algorithm estimates the interval in one recursion.
Thus, it encodes the data by generating a code string that corresponds to a fractional
value that lies between 0 and 1.
Figure 4 illustrates the arithmetic coding for an ensemble, namely, p(A) = 0.2,
p(B) = 0.3, and p(C) = 0.5, and the code generation is presented in Table 1.
Fig. 4 Code generation for arithmetic coding
Table 1 Arithmetic-coded
outputSymbols Lower bound Upper bound Output
A 0.0 0.2 –
AC 0.1 0.2 –
ACB 0.12 1.15 1
A 0 0.2 –
AA 0 0.02 0

Data Reduction in MMBD Computing 231
3.5 Source Coding
The compression can be very efficiently performed on frequency domain data, com-
pared to time domain counterparts. In this compression method, the original time
domain data are transformed into their frequency domain counterparts via FFT and
DCT. Subband source coding compresses only the critical frequency ranges of the
data stream and discards the other frequency ranges. This method is used in vocoder
for speech communication [34].
The simple audio compression systems are G.711, G.722, and G.723. The G.711
audio coding scheme uses pulse code modulation (PCM) with 64 kbps. The G.722
audio coding scheme uses delta pulse code modulation (DPCM) with data rates of
48, 56, and 64 kbps. The G.723 audio coding scheme uses Multi-pulse maximum
likelihood quantizer data rates of 6 to 3 kbps and algebraic codebook excitation linear
prediction (ACELP) rates of 5 to 3 kbps.
Video and audio conferencing compression methods that are used currently are
G.728, AV.253, and IS-54. The G.728 scheme is employed using the low delay code
excited linear prediction (LD-CELP) coding with a coding speed of 16 kbps and a
duration of less than 2 ms. This complex CODEC algorithm requires 40 MIPS to
complete coding and decoding. The coding speed of AV.253 is 32 kbps. IS-54 uses
VSELP with a coding speed 13 kbps. It performs well on voice data and poorly on
music.
The two types of coding methods for mobile telephone networks are RPE-
LTP (GSM) and GSM half-rate coders. RPE-LTP (GSM) stands for regular pulse
excitation—long-term predictor. Its coding speed is 13 kbps and it is used for speech
communication in European GSM networks. The coding speed range of GSM half-
rate coders is 5.6–6.25 kbps.
JPEG stands for Joint Photographic Expert Group, which developed this compres-
sion standard with the joint support of ISO/IEC JTC1/SC2/WG10 and Commission
Q.16 of CCITT SGVIII. It is an international standard for the coding and compres-
sion of both grayscale and color images with a compression ratio of 10:1. JPEG is a
common compression system. It does not depend on the image resolution, image or
pixel aspect ratio, color coordinate system, image complexity, or statistical charac-
teristics. It is a clear interchange format of encoded data that is implemented in both
software and hardware. MOTION JPEG is used for video compression by encoding
image sequences.
4 Image Compression Standards
IoT-enabled digital imaging devices, such as scanners and digital cameras, produce a
massive amount of image data, which motivates the development of image compres-
sion standards for efficient processing and storage. The JPEG standards are JPEG,
JPEG XT, JPEG-LS, JPEG 2000, JPEG XR, JBIG, AIC, JPSearch, JPEG Systems,

232 Y. H. Jbara
JPEG XS, and JPEG Pleno. In this section, we demonstrate that the JPEG STAN-
DARD, which is the wavelet-based JPEG 2000 standard, which is more efficient in
compressing IoT multimedia big data.
4.1 JPEG Standard
The Joint Photographic Experts Group developed the JPEG standard for the efficient
compression of images in 1992, which was the result of continuous efforts that
began in 1986. They released the latest version of JPEG in 1994. JPEG is a lossy
compression method, in which a high compression ratio was realized by discarding
some visual information [35]. This loss of information did not affect the visual quality
of the natural scene images. This will have an effect in medical images. In the JPEG
compression standard, the reconstructed image is not an exact replica of the original
image. The compressed output data stream is produced from the input image, with a
continuous process of DCT, quantization and binary encoding on 8 × 8-pixel blocks.
The five functional steps of the JPEG image compression technique are color
space conversion, spatial subsampling, DCT, quantization, and coding, as illustrated
in Fig. 5. In the first stage, the RGB image is converted into Y, Cb, Cr. In the second
stage, the Cb and Cr image components are subsampled separately with a size of
2 × 2 pixels. In the third stage, the spatial domain data are converted into their
frequency domain counterparts by applying 2D DCT on Y, Cb, Cr individually.
The frequency domain information is quantized in the fourth phase and, finally, the
quantized frequency domain information is encoded using Huffman coding.
The JPEG encoding process is illustrated in detail in Fig. 6. The processes that are
involved in encoding are the color transform, 8 × 8 DCT, uniform scalar quantization,
DPCM, zigzag scan, variable-length coding, run-length coding, and marker insertion.
Finally, the compressed data of the input image are output as a JPEG file.
4.1.1 Color Transform and Level Offset
The transformation matrix that is presented as Eq. 1 is used to convert the color image
from RGB format to YUV format, which represents the luminance and chrominance
Fig. 5 Functional steps of JPEG image compression
Data Reduction in MMBD Computing 233
Fig. 6 JPEG algorithm encoding
images. The proper level offset of [0, 128, 128] is also added to the resultant trans-
formed image, namely, YUV. In addition, the further U and V images are subsampled
to reduce the bit rate.
vTi =
⎛
⎝
0.299 0.587 0.114
−0.1687 −0.3313 0.5
0.5 −0.4187 −0.0813
⎞
⎠uTi +
⎛
⎝
0
128
128
⎞
⎠. (1)
4.1.2 Discrete Cosine Transform
The 2D DCT transforms the pixels in f (x, y) to the corresponding DCT coefficients,
which are denoted as F(u, v) via Eq. 2. The chrominance and luminance images
are divided into subimages of size 8 × 8. Then, DCT is performed on each 8 × 8
data matrix separately. Figure 7 presents the 8 × 8 subimage and its DCT coefficient
matrix. The value in the upper left corner of the DCT coefficient matrix is the total
signal energy. All other coefficients represent the high-frequency components of the
image, which contain negligible amounts of visible information and can be discarded
with a small amount of distortion. The forward transform of block fb is expressed in
Eq. 2.
Fb(u, v) =C(u)
√
N/
2
C(v)√
N/
2
N−1∑
x=0
N−1∑
yo0
fb(x, y) cos(2x + 1)uπ
2Ncos
(2y + 1)vπ
2N
(2)
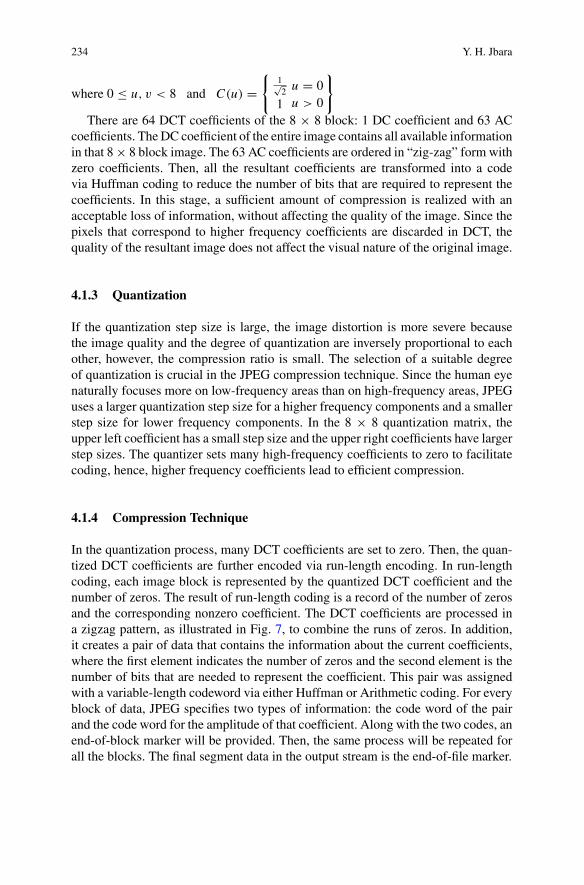
234 Y. H. Jbara
where 0 ≤ u, v < 8 and C(u) =
{
1√2
1
u = 0
u > 0
}
There are 64 DCT coefficients of the 8 × 8 block: 1 DC coefficient and 63 AC
coefficients. The DC coefficient of the entire image contains all available information
in that 8 × 8 block image. The 63 AC coefficients are ordered in “zig-zag” form with
zero coefficients. Then, all the resultant coefficients are transformed into a code
via Huffman coding to reduce the number of bits that are required to represent the
coefficients. In this stage, a sufficient amount of compression is realized with an
acceptable loss of information, without affecting the quality of the image. Since the
pixels that correspond to higher frequency coefficients are discarded in DCT, the
quality of the resultant image does not affect the visual nature of the original image.
4.1.3 Quantization
If the quantization step size is large, the image distortion is more severe because
the image quality and the degree of quantization are inversely proportional to each
other, however, the compression ratio is small. The selection of a suitable degree
of quantization is crucial in the JPEG compression technique. Since the human eye
naturally focuses more on low-frequency areas than on high-frequency areas, JPEG
uses a larger quantization step size for a higher frequency components and a smaller
step size for lower frequency components. In the 8 × 8 quantization matrix, the
upper left coefficient has a small step size and the upper right coefficients have larger
step sizes. The quantizer sets many high-frequency coefficients to zero to facilitate
coding, hence, higher frequency coefficients lead to efficient compression.
4.1.4 Compression Technique
In the quantization process, many DCT coefficients are set to zero. Then, the quan-
tized DCT coefficients are further encoded via run-length encoding. In run-length
coding, each image block is represented by the quantized DCT coefficient and the
number of zeros. The result of run-length coding is a record of the number of zeros
and the corresponding nonzero coefficient. The DCT coefficients are processed in
a zigzag pattern, as illustrated in Fig. 7, to combine the runs of zeros. In addition,
it creates a pair of data that contains the information about the current coefficients,
where the first element indicates the number of zeros and the second element is the
number of bits that are needed to represent the coefficient. This pair was assigned
with a variable-length codeword via either Huffman or Arithmetic coding. For every
block of data, JPEG specifies two types of information: the code word of the pair
and the code word for the amplitude of that coefficient. Along with the two codes, an
end-of-block marker will be provided. Then, the same process will be repeated for
all the blocks. The final segment data in the output stream is the end-of-file marker.

Data Reduction in MMBD Computing 235
Fig. 7 Luminance quantization table (left) and the quantized DCT coefficients (right)
4.2 JPEG Compression Modes
The JPEG standard employs four modes of compression techniques to compress
effectively all types of images: sequential, progressive, lossless and hierarchical.
JPEG employs both Huffman and Arithmetic encoding procedures with either 8- or
12-bit resolution. Figure 8 illustrates the compression modes that are associated with
the encoding techniques.
In the sequential mode of compression, images are encoded from top to bottom
with precisions of 8 and 12 bits. In a single scan, each color component is encoded.
Fig. 8 JPEG operation modes

236 Y. H. Jbara
The sequential mode uses both Huffman encoding and arithmetic coding. In the pro-
gressive compression mode, several scans are employed for encoding image modules.
The first scan produces a coarse style of the image and the subsequent scans produce
progressively smoother versions of that image. Each component scanned a minimum
of 2 and a maximum of 896 times. The lossless compression mode produces an exact
replica of the original image with a small compression ratio. It is used much less
frequently and is more suitable for the compression of medical images.
In the hierarchical compression mode, frames are created from the image by
dividing the entire image into subimages. Each frame contains more than one scan
of the image. The first frame generates a low-resolution version of the image and the
remaining frames generate higher resolution versions of the same image.
4.2.1 JPEG Compressed Data Format
Figure 9 illustrates the JPEG compressed data format. Each data format starts with
SOI and ends with EOI. In between SOI and EOI, various scans of the same frame
with the frame header are available. The arrangement of a simple compressed image
data format corresponds to a frame that begins with the frame header. The table
information is provided before the frame header. In between SOI and EOI, scan-
ning information is provided. The define number of lines (DLN) segment separates
successive scans.
4.2.2 Decompression of JPEG
The block diagram shown in Fig. 10 provides a detailed functional description of
the reconstruction procedure for a compressed JPEG image. This system is the exact
reverse of the JPEG compression algorithm.
In the first step, the compressed data stream is applied to the table construction
phase, from which the quantization table, DC Huffman table, and AC Huffman table
are reconstructed. The decoded header information is used to determine the size and
precision of the decompressed image. The DC and AC codes that belong to each
8 × 8 block are separated from the compressed data stream. The DC is decoded
by retrieving the DC coefficient from the DC Huffman table. The sum of the DC
coder value and the DC value of the previous block is obtained from the output
of IDPCM, which is used as input to the subsequent operations. Similarly, the AC
coefficient is retrieved from the AC code via decoding using the Huffman table [36].
The unzigzag operation restores the exact AC coefficient in 8 × 8 block size. After
the dequantization, IDCT reconstructs replica of the original image that is inexact
due to the quantization error. The chrominance and luminance images from IDCT are
added with the offset value and converted into RGB format, as illustrated in Fig. 11.

Data Reduction in MMBD Computing 237
Fig. 9 Simple compressed image data format
Fig. 10 JPEG decompression structure

238 Y. H. Jbara
Fig. 11 Color inverse transformation at the decoder
4.3 JPEG 2000
The overall performance of the JPEG standard depends on the f bit rate that is
employed for compression, the acceptable amount of data loss and the noisy nature
of the communication channel. JPEG is most suitable at high and moderate bit rate,
but performs poorly for low bit rates. The wavelet decomposition that is used in
JPEG 2000 overcomes the shortcomings of the JPEG standard. It is a collaborative
achievement of JPEG with ISO and IEC. The embedded block coding with optimized
truncation (EBCOT) algorithm enhances the JPEG 2000 standard to realize supe-
rior compression compared to JPEG. The compressed bits stream has resolution and
SNR scalability and random access. The main features are lossless and lossy com-
pression, protective image security, region-of-interest coding, and, robustness to bit
errors. JPEG 2000 provides higher quality compression using the lossy compression
technique at low bit rates. The progressive decoding provides lossless compression.
JPEG 2000 protects images with watermarking, labeling, stamping or encryption.
The region-of-interest coding technique yields a higher degree of compression with
low information loss. The coded bitstream is more robust to transmission errors due
to the use of error-resilient tools.
4.3.1 JPEG 2000 Codec
The compression system for the JPEG 2000 standard is illustrated in Fig. 12. The
encoding process consists of preprocessing, forward transform, quantization, and
entropy coding, similarly to other compression standards. The unique feature of this
standard is that each subband has a different step size for the process of quantization
and we can skip quantization to achieve lossless compression in the case of medical
images [37]. Another significant advantage of this standard is the use of bit plane
coding in the process of entropy coding, which assigns high coding priority to the

Data Reduction in MMBD Computing 239
Fig. 12 JPEG 2000 compression engine
MSB plane compared to the other bit planes. In arithmetic coding, this standard
encodes the data stream via a context-based approach. This provides higher quality
scalability by decoding the bit pane partially. The decoding begins from the MSB
bit plane. The quantization step is repeated after discarding the 1-bit plane from the
decoding process.
The three preprocessing steps are image tiling, color transformation, and DC level
shifting. Among these, image tiling and color transformation are optional for each
image component [38]. The sample of each image component is subtracted from the
same quantity in DC level shifting. The color transformation transforms RGB into
Y, Cb, Cr.
Forward Transform
In this standard, the image is decomposed into multiresolution subbands via the dis-
crete wavelet transform (DWT), which is also an important component of the JPEG
2000 standard. The low-pass samples represent a down-sampled, low-resolution ver-
sion of the original set and the high-pass samples represent a down-sampled residual
version of the original set (details). The 2D DCT decomposed the image into four
frequency levels: LH, HL, HL, and HH. These spectral subbands differed from one
another in terms of visual quality. The HH subband contains the low-frequency infor-
mation and LH contains the high-frequency information of the horizontal details. The
high-frequency information of the vertical details is available in the HL subband and
HH contains the high-frequency information of the diagonal details.
240 Y. H. Jbara
Quantization
After transformation, all coefficients are quantized via scalar quantization. The quan-
tization reduces the precision of the coefficients. The operation is lossy unless the
quantization step size is 1 and the coefficients are integers. The quantization formula
is presented below.
qb(u, v) = sign(ab(u, v))|ab(u, v)|
�b
(3)
where
qb(u, v) is the quantized value
ab(u, v) is the transform coefficient of subband b
�b is the quantization step size
|ab(u, v)| is the largest integer that does not exceed ab.
Modes of Quantization
Quantization is achieved by two modes: the integer mode and the real mode. The
integer-mode quantization uses integer-to-integer transforms, a fixed quantization
step and bit plane discarding. The real mode uses real-to-real transforms, a rate
control-based-quantization step and bit plane discarding [39].
The entropy encoder encodes each code block individually. As illustrated in
Fig. 13, each subband is split into several precincts, which are rectangular. The
three spatially consistent rectangles comprise a packet. The code block is created
after further dividing the precinct into nonoverlapping rectangles. The code blocks
in a packet are scanned in raster order. The values of a code block are converted to
bit planes [40]. The MSB of each coefficient in the code block is coded via entropy
coding. The code blocks, precincts, and packets that are used in JPEG 2000 and the
entire process of a single code block are illustrated in Fig. 13.
JPEG 2000 Bitstream and Layers
JPEG 2000 generates an individual stream of codes for each code block, which is
contained within a packet. In multilayer encoding of an image, all the encoded data
that correspond to a code block are disseminated through packets that correspond to
various layers. Figure 14 illustrates the JPEG 2000 bitstream and the structure of the
layer [41].

Data Reduction in MMBD Computing 241
Fig. 13 Code blocks, precincts and packets and code block processing
Fig. 14 JPEG 2000 bitstream and the structure of the layer
4.4 H.261 Standard
ITU-T recommended H261 for video compression in video conferencing and video
telephony over ISDN lines, in combination with standards H221, H230 H242, and
H320, during the period 1988–1990. It performs the decoding and encoding at the
rate of p* 64 kbps (the range of p is 1–30). It defines the various components in a video
conferencing system. It achieves a high compression ratio by removing both spatial
and temporal redundancies of video sequences. It supports the common intermediate
format (CIF) with an image resolution of 352 × 288 pixels and quarter CIF (QCIF)
with an image resolution of 176 × 144 pixels, with a maximum frame rate of 30
frames per second. The frame rate can be reduced based on the application and
bandwidth availability. The input images are coded as a luminance and two color
difference components (Y, Cb, Cr). The luminance matrix is double the size of the
Cb and Cr matrices [42]. The encoded sequence consists of one I-frame (intra-frame)
followed by three consecutive P-frames (inter-frames), as illustrated in Fig. 15. JPEG
is used for I-frames and P-frames use pseudo differences from previous frames.

242 Y. H. Jbara
Fig. 15 Encoding sequence
The H.261 encoder is composed of three main steps: Prediction, Block transfor-
mation and Quantization & Entropy Coding.
In the prediction step, H261 uses both intra-coding and inter-coding. The resultant
coded image is passed to the block transformation step, along with the prediction
error. In the block Transformation step, the 8 × 8 block that is received from the
prediction step, which consists of both coded frames and the prediction error, is
subjected to the two-dimensional FDCT algorithm for conversion into a coefficient
matrix. In the last step, quantization and entropy coding are applied to the DCT coef-
ficients, which provides additional compression. Motion vector search, propagation
of errors and bit-rate control are the three important, challenging issues in the H.261
standards.
4.4.1 Bitstream Structure
The bitstream structure of compression standard H.261 is illustrated in Fig. 16.
The boundaries between pictures are designated with picture start code (PSC). The
timestamp for each picture is indicated with a temporal reference (TR). The picture
type (PType) is used to specify the type of frame as either P-frame or I-frame [37].
Fig. 16 Encoding sequence

Data Reduction in MMBD Computing 243
The group of blocks (GOB) component of the bitstream indicates the separation of
the picture into 11 × 3 macroblock regions. The group number (Grp #) indicates
whole groups that should be skipped and the group quantization value (GQuant)
indicates the single quantization value for the whole group.
5 Conclusions
The Internet of Things technology has generated a radical increase in the production
of multimedia big data and is likely to transform enterprises, industries, and homes
globally. The resultant tremendous amount of multimedia data has caused a scarcity
of storage and a shortage in bandwidth for transmission, processing and receiving. It
is essential and inevitable to develop methods for influencing the usage trajectory of
the Internet of Things. The combined effort of researchers and scientists is necessary
for the development of effective compression techniques for handling the tremendous
amount of multimedia big data that is available in IoT.
This chapter, which is devoted to the compression of IoT multimedia big data,
contains technical information that was obtained via the combined effort of many
writers, academic investigators, technical investigators, scientific societies, software
organizations, and professionals from various geographical areas. Exploring these
technical details has motivated the recent research by the students and scientists
who are working in this area. This effort also provides the opportunity to exchange
knowledge between scientists and various technical societies.
In addition, this effort provides proper guidance for scholarly societies who are
supporting the IoT industry and the processing and compression of multimedia big
data from IoT applications. Almost all experts unanimously agree that compression of
multimedia big data is an important and unavoidable requirement for the assurance of
an excellent QoS in all multimedia applications. Almost all compression techniques
that are used on multimedia big data currently can be applied to multimedia big data
from a variety of IoT-enabled sources.
We have confidence that research on multimedia compression will yield optimal
performance for all encoders that are applied to multimedia big data. Actions are
already being taken by scientific societies on improving compression standards. IoT
systems must accommodate the specifications of multimedia big data so that they can
be incorporated into an international standard. This will provide assurance regarding
the durability of multimedia big data. In addition, preprocessing and postprocessing
techniques improve the quality of multimedia big data.
The compression of multimedia big data is now unanimously acknowledged
as compulsory for enhancing the availability of bandwidth and storage require-
ments. Therefore, all compression standards and techniques can be applied to mono-
dimensional, two-dimensional and multidimensional multimedia big data. It is also
important to consider the security of multimedia big data during compression because
IoT information is freely transmitted over the internet. We are confident that our pre-
sentation in this chapter properly guides scientists, scholars, and IoT professionals
in conducting additional research in the area of multimedia big data compression.

244 Y. H. Jbara
References
1. L. Atzori, A. Iera, G. Morabito, The Internet of Things: a survey. Comput. Netw. 54, 2787–2805
(2010)2. D. Evans, The Internet of Things: how the next evolution of the internet is changing everything
(2011)3. S. Kumari, S. Tanwar, N. Tyagi, M. Kumar, K.K.R. Maasberg, Choo multimedia big data com-
puting and Internet of Things applications: a taxonomy and process model. J. Netw. Comput.
Appl. 124, 169–195 (2018)4. F.H. George, V. Jeffrey, W.M. Keith, The Internet of Things: a reality check. IEEE Comput.
Soc. 14(3), 56–59 (2012)5. The Statistics Portal. Internet of Things (IoT) connected devices installed base worldwide from
2015 to 2025 (in billions) (2017), https://www.statista.com/statistics/471264/iot-number-of-
connected-devices-worldwide/6. IDC. Internet of Things Market Statistics (2016), http://www.ironpaper.com/webintel/articles/
internet-of-things-market-statistics/7. A. Kumari, S. Tanwar, S. Tyagi, N. Kumar, Fog computing for healthcare 4.0 environment:
opportunities and challenges. Comput. Electr. Eng. 72, 1–13 (2018)8. L. Jie et al., A survey on Internet of Things: architecture, enabling technologies, security and
privacy, and applications. IEEE Internet of Things J. 99, 1 (2017)9. S. Tanwar, P. Patel, K. Patel, S. Tyagi, N. Kumar, M.S. Obaidat, An advanced internet of
thing based security alert system for smart home, in International Conference on Computer,
Information and Telecommunication Systems (IEEE CITS-2017), Dalian University, Dalian,
China, 21–23 July 2017, pp. 25–29 (2017)10. D.X. Li, H. Wu, L. Shancang, Internet of Things in industries: a survey. IEEE Trans. Ind.
Inform. 10, 2233–2243 (2014)11. L. Yu, Y. Lu, X. Zhu, Smart hospital based on Internet of Things. J. Netw. 7, 1654–1661 (2012)12. P. Mark, G. Eric, C. Ryan, F. Samantha, W. Leon, C. Hsinchun, Uninvited connections: a
study of vulnerable devices on the Internet of Things (IoT), in Proceedings of the 2014 IEEE
Joint Intelligence and Security Informatics Conference (JISIC), The Hague, The Netherlands,
pp. 232–235 (2014)13. W. Zhu, P. Cui, Z. Wang, G. Hua, Multimedia big data computing. IEEE Multimedia 22(3),
96–106 (2015)14. S.-C. Chen, R. Jain, Y. Tian, H. Wang, Special issue on multimedia: the biggest big data. IEEE
Trans. Multimed. 1 and 17, 1401–1403 (2015)15. M.K. Jeong, J.-C. Lu, X. Huo, B. Vidakovic, D. Chen, Wavelet based data reduction techniques
for process fault detection. Technometrics 48(1), 26–40 (2006)16. M. Chen, S. Mao, Y. Liu, Big data: a survey. Springer Mob. Netw. Appl. J. (MONET) 19(2),
171–209 (2014)17. M. Chen, S. Mao, Y. Zhang, V.C. Leung, Big data: related technologies, challenges and future
prospects (Springer, New York, NY, 2014)18. K. Wang, J. Mi, C. Xu, L. Shu, D.-J. Deng, Real-time big data analytics for multimedia transmis-
sion and storage, in Proceedings of IEEE/CIC International Conference on Communications
in China (ICCC), Chengdu, China, pp. 1–6 (2016)19. S.A. Hyder, R. Sukanesh, An Efficient Algorithm for Denoising MR and CT Images Using Digi-
tal Curvelet Transform. Springer Advances in Experimental Medicine and Biology—Software
Tools and Algorithms for Biological Systems, vol. 696, Part 6, pp. 471–480 (2011)20. A. Yassine, A.A.N. Shirehjini, S. Shirmohammadi, Bandwidth on demand for multimedia big
data transfer across geo-distributed cloud data centers. IEEE Transa. Cloud Comput. PP(99),
1 (2016)21. D. Ren, L. Zhuo, H. Long, P. Qu, J. Zhang, MPEG-2 video copy detection method based
on sparse representation of spatial and temporal features, in Proceedings of IEEE Second
International Conference on Multimedia Big Data (BigMM), Taipei, Taiwan, pp. 233–236
(2016)

Data Reduction in MMBD Computing 245
22. A. Paul, A. Ahmad, M.M. Rathore, S. Jabbar, Smartbuddy: defining human behaviors using
big data analytics in social Internet of Things. IEEE Wirel. Commun. 23(5), 68–74 (2016)
23. JPEG 2000 image coding system—Part 8: JPSEC Final Committee Draft—Version 1.0,
ISO/IEC JTC1/SC29/WG1N 3480 (2004)
24. J. Yosef, S.A. Hyder, An efficient artifact free denoising technique for MR images relying on
total variation based thresholding in wavelet domain. ICGST J. Graph. Vis. Image Process.
18(1) (2018)
25. JPEG 2000 image coding system—Part 1: Core Coding System, ISO/IEC JTC 1/SC 29/WG 1
15444–1
26. T. Ebrahimi, C. Christopoulos, D.T. Lee, Special issue on JPEG-2000. Image Commun. J.
17(1) (2002)
27. T. Ebrahimi, D.D. Giusto, Special section on JPEG2000 digital imaging. IEEE Trans. Consum.
Electr. 49(4), 771–888 (2003)
28. JPEG 2000 image coding system—Part 9: Interactivity tools, APIs and protocols, ITU-T Rec-
ommendation T.808, ISO/IEC 15444–9, July 2004
29. S. Pouyanfar, Y. Yimin, C. Shu-Ching, S. Mei-Ling, S.S. Iyengar, Multimedia big data analytics:
a survey. ACM Comput. Surv. 51(1), Article 10, 34 (2018), https://doi.org/10.1145/3150226
30. C.A. Bhatt, M.S. Kankanhalli, Multimedia data mining: state of the art and challenges. Mul-
timed. Tools Appl. 51(1), 35–76 (2011)
31. C. Min, A hierarchical security model for multimedia big data. Int. J. Multimed. Data Eng.
Manage. 5(1), 1–13 (2014)
32. S. Kaneriya, S. Tanwar, S. Buddhadev, J.P. Verma, S. Tyagi, N. Kumar, S. Misra, A range-
based approach for long-term forecast of weather using probabilistic markov model, in IEEE
International Conference on Communication (IEEE ICC-2018), Kansas City, MO, USA, 20–24
May 2018, pp. 1–6 (2018)
33. C. Shu-Ching, Multimedia databases and data management: a survey. Int. J. Multimed. Data
Eng. Manage. 1(1), 1–11 (2010)
34. C. Ming, S. James, J. Zhanming, Connection discovery using big data of user-shared images
in social media. IEEE Trans. Multimed. 17(9), 1417–1428 (2015)
35. O.H. Ben, W. Matthew, JPEG compression, in Student Projects in Linear Algebra, ed. by D.
Arnold (2005). Accessed 2009
36. P. Penfield, Chapter 3: compression, in Notes (MIT, 2004). Accessed 6 Sept 2009
37. P. Charles, Digital video and HDTV: algorithms and interfaces, in The JPEG Still Picture
Compression Standard, ed. by G.K. Wallace. Communications of the ACM, 1 April 1991,
pp. 30–44 (1991)
38. J. Yosef, Principal component analysis based multimodal medical image fusion of MRI and
CT in wavelet domain, in Transactions on Mass-Data Analysis of Images and Signals, Vol. 9,
no. 1, pp. 17–30, September (2018). ISSN: 1868–6451
39. T.P. Mahsa, D. Colin, A. Maryam, N. Panos: HEVC: the new gold standard for video compres-
sion. IEEE Consum. Electr. Mag. pp 36–46 (2012)
40. O.-R. Jens, J.S. Gary, S. Heiko, K.N. Thiow, W. Thomas, Comparison of coding efficiency of
video coding standards—including high efficiency video coding (HEVC). IEEE Trans. Circuits
Syst. Video Technol. 22(12), 1669–1684 (2012)
41. K.R. Rao et al., Video Coding Standards, Signals and Communication Technology (Springer
Science Business Media, Dordrecht, 2014), https://doi.org/10.1007/978-94-007-6742-3_2
42. W. Raymond, F. Borko, Real-Time Video Compression—Techniques and Algorithms, vol. 376,
1st edn. (Springer Science Business Media, Dordrecht, 1997)

Large-Scale MMBD Management
and Retrieval
Manish Devgan and Deepak Kumar Sharma
Abstract This chapter explores the field of Multimedia Big Data management and
retrieval. Multimedia data is a major contributor to the big data bubble. Therefore,
we require separate databases for storing and managing it, hence, the chapter covers
all the requirements of a Multimedia DBMS. Multimedia data modelling has also
been covered since multimedia data is mostly unstructured. Further, the chapter
covers the annotation and indexing techniques that help manage the large amount
of multimedia data and finally followed by a detailed description about different
databases that can be used for storing, managing and retrieving the Multimedia Big
Data. Different databases such as SQL and No-SQL approaches are discussed such
as Graph, Key-Value DBs, Column Family, Spatio-temporal Databases.
Keywords Big data · Database management · Storing multimedia data · Indexing
of MMBD · Performance and retrieval capacities · Different databases · Graph
DBs · Spatio-temporal · Data modelling
1 Introduction
In the recent years, with the emergence of mobile and internet technologies, the world
has seen a massive growth in the use of multimedia such as video, images, text and
audio, etc., and this has resulted in a big revolution in multimedia data management
systems (Wikipedia.com 2018). With the emergence of new technologies and the
advanced capabilities of smartphones, smart televisions and tablets, people, espe-
cially younger generations, spend a lot of time on the internet and social networks
to communicate with others to share information [1]. This information can be in the
M. Devgan · D. K. Sharma (B)
Division of Information Technology, Netaji Subhas University of Technology, (Formerly Known
as NSIT), New Delhi, India
e-mail: [email protected]
M. Devgan
e-mail: [email protected]
© Springer Nature Singapore Pte Ltd. 2020
S. Tanwar et al. (eds.), Multimedia Big Data Computing
for IoT Applications, Intelligent Systems Reference Library 163,
https://doi.org/10.1007/978-981-13-8759-3_9
247

248 M. Devgan and D. K. Sharma
form of text, audio, image or even video graphics. This vast amount of information
is called ‘big data’.
Unlike traditional alphanumeric data, multimedia data is usually unstructured and
noisy. Conventional data analysis is not a feasible mode to handle this huge amount
of complex data. Therefore, more comprehensive and sophisticated solutions are
required to manage such large and unstructured multimedia data.
The biggest challenge of big data analytics is how to reduce the time consumed to
store and manage this data while producing accurate results from the datasets. Multi-
media big data explains what is happening in the world, emphasizes hot daily news,
shows special events and can be used to predict people’s behaviour and preferences.
In this book chapter, we first introduce the basics of Multimedia data and the
emergence of Big Data in Multimedia. We discuss the requirements that are essential
for a Multimedia Database Management System to function properly and produce
efficient results. Further, the chapter covers the annotation and indexing techniques
that help manage a large amount of multimedia data. Finally, a detailed description
of the databases that can be put to use for storing, managing and retrieving the
Multimedia Big Data. The aim of the chapter is not just to make the reader understand
the concept of managing the data but also to allow them to question the possibilities
of improving the already available methods.
1.1 What Comprises Multimedia Data
‘In computation, data is information that has been translated into a form that is
efficient for movement or processing, Relative to today’s computer systems and
transmission media, data is information that has been converted into digital form’. It
is acceptable for data to be used as a singular subject or plural subject. Raw data is
the term that is mostly used to designate data in its most primitive form. Data is, as of
today, one of the most important factors that define the company’s value. The better
data collection and processing is applied the better is the outcome of the product or
project.
Terms like ‘data processing’ and ‘electronic data processing’ have made data a big
influence in the field of business computing, which for a time, came to encompass
the full gamut of what is now known as information technology. With the advent
of computational statistics in corporate world, a distinct data profession termed as
corporate data processing emerged.
Currently, we no longer just communicate using text as the only source of com-
munication. There are multiple media that we can use to transmit the information.
Multimedia data is a term that is composed of ‘Multimedia’ and ‘Data’, Multimedia
is further a split of ‘Multiple Media’, that can be used for transmission and Data
is the statistic collected that will be processed and analysed. Multimedia data can
comprise of any one or more of the following media such as text, audio, still images,
animation, video or other types of media.

Large-Scale MMBD Management and Retrieval 249
Multimedia data can be stored, easily recorded, displayed and even interacted
with or accessed by multimedia processing devices, and can also be a part of live
performance. Currently, most of the electronic devices are capable of all multimedia
functionalities. Multimedia is refining the way we share and interact with data. In
contrary to how we share them, it also affects our decisions since products and
companies use data analytics on multimedia data to predict future and provide a
better solution to our queries.
1.2 Big Data in Multimedia
Data is, as stated above, information that has been translated into a form that is
efficient for movement or processing. With the advent of mobile technology and
Internet, there has been a rapid increase in the amount of multimedia data that humans
have produced in a very few times. Today, we generate over 2.5 quintillion bytes of
data everyday which consists of text, audio, video and other types of multimedia
data, which is shared on data sharing and social media platforms such as Facebook,
Instagram and more (IBM, 2013). The increase in the use of Internet of Things
(IOT) products are also contributing to the increasing rate of data being produced
and dumped over the internet every single moment.
According to recent studies and surveys, around 527,760 images are shared on
Snapchat every minute of the day, which is an image sharing platform service popular
nowadays [2]. More than 120 people register every minute on LinkedIn, people watch
over 4M YouTube videos every minute and post around 50k images on Instagram,
an online social media platform (Koetsier, n.d.)
The above facts are enough to develop an understanding of the amount of data
being dumped onto the server farms every day. Most of this data is image and video
data and rarely comprise of texts. So, we can easily attach the term ‘Big’ with Mul-
timedia Data. Big data is often characterized by the Five V’s, which are Velocity,
Volume, Value, Variety, and Veracity. These characteristics make the big data differ-
ent from ‘data’ (Fig. 1).
In the next section, we will study about the requirements that a Multimedia
Database Management System must have.
2 Requirements of a MMDBMS
There exist not many differences in the requirements for a Multimedia Database
Management System (MMDBMS) than a regular Database Management System
(DBMS). MMDBMS works alike a DBMS that is used for storing, accessing and
managing the data.

250 M. Devgan and D. K. Sharma
Fig. 1 Five V’s of big data
There are several properties that serve as the basic requirements of a DBMS but
additional capabilities such as the managing huge data, query support and intractabil-
ity with multimedia data is defined as MMDBMS. Let us define the traditional capa-
bilities in the section below.
2.1 Traditional Capabilities
Any MMDBMS should be able to serve as a regular DBMS before it can cater to the
needs of multimedia data. It must have the basic capabilities as displayed by software
such as Oracle (Oracle.com, 2018), FoxPro (VisualFoxPro, 2018), SQL Server, etc.
A list of basic DBMS capabilities is listed below.
• Providing Data Definition Capabilities
– Defining a DDL and providing a User-Accessible catalogue
• Providing facilities for storing, retrieval and updating data
– Defining a Data Manipulation Language
• Supporting multiple views of data
– An interacting application must see only the required information
• Providing facilities for specifying integrity constraints
Large-Scale MMBD Management and Retrieval 251
– General Constraints
– Primary key constraints
– Secondary Key Constraints
• Controlling access to data
– Preventing unauthorized access to the stored data
• Concurrency Control
• Supporting Transactions
• Database recovery and maintenance
– Bringing data back to the consistent state in case of system failure
– Unloading, reloading, validation etc.
The features defined above are the basic functionalities that a DBMS must possess.
A MMDBMS must have other multimedia and big data-specific features as well such
as data modelling, huge capacity storage.
2.2 Multimedia Data Modelling
Before we understand the use of data modelling when dealing with multimedia data,
we first need to understand what exactly is data modelling? Why is it needed? How
is it related to multimedia?
What is Data Modelling?
Data modelling is a software engineering concept of processing raw data to make a
data model for any information system using some or the other formal techniques.
A data model is a modelling technique, i.e. organizes the elements of data and stan-
dardize as to how they relate to each other and to the real world [3].
Need for Data Modelling?
Data modelling techniques and methodologies are used to model data in a consistent,
standard, predictable manner in order to manage it as a valuable resource. Any project
that requires a standard means of defining and analysing the must follow set defined
data modelling standards, which are [3]:
• Assisting programmers, business analysts, manual writers, testers, IT package
selectors, engineers, managers, related organizations and clients to understand
and use an agreed semi-formal model;
• Managing data as a resource;
• Integrating information systems;
• Designing databases and data warehouses (Fig. 2).
With the advent of IOT and devices such as smartphones, there is a humongous
amount of multimedia data that get registered every day on the face of the internet

252 M. Devgan and D. K. Sharma
Fig. 2 Importance of data modelling
Fig. 3 NLP techniques for modelling data
and cloud storage. Managing, storing and retrieving this immense amount of data is
not just tough but also time-consuming. Using techniques such as data modelling can
certainly help in aiding to this problem of managing Multimedia Big Data (MMBD).
Although there are various existing models for traditional databases, such as net-
work, relational and semantic models, only very few have been proposed for multi-
media databases. The unique nature of multimedia data requires object-oriented data
models for each type of media data that exists [3] (Fig. 3).
The question still is that how can we apply the theory of data models on such a
vast amount of unstructured data to manage it properly? The problem is generally
solved in a conventional way of applying specific schemes to data to make ‘sense out
of it’. In recent times, multimedia has contributed to a vast amount of information
being produced over the internet in the last decade. Information retrieval or data
modelling from unstructured multimedia data is done using advanced techniques
such as Natural Language Processing (NLP), Neural Networks (NN) and more. A
combination of above schemes along with Object-Relational Database Management
System (ORDBMS) is also used to provide semantic retrieval. The ultimate goal
of data modelling is to allow the automatic retrieval of target information based on
formal information of the related domain.

Large-Scale MMBD Management and Retrieval 253
2.3 Huge Capacity Storage and Management
Multimedia such as images and videos can vary in size ranging from a few megabytes
to 3–4 gigabytes and even more. Due to the high volume and high variety of multi-
media big data, the problem arises of storage management, which is characterized
by its huge capacity of data storage and hierarchical structure. Appropriate storage
mechanism for multimedia must be employed in order to achieve better results with
analysis and predictions. Multimedia data comprises of interrelated objects that need
to be stored perfectly to increase the throughput of the program (a program here can
be anything from a large-scale software to a simple look-up machine for the stored
data). These objects are placed in a hierarchical storage that can range from online to
offline, with increasing storage capacity and decreasing performance. An example
can be a simple server with, let’s say ‘n’ levels of data storage, the first ‘m’ levels
may use a Solid-state Storage Device (SSD) for storing the data whereas the rest
‘n-m’ levels can have greater storage capacity but less accessibility speed due to the
usage of Hard Disk Drive (HDD).
There are a few examples of software that allow easy storage of big data, big
multimedia data as well, which are listed below:
• Apache Hadoop [4, 5]
Apache Hadoop is a free and open-source software framework that allows effective
storing of data in clusters. It runs parallelly and is capable of performing computation
on every node simultaneously. It is a JAVA-based framework and uses the Hadoop
Distributed File System (HDFS) as the storage system of Hadoop, which splits big
data and distribute across many nodes in a cluster. This also replicates data in a cluster
thus providing high availability. (hadoop.apache.org 2018) [6]
• Microsoft HDInsight
HDInsight is a cloud-based wrapper around Apache Hadoop provided by Microsoft.
• NoSQL
SQL can be used to handle structured data very well, but we need NoSQL (Not Only
SQL) to handle unstructured data. NoSQL databases are schema-less databases.
Every row can have a set of columns different from each other. They provide bet-
ter performance in storing very large amount of data. There are many open-source
NoSQL DBs available to analyse Big Data (Wikipedia & TechTarget 2018):
• Hive,
• Sqoop,
• Polybase, etc.
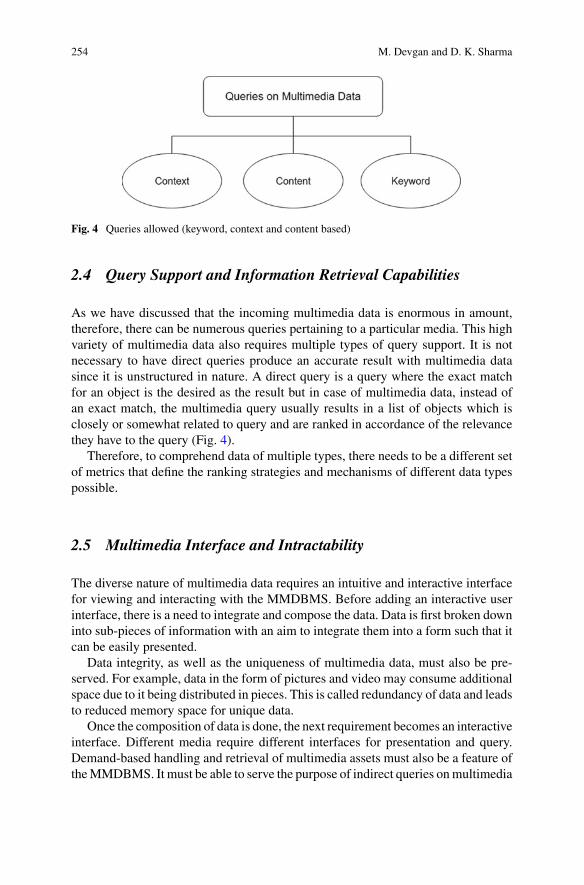
254 M. Devgan and D. K. Sharma
Fig. 4 Queries allowed (keyword, context and content based)
2.4 Query Support and Information Retrieval Capabilities
As we have discussed that the incoming multimedia data is enormous in amount,
therefore, there can be numerous queries pertaining to a particular media. This high
variety of multimedia data also requires multiple types of query support. It is not
necessary to have direct queries produce an accurate result with multimedia data
since it is unstructured in nature. A direct query is a query where the exact match
for an object is the desired as the result but in case of multimedia data, instead of
an exact match, the multimedia query usually results in a list of objects which is
closely or somewhat related to query and are ranked in accordance of the relevance
they have to the query (Fig. 4).
Therefore, to comprehend data of multiple types, there needs to be a different set
of metrics that define the ranking strategies and mechanisms of different data types
possible.
2.5 Multimedia Interface and Intractability
The diverse nature of multimedia data requires an intuitive and interactive interface
for viewing and interacting with the MMDBMS. Before adding an interactive user
interface, there is a need to integrate and compose the data. Data is first broken down
into sub-pieces of information with an aim to integrate them into a form such that it
can be easily presented.
Data integrity, as well as the uniqueness of multimedia data, must also be pre-
served. For example, data in the form of pictures and video may consume additional
space due to it being distributed in pieces. This is called redundancy of data and leads
to reduced memory space for unique data.
Once the composition of data is done, the next requirement becomes an interactive
interface. Different media require different interfaces for presentation and query.
Demand-based handling and retrieval of multimedia assets must also be a feature of
the MMDBMS. It must be able to serve the purpose of indirect queries on multimedia
Large-Scale MMBD Management and Retrieval 255
data which appeals to the user. Although serving indirect queries is an important issue
but the performance of the system should not be affected.
2.6 Performance
Considering the five V’s of multimedia big data, the performance of the DBMS is a big
and important requirement which must be fulfilled in order to ensure the productivity
of the product/application. The system must be efficient, reliable, supports real-time
execution of queries, must guarantee delivery of multimedia assets in order of query,
their integration and the Quality of Service (QoS) [7] acceptable to the user.
Therefore, a DBMS should be fast and secure. Neither should be compromised
for the other in order to ensure a perfect database management system for multimedia
big data.
3 Annotation and Indexing of Multimedia Big Data
In this chapter, we have been dealing with the topic of creating a DBMS software
that allows us to easily store, retrieve and maintain the multimedia data. In any data
storage software, annotation and indexing of records play a very important role. It
determines the speed and also the accuracy by which the data will be retrieved for a
particular query submitted into the MMDBMS.
Let us study about what annotation and indexing are in terms of a DBMS and
MMDBMS.
3.1 Multimedia Annotations
‘Annotation is a note added to a text, for example, a comment beside a topic of the
book is an annotation’ [8]. In real life, annotation helps in understanding the topics
better as well as makes the lookup of different topics and categories a lot easy for
the reader of the book.
Similarly, annotations play a significant role in assisting in data management
and retrieval, specifically for heterogeneous and unstructured data. The data that is
raw and needs a significant amount of cleaning is benefited from this technique [9]
(Fig. 5).
There are two main categories of multimedia annotations:
1. Manual,
2. Automatic.

256 M. Devgan and D. K. Sharma
Fig. 5 Manual and automatic annotations
Since the data is to mark with specific notes, it can either be done by the user or a
machine can be employed to do the same work. Therefore, two kinds of annotation
techniques exist.
Manual Annotation
The manual process of annotation of incoming multimedia data is very time con-
suming for the uploader/user. The annotation process is about understanding the
multimedia data from start to end (in case of audio and video) and marking all
annotations in order of occurrence.
Although this process need not give the desired result, therefore a set of rules
must be followed by all the annotators while making annotations for multimedia (or
any) data.
• Reading/Understanding the data
– Viewing the data of the multimedia image, video or audio in its entirety to
generate an understanding of the raw available data.
• Marking the entities
– This step involves a proof reading of the document and marking any available
entities that occur in the document
• Looking Again
– Reviewing your work to be certain about the fact that no possible annotation
is missed and also that the features are correctly mapped according to their
occurrence in the data.
• Recording any additional information
– The annotator is expected to record the experience while annotating the docu-
ment/data. This can be done using other tools to make comments or sometimes
can be done using the annotation tool itself (Fig. 6).
These sources of annotation are reliable but this process is very time-consuming as
it wastes a big amount of time from the user’s side to add comments or metadata about

Large-Scale MMBD Management and Retrieval 257
Fig. 6 LEAR is an image annotation tool for windows
the multimedia data. The problem becomes even more serious when the growing
entropy of the big data bubble is taken into consideration.
Therefore, a new faster method must be devised to prepare annotations for the
multimedia data. So, we have the automatic annotation process.
Automatic Annotation Process
The automatic annotation process is backed by the highly sophisticated machine
learning algorithms, which is more appealing than the manual method, consider-
ing the ever-increasing amount of data. However, it is more challenging because
of the notorious semantic map problem. Semantic mapping is a process of creat-
ing a map which can be used to visually display the meaning-based connections
between a word or a phrase and a set of unrelated words. With access to the shared
information available over the connected network and to heterogeneous sources, the
problem involving terminology provision and interoperability of systematic vocab-
ulary schemes still exist and require urgent attention [10]. Therefore, solutions are
needed to improve the performance of full-text retrieval system.
Although using machine learning algorithms to ease out the work seems a good
option for the difficulties associated with its implementation must also be taken care
of.
In spite of big challenges and difficulties of multimedia automatic annotation,
there have been many research endeavours in this hot topic. One such research is to
use Latent Dirichlet Modelling (LDA) to extract semantic topics from multimedia

258 M. Devgan and D. K. Sharma
Fig. 7 Using neural nets to identify text from images to provide better annotations
text documents such as still images [11]. Some other seek the combination of both
humans as well as the computer for multimedia data annotation.
Deep Learning, a field of Machine Learning, involving the extensive use of Arti-
ficial Neural Networks is also being used to generate annotations for images, videos,
and audio. Deep Nets have shown promising results when compared to conventional
machine learning algorithms.
Figure 7 shows how we can use images of scanned images and convert it into a
file of the same using supervised neural networks. It is a case of Optical Charac-
ter Recognition or OCR, which is used to convert written text into digital text by
identifying the words in an image using a pre-trained neural network.
3.2 Multimedia Indexing
As mentioned earlier, multimedia big data is mostly unstructured. This means that
the data is lost in a relational sense. While the traditional RDBMS were used for
managing the structured data, this means that they could not be used for managing
multimedia data without any change. To solve this problem, a number of indexing
strategies have been proposed, targeting different types of data and queries. The
indexing strategies can be roughly categorized into AI approaches and the non-AI
approaches [12].

Large-Scale MMBD Management and Retrieval 259
Specifically, the non-AI approaches treat each individual item independently and
do not rely on the context or data relationships. They can be further classified into tree-
based strategies, such as R-Tree, B-Tree, Hash, X-Tree, Gist and inverted indexing
cloud services can be answered by retrieving and ranking the corresponding list of
documents [13, 14]. On the other hand, the AI approaches capture the data semantics
by analysing the relationship between the data and the context among them to better
structure and organize the multimedia data items. These advantages of AI approaches
make them more accurate and effective than the non-AI methods. However, they are
generally more complicated and computationally expensive. The AI methods are still
a field of vast studies and research [15].
4 Storage and Retrieval
As discussed before, we know that storage is the main purpose of why we employ
databases in the first place. It is to store the important information and use it there-
after, for example, to enhance the customer experience. There are multiple types of
databases that can be employed to store the multimedia data, and each of it has its
unique feature (Fig. 8).
There are two basic types of databases that can be employed to store the multi-
media data so that it can be used further, viz. SQL and no-SQL. Their capabilities of
storing and retrieving vary to different extents, so we are going to study about them.
Fig. 8 Spatio-temporal and NoSQL databases
260 M. Devgan and D. K. Sharma
4.1 Spatio-temporal Databases
Spatio-temporal means to consist of both space and time. In a spatio-temporal
database, as the name suggests, the emphasis is laid on space-time information.
Use case of Spatio-temporal Databases
Spatio-temporal database is capable of analysing data that exists in either space, time
or both of the frames. It is therefore suitable for the following purposes:
• Keeping track of moving objects. The objects in a moving plane are known to
exist at a single position at any given frame of time. This is an apt example of the
space-time dependent data.
• A data consisting of wireless communication networks, which may exist only for
a short timespan within a particular geographic region
• Maintaining an index of animal species in a given region, a new species may be
found or an old one can become extinct, so this is also an example for spatio-
temporal data
• Tracking historical plate data and more
We can also make use of artificial intelligence to predict the behaviour of the
object that has the characteristics stored in a spatio-temporal database.
Since multimedia is unstructured raw data, therefore, using spatio-temporal
databases for time-dependent data is a big advantage for managing and storing time-
dependent data. Some example of spatio-temporal data areGPS, payments, digital
photos, any smartphone data, etc. (Figs. 9 and 10).
Implementing Spatio-temporal DB
Since there are no RDBMS that incorporate a spatio-temporal database therefore it
must always be implemented so that it can be used. Since the extensions do not exist,
so it is very difficult to implement it. Software such as TerraLib (TerraLib, Open
Source), which is an open-source project, uses a middleware approach for storing
data in a relational database. The theory of this area is not completely developed.
Another approach for this is to use constraint database system such as MLPQ or
Management of Linear Programming Queries (Fig. 11).
4.2 No-SQL Databases
A NoSQL database provides a software mechanism for storing, managing and retriev-
ing data that is modelled in means other than the relationaltables used in relational
databases [3].
Big data and real-time web applications make consistent use of NoSQL Databases.
Many NoSQL stores compromise on consistency in favour of availability, partition
tolerance and speed. It is not used to a much greater extent due to its use of low-level
query languages, lack of standardized interfaces, and huge previous investments in

Large-Scale MMBD Management and Retrieval 261
Fig. 9 Examples of using spatio-temporal queries
Fig. 10 The storage manager in a spatio-temporal DBMS

262 M. Devgan and D. K. Sharma
Fig. 11 TerraLib and Geomesa are open-source tools
existing relational databases. But it’s ability to be able to hold multiple types of data
under a single collection is what makes it so popular and a good choice for storing
multimedia data.
NoSQL Databases—Types
There are multiple types of NoSQL Databases that are used to store, retrieve and
manage data. Some of these may overlap with the other in terms of functionality.
Below is a classification of NoSQL tables with respect to data model:
• Column,
• Document,
• Key-Value,
• Graph.
Uses of NoSQL DBs
NoSQL is not specific to store just text but all kind of data, be it large or small, text or
image, it works perfectly on any kind of data. It is considered a distributed, efficient,
and non-relational database. Most of the conventional database cannot store and man-
age the Binary Large Objects data or BLOB data. BLOBs are a set of default binary
data that can be used to store any type of multimedia objects. However, unstructured
multimedia data can be stored, processed and analysed using NoSQL schema-less
documented-oriented architecture to treat data more efficiently and flexibly [16].
4.2.1 Key-Value Stores
Key-value databases are designed to store, retrieve and manage a collection of objects
which can be string, JSON, BLOB or anything [3]. It is a giant mapping of a key
with its associated value. This collection of objects is generally called as a dictionary
or a hash. Each object is a record in a dictionary is identified by a unique key that is
used to quickly retrieve the data in the database.
Compared to relational databases, key-value store significantly improves the per-
formance due to the cache techniques used for mapping. Amazon Simple Service S3
(Dynamo) is a cloud-based key-value store that is most commonly used for storing
large data (Fig. 12).
Key-Value databases can use consistency models which can range from eventual
consistency to serializability [3]. There are some stores which support ordering
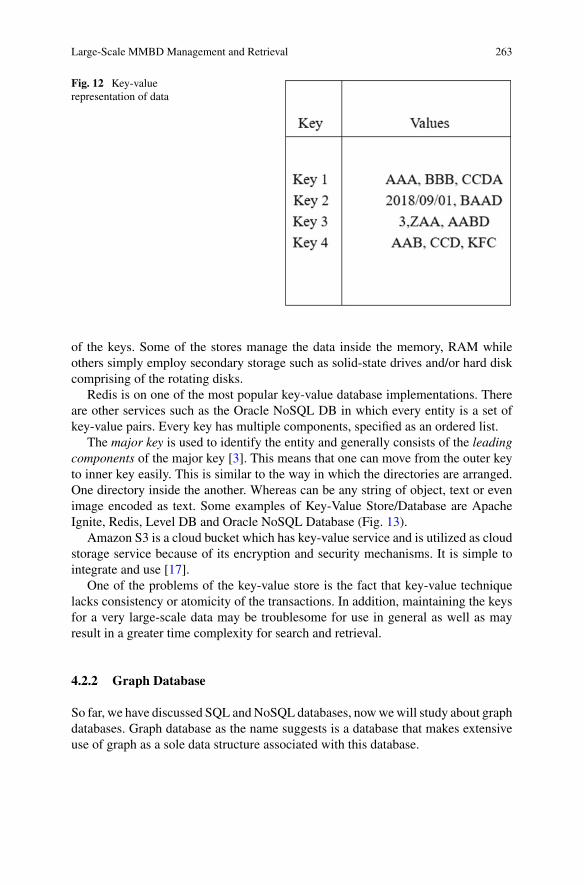
Large-Scale MMBD Management and Retrieval 263
Fig. 12 Key-value
representation of data
of the keys. Some of the stores manage the data inside the memory, RAM while
others simply employ secondary storage such as solid-state drives and/or hard disk
comprising of the rotating disks.
Redis is on one of the most popular key-value database implementations. There
are other services such as the Oracle NoSQL DB in which every entity is a set of
key-value pairs. Every key has multiple components, specified as an ordered list.
The major key is used to identify the entity and generally consists of the leading
components of the major key [3]. This means that one can move from the outer key
to inner key easily. This is similar to the way in which the directories are arranged.
One directory inside the another. Whereas can be any string of object, text or even
image encoded as text. Some examples of Key-Value Store/Database are Apache
Ignite, Redis, Level DB and Oracle NoSQL Database (Fig. 13).
Amazon S3 is a cloud bucket which has key-value service and is utilized as cloud
storage service because of its encryption and security mechanisms. It is simple to
integrate and use [17].
One of the problems of the key-value store is the fact that key-value technique
lacks consistency or atomicity of the transactions. In addition, maintaining the keys
for a very large-scale data may be troublesome for use in general as well as may
result in a greater time complexity for search and retrieval.
4.2.2 Graph Database
So far, we have discussed SQL and NoSQL databases, now we will study about graph
databases. Graph database as the name suggests is a database that makes extensive
use of graph as a sole data structure associated with this database.

264 M. Devgan and D. K. Sharma
Fig. 13 An example of
directory listing
Design of a Graph DB
The key concept of this design is the node and edge system of the graph, which allows
the data to be linked to any node in any possible way. This allows a multi-relational
design in which any data can be directly or indirectly connected to other using edges.
This is different from the relational database design as the links in the relational
tables are logical and can be consumed with operations such as ‘join’ but in case of
graph database they can simply be done using the physical links between the nodes.
Executing relational queries is possible with the help of the database management
systems at the physical level [3], which allows boosting the performance without
modifying the internal logical structure of the database. The main advantage of the
graph structure is the simple and fast retrieval of complex hierarchical structures
that are difficult to model and implement.
Normally, a graph database is a NoSQL structure since it uses key-value structure
or document-oriented database for storing data (Fig. 14)
Properties of Graph DB
One of the important properties of the graph database is the use of tags or properties
to annotate the stored. Tags are just another pointer to a document of a similar kind.
This allows for easy mass retrieval of data at once.
Like other NoSQL databases, maintaining the consistency of data is not inherently
done by the graph databases, and hence, the application system is responsible for
governing the consistency over the graph data.
The other tough tasks that are included in this data structure is to scale out the
graph database and finding a way to design generic queries.
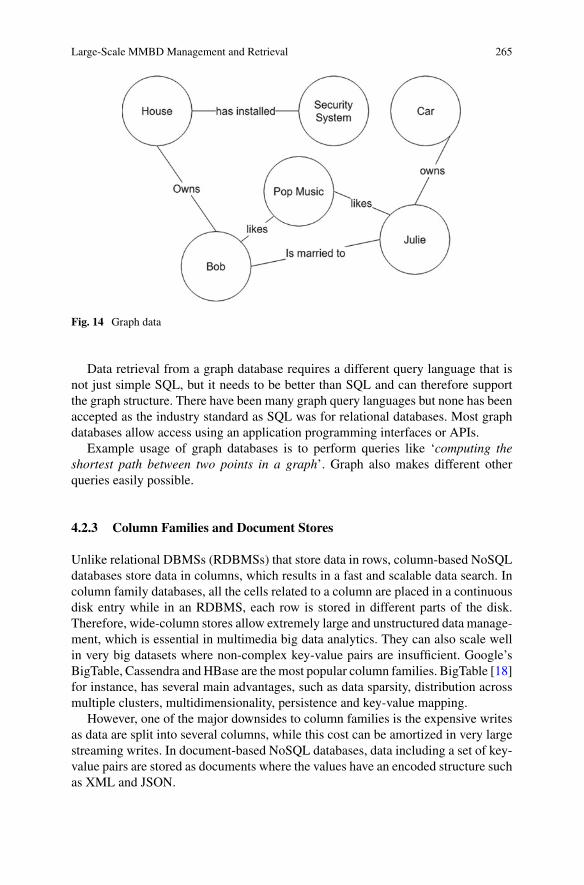
Large-Scale MMBD Management and Retrieval 265
Fig. 14 Graph data
Data retrieval from a graph database requires a different query language that is
not just simple SQL, but it needs to be better than SQL and can therefore support
the graph structure. There have been many graph query languages but none has been
accepted as the industry standard as SQL was for relational databases. Most graph
databases allow access using an application programming interfaces or APIs.
Example usage of graph databases is to perform queries like ‘computing the
shortest path between two points in a graph’. Graph also makes different other
queries easily possible.
4.2.3 Column Families and Document Stores
Unlike relational DBMSs (RDBMSs) that store data in rows, column-based NoSQL
databases store data in columns, which results in a fast and scalable data search. In
column family databases, all the cells related to a column are placed in a continuous
disk entry while in an RDBMS, each row is stored in different parts of the disk.
Therefore, wide-column stores allow extremely large and unstructured data manage-
ment, which is essential in multimedia big data analytics. They can also scale well
in very big datasets where non-complex key-value pairs are insufficient. Google’s
BigTable, Cassendra and HBase are the most popular column families. BigTable [18]
for instance, has several main advantages, such as data sparsity, distribution across
multiple clusters, multidimensionality, persistence and key-value mapping.
However, one of the major downsides to column families is the expensive writes
as data are split into several columns, while this cost can be amortized in very large
streaming writes. In document-based NoSQL databases, data including a set of key-
value pairs are stored as documents where the values have an encoded structure such
as XML and JSON.

266 M. Devgan and D. K. Sharma
Advantages
The advantage of this structure is that the document stores embed metadata aliased
with the data contents. In addition, any complex data can be represented as a doc-
ument and can be stored in these databases. However, this powerful schema-less
characteristic can also raise the potential for accidents and abuse, as well as perfor-
mance issue.
MongoDB—Popular Open-Source DB
MongoDB is a popular document-based database that is publicly available and is
written in C++ (MongoDB.Com 2016). It usually stores and groups documents
based on their structure. In MongoDB, Binary JSON is the encoded format used to
store unstructured or semi-structured documents such as multimedia and social media
posts, and the indexing is very similar to that of relational databases. MongoDB has
several advantages, such as durability using the Master–Slave replication technique
and concurrency using locks, while the main limitation of this database is its limited
data storage per node. It is also widely used for social data and multimedia big data
analytics.
5 Conclusion
In this chapter, we’ve studied about what is multimedia data, how can it be stored and
what are the ways in which the database can be made ensuring that this unstructured
data can be stored inside it. We have also learned about the typical characteristics
about the multimedia big database management system. The things that define a good
database system are the traditional database capabilities, data management and huge
capacity storage, multimedia data modelling, media integration and a lot more.
We’ve also studied about how annotation can help in making the data retrieval
process easy and the ways to annotate the multimedia or any regular data. The process
of indexing can be a much helpful process when it comes to gather information and
execute queries.
Finally, we studied about various types of databases that can be used to store
the multimedia big data. The only two types are SQL and NoSQL, for example, the
spatio-temporal database that deals with both space and time and NoSQL are divided
into further types such as the key-value, document store, graph database, etc. We read
about how different techniques work, how they are implemented and how can we
use them in regular day to day for a company or a project which has multimedia data
at a large extent.
There were citations of different software that can be chosen as an apt database
for the use case as and when desired.
The purpose of the chapter was to impart knowledge about the field of database
management and retrieval in multimedia big data, readers can also check out the
references to other research papers and websites to read more.

Large-Scale MMBD Management and Retrieval 267
References
1. S.-C. Chen, Multimedia databases and data management: a survey. Int. J. Multimedia Data
Eng. Manage. 1(1), 1–11
2. E. Adler, Social media engagement: the surprising facts about how much time people spend
on the major social networks (2016). Retrieved from http://www.businessinsider.com/social-
media-engagement-statistics-2013-12
3. V. Abramova, J. Bernardino, NoSQL databases: MongoDB vs Cassandra, in Proceedings of the
International C* Conference on Computer Science and Software Engineering. (ACM, 2013),
pp 14–22
4. Hadoop, Apache Hadoop (2018). http://hadoop.apache.org
5. Mahout, Apache Mahout (2018). http://mahout.apache.org
6. D.A. Adjeroh, K.C. Nwosu, Multimedia database management—requirements and issues.
IEEE MultiMedia 4(3), 24–33 (1997)
7. Kumari, S. Tanwar, S. Tyagi, N. Kumar, M. Maasberg, K.K.R. Choo, Multimedia big data
computing and internet of things applications: a taxonomy and process model. J. Netw. Comput.
Appl. 124, 169–195 (2018)
8. V. Alvarez, S. Richter, X. Chen, J. Dittrich, A comparison of adaptive radix trees and hash tables,
in Proceedings of the 31st IEEE International Conference on Data Engineering. 1227–1238
(2015)
9. F. Amato, F. Colace, L. Greco, V. Moscato, A. Picariello, Semantic processing of multimedia
data for e-government applications. J. Vis. Lang. Comput. 32(2016), 35–41 (2016)
10. S.-C. Chen, R.L. Kashyap, A spatio-temporal semantic model for multimedia database systems
and multimedia information systems. IEEE Trans. Knowl. Data Eng. 13(4), 607–622 (2001)
11. P.K. Atrey, M. Anwar Hossain, A. El Saddik, M.S. Kankanhalli, Multimodal fusion for multi-
media analysis: a survey. Multimed. Syst. 16(6), 345–379
12. F. BintaAdamu, A. Habbal, S. Hassan, R.L. Cottrell, B. White, I. Abdullahi, A Survey on Big
Data Indexing Strategies. Technical Report. SLAC National Accelerator Laboratory (2016)
13. D. Che, M. Safran, Z. Peng, From big data to big data mining: challenges, issues, and oppor-
tunities, Database Syst. Adv. Appl. (Springer, Wuhan, China, 2013), pp. 1–15
14. K. Chatterjee, S.-C. Chen, HAH-tree: towards a multidimensional index structure supporting
different video modelling approaches in a video database management system. Int. J. Inf. Decis.
Sci. 2(2), 188–207
15. R. Bryant, R.H. Katz, E.D. Lazowska, Big-data computing: creating revolutionary break-
throughs in commerce, science and society (2008). Retrieved from https://pdfs.semanticscholar.
org/65a8/b00f712d5c230bf0de6b9bd13923d20078.pdf
16. T. Chardonnens, Big data analytics on high velocity streams: specic use cases with storm. Mas-
ter’s thesis. Software Engineering Group, Department of Informatics, University of Fribourg,
Switzerland (2013)
17. Amazon AWS official docs
18. F. Chang, J. Dean, S. Ghemawat, W.C. Hsieh, D.A. Wallach, M. Burrows, T. Chandra, A. Fikes,
R.E. Gruber, Bigtable: a distributed storage system for structured data. ACM Trans. Comput.
Syst. 26(2), 4:1–4:26

Data Reduction Technique for Capsule
Endoscopy
Kuntesh Jani and Rajeev Srivastava
Abstract The advancements in the field of IoT and sensors generate a huge amountof data. This huge data serves as an input to knowledge discovery and machinelearning producing unprecedented results leading to trend analysis, classification,prediction, fraud and fault detection, drug discovery, artificial intelligence and manymore. One such cutting-edge technology is capsule endoscopy (CE). CE is a non-invasive, non-sedative, patient-friendly and particularly child-friendly alternative toconventional endoscopy for diagnosis of gastrointestinal tract diseases. However,CE generates approximately 60000 images from each video. Further, when com-puter vision and pattern recognition techniques are applied to CE images for diseasedetection, the resultant data called feature vector sizes to 181548 for one image. Nowa machine learning task for computer-aided disease detection would include nothingless than thousands of images leading to highly data intensive task. Processing suchhuge amount of data is an expensive task in terms of computation, memory and time.Hence, a data reduction technique needs to be employed in such a way that mini-mum information is lost. It is important to note that features must be discriminativeand thus redundant or correlative data is not very useful. In this study, a data reduc-tion technique is designed with the aim of maximizing the information gain. Thistechnique exhibits high variance and low correlation to achieve this task. The datareduced feature vector is fed to a computer based diagnosis system in order to detectulcer in the gastrointestinal tract. The proposed data reduction technique reduces thefeature set to 98.34%.
Keywords Data reduction · CAD · Capsule endoscopy
K. Jani (B) · R. SrivastavaComputer Science and Engineering Department, Indian Institute of Technology (BHU),Varanasi, Indiae-mail: [email protected]
R. Srivastavae-mail: [email protected]
© Springer Nature Singapore Pte Ltd. 2020S. Tanwar et al. (eds.), Multimedia Big Data Computing
for IoT Applications, Intelligent Systems Reference Library 163,https://doi.org/10.1007/978-981-13-8759-3_10
269

270 K. Jani and R. Srivastava
1 Introduction
The advancements in the field of IoT and sensors generate a huge amount of data.This huge data serves as an input to knowledge discovery and machine learningproducing unprecedented results leading to trend analysis, classification, prediction,fraud and fault detection, drug discovery, artificial intelligence and many more [1].One such cutting-edge technology is capsule endoscopy (CE). CE was introducedin the year 2000 by Given Imaging Inc, Israel. CE is a non-invasive, non-sedativedisposable and painless alternative to conventional endoscopy procedure [2]. It pro-vides a comfortable and efficient way to view the complete gastrointestinal (GI) tract[3]. The endoscopic device a swallowable capsule with 3.7 g weight and 11 × 26 mmdimensions. This capsule is ingested by the patient and it is propels through the GItract by natural peristalsis. Figure 1 presents various components as well as the lengthof the capsule. The capsule captures the images of the GI tract and transmits it to areceiver. This receiver is tied on the waist of the patient. The experts then with thehelp of a computer system analyze the received video to detect irregularities of the GItract. With endoscopic techniques such as colonoscopy and conventional endoscopy,it is not possible to visualize the entire small intestine. Since the CE can help thedoctors visualize the entire GI tract without using any sedation, invasive equipments,air-inflation or radiation, the use of this technology is increasing in hospitals. To pro-vide timely decision from specialists on remote location, CE can be combined withIoT [4] and mobile computing technology. Looking at various restrictions relatedto memory, power of the battery and the available communication capabilities, thetransmitting and study of these CE video data gets even more challenging.
Figure 2 presents a general idea of computer-aided CE system. While propellingthrough the GI tract, the capsule transmits data to receiver at frame rate of 2 frames persecond. Approximately 8 h later when the procedure ends, the images are retrievedinto a computer for experts to study for potential abnormalities. Patient passes thecapsule from the body through natural passage. There is no need to retrieve the cap-sule. Thus problems related to sterilization and hygiene is automatically addressed.
By year 2015 since its approval by the U.S. food and drug administration (FDA),more than 10 lac capsules have been used [8]. However, CE videos length ranges from6 to 8 h generating 55000–60000 frames which make the analysis time-consuming.Depending on the expertise of the examiner, the examination would take 45 min to 2 h.
Fig. 1 Capsule length and components [5, 6]

Data Reduction Technique for Capsule Endoscopy 271
Fig. 2 Capsule endoscopy system [7]
In addition to a huge number of frames, GI tract appearance, and intestinal dynamics,the need for constant concentration further complicates the diagnostic and analysisprocedure. With advancements in technology, the volume of data is likely to grow bymany folds [9]. Thus, using computer vision and machine learning together build as acomputer-aided diagnosis (CAD) system and artificial intelligence in health care canbe a great help for experts and physicians in diagnosing the abnormalities [10, 11]. ACAD system capable of analyzing and understanding the visual scene will certainlyassist the doctor with a precise, fast and accurate diagnosis. After manual analysis ofCE video, CAD can also provide a second opinion to a gastroenterologist. In medicalimaging, CAD is a prominent research area capable of providing a precise diagnosis.The ultimate goal of a CAD is to limit the errors in interpretation and search. Italso aims to limit the variation among the experts. In particular, a computer-aidedmedical diagnostic system for CE can consist of following units: (1) a data capturingand transmitting unit—the capsule (2) a data receiver and storage unit—the waistbelt (3) a data processing unit for pre-processing and feature extraction (4) a machinelearning based classification unit or decision support system (5) a user interaction unitfor final diagnostic report. In general, a complete automated abnormality detectionsystem comprises of a pre-processing unit, segmentation unit, feature extraction unit,and classification unit. CE images also contain un-informative images such as noise,dark regions, duplicate frames, bubbles, intestinal fluids and, food remains. By pre-processing it is important that such un-informative regions or images be isolated.Poisson maximum likelihood estimation method may be used to remove Poissonnoise [12]. Pre-processing noticeable improves computational efficiency and overalldetection rate. The task of pre-processing and feature extraction unit is to supply aCAD system friendly data [13]. Few methods adopted for pre-processing in CE arecontrast stretching, histogram equalization and, adaptive contrast diffusion [14].
Segmentation is the process of extracting only a useful or informative part fromthe whole image. This process will help us concentrated only on the required portioninstead of whole image. Segmentation is performed using edge based or regionbased or a combination of both approaches. Both methods have their advantages

272 K. Jani and R. Srivastava
and disadvantages. Many techniques have been used in CE images for segmentationsuch as Hidden Markov Model(HMM) [15], total variation(TV) model [16] and, theProbabilistic Latent Semantic Analysis(pLSA) [17]. TV is a hybrid active contourmodel based on region and edge information; HMM is a statistical Markov modeland, pLSA is an unsupervised machine learning technique.
Features in image analysis refer to a derived set of values providing discrimi-native and non-redundant information of the image. For visual patterns, extractingdiscriminative and robust features from the image is the most critical yet the mostdifficult step [18]. Researchers have explored texture, color, and shape based featuresin spatial as well as frequency domain to discriminate between normal and abnormalimages of CE.
Classification is the last phase of the automated system. The process to predictunknown instances using the generated model is referred to as classification. Figure 3presents a diagrammatic representation of the entire process.
Amongst all GI tract abnormalities, the most common lesion is an ulcer. Themortality rate for bleeding ulcers is nearly 10% [19]. Two of the important causes ofGIT ulcers are non-steroidal anti-inflammatory drugs (NSAIDs) and bacteria calledHelicobacter pylori (H. pylori). A un-treated ulcer may lead to ulcerative colitisand Crohn’s disease. Thus a timely detection of ulcer is a must. Table 1 presents asummary of various ulcer detection systems.
Fig. 3 Diagrammatic representation of entire process

Data Reduction Technique for Capsule Endoscopy 273
Table 1 Summary of prior art on ulcer detection
Work Features used Method/classifierused
Limitations Performance Dataset size
[20] Texture andcolor
SVM Very lessnumber ofdata samples
Accuracy =
92.65%Sensitivity =
94.12%
Totalimages 340
[21] Thechromaticmoment
Neural network Texturefeature isneglected.Too fewsamples
Specificity =
84.68 ± 1.80Sensitivity =
92.97 ± 1.05
100 images
[22] LBPhistogram
Multi-layerperceptron (MLP)and SVM
Too fewsamples fortraining
Accuracy =
92.37%,Specificity =
91.46%,Sensitivity =
93.28%
100 images
[23] Dif lacanalysis
De-noising usingBi-dimensionalensembleempirical modedecomposition(BEEMD)
Too fewsamples fortraining
Meanaccuracy>95%
176 images
[24] Texture andcolour
Vector supportedconvex hullmethod
Specificity isless. Skeweddata
Recall =
0.932Precision =
0.696Jaccard index= 0.235
36 images
[25] Leung andMalik (LM)and LBP
k-nearestneighbor (k-NN)
Computationallyintense.Skewed data
Recall = 92%Specificity =
91.8%
1750 images
This study proposes a CAD system for ulcer detection in CE using optimizedfeature set. Major contributions to this work are:
• Data reduction technique• Automated ulcer detection using an optimized feature set• A thorough comparative analysis of the our designed feature selection technique
with other techniques• A thorough analysis of the performance of designed system with other systems.
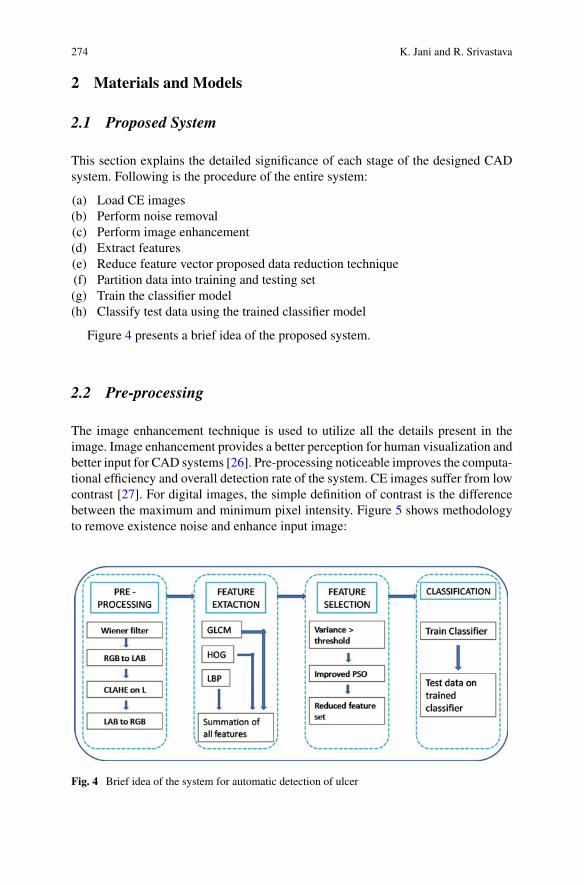
274 K. Jani and R. Srivastava
2 Materials and Models
2.1 Proposed System
This section explains the detailed significance of each stage of the designed CADsystem. Following is the procedure of the entire system:
(a) Load CE images(b) Perform noise removal(c) Perform image enhancement(d) Extract features(e) Reduce feature vector proposed data reduction technique(f) Partition data into training and testing set(g) Train the classifier model(h) Classify test data using the trained classifier model
Figure 4 presents a brief idea of the proposed system.
2.2 Pre-processing
The image enhancement technique is used to utilize all the details present in theimage. Image enhancement provides a better perception for human visualization andbetter input for CAD systems [26]. Pre-processing noticeable improves the computa-tional efficiency and overall detection rate of the system. CE images suffer from lowcontrast [27]. For digital images, the simple definition of contrast is the differencebetween the maximum and minimum pixel intensity. Figure 5 shows methodologyto remove existence noise and enhance input image:
Fig. 4 Brief idea of the system for automatic detection of ulcer

Data Reduction Technique for Capsule Endoscopy 275
Fig. 5 Pre-processingmethodology
The Wiener filtering is used for noise smoothing. It performs linear estimation oflocal mean and variance of pixels in the actual image and minimizes the overall error.For enhancement of the given image, contrast-limited adaptive histogram equaliza-tion (CLAHE) is used after smoothing by Wiener filter. Instead of the whole image,CLAHE functions on small areas in the given image. It calculates the contrast trans-form function for each region individually. The bilinear interpolation is used to mergenearby regions to eliminate artificially induced boundaries. By this technique, thecontrast of the image is limited while avoiding the amplification of the noise. SinceCE images are prone to illumination related problems and low contrast, CLAHE isapplied only on the L component of Lab color space for better enhancement. Finally,the image is converted back to RGB and passed for post-processing. Figure 6 showsthe sample output of this stage.

276 K. Jani and R. Srivastava
Input Output
Fig. 6 Sample output of pre-processing
2.3 Extraction of Features
Three different features are included in this study. Local binary pattern (LBP), gray-level co-occurrence matrix (GLCM) and the Histogram of oriented gradients (HOG)together forms the feature set. Ulcer in CE images exhibits very discriminative tex-ture and color properties. GLCM is a statistical method. It is helpful for analyz-ing textures. This study utilizes 13 texture features computed from GLCM namelyhomogeneity, contrast, mean, correlation, energy, standard deviation, skewness, rootmean square (RMS), variance, entropy, smoothness, kurtosis and inverse differencemoment(IDM). Energy measures uniformity. Entropy is a measure of complexity andit is large for non-uniform images. Energy and Entropy are inversely and stronglycorrelated. Variance is a measure of non-uniformity. Standard deviation and varianceare strongly correlated. IDM is a measure of similarity. When all the elements in theimage are same, IDM reaches its maximum value.
HOG as a feature descriptor deals with ambiguities related to texture and color[28]. Distribution (histogram) of intensity gradients can better describe the appear-ance of object and shape within the image. HOG identifies the edges [29]. It is com-puted for every pixel after dividing the image into cells. All the cells within a blockare normalized, and concatenation of all these histograms is the feature descriptor.Figure 7 shows a sample CE image and visualization of the HOG descriptor.
LBP is a very discriminative textural feature [30]. CE images exhibits high vari-ations related to illumination due to limited illumination capacity, limited range ofvision inside GIT and motion of the camera. It is learned that LBP performs robustlyto illumination variations. A total of 256 patters are obtained from a 3 × 3 neigh-borhood. Texture feature descriptor is the LBP histogram of 256 bin occurrencecalculated over the region. A novel rotation invariant LBP is proposed in [30]. Pat-terns are uniform if they contain at most two transitions on a circular ring from 0 to1 or 1 to 0. Examples of uniform patterns are 11111111 (nil transitions), 01000000(2 transitions).

Data Reduction Technique for Capsule Endoscopy 277
Fig. 7 Sample CE image and HOG descriptor visualization
2.4 Feature Selection
The optimal size of the feature set reduces the cost of recognition as well as leadto improvement in accuracy of classification [31]. We compute 13 features fromGLCM, HOG feature extraction process yields 181476 features, and LBP featureextraction leads to 59 features. Total of 181548 features is extracted from each ofCE image in the dataset. Needless to say that this feature set produces extraordinaryresults for ulcer classification but, we must limit the number of features to a con-siderable number. To decrease the size of feature set and maintain the performanceof classification, this study proposes a novel feature selection technique. Featureswith high variance can easily discriminate between two classes but, variance aloneis not a good measure of information. Any two features can exhibit high variancebut they may be correlated. Therefore, the proposed feature selection technique isdesigned on a dual criterion: high variance and low co-relation. Proposed featureselection technique is termed as high variance low co-relation (HVLC) technique.HVLC technique reduces the obtained feature set by 98.34% to 3000 number offeatures. Proposed technique encompasses a minimum co-relation fitness functionbased particle swarm optimization (PSO). This technique finds the optimal solution.It is influenced by local and global best values. Here, pbest is the best value of aparticle and gbest is the best value of the whole swarm. At each iteration, ith particleupdates position P as per (1) and velocity V as per (2).
Pi(t + 1) = Pi(t) + Vi(t) (1)

278 K. Jani and R. Srivastava
Table 2 Data reductionalgorithm
Initial feature-set S = [1,2,…,n]
Set threshold T
Final feature set Fs = nullChoose features with variance > T
Surviving feature set Ss = [1,2,…,m] where m
< n
Set k = size of Fs from within Ss such that
classification error err is very small
Set values of PSO control parameters: w =
0.2, c1 = c2 = 2
Create and initialize particles with
values of P and V; initialize gbest of the
population as infinity
Repeat:
For itr = 1 to population
Compute correlation C as a ranking
criteria
f = argmin(C)
EndFor
Update pbest = min(f)
Update gbest = min (gbest,pbest)
Update P using (1)
Update V using (2)
Until the termination criterion is
satisfied
Return improved-PSO selected values
Final reduced futures FF = [1,2,3,4,5,…,k]
where k < m
Vi(t + 1) = wVi(t) + c1 ∗ rand([0, 1]) ∗ (pbest − Pi(t))
+ c2 ∗ rand([0, 1]) ∗ (gbest − Pi(t)) (2)
Where, t and (t + 1) are two successive iterations, inertia weight w, cognitivecoefficient c1, and social coefficient c2 are constants. Also, c1 and c2 control themagnitude of steps taken by particle towards pbest (personal) and gbest (global)respectively. Table 2 presents the data reduction algorithm.
The variance threshold is experimentally chosen to fit the application. These fea-tures are then fed to SVM classifier to classify between ulcer and normal images.
2.5 Classification
Ulcer detection in CE is a binary classification problem having exactly two classesnamely ulcer and normal. The SVM develops the widest possible hyperplane thatcan explicitly separate samples of two different classes. The support vectors are the

Data Reduction Technique for Capsule Endoscopy 279
Fig. 8 The concept of SVM [32]
observations falling on the boundary of the slab parallel to the hyperplane. Figure 8presents the concept of SVM.
The subsequent section presents detailed result analysis of the performance of theproposed system.
3 Results Analysis and Discussion
3.1 Dataset
Total of 1200 images from CE videos [33] is extracted out of which 201 images are ofulcers, and 999 images are normal. The dimension of each image is 576 × 576 pixels.All the images were manually diagnosed and annotated by physicians providing theground truth. To avoid imbalanced data and overfitting 100 ulcer images and 100normal images are carefully chosen from the annotated dataset.
3.2 Performance Metrics
Performance metrics used in this study are derived from a confusion matrix. Detaileddiscussion on the confusion matrix is given below (Table 3).
Accuracy: The accuracy is measure of capability of a system to identify samplescorrectly.
280 K. Jani and R. Srivastava
Accuracy = (TN + TP)/(TN + TP + FN + FP) (3)
Precision: The precision is a measure of probability of correct classification of anobservation.
Precision = [TP/(FP + TP)] (4)
Sensitivity: Sensitivity is a measure of probability of system to provide a resultthat is true positive.
Sensitivity = TP/TP + FN (5)
Specificity: Specificity is a measure of probability of system to classify a positiveobservation as a negative.
Specificity = FP/TN + FP (6)
F-measure: The harmonic average of the precision and sensitivity is given by thismetric. The value 100 indicates perfect system and 0 indicates worst system.
F − measure = 2 ∗ (Precision ∗ Sensitivity)/(Precision + Sensitivity) (7)
Matthews correlation coefficient (MCC): It is used even when the size of classesvaries largely [34]. MCC in case of binary classifiers in machine learning is a measureof the quality.
MCC = [(TN ∗ TP) − (FN ∗ FP)]/SQRT[(FP + TP)(FN + TP)(FP + TN)(FN + TN)](8)
The system is implemented on Dell Optiplex 9010 desktop computer with pro-cessor—intel core i7 and RAM—6 GB using MATLAB R2017a.
Table 3 Structure of theconfusion matrix
Observer versusclassifier
Prediction of classifier
+ −
Actualobservation
+ True-Positive[TP]
False-Negative[FN]
− False-Positive[FP]
True-Negative[TN]

Data Reduction Technique for Capsule Endoscopy 281
Table 4 A comparison of proposed feature selection
Method Accuracy Sensitivity Specificity Precision Fmeasure
MCC
Relief F 93.7 87.5 100 100 93.3 88.19
Fisher score 91.66 90 93.3 93.10 91.5 83.37
Laplacian score 91.66 83.33 100 100 90.9 84.51
Proposed (HVLC) 95 95 95 95 95 90
Fig. 9 Performance comparison of feature selection techniques
3.3 Analysis of Results
The achievement of the automated ulcer detection system largely depends on theachievement of the proposed feature selection technique. Therefore the performanceof the proposed method is thoroughly compared with three other feature selectionmethods namely relief F [35], Fisher score [36] and Laplacian score [37]. Relief Fgives a weight to a feature on the basis of the distance between observed featureand given feature. It finally provides a rank of most suitable features. Fisher scoreranks each feature based on Fisher criterion. Laplacian score based feature rankingexhibits power to preserve locality. Table 4 shows a comparision of the proposedfeature selection technique with three different techniques and Fig. 9 presents thegraphical representation of the same.
As presented by Fig. 9, feature set obtained by the proposed HVLC techniqueoutperforms in accuracy, sensitivity, f measure, and MCC as compared to three othertechniques. Further, the ulcer detection system is compared with two other systems.Suman et al. [3] extracted features from relevant color bands and ulcer images areclassified using SVM. Koshy and Gopi [38] extracted contourlet transform and logGabor based texture features and the classification task is performed using SVM. Wehave implemented both these prior art on our hardware and using our dataset. The
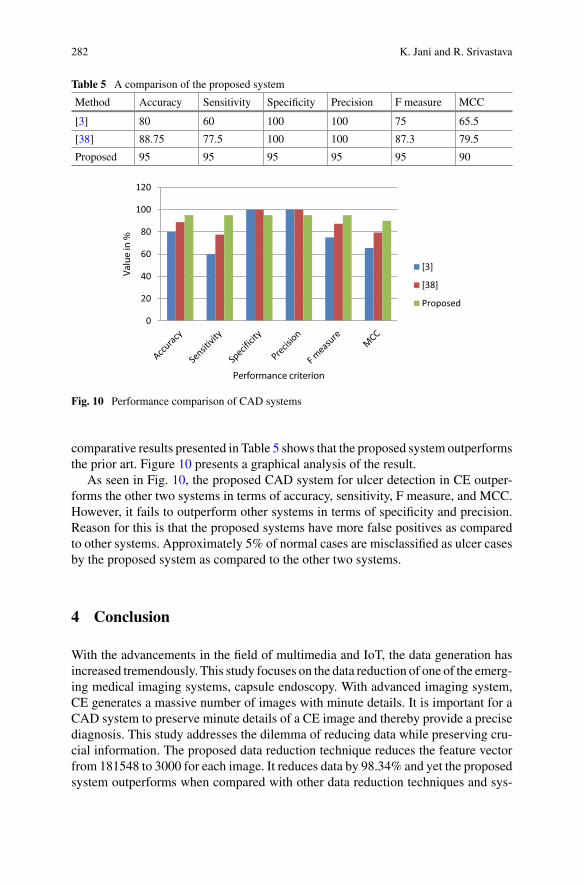
282 K. Jani and R. Srivastava
Table 5 A comparison of the proposed system
Method Accuracy Sensitivity Specificity Precision F measure MCC
[3] 80 60 100 100 75 65.5
[38] 88.75 77.5 100 100 87.3 79.5
Proposed 95 95 95 95 95 90
0
20
40
60
80
100
120
Va
lue
in
%
Performance criterion
[3]
[38]
Proposed
Fig. 10 Performance comparison of CAD systems
comparative results presented in Table 5 shows that the proposed system outperformsthe prior art. Figure 10 presents a graphical analysis of the result.
As seen in Fig. 10, the proposed CAD system for ulcer detection in CE outper-forms the other two systems in terms of accuracy, sensitivity, F measure, and MCC.However, it fails to outperform other systems in terms of specificity and precision.Reason for this is that the proposed systems have more false positives as comparedto other systems. Approximately 5% of normal cases are misclassified as ulcer casesby the proposed system as compared to the other two systems.
4 Conclusion
With the advancements in the field of multimedia and IoT, the data generation hasincreased tremendously. This study focuses on the data reduction of one of the emerg-ing medical imaging systems, capsule endoscopy. With advanced imaging system,CE generates a massive number of images with minute details. It is important for aCAD system to preserve minute details of a CE image and thereby provide a precisediagnosis. This study addresses the dilemma of reducing data while preserving cru-cial information. The proposed data reduction technique reduces the feature vectorfrom 181548 to 3000 for each image. It reduces data by 98.34% and yet the proposedsystem outperforms when compared with other data reduction techniques and sys-

Data Reduction Technique for Capsule Endoscopy 283
tems. The significant reduction in the size of data certainly reduces computationaltime and memory.
References
1. A. Kumari, S. Tanwar, S. Tyagi, N. Kumar, M. Maasberg, K.-K.R. Choo, Multimedia bigdata computing and Internet of Things applications: a taxonomy and process model. J. Netw.Comput. Appl. [Internet] 124, 169–195 (2018), https://linkinghub.elsevier.com/retrieve/pii/S1084804518303011
2. S. Charfi, Ansari M. El, Computer-aided diagnosis system for colon abnormalities detectionin wireless capsule endoscopy images. Multimed. Tools Appl. 77(3), 4047–4064 (2018)
3. S. Suman, F.A. Hussin, A.S. Malik, S.H. Ho, I. Hilmi, A.H.-R. Leow, et al., Feature selectionand classification of ulcerated lesions using statistical analysis for WCE images. Appl. Sci.7(10) (2017)
4. S. Tanwar, P. Patel, K. Patel, S. Tyagi, N. Kumar, M.S. Obaidat, An advanced Internet of Thingbased security alert system for smart home, in IEEE CITS 2017: 2017 International Conference
on Computer, Information and Telecommunication Systems (2017), pp. 25–295. Capsule image 1 [Internet]. [cited 2018 Mar 6], https://commons.wikimedia.org/w/index.php?
curid=8198966. Capsule image 2 [Internet]. [cited 2018 Mar 6], https://www.ecnmag.com/article/2012/02/
reducing-size-while-improving-functionality-and-safety-next-generation-medical-device-design
7. G. Liu, G. Yan, S. Kuang, Y. Wang, Detection of small bowel tumor based on multi-scalecurvelet analysis and fractal technology in capsule endoscopy. Comput. Biol. Med. [Internet]70, 131–138 (2016). http://dx.doi.org/10.1016/j.compbiomed.2016.01.021
8. Q. Zhao, G.E. Mullin, M.Q.H. Meng, T. Dassopoulos, R. Kumar, A general framework for wire-less capsule endoscopy study synopsis. Comput. Med. Imaging Graph [Internet] 41, 108–116(2015). http://dx.doi.org/10.1016/j.compmedimag.2014.05.011
9. A. Srivastava, S.K. Singh, S. Tanwar, S. Tyagi, Suitability of big data analytics in Indianbanking sector to increase revenue and profitability, in Proceedings of 2017, 3rd International
Conference on Advances in Computing Communication & Automation (Fall), ICACCA 2017,1–4 January 2018 (2018), pp. 1–4
10. A. Kumari, S. Tanwar, S. Tyagi, N. Kumar, Fog computing for Healthcare 4.0 environment:opportunities and challenges. Comput. Electr. Eng. [Internet] 72, 1–13 (2018). https://doi.org/10.1016/j.compeleceng.2018.08.015
11. N.I.R. Yassin, S. Omran, E.M.F. El Houby, H. Allam, Machine learning techniques for breastcancer computer aided diagnosis using different image modalities: a systematic review. Com-put. Methods Programs Biomed. [Internet] 156, 25–45 (2017), http://linkinghub.elsevier.com/retrieve/pii/S0169260717306405
12. R. Srivastava, S. Srivastava, Restoration of Poisson noise corrupted digital images with non-linear PDE based filters along with the choice of regularization parameter estimation. PatternRecognit. Lett. [Internet] 34(10), 1175–1185 (2013). http://dx.doi.org/10.1016/j.patrec.2013.03.026
13. V.S. Kodogiannis, M. Boulougoura, J.N. Lygouras, I. Petrounias, A neuro-fuzzy-based sys-tem for detecting abnormal patterns in wireless-capsule endoscopic images. Neurocomputing70(4–6), 704–717 (2007)
14. B. Li, M.Q.H. Meng, Wireless capsule endoscopy images enhancement via adaptive contrastdiffusion. J. Vis. Commun. Image Represent [Internet] 23(1), 222–228 (2012). http://dx.doi.org/10.1016/j.jvcir.2011.10.002
15. M. Mackiewicz, J. Berens, M. Fisher, Wireless capsule endoscopy color video segmentation.IEEE Trans. Med. Imaging 27(12), 1769–1781 (2008)

284 K. Jani and R. Srivastava
16. Y. Lan, X. Zhang, Z. Liu, L. Zhao, M. Li, Hybrid segmentation using region information forwireless capsule endoscopy images. Inf. Technol. J. 12(16), 3815–3819 (2013)
17. Y. Shen, P.P. Guturu, B.P. Buckles, Wireless capsule endoscopy video segmentation usingan unsupervised learning approach based on probabilistic latent semantic analysis with scaleinvariant features. IEEE Trans. Inf. Technol. Biomed. [Internet] 16(1), 98–105 (2012), http://www.ncbi.nlm.nih.gov/pubmed/22010158
18. X. Jiang, Feature extraction for image recognition and computer vision, in Proceedings of
2009, 2nd IEEE International Conference on Computer Science and Information Technology
ICCSIT 2009 (2009), pp. 1–1519. A. Karargyris, N. Bourbakis, Detection of small bowel polyps and ulcers in wireless capsule
endoscopy videos. IEEE Trans. Biomed. Eng. 58(10 PART 1), 2777–2786 (2011)20. Y. Yuan, J. Wang, B. Li, M.Q.H. Meng, Saliency based ulcer detection for wireless capsule
endoscopy diagnosis. IEEE Trans. Med. Imaging. 34(10), 2046–2057 (2015)21. B. Li, M.Q.H. Meng, Computer-based detection of bleeding and ulcer in wireless capsule
endoscopy images by chromaticity moments. Comput. Biol. Med. 39(2), 141–147 (2009)22. B. Li, M.Q.H. Meng, Texture analysis for ulcer detection in capsule endoscopy images. Image
Vis. Comput. [Internet] 27(9), 1336–1342 (2009). http://dx.doi.org/10.1016/j.imavis.2008.12.003
23. V.S. Charisis, L.J. Hadjileontiadis, C.N. Liatsos, C.C. Mavrogiannis, G.D. Sergiadis, Capsuleendoscopy image analysis using texture information from various colour models. Comput.Methods Programs Biomed. [Internet] 107(1), 61–74 (2012). http://dx.doi.org/10.1016/j.cmpb.2011.10.004
24. P. Szczypinski, A. Klepaczko, M. Pazurek, P. Daniel, Texture and color based image seg-mentation and pathology detection in capsule endoscopy videos. Comput. Methods ProgramsBiomed. 113(1), 396–411 (2014)
25. R. Nawarathna, J. Oh, J. Muthukudage, W. Tavanapong, J. Wong, P.C. de Groen, et al.,Abnormal image detection in endoscopy videos using a filter bank and local binary pat-terns. Neurocomputing [Internet] 144, 70–91 (2014), http://linkinghub.elsevier.com/retrieve/pii/S0925231214007334
26. S.I. Sahidan, M.Y. Mashor, A.S.W. Wahab, Z. Salleh, H. Ja’afar, Local and global contraststretching for color contrast enhancement on Zehl-Nelsen tissue section slide images. in IFMBE
Proc. 2008, vol. 21, no. 1 (IFMBE, 2008), pp. 583–58627. M. Moradi, A. Falahati, A. Shahbahrami, R. Zare-Hassanpour, Improving visual quality in wire-
less capsule endoscopy images with contrast-limited adaptive histogram equalization, in 2015
2nd International Conference Pattern Recognition and Image Analysis IPRIA 2015 (2015),pp. 0–4
28. Y.J. Cho, S.H. Bae, K.J. Yoon, Multi-classifier-based automatic polyp detection in endoscopicimages. J. Med. Biol. Eng. 36(6), 871–882 (2016)
29. N. Dalal, W. Triggs, Histograms of oriented gradients for human detection, in 2005 Conference
on Computer Vision & Pattern Recognition CVPR 2005 [Internet], vol. 1, no. 3 (IEEE ComputerSociety, 2004), pp. 886–893, http://eprints.pascal-network.org/archive/00000802/
30. T. Ojala, M. Pietikäinen, T. Mäenpää, Multiresolution gray-scale and rotation invariant textureclassification with local binary patterns. IEEE Trans. Pattern Anal. Mach. Intell. 24(7), 971–987(2002)
31. A. Jain, D. Zongker, Feature Selection: Evaluation, Application, and Small Sample Perfor-mance. IEEE Trans. Pattern Anal. Mach. Intell. [Internet] 19(2), 153–158 (1997), http://ieeexplore.ieee.org/lpdocs/epic03/wrapper.htm?arnumber=574797
32. D. Tao, X. Tang, X. Wu, Asymmetric bagging and random subspace for support vectormachines-based relevance feedback in image retrieval. IEEE Trans. Pattern Anal. Mach. Intell.28(7), 1088–1099 (2006)
33. E. Spyrou, D.K. Iakovidis, Video-based measurements for wireless capsule endoscope tracking.Meas. Sci. Technol. 25(1) (2014)
34. V.P. Singh, R. Srivastava, Improved image retrieval using fast Colour-texture features withvarying weighted similarity measure and random forests. Multimed. Tools Appl. 1–26 (2017)

Data Reduction Technique for Capsule Endoscopy 285
35. I. Kononenko, E. Šimec, M. Robnik-Šikonja, Overcoming the myopic of inductive learningalgorithms with RELIEFF. Appl. Intell. [Internet] 7(1), 39–55 (1997), http://citeseer.nj.nec.com/kononenko97overcoming.html
36. Q. Gu, Z. Li, J. Han, Generalized Fisher Score For Feature Selection (2005)37. B. Liao, Y. Jiang, W. Liang, W. Zhu, L. Cai, Z. Cao, Gene selection using locality sensitive
Laplacian score. IEEE/ACM Trans. Comput. Biol. Bioinforma. 11(6), 1146–1156 (2014)38. N.E. Koshy, V.P. Gopi, A new method for ulcer detection in endoscopic images, in 2nd
International Conference on Electronics and Communication Systems ICECS 2015 (2015),pp. 1725–1729

Part III
Societal Impact of Multimedia Big Data

Multimedia Social Big Data: Mining
Akshi Kumar, Saurabh Raj Sangwan and Anand Nayyar
Abstract The rapid evolution and adoption of the SMAC (Social media, Mobile,
Analytics and Cloud) technology paradigm, has generated massive volumes of
human-centric, real-time, multimodal, heterogeneous data. Human-sourced infor-
mation from social networks, process-mediated data from business systems and
machine-generated data from Internet-of-Things are the three primary sources of
big data which define the richness and scale of multimedia content available. With
the proliferation of social networks (Twitter, Tumblr, Google+, Facebook, Instagram,
Snapchat, YouTube, etc.), the user can post and share all kinds of multimedia con-
tent (text, image, audio, video) in the social setting using the Internet without much
knowledge about the Web’s client-server architecture and network topology. This
proffer novel opportunities and challenges to leverage high-diversity multimedia
data in concurrence to the huge amount of social data. In recent years, multime-
dia analytics as a technology-based solution has attracted a lot of attention by both
researchers and practitioners. The mining opportunities to analyze, model and dis-
cover knowledge from the social web applications/services are not restricted to the
text-based big data, but extend to the partially unknown complex structures of image,
audio and video. Interestingly, the big data is estimated to be 90% unstructured fur-
ther, making it crucial to tap and analyze information using contemporary tools. The
work presented is an extensive and organized overview of the multimedia social big
data mining and applications. A comprehensive coverage of the taxonomy, types and
techniques of Multimedia Social Big Data mining is put forward. A SWOT Analy-
sis is done to understand the feasibility and scope of social multimedia content and
big data analytics is also illustrated. Recent applications and suitable directions for
A. Kumar · S. R. Sangwan
Department of Computer Science & Engineering, Delhi Technological University,
New Delhi, India
e-mail: [email protected]
S. R. Sangwan
e-mail: [email protected]
A. Nayyar (B)
Graduate School, Duy Tan University, Da Nang, Vietnam
e-mail: [email protected]
© Springer Nature Singapore Pte Ltd. 2020
S. Tanwar et al. (eds.), Multimedia Big Data Computing
for IoT Applications, Intelligent Systems Reference Library 163,
https://doi.org/10.1007/978-981-13-8759-3_11
289

290 A. Kumar et al.
future research have been identified which validate and endorse this correlation of
multimedia to big data for mining social data.
Keywords Big data · Social data · Web mining
1 Introduction to Multimedia Social Big Data Mining
The unnceasing surge of the World Wide Web and the acquaintance of the people
around the world with the Internet create all the required prerequisites for a wide-
ranging adaptation of the elementary Internet as a general medium for exchange
of information, where any user can become a contributor. This new collaborative
Web (called Web 2.0) resiliently defines the techno-social system which augments
human cognition, communication, and co-operation; where cognition is the neces-
sary prerequisite to communicate and the precondition to co-operate. In other words,
cooperation needs communication and communication needs cognition. Such com-
plex social big data (human-sourced, process-mediated and device generated) calls
for cross disciplinary research from data mining, machine learning, pervasive and
ubiquitous computing, networking, and computational social science.
The term “Big Data” is of huge importance today for researchers and practitioners
alike. It is defined as ‘high-volume, high-velocity and high-variety information assets
that demand cost-effective, innovative forms of information processing for enhanced
insight and decision making’. Big Data is used to denote a collection of data sets
which are too large and complex to handle and process using conventional data
processing tools and applications. The size of data sets cannot be handled by common
software tools used to for capturing, curating, managing and processing data within
an acceptable time limit. The characteristics of Big Data are described by 7 V’s given
in the following Table 1.
Big Data is a trending set of techniques that demand new ways of consolidation of
various methods to uncover hidden information from the massive and complex raw
supply of data. User-generated content on the Web has been established as a type of
big data and thus the discussion on Big data is inevitable in any description of the
evolution of Web and its growth. Following are the types of Big Data that have been
identified across the literature:
• Social Networks (human-sourced information): Almost all of the data and infor-
mation generated by people today is digitized and can be stored on any device from
PCs to social websites. Such data is usually not structured and not governed by
anyone. Data generated from social media platforms like Facebook, Blog posts and
comments, Personal documents, Pictures from Instagram, Flickr, etc., and Videos
from YouTube, E-mail, Web search results and content from mobile phones: text
messages amongst others.
• Traditional Business systems (process-mediated data): Business events like
customer registration, product-manufacturing, placing and taking orders, etc. are

Multimedia Social Big Data: Mining 291
Table 1 Big-data Characteristics
Volume
Scale of data
It determines the amount of data that flows in,
which can be stored and originated further.
Depending on the amount of data that is
stored, it is decided whether it can fall in the
category of “big data” or not
Variety
Different forms of data
Different type and various sources of data are
specified including both structured and
unstructured data. For e.g. documents, emails,
images, videos, audio etc.
Velocity
Analysis of Streaming data
It is the aspect which deals with the pace of
the data in motion and its analysis where the
content flow is assumed to be continuous and
immense. Apart from the consideration of the
speed of the input, it also contemplates the
celerity of the generation of useful
information from it
Veracity
Uncertainty of data
This characteristic of big data deals with the
primary issue of reliability and whether the
analysis of data is being accurately done, so
that eventually there is a production of
credible and quality solutions
Variability
Contextual meaning of data
It refers to the inconsistency of the
information that is stored. In simpler words, it
deals with rapidly changing and alternative
meanings that are associated with the data
Visualization
Way to represent information/data
Visualization happens to make one of the
crucial characteristics of big data because all
the data that is being stored used as an input
and generated as a result, needs to be sorted
and viewed in a manner that is easy to read
and comprehend
Value
Cost of using data
It deals with the practice of retrieving the
usefulness of the data. It is perceived that data
in its original self won’t be valuable at all.
Under analysis, how data is turned into
knowledge and information is what the
“value” characteristic deals with
recorded and monitored by these. Such data include data from transactions, tables
of references, relations, etc. and is quite structured. Data generated by Public
organizations like Medical records and Data from Commercial transactions, Bank
and stock records, E-commerce and credit/debit cards etc. are some examples.
• Internet of Things (machine-generated data): This includes data generated by
the huge number of sensors and machines that are used for measuring and recording
the events in the real world. The data from sensors is well structured as it is
machine-generated, and range from simple sensor records to complex computer

292 A. Kumar et al.
logs. Data from fixed sensors like home automation, weather/pollution sensors,
traffic sensors/webcam and security/surveillance videos/images, data from mobile
sensors (tracking) such as mobile phone location, cars and satellite images and data
from computer systems such as logs and web logs are some examples.
Business innovation and social intelligence pave the way to a future in which smart
factories, intelligent machines, networked processes and big data are brought together
to foster industrial growth and shift the economics. Social media has emerged as a
key player which provides a platform for expression and distribution of content in
today’s world. The primary intent of social networking sites is to create, professional,
interest, relationship-based virtual communities, enabling stronger connections with
everyone around the world. Social media content is one of the major data sections
which have attracted people and organizations across the globe. This is primarily due
to the omnipresence and coverage of social applications world-wide. Social Media
applications allow users to share comments, opinions, ideas, and media with friends,
family, businesses, and organizations [1]. The data contained in these comments,
ideas, and media are valuable to many types of organizations. Moreover, social media
is inherently an informal way of communication with all kinds of multimedia content.
Social media dynamics keep changing with respect to the increasing user base and
user-activity which makes it a high dimensional, complex and fuzzy data space for
analytical processing. Thus, social big data mining contributes significantly to the
field of data analytics as a new technology-based solution to comprehend wider and
deeper applications of social media data. The maturity and growth of data science
and machine learning for real-time decision making are the key technology drivers
supporting viable, competent, and an actionable business model.
Social Media is one of the largest contributors to big data. With the increasing
number of social media platforms and the rapid increase in the number of users of
these platforms, huge amounts of data are generated around the world by the minute.
Facebook, Twitter, Instagram and YouTube are some of the prominent contributors
to social media. Analyzing the data from these websites would not only improve
decisions, but would also lead to cost reduction and new products and services better
suited to the needs of the users. The following Fig. 1 depicts the role of social big-data
analytics in a typical business setting.
The following Fig. 2 depicts the existence of multimedia social big data in a
typical business setting.
Variety and velocity are two key terms associated with big data. There are var-
ious sources of big data. Clickstream data, data from various electronic devices
like sensors, social media platforms like Facebook, Twitter, LinkedIn, Instagram,
Google+ tremendously contribute a variety of data apart from text like images,
videos and audios. Geo-spatial data sharing people’s locations feeds from business
companies, markets and even those related to government are increasing day by day.
Web 2.0 including data from mobiles, e-commerce websites like Amazon, Flipkart,
eBay, recommendations as well business and marketing data and data from Enter-
prise Resource Planning and Customer Relationship Management like bills and data
about stocks and inventory are subsets that contribute towards big data.

Multimedia Social Big Data: Mining 293
Efficient
Decision
Making
New
products
and
services
Reduction
in costs
Social Media
Big Data
YouTubeInstagram
Fig. 1 Social big-data analytics in business
Big Data
Click stream
data Data
from
Devices
Data
from
social
media
Geo
location
data
Audio
Video
Text
Images
Feeds,
Log files
Web 2.0
Business,
Search based
Marketing
Mobile
Devicese-
commerce,
Endorsem
ents
Recommendation
ERP/CRM
Bills, Stocks, Payroll, Sales Pipeline, Tracing business orders, Contacts
Fig. 2 Multimedia social big data in business

294 A. Kumar et al.
Fig. 3 Multimedia support by popular social networking sites
Recently, visual communication using images to express views, opinions, feelings,
emotions and sentiments has increased tremendously on social platforms like Flickr,
Instagram, Twitter, Tumblr, etc. [2–5]. Images are particularly powerful as they have
cognition associated and visual experiences convey sentiments and emotions better.
Consequently, the visual sentiment analysis has been of interest to researchers and
it has been observed that deep learning techniques have outperformed the conven-
tional machine learning techniques in analyzing the visual sentiment. Multimodal
capabilities offered by popular social networking websites such as Facebook, Twit-
ter, and Tumblr have further enabled mix of text and images in a variety of ways for
better social engagement. The ascendant use of infographics, typographic-images,
memes and GIFs in social feeds is a testimony to this. Text-driven analytics has
been widely studied [6–9] and few pertinent studies which report visual analytics
of images are available in literature [10–14]. Moreover, much of the reported work
has analyzed a single modality data, whereas multiple modalities of text and image
remain unexplored. The following Fig. 3 depicts the multimedia types supported by
popular social networking sites.
The following Table 2 lists out the media types supported by popular social media
platforms.
2 Process Model for Multimedia Social Big Data Mining
Big Data is a term used to describe data that is huge in amount and which keeps
growing with time. Big Data consists of structured, unstructured and semi-structured
data. This data can be used to track and mine information for analysis or research
purpose.
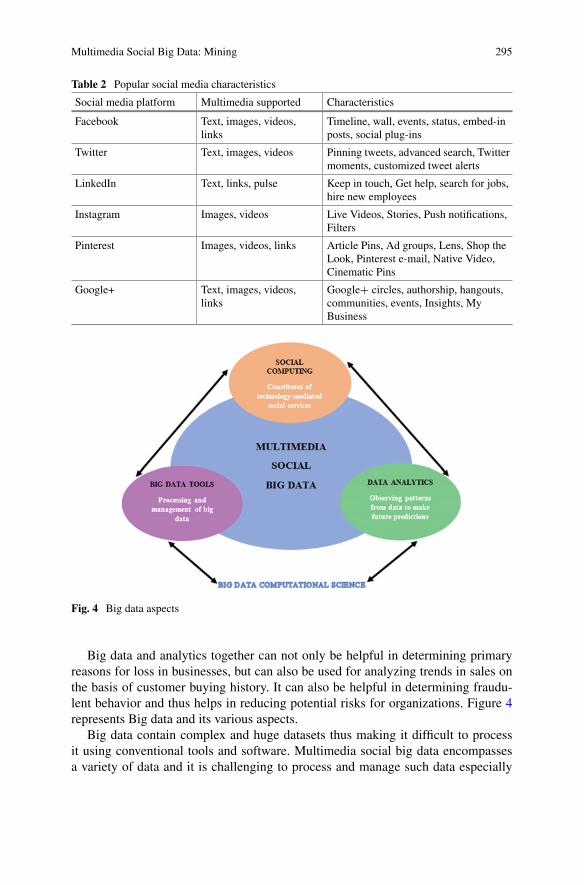
Multimedia Social Big Data: Mining 295
Table 2 Popular social media characteristics
Social media platform Multimedia supported Characteristics
Facebook Text, images, videos,
links
Timeline, wall, events, status, embed-in
posts, social plug-ins
Twitter Text, images, videos Pinning tweets, advanced search, Twitter
moments, customized tweet alerts
LinkedIn Text, links, pulse Keep in touch, Get help, search for jobs,
hire new employees
Instagram Images, videos Live Videos, Stories, Push notifications,
Filters
Pinterest Images, videos, links Article Pins, Ad groups, Lens, Shop the
Look, Pinterest e-mail, Native Video,
Cinematic Pins
Google+ Text, images, videos,
links
Google+ circles, authorship, hangouts,
communities, events, Insights, My
Business
Fig. 4 Big data aspects
Big data and analytics together can not only be helpful in determining primary
reasons for loss in businesses, but can also be used for analyzing trends in sales on
the basis of customer buying history. It can also be helpful in determining fraudu-
lent behavior and thus helps in reducing potential risks for organizations. Figure 4
represents Big data and its various aspects.
Big data contain complex and huge datasets thus making it difficult to process
it using conventional tools and software. Multimedia social big data encompasses
a variety of data and it is challenging to process and manage such data especially
296 A. Kumar et al.
related to its volume and complexity. A few important challenges for multimedia big
data are:
• Structuring the unstructured data.
• Understand and capture most important data eradicating irrelevant and redundant
data.
• Storing the huge amount of data that is growing day by day.
Some of the tools used for storage and analysis of big data are Apache Hadoop;
Microsoft HDInsight; Hive; Sqoop; PolyBase; Presto.
Another important aspect of social big data is Social Computing. Social Com-
puting is a research domain that helps us in understanding social behaviors. It is
concerned with the intersection of social behavior and computational systems and
deals with the mechanisms through which people interact with computational sys-
tems [15]. Some examples where social computing has helped in research in recent
times is given as follows:
• Researchers have looked at how people behave in various online communities
(such as Subreddits, Yikyak, etc.).
• What kind of users visit a website with what goals and the persona a person holds
in their online presence.
• Examining questions such as how and why people contribute user-generated con-
tent and how to design systems that better enable them to do so.
Some examples include collective intelligence, prediction markets, crowdsourc-
ing markets etc. The multimedia big-data from the popular social websites in the
form of videos, images, text, emails, are captured and store into various data repos-
itories from where it can be shared among users. Various steps to be followed in the
analysis of big data are represented in Fig. 5. and are described as follows:
• Data Pre-processing
Data pre-processing is done for cleaning and transforming the data collected in order
to remove noise.
Data cleaning includes
– Noise reduction
– Missing value imputation
– Inconsistencies elimination
Examples of data cleaning include removal of URLs, removal of punctuations
including hash-tag ‘#’, removal of repetitive characters, and extra spaces. Further,
tokenization is done to obtain a sequence of characters followed by stopping and
stemming. Stemming is done to reduce the derived words to their word stem, base
or root form. Stop words like the, a, is, she, him, on, etc. are removed as they are
used for structuring of sentence and are less influential in identifying sentiment of
a sentence. Followed by data cleaning the data is transformed into a structured data
format. Data transformation includes
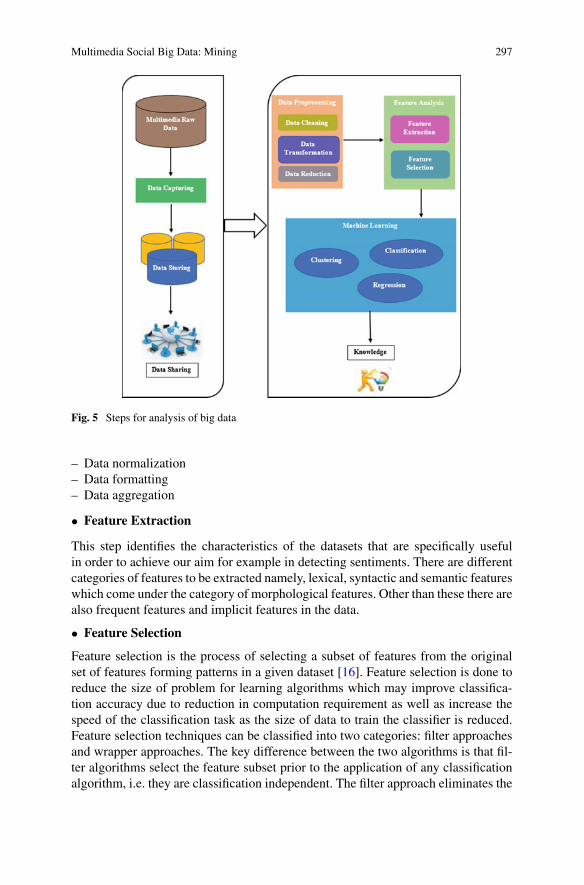
Multimedia Social Big Data: Mining 297
Fig. 5 Steps for analysis of big data
– Data normalization
– Data formatting
– Data aggregation
• Feature Extraction
This step identifies the characteristics of the datasets that are specifically useful
in order to achieve our aim for example in detecting sentiments. There are different
categories of features to be extracted namely, lexical, syntactic and semantic features
which come under the category of morphological features. Other than these there are
also frequent features and implicit features in the data.
• Feature Selection
Feature selection is the process of selecting a subset of features from the original
set of features forming patterns in a given dataset [16]. Feature selection is done to
reduce the size of problem for learning algorithms which may improve classifica-
tion accuracy due to reduction in computation requirement as well as increase the
speed of the classification task as the size of data to train the classifier is reduced.
Feature selection techniques can be classified into two categories: filter approaches
and wrapper approaches. The key difference between the two algorithms is that fil-
ter algorithms select the feature subset prior to the application of any classification
algorithm, i.e. they are classification independent. The filter approach eliminates the

298 A. Kumar et al.
less important features by using statistical properties of features. Wrapper algorithms
select the features according to the accuracy of the training data and afterwards learn
and test the classification model using the test data. Generally, for the implementation
of wrapper methods learning algorithm and the performance criteria are defined.
• Machine Learning
Machine learning focuses on the development of computer programs that can access
data and use for learning. Machine learning algorithms are broadly classified into
Supervised, Unsupervised, and Semi-supervised [17]. Regression and Classifica-
tion come under Supervised learning (answer for all the feature points are mapped)
and Clustering comes under unsupervised learning (answer will not be given for the
points).
• Regression—If the prediction value tends to be a continuous value, then it falls
under Regression type problem in machine learning.
• Clustering includes grouping a set of points to the given number of clusters.
• Classification—If the prediction value tends to be categorized like yes/no, posi-
tive/negative, etc., then it falls under classification type problem in machine learn-
ing.
3 SWOT Analysis of Adopting Multimedia Social Big Data
Mining in Real-Time Applications
The following Fig. 6 illustrates a typical lifecycle of data.
SWOT analysis can be defined as a model or technique which is used to figure out
the strengths, weaknesses, opportunities and threats to a particular person, project
or product. It lays the foundation stone for a project as it shows all the positives and
negatives in advance and therefore, plays a crucial role in decision making. As the
name implies, SWOT analysis for an entity deals with four factors:
• Strengths: The traits of the entity which provide it an edge over others.
• Weaknesses: The traits of the entity which are most likely to prove as a dis-benefit
to itself.
• Opportunities: The external elements that the entity can use in order to get maxi-
mum benefits.
• Threats: The external elements that can prove to be hazardous for the entity in the
future.
Considering the importance of SWOT analysis, a SWOT Analysis is carried out
to get to know the feasibility and scope of social multimedia content and big data
mining [18]. The following sub-sections discuss the details:

Multimedia Social Big Data: Mining 299
Fig. 6 Data lifecycle
3.1 Strengths
• Enhance the performance of the business
The major strength of multimedia social big data mining is that it upgrades the
performance of businesses. This is due to the intelligent business systems that it
provides. Every business can be analyzed with the use of big data to get to know
what is working in its favor and what is working otherwise. The results can be used
for modifying existing strategies for maximizing the profit.
• Targeted users/customers
Social multimedia content and big data mining provide the targeted customers to a
business which will lead to more profit. This is done on the basis of past interests
shown by a customer and other features of an individual’s profile which may imply
her/his liking for a particular product. This in turn benefits both, the business and the
customer.
Also, in social networks like Twitter, Facebook, Quora, it is used to recommend
news, users or stories to people based on their past choices and other factors derived
from big data mining.
• Speedy and precise analysis
By using various machine learning techniques, the analysis of the Social multimedia
content and big data has now become very fast. Moreover, if the most suitable tech-
nique is used for analyzing a particular problem, then the accuracy of the analysis is
also laudable.
300 A. Kumar et al.
• Improved Strategic decisions
It is a well-known fact that one takes better decision when she/he is well aware of all
the aspects of a situation. In this case also the social multimedia content and big data
mining provides a deep insight in the situation which leads to outstanding decision
making.
• Customer/User satisfaction
Due to targeted campaigning and better understanding of customer preferences pro-
vided by the big data, customer gets the required services easily without much effort.
Also, in social networks, users get a better experience due to personalized content.
3.2 Weaknesses
• Risk of wrong conclusions
While analyzing social multimedia content and big data there are many factors that
have to be kept in mind for an efficient and precise analysis, such as the expertise of
team in the field they are dealing with. For example, if a team is analyzing a trend
in the symptoms of a disease, then all members should have a basic understand-
ing of medical science otherwise it may end up in very wrong predictions. Wrong
conclusions are also derived when the data set is not of good quality.
• Lack of professionals
There is a need of small enterprises or people who are well efficient in carrying out
the analysis of big data. The expertise in this field is a must. Therefore, the focus
should be on training more and more individuals in this field so that we achieve the
desired level of expertise.
• Customer privacy at stake
All the data we are talking about is customer specific. For analysis, one needs a
well-defined and detailed data set which comes from the details of customers. This
is one of the major weaknesses of social multimedia content and big data analysis.
• Reduced data set may lead to incorrect analysis
For making machine learning techniques more effective, we stress on reducing the
size of data set, but sometimes this reduction might lead to an incorrect analysis as
we may lose some important and deciding features.

Multimedia Social Big Data: Mining 301
3.3 Opportunities
• Efficient tool for detecting rumor, bully, fake news etc.
This is one of the most important opportunities in the field of analyzing social mul-
timedia content and big data as it helps in making our environment safer. By using
the machine learning techniques efficiently, we can come up with a solution to all
these problems.
• Education and health sector
This is also a very important opportunity in this field as it touches millions of lives.
By analyzing the data related to education sector, we can come to know about the
performance of teachers. Also, whether the government education scheme is doing
well or not. This will not only lead to better performance of students but also will
increase the literacy rate. Similarly, in health sector social multimedia content and big
data analysis can prove to be a game changer. Better, low cost and efficient treatment
can be provided to everyone.
• Fraud detection
Fraud is a major problem every country is facing today. This is present in every
sphere of life. Social multimedia content and big data analysis, if done properly, can
lead to an efficient fraud detection system.
3.4 Threats
• Privacy
With this amount of access of an individual’s data social multimedia content and big
data analysis has to be very careful. As it may be opposed by people in the future.
• Identity theft
There is a very high chance of misuse of social multimedia content and big data
mining. One of the main threats is about identity theft as with so much data available
about an individual, one can easily access and misuse it for fraudulent practices.
• Costs
The costs involved in all these practices may rise up to a level where the cost-benefit
ratio goes very low.
• Social approval
Social multimedia content and big data analysis may face a challenge in terms of
social acceptance. This is due to the fact that it works in the public domain, uses peo-
ple’s information and recommends the results to them, i.e. totally public dependent.
Therefore, social acceptance is a must which can be very difficult to achieve when
people’s privacy is at stake. The following Table 3 summarizes the SWOT Matrix.
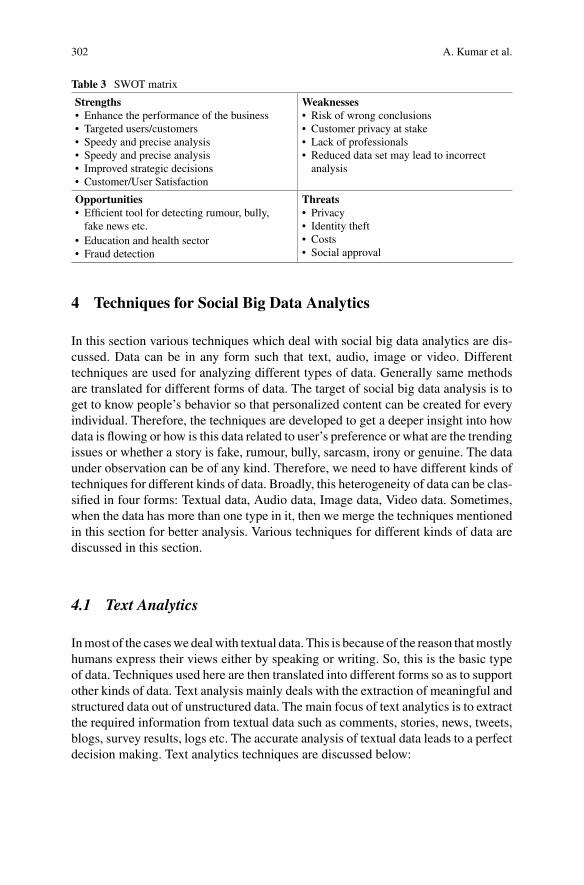
302 A. Kumar et al.
Table 3 SWOT matrix
Strengths
• Enhance the performance of the business
• Targeted users/customers
• Speedy and precise analysis
• Speedy and precise analysis
• Improved strategic decisions
• Customer/User Satisfaction
Weaknesses
• Risk of wrong conclusions
• Customer privacy at stake
• Lack of professionals
• Reduced data set may lead to incorrect
analysis
Opportunities
• Efficient tool for detecting rumour, bully,
fake news etc.
• Education and health sector
• Fraud detection
Threats
• Privacy
• Identity theft
• Costs
• Social approval
4 Techniques for Social Big Data Analytics
In this section various techniques which deal with social big data analytics are dis-
cussed. Data can be in any form such that text, audio, image or video. Different
techniques are used for analyzing different types of data. Generally same methods
are translated for different forms of data. The target of social big data analysis is to
get to know people’s behavior so that personalized content can be created for every
individual. Therefore, the techniques are developed to get a deeper insight into how
data is flowing or how is this data related to user’s preference or what are the trending
issues or whether a story is fake, rumour, bully, sarcasm, irony or genuine. The data
under observation can be of any kind. Therefore, we need to have different kinds of
techniques for different kinds of data. Broadly, this heterogeneity of data can be clas-
sified in four forms: Textual data, Audio data, Image data, Video data. Sometimes,
when the data has more than one type in it, then we merge the techniques mentioned
in this section for better analysis. Various techniques for different kinds of data are
discussed in this section.
4.1 Text Analytics
In most of the cases we deal with textual data. This is because of the reason that mostly
humans express their views either by speaking or writing. So, this is the basic type
of data. Techniques used here are then translated into different forms so as to support
other kinds of data. Text analysis mainly deals with the extraction of meaningful and
structured data out of unstructured data. The main focus of text analytics is to extract
the required information from textual data such as comments, stories, news, tweets,
blogs, survey results, logs etc. The accurate analysis of textual data leads to a perfect
decision making. Text analytics techniques are discussed below:

Multimedia Social Big Data: Mining 303
Information Extraction
This technique deals with the structuring of a huge unstructured data [19]. For exam-
ple, one gets to understand the relationships between various entities are using this
method. There are two methods which tell the correctness of an information extrac-
tion algorithm:
• Precision
• Recall
One of the major tasks of information extraction is to classify the data into entities,
i.e. recognizing the class/entity to which a particular entry belongs. The techniques
which are used for this classification of data entries into entities and then establishing
relationships between these entities based on data are:
• Supervised machine learning techniques
• Semi-supervised machine learning techniques
• Unsupervised machine learning techniques
Supervised machine learning techniques includes Support Vector Machine
(SVM), Hidden Markov models, decision tree, naive Bayes, k-nearest neighbor algo-
rithm. Examples of semi-supervised machine learning techniques are bootstrapping,
snowball, etc. Clustering algorithms are the examples of unsupervised machine learn-
ing techniques.
4.2 Audio Analytics
As the name suggests, audio analytics means analyzing the data which is in audio
form to derive the required information from these audio signals. There are many
applications of audio analytics. For example, in health care: Proper analysis of an
infant’s voice can tell his/her health status. Another example is in call centers, where
audio/speech analysis is done to improve the quality of their service. The main
techniques used for audio analysis are listed below [20].
• Approach based on phonetics
In this technique phonetics is used to classify the input audio. First, the system
converts the input audio into a sequence of phonemes. Then the system searches for
the output based on the labeling of phonemes.
• LVCSR
LVCSR stands for Large Vocabulary Continuous Speech Recognition. In this
approach first step is to match sound to words using various algorithms like ASR
(Automatic Speech recognition). The system matches the closest option if it fails to
find a perfect match. On the basis of the output an indexed file is maintained, which
provides the sequence in which words were spoken in the audio input. In the second
step the required information is extracted from the indexed file obtained in step 1.

304 A. Kumar et al.
4.3 Image Analytics
Image analytics deals with the extraction of meaningful information from a data
set composed of images. This is done using various image processing techniques.
The major applications of image analytics are facial recognition, movement analysis.
Nowadays, most of the unstructured data available is in image or video form. So, it
becomes very important to come up with effective techniques for image analysis. For
image analytics the methods or techniques used are basically the translated versions
of basic machine learning techniques such as recurrent neural networks, convolution
neural networks, deep learning algorithms etc. There is still a huge scope of research
in this field. With increase in internet services and devices, more and more people
and applications are contributing to data nowadays. To cope up with this speed, we
need efficient techniques and infrastructure for better and accurate analysis of data
in the form of an image.
4.4 Video Analytics
Video analytics is the most challenging one among all. It is mainly due to its size.
We can get an idea of this problem with the fact that two second of an HD video
is equivalent to 4000 pages of text, in terms of size. So much of data which is very
large in size, due to its nature, is being generated in video form [21]. For example,
CCTV footages, a camera in everyone’s hand, videos uploaded to YouTube and other
sites, etc. For analysis the basic machine learning techniques are modified for video
analysis. These techniques also deal with the reduction in frame rate, resolution of
images for easier analysis, but this reduction may lead to a less accurate prediction.
Here also, there is a huge scope of improvement in techniques. A better database
management system is also the need of the hour for analyzing data in the form of
video. This will also reduce the training time.
5 Applications of Multimedia Social Big Data Mining
5.1 Trust and Information Veracity Analysis of Social Media
Data
The web and social media have become an integral part of the daily lives of the gen-
eral mass of people for the past decade. Social network platforms like Facebook and
microblogging sites like Twitter have become ubiquitous. Given how readily acces-
sible these platforms are they have become an indispensable source of information

Multimedia Social Big Data: Mining 305
during real-time events be it a natural disaster, terrorist attacks, political campaigns,
epidemics or any other breaking news. Social media users are far ahead in posting
up-to-date information than any news channels or news websites. As a result, many
people rely on these platforms for getting real-time information in times of crisis
and otherwise. Given the humungous data generated by social media users, it is
challenging and at the same time imperative to analyze the trustworthiness and the
veracity of the information. Although, a rich and accessible source of information,
it is not a reliable one. On one hand the accessibility allows greater dissemination of
important information, but on the other hand it also allows the spread of unauthentic
information.
Indeed, trust and veracity are one of the major caveats of social media posts.
To add to it, sometimes this happens that the user is posting some information and
doesn’t know that what he is posting is wrong. The restlessness of people to post latest
information which in turn leads to greater likes, shares, comments and shares on their
updates overpowers their ability to pause, think and research if what they are posting is
even true or not or even if their information is coming from a credible source. Credible
sources, on the other hand, like news websites, news channels’ websites, blogs of
reporters and journalists are themselves not completely trustworthy, to say nothing
of others. They are always on verge of competition and trying to be the first one to
bring the latest updates that they do not verify the veracity status of their information.
Fake news generation is also a major issue with news websites. Although, some fake
news are honest mistakes, but usually it is too late by the time the mistake is realized,
the harm has already been done. Public figures like politicians, celebrities suffer the
most due to these fake news and untrustworthy information sometimes forcing them
to take extreme measures. Disasters are another crucial time when the credibility of
information is most crucial. Although there are many people who genuinely want
to help and post true or eye witness updates, there are many who simply pass on
the information but proper verification. Although, they might not personally aim to
cause mischief, but most people get trapped by the rumor mongers. For instance,
during an earthquake in Chile rumors spread through Twitter that a volcano became
active and there was a tsunami warning in Valparaiso [22]. Later, these reports were
found to be false.
Thus, if not monitored, social media can be a breeding ground of rumors. Rumors
not only give out false information (which may be intended or unintended) but can
jeopardize the lives of people in some situations, tarnish the images of public figures
in some and cause general unrest among the masses in others. This has been a great
concern lately and many researchers have probed into the area of rumor detection
and veracity.
Kumar and Sangwan [23] define rumor as, “any piece of information put out
in public without sufficient knowledge and/or evidence to support it thus putting a
question on its authenticity. It may be true, false or unspecified and is generated
intentionally (attention seeking, self-ambitions, finger-pointing someone, prank, to
spread fear and hatred) or unintentionally (error). Further, these can be personal
as well as professional.” They further provide the classification of information into
rumor and non-rumor as shown in Fig. 7.

306 A. Kumar et al.
Fig. 7 Classification of rumors [23]
Fig. 8 Architecture of a rumor classification system [26]
There have been other attempts in classifying rumors such as based on veracity
[24], credibility [25] and temporal characteristics [26].
Majority of the rumor detection work has been done on Twitter and Sina Weibo, a
Chinese micro blogging platform with features similar to Twitter. Facebook, although
one of the most popular social media on the web has not been explored much by
researchers due to its restriction for data collection. Twitter provides its API for
extracting data easily and free of cost, hence it is a viable choice for researchers. The
data collections also depend largely on the type of rumors that one is gathering data
for. It is easier for long standing rumors as one can search well defined hashtags and
keywords for the rumors. Data collected from these rumors is useful for monitoring
shift in the public opinion regarding the issue over a large span of time [26]. When
it comes to gathering data for emerging rumors, it becomes more challenging due
to the absence of well-defined keywords and hashtags. The rumor detection system
can be used to detect these emerging rumors (Fig. 8).
Zubaiga et al. [26] propose the following components of a typical rumor classifi-
cation system:
a. Rumor Detection: Given a stream of text/tweets as input this component can act
as a binary classifier for detecting emerging rumors. PHEME and RumorEval
are the two most popular publicly available annotated data sets for rumors.

Multimedia Social Big Data: Mining 307
b. Rumor Tracking: Given the identified rumors, this component keeps track of the
posts discussing the rumor and keeping only those which are relevant and dis-
carding the irrelevant ones. This component of the rumor detection system comes
into play after a rumor has been detected and the subsequent posts regarding the
rumor are tracked. The posts can either be filtered using relevant keywords that
are monitored thus restricting the scope of the rumor tracking system or it can be
input a stream of posts that are not limited by the filtering keywords thus broad-
ening the scope. The output of the rumor tracking component would be posts
labeled as being ‘related’ or ‘unrelated’ to the rumor being tracked. The dataset
of 10,000 tweets developed by is the most widely used for rumor tracking.
c. Stance Classification: Given the posts discussing a rumor as tracked by the pre-
vious component, stance classifier can act as a multi class classifier labeling each
post into classes such as denying, supporting or questioning the rumor. Thus,
it can be used to determine the orientation of each post in response to a source
tweet. However, it can be omitted where the stance of the public is not consid-
ered useful, e.g., cases solely relying on input from experts or validation from
authoritative sources. PHEME is a widely used dataset that is publicly available
for stance classification and gives annotations for stance of each tweet as support,
deny, query, comment.
d. Veracity Classification: This final component uses the labeled posts from the
stance classifier and additionally data from other sources like news websites and,
or other databases to determine a truth value for the rumor. The rumor can be
verified to be true, debunked as being false or labeled as being unresolved yet. The
performance of this component can be measured using measures such as accuracy,
precision and recall. The RumorEval 2017 dataset under the SemEVal2017 task
consist of 300 rumors with veracity labeled as being true, false or unverified.
The first work that focused on detecting emerging rumours was done by Zhao
et al. [27]. They assume that the rumors will invoke questioning tweets inquiring
about their veracity. This can be used to detect the tweets as being rumors. They have
used SVM, and decision trees for their approach. Zubiaga et al. [28], on the other
hand, proposed an approach that is able to learn context during a breaking news story
and can determine whether a tweet is rumorous or not. They used the hypothesis that
a single tweet might not be sufficient for knowing if its underlying story is a rumour,
as there is insufficient context. They used Conditional Random Fields (CRF) as a
sequential classifier that was able to learn the dynamics of reporting during an event,
such that the classifier can decide, for every incoming tweet, if it is a rumor on the
basis of what has been seen by the system up to that point regarding the event. Their
method improved the result in comparison to the baseline classifier by Zhao et al.
[27], The classifier achieved 0.667 in precision and 0.556 in the recall, compared to
0.410 and 0.065 respectively for the classifier by Zhao et al. [27].
Rumor tracking has been explored little with the early work by Qazvinian et al.
[29] being the only prominent one. They performed automated rumor tracking on a
collection 10,000 tweets and used supervised machine leaning on various categories
of features like content, network and Twitter specific. They have also studied stance

308 A. Kumar et al.
classification in their work However, the most pioneering work in stance classification
has been done by Mendoza et al. [30] from which they found that Twitter users largely
support true rumors. Their study indicates that stances to rumorous tweets can be
helpful in predicting veracity. Veracity classification has been one of the most studied
aspects of rumors. The research for this task was initiated by Castillo et al. [31] who
studied credibility perceptions of rumors and is considered a baseline for many
subsequent works regarding veracity. Kwon et al. [32] suggested a novel feature
types: temporal, structural and linguistic and used random forest, SVM and logistic
regression and perform feature selection with the latter giving the best results. In [33]
they have analyzed feature stability and found that structural and temporal features
identify rumors over a long-term window. However, these are available only at later
stages of rumor spread.
Little work has been on rumor tracking and origin detection. These areas can be
explored extensively. Also, a finer grain classification of rumors into misinformation,
hoaxes etc. as classified by Kumar and Sangwan can be explored.
5.2 Sentiment Analysis and Opinion Mining for Social
Well-Being
Sentiment Analysis and Opinion Mining is “the field of study that examines people’s
opinions, sentiments, evaluations, attitudes, and emotions from written language”
[34]. Due to the abundant volume of opinion rich Web data, for example, micro
blogging, news and website reviews, etc. accessible online via Internet, a significant
part of the recent research is concentrating on the ongoing area of text mining (TM)
field which is called as Sentiment Analysis (SA).
The term “opinion mining” was first observed in 2003 in a research paper by Dave
et al. by 2006 [35] and thereafter, it spread to include Web applications and vari-
ous other social wellbeing domains like marketing for product and service reviews,
entertainment, politics, business, recommendations etc. which in turn broaden its
application spectra. With the rapid rise of peoples’ participation and communication
over social web where they express their ideas, opinions or sentiments over a public
forum; SA extracts the public mindset and the findings are being used in various
domains [36]. Next section briefs about the “What, Why and How Factors-WWH”
of SA for Social well-being.
5.2.1 Sentiment Analysis: What?
SA is computational identification and classification of sentiments which are being
expressed as written text on any particular topic, blogs, product reviews etc. [37]
and has emerged as a dynamic area of research. Individuals are expected to build up
a system that can identify, distinguish, arrange and classify sentiments accurately.

Multimedia Social Big Data: Mining 309
Fig. 9 Structure of a
sentiment
The system should derive the mood and polarity of the sentiments [38]. SA analyzed
the vast amount of heterogeneous information generated by social media users every
day.
The ideology of SA is to search for opinions, identify the sentiments involved in
it and classifying it based on its polarity as illustrated in Fig. 9.
5.2.2 Sentiment Analysis: Why?
SA is an emerging area of research in Natural Language Processing (NLP) and is
widely studied in the fields of data, text and web mining. SA is not only limited to
the field of computer science, but it also has applications in management and social
sciences. The growing significance of SA accords with the development of social
media (SM) such as reviews, forum discussions, blogs, micro-blogs, Twitter, and
social networks etc. [39]. This is the first time when a large volume of digitized opin-
ionated data is available to us ready to be analyzed. Today, people express opinions
largely through social media thus increasing the reliance on social networking sites
Facebook, Twitter, etc. for decision making which extensively marks the increasing
significance of SA in our daily lives [40].
For example, if an individual need to visit a place, instead of asking his friends,
relatives or agents, etc., he simply turns on to its online real-time reviews of the
visitors before taking any decision. Also, in terms of business management, if a client
needs to buy a product, he first reads all its reviews and then eventually reaches to
a decision whether to buy or not buy that product. Hence, we see that this content
is available in huge quantity and is too vast to be analyzed meticulously, effectively
and efficiently. Here comes the role of SA, which classifies the opinions based on its
polarities.
5.2.3 Sentiment Analysis: How?
Sentiment analysis (SA) systems are being applied for practically all the social well-
beings i.e. to almost all the business and social domain as opinions are central to
most human activities and are considered to be the key influencers of our behaviors

310 A. Kumar et al.
as well. Our beliefs and perceptions of reality, and therefore the selections we tend to
make are basically conditioned on however others see and assess the world. For this
reason, when we need to make a decision we regularly hunt down the opinions of
others. This can be true not just for people, however conjointly for organizations as
well. Various Web 2.0 tools and technologies can be used for efficiently evaluating
the user opinions in real time [41].
5.2.4 Applications of Sentiment Analysis for Social Well-Being
With the rapid growth of SM, SA has become one of the most upcoming research
areas in NLP. Its application is also widespread, ranging from business services,
health cares, commercialization and industrialization to political campaigns [42–48]
etc. It also involves various types of social well-being such as:
• Tracking collective user opinions for rating of the products and services
(E-commerce and Product analytics)
• Analyzing consumer trends, competitors and market buzz
(E-industry)
• Measuring response to company-related events and incidents
(SM Monitoring)
• Monitoring critical issues to prevent negative viral effects
(Market Research and Analysis)
• Customer Support (Voice of Customer)
• Evaluating feedback in multiple languages
• Brand Monitoring
Thereafter, it is quite evident to say that sentiment analysis in the business can
prove a major breakthrough for the complete brand revitalization. The key to running
a successful business with sentiment data is the ability to exploit the unstructured
data [49–53] for following actionable insights.
1. Business intelligence build up
Having insight and knowledge about the information at hand, eradicates the guess
work enables to take and execute decisions in a timely fashion. Given the data today
abundant with the sentiments about the established and the new products, estimating
the customer retention rate has become much easier. Moreover, the reviews formed by
sentiment analysis can prove helpful in adjusting the business strategy in accordance
with the current market situation and hence lead to greater customer satisfaction.
Keeping up and maintaining dynamicity is imperative in business intelligence and
with the opinioned data at hand, one gets liberty.

Multimedia Social Big Data: Mining 311
2. Competitive advantage
Knowledge of the sentiments regarding the data of one’s business competitors facil-
itates us to better our performance learning from their strengths and limitations.
Sentiment Analysis and opinion mining can be also proved to be very helpful in
foreseeing customer trends and forming business and marketing strategies accord-
ingly.
3. Enhancing the customer experience
Customer satisfaction is the fertile ground on which any business flourishes. The
satisfaction level of customers can be analyzed using sentiment analysis regarding
various aspects of the business. This lets us know what has been well received in
relation to products, services and customer support and what needs to be improved.
4. Brand brisking
The transition a business from being a startup to being a well-known and reputed
brand depends on how well is the online marketing, social campaigning and content
marketing done as well as how good is the customer support service. Sentiment
analysis can help a business to know how its marketing strategies are being received,
what needs to change and what needs to be improved.
The applications of sentiment analysis in E-commerce, product analysis, E-
industry, market research and analysis [54–60] are overwhelming. It is also very
useful in checking social media as it lets us get an indication of the broader public
view on various topics. The applications of which are broad and powerful.
Few of the examples are as follows:
• The Obama administration used sentiment analysis to gauge public opinion to pol-
icy announcements and campaign messages ahead of 2012 presidential elections.
Being able to quickly see the sentiment behind everything from forum posts to
news articles means being better able to strategize and plan for future [61].
• Expedia Canada took advantage of this technique when they noticed there was
a steady increase in negative feedback to the music used in one of their televi-
sion advertisements [62]. Sentiment analysis conducted by the brand revealed that
the music played on the commercial had become irritating after multiple airings.
Rather than chalking it up as a failure, Expedia was able to address the nega-
tive sentiments in a playful and self-knowing way by airing a new version of the
advertisement which featured the offending violin being smashed.
These days, sentiment analysis is used to address social problems as well, such
as:
• Fighting infectious diseases
Understanding and influencing the confidence level and trust of the general public
during an outbreak can help public health officials slow the spread of the disease.

312 A. Kumar et al.
• Preparing people for the future of work
How positive of negative a population feeling about the threat of automation is an
indication of how well prepared they are for the upcoming changes.
• Promoting social inclusion
Efforts around the world to combat the spread of anti-immigrant, racist or anti-
LGBTQ sentiment among young people increasingly rely on effective monitoring
of the social media.
• Saving the environment
Whether raising public awareness about the impact of climate change or the pollution
of the world’s ocean, influencing public perceptions of environmental destruction is
critical to changing course.
These applications of sentiment analysis have a very positive impact on the society
and the environment, thus proving its huge relevance for social well-being.
5.3 Detection of Illicit Behavior and Bullying in Social Media
Web 2.0 is extending and evolving in terms of the volume, velocity and variety of
information accessible online across various social media portals which affirms that
the social media (SM) has global reach and has become widespread [63]. There are
various benefits of SM but few people use it in the wrong way. One such illicit use
of SM is to bully someone is known as Cyberbullying (CB). The term ‘Cyberbul-
lying’ was coined by anti-bullying activist Bill Belsey in the year 2003 [64]. Toku-
naga defined CB as “any behavior performed through electronic or digital media by
individuals or groups that repeatedly communicates hostile or aggressive messages
intended to inflict harm or discomfort on others” [65]. Different characteristics are
highlighted by this definition like, the technology part, the antagonistic behavior
of the act, reason to cause suffering, considered by most scholars to be crucial to
the definition, and repetitiveness [63]. Cyberbullying or illicit behavior over social
networks has already been designated as a major threat to public health by CDC
(Centers for Disease Control and Prevention) [63]. CB can be possible through any
of the media like mobile phones or using internet. CB may be done through emails,
instant messages, chat rooms, blogs, images, video clip, text messages etc. [66, 67].
CB can be classified into direct CB and indirect CB. Direct CB is to harass or
humiliate a person directly either through email, SMS etc. Indirect CB is done by
posting harmful of humiliating content related to someone on SM. There are various
types of CB explained in Table 4.

Multimedia Social Big Data: Mining 313
Table 4 Types of
CyberbullyingTypes of CB Description
Flaming Online fight between people posting
messages that contain offensive
language [68]
Harassment Posting messages in order to insult or
threat the victim [68]
Denigration Spreading rumors in order to harm the
reputation of the victim [68]
Impersonation Impersonate the victim and using this
fake identity in damaging ways [68]
Outing and trickery Acquiring the trust of the victim and the
violating it by disclosing secrets of the
victim [68]
Exclusion Excluding the victim from groups or
other online activities [68]
5.3.1 Incidences and Effects of Cyberbullying
Cyberbullying can happen at any age, sex and at any geographical location via any SM
like Twitter, Facebook, social forums. It can be related to personal, racial, religious
or cultural. The first reported case of CB was the case of Ryan Halligan of Vermont
in 2003 [69]. Ryan was an American student who was constantly being bullied
in person and via online by his classmates, that eventually forced him to commit
suicide at the age of 13 only. But no legal actions could be taken against the culprits
due to non-availability of proper laws pertaining to CB at that time. According to
a survey, two third of the students in grade 7–9 belonging to middle class family
or diverse communities in Calgary suffered from CB [70]. Another study [71] on
a similar pattern exhibited that 15% of the students of 7th grade bullied others.
Amongst all, fewer than 35% of the incidents were reported to the adults. Numerous
studies showed that in school CB may occur due to lower academic performances,
lower level of attachment and commitment to school or lower positivity in the school
climate [71]. Age and demographic features also add to it. All this eventually affects
the mind and body of the child and may lead to some of the disastrous effects
such as committing suicides. CB may also occur due to the feelings of low self-
confidence, suicidal ideation, annoyance, frustration, and various other emotional
and psychological problems [72].
Research shows that persons who are facing CB are the ones who are victims
of traditional bullying as well, but what makes CB more pervasive in the victim’s
life is the fact that CB can be reached at any given time of the day while in the
traditional bullying, the bullying behavior usually happens during school time and
stops once victims return home [64]. Therefore, the persistence of the cyber bullying
behaviors may result in even stronger negative outcomes than traditional bullying
[65, 73]. Moreover, CB has all those risk factors that are there in traditional bullying.

314 A. Kumar et al.
In addition, it has other aspects also that are very dangerous and can’t be ignored like
sometimes because of ignorance about the drawbacks and risks of sharing personal
information over the Internet or sharing passwords on the internet, communicating
with unknown people, a very little control exerted over personal information, which
may lead towards CB [74]. Therefore, rather than being physically strong, CB tend to
be more technologically savvy and should be able to catch the loopholes and remove
them. It should work in a way so as to hide the electronic trails of victims, and use
bullying “repertoire,” which now includes identity theft, account hacking, infecting
a victim’s computer, impersonation, or posting embarrassing content [63].
In the year 2015, it was shown in a report in Italy that the users of 11–17 ages are
bullied through email, SMS, or social networks. In the year 2016, there were 230 cases
of cyberbullying that had been reported [75]. Recently, the Anti-cyberbullying Law,
Law No. 71/17, officially came into force after getting approved by the parliament
of Italy, which targets to tackle online bullying of children after several high-profile
cases in which victims have committed suicide [76].
5.3.2 Cyberbullying Detection
Cyberbullying leaves an impression on the minds of cyber-victim. Thus, it is the
need of the hour to detect CB. The process of CB detection is divided into different
phases. It involves pre-processing of data, feature extraction, feature selection and
classification of messages in bullying and non-bullying as shown in Fig. 10.
The first phase involves pre-processing of data, such as cleaning of data, correcting
words, handling missing values, etc. Features are extracted from the pre-processed
data, such as n-grams, skip-grams, profane words etc. Features are selected from
Fig. 10 Generic CB
classification process Data Pre-processing
Feature Extraction
Feature Selection
Classification of
messages
Cyberbullying Non-
Cyberbullying

Multimedia Social Big Data: Mining 315
extracted features which are best and most effective. Finally, classification of mes-
sages is done to classify messages into bullying and non-bullying.
There are few software available to deal with cyberbullying e.g., [77–79]. Though,
filters generally work with a basic key word search and sentiments of the text cannot
be understood by the filters. There are some filters that block such webpage which
contains some offensive keyword, while there are some such filters that just shows
a blank webpage if any bullying keyword is detected. However, there are various
techniques by which the filters can be dodged very easily, and thus it is true that filters
are not that efficient and effective method for cyberbullying detection. Using chat
rooms, mobile communication and peer-to-peer networking the blocked content can
bypass central servers that maintain the filters. Another limitation is that the filtering
methods have to be set up and maintained manually.
Various cyber bullying detection techniques has been applied by the researchers
in the past few years in order to classify the bully comments more accurately and to
make such models that will work quietly efficiently for the required task.
The Table below shows a few examples of the recent work done by various
researchers for detection of cyber bullying. The Table 5 contains columns that show,
which dataset used by the researchers to work on, what type of techniques and tools
that have used, which type of social media site they have referred and also what
results they have got.
There are several deep learning methods also that nowadays are being used in order
to detect this illicit behavior over social networking sites. Deep learning methods, like
CNN, RNN, are more efficient and has been proved more accurate by the researchers.
6 Conclusion
The chapter presents various aspects of Big Data including its characteristics, types,
applications, etc. with the special attention on multimedia social big data which con-
stitutes of data generated on social media sites and that is progressively growing. The
data generated online not only consist of text, but images, videos, sensor information,
emails, etc., which makes it complex in nature and difficult to store. There are some
tools specifically used for storage and analysis of big data. Generation of big data can-
not be stopped, but if utilized properly, it can be used in various research domains.
Researchers are working on many applications of big data which includes rumor
detection, sentiment analysis, sarcasm detection, cyber bullying detection, which
have been explained in the chapter. As the data increases, it puts pressure on inter-
net, web, applications, technology, etc. and demands advanced technology tools and
software for processing of big data which could be challenging in the future. Some
other applications of big data include fraud detection (credit card fraud, online auc-
tion fraud, insurance fraud, etc.), analysis of sales trends based on customer’s buying
history, applications in healthcare (personalized medicine and prescriptive analyt-
ics, effective treatment, drug side effects), applications in manufacturing (product

316 A. Kumar et al.
Tab
le5
Sta
te-o
f-ar
tof
cyber
bull
yin
g
S.n
o.
Auth
or
Yea
rT
echniq
ues
So
cial
med
iaD
ata
set
Tools
Res
ult
s
1A
gra
wal
and
Aw
ekar
2018
Dee
pneu
ral
net
wo
rk
Tw
itte
rP
ost
sfr
om
Form
spri
ng,
Tw
itte
r,W
ikip
edia
CN
N,
LS
TM
,
BL
ST
M,
and
BL
ST
Mw
ith
atte
nti
on
DN
Nbas
edm
odel
s
cou
ple
dw
ith
tran
sfer
lear
nin
gb
eat
the
bes
t-know
nre
sult
sfo
r
all
thre
ed
atas
ets
2C
hen
etal
.2018
CN
N,
Word
2vec
,
Glo
ve
Tw
itte
rC
om
men
tsfr
om
Tw
itte
rW
ord
net
,port
erT
he
pro
pose
dC
NN
mo
del
wit
h
2-d
imen
sional
TF
-ID
F
mat
rix
resu
lts
in
imp
rovem
ent
(wit
h
accu
racy
equ
als
to
0.9
2an
dM
acro
-AU
C
equal
sto
0.9
8)
com
par
ed
wit
hth
ebas
elin
eS
VM
and
logis
tic
regre
ssio
n
met
hods
3A
ndri
ansy
ah
etal
.
2010
SV
MIn
stag
ram
Co
mm
ents
on
Inst
agra
m
acco
unts
of
som
eIn
dones
ian
cele
bri
ties
Rla
nguag
e,R
Stu
dio
ide
The
SV
Mm
odel
isab
le
tocl
assi
fyth
ete
stse
t
wit
han
accu
racy
of
79.4
12%
4T
ing
etal
.2017
So
cial
net
wo
rk
anal
ysi
s,dat
a
min
ing
Fac
ebook,
Tw
itte
r,P
ttan
d
CK
101
100
post
sfr
om
each
web
site
like
Fac
ebo
ok
,T
wit
ter,
ptt
and
ck101
–T
he
pre
cisi
on
accu
racy
isar
ound
0.7
9an
dth
e
reca
llis
0.7
1
5L
ore
nz
and
Kik
kas
2013
Dat
aw
asco
llec
ted
by
mea
ns
of
close
dques
tions
or
Lik
ert
scal
eopti
ons.
(stu
dy
was
per
form
edtw
ice
2009,
2012)
Ther
ew
ere
only
1–3
phones
inev
ery
clas
s
that
wer
euse
ful
asa
lear
nin
gdev
ice (c
onti
nued
)

Multimedia Social Big Data: Mining 317
Tab
le5
(conti
nued
)
S.n
o.
Auth
or
Yea
rT
echniq
ues
So
cial
med
iaD
ata
set
Tools
Res
ult
s
6B
adri
etal
.2016
T-t
ests
,ch
i
squar
e
More
than
31,0
00
chil
dre
n
from
pri
vat
ean
dpubli
c
sch
oo
lspar
tici
pat
edin
the
onli
ne
surv
ey.
More
than
31,0
00
chil
dre
n
from
pri
vat
ean
dpubli
c
sch
oo
lspar
tici
pat
edin
the
onli
ne
surv
ey.
Ahig
hh
om
eac
cess
to
the
Inte
rnet
of
91.7
%.
Ther
eis
aneg
ativ
e
corr
elat
ion
bet
wee
nti
me
spen
ton
soci
alnet
work
s
and
per
ceiv
edst
uden
t
per
form
ance
insp
ecifi
c
sub
ject
s
7B
inet
al.
2018
Ran
dom
fore
st
clas
sifi
er
Red
dit
Kag
gle
,It
consi
sted
of
6,5
94
raw
com
men
ts
Skip
-gra
m
model
arch
itec
ture
,
Gen
sism
(pyth
on
lib
rary
),nat
ura
l
languag
e
too
l-k
it
This
model
outp
erfo
rms
both
the
pre
-tra
ined
word
vec
tors
,as
wel
las
the
han
dcr
afte
dm
ethods
by
3%
more
inA
UC
and
12%
more
on
pre
cisi
on
8A
ldu
aile
jan
d
khan
2017
Tex
tm
inin
g,
lex
ical
appro
ach
Tw
itte
rA
rab
ictw
eet
conver
sati
on
fro
mT
wit
ter
Rap
idM
iner
,
Pyth
on
Usi
ng
text
min
ing
tech
niq
ues
cyber
bull
yin
g
can
be
det
ecte
d
auto
mat
ical
ly.T
he
crea
tion
of
lexic
on
of
off
ensi
ve
Ara
bic
word
s
isth
ese
cond
appro
ach
that
isp
rese
nte
din
the
pap
er
318 A. Kumar et al.
quality, supply planning, defects tracking), cybersecurity and intelligence, weather
forecasting, traffic optimization, and many more.
References
1. J. Oliverio, A survey of social media, big data, data mining, and analytics. J. Ind. Integr. Manag.
1850003 (2018)
2. D. Borth, T. Chen, R. Ji, S.-F. Chang, SentiBank: large-scale ontology and classifiers for detect-
ing sentiment and emotions in visual content, in Proceedings of the 21st ACM international
conference on Multimedia, 21–25 October 2013 (Barcelona, Spain, 2013), https://doi.org/10.
1145/2502081.2502268
3. A. Krizhevsky, I. Sutskever, G.E. Hinton, ImageNet classification with deep convolutional
neural networks, in Proceedings of the 25th International Conference on Neural Information
Processing Systems, 03–06 December, 2012 (Lake Tahoe, Nevada, 2012), pp. 1097–1105
4. J. Weston, S. Bengio, N. Usunier, Wsabie: scaling up to large vocabulary image annotation,
in Proceedings of the Twenty-Second International Joint Conference on Artificial Intelligence,
16–22 July 2011 (Barcelona, Catalonia, Spain, 2011), pp. 2764–2770, https://doi.org/10.5591/
978-1-57735-516-8/ijcai11-460
5. M. Wang, D. Cao, L. Li, S. Li, R. Ji, Microblog sentiment analysis based on cross-media bag-
of-words model, in Proceedings of International Conference on Internet Multimedia Comput-
ing and Service, 10–12 July 2014 (Xiamen, China, 2014), https://doi.org/10.1145/2632856.
2632912
6. A.B. Alencar, M.C.F. de Oliveira, F.V. Paulovich, Seeing beyond reading: a survey on visual
text analytics. Wiley Interdiscip. Rev. Data Min. Knowl. Discov.2(6), 476–492 (2012)
7. I.E. Fisher, et al., The role of text analytics and information retrieval in the accounting domain.
J. Emerg. Technol. Account. 7(1), 1–24 (2010)
8. X. Hu, H. Liu, Text analytics in social media, in Mining Text Data, (Springer, Boston, MA,
2012), pp. 385–414
9. C.C. Aggarwal, H. Wang, Text mining in social networks, in Social Network Data Analytics
(Springer, Boston, MA, 2011), pp. 353–378
10. Tobias Schreck, Daniel Keim, Visual analysis of social media data. Computer 46(5), 68–75
(2013)
11. K. O’Halloran, A. Chua, A. Podlasov, The role of images in social media analytics: a multimodal
digital humanities approach, in Visual Communication (De Gruyter, 2014), pp. 565–588
12. N. Diakopoulos, M. Naaman, F. Kivran-Swaine, Diamonds in the rough: social media visual
analytics for journalistic inquiry. in 2010 IEEE Symposium on Visual Analytics Science and
Technology (VAST) (IEEE, 2010)
13. Bogdan Batrinca, Philip C. Treleaven, Social media analytics: a survey of techniques, tools
and platforms. AI Soc. 30(1), 89–116 (2015)
14. Tobias Schreck, Daniel Keim, Visual analysis of social media data. Computer 46(5), 68–75
(2013)
15. W. Mason, J.W. Vaughan, H. Wallach, Mach. Learn. 95, 257 (2014). https://doi.org/10.1007/
s10994-013-5426-8
16. X. Wang, J. Yang, X. Teng et al., Feature selection based on rough sets and particle swarm
optimization. Pattern Recogn. Lett. 28(4), 459–471 (2007)
17. M.I. Jordan, T.M. Mitchell, Machine learning: trends, perspectives, and prospects. Science
349(6245), 255–260 (2015)
18. Mohammad Ahmadi, Parthasarati Dileepan, K. Wheatley Kathleen, A SWOT analysis of big
data. J. Educ. Bus. 91, 1–6 (2016). https://doi.org/10.1080/08832323.2016.1181045
19. R. Talib, M.K. Hanif, S. Ayesha, F. Fatima, Text mining: techniques, applications and issues.
Int. J. Adv. Comput. Sci. Appl. (IJACSA) 7(11) (2016)

Multimedia Social Big Data: Mining 319
20. P. Vashisht, V. Gupta, (2015). Big data analytics techniques: a survey, pp. 264–269. https://doi.
org/10.1109/icgciot.2015.7380470
21. R. Reka Dr, K. Saraswathi, K. Sujatha Dr, A review on big data analytics. Asian J. Appl. Sci.
Technol. (AJAST) 1(1), 233–234 (2017)
22. Carlos Castillo, Marcelo Mendoza, Barbara Poblete, Predicting information credibility in time-
sensitive social media. Internet Res. 23(5), 560–588 (2013)
23. A. Kumar, S.R. Sangwan, Rumour detection using machine learning techniques on social
media, in International Conference on Innovative Computing and Communication. Lecture
Notes in Networks and Systems (Springer, 2018)
24. A. Zubiaga, M. Liakata, R. Procter, G.W.S. Hoi, P. Tolmie, Analysing how people orient to and
spread rumours in social media by looking at conversational threads. PLoS One 11(3), 1–29
(2016)
25. M.E. Jaeger, S. Anthony, R.L. Rosnow, Who hears what from whom and with what effect a
study of rumor. Personal. Soc. Psychol. Bull. 6(3), 473–478 (1980)
26. A. Zubiaga, et al., Detection and resolution of rumours in social media: a survey. ACM Comput.
Surv. (CSUR) 51(2), 32 (2018)
27. Z. Zhao, P. Resnick, Q. Mei, Enquiring minds: early detection of rumors in social media
from enquiry posts, in Proceedings of the 24th International Conference on World Wide Web
(International World Wide Web Conferences Steering Committee, 2015)
28. A. Zubiaga, M. Liakata, R. Procter, Learning reporting dynamics during breaking news for
rumour detection in social media (2016). arXiv:1610.07363
29. V. Qazvinian, et al., Rumor has it: identifying misinformation in microblogs, in Proceedings
of the Conference on Empirical Methods in Natural Language Processing (Association for
Computational Linguistics, 2011)
30. M. Mendoza, B. Poblete, C. Castillo, Twitter under crisis: can we trust what we RT? in Pro-
ceedings of the first workshop on social media analytics (ACM, 2010)
31. C. Castillo, M. Mendoza, B. Poblete, Information credibility on Twitter, in Proceedings of the
20th international conference on World wide web (ACM, 2011)
32. S. Kwon, et al., Prominent features of rumor propagation in online social media, in 2013 IEEE
13th International Conference on Data Mining (IEEE, 2013)
33. Sejeong Kwon, Meeyoung Cha, Kyomin Jung, Rumor detection over varying time windows.
PLoS One 12(1), e0168344 (2017)
34. A. Kumar, T.M. Sebastian, Sentiment analysis on Twitter. IJCSI Int. J. Comput. Sci. 9(4),
372–378 (2012)
35. K. Dave, S. Lawrence, D.M. Pennock, Mining the peanut gallery: opinion extraction and
semantic classification of product reviews, in Proceedings of the 12th international conference
on World Wide Web (ACM, 2003), pp. 519–528
36. A. Kumar, A. Sharma, A. Socio-sentic framework for sustainable agricultural governance.
Sustain. Comput. Inform. Syst. (2018)
37. B. Pang, L. Lee, Opinion mining and sentiment analysis. Found. Trends Inf. Retr. J. 2(2), 1–135
(2008)
38. A. Kumar, T. Sebastian, Sentiment analysis: A perspective on its past, present and future. Int.
J. Intell. Syst. Appl. 10, 1–14 (2012)
39. A. Kumar, A. Jaiswal, Empirical Study of Twitter and tumblr for sentiment analysis using soft
computing techniques, in Proceedings of the World Congress on Engineering and Computer
Science, vol. 1 (2017)
40. B. Liu, Sentiment Analysis Mining Opinions, Sentiments, and Emotions (Cambridge University
Press, Chicago, 2015)
41. A. Kumar, V. Dabas, A social media complaint workflow automation tool using sentiment
intelligence, in Proceedings of The World Congress on Engineering 2016. Lecture Notes in
Engineering and Computer Science (2016), pp. 176–181
42. A. Kumar, A. Joshi, Ontology Driven Sentiment Analysis on Social Web for Government
Intelligence, in Special Collection on eGovernment Innovation in India (2017), pp. 134–139

320 A. Kumar et al.
43. E. Cambria, B. Schuller, Y. Xia, C. Havasi, New avenues in opinion mining and sentiment
analysis. IEEE Intell. Syst. 28, 15–21 (2013)44. R. Feldman, Techniques and applications for sentiment analysis. Commun. ACM 56, 82–89
(2013)45. A. Montoyo, P. Martínez-Barco, A. Balahur, An overview of the current state of the area and
envisaged developments. Decis. Support Syst. 53, 675–679 (2012)46. S. Finn, E. Mustafaraj, Learning to discover political activism in the Twitter verse. KI-
KünstlicheIntelligenz 27, 17–24 (2013)47. A. Trilla, F. Alias, Sentence-based sentiment analysis for expressive text-to-speech. IEEE Trans.
Audio Speech Lang. Process. 21, 223–233 (2013)48. S. Tuarob, C.S. Tucker, M. Salathe, N. Ram, An ensemble heterogeneous classification method-
ology for discovering health-related knowledge in social media messages. J. Biomed. Inform.
49, 255–268 (2014)49. J. Brynielsson, F. Johansson, C. Jonsson, A. Westling, Emotion classification of social media
posts for estimating people’s reactions to communicated alert messages during crises. Secur.
Inform. 3, 1–11 (2014)50. P. Burnap, M.L. Williams, L. Sloan, O. Rana, W. Housley, A. Edwards, V. Knight, R. Procter,
A. Voss, Tweeting the terror: modelling the social media reaction to the Woolwich terrorist
attack. Soc. Netw. Anal. Min. 4, 1–14 (2014)51. A. Makazhanov, D. Rafiei, M. Waqar, Predicting political preference of Twitter users. Soc.
Netw. Anal. Min. 4, 1–15 (2014)52. P. Bogdanov, M. Busch, J. Moehlis, A.K. Singh, B.K. Szymanski, Modeling individual topic-
specific behavior and influence backbone networks in social media. Soc. Netw. Anal. Min. 4,
1–16 (2014)53. X. Fu, Y. Shen, Study of collective user behaviour in Twitter: a fuzzy approach. Neural Comput.
Appl. 25, 1603–1614 (2014)54. X. Chen, M. Vorvoreanu, K. Madhavan, Mining social media data for understanding students’
learning experiences. IEEE Trans. Learn. Technol. 7, 246–259 (2014)55. P. Burnap, M.L. Williams, Cyber hate speech on Twitter: an application of machine classi-
fication and statistical modeling for policy and decision making. Policy Internet 7, 223–242
(2015)56. A. Zubiaga, D. Spina, R. Martinez, V. Fresno, Real-time classification of Twitter trends. J.
Assoc. Inf. Sci. Technol. 66, 462–473 (2015)57. P. Andriotis, G. Oikonomou, T. Tryfonas, S. Li, Highlighting relationships of a smartphone’s
social ecosystem in potentially large investigations. IEEE Trans. Cybern. 46, 1974–1985 (2016)58. P. Burnap, M.L. Williams, Us and them: identifying cyber hate on Twitter across multiple
protected characteristics. EPJ Data Sci. 5, 1–15 (2016)59. N. Oliveira, P. Cortez, N. Areal, The impact of microblogging data for stock market prediction:
using Twitter to predict returns, volatility, trading volume and survey sentiment indices. Expert
Syst. Appl. 73, 125–144 (2017)60. A. Singh, N. Shukla, N. Mishra, Social media data analytics to improve supply chain manage-
ment in food industries. Transp. Res. Part E Logist. Transp. Rev. 114, 398–415 (2018)61. H. Wang, D. Can, A. Kazemzadeh, F. Bar, S. Narayanan, A system for real-time Twitter
sentiment analysis of 2012 us presidential election cycle, in Proceedings of the ACL 2012
System Demonstrations (Association for Computational Linguistics, 2012), pp. 115–12062. Understanding sentiment analysis: what it is & why it’s used, https://www.brandwatch.com/
blog/understanding-sentiment-analysis/. Accessed 19 Oct 201863. E. Aboujaoude, M.W. Savage, V. Starcevic, W.O. Salame, Cyberbullying: review of an old prob-
lem gone viral. J. Adolesc. Health 57(1), 10–18 (2015). https://doi.org/10.1016/j.jadohealth.
2015.04.01164. M.A. Campbell, Cyber bullying: an old problem in a new guise? J. Psychol. Couns. Sch. 15(1),
68–76 (2005)65. Tokunaga Following you home from school, A critical review and synthesis of research on
cyberbullying victimization. Comput. Hum. Behav. 26, 277–287 (2010). https://doi.org/10.
1016/j.chb.2009.11.014

Multimedia Social Big Data: Mining 321
66. Centers for Disease Control and Prevention. Youth violence: technology and youth protecting
your child from electronic aggression (2014), http://www.cdc.gov/violenceprevention/pdf/ea-
tipsheet-a.pdf. Accessed 11 Sept 2017
67. P.K. Smith, J. Mahdavi, M. Carvalho, S. Fisher, S. Russell, N. Tippett, Cyberbullying: its nature
and impact in secondary school pupils. J. Child Psychol. Psychiatry 49(4), 376–385 (2008).
https://doi.org/10.1111/j.1469-7610.2007.01846
68. G. Sarna, M.P. Bhatia, Content based approach to find the credibility of user in social networks:
an application of cyberbullying. Int. J. Mach. Learn. Cybernet. 8(2), 677–689 (2017)
69. All you need to know about anti-bullying laws in India, https://blog.ipleaders.in/anti-bullying-
laws/ Accessed 14 July 2018
70. Qing Li, Cyberbullying in high schools: a study of students’ behaviors and beliefs about this
new phenomenon. J. Aggress. Maltreatment Trauma 19(4), 372–392 (2010). https://doi.org/
10.1080/10926771003788979
71. Qing Li, Cyberbullying in high schools: a study of students’ behaviors and beliefs about this
new phenomenon. J. Aggress. Maltreatment Trauma 19(4), 372–392 (2010). https://doi.org/
10.1080/10926771003788979
72. J. Wang, T.R. Nansel, R.J. Iannotti, Cyber bullying and traditional bullying: differential asso-
ciation with depression. J. Adolesc. Health 48(4), 415–417 (2011)
73. M.P. Hamm, A.S. Newton, A. Chisholm, J. Shulhan, A. Milne, P. Sundar et al., Prevalence and
effect of cyberbullying on children and young people: a scoping review of social media studies.
JAMA Pediatr. 169(8), 770–777 (2015). https://doi.org/10.1001/jamapediatrics.2015.0944
74. J.A. Casas, R. Del Rey, R. Ortega-Ruiz, Bullying and cyberbullying: convergent and divergent
predictor variables. Comput. Hum. Behav. 29, 580–587 (2013). https://doi.org/10.1016/j.chb.
2012.11.015
75. Commissariato di PS, Una vita da social, https://www.commissariatodips.it/uploads/media/
Comunicato_stampa_Una_vita_da_social_4__edizione_2017.pdf. Accessed 28 Nov 2017
76. Law n. 71/17 of 29/05/2017, GU n. 127 of 03/06/2017. Senatodella Repubblica, http://www.
senato.it/leg/17/BGT/Schede/Ddliter/43814.htm. Accessed 11 Sept 2017
77. Bsecure, http://www.safesearchkids.com/BSecure.html
78. Cyber Patrol, http://www.cyberpatrol.com/cpparentalcontrols.asp
79. eBlaster, http://www.eblaster.com/

Advertisement Prediction in Social Media
Environment Using Big Data Framework
Krishna Kumar Mohbey, Sunil Kumar and Vartika Koolwal
Abstract With the development of mobile technologies and IOT devices, the world
has stepped into the era of big data and social media as well. Having collected data
from social media, business companies can easily understand behavior and buying
patterns of the individual customers. The data is being collected via machine learn-
ing algorithms and social media platforms. A prediction mechanism is needed to
process these larger data. Based on the results generated by big data framework,
business companies can directly target individuals for sending advertises. In this
chapter, an advertisement prediction framework has been proposed that uses predic-
tion approaches on big data platforms. In addition, social media platforms are used
to collect data that is based on user interest. The experiments has been performed on
real-time data that is collected from social media platforms. The introduced frame-
work can be served as a benchmark for business companies to send appropriate
advertisement to the individuals.
Keywords Social media · Big data · IoT · Advertisement prediction ·Prediction approaches · MapReduce
K. K. Mohbey (B) · S. Kumar · V. Koolwal
Central University of Rajasthan, Kishangarh, India
e-mail: [email protected]
S. Kumar
e-mail: [email protected]
V. Koolwal
e-mail: [email protected]
© Springer Nature Singapore Pte Ltd. 2020
S. Tanwar et al. (eds.), Multimedia Big Data Computing
for IoT Applications, Intelligent Systems Reference Library 163,
https://doi.org/10.1007/978-981-13-8759-3_12
323

324 K. K. Mohbey et al.
1 Introduction
The escalating growth and betterment of cellular communication technologies, IoT
(Internet of Things), and portable sensor network have created various opportunities
for business companies. In the present scenario, online purchasing behavior is ele-
vating day by day. Business companies are interested to know about the customer
interest, their behavior, and purchasing pattern. In addition to the online activities of
customers and companies, big data also plays an significant role to enhance the facil-
ities and business. Big data can be used to target people according to their behavior
activities. It ultimately saves money and increases efficiency by targeting the right
people with the right product.
A customer’s online activity such as searching products, online purchasing, and
providing products reviews increases values to the marketing and advertising. There
is such a vast amount of activity information that are generating every second, which
is acknowledged as the big data.
Social media forum such as Twitter, Facebook, Youtube, and review sites are
currently the key sources to generate big data. These collected data are unstructured
and large in quantity that so various algorithms and strategies are needed to handle
such kind of collected data. Most of the giant business companies already started
to use big data technologies for their product advertisements as well as sales and
marketing [1].
The aim of these business companies is to target the consumers for selling their
products according to their choice and activities. Various prediction and classification
approaches can be used for advertisement within big data frameworks. To predict
target advertisement, different parameters such as user’s preference, location history,
user’s review, and search patterns can be used [2].
This chapter addresses the strong demand for advertisement prediction based on
social media review/tweet using big data analytic approaches. In this chapter, big
data is obtained from Twitter using Twitter API with different hashtags. Among
the obtained large amount of big data, prediction approaches have been applied to
generate an appropriate advertisement for specific users.
The target of this chapter is to analyze big data, coming from Twitter or any
other social media sources. The outcome will predict advertisement for business
enhancement. Based on the predicted results, business companies can take appropri-
ate decision for enhancing their business. It includes introducing a new product in the
market, stopping sales of a product, increasing product quantities as well as product
price fixing. This chapter presents our big data analysis framework for advertisement
prediction with data collection from social sites.
The plot of this paper is presented in the following manner. Section 2 explores the
fundamental ideas and methods for big data technologies for advertisement predic-
tion. Section 3 describes a description of the social media platform and data collec-
tion methods.It also illustrates various methods of data processing. Section 4 presents
our proposed framework for advertisement prediction using big data technologies.It
also depicts several classification methods, used for prediction of advertisement.

Advertisement Prediction in Social Media Environment Using Big Data Framework 325
Section 5 reports experimental results and discussion about the proposed work.
Section 6 will be concluding the outcome and future possibilities.
2 Big Data and Advertisement Prediction
Social media is the main source of information toward big data technology enhance-
ment. Currently, millions of users are expressing their views and put forward their
opinion about a product or service on such platform. The big data technologies have
achieved value due to huge data produced by these mediums. These technologies
are adequate for handling such kind of vast data. There are lots of application areas
where big data technologies are currently used. These applications include health
care, education, smart city, smart transportation, traffic management, advertisement,
marketing, and so on. Big data technologies are capable of handling data storage,
data accessing, and producing appropriate solutions [3].
There are many techniques available for big data such as association rule mining,
clustering, classification, prediction, and data analysis. These techniques use machine
learning algorithms as well as data mining approaches.
Francis X was the first person to introduce the idea of big data. Diebold in 2000
[4] with the rapid development and enhancement in the internet, sensors, wireless
network, and social networking. Due to these developments, the volume of data is
increasing rapidly. This generated data is more complex and unstructured [3, 5].
Another important enhancement in technology is smartphone, mobile devices, and
online transactions. At present, more than 50 GB data are generating per second, and
it will increase gradually in the future [6].
2.1 Big Data and its Characteristics
The big data framework may collect, store, process, and produce the required solu-
tions to the specific problem in various domains. It is also capable of making pre-
dictive analysis to enhance business via advertisement recommendations. Big data
framework is also helpful for decision makers to make new decision and strategies.
Four V’s (Variety, Volume, Velocity, and Value) are the fundamental features of big
data [7–9]. These V’s are shown in Fig. 1.
2.1.1 Volume
Volume is the fundamental aspect of big data. It refers to the quantity of data that is
being generated by different sources and applications. The main source of increasing
volume is social networking applications such as Youtube, Facebook, Twitter, and
online transactions [10].

326 K. K. Mohbey et al.
Fig. 1 4 V’s of Big Data
2.1.2 Velocity
It is pertaining to the speed of data generation and transfer as well. The velocity of
data may be high or low. Some applications required high-velocity data, which is
closer to the real-time data processing. Sometimes velocity can be more important
than volume because it can give us a bigger competitive advantage. For instance,
Youtube shows the velocity of big data [11].
2.1.3 Variety
It indicates the heterogeneity of data which is generated by the different sources. The
generated data may be structured, unstructured or semi-structured. Perhaps, nearly,
all the big data are unstructured. Big data are fusion of multiple forms of data such as
audio, video, document, text, tweet, review, comments, logs, social media updates,
sensor data, and clickstream [11].
2.1.4 Value
Value being the vital characteristic of big data. All other characteristics are mean-
ingless if the data doesn’t have a value. There are various research techniques to
obtain value from the collected data. To find a value from available data requires new
analytics and approaches [10].

Advertisement Prediction in Social Media Environment Using Big Data Framework 327
2.2 Big Data Technologies
Presently, big data analytics has become very significant due to its processing power
and capabilities of handling huge amount of data. The first open-source big data ana-
lytics framework for distributed computing,which includes HDFS, i.e., a distributed
file system and MapReduce processing unit. Apache Hadoop is apparently the most
popular and standard big data framework at present [12]. On the other hand, some
platforms have more leverage to the standard Hadoop implementation. Hadoop is not
capable of handling dynamic information in the real-time analysis. Besides Hadoop,
the storm is a stream processing engine which focuses on incremental computing. It
is an also open-source framework that was developed to process Twitter reviews [13].
Furthermore, Spark is another big data analytics, which enables in-memory com-
putation with higher performance than Hadoop. It is coded in Scala, which allows
it to work on single data processing engine. It also supports iterative jobs [14].
Nowadays, advertisement prediction has become an interesting research issue for
business enhancement. Various business companies want to provide an appropriate
advertisement to the consumer based on their needs and preferences. Unlike tradi-
tional advertisement system, recent advertisement strategies focus on target a specific
group of peoples. Therefore, big data frameworks have taken a place to predict certain
advertisement on real-time Twitter data.
3 Data Collection Through Social Media
Today, people are acquainted with multiple social networking sites at a rapid rate.
It is playing a crucial role in acquiring sharing information in multiple forum such
as feedback for a product or service [15]. We can transfer different kinds of data via
social media platform including text, image, video, audio, and files. Social media has
opened plenty of opportunities for examining data and resulting in various outcome.
One of the major aspects of social media analytics is predicting advertisement
to enhance business. Moreover, it also contributes in decision-making. It includes
real-time data collection via social media blogs or sites such as Twitter to store in
big data storage format like HDFS or RDD (Resilient Distributed Datasets).
To perform advertisement prediction in big data framework, Twitter is the main
source of data collection, which provides the facility to write a review or opinion
about any topic or product. It has been reported that Twitter have more than 330
million monthly active users in the first quarter of 2019 [16].
Twitter API is used to collect tweet using given hashtag such as #mobile, #vivo,
#iphone, and #samsung. In this API, it is needed to create an application first with
four secret keys. These keys are important for fetching Twitter data. After creating
Twitter API, live tweets can be directly fetched in the big data environment. Flume is
a distributed and reliable engine for acquiring a huge number of tweets from Twitter

328 K. K. Mohbey et al.
Fig. 2 Data collection from twitter
Fig. 3 Snapshot of tweets collected from Twitter
to HDFS environment [17]. It has a basic architecture, which works on live streaming
data flow. Figure 2 shows the data collection process from Twitter.
When tweets are fetched from livestreams, it is unstructured and noisy. It needs
to be preprocessed for further processing. Figure 3 shows a sample tweet collected
from Twitter.
3.1 Preprocessing
Collected data needs to preprocess before analyzing and prediction. Preprocessing is
a necessary step for data preparing before the process. As the downloaded tweets are
noisy, skewed in nature, when it is acquired. Therefore, a preprocessing is needed to
turn the raw data to the proper formats. Different processing methods have been used

Advertisement Prediction in Social Media Environment Using Big Data Framework 329
for data preprocessing. This step includes stop word removal, stemming, and feature
extraction. When this step is completed, processed data is ready for advertisement
prediction [12].
3.1.1 Data Filtering
After collecting the unstructured Twitter data, we need to smooth it out by remov-
ing website URLs (https), eliminating hashtags (#), and discarding twitter mention
(@username). Besides this, we need to discard, the common word RT, i.e., retweet.
We need to take care of the additional white spaces, along with special characters. It
will be quite convenient if we consider only distinct tweets and convert all the unique
filtered tweets into lowercase for ease in further processes.
3.1.2 Stopword Removal
Some very common words like “is, am, are, to, we, this, that” has high occurrence
which holds no feature information. So, it’s better to remove such words resulting
in reducing the clutter from tweets. We can achieve it by using the available list of
stopwords. To remove stopword, we compare each word of the tweets from available
stopword list. We eliminate the words inside the tweets which match from the list [19].
3.1.3 Stemming
Stemming is the process of substituting the derived word with their root word. For
example words like amusing, amusement, and amused will be replaced by amus,
by Porter algorithm. Using stemming, we can get the root word which helps in the
analysis of tweets [19].
3.1.4 Feature Extraction
First, we perform tokenization to extract features. Tokenization is the process of
creating individual terms by splitting the sentences. Second, we use tF–IDF method,
which is used for feature vectorization in text mining to depicts the significance of
the term in the document. Third, we implement Word2Vec estimator, which generate
Word2Vector model by taking a sequence of words representing a document. The
model associates each word to the distinct vector. The model changes all the docu-
ments using the averaging of every term in the document into a vector; this vector then
is used as a feature for prediction or document similarity [19–21]. Lastly, CountVec-
torizor and CountVectorizer model seek to convert a group of a text document to
token count vector.

330 K. K. Mohbey et al.
Table 1 Refined tweets with classes
# Tweet Class
1 Super challeng codeword puzzl abundance download
androidbrain fun
Positive
2 Announc success connect smartphone g network partnership
samsung
Positive
3 Typepixel xl regret yugeli choic phone purchase missphone
motorola
Negative
4 Total free total challenging get free googl play phone
mobileapp tablets
Positive
5 Lightshot phonemotographi motogplus Delhi diwali light
motorola
Neutral
6 When launch new phone feature p processor Neutral
7 Slow motion option camera pleas Negative
8 Im use colour os bad poor os Negative
9 I think curious os come realm devices Neutral
10 Batteri life realmpro great even good just like iphone Positive
After applying preprocessing methods, we have refined tweets, which can be
further used for classification and prediction. In the training set of tweets, we have
also assign classes to each tweet. The class assignment has been carried out with the
help of a tweet score. Here, classes are positive, negative, and neutral. Table 1 shows
an example of refined tweets with their classes.
4 Advertisement Prediction Framework
In this section, we have proposed an advertisement prediction framework, which
shows the complete process of prediction. This framework is based on big data tech-
nologies such as Hadoop, Spark, and related approaches. After collecting livestream
twitter data, different machine learning approaches has applied. Here, advertisement
prediction has been performed using well-known machine learning approaches such
as Naive Bayes classification, SVM (support vector machine), random forest, logis-
tic regression, and decision tree. The complete architecture of the advertisement
prediction using social media data is shown in Fig. 4.
The first step of this architecture is to collect tweets from Twitter. Different tweets
related to advertisement have gathered from Twitter using Twitter API and Flume.
These collected tweets are stored in the big data environment in HDFS or RDD
formats. This data is unstructured and also have noise; therefore, it is needed to
perform preprocessing steps. It includes stopword removal and stemming. After
data cleaning, useful features are again stored in the proper format, i.e., HDFS or
RDD format. In the next step, these refined tweets are classified using different

Advertisement Prediction in Social Media Environment Using Big Data Framework 331
Fig. 4 Advertisement prediction framework
well-known supervised classification approaches. Based on the classification results
of these approaches, appropriate advertisement recommendation can be made to a
specific group of peoples. This step is known as the prediction under this architecture.
The description of these classification approaches is given below.
4.1 Naive Bayes Classifier
It is a prominent, probabilistic, and supervised classification approach. It focuses
on the application of Bayes theorem with naive (high) nondependent assumptions
among the attributes. It is use to predict the probability for a tweet to reside in a
particular class [22, 23]. This model discovers the tweet’s sentiment as positive,
neutral, or negative.
P(C | d) =P(d | C) · P(C)
P(d)(1)
332 K. K. Mohbey et al.
where
C: specified class
D: tweet wants to classify
P(C) and P(d): prior probabilities
P(C | d): Posterior probability
Given tweet data points D = d1, d2, ..., di, which are required to be classified in
class C. The numerical equation of Naive Bayes P(C/D) is as follows:
P(C | d) = P(C) · P(di)
(C)(2)
4.2 SVM Classifier
SVM is a supervised learning model developed by Vapnik [24]. They are applied
on data set to examine for classification and regression. The SVM model is used
to predict the class of the new examples based on the marked labels learned from
the training data. It is binary, linear and non-probabilistic classifier [25]. In linear
SVM, we have N points of training examples such as (x1, y1), . . . , (xN , yN ) where
an example xi is representing a vector RN and the class label yi has value either −1
or 1. We need to identify the hyperplane that separates the negative instance from
that of positive ones with an optimum margin. That optimal margin is the maximum
distance of the hyperplane to the closest of the negative instance and positive set of
examples [26]. Figure 5 displays an instance of SVM classifier. In this figure, there
are two classes—blue triangle and pink parallelogram. It also has three hyperplanes,
in which dark line signify possible best separation among these two classes. In the
division, the normal distance of every data point is the largest. Therefore, it presents
the maximum margin of separation.
4.3 Decision Tree
It is a decision support technique which is one of the widely applied supervised
classification techniques due to its high accuracy [27]. It has a flowchart-like structure
with its internal nodes to represent a “test” condition, each branch indicates the result
of the test condition and every leaf node depicts a class label which is the decision
undertaken. It follows top to down approach representing the classification rule.
Figure 6 shows an example of decision tree.

Advertisement Prediction in Social Media Environment Using Big Data Framework 333
Fig. 5 Support vector machine classification
Fig. 6 Decision tree classification

334 K. K. Mohbey et al.
If the classes along with its attributes are given, a decision tree generates a series of
rules or sequence of questions that are used to identify the class. To measure impurity,
we can use entropy which is a measure of uncertainty related to a random variable.
The entropy is directly proportional to the uncertainty or randomness. Entropy has
its value between 0 and 1.
Let’s define entropy on given collection T , entropy(T ) is defined as
Entropy(T ) =
c∑
j=1
−pj · log2 pj (3)
where, pj is the probability that an random row in T refer to class X and is given by|Cj,t |
|T |. A base log 2 method implies as entropy is concealed into bits 0 and 1.
We use Information Gain measure to bring out the best attribute for a node . The
information gain, of an attribute, is
Gain(T , A) = Entropy(T ) −
v∑
j=1
|Tj|
|Tv|· Entropy(Tj) (4)
where
T: given data set
A: Attribute
V: Using attribute A, the tuples in T are partition with d unique values.
T: is divided into d subsets, (T1, T2, . . . , Tj) where Tj consists of only that tuples in
T which has result of A.
The attribute that has the maximum information gain is selected.
4.4 Random Forest Classifier
It is a kind of ensemble learning method that renders predictions by averaging the
predictions of multiple independent base models. Since its creation by Breiman [28]
the random forests as a classifier for regression and classification purpose has been
extremely successful. It consists of a group of tree-like classifier where independent
random vector are dispersed identically, and every tree cast a single vote for the most
favored class. A random vector is formed that is independent of the earlier vector
for the same distribution resulting in the generation of the tree [28]. The random
forest has certain advantages over another classifier such as it doesn’t suffer from
the problem of overfitting [29], the same random forest algorithm can be used for
classification and regression, and it can be used for feature engineering, i.e., selecting
the most important features from the available features of the training set.

Advertisement Prediction in Social Media Environment Using Big Data Framework 335
4.5 Logistic Regression
Logistic regression is a well-known predictive analysis approach.It is mostly used
when data is binary. It is used to analyze the data and its relationship of one binary
dependent variable, with multiple ordinal, nominal, ratio-level, or interval indepen-
dent variables. The dependent data has values such as win/lose, on/off, and true/false
from which are considered as indicator variables [30]. Linear model has log odds
(logarithm of the odds) for the value tagged as “1” is the fusion with another inde-
pendent variable (predictors).
5 Results and Discussion
The performance of our proposed approach has been measured regarding accuracy,
precision, and recall. Different experiments have been carried out to bring out the
effectiveness of the approach in different perspectives. We have conducted all the
experiments on big data platform, i.e., Spark. The effectiveness of advertisement
prediction has been tested using SVM, Logistic Regression, Naive Bayes, Decision
Tree, and Random Forest Approach.
5.1 Performance Evaluation
To critically analyze the performance of classification approaches, the collected data
is partitioned into 70 and 30% vis-a-vis training and testing, respectively. To enhance
the performance of experimental evaluation, we have removed all the tweets that have
neutral classes because it decreases the accuracy of the classification models. The
performance of the proposed approaches has been measured by different parameters
such as accuracy, precision, recall, and F-measure. Table 2 shows a 2 × 2 confusion
matrix of positive and negative instances.
According to positive and negative instances, the performance can be measured.
The following equations show the performance parameters:
Precision =TP
TPPWhere, TPP(Total Predicted Positive) : TP + FP (5)
Table 2 Confusion matrix
Predicted class
Negative (0) Positive (1)
Actual class Negative (0) True Negative (TN) False Positive (FP)
Positive (1) False Negative (FN) True Positive (TP)

336 K. K. Mohbey et al.
Recall =TP
TAPWhere, TAP(Total Actual Positive) : TP + FN (6)
Accuracy =TP + TN
TPP + TPNWhere, TPN(Total Predicted Negative) : TN + FN
(7)
F1 =2 · Precision · Recall
Precision + Recall(8)
Furthermore, the performance of different machine learning classification
approaches is portrayed in Table 3, Table 4, Table 5, and Table 6, respectively.
Table 3 Performance comparison (Tweet size = 10 k)
Classification approach Accuracy Recall F1-measure Precision
Naive Bayes 0.84337 0.84337 0.84347 0.84482
SVM 0.87184 0.87184 0.87179 0.87205
Decision tree 0.65418 0.65418 0.60165 0.76818
Logistic regression 0.86420 0.86418 0.86418 0.86426
Random forest 0.70385 0.70385 0.68375 0.76562
Table 4 Performance comparison (Tweet size = 20 k)
Classification approach Accuracy Recall F1-measure Precision
Naive Bayes 0.83813 0.83813 0.84265 0.85077
SVM 0.86387 0.86387 0.85476 0.86004
Decision tree 0.81283 0.81283 0.76944 0.82376
Logistic regression 0.87580 0.87580 0.87231 0.87187
Random forest 0.75708 0.75708 0.65471 0.65523
Table 5 Performance comparison (Tweet size = 30 k)
Classification approach Accuracy Recall F1-measure Precision
Naive Bayes 0.81609 0.81609 0.81678 0.81859
SVM 0.85489 0.854889 0.85451 0.85451
Decision tree 0.62328 0.62328 0.51552 0.75617
Logistic regression 0.85799 0.85799 0.85788 0.85781
Random forest 0.64122 0.64122 0.55422 0.75671

Advertisement Prediction in Social Media Environment Using Big Data Framework 337
Table 6 Performance comparison (Tweet size = 40 k)
Classification approach Accuracy Recall F1-measure Precision
Naive Bayes 0.82511 0.82511 0.82755 0.83226
SVM 0.85176 0.85176 0.84723 0.84973
Decision tree 0.73037 0.73037 0.65481 0.78226
Logistic regression 0.86117 0.86117 0.85932 0.85905
Random forest 0.71177 0.71177 0.61697 0.79019
5.2 Comparison of Different Machine Learning Approaches
In this subsection, we have compared different machine learning classification
approaches under the big data framework. This comparison is done under different
parameters. Figures 7 and 8 show the comparison of different approaches concerning
training and prediction time on different sizes of tweets.
Figure 7 describes that Naïve Bayes takes less time for the training model. Simi-
larly, random forest classification takes more time to prepare the model. This figure
also describes that when tweet size increases, training time is also increased.
Figure 8 shows prediction time comparison results of all approaches. This figure
indicates that logistic regression takes less time to perform prediction. All other
approaches approximately take a similar time to predict results.
Accuracy comparison of all the approaches is shown in Fig. 9. This figure describes
that logistic regression performs best for larger data sizes. When tweet size is 10 k,
Fig. 7 Training time comparison
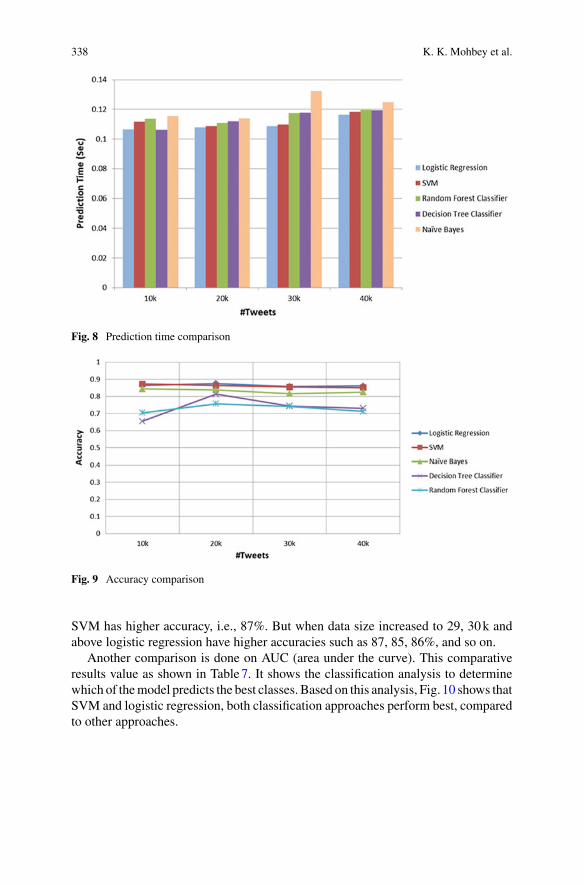
338 K. K. Mohbey et al.
Fig. 8 Prediction time comparison
Fig. 9 Accuracy comparison
SVM has higher accuracy, i.e., 87%. But when data size increased to 29, 30 k and
above logistic regression have higher accuracies such as 87, 85, 86%, and so on.
Another comparison is done on AUC (area under the curve). This comparative
results value as shown in Table 7. It shows the classification analysis to determine
which of the model predicts the best classes. Based on this analysis, Fig. 10 shows that
SVM and logistic regression, both classification approaches perform best, compared
to other approaches.

Advertisement Prediction in Social Media Environment Using Big Data Framework 339
Table 7 AUC results
Classification approach 10 k 20 k 30 k 40 k
Naive Bayes 0.44885 0.53668 0.51922 0.50106
SVM 0.936209 0.90786 0.92343 0.91386
Logistic regression 0.9354744 0.91665 0.92731 0.92216
Decision tree classifier 0.45938 0.47716 0.62903 0.55181
Random forest classifier 0.8053398 0.81072 0.82305 0.81109
Fig. 10 AUC comparison
6 Conclusions and Future Work
Exploring the notion of social media and big data technologies together, the contri-
bution of advertisement prediction has been proposed. Unlike previous studies, the
issues of handling huge data are also discussed. The objective of this chapter is to
propose a framework for advertisement prediction. The big data has been collected
from Twitter as user tweets. Then, various preprocessing methods have applied to
clean that data. Various well-known classification approaches are used to predict
appropriate advertisement for a specific or group of users. Based on a user tweet,
its class is predicted. If the predicted class is positive, then advertisement can be
recommended to that particular user. The performance has been analyzed by above-
mentioned classifier approach on different sizes of data. The experimental results
show that logistic regression has higher accuracy as compared to other approaches.
In the future, this work can explore multiple categories of data on different social
media review such as e-commerce review and blog reviews. Also, we can work to
enhance prediction accuracy with big data tools.

340 K. K. Mohbey et al.
References
1. L. Deng, J. Gao, An advertising analytics framework using social network big data, in Infor-
mation Science and Technology (ICIST), pp. 470–475 (IEEE, 2015)
2. J. Bao, Y. Zheng, M. F. Mokbel, Location-based and preference-aware recommendation using
sparse geo-social networking data, in Proceedings of the 20th International Conference on
Advances in Geographic Information Systems, pp. 199–208 (ACM, 2012)
3. Natalija Koseleva, Guoda Ropaite, Big data in building energy efficiency: understanding of big
data and main challenges. Proc. Eng. 172, 544–549 (2017)
4. F.X. Diebold, Big data dynamic factor models for macroeconomic measurement and forecast-
ing, in Advances in Economics and Econometrics: Theory and Applications, Eighth World
Congress of the Econometric Society, ed. by M. Dewatripont, L.P. Hansen, S. Turnovsky, pp.
115–122 (2003)
5. Abdulkhaliq Alharthi, Vlad Krotov, Michael Bowman, Addressing barriers to big data. Bus.
Horiz. 60(3), 285–292 (2017)
6. B. Walker, Every day big data statistics–2.5 quintillion bytes of data created daily. VCloudNews
April 5 (2015)
7. E. Al Nuaimi, H. Al Neyadi, N. Mohamed, J. Al-Jameela, Applications of big data to smart
cities. J. Internet Serv. Appl. 6(1), 25 (2015)
8. Krishna Kumar Mohbey, The role of big data, cloud computing and IoT to make cities smarter.
Int. J. Soc. Syst. Sci. 9(1), 75–88 (2017)
9. Umit Can, Bilal Alatas, Big social network data and sustainable economic development. Sus-
tainability 9(11), 2027 (2017)
10. An Enterprise Architect’s Guide to Big Data, Oracle (2017). http://www.oracle.com/
technetwork/topics/entarch/articles/oea-big-data-guide-1522052.pdf. Accessed on 15 Sept
2017
11. A. Oussous, F.Z. Benjelloun, A.A. Lahcen, S. Belfkih, Big data technologies: a survey. J. King
Saud Univ. Comput. Inf. Sci. (2017)
12. J. Liu, X.X. Chen, L. Fang, J.X. Li, T. Yang, Q. Zhan, K. Tong, Z. Fang, Mortality prediction
based on imbalanced high-dimensional ICU big data. Comput. Ind. 98, 218–225 (2018)
13. V.S. Agneeswaran, Big Data Analytics Beyond Hadoop: Real-time Applications with Storm,
Spark, and More Hadoop Alternatives (FT Press, 2014)
14. Jorge L. Reyes-Ortiz, Luca Oneto, Davide Anguita, Big data analytics in the cloud: spark on
hadoop vs mpi/openmp on beowulf. Proc. Comput. Sci. 53, 121–130 (2015)
15. Stefan Stieglitz, Milad Mirbabaie, Björn Ross, Christoph Neuberger, Social media analytics-
challenges in topic discovery, data collection, and data preparation. Int. J. Inf. Manag. 39,
156–168 (2018)
16. Statista (2019) Number of monthly active Twitter users worldwide from 1st quarter 2010 to 1st
quarter 2019 (in millions). https://www.statista.com/statistics/282087/number-of-monthly-
active-twitter-users/. Accessed 2 June 2019
17. Alexander Pak, Patrick Paroubek, Twitter as a corpus for sentiment analysis and opinion mining.
In: LREc vol. 10, pp. 1320–1326 (2010)
18. H.A. Alaka, L.O. Oyedele, H.A. Owolabi, M. Bilal, S.O. Ajayi, O.O. Akinade, A framework
for big data analytics approach to failure prediction of construction firms. Appl. Comput. Inf.
(2018)
19. C.C. Aggarwal, C.X. Zhai (eds.), Mining Text Data (Springer Science & Business Media, New
York, 2012)
20. M. Hu, B. Liu, Mining and summarizing customer reviews, in Proceedings of the Tenth ACM
SIGKDD International Conference on Knowledge Discovery and Data Mining, pp. 168–177
(ACM, 2004)
21. C. Whitelaw, N. Garg, S. Argamon, Using appraisal groups for sentiment analysis, in Proceed-
ings of the 14th ACM International Conference on Information and Knowledge Management,
pp. 625–631 (ACM, 2005)

Advertisement Prediction in Social Media Environment Using Big Data Framework 341
22. K.K. Mohbey, B. Bakariya, V. Kalal, A study and comparison of sentiment analysis tech-
niques using demonetization: case study, in Sentiment Analysis and Knowledge Discovery in
Contemporary Business, pp. 1–14 (IGI Global, 2019)
23. Walaa Medhat, Ahmed Hassan, Hoda Korashy, Sentiment analysis algorithms and applications:
a survey. Ain Shams Eng. J. 5(4), 1093–1113 (2014)
24. Corinna Cortes, Vladimir Vapnik, Support-vector networks. Mach. Learn. 20(3), 273–297
(1995)
25. V. Vapnik, The Nature of Statistical Learning Theory (Springer Science & Business Media,
New York, 2013)
26. J. Gimenez, L. Marquez, SVMTool Technical Manual v1. 3 (2006)
27. B. Nithyasri, K. Nandhini, E. Chandra, Classification techniqes in education domain. Int. J.
Comput. Sci. Eng. 2(5) (2010)
28. Leo Breiman, Bagging predictors. Mach. Learn. 24(2), 123–140 (1996)
29. J. Friedman, T. Hastie, R. Tibshirani, The elements of statistical learning, vol. 1, no. 10 (Springer
Series in Statistics, New York, 2001)
30. D.R. Cox, The regression analysis of binary sequences. J. R. Stat. Soc. Series B (Methodolog-
ical) 215–242 (1958)

MMBD Sharing on Data Analytics
Platform
Manish Devgan and Deepak Kumar Sharma
Abstract This chapter explores the field of Multimedia Big Data sharing on Data
analytics platform. Multimedia data is a major contributor to the big data bubble. It
is produced so that it can be shared among family, friends and even masses. Sharing
of media data can be done in various ways and all of them have been covered in this
chapter. Further, the chapter covers cloud services as a recently developed area for
storage and computation. Impacts of social media giants like Facebook and Twitter
along with Google Drive have been discussed. The chapter ends with a brief mention
of security of online data and analysing the MMBD.
Keywords Big Data · Sharing · Wireless sharing · WLAN sharing · Image
sharing · Cloud and benefits · Data analytics · Google cloud · Facebook · Sharing
media data
1 Introduction
Since the mid-2000s, multimedia storing and sharing websites and services, such as
Yahoo Flickr, Google photos, Dropbox, and Apple iCloud, have played a critical role
in digital multimedia management. Nowadays, users have the availability of various
platforms that allow them to create, manage and backup a huge amount of data. This
data can be created from as simple as a smartphone to as complex as a social network
such as Facebook. Facebook alone is responsible for generating 2.5 billion pieces of
content and 500+ terabytes of data almost every day [1].
As multimedia data are increasing exponentially, the services that offer data shar-
ing are providing the users with lots of options to choose from. Unlimited storage,
M. Devgan · D. K. Sharma (B)
Division of Information Technology, Netaji Subhas University of Technology, (Formerly Known
as NSIT), New Delhi, India
e-mail: [email protected]
M. Devgan
e-mail: [email protected]
© Springer Nature Singapore Pte Ltd. 2020
S. Tanwar et al. (eds.), Multimedia Big Data Computing
for IoT Applications, Intelligent Systems Reference Library 163,
https://doi.org/10.1007/978-981-13-8759-3_13
343

344 M. Devgan and D. K. Sharma
unlimited bandwidth limits, and maximum file upload sizes are just to name a few.
There are services that offer a platform for sharing multimedia data to not just close-
by people but also to masses. There is analytics engine that run behind these sharing
services that makes ‘sense’ out of data to enhance the customer experience. Plat-
forms could range from being a simple website or a cloud service to a more complex
mobile application.
In this chapter, we will discuss on the topic of sharing multimedia data. The
chapter will work on enticing the reader with the possibilities associated with the
big data world. We will read about how multimedia is shared among people and will
further discuss about storing this data. A brief note on security of this data will also
be considered in this chapter.
We will end with discussing the Multimedia Big Data Analysis and how it helps
everyone.
Finalizing the chapter will be a conclusion containing a wrap-up of the chapter.
1.1 Characteristics of Big Data
Data is, as stated above, is information that has been translated into a form that is
efficient for movement or processing. Big data is characterized by the leading ‘Big’
in front of the data. This ‘big’ defines the volume of the data that has to be processed.
Today, the human population generates a huge chunk of data online which is being
dumped onto the servers in valleys far away from the original source of creation.
Big data doesn’t always need to be structured, i.e. be in a proper format but can
also be unstructured. Here, we are only concerned with the volume of the data being
produced and not the content that is being generated by a particular user or a device
connected to the internet. Data, in general, saw a huge boom after the common
man was introduced to the devices such as laptops and mobiles which are usually
connected to the internet either wirelessly or through some wired connection. Tens of
quintillion bytes of data are being generated every day and this is not just ASCII text
data but also comprises of multimedia data such as audio messages, music, images,
videos and even animations. This main contributor to the big data is social media
platform such as Facebook (Facebook.com 2018), Snapchat (Snapchat Application,
2018) and Instagram (Instagram.com 2018).
According to recent studies and surveys around 527,760 images are shared on
Snapchat every minute of the day, which is an image sharing platform service popular
nowadays. More than 120 people register every minute on LinkedIn, people watch
over 4 M YouTube videos every minute and post around 50 k images on Instagram,
an online social media platform (Koetsier n.d.)
The above terms are enough to understand the big data term on a broad scale. But
let us also see what other factors instead of volume actually define the Big Data that
we are going to discuss in this chapter (Fig. 1) [2, 3].

MMBD Sharing on Data Analytics Platform 345
Fig. 1 Five V’s of big data
Big Data is defined using five V’s [4]. They are:
• Velocity,
• Volume,
• Value,
• Variety,
• Veracity.
Let us discuss about them in detail below [5].
Velocity Velocity in big data refers to the speed at which the data is being generated.
It also deals with the amount of data being processed and analysed at the same time.
The emails, images, videos, animation graphics and music audio are increasing at
lightning speed throughout the world, therefore, this term is everchanging as there
can be no specific ‘velocity’ of the big data. As more and more people are being
introduced to mobile and Internet technologies, the pace at which they combinedly
create data over the network increases exponentially.
Initially, the services that offered analytics on big data used batch processing to
handle requests. A batch would be delivered to the server to generate response and
then a new batch would be formed. This was good only when the contributors to the
big data bubble were not very big in number. This means when the response time
was faster than the incoming data rate (Fig. 2).
Now, with increasing users the service providers have also organized themselves
in a proper manner so that they can provide real-time analytics to the data being
generated and stored on the platform. They use big data technologies that employ
various standardized databases and API techniques that ensure that not only the

346 M. Devgan and D. K. Sharma
Fig. 2 Delayed processing
Fig. 3 Real-time processing and serving results
processing time taken fir transmitting the data, from the user and back to the user is
also minimum. Technologies such as Hadoop and NoSQL Databases are allowing
platforms the freedom to exercise their analytics without worrying much about the
time taken in storing and transmission of the same (Fig. 3).
Volume Volume is defined as the amount of space that a substance occupies of takes.
Volume in big data is a term associated with the enormous amount of data that the
machinery sensors, our mobile phones or even the simplest of reactions to any social
media post contribute to this overflowing bubble of big data.
The size of consumable data is increasing day by day, for example a simple text
file can range from bytes to a few kilo bytes, an image captured from a smartphone
can be in a range of 2–8 MB or more, an audio file containing a song is somewhere
around the same size and a movie video can be in gigabytes. There are several games
that surpass the 50 GB mark as well. This shows that the current rate of data transfer
and data storage on cloud is very high. This enormous data in contributing to the
entropy of the big data bubble (Fig. 4).
This addition to the voluminous data is not just by active participants in the
network but also by cars, credit cards, M2 M sensors, CCTV cameras and a lot more.
Currently, any IOT device, i.e. network of physical objects that feature an IP address,
is one of the biggest contributors to the big data. The data they produce is raw and
unstructured but hold a great value in the data market.
Collecting and analysing this immense data is a technically difficult task, but there
are certain technologies that allow us to manage them efficiently. We will discuss
about them later in this chapter.
Value Value in terms of big data is not the worth of the raw data being stored
on a platform. It is the measure of the influential data that can be generated after

MMBD Sharing on Data Analytics Platform 347
Fig. 4 Adding data to the big data bubble
processing the unstructured or raw incoming data. It is a measure of the usefulness
of the processed data. While we can safely say that there is a direct link between the
data and the insights of it but we cannot undermine the statement that more the data
cannot always guarantee better insights, i.e. having more data does not mean having
a better understanding of it. One of the most important aspects of data analysis is
to understand and calculate the cost of storing, processing and analysing this data
beforehand so that it does not incur any loss.
Therefore, the value associated with the data can be defined as the worth of data
after collecting, processing and analysing and reaping monetary benefits out of it.
Variety Variety, as the name suggests, means that the incoming data being stored
on the servers is not just in a single form. It need not be textual data. With the current
age of modern technology and increasing numbers of media formats, we can safely
assume that the big data, today, comprises mostly of multimedia data. This data can
be in the form of text, audio, video, animation graphics or other formats of media
storage.

348 M. Devgan and D. K. Sharma
Data comes in all types and formats such as structured data like numerical data
in databases to unstructured data such as audio, financial market stats and more. We
employ different strategies and technological hardware/software to ensure proper
management of such data.
Veracity Veracity means ‘conformity to the facts’ or ‘accuracy’ of the facts. In
big data terms, Veracity relates to biases, abnormalities and the noises in the data. It
associates with the adulterated material in the big data scenario. Basically, ‘is the data
being stored and analysed useful to the problem being discussed?’ is what veracity
deals with. It is considered a bigger problem in data when compared to the volume
or value of the stored big data.
We as analysts can try to reduce the noise as much as possible but certainly cannot
reduce it to a complete zero. Data processing before analysing is a way to ensure
that less amount of noise is being carried into the analysing platform and there are
specific tools to identify the outliers for a specific problem so that we can have a
better data to analyse.
Big data deals with issues beyond just volume and value, they are as above-
mentioned veracity, variety and velocity. There is yet another V, called volatility, it
refers to how long data is valid and must be stored before it is rendered useless for
any analysing.
1.2 Big Data Analytics
So far, we have discussed a lot about analysing data in the above section. Here, we
will discuss briefly about what data analytics is and what is its application. Analysis,
in general, is a process of breaking complex things into smaller and simpler things
to make a better understanding of it [6].
Use of advanced techniques such as application of complex models with elements
such as predictive models, what-if analysis of data as well as applying statistical
algorithms to raw data to perform analytical insights on it is what drives big data
analytics. Big data analytics has given birth to various jobs such as data analysts
and data scientist who analyse the ever-increasing volume of unstructured as well as
structured data to ensure the growth of their respective companies or platforms.
In the next portion, we shall discuss about the applications that Big Data has in
Multimedia Analysis.
Applications of Big Data in Multimedia Analytics
Big Data techniques have been employed to store and manage the multimedia data
in the industry for a good while now. This allows a sensible way to collect and store
data as well as a cost-effective option to analyse and give out results. Given below
are a few applications of big data in multimedia analysis.

MMBD Sharing on Data Analytics Platform 349
• Social Networks
Social Networks can be considered as the paradise of Big Data. Modern day social
media consists of all types of data ranging from simple text to complex animations.
Social Network is a wide area of research as it houses the biggest data collection
on the planet. There has been a tremendous amount of publications as well as
development in the field of social media big data analysis.
Analysing human social behaviour and activities based on the Twitter Feed (Twit-
ter.com 2018) is one of the most famous projects. The ease of availability of huge
amount of hashtag and tweet data of the user allows the creation of such enor-
mous dataset. Twitter sentiment analysis is another hot topic that data scientists
are working on. Using the twitter trending to analyse the tone of a tweet. It is also
known as opinion mining as it is a computational process of determining whether
a particular writing is positive, negative or neutral. Another such research was
conducted on Facebook’s data (Facebook.com 2018) since it is considered a more
valuable data source.
Another use of multimedia analytics in big data field is the emerging research field
of social recommender system. Such systems can range anywhere from an online
e-commerce ‘What users also bought’ to a video streaming platform’s ‘Recom-
mended for you’ section. They incorporate social data into a recommender system
to get the desired outputs for a user.
• Surveillance Videos
CCTV cameras or the surveillance cameras are the biggest sources of unstructured
multimedia data. They are a constant source of streaming video data that can be
put to great use using the advanced analytical solutions currently available in
the world. The data captured using the surveillance cameras are considered of
very high value. With the upcoming big data trends and technologies, a major
breakthrough can be seen in the video feed research. Object identification is one
of the primary goals of video research in any surveillance camera feed. It allows
us to monitor sudden and certain changes in a video by applying methodologies
such as convolutional neural networks to identify objects in a live video feed.
In the US, one such project was identifying the cars number plates via the camera
feeds on the traffic signals. This helped to identify and locate a lot of stolen cars
and even improved the traffic laws being followed all throughout the states.
• Smart Phones
In the recent years, mobile phones particularly smart mobile phones or smart-
phones, in general, have taken over the electronic world. The user base of smart-
phone has taken over the entire userbase of laptops and PCs combined. Billions
of individuals carry smartphones inside their pockets almost anywhere and every-
where. A single smartphone is equipped with technologies such as powerful CPUs,
intense graphics engine, multimedia capabilities, Bluetooth, Wi-Fi and all sorts of
network connection capabilities. Alongside that, the flooding of applications for
smart devices has also made them a root cause of the production of vast multimedia
data.

350 M. Devgan and D. K. Sharma
With many sorts of functionalities that a smartphone possesses there are vulnera-
bilities that must also be taken into account such as network security vulnerabilities
that may cause the user’s data into unwanted hands. We shall discuss about security
later in this chapter.
• Other Areas
If we look beyond the scope of what has been discussed as the application of big
data analysis in multimedia data there are several places where big data analysis
is used. Multimedia summarization, Internet of Things, disaster management sys-
tems and healthcare are a few industries to name. There can be a variety of data
such as records, patient’s history, genomic records and a lot more that needs to be
stored and analysed. Biomedicine is a growing field that has been benefited by the
use of big data analytics.
2 Sharing Multimedia
The user’s perspective of multimedia data has always been sharing it. Sharing is a
primary goal of creating the multimedia data. Any sorts of multimedia are a replace-
ment for text messages, because they can be used to express various things and not
just words, they can express joy, sadness and other expressions in a single frame of
a picture or multiple frames of a video.
In this section, we shall study about how data is shared between devices. Though
the topics are more networking based, but a brief introduction to the required
subtopics has been provided.
2.1 Sharing Multimedia Over a Wired Network
This is one of the primitive ways in which data has been shared across devices.
Although this is not a very old method of sharing data, there exist better methods
to facilitate media sharing among devices in a network. We will discuss about the
topologies that allow the formation of a network.
Wired network is an interconnection of devices that are connected to a common
network through a communication medium which is wire. Two devices may be
connected in some way to the same link at the same time so that communication can
occur. There are two types of connections: point-to-point (P2P) and multipoint.
Figure 5 shows the involvement of a sender, a receiver, a message that contains
the data that needs to be transmitted or shared, the medium is the wired connection,
and some protocols governing the information exchange between the sender and
receiver. The process is the same for any kind of data since the packets follow a strict
protocol for being delivered.

MMBD Sharing on Data Analytics Platform 351
Fig. 5 Components of data communication
The interconnection of devices in a network is called as topology. Topology is the
way in which the devices are arranged in a network connection. The way in which
the network is laid out physically is defined by the topology of the network. It is a
geometric representation of the links that are formed between the devices, sometimes
also called as nodes of the network. There are four basic topologies: mesh, star, bus
and ring.
There are other ways in which the nodes can be arranged in a network to create
a physical layout which may be a combination of two or more of the four discussed
topologies. These topologies are called hybrid topologies.
2.2 Multimedia Sharing OTA (Wirelessly)
Mobile phones and laptops today come equipped with the latest technologies that
allow not only sharing of data through wired medium but also sharing data via
wireless mediums, for example, Bluetooth, Infrared and Wi-Fi networks [7].
In this section, we shall have a brief overview about what these technologies are
and how does data transfer happen in them.
2.2.1 IEEE 802.11
IEEE has defined the specifications for a wireless LAN called the WLAN or the
IEEE 802.11. It defines a Basic Service Set (BSS) as the building block which may
or may not be controlled by a central base station also known as the access point. A
BSS without an AP is an ad hoc network whereas a BSS with AP is an infrastructure
network (Fig. 6).
Data transmission in a wireless network works in the same way as it works in the
wired networks. The information to be transmitted is broken down into pieces called
as packets. These packets then run through the entire network and are transmitted
from the sender to the receiver. Since there are no direct physical connections between
the devices and the delivery of packets must be done in order to make sure that the data

352 M. Devgan and D. K. Sharma
Fig. 6 Nodes connected to a wireless router Note: the connections are not done using wires
Table 1 Implementations of
IEEE 802.11FHSS Frequency Hopping Spread Spectrum
DSSS Direct Sequence Spread Spectrum
Infrared Using Infrared for Transmission
is being transmitted throughout the network and any corrupt frame is retransmitted.
The noisy wireless environment requires fragmentation––dividing the bigger data
frames into smaller ones. It is more efficient to resend a small frame than to retransmit
a large one in the entire network.
The main implementations of IEEE 802.11 WLAN are: (Table 1).
The wireless LAN technology allows the devices to share data, files, audio and
a lot more on a common network without even being physically connected to the
other node. The initial cost of setting up a wireless router may be high but the overall
cost of maintaining the network is very less when compared to the wired network.
Wireless networks also pose another advantage over the traditional wired networks
that is the ease of removal and addition of a new node to the network. Previously, a
new node could only be added once the central router has a free slot and a link was
needed in order to connect the node to the network. This additional link added to the
cost of maintaining the network. But with wireless LAN, a network is created which
does not require any physical connection such as a wire. Therefore, adding a new
node or removing one from the network is very easy.

MMBD Sharing on Data Analytics Platform 353
2.2.2 Bluetooth
Bluetooth is also a wireless LAN technology designed to connect devices of different
types together. The devices connected to a Bluetooth network can range from a mobile
phone, headphone, notebooks, cameras and even printers. There are a lot of devices
that are Bluetooth Enabled. A Bluetooth network is an ad hoc network which means
that the network is formed spontaneously. The Bluetooth network can be connected
to the internet if any one of the devices on the network has the access to the internet.
Applications of Bluetooth
• Connecting peripheral Bluetooth device such as wireless mouse and keyboard to
communicate with the computer.
• Streaming music audio directly to the Bluetooth headset device. Bluetooth stream-
ing of audio plays an important role in hassle-free media streaming.
• Manipulating hidden computing paradigm to make automatic synchronizations
which helps in devices which carry out tasks without the user’s intervention.
• Multimedia transfer is another usage of Bluetooth. Users can exchange multimedia
data such as texts, images, videos and other animations using Bluetooth networks.
• Bluetooth is used by Home security devices to connect to sensors to gather data
from them wirelessly.
Bluetooth, today, is an implementation of a protocol defined by the IEEE 802.15
standard. The standard defines a wireless PAN (Personal Area Network) which can
operate in an area as small as room or maybe a hall.
Bluetooth has two network types, viz. Piconet and Scatternet.
A piconet is a small Bluetooth network which can have up to eight stations, one
of which must be a primary station and the others will be secondary stations. There
also exists a parked state, in which the node is in sync with the primary of the net
but cannot take part in any communication or data transfer in the network.
A scatternet is a combination of more than one piconets in which a secondary of
a piconet is the primary of other piconets (Fig. 7).
Bluetooth devices have a short-range radio transmitter. The current data rate is 1
Mbps with a 2.4 GHz bandwidth.
Layers of Bluetooth
Bluetooth protocol stack consists of 5-layer (Table 2).
2.3 Continuous Media Sharing
Continuous media sharing is a relatively new methodology that is used in streaming
the content of a multimedia over the network in real time. Streaming music or video
online on a service such as Spotify (Spotify.COM) or YouTube (Youtube.COM).
Media streaming solutions like these have become a solution to share data to the
people in real time. One of the most popular usages of CMS is Internet Television,

354 M. Devgan and D. K. Sharma
Fig. 7 Scatter-net and Piconet
Table 2 Layers of BluetoothRadio This layer specifies the requirement for
radio transmission
Baseband layer This can be considered similar to the MAC
sublayer in LANs
LMP Link Manager Protocol defines the
procedure for link set up and link
management
L2CAP Logic Link Control and Adaption Protocol
is responsible for adapting the upper layer
protocols to the baseband layer
SDP Service Discovery Protocol allows querying
of available devices for a Bluetooth
connection
providers such as Hotstar (HotStar.COM) use this service to broadcast television
network over the internet to its registered users.
There are several ways in which a media can be streamed over the network.
• Serving the file over the Web.
• Using a Media Server.
• Real-Time Streaming Protocol (RTSP).

MMBD Sharing on Data Analytics Platform 355
Fig. 8 VoIP video calling
Streaming live audio and media is similar to that in case of a radio or TV, but the
broadcasting is done over the internet and not the cable networks.
Real-time Transport Protocol (RTP) and RTSP are designed to handle real-time
traffic on the internet and adding more functionalities to the streaming process.
VoIP: Voice Over IP is one such interactive audio/video application of multimedia
sharing. This application allows communication over the internet to facilitate com-
munication between two parties. Voice and Video calling support in popular chat
applications such as WhatsApp and Facebook work on this principle (Fig. 8).
2.4 Mobile Networks and Cloud Sharing
All electronic devices are capable of storing data on themselves. It can be stored
in the device’s memory, often called as the internal memory or an extended service
memory can be added to the device to extend the storage capacity, often a secondary
memory like a MicroSD Card in a mobile phone can be used.
Now a days, people are shifting to a more cloud-based lifestyle. But What exactly
is a cloud? Cloud, in simple terms is an extended memory for your device. Any
device has internet connectivity can access cloud services (Fig. 9).
Data storage in cloud is done in physical or virtual servers. These servers are
controlled by a Cloud Computing Provider (CCP). CCP(s) provide physical storage
for use. Storage is done on physical devices in server farms. A registered user can
take certain amount of storage space from the cloud for a set of pricing and use it
for storing and sharing the data. Cloud services can be free up to a certain amount
of storage and then charge for more or in some cases can only be used after paying
a certain amount of money [8].
With internet connectivity provided by the mobile carriers, it is fairly easy to
connect and use the cloud service.

356 M. Devgan and D. K. Sharma
Fig. 9 Cloud services allowing seamless data transfer among all devices
Benefits of Cloud Services [8, 9]
Data storage on Cloud. Cloud platforms provide the user with accessible storage
units via the internet. These storage units service serve the purpose of storing the
data online. By storing all the files and folders online, we are provided with the
ease of accessibility of the file anywhere and anytime. Any electronic device can
be used to access the cloud storage as long as it is connected to the internet. Using
cloud solutions for managing the data enhances the productivity, operations and the
efficiency of the business solution.
Easy File Transfers. Seamless data transfer to and from the cloud server is another
intimidating feature. There are services that provide only one type of files to be stored,
but mostly clouds allow heterogenous data to be stored and modified. Typically
accepted files on a cloud can range from PDFs to Docs, pictures and motion videos
to spreadsheets and music files. Multiple compression algorithms along with security
mechanisms are used to ensure data safety as well as faster downloads and uploads.
Backup Files on Cloud. The most common functionality of the cloud is to backup
files. Services such as Google Drive or Google Photos are constantly used to create
an automatic backup of your files and media to ensure data safety in case the device
is no longer available with the user. Automatic backups ensure timely updates of all
files on the device.
Sharing Media and Data. Cloud platforms provide with different level views, these
views allow certain restrictions on the intractability of the user. For example, uploads
MMBD Sharing on Data Analytics Platform 357
can be restricted to the owner of the cloud but the files on the cloud of a user can be
made available to the world for download purpose. Google Photos create a link that
allows others to browse through your album without (sometimes with) the authority
to add/delete media to/from it. Sharing data has been made easier with the cloud
storage solutions such as OneDrive, Google Drive and Amazon Servers.
3 Storing and Saving Multimedia Data
Multimedia data is accompanied by a lot of metadata. Metadata is what defines the
data. It is the data about the data generated or stored. Media data consists of a lot more
than just the media, therefore, it requires more space than the media itself. Storing
and serving a huge quantity of data is not easily possible and hence, provisions such
as cloud storage for sharing and saving media data and other has been developed
[10].
In this section, a discussion on services that offer multimedia storage has been
done. Social media and its applications along with the impact that the cloud has to
offer on the social media. We will also do a brief discussion on the security threats
posed on the multimedia data.
3.1 Services for Multimedia Storage
Multimedia storage is provided by a variety of cloud platforms. These storages sup-
port heterogenous data to be uploaded to the drive (space allotted to the user is often
called as a drive). There are a lot of cloud providers, for this section we are going to
compare the three biggest user-centric cloud services providers viz. Google Drive,
Dropbox and OneDrive.
Dropbox
Dropbox is an online storage service. Dropbox is the oldest available cloud service
among the three proprietary services that we are going to discuss in this chapter.
It was launched to the public in 2007. It is a heterogenous cloud storage platform
capable of seamlessly storing all kinds of media and data. It allows for storing of
any files, sharing of the media with friends and family and an additional plus of
automatically syncing local data. Although the basic services are free for Dropbox
users there exists a pro version that allows for extended storage options as well.
Dropbox can be availed by the regular user on all platforms like iOS, Android as
well as Linux, Blackberry, etc.
Google Drive
In 2012, Google launched its cloud storage service called the Google Drive and hence
the term drive was made analogous to cloud storage for general purpose users. Google

358 M. Devgan and D. K. Sharma
Drive made a mark after it hit the smartphones with special apps for Android, iOS
Devices, etc. It operates freely with a Google account but services for more storage
options can always be purchased for a varying fee. It is also a heterogenous media
storage option with access to Google Drive office suite. It is available on potentially
all platforms across the globe.
OneDrive
OneDrive was initially launched as SkyDrive before being acquired by Microsoft and
renamed to OneDrive and was opened to public in the year 2014. It is Microsoft’s
contender to the world of cloud storage. It is, again, a heterogenous storage service
that allows all popular files to be stored on the servers. The service comes integrated
with Microsoft’s popular operating system Windows 8 and Windows 10. It has cross-
platform applications for users using other operating systems (Table 3).
Some popular homogenous data storage services include:
Google Photos. Allows storing of Photos on the Cloud.
Flickr. Another Photo Storage Service.
Dailymotion. Video storage and sharing platform.
YouTube. Most popular public video storing and sharing platform.
3.2 Social Media and Data Sharing
Social media is a platform to connect with people. The sharing of data is not limited
to text but also has images, videos and voice notes. There are various applications
that are ruling the social media industry and account for the maximum media sharing
across any platform.
3.2.1 Emergence of Facebook and Twitter
Facebook and Twitter are the biggest names on the planet in terms of social media
outage. Facebook, till date, remains the biggest social network to ever exist across
the globe with a monthly usage by about 2.27 billion users. Users are allowed to
share their expressions in the form of text, images and videos. Facebook and Twitter
have become popular media sharing platforms used by masses to drive the world.
Twitter has approximately 336 million monthly users and is more popular among
movie stars and athletes as it allows a ‘follow-based’ system to get notified of the
updates instead of the ‘friend-based’ system followed by Facebook.
Facebook and Twitter currently account as one of the biggest producers of multi-
media data. They make sharing media easy for people. Once connected to the fellow
users a user can simply ‘post on the wall’ or ‘tweet’ a sentiment, which may contain
a textual data, an image or video corresponding to any topic, some graphic content
and even audio files.

MMBD Sharing on Data Analytics Platform 359
Table 3 Comparison of cloud providers
Feature Google drive Dropbox One drive
Ownership Google LLC
(Google.com)
Dropbox, Inc
(Drobbox.com)
Microsoft
(Microsoft.com)
Release 24 April 2012 June 2007 February 2014
(Following a
Lawsuit)
Industry type Cloud storage, Client
software, file sharing
Online cloud, file
sharing
Cloud, File share
Written in language(s) Python, Objective-C
(Mac client),
wxPython
(Windows)
Python, Go,
Typescript
C, C++ and Python
License Freeware Combined with
GPLv2 and
proprietary software
–
Allowed free usage 15 GBs 2 GBs 5 GBs
Storage options 100 GB, 1 TB,
ranging up to 30 TB
1 TB and more 50 GB, 1 TB, 5 TB
Cross-platform clients Available on all
devices like Android,
Linux, Windows,
iOS and more
Has applications
developed for all
platforms like
Android, iOS,
Blackberry and more
along with desktop
platforms
Available on all
major operating
systems and mobile
OS(s)
Extended abilities Yes Yes Yes
Abilities/Software Google Docs,
available for free to
use, is an online
office solution
Dropbox has
Dropbox Paper, a
collaborative text
editor for special
users
Office 365 suite
Number of users
(approx.)
1 billion users Greater than half a
million
Quarter of a million
users
Companies and business have been using the power of social media to improve
their growth by ensuring proper content sharing across the network using dedicated
Social Media teams. Twitter and Facebook have made it easier to connect to the
people across the globe and hence sharing of content on a platform like this give it an
edge above everything. Although both are considered equally good, but studies have
shown that Facebook posts are 6 times more effective and have a bigger outreach
than Twitter tweet.

360 M. Devgan and D. K. Sharma
3.2.2 Image Sharing Platforms
While social media applications have a predominant upper hand on the media sharing
but after the development of dedicated media sharing applications and platforms,
there has been a gradual decline in the growth of amount of data produced and
shared across the two popular social network sites. Applications and platforms such
as Snapchat, Instagram, Google Photos and Flickr have added to the Image sharing
entropy.
Instagram. It is a photo and video sharing service owned by Facebook. Service
allows the registered users to post images with various captions and filters to further
enhance the image. It has become one of the popular choices of users to share media,
specifically visible media like images and videos. Instagram has a bigger outreach
to offer since most of its users are Facebook users and are quite familiar with the
service. It is available for users as a cross-platform application.
Snapchat. Snapchat is a multimedia messaging application developed by Snap Inc.
Snapchat provides the user with a completely new feature for data sharing. The
pictures and messages shared across the platform were visible only for a certain
amount of time and could not be retained initially and became inaccessible to the
user. It has since then evolved and introduced yet another important sharing feature
of stories of 24 h of chronological content. It is a mobile-first application and near
about 200 million registered users.
Google Photos. While the previous two applications can be considered as a social
media for image/video sharing, Google Photos is an online storage unit that allows
the user to upload, download and share the clicked images and videos (only) with
the people of their choice. It ‘generates link’ for the selected items to be shared. The
visibility of the items in the album can be controlled by the original author and can
also give special permission to add more content to the album etc.
Flickr. Flickr is an image and video hosting service acquired by Yahoo!. Developed
in 2005 it has been a source of hosting images and videos for the phot researchers
and bloggers across the globe.
There are other important platforms that provide media sharing capabilities like
Pinterest, DeviantArt and Imgur that allow free image hosting and sharing capabili-
ties.
3.3 Cloud and Its Impact
We have discussed various services that offer cloud services. Let us have an overview
of the impact that the cloud has on users and businesses [11].
Accessibility and Usability. With the easy options of seamless transfer of files to
the cloud simply by dragging and dropping files and folders, cloud provides ease of

MMBD Sharing on Data Analytics Platform 361
use. Saving files on a cloud is as easy as saving them on the local machine and hence
requires little to no technical knowledge.
Disaster Recovery. Cloud acts as a secure backup plan for business in case of
an emergency. Backup is one of the most important uses that cloud storage is put
to. Users can save their work, images, videos and be carefree about losing them.
Snapshots and automated backups allow easy data recovery in the cloud.
Security. Since the data on cloud is distributed across different servers hence allows
for better security of the data. Using redundant data servers along with snapshot
mechanism for automating backups helps in improving security.
Cost Saving. Cloud is an extended storage for users as well as businesses. There is not
need to be bothered about managing huge server farms for storing data performing
computation on a large scale. Cloud providers provide storage units at different costs
which is very less than managing the entire storage physically.
Easy Sharing. Cloud allows the user to share a similar environment together. The
author of the original data can give permissions to the others to view, modify and
delete the contents of the drive. Hence providing an easy-to-share interface.
Automation. Servers that store the data on cloud are configured with continuous
integration or CI. CI helps in automating tasks that could be performed on the drive
for different hooks. A hook is an action performed on the drive’s data. In addition to
it, we have periodic backups as well.
Collaboration. Online cloud acts as a platform for the shared learning experience.
It is a collaboration platform where multiple people can access, edit, modify and
collaborate on a single file. Any user with internet connectivity and access to the
cloud data can collaborate with the original author.
Scalable Service. Service providers create plans on ‘pay what you use’ basis. Cloud,
henceforth, is scalable in nature. The dimensionality of the environment can be
changed as and when required by simply choosing a different plan or different set of
configurations for the drive.
Convenience. Cloud provides an enriching experiencing of getting your files and
folders wherever you want. The data stored on servers does not require any manual
interventions as no physical device needs to be carried in order to procure the data.
The seamless transfer of data from cloud to the device and vice versa makes it really
convenient.
Synchronization. Data on the local machine is either automatically synchronized or
done manually in order to update files on the cloud. It removes the stress of manually
transferring the data after every update to the file or data.
Cloud provides more than just storage units, there are deployment containers
that allow easy and scalable deployment environments for the builds [12]. One such
free service is Heroku. There exist computationally extensive containers provided
by providers such as Microsoft Azure and Amazon AWS. Google Cloud also offers
computationally extensive cloud experience embedded with their own Tensorflow
engines for heavy machine and deep learning.

362 M. Devgan and D. K. Sharma
3.4 Multimedia Data and Security
Although cloud services provide with numerous benefits, but the business enterprises
still do not use the cloud for big data. It may be because of lack of visibility and not
enough trust in this new infrastructure. Mobile security is another threat to multimedia
big data. With the rapid escalation in the number of mobile devices, data privacy and
security have been a major concern. Privacy control on different levels must be
provided to ensure maximum safety of the data. Security mechanisms may include
security storage and management, multi-granularity access control and privacy-aware
data mining and analysis.
A multimedia platform, or a cloud platform must find the appropriate balance
between access control and processing convenience. Furthermore, proper methods
for encrypting multimedia data must also be employed in order to ensure data safety.
4 Analysing MMBD
4.1 Data Transformations
Data store contains the data that has been accepted for the next analysis. OLAP
technology can then be used for performing this analysis. Analysis is done using
data mining techniques or by the help of reporting services. This process requires a
great amount of skill and expertise. It is an important step in the analysis of content
and technologically heterogeneous data sources so that relevant data can be chosen.
Aggregation, integration, collection and centralization of data takes place afterwards.
Data pumps serve to collection and transmission of data from source systems to data
stores and dumping ground. They include:
• Extraction, transmission and transformation of the data (ETL).
• Applications integration systems (EIL).
4.2 Database Components
The concept of data warehousing was coined in 1991 by Bill Inmon. Data ware-
houses were established as an independent information system set above business
data. Data market is problem oriented, whereas, data warehouse is subject oriented.
New multidimensional database models were introduced for the purpose of storing
data which allowed easy and quick creation of views on data. This technology is the
bases of today analytical tools of Business Intelligence (BI). Corporate Performance
Management (CPM), is a new type of business planning created by the integration of
BI with business planning. Data warehouses are special types of business databases

MMBD Sharing on Data Analytics Platform 363
which contain consolidated data from all accessible service systems. Their optimiza-
tion is done for quick administration of analytical information and not for quick data
processing or quick transaction since the main aim is to mine data from the sources.
They ensure processes of storing, actualization and administration of data. There
exists two basic types of data stores:
Data Warehouse
Data warehouse is a wide centralized database for business application wherein data
from all sources and external databases are saved.
Data Marts
Data marts are different from data warehouses as they are decentralized and thematic
oriented. The analytical information that they provide is centric to one section or one
specific group of people.
There exist two types of Auxiliary data stores:
Operational Data Store (ODS).
Data Staging Areas (DSA).
4.3 Analytical Components
OLAP [13, 14]
Data in data warehouse is cleaned out and integrated but it is often very voluminous
and hence maintaining is not easy. OLAP (Online Analytical Processing) is a special
technology used for this purpose and it employs special data structures for the same.
OLAP tools are simple, readily available and very popular as well as susceptible to
create multidimensional analysis.
The OLAP technology is employed on multidimensional data. The data is stored
in an n-dimensional cube. The database so formed is not in normalized state. A
schema is formed by the tables and facts. A different visual angle is provided by
every dimension on the data. Data can therefore be organized logically as well as
hierarchically.
Knowledge Mining from Data [15]
Objective setting
It begins with a problem statement which can be related to the real world and hence
begins the data mining process. The end of the process is marked by enough amount
of extracted information to solve the problem statement [16]. These properties of
data mining make marketing an apt area of its use.
Data selection
Data for data mining must be chosen carefully. In normal circumstances, data is
usually extracted from source systems to a special server.

364 M. Devgan and D. K. Sharma
Data preprocessing
Preparing data for analytical processing is an exacting process. It is necessary to
choose corresponding information from the voluminous databases and save it to a
simple relational database. Data preprocessing consist of next steps:
• Clearing Data—solving the inconsistent data or missing data problem.
• Integrating Data—multiple sources can often lead to redundant data in the server,
which must be resolved.
• Data transformation—formatting of data.
• Data reduction—normalizing the data in the database as well as the formation of
data models.
• Analysis and exploration of data—independent data searching without previous
knowledge.
• Description—describing the complete data set.
• Prediction—Prediction phase is used to calculate the values for unknown input.
Data mining methods include
• Regression methods—linear, non-linear regressions, neural networks, etc.
• Classification of data—decision trees, SVM etc.
• Data segmentation—clustering analysis, genetic algorithms, neural clustering
• Time series prediction—Box–Jenkins method, neural networks
• Deviation detection
4.4 Tools for End Users [17]
Analytical Tool—Microsoft SQL Server 2008
Just after OLAP was introduced, Microsoft began implementing a model of self-
service analytical tool. In the 2005 version of Microsoft SQL Server, all analytical
levels were joined into a Unified Dimension Model. MS SQL Server 2008 is the focal
point in Analysis Services which are containing OLAP, Data Mining, Reporting Ser-
vices and Integration Services. With the addition of SQL Server Integration Services
(SSIS) it worked as an ETL data pump. It provided benefits such as allowance of
creation of data administration applications. Manipulation with files in directories,
data import and data export were another set of features. Reporting Services such as
SQL Server Reporting Services (SSRS) provides a flexible platform for creating and
distributing reports. MS SQL Server report builder is a free tool, that is usable for
reports creation. SQL Server Analysis Services (SSAS) is a key analytical service
for data analysis. It consists of two components:
OLAP module for multidimensional data analysis enabling loading, question-
ing and administration of data cubes created by Business Intelligence Development
Studio (BIDS) [18].
Data Mining module which extended possibilities of business analyses.

MMBD Sharing on Data Analytics Platform 365
Data Analysis User Tools—MS Excel
Microsoft Excel is the easiest and the most obtainable of business data analytics
tool. Every manager or chief executive has this software installed onto the desktop of
his/her office desk. The ease and simplicity of MS Excel allow users to create reports
without any external software. Graphs and reports along with other mathematical
representation of data can be easily produced using MS Excel. Microsoft Excel
provides a dynamic and effective range of data analysis. It offers a dynamic set of
views and graphical views for the data. The most common way of inserting data to
MS Excel is the manual table filling from business reports. The second way is easier
and fast. It deals with importing data directly from the BIS, Business Information
System. Another possible way is directly connecting the BIS to the databases. This
way is most operative. MS Excel provides a set of different analysis done using pivot
tables and graph pivot table. They are considered to be the most important tools of
Excel. Excel enables data summarization, filtration and ordering. It is possible to
create a lot of different views, reports and graphs from one data source. Creation of
pivot table is easy––we can add or delete data, columns, rows or change summaries
without influencing the data of other data sources. Pivot tables are very often used
as a user tool for working with data cube used by SQL Server.
5 Conclusion
In this chapter, we discussed the field of Multimedia Big Data sharing on Data
analytics platform. Multimedia data is a major contributor to the big data bubble. It
is produced so that it can be shared among family, friends and even masses. Sharing
of media data can be done in various ways and all of them have been covered in this
chapter. Further, the chapter covered cloud services as a recently developed area for
storage and computation. Impacts of social media giants like Facebook and Twitter
along with Google Drive have been discussed. The chapter ends with a brief mention
of security of online data and analysing the MMBD. Tools for user end analysis of
data have also been given a brief mention in this chapter.
References
1. E. Adler, Social media engagement: the surprising facts about how much time people spend
on the major social networks (2016). Retrieved from http://www.businessinsider.com/social-
media-engagement-statistics-2013-12
2. A. Labrinidis, H.V. Jagadish, Challenges and opportunities with big data. Proc. VLDB Endow.
5(12), 2032–2033 (2012)
3. K. Michael, K.W. Miller, Big data: new opportunities and new challenges [guest editors’ intro-
duction]. Computer 46(6), 22–24 (2013)
4. S.B. Siewert, Big data in the cloud - Data velocity, volume, variety and veracity (2013). https://
www.ibm.com/developerworks/library/bd-bigdatacloud/index.html

366 M. Devgan and D. K. Sharma
5. C.L. Philip Chen, C.-Y. Zhang, Data-intensive applications, challenges, techniques and tech-
nologies: a survey on big data. Inf. Sci. 275(2014), 314–347 (2014)
6. P. Tan, M. Steinbach, V. Kumar, Introduction to Data Mining (2005). ISBN 0-321-32136-7
7. J. Bergstrom, M. Drovdahl, S. Temple, Wireless data capture and sharing system, such as image
capture and sharing of digital camera images via a wireless cellular network and related tagging
of images. US Patent App. 12/182,952 (2008)
8. M.D. Assunção, R.N. Calheiros, S. Bianchi, M.A. Netto, R. Buyya, Big data computing and
clouds: trends and future directions. J. Parallel Distrib. Comput. 79(2015), 3–15 (2015)
9. S. Dey, A. Chakraborty, S. Naskar, P. Misra, Smart city surveillance: leveraging benefits of
cloud data stores, in Proceedings of the IEEE 37th Conference on Local Computer Networks
Workshops (IEEE, 2012), pp. 868–876
10. S. Pouyanfar, Y. Yang, S. Chen, Multimedia Big Data Analytics: A Survey, Florida International
University (2018)
11. G. Shmueli, N. R. Patel, P. C. Bruce, Data Mining for Business Intelligence (2006). ISBN 0-
470-08485-5
12. S. Sakr, A. Liu, D.M. Batista, M. Alomari, A survey of large scale data management approaches
in cloud environments. Commun. Surv. Tutor. 13(3), 311–336 (2011)
13. D. Pokorná, Business Data Analyses Possibilities. Diploma thesis. Faculty of Applied Infor-
matics, Tomas Bata University in Zlín (2010)
14. M. Berthold, D. Hand, Intelligent Data Analysis (Springer, Berlin, 2009)
15. S.C. Hoi, J. Wang, P. Zhao, R. Jin, Online feature selection for mining big data, in Proceedings
of the 1st International Workshop on Big Data, Streams and Heterogeneous Source Mining:
Algorithms, Systems, Programming Models and Applications (ACM, 2012), pp. 93–100
16. A. Bifet, Mining big data in real time. Informatica (Slovenia) 37(1), 15–20 (2013)
17. P. Zdenka, S. Petr, S. Radek, Data analysis: tools and methods, Tomas Bata University in ZLin
(2011)
18. H. P. Luhn, A business intelligence systems. IBM J. Res. Dev 314–319 (1958)

Legal/Regulatory Issues for MMBD
in IoT
Prateek Pandey and Ratnesh Litoriya
Abstract Internet of Things (IoT) is a network of connected devices that collect
and transmit data for further processing. The size and nature of the data generated
by IoT devices determine processing, transmission, and regulations involved in the
application. IoT applications that require Multimedia Big Data (MMBD) also pose
some privacy and security issues. Legal frameworks to deal with IoT related issues
are either nonexistent or nascent. Effective regulatory measures are required to set
in place to deter the unlawful use of the colossal data that is generated through IoT
devices from every walk of life, including but not limited to, smart homes, wearables,
connected cars, health care, smart retail, and many more. The flow of data across the
continents and countries rises accountability, security, and privacy concerns, because
the country from which the data was collected and the country in which it is processed
may have incompatible laws. This chapter details the fundamental issues related to
the use of MMBD in IoT applications and also presents a systematic discussion of
some emerging questions regarding the transfer and use of data across the internet.
Keywords MMBD · IoT · Cybersecurity · Regulations · Privacy · Issues
1 MMBD in IoT Applications at a Glance
Human beings are different from other living creatures because they have curiosity.
Due to this curiosity humans questions a lot. We are the one who challenges day to
day business out of existing human traits and tries to create something improved.
This effort and curiosity guaranteed us an existence where electronic gadgets and
machines will most likely turn into our closest companion. Indeed, the vision is
to make machines adequately brilliant to diminish human work to near nil. The
P. Pandey · R. Litoriya (B)Jaypee University of Engineering and Technology, Guna 473226, MP, Indiae-mail: [email protected]
P. Pandeye-mail: [email protected]
© Springer Nature Singapore Pte Ltd. 2020S. Tanwar et al. (eds.), Multimedia Big Data Computing
for IoT Applications, Intelligent Systems Reference Library 163,https://doi.org/10.1007/978-981-13-8759-3_14
367

368 P. Pandey and R. Litoriya
initiatives of connected machines/devices where the machines are smart enough to
generate and share information with us, to cloud-based applications and each other
are commonly called smart devices. Smart devices are designed so that they catch
and use all of the information which you throw in your routine life. What’s more,
these smart devices will utilize this information to help you in accomplishing your
tasks efficiently.
The world is waiting for the diffusion of internet-connected devices, also called the
Internet of Things (IoT)––a network of networks––to provide value-added services
[1] into our daily walks of life. Despite the fact that the universally accepted definition
of IoT doesn’t exist, but for common understanding, the IoT can easily be defined
as a network of networks—where a vast number of embedded devices are connected
all the way through the communication infrastructure to make value-added services
available to different classes of users [2]. This is a setup wherein people, animals, or
objects/devices are provided with inimitable identifiers and the capacity to transmit
and receive data over internet/intranet without a need of human-to-human or human-
to-computer interaction [3].
IoT is a rising technology of physical devices that are capable of connecting and
to the other networks over the wireless Internet. IoT systems have different technolo-
gies such as: RIFD, NFC, 3G, 4G, and sensors [4] working over a connected array
of devices such as smart cars, smartphones, wireless cameras, smart thermostats,
smart refrigerators, smart baby monitors, wearable devices (such as Fitbit and smart
watches), and implantable medical devices [5]. Development and analysis of the
combination of fog computing, cloud computing, and IoT have widely carried out
to provide uninterrupted context-aware healthcare services to the end users as and
when required [6].
The IoT enables individuals and objects/things to be linked with anyone and any-
thing, at anyplace and anytime, preferably utilizing any heterogeneous network and
service [7]. These smart IoT devices are persistently transforming our homes, cities,
education, transportation, healthcare technologies, energy infrastructure and many
more domains of life [8]. These smart IoT devices when combined with software
applications along with network connectivity, and cloud storage has built a new gen-
eration of embedded systems [9]. All these smart devices are seamlessly generating
multimedia and Big data.
After some time, this innovation will be used in a large number of daily aims and
to a great extent will also be imperceptible to customers. Unquestionably, IoT has
entered into every aspect of our lives, and in reality, is gradually creeping into the
regular day-today existence of many. Gartner points out the market for IoT devices
is on edge to burst and will reach a figure of about 21 billion connected devices by
2020 [10], see Table 1.
For hardware spending, Business: Vertical-Specific applications will amount to
$667 billion in 2016, whereas the use of connected things in the consumer will drive
$1534 billion in 2020 [11] (Table 2).
The speed of acceptance of smart devices (IoT) and the technical and societal
shifts it has produced remains unparalleled. These smart devices will cross over any
barrier, be it digital or physical, enhance the quality and efficiency of life, society,

Legal/Regulatory Issues for MMBD in IoT 369
Table 1 Internet of things units installed base by category (Millions of Units)
Category 2014 2015 2016 2020
Consumer 2,277 3,023 4,024 13,509
Business: Cross-industry 632 815 1,092 4,408
Business: Vertical-specific 898 1,065 1,276 2,880
Grand total 3,807 4,902 6,392 20,797
Table 2 Internet of things endpoint spending by category (Billions of Dollars)
Category 2014 2015 2016 2020
Consumer 257 416 546 1,534
Business: Cross-industry 115 155 201 566
Business: Vertical-specific 567 612 667 911
Grand total 939 1,183 1,414 3,010
Fig. 1 Market share of smart devices
and organizations. Through IoT, smart homes are the most anticipated feature, with
brands as of now getting into the competitive market with brilliant appliances. Wear-
ables are another component inclining second on the web. Apple Watch and other
devices will let people consume the interconnected world. Figure 1 illustrates the
demand and popularity of different smart devices in the market.
KRC Research surveyed in various developed countries which were aimed to find
the smart IoT appliances going to be liked by the consumers in the coming time (see
Fig. 1). The research revealed that the customers most preferred smart appliances
are smart refrigerator and thermostat customers and appear to change the manner in
which we work [12].
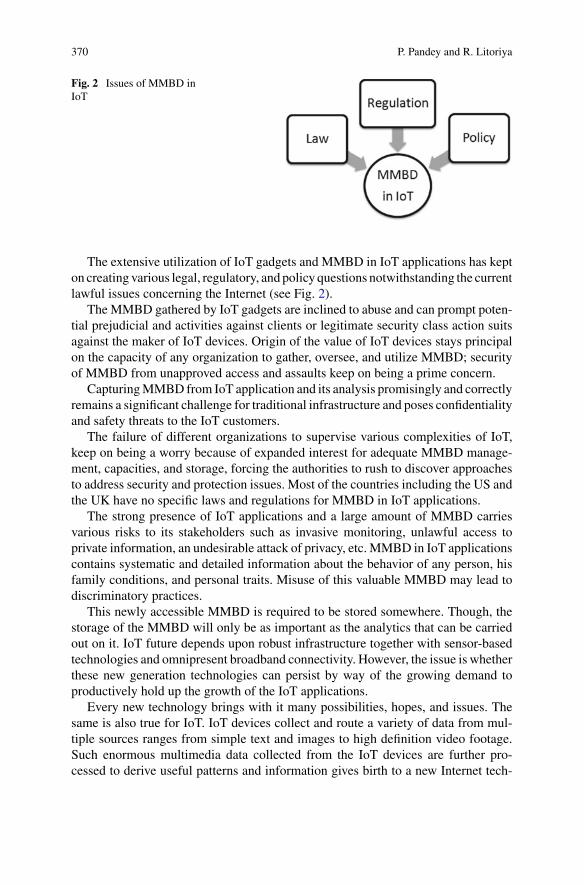
370 P. Pandey and R. Litoriya
Fig. 2 Issues of MMBD inIoT
The extensive utilization of IoT gadgets and MMBD in IoT applications has kept
on creating various legal, regulatory, and policy questions notwithstanding the current
lawful issues concerning the Internet (see Fig. 2).
The MMBD gathered by IoT gadgets are inclined to abuse and can prompt poten-
tial prejudicial and activities against clients or legitimate security class action suits
against the maker of IoT devices. Origin of the value of IoT devices stays principal
on the capacity of any organization to gather, oversee, and utilize MMBD; security
of MMBD from unapproved access and assaults keep on being a prime concern.
Capturing MMBD from IoT application and its analysis promisingly and correctly
remains a significant challenge for traditional infrastructure and poses confidentiality
and safety threats to the IoT customers.
The failure of different organizations to supervise various complexities of IoT,
keep on being a worry because of expanded interest for adequate MMBD manage-
ment, capacities, and storage, forcing the authorities to rush to discover approaches
to address security and protection issues. Most of the countries including the US and
the UK have no specific laws and regulations for MMBD in IoT applications.
The strong presence of IoT applications and a large amount of MMBD carries
various risks to its stakeholders such as invasive monitoring, unlawful access to
private information, an undesirable attack of privacy, etc. MMBD in IoT applications
contains systematic and detailed information about the behavior of any person, his
family conditions, and personal traits. Misuse of this valuable MMBD may lead to
discriminatory practices.
This newly accessible MMBD is required to be stored somewhere. Though, the
storage of the MMBD will only be as important as the analytics that can be carried
out on it. IoT future depends upon robust infrastructure together with sensor-based
technologies and omnipresent broadband connectivity. However, the issue is whether
these new generation technologies can persist by way of the growing demand to
productively hold up the growth of the IoT applications.
Every new technology brings with it many possibilities, hopes, and issues. The
same is also true for IoT. IoT devices collect and route a variety of data from mul-
tiple sources ranges from simple text and images to high definition video footage.
Such enormous multimedia data collected from the IoT devices are further pro-
cessed to derive useful patterns and information gives birth to a new Internet tech-

Legal/Regulatory Issues for MMBD in IoT 371
Fig. 3 Issues that different stakeholders face due to the surge of IoT into already evolving ITecosystem
nology paradigm called Multimedia Big Data (MMBD) in IoT. Multimedia active IoT
devices are installed in large numbers from offices to living rooms and from cinema
theaters to lavatories are manufactured in bulk, and their design, manufacturing, and
operations are either unregulated or are governed by not so strong legislative mea-
sures. There exist a multitude of stakeholders who directly or indirectly get affected
by the penetration of IoT [13].
Figure 3 shows the stakeholders and the regulatory issues prospectively faced
by each stakeholder. The existing regulation of the internet and telecommunications
industry has never predicted the fast grow-up of device-to-device communications
and does not cater for all facet of the IoT. This chapter looks upon a group of
stakeholders of the IoT applications, which generates MMBD, and the legal and
regulatory issues that may be of most concern to them.
In an interview with MIT technology review [14], Tim Cook, CEO of Apple,
honestly said that the technology should serve humanity; not the other way round.
Among the multiple stakeholders mentioned in Fig. 3, the issues faced by the Society
and the Individual are, therefore, sensitive and must be dealt with care. Privacy and
security of user’s multimedia data is a subject that questions the overall integrity of
IoT-based systems and is discussed separately in the following section.

372 P. Pandey and R. Litoriya
2 Issues of Privacy and Security
Consumer privacy and security are two different but related concepts. Consumer
privacy is related to consumer security in that privacy is concerned with consumer’s
rights that she has to control her personal information and how this information is
used; while security governs, the ways in which consumer’s personal information is
secured [15].
IoT devices in today generate, route and analyze a large amount of multimedia data
which due to the lack of proper infrastructural facilities do not do so timely, and also
pose a security and privacy threat. Direct attacks like “denial of service” on the IoT
networks are possible. The more concerning fact is that any IoT device compromised
in the network gives access to other devices as well [16]. Smart TVs store and
transmit the information which if compromised put forth a severe privacy issue to
the customers [17]. Refrigerators as IoT devices, if compromised with malware,
might be used as a source of sending spam emails worldwide by the attacker.
IoT applications involve objects of daily use to connect to the Internet, send, and
receive data like implantable medical devices and internet-connected cameras that
upload pictures at intervals [18]. IoT applications provide a galaxy of opportunities
to make our life comfortable and working more efficient, but they also pose serious
challenges in securing the privacy of consumers that would otherwise be exposed
to misuse. Even though the universal standards and protocols for IoT are missing,
the count of connected smart devices is progressing to become 20 billion by the end
of 2020 [15]. Thus, protecting customer’s privacy has become an affair of immense
importance to the organizations and the governments.
2.1 The Real Issues
The real culprits that lead to the privacy and security issues linked to MMBD in IoT
are the demeaning of quality over quantity and the unaccountability, both of which
are discussed below:
1. Demand Versus Quality
Home automation, health monitoring, waste management, smart cities, and all walks
of life demand an automated internet-based solution to make human life easier which,
as a result, is responsible for a surge in the demand of cheap IoT devices. Most of
the IoT devices run on Radio-Frequency Identification (RFID) technology which is a
short-range wireless technology that suffers from lack of privacy protocols and also
has terrible encryption and security [16]. Thus, in order to meet the demand, quality
of the IoT devices are compromised.
2. The Battle over Ownership
IoT devices often run on cloud services provided by their vendors. In such cases,
it cannot be said decisively that who owns these IoT devices—the vendor or the

Legal/Regulatory Issues for MMBD in IoT 373
customer. Proper legislation is not in place to fix the accountability which results
in chaos—the incidence of Apple versus FBI on iPhone security is one example
[19]. Mirai, a malware that attacked DVRs and poorly secured webcams in the
US in October 2016, is another example where it was unclear that who would be
held responsible for this attack—the malware programmer, the unleashing, or the
internet’s infrastructure [20].
3 Security Spectrum of IoT Devices
Securities in IoT devices cannot be explained in binary terms—exist or absent.
Instead, a security spectrum of IoT device vulnerabilities explains it better. There
exist IoT devices that offer no or minimal security at the lower end while medium
to high security offering devices is lying on the later parts of the security spectrum
shown in Fig. 4. In Fig. 4 a triangle shows a typical IoT device and the number of
stars represents the robustness of the device. In a typical got-hit-and-improve system
of evolution, network operators and device vendors respond to mitigate the threats
or vulnerabilities infused by the attackers into the IoT network.
Consequently, the more sophisticated IoT devices that lie on the upper side of
the spectrum tend to come at higher prices than its lower end counterparts [21]. A
user who cannot afford to bear any security risk as in the case of a person who has
a medical IoT device implanted under his belly, he may be justified in spending a
higher price to protect his device from attack. Where a user is little concerned over
the theft or privacy of his data like in the case of the data about the number of steps
he had taken on a specific day, may go for a device in the lower end of the spectrum.
On ethical grounds, the vendors of IoT devices should not make IoT objects to be
exposed to the MMBD of their customers. However, on the business and economic
grounds, manufacturers of IoT devices display some propensity in reducing cost,
offering simplicity and time to market their devices [22]. This can be understood
from the example of types of equipment that have inbuilt IoT devices. If the memory
and processing power of such a device is increased to provide enhanced security, the
increased cost of the equipment will hurt its competitive advantage.
Economically, security-deficient IoT devices result in a cost that is suffered by a
third party (parties). This can be understood by taking the example of an industry
that is minting money by manufacturing units and dispose of the industrial waste
Fig. 4 Spectrum for risk vulnerabilities in IoT devices

374 P. Pandey and R. Litoriya
into the rivers and smoke in the air. The industry here doesn’t take proper measures
to curb pollution, but the victims are those who inhale the polluted air or drink the
river water. In the case of pollution, the authorities can impose some penalty on the
industry to discourage them from creating pollution, but in general, such costs to be
borne by a third party are not taken into account during decision-making. In the case
of information security, the vendors making the IoT devices do not bear the cost due
to the security breach [23]. Thus, accountability laws are the need of the time that
forces the vendors into making more security compliant IoT devices.
4 Unique Security Challenges in IoT Devices
IoT devices tend to differ from traditional computing devices in several ways that
affect security. A few idiosyncrasies of the IoT devices are listed as follows.
4.1 Scale of Deployment
Unlike other internet computing devices, IoT devices are built to be deployed in bulk.
As a result, a complex network of interconnected devices comes into existence. Since
any device on this network may potentially establish a link with any other device by
its own dynamically and unpredictably, the potential count of such links is infeasible
to estimate, and existing methods, tools, and strategies associated with IoT need to
be reconsidered.
4.2 Issue of Homogeneity
IoT-based systems generally have a collection of similar devices. The drawback of
this approach is that vulnerability in one class of devices would expose the other
characteristically similar connected devices to cyberattack. For example, the weak-
ness in the security protocol of one line of product from an organization will extend
to every make and model of a device that uses the same protocol.
4.3 Longevity
Though it may appear to be a boon, it is also a curse. IoT devices often outlive the
companies that manufactured those devices without necessary support and service.
Some IoT devices are installed in the environments where to fix and reconfigure
them is practically impossible. This nature of IoT devices provides a contrast to the

Legal/Regulatory Issues for MMBD in IoT 375
conventional computer systems which are upgraded along with the operating system
to counter security threats throughout the lifetime [24]. Thus, the long-term support
and management of IoT devices is a critical security challenge.
4.4 Lack of Transparency
Users have little or no understanding of the internal working of the IoT devices. This
tantamount to the security breach, primarily, when a user expects an IoT device to
perform in some way while the device collect, analyze, or transmit the user’s data
in an unintended way. The device could also start functioning differently with a
software upgrade by the manufacturer leaving the user data vulnerable to misuse.
4.5 Protective Legislation
Certain members of the industry have lobbied for protective legislation that allows
companies to release IoT software without disclosing known security threats. Such
legislation would also intend to exempt manufacturers from any liability for the
damages resulting from these known defects. It constrains others from disclosing
the known security issues without the permission of the manufacturer. It would also
allow the developers to incorporate “self-help” software within a device that can
disable the operation of the device, and exempt the developers of the device with
“self-help” from damages should a third party disable the device. However, many
people feel that the protective legislation, if improperly drafted would lead to conflict
with the code of ethics by indirectly exempting manufacturers of their responsibility
to provide security into the IoT devices [25].
The privacy challenges in the era of IoT must be taken seriously because the
privacy issues are concerned with the fundamental rights of the users and the ability
of the users to trust the internet and the connected devices. Some privacy challenges
posed by the expansion of IoT devices are discussed as follows.
4.6 Problem of Consent
Unlike banking or other commercial websites that respect their user’s consent by
making him agree on certain privacy conditions by checking on “I Agree” checkbox,
various IoT devices do not offer such a feature owing to the lack of a mechanism
for user interaction. In many IoT configurations, users have no idea about the way in
which their personal information is being collected and used. Even if a mechanism
to interact with the user to get his privacy consent is developed, it will be impossible
to interact with every IoT device to configure it for privacy requirements.

376 P. Pandey and R. Litoriya
4.7 Threat of Societal Norms
A person’s expectation of privacy is different in public places and private places,
owing to individual perception and societal norms. The ubiquity of IoT devices
poses a threat to this privacy expectation of people. For example, a person might
expect a different nature of privacy in his car than on the public park. The presence
of sensors, cameras and other IoT devices inside the cars and houses of the people
offer challenges to the privacy of the individuals. Similarly, the increased presence of
surveillance cameras and other IoT devices in public places may collect and process
more data than expected.
4.8 Threat of Proximity
IoT devices collect data of all individuals, who are in their proximity whether or not
they intend to offer it. For example, in a car, the data of all individuals sitting in the
proximity of a device will be captured and sent while only one of those could have
consented to it. In such circumstances, it might be difficult to honor peoples’ privacy
preferences.
4.9 Threat of Discrimination
IoT devices can collect information about people with complete details. Big data
analytics on this aggregated and correlated information may construct profiles of
individuals or groups that create the potential for discrimination.
4.10 False Sense of Security
IoT devices and systems are getting a warm welcome by society at large. This social
acceptance gives a false sense of security and motivates individuals to divulge their
sensitive and personal information without knowing the possible consequences.
4.11 Maintaining Anonymity
Network interfaces typically use MAC addresses to trace back the path of digital
communication. The combination of multiple MAC addresses forms the footprints
to profile an individual’s activity and location. Thus, the anonymity of Internet users

Legal/Regulatory Issues for MMBD in IoT 377
is always at risk, and it is crucial to find new methods to anonymize the data commu-
nication path to preserve the privacy of the user. With the increased use of sensors and
other IoT devices along with big data analytics, a threat to preserving the individual’s
anonymity becomes an important task.
The ever-increasing use of IoT devices poses new sets of challenges that demand
the attention of legislative and regulatory measures. Sometimes, IoT devices seem-
ingly violate the existing civil rights and create new regulatory and legal situations
that were unavailable earlier. While at other times, these devices create a broader
outlook of the already existing legal issues. Thus, the presence of IoT devices in the
markets, households, offices and other public places make a perfect case for relook-
ing at the existing legislative and regulatory measures to curb the misuse of personal
information of the billions of users whose trust on this Internet-based system of
connected devices is at stake.
5 Other Key Issues and Stakeholders
5.1 Key Issue: Interference, Interoperability, and Issues
of Weak or No Standards
Stake Holder Profile: Service Provider and Industry
Discussion:
IoT as a concept has proved its worth in many applications that several major tech-
nology players have already invested their fortunes into the development of IoT
support systems. A large number of connected IoT devices also pose a stack full of
challenges including interoperability and interference issues. However, for success-
ful deployment and hassle-free use the devices should be interoperable for a range
of standards and at the same time devices must be interference averse too. Thus,
industry standards should be set in place for IoT devices to offer interference-free
interoperability (IFI).
5.2 Key Issue: Numbering Plan Issues
Stake Holder Profile: Service Provider and Industry
Discussion:
Currently, two types of IP address systems are prevailing: IPv4 and IPv6. IPv4 being
the most used system has no vacancy left for Asia, Europe, and the US. IPv6 which
offers trillions of addresses also provides better security and interoperability along
with efficient network management. Therefore, organizations are required to speed
up their process of upgrading their network operated hardware to avoid cutting off

378 P. Pandey and R. Litoriya
their ability to cater to the needs of their customers [26]. No Internet authority has yet
published a clear policy on the effect that this network of interconnected devices over
the Internet (IoT) has on the service levels, demand and fee structures regarding IP
addresses. It is a matter of excitement to watch how the information industry answers
to the demand that IoT has on IP addresses.
5.3 Key Issue: Roaming
Stake Holder Profile: Service Provider and Industry
Discussion:
Because a large number of IoT devices will be movable, policies and agreements
on changing network boundaries become essential. As of now, various countries do
not have any regulations over domestic roaming, which is governed by agreements
and arrangements between different carriers. There is a need to form a well-defined
inter-carriers tariff structure not to impede the momentum of IoT growth. Effective
inter-carrier roaming services are a need of the time to surmount the pressure on
network bandwidth due to the surge in IoT devices.
5.4 Key Issue: Spectrum Allocation Policy
Stake Holder Profile: Service Provider and Industry
Discussion:
Mushrooming of IoT devices also claims its share on an already burdened free band-
width. A typical IoT device is connected through WiFi or Bluetooth to a nearby
mobile phone, which in turn is connected to the cloud through a fixed or cellular
network. The wireless channel that was already carrying huge mobile traffic is now
saddled with this new kind of traffic. For the smooth functioning of IoT, the ISM band
must be large enough to accommodate traffic so that the bulk of data packets would
flow smoothly. Current spectrum allocation schemes are not flexible in describing
apparatus, class, and spectrum license type. Thus, there is a need to develop flexible
frameworks to cater to the needs of growing users and uses.
5.5 Key Issue: Net Neutrality
Stake Holder Profile: Content Provider
Discussion:
Net Neutrality requires that there must not be any form of discrimination or interfer-
ence with data, including blocking, degrading, slowing down, or granting preferential

Legal/Regulatory Issues for MMBD in IoT 379
speeds or treatment to any content. The issue is that such a kind of neutrality will
also have a conflict of interest with critical IoT services or specialized services. For
example, remote surgery operations should get preference over bandwidth and other
networking resources due to minimum tolerance for the quality of service. This can
be compared to ambulances which often break traffic rules to provide quality of ser-
vice legally. Thus, an agreement should be made between the ISPs and the authorities
over exceptions before providing licenses. In India recently two of the significant
American IT giants, including Facebook, have announced zero-rating plans that faced
the criticism of many net-neutrality flag bearers. It was supposed that such kind of
allowances would give American giants an unfair advantage over burgeoning local
startups. India in 2016 banned Facebook’s Free Basics program.
5.6 Key Issue: Cyber Security
Stake Holder Profile: Government
Discussion:
Considering the ubiquity of IoT devices, the security of user data becomes more
critical. The range of IoT devices over a variety of networks has increased the space
for cyberattackers to target. Typical IoT devices do not possess security features
such as encryption, due to their low power operating requirements [17], which would
otherwise require high computational capabilities and hence more power. Similarly,
the networks that allow these low power IoT devices to establish a connection are
also prone to cyberattacks.
Attackers are becoming better equipped with, and it is becoming harder to deal
with them. A more significant number of functional IoT devices also offer more
possibilities for cyberattackers. HP in a study conducted in 2014 [27] revealed that
around 70% of the IoT devices are attacked vulnerable. What causes more concern
is the fact that nowadays, organizations own only a fraction of the data that flow
through their network. Security circle must, therefore, envelop networks beyond
the limits of the organizations. In the absence of strong legislation, cybersecurity
risks created by IoT need a specific response. Though IoT related legislation would
never be sufficient given the ever-changing nature of IoT technologies, but still some
notification legislation
5.7 Key Issue: Mandatory Data Retention
Stake Holder Profile: Government
Discussion:
Internet Service Providers (ISPs) are required to provide some data to certain govern-
ment authorities and bodies. Telecommunication carriers and ISPs are also instructed

380 P. Pandey and R. Litoriya
to store the data for the specific duration so that it can be used in case of surveil-
lance or investigations [28]. This data is usually meta-data and covers information
about the type and size of the content (e.g., 1 KB of email), the address to which the
message was sent to, the address from which the message was sent, and the location
of the user device. The rule of data retention does not apply to the content of the
data. The question that needs to be addressed in the context of IoT is regarding the
ownership that who would be held responsible for storing the data? Customer, cloud
service operator or the device manufacturer.
5.8 Key Issue: Ethical Issues
Stake Holder Profile: Individual and the Society
Discussion:
IoT as a technological establishment has raised some ethical questions [29]. Though
IoT claims to bridge the gap between the rich and the poor, the urban and the rural,
in reality, it does not seem to do so [30]. Various societies and places have no access
to the internet due to the lack of infrastructure or financial resources which accounts
for unreachability of certain services and benefits meant to be offered through this
medium. Big-nudging is another ethical issue [31] which is used to subtly manipulate
the society to nudge it towards a specific outcome. This is done by drawing the insights
from the consumer’s data and uses these insights to learn the thoughts, feelings, and
behavior of individuals.
5.9 Key Issue: Discrimination and the Digital Divide
Stake Holder Profile: Individual and the Society
Discussion:
Discrimination is the capability to determine the user’s demographic behaviors all
the way through algorithms and aggregation of MMBD has an impending danger
beyond just privacy concerns.
The profiling and aggregation of client information may prompt marginalization
and make new open doors to digital discrimination [32]. Refusing access to financial
services by the bank based on the communities from which needy applicants come
has a long history. Sometimes this practice is called “redlining” [33].
In IoT, there is a term “Sensor fusion”, which provides the capacity to join
data from two separated sensing devices to make more noteworthy and more mind-
boggling information. This can prompt the controllers of the MMBD profiling IoT
application consumers based on a limitless number of attributes, e.g. race, sexual
orientation, level of action, work, financial status and so on [34].

Legal/Regulatory Issues for MMBD in IoT 381
This can prompt consumers being looked with exceptionally focused on and
greedy strategies of marketing that go after their recognized practices, examples
and inclinations. For instance, individuals in money related trouble might be drawn
nearer by finance companies offering them a loan at a high-interest rate, when they
would least be able to bear the cost of it.
The least IoT application user group such as elderly persons or relatively poor
community may likewise end up progressively unimportant. For instance, in some
country, a mobile App is used to spot potholes on the streets of inner city areas [35].
It helped the city’s Public Works Department to focus on road maintenance of the
affected regions of the city. In any case, given poor people and elderly persons might
be less inclined to download the application, there were concerns the city’s adminis-
trations could be redirected far from the territories that need most consideration for
more youthful and wealthier neighborhoods.
The MMBD data that can be generated and managed by the IoT application can be
of enormous importance, yet measures must be set up to guarantee that regardless how
much intentional or unintentional, the data does not prompt unintended outcomes in
opposition to the public development policies. It may also happen that one service
provider may refuse to transfer data to other service providers as per the needs of
the customers. The MMBD, after a certain length of time, may become necessary to
other service providers like critical health management services, but an uncompetitive
attitude of service providers will work as a deterrent to make this transfer happen.
The automated decision-making and its backend technologies are not at all trans-
parent, and to a great extent unavailable to the typical individual [36]. However,
they are expecting growing significance and being utilized in many vital contexts
of human life like health, employment, credits, goods, education and many more.
This blend of conditions and innovations raises hard questions regarding how to
guarantee that digital discrimination impacts which resulted from automated pro-
cesses of decision-making, regardless of whether deliberated or unintended, can be
distinguished, estimated, and reviewed.
6 The IoT Consumer and the Challenge of Transparency
In this hyper-connected world, one can easily imagine the realities for IoT Con-
sumers. We are the potential consumer of novel new IoT devices, as well as already
connected to networks and services, such as through TVs, home assistants, smart
energy meters, smart cities, and smart transportation. There is often divergence on
what is the rigorousness of the transparency challenge.
We are entirely agreed on the significant challenges for IoT consumers in the
present approach to providing an accepting of why, where and how our data is used.
The visibility, transparency, and control are found to be the major challenges in the
field of MMBD in IoT application. Usually, this is practiced by using the provisions
of information in the form of terms and conditions and privacy policies with the
facility to amend settings.

382 P. Pandey and R. Litoriya
7 Trust and the Inevitable Increase of Regulation
on MMBD in IoT
Trust plays a significant role in the acceptance of IoT applications, among organi-
zations and IoT consumers. Trust on the subject of transparency, security, privacy,
discrimination in MMBD usage, etc. According to the Edelman Trust Barometer
(2017) [37], there exist constant low levels of trust concerning technological evolu-
tions including IoT. It as of now begins with essential levels of trust, for example,
the trust in IoT gadget producers to give data collection Information.
Figure 5 illustrates the trust data of 2016 collected from various IoT consumers
in Europe [38].
A significant part of European IoT customer, around 39% said they disagree the
way that IoT organizations give adequate data about the information/data they gather.
Another 42% of consumers reasonably oppose this idea. The results of the survey
indicate that the overall trust scenario is not good. All things considered, one of the
essentials of the GDPR is that the end user (IoT consumer) needs to give agreement,
clearly and visibly unambiguously. Also, consistently users have the privilege to
know the what, why and who of the handling of their personal information.
The Global Privacy Enforcement Network [6] conducted another research. 25
data protection regulators worldwide participated in this research. The results are
shocking. 59% IoT gadgets failed to convey about the process satisfactorily, and
motive of the collection of users personal data. 68% devices failed to explain the
data storage process. 72% of devices did not clarify users about the process of data
deletion from the devices.
Fig. 5 Trust of consumers in data collection information

Legal/Regulatory Issues for MMBD in IoT 383
It is expected that more regulations, laws, and policies should be made not only
in European countries but throughout the world. Do expect more regulations in
the interconnected platform of IoT, AI, and robotics. IoT is today’s new reality:
an absence of consideration for security and individual information will not go on
without serious consequences as the growing of stakes and increase in risks.
8 Regulatory Bodies and Government
The present consumer lawsuit will, for the most part, apply in consumer transactions.
Present framework precludes misdirecting, or misleading behavior infers statutory
assurances into individual contracts with the consumer. It also establishes a product
accountability management and may likewise void contracts which are unjustifiable
or unconscionable. The current framework of privacy protection will likewise apply
where an individual (under regulation) gathers, utilizes, or reveals individual data
about an end user.
The swift advancements in information technology particularly in IoT are chang-
ing how individuals function, spend time, play, and cooperate. The policies of the
government will inevitably impact the bearing of innovative development and reg-
ulations and laws will without a doubt need to face the new reality and challenges
efficiently.
To enforce the standardization and legal efforts, independent regulatory bodies,
government, or both must show the way [39]. The efforts of standardization must
involve certification practice together with the technological development process.
Be that as it may, these efforts should not block the innovations and technology
development but instead guarantee interoperability among different technological
solutions of IoT, competition, and marketplace. The standardization of storage and
MMBD data processing and the transfer will inevitably diminish the entry blockade
to the marketplace of IoT.
It is imperative to build up an administering body like the World Wide Web
Consortium for the IoT to control and govern the efforts of standardization and
certification [40]. Few crucial areas of standardization may include Data modeling,
routing, user permission mechanism, exchange of MMBD, device description and
discovery, encryption and routing.
As expressed already, the endeavors to standardize these areas must be synchro-
nized with the necessary certification process. Now a day, the IoT service companies
are trying to certify their IoT devices and applications on their own. Regrettably,
these efforts will deter interoperability.
In order to inculcate the transparency and fairness, the mechanism of certification
for the IoT devices and its MMBD would be analogous to the certificate authority
model of the Internet. Nevertheless, the model of IoT certification would be sig-
nificantly more extensive since it may need to ensure both software services and
hardware product/devices [41].

384 P. Pandey and R. Litoriya
8.1 General Data Protection Regulation (GDPR)
The increased cyberattacks and privacy breaches forcing the government to impose
strict regulations. The General Data Protection Regulation (GDPR) of European
Union (EU) is the most recent effort to mitigate these kinds of activities. Although
the EU adopted this regulation in 2016, it became effective on May 25, 2018. This
Regulation has broad consequences. In this regulation, a range of identifiers is pointed
out they are called online identifiers. These openly include Radio Frequency Iden-
tification (RFID) tags. Furthermore, the list of online identifiers is not extensive
[13].
A standout amongst the unique components of the new regulation is the reporting
of the incidents of the data breach within 72 h to regulators. This applies to the
European organizations and, in some situation, organizations across the world that
handle data from individuals in the EU. The punishment for neglect to do as such
is steep—up to 4% of an organization’s yearly worldwide income. Different nations
like Japan, Singapore, and Australia are also adopting similar laws for privacy and
cybersecurity.
9 Future Challenges
In an article by Open Mind [42], few trends of IoT are discussed which also offer
specific challenges that need to be tackled in the future, and are presented as follows.
9.1 Platforms
To overcome the management of the exponentially growing population of IoT sys-
tems, platforms play a crucial role. With passing time, IoT devices will cost pennies,
IoT based applications will multiply, and operation cost is going to be inexpensive.
IoT platforms integrate a varied collection of infrastructural components and services
all in one place making it convenient to handle associated complexities. The future
challenge is to efficiently calibrate the low-level services offered by such platforms as
communication, monitoring and regular updates of the IoT devices; improving data
acquisition and routing capabilities; and application development including analytics
and visualization.

Legal/Regulatory Issues for MMBD in IoT 385
9.2 Ecosystems Warfare
With the growth of IoT devices various new and new ecosystems which include
processors, aggregators, operating systems and platforms [43] are bound to emerge.
Some ecosystems will offer security but might not be so viable commercially. Some
ecosystems would offer a boost to your business but may also expose your organi-
zational or personal information at risk. Therefore, organizations will have to cope
up with the developing and conflicting ecosystems and standards by making their
devices remain compatible through means of regular updates.
9.3 Low-Power Architecture
Making devices that understand the low power requirements of IoT systems while
keeping their security jacket impervious need skills and is a pertinent challenge to
overcome.
9.4 Advanced Analytics
In a couple of years, trillions of IoT devices generation petabytes of MMBD will
populate the world. The traditional analytics will no longer remain useful and thus
a challenge to design and develop algorithms to transform this bulk of MMBD into
useful information to take the decision and perform actions to make human life more
comfortable and safe.
9.5 Security
No matter how robust an IoT device is today, it will not remain so tomorrow. Cyber-
attackers are becoming more sophisticated and learned by each passing day making
the life of an IoT engineer difficult. Developing devices to outsmart attackers is a
continuing challenge and is expected to remain so in the coming future.
9.6 Smaller Time Window
The governments and companies that operate on power grids and other critical infras-
tructure have relatively a shorter window to frame new policies and regulations for
IoT [44]. With the continuous surge of IoT devices, the governments will tend to

386 P. Pandey and R. Litoriya
observe fewer opportunities to act and mitigate the risks, thus making it essential to
work on the legal and regulatory framework to handle this transformation.
10 Conclusions
Receiving data of every nature from multiple sensors, processing it in real time, and
taking appropriate action is all that an IoT-based system does. MMBD generated by
the IoT devices is prone to many privacy and security issues. IoT devices generally
operate on low-power batteries due to which sophisticated security measures cannot
be embedded in them. Lack of proper legal frameworks around the globe intensifies
the problem of security and privacy in IoT to the next level. Homogeneity in IoT
devices exposes them to the cyberattacks which are worsened by the lack of services
and support from the manufacturers due to the property of longevity that exists in
IoT devices. These IoT devices sometimes violate the civil rights in a country and
create a new set of interwoven privacy and security issues that are impossible to be
handled by the existing regulatory provisions. Thus strict penalties are needed to be
imposed on the offenders and misusers of MMBD, and an adequate legal framework
that addresses the regulatory and legal issues for MMBD in IoT are required.
References
1. S. Tanwar, P. Patel, K. Patel, S. Tyagi, N. Kumar, M. S. Obaidat, An advanced internet of thingbased security alert system for smart home, in IEEE International Conference on Computer,
Information and Telecommunication Systems, Dalian University, Dalian, China, pp. 25–29(2017)
2. K. Britton, Handling privacy and security in the internet of things. J. Int. Law (2016). https://www.coursehero.com/file/16667577/Handling-Privacypdf/
3. A. Kumari, S. Tanwar, S. Tyagi, N, M. Maasberg, K.K.R. Choo, Multimedia big data computingand internet of things applications: a taxonomy and process model. J. Netw. Comput. Appl.124, 169–195 (2018)
4. L. Atzori, A. Iera, G. Morabito, The internet of things: a survey. Comput. Netw. 54(15),2787–2805 (2010)
5. J. Vora, P. Italiya, S. Tanwar, S. Tyagi, N. Kumar, M.S. Obaidat, K-F. Hsiao, Ensuring privacyand security in E-Health records, in International Conference on Computer, Information and
Telecommunication Systems (IEEE CITS-2018), Colmar, France, pp. 192–196 (2018)6. A. Kumari, S. Tanwar, S. Tyagi, N. Kumar, Fog computing for healthcare 4.0 environment:
opportunities and challenges. Comput. Electr. Eng. 72(1–13) (2018)7. D. McAuley, R. Mortierm, J. Goulding, the Dataware manifesto, in Communication Systems
and Networks (COMSNETS), Third International Conference (2011)8. S. Tanwar, S. Tyagi, S. Kumar, The role of internet of things and smart grid for the development
of a smart city, in Intelligent Communication and Computational Technologies (Lecture Notes
in Networks and Systems: Proceedings of Internet of Things for Technological Development,
IoT4TD 2017, Springer International Publishing, Vol. 19, pp. 23–33 (2017)9. J. Schultz, The internet of things don’t own. Commun. ACM 59(5). https://doi.org/10.1145/
2903749 (2016)

Legal/Regulatory Issues for MMBD in IoT 387
10. https://www.informationweek.com/mobile/mobile-devices/gartner-21-billion-iot-devices-to-invade-by-2020/d/d-id/1323081
11. Gartner report on the market of IoT devices. https://www.gartner.com/newsroom/id/316531712. S. Kashyap, 10 Real World Applications of Internet of Things (IoT)—Explained
in Videos. https://www.analyticsvidhya.com/blog/2016/08/10-youtube-videos-explaining-the-real-world-applications-of-internet-of-things-iot/
13. M. Goddard, The EU General Data Protection Regulation (GDPR): European regulation thathas a global impact. Int. J. Mark. Res. 59(6), 703–705 (2017)
14. https://www.technologyreview.com/s/608051/tim-cook-technology-should-serve-humanity-not-the-other-way-around/
15. C. Chike, The Legal Challenges of Internet of Things. Bowie State University (FTC), F.T. (2018). https://www.ftc.gov/news-events/press-releases/2017/01/breathometer-marketers-settle-ftc-charges-misrepresenting-ability
16. H.M. O’Brien, The internet of things. J. Int. Law 19(12) (2016)17. http://www8.hp.com/us/en/hpnews/pressrelease.html?id=1744676#.VrLfonJf2Gk18. K. Britton, Handling privacy and security in the internet of things. J. Int. Law. https://www.
coursehero.com/file/16667577/Handling-Privacypdf/19. H. Pressman, R.S., Software Engineering: A Practitioner’s Approach (5th ed.). Boston, Mass.:
McGraw Hill. (2017)20. A. Abobakr, M.A. Azer, IoT ethics challenges and legal issues, in 12th International Conference
on Computer Engineering and Systems, Cairo, pp. 233–237 (2017)21. A. Asin, D. Gascon: 50 Sensor Applications for a Smarter World (2012). http://www.libelium.
com/resources/top_50_iot_sensor_applications_ranking/22. S.S. Bhadauria, V. Sharma, R. Litoriya, Empirical analysis of Ethical issues in the era of
future information technology, in 2nd International Conference on Software Technology and
Engineering, San Juan, PR, USA (2010)23. H. Sundmaeker, P. Guillemin, P. Friess, S. Woelffle, Vision and challenges for realising the
internet of things. Cluster of European Research Projects on the Internet of Things (2010)24. R. Roman, P. Najera, J. Lopez, Securing the internet of things. Computer 44(9), 51–58 (2011)25. I. Baker, McKenzie, Internet of things: some legal and regulatory implications (2016)26. J. Stankovic, Research directions for the internet of things. Int. Things J. IEEE 1(1), 3–9 (2014)27. Apple vs. FBiI: What’s going on? (2016, February 23). Retrieved October 7, 2018, from
KasperSky. https://www.kaspersky.com/blog/apple-versus-fbi/11381/28. Edelman Trust Barometer. https://www.edelman.com/trust2017/29. Ethical Pitfalls and the Internet of Things. https://aquicore.com/blog/ethical-pitfalls-internet-
things/30. D. Popescul, M. Georgescu, Internet of things-some ethical issues. USV Ann. Econ. Public
Adm. 13(2) (2013)31. M. Pandey, R. Litoriya, P. Pandey, An ISM approach for modeling the issues and factors of
mobile app development. Int. J. Softw. Eng. Knowl. Eng. 28(7), 937–953 (2018)32. B.G. Edelman, M. Luca, Digital Discrimination: The Case of Airbnb.com (2014). Retrieved
from https://hbswk.hbs.edu/item/digital-discrimination-the-case-of-airbnb-com33. A. Srivastava, S.K. Singh, S. Tanwar, S. Tyagi, Suitability of big data analytics in indian banking
sector to increase revenue and profitability, in 3rd International Conference on Advances in
Computing, Communication & Automation, Tula Institute, Dehradun, UA, pp. 1–6 (2017)34. Peppet, Scott: Regulating the Internet of Things: First Steps Toward Managing Discrimination,
Privacy, Security, and Consent, 93 Tex. L. Rev. 85 (2015)35. K. Finch, O. Tene, Welcome to the Metropticon: Protecting Privacy in a Hyperconnected Town,
1581 (2014)36. Big Data: Seizing Opportunities, Preserving Values. The White House Report Washington
(2014)37. https://www.statista.com/statistics/609021/trust-in-iot-device-manufacturers-eu/38. GPEN Privacy Sweep, Internet of Things: Participating Authorities’ Press Releases. https://
www.privacyenforcement.net/node/717

388 P. Pandey and R. Litoriya
39. R.H. Weber, Internet of things—need for a new legal environment? Comput. Law Secur. Rev.25(6), 522–527 (2009)
40. R. Litoriya, A. Kothari, Cost estimation of web projects in context with agile paradigm:improvements and validation. Int. J. Softw. Eng. 6(2), 91–114 (2013)
41. C. Perera, R. Ranjan, L. Wang, S.U. Khan, A.Y. Zomaya, Big data privacy in the internet ofthings era. IT Pro, 1–9 (2015)
42. http://connectedcityusa.com/2017/11/connected-device-forecast-federal-regulations-and-the-future-of-iot/
43. S. Tanwar, S. Tyagi, N. Kumar, M.S. Obaidat, Ethical, Legal, and Social Implications of Bio-
metrics Technologies, Biometric Based Security Systems. Springer (2018)44. F. Jindal, R. Jamar, P. Churi, Future and challenges of internet of things. IJCSIT 10(2), 13–25
(2018)

Part IV
Application Environments

Recent Advancements in Multimedia Big
Data Computing for IoT Applications
in Precision Agriculture: Opportunities,Issues, and Challenges
Shradha Verma, Anshul Bhatia, Anuradha Chug and Amit Prakash Singh
Abstract This chapter aims to present a survey on the existing techniques andarchitectures of Multimedia Big Data (MMBD) computing for Internet of Things(IoT) applications in Precision Agriculture, along with the opportunities, issues, andchallenges it poses in the context. As a consequence of the digital revolution and easeof availability of electronic devices, a massive amount of data is being acquired froma variety of sources. On one hand, this overwhelming quantity of multimedia dataposes several challenges, from its storage to transmission, and on the other, it presentsan opportunity to provide an insight into the business trends, intelligence and renderrich decision support. One of the key applications of MMBD Computing is PrecisionAgriculture. The chapter focuses on major agricultural applications, cyber-physicalsystems for smart farming, multimedia data collection approaches, and various IoTsensors along with wireless communication technologies employed in the field ofPrecision Agriculture.
Keywords Multimedia Big Data (MMBD) · Internet of Things (IoT) · Precisionagriculture · Digital revolution · Sensors · Data analytics · Data collection inagriculture · Smart farming · Plant pathology
S. Verma (B) · A. Bhatia · A. Chug · A. P. SinghUSICT GGSIP University, New Delhi, Indiae-mail: [email protected]; [email protected]
A. Bhatiae-mail: [email protected]
A. Chuge-mail: [email protected]
A. P. Singhe-mail: [email protected]
© Springer Nature Singapore Pte Ltd. 2020S. Tanwar et al. (eds.), Multimedia Big Data Computing
for IoT Applications, Intelligent Systems Reference Library 163,https://doi.org/10.1007/978-981-13-8759-3_15
391

392 S. Verma et al.
1 Introduction
With the advent of the digital revolution and constant generation of user contentonline through a plethora of electronic gadgets and social media, there arises a chal-lenge on how to deal with such vast amounts of Multimedia Big Data (MMBD)[1]. From collection to storage, processing, analysis, and presentation, it comprisesof a cumbersome task. Conventional data processing tools are insufficient to pro-cess these complex datasets as the data scale reaches up to petabyte levels. Due toits unstructured and heterogeneous nature, we face additional problems, viz., com-pression, analysis, interpretation, transmission, and distribution as well as the issuesof scale and complexity. Nevertheless, MMBD can be utilized to provide greateropportunities and insight into the context. With the analysis of such huge amount ofdata, we can build better computational models leading to better decision-making,further applicable to a multitude of real-life domains, agriculture being one of thecrucial fields. Precision agriculture necessitates the use of automated and innova-tive technologies for data collection and analysis in plant pathology. Research workspanning more than a decade has led to several algorithms and techniques that applythe advancements in the computing technologies to the field of agriculture. Given therestricted access to resources and limited expertise, there is a dire need for automatedprocesses for smart farming. Agriculture is dependent on several factors such as soilquality, climate, temperature, humidity, rainfall, irrigation, fertilizers, etc [2]. Internetof Things (IoT) sensors can be used to create an intelligent system in which vari-ous environmental parameters such as temperature, humidity, pressure, CO2, waterlevel, etc., along with images, can be observed and acquired for analysis. Data clus-tering and data mining techniques can be exploited to discover patterns in the dataset.IoT allows the unification of various communication technologies, IP protocol andembedded devices, to create a smart system that interacts constantly with both realas well as digital worlds simultaneously. It imbibes daily objects with intelligencethat can acquire and share information, as well as control the physical aspects of theworld. Analysis and interpretation of the MMBD collected from these pre-configuredIoT sensors can be employed to optimize the production and quality of the crops.
The major contributions of this chapter are enlisted as follows: (a) broad reviewof the existing literature on generation of multimedia data in the field of precisionagriculture, (b) exploration of the role of IoT devices/sensors for agricultural datacollection along with big data analytics, (c) interpretation of the MMBD computingparadigm and its applications in smart farming, (d) presenting the relevant agriculturalapplications, IoT sensors and communication modules (summarized in Table 2) and(e) listing the opportunities, issues and challenges along with future directions in thecontext.

Recent Advancements in Multimedia Big Data Computing … 393
1.1 Research Objectives
This chapter aims to present a survey on the existing techniques and architecturesof MMBD computing for IoT applications in precision agriculture, along with theopportunities and challenges it poses in the context. Initially, 103 research articleswere picked out for this study. Out of these, papers pertaining to specifically pre-cision agriculture were selected along with a few papers on MMBD Computing,published in peer-reviewed, reputed journals and conferences. Remaining paperswere not included on the basis of applications, relevance, and quality. The studypresented in this chapter attempts to answer the following research questions:
RQ1: What are the sources of data collection for precision agriculture?RQ2: With the use of IoT sensors and big data, what applications in precision
agriculture are being worked upon?RQ3: What are the commonly used IoT devices for precision agriculture?RQ4: What kind of MMBD is being acquired for precision agriculture?
Rest of the chapter is organized as follows: Sect. 2 presents the conceptual frame-work of MMBD Computing, Sect. 3 introduces the Cyber-Physical Systems for pre-cision agriculture, Sect. 4 lists the data collection techniques in precision agriculture,Sect. 5 presents the role of MMBD and IoT in precision agriculture, Sect. 6 enlistsvarious techniques studied and their usage distribution, Sect. 7 drafts the opportu-nities and challenges of MMBD and IoT in precision agriculture, Sect. 8 draws aconclusion and Sect. 9 stages the future direction.
2 Conceptual Framework: Multimedia Big Data
Computing (MMBD)
With the proliferation of cheap electronic devices such as cell phones, equipped withhigh-end cameras and unlimited internet usage, it is quite easy for a daily user toproduce and exchange data with multimedia content [3]. Sharing of personal data,messages, images, videos, etc., on social networking sites, viz., Facebook, Instagram,Twitter, etc., is a common occurrence.
Privacy, confidentiality, and authentication are the keys factors to be consideredin order to provide a secure environment for numerous crucial applications, viz.,banking, health care [4, 5], defense, etc. Installed for security reasons, even thesurveillance cameras generate an immense amount of continuous video content, notto mention the data generated by the biometric systems for identification purposes[6, 7]. Also, video lectures and demonstrations for educational purposes are grow-ing day-by-day. The sheer volume and heterogeneity of this big data from variousmultimedia devices requires pertinent storage, processing, and analyzing capabilitiesfrom the current systems, both in terms of hardware and software. Analyzing MMBD,which is essentially big data with several media types, requires complex algorithms,

394 S. Verma et al.
Fig. 1 Basic framework of Multimedia Big Data Computing (MMBD)
parallel and distributed computing, Graphics Processing Units (GPUs), etc., to comeinto play [8]. MMBD is a useful tool for human perception and understanding butposes several challenges in the context of a machine. Data acquisition from multipleand heterogeneous sources such as cameras, IoT sensors, social media, etc., adds tothe unstructured nature of big data, rendering it difficult to model. Hence, there arisesa need for data preprocessing that encompasses data cleaning, data transformation,compression and reduction, which is a time consuming task. In addition to volu-minous storage, it requires fast processing for real-time computing. Figure 1 showsthe basic framework of MMBD computing and its essential processes, divided intofour stages namely, data acquisition, processing, knowledge generation and decisionsupport. Raw and unstructured data from multiple sources is collected, preprocessed,stored, and analyzed using novel big data analytics tools, to derive conclusions, andinterpretations, for improved decision support.
In spite of the large datasets, researchers are unable to utilize them efficiently, dueto the lack of annotations. In recent times, data annotation in itself has emerged asa research area, whereby manual, as well as machine learning based annotation, hasbeen studied with promising results. Understanding and analyzing MMBD via datamining techniques and feature extraction methods can be exploited to uncover pat-terns and enhance decision-making abilities. With the advent of big data techniques

Recent Advancements in Multimedia Big Data Computing … 395
such as MapReduce, Hadoop, RapidMiner, Spark, and platforms for data sciencesuch as R Studio, research has accelerated in this direction.
3 Precision Agriculture and Its Cyber-Physical
Management
Cyber-Physical Systems (CPS) are a milestone in the development of computationaltechnologies, having achieved widespread success in applications, viz., automotives,healthcare, manufacturing, entertainment, military, etc., precision agriculture beingone of the most significant applications. With the projected population growth ofaround 9 billion by the year 2050, Food and Agriculture Organization (FAO) of theUnited Nations, has estimated a need for nearly 60% increase in the agriculturalproduction [9]. From irrigation systems to monitoring crop vegetation and smartpest control, CPS-based architectures for precision agriculture have been proposedin various research articles. A CPS encapsulates the physical elements along with thecomputational components, integrated and interacting in the real world at every levelof complexity and scale, with the help of extensive networking capabilities. With thecollaboration of computation, communications, and control (3C) technology, real-time sensing and dynamic control of information can be realized effectively [10].
Figure 2 demonstrates the basic model of a CPS along with its governing factors,i.e., the three Cs, communication, computation and control. IoT and Wireless SensorNetworks (WSN) have a lot in common with the CPS, all comprising of a 4-layeredarchitecture (sensing, networking, analyzing, and application) but CPS dominatesthe degree of integration and interactions between the physical and computationalelements. To analyze the environmental variables, data from multiple sources such asIoT sensors, satellite networks as well as advanced remote sensing techniques, viz.,multispectral cameras, hyperspectral cameras, IR cameras, etc., is being capturedfor smart farming applications, to enhance the quality of the crop yield and earlyprediction of plant diseases [11].
Rad et al. [12] have presented a CPS-based crop status monitoring system forpotato vegetation, whereby multispectral data is captured to compute the vegetationindices, which are helpful in detecting the nutrient content, soil type, water content,etc., for a particular area of the field. This could prove to be beneficial in identifyingthe profitability of the field and in turn improve decision-making for better eco-nomic results. Fresco and Ferrari [13] have emphasized on the correlation betweensustainable agriculture and public health, agriculture and biodiversity, and the needfor digital dimensions and solutions based on CPS architectures. Also, CPS alongwith the pre-established paradigms can bring about a revolution in the precisionagriculture arena.

396 S. Verma et al.
Fig. 2 Basic model of a Cyber-physical System (CPS)
4 Data Collection in Precision Agriculture
As mentioned earlier, data from various sources is being acquired for smart farmingapplications. There are a plethora of sensors available, to be put to good use forthe monitoring of environmental factors dominating the plant growth, along withthe imaging and remote sensing techniques utilized for monitoring plant health withminimum human intervention. The humongous amount of data being generated viathese techniques can prove to be overwhelming, hence huge database storage and fastand efficient processing is essential. Table 1 lists the data collection techniques stud-ied. These sensors can be installed in the field, on robotic vehicles and/or UnmannedAerial Vehicles (UAVs).
5 MMBD Computing and IoT in Precision Agriculture
Collaboration of Big Data with Cloud Computing and IoT has transpired a newrange of applications spanning multiple domains. But lack of automated processesis a major hindrance in the area of agriculture. Fog computing, a recent technologi-

Recent Advancements in Multimedia Big Data Computing … 397
Table 1 Multimedia Big Data (MMBD) collection methods
Data collection andcommunication tools
List of available sensors Type of MMBD
IoT Sensors Air Humidity andTemperature sensor, SoilHumidity and TemperatureSensor, Light Sensor, pHSensor, Gas Sensor, ElectricConductivity Sensor, WindSpeed/ Direction Sensor,Pressure Sensor,Liquid-Level Sensor,Water-Level IndicatorSensor, Smoke Sensor,Passive InfraRed (PIR)Sensor, URD Sensor,Thermocouple Sensor, LeafWetness Sensor, Rain VolumeSensor, PPFD Sensor
Text, Audio
Imaging and Remote Sensing Digital Cameras, IRCameras, MultispectralCameras, HyperspectralCameras, Depth Cameras
Audio, Images (Spatial dataas well as Spectral Data),Video
Microcontrollers Arduino, Raspberry Pi,Atmega 128L, S3C2440,CC2420, STM85103F3.
–
Wireless CommunicationTechnologies
ZigBee, WiFi, RFID,Multi-hop, UART, SMS
–
cal progression, similar to cloud computing, is already being studied in the field ofhealthcare, providing uninterrupted services to the customers. It supports real-timedata acquisition and analysis [14], which can be applied to agricultural applica-tions as well. Gill et al. [15] have proposed a cloud-based service for agricultureknown as Agriculture-as-a-service (AaaS), whereby the data captured via severalpre-configured IoT sensors is sent to the cloud for processing with the help of bigdata analytics. The processed result reaches customers simultaneously and automati-cally. With respect to agriculture, the decision-making trends have been passed downthrough generations of farmers, but now, with the advent of advanced computationaltechnologies and complex data processing capabilities, the massive data being cap-tured daily, can be exploited to establish a Decision Support System (DSS) for smartfarming [16]. Similar to health care, agriculture is a broad area that encapsulatesseveral distinct markets from farmers, traders to retailers and customers. In theirpaper, Pham and Stack [17] have discussed the similarities and differences betweenconventional and precision agricultural practices, and explained how with the aidof Global Positioning Systems, sensor data and communication systems, precisionagriculture is leaps and bounds ahead. Data is the most significant resource with
398 S. Verma et al.
respect to precision agriculture. Big data has led to the emergence of positions, viz.,data scientists, data holders, data analysts, etc. In addition, various firms have sprungup focusing on data collection, storage, and processing, along with providing agricul-tural prescription services. Carolan [18] has drawn conclusions on the use of big datain precision agriculture on the basis of interviews conducted in Iowa, with severalfarmers, big data analysts, and entrepreneurs in the local food industry. The discus-sion on feeding the future generations and flourishing possibilities of exploiting thetechnology was evident.
IoT has the ability to alter and guide the world in a positive direction. Securityalert systems for smart homes [19], smart cities, connected cars, health sector, etc.,are the most common applications of IoT in today’s scenario. Nevertheless, IoTtechnologies have a special impact on the field of agriculture. There is an assumptionthat global population is going to touch the estimated magical number of 9.6 billiontill 2050. Therefore, it is a matter of serious concern for the agricultural industry.They must be able to provide sufficient and quality food for the upcoming generationswithout unnecessary wastage of the essential resources. So, the use of IoT based smarttechnology named ‘Precision Agriculture’ will help out the farmers to decrease thewastage of resources and enhance the quality and productivity of crops and foodrespectively. Precision agriculture refers to a number of unique tools and techniquesthat are necessary for the precise evaluation of farming requirements. These tools andtechniques basically accentuate on the variations of natural components in the farmfield, including the amount of water, soil components, drainage, runoff, chemicalleakage, etc. The primary goal of the precision agriculture is to use new technologieslike sensors, RFID (Radio-Frequency Identification) tags, remote sensing, WiFi,ZigBee, satellites, etc., to precisely measure the variations in a field. Consequently,agronomic activities like pesticide management, irrigation, fertilizer management,seeding, and pest control can be programmed independently based on the evaluationof a farm field. The following section is going to explain these IoT based technologiesin detail.
5.1 Sensor-Based Technology
A sensor is a device that senses and reacts to a special type of input from the nearestenvironment. Sensors are the eyes and ears of IoT, that’s why no one can imaginethe existence of IoT without the use of sensors. Today, sensors are widely used in thefield of precision agriculture in various applications like monitoring of crops, threatdetection in the field, monitoring of soil conditions, observing the climatic conditionnear the farming field, etc. Till date, various sensors have been employed in thefield of precision agriculture like air humidity and temperature sensors, soil moisturesensors, pressure sensors, gas sensors, soil pH sensors, PIR (Passive Infrared) sensors,etc. Figure 3 demonstrates a few of the several sensors available for use in precisionagriculture.

Recent Advancements in Multimedia Big Data Computing … 399
Fig. 3 List of a few sensors used in precision agriculture
5.2 RFID-Based Technology
RFID is an acronym for “Radio-Frequency Identification”. The RFID technologyis very much similar to the barcode technology in which digital data from a smartlabel is captured by a special device and stored into the database. It is basicallyused for object identification and tracking. The reader present in the RFID taggingsystem captures the digital data from the RFID tag, attached to the object which hasto be identified or tracked. The RFID technology has one main advantage over thebarcode technology, that the data of RFID tag can be captured by the reader outsidethe view of the tag, but in barcode technology, the barcode must be associated withan optical reader for capturing the data. The in-depth integration of RFID technologyand Global Positioning System (GPS) can be used for monitoring and controllingthe object intelligently. There are various RFID products available in the market, butonly a few of them can be used in the precision agriculture applications.
5.3 Wireless Communication Technology
With the rapid increase in the field of information technology, wireless commu-nication technology has also grown gradually. Today, wireless communication hasbecome an essential mode of information exchange among remote users. Wirelesscommunication technologies can be classified into various categories on the basisof the type of devices, range of data and distance of communication. ZigBee, WiFi,

400 S. Verma et al.
Bluetooth, General Packet Radio Service (GPRS), radio communication, satellitecommunication, etc. are the most common wireless communication technologiesbeing used currently. ZigBee technology has a monopoly over other communicationtechnologies because of its unique characteristics like low cost, unified standard,less power consumption and versatility. ZigBee, WiFi and GPRS technologies arewidely used in the field of precision agriculture because of their cheap and sustainablebehavior.
5.4 Automation-Based Technology
Precision agriculture depends on automation based technologies for monitoring andcontrolling farming related activities. Automation technology is electromechanicalin nature; a decision-making framework along with the controller is the main partof the automation technology. Numerous scientists have been working in the fieldof agriculture automation since the past 8–10 years. Automated irrigation system,crop monitoring system, plant disease detection system, fertilizer and pesticide con-trol system, are some example of agricultural-automation technologies developedby the scientists, mentioned in their research work. These agricultural-automationtechnologies not only precisely utilize the resources, but also improve the quality ofcrops and food.
6 Comparative Analysis of Various Techniques
Till date, numerous IoT applications have been proposed in the field of precisionagriculture, where automated irrigation system, plant/ crop monitoring system, cli-mate monitoring system, plant disease detection and removal, monitoring and eval-uation of soil, fire detection system, weed detection system are the most commonapplications. A precise and robust architecture is required for the implementationof such applications. Anurag et al. [20] have proposed a wireless sensor networkbased architecture for precision agriculture applications which senses environmentaland meteorological parameters and propagate them to a central repository for furtherintimation to the farmers and end users. Similarly, Khattab et al. [21] have also devel-oped and implemented a cloud-based three-layered architecture for smart farmingapplications. Their proposed architecture was intended to collect the required datafrom the sensing nodes, present on the front-end layer and to propagate it to a gatewaylayer. Further, the gateway layer propagates the collected data (most probably themanipulated data) to the cloud servers in the back-end layer where this data is stored,processed and analyzed. The required feedback actions that are uncovered from thedata analysis and processing are sent back to front-end nodes for the implementa-tion. These types of architectures are the fundamental units for the implementationof any precision agricultural application. Precision agriculture is a science of using

Recent Advancements in Multimedia Big Data Computing … 401
Fig. 4 Distribution as per various precision agriculture applications
IoT technology to improve the production of a farm field. This can be achieved byreal-time monitoring and controlling of various agricultural parameters like crops,plants, climatic conditions, etc. We have gone through a number of research paperson IoT applications in the field of precision agriculture and found that 32% of theresearchers have focused primarily on monitoring and controlling systems, 18% ofthem focused on automated irrigation systems, 22% researchers emphasized on plantleaf disease detection and removal, another 14% talked about soil monitoring andevaluation, and remaining 14% focused on emergency systems like fire detection,weed detection, security system etc. in their research papers. Figure 4 depicts thedistribution of research papers as per various precision agriculture applications.
Mohanraj et al. [22] have proposed an application named “e-Agriculture” to moni-tor several meteorological parameters based on a knowledge base. They also provideda mechanism for controlling these parameters in order to increase farm production.Further, a livestock monitoring system has been developed by Tanmay et al. [23],near the field and grain store, without any human intervention. Similarly, [24–29]also used IoT technologies for monitoring various agricultural parameters as crops,plants, climatic conditions, etc. in their research. The main objective of precisionfarming is the efficient utilization of the agricultural resources like water, pesticides,and fertilizers, etc. To this effect several researchers [22, 30–33] have focused on theproficient utilization of water resources by giving the concept of an automated irri-gation system. In precision agriculture, diseases and pests cause excessive monetaryloss to farmers by reducing the quality and quantity of crops. Even the pesticides andfertilizers used for controlling these pests and pathogens are very costly, which leadsto increased financial pressure on the farmers. So for the detection and removal ofplant diseases, many researchers [25, 28, 34–37] have developed various inexpen-sive and accurate automation techniques, so that they can guide the farmer throughproviding high security to the farm fields, with minimum cost.
Agricultural productivity is directly and/or indirectly dependent on the soil presentin the farm field. Soil improves the growth of plants by mediating the organic, bio-

402 S. Verma et al.
Fig. 5 Distribution as per the type of sensors used
chemical, and physical processes that supply plants with nutrients, water, and otherelements. That’s why observation and evaluation of soil is very important for theimprovement of agricultural land. Till date, several researchers [22, 30, 34, 38, 39]have focused on the exogenous variables derived from soil monitoring and theirsubsequent evaluation.
As discussed earlier, there is a multitude of sensors which have been used in thefield of precision agriculture like air humidity and temperature sensors, soil moisturesensors, pressure sensors, gas sensors, soil pH sensors, PIR sensors, etc. Figure 5demonstrates the distribution of research papers on the basis of the type of sensorsused in them.
Sensor outputs are basically fed as inputs to the microcontrollers and they repre-sent the electrical equivalent values of any physical quantity. They generally measurephysical quantities like light intensity, distance, acceleration, etc., essentially as con-tinuously varying values. So no one can use the sensors without interfacing it with aspecific type of microcontroller. There are various microcontrollers available in themarket like Raspberry Pi, Arduino, Atmega 128L, etc. Figure 6 shows the distributionof research papers on the basis of types of microcontrollers employed.
Figure 7 shows the distribution of research papers on the basis of sources of datacollection. As per our study, we found that 70% of researchers have used sensorsfor collecting the data. 25% of researchers focused on only images in their researchwork and 5% of them have used both images and sensors as the data source.
Figure 8 shows the distribution of research papers on the basis of wireless com-munication technology. As per our study, we found that 45% of researchers haveused ZigBee for wireless communication. 25% of them focused on WiFi, RFID tags
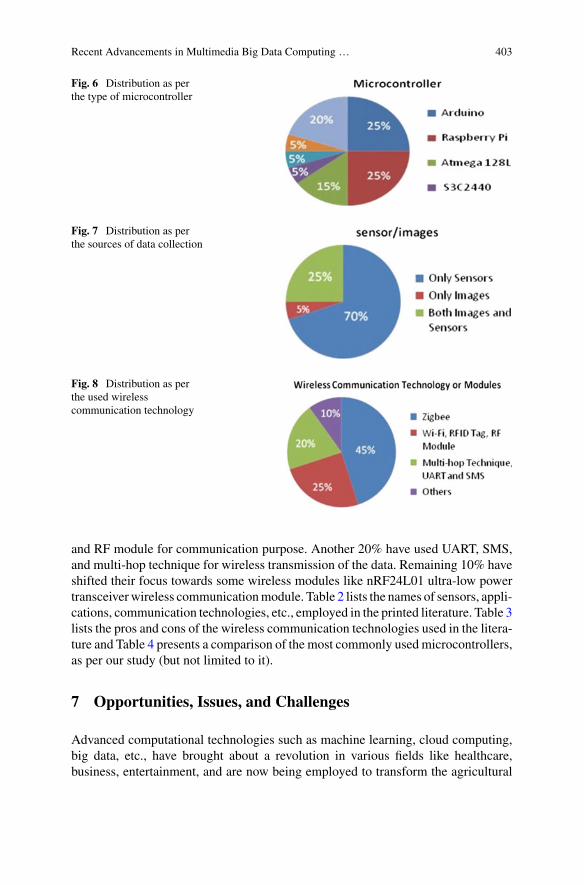
Recent Advancements in Multimedia Big Data Computing … 403
Fig. 6 Distribution as perthe type of microcontroller
Fig. 7 Distribution as perthe sources of data collection
Fig. 8 Distribution as perthe used wirelesscommunication technology
and RF module for communication purpose. Another 20% have used UART, SMS,and multi-hop technique for wireless transmission of the data. Remaining 10% haveshifted their focus towards some wireless modules like nRF24L01 ultra-low powertransceiver wireless communication module. Table 2 lists the names of sensors, appli-cations, communication technologies, etc., employed in the printed literature. Table 3lists the pros and cons of the wireless communication technologies used in the litera-ture and Table 4 presents a comparison of the most commonly used microcontrollers,as per our study (but not limited to it).
7 Opportunities, Issues, and Challenges
Advanced computational technologies such as machine learning, cloud computing,big data, etc., have brought about a revolution in various fields like healthcare,business, entertainment, and are now being employed to transform the agricultural

404 S. Verma et al.
Tab
le2
Lis
tof
Agr
icul
ture
appl
icat
ions
,sen
sors
and
com
mun
icat
ion
mod
ules
used
Ref
,yea
rP
reci
sion
agri
cult
ure
appl
icat
ion(
s)
Sen
sors
orim
ages
used
Nam
eof
sens
ors
Com
mun
icat
ion
Tech
nol-
ogy/
mod
ule
Mic
roco
ntro
ller
used
Cro
p/P
lant
Ref
eren
ce[3
4],
2018
•D
etec
tion
ofD
isea
seaf
fect
edpl
ant
•R
ecog
niti
onof
wee
ds•
Che
ckin
gth
efe
rtil
ity
ofso
il•
Fir
edi
sast
erde
tect
ion
Bot
him
ages
and
sens
or•
Soi
lMoi
stur
eS
enso
rE
C-5
•S
oilT
empe
ratu
reS
enso
rT
HE
RM
200
•S
oilp
HS
enso
r•
Soi
lEle
ctri
cC
ondu
ctiv
ity
WE
T-2
•H
umid
ity
Sen
sor
ST
DS
75(S
TM
)•
Tem
pera
ture
Sen
sor
HIH
-400
0–00
1(H
oney
wel
l)•
Lig
htIn
tens
ity
Sen
sor
BH
1750
FV
I(D
LI)
•C
arbo
nM
onox
ide
Sen
sor
GG
S-2
00T
(US
T)
•A
tmos
pher
icP
ress
ure
sens
orM
S55
40B
(Int
erse
ema)
•S
mok
eS
enso
rE
C01
000
(Hon
eyw
ell)
Mul
ti-h
opte
chni
que
––
(con
tinu
ed)
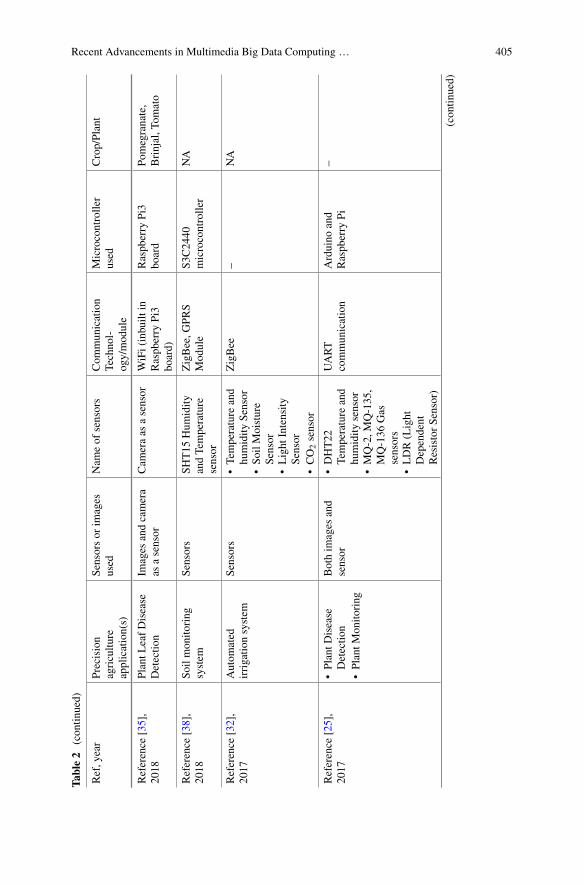
Recent Advancements in Multimedia Big Data Computing … 405
Tab
le2
(con
tinu
ed)
Ref
,yea
rP
reci
sion
agri
cult
ure
appl
icat
ion(
s)
Sen
sors
orim
ages
used
Nam
eof
sens
ors
Com
mun
icat
ion
Tech
nol-
ogy/
mod
ule
Mic
roco
ntro
ller
used
Cro
p/P
lant
Ref
eren
ce[3
5],
2018
Pla
ntL
eaf
Dis
ease
Det
ecti
onIm
ages
and
cam
era
asa
sens
orC
amer
aas
ase
nsor
WiF
i(in
buil
tin
Ras
pber
ryP
i3bo
ard)
Ras
pber
ryP
i3bo
ard
Pom
egra
nate
,B
rinj
al,T
omat
o
Ref
eren
ce[3
8],
2018
Soi
lmon
itor
ing
syst
emS
enso
rsS
HT
15H
umid
ity
and
Tem
pera
ture
sens
or
Zig
Bee
,GP
RS
Mod
ule
S3C
2440
mic
roco
ntro
ller
NA
Ref
eren
ce[3
2],
2017
Aut
omat
edir
riga
tion
syst
emS
enso
rs•
Tem
pera
ture
and
hum
idit
yS
enso
r•
Soi
lMoi
stur
eS
enso
r•
Lig
htIn
tens
ity
Sen
sor
•C
O2
sens
or
Zig
Bee
–N
A
Ref
eren
ce[2
5],
2017
•P
lant
Dis
ease
Det
ecti
on•
Pla
ntM
onit
orin
g
Bot
him
ages
and
sens
or•
DH
T22
Tem
pera
ture
and
hum
idit
yse
nsor
•M
Q-2
,MQ
-135
,M
Q-1
36G
asse
nsor
s•
LD
R(L
ight
Dep
ende
ntR
esis
tor
Sen
sor)
UA
RT
com
mun
icat
ion
Ard
uino
and
Ras
pber
ryP
i–
(con
tinu
ed)

406 S. Verma et al.
Tab
le2
(con
tinu
ed)
Ref
,yea
rP
reci
sion
agri
cult
ure
appl
icat
ion(
s)
Sen
sors
orim
ages
used
Nam
eof
sens
ors
Com
mun
icat
ion
Tech
nol-
ogy/
mod
ule
Mic
roco
ntro
ller
used
Cro
p/P
lant
Ref
eren
ce[3
7],
2017
Dis
ease
Det
ecti
onan
dre
mov
alS
enso
rs•
DH
T11
Hum
idit
yan
dTe
mpe
ratu
reS
enso
r•
Soi
lMoi
stur
eS
enso
r•
Soi
lpH
valu
eS
enor
•N
itro
gen
Sen
sor
ES
P82
66W
iFi
Mod
ule
Ard
uino
Ric
ecr
op
Ref
eren
ce[2
2],
2016
•P
lant
Gro
wth
Mon
itor
ing
•Ir
riga
tion
sche
dule
plan
ner
•Id
enti
fica
tion
ofso
ilty
pean
dso
ilde
fici
ency
Sen
sors
•D
HT
11Te
mpe
ratu
rean
dH
umid
ity
Sen
sor
•S
oilM
oist
ure
Sen
sor
(KG
003)
•B
allF
loat
Liq
uid
leve
lSen
sor
•M
agne
tic
floa
tse
nsor
(for
wat
erle
velI
ndic
ator
)•
BH
1750
Mod
ule
digi
tall
ight
inte
nsit
yse
nsor
/L
DR
Res
isto
r
–T
1C
C32
00la
unch
pad
and
1.6.
8A
rdui
noU
nobo
ard
–
Ref
eren
ce[2
3],
2016
Mon
itor
ing
and
smar
tsec
urit
yof
the
fiel
dan
dgr
ain
stor
es
Sen
sors
•P
IRse
nsor
•W
ebC
amer
as•
UR
D(U
ltra
soni
cR
angi
ngD
evic
e)S
enso
r
SM
SR
aspb
erry
Pi2
Mod
elB
+–
(con
tinu
ed)

Recent Advancements in Multimedia Big Data Computing … 407
Tab
le2
(con
tinu
ed)
Ref
,yea
rP
reci
sion
agri
cult
ure
appl
icat
ion(
s)
Sen
sors
orim
ages
used
Nam
eof
sens
ors
Com
mun
icat
ion
Tech
nol-
ogy/
mod
ule
Mic
roco
ntro
ller
used
Cro
p/P
lant
Ref
eren
ce[2
1],
2016
Gen
eral
clou
d-ba
sed
arch
itec
ture
for
prec
isio
nag
ricu
ltur
eap
plic
atio
ns
Sen
sors
•A
irte
mpe
ratu
reS
HT
11•
Air
Hum
idit
yH
TU
21D
•S
oilM
oist
ure
Sen
sor
SE
N01
14•
Lea
fW
etne
ssF
C-3
7•
Win
dS
peed
/D
irec
tion
SE
N-0
8942
•R
ain
Vol
ume
Sen
sor
SE
N-0
8942
nRF
24L
01ul
tra-
low
pow
ertr
ans-
rece
iver
wir
eles
sco
mm
unic
atio
nm
odul
e
Ras
pber
ryP
iN
A
Ref
eren
ce[3
1],
2015
Aut
omat
edir
riga
tion
syst
emS
enso
rs•
Soi
lMoi
stur
eS
enso
rV
H40
0•
Tem
pera
ture
Sen
sor
DS
1822
Zig
Bee
,GP
RS
Mod
ule
PIC
24F
J64G
B00
4M
icro
cont
roll
erN
A
Ref
eren
ce[2
6],
2015
Mon
itor
ing
and
cont
roll
ing
the
conn
ecte
dfa
rm
Sen
sors
•C
ompo
und
sens
orfo
rte
mpe
ratu
re,
hum
idit
y,an
dC
O2
•P
hoto
synt
heti
cph
oton
flux
dens
ity
(PP
FD
)se
nsor
•S
oilM
oist
ure
Sen
sor
Zig
Bee
Ras
pber
ryP
iN
A
(con
tinu
ed)
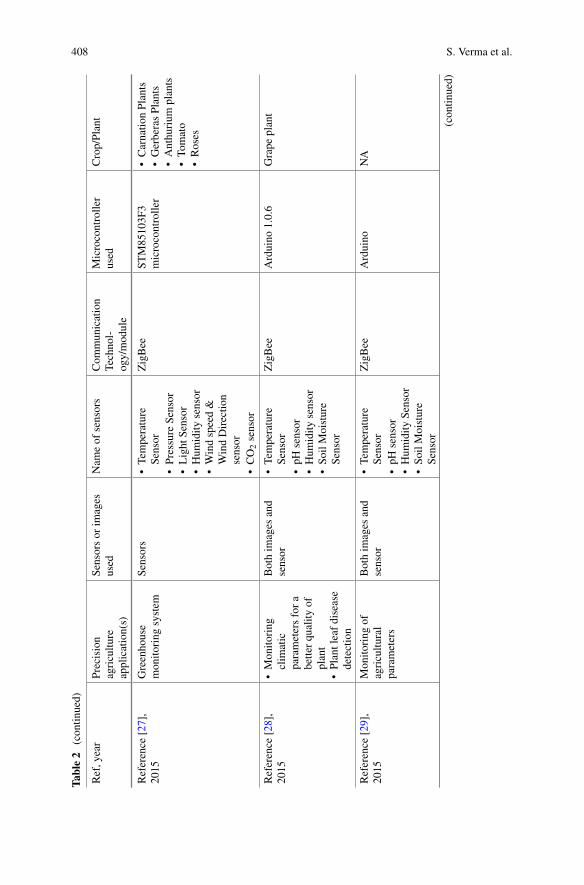
408 S. Verma et al.
Tab
le2
(con
tinu
ed)
Ref
,yea
rP
reci
sion
agri
cult
ure
appl
icat
ion(
s)
Sen
sors
orim
ages
used
Nam
eof
sens
ors
Com
mun
icat
ion
Tech
nol-
ogy/
mod
ule
Mic
roco
ntro
ller
used
Cro
p/P
lant
Ref
eren
ce[2
7],
2015
Gre
enho
use
mon
itor
ing
syst
emS
enso
rs•
Tem
pera
ture
Sen
sor
•P
ress
ure
Sen
sor
•L
ight
Sen
sor
•H
umid
ity
sens
or•
Win
dsp
eed
&W
ind
Dir
ecti
onse
nsor
•C
O2
sens
or
Zig
Bee
ST
M85
103F
3m
icro
cont
roll
er•
Car
nati
onP
lant
s•
Ger
bera
sP
lant
s•
Ant
huri
umpl
ants
•To
mat
o•
Ros
es
Ref
eren
ce[2
8],
2015
•M
onit
orin
gcl
imat
icpa
ram
eter
sfo
ra
bett
erqu
alit
yof
plan
t•
Pla
ntle
afdi
seas
ede
tect
ion
Bot
him
ages
and
sens
or•
Tem
pera
ture
Sen
sor
•pH
sens
or•
Hum
idit
yse
nsor
•S
oilM
oist
ure
Sen
sor
Zig
Bee
Ard
uino
1.0.
6G
rape
plan
t
Ref
eren
ce[2
9],
2015
Mon
itor
ing
ofag
ricu
ltur
alpa
ram
eter
s
Bot
him
ages
and
sens
or•
Tem
pera
ture
Sen
sor
•pH
sens
or•
Hum
idit
yS
enso
r•
Soi
lMoi
stur
eS
enso
r
Zig
Bee
Ard
uino
NA
(con
tinu
ed)

Recent Advancements in Multimedia Big Data Computing … 409
Tab
le2
(con
tinu
ed)
Ref
,yea
rP
reci
sion
agri
cult
ure
appl
icat
ion(
s)
Sen
sors
orim
ages
used
Nam
eof
sens
ors
Com
mun
icat
ion
Tech
nol-
ogy/
mod
ule
Mic
roco
ntro
ller
used
Cro
p/P
lant
Ref
eren
ce[3
0],
2013
•S
oilm
onit
orin
g•
Aut
omat
edir
riga
tion
syst
em
Sen
sors
•S
oilM
oist
ure
Sen
sor
(cap
acit
ance
sens
orE
CH
2O,
EC
-5D
ecag
onD
evic
es)
•Te
mpe
ratu
reS
enso
r(S
ensi
rion
Sen
sors
)
Mul
ti-h
opte
chni
que
–A
pple
tree
orch
ard
Ref
eren
ce[4
0],
2011
Cro
pM
onit
orin
gan
dse
curi
tyS
enso
rs•
Soi
lpH
sens
orS
8000
•H
ydra
Pro
be-I
Ise
nsor
(con
duct
ivit
y,sa
lini
ty,s
oil
moi
stur
ean
dte
mpe
ratu
re)
•M
TS
-420
Boa
rd(a
mbi
entl
ight
sens
or)
•E
C-1
0H
Sso
ilm
oist
ure
sens
or•
Cam
era
sens
or
Zig
Bee
Atm
ega
128L
Mic
roco
ntro
ller
–
Ref
eren
ce[2
4],
2011
Cro
pM
onit
orin
gB
oth
imag
esan
dse
nsor
•Im
age
Sen
sor
OV
7640
•Te
mpe
ratu
reS
enso
r•
Hum
idit
yS
enso
r
RF
Mod
ule
CC
1101
Atm
ega
128L
Mic
roco
ntro
ller
NA
(con
tinu
ed)

410 S. Verma et al.
Tab
le2
(con
tinu
ed)
Ref
,yea
rP
reci
sion
agri
cult
ure
appl
icat
ion(
s)
Sen
sors
orim
ages
used
Nam
eof
sens
ors
Com
mun
icat
ion
Tech
nol-
ogy/
mod
ule
Mic
roco
ntro
ller
used
Cro
p/P
lant
Ref
eren
ce[3
3],
2008
Aut
omat
edir
riga
tion
syst
emS
enso
rs•
Wat
erm
ark
soil
moi
stur
ese
nsor
•T
herm
ocou
ple
Sen
sor
RF
IDTa
g–
Cot
ton
crop
Ref
eren
ce[2
0],
2008
Gen
eral
Arc
hite
ctur
efo
rpr
ecis
ion
agri
cult
ure
appl
icat
ions
Sen
sors
•S
oilp
HS
enso
r•
Soi
lMoi
stur
eS
enso
r•
Soi
lTem
pera
ture
Sen
sor
Zig
Bee
CC
2420
,Ti(
Texa
sIn
stru
men
ts)
base
sbo
ard
NA
Ref
eren
ce[3
6],
2006
Pla
ntD
isea
seD
etec
tion
Sen
sors
Sen
siri
onS
HT
75D
igit
alH
umid
ity
and
Tem
pera
ture
sens
or
WiF
iA
tmeg
a12
8LM
icro
cont
roll
erP
otat
opl
ants

Recent Advancements in Multimedia Big Data Computing … 411
Tab
le3
Pro
san
dco
nsof
wir
eles
sco
mm
unic
atio
nte
chno
logi
esem
ploy
ed
Wir
eles
sC
omm
unic
atio
nTe
chno
logy
Gen
eral
desc
ript
ion
Pro
sC
ons
WiF
i•
Mos
tly
used
toco
nnec
tvar
ious
elec
tron
icde
vice
sw
ith
aw
irel
ess
loca
lare
ane
twor
k•
Sta
ndar
d––I
EE
E80
2.11
•U
ses
2.4
GH
zan
d5.
8G
Hz
freq
uenc
yra
dio
band
s.•
Dat
aR
ates
—11
to10
5M
bps
•R
ange
—10
–100
m
•S
impl
eIn
stal
lati
on•
Inex
pens
ive
•E
asil
yA
cces
sibl
e•
Sca
labl
e
•H
ighl
yV
ulne
rabl
e•
Sec
urit
yis
sues
•R
estr
icte
dR
ange
•T
hede
vice
sw
orki
ngin
the
sam
eba
ndca
nin
terf
ere
Zig
Bee
•C
onne
cta
num
ber
ofel
ectr
onic
devi
ces
wit
hpe
rson
alar
eane
twor
k•
Sta
ndar
d––I
EE
E80
2.15
.4•
Fre
quen
cyB
ands
––86
8/91
5M
Hz—
2.4
GH
z•
Dat
aR
ates
––25
0K
bps
•R
ange
––10
–to
300
m
•L
ess
Pow
erC
onsu
mpt
ion
•N
odes
can
beac
cess
ible
wit
hsm
all
confi
gura
tion
•S
uppo
rtm
any
topo
logi
esli
keO
neto
One
,Sta
r,M
esh
etc.
•E
xpen
sive
•D
ata
Rat
eis
low
•F
requ
enci
esot
her
than
2.4
GH
zre
quir
esli
cens
ing
inm
any
coun
trie
s.
Blu
etoo
th•
Use
din
shor
tdis
tanc
eco
mm
unic
atio
n•
Sta
ndar
d––I
EE
E80
2.15
.1•
Fre
quen
cyB
ands
—2.
4–2.
485
GH
z•
Dat
aR
ates
—25
Mbp
s•
Ran
ge—
0–10
M
•In
expe
nsiv
e•
Les
sen
ergy
util
izat
ion
•H
ighl
yS
ecur
e•
Low
pow
erco
nsum
ptio
n
•L
owR
ange
•L
ess
Dat
aR
ates
RF
ID•
Use
sel
ectr
omag
neti
cfi
eld
and
stor
ein
form
atio
nel
ectr
onic
ally
•U
sed
tode
tect
and
trac
kth
eob
ject
thro
ugh
tag
atta
ched
toit
•S
tand
ard–
–EP
Cgl
obal
stan
dard
san
dIS
OR
FID
stan
dard
s•
Fre
quen
cyB
ands
—12
0kH
z–15
0kH
z,13
.56
MH
z,43
3M
Hz,
865–
868
MH
zan
d90
2to
928
MH
z•
Dat
aR
ates
—10
–100
Kbp
s•
Ran
ge—
10C
M—
100
M
•E
asy
Inst
alla
tion
•D
oes
notn
eed
any
pow
er•
Hig
hly
secu
re
•In
vasi
veTe
chno
logy
•If
tags
inst
alle
din
flui
dsor
met
als
than
RF
IDre
ader
find
diffi
cult
yto
read
them
•In
com
pati
ble
wit
hsm
artp
hone
s

412 S. Verma et al.
Table 4 Pros and cons of Arduino and Raspberry Pi (microcontroller used)
Microcontroller Pros Cons
Arduino • Easier to get started• Best for real-time applications• No need for high programming
language• Easy to extend• Comprises of various libraries and
contributed shields
• Can only be programmed using Cor C++
• Connection to the internet iscomplex
Raspberry Pi • Easily connects to the internet• Entire Linux software stack
available with it• Can be programmed using
multiple languages
• No real-time access to hardware• Hardware is not open source• Does not contain inbuilt
analog-to-digital converter• Insufficient power to drive
inductive loads
domain. With larger investments being poured in this arena, it is evident that thereis huge excitement over the potential of these technologies to increase the farm out-put with minimum input, in terms of land, cost, usage of pesticides, and decreasedenvironmental footprint.
Ease of access to a gamut of electronic devices and social networking sites hasresulted in the vast amounts of data being generated by the second. On one hand,the MMBD poses the challenge of storage, processing, transmission, and analysis,and on the other, it presents an opportunity to unfold hidden patterns to be utilizedfor efficient decision-making. Data being generated is useless unless it is adminis-tered in the direction of creating better decision support tools for the stakeholders.MMBD has showcased huge potential towards solving future agricultural problemsfaced due to growing population and reduced resources. Previously, field relateddata was collected by the farmers and environmental data was acquired by gov-ernment agencies. But now, with the slumping costs of sensor-based technologies,much better degree of automation, computational abilities for data generation anddata analysis is affordable and evolving day by day. This leads to another challenge,i.e., the heterogeneous and unstructured nature of the acquired data from a plethora ofsources. However, this data can be the driving factor for profound advances in plantphenotyping, detection of plant diseases, land cover, soil fertility, study of weatherstatistics, and deploying farm management systems. Data from multiple growers canbe integrated to identify the problem areas and improve the decision-making. Currentsystems are not equipped with dynamic data aligning and processing capabilities.Another major hindrance is the lack of proper training to the farmers to exercise thedata collection equipment and tools, not to mention the lack of sound protocols andpolicies in place, for consolidation and interpretation of collected data.
One of the principal issues is the privacy of the captured data along with itsauthenticity. Before moving forward, we need to take into account the measures forvalidation and verification of the acquired data and the ethical factors as well. Enor-mous data generated poses the challenge of high dimensionality which hampers the

Recent Advancements in Multimedia Big Data Computing … 413
process of visualization. Along with visualization, we need data integration capabil-ities for structured, semi-structured and unstructured multimedia data. These are thefew likely factors due to which we have not been able to realize the full potentialpromised by the novel precision agriculture technologies and reap their benefits.
8 Conclusion
This chapter focused on the applications of MMBD and IoT in the field of precisionagriculture. In today’s scenario, about two-thirds of the data traffic over the internetcomprises of multimedia data. Along with the challenges of handling such heteroge-neous and voluminous, structured as well as unstructured data, comes the opportunityof analyzing and utilizing it, in order to respond to real-world situations. Current bigdata systems are not configured to process multiple data types and execute com-plex image processing and audio/video analytics algorithms. MMBD Computing isone such area that focuses on multimedia data acquisition, storage, to processingand its visualization. One of its major application areas is precision agriculture thatrequires decision-making abilities to enhance the crop yield and quality, based on thedata acquired via an amalgamation of sensors. IoT sensors can be used to create anintelligent system in which various environmental parameters can be observed andacquired to be analyzed. These sensors along with remote sensing technologies accu-mulate all types of multimedia data, viz., text, audio, images (RGB, multispectral,hyperspectral) and video.
Over the past decade, agricultural applications such as crop monitoring systemsand plant disease detection are dominant and on the rise with multiple technologiesbeing implemented for empirical studies. According to our research, mostly usedsensors for precision agriculture were Air humidity and temperature sensors, soilhumidity and temperature sensors, light sensors and pH sensors. Majority of theresearchers have utilized ZigBee as the wireless communication technology becauseof its low power consumption and cost. Also, Arduino and Raspberry Pi are the mostcommonly used microcontrollers with multifaceted applications in smart farming.There has been a huge increase in the use of advanced technologies to precisionagriculture for quantifying the shortcomings related to data collection and analy-sis. While there are numerous concerns, such as reliability, cost, security, deficientprocedures, etc., it is expected that in future, with new designs in advanced remotesensing technologies and relevant protocols in place, there will be greater benefitsfor precision agriculture and its subsequent impact on the ecosystem.
9 Future Direction
In the near future, the agricultural domain will come face to face with several chal-lenges such as water shortage, reduced soil fertility, weeds, use of fertilizers and

414 S. Verma et al.
their negative impact on the environment and human health, growing population,increased cost of seeds, chemicals, etc. Use of advanced computational technologiescan heighten the decision-making capabilities and reduce the wastage of resources.The CPS-based agricultural systems can be equipped with advanced functionalitiessuch as tracking capabilities, dynamic data aggregation, multimedia content anal-ysis, data mining methods, detection of faulty sensors, generating yield maps forthe field, daily task manager, notifications to be sent to the grower along with sug-gestions, updates to be sent periodically, remote control of agricultural devices etc.Work needs to be done to make the existing methods reach the farmers effectively,to be user-friendly, secure, and accurate.
References
1. A. Kumari, S. Tanwar, S. Tyagi, N. Kumar, M. Maasberg, K.K.R. Choo, Multimedia big datacomputing and Internet of things applications: a taxonomy and process model. J. Netw. Comput.Appl. 124, 169–195 (2018)
2. T. Iizumi, N. Ramankutty, How do weather and climate influence cropping area and intensity?Global Food Secur. 4, 46–50 (2015)
3. Z. Wang, S. Mao, L. Yang, P. Tang, A survey of multimedia big data. China Commun. 15(1),155–176 (2018)
4. J. Vora, P. Italiya, S. Tanwar, S. Tyagi, N. Kumar, M.S. Obaidat, K.F. Hsiao, Ensuring privacyand security in E-Health records, in 2018 International Conference on Computer, Information
and Telecommunication Systems (CITS) (IEEE, 2018) pp. 192–1965. J. Vora, P. DevMurari, S. Tanwar, S. Tyagi, N. Kumar, M.S. Obaidat, Blind signatures based
secured E-Healthcare system, in 2018 International Conference on Computer, Information and
Telecommunication Systems (CITS) (IEEE, 2018) pp. 177–1816. S. Tanwar, M.S. Obaidat, S. Tyagi, N. Kumar, Online signature-based biometric recognition,
in Biometric-Based Physical and Cybersecurity Systems (Springer, Cham, 2018) pp. 255–2857. S. Tanwar, S. Tyagi, N. Kumar, M.S. Obaidat, Ethical, legal, and social implications of biometric
technologies, in Biometric-Based Physical and Cybersecurity Systems (Springer, Cham, 2018)pp. 535–569
8. S. Pouyanfar, Y. Yang, S.C. Chen, M.L. Shyu, S.S. Iyengar, Multimedia big data analytics: asurvey. ACM Comput. Surv. (CSUR) 51(1), 10 (2018)
9. Food and Agriculture Organization of the United Nations. http://www.fao.org10. Y. Liu, Y. Peng, B. Wang, S. Yao, Z. Liu, Review on cyber-physical systems. IEEE/CAA J.
Autom. Sin. 4(1), 27–40 (2017)11. S. Verma, A. Chug, A.P. Singh, Prediction models for identification and diagnosis of tomato
plant diseases, in Advances in Computing, Communications and Informatics (ICACCI), 2018
International Conference (IEEE, 2018), pp. 1557–156312. C.R. Rad, O. Hancu, I.A. Takacs, G. Olteanu, Smart monitoring of potato crop: a cyber-physical
system architecture model in the field of precision agriculture. Agric. Agric. Sci. Proced. 6,73–79 (2015)
13. R. Fresco, G. Ferrari, Enhancing precision agriculture by internet of things and cyber physicalsystems. Atti Soc. Tosc. Sci. Nat. Mem. Supplemento 125, 53–60, (2018)
14. A. Kumari, S. Tanwar, S. Tyagi, N. Kumar, Fog computing for healthcare 4.0 environment:opportunities and challenges. Comput. Electr. Eng. 72, 1–13 (2018)
15. S.S. Gill, I. Chana, R. Buyya, IoT based agriculture as a cloud and big data service: the beginningof digital India. J. Organ. End User Comput. (JOEUC) 29(4), 1–23 (2017)

Recent Advancements in Multimedia Big Data Computing … 415
16. L. Tan, Cloud-based decision support and automation for precision agriculture in orchards.IFAC-PapersOnLine 49(16), 330–335 (2016)
17. X. Pham, M. Stack, How data analytics is transforming agriculture. Bus. Horiz. 61(1), 125–133(2018)
18. M. Carolan, Publicising food: big data, precision agriculture, and co-experimental techniquesof addition. Sociol. Ruralis 57(2), 135–154 (2017)
19. S. Tanwar, P. Patel, K. Patel, S. Tyagi, N. Kumar, M.S. Obaidat, An advanced internet of thingbased security alert system for smart home, in Computer, Information and Telecommunication
Systems (CITS), 2017 International Conference on (IEEE, 2017) pp. 25–2920. D. Anurag, S. Roy, S. Bandyopadhyay, Agro-sense: Precision agriculture using sensor-based
wireless mesh networks, in First ITU-T Kaleidoscope Academic Conference-Innovations in
NGN: Future Network and Services, (IEEE 2008) pp. 383–38821. A. Khattab, A. Abdelgawad, K. Yelmarthi, Design and implementation of a cloud-based IoT
scheme for precision agriculture, in Microelectronics (ICM), 28th International Conference,(IEEE 2016) pp. 201–204
22. I. Mohanraj, K. Ashokumar, J. Naren, Field monitoring and automation using IOT in agriculturedomain. Procedia Comput. Sci. 93, 931–939 (2016)
23. T. Baranwal, P.K. Pateriya, Development of IoT based smart security and monitoring devicesfor agriculture, in Cloud System and Big Data Engineering (Confluence), 6th International
Conference (IEEE 2016), pp. 597–60224. Z. Liqiang, Y. Shouyi, L. Leibo, Z. Zhen, W. Shaojun, A crop monitoring system based on
wireless sensor network. Procedia Environ. Sci. 11, 558–565 (2011)25. B. Patil, M.H. Panchal, M.S. Yadav, M.A. Singh, M.D. Patil, Plant Monitoring using image pro-
cessing, raspberry Pi & Iot, in International Research Journal of Engineering and Technology
(IRJET), pp. 1337–1342 (2017)26. M. Ryu, J. Yun, T. Miao, I.Y. Ahn, S.C. Choi, J. Kim, Design and implementation of a connected
farm for smart farming system, in Sensors, IEEE (IEEE 2015), pp. 1–427. L.I.U. Dan, C. Xin, H. Chongwei, J. Liangliang, Intelligent agriculture greenhouse environment
monitoring system based on IOT technology, in Intelligent Transportation, Big Data and Smart
City (ICITBS), 2015 International Conference (IEEE, 2015), pp. 487–49028. G.H. Agrawal, S.G. Galande, R. Shalaka, Leaf disease detection and climatic parameter mon-
itoring of plants using IoT. Int. J. Innov. Res. Sci. Eng. Technol., 9927–9932 (2015)29. S.G. Galande, G.H. Agrawal, M.L.S. Rohan, Internet of things implementation for wireless
monitoring of agricultural parameters, in International Journal of Advanced Research in Elec-
tronics and Communication Engineering (IJARECE), pp. 2121–2124. (2015)30. B. Majone, F. Viani, E. Filippi, A. Bellin, A. Massa, G. Toller, M. Salucci, Wireless sensor
network deployment for monitoring soil moisture dynamics at the field scale. Procedia Environ.Sci. 19, 426–435 (2013)
31. J. Gutiérrez, J.F. Villa-Medina, A. Nieto-Garibay, M.Á. Porta-Gándara, Automated irrigationsystem using a wireless sensor network and GPRS module. IEEE Trans. Instrum. Meas. 63(1),166–176 (2015)
32. B. Zhou, L. Li, Security monitoring for intelligent water-saving precision irrigation systemusing cloud services in multimedia context. Multimed. Tools Appl., 1–15. (2017)
33. G. Vellidis, M. Tucker, C. Perry, C. Kvien, C. Bednarz, A real-time wireless smart sensor arrayfor scheduling irrigation. Comput. Electr. Agric. 61(1), 44–50 (2008)
34. K.N. Bhanu, T.B. Reddy, M. Hanumanthappa, Multi-agent based context aware informationgathering for agriculture using wireless multimedia sensor networks. Egypt. Inform. J. (2018)
35. S.A. Nandhini, R. Hemalatha, S. Radha, K. Indumathi, Web enabled plant disease detectionsystem for agricultural applications using WMSN. Wirel. Pers. Commun. 102(2), 725–740(2018)
36. K. Langendoen, A. Baggio, O. Visser, Murphy loves potatoes: experiences from a pilot sensornetwork deployment in precision agriculture, in Parallel and Distributed Processing Sympo-
sium, 2006. IPDPS 2006. 20th International (IEEE, 2006) p. 8

416 S. Verma et al.
37. T.S.T. Bhavani, S. Begum, Agriculture productivity enhancement system using IOT. Int. J.Theor. Appl. Mech. 12(3), 543–554 (2017)
38. G.V. Satyanarayana, S.D. Mazaruddin, Wireless sensor based remote monitoring system foragriculture using ZigBee and GPS. Conf. Adv. Commun. Control Syst. 3, 237–241 (2013)
39. S. Tyagi, M.S. Obaidat, S. Tanwar, N. Kumar, M. Lal, Sensor cloud based measurement tomanagement system for precise irrigation, in GLOBECOM 2017–2017 IEEE Global Commu-
nications Conference (IEEE, 2017), pp. 1–640. A.J. Garcia-Sanchez, F. Garcia-Sanchez, J. Garcia-Haro, Wireless sensor network deployment
for integrating video-surveillance and data-monitoring in precision agriculture over distributedcrops. Comput. Electr. Agric. 75(2), 288–303 (2011)

Applications of Machine Learning
in Improving Learning Environment
Pallavi Asthana and Bramah Hazela
Abstract Machine learning are having a tremendous impact on the teaching indus-
try. Teaching industry is adopting new technologies to predict the future of edu-
cation system. It is Machine learning which predict the future nature of education
environment by adapting new advanced intelligent technologies. This work explores
the application of Machine Learning in teaching and learning for further improve-
ment in the learning environment in higher education. We explore the application
of machine learning in customized teaching and learning environment and explore
further directions for research. Customized teaching and learning consider student
background, individual student aptitude, learning speed and response of each stu-
dent. This customized teaching and learning approach provide feedback to teacher
after real-time processing of the data. This way a teacher can easily recognize stu-
dent attention and take corrective measures. This will improve student participation
and hence the overall results. Individual student concepts and goals can easily be
track with the help of Machine learning by taking real-time feedback. Based on that
feedback, curriculum, topics and methodology can be improved further. In simple
terms, machine learning makes the process automatic for decision making process
and analyzed the individual student data. Overall, the assessment process is made
more streamlined, accurate and unbiased with the help of machine learning. In the
near future, machine learning will be more efficient and produce even better results.
Finally, Machine learning will help educators to make our teaching and learning envi-
ronment more fun and challenging with the aid of intelligent technologies and take
P. Asthana
Department of Electronics and Communication Engineering, Amity School of Engineering and
Technology, Amity University Lucknow, Lucknow, India
e-mail: [email protected]
B. Hazela (B)
Department of Computer Science and Engineering, Amity School of Engineering and
Technology, Amity University Lucknow, Lucknow, India
e-mail: [email protected]
© Springer Nature Singapore Pte Ltd. 2020
S. Tanwar et al. (eds.), Multimedia Big Data Computing
for IoT Applications, Intelligent Systems Reference Library 163,
https://doi.org/10.1007/978-981-13-8759-3_16
417

418 P. Asthana and B. Hazela
our education to new heights, as soon as education system implement the machine
learning concept in their curriculums.
Machine learning can potentially redefine not only how education is delivered, but
also foster quality learning on the students’ part. Probably the most important part
of the role of machine learning in teaching is customized teaching. With machine
learning, we are moving away from the one-size-fits-all methodology. Machine learn-
ing promises to deliver custom in-class teaching by providing real-time feedback
based on individual student behavior and other factors. This improves the chances
of better learning. Machine learning also plays an important role in assessments or
evaluations by removing biases. Customized teaching is the direct opposite of the
one-size-fits-all methodology or philosophy. It considers individual student aptitude,
learning speed, background, response and other variables. It processes the data in
real time and provides feedback to the teacher, so that the teacher can recognize
flagging student attention or poor response immediately and take corrective actions.
This can potentially improve student participation and, in the process, the overall
results. Machine learning will be able to explain the concepts as well as set the goals
for individual students. On the other hand, teachers will be able to track whether
or not the students are able to digest the concepts. Based on that feedback, educa-
tors can change or modify the methodology, curriculum or topics accordingly. And,
the result is more accurate and targeted for individuals. In simple terms, machine
learning does the analytics based on individual student data, and makes the decision-
making process automatic and uniform. Assessment is a major part of the teaching
and learning process. Machine learning technology can help teachers assess or eval-
uate tests objectively and provide feedback. Machine learning applications can do
the assessment and provide scores. The process is taken care of by the machines,
removing human intervention and helping to remove human prejudice or bias from
the process.
However, at the same time, we need to remember that the assessment is done
by machine learning algorithms, based on the data feed. Therefore, some human
intervention might be required on a case-to-case basis. For example, occasions such
as research paper evaluation, interactive work, oral examination, etc., some human
intervention is still necessary. Overall, the assessment process is made more stream-
lined, accurate and unbiased with the help of machine learning.
To date, lesson plans have been made in a generic way, so they are the same plan
for all the students. However, students have different types of learning ability, so
the same lesson plan may not be ideal for all students. Imagine a scenario where a
student is able to learn quickly through visual representations/figures/diagrams, but
he/she is given text-based study material—the student may struggle with learning the
material. Before AI and machine learning, there wasn’t a practical way to detect this
and find a possible solution. As a result, it imposes a tremendous amount of pressure
on the student and sometimes leads to failure, although the student might have had a
good potential. If the material had only been presented differently, the student may
have easily understood and learned it.
AI applications are a great solution to this situation. Custom lesson plans can
potentially result in better learning because the technology can assess student data

Applications of Machine Learning … 419
and determine the best methods in which students can learn. It will also determine a
better mapping of subjects based on student interest.
Feedback is an important part of any learning system. In teaching as well, feedback
is one of the most important components. When we talk about feedback, it means
360-degree feedback. Here, it is applied to both student and teacher. Machine learn-
ing analyzes the student data (grading, interest, score, behavior, etc.) and provides
feedback. Machine learning also analyzes teachers’ data (subject taught, method of
teaching, acceptance, etc.) and prepares feedback. This feedback helps both parties.
Students are able to get constructive feedback and act accordingly to get better results.
On the other hand, teachers are able to adjust themselves to provide a better teach-
ing experience. While the teacher does already provide student feedback, machine
learning will go further and deeper. It will assess student behavior, responses and his-
torical data, and arrive at data-based conclusions and provide objective feedback. As
for assessments, it will eliminate the possibility of human prejudice while providing
feedback.
Career Prediction is one area where students can get confused and make a decision
that may not work out for the best. The career path of a student is very important for
their future. If the path is not chosen with care, frustration and disappointment can be
the result. In general, the decision for a student’s career path can be greatly influenced
by a number of factors, including the family profession, parents and neighbors—and,
of course, the most lucrative careers options. However, the most important thing is
missing: the interest of the individual student. AI and machine learning can play a
major role here. Machine learning applications for career path prediction are able
to track student interest, aptitudes and dislikes. It analyzes student behavior and
reactions. Based on the analysis, it can fairly predict interest areas in which the
student can excel. (For more on cutting-edge education, see Education Must Turn to
the Cloud.)
Artificial intelligence and machine learning are having a tremendous impact on
the teaching industry. Before the introduction of AI/machine learning, a generic, one-
size-fits-all type of approach was commonly used. As a result, students were forced
to try to adjust their style of learning to the lesson plan, rather than the other way
around. On the other hand, educators were facing a lot of trouble, trying to understand
the students’ needs and the possible solutions. So, the teaching experience and the
success rate was not as per expectation. With the advent of machine learning and AI, it
is becoming more focused, accurate and successful. Machine learning, if harnessed,
can revolutionize teaching just based on data. In the near future, machine learning
will be more efficient and produce even better results.
1 Machine Learning in Education
Tools developed with Machine Learning and Artificial Intelligence can be useful to
enhance teaching capabilities. It can work independent of teachers and can be useful
to support teachers [1]. Main areas utilizing these applications are [2]:

420 P. Asthana and B. Hazela
Fig. 1 Testing of software
(i) Tutoring: Intelligent tutoring systems are the adaptive tutoring systems that
are capable of engaging students in dialogues, answering them and they can
also provide feedback.
(ii) Customized Learning: Adaptive tutoring systems can be customized as
requirement of students in terms of learning material, sequence of the learning,
material and understanding of different students in different topics. It is also
useful for the students with special needs in enabling them to identify facial
expressions.
(iii) Automated Assessment: Automated are highly efficient to evaluate the under-
standing level of the students as these systems are able to adjust the difficulty
level of successive questions based on past performance.
(iv) Teachers Support: Machine learning algorithms could be utilized to perform
routine task of taking attendance, evaluating assignments and to generate the
questions. This is helpful for the teachers.
Machine Learning in Testing of the Educational Software: Educational soft-
ware are required to be very precise as they impact upon the learning process of
students. They are also utilized for the assessment and tutoring of the students.
Hence, they are required to undergo intensive testing process before implementa-
tion. Software testing is validates the alignment of a software with attributes of the
system and also verifies that it is able to meet the intended goals. With the increase
in the complexity of the software, testing process becomes more intensive [3]. Met-
rices and specification of software, Control flow graph, call graph execution data,
test case failure report and coverage data are elements of learning. Testing of the
software includes the following steps:
(i) Analysis of problem domain and its corresponding data sets.
(ii) Analysis of the algorithm.
(iii) Analysis of the implementation runtime options.
Automated testing process is used to reduce the cost of testing and time required in
the testing. Various Machine learning algorithms Artificial Neural Networks, Deci-
sion trees, Genetic algorithms, Bayseian learning, Instance base learning, Clustering
etc. are used in the testing of the software. These methods also enhance the perfor-
mance in the testing [4] (Fig. 1).

Applications of Machine Learning … 421
Fig. 2 Intelligent learning environment utilizing both supervised and unsupervised learning
Machine Learning in Intelligent Learning Environment: Intelligent Leraning
environment are referred to the systems that utilize both Supervised and Unsuper-
vised learning. This is highly useful to represent the learning of the students in traits
like knowledge, meta-cognitive abilities and learning behaviour to predict the future
behavior of student. These systems are generally based on statistical pattern recog-
nition [5]. These patterns are achieved by data acquisition, processing, learning and
testing. This can be done through manually labeling of data and then applying super-
vised learning algorithms to identify behavior. To reduce the implementation time
can be further achieved by using Unsupervised learning algorithms like k means clus-
tering to identify common learning behavior and supervised learning is implemented
to actually build the user model from the identified patterns. Intelligent learning envi-
ronment provides tools to support the exploration of student in certain subject and
adaptive models can provide customized suggestions to improve the exploration of
students (Fig. 2).
Machine Learning for Career Prediction and Career Planning: This appears
to be an interesting application of Machine learning for the career prediction and
career planning.
(i) Career Prediction: Career Prediction is based on the activity of individuals
on various social websites. This is achieved by multi-view multi-task learning.
It provides both feature heterogeneity and task heterogeneity both. Thus it is
more suitable for complex problem like career prediction. This type of learning
mainly uses the graph based approach. Multi view learning makes use of the
consistency among different views to achieve the better performance as infor-
mation from multiple social sites of the same user can reveal their characteristics

422 P. Asthana and B. Hazela
from different views and Multitask learning can model the tasks that are related
to each other. In general, it has been found that features that are extracted from
multiple sources are in high dimension and sometimes this information is highly
sparse in nature. LASSO regression analysis is used to control sparsity and to
identify task- sharing and task specific features that are crucial in determining
the influential factors that have a effect on the career progression of specific
User [6].
(ii) Career Planning: For the career planning, data related to the qualification,
present and past experience of the user is collected and based on the given
profile, best career option is presented to the user [7]. To create this model, k-
means clustering is done to identify the users with similar backgrounds and then
Markov’s chain model is used to estimate transition probability matrix. It makes
an assumption that next state depends on present state. Log likelihood method is
used to extract the goals with maximum probability from transition probability
matrix and Langrangian is helpful while optimizing the results. Shortest path
based on these optimized results is calculated by Dijkstra’s Algorithm. Model
is able to guide the user for career planning by suggesting the most appropriate
career path. If a person wants to join as a Director in a financial firm, then model
will guide him to obtain a degree in finance and then follow a complete path
through joining as a assistant manager, Manager and then reaching the position
of manager. This is a drawback of this system that it works in small steps. So,
cannot provide the solution based on other factors like expertise of person, their
reputation etc.
Machine Learning in Automated Assessment: Assessment is a powerful learn-
ing tool that can enhance learning and education. The process of student assess-
ment should align with curricular goals and educational objectives. Identifying the
assessment strategies necessary for the proper evaluation of students’ progress within
individual programs is as important as establishing curricular content and delivery
methods. The purpose of this paper is to discuss elements to be considered in assess-
ment design and implementation as well as common challenges encountered during
this process. Elements to be considered during assessment design include purpose
of assessment, domains to be tested, and characteristics of the assessment tools to
be employed. Assessment tools are evaluated according to four main characteristics:
relevance, feasibility, validity, and reliability. Based on the evidence presented in the
literature, the use of a variety of assessment tools is recommended to match diverse
domains and learning styles. The assessment cycle concludes with the evaluation of
the results and, based on these, the institution, program, or course can make changes
to improve the quality of education. If assessment design aligns with educational out-
comes and instructional methods, it improves the quality of education and supports
student learning.
Assessment methods are the strategies, techniques, tools and instruments that
are developed with heuristic for collecting information to determine the extent to
which students demonstrate desired learning outcomes. Machine learning has been

Applications of Machine Learning … 423
variedly employed to generate the questions and also in evaluation [8]. Different
types of machine learning applications utilised for the automated assessment are:
(a) Neural Network: These are the layered network. They have input layer, hidden
layers and output layers [9, 10]. For the assessment, weights are allocated to
each questions and on the basis of the correctness of the answer, difficulty level
of the next question is adjusted.
(i) Long Short Term Memory: These are specific types of recurrent neural
networks that are able to model temporal sequence [11]. They are also
able to accurately model long range dependencies. These are reward based
systems and show fast response [12].
(ii) Convolutional Neural Network: Convolutional Neural Networks are
more sophisticated version of the ANN. They are the class of deep feed
forward Artificial Neural Networks. In artificial neural networks, each
neuron is connected with neuron of the next layer whereas in CNN, only
spatially similar neurons are connected to neurons of next layer it means
they are grouped on the basis of their functionalities. This makes use of
the process of feature extraction and feature map to reduce the number of
free parameter [13]. CNN reduces the task of learning for all neurons and
enhances the efficiency of the systems. This method is more useful in the
systems that have more images so pattern recognition is done efficiently.
In the assessment of subject, same words can be repeatedly used and most
of the words are related so, this is quite useful in assessment [14].
(iii) Deep Reinforcement Learning: Deep Learning is useful in question set-
ting of the difficulty level of the next question in the automated assess-
ment. This supports a flexible environment with high dimensional state
and action spaces. These algorithms are capable of altering their own con-
sequence of actions on the basis of interaction and rewards. It works on
the paradigm of trial and error [15].
(b) Natural Language Processing: Natural Language processing has been used for
the generation of multiple choice questions where labels are extracted from given
sentence. These labels are extracted from Semantic Role labeler [16]. Informa-
tive sentences are selected to find key and distractors. NLP can categorize each
word into its part of speech through the series of coded rules of Grammar. These
grammar rules rely on the algorithms that are based on statistical rules Maxi-
mum Likelihood estimators, Methods of parametric estimation, Non-parametric
distribution, Standard distribution, Binomial distribution, Multinomial and stan-
dard distributions. Semantic analysis and is achieved by various methods like
Context free Grammar etc. [17]
Informative sentences, key and distractors are found with the Syntactic and lex-
ical features. With the help of all these entities, similarity between the question
is determined through all the existing knowledge in database (Fig. 3).
(c) Fuzzy Logic: Fuzzy logic is popular in many applications now because of it
reasoning and computation capabilities. Systems that utilize fuzzy logic are

424 P. Asthana and B. Hazela
Fig. 3 Natural language processing based system [17]
good in approximate and precise, both type of reasoning. This ability of these
system has been exploited in setting of the question paper as the framing of a
question paper counts a number of parameters [18]. These parameters includes
difficulty level, numerical and theoretical content, weightage of the marks for
particular questions etc.
For some subjects like literature, behavior sciences etc., fuzzy logic is used for
setting of question paper. In fuzzy logic, membership function is defined and
output is chosen on its basis. Fuzzy mathematics makes use of set theory.
(d) Genetic Algorithm: Genetic Algorithms are good at taking large, potentially
huge search spaces and navigating them, looking for optimal combinations of
things. Genetic Algorithm is able to provide a specific solution that has been
designed in order to determine the difficulty level of open questions in an auto-
matic and objective way. In the context of Outcome based education, questions
can be matched and validated with the specifications that are already defined
with the course [19]. Auto generated systems are good in setting up of difficulty
level of questions. Genetic Algorithms are a part of evolutionary algorithms and
they are categorized as global search heuristic. They are inspired by process of
evolution such as inheritance, selection, mutation and crossover(recombination).
These algorithms are implemented in computer simulation where various solu-
tions are optimized towards better solutions. This is achieved by initially eval-
uating the fitness function of each candidate (solution) in the population (set
of possible solutions)and modifying them through recombination and mutation

Applications of Machine Learning … 425
to form new population. Algorithms will keep on iterating until the optimized
result is achieved based on the fitness function [20].
Apart from these techniques combination of various technique is also used to
design automated assessment systems like combination of PCA with NLP or SVM
with NLP, Neural network with fuzzy system or genetic algorithm with fuzzy system.
Development of multiple choice questionnaires using the adaptive graph has also
been developed recently [21, 22].
2 Machine Learning in Virtual Learning
Over 78% of Virtual learning systems that has been developed are being utilized in the
Education sector. Machine learning can analyze and extract data, to find correlation
and patterns from large data sets to make useful information. Various techniques
that are used in creating Virtual learning environment are Neural networks that are
a network of highly connected nodes that work collectively to provide solution,
Support Vector Machine (SVM) are useful to classify the data to provide the best
solution space, Decision trees create a pictures of decision to determine a strategy for
finding best suitable path that reaches to solution, Fuzzy logic is good in reasoning
and comprehending the possible set. Others algorithms that are utilized to create
Virtual learning system are Roulette wheel Algorithms that maximize the choice of
learning path and evolutionary algorithms provides the optimal paths in data and
processes similar to the behavior of living organisms like ants, swarms etc [23].
It has become important explore these techniques as in Virtual learning system
consist of a very large amount of Data that remains available to be captured and
exploitation. Multi-dimensional analysis is required due to the increasing complexity
and interdependence of large number of data classes and attributes.
Various techniques that have been developed for research and development in
the education System are grouped like Adaptive Learning Systems, Intelligent Tutor
Systems, Cognitive Systems and recommender Systems.
Machine Learning to Predict Learning Outcomes: Machine learning can be
utilized to predict the learning outcomes of the students. This system is useful to
improve the dropout rate of the students by early intervention. System are accurate,
sensitive and specific in terms of utilizing Machine learning algorithms to predict the
performance of the students on early stages of training [24]. They mainly complete
the following tasks:
(i) Automatic collection of exam scores
(ii) Data available on the exam scores
Unobservable variables are then find out based on this data like pre-knowledge,
talent and diligence of the student. On the basis of this information predictive model
is created to predict the Learning outcomes of students.

426 P. Asthana and B. Hazela
3 Machine Learning in Agent-Based Educational
Applications
In the era of Artificial intelligence, Machine Learning facilitate customized teaching
and learning process to improve efficiency of educational application. Efficiency and
effectiveness of the education system can be improve by Dynamic adaptive learning
and teaching strategies. In current pedagogical systems only few learning systems
exist which are dynamic and able to satisfy individual students need. Availability of
these systems needs to be increase by incorporation of agents and learning objects in
educational applications. Such intelligent learning systems must be adaptive, able to
learn and dynamic [25]. Many educational technology are projects available as either
stand-alone learning systems or Web based learning tools. All these projects involve
the use of techniques such as multimedia interaction, learning models and asyn-
chronous learning. Required integrated approach has been given for the architectural
design of pedagogic information [26].
An agent-based educational architecture system defines the key functions for
dynamic and adaptive learning system. To address the challenges of modern edu-
cation system agent-based technology is being used to provide dynamic adapting
learning [27]. Various types of agent types frameworks are:
(i) Simulation Based Study—Simulation is done by the application of Machine
Learning to analyze the architecture of Agent-based system. This analysis
enables the approach to be student centered and handle individual students’
requirements. This also improve the dynamic adaptivity in education systems.
Learning adaptability at conceptual level can also be achieved by combining
the learning theory with agent-based systems. This analysis is based on the
presentation of learning objects to individual students using multi-disciplinary
approach. Practical level adaptivity is achieved through multi-agent system.
This system uses a pre-built knowledge to determine the learning objects and
learning styles that are appropriate for the need of individual students.
(ii) An Agent-Based Distributed Framework—This framework uses machine
learning and data mining. It enables agents to exchange local learning pro-
cesses model and integration of processes among different number of methods.
Individual learning processes model among agents is supported by exchange of
meta-level descriptions which ensure online reasoning about learning progress
and learning success by learning agents. The mechanism of interaction among
agent allows to apply to distribute various tasks of machine learning. It requires
a powerful coordination among agents available in agent-based computing.
Learning decisions with in agents enables agents to engage in meta-reasoning
process. Conceptual frameworks are used in applications where different
learner uses different data sets to implement the architecture of Modern real
world distributed clustering.
(iii) Agent-Based Computational Economics (ACE)—Analysis of non-linear
processes and representation of such system is based on the computer simula-
tion method of Agent-based Computational Economics. Agents and learning

Applications of Machine Learning … 427
processes of ACE models are represented through artificial intelligence and
methods of machine learning. These systems are developed by reinforcement
learning framework that are realized in Simulation system. They are able to
illustrate the features of learning framework and to analyze the non-linearity
of the agent-based modeling.
4 Machine Learning in Education Data Mining
Educational Data Mining is concerned with the data which comes from educational
setup that is related with the improvement in the teaching learning processes by
developing various methods. Educational Data mining can be categorized as: statics
and visualization of Data, Web mining and Text mining. Educational data mining
is done to predict, classify, regression, estimation of density and clustering. Various
types of techniques are used to implement these goals like relationship mining,
association mining, correlation mining, sequential mining etc.
Data is collected from varied sources including the learning of individual from
software used for education purposes, collaborative learning supported by computer,
and various automatic testing. Main aim of all the analysis is to improve upon stu-
dents models. These models represent the information about students in terms of
their current knowledge, level of motivation and cognitive skills as these factors are
associated with performance of the students with the help of educational data mining
methods. It is interesting to know that with the help of various models developed
with the help of data mining tools, it is possible to find about real-time monitoring
of students as when they are gaming on system or when they are experiencing poor
efficacy or getting bored or frustrated. With the help of these models, it is possible
to predict the student’s retention, non-retention or failure in different courses taught
at college as these model represents information about student’s characteristics or
attitude.
Space searching algorithms from Machine learning have been applied for the
developing automated approaches to make accurate domain structure models from the
data itself. Methods like making q matrix based on the responses of the students and
feedback from students [28]. Skills labels from different item types can be assigned
to different items by utilizing the method of covariance. It helps in identifying the
role of various skills in learning of the complete domain. Partial order knowledge
structures are being used to analyze relation between statistical tools like covariance
for outcome relationship in item type. Relationship between item type and duration
are found by Pearson correlation.
Educational Data mining is also being used to find out the student-pedagogical
relations. It is able to find as which types of pedagogy will be effective for a group of
students or individual in various situations. Hence, it has application in the collabo-
rative learning also. This can be achieved by using learning decomposition methods.
Data pertaining to performance of the students in varying pedagogies is plotted on a
curve mostly the success of student. Best fitted model is created based on the curve

428 P. Asthana and B. Hazela
and weights relative to each of the pedagogy in the model is supportive to select the
suitable pedagogy for learning.
Another application of Educational Data Mining is to refine and extend the under-
standing of educational theories and phenomenon for better understandings and
improvement in it. Education at different levels is required to be taught in different
ways and to extract the information in various situation related with the performance
of the students is highly important. In an educational system, it becomes essential to
monitor student’s behavior and improvement in academic performance.
5 Machine Learning in Education Science for Educational
Research
Earlier research related to education was mostly limited to the students studying is
any course, area or Institute. So the data related with the educational research was
limited. Statistical tools used to analyze these amount of data were not sufficient o
model the parameters is received from this huge amount of data number in millions
of students through Massive open online courses.
Various Machine learning have greater potential for the analysis of large data
sets that are generated through the Massive Open Online courses. Data sets of these
courses is also varying in nature due to high diversity in the backgrounds of the
students, their conceptual knowledge, their demographic location etc. Many data
Scientist are collecting data from these sites and this data is utilized by educational
researchers and scientist for analysis [29].
Machine learning based data –driven predictive models provide support in forming
and testing of the hypothesis for problems associated with these huge data sets
(Fig. 4).
To analyze the deeper context of the data, hypothesis is set and is based on the
questionnaire, independence of the course with respect to structure of the course and
course content is found for example, if we want to analyze Java programming and
C++, then, its basic structure is same, but course content is different, still, they both
object oriented programming. If the same course is taught by different teachers, then
mode of delivery may be different.
Information extracted from questionnaire, is processed and part of the informa-
tion that supports the hypothesis is used to create Predictive models. In an Online
system, data is collected on the various aspects like number of students registered for
course, lecture view, lecture review, submission of the quiz based on video (lecture),
resubmission of quiz, completion of the assignments, re-submission of assignments,
completion of Complete course.
Various types of Machine learning can be used to predict the output of students.
Supervised learning is utilized the independent variable to predict the behaviour
of dependent variable. Data is transformed using techniques like exploratory Data
Analysis and based on these transformed data, relevant data is filtered for example

Applications of Machine Learning … 429
Fig. 4 Data driven predictive model through machine learning
percentage of students completing the course or submitting assignment, predictive
model is created that can predict the grades of students, if they have completed course
[30].
6 Machine Learning in Instructional Applications
Machine Learning based Instructional applications requires the knowledge in
domains:
(i) Conceptual Knowledge: In the computer algorithms, conceptual knowledge
is represented in the form of Semantic networks. Concepts is the knowledge
about facts and relation between different facts. Nodes in the semantic networks
represnts the concepts and links represents the relation between these concepts
(Fig. 5).
(ii) Procedural Knowledge: Procedural knowledge is the knowledge to understand
the subjects that follows a definite pattern or procedure during learning for exam-
ple Mathematics, spoken sentences, computer programming etc. These systems
typically consists three parts; working memory, rule set and rule Interpreter.
Working Memory: It contains information about the solution. It also hold the
intermediate calculations and also stores information about the attention of problem
solver.
Rule Set: It is set of rule that works for providing solution and it also has poten-
tial for changing the working memory based on the current results in intermediate
calculation s. It has two parts:
(a) Condition: Base on the condition, rules are applied on working memory.
(b) Action: It governs the process applied to working memory.

430 P. Asthana and B. Hazela
Fig. 5 Example of a semantic network
Fig. 6 Major part of expert system
One or more than rule may be applied during the execution by interpreter. Rule
based systems are used in expert system used to solve tough technical problem using
Inference engines [31].
(iii) Imaginal knowledge: Imaginal knowledge seems to be basically about the per-
ception of things. Computer graphs are mainly used in such application. How-
ever, with the advancement in Machine learning, systems based on pattern
recognition are also applied to create application.
(iv) Problem Solving Skills: Problem solving skills requires forward reasoning
and backward reasoning. These methods are specifically termed as Artificial
Intelligence. Importance of expert systems in academics is intelligible so it
generates necessity of brief discussion on Inference engines in academics where
problem solving skills has a significant role. These engine generally utilizes
forward and backward chaining as a part of reasoning systems (Fig. 6).

Applications of Machine Learning … 431
Inference engines works on forward chaining and backward chaining models to
obtain logical conclusion. They can utilize top to bottom or bottom to top compu-
tational models. Facts and knowledge pertaining to any task and rules required to
implement that task is kept with Knowledge base of system [32].
(a) Forward Chaining:
It is based on bottom- model of computation. It uses information from known facts to
draw a reasonable conclusion. New facts are generated with the knowledge of known
facts to reach a pre- determined goal. This works in cycles and continues until no
new rule can be drawn. Facts are checked against the predetermined goals indicating
forward movement of inference towards goals from the facts.
(b) Backward Chaining:
Backward chaining is a goal driven search and it is based on the hypothesis testing.
Here goal is known and different variables are searched to valid facts in data. It is
based on top-down model of computation. In an expert system, it works by checking
memory for new goal, to confirm, whether, rules are listed in memory and to continue
the recursive program to find any area where any rule is not applied. Information
about this area proves the sub goals and original goals.
Machine learning has a wider role in educational application and system. These
applications can be utilized as setting up of course module, tutoring, assessment,
determining learning outcome and even in predicting the career. Adaptive learning
systems can be customized based on the cognitive skills and behavior of individual
or a group of students.
Apart of learning processes, it is highly useful in the assessment and evaluation
that sometimes becomes monotonous tasks for teachers. It can provide substantial
time to teachers to create innovative methods for improved learning environment.
Huge data sets received from Massive open online Courses is quite useful in
educational research. This large amount of data can be modeled using machine
learning technique to create predictive models.
Education is one of the sensitive area and new and accurate methods of Module
delivery, feedback systems and problem solving are developed.
References
1. J.J. Lu, L.A. Harris, in Congressional Reasearch Service (2018). www.crs.gov, In Focus
2. R. Luckin, W. Holmes, M. Griffiths, L.B. Focier, Intelligence Unleashed: An Argument for AI
In Education, Pearson (2016)
3. M. Noorian, E. Bagheri, W. Du, Machine learning-based software testing: towards a classifica-
tion framework, in Proceedings of the 23rd International Conference on Software Engineering
& Knowledge Engineering (2011)
4. C. Murphy, G. Kaiser, M. Arias, An Approach to Software Testing of Machine Learning Appli-
cations. Columbia University Computer Science Technical Reports (2007)

432 P. Asthana and B. Hazela
5. S. Amershi, C. Conati, Unsupervised and supervised machine learning in user modeling for
intelligent learning environments, in Proceedings of 12th International Conference on Intelli-
gent User interfaces, pp. 72–81 (2007)6. Y. Liu, L. Zhang, L. Nie, Y. Yan, D.S. Rosenblum, Fortune teller: predicting your career path,
in Proceedings of the Thirtieth AAAI Conference on Artificial Intelligence (2016)7. Y. Lou, R. Ren, Y. Zhao, A Machine Learning Approach for Future Career Planning
8. H.F. El-Sofany, N. Al-Jaidah, S. Ibra-him, S. Al-kubaisi, Web-based “Questions-Bank” system
to improve E-Learning education in Qatari school. J. Comput. Sci. 5(2), 97–108 (2009), 2009
ISSN 1549-36369. M. Liu, R.A. Calvo, V. Rus, Automatic question generation for literature review writing sup-
port, in International Conference on Intelligent Tutoring Systems, Intelligent Tutoring Systems,
pp. 45–54 (2010)10. D. Liu, C. Lin, Sherlock: a semi-automatic quiz generation system using linked data, in 13th
International Semantic Web Conference (2014)11. K. Greff, R.K. Srivastava, J. Koutn´ık, B.R. Steunebrink, J. Schmidhuber, LSTM: A Search
Space Odyssey, Transactions on Neural Networks and Learning Systems (2015)12. H. Sak, A. Senior, F. Beaufays, Long Short-Term Memory Recurrent Neural Network Archi-
tectures for Large Scale Acoustic Modeling. Cornell University Library (2014)13. T. Liu, S. Fang, Y. Zhao, P. Wang, J. Zhang, Implementation of Training Convolutional Neural
Networks. Cornell University Library (2015)14. V. Kalogeiton, Introduction to Convolutional Neural Networks, Reading Group on Deep Learn-
ing: Session 3 (2016)15. I.E. Fattoh, Automatic multiple choice question generation system for semantic attributes using
string similarity measures. Comput. Eng. Intell. Syst. 5(8) (2014), ISSN 2222-1719 (Paper)
ISSN 2222-2863 (Online)16. L. Padrio, Statistical Methods for Natural Language Processing (2009)17. M. Collins, Statistical Methods in Natural Language Processing. AT&T Labs-Research18. A.A. Khan, O. Naseer, Fuzzy logic based multi user adaptive test system. Int. J. Soft Comput.
Softw. Eng. 2(08) (2012), e-ISSN: 2251-754519. W. Huang, Z.-H. Wang, Design of examination paper generating system from item bank by
using genetic algorithm, in Proceeding of International Conference on Computer Science and
Software Engineering (2008)20. A.V. Sharma, Review of evolutionary optimization algorithms for test case minimization. Int.
J. Eng. Comput. Sci. 4(7), 13292–13297 (2015), ISSN:2319-724221. V.U.B. Challagulla, F.B. Bastani, I.-L. Yen, R.A. Paul, Empirical assessment of machine learn-
ing based software defect prediction techniques. Int. J. Artif. Intell. Tools 17(2) (2008)22. J.F. Sowa, Conceptual graphs as a Universal knowledge representation. Comput. Math. Appl.
23(2–5), 75–93 (1992), ISSN -0097-4943/9223. A. Jefferies, R. Hyde, Building the future students’ blended learning experiences from current
research findings. Electron. J. e-Learning 8, 133–140 (2010)24. F. Duzhin, A. Gustafsson, Machine learning-based app for self-evaluation of teacher-specific
instructional style and tools’ education sciences. MDPI J. (2018)25. M.A. Razek, C. Frasson, M. Kaltenbach, Toward more cooperative intelligent distance learning
environments. Softw. Agents Coop. Hum. Activity (2002). http://www-perso.iro.umontreal.ca/
˜abdelram. Accessed Feb 200326. H. Shi, Y. Shang, S. Chen, A multi-agent system for computer science education, in Proceedings
of the 5th Annual SIGCSE/SIGCUE ITiCSE Conference on Innovation and Technology in
Computer Science Education, pp. 1–4 (2000)27. L. Aroyo, P. Kommers, Special issue preface, intelligent agents for educational computer-aided
systems. Interact. Learn. Res. 10(3/4), 235–242 (1999)28. R.S.J.D. Baker, K. Yacef, The state of educational data mining in 2009: a review and future
visions. J. Educ. Data Min. 1(1), Fall (2009), Article 129. L. Kidzi nski et al., A tutorial on machine learning in educational science, in Proceedings
of International Conference on Future Buildings and Districts—Sustainability from Nano to
Urban Scale—Vol. II, Scartezzini, Jean-Louis (2015)

Applications of Machine Learning … 433
30. C.J. Burges, A tutorial on support vector machines for pattern recognition. Datamining Knowl.
Discov. 2(2), 121–167 (1998)
31. H.M. Half, Instructional applications of artificial intelligence. Educ. Leadersh., 24–31 (1986)
32. A. Al-Ajlan, The comparison between forward and backward chaining. Int. J. Mach. Learn.
Comput. 5(2) (2015)
Network-Based Applications
of Multimedia Big Data Computing
in IoT Environment
Anupam Singh and Satyasundara Mahapatra
Abstract In the modern business world, business management techniques are con-
tinuously increased and governed by smart devices and innovative technologies.
These devices are associated with internet can be called as a device of Internet of
Things (IoT). Wi-Fi, Bluetooth, Infrared and Hotspot technologies are the connecting
medium for these devices. Somehow, these devices are connected to the servers for
processing the user request. These sensing devices are producing enormous amount
of data in structured or semi-structured or unstructured form otherwise known as
big data. The data are stored, manipulated and analyzed with the help of big data
techniques for taking well-defined decisions. Thus, the top management people of
the business world are able to drive their business in real time. The uses of smart
devices are rapidly increased in different application categories of IoT known as
Personal, Group, Community and Industrial. Due to easy access to internet, inde-
pendent power source and sensing without human intervention makes smart devices
as an important component of IoT. This chapter first gives a brief introduction on
IoT with its structure. Then different technologies are discussed in the field of IoT.
The different application areas of IoT are also presented. Finally, Big Data and the
importance of IoT based sensor devises in Big Data is presented.
Keywords Big data · IoT · RFID · Bluetooth · Wireless sensor network
1 Introduction
Internet of Things (IoT), the most remarkable network of intelligent electronic
devices stands for “Connect with everyone, everything, always, everywhere for each
service and each network” [1]. This development brings an immense revolution in
A. Singh (B) · S. Mahapatra
Pranveer Singh Institute of Technology Kanpur, UP Bhautipratappur, India
e-mail: [email protected]
S. Mahapatra
e-mail: [email protected]
© Springer Nature Singapore Pte Ltd. 2020
S. Tanwar et al. (eds.), Multimedia Big Data Computing
for IoT Applications, Intelligent Systems Reference Library 163,
https://doi.org/10.1007/978-981-13-8759-3_17
435

436 A. Singh and S. Mahapatra
the field business world. Catching information with the help of smart devices, store
it and take decision for business world with the help of emerging technologies is the
way Big Data is handled. These smart devices are connected through internet and
send contextual information such as location, temperature, auto generated machine
reports, etc. at any time or any moment from one location to other location [1]. The
devices are executed with the help of sensors and processors. Due to lower price of
sensors, processors and spreading of internet connection, the usages of these devices
are increased strongly. Hence in real business world these devices are used as human
necessity rather than “good to have.”
As per the Gartner expectation the number of users who uses the smart devices
will be rise to 20 billion by 2020 while the other scientist estimate that it should be
50 billion [2]. But in order for this to happen, only holding smart devices is not the
solution. The requirement is, design a device with its own internet, independent power
source and a way of sensing the physical environment [2]. Somehow, to happen these
things a number of technologies are very much available with us. These are RFID,
Bluetooth, 3G, 4G, 5G, wireless sensor networks, solar chargeable batteries, and
portable devices. These technologies are operated with the help of sensor devices.
These devices are not only very much capable to collect, analyze, transmit a large set
of structured, unstructured or semi-structured data in real time but also monitored
and control the complex industrial processes. For that reason, without data, the IoT
devices do not have features and capabilities that have been backed by worldwide
attitudes. These large set of data are otherwise known as Big Data.
IoT is an excellent driven approach to implement in today’s business world [3, 4].
But the biggest problem for enterprises is how to generate the huge amount of data,
collect those data, store them in an efficient manner for processing them to achieve
their business objective. For generating such amount data is only possible with the
help of the things and technologies used in IoT. Hence the researchers as well as the
engineers are relaxed by using these devices. But still they are facing challenges in
some research related work and real time scenario. i.e. how to manage these massive
and heterogeneous data in highly distributed environment [3, 4]. This is possible only
with the help of wear Operating System by Google such as Android Wear known
as ‘brain’ of human Body area Network (BAN) [5] which gives the storage and
communication capabilities of smart devices. Last but not least with technologies
such as Near Field Communications (NFC) [6]. The smart sensor devices are also
used as actuators and the actions with trigger control the devises like televisions,
moor car, etc.
This chapter presents an overview on Internet of Things (IoT) like Bluetooth, Wi-
Fi, Optical tags and quick response codes, Bluetooth, Body area Network (BAN),
Near Field Communications (NFC), etc. A number of applications with the help of
smart devices interconnected to other devices are discussed. Big Data and the role of
IoT in big data are also discussed. The processing of IoT based big data is discussed
through which how the business world will be benefited are also discussed. At the
end of this chapter the future opportunities of IoT and it’s use in big data analysis
for business development is discussed.

Network-Based Applications of Multimedia Big Data Computing … 437
2 Internet of Things (IoT)
IoT is an wide and expanded networks of intelligent devices that are auto organized
among them and share their data, information and resources over internet for changing
the environments in a smart way [7]. The advanced IoT aims to enhance the lifestyle
of peoples by using “smart” devices in the environment, which is fully integrated
with Internet [4]. This will convert the people-to-people communication lifestyle to
device-to-device communication lifestyle. It is also expected that the model of IoT
includes a huge numbers of smart devices that are actuating, sensing and processing
for establishing connection with Internet [8]. As the time passes away, the numbers
of smart devices otherwise known as “things” which are connected to the internet are
increased and finally these things are the major producers as well as the consumers of
the data or resources. These things are obtain their data or resources from the physical
world in real time over Internet by using wireless technology or through gateway
[8]. These things are also able to connect other things and obtain the information by
sensing and make independent decision [9–11].
In today’s world, IoT is a primary need for the business world. This world depends
on other enterprises to fulfill their requirements time to time. These needs of their
requirements are maintained very easily with the help of smart devices or things.
The ability of tracking their requirements make entrepreneur more efficient by speed
up their process, reducing error and prevent theft through IOT [8]. Providing an
authenticated and satisfactory connection to those smart devices of their companies is
a big challenge. In this direction, the things of IoT can play bigger role as it was always
connected with Internet through several communication interfaces, availability of
many useful features, significant storage capacity and ability for taking decision
by computing [12]. The term IoT has attracted the attention of today’s IT world
with a vision by projecting the global infrastructure of physical objects connected
in a common network, enabling anytime, anywhere for everybody [13]. The IoT is
also trying to create a global network, that communicates between people-to-people
(P2P), people-to-things (P2T), things-to-things (T2T) (i.e. anything-to-anything) by
providing a unique identity [14].
3 Structure of IoT
IoT is a large network of sensor devices, like RFID, barcodes, wired and wireless
access, as well as the subnets of intelligence devices (i.e. computers) connected
through a range of intermediary technologies that can act as a means of connectivity
possible. International telecommunication Union (ITU) provide the structure of IoT
and classified into four dimensions as given in Fig. 1 [15, 16].
For tagging things, RFID plays a vital role by automatically identifying a thing in
real time for complete the identification process [17]. For Feeling thing, sensors are
collecting the data from the environment by establishing the communication between

438 A. Singh and S. Mahapatra
Fig. 1 Structure of internet
of things [59]
physical and information world: for example measure the temperature and pressure
[18]. In case of shrinking things, nanotechnology has been applied for connecting
within small things: for example “for monitoring the quality of water in reasonable
cost by using nano-sensors [18] in the field of healthcare the use of nano-sensors is
utilized for diagnosis and treatment of diseases like HIV and AIDS [19]. In case of
thinking, the embedded intelligence thing has established the network connection
to the Internet with the help of sensors: for example maintaining the freshness of
perishable items inside the refrigerators.
4 Technologies Used in IoT
IoT is a system, where the interrelated computing sensor devices or things are con-
nected among themselves with the help of a number of technologies. Some of the
technologies are discussed below.
4.1 Radio Frequency Identification (RFID)
RFID is a well known automated wireless identification mechanism [7]. It consists
of three components named as scanning antenna, transceiver and RFID tags. This tag
consists of a microchips, memory and antenna. It works on radio frequency waves
for transmitting the signals. The tags are first activated with the help of this signal.
After that the activated tag send a wave back to antenna, then it translated into data.
RFID tags are basically two types named as active tag and passive tag. Active tag has
work with its own energy source, i.e. a battery. On the other hand, passive tag draws
energy from the reading antenna, whose electromagnetic wave activates the energy
in the RFID tag’s antenna. These tags are classified into two categories on the basis

Network-Based Applications of Multimedia Big Data Computing … 439
of their memory types. These are read-only and write only. The RFID technology is
divided into four types on the basis of low, high, ultra-high and microwave frequency
[7, 20].
4.2 Barcode
Barcode is an optical of machine-readable form of a product to which it’s stick. It is
a way to code the numbers as well as letters with a formulation which includes space
and different size of bars. It looks just like numbers of black lines with different width
are placed in the form of square or rectangle with gaps [7]. These images are read
by a laser scanner known as Barcode reader. These images are also read by using
cameras [7]. The reader read these line thickness and space by the help of laser beam
[7]. Then the reader transforms the reflected light into digital form for immediate
intervention or storage. These barcode are basically three types named as Numeric,
Alpha Numeric and Two dimensional [7].
4.3 Electronic Product Code (EPC)
Electronic Product Code (EPC) is used for single identification. In general EPC is
an advanced form of barcode. EPC has its own numerical formulation system with
greater capabilities for recognizing the products. In EPC the contained numbers
are associated with specific information. These are the information of manufacture,
starting point and end point of a shipment [7]. EPC consists of four parts, namely
ONS (Object Naming Service), EPCDS (EPC Discovery Services), EPCIS (EPC
Information Services) and EPCSS (EPC Security Services) [21]. EPC is designed in
such a way so that it placed on a RFID tag and transmits data and activated when
a signal is released from a reader. In today’s fast moving environment the industry-
driven standard of EPC was maintained by EPCglobal, a neutral and non-profit
organization [22].
4.4 Internet Protocol (IP)
IP or Internet Protocol is a technique or protocol through which data or information
is transmitted from one intelligence device to another over internet. The objective is
to assign at least one IP in the form of binary to each intelligence device for achieving
the uniqueness [7]. In the current scenario two version of IP are exist. They are IPv4
(IP version 4) consists of 32 bits and IPv6 (IP version 6) consists of 64 bits [7]. IPv6
and IPv4 are two completely separate protocols and not compatible with each other.

440 A. Singh and S. Mahapatra
So these protocols cannot interact with each other directly but with the help of “dual
stack” system exchanging data between IPv4 and IPv6 is possible [21].
4.5 Wireless Fidelity (Wi-Fi)
Wi-Fi is a network connectivity technology used for transferring high-speed data
over short distance by using radio wave based devices (router, laptop, smartphones,
etc.). These devises are bases on IEEE 802.11 standards in 1997 [3]. Different types
of Wi-Fi standards are used by the wave-based devices. These standards are 802.11a,
802.11b, 80.2.11 g, and 802.11n [7, 23]. Now a day this wireless connectivity is an
established part of everyday life. All smart devices like smartphones, laptops, tablets,
cameras and very much other devices are used Wi-Fi connectivity. Due to the high-
speed data transfer nature, Wi-Fi technology is highly accepted by hotels, homes,
airports, and cafes in the society by using wireless access points [23].
4.6 Bluetooth
Bluetooth is a short-range low-cost wireless communication technology. With the
help of this technology smart devices like smartphones, laptop, printer, cameras,
tablet, PDAs, and other peripherals are transmitted data or voice wirelessly in short
distances. The main purpose of Bluetooth technology is to replace the cables that nor-
mally connect with devices and keep a secured communication between the devices
[24]. This technology was developed in the year 1994. It uses almost same fre-
quency as other wireless technologies like cordless phones and Wi-Fi routers are
used. It generates a 10 m radius wireless communication network known as personal
area network (PAN), which can establish the communication between two to eight
smart intelligence devices. This low cost and short-range wireless network allows us
to send data like images, videos, voice and commonly text between the devices. The
most important part of the Bluetooth technology is, it uses less power than the Wi-Fi
technology. Its low power makes it less far from any of the other wireless devices
in the 2.4 GHz radio band. Bluetooth v3.0 with high-speed technology incorporated
devices can transfer up to 24 Mbps of data, which is faster than the 802.11b Wi-Fi
standard, but slower than 802.11a and 802.11 g Wi-Fi standards. It was expected that
as the technology has evolved, Bluetooth speeds have increased.
4.7 ZigBee
ZigBee is a wireless technology used for transmits data from one intelligent device
to another in low cost and low power [25]. Specifically it was designed to control the

Network-Based Applications of Multimedia Big Data Computing … 441
sensor network on IEEE 802.15.4 standard used for WPANs. This device is designed
by ZigBee alliance and operates at 868 MHz, 902–928 MHz and 2.4 GHz frequencies
only [25]. This is a very simple and less expensive communication system used widely
for short-range wireless networks like Wi-Fi and Bluetooth. The communication
network of ZigBee is also utilized for wide area network with the help of routers and
allow other intelligent devices to join in his network. The ZigBee communication
system consists of at least one coordinator, router and an end device for its operation
in an efficient manner [25]. The coordinator behaves like a root and creates a bridge
between the networks. The responsibility of ZigBee coordinator is to keep track of
data when the transmission is performed and also store the data. It works like an
intermediary router which gives permission to route the data through him from one
device to another. The ZigBee devices connect themselves through the parent node
of end device and maintain the life of the energy unit (i.e. battery) for long time. The
router, coordinator and end device numbers are calculated on the type of network
(i.e. star, mesh, tree, etc.) for which it works.
4.8 Near Field Communication (NFC)
NFC is a wireless communication technique on wave for intelligent compatible
devices [7]. The benefit is, a user can transmit the data or information without need-
ing to touch both the devices together. This technology is designed and developed
by jointly “Philips and Sony” in the year 2004. This technology is very popular in
Europe and Asia. It was also migrated to United State because of its popularity. This
technology comes under the category of short-range wireless connectivity standard
(i.e. ISO/IEC 14443). It creates a magnetic field for enabling the communication
[26]. NFC technology started becoming widely available to consumers in the field
of mobile payment like Google Wallet and mobile ticketing like Oyster Card [26].
4.9 Wireless Sensor Networks (WSNs)
WSN is a wireless sensor based network, specifically designed for the sensor devices
which are available at distributed autonomous location. These devices are moni-
tored the environmental conditions like pressure, location, temperature, heat, light
etc [7, 27]. A WSN system built a wireless gateway among the distributed sensor
devices. This sensor device consists of several technical components. These com-
ponents are radio, power bank, microcontroller, analog circuit, and sensor interface.
The radio technology of WSN system is consuming more battery power. So today’s
WSN systems are based on ZigBee due to its low consumption power. Depend-
ing on the environment, different types of WSN networks are selected and can be
deployed underwater, underground, on land, and so on. These types of WSNs are
used in different application areas like agriculture monitoring, Home Control, Build-
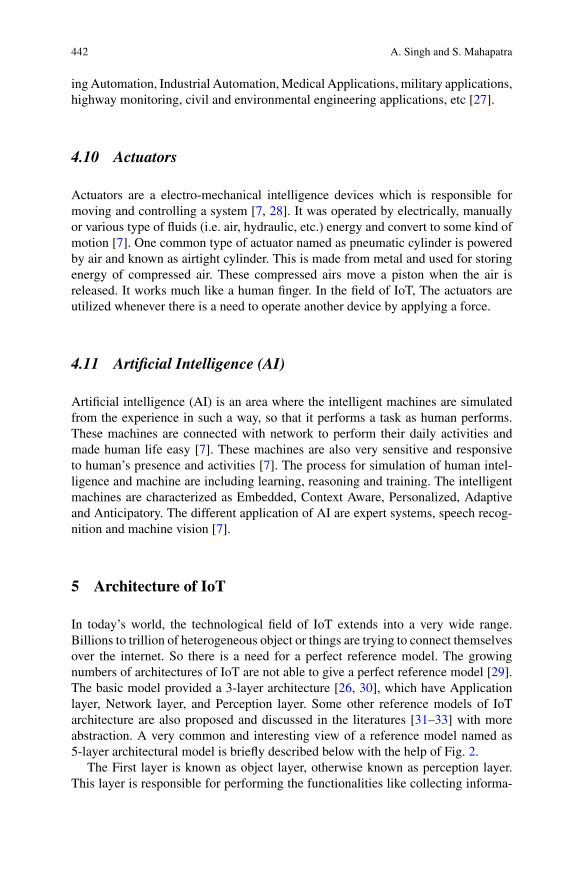
442 A. Singh and S. Mahapatra
ing Automation, Industrial Automation, Medical Applications, military applications,
highway monitoring, civil and environmental engineering applications, etc [27].
4.10 Actuators
Actuators are a electro-mechanical intelligence devices which is responsible for
moving and controlling a system [7, 28]. It was operated by electrically, manually
or various type of fluids (i.e. air, hydraulic, etc.) energy and convert to some kind of
motion [7]. One common type of actuator named as pneumatic cylinder is powered
by air and known as airtight cylinder. This is made from metal and used for storing
energy of compressed air. These compressed airs move a piston when the air is
released. It works much like a human finger. In the field of IoT, The actuators are
utilized whenever there is a need to operate another device by applying a force.
4.11 Artificial Intelligence (AI)
Artificial intelligence (AI) is an area where the intelligent machines are simulated
from the experience in such a way, so that it performs a task as human performs.
These machines are connected with network to perform their daily activities and
made human life easy [7]. These machines are also very sensitive and responsive
to human’s presence and activities [7]. The process for simulation of human intel-
ligence and machine are including learning, reasoning and training. The intelligent
machines are characterized as Embedded, Context Aware, Personalized, Adaptive
and Anticipatory. The different application of AI are expert systems, speech recog-
nition and machine vision [7].
5 Architecture of IoT
In today’s world, the technological field of IoT extends into a very wide range.
Billions to trillion of heterogeneous object or things are trying to connect themselves
over the internet. So there is a need for a perfect reference model. The growing
numbers of architectures of IoT are not able to give a perfect reference model [29].
The basic model provided a 3-layer architecture [26, 30], which have Application
layer, Network layer, and Perception layer. Some other reference models of IoT
architecture are also proposed and discussed in the literatures [31–33] with more
abstraction. A very common and interesting view of a reference model named as
5-layer architectural model is briefly described below with the help of Fig. 2.
The First layer is known as object layer, otherwise known as perception layer.
This layer is responsible for performing the functionalities like collecting informa-
Network-Based Applications of Multimedia Big Data Computing … 443
Fig. 2 5-layer architectural
model of IoT
tion about location, weight, temperature, etc. by using standardized heterogeneous
devices which have plug-and-play mechanism. This layer is also responsible for dig-
italizing the data and sends them through a secured channel to the next layer. The
perception layer of IoT is the creator of Big data [29]. The second layer is Object
Abstraction Layer and responsible for transferring the data which are collected in
perception layer to the next layer. These data can be transferred through various
devices having wireless technologies like RFID, 3G, GSM, Wi-Fi, Bluetooth with
Low Energy, infrared, ZigBee, etc. [29]. This layer is also handling the data manage-
ment process as well as cloud computing [31]. The third layer is known as Service
Management layer Middleware layer. This layer is responsible for pairing a service
with its requester based on addresses and names. This layer enables the IoT appli-
cation programmers to work with heterogeneous devices or objects. This layer also
processed the received data, take decision and provide the required services over the
wireless network [32, 34]. The fourth layer is Application layer and responsible for
providing the services requested by the customers. The ability of providing quality
intelligent services to the customers need until their satisfaction is the main motto
of this layer. The importance of this layer is to provide high-quality intelligent ser-
vice as per the customer requirements. This layer is responsible to make smart and
automated many business market domain such as home, building, transportation,
industry, and healthcare [31, 33]. The fifth layer is Business Layer and maintains
the overall activities and services of a system. This layer is responsible for building
business models and makes it possible to take support decision by analyzing big data
[29]. This layer is also responsible for monitoring and managing the above four layer
of IoT architecture. Apart from this an architecture on e-health care is also proposed
in [35]. FlexRFID, a middleware architecture of IoT was also implemented on differ-
ent application domains like supply chain management, smart library management
and healthcare sector [36–38].

444 A. Singh and S. Mahapatra
6 Application Areas of IoT
In the professional life or day to day life humans are curious in nature. These curiosi-
ties provide a new begin where human start to make machines smart enough, so that
it reduces the work load. The designed interconnected smart devices have captured
the data and shared these data between machine to machine or machine to human
or human to machine on a daily basis in different application areas of IoT. They
are Logistic and supply chain management (SCM), transportation, healthcare, and
environment and disaster monitoring, etc. [39].
6.1 Logistics and Supply Chain Management (SCM)
There are huge potential for applying IoT in many domain areas of Supply Chain
Management. It helps the objects to communicate freely and enables better control
on the logistics as discussed in [39–41]. It increases the efficiency of the process by
scanning the data with the help of RFID tags, barcodes, NFC, and mobile phones and
creates a smart ways of transmitting the things by using transmission protocols such
as WSNs, GSM network, 3G, 4G, or even 5G networks, it brings in transparency in
an organization [39]. It creates the real-time visibility of inventory system and brings
transparency in an organization. A numerous examples on different application of
IoT in the field of logistics and SCM are discussed in [39]. A supermarket chain man-
agement, where things (goods) are tracked and maintained the stock automatically
by using WSNs, barcodes, and RFIDs is illustrated in [40]. The Use of Aspire RFID
with session initiation protocol (SIP) to detect the location and mobility management
of RFID tags is discussed in [39]. The design of Logistic Geographical Information
Detecting Unified Information System Based on IoT is discussed in [42]. The con-
cept of “circular economy,” with the help of supply chain where tagging a product
from manufacturing unit to the end of product life i.e recycling enables a new way
of resource optimization is discussed in [43].
6.2 Transportation
IoT transforms the transport sector by optimizing the movement of human and things
(goods), economy of the country and safety of the public. This smart transport system
will automate the roads, railways, airways transform the experiences of passengers
and give a new form to the way of goods tracked and delivered. The monitoring of
road in real time and provide the status of road condition as alert system reported
is discussed in [44]. Applications like license plate identification, parking place
indexing and secure vehicle system are reported in [45]. A vehicle monitoring system
based on WSN for measuring the performance of lithium-ion batteries used in electric
Network-Based Applications of Multimedia Big Data Computing … 445
vehicles and enhance the uses of batteries by providing the route status to the driver
is discussed in [46]. By using the IoT system the manufactures of electric vehicles
provide a battery monitoring system and their charging schedule is presented in
[43]. A fully autonomous vehicle integrated system, parking sensor system is also
presented in [43]. How to improve customer experience and control the flow of
passenger in London City Airport and provide them the “doorstep to destination”
data time to time with the help of smartphone is discussed in [43].
6.3 Healthcare
The benefits of IoT technology have greatly reflected on healthcare. IoT intelligence
devices are multiplied and used across the entire healthcare industry throughout the
world. These devices are portable heart rate, check blood pressure and blood sugar,
smart pill boxes, etc. A cooperative IoT based approach for better health monitoring
and control of rural and poor human is proposed in [47]. How IoT is able to shift
healthcare from cure to prevention, and give people a greater control over their
decisions is discussed in [43]. The uses of smartphone for monitoring vital signs and
transmit health data directly to the care centers are proposed in [48]. This system
provides emergency help to patients, who suffer from critical illness. As most of
the IoT devices are connected via the cloud, healthcare providers i.e hospital can
constantly and consistently check-up their patients.
6.4 Environment and Disaster
Hurricanes, earthquakes and tsunamis that destroy everything. Due to lack of tech-
nical resources and physical obstacles execute the work of the emergency services
is very difficult. Thanks to the devices of IoT, those are being seen as a solution for
reducing the impact of these disasters [39]. These devices are made up of smart sen-
sors and connect themselves with the help of Internet. They transmit information in
real time and help the disaster recovery process. Sensors are also utilized to monitor
physical or environmental conditions, such as temperature, pressure and sound etc.
and pass their data through the network for taking right decision of facing a disas-
ter [39]. A Long-Term Environmental Monitoring system with the help of WSN is
discussed in [49].
6.5 Smart Home
A smart home, otherwise known as automated home where the available devices
placed anywhere is controlled remotely from any place in the world. These devices

446 A. Singh and S. Mahapatra
are interconnected through internet and accessible through one central point [50, 51].
This central point is a smart device like smartphone, tablet, laptop, game console,
etc. Examples like Door locks, televisions, home monitors, cameras, lights and even
appliances such as the refrigerator can be controlled through one home automation
system. The whole system is installed on a smart network device for certain changes
to take effect time to time. These devices come with self-learning skills. It learns the
homeowner’s schedules and adjusts as needed. A Bluetooth based home automation
system is discussed in [52].
6.6 Smart Farming
In Smart farming, The IoT based intelligent devices are monitoring the crop and
give information so that the farmer able to take decision instantly with the help of
expert management system. This makes our system as an automated irrigation system
discussed in [43, 50]. Sensors can also used for tracking animals, diseases, etc. The
farmer can monitor the field condition from anywhere. The IoT based automated
farming system is more efficient than the traditional farming system. The farm who
uses smart farming can share their data with other firm, consumers and regulators [43].
The smart farming not only targets conventional large farming operations, but also
provide new levers to uplift other growing trends in agricultural like organic farming,
family farming and enhance highly transparent farming. From environmental point of
view, smart farming can provide a lot of benefits like efficient water usage, optimize
use of fertilizer and meditational treatments if required in the field. A special Android
application for with user-friendly GUI for irrigation control by using smartphone is
developed and presented in [53].
7 Big Data
Big Data is an important topic for today’s business world where the data sets are
so large and produced at astronomical rate [54]. These data cannot be managed and
analyzed efficiently by traditional data mining and handling techniques. The types
of data are unstructured or sensitive w.r.t time or very large in size and not able to
process by the engine of relational database [55, 56]. Such type of data requires an
efficient processing approach called as Big Data. To make sense of such huge amount
of data, they are often categorized into five V’s named as Velocity, Volume, Value,
Variety, and Veracity as reported by Google (Fig. 3).
• Velocity refers to the speed at which the large amounts of data are being generated.
• Volume refers to the unbelievable amount of data generated per second.
• Value refers to worth of the data being extracted.

Network-Based Applications of Multimedia Big Data Computing … 447
Fig. 3 5V’s of big data
• Variety refers to the different types of data (i.e. Structured, Unstructured and Semi-
structured)
• Veracity refers to the quality or trustworthiness of the data (Fig. 3).
In the recent trend the Big Data technology analyze the data at the time of genera-
tion without storing in database because collecting the huge data and then analyzing
it is a big challenge from the point of view of organisation. The most important part
of such data is to realize it’s cost and benefit. The new and efficient big data tech-
nologies allow the structured, unstructured and semi-structured data for harvesting,
storing, utilizing and the trustworthiness of the data is also maintained at the same
time.
8 Role of IoT in Big Data
When business world wants to analyze the huge amount of data, IoT plays a vital
role as a source of those data [54]. This is the point where the role of IoT in Big
Data comes into the picture. To analyze the IoT sensor devices data, the big data
analytics is emerging as a key. This helps the entrepreneurs of business world for
making fruitful decisions to achieve their goal. The role of IoT is to generate huge
amount of data in real time w.r.t the concept of 5Vs. These data are processed and
stored in distributed locations. The IoT based big data are processed as follows:
1. Huge amounts of structured, unstructured and semi-structured data are generated
by IoT based smart sensor devices. These data otherwise known as big data
depend on Velocity, Volume, Value, Variety, and Veracity. i.e. 5Vs.
2. The huge amount of data generated in step 1 is stored in big data files, which is
a shared distributed database.
3. These IoT based big data is now analyzing with the help of analytic tools like
Hadoop MapReduce or Spark.
4. Finally the reports are generated by analyzing the data (Fig. 4).
There is a strong interdependent relation between big data and IoT, as they help
each other for taking decision in real time for business world [57, 58]. As the business

448 A. Singh and S. Mahapatra
Fig. 4 IoT based big data processing
grows, IoT sensor devices also grow and it creates more demands on the capabilities
of big data. Due to the huge amount of data generated by IoT based sensor devices,
the traditional data storage technology unable to store the data. As a result, more
advanced and innovative storage technology are designed and developed and update
the big data infrastructure of the business organisation. Due to this updating the IoT
based big data combined applications are expedite the scope of research in both
the areas. Hence, from the perspective of IoT, it is the fuel that drive the big data
technology.
9 Conclusion
IoT or Internet of Things is a system of interconnected intelligent devices with unique
identifier and ability to transfer data or information over a wireless network automat-
ically. This allows the development of intelligent devices and its applications in the
field of energy, logistics, industrial control, retail, agriculture, etc. The word “things”
in IoT refers to the devices which have unique identifiers and allow remote sensing,
remote monitoring and actuating. This chapter tries to present a brief overview on the
structure of IoT from point of view of International telecommunication Union (ITU).
A numerous data transfer technologies are utilized by the sensors or devices of the
IoT system. Some of the technologies named as RFID, Barcode, EPC, Internet proto-
col, Wi-Fi, Bluetooth, ZigBee, NFC, WSNs, Actuators and AI are explained briefly
in this chapter. From the architectural point of view, A 5-layer architectural model
of IoT is briefly described. As internet is hype of the IoT, it has many application
areas. A few application areas such as Supply chain management, Transportation,
Healthcare, Environment and disaster, Smart home and Smart Farming are briefly
described in this chapter. Big data and the role of IoT in big data for business world

Network-Based Applications of Multimedia Big Data Computing … 449
is also explored in this chapter. The IoT based big data processing is also described
in this chapter. Through which the business organisations are able to analyze IoT
based big data, manage them and able to take well-informed decision for their future
goal.
References
1. S.M.R. Islam, D. Kwak, M.D.H. Kabir, M. Hossain, K.S. Kwak, The internet of things for
health care: a comprehensive survey. IEEE Access. 3, 678–708 (2015). https://doi.org/10.1109/
ACCESS.2015.24379512. P. Mukherjee, the smartphone and the internet of things [Internet] (2015). http://praxis.ac.in/
the-smartphone-and-the-internet-of-things/. Accessed 2 Oct 20183. S. Meyer, A. Ruppen, C. Magerkurth, Internet of Things-aware process modeling: integrat-
ing IoT devices as business process resources, in Proceedings International Conference on
Advanced Information Systems Engineering, pp. 84–98 (2013)4. D. Mourtzis, E. Vlachou, N. Milas, Industrial big data as a result of IoT adoption in manufac-
turing. Procedia CIRP 55, 290–295 (2016)5. T. O’Donovan, A context aware wireless body area network (BAN), in Proceedings 3rd Interna-
tional Conference Pervasive Computing Technologies for Healthcare (Pervasive-Health 2009),
pp. 1–8 (2009)6. C. Faulkner, What is NFC? everything you need to know, November 2015. Techradar.com7. S. Madakam, R. Ramaswamy, S. Tripathi, Internet of Things (IoT): a literature review. J.
Comput. Commun. 3, 164–173 (2015). https://doi.org/10.4236/jcc.2015.350218. G. Aloi, G. Caliciuri, G. Fortino, R. Gravina, P. Pace, W. Russo, C. Savaglio, Enabling IoT
interoperability through opportunistic smartphone-based mobile gateways. J. Netw. Comput.
Appl. 81(74–84) (2017)9. G. Fortino, P. Trunfio, Internet of Things Based on Smart Objects, Technology, Middleware
and Applications. Springer (2014). ISBN 978-3-319-00490-710. G. Fortino, D. Parisi, V. Pirrone, G. Fatta Di, Bodycloud: a saas approach for community body
sensor networks. Future Gener. Comput. Syst. 35(6), 62–79 (2014)11. G. Fortino, A. Guerrieri, W. Russo, C. Savaglio, Integration of agent-based and cloud computing
for the smart objects-oriented IoT, in IEEE International Conference on Computer Supported
Cooperative Work in Design—CSCWD, pp. 493–498 (2014)12. G. Aloi, G. Caliciuri, G. Fortino, P. Pace, A smartphone-centric approach for integrating het-
erogeneous sensor networks, in International Conference on Body Area Networks BODYNETS,
London, Great Britain September 29–October 1, 201413. E.A. Kosmatos, N.D. Tselikas, A.C. Boucouvalas, Integrating RFIDs and smart objects into a
unified internet of things architecture. Adv. Int. Things: Sci. Res. 1, 5–12 (2011)14. R. Aggarwal, M. Lal Das, RFID security in the context of “internet of things”, in First Inter-
national Conference on Security of Internet of Things, Kerala, 17–19 August 2012, pp. 51–56
(2012)15. L. Atzori, A. Iera, Morabito, G., The internet of things: a survey. Comput. Netw., 2787–2805
(2010)16. L. Coetzee, J. Eksteen, The internet of things–promise for the future? An introduction, in
Proceedings of the 2011 IST-Africa Conference; May 11–13, 2011; Gaborone, Botswana; IIMC
International Information Management Corporation, pp. 1–9 (2011)17. S. Vongsingthong, S. Smanchat, Internet of things: a review of applications & technologies.
Suranaree J. Sci. Technol. 21(4), 359–374 (2014)18. O. Vermesan, P. Friess, Internet of Things: Converging Technologies for Smart Environments
and Integrated Ecosystems. River Publishers Series In Communications, London, UK, 364p.
(2013)

450 A. Singh and S. Mahapatra
19. J. Gubbi, R. Buyya, S. Marusic, M. Palaniswami, Internet of things (IoT): a vision, architectural
elements, and future directions. FutureGener. Comp. Syst. 29, 1645–1660 (2013)
20. M.E. Ajana, M. Boulmalf, H. Harroud, M. Elkoutbi, RFID middleware design and architecture,
in Dr. Cristina Turcu, editor. Designing and Deploying RFID Applications. Rijeka, Croatia:
InTech; https://doi.org/10.5772/16917 (2011)
21. S.M. Kywe, J. Shi, Y. Li, R. Kailash, Evaluation of different electronic product code discovery
service model. Adv. Int. Things (AIT) 2(2), 37–46 (2012)
22. ZIH Corp. Electronic Product Code (EPC) RFID Technology [Internet]. 2017. https://www.
zebra.com/us/en/resource-library/geting-started/rid-printing-encoding/epc-rid-technology.
html. Accessed 2 Oct 2018
23. Tutorials Point. Wi-Fi Wireless Communication [Internet]. 2015. www.tutorialspoint.com/wi-
i/wii_tutorial.pdf. Accessed 2 Oct 2018
24. P.I. Bluetooth [Internet]. 2008. webuser.hs-furtwangen.de/~heindl/ebte-08ss-bluetooth-Ingo-
Puy-Crespo.pdf [Accessed: 2 October 2018]
25. T. Obaid, H. Rashed, A. Abou-Elnour, M. Rehan, M. Muhammad-Saleh, M. Tarique, Zigbee
technology and its application in wireless home automation systems: a survey. Int. J. Comput.
Netw. Commun. 6(4). https://doi.org/10.5121/ijcnc.2014.6411 (2014)
26. S. Burkard, Near Field Communication in Smartphones [Internet]. https://www.snet.tu-berlin.
de/fileadmin/fg220/courses/WS1112/snet-project/nfc-insmartphones_burkard.pdf. Accessed
2 Oct 2018
27. K. Sohraby, D. Minoli, T. Znati, Wireless Sensor Networks: Technology, Protocols, and Appli-
cations. 1st ed. (John Wiley & Sons, Hoboken, NJ, 2017), pp. 38–69
28. Southwest Center for Microsystems Education (SCME) University of New Mexico. Intro-
duction to Transducers, Sensors and Actuators [Internet] (2011). http://engtech.weebly.com/
uploads/5/1/0/6/5106995/more_on_transducers_sensors_actuators.pdf. Accessed 2 Oct 2018
29. A. Al-Fuqaha, M. Guizani, M. Mohammadi, M. Aledhari, M. Ayyash, Internet of things: a
survey on enabling technologies, protocols, and applications. IEEE Commun. Surv. Tutor.
17(4), 2347–2376. https://doi.org/10.1109/COMST.2015.2444095 (2015)
30. R. Khan, S.U. Khan, R. Zaheer, S. Khan, Future internet: the internet of things architecture,
possible applications and key challenges, in Frontiers of Information Technology (FIT), 10th
International Conference on, pp. 257–260 (2012)
31. Z. Yang, Y. Peng, Y. Yue, X. Wang, Y. Yang, W. Liu, Study and application on the architecture
and key technologies for IOT, in Multimedia Technology (ICMT), International Conference
on, pp. 747–751 (2011)
32. M. Wu, T.J. Lu, F.Y. Ling, J. Sun, H.Y. Du, Research on the architecture of internet of things,
in Advanced Computer Theory and Engineering (ICACTE), 3rd International Conference on,
pp. V5-484-V5-487 (2010)
33. L. Tan, N. Wang, Future internet: the internet of things, in Advanced Computer Theory and
Engineering (ICACTE), 2010 3rd International Conference on, pp. V5-376-V5-380 (2010)
34. M.A. Chaqfeh, N. Mohamed, Challenges in middleware solutions for the internet of things,
in Collaboration Technologies and Systems (CTS), International Conference on, pp. 21–26
(2012)
35. M.E. Ajana, H. Harroud, M. Boulmalf, M. Elkoutbi, A. Habbani, Emerging wireless tech-
nologies in e-health trends, challenges, and framework design issues, in Proceedings of the
International Conference on Multimedia Computing and Systems (ICMCS), 10–12 October,
pp. 440–445 (2012)
36. M.E. Ajana, H. Harroud, M. Boulmalf, H. Hamam, FlexRFID: a lexible middleware for RFID
applications development, in: Proceedings of the 6th International Wireless and Optical Net-
works Communications (WOCN) Conference; April; Cairo, Egypt (2009)
37. M.E. Ajana, H. Harroud, M. Boulmalf, M. Elkoutbi, FlexRFID middleware in the supply
chain: Strategic values and challenges. Int. J. Mobile Comput. Multimed. Commun. 3(2),
19–32 (2011). https://doi.org/10.4018/jmcmc.2011040102
38. E.M. Ajana, M. Chraibi, H. Harroud, M. Boulmalf, M. Elkoutbi, A. Maach, FlexRFID: a
security and service control policy-based middleware for context-aware pervasive computing.
Network-Based Applications of Multimedia Big Data Computing … 451
Int. J. Adv. Res. Artif. Intell. (IJARAI). 3(10). https://doi.org/10.14569/ijarai.2014.031004
(2014)
39. S. Vongsingthong, S. Smanchat, Internet of things: a review of applications & technologies
[Internet] (2014). http://www.thaiscience.info/journals/Article/SJST/10966646.pdf. Accessed
2 Oct 2018
40. R. Li, H. Luo, Based on the internet of things the supermarket chain management informa-
tion system development and safety stock research, in Proceedings of the 2nd International
Conference on Education Technology and Computer (ICETC); 22–24 June; Shanghai, China.
pp. 368–371 (2010)
41. Y. Wei, Design and realization of mobile information collection module in logistic internet
of things uniied information system, in Proceedings of IEEE 3rd International Conference
on Communication Software and Networks (ICCSN); 27–29 May; Xian, China. pp. 263–266
(2011)
42. X. Lin, Logistic geographical information detecting unified information system based on inter-
net of things, in Proceedings of the 3rd International Conference on Communication Software
and Networks (ICCSN); 27–29 May; Xian, China, pp. 303–307 (2011)
43. Government Office for Science. The Internet of Things: Making the Most of the Second Digital
Revolution [Internet]. www.gov.uk/government/uploads/system/uploads/attachment_data/file/
409774/14-1230-internet-of-things-review.pdf. Accessed 2 Oct 2018
44. A. Ghose, P. Biswas, C. Bhaumik, M. Sharma, A. Pal, A. Jha, Road condition monitoring and
alert application: using in-vehicle Smartphone as internet-connected sensor, in Proceedings
of the IEEE 10th International Conference on Pervasive Computing and Communications
(PERCOM Workshops); 19–23 March; Lugano, Swizerland. pp. 489–491 (2012)
45. X. Ren, H. Jiang, Y. Wu, X. Yang, K. Liu, The Internet of things in the license plate recognition
technology application and design, in Proceedings of the Second International Conference on
Business Computing and Global Informatization (BCGIN); 12–14 October; Shanghai, China.
pp. 969–972 (2012)
46. W. Haiying, H. Long, Q. Xin, W. Hongbo, L. Gechen, D. Xianqing, Simulation system of the
performance of power batery for electrical vehicle based on Internet of things, in Proceedings
of the 2012 International Conference on Measurement, Information and Control (MIC); 18–20
May; Harbin, China, pp. 681–684 (2012)
47. V.M. Rohokale, N.R. Prasad, R. Prasad, A cooperative internet of things (IoT) for rural health-
care monitoring and control, in Proceedings of the 2nd International Conference on Wireless
Communication, Vehicular Technology, Information Theory and Aerospace &Electronic Sys-
tems Technology (Wireless VITAE); 28 February 3 March; Chennai, India, pp. 1–6 (2011)
48. A.J. Jara, M.A. Zamora, A.F. Skarmeta, Knowledge acquisition and management architecture
for mobile and personal health environments based on the internet of things, in Proceedings
of the IEEE 11th International Conference on Trust, Security and Privacy in Computing and
Communications (TrustCom); 25–27 June; Liverpool, UK, pp. 1811–1818 (2012)
49. M.T. Lazarescu, Design of a WSN platform for long-term environmental monitoring for IoT
applications. IEEE J. Emerg. Sel. Topics Circuits Syst. 3(1), 4554 (2013)
50. M.U. Farooq, M. Waseem, S. Mazhar, A. Khairi, T. Kamal, A review on internet of things
(IoT). Int. J. Comput. Appl. 113(1). https://doi.org/10.5120/19787-1571 (2015)
51. M. Khan, B.N. Silva, K. Han, Internet of things based energy aware smart home control system.
IEEE Access 4, 7556–7566 (2016)
52. R. Piyare, M. Tazil, Bluetooth based home automation system using cell phone, in IEEE 15th
International Symposium on Consumer Electronics (2011)
53. V.D. Bachuwar, A.D. Shligram, L.P. Deshmukh, Monitoring the soil parameters using IoT and
android based application for smart agriculture, in AIP Conference Proceedings 1989, 020003,
2018); Vol. 1989, Issue 1. https://doi.org/10.1063/1.5047679, Published Online: 23 July 2018
54. E. Ahmed, I. Yaqoob, I.A.T. Hashem, I. Khan, A.I.A. Ahmed, The role of big data analytics in
internet of things. Comput. Netw. 129, 459–471 (2017)
55. Y.-S. Kang, I.-H. Park, J. Rhee, Y.-H. Lee, MongoDB-based repository design for IoT-generated
RFID/sensor big data. IEEE Sens. J. 16(2), 485–497 (2016)

452 A. Singh and S. Mahapatra
56. H. Cai, B. Xu, L. Jiang, A.V. Vasilakos, Iot-based big data storage systems in cloud computing:
perspectives and challenges. IEEE Int. Things J. 4(1), 75–87 (2017)
57. L.D. Xu, W. He, S. Li, Internet of things in industries: a survey. IEEE Trans. Ind. Informat.
10(4), 2233–2243 (2014)
58. D. El-Baz, J. Bourgeois, T. Saadi, A. Bassi, ALMA, a logistic mobile application based on
Internet of Things, in: Proceedings of the IEEE International Conference on Green Computing
and Communications (GreenCom) and IEEE Internet of Things and IEEE Cyber, Physical and
Social Computing; 20–23 August; Beijing, China. pp. 355–358 (2013)
59. https://www.researchgate.net/figure/Four-dimensions-for-the-IoT-ITU_fig1_308711274

Evolution in Big Data Analytics
on Internet of Things: Applications
and Future Plan
Rohit Sharma, Pankaj Agarwal and Rajendra Prasad Mahapatra
Abstract The term Big Data shows the large and varied set of electronic information
that can be the combination of data collected from multiple sources. Reliably, we
make 2.5 quintillion bytes of facts; so much that 90% of the facts on earth nowadays
has been made over the trendy two years alone. Security and surety problems are
widely spreading out by using velocity, volume, and mixture of colossal records,
as an example, generous scale cloud systems, varying characteristics of informa-
tion sources and setups, spilling nature of information acquirement and high extent
among cloud movements. IoT is a great idea for everyone and also the best path for
innovation age. The IoT could play a very important role and be extensively delivered
with the aid of the splendid amount of heterogeneous devices that produce critically
“Huge information” (Lee et al. Research on iot based cyber physical system for
industrial big data analytics. IEEE, pp. 1855–1859, [1]). As we know that a number
of records are being gathered today through numerous associations and these records
need a large storage, so how to accommodate a large memory space is also a big
question in today scenario. It ends up being computationally wasteful to dissect any
such huge data. The amount of the handy crude facts has been developing an expo-
nential scale. A standout amongst the maximum vital highlights of IoT is its ongoing
or close to constant correspondence of facts approximately the “connected matters”.
The four precept peculiarity of IoT is (a) Large information degree (TBs to PBs),
(b) High velocity of statistics circulation, information alternate (OLTP) and facts
making ready (OLAP, examination) (c) Diverse prepared and unstructured informa-
tion, differing information models and inquiry dialects, diverse facts resources and
veracity (Rizwan et al. Real-time smart trafficmanagement systemfor smart cities by
using internet of things and big data. IEEE, pp. 1–7, [2]). Big data and IoT are widely
used in many applications worldwide. Many researchers are working day night to
improve the services of Big data and IoT. There are many deficiencies are present in
both the technologies. And the most common is its security. Big data and IoT both
requires the concern about its security. The reason behind is that, the big data and
IoT applications are accessing the use of cloud widely. And in many cases, the data
R. Sharma (B) · P. Agarwal · R. P. Mahapatra
SRM Institute of Science and Technology, Ghaziabad, India
e-mail: [email protected]
© Springer Nature Singapore Pte Ltd. 2020
S. Tanwar et al. (eds.), Multimedia Big Data Computing
for IoT Applications, Intelligent Systems Reference Library 163,
https://doi.org/10.1007/978-981-13-8759-3_18
453
454 R. Sharma et al.
stored to cloud is very secret. So from the security point of view, it is necessary to
take these technologies seriously. Some researchers are also working on RFID and
Internet of Things, like a combine approach. RFID is also a latest technology and
due to its deficiencies, RFID technology is extracting out by many vendors. In UK,
big numbers of RFID cards have been deployed in many places but it failed due to
lacking in security. To improve RFID security, researchers are also having a look
at IOT. The question is what the outcome will be. Will the researchers get success
by using this combine approach? May be yes. In this chapter, some applications are
discussed and try to explain the utilization of Big data and IoT in brief. Secondly, the
deficiencies are also the matter of concern in the chapter. The desired solutions to
overcome the drawbacks of the Big Data and Internet of Things are also discussed.
This chapter is present about the development in the subject of Big Data on Internet
of things applications.
Keywords IoT · Big data · IoT architecture · IoT in healthcare · Cloud
computing in big data
1 Introduction
IoT paperwork is a speaking-actuating community of a massive quantity of things
which includes RFID tags, cellular phones, sensors, and actuators, and so on. For
many applications, we required a big storage to store the data. Because in some case
the data is real time value that automatically update it after few moments. Like in
health care system, the human body parameter is based on real time data. That will
change after every moment. So here I am discussing about the same. The records
generated from IoT have the subsequent features:
• Large-scale statistics: Masses of data acquisition gadget are allotted. For analysis
and processing, now not most effective the presently received statistics.
• Effective statistics debts for most effective small part of large facts: a fantastic
amount of noises can also occur throughout the purchase and transmission of
statistics in IoT. In a few conditions, most effective small quantity of strange
statistics is treasured [3, 4].
Big data and IoT are widely used in many applications worldwide. Many researchers
are working day night to improve the services of Big data and IoT. There are many
deficiencies are present in both the technologies. And the most common is its security.
Big data and IoT both requires the concern about its security. The reason behind is
that, the Big data and IoT applications are accessing the use of cloud widely [5].
The term Big Data shows the large and varied set of electronic information that
can be the combination of data collected from multiple sources. Reliably, we make
2.5 quintillion bytes of facts; so much that 90% of the facts on earth nowadays
has been made over the trendy two years alone. Security and surety problems are
widely spreading out by using velocity, volume, and mixture of colossal records,
Evolution in Big Data Analytics on Internet of Things … 455
Table 1 Architecture using Five-layer for IoT
Layers Description
Perception layer Composed of physical gadgets and sensor devices
Network layer In this layer, the usage of era may be Wi-Fi, Z-Wave, 3G, Zig-Bee and so
forth
Middleware layer For processing, storing, and studying the data of objects that obtained from
the community layer and related to the database
Application layer It is based on the objects statistics processed inside the middleware layer
Business layer This layer is a manager of Internet of Things. The control includes
programs, relevant device version, and services
as an example, generous scale cloud systems, varying characteristics of information
sources and setups, spilling nature of information acquirement and high extent among
cloud movements.
Internet of thing is very important for everyone in current scenario. It is widely
useful in multiple applications like human healthcare systems, traffic monitoring
systems and environments monitoring systems etc. The IoT can make the human
life easier. The human health care system is widely used system that provides the
online record of health for a person. The environment tracking system can help us
to track the present environments condition for any location. The traffic intensity is
also a big problem in current scenario. This problem can be solving out by using
the Internet of thing. The traffic can be monitor and controlled with the help of IoT.
Some researchers are also doing funded project of IoT. These projects will be very
helpful for the society. So it is necessary to discuss about the recent trends of Internet
of things.
Complex facts sorts generally in IoT applications can be represented and modeled
extra successfully the usage of JSON (Java Script Object Notation) files, instead of
tables. IoT may be divided into 5 layers as proven in Table 1.
2 Recent Trends in IoT-Based Analytics and Big Data
Lot of applications recently comes in trend that links to Big data and IoT. It is very
important to learn and discuss about these recent trends. Today, many applications
are directly or indirectly linked to Big data and IoT. Big Data are widely used in
many applications worldwide. Many researchers are working day night to improve
the services of Big data and IoT. There are many deficiencies are present in both the
technologies. And the most common is its security. Big data and IoT both requires the
concern about its security. The reason behind is that, the big data and IoT applications
are accessing the use of cloud widely. Out of these, the use of IoT in healthcare, home
security, human tracking are widely acceptable by the world. Yes, while we are talking
about the benefits of a technology then few drawbacks and sophisticated issue are also

456 R. Sharma et al.
being in concern. Some researchers are also working on RFID and Internet of Things,
like a combine approach. RFID is also a latest technology and due to its deficiencies,
RFID technology is extracting out by many vendors. In UK, big numbers of RFID
cards have been deployed in many places but it failed due to lacking in security. To
improve RFID security, researchers are also having a look at IOT. The question is
what the outcome will be. Will the researchers get success by using this combine
approach? May be yes. Internet of thing is very important for everyone in current
scenario. It is widely useful in multiple applications like human healthcare systems,
traffic monitoring systems and environments monitoring systems etc. The IoT can
make the human life easier. The human health care system is widely used system that
provides the online record of health for a person. The environment tracking system
can help us to track the present environments condition for any location. The traffic
intensity is also a big problem in current scenario. This problem can be solving out
by using the Internet of thing. The traffic can be monitor and controlled with the help
of IoT. Some researchers are also doing funded project of IoT. These projects will
be very helpful for the society. So it is necessary to discuss about the recent trends
of Internet of things.
In this chapter, some applications are discussed and try to explain the utilization
of Big data and IoT in brief. Secondly, the deficiencies are also the matter of concern
in the chapter. The desired solutions to overcome the drawbacks of the Internet of
Things and Big Data are also discussed. This chapter is present about the development
in the subject of Big Data on Internet of things applications. So in this chapter I am
discussing about these advantages along with few drawbacks of Big data and IoT
[6]. The term Big Data shows the large and varied set of electronic information
that can be the combination of data collected from multiple sources. Reliably, we
make 2.5 quintillion bytes of facts; so much that 90% of the facts on earth nowadays
has been made over the trendy two years alone. Security and surety problems are
widely spreading out by using velocity, volume, and mixture of colossal records,
as an example, generous scale cloud systems, varying characteristics of information
sources and setups, spilling nature of information acquirement and high extent among
cloud movements. Here I am trying to share few reviewed papers on Big data and
IoT. I consider few researchers’ views. They are sharing their ideas in the field of Big
data and IoT. The concept and logic are different but the target is same how analyze
the performance of Big data and IoT.
Alam et al. [7] Have a study that has an applicability of 8 facts mining algorithms,
inclusive of KNN, SVM, NB, C5. Zero, C4. Five, linear discriminate evaluation
(LDA), synthetic neural community (ANN), and ANN (DLANN), deep studying for
IoT-generated statistics.
Lee et al. [1] Propose an Internet of Things-based completely cyber physical
gadget that helps information evaluation and information acquisition techniques to
enhance productivity in sever industries.
Rathore et al. [4] Advocate a clever town manage gadget based totally mostly on
Internet of Things that exploits analytics and big data. The records are amassed by
using deploying specific sensors, including water sensors and weather, surveillance
gadgets, vehicular networking sensors. The proposed model is carried out the usage of

Evolution in Big Data Analytics on Internet of Things … 457
the Map Reduce Hadoop environment in a actual environment. The implementation
technique consists of sever steps, together with information era, statistics amassing.
Rizwan et al. [2] Have an example that the weaknesses and strengths of numerous
visitors control systems. They recommend a low value, actual-time visitors control
machine that deploys sensors and IoT devices to seize actual-time site visitors infor-
mation. Specifically, low-price web site sensors for traffic detection are installed
within the center of the street for each 500 or one thousand meters. Compared with
the existing structures, the proposed device offers a higher alternative technique for
coping with web page site visitors.
Zhang et al. [3] Endorse Firework, a contemporary computing paradigm that
permits dispensed facts sharing and processing in an Internet of Things based totally,
collaborative region environment. Firework combines bodily allotted information
through manner of supplying digital statistics perspectives to give up customers
using predefined interfaces. Firework instance has many stakeholders who should
sign in their corresponding features and datasets which are abstracted as records
perspectives. They illustrate such concept through the usage of appearing case studies
of linked health and locate the misplaced.
Ahlgren et al. [5] talks the importance of using Internet of things to deliver ser-
vices for enhancing the lives of residents, which include air excellent, transportation,
and strength overall performance. The authors explain that Internet of things based
totally systems need to be primarily based on open facts and requirements, including
protocols and interfaces, to permit 0.33- birthday celebration innovations through
way of mitigating producer lock-ins.
Wang et al. [8] discusses the possibilities and challenges because of IoT and
big statistics for the cluster of maritime. They also boom a modern day framework
for integrating business Internet of things with massive information and analytics
generation.
Sezer et al. [9] proposes a model that integrates massive statistics, semantic net
technology, and Internet of things. The key necessities for the proposed model are the
conceptual and analyzed format of the predicted Internet of things gadget is proposed
based at the analysis consequences. The logical model deals with 5 layers, especially,
extract-rework-load (ETL), data acquisition, semantic rule reasoning, analyzing, and
motion.
Prez and Carrera [6] conclude a comprehensive study at the overall characteriza-
tion performance of the IOT. They specifically reputation on the contemporary day
infrastructure for website hosting Internet of things loads in the cloud with a goal
to provide multi-tenant facts move advanced querying mechanisms, processing abil-
ties, software answers through combining superior information-centric generation
and multi-protocol help.
Jara et al. [10] discusses a survey to spotlight the prevailing answers and demand-
ing situations to big data which can be posed thru cyber-physical structures. There
have a look at makes a specialty of cloud safety and the heterogeneous integration
of information from a couple of assets.
Vuppalapati et al. [11] Examine the function of large statistics in health system and
find out that sensors for body generate massive amounts of fitness related information.
458 R. Sharma et al.
Ding et al. [12] Recommend a contemporary cluster mechanism for statistical
database for massive statistics analysis in the (IOT-Statistic DB) IoT paradigm. The
statistical evaluation is completed in a disbursed and parallel fashion the usage of
more than one server.
Yen et al. [13] look at the capability of service composition techniques and discov-
ery in fixing actual-worldwide issues primarily based at the statistics generated via
IoT. They look at how diverse technology, consisting of statistics artificial intelligence
and analytics can be used inside the clever global to derive situational information
and to take moves therefore.
Ahmad et al. [14] makes analysis on the behavior of human by the usage of the
use of huge facts and analytics inside the social IoT paradigm. They recommend an
structure that contains three domains.
Arora et al. [15] Make use of huge records and analytics strategies to categories
network-enabled gadgets. They additionally examine the general overall performance
of four gadget studying algorithms, which include good Nave Bayes (NB), enough-
nearest neighbor (KNN), random forest and manual vector machines (SVM).
Minch et al. [16] Perform few studies about place privateness within the generation
of IoT, huge data, and analytics. They come to be privy to, describe and classify
privateness issues and display the viable ache elements inside the context of huge
information and analytics.
Mukherjee et al. [17] Endorse an Internet of things model for the execution of facts
parallel analytic jobs. They aim to turn out to be aware of a appropriate analytical
set of rules that would cope up with the necessities of processing and reading large
quantities of statistics.
Ramakrishnan et al. [18] Analyze the contemporary energy improvement in India
and determine the blessings that may be received via analytics and cloud computing.
Berlian et al. [19] Introduce a model for tracking and studying massive quantities
of information that are generated via the (IoUT) Internet of Underwater Things.
Mourtzis et al. [20] Display that the adoption of Internet of things within the man-
ufacturing enterprise can remodel conventional systems into contemporary ones.
Moreover, such transformation results in a records production manner that turns
commercial information into commercial enterprise large statistics, which is proba-
bly rendered vain without analytics power. The term Big Data shows the large and
varied set of electronic information that can be the combination of data collected
from multiple sources. Reliably, we make 2.5 quintillion bytes of facts; so much that
90% of the facts on earth nowadays has been made over the trendy two years alone.
Security and surety problems are widely spreading out by using velocity, volume,
and mixture of colossal records, as an example, generous scale cloud systems, vary-
ing characteristics of information sources and setups, spilling nature of information
acquirement and high extent among cloud movements. Big data and IoT are widely
used in many applications worldwide. Many researchers are working day night to
improve the services of Big data and IoT. There are many deficiencies are present in
both the technologies. And the most common is its security. Big data and IoT both
require the concern about its security [21].

Evolution in Big Data Analytics on Internet of Things … 459
And in many cases, the data stored to cloud is very secret. Some researchers are
also working on RFID and Internet of Things, like a combine approach. RFID is also
a latest technology and due to its deficiencies, RFID technology is extracting out
by many vendors. In UK, big numbers of RFID cards have been deployed in many
places but it failed due to lacking in security. To improve RFID security, researchers
are also having a look on IOT. The question is what outcome will be. In this chapter,
some applications are discussed and try to explain the utilization of Big data and IoT
in brief. Secondly, the deficiencies are also the matter of concern in the chapter. The
desired solutions to overcome the drawbacks of IoT and bog data are also discussed.
3 The Need of Big Data and IoT Implementation
IoT will permit massive records, large facts needs analytics, and analytics will
enhance procedures for greater IoT gadgets. The parent below suggests the regions
of massive facts produced. Some or the alternative way, facts is produced through
connected devices [22].
Figure 1 show the different areas relates to big data. Figure shows that, how the
different technologies are connected to each other in big data.
• Analytical monitoring
• Enable mass customization
• Improved situational alertness
• Safety enhancements
• Process optimization
Fig. 1 Various areas relates to Big data

460 R. Sharma et al.
• Labor Efficient use
• Optimized resource utilization
• Improved quality
The above are few viable motives to put in force Big data and IoT.
4 IoT Impacts on Big Data
Internet of Things is a network including devices (physical), which can be addition-
ally implanted with electronics, software and sensors thereby allowing those gadgets
to trade records. This surely allows good incorporation among actual world bodily
entities and laptop-operated systems. The term Big Data shows the large and varied
set of electronic information that can be the combination of data collected from mul-
tiple sources. Reliably, we make 2.5 quintillion bytes of facts; so much that 90% of
the facts on earth nowadays has been made over the trendy two years alone. Security
and surety problems are widely spreading out by using velocity, volume, and mixture
of colossal records, as an example, generous scale cloud systems, varying character-
istics of information sources and setups, spilling nature of information acquirement
and high extent among cloud movements. Lot of applications are recently comes in
trend that links to Big data and IoT. It is very important to learn and discuss about
these recent trends. Today, many applications are directly or indirectly linked to Big
data and IoT. Out of these, the use of IoT in healthcare, home security, human track-
ing are widely acceptable by the world. Yes, while we asking about the advantages of
any technology then few drawbacks and sophisticated issue are also be present there.
So in this chapter I am discussing about these advantages along with few drawbacks
of Big data and IoT [23].
The term Big Data shows the large and varied set of electronic information that
can be the combination of data collected from multiple sources. Reliably, we make
2.5 quintillion bytes of facts; so much that 90% of the facts on earth nowadays
has been made over the trendy two years alone. Security and surety problems are
widely spreading out by using velocity, volume, and mixture of colossal records,
as an example, generous scale cloud systems, varying characteristics of information
sources and setups, spilling nature of information acquirement and high extent among
cloud movements. Big data and IoT are widely used in many applications worldwide.
Many researchers are working day night to improve the services of Big data and IoT.
There are many deficiencies are present in both the technologies. And the most
common is its security. Big data and IoT both require the concern about its security.
a. Issues of Security for data
The Internet of things has given new protection demanding situations that cannot
be controlled by way of using conventional protection techniques. Big data and IoT
are widely used in many applications worldwide. Many researchers are working day
night to improve the services of Big data and IoT. There are many deficiencies are

Evolution in Big Data Analytics on Internet of Things … 461
present in both the technologies. And the most common is its security. Big data and
IoT both requires the concern about its security. The reason behind is that, the Big
data and IoT applications are accessing the use of cloud widely. In UK, big numbers
of RFID cards have been deployed in many places but it failed due to lacking in
security. To improve RFID security, researchers are also having a look at IOT. The
question is what the outcome will be. Will the researchers get success by using this
combine approach? May be yes. In this chapter, some applications are discussed and
try to explain the utilization of Big data and IoT in brief. Secondly, the deficiencies
are also the matter of concern in the chapter. The desired solutions to overcome the
drawbacks of the Internet of Things and Big Data are also discussed. This chapter
is present about the development in the subject of Big Data on Internet of things
applications. So in this chapter I am discussing about these advantages along with
few drawbacks of Big data and IoT [6]. Facing IoT safety troubles require a shift.
Few security troubles are
• Secure filtering of redundant statistics
• Secure statistics facilities
• Secure transactions
• Access manage
• Imposing real time protection, and so on.,
A multi-layered protection device and proper network tool will assist avoid attacks
and maintain them from scattering to different elements of the community.
b. Storage for Big Data
Obviously Internet of things has an instantaneous impact at the storage infrastructure
of massive facts. For many applications, we required a big storage to store the data.
Because in some case the data is real time value that automatically update it after
few moments. Like in health care system, the human body parameter is based on real
time data. That will change after every moment. So here I am discussing about the
same. The records generated from IoT have the subsequent features: Collection of
Internet of things Big Data is a difficult assignment because filtering redundant facts
is necessarily required [24].
c. Year by year living Impact:
At domestic, the dwelling theatre gambling the favorite film of ours as rapid as you
flip on the TV, clever gadgets could have got to shop plenty of power and cash through
robotically switching off electric devices even as you go away domestic.
The above mentioned goes to reveal up in a fully temporary time given that of the
fast improvement in web of things and large information science [25].
d. Analytics of Big Data:
IoT significant knowledge analytics may also be very needed to grow to be in a
optimized decision. Consistent with the Gartner IT dictionary, massive information
is style of know-how belongings, immoderate-quantity, and immoderate-pace and
progressive forms of records processing for higher approach and option making

462 R. Sharma et al.
[26]. The term Big Data shows the large and varied set of electronic information
that can be the combination of data collected from multiple sources. Reliably, we
make 2.5 quintillion bytes of facts; so much that 90% of the facts on earth nowadays
has been made over the trendy two years alone. Security and surety problems are
widely spreading out by using velocity, volume, and mixture of colossal records,
as an example, generous scale cloud systems, varying characteristics of information
sources and setups, spilling nature of information acquirement and high extent among
cloud movements [6].
The charge at which expertise streams in from property along with cellular items;
click on streams, gadget-to-method approaches is giant and constantly fast trans-
ferring. Significant know-how mining and analytics makes it possible for to reveal
secret patterns, unidentified correlations, and specific manufacturer documents [11].
5 Internet of Things Applications
The IoT is anything but an all around coordinated statute. It is an application time
and valuable to our life. There exist some effective projects officially progressed in
exceptional fields like transportation, astute situations territory, wellness care put,
dinner’s manageability, and advanced applications [27].
a. Transportation
• Brilliant stopping
The brilliant stopping gives answers for control of stopping that can assist
drivers with keeping time and gas. By providing right information about vehi-
cles stopping territories, it will be valuable for improving site guests float and
abatement site guests stick [28].
• Three-D Assisted driving
Vehicles like autos, transports and prepares which is presumably furnished
with sensors can supply gainful data to the main impetus to keep better route
and wellbeing. By utilizing 3D helped utilizing, the drivers can decide the right
course in view of on prior comprehension about guests stick and mischance’s
[12].
b. Shrewd conditions
• Shrewd houses and work environments
Sensors, controllers and actuators might be added to various residential and
authoritative focus gadgets as a fan, icebox, clothes washer, forced air system,
and microwave. For instance in Turkey, they watch a product for a residential
that is a response for masses issues [29].
• Brilliant water supply
Water supply in sharp urban communities needs to be followed to guarantee
that the water amount is sufficient for ways of life wishes. The keen urban

Evolution in Big Data Analytics on Internet of Things … 463
areas might be fit for find water misfortune bother sooner than it takes area,
thus it can broadly keep on the value assortment. It enables the sharp urban
areas to find the water spill sites and select out change priority to keep parts
measure of water from misfortune.
c. Medicinal services
• Pharmaceutical stock
Keen drug store is a perfect program that enables smooth gets to treatment.
Sensors associated devices can show the use of the medicine. On account of
finding terminated pills, it will keep it from gets to the influenced individual.
For instance, keen physician recommended drugs is a South African venture
that gives a settled of over the top abilities, low-charge pharmaceuticals to drug
stores, specialists, and extraordinary human services social orders.
• Wellbeing following
Radio Frequency Identification (RFID) age is valuable for screen character’s
wellness. The influenced man or lady’s restorative insights might be estimated
by means of detecting gadgets and dispatched remotely to his to seek after his
wellness [30].
d. Advanced projects
The applications noted inside the past segments are commonsense as they both
were at that point conveyed or might be expert in a short or medium period con-
sidering the predefined time are now accessible. The following noted applications
aren’t done; it’ll see inside what’s to come.
e. Sustenance manageability
There are various stages that crosses from it before setting into the ice chest.
These extents are fabricating, collecting, transportation, and dissemination. The
sustenance can be put away from harm through the utilization of sensors that ready
to show the fame of the nourishment and track temperature, mugginess, and light
to safeguard nourishment. Powerful dinners checking let in plant security from
damage and oversee water sum [31].
City data variant
The (CIM) City Information Model is based on the conviction that recommends
all homes is followed by means of the experts and permitted to the third birthday
festivity. Can obviously interconnect with every uncommon. Shrewd urban areas
models must be incorporated to improve execution and effectiveness of the gadget
[18].
Taxi using Robot
Savvy robot taxis in brilliant urban communities can address with each other and
offer contributions while solicited by route from people. Robot cabs can treat without
issues with activity blockage. On account of ceasing in the meantime as sensors told
that actuators start off energizing batteries, it can make straightforward safeguarding
and smooth the vehicle.

464 R. Sharma et al.
6 Methodologies and Techniques
Lot of methodologies and techniques are available for improving the services of Big
data and IoT. Few of them, we are going to discuss here (Fig. 2).
a. Map Reduce:
Map Reduce move toward becoming built as a broad programming worldview. A
portion of the valid jobs provided all the key wants of parallel execution, adapta-
tion to internal failure, stack adjusting, and data control. The Map Reduce structure
accumulates all gadgets with the not strange key from all information and goes along
with them by and large. Hence, it secures shaping one business endeavor for every
last one of the super created keys. Map Reduce is one of the new age, anyway it’s far
obviously an arrangement of rules, a strategy for the best approach to fit as a fiddle
the majority of the insights. To accumulate the awe inspiring from Map Reduce, we
need more noteworthy than only a calculation. We need an arrangement of items and
innovations made to control the difficulties of Big data [33].
b. Hadoop:
Hadoop is proposed to parallelize records preparing through processing hubs to
surge calculations and shroud idleness. Map Reduce is a structure that is utilized for
handling enormous records sets in an assigned style through various machines [34].
c. Pig:
The Pig usage planned in the Hadoop structure to offer additional database as ability.
A work area in Pig is a settled of tuples, and each issue is a rate or an arrangement
of tuples. Along these lines, this structure takes into consideration settled tables,
that is a surprising conviction. Pig additionally offers a scripting dialect known as
Fig. 2 Hadoop ecosystem of
Apache [32]

Evolution in Big Data Analytics on Internet of Things … 465
Pig Latin that gives the majority of the not unordinary ideas of SQL, together with
projections, joins, arranging, and gathering. Pig Latin contrasts from SQL as contents
are procedural and are perfect for software engineers to be comprehended [29].
d. HBase:
HBase is a database show inside the Hadoop structure that resembles the first gadget
of Big Table. The records in HBase are similarly spared as (key, rate) gadgets, wherein
the mission inside the non-key segments might be spoken to by the qualities.
e. Mahout:
Mahout is particularly built on an Apache open-convey library which ready to be
scaled and overseen for the huge amount of realities. These fragments rely upon three
full-estimate framework considering missions that Mahout as of now works.
• Collaborative separating
• Clustering
• Categorization/Classification.
f. NoSQL:
In light of the blast of the Internet ease of use and the openness of minimal effort
stockpiling, a major amount of built up, semi-set up and unstructured certainties
are obtained and put something aside for sublime styles of bundles. This measure-
ment is usually signified to as big records. Google, Facebook, Amazon, and severa
uncommon organizations utilize NoSQL databases [35].
g. GFS:
GFS is an assigned report gadget set up by methods for Google Inc. GFS is more suited
for Google’s most imperative realities stockpiling and use prerequisites which can
create huge parts of insights that calls for reviewing. GFS has numerous capacities,
which incorporate conventional in general execution, adaptability, dependability, and
accessibility of the apportioned report framework controlled through way of utility
outstanding tasks at hand and innovative condition of Google [30].
h. Big Table:
A Big Table improvement is started in 2004 and is presently used by a far of Google
applications, all in all with Map Reduce.
Big Table is enlarged for insights take a gander at procedures, by utilizing method
for allocated data carport control demonstrate, it truly is basically founded for the
most part on segment stockpiling to finish information recovering viability [20].
The term Big Data shows the large and varied set of electronic information that
can be the combination of data collected from multiple sources. Reliably, we make
2.5 quintillion bytes of facts; so much that 90% of the facts on earth nowadays
has been made over the trendy two years alone. Security and surety problems are
widely spreading out by using velocity, volume, and mixture of colossal records,
as an example, generous scale cloud systems, varying characteristics of information

466 R. Sharma et al.
sources and setups, spilling nature of information acquirement and high extent among
cloud movements. Big data and IoT are widely used in many applications worldwide.
Many researchers are working day night to improve the services of Big data and IoT.
There are many deficiencies are present in both the technologies. And the most
common is its security. Big data and IoT both require the concern about its security
[36].
i. Ontology
Metaphysics is the focal point of any semantic time as semantic sensor Web. It is a
gadget for data designations and use. Semantic Ontology might be separated into a
couple of codecs as OWL and RDF.
j. Semantic Sensor Web
The measure of blessing sensors can be full-estimate, and the aggregated information
might be escalated. On the off chance that we’ve the capacity to put the accumulations
of records legitimate into a homogeneous and heterogeneous frame, at that point
the interoperability issues of insights the information will depend upon the semantic
advancements to device the data. There are numerous components of semantic sensor
Web as [31]:
k. RDF:
RDF is a shortening for portrayal considers structure. It is an investigations depiction
dialect. This dialect decides the manner in which that sources can interconnect with
each unique and perform understandings.
l. Data Fusion
It is a multidisciplinary volume that incorporates server fields, and it is hard to
discharge an unmistakable and specific class. The created systems and methods can
be partitioned as said through the accompanying prerequisites:
– According to the particular records combination levels said by method for the
utilization of the JDL.
– According to the structure kind: (a) concentrated, (b) decentralized, or (c) dis-
pensed.
In the accompanying subsections, a couple of IoT middleware proposition are
ordered:
UBIWARE
The middle thoughts of UBIWARE is to allow computerized revelation, organization,
movement, summon and execution of different Business Intelligence contributions.
Connection Smart Middleware
Connection Smart is predicated on a semantic model-driven design and allows the
utilization of gadgets as administrations each with the valuable asset of inserting
contributions in gadgets and with the asset of intermediary administrations for gad-
gets. The semantic depiction of gadgets depends on ontology the utilization of OWL,
SAWSDL and OWL-s [24].

Evolution in Big Data Analytics on Internet of Things … 467
Hydra
The Hydra middleware incorporates of a transporter arranged shape. It relies upon
Web contributions to help the asset revelation, depiction, and get passage to that
depends absolutely on XML and Web conventions. Hydra people group utilizes an
intermediary to join the limited gadgets to it. The two standard obligations wrapped
up by method for Hydra developers are (I) incorporating non-Hydra gadgets and (ii)
interfacing Hydra-empowered contraptions to a system.
7 Cloud Computing and Big Data Analytics for IOT
Big data and IoT are widely used in many applications worldwide. Many researchers
are working day night to improve the services of Big data and IoT. There are many
deficiencies are present in both the technologies. And the most common is its security.
Big data and IoT both require the concern about its security. The reason behind
is that, the Big data and IoT applications are accessing the use of cloud widely.
The term Big Data shows the large and varied set of electronic information that
can be the combination of data collected from multiple sources. Reliably, we make
2.5 quintillion bytes of facts; so much that 90% of the facts on earth nowadays
has been made over the trendy two years alone. Security and surety problems are
widely spreading out by using velocity, volume, and mixture of colossal records,
as an example, generous scale cloud systems, varying characteristics of information
sources and setups, spilling nature of information acquirement and high extent among
cloud movement [15] (Table 2).
Map Reduce is a processing version and programming in big statistics. Some Map
Reduce initiatives and related software program are shown in Table 3.
Web of Things has been advanced in one of a kind districts and states in 3 principal
designs and probabilities financing strategy. In the states together with the USA, the
brief timeframe period respect fund weight of the advancement of cunning power,
sharp towns, and RFIDs. Through the online life arrange, a couple of administrations,
and bundles, together with locale based absolutely contributions, expanded truth, and
cell phones, are primary to the advancement of Internet of Things. Despite the fact
that it isn’t in every case yet evident which procedure is all the more ground-breaking,
every one of them can support Internet of Things and its projects. Be that as it may, an
approach to decide the endeavors of accessible sources at an arranged level obtains
each other task [26].
Joining big statistics with conventional statistics is any other path to value. For
instance, so-referred to as 360-diploma perspectives of clients and different business
entities are extra entire and larger whilst based totally on both traditional business
enterprise records and large records [13]. Big data and IoT are widely used in many
applications worldwide. Many researchers are working day night to improve the
services of Big data and IoT [37]. There are many deficiencies are present in both the
technologies. And the most common is its security. Big data and IoT both requires
the concern about its security. The term Big Data shows the large and varied set of

468 R. Sharma et al.
Table 2 Classification for Big data
Classification Description
Data sources • Web and Social: Generating information thru URL to share or change
facts in digital communities and networks, consisting of blogs, Facebook,
and Twitter
• Machine: automatically producing information from computer systems,
medical devices, or other machines
• Sensing: producing information from sensing devices
• Transactions: Transaction statistics, consisting of monetary and paintings
statistics
• IoT: Internet of things produces huge amounts of statistics
• Semi-structured: not following a conventional database device; within the
form of structured facts that are not prepared in relational database
fashions
• Unstructured: along with textual content messages, movies, and social
media information; now not following a designated layout
Data stores • Document-oriented: A document-orientated information save is much like
a document or row in a database type relational
• Graph primarily based: storing and representing records that make use of
a graph model with nodes, edges, and houses related to each other through
members of the family
• Key-value: Key-cost is an opportunity relational database device that
shops and accesses records designed to scale to a very big length
Data staging • Cleaning: identifying incomplete and unreasonable facts
• Transform: remodeling data into a form appropriate for evaluation
Data processing • Batch: Map Reduce-primarily based structures were followed for
lengthy-going for walks batch jobs
• Real time: including easy scalable streaming system (S4)
Table 3 Some related software and Map Reduce projects
Software Brief description
Hive Offers a HDFS warehouse structure
Hbase Scalable distributed database assisting based statistics garage for big tables
SparkTM A speedy computation engine for Hadoop statistics
Cassandra A scalable multi-master database without a single factor of failure
ZookeeperTM High-performance provider to coordinate the approaches of allotted programs;
a distributed carrier with grasp and slave nodes and stores configuration facts
MadoutTM A device-studying and information-mining library that can be completed in a
allotted mode and is executable via Map Reduce

Evolution in Big Data Analytics on Internet of Things … 469
Table 4 Big data IoT
management subsystemLayers Management subsystems
Layer 1 IoT objects management (physical devices)
Layer 2 IoT big-data management
Layer 3 IoT intelligence management
Layer 4 IoT applications management
Table 5 Overall big data IoT
layering architectureLayering Architecture representation
Application layer IoT applications
Knowledge processing layer IoT tools
Data management layer IoT middleware
Transport layer IoT network
Physical sensing layer IoT objects
electronic information that can be the combination of data collected from multiple
sources. Reliably, we make 2.5 quintillion bytes of facts; so much that 90% of the
facts on earth nowadays has been made over the trendy two years alone. Security and
surety problems are widely spreading out by using velocity, volume, and mixture of
colossal records, as an example, generous scale cloud systems, varying characteristics
of information sources and setups, spilling nature of information acquirement and
high extent among cloud movements [6].
In UK, big numbers of RFID cards have been deployed in many places but it failed
due to lacking in security. To improve RFID security, researchers are also having a
look at IOT. The question is what the outcome will be. Will the researchers get success
by using this combine approach? May be yes. In this chapter, some applications are
discussed and try to explain the utilization of Big data and IoT in brief. Secondly, the
deficiencies are also the matter of concern in the chapter. The desired solutions to
overcome the drawbacks of the Internet of Things and Big Data are also discussed.
This chapter is present about the development in the subject of Big Data on Internet
of things applications. So in this chapter I am discussing about these advantages
along with few drawbacks of Big data and IoT [6].
An information type procedure is anticipated to formulate fused information into
more than one fact groups [31]. The fused information can be labeled into more than
one businesses of having more than one occasion kinds inclusive of system popularity
records, functional facts, inventory records, manufacturing facts, and product great
information, etc. [16, 27] (Tables 4 and 5).
IoT will power Big Data by way of supplying extra information, from many
distinct resources, in real-time. Big Data has few key skills for records management
in IoT:
• Creating rich and useful packages: Data control have to aid the improvement of
functionally wealthy packages with complicated information and algorithms [15].

470 R. Sharma et al.
• Unlocking commercial enterprise agility: The potential to aid many new and reg-
ularly converting business necessities.
• Enabling a unmarried point of truth and commercial enterprise convergence:
Aggregate more than one views of associated facts from multiple structures into
one constant version of the facts [38].
The product of huge simple insights is the antecedent to the upward push of the
(IIoT) Industrial Internet of Things. By making machines more quick witted by means
of neighborhood preparing and discussion, the IIoT will resolve inconveniences in
systems which have been some time ago impossible [35]. This is in which enormous
records investigation (BDA) will coordinate in. Indeed, BDA and IoT supplement
each uncommon and increment as a twofold “helix”. BDA on sensor-empowered
task records can upgrade vitality execution and natural generally speaking execution,
assurance confirmation and assessment, and the following of wounds and condition
dangers. In standard, BDA requires overwhelming computational quality. As people
have decided in the HPC arrange, super pc frameworks have just been worked with a
half and half CPU and GPU structure to use the huge pool of preparing contraptions
in GPUs [30].
Web of Things has been advanced in one of a kind districts and states in 3 principal
designs and probabilities financing strategy. In the states together with the USA, the
brief timeframe period respect fund weight of the advancement of cunning power,
sharp towns, and RFIDs. Through the online life arrange, a couple of administrations,
and bundles, together with locale based absolutely contributions, expanded truth, and
cell phones, are primary to the advancement of Internet of Things. Despite the fact
that it isn’t in every case yet evident which procedure is all the more ground-breaking,
every one of them can support Internet of Things and its projects. Be that as it may, an
approach to decide the endeavors of accessible sources at an arranged level obtains
each other task [26].
A comprehensive Big Data approach changed into proposed to uncover the not
bizarre direction from tremendous RFID-empowered creation realities for support-
ing assembling coordinations decision makings. This system includes several key
advances: warehousing for crude RFID information, purging instrument for RFID
enormous certainties, mining not strange examples, and also test elucidation and
representation. For IoT programs, they got substantial detecting records might be in
various abilities, that is a test. Enormous Data investigation has been vast heteroge-
neous records examination in nonlinear, high-dimensional, dispensed, and parallel
insights handling. In Big Data procedures for IoT, a calculation changed into pro-
posed for peculiarity discovery in enormous sensor actualities. Big data and IoT are
widely used in many applications worldwide. Many researchers are working day
night to improve the services of Big data and IoT. There are many deficiencies are
present in both the technologies. And the most common is its security. Big data and
IoT both requires the concern about its security. The reason behind is that, the Big
data and IoT applications are accessing the use of cloud widely. In exact, an arrange-
ment of tenets of relevant inconsistency location moved toward becoming conveyed
to improvement a thing abnormality recognition set of principles. A post-preparing

Evolution in Big Data Analytics on Internet of Things … 471
setting cognizant irregularity location algorithm changed into proposed in light of on
a multivariate grouping set of directions. A Map Reduce technique turned out to be
moreover proposed to characterize the sensor profiles utilized in the setting locator
[33, 39].
8 Future Directions and Challenges of Internet of Things
The Internet of Things is offers various new conceivable outcomes to the venture
and end shopper in loads of programming fields. Lot of applications are recently
comes in trend that links to Big data and IoT. It is very important to learn and discuss
about these recent trends. In UK, big numbers of RFID cards have been deployed
in many places but it failed due to lacking in security. To improve RFID security,
researchers are also having a look at IOT. The question is what the outcome will be.
Will the researchers get success by using this combine approach? May be yes. In
this chapter, some applications are discussed and try to explain the utilization of Big
data and IoT in brief. Secondly, the deficiencies are also the matter of concern in the
chapter. The desired solutions to overcome the drawbacks of the Internet of Things
and Big Data are also discussed. The term Big Data shows the large and varied set of
electronic information that can be the combination of data collected from multiple
sources. Reliably, we make 2.5 quintillion bytes of facts; so much that 90% of the
facts on earth nowadays has been made over the trendy two years alone. Security and
surety problems are widely spreading out by using velocity, volume, and mixture of
colossal records, as an example, generous scale cloud systems, varying characteristics
of information sources and setups, spilling nature of information acquirement and
high extent among cloud movements. This chapter is present about the development
in the subject of Big Data on Internet of things applications. So in this chapter I
am discussing about these advantages along with few drawbacks of Big data and
IoT [6]. Today, many applications are directly or indirectly linked to Big data and
IoT. Internet of thing is very important for everyone in current scenario. It is widely
useful in multiple applications like human healthcare systems, traffic monitoring
systems and environments monitoring systems etc. The IoT can make the human
life easier. The human health care system is widely used system that provides the
online record of health for a person. The environment tracking system can help us
to track the present environments condition for any location. The traffic intensity is
also a big problem in current scenario. This problem can be solving out by using
the Internet of thing. The traffic can be monitor and controlled with the help of IoT.
Some researchers are also doing funded project of IoT. These projects will be very
helpful for the society. So it is necessary to discuss about the recent trends of Internet
of things.
Out of these, the use of IoT in healthcare, home security, human tracking are
widely acceptable by the world. Yes, while we asking about the advantages of any
technology then few drawbacks and sophisticated issue are also be present there. So

472 R. Sharma et al.
in this chapter I am discussing about these advantages along with few drawbacks of
Big data and IoT [33].
a. Challenge of Environment Innovation:
Web of Things is a muddled system that is most likely executed with the guide of
a few supporters, in which administrations should be audaciously delivered. In this
way, new administrations or projects must be upheld without coming about hundreds
for the commercial center gets to or other task squares. In this way, the move-area
frameworks helping advancement keeps on being poor [40].
b. Challenge of Architecture:
Web of Things covers a serious sort of innovation. Web of Things comprises of
a combined scope of cunning interconnected contraptions and sensors alongside
cameras, biometric, substantial, and concoction sensors [41]. They are frequently
nonintrusive, seen, and covered up.
c. Challenge of Technical Protocols:
There are a few specialized requesting circumstances as Heterogeneous design inside
the network innovation and applications. Web of Things comprises of unmistakable
sorts of systems that are not smooth to coordinate them. The cost of report age
should be little and associations must be dependable. Characterizing the type of
proper wellbeing and privateness answer is an entangled procedure. Initiation of
programmed contributions stills an endeavor [42].
d. Challenge of Security and Privacy:
Issues of security and privateness in Internet of Things wind up more noteworthy
clear than a customary system. Notwithstanding there exist an outstanding wide
assortment of specialists in insurance and privateness, there’s a constant interest for
security wellbeing and secret privateness of records. Todays, client’s realities have
an inside and out security, so privateness assurance is an enormous issue. Security
models which can be composed presently may not be ideal for Internet of Things
structures [43, 44].
Endorsement of most recent innovation and contributions depend on trustfulness
of certainties and security of data and its privateness.
e. Challenge of Hardware:
Keen gadgets with more noteworthy between instrument correspondence will prompt
shrewd frameworks with unnecessary degrees of insight. There are 5 requesting cir-
cumstances that face equipment in Internet of Things, esteem, power and quality,
condition related inconveniences, network, and upkeep. Web of Things associations
depend upon remote that moderately low expense and incidental size [45]. Equip-
ment gadgets must be intended to apply the littlest measure of power and long-lasting
battery. The external condition can likewise affect the equipment effectiveness as con-
tamination, dampness, and warming. The association ought to be solid and adaptable
and now not depend handiest on remote, the Internet or records should be permitted.
Evolution in Big Data Analytics on Internet of Things … 473
It is costly to keep harms in detecting devices, so insurance and guide should be
neighborhood [46, 47].
f. Challenge of Standard:
Measures make an essential endeavor in creating Internet of Things. A broad is vital
to allow smooth and equivalent access and use to all performing artists. Standard
and idea characteristics will rouse the change of Internet of Things foundations
and projects, administrations and contraptions. Institutionalization lets in item and
contributions to do the incredible. The institutionalization could be extreme because
of sizable speed in Internet of Things. Conventions and multi-equalities can expand
institutionalization. It must be open. Moreover, the standard improvement framework
should be available to all on-screen characters and the following well known must
be open and free [48].
g. Strategies for Development:
Web of Things has been advanced in one of a kind districts and states in 3 principal
designs and probabilities financing strategy. In the states together with the USA, the
brief timeframe period respect fund weight of the advancement of cunning power,
sharp towns, and RFIDs. Through the online life arrange, a couple of administrations,
and bundles, together with locale based absolutely contributions, expanded truth, and
cell phones, are primary to the advancement of Internet of Things. Despite the fact
that it isn’t in every case yet evident which procedure is all the more ground-breaking,
every one of them can support Internet of Things and its projects. Be that as it may, an
approach to decide the endeavors of accessible sources at an arranged level obtains
each other task [26].
h. Business Challenge:
The issue is that there might be no arrangement of business venture period set of
guidelines to fit as a fiddle all. The Internet of Things is avoidance to regular business
endeavor variant. In the initial phase in business undertaking rendition advancement
in Internet of Things, endeavor necessities must start with diminishing device disap-
pointment [49, 50].
i. Challenges for Data Processing:
Information handling is a critical resources in the Internet of Things. By taking
a gander at the interconnecting gadgets and devices that exchange stand-out sorts
of data, the subsequent gathered data has a top to bottom degree. The capacity
records focuses that store this following information will require more spaces, power
and power resources. This data require association and handling. Semantic realities
combination models might be utilized for extricating that implies from insights.
Additionally, engineered insight calculations should be suggested to harvest which
implies from these repetitive records. Information carport and examination will be
an inconvenience amid all worldwide will be connected through Internet of Things.
Dealing with out the majority of the information from the Internet of Things is a
training in Big information that executed 3 most vital advances: realities ingestion,

474 R. Sharma et al.
actualities carport, and examination [24, 51]. Internet of thing is very important for
everyone in current scenario. It is widely useful in multiple applications like human
healthcare systems, traffic monitoring systems and environments monitoring systems
etc. The IoT can make the human life easier. The human health care system is widely
used system that provides the online record of health for a person. The environment
tracking system can help us to track the present environments condition for any
location. The traffic intensity is also a big problem in current scenario. This problem
can be solving out by using the Internet of thing. The traffic can be monitor and
controlled with the help of IoT. Some researchers are also doing funded project of
IoT. These projects will be very helpful for the society. So it is necessary to discuss
about the recent trends of Internet of things.
Consequently, associations need to acclimatize new advances like Map Reduce
and Hadoop. It must be fit for give enough circles, organize, and register capacity to
keep with the inflow of late insights, numerous measuremens preparing challenges
are listed inside the accompanying subsections.
9 Conclusions
Big data and IoT are widely used in many applications worldwide. Many researchers
are working day night to improve the services of Big data and IoT. There are many
deficiencies are present in both the technologies. And the most common is its security.
Big data and IoT both require the concern about its security. The reason behind is
that, the Big data and IoT applications are accessing the use of cloud widely.
And in many cases, the data stored to cloud is very secret. So from the security
point of view, it is necessary to look these technologies seriously. Some researchers
are also working on RFID and Internet of Things, like a combine approach. RFID is
also a latest technology and due to its deficiencies, RFID technology is extracting out
by many vendors. Big data and IoT are widely used in many applications worldwide.
Many researchers are working day night to improve the services of Big data and
IoT. There are many deficiencies are present in both the technologies. And the most
common is its security. Big data and IoT both requires the concern about its security.
The reason behind is that, the Big data and IoT applications are accessing the use
of cloud widely. In UK, big numbers of RFID cards have been deployed in many
places but it failed due to lacking in security. To improve RFID security, researchers
are also having a look on IOT. The question is what outcome will be. In this chapter,
some applications are discussed and try to explain the utilization of Big data and IoT
in brief. Secondly, the deficiencies are also the matter of concern in the chapter. The
desired solutions to overcome the drawbacks of IoT and bog data are also discussed.
Lot of applications are recently comes in trend that links to Big data and IoT.
It is very important to learn and discuss about these recent trends. Today, many
applications are directly or indirectly linked to Big data and IoT. Out of these, the
use of IoT in healthcare, home security, human tracking are widely acceptable by
the world. Yes, while we asking about the advantages of any technology then few

Evolution in Big Data Analytics on Internet of Things … 475
drawbacks and sophisticated issue are also be present there. So in this chapter I am
discussing about these advantages along with few drawbacks of Big data and IoT
[52].
References
1. C. Lee, C. Yeung, M. Cheng, Research on iot based cyber physical system for industrial big
data analytics, in Industrial Engineering and Engineering Management (IEEM), 2015 EEE
International Conference on (IEEE, 2015), pp. 1855–1859
2. P. Rizwan, K. Suresh, M.R. Babu, Real-time smart traffic management system for smart cities by
using internet of things and big data, in Emerging Technological Trends (ICETT), International
Conference on (IEEE, 2016), pp. 1–7
3. Q. Zhang, X. Zhang, Q. Zhang, W. Shi, H. Zhong, Firework: big data sharing and processing
in collaborative edge environment, in Hot Topics in Web Systems and Technologies (HotWeb),
2016 Fourth IEEE Workshop on (IEEE, 2016), pp. 20–25
4. M.M. Rathore, A. Ahmad, A. Paul, Iot-based smart city development using big data analytical
approach, in Automatica (ICA-ACCA), IEEE International Conference on (IEEE, 2016), pp. 1–8
5. B. Ahlgren, M. Hidell, E.C.-H. Ngai, Internet of things for smart cities: Interoperability and
open data. IEEE Int. Comput. 20(6), 52–56 (2016)
6. J.L. P´erez, D. Carrera, Performance characterization of the servioticy api: an iot-as-a-service
data management platform, in Big Data Computing Service and Applications (BigDataService),
2015 IEEE First International Conference on (IEEE, 2015), pp. 62–71
7. F. Alam, R. Mehmood, I. Katib, A. Albeshri, Analysis of eight data mining algorithms for
smarter internet of things (iot). Procedia Comput. Sci. 98, 437–442 (2016)
8. H. Wang, O.L. Osen, G. Li, W. Li, H.-N. Dai, W. Zeng, Big data and industrial internet of
things for the maritime industry in northwestern norway, in TENCON 2015-2015 IEEE Region
10 Conference (IEEE, 2015), pp. 1–5
9. O.B. Sezer, E. Dogdu, M. Ozbayoglu, A. Onal, An extended iot framework with semantics, big
data, and analytics, in Big Data (Big Data), 2016 IEEE International Conference on (IEEE,
2016), pp. 1849–1856
10. A.J. Jara, D. Genoud, Y. Bocchi, Big data for cyber physical systems: an analysis of chal-
lenges, solutions and opportunities, in Innovative Mobile and Internet Services in Ubiquitous
Computing (IMIS), 2014 Eighth International Conference on (IEEE, 2014), pp. 376–380
11. C. Vuppalapati, A. Ilapakurti, S. Kedari, The role of big data in creating sense ehr, an integrated
approach to create next generation mobile sensor and wearable data driven electronic health
record (ehr), in Big Data Computing Service and Applications (BigDataService), 2016 IEEE
Second International Conference on (IEEE, 2016), pp. 293–296
12. Z. Ding, X. Gao, J. Xu, H. Wu, Iot-statisticdb: a general statistical database cluster mechanism
for big data analysis in the internet of things, in Green Computing and Communications (Green-
Com), 2013 IEEE and Internet of Things (iThings/CPSCom), IEEE International Conference
on and IEEE Cyber, Physical and Social Computing (IEEE, 2013), pp. 535–543
13. I.-L. Yen, G. Zhou, W. Zhu, F. Bastani, S.-Y. Hwang, A smart physical world based on service
technologies, big data, and game-based crowd sourcing, in Web Services (ICWS), 2015 IEEE
International Conference on (IEEE, 2015), pp. 765–772
14. A. Ahmad, M.M. Rathore, A. Paul, S. Rho, Defining human behaviors using big data analytics
in social internet of things, in Advanced Information Networking and Applications (AINA),
2016 IEEE 30th International Conference on (IEEE, 2016), pp. 1101–1107
15. D. Arora, K.F. Li, A. Loffler, Big data analytics for classification of network enabled devices,
in Advanced Information Networking and Applications Workshops (WAINA), 2016 30th Inter-
national Conference on (IEEE, 2016), pp. 708–713
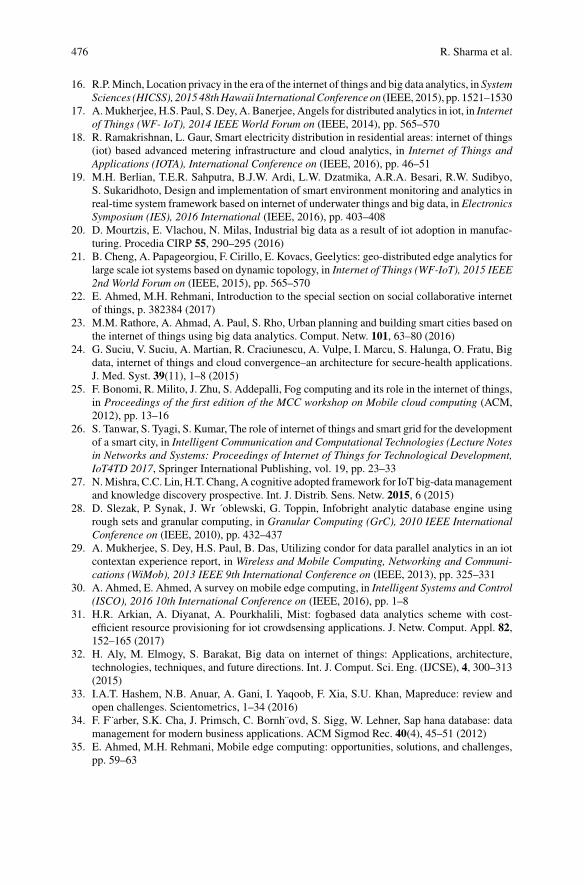
476 R. Sharma et al.
16. R.P. Minch, Location privacy in the era of the internet of things and big data analytics, in System
Sciences (HICSS), 2015 48th Hawaii International Conference on (IEEE, 2015), pp. 1521–1530
17. A. Mukherjee, H.S. Paul, S. Dey, A. Banerjee, Angels for distributed analytics in iot, in Internet
of Things (WF- IoT), 2014 IEEE World Forum on (IEEE, 2014), pp. 565–570
18. R. Ramakrishnan, L. Gaur, Smart electricity distribution in residential areas: internet of things
(iot) based advanced metering infrastructure and cloud analytics, in Internet of Things and
Applications (IOTA), International Conference on (IEEE, 2016), pp. 46–51
19. M.H. Berlian, T.E.R. Sahputra, B.J.W. Ardi, L.W. Dzatmika, A.R.A. Besari, R.W. Sudibyo,
S. Sukaridhoto, Design and implementation of smart environment monitoring and analytics in
real-time system framework based on internet of underwater things and big data, in Electronics
Symposium (IES), 2016 International (IEEE, 2016), pp. 403–408
20. D. Mourtzis, E. Vlachou, N. Milas, Industrial big data as a result of iot adoption in manufac-
turing. Procedia CIRP 55, 290–295 (2016)
21. B. Cheng, A. Papageorgiou, F. Cirillo, E. Kovacs, Geelytics: geo-distributed edge analytics for
large scale iot systems based on dynamic topology, in Internet of Things (WF-IoT), 2015 IEEE
2nd World Forum on (IEEE, 2015), pp. 565–570
22. E. Ahmed, M.H. Rehmani, Introduction to the special section on social collaborative internet
of things, p. 382384 (2017)
23. M.M. Rathore, A. Ahmad, A. Paul, S. Rho, Urban planning and building smart cities based on
the internet of things using big data analytics. Comput. Netw. 101, 63–80 (2016)
24. G. Suciu, V. Suciu, A. Martian, R. Craciunescu, A. Vulpe, I. Marcu, S. Halunga, O. Fratu, Big
data, internet of things and cloud convergence–an architecture for secure-health applications.
J. Med. Syst. 39(11), 1–8 (2015)
25. F. Bonomi, R. Milito, J. Zhu, S. Addepalli, Fog computing and its role in the internet of things,
in Proceedings of the first edition of the MCC workshop on Mobile cloud computing (ACM,
2012), pp. 13–16
26. S. Tanwar, S. Tyagi, S. Kumar, The role of internet of things and smart grid for the development
of a smart city, in Intelligent Communication and Computational Technologies (Lecture Notes
in Networks and Systems: Proceedings of Internet of Things for Technological Development,
IoT4TD 2017, Springer International Publishing, vol. 19, pp. 23–33
27. N. Mishra, C.C. Lin, H.T. Chang, A cognitive adopted framework for IoT big-data management
and knowledge discovery prospective. Int. J. Distrib. Sens. Netw. 2015, 6 (2015)
28. D. Slezak, P. Synak, J. Wr ´oblewski, G. Toppin, Infobright analytic database engine using
rough sets and granular computing, in Granular Computing (GrC), 2010 IEEE International
Conference on (IEEE, 2010), pp. 432–437
29. A. Mukherjee, S. Dey, H.S. Paul, B. Das, Utilizing condor for data parallel analytics in an iot
contextan experience report, in Wireless and Mobile Computing, Networking and Communi-
cations (WiMob), 2013 IEEE 9th International Conference on (IEEE, 2013), pp. 325–331
30. A. Ahmed, E. Ahmed, A survey on mobile edge computing, in Intelligent Systems and Control
(ISCO), 2016 10th International Conference on (IEEE, 2016), pp. 1–8
31. H.R. Arkian, A. Diyanat, A. Pourkhalili, Mist: fogbased data analytics scheme with cost-
efficient resource provisioning for iot crowdsensing applications. J. Netw. Comput. Appl. 82,
152–165 (2017)
32. H. Aly, M. Elmogy, S. Barakat, Big data on internet of things: Applications, architecture,
technologies, techniques, and future directions. Int. J. Comput. Sci. Eng. (IJCSE), 4, 300–313
(2015)
33. I.A.T. Hashem, N.B. Anuar, A. Gani, I. Yaqoob, F. Xia, S.U. Khan, Mapreduce: review and
open challenges. Scientometrics, 1–34 (2016)
34. F. F¨arber, S.K. Cha, J. Primsch, C. Bornh¨ovd, S. Sigg, W. Lehner, Sap hana database: data
management for modern business applications. ACM Sigmod Rec. 40(4), 45–51 (2012)
35. E. Ahmed, M.H. Rehmani, Mobile edge computing: opportunities, solutions, and challenges,
pp. 59–63

Evolution in Big Data Analytics on Internet of Things … 477
36. R. T¨ onjes, P. Barnaghi, M. Ali, A. Mileo, M. Hauswirth, F. Ganz, S. Ganea, B. Kjærgaard,
D. Kuemper, S. Nechifor et al., Real time iot stream processing and large-scale data ana-
lytics for smart city applications, in Poster Session, European Conference on Networks and
Communications (2014)
37. M. Villari, A. Celesti, M. Fazio, A. Puliafito, Alljoyn lambda: an architecture for the manage-
ment of smart environments in iot, in Smart Computing Workshops (SMARTCOMP Workshops),
2014 International Conferenceon (IEEE, 2014), pp. 9–14
38. M.A. Hayes, M.A.M. Capretz, Contextual anomaly detection in big sensor data, in IEEE
International Congress On Big Data, 2014, pp. 64–70
39. U. Shaukat, E. Ahmed, Z. Anwar, F. Xia, Cloudlet deployment in local wireless networks:
Motivation, architectures, applications, and open challenges. J. Netw. Comput. Appl. 62, 18–40
(2016)
40. J. Nandimath, E. Banerjee, A. Patil, P. Kakade, S. Vaidya, D. Chaturvedi, Big data analysis
using apache hadoop, in Information Reuse and Integration (IRI), 2013 IEEE 14th International
Conference on (IEEE, 2013), pp. 700–703
41. V. Morabito, Managing change for big data driven innovation, in Big Data and Analytics
(Springer, 2015), pp. 125–153
42. S. Burke, Hp haven big data platform is gaining partner momentum, CRN [online] http://www.
crncom/news/applications-os/240161649 (2013)
43. A. Bhardwaj, S. Bhattacherjee, A. Chavan, A. Deshpande, A.J. Elmore, S. Madden, A.G.
Parameswaran, Datahub: collaborative data science and dataset version management at scale,
arXiv preprint arXiv:1409.0798 (2014)
44. J. Jin, J. Gubbi, T. Luo, M. Palaniswami, Network architecture and qos issues in the internet
of things for a smart city, in Communications and Information Technologies (ISCIT), 2012
International Symposium on (IEEE, 2012), pp. 956–961
45. 2017, Accessed on 3rd June) Hortonworks. [Online]. https://hortonworks.com/
46. Y. Zhuang, Y. Wang, J. Shao, L. Chen, W. Lu, J. Sun, B. Wei, J. Wu, D-ocean: an unstructured
data management system for data ocean environment. Front. Comput. Sci. 10(2), 353–369
(2016). http://dx.doi.org/10.1007/s11704-015-5045-6
47. Z. Ding, Q. Yang, H. Wu, Massive heterogeneous sensor data management in the internet of
things, in IEEE International Conferences On Internet Of Things, And Cyber, Physical And
Social Computing, pp. 100–108 (2011)
48. 2017, Accessed on 3rd June) Mapr. [Online]. https://mapr.com
49. E. Al Nuaimi, H. Al Neyadi, N. Mohamed, J. AlJaroodi, Applications of big data to smart
cities. J. Int. Serv. Appl. 6(1), 1 (2015)
50. E. Ahmed, M. Imran, M. Guizani, A. Rayes, J. Lloret, G. Han, W. Guibene, Enabling mobile
and wireless technologies for smart cities: Part 2. IEEE Commun. Mag. 55(3), 12–13 (2017)
51. S. Tanwar, P. Patel, K. Patel, S. Tyagi, N. Kumar, M.S. Obaidat, An advanced internet of
thing based security alert system for smart home, in International Conference on Computer,
Information and Telecommunication Systems (IEEE CITS-2017), Dalian University, Dalian,
China, 21–23 July 2017, pp. 25–29
52. R. Sharma, Steps for implementing big data and its security challenges, of the book titled
“Data Intensive Computing Application for Big Data” to be published by Advances in Parallel
Computing series of IOS PRESS (Scopus Indexed) ISSN 1879-808X, Vol. 29, February 2018