Studying the WHIM Content of Large-scale Structures Along the Line of Sight to H 2356-309
29
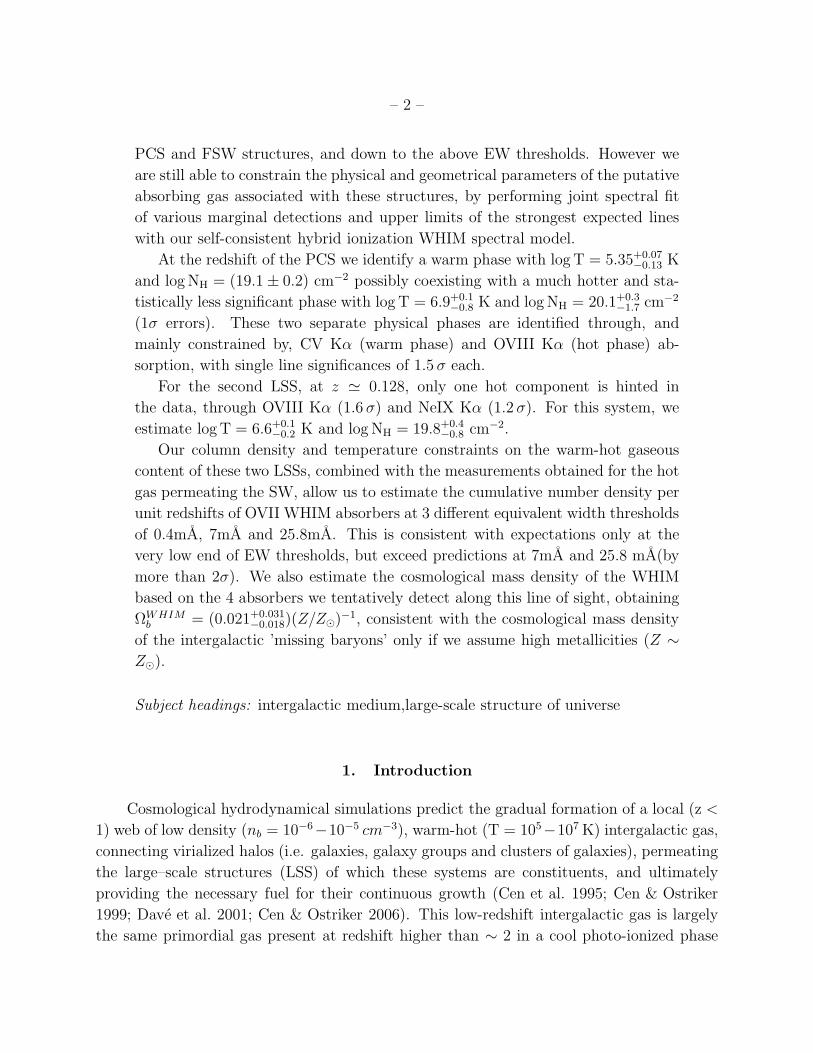
arXiv:1004.5359v1 [astro-ph.CO] 29 Apr 2010 Studying the WHIM Content of the Galaxy Large–Scale Structures along the Line of Sight to H 2356-309 L. Zappacosta 1,2 , F. Nicastro 1,3,4 , R. Maiolino 3 , G. Tagliaferri 5 , D.A. Buote 6 , T. Fang 6 , P.J. Humphrey 6 , F. Gastaldello 7 Harvard-Smithsonian Center for Astrophysics, Cambridge, MA, 02138, USA ABSTRACT We make use of a 500 ks Chandra HRC-S/LETG spectrum of the blazar H 2356-309, combined with a lower S/N (100 ks) pilot LETG spectrum of the same target, to search for the presence of warm-hot absorbing gas associated with two Large–Scale Structures (LSSs) crossed by this sightline, and to constrain its physical state and geometry. Strong (logN OV II ≥ 10 16 cm −2 ) OVII Kα absorption associated with a third LSS crossed by this line of sight (the Sculptor Wall, SW), at z =0.03, has already been detected in a previous work. Here we focus on two additional prominent filamentary LSSs along the same line of sight, at z=0.062 (the Pisces-Cetus Supercluster, PCS) and at z=0.128 (the “Farther Sculptor Wall”, FSW). The combined LETG spectrum has a S/N of ∼ 11.6 − 12.6 per resolution element in the 20 − 25 ˚ A, and an average 3σ sensitivity to intervening OVII Kα absorption line equivalent widths of EW OV II > ∼ 14 m ˚ A in the available redshift range (z< 0.165). No statistically significant (i.e. ≥ 3σ) individual absorption is detected from any of the strong He- or H-like transitions of C, O and Ne (the most abundant metals in gas with solar-like composition) at the redshifts of the 1 Harvard-Smithsonian Center for Astrophysics, 60 Garden Street, Cambridge, MA 02138; lzappa- [email protected] 2 INAF - Osservatorio Astronomico di Trieste, via G.B. Tiepolo 11, I-34143, Trieste, Italy. 3 INAF - Osservatorio Astronomico di Roma, via di Frascati 33, 00040 Monte Porzio Catone, Italy 4 IESL, FoundationforResearchandTechnology, 71110, Heraklion, Crete (Greece) 5 INAF - Osservatorio Astronomico di Brera, via Bianchi 46, 23807 Merate (LC), Italy 6 Department of Physics and Astronomy, 4129 Frederick Reines Hall, University of California, Irvine, CA 92697 7 INAF - IASF, via Bassanini 15, I-20133 Milano, Italy; Occhialini Fellow
Transcript of Studying the WHIM Content of Large-scale Structures Along the Line of Sight to H 2356-309
arX
iv:1
004.
5359
v1 [
astr
o-ph
.CO
] 2
9 A
pr 2
010
Studying the WHIM Content of the Galaxy Large–Scale
Structures along the Line of Sight to H 2356-309
L. Zappacosta1,2, F. Nicastro1,3,4, R. Maiolino3, G. Tagliaferri5, D.A. Buote6, T. Fang6, P.J.
Humphrey6, F. Gastaldello7
Harvard-Smithsonian Center for Astrophysics, Cambridge, MA, 02138, USA
ABSTRACT
We make use of a 500 ks Chandra HRC-S/LETG spectrum of the blazar
H 2356-309, combined with a lower S/N (100 ks) pilot LETG spectrum of the
same target, to search for the presence of warm-hot absorbing gas associated with
two Large–Scale Structures (LSSs) crossed by this sightline, and to constrain its
physical state and geometry. Strong (logNOV II ≥ 1016 cm−2) OVII Kα absorption
associated with a third LSS crossed by this line of sight (the Sculptor Wall, SW),
at z = 0.03, has already been detected in a previous work. Here we focus on two
additional prominent filamentary LSSs along the same line of sight, at z=0.062
(the Pisces-Cetus Supercluster, PCS) and at z=0.128 (the “Farther Sculptor
Wall”, FSW).
The combined LETG spectrum has a S/N of ∼ 11.6 − 12.6 per resolution
element in the 20− 25 A, and an average 3σ sensitivity to intervening OVII Kα
absorption line equivalent widths of EWOV II>
∼14 mA in the available redshift
range (z < 0.165). No statistically significant (i.e. ≥ 3σ) individual absorption
is detected from any of the strong He- or H-like transitions of C, O and Ne (the
most abundant metals in gas with solar-like composition) at the redshifts of the
1Harvard-Smithsonian Center for Astrophysics, 60 Garden Street, Cambridge, MA 02138; lzappa-
2INAF - Osservatorio Astronomico di Trieste, via G.B. Tiepolo 11, I-34143, Trieste, Italy.
3INAF - Osservatorio Astronomico di Roma, via di Frascati 33, 00040 Monte Porzio Catone, Italy
4IESL, FoundationforResearchandTechnology, 71110, Heraklion, Crete (Greece)
5INAF - Osservatorio Astronomico di Brera, via Bianchi 46, 23807 Merate (LC), Italy
6Department of Physics and Astronomy, 4129 Frederick Reines Hall, University of California, Irvine, CA
92697
7INAF - IASF, via Bassanini 15, I-20133 Milano, Italy; Occhialini Fellow
– 2 –
PCS and FSW structures, and down to the above EW thresholds. However we
are still able to constrain the physical and geometrical parameters of the putative
absorbing gas associated with these structures, by performing joint spectral fit
of various marginal detections and upper limits of the strongest expected lines
with our self-consistent hybrid ionization WHIM spectral model.
At the redshift of the PCS we identify a warm phase with logT = 5.35+0.07−0.13 K
and logNH = (19.1± 0.2) cm−2 possibly coexisting with a much hotter and sta-
tistically less significant phase with log T = 6.9+0.1−0.8 K and logNH = 20.1+0.3
−1.7 cm−2
(1σ errors). These two separate physical phases are identified through, and
mainly constrained by, CV Kα (warm phase) and OVIII Kα (hot phase) ab-
sorption, with single line significances of 1.5 σ each.
For the second LSS, at z ≃ 0.128, only one hot component is hinted in
the data, through OVIII Kα (1.6 σ) and NeIX Kα (1.2 σ). For this system, we
estimate logT = 6.6+0.1−0.2 K and log NH = 19.8+0.4
−0.8 cm−2.
Our column density and temperature constraints on the warm-hot gaseous
content of these two LSSs, combined with the measurements obtained for the hot
gas permeating the SW, allow us to estimate the cumulative number density per
unit redshifts of OVII WHIM absorbers at 3 different equivalent width thresholds
of 0.4mA, 7mA and 25.8mA. This is consistent with expectations only at the
very low end of EW thresholds, but exceed predictions at 7mA and 25.8 mA(by
more than 2σ). We also estimate the cosmological mass density of the WHIM
based on the 4 absorbers we tentatively detect along this line of sight, obtaining
ΩWHIMb = (0.021+0.031
−0.018)(Z/Z⊙)−1, consistent with the cosmological mass density
of the intergalactic ’missing baryons’ only if we assume high metallicities (Z ∼
Z⊙).
Subject headings: intergalactic medium,large-scale structure of universe
1. Introduction
Cosmological hydrodynamical simulations predict the gradual formation of a local (z <
1) web of low density (nb = 10−6−10−5 cm−3), warm-hot (T = 105−107K) intergalactic gas,
connecting virialized halos (i.e. galaxies, galaxy groups and clusters of galaxies), permeating
the large–scale structures (LSS) of which these systems are constituents, and ultimately
providing the necessary fuel for their continuous growth (Cen et al. 1995; Cen & Ostriker
1999; Dave et al. 2001; Cen & Ostriker 2006). This low-redshift intergalactic gas is largely
the same primordial gas present at redshift higher than ∼ 2 in a cool photo-ionized phase
– 3 –
(the so called ’Lyman-α Forest)’, but in a much hotter and metal-enriched phase, because
of efficient shock-heating during the continuous process of LSS assembly and growth in a
non-linear Universe, and of strong feedback with the same structures for which it provides
building blocks. Due to its high temperatures this IGM phase has been dubbed Warm-Hot
Intergalactic Medium (WHIM).
Electrons and baryons in the WHIM are shock-heated during their infall in the dark mat-
ter LSS potential well, and settle in filamentary/sheet-like structures surrounding LSSs. Such
matter is predicted to account for a sizable fraction (∼ 50%) of all the baryons in the local
(z < 1) universe, and it is thus considered the best candidate to host the baryons seen at high
redshift and missing from the low redshift census (Fukugita et al. 1998; Fukugita & Peebles
2004).
Given its high temperature the WHIM can only emit or absorb in the Far UV and soft
X-rays, mainly through Li- through H-like metal transitions and bremsstrahlung continuum
emission. However, at WHIM densities both line and continuum emission are highly de-
pressed (due to the dependency of these mechanisms on the square power of the emitters
volume densities), and on average well below the sensitivity of current instrumentations.
Nonetheless, statistical techniques based on cross correlation of regions with excess diffuse X-
ray emission in ROSAT, Chandra and XMM-Newton deep exposures, with large–scale galaxy
distribution, have probably already allowed the marginal detection of the density peak of
the WHIM distribution (e.g. Scharf et al. 2000; Zappacosta et al. 2002, 2005; Werner et al.
2008).
A far more promising way to detect the WHIM is through resonant absorption by highly
ionized metals. Intervening WHIM filaments should imprint a ’forest’, i.e. the so called X-
ray Forest (Hellsten et al. 1998; Perna & Loeb 1998), by analogy with the HI Ly α Forest
copiously seen at z & 2, of metal absorption lines onto the spectra of bright background
sources, whose strength depends only linearly on the absorber density, and is therefore less
suppressed than the corresponding emission. Predicted equivalent widths (EWs) from the
most abundant ions in WHIM, range from 1 mA to . 20 mA for the densest filaments. The
detection of even the strongest of such absorption lines (probing only the very high density
tail of the WHIM distribution: overdensity δ = nb/ < nb >& 300, compared to the average
density of the Universe: < nb >= 2 × 10⁻⁷(1 + z)3(Ωbh2/0.02), where Ωb is the baryonic
density parameter and h is the Hubble constant in units of 100 km/s/Mpc) is extremely
challenging with the limited sensitivity (Aeff < 60cm2) and resolution (R=E/∆E = 400 −
800) of the current Chandra and XMM-Newton high resolution X-ray gratings. A ≥ 3σ
detection of an EW=20 mA absorption line, requires spectra of the background targets with
S/N& 8 per 50 mA resolution element (i.e. & 70 net counts per bin). These can only be
– 4 –
obtained, for the brightest (∼ 10−11erg s−1 cm−2) soft X-ray (0.5 − 2 keV) targets in the
extragalactic sky (preferably blazars, because of their intrinsically featureless spectra), with
& 0.5 Ms exposures, while in quiescence, or & 100 ks exposures in outburst.
Such dense WHIM filaments are rare. According to hydrodynamical simulations, at
z ≃ 0 one expects ≤ 0.05 WHIM filaments with EW(OVIIKα)≥ 20 mA, per unit redshift.
The probability of having one of such filaments along a random line of sight up to z = 0.3,
is therefore only 1.5% (Gehrels 1986), and only few z ≥ 0.3 targets with quiescent F(0.5-
2 keV)≥ 10−11 erg s−1 cm−2 are available (e.g. Conciatore et al., 2009, priv. comm.).
The number density of OVII WHIM absorbers per unit redshift increases by almost two
orders of magnitude by lowering the EW(OVIIKα) detection threshold down to ≥ 2 mA
so dramatically increasing the probability of randomly detecting one of such filaments to
P(z = 0.3)=97.5%. This observational strategy has the advantage to probe, in theory,
the bulk of the WHIM mass distribution, but requires incredibly high S/N spectra (≥ 75
per resolution element with the Chandra LETG, and ≥ 180 per resolution element with
the XMM-Newton RGS, for a ≥ 3σ detection), obtainable only with several Ms exposures
on the brightest possible z ≥ 0.3 targets in their quiescent states. Moreover, even when
such high S/N spectra are obtained (for example by observing background target during
exceptionally high outburst: Nicastro et al. 2005a,b) the clear assessment of the statistical
significance of such weak 2-3 mA absorption lines is hampered by our limited knowledge of
the instrument systematics, which is comparable to the statistical uncertainties on the lines
EWs (Kaastra et al. 2003; Rasmussen et al. 2007; Nicastro et al. 2008)
An alternative observational strategy is to select lines of sight where the probability to
cross dense WHIM filament is enhanced (e.g. Zappacosta 2005, 2006). WHIM gas density
and metallicity is predicted (and possibly in the UV observed Stocke et al. 2006) to correlate
with LSS galaxy overdensity (Viel et al. 2005). Thus, chances of intercepting a dense WHIM
filament may be improved by carefully selecting bright sources in the background of extreme
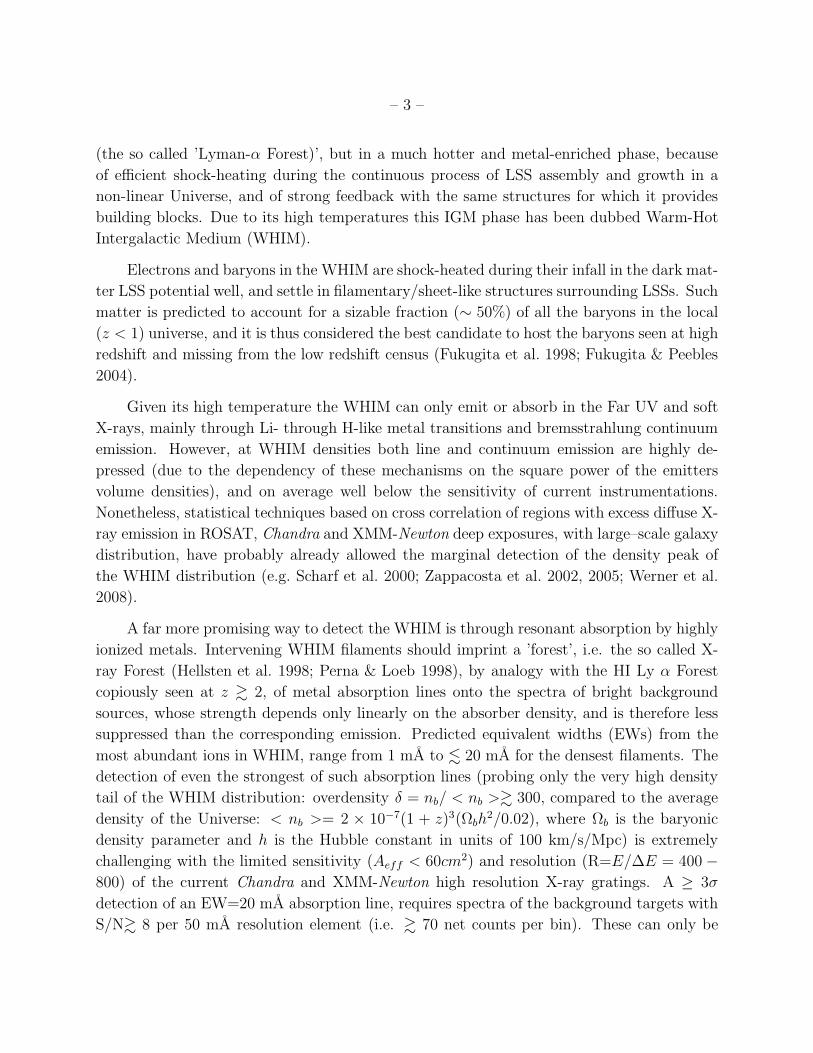
filamentary LSS concentrations (Fig. 1). This observational strategy has been successfully
exploited recently in Buote et al. (2009), who detected a strong (EW∼ 30mA) absorption line
in two XMM-Newton RGS and Chandra LETG spectra of the blazar H 2356-309 (z=0.165),
and tentatively identified it with OVII Kα at a redshift consistent with that spanned by the
intervening Sculptor Wall (SW; da Costa et al. 1988).
Here, and in our companion paper (Fang et al. 2009), we report on the successful ex-
tension of this observational program. H 2356-309 has been recently re-observed with the
Chandra LETG for 500 ks, as part of an approved cycle 10 GO observational program. The
main goal of this deep observation was to confirm, at higher significance, the SW OVII detec-
tion (Fang et al. 2009). Secondary objectives, were to confirm the presence of other (lower
– 5 –
Fig. 1.— Sky map and wedge diagram of the region of the Sculptor Wall where the blazar
H 2356-309 is located. The upper sky map refer to the FSW and the lower to the PCS.
Galaxies (black point) clusters and groups of galaxies (magenta circles) in the wall are taken
from NED. The wedge diagram show galaxies inside the dashed blue box drawn in the sky
map and report the sightline to the blazar as red dashed line. The galaxy and cluster catalogs
contain objects belonging to different parent catalogs. Hence we point out that some holes
in the projected galaxy distribution are artificially caused by this non homogeneity like the
hole at north-east of the blazar position visible at RA = 0.1hours and DEC = −29.5deg in
the PCS sky map.
– 6 –
significance) lines from the same absorber (Buote et al., 2010 in prep.). Here instead we focus
on constraining the physical parameters of the putative WHIM gas content of two additional
galaxy LSSs present along this line of sight, at z = 0.062 (the Pisces-Cetus Supercluster;
PCS) and z = 0.128 (a farther wall which we will call Farther Sculptor Wall; FSW). In this
paper we use all the existing Chandra LETG data of H 2356-309, to characterize the physical
properties of the WHIM permeating these additional structures, and conclude by estimating
the contribution of such dense gaseous component of LSSs, to the WHIM cosmological mass
density. In §2 we describe the richness of LSSs along the line of sight to H 2356-309. In
§3 and §4 we present the data and describe their reduction and analysis. §5 is devoted to
a critical discussion of our findings. In §6 we summarize our conclusions. Throughout the
paper we adopt a Λ-CDM cosmology, with h = 0.71, ΩM = 0.27, ΩΛ = 0.73.
2. The LSS Richness of the Line of Sight to H 2356-309
Figure 1 shows the wedge diagram of the line of sight to H 2356-309 in the declination
range −33 < δ < −29. Galaxies (black point), clusters and groups of galaxies (magenta
circles) shown in the diagrams of Fig. 1, are extracted from a number of different and
non-homogeneous catalogs and galaxy surveys (including the 2dF Galaxy Redshift Survey -
2dFGRS, Colless et al. 2003; and 6dF Galaxy Redshift Survey - 6dFGRS, Jones et al. 2004),
and are the result of a general query to the Nasa/Ipac Extragalactic Database (NED)1. As
such, these diagrams do not represent complete flux-limited sample of the actual galaxy
distribution along this line of sight.
Several strong LSS concentrations are clearly visible, and cross the line of sight to
H 2356-309 at, at least, three different average redshifts: < z1 >= 0.03 (the SW), < z2 >=
0.062 (the PCS), and < z3 >= 0.128 (the FSW). Both the PCS and the FSW LSSs are
significantly larger than the SW, and are delimited in the wedge diagram of Fig. 1 by cyan
dashed arcs. The two 2D sky map projections on the right of the wedge diagram of Fig. 1,
show the RA versus DEC extent of these two LSSs.
The PCS (Burns & Batuski 1984; Tully et al. 1992) is one of the richest nearby (z<0.1)
superclusters. It is clearly visible in the SDSS and 2dF redshift surveys as a remarkable
filament of galaxies (Porter & Raychaudhury 2005). The structure intercepted by the line
of sight to H 2356-309 is a long filament of galaxies located on the plane of the sky at
z=0.06-0.063, within < 1Mpc from the projected blazar position.
1The NASA/IPAC Extragalactic Database (NED) is operated by the Jet Propulsion Laboratory, Cali-
fornia Institute of Technology, under contract with the National Aeronautics and Space Administration.
– 7 –
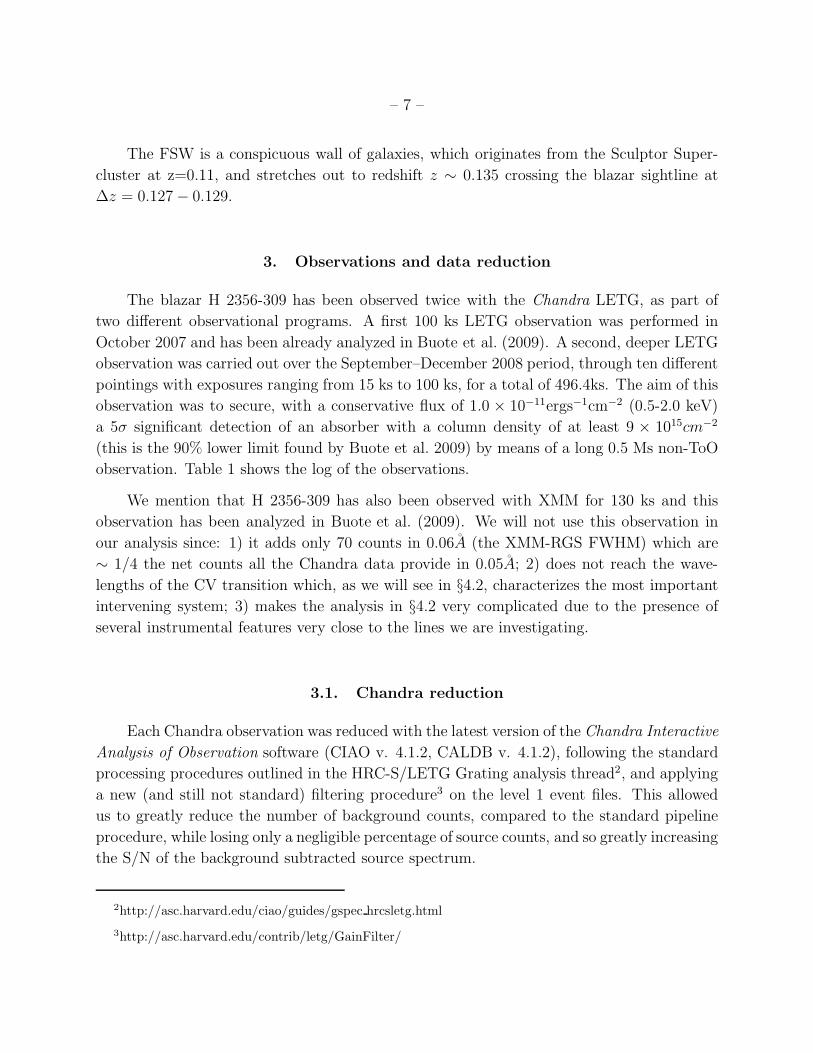
The FSW is a conspicuous wall of galaxies, which originates from the Sculptor Super-
cluster at z=0.11, and stretches out to redshift z ∼ 0.135 crossing the blazar sightline at
∆z = 0.127− 0.129.
3. Observations and data reduction
The blazar H 2356-309 has been observed twice with the Chandra LETG, as part of
two different observational programs. A first 100 ks LETG observation was performed in
October 2007 and has been already analyzed in Buote et al. (2009). A second, deeper LETG
observation was carried out over the September–December 2008 period, through ten different
pointings with exposures ranging from 15 ks to 100 ks, for a total of 496.4ks. The aim of this
observation was to secure, with a conservative flux of 1.0 × 10⁻¹¹ergs−1cm−2 (0.5-2.0 keV)
a 5σ significant detection of an absorber with a column density of at least 9 × 1015cm−2
(this is the 90% lower limit found by Buote et al. 2009) by means of a long 0.5 Ms non-ToO
observation. Table 1 shows the log of the observations.
We mention that H 2356-309 has also been observed with XMM for 130 ks and this
observation has been analyzed in Buote et al. (2009). We will not use this observation in
our analysis since: 1) it adds only 70 counts in 0.06A (the XMM-RGS FWHM) which are
∼ 1/4 the net counts all the Chandra data provide in 0.05A; 2) does not reach the wave-
lengths of the CV transition which, as we will see in §4.2, characterizes the most important
intervening system; 3) makes the analysis in §4.2 very complicated due to the presence of
several instrumental features very close to the lines we are investigating.
3.1. Chandra reduction
Each Chandra observation was reduced with the latest version of the Chandra Interactive
Analysis of Observation software (CIAO v. 4.1.2, CALDB v. 4.1.2), following the standard
processing procedures outlined in the HRC-S/LETG Grating analysis thread2, and applying
a new (and still not standard) filtering procedure3 on the level 1 event files. This allowed
us to greatly reduce the number of background counts, compared to the standard pipeline
procedure, while losing only a negligible percentage of source counts, and so greatly increasing
the S/N of the background subtracted source spectrum.
2http://asc.harvard.edu/ciao/guides/gspec hrcsletg.html
3http://asc.harvard.edu/contrib/letg/GainFilter/
– 8 –
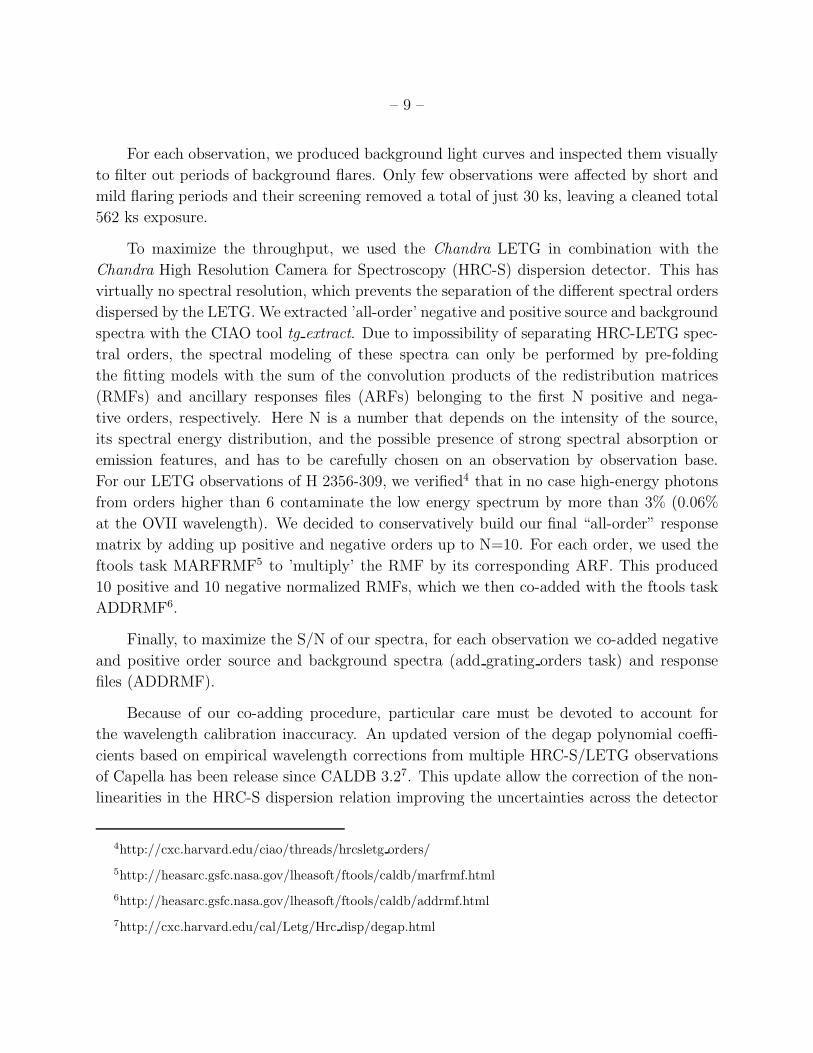
Table 1: Log of the Chandra observations of H 2356-309.
ObsID Instrument Exposure Date of observation
8120 HRC-S/LETG 96.49 2007-10-11
10497 HRC-S/LETG 53.93 2008-09-19
10498 HRC-S/LETG 77.88 2008-09-22
10499 HRC-S/LETG 58.69 2008-09-29
10500 HRC-S/LETG 16.15 2008-12-25
10577 HRC-S/LETG 81.72 2008-09-17
10761 HRC-S/LETG 42.15 2008-09-27
10762 HRC-S/LETG 35.17 2008-09-25
10764 HRC-S/LETG 100.4 2008-10-10
10840 HRC-S/LETG 15.14 2008-12-23
10841 HRC-S/LETG 15.15 2008-12-28
20 20.5 21 21.5 22 22.5
8×10
−3
0.01
0.01
20.
014
Cou
nts/
s/A
ngst
rom
Wavelength (Angstrom)
OVII (SW)
OVII (z=0)
OVIII (FSW)OVIII (PCS)
39.5 40 40.5 41 41.5 42 42.5 43
10−
32×
10−
35×
10−
3
Cou
nts/
s/A
ngst
rom
Wavelength (Angstrom)
instr. feature
CV (z=0) CV (PCS)
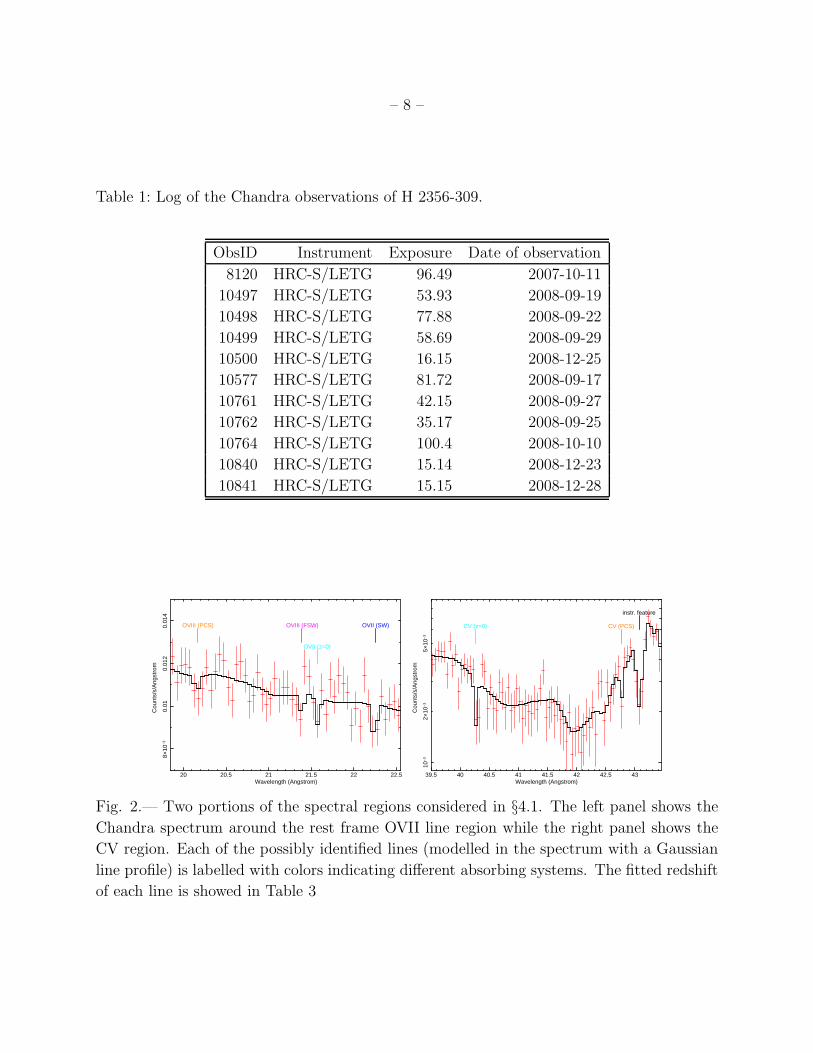
Fig. 2.— Two portions of the spectral regions considered in §4.1. The left panel shows the
Chandra spectrum around the rest frame OVII line region while the right panel shows the
CV region. Each of the possibly identified lines (modelled in the spectrum with a Gaussian
line profile) is labelled with colors indicating different absorbing systems. The fitted redshift
of each line is showed in Table 3
– 9 –
For each observation, we produced background light curves and inspected them visually
to filter out periods of background flares. Only few observations were affected by short and
mild flaring periods and their screening removed a total of just 30 ks, leaving a cleaned total
562 ks exposure.
To maximize the throughput, we used the Chandra LETG in combination with the
Chandra High Resolution Camera for Spectroscopy (HRC-S) dispersion detector. This has
virtually no spectral resolution, which prevents the separation of the different spectral orders
dispersed by the LETG. We extracted ’all-order’ negative and positive source and background
spectra with the CIAO tool tg extract. Due to impossibility of separating HRC-LETG spec-
tral orders, the spectral modeling of these spectra can only be performed by pre-folding
the fitting models with the sum of the convolution products of the redistribution matrices
(RMFs) and ancillary responses files (ARFs) belonging to the first N positive and nega-
tive orders, respectively. Here N is a number that depends on the intensity of the source,
its spectral energy distribution, and the possible presence of strong spectral absorption or
emission features, and has to be carefully chosen on an observation by observation base.
For our LETG observations of H 2356-309, we verified4 that in no case high-energy photons
from orders higher than 6 contaminate the low energy spectrum by more than 3% (0.06%
at the OVII wavelength). We decided to conservatively build our final “all-order” response
matrix by adding up positive and negative orders up to N=10. For each order, we used the
ftools task MARFRMF5 to ’multiply’ the RMF by its corresponding ARF. This produced
10 positive and 10 negative normalized RMFs, which we then co-added with the ftools task
ADDRMF6.
Finally, to maximize the S/N of our spectra, for each observation we co-added negative
and positive order source and background spectra (add grating orders task) and response
files (ADDRMF).
Because of our co-adding procedure, particular care must be devoted to account for
the wavelength calibration inaccuracy. An updated version of the degap polynomial coeffi-
cients based on empirical wavelength corrections from multiple HRC-S/LETG observations
of Capella has been release since CALDB 3.27. This update allow the correction of the non-
linearities in the HRC-S dispersion relation improving the uncertainties across the detector
4http://cxc.harvard.edu/ciao/threads/hrcsletg orders/
5http://heasarc.gsfc.nasa.gov/lheasoft/ftools/caldb/marfrmf.html
6http://heasarc.gsfc.nasa.gov/lheasoft/ftools/caldb/addrmf.html
7http://cxc.harvard.edu/cal/Letg/Hrc disp/degap.html
– 10 –
from 0.014A to 0.010A (RMS deviation). This uncertainty is lower at shorter wavelengths
and higher at longer wavelengths. Since we have coadded positive and negative orders we
should consider a larger uncertainty. The propagation of the RMS deviations gives an un-
certainty of 0.014A. However to be conservative we adopt 20mA of uncertainty since the
updated wavelength corrections have been applied to the rest frame position of the strongest
soft X-ray metal electronic transitions and the interpolation of the correction may not be
strictly valid to the position of blue- and red-shifted lines.
4. Spectral Analysis
We performed all our spectral analysis with the fitting package Sherpa of CIAO (v.
4.1.2). The statistics we used for our fits is the data weighted χ2 with the Gehrels variance
function (Gehrels 1986), the default in Sherpa. We first checked for variability of the broad
band 10-50A continuum (flux and spectral shape) of H 2356-309, between the 11 Chandra
observations. We grouped each spectrum at a minimum of 20 counts per bin, and modeled
each data-set independently with a power law attenuated by the sightline Galactic column
of neutral gas (NH = 1.44×1020 cm−2; Kalberla et al. 2005). We found that both the source
spectral shape and flux varied only moderately (12% and 20%, respectively) between the
ten 2008 observations: the 0.3-1.0 keV flux ranges within the 1.25− 1.5× 10⁻¹¹ergs−1cm−2
interval, while the power law best fitting spectral indices vary between Γ = 1.96− 2.20. The
0.3-1 keV source flux during the 2007 observation, is 50-80% lower than during the 2009
observations, but the best fitting power law spectral index of Γ = 2.19 ± 0.06 is still in the
range measured during the 2008 observations. Since both the 10-50 A flux and spectral
shape of the target varied only moderately between the different observations, and because
we are interested in the search of narrow spectral features, which are not affected by broad-
band spectral-shape variability, we decided to co-add the HRC-S/LETG spectra of all the
observations, to increase the final S/N per resolution element. The resulting spectrum has
≃ 290 net source Counts per 50 mA Resolution Element (CPRE) and∼ 120−160 background
CPRE at 22 A , and so a S/N∼ 11..6−12.6 at 22 A. This gives a theoretical ≥ 1σ sensitivity
to absorption lines with EW≥ 12−13 mA, at 22 A. We grouped the data to half the nominal
FWHM of LETG spectra with 25 mA per bin for all the subsequent analysis.
4.1. Search for Intervening Absorption Lines
Our main goal is to constrain the warm-hot gaseous content of the two filamentary
galaxy structures here identified as PCS and FSW. At the expected WHIM temperatures
– 11 –
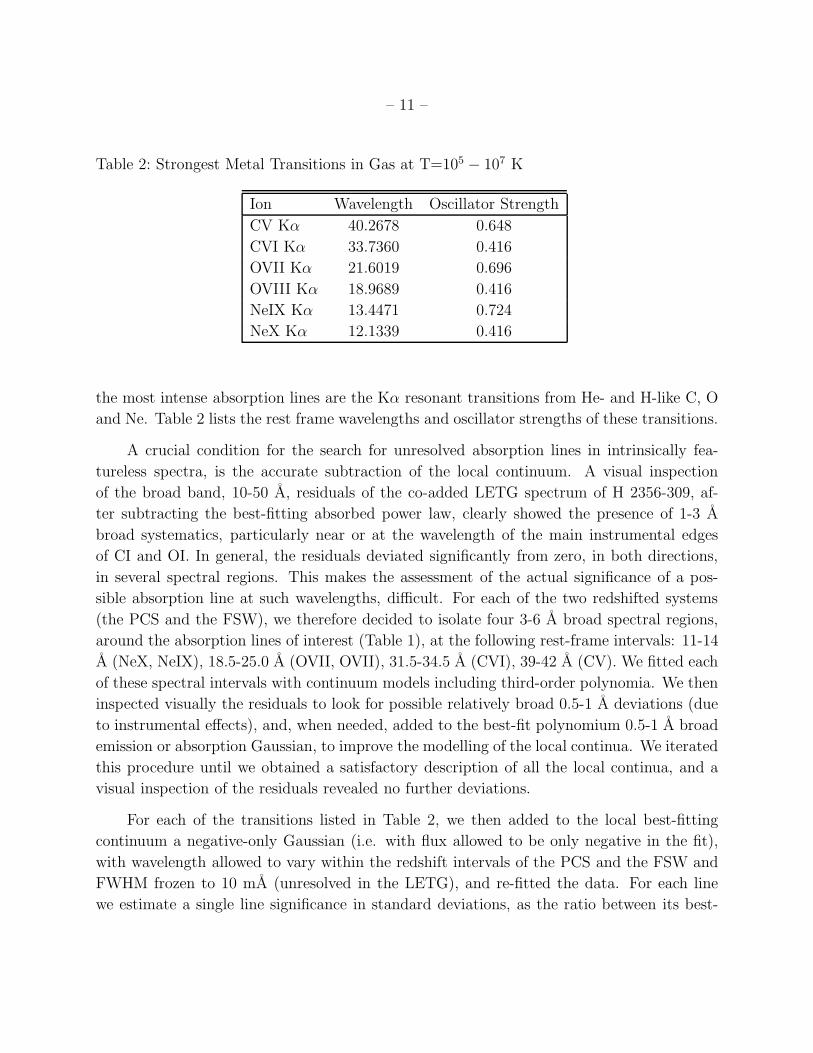
Table 2: Strongest Metal Transitions in Gas at T=105 − 107 K
Ion Wavelength Oscillator Strength
CV Kα 40.2678 0.648
CVI Kα 33.7360 0.416
OVII Kα 21.6019 0.696
OVIII Kα 18.9689 0.416
NeIX Kα 13.4471 0.724
NeX Kα 12.1339 0.416
the most intense absorption lines are the Kα resonant transitions from He- and H-like C, O
and Ne. Table 2 lists the rest frame wavelengths and oscillator strengths of these transitions.
A crucial condition for the search for unresolved absorption lines in intrinsically fea-
tureless spectra, is the accurate subtraction of the local continuum. A visual inspection
of the broad band, 10-50 A, residuals of the co-added LETG spectrum of H 2356-309, af-
ter subtracting the best-fitting absorbed power law, clearly showed the presence of 1-3 A
broad systematics, particularly near or at the wavelength of the main instrumental edges
of CI and OI. In general, the residuals deviated significantly from zero, in both directions,
in several spectral regions. This makes the assessment of the actual significance of a pos-
sible absorption line at such wavelengths, difficult. For each of the two redshifted systems
(the PCS and the FSW), we therefore decided to isolate four 3-6 A broad spectral regions,
around the absorption lines of interest (Table 1), at the following rest-frame intervals: 11-14
A (NeX, NeIX), 18.5-25.0 A (OVII, OVII), 31.5-34.5 A (CVI), 39-42 A (CV). We fitted each
of these spectral intervals with continuum models including third-order polynomia. We then
inspected visually the residuals to look for possible relatively broad 0.5-1 A deviations (due
to instrumental effects), and, when needed, added to the best-fit polynomium 0.5-1 A broad
emission or absorption Gaussian, to improve the modelling of the local continua. We iterated
this procedure until we obtained a satisfactory description of all the local continua, and a
visual inspection of the residuals revealed no further deviations.
For each of the transitions listed in Table 2, we then added to the local best-fitting
continuum a negative-only Gaussian (i.e. with flux allowed to be only negative in the fit),
with wavelength allowed to vary within the redshift intervals of the PCS and the FSW and
FWHM frozen to 10 mA (unresolved in the LETG), and re-fitted the data. For each line
we estimate a single line significance in standard deviations, as the ratio between its best-
– 12 –
fitting flux, and its 1σ error (computed with the Sherpa routine projection8, by leaving both
the continua and Gaussian normalizations free to vary). Four and three of the transitions
listed in Table 2 were preliminarly, and tentatively, identified at a single line significance
> 1σ, for the PCS (CV, OVII, OVIII, and NeIX) and the FSW (CVI, OVIII and NeIX),
respectively. For the remaining transitions we list their 3σ EW upper limits. For comparison,
and completeness, Table 3 also lists the result of our fitting procedure for the lines listed
in Table 2, at z ≃ 0. five of these transitions are detected at ≥ 1σ at z ≃ 0 (CV, OVII,
OVIII, NeIX and NeX). What discussed above provides only a preliminary attempt to check
for the presence of the expected absorption lines at the redshifts of the Large–Scale galaxy
Structures present along the lines of sight. The presence (or absence) of a given line (at the
quoted significance level: Table 3) is only used as a guidance for the detailed global fitting
procedure presented in next section, and that that makes use of our self-consistent WHIM
collisional ionization plus photoionization model.
Figure 2 shows two spectral portions of the total Chandra LETG spectrum of H 2356-
309, containing the three lines tentatively identified at the redshifts of the PCS and the FSW.
4.2. Constraining the Physics of the Putative PCS and FSW Absorbers with
a Self -Consistent WHIM Model
In §4.1 we generally searched for the presence of the strongest absorption metal lines
expected from highly ionized gas with temperatures in the broad interval T = 105 − 107 K.
However, these transitions belong to ions with quite different ionization potential (e.g CV
and NeX) and whose relative abundances critically depend on the ionization mechanisms at
work, and on the actual gas temperature. For example, in collisionally ionized gas, OVII,
being H-like and so quite stable, is virtually the only abundant ion of O within a broad
interval of temperatures, within logT(K)=5.5-6.2. In the same temperature interval the
lower ionization ions CV and CVI are relatively abundant, with CV decreasing monotonically
from ∼ 75% down to ∼ 5%, and CVI raising from ∼ 25% up to ∼ 50% at its logT(K)=6
peak temperature, and then decreasing again down to ∼ 20%. On the contrary the higher
ionization ions OVIII, NeIX and NeX are only important at the high-temperature extreme
of this interval, with relative abundances steeply raising from very low values up to 23%
(OVIII), 96% (NeIX) and 3% (NeX). Modeling the spectra of extragalactic sources crossing
regions of the Universe with large galaxy overdensities (expected to trace WHIM filaments)
8http://cxc.harvard.edu/sherpa/ahelp/projection.py.html
– 13 –
with self-consistent ionized absorber models, may therefore provide useful constraints on the
ionization state and column density of the putative absorbers embedded in these LSSs, even
if the spectral signature of the gas are individually marginally detected (and/or upper limits
are obtained) as long as they are modelled jointly.
Here we make use of an adaptation of the Photoionized Absorber Spectral Engine
(PHASE; Krongold et al., 2003) code, for WHIM gas (e.g. Nicastro et al. 2009). The code
includes more than 3000 electronic resonant transitions (including metal inner-shell) from
all elements lighter than Ni, and computes, for a given H equivalent column density, tem-
perature and turbulence velocity of the absorber, the Voigt-profile folded opacity of each
transition. The ionization balance in the gas is computed by perturbating the equilibrium
collisional ionization balance at a given temperature T, with photoionization by the meta-
galactic UV and X-ray background at a given redshift (the redshift of the absorber). Such
second-order photoionization contribution depends uniquely on the baryon density nb in the
gas (the lower the density the higher the contribution of photoionization), and it starts to
be effective at nb<
∼10−5 cm−3.
In our fitting procedure, we use the same initial methodology adopted in §4.1. For
each of the two super-structures, the PCS and the FSW, we fit the 4 different narrow-band
portions of the continuum where the main transitions lie, independently. For each spectral
interval, our fitting model includes the best-fitting continuum determined in §4.1 attenuated
by our hybrid-ionization absorption WHIM model. For each spectral interval we leave free
to vary in the fit, the continuum normalization and two out of the five parameters of the
WHIM model, namely: the equivalent H column density NH and the temperature T of
the gas. Both NH and T are linked to their same respective values in the 4 independently
fitted spectral regions. The remaining parameters of our WHIM model are the turbulence
velocity v (summed in quadrature to the thermal Doppler parameter of a given transition),
the redshift z and the baryon density nb of the absorbers. The baryon density nb is highly
degenerate with the electron temperature (which is set mainly by collisions in shock-heated
WHIM gas), and modifies only slightly the ionization balance of the gas, compared with
pure collisional equilibrium at a given temperature.Consequently, nb can be constrained
independently of temperature only with data where several transitions from different ions of
the same element are clearly detected. In our fit of the putative absorbers at the redshifts
of the PCS and the FSW, we therefore freeze the gas baryon density to a typical WHIM
value of nb = 10−5 cm−3. Analogously, the turbulent velocity of the absorber (degenerate
with the ion column density for saturated lines), can only be properly constrained when the
single absorption lines are resolved and their profile clearly detected at high significance. We
freeze this parameter to v = 100 km s−1, comparable to typical values of Doppler velocities
inferred by hydrodynamical simulations (e.g. Cen & Fang 2006). Finally, for each of the
– 14 –
4 spectral regions, we first leave the redshift of the absorbers to vary independently over
the entire redshift extent of the two super-structures (z = 0.060 − 0.063 for the PCS and
z = 0.127 − 0.129 for the FSW), and then refine the fitting by freezing the redshift of the
absorber in the spectral region where the most significant absorption line is detected to its
best fitting value, and leaving the redshifts of the other absorbers in the three remaining
spectral regions, free to vary between ±20 mA from the frozen redshift of the most significant
absorption line, to account for the 90% systematic wavelength uncertainties in the HRC-S
LETG.
Table 4 summarizes the results of our fit. Errors are quoted at a 68% confidence limit.
For each parameter listed in table 4, we compute errors by allowing the continuum normaliza-
tion to vary within its 1σ uncertainty and allowing the other free WHIM model parameters
free to vary except in the case of the estimation of logNH and log T errors where we fixed
the redshifts to their best-fit value.
4.2.1. The PCS filament
For this structure, we found the possible co-existence of two distinct WHIM phases
(Figure 3): a warm phase, traced by CV absorption (Figure 4), with log T = 5.35+0.07−0.13 K
and logNH = (19.1± 0.2)× (Z/Z⊙)−1 cm−2, and a much hotter and less constrained phase,
traced by OVIII absorption (Figure 5), with log T = 6.9+0.1−0.8 K and logNH = 20.1+0.3
−1.7 ×
(Z/Z⊙)−1 cm−2.
The redshift interval traced by the distribution of galaxies of the PCS, along the line of
sight to H 2356-309, is 0.060 < z < 0.063. The two WHIM phases tentatively identified here
have best-fitting redshifts consistent with each-other, and with the PCS redshift interval,
namely: zwarm = 0.0623± 0.0005 and zhot = 0.063± 0.001.
We note that the physical parameters of the putative warm component of the PCS are
constrained much better than those of the hot component (Figure 3). This is because the
opacity of absorbing gas to light metal transitions decreases with increasing temperatures.
At the best-fitting temperature of the hot component of the PCS, only residual opacity
from highly ionized O, Ne and Fe is present (Figure 5), and the two free model parameters,
temperature and NH , becomes highly correlated (Figure 3, red, dotted lines), and therefore
only poorly constrained. At the temperatures of the warm PCS phase, instead, several strong
transitions from a number of abundant ions can still produce enough opacity in the data,
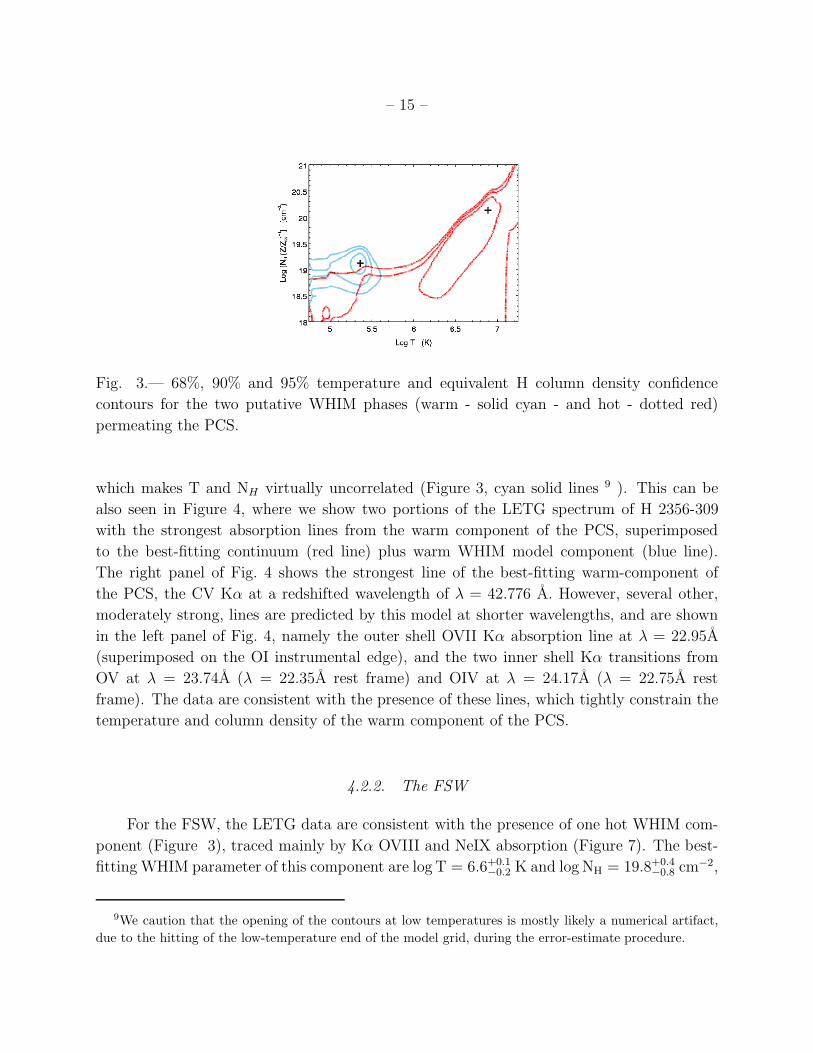
– 15 –
Fig. 3.— 68%, 90% and 95% temperature and equivalent H column density confidence
contours for the two putative WHIM phases (warm - solid cyan - and hot - dotted red)
permeating the PCS.
which makes T and NH virtually uncorrelated (Figure 3, cyan solid lines 9 ). This can be
also seen in Figure 4, where we show two portions of the LETG spectrum of H 2356-309
with the strongest absorption lines from the warm component of the PCS, superimposed
to the best-fitting continuum (red line) plus warm WHIM model component (blue line).
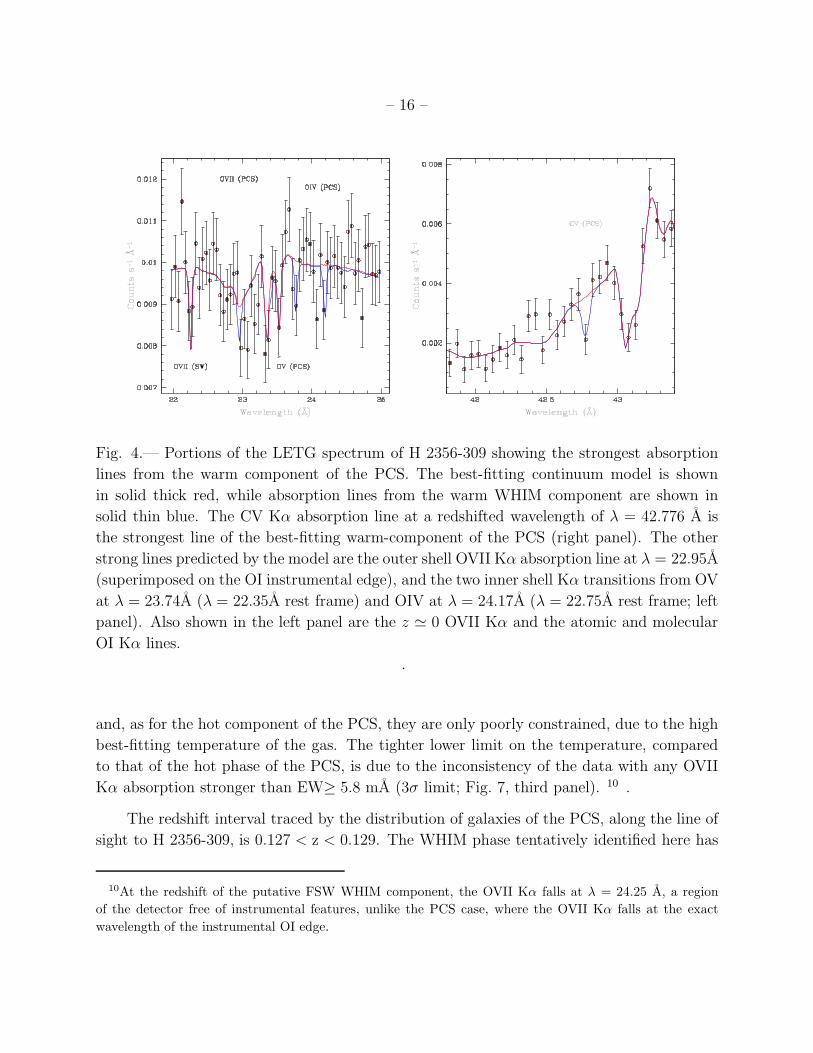
The right panel of Fig. 4 shows the strongest line of the best-fitting warm-component of
the PCS, the CV Kα at a redshifted wavelength of λ = 42.776 A. However, several other,
moderately strong, lines are predicted by this model at shorter wavelengths, and are shown
in the left panel of Fig. 4, namely the outer shell OVII Kα absorption line at λ = 22.95A
(superimposed on the OI instrumental edge), and the two inner shell Kα transitions from
OV at λ = 23.74A (λ = 22.35A rest frame) and OIV at λ = 24.17A (λ = 22.75A rest
frame). The data are consistent with the presence of these lines, which tightly constrain the
temperature and column density of the warm component of the PCS.
4.2.2. The FSW
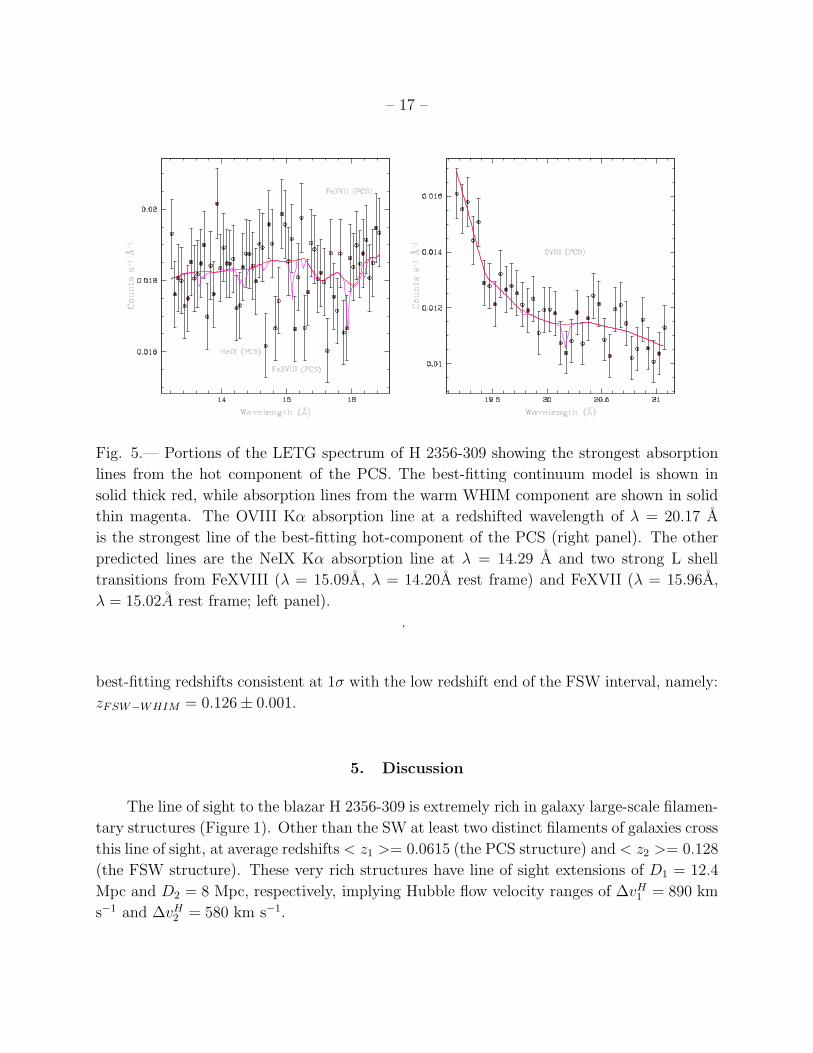
For the FSW, the LETG data are consistent with the presence of one hot WHIM com-
ponent (Figure 3), traced mainly by Kα OVIII and NeIX absorption (Figure 7). The best-
fitting WHIM parameter of this component are logT = 6.6+0.1−0.2 K and log NH = 19.8+0.4
−0.8 cm−2,
9We caution that the opening of the contours at low temperatures is mostly likely a numerical artifact,
due to the hitting of the low-temperature end of the model grid, during the error-estimate procedure.
– 16 –
Fig. 4.— Portions of the LETG spectrum of H 2356-309 showing the strongest absorption
lines from the warm component of the PCS. The best-fitting continuum model is shown
in solid thick red, while absorption lines from the warm WHIM component are shown in
solid thin blue. The CV Kα absorption line at a redshifted wavelength of λ = 42.776 A is
the strongest line of the best-fitting warm-component of the PCS (right panel). The other
strong lines predicted by the model are the outer shell OVII Kα absorption line at λ = 22.95A
(superimposed on the OI instrumental edge), and the two inner shell Kα transitions from OV
at λ = 23.74A (λ = 22.35A rest frame) and OIV at λ = 24.17A (λ = 22.75A rest frame; left
panel). Also shown in the left panel are the z ≃ 0 OVII Kα and the atomic and molecular
OI Kα lines.
.
and, as for the hot component of the PCS, they are only poorly constrained, due to the high
best-fitting temperature of the gas. The tighter lower limit on the temperature, compared
to that of the hot phase of the PCS, is due to the inconsistency of the data with any OVII
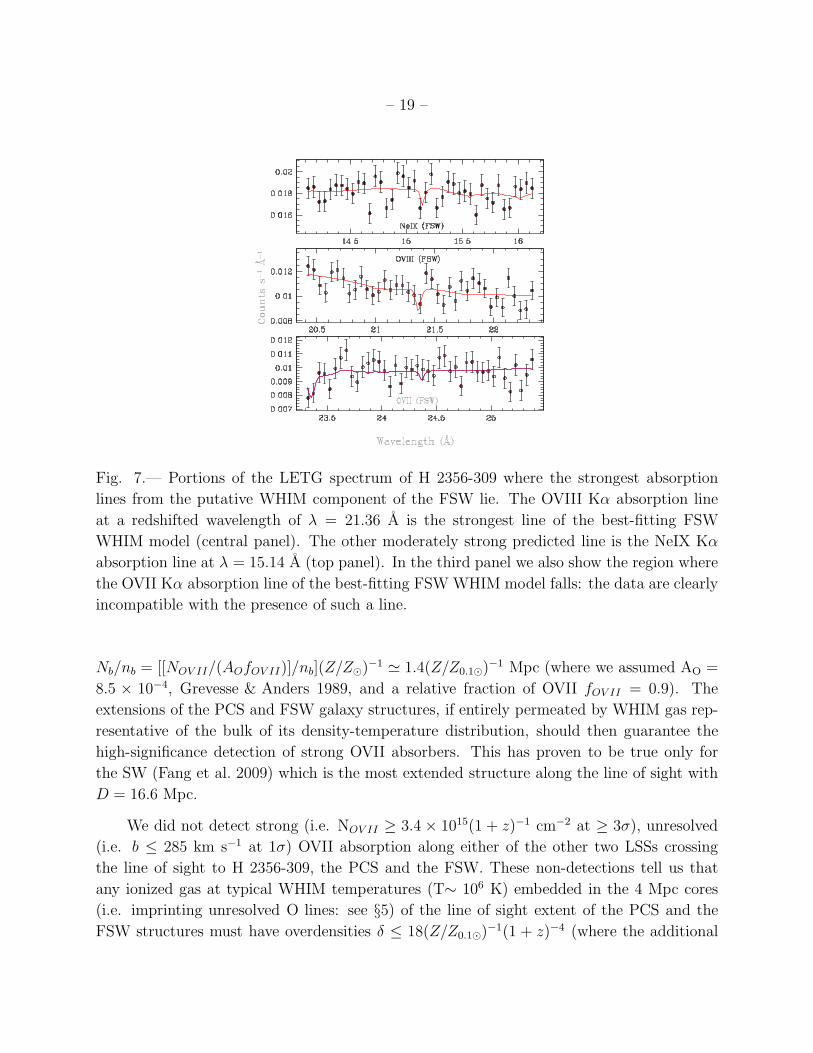
Kα absorption stronger than EW≥ 5.8 mA (3σ limit; Fig. 7, third panel). 10 .
The redshift interval traced by the distribution of galaxies of the PCS, along the line of
sight to H 2356-309, is 0.127 < z < 0.129. The WHIM phase tentatively identified here has
10At the redshift of the putative FSW WHIM component, the OVII Kα falls at λ = 24.25 A, a region
of the detector free of instrumental features, unlike the PCS case, where the OVII Kα falls at the exact
wavelength of the instrumental OI edge.
– 17 –
Fig. 5.— Portions of the LETG spectrum of H 2356-309 showing the strongest absorption
lines from the hot component of the PCS. The best-fitting continuum model is shown in
solid thick red, while absorption lines from the warm WHIM component are shown in solid
thin magenta. The OVIII Kα absorption line at a redshifted wavelength of λ = 20.17 A
is the strongest line of the best-fitting hot-component of the PCS (right panel). The other
predicted lines are the NeIX Kα absorption line at λ = 14.29 A and two strong L shell
transitions from FeXVIII (λ = 15.09A, λ = 14.20A rest frame) and FeXVII (λ = 15.96A,
λ = 15.02A rest frame; left panel).
.
best-fitting redshifts consistent at 1σ with the low redshift end of the FSW interval, namely:
zFSW−WHIM = 0.126± 0.001.
5. Discussion
The line of sight to the blazar H 2356-309 is extremely rich in galaxy large-scale filamen-
tary structures (Figure 1). Other than the SW at least two distinct filaments of galaxies cross
this line of sight, at average redshifts < z1 >= 0.0615 (the PCS structure) and < z2 >= 0.128
(the FSW structure). These very rich structures have line of sight extensions of D1 = 12.4
Mpc and D2 = 8 Mpc, respectively, implying Hubble flow velocity ranges of ∆vH1 = 890 km
s−1 and ∆vH2 = 580 km s−1.
– 18 –
Log T (K)
5 5.5 6 6.5 7
Log [N
H (
Z/ZÔ)−
1
] (c
m−
2
)
18
18.5
19
19.5
20
20.5
Fig. 6.— 68%, 90% and 95% temperature and equivalent H column density confidence
contours for the putative WHIM gas permeating the FSW.
The thermal broadening of C or O lines in gas with T< 107 K is b < 85 km s−1 (C)
or b < 74 km s−1 (O), negligible compared to turbulence induced by peculiar motion of
the structures. In simulations (e.g. Cen & Ostriker 2006) WHIM intrinsic (i.e. excluding
Hubble flow broadening) turbulence are observed to be of ∼ 100 km/s. If the PCS and the
FSW galaxy structures were homogeneously embedded by WHIM, therefore, the Hubble-
flow braodening would be by far the dominant broadening mechanism, and the gas would
imprint metal absorption lines with FWHM∼ 890 km s−1 and FWHM∼ 580 km s−1, for the
PCS and the FSW respectively, easily resolved by the HRC-S/LETG (FWHM=750 km s−1
at 20 A and FWHM=375 km s−1 at 40 A).
On the contrary, unresolved O absoprtion lines in the HRC-LETG must imply that the
gas is homogeneously spread over a limited portion of these two galaxy structures, extending
not more than 4 Mpc along the line of sight (corresponding to Hubble-flow broadening of
0.021A at 20 A, i.e. 1σ of the LETG Line Spread Function)
5.1. On the OVII Bearing WHIM or Galaxy Halo Gas
Our total Chandra LETG spectrum of H 2356-309 is sensitive to absorption line EW≥ 14
mA at 22 A, at ≥ 3σ confidence level. For unsaturated lines (b>
∼200 km s−1) this cor-
responds to OVII column densities NOV II ≥ 3.4 × 10¹⁵(1 + z)−1 cm−2. At overdensi-
ties δ ≃ 50(1 + z)−3 and temperature T≃ 106 K, typical of the bulk (∼ 50%) of the
WHIM density-temperature distribution (e.g. Cen & Ostriker 2006), and assuming ho-
mogeneity, these columns correspond to line of sight extensions of the filament of D ≥
– 19 –
Fig. 7.— Portions of the LETG spectrum of H 2356-309 where the strongest absorption
lines from the putative WHIM component of the FSW lie. The OVIII Kα absorption line
at a redshifted wavelength of λ = 21.36 A is the strongest line of the best-fitting FSW
WHIM model (central panel). The other moderately strong predicted line is the NeIX Kα
absorption line at λ = 15.14 A (top panel). In the third panel we also show the region where
the OVII Kα absorption line of the best-fitting FSW WHIM model falls: the data are clearly
incompatible with the presence of such a line.
Nb/nb = [[NOV II/(AOfOV II)]/nb](Z/Z⊙)−1 ≃ 1.4(Z/Z0.1⊙)
−1 Mpc (where we assumed AO =
8.5 × 10⁻⁴, Grevesse & Anders 1989, and a relative fraction of OVII fOV II = 0.9). The
extensions of the PCS and FSW galaxy structures, if entirely permeated by WHIM gas rep-
resentative of the bulk of its density-temperature distribution, should then guarantee the
high-significance detection of strong OVII absorbers. This has proven to be true only for
the SW (Fang et al. 2009) which is the most extended structure along the line of sight with
D = 16.6 Mpc.
We did not detect strong (i.e. NOV II ≥ 3.4 × 10¹⁵(1 + z)−1 cm−2 at ≥ 3σ), unresolved
(i.e. b ≤ 285 km s−1 at 1σ) OVII absorption along either of the other two LSSs crossing
the line of sight to H 2356-309, the PCS and the FSW. These non-detections tell us that
any ionized gas at typical WHIM temperatures (T∼ 106 K) embedded in the 4 Mpc cores
(i.e. imprinting unresolved O lines: see §5) of the line of sight extent of the PCS and the
FSW structures must have overdensities δ ≤ 18(Z/Z0.1⊙)−1(1 + z)−4 (where the additional
– 20 –
(1 + z)−3 term comes from the (1 + z)3 redshift dependency of < nb >). For both the PCS
(δ ≤ 14(Z/Z0.1⊙)−1 at ≥ 3σ), and the FSW (δ ≤ 11(Z/Z0.1⊙)
−1 at ≥ 3σ) these overdensities
lie on the lower end of the predicted overdensity interval for the bulk of the WHIM, ranging
between δ ≃ 5 − 50. This is the opposite of what intuitively expected (though with a large
scatter, e.g. Viel et al., 2005), that richer galaxy LSSs potentially harbor denser WHIM
filaments.
Alternatively the OVII bearing gas in these structures, could spread over the large extent
of the galaxy super-structure along the line of sight, and so produce broader and resolved
shallow (hence more difficult to detect) lines in the LETG (see §5) , or could have metallicity
lower than 10% Solar, in either cases relaxing the above limits on the gas overdensities.
However, any denser WHIM gas at the typical T ∼ 106 K temperature and with line of sight
turbulence velocity lower than a few hundreds km s−1, should have been detected at high
significance in the LETG spectrum of H 2356-309.
An alternative interpretation of the OVII absorption, is that it could be associated with
the hot extended halo of a single galaxy with small line of sight impact parameter. In this sce-
nario, if r is the galaxy spherical halo radius, the impact parameter d must be smaller than r,
and the line of sight can only cross a section of the halo D = 2rsin(α), where 0 ≤ α ≤ π/2 is
the angle between the direction of the galaxy-line of sight impact parameter d and the halo ra-
dius r in the direction of the interception of the halo external boundary with the line of sight.
By averaging over 0 ≤ α ≤ π/2, we get < D >= 4r/π. With this assumptions the baryon
density of the galaxy halo is given by nb = Nb/D<
∼[[NOV II/(AOfOV II)]/(4d/π)](Z/Z⊙)
−1.
The non-detection of OVII bearing gas up to the NOV II ≥ 3.4× 10¹⁵(1 + z)−1 cm−2 3σ
limit, allows us to estimate stringent upper limits on the densities of putative galaxy halo
gas with T ∼ 106 K intercepting the line of sight to H 2356-309 at the redshifts of the PCS
and the FSW structures. By using an impact parameters 200 . d . 300 kpc (Stocke et al.
2006), we obtain nb ≃ (3 − 5) × 10−5(Z/Z0.1⊙)−1 cm−3 for both the PCS and the FSW
which is lower than the values derived for our galaxy halo or extended Local Group gas (e.g.
Rasmussen et al. 2003; Williams et al. 2005). These values would be raised at most by a
factor of 2 by accounting for non constant gas density profile11.
11We assumed a β −model (Cavaliere & Fusco-Femiano 1976) gas density distribution with β parameter
ranging between 0.6 and 0.9 and assumed core radius ranging from 1 kpc to an unrealistically high 400 kpc
value.
– 21 –
5.2. The Ionized Gas Content of the PCS and FSW Galaxy Structures
As discussed in the previous section, we do not detect significant amount of OVII-
bearing (i.e. typical of the bulk WHIM temperature-density distribution) gas in either
the PCS or the FSW galaxy super-structures. However, at the redshift of these structure,
we do marginally detect a number of (individually low-significance) metal absorption lines,
from either low-ionization (OVI, OV, CV) or high-ionization (OVIII, NeIX) ions. Such
ions populate gas with temperatures in the low- or high-end of the WHIM temperature
distribution, containing roughly 27% and 23% of the predicted WHIM mass, respectively.
The absorption lines hinted in the LETG spectrum of H 2356-309 at the redshifts of the
PCS and the FSW, are all unresolved, which implies line of sight extensions of the absorber
D<
∼4 Mpc.
Despite the low statistical significance of each of these individual absorption lines, we
were still able to constrain the main physical parameters of the absorbing gas, namely its
equivalent H column density and temperature, by modelling the broad-band LETG data
with our hybridly ionized WHIM gas model. We identify two different absorbing WHIM
phases at the redshift of the PCS, with log T = 5.35+0.07−0.13, logNH = 19.1± 0.2(Z/Z⊙)
−1, and
log T = 6.9+0.1−0.8, logNH = 20.1+0.3
−1.7(Z/Z⊙)−1, for the warm and the hot phases respectively.
For the FSW, instead, only one hot phase is tentatively detected, with log T = 6.6+0.1−0.2 and
log NH = 19.8+0.4−0.8(Z/Z⊙)
−1.
We can infer baryon densities lower limits for these systems, by assuming that the
absorbers are embedded in their galaxy superstructures, and have dense cores extending < 4
Mpc along the line of sight (we note that for the two phases in the PCS, assuming their
are physically separated, the total extent can be close to the entire line of sight extension
of the PCS galaxy filament). By conservatively assuming the −1σ NH value as Nb for the
two PCS WHIM phases we get nb(Warm) = Nb(Warm)/D > 6.4 × 10⁻⁷(Z/Z⊙)−1 cm−3
(δ > 2.7(Z/Z⊙)−1) and nb(hot) = Nb(hot)/D > 2.0×10⁻⁷(Z/Z⊙)
−1 (δ > 0.9(Z/Z⊙)−1), while
for the hot phase of the FSW we obtain nb = Nb/D > 8.1×10⁻⁷(Z/Z⊙)−1 (δ > 2.8(Z/Z⊙)
−1),
all consistent with predicted WHIM overdensities.
5.3. Number density of OVII absorbers along the line of sight to H 2356-309
From our best-fitting WHIM model temperatures for the three putative WHIM ab-
sorbers at the redshifts of the PCS and the FSW, we can infer the relative fraction of OVII
in each phase. These are fW−PCSOV II = 0.15, fH−PCS
OV II = 9× 10⁻⁴ and fFSWOV II = 0.028. These ion
fractions correspond to columns of NW−PCSOV II = 1.6+1.8
−0.6 × 1015 cm−2, NH−PCSOV II = 9.6+9.5
−9.4× 10¹³
– 22 –
cm−2 and NFSWOV II = 1.5+2.3
−1.3 × 1015 cm−2, or to unsaturated OVII EWs of 7+8−3 mA, 0.42+0.42
−0.41
mA and 7+11−6 mA, respectively.
Assuming the best-fitting temperature and NH values as face values, the lowest OVII
equivalent width that we are indirectly probing, through our hybrid-ionization WHIM code,
along the line of sight to H 2356-309. is therefore EW(OVII)>
∼0.4 mA, corresponding to the
hot phase of the PCS. Combining our three tentative WHIM detections, with the WHIM
detection associated with the SW, leaves us with 4 distinct WHIM systems with EW(OVII)≥
0.4 mA, along a ∆z = 0.165 path length, or a number density of EW(OVII)≥ 0.4 mA
filaments of dN(EW > 0.4)/dz = 24.2+19.211.6 (allowing for the large 1σ uncertainties due to
the small number statistics, i.e. Gehrels 1986). This is fully consistent with hydrodynamical
simulation predictions (e.g. Cen & Fang 2006).
We can, in principle, also compute the cumulative number density of OVII filaments
per unit redshifts, with EW larger than a given threshold, for two additional EW thresh-
olds: ≥ 7 mA (3 absorbers) and ≥ 25.8 mAA (1 absorber: Fang et al. 2009). We get
dN(EW > 7)/dz = 18.2+17.79.9 and dN(EW > 25.8)/dz = 6.1+13.9
−5.1 . We plot such derived
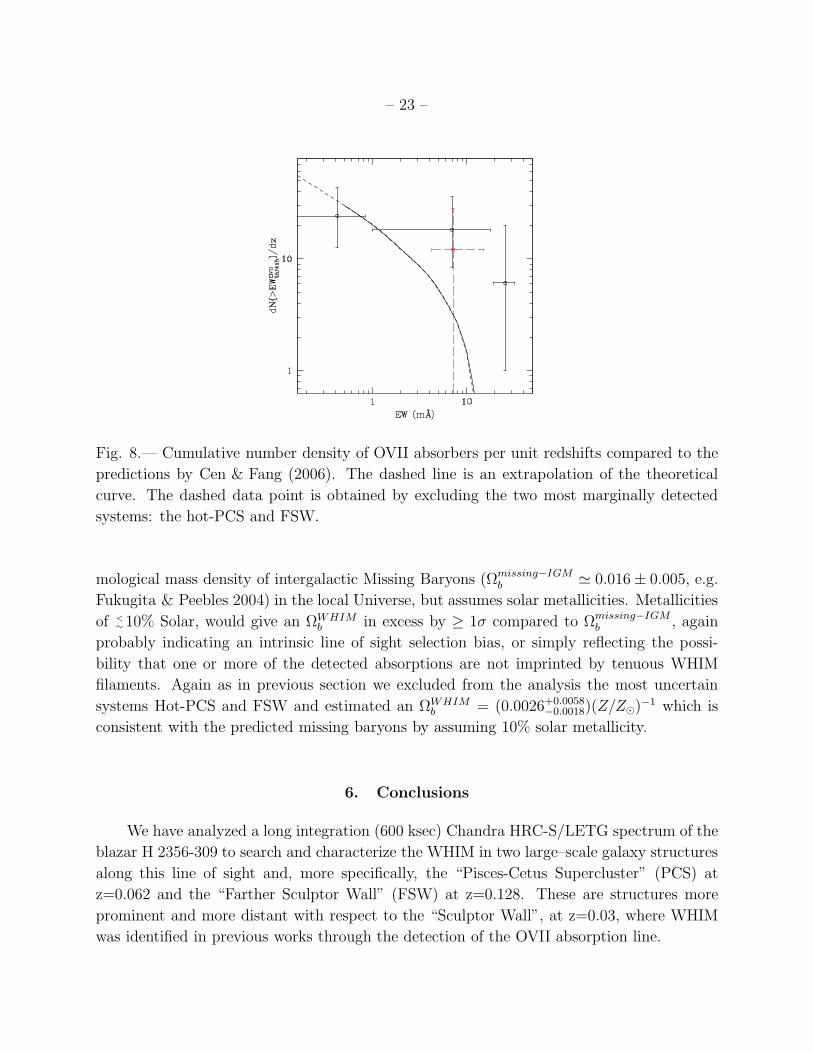
number density per unit redshift, in Figure 8, superimposed to the theoretical cumulative
dN(> EWthresh)/dz curve from Cen & Fang (2006). The data-point at 25.8 mA, exceeds
the predictions by more than 2σ. This could be due to a line of sight selection bias, or may
reflect the possibility that one or more of the detected absorption do not actually arise in
tenuous WHIM filaments, but in much denser galaxy halos of one (or more) components of
the LSSs with line of sight impact parameter of ∼ 200 − 300kpc. It may finally be that
the most marginally detected systems, the Hot-PCS and the FSW, given their large uncer-
tainties in temperature and column density may just be explained as occasional statistical
fluctuation. In this case, considering only the SW and Warm-PCS systems, the number
density of EW(OVII)≥ 7 mA filaments would be dN(EW > 7)/dz = 12.1+16.0−11.7 which within
the large uncertainties is consistent with the predictions (see Figure 8 dashed data point).
5.4. Cosmological Mass Density of the WHIM from the H 2356-309 Line of
Sight Absorbers
Finally, we derive the Cosmological mass density of the WHIM as measured along the
line of sight to H 2356-309, by assuming that all 4 different phases seen at the redshifts of
the three SW, PCS and FSW galaxy superstructures are intervening WHIM filaments. By
propagating in quadrature the large errors associated with the equivalent H column den-
sity measurements of the absorbers, and those intrinsic with cosmic variance low-number
statistics, we obtain: ΩWHIMb = (0.021+0.031
−0.018)(Z/Z⊙)−1. This is consistent with the cos-
– 23 –
Fig. 8.— Cumulative number density of OVII absorbers per unit redshifts compared to the
predictions by Cen & Fang (2006). The dashed line is an extrapolation of the theoretical
curve. The dashed data point is obtained by excluding the two most marginally detected
systems: the hot-PCS and FSW.
mological mass density of intergalactic Missing Baryons (Ωmissing−IGMb ≃ 0.016± 0.005, e.g.
Fukugita & Peebles 2004) in the local Universe, but assumes solar metallicities. Metallicities
of <
∼10% Solar, would give an ΩWHIM
b in excess by ≥ 1σ compared to Ωmissing−IGMb , again
probably indicating an intrinsic line of sight selection bias, or simply reflecting the possi-
bility that one or more of the detected absorptions are not imprinted by tenuous WHIM
filaments. Again as in previous section we excluded from the analysis the most uncertain
systems Hot-PCS and FSW and estimated an ΩWHIMb = (0.0026+0.0058
−0.0018)(Z/Z⊙)−1 which is
consistent with the predicted missing baryons by assuming 10% solar metallicity.
6. Conclusions
We have analyzed a long integration (600 ksec) Chandra HRC-S/LETG spectrum of the
blazar H 2356-309 to search and characterize the WHIM in two large–scale galaxy structures
along this line of sight and, more specifically, the “Pisces-Cetus Supercluster” (PCS) at
z=0.062 and the “Farther Sculptor Wall” (FSW) at z=0.128. These are structures more
prominent and more distant with respect to the “Sculptor Wall”, at z=0.03, where WHIM
was identified in previous works through the detection of the OVII absorption line.
– 24 –
Although we do not detect significant individual absorption lines in the PCS nor in the
FSW, the joint analysis of the marginally detected lines (as well as of stringent upper limits)
through a self-consistent hybrid ionization spectral model, allow us to constrain the physics
of the WHIM in the two farther superstructures. The main results are summarized in the
following:
• At the redshift of the PCS we identify two distinct phases: a warm phase, with log T =
5.35+0.070.13 K and logNH = (19.1 ± 0.2) cm2, and a much hotter less significant phase,
with logT = 6.9+0.10.8 K and logNH = 20.1+0.3
−1.7 cm−2 (1σ errors).
• At the redshift of the FSW only one hot component is hinted in the data, with logT =
6.6+0.10.2 K and logNH = 19.8+0.4
−0.8 cm−2.
• Under the assumption that the absorbers are embedded in their galaxy superstructures
having baryonic column densities Nb equal to the −1σ NH value, and have dense cores
extending <4 Mpc along the line of sight, we can infer conservative lower limits on
the baryons densities in the two systems for the three absorbers. More specifically, for
the two PCS WHIM phases we get δ > 2.7(Z/Z⊙)−1 and δ > 0.9(Z/Z⊙)
−1, while for
the hot FSW phase we obtain δ > 2.8(Z/Z⊙)−1, all consistent with predicted WHIM
overdensities.
• By combining the constraints on the OVII absorbers in the PCS and in the FSW, with
the previous detection in the SW (Fang et al. 2009), we derive the cumulative number
density of OVII absorbers per unit redshift, as a function of the EW(OVII). While
at low equivalent widths (EW(OVII)>0.4 mA) the absorbers number density is fully
consistent with the predictions of hydrodynamical simulations, at EW(OVII)>10 mA
the inferred absorbers number density exceeds significantly the theoretical predictions.
The latter finding may result from a line of sight selection bias, or may reflect the
possibility that one or more of the detected absorptions do not arise in WHIM filaments
but in galaxy halos. We considered also the possibility that the two most marginally
detected systems (Hot-PCS and FSW) may be just statistical fluctuations and not
absorbers. In this case the number density of OVII absorbers per unit redshift would
agree with the predictions within the large uncertainties.
• Finally, by combining the measurements in all absorbers we derive a cosmological
mass density of the WHIM of ΩWHIMb = (0.021+0.031
−0.018)(Z/Z⊙)−1, consistent with the
cosmological mass density of intergalactic missing baryons in the local universe. Yet,
if the WHIM metallicities are <10% Solar, then the resulting ΩWHIMb is significantly in
excess of the missing baryon density, again possibly indicating a line of sight selection
– 25 –
bias, or reflecting the possibility that one or more absorbers are not associated with
WHIM. The exclusion of the two most marginally detected systems may bring in
agreement the ΩWHIMb value if we assume 0.1Z⊙.
We thank the anonymous referee for comments and suggestions which improved the
paper presentation. We thank Jeremy Drake for useful discussion and support on Chan-
dra LETG calibration. We also thank Yair Krongold for providing the latest version of
his hybrid-ionization WHIM models, and Doug Burke for writing the interface routines be-
tween Sherpa and our hybrid-ionization models. FN and LZ acknowledge support from the
LTSA grant NNG04GD49G and the ASI-AAE grant I/088/06/0. FN acknoleges support
from the FP7-REGPOT-2007-1 EU grant No. 206469. This research has made use of the
NASA/IPAC Extragalactic Database (NED) which is operated by the Jet Propulsion Labo-
ratory, California Institute of Technology, under contract with the National Aeronautics and
Space Administration.
REFERENCES
Buote, D. A., Zappacosta, L., Fang, T., Humphrey, P. J., Gastaldello, F., & Tagliaferri, G.
2009, ApJ, 695, 1351
Burns, J. O. & Batuski, D. J. 1984, in ASSL Vol. 111: Clusters and Groups of Galaxies,
43–+
Cavaliere, A. & Fusco-Femiano, R. 1976, A&A, 49, 137
Cen, R. & Fang, T. 2006, ApJ, 650, 573
Cen, R., Kang, H., Ostriker, J. P., & Ryu, D. 1995, ApJ, 451, 436
Cen, R. & Ostriker, J. P. 1999, ApJ, 514, 1
—. 2006, ApJ, 650, 560
Colless, M., Peterson, B. A., Jackson, C., Peacock, J. A., et al. 2003, ArXiv Astrophysics
e-prints
da Costa, L. N., Pellegrini, P. S., Sargent, W. L. W., Tonry, J., Davis, M., Meiksin, A.,
Latham, D. W., Menzies, J. W., & Coulson, I. A. 1988, ApJ, 327, 544
Dave, R., Cen, R., Ostriker, J. P., Bryan, G. L., Hernquist, L., et al. 2001, ApJ, 552, 473
– 26 –
Fang, T., Buote, D. A., Humphrey, P. J., Canizares, C. R., Zappacosta, L., Maiolino, R.,
Tagliaferri, G., & Gastaldello, F. 2009, ArXiv e-prints
Fukugita, M., Hogan, C. J., & Peebles, P. J. E. 1998, ApJ, 503, 518
Fukugita, M. & Peebles, P. J. E. 2004, ApJ, 616, 643
Gehrels, N. 1986, ApJ, 303, 336
Grevesse, N. & Anders, E. 1989, in American Institute of Physics Conference Series, Vol.
183, Cosmic Abundances of Matter, ed. C. J. Waddington, 1–8
Hellsten, U. et al. 1998, ApJ, 509, 56
Jones, D. H., Saunders, W., Colless, M., Read, M. A., Parker, Q. A., et al. 2004, MNRAS,
355, 747
Kaastra, J. S., Lieu, R., Tamura, T., Paerels, F. B. S., & den Herder, J. W. 2003, A&A,
397, 445
Kalberla, P. M. W., Burton, W. B., Hartmann, D., Arnal, E. M., Bajaja, E., Morras, R., &
Poppel, W. G. L. 2005, A&A, 440, 775
Nicastro, F., Krongold, Y., Fields, D., Conciatore, M. L., Zappacosta, L., Elvis, M., Mathur,
S., & Papadakis, I. 2009, ArXiv e-prints
Nicastro, F., Mathur, S., & Elvis, M. 2008, Science, 319, 55
Nicastro, F., Mathur, S., Elvis, M., Drake, J., Fiore, F., Fang, T., Fruscione, A., Krongold,
Y., Marshall, H., & Williams, R. 2005a, ApJ, 629, 700
Nicastro, F. et al. 2005b, Nature, 433, 495
Perna, R. & Loeb, A. 1998, ApJ, 503, L135+
Porter, S. C. & Raychaudhury, S. 2005, MNRAS, 364, 1387
Rasmussen, A., Kahn, S. M., & Paerels, F. 2003, in astro-ph/0301183, 109–+
Rasmussen, A. P. et al. 2007, ApJ, 656, 129
Scharf, C., Donahue, M., et al. 2000, ApJ, 528, L73
Stocke, J. T., Penton, S. V., Danforth, C. W., Shull, J. M., Tumlinson, J., & McLin, K. M.
2006, ApJ, 641, 217
– 27 –
Tully, R. B., Scaramella, R., Vettolani, G., & Zamorani, G. 1992, ApJ, 388, 9
Viel, M., Branchini, E., Cen, R., Ostriker, J. P., Matarrese, S., Mazzotta, P., & Tully, B.
2005, MNRAS, 360, 1110
Werner, N., Finoguenov, A., Kaastra, J. S., Simionescu, A., Dietrich, J. P., Vink, J., &
Bohringer, H. 2008, A&A, 482, L29
Williams, R. J., Mathur, S., Nicastro, F., Elvis, M., Drake, J. J., Fang, T., Fiore, F.,
Krongold, Y., Wang, Q. D., & Yao, Y. 2005, ApJ, 631, 856
Zappacosta, L. 2005, in Chandra Proposal, 2041–+
Zappacosta, L. 2006, in XMM-Newton Proposal ID #05043713, 165–+
Zappacosta, L. et al. 2002, A&A, 394, 7
—. 2005, MNRAS, 357, 929
This preprint was prepared with the AAS LATEX macros v5.2.
– 28 –
Table 3: Best-Fitting Absorption Line Parameters and Ids for the PCS and the FSW
Wavelength EW Significancea Identification Redshiftb
(in A) (in mA) (in σ)
Pisces-Cetus Supercluster (PCS)
42.770± 0.015 19.6± 13.1 1.5 CV Kα 0.0621± 0.0004
35.76 – 35.86 < 5.5 NA CVI Kα 0.060 – 0.063
22.970± 0.015 6.2± 5.5 1.1 OVII Kα 0.0633± 0.0008
20.160± 0.015 7.3± 4.8 1.5 OVIII Kα 0.0628± 0.0007
14.280± 0.015 5.0± 3.3 1.5 NeIX Kα 0.062± 0.001
12.86 – 12.90 < 3.2 NA NeX Kα 0.060 – 0.063
Farther Sculptor Wall (FSW)
45.38 – 45.46 < 6.1 NA CV Kα 0.127 – 0.129
38.042± 0.015 10.4± 8.5 1.2 CVI Kα 0.1278± 0.0004
24.32 – 24.39 < 5.8 NA OVII Kα 0.126 – 0.129
21.396± 0.015 7.7± 4.9 1.6 OVIII Kα 0.1279± 0.0008
15.161± 0.015 4.0± 3.3 1.2 NeIX Kα 0.127± 0.001
12.46 – 12.47 < 3.1 NA NeX Kα 0.127 – 0.129
z ≃ 0
40.274± 0.015 38.5± 12.3 3.1 CV Kα 0.0002± 0.0005
33.72 – 33.75 < 7.1 NA CVI Kα ±0.0004
21.561± 0.015 8.1± 5.0. 1.6 OVII Kα −0.0019± 0.0007
18.952± 0.015 4.6± 3.6 1.3 OVIII Kα −0.0009± 0.0008
13.449± 0.015 7.6± 3.3 2.3 NeIX Kα ±0.001
12.131± 0.015 7.7± 2.9 2.7 NeX Kα ±0.001
a Single Line Significance in Standard Deviations, evaluated as the ratio between the best
fitting EW and its 1σ error (see text for details).b The error is derived from the systematic 1σ wavelength uncertainty of ±15 mA due to the
non-linearity of the HRC-S LETG dispersion relationship.
– 29 –
Table 4: Redshift and physical parameters resulting from the fits
log T logNH Redshift
(in K) (in (Z/Z⊙)−1 cm−2)
PCS (z=0.06-0.063: Warm Phase)
5.35+0.07−0.13 19.1± 0.2 0.0623± 0.0005
PCS (z=0.06-0.063: Hot Phase)
6.9+0.1−0.8 20.1+0.3
−1.7 0.063± 0.001
FSW (z=0.127-0.129)
6.6+0.1−0.2 19.8+0.4
−0.8 0.126± 0.001