STUDY REPORT - PIPA
41
STUDY REPORT Adaptation of the USGBC TSAC Report for Relevance to Australian DWV Pipe FINAL N. P. Howard © BRANZ 2008
-
Upload
khangminh22 -
Category
Documents
-
view
4 -
download
0
Transcript of STUDY REPORT - PIPA
STUDY REPORTAdaptation of theUSGBC TSAC Report
for Relevance to AustralianDWV PipeFINAL
N. P. Howard
© BRANZ 2008
i
Adaptation of the USGBC TSAC Report forRelevance to Australian DWV Pipe
N. P. Howard
AbstractThis report has been prepared by BRANZ on behalf of PIPA and a consortium of stakeholders toreview the US Green Building Council (USGBC) Technical Scientific Advisory Committee (TSAC)report “Assessment of the Technical Basis for a PVC-Related Materials Credit for LEED” toassess and adapt it for relevance to Australian Drain Waste Vent (DWV) pipe.
The report has been peer reviewed by Dr Greg Peters of UNSW and Dr John Schiers ofExcelPlas – reviewers selected and agreed by the consortium members.
The USGBC TSAC report is the most comprehensive assessment of the environmental andhealth risk implications of using PVC products in construction. The report provides a technicaltouchstone for industry and environmental groups because it is the first time when bothenvironmental impacts and health risk assessment have been addressed together in acomplementary way. Despite reviewing thousands of sources there still remain some significantgaps in coverage of the health risk impacts for PVC products, but even more so for manyalternatives.
The PVC industry have faced opposition from environmental groups for many years but claim thattheir products are no worse for their environmental and health impacts than competing products.This environmental opposition manifests in Australia in a credit within the Green Building Councilof Australia’s Green Star Rating Systems for minimisation or elimination of PVC, in the Guidelinesfor the Sydney Olympic Park Authority seeking PVC minimisation and in the NSW Department ofEnvironment and Climate Change registration of PVC as a waste of concern. This report aims toprovide evidence to assist all stakeholders to reach rational conclusions based on best availablescience, by adapting the TSAC report to Australian product, production processes and competingalternatives.
The project has reproduced the TSAC LCA results adapted to Australian product and processesbut assessed using the US Environmental Protection Agency’s Tool for the Reduction andAssessment of Chemical and Other Environmental Impacts (TRACI) impact assessmentmethodology. Results are compared and contrasted with US results extending the productsassessed from PVC, ABS and Cast Iron to also include Copper and HDPE. The results showthat against a wide range of environmental impacts, the PVC pipe performs favourably comparedto its main competitors, only HDPE pipe having a comparable environmental performance. Thisperformance is demonstrated over production and use phases of the product life cycle.
The project has attempted to reproduce the TSAC Health Risk assessment results, but found thatgaps in the available data prevented a complete assessment. Using a strategy of top downadaptation of TSAC results and bottom up estimation of results it has nonetheless been possibleto replicate or simulate Australian pipe performance and verify or refute results and conclusionsfor their relevance to Australian pipe. The health risk assessment demonstrates that particulateemissions from cast iron and copper production dominate the health risks from the pipealternatives and PVC pipe performance has a lower associated health risk compared toalternatives than that in the US. ABS pipe appears to have a higher associated risk than found in
ii
the TSAC report from production. The assessment has also confirmed that if the frequency oflandfill fires is at the high end of the TSAC scenarios, PVC pipe may have a higher end-of-lifecancer risk associated with it (but this is still small compared to the particulate emissions risks).Overall, PE pipe has the lowest health risk implications.
A surprise side result form this study was that US dioxin emissions from well managed andcontrolled incinerated wastes (where the incinerators operate at high temperatures) are probablylower than the dioxin emissions from landfilled waste subject to accidental uncontrolled fires.This means that the dioxin emissions associated with the 100% landfilled wastes in Australia maybe higher on average than those where a significant proportion of wastes are incinerated. This isgenerally counter to the expectations and advocacy of environmental groups.
It is recommended:
x That the PVC pipe industry commit to the recycling of UPVC waste from the wastestream and work with State governments to recover these wastes and mitigate anyremaining concerns over UPVC related dioxin or other emissions from landfill fires.
x That this report be presented to NSW DECC with a request to investigate landfill firefrequency and burn mass to confirm and improve these findings and with acommitment in place to recover UPVC waste from the waste stream reconsider PVCas a waste of concern.
x That this report be presented to the Green Building Council of Australia to seek awithdrawal or modification of the PVC minimization credit to permit the use of PVCDWV pipe.
x That this report be presented to the Sydney Olympic park Authority to seek awithdrawal or modification of the PVC minimization requirements in its developmentguidelines.
x That the pipe industry proceed with a full LCA of their products and establish anecolabel standard for pipe systems – this report indicates that PVC pipe products arelikely to be environmentally preferable.
iii
Contents Page
1. Introduction........................................................................................................................................................................12. Background.........................................................................................................................................................................13. Objective.............................................................................................................................................................................. 24. Methodology......................................................................................................................................................................34.1 Functional Unit: ......................................................................................................................................................34.2 Scope: .......................................................................................................................................................................... 44.3 Product Alternatives:.......................................................................................................................................... 44.4 LCA Impact Assessment: .................................................................................................................................. 44.5 Health Risk Assessment:..................................................................................................................................54.5.1 Top Down: .............................................................................................................................................................54.5.2 Bottom Up: ...........................................................................................................................................................54.5.3 From TRACI ..........................................................................................................................................................6
5. Results ..................................................................................................................................................................................65.1 LCA Results ...............................................................................................................................................................65.1.1 Production Excluding End-Of-Life ...........................................................................................................65.1.2 Production Including End-Of-Life ............................................................................................................7
5.2 Human Health Results .......................................................................................................................................9Top Down Assessment.................................................................................................................................................9Bottom Up Assessment .............................................................................................................................................18TRACI Health Characterisation............................................................................................................................ 23
6. Conclusions.....................................................................................................................................................................246.1 TSAC Report Statements.................................................................................................................................246.1.1 Key Positive Findings and Issues Identified ................................................................................ 256.1.2 Key Findings for Vinyl Pipe...................................................................................................................... 256.1.2.1 Human Health ......................................................................................................................................... 26
6.1.3 Data Gaps and Uncertainty ...................................................................................................................... 277. Recommendations...................................................................................................................................................... 288. References ...................................................................................................................................................................... 29APPENDIX.A LCA Data .........................................................................................................................................................30APPENDIX.B Health Risk Assessment..........................................................................................................................1
1
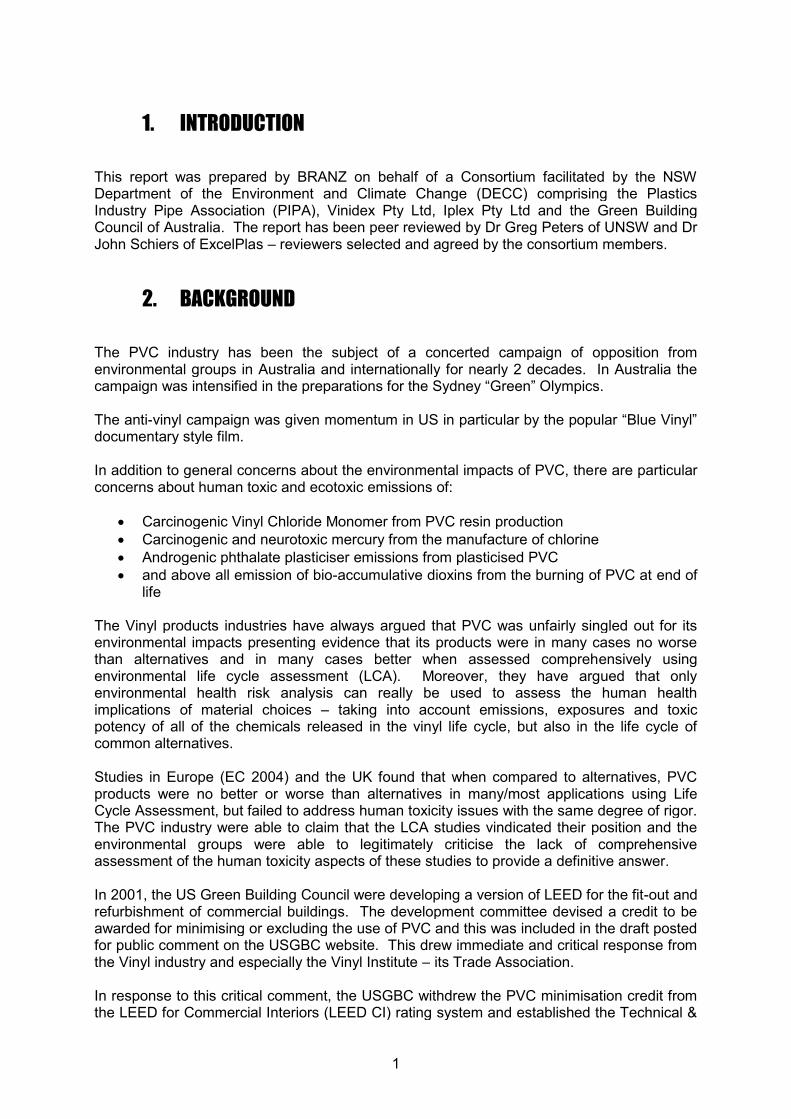
1. INTRODUCTION
This report was prepared by BRANZ on behalf of a Consortium facilitated by the NSWDepartment of the Environment and Climate Change (DECC) comprising the PlasticsIndustry Pipe Association (PIPA), Vinidex Pty Ltd, Iplex Pty Ltd and the Green BuildingCouncil of Australia. The report has been peer reviewed by Dr Greg Peters of UNSW and DrJohn Schiers of ExcelPlas – reviewers selected and agreed by the consortium members.
2. BACKGROUND
The PVC industry has been the subject of a concerted campaign of opposition fromenvironmental groups in Australia and internationally for nearly 2 decades. In Australia thecampaign was intensified in the preparations for the Sydney “Green” Olympics.
The anti-vinyl campaign was given momentum in US in particular by the popular “Blue Vinyl”documentary style film.
In addition to general concerns about the environmental impacts of PVC, there are particularconcerns about human toxic and ecotoxic emissions of:
x Carcinogenic Vinyl Chloride Monomer from PVC resin productionx Carcinogenic and neurotoxic mercury from the manufacture of chlorinex Androgenic phthalate plasticiser emissions from plasticised PVCx and above all emission of bio-accumulative dioxins from the burning of PVC at end of
life
The Vinyl products industries have always argued that PVC was unfairly singled out for itsenvironmental impacts presenting evidence that its products were in many cases no worsethan alternatives and in many cases better when assessed comprehensively usingenvironmental life cycle assessment (LCA). Moreover, they have argued that onlyenvironmental health risk analysis can really be used to assess the human healthimplications of material choices – taking into account emissions, exposures and toxicpotency of all of the chemicals released in the vinyl life cycle, but also in the life cycle ofcommon alternatives.
Studies in Europe (EC 2004) and the UK found that when compared to alternatives, PVCproducts were no better or worse than alternatives in many/most applications using LifeCycle Assessment, but failed to address human toxicity issues with the same degree of rigor.The PVC industry were able to claim that the LCA studies vindicated their position and theenvironmental groups were able to legitimately criticise the lack of comprehensiveassessment of the human toxicity aspects of these studies to provide a definitive answer.
In 2001, the US Green Building Council were developing a version of LEED for the fit-out andrefurbishment of commercial buildings. The development committee devised a credit to beawarded for minimising or excluding the use of PVC and this was included in the draft postedfor public comment on the USGBC website. This drew immediate and critical response fromthe Vinyl industry and especially the Vinyl Institute – its Trade Association.
In response to this critical comment, the USGBC withdrew the PVC minimisation credit fromthe LEED for Commercial Interiors (LEED CI) rating system and established the Technical &
2
Scientific Advisory Committee (TSAC) to investigate. The TSAC commissioned an expertgroup to investigate including LCA experts, Toxicology experts and Building material experts.
The charge to the TSAC was To review the evidence offered by stakeholdersand information from independent sources and to advise the LEEDSteering Committee on whether sufficient evidence exists to make areasoned decision about the inclusion of a credit under LEED related tothe use of PVC products in LEED certified buildings, and if not torecommend a defined approach to resolve identified issue.
The expert group reviewed around 2,600 scientific papers from the literature and fromstakeholders. A preliminary draft report was issued in December 2004 identifying gaps in theavailable data (especially for PVC competing products). The report was finalised in February2007 with remaining data gaps mainly around end-of-life disposal from back-yard burningand landfill fires.
The USGBC TSAC review is almost certainly the most complete assessment conductedinternationally and it confirmed that against a broad range of environmental impacts, PVCDWV pipe was generally preferable to common US alternatives from ABS or Cast Iron.However, when it came to Human Health impacts, ABS was generally better, with Cast Irongenerally worst, except for human cancer implications arising from the disposal of pipe inlandfill, through incineration or from backyard burning.
In Australia, it was expected that PVC DWV pipe would perform even better compared toABS and Cast Iron alternatives because of the use of thinner walled pipe, PVC O pipe andfoamed core PVC pipe – all of which reduce the quantities of PVC used per unit length ofpipe. Also in Australia, PE, copper and fibre cement are more common viable alternatives.
The PVC pipe industry consider that there are three key documents that underpin specifiers’and designers’ concerns about the environmental credentials of PVC pipe. These are:
1. Extended Producer Responsibility Priority Statement, Department of Environmentand Climate Change (DECC);
2. Green Star Building Rating Tools, Green Building Council of Australia (GBCA);3. Sydney Olympic Park Design Guidelines, Sydney Olympic Park Authority (SOPA)
These documents encourage avoidance of PVC products in general indicating that PVC is anenvironmentally unsound building material.
The PVC pipe industries have been working with the Department of Environment andClimate Change in the Sustainability Advantage Programme. Through this programme theDECC are resourcing stakeholder engagement for Vinidex and Iplex with DECC themselves(as stewards of the Extended Producer Responsibility Priority Statement), with GBCA andSydney Olympic Park Authority.
3. OBJECTIVE
The objective of this report is to adapt the USGBC TSAC PVC pipe findings so that they arerelevant to Australian feedstocks, energy sources, production processes and product andcompare this to common Australian product alternatives. In doing so, this report should
3
provide the basis for reconsideration of the implications of PVC DWV pipe by the DECC, bythe GBCA and by the Sydney Olympic Park Authority.
4. METHODOLOGYThe approach taken was to replicate the goal, scope and LCA methodology used within theUS TSAC report as far as possible, but drawing from the Australian dataset provided with theSima Pro LCA software. Accordingly, this report should be read in conjunction with theoriginal TSAC report (TSAC 2007).
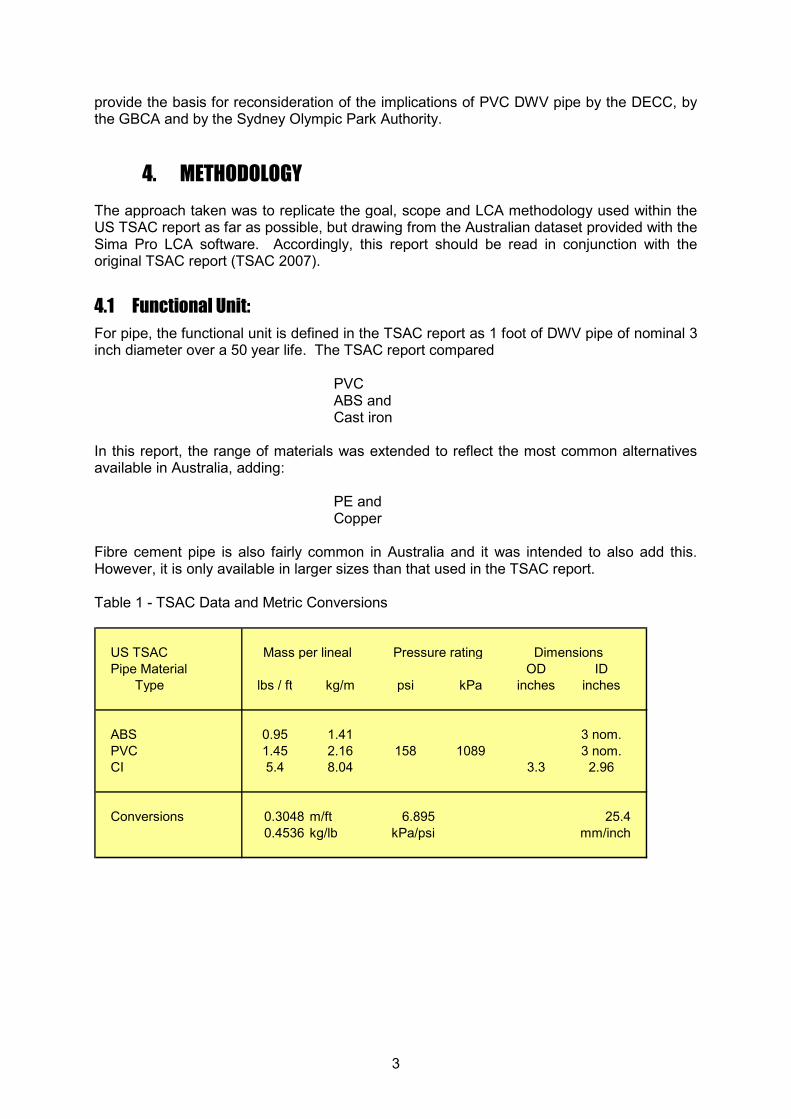
4.1 Functional Unit:For pipe, the functional unit is defined in the TSAC report as 1 foot of DWV pipe of nominal 3inch diameter over a 50 year life. The TSAC report compared
PVCABS andCast iron
In this report, the range of materials was extended to reflect the most common alternativesavailable in Australia, adding:
PE andCopper
Fibre cement pipe is also fairly common in Australia and it was intended to also add this.However, it is only available in larger sizes than that used in the TSAC report.
Table 1 - TSAC Data and Metric Conversions
US TSACPipe Material OD ID
Type lbs / ft kg/m psi kPa inches inches
ABS 0.95 1.41 3 nom.PVC 1.45 2.16 158 1089 3 nom.CI 5.4 8.04 3.3 2.96
Conversions 0.3048 m/ft 6.895 25.40.4536 kg/lb kPa/psi mm/inch
Mass per lineal Pressure rating Dimensions
4
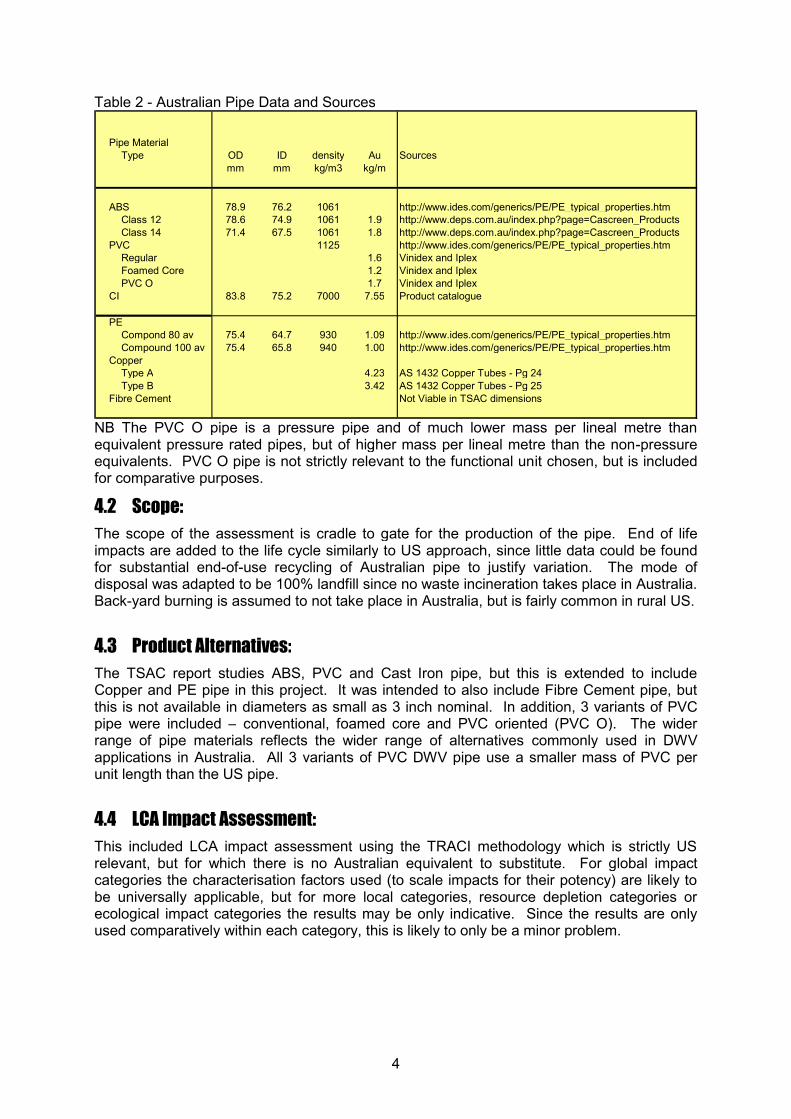
Table 2 - Australian Pipe Data and Sources
Pipe MaterialType OD ID density Au Sources
mm mm kg/m3 kg/m
ABS 78.9 76.2 1061 http://www.ides.com/generics/PE/PE_typical_properties.htmClass 12 78.6 74.9 1061 1.9 http://www.deps.com.au/index.php?page=Cascreen_ProductsClass 14 71.4 67.5 1061 1.8 http://www.deps.com.au/index.php?page=Cascreen_Products
PVC 1125 http://www.ides.com/generics/PE/PE_typical_properties.htmRegular 1.6 Vinidex and IplexFoamed Core 1.2 Vinidex and IplexPVC O 1.7 Vinidex and Iplex
CI 83.8 75.2 7000 7.55 Product catalogue
PECompond 80 av 75.4 64.7 930 1.09 http://www.ides.com/generics/PE/PE_typical_properties.htmCompound 100 av 75.4 65.8 940 1.00 http://www.ides.com/generics/PE/PE_typical_properties.htm
CopperType A 4.23 AS 1432 Copper Tubes - Pg 24Type B 3.42 AS 1432 Copper Tubes - Pg 25
Fibre Cement Not Viable in TSAC dimensions
NB The PVC O pipe is a pressure pipe and of much lower mass per lineal metre thanequivalent pressure rated pipes, but of higher mass per lineal metre than the non-pressureequivalents. PVC O pipe is not strictly relevant to the functional unit chosen, but is includedfor comparative purposes.
4.2 Scope:The scope of the assessment is cradle to gate for the production of the pipe. End of lifeimpacts are added to the life cycle similarly to US approach, since little data could be foundfor substantial end-of-use recycling of Australian pipe to justify variation. The mode ofdisposal was adapted to be 100% landfill since no waste incineration takes place in Australia.Back-yard burning is assumed to not take place in Australia, but is fairly common in rural US.
4.3 Product Alternatives:The TSAC report studies ABS, PVC and Cast Iron pipe, but this is extended to includeCopper and PE pipe in this project. It was intended to also include Fibre Cement pipe, butthis is not available in diameters as small as 3 inch nominal. In addition, 3 variants of PVCpipe were included – conventional, foamed core and PVC oriented (PVC O). The widerrange of pipe materials reflects the wider range of alternatives commonly used in DWVapplications in Australia. All 3 variants of PVC DWV pipe use a smaller mass of PVC perunit length than the US pipe.
4.4 LCA Impact Assessment:This included LCA impact assessment using the TRACI methodology which is strictly USrelevant, but for which there is no Australian equivalent to substitute. For global impactcategories the characterisation factors used (to scale impacts for their potency) are likely tobe universally applicable, but for more local categories, resource depletion categories orecological impact categories the results may be only indicative. Since the results are onlyused comparatively within each category, this is likely to only be a minor problem.
5
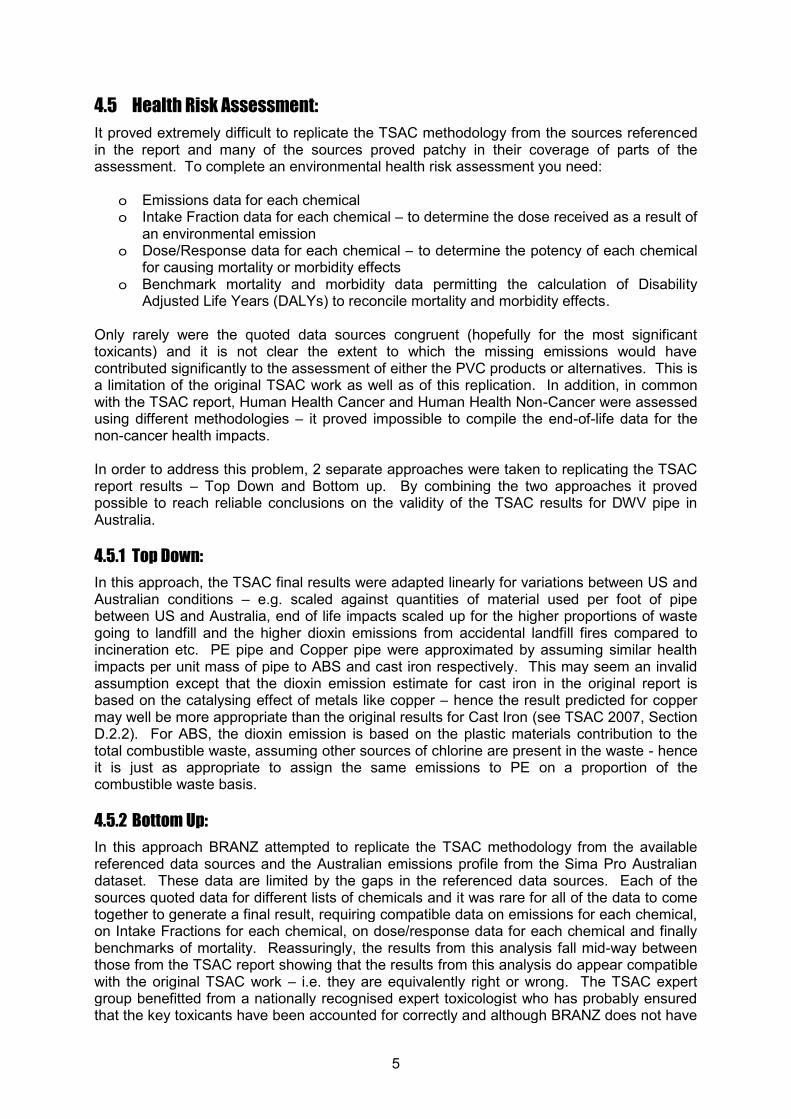
4.5 Health Risk Assessment:It proved extremely difficult to replicate the TSAC methodology from the sources referencedin the report and many of the sources proved patchy in their coverage of parts of theassessment. To complete an environmental health risk assessment you need:
o Emissions data for each chemicalo Intake Fraction data for each chemical – to determine the dose received as a result of
an environmental emissiono Dose/Response data for each chemical – to determine the potency of each chemical
for causing mortality or morbidity effectso Benchmark mortality and morbidity data permitting the calculation of Disability
Adjusted Life Years (DALYs) to reconcile mortality and morbidity effects.
Only rarely were the quoted data sources congruent (hopefully for the most significanttoxicants) and it is not clear the extent to which the missing emissions would havecontributed significantly to the assessment of either the PVC products or alternatives. This isa limitation of the original TSAC work as well as of this replication. In addition, in commonwith the TSAC report, Human Health Cancer and Human Health Non-Cancer were assessedusing different methodologies – it proved impossible to compile the end-of-life data for thenon-cancer health impacts.
In order to address this problem, 2 separate approaches were taken to replicating the TSACreport results – Top Down and Bottom up. By combining the two approaches it provedpossible to reach reliable conclusions on the validity of the TSAC results for DWV pipe inAustralia.
4.5.1 Top Down:In this approach, the TSAC final results were adapted linearly for variations between US andAustralian conditions – e.g. scaled against quantities of material used per foot of pipebetween US and Australia, end of life impacts scaled up for the higher proportions of wastegoing to landfill and the higher dioxin emissions from accidental landfill fires compared toincineration etc. PE pipe and Copper pipe were approximated by assuming similar healthimpacts per unit mass of pipe to ABS and cast iron respectively. This may seem an invalidassumption except that the dioxin emission estimate for cast iron in the original report isbased on the catalysing effect of metals like copper – hence the result predicted for coppermay well be more appropriate than the original results for Cast Iron (see TSAC 2007, SectionD.2.2). For ABS, the dioxin emission is based on the plastic materials contribution to thetotal combustible waste, assuming other sources of chlorine are present in the waste - henceit is just as appropriate to assign the same emissions to PE on a proportion of thecombustible waste basis.
4.5.2 Bottom Up:In this approach BRANZ attempted to replicate the TSAC methodology from the availablereferenced data sources and the Australian emissions profile from the Sima Pro Australiandataset. These data are limited by the gaps in the referenced data sources. Each of thesources quoted data for different lists of chemicals and it was rare for all of the data to cometogether to generate a final result, requiring compatible data on emissions for each chemical,on Intake Fractions for each chemical, on dose/response data for each chemical and finallybenchmarks of mortality. Reassuringly, the results from this analysis fall mid-way betweenthose from the TSAC report showing that the results from this analysis do appear compatiblewith the original TSAC work – i.e. they are equivalently right or wrong. The TSAC expertgroup benefitted from a nationally recognised expert toxicologist who has probably ensuredthat the key toxicants have been accounted for correctly and although BRANZ does not have
6
this level of expertise on toxicity aspects, the results do appear to replicate the TSAC resultsreliably. It proved impossible to compile the data for non-cancer health risks at the end-of-life.
4.5.3 From TRACIFinally, the TRACI impact assessment methodology provides direct characterization factorsfor a range of Health impacts expressed in different units – the Australian Sima Pro data ischaracterized using these TRACI health classes and the results plotted relative to themaximum in each class. The health categories and units of expression in TRACI are:
Global Warming HH DALYHH Cancer Air (benzene-e / kg)HH Cancer Water (benzene-e / kg)HH Noncancer Air (toluene-e / kg)HH Noncancer Water (toluene-e / kg)HH Criteria Air (milli-DALYs / kg)Smog Air (g NOx / m / kg)
5. RESULTSThe detailed results are presented in the Appendix and summarized here as a side by sidecomparison with the original TSAC results and then discussed in context of the text in theTSAC report. Not all of the graphs could be reproduced, but those shown here are sufficientto be able to provide a commentary on the TSAC report results and conclusions. Pleasenote that in the original TSAC work and in this report, the different scenarios described by theassumptions represent extreme highs, extreme lows and an average or mid-point value.These scenarios often result in several orders of magnitude difference in impacts and cannotbe construed as ranges (as implied statistically by +- 1 standard deviation of the mean).
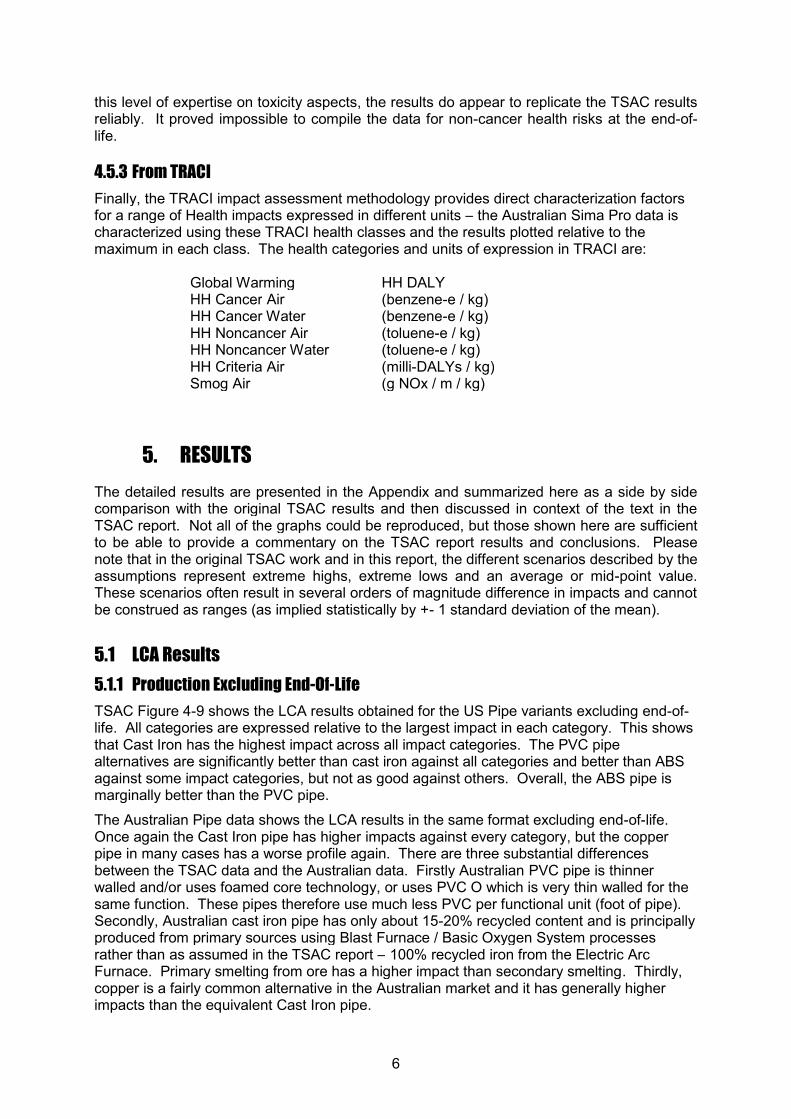
5.1 LCA Results5.1.1 Production Excluding End-Of-LifeTSAC Figure 4-9 shows the LCA results obtained for the US Pipe variants excluding end-of-life. All categories are expressed relative to the largest impact in each category. This showsthat Cast Iron has the highest impact across all impact categories. The PVC pipealternatives are significantly better than cast iron against all categories and better than ABSagainst some impact categories, but not as good against others. Overall, the ABS pipe ismarginally better than the PVC pipe.
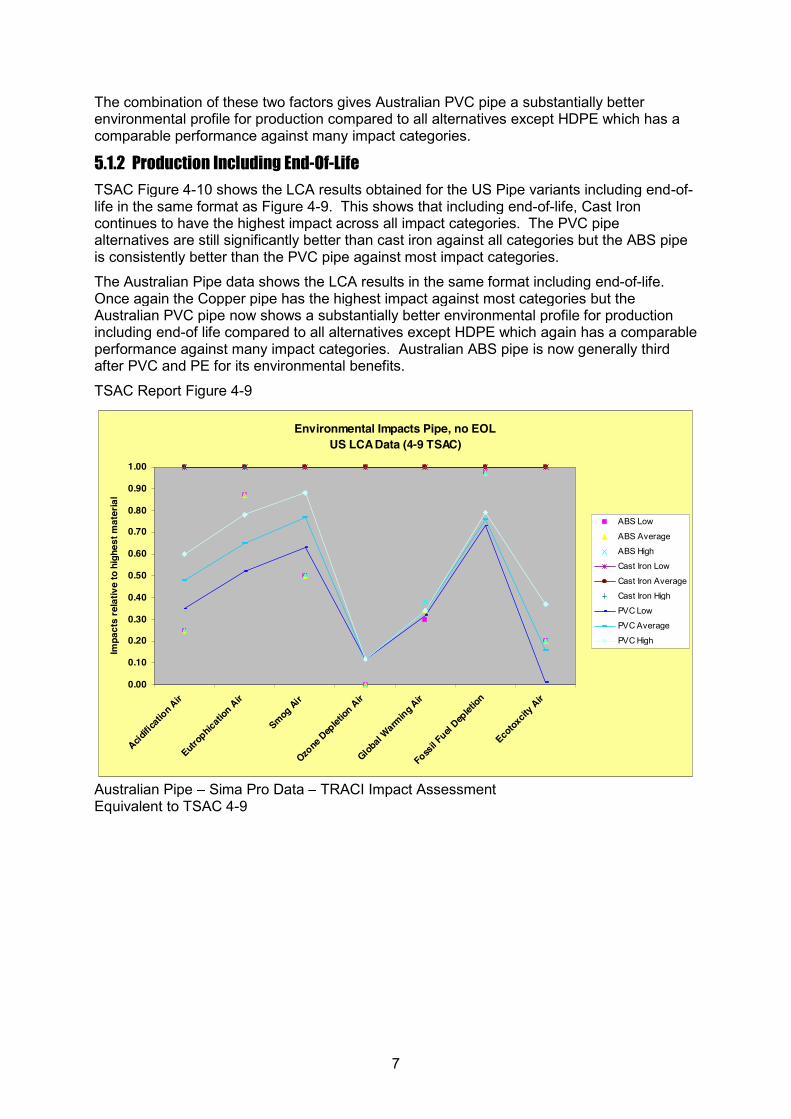
The Australian Pipe data shows the LCA results in the same format excluding end-of-life.Once again the Cast Iron pipe has higher impacts against every category, but the copperpipe in many cases has a worse profile again. There are three substantial differencesbetween the TSAC data and the Australian data. Firstly Australian PVC pipe is thinnerwalled and/or uses foamed core technology, or uses PVC O which is very thin walled for thesame function. These pipes therefore use much less PVC per functional unit (foot of pipe).Secondly, Australian cast iron pipe has only about 15-20% recycled content and is principallyproduced from primary sources using Blast Furnace / Basic Oxygen System processesrather than as assumed in the TSAC report – 100% recycled iron from the Electric ArcFurnace. Primary smelting from ore has a higher impact than secondary smelting. Thirdly,copper is a fairly common alternative in the Australian market and it has generally higherimpacts than the equivalent Cast Iron pipe.
7
The combination of these two factors gives Australian PVC pipe a substantially betterenvironmental profile for production compared to all alternatives except HDPE which has acomparable performance against many impact categories.
5.1.2 Production Including End-Of-LifeTSAC Figure 4-10 shows the LCA results obtained for the US Pipe variants including end-of-life in the same format as Figure 4-9. This shows that including end-of-life, Cast Ironcontinues to have the highest impact across all impact categories. The PVC pipealternatives are still significantly better than cast iron against all categories but the ABS pipeis consistently better than the PVC pipe against most impact categories.
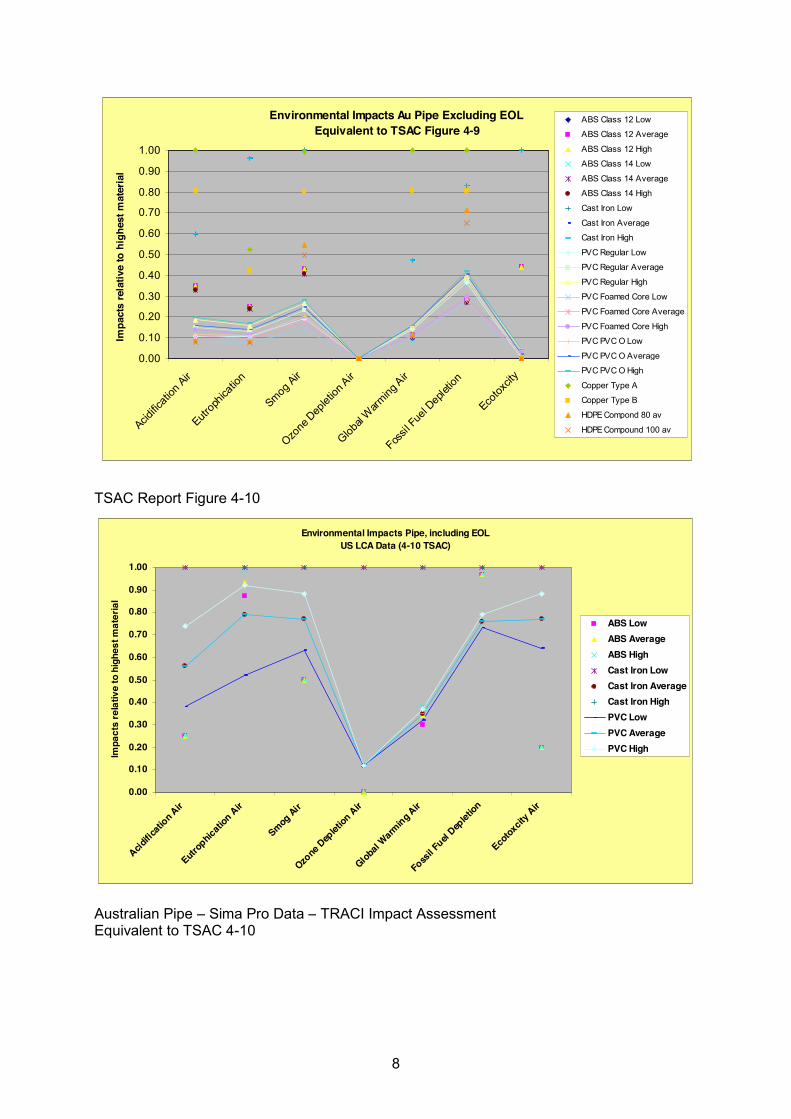
The Australian Pipe data shows the LCA results in the same format including end-of-life.Once again the Copper pipe has the highest impact against most categories but theAustralian PVC pipe now shows a substantially better environmental profile for productionincluding end-of life compared to all alternatives except HDPE which again has a comparableperformance against many impact categories. Australian ABS pipe is now generally thirdafter PVC and PE for its environmental benefits.
TSAC Report Figure 4-9
Environmental Impacts Pipe, no EOLUS LCAData (4-9 TSAC)
0.00
0.10
0.20
0.30
0.40
0.50
0.60
0.70
0.80
0.90
1.00
AcidificationAir
Eutrophication Air
SmogAir
Ozone DepletionAir
GlobalWarmingAir
Fossil Fuel Depletion
EcotoxcityAir
Impactsrelativetohighestm
aterial
ABS Low
ABS Average
ABS High
Cast Iron Low
Cast Iron Average
Cast Iron High
PVC Low
PVC Average
PVC High
Australian Pipe – Sima Pro Data – TRACI Impact AssessmentEquivalent to TSAC 4-9
8
Environmental Impacts Au Pipe Excluding EOLEquivalent to TSAC Figure 4-9
0.00
0.10
0.20
0.30
0.40
0.50
0.60
0.70
0.80
0.90
1.00
Acidific
ation
Air
Eutrop
hicati
on
SmogAir
Ozone
Deplet
ionAir
Global
Warm
ingAir
Fossil
Fuel
Deplet
ion
Ecotox
city
Impactsrelativetohighestm
aterial
ABS Class 12 Low
ABS Class 12 Average
ABS Class 12 High
ABS Class 14 Low
ABS Class 14 Average
ABS Class 14 High
Cast Iron Low
Cast Iron Average
Cast Iron High
PVC Regular Low
PVC Regular Average
PVC Regular High
PVC Foamed Core Low
PVC Foamed Core Average
PVC Foamed Core High
PVC PVC O Low
PVC PVC O Average
PVC PVC O High
Copper Type A
Copper Type B
HDPE Compond 80 av
HDPE Compound 100 av
TSAC Report Figure 4-10
Environmental Impacts Pipe, including EOLUS LCAData (4-10 TSAC)
0.00
0.10
0.20
0.30
0.40
0.50
0.60
0.70
0.80
0.90
1.00
AcidificationAir
Eutrophication Air
SmogAir
Ozone DepletionAir
GlobalWarmingAir
Fossil Fuel Depletion
EcotoxcityAir
Impactsrelativetohighestm
aterial
ABS LowABS AverageABS HighCast Iron LowCast Iron AverageCast Iron HighPVCLowPVCAveragePVCHigh
Australian Pipe – Sima Pro Data – TRACI Impact AssessmentEquivalent to TSAC 4-10
9
Environmental Impacts Au Pipe Including EOLEquivalent to TSAC Figure 4-10
0.00
0.10
0.20
0.30
0.40
0.50
0.60
0.70
0.80
0.90
1.00
Acidific
ation
Air
Eutrop
hicati
on
SmogAir
Ozone
Deplet
ionAir
Global
Warm
ingAir
Fossil
Fuel
Deplet
ion
Ecotox
city
Impactsrelativetohighestm
aterial
ABS Class 12 LowABS Class 12 AverageABS Class 12 HighABS Class 14 LowABS Class 14 AverageABS Class 14 HighCast Iron 0 LowCast Iron 0 AverageCast Iron 0 HighPVC Regular LowPVC Regular AveragePVC Regular HighPVC Foamed Core LowPVC Foamed Core AveragePVC Foamed Core HighPVC PVC O LowPVC PVC O AveragePVC PVC O HighCopper Type A LowCopper Type A AverageCopper Type A HighCopper Type B LowCopper Type B AverageCopper Type B HighHDPE Compond 80 av LowHDPE Compond 80 av AverageHDPE Compond 80 av HighHDPE Compound 100 av LowHDPE Compound 100 av AverageHDPE Compound 100 av High
5.2 Human Health ResultsTop Down Assessment
Figures 4-11, 4-12 and 4-13 in the TSAC report show the Human Health impacts inaggregate for the different pipe variants. The results are all expressed in micro DALYs andare therefore directly comparable between the categories of:
HH Cancer Stockholm only Refers to persistent bioaccumulative toxicants listed in theStockholm convention for Persistent Organic Pollutants
HH Cancer Refers to all of the human cancer toxicants assessed
HH PM Refers to human health damage from particulates – includingMortality and morbidity from chronic bronchitis, cardiovasculardisease and restricted activity days
HH GW Refers to human health impacts from global warming
HH Hg High Refers to human health neurotoxic effects from mercury at ahigh exposure level
HH Hg Low Refers to human health neurotoxic effects from low mercury ata low exposure level
Total microDALY Sums the DALYs from all causes
It should be noted that figure 4-11 uses a logarithmic scale, whereas figures 4-12 and 4-13use a linear scale. The reason for this is not explained in the TSAC report, but it isreproduced here for comparability.
10
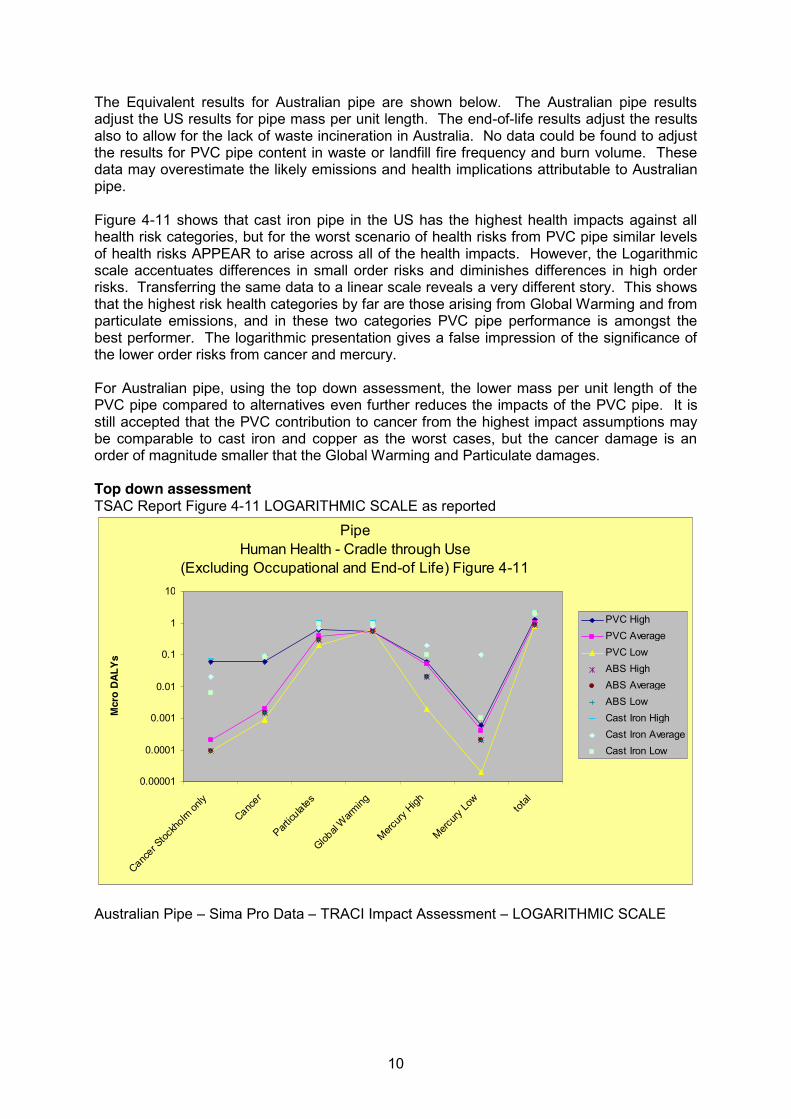
The Equivalent results for Australian pipe are shown below. The Australian pipe resultsadjust the US results for pipe mass per unit length. The end-of-life results adjust the resultsalso to allow for the lack of waste incineration in Australia. No data could be found to adjustthe results for PVC pipe content in waste or landfill fire frequency and burn volume. Thesedata may overestimate the likely emissions and health implications attributable to Australianpipe.
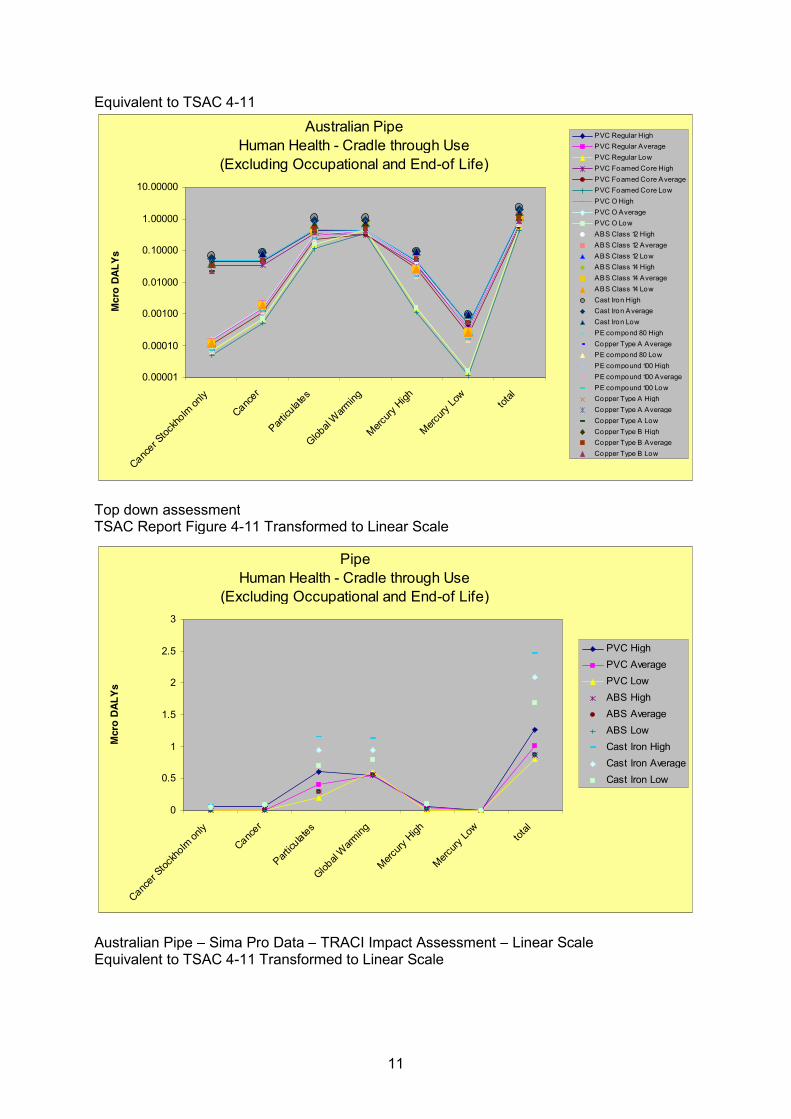
Figure 4-11 shows that cast iron pipe in the US has the highest health impacts against allhealth risk categories, but for the worst scenario of health risks from PVC pipe similar levelsof health risks APPEAR to arise across all of the health impacts. However, the Logarithmicscale accentuates differences in small order risks and diminishes differences in high orderrisks. Transferring the same data to a linear scale reveals a very different story. This showsthat the highest risk health categories by far are those arising from Global Warming and fromparticulate emissions, and in these two categories PVC pipe performance is amongst thebest performer. The logarithmic presentation gives a false impression of the significance ofthe lower order risks from cancer and mercury.
For Australian pipe, using the top down assessment, the lower mass per unit length of thePVC pipe compared to alternatives even further reduces the impacts of the PVC pipe. It isstill accepted that the PVC contribution to cancer from the highest impact assumptions maybe comparable to cast iron and copper as the worst cases, but the cancer damage is anorder of magnitude smaller that the Global Warming and Particulate damages.
Top down assessmentTSAC Report Figure 4-11 LOGARITHMIC SCALE as reported
PipeHuman Health - Cradle through Use
(Excluding Occupational and End-of Life) Figure 4-11
0.00001
0.0001
0.001
0.01
0.1
1
10
Cancer Stoc
kholm
only
Cancer
Particu
lates
Global
Warm
ing
Mercury
High
Mercury
Low
total
McroDALYs
PVC HighPVC AveragePVC LowABS HighABS AverageABS LowCast Iron HighCast Iron AverageCast Iron Low
Australian Pipe – Sima Pro Data – TRACI Impact Assessment – LOGARITHMIC SCALE
11
Equivalent to TSAC 4-11
Australian PipeHuman Health - Cradle through Use
(Excluding Occupational and End-of Life)
0.00001
0.00010
0.00100
0.01000
0.10000
1.00000
10.00000
Cancer Stoc
kholm
only
Cancer
Particu
lates
Global
Warm
ing
Mercury
High
Mercury
Low
total
McroDALYs
PVC Regular HighPVC Regular AveragePVC Regular LowPVC Foamed Core HighPVC Foamed Core AveragePVC Foamed Core LowPVC O HighPVC O AveragePVC O LowABS Class 12 HighABS Class 12 AverageABS Class 12 LowABS Class 14 HighABS Class 14 AverageABS Class 14 LowCast Iron HighCast Iron AverageCast Iron LowPE compond 80 HighCopper Type A AveragePE compond 80 LowPE compound 100 HighPE compound 100 AveragePE compound 100 LowCopper Type A HighCopper Type A AverageCopper Type A LowCopper Type B HighCopper Type B AverageCopper Type B Low
Top down assessmentTSAC Report Figure 4-11 Transformed to Linear Scale
PipeHuman Health - Cradle through Use
(Excluding Occupational and End-of Life)
0
0.5
1
1.5
2
2.5
3
Cancer Stoc
kholm
only
Cancer
Particu
lates
Global
Warm
ing
Mercury
High
Mercury
Low
total
McroDALYs
PVC HighPVC AveragePVC LowABS HighABS AverageABS LowCast Iron HighCast Iron AverageCast Iron Low
Australian Pipe – Sima Pro Data – TRACI Impact Assessment – Linear ScaleEquivalent to TSAC 4-11 Transformed to Linear Scale
12
Australian PipeHuman Health - Cradle through Use
(Excluding Occupational and End-of Life)
0.00000
0.50000
1.00000
1.50000
2.00000
2.50000
Cancer Stoc
kholm
only
Cancer
Particu
lates
Global
Warm
ing
Mercury
High
Mercury
Low
total
McroDALYs
PVC Regular HighPVC Regular AveragePVC Regular LowPVC Foamed Core HighPVC Foamed Core AveragePVC Foamed Core LowPVC O HighPVC O AveragePVC O LowABS Class 12 HighABS Class 12 AverageABS Class 12 LowABS Class 14 HighABS Class 14 AverageABS Class 14 LowCast Iron HighCast Iron AverageCast Iron LowPE compond 80 HighCopper Type A AveragePE compond 80 LowPE compound 100 HighPE compound 100 AveragePE compound 100 LowCopper Type A HighCopper Type A AverageCopper Type A LowCopper Type B HighCopper Type B AverageCopper Type B Low
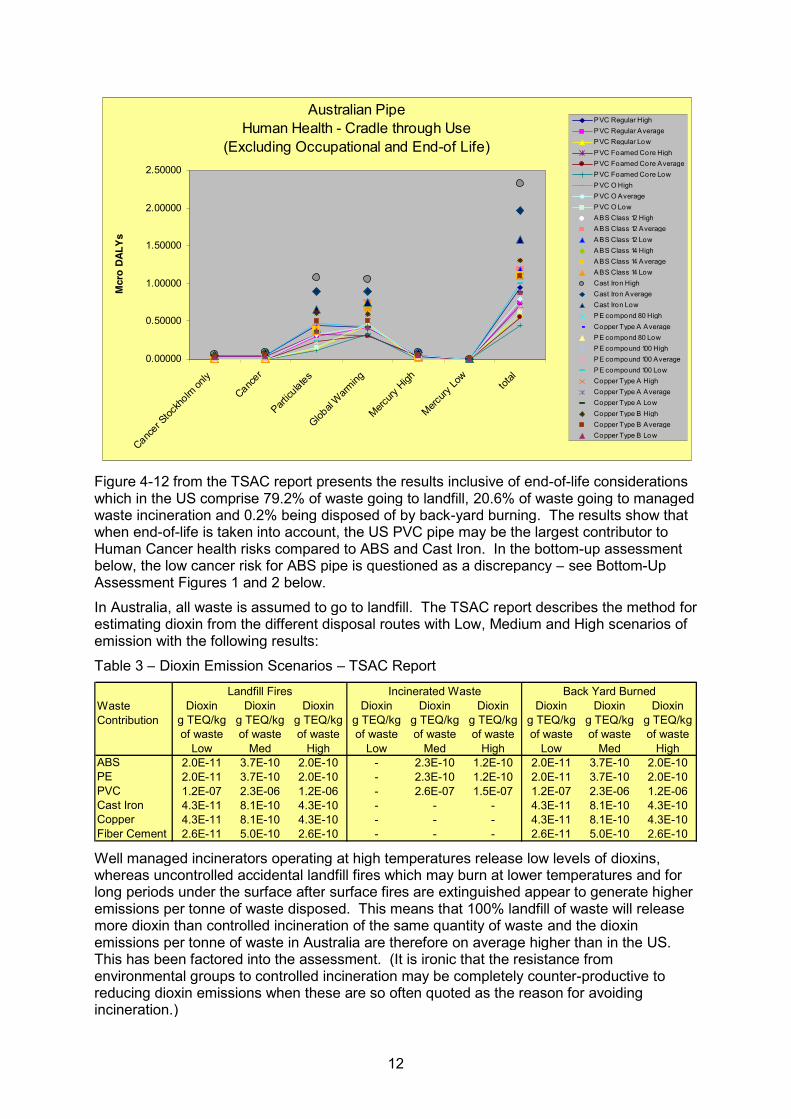
Figure 4-12 from the TSAC report presents the results inclusive of end-of-life considerationswhich in the US comprise 79.2% of waste going to landfill, 20.6% of waste going to managedwaste incineration and 0.2% being disposed of by back-yard burning. The results show thatwhen end-of-life is taken into account, the US PVC pipe may be the largest contributor toHuman Cancer health risks compared to ABS and Cast Iron. In the bottom-up assessmentbelow, the low cancer risk for ABS pipe is questioned as a discrepancy – see Bottom-UpAssessment Figures 1 and 2 below.
In Australia, all waste is assumed to go to landfill. The TSAC report describes the method forestimating dioxin from the different disposal routes with Low, Medium and High scenarios ofemission with the following results:
Table 3 – Dioxin Emission Scenarios – TSAC Report
Waste Dioxin Dioxin Dioxin Dioxin Dioxin Dioxin Dioxin Dioxin DioxinContribution g TEQ/kg g TEQ/kg g TEQ/kg g TEQ/kg g TEQ/kg g TEQ/kg g TEQ/kg g TEQ/kg g TEQ/kg
of waste of waste of waste of waste of waste of waste of waste of waste of wasteLow Med High Low Med High Low Med High
ABS 2.0E-11 3.7E-10 2.0E-10 - 2.3E-10 1.2E-10 2.0E-11 3.7E-10 2.0E-10PE 2.0E-11 3.7E-10 2.0E-10 - 2.3E-10 1.2E-10 2.0E-11 3.7E-10 2.0E-10PVC 1.2E-07 2.3E-06 1.2E-06 - 2.6E-07 1.5E-07 1.2E-07 2.3E-06 1.2E-06Cast Iron 4.3E-11 8.1E-10 4.3E-10 - - - 4.3E-11 8.1E-10 4.3E-10Copper 4.3E-11 8.1E-10 4.3E-10 - - - 4.3E-11 8.1E-10 4.3E-10Fiber Cement 2.6E-11 5.0E-10 2.6E-10 - - - 2.6E-11 5.0E-10 2.6E-10
Back Yard BurnedIncinerated WasteLandfill Fires
Well managed incinerators operating at high temperatures release low levels of dioxins,whereas uncontrolled accidental landfill fires which may burn at lower temperatures and forlong periods under the surface after surface fires are extinguished appear to generate higheremissions per tonne of waste disposed. This means that 100% landfill of waste will releasemore dioxin than controlled incineration of the same quantity of waste and the dioxinemissions per tonne of waste in Australia are therefore on average higher than in the US.This has been factored into the assessment. (It is ironic that the resistance fromenvironmental groups to controlled incineration may be completely counter-productive toreducing dioxin emissions when these are so often quoted as the reason for avoidingincineration.)
13
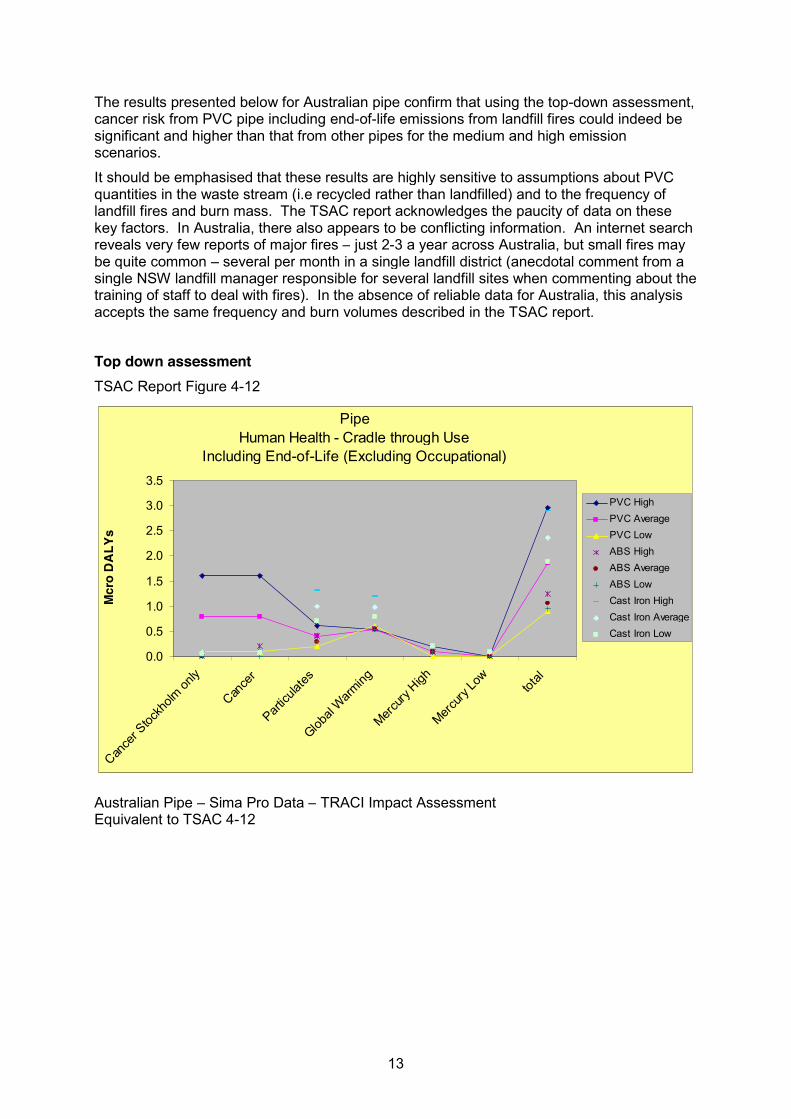
The results presented below for Australian pipe confirm that using the top-down assessment,cancer risk from PVC pipe including end-of-life emissions from landfill fires could indeed besignificant and higher than that from other pipes for the medium and high emissionscenarios.
It should be emphasised that these results are highly sensitive to assumptions about PVCquantities in the waste stream (i.e recycled rather than landfilled) and to the frequency oflandfill fires and burn mass. The TSAC report acknowledges the paucity of data on thesekey factors. In Australia, there also appears to be conflicting information. An internet searchreveals very few reports of major fires – just 2-3 a year across Australia, but small fires maybe quite common – several per month in a single landfill district (anecdotal comment from asingle NSW landfill manager responsible for several landfill sites when commenting about thetraining of staff to deal with fires). In the absence of reliable data for Australia, this analysisaccepts the same frequency and burn volumes described in the TSAC report.
Top down assessmentTSAC Report Figure 4-12
PipeHuman Health - Cradle through Use
Including End-of-Life (Excluding Occupational)
0.0
0.5
1.0
1.5
2.0
2.5
3.0
3.5
Cance
r Stockh
olmon
ly
Cance
r
Particu
lates
Global
Warming
Mercury
High
Mercury
Low
total
McroDALYs
PVC HighPVC AveragePVC LowABS HighABS AverageABS LowCast Iron HighCast Iron AverageCast Iron Low
Australian Pipe – Sima Pro Data – TRACI Impact AssessmentEquivalent to TSAC 4-12
14
PipeHuman Health - Cradle through Use
Including End-of-Life (Excluding Occupational)
0.0
0.5
1.0
1.5
2.0
2.5
3.0
Cance
r Stockh
olmon
ly
Cance
r
Particu
lates
Global
Warming
Mercury
High
Mercury
Low
total
McroDALYs
PVC Regular HighPVC Regular AveragePVC Regular LowPVC Foamed Core HighPVC Foamed Core AveragePVC Foamed Core LowPVC O HighPVC O AveragePVC O LowABS Class 12 HighABS Class 12 AverageABS Class 12 LowABS Class 14 HighABS Class 14 AverageABS Class 14 LowCast Iron HighCast Iron AverageCast Iron LowPE compond 80 HighPE compond 80 AveragePE compond 80 LowPE compound 100 HighPE compound 100 AveragePE compound 100 LowCopper Type A HighCopper Type A AverageCopper Type A LowCopper Type B HighCopper Type B AverageCopper Type B Low
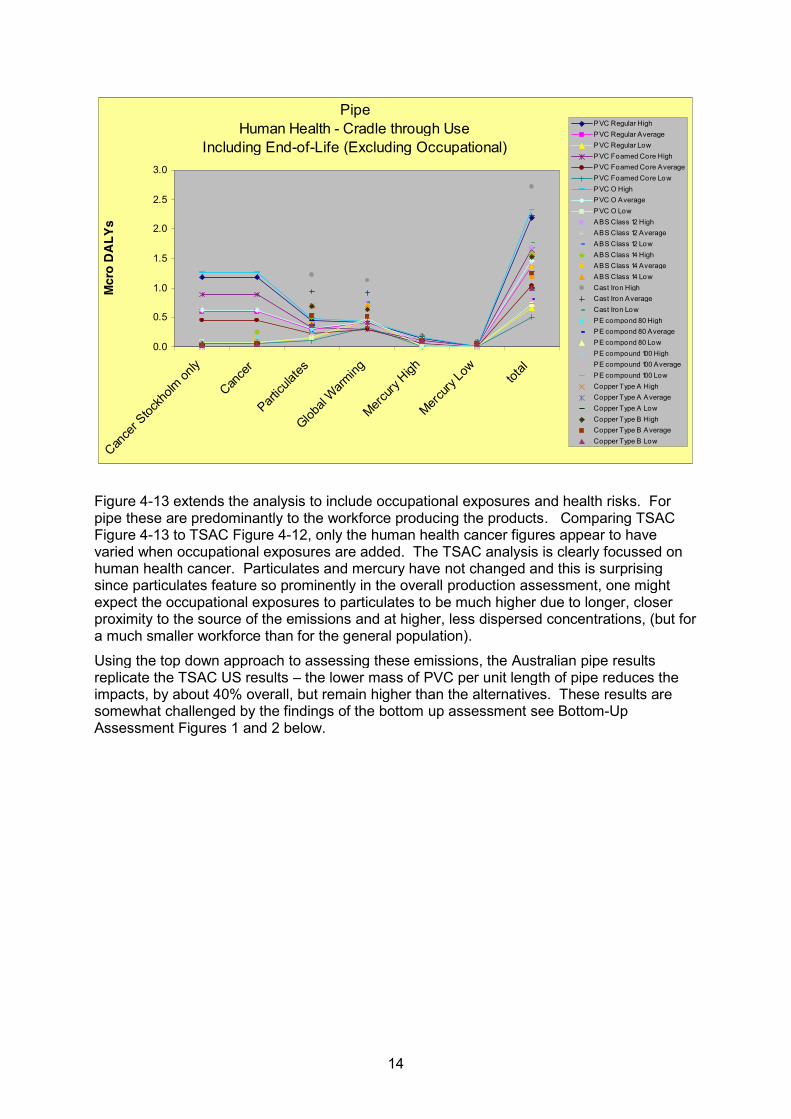
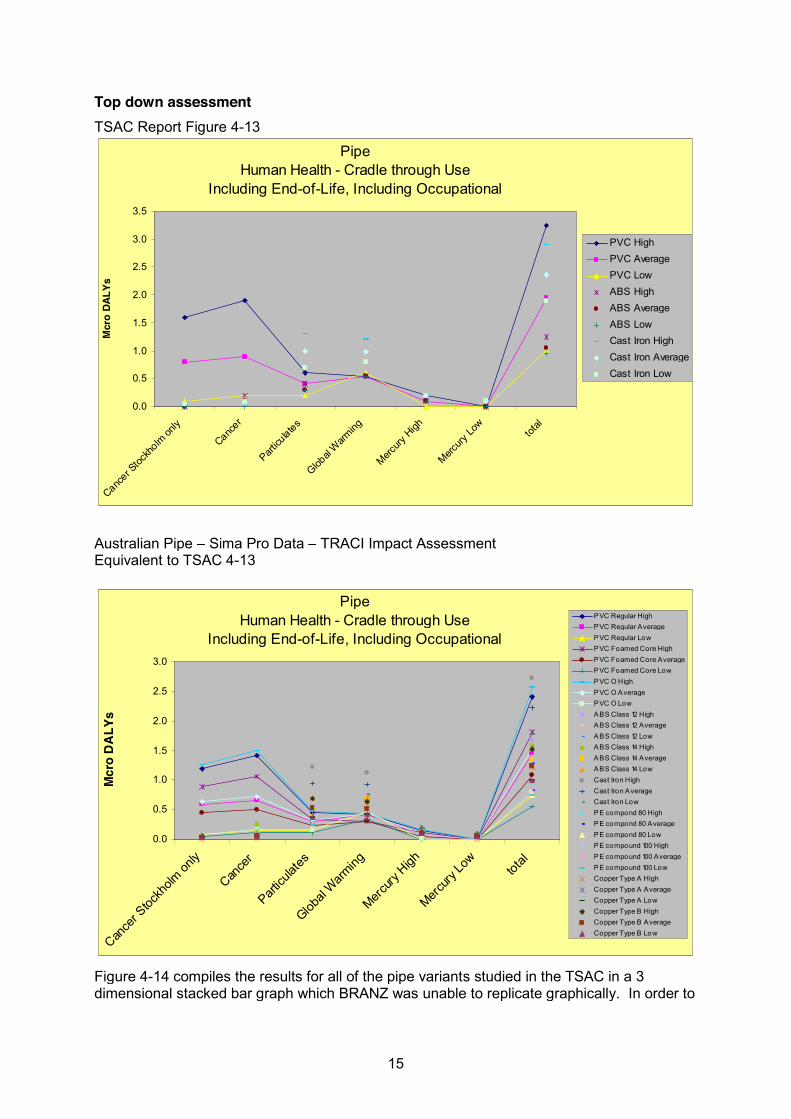
Figure 4-13 extends the analysis to include occupational exposures and health risks. Forpipe these are predominantly to the workforce producing the products. Comparing TSACFigure 4-13 to TSAC Figure 4-12, only the human health cancer figures appear to havevaried when occupational exposures are added. The TSAC analysis is clearly focussed onhuman health cancer. Particulates and mercury have not changed and this is surprisingsince particulates feature so prominently in the overall production assessment, one mightexpect the occupational exposures to particulates to be much higher due to longer, closerproximity to the source of the emissions and at higher, less dispersed concentrations, (but fora much smaller workforce than for the general population).
Using the top down approach to assessing these emissions, the Australian pipe resultsreplicate the TSAC US results – the lower mass of PVC per unit length of pipe reduces theimpacts, by about 40% overall, but remain higher than the alternatives. These results aresomewhat challenged by the findings of the bottom up assessment see Bottom-UpAssessment Figures 1 and 2 below.
15
Top down assessmentTSAC Report Figure 4-13
PipeHuman Health - Cradle through Use
Including End-of-Life, Including Occupational
0.0
0.5
1.0
1.5
2.0
2.5
3.0
3.5
Cancer Stoc
kholm
only
Cancer
Particu
lates
Global
Warm
ing
Mercury
High
Mercury
Low
total
McroDALYs
PVC HighPVC AveragePVC LowABS HighABS AverageABS LowCast Iron HighCast Iron AverageCast Iron Low
Australian Pipe – Sima Pro Data – TRACI Impact AssessmentEquivalent to TSAC 4-13
PipeHuman Health - Cradle through Use
Including End-of-Life, Including Occupational
0.0
0.5
1.0
1.5
2.0
2.5
3.0
Cance
r Stockh
olmon
ly
Cance
r
Particu
lates
Global
Warming
Mercury
High
Mercury
Low
total
McroDALYs
PVC Regular HighPVC Regular AveragePVC Regular LowPVC Foamed Core HighPVC Foamed Core AveragePVC Foamed Core LowPVC O HighPVC O AveragePVC O LowABS Class 12 HighABS Class 12 AverageABS Class 12 LowABS Class 14 HighABS Class 14 AverageABS Class 14 LowCast Iron HighCast Iron AverageCast Iron LowPE compond 80 HighPE compond 80 AveragePE compond 80 LowPE compound 100 HighPE compound 100 AveragePE compound 100 LowCopper Type A HighCopper Type A AverageCopper Type A LowCopper Type B HighCopper Type B AverageCopper Type B Low
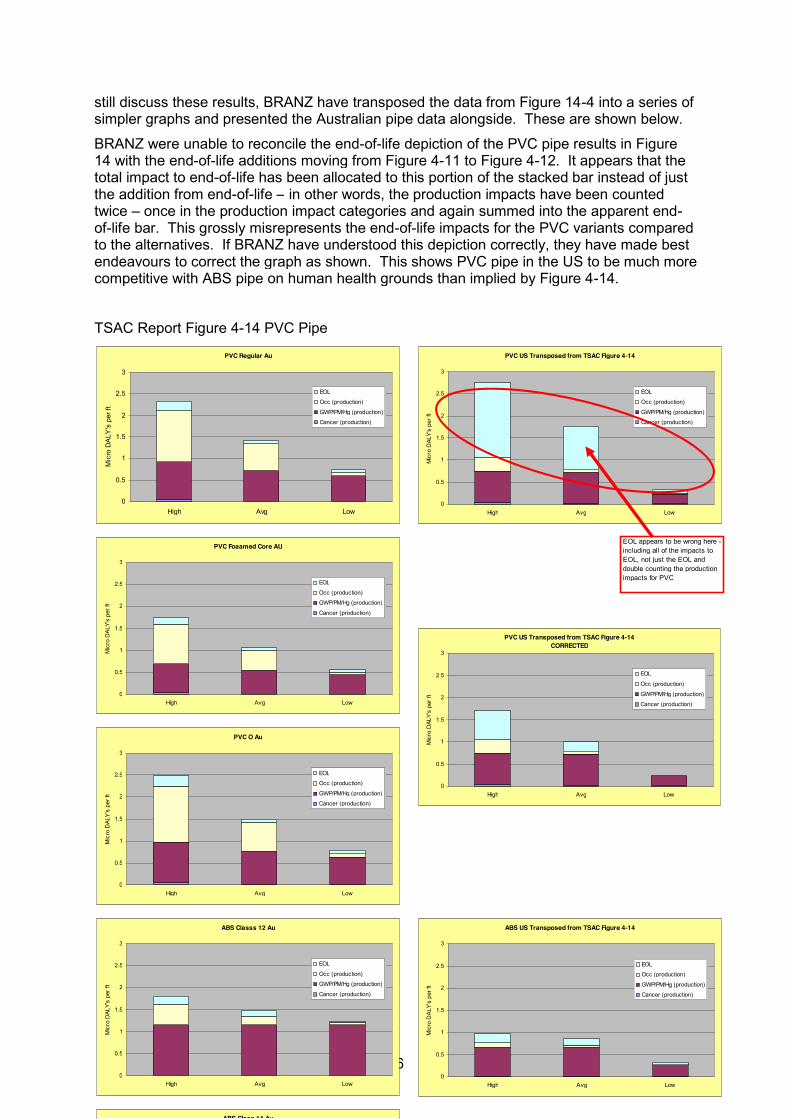
Figure 4-14 compiles the results for all of the pipe variants studied in the TSAC in a 3dimensional stacked bar graph which BRANZ was unable to replicate graphically. In order to
16
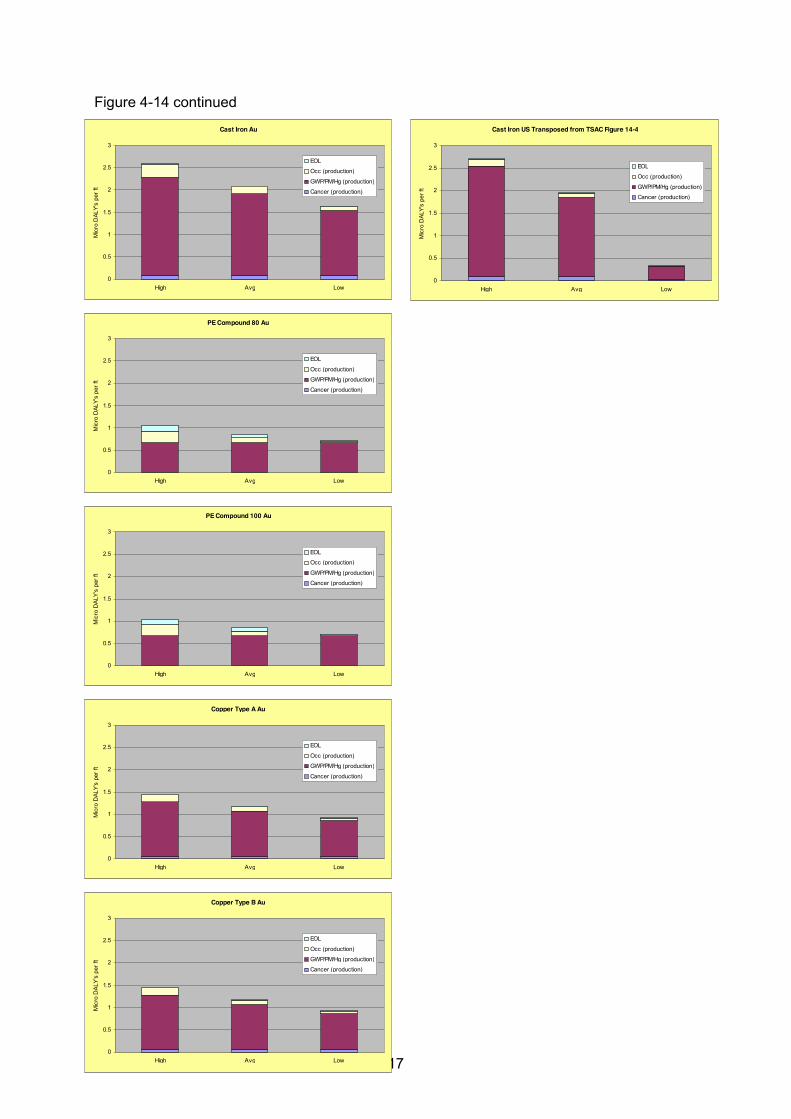
still discuss these results, BRANZ have transposed the data from Figure 14-4 into a series ofsimpler graphs and presented the Australian pipe data alongside. These are shown below.
BRANZ were unable to reconcile the end-of-life depiction of the PVC pipe results in Figure14 with the end-of-life additions moving from Figure 4-11 to Figure 4-12. It appears that thetotal impact to end-of-life has been allocated to this portion of the stacked bar instead of justthe addition from end-of-life – in other words, the production impacts have been countedtwice – once in the production impact categories and again summed into the apparent end-of-life bar. This grossly misrepresents the end-of-life impacts for the PVC variants comparedto the alternatives. If BRANZ have understood this depiction correctly, they have made bestendeavours to correct the graph as shown. This shows PVC pipe in the US to be much morecompetitive with ABS pipe on human health grounds than implied by Figure 4-14.
TSAC Report Figure 4-14 PVC Pipe
PVCRegular Au
0
0.5
1
1.5
2
2.5
3
High Avg Low
Mic
roD
ALY
'spe
rft
EOL
Occ (production)
GWP/PM/Hg (production)
Cancer (production)
PVC Foaamed Core AU
0
0.5
1
1.5
2
2.5
3
High Avg Low
Mic
roD
ALY'
spe
rft
EOL
Occ (production)
GWP/PM/Hg (production)
Cancer (production)
PVCOAu
0
0.5
1
1.5
2
2.5
3
High Avg Low
Mic
roD
ALY'
spe
rft
EOL
Occ (production)
GWP/PM/Hg (production)
Cancer (production)
ABS Classs 12 Au
0
0.5
1
1.5
2
2.5
3
High Avg Low
Mic
roD
ALY'
spe
rft
EOL
Occ (production)
GWP/PM/Hg (production)
Cancer (production)
ABS Class 14 Au
PVCUS Transposed from TSAC Figure 4-14
0
0.5
1
1.5
2
2.5
3
High Avg Low
Mic
roD
ALY'
spe
rft
EOL
Occ (production)
GWP/PM/Hg (production)
Cancer (production)
ABS US Transposed from TSAC Figure 4-14
0
0.5
1
1.5
2
2.5
3
High Avg Low
Mic
roD
ALY'
spe
rft
EOL
Occ (production)
GWP/PM/Hg (production)
Cancer (production)
EOL appears to be wrong here -including all of the impacts toEOL, not just the EOL anddouble counting the productionimpacts for PVC
PVCUS Transposed from TSAC Figure 4-14CORRECTED
0
0.5
1
1.5
2
2.5
3
High Avg Low
Mic
roD
ALY'
spe
rft
EOL
Occ (production)
GWP/PM/Hg (production)
Cancer (production)
17
Figure 4-14 continued
Cast Iron Au
0
0.5
1
1.5
2
2.5
3
High Avg Low
Mic
roD
ALY'
spe
rft
EOL
Occ (production)
GWP/PM/Hg (production)
Cancer (production)
PECompound 80 Au
0
0.5
1
1.5
2
2.5
3
High Avg Low
Mic
roD
ALY'
spe
rft
EOL
Occ (production)
GWP/PM/Hg (production)
Cancer (production)
PECompound 100 Au
0
0.5
1
1.5
2
2.5
3
High Avg Low
Mic
roD
ALY'
spe
rft
EOL
Occ (production)
GWP/PM/Hg (production)
Cancer (production)
Copper Type AAu
0
0.5
1
1.5
2
2.5
3
High Avg Low
Mic
roD
ALY'
spe
rft
EOL
Occ (production)
GWP/PM/Hg (production)
Cancer (production)
Copper Type BAu
0
0.5
1
1.5
2
2.5
3
High Avg Low
Mic
roD
ALY'
spe
rft
EOL
Occ (production)
GWP/PM/Hg (production)
Cancer (production)
Cast Iron US Transposed from TSACFigure 14-4
0
0.5
1
1.5
2
2.5
3
High Avg Low
Mic
roD
ALY'
spe
rft
EOL
Occ (production)
GWP/PM/Hg (production)
Cancer (production)
18
Bottom Up Assessment
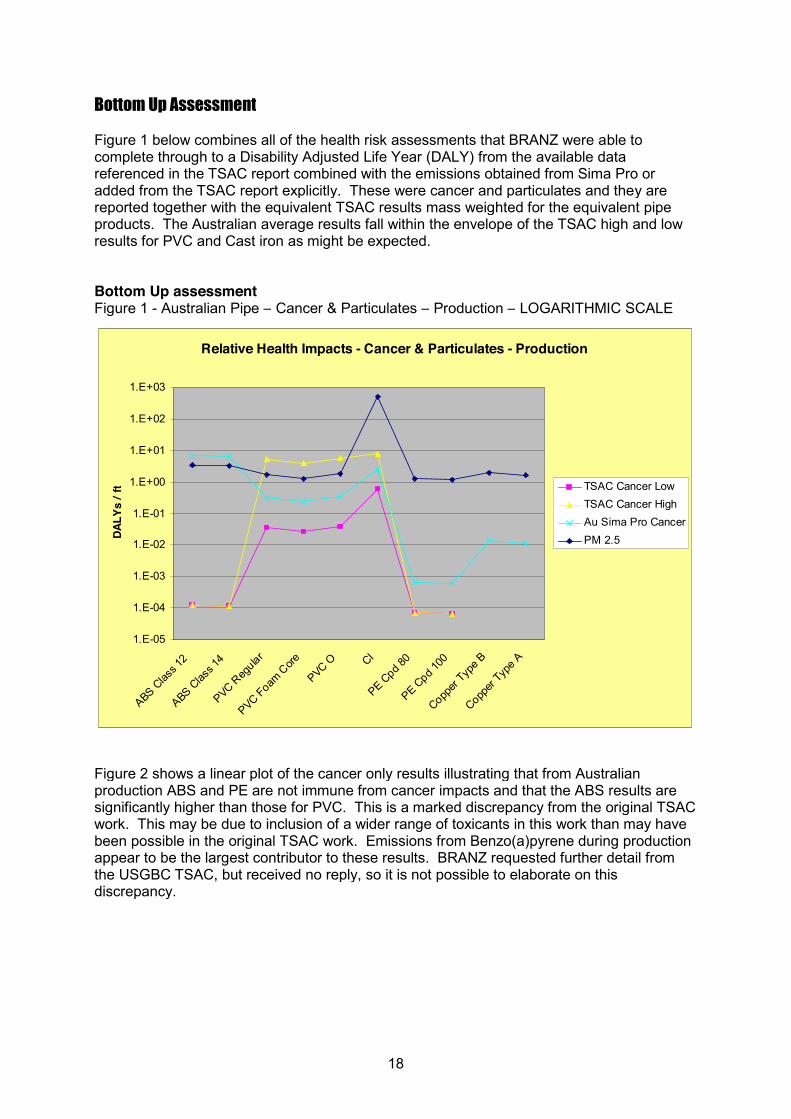
Figure 1 below combines all of the health risk assessments that BRANZ were able tocomplete through to a Disability Adjusted Life Year (DALY) from the available datareferenced in the TSAC report combined with the emissions obtained from Sima Pro oradded from the TSAC report explicitly. These were cancer and particulates and they arereported together with the equivalent TSAC results mass weighted for the equivalent pipeproducts. The Australian average results fall within the envelope of the TSAC high and lowresults for PVC and Cast iron as might be expected.
Bottom Up assessmentFigure 1 - Australian Pipe – Cancer & Particulates – Production – LOGARITHMIC SCALE
Relative Health Impacts - Cancer & Particulates - Production
1.E-05
1.E-04
1.E-03
1.E-02
1.E-01
1.E+00
1.E+01
1.E+02
1.E+03
ABSClas
s 12
ABSClas
s 14
PVCReg
ular
PVCFoam
Core
PVCO CI
PE Cpd 80
PE Cpd 100
Copper
Type B
Copper
Type A
DALYs/ft TSAC Cancer Low
TSAC Cancer HighAu Sima Pro CancerPM 2.5
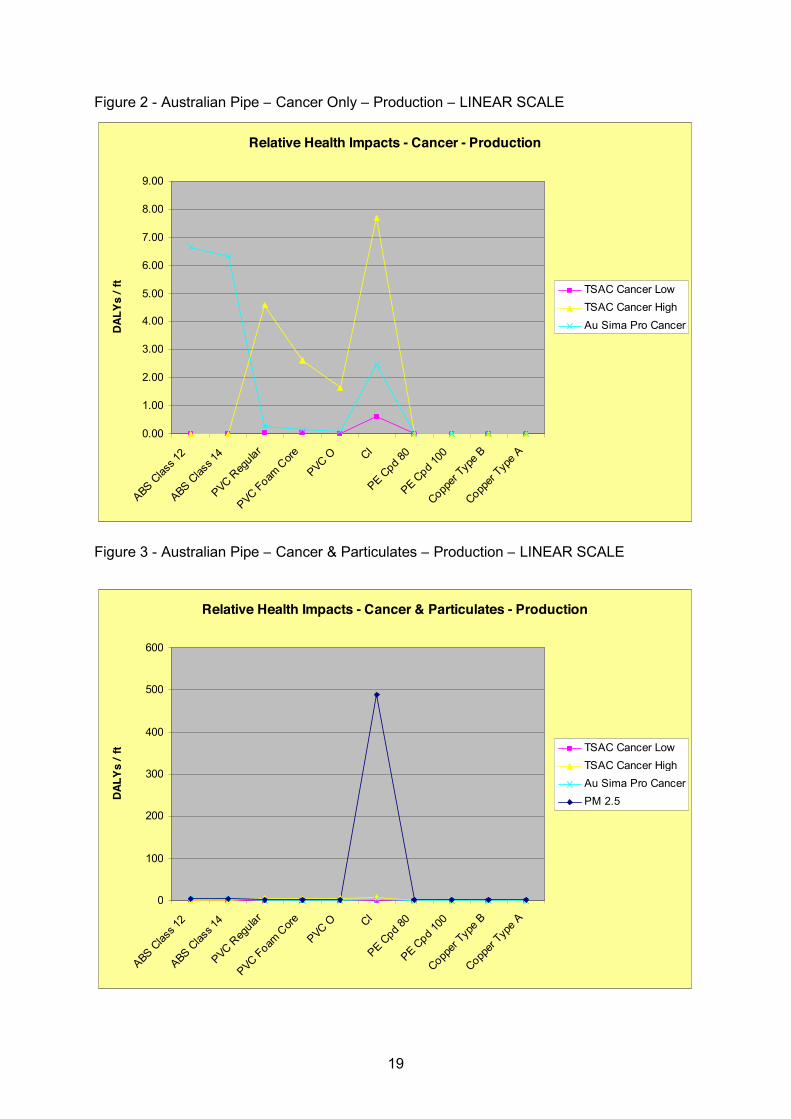
Figure 2 shows a linear plot of the cancer only results illustrating that from Australianproduction ABS and PE are not immune from cancer impacts and that the ABS results aresignificantly higher than those for PVC. This is a marked discrepancy from the original TSACwork. This may be due to inclusion of a wider range of toxicants in this work than may havebeen possible in the original TSAC work. Emissions from Benzo(a)pyrene during productionappear to be the largest contributor to these results. BRANZ requested further detail fromthe USGBC TSAC, but received no reply, so it is not possible to elaborate on thisdiscrepancy.
19
Figure 2 - Australian Pipe – Cancer Only – Production – LINEAR SCALE
Relative Health Impacts - Cancer - Production
0.00
1.00
2.00
3.00
4.00
5.00
6.00
7.00
8.00
9.00
ABSClas
s 12
ABSClas
s 14
PVCReg
ular
PVCFoam
Core
PVCO CI
PE Cpd 80
PE Cpd 100
Copper
Type B
Copper
Type A
DALYs/ft
TSAC Cancer LowTSAC Cancer HighAu Sima Pro Cancer
Figure 3 - Australian Pipe – Cancer & Particulates – Production – LINEAR SCALE
Relative Health Impacts - Cancer & Particulates - Production
0
100
200
300
400
500
600
ABSClas
s 12
ABSClas
s 14
PVCReg
ular
PVCFoam
Core
PVCO CI
PE Cpd 80
PE Cpd 100
Copper
Type B
Copper
Type A
DALYs/ft TSAC Cancer Low
TSAC Cancer HighAu Sima Pro CancerPM 2.5
20
Linear plot of the full set of results retaining the particulate figures as in Figure 3, reveals thereal scale of the particulate emission health risks from cast iron pipe and the extent to whichthis dominates the DALY assessment. This confirms a TSAC result from the first draft report,but it is further amplified for Australian pipe because this will predominantly come fromprimary production – Blastfurnace/Basic Oxygen System rather than the less pollutingElectric Arc Furnace for recycled steel (as assumed for US cast iron pipe by TSAC).
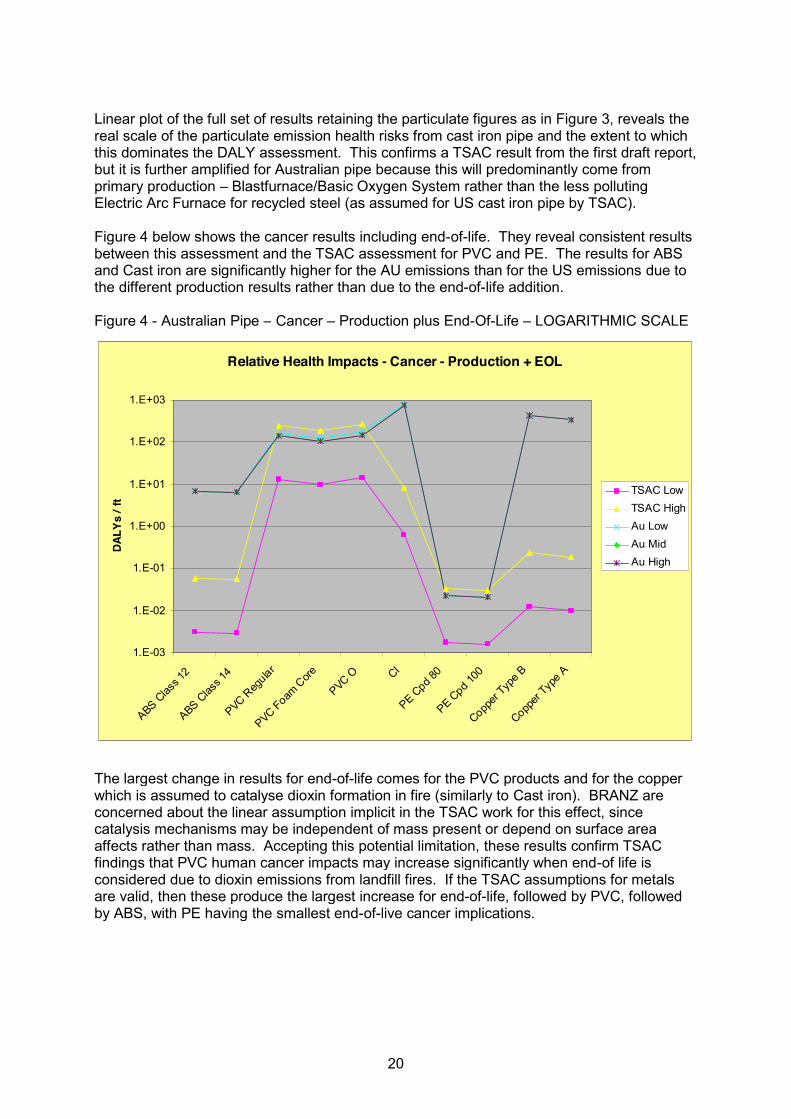
Figure 4 below shows the cancer results including end-of-life. They reveal consistent resultsbetween this assessment and the TSAC assessment for PVC and PE. The results for ABSand Cast iron are significantly higher for the AU emissions than for the US emissions due tothe different production results rather than due to the end-of-life addition.
Figure 4 - Australian Pipe – Cancer – Production plus End-Of-Life – LOGARITHMIC SCALE
Relative Health Impacts - Cancer - Production + EOL
1.E-03
1.E-02
1.E-01
1.E+00
1.E+01
1.E+02
1.E+03
ABSClas
s 12
ABSClas
s 14
PVCReg
ular
PVCFoam
Core
PVCO CI
PE Cpd 80
PE Cpd 100
Copper
Type B
Copper
Type A
DALYs/ft
TSAC LowTSAC HighAu LowAu MidAu High
The largest change in results for end-of-life comes for the PVC products and for the copperwhich is assumed to catalyse dioxin formation in fire (similarly to Cast iron). BRANZ areconcerned about the linear assumption implicit in the TSAC work for this effect, sincecatalysis mechanisms may be independent of mass present or depend on surface areaaffects rather than mass. Accepting this potential limitation, these results confirm TSACfindings that PVC human cancer impacts may increase significantly when end-of life isconsidered due to dioxin emissions from landfill fires. If the TSAC assumptions for metalsare valid, then these produce the largest increase for end-of-life, followed by PVC, followedby ABS, with PE having the smallest end-of-live cancer implications.
21
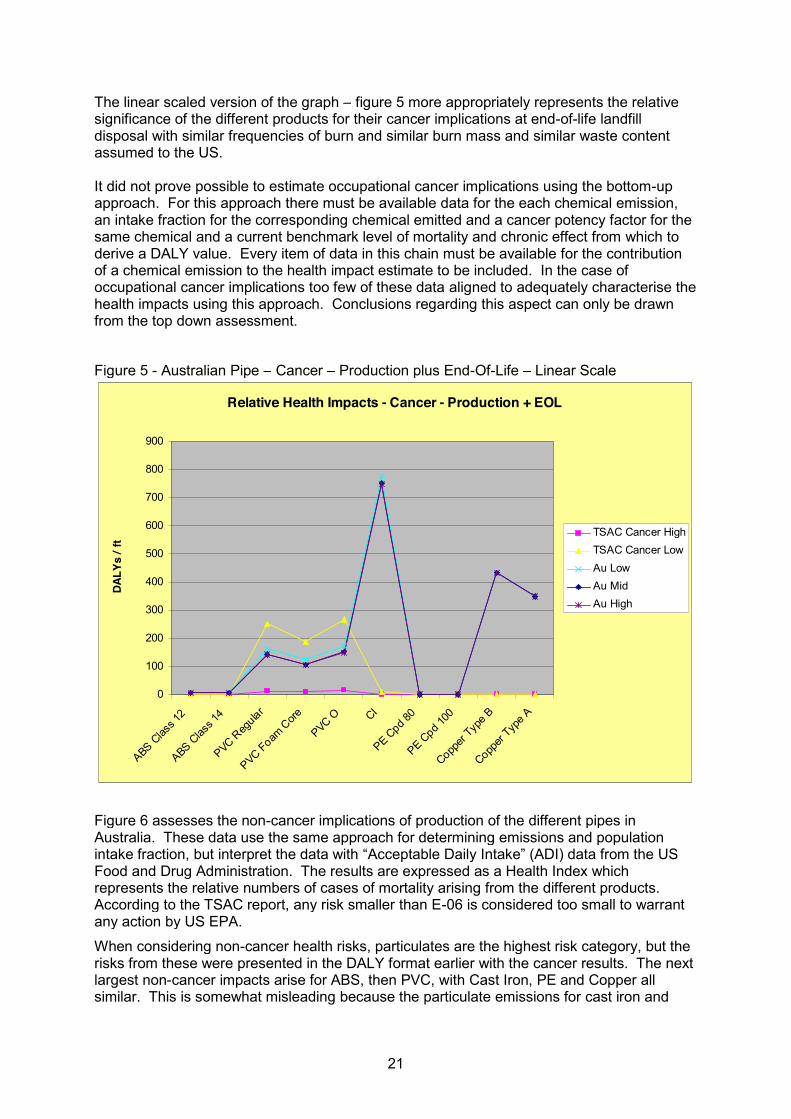
The linear scaled version of the graph – figure 5 more appropriately represents the relativesignificance of the different products for their cancer implications at end-of-life landfilldisposal with similar frequencies of burn and similar burn mass and similar waste contentassumed to the US.
It did not prove possible to estimate occupational cancer implications using the bottom-upapproach. For this approach there must be available data for the each chemical emission,an intake fraction for the corresponding chemical emitted and a cancer potency factor for thesame chemical and a current benchmark level of mortality and chronic effect from which toderive a DALY value. Every item of data in this chain must be available for the contributionof a chemical emission to the health impact estimate to be included. In the case ofoccupational cancer implications too few of these data aligned to adequately characterise thehealth impacts using this approach. Conclusions regarding this aspect can only be drawnfrom the top down assessment.
Figure 5 - Australian Pipe – Cancer – Production plus End-Of-Life – Linear Scale
Relative Health Impacts - Cancer - Production + EOL
0
100
200
300
400
500
600
700
800
900
ABSClas
s 12
ABSClas
s 14
PVCReg
ular
PVCFoam
Core
PVCO CI
PE Cpd 80
PE Cpd 100
Copper
Type B
Copper
Type A
DALYs/ft
TSAC Cancer HighTSAC Cancer LowAu LowAu MidAu High
Figure 6 assesses the non-cancer implications of production of the different pipes inAustralia. These data use the same approach for determining emissions and populationintake fraction, but interpret the data with “Acceptable Daily Intake” (ADI) data from the USFood and Drug Administration. The results are expressed as a Health Index whichrepresents the relative numbers of cases of mortality arising from the different products.According to the TSAC report, any risk smaller than E-06 is considered too small to warrantany action by US EPA.
When considering non-cancer health risks, particulates are the highest risk category, but therisks from these were presented in the DALY format earlier with the cancer results. The nextlargest non-cancer impacts arise for ABS, then PVC, with Cast Iron, PE and Copper allsimilar. This is somewhat misleading because the particulate emissions for cast iron and
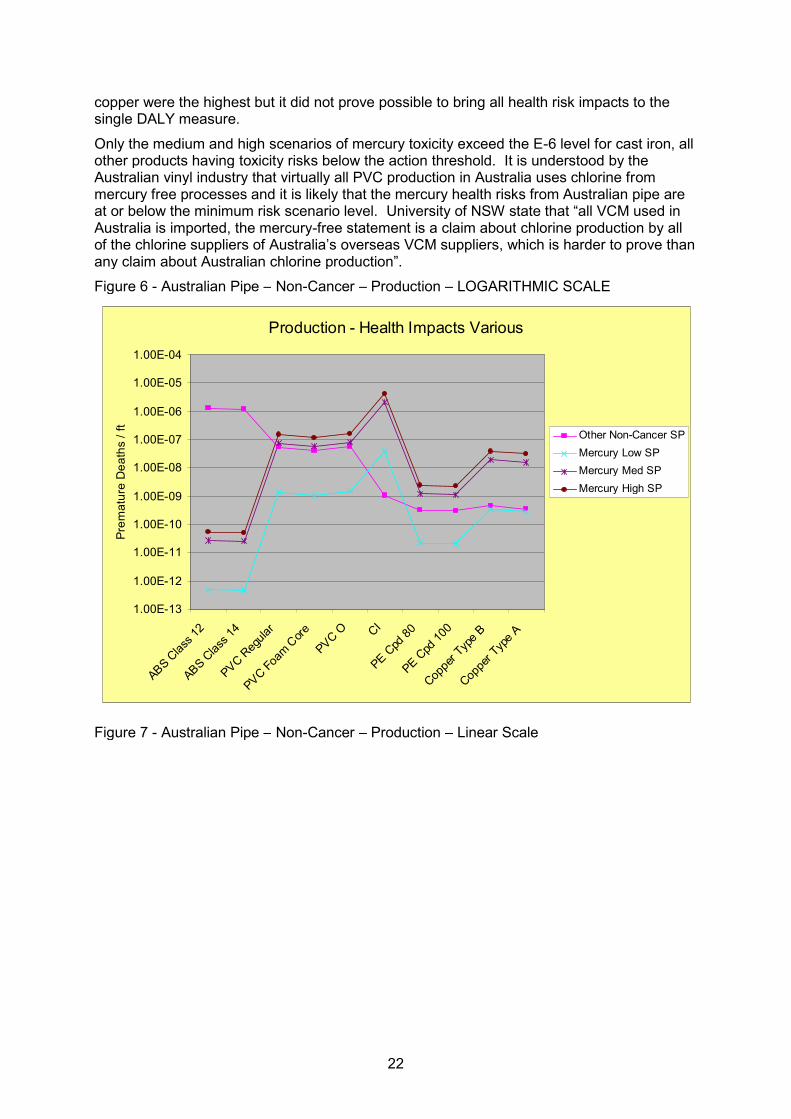
22
copper were the highest but it did not prove possible to bring all health risk impacts to thesingle DALY measure.
Only the medium and high scenarios of mercury toxicity exceed the E-6 level for cast iron, allother products having toxicity risks below the action threshold. It is understood by theAustralian vinyl industry that virtually all PVC production in Australia uses chlorine frommercury free processes and it is likely that the mercury health risks from Australian pipe areat or below the minimum risk scenario level. University of NSW state that “all VCM used inAustralia is imported, the mercury-free statement is a claim about chlorine production by allof the chlorine suppliers of Australia’s overseas VCM suppliers, which is harder to prove thanany claim about Australian chlorine production”.
Figure 6 - Australian Pipe – Non-Cancer – Production – LOGARITHMIC SCALE
Production - Health Impacts Various
1.00E-13
1.00E-12
1.00E-11
1.00E-10
1.00E-09
1.00E-08
1.00E-07
1.00E-06
1.00E-05
1.00E-04
ABS Class 12
ABS Class 14
PVCReg
ular
PVCFo
amCore
PVCO CI
PECpd
80
PECpd
100
Coppe
r Type B
Coppe
r Type A
Prem
atur
eD
eath
s/f
t
Other Non-Cancer SPMercury Low SPMercury Med SPMercury High SP
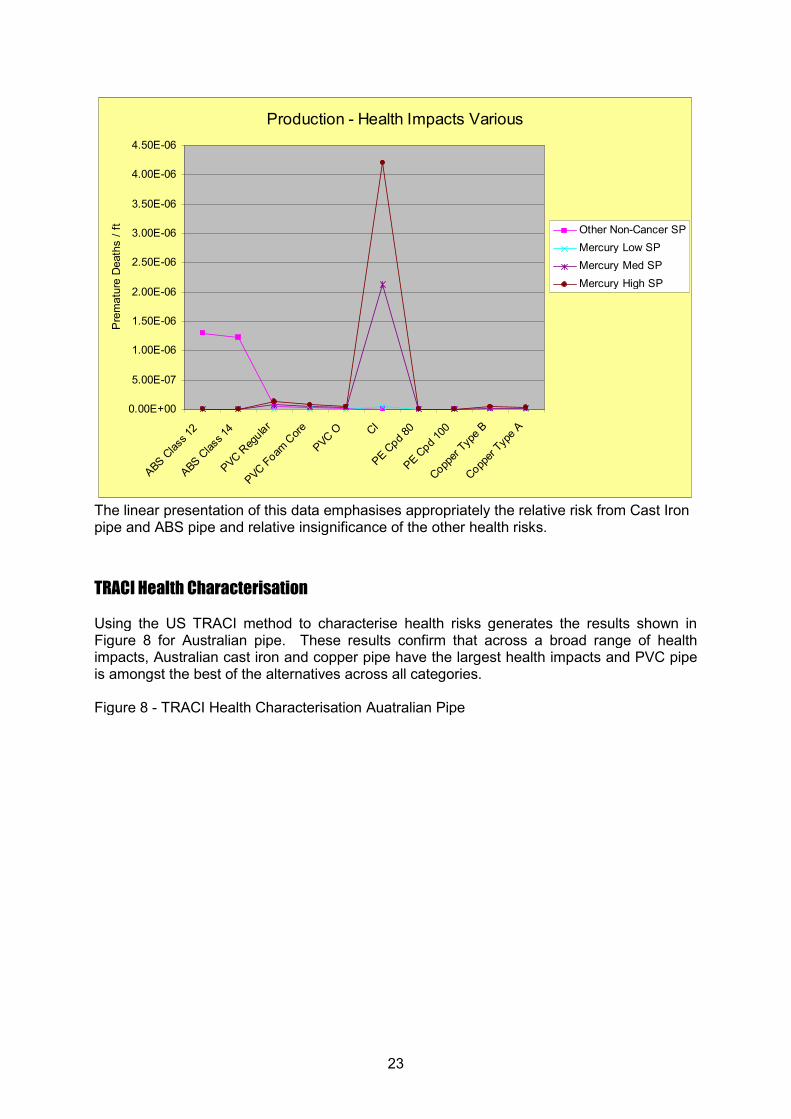
Figure 7 - Australian Pipe – Non-Cancer – Production – Linear Scale
23
Production - Health Impacts Various
0.00E+00
5.00E-07
1.00E-06
1.50E-06
2.00E-06
2.50E-06
3.00E-06
3.50E-06
4.00E-06
4.50E-06
ABSClas
s 12
ABSClas
s 14
PVCReg
ular
PVCFoam
Core
PVCO CI
PE Cpd 80
PE Cpd 100
Copper
Type B
Copper
Type A
Pre
mat
ure
Dea
ths
/ft Other Non-Cancer SP
Mercury Low SPMercury Med SPMercury High SP
The linear presentation of this data emphasises appropriately the relative risk from Cast Ironpipe and ABS pipe and relative insignificance of the other health risks.
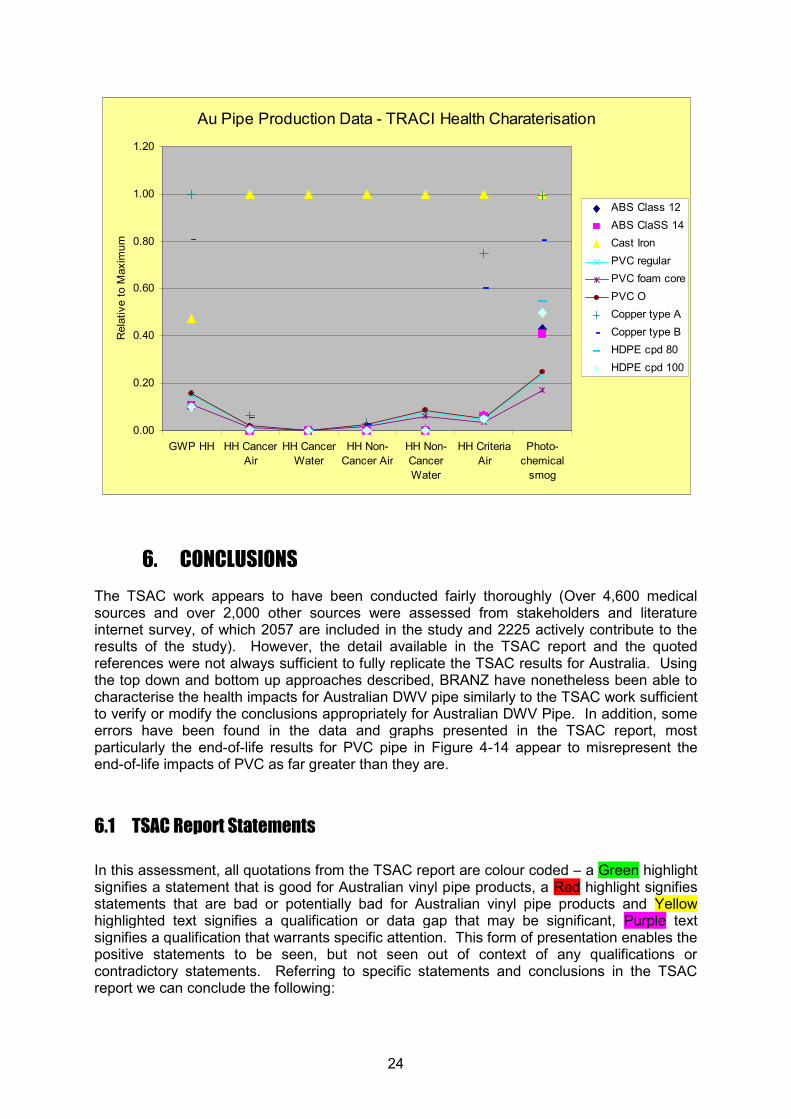
TRACI Health Characterisation
Using the US TRACI method to characterise health risks generates the results shown inFigure 8 for Australian pipe. These results confirm that across a broad range of healthimpacts, Australian cast iron and copper pipe have the largest health impacts and PVC pipeis amongst the best of the alternatives across all categories.
Figure 8 - TRACI Health Characterisation Auatralian Pipe
24
Au Pipe Production Data - TRACI Health Charaterisation
0.00
0.20
0.40
0.60
0.80
1.00
1.20
GWP HH HH CancerAir
HH CancerWater
HH Non-Cancer Air
HH Non-CancerWater
HH CriteriaAir
Photo-chemical
smog
Rel
ativ
eto
Max
imum
ABS Class 12ABS ClaSS 14Cast IronPVC regularPVC foam corePVC OCopper type ACopper type BHDPE cpd 80HDPE cpd 100
6. CONCLUSIONSThe TSAC work appears to have been conducted fairly thoroughly (Over 4,600 medicalsources and over 2,000 other sources were assessed from stakeholders and literatureinternet survey, of which 2057 are included in the study and 2225 actively contribute to theresults of the study). However, the detail available in the TSAC report and the quotedreferences were not always sufficient to fully replicate the TSAC results for Australia. Usingthe top down and bottom up approaches described, BRANZ have nonetheless been able tocharacterise the health impacts for Australian DWV pipe similarly to the TSAC work sufficientto verify or modify the conclusions appropriately for Australian DWV Pipe. In addition, someerrors have been found in the data and graphs presented in the TSAC report, mostparticularly the end-of-life results for PVC pipe in Figure 4-14 appear to misrepresent theend-of-life impacts of PVC as far greater than they are.
6.1 TSAC Report Statements
In this assessment, all quotations from the TSAC report are colour coded – a Green highlightsignifies a statement that is good for Australian vinyl pipe products, a Red highlight signifiesstatements that are bad or potentially bad for Australian vinyl pipe products and Yellowhighlighted text signifies a qualification or data gap that may be significant, Purple textsignifies a qualification that warrants specific attention. This form of presentation enables thepositive statements to be seen, but not seen out of context of any qualifications orcontradictory statements. Referring to specific statements and conclusions in the TSACreport we can conclude the following:
25
6.1.1 Key Positive Findings and Issues IdentifiedReferring to specific statements and conclusions in the TSAC report we can conclude thefollowing:
Executive Summary - Pg 9 line 33-36“No single material shows up as the best across all the human health andenvironmental impact categories, nor the worst.”
Confirmed for Australia, but in the case of DWV pipe, cast iron is consistently worstagainst most environmental and health impacts and should probably be avoided for thisapplication.
Pg 11 line 8-11If buyers switched from PVC to aluminium window frames, to aluminium siding, or to castiron pipe, it could be worse than using PVC.” Data on end-of-life emissions are highlyuncertain and therefore there is a wide range of exposure possibilities; if end-of-lifeemissions are close to the upper end of our range, then PVC is among the worstmaterials studied for health risk, but if end-of-life emissions are close to the lower end ofour range of possible values , then PVC is among the mid or better materials studied forhealth risk in the product categories of window frames, pipe and siding. Policies toprohibit backyard burning and reduce landfill fires would improve the profile of PVC inpiping, windows and siding as compared to the other alternatives considered.”
Confirmed, except that all waste in Australia is recycled or goes to landfill. This result isparticularly sensitive to the frequency and burn mass of landfill fires in Australia and onthe proportions of PVC in the waste. The Australian PVC industry should work with StateGovernment to optimise the recycling of PVC from the waste stream so that this valuableresource is not lost to productive use and does not contribute to the burn mass that mayrelease dioxins and other toxicants. Other combustible materials in the waste (ABS andPE pipe) also contribute to the burn mass and release dioxins and other toxicants oncombustion and metals in the waste can also contribute by catalysing the production ofdioxins. In addition, the public need to be better informed about the emissions fromlandfill fires and the benefits of incineration with energy cogeneration and useful heatrecovery to more productively use wastes and reduce dioxin and other persistent bio-accumulative toxicant emissions.
Pg 11 line 20-23Environmental Impact The evidence indicates that a credit that rewards avoidance ofPVC would steer decision makers toward using materials that are worse on mostenvironmental impactsConfirmed
6.1.2 Key Findings for Vinyl Pipe“4.3 Pipe
4.3.1 Summary
Environmental Impacts: Cast iron pipe is generally the worst material relative toenvironmental impact categories amongst the alternatives studied
Confirmed for Australia
26
Human Health Impacts: PVC is worst for cancer related impacts amongst the alternativesstudied whilst cast iron or PVC is worse for overall health impacts depending on theassumptions when both end-of-life and occupational exposures are included. For the cradle-through-use, cast iron is worst overall among the alternatives studied form a human healthpoint of view.”
Refuted for Australia – The bottom-up assessment shows that in Australia, Cast Iron andABS pipe all have higher cancer related impacts than PVC pipe in production. When end-oflife is taken into account, the Cast Iron and Copper remain the worst, but the ABS is betterthan PVC. Australian PE pipe has the lowest cancer impacts. Although the top downassessment doesn’t confirm this, this assessment is limited in the range of factors that ittakes into account and provides less relevant evidence for this conclusion. In addition, theTRACI characterisation supports the position that Cast Iron and Copper have higher cancerrisks than the PVC pipes, but is less conclusive for ABS.
Pg 49“The results show that cast iron is consistently the worst material among alternatives studiedexcept for eutrophication, for which ABS is the worst when end-of-life emissions areconsidered.”
Confirmed - Moreover, the thinner walled, foam cored or PVC pipes use substantially lessPVC per foot of pipe than the US equivalents, further improving the overall environmentalbenefits of the Australian PVC pipe.
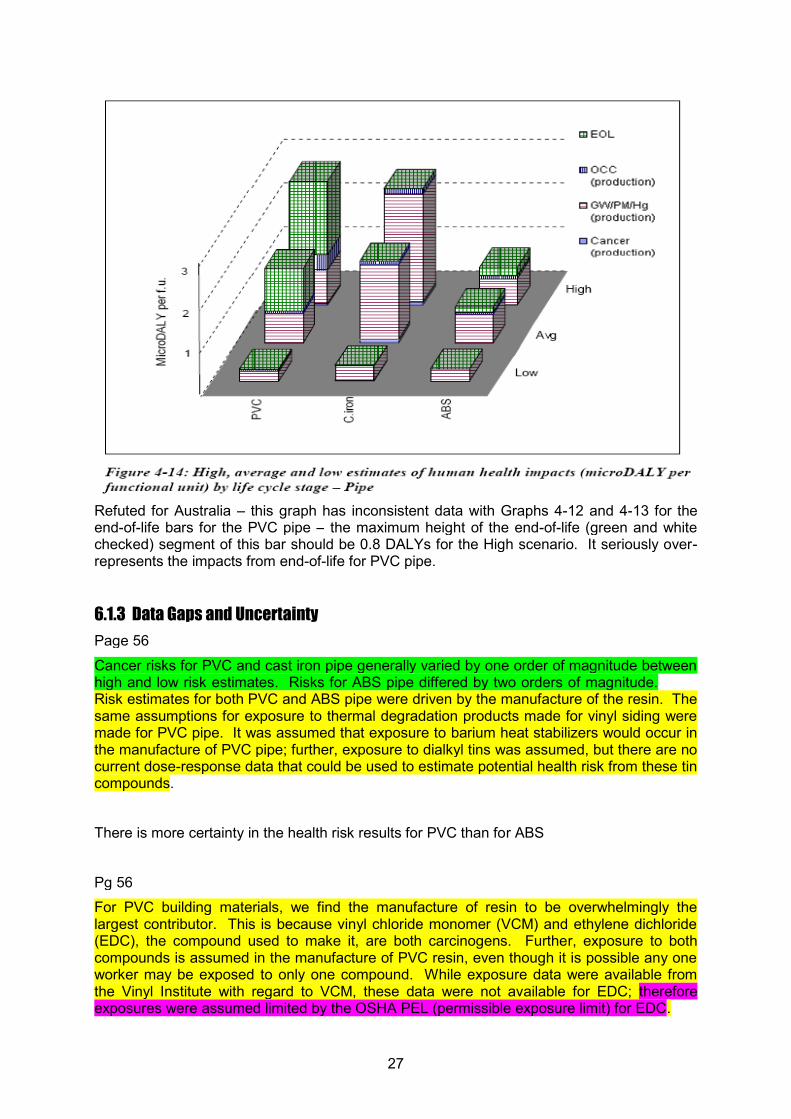
6.1.2.1 Human HealthPage 53“Human Health Impacts – Cradle through Use Plus End-of-Life and Occupational Effects
Adding the impacts to health from exposures of workers in the production and installation ofthe products leads to the results shown in figure below. These are the most comprehensivehuman health results in terms of the scope of the life cycle model. The resulting conclusionsare that for overall health impacts, cast iron is worse than PVC for the maximum and averagecases. The determination of the worst material among alternatives studied is sensitive to theuncertainties about emission emissions factors in the life cycle and risk modelling of thestudied systems. For cancer-related impacts, the maximum and average PVC models areclearly worse than other materials.”
Confirmed for Australia that the overall health impacts for cast iron (and copper) pipe areworse than PVC, but in all scenarios for the Australian pipe, not just the maximum andaverage cases.Refuted for Australia that the maximum and average PVC models are worse than othermaterials.
Pg 53
27
Refuted for Australia – this graph has inconsistent data with Graphs 4-12 and 4-13 for theend-of-life bars for the PVC pipe – the maximum height of the end-of-life (green and whitechecked) segment of this bar should be 0.8 DALYs for the High scenario. It seriously over-represents the impacts from end-of-life for PVC pipe.
6.1.3 Data Gaps and UncertaintyPage 56
Cancer risks for PVC and cast iron pipe generally varied by one order of magnitude betweenhigh and low risk estimates. Risks for ABS pipe differed by two orders of magnitude. Risk estimates for both PVC and ABS pipe were driven by the manufacture of the resin. Thesame assumptions for exposure to thermal degradation products made for vinyl siding weremade for PVC pipe. It was assumed that exposure to barium heat stabilizers would occur inthe manufacture of PVC pipe; further, exposure to dialkyl tins was assumed, but there are nocurrent dose-response data that could be used to estimate potential health risk from these tincompounds.
There is more certainty in the health risk results for PVC than for ABS
Pg 56
For PVC building materials, we find the manufacture of resin to be overwhelmingly thelargest contributor. This is because vinyl chloride monomer (VCM) and ethylene dichloride(EDC), the compound used to make it, are both carcinogens. Further, exposure to bothcompounds is assumed in the manufacture of PVC resin, even though it is possible any oneworker may be exposed to only one compound. While exposure data were available fromthe Vinyl Institute with regard to VCM, these data were not available for EDC; thereforeexposures were assumed limited by the OSHA PEL (permissible exposure limit) for EDC.
28
The TSAC work assumes “worst case exposure” of workers to VCM and this assumption isreplicated for Australian production. In addition, exposure to EDC is assumed at themaximum permissible OSHA limit (because there is no real exposure data).
The estimation of Dioxin emissions is also related to EDC on the basis of 2kg EDC per kg ofPVC – which is 25% greater than would be expected from stoichiometry (unless this reactiononly achieves 75% yield), so Dioxin emissions may be overestimated by up to 25%.
7. RECOMMENDATIONS
x That the PVC pipe industry commit to the recycling of UPVC waste from the wastestream and work with State governments to recover these wastes and mitigate anyremaining concerns over UPVC related dioxin or other emissions from landfill fires.
x That this report be presented to DECC with a request to investigate landfill firefrequency and burn mass to confirm and improve these findings and with acommitment in place to recover UPVC waste from the waste stream reconsider PVCas a waste of concern.
x That this report be presented to the Green Building Council of Australia to seek awithdrawal or modification of the PVC minimization credit to permit the use of PVCDWV pipe.
x That this report be presented to the Sydney Olympic park Authority to seek awithdrawal or modification of the PVC minimization requirements in its developmentguidelines.
x That the pipe industry proceed with a full LCA of their products and establish anecolabel standard for pipe systems – this report indicates that PVC pipe products arelikely to be environmentally preferable.
29
8. REFERENCES
A comprehensive bibliography of TSAC sources relevant to PVC, ABS, Cast Ironand supplementary sources for PE, Copper and Fibre Cement has been compiledfor this project and is available on request. Key references are listed here:
TSAC 2007, US Green Building Council, Technical Scientific Advisory CommitteeTask Group Report, Altshuler K, Horst S, Malin N, Norris G, Nishioka Y, USGBC,Washington DC.
TRACI Characterisation Factors – personal communication Jane Bare USEPA.Bennet DH, Margni MD, McKone TE, Jolliet O (2002) Intake Fraction formultimedia pollutants: a tool for life cycle analysis and comparative riskassessment - Risk Anal 22:905-918
Office of Environmental Health Hazard Assessment, 2005, Air Toxics HotSpots Program, Risk Assessment Guidelines, Part II, Technical SupportDocument for Describing Available Cancer Potency Factors
CEDI/ADI Table, CFSAN/Office of Food Additive Safety, September 2007, USFood and Drug Administration - http://www.cfsan.fda.gov/~dms/opa-tedi.html
EC (2004) Life Cycle Assessment of PVC and of principal competing materials.Final Report. PE Europe GmbH, IKP Universitat Stuttgart, IPU DanmarksTekniska Hogskolan and Randa Group Spain for European Commission[ec.europa.eu/enterprise/chemicals/sustdev/pvc_en.htm] accessed May 2008
30
APPENDIX.A LCA DATA
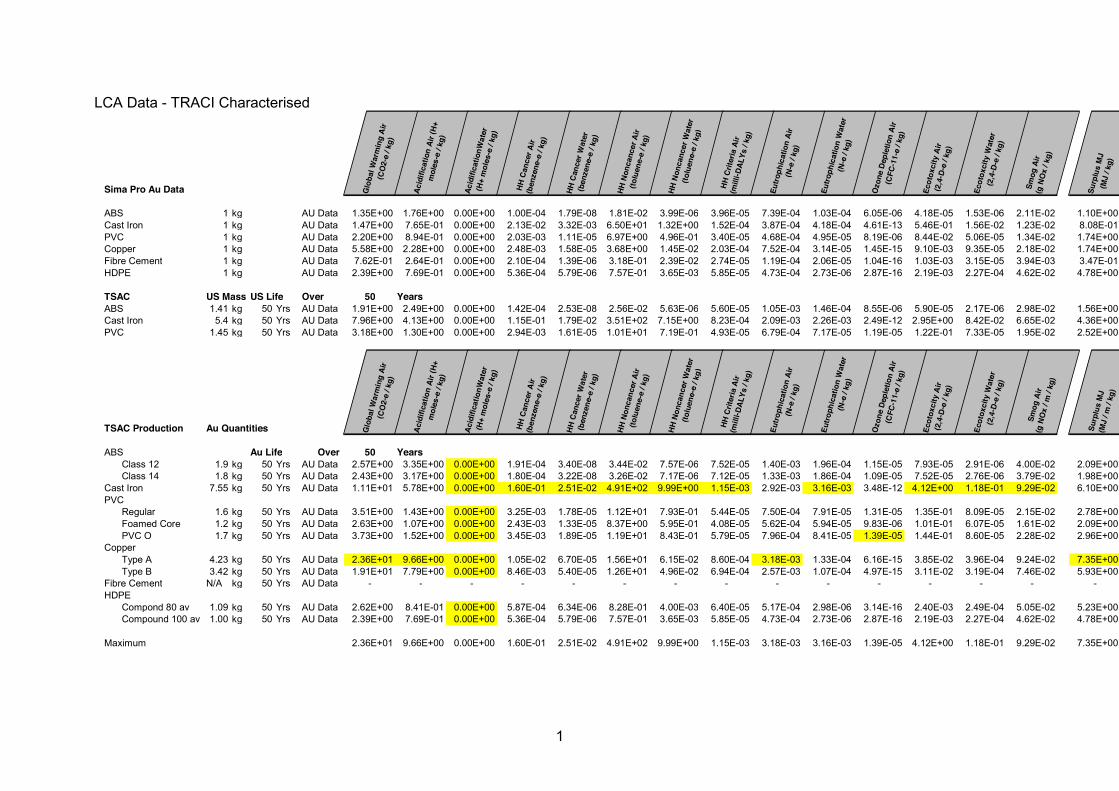
1 LCA Data - TRACI Characterised
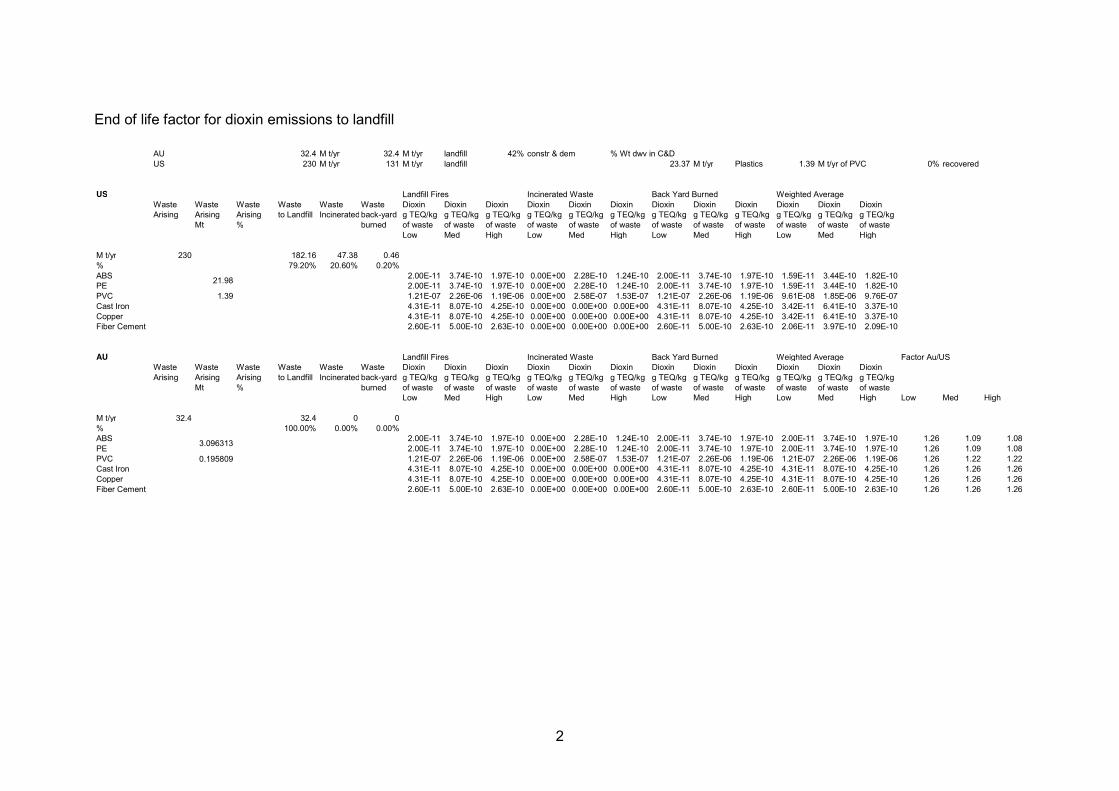
2 End of life factor for dioxin emissions to landfill
1
LCA Data - TRACI Characterised
Sima Pro Au Data Global W
armingAir
(CO2-e/ kg)
AcidificationAir (H+
moles-e/ kg)
AcidificationW
ater
(H+moles-e/ kg)
HHCancerAir
(benzene-e/ kg)
HHCancer W
ater
(benzene-e/ kg)
HHNoncancerAir
(toluene-e/ kg)
HHNoncancerWater
(toluene-e/ kg)
HHCriteria
Air
(milli-DALYs
/ kg)
EutrophicationAir
(N-e/ kg)
EutrophicationWater
(N-e/ kg)
OzoneDepletionAir
(CFC-11-e/ kg)
EcotoxcityAir
(2,4-D-e/ kg)
EcotoxcityWater
(2,4-D-e/ kg)
Smog
Air
(gNO
x/ kg)
SurplusMJ
(MJ/ kg)
ABS 1 kg AU Data 1.35E+00 1.76E+00 0.00E+00 1.00E-04 1.79E-08 1.81E-02 3.99E-06 3.96E-05 7.39E-04 1.03E-04 6.05E-06 4.18E-05 1.53E-06 2.11E-02 1.10E+00Cast Iron 1 kg AU Data 1.47E+00 7.65E-01 0.00E+00 2.13E-02 3.32E-03 6.50E+01 1.32E+00 1.52E-04 3.87E-04 4.18E-04 4.61E-13 5.46E-01 1.56E-02 1.23E-02 8.08E-01PVC 1 kg AU Data 2.20E+00 8.94E-01 0.00E+00 2.03E-03 1.11E-05 6.97E+00 4.96E-01 3.40E-05 4.68E-04 4.95E-05 8.19E-06 8.44E-02 5.06E-05 1.34E-02 1.74E+00Copper 1 kg AU Data 5.58E+00 2.28E+00 0.00E+00 2.48E-03 1.58E-05 3.68E+00 1.45E-02 2.03E-04 7.52E-04 3.14E-05 1.45E-15 9.10E-03 9.35E-05 2.18E-02 1.74E+00Fibre Cement 1 kg AU Data 7.62E-01 2.64E-01 0.00E+00 2.10E-04 1.39E-06 3.18E-01 2.39E-02 2.74E-05 1.19E-04 2.06E-05 1.04E-16 1.03E-03 3.15E-05 3.94E-03 3.47E-01HDPE 1 kg AU Data 2.39E+00 7.69E-01 0.00E+00 5.36E-04 5.79E-06 7.57E-01 3.65E-03 5.85E-05 4.73E-04 2.73E-06 2.87E-16 2.19E-03 2.27E-04 4.62E-02 4.78E+00
TSAC US Mass US Life Over 50 YearsABS 1.41 kg 50 Yrs AU Data 1.91E+00 2.49E+00 0.00E+00 1.42E-04 2.53E-08 2.56E-02 5.63E-06 5.60E-05 1.05E-03 1.46E-04 8.55E-06 5.90E-05 2.17E-06 2.98E-02 1.56E+00Cast Iron 5.4 kg 50 Yrs AU Data 7.96E+00 4.13E+00 0.00E+00 1.15E-01 1.79E-02 3.51E+02 7.15E+00 8.23E-04 2.09E-03 2.26E-03 2.49E-12 2.95E+00 8.42E-02 6.65E-02 4.36E+00PVC 1.45 kg 50 Yrs AU Data 3.18E+00 1.30E+00 0.00E+00 2.94E-03 1.61E-05 1.01E+01 7.19E-01 4.93E-05 6.79E-04 7.17E-05 1.19E-05 1.22E-01 7.33E-05 1.95E-02 2.52E+00
TSAC Production Au Quantities Global W
armingAir
(CO2-e/ kg)
AcidificationAir (H+
moles-e/ kg)
AcidificationW
ater
(H+moles-e/ kg)
HHCancerAir
(benzene-e/ kg)
HHCancerWater
(benzene-e/ kg)
HHNoncancer Air
(toluene-e/ kg)
HHNoncancer W
ater
(toluene-e/ kg)
HHCriteria
Air
(milli-DALYs
/ kg)
EutrophicationAir
(N-e/ kg)
EutrophicationWater
(N-e/ kg)
OzoneDepletionAir
(CFC-11-e/ kg)
EcotoxcityAir
(2,4-D-e/ kg)
EcotoxcityWater
(2,4-D-e/ kg)
Smog
Air
(gNO
x/ m
/ kg)
SurplusMJ
(MJ/ m
/ kg)
ABS Au Life Over 50 YearsClass 12 1.9 kg 50 Yrs AU Data 2.57E+00 3.35E+00 0.00E+00 1.91E-04 3.40E-08 3.44E-02 7.57E-06 7.52E-05 1.40E-03 1.96E-04 1.15E-05 7.93E-05 2.91E-06 4.00E-02 2.09E+00Class 14 1.8 kg 50 Yrs AU Data 2.43E+00 3.17E+00 0.00E+00 1.80E-04 3.22E-08 3.26E-02 7.17E-06 7.12E-05 1.33E-03 1.86E-04 1.09E-05 7.52E-05 2.76E-06 3.79E-02 1.98E+00
Cast Iron 7.55 kg 50 Yrs AU Data 1.11E+01 5.78E+00 0.00E+00 1.60E-01 2.51E-02 4.91E+02 9.99E+00 1.15E-03 2.92E-03 3.16E-03 3.48E-12 4.12E+00 1.18E-01 9.29E-02 6.10E+00PVC
Regular 1.6 kg 50 Yrs AU Data 3.51E+00 1.43E+00 0.00E+00 3.25E-03 1.78E-05 1.12E+01 7.93E-01 5.44E-05 7.50E-04 7.91E-05 1.31E-05 1.35E-01 8.09E-05 2.15E-02 2.78E+00Foamed Core 1.2 kg 50 Yrs AU Data 2.63E+00 1.07E+00 0.00E+00 2.43E-03 1.33E-05 8.37E+00 5.95E-01 4.08E-05 5.62E-04 5.94E-05 9.83E-06 1.01E-01 6.07E-05 1.61E-02 2.09E+00PVC O 1.7 kg 50 Yrs AU Data 3.73E+00 1.52E+00 0.00E+00 3.45E-03 1.89E-05 1.19E+01 8.43E-01 5.79E-05 7.96E-04 8.41E-05 1.39E-05 1.44E-01 8.60E-05 2.28E-02 2.96E+00
CopperType A 4.23 kg 50 Yrs AU Data 2.36E+01 9.66E+00 0.00E+00 1.05E-02 6.70E-05 1.56E+01 6.15E-02 8.60E-04 3.18E-03 1.33E-04 6.16E-15 3.85E-02 3.96E-04 9.24E-02 7.35E+00Type B 3.42 kg 50 Yrs AU Data 1.91E+01 7.79E+00 0.00E+00 8.46E-03 5.40E-05 1.26E+01 4.96E-02 6.94E-04 2.57E-03 1.07E-04 4.97E-15 3.11E-02 3.19E-04 7.46E-02 5.93E+00
Fibre Cement N/A kg 50 Yrs AU Data - - - - - - - - - - - - - - -HDPE
Compond 80 av 1.09 kg 50 Yrs AU Data 2.62E+00 8.41E-01 0.00E+00 5.87E-04 6.34E-06 8.28E-01 4.00E-03 6.40E-05 5.17E-04 2.98E-06 3.14E-16 2.40E-03 2.49E-04 5.05E-02 5.23E+00Compound 100 av 1.00 kg 50 Yrs AU Data 2.39E+00 7.69E-01 0.00E+00 5.36E-04 5.79E-06 7.57E-01 3.65E-03 5.85E-05 4.73E-04 2.73E-06 2.87E-16 2.19E-03 2.27E-04 4.62E-02 4.78E+00
Maximum 2.36E+01 9.66E+00 0.00E+00 1.60E-01 2.51E-02 4.91E+02 9.99E+00 1.15E-03 3.18E-03 3.16E-03 1.39E-05 4.12E+00 1.18E-01 9.29E-02 7.35E+00
2
End of life factor for dioxin emissions to landfill
AU 32.4 M t/yr 32.4 M t/yr landfill 42% constr & dem % Wt dwv in C&DUS 230 M t/yr 131 M t/yr landfill 23.37 M t/yr Plastics 1.39 M t/yr of PVC 0% recovered
US Landfill Fires Incinerated Waste Back Yard Burned Weighted AverageWaste Waste Waste Waste Waste Waste Dioxin Dioxin Dioxin Dioxin Dioxin Dioxin Dioxin Dioxin Dioxin Dioxin Dioxin DioxinArising Arising Arising to Landfill Incinerated back-yard g TEQ/kg g TEQ/kg g TEQ/kg g TEQ/kg g TEQ/kg g TEQ/kg g TEQ/kg g TEQ/kg g TEQ/kg g TEQ/kg g TEQ/kg g TEQ/kg
Mt % burned of waste of waste of waste of waste of waste of waste of waste of waste of waste of waste of waste of wasteLow Med High Low Med High Low Med High Low Med High
M t/yr 230 182.16 47.38 0.46% 79.20% 20.60% 0.20%ABS 2.00E-11 3.74E-10 1.97E-10 0.00E+00 2.28E-10 1.24E-10 2.00E-11 3.74E-10 1.97E-10 1.59E-11 3.44E-10 1.82E-10PE 2.00E-11 3.74E-10 1.97E-10 0.00E+00 2.28E-10 1.24E-10 2.00E-11 3.74E-10 1.97E-10 1.59E-11 3.44E-10 1.82E-10PVC 1.39 1.21E-07 2.26E-06 1.19E-06 0.00E+00 2.58E-07 1.53E-07 1.21E-07 2.26E-06 1.19E-06 9.61E-08 1.85E-06 9.76E-07Cast Iron 4.31E-11 8.07E-10 4.25E-10 0.00E+00 0.00E+00 0.00E+00 4.31E-11 8.07E-10 4.25E-10 3.42E-11 6.41E-10 3.37E-10Copper 4.31E-11 8.07E-10 4.25E-10 0.00E+00 0.00E+00 0.00E+00 4.31E-11 8.07E-10 4.25E-10 3.42E-11 6.41E-10 3.37E-10Fiber Cement 2.60E-11 5.00E-10 2.63E-10 0.00E+00 0.00E+00 0.00E+00 2.60E-11 5.00E-10 2.63E-10 2.06E-11 3.97E-10 2.09E-10
AU Landfill Fires Incinerated Waste Back Yard Burned Weighted Average Factor Au/USWaste Waste Waste Waste Waste Waste Dioxin Dioxin Dioxin Dioxin Dioxin Dioxin Dioxin Dioxin Dioxin Dioxin Dioxin DioxinArising Arising Arising to Landfill Incinerated back-yard g TEQ/kg g TEQ/kg g TEQ/kg g TEQ/kg g TEQ/kg g TEQ/kg g TEQ/kg g TEQ/kg g TEQ/kg g TEQ/kg g TEQ/kg g TEQ/kg
Mt % burned of waste of waste of waste of waste of waste of waste of waste of waste of waste of waste of waste of wasteLow Med High Low Med High Low Med High Low Med High Low Med High
M t/yr 32.4 32.4 0 0% 100.00% 0.00% 0.00%ABS 2.00E-11 3.74E-10 1.97E-10 0.00E+00 2.28E-10 1.24E-10 2.00E-11 3.74E-10 1.97E-10 2.00E-11 3.74E-10 1.97E-10 1.26 1.09 1.08PE 2.00E-11 3.74E-10 1.97E-10 0.00E+00 2.28E-10 1.24E-10 2.00E-11 3.74E-10 1.97E-10 2.00E-11 3.74E-10 1.97E-10 1.26 1.09 1.08PVC 0.195809 1.21E-07 2.26E-06 1.19E-06 0.00E+00 2.58E-07 1.53E-07 1.21E-07 2.26E-06 1.19E-06 1.21E-07 2.26E-06 1.19E-06 1.26 1.22 1.22Cast Iron 4.31E-11 8.07E-10 4.25E-10 0.00E+00 0.00E+00 0.00E+00 4.31E-11 8.07E-10 4.25E-10 4.31E-11 8.07E-10 4.25E-10 1.26 1.26 1.26Copper 4.31E-11 8.07E-10 4.25E-10 0.00E+00 0.00E+00 0.00E+00 4.31E-11 8.07E-10 4.25E-10 4.31E-11 8.07E-10 4.25E-10 1.26 1.26 1.26Fiber Cement 2.60E-11 5.00E-10 2.63E-10 0.00E+00 0.00E+00 0.00E+00 2.60E-11 5.00E-10 2.63E-10 2.60E-11 5.00E-10 2.63E-10 1.26 1.26 1.26
21.98
3.096313
1
APPENDIX.B HEALTH RISK ASSESSMENTSima Pro Au TRACI Human Health Characterised
Top Down Assessment
Bottom Up Assessment
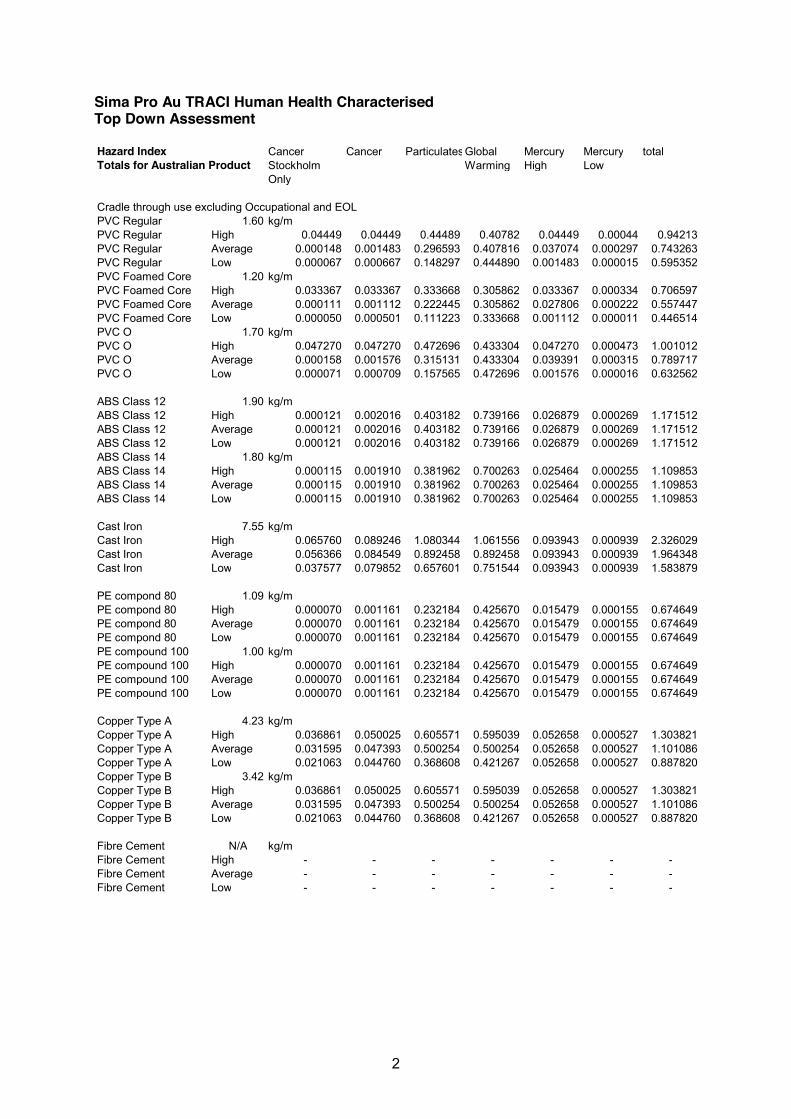
2
Sima Pro Au TRACI Human Health CharacterisedTop Down Assessment
Hazard Index Cancer Cancer ParticulatesGlobal Mercury Mercury totalTotals for Australian Product Stockholm Warming High Low
Only
Cradle through use excluding Occupational and EOLPVC Regular 1.60 kg/mPVC Regular High 0.04449 0.04449 0.44489 0.40782 0.04449 0.00044 0.94213PVC Regular Average 0.000148 0.001483 0.296593 0.407816 0.037074 0.000297 0.743263PVC Regular Low 0.000067 0.000667 0.148297 0.444890 0.001483 0.000015 0.595352PVC Foamed Core 1.20 kg/mPVC Foamed Core High 0.033367 0.033367 0.333668 0.305862 0.033367 0.000334 0.706597PVC Foamed Core Average 0.000111 0.001112 0.222445 0.305862 0.027806 0.000222 0.557447PVC Foamed Core Low 0.000050 0.000501 0.111223 0.333668 0.001112 0.000011 0.446514PVC O 1.70 kg/mPVC O High 0.047270 0.047270 0.472696 0.433304 0.047270 0.000473 1.001012PVC O Average 0.000158 0.001576 0.315131 0.433304 0.039391 0.000315 0.789717PVC O Low 0.000071 0.000709 0.157565 0.472696 0.001576 0.000016 0.632562
ABS Class 12 1.90 kg/mABS Class 12 High 0.000121 0.002016 0.403182 0.739166 0.026879 0.000269 1.171512ABS Class 12 Average 0.000121 0.002016 0.403182 0.739166 0.026879 0.000269 1.171512ABS Class 12 Low 0.000121 0.002016 0.403182 0.739166 0.026879 0.000269 1.171512ABS Class 14 1.80 kg/mABS Class 14 High 0.000115 0.001910 0.381962 0.700263 0.025464 0.000255 1.109853ABS Class 14 Average 0.000115 0.001910 0.381962 0.700263 0.025464 0.000255 1.109853ABS Class 14 Low 0.000115 0.001910 0.381962 0.700263 0.025464 0.000255 1.109853
Cast Iron 7.55 kg/mCast Iron High 0.065760 0.089246 1.080344 1.061556 0.093943 0.000939 2.326029Cast Iron Average 0.056366 0.084549 0.892458 0.892458 0.093943 0.000939 1.964348Cast Iron Low 0.037577 0.079852 0.657601 0.751544 0.093943 0.000939 1.583879
PE compond 80 1.09 kg/mPE compond 80 High 0.000070 0.001161 0.232184 0.425670 0.015479 0.000155 0.674649PE compond 80 Average 0.000070 0.001161 0.232184 0.425670 0.015479 0.000155 0.674649PE compond 80 Low 0.000070 0.001161 0.232184 0.425670 0.015479 0.000155 0.674649PE compound 100 1.00 kg/mPE compound 100 High 0.000070 0.001161 0.232184 0.425670 0.015479 0.000155 0.674649PE compound 100 Average 0.000070 0.001161 0.232184 0.425670 0.015479 0.000155 0.674649PE compound 100 Low 0.000070 0.001161 0.232184 0.425670 0.015479 0.000155 0.674649
Copper Type A 4.23 kg/mCopper Type A High 0.036861 0.050025 0.605571 0.595039 0.052658 0.000527 1.303821Copper Type A Average 0.031595 0.047393 0.500254 0.500254 0.052658 0.000527 1.101086Copper Type A Low 0.021063 0.044760 0.368608 0.421267 0.052658 0.000527 0.887820Copper Type B 3.42 kg/mCopper Type B High 0.036861 0.050025 0.605571 0.595039 0.052658 0.000527 1.303821Copper Type B Average 0.031595 0.047393 0.500254 0.500254 0.052658 0.000527 1.101086Copper Type B Low 0.021063 0.044760 0.368608 0.421267 0.052658 0.000527 0.887820
Fibre Cement N/A kg/mFibre Cement High - - - - - - -Fibre Cement Average - - - - - - -Fibre Cement Low - - - - - - -
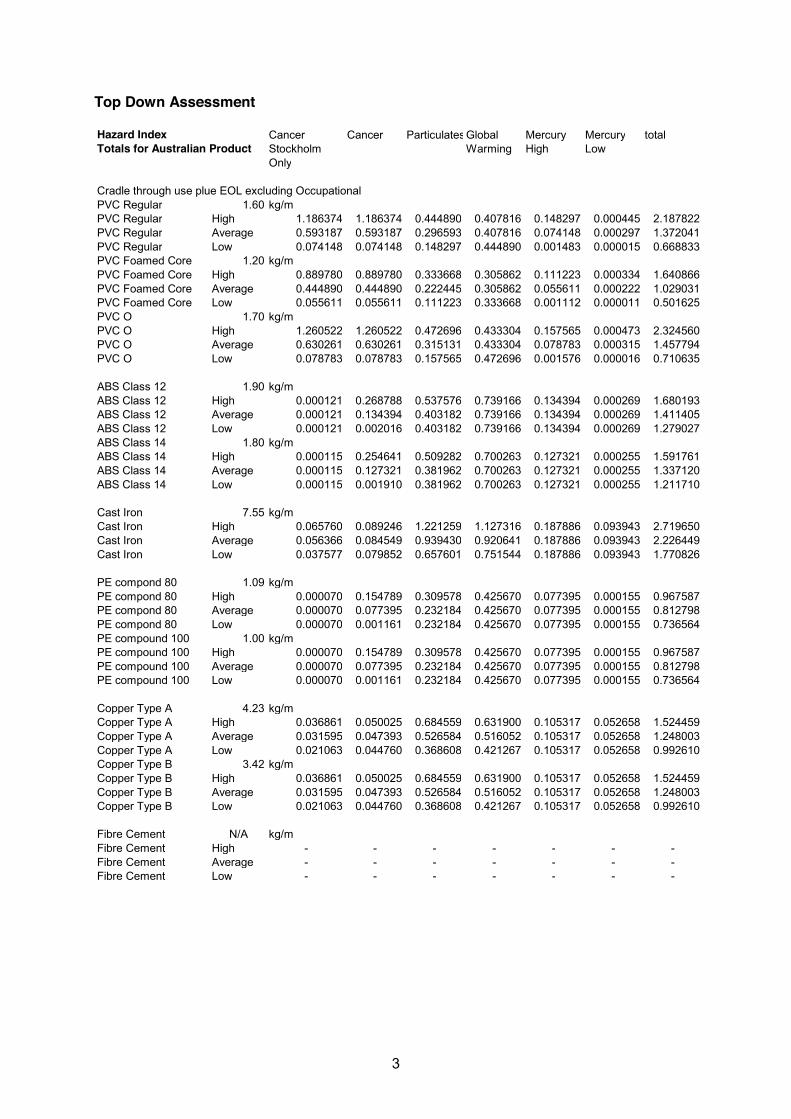
3
Top Down Assessment
Hazard Index Cancer Cancer ParticulatesGlobal Mercury Mercury totalTotals for Australian Product Stockholm Warming High Low
Only
Cradle through use plue EOL excluding OccupationalPVC Regular 1.60 kg/mPVC Regular High 1.186374 1.186374 0.444890 0.407816 0.148297 0.000445 2.187822PVC Regular Average 0.593187 0.593187 0.296593 0.407816 0.074148 0.000297 1.372041PVC Regular Low 0.074148 0.074148 0.148297 0.444890 0.001483 0.000015 0.668833PVC Foamed Core 1.20 kg/mPVC Foamed Core High 0.889780 0.889780 0.333668 0.305862 0.111223 0.000334 1.640866PVC Foamed Core Average 0.444890 0.444890 0.222445 0.305862 0.055611 0.000222 1.029031PVC Foamed Core Low 0.055611 0.055611 0.111223 0.333668 0.001112 0.000011 0.501625PVC O 1.70 kg/mPVC O High 1.260522 1.260522 0.472696 0.433304 0.157565 0.000473 2.324560PVC O Average 0.630261 0.630261 0.315131 0.433304 0.078783 0.000315 1.457794PVC O Low 0.078783 0.078783 0.157565 0.472696 0.001576 0.000016 0.710635
ABS Class 12 1.90 kg/mABS Class 12 High 0.000121 0.268788 0.537576 0.739166 0.134394 0.000269 1.680193ABS Class 12 Average 0.000121 0.134394 0.403182 0.739166 0.134394 0.000269 1.411405ABS Class 12 Low 0.000121 0.002016 0.403182 0.739166 0.134394 0.000269 1.279027ABS Class 14 1.80 kg/mABS Class 14 High 0.000115 0.254641 0.509282 0.700263 0.127321 0.000255 1.591761ABS Class 14 Average 0.000115 0.127321 0.381962 0.700263 0.127321 0.000255 1.337120ABS Class 14 Low 0.000115 0.001910 0.381962 0.700263 0.127321 0.000255 1.211710
Cast Iron 7.55 kg/mCast Iron High 0.065760 0.089246 1.221259 1.127316 0.187886 0.093943 2.719650Cast Iron Average 0.056366 0.084549 0.939430 0.920641 0.187886 0.093943 2.226449Cast Iron Low 0.037577 0.079852 0.657601 0.751544 0.187886 0.093943 1.770826
PE compond 80 1.09 kg/mPE compond 80 High 0.000070 0.154789 0.309578 0.425670 0.077395 0.000155 0.967587PE compond 80 Average 0.000070 0.077395 0.232184 0.425670 0.077395 0.000155 0.812798PE compond 80 Low 0.000070 0.001161 0.232184 0.425670 0.077395 0.000155 0.736564PE compound 100 1.00 kg/mPE compound 100 High 0.000070 0.154789 0.309578 0.425670 0.077395 0.000155 0.967587PE compound 100 Average 0.000070 0.077395 0.232184 0.425670 0.077395 0.000155 0.812798PE compound 100 Low 0.000070 0.001161 0.232184 0.425670 0.077395 0.000155 0.736564
Copper Type A 4.23 kg/mCopper Type A High 0.036861 0.050025 0.684559 0.631900 0.105317 0.052658 1.524459Copper Type A Average 0.031595 0.047393 0.526584 0.516052 0.105317 0.052658 1.248003Copper Type A Low 0.021063 0.044760 0.368608 0.421267 0.105317 0.052658 0.992610Copper Type B 3.42 kg/mCopper Type B High 0.036861 0.050025 0.684559 0.631900 0.105317 0.052658 1.524459Copper Type B Average 0.031595 0.047393 0.526584 0.516052 0.105317 0.052658 1.248003Copper Type B Low 0.021063 0.044760 0.368608 0.421267 0.105317 0.052658 0.992610
Fibre Cement N/A kg/mFibre Cement High - - - - - - -Fibre Cement Average - - - - - - -Fibre Cement Low - - - - - - -

4
Top Down Assessment
Hazard Index Cancer Cancer ParticulatesGlobal Mercury Mercury totalTotals for Australian Product Stockholm Warming High Low
Only
Cradle through use plus EOL plus OccupationalPVC Regular 1.60 kg/mPVC Regular High 1.186374 1.408819 0.444890 0.407816 0.148297 0.000445 2.410267PVC Regular Average 0.593187 0.667335 0.296593 0.407816 0.074148 0.000297 1.446190PVC Regular Low 0.074148 0.148297 0.148297 0.444890 0.001483 0.000015 0.742981PVC Foamed Core 1.20 kg/mPVC Foamed Core High 0.889780 1.056614 0.333668 0.305862 0.111223 0.000334 1.807700PVC Foamed Core Average 0.444890 0.500501 0.222445 0.305862 0.055611 0.000222 1.084642PVC Foamed Core Low 0.055611 0.111223 0.111223 0.333668 0.001112 0.000011 0.557236PVC O 1.70 kg/mPVC O High 1.260522 1.496870 0.472696 0.433304 0.157565 0.000473 2.560908PVC O Average 0.630261 0.709044 0.315131 0.433304 0.078783 0.000315 1.536576PVC O Low 0.078783 0.157565 0.157565 0.472696 0.001576 0.000016 0.789418
ABS Class 12 1.90 kg/mABS Class 12 High 0.000121 0.268788 0.537576 0.739166 0.134394 0.000269 1.680193ABS Class 12 Average 0.000121 0.134394 0.403182 0.739166 0.134394 0.000269 1.411405ABS Class 12 Low 0.000121 0.002016 0.403182 0.739166 0.134394 0.000269 1.279027ABS Class 14 1.80 kg/mABS Class 14 High 0.000115 0.254641 0.509282 0.700263 0.127321 0.000255 1.591761ABS Class 14 Average 0.000115 0.127321 0.381962 0.700263 0.127321 0.000255 1.337120ABS Class 14 Low 0.000115 0.001910 0.381962 0.700263 0.127321 0.000255 1.211710
Cast Iron 7.55 kg/mCast Iron High 0.065760 0.089246 1.221259 1.127316 0.187886 0.093943 2.719650Cast Iron Average 0.056366 0.084549 0.939430 0.920641 0.187886 0.093943 2.226449Cast Iron Low 0.037577 0.079852 0.657601 0.751544 0.187886 0.093943 1.770826
PE compond 80 1.09 kg/mPE compond 80 High 0.000070 0.154789 0.309578 0.425670 0.077395 0.000155 0.967587PE compond 80 Average 0.000070 0.077395 0.232184 0.425670 0.077395 0.000155 0.812798PE compond 80 Low 0.000070 0.001161 0.232184 0.425670 0.077395 0.000155 0.736564PE compound 100 1.00 kg/mPE compound 100 High 0.000070 0.154789 0.309578 0.425670 0.077395 0.000155 0.967587PE compound 100 Average 0.000070 0.077395 0.232184 0.425670 0.077395 0.000155 0.812798PE compound 100 Low 0.000070 0.001161 0.232184 0.425670 0.077395 0.000155 0.736564
Copper Type A 4.23 kg/mCopper Type A High 0.036861 0.050025 0.684559 0.631900 0.105317 0.052658 1.524459Copper Type A Average 0.031595 0.047393 0.526584 0.516052 0.105317 0.052658 1.248003Copper Type A Low 0.021063 0.044760 0.368608 0.421267 0.105317 0.052658 0.992610Copper Type B 3.42 kg/mCopper Type B High 0.036861 0.050025 0.684559 0.631900 0.105317 0.052658 1.524459Copper Type B Average 0.031595 0.047393 0.526584 0.516052 0.105317 0.052658 1.248003Copper Type B Low 0.021063 0.044760 0.368608 0.421267 0.105317 0.052658 0.992610
Fibre Cement N/A kg/mFibre Cement High - - - - - - -Fibre Cement Average - - - - - - -Fibre Cement Low - - - - - - -
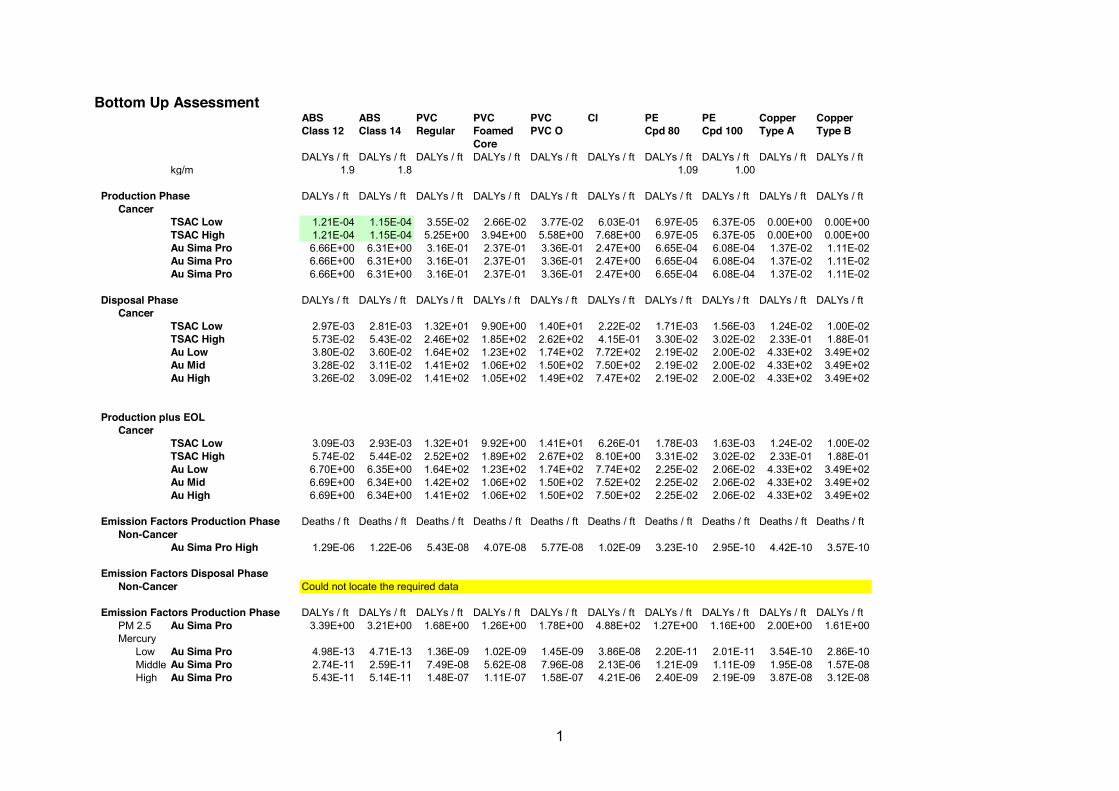
1
Bottom Up AssessmentABS ABS PVC PVC PVC CI PE PE Copper CopperClass 12 Class 14 Regular Foamed PVC O Cpd 80 Cpd 100 Type A Type B
CoreDALYs / ft DALYs / ft DALYs / ft DALYs / ft DALYs / ft DALYs / ft DALYs / ft DALYs / ft DALYs / ft DALYs / ft
kg/m 1.9 1.8 1.09 1.00
Production Phase DALYs / ft DALYs / ft DALYs / ft DALYs / ft DALYs / ft DALYs / ft DALYs / ft DALYs / ft DALYs / ft DALYs / ftCancer
TSAC Low 1.21E-04 1.15E-04 3.55E-02 2.66E-02 3.77E-02 6.03E-01 6.97E-05 6.37E-05 0.00E+00 0.00E+00TSAC High 1.21E-04 1.15E-04 5.25E+00 3.94E+00 5.58E+00 7.68E+00 6.97E-05 6.37E-05 0.00E+00 0.00E+00Au Sima Pro 6.66E+00 6.31E+00 3.16E-01 2.37E-01 3.36E-01 2.47E+00 6.65E-04 6.08E-04 1.37E-02 1.11E-02Au Sima Pro 6.66E+00 6.31E+00 3.16E-01 2.37E-01 3.36E-01 2.47E+00 6.65E-04 6.08E-04 1.37E-02 1.11E-02Au Sima Pro 6.66E+00 6.31E+00 3.16E-01 2.37E-01 3.36E-01 2.47E+00 6.65E-04 6.08E-04 1.37E-02 1.11E-02
Disposal Phase DALYs / ft DALYs / ft DALYs / ft DALYs / ft DALYs / ft DALYs / ft DALYs / ft DALYs / ft DALYs / ft DALYs / ftCancer
TSAC Low 2.97E-03 2.81E-03 1.32E+01 9.90E+00 1.40E+01 2.22E-02 1.71E-03 1.56E-03 1.24E-02 1.00E-02TSAC High 5.73E-02 5.43E-02 2.46E+02 1.85E+02 2.62E+02 4.15E-01 3.30E-02 3.02E-02 2.33E-01 1.88E-01Au Low 3.80E-02 3.60E-02 1.64E+02 1.23E+02 1.74E+02 7.72E+02 2.19E-02 2.00E-02 4.33E+02 3.49E+02Au Mid 3.28E-02 3.11E-02 1.41E+02 1.06E+02 1.50E+02 7.50E+02 2.19E-02 2.00E-02 4.33E+02 3.49E+02Au High 3.26E-02 3.09E-02 1.41E+02 1.05E+02 1.49E+02 7.47E+02 2.19E-02 2.00E-02 4.33E+02 3.49E+02
Production plus EOLCancer
TSAC Low 3.09E-03 2.93E-03 1.32E+01 9.92E+00 1.41E+01 6.26E-01 1.78E-03 1.63E-03 1.24E-02 1.00E-02TSAC High 5.74E-02 5.44E-02 2.52E+02 1.89E+02 2.67E+02 8.10E+00 3.31E-02 3.02E-02 2.33E-01 1.88E-01Au Low 6.70E+00 6.35E+00 1.64E+02 1.23E+02 1.74E+02 7.74E+02 2.25E-02 2.06E-02 4.33E+02 3.49E+02Au Mid 6.69E+00 6.34E+00 1.42E+02 1.06E+02 1.50E+02 7.52E+02 2.25E-02 2.06E-02 4.33E+02 3.49E+02Au High 6.69E+00 6.34E+00 1.41E+02 1.06E+02 1.50E+02 7.50E+02 2.25E-02 2.06E-02 4.33E+02 3.49E+02
Emission Factors Production Phase Deaths / ft Deaths / ft Deaths / ft Deaths / ft Deaths / ft Deaths / ft Deaths / ft Deaths / ft Deaths / ft Deaths / ftNon-Cancer
Au Sima Pro High 1.29E-06 1.22E-06 5.43E-08 4.07E-08 5.77E-08 1.02E-09 3.23E-10 2.95E-10 4.42E-10 3.57E-10
Emission Factors Disposal PhaseNon-Cancer Could not locate the required data
Emission Factors Production Phase DALYs / ft DALYs / ft DALYs / ft DALYs / ft DALYs / ft DALYs / ft DALYs / ft DALYs / ft DALYs / ft DALYs / ftPM 2.5 Au Sima Pro 3.39E+00 3.21E+00 1.68E+00 1.26E+00 1.78E+00 4.88E+02 1.27E+00 1.16E+00 2.00E+00 1.61E+00Mercury
Low Au Sima Pro 4.98E-13 4.71E-13 1.36E-09 1.02E-09 1.45E-09 3.86E-08 2.20E-11 2.01E-11 3.54E-10 2.86E-10Middle Au Sima Pro 2.74E-11 2.59E-11 7.49E-08 5.62E-08 7.96E-08 2.13E-06 1.21E-09 1.11E-09 1.95E-08 1.57E-08High Au Sima Pro 5.43E-11 5.14E-11 1.48E-07 1.11E-07 1.58E-07 4.21E-06 2.40E-09 2.19E-09 3.87E-08 3.12E-08