Study on the Economic Contribution of Copyright Industries in ...
118
Study on the Economic Contribution of Copyright Industries in Turkey Creative Industries Series No. 8 Credits for Cover Screenshots: Image (top left) courtesy of franky242 / FreeDigitalPhotos.net Image (lower right) courtesy of domdeen / FreeDigitalPhotos.net
-
Upload
khangminh22 -
Category
Documents
-
view
0 -
download
0
Transcript of Study on the Economic Contribution of Copyright Industries in ...
For more information contact WIPO at www.wipo.int
World Intellectual Property Organization34, chemin des ColombettesP.O. Box 18CH-1211 Geneva 20Switzerland
Telephone:+41 22 338 91 11Fax:+41 22 733 54 28
Study on the Economic Contribution
of Copyright Industries in Turkey
WIPO Publication No. 1044E ISBN 978-92-805-2547-2 October 2014
C r e a t i v e I n d u s t r i e s S e r i e s N o . 8
Cred
its
for C
over
Scr
eens
hots
: Im
age
(top
left
) cou
rtes
y of
fra
nky2
42 /
Free
Dig
italP
hoto
s.ne
tIm
age
(low
er r
ight
) cou
rtes
y of
dom
deen
/ Fr
eeD
igita
lPho
tos.
net
Study on the Economic Contribution of Copyright
Industries in Turkey
Study on the Economic Contribution of Copyright Industries in Turkey
June 2014

Stud
y on t
he Ec
onom
ic C
ontri
butio
n of C
opyr
ight
Indu
strie
s in
Turk
ey
PREPARED BY:
Prof. Dr. Ramazan AKTAŞ
Prof. Dr. M. Mete DOĞANAY
Ş. Şenol BOZDAĞ
Ayşe Beyhan KARADUMAN
Kenan ORHAN
Hasibe IŞIKLI
Belgin ASLAN
İrfan Taylan ÇOKYAMAN
Erdem BAŞDEMİRCİ
Aysun ALTUNBAŞ
Study on the Economic Contribution of Copyright Industries in Turkey
1
Ta b l e o f C o n t e n t s
List of Abbreviations 8
Special Thanks 8
Executive Summary 9
1. INTRODUCTION 13
1.1 Current Situation 13
1.2 Objectives 13
1.3 Scope 14
1.4 Methodology of the Study 15
1.5 Structure of the Study 16
2. NATIONAL POLICIES 17
2.1 Development Plans 17
2.2 National Strategy 17
2.3 Legal and Institutional Framework 17
2.3.1 LEGAL FRAMEWORK 17
2.3.2 INSTITUTIONAL FRAMEWORK 22
2.4 Collective Management 24
3. METHODOLOGY AND ECONOMIC CONTRIBUTION OF COPYRIGHT INDUSTRIES 25
3.1 Classification of Copyright Industries according to Wipo Methodology 25
3.2 Data Collection Methodology 27
3.3 Copyright Factors 31
3.4 Contribution of Copyright Industries to the Turkish Economy 34
3.4.1 Economic Size of Copyright Industries (2011) 34
3.4.2 Turnover Posted by Copyright Industries (2011) 34
3.4.3 The Value Added Generated by Copyright Industries and the Share of Value Added in GDP (2011) 35
3.4.4 Employment by Copyright Industries and the Share of Employment in Total Employment (2011) 37
3.4.5 Economic Contribution Trends of Copyright Industries (2009-2011) 38
3.5 Economic Contribution of the Core Copyright Industries (2009-2011) 45
3.5.1 The Turnover Posted by Core Copyright Industries (2011) 45
3.5.2 Value Added Generated by the Core Copyright Industries (2011) 46
3.5.3 Employment in Core Copyright Industries (2011) 47
3.5.4 Trends in the Economic Contribution of Core Copyright Industries (2009-2011) 47
3.6 Economic Contribution of Interdependent Copyright Industries (2009-2011) 53
3.6.1 Turnover Posted by Interdependent Copyright industries (2011) 53
3.6.2 Value Added Generated by Interdependent Copyright Industries (2011) 54
3.6.3 Employment in Interdependent Copyright Industries (2011) 56
3.6.4 Trends in the Economic Contribution of the Interdependent Copyright Industries (2009-2011) 56
3.7 Economic Contribution of Partial Copyright Industries (2009-2011) 62
3.7.1 Turnover Posted by the Partial Copyright Industries (2011) 62
3.7.2 Added Value Generated by the Partial Copyright Industries (2011) 63
3.7.3 Employment Created by the Partial Copyright Industries (2011) 64
Stud
y on t
he Ec
onom
ic C
ontri
butio
n of C
opyr
ight
Indu
strie
s in
Turk
ey
2
3.7.4 Trend in the Economic Contribution of the Partial Copyright Industries (2009-2011) 65
3.8 Economic Contribution of Non-Dedicated Support Industries (2009-2011) 71
3.8.1 Turnover Posted by Non-dedicated Support Industries (2011) 71
3.8.2 Value Added of Non-dedicated Support Industries (2011) 72
3.8.3 Employment Created by Non-dedicated Support Industries (2011) 73
3.8.4 Trends in the Economic Contribution of Non-dedicated Support Industries (2009-2011) 73
3.9 Foreign Trade Contribution of the Copyright Industries 76
3.10 Comparison of the Copyright Industries with Other Industries in Turkey (2011) 81
3.11 International Benchmarking 82
4. ASSESSMENT 86
4.1 Overall Assessment 86
4.2 Sectoral Overview and Assessment of the Core Copyright Industries 87
4.2.1 Music industry in Turkey 87
4.2.2 Motion picture industry in Turkey 88
4.2.3 Publishing Sector in Turkey 92
4.2.4 Radio and Television Broadcasting Industry in Turkey 94
4.2.5 Software Industry in Turkey 98
5. CONCLUSIONS AND RECOMMENDATIONS 100
5.1 Conclusions 100
5.2 Recommendations 102
REFERENCES 104
ANNEXES 105
ANNEX 1 TENTH DEVELOPMENT PLAN (2014-2018) AND POLICIES ON INTELLECTUAL PROPERTY RIGHTS 105
ANNEX 2 LEGISLATION 109
ANNEX 3 COPYRIGHT COLLECTIVE MANAGEMENT SOCIETIES IN TURKEY (LIST) 110
ANNEX 4 SUMMARY TABLE FOR THE CONTRIBUTION OF COPYRIGHT INDUSTRIES 114
Study on the Economic Contribution of Copyright Industries in Turkey
3
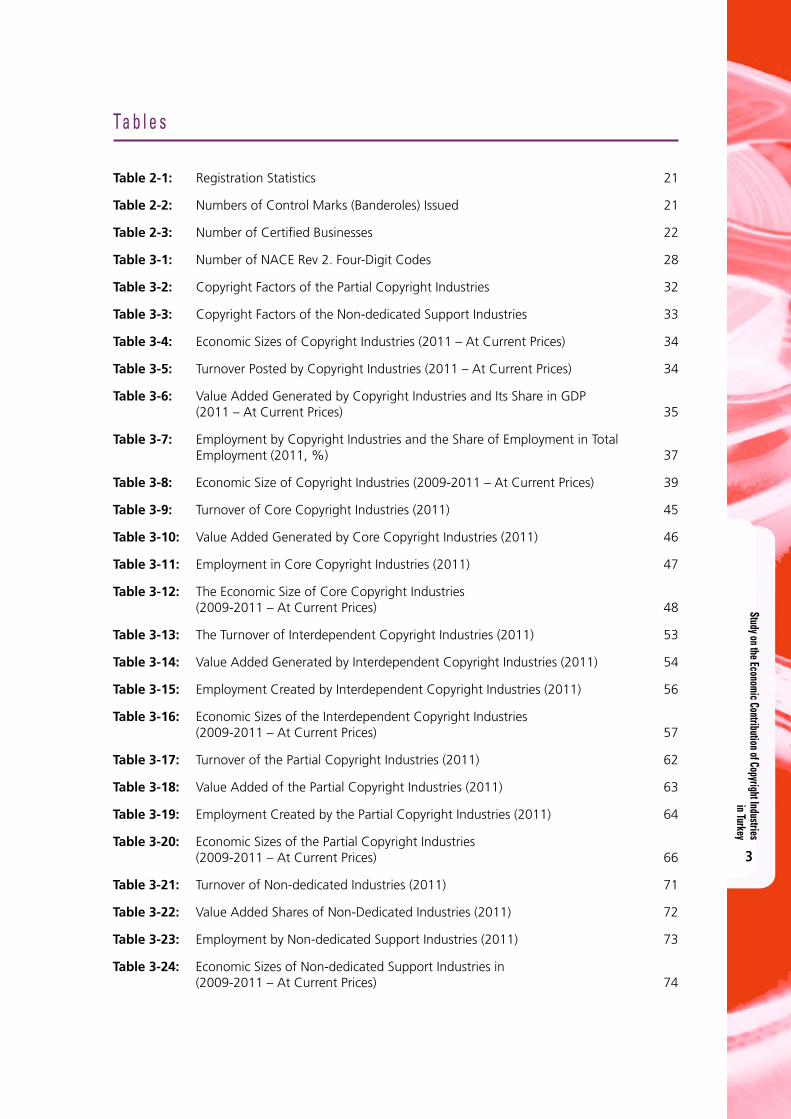
Ta b l e s
Table 2-1: Registration Statistics 21
Table 2-2: Numbers of Control Marks (Banderoles) Issued 21
Table 2-3: Number of Certified Businesses 22
Table 3-1: Number of NACE Rev 2. Four-Digit Codes 28
Table 3-2: Copyright Factors of the Partial Copyright Industries 32
Table 3-3: Copyright Factors of the Non-dedicated Support Industries 33
Table 3-4: Economic Sizes of Copyright Industries (2011 – At Current Prices) 34
Table 3-5: Turnover Posted by Copyright Industries (2011 – At Current Prices) 34
Table 3-6: Value Added Generated by Copyright Industries and Its Share in GDP (2011 – At Current Prices) 35
Table 3-7: Employment by Copyright Industries and the Share of Employment in Total Employment (2011, %) 37
Table 3-8: Economic Size of Copyright Industries (2009-2011 – At Current Prices) 39
Table 3-9: Turnover of Core Copyright Industries (2011) 45
Table 3-10: Value Added Generated by Core Copyright Industries (2011) 46
Table 3-11: Employment in Core Copyright Industries (2011) 47
Table 3-12: The Economic Size of Core Copyright Industries (2009-2011 – At Current Prices) 48
Table 3-13: The Turnover of Interdependent Copyright Industries (2011) 53
Table 3-14: Value Added Generated by Interdependent Copyright Industries (2011) 54
Table 3-15: Employment Created by Interdependent Copyright Industries (2011) 56
Table 3-16: Economic Sizes of the Interdependent Copyright Industries (2009-2011 – At Current Prices) 57
Table 3-17: Turnover of the Partial Copyright Industries (2011) 62
Table 3-18: Value Added of the Partial Copyright Industries (2011) 63
Table 3-19: Employment Created by the Partial Copyright Industries (2011) 64
Table 3-20: Economic Sizes of the Partial Copyright Industries (2009-2011 – At Current Prices) 66
Table 3-21: Turnover of Non-dedicated Industries (2011) 71
Table 3-22: Value Added Shares of Non-Dedicated Industries (2011) 72
Table 3-23: Employment by Non-dedicated Support Industries (2011) 73
Table 3-24: Economic Sizes of Non-dedicated Support Industries in (2009-2011 – At Current Prices) 74

Stud
y on t
he Ec
onom
ic C
ontri
butio
n of C
opyr
ight
Indu
strie
s in
Turk
ey
4
Table 3-25: Foreign Trade Values of the Core Copyright Industries (US$) 76
Table 3-26: Foreign Trade Values of the Interdependent Copyright Industries (US$) 77
Table 3-27: Foreign Trade Values of the Partial Copyright Industries (US$) 77
Study on the Economic Contribution of Copyright Industries in Turkey
5
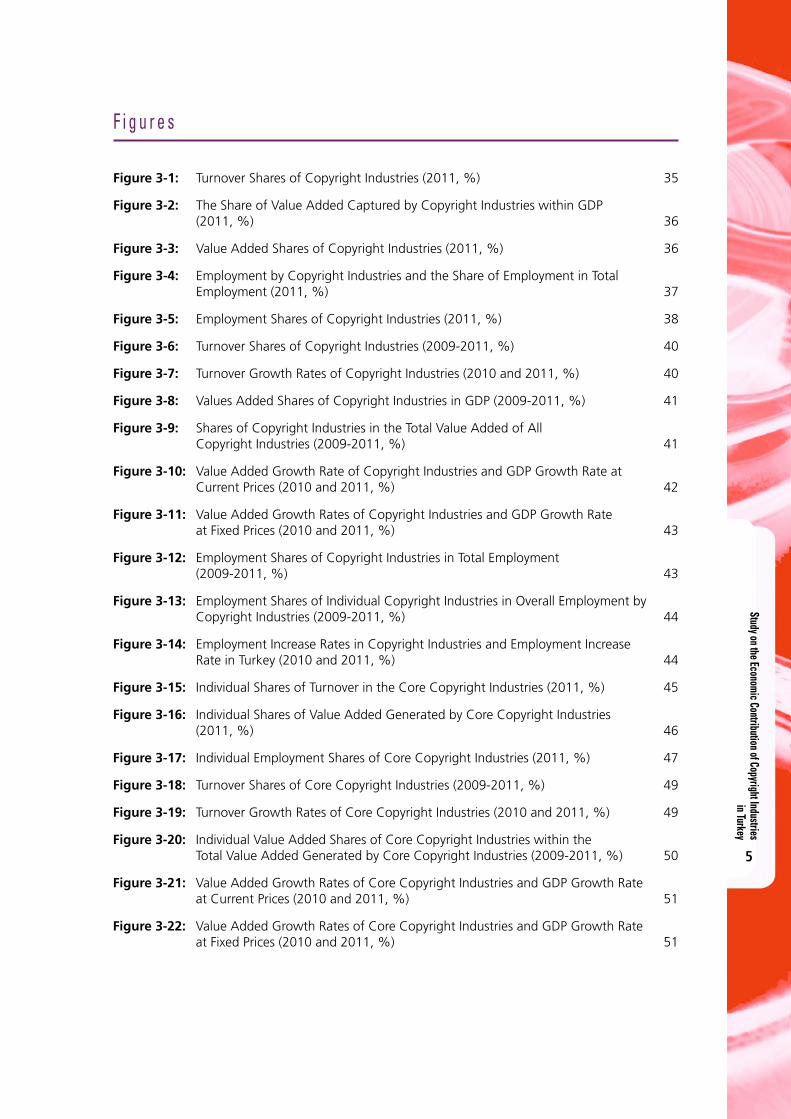
F i g u r e s
Figure 3-1: Turnover Shares of Copyright Industries (2011, %) 35
Figure 3-2: The Share of Value Added Captured by Copyright Industries within GDP (2011, %) 36
Figure 3-3: Value Added Shares of Copyright Industries (2011, %) 36
Figure 3-4: Employment by Copyright Industries and the Share of Employment in Total Employment (2011, %) 37
Figure 3-5: Employment Shares of Copyright Industries (2011, %) 38
Figure 3-6: Turnover Shares of Copyright Industries (2009-2011, %) 40
Figure 3-7: Turnover Growth Rates of Copyright Industries (2010 and 2011, %) 40
Figure 3-8: Values Added Shares of Copyright Industries in GDP (2009-2011, %) 41
Figure 3-9: Shares of Copyright Industries in the Total Value Added of All Copyright Industries (2009-2011, %) 41
Figure 3-10: Value Added Growth Rate of Copyright Industries and GDP Growth Rate at Current Prices (2010 and 2011, %) 42
Figure 3-11: Value Added Growth Rates of Copyright Industries and GDP Growth Rate at Fixed Prices (2010 and 2011, %) 43
Figure 3-12: Employment Shares of Copyright Industries in Total Employment (2009-2011, %) 43
Figure 3-13: Employment Shares of Individual Copyright Industries in Overall Employment by Copyright Industries (2009-2011, %) 44
Figure 3-14: Employment Increase Rates in Copyright Industries and Employment Increase Rate in Turkey (2010 and 2011, %) 44
Figure 3-15: Individual Shares of Turnover in the Core Copyright Industries (2011, %) 45
Figure 3-16: Individual Shares of Value Added Generated by Core Copyright Industries (2011, %) 46
Figure 3-17: Individual Employment Shares of Core Copyright Industries (2011, %) 47
Figure 3-18: Turnover Shares of Core Copyright Industries (2009-2011, %) 49
Figure 3-19: Turnover Growth Rates of Core Copyright Industries (2010 and 2011, %) 49
Figure 3-20: Individual Value Added Shares of Core Copyright Industries within the Total Value Added Generated by Core Copyright Industries (2009-2011, %) 50
Figure 3-21: Value Added Growth Rates of Core Copyright Industries and GDP Growth Rate at Current Prices (2010 and 2011, %) 51
Figure 3-22: Value Added Growth Rates of Core Copyright Industries and GDP Growth Rate at Fixed Prices (2010 and 2011, %) 51
Stud
y on t
he Ec
onom
ic C
ontri
butio
n of C
opyr
ight
Indu
strie
s in
Turk
ey
6
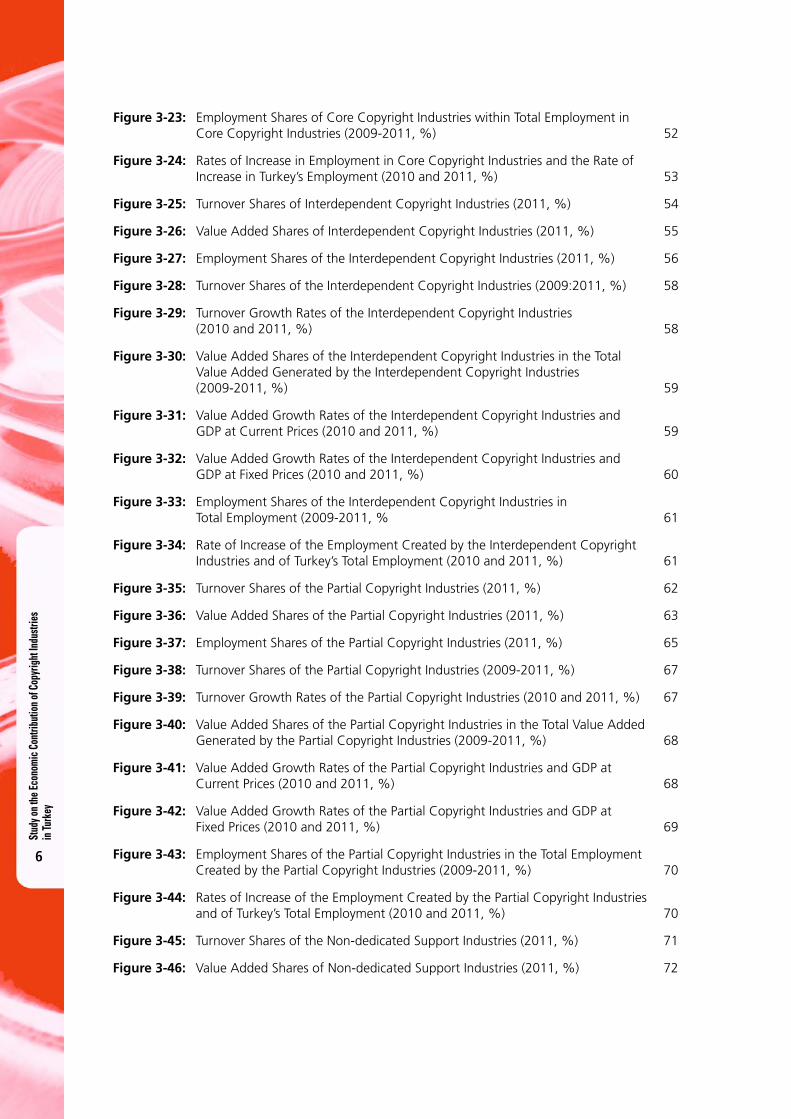
Figure 3-23: Employment Shares of Core Copyright Industries within Total Employment in Core Copyright Industries (2009-2011, %) 52
Figure 3-24: Rates of Increase in Employment in Core Copyright Industries and the Rate of Increase in Turkey’s Employment (2010 and 2011, %) 53
Figure 3-25: Turnover Shares of Interdependent Copyright Industries (2011, %) 54
Figure 3-26: Value Added Shares of Interdependent Copyright Industries (2011, %) 55
Figure 3-27: Employment Shares of the Interdependent Copyright Industries (2011, %) 56
Figure 3-28: Turnover Shares of the Interdependent Copyright Industries (2009:2011, %) 58
Figure 3-29: Turnover Growth Rates of the Interdependent Copyright Industries (2010 and 2011, %) 58
Figure 3-30: Value Added Shares of the Interdependent Copyright Industries in the Total Value Added Generated by the Interdependent Copyright Industries (2009-2011, %) 59
Figure 3-31: Value Added Growth Rates of the Interdependent Copyright Industries and GDP at Current Prices (2010 and 2011, %) 59
Figure 3-32: Value Added Growth Rates of the Interdependent Copyright Industries and GDP at Fixed Prices (2010 and 2011, %) 60
Figure 3-33: Employment Shares of the Interdependent Copyright Industries in Total Employment (2009-2011, % 61
Figure 3-34: Rate of Increase of the Employment Created by the Interdependent Copyright Industries and of Turkey’s Total Employment (2010 and 2011, %) 61
Figure 3-35: Turnover Shares of the Partial Copyright Industries (2011, %) 62
Figure 3-36: Value Added Shares of the Partial Copyright Industries (2011, %) 63
Figure 3-37: Employment Shares of the Partial Copyright Industries (2011, %) 65
Figure 3-38: Turnover Shares of the Partial Copyright Industries (2009-2011, %) 67
Figure 3-39: Turnover Growth Rates of the Partial Copyright Industries (2010 and 2011, %) 67
Figure 3-40: Value Added Shares of the Partial Copyright Industries in the Total Value Added Generated by the Partial Copyright Industries (2009-2011, %) 68
Figure 3-41: Value Added Growth Rates of the Partial Copyright Industries and GDP at Current Prices (2010 and 2011, %) 68
Figure 3-42: Value Added Growth Rates of the Partial Copyright Industries and GDP at Fixed Prices (2010 and 2011, %) 69
Figure 3-43: Employment Shares of the Partial Copyright Industries in the Total Employment Created by the Partial Copyright Industries (2009-2011, %) 70
Figure 3-44: Rates of Increase of the Employment Created by the Partial Copyright Industries and of Turkey’s Total Employment (2010 and 2011, %) 70
Figure 3-45: Turnover Shares of the Non-dedicated Support Industries (2011, %) 71
Figure 3-46: Value Added Shares of Non-dedicated Support Industries (2011, %) 72
Study on the Economic Contribution of Copyright Industries in Turkey
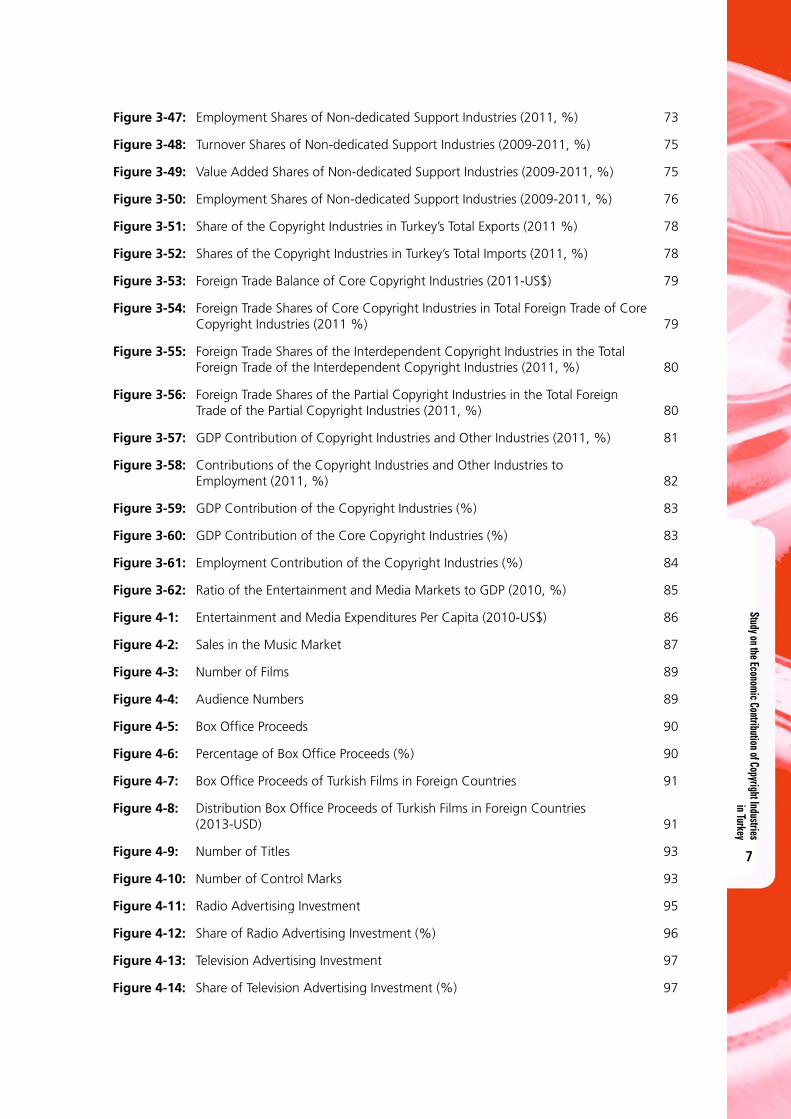
7
Figure 3-47: Employment Shares of Non-dedicated Support Industries (2011, %) 73
Figure 3-48: Turnover Shares of Non-dedicated Support Industries (2009-2011, %) 75
Figure 3-49: Value Added Shares of Non-dedicated Support Industries (2009-2011, %) 75
Figure 3-50: Employment Shares of Non-dedicated Support Industries (2009-2011, %) 76
Figure 3-51: Share of the Copyright Industries in Turkey’s Total Exports (2011 %) 78
Figure 3-52: Shares of the Copyright Industries in Turkey’s Total Imports (2011, %) 78
Figure 3-53: Foreign Trade Balance of Core Copyright Industries (2011-US$) 79
Figure 3-54: Foreign Trade Shares of Core Copyright Industries in Total Foreign Trade of Core Copyright Industries (2011 %) 79
Figure 3-55: Foreign Trade Shares of the Interdependent Copyright Industries in the Total Foreign Trade of the Interdependent Copyright Industries (2011, %) 80
Figure 3-56: Foreign Trade Shares of the Partial Copyright Industries in the Total Foreign Trade of the Partial Copyright Industries (2011, %) 80
Figure 3-57: GDP Contribution of Copyright Industries and Other Industries (2011, %) 81
Figure 3-58: Contributions of the Copyright Industries and Other Industries to Employment (2011, %) 82
Figure 3-59: GDP Contribution of the Copyright Industries (%) 83
Figure 3-60: GDP Contribution of the Core Copyright Industries (%) 83
Figure 3-61: Employment Contribution of the Copyright Industries (%) 84
Figure 3-62: Ratio of the Entertainment and Media Markets to GDP (2010, %) 85
Figure 4-1: Entertainment and Media Expenditures Per Capita (2010-US$) 86
Figure 4-2: Sales in the Music Market 87
Figure 4-3: Number of Films 89
Figure 4-4: Audience Numbers 89
Figure 4-5: Box Office Proceeds 90
Figure 4-6: Percentage of Box Office Proceeds (%) 90
Figure 4-7: Box Office Proceeds of Turkish Films in Foreign Countries 91
Figure 4-8: Distribution Box Office Proceeds of Turkish Films in Foreign Countries (2013-USD) 91
Figure 4-9: Number of Titles 93
Figure 4-10: Number of Control Marks 93
Figure 4-11: Radio Advertising Investment 95
Figure 4-12: Share of Radio Advertising Investment (%) 96
Figure 4-13: Television Advertising Investment 97
Figure 4-14: Share of Television Advertising Investment (%) 97
L i s t o f A b b r e v i a t i o n s
EU European Union
R & D Research and Development
WTO World Trade Organization
TNP Turkish National Police
LIAW Law on Intellectual and Artistic Works (Turkish Copyright Law)
IIPRCC Intellectual and Industrial Property Rights Coordination Council
GDP Gross Domestic Product
HCJP High Council of Judges and Prosecutors
DL Decree-Law
NGO Non-Governmental Organization
TGNA Turkish Grand National Assembly (Parliament)
DGC Directorate General for Copyright
TOBB Union of Chambers and Commodity Exchanges of Turkey
TRIPS Trade Related Intellectual Property Agreement
TURKSTAT Turkish Statistics Institute
UNESCO United National Educational, Scientific and Cultural Organization
YASAD Turkish Software Industrialists Association
YOIKK Coordination Council for the Improvement of Investment Environment
WIPO World Intellectual Property Organization
S p e c i a l T h a n k s
The authors of the present report would like to express their sincere thanks and gratitude to the World Intellectual Property Organization (WIPO) for initiating this research project, which is very important for Turkey, and for the methodological assistance provided. The authors would particularly like to express their gratitude to Mr. Dimiter Gantchev and Professor Robert Picard PhD, for their comments and recommendations offered in the course of carrying out the research and writing the report, which were materially significant in achieving the defined goals.
We express our thanks to the Ministry of the Economy, the Ministry of Development, the Ministry of Finance, the Turkish Statistics Institute (TURKSTAT), collective management societies and industrial representatives for their invaluable contributions to this study. We are indebted to Ş. Abdurrahman Çelik, Advisor to the Minister of Culture and Tourism, and Erkin Yılmaz, Acting Director General for Copyright, for initiating this study and giving it their full backing. Our deepest thanks particularly go to TURKSTAT President Birol Aydemir, who gave considerable support to the provision and analysis of data in this study.
Stud
y on t
he Ec
onom
ic C
ontri
butio
n of C
opyr
ight
Indu
strie
s in
Turk
ey
8
Study on the Economic Contribution of Copyright Industries in Turkey
9
E x e c u t i v e S u m m a r y
Industries whose activities are related to the creation, production, and distribution of copyrighted work have received great attention because of their significant contribution to national economies; in many countries, these industries are now considered to be one of the major driving forces of economic growth. As a result, where once only the legal aspect of copyright was considered, its economic aspect has attracted the attention of policy-makers and economic researchers.
There are several reasons why copyright industries are important for an economy. First of all, many goods and services are involved in copyright industries. For example, a novel is the work protected by the copyright. A novelist creates (writes) the novel. But this novel has no economic meaning unless it is published by a publisher and consumed by consumers. When the book is published the novelist receives an economic benefit in terms of copyright payment; but the publisher also contributes to the economy by making wage payments, consuming fixed capital (using printing machines), purchasing paper to print the book, etc. The copyrighted work (novel) becomes a good (a book) through the printing process (which can be considered a service). This good must be delivered and sold to the final consumers, which also requires other services (for example transportation, wholesale, and retailing). This involvement of many goods and services is also true for other copyrighted work such as songs, motion pictures, TV programs, software, etc. Another important aspect of copyrighted works is that their creation requires huge intellectual effort and there is a very considerable economic reward for this effort through copyright payments. Since copyright industries create a distinct economy, many countries have taken an interest in measuring the size of this economy and have found that copyright industries made a significant contribution to their national economies.
Public authorities and researchers in Turkey have also been interested in the size of the copyright industries in Turkey and the contribution of these industries to the Turkish economy. As a result, the Turkish Ministry of Culture and Tourism expressed to the World Intellectual Property Organization (WIPO) its desire to carry out a study to measure the economic contribution of copyright industries in Turkey. Having received WIPO’s consent, this study was initiated and was carried out under its auspices. The objectives of the study can be expressed as follows:
• To analyze the national policy and legal and institutional framework of copyright in Turkey;
• To measure the economic size of the copyright industries in terms of turnover, value added, employment, and foreign trade (import and export);
• To assess the contribution of copyright industries to GDP, employment, and foreign trade;
• To compare the economic size and contribution of copyright industries with those of other sectors within the national economy;
• To compare the economic size and contribution of Turkey’s copyright industries with those of other selected countries;
• To identify trends in the economic indicators (turnover, value added, employment, foreign trade) of copyright industries;
• To analyze recent developments in selected copyright industries;
• To formulate recommendations to improve the economic contribution of copyright industries based on the analyses; and
• To identify statistical difficulties encountered during the study and recommend remedies.
This study follows the methodological guidelines set out in WIPO’s Guide on Surveying the Economic Contribution of Copyright Industries (2003). A project team comprised of experts from different entities (the Ministry of Culture and Tourism, the Ministry of Development, the Ministry of the Economy of the Republic of Turkey, TURKSTAT specialists and academicians), all specialized in their respective disciplines, was set up in order to ensure that this study was performed accurately and to an appropriate standard, and the study was carried out by this project team.
Stud
y on t
he Ec
onom
ic C
ontri
butio
n of C
opyr
ight
Indu
strie
s in
Turk
ey
10
First of all, national policies and the legal and institutional framework relating to copyright in Turkey were analyzed. Next, statistical analyses were carried out following the methodological approach explained in WIPO’s Guide on Surveying the Economic Contribution of Copyright Industries (2003). This methodological approach has been accepted as an international standard and has been followed in all the studies commissioned by WIPO.
It was necessary to identify the copyright industries in order to gather statistical data. The WIPO guide defines an industry as ‘a cluster of activities which can be identified and are statistically measurable’ and classifies copyright industries into four groups based on the industry’s level of dependence on copyrighted work. We also followed the same classification in this study. These groups and the industries they covered are explained as follows:
• Core Copyright Industries: All the activities of these industries are related to the creation of copyright products (writing, composing, programming, etc.), and the production (printing, filming, etc.), screening, staging, performance, broadcasting, distribution, wholesaling and retailing of such subject-matter These industries have the highest level of dependence on copyright. Industries in this group are: press and literature; music, theatrical productions, operas; motion picture and video; radio and television; photography; software and databases; visual and graphical arts; advertising services; and copyright collective management societies.
• Interdependent Copyright Industries: The activities of these industries are related to the production and sale of equipment for creating, producing or making use of copyrighted work. Examples of these industries are: the manufacture, wholesale and retail of TV sets, radios, VCRs, CD players, DVD players, cassette players, computers and equipment, musical instruments, etc.
• Partial Copyright Industries: A portion of the activities of these industries is related to the creation, production and sale of copyrighted work. Examples of these industries are: apparel, textiles, footwear, jewelry and coins, furniture, etc.
• Non-Dedicated Support Industries: A portion of the activities of these industries is related to the transportation, distribution and sale of copyrighted work. These industries are: general wholesale and retailing; general transportation; the internet.
After the copyright industries had been classified into the four major groups, specific types of data required under these classifications were identified and it was decided to collect data relating to the turnover, value added, employment, exports, and imports of the above-mentioned copyright industries. After deciding on the types of data to be collected, research was conducted as to the specific sources and methods to use for compiling such data. As a result of this research, it was found out that TURKSTAT has been collecting statistics relating to turnover, value added and employment since 2009, in harmony with the economic activity classifications presented in the Statistical Classification of Economic Activities in the European Community (NACE Rev.2). After determining the NACE Rev.2 activity classification codes that applied to the copyright industries, data on the turnover, value added and employment were compiled from the TURKSTAT database. It was found that some activity codes covered several copyright industries, or also covered some industries that were not based on copyright. Additional data was obtained from the Ministry of Finance, while experts’ opinions were sought in order to disaggregate these mixed codes. The data relating to foreign trade (exports and imports) was compiled using two methods. The foreign trade data in connection with goods was mainly compiled from the TURKSTAT database and if not available on the database was obtained from the relevant professional organizations. Data regarding various payments and collections made to and received from foreign countries in connection with copyrighted works (copyright, TV program broadcasting rights, TV program formats, digital music proceeds, cinematographic movie screening rights, etc.) was obtained from the relevant professional organizations as well as leading companies in the respective industries. Finally, the copyright factors regarding the partial copyright industries were determined on the basis of the comments obtained from the Sectoral Assemblies of the Union of Chambers and Commodity Exchanges of Turkey and from other experts.
The results of the analyses may be summarized as follows:
The combined copyright industries posted a turnover of 197,235,775,754 TL at current prices in 2011. Of this turnover, 30.13%, 22.62%, 36.91% and 10.34% were accounted for by the core
Study on the Economic Contribution of Copyright Industries in Turkey
11
copyright industries, interdependent copyright industries, partial copyright industries and non-dedicated support industries, respectively.
The highest turnover among the core copyright industries was posted by press and literature (31.32%). This was followed by software and databases (18.53%), and radio and television (16.15%).
The highest turnover among the interdependent copyright industries was posted by computers and equipment (42.82%). This was followed by TV sets, radio, VCR, CD players, etc. (27.80%) and paper (23.30%).
The highest turnover among the partial copyright industries was posted by apparel, textiles and footwear (73.11%). This was followed by furniture (20.51%), and architecture, engineering and surveying (2.73%).
The combined copyright industries generated value added of 35,463,814,234 TL at current prices in 2011. This value added accounted for 2.73% of Turkey’s GDP, which was 1,297,713,210,117 TL at current prices in 2011. Of the value added, 45.52%, 14.28%, 32.97% and 7.23% were generated by the core copyright industries, interdependent copyright industries, partial copyright industries and non-dedicated support industries, respectively.
Although the highest turnover among the copyright industries was posted by the partial copyright industries (36.91%), the highest value added was generated by core copyright industries (45.52%). This situation indicates that the core copyright industries have high value added and make a significant contribution to the economy thanks to this aspect.
The highest value added among the core copyright industries was generated by radio and television (31.36%). This was followed by press and literature (25.39%) and software and databases (21.68%).
The highest value added among the interdependent copyright industries was generated by computers and equipment (32.25%). This was followed by TV sets, radio, VCR, CD Players, etc. (30.81%) and paper (28.43%).
The highest value added among the partial copyright industries was generated by apparel, textiles and footwear (70.19%). This was followed by furniture (21.50%) and architecture, engineering and surveying (5.59%).
The combined copyright industries employed 1,301,527 persons in 2011. This employment accounted for 5.40% of Turkey’s total employment in 2011, which was 24,110,000 persons. Out of the employment total, 32.44%, 13.25%, 46.96% and 7.35% were generated by the core copyright industries, interdependent copyright industries, partial copyright industries, and other non-dedicated support industries, respectively.
The highest employment among the core copyright industries was generated by press and literature (35.71%). This was followed by advertising services (19.84%) and software and databases (16.84%)
The highest employment among the interdependent copyright industries was generated by computers and equipment (30.39%). This was followed by paper (29.43%) and TV sets, radio, VCR, CD players, etc. (28.76%).
The highest employment among the partial copyright industries was generated by apparel, textiles and footwear (67.19%). This was followed by furniture (26.51%), and architecture, engineering and surveying (4.33%).
The combined copyright industries achieved exports of 9,272,261,947 US$ in 2011. This represented 6.87% of Turkey’s total exports in 2011, which amounted to 134,906,869,000 US$.
The shares of Turkey’s total exports in 2011 contributed held by the core copyright industries, interdependent copyright industries, and partial copyright industries in Turkey’s exports in 2011 were 0.29 %%, 3.13 %% and 3.46 %%, respectively.
Imports of all the copyright industries combined (excluding software and databases) totaled 9,231,967,406 US$ in 2011. This sum represented 3.83% of Turkey’s total imports in 2011, which amounted to 240,841,676,000 US$.
Stud
y on t
he Ec
onom
ic C
ontri
butio
n of C
opyr
ight
Indu
strie
s in
Turk
ey
12
Exports of the copyright industries were greater than their imports in 2011. However, imports did not include software and databases, because no reliable data could be obtained in connection with software and databases imports. Representatives of the software industry noted that imports of software and databases were very high. This fact must be taken into account when interpreting the foreign trade data. Turkey has a negative trade balance (imports are higher than exports) in all the core copyright industries.
The shares of the core copyright industries (excluding software and databases), interdependent copyright industries, and partial copyright industries in Turkey’s imports in 2011 were 0.12%, 3.08% and 0.64%, respectively.
A comparison between the value added generated by the copyright industries and that generated by other industries in Turkey indicates that the contribution made by the copyright industries to GDP in 2011 was greater than the contribution made by the industries of healthcare and social services; hotels and restaurants; electricity, gas, steam and air conditioning generation and distribution. It was very close to the contribution made by financial services and the education sector.
A comparison between the employment created by the copyright industries and the employment created by other industries in Turkey indicates that the copyright industries created more jobs in 2011 than many major industries such as education, health care, financial services, hotels and restaurants, transportation and storage, and communications. The contribution made by the copyright Industries to employment was almost at the same level as the contribution made by public administration and defense. This is an indication that the copyright industries create a significant amount of employment. However, it is worth re-emphasizing that the highest contribution to employment was made by the partial copyright industries, which also covered the apparel, textile and footwear, and furniture industries. These industries are labor-intensive.
An analysis of the contribution made by the value added of the copyright industries to Turkey’s GDP shows that this contribution is not at a desired level. In particular, the contribution of core copyright industries is low. The structure of the Turkish economy, the expenditure pattern of households, and the interest of the population in the works of core copyright industries are the causes of this low level of contribution of core copyright industries to the economy.
Although Turkey has legal and institutional frameworks concerning copyright which are in line with world standards, piracy is still a problem. Digital piracy, especially, is a major problem for the music industry. This situation also affects the economic size of the core copyright industries.
Core copyright sectors have not been fully industrialized in the same way as other mature industries. This fact also has an impact on the economic size of these industries.
We can say that there is great growth potential in the software and databases, motion picture and video, and radio and television sectors. Growth in the radio and television sector also positively affects the advertisement sector.
Public awareness should be increased and legal procedures should be sped up in order to fight against piracy.
Education from an early age is necessary in order to increase the interest of the population in cultural and literary works.
Core copyright industries should be accepted as distinct industries, like other manufacturing and service industries, and special incentives should be designed to support their growth.
As for the statistical difficulties, TURKSTAT has initiated a study on how it can better compile cultural statistics, including foreign trade data concerning payments and collections related to copyright. This study will be finalized soon.
Study on the Economic Contribution of Copyright Industries in Turkey
13
1 . I N T R O D U C T I O N
1.1 Current Situation In today’s world, where intellectual productions are perceived as the most significant capital input on the path to the information society, the concepts of producing and protecting have acquired dimensions that will direct the future both culturally and economically. Although the concept of copyright has so far been treated mostly in its legal aspects, in the context of the protection of work owners and the transfer of culture to the future by this means, it has also gained significance recently in economic terms. As areas such as motion picture, music, publishing and information technologies, which have become attractive in terms of new investment and are protected by copyright, have turned into industries, these products have started to occupy an undeniably high share of national economies. In this context, it is highly important to identify the national potential in this area, in order to increase the contribution of the copyright industries to the national development process.
The policies to protect copyright in Turkey have gained new dimensions with the growing awareness of the role of the copyright concept in the formation and development of relevant industries and thus efforts to industrialize the copyright-protected sectors have become prominent. Within this context, studies have been initiated by the Directorate General for Copyright of the Ministry of Culture and Tourism with a view to determining the economic size of the copyright industries and hence to develop them as among the growth axes of the country in the 21st century. The aim is to define the industries that produce intellectual and artistic works, reproduce them, distribute them or communicate them to the public, and to measure the share of these industries in GDP and their foreign trade capacity as well as the employment they create.
Since 2003, the World Intellectual Property Organization (WIPO) has been carrying out a series of surveys entitled National Studies on the Economic Contribution of Copyright Industries and studies have been completed so far in more than 40 countries. The country reports published on the basis of these studies demonstrate that the copyright industries hold a major position in national economies and that an effective copyright protection system plays an important role in establishing and strengthening these industries.
This study was initiated in cooperation with WIPO in March 2013 and was carried out on the basis of three-year data encompassing the period between 2009 and 2011; it was concluded in March 2014. The study report has been prepared using the methodology set out by WIPO and finalized thanks to the technical assistance provided by WIPO. It will be updated in the forthcoming years so that it remains as an important reference document that will be made available to all relevant parties, academics, law-makers and policy-makers.
1.2 ObjectivesThe objectives of the study are as follows:
• To analyze the national policy, legal and institutional framework of copyright in Turkey;
• To accurately and properly reflect on international platforms the data on the economic contribution of the copyright industries, which are among the growth axes of the country in the 21st century;
• To compare the economic size and contribution of copyright industries with those of other sectors within the national economy;
• To compare the economic size and contribution of Turkey’s copyright industries with those of other selected countries;
• To provide reliable and high quality economic evidence in order to develop cultural policies;
• To identify the trends in economic indicators (turnover, value added, employment, foreign trade) of copyright industries and set up benchmarks for monitoring the trends in the future;
Stud
y on t
he Ec
onom
ic C
ontri
butio
n of C
opyr
ight
Indu
strie
s in
Turk
ey
14
• To identify the drivers of the creative economy in Turkey by analyzing the recent developments in selected copyright industries;
• To identify statistical difficulties encountered during the study and recommend remedies.
This study will pave the way for regularly maintaining and updating data on the economic contribution of Turkey’s copyright industries, thanks to the cooperation of the governmental bodies and industries.
1.3 ScopeThis study follows the methodological guidelines of WIPO’s Guide on Surveying the Economic Contribution of Copyright Industries (2003). This guide groups the copyright industries under four categories based on the industry’s level of dependence on copyrighted work. These groups are:
(a) Core Copyright Industries
(b) Interdependent Copyright Industries
(c) Partial Copyright Industries
(d) Non-dedicated Support Industries
• Core copyright industries: This refers to industries that are wholly engaged in the creation, production, manufacturing, distribution, performance, broadcast, communication and exhibition and distribution and sales of works as well as other productions, performances and publications subject to protection. These industries have the highest level of dependence on copyright. They include press and literature; music, theatrical productions, operas; motion picture and video; radio and television; photography; software and databases; visual and graphical arts; advertising services; copyright collective management societies.
• Interdependent copyright industries: These are defined as industries that are engaged in production, manufacturing and sale of equipment that wholly or primarily facilitates the creation, production and use of works and other performances, productions and broadcasts subject to protection. They include manufacture, wholesale and retail of TV sets, radios, VCRs, CD players, DVD players, cassette players, etc.; manufacture, wholesale and retail of computers and equipment; manufacture, wholesale and retail of musical instruments; manufacture, wholesale and retail of photographic and cinematographic instruments; manufacture, wholesale and retail of photocopiers; manufacture, wholesale and retail of blank recording materials; manufacture, wholesale and retail of paper.
• Partial copyright industries: These are defined as those industries in which a portion of the activities is related to the creation, production, performance, publication, communication, exhibition, distribution and sale of works and other performances, productions and publications subject to protection. These industries include apparel, textiles and footwear; jewelry and coins; furniture; household goods, china and glass; wall coverings and carpets; toys and games; architecture (including interior design), engineering, surveying; museums.
• Non-dedicated support industries: These are defined as general wholesale and retailing, general transportation, telephony and internet industries in which a portion of the activities is related to facilitating the broadcast, communication, distribution or sale of works and other protected performances, productions and publications, and whose activities have not been included in the core copyright industries but can be connected with the associated copyright activities.
Study on the Economic Contribution of Copyright Industries in Turkey
15
1.4 Methodology of the Study A working group of experts and academics was set up in order to efficiently carry out the study initiated under the coordination of the Ministry of Culture and Tourism, Directorate General for Copyright. The members of the working group are presented below:
1. Prof. Dr. Ramazan AKTAŞ (National Coordinator) Chairman of the Business Administration Department, TOBB University of Economics and Technology
2. Prof. Dr. Mehmet Mete DOĞANAY Chairman of the Business Administration Department, Çankaya University
3. Ş. Şenol BOZDAĞ Department Head, Turkish Statistics Institute
4. Ayşe Beyhan KARADUMAN Expert, Turkish Statistics Institute
5. Kenan ORHAN Expert, Turkish Statistics Institute
6. Hasibe IŞIKLI Expert, Ministry of Development, Republic of Turkey
7. Belgin ASLAN Expert, Ministry of Culture and Tourism, Republic of Turkey, Copyright General Directorate
8. İrfan Taylan ÇOKYAMAN Assistant Expert, Ministry of Culture and Tourism, Republic of Turkey, Copyright General Directorate
9. Erdem BAŞDEMİRCİ Expert, Ministry of the Economy, Republic of Turkey
10. Aysun ALTUNBAŞ Inspector, Ministry of Culture and Tourism, Republic of Turkey
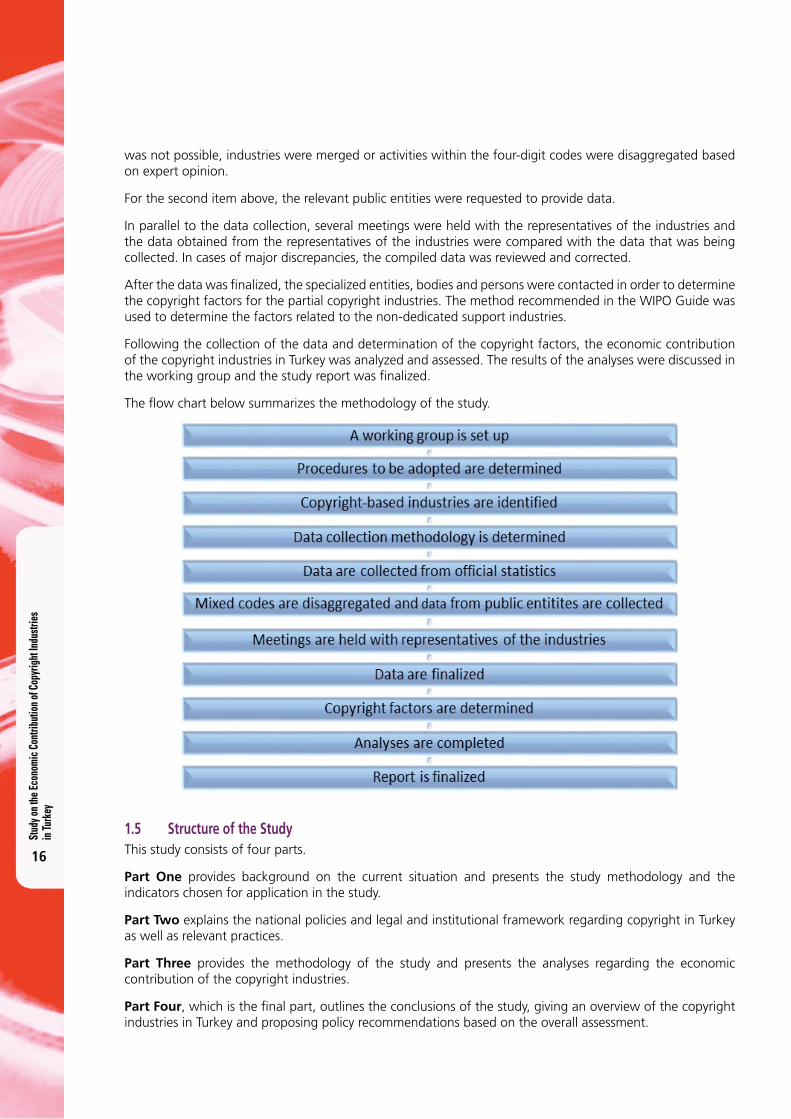
After the working group had been formed, several meetings were held to determine the method to be adopted. As presented above, the working group consisted of public officers and academics specialized in various disciplines and in the meetings it was agreed to adopt an appropriate method which would take into account the comments of all the members of the working group. In this way, the viewpoints of the various specialists could be reflected in the method to be applied.
As the first step, the copyright industries were identified, on the basis of the Guide on Surveying the Economic Contribution of Copyright Industries which was published by WIPO in 2003.
Following the identification of the copyright industries, the method of collecting data regarding these industries was explored. The experts from the Turkish Statistics Institute (TURKSTAT) in the working group were asked to comment on this matter first. The TURKSTAT experts noted that the existing statistics were compiled on the basis of the economic activities presented in the Statistical Classification of Economic Activities in the European Community (NACE Rev 2). Following this, the economic activities for each copyright industry in the WIPO Guide were identified in compliance with NACE Rev 2. Then, the turnover, value added, and employment data related to each economic activity were compiled from the TURKSTAT database.
Following the data collection, the working group analyzed the data and drew the following conclusions:
• TURKSTAT collects the data related to the economic activities on the basis of four-digit activity codes. However, the four-digit activity codes may relate to several copyright industries or may include activities that are not related to copyright.
• Public entities carry out significant activities, particularly in the field of music and theatrical productions and museum industries. TURKSTAT does not collect any data regarding the activities of such public entities.
The economic activities within the mixed four-digit codes were sorted by obtaining data from the Revenues Administration Department of the Ministry of Finance, which used the six-digit codes. In the event that this
Stud
y on t
he Ec
onom
ic C
ontri
butio
n of C
opyr
ight
Indu
strie
s in
Turk
ey
16
was not possible, industries were merged or activities within the four-digit codes were disaggregated based on expert opinion.
For the second item above, the relevant public entities were requested to provide data.
In parallel to the data collection, several meetings were held with the representatives of the industries and the data obtained from the representatives of the industries were compared with the data that was being collected. In cases of major discrepancies, the compiled data was reviewed and corrected.
After the data was fi nalized, the specialized entities, bodies and persons were contacted in order to determine the copyright factors for the partial copyright industries. The method recommended in the WIPO Guide was used to determine the factors related to the non-dedicated support industries.
Following the collection of the data and determination of the copyright factors, the economic contribution of the copyright industries in Turkey was analyzed and assessed. The results of the analyses were discussed in the working group and the study report was fi nalized.
The fl ow chart below summarizes the methodology of the study.
1.5 Structure of the Study This study consists of four parts.
Part One provides background on the current situation and presents the study methodology and the indicators chosen for application in the study.
Part Two explains the national policies and legal and institutional framework regarding copyright in Turkey as well as relevant practices.
Part Three provides the methodology of the study and presents the analyses regarding the economic contribution of the copyright industries.
Part Four, which is the fi nal part, outlines the conclusions of the study, giving an overview of the copyright industries in Turkey and proposing policy recommendations based on the overall assessment.
Study on the Economic Contribution of Copyright Industries in Turkey
17
2 . N AT I O N A L P O L I C I E S
2.1 Development Plans Development plans are of great importance as top-level policy documents setting forth national development policies. Since the early 1990s, these plans have also incorporated targets and policies on the protection and exercise of intellectual property rights, in addition to economic and social policies.
Ten development plans have so far been prepared under the planned development efforts that began in the 1960s in our country. The policies related to intellectual property rights that also include copyright have been incorporated into the Tenth Development Plan for the period of 2014 -2018 under the title ‘Innovative Production, Stable and High Growth’. According to this Plan, the main objective is to ‘increase the contribution of intellectual property rights and products protected by these rights to the development process through the establishment of an effective, common system of intellectual property rights that is internalized by the society for protection and use of intellectual property rights’.1
2.2 National StrategyThe need for a national strategy in the field of intellectual property rights arose in the period of the Ninth Development Plan (2007-2013) and was one of the main objectives and policies designated in the Plan. The Plan also identified the framework of the strategy that would be developed by the policy, stating that ‘short, medium and long term strategies will be set in the field of intellectual rights by taking into account of the impact of the intellectual rights system on the national economy’.
For this purpose, strategy studies were commenced and the current situation was analyzed. As a result of this analysis, it was found that the legislation regarding the registration and civil and criminal protection of intellectual property rights and innovative support infrastructure in Turkey was at a very good level, but there was a need to identify problems related to the functioning of the system and to propose solutions. Accordingly, two workshops were organized with the participation of the relevant public entities, Non-Governmental Organizations (NGOs), academics and members of the judiciary; one of the workshops was on copyrights and the other specifically addressed industrial rights. After the assessment of the workshop outcomes, a strategy document was structurally developed and an action plan was prepared for the implementation of the strategies. The strategy document and action plan, which are presently in the form of a draft, aim at covering the period of 2014-2018 parallel to the Tenth Development Plan.
2.3 Legal and Institutional Framework
2.3.1 LEGAL FRAMEWORK
The longstanding and deep-rooted history of Turkey in the field of copyright should be remembered when describing the existing system in the country. Legislative efforts that date back to 1850, when the Regulation establishing the Ottoman Academy of Sciences was enacted, have been continuing with a steadily increasing momentum since the foundation of the Republic of Turkey.
The modernization process of the copyright system in Turkey has further gained momentum following the Customs Union established as per the Decision No 1/95 by the EC-Turkey Association Council and EU accession negotiations. The legislation on copyright in Turkey has been amended several times due to various reasons, such as harmonizing with the international conventions and EU Acquits, catching up with technological advances, rendering the collective management system effective and combating piracy; and finally the current copyright system has been developed in the light of international developments and national requirements.
1 Further information on the objectives and policies set forth in the Tenth Development Plan regarding intellectual property rights is presented in Annex 1.
Stud
y on t
he Ec
onom
ic C
ontri
butio
n of C
opyr
ight
Indu
strie
s in
Turk
ey
18
2.3.1.1 Currently Applicable Legislation
The Law No 5846 on Intellectual and Artistic Works (Turkish Copyright Law) is the basic law that covers the legal arrangements regarding copyright in Turkey. The Law No 5846 primarily contains provisions on the economic and moral rights of work owners and holders of related rights (performing artists, phonogram producers, movie producers and radio and television entities), on their respective products as well as on the procedures and principles for the exercise of such rights, including legal remedies and sanctions in connection therewith. In addition to this law, 2 Cabinet Decrees, 2 by-laws, 10 regulations and 1 statute are presently applicable to the functioning of the copyright system.2
The current Copyright Law consists of the following chapters: Chapter 1, Intellectual and Artistic Works; Chapter 2, Author; Chapter 3, Intellectual Rights; Chapter 4, Contracts and Disposals; Chapter 5, Civil And Criminal Actions; Chapter 6, Miscellaneous Provisions (Related Rights etc.)
Work
The Turkish Copyright Law defines ‘work’ as ‘any intellectual or artistic product demonstrating the characteristic of its author, which is deemed a scientific and literary or musical work or work of fine arts or cinematographic work.’ (Art. 1/B (a) of Law no 5846).
Works can include: (Articles 2-5 of Law no 5846)
• Literary and scientific works (such as maps, technical photographs, drawings, plans, computer programs, choreographies);
• Musical works (all type of musical compositions with or without lyrics);
• Works of fine arts (such as paintings, sculptures, architectural works, cartoons, handicrafts, photographs);
• Cinematographic works (series of related moving images with or without sound).
It should be mentioned that copyright protection also extends to adaptations and collections such as translations, conversions of works into another type (for example a book adapted into a film), commentaries, collections of several works of a specific author, databases. (Article 6 of Law no 5846)
Author (owner) of Work (Articles 8-10 of Law No 5846)
The general rule of copyright is that the author (owner) of a work is the person who has created it.
The author of an adaptation or collection is the person who has made the adaptation, provided that the rights of the original author are reserved.
In the case of cinematographic works, the director, the composer of original music, the scriptwriter and the dialogue writer are joint authors of the work. For cinematographic works which are produced with the technique of animation, the animator is also among the joint authors of the work.3
If a work created jointly by more than one person can be divided into parts, each person shall be deemed the owner of the part she/he created. If a work created by the participation of more than one person constitutes an indivisible whole, the author of the work is the union of the persons who created it.
Rights Granted To Right Holders
Economic rights:
The authority to exercise economic rights belongs exclusively to the author. These rights include: right of adaptation (Art. 21); right of reproduction (Art.22); right of distribution including the right to rent, lend, put up for sale or distribute in any other way (Art. 23); right of performance (Art. 24); right to communicate to
2 A list of legislation is provided in Annex 2. 3 The author of cinematographic works, of which the production was commenced before 12.06.1995, is the film’s producer.
(Additional Art.2/final of Law No.5846)
Study on the Economic Contribution of Copyright Industries in Turkey
19
the public by devices that transmit signs, sounds and/or images (Art. 25); payment of a share of sale proceeds of works of fine arts (resale right) (Art.45).
Right of adaptation: The author shall have the exclusive right to exploit her/his work by adaptation. (i.e. the translation of a book or arrangements of a musical work );
Right of reproduction: The author shall have the exclusive right to exploit her/his work by reproducing the original or an adaptation, by any kind of method or procedure, in part or in whole, directly or indirectly, permanently or temporarily.
The making of a second copy of the original of the work or the recording of the work on all types of devices enabling the transmission or repetition of signs, sounds and images; all kinds of sound and music recordings as well as the application of plans, projects and sketches of architectural works are deemed reproduction.
The right of reproduction also covers the acts of loading, displaying, running, transmitting and storing a computer program to the extent that such acts require the temporary reproduction of the computer program.
Right of distribution: The exclusive right to rent, lend, put up for sale or distribute in any other way, the original or copies of a work, belongs to the author.
The exhaustion of the right of distribution: By the first sale or distribution of reproduced copies of a work with the author’s consent, the distribution right of the author is exhausted for these copies. This principle is also valid for the related right holders. The principle of the exhaustion is national. Renting and lending right shall not be exhausted by any sale or other act of distribution of originals and copies of works.
Right of performance: The author shall have the exclusive right of performance of her/his work by reciting, playing, dancing or showing the original or an adaptation on public premises, either live or by means of devices permitting the transmission of signs, sounds or images.
Right to communicate to the public: The author shall have the exclusive right of broadcasting the work by means of organizations broadcasting by wires or by wireless broadcasting organizations like radio, television, satellite and cable broadcasting by devices used for transmitting signs, sounds and/or images included digital transmission, and the right of communicating these works to the public by rebroadcasting by different broadcasting organizations after obtaining materials from the previous broadcasts.
Additionally, the author shall have the right to give permission or to prohibit the sale, distribution or presentation of her/his original work or reproduced copies to the public by devices working by wire and wireless and making available to the public of works by providing any access from a place and at a time chosen by the natural persons.
Moral Rights:
Turkish national law, like many other national legislations, provides for the following prerogatives of moral rights:
• Authority to disclose the work to the public: The author shall exclusively determine whether or not her/his work shall be disclosed to the public and the time and manner of its publishing.
Only the author may give information on the contents of a work of which the whole or a substantial part has not yet been made public, or whose main features have not yet been introduced to the public in any way. (art. 14 of the Turkish Copyright Law).
• Authority to designate the name: The author shall have the exclusive authority to decide whether the work shall be disclosed to the public or published with or without the name of the author or under a pseudonym.
The name or mark of the original author must be shown in the manner which is agreed upon or is customary, on copies of a work of fine arts created by reproduction and on the original and copies of an adaptation, and it must be clearly depicted that the work is a copy or an adaptation.
Stud
y on t
he Ec
onom
ic C
ontri
butio
n of C
opyr
ight
Indu
strie
s in
Turk
ey
20
For architectural constructions that are considered as a work, the name of the author shall be inscribed in an indelible way with material considered suitable by the author on a visible part of the work, upon written request. (art. 14 of the Turkish Copyright Law).
• Authority to prohibit modifications of the work (integrity right): Any kind of modification, deterioration, addition or abbreviation of the work is prohibited without the permission of the author. The provision of the power guarantees not only the reputation and honor of the author (which may be harmed by changes not representing her/his ideas or beliefs), but also the integrity and authenticity of the work itself. (Art. 16 of Law no 5846)
• Authority to access original work of fine arts: Especially in the case of works of fine arts existing in only one original copy (for example a sculpture or a painting), the author possesses the right to access her/his work under specific circumstances. (Art.17 of Law no 5846)
Related Rights:
In Turkey, the protection of related rights has been provided since 7 June 1995. The Turkish Copyright Law protects the related rights of performers, phonogram producers, radio and television organizations and producers of the first fixation of films. The owners of related rights may also exercise the rights of filing cases of elimination of violation, prevention of violation and indemnification as well as the authors. (Art. 80 of Law No: 5846).
Civil and Criminal Actions Provided Under The Turkish Copyright Law Infringement of Moral, Economic or Related Rights
Any person whose moral and economic rights have been infringed may bring an action against the infringer to cease the infringement.
Two types of action can be followed, civil action and criminal action.
In a civil action (Art. 66-70): the rights holder demands the cessation of the infringement of moral or economic rights. The rights holder can also act preventively to stop the infringement (Art. 69 of the Turkish Copyright Law). She/he may in all cases claim compensation (Art.70 of the Turkish Copyright Law).
In a criminal action (Art. 71): any person who infringes the moral, economic and related rights regarding intellectual and artistic works shall be sentenced to imprisonment from six months to six years or a judicial fine. It should be noted that the prosecution in criminal cases is subject to complaint.
Control Mark (Banderole) Crime and Sanctions (art. 81)
According to Turkish Copyright Law; it is compulsory to affix security labels with control marks (‘banderoles’) on the reproduced copies of musical and cinematographic works and on books. In order to obtain control marks for a work, the applicant must be the legitimate right holder.
The Inspection Commissions may at any time inspect whether control marks are present on copies and books on which control marks should be affixed.
Any person who infringes the control mark requirements shall be sentenced to imprisonment from one year to seven years or a judicial fine.
Turkey is a party to the following international agreements in the area of copyright:
− Bern Convention for the Protection of Literary and Artistic Works − Rome Convention for the Protection of Performers, Producers of Phonograms and Broadcasting
Organizations − Agreement on Trade Related Aspects of Intellectual Property Rights (TRIPS) − World Intellectual Property Organization (WIPO) Copyright Treaty − World Intellectual Property Organization (WIPO) Performances and Phonograms Treaty − Marrakesh Treaty to facilitate access to publications by visually impaired persons and persons with
print disabilities (internal approval process is on-going for its entry into force).
Study on the Economic Contribution of Copyright Industries in Turkey
21
2.3.1.2 Enforcement and Practices
The Directorate General for Copyright currently implements the registration, control marks (banderoles) and certification systems in order to prevent copyright infringements and enable the enforcement units to perform their inspection and trial activities effectively, rapidly and systematically in response to such infringements. Furthermore, the inspections carried out by the provincial Inspection Commissions and the Copyright Automation System (TEHAKSİS) contribute to the effectiveness of the practices.
• Registration System
Unlike the industrial property rights, the rights on intellectual and artistic works are not subject to the registration requirement and such rights exist from the moment when the work is created. However, a ‘registration system’ is implemented in order to provide evidential proof of the right holder and to follow up the authority to exercise financial rights without aiming at creating rights as per the Article 13 of LIAW. Within this framework, the Istanbul Copyright and Cinema Directorate carries out the registration formalities for productions that incorporate cinematographic and musical works and computer games locally produced or imported into the country. Moreover, recording and registration formalities are carried out by CGD optionally for all groups of works upon declaration.
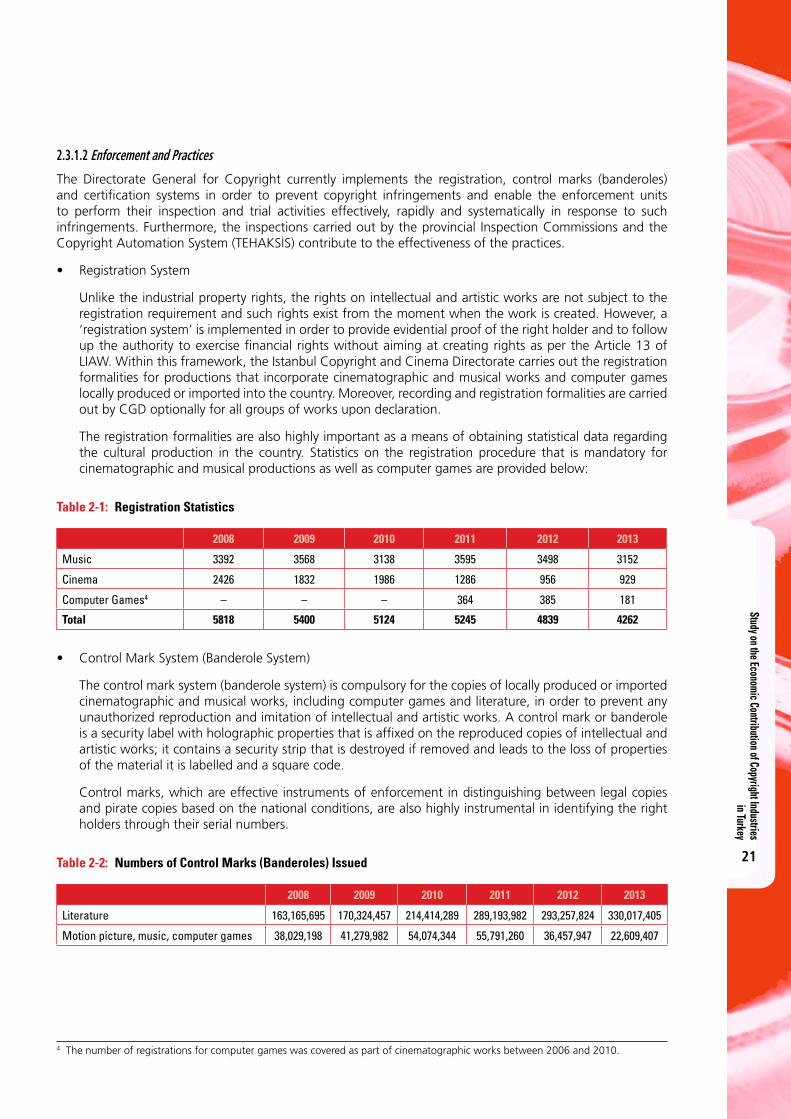
The registration formalities are also highly important as a means of obtaining statistical data regarding the cultural production in the country. Statistics on the registration procedure that is mandatory for cinematographic and musical productions as well as computer games are provided below:
Table 2-1: Registration Statistics4
2008 2009 2010 2011 2012 2013
Music 3392 3568 3138 3595 3498 3152
Cinema 2426 1832 1986 1286 956 929
Computer Games4 – – – 364 385 181
Total 5818 5400 5124 5245 4839 4262
• Control Mark System (Banderole System)
The control mark system (banderole system) is compulsory for the copies of locally produced or imported cinematographic and musical works, including computer games and literature, in order to prevent any unauthorized reproduction and imitation of intellectual and artistic works. A control mark or banderole is a security label with holographic properties that is affixed on the reproduced copies of intellectual and artistic works; it contains a security strip that is destroyed if removed and leads to the loss of properties of the material it is labelled and a square code.
Control marks, which are effective instruments of enforcement in distinguishing between legal copies and pirate copies based on the national conditions, are also highly instrumental in identifying the right holders through their serial numbers.
Table 2-2: Numbers of Control Marks (Banderoles) Issued
2008 2009 2010 2011 2012 2013
Literature 163,165,695 170,324,457 214,414,289 289,193,982 293,257,824 330,017,405
Motion picture, music, computer games 38,029,198 41,279,982 54,074,344 55,791,260 36,457,947 22,609,407
4 The number of registrations for computer games was covered as part of cinematographic works between 2006 and 2010.

Stud
y on t
he Ec
onom
ic C
ontri
butio
n of C
opyr
ight
Indu
strie
s in
Turk
ey
22
• Certification System
Any premises engaged in recording, reproduction, distribution and sale of intellectual and artistic works are subject to certification by the Ministry of Culture and Tourism. Within this scope, recording facilities, printing houses, publishing houses, movie theatres as well as premises and venues engaged in the sale, distribution, import or rental of intellectual and artistic works are subject to certification as per the relevant Regulation. The certification system also contributes to obtaining statistical data on the industry, in addition to facilitating the inspection of businesses operating in this field.
Table 2-3: Number of Certified Businesses5
2008 2009 2010 2011 2012 2013
1,695 2,308 2,616 2,998 4,156 3,699
Producers of cinematographic and musical works operating in the country are strictly required to obtain producer certificates from the Ministry of Culture and Tourism. Within this scope, a total of 1508 producers, of which 739 were music producers and 769 were cinematographic producers, were operating in Turkey by the end of 2013.
• Automation System (TEHAKSİS)
The control mark, certification, producer certification and registration systems are implemented by the Directorate General for Copyright via its Automation System (TEHAKSİS). The information retrieved from this system is shared with the relevant units to accelerate the prosecution and trial processes as well as to generate statistical data.
2.3.2 INSTITUTIONAL FRAMEWORK
The regulatory and enforcement units in the field of copyright in Turkey are as follows:
− Ministry of Culture and Tourism – Copyright General Directorate − Law Enforcement Units (Ministry of the Interior, Turkish National Police and General Command of
Gendarmerie) − Judiciary − Customs Authority – Ministry of Customs and Trade − Provincial Inspection Commissions
2.3.2.1 Ministry of Culture and Tourism – Directorate General for Copyright
The Directorate General for Copyright (DGC), affiliated to the Ministry of Culture and Tourism, is assigned to fulfil the tasks and duties in the field of copyright in Turkey. In addition, the Istanbul Copyright and Cinema Directorate also operates in this area as a provincial unit directly affiliated to the central administration.
The DGC is responsible for fulfilling the duties of setting, implementing and following strategies for the purposes of: regulating, protecting and developing the area of copyright in harmony with public interest, economic and social developments and promoting the production of quality works; following up on the international developments in this field; taking necessary measures in order to prevent copyright violations; carrying out preparatory works for legislation; determining the principles in connection with administrative and legal measures to be implemented; preparing the infrastructure in line with technological advances and ensuring its effective functioning; ensuring cooperation and coordination with collective management societies, relevant entities and bodies; organizing or supporting national or international scientific, cultural, artistic and social projects and events in the field of copyright.
5 Source : Directorate General for Copyright, the Culture and Tourism Ministry
Study on the Economic Contribution of Copyright Industries in Turkey
23
2.3.2.2 Law Enforcement Units
In order to carry out the activities stipulated in the laws regarding the protection of intellectual property rights and combating violations of rights in Turkey, the Intellectual Property Crimes and Press Section Directorate under the Turkish National Police Security Department is responsible at the central level and the Intellectual Property Crimes Office under the Security Section Directorates is responsible at the provincial level (81 provinces); the Gendarmerie Organization is entrusted with this duty for the rural areas. Law enforcement units are authorized to conduct investigations ex officio against offences involving control marks.
2.3.2.3 Judiciary
Legal actions regarding disputes in the field of intellectual property are basically heard by specialized courts. Civil and Criminal Courts for Intellectual and Industrial Property Rights (IIPR) were established for the first time in 2001. At present, there are a total of 21 IIPR specialized courts in Istanbul, Ankara and İzmir, of which 11 are civil courts and 10 are criminal courts. Civil courts of first instance and criminal courts of first instance have the jurisdiction to hear cases related to the Intellectual and Industrial Property Rights in places that do not have any specialized courts.
2.3.2.4 Customs Authority – Ministry of Customs and Trade
The Ministry of Customs and Trade fulfils the duty of exercising enforcement on persons, articles and vehicles within any customs zones in the Republic of Turkey under anti-smuggling practices. Those articles that violate the rights of the intellectual property right holders are seized or are not allowed to be cleared by customs administrations upon the request of the right holders or their representatives or ex officio.
2.3.2.5 Provincial Inspection Commissions
The Inspection Commissions play a significant role in initiating the trial process with respect to violations of intellectual property rights, by performing inspections ex officio to uncover any pirated materials.
Inspection Commissions were set up in the provinces (81 provinces) to perform inspections as to whether copies that are required to carry control marks actually have such marks. These Commissions are composed of representatives of law enforcement forces, staff of the provincial directorates of culture and tourism and collective management societies.
Within the framework of cooperation established between the Ministry of the Interior and the Ministry of Culture and Tourism for the effective control of violations of intellectual property rights, information seminars are organized about the legislation and the implementation thereof, to enable these inspection commissions to fulfil their tasks rapidly and effectively.
In order to enable the Provincial Inspection Commissions to perform inspections rapidly and effectively by penetrating into the roots of piracy, the inspections are accelerated by on-the-spot verifications of pirated materials through the use of mobile devices integrated into TEHAKSİS.
Furthermore, all inspection costs, including expenses incurred due to the technical hardware and devices supplied, are borne by the Ministry of Culture and Tourism and bonuses are paid to the members of the Commissions in order to encourage them, with incentives proportional to the number of pirated materials seized.
2.3.2.6 Intellectual and Industrial Property Rights Coordination Council
Although a legal and administrative structure that conforms to international norms is in place in the field of intellectual property rights in the country, there has been an obvious need for effective cooperation between the relevant entities and bodies so that objectives set could be achieved. Accordingly, the Intellectual and Industrial Property Rights Coordination Council was set up in 2008, with a view to setting common strategies and policies between the public entities and ensuring harmony in practice. The duties of the Council include
Stud
y on t
he Ec
onom
ic C
ontri
butio
n of C
opyr
ight
Indu
strie
s in
Turk
ey
24
setting short, medium and long term strategies regarding intellectual property rights and ensuring effective implementation through coordination and cooperation between the relevant entities.
2.4 Collective ManagementCopyright Collective Management Societies are set up by work owners, related right holders and publishers of scientific and literary works in order to manage and enforce their rights recognized by law and to collect remuneration from these rights and distribute it to the right holders.
In our country, collective management societies gain legal entity status upon submission of the documents stipulated in the legislation to the Ministry of Culture and Tourism, and they may start operating upon authorization issued by the Ministry. Several collective management societies can be opened in the same field and societies operating in the same field can be organized into a federation.
All collective management societies are subject to administrative and financial audits by the Ministry of Culture and Tourism. The ‘By-Law on Collective Management Societies and Federations of Intellectual and Artistic Work Owners and Related Right Holders’ is applicable to the establishment of collective management societies and their federations as well as their duties and authorities.
Collective management societies may be set up in the following areas pursuant to the abovementioned by-law:
1. As regards the work owners:
(a) Owners of scientific and literary works;
(b) Owners of musical works;
(c) Owners of fine arts;
(d) Owners of cinematographic works;
(e) Owners of adaptations and collections.
2. As regards the related rights holders
(a) Performers;
(b) Phonogram publishers;
(c) Radio and television entities;
(d) Producers of first fixation of films;
3. Publishers reproducing and distributing non-periodical publications
At present, there are a total of 27 collective management societies, of which 13 represent work owners, 11 represent related right holders and three are in the area of broadcasting, and there is one federation representing the scientific and literary work publishers in the country.6
6 A list of the collective management societies in Turkey is presented in Annex 3.
Study on the Economic Contribution of Copyright Industries in Turkey
25
3 . M E T H O D O L O G Y A N D E C O N O M I C C O N T R I B U T I O N O F C O P Y R I G H T I N D U S T R I E S
This part of the study presents: the main approach to classifying copyright industries in order to facilitate data collection; the data collection methodology; methods used to determine the copyright factors in order to adjust partial and non-dedicated support industries data; the contribution of copyright industries to the Turkish economy (contribution to GDP, employment, and foreign trade); trends in the contribution of copyright industries; comparisons with other sectors within the national economy; and international comparisons.
In brief, the next section presents the methodology applied in data gathering, the data, and analyses.
3.1 Classification of Copyright Industries according to Wipo MethodologyAlthough the copyright-protected works are varied, they usually include the following (WIPO, 2003):
• Press and literature (periodicals such as newspapers, magazines and books, poems, stories, etc.);
• Musical works;
• Works of fine arts (paintings, sculptures, graphics, etc.);
• Maps and technical drawings (architectural and engineering drawings, etc.);
• Photographic works;
• Motion pictures and other cinematographic works (documentaries, television programs, television serials, etc.);
• Software and databases;
• Radio programs;
• Products such as jewelry, furniture, textiles, toys, carpets and household goods having an element of artistic creativity (incorporating intellectual labor) in their creation.
The copyright industries that are also defined as creative or cultural industries are those industries that are engaged in creating and producing the abovementioned works and distributing them to consumers. Any given industry must absolutely be related to a work based on copyright for it to be referred to as a copyright industry. Such relation can be in the form of actual creation and production of the work (such as writing and printing a book, writing and staging a play, making and performing a composition, writing scripts and shooting them as a film, programming software, etc.) as well as in the form of contributing to the production of such works (manufacturing and sale of paper to print books, manufacturing and sale of equipment to shoot a film, manufacturing and sale of musical instruments to make compositions, etc.) and contributing to the distribution and consumption by users (screening a movie at a movie theatre, production and sale of television sets to view television programs, manufacturing and sale of computers to program and use software, etc.). So, the activities of copyright industries include both goods and services.
While assessing the economic contribution of the copyright industries for statistical purposes, it is important to identify these industries accurately in light of the general principles outlined above.
Researchers found that the copyright industries were identified using different methods in the studies conducted in the past in various countries. This led to certain challenges in comparing the economic contributions of the copyright industries in different countries. In order to overcome these challenges, WIPO issued the Guide on Surveying the Economic Contribution of Copyright Industries in 2003. This guide defines an industry as ‘a cluster of activities which can be identified and are statistically measurable’. Thus, various activities related to copyright were grouped under certain industries and categories of copyright industries were formed. In the meantime, it was found out that certain industries had greater relations with copyright compared to other industries; therefore, the copyright industries were grouped under four main categories
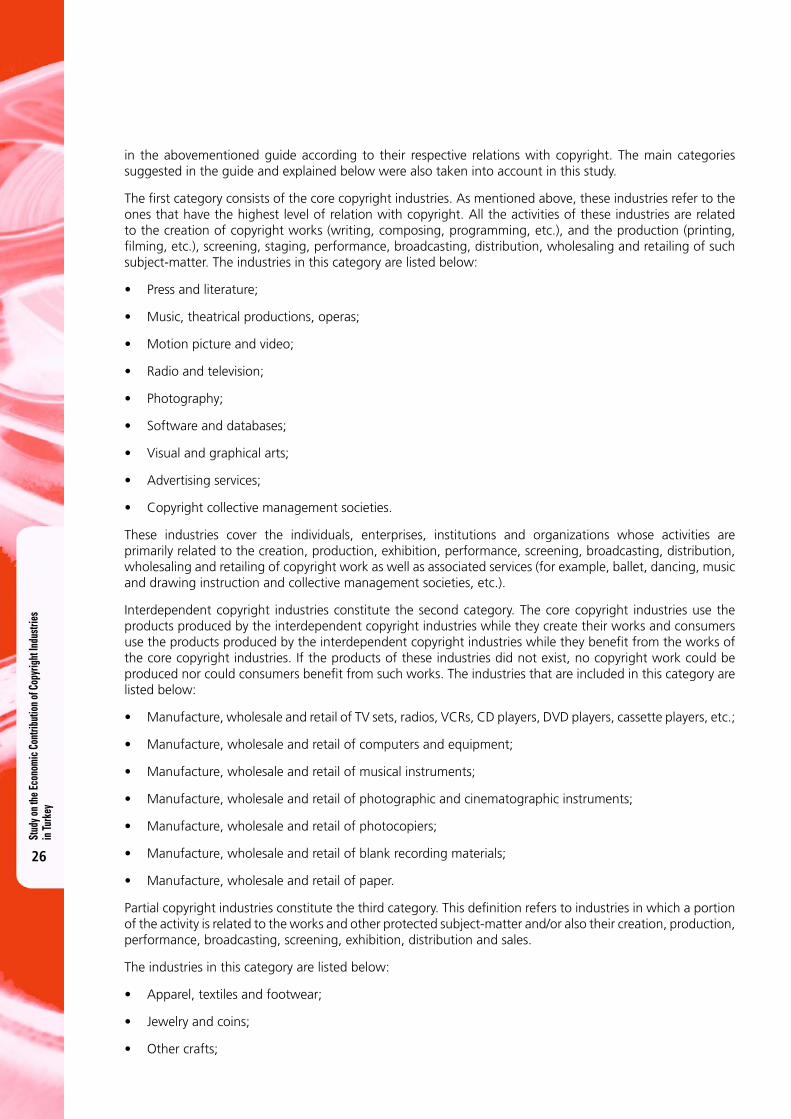
Stud
y on t
he Ec
onom
ic C
ontri
butio
n of C
opyr
ight
Indu
strie
s in
Turk
ey
26
in the abovementioned guide according to their respective relations with copyright. The main categories suggested in the guide and explained below were also taken into account in this study.
The first category consists of the core copyright industries. As mentioned above, these industries refer to the ones that have the highest level of relation with copyright. All the activities of these industries are related to the creation of copyright works (writing, composing, programming, etc.), and the production (printing, filming, etc.), screening, staging, performance, broadcasting, distribution, wholesaling and retailing of such subject-matter. The industries in this category are listed below:
• Press and literature;
• Music, theatrical productions, operas;
• Motion picture and video;
• Radio and television;
• Photography;
• Software and databases;
• Visual and graphical arts;
• Advertising services;
• Copyright collective management societies.
These industries cover the individuals, enterprises, institutions and organizations whose activities are primarily related to the creation, production, exhibition, performance, screening, broadcasting, distribution, wholesaling and retailing of copyright work as well as associated services (for example, ballet, dancing, music and drawing instruction and collective management societies, etc.).
Interdependent copyright industries constitute the second category. The core copyright industries use the products produced by the interdependent copyright industries while they create their works and consumers use the products produced by the interdependent copyright industries while they benefit from the works of the core copyright industries. If the products of these industries did not exist, no copyright work could be produced nor could consumers benefit from such works. The industries that are included in this category are listed below:
• Manufacture, wholesale and retail of TV sets, radios, VCRs, CD players, DVD players, cassette players, etc.;
• Manufacture, wholesale and retail of computers and equipment;
• Manufacture, wholesale and retail of musical instruments;
• Manufacture, wholesale and retail of photographic and cinematographic instruments;
• Manufacture, wholesale and retail of photocopiers;
• Manufacture, wholesale and retail of blank recording materials;
• Manufacture, wholesale and retail of paper.
Partial copyright industries constitute the third category. This definition refers to industries in which a portion of the activity is related to the works and other protected subject-matter and/or also their creation, production, performance, broadcasting, screening, exhibition, distribution and sales.
The industries in this category are listed below:
• Apparel, textiles and footwear;
• Jewelry and coins;
• Other crafts;
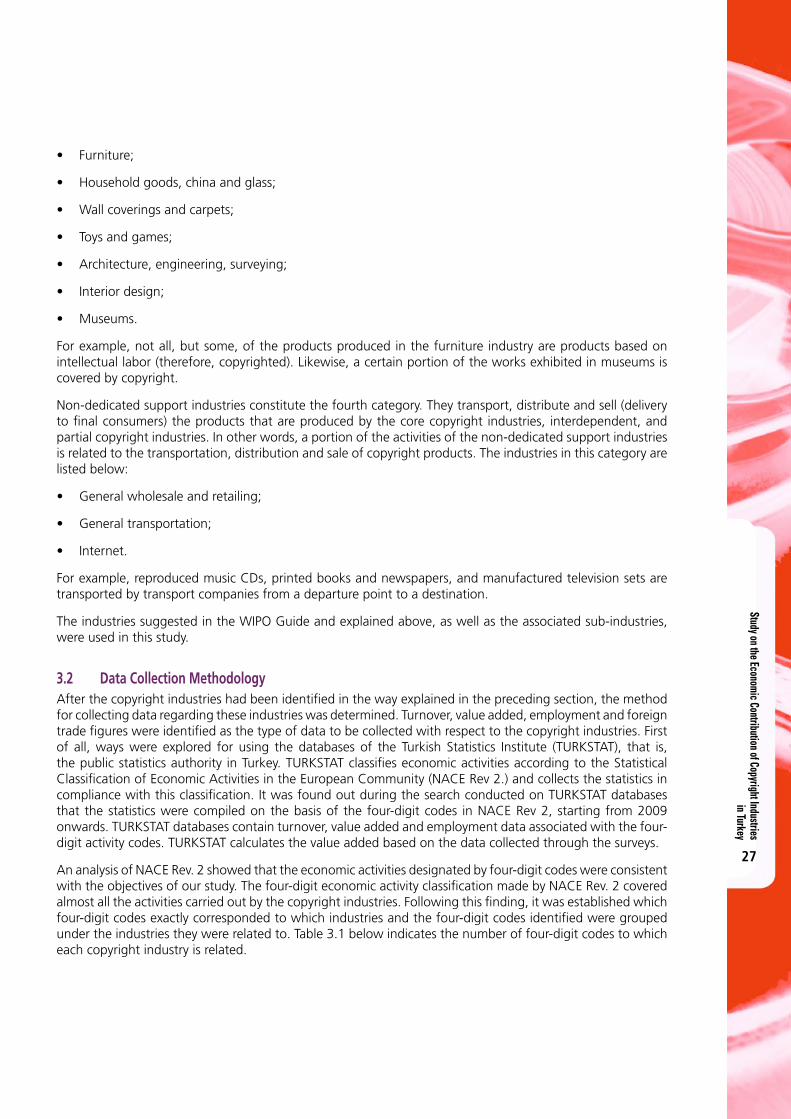
Study on the Economic Contribution of Copyright Industries in Turkey
27
• Furniture;
• Household goods, china and glass;
• Wall coverings and carpets;
• Toys and games;
• Architecture, engineering, surveying;
• Interior design;
• Museums.
For example, not all, but some, of the products produced in the furniture industry are products based on intellectual labor (therefore, copyrighted). Likewise, a certain portion of the works exhibited in museums is covered by copyright.
Non-dedicated support industries constitute the fourth category. They transport, distribute and sell (delivery to final consumers) the products that are produced by the core copyright industries, interdependent, and partial copyright industries. In other words, a portion of the activities of the non-dedicated support industries is related to the transportation, distribution and sale of copyright products. The industries in this category are listed below:
• General wholesale and retailing;
• General transportation;
• Internet.
For example, reproduced music CDs, printed books and newspapers, and manufactured television sets are transported by transport companies from a departure point to a destination.
The industries suggested in the WIPO Guide and explained above, as well as the associated sub-industries, were used in this study.
3.2 Data Collection Methodology After the copyright industries had been identified in the way explained in the preceding section, the method for collecting data regarding these industries was determined. Turnover, value added, employment and foreign trade figures were identified as the type of data to be collected with respect to the copyright industries. First of all, ways were explored for using the databases of the Turkish Statistics Institute (TURKSTAT), that is, the public statistics authority in Turkey. TURKSTAT classifies economic activities according to the Statistical Classification of Economic Activities in the European Community (NACE Rev 2.) and collects the statistics in compliance with this classification. It was found out during the search conducted on TURKSTAT databases that the statistics were compiled on the basis of the four-digit codes in NACE Rev 2, starting from 2009 onwards. TURKSTAT databases contain turnover, value added and employment data associated with the four-digit activity codes. TURKSTAT calculates the value added based on the data collected through the surveys.
An analysis of NACE Rev. 2 showed that the economic activities designated by four-digit codes were consistent with the objectives of our study. The four-digit economic activity classification made by NACE Rev. 2 covered almost all the activities carried out by the copyright industries. Following this finding, it was established which four-digit codes exactly corresponded to which industries and the four-digit codes identified were grouped under the industries they were related to. Table 3.1 below indicates the number of four-digit codes to which each copyright industry is related.
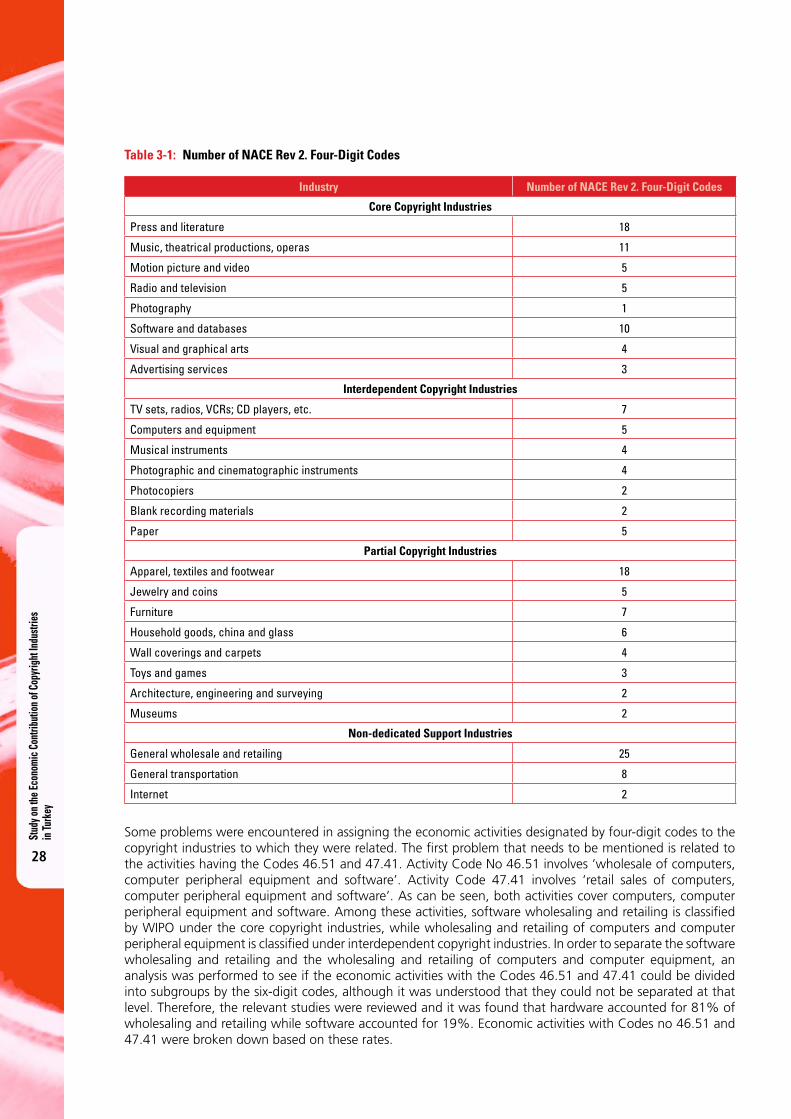
Stud
y on t
he Ec
onom
ic C
ontri
butio
n of C
opyr
ight
Indu
strie
s in
Turk
ey
28
Table 3-1: Number of NACE Rev 2. Four-Digit Codes
Industry Number of NACE Rev 2. Four-Digit Codes
Core Copyright Industries
Press and literature 18
Music, theatrical productions, operas 11
Motion picture and video 5
Radio and television 5
Photography 1
Software and databases 10
Visual and graphical arts 4
Advertising services 3
Interdependent Copyright Industries
TV sets, radios, VCRs; CD players, etc. 7
Computers and equipment 5
Musical instruments 4
Photographic and cinematographic instruments 4
Photocopiers 2
Blank recording materials 2
Paper 5
Partial Copyright Industries
Apparel, textiles and footwear 18
Jewelry and coins 5
Furniture 7
Household goods, china and glass 6
Wall coverings and carpets 4
Toys and games 3
Architecture, engineering and surveying 2
Museums 2
Non-dedicated Support Industries
General wholesale and retailing 25
General transportation 8
Internet 2
Some problems were encountered in assigning the economic activities designated by four-digit codes to the copyright industries to which they were related. The first problem that needs to be mentioned is related to the activities having the Codes 46.51 and 47.41. Activity Code No 46.51 involves ‘wholesale of computers, computer peripheral equipment and software’. Activity Code 47.41 involves ‘retail sales of computers, computer peripheral equipment and software’. As can be seen, both activities cover computers, computer peripheral equipment and software. Among these activities, software wholesaling and retailing is classified by WIPO under the core copyright industries, while wholesaling and retailing of computers and computer peripheral equipment is classified under interdependent copyright industries. In order to separate the software wholesaling and retailing and the wholesaling and retailing of computers and computer equipment, an analysis was performed to see if the economic activities with the Codes 46.51 and 47.41 could be divided into subgroups by the six-digit codes, although it was understood that they could not be separated at that level. Therefore, the relevant studies were reviewed and it was found that hardware accounted for 81% of wholesaling and retailing while software accounted for 19%. Economic activities with Codes no 46.51 and 47.41 were broken down based on these rates.

Study on the Economic Contribution of Copyright Industries in Turkey
29
However, another concern was related to the economic activities having codes 59.11 and 59.12. Economic activities having Code 59.11 entail ‘Motion picture, video and television program production activities’. Economic activities having Code 59.12 entail ‘Motion picture, video and television program post-production activities’. A closer look at these codes reveals that motion pictures, video and television programs are covered jointly and there is no further separation by the six-digit codes. This is because the same company may film motion pictures and television programs (for example, television serials) and perform their video recording. We sought the guidance of Movie Producers Professional Association in order to separate these two four-digit codes into appropriate core copyright industries.
Besides the abovementioned matters, each four-digit economic activity was analyzed in detail to see if one code covered several copyright industries. As a result of this analysis, it was found that some four-digit economic activity codes were related to several copyright industries. For example, the four-digit activity code no 46.49 was related to ‘wholesale of other household goods’. This was a very broad classification, including the wholesaling of many products. While some of these products were related to copyright, others were not; furthermore, those that were related to copyright were related to different copyright industries. However, the four-digit activity code no 46.49 was broken down into six-digit codes and elaborated accordingly. The six-digit codes under activity code no 46.49, and the copyright industries to which activities defined by these codes are related, are as follows (the copyright industry to which the six-digit code relates is indicated in brackets):
• 46.49.03 Wholesaling of stationeries (paper);
• 46.49.04 wholesaling of toys and games (toys);
• 46.49.06 wholesaling of musical instruments (musical instruments);
• 46.49.11 wholesaling of books, magazines and newspapers (press and literature);
• 46.49.21 wholesaling of artistic works (visual and graphical arts).
Although these six-digit codes exist, TURKSTAT does not collect statistics on the basis of the six-digit codes. However, the tax administration breaks down activities based on six-digit codes and takes into consideration the six-digit codes in tax returns. Therefore, the proportion of the abovementioned six-digit codes in the four-digit activity code (46.49) was obtained from the tax administration and turnover, value added and employment related to the Activity Code No 46.49 were broken down to the activities related to the six-digit codes by using these ratios.
Another relevant example is related to the four-digit activity code no 46.52. This four-digit activity code covers wholesaling of electronic and telecommunication equipment and parts and thus involves wholesaling of such products that are not based on copyright. This was also broken down to six digits. Of the six-digit activity codes, only the code no 46.52.04, indicating the wholesaling of blank audio and video recording materials and disks, and magnetic and optical disks, CDs and DVDs, constitutes a copyright activity. The proportion of the six-digit code (46.52.04) related to the copyright activity in the four-digit activity code (46.52) was obtained from the tax administration and turnover, value added and employment related to Activity Code no 46.52 was broken down to the relevant activity by using this ratio. Twenty similar four-digit mixed activity codes were identified and the same method was used to break down these codes into six-digit codes related to copyright. This was largely encountered in the four-digit activity codes related to wholesaling and retailing.
There is another issue relating to public bodies operating in the copyright industries. Public bodies have substantial activities in the fields of music and theatrical productions and operas, as well as museums. The State Opera and Ballet, State Theatres, Chorus and Symphony Orchestras affiliated to the Fine Arts General Directorate are the governmental bodies operating in the music, theatrical productions and opera industries. The Ministry of Culture and Tourism, Central Directorate of Revolving Fund (CDRF) operates museums and archaeological sites throughout Turkey. However, TURKSTAT does not collect any statistics on the basis of economic activities of public bodies; it only collects general data related to the public sector in order to calculate the GDP. Therefore, the necessary data was obtained from the Ministry of Culture and Tourism, the State Theatres General Directorate; the State Opera and Ballet General Directorate; the Fine Arts General Directorate, and the Central Directorate of Revolving Funds and used in the study.
Stud
y on t
he Ec
onom
ic C
ontri
butio
n of C
opyr
ight
Indu
strie
s in
Turk
ey
30
Other economic activity codes requiring particular attention are four-digit codes no 61.10 – wired telecommunications activities – and 61.20 – wireless telecommunications activities. Under the four-digit codes no 61.10, there are six-digit codes, no 61.10.15: cable telecommunication activities (excluding internet access); and 61.10.17: provision of internet access via cable networks. Likewise, the six-digit codes no 61.20.20: wireless telecommunication activities (excluding provision of internet access over the networks and those conducted via satellite) and 61.20.03: provision of internet access over wireless networks, are both under the four-digit code no 61.20. The four-digit code no 61.30 is related to telecommunication activities over satellite and is not broken down into any six-digit activity codes. Telecommunication activities are very broad and involve many activities. They were broken down as required by taking into consideration the market data published by the Information and Communication Technologies Authority and opinions of the experts from this authority, as well as the ratios obtained from the tax administration. In particular, opinions of experts from the Information and Communication Technologies Authority were taken into consideration in identifying the data related to cable TV, and television broadcasts by satellite.
After collecting the data from TURKSTAT and governmental bodies by using the methods explained above, a meeting was held with the representatives of the copyright industries, at which the representatives of the industries were briefed on the objectives of the study and its method and requested to provide specific figures relating to their respective industries. This would serve the purpose of obtaining representatives views from the industries. The representatives of the industries were also asked to comment on the specific problems in their respective industries, as well as on any industry-related developments and their expectations, including any proposed action to be taken to increase the shares of their respective industries in Turkey’s GDP. After this meeting, the data provided by these industrial representatives were compared with the data collected by the study team and the data were reviewed and corrected if a significant inconsistency was found between them. After this action, the data set was finalized. One fact is worth underlining at this point: if the data provided by the industry representatives were significantly different from the data collected, the reason for such a difference was assessed and checks were made to see if there were any missing or incorrect data. If such a case was detected, the missing data or incorrect data were retrieved from the database.
A different method was followed in compiling data on foreign trade. This was because foreign trade related to the copyright industries consisted of two basic components: the foreign trade of goods (press and literature, television sets, radio sets, cinematographic instruments, etc.) and various payments to and collections from foreign entities in connection with copyright products (copyright, TV programs broadcasting rights, proceeds of TV program formats, digital music and motion picture screening rights, etc.). Data relating to the foreign trade of goods could easily be obtained. For this purpose, appropriate Customs Tariff Statistical Positions (CTSP) were identified and the export and import data on the copyright goods were compiled from TURKSTAT according to their CTSP codes. There are no CTSP codes for some goods; information regarding the import and export of such goods was obtained from the collective management societies. Moreover, foreign trade data regarding three activities (photography, museum studies, architecture and engineering) were also obtained according to their ISIC codes from TURKSTAT. The data regarding other payments and collections were not available in the official statistics, nor could such data be found either through the Central Bank or through the banks. Therefore, a series of discussions were held with the collective management societies and leading companies of the industries in an attempt to obtain such foreign trade data. The data on the control marks regarding the imported CDs and DVDs, as well as data on the control marks regarding translated books, were obtained from the Ministry of Culture and Tourism, while the data on the duration of foreign programs on TV and radio channels were obtained from TURKSTAT. The foreign trade figures on the core copyright industries in particular were derived from such data acquired in this way. Because the foreign trade of interdependent copyright industries and partial copyright industries were based on the import and export of goods, no problems were encountered in compiling the foreign trade data on these industries; however, as most of the core copyright industries did not involve trade of goods, the foreign trade data on these industries were not primarily based on official statistics. Because foreign trade figures on some of the core copyright industries for some years could not be reliably acquired despite these efforts, the foreign trade data relating to such industries could not be included in this study. The flow chart below summarizes the data collection methodology.
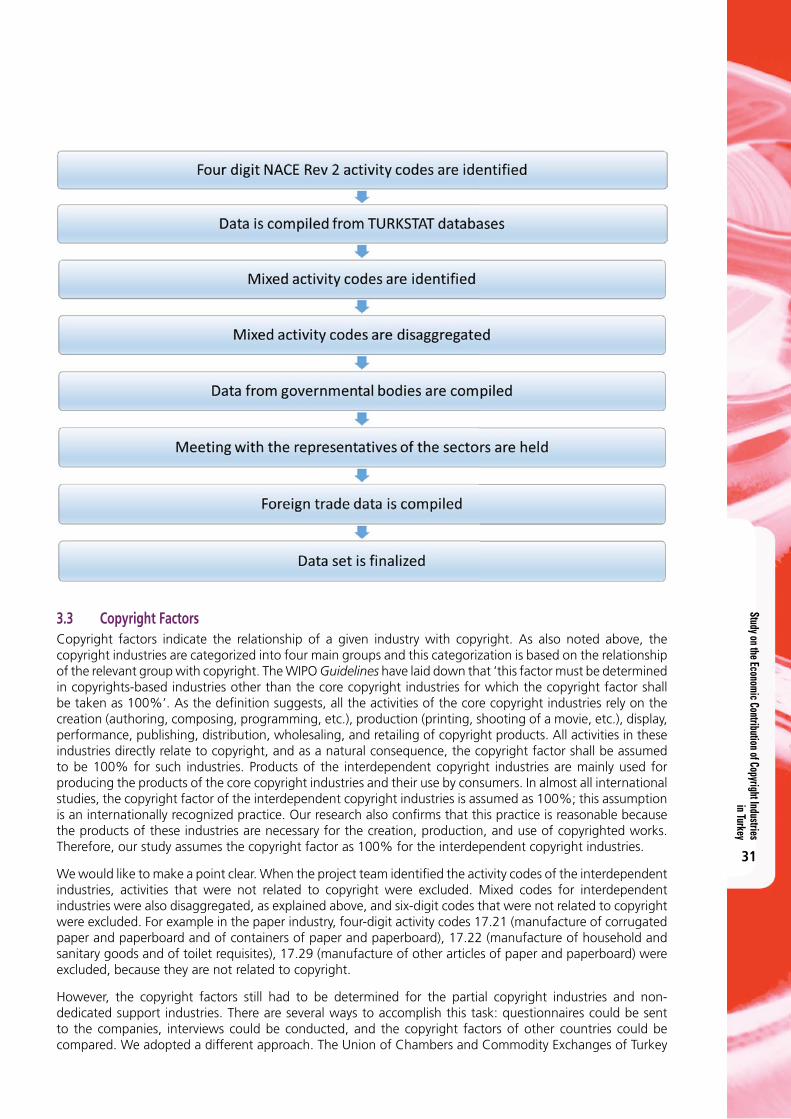
Study on the Economic Contribution of Copyright Industries in Turkey
31
3.3 Copyright Factors Copyright factors indicate the relationship of a given industry with copyright. As also noted above, the copyright industries are categorized into four main groups and this categorization is based on the relationship of the relevant group with copyright. The WIPO Guidelines have laid down that ‘this factor must be determined in copyrights-based industries other than the core copyright industries for which the copyright factor shall be taken as 100%’. As the defi nition suggests, all the activities of the core copyright industries rely on the creation (authoring, composing, programming, etc.), production (printing, shooting of a movie, etc.), display, performance, publishing, distribution, wholesaling, and retailing of copyright products. All activities in these industries directly relate to copyright, and as a natural consequence, the copyright factor shall be assumed to be 100% for such industries. Products of the interdependent copyright industries are mainly used for producing the products of the core copyright industries and their use by consumers. In almost all international studies, the copyright factor of the interdependent copyright industries is assumed as 100%; this assumption is an internationally recognized practice. Our research also confi rms that this practice is reasonable because the products of these industries are necessary for the creation, production, and use of copyrighted works. Therefore, our study assumes the copyright factor as 100% for the interdependent copyright industries.
We would like to make a point clear. When the project team identifi ed the activity codes of the interdependent industries, activities that were not related to copyright were excluded. Mixed codes for interdependent industries were also disaggregated, as explained above, and six-digit codes that were not related to copyright were excluded. For example in the paper industry, four-digit activity codes 17.21 (manufacture of corrugated paper and paperboard and of containers of paper and paperboard), 17.22 (manufacture of household and sanitary goods and of toilet requisites), 17.29 (manufacture of other articles of paper and paperboard) were excluded, because they are not related to copyright.
However, the copyright factors still had to be determined for the partial copyright industries and non-dedicated support industries. There are several ways to accomplish this task: questionnaires could be sent to the companies, interviews could be conducted, and the copyright factors of other countries could be compared. We adopted a different approach. The Union of Chambers and Commodity Exchanges of Turkey

Stud
y on t
he Ec
onom
ic C
ontri
butio
n of C
opyr
ight
Indu
strie
s in
Turk
ey
32
has sector assemblies. These assemblies are the focal point of contact for the respective industries and have the best knowledge for their sectors. We considered the sector assemblies as the best source to provide the information required and contacted them. Representatives of the industry assemblies were briefed on the purpose of the study and given the definition of the copyright factor, and they were asked to prepare brief reports on copyright factors. We contacted the following industry assemblies, which prepared the reports in return:
• Glass and Glass Products Industry Assembly
• Ceramic and Refractory Industry Assembly
• Clothing and Apparel Industry Assembly
• Jewelry Industry Assembly
• Furniture Products Assembly
The Carpet Industry Report, which had been prepared by the Ministry of the Economy of the Republic of Turkey, was reviewed to reflect on the carpet industry. Industry experts were consulted for the toys, architecture, engineering and surveying industries. The copyright factor for museums was obtained from the Ministry of Culture and Tourism. Thus it can be understood that our research method to determine copyright factors was based on interviews: we determined that if we sent questionnaires to firms, the rate of reply would be too small to draw useful conclusions. But sector assemblies and other experts have the best knowledge in their respective industries and for this reason, we decided to interview them and we obtained very useful results. As we indicated above, after we presented the questions we requested them to prepare a written report.
We benefited from the Republic of Korea’s study when we prepared the questions for the interviews. The basic questions we asked are presented below:
• How important is copyright in the operations of the sector?
• Do the companies in the sector receive or pay any form of payments (royalties or license fees) for the use of intellectual rights?
• What is the percentage of the sector’s operations, on average, that is based on copyright or creative activities?
We should point out that these are the basic questions we asked. We then discussed further with the industry representatives, to clarify what we wanted to learn.
As a result of all these efforts, the copyright factors were determined for the partial copyright industries, as indicated in Table 3.2 below.
Table 3-2: Copyright Factors of the Partial Copyright Industries
Industries Copyright Factors
Textile, apparel and footwear 0.25
Jewelry and coins 0.07
Furniture 0.45
Household goods, ceramic and glass 0.01
Wall coverings and carpets 0.10
Toys and games 0.03
Architectural, engineering, surveying 0.25
Museums 0.20
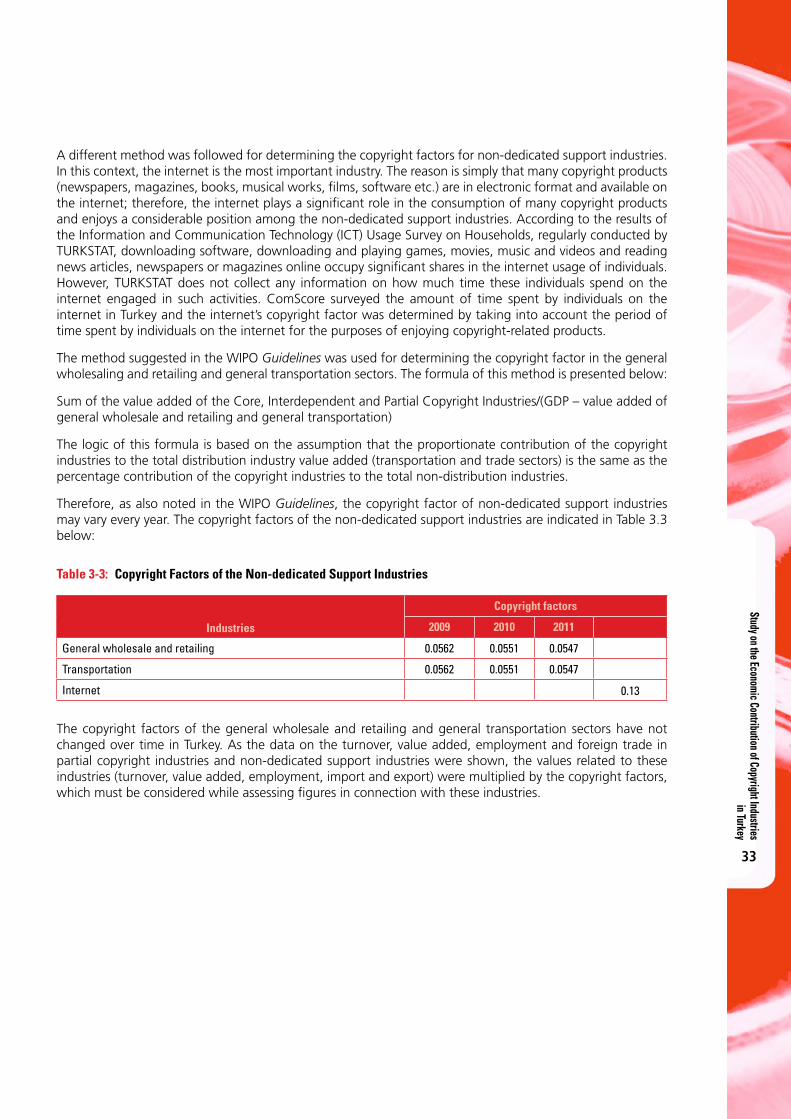
Study on the Economic Contribution of Copyright Industries in Turkey
33
A different method was followed for determining the copyright factors for non-dedicated support industries. In this context, the internet is the most important industry. The reason is simply that many copyright products (newspapers, magazines, books, musical works, films, software etc.) are in electronic format and available on the internet; therefore, the internet plays a significant role in the consumption of many copyright products and enjoys a considerable position among the non-dedicated support industries. According to the results of the Information and Communication Technology (ICT) Usage Survey on Households, regularly conducted by TURKSTAT, downloading software, downloading and playing games, movies, music and videos and reading news articles, newspapers or magazines online occupy significant shares in the internet usage of individuals. However, TURKSTAT does not collect any information on how much time these individuals spend on the internet engaged in such activities. ComScore surveyed the amount of time spent by individuals on the internet in Turkey and the internet’s copyright factor was determined by taking into account the period of time spent by individuals on the internet for the purposes of enjoying copyright-related products.
The method suggested in the WIPO Guidelines was used for determining the copyright factor in the general wholesaling and retailing and general transportation sectors. The formula of this method is presented below:
Sum of the value added of the Core, Interdependent and Partial Copyright Industries/(GDP – value added of general wholesale and retailing and general transportation)
The logic of this formula is based on the assumption that the proportionate contribution of the copyright industries to the total distribution industry value added (transportation and trade sectors) is the same as the percentage contribution of the copyright industries to the total non-distribution industries.
Therefore, as also noted in the WIPO Guidelines, the copyright factor of non-dedicated support industries may vary every year. The copyright factors of the non-dedicated support industries are indicated in Table 3.3 below:
Table 3-3: Copyright Factors of the Non-dedicated Support Industries
Industries
Copyright factors
2009 2010 2011
General wholesale and retailing 0.0562 0.0551 0.0547
Transportation 0.0562 0.0551 0.0547
Internet 0.13
The copyright factors of the general wholesale and retailing and general transportation sectors have not changed over time in Turkey. As the data on the turnover, value added, employment and foreign trade in partial copyright industries and non-dedicated support industries were shown, the values related to these industries (turnover, value added, employment, import and export) were multiplied by the copyright factors, which must be considered while assessing figures in connection with these industries.
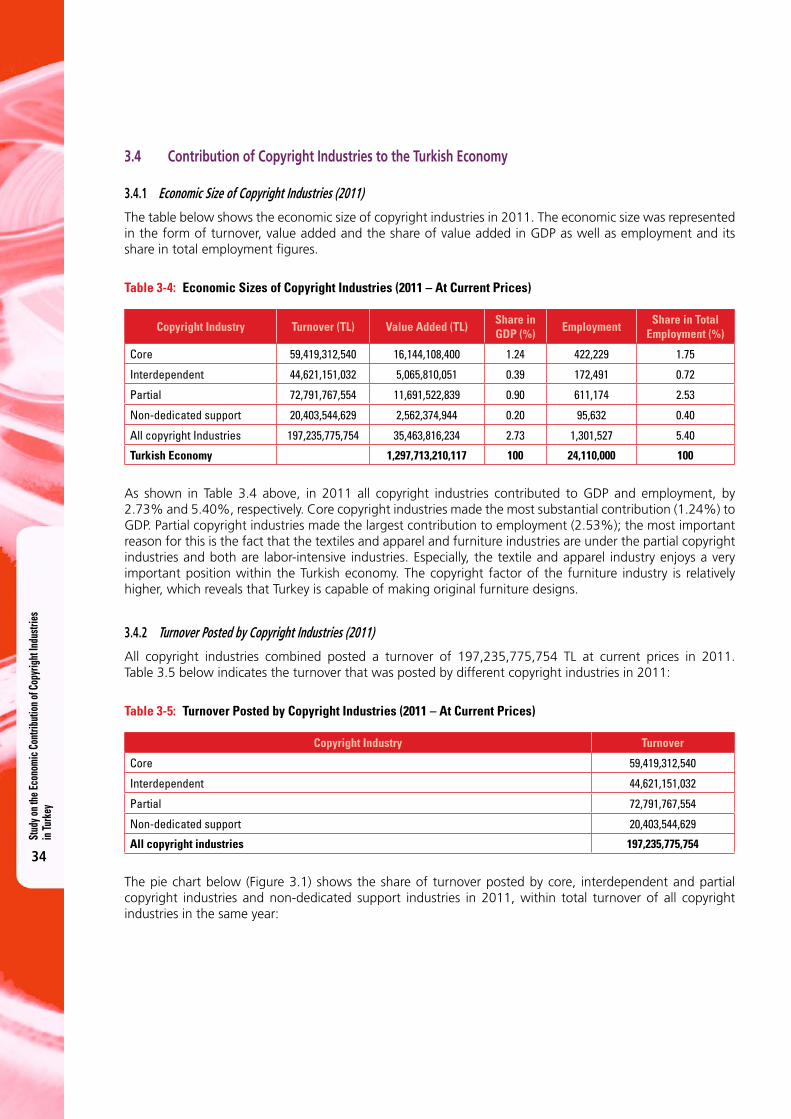
Stud
y on t
he Ec
onom
ic C
ontri
butio
n of C
opyr
ight
Indu
strie
s in
Turk
ey
34
3.4 Contribution of Copyright Industries to the Turkish Economy
3.4.1 Economic Size of Copyright Industries (2011)
The table below shows the economic size of copyright industries in 2011. The economic size was represented in the form of turnover, value added and the share of value added in GDP as well as employment and its share in total employment figures.
Table 3-4: Economic Sizes of Copyright Industries (2011 – At Current Prices)
Copyright Industry Turnover (TL) Value Added (TL)Share in GDP (%)
EmploymentShare in Total
Employment (%)
Core 59,419,312,540 16,144,108,400 1.24 422,229 1.75
Interdependent 44,621,151,032 5,065,810,051 0.39 172,491 0.72
Partial 72,791,767,554 11,691,522,839 0.90 611,174 2.53
Non-dedicated support 20,403,544,629 2,562,374,944 0.20 95,632 0.40
All copyright Industries 197,235,775,754 35,463,816,234 2.73 1,301,527 5.40
Turkish Economy 1,297,713,210,117 100 24,110,000 100
As shown in Table 3.4 above, in 2011 all copyright industries contributed to GDP and employment, by 2.73% and 5.40%, respectively. Core copyright industries made the most substantial contribution (1.24%) to GDP. Partial copyright industries made the largest contribution to employment (2.53%); the most important reason for this is the fact that the textiles and apparel and furniture industries are under the partial copyright industries and both are labor-intensive industries. Especially, the textile and apparel industry enjoys a very important position within the Turkish economy. The copyright factor of the furniture industry is relatively higher, which reveals that Turkey is capable of making original furniture designs.
3.4.2 Turnover Posted by Copyright Industries (2011)
All copyright industries combined posted a turnover of 197,235,775,754 TL at current prices in 2011. Table 3.5 below indicates the turnover that was posted by different copyright industries in 2011:
Table 3-5: Turnover Posted by Copyright Industries (2011 – At Current Prices)
Copyright Industry Turnover
Core 59,419,312,540
Interdependent 44,621,151,032
Partial 72,791,767,554
Non-dedicated support 20,403,544,629
All copyright industries 197,235,775,754
The pie chart below (Figure 3.1) shows the share of turnover posted by core, interdependent and partial copyright industries and non-dedicated support industries in 2011, within total turnover of all copyright industries in the same year:
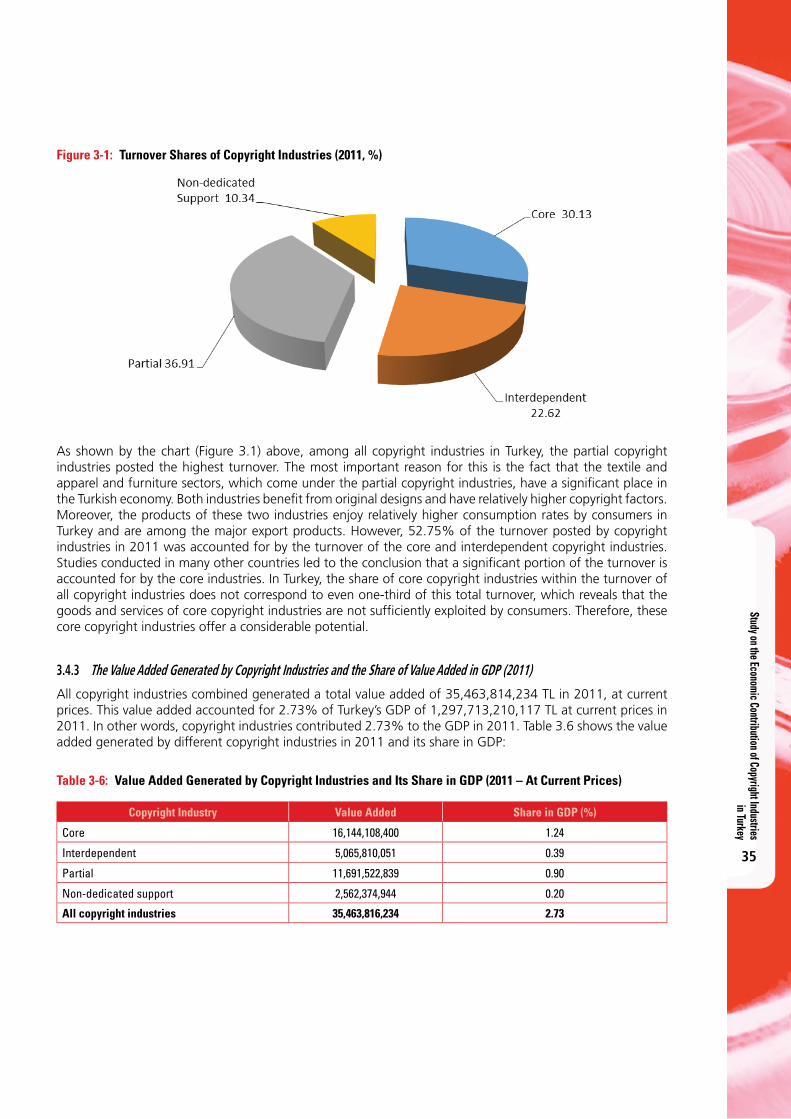
Study on the Economic Contribution of Copyright Industries in Turkey
35
Figure 3-1: Turnover Shares of Copyright Industries (2011, %)
As shown by the chart (Figure 3.1) above, among all copyright industries in Turkey, the partial copyright industries posted the highest turnover. The most important reason for this is the fact that the textile and apparel and furniture sectors, which come under the partial copyright industries, have a signifi cant place in the Turkish economy. Both industries benefi t from original designs and have relatively higher copyright factors. Moreover, the products of these two industries enjoy relatively higher consumption rates by consumers in Turkey and are among the major export products. However, 52.75% of the turnover posted by copyright industries in 2011 was accounted for by the turnover of the core and interdependent copyright industries. Studies conducted in many other countries led to the conclusion that a signifi cant portion of the turnover is accounted for by the core industries. In Turkey, the share of core copyright industries within the turnover of all copyright industries does not correspond to even one-third of this total turnover, which reveals that the goods and services of core copyright industries are not suffi ciently exploited by consumers. Therefore, these core copyright industries offer a considerable potential.
3.4.3 The Value Added Generated by Copyright Industries and the Share of Value Added in GDP (2011)
All copyright industries combined generated a total value added of 35,463,814,234 TL in 2011, at current prices. This value added accounted for 2.73% of Turkey’s GDP of 1,297,713,210,117 TL at current prices in 2011. In other words, copyright industries contributed 2.73% to the GDP in 2011. Table 3.6 shows the value added generated by different copyright industries in 2011 and its share in GDP:
Table 3-6: Value Added Generated by Copyright Industries and Its Share in GDP (2011 – At Current Prices)
Copyright Industry Value Added Share in GDP (%)
Core 16,144,108,400 1.24
Interdependent 5,065,810,051 0.39
Partial 11,691,522,839 0.90
Non-dedicated support 2,562,374,944 0.20
All copyright industries 35,463,816,234 2.73
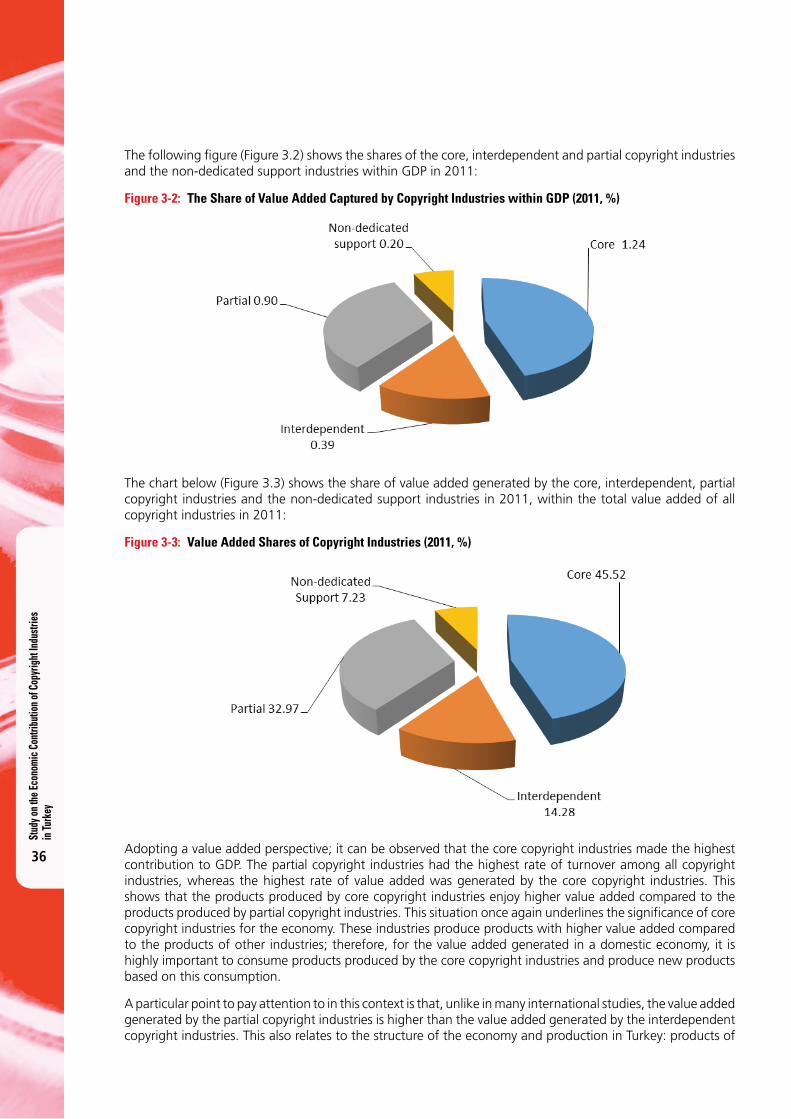
Stud
y on t
he Ec
onom
ic C
ontri
butio
n of C
opyr
ight
Indu
strie
s in
Turk
ey
36
The following fi gure (Figure 3.2) shows the shares of the core, interdependent and partial copyright industries and the non-dedicated support industries within GDP in 2011:
Figure 3-2: The Share of Value Added Captured by Copyright Industries within GDP (2011, %)
The chart below (Figure 3.3) shows the share of value added generated by the core, interdependent, partial copyright industries and the non-dedicated support industries in 2011, within the total value added of all copyright industries in 2011:
Figure 3-3: Value Added Shares of Copyright Industries (2011, %)
Adopting a value added perspective; it can be observed that the core copyright industries made the highest contribution to GDP. The partial copyright industries had the highest rate of turnover among all copyright industries, whereas the highest rate of value added was generated by the core copyright industries. This shows that the products produced by core copyright industries enjoy higher value added compared to the products produced by partial copyright industries. This situation once again underlines the signifi cance of core copyright industries for the economy. These industries produce products with higher value added compared to the products of other industries; therefore, for the value added generated in a domestic economy, it is highly important to consume products produced by the core copyright industries and produce new products based on this consumption.
A particular point to pay attention to in this context is that, unlike in many international studies, the value added generated by the partial copyright industries is higher than the value added generated by the interdependent copyright industries. This also relates to the structure of the economy and production in Turkey: products of

Study on the Economic Contribution of Copyright Industries in Turkey
37
the partial copyright industries (especially textile, apparel, furniture and other household goods) are produced and consumed more than the products of the interdependent copyright industries. Furthermore, in Turkey the products of the partial copyright industries have relatively higher value added compared to the products of the interdependent copyright industries. From another viewpoint, the local content in the products of interdependent industries, namely the value added, is not so high.
3.4.4 Employment by Copyright Industries and the Share of Employment in Total Employment (2011)
All the copyright industries combined employed 1,301,527 persons in 2011. This fi gure corresponded to 5.40% of Turkey’s total employment fi gure, which was 24,110,000 in 2011. The following table shows the numbers of people employed by different copyright industries in 2011, and the share of their employment fi gures in Turkey’s total employment in 2011.
Table 3-7: Employment by Copyright Industries and the Share of Employment in Total Employment (2011, %)
Copyright Industry Employment Share in Total Employment (%)
Core 422,229 1.75
Interdependent 172,491 0.72
Partial 611,174 2.53
Non-dedicated Support 95,632 0.40
All Copyright Industries 1,301,527 5.40
Figure 3.4 shows the shares of 2011 employment fi gures for the core, interdependent and partial copyright industries and the non-dedicated support industries, within Turkey’s 2011 total employment:
Figure 3-4: Employment by Copyright Industries and the Share of Employment in Total Employment (2011, %)
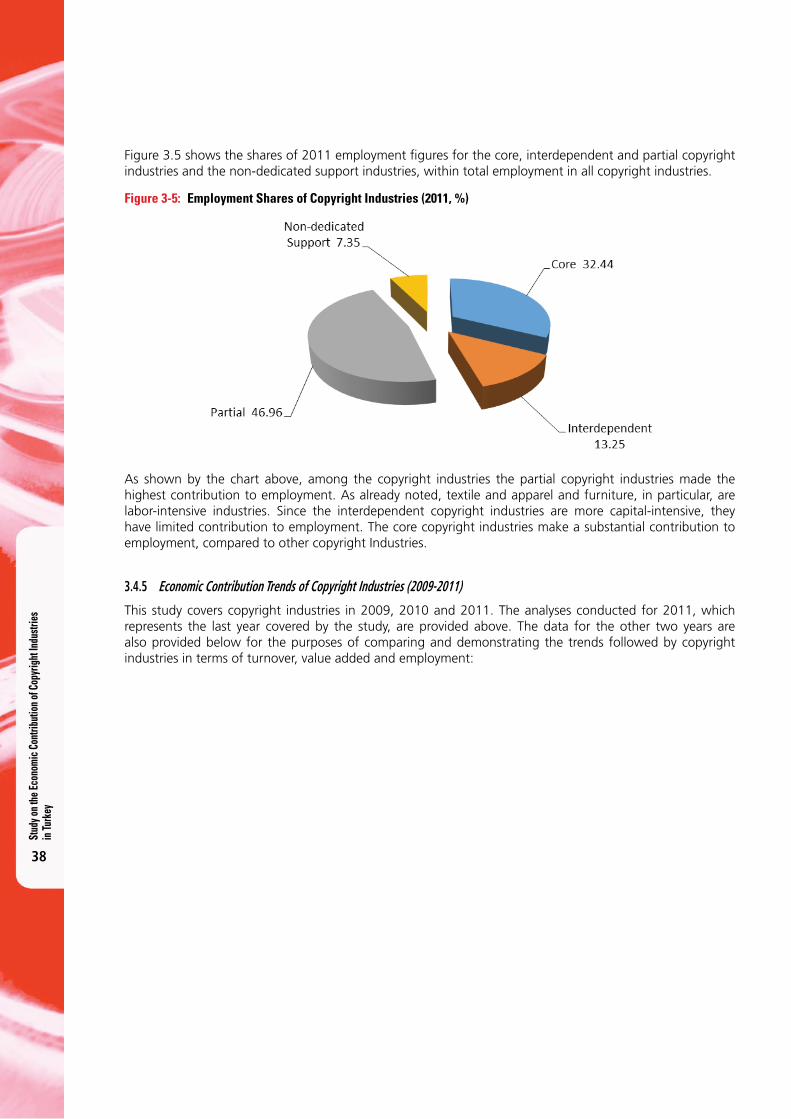
Stud
y on t
he Ec
onom
ic C
ontri
butio
n of C
opyr
ight
Indu
strie
s in
Turk
ey
38
Figure 3.5 shows the shares of 2011 employment fi gures for the core, interdependent and partial copyright industries and the non-dedicated support industries, within total employment in all copyright industries.
Figure 3-5: Employment Shares of Copyright Industries (2011, %)
As shown by the chart above, among the copyright industries the partial copyright industries made the highest contribution to employment. As already noted, textile and apparel and furniture, in particular, are labor-intensive industries. Since the interdependent copyright industries are more capital-intensive, they have limited contribution to employment. The core copyright industries make a substantial contribution to employment, compared to other copyright Industries.
3.4.5 Economic Contribution Trends of Copyright Industries (2009-2011)
This study covers copyright industries in 2009, 2010 and 2011. The analyses conducted for 2011, which represents the last year covered by the study, are provided above. The data for the other two years are also provided below for the purposes of comparing and demonstrating the trends followed by copyright industries in terms of turnover, value added and employment:
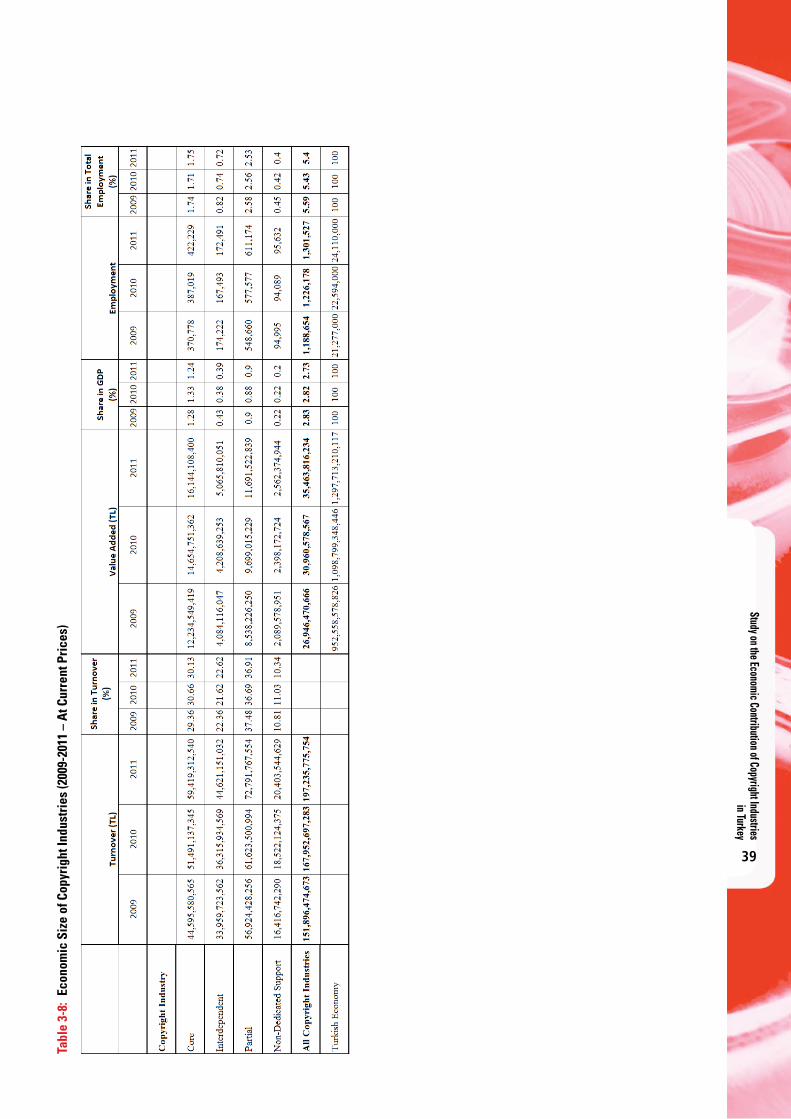
Study on the Economic Contribution of Copyright Industries in Turkey
39
Tabl
e 3-
8: E
cono
mic
Siz
e of
Cop
yrig
ht In
dust
ries
(200
9-20
11 –
At C
urre
nt P
rice
s)
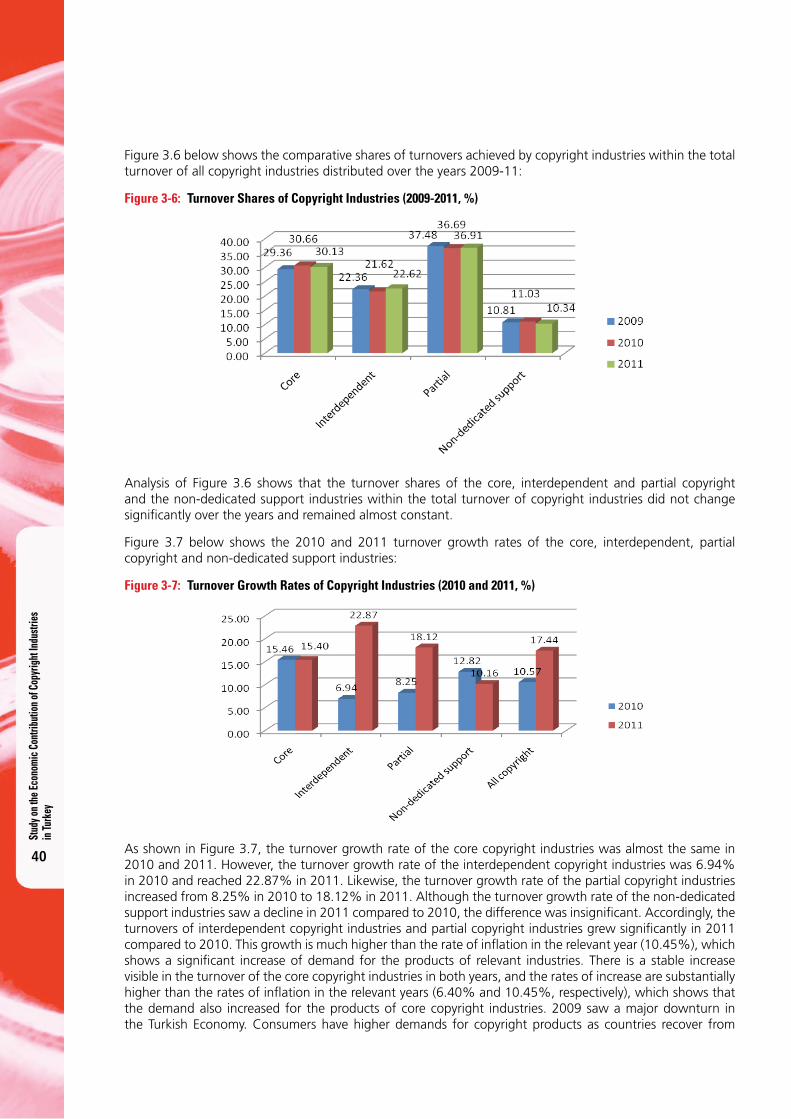
Stud
y on t
he Ec
onom
ic C
ontri
butio
n of C
opyr
ight
Indu
strie
s in
Turk
ey
40
Figure 3.6 below shows the comparative shares of turnovers achieved by copyright industries within the total turnover of all copyright industries distributed over the years 2009-11:
Figure 3-6: Turnover Shares of Copyright Industries (2009-2011, %)
Analysis of Figure 3.6 shows that the turnover shares of the core, interdependent and partial copyright and the non-dedicated support industries within the total turnover of copyright industries did not change signifi cantly over the years and remained almost constant.
Figure 3.7 below shows the 2010 and 2011 turnover growth rates of the core, interdependent, partial copyright and non-dedicated support industries:
Figure 3-7: Turnover Growth Rates of Copyright Industries (2010 and 2011, %)
As shown in Figure 3.7, the turnover growth rate of the core copyright industries was almost the same in 2010 and 2011. However, the turnover growth rate of the interdependent copyright industries was 6.94% in 2010 and reached 22.87% in 2011. Likewise, the turnover growth rate of the partial copyright industries increased from 8.25% in 2010 to 18.12% in 2011. Although the turnover growth rate of the non-dedicated support industries saw a decline in 2011 compared to 2010, the difference was insignifi cant. Accordingly, the turnovers of interdependent copyright industries and partial copyright industries grew signifi cantly in 2011 compared to 2010. This growth is much higher than the rate of infl ation in the relevant year (10.45%), which shows a signifi cant increase of demand for the products of relevant industries. There is a stable increase visible in the turnover of the core copyright industries in both years, and the rates of increase are substantially higher than the rates of infl ation in the relevant years (6.40% and 10.45%, respectively), which shows that the demand also increased for the products of core copyright industries. 2009 saw a major downturn in the Turkish Economy. Consumers have higher demands for copyright products as countries recover from
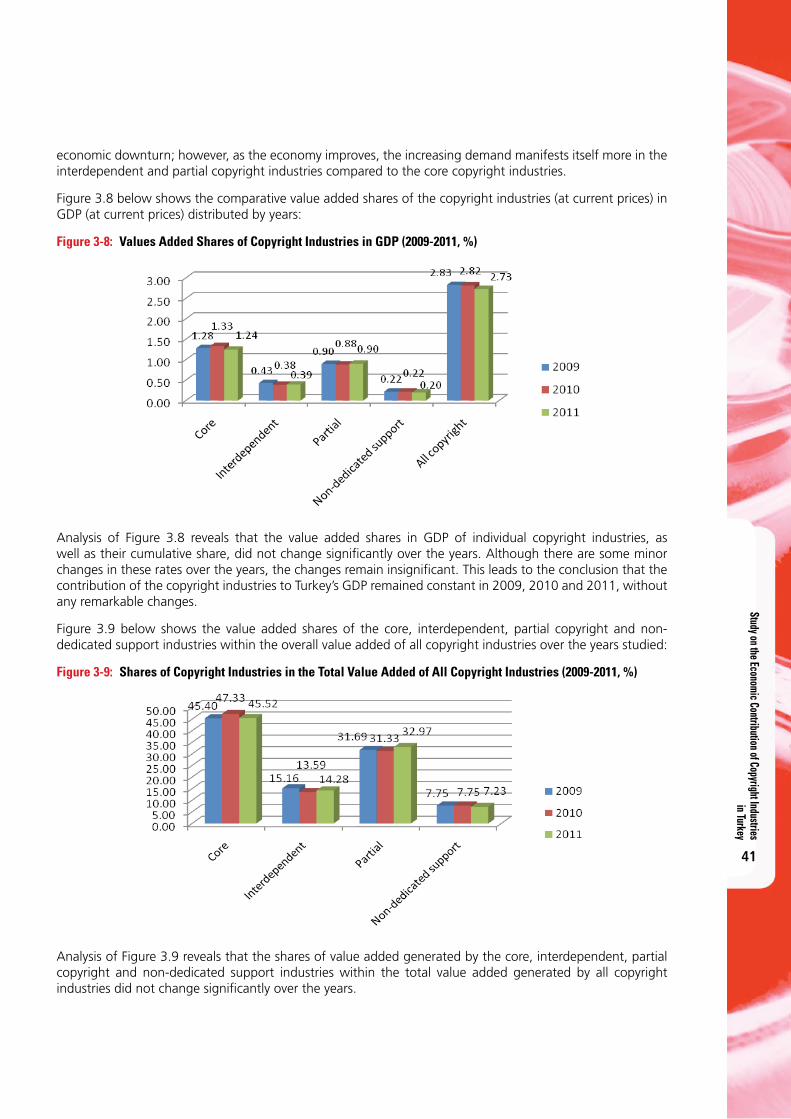
Study on the Economic Contribution of Copyright Industries in Turkey
41
economic downturn; however, as the economy improves, the increasing demand manifests itself more in the interdependent and partial copyright industries compared to the core copyright industries.
Figure 3.8 below shows the comparative value added shares of the copyright industries (at current prices) in GDP (at current prices) distributed by years:
Figure 3-8: Values Added Shares of Copyright Industries in GDP (2009-2011, %)
Analysis of Figure 3.8 reveals that the value added shares in GDP of individual copyright industries, as well as their cumulative share, did not change signifi cantly over the years. Although there are some minor changes in these rates over the years, the changes remain insignifi cant. This leads to the conclusion that the contribution of the copyright industries to Turkey’s GDP remained constant in 2009, 2010 and 2011, without any remarkable changes.
Figure 3.9 below shows the value added shares of the core, interdependent, partial copyright and non-dedicated support industries within the overall value added of all copyright industries over the years studied:
Figure 3-9: Shares of Copyright Industries in the Total Value Added of All Copyright Industries (2009-2011, %)
Analysis of Figure 3.9 reveals that the shares of value added generated by the core, interdependent, partial copyright and non-dedicated support industries within the total value added generated by all copyright industries did not change signifi cantly over the years.
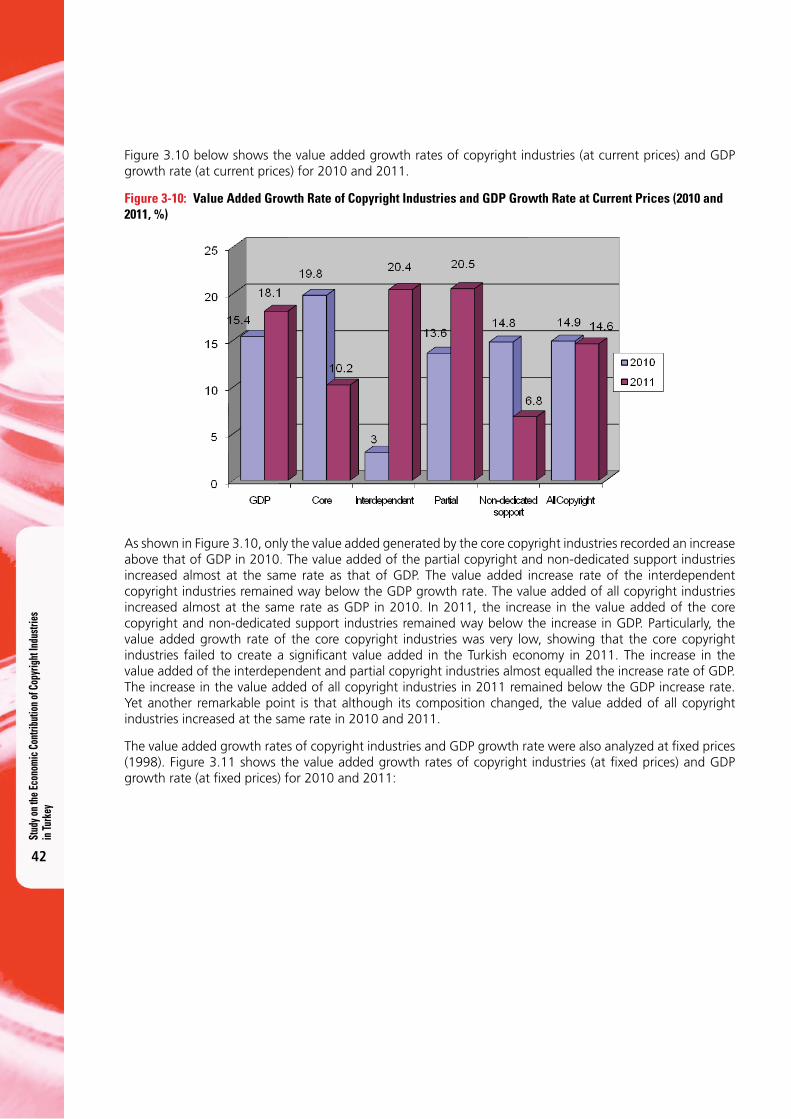
Stud
y on t
he Ec
onom
ic C
ontri
butio
n of C
opyr
ight
Indu
strie
s in
Turk
ey
42
Figure 3.10 below shows the value added growth rates of copyright industries (at current prices) and GDP growth rate (at current prices) for 2010 and 2011.
Figure 3-10: Value Added Growth Rate of Copyright Industries and GDP Growth Rate at Current Prices (2010 and 2011, %)
As shown in Figure 3.10, only the value added generated by the core copyright industries recorded an increase above that of GDP in 2010. The value added of the partial copyright and non-dedicated support industries increased almost at the same rate as that of GDP. The value added increase rate of the interdependent copyright industries remained way below the GDP growth rate. The value added of all copyright industries increased almost at the same rate as GDP in 2010. In 2011, the increase in the value added of the core copyright and non-dedicated support industries remained way below the increase in GDP. Particularly, the value added growth rate of the core copyright industries was very low, showing that the core copyright industries failed to create a signifi cant value added in the Turkish economy in 2011. The increase in the value added of the interdependent and partial copyright industries almost equalled the increase rate of GDP. The increase in the value added of all copyright industries in 2011 remained below the GDP increase rate. Yet another remarkable point is that although its composition changed, the value added of all copyright industries increased at the same rate in 2010 and 2011.
The value added growth rates of copyright industries and GDP growth rate were also analyzed at fi xed prices (1998). Figure 3.11 shows the value added growth rates of copyright industries (at fi xed prices) and GDP growth rate (at fi xed prices) for 2010 and 2011:
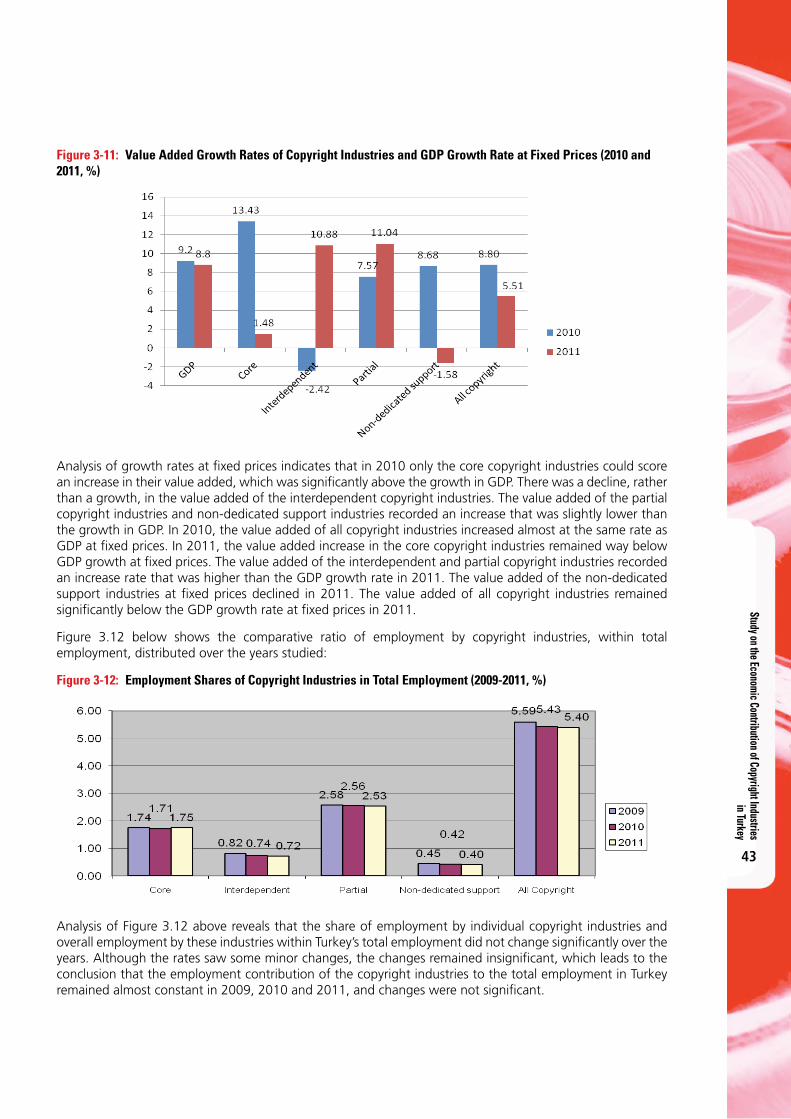
Study on the Economic Contribution of Copyright Industries in Turkey
43
Figure 3-11: Value Added Growth Rates of Copyright Industries and GDP Growth Rate at Fixed Prices (2010 and 2011, %)
Analysis of growth rates at fi xed prices indicates that in 2010 only the core copyright industries could score an increase in their value added, which was signifi cantly above the growth in GDP. There was a decline, rather than a growth, in the value added of the interdependent copyright industries. The value added of the partial copyright industries and non-dedicated support industries recorded an increase that was slightly lower than the growth in GDP. In 2010, the value added of all copyright industries increased almost at the same rate as GDP at fi xed prices. In 2011, the value added increase in the core copyright industries remained way below GDP growth at fi xed prices. The value added of the interdependent and partial copyright industries recorded an increase rate that was higher than the GDP growth rate in 2011. The value added of the non-dedicated support industries at fi xed prices declined in 2011. The value added of all copyright industries remained signifi cantly below the GDP growth rate at fi xed prices in 2011.
Figure 3.12 below shows the comparative ratio of employment by copyright industries, within total employment, distributed over the years studied:
Figure 3-12: Employment Shares of Copyright Industries in Total Employment (2009-2011, %)
Analysis of Figure 3.12 above reveals that the share of employment by individual copyright industries and overall employment by these industries within Turkey’s total employment did not change signifi cantly over the years. Although the rates saw some minor changes, the changes remained insignifi cant, which leads to the conclusion that the employment contribution of the copyright industries to the total employment in Turkey remained almost constant in 2009, 2010 and 2011, and changes were not signifi cant.
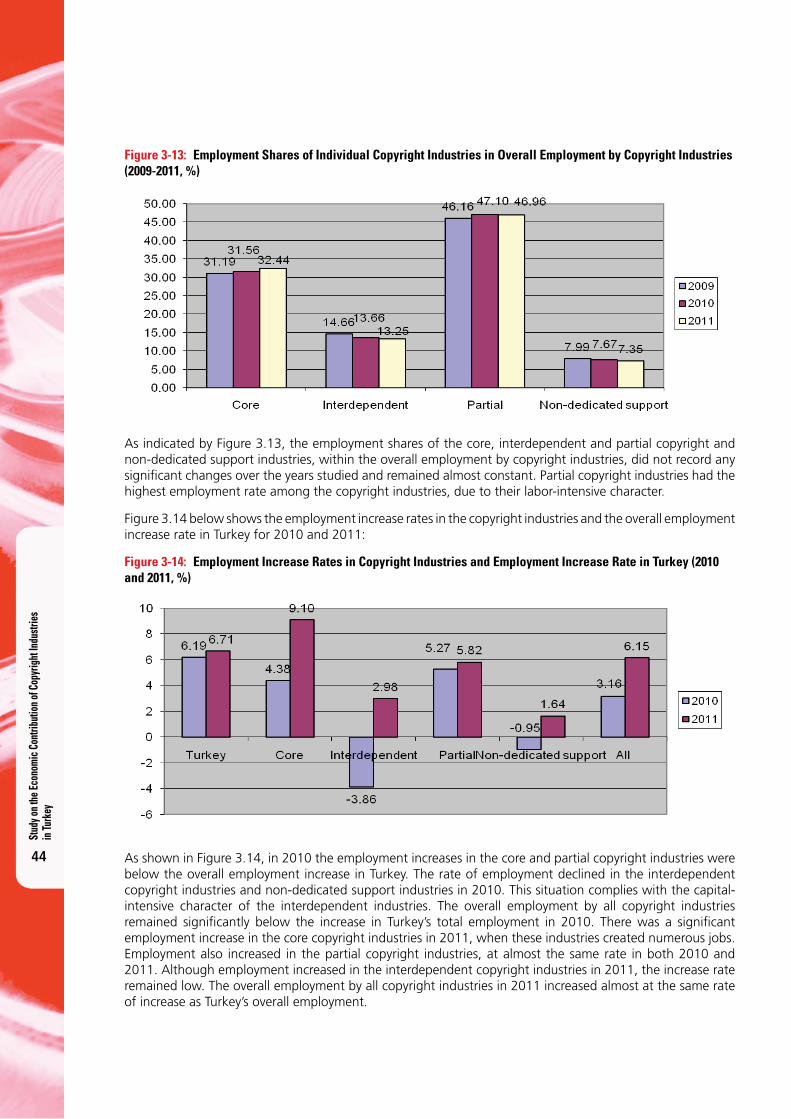
Stud
y on t
he Ec
onom
ic C
ontri
butio
n of C
opyr
ight
Indu
strie
s in
Turk
ey
44
Figure 3-13: Employment Shares of Individual Copyright Industries in Overall Employment by Copyright Industries (2009-2011, %)
As indicated by Figure 3.13, the employment shares of the core, interdependent and partial copyright and non-dedicated support industries, within the overall employment by copyright industries, did not record any signifi cant changes over the years studied and remained almost constant. Partial copyright industries had the highest employment rate among the copyright industries, due to their labor-intensive character.
Figure 3.14 below shows the employment increase rates in the copyright industries and the overall employment increase rate in Turkey for 2010 and 2011:
Figure 3-14: Employment Increase Rates in Copyright Industries and Employment Increase Rate in Turkey (2010 and 2011, %)
As shown in Figure 3.14, in 2010 the employment increases in the core and partial copyright industries were below the overall employment increase in Turkey. The rate of employment declined in the interdependent copyright industries and non-dedicated support industries in 2010. This situation complies with the capital-intensive character of the interdependent industries. The overall employment by all copyright industries remained signifi cantly below the increase in Turkey’s total employment in 2010. There was a signifi cant employment increase in the core copyright industries in 2011, when these industries created numerous jobs. Employment also increased in the partial copyright industries, at almost the same rate in both 2010 and 2011. Although employment increased in the interdependent copyright industries in 2011, the increase rate remained low. The overall employment by all copyright industries in 2011 increased almost at the same rate of increase as Turkey’s overall employment.
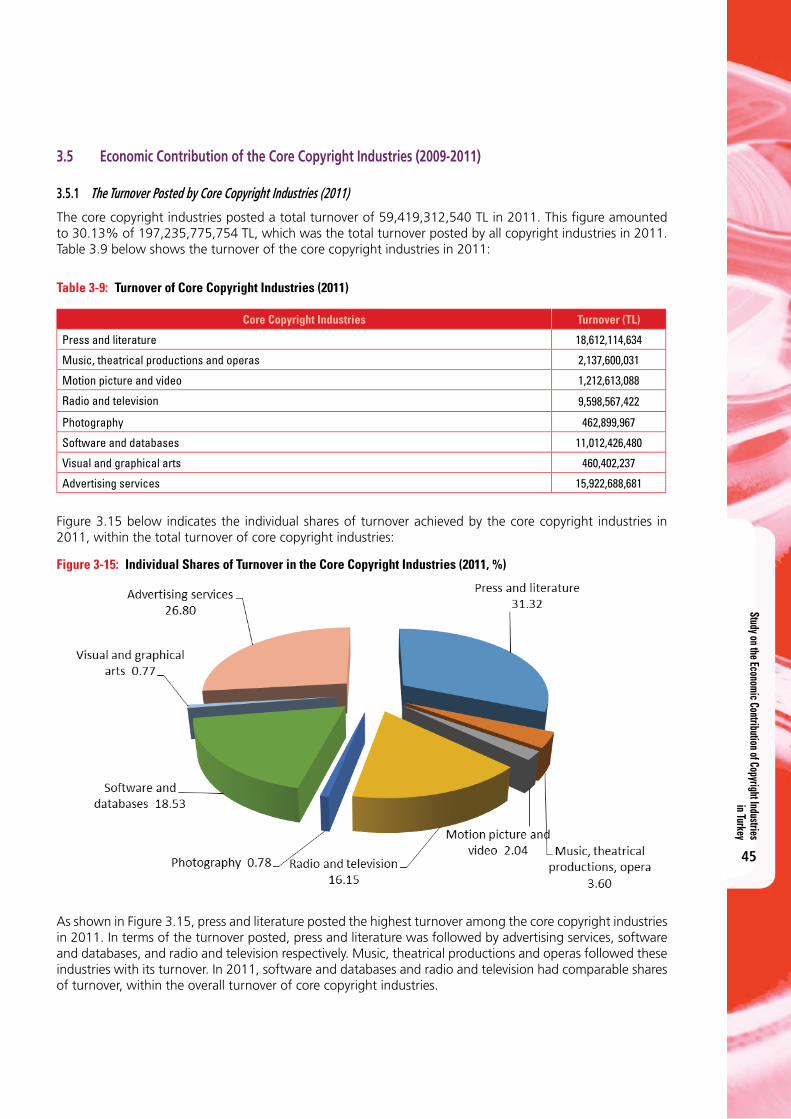
Study on the Economic Contribution of Copyright Industries in Turkey
45
3.5 Economic Contribution of the Core Copyright Industries (2009-2011)
3.5.1 The Turnover Posted by Core Copyright Industries (2011)
The core copyright industries posted a total turnover of 59,419,312,540 TL in 2011. This fi gure amounted to 30.13% of 197,235,775,754 TL, which was the total turnover posted by all copyright industries in 2011. Table 3.9 below shows the turnover of the core copyright industries in 2011:
Table 3-9: Turnover of Core Copyright Industries (2011)
Core Copyright Industries Turnover (TL)
Press and literature 18,612,114,634
Music, theatrical productions and operas 2,137,600,031
Motion picture and video 1,212,613,088
Radio and television 9,598,567,422
Photography 462,899,967
Software and databases 11,012,426,480
Visual and graphical arts 460,402,237
Advertising services 15,922,688,681
Figure 3.15 below indicates the individual shares of turnover achieved by the core copyright industries in 2011, within the total turnover of core copyright industries:
Figure 3-15: Individual Shares of Turnover in the Core Copyright Industries (2011, %)
As shown in Figure 3.15, press and literature posted the highest turnover among the core copyright industries in 2011. In terms of the turnover posted, press and literature was followed by advertising services, software and databases, and radio and television respectively. Music, theatrical productions and operas followed these industries with its turnover. In 2011, software and databases and radio and television had comparable shares of turnover, within the overall turnover of core copyright industries.
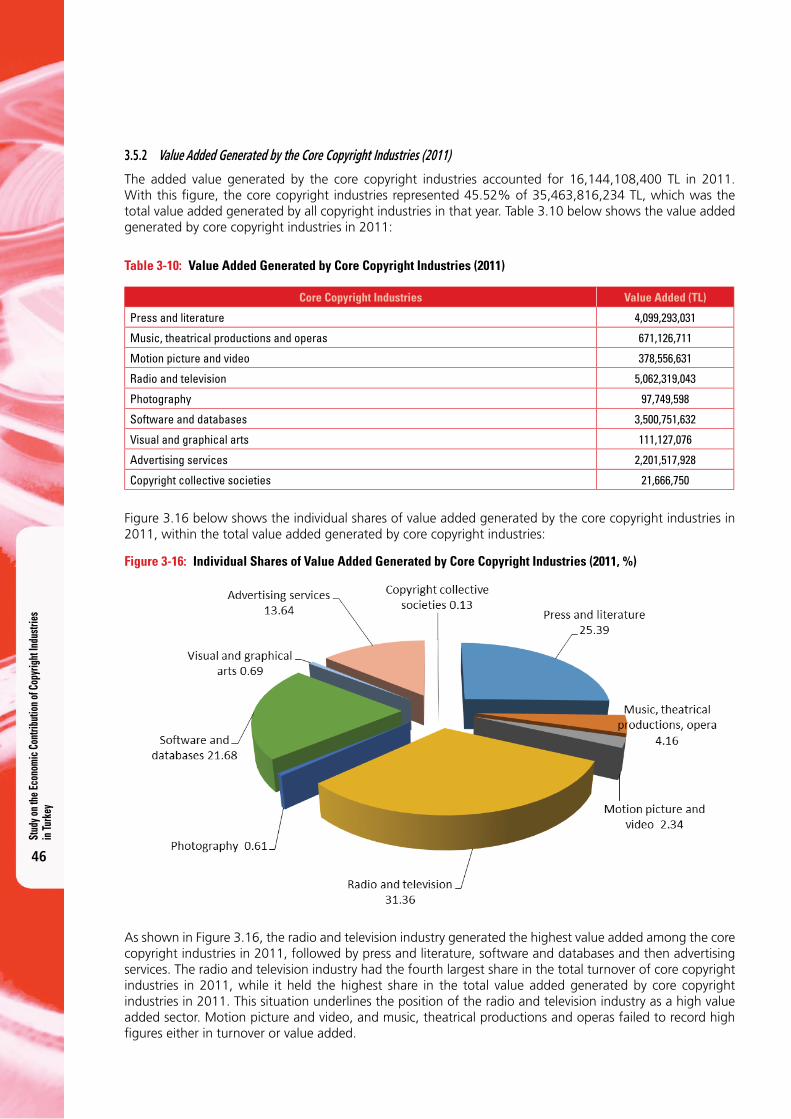
Stud
y on t
he Ec
onom
ic C
ontri
butio
n of C
opyr
ight
Indu
strie
s in
Turk
ey
46
3.5.2 Value Added Generated by the Core Copyright Industries (2011)
The added value generated by the core copyright industries accounted for 16,144,108,400 TL in 2011. With this fi gure, the core copyright industries represented 45.52% of 35,463,816,234 TL, which was the total value added generated by all copyright industries in that year. Table 3.10 below shows the value added generated by core copyright industries in 2011:
Table 3-10: Value Added Generated by Core Copyright Industries (2011)
Core Copyright Industries Value Added (TL)
Press and literature 4,099,293,031
Music, theatrical productions and operas 671,126,711
Motion picture and video 378,556,631
Radio and television 5,062,319,043
Photography 97,749,598
Software and databases 3,500,751,632
Visual and graphical arts 111,127,076
Advertising services 2,201,517,928
Copyright collective societies 21,666,750
Figure 3.16 below shows the individual shares of value added generated by the core copyright industries in 2011, within the total value added generated by core copyright industries:
Figure 3-16: Individual Shares of Value Added Generated by Core Copyright Industries (2011, %)
As shown in Figure 3.16, the radio and television industry generated the highest value added among the core copyright industries in 2011, followed by press and literature, software and databases and then advertising services. The radio and television industry had the fourth largest share in the total turnover of core copyright industries in 2011, while it held the highest share in the total value added generated by core copyright industries in 2011. This situation underlines the position of the radio and television industry as a high value added sector. Motion picture and video, and music, theatrical productions and operas failed to record high fi gures either in turnover or value added.
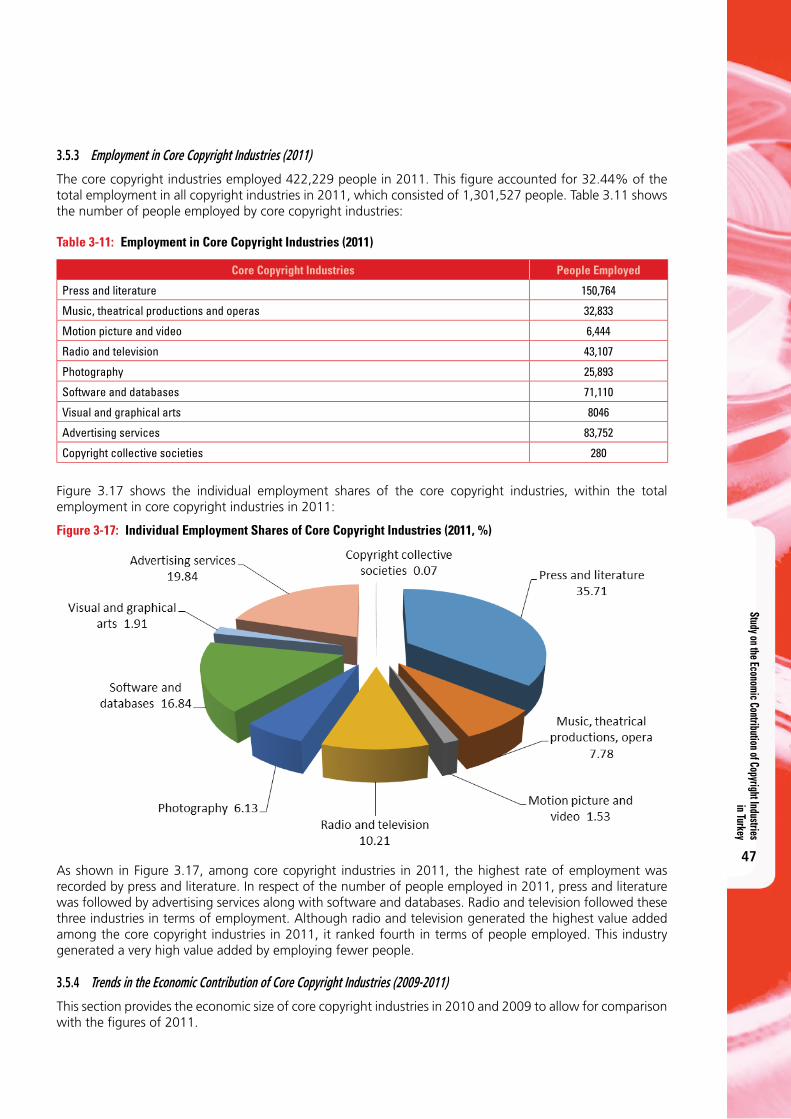
Study on the Economic Contribution of Copyright Industries in Turkey
47
3.5.3 Employment in Core Copyright Industries (2011)
The core copyright industries employed 422,229 people in 2011. This fi gure accounted for 32.44% of the total employment in all copyright industries in 2011, which consisted of 1,301,527 people. Table 3.11 shows the number of people employed by core copyright industries:
Table 3-11: Employment in Core Copyright Industries (2011)
Core Copyright Industries People Employed
Press and literature 150,764
Music, theatrical productions and operas 32,833
Motion picture and video 6,444
Radio and television 43,107
Photography 25,893
Software and databases 71,110
Visual and graphical arts 8046
Advertising services 83,752
Copyright collective societies 280
Figure 3.17 shows the individual employment shares of the core copyright industries, within the total employment in core copyright industries in 2011:
Figure 3-17: Individual Employment Shares of Core Copyright Industries (2011, %)
As shown in Figure 3.17, among core copyright industries in 2011, the highest rate of employment was recorded by press and literature. In respect of the number of people employed in 2011, press and literature was followed by advertising services along with software and databases. Radio and television followed these three industries in terms of employment. Although radio and television generated the highest value added among the core copyright industries in 2011, it ranked fourth in terms of people employed. This industry generated a very high value added by employing fewer people.
3.5.4 Trends in the Economic Contribution of Core Copyright Industries (2009-2011)
This section provides the economic size of core copyright industries in 2010 and 2009 to allow for comparison with the fi gures of 2011.
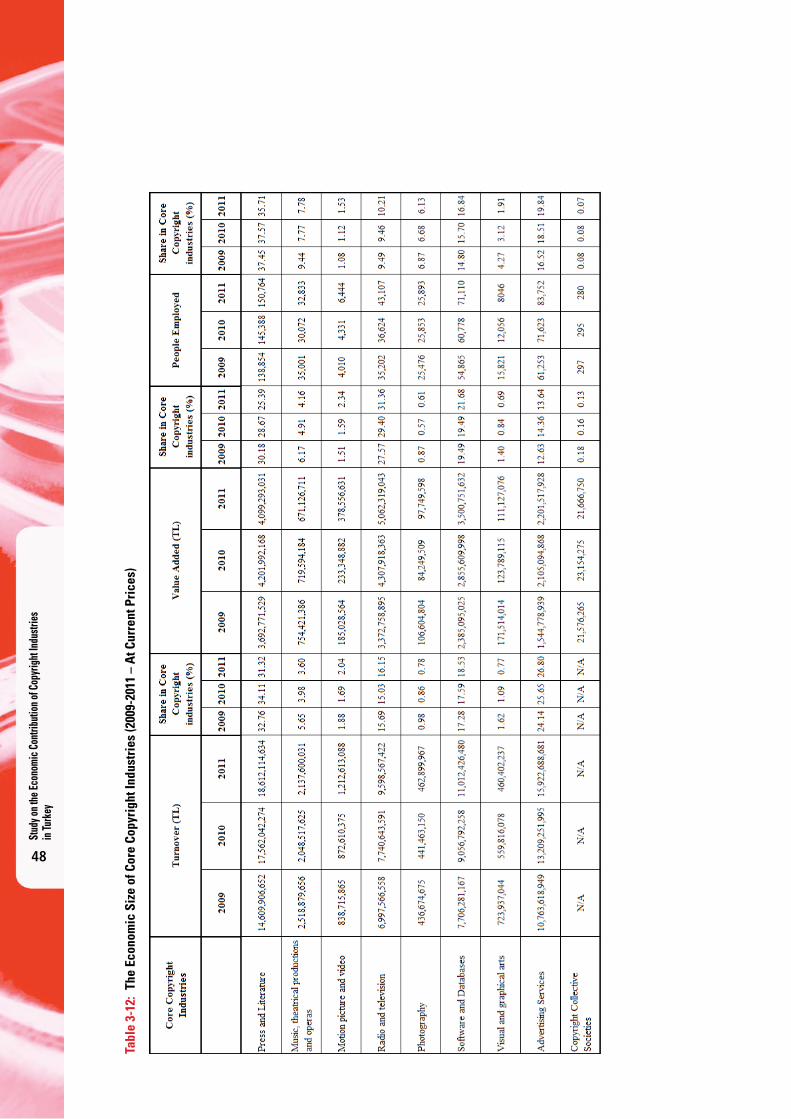
Stud
y on t
he Ec
onom
ic C
ontri
butio
n of C
opyr
ight
Indu
strie
s in
Turk
ey
48
Tabl
e 3-
12:
The
Econ
omic
Siz
e of
Cor
e Co
pyri
ght I
ndus
trie
s (2
009-
2011
– A
t Cur
rent
Pri
ces)
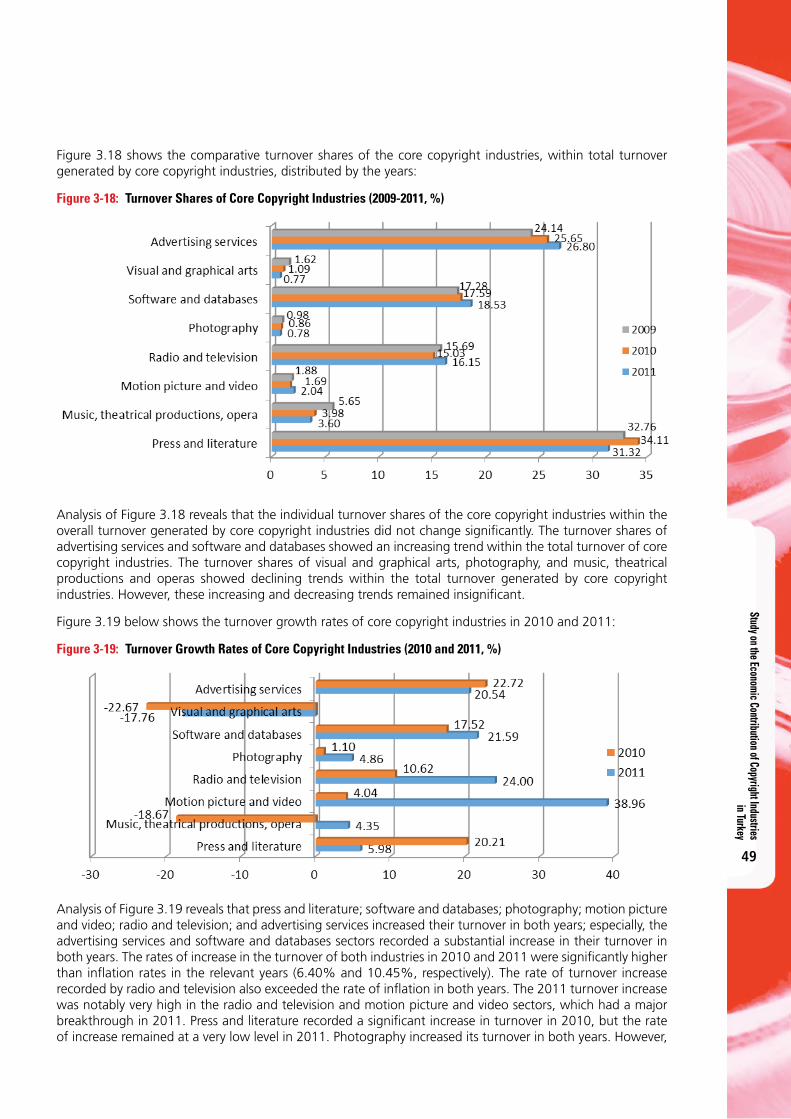
Study on the Economic Contribution of Copyright Industries in Turkey
49
Figure 3.18 shows the comparative turnover shares of the core copyright industries, within total turnover generated by core copyright industries, distributed by the years:
Figure 3-18: Turnover Shares of Core Copyright Industries (2009-2011, %)
Analysis of Figure 3.18 reveals that the individual turnover shares of the core copyright industries within the overall turnover generated by core copyright industries did not change signifi cantly. The turnover shares of advertising services and software and databases showed an increasing trend within the total turnover of core copyright industries. The turnover shares of visual and graphical arts, photography, and music, theatrical productions and operas showed declining trends within the total turnover generated by core copyright industries. However, these increasing and decreasing trends remained insignifi cant.
Figure 3.19 below shows the turnover growth rates of core copyright industries in 2010 and 2011:
Figure 3-19: Turnover Growth Rates of Core Copyright Industries (2010 and 2011, %)
Analysis of Figure 3.19 reveals that press and literature; software and databases; photography; motion picture and video; radio and television; and advertising services increased their turnover in both years; especially, the advertising services and software and databases sectors recorded a substantial increase in their turnover in both years. The rates of increase in the turnover of both industries in 2010 and 2011 were signifi cantly higher than infl ation rates in the relevant years (6.40% and 10.45%, respectively). The rate of turnover increase recorded by radio and television also exceeded the rate of infl ation in both years. The 2011 turnover increase was notably very high in the radio and television and motion picture and video sectors, which had a major breakthrough in 2011. Press and literature recorded a signifi cant increase in turnover in 2010, but the rate of increase remained at a very low level in 2011. Photography increased its turnover in both years. However,
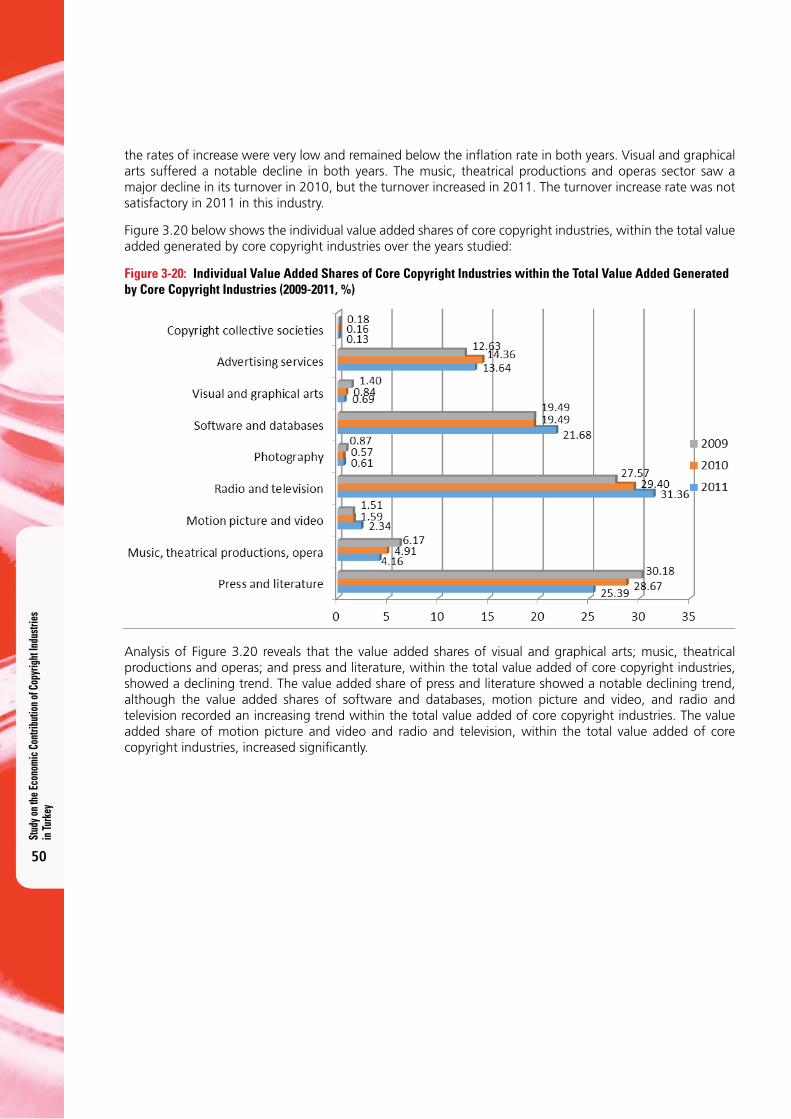
Stud
y on t
he Ec
onom
ic C
ontri
butio
n of C
opyr
ight
Indu
strie
s in
Turk
ey
50
the rates of increase were very low and remained below the infl ation rate in both years. Visual and graphical arts suffered a notable decline in both years. The music, theatrical productions and operas sector saw a major decline in its turnover in 2010, but the turnover increased in 2011. The turnover increase rate was not satisfactory in 2011 in this industry.
Figure 3.20 below shows the individual value added shares of core copyright industries, within the total value added generated by core copyright industries over the years studied:
Figure 3-20: Individual Value Added Shares of Core Copyright Industries within the Total Value Added Generated by Core Copyright Industries (2009-2011, %)
Analysis of Figure 3.20 reveals that the value added shares of visual and graphical arts; music, theatrical productions and operas; and press and literature, within the total value added of core copyright industries, showed a declining trend. The value added share of press and literature showed a notable declining trend, although the value added shares of software and databases, motion picture and video, and radio and television recorded an increasing trend within the total value added of core copyright industries. The value added share of motion picture and video and radio and television, within the total value added of core copyright industries, increased signifi cantly.
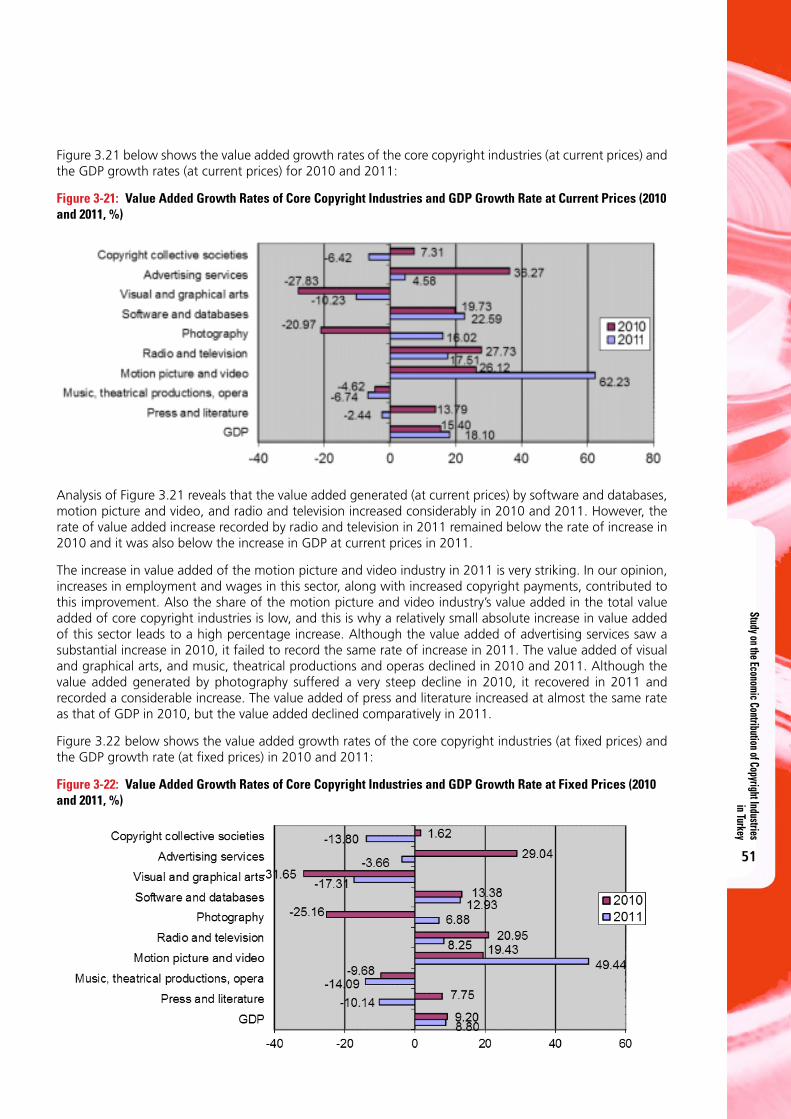
Study on the Economic Contribution of Copyright Industries in Turkey
51
Figure 3.21 below shows the value added growth rates of the core copyright industries (at current prices) and the GDP growth rates (at current prices) for 2010 and 2011:
Figure 3-21: Value Added Growth Rates of Core Copyright Industries and GDP Growth Rate at Current Prices (2010 and 2011, %)
Analysis of Figure 3.21 reveals that the value added generated (at current prices) by software and databases, motion picture and video, and radio and television increased considerably in 2010 and 2011. However, the rate of value added increase recorded by radio and television in 2011 remained below the rate of increase in 2010 and it was also below the increase in GDP at current prices in 2011.
The increase in value added of the motion picture and video industry in 2011 is very striking. In our opinion, increases in employment and wages in this sector, along with increased copyright payments, contributed to this improvement. Also the share of the motion picture and video industry’s value added in the total value added of core copyright industries is low, and this is why a relatively small absolute increase in value added of this sector leads to a high percentage increase. Although the value added of advertising services saw a substantial increase in 2010, it failed to record the same rate of increase in 2011. The value added of visual and graphical arts, and music, theatrical productions and operas declined in 2010 and 2011. Although the value added generated by photography suffered a very steep decline in 2010, it recovered in 2011 and recorded a considerable increase. The value added of press and literature increased at almost the same rate as that of GDP in 2010, but the value added declined comparatively in 2011.
Figure 3.22 below shows the value added growth rates of the core copyright industries (at fixed prices) and the GDP growth rate (at fixed prices) in 2010 and 2011:
Figure 3-22: Value Added Growth Rates of Core Copyright Industries and GDP Growth Rate at Fixed Prices (2010 and 2011, %)
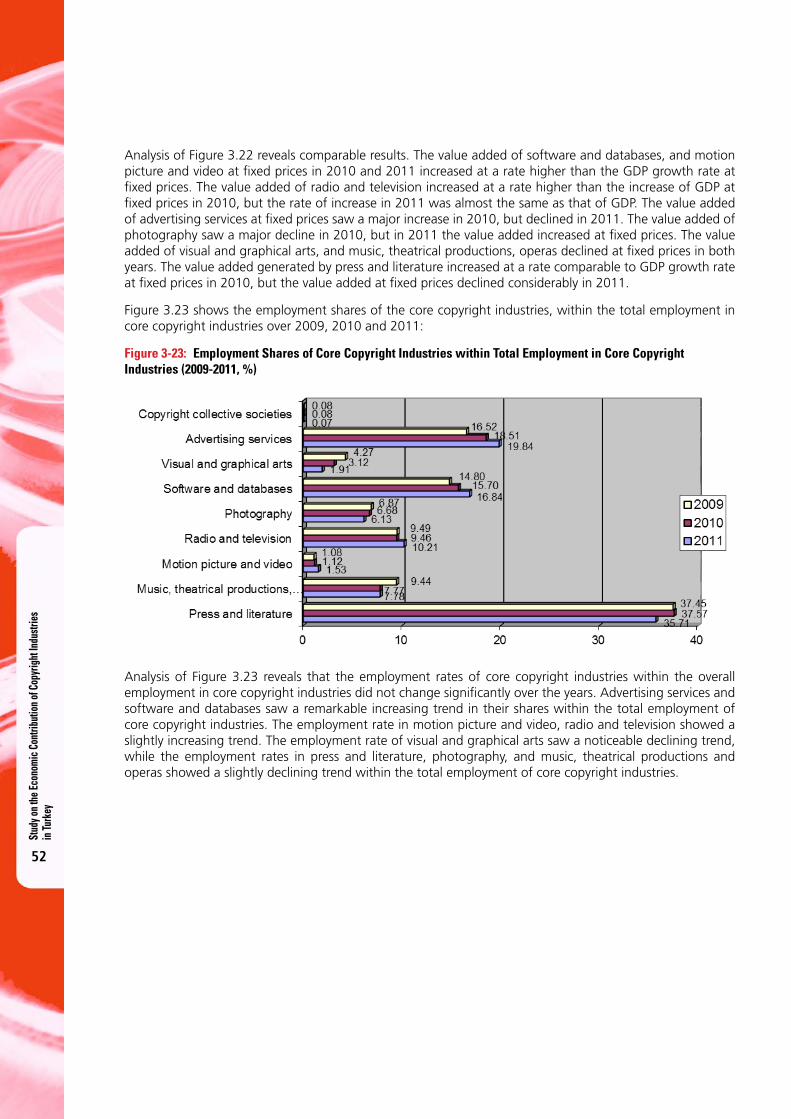
Stud
y on t
he Ec
onom
ic C
ontri
butio
n of C
opyr
ight
Indu
strie
s in
Turk
ey
52
Analysis of Figure 3.22 reveals comparable results. The value added of software and databases, and motion picture and video at fixed prices in 2010 and 2011 increased at a rate higher than the GDP growth rate at fixed prices. The value added of radio and television increased at a rate higher than the increase of GDP at fixed prices in 2010, but the rate of increase in 2011 was almost the same as that of GDP. The value added of advertising services at fixed prices saw a major increase in 2010, but declined in 2011. The value added of photography saw a major decline in 2010, but in 2011 the value added increased at fixed prices. The value added of visual and graphical arts, and music, theatrical productions, operas declined at fixed prices in both years. The value added generated by press and literature increased at a rate comparable to GDP growth rate at fixed prices in 2010, but the value added at fixed prices declined considerably in 2011.
Figure 3.23 shows the employment shares of the core copyright industries, within the total employment in core copyright industries over 2009, 2010 and 2011:
Figure 3-23: Employment Shares of Core Copyright Industries within Total Employment in Core Copyright Industries (2009-2011, %)
Analysis of Figure 3.23 reveals that the employment rates of core copyright industries within the overall employment in core copyright industries did not change significantly over the years. Advertising services and software and databases saw a remarkable increasing trend in their shares within the total employment of core copyright industries. The employment rate in motion picture and video, radio and television showed a slightly increasing trend. The employment rate of visual and graphical arts saw a noticeable declining trend, while the employment rates in press and literature, photography, and music, theatrical productions and operas showed a slightly declining trend within the total employment of core copyright industries.
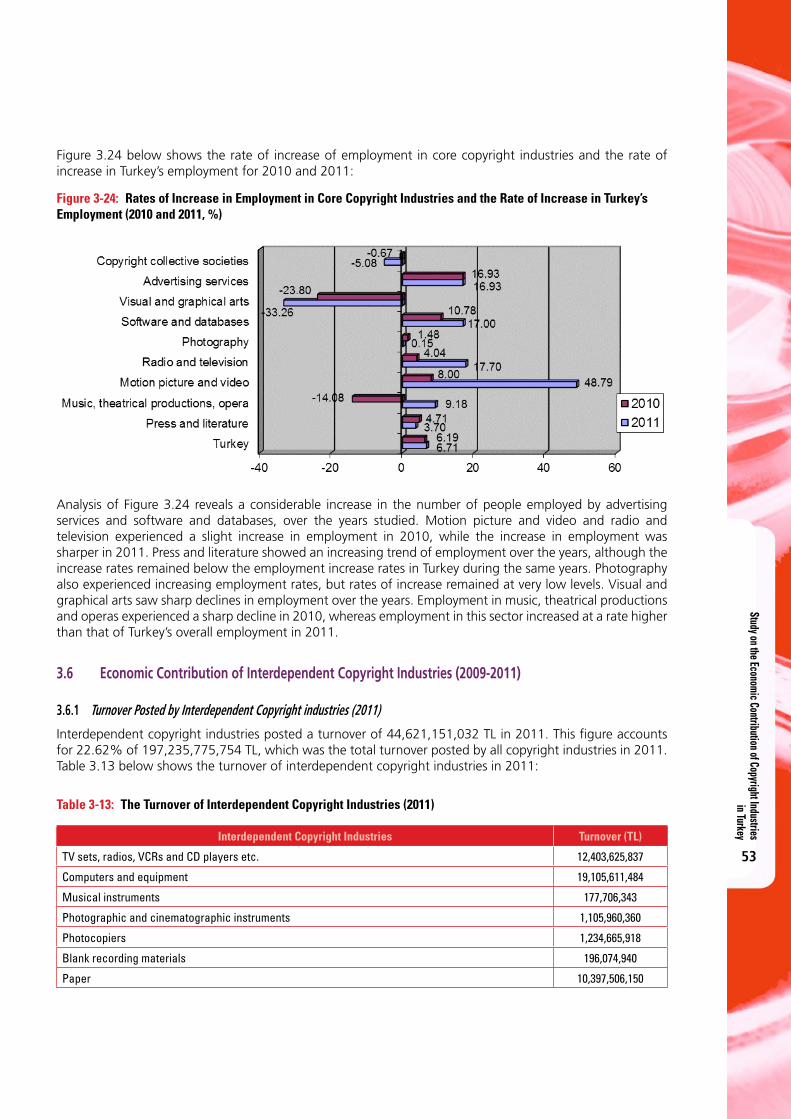
Study on the Economic Contribution of Copyright Industries in Turkey
53
Figure 3.24 below shows the rate of increase of employment in core copyright industries and the rate of increase in Turkey’s employment for 2010 and 2011:
Figure 3-24: Rates of Increase in Employment in Core Copyright Industries and the Rate of Increase in Turkey’s Employment (2010 and 2011, %)
Analysis of Figure 3.24 reveals a considerable increase in the number of people employed by advertising services and software and databases, over the years studied. Motion picture and video and radio and television experienced a slight increase in employment in 2010, while the increase in employment was sharper in 2011. Press and literature showed an increasing trend of employment over the years, although the increase rates remained below the employment increase rates in Turkey during the same years. Photography also experienced increasing employment rates, but rates of increase remained at very low levels. Visual and graphical arts saw sharp declines in employment over the years. Employment in music, theatrical productions and operas experienced a sharp decline in 2010, whereas employment in this sector increased at a rate higher than that of Turkey’s overall employment in 2011.
3.6 Economic Contribution of Interdependent Copyright Industries (2009-2011)
3.6.1 Turnover Posted by Interdependent Copyright industries (2011)
Interdependent copyright industries posted a turnover of 44,621,151,032 TL in 2011. This figure accounts for 22.62% of 197,235,775,754 TL, which was the total turnover posted by all copyright industries in 2011. Table 3.13 below shows the turnover of interdependent copyright industries in 2011:
Table 3-13: The Turnover of Interdependent Copyright Industries (2011)
Interdependent Copyright Industries Turnover (TL)
TV sets, radios, VCRs and CD players etc. 12,403,625,837
Computers and equipment 19,105,611,484
Musical instruments 177,706,343
Photographic and cinematographic instruments 1,105,960,360
Photocopiers 1,234,665,918
Blank recording materials 196,074,940
Paper 10,397,506,150
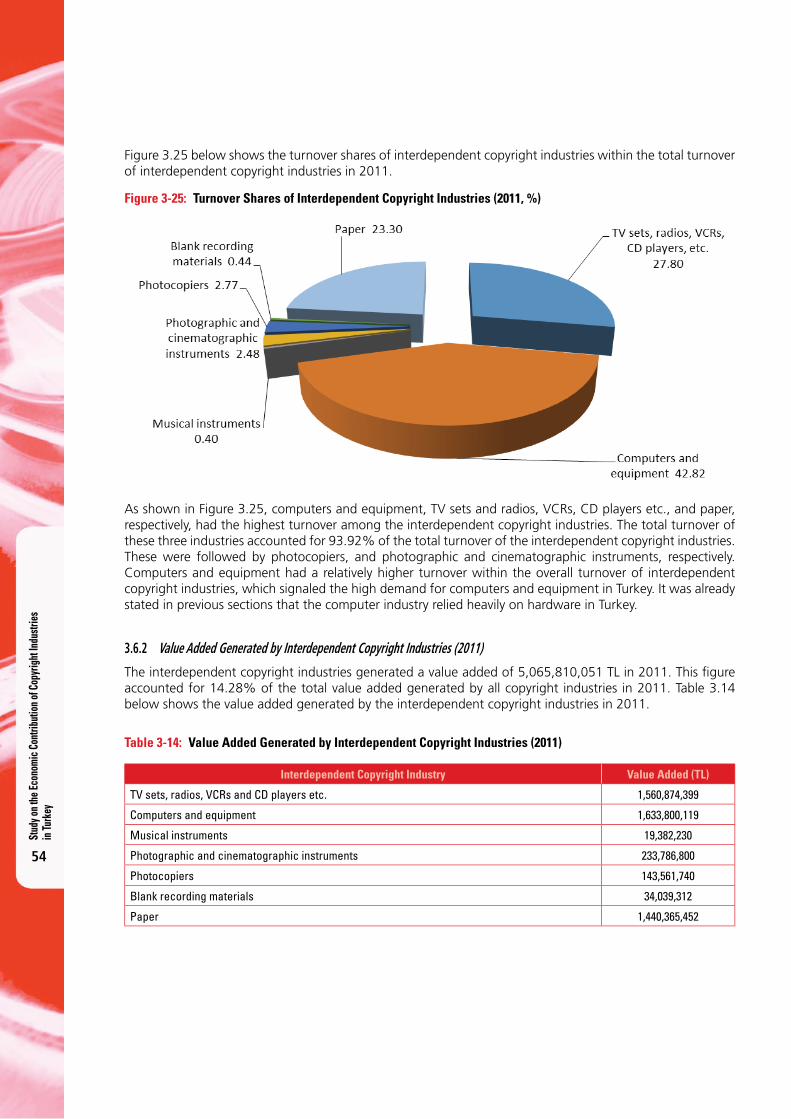
Stud
y on t
he Ec
onom
ic C
ontri
butio
n of C
opyr
ight
Indu
strie
s in
Turk
ey
54
Figure 3.25 below shows the turnover shares of interdependent copyright industries within the total turnover of interdependent copyright industries in 2011.
Figure 3-25: Turnover Shares of Interdependent Copyright Industries (2011, %)
As shown in Figure 3.25, computers and equipment, TV sets and radios, VCRs, CD players etc., and paper, respectively, had the highest turnover among the interdependent copyright industries. The total turnover of these three industries accounted for 93.92% of the total turnover of the interdependent copyright industries. These were followed by photocopiers, and photographic and cinematographic instruments, respectively. Computers and equipment had a relatively higher turnover within the overall turnover of interdependent copyright industries, which signaled the high demand for computers and equipment in Turkey. It was already stated in previous sections that the computer industry relied heavily on hardware in Turkey.
3.6.2 Value Added Generated by Interdependent Copyright Industries (2011)
The interdependent copyright industries generated a value added of 5,065,810,051 TL in 2011. This fi gure accounted for 14.28% of the total value added generated by all copyright industries in 2011. Table 3.14 below shows the value added generated by the interdependent copyright industries in 2011.
Table 3-14: Value Added Generated by Interdependent Copyright Industries (2011)
Interdependent Copyright Industry Value Added (TL)
TV sets, radios, VCRs and CD players etc. 1,560,874,399
Computers and equipment 1,633,800,119
Musical instruments 19,382,230
Photographic and cinematographic instruments 233,786,800
Photocopiers 143,561,740
Blank recording materials 34,039,312
Paper 1,440,365,452
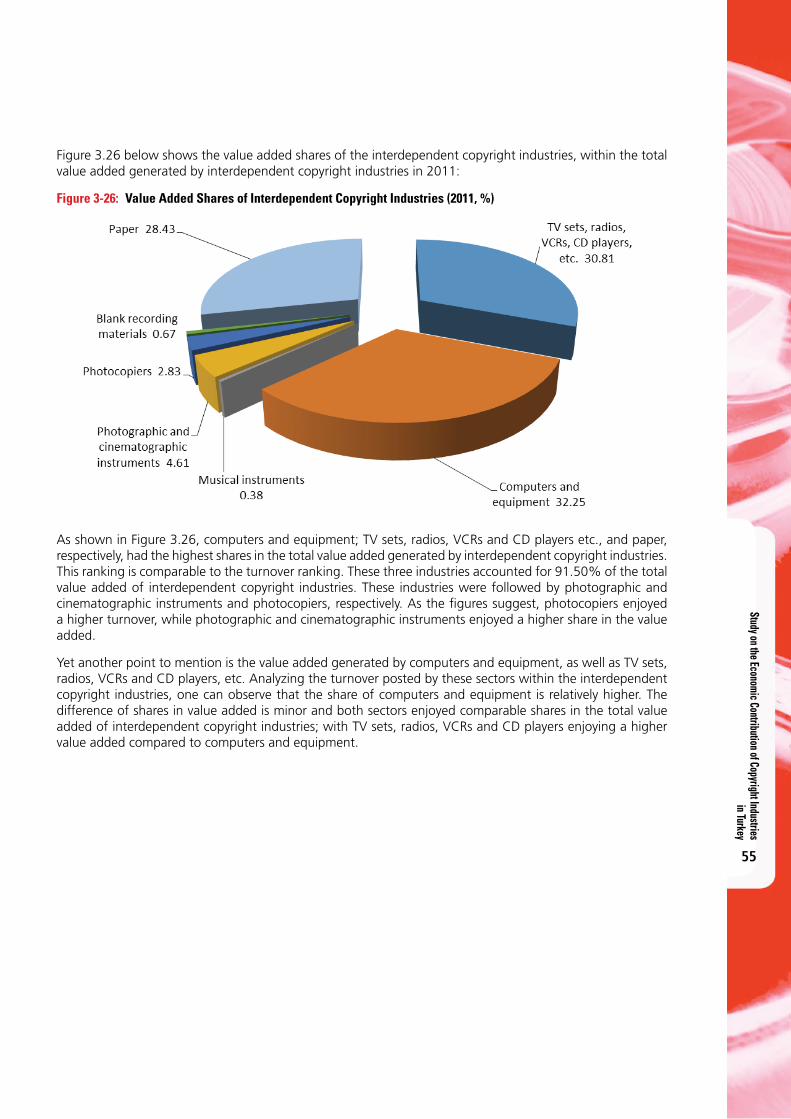
Study on the Economic Contribution of Copyright Industries in Turkey
55
Figure 3.26 below shows the value added shares of the interdependent copyright industries, within the total value added generated by interdependent copyright industries in 2011:
Figure 3-26: Value Added Shares of Interdependent Copyright Industries (2011, %)
As shown in Figure 3.26, computers and equipment; TV sets, radios, VCRs and CD players etc., and paper, respectively, had the highest shares in the total value added generated by interdependent copyright industries. This ranking is comparable to the turnover ranking. These three industries accounted for 91.50% of the total value added of interdependent copyright industries. These industries were followed by photographic and cinematographic instruments and photocopiers, respectively. As the fi gures suggest, photocopiers enjoyed a higher turnover, while photographic and cinematographic instruments enjoyed a higher share in the value added.
Yet another point to mention is the value added generated by computers and equipment, as well as TV sets, radios, VCRs and CD players, etc. Analyzing the turnover posted by these sectors within the interdependent copyright industries, one can observe that the share of computers and equipment is relatively higher. The difference of shares in value added is minor and both sectors enjoyed comparable shares in the total value added of interdependent copyright industries; with TV sets, radios, VCRs and CD players enjoying a higher value added compared to computers and equipment.
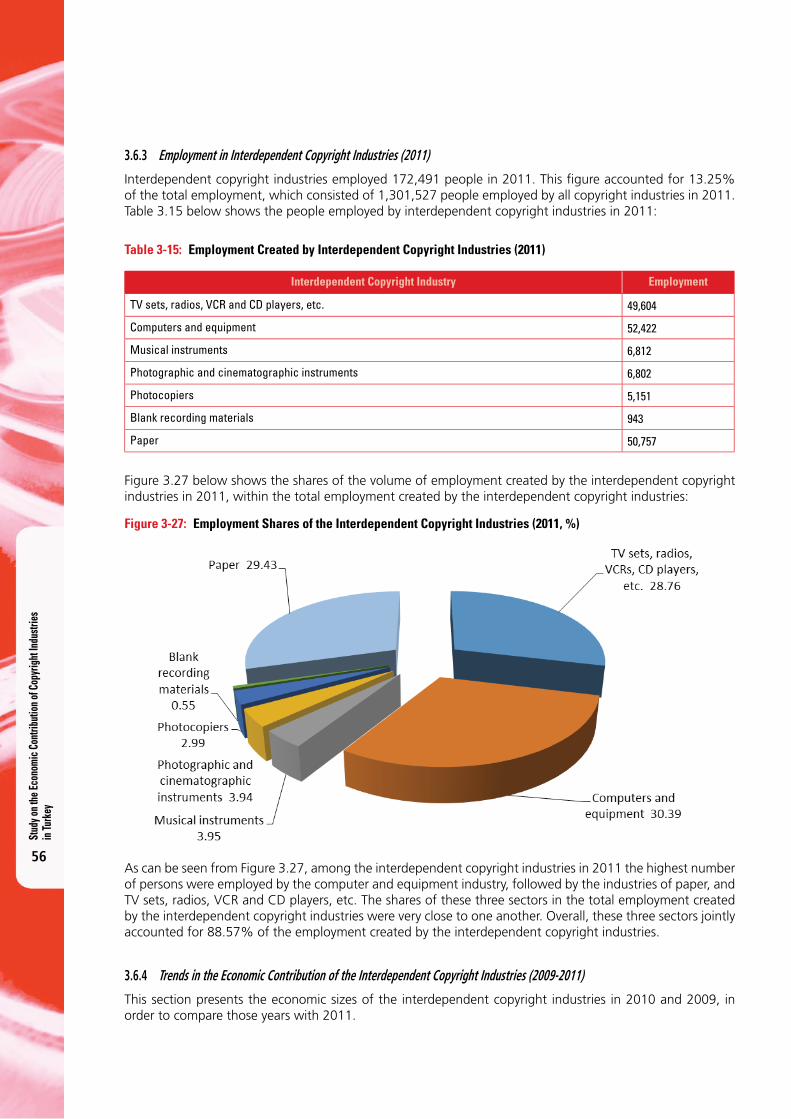
Stud
y on t
he Ec
onom
ic C
ontri
butio
n of C
opyr
ight
Indu
strie
s in
Turk
ey
56
3.6.3 Employment in Interdependent Copyright Industries (2011)
Interdependent copyright industries employed 172,491 people in 2011. This fi gure accounted for 13.25% of the total employment, which consisted of 1,301,527 people employed by all copyright industries in 2011. Table 3.15 below shows the people employed by interdependent copyright industries in 2011:
Table 3-15: Employment Created by Interdependent Copyright Industries (2011)
Interdependent Copyright Industry Employment
TV sets, radios, VCR and CD players, etc. 49,604
Computers and equipment 52,422
Musical instruments 6,812
Photographic and cinematographic instruments 6,802
Photocopiers 5,151
Blank recording materials 943
Paper 50,757
Figure 3.27 below shows the shares of the volume of employment created by the interdependent copyright industries in 2011, within the total employment created by the interdependent copyright industries:
Figure 3-27: Employment Shares of the Interdependent Copyright Industries (2011, %)
As can be seen from Figure 3.27, among the interdependent copyright industries in 2011 the highest number of persons were employed by the computer and equipment industry, followed by the industries of paper, and TV sets, radios, VCR and CD players, etc. The shares of these three sectors in the total employment created by the interdependent copyright industries were very close to one another. Overall, these three sectors jointly accounted for 88.57% of the employment created by the interdependent copyright industries.
3.6.4 Trends in the Economic Contribution of the Interdependent Copyright Industries (2009-2011)
This section presents the economic sizes of the interdependent copyright industries in 2010 and 2009, in order to compare those years with 2011.
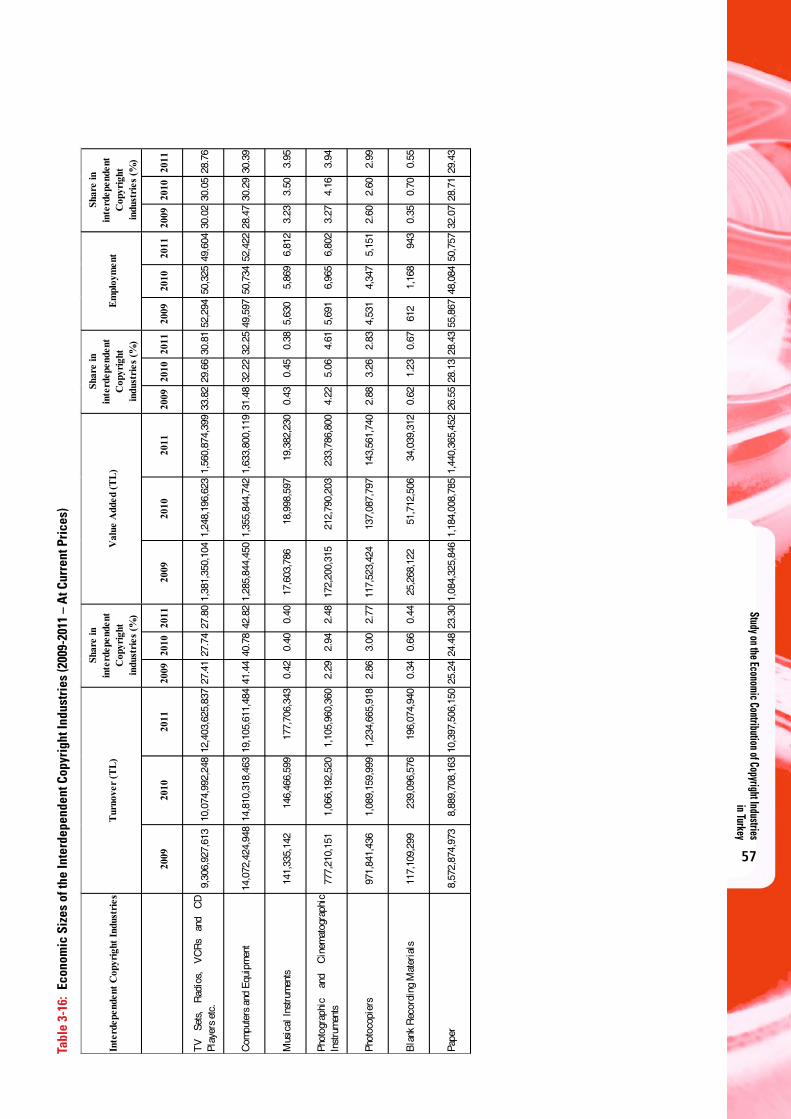
Study on the Economic Contribution of Copyright Industries in Turkey
57
Tabl
e 3-
16:
Econ
omic
Siz
es o
f the
Inte
rdep
ende
nt C
opyr
ight
Indu
stri
es (2
009-
2011
– A
t Cur
rent
Pri
ces)
Inte
rdep
ende
nt C
opyr
ight
Indu
strie
s
2009
2010
2011
2009
2010
2011
2009
2010
2011
2009
2010
2011
2009
2010
2011
2009
2010
2011
TVSe
ts,
Rad
ios,
VC
Rs
and
CD
Play
ers
etc.
9,30
6,92
7,61
310
,074
,992
,248
12,4
03,6
25,8
3727
.41
27.7
427
.80
1,38
1,35
0,10
41,
248,
196,
623
1,56
0,87
4,39
933
.82
29.6
630
.81
52,2
9450
,325
49,6
0430
.02
30.0
528
.76
Com
pute
rs a
nd E
quip
men
t14
,072
,424
,948
14,8
10,3
18,4
6319
,105
,611
,484
41.4
440
.78
42.8
21,
285,
844,
450
1,35
5,84
4,74
21,
633,
800,
119
31.4
832
.22
32.2
549
,597
50,7
3452
,422
28.4
730
.29
30.3
9
Mus
ical
Inst
rum
ents
141,
335,
142
146,
466,
599
177,
706,
343
0.42
0.40
0.40
17,6
03,7
8618
,998
,597
19,3
82,2
300.
430.
450.
385,
630
5,86
96,
812
3.23
3.50
3.95
Phot
ogra
phic
and
Cin
emat
ogra
phic
Inst
rum
ents
777,
210,
151
1,06
6,19
2,52
01,
105,
960,
360
2.29
2.94
2.48
172,
200,
315
212,
790,
203
233,
786,
800
4.22
5.06
4.61
5,69
16,
965
6,80
23.
274.
163.
94
Phot
ocop
iers
971,
841,
436
1,08
9,15
9,99
91,
234,
665,
918
2.86
3.00
2.77
117,
523,
424
137,
087,
797
143,
561,
740
2.88
3.26
2.83
4,53
14,
347
5,15
12.
602.
602.
99
Bla
nk R
ecor
ding
Mat
eria
ls11
7,10
9,29
923
9,09
6,57
619
6,07
4,94
00.
340.
660.
4425
,268
,122
51,7
12,5
0634
,039
,312
0.62
1.23
0.67
612
1,16
894
30.
350.
700.
55
Pape
r8,
572,
874,
973
8,88
9,70
8,16
310
,397
,506
,150
25.2
424
.48
23.3
01,
084,
325,
846
1,18
4,00
8,78
51,
440,
365,
452
26.5
528
.13
28.4
355
,867
48,0
8450
,757
32.0
728
.71
29.4
3
Shar
e in
in
terd
epen
dent
C
opyr
ight
in
dust
ries (
%)
Turn
over
(TL)
Val
ue A
dded
(TL)
Empl
oym
ent
Shar
e in
in
terd
epen
dent
C
opyr
ight
in
dust
ries (
%)
Shar
e in
in
terd
epen
dent
C
opyr
ight
in
dust
ries (
%)
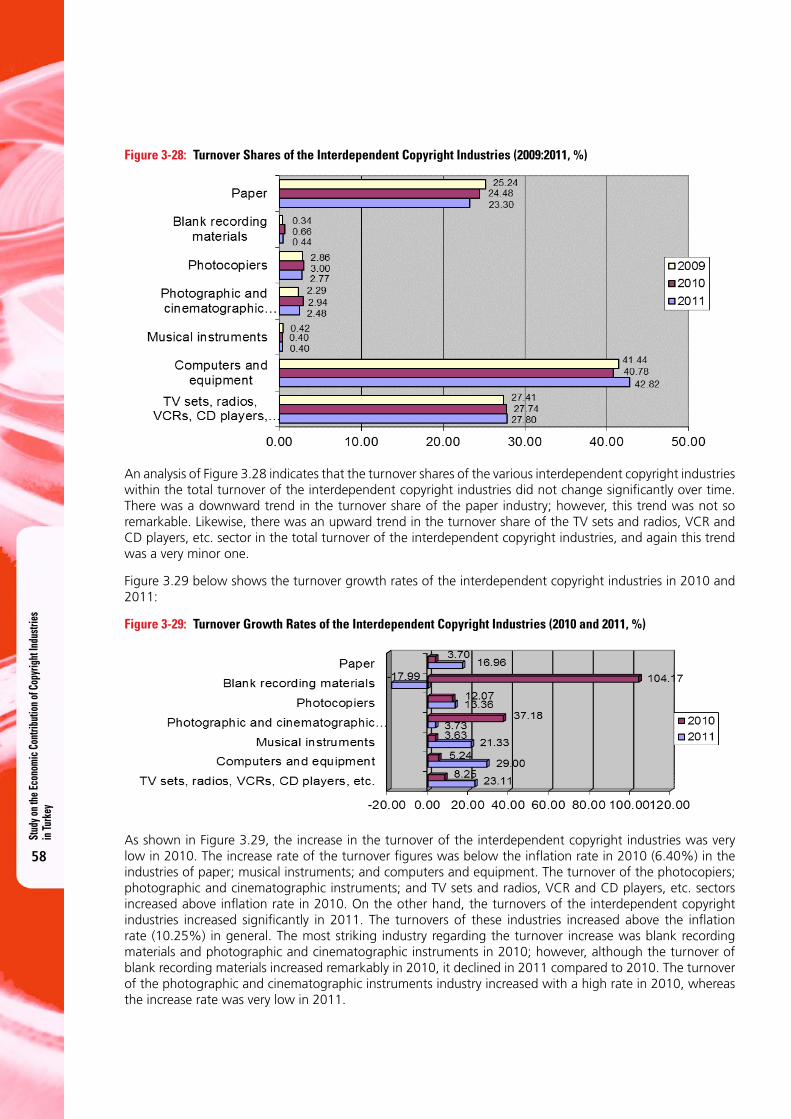
Stud
y on t
he Ec
onom
ic C
ontri
butio
n of C
opyr
ight
Indu
strie
s in
Turk
ey
58
Figure 3-28: Turnover Shares of the Interdependent Copyright Industries (2009:2011, %)
An analysis of Figure 3.28 indicates that the turnover shares of the various interdependent copyright industries within the total turnover of the interdependent copyright industries did not change significantly over time. There was a downward trend in the turnover share of the paper industry; however, this trend was not so remarkable. Likewise, there was an upward trend in the turnover share of the TV sets and radios, VCR and CD players, etc. sector in the total turnover of the interdependent copyright industries, and again this trend was a very minor one.
Figure 3.29 below shows the turnover growth rates of the interdependent copyright industries in 2010 and 2011:
Figure 3-29: Turnover Growth Rates of the Interdependent Copyright Industries (2010 and 2011, %)
As shown in Figure 3.29, the increase in the turnover of the interdependent copyright industries was very low in 2010. The increase rate of the turnover figures was below the inflation rate in 2010 (6.40%) in the industries of paper; musical instruments; and computers and equipment. The turnover of the photocopiers; photographic and cinematographic instruments; and TV sets and radios, VCR and CD players, etc. sectors increased above inflation rate in 2010. On the other hand, the turnovers of the interdependent copyright industries increased significantly in 2011. The turnovers of these industries increased above the inflation rate (10.25%) in general. The most striking industry regarding the turnover increase was blank recording materials and photographic and cinematographic instruments in 2010; however, although the turnover of blank recording materials increased remarkably in 2010, it declined in 2011 compared to 2010. The turnover of the photographic and cinematographic instruments industry increased with a high rate in 2010, whereas the increase rate was very low in 2011.
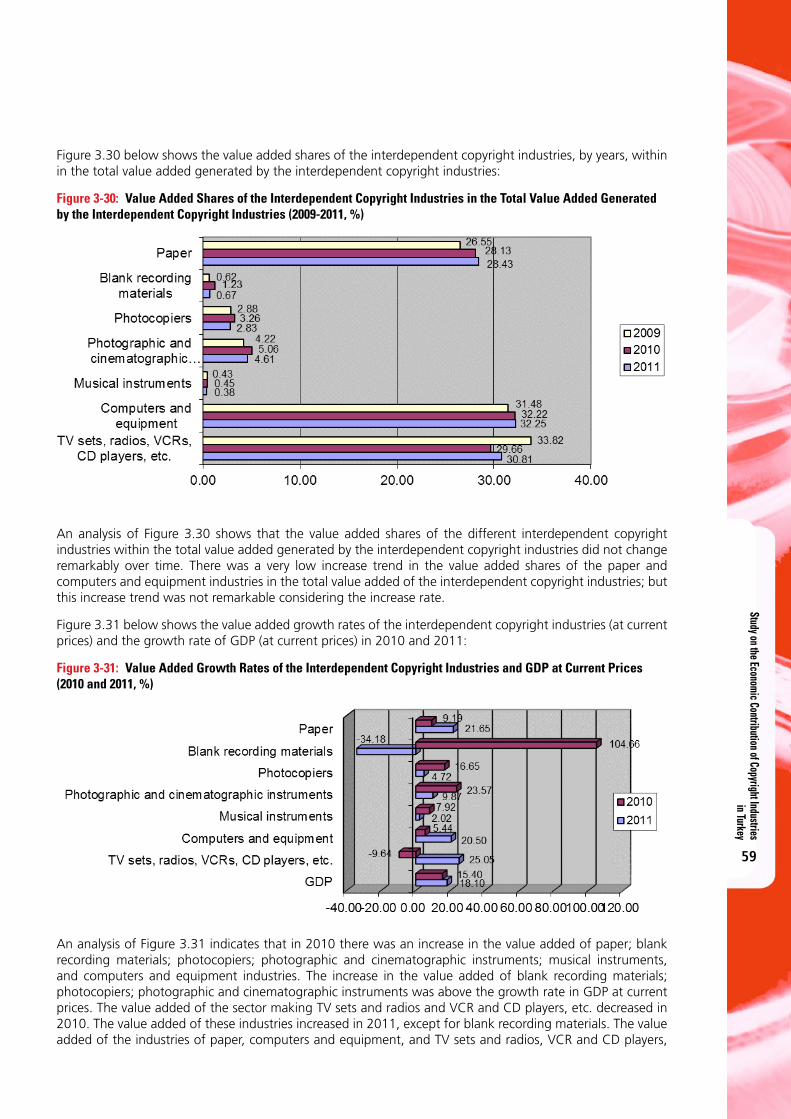
Study on the Economic Contribution of Copyright Industries in Turkey
59
Figure 3.30 below shows the value added shares of the interdependent copyright industries, by years, within in the total value added generated by the interdependent copyright industries:
Figure 3-30: Value Added Shares of the Interdependent Copyright Industries in the Total Value Added Generated by the Interdependent Copyright Industries (2009-2011, %)
An analysis of Figure 3.30 shows that the value added shares of the different interdependent copyright industries within the total value added generated by the interdependent copyright industries did not change remarkably over time. There was a very low increase trend in the value added shares of the paper and computers and equipment industries in the total value added of the interdependent copyright industries; but this increase trend was not remarkable considering the increase rate.
Figure 3.31 below shows the value added growth rates of the interdependent copyright industries (at current prices) and the growth rate of GDP (at current prices) in 2010 and 2011:
Figure 3-31: Value Added Growth Rates of the Interdependent Copyright Industries and GDP at Current Prices (2010 and 2011, %)
An analysis of Figure 3.31 indicates that in 2010 there was an increase in the value added of paper; blank recording materials; photocopiers; photographic and cinematographic instruments; musical instruments, and computers and equipment industries. The increase in the value added of blank recording materials; photocopiers; photographic and cinematographic instruments was above the growth rate in GDP at current prices. The value added of the sector making TV sets and radios and VCR and CD players, etc. decreased in 2010. The value added of these industries increased in 2011, except for blank recording materials. The value added of the industries of paper, computers and equipment, and TV sets and radios, VCR and CD players,
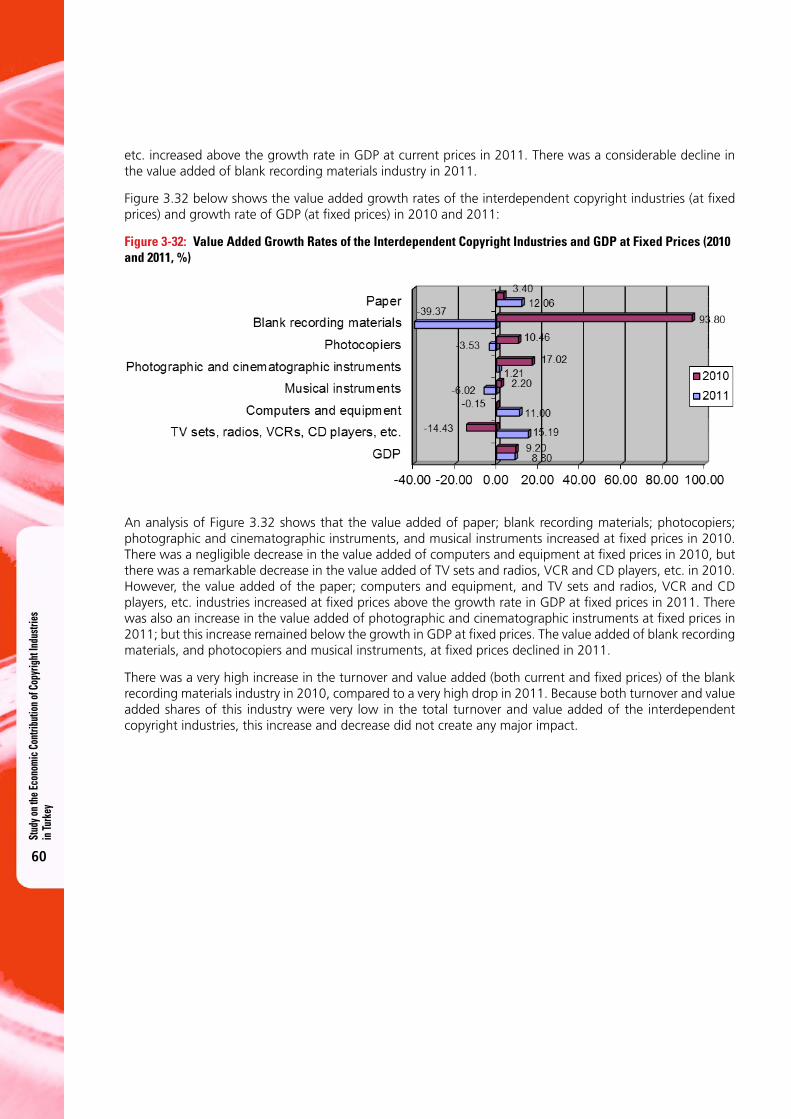
Stud
y on t
he Ec
onom
ic C
ontri
butio
n of C
opyr
ight
Indu
strie
s in
Turk
ey
60
etc. increased above the growth rate in GDP at current prices in 2011. There was a considerable decline in the value added of blank recording materials industry in 2011.
Figure 3.32 below shows the value added growth rates of the interdependent copyright industries (at fixed prices) and growth rate of GDP (at fixed prices) in 2010 and 2011:
Figure 3-32: Value Added Growth Rates of the Interdependent Copyright Industries and GDP at Fixed Prices (2010 and 2011, %)
An analysis of Figure 3.32 shows that the value added of paper; blank recording materials; photocopiers; photographic and cinematographic instruments, and musical instruments increased at fixed prices in 2010. There was a negligible decrease in the value added of computers and equipment at fixed prices in 2010, but there was a remarkable decrease in the value added of TV sets and radios, VCR and CD players, etc. in 2010. However, the value added of the paper; computers and equipment, and TV sets and radios, VCR and CD players, etc. industries increased at fixed prices above the growth rate in GDP at fixed prices in 2011. There was also an increase in the value added of photographic and cinematographic instruments at fixed prices in 2011; but this increase remained below the growth in GDP at fixed prices. The value added of blank recording materials, and photocopiers and musical instruments, at fixed prices declined in 2011.
There was a very high increase in the turnover and value added (both current and fixed prices) of the blank recording materials industry in 2010, compared to a very high drop in 2011. Because both turnover and value added shares of this industry were very low in the total turnover and value added of the interdependent copyright industries, this increase and decrease did not create any major impact.
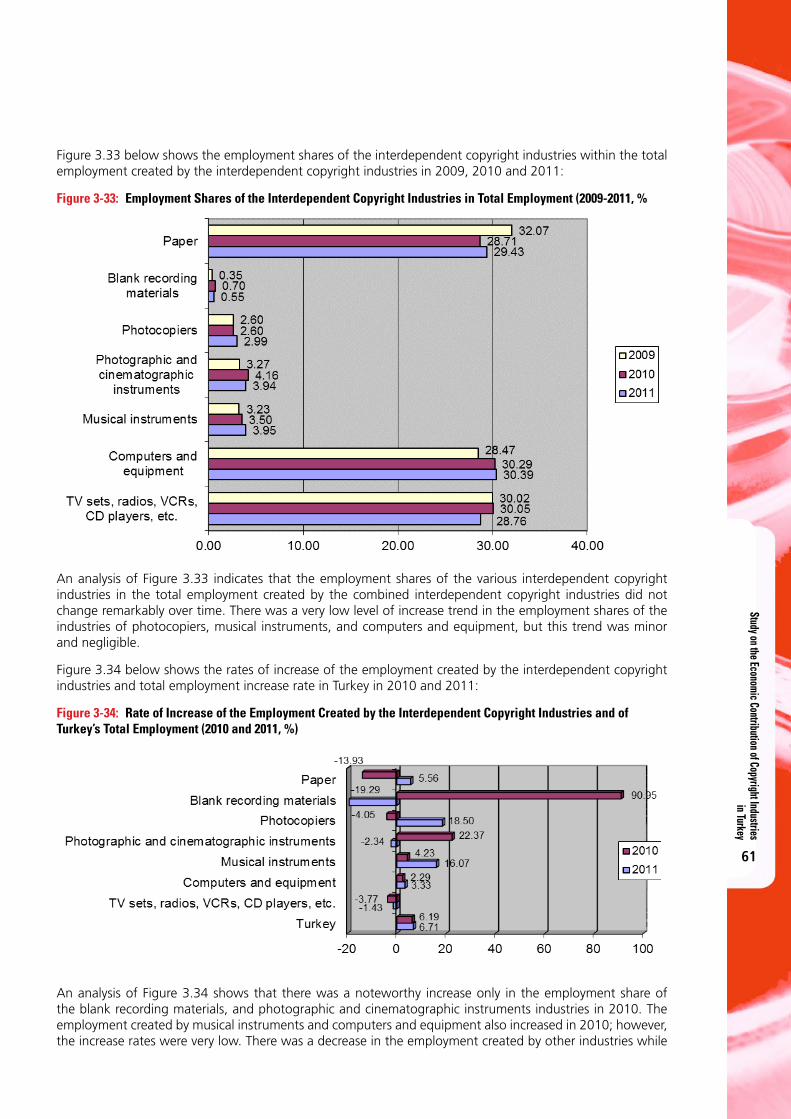
Study on the Economic Contribution of Copyright Industries in Turkey
61
Figure 3.33 below shows the employment shares of the interdependent copyright industries within the total employment created by the interdependent copyright industries in 2009, 2010 and 2011:
Figure 3-33: Employment Shares of the Interdependent Copyright Industries in Total Employment (2009-2011, %
An analysis of Figure 3.33 indicates that the employment shares of the various interdependent copyright industries in the total employment created by the combined interdependent copyright industries did not change remarkably over time. There was a very low level of increase trend in the employment shares of the industries of photocopiers, musical instruments, and computers and equipment, but this trend was minor and negligible.
Figure 3.34 below shows the rates of increase of the employment created by the interdependent copyright industries and total employment increase rate in Turkey in 2010 and 2011:
Figure 3-34: Rate of Increase of the Employment Created by the Interdependent Copyright Industries and of Turkey’s Total Employment (2010 and 2011, %)
An analysis of Figure 3.34 shows that there was a noteworthy increase only in the employment share of the blank recording materials, and photographic and cinematographic instruments industries in 2010. The employment created by musical instruments and computers and equipment also increased in 2010; however, the increase rates were very low. There was a decrease in the employment created by other industries while
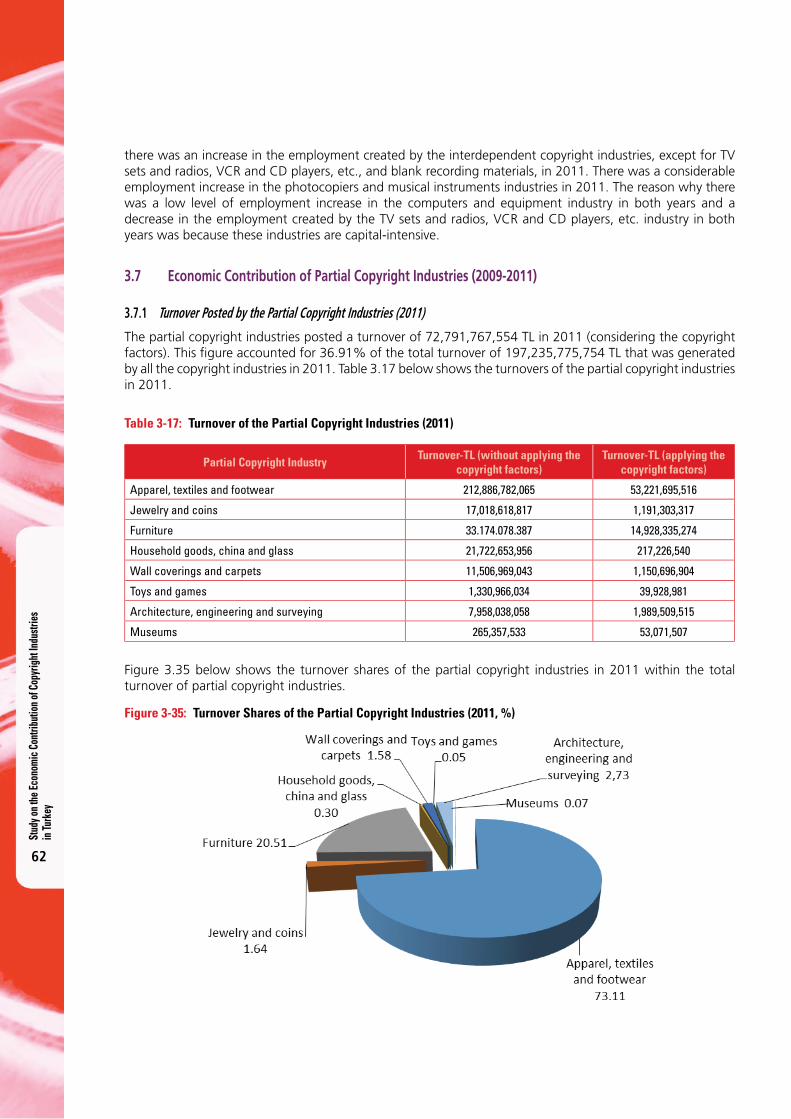
Stud
y on t
he Ec
onom
ic C
ontri
butio
n of C
opyr
ight
Indu
strie
s in
Turk
ey
62
there was an increase in the employment created by the interdependent copyright industries, except for TV sets and radios, VCR and CD players, etc., and blank recording materials, in 2011. There was a considerable employment increase in the photocopiers and musical instruments industries in 2011. The reason why there was a low level of employment increase in the computers and equipment industry in both years and a decrease in the employment created by the TV sets and radios, VCR and CD players, etc. industry in both years was because these industries are capital-intensive.
3.7 Economic Contribution of Partial Copyright Industries (2009-2011)
3.7.1 Turnover Posted by the Partial Copyright Industries (2011)
The partial copyright industries posted a turnover of 72,791,767,554 TL in 2011 (considering the copyright factors). This fi gure accounted for 36.91% of the total turnover of 197,235,775,754 TL that was generated by all the copyright industries in 2011. Table 3.17 below shows the turnovers of the partial copyright industries in 2011.
Table 3-17: Turnover of the Partial Copyright Industries (2011)
Partial Copyright Industry Turnover-TL (without applying the
copyright factors)Turnover-TL (applying the
copyright factors)
Apparel, textiles and footwear 212,886,782,065 53,221,695,516
Jewelry and coins 17,018,618,817 1,191,303,317
Furniture 33.174.078.387 14,928,335,274
Household goods, china and glass 21,722,653,956 217,226,540
Wall coverings and carpets 11,506,969,043 1,150,696,904
Toys and games 1,330,966,034 39,928,981
Architecture, engineering and surveying 7,958,038,058 1,989,509,515
Museums 265,357,533 53,071,507
Figure 3.35 below shows the turnover shares of the partial copyright industries in 2011 within the total turnover of partial copyright industries.
Figure 3-35: Turnover Shares of the Partial Copyright Industries (2011, %)
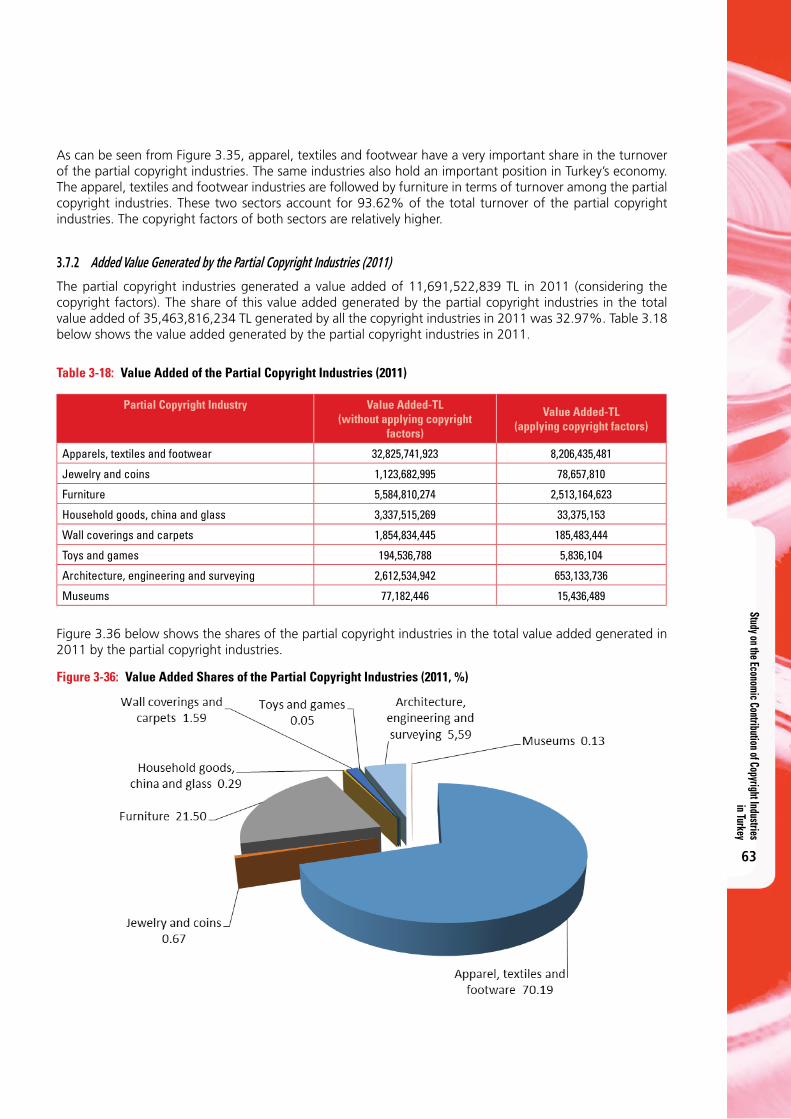
Study on the Economic Contribution of Copyright Industries in Turkey
63
As can be seen from Figure 3.35, apparel, textiles and footwear have a very important share in the turnover of the partial copyright industries. The same industries also hold an important position in Turkey’s economy. The apparel, textiles and footwear industries are followed by furniture in terms of turnover among the partial copyright industries. These two sectors account for 93.62% of the total turnover of the partial copyright industries. The copyright factors of both sectors are relatively higher.
3.7.2 Added Value Generated by the Partial Copyright Industries (2011)
The partial copyright industries generated a value added of 11,691,522,839 TL in 2011 (considering the copyright factors). The share of this value added generated by the partial copyright industries in the total value added of 35,463,816,234 TL generated by all the copyright industries in 2011 was 32.97%. Table 3.18 below shows the value added generated by the partial copyright industries in 2011.
Table 3-18: Value Added of the Partial Copyright Industries (2011)
Partial Copyright Industry Value Added-TL(without applying copyright
factors)
Value Added-TL(applying copyright factors)
Apparels, textiles and footwear 32,825,741,923 8,206,435,481
Jewelry and coins 1,123,682,995 78,657,810
Furniture 5,584,810,274 2,513,164,623
Household goods, china and glass 3,337,515,269 33,375,153
Wall coverings and carpets 1,854,834,445 185,483,444
Toys and games 194,536,788 5,836,104
Architecture, engineering and surveying 2,612,534,942 653,133,736
Museums 77,182,446 15,436,489
Figure 3.36 below shows the shares of the partial copyright industries in the total value added generated in 2011 by the partial copyright industries.
Figure 3-36: Value Added Shares of the Partial Copyright Industries (2011, %)
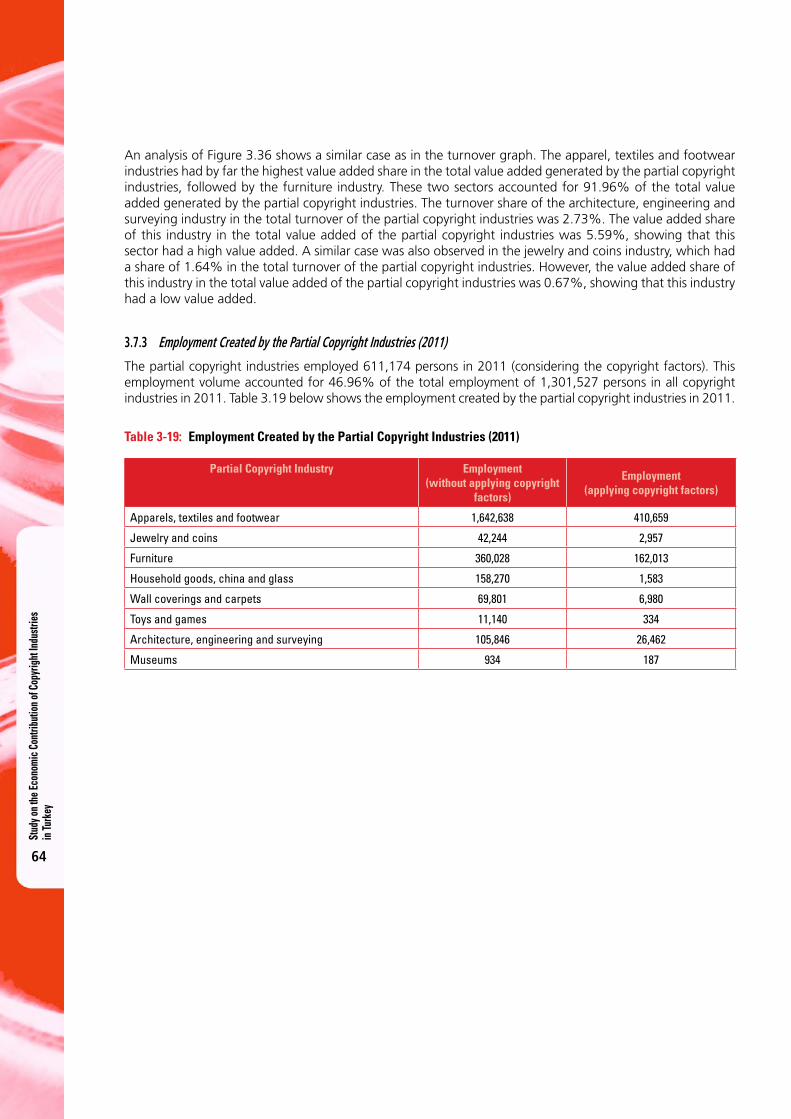
Stud
y on t
he Ec
onom
ic C
ontri
butio
n of C
opyr
ight
Indu
strie
s in
Turk
ey
64
An analysis of Figure 3.36 shows a similar case as in the turnover graph. The apparel, textiles and footwear industries had by far the highest value added share in the total value added generated by the partial copyright industries, followed by the furniture industry. These two sectors accounted for 91.96% of the total value added generated by the partial copyright industries. The turnover share of the architecture, engineering and surveying industry in the total turnover of the partial copyright industries was 2.73%. The value added share of this industry in the total value added of the partial copyright industries was 5.59%, showing that this sector had a high value added. A similar case was also observed in the jewelry and coins industry, which had a share of 1.64% in the total turnover of the partial copyright industries. However, the value added share of this industry in the total value added of the partial copyright industries was 0.67%, showing that this industry had a low value added.
3.7.3 Employment Created by the Partial Copyright Industries (2011)
The partial copyright industries employed 611,174 persons in 2011 (considering the copyright factors). This employment volume accounted for 46.96% of the total employment of 1,301,527 persons in all copyright industries in 2011. Table 3.19 below shows the employment created by the partial copyright industries in 2011.
Table 3-19: Employment Created by the Partial Copyright Industries (2011)
Partial Copyright Industry Employment (without applying copyright
factors)
Employment (applying copyright factors)
Apparels, textiles and footwear 1,642,638 410,659
Jewelry and coins 42,244 2,957
Furniture 360,028 162,013
Household goods, china and glass 158,270 1,583
Wall coverings and carpets 69,801 6,980
Toys and games 11,140 334
Architecture, engineering and surveying 105,846 26,462
Museums 934 187
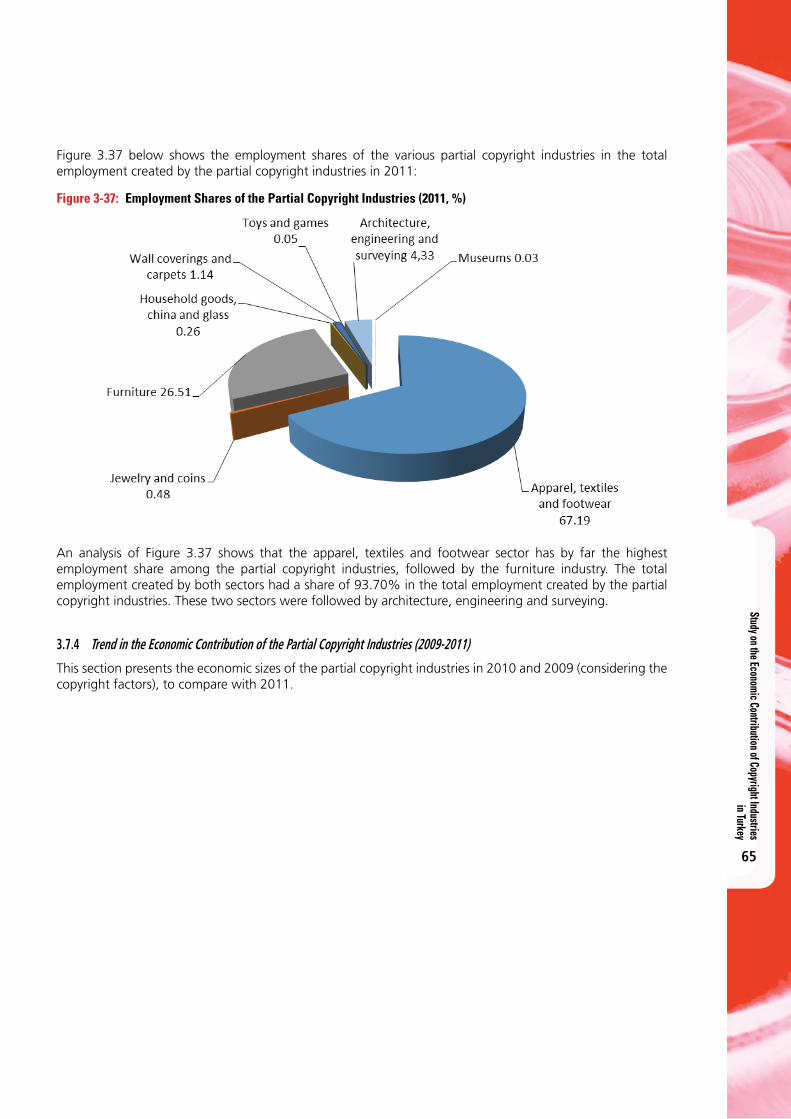
Study on the Economic Contribution of Copyright Industries in Turkey
65
Figure 3.37 below shows the employment shares of the various partial copyright industries in the total employment created by the partial copyright industries in 2011:
Figure 3-37: Employment Shares of the Partial Copyright Industries (2011, %)
An analysis of Figure 3.37 shows that the apparel, textiles and footwear sector has by far the highest employment share among the partial copyright industries, followed by the furniture industry. The total employment created by both sectors had a share of 93.70% in the total employment created by the partial copyright industries. These two sectors were followed by architecture, engineering and surveying.
3.7.4 Trend in the Economic Contribution of the Partial Copyright Industries (2009-2011)
This section presents the economic sizes of the partial copyright industries in 2010 and 2009 (considering the copyright factors), to compare with 2011.

Stud
y on t
he Ec
onom
ic C
ontri
butio
n of C
opyr
ight
Indu
strie
s in
Turk
ey
66
Tabl
e 3-
20:
Econ
omic
Siz
es o
f the
Par
tial C
opyr
ight
Indu
stri
es (2
009-
2011
– A
t Cur
rent
Pri
ces)
*
Part
ial I
ndus
trie
s
2009
2010
2011
2009
2010
2011
2009
2010
2011
2009
2010
2011
2009
2010
2011
2009
2010
2011
App
arel
s,te
xtile
san
dfo
otw
ear
42,5
55,3
64,5
4746
,007
,213
,576
53,2
21,6
95,5
1674
.76
74.6
673
.11
5,96
3,51
9,18
36,
664,
710,
755
8,20
6,43
5,48
169
.84
68.7
270
.19
377,
997
395,
091
410,
659
68.8
968
.40
67.1
9
Jew
elry
and
coi
ns97
7,66
2,96
271
1,19
7,31
61,
191,
303,
317
1.72
1.15
1.64
79,3
49,1
1059
,086
,488
78,6
57,8
100.
930.
610.
672,
584
2,60
72,
957
0.47
0.45
0.48
Furn
iture
11,1
16,2
68,2
1012
,096
,490
,886
14,9
28,3
35,2
7419
.53
19.6
320
.51
1,89
8,94
9,67
32,
190,
625,
425
2,51
3,16
4,62
322
.24
22.5
921
.50
139,
942
148,
197
162,
013
25.5
125
.66
26.5
1H
ouse
hold
good
s,ch
ina
and
glas
s21
0,37
0,97
019
6,35
6,31
321
7,22
6,54
00.
370.
320.
3031
,101
,277
32,8
23,5
1233
,375
,153
0.36
0.34
0.29
1,59
41,
511
1,58
30.
290.
260.
26
Wal
lco
veri
ngs
and
carp
ets
811,
820,
569
974,
719,
159
1,15
0,69
6,90
41.
431.
581.
5812
6,71
9,41
714
7,90
3,22
118
5,48
3,44
41.
481.
521.
596,
543
6,26
16,
980
1.19
1.08
1.14
Toys
and
gam
es28
,877
,515
35,1
09,9
6039
,928
,981
0.05
0.06
0.05
3,19
8,79
84,
002,
397
5,83
6,10
40.
040.
040.
0528
433
733
40.
050.
060.
05A
rchi
tect
ure,
en
gine
erin
g an
d su
rvey
ing
1,19
2,81
4,59
71,
566,
109,
365
1,98
9,50
9,51
52.
102.
542.
7342
3,11
6,32
258
7,05
7,50
665
3,13
3,73
64.
966.
055.
5919
,497
23,3
6526
,462
3.55
4.05
4.33
Mus
eum
s31
,248
,888
36,3
04,4
1853
,071
,507
0.05
0.06
0.07
12,2
72,4
7012
,805
,925
15,4
36,4
890.
140.
130.
1321
720
918
70.
040.
040.
03
Shar
e in
par
tial
Cop
yrig
ht
indu
strie
s (%
)Tu
rnov
er (T
L)V
alue
Add
ed (T
L)Em
ploy
men
tSh
are
in p
artia
l C
opyr
ight
in
dust
ries (
%)
Shar
e in
par
tial
Cop
yrig
ht
indu
strie
s (%
)
* C
opyr
ight
fac
tors
are
app
lied.
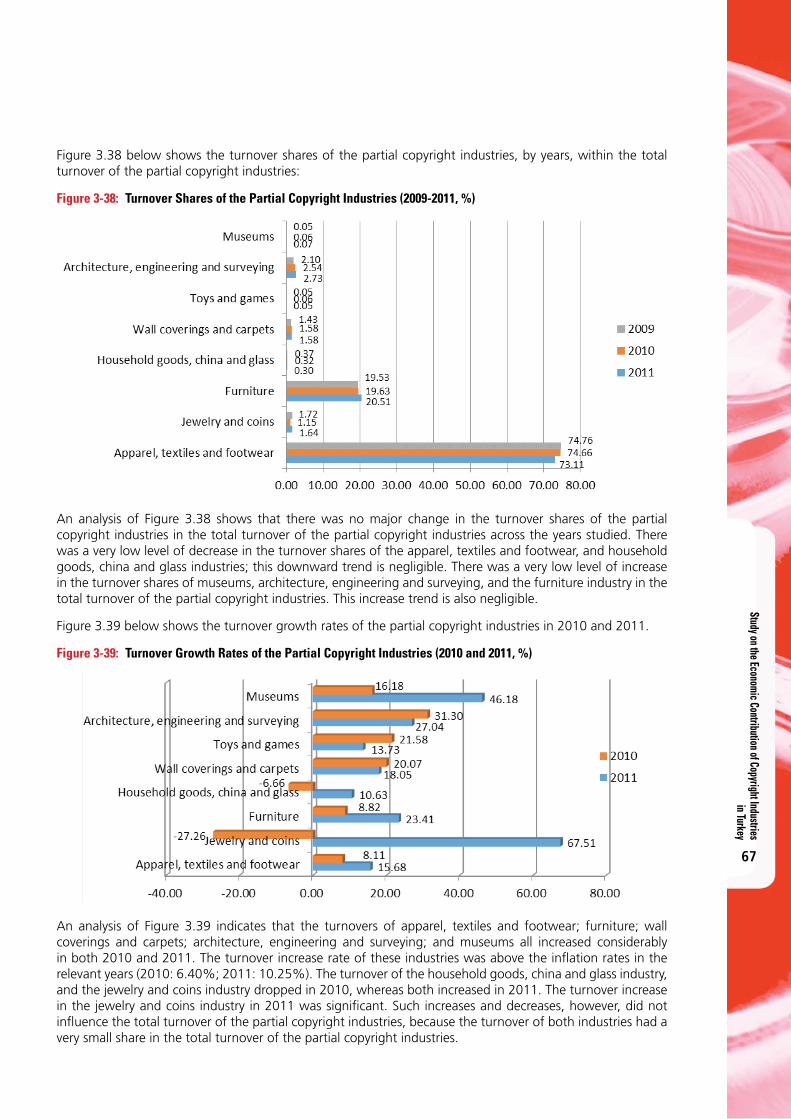
Study on the Economic Contribution of Copyright Industries in Turkey
67
Figure 3.38 below shows the turnover shares of the partial copyright industries, by years, within the total turnover of the partial copyright industries:
Figure 3-38: Turnover Shares of the Partial Copyright Industries (2009-2011, %)
An analysis of Figure 3.38 shows that there was no major change in the turnover shares of the partial copyright industries in the total turnover of the partial copyright industries across the years studied. There was a very low level of decrease in the turnover shares of the apparel, textiles and footwear, and household goods, china and glass industries; this downward trend is negligible. There was a very low level of increase in the turnover shares of museums, architecture, engineering and surveying, and the furniture industry in the total turnover of the partial copyright industries. This increase trend is also negligible.
Figure 3.39 below shows the turnover growth rates of the partial copyright industries in 2010 and 2011.
Figure 3-39: Turnover Growth Rates of the Partial Copyright Industries (2010 and 2011, %)
An analysis of Figure 3.39 indicates that the turnovers of apparel, textiles and footwear; furniture; wall coverings and carpets; architecture, engineering and surveying; and museums all increased considerably in both 2010 and 2011. The turnover increase rate of these industries was above the infl ation rates in the relevant years (2010: 6.40%; 2011: 10.25%). The turnover of the household goods, china and glass industry, and the jewelry and coins industry dropped in 2010, whereas both increased in 2011. The turnover increase in the jewelry and coins industry in 2011 was signifi cant. Such increases and decreases, however, did not infl uence the total turnover of the partial copyright industries, because the turnover of both industries had a very small share in the total turnover of the partial copyright industries.
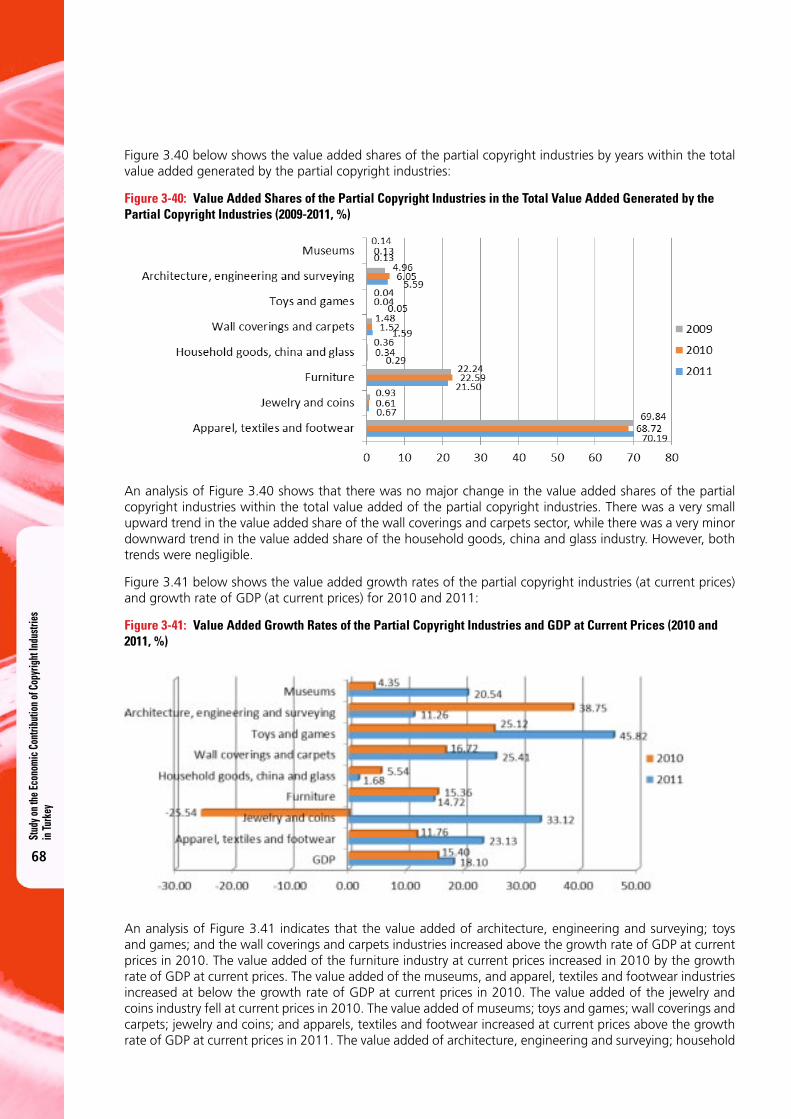
Stud
y on t
he Ec
onom
ic C
ontri
butio
n of C
opyr
ight
Indu
strie
s in
Turk
ey
68
Figure 3.40 below shows the value added shares of the partial copyright industries by years within the total value added generated by the partial copyright industries:
Figure 3-40: Value Added Shares of the Partial Copyright Industries in the Total Value Added Generated by the Partial Copyright Industries (2009-2011, %)
An analysis of Figure 3.40 shows that there was no major change in the value added shares of the partial copyright industries within the total value added of the partial copyright industries. There was a very small upward trend in the value added share of the wall coverings and carpets sector, while there was a very minor downward trend in the value added share of the household goods, china and glass industry. However, both trends were negligible.
Figure 3.41 below shows the value added growth rates of the partial copyright industries (at current prices) and growth rate of GDP (at current prices) for 2010 and 2011:
Figure 3-41: Value Added Growth Rates of the Partial Copyright Industries and GDP at Current Prices (2010 and 2011, %)
An analysis of Figure 3.41 indicates that the value added of architecture, engineering and surveying; toys and games; and the wall coverings and carpets industries increased above the growth rate of GDP at current prices in 2010. The value added of the furniture industry at current prices increased in 2010 by the growth rate of GDP at current prices. The value added of the museums, and apparel, textiles and footwear industries increased at below the growth rate of GDP at current prices in 2010. The value added of the jewelry and coins industry fell at current prices in 2010. The value added of museums; toys and games; wall coverings and carpets; jewelry and coins; and apparels, textiles and footwear increased at current prices above the growth rate of GDP at current prices in 2011. The value added of architecture, engineering and surveying; household
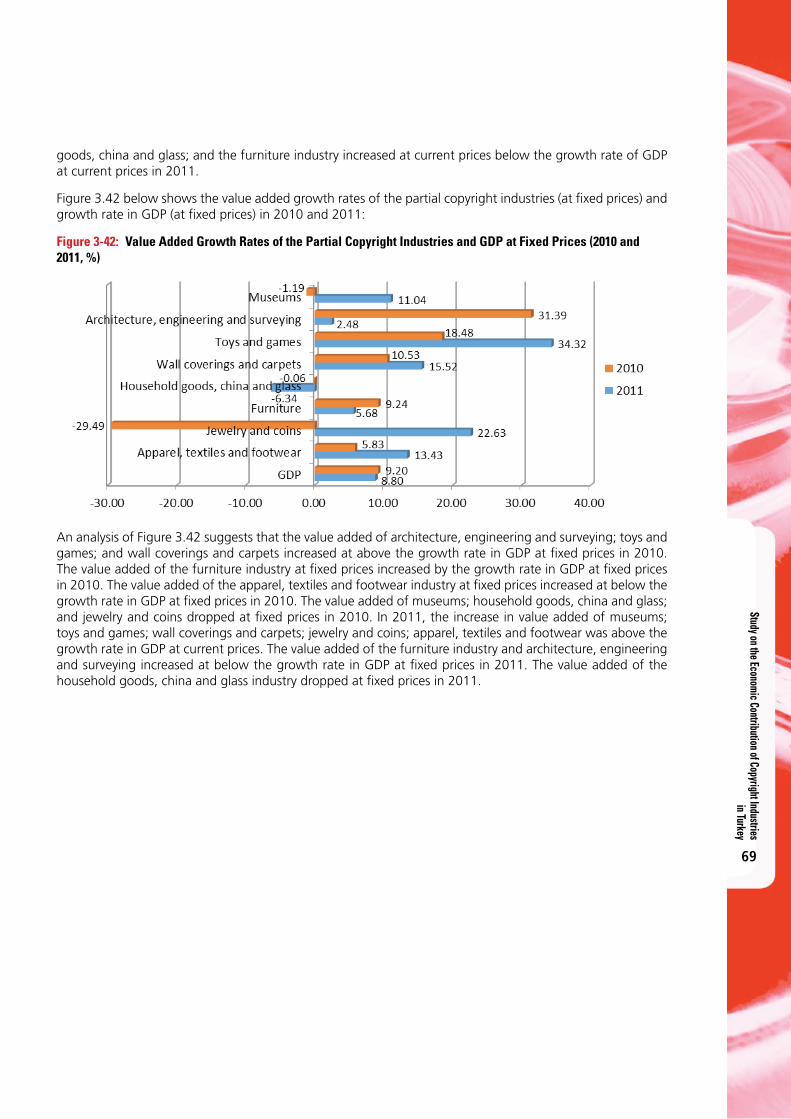
Study on the Economic Contribution of Copyright Industries in Turkey
69
goods, china and glass; and the furniture industry increased at current prices below the growth rate of GDP at current prices in 2011.
Figure 3.42 below shows the value added growth rates of the partial copyright industries (at fi xed prices) and growth rate in GDP (at fi xed prices) in 2010 and 2011:
Figure 3-42: Value Added Growth Rates of the Partial Copyright Industries and GDP at Fixed Prices (2010 and 2011, %)
An analysis of Figure 3.42 suggests that the value added of architecture, engineering and surveying; toys and games; and wall coverings and carpets increased at above the growth rate in GDP at fi xed prices in 2010. The value added of the furniture industry at fi xed prices increased by the growth rate in GDP at fi xed prices in 2010. The value added of the apparel, textiles and footwear industry at fi xed prices increased at below the growth rate in GDP at fi xed prices in 2010. The value added of museums; household goods, china and glass; and jewelry and coins dropped at fi xed prices in 2010. In 2011, the increase in value added of museums; toys and games; wall coverings and carpets; jewelry and coins; apparel, textiles and footwear was above the growth rate in GDP at current prices. The value added of the furniture industry and architecture, engineering and surveying increased at below the growth rate in GDP at fi xed prices in 2011. The value added of the household goods, china and glass industry dropped at fi xed prices in 2011.
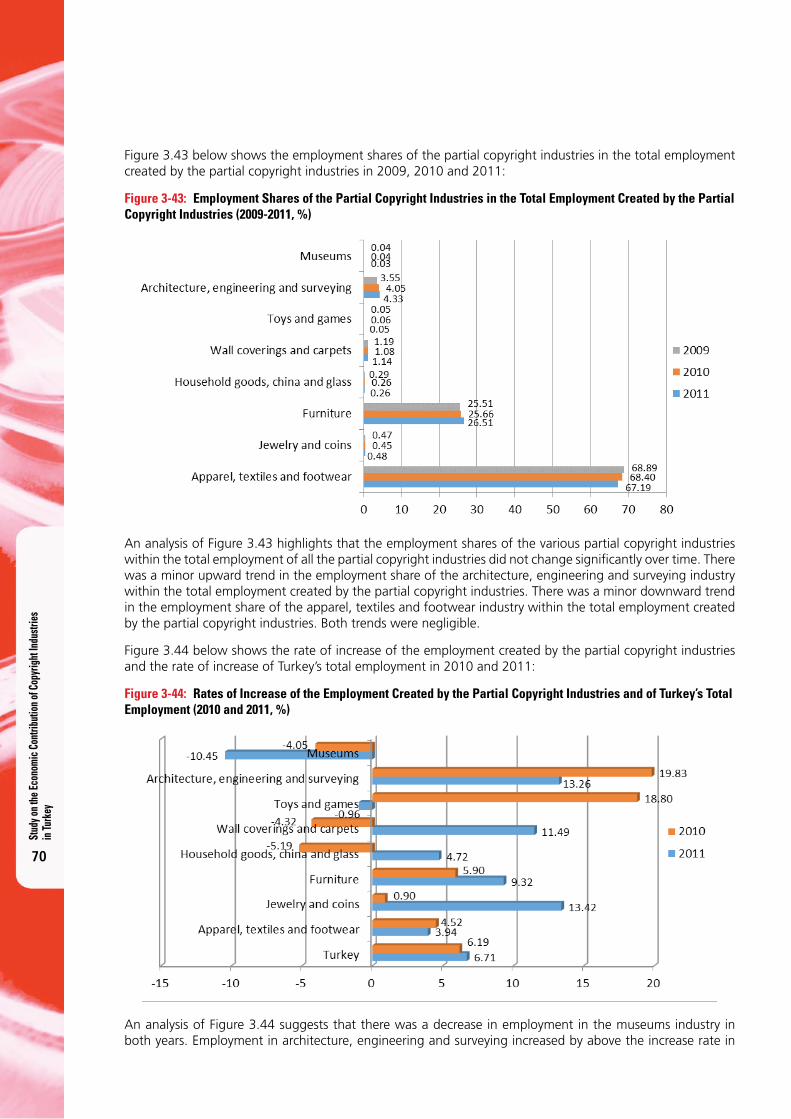
Stud
y on t
he Ec
onom
ic C
ontri
butio
n of C
opyr
ight
Indu
strie
s in
Turk
ey
70
Figure 3.43 below shows the employment shares of the partial copyright industries in the total employment created by the partial copyright industries in 2009, 2010 and 2011:
Figure 3-43: Employment Shares of the Partial Copyright Industries in the Total Employment Created by the Partial Copyright Industries (2009-2011, %)
An analysis of Figure 3.43 highlights that the employment shares of the various partial copyright industries within the total employment of all the partial copyright industries did not change signifi cantly over time. There was a minor upward trend in the employment share of the architecture, engineering and surveying industry within the total employment created by the partial copyright industries. There was a minor downward trend in the employment share of the apparel, textiles and footwear industry within the total employment created by the partial copyright industries. Both trends were negligible.
Figure 3.44 below shows the rate of increase of the employment created by the partial copyright industries and the rate of increase of Turkey’s total employment in 2010 and 2011:
Figure 3-44: Rates of Increase of the Employment Created by the Partial Copyright Industries and of Turkey’s Total Employment (2010 and 2011, %)
An analysis of Figure 3.44 suggests that there was a decrease in employment in the museums industry in both years. Employment in architecture, engineering and surveying increased by above the increase rate in
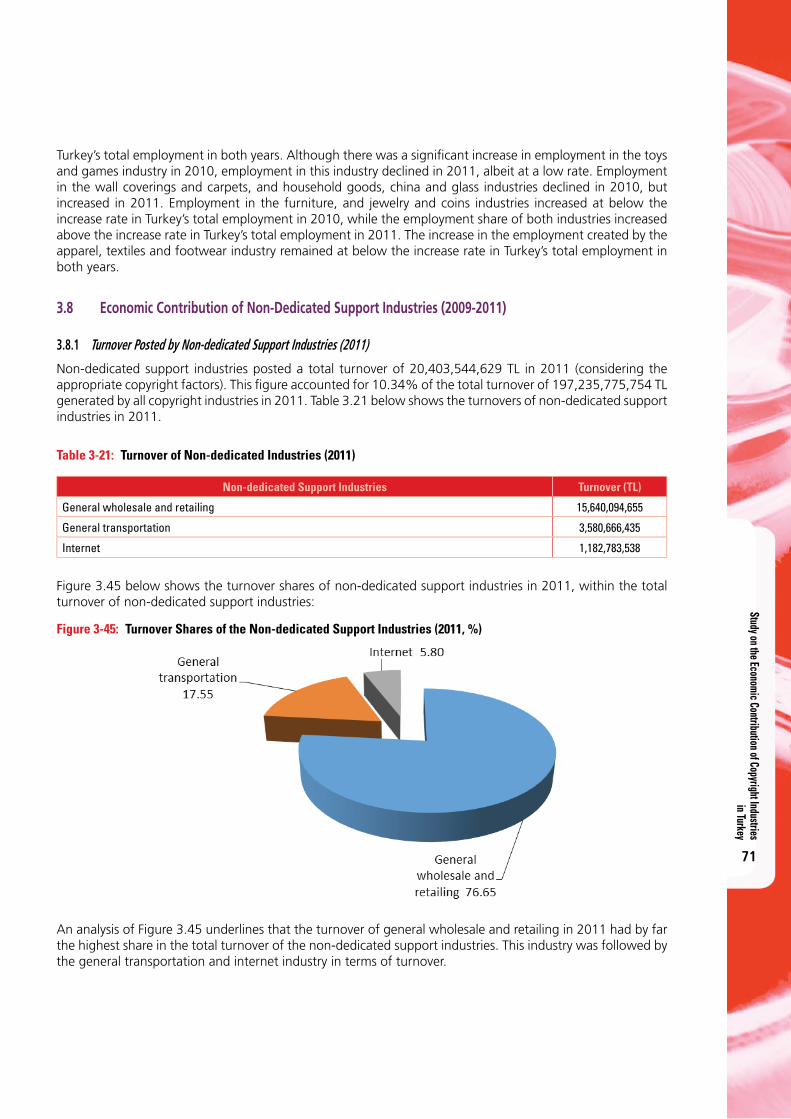
Study on the Economic Contribution of Copyright Industries in Turkey
71
Turkey’s total employment in both years. Although there was a signifi cant increase in employment in the toys and games industry in 2010, employment in this industry declined in 2011, albeit at a low rate. Employment in the wall coverings and carpets, and household goods, china and glass industries declined in 2010, but increased in 2011. Employment in the furniture, and jewelry and coins industries increased at below the increase rate in Turkey’s total employment in 2010, while the employment share of both industries increased above the increase rate in Turkey’s total employment in 2011. The increase in the employment created by the apparel, textiles and footwear industry remained at below the increase rate in Turkey’s total employment in both years.
3.8 Economic Contribution of Non-Dedicated Support Industries (2009-2011)
3.8.1 Turnover Posted by Non-dedicated Support Industries (2011)
Non-dedicated support industries posted a total turnover of 20,403,544,629 TL in 2011 (considering the appropriate copyright factors). This fi gure accounted for 10.34% of the total turnover of 197,235,775,754 TL generated by all copyright industries in 2011. Table 3.21 below shows the turnovers of non-dedicated support industries in 2011.
Table 3-21: Turnover of Non-dedicated Industries (2011)
Non-dedicated Support Industries Turnover (TL)
General wholesale and retailing 15,640,094,655
General transportation 3,580,666,435
Internet 1,182,783,538
Figure 3.45 below shows the turnover shares of non-dedicated support industries in 2011, within the total turnover of non-dedicated support industries:
Figure 3-45: Turnover Shares of the Non-dedicated Support Industries (2011, %)
An analysis of Figure 3.45 underlines that the turnover of general wholesale and retailing in 2011 had by far the highest share in the total turnover of the non-dedicated support industries. This industry was followed by the general transportation and internet industry in terms of turnover.
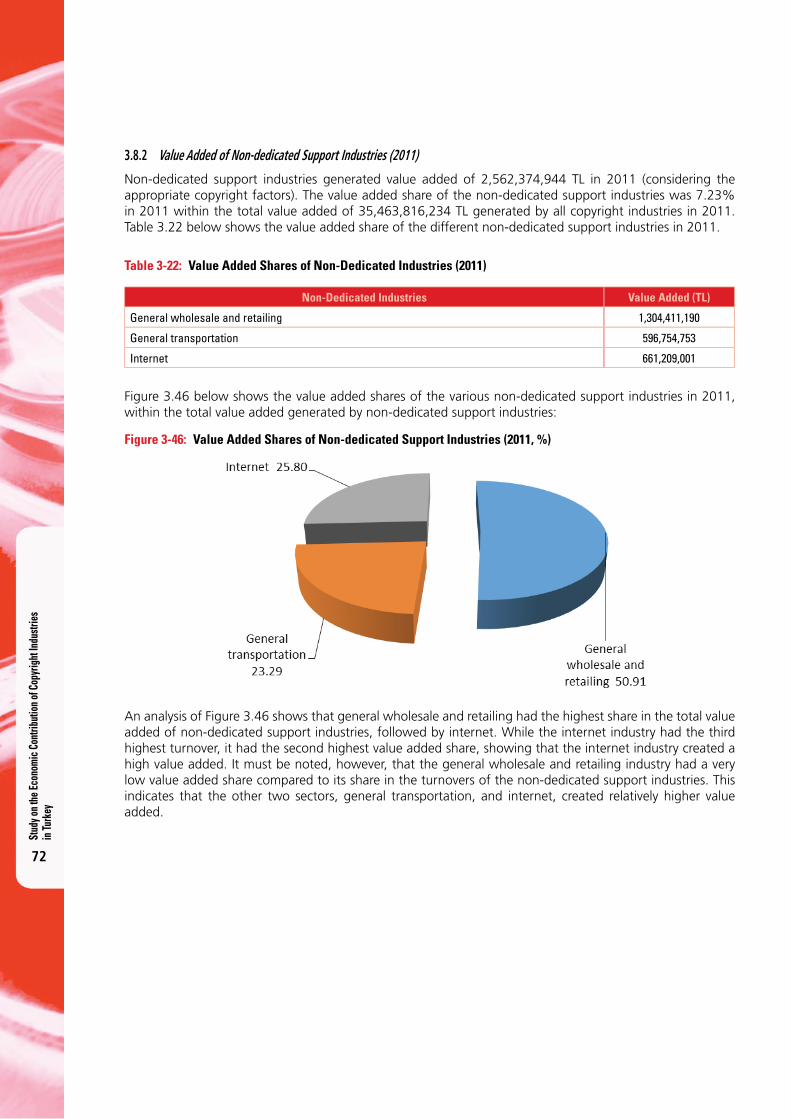
Stud
y on t
he Ec
onom
ic C
ontri
butio
n of C
opyr
ight
Indu
strie
s in
Turk
ey
72
3.8.2 Value Added of Non-dedicated Support Industries (2011)
Non-dedicated support industries generated value added of 2,562,374,944 TL in 2011 (considering the appropriate copyright factors). The value added share of the non-dedicated support industries was 7.23% in 2011 within the total value added of 35,463,816,234 TL generated by all copyright industries in 2011. Table 3.22 below shows the value added share of the different non-dedicated support industries in 2011.
Table 3-22: Value Added Shares of Non-Dedicated Industries (2011)
Non-Dedicated Industries Value Added (TL)
General wholesale and retailing 1,304,411,190
General transportation 596,754,753
Internet 661,209,001
Figure 3.46 below shows the value added shares of the various non-dedicated support industries in 2011, within the total value added generated by non-dedicated support industries:
Figure 3-46: Value Added Shares of Non-dedicated Support Industries (2011, %)
An analysis of Figure 3.46 shows that general wholesale and retailing had the highest share in the total value added of non-dedicated support industries, followed by internet. While the internet industry had the third highest turnover, it had the second highest value added share, showing that the internet industry created a high value added. It must be noted, however, that the general wholesale and retailing industry had a very low value added share compared to its share in the turnovers of the non-dedicated support industries. This indicates that the other two sectors, general transportation, and internet, created relatively higher value added.
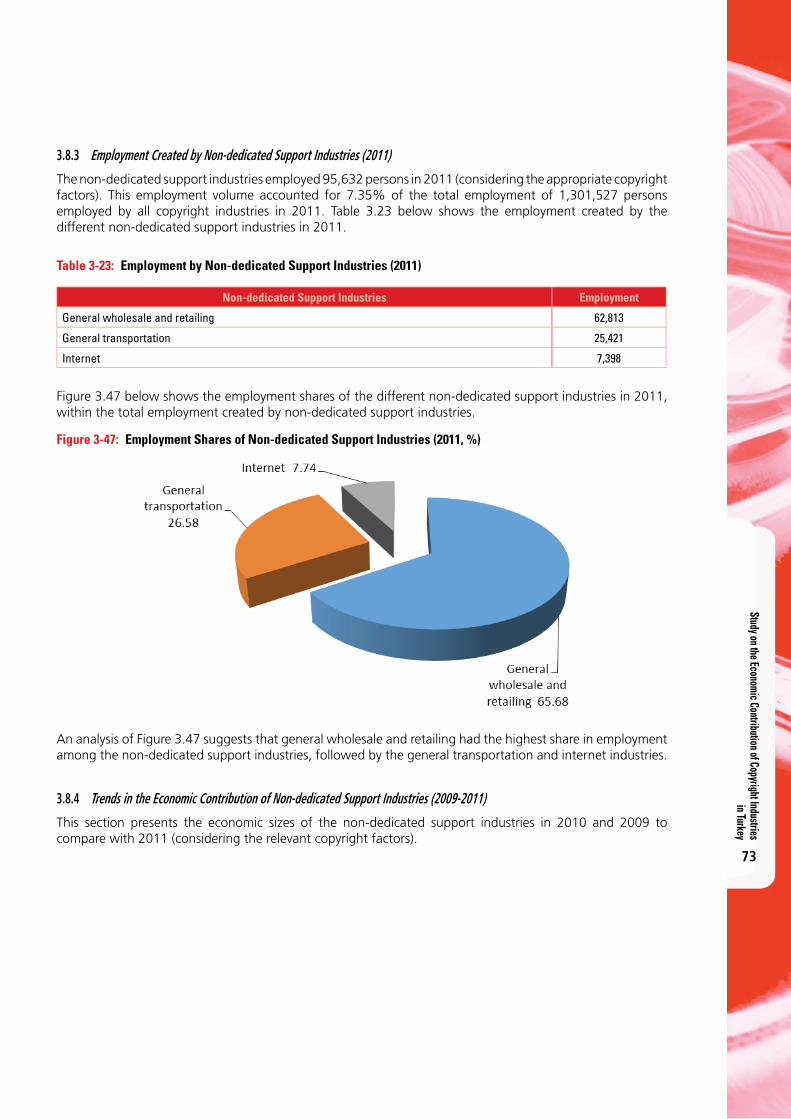
Study on the Economic Contribution of Copyright Industries in Turkey
73
3.8.3 Employment Created by Non-dedicated Support Industries (2011)
The non-dedicated support industries employed 95,632 persons in 2011 (considering the appropriate copyright factors). This employment volume accounted for 7.35% of the total employment of 1,301,527 persons employed by all copyright industries in 2011. Table 3.23 below shows the employment created by the different non-dedicated support industries in 2011.
Table 3-23: Employment by Non-dedicated Support Industries (2011)
Non-dedicated Support Industries Employment
General wholesale and retailing 62,813
General transportation 25,421
Internet 7,398
Figure 3.47 below shows the employment shares of the different non-dedicated support industries in 2011, within the total employment created by non-dedicated support industries.
Figure 3-47: Employment Shares of Non-dedicated Support Industries (2011, %)
An analysis of Figure 3.47 suggests that general wholesale and retailing had the highest share in employment among the non-dedicated support industries, followed by the general transportation and internet industries.
3.8.4 Trends in the Economic Contribution of Non-dedicated Support Industries (2009-2011)
This section presents the economic sizes of the non-dedicated support industries in 2010 and 2009 to compare with 2011 (considering the relevant copyright factors).

Stud
y on t
he Ec
onom
ic C
ontri
butio
n of C
opyr
ight
Indu
strie
s in
Turk
ey
74
Tabl
e 3-
24:
Econ
omic
Siz
es o
f Non
-ded
icat
ed S
uppo
rt In
dust
ries
in (2
009-
2011
– A
t Cur
rent
Pri
ces)
Non
-ded
icat
ed
supp
ort i
ndus
trie
s
2009
2010
2011
2009
2010
2011
2009
2010
2011
2009
2010
2011
2009
2010
2011
2009
2010
2011
Gen
eral
who
lesa
lean
dre
taili
ng13
,069
,283
,930
14,0
71,5
85,1
4715
,640
,094
,655
79.6
175
.97
76.6
51,
107,
498,
854
1,18
2,55
4,13
41,
304,
411,
190
53.0
049
.31
50.9
164
,242
60,3
9562
,813
67.6
364
.19
65.6
8
Gen
eral
tran
spor
tatio
n2,
481,
403,
438
3,24
0,23
3,64
43,
580,
666,
435
15.1
217
.49
17.5
545
2,72
5,51
955
0,73
2,52
759
6,75
4,75
321
.67
22.9
623
.29
24,3
3825
,553
25,4
2125
.62
27.1
626
.58
Inte
rnet
866,
054,
922
1,21
0,30
5,58
41,
182,
783,
538
5.28
6.53
5.80
529,
354,
578
664,
886,
063
661,
209,
001
25.3
327
.72
25.8
06,
415
8,14
07,
398
6.75
8.65
7.74
Turn
over
(TL)
Shar
e in
non
-de
dica
ted
supp
ort
indu
strie
s (%
)V
alue
Add
ed (T
L)Sh
are
in n
on-
dedi
cate
d su
ppor
t in
dust
ries (
%)
Empl
oym
ent
Shar
e in
non
-de
dica
ted
supp
ort
indu
strie
s (%
)
Cop
yrig
ht f
acto
rs a
re a
pplie
d
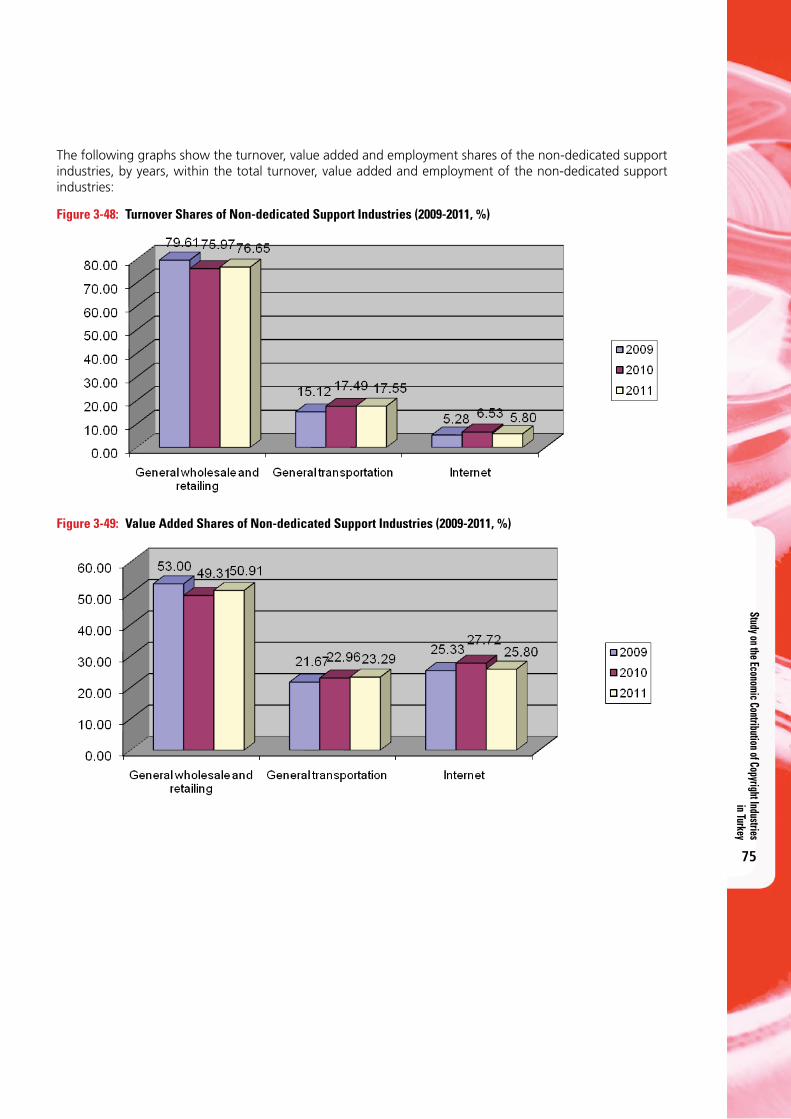
Study on the Economic Contribution of Copyright Industries in Turkey
75
The following graphs show the turnover, value added and employment shares of the non-dedicated support industries, by years, within the total turnover, value added and employment of the non-dedicated support industries:
Figure 3-48: Turnover Shares of Non-dedicated Support Industries (2009-2011, %)
Figure 3-49: Value Added Shares of Non-dedicated Support Industries (2009-2011, %)
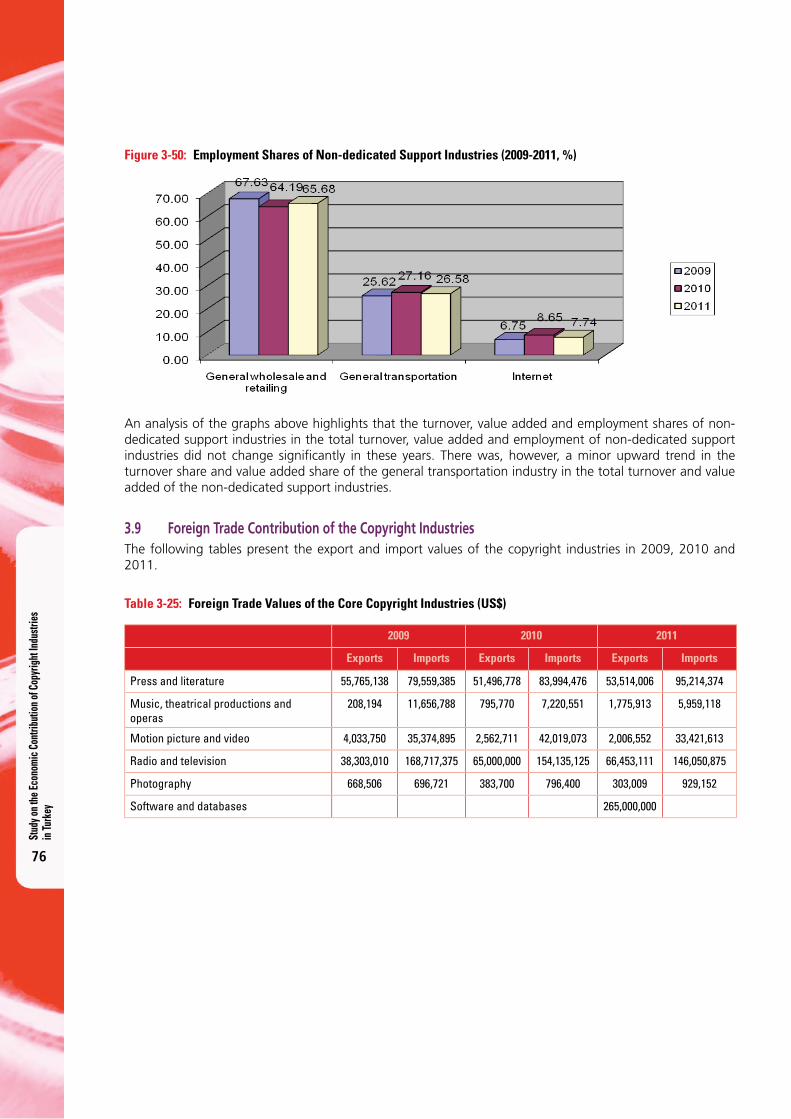
Stud
y on t
he Ec
onom
ic C
ontri
butio
n of C
opyr
ight
Indu
strie
s in
Turk
ey
76
Figure 3-50: Employment Shares of Non-dedicated Support Industries (2009-2011, %)
An analysis of the graphs above highlights that the turnover, value added and employment shares of non-dedicated support industries in the total turnover, value added and employment of non-dedicated support industries did not change signifi cantly in these years. There was, however, a minor upward trend in the turnover share and value added share of the general transportation industry in the total turnover and value added of the non-dedicated support industries.
3.9 Foreign Trade Contribution of the Copyright Industries The following tables present the export and import values of the copyright industries in 2009, 2010 and 2011.
Table 3-25: Foreign Trade Values of the Core Copyright Industries (US$)
2009 2010 2011
Exports Imports Exports Imports Exports Imports
Press and literature 55,765,138 79,559,385 51,496,778 83,994,476 53,514,006 95,214,374
Music, theatrical productions and operas
208,194 11,656,788 795,770 7,220,551 1,775,913 5,959,118
Motion picture and video 4,033,750 35,374,895 2,562,711 42,019,073 2,006,552 33,421,613
Radio and television 38,303,010 168,717,375 65,000,000 154,135,125 66,453,111 146,050,875
Photography 668,506 696,721 383,700 796,400 303,009 929,152
Software and databases 265,000,000
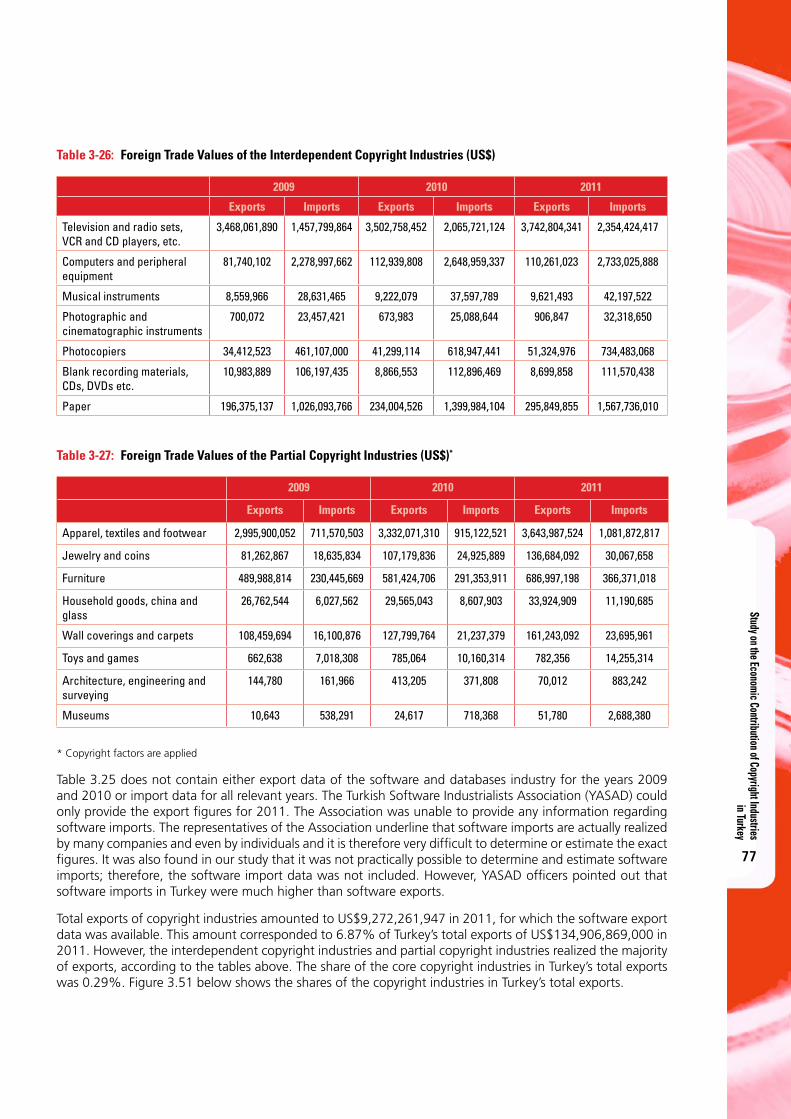
Study on the Economic Contribution of Copyright Industries in Turkey
77
Table 3-26: Foreign Trade Values of the Interdependent Copyright Industries (US$)
2009 2010 2011
Exports Imports Exports Imports Exports Imports
Television and radio sets, VCR and CD players, etc.
3,468,061,890 1,457,799,864 3,502,758,452 2,065,721,124 3,742,804,341 2,354,424,417
Computers and peripheral equipment
81,740,102 2,278,997,662 112,939,808 2,648,959,337 110,261,023 2,733,025,888
Musical instruments 8,559,966 28,631,465 9,222,079 37,597,789 9,621,493 42,197,522
Photographic and cinematographic instruments
700,072 23,457,421 673,983 25,088,644 906,847 32,318,650
Photocopiers 34,412,523 461,107,000 41,299,114 618,947,441 51,324,976 734,483,068
Blank recording materials, CDs, DVDs etc.
10,983,889 106,197,435 8,866,553 112,896,469 8,699,858 111,570,438
Paper 196,375,137 1,026,093,766 234,004,526 1,399,984,104 295,849,855 1,567,736,010
Table 3-27: Foreign Trade Values of the Partial Copyright Industries (US$)*
2009 2010 2011
Exports Imports Exports Imports Exports Imports
Apparel, textiles and footwear 2,995,900,052 711,570,503 3,332,071,310 915,122,521 3,643,987,524 1,081,872,817
Jewelry and coins 81,262,867 18,635,834 107,179,836 24,925,889 136,684,092 30,067,658
Furniture 489,988,814 230,445,669 581,424,706 291,353,911 686,997,198 366,371,018
Household goods, china and glass
26,762,544 6,027,562 29,565,043 8,607,903 33,924,909 11,190,685
Wall coverings and carpets 108,459,694 16,100,876 127,799,764 21,237,379 161,243,092 23,695,961
Toys and games 662,638 7,018,308 785,064 10,160,314 782,356 14,255,314
Architecture, engineering and surveying
144,780 161,966 413,205 371,808 70,012 883,242
Museums 10,643 538,291 24,617 718,368 51,780 2,688,380
* Copyright factors are applied
Table 3.25 does not contain either export data of the software and databases industry for the years 2009 and 2010 or import data for all relevant years. The Turkish Software Industrialists Association (YASAD) could only provide the export figures for 2011. The Association was unable to provide any information regarding software imports. The representatives of the Association underline that software imports are actually realized by many companies and even by individuals and it is therefore very difficult to determine or estimate the exact figures. It was also found in our study that it was not practically possible to determine and estimate software imports; therefore, the software import data was not included. However, YASAD officers pointed out that software imports in Turkey were much higher than software exports.
Total exports of copyright industries amounted to US$9,272,261,947 in 2011, for which the software export data was available. This amount corresponded to 6.87% of Turkey’s total exports of US$134,906,869,000 in 2011. However, the interdependent copyright industries and partial copyright industries realized the majority of exports, according to the tables above. The share of the core copyright industries in Turkey’s total exports was 0.29%. Figure 3.51 below shows the shares of the copyright industries in Turkey’s total exports.
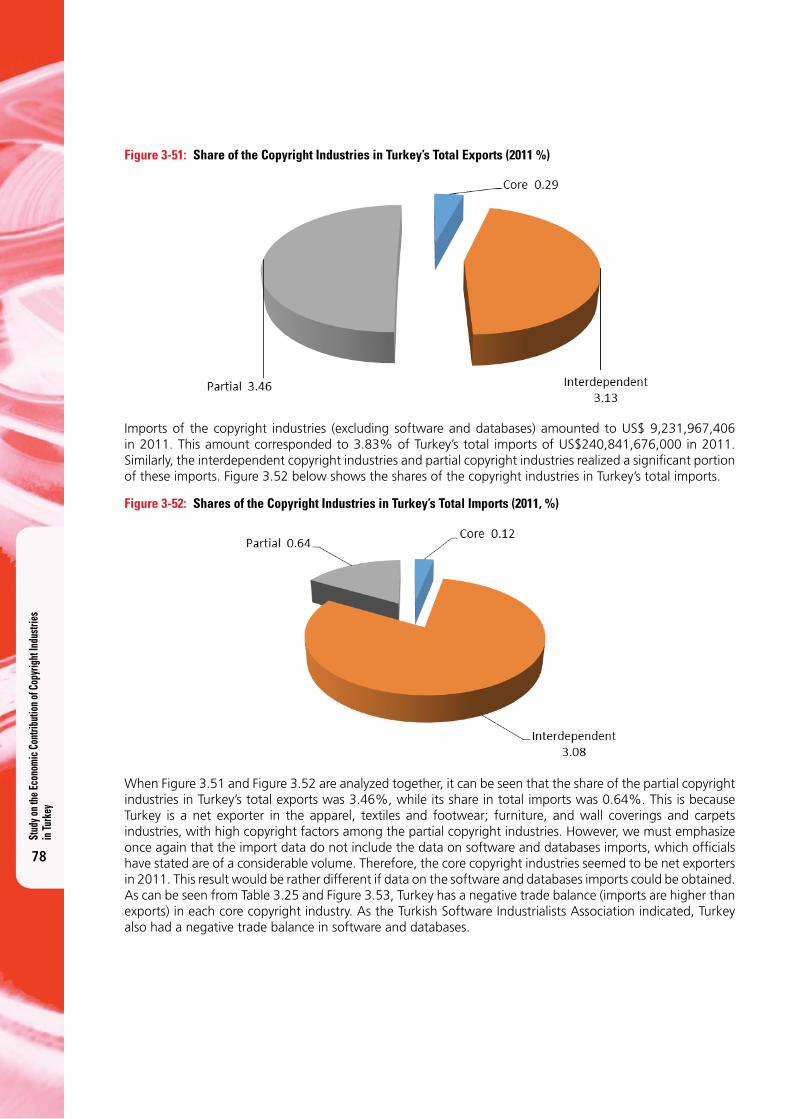
Stud
y on t
he Ec
onom
ic C
ontri
butio
n of C
opyr
ight
Indu
strie
s in
Turk
ey
78
Figure 3-51: Share of the Copyright Industries in Turkey’s Total Exports (2011 %)
Imports of the copyright industries (excluding software and databases) amounted to US$ 9,231,967,406 in 2011. This amount corresponded to 3.83% of Turkey’s total imports of US$240,841,676,000 in 2011. Similarly, the interdependent copyright industries and partial copyright industries realized a signifi cant portion of these imports. Figure 3.52 below shows the shares of the copyright industries in Turkey’s total imports.
Figure 3-52: Shares of the Copyright Industries in Turkey’s Total Imports (2011, %)
When Figure 3.51 and Figure 3.52 are analyzed together, it can be seen that the share of the partial copyright industries in Turkey’s total exports was 3.46%, while its share in total imports was 0.64%. This is because Turkey is a net exporter in the apparel, textiles and footwear; furniture, and wall coverings and carpets industries, with high copyright factors among the partial copyright industries. However, we must emphasize once again that the import data do not include the data on software and databases imports, which offi cials have stated are of a considerable volume. Therefore, the core copyright industries seemed to be net exporters in 2011. This result would be rather different if data on the software and databases imports could be obtained. As can be seen from Table 3.25 and Figure 3.53, Turkey has a negative trade balance (imports are higher than exports) in each core copyright industry. As the Turkish Software Industrialists Association indicated, Turkey also had a negative trade balance in software and databases.
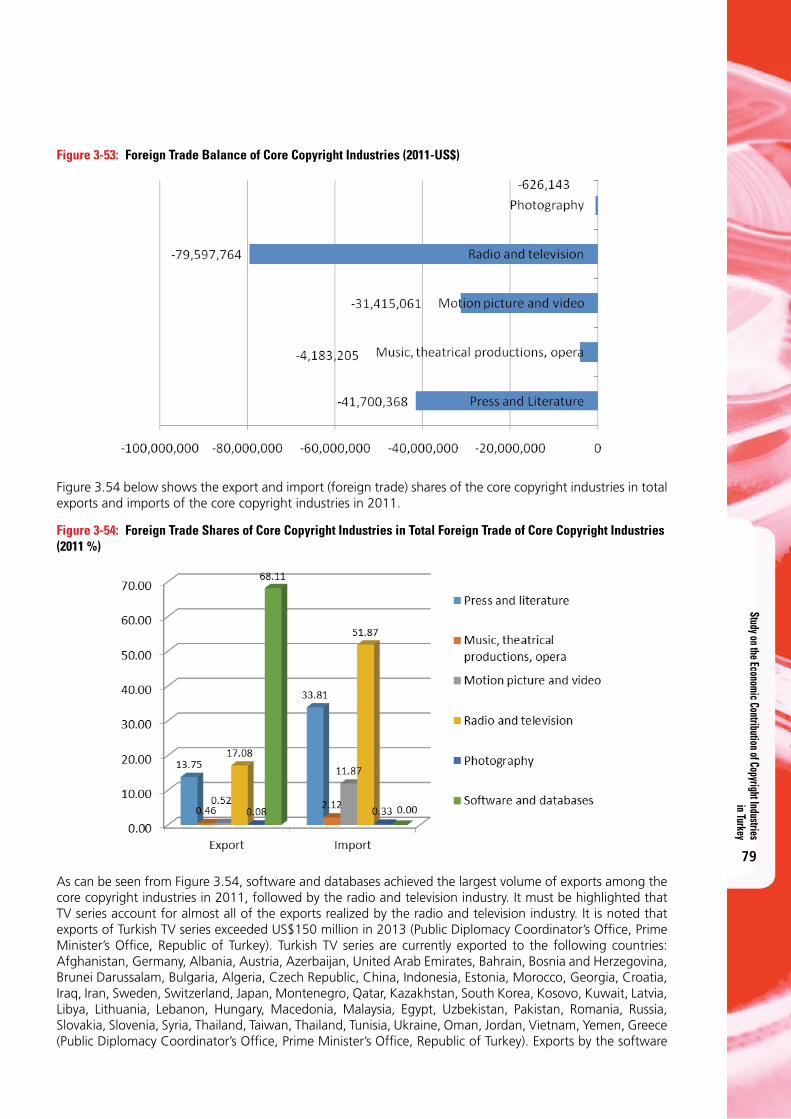
Study on the Economic Contribution of Copyright Industries in Turkey
79
Figure 3-53: Foreign Trade Balance of Core Copyright Industries (2011-US$)
Figure 3.54 below shows the export and import (foreign trade) shares of the core copyright industries in total exports and imports of the core copyright industries in 2011.
Figure 3-54: Foreign Trade Shares of Core Copyright Industries in Total Foreign Trade of Core Copyright Industries (2011 %)
As can be seen from Figure 3.54, software and databases achieved the largest volume of exports among the core copyright industries in 2011, followed by the radio and television industry. It must be highlighted that TV series account for almost all of the exports realized by the radio and television industry. It is noted that exports of Turkish TV series exceeded US$150 million in 2013 (Public Diplomacy Coordinator’s Offi ce, Prime Minister’s Offi ce, Republic of Turkey). Turkish TV series are currently exported to the following countries: Afghanistan, Germany, Albania, Austria, Azerbaijan, United Arab Emirates, Bahrain, Bosnia and Herzegovina, Brunei Darussalam, Bulgaria, Algeria, Czech Republic, China, Indonesia, Estonia, Morocco, Georgia, Croatia, Iraq, Iran, Sweden, Switzerland, Japan, Montenegro, Qatar, Kazakhstan, South Korea, Kosovo, Kuwait, Latvia, Libya, Lithuania, Lebanon, Hungary, Macedonia, Malaysia, Egypt, Uzbekistan, Pakistan, Romania, Russia, Slovakia, Slovenia, Syria, Thailand, Taiwan, Thailand, Tunisia, Ukraine, Oman, Jordan, Vietnam, Yemen, Greece (Public Diplomacy Coordinator’s Offi ce, Prime Minister’s Offi ce, Republic of Turkey). Exports by the software
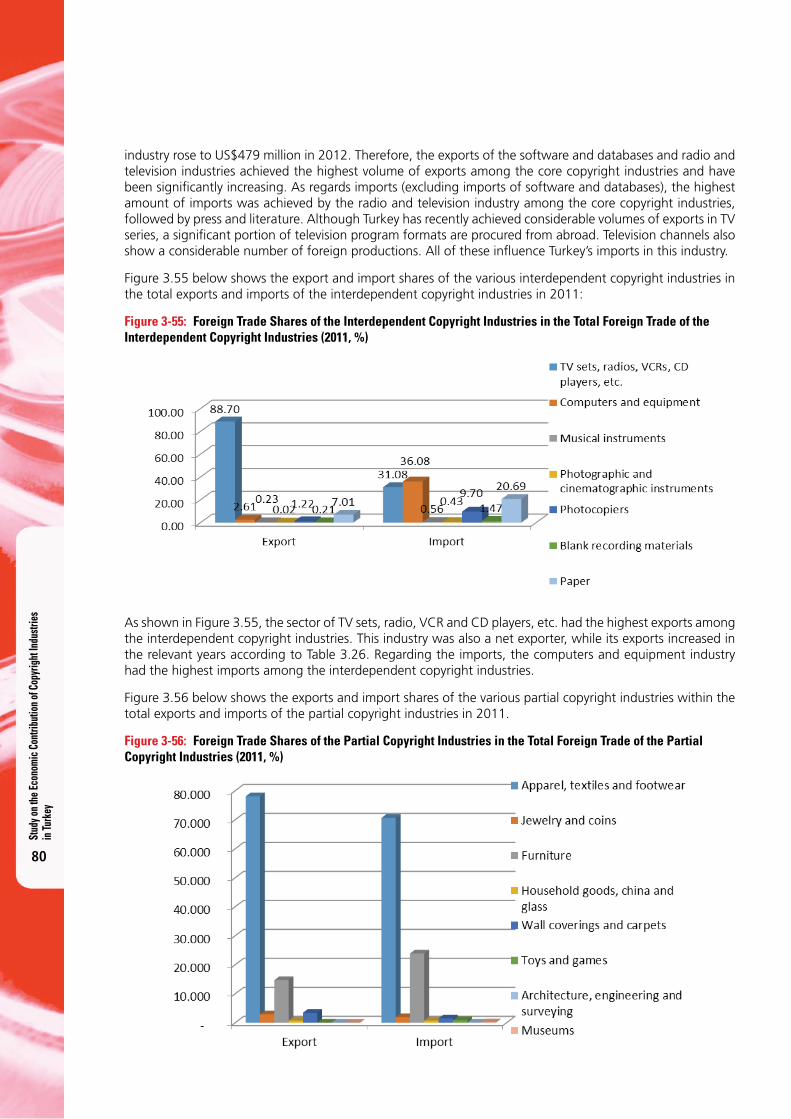
Stud
y on t
he Ec
onom
ic C
ontri
butio
n of C
opyr
ight
Indu
strie
s in
Turk
ey
80
industry rose to US$479 million in 2012. Therefore, the exports of the software and databases and radio and television industries achieved the highest volume of exports among the core copyright industries and have been signifi cantly increasing. As regards imports (excluding imports of software and databases), the highest amount of imports was achieved by the radio and television industry among the core copyright industries, followed by press and literature. Although Turkey has recently achieved considerable volumes of exports in TV series, a signifi cant portion of television program formats are procured from abroad. Television channels also show a considerable number of foreign productions. All of these infl uence Turkey’s imports in this industry.
Figure 3.55 below shows the export and import shares of the various interdependent copyright industries in the total exports and imports of the interdependent copyright industries in 2011:
Figure 3-55: Foreign Trade Shares of the Interdependent Copyright Industries in the Total Foreign Trade of the Interdependent Copyright Industries (2011, %)
As shown in Figure 3.55, the sector of TV sets, radio, VCR and CD players, etc. had the highest exports among the interdependent copyright industries. This industry was also a net exporter, while its exports increased in the relevant years according to Table 3.26. Regarding the imports, the computers and equipment industry had the highest imports among the interdependent copyright industries.
Figure 3.56 below shows the exports and import shares of the various partial copyright industries within the total exports and imports of the partial copyright industries in 2011.
Figure 3-56: Foreign Trade Shares of the Partial Copyright Industries in the Total Foreign Trade of the Partial Copyright Industries (2011, %)
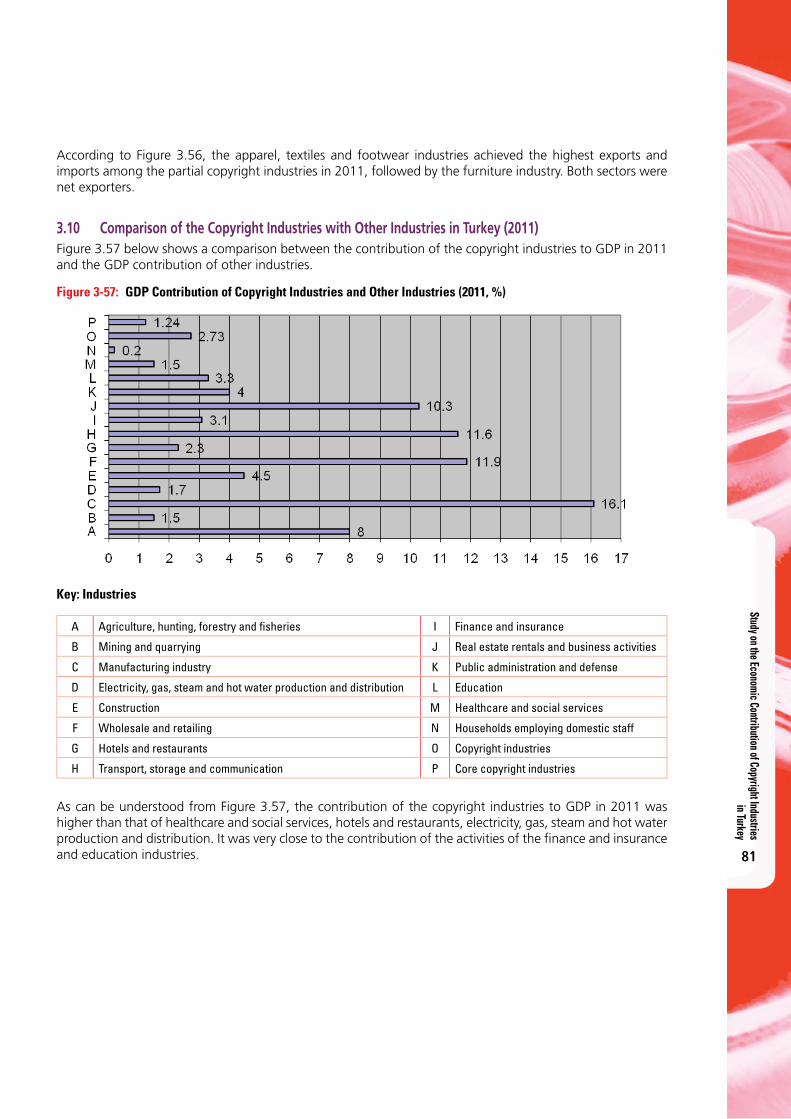
Study on the Economic Contribution of Copyright Industries in Turkey
81
According to Figure 3.56, the apparel, textiles and footwear industries achieved the highest exports and imports among the partial copyright industries in 2011, followed by the furniture industry. Both sectors were net exporters.
3.10 Comparison of the Copyright Industries with Other Industries in Turkey (2011)Figure 3.57 below shows a comparison between the contribution of the copyright industries to GDP in 2011 and the GDP contribution of other industries.
Figure 3-57: GDP Contribution of Copyright Industries and Other Industries (2011, %)
Key: Industries
A Agriculture, hunting, forestry and fi sheries I Finance and insurance
B Mining and quarrying J Real estate rentals and business activities
C Manufacturing industry K Public administration and defense
D Electricity, gas, steam and hot water production and distribution L Education
E Construction M Healthcare and social services
F Wholesale and retailing N Households employing domestic staff
G Hotels and restaurants O Copyright industries
H Transport, storage and communication P Core copyright industries
As can be understood from Figure 3.57, the contribution of the copyright industries to GDP in 2011 was higher than that of healthcare and social services, hotels and restaurants, electricity, gas, steam and hot water production and distribution. It was very close to the contribution of the activities of the fi nance and insurance and education industries.
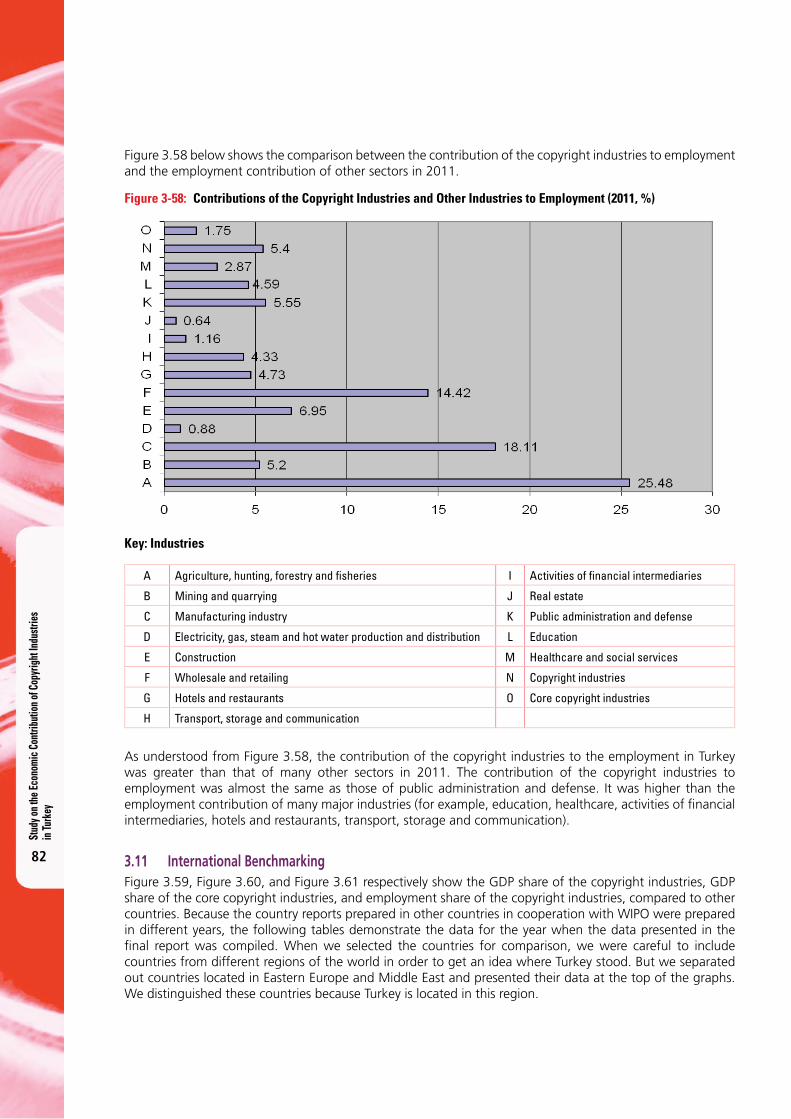
Stud
y on t
he Ec
onom
ic C
ontri
butio
n of C
opyr
ight
Indu
strie
s in
Turk
ey
82
Figure 3.58 below shows the comparison between the contribution of the copyright industries to employment and the employment contribution of other sectors in 2011.
Figure 3-58: Contributions of the Copyright Industries and Other Industries to Employment (2011, %)
Key: Industries
A Agriculture, hunting, forestry and fi sheries I Activities of fi nancial intermediaries
B Mining and quarrying J Real estate
C Manufacturing industry K Public administration and defense
D Electricity, gas, steam and hot water production and distribution L Education
E Construction M Healthcare and social services
F Wholesale and retailing N Copyright industries
G Hotels and restaurants O Core copyright industries
H Transport, storage and communication
As understood from Figure 3.58, the contribution of the copyright industries to the employment in Turkey was greater than that of many other sectors in 2011. The contribution of the copyright industries to employment was almost the same as those of public administration and defense. It was higher than the employment contribution of many major industries (for example, education, healthcare, activities of fi nancial intermediaries, hotels and restaurants, transport, storage and communication).
3.11 International Benchmarking Figure 3.59, Figure 3.60, and Figure 3.61 respectively show the GDP share of the copyright industries, GDP share of the core copyright industries, and employment share of the copyright industries, compared to other countries. Because the country reports prepared in other countries in cooperation with WIPO were prepared in different years, the following tables demonstrate the data for the year when the data presented in the fi nal report was compiled. When we selected the countries for comparison, we were careful to include countries from different regions of the world in order to get an idea where Turkey stood. But we separated out countries located in Eastern Europe and Middle East and presented their data at the top of the graphs. We distinguished these countries because Turkey is located in this region.
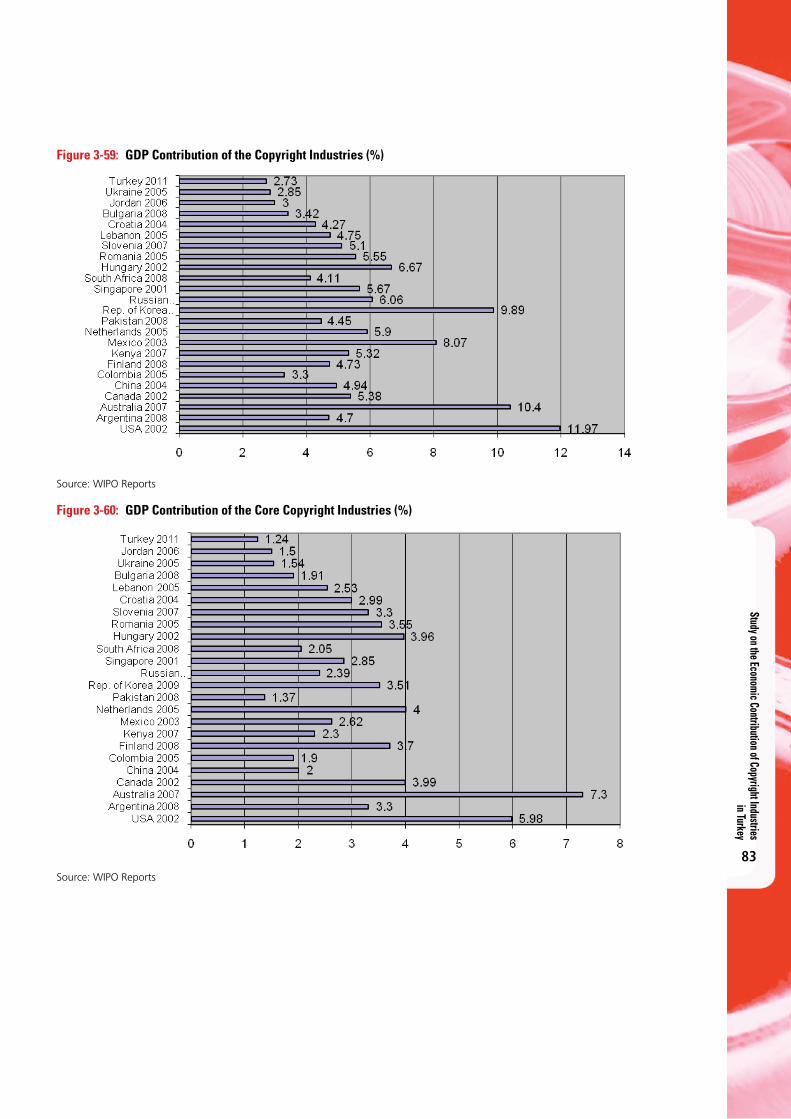
Study on the Economic Contribution of Copyright Industries in Turkey
83
Figure 3-59: GDP Contribution of the Copyright Industries (%)
Source: WIPO Reports
Figure 3-60: GDP Contribution of the Core Copyright Industries (%)
Source: WIPO Reports
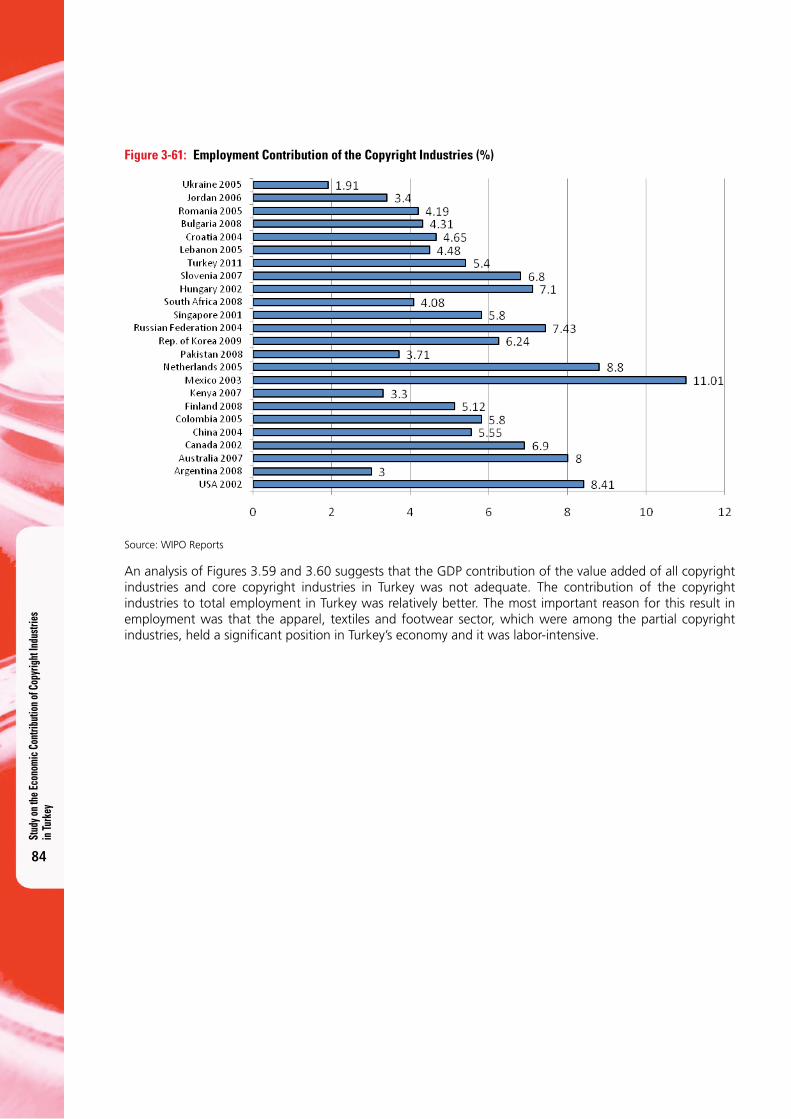
Stud
y on t
he Ec
onom
ic C
ontri
butio
n of C
opyr
ight
Indu
strie
s in
Turk
ey
84
Figure 3-61: Employment Contribution of the Copyright Industries (%)
Source: WIPO Reports
An analysis of Figures 3.59 and 3.60 suggests that the GDP contribution of the value added of all copyright industries and core copyright industries in Turkey was not adequate. The contribution of the copyright industries to total employment in Turkey was relatively better. The most important reason for this result in employment was that the apparel, textiles and footwear sector, which were among the partial copyright industries, held a signifi cant position in Turkey’s economy and it was labor-intensive.
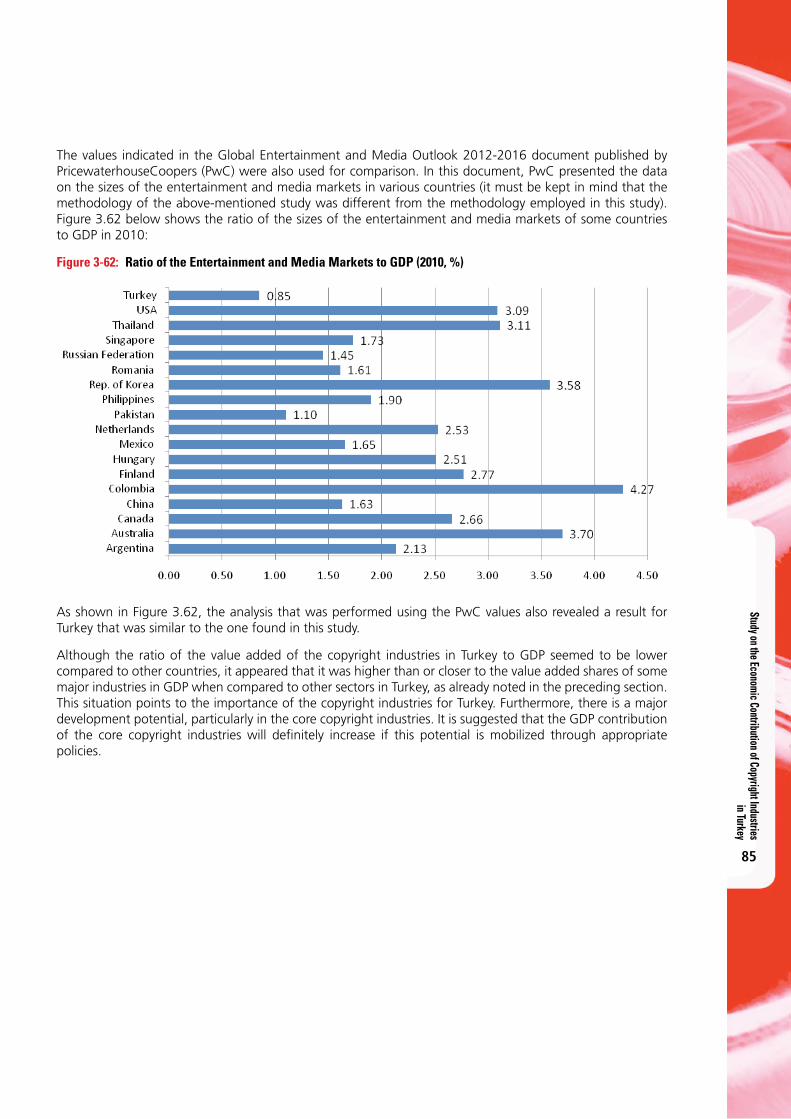
Study on the Economic Contribution of Copyright Industries in Turkey
85
The values indicated in the Global Entertainment and Media Outlook 2012-2016 document published by PricewaterhouseCoopers (PwC) were also used for comparison. In this document, PwC presented the data on the sizes of the entertainment and media markets in various countries (it must be kept in mind that the methodology of the above-mentioned study was different from the methodology employed in this study). Figure 3.62 below shows the ratio of the sizes of the entertainment and media markets of some countries to GDP in 2010:
Figure 3-62: Ratio of the Entertainment and Media Markets to GDP (2010, %)
As shown in Figure 3.62, the analysis that was performed using the PwC values also revealed a result for Turkey that was similar to the one found in this study.
Although the ratio of the value added of the copyright industries in Turkey to GDP seemed to be lower compared to other countries, it appeared that it was higher than or closer to the value added shares of some major industries in GDP when compared to other sectors in Turkey, as already noted in the preceding section. This situation points to the importance of the copyright industries for Turkey. Furthermore, there is a major development potential, particularly in the core copyright industries. It is suggested that the GDP contribution of the core copyright industries will defi nitely increase if this potential is mobilized through appropriate policies.
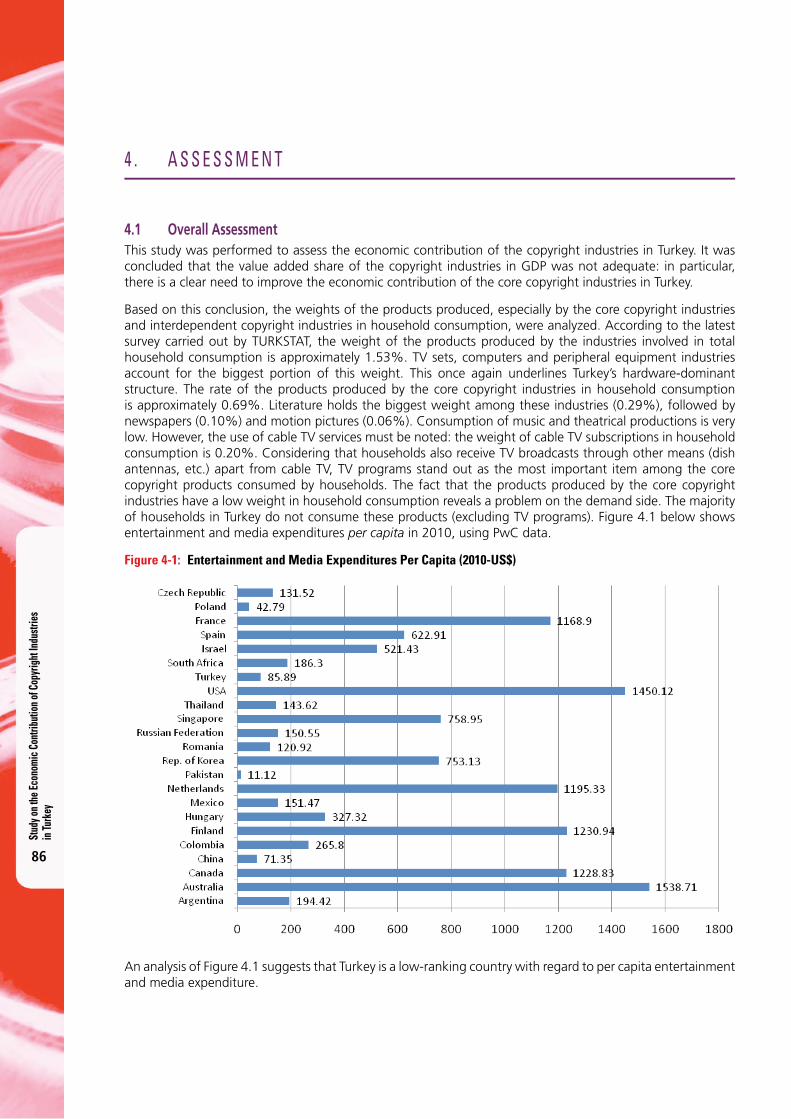
Stud
y on t
he Ec
onom
ic C
ontri
butio
n of C
opyr
ight
Indu
strie
s in
Turk
ey
86
4 . A S S E S S M E N T
4.1 Overall Assessment This study was performed to assess the economic contribution of the copyright industries in Turkey. It was concluded that the value added share of the copyright industries in GDP was not adequate: in particular, there is a clear need to improve the economic contribution of the core copyright industries in Turkey.
Based on this conclusion, the weights of the products produced, especially by the core copyright industries and interdependent copyright industries in household consumption, were analyzed. According to the latest survey carried out by TURKSTAT, the weight of the products produced by the industries involved in total household consumption is approximately 1.53%. TV sets, computers and peripheral equipment industries account for the biggest portion of this weight. This once again underlines Turkey’s hardware-dominant structure. The rate of the products produced by the core copyright industries in household consumption is approximately 0.69%. Literature holds the biggest weight among these industries (0.29%), followed by newspapers (0.10%) and motion pictures (0.06%). Consumption of music and theatrical productions is very low. However, the use of cable TV services must be noted: the weight of cable TV subscriptions in household consumption is 0.20%. Considering that households also receive TV broadcasts through other means (dish antennas, etc.) apart from cable TV, TV programs stand out as the most important item among the core copyright products consumed by households. The fact that the products produced by the core copyright industries have a low weight in household consumption reveals a problem on the demand side. The majority of households in Turkey do not consume these products (excluding TV programs). Figure 4.1 below shows entertainment and media expenditures per capita in 2010, using PwC data.
Figure 4-1: Entertainment and Media Expenditures Per Capita (2010-US$)
An analysis of Figure 4.1 suggests that Turkey is a low-ranking country with regard to per capita entertainment and media expenditure.
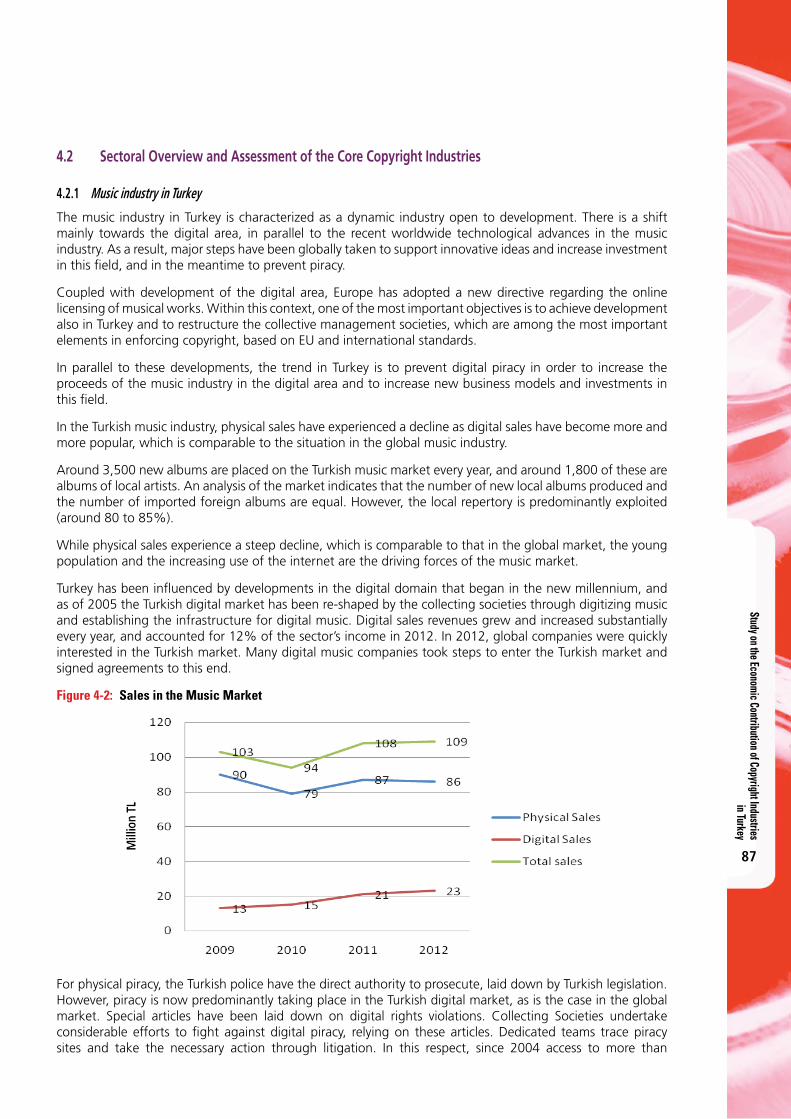
Study on the Economic Contribution of Copyright Industries in Turkey
87
4.2 Sectoral Overview and Assessment of the Core Copyright Industries
4.2.1 Music industry in Turkey
The music industry in Turkey is characterized as a dynamic industry open to development. There is a shift mainly towards the digital area, in parallel to the recent worldwide technological advances in the music industry. As a result, major steps have been globally taken to support innovative ideas and increase investment in this fi eld, and in the meantime to prevent piracy.
Coupled with development of the digital area, Europe has adopted a new directive regarding the online licensing of musical works. Within this context, one of the most important objectives is to achieve development also in Turkey and to restructure the collective management societies, which are among the most important elements in enforcing copyright, based on EU and international standards.
In parallel to these developments, the trend in Turkey is to prevent digital piracy in order to increase the proceeds of the music industry in the digital area and to increase new business models and investments in this fi eld.
In the Turkish music industry, physical sales have experienced a decline as digital sales have become more and more popular, which is comparable to the situation in the global music industry.
Around 3,500 new albums are placed on the Turkish music market every year, and around 1,800 of these are albums of local artists. An analysis of the market indicates that the number of new local albums produced and the number of imported foreign albums are equal. However, the local repertory is predominantly exploited (around 80 to 85%).
While physical sales experience a steep decline, which is comparable to that in the global market, the young population and the increasing use of the internet are the driving forces of the music market.
Turkey has been infl uenced by developments in the digital domain that began in the new millennium, and as of 2005 the Turkish digital market has been re-shaped by the collecting societies through digitizing music and establishing the infrastructure for digital music. Digital sales revenues grew and increased substantially every year, and accounted for 12% of the sector’s income in 2012. In 2012, global companies were quickly interested in the Turkish market. Many digital music companies took steps to enter the Turkish market and signed agreements to this end.
Figure 4-2: Sales in the Music Market
For physical piracy, the Turkish police have the direct authority to prosecute, laid down by Turkish legislation. However, piracy is now predominantly taking place in the Turkish digital market, as is the case in the global market. Special articles have been laid down on digital rights violations. Collecting Societies undertake considerable efforts to fi ght against digital piracy, relying on these articles. Dedicated teams trace piracy sites and take the necessary action through litigation. In this respect, since 2004 access to more than
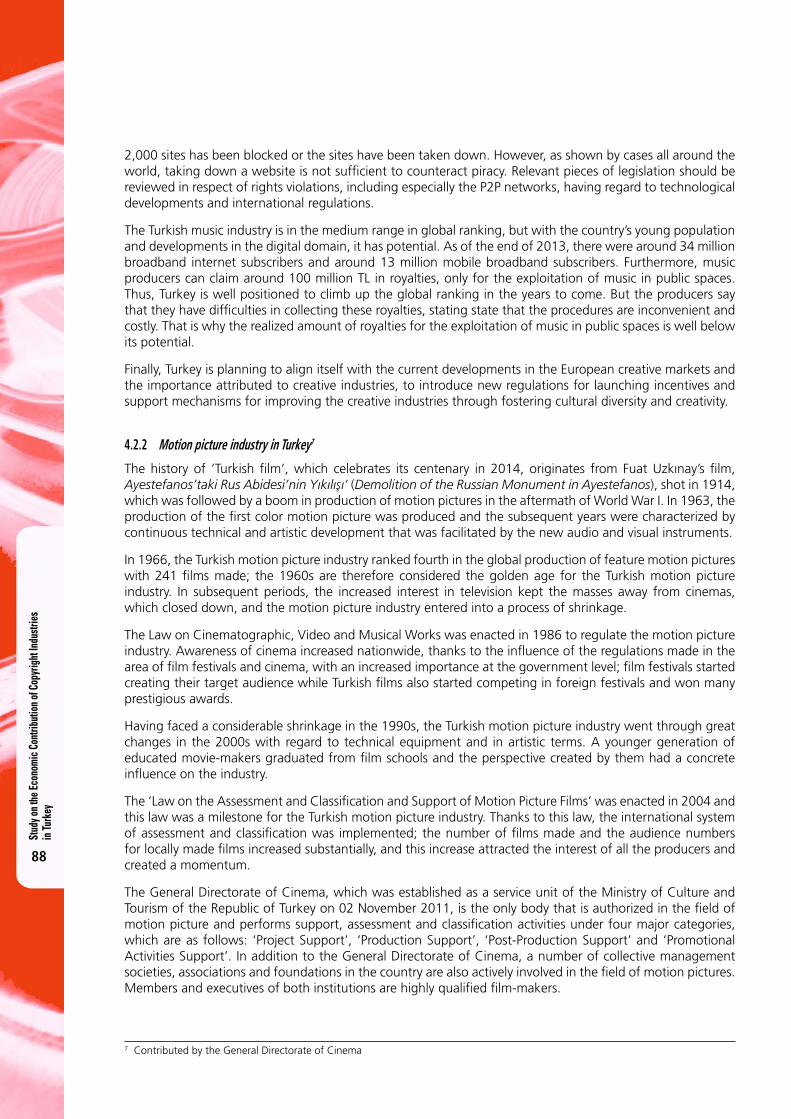
Stud
y on t
he Ec
onom
ic C
ontri
butio
n of C
opyr
ight
Indu
strie
s in
Turk
ey
88
2,000 sites has been blocked or the sites have been taken down. However, as shown by cases all around the world, taking down a website is not sufficient to counteract piracy. Relevant pieces of legislation should be reviewed in respect of rights violations, including especially the P2P networks, having regard to technological developments and international regulations.
The Turkish music industry is in the medium range in global ranking, but with the country’s young population and developments in the digital domain, it has potential. As of the end of 2013, there were around 34 million broadband internet subscribers and around 13 million mobile broadband subscribers. Furthermore, music producers can claim around 100 million TL in royalties, only for the exploitation of music in public spaces. Thus, Turkey is well positioned to climb up the global ranking in the years to come. But the producers say that they have difficulties in collecting these royalties, stating state that the procedures are inconvenient and costly. That is why the realized amount of royalties for the exploitation of music in public spaces is well below its potential.
Finally, Turkey is planning to align itself with the current developments in the European creative markets and the importance attributed to creative industries, to introduce new regulations for launching incentives and support mechanisms for improving the creative industries through fostering cultural diversity and creativity.
4.2.2 Motion picture industry in Turkey7
The history of ‘Turkish film’, which celebrates its centenary in 2014, originates from Fuat Uzkınay’s film, Ayestefanos’taki Rus Abidesi’nin Yıkılışı’ (Demolition of the Russian Monument in Ayestefanos), shot in 1914, which was followed by a boom in production of motion pictures in the aftermath of World War I. In 1963, the production of the first color motion picture was produced and the subsequent years were characterized by continuous technical and artistic development that was facilitated by the new audio and visual instruments.
In 1966, the Turkish motion picture industry ranked fourth in the global production of feature motion pictures with 241 films made; the 1960s are therefore considered the golden age for the Turkish motion picture industry. In subsequent periods, the increased interest in television kept the masses away from cinemas, which closed down, and the motion picture industry entered into a process of shrinkage.
The Law on Cinematographic, Video and Musical Works was enacted in 1986 to regulate the motion picture industry. Awareness of cinema increased nationwide, thanks to the influence of the regulations made in the area of film festivals and cinema, with an increased importance at the government level; film festivals started creating their target audience while Turkish films also started competing in foreign festivals and won many prestigious awards.
Having faced a considerable shrinkage in the 1990s, the Turkish motion picture industry went through great changes in the 2000s with regard to technical equipment and in artistic terms. A younger generation of educated movie-makers graduated from film schools and the perspective created by them had a concrete influence on the industry.
The ‘Law on the Assessment and Classification and Support of Motion Picture Films’ was enacted in 2004 and this law was a milestone for the Turkish motion picture industry. Thanks to this law, the international system of assessment and classification was implemented; the number of films made and the audience numbers for locally made films increased substantially, and this increase attracted the interest of all the producers and created a momentum.
The General Directorate of Cinema, which was established as a service unit of the Ministry of Culture and Tourism of the Republic of Turkey on 02 November 2011, is the only body that is authorized in the field of motion picture and performs support, assessment and classification activities under four major categories, which are as follows: ‘Project Support’, ‘Production Support’, ‘Post-Production Support’ and ‘Promotional Activities Support’. In addition to the General Directorate of Cinema, a number of collective management societies, associations and foundations in the country are also actively involved in the field of motion pictures. Members and executives of both institutions are highly qualified film-makers.
7 Contributed by the General Directorate of Cinema
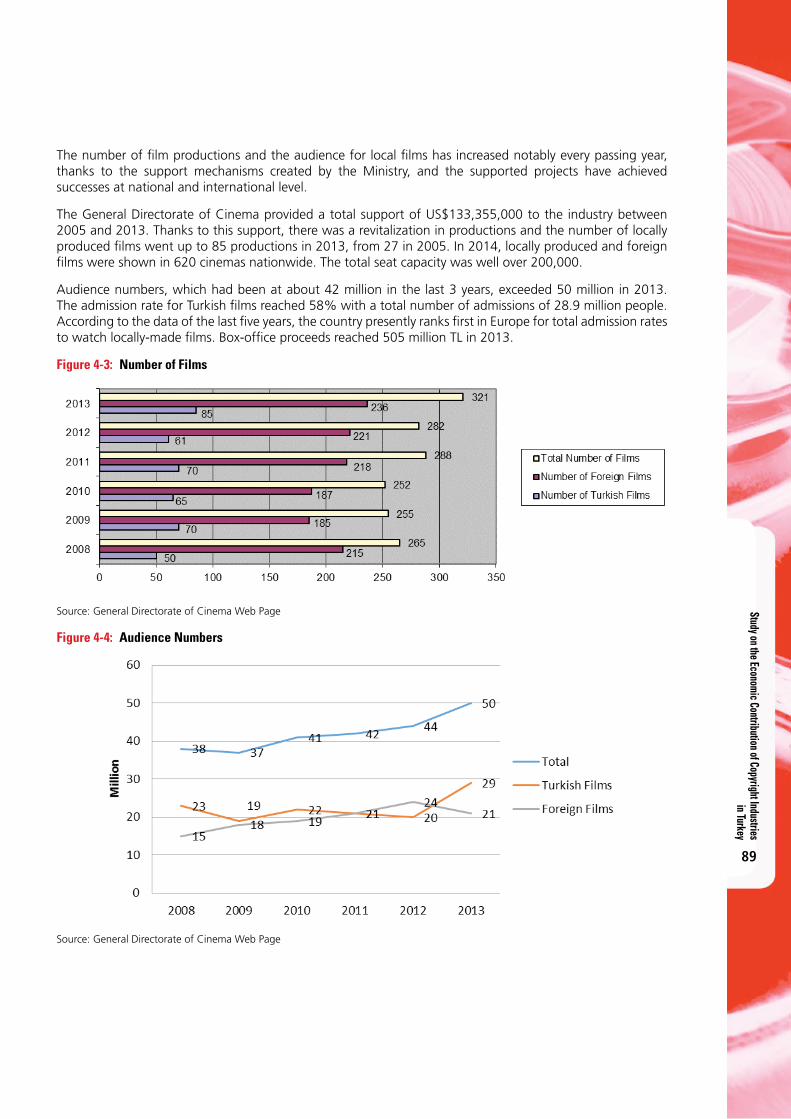
Study on the Economic Contribution of Copyright Industries in Turkey
89
The number of fi lm productions and the audience for local fi lms has increased notably every passing year, thanks to the support mechanisms created by the Ministry, and the supported projects have achieved successes at national and international level.
The General Directorate of Cinema provided a total support of US$133,355,000 to the industry between 2005 and 2013. Thanks to this support, there was a revitalization in productions and the number of locally produced fi lms went up to 85 productions in 2013, from 27 in 2005. In 2014, locally produced and foreign fi lms were shown in 620 cinemas nationwide. The total seat capacity was well over 200,000.
Audience numbers, which had been at about 42 million in the last 3 years, exceeded 50 million in 2013. The admission rate for Turkish fi lms reached 58% with a total number of admissions of 28.9 million people. According to the data of the last fi ve years, the country presently ranks fi rst in Europe for total admission rates to watch locally-made fi lms. Box-offi ce proceeds reached 505 million TL in 2013.
Figure 4-3: Number of Films
Source: General Directorate of Cinema Web Page
Figure 4-4: Audience Numbers
Source: General Directorate of Cinema Web Page
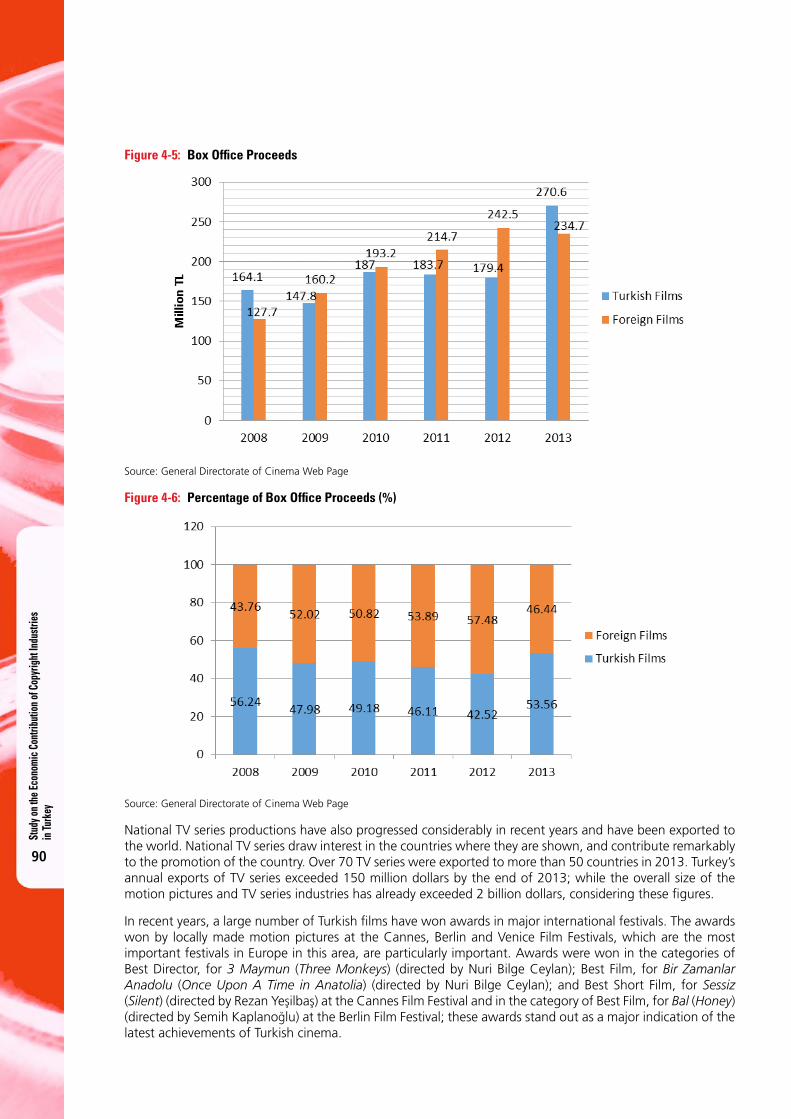
Stud
y on t
he Ec
onom
ic C
ontri
butio
n of C
opyr
ight
Indu
strie
s in
Turk
ey
90
Figure 4-5: Box Office Proceeds
Source: General Directorate of Cinema Web Page
Figure 4-6: Percentage of Box Office Proceeds (%)
Source: General Directorate of Cinema Web Page
National TV series productions have also progressed considerably in recent years and have been exported to the world. National TV series draw interest in the countries where they are shown, and contribute remarkably to the promotion of the country. Over 70 TV series were exported to more than 50 countries in 2013. Turkey’s annual exports of TV series exceeded 150 million dollars by the end of 2013; while the overall size of the motion pictures and TV series industries has already exceeded 2 billion dollars, considering these figures.
In recent years, a large number of Turkish films have won awards in major international festivals. The awards won by locally made motion pictures at the Cannes, Berlin and Venice Film Festivals, which are the most important festivals in Europe in this area, are particularly important. Awards were won in the categories of Best Director, for 3 Maymun (Three Monkeys) (directed by Nuri Bilge Ceylan); Best Film, for Bir Zamanlar Anadolu (Once Upon A Time in Anatolia) (directed by Nuri Bilge Ceylan); and Best Short Film, for Sessiz (Silent) (directed by Rezan Yeşilbaş) at the Cannes Film Festival and in the category of Best Film, for Bal (Honey) (directed by Semih Kaplanoğlu) at the Berlin Film Festival; these awards stand out as a major indication of the latest achievements of Turkish cinema.
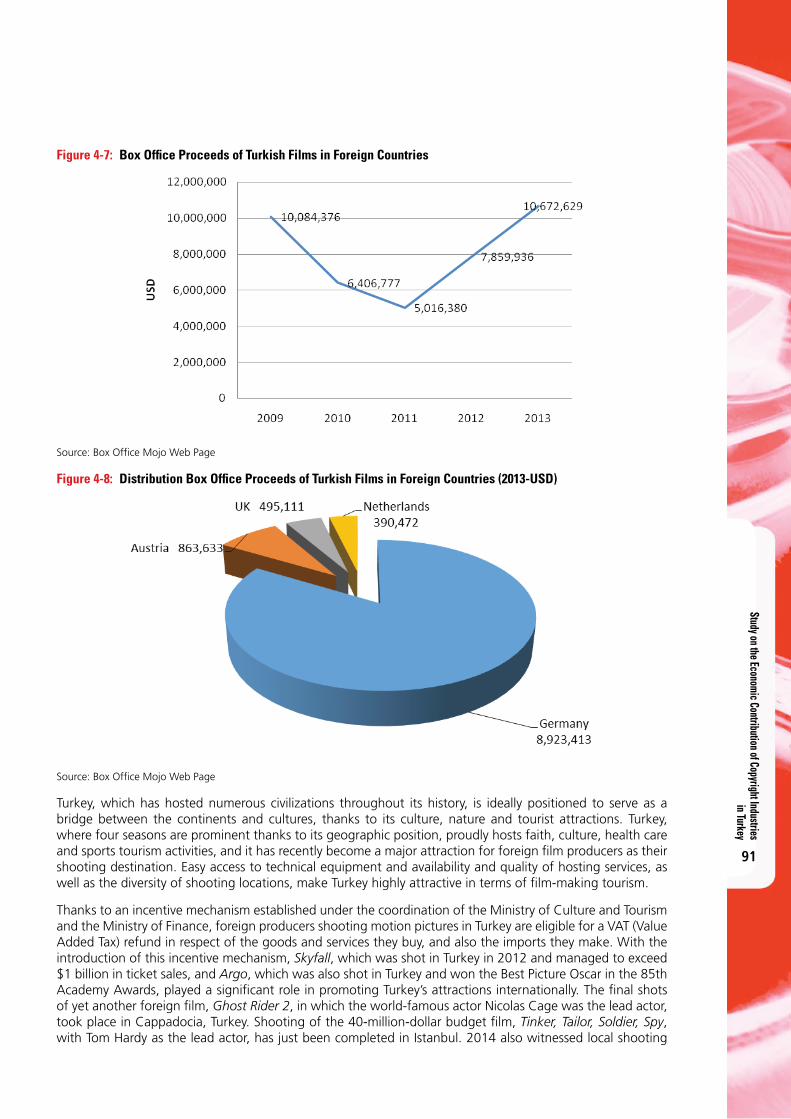
Study on the Economic Contribution of Copyright Industries in Turkey
91
Figure 4-7: Box Offi ce Proceeds of Turkish Films in Foreign Countries
Source: Box Offi ce Mojo Web Page
Figure 4-8: Distribution Box Offi ce Proceeds of Turkish Films in Foreign Countries (2013-USD)
Source: Box Offi ce Mojo Web Page
Turkey, which has hosted numerous civilizations throughout its history, is ideally positioned to serve as a bridge between the continents and cultures, thanks to its culture, nature and tourist attractions. Turkey, where four seasons are prominent thanks to its geographic position, proudly hosts faith, culture, health care and sports tourism activities, and it has recently become a major attraction for foreign fi lm producers as their shooting destination. Easy access to technical equipment and availability and quality of hosting services, as well as the diversity of shooting locations, make Turkey highly attractive in terms of fi lm-making tourism.
Thanks to an incentive mechanism established under the coordination of the Ministry of Culture and Tourism and the Ministry of Finance, foreign producers shooting motion pictures in Turkey are eligible for a VAT (Value Added Tax) refund in respect of the goods and services they buy, and also the imports they make. With the introduction of this incentive mechanism, Skyfall, which was shot in Turkey in 2012 and managed to exceed $1 billion in ticket sales, and Argo, which was also shot in Turkey and won the Best Picture Oscar in the 85th Academy Awards, played a signifi cant role in promoting Turkey’s attractions internationally. The fi nal shots of yet another foreign fi lm, Ghost Rider 2, in which the world-famous actor Nicolas Cage was the lead actor, took place in Cappadocia, Turkey. Shooting of the 40-million-dollar budget fi lm, Tinker, Tailor, Soldier, Spy, with Tom Hardy as the lead actor, has just been completed in Istanbul. 2014 also witnessed local shooting
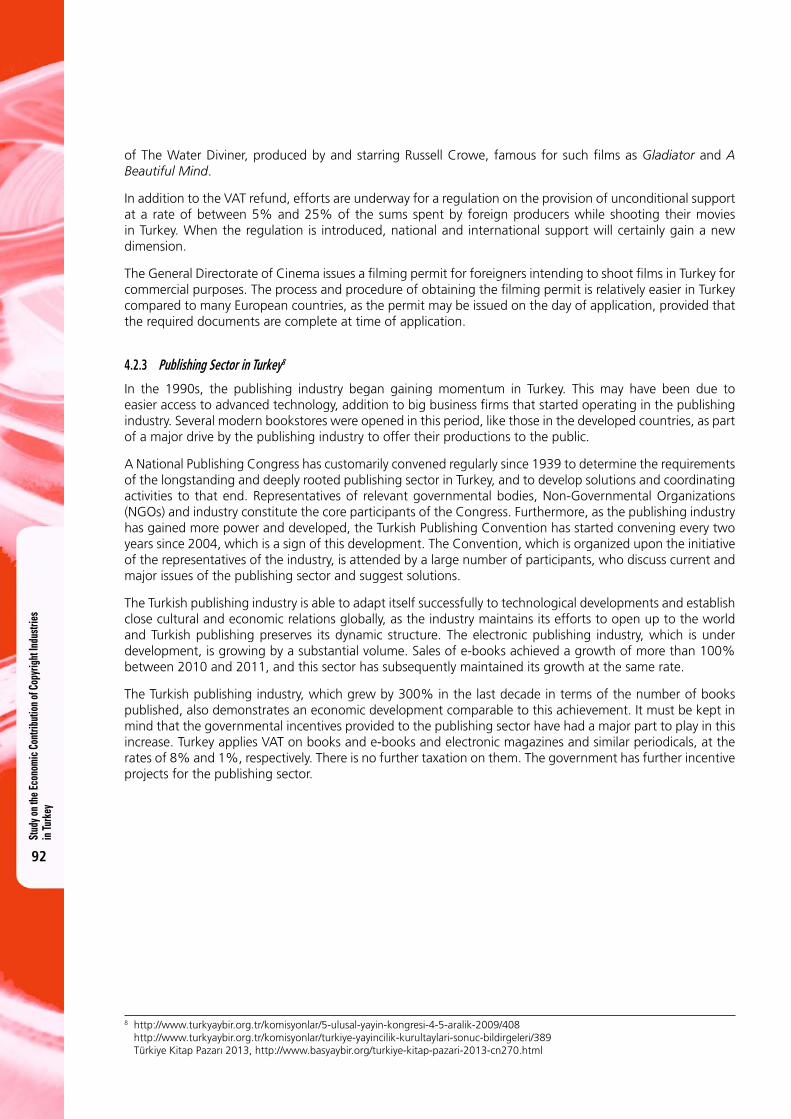
Stud
y on t
he Ec
onom
ic C
ontri
butio
n of C
opyr
ight
Indu
strie
s in
Turk
ey
92
of The Water Diviner, produced by and starring Russell Crowe, famous for such films as Gladiator and A Beautiful Mind.
In addition to the VAT refund, efforts are underway for a regulation on the provision of unconditional support at a rate of between 5% and 25% of the sums spent by foreign producers while shooting their movies in Turkey. When the regulation is introduced, national and international support will certainly gain a new dimension.
The General Directorate of Cinema issues a filming permit for foreigners intending to shoot films in Turkey for commercial purposes. The process and procedure of obtaining the filming permit is relatively easier in Turkey compared to many European countries, as the permit may be issued on the day of application, provided that the required documents are complete at time of application.
4.2.3 Publishing Sector in Turkey8
In the 1990s, the publishing industry began gaining momentum in Turkey. This may have been due to easier access to advanced technology, addition to big business firms that started operating in the publishing industry. Several modern bookstores were opened in this period, like those in the developed countries, as part of a major drive by the publishing industry to offer their productions to the public.
A National Publishing Congress has customarily convened regularly since 1939 to determine the requirements of the longstanding and deeply rooted publishing sector in Turkey, and to develop solutions and coordinating activities to that end. Representatives of relevant governmental bodies, Non-Governmental Organizations (NGOs) and industry constitute the core participants of the Congress. Furthermore, as the publishing industry has gained more power and developed, the Turkish Publishing Convention has started convening every two years since 2004, which is a sign of this development. The Convention, which is organized upon the initiative of the representatives of the industry, is attended by a large number of participants, who discuss current and major issues of the publishing sector and suggest solutions.
The Turkish publishing industry is able to adapt itself successfully to technological developments and establish close cultural and economic relations globally, as the industry maintains its efforts to open up to the world and Turkish publishing preserves its dynamic structure. The electronic publishing industry, which is under development, is growing by a substantial volume. Sales of e-books achieved a growth of more than 100% between 2010 and 2011, and this sector has subsequently maintained its growth at the same rate.
The Turkish publishing industry, which grew by 300% in the last decade in terms of the number of books published, also demonstrates an economic development comparable to this achievement. It must be kept in mind that the governmental incentives provided to the publishing sector have had a major part to play in this increase. Turkey applies VAT on books and e-books and electronic magazines and similar periodicals, at the rates of 8% and 1%, respectively. There is no further taxation on them. The government has further incentive projects for the publishing sector.
8 http://www.turkyaybir.org.tr/komisyonlar/5-ulusal-yayin-kongresi-4-5-aralik-2009/408 http://www.turkyaybir.org.tr/komisyonlar/turkiye-yayincilik-kurultaylari-sonuc-bildirgeleri/389 Türkiye Kitap Pazarı 2013, http://www.basyaybir.org/turkiye-kitap-pazari-2013-cn270.html
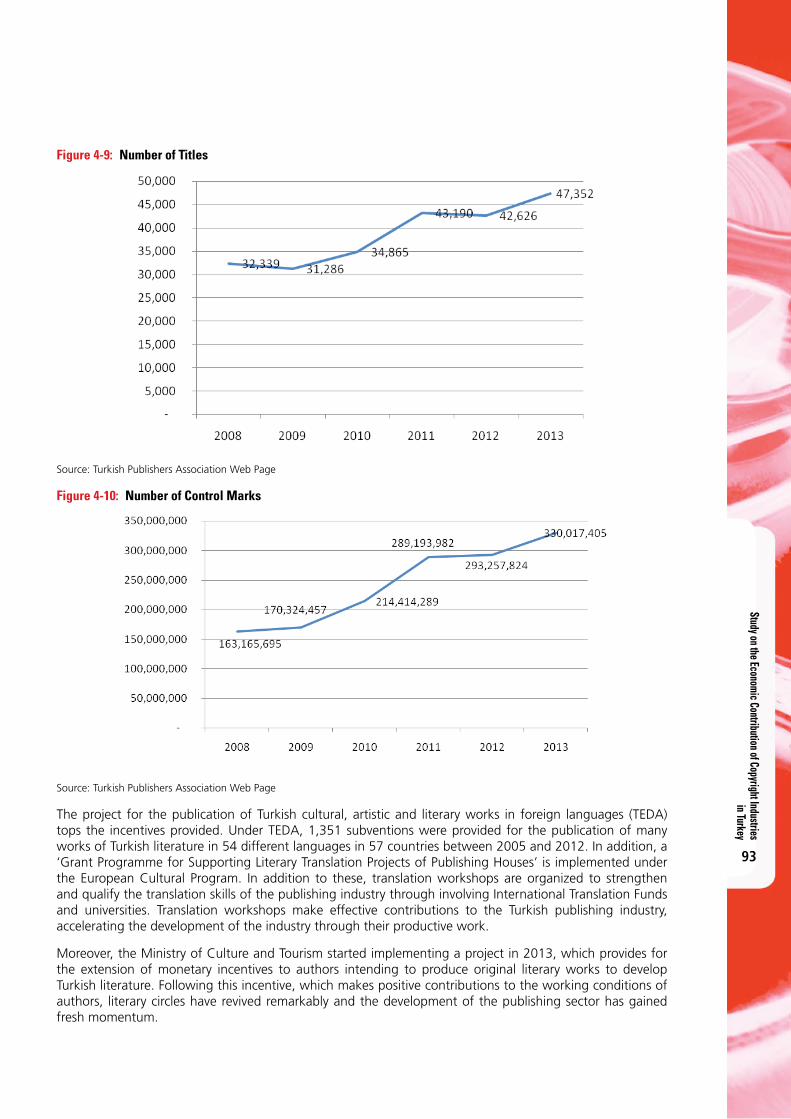
Study on the Economic Contribution of Copyright Industries in Turkey
93
Figure 4-9: Number of Titles
Source: Turkish Publishers Association Web Page
Figure 4-10: Number of Control Marks
Source: Turkish Publishers Association Web Page
The project for the publication of Turkish cultural, artistic and literary works in foreign languages (TEDA) tops the incentives provided. Under TEDA, 1,351 subventions were provided for the publication of many works of Turkish literature in 54 different languages in 57 countries between 2005 and 2012. In addition, a ‘Grant Programme for Supporting Literary Translation Projects of Publishing Houses’ is implemented under the European Cultural Program. In addition to these, translation workshops are organized to strengthen and qualify the translation skills of the publishing industry through involving International Translation Funds and universities. Translation workshops make effective contributions to the Turkish publishing industry, accelerating the development of the industry through their productive work.
Moreover, the Ministry of Culture and Tourism started implementing a project in 2013, which provides for the extension of monetary incentives to authors intending to produce original literary works to develop Turkish literature. Following this incentive, which makes positive contributions to the working conditions of authors, literary circles have revived remarkably and the development of the publishing sector has gained fresh momentum.
Stud
y on t
he Ec
onom
ic C
ontri
butio
n of C
opyr
ight
Indu
strie
s in
Turk
ey
94
Positive developments were also experienced in the field of book fairs, which was in line with the development of the publishing industry in Turkey. Istanbul Book Fair, which originally started with an ambition to become one of the biggest fairs in its region, increased its participants substantially within the last three to four years, thanks to the joint projects of the Ministry of Culture and Tourism and the Turkish National Organizing Committee for International Book Fairs. This fair has attracted the interest of many publishers, authors, copyright agencies, translators, etc., and more than 250 participants attended this fair in 2012.
As more and more works of Turkish authors have been translated into foreign languages within the last decade, the number of authors/copyright agencies working for the protection of copyright of Turkish authors in foreign countries has increased by 400%. Following this development, almost all the agencies began developing portfolios, thus commencing efforts for marketing the copyright of Turkish authors throughout the world, rather than buying the copyright of Turkish publishers. Development of the Turkish publishing industry has also become internationally apparent and Turkish publishers at high-profile international fairs are the obvious signs of this development.
The publishing sector, with its deeply rooted and longstanding history in Turkey, currently maintains its quest for solutions to the problems encountered in its efforts to take the industry to a higher level through its development speed and potential. To this end, the following efforts are underway:
• Ensuring concerted action between the government and private sector and developing joint policies to ensure the industrialization of the publishing industry;
• Developing resources for promotion of the NGOs in the publishing area, channeling these resources through the projects developed and conducting research into new markets upon development of the industry;
• Promoting membership of the publishing industry with international organizations and encouraging and supporting participation in events such as seminars, conferences, etc., to ensure follow-up on developments in the industry; and
• Training the participants of the publishing industry through relevant entities and organizations on EU funds as well as national and international support mechanisms and incentives available to the publishing industry.
4.2.4 Radio and Television Broadcasting Industry in Turkey9
Influenced by the developments that took place in Information Technologies, radio and television broadcasting contents have become richer, as data as well as sound and images have been added; thus, broadcasting content transmission methods and the physical infrastructure used in such transmission (satellites, cable, terrestrial media) have changed. According to the data of the Radio and Television Supreme Council (RTÜK), broadcasting is presently carried out in Turkey by 24 national television channels, 15 regional television channels and 209 local television channels, as well as 35 national radio stations, 98 regional radio stations and 926 local radio stations, including 50 radio stations broadcasting via satellite under licenses held by them.
The radio and television broadcasting industry has recently gained particular importance, not only for the production of communication content but also for its contributions to the economy. The advertising revenues of radio and television channels create substantial economic activity thanks to their volume.
In developed countries, the mass media deserves particular attention not only as a producer of communication content and information, but also as a contributor to internal economic developments along with its own economy. It is well known that in the media market, which is structured through private sector involvement, any mass communication tool and advertising industry contribute to advertising and marketing to allow national products and brands to find buyers. Advertising, which is the sole source of income for radio and television stations, constitutes a major business, thanks to the industry it builds on to help national products become brands and to generate sales revenues. The radio and television industry ensures a buoyant advertising industry through the advertising production it entails and communication of the advertisements
9 Türkiye Radyo ve Televizyon Yayıncılığı Sektör Raporu (Turkish Radio and Television Broadcasting Industry Report) 2013, Prof Dr. Peyami Çelikcan
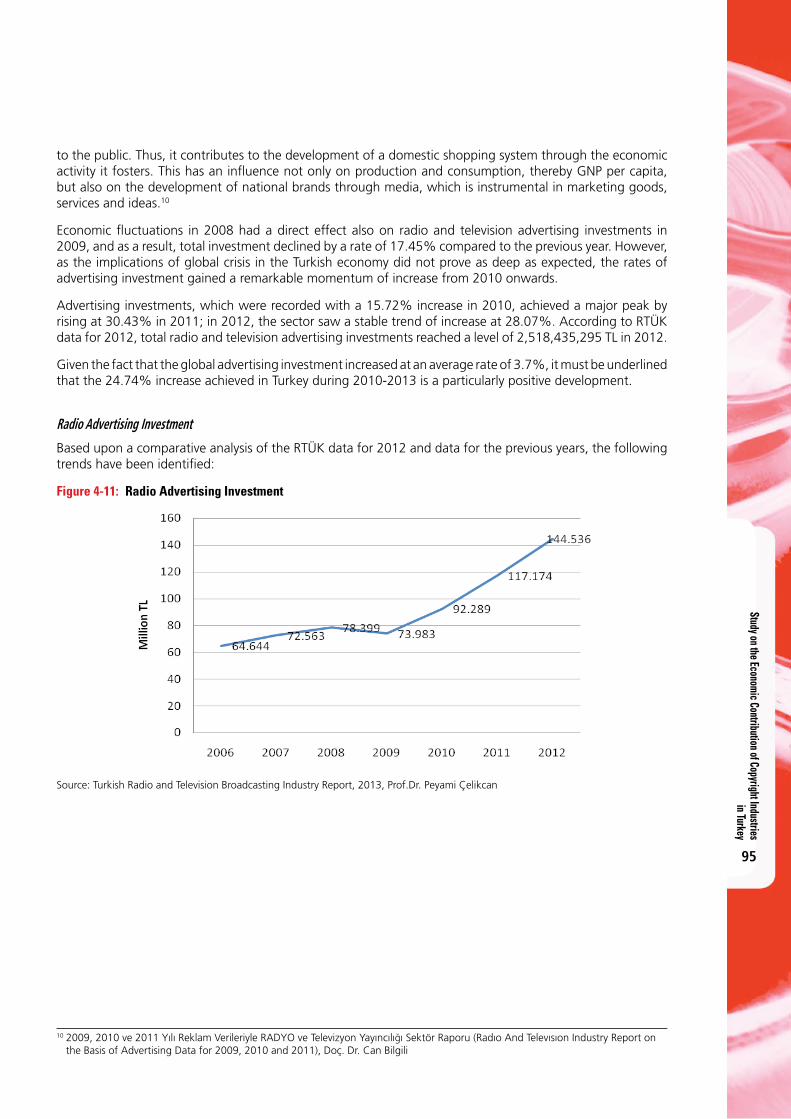
Study on the Economic Contribution of Copyright Industries in Turkey
95
to the public. Thus, it contributes to the development of a domestic shopping system through the economic activity it fosters. This has an infl uence not only on production and consumption, thereby GNP per capita, but also on the development of national brands through media, which is instrumental in marketing goods, services and ideas.10
Economic fl uctuations in 2008 had a direct effect also on radio and television advertising investments in 2009, and as a result, total investment declined by a rate of 17.45% compared to the previous year. However, as the implications of global crisis in the Turkish economy did not prove as deep as expected, the rates of advertising investment gained a remarkable momentum of increase from 2010 onwards.
Advertising investments, which were recorded with a 15.72% increase in 2010, achieved a major peak by rising at 30.43% in 2011; in 2012, the sector saw a stable trend of increase at 28.07%. According to RTÜK data for 2012, total radio and television advertising investments reached a level of 2,518,435,295 TL in 2012.
Given the fact that the global advertising investment increased at an average rate of 3.7%, it must be underlined that the 24.74% increase achieved in Turkey during 2010-2013 is a particularly positive development.
Radio Advertising Investment
Based upon a comparative analysis of the RTÜK data for 2012 and data for the previous years, the following trends have been identifi ed:
Figure 4-11: Radio Advertising Investment
Source: Turkish Radio and Television Broadcasting Industry Report, 2013, Prof.Dr. Peyami Çelikcan
10 2009, 2010 ve 2011 Yılı Reklam Verileriyle RADYO ve Televizyon Yayıncılığı Sektör Raporu (Radıo And Televısıon Industry Report on the Basis of Advertising Data for 2009, 2010 and 2011), Doç. Dr. Can Bilgili
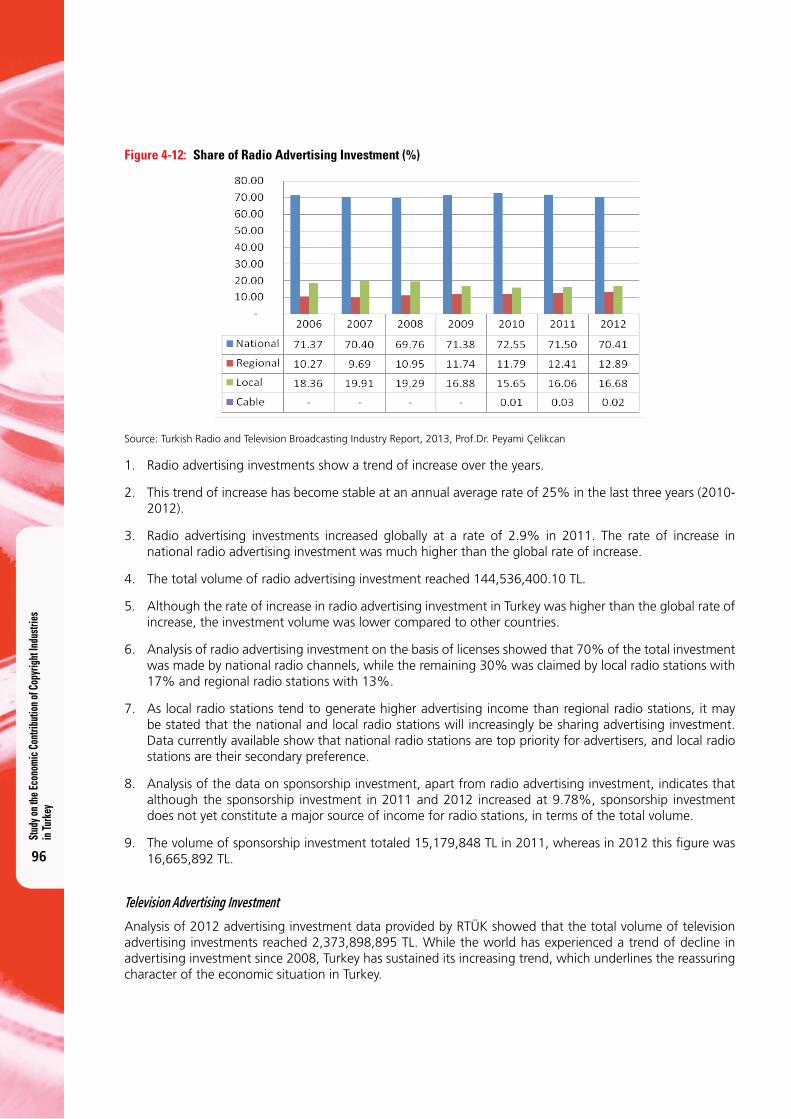
Stud
y on t
he Ec
onom
ic C
ontri
butio
n of C
opyr
ight
Indu
strie
s in
Turk
ey
96
Figure 4-12: Share of Radio Advertising Investment (%)
Source: Turkish Radio and Television Broadcasting Industry Report, 2013, Prof.Dr. Peyami Çelikcan
1. Radio advertising investments show a trend of increase over the years.
2. This trend of increase has become stable at an annual average rate of 25% in the last three years (2010-2012).
3. Radio advertising investments increased globally at a rate of 2.9% in 2011. The rate of increase in national radio advertising investment was much higher than the global rate of increase.
4. The total volume of radio advertising investment reached 144,536,400.10 TL.
5. Although the rate of increase in radio advertising investment in Turkey was higher than the global rate of increase, the investment volume was lower compared to other countries.
6. Analysis of radio advertising investment on the basis of licenses showed that 70% of the total investment was made by national radio channels, while the remaining 30% was claimed by local radio stations with 17% and regional radio stations with 13%.
7. As local radio stations tend to generate higher advertising income than regional radio stations, it may be stated that the national and local radio stations will increasingly be sharing advertising investment. Data currently available show that national radio stations are top priority for advertisers, and local radio stations are their secondary preference.
8. Analysis of the data on sponsorship investment, apart from radio advertising investment, indicates that although the sponsorship investment in 2011 and 2012 increased at 9.78%, sponsorship investment does not yet constitute a major source of income for radio stations, in terms of the total volume.
9. The volume of sponsorship investment totaled 15,179,848 TL in 2011, whereas in 2012 this fi gure was 16,665,892 TL.
Television Advertising Investment
Analysis of 2012 advertising investment data provided by RTÜK showed that the total volume of television advertising investments reached 2,373,898,895 TL. While the world has experienced a trend of decline in advertising investment since 2008, Turkey has sustained its increasing trend, which underlines the reassuring character of the economic situation in Turkey.
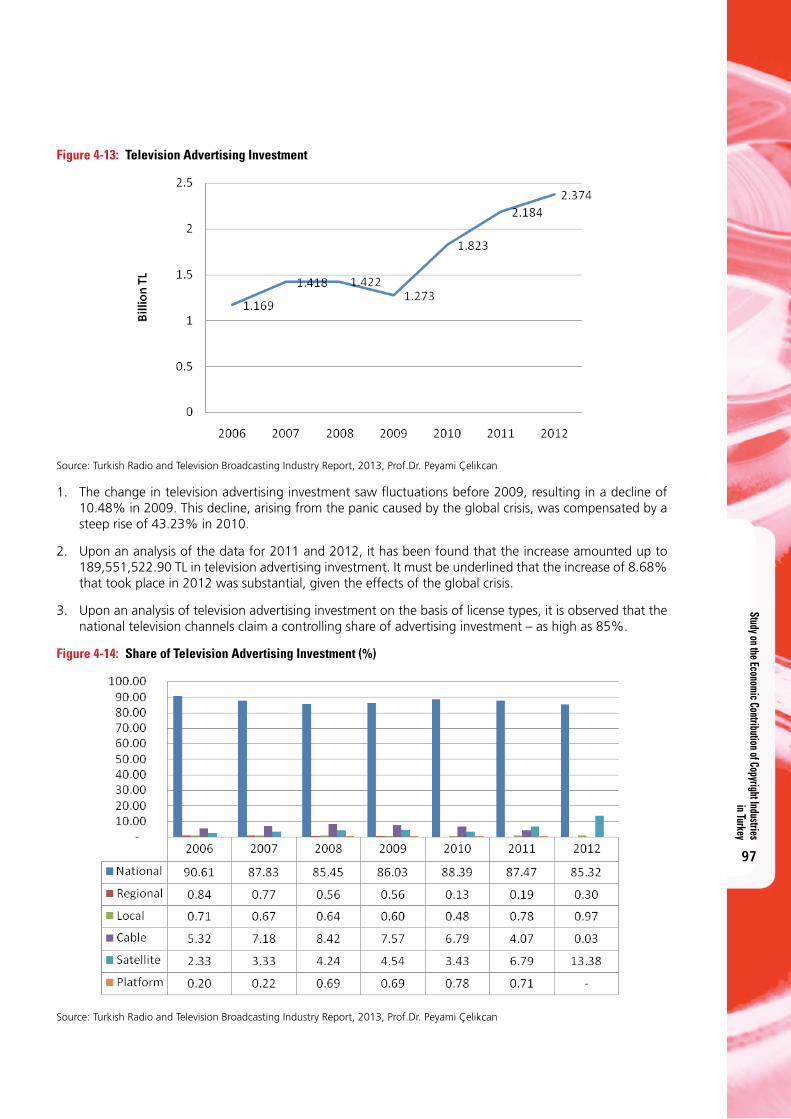
Study on the Economic Contribution of Copyright Industries in Turkey
97
Figure 4-13: Television Advertising Investment
Source: Turkish Radio and Television Broadcasting Industry Report, 2013, Prof.Dr. Peyami Çelikcan
1. The change in television advertising investment saw fl uctuations before 2009, resulting in a decline of 10.48% in 2009. This decline, arising from the panic caused by the global crisis, was compensated by a steep rise of 43.23% in 2010.
2. Upon an analysis of the data for 2011 and 2012, it has been found that the increase amounted up to 189,551,522.90 TL in television advertising investment. It must be underlined that the increase of 8.68% that took place in 2012 was substantial, given the effects of the global crisis.
3. Upon an analysis of television advertising investment on the basis of license types, it is observed that the national television channels claim a controlling share of advertising investment – as high as 85%.
Figure 4-14: Share of Television Advertising Investment (%)
Source: Turkish Radio and Television Broadcasting Industry Report, 2013, Prof.Dr. Peyami Çelikcan
Stud
y on t
he Ec
onom
ic C
ontri
butio
n of C
opyr
ight
Indu
strie
s in
Turk
ey
98
4. Unlike the picture drawn by the data on radio advertising investment, the share of local and regional channels in total television advertising investment accounts for 1%.
5. It was found that the share of channels with satellite licenses had increased within total television advertising investment. The share held by satellite television channels, which was 7% in 2011, increased up to 14% in 2012. Given the fact that some of the channels with satellite television licenses are local and regional channels, it may be commented that local and regional television channels can have advertising revenues only if they broadcast via satellite transmission.
6. Although the advertising investment shares of the cable television channels and platform channels, which are included in television licenses, appear to have declined, their advertising revenues are maintained, though to a limited extent, due to the increasing inclusion of such channels in satellite licenses.
7. The cable and platform channels had a share of 5% in advertising revenues in 2011, but this rate was recorded as zero in 2012, as they were included in satellite broadcasting.
8. Television advertising investment is predominantly claimed by the national channels (85%) and also by the satellite channels (13%) which are enjoying an increasing trend.
9. Television sponsorship investment also attracts particular attention as an individual revenue item as of 2011. Sponsorship investment totaled 143,505,230 TL in 2011. This sum declined in 2012 to 130,995,405 TL.
10. The share received by the national television channels from sponsorship investment was 83%, whereas it declined to 77% in 2012.
11. As the share received by the national television channels from sponsorship investment declined, the share of the satellite channels increased from 7% to 16%.
4.2.5 Software Industry in Turkey11
Software, which has become an integral part of daily life at every single stage from generation of information to its effective processing and use, is of vital importance in view of its social and economic effects; and the industry where such software packages are produced, commercialized and marketed is are of vital importance for the future of information-based development in particular.
It is also true that the use of Information and Communication Technologies (ICT) fosters growth, competitiveness and employment and enhances the quality of life. Since it is an industry that creates the highest number of jobs and maximum value added with minimum investment, the software industry may be defined as the new development force of the economy. The value added generated by software has major effects on exports and competitiveness in other industries, Research and Development (R&D) activities, GDP and increased employment. Besides, the software industry is one of the industries with major contributions to R&D activities.
The value added generated individually by software to the national economy ranges between 1.5% and 3% on the OECD average. A 22% ICT investment generates 58% productivity. Expenditure on software products and software services amounts to up to 258 billion Euros in the EU Member States, and this expenditure accounts for an average of 2.6% within the GDP of Member States. Software investments made in the OECD countries have helped the countries to increase their GDP by an average of 0.5 to 2.7%.
The Turkish information technologies market is dominated by hardware, which claims a share of 39% in total information technologies expenditure globally; this rate is almost 81% in Turkey. Software and services account for 19% of the information technologies market. This hardware-controlled composition is expected to change, with the industry growing further in the area of software and services.
11 http://www.baka.org.tr/uploads/1357649691YAZiLiM-SEKTORU-RAPORU-3ARALiK.pdf http://www.sde.org.tr/userfiles/file/TURKIYEDE_YAZILIM_%20SEKTORU.pdf http://www.yasad.org.tr/RaporDetay.aspx?id=15
Study on the Economic Contribution of Copyright Industries in Turkey
99
Compared to other sectors, the software sector employs the youngest labor force. Developments in the software sector also contribute to the reduction of unemployment in Turkey, as it offers significant opportunities for youth and women’s employment.
In recent years, the software sector has been one of the leading sectors, with a rapidly increasing potential. It is one of the advanced technology sectors and it offers innovative products and services to both domestic and foreign markets in line with the rapid advancements in recent years.
According to the ‘Software Industry in Turkey’ report published by the Turkish Software Industrialists Association (YASAD), 2300 software companies operate in Turkey. Among them, 1060 operate in the 37 Technology Development Regions. 46% of the software companies are based in İstanbul, while 20% are based in Ankara. The Istanbul market is dominated by companies developing system software, mobile software and applications, whereas companies based in Ankara focus on security and defense software, as well as software for public bodies. Software companies based in İzmir predominantly offer software applications.
As indicated earlier on in this study, Turkey’s software exports reached US $265 million in 2011. This figure reached US $479 million in 2012. The figures for 2013 have not yet been declared, but the expected figure is around US $650 million. Turkey aims at reaching US $1 billion in software exports by the end of 2015. According to the most recent data, around 100 companies from Turkey export software to 50 countries and 12 free zones. Turkey’s neighboring regions, such as the European Union, Northern Africa, the Middle East, the Caucasus and the Turkic Republics of Central Asia offer a remarkable potential for software exports and it is expected to utilize this potential to reach the target export figures.
In addition to potential countries of export, the 1.5 million SMEs in Turkey are also potential users of information and communication technologies. Most transactions in Turkey are performed by e-applications. It is expected that the SMEs will use these applications ever more widely and this will potentially foster the domestic market. In addition, government also has e-application projects and these projects are implemented according to a schedule. It can easily be said that there is an e-transformation activity in both private and public sector in Turkey in recent years.
Thus, the software sector is considered to be likely to make significant contributions to the GDP, export figures and employment in Turkey in the years to come.
Stud
y on t
he Ec
onom
ic C
ontri
butio
n of C
opyr
ight
Indu
strie
s in
Turk
ey
100
5 . C O N C L U S I O N S A N D R E C O M M E N D AT I O N S
5.1 ConclusionsIn this study, the legal and institutional framework related to copyright in Turkey has been examined. Then, the contribution of copyright industries to the Turkish economy has been assessed, based on statistical evidence. Having completed these, information and recent trends with regard to selected copyright industries have been presented. This section of the study presents conclusions concerning the legal and institutional framework, the economic contribution of copyright industries, and development in selected sectors.
The legal and institutional basis for the intellectual property system, which has been in place in Turkey for more than one hundred and fifty years, was completed in the last two decades. Bodies in charge of establishing and enforcing the rights were established (for example, the Directorate General for Copyright, specialized bureaus in police departments, Provincial Inspection Commissions), the relevant legislation was streamlined, and a specialized judicial system (specialized bureaus in prosecutors’ offices and specialized courts dealing with copyright offences) was developed. In this sense, we can say that Turkey has a legal and institutional framework consistent with world standards. However, the system is constantly changing, due to its dynamic structure. New types of rights arise as enforcement tools are developed to deal with them, and all is covered by international regulations. All of these recent developments are also followed by the Turkish authorities and the legal and institutional framework is constantly updated in accordance with international developments and European Union regulations.
What really counts for Turkey is ensuring that authors, businesses and producers are better informed in this respect, so that their awareness of the benefits of the system can be enhanced. In addition, users should be encouraged and supported to make better use of the instruments offered by the system.
Furthermore, existence of an effective intellectual property system has a direct effect on development. The new mode of production created by the information economy consists of information-based products with higher value added, all of which require effective protection. Effective protection of intellectual property and effective efforts to fight against piracy are factors directly influencing growth in the national economy. Today, piracy, in other words, theft of labor, is detrimental not only to cultural and artistic life but also to the national economy. Due to the informal economy, the government suffers tax revenue losses amounting up to billions of lira, which leads to a stagnation in the country’s international competitiveness in areas such as music, cinema and software, which are indispensable for both the national economy and cultural life.
At this point we must state that, despite all the efforts to prevent piracy, we cannot say that the desired results have fully been achieved. There are several reasons why piracy is still a major problem. First of all, public awareness regarding the harms of piracy has not been fully raised. People still buy pirated materials and they are reluctant to inform the authorities when they detect piracy. Second, right holders whose moral and economic rights have been infringed mostly do not bring any legal action against the infringer to cease the infringement, because of the high cost of legal representation. Third, the judicial process takes a long time and this situation erodes the deterrence. Also, measures designed to prevent digital piracy, which is one of the major problems of music sector, have not yet been proved to be very effective.
As for the contribution of copyright industries to the economy, statistical analyses revealed that, contrary to our expectations, economic contribution of copyright industries is not at a desired level. Especially, the economic contribution of core copyright industries is relatively low. Although the overall contribution of copyright industries is greater than some important sectors, we believe that the contribution of these industries must be improved.
There are several reasons why the contribution of copyright industries is not at a desired level. First of all, the structure of the Turkish economy plays an important role. Turkey has large agriculture, manufacturing, construction and real estate sectors and most of the contribution to GDP comes from these sectors – especially the manufacturing sector, which is the top contributor to GDP. The automotive, food and beverage, basic metals, non-metallic minerals, fabricated metal, machinery and equipment, and chemicals industries have substantial economic size in terms of value added (the apparel, textile and footwear sector also occupies
Study on the Economic Contribution of Copyright Industries in Turkey
101
an important position in manufacturing. But it is a copyright sector). The size of these sectors dominates the size of the core copyright industries and makes the contribution of copyright industries relatively low. Manufacturing industries are also relatively more mature than core copyright industries. We cannot say that the industrialization of core copyright sectors has been fully achieved. Secondly, the expenditure pattern of households is important. As stated above, consumption of the goods and services produced by core copyright industries is relatively low in Turkey. Cinemas and theaters are not evenly distributed throughout the country and they are concentrated in certain regions. This situation also affects the size of these sectors. Thirdly, as stated above, although it is declining, piracy is still a problem in the press and literature, motion picture and video, and music sectors and affects the size of these core copyright industries. Digital piracy is especially a major problem in the music industry since digital sales have become more and more popular. Fourthly, copyright collective management societies have some difficulty in collecting copyright remunerations for the performance of musical works in public spaces; this causes a loss in revenue.
Although the contribution of core copyright industries to GDP is relatively low, there is a remarkable pattern of growth in the software and databases, radio and television, and motion picture and video industries. The growth in the motion picture and video sector is especially striking. Turkey’s TV series exports are increasing and reached 150 million US dollars in 2013. Turkish TV series are broadcast in more than 50 countries. The audience numbers in the motion picture industry, which were around 42 million in the last 3 years, exceeded 50 million in 2013. The admission rate for Turkish motion pictures reached 58%; according to data from the last five years, Turkey presently ranks first in Europe with regard to the total admission rates for locally made films. As a result of the increasing preference of the Turkish audience for local films, the number of productions has also increased. However, we have to point out another finding here: although Turkish TV series are exported in increasing numbers, we cannot say the same thing for Turkish motion pictures. Turkish films have won international awards but this success has not yet been commercialized. Very few Turkish films are on screen worldwide and they are generally shown in countries where there is a large Turkish population, such as Germany and Austria.
E-applications in both public and private sectors are increasing very rapidly and this increase offers tremendous opportunities for the software and databases industry. Also, the exports of the industry are increasing to a striking extent. Nevertheless, experts in the sector say that Turkey is importing a huge amount of software; industry experts point out that if users’ perception changes concerning local products and if they demand more and more local products and services, the contribution of this sector to GDP will improve.
We can say that the software and databases, motion picture and video, and radio and television industries in Turkey have tremendous growth potential that must be exploited. Growth in the radio and television sector also positively affects the advertising sector.
Mixed codes, data from public sector institutions, and foreign trade data were the main statistical difficulties encountered during the study. The problems of mixed codes and data from public institutions were easily handled, but foreign trade data remained the major problem, because official statistics related to collections from foreign entities and payments to foreign entities concerning copyright were virtually non-existent. We had to rely on expert opinions and data from associations and societies to come up with the export and import figures. Also, the I/O tables provided by TURKSTAT were very old and for this reason we could not perform multiplier analyses; however, TURKSAT is preparing new I/O tables, so we expect that future studies will contain multiplier analyses.
The Tenth Development Plan states as one of its primary objectives to increase the contribution of intellectual rights and their works to the development process. In that sense, the Plan accepts that copyright industries are among the growth axes of the country in the 21st century. It is also stated in the Development Plan that the ‘contribution of the products and works covered by intellectual property rights to the national economy will be determined, monitored and evaluated, and information and data infrastructure will be strengthened.’ Thus, determination of the value added generated within the national economy can be considered as a major parameter for use in making policies in this area This study contributes to the implementation of the Development Plan by assessing the economic contribution of the copyright industries, proposing a methodology for the further studies to monitor the developments in economic contribution of copyright industries, and highlighting the statistical difficulties.
Stud
y on t
he Ec
onom
ic C
ontri
butio
n of C
opyr
ight
Indu
strie
s in
Turk
ey
102
5.2 RecommendationsWe can recommend some policies and actions in order to improve the economic contribution of copyright industries. Turkey wants to advance to a high income level country from a middle income one. High value added sectors such as core copyright industries should be encouraged and supported in order to achieve this objective. Increase in the value added of core copyright industries also directly affects economic growth. The following recommendations are intended to achieve this objective.
As explained in the conclusions, although there is an adequate legal framework and effective enforcement, piracy is still a major problem for the press and literature, motion picture and video, and music sectors. Public awareness concerning piracy should be raised: in this regard, education plays an important role. At every level of education, the harms of piracy should be stressed and it should be clearly stated that piracy is a crime that is prosecuted like any other crime. Every type of media should also be used to raise public awareness related to piracy. Procedures in the courts should be sped up and the punishments (fine or imprisonment) should be deterrent. Training programs should be organized for members of the judiciary assigned to the prosecutors’ offices and courts dealing with piracy offences. Also, special legal arrangements are necessary to fight digital piracy.
The legal capacities of the copyright collective management societies should be strengthened so that they can provide better legal assistance to their members when they encounter right infringements. We believe that effective deterrence is of utmost importance in the fight against infringements (including piracy). If this is accomplished, the economic contribution of certain core copyright industries will increase.
Procedures should be simplified and costs should be reduced to a reasonable level for the copyright collective management societies, in order to enable them to collect remunerations for the performance of musical works in public spaces.
Some measures should also be taken to increase the demand for copyright goods and services. Education policies are necessary to encourage children and young people in particular to acquire the habit of reading (especially cultural and literary publications) and to participate in cultural and artistic activities. If this is accomplished through education at an early age, then the interest of the population in the works of the core copyright industries will increase. This leads to an increase in demand for such works.
The copyright sectors should be industrialized in the same way as the manufacturing sectors and other service sectors. Government should also recognize these sectors as distinct industries and devise special incentives for their development. There should be special incentives to encourage investment in the digital area in the music industry and to encourage the international commercialization of Turkish motion pictures. Of course, content is very important for motion pictures to be accepted by a global audience and special incentives will encourage the producers and authors to come up with appropriate content. Likewise, there must be special incentives to encourage the export of TV series and formats.
The advertising revenues of regional and local radio and television channels are very low. Measures should be taken to increase their advertising revenues; in particular, a certain portion of public announcements by government authorities can be allocated to regional and local channels. Financial support should also be given to regional and local channels in order to enable them to build common transmitters and antennas, and digital broadcasting infrastructure.
Finally we would like to point out another aspect of the study that requires the attention of the policy-makers. Among the core copyright industries, the radio and television sector has the highest value added. The motion picture and video sector is the fastest growing. Some of our recommendations target increased contributions from these sectors and special attention must be paid to these sectors, because of their high performance and also the growing interest of the population in their products. On the other hand, photography has the lowest value added among the core copyright industries, mainly because of the lack of interest of Turkish people in this sector; special measures, especially through education, should be taken to promote the interest of the population. Among the interdependent copyright industries, the computers and equipment sector has the highest value added, because Turkish people are highly interested in this kind of equipment; but the local content in computers and equipment must be increased in order to improve the value added. The musical instruments industry has the lowest value added among the interdependent copyright industries and this situation stems from the fact that the society generally is not interested in playing musical instruments

Study on the Economic Contribution of Copyright Industries in Turkey
103
and most of these instruments are imported. If young people are motivated to play a musical instrument during their education, the interest of the population will increase accordingly and local businesses will be encouraged to invest in manufacturing musical instruments. As for the partial copyright industries, the highest contribution to value added comes from apparel, textiles and footwear, which is traditionally one of the important sectors in Turkey. Original designs must be encouraged in order to increase the copyright factor of this industry. The toys and games industry has the lowest value added among the partial copyright industries: most toys and games are imported, because it is cheaper to do that. Special incentives must be given in this sector to encourage creativity and compete with imported products.
TURKSTAT is aware of the statistical hardships concerning cultural industries and foreign trade data. For this reason, TURKSTAT has initiated a study to better compile cultural statistics and related foreign trade data, in conjunction with the Ministry of Culture and Tourism, and Ministry of Economy. This study is about to be finished as this report is being finalized and TURKSTAT experts say that they will be able to provide these statistics in a year.
The Ministry of Culture and Tourism is committed to repeating this study in the future with new data and monitoring the economic trends in copyright industries. We believe that, with the experience gained in this study and with better statistics, government authorities and sectors in Turkey will have valuable data for developing policies and business plans.
Stud
y on t
he Ec
onom
ic C
ontri
butio
n of C
opyr
ight
Indu
strie
s in
Turk
ey
104
R E F E R E N C E S
[1] http://www.tuik.gov.tr/PreTable.do?alt_id=1086
[2] http://www.baka.org.tr/uploads/1357649691YAZiLiM-SEKTORU-RAPORU-3ARALiK.pdf
[3] http://www.sde.org.tr/userfiles/file/TURKIYEDE_YAZILIM_%20SEKTORU.pdf
[4] http://www.turkyaybir.org.tr/komisyonlar/5-ulusal-yayin-kongresi-4-5-aralik-2009/408
[5] http://www.turkyaybir.org.tr/komisyonlar/turkiye-yayincilik-kurultaylari-sonuc-bildirgeleri/389
[6] Türkiye Kitap Pazarı 2013, http://www.basyaybir.org/turkiye-kitap-pazari-2013-cn270.html
[7] http://www.yasad.org.tr/RaporDetay.aspx?id=15
[8] T.C. Başbakanlık Kamu Diplomasisi Koordinatörlüğü, ‘Türkiye’nin Dizi Film İhracatı 150 Milyon Doları Aştı’, (Public Diplomacy Coordinator’s Office, Prime Minister’s Office, Republic of Turkey: ‘Turkey’s Exports of Serial Movies Exceed 150 Million Dollars’) http://www.kdk.gov.tr/haber/turkiyenin-dizi-film-Exportsi-150-million-dolari-asti/362.
[9] PricewaterhouseCoopers (PwC), Global Entertainment and Media Outlook 2012-2016.
[10] World Intellectual Property Organization, Guide on Surveying the Economic Contribution of the Copyright Industries, 2003.
[11] 2009, 2010 ve 2011 Yılı Reklam Verileriyle RADYO ve TELEVİZYON YAYINCILIĞI SEKTÖR RAPORU (RADIO AND TELEVISION INDUSTRY REPORT on the Basis of Advertising Data for 2009, 2010 and 2011), Doç. Dr. Can Bilgili
[12] Türkiye Radyo ve Televizyon Yayıncılığı Sektör Raporu (Turkish Radio and Television Broadcasting Industry Report) 2013, Prof. Dr. Peyami Çelikcan
Study on the Economic Contribution of Copyright Industries in Turkey
105
A n n e x e s
A n n e x 1 Te n t h D e v e l o p m e n t P l a n ( 2 0 1 4 - 2 0 1 8 ) a n d P o l i c i e s o n I n t e l l e c t u a l P r o p e r t y R i g h t s
1.1 Development Plans The Development Plans are of utmost importance as top level policy documents setting forth national development policies; targets and policies for protection and use of intellectual rights in addition to economic and social policies have been incorporated into the Plans since the start of the 1990s. Based on an overall assessment, the major service provided by the Development Plans regarding the protection of intellectual rights has been to provide guidance to the relevant public entities and private sector concerns on future potential developments and to indicate problems and proposed solutions in light of the studies of the ad hoc committees having broad participation.
Development Plans are prepared by safeguarding an understanding of participatory planning and inter-sectoral balance from an holistic view in compliance with the long-term targets. Comments and recommendations from various segments of the public on economic and social policies and targets, channeled through the ad hoc committees formed during plan preparations, are reflected in the Development Plans.
Ten Development Plans have so far been prepared under the planned development studies, which were first initiated in the country in the 1960’s. The Tenth Development Plan will cover the period between 2014 and 2018 and is aimed to ensure national convergence on the 2023 Long Term Strategic Targets.
It is the fundamental objective of the 2023 Long Term Strategy to claim a higher share of global production through transformation to an information society, and thus to improve social living standards. The Strategy primarily pursues the objectives of including the country among the World’s top ten economies on the centenary of the Republic, attaining a GDP of US$2 trillion and a per capita income of US$25 thousand, increasing exports to US$500 billion, cutting back the rate of unemployment to 5 per cent and helping R&D activities to claim a share of 3 per cent in GDP.
1.2 The Tenth Development Plan (2014-2018)The Tenth Development Plan, covering the period between 2014 and 2018, is prepared in line with Turkey’s 2023 targets and has been designed to embody elements such as rule of law, information society, international competitiveness, human development, environmental protection and sustainable use of resources.
The preparatory process for the Tenth Plan was launched upon the Prime Ministry’s Communiqué of June 5, 2012, and was ratified by the Turkish Grand National Assembly (Parliament) on July 2, 2013 following approval by the Supreme Planning Council and Council of Ministers (Cabinet).
The Tenth Development Plan pursues the objectives of accelerating the development process and raising the level of public welfare by setting the national potential, regional dynamics and citizens’ abilities into full motion.
The Tenth Development Plan sets forth the critical areas of intervention through transformation programs, in addition to its coverage of economic, social, industrial and regional areas by placing the strategic viewpoint in the center. A couple of critical areas of reform, which could provide solutions to the national basic structural problems and make contributions to the transformation process, have been identified through 25 priority transformation programs aiming at enhancing implementation effectiveness of the plan; besides, an implementation mechanism and tools of intervention and responsible agencies have been centrally identified for such programs.
Stud
y on t
he Ec
onom
ic C
ontri
butio
n of C
opyr
ight
Indu
strie
s in
Turk
ey
106
The Tenth Development Plan has been based on four major footings – qualified individuals, strong society; innovative production, stable high growth; liveable places, sustainable environment; and international cooperation for development.
The title, ‘qualified individuals, strong society’, incorporates policies to be implemented to set in motion the approach of development ‘for people, together with people’ and extending development across different social segments. In this framework, compatible and integrated policies will continue being implemented in areas such as basic rights and freedoms, democratization, justice, education, health, culture and arts, labor, social security and public management, to reach a stronger and more prosperous social composition and strengthen human capital.
The title, ‘innovative production, stable high growth’, sets forth the policies and targets for structural transformation in production and increased welfare. A growth strategy has been adopted based on development of an export-oriented and competitive production composition, under the leadership of the private sector, through increased efficiency and accelerated industrialization in line with the fundamental objective of stable and high growth. Accordingly, policies have been identified to increase employment and productive investments, reduce current accounts deficit and increase domestic savings, in addition to policies for the preservation and consolidation of macro-economic stability. These policies have been complemented by the industrial policies as well as by policies for the development of technological and innovative capacities and are thus targeted to transforming the economy into an innovative composition whereby its dependence on imports is reduced. This transformation process is expected through increasing capacity for innovation and integrating innovations with current production composition in Turkey.
‘Liveable places, sustainable environment’, which is the third title of the Plan’s targets and policies, incorporates the policies and targets for increasing the social and economic benefits of environmentally sensitive approaches, enhancing citizens’ living quality in urban and rural areas in a sustainable manner and, last but not least, reducing inter-regional development differences accordingly. It aims to improve competitiveness by strengthening socio-economic compatibility and ensuring overall development and making proper use of the potentials of the regions and cities. It is thus primarily envisaged to develop standards for basic living quality in settlements, facilitating access to the markets and public services by improving the utilities of transport, logistics and communication, particularly in low income regions and cities, and reinforcing integration of the developed regions and cities into the global economy.
Under ‘International Cooperation for Development’, support is to be extended to the development efforts of the countries with which the country has close cooperation, particularly those countries in the region which are presently in the process of transformation.
1.2.6 Basic Objectives and Principles of the Plan
The target is to increase GDP to $1.3 trillion, would raise per capita income to $16 thousand, increase exports to $277 billion, and reduce the rate of unemployment to 7.2 per cent by 2018. These targets are to be achieved through increased capital accumulation, accelerated industrialization, increased domestic savings and efficiency of production factors and lower current accounts deficit.
It is further targeted to develop a social setting where citizens of Turkey can have self-development and lead a free, healthy and secure life with high standards, so that they can live happily, prosperously and in dignity.
Turkey aims at helping urban and rural areas to offer better business opportunities and living spaces according to their specific conditions and characteristics.
The target is to rely on the principles of being human-focused, participation, inclusion, accountability and transparency to develop an ownership of the development process on a political and social level and maintain it through an integral approach.
Study on the Economic Contribution of Copyright Industries in Turkey
107
1.2.7 Intellectual Property Rights
The policies in connection with intellectual property rights are covered under the title, ‘Innovative production, stable high growth’, of the Tenth Development Plan. The primary objective of this section is to increase the contribution of intellectual rights and their products to the development process by setting up an effective, extensive and socially adopted system of intellectual property rights for the protection of intellectual property and use of relevant rights.
The target is to ensure that, by the end of the Plan period, the number of local patent applications will have reached 16,000, with their share in total applications rising to 55 per cent, as Turkey’s international patent applications go up to 2,140.
The policies formulated to attain such basic objectives and targets are divided into some axis such as developing human and institutional capacity, ensuring effective utilization of intellectual rights system by businesses, ensuring commercialization of intellectual rights, increasing the number of promotion, training and awareness building activities and strengthening the information and data infrastructure of the intellectual rights system. They are expressed by the Plan as follows:
• Adequate human and institutional capacity will be developed in the governmental units in charge of intellectual property rights protection, and supervision, particularly in the judiciary, customs authorities and law enforcement.
• Service capacity will be developed in the technology transfer and innovation centers in order to ensure that businesses use and support the intellectual rights system more effectively.
• Effectiveness of present mechanisms on the commercialization of intellectual property rights will be further enhanced.
• Public awareness will be enhanced through promotion and training activities for building public awareness on the intellectual rights systems at all levels.
• Contribution of the products and works covered by intellectual property rights to the national economy will be determined, monitored and evaluated, and information and data infrastructure will be strengthened.
1.3 Priority Transformation Programs‘Priority transformation programs’ are designed for critical areas of reform, which hold particular importance for attaining the objectives of the Tenth Development Plan, can serve as solutions to basic structural problems, can make contributions to the transformation process, generally fall in the demarcation of several ministries, and call for effective inter-agency coordination and responsibility. Among such programs, the ‘Program for Commercialization in the Priority Technological Areas’ and ‘Program for Technological Development and Local Production Through Public Procurements’ are of immediate interest to innovations, R & D activities and intellectual property rights.
1.4 Program for Commercialization in the Priority Technological AreasAlthough significant progress has been made in increasing and extending R&D activities in Turkey, there is a particular need for development of the commercialization component of new technological production, starting from basic research and extending to the stage of putting the products in the market. Accordingly, the following goals are pursued within the planning period: implementing the commercialization program in priority technological areas and increasing the amount of technological products and brands in the priority industries through this program; training qualified researchers and fostering employment in the private sector; increasing the number of research centers as well as incubation, acceleration, technology and innovation centers; making the technological development zones industry-oriented; developing innovative entrepreneurship and increasing technology transfer interfaces.

Stud
y on t
he Ec
onom
ic C
ontri
butio
n of C
opyr
ight
Indu
strie
s in
Turk
ey
108
1.5 Program for Technological Development and Local Production through Public ProcurementsAs priority is given to approaches contributing to R&D and innovative activities in public procurements, the costs of local products can be reduced, import products can be produced locally and local firms can be more effective in export markets. The following goals are pursued accordingly: implementing the technological development and local production program through public procurement and increasing the shares of local companies in the medium-high and high technology industries in public procurements through this program; supporting the process of international branding in the high technology industries and increasing the number of branded products; increasing R&D spending through the public procurement system and increasing international direct investments through policies to be implemented in public procurements.
Study on the Economic Contribution of Copyright Industries in Turkey
109
A n n e x 2 L e g i s l a t i o n
(a) Law No 5846 of 05.12.1951 on Intellectual and Artistic Works (FSEK)
(b) ‘Ordinance on the Collecting Societies and Federations of Authors and Right Holders of Intellectual and Artistic Works’ dated 10.03.1999; Type Status of Collecting Societies and Federations of Authors and Right Holders of Intellectual and Artistic Works dated 30.01.2003; Decision No 2013/5260 on the Determination of Deduction Rates Applicable on the Manufacturing or Import of Technical Devices and Blank Carrier Media Used in the Reproduction of Intellectual and Artistic Works.
(c) Decree No 2006/10880 on Granting Shares on the Sales Prices of Hand Written Original Manuscripts of Fine Arts, Scientific and Literary Works and Musical Works
(d) Regulation dated 17.05.2006 on the Recording and Registration of Intellectual and Artistic Works
(e) Regulation dated 08.11.2001 on the Procedure and Principles for the Implementation of the Control Mark (Banderole) System
(f) Regulation dated 18.04.2005 on the Procedures and Principles Regarding the Certification of Enterprises Disseminating or Performing the Recording, Copying and Sale of the Materials on which Intellectual and Artistic Works are Fixed
(g) Regulation on Procedures and Principles on Broadcasting and/or Transmission of Works, Performances and Productions dated 08.06.2004
(h) Regulation of 04.09.1986 on Certificate of Authority to be issued by Authors of Intellectual and Artistic Works
(i) Regulation of 16.11.1997 on the Marking of Intellectual and Artistic Works
(j) Regulation of 16.12.1997 on Neighboring Rights to the Authors of Works
(k) Regulation of 13.04.2006 on Procedures and Principles Regarding the Use of Deductions Made from the Costs of Carrying Materials that Include Intellectual and Artistic Works and Technical Devices Used to Copy These Works
(l) Regulation of 06.11.2010 on Intellectual Property Rights Common Database
(m) Regulation of 23.01.2007 on the royalties and derivation fees payable by public bodies
(n) Regulation of 11.08.2009 on the procedures and principles of bonus payment to the president and members of the Inspection Commission.
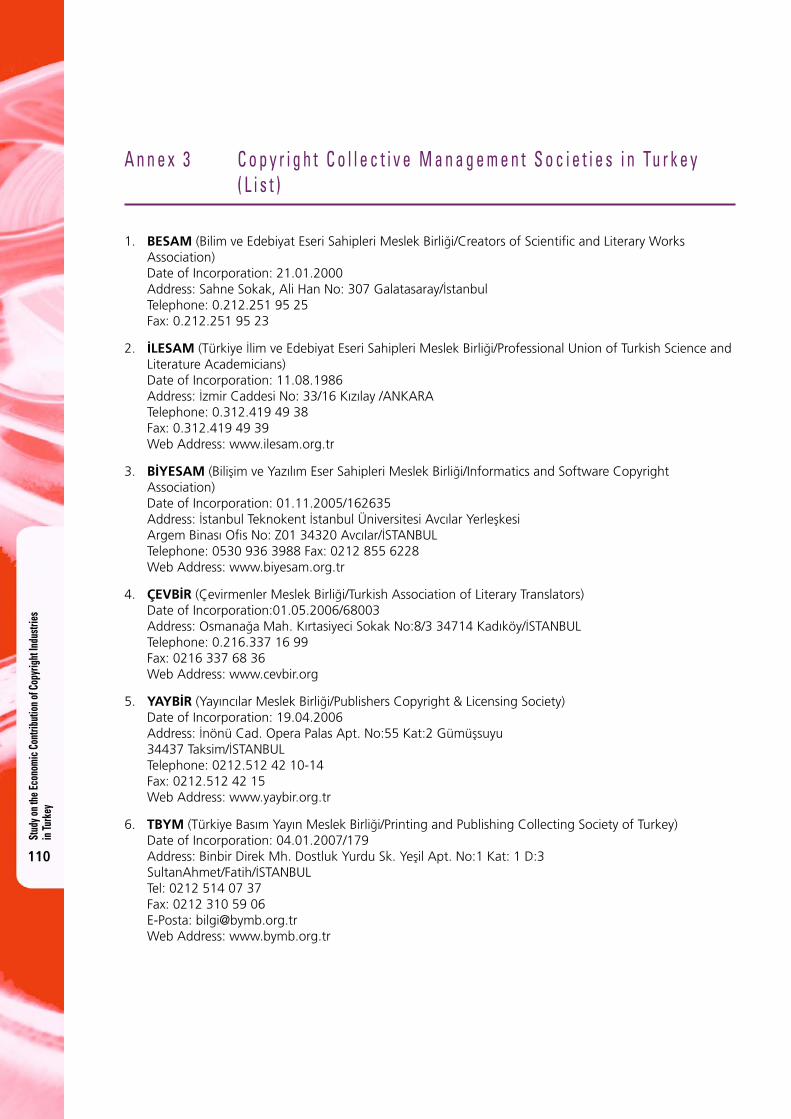
Stud
y on t
he Ec
onom
ic C
ontri
butio
n of C
opyr
ight
Indu
strie
s in
Turk
ey
110
A n n e x 3 C o p y r i g h t C o l l e c t i v e M a n a g e m e n t S o c i e t i e s i n Tu r k e y ( L i s t )
1. BESAM (Bilim ve Edebiyat Eseri Sahipleri Meslek Birliği/Creators of Scientific and Literary Works Association) Date of Incorporation: 21.01.2000 Address: Sahne Sokak, Ali Han No: 307 Galatasaray/İstanbul Telephone: 0.212.251 95 25 Fax: 0.212.251 95 23
2. İLESAM (Türkiye İlim ve Edebiyat Eseri Sahipleri Meslek Birliği/Professional Union of Turkish Science and Literature Academicians) Date of Incorporation: 11.08.1986 Address: İzmir Caddesi No: 33/16 Kızılay /ANKARA Telephone: 0.312.419 49 38 Fax: 0.312.419 49 39 Web Address: www.ilesam.org.tr
3. BİYESAM (Bilişim ve Yazılım Eser Sahipleri Meslek Birliği/Informatics and Software Copyright Association) Date of Incorporation: 01.11.2005/162635 Address: İstanbul Teknokent İstanbul Üniversitesi Avcılar Yerleşkesi Argem Binası Ofis No: Z01 34320 Avcılar/İSTANBUL Telephone: 0530 936 3988 Fax: 0212 855 6228 Web Address: www.biyesam.org.tr
4. ÇEVBİR (Çevirmenler Meslek Birliği/Turkish Association of Literary Translators) Date of Incorporation:01.05.2006/68003 Address: Osmanağa Mah. Kırtasiyeci Sokak No:8/3 34714 Kadıköy/İSTANBUL Telephone: 0.216.337 16 99 Fax: 0216 337 68 36 Web Address: www.cevbir.org
5. YAYBİR (Yayıncılar Meslek Birliği/Publishers Copyright & Licensing Society) Date of Incorporation: 19.04.2006 Address: İnönü Cad. Opera Palas Apt. No:55 Kat:2 Gümüşsuyu 34437 Taksim/İSTANBUL Telephone: 0212.512 42 10-14 Fax: 0212.512 42 15 Web Address: www.yaybir.org.tr
6. TBYM (Türkiye Basım Yayın Meslek Birliği/Printing and Publishing Collecting Society of Turkey) Date of Incorporation: 04.01.2007/179 Address: Binbir Direk Mh. Dostluk Yurdu Sk. Yeşil Apt. No:1 Kat: 1 D:3 SultanAhmet/Fatih/İSTANBUL Tel: 0212 514 07 37 Fax: 0212 310 59 06 E-Posta: [email protected] Web Address: www.bymb.org.tr
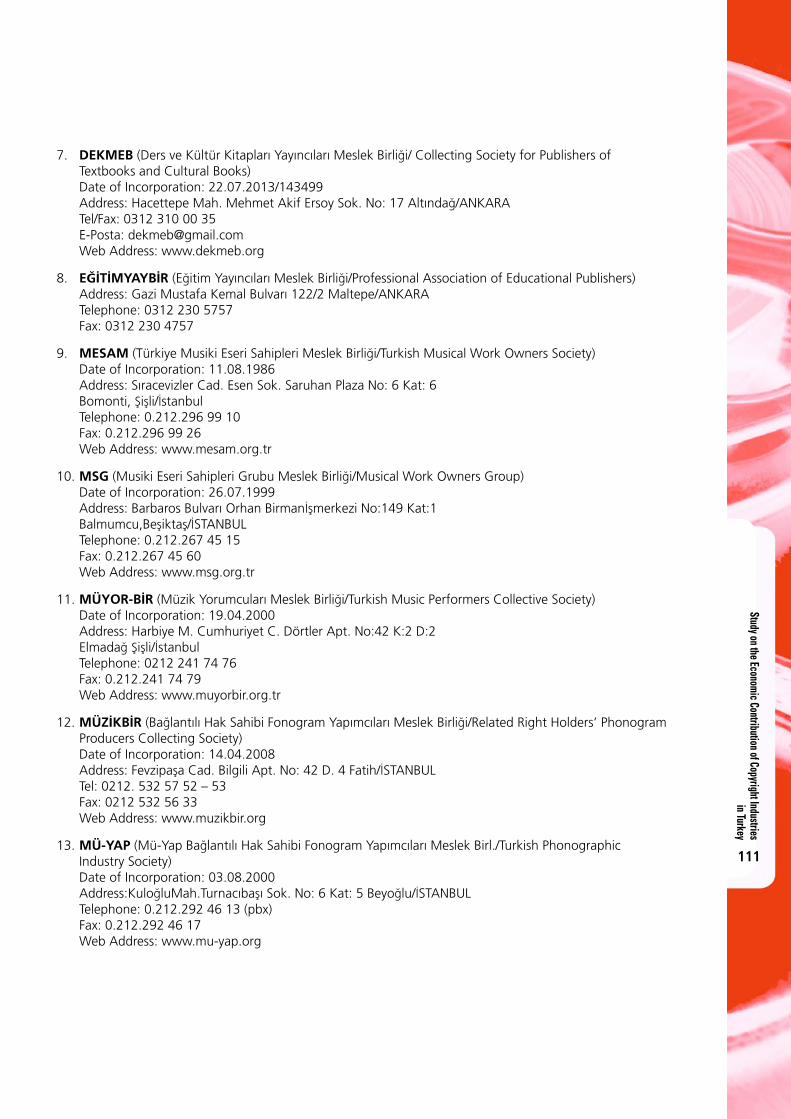
Study on the Economic Contribution of Copyright Industries in Turkey
111
7. DEKMEB (Ders ve Kültür Kitapları Yayıncıları Meslek Birliği/ Collecting Society for Publishers of Textbooks and Cultural Books) Date of Incorporation: 22.07.2013/143499 Address: Hacettepe Mah. Mehmet Akif Ersoy Sok. No: 17 Altındağ/ANKARA Tel/Fax: 0312 310 00 35 E-Posta: [email protected] Web Address: www.dekmeb.org
8. EĞİTİMYAYBİR (Eğitim Yayıncıları Meslek Birliği/Professional Association of Educational Publishers) Address: Gazi Mustafa Kemal Bulvarı 122/2 Maltepe/ANKARA Telephone: 0312 230 5757 Fax: 0312 230 4757
9. MESAM (Türkiye Musiki Eseri Sahipleri Meslek Birliği/Turkish Musical Work Owners Society) Date of Incorporation: 11.08.1986 Address: Sıracevizler Cad. Esen Sok. Saruhan Plaza No: 6 Kat: 6 Bomonti, Şişli/İstanbul Telephone: 0.212.296 99 10 Fax: 0.212.296 99 26 Web Address: www.mesam.org.tr
10. MSG (Musiki Eseri Sahipleri Grubu Meslek Birliği/Musical Work Owners Group) Date of Incorporation: 26.07.1999 Address: Barbaros Bulvarı Orhan Birmanİşmerkezi No:149 Kat:1 Balmumcu,Beşiktaş/İSTANBUL Telephone: 0.212.267 45 15 Fax: 0.212.267 45 60 Web Address: www.msg.org.tr
11. MÜYOR-BİR (Müzik Yorumcuları Meslek Birliği/Turkish Music Performers Collective Society) Date of Incorporation: 19.04.2000 Address: Harbiye M. Cumhuriyet C. Dörtler Apt. No:42 K:2 D:2 Elmadağ Şişli/İstanbul Telephone: 0212 241 74 76 Fax: 0.212.241 74 79 Web Address: www.muyorbir.org.tr
12. MÜZİKBİR (Bağlantılı Hak Sahibi Fonogram Yapımcıları Meslek Birliği/Related Right Holders’ Phonogram Producers Collecting Society) Date of Incorporation: 14.04.2008 Address: Fevzipaşa Cad. Bilgili Apt. No: 42 D. 4 Fatih/İSTANBUL Tel: 0212. 532 57 52 – 53 Fax: 0212 532 56 33 Web Address: www.muzikbir.org
13. MÜ-YAP (Mü-Yap Bağlantılı Hak Sahibi Fonogram Yapımcıları Meslek Birl./Turkish Phonographic Industry Society) Date of Incorporation: 03.08.2000 Address:KuloğluMah.Turnacıbaşı Sok. No: 6 Kat: 5 Beyoğlu/İSTANBUL Telephone: 0.212.292 46 13 (pbx) Fax: 0.212.292 46 17 Web Address: www.mu-yap.org
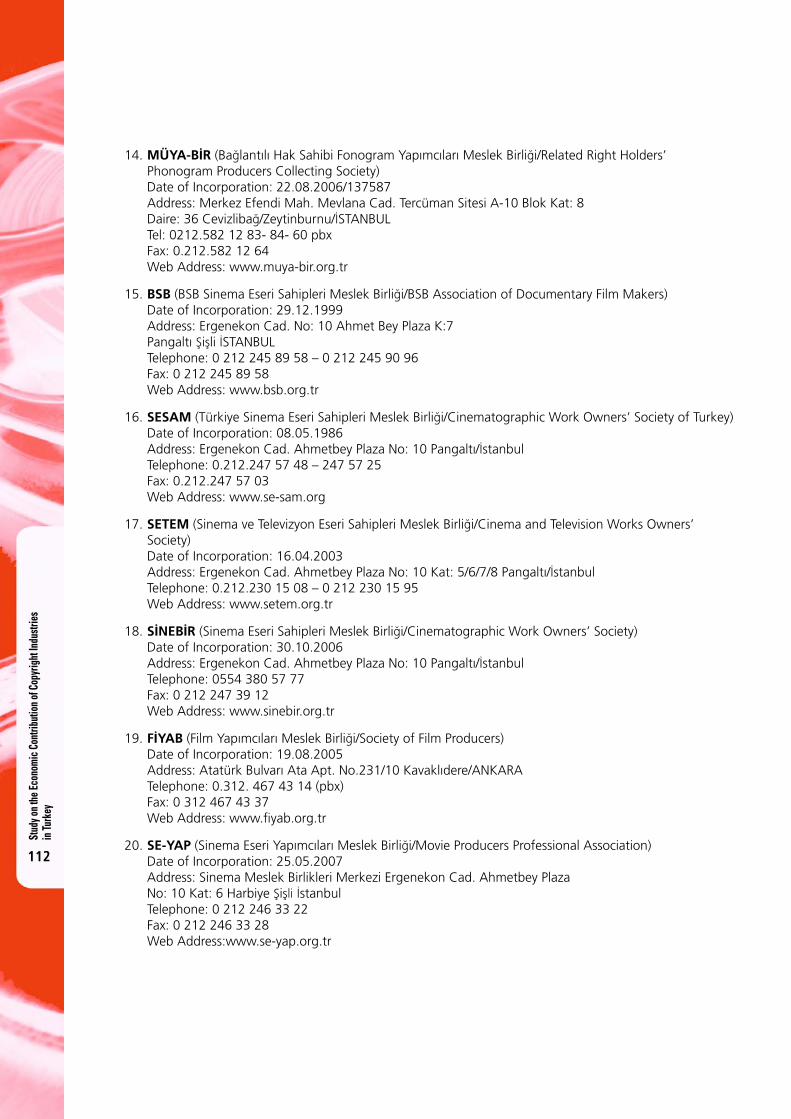
Stud
y on t
he Ec
onom
ic C
ontri
butio
n of C
opyr
ight
Indu
strie
s in
Turk
ey
112
14. MÜYA-BİR (Bağlantılı Hak Sahibi Fonogram Yapımcıları Meslek Birliği/Related Right Holders’ Phonogram Producers Collecting Society) Date of Incorporation: 22.08.2006/137587 Address: Merkez Efendi Mah. Mevlana Cad. Tercüman Sitesi A-10 Blok Kat: 8 Daire: 36 Cevizlibağ/Zeytinburnu/İSTANBUL Tel: 0212.582 12 83- 84- 60 pbx Fax: 0.212.582 12 64 Web Address: www.muya-bir.org.tr
15. BSB (BSB Sinema Eseri Sahipleri Meslek Birliği/BSB Association of Documentary Film Makers) Date of Incorporation: 29.12.1999 Address: Ergenekon Cad. No: 10 Ahmet Bey Plaza K:7 Pangaltı Şişli İSTANBUL Telephone: 0 212 245 89 58 – 0 212 245 90 96 Fax: 0 212 245 89 58 Web Address: www.bsb.org.tr
16. SESAM (Türkiye Sinema Eseri Sahipleri Meslek Birliği/Cinematographic Work Owners’ Society of Turkey) Date of Incorporation: 08.05.1986 Address: Ergenekon Cad. Ahmetbey Plaza No: 10 Pangaltı/İstanbul Telephone: 0.212.247 57 48 – 247 57 25 Fax: 0.212.247 57 03 Web Address: www.se-sam.org
17. SETEM (Sinema ve Televizyon Eseri Sahipleri Meslek Birliği/Cinema and Television Works Owners’ Society) Date of Incorporation: 16.04.2003 Address: Ergenekon Cad. Ahmetbey Plaza No: 10 Kat: 5/6/7/8 Pangaltı/İstanbul Telephone: 0.212.230 15 08 – 0 212 230 15 95 Web Address: www.setem.org.tr
18. SİNEBİR (Sinema Eseri Sahipleri Meslek Birliği/Cinematographic Work Owners’ Society) Date of Incorporation: 30.10.2006 Address: Ergenekon Cad. Ahmetbey Plaza No: 10 Pangaltı/İstanbul Telephone: 0554 380 57 77 Fax: 0 212 247 39 12 Web Address: www.sinebir.org.tr
19. FİYAB (Film Yapımcıları Meslek Birliği/Society of Film Producers) Date of Incorporation: 19.08.2005 Address: Atatürk Bulvarı Ata Apt. No.231/10 Kavaklıdere/ANKARA Telephone: 0.312. 467 43 14 (pbx) Fax: 0 312 467 43 37 Web Address: www.fiyab.org.tr
20. SE-YAP (Sinema Eseri Yapımcıları Meslek Birliği/Movie Producers Professional Association) Date of Incorporation: 25.05.2007 Address: Sinema Meslek Birlikleri Merkezi Ergenekon Cad. Ahmetbey Plaza No: 10 Kat: 6 Harbiye Şişli İstanbul Telephone: 0 212 246 33 22 Fax: 0 212 246 33 28 Web Address:www.se-yap.org.tr
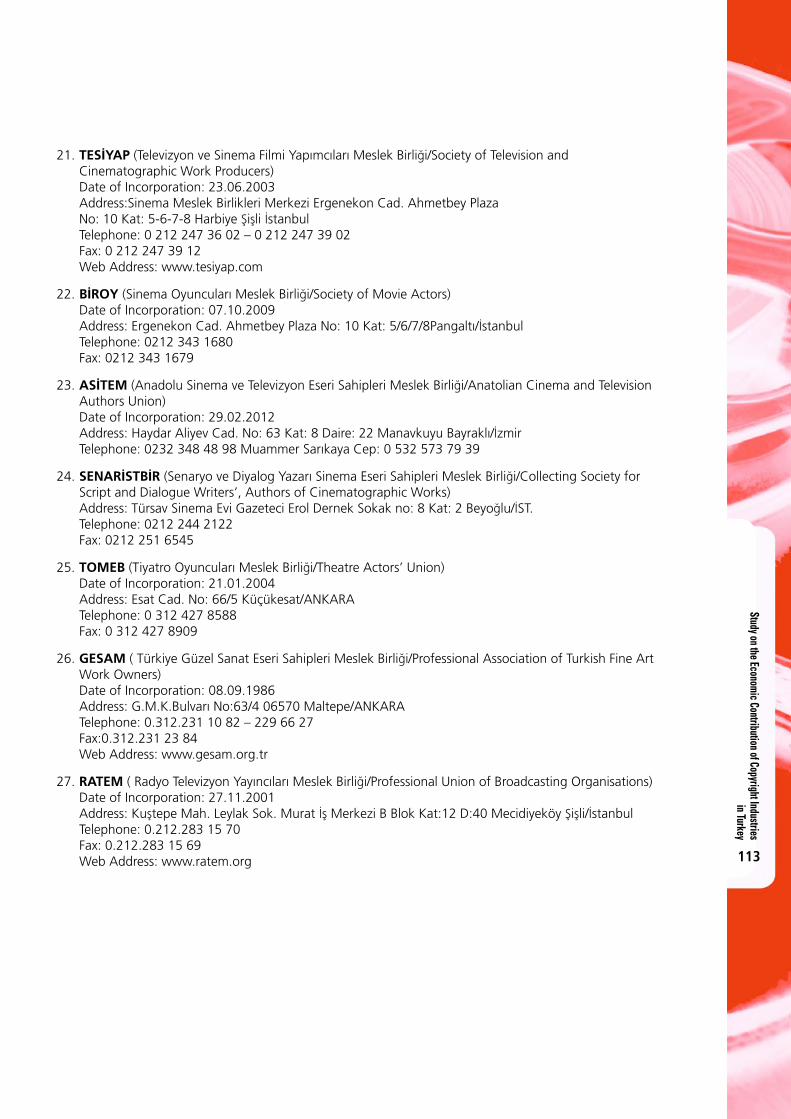
Study on the Economic Contribution of Copyright Industries in Turkey
113
21. TESİYAP (Televizyon ve Sinema Filmi Yapımcıları Meslek Birliği/Society of Television and Cinematographic Work Producers) Date of Incorporation: 23.06.2003 Address:Sinema Meslek Birlikleri Merkezi Ergenekon Cad. Ahmetbey Plaza No: 10 Kat: 5-6-7-8 Harbiye Şişli İstanbul Telephone: 0 212 247 36 02 – 0 212 247 39 02 Fax: 0 212 247 39 12 Web Address: www.tesiyap.com
22. BİROY (Sinema Oyuncuları Meslek Birliği/Society of Movie Actors) Date of Incorporation: 07.10.2009 Address: Ergenekon Cad. Ahmetbey Plaza No: 10 Kat: 5/6/7/8Pangaltı/İstanbul Telephone: 0212 343 1680 Fax: 0212 343 1679
23. ASİTEM (Anadolu Sinema ve Televizyon Eseri Sahipleri Meslek Birliği/Anatolian Cinema and Television Authors Union) Date of Incorporation: 29.02.2012 Address: Haydar Aliyev Cad. No: 63 Kat: 8 Daire: 22 Manavkuyu Bayraklı/İzmir Telephone: 0232 348 48 98 Muammer Sarıkaya Cep: 0 532 573 79 39
24. SENARİSTBİR (Senaryo ve Diyalog Yazarı Sinema Eseri Sahipleri Meslek Birliği/Collecting Society for Script and Dialogue Writers’, Authors of Cinematographic Works) Address: Türsav Sinema Evi Gazeteci Erol Dernek Sokak no: 8 Kat: 2 Beyoğlu/İST. Telephone: 0212 244 2122 Fax: 0212 251 6545
25. TOMEB (Tiyatro Oyuncuları Meslek Birliği/Theatre Actors’ Union) Date of Incorporation: 21.01.2004 Address: Esat Cad. No: 66/5 Küçükesat/ANKARA Telephone: 0 312 427 8588 Fax: 0 312 427 8909
26. GESAM ( Türkiye Güzel Sanat Eseri Sahipleri Meslek Birliği/Professional Association of Turkish Fine Art Work Owners) Date of Incorporation: 08.09.1986 Address: G.M.K.Bulvarı No:63/4 06570 Maltepe/ANKARA Telephone: 0.312.231 10 82 – 229 66 27 Fax:0.312.231 23 84 Web Address: www.gesam.org.tr
27. RATEM ( Radyo Televizyon Yayıncıları Meslek Birliği/Professional Union of Broadcasting Organisations) Date of Incorporation: 27.11.2001 Address: Kuştepe Mah. Leylak Sok. Murat İş Merkezi B Blok Kat:12 D:40 Mecidiyeköy Şişli/İstanbul Telephone: 0.212.283 15 70 Fax: 0.212.283 15 69 Web Address: www.ratem.org
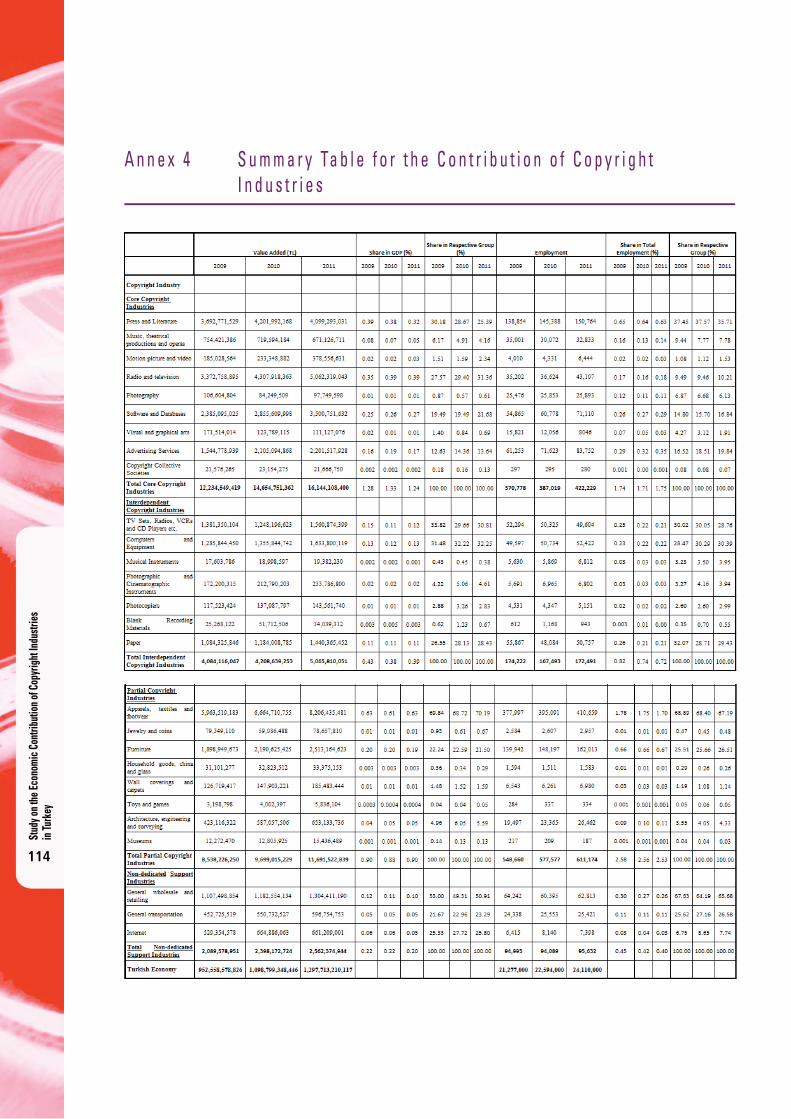
Stud
y on t
he Ec
onom
ic C
ontri
butio
n of C
opyr
ight
Indu
strie
s in
Turk
ey
114
A n n e x 4 S u m m a r y Ta b l e f o r t h e C o n t r i b u t i o n o f C o p y r i g h t I n d u s t r i e s

For more information contact WIPO at www.wipo.int
World Intellectual Property Organization34, chemin des ColombettesP.O. Box 18CH-1211 Geneva 20Switzerland
Telephone:+41 22 338 91 11Fax:+41 22 733 54 28
C r e a t i v e I n d u s t r i e s S e r i e s N o . 8
The Economic Contribution of Copyright-Based Industries
in Argentina
Cred
its
for C
over
Scr
eens
hots
: Im
age
(top
left
) cou
rtes
y of
fra
nky2
42 /
Free
Dig
italP
hoto
s.ne
tIm
age
(low
er r
ight
) cou
rtes
y of
dom
deen
/ Fr
eeD
igita
lPho
tos.
net