
Study on indoor thermal environment of office space controlled by cooling panel system using field...
10
Building and Environment 40 (2005) 301 – 310 www.elsevier.com/locate/buildenv Study on indoor thermal environment of oce space controlled by cooling panel system using eld measurement and the numerical simulation Taeyeon Kim a ; ∗ , Shinsuke Kato b , Shuzo Murakami c , Ji-woong Rho d a Yonsei University, South Korea b Institute of Industrial Science, University of Tokyo, Japan c Keio University, Japan d Hongik University, Republic of Korea Received 28 January 2004; accepted 6 April 2004 Abstract The purpose of this study was to analyze the performance of a cooling panel system installed in the vertical plane with condensation (hereinafter a cooling panel system) using eld measurement and coupled simulation of convection and radiation (CFD). Unlike an all-air cooling system, the cooling panel system could remove the cooling load by convection and radiation. Since the surface temperature of the cooling panel analyzed in this study can be controlled under the dew point, this system is expected to be energy-saving and dehumidifying. In the rst step of this study, the indoor thermal environment of the oce space, which is air-conditioned by a cooling panel system, was analyzed by eld measurement and CFD. By comparing both results, the expected precision of CFD for an indoor space with a cooling panel was examined and the CFD method veried from a practical point of view. In the next step, the thermal environment of the model oce space, which is cooled by three types of HVAC system (cooling panel system, all-air cooling system, and hybrid air cooling system composed of cooling panel and natural ventilation), was analyzed using CFD. Installing a human model in the oce, the characteristics of heat transportation from the human model were also analyzed. The analysis deals with only sensible heat in this study. The operative temperature in the cooling panel system was lower than that in the all-air cooling system when each of the sensible cooling loads of all types of HVAC system was the same. In conclusion, the cooling panel system was found to be very energy-ecient. ? 2004 Elsevier Ltd. All rights reserved. Keywords: Cooling panel system; CFD; Coupled simulation 1. Introduction The purpose of this study was to analyze the performance of a cooling panel system with condensation (hereafter a cooling panel system) by eld measurement and coupled simulation of convection and radiation (CFD). Unlike an all-air cooling system, the cooling panel system could re- move the cooling load by convection and radiation. Many researchers have studied the cooling panel system and found that it was very useful from the viewpoint of thermal en- vironment, cost, etc. [1–3]. Most current systems of this type have a cooling panel whose surface temperature is not lower than the dew point in order to avoid condensation. It is ∗ Corresponding author. E-mail address: [email protected] (T. Kim). dicult to apply these systems to a space whose cooling load is large and that requires dehumidifying. In this study, since the surface temperature of the cooling panel analyzed can even be controlled under the dew point, the system can be applied and is expected to be energy-saving and dehu- midifying. Since the system, which has a low-temperature panel surface, removes heat by radiation eectively, the op- erative temperature of a human body could be low in spite of high room air temperature. However, there are some prob- lems with this type of cooling system. One is that it has an open-air condensation surface and a condensed water pan that may become mildewed. There is a potential risk of pol- luting the room air. This study does not deal with this issue. It supposes appropriate measures against this risk, such as a sophisticated design to make it easy to clean the surface of the cooling panel and the condensed water pan on a daily 0360-1323/$ - see front matter ? 2004 Elsevier Ltd. All rights reserved. doi:10.1016/j.buildenv.2004.04.010
-
Upload
independent -
Category
Documents
-
view
2 -
download
0
Transcript of Study on indoor thermal environment of office space controlled by cooling panel system using field...
Building and Environment 40 (2005) 301–310www.elsevier.com/locate/buildenv
Study on indoor thermal environment of o#ce space controlled bycooling panel system using %eld measurement and the numerical
simulation
Taeyeon Kima ;∗, Shinsuke Katob, Shuzo Murakamic, Ji-woong Rhod
aYonsei University, South KoreabInstitute of Industrial Science, University of Tokyo, Japan
cKeio University, JapandHongik University, Republic of Korea
Received 28 January 2004; accepted 6 April 2004
Abstract
The purpose of this study was to analyze the performance of a cooling panel system installed in the vertical plane with condensation(hereinafter a cooling panel system) using %eld measurement and coupled simulation of convection and radiation (CFD). Unlike an all-aircooling system, the cooling panel system could remove the cooling load by convection and radiation. Since the surface temperature of thecooling panel analyzed in this study can be controlled under the dew point, this system is expected to be energy-saving and dehumidifying.In the %rst step of this study, the indoor thermal environment of the o#ce space, which is air-conditioned by a cooling panel system, wasanalyzed by %eld measurement and CFD. By comparing both results, the expected precision of CFD for an indoor space with a coolingpanel was examined and the CFD method veri%ed from a practical point of view. In the next step, the thermal environment of the modelo#ce space, which is cooled by three types of HVAC system (cooling panel system, all-air cooling system, and hybrid air cooling systemcomposed of cooling panel and natural ventilation), was analyzed using CFD. Installing a human model in the o#ce, the characteristicsof heat transportation from the human model were also analyzed. The analysis deals with only sensible heat in this study. The operativetemperature in the cooling panel system was lower than that in the all-air cooling system when each of the sensible cooling loads of alltypes of HVAC system was the same. In conclusion, the cooling panel system was found to be very energy-e#cient.? 2004 Elsevier Ltd. All rights reserved.
Keywords: Cooling panel system; CFD; Coupled simulation
1. Introduction
The purpose of this study was to analyze the performanceof a cooling panel system with condensation (hereafter acooling panel system) by %eld measurement and coupledsimulation of convection and radiation (CFD). Unlike anall-air cooling system, the cooling panel system could re-move the cooling load by convection and radiation. Manyresearchers have studied the cooling panel system and foundthat it was very useful from the viewpoint of thermal en-vironment, cost, etc. [1–3]. Most current systems of thistype have a cooling panel whose surface temperature is notlower than the dew point in order to avoid condensation. It is
∗ Corresponding author.E-mail address: [email protected] (T. Kim).
di#cult to apply these systems to a space whose coolingload is large and that requires dehumidifying. In this study,since the surface temperature of the cooling panel analyzedcan even be controlled under the dew point, the system canbe applied and is expected to be energy-saving and dehu-midifying. Since the system, which has a low-temperaturepanel surface, removes heat by radiation e@ectively, the op-erative temperature of a human body could be low in spite ofhigh room air temperature. However, there are some prob-lems with this type of cooling system. One is that it has anopen-air condensation surface and a condensed water panthat may become mildewed. There is a potential risk of pol-luting the room air. This study does not deal with this issue.It supposes appropriate measures against this risk, such as asophisticated design to make it easy to clean the surface ofthe cooling panel and the condensed water pan on a daily
0360-1323/$ - see front matter ? 2004 Elsevier Ltd. All rights reserved.doi:10.1016/j.buildenv.2004.04.010
302 T. Kim et al. / Building and Environment 40 (2005) 301–310
basis. Another problem is that the human body might beover-cooled, especially if it is close to the cooling panel. Toanalyze this problem, it is necessary to consider the char-acteristics of the inhomogeneous radiation–convection ther-mal environment generated by the cooling panel as a resultof heat transportation between the human body and the sur-rounding environment.In the %rst step of this study, the thermal environment of
an o#ce space air-conditioned by a cooling panel systemwas analyzed by %eld measurement and CFD. The analysisdeals with only sensible heat; latent heat is not dealt withbecause of the di#culty of %eld measurement in this study.By comparing both the results of the %eld measurement andthe simulation, the expected precision of the CFD for an in-door space with a cooling panel is examined from a practicalpoint of view.In the next step, the thermal environment (i.e., that of
sensible heat) of the model o#ce space, which is cooled bythree types of HVAC system (cooling panel system, all-aircooling system, and hybrid air cooling system composed ofcooling panel and natural ventilation), was analyzed usingCFD to examine the e@ectiveness of the cooling panel sys-tem. A human model generating heat was installed to closelyanalyze the characteristics of sensible heat transportation be-tween the surrounding environment and the human body.
2. Field measurement of an o�ce space air-conditionedby a cooling panel
Many experimental studies have been conducted to ver-ify the expected precision of numerical simulation of theindoor thermal environment using CFD. The validity of theindoor thermal environment analysis based on a turbulentEow model, such as the standard k-� model, has proved ac-curate to some extent [4]. But, most of these studies havebeen based on an all-air conditioning system with supply in-lets and exhaust outlets. Few reports can be found concern-ing the analysis of an indoor thermal environment generatedby a cooling panel, whose radiation heat transfer charac-teristics are more important than for an all-air conditioningsystem. In this study, the thermal environment of an o#cespace cooled by a cooling panel was analyzed by %eld mea-surement and CFD to verify the reliability of the CFD.
2.1. O1ce space for 2eld measurement
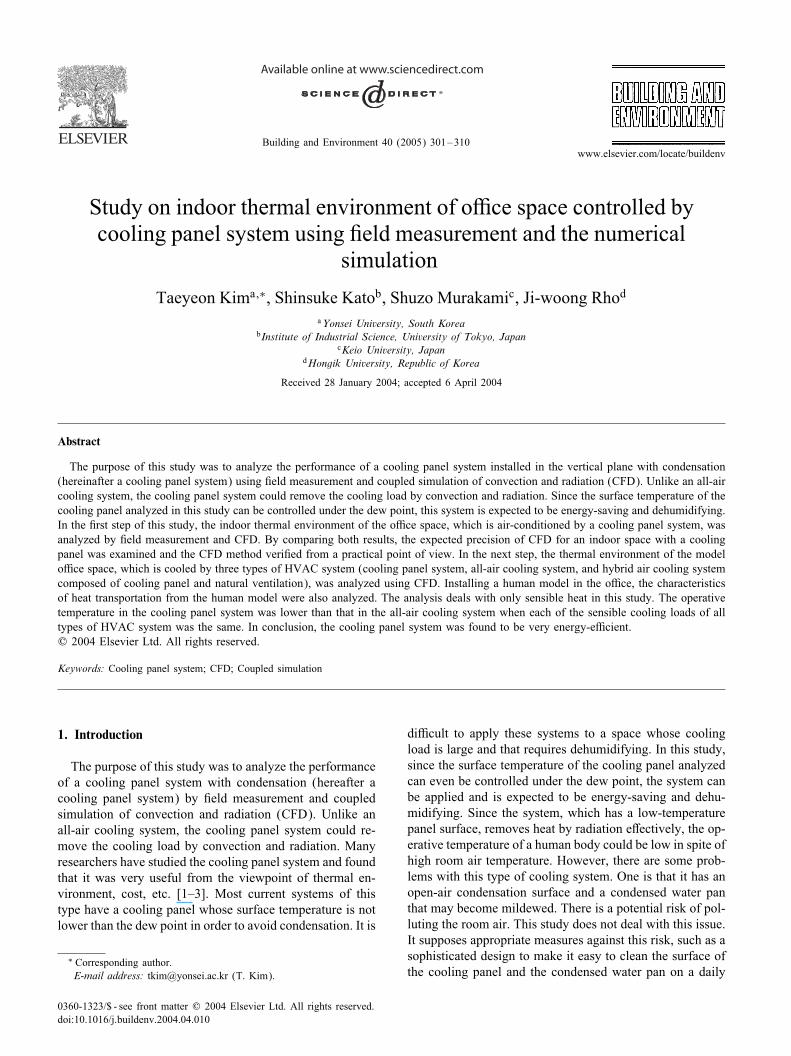
The o#ce space (7:5 m×5:0 m×2:1 m) used in the %eldmeasurement and the CFD is shown in Fig. 1. This spaceis on the ground Eoor of a six-storey reinforced concretebuilding located in Shibuya Ward, Tokyo, Japan. The eastand north walls are adjacent to other o#ces while the westand south walls are exterior walls. The ceiling is made ofplasterboard hung from reinforced concrete slabs. The Eoor,made of reinforced concrete, is covered by carpet. The roomis cooled by a cooling panel (1:8 m×2:4 m×0:2 m). There
(Section A)
(Section B)N
2.1
5.07.5
Cooling panel
Human modelDoor
Window
OutdoorCenter line
Lighting
Fig. 1. O#ce space for %eld measurement and numerical simulation.
are no supply inlets and exhaust outlets for ventilation and airconditioning, therefore the airEow in the room is producedby natural convection caused by buoyancy. A heating panelwhich generates 200 W (=50 W× 4 persons) was installedin the room.
2.2. Terms of 2eld measurement
(1) Measurement time: from 31st August to 10th Septem-ber, 1998(2) Measurement variables: shown in Table 1.
2.3. Results of 2eld measurement
Following are the results of measurements made on 9thSeptember for the most part.
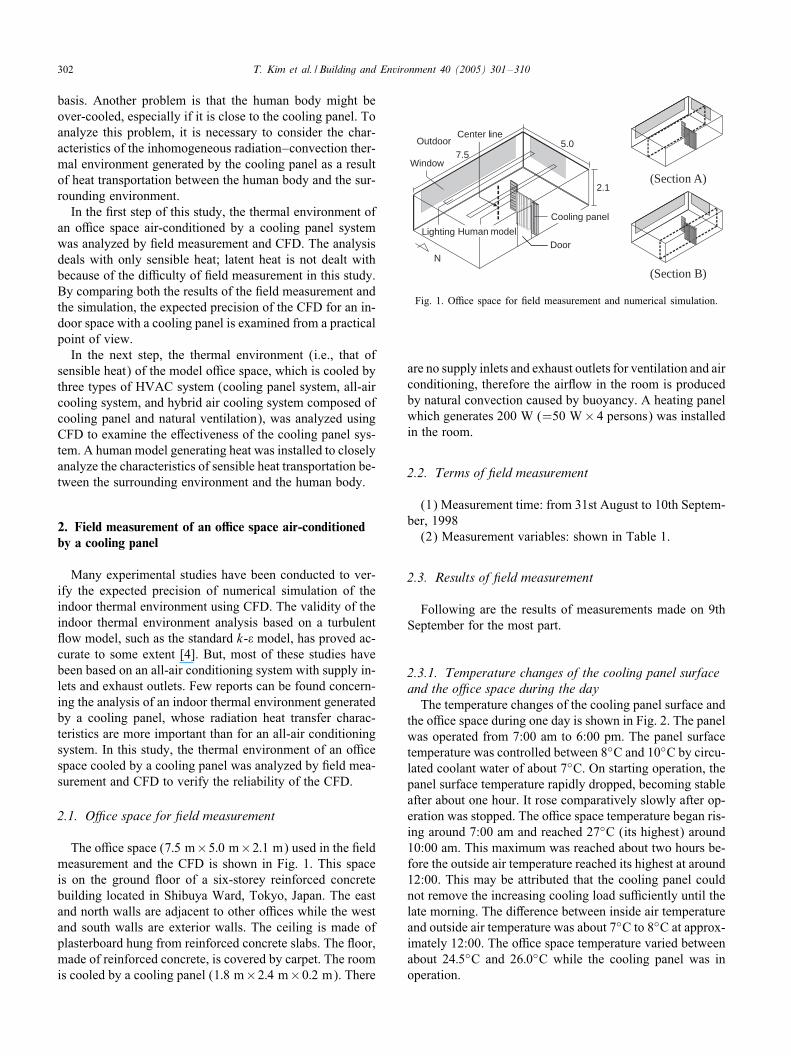
2.3.1. Temperature changes of the cooling panel surfaceand the o1ce space during the dayThe temperature changes of the cooling panel surface and
the o#ce space during one day is shown in Fig. 2. The panelwas operated from 7:00 am to 6:00 pm. The panel surfacetemperature was controlled between 8◦C and 10◦C by circu-lated coolant water of about 7◦C. On starting operation, thepanel surface temperature rapidly dropped, becoming stableafter about one hour. It rose comparatively slowly after op-eration was stopped. The o#ce space temperature began ris-ing around 7:00 am and reached 27◦C (its highest) around10:00 am. This maximum was reached about two hours be-fore the outside air temperature reached its highest at around12:00. This may be attributed that the cooling panel couldnot remove the increasing cooling load su#ciently until thelate morning. The di@erence between inside air temperatureand outside air temperature was about 7◦C to 8◦C at approx-imately 12:00. The o#ce space temperature varied betweenabout 24:5◦C and 26:0◦C while the cooling panel was inoperation.
T. Kim et al. / Building and Environment 40 (2005) 301–310 303
Table 1Items and instruments for %eld measurement
Variables Instrument Place for measuring point Number of points
Vertical temperature distribution Thermocouple + data logger Center of the room (including 10ceiling and Eoor surface temperature)
Surface temperature of the walls Thermocouple + data logger Radiation cooling panel 5and the radiation cooling panel
Walls and windows 2 at each locationAir temperature and humidity Temperature and humidity recorder Center of the room 1in the roomGlobe temperature Temperature and humidity recorder Center of the room 1Air change rate of the room SF6 gas, multi-gas monitor (B& K) Center of the room 1
5
10
15
20
25
30
35
00:00 02:00 04:00 06:00 08:00 10:00 12:00 14:00 16:00 18:00 20:00 22:00
Tem
pera
ture
[°C
]
Time
Office OutdoorCooling panel
Fig. 2. Surface temperature of the cooling panel, indoor air tempera-ture, and outdoor air temperature (at a height of 1:5m above the Eoor,September 9, 1998).
0.0
0.5
1.0
1.5
2.0
2.5
18 20 22 24 26 28
Temperature[°C]
Hei
ght[m
]
Fig. 3. Vertical temperature distribution.
2.3.2. Temperature distribution in the vertical directionVertical temperature distribution at the center of the room
at 1:00 pm is shown in Fig. 3. Since cooled air from thecooling panel accumulated near the Eoor, the air temperatureclose to the Eoor was low. The di@erence between the upperair temperature and the lower air temperature was about
6◦C. This may be attributed to the stable air enclosed bythe walls and to the air cooled by the cooling panel. TheEoor surface temperature was a little higher than the airtemperature close to the Eoor due to solar radiation andlighting. The ceiling surface temperature was a little lowerthan the air temperature close to the ceiling due to the coolradiation from the cooling panel.
3. Prediction of thermal environment in an o�ce spaceby CFD and comparison with "eld measurement results
Taking measurement data at 1:00 pm as the boundary con-dition and assuming a steady state, CFD coupled simulationwith radiation was performed and the result was examinedand compared with the measurement data. Only sensibleheat was considered. Latent heat was ignored.
3.1. Conditions of calculation
3.1.1. CFDSimulation of indoor air Eow was conducted by coupled
simulation based on a standard k-� model [5,6]. The heattransmission through each wall and window was computedusing the given outside air temperature as reference, assum-ing stationary heat transfer and neglecting heat accumula-tion. To analyze the radiation heat transfer considering mu-tual reEection, the Monte Carlo method for calculating theview factor and the Gebhart absorption coe#cient methodwere used.
3.1.2. Indoor cooling loadThe indoor cooling load, calculated based on %eld mea-
surement, is shown in Table 2. The cooling load from the hu-manmodel was equal to the generated sensible heat (200 W)from the heaters used in the %eld measurement. In this sim-ulation only one human model which generates 50 W wasintroduced to evaluate thermal sensation (Mean radiant tem-perature, operative temperature). The human model wasmade by considering the view factor between the human andthe walls. The balance was given by generating heat on theEoor (150 W). The main indoor cooling loads were: light-ing, human bodies, and heat transmitted through walls and

304 T. Kim et al. / Building and Environment 40 (2005) 301–310
Table 2Indoor cooling load [W]
Human bodya Lightingb Solar radiationc Heat transmitted through walls and windowsd Ventilatione Total
200.0 940.0 18.6 380.0 45.8 1584.4
a50 W × 4 persons. 50 W is given uniformly on the human model, 150 W is given on the Eoor.bEstimated value from input power of lights.cHeat passing through the window. This value is estimated from the heat balance of the room using other measured cooling loads. The solar radiation
analysis method was used to analysis the solar heat distribution of the room [7].dEstimated value based on the results of %eld measurements. Heat transmission is roughly estimated based on the thermal properties of the walls
and windows. Outdoor reference temperature used for the calculation of heat transmission is the result of %eld measurements. Steady-state is assumed.Measured indoor surface temperature was used here for heat transmission.
eEstimated values based on the result of %eld measurement. Cooling load by ventilation is acquired as follows:
qa = �Cp(Tref − Tair) × Vroom × Qair ;
qa: cooling load by ventilation [W], � : air density [kg=m3], Cp: speci%c heat [J=(kg ◦C)], T ref : reference temperature [◦C] (here outdoor temperature),T air : air temperature [◦C], V room: volume of the room [m3], Qair : air change rate [1=s] (0.3 times/hour based on %eld measurement), In the simulation,cooling load by ventilation was generated throughout the whole space of the room.
Table 3Condition of each wall
Place Overall heat Referencetransfer coe#cient temperature(W=m2 ◦C)a (◦C)b
Exterior wallSouth, west windows 5.5 33.4South, west side walls 2.3 33.4
(reinforced concrete)
Inner wallEast, north side walls 2.3 24.6(reinforced concrete)
Ceiling, Eoor (reinforced concrete) 2.3 24.0
aEstimated value from the outer air to the inner surface.bMeasured outer temperature, or air temperature in neighboring o#ce.
windows. Solar radiation penetrating windows was compar-atively small due to the building’s direction and the neigh-boring buildings.
3.1.3. Conditions of wallsCoe#cients of heat transfer and conditions of outside
reference temperatures which were used to calculate heattransmission are shown in Table 3. Outside reference tem-peratures were the results from %eld measurements, whilecoe#cients of heat transfer through walls and widows wereestimated values based on the walls’ structure.
3.1.4. Boundary condition for CFDThe detailed boundary condition for CFD is shown in
Table 4. Convective heat transfer at the walls and windowswas calculated from the di@erence between the air temper-ature close to the walls and the surface temperature of thewalls, using the given convective heat transfer coe#cient.The panel surface temperature was equal to 8:3◦C as mea-sured. The cooling panel in the simulation was assumed tobe a simple single-plate type, whereas the actual cooling
panel was a multi-plate type. Larger values for convectiveheat transfer coe#cients were therefore used so that the con-vective heat transfer of the cooling panel in the simulationwould be consistent with that of the actual cooling panel.The values adopted were: 17:4 W=(m2 ◦C) for the coolingpanel and 4:0 W=(m2◦C) for other surfaces, including thehuman model. The radiative heat transfer coe#cient was as-sumed to be unchanged by modeling of the cooling panel.
3.2. Results of the CFD analysis and comparison withthe result of 2eld measurement
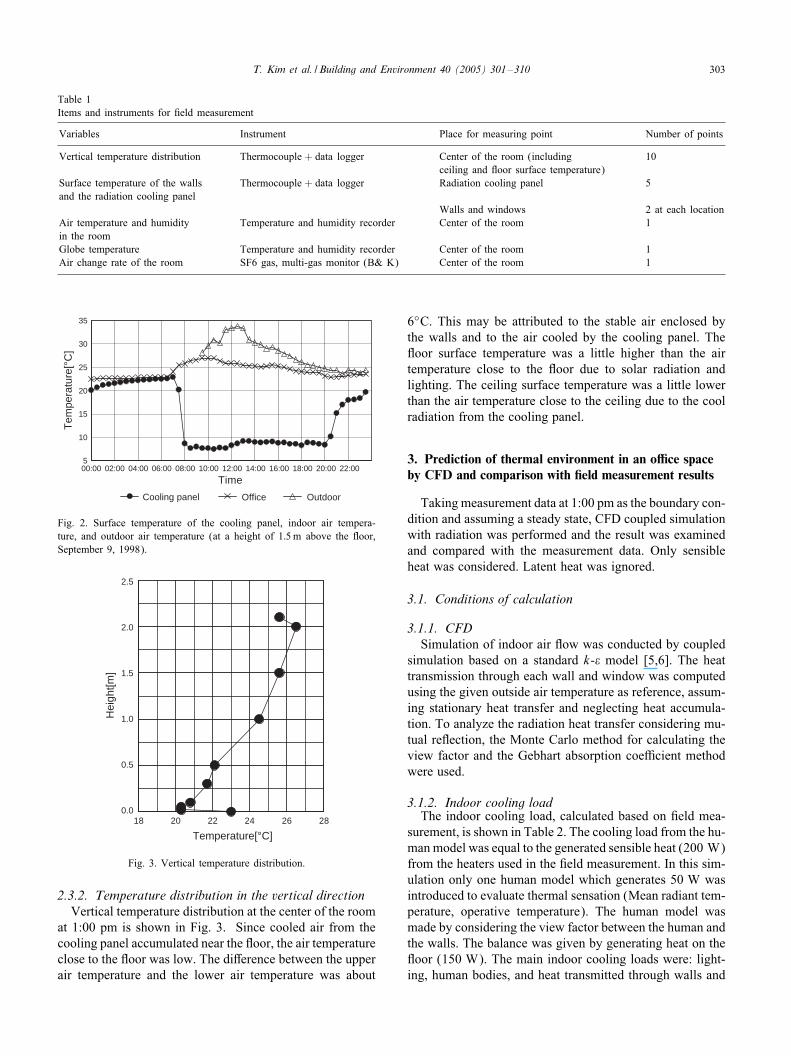
3.2.1. Air7ow distributionEstimated airEow distribution by CFD is shown in
Fig. 4. Downward Eow of cooled air (about 0.2–0:4 m=s)was observed close to the cooling panel, generating a cir-culating airEow. AirEow speed was low (less than 0:1 m=sexcept for close to the Eoor), and was a little faster (about0:3 m=s) close to the Eoor, while an upward Eow wasobserved close to the windows.
3.2.2. Temperature distributionIndoor temperature distribution is shown in Fig. 5. Tem-
perature strati%cation covered almost all the room. Closeto the Eoor the temperature was relatively low (about 20–22◦C) due to the cooled air from the cooling panel. Thetemperature was about 26◦C in the upper part of the room.The temperature di@erence between the upper part and thelower part was 4–6◦C.
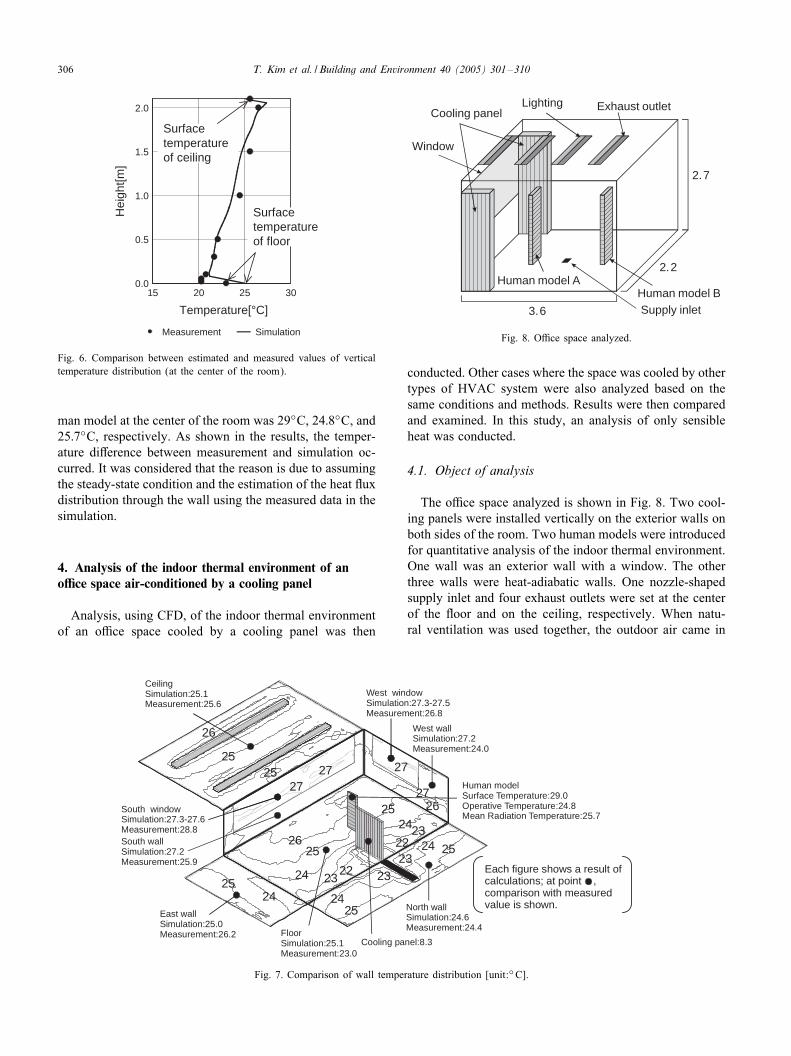
3.2.3. Vertical temperature distributionEstimated and measured temperature distribution in the
perpendicular direction at the center of the room is shownin Fig. 6. Di@erences between the expected and measuredvalues were about 0.5–0:7◦C (the largest) at 1.0–1:5 m overthe Eoor; at other points they were less than this. The resultsshow that the CFD given convective heat transfer coe#cient
T. Kim et al. / Building and Environment 40 (2005) 301–310 305
Table 4Calculate condition and boundary condition for CFD
Wall (Velocity) standardized log-law(Temperature) Solving the following heat equilibrium equation for each wall element i (positive for inEow, negative for outEow)qw;i + qcv; i + qr; i + qs; i = 0qw; i = Kwa(Tref − Tw; i)qcv; i = �c(Tw; i − Tair; i), for convective heat transfer coe#cient �c, a constant value is given.qr; i = ��i
∑Bij((Tw; i + 273:6)4 + (Tw; j + 273:0)4)
(Emissivity) 0.0 for symmetric plane, 0.9 for surfaces of human model and others.(MRT) The MRT is calculated as follows:
qi; inc =N∑j=1Bij�i�(Tj + 273)4 = �i�(MRTi + 273)4
MRTi = 4
√N∑j=1Bij(Tj + 273)4 − 273
Supply inlet kin = 3=2(Uin × 0:05)2, �in = C�k3=2in =lin, lin = width of the supply inlet
Exhaust outlet Free slip
Mesh 54 × 40 × 26 for Eow simulation, 14 × 11 × 7 for radiation simulation
[Symbol]qw, heat transmission through a wall (W=m2); qcv, convective heat component (W=m2); qr , radiation heat component (W=m2); qs, heat generationcomponent on wall surface (W=m2); qi; inc, radiation heat from other walls in surface i (W=m2); KWA, heat transmission coe#cient of a wall (W=(m2◦C));�c, convective heat transfer coe#cient (W=(m2◦C)); �, Stefan–Bolzmann constant (W=(m2K4)); �, emissivity (dimensionless); Bij , Gebhart absorptioncoe#cient (dimensionless); MRTi , mean radiant temperature of surface i (◦C); T i , temperature of surface i (◦C); T ref , reference temperature (◦C); Tw,wall surface temperature (◦C); T air , air temperature (◦C); k in, turbulence energy (m2=s2); �in, turbulence energy dissipation rate (m2=s3); lin, speci%clength scale (m).
0.5m/s
Cooling Panel
Human model
(b)
(a)
Fig. 4. Predicted wind velocity distribution (by coupled simulation): (a)cross-section including cooling panel (Section A, see Fig. 1) and (b)cross-section including human model (Section B, see Fig. 1).
has su#cient accuracy for practical estimation of the indoorthermal environment.
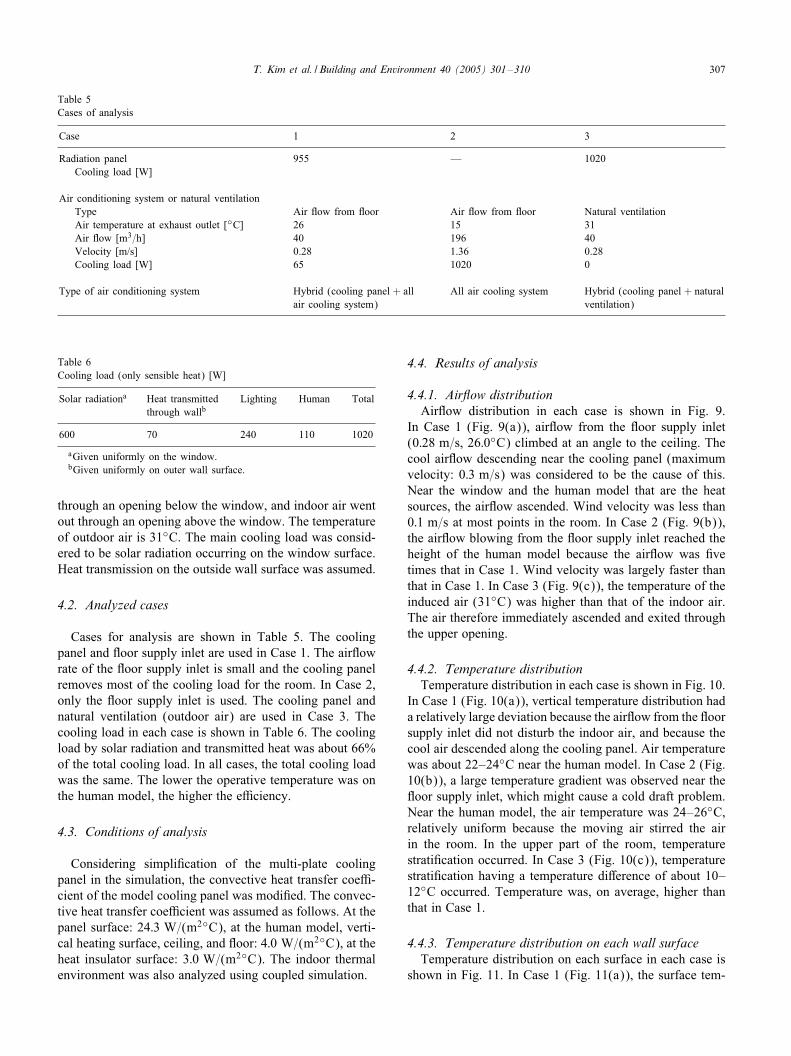
3.2.4. Wall surface temperaturesBoth estimated and measured wall surface temperatures
are shown in Fig. 7. Floor surface temperature was 22–24◦Cclose to the cooling panel and 25–26◦C at other points,showing about 2◦C higher than the measured value. Ceilingsurface temperature was about 25◦C, showing a di@erencefrom the measured value by about 0:5◦C. The surface tem-
24 24
23
2221
25
26
23
22
21
2526
24 24
23
222120
2526
23
2221 20
25
26
(b)
(a)
Fig. 5. Predicted temperature distribution [unit:◦C]: (a) cross-sectionincluding cooling panel and (b) cross-section including humanmodel.
perature of the south and west windows and south externalwall was about 27◦C, showing a di@erence from the mea-sured value of about 1◦C. The surface temperature of thewest wall has the maximum di@erence of about 3◦C from themeasured value. Thus, the di@erence between the estimatedand measured values of wall surface temperature were lessthan 1◦C at almost all points. This shows that CFD pro-vides su#cient accuracy as a tool for estimating the indoorthermal environment. Surface temperature, operative tem-perature, and mean radiant temperature (MRT) of the hu-
306 T. Kim et al. / Building and Environment 40 (2005) 301–310
Hei
ght[m
]
0.0
0.5
1.0
1.5
2.0
15 20 25 30
Temperature[°C]
Surfacetemperatureof floor
Surfacetemperatureof ceiling
Measurement Simulation
Fig. 6. Comparison between estimated and measured values of verticaltemperature distribution (at the center of the room).
man model at the center of the room was 29◦C, 24:8◦C, and25:7◦C, respectively. As shown in the results, the temper-ature di@erence between measurement and simulation oc-curred. It was considered that the reason is due to assumingthe steady-state condition and the estimation of the heat Euxdistribution through the wall using the measured data in thesimulation.
4. Analysis of the indoor thermal environment of ano�ce space air-conditioned by a cooling panel
Analysis, using CFD, of the indoor thermal environmentof an o#ce space cooled by a cooling panel was then
24
24
2425
2524
25
2526
26
27
27 2725
24
23 2323
23
22
22
2525
26
27
West windowSimulation:27.3-27.5Measurement:26.8
Each figure shows a result ofcalculations; at point ,comparison with measuredvalue is shown.
South windowSimulation:27.3-27.6Measurement:28.8South wallSimulation:27.2Measurement:25.9
CeilingSimulation:25.1Measurement:25.6
FloorSimulation:25.1Measurement:23.0
North wallSimulation:24.6Measurement:24.4
Cooling panel:8.3
Human modelSurface Temperature:29.0Operative Temperature:24.8Mean Radiation Temperature:25.7
East wallSimulation:25.0Measurement:26.2
West wallSimulation:27.2Measurement:24.0
Fig. 7. Comparison of wall temperature distribution [unit:◦C].
3.6
2.2
2.7
Cooling panel
Human model AHuman model BSupply inlet
Window
Lighting Exhaust outlet
Fig. 8. O#ce space analyzed.
conducted. Other cases where the space was cooled by othertypes of HVAC system were also analyzed based on thesame conditions and methods. Results were then comparedand examined. In this study, an analysis of only sensibleheat was conducted.
4.1. Object of analysis
The o#ce space analyzed is shown in Fig. 8. Two cool-ing panels were installed vertically on the exterior walls onboth sides of the room. Two human models were introducedfor quantitative analysis of the indoor thermal environment.One wall was an exterior wall with a window. The otherthree walls were heat-adiabatic walls. One nozzle-shapedsupply inlet and four exhaust outlets were set at the centerof the Eoor and on the ceiling, respectively. When natu-ral ventilation was used together, the outdoor air came in
T. Kim et al. / Building and Environment 40 (2005) 301–310 307
Table 5Cases of analysis
Case 1 2 3
Radiation panel 955 — 1020Cooling load [W]
Air conditioning system or natural ventilationType Air Eow from Eoor Air Eow from Eoor Natural ventilationAir temperature at exhaust outlet [◦C] 26 15 31Air Eow [m3=h] 40 196 40Velocity [m/s] 0.28 1.36 0.28Cooling load [W] 65 1020 0
Type of air conditioning system Hybrid (cooling panel + all All air cooling system Hybrid (cooling panel + naturalair cooling system) ventilation)
Table 6Cooling load (only sensible heat) [W]
Solar radiationa Heat transmitted Lighting Human Totalthrough wallb
600 70 240 110 1020
aGiven uniformly on the window.bGiven uniformly on outer wall surface.
through an opening below the window, and indoor air wentout through an opening above the window. The temperatureof outdoor air is 31◦C. The main cooling load was consid-ered to be solar radiation occurring on the window surface.Heat transmission on the outside wall surface was assumed.
4.2. Analyzed cases
Cases for analysis are shown in Table 5. The coolingpanel and Eoor supply inlet are used in Case 1. The airEowrate of the Eoor supply inlet is small and the cooling panelremoves most of the cooling load for the room. In Case 2,only the Eoor supply inlet is used. The cooling panel andnatural ventilation (outdoor air) are used in Case 3. Thecooling load in each case is shown in Table 6. The coolingload by solar radiation and transmitted heat was about 66%of the total cooling load. In all cases, the total cooling loadwas the same. The lower the operative temperature was onthe human model, the higher the e#ciency.
4.3. Conditions of analysis
Considering simpli%cation of the multi-plate coolingpanel in the simulation, the convective heat transfer coe#-cient of the model cooling panel was modi%ed. The convec-tive heat transfer coe#cient was assumed as follows. At thepanel surface: 24:3 W=(m2◦C), at the human model, verti-cal heating surface, ceiling, and Eoor: 4:0 W=(m2◦C), at theheat insulator surface: 3:0 W=(m2◦C). The indoor thermalenvironment was also analyzed using coupled simulation.
4.4. Results of analysis
4.4.1. Air7ow distributionAirEow distribution in each case is shown in Fig. 9.
In Case 1 (Fig. 9(a)), airEow from the Eoor supply inlet(0:28 m=s, 26:0◦C) climbed at an angle to the ceiling. Thecool airEow descending near the cooling panel (maximumvelocity: 0:3 m=s) was considered to be the cause of this.Near the window and the human model that are the heatsources, the airEow ascended. Wind velocity was less than0:1 m=s at most points in the room. In Case 2 (Fig. 9(b)),the airEow blowing from the Eoor supply inlet reached theheight of the human model because the airEow was %vetimes that in Case 1. Wind velocity was largely faster thanthat in Case 1. In Case 3 (Fig. 9(c)), the temperature of theinduced air (31◦C) was higher than that of the indoor air.The air therefore immediately ascended and exited throughthe upper opening.
4.4.2. Temperature distributionTemperature distribution in each case is shown in Fig. 10.
In Case 1 (Fig. 10(a)), vertical temperature distribution hada relatively large deviation because the airEow from the Eoorsupply inlet did not disturb the indoor air, and because thecool air descended along the cooling panel. Air temperaturewas about 22–24◦C near the human model. In Case 2 (Fig.10(b)), a large temperature gradient was observed near theEoor supply inlet, which might cause a cold draft problem.Near the human model, the air temperature was 24–26◦C,relatively uniform because the moving air stirred the airin the room. In the upper part of the room, temperaturestrati%cation occurred. In Case 3 (Fig. 10(c)), temperaturestrati%cation having a temperature di@erence of about 10–12◦C occurred. Temperature was, on average, higher thanthat in Case 1.
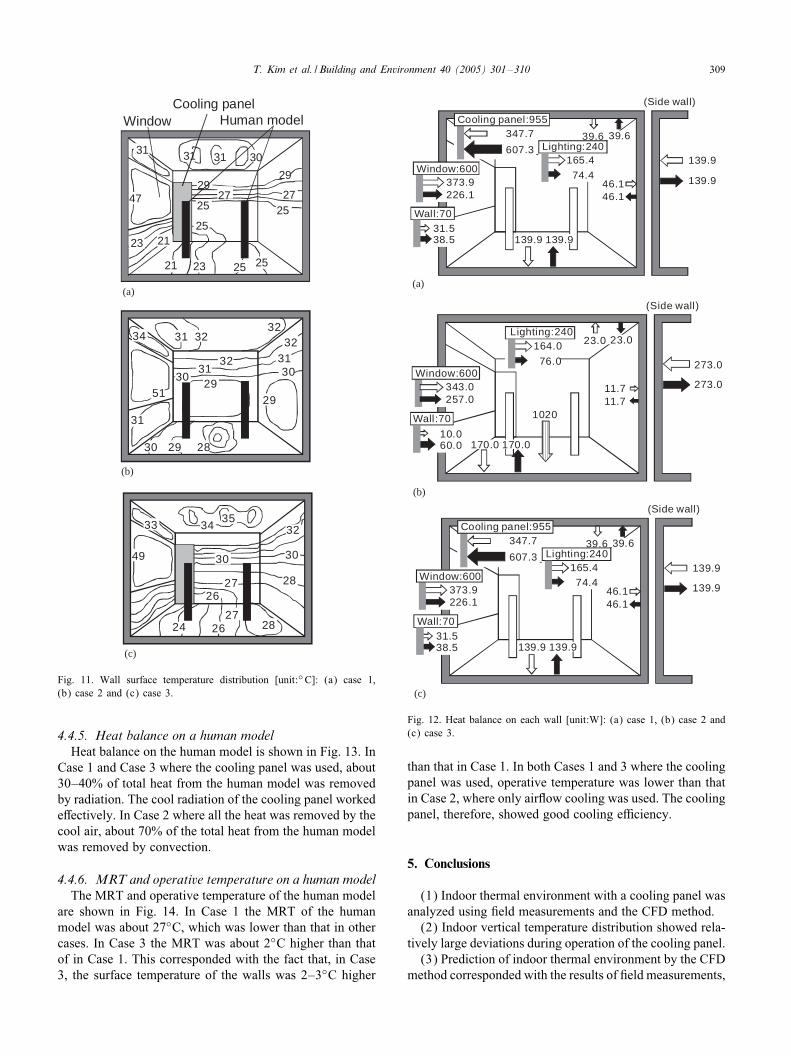
4.4.3. Temperature distribution on each wall surfaceTemperature distribution on each surface in each case is
shown in Fig. 11. In Case 1 (Fig. 11(a)), the surface tem-

308 T. Kim et al. / Building and Environment 40 (2005) 301–310
Section C Section D
Section C Section D
Section C Section E
Section E
Section C Section D (c)
(b)
(a)
Fig. 9. Velocity distribution: (a) case 1, (b) case 2 and (c) case 3.
perature on the window that received solar radiation reachedabout 47◦C whereas that of the Eoor was 21–25◦C. Thereason was probably the cooling radiation from the coolingpanel. The surface temperature on the cooling panel wasabout 12:5◦C. In Case 2 (Fig. 11(b)), the surface temper-ature on the walls was shown to be about 3–5◦C higher
28
3032
28 2828
26 26
2424
2222
31
24
20
30 30
(Section C)
(Section C)
(Section C)
(a)
(b)
(c)
Fig. 10. Temperature distribution [unit:◦C]: (a) case 1, (b) case 2 and(c) case 3.
than that in Case 1. On the Eoor and the walls, which wereconsidered to receive a large radiation heat transfer fromthe human model, the temperature was 28–31◦C and 29–32◦C, respectively. In Case 3 (Fig. 11(c)), the temperaturewas about 2–3◦C higher than that in Case 1. Because therewere large di@erences in temperature between the upper andlower parts of the room, the temperature on the ceiling wasa little higher than that in Case 2.
4.4.4. Heat balance on each wallHeat balance on each wall is shown in Fig. 12. In Case 1
(Fig. 12(a)), 60% of the total cooling load (670 W) whichcame through the window and the walls was transferredinto the room by radiation. 40% of the total cooling loadwas removed by the cooling panel. In Case 2 (Fig. 12(b)),radiation heat through the window and the walls was a littleless than that in Case 1. The reason was considered to bethat there was no cooling panel to absorb the radiation heat,and the temperature of the other walls was higher. In Case 3(Fig. 12(c)) where the cooling panel was installed, the heatbalance was largely the same as that in Case 1.
T. Kim et al. / Building and Environment 40 (2005) 301–310 309
(a)
3131
2929
2725
2725
25
252523
23
31
47
21
21
30
Cooling panelWindow Human model
31
51
31
3131
30
3030
29
29
29
28
32
32
323432
34
49
24 2627
26
28
2827
3030
323335
(b)
(c)
Fig. 11. Wall surface temperature distribution [unit:◦C]: (a) case 1,(b) case 2 and (c) case 3.
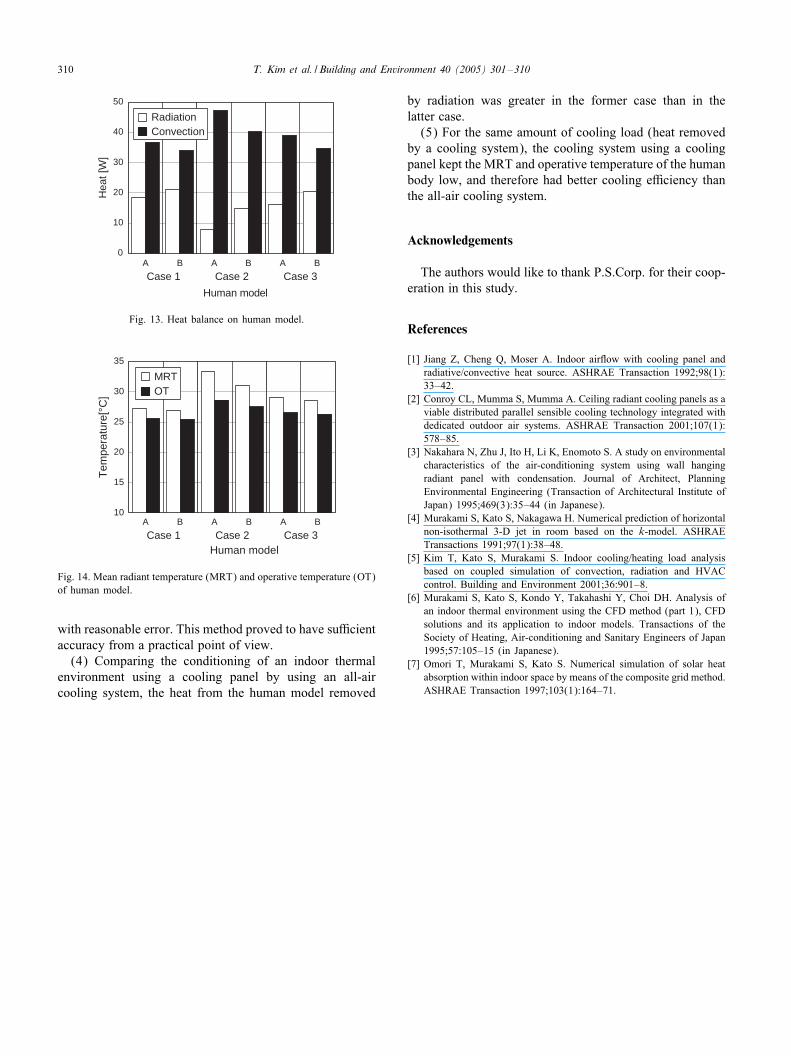
4.4.5. Heat balance on a human modelHeat balance on the human model is shown in Fig. 13. In
Case 1 and Case 3 where the cooling panel was used, about30–40% of total heat from the human model was removedby radiation. The cool radiation of the cooling panel workede@ectively. In Case 2 where all the heat was removed by thecool air, about 70% of the total heat from the human modelwas removed by convection.
4.4.6. MRT and operative temperature on a human modelThe MRT and operative temperature of the human model
are shown in Fig. 14. In Case 1 the MRT of the humanmodel was about 27◦C, which was lower than that in othercases. In Case 3 the MRT was about 2◦C higher than thatof in Case 1. This corresponded with the fact that, in Case3, the surface temperature of the walls was 2–3◦C higher
139.9139.931.538.5
39.6
46.146.1
39.6347.7
607.3
373.9226.1
139.9
139.9
165.4
74.4
Cooling panel:955
Window:600
Wall:70
Lighting:240
(Side wall)
10.060.0
11.711.7
23.0 23.0
343.0257.0
273.0
273.0
1020
164.0
76.0
170.0170.0
Lighting:240
Window:600
Wall:70
(Side wall)
139.9139.931.538.5
39.6
46.146.1
39.6347.7
607.3
373.9226.1
139.9
139.9
165.474.4
Cooling panel:955
Window:600
Wall:70
Lighting:240
(Side wall)
(a)
(b)
(c)
Fig. 12. Heat balance on each wall [unit:W]: (a) case 1, (b) case 2 and(c) case 3.
than that in Case 1. In both Cases 1 and 3 where the coolingpanel was used, operative temperature was lower than thatin Case 2, where only airEow cooling was used. The coolingpanel, therefore, showed good cooling e#ciency.
5. Conclusions
(1) Indoor thermal environment with a cooling panel wasanalyzed using %eld measurements and the CFD method.(2) Indoor vertical temperature distribution showed rela-
tively large deviations during operation of the cooling panel.(3) Prediction of indoor thermal environment by the CFD
method corresponded with the results of %eld measurements,
310 T. Kim et al. / Building and Environment 40 (2005) 301–310
A B A B A B0
10
20
30
40
50H
eat [
W]
Case 1 Case 2 Case 3
Human model
RadiationConvection
Fig. 13. Heat balance on human model.
10
15
20
25
30
35
Tem
pera
ture
[°C
]
A B A B A B
Case 1 Case 2 Case 3Human model
MRTOT
Fig. 14. Mean radiant temperature (MRT) and operative temperature (OT)of human model.
with reasonable error. This method proved to have su#cientaccuracy from a practical point of view.(4) Comparing the conditioning of an indoor thermal
environment using a cooling panel by using an all-aircooling system, the heat from the human model removed
by radiation was greater in the former case than in thelatter case.(5) For the same amount of cooling load (heat removed
by a cooling system), the cooling system using a coolingpanel kept the MRT and operative temperature of the humanbody low, and therefore had better cooling e#ciency thanthe all-air cooling system.
Acknowledgements
The authors would like to thank P.S.Corp. for their coop-eration in this study.
References
[1] Jiang Z, Cheng Q, Moser A. Indoor airEow with cooling panel andradiative/convective heat source. ASHRAE Transaction 1992;98(1):33–42.
[2] Conroy CL, Mumma S, Mumma A. Ceiling radiant cooling panels as aviable distributed parallel sensible cooling technology integrated withdedicated outdoor air systems. ASHRAE Transaction 2001;107(1):578–85.
[3] Nakahara N, Zhu J, Ito H, Li K, Enomoto S. A study on environmentalcharacteristics of the air-conditioning system using wall hangingradiant panel with condensation. Journal of Architect, PlanningEnvironmental Engineering (Transaction of Architectural Institute ofJapan) 1995;469(3):35–44 (in Japanese).
[4] Murakami S, Kato S, Nakagawa H. Numerical prediction of horizontalnon-isothermal 3-D jet in room based on the k-model. ASHRAETransactions 1991;97(1):38–48.
[5] Kim T, Kato S, Murakami S. Indoor cooling/heating load analysisbased on coupled simulation of convection, radiation and HVACcontrol. Building and Environment 2001;36:901–8.
[6] Murakami S, Kato S, Kondo Y, Takahashi Y, Choi DH. Analysis ofan indoor thermal environment using the CFD method (part 1), CFDsolutions and its application to indoor models. Transactions of theSociety of Heating, Air-conditioning and Sanitary Engineers of Japan1995;57:105–15 (in Japanese).
[7] Omori T, Murakami S, Kato S. Numerical simulation of solar heatabsorption within indoor space by means of the composite grid method.ASHRAE Transaction 1997;103(1):164–71.