
Study of stable isotopes in the Kouris catchment (Cyprus) for the description of the regional...
13
Study of stable isotopes in the Kouris catchment (Cyprus) for the description of the regional groundwater flow Anastasia Boronina a, * , Werner Balderer a,1 , Philippe Renard b,2 , Willibald Stichler c,3 a Institute of Geology, ETH Zu ¨rich, Switzerland b Centre of Hydrogeology, University of Neucha ˆtel, Neucha ˆtel, Switzerland c GSF-Institut of Hydrology, Neuherberg, Germany Received 26 May 2003; revised 5 November 2004; accepted 5 November 2004 Abstract The stable isotopes of oxygen and hydrogen in groundwater and precipitation were integrated for the description of groundwater flow in the Kouris catchment (Cyprus). The catchment consists of an ophiolitic complex in the North and sediments in the South. It is characterized by strong heterogeneity of the underground media and steep slopes of the topography. The regression line, constructed from the data of 70 rainfall samples, is described by the equation: dDZ6.6d 18 OC10.9, which shows evaporation during precipitation. The altitude gradients in the precipitation were estimated to be K1.7‰/100 m for dD and —0.27/100 m for d 18 O. The stable isotope analysis of 234 groundwater samples reflected fractionation due to evaporation. The origin of groundwaters in the catchment was described based on the regression equation between surface elevations and dD contents for 33 selected springs of the ophiolitic complex. It was found that the groundwaters in the ophiolitic aquifer and in the consolidated sediments originated from local recharge at high and low altitudes, respectively. On the contrary, the groundwater in the alluvium aquifer originates from the high altitudes in the ophiolitic complex. Additionally, dD data were used for the calibration of the recharge rates for a steady state groundwater flow and transport model. The resulting calibrated total steady state recharge rate was 100–130 mm per year. q 2004 Elsevier B.V. All rights reserved. Keywords: Stable isotopes; Ophiolites; Semi-arid climate; Cyprus; Groundwater; Recharge 1. Introduction Water conflicts in Cyprus have risen dramatically within the last 30 years due to growing water demands and a semi-arid climate enveloping the majority of the island. A description of the hydrogeology and calculation of groundwater balance become very urgent. Additionally, these tasks are challenging from a scientific point of view because of Journal of Hydrology 308 (2005) 214–226 www.elsevier.com/locate/jhydrol 0022-1694/$ - see front matter q 2004 Elsevier B.V. All rights reserved. doi:10.1016/j.jhydrol.2004.11.001 * Corresponding author. Hydrosciences UMR IRD-UMI&II-IRD, case MSE, UMII, place Euge `ne Bataillon, 34 095 Montpellier cedex 5, France, Tel.: C33 4 67 14 90 46; fax: C33 4 67 14 47 74. E-mail addresses: [email protected] (A. Boronina), [email protected] (W. Balderer), philippe. [email protected] (P. Renard), [email protected] (W. Stichler). 1 Tel.: C41 1 633 27 43; fax: C41 1 633 11 08. 2 Tel.: C41 32 718 26 90; fax: C41 32 718 26 03. 3 Tel.: C49 89 318 725 66; fax: C49 89 318 733 61.
-
Upload
independent -
Category
Documents
-
view
3 -
download
0
Transcript of Study of stable isotopes in the Kouris catchment (Cyprus) for the description of the regional...
Study of stable isotopes in the Kouris catchment (Cyprus)
for the description of the regional groundwater flow
Anastasia Boroninaa,*, Werner Balderera,1, Philippe Renardb,2, Willibald Stichlerc,3
aInstitute of Geology, ETH Zurich, SwitzerlandbCentre of Hydrogeology, University of Neuchatel, Neuchatel, Switzerland
cGSF-Institut of Hydrology, Neuherberg, Germany
Received 26 May 2003; revised 5 November 2004; accepted 5 November 2004
Abstract
The stable isotopes of oxygen and hydrogen in groundwater and precipitation were integrated for the description of
groundwater flow in the Kouris catchment (Cyprus). The catchment consists of an ophiolitic complex in the North and
sediments in the South. It is characterized by strong heterogeneity of the underground media and steep slopes of the topography.
The regression line, constructed from the data of 70 rainfall samples, is described by the equation: dDZ6.6d18OC10.9,
which shows evaporation during precipitation. The altitude gradients in the precipitation were estimated to be K1.7‰/100 m
for dD and —0.27/100 m for d18O. The stable isotope analysis of 234 groundwater samples reflected fractionation due to
evaporation. The origin of groundwaters in the catchment was described based on the regression equation between surface
elevations and dD contents for 33 selected springs of the ophiolitic complex. It was found that the groundwaters in the ophiolitic
aquifer and in the consolidated sediments originated from local recharge at high and low altitudes, respectively. On the
contrary, the groundwater in the alluvium aquifer originates from the high altitudes in the ophiolitic complex. Additionally, dD
data were used for the calibration of the recharge rates for a steady state groundwater flow and transport model. The resulting
calibrated total steady state recharge rate was 100–130 mm per year.
q 2004 Elsevier B.V. All rights reserved.
Keywords: Stable isotopes; Ophiolites; Semi-arid climate; Cyprus; Groundwater; Recharge
0022-1694/$ - see front matter q 2004 Elsevier B.V. All rights reserved.
doi:10.1016/j.jhydrol.2004.11.001
* Corresponding author. Hydrosciences UMR IRD-UMI&II-IRD,
case MSE, UMII, place Eugene Bataillon, 34 095 Montpellier cedex
5, France, Tel.: C33 4 67 14 90 46; fax: C33 4 67 14 47 74.
E-mail addresses: [email protected]
(A. Boronina), [email protected] (W. Balderer), philippe.
[email protected] (P. Renard), [email protected] (W. Stichler).1 Tel.: C41 1 633 27 43; fax: C41 1 633 11 08.2 Tel.: C41 32 718 26 90; fax: C41 32 718 26 03.3 Tel.: C49 89 318 725 66; fax: C49 89 318 733 61.
1. Introduction
Water conflicts in Cyprus have risen dramatically
within the last 30 years due to growing water demands
and a semi-arid climate enveloping the majority of the
island. A description of the hydrogeology and
calculation of groundwater balance become very
urgent. Additionally, these tasks are challenging
from a scientific point of view because of
Journal of Hydrology 308 (2005) 214–226
www.elsevier.com/locate/jhydrol
A. Boronina et al. / Journal of Hydrology 308 (2005) 214–226 215
the variability in time and space of climatic conditions
and because of the highly heterogeneous nature of
underground properties.
This paper presents application of both new and
published (Jacovides, 1979) stable isotope analyses
for the description of precipitation and groundwaters
in the Kouris catchment (Cyprus). Stable water
isotopes have been used for decades all over the
world as a powerful tool in understanding ground-
water flow systems, especially for highly hetero-
geneous regions or for those with a high role of
evaporation. In Cyprus, stable isotopes analyses were
performed in 1976–1979 by Jacovides (1979),
encompassing the study area that included a part of
the Kouris catchment. Other investigations (Verhagen
et al., 1991) focused on the description of the stable
isotope composition of the groundwaters of the
Lefkara aquifer (chalks, marls), located approxi-
mately 30 km to the East from the Kouris catchment.
The analysis of stable isotopes in precipitation was
the subject of a great number of scientific investi-
gations (Araguas-Araguas et al., 2000; Gat, 2000,
1996; Dansgaard, 1964; Craig and Gordon, 1965;
Craig et al., 1963); our research delivers new results
for the precipitation in Cyprus. In the present study,
we establish the regression between dD and d18O and
analyze isotopic variations due to different seasons
and altitudes.
Although the ‘stable isotopes altitude effect’ can be
easily observed in precipitation, it is often different
from the altitude effect in recharged water because of
evaporation prior to- or during infiltration (Allison
et al., 1983; Gonfiantini, 1986). In the present study,
we show changes in the groundwater isotopic content
due to evaporation and describe the altitude effect in
recharge on the basis of observations from several
springs.
The stable isotopes altitude effect in recharge has
been successfully applied for the understanding of
groundwater origins in mountainous basins (see as
examples: Leonitiadis and Nikolaou, 1999; Christo-
doulou et al., 1993). In our paper, we show how this
effect is used for tracing the origin of groundwater in
the Kouris catchment. In parallel, the tritium and
chemical data, collected in 1998–2001, were included
in the study to support our hypothesis. Deuterium data
were also applied for calibrating the recharge rate for
the steady state groundwater flow model of the Kouris
catchment. The model was developed in previous
research (Boronina et al., 2003), while in this study we
use isotope data as an independent tool to estimate an
optimal range for recharge.
2. Study area
The hydrogeology of the area was described in
detail by Boronina et al. (2003); Jacovides (1979);
Afrodisis et al. (1986); in the present paper we provide
only the most essential information. The Kouris
catchment is bounded on the South by the Mediterra-
nean Sea and covers 300 km2 on the southern side of
the Troodos Massif (Fig. 1). Elevations range from
sea level to 2000 m within a distance of 30 km and
with local slopes of up to 70%.
Annual precipitation increases from 300 mm along
the coast to nearly 1200 mm in the Troodos
mountains. Annual rainfall correlates with surface
elevation (average correlation coefficient for 1970–
1994 was 0.93), and has been highly variable over the
years. The rain falling from November to March is
usually about 80% of the total annual amount.
The calculated mean annual potential evapotran-
spiration for the catchment for 1986–1996 varied
from 1060 to 1360 mm per year for the stations at
different surface elevations.
The basin is divided into two main geological
zones: an ophiolitic complex in the North and an
overlying sedimentary complex in the South. The
ophiolites include ultramafic rocks, gabbros, sheeted
dykes and pillow lavas, while the sediments are
mainly chalks, marls, calcarenites and limestones
(Fig. 2).
The ophiolitic rocks are highly heterogeneous
because of the presence of different lithological
units, which are fractured and altered at different
scales. These rocks contain the major groundwater
resources of Cyprus; the water is stored in the
fractured and altered zones of harzburgites, dunites,
gabbros and diabase dykes. The transmissivities of the
gabbros and the diabase dykes vary from 2 and
703 m2/day with a geometrical mean of 20 m2/day
according to the results of 40 pumping tests (Boronina
et al., 2003). Groundwater in the ultramafic rocks,
gabbros and diabases is generally of CaMg–HCO3
and Na–HCO3 types with low to moderate salinities
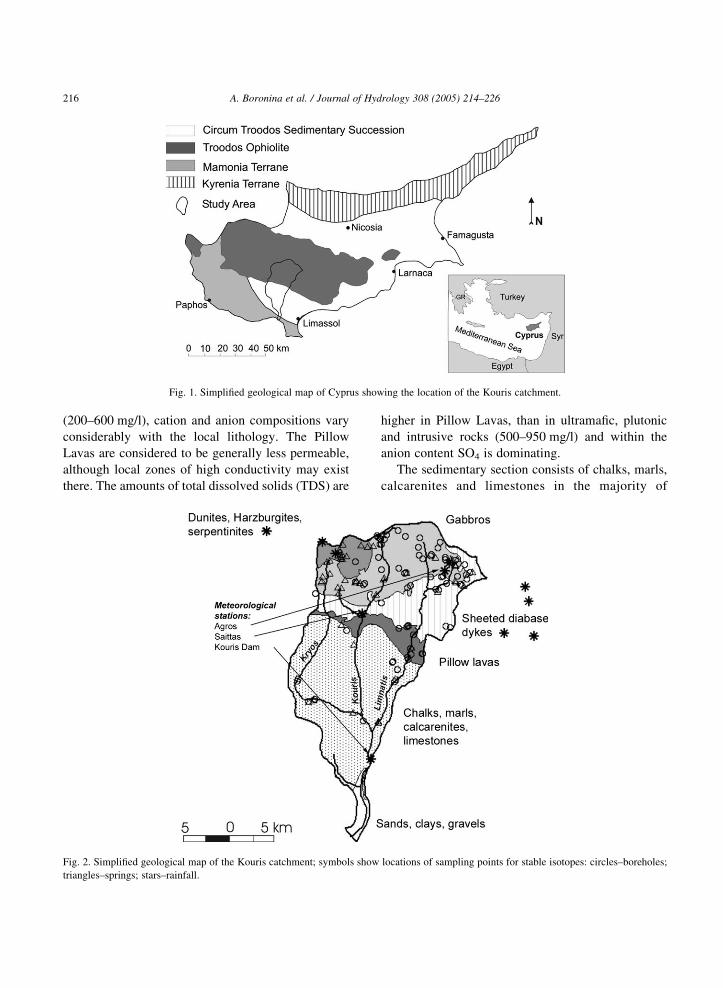
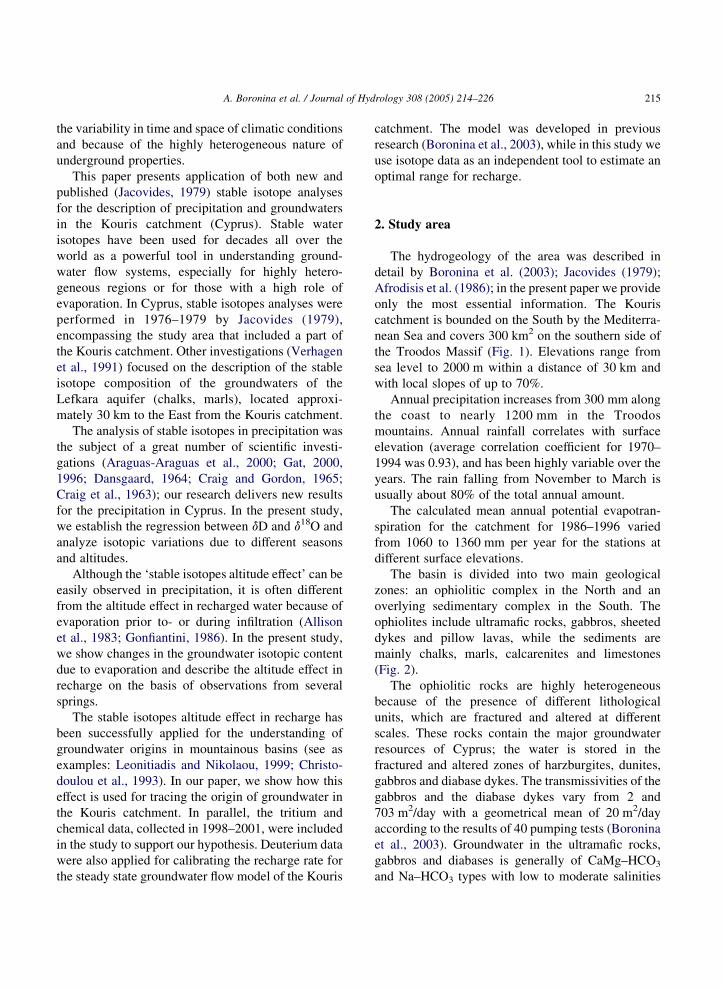
Fig. 1. Simplified geological map of Cyprus showing the location of the Kouris catchment.
A. Boronina et al. / Journal of Hydrology 308 (2005) 214–226216
(200–600 mg/l), cation and anion compositions vary
considerably with the local lithology. The Pillow
Lavas are considered to be generally less permeable,
although local zones of high conductivity may exist
there. The amounts of total dissolved solids (TDS) are
Fig. 2. Simplified geological map of the Kouris catchment; symbols show
triangles–springs; stars–rainfall.
higher in Pillow Lavas, than in ultramafic, plutonic
and intrusive rocks (500–950 mg/l) and within the
anion content SO4 is dominating.
The sedimentary section consists of chalks, marls,
calcarenites and limestones in the majority of
locations of sampling points for stable isotopes: circles–boreholes;
A. Boronina et al. / Journal of Hydrology 308 (2005) 214–226 217
the Kouris catchment (with an estimated average
transmissivity of 3 m2/day), and it consists of river
alluvium (sand, gravel) in the Kryos, Kouris and
Limnatis valleys. Of the boreholes, drilled in this part
for irrigation purposes to depths of 200–300 m, 70%
stayed dry. The alluvial aquifer is narrow (sometimes
less than 100 m) and discontinuous, although it
contains major amounts of water in the southern
part in the Kouris catchment. Groundwater in the hard
sedimentary rocks are generally moderately miner-
alized, with salinity higher than in the ophiolites; it
varies between 600 and 1600 mg/l. The waters are of
Na–Ca–HCO3–SO4, Na–Ca–SO4–HCO3 or Ca–Na–
HCO3–Cl types. Groundwaters in the alluvial aquifer
are less mineralized (500–600 mg/l), of the Ca–Mg–
HCO3, Mg–Ca–HCO3 or Mg–Na–HCO3 types.
Springs of the area originate mainly from ultra-
mafic, plutonic and intrusive rocks (harzburgites,
gabbro, sheeted dykes) in the upper part of the
catchment. Only a few springs are located in the
sediments, discharging water in the river valleys (if
not captured). In total, 64 springs have been mapped
within the catchment and there are some areas
(especially in plutonic rocks) where many small
springs could not be mapped separately. The Kouris
catchment is drained by the rivers Kryos, Kouris and
Limnatis (Fig. 2) originally discharging spring water
during dry seasons, but being captured and diverted
during the last summers. Kouris is the largest river in
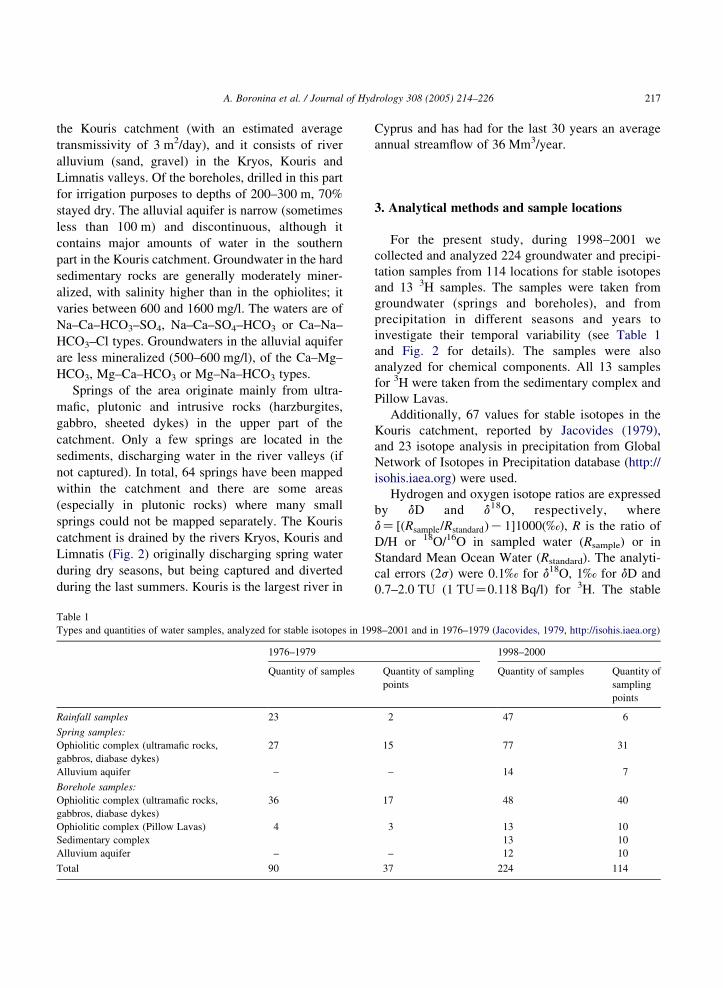
Table 1
Types and quantities of water samples, analyzed for stable isotopes in 19
1976–1979
Quantity of samples
Rainfall samples 23
Spring samples:
Ophiolitic complex (ultramafic rocks,
gabbros, diabase dykes)
27
Alluvium aquifer –
Borehole samples:
Ophiolitic complex (ultramafic rocks,
gabbros, diabase dykes)
36
Ophiolitic complex (Pillow Lavas) 4
Sedimentary complex
Alluvium aquifer –
Total 90
Cyprus and has had for the last 30 years an average
annual streamflow of 36 Mm3/year.
3. Analytical methods and sample locations
For the present study, during 1998–2001 we
collected and analyzed 224 groundwater and precipi-
tation samples from 114 locations for stable isotopes
and 13 3H samples. The samples were taken from
groundwater (springs and boreholes), and from
precipitation in different seasons and years to
investigate their temporal variability (see Table 1
and Fig. 2 for details). The samples were also
analyzed for chemical components. All 13 samples
for 3H were taken from the sedimentary complex and
Pillow Lavas.
Additionally, 67 values for stable isotopes in the
Kouris catchment, reported by Jacovides (1979),
and 23 isotope analysis in precipitation from Global
Network of Isotopes in Precipitation database (http://
isohis.iaea.org) were used.
Hydrogen and oxygen isotope ratios are expressed
by dD and d18O, respectively, where
dZ ½ðRsample=RstandardÞK1�1000ð‰Þ, R is the ratio of
D/H or 18O/16O in sampled water (Rsample) or in
Standard Mean Ocean Water (Rstandard). The analyti-
cal errors (2s) were 0.1‰ for d18O, 1‰ for dD and
0.7–2.0 TU (1 TUZ0.118 Bq/l) for 3H. The stable
98–2001 and in 1976–1979 (Jacovides, 1979, http://isohis.iaea.org)
1998–2000
Quantity of sampling
points
Quantity of samples Quantity of
sampling
points
2 47 6
15 77 31
– 14 7
17 48 40
3 13 10
13 10
– 12 10
37 224 114
A. Boronina et al. / Journal of Hydrology 308 (2005) 214–226218
isotopes were measured with mass-spectrometers
(type Delta-S) after equilibration with CO2 for 18O
and reduction with uranium for D, respectively. The
tritium determinations were performed with a liquid
scintillation counter after electrolytic enrichment.
4. Results
4.1. Stable isotopes in precipitation
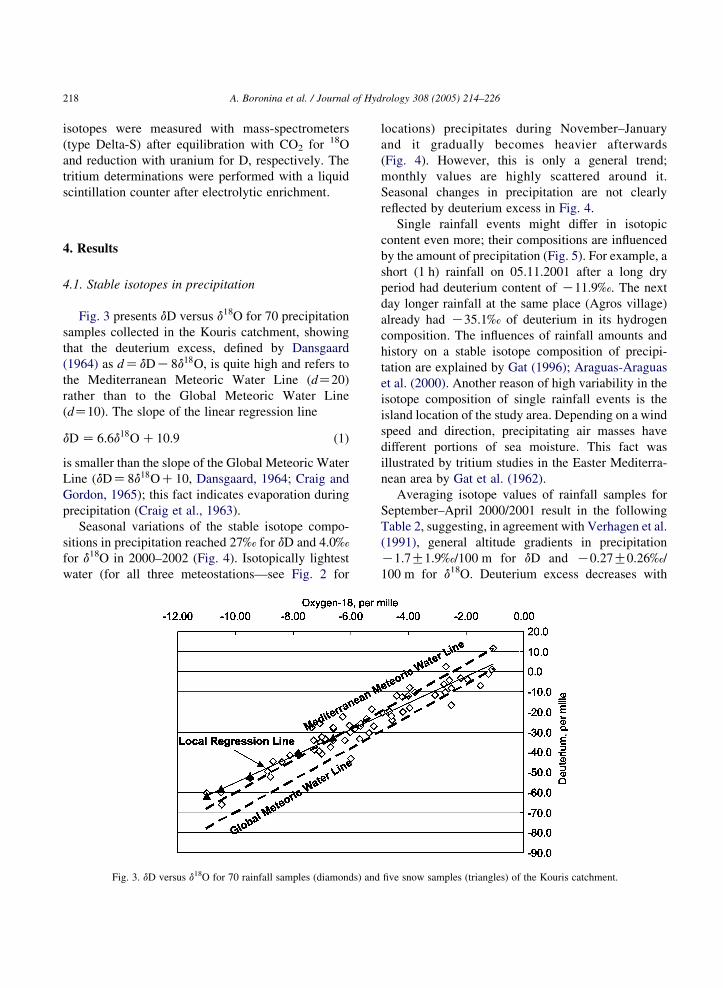
Fig. 3 presents dD versus d18O for 70 precipitation
samples collected in the Kouris catchment, showing
that the deuterium excess, defined by Dansgaard
(1964) as dZdDK8d18O, is quite high and refers to
the Mediterranean Meteoric Water Line (dZ20)
rather than to the Global Meteoric Water Line
(dZ10). The slope of the linear regression line
dD Z 6:6d18O C10:9 (1)
is smaller than the slope of the Global Meteoric Water
Line (dDZ8d18OC10, Dansgaard, 1964; Craig and
Gordon, 1965); this fact indicates evaporation during
precipitation (Craig et al., 1963).
Seasonal variations of the stable isotope compo-
sitions in precipitation reached 27‰ for dD and 4.0‰
for d18O in 2000–2002 (Fig. 4). Isotopically lightest
water (for all three meteostations—see Fig. 2 for
Fig. 3. dD versus d18O for 70 rainfall samples (diamonds) and
locations) precipitates during November–January
and it gradually becomes heavier afterwards
(Fig. 4). However, this is only a general trend;
monthly values are highly scattered around it.
Seasonal changes in precipitation are not clearly
reflected by deuterium excess in Fig. 4.
Single rainfall events might differ in isotopic
content even more; their compositions are influenced
by the amount of precipitation (Fig. 5). For example, a
short (1 h) rainfall on 05.11.2001 after a long dry
period had deuterium content of K11.9‰. The next
day longer rainfall at the same place (Agros village)
already had K35.1‰ of deuterium in its hydrogen
composition. The influences of rainfall amounts and
history on a stable isotope composition of precipi-
tation are explained by Gat (1996); Araguas-Araguas
et al. (2000). Another reason of high variability in the
isotope composition of single rainfall events is the
island location of the study area. Depending on a wind
speed and direction, precipitating air masses have
different portions of sea moisture. This fact was
illustrated by tritium studies in the Easter Mediterra-
nean area by Gat et al. (1962).
Averaging isotope values of rainfall samples for
September–April 2000/2001 result in the following
Table 2, suggesting, in agreement with Verhagen et al.
(1991), general altitude gradients in precipitation
K1.7G1.9‰/100 m for dD and K0.27G0.26‰/
100 m for d18O. Deuterium excess decreases with
five snow samples (triangles) of the Kouris catchment.
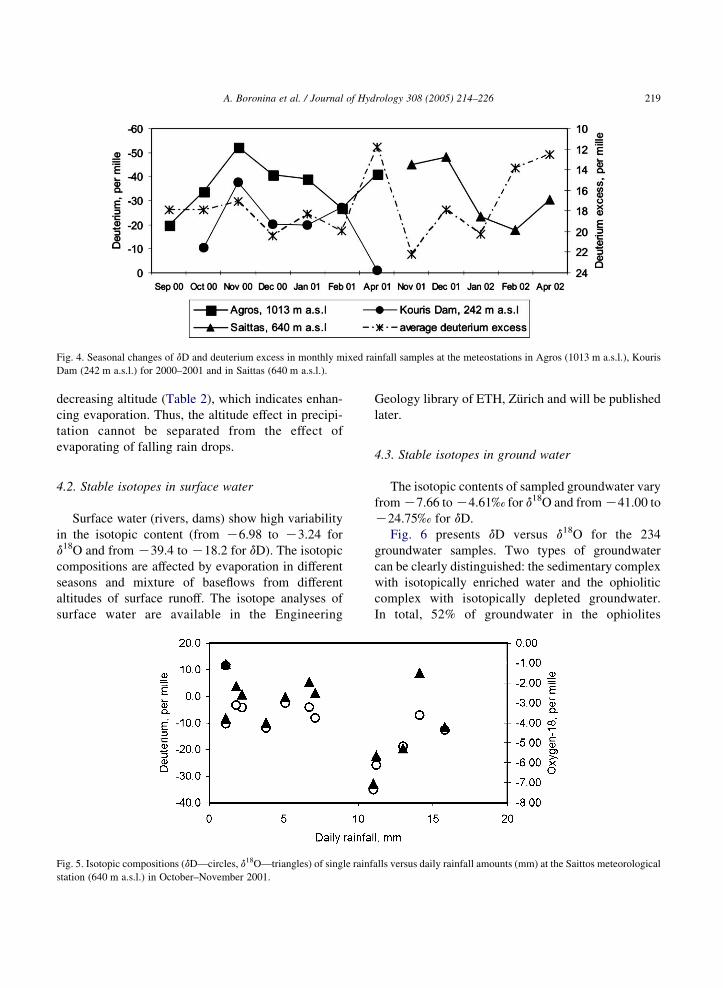
Fig. 4. Seasonal changes of dD and deuterium excess in monthly mixed rainfall samples at the meteostations in Agros (1013 m a.s.l.), Kouris
Dam (242 m a.s.l.) for 2000–2001 and in Saittas (640 m a.s.l.).
A. Boronina et al. / Journal of Hydrology 308 (2005) 214–226 219
decreasing altitude (Table 2), which indicates enhan-
cing evaporation. Thus, the altitude effect in precipi-
tation cannot be separated from the effect of
evaporating of falling rain drops.
4.2. Stable isotopes in surface water
Surface water (rivers, dams) show high variability
in the isotopic content (from K6.98 to K3.24 for
d18O and from K39.4 to K18.2 for dD). The isotopic
compositions are affected by evaporation in different
seasons and mixture of baseflows from different
altitudes of surface runoff. The isotope analyses of
surface water are available in the Engineering
Fig. 5. Isotopic compositions (dD—circles, d18O—triangles) of single rainf
station (640 m a.s.l.) in October–November 2001.
Geology library of ETH, Zurich and will be published
later.
4.3. Stable isotopes in ground water
The isotopic contents of sampled groundwater vary
from K7.66 to K4.61‰ for d18O and from K41.00 to
K24.75‰ for dD.
Fig. 6 presents dD versus d18O for the 234
groundwater samples. Two types of groundwater
can be clearly distinguished: the sedimentary complex
with isotopically enriched water and the ophiolitic
complex with isotopically depleted groundwater.
In total, 52% of groundwater in the ophiolites
alls versus daily rainfall amounts (mm) at the Saittos meteorological
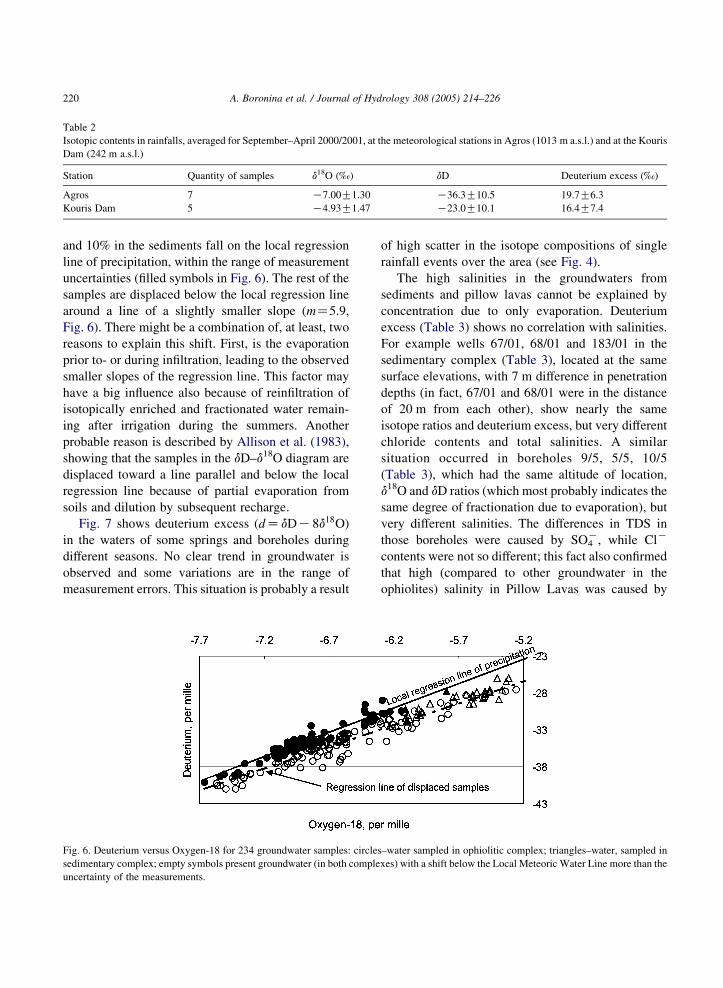
Table 2
Isotopic contents in rainfalls, averaged for September–April 2000/2001, at the meteorological stations in Agros (1013 m a.s.l.) and at the Kouris
Dam (242 m a.s.l.)
Station Quantity of samples d18O (‰) dD Deuterium excess (‰)
Agros 7 K7.00G1.30 K36.3G10.5 19.7G6.3
Kouris Dam 5 K4.93G1.47 K23.0G10.1 16.4G7.4
A. Boronina et al. / Journal of Hydrology 308 (2005) 214–226220
and 10% in the sediments fall on the local regression
line of precipitation, within the range of measurement
uncertainties (filled symbols in Fig. 6). The rest of the
samples are displaced below the local regression line
around a line of a slightly smaller slope (mZ5.9,
Fig. 6). There might be a combination of, at least, two
reasons to explain this shift. First, is the evaporation
prior to- or during infiltration, leading to the observed
smaller slopes of the regression line. This factor may
have a big influence also because of reinfiltration of
isotopically enriched and fractionated water remain-
ing after irrigation during the summers. Another
probable reason is described by Allison et al. (1983),
showing that the samples in the dD–d18O diagram are
displaced toward a line parallel and below the local
regression line because of partial evaporation from
soils and dilution by subsequent recharge.
Fig. 7 shows deuterium excess ðdZdDK8d18OÞ
in the waters of some springs and boreholes during
different seasons. No clear trend in groundwater is
observed and some variations are in the range of
measurement errors. This situation is probably a result
Fig. 6. Deuterium versus Oxygen-18 for 234 groundwater samples: circles
sedimentary complex; empty symbols present groundwater (in both comple
uncertainty of the measurements.
of high scatter in the isotope compositions of single
rainfall events over the area (see Fig. 4).
The high salinities in the groundwaters from
sediments and pillow lavas cannot be explained by
concentration due to only evaporation. Deuterium
excess (Table 3) shows no correlation with salinities.
For example wells 67/01, 68/01 and 183/01 in the
sedimentary complex (Table 3), located at the same
surface elevations, with 7 m difference in penetration
depths (in fact, 67/01 and 68/01 were in the distance
of 20 m from each other), show nearly the same
isotope ratios and deuterium excess, but very different
chloride contents and total salinities. A similar
situation occurred in boreholes 9/5, 5/5, 10/5
(Table 3), which had the same altitude of location,
d18O and dD ratios (which most probably indicates the
same degree of fractionation due to evaporation), but
very different salinities. The differences in TDS in
those boreholes were caused by SO4K, while ClK
contents were not so different; this fact also confirmed
that high (compared to other groundwater in the
ophiolites) salinity in Pillow Lavas was caused by
–water sampled in ophiolitic complex; triangles–water, sampled in
xes) with a shift below the Local Meteoric Water Line more than the
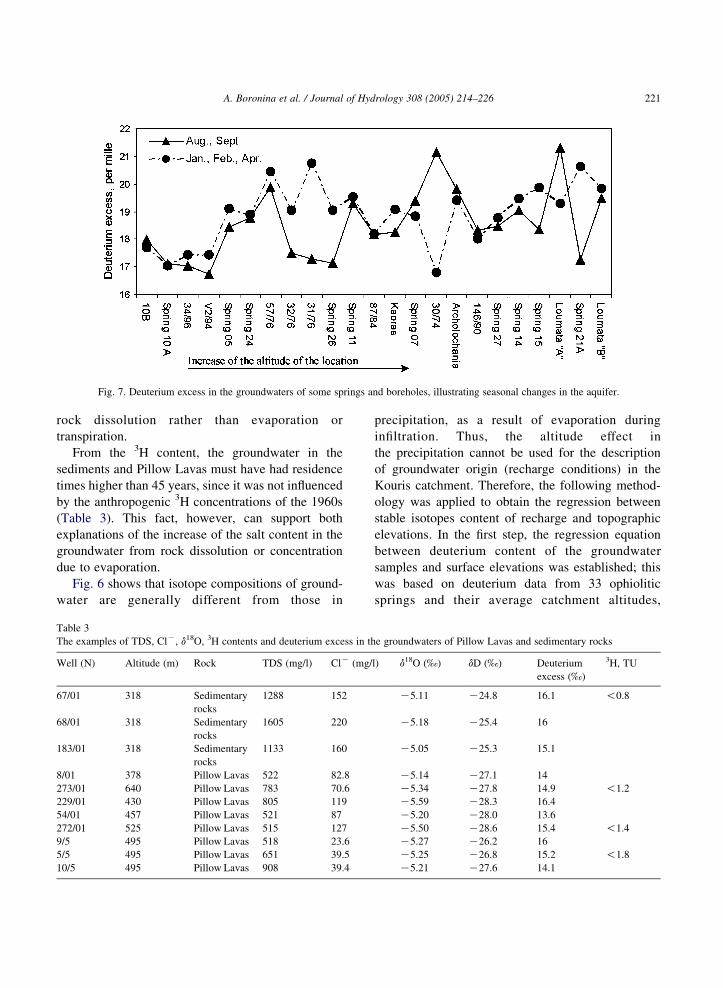
Fig. 7. Deuterium excess in the groundwaters of some springs and boreholes, illustrating seasonal changes in the aquifer.
A. Boronina et al. / Journal of Hydrology 308 (2005) 214–226 221
rock dissolution rather than evaporation or
transpiration.
From the 3H content, the groundwater in the
sediments and Pillow Lavas must have had residence
times higher than 45 years, since it was not influenced
by the anthropogenic 3H concentrations of the 1960s
(Table 3). This fact, however, can support both
explanations of the increase of the salt content in the
groundwater from rock dissolution or concentration
due to evaporation.
Fig. 6 shows that isotope compositions of ground-
water are generally different from those in
Table 3
The examples of TDS, ClK, d18O, 3H contents and deuterium excess in th
Well (N) Altitude (m) Rock TDS (mg/l) ClK (mg/
67/01 318 Sedimentary
rocks
1288 152
68/01 318 Sedimentary
rocks
1605 220
183/01 318 Sedimentary
rocks
1133 160
8/01 378 Pillow Lavas 522 82.8
273/01 640 Pillow Lavas 783 70.6
229/01 430 Pillow Lavas 805 119
54/01 457 Pillow Lavas 521 87
272/01 525 Pillow Lavas 515 127
9/5 495 Pillow Lavas 518 23.6
5/5 495 Pillow Lavas 651 39.5
10/5 495 Pillow Lavas 908 39.4
precipitation, as a result of evaporation during
infiltration. Thus, the altitude effect in
the precipitation cannot be used for the description
of groundwater origin (recharge conditions) in the
Kouris catchment. Therefore, the following method-
ology was applied to obtain the regression between
stable isotopes content of recharge and topographic
elevations. In the first step, the regression equation
between deuterium content of the groundwater
samples and surface elevations was established; this
was based on deuterium data from 33 ophiolitic
springs and their average catchment altitudes,
e groundwaters of Pillow Lavas and sedimentary rocks
l) d18O (‰) dD (‰) Deuterium
excess (‰)
3H, TU
K5.11 K24.8 16.1 !0.8
K5.18 K25.4 16
K5.05 K25.3 15.1
K5.14 K27.1 14
K5.34 K27.8 14.9 !1.2
K5.59 K28.3 16.4
K5.20 K28.0 13.6
K5.50 K28.6 15.4 !1.4
K5.27 K26.2 16
K5.25 K26.8 15.2 !1.8
K5.21 K27.6 14.1
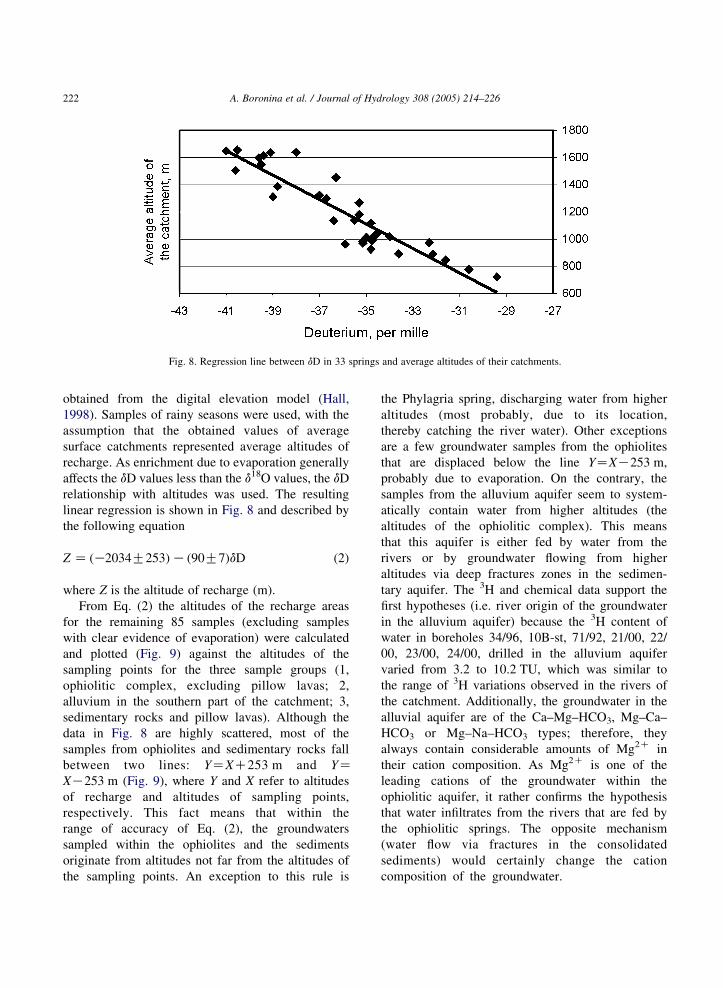
Fig. 8. Regression line between dD in 33 springs and average altitudes of their catchments.
A. Boronina et al. / Journal of Hydrology 308 (2005) 214–226222
obtained from the digital elevation model (Hall,
1998). Samples of rainy seasons were used, with the
assumption that the obtained values of average
surface catchments represented average altitudes of
recharge. As enrichment due to evaporation generally
affects the dD values less than the d18O values, the dD
relationship with altitudes was used. The resulting
linear regression is shown in Fig. 8 and described by
the following equation
Z Z ðK2034G253ÞK ð90G7ÞdD (2)
where Z is the altitude of recharge (m).
From Eq. (2) the altitudes of the recharge areas
for the remaining 85 samples (excluding samples
with clear evidence of evaporation) were calculated
and plotted (Fig. 9) against the altitudes of the
sampling points for the three sample groups (1,
ophiolitic complex, excluding pillow lavas; 2,
alluvium in the southern part of the catchment; 3,
sedimentary rocks and pillow lavas). Although the
data in Fig. 8 are highly scattered, most of the
samples from ophiolites and sedimentary rocks fall
between two lines: YZXC253 m and YZXK253 m (Fig. 9), where Y and X refer to altitudes
of recharge and altitudes of sampling points,
respectively. This fact means that within the
range of accuracy of Eq. (2), the groundwaters
sampled within the ophiolites and the sediments
originate from altitudes not far from the altitudes of
the sampling points. An exception to this rule is
the Phylagria spring, discharging water from higher
altitudes (most probably, due to its location,
thereby catching the river water). Other exceptions
are a few groundwater samples from the ophiolites
that are displaced below the line YZXK253 m,
probably due to evaporation. On the contrary, the
samples from the alluvium aquifer seem to system-
atically contain water from higher altitudes (the
altitudes of the ophiolitic complex). This means
that this aquifer is either fed by water from the
rivers or by groundwater flowing from higher
altitudes via deep fractures zones in the sedimen-
tary aquifer. The 3H and chemical data support the
first hypotheses (i.e. river origin of the groundwater
in the alluvium aquifer) because the 3H content of
water in boreholes 34/96, 10B-st, 71/92, 21/00, 22/
00, 23/00, 24/00, drilled in the alluvium aquifer
varied from 3.2 to 10.2 TU, which was similar to
the range of 3H variations observed in the rivers of
the catchment. Additionally, the groundwater in the
alluvial aquifer are of the Ca–Mg–HCO3, Mg–Ca–
HCO3 or Mg–Na–HCO3 types; therefore, they
always contain considerable amounts of Mg2C in
their cation composition. As Mg2C is one of the
leading cations of the groundwater within the
ophiolitic aquifer, it rather confirms the hypothesis
that water infiltrates from the rivers that are fed by
the ophiolitic springs. The opposite mechanism
(water flow via fractures in the consolidated
sediments) would certainly change the cation
composition of the groundwater.
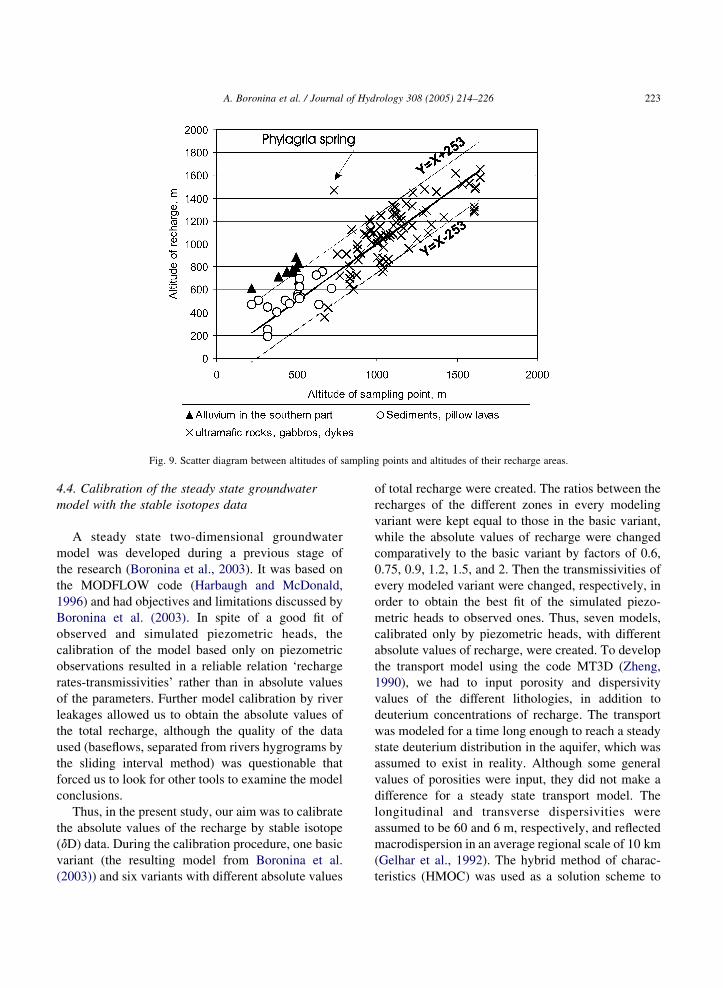
Fig. 9. Scatter diagram between altitudes of sampling points and altitudes of their recharge areas.
A. Boronina et al. / Journal of Hydrology 308 (2005) 214–226 223
4.4. Calibration of the steady state groundwater
model with the stable isotopes data
A steady state two-dimensional groundwater
model was developed during a previous stage of
the research (Boronina et al., 2003). It was based on
the MODFLOW code (Harbaugh and McDonald,
1996) and had objectives and limitations discussed by
Boronina et al. (2003). In spite of a good fit of
observed and simulated piezometric heads, the
calibration of the model based only on piezometric
observations resulted in a reliable relation ‘recharge
rates-transmissivities’ rather than in absolute values
of the parameters. Further model calibration by river
leakages allowed us to obtain the absolute values of
the total recharge, although the quality of the data
used (baseflows, separated from rivers hygrograms by
the sliding interval method) was questionable that
forced us to look for other tools to examine the model
conclusions.
Thus, in the present study, our aim was to calibrate
the absolute values of the recharge by stable isotope
(dD) data. During the calibration procedure, one basic
variant (the resulting model from Boronina et al.
(2003)) and six variants with different absolute values
of total recharge were created. The ratios between the
recharges of the different zones in every modeling
variant were kept equal to those in the basic variant,
while the absolute values of recharge were changed
comparatively to the basic variant by factors of 0.6,
0.75, 0.9, 1.2, 1.5, and 2. Then the transmissivities of
every modeled variant were changed, respectively, in
order to obtain the best fit of the simulated piezo-
metric heads to observed ones. Thus, seven models,
calibrated only by piezometric heads, with different
absolute values of recharge, were created. To develop
the transport model using the code MT3D (Zheng,
1990), we had to input porosity and dispersivity
values of the different lithologies, in addition to
deuterium concentrations of recharge. The transport
was modeled for a time long enough to reach a steady
state deuterium distribution in the aquifer, which was
assumed to exist in reality. Although some general
values of porosities were input, they did not make a
difference for a steady state transport model. The
longitudinal and transverse dispersivities were
assumed to be 60 and 6 m, respectively, and reflected
macrodispersion in an average regional scale of 10 km
(Gelhar et al., 1992). The hybrid method of charac-
teristics (HMOC) was used as a solution scheme to
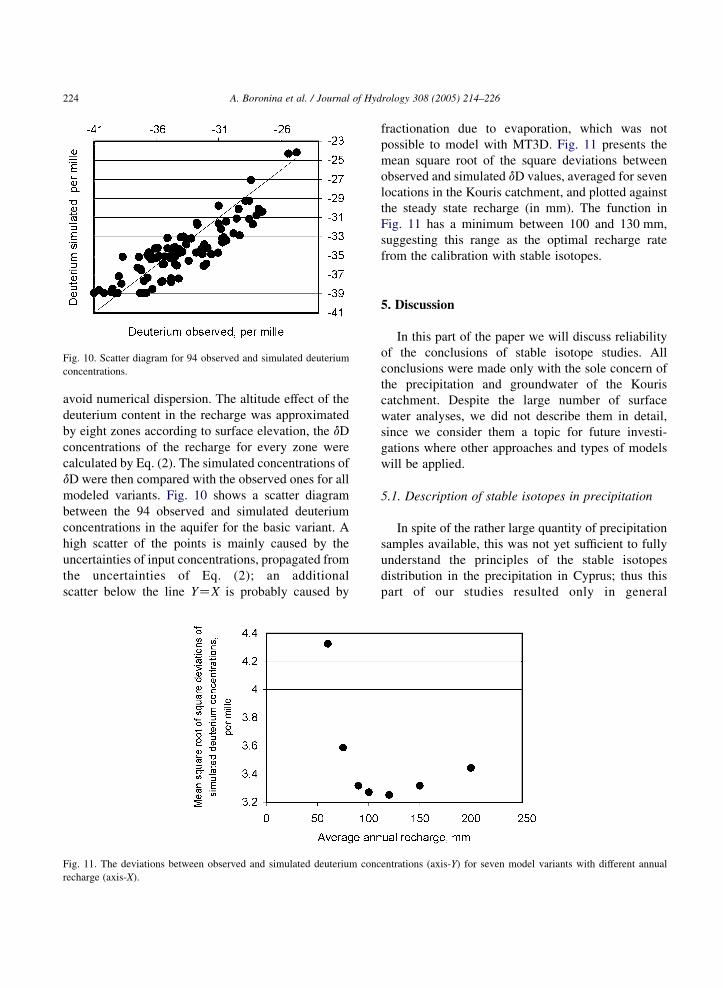
Fig. 10. Scatter diagram for 94 observed and simulated deuterium
concentrations.
A. Boronina et al. / Journal of Hydrology 308 (2005) 214–226224
avoid numerical dispersion. The altitude effect of the
deuterium content in the recharge was approximated
by eight zones according to surface elevation, the dD
concentrations of the recharge for every zone were
calculated by Eq. (2). The simulated concentrations of
dD were then compared with the observed ones for all
modeled variants. Fig. 10 shows a scatter diagram
between the 94 observed and simulated deuterium
concentrations in the aquifer for the basic variant. A
high scatter of the points is mainly caused by the
uncertainties of input concentrations, propagated from
the uncertainties of Eq. (2); an additional
scatter below the line YZX is probably caused by
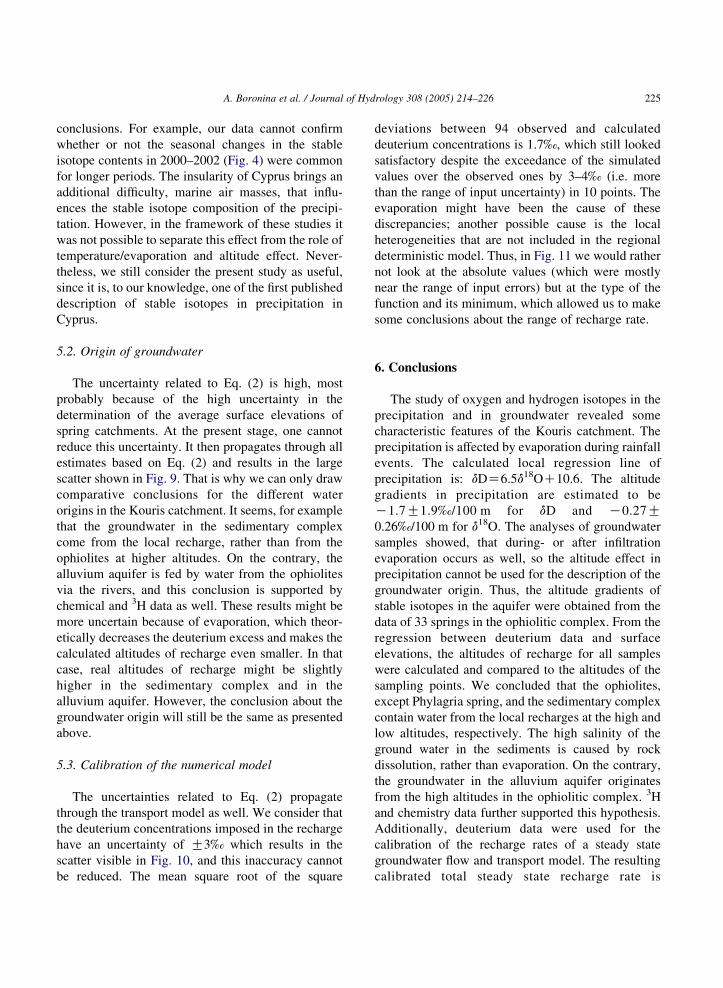
Fig. 11. The deviations between observed and simulated deuterium conc
recharge (axis-X).
fractionation due to evaporation, which was not
possible to model with MT3D. Fig. 11 presents the
mean square root of the square deviations between
observed and simulated dD values, averaged for seven
locations in the Kouris catchment, and plotted against
the steady state recharge (in mm). The function in
Fig. 11 has a minimum between 100 and 130 mm,
suggesting this range as the optimal recharge rate
from the calibration with stable isotopes.
5. Discussion
In this part of the paper we will discuss reliability
of the conclusions of stable isotope studies. All
conclusions were made only with the sole concern of
the precipitation and groundwater of the Kouris
catchment. Despite the large number of surface
water analyses, we did not describe them in detail,
since we consider them a topic for future investi-
gations where other approaches and types of models
will be applied.
5.1. Description of stable isotopes in precipitation
In spite of the rather large quantity of precipitation
samples available, this was not yet sufficient to fully
understand the principles of the stable isotopes
distribution in the precipitation in Cyprus; thus this
part of our studies resulted only in general
entrations (axis-Y) for seven model variants with different annual
A. Boronina et al. / Journal of Hydrology 308 (2005) 214–226 225
conclusions. For example, our data cannot confirm
whether or not the seasonal changes in the stable
isotope contents in 2000–2002 (Fig. 4) were common
for longer periods. The insularity of Cyprus brings an
additional difficulty, marine air masses, that influ-
ences the stable isotope composition of the precipi-
tation. However, in the framework of these studies it
was not possible to separate this effect from the role of
temperature/evaporation and altitude effect. Never-
theless, we still consider the present study as useful,
since it is, to our knowledge, one of the first published
description of stable isotopes in precipitation in
Cyprus.
5.2. Origin of groundwater
The uncertainty related to Eq. (2) is high, most
probably because of the high uncertainty in the
determination of the average surface elevations of
spring catchments. At the present stage, one cannot
reduce this uncertainty. It then propagates through all
estimates based on Eq. (2) and results in the large
scatter shown in Fig. 9. That is why we can only draw
comparative conclusions for the different water
origins in the Kouris catchment. It seems, for example
that the groundwater in the sedimentary complex
come from the local recharge, rather than from the
ophiolites at higher altitudes. On the contrary, the
alluvium aquifer is fed by water from the ophiolites
via the rivers, and this conclusion is supported by
chemical and 3H data as well. These results might be
more uncertain because of evaporation, which theor-
etically decreases the deuterium excess and makes the
calculated altitudes of recharge even smaller. In that
case, real altitudes of recharge might be slightly
higher in the sedimentary complex and in the
alluvium aquifer. However, the conclusion about the
groundwater origin will still be the same as presented
above.
5.3. Calibration of the numerical model
The uncertainties related to Eq. (2) propagate
through the transport model as well. We consider that
the deuterium concentrations imposed in the recharge
have an uncertainty of G3‰ which results in the
scatter visible in Fig. 10, and this inaccuracy cannot
be reduced. The mean square root of the square
deviations between 94 observed and calculated
deuterium concentrations is 1.7‰, which still looked
satisfactory despite the exceedance of the simulated
values over the observed ones by 3–4‰ (i.e. more
than the range of input uncertainty) in 10 points. The
evaporation might have been the cause of these
discrepancies; another possible cause is the local
heterogeneities that are not included in the regional
deterministic model. Thus, in Fig. 11 we would rather
not look at the absolute values (which were mostly
near the range of input errors) but at the type of the
function and its minimum, which allowed us to make
some conclusions about the range of recharge rate.
6. Conclusions
The study of oxygen and hydrogen isotopes in the
precipitation and in groundwater revealed some
characteristic features of the Kouris catchment. The
precipitation is affected by evaporation during rainfall
events. The calculated local regression line of
precipitation is: dDZ6.5d18OC10.6. The altitude
gradients in precipitation are estimated to be
K1.7G1.9‰/100 m for dD and K0.27G0.26‰/100 m for d18O. The analyses of groundwater
samples showed, that during- or after infiltration
evaporation occurs as well, so the altitude effect in
precipitation cannot be used for the description of the
groundwater origin. Thus, the altitude gradients of
stable isotopes in the aquifer were obtained from the
data of 33 springs in the ophiolitic complex. From the
regression between deuterium data and surface
elevations, the altitudes of recharge for all samples
were calculated and compared to the altitudes of the
sampling points. We concluded that the ophiolites,
except Phylagria spring, and the sedimentary complex
contain water from the local recharges at the high and
low altitudes, respectively. The high salinity of the
ground water in the sediments is caused by rock
dissolution, rather than evaporation. On the contrary,
the groundwater in the alluvium aquifer originates
from the high altitudes in the ophiolitic complex. 3H
and chemistry data further supported this hypothesis.
Additionally, deuterium data were used for the
calibration of the recharge rates of a steady state
groundwater flow and transport model. The resulting
calibrated total steady state recharge rate is
A. Boronina et al. / Journal of Hydrology 308 (2005) 214–226226
100–130 mm per year, which is in agreement with the
recharge rate obtained by the chloride mass-balance
method and by the previous calibration of the
numerical model with river leakages (Boronina et
al., 2003).
Acknowledgments
We would like to thank W. Kinzelbach and I.
Tokarev for helpful discussions; we are also
grateful to F. Leuenberger S. Young for correcting
the language of this paper. We acknowledge the
Water Development Department of Cyprus for
providing data and assisting with field trips. The
work was financially supported by the Swiss
Federal Institute of Technology (Internal Research
Project TH-22./01-1).
References
Afrodisis, S., Avraamides, C., Fischbach, P., Hahn, J., Udluft, P.,
Wagner, W., 1986. Hydrogeological and hydrochemical studies
in the Troodos region. Technical Report N6 in Cyprus–German
Geological and Pedological Project No. 81.2224.4, Ministry of
Agriculture and Natural Resources, Geological Survey Depart-
ment, Nicosia, Cyprus. p. 101.
Allison, G.B., Barnes, C.J., Hughes, M.W., Leaney, F.W.J., 1983.
Effect of climate and vegetation on oxygen-18 and deuterium
profiles in soils, Isotope Hydrology. IAEA, Vienna pp. 105–123.
Araguas-Araguas, L., Froehlich, K., Rozanski, K., 2000. Deuterium
and oxygen-18 isotope composition of precipitation and
atmospheric moisture. Hydrological Processes 14, 1341–1355.
Boronina, A., Renard, P., Balderer, W., Christodoulides, A., 2003.
Groundwater resources in the Kouris catchment (Cyprus): data
analysis and numerical modelling. Journal of Hydrology 271,
130–149.
Christodoulou, Th., Leontiadis, I.L., Morfis, A., Payne, B.R.,
Tzimourtas, S., 1993. Isotope hydrology study of Axios River
plain in northern Greece. Journal of Hydrology 146, 391–404.
Craig, H., Gordon, L., 1965. Deuterium and Oxygen-18 variations
in the ocean and the marine atmosphere. In: Stable isotopes in
oceanographic studies and paleotemperatures. Spoleta. pp.
9–130.
Craig, H., Gordon, L., Horibe, Y., 1963. Isotopic exchange effects in
the evaporation of water. Low-temperature experimental results.
Journal of Geophysical Research 68, 5079–5087.
Dansgaard, W., 1964. Stable isotopes in precipitation. Tellus 16,
436–468.
Gat, J.R., 1996. Oxygen and hydrogen isotopes in the hydrologic
cycle. Annual Review of Earth and Planetary Sciences 24, 225–
262.
Gat, J.R., 2000. Atmospheric water balance—the isotopic perspec-
tive. Hydrological Processes 14, 1357–1369.
Gat, J.R., Karfunkel, U., Nir, A., 1962. Tritium content of rainwater
from the Eastern Mediterranean area, Proceedings of Tritium in
the Physical and Biological Studies, vol. 1. IAEA, Vienna pp.
41–54.
Gelhar, L.W., Welty, C., Rehfeldt, K.R., 1992. A critical review of
data on field-scale dispersion in aquifers. Water Resources
Research 28 (7), 1955–1974.
Gonfiantini, R., 1986. Environmental isotopes in lake studies, in:
Fritz, P., Fontes, J.C. (Eds.), Handbook of environmental
isotope Geochemistry The Terrestrial environment, B, vol. 2.
Elsevier, Amsterdam, The Netherlands, pp. 113–168.
Hall, J.K., 1998. Digital terrain model (DTM) of the Island of
Cyprus, CSI Current Research 11 1998 pp. 45–50.
Harbaugh, A.W., McDonald, M.G., 1996. User’s documentation for
Modflow-96, an update to the U.S. Geological Survey modular
finite-difference ground-water flow model. Open-File Report
96-485, US Geological Survey. p. 56.
Jacovides, J., 1979. Environmental isotope survey (Cyprus). Final
report on I.A.E.A., research contract No: 1039/RB, Technical
Report, Ministry of Agriculture and Natural Resources,
Department of Water Development, Nicosia, Cyprus. p. 82.
Leonitiadis, I.L., Nikolaou, E., 1999. Environmental isotopes in
determining groundwater flow systems, northern part of Epiris,
Greece. Hydrogeology Journal 7, 219–226.
Verhagen, B.T., Geyh, M.A., Frohlich, K., With, K., 1991. The
Lefkara area, Cyprus. In: Isotope hydrological methods for the
quantitative evaluation of ground water resources in arid and
semi-arid areas. Research Reports of the Federal Ministry for
Economic Cooperation of the Federal Republic of Germany,
Bonn, Germany. pp. 43–59.
Zheng, C., 1990. MT3D, a Modular Three-Dimensional Transport
Model. S.S. Papadopulos & Associates, Inc., Rockville,
Maryland.