Study of dose-dependent combination immunotherapy using ...
12
UC Riverside UC Riverside Previously Published Works Title Study of dose-dependent combination immunotherapy using engineered T cells and IL-2 in cervical cancer. Permalink https://escholarship.org/uc/item/771609ss Authors Cho, Heyrim Wang, Zuping Levy, Doron Publication Date 2020-11-01 DOI 10.1016/j.jtbi.2020.110403 Peer reviewed eScholarship.org Powered by the California Digital Library University of California
-
Upload
khangminh22 -
Category
Documents
-
view
0 -
download
0
Transcript of Study of dose-dependent combination immunotherapy using ...
UC RiversideUC Riverside Previously Published Works
TitleStudy of dose-dependent combination immunotherapy using engineered T cells and IL-2 in cervical cancer.
Permalinkhttps://escholarship.org/uc/item/771609ss
AuthorsCho, HeyrimWang, ZupingLevy, Doron
Publication Date2020-11-01
DOI10.1016/j.jtbi.2020.110403 Peer reviewed
eScholarship.org Powered by the California Digital LibraryUniversity of California
Dose-dependent treatment of engineered T cell therapy in cancer
Recent advances in cell-based immunotherapy have enabled doctors to overcome this limitation
H Cho, Z Wang, D Levy: Preprint submitted to Elsevier Page 1 of 9

HighlightsStudy of dose-dependent combination immunotherapy using engineered T cells and IL-2 in cervi-cal cancerHeyrim Cho,Zuping Wang,Doron Levy
• A mathematical model for combination therapy using engineered T cells and IL-2• The results provide a TCR T cell dose window for a successful therapy• Combination therapy does not always provide a better outcome
Study of dose-dependent combination immunotherapy usingengineered T cells and IL-2 in cervical cancerHeyrim Choa, Zuping Wangb and Doron Levyb,c,∗,1aDepartment of Mathematics, University of California, Riverside, CA 92521bDepartment of Mathematics, University of Maryland, College Park, College Park, MD 20742cCenter for Scientific Computation and Mathematical Modeling (CSCAMM), University of Maryland, College Park, College Park, MD 20742
ART ICLE INFOKeywords:Adoptive T cell transferTCR T cellsIL-2 treatmentcombination cancer therapymathematical oncology
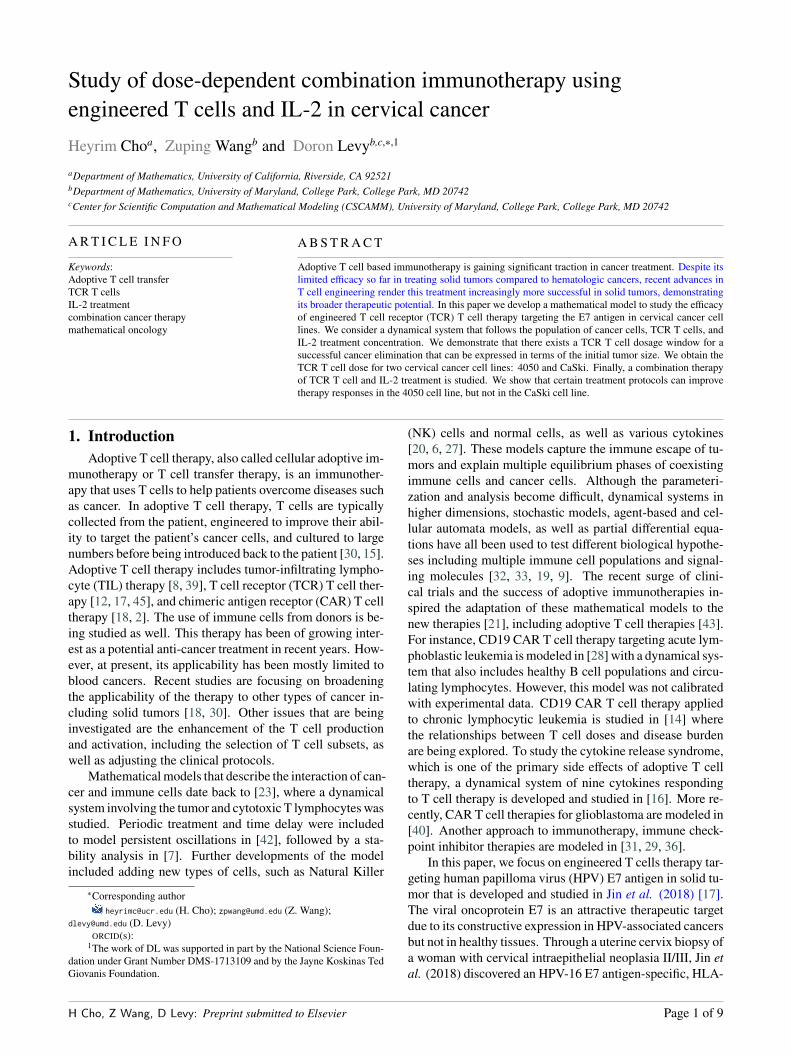
ABSTRACTAdoptive T cell based immunotherapy is gaining significant traction in cancer treatment. Despite itslimited efficacy so far in treating solid tumors compared to hematologic cancers, recent advances inT cell engineering render this treatment increasingly more successful in solid tumors, demonstratingits broader therapeutic potential. In this paper we develop a mathematical model to study the efficacyof engineered T cell receptor (TCR) T cell therapy targeting the E7 antigen in cervical cancer celllines. We consider a dynamical system that follows the population of cancer cells, TCR T cells, andIL-2 treatment concentration. We demonstrate that there exists a TCR T cell dosage window for asuccessful cancer elimination that can be expressed in terms of the initial tumor size. We obtain theTCR T cell dose for two cervical cancer cell lines: 4050 and CaSki. Finally, a combination therapyof TCR T cell and IL-2 treatment is studied. We show that certain treatment protocols can improvetherapy responses in the 4050 cell line, but not in the CaSki cell line.
1. IntroductionAdoptive T cell therapy, also called cellular adoptive im-
munotherapy or T cell transfer therapy, is an immunother-apy that uses T cells to help patients overcome diseases suchas cancer. In adoptive T cell therapy, T cells are typicallycollected from the patient, engineered to improve their abil-ity to target the patient’s cancer cells, and cultured to largenumbers before being introduced back to the patient [30, 15].Adoptive T cell therapy includes tumor-infiltrating lympho-cyte (TIL) therapy [8, 39], T cell receptor (TCR) T cell ther-apy [12, 17, 45], and chimeric antigen receptor (CAR) T celltherapy [18, 2]. The use of immune cells from donors is be-ing studied as well. This therapy has been of growing inter-est as a potential anti-cancer treatment in recent years. How-ever, at present, its applicability has been mostly limited toblood cancers. Recent studies are focusing on broadeningthe applicability of the therapy to other types of cancer in-cluding solid tumors [18, 30]. Other issues that are beinginvestigated are the enhancement of the T cell productionand activation, including the selection of T cell subsets, aswell as adjusting the clinical protocols.
Mathematicalmodels that describe the interaction of can-cer and immune cells date back to [23], where a dynamicalsystem involving the tumor and cytotoxic T lymphocyteswasstudied. Periodic treatment and time delay were includedto model persistent oscillations in [42], followed by a sta-bility analysis in [7]. Further developments of the modelincluded adding new types of cells, such as Natural Killer
∗Corresponding [email protected] (H. Cho); [email protected] (Z. Wang);
[email protected] (D. Levy)ORCID(s):
1The work of DL was supported in part by the National Science Foun-dation under Grant Number DMS-1713109 and by the Jayne Koskinas TedGiovanis Foundation.
(NK) cells and normal cells, as well as various cytokines[20, 6, 27]. These models capture the immune escape of tu-mors and explain multiple equilibrium phases of coexistingimmune cells and cancer cells. Although the parameteri-zation and analysis become difficult, dynamical systems inhigher dimensions, stochastic models, agent-based and cel-lular automata models, as well as partial differential equa-tions have all been used to test different biological hypothe-ses including multiple immune cell populations and signal-ing molecules [32, 33, 19, 9]. The recent surge of clini-cal trials and the success of adoptive immunotherapies in-spired the adaptation of these mathematical models to thenew therapies [21], including adoptive T cell therapies [43].For instance, CD19 CAR T cell therapy targeting acute lym-phoblastic leukemia ismodeled in [28] with a dynamical sys-tem that also includes healthy B cell populations and circu-lating lymphocytes. However, this model was not calibratedwith experimental data. CD19 CAR T cell therapy appliedto chronic lymphocytic leukemia is studied in [14] wherethe relationships between T cell doses and disease burdenare being explored. To study the cytokine release syndrome,which is one of the primary side effects of adoptive T celltherapy, a dynamical system of nine cytokines respondingto T cell therapy is developed and studied in [16]. More re-cently, CAR T cell therapies for glioblastoma are modeled in[40]. Another approach to immunotherapy, immune check-point inhibitor therapies are modeled in [31, 29, 36].
In this paper, we focus on engineered T cells therapy tar-geting human papilloma virus (HPV) E7 antigen in solid tu-mor that is developed and studied in Jin et al. (2018) [17].The viral oncoprotein E7 is an attractive therapeutic targetdue to its constructive expression in HPV-associated cancersbut not in healthy tissues. Through a uterine cervix biopsy ofa woman with cervical intraepithelial neoplasia II/III, Jin etal. (2018) discovered an HPV-16 E7 antigen-specific, HLA-
H Cho, Z Wang, D Levy: Preprint submitted to Elsevier Page 1 of 9
Dose-dependent treatment of engineered T cell therapy in cancer
A*02:01-restricted TCR. In vitro, genetic engineered T cellsthat express E7-targeting TCR demonstrated effector T cellfunctions, including IFN- production and CD8 coreceptorindependent tumor cell killing. To investigate the potentialfor E7 TCR T cells to mediate regression of cancers in vivo,immunodeficient, NOD/SCID (NSG) mice were treatedwith 12-day subcutaneous HPV-16+ cervical cancer tumorswith a single intravenous injection of E7 TCR T cells. [17]used E7 TCR T cells at multiple doses of 1×10⁵, 1×10⁶, or1 × 107 cells per mouse, or untransduced T cells at doses of1 × 107 cells per mouse, either with or without adjuvant in-traperitoneal 198,000 IU of IL-2 per mouse daily for 3 days.This motivated our model and study of dose dependent com-bination treatment. The perpendicular diameters of each tu-mor from E7 TCR T cells treatment group and the untreatedgroup (5 mice per group) was measured at days 2, 5, 9, 12and beyond after T cell injection in two independent exper-iment that is the data we use to calibrate our model. Theauthors in [17] demonstrates that administration of E7 TCRT cells at doses of 1× 10⁶ or 1× 10⁷ cells induced completeregression of 4050 tumors; while, administration of E7 TCRT cells at a dose of 1 × 10⁷ cells resulted in suppression butnot elimination of CaSki tumors. Moreover, either E7 TCRT cells alone or in combination with IL-2 could mediate an-titumor activity against human cervical cancers, comparedwith the untreated group or the untransduced T cell group.
The goal of this study is to demonstrate the potential roleof mathematical modeling in improving the administrationof adoptive TCR T cell therapy for cancer treatment. InSection 2, we present a cancer-immune interaction modelthat follows the dynamics of cancer cells, TCR engineeredT cells, and the cytokine IL-2 drug concentration. We de-scribe the model parameters and assumptions, and the pro-cedure of sequential model calibration. In Section 3.1, sta-bility analysis of the model is conducted, resulting with con-ditions for therapy success. In Section 3.2, we study thedose-dependent response of two cancer cell lines, 4050 andCaSki to TCR T cell treatment. We demonstrate the exis-tence of a TCR T cell dose-dependent therapeutic window.The combination of TCR T cell and IL-2 treatment is studiedin Section 3.3, where we investigate the effect of different IL-2 treatment schedules, and show that IL-2 treatment given ina longer period of time is effective in the 4050 cell line, butnot in the CaSki cell line. A summary and future outlook areprovided in Section 4.
2. ModelWe denote cancer cells by C(t), TCR engineered T cells
by T (t), and the recombinant cytokine IL-2 drug (Aldesleukin)concentration in the blood stream by I(t). The dynamics ofcancer-immune interactions is then modeled as
C = aC(1 − bC) − nTC, (1)T = sT (t) − dT + pT C
g + C− mCT + p1T
Ig1 + I
,
(2)
I = sI (t) − kI + p2TC
g2 + C. (3)
The system (1)–(3) is adapted from existing models de-scribing the interaction of cancer cells and T cells [23, 20,34].
In Eq. (1), the cancer is assumed to follow a logisticgrowth with growth rate a and tumor capacity 1∕b. The in-teraction between cancer cells and T cells results with a tu-mor death that is induced by the T cells with death rate n.
The TCR T cell therapy is represented by a source termsT (t) in Eq. (2). These cells die exponentially at rate d. Theengineered TCR T cells are activated by the presence of thecancer cells with E7 antigen, that is modeled with the param-eter p denoting the rate of proliferation of T cells induced bycancer. The saturation of this proliferation for large valuesof cancer cells follows a Michaelis-Menten dynamics, and isgiven by g, a parameter that represents the number of cancercells that reduce the maximal T cell activation by half. Inaddition, we assume that the interaction between cancer andT cells further reduces the T cell population at a rate m.
In Eq. (3), the IL-2 therapy ismodeled similarly to Eq. (2)with a source term sI (t) and a decay rate k. The modelincludes the interaction between the IL-2 provided throughtherapy and T cells, where we assume that the two popula-tions stimulate each other. Although the effect of IL-2 onT cells is known to be both stimulating and inhibitory [4],we assume that the net effect is positive, supported by thedata inn [17] that we use to calibrate the model. The rates ofT cell and IL-2 production stimulated by each other are de-noted as p1 and p2, respectively. We also assume saturationin the growth dynamics of T cells and IL-2 with parametersg1 and g2.The treatments are given as follows. The T cell treat-ment is given once at the initial time t0 = 0, while the IL-2treatment is given d times at times t1, ..., td . Accordingly,the source terms are defined as
sT (t) = s11t=t0 (t), sI (t) =d∑
i=1s21t=ti (t).
The model parameters and their biological interpreta-tions are summarized in Table 1.2.1. Sequential model calibration
The experimental data in [17] was obtained in three ex-perimental settings: (1) cancer growth without treatment;(2) TCR T cell treatment; and (3) a combination of TCRT cell and IL-2 treatments. These experiments allow us tosequentially estimate the model parameters, and ensure theirrobust identification. The ranges of parameters found in theliterature are presented in Table 2 with references. We em-ploy aMarkov chainMonte Carlo (MCMC) algorithm, namely,delayed rejection adaptivemetropolis (DRAM) [13]. The fit-ted parameter values are shown in Table 3. Due to the lackof IL-2 drug concentration data and internal IL-2 level invivo, we assume that the IL-2 drug concentration I(t) doesnot interact with the internal IL-2, and also take p2 = 0 and
H Cho, Z Wang, D Levy: Preprint submitted to Elsevier Page 2 of 9
Dose-dependent treatment of engineered T cell therapy in cancer
parameter biological meaninga tumor proliferation rateb inverse of tumor carrying capacityp rate of T cell proliferation induced by tumorm T cell inactivation rate induced by tumorn tumor death rate induced by T cellsd death rate of T cellsg steepness coefficient of T cell recruitmentp1 rate of T cell proliferation stimulated by IL-2g1 steepness of T cell proliferation curve by IL-2p2 rate of IL-2 production by T cell and tumor
interactiong2 steepness of IL-2 production curvek decay rate of IL-2
Table 1Model parameters and their biological interpretation
parameter units rangea day−1 [0.01, 0.52]b cell−1 [10−14, 10−4]p day−1 [0.1, 0.4]m day−1cell−1 [10−12, 5 ⋅ 10−7]n day−1cell−1 [3.4 ⋅ 10−10, 3 ⋅ 10−7]d day−1 [0.02, 0.04]g cell [2 ⋅ 104, 2 ⋅ 107]p1 day−1 [0.124, 2.971]g1 IU [103, 2 ⋅ 107]p2 IU cells−1day−1 [0, 5]g2 cells 103k day−1 5
Table 2Model parameters and their ranges taken from [43, 34, 33, 37,35, 32, 38, 11].
parameters 4050 cell line CaSki cell linea 0.1828 0.1212b 2.6269⋅10−7 1.5201⋅10−7
p 0.1749 0.2144m 7.2590⋅10−8 3.3315⋅10−8n 1.2883⋅10−7 7.0924⋅10−9d 0.0212 0.0330g 1.7479⋅105 5.0880⋅105
p1 0.3388 0.3071g1 1648.8 3718k 5 5
Table 3Parameter values obtained with the MCMC algorithm usingthe [17] data for the 4050 cell line and the CaSki cell line.
g2 = 1000. A parameter sensitivity study and further com-ments about identifiability of the parameters are presented inAppendix B.
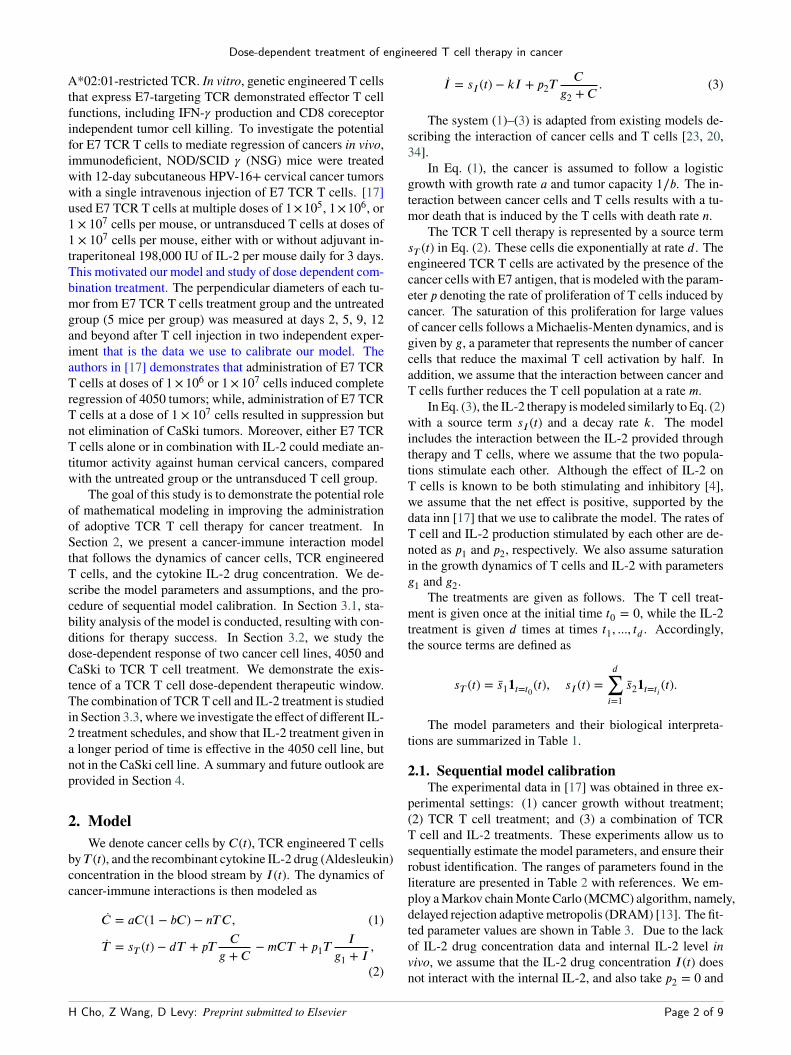
Fig. 1 shows the experimental data of tumor growthwith-out treatment and the fitted logistic growth model (1), that is,parameters a and b, for the two cancer cell lines, 4050 andCaSki. The 4050 cell line reaches its full capacity around
0 10 20 30 40Time
0
1
2
3
4
Tum
or c
ell
106 Cancer 4050
0 20 40 60Time
0
2
4
6
Tum
or c
ell
106 Cancer Caski
Figure 1: A calibration of the tumor growth model Eq. (1) tothe cancer growth data (∙) for the 4050 cell line (left) and theCaSki cell line (right) without treatment [17].
T (0) = 105 T (0) = 106 T (0) = 107
4050
cell
line
0 10 20 30Time
0
1
2
3
4
5106
0 20 40Time
0
1
2
3
4106
0 20 40Time
0
2
4
6
8
10
106
Cancer cellT cellcancer data
CaS
kice
lllin
e
0 10 20 30Time
0
0.5
1
1.5
2
2.5 106
0 20 40Time
0
2
4
6
8
10 106
0 20 40Time
0
0.5
1
1.5
2 107
Cancer cellT cellCancer data
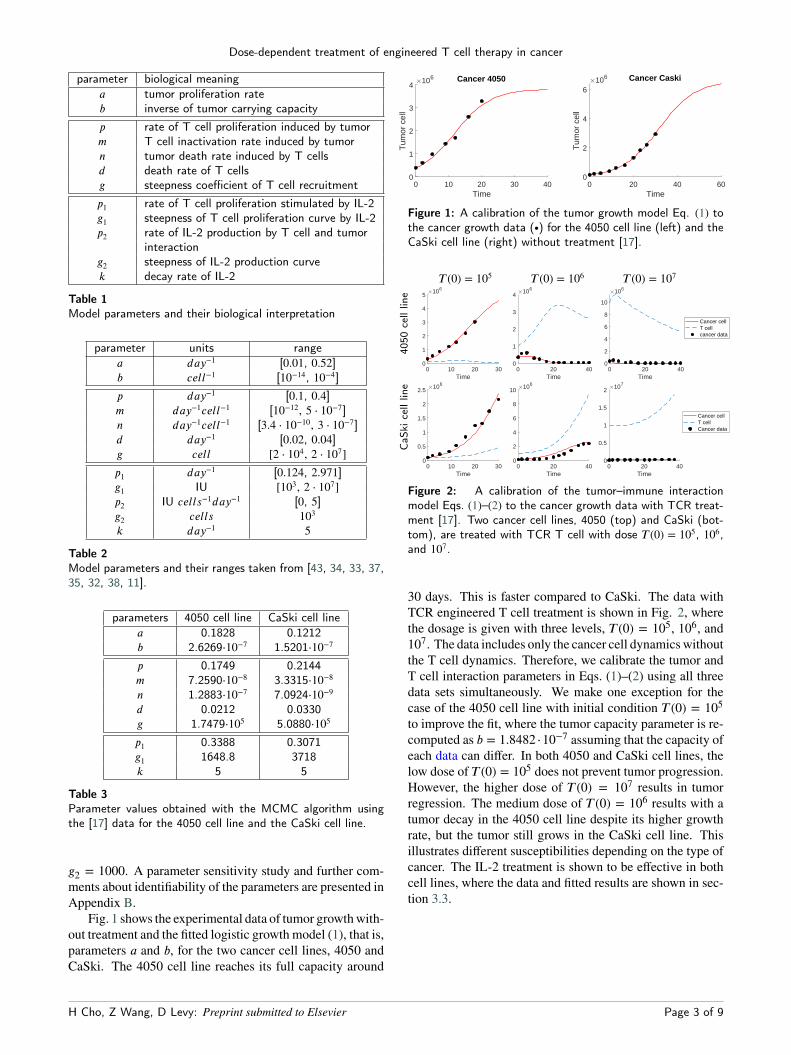
Figure 2: A calibration of the tumor–immune interactionmodel Eqs. (1)–(2) to the cancer growth data with TCR treat-ment [17]. Two cancer cell lines, 4050 (top) and CaSki (bot-tom), are treated with TCR T cell with dose T (0) = 105, 106,and 107.
30 days. This is faster compared to CaSki. The data withTCR engineered T cell treatment is shown in Fig. 2, wherethe dosage is given with three levels, T (0) = 105, 106, and107. The data includes only the cancer cell dynamicswithoutthe T cell dynamics. Therefore, we calibrate the tumor andT cell interaction parameters in Eqs. (1)–(2) using all threedata sets simultaneously. We make one exception for thecase of the 4050 cell line with initial condition T (0) = 105to improve the fit, where the tumor capacity parameter is re-computed as b = 1.8482 ⋅10−7 assuming that the capacity ofeach data can differ. In both 4050 and CaSki cell lines, thelow dose of T (0) = 105 does not prevent tumor progression.However, the higher dose of T (0) = 107 results in tumorregression. The medium dose of T (0) = 106 results with atumor decay in the 4050 cell line despite its higher growthrate, but the tumor still grows in the CaSki cell line. Thisillustrates different susceptibilities depending on the type ofcancer. The IL-2 treatment is shown to be effective in bothcell lines, where the data and fitted results are shown in sec-tion 3.3.
H Cho, Z Wang, D Levy: Preprint submitted to Elsevier Page 3 of 9
Dose-dependent treatment of engineered T cell therapy in cancer
3. Results3.1. Stability analysis reveals critical parameters
for therapy successThe experimental data reveals both scenarios of tumor
progression and regression depending on the initial T celldose. In this section, we study the steady states and theirstability to gain a better understanding of the interaction be-tween cancer and T cells in the model. We first focus on thesteady states without the IL-2 treatment, that is, (C, T , I) =(C, T , 0). We assume that all the parameters are non-negative.We also assume that sT (t) = 0 with a nonzero initial condi-tion for the T cells, since the T cell treatment is given as aninstant treatment at the initial time. The equilibrium statesof the system satisfy
0 = aC(1 − bC) − nTC = C[a(1 − bC) − nT ],
0 = −dT + pT Cg + C
− mCT
= T[
−d + p Cg + C
− mC]
,
where the linearized Jacobian is
L =⎛
⎜
⎜
⎝
a − 2abC − nT −nC
T[
pg(g + C)2
− m]
−d + p Cg + C
− mC
⎞
⎟
⎟
⎠
.
There exist four possible steady states (C, T ). However, thesteady states of interest are those with non-negative values.In particular, the equilibrium point (C, T ) = (b−1, 0) is thecase of tumor cells reaching their maximum capacity, whilethe T cells go extinct. This equilibrium state becomes stablewhen −d + p(gb + 1)−1 − mb−1 < 0, which holds if
p <(mb+ d
)
(gb + 1). (4)
See Appendix A for the derivation. Otherwise it is unstable.This provides us with a necessary condition so that the Tcell therapy is successful, that is, the minimum level of theproliferation rate of T cells that needs to be attained.
Another set of equilibrium points are (Ci, Ti) for i = 1and 2, where
Ci =(p − d − mg) ±
√
(p − d − mg)2 − 4mgd2m
,
andTi =
a(1 − bCi)n
.
For these equilibrium points to be real and positive, it is re-quired that p − d −mg ≥ 0 and (p − d −mg)2 − 4mgd ≥ 0,or equivalently,
(√
d +√
mg)2 ≤ p. (5)By ordering the points as 0 < C1 < C2, we have T1 > T2 >0. We denote (C1, T1) as the T cell therapy success case that
has a relatively smaller cancer size with a large T cell pop-ulation. The conditions derived above classify the scenarioof T cell therapy success, particularly relating the model pa-rameters in terms of the cancer-induced proliferation rate p.In particular, T cell therapy always fails if the cancer inducedproliferation rate is less than (√d+√
mg)2. This is the min-imum level of proliferation rate that should be achieved forthe engineered T cells to be effective. On the other hand, ifthe T cell proliferation rate is larger than (mb−1+d)(gb+1),the tumor cannot achieve its maximum capacity and the ther-apy will result in a relatively small tumor equilibrium.Theorem 1 The T cell therapy fails regardless of the dose ifp < (
√
d+√
mg)2. The therapy succeeds if (mb +d)(gb+1) <
p. If the T cell proliferation is in the range (√
d +√
mg)2 <p < (mb +d)(gb+1), treatment success depends on the initialcancer size and T cell dosage.
We note that this result can be used to restrict the search in-terval when estimating the model parameters. For instance,the experimental data in [17] show both scenarios of T celltherapy success and failure, which indicates that the modelshould be able to capture both cases. Therefore, we shouldsearch for parameters that satisfy the condition
(√
d +√
mg)2 < p <(mb+ d
)
(gb + 1). (6)
We remark that the trivial equilibrium state, (C, T ) = (0, 0),and the relatively large tumor equilibrium, (C2, T2), are bothsaddle points. The results are summarized in Table 4 and thestability analysis and the proof of theorem 1 can be found inAppendix A.3.2. A study of the TCR T cell dose depending on
the initial tumor sizeThe stability analysis of Section 3.1 suggests that if the
parameters satisfy the condition in Eq. (6), the system caneither converge to a therapy success or failure outcome. Weensured that the parameters identified for the data of the 4050cell line and the CaSki cell line in Fig. 2 fall into this cate-gory, since the data shows both trajectories depending on theinitial T cell dosage.
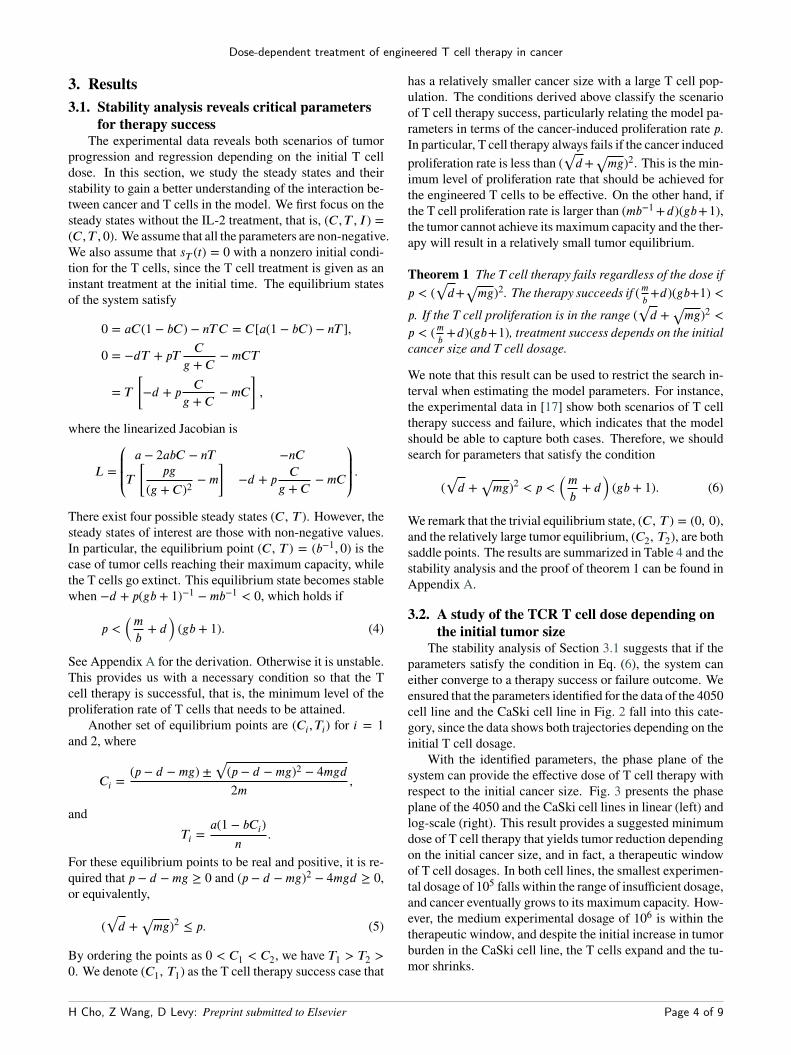
With the identified parameters, the phase plane of thesystem can provide the effective dose of T cell therapy withrespect to the initial cancer size. Fig. 3 presents the phaseplane of the 4050 and the CaSki cell lines in linear (left) andlog-scale (right). This result provides a suggested minimumdose of T cell therapy that yields tumor reduction dependingon the initial cancer size, and in fact, a therapeutic windowof T cell dosages. In both cell lines, the smallest experimen-tal dosage of 105 falls within the range of insufficient dosage,and cancer eventually grows to its maximum capacity. How-ever, the medium experimental dosage of 106 is within thetherapeutic window, and despite the initial increase in tumorburden in the CaSki cell line, the T cells expand and the tu-mor shrinks.
H Cho, Z Wang, D Levy: Preprint submitted to Elsevier Page 4 of 9
Dose-dependent treatment of engineered T cell therapy in cancer
condition (0, 0) (0, 1∕b) (T1, C1) (T2, C2)p < (
√
d +√
mg)2 saddle stable N/A N/A(√
d +√
mg)2 < p < (mb+ d)(gb + 1) saddle stable stable saddle
(mb+ d)(gb + 1) < p saddle unstable stable saddle
Table 4Stability of the equilibrium points as a function of the range of the TCR T cell proliferationrate p.
Figure 3: The phase plane of the model (1)–(2) for the 4050cell line (top) and the CaSki cell line (bottom) in linear (left)and log (right) scale. ’F’ denotes the initial tumor size and Tcell dosage for which therapy fails and the tumor grows to itscarrying capacity. ’S’ denotes the case when T cell therapy issuccessful, and the tumor shrinks to 2.67 × 10⁴ (4050 cell line)and 1.04 × 10⁵ (CaSki cell line).
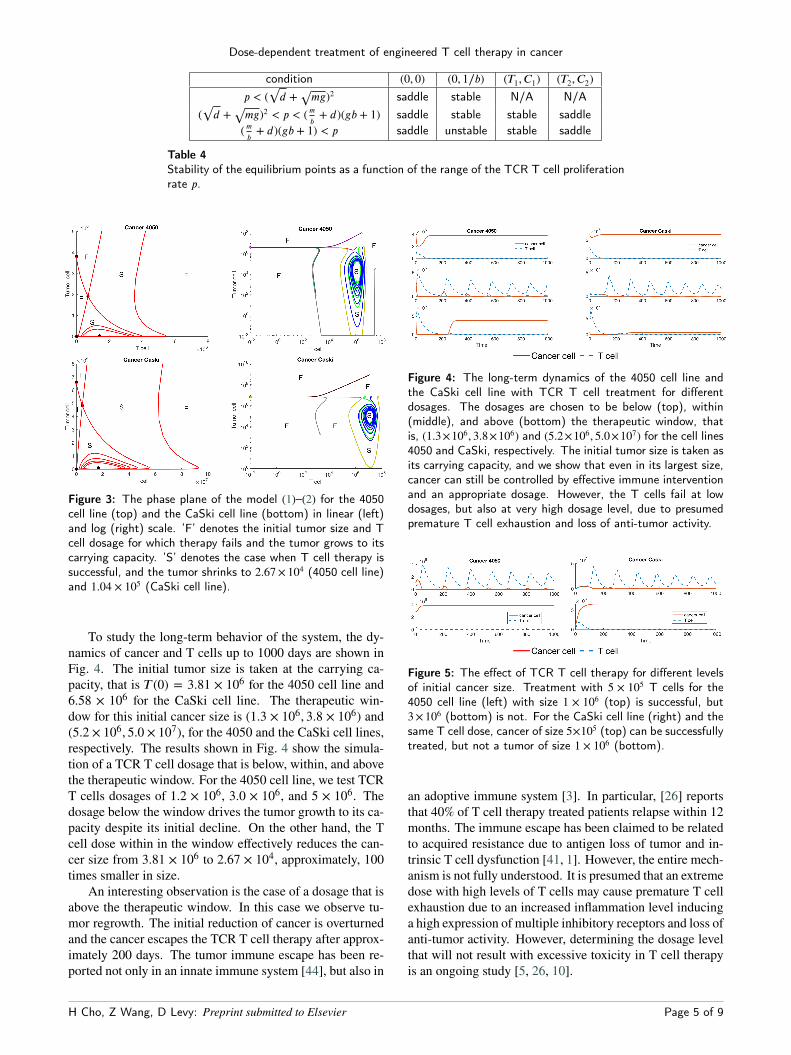
To study the long-term behavior of the system, the dy-namics of cancer and T cells up to 1000 days are shown inFig. 4. The initial tumor size is taken at the carrying ca-pacity, that is T (0) = 3.81 × 10⁶ for the 4050 cell line and6.58 × 106 for the CaSki cell line. The therapeutic win-dow for this initial cancer size is (1.3 × 10⁶, 3.8 × 10⁶) and(5.2 × 10⁶, 5.0 × 10⁷), for the 4050 and the CaSki cell lines,respectively. The results shown in Fig. 4 show the simula-tion of a TCR T cell dosage that is below, within, and abovethe therapeutic window. For the 4050 cell line, we test TCRT cells dosages of 1.2 × 10⁶, 3.0 × 10⁶, and 5 × 10⁶. Thedosage below the window drives the tumor growth to its ca-pacity despite its initial decline. On the other hand, the Tcell dose within in the window effectively reduces the can-cer size from 3.81 × 10⁶ to 2.67 × 10⁴, approximately, 100times smaller in size.
An interesting observation is the case of a dosage that isabove the therapeutic window. In this case we observe tu-mor regrowth. The initial reduction of cancer is overturnedand the cancer escapes the TCR T cell therapy after approx-imately 200 days. The tumor immune escape has been re-ported not only in an innate immune system [44], but also in
Figure 4: The long-term dynamics of the 4050 cell line andthe CaSki cell line with TCR T cell treatment for differentdosages. The dosages are chosen to be below (top), within(middle), and above (bottom) the therapeutic window, thatis, (1.3×10⁶, 3.8×10⁶) and (5.2×10⁶, 5.0×10⁷) for the cell lines4050 and CaSki, respectively. The initial tumor size is taken asits carrying capacity, and we show that even in its largest size,cancer can still be controlled by effective immune interventionand an appropriate dosage. However, the T cells fail at lowdosages, but also at very high dosage level, due to presumedpremature T cell exhaustion and loss of anti-tumor activity.
Figure 5: The effect of TCR T cell therapy for different levelsof initial cancer size. Treatment with 5 × 10⁵ T cells for the4050 cell line (left) with size 1 × 10⁶ (top) is successful, but3×106 (bottom) is not. For the CaSki cell line (right) and thesame T cell dose, cancer of size 5×10⁵ (top) can be successfullytreated, but not a tumor of size 1 × 10⁶ (bottom).
an adoptive immune system [3]. In particular, [26] reportsthat 40% of T cell therapy treated patients relapse within 12months. The immune escape has been claimed to be relatedto acquired resistance due to antigen loss of tumor and in-trinsic T cell dysfunction [41, 1]. However, the entire mech-anism is not fully understood. It is presumed that an extremedose with high levels of T cells may cause premature T cellexhaustion due to an increased inflammation level inducinga high expression of multiple inhibitory receptors and loss ofanti-tumor activity. However, determining the dosage levelthat will not result with excessive toxicity in T cell therapyis an ongoing study [5, 26, 10].
H Cho, Z Wang, D Levy: Preprint submitted to Elsevier Page 5 of 9
Dose-dependent treatment of engineered T cell therapy in cancer
For the CaSki cell line, similar results are shown in theright column of Fig. 4. A TCR T cell dosage within therange of (5.2×10⁶, 5.0×10⁷) results with a tumor reductionof approximately 65 times from 6.58 × 10⁶ to 1.04 × 10⁵.However, for other dosages, therapy fails. Once again weverify the effective dosage characterized in Fig. 3 by con-sidering different initial cancer sizes. The results shown inFig. 5 are obtained using the T cell dosage of 5×10⁵ for bothcell lines, where the initial cancer size is taken as 1×10⁶ and3×106 for 4050, and 5×10⁵ and 1×10⁶ for CaSki. While thedosage of 5 × 10⁵ was sufficient to reduce smaller cancers,the larger cancers cannot be reduced by this dosage.
The results of this section stress the significance of thedosage of T cells in driving treatment success, especiallygiven the toxicity of high-dosages. Moreover, our modelcan be used to identify the effective therapeutic window ofT cell dosages in different cancer cell lines as a function ofthe initial tumor size. This result can potentially guide futuretherapy design.3.3. Studying the combination of T cell and IL-2
treatments, and the effect of IL-2 schedulingIn addition to TCR T cell therapy, IL-2 treatment can
stimulate the anti-tumor effect of TCR T cells. The experi-mental data from [17] provides the IL-2 treatment for threeconsecutive days with dosage 198,000 IU. Jin et al. (2018)demonstrates that the combination of TCR T cell and IL-2treatment is especially valuable when the T cells are given atlow dosages. For instance, the IL-2 treatment did not showany apparent effect when the T cell therapy is given in highdosages of 107 cells. However, it improved the T cell treat-ment in the 4050 cell line treated with 105 cells and in theCaSki cell line treated with 106 cells. In this section, we cal-ibrate the parameters related to I(t) in the model Eqs. (1–3)to the experimental data with IL-2 treatment administeredat three consecutive days and study the effect of altering thetreatment schedules, while keeping the total dosage admin-istered throughout the treatment as 594,000 IU.
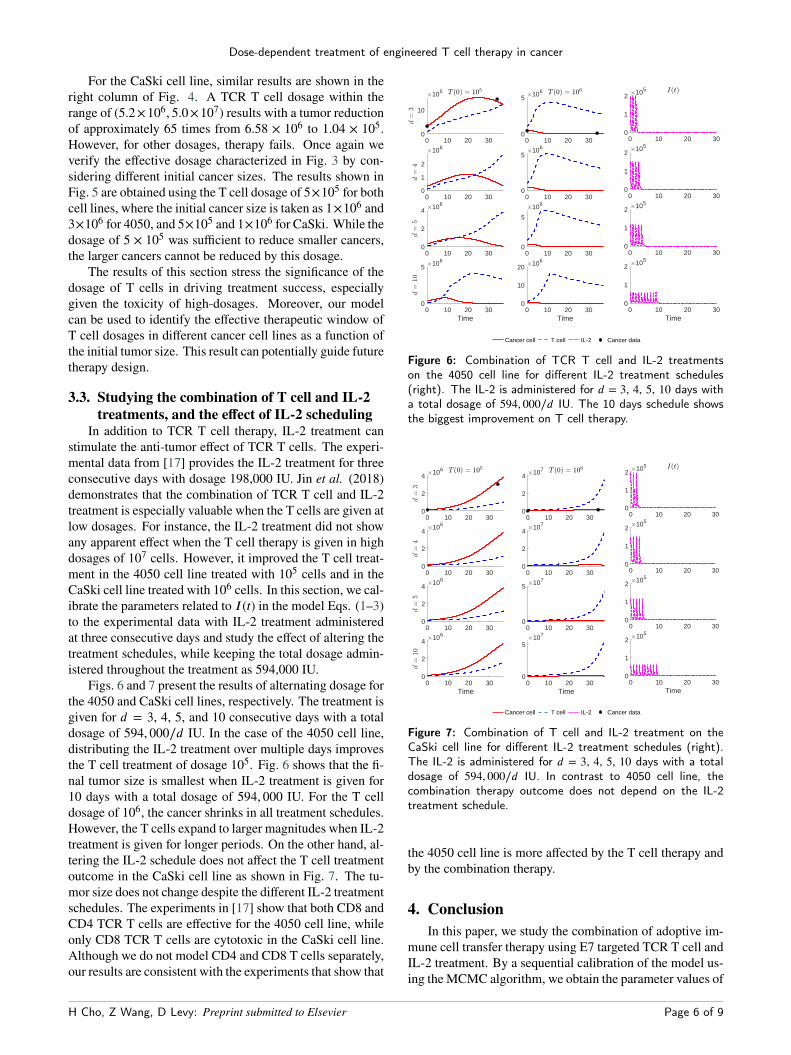
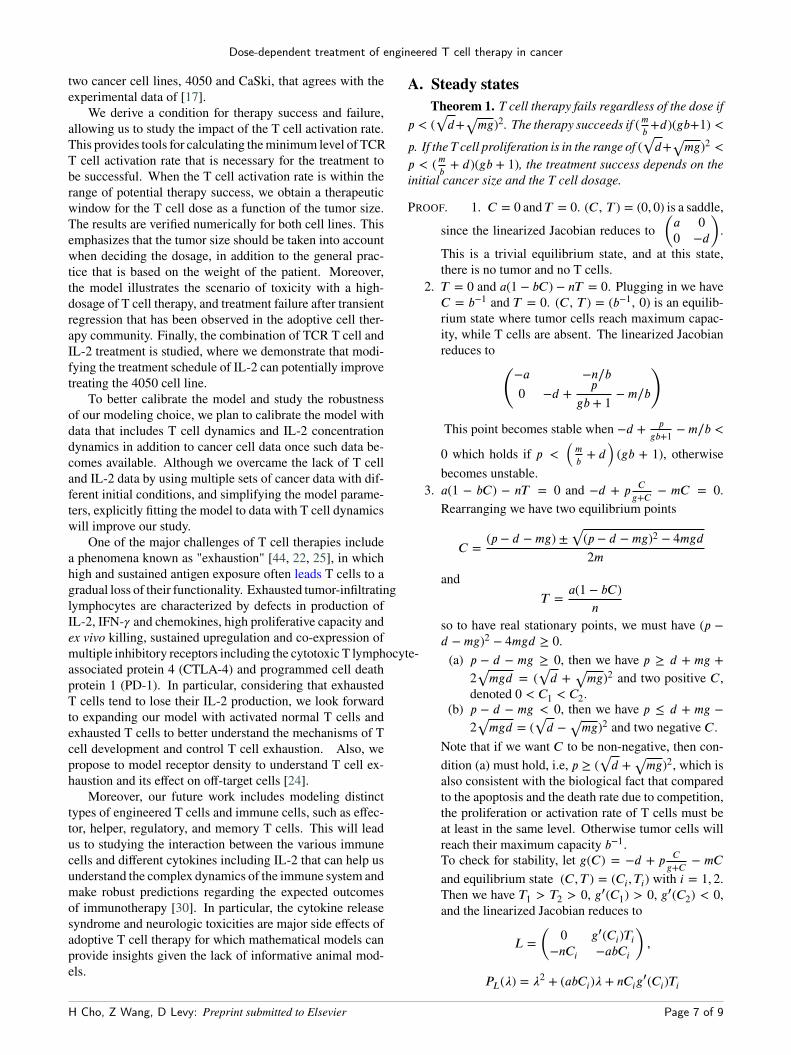
Figs. 6 and 7 present the results of alternating dosage forthe 4050 and CaSki cell lines, respectively. The treatment isgiven for d = 3, 4, 5, and 10 consecutive days with a totaldosage of 594, 000∕d IU. In the case of the 4050 cell line,distributing the IL-2 treatment over multiple days improvesthe T cell treatment of dosage 105. Fig. 6 shows that the fi-nal tumor size is smallest when IL-2 treatment is given for10 days with a total dosage of 594, 000 IU. For the T celldosage of 106, the cancer shrinks in all treatment schedules.However, the T cells expand to larger magnitudes when IL-2treatment is given for longer periods. On the other hand, al-tering the IL-2 schedule does not affect the T cell treatmentoutcome in the CaSki cell line as shown in Fig. 7. The tu-mor size does not change despite the different IL-2 treatmentschedules. The experiments in [17] show that both CD8 andCD4 TCR T cells are effective for the 4050 cell line, whileonly CD8 TCR T cells are cytotoxic in the CaSki cell line.Although we do not model CD4 and CD8 T cells separately,our results are consistent with the experiments that show that
0 10 20 300
10
105
0 10 20 300
5 106
0 10 20 300
1
2
106
0 10 20 300
5106
0 10 20 300
2
4 106
0 10 20 300
5
106
0 10 20 30Time
0
5 106
0 10 20 30Time
0
10
20 106
0 10 20 300
1
2 105
0 10 20 300
1
2105
0 10 20 300
1
2 105
0 10 20 30Time
0
1
2 105
Cancer cell T cell IL-2 Cancer data
Figure 6: Combination of TCR T cell and IL-2 treatmentson the 4050 cell line for different IL-2 treatment schedules(right). The IL-2 is administered for d = 3, 4, 5, 10 days witha total dosage of 594, 000∕d IU. The 10 days schedule showsthe biggest improvement on T cell therapy.
0 10 20 300
2
4 106
0 10 20 300
2
4 107
0 10 20 300
2
4106
0 10 20 300
2
4107
0 10 20 300
2
4 106
0 10 20 300
5 107
0 10 20 30Time
0
2
4 106
0 10 20 30Time
0
5107
0 10 20 300
1
2 105
0 10 20 300
1
2105
0 10 20 300
1
2 105
0 10 20 30Time
0
1
2 105
Cancer cell T cell IL-2 Cancer data
Figure 7: Combination of T cell and IL-2 treatment on theCaSki cell line for different IL-2 treatment schedules (right).The IL-2 is administered for d = 3, 4, 5, 10 days with a totaldosage of 594, 000∕d IU. In contrast to 4050 cell line, thecombination therapy outcome does not depend on the IL-2treatment schedule.
the 4050 cell line is more affected by the T cell therapy andby the combination therapy.
4. ConclusionIn this paper, we study the combination of adoptive im-
mune cell transfer therapy using E7 targeted TCR T cell andIL-2 treatment. By a sequential calibration of the model us-ing theMCMC algorithm, we obtain the parameter values of
H Cho, Z Wang, D Levy: Preprint submitted to Elsevier Page 6 of 9
Dose-dependent treatment of engineered T cell therapy in cancer
two cancer cell lines, 4050 and CaSki, that agrees with theexperimental data of [17].
We derive a condition for therapy success and failure,allowing us to study the impact of the T cell activation rate.This provides tools for calculating theminimum level of TCRT cell activation rate that is necessary for the treatment tobe successful. When the T cell activation rate is within therange of potential therapy success, we obtain a therapeuticwindow for the T cell dose as a function of the tumor size.The results are verified numerically for both cell lines. Thisemphasizes that the tumor size should be taken into accountwhen deciding the dosage, in addition to the general prac-tice that is based on the weight of the patient. Moreover,the model illustrates the scenario of toxicity with a high-dosage of T cell therapy, and treatment failure after transientregression that has been observed in the adoptive cell ther-apy community. Finally, the combination of TCR T cell andIL-2 treatment is studied, where we demonstrate that modi-fying the treatment schedule of IL-2 can potentially improvetreating the 4050 cell line.
To better calibrate the model and study the robustnessof our modeling choice, we plan to calibrate the model withdata that includes T cell dynamics and IL-2 concentrationdynamics in addition to cancer cell data once such data be-comes available. Although we overcame the lack of T celland IL-2 data by using multiple sets of cancer data with dif-ferent initial conditions, and simplifying the model parame-ters, explicitly fitting the model to data with T cell dynamicswill improve our study.
One of the major challenges of T cell therapies includea phenomena known as "exhaustion" [44, 22, 25], in whichhigh and sustained antigen exposure often leads T cells to agradual loss of their functionality. Exhausted tumor-infiltratinglymphocytes are characterized by defects in production ofIL-2, IFN- and chemokines, high proliferative capacity andex vivo killing, sustained upregulation and co-expression ofmultiple inhibitory receptors including the cytotoxic T lymphocyte-associated protein 4 (CTLA-4) and programmed cell deathprotein 1 (PD-1). In particular, considering that exhaustedT cells tend to lose their IL-2 production, we look forwardto expanding our model with activated normal T cells andexhausted T cells to better understand the mechanisms of Tcell development and control T cell exhaustion. Also, wepropose to model receptor density to understand T cell ex-haustion and its effect on off-target cells [24].
Moreover, our future work includes modeling distincttypes of engineered T cells and immune cells, such as effec-tor, helper, regulatory, and memory T cells. This will leadus to studying the interaction between the various immunecells and different cytokines including IL-2 that can help usunderstand the complex dynamics of the immune system andmake robust predictions regarding the expected outcomesof immunotherapy [30]. In particular, the cytokine releasesyndrome and neurologic toxicities are major side effects ofadoptive T cell therapy for which mathematical models canprovide insights given the lack of informative animal mod-els.
A. Steady statesTheorem 1. T cell therapy fails regardless of the dose if
p < (√
d+√
mg)2. The therapy succeeds if (mb +d)(gb+1) <
p. If the T cell proliferation is in the range of (√
d+√
mg)2 <p < (mb + d)(gb + 1), the treatment success depends on theinitial cancer size and the T cell dosage.
PROOF. 1. C = 0 and T = 0. (C, T ) = (0, 0) is a saddle,since the linearized Jacobian reduces to
(
a 00 −d
)
.This is a trivial equilibrium state, and at this state,there is no tumor and no T cells.
2. T = 0 and a(1 − bC) − nT = 0. Plugging in we haveC = b−1 and T = 0. (C, T ) = (b−1, 0) is an equilib-rium state where tumor cells reach maximum capac-ity, while T cells are absent. The linearized Jacobianreduces to
(
−a −n∕b0 −d +
pgb + 1
− m∕b
)
This point becomes stable when −d + pgb+1 −m∕b <
0 which holds if p <(
mb + d
)
(gb + 1), otherwisebecomes unstable.
3. a(1 − bC) − nT = 0 and −d + p Cg+C − mC = 0.
Rearranging we have two equilibrium points
C =(p − d − mg) ±
√
(p − d − mg)2 − 4mgd2m
andT =
a(1 − bC)n
so to have real stationary points, we must have (p −d − mg)2 − 4mgd ≥ 0.(a) p − d − mg ≥ 0, then we have p ≥ d + mg +
2√
mgd = (√
d +√
mg)2 and two positive C ,denoted 0 < C1 < C2.(b) p − d − mg < 0, then we have p ≤ d + mg −2√
mgd = (√
d −√
mg)2 and two negative C .Note that if we want C to be non-negative, then con-dition (a) must hold, i.e, p ≥ (
√
d +√
mg)2, which isalso consistent with the biological fact that comparedto the apoptosis and the death rate due to competition,the proliferation or activation rate of T cells must beat least in the same level. Otherwise tumor cells willreach their maximum capacity b−1.To check for stability, let g(C) = −d + p C
g+C − mCand equilibrium state (C, T ) = (Ci, Ti) with i = 1, 2.Then we have T1 > T2 > 0, g′(C1) > 0, g′(C2) < 0,and the linearized Jacobian reduces to
L =(
0 g′(Ci)Ti−nCi −abCi
)
,
PL(�) = �2 + (abCi)� + nCig′(Ci)Ti
H Cho, Z Wang, D Levy: Preprint submitted to Elsevier Page 7 of 9
Dose-dependent treatment of engineered T cell therapy in cancer
The eigenvalues are
�1,2 =−(abCi) ±
√
(abCi)2 − 4nCig′(Ci)Ti2
.
Since g′(C1) > 0, (C1, T1) is a stable nodal sink if(abCi)2 − 4nCig′(Ci)Ti > 0, a stable twist sink if(abCi)2 − 4nCig′(Ci)Ti = 0, and a stable spiral sinkif (abCi)2 − 4nCig′(Ci)Ti < 0. Since g′(C2) < 0,(C2, T2) is a saddle.
In short, the range in terms of T cell proliferation can beordered as
d + mg ≤ d + mg + 2√
mgd ≤(mb+ d
)
(gb + 1),
which classifies the stability of the equilibrium points.□
B. Parameter sensitivity and identifiabilityWe study the sensitivity of the parameters by computing
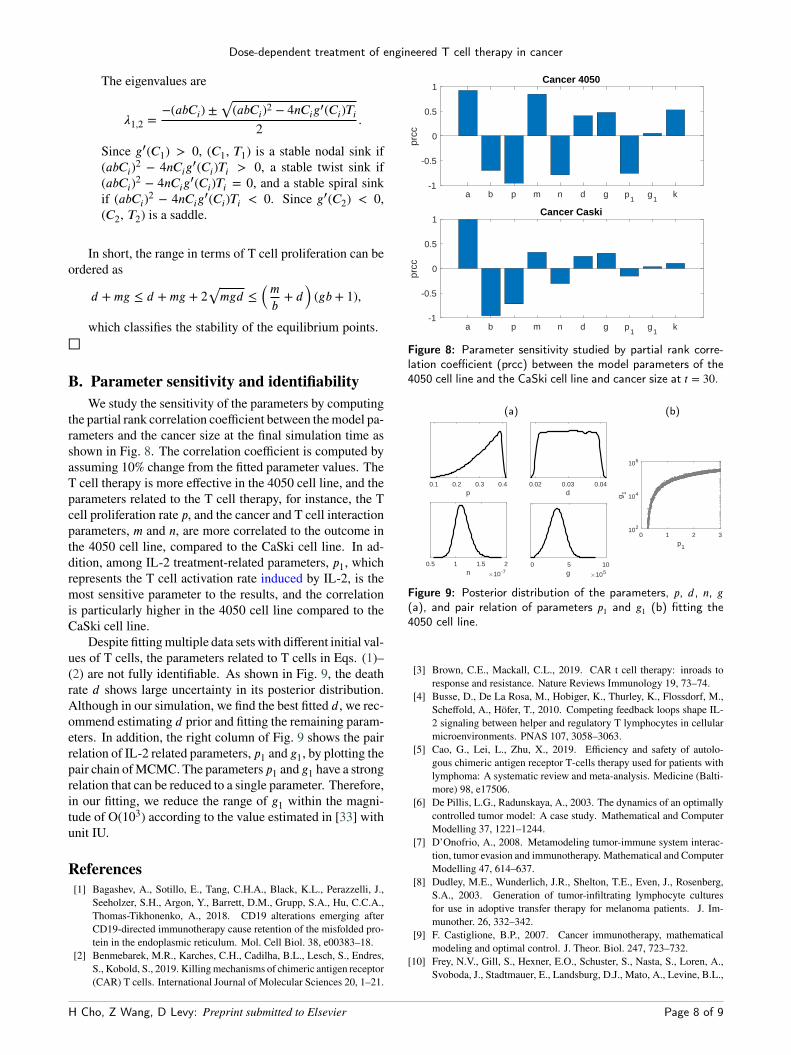
the partial rank correlation coefficient between themodel pa-rameters and the cancer size at the final simulation time asshown in Fig. 8. The correlation coefficient is computed byassuming 10% change from the fitted parameter values. TheT cell therapy is more effective in the 4050 cell line, and theparameters related to the T cell therapy, for instance, the Tcell proliferation rate p, and the cancer and T cell interactionparameters, m and n, are more correlated to the outcome inthe 4050 cell line, compared to the CaSki cell line. In ad-dition, among IL-2 treatment-related parameters, p1, whichrepresents the T cell activation rate induced by IL-2, is themost sensitive parameter to the results, and the correlationis particularly higher in the 4050 cell line compared to theCaSki cell line.
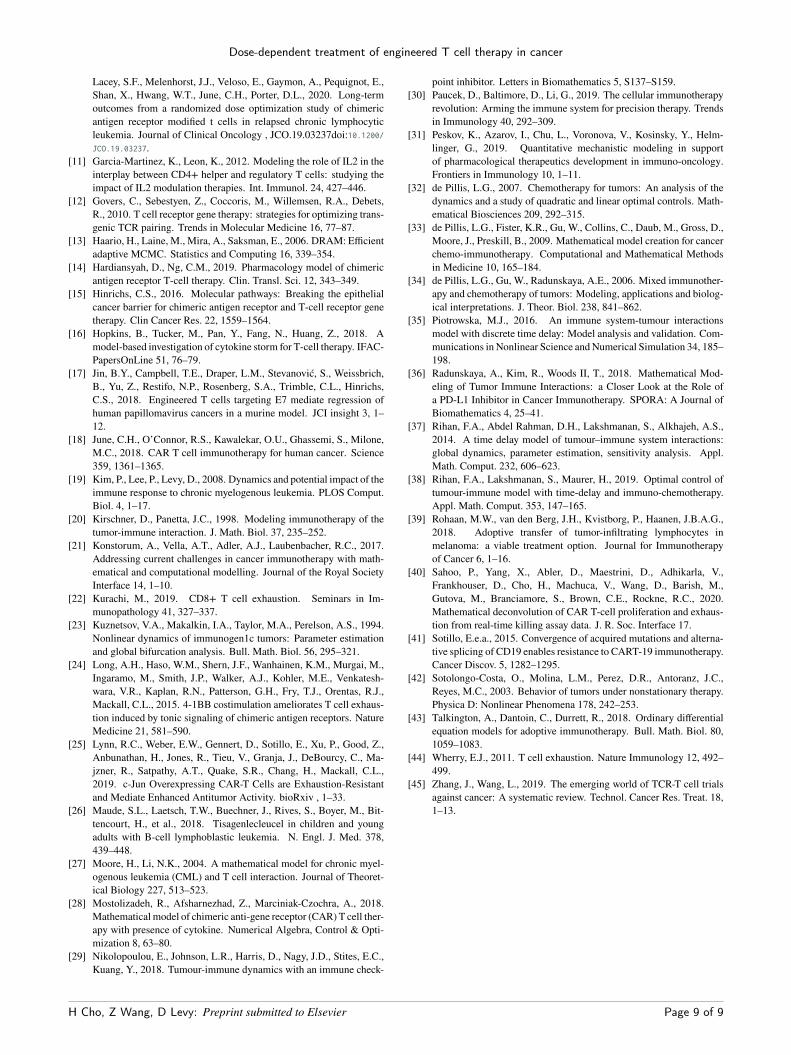
Despite fittingmultiple data sets with different initial val-ues of T cells, the parameters related to T cells in Eqs. (1)–(2) are not fully identifiable. As shown in Fig. 9, the deathrate d shows large uncertainty in its posterior distribution.Although in our simulation, we find the best fitted d, we rec-ommend estimating d prior and fitting the remaining param-eters. In addition, the right column of Fig. 9 shows the pairrelation of IL-2 related parameters, p1 and g1, by plotting thepair chain ofMCMC. The parameters p1 and g1 have a strongrelation that can be reduced to a single parameter. Therefore,in our fitting, we reduce the range of g1 within the magni-tude of O(103) according to the value estimated in [33] withunit IU.
References[1] Bagashev, A., Sotillo, E., Tang, C.H.A., Black, K.L., Perazzelli, J.,
Seeholzer, S.H., Argon, Y., Barrett, D.M., Grupp, S.A., Hu, C.C.A.,Thomas-Tikhonenko, A., 2018. CD19 alterations emerging afterCD19-directed immunotherapy cause retention of the misfolded pro-tein in the endoplasmic reticulum. Mol. Cell Biol. 38, e00383–18.
[2] Benmebarek, M.R., Karches, C.H., Cadilha, B.L., Lesch, S., Endres,S., Kobold, S., 2019. Killingmechanisms of chimeric antigen receptor(CAR) T cells. International Journal of Molecular Sciences 20, 1–21.
Cancer 4050
a b p m n d g p1
g1
k-1
-0.5
0
0.5
1
prcc
Cancer Caski
a b p m n d g p1
g1
k-1
-0.5
0
0.5
1
prcc
Figure 8: Parameter sensitivity studied by partial rank corre-lation coefficient (prcc) between the model parameters of the4050 cell line and the CaSki cell line and cancer size at t = 30.
(a) (b)
0.1 0.2 0.3 0.4p
0.02 0.03 0.04d
0.5 1 1.5 2n 10-7
0 5 10g 105
0 1 2 3p1
102
104
106
g1
Figure 9: Posterior distribution of the parameters, p, d, n, g(a), and pair relation of parameters p1 and g1 (b) fitting the4050 cell line.
[3] Brown, C.E., Mackall, C.L., 2019. CAR t cell therapy: inroads toresponse and resistance. Nature Reviews Immunology 19, 73–74.
[4] Busse, D., De La Rosa, M., Hobiger, K., Thurley, K., Flossdorf, M.,Scheffold, A., Höfer, T., 2010. Competing feedback loops shape IL-2 signaling between helper and regulatory T lymphocytes in cellularmicroenvironments. PNAS 107, 3058–3063.
[5] Cao, G., Lei, L., Zhu, X., 2019. Efficiency and safety of autolo-gous chimeric antigen receptor T-cells therapy used for patients withlymphoma: A systematic review and meta-analysis. Medicine (Balti-more) 98, e17506.
[6] De Pillis, L.G., Radunskaya, A., 2003. The dynamics of an optimallycontrolled tumor model: A case study. Mathematical and ComputerModelling 37, 1221–1244.
[7] D’Onofrio, A., 2008. Metamodeling tumor-immune system interac-tion, tumor evasion and immunotherapy. Mathematical and ComputerModelling 47, 614–637.
[8] Dudley, M.E., Wunderlich, J.R., Shelton, T.E., Even, J., Rosenberg,S.A., 2003. Generation of tumor-infiltrating lymphocyte culturesfor use in adoptive transfer therapy for melanoma patients. J. Im-munother. 26, 332–342.
[9] F. Castiglione, B.P., 2007. Cancer immunotherapy, mathematicalmodeling and optimal control. J. Theor. Biol. 247, 723–732.
[10] Frey, N.V., Gill, S., Hexner, E.O., Schuster, S., Nasta, S., Loren, A.,Svoboda, J., Stadtmauer, E., Landsburg, D.J., Mato, A., Levine, B.L.,
H Cho, Z Wang, D Levy: Preprint submitted to Elsevier Page 8 of 9
Dose-dependent treatment of engineered T cell therapy in cancer
Lacey, S.F., Melenhorst, J.J., Veloso, E., Gaymon, A., Pequignot, E.,Shan, X., Hwang, W.T., June, C.H., Porter, D.L., 2020. Long-termoutcomes from a randomized dose optimization study of chimericantigen receptor modified t cells in relapsed chronic lymphocyticleukemia. Journal of Clinical Oncology , JCO.19.03237doi:10.1200/JCO.19.03237.
[11] Garcia-Martinez, K., Leon, K., 2012. Modeling the role of IL2 in theinterplay between CD4+ helper and regulatory T cells: studying theimpact of IL2 modulation therapies. Int. Immunol. 24, 427–446.
[12] Govers, C., Sebestyen, Z., Coccoris, M., Willemsen, R.A., Debets,R., 2010. T cell receptor gene therapy: strategies for optimizing trans-genic TCR pairing. Trends in Molecular Medicine 16, 77–87.
[13] Haario, H., Laine, M., Mira, A., Saksman, E., 2006. DRAM: Efficientadaptive MCMC. Statistics and Computing 16, 339–354.
[14] Hardiansyah, D., Ng, C.M., 2019. Pharmacology model of chimericantigen receptor T-cell therapy. Clin. Transl. Sci. 12, 343–349.
[15] Hinrichs, C.S., 2016. Molecular pathways: Breaking the epithelialcancer barrier for chimeric antigen receptor and T-cell receptor genetherapy. Clin Cancer Res. 22, 1559–1564.
[16] Hopkins, B., Tucker, M., Pan, Y., Fang, N., Huang, Z., 2018. Amodel-based investigation of cytokine storm for T-cell therapy. IFAC-PapersOnLine 51, 76–79.
[17] Jin, B.Y., Campbell, T.E., Draper, L.M., Stevanović, S., Weissbrich,B., Yu, Z., Restifo, N.P., Rosenberg, S.A., Trimble, C.L., Hinrichs,C.S., 2018. Engineered T cells targeting E7 mediate regression ofhuman papillomavirus cancers in a murine model. JCI insight 3, 1–12.
[18] June, C.H., O’Connor, R.S., Kawalekar, O.U., Ghassemi, S., Milone,M.C., 2018. CAR T cell immunotherapy for human cancer. Science359, 1361–1365.
[19] Kim, P., Lee, P., Levy, D., 2008. Dynamics and potential impact of theimmune response to chronic myelogenous leukemia. PLOS Comput.Biol. 4, 1–17.
[20] Kirschner, D., Panetta, J.C., 1998. Modeling immunotherapy of thetumor-immune interaction. J. Math. Biol. 37, 235–252.
[21] Konstorum, A., Vella, A.T., Adler, A.J., Laubenbacher, R.C., 2017.Addressing current challenges in cancer immunotherapy with math-ematical and computational modelling. Journal of the Royal SocietyInterface 14, 1–10.
[22] Kurachi, M., 2019. CD8+ T cell exhaustion. Seminars in Im-munopathology 41, 327–337.
[23] Kuznetsov, V.A., Makalkin, I.A., Taylor, M.A., Perelson, A.S., 1994.Nonlinear dynamics of immunogen1c tumors: Parameter estimationand global bifurcation analysis. Bull. Math. Biol. 56, 295–321.
[24] Long, A.H., Haso, W.M., Shern, J.F., Wanhainen, K.M., Murgai, M.,Ingaramo, M., Smith, J.P., Walker, A.J., Kohler, M.E., Venkatesh-wara, V.R., Kaplan, R.N., Patterson, G.H., Fry, T.J., Orentas, R.J.,Mackall, C.L., 2015. 4-1BB costimulation ameliorates T cell exhaus-tion induced by tonic signaling of chimeric antigen receptors. NatureMedicine 21, 581–590.
[25] Lynn, R.C., Weber, E.W., Gennert, D., Sotillo, E., Xu, P., Good, Z.,Anbunathan, H., Jones, R., Tieu, V., Granja, J., DeBourcy, C., Ma-jzner, R., Satpathy, A.T., Quake, S.R., Chang, H., Mackall, C.L.,2019. c-Jun Overexpressing CAR-T Cells are Exhaustion-Resistantand Mediate Enhanced Antitumor Activity. bioRxiv , 1–33.
[26] Maude, S.L., Laetsch, T.W., Buechner, J., Rives, S., Boyer, M., Bit-tencourt, H., et al., 2018. Tisagenlecleucel in children and youngadults with B-cell lymphoblastic leukemia. N. Engl. J. Med. 378,439–448.
[27] Moore, H., Li, N.K., 2004. A mathematical model for chronic myel-ogenous leukemia (CML) and T cell interaction. Journal of Theoret-ical Biology 227, 513–523.
[28] Mostolizadeh, R., Afsharnezhad, Z., Marciniak-Czochra, A., 2018.Mathematical model of chimeric anti-gene receptor (CAR) T cell ther-apy with presence of cytokine. Numerical Algebra, Control & Opti-mization 8, 63–80.
[29] Nikolopoulou, E., Johnson, L.R., Harris, D., Nagy, J.D., Stites, E.C.,Kuang, Y., 2018. Tumour-immune dynamics with an immune check-
point inhibitor. Letters in Biomathematics 5, S137–S159.[30] Paucek, D., Baltimore, D., Li, G., 2019. The cellular immunotherapy
revolution: Arming the immune system for precision therapy. Trendsin Immunology 40, 292–309.
[31] Peskov, K., Azarov, I., Chu, L., Voronova, V., Kosinsky, Y., Helm-linger, G., 2019. Quantitative mechanistic modeling in supportof pharmacological therapeutics development in immuno-oncology.Frontiers in Immunology 10, 1–11.
[32] de Pillis, L.G., 2007. Chemotherapy for tumors: An analysis of thedynamics and a study of quadratic and linear optimal controls. Math-ematical Biosciences 209, 292–315.
[33] de Pillis, L.G., Fister, K.R., Gu, W., Collins, C., Daub, M., Gross, D.,Moore, J., Preskill, B., 2009. Mathematical model creation for cancerchemo-immunotherapy. Computational and Mathematical Methodsin Medicine 10, 165–184.
[34] de Pillis, L.G., Gu, W., Radunskaya, A.E., 2006. Mixed immunother-apy and chemotherapy of tumors: Modeling, applications and biolog-ical interpretations. J. Theor. Biol. 238, 841–862.
[35] Piotrowska, M.J., 2016. An immune system-tumour interactionsmodel with discrete time delay: Model analysis and validation. Com-munications in Nonlinear Science andNumerical Simulation 34, 185–198.
[36] Radunskaya, A., Kim, R., Woods II, T., 2018. Mathematical Mod-eling of Tumor Immune Interactions: a Closer Look at the Role ofa PD-L1 Inhibitor in Cancer Immunotherapy. SPORA: A Journal ofBiomathematics 4, 25–41.
[37] Rihan, F.A., Abdel Rahman, D.H., Lakshmanan, S., Alkhajeh, A.S.,2014. A time delay model of tumour–immune system interactions:global dynamics, parameter estimation, sensitivity analysis. Appl.Math. Comput. 232, 606–623.
[38] Rihan, F.A., Lakshmanan, S., Maurer, H., 2019. Optimal control oftumour-immune model with time-delay and immuno-chemotherapy.Appl. Math. Comput. 353, 147–165.
[39] Rohaan, M.W., van den Berg, J.H., Kvistborg, P., Haanen, J.B.A.G.,2018. Adoptive transfer of tumor-infiltrating lymphocytes inmelanoma: a viable treatment option. Journal for Immunotherapyof Cancer 6, 1–16.
[40] Sahoo, P., Yang, X., Abler, D., Maestrini, D., Adhikarla, V.,Frankhouser, D., Cho, H., Machuca, V., Wang, D., Barish, M.,Gutova, M., Branciamore, S., Brown, C.E., Rockne, R.C., 2020.Mathematical deconvolution of CAR T-cell proliferation and exhaus-tion from real-time killing assay data. J. R. Soc. Interface 17.
[41] Sotillo, E.e.a., 2015. Convergence of acquired mutations and alterna-tive splicing of CD19 enables resistance to CART-19 immunotherapy.Cancer Discov. 5, 1282–1295.
[42] Sotolongo-Costa, O., Molina, L.M., Perez, D.R., Antoranz, J.C.,Reyes, M.C., 2003. Behavior of tumors under nonstationary therapy.Physica D: Nonlinear Phenomena 178, 242–253.
[43] Talkington, A., Dantoin, C., Durrett, R., 2018. Ordinary differentialequation models for adoptive immunotherapy. Bull. Math. Biol. 80,1059–1083.
[44] Wherry, E.J., 2011. T cell exhaustion. Nature Immunology 12, 492–499.
[45] Zhang, J., Wang, L., 2019. The emerging world of TCR-T cell trialsagainst cancer: A systematic review. Technol. Cancer Res. Treat. 18,1–13.
H Cho, Z Wang, D Levy: Preprint submitted to Elsevier Page 9 of 9