![Patch Antenna[1]](https://static.fdokumen.com/doc/165x107/63158e4cc32ab5e46f0d5c89/patch-antenna1.jpg)
STUDY OF A FLUORESCENT TUBE AS PLASMA ANTENNA
10
Progress In Electromagnetics Research Letters, Vol. 24, 17–26, 2011 STUDY OF A FLUORESCENT TUBE AS PLASMA ANTENNA V. Kumar 1, * , M. Mishra 1 , and N. K. Joshi 2 1 Electronics and Communication Department, Birla Institute of Technology Mesra, Ranchi 835215, India 2 Applied Physics Department, Birla Institute of Technology Mesra, Ranchi 835215, India Abstract—The present paper is a work on fluorescent tube performing the function of a monopole plasma antenna. In the construction, the needed power supply to the fluorescent tube is controlled by an IC 555 timer. In the experiments the supply frequency varies from 25 Hz to 200 Hz. By using a vector network analyzer it is shown that the persistence of plasma developed inside the tube persists for longer duration with increase in supply frequency. It is also found that the stability of resonant frequency increases with the increase in frequency of the AC power supply measured up to 200 Hz. Result shows that the effective part of a fluorescent tube functioning as Monopole plasma antenna is about 60% of the total length of the tube. 1. INTRODUCTION Plasma antenna is an agile antenna which hides itself from hostile radar in switch off mode and brought to functioning or switch on mode immediately when it is needed. Plasma antenna consists of glass tube filled with some neutral gases such as Argon energized by any non-thermal plasma generation method. Functioning of a plasma antenna largely depends upon the behavior of electromagnetic waves propagating in plasma. Previous works on plasma antenna have shown that plasma antenna is just as effective as a metal antenna [1] in which the length of the plasma column increases by the square root of the applied power [2]. The research work done on circular fluorescent tube in order to find out the gain shows that the average gain in the Received 2 March 2011, Accepted 28 April 2011, Scheduled 19 May 2011 * Corresponding author: Vikram Kumar ([email protected]).
Transcript of STUDY OF A FLUORESCENT TUBE AS PLASMA ANTENNA

Progress In Electromagnetics Research Letters, Vol. 24, 17–26, 2011
STUDY OF A FLUORESCENT TUBE AS PLASMAANTENNA
V. Kumar1, *, M. Mishra1, and N. K. Joshi2
1Electronics and Communication Department, Birla Institute ofTechnology Mesra, Ranchi 835215, India2Applied Physics Department, Birla Institute of Technology Mesra,Ranchi 835215, India
Abstract—The present paper is a work on fluorescent tube performingthe function of a monopole plasma antenna. In the construction, theneeded power supply to the fluorescent tube is controlled by an IC555 timer. In the experiments the supply frequency varies from 25Hzto 200Hz. By using a vector network analyzer it is shown that thepersistence of plasma developed inside the tube persists for longerduration with increase in supply frequency. It is also found that thestability of resonant frequency increases with the increase in frequencyof the AC power supply measured up to 200 Hz. Result shows that theeffective part of a fluorescent tube functioning as Monopole plasmaantenna is about 60% of the total length of the tube.
1. INTRODUCTION
Plasma antenna is an agile antenna which hides itself from hostileradar in switch off mode and brought to functioning or switch onmode immediately when it is needed. Plasma antenna consists ofglass tube filled with some neutral gases such as Argon energized byany non-thermal plasma generation method. Functioning of a plasmaantenna largely depends upon the behavior of electromagnetic wavespropagating in plasma. Previous works on plasma antenna have shownthat plasma antenna is just as effective as a metal antenna [1] in whichthe length of the plasma column increases by the square root of theapplied power [2]. The research work done on circular fluorescenttube in order to find out the gain shows that the average gain in the
Received 2 March 2011, Accepted 28 April 2011, Scheduled 19 May 2011* Corresponding author: Vikram Kumar ([email protected]).

18 Kumar, Mishra, and Joshi
case of fluorescent tube functioning as a plasma antenna is 6 dB lowerthan its metallic counterpart with the same dimensions [3]. Also, DCbiased plasma antenna has been studied, and it is found that the gainof a plasma antenna which consists of Ar-Hg vapour is particularlyhigh at high frequency [4]. The fluorescent tube operates by theprinciple of electron flow and photo phosphoresces. When an ACvoltage is applied across the filaments present at both ends of a tube,it provides an intense source of electrons. Each end acts as cathode foralternate halves of a voltage cycle. As this behavior of the electrodesis repeated, Argon gas is energized to the plasma state which excitesMercury vapour to radiate UV rays. These UV rays strike the layerof phosphorus compound coated inside the tube, and the phosphorussplits the UV rays into visible rays.
In the present work, a fluorescent tube of 20 cm length and 1 cmdiameter is used to get the antenna effect. The operating circuit ismade using an IC 555 chip which controls the voltage of the tubeand maintains a consistence source of power to its electrodes. Thefrequency of the applied voltage is varied from 25 Hz to 200 Hz, andthe return loss results have been observed on a vector network analyzer.
2. EXPERIMENTAL SETUP
plasma antenna has been constructed and tested for return losscharacteristic, as shown in Figures 1 and 2. An Agilent PNA-LVector Network Analyzer is connected between coupling sleeves overthe fluorescent tube and the ground plane. An aluminum disc of radius11 cm is used for the ground plane. The tube is 20 cm long and 1 cmin its diameter. 230 V AC is applied across electrodes of the tube.
The glow due to fluorescence indicates that the Argon gas inside
Figure 1. Experimentalsetup of plasma antennafor measuring return loss.
Figure 2. Experimental setup of plasmaantenna for measuring return loss.

Progress In Electromagnetics Research Letters, Vol. 24, 2011 19
Figure 3. AC power supply using astable multi vibrator for 50 Hzsupply frequency. Here in place of indicator we are using fluorescenttube and V 1 is the variable DC power supply.
the tube changes into the plasma state and forms the plasma column.This plasma column behaves as a conductor and used as an antennawith the help of coupling sleeves. The return loss characteristics ofplasma antenna in a frequency range of 10 MHz–900 MHz have beenobserved on the network analyzer. Figure 2 shows the schematicdiagram of the experimental setup for this measurement.
An electronic circuit employing IC555 timer is used as an astablemulti-vibrator, as shown in Figure 3. To obtain frequencies 25Hz,50Hz, and 200 Hz we change the resistances of specific value. Theoutput pulse at port 2 of IC 555 is used for switching the transistorQ1, which results in pulse from the MOSFETs.
Capacitance C1 has a value 10µF. The combination of R1 and R2
is used for varying the frequency of power supply. The frequency isgiven by the relation
f =1
ln(2)× C1 × (R1 + 2R2)(1)
The capacitor C1 is charged through R1 and R2, and discharged onlythrough R2 since the impedance between the discharge and ground-plane is low during the lower half of the output cycle. The timerproduces square wave for all three frequencies and for these frequenciesthe output of whole circuit will also be a square wave. The combinationof R1 and R2 used for varying the frequency of power supply accordingto Equation (1) has been tabulated in Table 1, which shows theresistance value in the circuit to generate the three different frequencies(25Hz, 50 Hz, and 200 Hz).
20 Kumar, Mishra, and Joshi
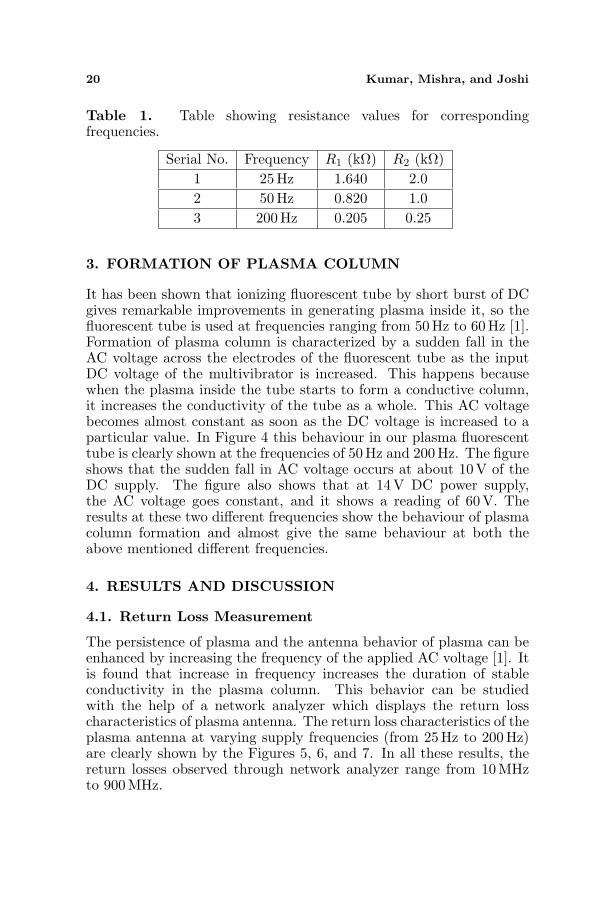
Table 1. Table showing resistance values for correspondingfrequencies.
Serial No. Frequency R1 (kΩ) R2 (kΩ)1 25Hz 1.640 2.02 50Hz 0.820 1.03 200 Hz 0.205 0.25
3. FORMATION OF PLASMA COLUMN
It has been shown that ionizing fluorescent tube by short burst of DCgives remarkable improvements in generating plasma inside it, so thefluorescent tube is used at frequencies ranging from 50 Hz to 60Hz [1].Formation of plasma column is characterized by a sudden fall in theAC voltage across the electrodes of the fluorescent tube as the inputDC voltage of the multivibrator is increased. This happens becausewhen the plasma inside the tube starts to form a conductive column,it increases the conductivity of the tube as a whole. This AC voltagebecomes almost constant as soon as the DC voltage is increased to aparticular value. In Figure 4 this behaviour in our plasma fluorescenttube is clearly shown at the frequencies of 50 Hz and 200Hz. The figureshows that the sudden fall in AC voltage occurs at about 10 V of theDC supply. The figure also shows that at 14V DC power supply,the AC voltage goes constant, and it shows a reading of 60 V. Theresults at these two different frequencies show the behaviour of plasmacolumn formation and almost give the same behaviour at both theabove mentioned different frequencies.
4. RESULTS AND DISCUSSION
4.1. Return Loss Measurement
The persistence of plasma and the antenna behavior of plasma can beenhanced by increasing the frequency of the applied AC voltage [1]. Itis found that increase in frequency increases the duration of stableconductivity in the plasma column. This behavior can be studiedwith the help of a network analyzer which displays the return losscharacteristics of plasma antenna. The return loss characteristics of theplasma antenna at varying supply frequencies (from 25Hz to 200 Hz)are clearly shown by the Figures 5, 6, and 7. In all these results, thereturn losses observed through network analyzer range from 10 MHzto 900 MHz.

Progress In Electromagnetics Research Letters, Vol. 24, 2011 21
Figure 4. Plasma column formation characterization in the tube atdifferent frequencies.
Figure 5. Response at 25 Hz AC voltage shows inefficient antennacharacteristic.
It is very essential to observe and show the state of fluorescenttube functioning as plasma antenna in a switch off mode throughthe network analyzer. In order to calculate the actual return loss,observations are also taken through a network analyzer in a switchoff mode. In this process we get a reference level of return loss

22 Kumar, Mishra, and Joshi
Figure 6. Response at 50Hz AC voltage showing improved antennacharacteristic but fluctuating resonant frequency.
characteristics in order to get the losses other than antenna losses(absolute loss in the switch on mode). These are also shown byFigures 5, 6, and 7 and marked as curve ‘A’ in these figures.
In a switch on mode, two most different fluctuating resultson network analyzer are found, which explain the antenna losscharacteristics of fluorescent tube as plasma antenna shown inFigures 5, 6, and 7 through the curves ‘B’ and ‘C’. The antenna losscharacteristics results are shown by using three supply frequencies, i.e.,at 25 Hz, 50 Hz and 200Hz, respectively.
It is found that at 25Hz the return loss characteristics show theresonant frequency of about 585 MHz once, but so far no clear resonantfrequency is found at 25 Hz. The return loss fluctuates around theresonant frequency which is between −10 dB and −20 dB, showinginefficient antenna characteristics.
4.2. Persistent Plasma and Improved Resonant Behavior
It is known that at a low frequency of AC supply, striation developsin the fluorescent tube [5]. This may introduce fluctuating resonantfrequency and significant reduction in efficiency of plasma columnfunctioning as an antenna. At lower frequencies, electrons move fromone electrode to another, producing few secondary electrons, due toother collision with neutral atoms in the tube [6].

Progress In Electromagnetics Research Letters, Vol. 24, 2011 23
Figure 7. Response at 200Hz AC voltage shows efficient antennacharacteristics with sharply defined resonant frequency.
When the frequency is increased, the ions and electrons are unableto reach the electrode at the other side and keep on oscillating in a toand fro motion at their places. It results in the generation of largenumber of secondary electrons and ions, thereby persistent plasmaevolves. Figure 6 shows the return loss characteristic at an AC voltagefrequency of 50Hz.
In the present work return loss characteristics is assessed at an ACvoltage frequency of 50Hz to check the efficiency of a fluorescent tubefunctioning as plasma antenna. At 50 Hz the fluctuation in return losscharacteristics is still found to be prevailing, but it is different fromwhat is observed at 25 Hz. At 25 Hz the return loss characteristic doesnot show any specific resonant frequency in most of the situations asshown in Figure 5. Curves B and C at 50 Hz supply frequency exhibita return loss characteristic with fluctuating resonant frequency asshown in Figure 6. At 50 Hz supply frequency, fluctuation in resonantfrequency is observed around the values of 540MHz to 596 MHz inwhich return loss is around −25 dB, which shows a rise in the efficiencyof a fluorescent tube functioning as plasma antenna. It is concludedthat at 50 Hz, the fluorescent tube under experiment does not becomean efficient antenna.
Further, the supply frequency is increased to a value of 200 Hz, andit is found that the variation in the resonant frequency is negligible as

24 Kumar, Mishra, and Joshi
shown in Figure 7. In this situation the resonant frequency is observedat a value of 596.9MHz with the return loss of −34 dB as shown bycurve B in Figure 7. This certainly shows an increase in efficiency ofantenna characteristics of the fluorescent tube. It is concluded that at200Hz supply frequency fluorescent tubes are capable to perform asan efficient antenna.
4.3. Effective Length of Plasma Antenna
The effective length of the monopole plasma antenna * radiating at596.9MHz is obtained by noting that λ = c
υ = (300×108)/(596.9×106),i.e., λ = 50.26 cm. Thus its effective length is Leff = λ
4 , or Leff =12.565 cm. The fluorescent tube is 20 cm long, and the effective lengthof plasma antenna is 62.825% of its physical length.
5. RADIATION PATTERN
The radiation pattern of the tube working as an antenna is measuredby a standard transmitter-receiver system ‘Signet Antenna AnalyzingEquipment’s (S-99R, S-99T, S-99V)’ as shown in Figure 8. Theschematic experimental set up for this purpose is shown in Figure 9.The radiation pattern is measured in the H plane (perpendicular tothe antenna).
A 3 element Yagi antenna is taken as the transmitter to radiate at590MHz. The plasma antenna is mounted on the revolving machineand connected to the receiver. For each 1 degree, the receiver measuresthe power received by the plasma antenna in dB micro Volt (dBµV)and stores it in the internal array memory. Two such arrays (of
Figure 8. Picture ofPlasma antenna on theSignet receiver.
Figure 9. Schematic picture showingthe antenna with respect to the Trans-mitting system in the co polar position.
Progress In Electromagnetics Research Letters, Vol. 24, 2011 25
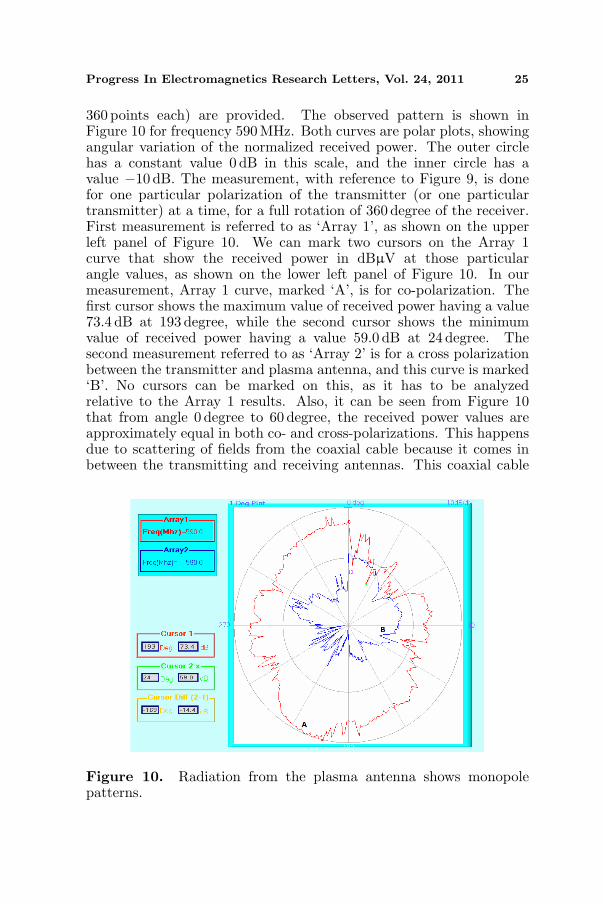
360 points each) are provided. The observed pattern is shown inFigure 10 for frequency 590MHz. Both curves are polar plots, showingangular variation of the normalized received power. The outer circlehas a constant value 0 dB in this scale, and the inner circle has avalue −10 dB. The measurement, with reference to Figure 9, is donefor one particular polarization of the transmitter (or one particulartransmitter) at a time, for a full rotation of 360 degree of the receiver.First measurement is referred to as ‘Array 1’, as shown on the upperleft panel of Figure 10. We can mark two cursors on the Array 1curve that show the received power in dBµV at those particularangle values, as shown on the lower left panel of Figure 10. In ourmeasurement, Array 1 curve, marked ‘A’, is for co-polarization. Thefirst cursor shows the maximum value of received power having a value73.4 dB at 193 degree, while the second cursor shows the minimumvalue of received power having a value 59.0 dB at 24 degree. Thesecond measurement referred to as ‘Array 2’ is for a cross polarizationbetween the transmitter and plasma antenna, and this curve is marked‘B’. No cursors can be marked on this, as it has to be analyzedrelative to the Array 1 results. Also, it can be seen from Figure 10that from angle 0 degree to 60 degree, the received power values areapproximately equal in both co- and cross-polarizations. This happensdue to scattering of fields from the coaxial cable because it comes inbetween the transmitting and receiving antennas. This coaxial cable
Figure 10. Radiation from the plasma antenna shows monopolepatterns.

26 Kumar, Mishra, and Joshi
has been used for power supply to the upper electrode of the fluorescenttube.
6. CONCLUSION
The study of plasma antenna shows that a simple fluorescent tube, usedfor household applications can be used to work as a plasma antenna.This can be done by applying AC voltage of 200 Hz or more, acrossthe electrodes of fluorescent tube. The performance of plasma antennacan be improved by increasing the frequency of applied AC voltage, sothat the plasma persists inside the fluorescent tube for longer duration.Persistent plasma that results in an efficient antenna radiator can beobtained even at lower frequency of 200 Hz. This frequency can beachieved by using Astable multivibrator (fabricated from IC555 chip).The electronic ballast using IC 555 chip is much cheaper and easierto calibrate than RF power supply used for earlier plasma antennas.In the future, it is possible to have cheaper and more effective plasmaantennas by using fluorescent tubes.
REFERENCES
1. Alexeff, I., T. Anderson, S. Parameswaran, E. P. Pradeep,J. Hulloli, and P. Hulloli, “Experimental and theoretical resultswith plasma antennas,” IEEE Transactions on Plasma Science,Vol. 34, No. 2, 2006.
2. Rayner, J. P., A. P. Whichello, and A. D. Cheetham, “Physicalcharacteristics of plasma antennas,” IEEE Transactions onPlasma Science, Vol. 32, No. 1, February 2004.
3. Zheng, L., L. Cao, and Z. Zhang, “Study on the gain of plasmaantenna,” Antennas, Propagation and EM Theory, ISAPE 2008,2008.
4. Chung, M., W. S. Chen, Y. H. Yu, and Z. Y. Liou, “Properties ofDC-biased plasma antenna,” ICMMT Proceedings, 2008.
5. Liu, Y., D. Chen, D. Buso, S. Bhosle, and G. Zissis, “Experimentalinvestigations on moving striations in a 50Hz AC fluorescentlamp,” Journal of Physics D: Applied Physics, Vol. 41, No. 13,2008.
6. Conrads, H. and M. Schmidt, “Plasma generation and plasmasources,” Plasma Sources Science and Technology, Vol. 9, No. 4,2000.