
Study & Master Life Sciences Grade 11 Teacher's Guide
234
Life Sciences Annemarie Gebhardt • Peter Preethlall Sagie Pillay • Bridget Farham PROMOTION COPY CAPS Teacher’s Guide Grade 11
-
Upload
khangminh22 -
Category
Documents
-
view
1 -
download
0
Transcript of Study & Master Life Sciences Grade 11 Teacher's Guide

Life Sciences
Annemarie Gebhardt • Peter Preethlall Sagie Pillay • Bridget Farham
PROMOTION COPY
CAPS
Teacher’s Guide Grade
11SM_Life Sciences_11_TG_CAPS_ENG.indd 1 2012/08/06 8:42 AM

Life Sciences
Study & Master
Annemarie Gebhardt • Peter Preethlall Sagie Pillay • Bridget Farham
Grade 11Teacher’s Guide
G11_TG_CAPS.indb 1 2012/08/01 9:01 PM

CAMBRIDGE UNIVERSITY PRESSCambridge, New York, Melbourne, Madrid, Cape Town, Singapore, São Paulo, Delhi, Mexico City
Cambridge University PressThe Water Club, Beach Road, Granger Bay, Cape Town 8005, South Africa
www.cup.co.za
© Cambridge University Press 2012
This book is copyright. Subject to statutory exception and to the provisions of relevant collective licensing agreements, no reproduction of any part may take place without the written permission of Cambridge University Press.
First published 2012
ISBN 978-1-107-38053-0
Editor: Bridget Farham of The Science PressProof reader: Sean FraserTypesetters: John Moss and Craig Farham of The Science PressIllustrators: Laura Brecher, Craig Farham, Andrew Kerr, André Plant, James Whitelaw. . . . . . . . . . . . . . . . . . . . . . . . . . . . . . . . . . . . . . . . . . . . . . . . . . . . . . . . . . . . . . . . . . .
ACKNOWLEDGEMENTSCover image: Idea leuconoe, commonly known as the paper kite or large tree nymph butterfly, © Russell Morales, Getty Images
Photographs: iStock: Section A, B, C, D, E and F; SPL: pages C45, C47, C65; Wikimedia Commons: pages C62, C63.
Every effort has been made to trace copyright holders. Should infringements have occurred, please inform the publishers who will correct these in the event of a reprint.. . . . . . . . . . . . . . . . . . . . . . . . . . . . . . . . . . . . . . . . . . . . . . . . . . . . . . . . . . . . . . . . . . .
Cambridge University Press has no responsibility for the persistence or accuracy of urls for external or third-party Internet websites referred to in this book, and does not guarantee that any content on such websites is, or will remain, accurate or appropriate.. . . . . . . . . . . . . . . . . . . . . . . . . . . . . . . . . . . . . . . . . . . . . . . . . . . . . . . . . . . . . . . . . . .
If you want to know more about this book or any other Cambridge University Press publication, phone us at (021) 412-7800, fax us at (021) 419-8418 or send an e-mail to [email protected]
G11_TG__Prelim.indd 2 2012/08/06 8:49 AM

iiiC O N T E N T S
Table of contents
Section Title Contents Page number
A Introduction Introduction to Life SciencesHow to use the Learner’s Book and this Teacher’s Guide
A1A4
B Planning Weekly year planner B1
C Teaching guidelines
Formal assessment tasks and Prescribed Practical Tasks in the Learner’s BookTeaching notes for the modules in the Learner’s Book, answers to activities and informal assessment suggestionsStrand 1 Diversity, change and continuity Strand 2 Life processes in plants and animals Strand 3 Environmental studies
C1
C5 C44 C83
D Assessment Grade 11 ExaminationsLife Sciences weighting gridsAnalysis of test/examsList of skills/sub-skills for Specific Aim 2 Formal Assessment TasksLife Sciences examinations: Exemplar papers Exemplar paper memoranda of answers
D1D2D4D5D7D43D61
E Photocopiable sheets
Photocopiable sheets for use in teaching E1
F Documents Space to add further notes as needed F1
G11_TG_CAPS.indb 3 2012/08/01 9:01 PM

SECTION A
INTRODUCTION
Introduction to Life Sciences A1
The organisation of the Life Sciences curriculum A1
The specific aims of Life Sciences A2
The meaning of the specific aims and their
relationship to assessment A2
How to use the Learner’s Book and this Teacher’s Guide A4
G11_TG_CAPS.indb 1 2012/08/01 9:01 PM

A1I n t r o d u c t I o n
Introduction to Life SciencesLife Sciences could be defined as the scientific study of living things from molecular level to their interactions with one another and their interactions with the environment.
Life Sciences is important for the following reasons:• To provide useful knowledge and skills that are needed in everyday life.• To expose learners to the range and scope of biological studies, to
stimulate interest in and create awareness of possible specialisations, e.g. medicine, pharmacy, genetics, research, environmental occupations, botany, zoology, and so on.
• To provide sufficient background/foundation for further studies in one or more of the biological sub-disciplines, e.g. Botany, Zoology, Physiology, Genetics, Biochemistry, Biotechnology, and so on.
The organisation of the Life Sciences curriculumFour “Knowledge Strands” are used as organisers of the Life Sciences content framework. These are developed progressively over the three years of FET.
In Grade 11, three of the four Knowledge Strands are addressed and serve to ensure progression. The content described in Life at Molecular, Cellular and Tissue level in Grade 10 is used to understand Life Processes in Plant and Animals in Grade 11 but it is not taught as a separate strand in Grade 11.
The recommended Grade 11 teaching sequence for the three Knowledge Strands is: 1 Diversity, Change and Continuity (Micro-organisms, plants and animals) 2 Life Processes in Plants and Animals (Processes that sustain life) 3 Environmental Studies (Population ecology and human impact on the
environment) This is the recommended teaching sequence in Grade 11. However, none of the Knowledge Strands, nor the topics within each Strand, should be studied separately or independently. Learners should be able to see the links with related topics so that they acquire a thorough understanding of the nature and inter-connectedness of life. These links must also be made across grades.
It is useful, therefore, to know the content and concept progression of Life Sciences over the three years of FET, as shown in Table 1.
G11_TG_CAPS.indb 1 2012/08/01 9:01 PM

A2 I n t r o d u c t I o n
Table 1 The concept and content progression of Life Sciences through Grades 10–12
The specific aims of Life SciencesThere are three broad subject-specific aims in Life Sciences, which relate to the purposes of learning science. These are:SpecificAim1: which relates to knowing the subject contentSpecificAim2: which relates to doing science or practical work
and investigationsSpecificAim3: which relates to understanding the applications of
Life Sciences in everyday life, as well as understanding the history of scientific discoveries and the relationship between indigenous knowledge and science.
The meaning of the specific aims and their relationship to assessmentSpecificAim1: Knowing Life Sciences (Life Sciences concepts, processes, phenomena, mechanisms, principles, theories, laws, models, etc.)
The following cognitive (thinking) skills comprise the range of skills that all learners should develop by working through the curriculum in a school year. These skills indicate what should be assessed at the appropriate grade level using a variety of assessments:
• Acquire knowledge – learners must: access information from a variety of sources (teachers, textbooks, internet, parents, etc); select key ideas; recall facts and describe concepts, processes, phenomena, mechanisms, principles, theories, laws and models in Life Sciences.
Actionverbs to be used in assessment include: state, name, label, list, define, describe.
Strands/grades Life at the molecular, cellular and tissue level
Life processes in plants and animals
Environmental studies
Diversity, change and continuity
Grade 10 1 Chemistry of life – inorganic and organic compounds
2 Cell – unit of life3 Cell division
(mitosis)4 Plant and animal
tissues
1 Support and transport systems in plants
2 Support systems in animals
3 Transport systems in mammals (humans)
1 Biosphere to ecosystems
1 Biodiversity and classification
2 History of life and Earth
Grade 11 1 Energy transformations to support life: photosynthesis
2 Animal nutrition3 Energy
transformations: respiration
4 Gas exchange 5 Excretion
1 Population ecology
2 Human impact on environment: current crises
1 Biodiversity – classification of micro-organisms
2 Biodiversity – plants
3 Reproduction – plants
4 Biodiversity -– animals
Grade 12 1 DNA code of life 2 RNA and protein
synthesis3 Meiosis 4 Genetics
1 Reproduction in vertebrates
2 Human reproduction
3 Nervous system4 Senses 5 Endocrine system 6 Homeostasis
1 Darwinism and natural selection
2 Human evolution
G11_TG_CAPS.indb 2 2012/08/01 9:01 PM

A3I n t r o d u c t I o n
• Understand and make connections between ideas and concepts to make meaning of Life Sciences – learners must: build a conceptual framework of science ideas; organise or reorganise knowledge to derive new meaning; write summaries; develop flow charts, diagrams and mind maps; and recognise patterns and trends.
Actionverbs to be used in assessment include: explain, compare, rearrange, give an example of, illustrate, calculate, suggest a reason, make a generalisation, interpret information or data, predict, select, differentiate.
• Apply knowledge of Life Sciences in new and unfamiliar contexts –
learners must: use information in a new way; and apply knowledge to new and unfamiliar contexts.
Actionverbs to be used in assessment include: demonstrate, interpret, predict, compare, differentiate, illustrate, solve, select.
• Analyse, evaluate and synthesise scientific knowledge, concepts and ideas – learners must: analyse information/data; recognise relationships between existing knowledge and new ideas; critically evaluate scientific information; identify assumptions; and categorise information.
Actionverbs to be used in assessment include: appraise, argue, judge, select, evaluate, defend (a point of view), compare, contrast, criticise (an argument or assumption), differentiate, distinguish, discuss.
SpecificAim2: Doing Life Sciences (doing practical work and investigations)
The following seven skills relate to doing practical work in Life Sciences. All seven skills will not apply equally to every activity: a follow instructions b handle equipment/apparatus c make observations in the following ways: drawings; descriptions; group
materials or examples based on observable similarities and/or differences; take measurements; compare materials before and after treatment; observe results of an experiment/investigation involving recording information in an appropriate way; and counting.
d record information/data in the following ways: as drawings, descriptions, in tables, graphs, etc.
e measure – measure length, volume, temperature, weight, mass, and count accurately
f interpret/translate – convert information from one form into another, e.g. converting a table into an appropriate graph
g design/plan investigations/experiments – Grade 11 learners must be able to plan and design a simple investigation/experiment.
The steps/skills required to design/plan investigations include: 1 identifying a problem2 stating a hypothesis3 select apparatus/equipment/materials4 identify variables5 suggest ways of controlling variables6 plan – make all the logistical arrangements7 suggest ways of recording results8 understand the need for replication and verification.
G11_TG_CAPS.indb 3 2012/08/01 9:01 PM

A4 I n t r o d u c t I o n
SpecificAim3: Appreciating and understanding the history, importance and applications of Life Sciences in society. The skills that can be developed in the process of achieving Specific Aim 3 are cognitive (same skills as for Specific Aim 1) rather than practical skills: • understand the history and relevance of some scientific discoveries • understand the relationship between indigenous knowledge and Life
Sciences. All knowledge grows out of a view of how the world works. Science and indigenous knowledge have their origins in different world views.
• understand the value and application of Life Sciences knowledge in industry, in respect of career opportunities and in everyday life. Some careers that can be pursued after doing Life Sciences include: medical fields, research, genetics, environmental fields (game management, ecology, ecotourism, etc.), agricultural fields, education fields.
How to use the Learner’s Book and this Teacher’s GuideStudy and Master Life Sciences is written in a way that should be easy for you and the learners to understand and help you and the learners to come to grips with the requirements of the curriculum.
The special features of this book include: • The activities in this book are structured in a logical way, progressing
from simple to new and complex learning.• Each strand has strand openers, which clearly explain the key questions
that will be addressed in that strand.• Each unit has boxes listing the key questions to assist learners whose
home language may not be English to deal with new terms.• Each unit includes investigations in which learners solve problems, design
solutions, set up experiments and controls, and record their results.• Each unit includes assessment activities, ensuring continuous self-, peer
and group assessment.• Projects are provided that deal with issues related to the real world and
move learners beyond the confines of the classroom.
Advise learners that the best way to use this book is to:• Carefully read each topic.• Summarise the information in each topic in point form. Do flow
diagrams to enhance their understanding of concepts. Infuse other material dealt with in class.
• Do the activities under each topic – these are meant to give the learners a better understanding of concepts and practical skills in the topic.
• Learners need to practise drawing diagrams and adding labels in the correct way – they can check the accuracy of their diagrams and labels by comparing them with the diagrams in this book.
• The more the learners practise the skills (cognitive and practical), the better they will understand them and the better you, the teacher, will be able to assess the learners.
• Learners must test their knowledge during and after each topic. Encourage them to find examination question papers and work out the answers first before looking up the answers in the textbook.
G11_TG_CAPS.indb 4 2012/08/01 9:01 PM

SECTION B
PLANNING
Weekly year planner B1
G11_TG_CAPS.indb 1 2012/08/01 9:01 PM

G11_TG_CAPS.indb 2 2012/08/01 9:01 PM

B1w e e k ly y e A R P l A N N e R
Weekly year plannerYear _____________
Week Planned date (week ending)
Completion date (week ending)
Topic for the week
TERM 1
Week 1 Biodiversity of micro-organisms
Week 2 Effect and management of one viral, one bacterial and one protist disease and of malaria
Week 3 Immunity, use of drugs, traditional technology
Week 4 Grouping of bryophytes, pteridophytes, gymnosperms and angiosperms
Week 5 Asexual and sexual reproduction, flowers as reproductive structures
Week 6 Flowers as reproductive structures (cont.), significance of seeds
Week 7 Relationship between body plan and grouping of animals in phyla, six phyla listed in CAPS document
Week 8 Key features of phyla in respect of body plans, relationship between body plans and mode of life, role of invertebrates in agriculture and ecosystemsFormal assessment and practical task
TERM 2
Week 1 Process of photosynthesis, importance of photosynthesis
Week 2 Variables affecting the rate of photosynthesis
Week 3 Variables affecting rate of photosynthesis (cont.), role of CO2 enrichment, etc. in greenhouse systems,role of ATP as energy carrier in the cell
Week 4 Differences in dentition in herbivores, carnivores and omnivores, human nutrition, processes and significance of ingestion, digestion, absorption, assimilation and egestion
Week 5 Mechanical and chemical digestion, absorption and assimilation, hormonal control of blood glucose (diabetes), relationship between food intake, energy, growth and health
Week 6 Different diets, supplements, malnutrition, tooth decay, substance abuse
Week 7 Cellular respiration, aerobic and anaerobic respiration
Week 8 Role of anaerobic respiration in industry, comparison between aerobic and anaerobic respiration
Week 9 June exam
Week 10 June exam
G11_TG_CAPS.indb 1 2012/08/01 9:01 PM

B2 w e e k ly y e A R P l A N N e R
TERM 3
Week 1 Gaseous exchange, requirements for efficient gas exchange organs, requirements in different organisms, human gas exchange
Week 2 Human gas exchange (cont.), respiratory diseases, smoking legislation in South Africa
Week 3 Artificial respirationEffects of altitude on gas exchangeExcretion in humansExcretion in various organs
Week 4 Structure of different parts of human renal systemHomeostatic control of water and salts
Week 5 Diseases affecting the kidneyPopulation ecologyPopulation size and factors affecting population size
Week 6 Interactions in the environment
Week 7 Interactions in the environment (cont.)Social organisation
Week 8 Community change over timeHuman population demographics
Week 9 Human population demographics (cont)
Week 10 Formal assessment and practical task
TERM 4
Week 1 Start practical on human influences on local environmentAtmosphere and climate change
Week 2 Atmosphere and climate change (cont.)Water – availability and quality
Week 3 Water – quality (cont.)Food security
Week 4 Loss of biodiversity
Week 5 Loss of biodiversity (cont.)Solid waste disposal
Week 6 Solid waste disposal (cont.)
Week 7 Revision
Week 8 Formal assessment and practical tasks
Week 9 Formal assessment and practical tasks
Week 10 Formal assessment and practical tasks
G11_TG_CAPS.indb 2 2012/08/01 9:01 PM

SECTION C
TEACHING GUIDELINES
This section contains teaching notes for the modules in the Learner’s Book, and answers to all the activities and informal assessment suggestions.
Formal Assessment Tasks and Prescribed Practical Tasks in the Learner’s Book C1
Strand 1 Diversity, change and continuity C5
Unit 1 Biodiversity and classification of
micro-organisms C5
Unit 2 Biodiversity of plants C24
Unit 3 Biodiversity of animals C36
Strand 2 Life processes in plants and animals C44
Unit 1 Photosynthesis C44
Unit 2 Animal nutrition C56
Unit 3 Cellular respiration C65
Unit 4 Gasous exchange C70
Unit 5 Excretion in humans C78
Strand 3 Environmental studies C83
Unit 1 Population ecology C83
Unit 2 Human impact on the environment C99
G11_TG_C_Cover.indd 1 2012/08/02 10:05 AM

G11_TG_CAPS.indb 2 2012/08/01 9:01 PM
C1F O R M A L A S S E S S M E N T T A S K S
Formal assessment tasks and Prescribed Practical tasks in
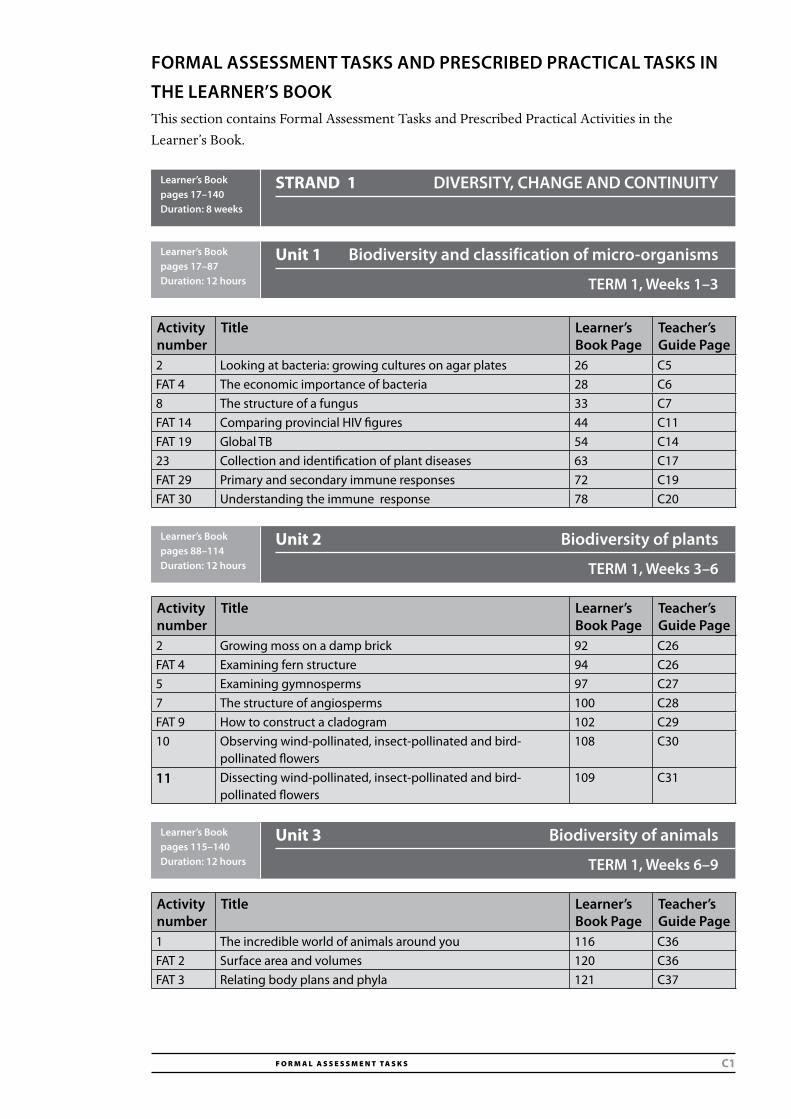
the learner’s book This section contains Formal Assessment Tasks and Prescribed Practical Activities in the Learner’s Book.
activity number
title learner’s book Page
teacher’s Guide Page
2 Looking at bacteria: growing cultures on agar plates 26 C5FAT 4 The economic importance of bacteria 28 C68 The structure of a fungus 33 C7FAT 14 Comparing provincial HIV figures 44 C11FAT 19 Global TB 54 C1423 Collection and identification of plant diseases 63 C17FAT 29 Primary and secondary immune responses 72 C19FAT 30 Understanding the immune response 78 C20
activity number
title learner’s book Page
teacher’s Guide Page
2 Growing moss on a damp brick 92 C26FAT 4 Examining fern structure 94 C265 Examining gymnosperms 97 C277 The structure of angiosperms 100 C28FAT 9 How to construct a cladogram 102 C2910 Observing wind-pollinated, insect-pollinated and bird-
pollinated flowers108 C30
11 Dissecting wind-pollinated, insect-pollinated and bird-pollinated flowers
109 C31
activity number
title learner’s book Page
teacher’s Guide Page
1 The incredible world of animals around you 116 C36FAT 2 Surface area and volumes 120 C36FAT 3 Relating body plans and phyla 121 C37
STRAND 1 diVersitY, chanGe and continUitYlearner’s book pages 17–140duration: 8 weeks
Unit 1 biodiversity and classification of micro-organisms
term 1, Weeks 1–3
learner’s book pages 17–87duration: 12 hours
Unit 2 biodiversity of plants
term 1, Weeks 3–6
learner’s book pages 88–114duration: 12 hours
Unit 3 biodiversity of animals
term 1, Weeks 6–9
learner’s book pages 115–140duration: 12 hours
G11_TG_CAPS.indb 1 2012/08/01 9:01 PM

C2 F O R M A L A s s e s s M e n t t A s k s
activity number
title learner’s book Page
teacher’s Guide Page
1 Testing for starch in leaves 147 C442 Photosynthesis: Investigation 1 148 C453 Photosynthesis: Investigation 2 148 C454 Photosynthesis: Investigation 3 149 C465 Factors affecting the process of photosynthesis 150 C46FAT 6 Showing that oxygen is a product of photosynthesis 152 C47
activity number
title learner’s book Page
teacher’s Guide Page
2 How food moves through the alimentary tract 165 C5612 Energy content of foods 179 C5913 Nutritional composition of foods 181 C60FAT 16 Nutrient sources 187 C61
activity number
title learner’s book Page
teacher’s Guide Page
FAT 4 An investigation into respiration (1) 197 C665 An investigation into respiration (2) 198 C66FAT 7 Do germinating seeds release heat energy? 199 C67
activity number
title learner’s book Page
teacher’s Guide Page
1 Investigation 209 C705 Looking at lungs 216 C719 Using a model to demonstrate the mechanism of breathing
in humans219 C73
FAT 11 The mechanism of breathing 222 C7312 To demonstrate that exhaled air contains carbon dioxide 225 C74
14 The effect of exercise on breathing rate 226 C74
FAT 17 Investigating the effects of smoking 232 C7418 Physiological adaptations to exercise and altitude 235 C75
STRAND 2 liFe Processes in Plants and animalslearner’s book pages 141–263duration: 12,5 weeks
Unit 1 Photosynthesis
term 2, Weeks 1–3
learner’s book pages 141–161duration: 12 hours
Unit 2 animal nutrition (mammals)
term 2, Weeks 3–6
learner’s book pages 162–193duration: 16 hours
Unit 3 cellular respiration
term 2, Weeks 6–7,5
learner’s book pages 194–207duration: 6 hours
Unit 4 Gas exchange
term 3, Weeks 1–2
learner’s book pages 208–240duration: 10 hours
G11_TG_CAPS.indb 2 2012/08/01 9:01 PM

C3F O R M A L A S S E S S M E N T T A S K S
activity number
title learner’s book Page
teacher’s Guide Page
1 Dissection of a kidney 244 C78
FAT 3 ADH 254 C79
activity number
title learner’s book Page
teacher’s Guide Page
FAT 2 Mark–recapture: simulated seed population 273 C83
FAT 8 Competition 292 C89
9 The life cycle of a parasite 294 C90
10 Case study: Science versus ethics 296 C91
11 Secondary succession 302 C93
activity number
title learner’s book Page
teacher’s Guide Page
FAT 3 What is the greenhouse effect? 321 C103
FAT 10 Effect of invasive alien plants (IAPs) on your local indigenous vegetation
348 C111
FAT 14 Rhino poaching: the downside of inigenous knowledge 367 C122
16 Household waste analysis 377 C125
Unit 5 excretion in humans
term 3, Weeks 2,5–5
learner’s book pages 241–263duration: 10 hours
STRAND 3 enVironmental stUdieslearner’s book pages 265–381duration: 11 weeks
Unit 1 Population ecology
term 3, Weeks 5–9
learner’s book pages 268–312duration: 24 hours
Unit 2 human impact on the environment
term 4, Weeks 1–7
learner’s book pages 313–381duration: 28 hours
G11_TG_CAPS.indb 3 2012/08/01 9:01 PM

C4 F O R M A L A s s e s s M e n t t A s k s
G11_TG_CAPS.indb 4 2012/08/01 9:01 PM

C5S t r a n d 1 • U N I T 1
Unit 1: Biodiversity and classification of micro-organismsUnit 2: Biodiversity of plantsUnit 3: Biodiversity of animals
Learner’s Book page 24Answers will vary but this is an outline of the viral diseases that the learners should cover.1 Common childhood diseases are: measles, mumps, chicken pox and
rubella (German measles).2 All these diseases can be prevented by immunisation. There is no
treatment once the person has the disease because they are caused by viruses.
3
Learner’s Book page 261 The ways in which you could sterilise a petri dish are to:
• autoclave it• boil it in a pressure cooker• use a disinfectant.
strand 1
dIVErsItY, CHanGE and COntInUItY
UNIT 1 Biodiversity and classification of micro-organisms
tErM 1
Learner’s Book pages 20–87duration: 12 hours
Activity 1 The medical importance of viruses (Specific Aim 1)
disease Virus symptoms treatment/preventionMeasles paramyxovirus
(measles virus)Starts with fever, runny nose, cough, conjunctivitis, rash 3–5 days later, spreads across whole body, child feels very ill
Prevented by immunisation, treatment once the disease is present is with medication to reduce fever and plenty of fluids
Mumps paramyxovirus (mumps virus)
chills, headache, poor appetite, malaise, fever, swollen salivary glands, painful swallowing, enlarged testicles in boys
Prevented by immunisation, treatment once the disease is present is with medication to reduce fever and plenty of fluids
Chicken pox
varicella zoster virus
Mild headache, moderate fever, rash – crops of vesicles that spread across the body
Prevented by immunisation, treatment once the disease is present is with medication to reduce fever and plenty of fluids
Rubella RNA virus Mild symptoms, slightly swollen glands, rash
Prevented by immunisation, treatment once the disease is present is with medication to reduce fever and plenty of fluids
PPA Activity 2 Looking at bacteria: growing cultures on agar plates (Specific Aim 2)
G11_TG_CAPS.indb 5 2012/08/01 9:01 PM

C6 S t r a n d 1 • U N I T 1
2 The petri dish plates must be closed or covered immediately after inoculation to prevent air-borne bacteria from contaminating the plates.
3 An aim for this activity could be to determine the presence of bacteria in different parts of the body.
4 From our observations we can conclude that different parts of the body host a variety of organisms or bacteria.
Learner’s Book page 281 Similarities – both viruses and bacteria:
• are microscopic• occur in a wide range of habitats• have pathogenic varieties that cause disease
2 Differences between viruses and bacteria:• viruses are not cells, bacteria are cellular• viruses cannot reproduce or be active independently of a host cell,
bacteria can• viruses have strands of RNA or DNA, never both, bacteria contain
RNA and DNA
Learner’s Book page 28The learner’s essay should contain information on the following points:• Production of food and beverages: fermented dairy products: e.g.
yoghurt made by fermenting milk with a mixture of Lactobacillus bulgaricus and Streptococcus thermophilus – sour milk/maas cheese – involves lactic acid fermentation.
• Production of pharmaceuticals.• Antibiotics: substances made in nature by various micro-organisms
that inhibit or kill other micro-organisms, e.g. penicillin, bacitracin, erythromycin, and kanamycin.
• Steroids: these hormones regulate various aspects of human metabolism.• Human proteins: produced by genetically engineered bacteria, e.g.
human insulin is produced by a recombinant Escheria coli strain.• Vitamins: some vitamins are produced as a result of secondary
metabolism, e.g. vitamin B12 is produced as a by-product of streptomyces antibiotic fermentation. Vitamin B12 is also produced commercially by using Propionibacterium shermanii or Pseudomonas denitrificans.
• Organic acids: several organic acids can be produced by microbial fermentation, e.g. gluconic acid by Azotobacter, lactic acid by Lactobacillus delbrueckii.
• Amino acids such as lysine are produced by Corynebacterium glutamicum.• In addition to the above, bacteria are used commercially to produce
enzymes such as proteases and amylases; solvents such as acetone and butanol; and fuels such as ethanol.
• Bacteria are also used to recover mineral resources by the process of bioleaching.
Activity 3 Comparing viruses and bacteria (Specific Aim 1)
Activity 4 The economic importance of bacteria (Specific Aims 1 and 3)
G11_TG_CAPS.indb 6 2012/08/01 9:01 PM

C7S t r a n d 1 • U N I T 1
Learner’s Book page 291 Euglena and Chlamydomonas2 Both the organisms have chloroplasts, which allows them to make food
through photosynthesis.3 Amoeba and Paramecium 4 A parasite
Learner’s Book page 30The answers will vary, but this is a guide:1 A variety of different micro-organisms – the learners should describe
these. 2 Some of them should be seen moving about.3 The shapes of the different micro-organisms vary from spherical to oval
to elongated.4 Learners should mention that they can or cannot see chloroplasts or food
vacuoles to distinguish autotrophs from heterotrophs.
Learner’s Book page 32The different fungi the learners could list are:• bread mould• yeast• mushrooms• bracket fungi• fungi around the bathand so on.
Learner’s Book page 33Part 17 a Answers will vary.
b i The colour of the threads could be anything between grey, white or green.
ii The threads are called hyphae, which form a mycelium. iii Mycelium do not contain chlorophyll. iv Learners should be able to identify three types of mycelium. v Mycelium can be found:
• on the surface of the bread• growing upwards into the atmosphere• growing into the bread.
vi Mycelium: gives rise to stolon. Stolon: gives rise to more sporangiophores and rhizoids. Sporangiophores: These are the reproductive hyphae; they produce spores. Rhizoids: They anchor the mould and also digest and absorb nutrients from the substrate.
vii The tips are swollen to form a sporangium, which forms spores.c Saprophytic, because it absorbs its nutrients from decaying
organic matter.
Activity 5 Nutrition in unicellular protists (Specific Aim 1)
RPA Activity 6 Protists all around us (Specific Aim 2)
Activity 7 The fungi around us (Specific Aim 1)
PPA Activity 8 The structure of a fungus (Specific Aim 2)
G11_TG_CAPS.indb 7 2012/08/01 9:01 PM

C8 S t r a n d 1 • U N I T 1
Part 26 No cross walls exist in the hyphae.7 It has rhizoids to anchor it to the substrate.
It does not photosynthesise, therefore it does not require moisture. Its sporangiophores are long and efficiently exposed to the air for the dispersal of spores by air currents. A large number of spores are produced, thereby facilitating its survival. Spores are light and can therefore be carried easily by the air currents.
Learner’s Book page 341 Vegetative structure of bread mould
Although a few unicellular types of fungi such as yeast exist, most fungi are multicellular. The basic structural units of a multicellular fungus are thread-like filaments called hyphae, which develop from fungal spores. These hyphae elongate at their tips and branch extensively to form a network of filaments called mycelium. Some fungi have hyphae that are divided into uninucleate cells by septa. Hyphae without such cross walls look like large multinucleate cells. These hyphae are described as being coenocytic.
2 Reproductive structures of bread mould The reproductive structures of bread mould can either be asexual or sexual.
Asexual The spore is the reproductive cell that germinates and develops into a
new organism. Most fungi produce spores. When a spore lands on a suitable substrate a thread-like hypha emerges and begins to grow and branches to form a mycelium. Eventually some hyphae may grow upward from the substrate and produce a spore-containing structure called a sporangium. This hypha that grows upward is called the sporangiophore. A sporangium is a sac in which spores are produced.
Sexual When poor growth conditions prevail, bread mould is able to reproduce
sexually by producing zygospores. Zygospores are thick-walled spores adapted to withstand poor or unfavourable conditions. Sexual reproduction takes place when the tips of the hyphae from two different mycelia come together and fuse. Where the hyphae fuse, two gametangia form, each with a haploid nucleus inside. A gametangium is a structure with a haploid nucleus and in which gametes are produced. When the contents of the two gametangia fuse, a diploid zygote forms. This zygote then develops into a thick-walled zygospore. A zygospore may be dormant for months and can survive periods of drought, cold, and heat. When conditions become favourable, the zygospore absorbs water, undergoes meiosis, and germinates to produce an upright hypha with a sporangium. Each haploid spore formed in this sporangium is capable of growing into a new mycelium.
Learner’s Book page 34When designing an investigation to determine the optimum conditions for the growth of Rhizopus stolonifer, the following should be taken into consideration:• the independent and dependent variables
Activity 9 Understanding fungal structure (Specific Aim 1)
Activity 10 Investigating fungal growth (Specific Aim 1)
G11_TG_CAPS.indb 8 2012/08/01 9:01 PM

C9S t r a n d 1 • U N I T 1
• the factor (or factors) that must be controlled• the data to be collected• how the data will be collected• how the data will be recorded• the precautions that need to be adopted to ensure that the data that is
collected and the deductions made from them are as reliable as possible• how the data will be used to make the comparison.Examples of independent variables:• nutrients: type and amount • moisture• light • temperature.Examples of dependent variables:• increase in mass or• increase in amount of a factor.Depending on which factor (among the independent variables) is being tested, the others will therefore be the controlled factors.
Learner’s Book page 351 The features of plants that differentiate them from fungi are:
• most plants are autotrophic since they possess chlorophyll• plant cells are uninucleate and separated by means of cross walls• plants have roots stems and leaves• plants have specialised cells.
2 a Hyphae are branched or unbranched filaments that constitute the vegetative form of a fungus, while mycelium is the interwoven mass of discrete hyphae.
b Sporangia are asexual reproductive structures produced by the sporangiophore, while gametangia are the sexual reproductive structures in fungi. Sporangia produce spores while gametangia produce gametes.
Learner’s Book page 35The first three topics are interrelated, while the fourth topic is about indigenous knowledge and/or beliefs.
the economic value of fungi• Learners should include aspects such as the beneficial use of fungi, for
example in dairy products and as food, such as mushrooms.• The harmful effects of fungi could include examples such as the infection
of plants and humans.
the ecological role of fungiFungi act as:• decomposers, which makes them useful in nutrient recycling• food for other organisms • saprophytes.Some fungi are parasites.
Activity 11 Terminology (Specific Aim 1)
Activity 12 A project (Specific Aims 1 and 3)
G11_TG_CAPS.indb 9 2012/08/01 9:01 PM
C10 S t r a n d 1 • U N I T 1
Fungi and medicineDiseases caused by fungi include:• fungal disease of the respiratory tract, for example histoplasmosis
pneumonia• diseases of the gastrointestinal tract, for example aspergillosis• diseases of the vaginal tract, for example candidiasis, caused by Candida
species• diseases of the central nervous system, for example mushroom poisoning• diseases of the skin, for example athlete’s foot• diseases of the oral cavity, for example thrush.
The perception that mushrooms grow after a period of thunder and lightning: The answer to this question will depend on what indigenous information learners bring to the class. However, the information must be linked to the requirements for the growth of fungi.
ExampleIn KwaZulu-Natal after a storm, members of communities that live along the sugar belt will often be found selling large mushrooms on the roadside. People believe that, due to the thunder and lightening, cracks appear in the ground and therefore allow the fruiting bodies of the mushrooms to emerge. This is a misconception from a scientific point of view. Numerous microscopic fungal spores are present in the air, ready to germinate when favourable conditions occur. These favourable conditions include moisture, organic nutrients, appropriate temperature and darkness to stimulate its germination of spores. Thunder and lightning are usually accompanied by rain. The rain pushes the spores to the ground, allowing it to come into contact with organic nutrients from the soil and thereby facilitate its germination. Due to the abundance of nutrients and moisture the mycelia are able to grow rapidly and produce large fruiting bodies (mushrooms) in a very short time. Note: The sugar-cane plantation contains large amounts of organic material.
Learner’s Book page 401 This information will be quite difficult to find and this question is here
as a challenge to the learners to stimulate them into using different ways of researching an interesting question. One good internet reference can be found on http://www.daff.gov.za/docs/GenPub/rabiesB5.pdf. This document shows that between 1984 and 2000 there were 226 confirmed cases of human rabies in KwaZulu-Natal. The other useful document can be found at http://www.who.int/rabies/Celebrating_one_year_rabies_free_KwaZuluNatal/en/.
2 The estimated population of KwaZulu-Natal is 10,6 million and this is 21,3% of the South African population.
3 KwaZulu-Natal is a large province with international boundaries and a large rural population. Dogs are the main carriers of rabies in the province. If someone is bitten in an area that is far from medical attention then the disease will have progressed by the time that post-exposure vaccination can be given. Rabies control in neighbouring countries is not good and so rabid animals will continue to enter the province and potentially bite people.
4 Dogs are a reservoir for the rabies virus, so vaccinating dogs will provide a pool of immune animals who cannot catch and so transmit the virus.
RPA Activity 13 Preventing rabies (Specific Aims 2 and 3)
G11_TG_CAPS.indb 10 2012/08/01 9:01 PM

C11S t r a n d 1 • U N I T 1
Learner’s Book page 441 KwaZulu-Natal consistently has the highest percentage of HIV-infected
women attending antenatal clinics and this percentage has risen from 2001 to 2009 – the difference between 40,7 (2004) and 39,5 (2009) is unlikely to be statistically significant. The Western Cape and the Northern Cape have consistently had the lowest percentage of HIV-infected women attending antenatal clinics. But, the percentage in the Western Cape has shown a steady increase between 2001 and 2009, while it has remained steady in the Northern Cape. Mpumalanga has the second highest percentage of HIV-infected women attending antenatal clinics. Gauteng, Free State and North West show similar percentages. Nationally, there has been an increase from 2001 to 2009.
2 Possible reasons for the distribution of HIV in South Africa could include:• differences with respect to the size of the provinces and population size• differences in literacy• improved AIDS education programmes, thus bringing about a change
in behaviour among young women• the improvement of the status of women by government through its
affirmative action policies• the increased power of women to say “no”.
3 The figures in the table are taken from sampling that is done at antenatal clinics, so they reflect HIV prevalence in a particular section of the population – sexually active, young women. This means that it is not possible to directly extrapolate the HIV prevalence in this population to the general population of South Africa. However, the figures do act as a consistent measure of HIV prevalence in particular areas over time.
4 This question will generate a large amount of discussion. Be sure to provide guidance and adjudication on issues around the appropriate measures.
Learner’s Book page 441 HIV can be transmitted through:
• sexual intercourse• a blood transfusion• the use of infected needles, for example shared needles in health care
facilities and in intravenous drug abuse• an infected mother passing the virus on to her unborn child• mother breast-feeding her baby.
2 This activity is a simulation of the transmission of HIV.
You may describe one method of HIV transmission. Then demonstrate how HIV can be transmitted by conducting the activity that follows.
Prior preparationApparatus and materials that are required include the following:• a large test tube for each learner• one medicine dropper for each learner• 250 ml beaker• starch powder• iodine solution• waste bin• a source of music such as a tape recorder/CD player/radio/etc.
RPA Activity 14 Comparing provincial HIV figures (Specific Aims 2 and 3)
Activity 15 Transmission of HIV (Specific Aims 1 and 3)
G11_TG_CAPS.indb 11 2012/08/01 9:01 PM

C12 S t r a n d 1 • U N I T 1
Procedure• Prepare a starch solution by mixing approximately 25 grams of starch
powder in warm water in the 250 ml beaker.• Divide the total number of test tubes to be used into two groups so that
you have Batch A and Batch B.• Pour approximately 10 ml of this starch solution into each test tube
of Batch A. Mark these test tubes A1 to A15 (if you have a class of 30 learners).
• Into the other test tubes of Batch B pour 10 ml of water. Mark these test tubes B1 to B15.
Note: Learners must not know the contents of these test tubes.• Arrange the learners into two groups, in two circles as shown on the left.• Hand out a medicine dropper and the prepared test tubes at random to
each learner.• In each group, learners will now have test tubes marked A or B i.e. in the
outer circle there will be learners with test tubes marked A and others with test tubes marked B. The inner circle will also have a combination of test tubes.
• When the music is played, learners in the outer circle begin to move in one direction (see diagram).
• When the music is stopped – while learners in the inner circle move in opposite directions, members of each circle will exchange a little of their solution with the person standing in front of them in the opposite circle.
• Learners take note of the test tube number from which they received solution, and to whom they donated solution as well.
• At this point, you may introduce the concept of body fluids such as sperm, and explain that the solutions in the test tubes represent body fluids.
• Once the solutions have been shared, the contents of the test tubes are mixed well by gently tapping the bottom of the tube with the forefinger and index finger.
• This exchange of solution may be repeated another three times. Ensure that each encounter is with another person.
• After the third encounter, pass the iodine solution around and pour approximately five drops into each tube. In the presence of starch, iodine changes the colour of the solution to blue-black.
results and discussionIf the contents of the tube turns blue-black this indicates an infection while those that are colourless are not infected. At this point a more in-depth discussion may take place, with learners actively engaging and making use of the notes that they have made.3 Learners discuss whether or not condoms should be available in vending
machines at school. Opinions will vary, depending on their religious and cultural persuasion, as well as their personal view on life. Monitor the debates and be sure to add different points of view, if needed.
4 Learners discuss whether the increase in the incidence of HIV corresponds with an increase in the use of condoms. If HIV is more prevalent, will more people start to use condoms? Will this, in turn, decrease the incidence of HIV (slow down the rate of spread)? Or will an increase in the use of condoms indicate an increase in promiscuity, and therefore increase the incidence of HIV?
G11_TG_CAPS.indb 12 2012/08/01 9:01 PM

C13S t r a n d 1 • U N I T 1
Learner’s Book page 45Learners report their findings on:• Restoring the immune system.• Developing new drugs.• Developing a vaccine against the virus and/or other prevention
approaches such as microbicides.• Indigenous or traditional approaches to treating HIV and AIDS.
Learner’s Book page 471 The main flu season is between May and August.2 The main strain of flu during the 2011 season was A(H1N1).3 The detection rate at the peak of the flu season was around 80%.4 The detection rate was probably lower than it could have been because
not everyone with flu symptoms will have been tested for a specific virus.5 The second peak was caused by A(H3N2).6 The change in strain could have been caused by a mutation or by the new
strain being introduced into South Africa from elsewhere.7 People who are vaccinated against flu are less likely to catch the disease
and so there is break in the transmission of the virus.
Learner’s Book page 501 The two main Zimbabwean cities, Harare and Bulawayo, are located on
watershed divides (the line separating neighbouring drainage basins), which means that the water draining out of the cities flows into drinking water sources, all of which are placed downstream from the area where the water flows back into the cities. This was made worse because the urban water supply infrastructure had collapsed, as well as sanitation and rubbish collection systems. The outbreak also occurred at the start of the rainy season, which meant that faeces and cholera bacteria were washed into water sources, particularly public drains.
2 The collapse of the sanitation and rubbish collection systems would have meant that public water supplies were contaminated with raw sewage and run-off from uncollected rubbish.
3 Harare stopped receiving piped water in December 2008 because the authorities had run out of water purification chemicals.
4 The spread from urban to rural areas was because infected city-dwellers visited their families over Christmas and people who had died of cholera in the cities were often taken back to their original rural area to be buried.
5 Infected people and people carrying the cholera bacterium entered South Africa. The South African authorities needed to break the cycle of transmission by making sure that infected people were treated promptly, there was clean, purified water available for domestic use and good sewage systems to prevent contamination of the water supply. All waste from infected people should be disposed of in a way that prevents contamination of the water supply.
RPA Activity 16 AIDS project (Specific Aims 2 and 3)
RPA Activity 17 Flu in South Africa (Specific Aims 2 and 3)
RPA Activity 18 A cholera outbreak (Specific Aims 1, 2 and 3)
G11_TG_CAPS.indb 13 2012/08/01 9:01 PM

C14 S t r a n d 1 • U N I T 1
Learner’s Book page 541
2
3 Africa was the region with the highest number of TB cases in 2009.4 South-East Asia had the highest nimber of deaths from TB in 2009.5 Europe and the Americas consist of developed countries with low levels
of poverty and good health and social infrastructure. TB is an uncommon disease where most people are well nourished and do not live in crowded conditions.
6 Europe may have more cases of TB than the Americas because Europe receives more immigrants from areas of the world where there are high levels of TB.
RPA Activity 19 Global TB (Specific Aims 1, 2 and 3)
Num
ber o
f cas
es (1
000
s)
Africa Americas Eastern Mediterranean
Europe South-East Asia
5 000
4 000
3 000
2 000
1 000
0Western Pacific
Num
ber o
f dea
ths (
1 00
0s)
Africa Americas Eastern Mediterranean
Europe South-East Asia
500
400
300
200
100
0Western Pacific
region number of cases (% of total)
number of deaths (% of total)
Africa 27,85 33,00
The Americas 25,00 1,50
Eastern Mediterranean 7,00 7,60
Europe 4,00 4,76
South-East Asia 35,00 36,92
Western Pacific 20,70 18,46
G11_TG_CAPS.indb 14 2012/08/01 9:01 PM

C15S t r a n d 1 • U N I T 1
Learner’s Book page 57The learner’s short essay should mention the following:• Anthrax is highly contagious and is caused by Bacillus anthracis.• The bacterium forms endospores that can survive in dry ground for
man years. • It affects dometic and wild animals, who consume endospores while
grazing, drinking contaminated water or licking the skin of an infected animal. Humans are infected by direct contact with affected animals or animal products or by inhaling dust that contains endospores.
• Resistant endospores are formed when animals die or when infected carcasses are cut open and these spores are dispersed in various ways.
• Anthrax can be prevented by breaking the cycle of transmission by vaccinating domestic animals, notifying cases of the disease and avoiding eating contaminated meat or coming into contact with contaminated animal products.
Learner’s Book page 611 There are four species that cause malaria in human beings. Plasmodium
vivax and P. falciparum are responsible for 95% of infections worldwide. P. malariae and P. ovale are the other two species that cause malaria.
2 Malaria is spread/transmitted by the female Anopheles mosquito.3 Malaria is rife in the African savanna and forests, Ethiopia, Madagascar,
Papua New Guinea, Amazon rainforests, Central America.4 High temperatures and moisture promote the spread of malaria.
Learner’s Book page 611 Research reports may vary.
Information in the form of pamphlets and leaflets can be obtained from the Department of Health – Communicable Diseases as well as from the Medical Research Council.
The following rubrics may be used to assess the reports and the presentations.
rubric for research report
assessment criteria
3 2 1 Comments
Research design
Clearly stated and to the point.
Some parts are clear and well organised.
Some parts are confusing. No clear organisation or vision. Too simplistic.
Physical resources accessed
A variety of physical resources accessed.
Limited/insufficient resources accessed.
None accessed.
Activity 20 Preventing the transmission of anthrax (Specific Aims 1 and 3)
Activity 21 Facts about malaria (Specific Aim 1)
Activity 22 Research on malaria (Specific Aims 1 and 3)
G11_TG_CAPS.indb 15 2012/08/01 9:01 PM

C16 S t r a n d 1 • U N I T 1
assessment criteria
3 2 1 Comments
Human resources accessed
A variety of people consulted
Limited number of people consulted
None accessed
Appropriate statistical evidence utilised
A variety of statistical data utilised
Very limited and superficial statistical data
None used
Correct interpertation of statistics
Data correctly analysed
Some aspects correctly interpreted
Statistics incorrectly interpreted
Organisation and quality of report
High quality and high standard
Satisfactory but can improve
Poor layout and quality
Sensitivity towards cultural differences
Clearly stated and to the point
Sensitivity displayed
Lacked sensitivity
Key: 3: Good 2: satisfactory 1: needs attention total: _____ out of 21 marks
The rubric below may be used to assess the oral presentations.
assessment criteria 4 3 2 1Could the speaker be heard?Did the speaker make eye contact with the audience?Did the speaker make use of a variety of relevant presentation aids?Did these aids assist the audience in understanding the topic?Did the speaker capture the audience’s interest?Did the introduction get the audience wanting to know more?Was the presentation logical and easy to follow?Did the speaker refer to notes?Was the speaker enthusiastic about the topic?Did the speaker use body language to support the presentation?Did the speaker make effective use of time?Did the speaker allow the audience to participate, i.e. was the presentation interactive?Was the reponse to questions satisfactory?Key: 4: always 2: sometimes 3: Most of the time 1: not at all total: 52 marks
G11_TG_CAPS.indb 16 2012/08/01 9:01 PM
C17S t r a n d 1 • U N I T 1
Learner’s Book page 631 Discuss the importance of recording and/or photographing observations
in the field.2 Discuss the importance of taking a number of samples (leaves) making
sure that the learners know that this is necessary to reduce the margin of error in any experiment as well as to attempt to gain a general picture of a system or set of circumstances.
3 The reason for obtaining specimens from two different species is to see whether it is the same pathogen or whether it is different – so that the issue of host specificity may be highlighted.
4 Learners will be able to share their observations and findings with each other. From this they can make generalisations, such as the surface on which the disease is more prominent.
Learner’s Book page 661 Ringworm results in the development of a raised red welt (striped mark)
on the skin. This led people to believe that an earthworm had crawled under the skin and coiled up in a ring. There is a characteristic red ring that appears on infected skin.
2 Athlete’s foot is often associated with the high moisture levels and bare feet of athletes in a change room.
3 Athlete’s foot may be transmitted by direct contact with change rooms, socks and shoes through abrasions on the skin.
4 High moisture and warmth are required for growth of the fungi that cause athlete’s foot.
Learner’s Book page 67This activity is intended for learners to share their indigenous knowledge.
Learner’s Book page 671 Bordetella pertussis causes whooping cough.2 Between days 5 and 10, Busi had a runny nose, was sneezing, and
generally feeling sick. This was accompanied by fever, and severe coughing episodes. The coughing episodes persisted up until day 15. Between days 15 and 20, Busi was feeling better but was still coughing.
3 Busi caught this “bug” through the air by means of droplets.4 Our body has a number of ways of protecting itself against infectious
diseases. We have physical, chemical and cellular mechanisms that prevent the entry and/or spread of diseases. Hydrochloric acid in the stomach kills many bacteria that we ingest with our food and drink.
Blood clotting is a defence mechanism that stops the loss of blood and prevents the entry of pathogens through wounds in the skin. If pathogens enter the body, white blood cells can recognise them as being foreign and destroy them. White blood cells are part of the immune system.
Learners should be given a brief explanation about the defence system of the body.
PPA Activity 23 Collection and identification of plant diseases (Specific Aim 2)
Activity 24 Ringworm (Specific Aim 1)
Activity 25 Home remedies (Specific Aims 1 and 3)
Activity 26 The immune system and disease (Specific Aim 1)
G11_TG_CAPS.indb 17 2012/08/01 9:01 PM

C18 S t r a n d 1 • U N I T 1
5 It is possible that Rajen may have contracted this disease some time ago or could have been immunised against whooping cough. Therefore, if Rajen came into contact with B. pertussis, his body’s defence mechanism would have been activated and the antibodies already prepared against B. pertussis would have destroyed the invading organism.
Learner’s Book page 681 The physical barriers protect the body in the following ways:
skinThe outermost layer of the skin is composed of epithelial cells that are cornified and keratanised, in other words, they are compacted and cemented together, and impregnated with an insoluble protein, known as keratin. This results in a thick, tough, layer that is impermeable and waterproof. Hence, very few pathogens can penetrate this unbroken barrier. The regular flaking of the skin also provides a means to rid the body of potential pathogens. Sweat glands could provide access to micro-organisms, but the flushing effect (sweating/perspiration) helps to remove micro-organisms that may be present.
the mucous membrane of the respiratory and digestive tract The presence of nasal hairs helps to trap large particles. Rhinitis caused by allergy and colds results in the flow of mucus and fluids, and has a flushing effect. Ciliated epithelium conveys foreign particles entrapped in mucus toward the pharynx either to be expelled or to be swallowed. Irritation of the nasal passage can initiate a sneeze, which expels large volumes of air at high velocity. Similarly, the acute sensitivity of the bronchi, trachea, and larynx to foreign matter ensures that the cough reflex is readily triggered and that irritants are explosively expelled. The digestive tract secretes saliva, acids and enzymes that are able to destroy foreign substances.
Mucocutaneous membranes (mucous membrane and skin)These membranes of the respiratory, urinary and digestive tracts and the eye are thin, moist, permeable surfaces. Damaged cells here are rapidly replaced. The mucous layer on the free surface of these tissues prevents the entry of bacteria. Blinking and the production of tears (lacrimation) help flush the eye and rid it of irritants. The constant flow of saliva helps carry the micro-organisms into the harsh environment of the stomach. Vomiting and defaecation also gets rid of toxic substances and micro-organisms.
2 Irritation of the nasal passage initiates a sneeze that expels large volume of air at high velocity. Similarly, the acute sensitivity of the bronchi, trachea, and larynx to foreign matter ensures that the cough reflex is readily triggered and that irritants are explosively expelled.
Learner’s Book page 69
secretions of the sebaceous glandSebaceous glands occur in the skin. Its secretions coat the hair shaft and have an antimicrobial effect.
Activity 27 Protecting the body (Specific Aim 1)
Activity 28 Chemical barriers (Specific Aim 1)
G11_TG_CAPS.indb 18 2012/08/01 9:01 PM

C19S t r a n d 1 • U N I T 1
PerspirationPerspiration is secreted by the sweat glands of the skin. It can contain a high concentration of sodium chloride, potassium ions, and lactic acid, which discourage invasion by micro-organisms.
tearsTears are produced by the tear duct of the eye. A tear contains an enzyme known as lysozyme, which hydrolyses the peptidoglycan of the bacterial cell wall.
LysozymeThis occurs in saliva and tears. It hydrolyses cell walls of bacteria.
Hydrochloric acidThis is produced in the stomach. It destroys pathogens that are swallowed.
semenSemen contains an antimicrobial substance known as spermine, which inhibits bacteria.
InterferonsThese are naturally occurring polypeptides produced by fibroblasts and lymphocytes that can block viral replication and regulate a variety of immune responses.
Learner’s Book page 721 Primary response:
This is characterised by a fairly long lag period and a gentle or slow increase in the production of antibodies. This allows the pathogen to reach high concentrations which causes disease. Secondary response: This is characterised by a very short lag phase and a rapid increase in the production of antibodies. The increase in antibody concentration destroys the pathogen and prevents disease.
2 The specific immune response is characterised by specificity, memory and the acquired ability to detect and eliminate foreign substances. The immune response reacts to particular substances called antigens. Antigens activate the immune system and interact with cells and chemicals of the immune response system. Once a response to an antigen has occurred, a memory system is established that allows a rapid and specific secondary response on re-exposure to the same substance. Hence, the secondary response which occurs with subsequent exposure to an antigen that the body “remembers”, is very much quicker. It must also be noted that the population of memory cells is much larger than the original population of B cells from which they came. Therefore, the response to the second infection is much more rapid and greater than the primary response.
Learner’s Book page 781 A secondary immune response is the response of an individual to
the second or subsequent contact with a specific antigen. This is characterised by a short lag period and the production of a high concentration of antibodies.
RPA Activity 29 Primary and secondary immune responses (Specific Aims 1 and 2)
Activity 30 Understanding the immune response (Specific Aim 1)
G11_TG_CAPS.indb 19 2012/08/01 9:01 PM

C20 S t r a n d 1 • U N I T 1
2 Refer to the table below.
differences between primary and secondary immune responses
Primary immune response secondary immune response
Slow Rapid
Longer lag period Shorter lag period
Gentle increase in antibody production
Very sharp increase in antibody concentration
Pathogen population allowed to increase rapidly
Pathogen not given opportunity to increase in population size
Disease usually manifests itself Disease does not manifest itself
Learner’s Book page 801 From the information given, it can be seen that when only a few
individuals are immune, a pathogen can spread rapidly within a population, resulting in an epidemic. However, when more than 70% of a population is immune, the transmission of the pathogen from one individual to another is prevented and therefore epidemics do not occur. This is due to the fact that many of these individuals would have developed a secondary response. It is also important to discuss the scientific basis of immunisation, for example:• Any macromolecule associated with a pathogen can serve as an
antigen – it does not have to be the entire micro-organism. Hence, specific target antigens associated with pathogens may be used to elicit the immune response without causing disease.
• After exposure to the antigen, the body may develop a memory response. Hence, subsequent exposure to the antigen will bring about a rapid and enhanced response that will prevent the increase in the pathogen population and avoid the manifestation of the disease.
• When a large percentage of the population is immune to a disease, there is no fear of an epidemic, since individuals are no longer susceptible and thus no longer participate in the chain of disease transmission.
• When approximately 70% of the population is immune it is safe to say that the entire population is safe/protected. This concept is referred to as herd immunity. Herd immunity is established by artificially stimulating the immune system through the use of vaccines – thus providing protection to the entire population against particular diseases.
2 Learners should discuss also the (almost) elimination of a number of contagious diseases such as bubonic plague, measles, chicken pox, polio, and so on.
Example: the eradication of smallpoxSmallpox is a highly infectious disease caused by the variola virus that is transmitted by direct contact. Smallpox killed as many as 12 to 30% of its victims. The WHO began a programme to eradicate it in 1956. By 1967 its intention was to rid the world of this disease within ten years. There were two main aspects of the programme, namely, vaccination and surveillance. Successful attempts were made across the world to vaccinate more than 80% of populations at risk of smallpox. Whenever a case of the disease was reported, everyone in the household and surrounding households, as
RPA Activity 31 Herd immunity (Specific Aims 1, 2 and 3)
G11_TG_CAPS.indb 20 2012/08/01 9:01 PM

C21S t r a n d 1 • U N I T 1
well as relatives and possible contacts in the area, were vaccinated. This procedure, known as ring vaccination, protected everyone who could possibly have come into contact with the infected person. This served to reduce the chance of transmission and spread of the disease. The world was declared free of smallpox by WHO in 1980. The following reasons may be attributed to the successful programme:• The vaccine was cheap to produce and the same vaccine was used
throughout the world. This was largely due to the fact that the variola virus is relatively stable, that is, it did not mutate and change its surface antigens.
• The vaccine was effective because it was created from a similar strain of virus that was harmless, that is, it was a “live” vaccine.
• The vaccine was freeze-dried and this meant that it could be kept for as long as six months, making its use in the tropics viable.
• Infected people were easy to identify.• It was easy to administer because of the development of a stainless
steel, bifurcated (two-pronged), reusable needle.• The virus did not remain in the body after infection so that it could
become active at a later time or form a reservoir of infection.• Human beings are the only known hosts for the virus and it has a
relatively short survival time outside the human host. This meant that the cycle could be easily broken.
• Many teenagers became enthusiastic vaccinators and suppliers of information about cases – this was especially valuable in remote areas.
Smallpox is the only infectious human disease known to be permanently eliminated through human intervention, ingenuity and cooperation. In 1991 the WHO declared the Americas also to be free of polio. In 2011 India also became free of polio, but at the time of writing an official declaration had not been made.
Learner’s Book page 871 Viruses are very small, between 20–450 nm. A virus is made up of a core
of deoxyribonucleic acid (DNA) or ribonucleic acid (RNA). The strand of either DNA or RNA is enclosed in a protein coat called a capsid. The protein coat is made up of protein subunits called capsomeres. There are different numbers of capsomeres in the protein sheaths of different viruses. Most scientists do not think that viruses are living organisms because they do not respire, feed, excrete, move, grow or respond to stimuli. Viruses are found in the air or in water or soil, but unless they are in the cell of another organism, viruses are inactive. Viruses can only replicate or reproduce within specific host cells.
2 The chemical is peptidoglycan.3 Bacteria have a single strand of DNA that is clumped together to form
the nucleoid.4 Most protists move by means of flagella. Malaria is an example of a
disease caused by a protist. Malaria is transmitted to humans by the Anopheles mosquito.
Activity Self assessment
G11_TG_CAPS.indb 21 2012/08/01 9:01 PM

C22 S t r a n d 1 • U N I T 1
5 Learners will a draw a diagram that is similar to that on page 32 of the Learner’s Book.
6 Fungi reproduce sexually by spores produced by fertile hyphae and asexually by budding.
7 A saprophyte is an organism that derives its food by breaking down organic material. Saprophytic bacteria and fungi are important in the environment because they break organic matter down and recycle nutrients and minerals.
8 Nitrogen-fixing bacteria trap atmospheric nitrogen and convert it into a form of nitrogen that can be used by plants.
9 The essential elements of this cycle are:• The presence of a disease-causing organism – a pathogen. Each type of
pathogen causes a specific disease or set of symptoms.• A reservoir or a source of pathogens. This could be the human body, the
air, the water or the soil. Humans are the main reservoir for micro-organisms that cause human disease, although farm animals such as pigs also provide reservoirs for human disease.
• Routes of disease transmission. Pathogens get into the body through specific sites called portals of entry, for example the skin (open wounds), the respiratory tract, the gastrointestinal tract, and the genitourinary tract. Pathogens also leave the body through sites of exit, such as body fluids or faeces.
• Mode of transmission. Transmission is the movement of pathogens from the source to an entry portal. Examples of direct contact are kissing, shaking hands or sexual intercourse. Examples of indirect contact are clothing, cooking utensils, bedding and door handles and other surfaces.
• Incubation period. This is the time between exposure to the pathogen and the start of symptoms. Different diseases have different incubation periods.
• Period of communicability. This is a time during which the pathogen is particularly easily transmitted. For example, a person who is infected with the human immunodeficiency virus (HIV) is most able to transmit the disease early in the infection when the viral load is high.
• Susceptibility. Pathogens may only cause a disease when the exposed person’s immune system is weak.
Learners will chose the life cycle of one disease that they have studied.10 The physical barriers are:
• the skin• mucous membrane of the respiratory, urinary and digestive tracts• skin of the eye and ear.
11 Fluids secreted by different parts of the body act as chemical barriers. These include:• secretions of the sebaceous glands• perspiration (sweat)• tears• lysozymes• hydrochloric acid in the gut• semen• interferon – proteins made and released by host cells in response to
different pathogens.
G11_TG_CAPS.indb 22 2012/08/01 9:01 PM

C23S t r a n d 1 • U N I T 1
12 Specific immunity is an acquired response that allows the body to detect and destroy particular substances. This type of immunity responds to chemicals called antigens. Each pathogen stimulates the production of a specific antigen. Antigens activate the immune response and interact with cells of the immune system. Once the body has responded to an antigen it “remembers” the pathogen. The next time the body encounters that pathogen or foreign substance there is a fast, specific secondary response to the pathogen.
13 The thymus gland, which is part of the lymphatic system, processes some of the lymphocytes that are involved in the body’s defence system. In the thymus the lymphocytes mature and differentiate into cells that fight specific pathogens.
14 A vaccine is something that is put into the body to improve immunity to a particular disease. A vaccine usually contains a weakened or killed form of a micro-organism or the toxins produced by a micro-organism. This stimulates the body’s immune system so that it produces antibodies against a particular disease without making the person ill. Children are vaccinated against childhood diseases such as measles, mumps and rubella.
15 Antibiotic drugs used today are usually semi-synthetic modifications of natural antimicrobial compounds. For example, the beta-lactam antibacterial drugs include the penicillin antibacterials, which are produced by fungi of the genus Penicillium. Aminoglycoside antibacterials are isolated from living organisms.
16 Learners should outline the process of fermentation that is used in making traditional beer.
G11_TG_CAPS.indb 23 2012/08/01 9:01 PM

C24 S t r a n d 1 • U N I T 2
Your class will benefit greatly if you can arrange access to the resource books listed below:The Wildlife of Southern Africa, Vincent Carruthers, Struik 2008The Vegetation of South Africa, Lesotho and Swaziland, Ladislav Mucina & Michael C Rutherford, Strelizia 19. South African National Biodiversity Institute, 2006Veld Types of South Africa, JPH Acocks, Birds of Southern Africa, Kenneth Newman, Struik, 2002South African Wildflower Guides – published by the Botanical Society of South Africa, available for each region of the country.
Learner’s Book page 88It would be useful to revise the basic principles of classification before starting this activity. The learners should start to see the patterns that can be found in the morphology and habitats of the four major plant groupings. For reference, the major characteristics of the four plant groups discussed in this Unit are:
Bryophytes – mosses and liverwortsNo vascular tissue present. Spore producing with leaf-like structures growing from stems and solid-stalked spore capsules growing out of the leafy part of the plant. (Note that as Bryophytes do not have vascular tissue, these are not true leaves and stems.) Bryophytes are often found in moist areas, often in mats covering rocks and stones, but can occur in any habitat. They contain chlorophyll.
Pteridophytes – fernsNo vascular tissue present. Do not bear flowers and seeds, but produce wind-blown spores, which grow into small green discs (prothalli), which carry male and female organs. Sexually reproduce by means of spores. Spores are born in sporangia, which are usually grouped together to form sori, which are located on the leaf blade, or lamina.
GymnospermsVascular tissue present. Seeds not enclosed in an ovary but exposed either on top of a fleshy or rudimentary seed-bearing leaf.
Key to gymnosperm groups:Seeds exposed on the top of a fleshy or rudimentary seed-bearing leaf – Podocarpaceae (yellowwood family)Seeds concealed between woody scales and exposed only when ripe Leaves long and needle-like; cones with many spirally arranged scales – Pinaceae (pine trees)Leaves very small and opposite: cones with few, opposite scales – Cupressaceae (cypress trees)
AngiospermsVascular tissue present. Seeds enclosed in an ovary.
UNIT 2 Biodiversity of plants
TERM 2
Learner’s Book pages 88–114Duration: 12 hours
RPA Activity 1 Identifying major plant groups (Specific Aim 2)
G11_TG_CAPS.indb 24 2012/08/01 9:01 PM

C25S t r a n d 1 • U N I T 2
An easy-to-use key could be similar to this (learners are bound to pick up plants such as fungi and algae, which were covered in Grade 10, so they have been included here):
1 No vascular tissue present
2 Plant body not specialised into stems and leaves, and the reproductive cells not surrounded by a protective layer.
3 Chlorophyll is present4 Plant usually lives in water............................................ Algae
• Plant usually lives on rocks or in trees................. Lichens (also some algae)• Chlorophyll is not usually present......................... Fungi
• Plant body is often specialised into stems and leaves, and the reproductive cells are surrounded by a protective layer.
5 Plant body dorsiventral, thalloid or leafy................ Liverworts • Plant body radial, leafy.............................................. Mosses
• Vascular tissue present6 Sexual reproduction by spores................................... Ferns
• Sexual reproduction by seed7 Seeds not enclosed in an ovary, but often on
scales in a cone................................................................. Gymnosperms • Seeds enclosed in an ovary, flowers present..... Angiosperms
Again, this is an open-ended activity and one that serves to introduce the major plant groupings by giving learners the opportunity to look closely at plants before they start to tackle the details of each group.
Possible rubric for assessment:
4 3 2 1
Confidently sorted plants into different groups using specific characteristics and where they were found
Able to sort plants into groups, but some overlap occurred
Needed extensive help to start to see the characteristics that could be used to sort plants into groups
Unable to sort plants into groups
Confidently constructed a simple key to distinguish the different plants
Constructed a key, but found some difficulty in using characteristics to produce the key
Needed extensive help to start to construct a key
Unable to construct a key
G11_TG_CAPS.indb 25 2012/08/01 9:01 PM

C26 S t r a n d 1 • U N I T 2
Learner’s Book page 92This activity addresses Specific Aim 2 and learners should by now be comfortable setting up experimental apparatus and recording observations. Use the moss life cycle on page 91 of the Learner’s Book to discuss the alternation of generations, emphasising the dominance of the gametophyte.
You may use the following rubric to assess this activity.
4 3 2 1
Fully competent in the preparation of wet mounts
Almost fully competent in the preparation of wet mounts
Some competence in the preparation of wet mounts
Not yet competent in the preparation of wet mounts
Fully competent in the correct and appropriate use of the microscope
Almost fully competent in the correct and appropriate use of the microscope
Some competence in the correct and appropriate use of the microscope
Not yet competent in the correct and appropriate use of the microscope
Fully skilled in the accurate recording (drawing) of specimens as seen in microscope view
Adequately skilled in the accurate recording (drawing) of specimens as seen in microscope view
Limited skill in the accurate recording (drawing) of specimens as seen in microscope view
Still to develop the skill of accurate recording (drawing) of specimens as seen in microscope view
Learner’s Book page 94This activity shows learners how easy it is to grow ferns in the correct environment and allows them to construct the life cycle of a fern from their own observations. Make sure that each stage of the life cycle is identified (refer to page 95 in the Learner’s Book where the life cycle of a fern is illustrated). Discuss the alternation of generations, which is different from that of mosses in that now the sporophyte is dominant, allowing ferns to move into a greater variety of habitats than bryophytes and grow to a greater size.
Learner’s Book page 94Learners will examine and draw fern plants. Make sure that they understand the structures they are labelling (see diagram on next page).
PPA Activity 2 Growing moss on a damp brick (Specific Aim 2)
RPA Activity 3 Germinating fern spores (Specific Aim 2)
PPA Activity 4 Examining fern structure (Specific Aim 2)
G11_TG_CAPS.indb 26 2012/08/01 9:01 PM

C27S t r a n d 1 • U N I T 2
Learner’s Book page 97Learners will examine and draw the cones, needles and seeds of gymnosperms. Make sure that they understand the structures they are labelling.
Learner’s Book page 98This activity provides learners with the opportunity to look at two major plant groups in detail. They should be able to see the characteristics that make the gymnosperm leaf better adapted for a terrestrial existence:• presence of vascular tissue• a waxy cuticle on the leaves• the shape of the gynmosperm leaf.
pinnae
rachis
pinnules
petiole
young frond
rhizome
leaf scales
adventitious roots
frond
The structure of a fern
PPA Activity 5 Examining gymnosperms (Specific Aim 2)
Female cones: closed (left) and open (right) Cluster of male cones
Pine needles Pine seed (not to the same scale as the cones illustrated above)
RPA Activity 6 How well are mosses, ferns and gymnosperms adapted for life on land? (Specific Aims 1 and 2)
seeds
attachment points
G11_TG_CAPS.indb 27 2012/08/01 9:01 PM

C28 S t r a n d 1 • U N I T 2
Watching the sporangia open under the microscope should be particularly interesting and instructive as it provides a first-hand look at how spores are released. The activity also allowed learners to improve their laboratory and microscope skills.
Learner’s Book page 100Learners examine, draw and label specimens of angiosperm plants. Make sure that there are enough plants with seeds, fruits and flowers and that each learner manages to examine the full structure.
Learner’s Book page 1001 Answers should include:
• have xylem and phloem• xylem vessels have thick lignified cell walls• seeds produced by an ovary inside a flower• variable body forms.
2 Answers should include:• naked seeds• ovules also naked• land plants with well-adapted vascular tissue• many have tough needle-like leaves adapted for harsh conditions.
3 Spermatophyte – seed plant4 Learners will classify their seeds on the basis of morphology.5 Answers will vary, but learners should show that they understand the
principle of co-evolution.
PPA Activity 7 The structure of angiosperms (Specific Aim 2)
terminal bud
axillary bud
flower
leaf
internode
nodestem
root
An angiosperm plant showing a flower on a mature sporophyte
Activity 8 Angiosperms and gymnosperms (Specific Aim 1)
G11_TG_CAPS.indb 28 2012/08/01 9:01 PM
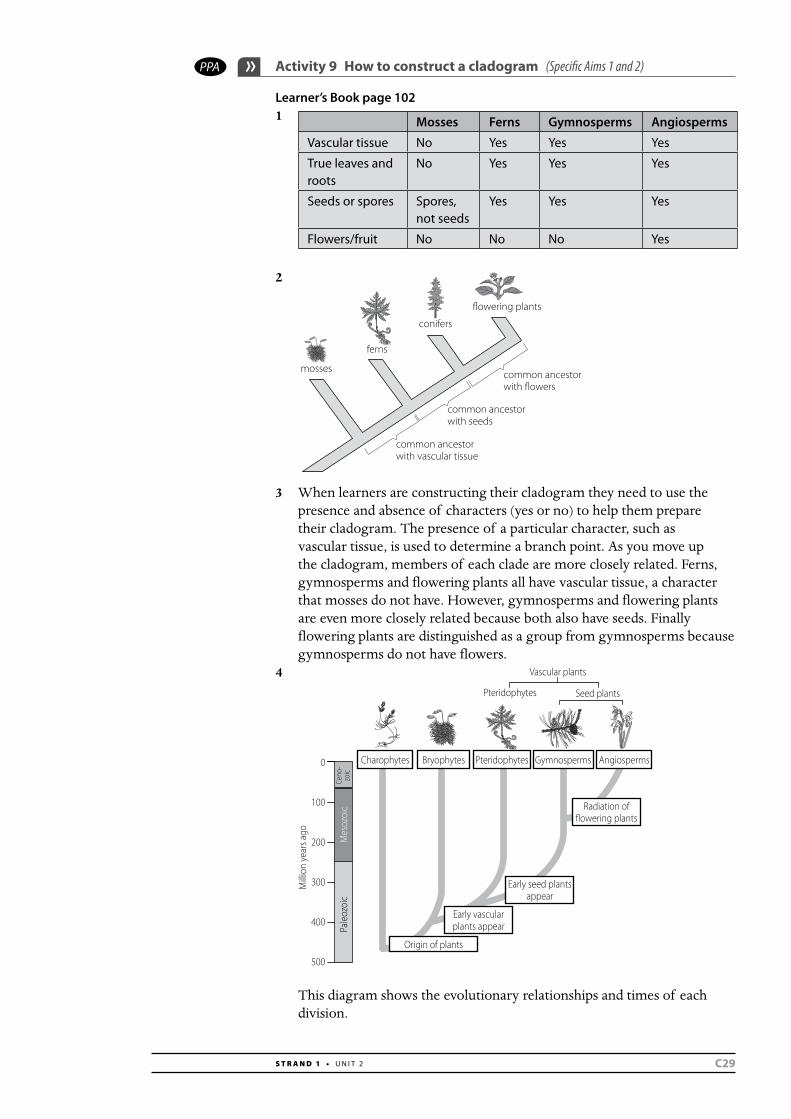
C29S t r a n d 1 • U N I T 2
Learner’s Book page 1021
2
3 When learners are constructing their cladogram they need to use the presence and absence of characters (yes or no) to help them prepare their cladogram. The presence of a particular character, such as vascular tissue, is used to determine a branch point. As you move up the cladogram, members of each clade are more closely related. Ferns, gymnosperms and flowering plants all have vascular tissue, a character that mosses do not have. However, gymnosperms and flowering plants are even more closely related because both also have seeds. Finally flowering plants are distinguished as a group from gymnosperms because gymnosperms do not have flowers.
4
This diagram shows the evolutionary relationships and times of each division.
PPA Activity 9 How to construct a cladogram (Specific Aims 1 and 2)
Mosses Ferns Gymnosperms Angiosperms
Vascular tissue No Yes Yes Yes
True leaves and roots
No Yes Yes Yes
Seeds or spores Spores, not seeds
Yes Yes Yes
Flowers/fruit No No No Yes
common ancestor with vascular tissue
common ancestor with seeds
common ancestor with flowers
mosses
ferns
conifers
flowering plants
Vascular plants
Pteridophytes Seed plants
Charophytes Bryophytes Pteridophytes Gymnosperms Angiosperms
Radiation of flowering plants
Early seed plants appear
Early vascular plants appear
Origin of plants
Milli
on ye
ars a
go
Pale
ozoi
cM
esoz
oic
Ceno
-zo
ic
0
100
200
300
400
500
G11_TG_CAPS.indb 29 2012/08/01 9:01 PM

C30 S t r a n d 1 • U N I T 2
Learner’s Book page 1083
The large anthers and feathery stigmas that hang outside the wind-pollinated flower should be prominent.
4 Three adaptations are:• Long and flexible filaments that allow the anthers to dangle outside
the flower, to catch the wind so that pollen grains are shaken out of them.
• Large quantities of very small and light pollen grains are produced by the anthers.
• The stigmas are long and feathery and hang outside the flower, where they expose a large surface area that increases the chances of trapping pollen grains that float in the air.
5 The colour of the flower will vary, as will the presence or absence of a scent. The insect pollinator will also vary. The anthers and stigmas will be deep inside the flower and the pollen grains will be sticky or spiny.
6 The adaptations are (any three of ):• Flowers are large and brightly coloured to attract insects.• Many insect-pollinated flowers produce a scent to attract insects.• Anthers and stigmas are inside the flower so that an insect brushes
against the anthers and stigma. • Pollen grains are usually sticky or spiny.
These adaptations are also suitable for bird pollination.
PPA Activity 10 Observing wind-pollinated, insect-pollinated and bird-pollinated flowers (Specific Aim 2)
coloured
not coloured
× 50
× 5
feathery stigma hanging outside the flower
anthers dangling outside the flower
Insect-pollinated flower Insect-pollinated flower
Bird-pollinated flower Wind-pollinated flower
× 2 × 2
× 2
G11_TG_CAPS.indb 30 2012/08/01 9:01 PM

C31S t r a n d 1 • U N I T 2
7 Table showing differences between insect-, wind- and bird-pollinated flowers:
Insect-pollinated flowers
Bird-pollinated flowers Wind-pollinated flowers
Large, conspicuous petals
Large, conspicuous petals
Small, inconspicuous petals/no petals
Often has scent Often has scent No scent
Anthers inside the flower where insect has to brush past them to get to the nectar
Anthers inside the flower where bird has to brush past them to get to the nectar
Anthers dangle outside flower, where they catch the wind
Stigmas inside the flower, where insect has to brush past them to get to the nectar
Stigmas inside the flower, where bird has to brush past them to get to the nectar
Stigmas large and feathery, dangling outside the flower, where pollen in the air may land on them
Sticky or spiky pollen grains, which stick to insects
Sticky or spiky pollen grains, which stick to birds
Smooth light pollen, which can be blown in the wind
Smaller quantity of pollen made, much reaches the target flowers because it is transported by insects
Smaller quantity of pollen made, much reaches the target flowers because it is transported by birds
Very large quantities of pollen made, because most will be lost by being blown away in the wind
Learner’s Book page 109Warn learners to take care while using the scalpel so that they do not cut themselves. Their diagrams should look similar to this, with the different features for each flower type.
PPA Activity 11 Dissecting wind-pollinated, insect-pollinated and bird-pollinated flowers (Specific Aim 2)
ovary
petal
anther
filamentstamen
style
stigma
pistil
sepal
seeds
G11_TG_CAPS.indb 31 2012/08/01 9:01 PM

C32 S t r a n d 1 • U N I T 2
Learner’s Book page 112When marking the essay, content scores a possible 17 and synthesis scores a possible 3 (total20).The essays should include the following content:
Whyseedshavemadespermatophytessuccessful• The seed can remain dormant (inactive but alive) and can survive harsh
weather conditions for a very long time.• The seed becomes active when there are good conditions for germination.• The testa and the cotyledons protect the embryo during the early stages
of development.• The cotyledons contain stored food to nourish the embryo in the
early stages of development until the seedling (young plant) can photosynthesise for itself.
• The seed is usually adapted for dispersal in many ways, e.g. it may have wings.
• Dispersal is significant because the seeds are spread away from the parent plant and from each other, thus reducing competition.
• The seed is a product of sexual reproduction and therefore every seed is genetically different, which increases its chances of survival in changing environmental conditions.
(6)Importanceofseedsasafoodsource• Seeds, which develop from fertilised ovules, are a valuable source of food
for humans and animals.• Seeds that are cultivated and harvested for food for humans include rice,
coffee, cacao, peas, soya beans and mealies.• Some of these form the staple diet, e.g. rice and mealies, of people in
different countries.• When these crops fail because of drought or flooding, this often causes
starvation and death in a population, especially in the poorer countries. (5)Seedbanksandbiodiversity• A seed bank is a facility, built by governments and other organisations, to
store seeds of different crop plants and wild plants, so that biodiversity is maintained.
• The Global Crop Diversity Trust has proposed that a seed bank be established in the Arctic region to ensure the safety of seeds, especially of essential crops, in case of natural and political disasters.
• There are approximately 150 crops that make up the majority of the food grown and consumed by humans.
• Farmers tend to cultivate crops that will increase desirable traits at the expense of genetic variation.
• The crops with these desirable traits are inbred to maintain only the desirable traits, which leads to a loss of genetic variation.
• The genetic variability of food crops needs to be maintained to safeguard food security.
• The reasons for maintaining a seed bank include: the crop could be wiped out if attacked by a disease, e.g. especially if all the plants are of the same variety.
• In a seed bank, samples of all the variations of a crop are preserved so that a hardier crop that is resistant to diseases may be grown.
Activity 12 Essay: The significance of seeds (Specific Aims 1 and 3)
G11_TG_CAPS.indb 32 2012/08/01 9:01 PM

C33S t r a n d 1 • U N I T 2
• A seed bank also preserves unusual and rare crop varieties that are not commercially farmed, to maintain biodiversity.
• A seed bank also keeps cultures of plants that are not grown from seed, in case they are needed, e.g. cassava.
(6) Content(17)Assessingthepresentationoftheessay
Marks Descriptions
3 Well structured – demonstrates insight and understanding of question2 Minor gaps or irrelevant information in the logic and flow of the answer1 Significant gaps or irrelevant information in the logic and flow of the
answer0 Not attempted/nothing written other than question number/no relevant
information Synthesis(3) Total(20)
Learner’s Book page 1131 Bryophytes are small (< 20 cm) simple green plants called mosses or
liverworts. The plant body is a structure called a thallus. The moss plant is made up of two distinct phases:• the gametophyte, which is haploid (n)• the sporophyte, which is diploid (2n)
Bryophytes:• do not have specialised true leaves, stems and roots• are very small because they do not have vascular tissue (xylem and
phloem) • produce spores, not seeds.
Bryophytes have rhizoids instead of roots, which are used mainly to anchor them to a surface rather than to absorb water and nutrients. Water and nutrients are moved through bryophytes through the processes of diffusion, cytoplasmic streaming inside cells and capillary action. They contain chlorophyll, and so can photosynthesise.
2 The gametophyte is the dominant generation in bryophytes. It is haploid.3 Alternation of generations:
• The gametophyte generation produces gametes.• The gametophyte generation is always haploid (n).• The sporophyte generation produces spores. • The sporophyte generation is always diploid (2n).• The life-cycle sequence is then: Gametophyte (n) – gametes (n)
– fertilisation (2n) – embryo (2n) – sporophyte (2n) – spores (n) – gametophyte again and repeat.
4 In both these groups of plants the sperm still need water to swim to meet the egg, so they are dependent on water for reproduction.
5 Ferns have true leaves, stems and roots. Ferns have vascular tissue – xylem and phloem.
6 Gymnosperms:• are tracheophytes, which means that they are land plants with a well-
developed vascular system, i.e. xylem and phloem• produce naked seeds in cones• have tough, needle-like leaves that are adapted for drought
conditions.
Activity Self assessment
G11_TG_CAPS.indb 33 2012/08/01 9:01 PM

C34 S t r a n d 1 • U N I T 2
• Pollen and seeds are produced in protective cones made up of tightly packed woody scales.
Angiosperms: • For the first time, fertilisation is not dependent on water.• Angiosperms have roots, stems and leaves. • Each of these organs has specialised tissue to allow the plant to live
successfully on land. • These tissues support the plant body, conduct substances to all parts
of the plant and are capable of producing organic food through photosynthesis.
• The dominant generation in angiosperms is the diploid (2n) sporophyte generation.
7 Advantages of asexual reproduction:• Only one parent is needed. The new individuals (offspring) are
genetically identical to the parent. If the parent is well adapted to survive in a particular environment, then the offspring will also be well adapted.
• Asexual reproduction allows lots of offspring to be produced in a short time, which allows them to crowd out the competition from other plants.
• In asexual reproduction, there is no need to rely on pollination or dispersal agents for new plants to form.
Disadvantages of asexual reproduction:• All the offspring are genetically identical so that if the environment
changes, the offspring may not survive.• Weakness in the parent will be transmitted to the offspring, for
example susceptibility to diseases.• Overcrowding – because of the rapid growth of offspring, this may
lead to increased competition for space, water, sunlight and so on. This can lead to unhealthy plants.
Advantages of sexual reproduction:• Sexual reproduction produces offspring that are genetically different
from the parents and from other offspring.• This leads to increased variation in the population, which increases
the chances of survival if the conditions in the environment change, e.g. the offspring can become more resistant to drought and diseases.
• Farmers can cross one organism that has certain desirable characteristics with another that has different desirable characteristics to produce offspring that give a better yield, e.g. cattle that give better meat or milk, or plants that produce better seeds and fruit.
Disadvantages of sexual reproduction:• Sexual reproduction requires two parents (one male and one female).• The offspring of sexual reproduction are often born helpless and
vulnerable and may take a long time to mature. This means that they may be vulnerable to predators or disease and are dependent on their parents for food and protection.
• Plants that reproduce sexually depend on pollinating agents to transfer pollen from one plant to another and on dispersal agents to spread seeds away from the parent.
G11_TG_CAPS.indb 34 2012/08/01 9:01 PM

C35S t r a n d 1 • U N I T 2
8 A mature flower is made up of calyx, corolla, androecium (male part) and gynaecium (female part). The androecium is made up of many stamens, each of which has a stalk called a filament, which is supporting an anther.
There are pollen sacs (also called microsporangia) inside the anthers. Pollen grains (n) are produced by meiosis from microspore mother cells (2n) that are found inside the microsporangia. Two haploid male gametes are found inside each microspore. The gynaecium is made up of ovaries, each of which contains ovules. There is a style at the top of each ovary. The style supports the stigma, which traps pollen grains.
9 Wind-pollinated flowers are relatively small flowers. Many grasses have wind-pollinated flowers. These flowers are normally found at the tip of long stalks so that they can easily catch the wind.
The filaments of wind-pollinated flowers are long and flexible, allowing the anthers to dangle outside the flower to catch the wind so that the pollen grains are shaken out of them. These flowers produce large quantities of very small, light pollen grains. The stigmas are long and feathery and hang outside the flower. The stigmas expose a large surface area, which increases the chances of catching pollen grains that float in the air.
Wind-pollinated flowers do not need to be brightly coloured and highly scented and do not produce nectar.
10 The features that would suggest insect or bird pollination are: brightly coloured flowers, scent, anthers with sticky pollen deep inside the flower, small quantities of pollen, sugar-rich nectar, protein-rich pollen, strong flowers and stems (bird pollination).
11 Seeds have made the spermatophytes the most successful plants on Earth because:• The seed can remain dormant (inactive but alive) and can survive
harsh weather conditions for a very long time. The seed becomes active when there are good conditions for germination.
• The testa and the cotyledons protect the embryo during the early stages of development.
• The cotyledons contain food to nourish the embryo in the early stages of development until the seedling (young plant) can photosynthesise for itself.
• The seed is usually adapted for dispersal in many ways (e.g. it may have wings). This is significant because the seeds are spread away from the parent plant and from each other, thus reducing competition between the parent and its offspring.
• The seed is a product of sexual reproduction and therefore every seed is genetically different, which increases its chances of survival in changing environmental conditions.
12 A seed bank is a facility, established by governments and other organisations, to store seeds of different crop plants and wild plants, so that biodiversity is maintained. The Global Crop Diversity Trust has proposed that a seed bank be established in the Arctic region to ensure the safety of seeds, especially of essential crops, in case of natural and political disasters.
G11_TG_CAPS.indb 35 2012/08/01 9:01 PM

C36 S t r a n d 1 • U N I T 3
Before starting any of the activities in this unit you would, once again, be well advised to make sure that you have plenty of field guides available, as well as book on mammals and other animals.
Suggested resource books include:The Wildlife of Southern Africa, Vincent Carruthers, Struik 2008Birds of Southern Africa, Kenneth Newman, Struik 2002A Field Guide to the Larger Mammals of Africa, Jean Dorste & Pierre Dandelot, CollinsA Field Guide to the Mammals of Africa, Theodor Haltenorth & Helmut Diller, CollinsField Guide to Butterflies of South Africa, Steve Woodhall, Struik 2005Frogs and Frogging in Southern Africa, Vincent Carruthers, Struik 2001Field Guide to Snakes and other Reptiles of Southern Africa, Bill Branch, Struik 1998African Insect Life, SH Skaife, Struik 1979The Living Shores of Southern Africa, Margo and George Branch, Struik 1981
Learner’s Book page 116This is an open-ended activity and could be one that continued through the course of teaching animal diversity because as the learners encounter new groups of animals in the classroom, they will want to go back to their phlogenetic tree and place the new animals on it. You could use the following criteria for assessment.
4 3 2 1Exceptionally skilled in the ability to access data
Well skilled in the ability to access data
Somewhat skilled in the ability to access data
Not yet skilled in the ability to access data
Fully competent in interpreting and synthesising data
Adequately competent in interpreting and synthesising data
Fairly competent in interpreting and synthesising data
Not yet competent in interpreting and synthesising data
Learner’s Book page 1201
UNIT 3 Biodiversity of animals
TERM 1
Learner’s Book pages 115–140Duration: 8 hours
PPA Activity 1 The incredible world of animals around you (Specific Aims 1 and 2)
PPA Activity 2 Surface area and volumes (Specific Aims 1 and 2)
Model organisms
A B C D E FLinear Area of
sideTotal
surface area
Volume Ratio C/D
No. of cm2 of surface
area for each cm3
1 1 cm 1 cm2 6 cm2 1 cm3 6 / 1 62 2 cm 4 cm2 24 cm2 8 cm2 24/8 3 3 10 cm 100 cm2 600 cm2 1 000 cm2 600/1 000 0,6
G11_TG_CAPS.indb 36 2012/08/01 9:01 PM

C37S t r a n d 1 • U N I T 3
2 • Thin–reduceddistanceforgasestodiffusethrough,sodiffusionis faster
• Moist–ensuresthatthesurfaceisalwayscleansothatthegasescandiffuseuninhibited.Inaddition,moistureallowsforthegasestodissolveinitinordertodiffusethroughtheexchangesurface.
• Largesurfaceareainrelationtothesizeof thebody–toensurethatdiffusionof gasesismoreefficientandoccursatafasterrate
• Transportsystem–ensuresthatthegasesareconstantlymovedtoandawayfromthesurfacetomaintainadiffusiongradientaswellas ensure delivery to cells
• Wellprotected–sincethegasexchangesurfaceisthinanddelicateit has to be protected from damage as well as from drying out
• Presenceof aventilationsystem–enhancestheeffectivenessof thediffusionsystembyensuringthemovementof gasestoandawayfromtheexchangesurface.
3 The more simple animals are generally small and are shaped in ways thatallowthesurfaceof theanimaltobethegasexchangesurface.Thatis, these smaller organisms have a larger surface area:volume ratio. The complexanimals,ontheotherhand,arelarger,andthereisagreaterdegree of division of labour among their more specialised organs and systems.Inaddition,theyusuallyhaveahigherrateof metabolism,andthereforerequiremoreoxygenandproducemorecarbondioxideperunitof body volume. Also, they have a low surface area:volume ratio.
Learner’s Book page 1212 The learners’ tables should look similar to this:
Phylum Symmetry Number of tissue layers
Present Absent
Porifera, cnidairans
Radial symmetry
Diploblastic _ Coelom Through gut
Platyhelminthes Bilateral symmetry
Triploblastic Coelom Through gut
Annelids Bilateral symmetry
Triploblastic CoelomThrough gut
_
Arthropods Bilateral symmetry
Triploblastic CoelomThrough gut
_
Molluscs Bilateral symmetry
Triploblastic CoelomThrough gut
_
Echinoderms Bilateral symmetry
Triploblastic CoelomThrough gut
_
Chordates Bilateral symmetry
Triploblastic CoelomThrough gut
_
4 When discussing body plans in relation to function, keep the following principles in mind:• Sponges are the first organisms where the cellular level of
organisationisseen–allowingspecialisationintofeeding,movementand reproductive cells. This in turn would allow the organism to moveintodifferenthabitatsandtogrowlargerthanthesingle-celledprotozoans were able to.
PPA Activity 3 Relating body plans and phyla (Specific Aim 1)
G11_TG_CAPS.indb 37 2012/08/01 9:01 PM

C38 S t r a n d 1 • U N I T 3
• Cnidarianstakethislevelof organisationfurther,withdifferentiationintothefree-swimmingmedusaandthesessilepolyp.Itisinthisgroupthatweseedifferentiationintomaleandfemaleindividuals.The life cycles of cnidarians generally contain both body types, each performingadifferentfunction.
• Platyhelminthesaretriploblasticandprovidethefirstexampleof differentiationintoadefinitehead(cephalisation)witheyesandothersensorystructures.Thebodyisdifferentiatedintoananteriorand posterior end. The animal is also dorso-ventrally flattened. This hasimplicationsformovement–theanimalcanmovepurposefullyaway from a stimulus. The addition of the mesoderm layer allows specialisation into tissues, such as muscles, which allows increasing complexityinactivities.
• From annelids onwards, tissues and organs and the through gut allow greater diversity of habitats and behaviour.
• Itisthedevelopmentof theexoskeletonandthentheendoskeletonthat allows true movement into terrestrial environments. Even annelids, apparently terrestrial, need to be in moist places.
Note:Thewaythatmosttextbooksorganiseanimalsfromleasttomostcomplexsuggestsalinearityinevolutionthatisfalse.Evolutionisnotalinearprocess,withoneorganism(commonlyportrayedas“man”)atthepinacle. Evolution is simply the process by which new species and new characteristics within species develop. So the process is identical, from the simplesttothemostcomplexorganism.
Aurelia life cycle
young polyp
planula larva
polyp-producing medusae
young medusa
mature adult medusa
G11_TG_CAPS.indb 38 2012/08/01 9:01 PM

C39S t r a n d 1 • U N I T 3
A note on molluscsYou will see that molluscs are not included in the list of phyla to be covered, but learners are likely to ask about them because they are so common. Here are some brief notes on the phyla for your reference. Molluscs are the second largest phylum in the animal kingdom. Snails are the most commonly recognised members of the phylum, but they are also representedbysquidandclams,whichdiffergreatlyinappearance. The body is bilaterally symmetrical, with a small, inconspicous head at the anterior end. The ventral surface is largely made up of a muscular foot. The soft internal organs are contained in the visceral mass, which is dorsal to the foot and completely covered by a mantle, which secretes a calcareous shell. The digestive system is a tube, from the mouth to the anus. The radula isuniquetomolluscs–achitinousribboncoveredwithmanyrowsof hardteeth,usedtoraspoff smallamountsof food. Molluscshaveanopencirculatorysystemandtwoexcretoryorgansthatsecrete nitrogenous waste from the blood and reabsorb salts and other nutrients from the pericardial fluid. The nervous system includes an anterior ring of nervous tissue around the gut. Egg or sperm are shed into the sea or into moist soil, so molluscs are dependent on water for reproduction.
Learner’s Book page 123This activity allows learners to see that organisms such as Hydra can easily be collected from their local environment and then observed in the classroom.
Learner’s Book page 124This activity provides the same type of activity as that in Activity 4.
RPA Activity 4 Collecting Hydra (Specific Aim 2)
mouth
tentacles
gastrovascular cavity
hydra bud
Hydra
RPA Activity 5 Trapping planarians (Specific Aim 2)
head
eyespot
sensory lobe
tail
A planarian
G11_TG_CAPS.indb 39 2012/08/01 9:01 PM

C40 S t r a n d 1 • U N I T 3
You may use the following criteria to assess both these activities.
4 3 2 1
Competent in setting up the collecting apparatus correctly
Mainly competent in setting up the apparatus correctly
Showed some competence in setting up the apparatus correctly
Was not able to set up the apparatus correctly
Competent in examining and drawing both hydra and planaria
Mainly competent in examining and drawing both hydra and planaria
Showed some competence in examining and drawing both hydra and planaria
Was not able to examine and draw hydra and planaria
Learner’s Book page 127This is another open-ended activity that could take place throughout this unit of the strand. Make sure that you have plenty of reference material available andif possiblearrangeexcursionstolocalmuseumsorparkstogathermoreinformation. Assess the project using the following criteria.
4 3 2 1
Used a wide variety of media and resources, e.g. books, the internet, videos, DVDs etc.
Consulted an adequate variety of resources
Consulted a few resources
Limited resources were consulted, e.g. only one book with limited information
Was able to accurately list the characteristic features of each arthropod class
Listed the characteristic features of each arthropod class
Was able to list a limited number of features of each arthropod class
Could not list the features of each arthropod class
Was confident in applying knowledge from a previous grade to a new situation
Could apply knowledge from a previous grade, but in a limited way
Struggled to apply knowledge from a previous grade
Was not able to apply knowledge from a previous grade
Learner’s Book page 128Thisactivityisagoodintroductiontotechniquesof fieldbiology.Itlinksinwith Activity 6 and can be carried out while the learners are still busy with Activity 6 because it will provide them with first-hand evidence of the range of arthropods that are in their areas. The pitfall traps will inevitably trap animals other than arthropods. Allow learners who are keen to do sotoidentifytheseanimalsaswell,sinceitwillgivethemexperienceof field biology in general and should stimulate interest in general animal and habitat diversity.
RPA Activity 6 The range of arthropods (Specific Aims 1 and 2)
RPA Activity 7 Collecting arthropods (Specific Aim 2)
G11_TG_CAPS.indb 40 2012/08/01 9:01 PM

C41S t r a n d 1 • U N I T 3
You can use the following criteria to assess the activity.
4 3 2 1
Confidently set up and monitored the apparatus required and placed it in well demarcated areas
Able to set up an monitor the apparatus, but less sure of how to carry out the activity
Limited ability to set up and monitor the apparatus and to demarcate specific areas
Unable to set up and monitor the appartus or to demarcate specific areas
Confidently drew and identified the arthropods collected
Drew the arthropods and identified some of them
Limited ability to draw and identify the arthropods collected
Unable to draw and identify the arthropods collected
Learner’s Book page 136The headings are: 1 Fish 2 Amphibians 3 Reptiles 4 Birds 5 Mammals
Learner’s Book page 1401 Aphylumisthetaxonomicrankbelowkingdomandaboveclass.A
kingdom contains more than one phylum. A phylum can be defined in two ways:• it is a group of organisms that have a similar body plan • it is also a group of organisms that are related through evolution.
2 There are five aspects of any animal body plan that are important and common to all living animals:• symmetry(asymmetry,bilateralsymmetryorradialsymmetry)and
cephalisation• numberof tissuelayersdevelopingfromtheembryo–two
(diploblastic)orthree(triploblastic)• presenceorabsenceof acoelom(acavitywithinthemesoderm)• presence or absence of a through gut.
3 Radial symmetry: an animal with radial symmetry has no left or right sides. Bilateral symmetry: an animal with bilateral symmetry has a left and a right side.
Threephylaof animals,sponges,cnidariansandctenophores(whichwedonotdealwith)showradialsymmetry.However,thisradialsymmetry in the sponges is not seen in the modern groups, which show asymmetry. All the remaining groups of animals show bilateral symmetry.
4 Cephalisation is the presence of a definite head containing sensory organs that face in the direction that the animal moves in. Cephalisation develops at the same time as changes in symmetry. Animals that are bilaterally symmetrical show cephalisation. The three phyla of animals that show radial symmetry do not show cephalisation.
5 Cephalisationisfirstseenintheplatyhelminthes–theflatworms–whichhave sense organs in the head region and is then present in all the rest of the bilaterally symmetrical animal phyla.
Activity 8 Classifying vertebrates (Specific Aim 1)
Activity Self assessment
G11_TG_CAPS.indb 41 2012/08/01 9:01 PM

C42 S t r a n d 1 • U N I T 3
Chordates(vertebrates)aretheonlyanimalsthathaveatrueheadthat contains a true brain, which is divided into several vesicles that control and co-ordinate the nervous responses of the body. The bony cranium is also unique to vertebrates, as is the concentration of sense organs–theeyes,earsandnose–onthehead.
6 Thenumberof tissue(germ)layersdevelopingintheembryoarealsoused to place animals in groups. The early embryo, called the blastula, consists of a ball of cells. The animal is either:• diploblastic, with two tissue layers with ectoderm on the outside and
endoderm on the inside• triploblastic, with three tissue layers, with mesoderm between the
ectoderm and the endoderm. The number of tissue layers in the blastula determines whether or not
the animal is diploblastic or triploblastic. Animals with radial symmetry, such as the cnidarians, produce two tissue layers, the ectoderm and the endoderm. They are diploblastic. All the rest of the animal groups have bilateral symmetry and produce a third layer between these two layers, called the mesoderm. They are triploblastic. These tissue layers eventually give rise to all of an animal’s tissues and organs through a process called organogenesis.
7 All the more advanced animal phyla, from annelids and arthropods to the chordates, have a coelom and a tube-within-a-tube arrangement. This particular arrangement is very important in animal evolution because it provides a number of advantages:• itallowsanimalstobecomelargerandmorecomplexbyproviding
space for organs to develop• it allows the body wall and the organs to behave independently of
eachother–inotherwords,theorgansdonotmovewiththebodywall
• in some phyla, such as the annelids, the coelom is filled with fluid that provides a hydrostatic skeleton, which helps members of the phylum to move and burrow in the soil
• insomephyla,coelomicfluidhelpstotransportfood,oxygenandwastes.8 Symmetry and
cephalisationNumber of tissue layers developing from the embryo
Number of openings in the gut
Presence or absence of a coelom and blood system
Porifera Asymmetrical, no cephalisation
Endoderm and ectoderm, diploblastic
No gut Acoelomate, no blood system
Cnidaria Radially symmetrical, no cephalisation
Endoderm and ectoderm, diploblastic
Blind-ending gut
Acoelomate, no blood system
Platyhel-minthes
Bilaterally symmetrical, cephalisation
Endoderm, mesoderm, ectoderm, triploblastic
Blind-ending gut
Acoelomate, no blood system
Annelida Bilaterally symmetrical, cephalisation
Endoderm, mesoderm, ectoderm, triploblastic
Through gut Coelomate, with blood vessels throughout length of body
G11_TG_CAPS.indb 42 2012/08/01 9:01 PM

C43S t r a n d 1 • U N I T 3
Symmetry and cephalisation
Number of tissue layers developing from the embryo
Number of openings in the gut
Presence or absence of a coelom and blood system
Arthropoda Bilaterally symmetrical, cephalisation
Endoderm, mesoderm, ectoderm, triploblastic
Through gut Coelomate, with blood vessels
Chordata Bilaterally symmetrical, cephalisation
Endoderm, mesoderm, ectoderm, triploblastic
Through gut Coelomate, with blood vessels and heart, lungs and gills
9 The main diagnostic features of crustaceans are:• compound eyes on stalks• two pairs of antennae• abodydividedintoacephalothorax(headandthorax)and
an abdomen• five pairs of jointed legs.
The diagnostic features of insects are: • Thebodyisdividedintoahead,athoraxandanabdomen.• The head carries a pair of antennae, a pair of compound eyes and a
series of mouthparts. • Insectshavethreepairsof jointedlegs.Mosthaveoneortwopairsof
wings, but some are wingless. There are two classes of myriapod:
• Centipedes: class chilopoda• Millipedes: class diplopoda.
Centipedes have flattened, segmented bodies and one pair of legs on each segment. They are well adapted for running fast. The head has a single pair of antenna, poison claws and strong mouthparts.
Millipedes have rounded, segmented bodies and two pairs of legs on each segment. The head has a single pair of antenna and strong mouthparts.
10 All chordates have a notochord, which is a long rod of supportive tissue derived from the dorsal wall of the gut in the embryo. The cells of the notochord are unique and it is surrounded by sheaths of connective tissue. All chordates have a notochord during early development and this becomes the bony vertebral column. This contains a nerve cord called the spinal column. The spinal column and the vertebral column are unique to chordates.
11 Young mammals suckle milk from their mother’s mammary glands.12 Learner’s should cover the main facts presented in the section on soil
food webs on page 138 of the Learner’s Book.
G11_TG_CAPS.indb 43 2012/08/01 9:01 PM

C44 S t r a n d 2 • U N I T 1
Unit 1: PhotosynthesisUnit 2: Animal nutrition (mammals)Unit 3: Cellular respirationUnit 4: Gas exchangeUnit 5: Excretion in humans
Learner’s Book page 147All the investigations described in this activity may be carried out by a number of groups at the same time. The results of the different groups should then be pooled, followed by a discussion about the requirements of photosynthesis. The activity describes the method for testing a leaf for starch. It is important for learners to understand this method, because it is used in subsequent investigations. Explain to the learners that the leaf is placed:• in hot water to soften the tissues and break down the cells• in alcohol to remove the chlorophyll from the leaf (be careful: alcohol is
flammable and should therefore not be heated directly over the flame)• back in warm water, after it is removed from the alcohol, so that it can
be softened• in an iodine solution, where it will turn blue-black.
Investigations into the factors required for photosynthesisActivities 2 to 4 help the learners to work out what factors are needed for the process of photosynthesis. Each group must conduct all the investigations that are explained on the following pages. You will need to de-starch all the potted plants that you used for these investigations. To do this, place the potted plants in the dark for a period of about 24 hours. The results for each investigation may be recorded in a table, a graph, as a drawing, or as a combination of all three.
strand 2
LIfe processes In pLants and anImaLs
UNIT 1 photosynthesis
term 2
Learner’s Book pages 145–161duration: 12 hours
PPA Activity 1 Testing for starch in leaves (Specific Aim 2)
G11_TG_CAPS.indb 44 2012/08/01 9:01 PM

C45S t r a n d 2 • U N I T 1
Learner’s Book page 1483
5 When tested for starch, the green part of the leaf should turn blue-black, while the other (white) part will take up the colour of the iodine solution.
6 The green part of the leaf turned blue-black because it contained starch. Starch formed here because it contained chlorophyll.
7 a Chlorophyllb When chlorophyll is present, the leaves will be able to produce starch.c To determine whether chlorophyll is essential for the production of
starch.d The chlorophyll-containing parts of a leaf contain starch, which
forms during photosynthesis, thus indicating that chlorophyll is essential for photosynthesis.
e The design of the investigation could be improved by using a greater number of samples or by using different species of plants with variegated leaves.
Learner’s Book page 1482 The part of the leaf that was exposed to the light turned blue-black with
the addition of iodine solution, while the part that was covered took up the colour of the iodine solution.
3 The part of the leaf that turned blue-black indicates the presence of starch. Starch could be present only if photosynthesis took place. Hence, the presence of light allowed photosynthesis to take place.
4 a Sugars will be formed and stored as starch in the presence of light or light is not necessary for starch production in plants.
b To determine whether light is necessary for the process of photosynthesis.
c Lightd CO2; chlorophyll; water.e It blocks the stomata since it is not porous, thereby preventing the
exchange of gases.f The design of the investigation could be improved in the following
ways: • Instead of using aluminium foil, dark porous paper could be used. • Cover both upper and lower surfaces. • Cover the leaf completely. • Use a number of samples.g When exposed to light, green leaves are able to produce starch,
indicating that light is essential for photosynthesis.
PPA Activity 2 Photosynthesis: Investigation 1 (Specific Aim 2)
white part of leaf
green part of leaf
PPA Activity 3 Photosynthesis: Investigation 2 (Specific Aim 2)
G11_TG_CAPS.indb 45 2012/08/01 9:01 PM

C46 S t r a n d 2 • U N I T 1
Learner’s Book page 1492 The leaves of plant A remained yellow or brown, which is the colour of
the iodine solution, while the leaves of plant B turned blue-black.3 Starch is present in plant B, indicating that photosynthesis has taken
place, while no starch is present in plant A, indicating that photosynthesis did not take place.
4 a When sufficient CO2 is present, leaves will be able to produce starch or CO2 is not required for photosynthesis.
b To determine whether CO2 is necessary for the production of starch in green leaves.
c One serves as a control for the other, so that a comparison can be made in order to determine the effect of the factor being tested. That is, to ensure that the result is due to the factor being investigated and not because of some other factor.
d CO2e Light intensity; temperature; water; chlorophyll.f i Hydroxide solution absorbs or removes CO2. ii Bicarbonate solution is a source of CO2.g The design can be improved by using a number of samples. It could
also be improved by placing a plastic bag over the pot to cover or isolate the soil. This is because soil micro-organisms could release CO2 into the air in plant A, which could influence the results.
h In the presence of CO2, green leaves are able to synthesise starch, that is, CO2 is required for photosynthesis.
Learner’s Book page 1501 To investigate the influence of light on photosynthesis or whether light
is required for photosynthesis or whether oxygen is produced during photosynthesis.
2 a In test tube A there was no photosynthesis because the foil reflected light and so CO2 was not absorbed for photosynthesis, which caused an increase in acidity.
b In test tube B there was a low rate of photosynthesis because perforated aluminium foil allows some light to pass through or to be absorbed, but there is a decrease in the light intensity and so only a small amount of CO2 is absorbed for photosynthesis, causing a slight accumulation of CO2 and thus a slight increase in acidity.
c In test tube C the rate of photosynthesis is high because of high light intensity, so all the CO2 in the test tube is used up causing the contents to become less acidic.
3 Any one of the following suggestions: • Move the light source either near or far away from the test tubes. • Increase or lower the temperature of water. • Put the container with water between the light source and the test
tubes to absorb heat from the light source.4 a To determine the effect of light intensity on the rate of
photosynthesis. b By counting the number of bubbles released per minute.
PPA Activity 4 Photosynthesis: Investigation 3 (Specific Aim 2)
PPA Activity 5 Factors affecting the process of photosynthesis (Specific Aim 2)
G11_TG_CAPS.indb 46 2012/08/01 9:01 PM

C47S t r a n d 2 • U N I T 1
c
d 1 500 kiloluxe With an increase in light intensity there is a corresponding increase in
the rate of photosynthesis until an optimum light intensity is reached, after which any further increase in the light intensity results in a decrease in the rate of photosynthesis.
Learner’s Book page 152In the previous investigations, the learners were exposed to the methodology, the designing of fair experiments, collecting and recording data, stating hypotheses, and aims and conclusions. In this activity they will have to apply what they have learned so far to design their own investigations.
The process of photosynthesisUsing the information from all the investigations with respect to the requirements and products of photosynthesis, develop the overall equation for the process.
This process may be illustrated by the following equation: chlorophyllCarbon dioxide + water + light → glucose + oxygen enzymes
This equation can also be illustrated by symbols as follows: chlorophyllCO2 + H2O + light → C6H12O6 + O2 enzymesBoth of these equations say the same thing, that is, carbon dioxide from either the atmosphere or water (in the case of aquatic plants) combines with water in the presence of light and chlorophyll to form glucose and oxygen. On a diagram of the transverse section through a leaf, indicate the main tissues that are involved in photosynthesis. Also explain to the learners how the leaf is structurally suited for the process of photosynthesis.
Ra
te o
f pho
tosy
nthe
sis
(bub
bles
of o
xyge
n
rele
ased
/min
ute) 60
40
20
0
Light intensity (kilolux)100 500 1 000 2 000 2 5001 500
10
30
50
7080
PPA Activity 6 Showing that oxygen is a product of photosynthesis (Specific Aim 2)
cuticle
chloroplasts
xylem vessel
phloem tube
air space
guard cell
stoma
upper epidermispalisade layer
spongy layer
lower epidermis
vein
vacuole cytoplasm
nucleus
mesophylllayer
G11_TG_C4_S2U1.indd 47 2012/08/02 12:56 PM

C48 S t r a n d 2 • U N I T 1
Allow learners to study and interpret the micrograph of chloroplasts in order to identify the grana and stroma.
The grana are made up of stacks of membranes or lamellae, called thylakoids. These membranes contain chlorophyll. Since chlorophyll is present in the grana, the light phase of photosynthesis takes place here. The stroma is the jelly-like layer in which the membranes and enzymes occur. The dark phase of photosynthesis takes place here. No biochemical details of the process of photosynthesis are required. The summary of the light phase and dark phase is sufficient to identify the requirements and products of the process. These diagrams will help you to help the learners understand the two processes.
A summary of the light phase
A summary of the dark phase
Learner’s Book page 1531 Protein is essential in the human diet and the majority of the world’s
population has a shortage of proteins.
oxygen gas
reactions of the light phase in grana of
chloroplasts
energy carriers: ATP and NADPH
water from the soil
light energy from the Sunused in dark phase
CO2 from air
reactions of the dark phase in stroma of
chloroplasts
glucose/ starch
NADPH
ATPfrom light
phase
Activity 7 The role of algae as food (Specific Aim 3)
G11_TG_CAPS.indb 48 2012/08/01 9:01 PM

C49S t r a n d 2 • U N I T 1
2 Since Spirulina is able to survive in water they could be cultivated in large tanks. Various nutrients can be added to it in the form of fertiliser.
3 50 000 = 4 000 kg/hectare 12,5
Learner’s Book page 1541 The aim of this investigation is to determine the effect of light intensity
on the rate of photosynthesis.2 Oxygen3 Immerse a glowing splint into the tube in which the gas is collected. If
the splint bursts into flames, it shows that oxygen is present.4 The higher the light intensity, the greater is the amount of gas released.5 Temperature, carbon dioxide concentration.
Learner’s Book page 1551 a 12:00 and 16:00 b 09:00 and 19:00 2 a 06:00 and 08:00 b 20:00 and 22:00 3 a photosynthesis b cellular respiration 4 a 0,485% b 0,335% 5 0,37% 6 11:00 and 17:00 7 CO2 is used by grass for photosynthesis during daylight hours. As light
intensity increases the rate of photosynthesis also increases. This brings about a decrease in the CO2 concentration. CO2 combines with 5C compounds in stroma of chloroplast to form 3C compounds, which are converted into sugar and starch.
Learner’s Book page 156The factors affecting the rate of photosynthesis are illustrated in Figures 2.1.11 and 2.1.12 on page 156 of the Learner’s Book. A discussion of this topic, along with a study of Figure 2.1.12, could be used to further the learners’ ability to interpret and understand graphical information.1 Possible reasons for the reason why the rate of photosynthesis decreases
with an increase in CO2 concentration are:a The increased CO2 becomes poisonous to the plant.b The increased CO2 forms carbonic acid and decreases the pH, thus
affecting the enzyme activity for photosynthesis.c While CO2 may be available, other factors that are necessary for
photosynthesis may not be available, i.e. the other factors may be limiting.
d The plant may become “overworked” and therefore will be unable to keep up with the high rate of photosynthesis.
RPA Activity 8 The rate of photosynthesis (Specific Aim 2)
RPA Activity 9 Photosynthesis and changes in carbon dioxide concentration (Specific Aim 2)
RPA Activity 10 Factors that affect the rate of photosynthesis (Specific Aims 1 and 2)
G11_TG_CAPS.indb 49 2012/08/01 9:01 PM

C50 S t r a n d 2 • U N I T 1
2 When two factors are essential raw materials for a process, and one factor is increased, the rate of the process increases up to a certain point because the other factor remains constant. The other factor therefore limits the rate of increase of the process and is termed the limiting factor.
For example, in baking, the raising agent and the flour are two essential ingredients. If the quantity of the raising agent is doubled and the quantity of flour remains constant, the cake size does not double, because there is not enough flour to make up the volume. Therefore, the size of the cake is limited by the amount of flour. Flour is thus the limiting factor.
a specific example in photosynthesisFor the rate of photosynthesis to be at its optimum in any species of plant, the plant must be provided with the optimum amount or concentration of the different requirements, such as light intensity, temperature, water, CO2, and so on. If any one of these requirements is not supplied at its optimum level, then that particular requirement will be regarded as a limiting factor.
3 CO2 concentration; water; chlorophyll.4 The ways in which leaves are structurally suited for the process of
photosynthesis are:• They are flattened with chlorophyll-containing cells close to the
epidermis, reducing the diffusion distance for carbon dioxide.• Cuticle and epidermis are transparent, allowing light to pass through
to the photosynthesising cells.• Palisade cells have numerous chloroplasts and are arranged with
their long axes perpendicular to the surface. This allows most of the incoming light to be captured.
• Palisade cells are elongated, which allows more cells to be exposed to the light.
• Chloroplasts within the cells can move, thus allowing them to arrange themselves in the best position for maximum absorption of light.
• Leaves have numerous stomata, which facilitate the diffusion of gases into and out of it.
• Stomata can be open and closed, thus controlling the uptake of carbon dioxide and the loss of water.
• Spongy mesophyll possesses many intercellular air spaces, which facilitate diffusion of gases and water.
• Mesophyll cells are thin-walled and moist, thus allowing for rapid diffusion of gases and water.
• Xylem is present to transport water to the photosynthesising cells.• Phloem is present to carry away the products of photosynthesis.
5 The chloroplast is suited for the process of photosynthesis in the following ways:• Grana consist of membranes called lamellae, which are stacked into
thylakoids, thus increasing the surface area for absorption of sunlight.• Enzymes are present in the stroma to catalyse the reactions of the
light independent phase.• The double membrane that covers the chloroplast is thin, thus
facilitating the diffusion of water and gases.• Grana contain chlorophyll, which traps sunlight.• Ribosomes are present in the stroma, which synthesise enzymes for
photosynthesis.• Starch is stored temporarily as starch granules as an energy source.
G11_TG_CAPS.indb 50 2012/08/01 9:01 PM

C51S t r a n d 2 • U N I T 1
6 When crops are grown in greenhouses, their yield is increased because of the following reasons:• The concentration of carbon dioxide is increased by burning coal
inside the greenhouse.• The temperature in the greenhouse is usually higher than the normal
environmental temperature, and can be controlled.• The light intensity inside the greenhouse is higher than in the normal
environment because of the glass used in the construction of the greenhouse.
• The light intensity and the periods of exposure can be controlled.• Humidity can be controlled.• The effect of adverse environmental conditions can be eliminated.• Plant pests can be eliminated.
Learner’s Book page 1571 1 palisade cell 2 xylem of leaf vein 3 intercellular air space 4 chloroplast in spongy cell. 2 • Numerouschloroplastsoccurinthemesophyllcell,thusincreasing
the surface area for photosynthesis. • Spongy mesophyll contains a number of intercellular air spaces,
which facilitates rapid diffusion of gases and water. • Spongy mesophyll cells are thin walled, moist and allow rapid
diffusion of gases and water 3 a 3 – photosynthesis starts at optimum rate, all CO2 is absorbed and
plenty of O2 is released. b 1 – O2 is used up for cellular respiration and CO2 is given off. c 2 – fresh air will contain the normal percentages of gases.
Learner’s Book page 1571 This investigation focuses on a developmental stage, rather than the
growth of the plant, because the effect of light intensity on the pattern of growth is being investigated. The growth rate per unit time is dependent on light intensity. The developmental stage must be selected, therefore, so that growth rate is not limited.
2
3
RPA Activity 11 The way in which leaves are adapted for photosynthesis (Specific Aims 1 and 2)
RPA Activity 12 The effects of light on growth (Specific Aim 2)
Light intesity 2,5 5,0 7,5 10,0 12,5 15,0 17,5 20,0 22,5 25,0 27,5 30,0
Ratio 5,0 3,9 2,75 2,13 2,0 1,3 1,3 1,3 1,3 1,5 1,4 1,35
0 2,5 5,0 7,5 10,0 12,5 15,0 17,5 20,0 22,5 25,0 27,5 30,00
1
2
3
4
5
6
Light intensity (kilolux)
Ratio
of m
ain
stem
leng
th a
nd
tota
l lat
eral
shoo
t len
gth
(cm
)
G11_TG_CAPS.indb 51 2012/08/01 9:01 PM

C52 S t r a n d 2 • U N I T 1
4 The ratio decreases almost exponentially. It decreases with increasing light intensity. It decreases up to about 15 klx, after which there is little change. Ratio changes are due to the inhibitory effect of light on main stem growth. Lateral shoots are unaffected by variations in light intensity.
5 The length of the main stem increases at low light intensity.6 increases the possibility of the plant growing into conditions of higher
light intensity.
Learner’s Book page 1591 Spray the air with bicarbonate of soda. 2 Any two of these three factors are correct:
• light intensity • temperature • water.
3 With an increased level of CO2 there is an increase in the rate of photosynthesis – thus more nutrients are produced and stored in the tomatoes.
4 Photosynthesis only takes place in the presence of light. 5 More than a 0,3% concentration of CO2 for a prolonged period may
decrease or even completely stop the process of photosynthesis because the accumulation of CO2 becomes poisonous.
Learner’s Book page 1601 Photosynthesis is the process that is used by green plants and some
bacteria to make their own food using light or radiant energy. Photosynthesis takes place in special organelles in the cell called chloroplasts.
This process may be illustrated by the following equation:
chlorophyll Carbon dioxide + water + light → glucose + oxygen enzymes
This equation can also be illustrated by symbols as follows:
chlorophyll CO2 + H2O + light → C6H12O6 + O2 enzymes
Both of these equations say the same thing, that is, carbon dioxide from either the atmosphere or water (in the case of aquatic plants) combines with water in the presence of light and chlorophyll to form glucose and oxygen.
2 Photosynthesis takes place in the green parts of the plant. The organelle in which photosynthesis takes place is the chloroplast and the pigment is chlrophyll.
Activity 13 Growing tomatoes in greenhouses (Specific Aim 3)
Activity Self assessment
G11_TG_CAPS.indb 52 2012/08/01 9:01 PM

C53S t r a n d 2 • U N I T 1
3 You can demonstrate that starch is important in the process of photosynthesis by de-starching a leaf or using a variagated leaf, exposing the leaf to sunlight and testing the leaf for the presence of starch.
4 Life depends on the process of photosynthesis because almost all organisms obtain their nutrients and therefore energy, either directly or indirectly from green plants. Organisms in the higher trophic levels obtain their energy from stored organic compounds in plants either directly, as in the case of herbivores, or indirectly as in the case of carnivores.
5 The rate of photosynthesis is affected by factors within the plant, as well as external factors, such as carbon dioxide concentration, temperature, and light intensity. Carbon dioxide: speeds up the rate of photosynthesis until a concentration of about 0,5%. After that more carbon dioxide is poisonous to the plant and slows the rate down. Temperature: the optimum temperature for photosynthesis is 25 °C. Therefore, as the temperature increases from 10 °C to 25 °C, the rate of photosynthesis will also increase. Any more of an increase in temperature will result in a decrease in the rate of photosynthesis because the enzymes controlling the dark phase become denatured. Light intensity: at the optimum temperature for photosynthesis, the rate of photosynthesis increases as the light intensity increases. Light intensity continues to increase the rate of photosynthesis even when temperatures are lower than the optimum, but not as much as when the temperature is at its optimum. Also, the rate of photosynthesis levels off at a much lower light intensity if the temperature is not optimal. Temperature is therefore a limiting factor.
6 When plants are growing in the natural environment not much can be done to change the environmental conditions for optimum photosynthesis. However, if crops are grown in greenhouses it is possible to control the environmental conditions so that they are able to photosynthesise as fast as possible. In some parts of the world, where it is often too cold for good growth of some crop plants such as tomatoes, they can be grown in heated greenhouses. The temperature in these greenhouses can be kept at the optimum level to encourage the tomatoes to grow well and fast, and to produce a large yield that ripens quickly. Light in a greenhouse can also be controlled. Extra lighting can be provided on dull days so that light does not limit the rate of photosynthesis. The type of light that is used need to be chosen carefully to provide the appropriate wavelength that is needed by the plants. Since the normal concentration of carbon dioxide in the atmosphere is generally low, it is often a limiting factor. It is however, possible to increase the carbon dioxide concentration in greenhouses.
7 Adenosine triphosphate (ATP) is a nucleotide that performs many essential roles in the cell: • It is the major energy carrier of the cell, providing the energy for
most of the energy-consuming activities of the cell. • It is one of the monomers used in the synthesis of RNA and DNA. • It regulates many biochemical pathways. • During photosynthesis it is synthesised in the chloroplasts.• It is also used during the formation of polysaccharides such as starch.
G11_TG_CAPS.indb 53 2012/08/01 9:01 PM

C54 S t r a n d 2 • U N I T 1
WorksheetThe following are two examples of experimental designs to show that oxygen is given off during photosynthesis. The text in italics is the memo for each activity.
Example 1:Hypothesis: In the presence of sunlight green water plants are capable of photosynthesising.Aim: To determine whether oxygen is given off by green water plants in the presence of sunlight.
1 Fill a 500 ml beaker with water.2 Place 0,5 g of indigo carmine powder (a blue powder) into the water in
the beaker. What happens to the water in the beaker? Takes on a blue colour Note: Indigo carmine is blue due to the presence of oxygen.
3 Now prepare a solution of hydrosulphite solution as follows:• Dissolve 10 g of sodium hydrosulphite into 100 ml water.• Pour this solution into a burette, which is clamped above the indigo
carmine solution.4 Now add the sodium hydrosulphite, drop by drop, to the indigo carmine
solution until the blue colour disappears completely.5 Suggest the function of sodium hydrosulphite.
Reduces the indigo carmine solution, i.e. brings about the loss of oxygen from the indigo carmine solution.
6 Now place a piece of water plant, such as Elodea or Egeria, into the colourless solution.
7 Place the beaker in sunlight for about 30 minutes.8 Describe your observations. The solution in the beaker turns blue.9 What can you conclude from this? That oxygen was produced by the plant –
most probably by the process of photosynthesis.
Notes:• If you add more sodium hydrosulphite solution into the beaker the blue
solution will clear again and the process may be repeated.• As a control, a similar apparatus can be placed in the dark or a similar
apparatus could be set-up but without the plant.
burette with sodium hydrosulphite solution
indigo carmine solution
water plant
G11_TG_CAPS.indb 54 2012/08/01 9:01 PM

C55S t r a n d 2 • U N I T 1
Example 2:Hypothesis: In the presence of sunlight green water plants are capable of photosynthesising.Aim: To determine whether oxygen is given off by green water plants in the presence of sunlight.
1 Set up the apparatus as shown in the diagram below.
2 A control apparatus may be set up in a similar way by either placing it in the dark or by leaving out the plant.
3 Bubbles of gas collect in the test tube.4 When there is sufficient gas in the test tube, lift the test tube from the
funnel and place a stopper over the mouth of the test tube while it is still under water.
5 Remove the test tube.6 Prepare a glowing splint by lighting a piece of wood and then
extinguishing the flame.7 Remove the stopper from the test tube and then insert the glowing splint
into the test tube.8 What do you observe? The glowing splint bursts into flame.9 What can you conclude from your observations? That oxygen was produced
by the water plant probably by the process of photosynthesis.
gas given off by plant
water plant
test tube
water
funnel
G11_TG_CAPS.indb 55 2012/08/01 9:01 PM

C56 S t r a n d 2 • U N I T 2
Learner’s Book page 163a Animal A eats grass or leaves. This is shown by the fact that it only has
incisors and molars. The incisors are used to tear or cut the plants and the molars to chew them.
b Animal B eats meat. This is shown by the fact that it has sharp canines, which can be used to tear into flesh.
Learner’s Book page 165Learner’s will dissect the alimentary system of a sheep and describe how food moves through each part of the system. They cut open the stomach, the small intestine and the large intestine and describe the gross anatomical differences that they can see.
Learner’s Book page 1681 A gullet/oesophagus B stomach F gall bladder2 Any two of: creates an acidic medium for the action of enzymes, acts as
an antiseptic, prevents food rotting 3 High blood sugar stimulates the Islet of Langerhans in the pancreas:
• to secrete insulin• which is transported by the blood to the liver and muscles• to stimulate the conversion of glucose to glycogen and the absorption
and oxidation of glucose by muscle cells• thereby decreasing the blood sugar level.
4 Any three of the following are acceptable:• The folds of mucosa/millions of villi with microvilli present increase
the surface area for absorption. • The movement of intestine wall/villi ensures close contact of
digested food with absorption area. • The absorption surface is thin-walled/consists of a single layer of
columnar epithelial cells for easy diffusion of digested nutrients. • The absorption surface is moist/as a result of digestive juices and
substances are absorbed in solution. • Blood capillaries and lacteals in the villi increase absorption and
ensure quick transport of nutrients.• Slow movement of food through the small intestines allows time
for maximum absorption. • The ileo-caecal valve stays closed for up to eight hours, allowing
enough time for absorption.
UNIT 2 Animal nutrition (mammals)
TERM 2
Learner’s Book pages 162–193Duration: 16 hours
Activity 1 How different types of teeth are related to lifestyle (Specific Aim 1)
PPA Activity 2 How food moves through the alimentary tract (Specific Aim 2)
Activity 3 The structure of the human digestive system (Specific Aim 1)
G11_TG_CAPS.indb 56 2012/08/01 9:01 PM

C57S t r a n d 2 • U N I T 2
Learner’s Book page 169Our bodies’ cells need the food that we eat for energy. For the cells to obtain this food, it has to be transported to the cells by the blood. The food therefore needs to be absorbed into the bloodstream. Since the food consists of large molecules, it cannot be absorbed, and must first be broken down or digested into smaller particles. These smaller particles are further digested by enzymes. The smaller particles provide a larger surface area for the action of enzymes.
Learner’s Book page 170The gastric mucosa is usually resistant to the harsh action of hydrochloric acid and pepsin. The reason for its resistance to pepsin activity is not clearly understood. Its resistance to hydrochloric acid seems to be due to three interrelated mechanisms:• The stomach lining is covered with a layer of alkaline mucus, which
forms a protective layer.• The epithelial cells of the mucosa are joined together by tight junctions,
which prevent acid from leaking into the submucosa.• The epithelial cells that are damaged are shed and replaced by new cells.These three mechanisms thus provide a barrier that prevents the self-digestion of the stomach.
Learner’s Book page 1741 Water 2 Any three of the following are acceptable:
• breaks down large food substances into their simpler forms • changes insoluble food substances into soluble food substances • facilitates absorption of food • facilitates metabolism (provides glucose)/energy.
3 Absorbed amino acids are transported by the hepatic portal vein to the liver, where they are deaminated into urea/uric acid and glucose/carbohydrate.
Learner’s Book page 174Learners create a concept map or poster to illustrate what happens to nutrients during the process of digestion. Make sure the following are included: breakdown, digestion, assimilation and excretion.
Learner’s Book page 1751 To create a similar condition to that of the body/It is the optimum body
temperature 2 a mass/amount of sample
b amount of gastric juice released in the stomach3 a fried eggs
b scrambled eggs
Activity 4 The breakdown of food (Specific Aim 1)
Activity 5 Why are the stomach walls not digested? (Specific Aim 1)
Activity 6 The process of digestion (Specific Aim 1)
Activity 7 Illustrating what happens to nutrients (Specific Aim 1)
RPA Activity 8 An investigation into digestion (Specific Aim 2)
G11_TG_CAPS.indb 57 2012/08/01 9:01 PM

C58 S t r a n d 2 • U N I T 2
4 a The sample was already partially mechanically broken down by scrambling/mixing process, thus creating a greater surface area for the gastric juice to act on.
b The samples underwent mechanical digestion by chewing and mastication in the mouth before undergoing chemical digestion and mechanical digestion by peristalsis in the stomach, correct pH in the stomach
5 The eggs could be chopped up to increase the surface area.6 • containsenzymes/proteases
• contains water, which provides the medium for chemical reaction • contains HCl, which provides an acid medium for enzyme action.
Learner’s Book page 1771 Diabetes mellitus is a disease that arises when the body either does not
secrete enough insulin or cannot use insulin effectively.2 Type 1 diabetes is treated using injections of insulin to regulate the blood
glucose. Type 2 diabetes occurs when the body can no longer efficiently use the insulin produced by the pancreas.
3 Type 1 diabetes is treated with injections of insulin.4 Type 2 diabetes is probably caused by the hormonal effects of obesity.5 Type 2 diabetes is probably increasing around the world because there is
an increase in obesity around the world.
Learner’s Book page 177When marking the essay, content scores a possible 17 and synthesis scores a possible 3 (total 20).
The essays should include the following content:
When abnormal levels of glucose are detected• by the pancreas • the Islets of Langerhans secrete hormones • into the bloodstream.
When the blood glucose level rises• insulinissecreted• todecreasethebloodglucoselevel• backtonormal• insulinsecretionistheninhibited. When the blood glucose level falls• glucagonissecreted• toincreasethebloodglucoselevel• backtonormal• glucagonsecretionistheninhibited. Any (10)Causes of diabetes mellitus• inadequatesecretion• non-secretionof insulin• productionof defectiveinsulin• bodycellsresistanttotheactionof insulin• inabilityof thecellstouseglucoseefficiently. Any (2)
Activity 9 Diabetes mellitus (Specific Aim 3)
Activity 10 Essay: The hormonal control of blood glucose (Specific Aims 1 and 3)
G11_TG_CAPS.indb 58 2012/08/01 9:01 PM

C59S t r a n d 2 • U N I T 2
Symptoms• glucoseintheurine• frequenturination• extremethirst• fatigue/lethargy/faintness• nausea/vomiting• weightloss• blurredvision• non-healingof wounds Any (3)Management of diabetes mellitus• exercise• eating diet suitable for diabetic person• using prescribed medication/drugs for the management
of diabetes mellitus Any (2) Content (17)Assessing the presentation of the essay
Marks Descriptions
3 Well structured – demonstrates insight and understanding of question2 Minor gaps or irrelevant information in the logic and flow of the answer1 Significant gaps or irrelevant information in the logic and flow of the
answer0 Not attempted/nothing written other than question number/no relevant
information Synthesis (3) Total (20)
Learner’s Book page 1781 60–69 years2 80+ years3 • Theprevalenceof diabetesincreaseswithage.
• The prevalence of diabetes is greater in women than in men.4 It is greater in women.5 • Womenmaybemorepronetoabdominalobesity.
• Hormonal changes after menopause may make women more prone to diabetes.
Learner’s Book page 1791 The answer will depend on what each learner brings to class.2 The learners should record the information in a table. 3 30 g of chips contain:
30 × 10/100 = 3 g protein, therefore the energy content: 3 × 17 kJ = 51 kJ30 × 35/100 = 10,5 g fat, therefore the energy content: 10,5 × 37 kJ = 388,5 kJ30 × 50/100 = 15 g carbohydrate, therefore the energy content: 15 × 16 kJ = 240 kJTotal energy content of packet of chips: 51 + 388,5 + 240 = 391,41 kJ
RPA Activity 11 The prevalence of diabetes mellitus in South Africa (Specific Aim 2)
PPA Activity 12 Energy content of foods (Specific Aim 2)
G11_TG_CAPS.indb 59 2012/08/01 9:01 PM

C60 S t r a n d 2 • U N I T 2
Learner’s Book page 1811 a Protein
• important component of cell membranes • enzymes are special proteins • important component of chromosomes • important component of protoplasm • serves as a reserve energy source • component of hormones b Fibre • reduces transit time of food in alimentary canal • adds bulk to the undigested material in the colon • absorbs and retains water • reacts with various poisonous substances and prevent it from
being absorbed into the blood • encourages peristalsis • reduces forming of haemorrhoids
2 100 × 5 500 2 000 = 275 g/0,275 kg
3
4 Cholesterol accumulates in blood vessels, thus clogging them and causing heart disease.
Learner’s Book page 184Each group will present their nutritional disorder to the class.
Learner’s Book page 1851 Sodium bicarbonate2 Baking soda neutralises the acid in the mouth.3 The advantages are that fluoride reduces the amount of tooth decay. The
disadvantages may be that too much fluoride in the water can lead to discolouration of the teeth in children.
PPA Activity 13 Nutritional composition of foods (Specific Aim 2)
carbohydrate
protein
fats
fibre
RPA Activity 14 Project: Nutritional disorders (Specific Aim 2)
Activity 15 Tooth decay (Specific Aim 1)
G11_TG_CAPS.indb 60 2012/08/01 9:01 PM

C61S t r a n d 2 • U N I T 2
Learner’s Book page 1871 Coke, white bread, potato chips2 a X
b Xc Yd Y
3 Carbohydrates: brown bread and bitter beer4 a Small intestine
b Y, because it contains a high protein content
Learner’s Book page 1901 a The stomach
b Peristalsisc Food is ground into a fine, soft pulp as part of mechanical digestion.
Food is mixed with gastric juice to form chyme. Food is forced into the duodenum in small quantities.
d Circular musclese The pyloric sphincterf When chyme reaches a certain pH level, the hydrochloric acid
stimulates the sphincter to relax.g Hydrochloric acid. It has a number of functions: • It provides the necessary acidic medium for enzyme action. • It stops the enzyme action of swallowed saliva. • It is capable of converting some sucrose to glucose and fructose. • It acts as an antiseptic and kills bacteria taken in with the food.
2 a 1 300 mg/100 cm3
b i About 3 hours and 20 minutes. ii About 4 hours and 15 minutes.c i The glucose level will return to normal more quickly. The curve
of the graph should be the same as that of the healthy person because insulin lowers the level of blood glucose.
ii Glucose is converted into glycogen.3 a E
b i 11:50–8:57 = 2.93 hours ii 8:27–6:30 = 1.97 hours c The small intestine is long and coiled. In addition to digestion most
of the absorption occurs here. d Glucose is absorbed in the small intestine by the villi against a
concentration gradient. That is, it is absorbed actively using energy and carrier molecules are involved. From the lumen of the small intestine the glucose passes through the microvilli into the epithelial cells and across the membrane. The glucose then enters the blood capillaries of the villi.
4 a i 0,7 g/ℓ ii 0,4 g/ℓb i 0,3 g/ℓ ii 95 minutes
c i In the beta cells of the Islets of Langerhans ii glycogen iii the liverd Glucagone The liver
Activity 16 Nutrient sources (Specific Aims 1 and 3)
Activity Self assessment
G11_TG_CAPS.indb 61 2012/08/01 9:01 PM

C62 S t r a n d 2 • U N I T 2
5 a Between 07:00–08:00 b 08:45 c i Glucose level rose from 60 to 70 mg/100ml in 15 minutes ii No effect d The increased blood glucose concentration has to first stimulate the
pancreas to secrete insulin. More glucose is available for oxidation and the release of energy and as a result less/no need for fatty acids to be oxidised and fatty acids will be reconverted to fats.
e As the concentration of insulin starts to increase, fatty acids are taken up by the cells.
f When the glucose concentration increases the Islets of Langerhans/pancreas is stimulated to secrete insulin, which stimulates the liver to convert the excess glucose into glycogen and so the glucose concentration decreases.
Worksheet
A: Tracing the passage of food in the sheep1 Each group must obtain a specimen consisting of a portion of the
digestive system of a sheep.2 Study the external features of the digestive system.3 Identify the following parts:
• oesophagus• stomach• small intestine • large intestine
4 In ruminant herbivores like the sheep the stomach is highly modified to act as a “fermentation vat”. a Examine the stomach and determine into how many parts it is
divided. b Name the different parts of the stomach. c Indicate the correct sequence in which the food passes through the
different parts and indicate what happens to the food in each part.d Draw and label the external view of the digestive system.
B: Comparison of the structure of the walls of the stomach, small intestine and large intestineThe interior of the rumen, reticulum and omasum is covered exclusively with stratified squamous epithelium similar to what is observed in the oesophagus. Each of these organs has a very distinctive mucosa structure. The images below are from a sheep.1 Using a sharp scalpel or a pair of scissors and a pair of forceps, cut the
organs as indicated by the dotted line on the diagram on page C64.2 Using a hand lens observe the internal lining of the walls of each part cut.3 Draw and label what you observe.
Practicals on stomach and intestines of sheep (Specific Aim 2)
G11_TG_CAPS.indb 62 2012/08/01 9:01 PM

C63S t r a n d 2 • U N I T 2
The inner surface of the rumen forms numerous papillae that vary in shape and size from short and pointed to long and foliate.
Reticular epithelium is thrown into folds that form polygonal cells that give it a reticular, honey-combed appearance. Numerous small papillae stud the interior floors of these cells.
The inside of the omasum is thrown into broad longitudinal folds or leaves similar to the pages in a book (hence a common term for the omasum is the “book”). The omasal folds are packed with finely ground ingesta, and have been estimated to represent about one-third of the total surface area of the forestomachs.
Note: Stratified, squamous epithelium such as found in the rumen is not usually considered an absorptive type of epithelium. Ruminal papillae are, however, very richly vascularised and the abundant volatile fatty acids produced by fermentation are readily absorbed across the epithelium. Venous blood from the forestomachs, as well as the abomasum, carries these absorbed nutrients into the portal vein, and hence, straight to the liver.
G11_TG_CAPS.indb 63 2012/08/01 9:01 PM

C64 S t r a n d 2 • U N I T 2
MemoA: Tracing the passage of food in the sheep4 a The stomach is divided into four parts. b Rumen, reticulum, omasum and abomasum
c • Oeophagus:musclecontractionschurnfood,opensintoreticulum and rumen.
• Reticulum and rumen: Here liquid is added and the muscular walls churn the food. These chambers provide the main fermentation area where bacteria start to act on the cellulose plant cell walls. These organisms break down the cellulose to smaller molecules the that ruminant can use and are absorbed to provide the animal with energy. In the process, the gases methane and carbon dioxide are produced. The micro-organisms not only break down the cellulose but they also produce the vitamins E, B and K, which the animal can use. Their digested bodies provide the ruminant with the majority of its protein requirements. In the wild, grazing is a dangerous activity as it exposes the herbivore to predators. They crop the grass as quickly as possible and then when the animal is in a safer place the food in the rumen can be regurgitated to be chewed at the animal’s leisure. This is “chewing the cud” or rumination. The finely ground food may be returned to the rumen for further work by the micro-organisms or, if the particles are small enough, it will pass down a special groove in the wall of the oesophagus straight into the omasum.
• Omasum: the food is kneaded and water is absorbed before they pass to the abomasum.
• Abomasum: This acts as a “proper” stomach and gastric juice is secreted to digest the protein.
d oesophagus
omasum
abomasum
to small intestine
reticulum rumen
G11_TG_CAPS.indb 64 2012/08/01 9:01 PM

C65S t r a n d 2 • U N I T 3
Learner’s Book page 1941 Movement, such as walking and running, growth, breathing,
reproduction, digestion and excretion.2 In all the above cases the energy comes either directly or indirectly from
the Sun. In the case of autotrophs, it comes directly from the Sun, i.e. radiant energy, which is then stored as chemical potential energy in substances like carbohydrates. In the case of heterotrophs, it is obtained indirectly from the Sun, by way of the food that is eaten. The energy from the food is eventually converted to ATP.
Learner’s Book page 1941 These foods are rich in starch. Starch is eventually broken down to
glucose, which serves as an energy or a source of fuel for the athletes.2 Coke and chocolates are high-energy foodstuffs due to their high sugar
content. These foodstuffs will replenish the energy required by the athletes.
Learner’s Book page 1951
2 For assessment of the learner’s drawing, marks should be awarded for the following aspects:• labels• proportion• size• correct position of the various parts• appropriate shape.
3 • Theinnermembraneisfoldedtoformcristae,whichincreasesthesurface area for the reactions of respiration.
• The outer membrane is smooth and permeable, allowing substances such as ions, and pyruvic acid to enter and ATP molecules to leave.
• Enzymes occur in the matrix as well as in between the outer and inner membranes, making it efficient for catalysing the process of respiration.
UNIT 3 Cellular respiration
TERM 2
Learner’s Book pages 194–207Duration: 6 hours
Activity 1 Energy and activity (Specific Aim 1)
Activity 2 Sources of energy (Specific Aim 1)
RPA Activity 3 The mitochondrion (Specific Aim 2)
outer membrane
inner folded membrane
cristae
matrix
outer membrane
inner membrane
crista
ribosomes
matrix
G11_TG_CAPS.indb 65 2012/08/01 9:01 PM

C66 S t r a n d 2 • U N I T 3
Learner’s Book page 197 7 When the glowing splint is inserted into tube B, it immediately bursts
into flame. In tube A it becomes dimmer. 8 The glowing splint is used to test for the presence of a gas that
supports combustion. 9 Oxygen10 The glowing splint burst into flame in tube B, which contained dead
seeds, indicating the presence of oxygen. The glowing splint in tube A, which contained germinating seeds, grew dimmer. This indicated the absence of oxygen. It can be concluded that the germinating seeds used up all the oxygen, probably for cellular respiration.
11 Enhancements to the investigation could include:• testing the air in the test tube with a glowing splint at the beginning
of the investigation.• using a number of samples or setups, for both the experiment and
the control.
Learner’s Book page 1982 A control apparatus must be identical to that of the experimental
apparatus, with only one factor left out. In this case, the control apparatus should not have any organisms or it could have dead, sterilised organisms.
5 The clear lime water in the experiment turned milky, while that of the control remained clear.
6 Since the clear lime water in the experimental apparatus turned milky, it can be concluded that the animals released carbon dioxide during the process of respiration.
7 The learners could list any one of the following flaws in the investigation: • The oxygen is not replenished, and the animals could die before
any results are obtained. • The excess carbon dioxide could prevent the process
of respiration. • The control apparatus also contains air with carbon dioxide,
which could cause the lime water to turn milky. There is, therefore, a need to ensure that no carbon dioxide is present here.
Learner’s Book page 198This is an enrichment activity. Assess the experimental design to ensure that it meets all the requirements for a fair, reliable and valid test.
PPA Activity 4 An investigation into respiration (1) (Specific Aim 2)
PPA Activity 5 An investigation into respiration (2) (Specific Aim 2)
RPA Activity 6 An investigation into the need for glucose in cellular respiration (Specific Aim 2)
G11_TG_CAPS.indb 66 2012/08/01 9:01 PM

C67S t r a n d 2 • U N I T 3
Learner’s Book page 1991 To show that heat energy is released by germinating pea seeds. 2 Bleach acts as an antiseptic and it will therefore prevent any micro-
organisms such as bacteria and fungi from growing on it.3 Any two of:
• To allow the carbon dioxide to escape out of the flasks. If the carbon dioxide accumulates inside the flask it will slow down the process of respiration.
• Hot air rises and so turning the flasks upside down will limit the loss of heat through the plug.
• So that the thermometer could be read and the temperature recorded.
4 Since only flask A had germinating seeds and since the temperature in this flask increased, it can be concluded that heat energy is released by germinating seeds.
5 • FlaskA:Thegerminatingseedsreleasedheatenergy.• Flask B: Because the seeds were boiled but not soaked in bleach,
micro-organisms grew on the dead seeds. Respiration by these micro-organisms caused the increase in temperature.
• Flask C: There were minimal changes to the temperature because the seeds were dead and therefore not respiring. Also there were no mirco-organisms growing in it because it was soaked with bleach.
6 Set up several sets of similar apparatus.
Learner’s Book page 2011 To show:
alcoholic fermentation/anaerobic respiration OR that yeast cells respire anaerobically/in the absence of oxygen OR that CO2/heat is released during anaerobic respiration/alcoholic fermentation.
2 To expel/remove the oxygen. 3 a To watch the temperature changes during the process of
fermentation. b To provide a substrate/food source for respiration by the yeast cells.
4 Use the same apparatus but kill/leave out the yeast cells.
Learner’s Book page 2011 The oil prevents the entry and exit of gases. 2 To allow time for the yeast to get used to the different temperatures. 3 Anaerobic respiration/fermentation 4 CO2 5 It is possible that respiration slowed down drastically at this
temperature because the very high temperature could have denatured the respiratory enzymes.
RPA Activity 7 Do germinating seeds release heat energy? (Specific Aim 2)
RPA Activity 8 Anaerobic respiration (Specific Aim 2)
RPA Activity 9 The process of fermentation (Specific Aim 2)
G11_TG_CAPS.indb 67 2012/08/01 9:01 PM
C68 S t r a n d 2 • U N I T 3
6 The sugar content will be depleted so there is not enough food for respiration, or the size of the yeast population could have increased drastically and so competition for space would have decreased respiration.
7 The production of wine and beer and other alcoholic drinks and baking.
Learner’s Book page 2023 a Yeast is used in the fermentation process to produce beer and
wine. These organisms are tolerant to an alcohol concentration of approximately 12–15%. Any concentration higher than this results in the death of the yeasts.
b Other alcoholic beverages attain a higher alcohol content by being produced through the process of distillation.
4 The alcohol in the bread evaporates due to the high baking temperature.5 a Cooling prevents further activity of the bacteria.
b You need to be mindful of the slight differences in the methodology.
Learner’s Book page 2031 Fermentation refers to the process of cellular respiration in the absence
of oxygen. 2 Fermentation results in the release of CO2. An increase in CO2 increases
acidity which causes the decrease in pH. 3 As the temperature of the room increases or decreases the temperature
of the brew container also increases or decreases. 4 The yeast releases heat energy, which keeps the brew container
temperature above room temperature. 5 18 hours 6 Over time, the steepness of the slope decreases, which shows that the
rate of fermentation slows down because less CO2 is being produced.
Learner’s Book page 2051 a Respiration
b Lime water/bromothymol blue c i It absorbs CO2 from the incoming air. ii To confirm absence of CO2. d Set up the apparatus as in the experiment. Leave out the living
organism/rat in flask C/use a dead sterilised seed or any living organism that does not photosynthesise.
2 a To determine whether CO2 is released during cellular respiration. b It absorbs CO2 from incoming air. c In flask A, the lime water is used to show that there is no CO2
coming in from the atmosphere. In flask B, the lime water is used to determine whether or not the animal has released CO2.
d • LimewaterinflaskBwillturnmilky. • In Flask A the lime water will stay clear.
Activity 10 Anaerobic respiration or fermentation (Specific Aim 3)
Activity 11 Anaerobic respiration/fermentation (Specific Aim 3)
Activity Self assessment
G11_TG_CAPS.indb 68 2012/08/01 9:01 PM

C69S t r a n d 2 • U N I T 3
e • Setupacontrolwithoutthemouse/setupasimilarinvestigationwith different living organisms to verify results.
• Set up a number of samples/repeat the experiment.3 a To determine whether living organisms (plants/animals) release CO2
during respiration. b
c As a control to verify that the organisms present in B and C are responsible for releasing carbon dioxide.
d To prevent photosynthesis from taking place and using up any CO2 produced, which will influence the results.
e Any two of the following are acceptable: • The carbon dioxide released during respiration serves as a raw
material for the process of photosynthesis. • The energy released during respiration is necessary for the life
activities of the animal. • The process brings about a balance in the O2 and CO2 levels. f i If the amount of CO2 released by the snail is the same as the
amount absorbed by the plants during photosynthesis the indicator will turn red.
OR If the amount of CO2 released by the snail is less than the amount absorbed by the plants during photosynthesis the indicator will turn purple. OR If the amount of CO2 released by the snail is more than the amount absorbed by the plants during photosynthesis the indicator will turn yellow.
ii The results will be the same/no change. High levels of CO2 will be released because the animal is still respiring, hence the solution will turn yellow.
4 a Test tube C serves as a control to verify the results. b To prevent carbon dioxide from entering and escaping from the
test tube. c Oxygen d Test tube A: Photosynthesis takes place. CO2 is absorbed by the green
leaves and CO2 concentration decreases. Test tube B: Respiration takes place. During the process CO2 is released by the worms and the concentration of CO2 increases. Test tube C: No CO2 is added or absorbed.
e i No change therefore colour remains orange. CO2 is released by the worms during respiration and is absorbed by leaves during photosynthesis.
ii The indicator colour changes to yellow. Both the leaves and the worms are respiring and give off CO2. Leaves do not photosynthesise and the CO2 that is given off by the worms is not absorbed.
A B C
Nothing will take place/no change/remains red Yellow Yellow
G11_TG_CAPS.indb 69 2012/08/01 9:01 PM

C70 S t r a n d 2 • U N I T 4
Learner’s Book page 2091–4 Learners refer back to Activity 2 in Strand 1 Unit 3 (page 120) and carry
out the calculations using this method.5 Learners should understand that a large surface area:volume ratio allows
a large gas exchange surface and therefore there is less need for specific respiratory organs and that a small surface area:volume ratio allows a relatively smaller gas exchange surface and so specific respiratory organs are needed.
Learner’s Book page 2131 Generally the aquatic organisms have a larger surface:volume ratio than
the terrestrial organisms and, because of their environment, aquatic organisms do not have the problem of desiccation of their exchange surfaces as their terrestrial counterparts do.
2 The gills consists of filaments that are folded into plate-like lamellae. In the capillaries of each lamella, the blood flows in the opposite direction to the movement of water across the gills. This is called a countercurrent flow. This countercurrent flow increases the amount of oxygen that can be taken up. As the blood in each lamella gains oxygen, it encounters water that has an even higher oxygen content. This mechanism allows about 80–90% of the initial dissolved oxygen in water to be extracted.
Learner’s Book page 2131 a The earthworm has a thick outer epidermis that is kept moist by
mucus secreted by glands. b Earthworms burrow in moist soil or keep to deep, moist vegetation.
Learner’s Book page 2141 a Earthworms:
• skin is covered by a cuticle, which prevents the excessive loss of moisture
• epidermis consists of epithelial cells, which secrete mucous throughout the skin
• coelomic fluid is excreted onto the skin to ensure that it is moist at all times
• by burrowing in moist cool soil • by spending most of its time in shady areas
UNIT 4 Gas exchange
TERM 3
Learner’s Book pages 208–240Duration: 10 hours
PPA Activity 1 Investigation (Specific Aim 2)
Activity 2 Gas exchange in water (Specific Aim 1)
Activity 3 Preventing desiccation (Specific Aim 1)
Activity 4 Gas exchange surfaces (Specific Aim 1)
G11_TG_CAPS.indb 70 2012/08/01 9:01 PM

C71S t r a n d 2 • U N I T 4
b Insects: • The body of the insect is covered by an exoskeleton that is
impervious to moisture. • The gas exchange occurs very deep inside the body of the insect
– due to the elaborate system of branching tubes called tracheae. The finest branches, called tracheoles, end among the cells where gas exchange takes place.
2 The tracheae branch and rebranch, ending in tiny channels that are referred to as tracheoles. These tracheoles are in direct contact with the body cells. Hence this tracheal system is very effective in delivering oxygen to the cells and therefore a circulatory system is not required for the exchange of gases.
Learner’s Book page 216Ensure that you and the learners take these precautions.• Wear disposable rubber gloves during the course of this activity.• Hands must be washed thoroughly with soap and water after handling
the specimen.• Do not to touch your face or mouth while conducting this activity, as
disease-causing micro-organisms can be easily transferred from the lungs to the mouth.
• The work surface and all instruments must be sterilised or washed with soapy water after the dissection.
• Wrap the specimen properly in a bag (preferably plastic) and dispose of it in a covered bin once the activity is over.
5 They are triangular in shape and they feel very flimsy or spongy. 6 They feel spongy because of the air in them. 7 Pinkish-reddish, due to the presence of blood in the capillaries in the
lungs or alveoli. 8 Ridges or bumps. 9 They are incomplete and shaped like the letter C.10 They allow for the food to move down the tube behind them.11 Rings of cartilage that support the trachea.12 The gullet or oesophagus13 The lung expands (like a balloon)..14 The size of the air passage decreases or becomes narrower.
Learner’s Book page 218Learners study the diagram and the table.
Learner’s Book page 218The learners’ paragraphs should include the following information.• The hairs in the nostrils remove dust from the inhaled air.• The nasal passages are lined by ciliated columnar epithelium with goblet
cells, which secrete mucus.• The mucus traps dust and germs.
PPA Activity 5 Looking at lungs (Specific Aim 2)
Activity 6 Comparing respiratory systems (Specific Aim 1)
Activity 7 Adaptation of air passages (Specific Aim 1)
G11_TG_CAPS.indb 71 2012/08/01 9:01 PM

C72 S t r a n d 2 • U N I T 4
• Each nasal passage is incompletely subdivided into three passages by three turbinate bones, which slow down the flow of air so that it can be warmed, moistened and cleansed by allowing the dust and germs to become trapped in the mucus.
• The trachea and bronchi consist of C-shaped cartilaginous rings, which help to keep the passage open at all times.
• The trachea is also lined by ciliated columnar epithelium, which help to sweep the trapped dust particles outwards.
• The opening of the trachea, referred to as the glottis, is covered by a leaf-like cartilage, known as the epiglottis. The epiglottis prevents food from entering the trachea and thus helps to avoid choking.
Learner’s Book page 2191 The learners’ descriptions will vary. They need to mention, however, that
the chest size is not expanded.2 The learner’s measurements will vary.3 The learners’ drawings of a relaxed chest should look something like this:
4 The chest becomes bigger.5 Learners’ measurements will vary.6 The learners’ drawings of an expanded chest should look something
like this:
It is important to get the learners to focus on the following:Inhalation (breathing in) causes the chest to move up, while exhalation causes it to move down. This is an indication that the ribs are involved in some way. That is, the chest becomes bigger when one breathes in, and smaller when one breathes out.
RPA Activity 8 Observing breathing (Specific Aim 2)
G11_TG_CAPS.indb 72 2012/08/01 9:01 PM

C73S t r a n d 2 • U N I T 4
Learner’s Book page 2196 • Theballoonsinflate.
• The volume of bell jar increases and pressure decreases – thus allowing air from outside to move in.
7 • Theballoontakesonitsoriginalshape.• The volume of bell jar decreases back to its original level – increasing
the pressure inside and thereby pushing the air out.8 • Theglass/plasticwallof thebelljar–ribcage
• Theinsideof thebelljar–thechest/thoraciccavity• “Y” tube – bronchi• Balloons – lungs• Therubber/plasticsheet–diaphragm
9 • Thebelljarisrigid–whileinrealitytheribscanmovebycontractionof the intercostals muscles, causing the thorax to increase laterally in size/volume.
• The balloons are hollow – while the lungs consists of numerous air sacs called alveoli.
• Theplastic/rubbersheetisflat–whilethediaphragmisconvex.
Learner’s Book page 221
Part of respiratory system Condition of part during exhalation
Diaphragm Relaxed and becomes dome-shaped or arched
External intercostal muscles Relax
Internal intercostal muscles Contract
Volume of thoracic cavity Decreases from top to bottom
Pressure on the lungs Increases
Atmospheric pressure Lower than pressure of air in the lungs
Air from the lungs Forced out through the nostrils
Learner’s Book page 2221 A – trachea; B – ribs; C – diaphragm2 • protectsthelungs
• allows for the attachment of intercostals muscles3 Any two of:
• external intercostal muscles• internal intercostal muscles• diaphragm• abdominal muscles
4 Diagram I5 • thelungsareexpanded
• the chest cavity is enlargened• the diaphragm is less convex-, less dome-shaped
6 Pressure has increased because the volume has decreased.
PPA Activity 9 Using a model to demonstrate the mechanism of breathing in humans (Specific Aim 2)
RPA Activity 10 Exhalation (Specific Aim 2)
Activity 11 The mechanism of breathing (Specific Aim 1)
G11_TG_CAPS.indb 73 2012/08/01 9:01 PM

C74 S t r a n d 2 • U N I T 4
Learner’s Book page 225The lime water turns milky, which shows that exhaled air contains CO2.
Learner’s Book page 2251 Water vapour2 2 79,00% - 78,8% = 0,2%3 The other 4,07% carbon dioxide is a product of respiration, which had to
be exhaled and removed from the body.
Learner’s Book page 226Learners complete the activity as shown. Make sure that each pair understands how to carry out the activity, can complete the table and can draw the bar graph.
Learner’s Book page 2271 3 litres 2 Breaths became deeper, possibly because the person was exercising and
so needed more oxygen for cellular respiration. 3 6 breaths
Learner’s Book page 2311 a 180 per 100 000
b 5 per 100 000 2 1949 3 Lung cancer, caused by increased pollutants in our environment and
increased levels of smoking generally. 4 a Peer/socialpressure;increasedstressduetobusiness/socialdemands;
to increase confidence. b Reduce the number of cigarettes smoked daily; smoke a brand with a
lowtarcontent;eatsweets/gumwhenthereisanurgetosmoke.5 Answers will vary according to the research that learners do. They should
be able to state the anti-smoking legislation in South Africa, mention the non-smoking signs that are obvious in all public places and in workplaces, and mention the fines imposed for smoking in non-smoking places.
Learner’s Book page 232The learners discuss the laws related to smoking in South Africa. Their discussion should include issues around:• smoking in public places, such as restaurants – should there be a smoking
section and a non-smoking section or should smoking be banned entirely
PPA Activity 12 To demonstrate that exhaled air contains carbon dioxide (Specific Aim 2)
RPA Activity 13 The composition of inhaled and exhaled air (Specific Aims 1 and 2)
PPA Activity 14 The effect of exercise on breathing rate (Specific Aim 2)
RPA Activity 15 The rate and depth of breathing (Specific Aim 2)
RPA Activity 16 Case study: respiratory diseases (Specific Aim 2)
RPA Activity 17 Investigating the effects of smoking (Specific Aim 2)
G11_TG_CAPS.indb 74 2012/08/01 9:01 PM

C75S t r a n d 2 • U N I T 4
• smoking in hotel rooms• smoking in government buildings• laws related to advertising cigarettes – at present cigarette advertising is
illegal• laws related to sponsorship in sports – tobacco companies are no longer
allowed to sponsor sporting events.
4 a The learners’ graphs should show the following information:
b From the results of the investigation, it seems that there is a drastic negative effect on the mass of the baby only when 10 or more cigarettes are smoked per day. Smoking seems to have very little negative effect on the height of the child.
5 The following respiratory diseases have been shown to be directly linked to smoking:• emphysema• lung cancer• chronic bronchitis.
6 The learners present the findings of their research to the class.
Learner’s Book page 2351 a The rate of breathing increased because there was an accumulation
of carbon dioxide in the blood due to the high rate of respiration. The body had an oxygen debt. In order to repay this oxygen debt the rate of breathing increased. Hence more oxygen entered the lungs and therefore the blood
b The carbon dioxide level in the blood increased rapidly due to increased rate of respiration. The sensory cells in the carotid arteries are stimulated by the high carbon dioxide concentration. Impulses from here are relayed to the medulla oblongata, which in turn sends impulses to the heart to breathe faster, to the intercostals muscles, diaphragm and the abdominal muscles to increase breathing rate.
c 20% – 16% = 4% 4% of 1 000 cm3 = 40 cm3
2 a The higher the altitude the greater the average number of red blood cells per volume of blood.
b Taking an average of results minimises the error factor that is found when only one result is used.
Aver
age
birt
h m
ass (
gram
s)
Key:
Average birth mass of baby
Average height of child at 14 years
No. of cigarettes smoked per day by pregnant mother
Aver
age
heig
ht (c
m)
4 000
3 500
3 000
2 500
2 000
1 500
1 000
500
00 1–9 10+
PPA Activity 18 Physiological adaptations to exercise and altitude (Specific Aim 2)
G11_TG_CAPS.indb 75 2012/08/01 9:01 PM

C76 S t r a n d 2 • U N I T 4
c For the shorter-distance races, like the 800 m, there is no significant difference in the time. However, for the longer distances, like the 5 000 m and 10 000 m there is a significant difference at higher altitudes and the running time becomes longer.
d The longer distance events – e.g. 5 000 m and 10 000 me Many of these athletes are acclimatised to high altitudes. Hence their
bodies were already adjusted to the lower oxygen content of the air. A person who normally lives at a height of over 1 000 m differs from a person who lives below 300 m in the following ways:
• his/herbreathingisdeeper • thevolumeof his/herbloodincreasesfromabout5–6,5litres • thenumberof redbloodcellsinhis/herbloodincreasesfrom
about 5 million per mm3 to about 7 million per mm3. Hence, these athletes suffered less muscle fatigue because of their ability to pay off their oxygen debt and were therefore more successful.
Learner’s Book page 2381 a A – larynx; B – bronchus; D – diaphragm; F – intercostal muscles
b i reduces friction during breathing ii keeps the bronchus open at all times iii moistens/cleans/removesdebrisc D contracts and move downwards, resulting in a decrease in pressure
on C, thus allowing air to rush into C from the atmosphere and size of C increases.
2 a A alveolus; B squamous epithelium; C red blood cellsb Diffusion/gaseousexchangec Any two of: • It consists of a single layer of cells, which makes it thin. • The alveolus is lined by a thin film of moisture for the gases to
dissolve in so that it will be able to diffuse into and out of the blood capillaries.
• It is surrounded by blood capillaries to ensure the transport of the gases.
d X–containsmorecarbondioxide/bringingcarbondioxidefromcellsto alveolus.
e • Itisshapedasabiconcavedisc,thuscreatingalargesurfaceareafor absorbing gases.
• It contains the pigment haemoglobin to absorb oxygen and carbon dioxide.
3 a Oxyhaemoglobin and dissolved in blood plasmab Endotheliumc i Diffusion ii • Thediffusiongradientbetweenthelungsandblood/blood
and cells allows gases to move down the diffusion gradient. • The moisture in which gases dissolve in order to pass through
the differentially permeable membrane.
Activity Self assessment
G11_TG_CAPS.indb 76 2012/08/01 9:01 PM

C77S t r a n d 2 • U N I T 4
iii
4 a To demonstrate the mechanism of breathingb i A – trachea; iiB–chest/thoraciccavity;iii C – lungc i Balloons – deflate ii Volume of air in the bell jar – decreasesd Any one of:
• Thebelljarisrigid–whileinrealitytheribscanmovebycontraction of the intercostals muscles, causing the thorax to increaselaterallyinsize/volume
• The balloons are hollow – while the lungs consists of numerous air sacs called alveoli
• Theplastic/rubbersheetisflat–whilethediaphragmisconvex5 a 35 ℓ
b 30 ℓc Oxygend During vigorous activity the rate of respiration is higher. Therefore
more oxygen is needed. e Increasing rate of breathing and increasing depth of breathing.
wall
erythrocytes
moisturesquamous epithelium
endothelium
direction of blood flow
capillary
alveolus
G11_TG_CAPS.indb 77 2012/08/01 9:01 PM

C78 S t r a n d 2 • U N I T 5
Learner’s Book page 244For this activity, you need to purchase sheep kidneys (at least one among five pupils). A good idea would be to first demonstrate the dissection and to point out the various parts that learners need to label. Use the checklist to assess each group’s dissection.
UNIT 5 Excretion in humans
TERM 3
Learner’s Book pages 241–263Duration: 10 hours
PPA Activity 1 Dissection of a kidney (Specific Aim 2)
Assessment of kidney dissection
Group number and learners’ names
External structure Internal structure
Clea
ning
aw
ay
Tota
l
Capt
ion
Scal
e
Rena
l cap
Hilu
m
Diss
ect
Cort
ex
Med
ulla
Pyra
mid
Caly
x
Pelv
is
Papi
lla
2 1 1 1 2 1 1 1 1 1 1 2 15
Group 1
1
2
3
4
Group 2
1
2
3
4
Group 3
1
2
3
4
Group 4
1
2
3
4
Group 5
1
2
3
4
G11_TG_CAPS.indb 78 2012/08/01 9:01 PM

C79S t r a n d 2 • U N I T 5
Learner’s Book page 2521 A: branch of renal artery B: cavity of Bowman’s capsule C: proximal convoluted tubules D: collecting duct 2 Osmoregulation; regulating the pH; regulation of salt concentration;
removal of metabolic waste. 3 The proximal convulated tubule is adapted for its function as follows:
• Cells of the proximal convoluted tubule contain numerous mitochondria, which supply energy for active transport from the tubule to the blood capillaries.
• Epithelial cells possess many microvilli, which enlarge the surface area and contact area with filtrate.
• Cells are in close contact with the endothelium of blood capillaries, for effective transport of absorbed substances.
4 a At B, filtrate contains less water than blood in A, but high concentration of solutes, less liquid and pressure and more solutes account for the decreased flow rate. At C, water is reabsorbed and the flow rate decreases. At D, more water is reabsorbed and the flow rate drops further.
b Due to high molecular mass and size, plasma proteins are not filtered through the cell layer of the Bowman’s capsule.
c Urea is filtered into the Bowman’s capsule. Reabsorption of water takes place but not of urea. The concentration of urea, therefore, increases.
d Glucose is filtered from the blood into B, but completely reabsorbed at the proximal convoluted tubule C.
e A large amount of water is reabsorbed at D, which leads to a corresponding increase in the urea concentration.
Learner’s Book page 2541 There is a linear or direct proportional relationship, that is, as the level of
ADH rises, tubular reabsorption increases proportionally. 2 Increased ADH has the following effect on the renal tubules:
• ADH increases the number of water-selective channels in the plasma membrane of the distal convoluted tubule and the collecting duct and increases the permeability of the cell membranes to water.
• This causes more water to leave the tubules by osmosis and enter the medulla of the kidney.
• The water in the medulla is reabsorbed by the blood capillaries that surround the tubule (peritubular capillaries).
• The amount of water in the blood thus increases and concentrated urine is produced and less water is excreted from the body.
3 If the body is losing a lot of water through sweat, more ADH will be produced to reduce water loss in urine. In hot conditions, less (and more concentrated) urine is produced compared to cold days. Also, if a person is unable to get a drink over a long period, high ADH levels will conserve as much water as possible and the volume of urine will be reduced.
RPA Activity 2 The function of the nephron (Specific Aims 1 and 2)
RPA Activity 3 ADH (Specific Aims 1 and 2)
G11_TG_CAPS.indb 79 2012/08/01 9:01 PM

C80 S t r a n d 2 • U N I T 5
4 ADH levels may be low on a cold day because: • on a cold day, very little water is being lost from the skin as sweat • the kidney will need to lose more water to maintain the water
balance, so less ADH is secreted.5 Other sources of water are: moisture in food and metabolic water from
cellular respiration. Other sources of water loss are: sweating, expired air, faeces and tears.
6 Skin (sweat); kidneys (urine); eyes (tears) 7 Salt balance is maintained in the body as follows:
• uptake of sodium ions occurs in the loop of Henle • the amount of salt absorbed, is controlled by the hormone
aldosterone (produced in the adrenal cortex) • the adrenal cortex is under the control of the pituitary gland • the pituitary gland detects salt levels in the blood and stimulates the
adrenal cortex to produce the necessary amount of aldosterone. 8 a The effect of drinking a lot of liquid will be to make the blood and
body fluids more dilute than usual. This excess liquid will be removed by the kidneys, which will form large amounts of dilute urine.
b Excess salt taken into the body must be excreted. This has to be done in solution, so the kidneys will produce an extra amount of urine to take the salt out. This can result in a shortage of water inside the body, and then the thirst response is stimulated. This is why a salty meal often makes you feel thirsty.
c A high-protein diet will lead to high amino acid levels. The excess amino acids are then converted into urea (in the liver), which is excreted by the kidneys. The urine in this case will have a high urea concentration.
d Living in a hot desert will increase water loss by sweating. The kidneys will therefore excrete less water. The urine formed will be highly concentrated and with the minimum amount of water.
Learner’s Book page 2561 A selectively permeable membrane allows certain substances (excretory
substances) to pass through and prevents other substances (useful) and blood components from passing through.
2 The dialysis fluid should contain the same amounts of useful substances (for example salt, amino acids, glucose, etc.) as for the blood of the patient. The dialysis fluid should not contain any excretory wastes (such as urea and uric acid). This would then allow the excretory wastes to diffuse out of the blood into the dialysis fluid. Since the concentration of useful substances in the blood and the dialysis fluid is the same, useful substances would not diffuse out of the blood.
3 The dialysis fluid is kept at about 37 ºC, which is the same as body temperature.
4 The many channels increase the surface area, so that more diffusion of excretory waste can take place from the blood into the dialysis fluid.
5 Air bubbles could create a blockage in the blood vessels of the patient and lead to the death of the patient.
6 Patients have to be treated on a kidney machine two to three times a week. Each treatment lasts several hours. This affects the quality of life of the patient. Some people feel unwell during dialysis. Kidney machines are expensive to run and maintain.
Activity 4 Dialysis (Specific Aims 1 and 3)
G11_TG_CAPS.indb 80 2012/08/01 9:01 PM

C81S t r a n d 2 • U N I T 5
7 R is an artery. 8 Heparin prevents the clotting of blood. 9 Differences in the composition of blood.
10 There is the same amount of glucose, amino acids and fat in the composition of blood at points A and B. They also have the same amount of oxygen and carbon dioxide.
Learner’s Book page 2611 a 1 Renal artery; 2 Aorta; 3 Adrenal gland; 4 Cortex; 5 Medulla;
6 Pelvis; 7 Renal vein; 8 Ureter; 9 Urinary bladder; 10 Ureter.
b i Malpighian body ii Blood is under pressure and ultra-filtration takes place. iii Renal tubulec tubular reabsorption and tubular excretiond • Bloodin1(renalartery)containsmorewasteproducts,e.g.urea,
uric acid, creatinine and drugs. • Bloodin1containsmorewaterthanbloodin7.
e Kidneys excrete waste products, perform an osmoregulatory function, regulate the water content of body fluids, maintain osmotic pressure of body fluids by excreting excess salts and by retaining water and glucose, regulate the pH of blood plasma by controlling the acid-base equilibrium in blood.
2 a X in renal cortex, Y in renal medullab A ultra-filtration; B tubular reabsorption;
C tubular secretion/excretionc i B ii B iii C d 1 Squamous epithelium cells
2 Podocytes 3 Cuboidal epithelium cells
e The walls of the proximal convoluted tubule consists of cuboidal epithelial cells. The cells with brush borders have numerous micro-villi that increase the surface area for absorption from the lumen of the tubule. The numerous mitochondria in the cells supply the energy need for active reabsorption of water and NaCl against a diffusion gradient.
f Lack of oxygen would adversely affect cellular respiration, mainly oxidative phosphorylation. Insufficient ATP will be produced in the mitochondria and therefore too little energy is available for the carrier molecules to perform active reabsorption, with the result that nutrients such as water, glucose, amino acids and inorganic ions needed by the body are drained away along the renal tubules. This will lead to dehydration, imbalance of acid-base equilibrium in the blood etc.
Point A Point B
more urea, uric acid more water more salt
less urea, uric acid less water less salt
Activity Self assessment (Specific Aims 1 and 3)
G11_TG_CAPS.indb 81 2012/08/01 9:01 PM

C82 S t r a n d 2 • U N I T 5
3 a There is an increase in a directly proportional relationship. An increase in ADH results in an increase in water reabsorption.
b ADH in the blood capillaries surrounding the distal convoluted tubules and collecting ducts increases the number of water-selective channels in the plasma membrane of the tubules and ducts. This increases the permeability of the tubules and ducts to water so that more water is reabsorbed and less excreted in the urine.
4 a i Blood capillary ii Columnar/cuboidal epithelial cell iii Mitochondrionb i Renal tubule between Malpighian body and descending limb of
loop of Henle ii Renal cortexc Cells of the proximal convoluted tubule contain numerous
mitochondria, which supply energy for active transport from tubule to blood capillaries. Epithelial cells have many micro-villi, which enlarge the surface area and contact area with filtrate. Cells are in close contact with enothelium of blood capillaries for effective transport of absorbed substances.
d Water, glucose and amino acids. They are carried by blood capillaries, which unite to form a venule and eventually the renal vein, which enters the inferior vena cava, which carries them to the heart and from there to the body cells. Water, glucose and amino acids are useful substances and vital to all lving body cells.
G11_TG_CAPS.indb 82 2012/08/01 9:01 PM

C83S t r a n d 3 • U N I T 1
Unit 1: Population ecologyUnit 2: Human impact on the environment
Learner’s Book page 2701 A collection of individuals of the same species that are found in the same
location or ecosystem.2 Population size refers to the total number of individuals of the same
species that are found in a given ecosystem or area at a given time.3 Birth/natality rate – increases the population number; death/mortality
rate – decreases the population number; immigration – adds to the population size; emigration – decreases the population size.
4 Positive factor – increased birth/natality rate; negative factor – decreased death/mortality rate, thus not able to balance the birth rate.
5 Equations explained: a Birth and immigration rates are greater than death and emigration
rate.b Birth and immigration rates are smaller than death and emigration
rate.c Population size is the sum of the birth and immigration rate minus
the sum of the death and emigration rate.
Learner’s Book page 273A teaching tip: If you have an overhead projector, an outline diagram of an ecosystem and beads or beans is a useful tool to demonstrate direct and indirect techniques of determining population size. If time permits, this activity could be done with, e.g. locusts on a sports field to allow a more realistic experience. Marking the caught specimens with a tiny dot of Tippex on the upper thorax will not harm the insects. Butterfly nets can be used or learners may make nets from recycled items such as wire hangers and old pantyhose. The example described in the text should provide sufficient guidance for the learners to conduct this investigation.
strand 3
EnvironmEntaL studiEs
UNIT 1 Population ecology
tErm 3
Learner’s Book pages 268–312duration: 24 hours
Activity 1 Population size (Specific Aim 1)
PPA Activity 2 Mark-recapture: simulated seed population (Specific Aim 2)
G11_TG_CAPS.indb 83 2012/08/01 9:01 PM

C84 S t r a n d 3 • U N I T 1
Circulate among the groups to ensure that learners understand how to select the correct data and do the calculation correctly. The margin of error should not be too great if learners ensured that the second catch was greater than the first catch. Guide these discussions in whole class participation. If time allows, let the groups repeat the procedure to see if the average of these repeats will produce a more accurate estimate. These precautions are outlined in the text:• The method of marking should not in any way harm the animal.• The method should not affect the free movement or behaviour of
the animal. • The marked animal should be returned to where it was caught so that it
may mix with the population again.• The second catch should occur soon after the first catch to limit
immigration and emigration, but allow enough time for the marked animals to mingle.
• The second catch sample should always be somewhat larger than the first catch so that a more realistic estimate can be obtained from the Petersen Index calculations.
Learner’s Book page 275Since this activity requires the construction of a quadrat, it is recommended that you acquire a few and keep them in stock for repeated use, year after year. Quadrat frames can be any size, so if storage is a problem, make them smaller e.g. 50 cm². Note that circles can also be used as quadrats, so if you can get hold of some hoola hoops, these will do. Just remember to modify the calculation procedure to suit the area of a circle. The method outlined for Activity 3 is quite simple and it is expected that the learners will have great fun while doing it on the selected field. From this point of view it is highly recommended that they do this activity, to do justice to Specific Aim 2 and to experience science in action. It is also recommended that you start the activity with a demonstration of the procedure outlined in the “NOTE” section, at the end of the method. Experience has shown that not all learners understand the concept of “random”. By doing this demonstration, these learners will realise that it means the “aimless, unplanned” selection of quadrat sampling areas and that where the quadrat will fall is anyone’s guess. A sports field is large enough for several groups to perform this activity at the same time, provided you have enough quadrat frames so that each group can use at least one. The groups can start at different points along the perimeter of the selected study field. If several groups perform this activity on the same field, then the average of all the group calculations will provide a more realistic estimate of the weed population.
Activity 3 Estimating the number of weeds on a field, by using the quadrat method (Specific Aim 2)
RPA
G11_TG_CAPS.indb 84 2012/08/01 9:01 PM

C85S t r a n d 3 • U N I T 1
Suggested rubric for assessment of skills used for Activities 2 and 3.
Learner’s Book page 2791 Carrying capacity – this is the sum total of resources available to support
a population, in a given habitat. If this total number of individuals in the population increases beyond this limit, the population will die back until the optimal number is restored again. Density-dependent factors – these include all the vital resources that individuals of a population will compete for as they become scarce. The larger the population size and density, the fewer the resources for survival. These may include food, shelter, breeding space, etc. Some authorities include other density-dependent factors, e.g. the spread of infectious disease among individuals living close together. Density-independent factors – these are environmental disasters that wipe out members of a population but which are not dependent on the density of the population. Such factors include floods, earthquakes, volcanic eruptions, etc.Competition – the greater the population size and density, the fiercer the competition for limited resources. Territoriality – if an entire habitat is divided into territories, protected by males, this limits the expansion of any more families, thus keeping the population density constant at a number that the natural resources can support.Predation – as prey species increase in numbers, the predator species will also increase. As the predators reduce the numbers of prey, predator numbers will also start to decrease.
2 a As time progresses the population size increases. This is due to the decrease in death rate while the population still increases in numbers, as shown by the constant birth rate.
b There are several possibilities, for example:• The population has been vaccinated against a deadly disease.• A starving population is being fed artificially.• Health services have improved dramatically in an isolated
community.• All the predators have been removed from, e.g. a game ranch.
Criteria 4 3 2 1
Following instructions
Swiftly carried out instructions without any further assistance
Required minimal assistance to follow procedure
Required assistance to boost confidence
Still requires substantial assistance to follow instructions
Making observations (counting procedure)
Carefully and accurately counted the specimens
Good counting speed and accuracy
Slow or less accurate counting procedure
Haphazard and distracted during counting procedure
Recording data Accurate recording of all relevant data
Minimal confusion in recording data
Required more assistance in recording data
Still not confident in data recording.
Calculations All calculations were done accurately, without assistance
Most calculations are accurate, some assistance was required
Required some supervision to calculate accurately
Required substantial assistance to calculate accurately
RPA Activity 4 Population size (Specific Aims 1, 2 and 3)
G11_TG_CAPS.indb 85 2012/08/01 9:01 PM

C86 S t r a n d 3 • U N I T 1
c The population will increase in number until it exceeds the carrying capacity of the environment. This will result in, e.g. a shortage of food, leading to a possible population crash and if it continues, possible extinction.
Learner’s Book page 2801 a
b Learners use the x-axis for years and the y-axis for population size to plot their graphs. An exponential growth form is shown in the graph.
c The phases are: lag phase and exponential growth phase.
d At the end of the eighth year the population size will be 512, of which 256 are males.
2 a Learners draw the line graph by using the x-axis for time (they may either use days or weeks) and the y-axis for population size of locusts. The following phases should be indicated on the graph: • lag phase • exponential growth phase • decelerating phase • equilibrium (stationary) phase. The graph represents a logistic growth curve. Explain to learners the difference between the concepts labelled graphs and annotated graphs. Note: The graph must have a heading.
b The carrying capacity is about 200 locusts per 100 maize plants. c Allow time for the learners to discuss in their groups the possible
reasons for the sudden drop (crash) in the size of the population after 12 weeks (7 × 12 = 84 days).
RPA Activity 5 Looking at logistic growth (Specific Aims 1 and 2)
Year 0 1 2 3 4 5 6 7
Breeding pairs 1 2 4 8 2 6 32 64
Offspring 0 2 4 8 16 32 64 128
Population size 2 4 8 16 32 64 128 256
700
500
300
100
0 10 20Time
Popu
latio
n siz
e
600
400
200
exponential growth phase
lag phase
decelerating phase
equilibrium phasecarrying capacity (K)
G11_TG_CAPS.indb 86 2012/08/01 9:01 PM

C87S t r a n d 3 • U N I T 1
A few factors that could be considered for discussion: • Environmental resistance influences the rate of population
growth, especially when the size of the population overshoots the carrying capacity.
• Drought, during which plants will wither and eventually die. • When food as a limited resource is exhausted, the locusts will
either die or leave the area and emigrate to new habitats. • Annual crops, such as maize, with short life cycles, can sustain the
locust population only for a short period of time.
Learner’s Book page 2831 a During geometric growth, a population exhibits its biotic potential.
The biotic potential of a population is the maximum growth that can possibly occur under ideal conditions. The geometric growth model predicts unlimited population increase under conditions of unlimited resources. The characteristic phases of this growth curve are: Lag phase. During this phase, growth is slow because the population is small. It may be that the population is adapting to its environment. Geometric (exponential) growth phase. During this phase, a population exhibits its biotic potential. Growth is accelerating and the population size increases unrestrictedly and rapidly with time. Under favourable conditions (sufficient space, unlimited resources and no predators and diseases) the struggle for existence is low and survival is high. At this point the species realises its full reproductive (biotic) potential.
b i and ii Learners answer the questions using the text in the unit. c In reality, geometric growth cannot continue for long because of
environmental resistance. As environmental resistance becomes effective, the increase suddenly comes to an end. The population will reach a size that can no longer be supported by the environment. In most populations this resistance may be lack of food and space, accumulation of waste products, disease, increased competition and predation. When the growth of a species population over-shoots the carrying capacity of the ecosystem, certain resources become exhausted. This results in a sudden decrease in the size of the population called a “crash”. The population then increases again, only to follow the same pattern. Populations whose numbers are drastically reduced by a catastrophic event and then rebounded have high reproductive potential, as in the case of locusts and certain species of plants. Populations that show this type of growth curve are referred to as “boom-and-bust” populations.
2 Learners draw a line graph. The graph is that of a geometric growth curve.
RPA Activity 6 Looking at exponential growth (Specific Aims 1 and 2)
70
50
30
10
0 5 10Time
Popu
latio
n siz
e
60
40
20
geometric growth phase
lag phase
G11_TG_CAPS.indb 87 2012/08/01 9:01 PM

C88 S t r a n d 3 • U N I T 1
3 a Learners plot the graph.
b There was an initial slow growth rate until 1970. Thereafter, the population numbers increased sharply to reach a peak in 1985. During the next five years the population crashed from a total of 98 in 1985 to only 26 in 1990. The population continued to decrease in numbers with its lowest population density of only 10 individuals persisting for nearly 10 years. Currently, there appears to be an increase in population numbers again since the total of 12 was reached in 2010.
c Geometric growth ( J-shaped growth pattern). The growth rate rose rapidly from a low number until it reached a maximum number that overshot the carrying capacity. This led to a population crash. Zebra, like other large mammals, normally have a logistic growth pattern.
d The estimated carrying capacity started to decline from 1975 and by 2010, the carrying capacity decreased from 45 to only 16 over the 45 years that the zebra were on the farm.
e Overgrazing. As the zebra population increased and overshot the carrying capacity of the game farm, heavy grazing, season after season, prevented regrowth of grasses and may have led to soil erosion and land degradtion.
Learner’s Book page 2881 a Predators concentrate mainly on weaker individuals of prey species.
b Prey population size is the driving force in predator-prey relationships.2 Predation is the relationship between a predator and its prey. The
predator-prey relationship has an effect on population size. As the prey population increases, the predator population also increases, probably because more food has become available. The increased number of predators will cause increased mortality in the prey and their numbers will drop. As the prey population declines, so does the predator population. The decline in predator population can be ascribed to emigration and increased mortality. This allows the prey population to increase again. The result will be a series of peaks and troughs, with the predator population lagging slightly behind the prey population.
70
50
30
10
1960 1975 1980
Year
Popu
latio
n siz
e
60
40
20
total zebra population
estimated carrying capacity
100
80
90
01965 1970 1985 2000 20051990 1995 2010
RPA Activity 7 Predator-prey relationships (Specific Aims 1 and 2)
G11_TG_CAPS.indb 88 2012/08/01 9:01 PM

C89S t r a n d 3 • U N I T 1
3 a Predation is the relationship between a predator and its prey.b Learners plot the graph.
Predation as illustrated in nature
c The populations are stable. A population is stable when the size of such a population fluctuates, but not to the extent that the population becomes extinct or causes habitat destruction.
d Learners can read the numbers off the graph.e Factors that could have an influence:
• Harsh weather during the winter meant that the hares needed more food, so death rates could have been higher.
• Other predators, such as owls and foxes, could have competed and complicated the lynx life cycle.
• Rising fur prices in Europe lead to more hares being trapped.• Predators (lynxes) turned to alternative prey species or might
have left the area during low points of the hare population cycle.4 a Fawns may be weak or slow and so are easier to catch than healthy
adults. They are also inexperienced in comparison to the adults and so will not be able to recognise cheetahs and wild dogs as predators and take evasive action.
b Reasons that adults escape their two main predators more easily than fawns include:• Adults can run faster.• Adults can take evasive action to avoid the predators, even if the
predators may be able to outrun them initially.• Adults have endurance over distance, while their predators have
only short-burst speed. Fawns do not have this endurance.c Cheetahs lose more distance to adults than they do to the other age
classes of gazelles.
Learner’s Book page 2921 Interspecific competition is involved in these scenarios. That is
competition between individuals of different species that have similar ecological requirements, for example, for the same limited resources. In answering these scenarios, learners may need to be assisted. a Where two species (A and B) occupy the same space as competitors
for limited resources, one species may out-compete the other and eliminate it from the area. This happens when the carrying capacity of one species is below that of another species.
b An unstable equilibrium may exist between two competing species where either of two species can win. Species A and B have their own carrying capacity respectively. None of the two species can increase in population size above the carrying capacity. If species A is above its carrying capacity and B not, B will continue to increase (dominate),
Key:
snowshoe hare
lynx
Time
Num
ber o
f ani
mal
s (1
000)
1845 2555 65 75 85 95 1905 15
160140120100
80604020
0
RPA Activity 8 Competition (Specific Aims 1 and 2)
G11_TG_CAPS.indb 89 2012/08/01 9:01 PM

C90 S t r a n d 3 • U N I T 1
but A will decrease until it is well below its original carrying capacity. The reverse for A and B is also true.
c In this scenario two species, A and B, may coexist with their populations in equilibrium (that is, not exceeding their carrying capacity). This can happen when the two competing species act as one, possessing such a behavioural trait as interspecific territoriality. If species A increases, species B decreases and vice versa. The density of each population depends upon some mechanism that shows the growth of species A before it becomes so abundant that it can stop or reverse the growth of species B. Eventually, the two competing species reach a stable equilibrium point.
2 a Logistic growth. At first the growth is slow (lag phase), then it accelerates (exponential phase), and eventually it slows down and stabilises at some equilibrium level (stationary phase).
b It is an indirect technique. c Six different samples were used to increase the reliability of the
results. d Shortage of living space.
Competition for mineral salts and light. Diseases.
e • Effect of unfavourable environmental factors are eliminated. • At higher and constant temperature, plants photosynthesise at an
optimum rate. • Rate of enzyme action also increases. • Rate of reproduction is thus increased.
f Intraspecific competition. This is competition among individuals of the same species for the same limited resources.
Learner’s Book page 2941 a Bilharzia life cycle
PPA Activity 9 The life cycle of a parasite (Specific Aims 1, 2 and 3)
Eggs hatch,
releasing larvae
Paired male and female adult worms migrate to
bowel, rectum or bladder
Migrate to portal blood
in liver and mature
into adults
Circulation
4 Larvae lose tails during
penetration and become
schistosomulae
Larvae
penetrate
snail tissue
Sporocytes
in snail
(successive
generations)Penetrate
skin
3 Larvae released by snail
into water and free swimming
1
2
5
in urinein faeces
Schistosoma species
G11_TG_CAPS.indb 90 2012/08/01 9:01 PM

C91S t r a n d 3 • U N I T 1
Taenia life cycle
Learners will chose one of the two parastitic diseases.b Bilharzia: Mostly successful in its mode of living because it does not
usually kill its host, so the parasite spreads from host to host. Taenia: Successful in its mode of living because its main host is unaffected by the parasite’s presence and humans are the only host for the adult tape worm, as long as the larval forms in pigs are eaten. It does not usually kill its host, so the parasite spreads from host to host.
c Bilharzia: Avoid wading or swimming in tropical or subtropical rivers, especially those near settlements. If you have to drink river water, look for a waterfall with a drop that is greater than one metre. Drinking water for the house must be boiled. If river water is pumped to the home, chemical treatment with blue copper sulphate is advised. Bilharzia in local dams can be detected by the presence of their host snails and these can then be mechanically removed, although it will be time consuming. Poisons in the water are not recommended – these will harm useful food webs. Taenia: Educate people who live in Eastern Cape and other areas where the parasite is common about safe pig-rearing practices and the dangers of eating pork that is contaminated – the larval stages can easily be seen in contaminated meat and are killed by correct cooking. Improve sanitation so that faeces from people who are carrying the tape worm are not eaten by pigs.
Learner’s Book page 2961 Examples of such questions may include:
• Do elephants pose a real threat to biodiversity in the Kruger National Park?
3 Oncospheres hatch, penetrate intestinal wall, and circulate to musculature in pigs or humans
Oncospheres develop into cysticerci in muscles of pigs or humans
4 Humans acquire the infection by ingesting raw or undercooked meat from infected animal host
Cysticerci may develop in any organ, being more common in subcutaneous tissues as well as in the brain and eyes
Cysticercosis
Scolex attaches to intestine
Adults in small intestine
2 Embryonated eggs and/or gravid proglottids ingested by pigs
5
6
1
= infective stage= diagnostic stage
Eggs or gravid proglottids in faeces and passed into environment
i
d
i d
i
PPA Activity 10 Case study: Science versus ethics (Specific Aims 2 and 3)
G11_TG_CAPS.indb 91 2012/08/01 9:01 PM

C92 S t r a n d 3 • U N I T 1
• Is the conservation of elephants important to the environment and humans?
• Do humans have the right to kill elephants?• Is culling of elephants the wisest option to control their population
numbers?• Do all people like elephants?• Have you ever interacted with elephants?• Do you think elephants grieve when a member of their family dies?
2 Two possible hypotheses could be:• The learners at my school are not in favour of the culling of
elephants.• The learners at my school are mostly in favour of the culling of
elephants.3 Learners can select and refine questions from responses to question 1
above and may also add new questions more appropriate to elephant culling. It is important that they finally phrase questions in such a way that it requires either “Yes” or “No” responses. Learners may also add a “Don’t know” option because some respondents (fellow learners) may be undecided regarding some of the questions. It is important that the five questions selected for the questionnaire do relate to the stated hypothesis. It is also important that the selected questions are stated in a concise manner to reduce reading time of the respondents. For the first hypothesis stated above, some appropriate questions may be:• Do you like elephants?• Do humans have the right to kill elephants?• Is culling elephants the wisest choice as a way of of saving
biodiversity in the Kruger National Park? • If you were given the opportunity, would you shoot an elephant?• Would you participate in a campaign to lobby against elephant
culling?
When the learners have selected their questions, it will be a good idea to ask them to read them out loud so that remaining class members can make suggestions to refine them to suit the hypothesis, if and where necessary. Once you, as teacher, are satisfied that the questions are appropriate, the groups can construct the questionnaire. An example is provided below:
Questionnaire on attitudes towards the culling of elephants in the KNP
Instruction: Place a cross in the space that represents your choice of answer.Yes No Don’t know
1. First question2. Second question3. Third question4. Fourth question5. Fifth question
4 Plan the time and approach for launching the questionnaire on the play ground. Help learners to choose appropriate lunch breaks when most learners are available. Also guide groups in selecting different zones of the play ground to prevent all groups from targeting the same learners. Alternatively, each group can be assigned a grade, e.g. Group 1 to target Grade 9 learners, Group 2 to target Grade 10 learners and so on.
G11_TG_CAPS.indb 92 2012/08/01 9:01 PM

C93S t r a n d 3 • U N I T 1
5 A result sheet that reflects the five selected questions will be required. On this sheet, the total responses per question should be entered, e.g:• Do humans have the right to kill elephants?
Yes: 11. No: 38. Don’t know: 76 Learners are expected to use these results to construct one pie graph per
question. First the total number of respondents should be calculated. i.e. in the example of point 5 above:• The total of respondents is 11 + 38 + 7 = 56• Now calculate the ratio of each subtotal in order to reflect this in a
segment on the pie chart. Since the pie chart forms a circle of 360º, the proportion of each subtotal (segment) of this circle needs to be calculated. Thus:
11 × 360º = 70,7º56
38 × 360º = 244,3º56
7 × 360º = 45º56
• Construct the pie chart, with the aid of a protractor, by using the segment values calculated above. Add a key (in colour) e.g. Blue to represent Yes; Red to represent No; and Green to represent Don’t know.
• Draw a pie chart for each one of the five questions on the questionnaire, to show the results.
7 Does the majority of responses reject or accept the group’s hypothesis? The answer to this can only be either “Yes” or “No”. Based on this finding, a conclusion should now be stated.
8 How can this investigation be streamlined to yield more reliable results? Offer an opportunity for a whole class discussion to make suggestions and also to share difficulties that may have been encountered during the various steps of the investigation.
Learner’s Book page 3021 Forms of habitat destruction may include: heavy foot traffic, flood
damage from roof drain pipes, fire damage, bare soil left where bricks were piled for some time, clearing of vegetation and then left bare, etc. These are only a few examples of many possible causes.
2 The area may be in the pioneer stage of succession if the groundcover plants are tiny or low growing, often creeping, and hardy pioneer weeds. Another characteristic of the pioneer stage is the lack of diversity of species among plants. If the area is in the secondary stage of succession, then expect to find taller plants in the process of replacing pioneer species. In this case a greater variety of species can be expected.
Yes
No
Don’t know
Key:
PPA Activity 11 Secondary succession (Specific Aim 2)
G11_TG_CAPS.indb 93 2012/08/01 9:01 PM

C94 S t r a n d 3 • U N I T 1
3 These pioneer plants differ from region to region across the country. Expect to find mainly weeds and alien invader species that are adapted to withstand harsh sunlight, wind and desiccation. Look out for adaptations, e.g.: • deep penetrating tap roots e.g. in dandelions. This is an adaptation to
overcome the problem of dry surface soil, relying instead on water deeper in the ground
• flat creeping plants e.g. purslane, an adaptation to withstand strong surface winds
• tiny leaves, i.e. a reduced surface area to limit water loss from transpiration
• thick cuticles on leaves and stems, to reduce water loss from evaporation
• tough but flexible stems and/or petioles that can sway in the wind, an adaptation to prevent these from breaking
• hairy surfaces on leaves and stems to trap water from morning dew and thus create a moist micro-climate for these exposed pioneer plants
Some of the most common pioneer weeds that are generally found in all the provinces include pig weed, blackjack, sorrel as well as dandelions and purslane mentioned earlier.
4 Secondary colonisers are usually taller plants than pioneers, e.g. khaki weed, wild oats, several grass species, thorn apple, etc. Ask the local farmer’s co-op (agricultural centre) for technical brochures that list and describe weeds common to your area. Also ask a keen gardener on your staff to help you to identify the plants. Secondary coloniser plants are often referred to as “nurse plants” because they provide shelter and humus for new arrivals that germinate in their shade.
5 As a teacher, you may consider making this the start of a long-term annual recording of succession of the selected area at your school. Let the learners record the appearance of the soil and the ground cover (the plants) as it appears in the current year. Help the learners to record the composition of the plant species present in the section, in order to compare this with new plant species that arrive in subsequent years. Thus, a record of how the species change during the succession process at your school will then be available to illustrate the sequence of steps in the succession process. A succession diary is strongly recommended for ongoing recording of the succession developmental stages for years to come. The group with the best description can be honoured by placing their work in the succession diary.
6 Learners with cameras/cell phones can take photographs, to record the distribution of the plants species. The best (most illustrative and representative) photographs can be added to the succession diary. Also give the learners an opportunity to draw whole plants of pioneer and secondary species, with descriptive labels to highlight adaptations. Plant pressings can also be another form of recording the plants from this succession study area.
7 Let each group collate all the information gathered from points 1–6 so far into a concise report, to describe the micro-landscape and succession stage of the selected area.
8 Schedule these visits to coincide with the changing of seasons and let the learners record the changes in plant appearance, behaviour and distribution. Annual plants may die and appear again the next season, others may change colour, set fruit and seed and so on.
G11_TG_CAPS.indb 94 2012/08/01 9:01 PM

C95S t r a n d 3 • U N I T 1
9 Add footnotes of changes to the annual report in the succession diary.10 As a formal homework exercise, allow each learner to write his or her
own overall report on observations of the process of succession observed and recorded to date. The content and quality of these individual reports will allow you as teacher to assess the learner’s insight on the process of succession. This in turn will offer you the opportunity for formative assessment and remedial action.
Consider the following tip:A very rewarding exercise is to construct an ecology pond near your classroom or laboratory. Create a shallow side that slants very gradually towards the centre of the pond. Appoint the Grade 11 class as mentors to ensure that the pond remains filled with water and to remove any litter that may land in it. Do not create a garden around the pond, to allow natural succession to take its course. Now the learners are given the opportunity to witness the succession of terrestrial plants around the perimeter of the pond as well as the succession of aquatic plants on the gradual slope created inside the pond.
Learner’s Book page 3091 • Improvedmedicaltechnology,alongwithareductioninchild
mortality and an increase in the numbers of people living into old age.
• Maize and other high-energy grains replacing former low-energy grain crops
• Industrial revolution increasing the productivity of goods and services
• The Green Revolution – improved farming techniques, use of fertilisers and insecticides increasing crop yields.
• Improved sanitation and water supplies, preventing the spread of infectious diseases.
2 Humans have the mental ability and technical skills to modify their environment most radically to suit their own needs. No other species are able to change their environment to the same extent.
3 South Africa is still a developing nation because we have not as yet undergone demographic transition. We will only achieve this once we establish a birth rate that does not exceed the death rate and maintain a consistent and balanced ratio between immigration and emigration.
4 a The steady decrease in birth rate will ultimately decrease population numbers but the positive effects of this will only be felt a few generations from now. This is because we are still largely a youthful nation with a high number of people still at reproductive age or about to enter reproductive age in the near future. Thus, the population number is expected to increase considerably within the next 20 years.
b HIV and AIDS will continue to cancel out efforts in reducing the death rate and life expectancy of the nation.
c Water, space and food shortages will increase. Environmental resources that are already under pressure will be placed under further pressure, especially habitat destruction, increased pollution and a reduction in the quality of ecological services. The ecological services that provide fresh air (photosynthesis) and those that provide clean
Activity 12 Global human population growth (Specific Aims 1 and 3)
G11_TG_CAPS.indb 95 2012/08/01 9:01 PM

C96 S t r a n d 3 • U N I T 1
water (healthy wetlands and functional water cycles) are likely to deteriorate further.
5 a 7 billion in 2011b Genetic modification of crops and livestock to increase productivityc The global population will then be 11 billion people. Any number
and variety of reasons may be given as an answer. You are advised to evaluate responses on merit of scientific reasoning, based on available information.
Learner’s Book page 3121 Birth (natality) rate and immigration rate increase; death (mortality) rate
and emigration decrease population size.2 Carying capacity, the sum of supporting ecological resources, limit
further growth. Density-dependent factors, e.g. available food and space. limit population increase. Density-independent factors, e.g. severe drought, may decrease population size. Competition for limited resources, which may lead to death or emigration. Territoriality limits the number of individuals who can survive in a particular ecosystem. Predation lowers the prey population, which in turn limits the predator population size.
3 Useful to: a Game managers on a game farm assess the ratio of predator to
prey numbers that can be introduced and maintained in the limited confines of the farm.
b Sheep farmers can sustain stock more effectively by protecting them by, e.g. introducing Anatolian sheep dogs and maintaining large population of, e.g. dassies in outcrops dotted around the farm.
c To determine the ratio of predator to prey fish that can be maintained in a tank.
4 Intra-specific competition occurs among members of the same species who compete for the same limited resources, e.g. food, shelter, space, nesting sites or territories to raise their young. Inter-specific competition occurs when members of different species compete for the same resources. Competitive exclusion is a specialised form of inter-specific competition. This is competition between two closely related species that occupy the same habitat and niche, e.g. two Paramecium species. The stronger species will increase in number while the weaker species decrease in population size and may ultimately disappear. (The same applies to two garden herbs: dill and fennel, so gardeners never plant them in the same bed.)
Activity Self assessment
G11_TG_CAPS.indb 96 2012/08/01 9:01 PM

C97S t r a n d 3 • U N I T 1
Resource partitioning is another specialised form of inter-specific competition. In this case, species that are competing for the same resource have solved the problem by moving into neighbouring niches eg. moths (nocturnal) and bees (diurnal) that pollinate the same flowering species (temporal), or different heights of plants in a forest (spatial).
5 Counting, e.g. human door-to-door census or counting individuals from aerial photographs, e.g. elephant in a game reserve.
6 The mark-recapture technique: This method is suitable for large populations of mobile animals. First a certain number of animals are caught, marked and then released again. Shortly afterwards a larger sample is caught. These totals are then used for the Petersen index, equation: N = M × C R
to calculate the estimated population size, N. The quadrat sampling method divides the area of study into a counting grid containing several quadrats. A few quadrats are randomy selected the number of individuals in each quadrat are counted. Thereafter, the average number of individuals per quadrat is calculated. This average can now be multiplied by the total number of quadrats in the counting grid of the area to obtain the estimated population size in the area of study.
7 Comparing logistic and geometric growth: a
b The life expectancy of a population that shows a logistic pattern of growth is relatively long, e.g. 70 or more in some human populations. The life expectancy of a population that shows a geometric growth pattern is much shorter, e.g. most insects.
Logistic (sigmoid or S-curve)
700
500
300
100
0 10 20Time
Popu
latio
n siz
e
600
400
200
exponential phase
lag phase
decelerating phase
equilibrium phasecarrying capacity (K)
70
50
30
10
0 5 10Time
Popu
latio
n siz
e
60
40
20
geometric growth phase
lag phase
Geometric (exponential or J-curve)
G11_TG_CAPS.indb 97 2012/08/01 9:01 PM

C98 S t r a n d 3 • U N I T 1
8 Primary succession occurs on a newly formed surface, e.g. an island that arose from volcanic activity in the ocean; it is a long-drawn, out process that may involve hundreds or millions of years and colonising is usually started by lichen and moss, to create soil.
Secondary succession occurs in places where vegetation was cleared. This requires less time because the soil has already been formed, although in dry areas it may take hundreds of years for vegetation to re-establish to former ecosystems. Colonising is started by hardy pioneers from surrounding ecosystems, or invasive alien weeds.
9 The characteristic outline of age pyramids of:a
b
c
female80+ 75–79 70–74 65–69 60–64 55–59 50–54 45–49 40–44 35–39 30–34 25–29 20–24 15–19 10–14
5–9 0–4
Age
(in y
ears
)
6 5 4 3 2 1 0 1 2 3 4 5 6Millions
male
Undeveloped countries
postreproductive
reproductive
prereproductive
Key for pyramids:
postreproductive
reproductive
prereproductive
Key:
female80+ 75–79 70–74 65–69 60–64 55–59 50–54 45–49 40–44 35–39 30–34 25–29 20–24 15–19 10–14
5–9 0–4
Age
(in y
ears
)
Millions
male
United States 2005
12 10 8 6 2 0 4 6 8 10 124 2
80+ 75–79 70–74 65–69 60–64 55–59 50–54 45–49 40–44 35–39 30–34 25–29 20–24 15–19 10–14
5–9 0–4
6 5 4 3 2 1 0 1 2 3 4 5 6
Age
(in y
ears
)
Millions
femalemale
Developed countries
postreproductive
reproductive
prereproductive
Key for pyramids:
G11_TG_CAPS.indb 98 2012/08/01 9:01 PM

C99S t r a n d 3 • U N I T 2
The unit contains some of the most important life lessons that learners will encounter during their schooling. Aspects of all sections can become depressing, but also inspirational if dealt with in a way that helps learners to realise that they have the power to change the world around them in a positive way. Addressing such an enormous subject in such a short time will be challenging to you and also to the learners. It is suggested that you find DVDs or videos that are related to the topics that you deal with, to enhance learners’ understanding of the content and experience it in a wider context. Also consider some short ice-breakers when situations require a mood lift, e.g. a ten-minute session in which learners are required to design car bumper stickers with an awareness/useful tips/etc. regarding adaptations for climate change. Throughout this unit, reference is made to various stages of human development. The graph below may be useful to share with learners. It will help to place environmental issues in the historical context of the key stages of human development.
The human population explosion from one individual to 11 billion individuals by the end of 2100
The atmosphere and climate change
The following activity is an orientation exercise to get learners thinking about the impact of lifestyles on the environment. Because there are so many variables in the four lifestyles outlined, there cannot be any right or wrong answers for the questions posed. It is actually the learners’ analysing and evaluation skills in terms of GHGs that are important in this activity. A classroom discussion should follow on completion of the activity, to allow exchange of ideas and development of further insight on the environmental “cost” of various lifestyles.
UNIT 2 Human impact on the environment
TERM 4
Learner’s Book pages 313–381Duration: 28 hours
Source: The Enviropaedia, May 2004. ECO-LOGIC Publishing cc. Tel: 021 786 4311 e-mail: [email protected]
Hunter-gatherers Agricultural revolution
Mito
chon
dria
l Eve
Satu
ratio
n po
pula
tion
thro
ugho
ut A
fric
a
Satu
ratio
n po
pula
tion
thro
ugho
ut W
orld
Dom
estic
atio
n G
row
th o
f citi
es
Inve
ntio
nof w
ritin
g
Inve
ntio
n of
prin
ting
pres
s
Scie
ntifi
c re
volu
tion
Indu
stria
l rev
olut
ion
Med
ical
revo
lutio
n El
ectr
onic
s re
volu
tionThe human population explosion
from 1 individual to 6 billion individuals
GLOBAL COLONISATION & THE SIXTH EXTINCTION
140
000
45 0
00
5 20
0 0
1454
AD 1800
1900
2000
2100AD
11 0
00
Hum
an p
opul
atio
n
Colonisation of Africa
(ca 100 000 years)
Colonisation of rest of World
(ca 30 000 years)
1 Individual 50 000 5 million 500 million1 billion
1,6 billion
6 billion
11 billion
G11_TG_CAPS.indb 99 2012/08/01 9:01 PM

C100 S t r a n d 3 • U N I T 2
Learner’s Book page 315Possible responses:1 Fifteen flights; large car and huge mileage; two flights; technology and
services; large consumption; consume resources with discretion; lots of electricity; use electricity sparingly; rarely eats meat; public transport; doesn’t travel much; wood for cooking; recycled building materials; grow own vegetables.
2 For 15 flights, large car and huge mileage, and two flights: travel less, share lifts. Use public transport infrastructure, replace short car trips with cycling, scooters or walking. For technology gadgets and large consumption: acquire only the essentials.
3 Locally produced foods, products and services: Advantages: smaller carbon footprint, fresher produce, less storage treatments, supports local suppliers, etc. Disadvantages: May not get needed items e.g. spares for family car, essential medication, etc. Import of goods: Advantages: stimulates the global economy and can help other developing countries because we import from other African countries. Disadvantages: large carbon footprint.
4 The government can:a Plan a better transport infrastructure, e.g. buses and trains to suit
everyone, bicycle lanes in each city and town, etc.b State buildings with solar systems, grey water systems, reduced
cement-based concrete and more glass or recycled/organic renewable building materials. More energy efficient by using natural light to reduce daylight need for electrical lights, LED lights only, water- saving devices on taps, etc.
c Stick to Kyoto Protocol CDM mandate to use renewable resources (solar, wind, water and biomass) and reduce reliance on coal, other fossil fuels and nuclear energy for electricity For your interest, and to share with your learners, a brief summary of the South African policy document, based on the Kyoto principals, is included below. Some comments are added. This is a useful document, with practical guidelines for adapting to climate change. Order the original version of this White Paper on SA Strategies from the DEAT, via the internet.
Activity 1 The carbon footprint of different socio-economic groups (Specific Aims 1 and 3)
South African government strategiesMany environmental strategies exist and are currently in operation in South Africa which includes a South African Climate Change Strategy to prepare us to adapt to climate change. HelplineDepartment of Environmental Affairs and Tourism (DEAT)Pvt. Bag X447, Pretoria 0001Tel: 012 310 2911Fax: 012 322 2682www.environment.gov.za
G11_TG_CAPS.indb 100 2012/08/01 9:01 PM

C101S t r a n d 3 • U N I T 2
The national climate change response strategy for South AfricaSouth Africa aims to reduce greenhouse gas (GHG) emissions by 21 tonnes by 2012. Since South Africa is a developing country (a so-called non-Annex 1 country), a period of grace was given to us before really stringent measures are put into place. This is to allow South Africa to boost its economy in order to eradicate poverty. South Africa’s economy is heavily dependent on the production and export of coal products, hence the period of leniency between 1997 and 2012, before applying stricter measures. A few key areas of focus in the National Climate Response Strategy are outlined below, with some comments added:1 Supporting national and sustainable development: As an example, new
RDP houses, new industries, other housing developments, street lights, etc. may be fitted with solar panels, instead of using only conventional electricity. New factories should be fitted with technological devices that prevent GHGs from escaping into the atmosphere. Each industry should be held fully accountable for their impact on the environment and rehabilitate, restore, clean up and neutralise accordingly.
2 Adapting to climate change: South Africa has identified the health sector, maize production, plant and animal biodiversity, water resources and agriculture as areas of high risk. These high-risk areas must seek alternative ways to overcome the negative effects of global warming. For instance, provinces in which cholera, malaria, bilharzia and gastrioenteritis do not occur very often at present should prepare their health services to treat and prevent the spread of potential outbreaks in future. Conservation farming methods should replace the current highly fossil-fuel dependent and soil-altering farming practices. Future agriculture should focus on water and biodiversity issues with the same intensity as it does on food production. Each community should have rescue plans in place to reduce the impact of intense floods, droughts, fires, diseases, hunger, etc. Empowerment programmes and training workshops should involve all citizens in each community.
3 Developing a sustainable energy programme: South Africa needs to move towards a cleaner development technology. This includes adopting the Clean Development Mechanism prescribed by the Kyoto Protocol. We need to reduce our current CO2, N2O (nitrous oxide) and CH4 (methane) emissions dramatically. Much more research in alternative technologies is required, especially on solar, wind, hydro, geothermal and waste to electricity forms of energy. The current attitude of “we continue to use and aim to increase coal and nuclear based electricity because this is what we are familiar with, understand and can do” is not environmentally sustainable.
4 Meeting international obligations: South Africa has signed the UNFCC and the Kyoto Protocol and this means that our industries, including agriculture and other sectors, are obliged to reduce GHG emissions. Industries are required to keep records of current emissions and their effects on the environment and to forward this to the United Nations Databank.
5 Integration of climate response in government: All government departments are to cooperate in a joint effort to prepare for the impacts of climate change. Currently, these departments are still
G11_TG_CAPS.indb 101 2012/08/01 9:01 PM

C102 S t r a n d 3 • U N I T 2
largely operating in separate “silos”. Since the Education Department is also a government sector, it may contribute by designing future schools in such a way that minimum electricity and other resources is required. The same applies to hospitals, prisons, and all other sectors.
6 Domestic legal (law) obligations: The NEMA (National Environmental Management Act) is an umbrella Act that serves as a guideline document for the development of remaining environmental laws. Climate change is addressed in the White Paper on Integrated Pollution and Waste Management, and also in the White Paper on a National Water Policy for South Africa. The new National Environmental Management: Air Quality Act addresses GHG emissions. These policy documents should become essential reading for mining developers, property developers, industry and all the other sectors of society who still favour economics and personal gain over sustainable development by continuing the destruction of life sustaining ecological services.
7 Climate change related to education and training: Environmental education is integrated in every subject in the school curriculum, in accordance with the government’s educational policy. Special calendar days such as National Atmospheric week, World Environment Day, Arbor Day, Biodiversity Day and World Meteorological Day should become a more meaningful part of the school curriculum. These days can be used to update learners on the current state of the environment and allow them to collaborate in future action plans for the school to take part in awareness, adaptation and sustainable living issues.
Learner’s Book page 3181 With reference to the carbon cycle: Plants absorb CO2 from the atmosphere through photosynthesis and
store it in their tissues as a source of energy for growth, reproduction, etc. This reduces the concentration of CO2 in the air, thus reducing the quantities of greenhouse gases in the air. At the same time O2 is emitted into the atmosphere. Deforestation, the removal of forest plants, removes natural CO2 filters, and this results in an accumulation of CO2 in the atmosphere. The CO2 that is emitted from livestock, factories, industry and vehicles can no longer adequately be removed by photosynthesis in deforested areas.
2 South American forests are rapidly being destroyed to make way for large cattle ranches. This deforestation is the result of a growing demand for beef, particularly from rapidly developing countries such as China.
3 a–b Forest floors normally have a thin layer of topsoil, held firmly by the root systems of trees and shrubs. When deforestation occurs, this thin layer of topsoil rapidly washes away, leaving the subsoil bare. In time the subsoil also washes away, leaving dongas and erosion scars. The soil that is left is infertile, nutrient poor and compact. This is unsuitable for any form of agriculture and it may take hundred of years for the topsoil to form again.
4 When it rains the water that seeps into the ground, is absorbed by plant roots. This water passes through the plant and is later gradually released into the atmosphere by transpiration. Slowly the vapour collects into
Activity 2 Deforestation (Specific Aim 1)
G11_TG_CAPS.indb 102 2012/08/01 9:01 PM

C103S t r a n d 3 • U N I T 2
clouds and precipitation (rain, hail, snow) may follow. Trees and shrubs are thus important pumps to keep water in circulation in the ecosystem. Furthermore, the roots of plants create a sponge effect in the soil and slowly absorb water for the trees. Without plants, water simply runs off against slopes, into rivers and towards the ocean – lost to the ecosystem.
5 It is hoped that learners will opt for indigenous forests, however, if a learner presents a convincing argument that exotic forests be planted, this should be accepted on merit.
6 Here are only some of many options:a Farmers: manuring instead of ploughing, intercropping with
indigenous trees (agroforestry), restoring wetlands, etc.b Home owners: create and maintain a compost heap/bin, surround
home with trees and shrubs, plant own fruit and vegetables, mulch continuously and never turn garden soil (destroys soil structure and decomposers).
c Schools: as for home, plus create a wetland, small forest, bird garden, rockery, etc. in school grounds that are large enough for this.
7 The nitrogen cycle:a Trees and shrubs with nitrogen-fixing bacteria can absorb
atmospheric nitrogen and convert it into nitrates to make the soil more fertile for remaining bacteria and decomposers to move in, putting nitrogen back into the cycle.
b The answer to question 7 a explains how natural nitrates can be introduced into the soil. Some crops and fruit trees will need additional compost, or other fertilisers.
c Roots of plants create a sponge effect in the soil as they pierce through soil particles. This causes soil to crumble and makes the soil porous enough to absorb and retain water. Tree roots can then gradually absorb this water. Without plants, water simply runs down slopes, causing accelerated erosion of top- and sub-soils.
8 Forest trees, shrubs and groundcovers all photosynthesise, respire and transpire. When they die, their remains become food for decomposers. These metabolic processes keep carbon, oxygen and water vapour circulating through the ecosystem. Nitrogen-fixing bacteria in some forest plants also keep nitrogen circulating.
Learner’s Book page 321The CAPS document refers specifically to the greenhouse effect without asking for details of greenhouse gases. The following information will be useful when assessing the quality of the learners’ answers.
Activity 3 What is the greenhouse effect? (Specific Aim1)
Greenhouse gases – where do they come from?
Worldwide, air pollution has been worsening as a result of the increasing consumption of fossil fuels, caused by an increase in the number of cars, other road vehicles and especially aircraft and ocean vessels. The combination of rapid economic development, a rise in consumerism, and the industry to support this, as well as a growing global population has accelerated the greenhouse effect over the past hundred years. Apart from their effect on global warming, many greenhouse gases are also responsible for a range of respiratory diseases such as bronchitis, pneumonia, asthma, other acute respiratory infections and lung cancer.
G11_TG_CAPS.indb 103 2012/08/01 9:01 PM

C104 S t r a n d 3 • U N I T 2
These are some of the greenhouse gases:1 Carbon dioxide: CO2 contributes as much as 50% of the Earth’s
greenhouse gases. It is released into the atmosphere mainly from burning fossil fuels, e.g. coal, petrol and diesel. Levels of CO2 have increased by 25% since the start of the industrial revolution. It is expected that levels will double by 2050. Electricity generation, cars, industrial plants, ships, aeroplanes, fires, deforestation, and so on, all contribute towards a rise in CO2. South Africa is the world’s third highest emitter of carbon dioxide!
2 Methane (CH4): This gas is released by cattle, waste dumps, rice paddies, burning any organic material, coal mining and natural gas distribution systems. Methane contributes 20% of global warming.
3 CFCs (chlorofluorocarbons) and HFCs (hydrofluorocarbons): As a result of the Montreal Protocol, which South Africa signed in 1990, CFC emissions have decreased dramatically, but it is nevertheless expected that the CFC level will continue to rise to make up 30% of the Earth’s greenhouse gases by 2030.
4 Oxides of nitrogen, e.g. nitrous oxide (N2O), and nitrogen dioxide (NO2) are by-products of fertilisers, burning organic material, fossil fuels, and the manufacture of synthetic materials such as nylon. Currently these account for about 6% of the greenhouse effect, with an increase of about 0,5% per annum.
5 Water vapour, in the form of fog, also contributes to global warming. When fog mixes with pollutants in the air, a dense layer of smog is formed. Smog layers over cities, settlements and industrial areas cause temperature inversions. The result is that heat is trapped below the smog layer.
6 Surface ozone in the troposphere is responsible for 12% of the greenhouse effect. This low-level ozone, close to the ground, is a pollutant that damages plant and animal tissue and causes human diseases. Low-level ozone (“photochemical smog”) forms when sunlight causes chemical reactions between nitrogen oxides, sulphur oxides, hydrocarbons and other chemicals. Most of these chemicals come from industrial processes, combustion processes and motorised vehicles. The higher the density of cars in the city, the higher the level of surface ozone in the area. These gases also contribute substantially towards the formation of acid rain – an increasing environmental problem in South Africa.
7 Other GHGs in smaller amounts: Water vapour, in the form of fog or smog, contributes to global warming by absorbing heat and also by causing temperature inversions over cities and industrial areas. The result is that heat rays are trapped below the smog layer. (Smog is smoke and other pollutants, mixed with fog.)
Answers to questions:1 Solar energy in short waves pass through all the layers of the
atmosphere with ease. These rays heat up the Earth’s surface, are used for photosynthesis and other ecological services and some of it is reflected back into the atmosphere as long waves. Normally, almost all of these rays would return to outer space, but because GHGs make the atmospheric layers denser, they cannot all penetrate the mesosphere or stratosphere layers and are thus reflected back to Earth or remain trapped in the troposphere closest to Earth. Under normal circumstances,
G11_TG_CAPS.indb 104 2012/08/01 9:01 PM

C105S t r a n d 3 • U N I T 2
this maintains a temperature on earth that is comfortable for life forms to flourish. However, as the concentration of GHGs increase in the atmosphere, more heat energy is trapped so that there is a steady rise in the average temperature of the Earth.
2
The learners’ diagrams should include the elements shown in this diagram.
3 The greenhouse effect is a natural phenomenon that maintains the ambient temperature required to sustain life in all the ecosystems on Earth. Without this effect, the Earth would be frozen, with an average
Mesosphere
Stratosphere
Troposphere
Earth’s surface
short-wave solar radiation (from the Sun)
long-wave heat rays reflected back to Earth
deforestation – no trees to absorb CO2
CO2, CFCs and nitrous oxides from industry
smog layer over cities trap heat
cities and motor cars produce CO2 and ozone cattle farms release methane and nitrous oxides
CO2 from aircraft
The greenhouse effect
G11_TG_CAPS.indb 105 2012/08/01 9:01 PM

C106 S t r a n d 3 • U N I T 2
temperature of –17 °C.This is too cold to sustain known life processes on Earth because enzymes, proteins and other macro-molecules require much higher temperatures to function normally. The greenhouse effect is thus essential for the maintenance of an optimal temperature to support homeostasis for life processes.
4 During the past century, since the industrial revolution, there has been an increase in the volume of CO2 and other greenhouse gases in the atmosphere. This is due to an increase in the use of fossil fuels; deforestation that reduces the natural terrestrial carbon sink; increase in methane from cattle ranches and landfill sites; increased use of CFCs; and an increase in nitrogen and sulphur compounds from fertilisers, motor exhaust fumes and industrial pollutants in the air – all directly related to human interventions on Earth.
Learner’s Book page 327Introduce this activity with a brief discussion of the possible impact that global warming has had on patterns and processes in the local environment. Some examples may include birds that no longer lose their summer breeding plumage in winter, deciduous trees that lose their leaves in winter instead of in autumn as in the past, spring flowers that appear much earlier than before, etc.
Suggested rubric for assessment:
4 3 2 1
Consulted several resources, e.g. books, the internet, videos, etc.
Consulted an adequate variety of resources e.g. books, the internet, videos, etc.
Consulted a few different resources
Limited resources were consulted, e.g. only one book with limited information
All key concepts are included, scientifically described, yet concise and in logical order
Most key concepts are included, scientifically described, yet concise and in logical order
Some key concepts are included. Some irrelevant information included in description
A few key concepts mentioned but in a haphazard, incomplete manner
All key concepts are illustrated and clearly visible at a glance. Drawing is clear and not overcrowded
Most key concepts are illustrated and clearly visible at a glance. Drawing is clear and not overcrowded
Only some key concepts are illustrated. Drawing tends to be somewhat overcrowded
Few concepts illustrated in a rather disjointed manner
Main ideas are supported with annotated labels. Heading is suitable and to the point
Most ideas are supported with annotated labels. Heading is suitable
Some ideas are supported with labels. Heading either too cumbersome or somewhat vague
Few concepts labelled. Heading either too vague or absent
RPA Activity 4 Human suffering caused by global climate changes (Specific Aims 1. 2 and 3)
G11_TG_CAPS.indb 106 2012/08/01 9:01 PM

C107S t r a n d 3 • U N I T 2
Learner’s Book page 3301 Complete records are shown for 1997 and 2002 – 12 months of records
are shown in the graph.2 January, February, November and December, i.e. the four summer
months.3 Two possible answers:
• Yes, when comparing the statistics of 1997 and 2002, there appears to be a reduction in the indirect measure of UV-B radiation, especially in the summer months.
OR• No, when comparing the statistics of 1997 and 2002, there appears
to be an increase in the UV-B dose in the months of April, August, September and October, although there is a reduction of UV-B rays in the summer months from November to February.
4 Not likely. The population density and level of industry are relatively low when compared to other parts of the country. Ozone holes are in the stratosphere and damage may have come from any place and any other country that uses excessive ozone-depleting substances.
5 Four effects:• Ozone reacts with UV-B rays to make them harmless, thus a
reduction in stratospheric ozone will increase the quantity of UV-B rays.
• Ozone depletion in the stratosphere causes more harmful UV-B rays to reach the Earth.
• UV-B rays destroy enzymes that are essential to maintain photosynthetic pathways, thus reducing the effectiveness of producers in food chains.
• A reduction in producers leads to a reduction in consumers in the food chain.
6 Yes. It damages all forms of life and thus also grasslands, scrub Karoo and the succulent Karoo, which are dry lands particularly prone to desertification.
7 CFC – chlorofluorocarbon and HFC – hydrofluorocarbon
Learner’s Book page 3321 These GHGs have the ability to absorb and retain heat. The larger the
concentrations in the atmosphere, the greater the quantity of long heat waves that are prevented from escaping from the atmosphere, resulting in the warming of the planet. CO2 is the most abundant (77%) in the atmosphere and up to now has had the greatest effect on global warming. CH4 occurs in lower concentrations (14%) but it is 21 times better at retaining heat. N2O occurs in lower concentrations (8%) but it is the most potent GHG since it can absorb 310 times more heat than CO2.
2 Shift in rainfall patterns: There are more frequent and intense floods along the eastern seaboard of KwaZulu-Natal, and longer drought periods in, e.g. the Western Cape. Shift in seasons: Spring and autumn now arrive earlier. Creep (shifting locations) of plants: e.g. quiver tree (Aloe dichotoma) towards the cooler south and migration of, e.g. beetles to higher, cooler levels up mountain slopes.
RPA Activity 5 The effects of ozone depletion on a South African community (Specific Aims 1, 2 and 3)
Activity Self assessment
G11_TG_CAPS.indb 107 2012/08/01 9:01 PM

C108 S t r a n d 3 • U N I T 2
3 Since the start of the industrial revolution, around 150 years ago, the use of fossil fuels has increased exponentially. This has released additional “ancient” carbon from its store in the ground, hence the increase in CO2.
4 a Plan to incorporate as many green belts and habitats as possible; continuous corridors of indigenous vegetation; large parks; succulent plants or grasses on flat rooftops, etc. Reduce impermeable concrete surfaces to allow adequate seepage of water into the soil, during floods, and to improve the carbon store in the soil by not disturbing natural ecosystems where possible. Incorporate bicycle lanes to encourage people not to use cars.
b Intercrop cane fields with large stands of local indigenous species of trees and shrubs to improve soil quality and to reinstate natural nutrient cycles and food webs that will reduce the need for pesticides, herbicides and excessive artificial fertilisers.
c Design a joint strategic plan for the family to reduce consumer spending. Together, all members must suggest ways to reduce the grocery, electricity, water, petrol, entertainment, etc. bills. Plan how best to recycle unwanted goods. Plan to establish a compost heap and vegetable garden. Think of how to alter the remaining garden towards becoming a greater carbon sink. Think about how and where to source recycled or renewable materials for any home-improvement projects. Use bicycles for shorter trips to the store or to school.
5 By drilling and extracting ice cores (long cylinders of ice) from ice sheets in the Arctic and Antarctic regions. These cores contain layers of air trapped in the ice. When they melt, the gas that bubbles out is analysed. The ratio between ancient and new carbon in GHGs in the air is then calculated, in accordance with the time that each layer of ice was laid down. This is a bit like determining the age of a tree by counting the annual rings in a trunk.
Water
Learner’s Book page 3361 a Dam D: it collects only 0,018 m³ silt/km²/annum and this is
significantly lower than that of the remaining dams.b Dam B. This is a high-rainfall area of the country, where exotic
plantations have replaced natural vegetation, thus much sediment is expected to be carried away in run-off water to rivers and dams.
c The catchments of dams B and C. These dams need regular dredging because large quantities of silt are deposited in a short time. Flood damage to ecosystems and man-made infrastructure also requires regular rehabilitation operations.
d Use conservation tillage instead of ploughing up all the soil, and plant crops along contours to prevent errosion of topsoil during rain bursts. Intercrop with indigenous vegetation to restore water-holding capacity of the soil. Restore wetlands and the river’s riparian zone.
2 a Wetland functions: • Store fresh water. • Release groundwater slowly when needed (dry weather). • Purify water by extracting harmful chemicals. • Detoxify polluted water by extracting heavy metals, industrial and
domestic toxins, fertilisers, pesticides and herbicides.
RPA Activity 6 Dams and wetlands (Specific Aims 1 and 2)
G11_TG_CAPS.indb 108 2012/08/01 9:01 PM

C109S t r a n d 3 • U N I T 2
• Trap silt so that water is clear enough for sunlight to penetrate. • Maintain nutrient cycles and vital food webs for the surrounding
ecosystem. • Provide breeding grounds for birds, fish, sedges, insects, etc. • Reduce flood damage by trapping and slowing down torrents of
water. • Reduce drought impact by slowly releasing water to surrounding
dry soil. • Because they are excellent water regulators, wetlands absorb
extra water during heavy rains and release this again when the area starts to dry out.
• Wetland biodiversity is always higher than that of habitats around it.
• Also a habitat to endangered species, e.g. crane species. b Crane species – in South Africa the wattled, crown and blue cranes
3 Because they act like kidneys by filtering out harmful chemicals and preventing these from spreading into the wider ecosystem’s food webs, nutrient cycles, etc.
4 Government established the Working for Wetlands Programme.
Learner’s Book page 341The purpose of this activity is to allow learners to develop a good understanding of the various ways in which water resources and the environment are affected by human activities. It is also a valuable opportunity for cooperative learning. If sufficient time is given for this activity to unfold in the way that it should then this exercise will be beneficial for all participants. It is suggested that groups and topics are allocated the day before so that learners can prepare their tasks as part of homework. This way, a full period can be set aside for these discussions.
Learner’s Book page 346The main water quality problems in South Africa include the following causes and effects:• Salinity, i.e. the concentration of inorganic salts in the water. Sources of
salt in water are mostly from agriculture and mining. When saline water is used to irrigate farms, it turns the soil salty. This leads to ex-osmosis of water from plant roots and finally, desertification if this continues.
• Water-borne diseases such as diarrhoea, dysentery, skin infections, intestinal worms, cholera, bilharzia, etc. are the result of poor sanitation, which allows the carriers of these diseases to contaminate available water resources.
• Low oxygen levels (anoxic conditions) occur when bacteria in the water decompose organic matter, using up all dissolved oxygen in the process. This happens when high concentrations of organic material and fertilisers are pumped into water sources due to poor waste disposal and agricultural practices.
• Eutrophication is due to an accumulation of nutrients (mostly nitrogen and phosphorous compounds). This also causes anoxic conditions.
• Suspended solids are insoluble sediments such as silt. These come from excessive erosion, destruction of riparian vegetation, overgrazing,
Activity 7 The impact of humans on the availability of water (Specific Aims 1 and 3)
RPA Activity 8 The main water quality problems in South Africa (Specific Aims 1, 2 and 3)
G11_TG_CAPS.indb 109 2012/08/01 9:01 PM

C110 S t r a n d 3 • U N I T 2
building construction, as well as domestic and industrial discharges. In rivers, this may ultimately change the aquatic food web. It also reduces penetration of sunlight, which undermines photosynthesis in the producers that support the food chain.
• Hydrocarbons can have toxic effects, e.g. suspended oil shuts off the diffusion of oxygen into the water. This suffocates all plants, animals and micro-organisms. Sources include petrol, paraffin, diesel, greases, tar, solvents, animal fats and plant oils.
• Acidification occurs when the pH of the water is lowered as a result of mining, industry, acid rain, waste disposal, etc. These dissolved acids are capable of reacting with compounds to set free heavy metals such as cadmium, lead and mercury, which can poison aquatic organisms and all other users of the contaminated water source.
• Solid litter occurs in many forms. Some are biodegradable (biogenic), e.g. vegetation, paper, etc. Others are non-biodegradable (non-biogenic), e.g. plastics, cans, polystyrene, etc. In water, these obstruct water flow and cause flooding upstream and draining downstream. Apart from this, they also damage aquatic organisms or cause agonising deaths in other animals that swallow pieces of litter.
• Other quality problems. Bio-active materials from medicines (hormones and nutrient supplements), herbicides, pesticides, trace elements and radioactive contamination are increasing in our water sources. In larger concentrations these may cause catastrophic metabolic reactions in all forms of aquatic life and damage water quality.
Learner’s Book page 347This task will test how well learners are able to pull together bits of information from across this section on water. All the information that is required is given. Learners just have to present it in a new format. To familiarise yourself with the challenges of this task, it is recommended that you do the same task independently. Your resulting summary can then serve as your memorandum for assessing the learners’ tasks.
Activity 9 Society’s impact on the quality of water (Specific Aims 1 and 3)
About the prescribed practical activity (PPA) in the curriculumLearners are required to do only one investigation as a prescribed practical activity (PPA). One formal investigation is detailed in the Learner’s Book (Activity 10, page 348). Several ideas as options for other topics that can be used instead are listed in the activity. However, bear in mind that the choice of investigation may be any other form of human impact on the environment. A second formal activity is included here to offer you or them some choice. The final choice should be determined by what it is most important and convenient to investigate in your area. The choices are almost endless if you look at all the sections in this unit: climate change, water availability and quality, food security, biodiversity and solid waste disposal. This could be a time-consuming activity since it will require the learners to find a suitable issue that can be investigated, carry out fieldwork, carry out tests, perhaps also experiments, collect data, perhaps at several intervals, manipulate data and present a written report. Learners should start with this prescribed practical activity as soon as possible in the term.
G11_TG_CAPS.indb 110 2012/08/01 9:01 PM

C111S t r a n d 3 • U N I T 2
Learner’s Book page 348
This activity will require a full-day excursion to complete. To assist with supervision of the teams in the field, consider inviting some parents to assist. They will require a briefing from you so that they are fully aware of their role in contributing to the learning process and the success of the activity.
Suggested rubric for assessment:
OR See the next page for an alternative for Activity 10.
PPA Activity 10 Human influences on the environment: Effect of invasive alien plants (IAPs) on your local indigenous vegetation (Specific Aims 1, 2 and 3)
4 3 2 1Competently identified natural vegetation and IAPs in local area
Acceptable indentification of natural vegetation and IAPs
Disorganised attempts to recognise natural vegetation versus IAPs
Unable to distinguish natural vegetation and IAPs
Immediately and confidently identified the most aggressive local IAPs
Slightly unsure which local IAPs were the most aggressive.
Difficulty deciding which IAPs were the most aggressive
Unable to identify the most aggressive IAPs in the area
Immediately and confidently identified the species most threatened by IAPs
Slightly unsure which local species were most threatened by IAPs
Difficulty deciding which species were most threatened by IAPs
Unable to identify which species were most threatened by IAPs
Competently designed logical hypotheses, keeping one independent variable in mind
Acceptable hypotheses, with one independent variable considered
Hypotheses are too vague or crowded, one independent variable was not considered
Hypotheses were not attempted
Systematically set out to collect and record data
Not entirely organised in collecting and recording data
Rather disorganised in collecting and recording data
Data collection and recording skills require serious attention
Competent in analysing data accurately
Mostly competent in analysing data accurately
Reasonably competent in analysing data accurately
Not yet competent in analysing data accurately
Action plan well thought out and competently outlined
Action plan adequately thought out and outlined
Poor attempt at an action plan
Unable to put together an action plan
Identified and thoroughly researched eradication methods
Identified some eradication methods, adequate research
Poor attempt to identify eradication methods
No attempt to identify eradication methods
Competent interpretation of data and presentation of results
Adequate interpretation of data and presentation of results
Poor attempt to interpret data and present results
Unable to interpret data and present results without substantial help
Competent presentation of findings in well-thought-out report
Adequate presentation of findings in well-thought-out report
Attempt to present findings in report, but not well thought-out
Unable to present findings in report without substantial help
G11_TG_CAPS.indb 111 2012/08/01 9:01 PM

C112 S t r a n d 3 • U N I T 2
You will need:• good references on aquatic organisms• a clean 2-litre ice-cream container (for captured animals)• a pond net made from a wire coat hanger and old pantihose• a soft make-up brush (to remove flat animals from rock/stone surfaces)• dipsticks to measure pH and nitrate concentration (buy at chemist)• suitable field guides to identify aquatic organisms• hand lenses• a yellow tennis ball attached to a stick• a metre stick• a clip board• pencil and paper
The following food web will help you to interpret your results.
A generalised food web found in streams
This activity has five stages:Stage 1:1 Identify two streams (A and B) where this activity can be done in your
local environment. Stream A should be a steam that you regard to be in good ecological balance. Stream B should be one that you consider to be degraded.
2 State a suitable hypothesis to investigate for each of the streams. Your hypotheses should relate to your expectations of the quality of water in the stream to be investigated.
Stage 2:1 Each group selects an area of stream A that is thought to be in perfect
condition (balanced ecosystem with natural, indigenous riparian vegetation). Groups should be spaced at least 5 m apart. Draw a food web of the aquatic organisms that you would expect to find in this stream. Compare your food web with that of other groups and have a brief discussion on your expectations of a balanced freshwater river ecosystem.
PPA Activity 10 (alternative) Human influences on the environment: Using bio-monitoring, food webs and other techniques to assess the quality of polluted and non-polluted water sources in your local area (Specific Aims 1, 2 and 3)
dragonfly nymph water beetles
rat-tailed maggot mayfly larvae
water snailwater boatman
tadpoles
flatwormsludge worm
midge larvaemosquito larvaestone-fly larvae
acquatic plantsalgae detritus (dead plant and animal matter)
G11_TG_CAPS.indb 112 2012/08/01 9:01 PM

C113S t r a n d 3 • U N I T 2
2 Collect free-swimming invertebrates using the pond net. About ten scoops at different water depths and in different areas of the stream should be enough. Keep these animals alive in the ice-cream container, with sufficient water to cover them. (Do not harm any of the animals and release them back into the water once you have completed step 5.)
3 Carefully lift large stones from the streambed and look for flatworms (Planaria) and other invertebrates that cling to the rock surface. Very gently remove these by twirling the make-up brush over them, first in a clockwise direction to lift the animal off the rock, and then in an anti-clockwise direction to release the animal into the ice-cream tub. Repeat this with about ten rocks in different zones of the stream.
4 Use the Bio-monitoring: Animal Indicators chart on page C114 to design a convenient scorecard with three columns in which to record: the name of the captured animal (column 1); numerical value of the group (column 2); and the food source of the animal (column 3).
5 Proceed to identify the animals that you have captured and record these, one by one, on your scorecard. Now add up the total score in order to evaluate the quality of the water. The lower the score, the better the quality of the water. (Remember to return the animals to the water.)
6 Measure the turbidity of the stream. Do this by lowering the tennis ball into the water. Let a partner observe and record the depth when you can no longer see the tennis ball. Lower the ball further down and then slowly back up again. Record the depth where the ball becomes visible again. Now calculate the average depth of visibility from these two readings and use the Turbidity Scale on page C115 to estimate how turbid or clear the water is. Repeat this a couple of times and record the average.
7 Measure the pH and nitrate concentration and read the value off the manufacturer’s guide card supplied with the testing strips. Note: in the “black” rivers of the Western Cape, a balanced river system should have a pH that ranges between 5 and 6. Elsewhere in the country the pH range should be 7–8. The concentration of nitrites should ideally be between 1–2 mg/ℓ. A concentration of 20–75 mg/ℓ indicates a serious problem of effluent pollution, such as fertiliser-rich run-off.
8 Now construct a new food web based on the animals that you have captured and compare it with the food web that you have constructed in Step 1 of Stage 2 above.
9 Study the riparian (river bank) zone alongside the stream. Is this a balanced ecosystem? How could you tell? Explain your answer.
10 Are fungi, lichen and mosses present in the riparian zone? If so, then the pollutants from agriculture, industry and other sources have not yet reached critical proportions.
11 Draw conclusions regarding the quality of water in this stream. Also consult your second food web for this conclusion. Make comments on the ecological status of the riparian zone and compare your findings with those of the remaining groups in your class.
Stage 3: 1 Groups select areas up and down stream B, the badly degraded stream or
heavily polluted stream. 2 Repeat steps 2–8 above to assess the quality of the water in this stream. 3 Repeat steps 9–11 above to determine the quality of the riparian zone.
G11_TG_CAPS.indb 113 2012/08/01 9:01 PM

C114 S t r a n d 3 • U N I T 2
Stage 4: 1 Do the conclusions from this investigation support or reject your two
hypotheses? Explain your answer. 2 Do you think that the methods used in this investigation are sufficient
to provide conclusive evidence of the quality of water in these streams? Explain your answer.
3 How could you improve on this investigation to obtain greater accuracy of results?
4 What variables should you keep constant so as to improve the validity of results if you were to compare the water quality in these two streams?
5 How would you find out whether any vectors (carriers) of water-borne diseases are present in a stream?
6 How would you find out whether the water is anoxic (short of oxygen) or not?
7 How would you find out where harmful chemicals present in the stream come from?
8 How would you find out whether thermo-pollution affects the quality of stream?
9 How could you tell whether or not eutrophication is present in water bodies?
10 Assuming eutrophication is present in a stream, how could you establish and confirm the sources of pollution that caused the condition?
Stage 5:Conduct a classroom discussion on the combined results from all groups. Make recommendations on possible strategies that could be implemented to reduce the sources of pollution that impact negatively on local streams and other water sources.
Bio-monitoring: animal indicators
SCORE OF 1 Invertebrates that are highly sensitive to chemical pollution
Mayfly nymph Flatworm Stonefly nymph Caddisfly nymph
SCORE OF 3 Invertebrates that can withstand low levels of pollution
Dragonfly nymph Bloodworms Whirligig beetle Water snail (midge larvae) (other beetles & bugs)
SCORE OF 5 Invertebrates that are able to survive in polluted waters
Rat-tail maggot Leeches Other true Sludge worms (hover fly larva) fly larvae (live in tubes)
G11_TG_CAPS.indb 114 2012/08/01 9:01 PM

C115S t r a n d 3 • U N I T 2
This activity will require a full-day excursion to complete. To assist with supervision of teams in the field, consider inviting some parents to assist. They will require a briefing from you so that they are fully aware of their role in contributing to the learning process and the success of the activity. Provide data on the diet of aquatic animals that are normally found in streams in South Africa. Copies of Stream and Pond Life (SHARE-NET booklet copies) will be ideal. Identify two streams near the school, one that looks in unspoilt condition (stream A) and the other that looks polluted (stream B). This activity is presented in five stages. Stage 1: Hypotheses are formulated for stream A and stream B. Stage 2: (at stream A) Learners draw a food web of expected organisms, then they catch aquatic animals, identify them and use them to assess the quality of the water. They also measure abiotic factors. Stage 3: (at stream B) Learners repeat procedures done at Stream A. Stage 4: Draw conclusions with respect to the hypotheses and answer related questions. Stage 5: Report back and discussion back in class.
Suggested rubric for assessment: (continued on the next page)
Model example: 10 animals caught may have the following range of scores: A score of 50 – indicates serious pollution
25 – water is polluted 10 – good clean water
Use this model as a guide to adapt your own unique scoring system based on the number of animals that your group has caught.
Turbidity ScaleDepth in cm 180 165 150 120 105 90 75 60 45 30 15% Turbidity 100 90 80 70 60 50 40 30 20 10 clear
4 3 2 1Competently designed logical hypotheses, keeping one independent variable in mind
Acceptable hypotheses, with one independent variable considered
Hypotheses are too vague or crowded, one independent variable was not considered
Hypotheses were not attempted
Systematically set out to collect and record data
Not entirely organised in collecting and recording data
Rather disorganised in collecting and recording data
Data collection and recording skills require serious attention
Competent in analysing data accurately
Mostly competent in analysing data accurately
Reasonably competent in analysing data accurately
Not yet competent in analysing data accurately
Competently constructed realistic food webs
Almost competent in constructing realistic food webs
Some deletions or errors in constructing food webs
Requires urgent skill development in constructing food webs
Considered all bio- indicators in evaluating the riparian zone
Considered most bio-indicators in evaluating the riparian zone
Considered some bio-indicators in evaluating the riparian zone
Did not consider any bio-indicators in evaluating the riparian zone
G11_TG_CAPS.indb 115 2012/08/01 9:01 PM

C116 S t r a n d 3 • U N I T 2
Learner’s Book page 3511 a 2 – On average 50% of South African wetlands are destroyed, up to
90% in some catchments, but there is a growing awareness of their value and prospects of wetland restoration are aided by the Working for Wetlands Programme.
b 3 – Tap water is still drinkable in most parts of the country, although most rivers and dams near settlements have some form of pollution and many in agricultural areas are laden with silt and farm chemicals.
c 5 – On average, underground water is not as yet over utilised but chemical pollution is threatening to decrease the quality of water in aquifers.
2 Impact on availability and quality;a IAPs: aquatic forms clog up rivers and dams and speed up
eutrophication; terrestrial forms absorb a great deal of groundwater, at the expense of indigenous vegetation.
b Mining: pollutes rivers, dams and underground water stores. c Desertification: soil loses water holding capacity, water table is
lowered, water cycle is impaired.d Deforestation: pronounced negative effect on the local water cycle.
3 Settlements without adequate sanitary facilities risk the accumulation of human faeces in the soil in and around the dwellings. After heavy rain, the micro-organisms in faeces, e.g. Escherichia coli and Amoeba species, start to multiply and this can contaminate drinking water, vegetables, etc. Outbreaks of cholera and dysentery are the result of contaminated water supplies.
4 Agricultural sector should:• Stop using large elevated sprinklers to irrigate crops. Most of this
water evaporates before it even touches the ground. Buried drip-irrigation is more suitable.
• Reduce tilling of the soil to the minimum to preserve soil structure and soil life forms that maintain the sponge effect and water-holding capacity of the soil.
• Plant hardy species of crops, fruit trees, vegetables that do not require a great deal of ongoing irrigation. Plant more delicate vegetables in tunnels that reduce the rate of transpiration and soil water evaporation.
• Retain or replant indigenous vegetation in among crops to retain a humid environment to reduce soil water evaporation.
• Avoid leaving soil surface bare. Practise crop rotation and mulching to enhance the waterholding capacity and fertility of the topsoil.
4 3 2 1Was able to apply knowledge on sources of pollution in order to suggest causes
Considered many learnt examples of pollution as a basis to suggest causes
Considered some learnt examples of pollution as a basis to suggest causes
Considered only one or two learnt examples of pollution as a basis to suggest causes
Made appropriate recom mend ations towards improving water resource quality
Mostly appropriate recom mendations towards improving water resource quality
Some appropriate recom mendations towards improving water resource quality
Did not suggest recommendations towards improving water resource quality
Activity Self assessment
G11_TG_CAPS.indb 116 2012/08/01 9:01 PM

C117S t r a n d 3 • U N I T 2
Food securityThe graph on page C99 provides an overview of the key events that shaped the human population into its rapid, exponential growth phase. You might like to use it as an introduction to this section. This is a relatively short section, but an extremely important one. Only two activities are included, apart from the self assessment at the end of the section. As an optional extra activity, it is recommended that the learners:
• plan a vegetable garden at school (can be prepared in one afternoon)• identify needy families near the school and plan a schedule of taking
the mature vegetables to them at a later stage• or some other related activity where learners engage in an outreach
task or programme.
Learner’s Book page 3581
2 Table of percentages to be used for bar graph:
Food waste by consumers as a % of the total food waste
Europe 32
North America and Oceania 37
Industrialised Asia 33
Sub-Saharan Africa 3
North Africa, West and Central Asia 16
South and South-East Asia 12
Latin America 11
RPA Activity 11 Food waste (Specific Aims 2 and 3)To
tal f
ood
loss
and
was
te
per p
erso
n pe
r yea
r (kg
)
Euro
pe
Nor
th A
mer
ica
and
Oce
ania
Indu
stria
lised
Asia
Sub-
Saha
ran
Afric
a
Nor
th A
frica
, Wes
t an
d Ce
ntra
l Asia
200
Food loss and wastage at the production and retail stages
Food loss and wastage by consumers
Key:
Sout
h an
d So
uth-
East
Asia
Latin
Am
eric
a
180160140120100
80604020
0
G11_TG_CAPS.indb 117 2012/08/01 9:01 PM

C118 S t r a n d 3 • U N I T 2
3 • Devlopedcountrypattern:Europe,NorthAmericaandOceania,Industrialised Asia.
• Developing country pattern: Sub-Saharan Africa, North Africa, West and Central Asia, South and South-East Asia, Latin America
4 Sub-Saharan Africa. This is the group of countries with probably the lowest levels of food security in the world. Access to food is scarce, and what food is available is either provided by international aid agencies or subsistence farming. Very little is bought – and even less is bought from supermarkets. There is no food left over to waste.
5 Industrialised Asia has the food waste pattern of a developed country, while South and South-East Asia have the food waste pattern of a developing country. People living in industrialised Asia will buy food from markets, shops and supermarkets, often in excess of their requirements and so will throw unused food away. The markets, shops and supermarkets will also throw away unsold food. People in South and South-East Asia will depend more on small, local sources of food, have less food security and will not have food in excess of their needs.
6 Possible ways to reduce food waste include: • Prevention: prevent consumers from throwing away food or stop
them from producing/buying more than they need.• Plan what you need before you shop and reduce impulse and
spontaneous buying.• Understand how to store and preserve food.• Ensure that unused food is used in some way, e.g. animal feed,
compost heaps.
Learner’s Book page 3591 People lack food security if they do not have sufficient access to food,
either because food is not locally available, or because the affected person is too poor to buy food.a People who lack food security are too poor to access food. Lack of
food security is not necessarily related to the production of food – in fact enough food is produced globally to feed the entire population.
b As human populations grow, it is likely that food security will decrease, particularly for the very poor.
c Food security is directly linked to the availability of food – either because food is not distributed to an area, people are too poor to buy the food or because local conditions prevent food from being grown in or reaching an area.
Food
was
te b
y co
nsum
ers a
s a
% o
f the
tota
l foo
d w
aste
Euro
pe
Nor
th A
mer
ica
and
Oce
ania
Indu
stria
lised
Asia
Sub-
Saha
ran
Afric
a
Nor
th A
frica
, Wes
t an
d Ce
ntra
l Asia
50
Sout
h an
d So
uth-
East
Asia
Latin
Am
eric
a
4540353025201510
50
Activity 12 Food security (Specific Aim 1)
G11_TG_CAPS.indb 118 2012/08/01 9:01 PM

C119S t r a n d 3 • U N I T 2
2 Increasing incidents of drought and flooding will decrease crop yields, and decrease food security in affected areas. Learners should refer to either examples in their own areas or the South African example given in the text.
3 Learners list the poor farming practices outlined in the text and the way that each of these can affect food security.
4 Alien plant invaders may decrease crop yields by outcompeting crop plants, increasing land degradation and reducing the amount of agricultural land available. Common alien plant invaders on farming land are: syringa (Melia azedarach), black wattle (Acacia mearnsii), silver wattle (Acacia dealbata), rooikrans (Acacia cyclops), Port Jackson (Acacia saligna), pine species, Eucalyptus species, e.g. blue gum, tick berry (Lantana camara), triffid weed (Chromolaena camara), mesquite (Prosopis species), Hakea species and bugweed (Solanum mauritianum).
5 Loss of wild varieties of plants and animals increases susceptibility to disease and pests, so potentially damaging crop yields and so food security.
6 Genetic engineering is the manipulation of DNA to produce plants and animals with specific, desirable characteristics. Domestic plant and animal stocks have been altered by genetic engineering to design a more robust form with greater crop yields, larger fruit, greater muscle bulk in animals bred for their meat, higher milk yield, more eggs per hen, and so on. Learners list the advantage and disadvantages of genetically engineered foods that are found in the text.
7 Food bought is not eaten, or is poorly stored and goes bad, shops throw food away once it has reached its “sell by” date, consumers throw it away if it has not been eaten before its “use by” date. Food waste can also occur at the production stage – subsistence farming on poor soils, pest infestation and so on. In developed countries food waste tends to happen at the consumption stage, while in developing countries food waste tends to happen at the production stage.
Learner’s Book page 3601 a People who have regular access to affordable food and who expect to
maintain that access.b People who do not have access, or who have only irregular access to
affordable food.c People with only intermittent access to food, who have irregular
employment and who are likely to soon not be able to afford food.2 Some possible answers include:
• Human population has exceeded the Earth’s carrying capacity.• Exponential growth rate may lead to exponential increase in food risk
and food insecurity.• Imbalance in food distribution. Surplus in developed countries and
deficits in many developing countries.• Politics and/or socio-economic barriers prevent the establishment of
a workable food security infrastructure in many countries at risk.• Climate change, e.g. droughts and floods, undermines food security.• Fluctuating currency, depression of currencies, supply and demand
issues, and price fixing all lead to food becoming more and more expensive.
3 Multiple possible answers – mainly in sub-Saharan Africa: Somalia, Ethiopia, south Sudan and so on.
Activity Self assessment
G11_TG_CAPS.indb 119 2012/08/01 9:01 PM

C120 S t r a n d 3 • U N I T 2
4 Adaptations to droughts and floods:• Switch to hardier crops that are more resilient to extreme weather
conditions.• Stockpile surplus food in a form that can be stored and be available
during climate catastrophes.• Change from conventional farming techniques.• Publish survival strategies and conduct regional empowerment
programmes so that people can become more proactive in planning, and better equipped with skills for survival.
5 • Safety to humans and the environment is uncertain.• There is a risk of gene pollution for both humans and the
environment.• Use of GMOs may lead to new diseases and loss of biodivesrsity.• There is no labelling policy in South Africa that allows people to
make informed choices about whether or not to buy GMOs.6 • Plantingcropsinpoor-qualitysoilandrelyingonlyonrainasawater
source.• Buying more food than is required, e.g. by supermarkets or
households.• Surplus stocks due to poor or absent planning and coordinating
networks.• Discarding food that does not meet market specifications, e.g. fruit is
too small.• Importing food items like butter when local supplies are adequate, i.e.
focus on trade agreements rather than local supply and demand.
Loss of biodiversity
Learner’s Book page 364
1 Overgrazing a Overstocking of grazersb Fence off area and allow natural succession to repair and/or replant
with palatable grasses and shrubs.c Reduce stock to suit carrying capacity and use pasture rotation.
Monoculture a Reduced biodiversity leading to nutrient depleted soil.b Interplant with companion crops/trees that will fertilise soil again. c Plan an integrated crop and wildlife complex/permaculture
strategies. Golf estates
a Vast expanse of cultivated lawn replaced biodiverse ecosystem, fertilisers and pesticides are killing food webs.
b Integrate the greens with pockets of local indigenous plants, restore wetlands.
c Replace exotic lawn with indigenous lawn or artificial lawn that allows drainage.
Mininga Totally destroys habitat, landscape and all biotab Rehabilitate area by speeding up secondary succession with suitable
pioneer plants.
Activity 13 Human impact on South Africa’s biodiversity (Specific Aim 1)
G11_TG_CAPS.indb 120 2012/08/01 9:01 PM

C121S t r a n d 3 • U N I T 2
c Change destructive mining strategies to new approaches that cause less damage, become accountable and adopt environmental responsibility.
Urbanisation a Obliterated ecosystems, now largely replaced by concrete and tar and
possibly exotic plants.b Create drainage holes for rain water infiltration.c Plan future cities around existing ecosystems by maintaing natural
corridors and significant clumps of local vegetation that interlink, to secure functional food webs.
Wetland destruction a Highly specialised and beneficial organisms were removed.b Replant pioneer sedges and grasses and allow time for secondary
succession to restore wetland as water starts to seep into the area again.
c Plan new developments around wetlands – integrate it as a filtering and flood attenuation annex to the new development projects located in the area.
Grassland destruction a Overgrazing and monoculture denuded natural biodiversity.b Remove grazers and leave area fallow for however many seasons it
requires to restore through secondary succession. Fill up dongas and erosion gullies with stones, then sprinkle local indigenous grass seeds on top and let the rain do the rest.
c limit livestock quota so that the population size is compatible with the carrying capacity of the grassland.
2 a Cattle are abundant in communal districts but occur in low numbers in commercial districts. Because communal districts are located in marginal lands, coupled with the high density of cattle grazing the land, the soil in these areas are very prone to soil erosion, as a result of overgrazing.
b Limpopo and KwaZulu-Natal have large range lands (grasslands), populated by cattle. KwaZulu-Natal’s higher rainfall causes accelerated soil erosion, faster than in remaining provinces. In Limpopo, the low fertility of the soil prevents speedy recovery of overgrazed grasslands.
c The graph indicates that agriculture has a heavier negative impact on overall habitat destruction because the provinces where agriculture is prominent, e.g. KwaZulu-Natal, Limpopo, Eastern Cape, etc, all show a much higher degree of soil and vegetation destruction than Gauteng, where gold and diamond mines occur in high density.
d Any two of the following are acceptable: monoculture (of sugar cane, bananas, etc); wetland destruction to plant sugar cane; grasslands cleared for sugar cane; overgrazing, especially in the northern parts of KwaZulu-Natal.
e North West, Gauteng, Free State, KwaZulu-Natal, and Eastern Cape.f Higher rainfall in KwaZulu-Natal causes gully erosion, which results
in huge dongas. This removes all available topsoil. This accounts for the greater degree of soil erosion. Traditional cattle herding is popular in both provinces and overgrazing remains a potential problem where demarcated grazing fields do not exist to manage field rotation. This leads to overgrazing and, with less rainfall, the vegetation takes longer to recuperate (restore itself ).
G11_TG_CAPS.indb 121 2012/08/01 9:01 PM

C122 S t r a n d 3 • U N I T 2
Learner’s Book page 366It is recommended that this activity be done at home and that learners work alone. A follow-up discussion is essential so that views may be shared on issues of ethics and South Africa’s wildlife heritage. Discussions may also include the fact that anyone smuggling drugs into countries of the Far East gets the death sentence. Yet, large numbers of rhino horns are smuggled into these countries. Invite opinions and briefly debate this anomaly. 1 No. TCM (Chinese IKS) is the main driver of rhino poaching, in pursuit
of myths that the powdered horn has aphrodisiac properties and is a cure for cancer. The cultural use of rhino horn in Yemen daggers, to acknowledge manhood, is another driver. Both of these forms of IKS create a million-dollar trade. If local poor people are involved, they receive very little money, risking their lives to line the pockets of the rich.
2 Reasons for the recent increase in rhino poaching:.• The rapid economic growth in countries of the Far East.• The rapid population growth of middle-class population with IKS
culture.• Governments sponsor students to study IKS use of rhino horn.• Gamefarm owners buy rhino at R25 000 each, often kill them and sell
horns at a huge profit (R500 000 for 1 kg horn)• Lack of control at auctions, or worse, auctioneers are partners in
crime.• Current export control is inadequate or officials are partners in crime.• Lucrative financial gain but pathetically small fines (only R10 000).• Jail sentence only 10 years.• CITES still issue licenses to import/export wild artifacts such as
horns and it is easy for professional hunters to obtain and then use these for participating in crime syndicates.
• Asian government’s cooperation in confiscating illegal horns can improve to the same level of their efficiency in arresting drug traffickers.
3 Yes, white rhinos are diurnal and grazers – easy to spot from helicopters during daytime. They are also less aggressive than black rhino. Black rhino are nocturnal and because they are browsers and are mostly concealed by forest canopies, they are more difficult to spot from helicopters.
4 Over-exploitation of indigenous medicinal plants by businesses; exploitation of animal organs based on the myth that these confer supernatural powers on those who eat them; the killing of wildlife to use skins, feathers, tails, etc. as part of traditional dress – all accelerate the decline of biodiversity.
5 Tighten up international import/export regulations or ban all trade in wildlife. Limit or ban the issue of hunting licences. Fire corrupt customs and other officials. Change the current popular notion that corruption is a fringe benefit for those appointed in positions that demand total trust – do this by means of serious awareness campaigns, as well as naming and shaming all persons found to be guilty.
6 Monkeys, gorillas, buck species, bush pigs, warthogs, other mammal species, reptiles, birds etc.
PPA Activity 14 Rhino poaching: the down side of indigenous knowledge (Specific Aims 1, 2 and 3)
G11_TG_CAPS.indb 122 2012/08/01 9:01 PM

C123S t r a n d 3 • U N I T 2
7 Many are related to poverty issues but, equally, poaching is part of lucrative and international trade. Many rural people hunt with dogs as a form of sport for entertainment. All these practices will have an impact on biodiversity, particularly where the species that is targeted are already in low numbers.
8 All of these organisations are concerned with biodiversity conservation:• CITES – Convention on International Trade in Endangered Species
of Wild Fauna and Flora. It issues permits for hunters, imports, exports.
• TRAFFIC – An International wildlife trade monitoring network.• WWF – World Wildlife Fund, for the protection of global
biodiversity.• EWT – Endangered Widlife Trust, which has particular focus on
threatened species.• WESSA – Wildlife and Environment Society for Southern Africa,
concerned with all environmentally related issues, strong on environmental education.
• SANBI – South African National Biodiversity Institute which update data continuously and publishes Red Data Lists (of threatened species) periodically.
9 Contact the nearest conservation organisation and have all the facts ready, e.g. place, time, date, who is involved (names or descriptions), what is being poached, any other information required for immediate action (e.g. colour, number plate and make of vehicles in the area). You have the right to remain anonymous.
Learner’s Book page 368If you or the school have access to the internet, visit http://www.stoprhinopoaching.com for an update on the latest poaching news, statistics and actions that can be considered to help to stem the tide of poaching.
Learner’s Book page 371If learners are keen to do this as a field research practical investigation, and they select local species, then this activity could, with your guidance, be modified into the CAPS Prescribed Activity, instead of the list of options given earlier on page 350 of the Learner’s Book. By now, learners should be comfortable in undertaking research projects. Encourage learners to choose different species. This will then expose the class to a large number of species to broaden their knowledge on IAPs and medicinal plants.
Learner’s Book page 3731 This is a term that refers to the different species of plants, animals and
other groups of organisms that occur on Earth, in a country, or in a habitat, a game reserve, a garden, etc.
2 Deep dongas in grasslandsa Overgrazing/vertical ploughingb Reduce number of grazers/horizontal ploughing or better still, no
ploughing.
Extended activity (Specific Aim 1)
RPA Activity 15 IAPs and over-exploitation of indigenous species (Specific Aims 1, 2 and 3)
Activity Self assessment
G11_TG_CAPS.indb 123 2012/08/01 9:01 PM

C124 S t r a n d 3 • U N I T 2
Flood water damage a Impervious pavements, roads and dense collection of rooftops b Drill drainage holes, plant up roof gardens on flat rooftops of, e.g.
supermarkets and factories.Sink holes a Too many boreholes in use that lower the water table b Implement a by-law to restrict an excess of boreholes and which
encourages indigenous gardens which require less water.Endangered Disa species a Expansion of residential development/heavy infestation of Port
Jacson and other IAPsb Create nature reserves in between residences to encourage the return
of biodiversity/eradicate IAP infestation and immediately plant fynbos.
Freak wave damage a Houses built on or too close to dunes/removal of dune vegetation b By-laws to prevent future development on or near dunes. Restore
natural succession of dune vegetation to anchor dunes – a protective barrier against waves.
3 Mechanical removal: digging out the plant, including the roots, ring barking, slashing but taking precautions against pieces left behind that may resprout. Chemical eradication but cautiously to prevent surrounding vegetation from contamination. Bio-control is best. Determine whether beetles, weevils, other insects or fungi are available, to introduce in affected area.
4 No natural enemies to keep numbers in check; rapid growth rate; very high reproductive rate (millions of seeds); often tasty seeds dispersed by birds can survive on little water in droughts; render soil useless for other species to compete for space,
5 Chief ’s private reserve for hunting to prevent exploitation, over-harvesting, over-grazing, etc; places of spiritual significance with many cultural and religious taboos to prevent degradation; culturally prescribed methods of, e.g. removing bark for medicine.
6 Over-exploitation for medicines; killing wildlife to use skin, feathers, tails, the heart or brain, etc. for tribal dress; killing animals to obtain organs, which are believed to bestow certain traits when eaten, e.g. rhino horn as aphrodisiac or a lion’s heart for bravery.
7 Excellent for grazing animals; excellent dry land biodiversity; very efficient carbon sequestration, stores carbon longer in dry soil than, e.g. a forest floor; sustains larger mammals thus maintaining greater biodiversity; provides valuable resources for rural people who depend on crafts as a means of income; topsoil is thicker in grasslands than in forests – more fertile.
G11_TG_CAPS.indb 124 2012/08/01 9:01 PM

C125S t r a n d 3 • U N I T 2
Solid waste disposal
Learner’s Book page 377Part A: ActionLearners should record all forms of waste generated by the family at the end of each day of the week. They should design their own record sheets and follow the sequence of steps provided in the method. Part B: ReportThe written report should be concise and the results are to be handed in for assessment.
Part C: Assess the effectiveness of waste managementArrange for a class visit to the local municipal landfill site. Do this under supervision of a waste management official from the local municipality. Learners produce a report as outlined in the activity.
Learner’s Book page 368Invite recycling firms to your class (or school) to give a talk or slide show on:• What can be done with the rubbish that you collected?• How can you, as an individual, contribute to the reduction of waste?• A case study where unemployed individuals have turned waste into a
profitable career.
Learner’s Book page 380When marking the essay, content scores a possible 17 and synthesis scores a possible 3 (total 20) The essays should include the following content:
Using alternative sources of energy• Fit solar panels to buildings• Use solar cookers• Extract methane from landfills to use as biofuel• Use wind generators• Use/explore hydroelectric power generators• Use self-winding apparatus such as mechanical radios and torches. (5)Dealing with pollution at source level• Fit air cleaners/scrubbers/catalytic converters to factory outlets to
remove SO2 and CO2• Use alternative/less harmful techniques and raw materials to replace
resources that add to greenhouse gases• Stop using organophosphates in pesticides• Place a ban on all open fires• Improve public transport to reduce the number of vehicles on the road• Add tax levies to privately owned SUVs, motorboats and aeroplanes. (6)
PPA Activity 16 Household waste analysis (Specific Aims 2 and 3)
Extended activity (Specific Aim 1)
Activity 17 Essay: Human influences on the environment (Specific Aims 1 and 3)
G11_TG_CAPS.indb 125 2012/08/01 9:01 PM

C126 S t r a n d 3 • U N I T 2
Implementing personal lifestyle changes and making environmentally friendly choices• Use natural fibres, e.g. cotton instead of synthetic fibres• Use natural building materials and fewer bricks and cement• Use organic and permaculture farming methods• Plant indigenous trees to compensate for unavoidable greenhouse gas
emissions• Reduce the use of paper, plastic, nylon, garden fertilisers• Avoid items with excessive wrappings• Support farmers’ markets instead of supermarkets. (6) Content (17)Assessing the presentation of the essay
Marks Descriptions
3 Well structured – demonstrates insight and understanding of question2 Minor gaps or irrelevant information in the logic and flow of the answer1 Significant gaps or irrelevant information in the logic and flow of the
answer0 Not attempted/nothing written other than question number/no relevant
information Synthesis (3) Total (20)
Learner’s Book page 3811 Exponential human population increase; increase in consumerism;
new technology; productive industry; human attitudes, e.g. greed, indifference, etc.
2 a Reduce – most effective in conserving both Reuse – effective but some waste Recover and recycle – energy required for, e.g. melting and reprocessing materials, redeemed by recycling some resources Landfill with energy recovery – wasteful in resources but redeemed by reducing GHGs and generating fuel Landfill without energy recovery – most wasteful in every respect.
b Answer depends on personal findings from household analysis.3 Water pollution (surface and underground); soil pollution (kills
decomposers, nutrient poor); air pollution (GHGs, climate change and acute respiratory infections)
5 a This clean development mechanism requires a “gas to electricity plant”. Landfill waste is compacted underground. Anaerobic bacteria in organic waste decomposes this so that methane is released as a by-product. Methane is then piped to a generator that converts the gas into electricity.
b Bulk of waste and harmful effluent is removed from the environment. Methane as GHG is sequestrated. Electricity is produced from waste instead of using fossil fuels. Waste water from the process can be filtered and toxins removed by wetland plants so that water resources are also recycled.
Activity Self assessment
G11_TG_CAPS.indb 126 2012/08/01 9:01 PM

SECTION D
ASSESSMENT
Grade 11 Examinations D1
Life Sciences weighting grids D2
Analysis of tests/exams D4
List of skills/sub-skills for Specific Aim 2 D5
Formal Assessment Tasks D7
Term 1 Test 1 D7
Term 1 Practical Exam D12
Term 2 Test 2 D15
Term 2 Practical Exam D20
Term 3 Test 3 D24
Term 3 Practical Exam D29
Term 4 Test 4 D33
Term 3–4 Project D40
Life Sciences examinations: Exemplar papers D43
Paper 1 D43
Paper 2 D54
Paper 3: Practical Paper D59
Exemplar paper memoranda of answers D61
Memo Paper 1 D61
Memo Paper 2 D64
Memo Paper 3 (Practical) D66
G11_TG_CAPS.indb 1 2012/08/01 9:01 PM

G11_TG_CAPS.indb 2 2012/08/01 9:01 PM

D1e x a m s a n d e x a m w e i g h t i n g g r i d s / a n a ly s i s o f t e s t s
Grade 11 Examinations The examination will consist of two examination papers of 2½ hours and 150 marks each, and a practical examination of 1 hour and 60 marks.
The weighting and assessment of topics in Paper 1 and Paper 2 will be as follows:
Paper 1
Paper 2
The weighting per topic is a guideline; slight deviations in respect of the number of marks allocated to a topic are acceptable. The purpose of providing the weighting is to ensure that all topics are covered with approximately the correct weighting.
The practical exam tests practical knowledge and skills. This should be set taking into account the resources that are available for practical examination.
TOPIC TIME (weeks)
WEIGHTING
% MARKS
Term 2
Energy transformations: photosynthesis 3 18 27
Animal nutrition 3 18 27
Energy transformations: cellular respiration 1,5 10 15
Term 3
Gas exchange 2,5 15 22
Excretion in humans 2,5 15 23
Population ecology 4 24 36
TOTALS 16,5 100 150
TOPIC TIME (weeks)
WEIGHTING
% MARKS
Term 1
Biodiversity and classification of micro-organisms 3 20 30
Biodiversity in plants and plant reproduction 3 20 30
Biodiversity of animals 2 13 20
Term 4
Human impact on the environment: current crises 7 47 70
TOTALS 15 100 150
G11_TG_CAPS.indb 1 2012/08/01 9:01 PM

D2 e x a m s a n d e x a m w e i g h t i n g g r i d s / a n a ly s i s o f t e s t s
Life
Sci
ence
s Wei
ghtin
g G
rid
– G
rade
11
PA
PER
1
Que
stio
n nu
mbe
rCo
gniti
ve a
bilit
y le
vels
Phot
o-sy
nthe
sis
Ani
mal
nu
triti
onRe
spira
tion
Gas
ex
chan
geEx
cret
ion
Popu
latio
n ec
olog
yTO
TAL
AB
CD
Actu
al
mar
ks
Nor
m %
4025
2015
1818
1015
1524
100%
Mar
ks60
37,5
3022
,527
2715
2223
3615
0
A =
kno
win
g sc
ienc
e
B =
unde
rsta
ndin
g sc
ienc
e
C =
appl
ying
sci
entifi
c kn
owle
dge
D
= e
valu
atin
g, a
naly
sing
, syn
thes
isin
g
G11_TG_CAPS.indb 2 2012/08/01 9:01 PM

D3e x a m s a n d e x a m w e i g h t i n g g r i d s / a n a ly s i s o f t e s t s
Life
Sci
ence
s Wei
ghtin
g G
rid
– G
rade
11
PA
PER
2
Que
stio
n nu
mbe
rCo
gniti
ve a
bilit
y le
vels
Biod
iver
sity
and
clas
sifica
tion
of
mic
ro-o
rgan
isms
Biod
iver
sity
of
plan
ts a
nd p
lant
re
prod
uctio
n
Biod
iver
sity
of
anim
als
Hum
an
impa
ct o
n th
e en
viro
nmen
tTO
TAL
AB
CD
Actu
al
mar
ks
Nor
m %
4025
2015
2020
1347
100%
Mar
ks60
37,5
3022
,530
3020
7015
0
A =
kno
win
g sc
ienc
e
B =
unde
rsta
ndin
g sc
ienc
e
C =
appl
ying
sci
entifi
c kn
owle
dge
D
= e
valu
atin
g, a
naly
sing
, syn
thes
isin
g
G11_TG_CAPS.indb 3 2012/08/01 9:01 PM

D4 e x a m s a n d e x a m w e i g h t i n g g r i d s / a n a ly s i s o f t e s t s
AnAlysis of TesTs/exAms
Test: __________________ Teacher: ________________________Grade: __________________
1. sTATisTiCAl AnAlysisClass Class Class Class Class Class
number wrote
number passed
number failed
median
2. DiAGnosTiC AnAlysis(Identify the questions where learners have performed poorly and indicate the reason/s for the poor performance. The reason could relate to teaching, learning or both or any other.)
Question number
Description of specific errors Remedial measures/intervention strategies
G11_TG_CAPS.indb 4 2012/08/01 9:01 PM

D5e x a m s a n d e x a m w e i g h t i n g g r i d s / a n a ly s i s o f t e s t s
LIST Of SKILLS/Sub-SKILLS fOR SPECIfIC AIM 2
1 Follow instructions2 Handle equipment or apparatus3 Make and record observations in different ways4 Record information or data in a variety of ways5 Measure6 Interpret, do calculations and represent information in different ways7 Design/plan investigations or experiments by:
7.1 Identifying a problem7.2 Hypothesising 7.3 Selecting apparatus/materials7.4 Identifying variables7.5 Suggesting ways of controlling variables7.6 Planning an experiment7.7 Suggesting ways of recording results7.8 Understanding the need for replication or verification
Skills assessed in the Exemplar formal Practicals, Project and Practical Exams
formal practicals or project and practical exam
skills and sub-skills
1 2 3 4 5 6 7.1 7.2 7.3 7.4 7.5 7.6 7.7 7.8
T1: Practicals ✓ ✓ ✓ ✓ ✓ ✓ ✓ ✓
T2: Practicals ✓ ✓ ✓ ✓ ✓ ✓
T3: Practicals ✓ ✓ ✓ ✓ ✓
T4: Project ✓ ✓ ✓ ✓ ✓ ✓ ✓ ✓ ✓ ✓ ✓ ✓ ✓ ✓
Practical Exams
Q1 ✓ ✓
Q2 ✓ ✓ ✓ ✓
Q3 ✓ ✓ ✓ ✓ ✓ ✓
Q4 ✓
G11_TG_CAPS.indb 5 2012/08/01 9:01 PM

G11_TG_CAPS.indb 6 2012/08/01 9:01 PM

D7T E R M 1 • T E S T 1
Formal Assessment Task Grade 11
Term 1: Test 1
Marks: 75 Time : 1 Hour
Section A
Question 1
1.1 Multiple choice Various options are given as possible answers to the following questions. Choose the correct answer and write only the letter (a to d) next to the question number, for example 1.1.6 d.
1.1.1 All viruses are: a prokaryotes b unicellular and pathogens c cellular in structure d acellular and non-living
1.1.2 The following is a list that describes viruses: iii play a significant role as decomposers iii are the major pathogens of humans iii are obligate parasites iv reproduce within host cells
From the list above, which of the following are of biological importance in viruses? a i, ii and iii b ii, iii and iv c i, iii and iv d ii and iv only
1.1.3 Bacteria reproduce: a sexually only b by binary fission c by fragmentation d inside living host cells only
1.1.4 Bryophytes are terrestrial plants that have no: a cellulose b vascular tissue c rhizoids d sporophyte phase
1.1.5 Leaves that bear sporangia are called: a sori b cones c sporophylls d sporogonia
(5 × 2) [10]
G11_TG_CAPS.indb 7 2012/08/01 9:01 PM

D8 T E R M 1 • T E S T 1
1.2 TerminologyGive the correct biological term for each of the following descriptions. Write only the term next to the question number. 1.2.1 An organism that consists of a nucleic acid surrounded by a shield of protein 1.2.2 A disease-causing organism such as bacteria1.2.3 A ripened ovule after the ovum within it has been fertilised 1.2.4 The hard, resistant outer wall of a pollen grain1.2.5 A nutritional relationship in which two different organisms live together1.2.6 An organism’s resistance to foreign substances
[6]1.3 Match the columns
Match the disease in column 1 with the causing agent in column 2. Write the letter of the correct answer next to the question number.
Column 1 Column 2
1.3.1 Ringworm1.3.2 Measles1.3.3 Tuberculosis 1.3.4 Malaria
a bacteria b fungi c viruses d protozoans e E. coli f breadmould
[4]1.4 The following is a list of characteristics of some micro-organisms:
a ultra-microscopic and filterableb unicellular with distinct shapes and arrangementsc cell walls contain peptidoglycand possess vegetative processes called hyphaee range from being aerobic to facultative anaerobicf lack metabolism and respiratory enzymesg cell walls consists of chitinh requires host cells to multiplyi contains strands of either DNA or RNA, never bothj reproduces asexually by means of spores
1.4.1 List three characteristics that pertain to bacteria only (3) 1.4.2 List two characteristics that pertain to viruses only (2)
[5]
Total question 1: [25]
Total section A: [25]
G11_TG_CAPS.indb 8 2012/08/01 9:01 PM

D9T E R M 1 • T E S T 1
Section B
Question 2
2.1 The bacterium, Vibrio cholerae, causes cholera. The El Tor strain of Vibrio cholerae originally occurred in Indonesia. In 1961, this strain began to spread, replacing existing strains in other parts of Asia. El Tor is now widespread throughout Asia, the Middle East, Africa and parts of Eastern Europe, but has never established itself in Western Europe. El Tor is hardier than the strain it replaced and the bacteria may continue to appear in the faeces for up to three months after patients have recovered. The bacteria may persist in water for up to 14 days.The United Nations recognised that most of the outbreaks of cholera were the result of polluted water supplies. It therefore set up a “Decade of Water” in 1981. Its aim was to provide safe water for everyone. Over the decade 1981–1990, the number of people lacking a safe water supply in developing countries dropped from 1800 million to 1200 million.2.1.1 State two ways in which V. cholerae is transmitted from infected to uninfected
persons. (2)2.1.2 Explain why cholera continues to be a worldwide problem, in spite of the
“Decade of Water” campaign. (2)2.1.3 The antibiotic tetracycline is sometimes used to treat cholera.
a Suggest how tetracycline can affect V. cholerae. (2)b Explain why tetracycline should not be used routinely for all cases
of cholera. (2)[8]
2.2 Measles is caused by a virus. Study the graph below and then answer the questions that follow.
2.2.1 Describe the information conveyed by the graph. (3)2.2.2 In which two years did the number of cases constitute an epidemic? (2)2.2.3 Suggest a reason for the pattern of the graph from 1917 to 1919. (2) 2.2.4 Viral diseases seldom disappear from a population between epidemics.
Give an explanation for this. (3) 2.2.5 After a number of years of research and control the virus that causes the disease
smallpox has been eliminated. Do you think that bacterial diseases can be totally eliminated? Provide reasons for your answer. (3)
[13]
2.3 Differentiate between the following pairs of concepts:2.3.1 aerobic bacteria and anaerobic bacteria (2)2.3.2 rhizoids and sporangiphores (2)
[4]
Total question 2: [25]
1916
250
150
50
0
Time in years
Aver
age
num
ber o
f ne
w m
easle
s cas
es n
otifi
ed
300
200
100
1917 1918 1919 1920
G11_TG_CAPS.indb 9 2012/08/01 9:01 PM

D10 T E R M 1 • T E S T 1
Question 3
3.1 Study the following diagram of a moss plant and answer the questions that follow.
3.1.1 Identify parts 2, 3 and 6. (3)3.1.2 State one function of part 5. (1)3.1.3 Name the structure into which the spore germinates. (1)
[5]
3.2 State five ways in which the sporophyte of a fern plant is able to survive in a terrestrial habitat. [5]
3.3 Study the following diagram of a flower of an angiosperm and then answer the questions that follow.
3.3.1 State one reason why the plant of this flower is classified as an angiosperm. (1)3.3.2 What is the common name given to parts A, B, and C? (1)3.3.3 Write down the letter of the structure in which the female gamete is produced. (1)3.3.4 Which letter represents the whorl, which is important for insect pollination? (1)3.3.5 Is this flower likely to be self-pollinated or cross-pollinated.
Give a reason for your answer. (2)3.3.6 Which letter represents the part that will develop into a fruit? (1)
[7]
3.4 Complete the following table by filling in the missing information.
Cnidaria Annelida Arthropoda
Symmetry a bilateral bSkeleton hydrostatic c dBlood system – open or closed none e fNumber of gut openings g two h
[8]
Total question 3: [25]
Total section B: [50]
1 2
3
4
5
6
AB
C
DE
F
G
HI
G11_TG_CAPS.indb 10 2012/08/01 9:01 PM

D11ANSWERS • T E S T 1
Formal Assessment Task Grade 11 (Memo)
Term 1: Test 1Marks: 75 Time: 1 Hour
Section AQUESTION 11.1 1.1.1 d 1.1.2 b 1.1.3 b 1.1.4 b 1.1.5 c (5 × 2) [10]1.2 1.2.1 virus1.2.2 pathogen1.2.3 seed1.2.4 testa1.2.5 symbiosis1.2.6 immunity [6]1.3 1.3.1 b 1.3.2 c1.3.3 a1.3.4 d [4]
1.41.4.1 a, f, h, i (3) 1.4.2 b, c, e (2) [5]
Total question 1: [25] Total section A: [25]
Section BQUESTION 22.12.1.1 through faeces, through contaminated water (2)2.1.2 The El Tor strain is very hardy and therefore difficult
to control. V. cholerae has the ability to mutate rapidly. Because the bacteria are hardy they are able to remain in water and faeces for long periods. (2)
2.1.3 a It affects the enzyme activity of the bacteria and thus interferes with its metabolism. (2)
b The bacteria will adapt to the tetracycline and mutate to produce new strains that are resistant to the drug thus making it more difficult to treat with tetracycline. (2)
[8]2.22.2.1 The average number of new cases of measles reported
from 1916 to 1920. (2)2.2.2 1916 and 1919 (2)2.2.3 Those who were infected in 1916 developed immunity
against the measles virus and it is possible that only a small number of people were infected because of lack of immunity to the disease.
2.2.4 Some people may not become immune to the disease. It is also possible that viruses may mutate and new strains develop. (3)
2.2.5 No, because very large numbers of bacteria exist and it would be impossible to eradicate all of them. (3)
[13]
2.32.3.1 Aerobic bacteria can survive only in the presence of
oxygen while anaerobic bacteria thrive in the absence of oxygen. (2)
2.3.2 Rhizoids are hyphae that grow into the substrate while sporangiophores are hyphae that grow upwards and bears the sporangia. (2)
[4]
Total question 2 : [25]
QUESTION 3 3.13.1.1 2 – calyptra, 3 – sporangiophore, 6 – rhizoids (3)3.1.2 carries out process of photosynthesis; absorbs water (1)3.1.3 protonema (1) [5]3.2 Any five of: • rhizome covered with tough epidermis, ramenta and
old leaf bases • fronds well supported in air by rachis • closely packed upper and lower epidermis with cuticle • stomata on abaxial (lower) side for gas exchange • spores develop inside sporangium • sporangium protected by indusium • sporangium adapted for spore dispersal in dry
conditions [5]3.33.3.1 ovules enclosed in ovary (1)3.3.2 pistil/gynoecium (1)3.3.3 G (1)3.3.4 D (1)3.3.5 cross-pollination – stigma grows higher than
anthers (2)3.3.6 C (1) [7]
3.4 Cnidaria Annelida Arthropoda
Symmetry a (radial) bilateral b (bilateral)
Skeleton hydrostatic c (hydrostatic) d (exoskeleton)
Blood system – open or closed
none e (closed) f (open)
Number of gut openings
g (one) two h (two)
[8]
Total question 2 : [25] Total section B: [50]
G11_TG_CAPS.indb 11 2012/08/01 9:01 PM

D12 T E R M 1 • P R A C T I C A L E X A M I N AT I O N 1
Formal Assessment Task Grade 11
Term 1: Practical Examination 1
Marks: 30 Time : 1 Hour
Part 1:Practicals: basic skills of slide preparation and drawing of the bread mould
Prior preparation (material used for macroscopic study)
1 Using the “lift-off ” technique, prepare a dry mount slide of the bread mould.2 Observe the slide under the medium power of the light microscope. 3 Make a fully labelled drawing of what you observe.4 Identify and label the following parts: mycelia, rhizoids, stolons, sporangiophores and
sporangia. 5 Do the thread-like structures have cross-walls?
Assessing the above task:1 Slide preparation
The following criteria can be used to assess this skill:
Criteria Suggested mark scheme
1 Condition of slide: Is it free of any dirt?
1
2 Amount of specimen: Was the thread teased out to allow light to pass through it?
1
3 Coverslip: Used or not used?Correct technique in placing over specimen?
2
4 Air bubbles under coverslip: Yes = 0 / No = 1
1
2 Drawing from the specimen
Criteria Suggested mark scheme
1 Correct representation: Does the drawing look the same as what is under the microscope?
1
2 Caption: Does it have a heading?
1
3 Magnification/scale: Is this indicated in the caption of the drawing?
1
4 Labels correctly representing parts: • mycelium• rhizoids • stolons • sporangiophores • sporangia
5
5 Biological drawing requirements: Are the position of parts correct? Are the parts drawn in appropriate proportion to one another?
2
[15]
G11_TG_CAPS.indb 12 2012/08/01 9:01 PM

D13T E R M 1 • P R A C T I C A L E X A M I N AT I O N 1
Part 2:The diagram below illustrates an experimental design with the bacterium, Escherichia coli, and two different antibiotics, namely streptomycin (S) and penicillin (P) with the same strength in a Petri dish.
a State one hypothesis that is being investigated. (3)b State the aim of the above investigation. (2) c Describe the result/s of this investigation. (2)d State one conclusion from the results of this investigation. (3)e Why was it necessary to incubate the Petri dish? (2)f X represents a colony of bacteria. Explain the presence of this colony near the
streptomycin disc. (3)
[15]
TOTAL: [30]
nutrient agar with E. coli
colonies of E. coli
After 24 hours of incubationAt the start of investigation
S
P
S
P
X
G11_TG_CAPS.indb 13 2012/08/01 9:01 PM

D14 T E R M 1 • P R A C T I C A L E X A M I N AT I O N 1
Part 1: Scoring sheet for assessment of microscopy
Grade/division: __________ Teacher: ______________________________
No. Learner names Slide preparation Drawing
TOTA
L
Slid
e co
nditi
on
Qua
lity
of s
peci
men
Cove
rslip
Air
bub
bles
Corr
ect r
epre
sent
atio
n
Capt
ion
Mag
nific
atio
n
Labe
ls
Dra
win
g
Max Mark 1 1 2 1 1 1 1 5 2 15
1
2
3
4
5
6
7
8
9
10
11
12
13
14
15
16
17
18
19
20
Part 2: Memo
a The same strength of streptomycin and penicillin affects E. coli differently. (3)b To determine the effect of streptomycin and penicillin on E. coli. (2)c Immediately around where the streptomycin disc was placed, there is a clear area.
There is no clear area around the penicillin disc. (2)d Streptomycin prevents the growth of E. coli while it would seem that penicillin has no
adverse effect on E. coli. (3)e Incubation provides the appropriate temperature for the growth of E. coli. (2)f It is possible that it is a contaminant – either another bacteria or a fungus – that was not
affected by the streptomycin. (3)
[15]
TOTAL: [30]
G11_TG_CAPS.indb 14 2012/08/01 9:01 PM

D15T E R M 2 • T E S T 2
Formal Assessment Task Grade 11
Term 2: Test 2
Marks: 75 Time : 1 Hour
Section A
Question 1
1.1 Multiple choice Various options are given as possible answers to the following questions. Choose the correct answer and write only the letter (A to D) next to the question number, for example 1.1.7 d.
1.1.1 Which of the following statements is true for respiration and photosynthesis? a only photosynthesis involves the conversion of energy in living cells b take place only in cells that contain chlorophyll c both can take place simultaneously in plant cells d photosynthesis involves catabolic reactions, while respiration involves anabolic
reactions1.1.2 Which one of the following occurs in both aerobic and anaerobic respiration?
a carbon dioxide is released b energy is released from food c carbon dioxide and water are released d both processes are the reverse of photosynthesis
1.1.3 Listed below are steps in a test for starch in green leaves: iii boil leaves in alcohol iii boil leaves in water for two minutes iii immerse leaves in iodine solution iv rinse leaves in water
From the list above, in what sequence are these steps carried out? a ii, i, iii, iv b i, ii, iii, iv c ii, i, iv, iii d iv, i, iii, ii
1.1.4 A group of learners set up an investigation to test the effect of light on the rate of photosynthesis. They counted the number of bubbles of gas given off by the water plant as the lamp was moved away from the plant.
Which one of the following graphs best shows the expected results?
bubbles of gas
water plant
lamp
rate
distance
rate
distance
rate
distance
rate
distance
a b c d
G11_TG_CAPS.indb 15 2012/08/01 9:01 PM

D16 T E R M 2 • T E S T 2
1.1.5 Anorexia nervosa refers to a: a deficiency disease resulting from daily intake of fat b nervous breakdown as a result of lack of vitamins in the diet c psychological condition when a person refuses to eat a balanced diet even
when food is available d deficiency disease as a result of lack of protein in the diet
1.1.6 Most of the absorption of the products of digestion takes place in humans across the:
a squamous epithelium of the oesophagus b convoluted walls of the stomach c finger-like villi of the small intestine d smooth wall of the large intestine
(6 × 2) [12]
1.2 Terminology Give the correct biological term for each of the following descriptions. Write only the biological term next to the question number. 1.2.1 The type of anaerobic respiration that takes place in yeast cells 1.2.2 The acid that accumulates in muscles under anaerobic conditions during
strenuous exercise 1.2.3 The elongated mesophyll cells in a leaf 1.2.4 The green pigment in leaves that absorbs radiant energy 1.2.5 The process by which absorbed food is incorporated into the cells 1.2.6 Wavelike motion of the wall of the alimentary canal caused by the alternate
contraction and relaxation of muscles
[6]
1.3 The diagram shows a set of apparatus used in an investigation.
1.3.1 Which one of the following statements best describes the aim of this investigation? Write only the number of your choice (2)
a To determine whether oxygen is released during photosynthesis b To determine whether oxygen is necessary for respiration c To determine whether carbon dioxide is required for photosynthesis d To determine whether carbon dioxide is required for respiration 1.3.2 What is the purpose of the potassium hydroxide solution? (1)1.3.3 State the expected results for the leaves in: a flask A (2) b flask B (2)
[7]
Total question 1: [15]
Total section A: [25]
cotton wool
potassium hydroxide solution
A
B
G11_TG_CAPS.indb 16 2012/08/01 9:01 PM

D17T E R M 2 • T E S T 2
Section B
Question 2
2.1 Differentiate between the following concepts: cellular respiration, breathing, and gaseous exchange. (6)
2.2 Two organelles in the green parts of plants are responsible for different but closely related processes. Study the flow diagram below and then answer the questions that follow.
2.2.1 Name: a organelles I and II (2) b gases A and B respectively (2) c the processes occurring at organelle I and organelle II respectively (2) d product C. (1)2.2.2 Explain two structural adaptations of organelle II for its function. (4)
[11]
2.3 Read the following passage and then answer the questions.
Cellular respirationAdenosine triphosphate (ATP) is the immediate source of energy used by muscles. When glucose is broken down during cellular respiration to release energy, this energy is transferred to ATP molecules. The first step in the breakdown of glucose molecules takes place in the absence of oxygen. This is known as the anaerobic phase. One of the substances produced here is lactic acid, which accumulates in the muscle cells. If plenty of oxygen is available then aerobic respiration takes place. This results in the formation of carbon dioxide and water instead of lactic acid.
2.3.1 Name: a the main fuel molecule for cellular respiration (1) b two products of aerobic respiration (2) c one product of anaerobic respiration in muscles. (1)2.3.2 Tabulate two differences between aerobic and anaerobic respiration. (4)
[8]
Total question 2: [25]
gas A
gas Borganelle I organelle II
Sun
waterC
G11_TG_CAPS.indb 17 2012/08/01 9:01 PM

D18 T E R M 2 • T E S T 2
Question 3
3.1 Answer the following questions based on photosynthesis.3.1.1 Name two inorganic substances that plants require for the process of
photosynthesis. Next to each, indicate where each of the substances comes from. (4)
3.1.2 Explain the reason for each of the following steps in the procedure to test for starch in a leaf:
a boiling the leaf in water b boiling the leaf in alcohol or methylated spirits c rinsing the leaf in water after it has been boiled in alcohol or methylated spirits d heating the alcohol or methylated spirits in a container placed in a water bath
rather than directly over the flame. (4)3.1.3 State two reasons why photosynthesis is considered to be biologically important. (2)
[10]
3.2 A tomato farmer was able to produce crops in greenhouses that were heated to between 15°C and 22°C. In addition, the carbon dioxide level was increased from its normal 0,03% to 0,1%. 3.2.1 Suggest one way in which the farmer could have enriched the air inside the
greenhouse with carbon dioxide, without burning any fuel. (1)3.2.2 Name two other factors that might have to be increased to obtain an even
greater yield when the carbon dioxide level is increased to above 0,1%. (2)3.2.3 Explain how increasing the carbon dioxide levels up to 0,1% can lead to an
increased production of tomatoes. (2)3.2.4 The additional carbon dioxide is provided only during the daylight hours.
Suggest a reason for this. (2)3.2.5 Predict what would happen if the carbon dioxide concentration within the
greenhouse is increased to 0,5% for between 10 to 15 days if all other factors are kept constant. (2)
[9]
3.3 Study the diagram below and answer the questions that follow.
3.3.1 Name the process illustrated by the diagram. (2)3.3.2 Identify parts A and B. (2)3.3.3 State two functions of the process named in question 3.3.1. (2)
[6]
Total question 3: [25]
Total section B: [50]
A
B
G11_TG_CAPS.indb 18 2012/08/01 9:01 PM

D19ANSWERS • T E S T 2
Formal Assessment Task Grade 11 (Memo)
Term 2: Test 2Marks: 75Time: 1 Hour
Section AQUESTION 11.11.1.1 c1.1.2 b1.1.3 c1.1.4 a1.1.5 c1.1.6 c (6 × 2) [12]1.2 1.2.1 fermentation1.2.2 lactic acid1.2.3 palisade1.2.4 chlorophyll1.2.5 assimilation1.2.6 peristalsis [6]1.3 1.3.1 a (2)1.3.2 It absorbs CO2. (1)1.3.3 a The test will show the absence of starch, i.e. the
leaves will take on the colour of the iodine solution. (2) b The leaves will turn blue-black with the addition of
iodine solution, indicating the presence of starch. (2) [7]
Total question 1: [25] Total section A: [25]Section BQUESTION 2
2.1 Cellular respiration Breathing Gaseous exchange
A chemical process that takes place in the cells. This involves the breakdown of fuel molecules to release energy (ATP), water and carbon dioxide.
A mechanical process that involves the intake of oxygen into the lungs and the release of carbon dioxide from the lungs.
A physical process that involves the diffusion of gases across membranes (gas exchange surfaces), for example between the air the blood in the lungs and between the blood and other tissues in the body.
[6]
2.2 2.2.1 a I is a chloroplast, II is a mitochondrion. (2) b A is O2, B is CO2 (2) c I is photosynthesis, II is cellular respiration. (2) d energy and water (1)2.2.2 • It has folded cristae that increase the surface area
available for enzyme action. • The outer membrane is smooth and permeable,
allowing substances such as ions and pyruvic acid to enter and ATP molecules to leave. (4)
[11]
2.32.3 .1 a glucose (1) b Any two of the following are acceptable: (2)
• energy/ATP • carbon dioxide • water.
c lactic acid (1)
2.3.2 Aerobic respiration Anaerobic respiration
Is dependent on oxygen Is independent of oxygen
Produces carbon dioxide and water
Produces lactic acid in animal cells and alcohol in plants
(4) [8]
Total question 2: [25]QUESTION 33.1 3.1.1 water – soil
CO2 – atmosphere (4)3.1.2 a to soften/break down the tissue b to extract the chlorophyll c to remove the excess alcohol d prevents alcohol from coming into direct contact
with heat since alcohol is flammable (4)3.1.3 • maintains the balance in O2 and CO2 in atmosphere • process that results in the synthesis of food for
consumers (2) [10]3.2 3.2.1 Spray the air with bicarbonate of soda. (1)3.2.2 Any two of these three factors are correct: (2) • light intensity • temperature • water. 3.2.3 With an increased level of CO2 there is an increase in
the rate of photosynthesis – thus more nutrients are produced and stored in the tomatoes. (2)
3.2.4 Photosynthesis only takes place in the presence of light and so to prevent the CO2 from being a limiting factor, additional CO2 is added. (2)
3.2.5 More than a 0,3% concentration of CO2 for a prolonged period may decrease or even completely stop of the process of photosynthesis because the accumulation of CO2 becomes poisonous. (2)
[9]3.33.3.1 peristalsis (2)3.3.2 A – muscles
B – food bolus (2)3.3.3 • helps in digestion • assists in moving the food in the alimentary
tract (2) [6]
Total question 3: [25] Total section B: [50]
G11_TG_CAPS.indb 19 2012/08/01 9:01 PM

D20 T E R M 2 • P R A C T I C A L E X A M I N AT I O N 2
Formal Assessment Task Grade 11
Term 2: Practical Examination 2
Marks: 35 Time : 1 Hour
Question 1 The diagram below represents a set of apparatus that was used in an investigation. A leafy twig of the same species and of the same size was placed in each of the test tubes A, B and C, which each contained a solution of hydrogen carbonate indicator.Each test tube was then treated as follows:• TesttubeA:wrappedinaluminiumfoil• TesttubeB:wrappedinaluminiumfoilwithholes• TesttubeC:notwrappedatall.
All the test tubes were then incubated in a water bath and exposed to light from a lamp.
The results are recorded in the table below.
Test tube Colour change of indicator solution
A Yellow
B Remains cherry red
C Purple
1.1 Suggest an aim for this investigation. (2)1.2 Give an explanation for the results obtained in each of the following:
1.2.1 test tube A (2) 1.2.2 test tube B (2) 1.2.3 test tube C. (2)
1.3 State one way in which the temperature in the above investigation can be changed. (1)
[]
Total question 1: []
90
80
70
60
50
40
30
20
10
0
thermometer aluminium foil with holes
aluminium foilwater bath
a leafy twig
indicator solution
G11_TG_CAPS.indb 20 2012/08/01 9:01 PM

D21T E R M 2 • P R A C T I C A L E X A M I N AT I O N 2
Question 2 Study the following experimental set up in which three thermos flasks were used.
Flask A contained moist germinating seeds.Flask B contained seeds that had been boiled.Flask C contained boiled seeds sterilised in formalin solution.
The results obtained, that is the changes in temperature, in °C, in the different thermos flasks are recorded in the table below.
Intervals between readings in hours 12 24 36 48 60
Flask A 20,0 20,1 22,6 23,0 23,3
Flask B 20,0 20,0 25,0 21,3 22,0
Flask C 20,0 20,0 20,1 20,1 20,1
2.1 Suggest an aim for this investigation. (2)2.2 State two reasons why the flasks were turned upside down. (4)2.3 Why is cotton wool used instead of a rubber stopper? (2)2.4 What caused the difference in temperatures that were recorded in the reading
between 36 and 60 hours in each of the different flasks? (3)2.5 Because the seeds in flasks B and C were treated, a chemical process that
normally generates energy in living cells could not take place. Name the process that is referred to. (1)
2.6 After a few days the temperature in flask B began to increase. Suggest a reason for this. (1)
2.7 Which of the curves, 1, 2, or 3 in the figure on the left indicates the results obtained for flask A? (2)
[15]
Total question 2: [15]
A B C
thermos flask
seeds
cotton wool
thermometer
thermos flask
seeds
cotton wool
thermometer
thermos flask
seeds
cotton wool
thermometer
1
3
2
Time in days
Tem
pera
ture
G11_TG_CAPS.indb 21 2012/08/01 9:01 PM

D22 T E R M 2 • P R A C T I C A L E X A M I N AT I O N 2
Question 3 An experiment was set up as shown in the diagram below. All the test tubes were kept in the light.
A change in the concentration of carbon dioxide in the test tubes causes the indicator to change colour as follows:• Normalamountof carbondioxide:indicator–orange• Lowamountof carbondioxide:indicator–purple• Higheramountsof carbondioxide:indicator–yellow
3.1 Why was test tube C included in this investigation? (1)3.2 Why was it necessary to seal each test tube with a rubber stopper? (1)3.3 Leavesandwormsof equalbiomasswerethenhungtogetherinanothertesttube,
D, containing fresh orange indicator. Suggest, with reasons, what the colour of the indicator in D might be: 3.3.1 after three hours in bright sunlight (2)3.3.2 after six hours in complete darkness. (2)
[6]
Total question 3: [6]
Question 4Studythediagramontheleftandanswerthequestionsthatfollow.
4.1 Give the labels for parts A, B and F. (3)4.2 Give the letter/s of :
4.2.1 one part that stores bile (1) 4.2.2 one part that secretes insulin (1)
[5]
Total question 4: [5]
TOTAL: [35]
fresh green leaves
bag of worms on fresh leaves carbon dioxide
indicator
air
CBA
light
A
B
C
D
E
F
G11_TG_CAPS.indb 22 2012/08/01 9:01 PM

D23ANSWERS • P r a c t i c a l 2
Formal Assessment Task Grade 11 (Memo)
Term 2: Practical 2Marks: 35Time: 1 Hour
QUESTION 11.1 To investigate the influence of light on photosynthesis
or whether light is required for photosynthesis or whether oxygen is produced during photosynthesis. (2)
1.2.1 In test tube A there was no photosynthesis because the foil reflected light and so CO2 was not absorbed for photosynthesis, which caused an increase in acidity. (2)
1.2.2 In test tube B there was a low rate of photosynthesis because perforated aluminium foil allows some light to pass through or to be absorbed, but there is a decrease in the light intensity and so only a small amount of CO2 is absorbed for photosynthesis, causing a slight accumulation of CO2 and thus a slight increase in acidity. (2)
1.2.3 In test tube C the rate of photosynthesis is high because of high light intensity, so all the CO2 in the test tube is used up causing the contents to become less acidic. (2)
1.3 Any one of the following suggestions: • Move the light source either near or far away from
the test tubes. • Increase or lower the temperature of water. • Put the container with water between light source
and the test tubes to absorb heat from the light source. (1)
[9]QUESTION 22.1 To show that heat energy is released by germinating
seeds. (2)2.2 Any two of the following are acceptable: (4) • So that the thermometer could be read and the
temperature recorded. • Because carbon dioxide is heavy, turning the flask
upside down allows the gas to escape, which will prevent respiration slowing down.
• Hot air rises and so turning the flask upside down will limit loss of heat through the plug.
2.3 To allow the oxygen to enter the flask so that the germinating seeds can respire and to allow the carbon dioxide to escape, otherwise respiration will slow down. (2)
2.4 • In flask A cellular respiration occurred in the germinating seeds.
• In flask B bacteria and fungi released energy in the form of heat due to anaerobic respiration.
• In flask C no respiration occurred since there were no living organisms in it. (3)
2.5 aerobic respiration (1)2.6 Bacteria and fungi begin to grow and heat is a product of
respiration. (1)2.7 curve 1 (2) [15]
QUESTION 33.1 Test tube C serves as a control to verify the results. (1)3.2 To prevent carbon dioxide from entering and escaping
from the test tube. (1)3.3.1 No change therefore colour remains orange. CO2 is
released by the worms during respiration and is absorbed by leaves during photosynthesis. (2)
3.3.2 The indicator colour changes to yellow. Both the leaves and the worms are respiring and give off CO2. Leaves do not photosynthesise and the CO2 that is given off by the worms is not absorbed. (2)
[6]QUESTION 44.1 A: gullet/oesophagus, B: stomach, F: gall bladder (3)4.2.1 F (1)4.2.2 D (1) [5]
Total: [35]
G11_TG_CAPS.indb 23 2012/08/01 9:01 PM

D24 T E R M 3 • T E S T 3
Formal Assessment Task Grade 11
Term 3: Test 3
Marks: 75 Time : 1 Hour
Section AQuestion 1
1.1 Multiple choice Various options are given as possible answers to the following questions. Choose the correct answer and write only the letter (a to d) next to the question number, for example 1.1.7 d.
1.1.1 The term gaseous exchange refers to the: a exchange of oxygen and carbon dioxide at the lung and tissue level b release of energy from fuel molecules in the cells c movement of air into and out of the lungs d uptake of carbon dioxide from blood
1.1.2 In humans gas exchange occurs in the: a trachea b alveoli c bronchi d diaphragm
1.1.3 Which of the following shows the correct path of air movement during exhalation? a alveolus → bronchus → bronchiole → trachea b alveolus → bronchiole → bronchus → trachea c trachea → bronchus → bronchiole →alveolus d bronchiole → bronchus → alveolus →trachea
1.1.4 Which waste product is excreted by skin, lungs and kidneys: a carbon dioxide b urea c water d mineral salts
1.1.5 Which of the following does not normally form part of the glomerular filtrate? a large plasma protein b glucose c urea d amino acids
1.1.6 The ureter carries urine from the: a kidneys to the urinary bladder b urinary bladder to the kidneys c kidneys to the exterior d urinary bladder to the exterior
(6 × 2) [12]
G11_TG_CAPS.indb 24 2012/08/01 9:01 PM

D25T E R M 3 • T E S T 3
1.2 Terminology Give the correct biological term for each of the following descriptions. Write only the term next to the question number. 1.2.1 The structures that keep the trachea open 1.2.2 A protective membrane surrounding the lungs 1.2.3 The process by which the body eliminates metabolic wastes from the body 1.2.4 A cup-shaped structure in the kidney that contains the glomerulus 1.2.5 The sum of all the individuals of the same species that occupy the same area in a
particular ecosystem [5]
1.3 Indicate whether each of the items in column 1 applies to a only, b only, a and b or neither a nor b in column 2.
Column 1 Column 2
1.3.1 Competition between individuals of the same species a intraspecific b interspecific
1.3.2 Interaction between different organisms whereby both benefits
a parasitism b commensalism
1.3.3 Results in decrease in the population size a emigration b mortality
1.3.4 Benefits of social organisation of organsims a division of labour b competition
(4 × 2) [8]
Total question 1: [25]Total section A: [25]
Section BQuestion 22.1 The table below shows the results of an investigation involving a person. The
person involved in the investigation was fit and healthy, and was subjected to the following conditions: • The person lay down throughout the investigation. • The person was given air to breathe which had different concentrations of carbon
dioxide while the oxygen concentration remained the same throughout the investigation.
During the investigation the rate and depth of breathing of this person was measured and the volume of air breathed was determined from this.
Concentration of CO2 breathed in (%)
Number of breaths per minute
Total volume of air breathed per minute (litres)
0,04 14 9,40,08 14 10,31,50 15 11,92,30 15 13,73,10 15 18,55,50 20 29,56,00 27 56,8
2.1.1 Suggest an aim for this investigation. (1)2.1.2 Describe how the increase in carbon dioxide concentration affects the following: a the rate of breathing (2) b the volume of air breathed in per minute. (1)2.1.3 Why did the volume of air breathed in per minute increase from 11,9 litres to
18,5 litres while the number of breaths remained the same at 15 per minute? (2) [6]
G11_TG_CAPS.indb 25 2012/08/01 9:01 PM

D26 T E R M 3 • T E S T 3
2.2 Study the diagram and answer the questions that follow.
2.2.1 What is the aim of this demonstration? (2)2.2.2 Which structure in the gas exchange system of humans is represented
by each of the following? a A (1)
b B (2) c C (3)2.2.3 What would happen to the following if the part labelled E is moved to position D? a balloons (1) b volume of air in the bell jar. (1)2.2.4 Give one reason why this apparatus is considered a poor representation of the
breathing system of humans. (3)
[10]
2.3 Study the following diagrams and answer the questions that follow.
2.3.1 Identify parts A, B and C. (3)2.3.2 Which diagram represents exhalation? (1)2.3.3 Give a reason for your answer in question 2.3.2. (1)2.3.4 What happens to each of the following in II when it changes from condition I? a volume (2) b pressure. (2)
[9]
Total question 2 : [25]
A
B
C
D
E
A
B
C
I IIPart of the respiratory system
G11_TG_CAPS.indb 26 2012/08/01 9:01 PM

D27T E R M 3 • T E S T 3
Question 3
3.1 Study the following diagram of the urinary system and its blood supply and answer the questions that follow.
3.1.1 Identify parts 1, 2, 3, 8 and 10. (5)3.1.2 a Which part of a nephron occurs in the region numbered 4? (1) b What happens to blood in that part of a nephron mentioned in 3.1.2 a? (1)3.1.3 a Which part of a nephron occurs in the region numbered 5? (1) b Name two functions performed by the nephron in the region mentioned
in 3.1.3 a. (2)3.1.4 Name two ways in which the blood in the part numbered 1 differs from that
in the part numbered 7. (2) [12]
3.2 The table below shows the concentration of substances in the blood plasma, glomerular filtrate and in the urine.
Substance % in plasma % in filtrate % in urine
Water 90–93 99–100 97,5
Proteins 7,0 0 0
Glucose 0,1 0,1 0
Salts 0,35 0,35 0,5
Urea 0,03 0,03 2,0
3.2.1 Which substances present in the blood plasma did not filter through into Bowman’s capsule? Give a reason for this phenomenon. (2)
3.2.2 Give an explanation for each of the following: a no glucose in the urine (3) b a higher concentration of salts in the urine (3) c a much higher concentration of urea in the urine (3)3.2.3 Give two possible reasons why glucose is sometimes found in human urine. (2)
[13]
Total question 3: [25]
Total section B: [50]
7
31
9
5
2
8
6
4
10
G11_TG_CAPS.indb 27 2012/08/01 9:01 PM

D28 ANSWERS • T E S T 3
Formal Assessment Task Grade 11 (Memo)
Term 3: Test 3 Marks: 75Time: 1 Hour
Section AQUESTION 1 1.1 1.1.1 a1.1.2 b1.1.3 c 1.1.4 c1.1.5 a1.1.6 a (6 × 2) [12]
1.21.2.1 cartilaginous rings1.2.2 pleura1.2.3 excretion1.2.4 Bowman’s capsule1.2.5 population [5]
1.31.3.1 a1.3.2 b1.3.3 b1.3.4 a (4 × 2) [8]
Total section A: [25]
Section BQUESTION 22.1 2.1.1 To determine the effect of different concentrations of
CO2 on the rate and depth of breathing on volume of air breathed in. (1)
2.1.2 a With a low CO2 concentration there is a very gradual increase in the rate and then it becomes constant. With a further increase in the CO2 concentration the rate increases sharply. (2)
b With a low CO2 concentration there is a very gradual increase in volume, then it increases sharply. (1)
2.1.3 In order to get rid of excess CO2, impulses were sent to the breathing muscles, especially the abdominal muscles to increase the depth of breathing. Since there was no exercise and therefore no increased need for O2 the rate of breathing (number of breaths per minute) did not increase. (2)
[6]2.2 2.2.1 To demonstrate the mechanism of breathing. (2)2.2.2 a trachea (1) b thoracic cavity (1) c lungs. (1)2.2.3 a balloons will deflate/reduce in size/become smaller (1) b decrease. (1)2.2.4 Any one of the following is acceptable: • Ribs and intercostal muscles are flexible in humans
but the bell jar is not flexible. • The lungs fill up the thoracic cavity in humans but
there is space in bell jar between the balloons and the bell jar.
• The diaphragm in humans is convex but in the bell jar the rubber sheet (part D/E) is flat. (3)
[10]2.3
2.3.1 A – lungs B – ribs C – diaphragm. (3)
2.3.2 I (1)2.3.3 The volume of the thoracic cavity is reduced. (1)2.3.4 a increases (2) b decreases. (2) [9]
Total Question 2: [25]
QUESTION 33.1 3.1.1 1 – renal artery; 2 – aorta; 3 – adrenal gland; 8 – ureter;
10 – urethra (5)3.1.2 a Malpighian body (1) b Blood is under pressure and ultra-filtration of
substances takes place. (1)3.1.3 a renal tubule (1) b tubular reabsorption and tubular excretion (2)3.1.4 The blood in 1 – the renal artery – contains more waste
products, e.g. urea and mineral salts than the blood in 7 – the renal vein. The blood in 1 contains more water than the blood in 7. (2)
[12]
3.2 3.2.1 Proteins, because protein molecules are too large to filter
throught the slit pores of the podocytes in Bowman’s capsule. (2)
3.2.2 a Glucose is a useful substance and is an important source of energy, so it will not be excreted in normal physiology and it is reabsorbed in the proximal convoluted tubule and the loop of Henle. Glucose is actively reabsorbed by the cuboidal cells with their brush border of microvilli. (3)
b The salt concentration of the blood is regulated by excretion and reabsorption and is controlled by aldosterone. Sodium and potassium ions play a role in maintaining the extracellular fluid. When there is too much sodium in the body, the secretion of aldosterone is inhibited and less sodium is reabsorbed and more is excreted in the urine. The secretion of potassium into the distal convoluted tubules and collecting ducts is enhanced by aldosterone, which lowers the potassium levels of the blood. (3)
c Urea is a nitrogenous waste and must be removed from the body. The cells of the distal convoluted tubules have a brush border with microvilli and numerous mitochondria. Urea from the surrounding tissue fluid and capillaries is actively secreted into the tubules and the collecting ducts (tubular excretion). (3)
3.2.3 • If glucose appears in the urine it is due to malfunctioning of the kidneys.
• It could be due to an abnormally high concentration of glucose in the blood as a result of insufficient insulin secretion by the pancreas. (2)
[13]
Total question 3: [25] Total section B: [50]
G11_TG_CAPS.indb 28 2012/08/01 9:01 PM

D29T E R M 3 • P R A C T I C A L E X A M I N AT I O N 3
Formal Assessment Task Grade 11
Term 3: Practical Examination 3
Marks: 30 Time: 1 hour
Part 1: Dissection of sheep kidney
1 Each candidate must collect a kidney specimen from the teacher.2 Also ensure that you have all relevant equipment and materials for this activity,- e.g.
newspaper, dissecting board, scalpel, etc. 3 Prepare the specimen appropriately and then do a longitudinal dissection of the kidney.4 Identify and label (with prepared flags) the following parts: cortex, medulla, pyramid, calyx,
pelvis, and papilla.5 Draw and label what you observe.6 Now call your teacher to assess your task.
Assessing the above task:1 Dissection
The following criteria can be used to assess this skill:
Criteria Suggested mark scheme
1 Getting started: Was the dissecting board used? Was the newspaper placed on the dissecting board? Did the candidate remove the fat from around the kidney?
1 1 1
2 Cutting of specimen: Longitudinal section made 1
3 Neatness of dissection: • Perfect with all parts clearly visible and no mutilation• Most parts clearly visible but some mutilation of specimen• Specimen badly mutilated and parts not clearly visible
4 2 0
2 Drawing from the specimen The following criteria can be used to assess this skill:
Criteria Suggested mark scheme
1 Correct representation: Does the drawing resemble the dissected spcimen . 1
2 Caption: Does it have a heading? 1
3 Magnification/scale: Is this indicated in the caption of the drawing? 1
4 Labels correctly representing parts: g cortex h medulla i pyramid j calyx
any 5
k pelvis f papilla
5
5 Biological drawing requirements: Are the position of parts correct? Are the parts drawn in appropriate proportion to one another?
1 1
[18]
G11_TG_CAPS.indb 29 2012/08/01 9:01 PM

D30 T E R M 3 • P R A C T I C A L E X A M I N AT I O N 3
Part 2:The main function of the kidney is to help to maintain homeostatic control in the body. The table below compares the concentration of different substances: blood plasma, the filtrate in Bowman’s capsule and urine in a person.
Substance Blood plasma (g/cm3) Glomerular filtrate (g/100 cm3)
Urine (g/100 cm3)
Proteins 7,00 0 0
Glucose 0,10 0,10 0
Urea 0,03 0,03 2,0
Uric acid 0,002 0,002 0,03
Sodium 0,32 0,32 0,60
Phosphates 0,003 0,003 0,18
Sulphates 0,003 0,003 0,12
Water 92,00 98,00 96,00
2.1 Name two substances, other than those listed in the table, that may be present in urine. (2)2.2 Briefly explain why:ii 2.2.1 glucose is present in the glomerular filtrate but absent in the urine (2) 2.2.2 in some cases glucose may appear in the urine (2) 2.2.3 no protein is found in the filtrate even though it is present in the blood plasma (2)2.3 Suggest a reason for the increased concentration of urea in urine. (2)2.4 Account for the high percentage of phosphates and sulphates in the urine compared
to the glomerular filtrate. (2)
[12]
TOTAL: [30]
G11_TG_CAPS.indb 30 2012/08/01 9:01 PM

D31T E R M 3 • P R A C T I C A L E X A M I N AT I O N 3
Part 1: Scoring sheet for dissection of kidneyGrade/Division: _______________________ Teacher: _______________________
No.Learner names
Dissection Drawing
Get
ting
star
ted
Cutt
ing
of
spec
imen
Nea
tnes
s of
di
ssec
tion
Corr
ect
repr
esen
tatio
n
Capt
ion
Mag
nific
atio
n
Labe
ls
Dra
win
g re
quire
men
ts
TOTA
L
Max Mark 3 1 4 1 1 1 5 2 18
1
2
3
4
5
6
7
8
9
10
11
12
13
14
15
16
17
18
19
20
21
22
23
24
25
26
27
28
29
30
31
32
33
34
35
[18]
G11_TG_CAPS.indb 31 2012/08/01 9:01 PM

D32 T E R M 3 • P R A C T I C A L E X A M I N AT I O N 3
Part 2: Memo2.1 creatinine in humans and hippicuric acid in herbivorous mammals (2)2.2
2.2.1 Glucose is conserved because it is used for energy in the body and is reabsorbed in the loop of Henle. (2) 2.2.2 Glucose may appear in the urine because: (2) • there is a kidney malfunction • the pancreas is failing to produce insulin, or the body is resistant to insulin
and so glucose is not taken up by the body cells. 2.2.3 Protein molecules are too large to pass through the pores in the endothelial layer of Bowman’s capsule. (2)2.3 Large amounts of protein in the diet result in deamination in the liver resulting in the
production of urea and so the concentration of urea in the blood and urine rises. (2)2.4 This is the result of tubular excretion. These substances are acidic salts and are
actively taken out of the blood and added to the filtrate. Their excretion maintains the slightly alkaline medium of the blood. (2)
[12]
TOTAL: [30]
G11_TG_CAPS.indb 32 2012/08/01 9:01 PM

D33T E R M 4 • T E S T 4
Formal Assessment Task Grade 11
Term 4: Test 4
Marks: 75 Time : 1 Hour
Section AQuestion 1
1.1 Multiple choice Various options are given as possible answers to the following questions. Choose the correct answer and write only the letter (a to d) next to the question number, for example 1.1.11 d.
1.1.1 The most important pressure on the Earth’s natural resources and ecological services is: a human numbers that exceed the Earth’s carrying capacityb too many livestock on agricultural landsc an increase in greenhouse gases in the atmosphered an increase in the evaporation of water into the atmosphere
1.1.2 The causes of global warming can be classified as:a a biophysical issue b a political issuec a socio-economic issue d all of the above
1.1.3 To monitor the impact of human development in South Africa:a Greenpeace was establishedb green courts were establishedc State of the Environment surveys were collated in a reportd National and Provincial Parks were brought into existence
1.1.4 Non-biodegradable pesticides have the greatest long term effect on:a target insectsb primary consumersc producers in the food webd higher predators
1.1.5 The quantity and quality of water is sustained by:a the building of several dams in series all along the streams of a
catchmentb reforestation of the catchment with indigenous treesc clearing wetlands alongside streams in the catchmentd cutting canals to relay water from wetlands to streams and
rivers
1.1.6 A water sample taken from a stream reveals the presence of the following invertebrates: leeches, rat-tail maggots, bloodworms, and dragonfly larvae. This indicates that the stream is:a clean and contains no pollutantsb pollutedc slightly pollutedd severely polluted
G11_TG_CAPS.indb 33 2012/08/01 9:01 PM

D34 T E R M 4 • T E S T 4
1.1.7 Which one of the following does not contribute significantly to green house gases?a coal-fired power stationsb oil refineriesc solar-powered panelsd permafrost melting in the tundra
1.1.8 Global warming causes:a more frequent and severe droughtsb mosquitoes to migrate to higher altitudesc an increase in rainfall in the east and a decrease in rainfall in the west of
South Africad all of the above
1.1.9 Which one of the following ecosystems is not an efficient natural carbon sink?a oceansb grasslandsc forestsd deserts
1.1.10 The Kyoto Protocol:a was signed and ratified by all the nations of the world in 2005b required developed countries to reduce their carbon emissions by
2030c required a significant reduction in CO2 emissions from South Africa,
Brazil and Indiad is a set of strategies and timeframes that aim to reduce global
warming (10 × 2) [20]
1.2 Terminology Give the correct biological term for each of the following descriptions. Write only the term next to the question number. 1.2.1 The increase in the concentration of nutrients in an ecosystem, which
causes an increase in primary producers such as algae 1.2.2 The condition that arises when excess soil from accelerated erosion
accumulates in dams so that the storage capacity for water is reduced 1.2.3 A term used to refer to water that has little or no dissolved oxygen left 1.2.4 The clearing of indigenous forests for human activities 1.2.5 The variety of plant and animal species in an ecosystem
[5]
Total section A: 25
G11_TG_CAPS.indb 34 2012/08/01 9:01 PM

D35T E R M 4 • T E S T 4
Section BQuestion 2
2.1 Answer the following questions based on environmental problems.2.1.1 Tabulate three causes, environmental effects and possible corrective measures
for the problem of deforestation. (9)2.1.2 Describe briefly the impact of desertification on each of the following:
a vegetationb biodiversityc seed bankd soil nutrients
(4) [13]2.2 Study the graph below, which indicates the amount of ozone depletion in the
stratosphere between 1982 and 1996.
2.2.1 Comment on the ozone depletion over the period 1982 to 1996. (4)2.2.2 How much of the ozone was lost from the atmosphere in 1990? (1)2.2.3 Besides CFCs, name three other greenhouse gases. (3)2.2.4 CFCs can stay around for 100 years. What is the implication of this for the
ozone layer? (1)2.2.5 Give three possible reasons for the decrease in ozone depletion after 1994. (3)
[12]
Total question 2: [25]
1982
Years
Tons
of o
zone
dep
letio
n
1984 1986 1988 1996
5 000
3 000
1 000
0
7 000
4 000
2 000
1990 1992
8 000
9 000
6 000
1994
Amount of ozone depletion of the stratosphere between 1982 and 1996
G11_TG_CAPS.indb 35 2012/08/01 9:01 PM

D36 T E R M 4 • T E S T 4
Question 3
3.1 The use of non-biodegradable detergents contributes to pollution. Study the table below showing the domestic and industrial use of non-biodegradable detergents in a province over a period of time.
The use of non-biodegradable detergents in thousands of tons in a certain province in South Africa between 1994 and 2004.
Year Domestic use (thousand tons) Industrial use (thousand tons)
1994 10,5 2,5
1996 14,0 3,8
1998 29,0 6,0
2000 34,0 6,5
2002 34,1 6,9
2004 37,5 7,4
3.1.1 Which one of the two categories of use (domestic or industrial) contributed more to detergent pollution in this period? (1)
3.1.2 How much detergent was used in 2000? (2)3.1.3 Between which years did the use of domestic detergents increase most rapidly? (2)3.1.4 Describe the trend that you observe in the domestic use and industrial use of
detergents. (2) [7]3.2 Study the bar graph below and answer the questions that follow.
3.2.1 By how much did the level of sulphur dioxide pollution in Sweden decrease between 2000 and 2005? (2)
3.2.2 Compare the general pattern of air pollution levels of France to that of the other countries. State the following:
a one similarity (1) b one difference (1)3.2.3 Which country had the lowest level of sulphur dioxide pollution in 2005? (1)3.2.4 Suggest two possible reasons for your answer to 3.2.3. (2)
[7]
The average air pollution levels of sulphur dioxide in different countries between 1995 and 2005
Leve
ls of
sulp
hur d
ioxi
de
(arb
itrar
y un
its)
Japan France South Africa Sweden Britain
160
140
120
100
80
60
40
20
0
1995 2000 2005Key:
G11_TG_CAPS.indb 36 2012/08/01 9:01 PM

D37T E R M 4 • T E S T 4
3.3 Read the passage below concerning the shortage of fuel in Rwanda and answer the questions that follow.
Going bananas for sustainable resources – scientists create fuel from African crop waste A big problem in the developing world is the availability of firewood. Huge areas of land are deforested every year. People need fuel to cook and stay warm, but they can’t afford the more expensive types of fuel, like gas. Bananas are an important source of food for Rwandans. The fruit of the banana tree is eaten raw, fried or baked. The rest of the banana plant – skins, leaves and stems – is left to rot as waste. Scientists are looking at ways to use the waste to produce fuel, by producing banana bricks that could be burnt for cooking and heating. Once dried, the bricks form an ideal fuel which, when burnt, release steady heat, suitable for cooking.
3.3.1 Give one reason, according to the passage, why deforestation takes place in Africa. (1)
3.3.2 Explain two ways in which the making of fuel from banana plants benefits humans and/or the environment. (4)
3.3.3 Give one reason why it is necessary for scientists to do research before the commercial production of the banana bricks can take place. (1)
[6]
3.4 Study the passage below and answer the questions that follow.
Devil’s claw Devil’s claw (Harpagophytum procumbens) is an indigenous plant found in southern Africa. Devil’s claw is given this name because of the small hooks that cover its fruit. It is a leafy perennial with branching roots and it thrives in clay or sandy soils. For many years the Khoisan people have used the roots as a cure for a variety of illnesses, such as treatment for pain, complications of pregnancies and as an ointment to heal sores and other skin problems. Nowadays, the dried roots of devil’s claw are produced commercially to restore appetite, relieve heartburn and reduce pain and inflammation.
3.4.1 Name one medical condition that the Khoisan people treated with devil’s claw. (1) 3.4.2 Explain how a reduction in the number of devil’s claw plants could change the
energy flow and energy relationships in an ecosystem. (2) 3.4.3 State one way in which the devil’s claw plant could be saved from extinction. (1) 3.4.4 Pharmaceutical companies are making a large profit by using devil’s claw to
produce medicine. Explain why these companies should share their profits with the Khoisan people. (1)
[5]
Total question 3: [25]
Total section B: [50]
G11_TG_CAPS.indb 37 2012/08/01 9:01 PM

D38 ANSWERS • T E S T 4
Formal Assessment Task Grade 11 (Memo)
Term 4: Test 4Marks: 75 Time: 1 Hour
Section AQUESTION 1 1.1 1.1.1. a1.1.2 d1.1.3 c1.1.4 d1.1.5 b1.1.6 b1.1.7 c1.1.8 d1.1.9 d1.1.10 d (10 × 2) [20]1.21.1.1 eutrophication1.1.2 siltation1.1.3 anoxic1.1.4 deforestation1.1.5 biodiversity [5]
Total question 1: [25]Section BQUESTION 22.12.1.1
Causes Environmental effects Corrective measures
Overgrazing: Too many grazers on too little land
• Producers are eaten faster than they can regrow to sustain their population numbers, thus a loss of biomass
• Livestock starts to starve
• Soil quality deteriorates
• Obtain technical advice from the nearest agricultural research station, e.g. value of the carrying capacity of the land
• Reduce the number of livestock to the required number per hectare
Deforestation: Harvesting trees for timber, furniture, settlements, to make way for exotic plantations or for agriculture
• The thin layer of top soil in forests erodes rapidly to leave deep erosion gulleys on down slopes
• Biodiversity of plants and animals is greatly reduced, as is the biomass and food webs
• The water cycle changes – less rain and the CO2 sink is removed
• Reforestation, i.e. planting back the same species of trees and plants that were removed
• Plant the canopy and emergent trees first, then later the sub-canopy and ground covers. These require at least partial shade and may perish in the Sun if all are planted at the same time. Birds attracted to the trees will also import some of the remaining species by dropping seeds
Wetland destruction: To plant crops in the fertile soil left behind
• Water quality in the catchment deteriorates – no more filtering
• Silt now washes into rivers and dams, reducing the water storage capacity. Accelerated soil erosion since there are no reeds left to slow down run off or to trap soil
• Biodiversity is severely reduced and breeding grounds destroyed
• Remove all crops and alien invasive plants. Keep livestock out of the area until rehabilitated. Plant a few reeds in clumps scattered through the area. Wait for water to start damming up again and for the birds to return with a variety of seeds to restock the wetland
[9]
2.1.2 a Reduced palatability (edible to grazers and browsers) of plants and livestock go hungry and lose body mass. Plants that photosynthesise (producers) decrease, thus biomass of ecosystem decreases. (1)
b Biodiversity declines rapidly. Producers die out and so do consumers, except for those who are able to emigrate to greener pastures. This includes vital pollinators. (1)
c Seed bank of palatable plants is depleted. Any seed that may have remained soon blows away in wind. Germination cannot occur on hard, baked soil surface. (1)
d Soil is rendered infertile since the soil nutrients and humus are now depleted. Nutrient cycles, vital ecosystem services, can no longer be sustained since the plant and decomposer links have been broken. Any remaining nutrients are soon washed away by rain and accelerated soil erosion. (1)
[4]
2.2.1 Between 1982 and 1996 the amount of ozone depletion increased. Then there was a slight decrease to 1988 and an increase unti 1994. Since 1994 ozone depletion has decreased. (4)
2.2.2 6 000 tons (1)2.2.3 carbon dioxide, methane, nitrogen oxides, water vapour
in fog, surface ozone (3)2.2.4 CFCs can carry on destroying the ozone. (1)2.2.5 Any three of: Legislation was passed, forcing countries
to control pollution from industries. CFCs were replaced by law by less harmful substances in fridges and cooling devices. Lead-free petrol was introduced. People were educated and became more aware of the problem. (3)
[12]
Total question 2: [25]
QUESTION 33.1.1 domestic use (1)3.1.2 domestic waste (2)3.1.3 Between 1996 and 1998 (2)3.1.4 Domestic use increases and industrial use increases
OR (both) show an increase OR domestic use is greater than industrial use (2)
[7]
G11_TG_CAPS.indb 38 2012/08/01 9:01 PM

D39ANSWERS • T E S T 4
3.2.1 It decreased from 100 units to 65 units, so the decrease was 35 units. (2)
3.2.2 Air pollution levels have increased in France while those in other countries have generally decreased.
a Levels of air pollution in 2000 were similar to those in other countries. (1)
b Levels of air pollution rose dramatically in 2005 compared to most other countries. (1)
3.2.3 Japan3.2.4 • Japan may have fewer industries that produce
sulphur dioxide. • Japan may have introduced strict measures to control
sulphur dioxide emissions. (2) [7]
3.3.1 People need firewood for cooking and staying warm. (1) 3.3.2 Any two of: (4) • Land is not deforested because the need for firewood
would be less so soil is not eroded CO2/O2 balance is not upset.
• People/women do not need to spend time collecting firewood for fuel.
• Poor people can’t afford the more expensive types of fuels such as gas, so they make use of waste from banana plants to produce their own fuel.
• Burning organic matter from the banana plant produces less pollution than burning fossil fuels, which give off, e.g. SO2 .
• Making fuel bricks out of organic waste creates jobs to reduce poverty/recycle waste.
3.3.3 Any one of: (1) • to ensure that they do not create other problems such
as more pollution/toxic gases • to ensure that it is cost-effective • to ensure that it is a sustainable venture • to ensure that there are no unexpected negative
effects (6)
3.4.1 Any of: (1) • pain • complications of pregnancies • heal sores • skin problems3.4.2 If the number of devil’s claw plants is reduced, the smaller
animals herbivores that eat it will decrease in numbers, the carnivores that rely on the herbivores will also decrease in number and the energy flow through the habitat will be reduced/changed. (2)
3.4.3 Any one of: (1) • by establishing nurseries to grow the plants • legislation on the amounts to be harvested • monitoring/policing the harvesting • collecting only the amount one requires • replanting the main root after the secondary tubers
have been removed • educating collectors on sustainable harvesting methods3.4.4 The Khoisan people were the first to use devil’s claw for
medicinal purposes. Pharmaceutical companies must acknowledge and compensate the Khoisan people for their indigenous knowledge/intellectual property. (1)
[5]
Total Question 3: [25] Total Section B: [50]
TOTAL: [75]
G11_TG_CAPS.indb 39 2012/08/01 9:01 PM

D40 T E R M 3 – 4 • P r o j e c t
Formal Assessment Task Grade 11
Term 3–4 Project This is a long-term task that should take between two to three months to complete.
Topic: Population ecology
You are asked to investigate the effect of temperature on the growth of a species of duckweed (an aquatic pond plant). Your teacher will point out this plant to you.
Design your own investigation to determine the effect of temperature on the growth of duckweed. When planning your investigation, take the following into account: • Identify and state the problem to be investigated.• Generate at least one hypothesis. • State at least one aim, and make at least one prediction of the outcome of your investigation. • Identify those variables that you will keep constant and the one that you will vary.• Ensure that the design of your experiment is fair.• Indicate how you would collect your data.• Decide how you will record your observations/data.• Interpret your observations. • Analyse your results. • Make inferences from your results. • Draw conclusion/s from your results.• Determine whether your hypothesis is supported by your results. • Write up your report, which must include aspects such as: shortcomings in your design (if
any), improving reliability and the validity of your design.
G11_TG_CAPS.indb 40 2012/08/01 9:01 PM

D41T E R M 3 – 4 • P r o j e c t
The following assessment grid will be used to evaluate your project.
Assessing hypothesis testing activity: a general score sheet
Criteria Y N Criteria Y N1. Experimental design 2. The write-up 1.1 Identification of a problem 2.1 Quality of the observation/data
(result) iStated as a causal relationship iii Made accurate observations/
measurements / calculations 1.2 Stating a hypothesis iii collected consistent data iii Linked effect to a variable (cause-
effect) iii Used correct units
iii Identified independent variable/s iv completed recording of data in, e.g. table
iii Identified dependent variable/s 2.2 Analysis of results iv Indicates a directional change iii translated quantitative data into,
e.g. graph iv Stated in a way that is testable
through experimentation iii Labelled axes correctly
1.3 Plan and conduct of experiment to test hypothesis
iii chose appropriate axes for the relevant variables
iii Logical aim stated iv Provided appropriate title for graph
iii Provided step-by-step detailed plan
v Plotted points accurately
iii Appropriate control/s set up vi joined points appropriately iv recognised that only one
independent factor should be variable
2.3 Drawing reasonable conclusion
iv clearly stated precautions iii Identified tendencies and trends in data
vi Appropriate use of specific equipment
iii conclusion/s is/are relevant to the aim /hypothesis
vii Identified and criticised limitations to experimental design
viii Appropriate sample size ix Diagram of experimental design 1.4 collection and recording of data iii Indicated the plan for collecting /
recording data iii recorded data appropriately (e.g.
table, drawing, etc.) iii recognised the existence of errors
in data
G11_TG_CAPS.indb 41 2012/08/01 9:01 PM

D42 T E R M 3 – 4 • P r o j e c t
Note to teacher: This is an open-ended task in so far as the experimental design is concerned. While a general set of criteria is presented (scoring sheet) in order to assess the general principles of investigative work, it is important to take into account each individual attempt and assess it in terms of the general principles.
Assessing hypothesis testing activity: score sheet for Term 3–4 Project
Criteria Y N Criteria Y N1. Experimental design 2. The write-up 1.1 Identification of a problem 2.1 Quality of the observation/data
(result) Do different environmental factors/
conditions have different effects on the rate of water loss in plants?
viii Made accurate observations/ measurements /calculations
1.2 Stating a hypothesis viii collected consistent data Plants lose water at a faster rate under
windy conditions and under high temperatures, than under normal conditions and under high humidity (compare with the general scoring sheet on the previous page to see whether this statement of hypothesis satisfies all of the criteria)
iii Used correct units viv completed recording of data in e.g.
table 2.2 Analysis of results viii translated quantitative data from
e.g. table into e.g. bar graph to make comparison
viii Labelled axes correctly 1.3 Plan and conduct experiment to test
hypothesis viii chose appropriate axes for the
relevant variable. See assessment criteria for different types of graphs
Aim: to determine the effect of different environmental factors on the rate of water loss in plants
iiv Provided appropriate title for graph
viii Provided step-by-step detailed plan iiv Plotted points accurately viii Appropriate control/s set up vivi joined points appropriately viiv recognised that only one
independent factor should be variable
2.3 Drawing reasonable conclusion
viiv clearly stated precautions i Identified tendencies and trends in data
vivi Appropriate use of specific equipment this will depend on the specific design
viii conclusion/s is/are relevant to the aim/hypothesis
vvii Identified and criticised limitations to experimental design
viii Appropriate sample size viix Diagram of experimental design 1.4 collection and recording of data iii Indicated the plan for collecting/
recording data – depends on design, e.g. could record distance bubble moves, difference in mass, etc.
viii recorded data appropriately (e.g. table, drawing, etc.)
viii recognised the existence of errors in data
G11_TG_CAPS.indb 42 2012/08/01 9:01 PM

D43F I N A L E X A M I N AT I O N • PA P E R 1
Life Sciences Examination: Exemplar Paper 1
Marks: 150 Time : 2 hours 30 minutes
Instructions and information
Read the following instructions carefully before answering the questions. 1 Answer ALL the questions. 2 Write ALL the answers in your ANSWER BOOK. 3 Start the answers to each question at the top of a NEW page. 4 Number the answers correctly according to the numbering system used in this question paper. 5 Present your answers according to the instructions of each question. 6 ALL drawings should be done in pencil and labelled in blue or black ink. 7 Draw diagrams or flow charts only when asked to do so. 8 The diagrams in this question paper are NOT necessarily all drawn to scale. 9 Do NOT use graph paper.10 You may use non-programmable calculators, protractors and compasses. 11 Write neatly and legibly.
G11_TG_CAPS.indb 43 2012/08/01 9:01 PM

D44 F I N A L E X A M I N AT I O N • PA P E R 1
Section A
Question 1
1.1 Various options are provided as possible answers to the following questions. Choose the correct answer and write only the letter (a to d) next to the question number (1.1.1 to 1.1.5) in your ANSWER BOOK, for example 1.1.6 d.
1.1.1 The following are involved in the process of cellular respiration: i energy ii carbohydrates iii carbon dioxide iv water v oxygen
Which ONE of the following combinations correctly represents their involvement in the above process?a ii + iii = i + iv + vb ii + iv = i + iii + vc i + ii = iii + iv + vd ii + v = i + iii + iv
QUESTION 1.1.2 and QUESTION 1.1.3 are based on the graph below. Study the graph and answer the questions that follow.
1.1.2 Which interaction in a community is illustrated by the graph above?a parasitismb predationc commensalismd division of labour in a colony
1.1.3 What effect does a decrease in the number of jackals have on the rabbit population?a rabbit population decreasesb rabbit population is eliminated from the habitat after a long period of timec rabbit population increasesd both the rabbit population and the jackal population are eliminated from
the habitat
Relationship between populations of jackals and rabbits over time
Year
Popu
latio
n siz
e
rabbits
jackals
1936 1946 1956 1966 1976 1986 19960
100
200
300
400
500
600
G11_TG_CAPS.indb 44 2012/08/01 9:01 PM
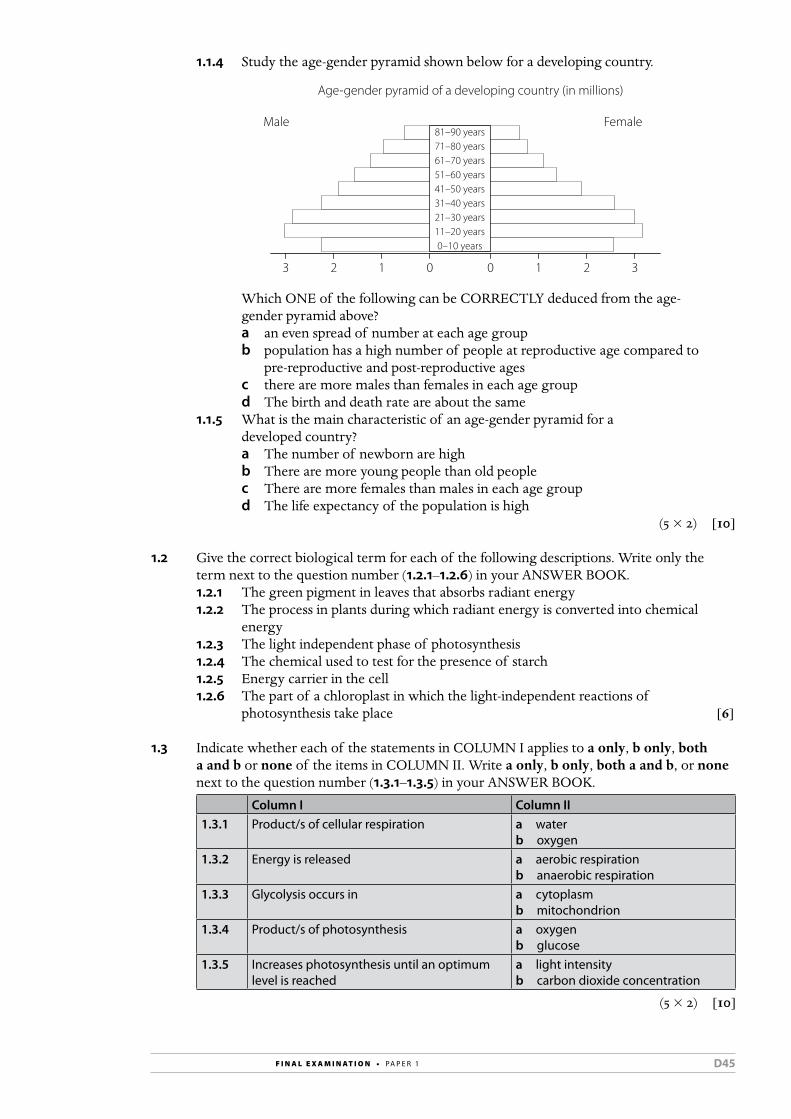
D45F I N A L E X A M I N AT I O N • PA P E R 1
1.1.4 Study the age-gender pyramid shown below for a developing country.
Which ONE of the following can be CORRECTLY deduced from the age-gender pyramid above? a an even spread of number at each age groupb population has a high number of people at reproductive age compared to
pre-reproductive and post-reproductive agesc there are more males than females in each age groupd The birth and death rate are about the same
1.1.5 What is the main characteristic of an age-gender pyramid for a developed country?a The number of newborn are highb There are more young people than old peoplec There are more females than males in each age groupd The life expectancy of the population is high
(5 × 2) [10]
1.2 Give the correct biological term for each of the following descriptions. Write only the term next to the question number (1.2.1–1.2.6) in your ANSWER BOOK.1.2.1 The green pigment in leaves that absorbs radiant energy 1.2.2 The process in plants during which radiant energy is converted into chemical
energy1.2.3 The light independent phase of photosynthesis1.2.4 The chemical used to test for the presence of starch 1.2.5 Energy carrier in the cell1.2.6 The part of a chloroplast in which the light-independent reactions of
photosynthesis take place [6]
1.3 Indicate whether each of the statements in COLUMN I applies to a only, b only, both a and b or none of the items in COLUMN II. Write a only, b only, both a and b, or none next to the question number (1.3.1–1.3.5) in your ANSWER BOOK.
Column I Column II1.3.1 Product/s of cellular respiration a water
b oxygen 1.3.2 Energy is released a aerobic respiration
b anaerobic respiration1.3.3 Glycolysis occurs in a cytoplasm
b mitochondrion1.3.4 Product/s of photosynthesis a oxygen
b glucose1.3.5 Increases photosynthesis until an optimum
level is reacheda light intensity b carbon dioxide concentration
(5 × 2) [10]
Age-gender pyramid of a developing country (in millions)
Male Female81–90 years 71–80 years 61–70 years 51–60 years 41–50 years 31–40 years 21–30 years 11–20 years 0–10 years
3 2 1 0 0 1 2 3
G11_TG_CAPS.indb 45 2012/08/01 9:01 PM

D46 F I N A L E X A M I N AT I O N • PA P E R 1
1.4 Study the diagram below and answer the questions that follow.
1.4.1 Label parts B and F. (2)1.4.2 List THREE substances present in A that are normally absent in D. (3)1.4.3 State ONE function of E. (1)1.4.4 List THREE functions of C. (3) [9]
1.5 Study the diagram below and answer the questions that follow.
1.5.1 Label parts A, E, F and H. (4)1.5.2 Write the letter of the part:
a that represents both an endocrine and exocrine gland (1)b where protein digestion begins (1)c where most water and mineral salts are absorbed (1)d that stores bile (1)
[8]
A
sphincter muscle
B
C
D
E
F
A
B
C
D
EF
G
H
I
Part of the human digestive system
G11_TG_CAPS.indb 46 2012/08/01 9:01 PM

D47F I N A L E X A M I N AT I O N • PA P E R 1
1.6 Study the diagram below and then answer the questions.
1.6.1 Provide labels for the parts A, B, D and F. (4)1.6.2 State ONE function of each of the following:
a the fluid in part E (1)b the cartilagenous rings in part B (1)c the epithelial tissue that lines the inside of part G (1)
[7]
Total section A: [50]
Section B
Question 2
2.1 Study the diagram of a Malpighian body below and answer the questions that follow.
2.1.1 Identify the parts labelled A, D and E. (3)2.1.2 Explain the advantage of part B having a smaller diameter than part A. (2)2.1.3 Name the liquids present in parts C and D respectively. (2)2.1.4 Which blood vessel (A or B) contains more urea? (1)2.1.5 State ONE difference in the composition of the liquids in parts C and D. (2)2.1.6 Explain why heart failure can sometimes lead to kidney failure. (3)2.1.7 Name the type of cells that make up the wall of part E. (1)
[14]
A
B
C
DE
F
G
Structure of the human respiratory system
C
Malpighian body of a human kidney
B
D
E
A
G11_TG_CAPS.indb 47 2012/08/01 9:01 PM

D48 F I N A L E X A M I N AT I O N • PA P E R 1
2.2 In an investigation to determine whether light is necessary for photosynthesis a leaf was obtained from a plant that was first placed in a dark cupboard for 48 hours before it was again exposed to light. Refer to the diagram below to answer the questions that follow.
2.2.1 Why was the plant placed in a dark cupboard? (2)2.2.2 Why is only part of the leaf covered with cardboard? (2)2.2.3 Draw a labelled diagram of the leaf to show the results after the starch
test at the end of the investigation. (3) [7]
2.3 The following information appears on the package of a brand of cereal eaten by a young boy. Study it and then answer the questions based on it. Nutritional composition of cereal:Ingredients Nutritional information (values per 100 g)Whole rolled oats, roasted wheat flakes, cane syrup, brown sugar, vegetable oil, sundried raisins
Energy 2 000 kJProtein 12,5 gCarbohydrates 50 gFats 12,5 gFibre 25 gCholesterol 0 mg
2.3.1 The total energy value of a 100 g cereal is 2 000 kJ. The boy requires 5 500 kJ of energy per day. How much cereal does he need to eat in order to obtain this (assuming that he does not eat any other foods)? Show ALL calculations. (3)
2.3.2 Draw a pie chart to illustrate the relative proportions of protein, carbohydrate, fats and fibre of this 100 g of cereal. (8)
[11]
2.4 Study the diagram below and then answer the questions that follow.
2.4.1 Name the processes represented by arrows:a A (1)b B (1)
cardboard
Leaf subjected to test to determine whether light is necessary for photosynthesis
B
large complex moleculeA
C
D
Diagrammatic representation of a portion of the digestive system
blood vessel
G11_TG_CAPS.indb 48 2012/08/01 9:01 PM

D49F I N A L E X A M I N AT I O N • PA P E R 1
2.4.2 Explain the role of water in process B. (2)2.4.3 Identify the finger-like projections found on D. (1)2.4.4 If the large, complex molecule is a protein, name molecules C. (1)2.4.5 Explain what happens to the excess of molecules C in the body. (2)
[8]
Total question 2: [40]
Question 3
3.1 A group of Grade 12 learners wanted to use the mark–recapture technique to determine the population size of a type of fish (Tilapia sparrmanii) in a large dam. Their results are shown in the table below.
October 2010 November 2010
Number marked and released in first sample
Number in recaptured/ second sample
Number marked in recaptured/second sample
Tilapia sparrmanii 15 150 10
3.1.1 List FOUR steps that should be considered when planning to determine the population size using this investigation. (4)
3.1.2 Use the formula below to estimate the population size of Tilapia sparrmanii in the dam.
P = F × S M F = Number caught in the first sample S = Number caught in the second sample M = Number marked in the second sample Show ALL working. (3)
[7]
3.2 Study the graph below showing the growth of a population over a period of time.
3.2.1 Identify the growth form indicated by the graph above. (1)3.2.2 Identify the phases labelled A, B and C. (3)3.2.3 Write down the letter (A, B or C) of the phase in the above graph
that illustrates rapid growth. (1)3.2.4 Explain why the population size at C stayed constant. (3) 3.2.5 Give TWO reasons why the population growth at A was slow. (2)
[10]
Time
Popu
latio
n siz
e
Growth of a population over time
A
B
C
G11_TG_CAPS.indb 49 2012/08/01 9:01 PM

D50 F I N A L E X A M I N AT I O N • PA P E R 1
3.3 Study the table below showing changes in the human population size on Earth from 1650 to 1950 and projected to 2050.
Year Human population size (millions)
1650 500
1750 750
1850 1 000
1950 2 010
2050 8 000
3.3.1 Use the information in the table to plot a line graph. (6)3.3.2 From your graph determine the following:
a The population size in the year 2000 (2)b The time taken for the human population to double for the first time. (2)
3.3.3 Give TWO reasons why it is important for any country to understand how the population will grow in the future. (2)
[12]
3.4 Read the following passage and then answer the questions.
Cellular respirationAdenosine triphosphate (ATP) is the immediate source of energy used by muscles. When glucose is broken down during cellular respiration to release energy, this energy is transferred to ATP molecules. The first step in the breakdown of glucose molecules takes place in the absence of oxygen. This is known as the anaerobic phase. One of the substances produced here is lactic acid, which accumulates in the muscle cells. If plenty of oxygen is available then aerobic respiration takes place This results in the formation of carbon dioxide and water instead of lactic acid.3.4.1 Name:
a The main fuel molecule for cellular respiration (1) b TWO products of aerobic respiration (2) c ONE product of anaerobic respiration in muscles. (1)
3.4.2 State ONE difference between anaerobic respiration in plant cells and in animal cells. (2)
[6]
3.5 Study the pictures below and the graph on the next page showing community interactions and answer the questions that follow.
A B
G11_TG_CAPS.indb 50 2012/08/01 9:01 PM

D51F I N A L E X A M I N AT I O N • PA P E R 1
Days
Rela
tive
popu
latio
n de
nsity
P. aurelia
P. caudatum
0 2 4 6 8 10 12 14 16
3.5.1 Name the following:a Community interaction represented in A (1)b Type of competition represented in B (1)c Community interaction represented in C. (1)
3.5.2 Describe the community interaction represented in A. (3) [6]
Total question 3: [40]
Section C
Question 4
“The movement of gases takes place in accordance with the laws of physical diffusion.”
Justify this statement by describing the exchange of gases in humans, between the blood and the lungs and between the blood and the tissues.
Factual content: (17)Synthesis: (03)
[20]
Total section C: 20
TOTAL: 150
C
G11_TG_CAPS.indb 51 2012/08/01 9:01 PM

D52 F I N A L E X A M I N AT I O N • PA P E R 1
G11_TG_CAPS.indb 52 2012/08/01 9:01 PM

D53F I N A L E X A M I N AT I O N • PA P E R 2
Life Sciences Examination: Exemplar Paper 2
Marks: 150 Time : 2 hours 30 minutes
Instructions and information
Read the following instructions carefully before answering the questions. 1 Answer ALL the questions. 2 Write ALL the answers in your ANSWER BOOK. 3 Start the answers to each question at the top of a NEW page. 4 Number the answers correctly according to the numbering system used in this question paper. 5 Present your answers according to the instructions of each question. 6 ALL drawings should be done in pencil and labelled in blue or black ink. 7 Draw diagrams or flow charts only when asked to do so. 8 The diagrams in this question paper are NOT necessarily all drawn to scale. 9 Do NOT use graph paper.10 You may use non-programmable calculators, protractors and compasses. 11 Write neatly and legibly.
G11_TG_CAPS.indb 53 2012/08/01 9:01 PM

D54 F I N A L E X A M I N AT I O N • PA P E R 2
Section A
Question 1
1.1 Various options are provided as possible answers to the following questions. Choose the correct answer and write only the letter (a to d) next to the question number (1.1.1 to 1.1.7) in your ANSWER BOOK, for example 1.1.8 d. 1.1.1 All viruses are:
a unicellular and pathogensb prokaryotesc acellular and non-livingd cellular in structure
1.1.2 The nitrogen cycle in nature is vital because animals and most green plants cannot:a use gaseous nitrogenb use nitratesc use organic nitrogen compoundsd synthesise their own proteins
1.1.3 In an ecosystem, bacteria and fungi are mainly:a predatorsb producersc decomposersd omnivores
1.1.4 HIV is the virus that causes AIDS, which can be spread:a by bacteriab during sexual intercoursec in the aird by vectors
1.1.5 Pollination is best defined as a process in which:a pollen unites with an ovuleb a male gamete fuses with a female gametec pollen is received by a receptive stigmad insects carry pollen from one flower to another
1.1.6 What is the relationship between pollination and fertilisation in a flower?a Pollination is sexual and fertilisation asexualb Fertilisation and pollination are the same activityc Pollination must occur before fertilisationd Fertilisation and pollination occur simultaneously
1.1.7 A seed and a spore differ in that:a spores are diploid and seeds are haploidb the spores only can be unicellularc spores can withstand dehydration while seeds cannotd spores are gametes while seeds give rise to new plants
(7 × 2) [14]
1.2 Give the correct biological term for each of the following descriptions. Write only the term next to the question number (1.2.1–1.2.11) in your ANSWER BOOK.1.2.1 The concentration of sense organs at the anterior end of an animal,
leading to the formation of a head1.2.2 Organisms such as bacteria, in which cells are characterised by having
no true nucleus1.2.3 A disease-causing organism1.2.4 The mass of hyphae that constitutes the vegetative part of a fungus1.2.5 A plant body that is not differentiated into roots, stems and leaves
G11_TG_CAPS.indb 54 2012/08/01 9:01 PM

D55F I N A L E X A M I N AT I O N • PA P E R 2
1.2.6 Symbiotic association of two different kinds of living organisms so that both benefit from the association
1.2.7 The protective coat of protein that encloses the nucleic acid in a virus1.2.8 The type of alimentary canal that stretches from the mouth to the anus1.2.9 The ripened ovary in a flowering plant1.2.10 An asexual reproductive cell1.2.11 The elongated horizontal underground stem in pteridophytes.
(11 × 1) [11]
1.3 Indicate whether each of the statements in COLUMN I applies to a only, b only, both a and b or none of the items in COLUMN II. Write a only, b only, both a and b, or none next to the question number (1.3.1–1.3.5) in the ANSWER BOOK.
Column I Column II
1.3.1 Triploblastic, bilateral symmetry and coelomate a earthworm b insect
1.3.2 Disease caused by a protist a ringworm b malaria
1.3.3 True roots and leaves and produces spores a bryophytes b pteridophytes
1.3.4 Requires water to undergo sexual reproduction a angiosperms b pteridophytes
1.3.5 Formation of seeds and fruit a angiosperms b gymnosperms
(5 × 2) [10]
1.4 Study the list of characteristics of plants and answer the questions that follow. Write only the letter/s of the characteristic/s next to the number of the question. Each characteristic may be used once, more than once or not at all.A HeterosporousB Embryo undergoes a period of rest before developing furtherC Dominant phase is haploidD Sporophyte possesses chlorophyll but is not an independent plantE Plant body is a thallusF Sporophyte is permanently joined to the gametophyteG Fertilisation is dependent on waterH Fertilisation does not depend on waterI Has/have vascular tissueJ Seeds enclosed in a fruitK True leaves and roots
1.4.1 TWO that are characteristic of spermatophyta (gymnosperms and angiosperms) (2)
1.4.2 TWO which are characteristic of bryophyta only (2)1.4.3 ONE that is common to both bryophyta and pteridophyta (1)1.4.4 ONE that applies to angiosperms only (1)1.4.5 TWO that are common to gymnosperms and angiosperms only (2)1.4.6 TWO that are common to pteridophyta, gymnosperms and angiosperms (2)
[10]
G11_TG_CAPS.indb 55 2012/08/01 9:01 PM

D56 F I N A L E X A M I N AT I O N • PA P E R 2
1.5 Study the diagrams of the structures of two flowers below. The magnification of each flower is indicated in brackets.
1.5.1 Provide labels for C, D and E. (3)1.5.2 Which flower (A or B) is probably pollinated by insects? (1)1.5.3 Which flower's (A or B) actual size is greater? (1)
[5]
Total section A: [50]
Section B
Question 2
2.1 A sample was taken from a patient suffering from a throat infection. The bacteria on the swab were cultured on a nutrient agar in a Petri dish. A multidisc with a different antibiotic at the end of each of its six arms was then placed on top of the bacteria. The two halves of the Petri dish were sealed together and placed in an incubator at 30 °C. The following diagram shows the result of the investigation after 48 hours.
2.1.1 State ONE difference in activity between antibiotics B and F. (2)2.1.2 The patient was known to be allergic to antibiotic B.
a Which antibiotic should the patient be given? (1)b Explain your answer to QUESTION 2.1.2 a. (2)
2.1.3 The organisms causing this infection seem to be resistant to two of these antibiotics.a Which TWO antibiotics are referred to in the statement above? (2)b Explain your answer to QUESTION 2.1.3 a (2)
2.1.4 In the early part of this century, spider’s webs (in which many fungal spores were trapped) were placed on small cuts and wound. Suggest ONE reason why…a this might have been a useful procedure. (2)b it could have been dangerous. (2)
[13]
Flower A (×20) Flower B (×0,5)
CD
E
AB
C
DE
FPetri dish
multidisc
agar
Result of the investigation
A–F Six different antibiotics
Zone of bacterial growth
Zone of no bacterial growth
Key:
G11_TG_CAPS.indb 56 2012/08/01 9:01 PM

D57F I N A L E X A M I N AT I O N • PA P E R 2
2.2 A type of bacterium called Escherichia coli (E. coli) normally lives in the large intestine of humans. To determine whether E. coli is present in water, a chemical indicator is used. If the chemical indicator changes from a clear red colour to a cloudy yellow colour, this indicates that E. coli is present. In an investigation conducted by a group of Grade 11 learners, samples taken from three rivers (X, Y, and Z) were investigated for the presence of E. coli. Samples were taken from each river and put into a glass bottle that contained the clear red indicator solution. The bottle was then incubated at 37 °C for 2 days. The results of the investigation are shown in the table below.
Colour of chemical indicator River X River Y River Z
Before incubation Clear red Clear red Clear red
After incubation Clear red Cloudy yellow Clear Red
2.2.1 Explain two safety precautions that the learners should take when conducting this investigation. (4)
2.2.2 Suggest ONE reason for incubating the sample at 37 °C. (2)2.2.3 Which river/s (X, Y or Z) showed the presence of E. coli? (1)2.2.4 Give a reason for your answer to QUESTION 2.2.3 above. (2)2.2.5 Explain ONE way that E. coli could have got into the river/s stated in
QUESTION 2.2.3. (2)[11]
2.3 Progressive advance in nutritive patterns can be observed in the animals you have studied.2.3.1 What type of symmetry does Hydra sp. (Cnidaria) and Taenia sp./Planaria sp.
(Platyhelminthes) display? (2)2.3.2 Describe how the symmetry of Hydra sp. is related to how it obtains its food. (3)2.3.3 Neither Hydra sp. (Cnidaria) nor Taenia sp./Planaria sp. (Platyhelminthes)
possesses a blood system yet in both of them all cells receive an adequate supply of food. Describe how this is achieved in BOTH animals. (6)
2.3.4 Would you regard the earthworm, because of its gut, as being more advanced than either of the two animals mentioned in 2.3.3? Justify your point of view. (5)
[16]
Total question 2: [40]
QUESTION 33.1 Deforestation is the destruction of forests by the removal of trees in large numbers.
The table below shows statistics related to deforestation in different regions from the years 1990 to 2000.
Region Total land area (ha)
Total forest cover (ha)
Forest cover (%) Deforestation rate 1990–2000 (%)
Africa 2 978 394 649 866 21,8 0,8Asia 3 084 746 547 793 X 0,1North and Central America
2 136 966 549 304 25,7 0,1
Oceania and Australia
849 096 197 623 23,3 0,2
3.1.1 Which region had the highest rate of deforestation in the 10-year period? (1)3.1.2 Calculate the forest cover (%) of Asia indicated as X. Show all working. (3)3.1.3 List any TWO reasons for deforestation. (2)3.1.4 Describe TWO consequences that deforestation has on the ecosystem. (4)3.1.5 Explain THREE management strategies to reduce deforestation. (6)
[16]
G11_TG_CAPS.indb 57 2012/08/01 9:01 PM

D58 F I N A L E X A M I N AT I O N • PA P E R 2
3.2 The table shows the annual catches of TWO species of fish, namely herring and cod, over a period of eight years.
Catch (thousands of tons)
Year Herring Cod
1 370 145
2 150 120
3 110 80
4 105 60
5 85 50
6 70 45
7 65 50
8 70 60
3.2.1 Plot line graphs, on the same set of axes, using the information in the table above. (12)
3.2.2 Describe how catch size of the herring population changes over the eight years. (4)
3.2.3 State any TWO management strategies which could prevent the over-exploitation of herring and cod. (2)
[18]3.3 Study the passage below and answer the questions that follow.
HoodiaHoodia gordonii is a spiny succulent plant indigenous to the semi-desert of South Africa, Botswana, Namibia and Angola. It grows in extremely high temperatures, and takes many years to reach maturity. Hoodia has been used by indigenous populations in southern Africa for centuries to treat indigestion and minor infections. However, the plant has become well known and is in big demand because of the discovery that indigenous people have always used the flesh of the plant to suppress their appetite while on long hunting trips in the desert. The South African Council for Scientific and Industrial Research has isolated the ingredient responsible for the plant’s appetite-suppressant quality and it is now marketed as a slimming tablet.
3.3.1 What is the habitat of Hoodia? (1)3.3.2 Name TWO medical conditions that can be treated with Hoodia. (2)3.3.3 Explain why indigenous people must be compensated for the selling of the
slimming tablets mentioned in the passage. (3)[6]
Total question 3: [40]
Total section B: [80]
Section C
Question 4Explain FOUR strategies you would use to manage solid waste if you were appointed as the head of the waste disposal division of your town/city. NOTE: NO marks will be awarded for answers in the form of flow charts or diagrams. [20]
Total section C: [20]
TOTAL: [150]
G11_TG_CAPS.indb 58 2012/08/01 9:01 PM

D59P R A C T I C A L E X A M I N AT I O N • PA P E R 3
Life Sciences Examination: Exemplar Paper 3 Practical Paper
Marks: 60 Time : 1 hour
Question 1: (Observation and drawing skills) – 10 minutesIf microscopes are available, do the following practical:• Teachertogrowbreadmouldonasliceof breadbeforetest.• Providelearnerswithfollowingitems:slide,coverslip,dropper,smallbeakerof water.
1.1 Makeawetmountslideof thespecimenprovided. (5)1.2 Setupyourmicroscopeandthenobserveyourslideunderthemicroscope.
Yourteacherwillallocateamarkforyourslide. (5)1.3 Drawandlabelasmallportionof yourspecimen. (5)
[15]
OR
If microscopes are not available, do the following practica:• Teachertogetfollowingspecimens:A:fernplantwithundergroundrhizomeB:asimplemonocotordicotflower/grassflowerswithmagnifyingglasses
1.1 Drawandlabeltheabovespecimens. (5+5)1.2 Is the flower wind pollinated or insect/bird pollinated?
GiveTWOreasonsforyouranswer. (5)[15]
Question 2: (Doing a practical) – 30 minutesTeachertoprovidethefollowingbasicequipment:greenleaf (e.g.geraniumleaf ), alcohol/methylatedspirits,boiledwaterinawatertrough,smalltesttube, whitesaucer/watchglass,iodine,dropper.
2.1 Testtheleaf forthepresenceof starch.2.2 Writedownyourreportunderthefollowingheadings:
Aim,apparatus,method/procedure,results,conclusion/discussion. (21)2.3 Whywasthechlorophyllextracted? (2)2.4 Whatprecautionsmustbetakenwhenworkingwithalcohol? (2)
[25]
G11_TG_CAPS.indb 59 2012/08/01 9:01 PM

D60 P R A C T I C A L E X A M I N AT I O N • PA P E R 3
Question 3: (Minds-on practical) – 10 minutesThediagrambelowrepresentstheapparatusthatwasusedinaninvestigation.Afteraperiodof 24hoursduringwhichthethreetesttubeswerekeptinthedark,redhydrogencarbonateindicatorwasaddedtoeachtesttube.Hint:Hydrogencarbonateindicatorisusedtoshowthechangesincarbondioxideconcentrations as follows:• ItturnsfromredtopurplewhentheCO2leveldecreases.• ItturnsfromredtoyellowwhentheCO2levelincreases.
3.1 Stateahypothesisforthisinvestigation. (2)3.2 Whatisthepurposeof testtubeA? (2)3.3 Whywerethetesttubeskeptinthedark? (2)3.4 Tabulatetheresultsafter24hoursthatwillbeobservedintesttubesA,BandC. (4)
[10]
Question 4: (Dissection) – 10 MinutesTeachertodissectasheep’s/pig’skidneytoshowitslongitudinalsection. Insertpinswithflags/labelsonit(A,B,C,D,E).StickpinsAtoEasfollows: A–capsule,B–cortex,C–medulla,D–pyramids,E–ureter.LearnerstoprovidelabelsforAtoE. (5×2) [10]
Total: [60]
A B C
Test tubes A–C in darkness
water
water plantsnail
water water
G11_TG_CAPS.indb 60 2012/08/01 9:01 PM

D61ANSWERS • F I N A L E X A M I N AT I O N PA P E R 1
Life Sciences Examination: Exemplar Paper 1Memorandum of answers
Marks: 150Time: 2 ½ Hours
Section AQUESTION 11.11.1.1 d1.1.2 b1.1.3 c1.1.4 b1.1.5 d (5 × 2) [10]
1.21.2.1 chlorophyll1.2.2 photosynthesis1.2.3 dark phase1.2.4 iodine1.2.5 ATP1.2.6 stroma (6 × 1) [6]
1.31.3.1 a only1.3.2 Both a and b1.3.3 a only1.3.4 Both a and b1.3.5 Both a and b (5 × 2) [10]
1.41.4.1 B – renal vein F – urethra (2)1.4.2 proteins glucose vitamins amino acids glycerol/fatty acids (any three) (3)1.4.3 stores urine temporarily (1)1.4.4 excretion osmoregulation regulates pH regulates salt concentration (any three) (3) [9]1.51.5.1 A – oesophagus E – rectum F – appendix H – gall bladder (4)1.5.2 a C b B c G d H (4) [8]1.61.6.1 A – larynx B – bronchus D – diaphragm F – intercostal muscles (4)1.6.2 a reduces friction during breathing (1) b keeps bronchus open at all times (1) c moistens/cleans/removes foreign bodies (1) [7] Total section A: [50]
Section BQUESTION 2
2.1.1 A – afferent arteriole D – Bowman’s capsule E – renal tubule (3)2.1.2 Creates a high pressure in the glomerulus
High pressure makes ultra-filtration possible (2)2.1.3 C – blood
D – glomerular filtrate (2)2.1.4 A (1)2.1.5 • C contains blood cells • D does not contain blood cells
OR • C contains blood proteins • D does not contain blood proteins (2)2.1.6 • when the heart pumps slower • this lowers the blood pressure • this reduces ultra-filtration
OR • less blood reaches the kidneys • and less oxygen and nutrients get to the kidneys • less cellular respiration takes place in the kidney cells • and kidneys cannot carry on functioning (3)2.1.7 cuboidal epithelium (1) [14]
2.22.2.1 To destarch it/no starch present at the start of the
experiment (2)2.2.2 To prevent light from falling on covered part/shade the
part from light/to serve as a control (2)2.2.3
(3) [7]2.32.3.1 100 × 5 500
2 000 = 275 g (0,275 kg) (3)
2.3.2
Correct type of graph 1
Correct proportions/% 4 × 1 = 4
Label / key for each slice 4 × 1 = 4
Title 1
(10) [13]
exposed part turns blue-black
covered part turns brown
carbohydrates
fibre
protein
fats
G11_TG_CAPS.indb 61 2012/08/01 9:01 PM

D62 ANSWERS • F I N A L E X A M I N AT I O N PA P E R 1
2.42.4.1 a digestion/hydrolysis b absorption (2)2.4.2 water acts as a solvent to dissolve the nutrients • it facilitates easy diffusion between the absorptive
surface (2)2.4.3 villi (1)2.4.4 amino acids (1)2.4.5 • excess amino acids (molecules C) cannot be stored
in the body • they are broken down in the liver • by the process of deamination • into glucose and urea • glucose is oxidised to release energy • while the urea is excreted by the kidneys (mark TWO only) (2)
[8]
Total question 2: [40]
QUESTION 33.13.1.1 • Obtain permission to catch fish/use dam • Conduct training to identify the Tilapia sparrmanii • Decide when to do the investigation • Decide on the tags/markers/apparatus to be used • Decide on the method of catching • Determine the sample size/number of repeat samples • Determine the period between the two successive
captures • Decide on how to record the results (mark FOUR only) (4)
3.1.2 Number of Tilapia sparrmanii (P) = (15 × 150) 10
= 225 (3) [7]3.23.2.1 Logistic growth form (1)3.2.2 A = lag/establishment phase B = exponential /geometric/accelerating/log/
logarithmic phase C = equilibrium/stationary/stabilising/constant phase (3)3.2.3 B (1)3.2.4 • Environmental resistance increased • causing the carrying capacity of the area to be reached • leading to increased competition • resulting in the death rate increasing to equal the
birth rate • or resulting in increased emigration that balances
with immigration (3)3.2.5 • Population is acclimatising/adapting to its new
environment • Few pairing partners • Time required for producing offspring is relatively
long • Not all individuals are sexually mature
(mark TWO only) (2) [10]
3.3 3.3.1
Guideline for the assessing the graph
Correct type of graph and joining of points
1
Title of graph 1
Correct label and scale x-axes 1
Correct label and scale y-axes 1
Plotting of points of line graph 1: 3 to 4 points plotted correctly 2: all 5 points plotted correctly
(6) NOTE: If the wrong type of graph is drawn: marks will
be lost for: • correct type of graph – 1 mark • plotting of points – 2 marks If labels of the axes are transposed, then marks will be
lost for: • label and scale for x and y axes – 2 marks3.3.2 a Read from the learners’ graphs (value and for
million/000 000) (2) b 200 years (2)3.3.3 • To budget for infrastructure development
e.g. housing • To plan for services in the future e.g. education • To have strategies/any example to improve the
sustainability of the environment (mark first TWO only) (2) [12] 3.4 3.4.1 a glucose (1) b energy/ATP
carbon dioxide water
(mark first TWO only) (2) c lactic acid (1)3.4.2 • Alcohol is formed in plant cells
Lactic acid is formed in animal cells • CO2 formed in plant cells – no CO2 formed in
animal cells (mark ONE only) (2) [6]3.53.5.1 a Resource/spatial/niche partitioning b Intraspecific competition c Competitive exclusion principle/interspecific
competition (3)3.5.2 • Different species • coexist in the same habitat • eating leaves of plant at different heights/use the
resources • slightly differently • minimising competition (mark THREE only) (3) [6] Total question 3: [40] Total section B: [80]
Hum
an po
pulat
ion si
ze
(milli
ons)
1650
900080007000600050004000300020001000
01750 1850 1950 2050
Year
Read value on learner’s y-axis to check answer given by the learner for Q 3.3.1
G11_TG_CAPS.indb 62 2012/08/01 9:01 PM

D63ANSWERS • F I N A L E X A M I N AT I O N PA P E R 1
Section CQUESTION 4Gas exchange at the lung surface/alveoli• Capillaries branching from the pulmonary artery carry
deoxygenated blood to the lungs• The concentration of carbon dioxide in the capillaries is higher
than that of the air of the alveoli• This concentration gradient causes carbon dioxide to DIFFUSE
from the blood through the endothelial wall of the capillaries • And through the squamous epithelia of the alveolus and into the
alveolus• Carbon dioxide is expelled from the lungs during exhalation• The oxygen content of the inhaled air is greater in the alveolus
than in the capillaries• Oxygen dissolves in the moisture lining the alveolus and
DIFFUSES through the squamous epithelia of the alveolus wall• And through the endothelial wall of the capillary into the blood
plasma• Most of the oxygen combines with haemoglobin of the
erythrocytes to form oxyhaemoglobin and is transported in this form to the tissues.
Gas exchange at the tissue surfaces:• Oxygenated blood coming from the lungs enter the tissues
through capillaries which penetrate between the cells• In the cells, the oxygen concentration is lower than in the
capillaries, because oxygen is constantly being used up during cellular respiration
• Oxyhaemoglobin in the blood of the capillaries releases the oxygen which DIFFUSES through the capillary wall
• Into the tissue fluid and then into the cells• The carbon dioxide concentration is higher in the cells than in
the tissue fluid and the blood in the capillaries, because it is a by-product of cellular respiration
• Carbon dioxide DIFFUSES from the cells into the surrounding tissue fluid through the capillary wall and into the blood plasma.
• It can be seen from the above account that the movement of both oxygen and carbon dioxide involves its DIFFUSION from an area of high concentration to an area of low concentration. Active transport, involving energy expenditure is NOT involved in gaseous exchange at the lung and tissue surfaces.
CONTENT (17) SYNTHESIS (3) Total question 4: [20] Total section C: [20]
TOTAL: [150]
G11_TG_CAPS.indb 63 2012/08/01 9:01 PM

D64 ANSWERS • F I N A L E X A M I N AT I O N PA P E R 2
Life Sciences Examination: Exemplar Paper 2Memorandum of answers
Marks: 150Time: 2 ½ Hours
Section AQUESTION 11.11.1.1 c1.1.2 a1.1.3 c1.1.4 b1.1.5 c1.1.6 c1.1.7 b (7 × 2) [14]
1.21.2.1 cephalisation1.2.2 prokaryote1.2.3 pathogen1.2.4 mycelium1.2.5 thallus1.2.6 mutualism1.2.7 capsid1.2.8 through gut1.2.9 fruit1.2.10 spore1.2.11 rhizome
(11 × 1) [11]
1.31.3.1 Both a and b1.3.2 b only1.3.3 b only1.3.4 b only1.3.5 a only
(5 × 2) [10]
1.41.4.1 A, B, H, I, K1.4.2 C, E1.4.3 G1.4.4 J1.4.5 B, H, I, K1.4.6 I, K
[10]
1.5 1.5.1 C – Petal /corolla
D – Anther E – Stigma (3)
1.5.2 B (1)1.5.3 B (1)
[5]
Total section A: [50]
QUESTION 22.12.1.1 Antibiotic B is more effective in destroying bacteria than
antibiotic F or antibiotic B has a larger area without bacterial growth compared to antibiotic F. (2)
2.1.2 a E (1) b Antibiotic E is the next most effective antibiotic after
antibiotic B, which you can see from the second largest zone of no bacterial growth. (2)
2.1.3 a A and C (2) b Both antibiotics A and C do not destroy any bacteria,
which you can see because there is no clear area without bacterial growth. (2)
2.1.4 a Fungal spores could act like an antibiotic. (2)
b Fungal spores could cause fungal diseases. (2) [13]
2.22.2.1 • Wear rubber gloves when taking the samples so as not to
get contaminated with germs • Samples should be taken by using a container/bottle
attached to a string to avoid stepping too close to the river bank/prevent drowning/falling into water/contamination (4)
2.2.2 Temperature of the human body at which the bacterium normally lives/E. coli normally lives in large intestinal of humans/human body temperature is 37 ˚C/ to allow bacteria to reproduce (2)
2.2.3 River Y (1)2.2.4 The chemical indicator changed to a cloudy yellow
colour, which indicates the presence of E. coli/which is a positive test for E. coli (2)
2.2.5 Lack/absence of proper sewage systems/poor hygiene/bacteria in water results in faeces getting into water (2)
[11]
2.32.3.1 Hydra sp. – radial symmetry
Planaria sp. – bilateral symmetry (2)2.3.2 • sessile organism
• does not go in search of food • mouth centrally situated • tentacles in a ring all around • sensory cells all around • these detect and capture food from all sides (3)
2.3.3 Hydra sp. • diploblastic • rapid diffusion of food • many phagocytic cells all over endoderm • distribution made easier. Planaria sp. • diverticulated gut that branches throughout the body • caeca present • all cells close to food supply • flattened form makes diffusion easier • phagocytic cells all over gut lining. (6)2.3.4 • yes – earthworm has a through gut • no mixing of food to be ingested and egested • gut has become specialised • parts e.g. crop, gizzard perform specific functions • systemic processing of food. (5) [16]
Total question 2: [40]
QUESTION 3
3.13.1.1 Africa (1)3.1.2 547 793 × 100
3 084 746 1 = 17,8 accept (17,7–17,8) (3)
G11_TG_CAPS.indb 64 2012/08/01 9:01 PM

D65ANSWERS • F I N A L E X A M I N AT I O N PA P E R 2
3.1.3 Trees used for: • fuel/fire • building houses • space for human settlements/farming/livelihood • furniture • medicinal purposes (any two) (2)
3.1.4 • Loss of habitat results in death of organisms/ extinction of species/migration of species
• The balance of gases/carbon dioxide/oxygen will be disturbed because of the loss of plants for photosynthesis
• Disturb food chains/species migrate/dying out• Habitat degradation which will result in
increased soil erosion reduces fertility of soil (any 2 × 2) (4)
3.1.5 • Introduce legislation to prevent the removing of trees• Impose heavy fines/penalties to discourage repeated
acts of deforestation• Educate people about the negative effects of the
deforestation/ about the importance of trees• Research new technologies to find other material
for building/furniture/fuel (any 3 × 2) (6)[16]
3.2.1
Rubric for the mark allocation of the graph
Correct type of graph 1
Title of graph (both variables) 1
Correct label for x-axis 1
Graphs labelled/key provided for 2 graphs
1
Correct label for y-axis including unit
1
All points joined for graph A 1
All points joined for graph B 1
Appropriate scale for x-axis 1
Appropriate scale for y-axis 1
Drawing of the graphs 1: 1 to 8 points plotted correctly 2: 9 to 15 points plotted correctly 3: all 16 points plotted accurately
(12)Note: If the wrong type of graph is drawn:• marks will be lost for “correct type of graph” • marks will be lost for joining of points If graphs are not drawn on the same system of axes:• mark the first graph only using the given criteriaIf axes are transposed:• marks will be lost for labelling of x-axis and y-axis
3.2.2 Herring population shows a sharp decline from year 1 to 2 and then a steady decline until year 7 and then small increase any (4)
Catch
es
(thou
sand
s of t
ons)
1
400350300250200150100
500
Year2 3 4 5 6 7 8 9
Herring
Cod
Annual catches of herring and cod over 8 years
3.2.3 Any two of:• Limit the size of fish caught• Limit the number/quotas of fish caught• Limit the fishing area• Licence to fish• Develop legislation to regulate fishing• Heavy penalties for flouting the legislation• Scientific research to inform legislation• Minimal or no fishing during breeding season/limited
fishing season• Education and awareness of endangered species• Encourage mariculture/sea farming• Discouraging illegal market by government selling it
at lower price• Stricter monitoring (2)
[18] 3.33.3.1 Semi-desert (1)3.3.2 Any two of:
• indigestion • minor infections • obesity (2)
3.3.3 • Indigenous people were the first to use the plant for suppressing appetite.
• Royalty must be paid for their intellectual property. (3) [6]
Total question 3: [40]Total section B: [80]
Section CQUESTION 4Possible answer
Management strategies to manage solid wasteLandfill and burning with energy recovery:• Utilise the heat generated from the burning of landfill sites to
generate electricity thus saving on the electricity bill• Investigate methods to collect and utilise methane gas as a fuel
Recovery and recycling:• Encourage citizens of the city to put different types of waste into
different waste containers/bins of different colours• Partnership with recycling companies for improved collection
of different wastes • Fines for people that do not separate the waste into different bins• This could generate income and reduce the transport cost • Educate people to use organic waste for example to make compost
which could fertilise soil, they can plant vegetables
Educate citizens and companies to reuse waste: • Glass containers for milk, cold drinks and alcohol etc.• This will reduce the need to produce more of these items thus
saving energy and money
Reducing waste:• Charge/penalties people extra if they generate more waste to
encourage citizens to manage waste more efficiently/renewable
CONTENT (17)SYNTHESIS (3)
Total question 4: [20]Total section C: [20]
TOTAL: [150]
G11_TG_CAPS.indb 65 2012/08/01 9:01 PM

D66 ANSWERS • F I N A L E X A M I N AT I O N PA P E R 3
Life Sciences Examination: Exemplar Paper 3 (Practical)
Memorandum of answers
Marks: 60 Time: 1 Hour
QUESTION 11.1 Use the following checklist to mark the preparation of the
wet mount.Preparation of a wet mount (slide preparation)
Criteria Description Mark
Condition of slide Is it free of dirt? 1
Thinness/amount of specimen
Is it thin enough/spread out for light to pass through it?
1
Mountant Was the correct amount of water used – not too little or not too much
1
Coverslip Is there a coverslip? Was the correct technique used when lowering the coverslip?
1
Presence of air bubbles under cover slip
Are there any air bubbles under the coverslip?
1
Total 5
1.2 To determine whether the microscope is set-up correctly:
Criteria Description Mark
The mirror Is the correct mirror used? Is it adjusted to allow light to pass through onto the specimen?
1
The condenser Is it adjusted correctly to focus the light source onto the specimen?
1
The diaphragm Is it adjusted to regulate the amount of light reaching the specimen?
1
Focus Is the specimen in clear focus? 2
Total 5
1.3 Drawing from the specimen
Criteria Description Marks
Correct representation
Does the drawing look like what is under the microscope, i.e. is the shape, size, proportion and position of all parts correct?
1
Caption Is there a suitable caption? 1
Labels Are all visible labels included and correct? Are all the labels one below the other? Are all the labels on the same side of the drawing?
1
Magnification/scale Is this indicated with the caption of the drawing?
1
Rules for biological drawings
There is no shading in the diagram The pencil lines of the drawing are neat and continuous The label lines have been drawn in ink There is no crossing-over of label lines
1
Total 5
OR
1.1 Drawing from the specimens
Criteria Description Marks
Correct representation Does the drawing look like what is under the magnifying glass i.e. is the shape, size, proportion and position of all parts correct?
1
Caption Is there a suitable caption? 1
Labels Are all visible labels correctly included? Are all the labels one below the other? Are all the labels on the same side of the drawing?
1
Magnification/scale Is this indicated with the caption of the drawing?
1
Rules for biological drawings
There is no shading in the diagram The pencil lines of the drawing are neat and continuous The label lines have been drawn in ink There is no crossing-over of label lines
1
Total 5
(5+5)
1.2 The answer depends on the type of flower used. Typical answer for insect-/bird-pollinated flower: • Flowers large and conspicuous • Flowered is coloured to attract pollinating vectors. Typical answer for wind-pollinated flower: • Flowers small and inconspicuous • Flowers have no colour • Stigma is feathery to catch pollen blown in the wind • Anthers are relatively large and dangle outside the
floral parts. (5) [15]
QUESTION 22.2 Aim: To investigate whether starch is manufactured
during photosynthesis (2) Apparatus: green leaf, alcohol/methylated spirits, water,
test tube, white saucer/watch glass, iodine, dropper (3) Drawing of Apparatus (3) Method/Procedure: 1 Green leaf exposed to sunlight for a few hours 2 Boil leaf in the water trough for about 2 minutes – to
break down the cell walls/cell membranes 3 Roll the leaf and place it in the test tube of alcohol/
methylated spirits 4 Place the test tube in the beaker of boiling water.
The alcohol boils at about 700 C – extracting the chlorophyll from the cells.
5 Repeat number 4 above until almost all the chlorophyll from the leaf is extracted.
6 Wash the leaf in the boiling water and place it on the watch glass/saucer.
7 Pour some iodine over the leaf and leave it aside for a few minutes. (7)
Results: The leaf turns blue-black – this indicates the presence of starch. (2)
G11_TG_CAPS.indb 66 2012/08/01 9:01 PM

D67ANSWERS • F I N A L E X A M I N AT I O N PA P E R 3
Conclusion/Discussion The green leaf was exposed to sunlight and while it
was attached to the plant received CO2, water, all the requirements for photosynthesis to take place. One product of photosynthesis is starch.
The fact that the leaf turned blue-black in the presence of iodine indicates that starch was produced during photosynthesis. (4)
2.3 To be able to see the colour change when iodine turns blue-black in the presence of starch, other the green chlorophyll will mask this change. (2)
2.4 The test tube of alcohol/methylated spirits must NOT be heated directly in a flame or even a hot plate because alcohol/methylated spirits is highly inflammable (therefore it is heated indirectly in a water bath). (2)
[25]
QUESTION 33.1 Living organisms (plants/animals) release carbon dioxide
during respiration (2)3.2 Act as control/to verify that living organisms are
responsible for releasing carbon dioxide (2)3.3 To prevent the influence of light/photosynthesis on the
results (2)3.4
(1 for table) (4)
[10]QUESTION 4A – capsuleB – cortexC – medullaD – pyramidsE – ureter (5 × 2) [10]
Total: [60]
A B C
Remains red/nothing will take place/no change
Hydrogen carbonate indicator turned yellow
Hydrogen carbonate indicator turned yellow
G11_TG_CAPS.indb 67 2012/08/01 9:01 PM

G11_TG_CAPS.indb 68 2012/08/01 9:01 PM

SECTION E
PHOTOCOPIABLE SHEETS
The assessment grids on the following pages may be photocopied for use with the Life Sciences Grade 11 Learner’s Book.
G11_TG_CAPS.indb 1 2012/08/01 9:01 PM

G11_TG_CAPS.indb 2 2012/08/01 9:01 PM

E1© c a m b r i d g e u n i v e r s i t y p r e s s y o u m ay p h o t o c o p y t h i s pa g e f o r u s e w i t h t h e g r a d e 1 1 l e a r n e r ’ s b o o k
Grids ATeacher assessmentDiagnostic assessment
Name: _______________________________________________ Date: _______________________________
Specific Aim(s)/ Criteria
Skills successfully achieved
Skills needing attention
Follow-up comments
G11_TG_CAPS.indb 1 2012/08/01 9:01 PM

E2 © c a m b r i d g e u n i v e r s i t y p r e s s y o u m ay p h o t o c o p y t h i s pa g e f o r u s e w i t h t h e g r a d e 1 1 l e a r n e r ’ s b o o k
Summative assessment
Name: _______________________________________________________________________________________
Activity: _______________________________________________ Date: _______________________________
(Please tick 3 the appropriate column)
Grids B Teacher assessment
Specific Aim(s)/ Criteria
Exceptional competence
Progress is fast Progress is consistent
Progress is slow
Unable to do task
G11_TG_CAPS.indb 2 2012/08/01 9:01 PM

E3© c a m b r i d g e u n i v e r s i t y p r e s s y o u m ay p h o t o c o p y t h i s pa g e f o r u s e w i t h t h e g r a d e 1 1 l e a r n e r ’ s b o o k
Grids CTeacher assessmentSummative/formative assessment
Name: _______________________________________________
Date Activity Criteria Observations and comments
G11_TG_CAPS.indb 3 2012/08/01 9:01 PM

E4 © c a m b r i d g e u n i v e r s i t y p r e s s y o u m ay p h o t o c o p y t h i s pa g e f o r u s e w i t h t h e g r a d e 1 1 l e a r n e r ’ s b o o k
Grids D Teacher assessment (class list)
Summative assessment
Activity: _______________________________________________ Date: ______________________________
Specific Aim(s): ______________________________________________________________________________
(Please tick 3 the appropriate column)
Learner’s name Exceptional competence
Progress is fast
Progress is consistent
Progress is slow
Unable to do task
G11_TG_CAPS.indb 4 2012/08/01 9:01 PM

E5© c a m b r i d g e u n i v e r s i t y p r e s s y o u m ay p h o t o c o p y t h i s pa g e f o r u s e w i t h t h e g r a d e 1 1 l e a r n e r ’ s b o o k
Grids ETeacher assessment
Baseline assessment
Name: _______________________________________________ Date: _______________________________
Specific Aim(s)/ Criteria
Exceptionally well
More than adequate
Adequate Needs assistance
Struggles with this
Not dealt with yet
G11_TG_CAPS.indb 5 2012/08/01 9:01 PM

E6 © c a m b r i d g e u n i v e r s i t y p r e s s y o u m ay p h o t o c o p y t h i s pa g e f o r u s e w i t h t h e g r a d e 1 1 l e a r n e r ’ s b o o k
Grids F Teacher assessment
Formative assessment
Learner’s name: __________________________________________
Date: ___________________________________________________
Key 4 exceeded the requirements 3 satisfied the requirements 2 partially satisfied the requirements 1 not satisfied the requirements
Specific Aim(s)/ Criteria
4 3 2 1 Comments
Research-based assessment
Assignment-based assessment
Project-based assessment
Case study-based assessment
Test-based assessment
G11_TG_CAPS.indb 6 2012/08/01 9:01 PM

E7© c a m b r i d g e u n i v e r s i t y p r e s s y o u m ay p h o t o c o p y t h i s pa g e f o r u s e w i t h t h e g r a d e 1 1 l e a r n e r ’ s b o o k
Grids GSelf assessment
Name: _______________________________________________________________________________________
Activity: _______________________________________________ Date: _______________________________
(Please tick 3 the column that describes how you worked)
Criteria Yes No Reasons
G11_TG_CAPS.indb 7 2012/08/01 9:01 PM

E8 © c a m b r i d g e u n i v e r s i t y p r e s s y o u m ay p h o t o c o p y t h i s pa g e f o r u s e w i t h t h e g r a d e 1 1 l e a r n e r ’ s b o o k
Grids H Teacher’s assessment of the individual in a group
Learner’s name: _______________________________________________________________________________
Activity: _______________________________________________ Date: _______________________________
Task skills Yes No Comments
Stays focused on task
Understands instructions
Can organise information
Suggests good ideas
Communication skills Yes No Comments
Speaks in turn
Listens to others
Uses appropriate vocabulary
Social skills Yes No Comments
Explains or shares ideas
Encourages others
Participates actively
G11_TG_CAPS.indb 8 2012/08/01 9:01 PM

E9© c a m b r i d g e u n i v e r s i t y p r e s s y o u m ay p h o t o c o p y t h i s pa g e f o r u s e w i t h t h e g r a d e 1 1 l e a r n e r ’ s b o o k
Grids ISelf assessment/Peer assessment/ Group assessmentName: ______________________________________________________________________________________
Activity: _______________________________________________ Date: _______________________________
Remember this is an opportunity for you to:
A be honest about what you know
A think about what you need help with
A watch and record your progress
A feel confident about your learning.
Key 4 exceeded the requirements 3 satisfied the requirements 2 partially satisfied the requirements 1 not satisfied the requirements
Criteria 4 3 2 1 What I think
G11_TG_CAPS.indb 9 2012/08/01 9:01 PM

E10 © c a m b r i d g e u n i v e r s i t y p r e s s y o u m ay p h o t o c o p y t h i s pa g e f o r u s e w i t h t h e g r a d e 1 1 l e a r n e r ’ s b o o k
Grids J Self assessment
My name: ____________________________________________________________________________________
Activity: _______________________________________________ Date: _______________________________
I could do this:
I found this difficult:
G11_TG_CAPS.indb 10 2012/08/01 9:01 PM

E11© c a m b r i d g e u n i v e r s i t y p r e s s y o u m ay p h o t o c o p y t h i s pa g e f o r u s e w i t h t h e g r a d e 1 1 l e a r n e r ’ s b o o k
Grids KSelf assessment on group work
My name: ___________________________________________
Activity: ______________________________________________
Date: ________________________________________________
Key 4 exceeded the requirements 3 satisfied the requirements 2 partially satisfied the requirements 1 not satisfied the requirements
(Please tick 3 the column that describes how well you worked in your group)
Criteria 4 3 2 1 Comments
I worked well in my group
I listened to the other group members
I contributed some of my own ideas
I thought about solutions to the problem
I asked questions
I learnt from the other group members
G11_TG_CAPS.indb 11 2012/08/01 9:01 PM

E12 © c a m b r i d g e u n i v e r s i t y p r e s s y o u m ay p h o t o c o p y t h i s pa g e f o r u s e w i t h t h e g r a d e 1 1 l e a r n e r ’ s b o o k
Grids L Peer assessment
First discuss what criteria you are going to assess with your teacher and your partner.
Name: _______________________________________________________________________________________
Activity: _______________________________________________ Date: _______________________________
What my partner did well:
What my partner could do better:
G11_TG_CAPS.indb 12 2012/08/01 9:01 PM

E13© c a m b r i d g e u n i v e r s i t y p r e s s y o u m ay p h o t o c o p y t h i s pa g e f o r u s e w i t h t h e g r a d e 1 1 l e a r n e r ’ s b o o k
Grids MPeer and self assessment
My name: ____________________________________________________________________________________
My partner’s name:____________________________________________________________________________
Activity: _______________________________________________ Date: _______________________________
(Please tick 3 the appropriate column)
Yes No
Did I complete the task?
Did my partner complete the task?
What I could do well:
What my partner could do well:
What I need to practise:
What my partner needs to practise:
G11_TG_CAPS.indb 13 2012/08/01 9:01 PM

E14 © c a m b r i d g e u n i v e r s i t y p r e s s y o u m ay p h o t o c o p y t h i s pa g e f o r u s e w i t h t h e g r a d e 1 1 l e a r n e r ’ s b o o k
Grids N Group assessment
Names of group members: _____________________________________________________________________
Activity: _______________________________________________ Date: _______________________________
(Please tick 3 the appropriate column)
Yes No
We worked well together
We helped each other
We took turns
We completed the activity
We enjoyed the activity, because:
We did not enjoy the activity, because:
G11_TG_CAPS.indb 14 2012/08/01 9:01 PM

E15© c a m b r i d g e u n i v e r s i t y p r e s s y o u m ay p h o t o c o p y t h i s pa g e f o r u s e w i t h t h e g r a d e 1 1 l e a r n e r ’ s b o o k
Grids OParent/Guardian assessment
I am assessing the work of: ______________________________ Date: _______________________________
(Please tick 3 the appropriate column)
Good Fair Needs attention
Understanding of the work
Presentation of the work
Accuracy
Attitude towards the work
Other comments:
Signature: ______________________________________
G11_TG_CAPS.indb 15 2012/08/01 9:01 PM

E16 © c a m b r i d g e u n i v e r s i t y p r e s s y o u m ay p h o t o c o p y t h i s pa g e f o r u s e w i t h t h e g r a d e 1 1 l e a r n e r ’ s b o o k
Scho
ol
Sc
hool
clos
ing
date
: ___
____
____
____
____
op
enin
g da
te: _
____
____
____
__
Prin
cip
al’s
sign
atur
e: _
____
____
____
____
____
D
ate:
___
____
____
____
____
___
Teac
her’s
sign
atur
e: _
____
____
____
____
____
D
ate:
___
____
____
____
____
___
Pare
nt’s/
Gua
rdia
n’s
sign
atur
e: _
____
____
____
____
____
D
ate:
___
____
____
____
____
___
Nam
e: _
____
____
____
____
____
____
____
____
____
____
____
____
____
Gra
de: _
____
____
____
____
____
____
____
____
____
____
____
____
____
Dat
e of
bir
th:
____
____
____
____
____
____
____
____
____
____
____
___
Year
: __
____
____
____
____
Te
rm:
____
____
____
____
____
____
____
Att
enda
nce:
___
____
____
___
out o
f __
____
____
____
____
scho
ol d
ays
[Sch
ool s
tam
p]
Rep
ort
card
[Nam
e of
sch
ool]
G11_TG_CAPS.indb 16 2012/08/01 9:01 PM

E17© c a m b r i d g e u n i v e r s i t y p r e s s y o u m ay p h o t o c o p y t h i s pa g e f o r u s e w i t h t h e g r a d e 1 1 l e a r n e r ’ s b o o k
Subj
ect
Lear
ning
ach
ieve
d (c
ode)
Lear
ner’s
com
pet
enci
es/s
tren
gths
(de
scrip
tion)
Sup
por
t nee
ded
(des
crip
tion)
Lang
uag
es: H
ome
lang
uag
e
Lang
uag
es:
Firs
t Add
ition
al L
angu
age
Lang
uag
es: (
Op
tiona
l)
Seco
nd A
dditi
onal
Lan
guag
e
Mat
hem
atic
s
Life
Orie
ntat
ion
Gro
up B
Sub
ject
1:
Gro
up B
Sub
ject
2:
Gro
up B
Sub
ject
3:
Gen
eral
com
men
ts: _
____
____
____
____
____
____
____
____
____
____
____
____
____
____
____
____
____
____
____
____
____
____
____
____
____
____
____
____
____
____
____
____
____
____
____
____
____
____
____
____
____
____
____
____
____
____
____
____
____
____
____
____
____
____
____
____
____
____
____
____
____
____
____
____
__
____
____
____
____
____
____
____
____
____
____
____
____
____
____
____
____
____
____
____
____
____
____
____
____
____
____
____
____
____
____
____
____
____
____
__
____
____
____
____
____
____
____
____
____
____
____
____
____
____
____
____
____
____
____
____
____
____
____
____
____
____
____
____
____
____
____
____
____
____
__
Des
crip
tion
of n
atio
nal c
odes
7 O
utst
andi
ng
6 M
erito
r ious
5
Subs
t ant
ial
4 A
deq
uate
3 M
oder
ate
2 El
emen
tary
1
Not
ach
ieve
d
G11_TG_CAPS.indb 17 2012/08/01 9:02 PM

G11_TG_CAPS.indb 18 2012/08/01 9:02 PM

SECTION F
DOCUMENTS
You may add any other documents you receive in this section and list them for easy reference.
G11_TG_CAPS.indb 1 2012/08/01 9:02 PM

G11_TG_CAPS.indb 2 2012/08/01 9:02 PM

Life SciencesStudy & Master Life Sciences Grade 11 has been especially developed by an experienced author team for the Curriculum and Assessment Policy Statement (CAPS). This new and easy-to-use course helps learners to master essential content and skills in Life Sciences.
The comprehensive Learner’s Book includes: an expanded contents page indicating the CAPS coverage
required for each strand a mind map at the beginning of each module that gives an
overview of the contents of that module activities throughout that help develop learners’ science
knowledge and skills as well as Formal Assessment tasks to test their learning
a review at the end of each unit that provides for consolidation of learning
case studies that link science to real-life situations and present balanced views on sensitive issues
‘Information’ boxes providing interesting additional information and ‘Note’ boxes that bring important information to the learner’s attention.
The innovative Teacher’s Guide includes: guidance on the teaching of each lesson for the year answers to all activities in the Learner’s Book assessment guidelines
photocopiable templates and resources for the teacher.
11Grade
www.cup.co.za
Study & Master
ISBN 978-1-107-60810-8
9 781107 608108
SM_Life Sciences_11_TG_CAPS_ENG.indd 2 2012/08/06 8:42 AM