Studies of Second Structure of 16S rRNA Gene in Uncultured Paenibacilus Species Clone T-168
15
ISSN: 0975-8585 January - February 2014 RJPBCS 5(1) Page No. 1 Research Journal of Pharmaceutical, Biological and Chemical Sciences Studies of Second Structure of 16S rRNA Gene in Uncultured Paenibacilus Species Clone T-168 Sheyda Akhshabi 1 and Abolhasan Rezaei 2 * 1 Young Researchers Club, Tonekabon Branch, Islamic Azad University, Tonekabon, Iran. 2 Department of Basic Science, Tonekabon Branch, Islamic Azad University, Tonekabon, Iran. ABSTRACT The 16S rRNA gene was sequenced and deposited in GenBank, Accession number: AB828175.1. The result of sequencing was compared by DNAMAN software. RNA structure analysis software was used for prediction and analysis of secondary structures of the 16S rRNA gene in three species of Uncultured Paenibacilus, including, clone T-168, clone SGR-280 and clone SGR-10. It was designed to make algorithms accessible for a variety of user needs. These include both free energy and change parameters at 37ºC and enthalpy change parameters to allow prediction of conformation stability at an arbitrary temperature. The results for the minimum free energy (MFE) prediction in form of the secondary structure in dot bracket notation and the free energy and centroid secondary structure were revealed between sequences. The minimum free energy prediction was -205.00, -562.20, and - 574.60 kcal/mol for clone T-168, clone SGR-280, and clone SGR-10 respectively. Furthermore, the ensemble diversity is 183.09, 380.21 and 284.80 for clone T-168, clone SGR-280 and clone SGR-10, respectively. The centroid secondary structure in dot-bracket notation with a minimum free energy of -153.20, -449.92 and -503.92 kcal/mol for clone T-168, clone SGR-280 and clone SGR-10 were reported respectively. According to these results, high variation between clone T-168, clone SGR-280 and clone SGR-10 were found, but there were high homology between both clone SGR-280 and clone SGR-10. Keywords: Uncultured Paenibacilus clone T-168, Secondary structure 16S rRNA gene *Corresponding Author E.mail: [email protected].
-
Upload
tonekaboniau -
Category
Documents
-
view
0 -
download
0
Transcript of Studies of Second Structure of 16S rRNA Gene in Uncultured Paenibacilus Species Clone T-168

ISSN: 0975-8585
January - February 2014 RJPBCS 5(1) Page No. 1
Research Journal of Pharmaceutical, Biological and Chemical
Sciences
Studies of Second Structure of 16S rRNA Gene in Uncultured Paenibacilus Species Clone T-168
Sheyda Akhshabi1 and Abolhasan Rezaei2*
1Young Researchers Club, Tonekabon Branch, Islamic Azad University, Tonekabon, Iran.
2Department of Basic Science, Tonekabon Branch, Islamic Azad University, Tonekabon, Iran.
ABSTRACT
The 16S rRNA gene was sequenced and deposited in GenBank, Accession number: AB828175.1. The result of sequencing was compared by DNAMAN software. RNA structure analysis software was used for prediction and analysis of secondary structures of the 16S rRNA gene in three species of Uncultured Paenibacilus, including, clone T-168, clone SGR-280 and clone SGR-10. It was designed to make algorithms accessible for a variety of user needs. These include both free energy and change parameters at 37ºC and enthalpy change parameters to allow prediction of conformation stability at an arbitrary temperature. The results for the minimum free energy (MFE) prediction in form of the secondary structure in dot bracket notation and the free energy and centroid secondary structure were revealed between sequences. The minimum free energy prediction was -205.00, -562.20, and -574.60 kcal/mol for clone T-168, clone SGR-280, and clone SGR-10 respectively. Furthermore, the ensemble diversity is 183.09, 380.21 and 284.80 for clone T-168, clone SGR-280 and clone SGR-10, respectively. The centroid secondary structure in dot-bracket notation with a minimum free energy of -153.20, -449.92 and -503.92 kcal/mol for clone T-168, clone SGR-280 and clone SGR-10 were reported respectively. According to these results, high variation between clone T-168, clone SGR-280 and clone SGR-10 were found, but there were high homology between both clone SGR-280 and clone SGR-10. Keywords: Uncultured Paenibacilus clone T-168, Secondary structure 16S rRNA gene
*Corresponding Author
E.mail: [email protected].

ISSN: 0975-8585
January - February 2014 RJPBCS 5(1) Page No. 2
INTRODUCTION The 16S rRNA gene in Uncultured Paenibacilus species were studied by researches regarding phylogenetic of these species. Generally, there was not a high variation between 16S rRNA genes in organisms, but in some organisms, comparing 16S rRNA genes between them revealed some variations. The 16S rRNA gene is important for finding the descent of species. In this study, we aimed for finding the rate of homology between species of the Paenibacilus when compared by secondary structure of the 16S rRNA gene. Our understanding of the role of ribosomal RNA in translation has been in a state of rapid evolution in recent years. No longer considered a mere scaffold for the positioning of ribosomal proteins, rRNA currently appears instead to play an active and probably crucial part in protein synthesis (reviewed in Noller, 1984). The 16S region has been studied on the presence of functional motifs (Berg et al. 1989; Nodwell and Greenblatt, 1993; Pfeiffer and Hartmann, 1997) and secondary structures (Nour, 1998; Liiv et al. 1998). The region of 16S rRNA was revealed in prokaryotic diversity at different species (Gurtler and Stanisich, 1996; Garcia-Martinez et al. 1999). In recent study, 16S rRNA genes from some microbial species were analyzed with helping of PCR techniques when restricted by endonuclease digestions (Papke et al. 2004; Pernthaler and Pernthaler, 2005; Philippe, 1993). These results also were supported on at least five phyletic lines especially Panibacilus (Ash et al. 1993). A very small variation between sequences of 16S rRNA genes was observed which could be used to classify and identify organisms correctly. Very small differences in sequences from one bacterial species to another can be used to classify and identify organisms correctly (Avaniss-Aghjani, 1994). The PCR primers were designed against Paenibacilus species. It was found to have seven nucleotide differences compared to P. alvei and 10 nucleotide differences compared to P. polymyxa. These results confirmed against the 16S rRNA gene in the Bacteria. However, the rate of homology in 16S rRNA genes, when compared between sequences, is very high, but on the secondary and tertiary structures of rRNA, there may has been a different situation about RNA genomics of Bacteria. The shape of secondary structures can be predicted by free energy minimization with nearest neighbor parameters to evaluate stability (Mathews et al. 1999; Stajich, et al. 2002; Zuker and Stiegler, 1981; Zuker, 1989; Zuker, and Sankoff, 1984; Gaspin and Westhof, 1995; Chen and Dill, 2000; Wuchty et al. 1999; Ding and Lawrence, 2003). A predicted secondary structure can guide further experiments or comparative sequence analysis (Wolfinger et al. 2004) and aid in the design of RNA molecules (Diamond et al. 2001; Pappalardo et al. 1998). The first step for understanding the rRNA function is to determine its structure (Mathews and Turner, 2006). Secondary structure of RNA revealed as a set of nucleotides (AU, GC and GU) can be compared between sequences (Gutell et al. 2002; Pace, 1999). The analysis of sequences will be determined where they are conserved in multiple sequences and instances of compensating base pair changes occur. The variation of base pair is an indicator for comparative sequences. As an alternative to comparative analysis, the secondary structure of an RNA can be predicted for a single sequence using thermodynamics (Mathews and Turner, 2006). The thermodynamic methods are based on nearest neighbor rules that predict the stability of a structure as quantified by folding free energy change (Xia et al. 1998; Mathews et al.1999; Mathews et al. 2004; Evers and Giegerich, 1999). Another

ISSN: 0975-8585
January - February 2014 RJPBCS 5(1) Page No. 3
alternative method for structure prediction is the prediction of a structure with the highest sum of pairing probabilities, called the maximum expected accuracy structure (Lu et al. 2009; Hamada, 2009). In this study we aimed to discuss about the relationship between secondary structure of RNA by using thermodynamics analysis between sequences of rRNA in Paenibacilus species.
MATERIALS AND METHODS The culture samples The Paenibacilus samples were collected from Salmo trutta caspius and Salmo trutta fario that were caught from Tonekabon River-Iran. The specimens representing fragments of fins were fixed in 96% ethanol. Total DNA was extracted from fin tissue using the method described by Taggart et al. (1992), with minor modifications. Briefly, tissue was digested in a digestion buffer, containing; (100 mM NaCl, 10 mM Tris pH 8.0, 25 mM EDTA PH 8.0, 0.5% sodium dodecyl sulphate (SDS), 0.1 mg/ml proteinase K) for 18 hours at 50°C. Samples were then extracted with an equal volume of phenol-chloroform-isoamyl alcohol (24:25:1), then samples were centrifuged for 5 min in room temperature, again ethanol(96%) was added for washing the DNA, and finally DNA was solved in 50µl TE buffer. Samples were stored at -20°C until using for PCR reaction. Primers for amplification of 16S rRNA gene The sequences of 16S rRNA genes were deposited in GenBank, so we designed primers of a 16S rRNA gene that was reported in GenBank. The universal primers could be amplifying around 1400 base pairs in the full length of the gene. The primers include:
Forward Primer: 5' CACCTCCCTTACACCGAGAA 3' Reverse Primer 5' GCCGAGTTCCTTCTCTTCCT 3'
The PCR amplification The PCR reaction used 10µg PCR reactions contained: 1µl template DNA, 2 µl forward primer (100 ng/µl), 2 µl reverse primer (100 ng/µl), 2 µl dNTP mix (2.5mM each), 5 µl 10X buffer, 0.5 µl Taq enzyme (3U/µl), Water 37.5 µl, in a total volume of 50µl. The cycles were 1 cycle of 95°C for 10 min, 30 cycles of 94°C for 30 Sec., 52.3ºC 30 Sec., and 72°C, 90 Sec. Two to ten µl of each PCR reaction were run on 1.5% agarose gel in TAE buffer containing ethidium bromide. One µl 500bp DNA ladder (Gibco-BRL) was used as a size standard. Then DNA full length DNA was visualized by ethidium bromide and photos were taken by Gel DOC, Bio RAD Company.

ISSN: 0975-8585
January - February 2014 RJPBCS 5(1) Page No. 4
Nucleotide sequencing The PCR products were separated by electrophoresis in a TAE agarose gel containing ethidium bromide using standard protocols. The desired PCR product band was excised using a clean, sterile razor blade or scalpel (band was visualized in a medium or long wavelength (e.g., ≥300 nm) UV light, and excised quickly to minimize exposure of the DNA to UV light). The minimum agarose slice was transferred to a 1.5 ml micro centrifuge or screw cap tube and then purified by Gel Extraction Spin-50 (RKT33) kit, Chromous Geni-India. Quantification was done by loading all of eluted sample in 1% agarose gel and comparing with standard molecular marker (500 bp DNA ladder). Only samples with good concentration (>50 ng/μl) were selected and subjected to sequencing. Sequence data analyses Sequenced data were analyzed mostly by DNAMAN and RNA fold web server genetics program. Database search The database search of sequences for a possible match to the RNA sequence of 16S rRNA genes was conducted using the BLAST algorithm available at the National Centre for Biotechnology, Accession number: AB828175.
RESULTS In this study, we extracted DNA from Uncultured Paenibacilus clone T-168. The genomic DNA was run on the gel electrophoresis and is shown in Figure 1. Also, one pair of primers that could be amplified around 700 base pairs was designed (Figure 2). The universal primers were selected from sequence of 16S rRNAs of some species of the Paenibacilus. However, we designed the primers for full length but we only sequenced from the forward primer. The forward primer could amplify 677 base pairs (Figure 3).
Fig. 1: Total genomic DNA of Uncultured Paenibacilus species clone: T-168.
ISSN: 0975-8585
January - February 2014 RJPBCS 5(1) Page No. 5
Fig. 2: PCR product of partial sequence of the 16S rRNA gene in UP clone: T-168. M: Size marker 1000bp.
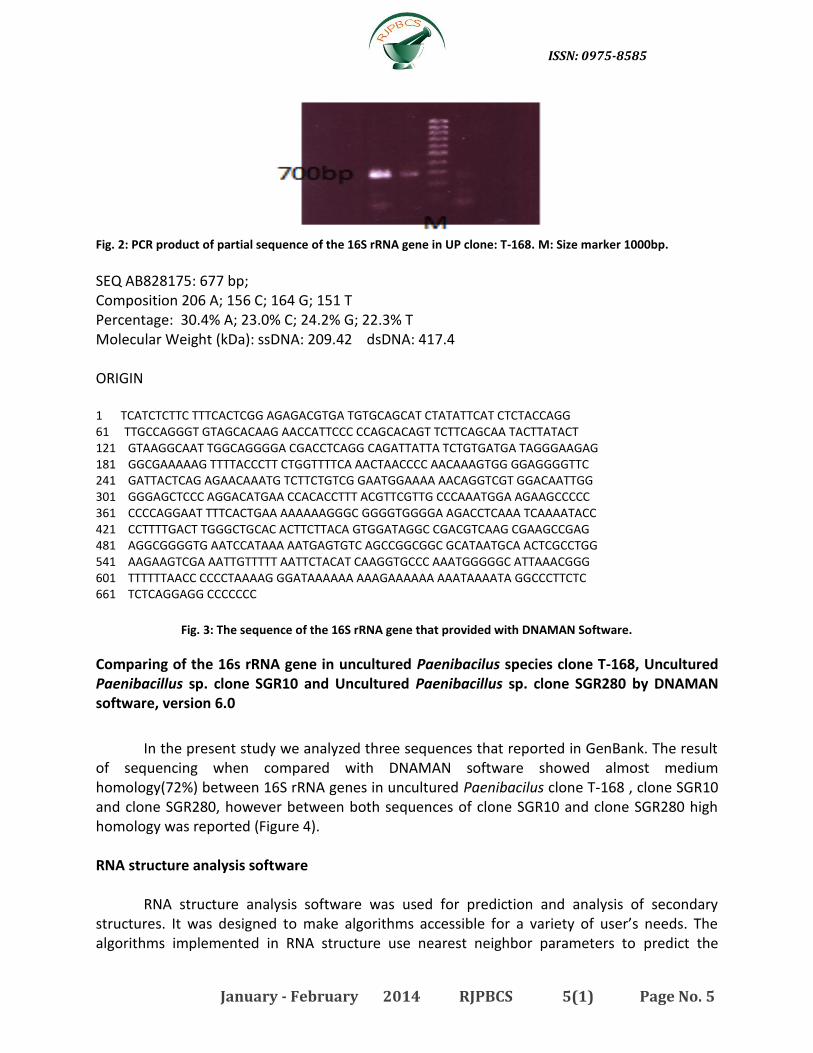
SEQ AB828175: 677 bp; Composition 206 A; 156 C; 164 G; 151 T Percentage: 30.4% A; 23.0% C; 24.2% G; 22.3% T Molecular Weight (kDa): ssDNA: 209.42 dsDNA: 417.4 ORIGIN 1 TCATCTCTTC TTTCACTCGG AGAGACGTGA TGTGCAGCAT CTATATTCAT CTCTACCAGG 61 TTGCCAGGGT GTAGCACAAG AACCATTCCC CCAGCACAGT TCTTCAGCAA TACTTATACT 121 GTAAGGCAAT TGGCAGGGGA CGACCTCAGG CAGATTATTA TCTGTGATGA TAGGGAAGAG 181 GGCGAAAAAG TTTTACCCTT CTGGTTTTCA AACTAACCCC AACAAAGTGG GGAGGGGTTC 241 GATTACTCAG AGAACAAATG TCTTCTGTCG GAATGGAAAA AACAGGTCGT GGACAATTGG 301 GGGAGCTCCC AGGACATGAA CCACACCTTT ACGTTCGTTG CCCAAATGGA AGAAGCCCCC 361 CCCCAGGAAT TTTCACTGAA AAAAAAGGGC GGGGTGGGGA AGACCTCAAA TCAAAATACC 421 CCTTTTGACT TGGGCTGCAC ACTTCTTACA GTGGATAGGC CGACGTCAAG CGAAGCCGAG 481 AGGCGGGGTG AATCCATAAA AATGAGTGTC AGCCGGCGGC GCATAATGCA ACTCGCCTGG 541 AAGAAGTCGA AATTGTTTTT AATTCTACAT CAAGGTGCCC AAATGGGGGC ATTAAACGGG 601 TTTTTTAACC CCCCTAAAAG GGATAAAAAA AAAGAAAAAA AAATAAAATA GGCCCTTCTC 661 TCTCAGGAGG CCCCCCC
Fig. 3: The sequence of the 16S rRNA gene that provided with DNAMAN Software.
Comparing of the 16s rRNA gene in uncultured Paenibacilus species clone T-168, Uncultured Paenibacillus sp. clone SGR10 and Uncultured Paenibacillus sp. clone SGR280 by DNAMAN software, version 6.0
In the present study we analyzed three sequences that reported in GenBank. The result of sequencing when compared with DNAMAN software showed almost medium homology(72%) between 16S rRNA genes in uncultured Paenibacilus clone T-168 , clone SGR10 and clone SGR280, however between both sequences of clone SGR10 and clone SGR280 high homology was reported (Figure 4). RNA structure analysis software
RNA structure analysis software was used for prediction and analysis of secondary structures. It was designed to make algorithms accessible for a variety of user’s needs. The algorithms implemented in RNA structure use nearest neighbor parameters to predict the

ISSN: 0975-8585
January - February 2014 RJPBCS 5(1) Page No. 6
stability of secondary structures. These include both free energy and change parameters at 37ºC and enthalpy change parameters to allow prediction of conformation stability at an arbitrary temperature. For analysis of prediction secondary structure of 16S rRNA we used three species of Paenibacilus, including, uncultured Paenibacilus species clone T-168, uncultured Paenibacilus species clone SGR10 and uncultured Paenibacilus species clone SGR280. First, we provided results for the minimum free energy (MFE) prediction in form of the secondary structure in dot bracket notation and the free energy and centroid secondary structure were revealed in uncultured Paenibacilus clone T-168, clone SGR10 and clone SGR280 for minimum free energy prediction -205.00 kcal/mol, -562.20 kcal/mol and -574.60 kcal/mol respectively which are given in figures 4a-c and 5a-c. The results of the free energy of thermodynamic ensemble prediction in uncultured Paenibacilus clone T-168, clone SGR10 and clone SGR280 are -217.63 kcal/mol, -594.49 kcal/mol and -582.63 kcal/mol, respectively. The results of the frequency of the MFE structure in the ensemble of three species cited in above was 0.00 %. Furthermore, the ensemble diversity is 183.09 for uncultured Paenibacilus clone T-168, the ensemble diversity is 380.21 for uncultured Paenibacilus clone SGR 280 and the ensemble diversity is 284.80 for uncultured Paenibacilus clone SGR10. The centroid secondary structure in dot-bracket notation with a minimum free energy of -153.20 kcal/mol is given for uncultured Paenibacilus clone T-168, and -449.92 kcal/mol and -503.92 kcal/mol were reported for clone SGR280 and clone SGR 10, respectively (Figure 6a-c).
Figures 7a-c present the mountain plot representation of the MFE structure, the thermodynamic ensemble of RNA structures, and the centroid structure. Additionally, we present the positional entropy for each position. Figures 8a-c include dot plots containing base pair probabilities. There was a variation between uncultured Paenibacilus clone T-168 , clone SGR10, and clone SGR280. However, a high homology was observed between both clone SGR10 and clone SGR280.

ISSN: 0975-8585
January - February 2014 RJPBCS 5(1) Page No. 7
Fig. 4: 16S rRNA genes in uncultured Paenibacilus clone T-168(GenBank: AB828175), clone SGR 10 (GenBank: JQ793386.1) and clone SGR 280 (GenBank:
JQ793582.1) were analysed by DNAMAN software. The results are showed a medium homology between clone T-168, clone SGR 10 and clone SGR 280
(72%) but a high homology was observed between clone SGR 10 and clone SGR 280.

ISSN: 0975-8585
January - February 2014 RJPBCS 5(1) Page No. 8
Fig. 5a-c: Screenshots of a MFE secondary structure of rRNA in uncultured Paenibacillus clone SGR-10, GenBank: JQ793386.1 (A), clone SGR 280, GenBank:
JQ793582.1 (B) and clone T-168, GenBank: AB828175(C). We display the barrier tree and provide the transition rates matrix for download.

ISSN: 0975-8585
January - February 2014 RJPBCS 5(1) Page No. 9
Fig. 6a-c: Screenshot of a secondary structure of rRNA in uncultured Paenibacillus clone SGR-10, GenBank: JQ793386.1 (A), clone SGR 280, GenBank:
JQ793582.1 (B) and clone T-168, GenBank: AB828175(C). We display the barrier tree and provide the transition rates matrix for download.

ISSN: 0975-8585
January - February 2014 RJPBCS 5(1) Page No. 10
Fig. 7a-c: Mountain plot representation of the MFE structure, the thermodynamic ensemble of RNA structures, and the centroid structure. Additionally we
present the positional entropy for each position. Screenshot of a secondary structure of rRNA in uncultured Paenibacillus clone SGR-10, GenBank:
JQ793386.1 (A), clone SGR 280, GenBank: JQ793582.1 (B) and clone T-168, GenBank: AB828175(C).

ISSN: 0975-8585
January - February 2014 RJPBCS 5(1) Page No. 11
A B
C
Fig. 8a-c: Screenshots of mountain plot of secondary structure of rRNA in uncultured Paenibacillus clone SGR-10, GenBank: JQ793386.1 (A), clone SGR 280, GenBank: JQ793582.1 (B) and clone T-168, GenBank: AB828175(C). There was a variation between uncultured Paenibacilus clone T-168, clone SGR10, and
clone SGR280. However, there was a high homology between both clone SGR10 and clone SGR280.

ISSN: 0975-8585
January - February 2014 RJPBCS 5(1) Page No. 12
DISCUSSION In this study were discussed the 16S rRNA gene for analysis of the phylogenetic parameters in Uncultured Paenibacilus species clone T-168 that we sequenced the 16S rRNA and deposited in GenBank. Usually the variation in 16S rRNA genes in Bacteria is low (Gutler and Stanisich 1996) but our results showed the rate of variation was high between sequences of 16S rRNA genes in uncultured Paenibacilus clone T-168 and other species like, uncultured Paenibacilus clone SGR-10 and uncultured Paenibacilus clone SGR280. In the GenBank, 16S rRNA genes with partial and complete sequences in some species of Bacteria are reported, especially uncultured Paenibacilus sp. According to these, we randomly selected two species of uncultured Paenibacilus. Since the variation of 16S rRNA genes between species of Bacteria is very low, we selected two species for comparing with uncultured Paenibacilus clone T-168. RNA fold web server did analysis between sequences and secondary RNA structures were reported. The RNA fold web server usually utilizes a minimum free energy for evaluation of the secondary structure of the RNA (Szymanski et al. 2000; Dynamic et al. 1999; Klein and Eddy, 2003). Figures 5a-c, 6a-c, 7a-c and 8a-c show a screenshot of the “Fold RNA Single Strand” input form from the JAVA GUI. This program predicts the lowest free energy structure for an input sequence and a set of low free energy structures called suboptimal structures. The program determined the default output (CT) file and the default parameters for determining suboptimal structures. Saved files can be written to accelerate the prediction of an alternative set of suboptimal structures with a subsequent calculation. This view of the GUI shows the checkbox unchecked and so no saved files will be written. The three remaining parameters control the prediction of suboptimal structures. “Max % Energy Difference” and “Max Number of Structures” place limits on the number of suboptimal structures predicted, with a maximum of the percentage difference in free energy change above the lowest free energy structure or an absolute limit on the number of structures, respectively. Suboptimal structures will be generated until the percent energy difference above the lowest free energy structure is reached, 10% in this case, or 20 structures have been generated (Zuker, 1989). Zero places with no restriction and larger integers become increasingly more stringent in the number of different pairs required between structures. In this studies we discussed the three species of Paenibacilus by RNA structure prediction. The results showed that the percent of energy structure between three species was different. The color of nucleotides indicates the rate of variation between species. The optimal secondary structure in dot-bracket notation with a minimum free energy is given in Figures 5a-c, 6a-c, 7a-c and 8a-c. According to these results, the screenshot of RNA secondary structure based on base pairing probabilities at the interactive drawing of the MFE and secondary structure in uncultured Paenibacilus sp. Clone T-168, clone SGR280 and clone SGR 10. For unpaired regions, the color denotes the probabilities of being unpaired that were different between three species. There were an existing result, because almost the screenshot of two sequences (Paenibacilus clone SGR280 and SGR10) were the same but there was a high variation with sequences of Paenibacilus clone T-168. The variations include the shape of RNA secondary structure, the value of energy (the rate of minimum and maximum), and different plot sequencing. The results of comparing the sequences of rRNA with DNAMAN software are also presented in Figure 4. That was different (between sequences of Accession number JQ793582.1, JQ793386.1 and AB8281.75). However same homology between both sequence of Accession number JQ793582.1 and JQ793386.1 were observed. According to the above results, there is a

ISSN: 0975-8585
January - February 2014 RJPBCS 5(1) Page No. 13
question that why there were variations between sequences of 16S rRNA in Uncultured Paenibacilus clones T-168, SGR-280, and SGR-10. There are some answers to this question:
1) The sequence of 16S rRNA in clone T-168, was only acquired from the forward primer, but the other sequences cited in this study are almost complete sequences, so after sequencing full length of this rRNA we can discuss about it. Since the homology of sequences was different when compared with DNAMAN, maybe after getting full length the rate of homology will be higher.
2) Maybe uncultured Paenibacilus clone T-168 was a new species that produced a
mutation variation in the genome of the uncultured Paenibacilus species. Because usually there are high variation in 16S rRNA genes within and between species, by these results we would say maybe some mutation penetrated in the genome of uncultured Paenibacilus clone T-168, especially in the 16S rRNA gene.
3) Maybe there are only some variation in 16S rRNA genes, because after determining the sequence of other genes in Paenubacilus, the rate of variation reduced; however these probability is very low.
Finally, only after sequencing the full length of the 16S RNA gene in uncultured Paenibacilus clone T-168 we can discuss about the rate of variation between 16S rRNA genes in species of Paenibacilus.By the way, there were high variation between 16Sr RNA genes in uncultured Paenibaclus clone T-168 and other species of Paenibacilus. It is better to study other genes and then decide about the rate of homology between uncultured species clone T-168 and other species of Paenibacilus.
ACKNOWLEDGMENTS This work was financially supported by the Research Council of Islamic Azad University Tonekabon Branch, Iran.
REFERENCES Ash, C. Priest, F. G. Collins, M. D.: Antonie Leeuwenhoek. 64:253–260 (1993). Avaniss-Aghjani, K. K. Jones, D. Chapman, and Brunk, C.: BioTech. 17:144-146 (1994). Berg, K. L. Squires, C. Squires, C. L.: J Mol Biol 209, 345–358 (1989). Chen, S.J. and K. A. Dill.: Proc. Natl. Acad. Sci. USA. 97:646–651 (2000). Dynamic, A.: J. Mol. Bio. 285:2053-2068 (1999). Diamond, J.M. Turner, D.H. and Mathews, D.H.: Bio.40, 6971-6981(2001). Ding, Y. Lawrence, C.E.: Nucleic Acids Res. 31:7280-7301(2003).

ISSN: 0975-8585
January - February 2014 RJPBCS 5(1) Page No. 14
Evers, D. and Giegerich,R.: Bio.15: 32–37(1999). Hamada, M. Kiryu, H. Sato, K. Mituyama, T. Asai, K.: Bioin. 25(4):465-473 (2009). Gutell, R.R. Lee, J.C. Cannone, J.J.: Curr. Opin. Struct. Biol. 12:301-310 (2002). Garcia-Martinez, J. Acinas, S. G. Anton, A. I. Rodriguez-Valera, F.: J. Microbiol. Method. 36, 55–64 (1999). Gaspin, C. Westhof, E.: J.Mol. Bio. 254: 163 174 (1995). Gurtler, V. Stanisich, V. A.: Micro. 142, 3–16 (1996). Klein,R.J. and Eddy,S.R.: BMC Bioinform. 4, 44 (2003). Liiv, A. Tenson, T. Margus, T. Remme, J.: Biol Chem 379, 783–793 (1998). Lu, Z.J. Gloor, J.W. Mathews, D.H.: RNA. 181-15: 1805 (2009). Mathews, D.H. Turner, D.H.: Curr. Opin. Struct. Biol., 16(3):270-278 (2006). Mathews, D.H. Disney, M.D. Childs, J.L. Schroeder, S.J. Zuker, M. Turner, D.H.: Proc Natl Acad Sci USA. 101:7287-7292 (2004). Mathews, D.H. Sabina, J. Zuker, M. Turner, D.H.: J. Mol. Biol. 288:911-940 (1999). Nour, M.: Res Microbiol 149, 433-448 (1998). Nodwell, J. R. Greenblatt, J.: Cell 72, 261–268 (1993). Papke, R. T. Koenig, J. E. Rodriguez-Valera, F. and Doolittle, W. F.: Sci. 306:1928–1929 (2004). Pernthaler, A. and Pernthaler, J.: Meth Enzymol. 397:352–371 (2005). Philippe, H.: Nucleic Acids Res. 21: 5264–5272 (1993). Pace, N.R. Thomas, B.C. Woese, C.R.: Probing RNA structure, function, and history bycomparative analysis. The RNA World Cold Spring Harbor Laboratory Press Gesteland RF, Cech TR, Atkins JF, 2, 113-141(1999). Pfeiffer, T. Hartmann, R. K.: J. Mol. Biol. 265, 385–393 (1997). Pappalardo, L. Kerwood, D.J. Pelczer, I. Borer P.N.: J. Mol. Biol. 282, 801-818(1998). Stajich, J.E. Block, D. Boulez, K. Brenner, S.E. Chervitz, S.A. Dagdigian, C. Fuellen, G. Gilbert, J.G. Korf,I. Lapp,H.: Genome Res., 12, 1611–1618 (2002).

ISSN: 0975-8585
January - February 2014 RJPBCS 5(1) Page No. 15
Szymanski, M. Barciszewska, M.Z. Barciszewski, J. Erdmann, V.A.: Nucleic Acids Res. 28:166-167 (2000). Wolfinger, M.T. Svrcek-Seiler, A.W. Flamm, C. Hofacker,I.L. and Stadler,P.F.: J. Phys. A: Math. Gen. 37, 4731–4741(2004). Wuchty, S. Fontana, W. Hofacker, I.L. Schuster, P.: Biop.49:145-165(1999). Xia, T. SantaLucia, J. J.r. Burkard, M.E. Kierzek, R. Schroeder, S.J. Jiao, X. Cox, C. Turner, D.H.: Bioch. 37:14719-14735(1998). Zuker, M. Sankoff, D.: Bull.Math. Biol. 46:591-621(1984). Zuker, M.: Sci., 244, 48-52 (1989). Zuker, M. Stiegler, P.: Nucleic Acids Res. 9:133-148 (1981).