
TURKMEN RUG STUDIES: Some \"S\" group 'salor' gol chuval Examined
MOLECULAR
Molecular Phylogenetics and Evolution 35 (2005) 344–362
PHYLOGENETICSANDEVOLUTION
www.elsevier.com/locate/ympev
Phylogeny and biogeography of Chinese sisorid catfishesre-examined using mitochondrial cytochrome b
and 16S rRNA gene sequences
Xianguang Guo a,b, Shunping He a,*, Yaoguang Zhang c
a Institute of Hydrobiology, Chinese Academy of Sciences, Wuhan 430072, PR Chinab Graduate school of Chinese Academy of Sciences, Beijing 100039, PR China
c School of Life Science, Southwest China Normal University, Chongqing 400715, PR China
Received 25 April 2004; revised 29 November 2004
Abstract
The family Sisoridae is one of the largest and most diverse Asiatic catfish families, most species occurring in the water systems ofthe Qinhai-Tibetan Plateau and East Himalayas. To date published morphological and molecular phylogenetics hypotheses of siso-rid catfishes are part congruent, and there are some areas of significant disagreement with respect to intergeneric relationships. Weused mitochondrial cytochrome b and 16S rRNA gene sequences to clarify existing gaps in phylogenetics and to test conflictingvicariant and dispersal biogeographical hypotheses of Chinese sisorids using dispersal–vicariance analysis and weighted ancestralarea analysis in combination with palaeogeographical data as well as molecular clock calibration. Our results suggest that: (1) Chi-nese sisorid catfishes form a monophyletic group with two distinct clades, one represented by (Gagata (Bagarius, Glyptothorax)) andthe other by (glyptosternoids, Pseudecheneis); (2) the glyptosternoid is a monophyletic group and Glyptosternum, Glaridoglanis, andExostoma are three basal species having a primitive position among it; (3) a hypothesis referring to Pseudecheneis as the sister groupof the glyptosternoids, based on morphological evidence, is supported; (4) the genus Pareuchiloglanis, as presently defined, is notmonophyletic; (5) congruent with previous hypotheses, the uplift of Qinghai-Tibetan Plateau played a primary role in the speciationand radiation of the Chinese sisorids; and (6) an evolutionary scenario combining aspects of both vicariance and dispersal theory isnecessary to explain the distribution pattern of the glyptosternoids. In addition, using a cytochrome b substitution rate of 0.91% permillion years and 0.23% for 16S rRNA, we tentatively date that the glyptosternoids most possibly originated in Oligocene–Mioceneboundary (19–24Myr), and radiated fromMiocene to Pleistocene, along with a center of origin in the Irrawaddy–Tsangpo drainagesand several rapid speciation in a relatively short time.� 2005 Elsevier Inc. All rights reserved.
Keywords: Sisoridae; Glyptosternoids; Cytochrome b; 16S rRNA; Phylogeny; Biogeography
1. Introduction
The family Sisoridae, established by Regan (1911), isone of the largest and most diverse Asiatic families,quite a few sisorid species inhabiting in basins aroundthe Qinghai-Tibetan Plateau and East Himalayas. The
1055-7903/$ - see front matter � 2005 Elsevier Inc. All rights reserved.
doi:10.1016/j.ympev.2004.12.015
* Corresponding author. Fax: +86 27 68 78 0123.E-mail address: [email protected] (S. He).
main basins in which these fishes live include: Yal-uzangbujiang (Tsangpo), Irrawady, Nujiang (Salween),Lancangjiang (Mekong River), Jingshajiang (UpperYangtze), Yuanjiang (Red River), Nanpanjiang (UpperPearl River), and Brahmaputra basin. They are highlyadaptive to torrential environment. Its special distribu-tion and phylogenetic interpretation would be helpfulin determining the development of water systems in thisarea. It is assumed that speciation events within this
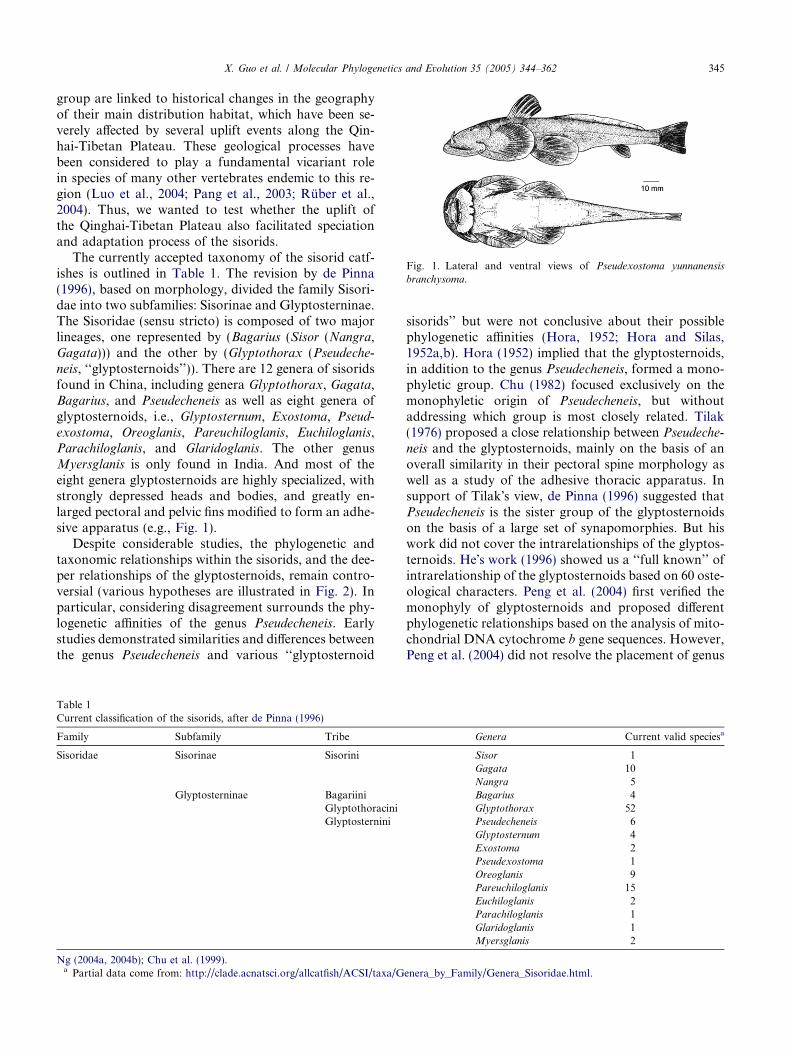
Fig. 1. Lateral and ventral views of Pseudexostoma yunnanensis
branchysoma.
X. Guo et al. / Molecular Phylogenetics and Evolution 35 (2005) 344–362 345
group are linked to historical changes in the geographyof their main distribution habitat, which have been se-verely affected by several uplift events along the Qin-hai-Tibetan Plateau. These geological processes havebeen considered to play a fundamental vicariant rolein species of many other vertebrates endemic to this re-gion (Luo et al., 2004; Pang et al., 2003; Ruber et al.,2004). Thus, we wanted to test whether the uplift ofthe Qinghai-Tibetan Plateau also facilitated speciationand adaptation process of the sisorids.
The currently accepted taxonomy of the sisorid catf-ishes is outlined in Table 1. The revision by de Pinna(1996), based on morphology, divided the family Sisori-dae into two subfamilies: Sisorinae and Glyptosterninae.The Sisoridae (sensu stricto) is composed of two majorlineages, one represented by (Bagarius (Sisor (Nangra,Gagata))) and the other by (Glyptothorax (Pseudeche-neis, ‘‘glyptosternoids’’)). There are 12 genera of sisoridsfound in China, including genera Glyptothorax, Gagata,Bagarius, and Pseudecheneis as well as eight genera ofglyptosternoids, i.e., Glyptosternum, Exostoma, Pseud-exostoma, Oreoglanis, Pareuchiloglanis, Euchiloglanis,Parachiloglanis, and Glaridoglanis. The other genusMyersglanis is only found in India. And most of theeight genera glyptosternoids are highly specialized, withstrongly depressed heads and bodies, and greatly en-larged pectoral and pelvic fins modified to form an adhe-sive apparatus (e.g., Fig. 1).
Despite considerable studies, the phylogenetic andtaxonomic relationships within the sisorids, and the dee-per relationships of the glyptosternoids, remain contro-versial (various hypotheses are illustrated in Fig. 2). Inparticular, considering disagreement surrounds the phy-logenetic affinities of the genus Pseudecheneis. Earlystudies demonstrated similarities and differences betweenthe genus Pseudecheneis and various ‘‘glyptosternoid
Table 1Current classification of the sisorids, after de Pinna (1996)
Family Subfamily Tribe
Sisoridae Sisorinae Sisorini
Glyptosterninae BagariiniGlyptothoraciniGlyptosternini
Ng (2004a, 2004b); Chu et al. (1999).a Partial data come from: http://clade.acnatsci.org/allcatfish/ACSI/taxa/G
sisorids’’ but were not conclusive about their possiblephylogenetic affinities (Hora, 1952; Hora and Silas,1952a,b). Hora (1952) implied that the glyptosternoids,in addition to the genus Pseudecheneis, formed a mono-phyletic group. Chu (1982) focused exclusively on themonophyletic origin of Pseudecheneis, but withoutaddressing which group is most closely related. Tilak(1976) proposed a close relationship between Pseudeche-
neis and the glyptosternoids, mainly on the basis of anoverall similarity in their pectoral spine morphology aswell as a study of the adhesive thoracic apparatus. Insupport of Tilak�s view, de Pinna (1996) suggested thatPseudecheneis is the sister group of the glyptosternoidson the basis of a large set of synapomorphies. But hiswork did not cover the intrarelationships of the glyptos-ternoids. He�s work (1996) showed us a ‘‘full known’’ ofintrarelationship of the glyptosternoids based on 60 oste-ological characters. Peng et al. (2004) first verified themonophyly of glyptosternoids and proposed differentphylogenetic relationships based on the analysis of mito-chondrial DNA cytochrome b gene sequences. However,Peng et al. (2004) did not resolve the placement of genus
Genera Current valid speciesa
Sisor 1Gagata 10Nangra 5Bagarius 4Glyptothorax 52Pseudecheneis 6Glyptosternum 4Exostoma 2Pseudexostoma 1Oreoglanis 9Pareuchiloglanis 15Euchiloglanis 2Parachiloglanis 1Glaridoglanis 1Myersglanis 2
enera_by_Family/Genera_Sisoridae.html.
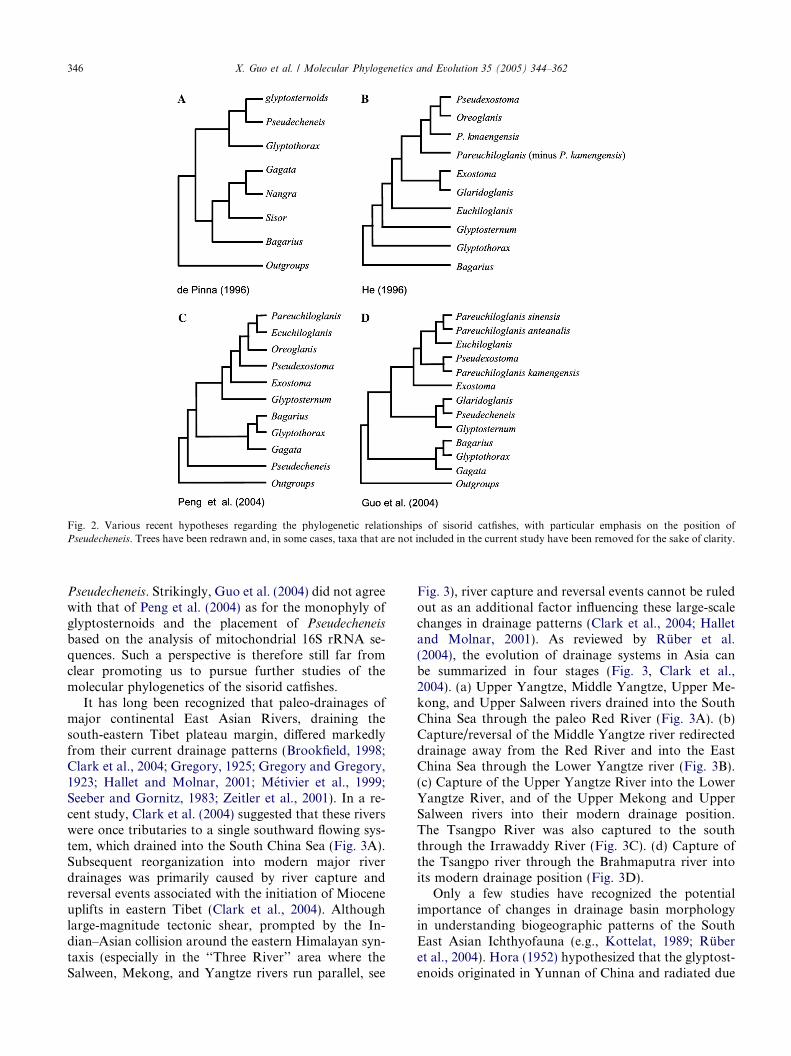
Fig. 2. Various recent hypotheses regarding the phylogenetic relationships of sisorid catfishes, with particular emphasis on the position ofPseudecheneis. Trees have been redrawn and, in some cases, taxa that are not included in the current study have been removed for the sake of clarity.
346 X. Guo et al. / Molecular Phylogenetics and Evolution 35 (2005) 344–362
Pseudecheneis. Strikingly, Guo et al. (2004) did not agreewith that of Peng et al. (2004) as for the monophyly ofglyptosternoids and the placement of Pseudecheneisbased on the analysis of mitochondrial 16S rRNA se-quences. Such a perspective is therefore still far fromclear promoting us to pursue further studies of themolecular phylogenetics of the sisorid catfishes.
It has long been recognized that paleo-drainages ofmajor continental East Asian Rivers, draining thesouth-eastern Tibet plateau margin, differed markedlyfrom their current drainage patterns (Brookfield, 1998;Clark et al., 2004; Gregory, 1925; Gregory and Gregory,1923; Hallet and Molnar, 2001; Metivier et al., 1999;Seeber and Gornitz, 1983; Zeitler et al., 2001). In a re-cent study, Clark et al. (2004) suggested that these riverswere once tributaries to a single southward flowing sys-tem, which drained into the South China Sea (Fig. 3A).Subsequent reorganization into modern major riverdrainages was primarily caused by river capture andreversal events associated with the initiation of Mioceneuplifts in eastern Tibet (Clark et al., 2004). Althoughlarge-magnitude tectonic shear, prompted by the In-dian–Asian collision around the eastern Himalayan syn-taxis (especially in the ‘‘Three River’’ area where theSalween, Mekong, and Yangtze rivers run parallel, see
Fig. 3), river capture and reversal events cannot be ruledout as an additional factor influencing these large-scalechanges in drainage patterns (Clark et al., 2004; Halletand Molnar, 2001). As reviewed by Ruber et al.(2004), the evolution of drainage systems in Asia canbe summarized in four stages (Fig. 3, Clark et al.,2004). (a) Upper Yangtze, Middle Yangtze, Upper Me-kong, and Upper Salween rivers drained into the SouthChina Sea through the paleo Red River (Fig. 3A). (b)Capture/reversal of the Middle Yangtze river redirecteddrainage away from the Red River and into the EastChina Sea through the Lower Yangtze river (Fig. 3B).(c) Capture of the Upper Yangtze River into the LowerYangtze River, and of the Upper Mekong and UpperSalween rivers into their modern drainage position.The Tsangpo River was also captured to the souththrough the Irrawaddy River (Fig. 3C). (d) Capture ofthe Tsangpo river through the Brahmaputra river intoits modern drainage position (Fig. 3D).
Only a few studies have recognized the potentialimportance of changes in drainage basin morphologyin understanding biogeographic patterns of the SouthEast Asian Ichthyofauna (e.g., Kottelat, 1989; Ruberet al., 2004). Hora (1952) hypothesized that the glyptost-enoids originated in Yunnan of China and radiated due
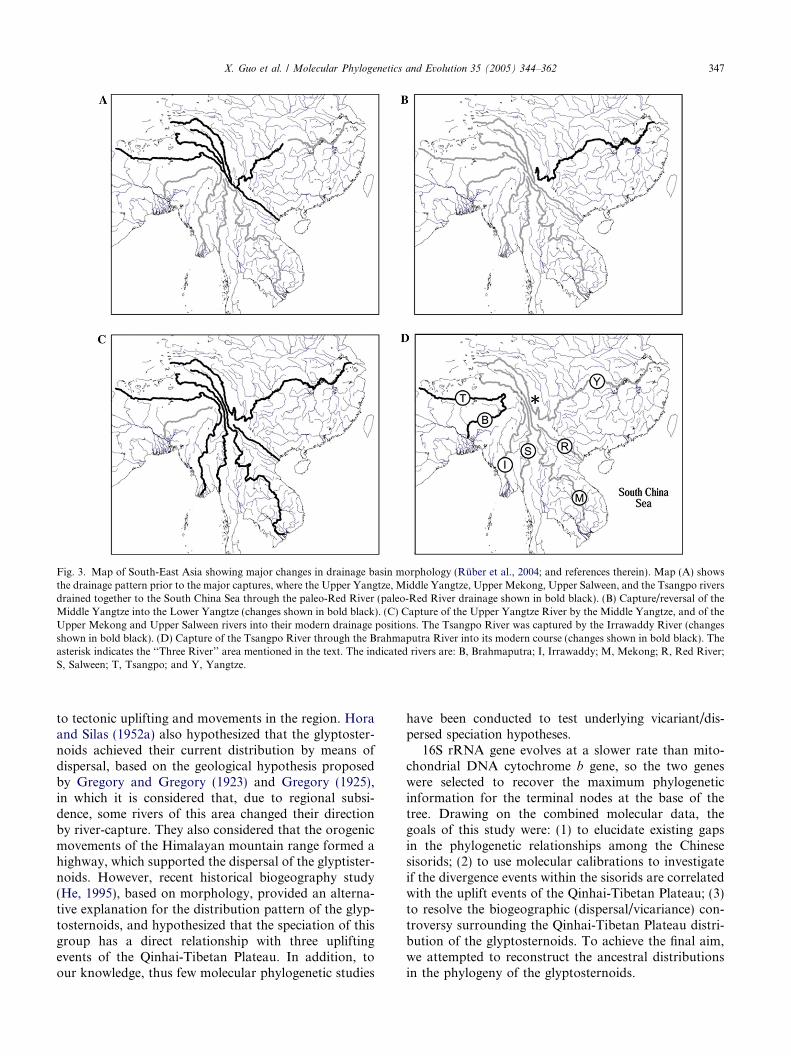
Fig. 3. Map of South-East Asia showing major changes in drainage basin morphology (Ruber et al., 2004; and references therein). Map (A) showsthe drainage pattern prior to the major captures, where the Upper Yangtze, Middle Yangtze, Upper Mekong, Upper Salween, and the Tsangpo riversdrained together to the South China Sea through the paleo-Red River (paleo-Red River drainage shown in bold black). (B) Capture/reversal of theMiddle Yangtze into the Lower Yangtze (changes shown in bold black). (C) Capture of the Upper Yangtze River by the Middle Yangtze, and of theUpper Mekong and Upper Salween rivers into their modern drainage positions. The Tsangpo River was captured by the Irrawaddy River (changesshown in bold black). (D) Capture of the Tsangpo River through the Brahmaputra River into its modern course (changes shown in bold black). Theasterisk indicates the ‘‘Three River’’ area mentioned in the text. The indicated rivers are: B, Brahmaputra; I, Irrawaddy; M, Mekong; R, Red River;S, Salween; T, Tsangpo; and Y, Yangtze.
X. Guo et al. / Molecular Phylogenetics and Evolution 35 (2005) 344–362 347
to tectonic uplifting and movements in the region. Horaand Silas (1952a) also hypothesized that the glyptoster-noids achieved their current distribution by means ofdispersal, based on the geological hypothesis proposedby Gregory and Gregory (1923) and Gregory (1925),in which it is considered that, due to regional subsi-dence, some rivers of this area changed their directionby river-capture. They also considered that the orogenicmovements of the Himalayan mountain range formed ahighway, which supported the dispersal of the glyptister-noids. However, recent historical biogeography study(He, 1995), based on morphology, provided an alterna-tive explanation for the distribution pattern of the glyp-tosternoids, and hypothesized that the speciation of thisgroup has a direct relationship with three upliftingevents of the Qinhai-Tibetan Plateau. In addition, toour knowledge, thus few molecular phylogenetic studies
have been conducted to test underlying vicariant/dis-persed speciation hypotheses.
16S rRNA gene evolves at a slower rate than mito-chondrial DNA cytochrome b gene, so the two geneswere selected to recover the maximum phylogeneticinformation for the terminal nodes at the base of thetree. Drawing on the combined molecular data, thegoals of this study were: (1) to elucidate existing gapsin the phylogenetic relationships among the Chinesesisorids; (2) to use molecular calibrations to investigateif the divergence events within the sisorids are correlatedwith the uplift events of the Qinhai-Tibetan Plateau; (3)to resolve the biogeographic (dispersal/vicariance) con-troversy surrounding the Qinhai-Tibetan Plateau distri-bution of the glyptosternoids. To achieve the final aim,we attempted to reconstruct the ancestral distributionsin the phylogeny of the glyptosternoids.
348 X. Guo et al. / Molecular Phylogenetics and Evolution 35 (2005) 344–362
2. Materials and methods
2.1. Sample collection
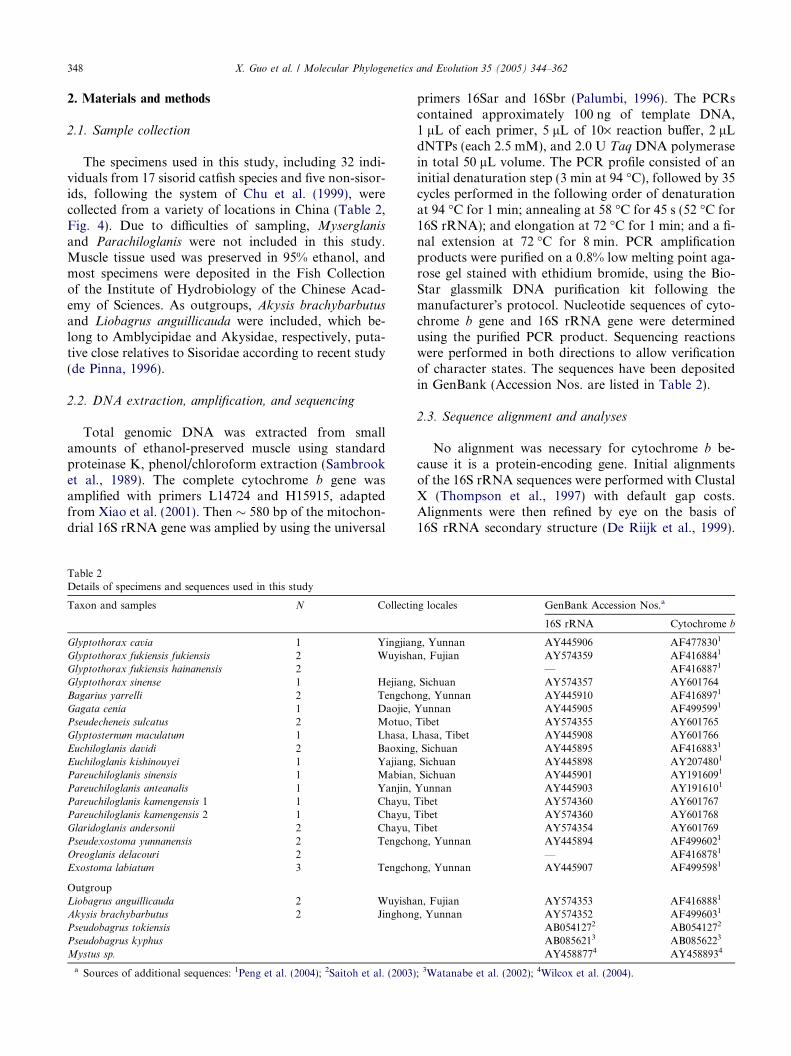
The specimens used in this study, including 32 indi-viduals from 17 sisorid catfish species and five non-sisor-ids, following the system of Chu et al. (1999), werecollected from a variety of locations in China (Table 2,Fig. 4). Due to difficulties of sampling, Myserglanis
and Parachiloglanis were not included in this study.Muscle tissue used was preserved in 95% ethanol, andmost specimens were deposited in the Fish Collectionof the Institute of Hydrobiology of the Chinese Acad-emy of Sciences. As outgroups, Akysis brachybarbutusand Liobagrus anguillicauda were included, which be-long to Amblycipidae and Akysidae, respectively, puta-tive close relatives to Sisoridae according to recent study(de Pinna, 1996).
2.2. DNA extraction, amplification, and sequencing
Total genomic DNA was extracted from smallamounts of ethanol-preserved muscle using standardproteinase K, phenol/chloroform extraction (Sambrooket al., 1989). The complete cytochrome b gene wasamplified with primers L14724 and H15915, adaptedfrom Xiao et al. (2001). Then � 580 bp of the mitochon-drial 16S rRNA gene was amplied by using the universal
Table 2Details of specimens and sequences used in this study
Taxon and samples N Collectin
Glyptothorax cavia 1 YingjianGlyptothorax fukiensis fukiensis 2 WuyishaGlyptothorax fukiensis hainanensis 2Glyptothorax sinense 1 Hejiang,Bagarius yarrelli 2 TengchoGagata cenia 1 Daojie,Pseudecheneis sulcatus 2 Motuo,Glyptosternum maculatum 1 Lhasa, LEuchiloglanis davidi 2 BaoxingEuchiloglanis kishinouyei 1 Yajiang,Pareuchiloglanis sinensis 1 Mabian,Pareuchiloglanis anteanalis 1 Yanjin,Pareuchiloglanis kamengensis 1 1 Chayu,Pareuchiloglanis kamengensis 2 1 Chayu,Glaridoglanis andersonii 2 Chayu,Pseudexostoma yunnanensis 2 TengchoOreoglanis delacouri 2Exostoma labiatum 3 Tengcho
OutgroupLiobagrus anguillicauda 2 WuyishaAkysis brachybarbutus 2 JinghonPseudobagrus tokiensis
Pseudobagrus kyphus
Mystus sp.
a Sources of additional sequences: 1Peng et al. (2004); 2Saitoh et al. (2003)
primers 16Sar and 16Sbr (Palumbi, 1996). The PCRscontained approximately 100 ng of template DNA,1 lL of each primer, 5 lL of 10· reaction buffer, 2 lLdNTPs (each 2.5 mM), and 2.0 U Taq DNA polymerasein total 50 lL volume. The PCR profile consisted of aninitial denaturation step (3 min at 94 �C), followed by 35cycles performed in the following order of denaturationat 94 �C for 1 min; annealing at 58 �C for 45 s (52 �C for16S rRNA); and elongation at 72 �C for 1 min; and a fi-nal extension at 72 �C for 8 min. PCR amplificationproducts were purified on a 0.8% low melting point aga-rose gel stained with ethidium bromide, using the Bio-Star glassmilk DNA purification kit following themanufacturer�s protocol. Nucleotide sequences of cyto-chrome b gene and 16S rRNA gene were determinedusing the purified PCR product. Sequencing reactionswere performed in both directions to allow verificationof character states. The sequences have been depositedin GenBank (Accession Nos. are listed in Table 2).
2.3. Sequence alignment and analyses
No alignment was necessary for cytochrome b be-cause it is a protein-encoding gene. Initial alignmentsof the 16S rRNA sequences were performed with ClustalX (Thompson et al., 1997) with default gap costs.Alignments were then refined by eye on the basis of16S rRNA secondary structure (De Riijk et al., 1999).
g locales GenBank Accession Nos.a
16S rRNA Cytochrome b
g, Yunnan AY445906 AF4778301
n, Fujian AY574359 AF4168841
— AF4168871
Sichuan AY574357 AY601764ng, Yunnan AY445910 AF4168971
Yunnan AY445905 AF4995991
Tibet AY574355 AY601765hasa, Tibet AY445908 AY601766, Sichuan AY445895 AF4168831
Sichuan AY445898 AY2074801
Sichuan AY445901 AY1916091
Yunnan AY445903 AY1916101
Tibet AY574360 AY601767Tibet AY574360 AY601768Tibet AY574354 AY601769ng, Yunnan AY445894 AF4996021
— AF4168781
ng, Yunnan AY445907 AF4995981
n, Fujian AY574353 AF4168881
g, Yunnan AY574352 AF4996031
AB0541272 AB0541272
AB0856213 AB0856223
AY4588774 AY4588934
; 3Watanabe et al. (2002); 4Wilcox et al. (2004).

Fig. 4. Map showing the sampling localities of the sisorids used in this study.
X. Guo et al. / Molecular Phylogenetics and Evolution 35 (2005) 344–362 349
Most of cytochrome b gene sequences used in this studywere downloaded from GenBank (see Table 2). Despitethe fact that some sequences originated from differentspecimens, there was little reason to assume inconsisten-cies with regard to identification. Most of the samplesused in this study and those of Peng et al. (2004) hadbeen identified following the criteria in Chu et al. (1999).
To ensure accuracy, several representatives from eachspecies were included whenever possible. However, theDNA of some samples used in this study was of poorquality and did not amplify readily during PCR. Forthis reason, some specimens included in the cytochromeb sequences are not represented in the 16S rRNA se-quences. Alignment gaps in 16S rRNA sequences weretreated as missing characters.
Phylogenetic congruence of cytochrome b and 16SrRNA data sets were tested by the partition homogene-
ity test of Farris et al. (1995) with PAUP* 4.0b10 (Swof-ford, 2002). The partition homogeneity test supportedthe combination of the cytochrome b and 16S rRNAdata sets (P = 0.518). As mentioned above, some sam-ples were of poor quality and did not amplify, resultingin the inclusion of missing data. However, Wiens (1998)suggested that unless the proportion of missing data islarge, addition of incomplete data sets is more likelyto improve phylogenetic accuracy than reduce them.Consequently, the analyses were performed using thecombined data set, which included eighteen taxa of Siso-ridae and five outgroups for two genes: cytochrome b
and 16S rRNA (Table 2).Base compositional frequencies and nucleotide sub-
stitutions between pairwise distances were determinedusing PAUP*. Also using PAUP*, random trees(n = 1000) were generated to examine the phylogenetic
350 X. Guo et al. / Molecular Phylogenetics and Evolution 35 (2005) 344–362
signal (Hillis and Huelsenbeck, 1992). The possibility ofsequence saturation was investigated by plotting uncor-rected sequence divergence versus pairwise numbers ofobserved changes (for first, second, and third codonpositions, and for transitions and transversions sepa-rately). The amount of sequence saturation is inferredfrom the shape of the trend line, with a linear relation-ship indicating that the sequence is unsaturated and anasymptotic relationship indicating the presence ofsaturation.
We performed a wide array of phylogenetic analysesusing different methods to gauge the robustness of ourresulting hypotheses. These methods were maximumparsimony (MP), neighbor-joining with maximum like-lihood distance (NJ), maximum likelihood (ML) asimplemented in PAUP*, and a Bayesian approach asimplemented in MrBayes ver. 3.0b (Huelsenbeck andRonquist, 2001). The TI bias was estimated with MLand an associated transversion (TV) weighting sheme(TV:TI = 3:1) was implemented for MP, using a stepm-atrix. Character weights of 2:1 and 4:1 were applied tofirst, and second-codon positions relative to third posi-tions, respectively, for cytochrome b. The MP methodwas performed using heuristic searches with 20 ran-dom-addition-sequence replicates and tree-bisection-re-connection (TBR) branch swapping. Likelihood ratiotests (Goldman, 1993a,b; Huelsenbeck and Crandall,1997), as implemented in MODELTEST 3.06 (Posadaand Crandall, 1998), were employed to choose modelsfor model-based methods (NJ, ML, and Bayesian anal-yses). The GTR + G + I model (Gu et al., 1995; Yang,1994) was selected by MODELTEST. Four indepen-dent MCMC chains were simultaneously run for1,000,000 replicates by sampling one tree per 100 repli-cates with the Bayesian procedure. We discarded thefirst 800 trees as part of a burn-in procedure, and usedthe remaining 9200 sampling trees (whose log-likeli-hoods converged to stable values) to construct a 50%majority rule consensus tree. In addition to Bayesianposterior probabilities, node supports were assessed
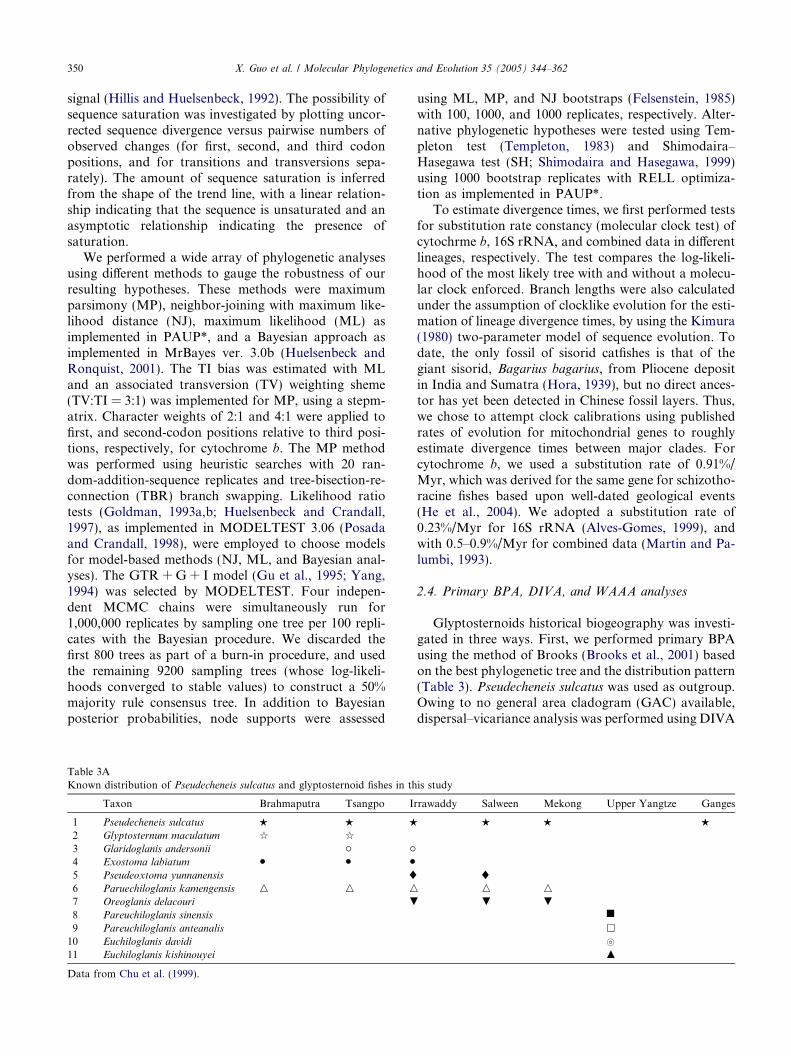
Table 3AKnown distribution of Pseudecheneis sulcatus and glyptosternoid fishes in th
Taxon Brahmaputra Tsangpo Ir
1 Pseudecheneis sulcatus % % %
2 Glyptosternum maculatum q q
3 Glaridoglanis andersonii � �4 Exostoma labiatum • • •5 Pseudeoxtoma yunnanensis ¤6 Paruechiloglanis kamengensis n n n
7 Oreoglanis delacouri .
8 Pareuchiloglanis sinensis
9 Pareuchiloglanis anteanalis
10 Euchiloglanis davidi
11 Euchiloglanis kishinouyei
Data from Chu et al. (1999).
using ML, MP, and NJ bootstraps (Felsenstein, 1985)with 100, 1000, and 1000 replicates, respectively. Alter-native phylogenetic hypotheses were tested using Tem-pleton test (Templeton, 1983) and Shimodaira–Hasegawa test (SH; Shimodaira and Hasegawa, 1999)using 1000 bootstrap replicates with RELL optimiza-tion as implemented in PAUP*.
To estimate divergence times, we first performed testsfor substitution rate constancy (molecular clock test) ofcytochrme b, 16S rRNA, and combined data in differentlineages, respectively. The test compares the log-likeli-hood of the most likely tree with and without a molecu-lar clock enforced. Branch lengths were also calculatedunder the assumption of clocklike evolution for the esti-mation of lineage divergence times, by using the Kimura(1980) two-parameter model of sequence evolution. Todate, the only fossil of sisorid catfishes is that of thegiant sisorid, Bagarius bagarius, from Pliocene depositin India and Sumatra (Hora, 1939), but no direct ances-tor has yet been detected in Chinese fossil layers. Thus,we chose to attempt clock calibrations using publishedrates of evolution for mitochondrial genes to roughlyestimate divergence times between major clades. Forcytochrome b, we used a substitution rate of 0.91%/Myr, which was derived for the same gene for schizotho-racine fishes based upon well-dated geological events(He et al., 2004). We adopted a substitution rate of0.23%/Myr for 16S rRNA (Alves-Gomes, 1999), andwith 0.5–0.9%/Myr for combined data (Martin and Pa-lumbi, 1993).
2.4. Primary BPA, DIVA, and WAAA analyses
Glyptosternoids historical biogeography was investi-gated in three ways. First, we performed primary BPAusing the method of Brooks (Brooks et al., 2001) basedon the best phylogenetic tree and the distribution pattern(Table 3). Pseudecheneis sulcatus was used as outgroup.Owing to no general area cladogram (GAC) available,dispersal–vicariance analysis was performed using DIVA
is study
rawaddy Salween Mekong Upper Yangtze Ganges
% % %
¤n n
. .
n
h
}
m
Table 3BBasins in which species 1-11 occur coded for primary BPA in this study
Basins Species Binary code
Ganges River 1, 100000000000000000001Brahmaputra basin 1, 2, 4, 6 110101000000000111111Tsangpo River 1, 2, 3, 4, 6 111101000000000111111Irrawaddy River 1, 3, 4, 5, 6, 7 101111100000001111111Salween River 1, 5, 6, 7 100011100000001111111Mekong River 1, 6, 7 100001100000001111111Upper Yangtze 8, 9, 10, 11 000000011111111011111
X. Guo et al. / Molecular Phylogenetics and Evolution 35 (2005) 344–362 351
1.1 (Ronquist, 1996) to determine possible ancestralareas for internal nodes, since this program can recon-struct ancestral distributions without taking general bio-geographic pattern into account. DIVA reconstructsancestral distributions by optimizing areas on a givencladogram based on the vicariance model, while at thesame time allowing dispersals, duplication and extinc-tions to occur (Ronquist, 1997). Duplications and vicar-iance receive a cost of 0 in DIVA, whereas dispersals andextinctions cost 1 per area added or deleted, respectively.This is because ‘‘dispersals and extinctions are unpredict-able events that can wipe out the traces of phylogeneti-cally constrained processes like vicariance andduplication’’ (Sanmartın, 2003), and unless extinctionsand dispersals are assigned a cost spurious events maybe introduced in optimal reconstructions (Sanmartınand Ronquist, 2002). To determine more reliable esti-mates of the distribution of the root node, we includedan additional outgroup Pseudecheneis sulcatus in theanalysis such that the node was no longer the root node.Species were assigned to seven main distribution areas:Brahmaputra, Tsangpo, Irrawaddy, Salween, Mekong,Upper Yangtze, and Ganges (Table 3; see also Fig. 7)and the combined data best tree was evaluated (DIVAsettings: maxareas = 7, bound = 250, hold = 32767,weight = 1.000, age = 1.000). Weighted ancestral areaanalysis (WAAA; Hausdorf, 1998), a cladistic methodfor estimating ancestral areas using reversible parsi-mony, was also performed on the best phylogenetic tree.WAAA produces ‘‘probability indices’’ indicating therelative probability that a particular area was part ofthe ancestral area for a particular node on a tree (thehigher the number, the more likely the area was part ofthe ancestral area).
3. Results
3.1. Characteristics of individual genes
3.1.1. Cytochrome bFor eight individuals, we sequenced the complete
cytochrome b gene and identified six haplotypes (see Ta-ble 2). The other 17 complete cytochrome b sequences(with the exception of Pseudobagrus kyphus, 1132 bp)
were obtained from GenBank. A total of 1138 positionswere analyzed, of which 564 characters were variable,and 458 of these characters were phylogenetically infor-mative (49.5 and 40.2%, respectively). Levels of se-quence divergence (uncorrected distance) between theoutgroup and ingroup lineages ranged from 16.1% (be-tween Akysis brachybarbatus and Glytosternum macula-
tum) to 25.9% (between Mystus sp. and Oreoglanis
delacouri). Sequence divergence within the ingroup taxawas as high as 25.6% (Exostoma delacouri compared toGagata cenia). The smallest divergence between two spe-cies was from Pareuchiloglanis sinensis to Pareuchilogl-
anis anteanalis (0). The saturation plots of uncorrectedsequence divergence against transitions and transver-sions divided by codon position indicated saturation atthird position transitions (not shown). The g1 statisticindicated that a significant phylogenetic signal was pres-ent: g1 = �0.63; P = 0.001; means ± SD tree length =4353.00 ± 101.51.
3.1.2. 16S rRNA
For 28 individuals, we sequenced the 16S rRNA frag-ments (about 580 bp) and identified 17 haplotypes (seeTable 2). The other three 16S rRNA sequences were ob-tained from GenBank. Twenty sequences of 567 bp(excluding primers) of the 16S rRNA gene were ana-lyzed. A total of 241 characters were variable, and 133of these were phylogenetically informative (42.5 and23.5%, respectively). Levels of sequence divergence(uncorrected distance) between the outgroup and in-group lineages ranged from 6.8% (between Liobagrus
anguillicauda and Glyptothorax cavia) to 33.0% (betweenPseudobagrus tokiensis and Pseudexostoma yunnanen-
sis). Sequence divergence within the ingroup was as highas 13.9% (between Bagarius yarrelli and Euchiloglanis
kishinouyei). The smallest divergence between two taxawas 0 (e.g., from Glyptothorax fukiensis fukiensis to Gly-
ptothorax sinense). When outgroup taxa were excluded,scatterplots of uncorrected sequence divergence versustransition and transversion suggested the transitionsand transversions were not saturated (not shown). Theg1 statistic indicated that significant phylogenetic signalwas present: g1 = �0.77; P = 0.001; mean ± SD treelength = 838.50 ± 30.65.
3.2. Phylogenetic relationships
Fig. 5A showed the Bayesian tree constructed from aset of 23 combined sequences, which confirmed themonophyly of the sisorids and glyptosternoids(PP = 97 and 95%, respectively). The other methodsyielded similar topologies (see Fig. 5B–D). Two majorclades within the sisorids were identified. Clade A con-tained the tribe Glyptosternini, i.e., Pseudecheneis andthe glyptosternoids. Clade B contained the non-glyptos-ternini sisorids in China. Clades A and B appeared to be
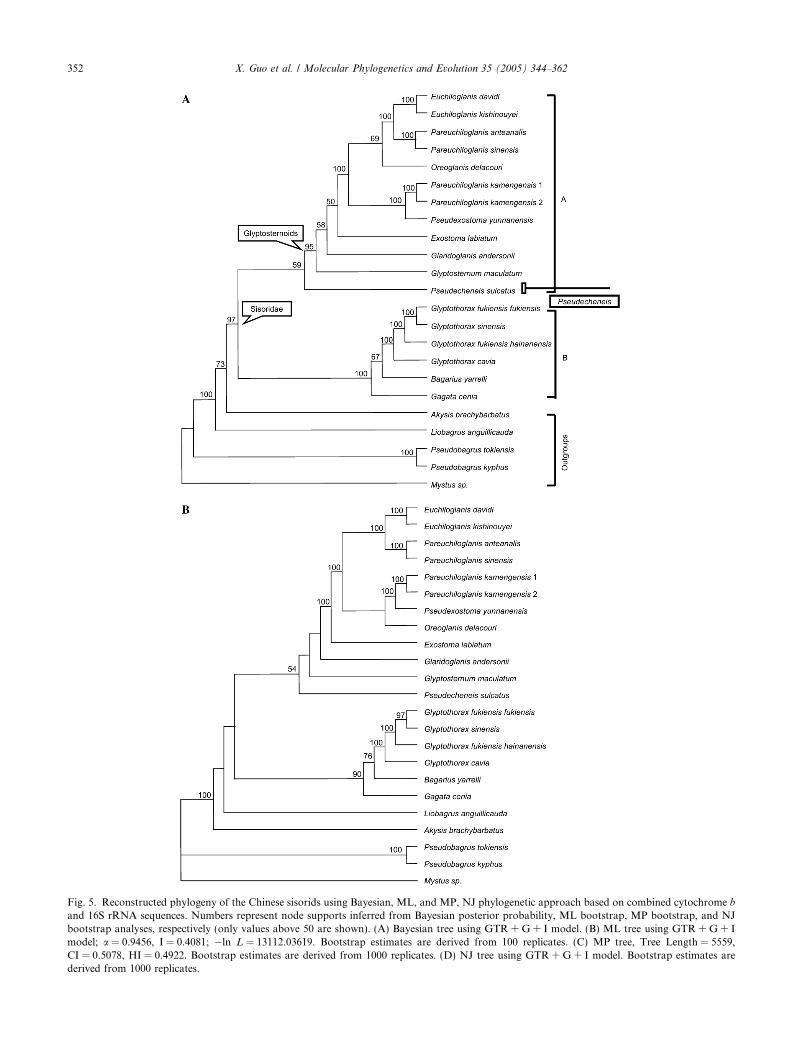
Fig. 5. Reconstructed phylogeny of the Chinese sisorids using Bayesian, ML, and MP, NJ phylogenetic approach based on combined cytochrome band 16S rRNA sequences. Numbers represent node supports inferred from Bayesian posterior probability, ML bootstrap, MP bootstrap, and NJbootstrap analyses, respectively (only values above 50 are shown). (A) Bayesian tree using GTR + G + I model. (B) ML tree using GTR + G + Imodel; a = 0.9456, I = 0.4081; �ln L = 13112.03619. Bootstrap estimates are derived from 100 replicates. (C) MP tree, Tree Length = 5559,CI = 0.5078, HI = 0.4922. Bootstrap estimates are derived from 1000 replicates. (D) NJ tree using GTR + G + I model. Bootstrap estimates arederived from 1000 replicates.
352 X. Guo et al. / Molecular Phylogenetics and Evolution 35 (2005) 344–362
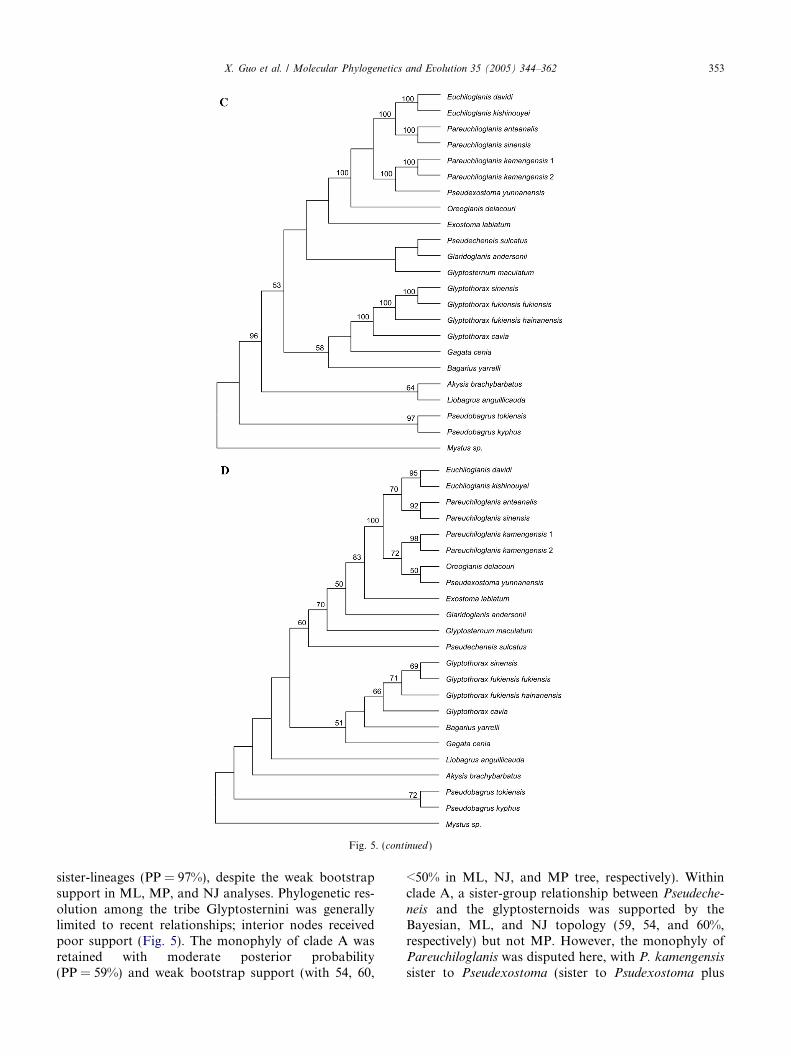
Fig. 5. (continued )
X. Guo et al. / Molecular Phylogenetics and Evolution 35 (2005) 344–362 353
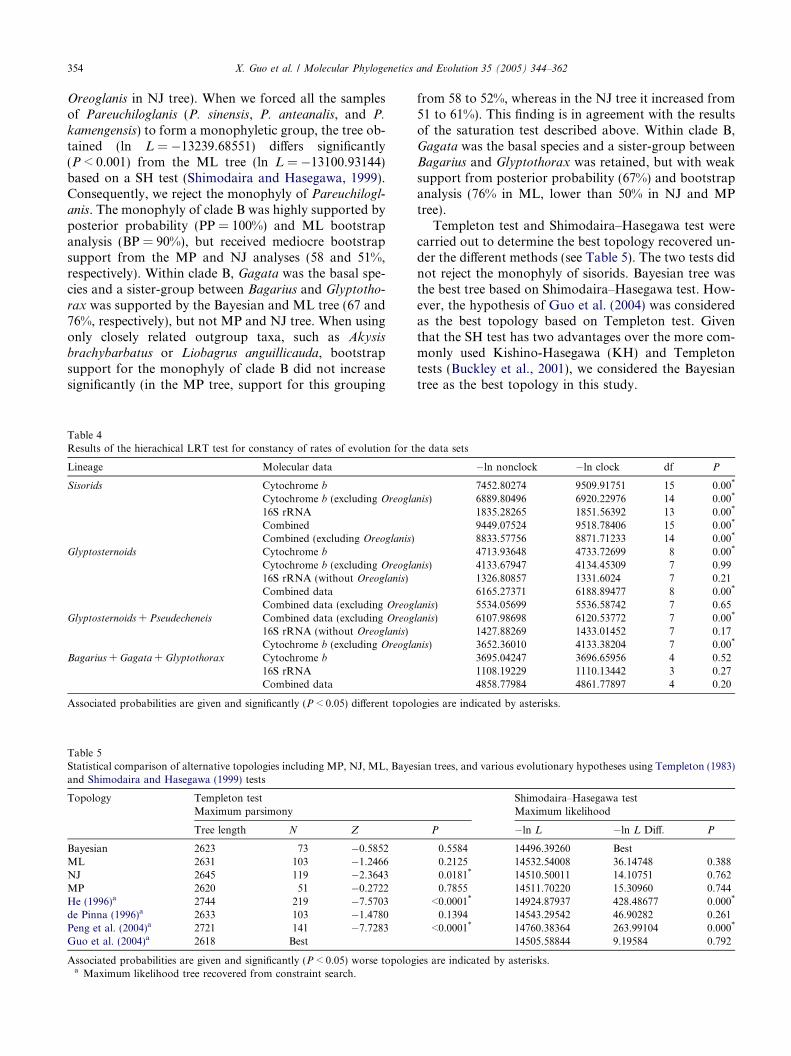
sister-lineages (PP = 97%), despite the weak bootstrapsupport in ML, MP, and NJ analyses. Phylogenetic res-olution among the tribe Glyptosternini was generallylimited to recent relationships; interior nodes receivedpoor support (Fig. 5). The monophyly of clade A wasretained with moderate posterior probability(PP = 59%) and weak bootstrap support (with 54, 60,
<50% in ML, NJ, and MP tree, respectively). Withinclade A, a sister-group relationship between Pseudeche-
neis and the glyptosternoids was supported by theBayesian, ML, and NJ topology (59, 54, and 60%,respectively) but not MP. However, the monophyly ofPareuchiloglanis was disputed here, with P. kamengensis
sister to Pseudexostoma (sister to Psudexostoma plus
354 X. Guo et al. / Molecular Phylogenetics and Evolution 35 (2005) 344–362
Oreoglanis in NJ tree). When we forced all the samplesof Pareuchiloglanis (P. sinensis, P. anteanalis, and P.
kamengensis) to form a monophyletic group, the tree ob-tained (ln L = �13239.68551) differs significantly(P < 0.001) from the ML tree (ln L = �13100.93144)based on a SH test (Shimodaira and Hasegawa, 1999).Consequently, we reject the monophyly of Pareuchilogl-anis. The monophyly of clade B was highly supported byposterior probability (PP = 100%) and ML bootstrapanalysis (BP = 90%), but received mediocre bootstrapsupport from the MP and NJ analyses (58 and 51%,respectively). Within clade B, Gagata was the basal spe-cies and a sister-group between Bagarius and Glyptotho-
rax was supported by the Bayesian and ML tree (67 and76%, respectively), but not MP and NJ tree. When usingonly closely related outgroup taxa, such as Akysis
brachybarbatus or Liobagrus anguillicauda, bootstrapsupport for the monophyly of clade B did not increasesignificantly (in the MP tree, support for this grouping
Table 4Results of the hierachical LRT test for constancy of rates of evolution for t
Lineage Molecular data
Sisorids Cytochrome b
Cytochrome b (excluding Oreogla
16S rRNACombinedCombined (excluding Oreoglanis)
Glyptosternoids Cytochrome b
Cytochrome b (excluding Oreogla
16S rRNA (without Oreoglanis)Combined dataCombined data (excluding Oreog
Glyptosternoids + Pseudecheneis Combined data (excluding Oreog
16S rRNA (without Oreoglanis)Cytochrome b (excluding Oreogla
Bagarius + Gagata + Glyptothorax Cytochrome b
16S rRNACombined data
Associated probabilities are given and significantly (P < 0.05) different topol
Table 5Statistical comparison of alternative topologies including MP, NJ, ML, Bayesand Shimodaira and Hasegawa (1999) tests
Topology Templeton testMaximum parsimony
Tree length N Z
Bayesian 2623 73 �0.5852ML 2631 103 �1.2466NJ 2645 119 �2.3643MP 2620 51 �0.2722He (1996)a 2744 219 �7.5703de Pinna (1996)a 2633 103 �1.4780Peng et al. (2004)a 2721 141 �7.7283Guo et al. (2004)a 2618 Best
Associated probabilities are given and significantly (P < 0.05) worse topologa Maximum likelihood tree recovered from constraint search.
from 58 to 52%, whereas in the NJ tree it increased from51 to 61%). This finding is in agreement with the resultsof the saturation test described above. Within clade B,Gagata was the basal species and a sister-group betweenBagarius and Glyptothorax was retained, but with weaksupport from posterior probability (67%) and bootstrapanalysis (76% in ML, lower than 50% in NJ and MPtree).
Templeton test and Shimodaira–Hasegawa test werecarried out to determine the best topology recovered un-der the different methods (see Table 5). The two tests didnot reject the monophyly of sisorids. Bayesian tree wasthe best tree based on Shimodaira–Hasegawa test. How-ever, the hypothesis of Guo et al. (2004) was consideredas the best topology based on Templeton test. Giventhat the SH test has two advantages over the more com-monly used Kishino-Hasegawa (KH) and Templetontests (Buckley et al., 2001), we considered the Bayesiantree as the best topology in this study.
he data sets
�ln nonclock �ln clock df P
7452.80274 9509.91751 15 0.00*
nis) 6889.80496 6920.22976 14 0.00*
1835.28265 1851.56392 13 0.00*
9449.07524 9518.78406 15 0.00*
8833.57756 8871.71233 14 0.00*
4713.93648 4733.72699 8 0.00*
nis) 4133.67947 4134.45309 7 0.991326.80857 1331.6024 7 0.216165.27371 6188.89477 8 0.00*
lanis) 5534.05699 5536.58742 7 0.65lanis) 6107.98698 6120.53772 7 0.00*
1427.88269 1433.01452 7 0.17nis) 3652.36010 4133.38204 7 0.00*
3695.04247 3696.65956 4 0.521108.19229 1110.13442 3 0.274858.77984 4861.77897 4 0.20
ogies are indicated by asterisks.
ian trees, and various evolutionary hypotheses using Templeton (1983)
Shimodaira–Hasegawa testMaximum likelihood
P �ln L �ln L Diff. P
0.5584 14496.39260 Best0.2125 14532.54008 36.14748 0.3880.0181* 14510.50011 14.10751 0.7620.7855 14511.70220 15.30960 0.744
<0.0001* 14924.87937 428.48677 0.000*
0.1394 14543.29542 46.90282 0.261<0.0001* 14760.38364 263.99104 0.000*
14505.58844 9.19584 0.792
ies are indicated by asterisks.
Tab
le6
Divergence
time(M
Y=
millionyears)
forselected
phylogenetic
splits
within
theChinesesisoridsas
based
onmolecularclock
calibrationsforcytochromebgene(H
eet
al.,20
04),fish
rRNA
(Alves-G
omes,19
99),an
dsalm
onid
mtD
NA
(Martinan
dPalumbi,19
93)
Phylogenetic
split
Cyt
b(%
)0.91%/M
Y16SrR
NA
(%)
0.23%/M
YmtD
NA
(%)
0.5–0.9%
/MY
E.davidi–E.kishinouyei
2.60
±0.47
1.43
±0.26
0.19
±0.17
0.41
±0.36
1.81
±0.33
1.01
±0.18
–1.81±
0.33
P.sinensis–P.anteanalis
00
00
Euchiloglanis—
(P.sinensis,
P.anteanalis)
7.28
±0.84
4.00
±0.46
1.41
±0.50
3.07
±1.07
5.32
±0.49
2.96
±0.27
–5.32±
0.49
Oreoglanis—
(Euchiloglanis,
P.sinensis,P.anteanalis)
——
——
—
(Pseudexostoma,P.kamengensis)–
(Oreoglanis,Euchiloglanis,
P.sinensis,P.anteanalis)
13.39±
0.98
7.36
±0.54
5.96
±0.99
12.95±
2.15
10.88±
0.77
6.04
±0.43
–10.88
±0.77
Pseudexostoma–P.kamengensis
9.35
±0.96
5.14
±0.53
0.74
±0.35
2.11
±0.76
6.42
±0.67
3.57
±0.37
–6.42±
0.67
Glyptosternum—
(Glaridoglanis,
Oreoglanis,Exostoma,
Pseudexostoma,Pareuchiloglanis,
Euchiloglanis)
19.57±
1.19
10.75±
0.65
9.82
±1.18
21.34±
2.57
16.28±
0.92
9.04
±0.51
–16.28
±0.92
Pseudecheneis–Glyptosternoids
——
9.97
±1.20
21.67±
2.61
—Bagarius–Glyptothorax
21.83±
1.34
11.99±
0.74
6.73
±1.13
14.63±
2.46
17.86±
0.10
9.92
±0.06
–17.86
±0.10
Gagata—
(Bagarius,Glyptothorax)
22.09±
1.36
12.14±
0.74
7.61
±1.08
16.54±
2.35
18.15±
0.97
10.08±
0.54
–18.15
±0.97
CladeA–C
ladeB
——
——
——
Nodes
that
failed
rate
constan
cywereexcluded
from
calibrations.
X. Guo et al. / Molecular Phylogenetics and Evolution 35 (2005) 344–362 355
3.3. Divergence time estimations
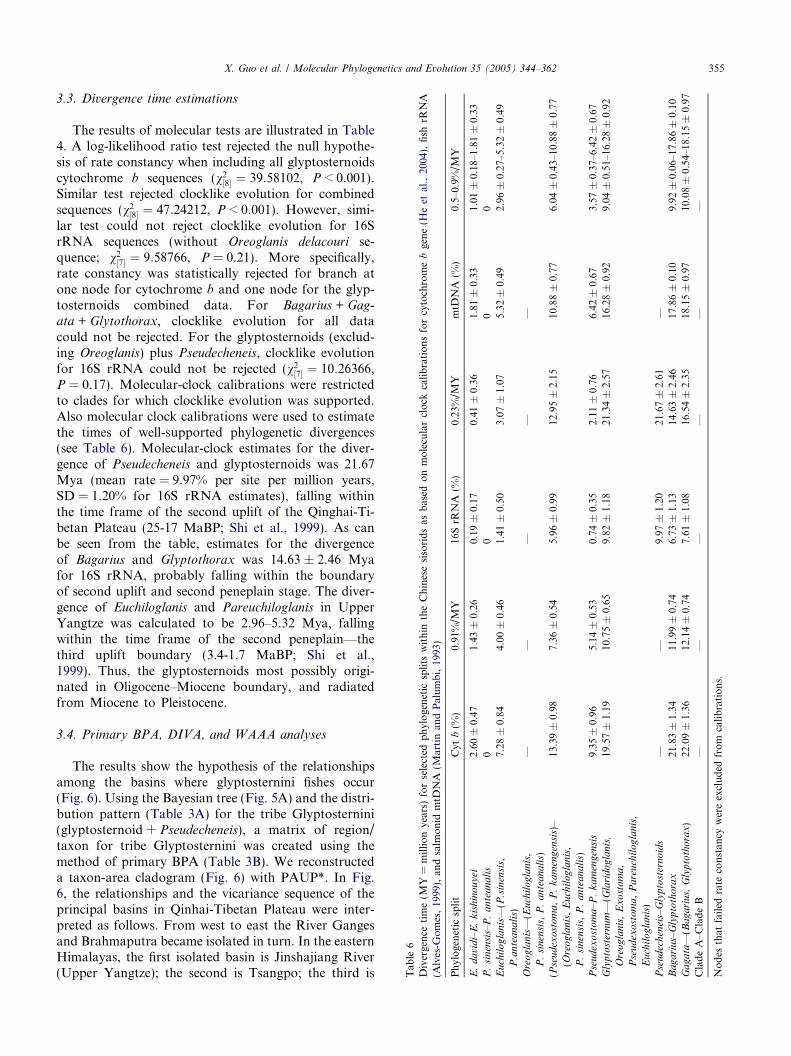
The results of molecular tests are illustrated in Table4. A log-likelihood ratio test rejected the null hypothe-sis of rate constancy when including all glyptosternoidscytochrome b sequences (v2½8� ¼ 39:58102, P < 0.001).Similar test rejected clocklike evolution for combinedsequences (v2½8� ¼ 47:24212, P < 0.001). However, simi-lar test could not reject clocklike evolution for 16SrRNA sequences (without Oreoglanis delacouri se-quence; v2½7� ¼ 9:58766, P = 0.21). More specifically,rate constancy was statistically rejected for branch atone node for cytochrome b and one node for the glyp-tosternoids combined data. For Bagarius + Gag-ata + Glytothorax, clocklike evolution for all datacould not be rejected. For the glyptosternoids (exclud-ing Oreoglanis) plus Pseudecheneis, clocklike evolutionfor 16S rRNA could not be rejected (v2½7� ¼ 10:26366,P = 0.17). Molecular-clock calibrations were restrictedto clades for which clocklike evolution was supported.Also molecular clock calibrations were used to estimatethe times of well-supported phylogenetic divergences(see Table 6). Molecular-clock estimates for the diver-gence of Pseudecheneis and glyptosternoids was 21.67Mya (mean rate = 9.97% per site per million years,SD = 1.20% for 16S rRNA estimates), falling withinthe time frame of the second uplift of the Qinghai-Ti-betan Plateau (25-17 MaBP; Shi et al., 1999). As canbe seen from the table, estimates for the divergenceof Bagarius and Glyptothorax was 14.63 ± 2.46 Myafor 16S rRNA, probably falling within the boundaryof second uplift and second peneplain stage. The diver-gence of Euchiloglanis and Pareuchiloglanis in UpperYangtze was calculated to be 2.96–5.32 Mya, fallingwithin the time frame of the second peneplain—thethird uplift boundary (3.4-1.7 MaBP; Shi et al.,1999). Thus, the glyptosternoids most possibly origi-nated in Oligocene–Miocene boundary, and radiatedfrom Miocene to Pleistocene.
3.4. Primary BPA, DIVA, and WAAA analyses
The results show the hypothesis of the relationshipsamong the basins where glyptosternini fishes occur(Fig. 6). Using the Bayesian tree (Fig. 5A) and the distri-bution pattern (Table 3A) for the tribe Glyptosternini(glyptosternoid + Pseudecheneis), a matrix of region/taxon for tribe Glyptosternini was created using themethod of primary BPA (Table 3B). We reconstructeda taxon-area cladogram (Fig. 6) with PAUP*. In Fig.6, the relationships and the vicariance sequence of theprincipal basins in Qinhai-Tibetan Plateau were inter-preted as follows. From west to east the River Gangesand Brahmaputra became isolated in turn. In the easternHimalayas, the first isolated basin is Jinshajiang River(Upper Yangtze); the second is Tsangpo; the third is
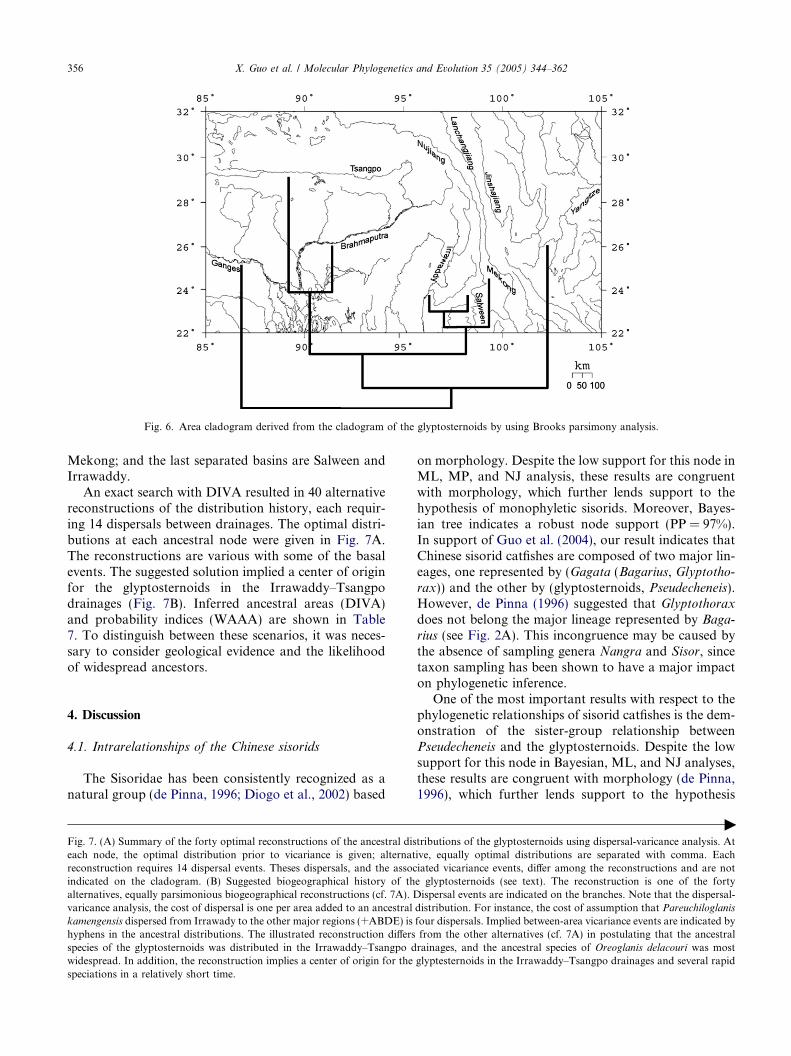
Fig. 6. Area cladogram derived from the cladogram of the glyptosternoids by using Brooks parsimony analysis.
356 X. Guo et al. / Molecular Phylogenetics and Evolution 35 (2005) 344–362
Mekong; and the last separated basins are Salween andIrrawaddy.
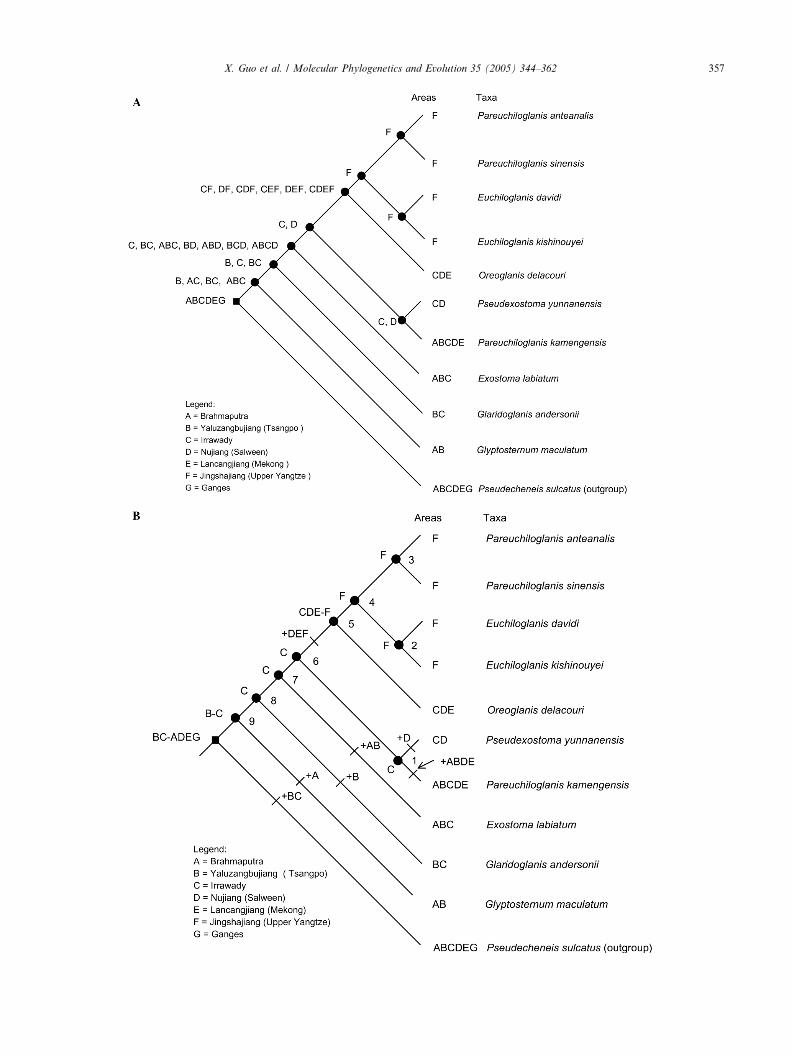
An exact search with DIVA resulted in 40 alternativereconstructions of the distribution history, each requir-ing 14 dispersals between drainages. The optimal distri-butions at each ancestral node were given in Fig. 7A.The reconstructions are various with some of the basalevents. The suggested solution implied a center of originfor the glyptosternoids in the Irrawaddy–Tsangpodrainages (Fig. 7B). Inferred ancestral areas (DIVA)and probability indices (WAAA) are shown in Table7. To distinguish between these scenarios, it was neces-sary to consider geological evidence and the likelihoodof widespread ancestors.
4. Discussion
4.1. Intrarelationships of the Chinese sisorids
The Sisoridae has been consistently recognized as anatural group (de Pinna, 1996; Diogo et al., 2002) based
Fig. 7. (A) Summary of the forty optimal reconstructions of the ancestral diseach node, the optimal distribution prior to vicariance is given; alternatreconstruction requires 14 dispersal events. Theses dispersals, and the associndicated on the cladogram. (B) Suggested biogeographical history of thalternatives, equally parsimonious biogeographical reconstructions (cf. 7A). Dvaricance analysis, the cost of dispersal is one per area added to an ancestralkamengensis dispersed from Irrawady to the other major regions (+ABDE) ishyphens in the ancestral distributions. The illustrated reconstruction differsspecies of the glyptosternoids was distributed in the Irrawaddy–Tsangpo dwidespread. In addition, the reconstruction implies a center of origin for thespeciations in a relatively short time.
on morphology. Despite the low support for this node inML, MP, and NJ analysis, these results are congruentwith morphology, which further lends support to thehypothesis of monophyletic sisorids. Moreover, Bayes-ian tree indicates a robust node support (PP = 97%).In support of Guo et al. (2004), our result indicates thatChinese sisorid catfishes are composed of two major lin-eages, one represented by (Gagata (Bagarius, Glyptotho-rax)) and the other by (glyptosternoids, Pseudecheneis).However, de Pinna (1996) suggested that Glyptothoraxdoes not belong the major lineage represented by Baga-
rius (see Fig. 2A). This incongruence may be caused bythe absence of sampling genera Nangra and Sisor, sincetaxon sampling has been shown to have a major impacton phylogenetic inference.
One of the most important results with respect to thephylogenetic relationships of sisorid catfishes is the dem-onstration of the sister-group relationship betweenPseudecheneis and the glyptosternoids. Despite the lowsupport for this node in Bayesian, ML, and NJ analyses,these results are congruent with morphology (de Pinna,1996), which further lends support to the hypothesis
tributions of the glyptosternoids using dispersal-varicance analysis. Ative, equally optimal distributions are separated with comma. Eachiated vicariance events, differ among the reconstructions and are note glyptosternoids (see text). The reconstruction is one of the fortyispersal events are indicated on the branches. Note that the dispersal-
distribution. For instance, the cost of assumption that Pareuchiloglanisfour dispersals. Implied between-area vicariance events are indicated byfrom the other alternatives (cf. 7A) in postulating that the ancestralrainages, and the ancestral species of Oreoglanis delacouri was mostglyptesternoids in the Irrawaddy–Tsangpo drainages and several rapid
c
X. Guo et al. / Molecular Phylogenetics and Evolution 35 (2005) 344–362 357
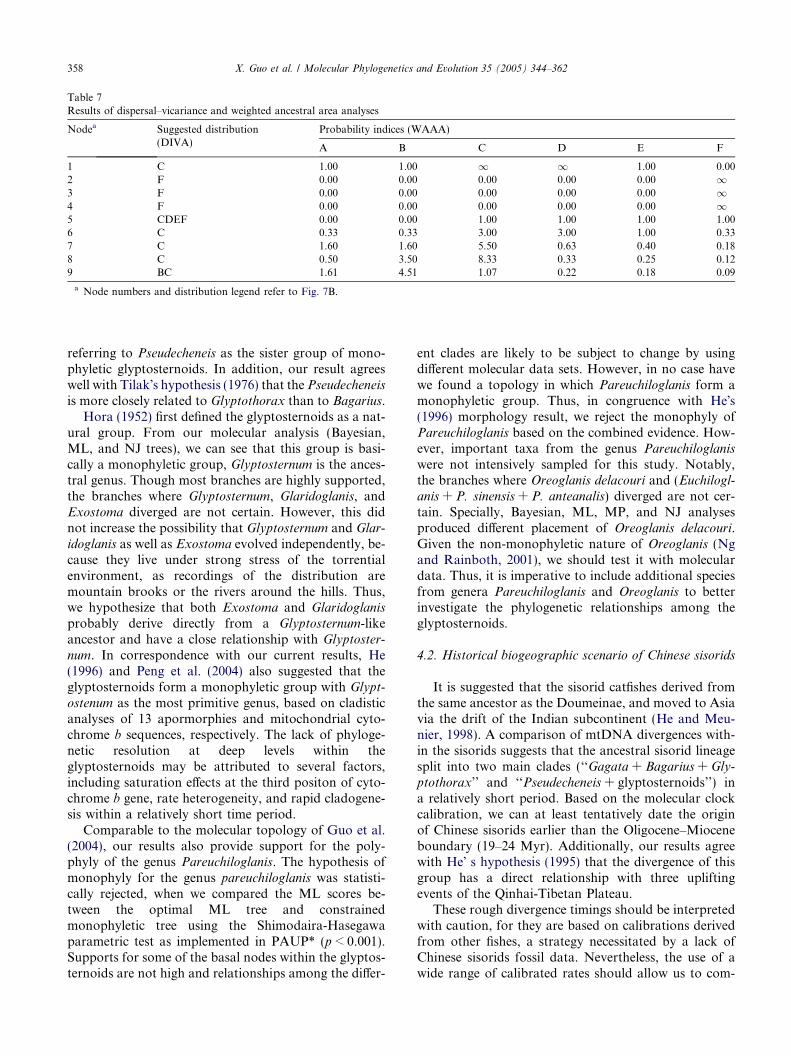
Table 7Results of dispersal–vicariance and weighted ancestral area analyses
Nodea Suggested distribution(DIVA)
Probability indices (WAAA)
A B C D E F
1 C 1.00 1.00 1 1 1.00 0.002 F 0.00 0.00 0.00 0.00 0.00 13 F 0.00 0.00 0.00 0.00 0.00 14 F 0.00 0.00 0.00 0.00 0.00 15 CDEF 0.00 0.00 1.00 1.00 1.00 1.006 C 0.33 0.33 3.00 3.00 1.00 0.337 C 1.60 1.60 5.50 0.63 0.40 0.188 C 0.50 3.50 8.33 0.33 0.25 0.129 BC 1.61 4.51 1.07 0.22 0.18 0.09
a Node numbers and distribution legend refer to Fig. 7B.
358 X. Guo et al. / Molecular Phylogenetics and Evolution 35 (2005) 344–362
referring to Pseudecheneis as the sister group of mono-phyletic glyptosternoids. In addition, our result agreeswell with Tilak�s hypothesis (1976) that the Pseudecheneisis more closely related to Glyptothorax than to Bagarius.
Hora (1952) first defined the glyptosternoids as a nat-ural group. From our molecular analysis (Bayesian,ML, and NJ trees), we can see that this group is basi-cally a monophyletic group, Glyptosternum is the ances-tral genus. Though most branches are highly supported,the branches where Glyptosternum, Glaridoglanis, andExostoma diverged are not certain. However, this didnot increase the possibility that Glyptosternum and Glar-
idoglanis as well as Exostoma evolved independently, be-cause they live under strong stress of the torrentialenvironment, as recordings of the distribution aremountain brooks or the rivers around the hills. Thus,we hypothesize that both Exostoma and Glaridoglanis
probably derive directly from a Glyptosternum-likeancestor and have a close relationship with Glyptoster-
num. In correspondence with our current results, He(1996) and Peng et al. (2004) also suggested that theglyptosternoids form a monophyletic group with Glypt-
ostenum as the most primitive genus, based on cladisticanalyses of 13 apormorphies and mitochondrial cyto-chrome b sequences, respectively. The lack of phyloge-netic resolution at deep levels within theglyptosternoids may be attributed to several factors,including saturation effects at the third positon of cyto-chrome b gene, rate heterogeneity, and rapid cladogene-sis within a relatively short time period.
Comparable to the molecular topology of Guo et al.(2004), our results also provide support for the poly-phyly of the genus Pareuchiloglanis. The hypothesis ofmonophyly for the genus pareuchiloglanis was statisti-cally rejected, when we compared the ML scores be-tween the optimal ML tree and constrainedmonophyletic tree using the Shimodaira-Hasegawaparametric test as implemented in PAUP* (p < 0.001).Supports for some of the basal nodes within the glyptos-ternoids are not high and relationships among the differ-
ent clades are likely to be subject to change by usingdifferent molecular data sets. However, in no case havewe found a topology in which Pareuchiloglanis form amonophyletic group. Thus, in congruence with He�s(1996) morphology result, we reject the monophyly ofPareuchiloglanis based on the combined evidence. How-ever, important taxa from the genus Pareuchiloglanis
were not intensively sampled for this study. Notably,the branches where Oreoglanis delacouri and (Euchilogl-anis + P. sinensis + P. anteanalis) diverged are not cer-tain. Specially, Bayesian, ML, MP, and NJ analysesproduced different placement of Oreoglanis delacouri.Given the non-monophyletic nature of Oreoglanis (Ngand Rainboth, 2001), we should test it with moleculardata. Thus, it is imperative to include additional speciesfrom genera Pareuchiloglanis and Oreoglanis to betterinvestigate the phylogenetic relationships among theglyptosternoids.
4.2. Historical biogeographic scenario of Chinese sisorids
It is suggested that the sisorid catfishes derived fromthe same ancestor as the Doumeinae, and moved to Asiavia the drift of the Indian subcontinent (He and Meu-nier, 1998). A comparison of mtDNA divergences with-in the sisorids suggests that the ancestral sisorid lineagesplit into two main clades (‘‘Gagata + Bagarius + Gly-
ptothorax’’ and ‘‘Pseudecheneis + glyptosternoids’’) ina relatively short period. Based on the molecular clockcalibration, we can at least tentatively date the originof Chinese sisorids earlier than the Oligocene–Mioceneboundary (19–24 Myr). Additionally, our results agreewith He� s hypothesis (1995) that the divergence of thisgroup has a direct relationship with three upliftingevents of the Qinhai-Tibetan Plateau.
These rough divergence timings should be interpretedwith caution, for they are based on calibrations derivedfrom other fishes, a strategy necessitated by a lack ofChinese sisorids fossil data. Nevertheless, the use of awide range of calibrated rates should allow us to com-
X. Guo et al. / Molecular Phylogenetics and Evolution 35 (2005) 344–362 359
pare molecular divergence times with the available dataon geological events in this area, and provide tests ofvicariance/dispersal hypotheses. Vicariance theorists as-sume that common distributional patterns result fromshared vicariance events. Under a vicariance model, taxawith parallel distributions would be expected to exhibitsimilar amounts of genetic divergence. The hypothesisof a vicariant event between the formerly connectedTsangpo and Upper Irrawaddy is also supported bydata from Badidae species (Ruber et al., 2004). Theuncorrected cytochrome b sequence divergence betweenGlyptosternum vs. the remaining glyptosternoids lin-eages represented by Glaridoglanis is 17.35 ± 0.85%(range 16.50–18.20%). Similar level of cytochrome bdivergence was found between the B. badis and B.assam-
ensis species group vs. the B. corycaeus species group(18.24–19.56%) that show comparable allopatric distri-bution (Ruber et al., 2004). Although preliminary, thesedata indicate that the levels of cytochrome b sequencedivergence between species pairs occurring in the Tsang-po–Brahmaputra drainages and the Irrawaddy drainageare in the same range. Thus, our data support a hypoth-esized paleo connection of the Tsangpo river with theIrrawaddy drainage that was most likely interruptedduring Miocene orogenic events through tectonic upliftsin eastern Tibet.
The reconstructed taxon-area cladogram by BPA waspartly not congruent with the geological evidence oflarge-scale changes in drainage patterns in the Mioceneaffecting the Irrawaddy- and Tsangpo–Brahmaputradrainages in the eastern Himalayas. Thus, the generalarea relationships may not be expected to conform toa hierarchical pattern. Dispersal–vicariance analysisand weighted ancestral area analysis provide much in-sight into cladogenesis within glyptosternoids. A con-nective ancestral distribution comprising the Tsangporiver and Irrawaddy drainage is inferred for the glyptos-ternoids ancestor (node 9, Fig. 7B; Table 7). In the glyp-tosternoids, we can suggest an ancestral divergence intoIrrawaddy- and Tsangpo-clade, following several rapidduplications (sympatric speciation, nodes 6–8 in Fig.7B) within a relatively short time period. This suggeststhat vicariance has played a fundamental role in theglyptosternoids cladogenesis, but that vicariance aloneis not a sufficient explanation. The dispersal–vicarianceanalysis highlights this finding, suggesting a minimumof 12 dispersal events in the glyptosternoids (see Fig.7B). For example, molecular-clock calibration betweenPseudexostoma yunnanensis and Pareuchiloglanis kam-
engensis (9.35 ± 0.96 Mya) postdates the cladogenesisof Irrawaddy and Tsangpo drainages, and thus favorsdispersal rather than vicariance for the wide distribu-tions of Pareuchiloglanis kamengensis (Fig. 7B). Fromthe suggested biogeographical history (Fig. 7B) andmolecular-clock calibration, we can infer the divergenceof the Euchiloglanis and Pareuchiloglanis sinensis and P.
anteanalis might have been caused by the third uplift(3.4-1.7 MaBP) of the Plateau. Geological studies indi-cated that the uplift events of the Qinhai-Tibetan Pla-teau occurred more strongly and frequently from 3.4Myr ago (Yu et al., 2000; and references therein). Therich geological and ecological diversity of the Qinhai-Ti-betan Plateau, together with habitat isolation due tochanging climatic conditions during the third uplift ofthe Plateau, may have promoted rapid speciation insmall, isolated populations, thus allowing the fixationof derived morphological characters. The main periodof salt forming was after 3.5 MaBP (An et al., 2001;Li et al., 2001). This period was named Qinghai-TibetanMovement A phase. Violent climate shifts in the Qinhai-Tibetan Plateau occurred about 1.7 MaBP, and the per-iod was called Qinghai-Tibetan Movement C Phase (Liet al., 1996). During that time, rivers around the Plateaueroded headward and cut down intensively, such as theUpper Yangtze and all those rivers trans-Himalayan be-gan to erode and form terraces. It justified the dispersaland duplication (sympatric speciation) events illustratedin Fig. 7B.
Chu (1979) demonstrated that the origin of the glyp-tosternoid fishes is most probably in the late Pliocene.However, we argue that this time of origin estimates isinconsistent with the historical episodes of geologicalchange. According to recent environmental data, biol-ogy and chronology (Fang et al., 2002; Ge et al.,2002; Sun, 1996), the Qinhai-Tibetan Plateau was sub-ject to three cycles of uplift and two large-scale pene-plain, during 45-38 MaBP, 25-17 MaBP, and 3.4-1.7MaBP, respectively, with each uplift less than 2000 m(Shi et al., 1999). Variations in the environment ofthe Plateau accompanied the changes in elevation.For sisorid catfishes, elevation of habitat can reflectdifferences of environment. The environment suitablefor one genus is commensurate with the conditions thatare necessary when the genus colonized in evolutionaryhistory. In a sense, elevations adapted to each genus ofthe sisorid catfishes may also represent the uplift heightof the Plateau attained when the genus appeared.Glyptosternum fishes mainly inhabit altitudes of 2900–3850 m. Given that the Plateau had raised up to morethan 2000 m, less than 4000 m above sea level during25-17 MaBP (Shi et al., 1999), the origin of glyptoster-noids could also have happened at that time, i.e., dur-ing the late Oligocene and Miocene. Interestingly, thisspeculation is practically in accordance with the molec-ular- clock calibration that the origin of the glyptoster-noids occurred at 19.03-24.08 MaBP, falling within thetime frame of the second uplift of the Qinghai-TibetanPlateau.
Our molecular evidence tentatively highlights theimportance of paleo river connections between theTsangpo and the Irrawaddy drainages. Calibration ofa molecular clock allowed us to date the proposed
360 X. Guo et al. / Molecular Phylogenetics and Evolution 35 (2005) 344–362
vicariant scenario at the Oligocene–Miocene boundary(19–24 Mya), which seems to agree with geological evi-dence for the separation of these drainages caused bytectonic uplifts in Eastern Tibet. These geologicalevents appear to have played a primary role in thediversification of Chinese sisorids. Based on dis-persal–vicariance analysis, we propose an evolutionaryscenario for the sisorids that combines aspects of bothvicariance and dispersal theory. Unfortunately, recon-structions of biogeographic events require variousassumptions regarding the weighting of particularevents (e.g., dispersal, extinction, and vicariance) (Ron-quist, 1997). Nearly any phylogenetic pattern of rela-tionships can be explained by invoking variouscombinations of vicariance, dispersal, and extinction.Historical biogeography can be particularly difficultwhen studying taxa with poor or nonexistent fossil re-cords, because existing methods that are designed towork in the absence of a general area cladogram(e.g., DIVA and WAAA) may produce inferred ances-tral distributions that are implausible. Undoubtedly,additional tests of the phylogenies and biogeographicscenarios proposed here are necessary. These testsshould include addition of new sequence data and taxafor phylogenetic analysis, as well as exploration of dis-persal/vicariance cost ratios or application of maxi-mum-likelihood techniques, analogous to recent workdone on character state reconstruction (e.g., Omland,1997; Schluter et al., 1997). Similar biogeographic anal-yses for other taxa endemic to Qinhai-Tibetan Plateau,in combination with the results presented here, will becritical for constructing a general area cladogram ofbasins in the Qinhai-Tibetan Plateau.
Acknowledgments
We extend our sincerest gratitude to Mrs. Sheng-hong Zhou, Zhen-quan Ye, and Dr. Zuo-gang Pengfor assistance in collecting specimens or providing tis-sues in their care, and Dr. C. Smith (University ofLeicester) for helpful suggestions. This work was sup-ported by the Chinese Academy of Sciences (KSCX2-SW-101B), the Innovation Program (220101) of theInstitute of Hydrobiology of Chinese Academy of Sci-ences to S.P. He. Insightful comments from the anony-mous reviewers improved the clarity and focus of themanuscript.
References
Alves-Gomes, J.A., 1999. Systematic biology of gymnotiform andmormyriform electric fishes: phylogenetic relationships, molecularclocks and rates of evolution in mitochondrial rRNA genes. J. Exp.Biol. 202, 1167–1183.
An, Z., Kutzbach, J.E., Prell, W.L., Porter, S.C., 2001. Evolution ofAsian monsoons and phased uplift of the Himalayas–TibetanPlateau since Late Miocene times. Nature 411, 62–66.
Brookfield, M.E., 1998. The evolution of the great river systems ofsouthern Asia during the Cenozoic India–Asia collision: riversdraining southwards. Geomorphology 22, 285–312.
Brooks, D.R., Veller, M., Van McLennan, D.A., 2001. How to doBPA, really. J. Biogeogr. 28, 345–358.
Buckley, T.R., Simon, C., Shimodaira, H., Chambers, G.K., 2001.Evaluating hypotheses on the origin and evolution of the NewZealand alpine cicadas (Maoricicada) using multiple-comparisontests of tree topology. Mol. Biol. Evol. 8, 223–234.
Chu, X., 1979. Systematics and evolutionary pedigree of theglyptosternoid fishes (Family Sisoridae). Acta Zootaxa. Sinica4, 72–82.
Chu, X., 1982. Phylogeny of the genus Pseudecheneis (Siluriformes:Sisoridae), with descriptions of two new species. Acta Zootaxon-omica Sinica (in Chinese) 7, 428–437.
Chu, X., Zheng, B., Dai, D., 1999. Fauna Sinica, Class Teleostei,Siluriformes (in Chinese). Scientific Press, Beijing.
Clark, M.K., Schoenbohm, L.M., Royden, L.H., Whipple, K.X.,Burchfiel, B.C., Zhang, X., Tang, W., Wang, E., Chen, L., 2004.Surface uplift, tectonics, and erosion of eastern Tibet from large-scale drainage patterns. Tectonics 23, TC106, doi:10.1029/2002TC001402.
de Pinna, M.C.C., 1996. A phylogenetic analysis of the Asian catfishfamilies Sisoridae, Akysidae, and Amblycipitidae, with a hypoth-esis on the relationships of the neotropical Aspredinidae (Teleostei:Ostariophysi). Fieldiana Zool. (N.S.) 84, 1–83.
De Riijk, P., Robbrecht, E., de Hoog, S., Caers, A., de Peer, V.Y., deWachter, R., 1999. Database on the structure of large subunitribosomal RNA. Nucleic Acids Res. 27, 174–178.
Diogo, R., Michel Chardon, M., Vandewalle, P., 2002. Osteology andmyology of the cephalic region and pectoral girdle of Glyptothoraxfukiensis (Rendahl, 1925), comparison with other sisorids, andcomments on the synapomorphies of the Sisoridae (Teleostei:Siluriformes). Belg. J. Zool. 132, 93–101.
Fang, X., Li, J., Li, B., An, Z., Jiang, P., Chen, X., 2002. Loess inKunlun Mountains and its implications on desert development andTibetan Plateau uplift in West China. Sci. China (Series D) 45,289–299.
Farris, J.S., Kallersjo, M., Kluge, A.G., Bult, C., 1995. Testingsignificance of incongruence. Cladistics 10, 315–319.
Felsenstein, J.P., 1985. Confidence limits on phylogenies: an approachusing the bootstrap. Evolution 39, 783–791.
Ge, X., Liu, Y., Ren, S., 2002. Uplift dynamics of Qinghai–TibetPlateau and Altun fault. Geol. China (in Chinese) 29, 346–350.
Goldman, N., 1993a. Simple diagnostic statistical tests of models ofDNA substitution. J. Mol. Evol. 37, 650–661.
Goldman, N., 1993b. Statistical tests of models of DNA substitution.J. Mol. Evol. 36, 182198.
Gregory, J.W., 1925. The evolution of the river system of South-Eastern Asia. Scottish Geograph. Mag. XLI, 129–141.
Gregory, J.W., Gregory, C.J., 1923. The Alps of Chinese Tibet andtheir geographical relations. Geograph. J. LXI, 153–179.
Gu, X., Fu, Y.X., Li, W.H., 1995. Maximum likelihood estimation ofthe heterogeneity of substitution rate among nucleotide sites. Mol.Biol. Evol. 12, 546–557.
Guo, X., Zhang, Y., He, S., Chen, Y., 2004. Mitochondrial 16S rRNAsequence variations and phylogeny of the Chinese sisorid catfishes.Chinese Sci. Bull. 49, 1586–1595.
Hallet, B., Molnar, P., 2001. Distorted drainage basins as markers ofcrustal strain east of the Himalaya. J. Geophys. Res. 106, 13697–13709.
Hausdorf, B., 1998. Weighted ancestral area analysis and a solution tothe redundant distribution problem. Syst. Biol. 47, 445–456.
X. Guo et al. / Molecular Phylogenetics and Evolution 35 (2005) 344–362 361
He, D., Chen, Y., Chen, Y., Chen, Z., 2004. Molecular phylogeny ofthe specialized schizothoracine fishes (Teleostei: Cyprinidae), withtheir implications for the uplift of the Qinghai-Tibetan Plateau.Chinese Sci. Bull. 49, 39–48.
He, S., 1995. The analysis of historical biogeography for theglyptosternoid fishes (Teleoste: Siluriformes, Sisoridae). Biogeo-graphica 71, 145–160.
He, S., 1996. The phylogeny of the glyptosternoid fishes (Teleostei:Siluriformes, Sisoridae). Cybium 20, 115–159.
He, S., Meunier, F., 1998. The biogeography of Amphiliidae andSisoridae (Teleositei: Siluriformes). Acta Zootax. Sinica. (in Chi-nese) 23 (Suppl.), 1–9.
Hillis, D.M., Huelsenbeck, J.P., 1992. Signal, noise, and reliability inmolecular phylogenetic analyses. J. Heredity 83, 189–195.
Hora, S.L., 1939. The game fishes of Indian, Part VI. The Goonch,Bagarius bagarius (Hamilton). J. Bombay. Nat. Hist. Soc., 583–593.
Hora, S.L., 1952. Parallel evolution of Pseudecheneis Blyth and similarfishes of South-East Asia. J. Asiatic Soc. 18, 123–128.
Hora, S.L., Silas, E.G., 1952a. Evolution and distribution of glyptos-ternoid fishes of the family Sisoridae (Order: Siluroidea). Proc. Nat.Inst. Sci. Indian 18, 309–322.
Hora, S.L., Silas, E.G., 1952b. Notes on fishes in the Indian Museum.XLVII. Revision of glyptosternoid fishes of the family Sisoridae,with description of new genera and species. Rec. Indian Mus. 49, 5–30.
Huelsenbeck, J.P., Crandall, K.A., 1997. Phylogeny estimation andhypothesis testing using maximum likelihood. Annu. Rev. Evol.Syst. 28, 437–466.
Huelsenbeck, J.P., Ronquist, F., 2001. MrBayes: bayesian inference ofphylogeny. Bioinformatics 17, 754–755.
Kimura, M., 1980. A simple method for estimating evolutionary rateof base substitutions through comparative studies of nucleotidesequences. J. Mol. Evol. 16, 111–120.
Kottelat, M., 1989. Zoogeography of the fishes from Indochinesinlandwaters with an annotated check-list. Bull. Zool. Mus. 12, 1–56.
Li, J., Fang, X., Ma, H., et al., 1996. Geomorphologic and environ-mental evolution in upper reaches of Yellow River during the lateCenozoic. Sci. China (Series D) 39, 380–390.
Li, J., Fang, X., Pan, B., 2001. Late Cenozoic intensive uplift ofQinghai-Xizang Plateau and its impact on environments insurrounding area. Q. Sci. 5, 381–391.
Luo, J., Yang, D., Suzuki, H., Wang, Y., Chen, W., Campbell, K.L.,Zhang, Y., 2004. Molecular phylogeny and biogeography ofOriental voles: Genus Eothenomys (Muridae, Mammalian). Mol.Phylogenet. Evol. 33, 349–362.
Martin, A.P., Palumbi, S.R., 1993. Body size, metabolic rate,generation time, and the molecular clock. Proc. Natl. Acad. Sci.USA 90, 4087–4091.
Metivier, F., Gaudemer, Y., Tapponnier, P., Klein, M., 1999. Massaccumulation rates in Asia during the Cenozoic. Geophys. J. Int.137, 280–318.
Ng, H.H., 2004a. Oreoglanis macronemus, a new species ofglyptosternine catfish (Teleostei: Siluriformes: Sisoridae)from northern Laos. The Raffles Bulletin of Zoology 52, 209–213.
Ng, H.H., 2004b. Two new glyptosternine catfishes (Teleostei: Siso-ridae) from Vietnam and China. Zootaxa 428, 1–12.
Ng, H.H., Rainboth, W.J., 2001. A review of the sisorid catfish genusOreoglanis (Siluriformes: Sisoridae) with descriptions of four newspecies. Occasional Papers of the Museum of Zoology, Universityof Michigan, 732, 1–34.
Omland, K.E., 1997. Examining two standard assumptions of ances-tral reconstructions: Repeated loss of dichromatism in dabblingducks (Anatini). Evolution 51, 1636–1646.
Palumbi, S.R., 1996. Nucleic acids II: the polymerase chain reaction.In: Hillis, D.M., Moritz, C., Mable, B.K. (Eds.), MolecularSystematics, second ed. Sinauer Associates, Sunderland, MA.
Pang, J.,Wang, Y., Zhong, Y., Hoelzel, A.R., Papenfuss, T.J., Zeng, X.,Ananjeva, N.B., Zhang, Y., 2003. A phylogeny of Chinese species inthe genus Phrynocephalus (Agamidae) inferred from mitochondrialDNA sequences. Mol. Phylogenet. Evol. 27, 398–409.
Peng, Z., He, S., Zhang, Y., 2004. Phylogenetic relationships ofglyptosternoid fishes (Siluriformes: Sisoridae) inferred from mito-chondrial cytochrome b gene sequences. Mol. Phylogenet. Evol. 31,979–987.
Posada, D., Crandall, K.A., 1998. MODELTEST: testing the model ofDNA substitution. Bioinformatics 14, 817–818.
Regan, C.T., 1911. The classification of the Teleostean fishes of theOrder Ostariophysi-2. Siluridea. Ann. Mag. N. Hist. vol. 8 (Ser. 8),553–557.
Ronquist, F., 1996. DIVA version 1.1. Computer program and manualavailable by anonymous FTP from Uppsala University (ftp.uu.seor ftp.systbot.uu.se).
Ronquist, F., 1997.Dispersal–vicariance analysis: a new approach to thequantification of historical biogeography. Syst. Biol. 46, 195–203.
Ruber, L., Britz, R., Kullandr, S.O., Zardoya, R., 2004. Evolutionaryand biogeographic patterns of the Badidae (Teleostei: Perciformes)inferred from mitochondrial and nuclear DNA sequence data. Mol.Phylogenet. Evol. 32, 1010–1022.
Saitoh, K., Miya, M., Inoue, J.G., Ishiguro, N.B., Nishida, M., 2003.Mitochondrial genomics of ostariophysan fishes: perspectives onphylogeny and biogeography. J. Mol. Evol. 56, 464–472.
Sambrook, J., Fritsch, E.F., Maniatis, T., 1989. Molecular Cloning: ALaboratory Manual, second ed. Cold Spring Harbor LaboratoryPress, New York.
Sanmartın, I., 2003. Dispersal versus vicariance in the Mediterranean:historical biogeography of the palearctic Pachydeminae (Coleop-tera, Scarabaeoidea). J. Biogeogr. 30, 1883–1997.
Sanmartın, I., Ronquist, F., 2002. New solutions to old problems:widespread taxa, redundant distributions, and missing areas inevent-based biogeography. Animal Biodiv. Conserv. 25, 75–93.
Schluter, D., Price, T., Mooers, A.Ø., Ludwig, D., 1997. Likelihood ofancestor states in adaptive radiation. Evolution 51, 1699–1711.
Seeber, L., Gornitz, V., 1983. River profiles along the Himalayan arcas indicators of active tectonics. Tectonophysics 92, 335–367.
Shi, Y.F., Li, J., Li, B., et al., 1999. Uplift of the Qinghai-TibetanPlateau and East Asia environmental change during late Cenozoic.Acta Geographical Sinica (in Chinese). 54, 10–20.
Shimodaira, H., Hasegawa, M., 1999. Multiple comparisons ofloglikelihoods with applications to phylogenetic inference. Mol.Biol. Evol. 16, 1114–1116.
Sun, H.L., 1996. Science monographic series: formation and evolutionof Qinghai-Xizang Plateau. In: Sun, H.L. (Ed.), Scientific Mono-graph Series. Shanghai Science and Technology Press, Shanghai,pp. 101–110.
Swofford, D.L., 2002. PAUP*. Phylogenetic Analysis Using Parsi-mony (*and other methods). Version 4. Sinauer, Sunderland, MA.
Templeton, A.R., 1983. Phylogenetic inference from restriction endo-nuclease cleavage site maps with particular reference to theevolution of humans and the apes. Evolution 37, 221–244.
Thompson, J.D., Gibson, T.J., Plewniak, F., Jeanmougin, F., Higgins,D.G., 1997. The Clustal X windows interface: flexible strategies formultiple sequences alignment aided by quality analysis tools.Nucleic Acids Res. 25, 4876–4882.
Tilak, R., 1976. The adhesive thoracic apparatus in the evolution ofglyptothoracoid fishes (Siluriformes: Sisoridae). Zool. Anz. 196,255–261.
Watanabe, K., Zhang, C., Zhao, Y., 2002. Redescription of the EastAsian bagrid catfish, Pseudobagrus kyphus Mai, 1978, and a newrecord from China. Ichthyol. Res. 49, 384–388.

362 X. Guo et al. / Molecular Phylogenetics and Evolution 35 (2005) 344–362
Wiens, J.J., 1998. Combining data sets with different phylogenetichistories. Syst. Biol. 47, 568–581.
Wilcox, T.P., Garcia de LeOn, F.J., Hendrickson, D.A., Hillis, D.M.,2004.Convergence among cave catfishes: long-branch attraction anda Bayesian relative rates test. Mol. Phylogenet. Evol. 31, 1101–1113.
Xiao, W., Zhang, Y., Liu, H., 2001. Molecular systematics ofXenocyprinae (Teleostei: Cyprinidae): Taxonomy, biogeography,and coevolution of a special group restricted in East Asia. Mol.Phylogenet. Evol. 18, 163–173.
Yang, Z., 1994. Estimating the pattern of nucleotide substitution. J.Mol. Evol. 39, 105–111.
Yu, N., Zheng, C., Zhang, Y.P., Li, W.H., 2000. Molecular systematicsof pikas (Genus Ochotona) inferred from mitochondrial DNAsequences. Mol. Phylogenet. Evol. 16, 85–95.
Zeitler, P.K., Meltzer, A.S., Koons, P.O., Craw, D., Hallet, B.,Chamberlain, C.P., Kidd, W.S.F., Park, S.K., Seeber, L., Bishop,M., Shroder, J., 2001. Erosion, Himalayan geodynamics, and thegeomorphology of metamorphosis. GSA Today 11, 4–9.
Copyright © 2022 FDOKUMEN