Students' Experience, Attitudes and Behaviour, and their ...
19
4 STUDENTS AND MONEY: FINANCIAL LITERACY SKILLS FOR THE 21ST CENTURY – VOLUME VI © OECD 2014 99 Students’ Experience, Attitudes and Behaviour, and their Performance in Financial Literacy This chapter explores the relationship between students’ experiences with money matters (through holding bank accounts and debit cards and through their sources of money), and their performance in the financial literacy assessment. The chapter also analyses the relationship between students’ attitudes and their performance in the assessment. It concludes by examining students’ performance in relation to their behaviour in a hypothetical spending situation.
-
Upload
khangminh22 -
Category
Documents
-
view
1 -
download
0
Transcript of Students' Experience, Attitudes and Behaviour, and their ...
4
StudentS and Money: Financial literacy SkillS For the 21St century – VoluMe Vi © OECD 2014 99
Students’ Experience, Attitudes and Behaviour,
and their Performance in Financial Literacy
This chapter explores the relationship between students’ experiences with money matters (through holding bank accounts and debit cards and through their sources of money), and their performance in the financial literacy assessment. The chapter also analyses the relationship between students’ attitudes and their performance in the assessment. It concludes by examining students’ performance in relation to their behaviour in a hypothetical spending situation.
4StudentS’ experience, AttitudeS And BehAviour, And their performAnce in finAnciAl literAcy
100 © OECD 2014 StudentS and Money: Financial literacy SkillS For the 21St century – VoluMe Vi
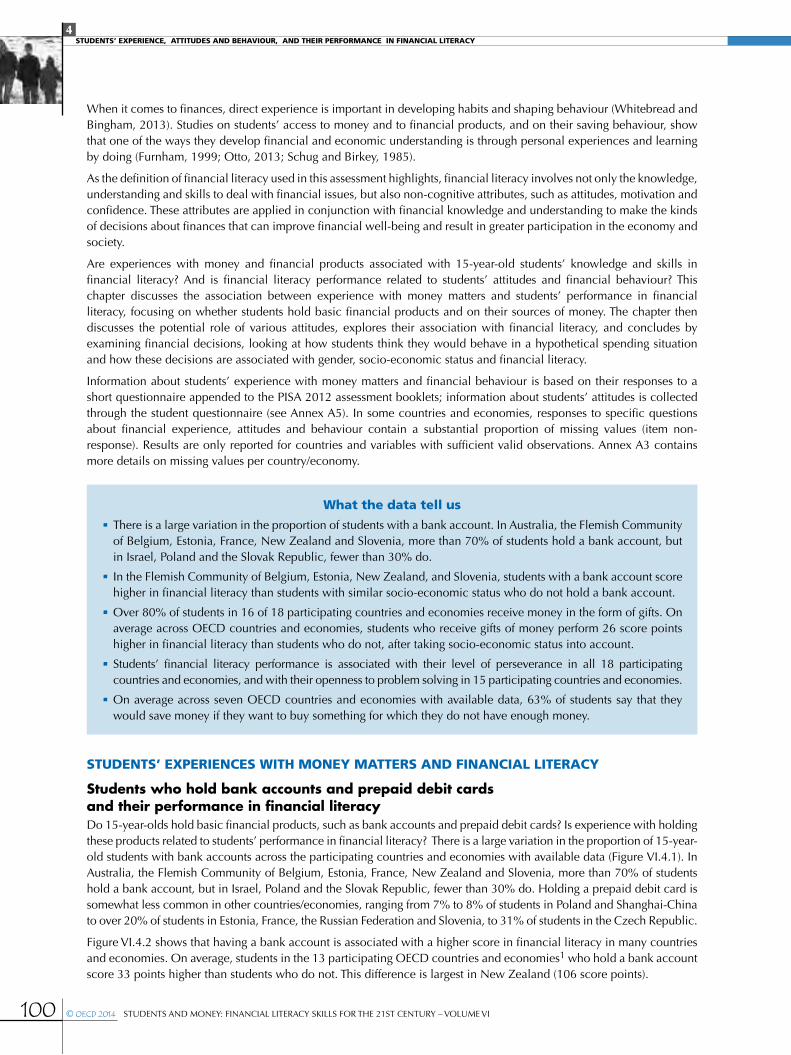
When it comes to finances, direct experience is important in developing habits and shaping behaviour (Whitebread and Bingham, 2013). Studies on students’ access to money and to financial products, and on their saving behaviour, show that one of the ways they develop financial and economic understanding is through personal experiences and learning by doing (Furnham, 1999; otto, 2013; Schug and Birkey, 1985).
as the definition of financial literacy used in this assessment highlights, financial literacy involves not only the knowledge, understanding and skills to deal with financial issues, but also non-cognitive attributes, such as attitudes, motivation and confidence. these attributes are applied in conjunction with financial knowledge and understanding to make the kinds of decisions about finances that can improve financial well-being and result in greater participation in the economy and society.
are experiences with money and financial products associated with 15-year-old students’ knowledge and skills in financial literacy? and is financial literacy performance related to students’ attitudes and financial behaviour? this chapter discusses the association between experience with money matters and students’ performance in financial literacy, focusing on whether students hold basic financial products and on their sources of money. the chapter then discusses the potential role of various attitudes, explores their association with financial literacy, and concludes by examining financial decisions, looking at how students think they would behave in a hypothetical spending situation and how these decisions are associated with gender, socio-economic status and financial literacy.
information about students’ experience with money matters and financial behaviour is based on their responses to a short questionnaire appended to the PiSa 2012 assessment booklets; information about students’ attitudes is collected through the student questionnaire (see annex a5). in some countries and economies, responses to specific questions about financial experience, attitudes and behaviour contain a substantial proportion of missing values (item non-response). results are only reported for countries and variables with sufficient valid observations. annex a3 contains more details on missing values per country/economy.
StudentS’ experienceS with money mAtterS And finAnciAl literAcy
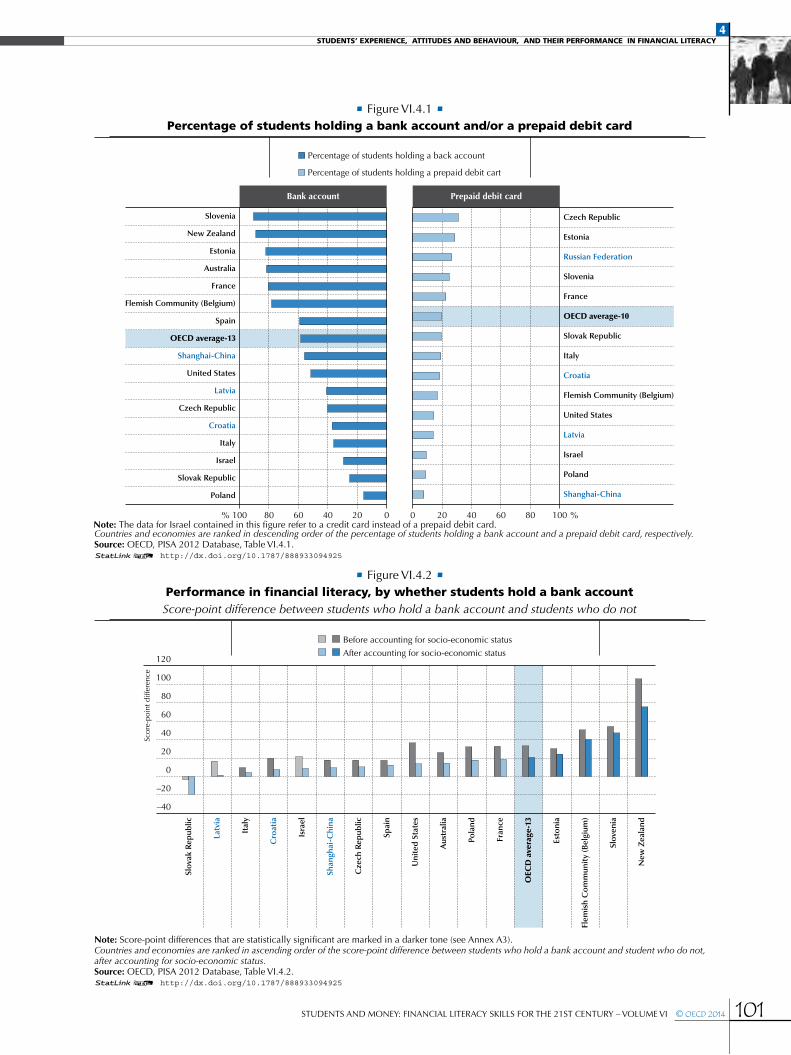
Students who hold bank accounts and prepaid debit cards and their performance in financial literacy do 15-year-olds hold basic financial products, such as bank accounts and prepaid debit cards? is experience with holding these products related to students’ performance in financial literacy? there is a large variation in the proportion of 15-year-old students with bank accounts across the participating countries and economies with available data (Figure Vi.4.1). in australia, the Flemish community of Belgium, estonia, France, new Zealand and Slovenia, more than 70% of students hold a bank account, but in israel, Poland and the Slovak republic, fewer than 30% do. holding a prepaid debit card is somewhat less common in other countries/economies, ranging from 7% to 8% of students in Poland and Shanghai-china to over 20% of students in estonia, France, the russian Federation and Slovenia, to 31% of students in the czech republic.
Figure Vi.4.2 shows that having a bank account is associated with a higher score in financial literacy in many countries and economies. on average, students in the 13 participating oecd countries and economies1 who hold a bank account score 33 points higher than students who do not. this difference is largest in new Zealand (106 score points).
what the data tell us
•there is a large variation in the proportion of students with a bank account. in australia, the Flemish community of Belgium, estonia, France, new Zealand and Slovenia, more than 70% of students hold a bank account, but in israel, Poland and the Slovak republic, fewer than 30% do.
•in the Flemish community of Belgium, estonia, new Zealand, and Slovenia, students with a bank account score higher in financial literacy than students with similar socio-economic status who do not hold a bank account.
•over 80% of students in 16 of 18 participating countries and economies receive money in the form of gifts. on average across oecd countries and economies, students who receive gifts of money perform 26 score points higher in financial literacy than students who do not, after taking socio-economic status into account.
•Students’ financial literacy performance is associated with their level of perseverance in all 18 participating countries and economies, and with their openness to problem solving in 15 participating countries and economies.
•on average across seven oecd countries and economies with available data, 63% of students say that they would save money if they want to buy something for which they do not have enough money.
4StudentS’ experience, AttitudeS And BehAviour, And their performAnce in finAnciAl literAcy
StudentS and Money: Financial literacy SkillS For the 21St century – VoluMe Vi © OECD 2014 101
• Figure Vi.4.1 • percentage of students holding a bank account and/or a prepaid debit card
100 80 60 40 20 0
Poland
Slovak Republic
Israel
Italy
Croatia
Czech Republic
Latvia
United States
Shanghai‐China
OECD average‐13
Spain
Flemish Community (Belgium)
France
Australia
Estonia
New Zealand
Slovenia
%
Shanghai‐China
Poland
Israel
Latvia
United States
Flemish Community (Belgium)
Croatia
Italy
Slovak Republic
OECD average‐10
France
Slovenia
Russian Federation
Estonia
Czech Republic
0 20 40 60 80 100 %
Bank account Prepaid debit card
Percentage of students holding a back account
Percentage of students holding a prepaid debit cart
Countries and economies are ranked in descending order of the percentage of students holding a bank account and a prepaid debit card, respectively.Source: oecd, PiSa 2012 database, table Vi.4.1.12 http://dx.doi.org/10.1787/888933094925
• Figure Vi.4.2 • performance in financial literacy, by whether students hold a bank accountScore-point difference between students who hold a bank account and students who do not
–40
–20
0
20
40
60
80
100
120
Slov
ak R
epub
lic
Latv
ia
Ital
y
Cro
atia
Isra
el
Shan
ghai
‐Chi
na
Cze
ch R
epub
lic
Spai
n
Uni
ted
Sta
tes
Aus
tral
ia
Pola
nd
Fran
ce
OEC
D a
vera
ge‐1
3
Esto
nia
Flem
ish
Co
mm
unit
y (B
elgi
um)
Slov
enia
New
Zea
land
Scor
e‐po
int d
iffer
ence
After accounting for socio‐economic status
Before accounting for socio‐economic status
Note: Score-point differences that are statistically significant are marked in a darker tone (see annex a3). Countries and economies are ranked in ascending order of the score-point difference between students who hold a bank account and student who do not, after accounting for socio-economic status.Source: oecd, PiSa 2012 database, table Vi.4.2.12 http://dx.doi.org/10.1787/888933094925
Note: the data for israel contained in this figure refer to a credit card instead of prepaid debit card. a
4StudentS’ experience, AttitudeS And BehAviour, And their performAnce in finAnciAl literAcy
102 © OECD 2014 StudentS and Money: Financial literacy SkillS For the 21St century – VoluMe Vi
the association between performance in financial literacy and holding a bank account is partly related to socio-economic status. on average across oecd countries and economies, students who hold a bank account score 21 points higher than students who do not, after accounting for their socio-economic status (table Vi.4.2). in particular, there is a positive relationship between financial literacy and holding a bank account in new Zealand (the difference in performance between students who have a bank account and students with similar socio-economic status who do not is equal to 76 score points), Slovenia (47 score points), the Flemish community of Belgium (40 score points), and estonia (24 score points). the difference in financial literacy scores between students who have a bank account and students with similar socio-economic status who do not is the largest in new Zealand and Slovenia, both of which are countries where it is relatively easy for 15-year-olds to hold a bank account (meaning that parents’ permission is not required; see Box Vi.4.1).
in contrast, in most countries and economies with available data, there is no relationship between holding a prepaid debit card and performance in financial literacy. in the Flemish community of Belgium, the czech republic, estonia, France, italy, Slovenia and the united States, and before accounting for socio-economic status, students who have a prepaid debit card perform better than students who do not have one (table Vi.4.2). comparing students of similar socio-economic status, the positive relationship between financial literacy and holding a prepaid debit card is only observed in estonia, where students who have a prepaid debit card score 48 points higher in financial literacy than students of the same socio-economic status who do not have one. in contrast, the relationship is negative in croatia, meaning that students who do not have a prepaid debit card perform better in financial literacy than students of the same socio-economic status who have such a card.
the positive relationship between financial literacy and holding a financial product may be interpreted in different ways, and any causal link may go either way. on the one hand, having greater financial knowledge and skills may motivate students to become engaged with formal financial products (instead of, for instance, asking their parents to look after any money they have), as suggested by otto (2013). on the other hand, it may be that using a bank account is one way for students to learn about money (Sherraden et al., 2011). Some studies have suggested that using a bank account to make deposits could foster the development of a saving habit, based on evidence showing that having a savings account as an adolescent (age 12-17) is related to saving in young adulthood (age 17-23) (Friedline, elliott and nam, 2011) and adulthood (kotlikoff and Bernheim, 2001). examining cross-country historical evidence of public polices to promote saving, Garon (2013) suggests that countries that fostered saving habits among children in the past tend to display higher saving in recent decades.
having a bank account has also been shown to be associated with higher financial literacy among adults. the oecd/inFe financial literacy survey conducted in 2010-11 showed, for instance, that adults who hold a payment product, such as a bank account or a debit card, scored higher in financial literacy, on average, than those without such a product, and that respondents with a savings or investment product were typically more financially literate than those without (oecd/inFe, 2013).
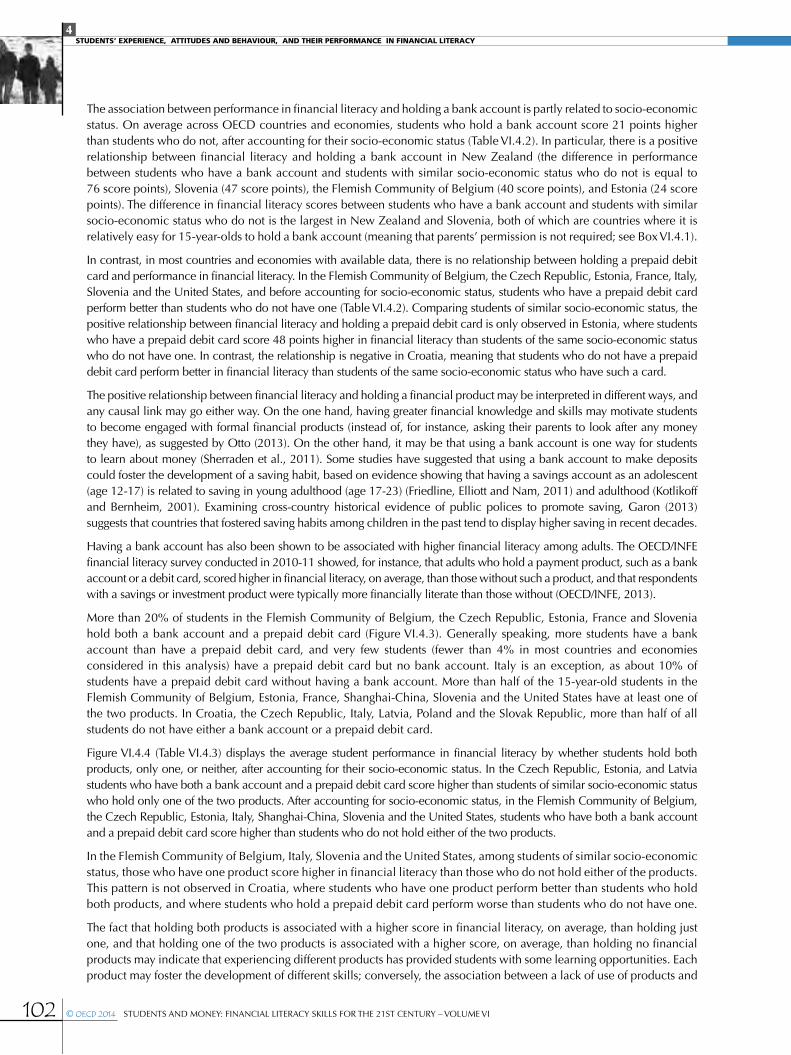
More than 20% of students in the Flemish community of Belgium, the czech republic, estonia, France and Slovenia hold both a bank account and a prepaid debit card (Figure Vi.4.3). Generally speaking, more students have a bank account than have a prepaid debit card, and very few students (fewer than 4% in most countries and economies considered in this analysis) have a prepaid debit card but no bank account. italy is an exception, as about 10% of students have a prepaid debit card without having a bank account. More than half of the 15-year-old students in the Flemish community of Belgium, estonia, France, Shanghai-china, Slovenia and the united States have at least one of the two products. in croatia, the czech republic, italy, latvia, Poland and the Slovak republic, more than half of all students do not have either a bank account or a prepaid debit card.
Figure Vi.4.4 (table Vi.4.3) displays the average student performance in financial literacy by whether students hold both products, only one, or neither, after accounting for their socio-economic status. in the czech republic, estonia, and latvia students who have both a bank account and a prepaid debit card score higher than students of similar socio-economic status who hold only one of the two products. after accounting for socio-economic status, in the Flemish community of Belgium, the czech republic, estonia, italy, Shanghai-china, Slovenia and the united States, students who have both a bank account and a prepaid debit card score higher than students who do not hold either of the two products.
in the Flemish community of Belgium, italy, Slovenia and the united States, among students of similar socio-economic status, those who have one product score higher in financial literacy than those who do not hold either of the products. this pattern is not observed in croatia, where students who have one product perform better than students who hold both products, and where students who hold a prepaid debit card perform worse than students who do not have one.
the fact that holding both products is associated with a higher score in financial literacy, on average, than holding just one, and that holding one of the two products is associated with a higher score, on average, than holding no financial products may indicate that experiencing different products has provided students with some learning opportunities. each product may foster the development of different skills; conversely, the association between a lack of use of products and
4StudentS’ experience, AttitudeS And BehAviour, And their performAnce in finAnciAl literAcy
StudentS and Money: Financial literacy SkillS For the 21St century – VoluMe Vi © OECD 2014 103
• Figure Vi.4.3 • percentage of students holding a bank account and a prepaid debit card (combined)
0 20 40 60 80 100 %
Poland
Slovak Republic
Israel
Latvia
Croatia
Czech Republic
Italy
United States
OECD average‐10
Shanghai‐China
Flemish Community (Belgium)
France
Estonia
Slovenia
Student has BOTH a bank account and a prepaid debit cardStudent has a BANK ACCOUNT but no prepaid debit cardStudent has a PREPAID DEBIT CARD but no bank accountStudent has NEITHER bank account nor prepaid debit card
Countries and economies are ranked in ascending order of the percentage of students holding at least one product. Source: oecd, PiSa 2012 database, table Vi.4.1.12 http://dx.doi.org/10.1787/888933094925
Countries and economies are ranked in ascending order of the performance in financial literacy of students who hold either a bank account or a prepaid debit card. Source: oecd, PiSa 2012 database, table Vi.4.3.12 http://dx.doi.org/10.1787/888933094925
• Figure Vi.4.4 • performance in financial literacy, by whether students hold a bank account
and a prepaid debit card, after accounting for socio-economic status
400
450
500
550
600
650
Slo
vak
Rep
ublic
Ital
y
Slo
veni
a
Isra
el
Latv
ia
Cze
ch R
epub
lic
OEC
D a
vera
ge‐1
0
Fran
ce
Uni
ted
Sta
tes
Cro
atia
Esto
nia
Pola
nd
Flem
ish
Co
mm
unit
y (B
elgi
um)
Shan
ghai
‐Chi
na
Scor
e po
ints
, afte
r ac
coun
ting
for
soci
o‐ec
onom
ic s
tatu
s
Student has BOTH a bank account and a prepaid debit cardStudent has either a BANK ACCOUNT or a PREPAID DEBIT CARDStudent has NEITHER bank account nor prepaid debit card
Note: the data for israel contained in this figure refer to a credit card instead of a prepaid debit card.
Note: the data for israel contained in this figure refer to a credit card instead of a prepaid debit card.
4StudentS’ experience, AttitudeS And BehAviour, And their performAnce in finAnciAl literAcy
104 © OECD 2014 StudentS and Money: Financial literacy SkillS For the 21St century – VoluMe Vi
low levels of financial literacy may indicate that students with low financial literacy are less interested in using these products to manage their money or make payments, perhaps because they do not recognise the potential benefits.
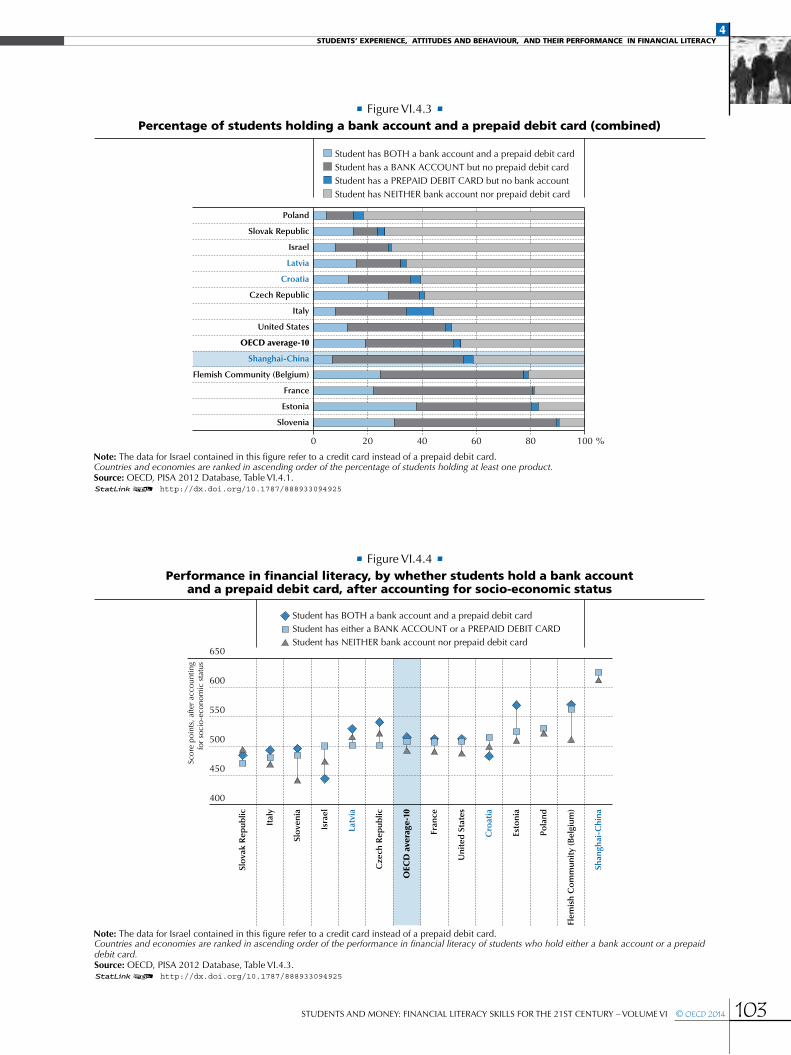
in most countries and economies, similar proportions of boys and girls hold bank accounts (table Vi.4.4). there are only a few exceptions: more boys than girls hold a bank account in croatia (14 percentage-point difference) and Poland (9 percentage-point difference), while more girls than boys hold a bank account in australia (8 percentage-point difference), estonia (8 percentage-point difference) and Shanghai-china (11 percentage-point difference). across all participating countries and economies, a similar percentage of boys and girls hold a prepaid debit card.
Figure Vi.4.5 shows a positive relationship between holding a bank account and socio-economic status. in australia, the Flemish community of Belgium, croatia, estonia, France, israel, italy, latvia, Poland, Shanghai-china and the united States, more advantaged students than disadvantaged students hold a bank account. the difference between
• Figure Vi.4.5 • percentage of students holding a bank account, by socio-economic status
0
10
20
30
40
50
60
70
80
90
100
Uni
ted
Sta
tes
Latv
ia
Cro
atia
Pola
nd
Flem
ish
Co
mm
unit
y(B
elgi
um)
Fran
ce
Isra
el
OEC
D a
vera
ge‐1
0
Ital
y
Esto
nia
Shan
ghai
‐Chi
na
Aus
tral
ia
Cze
ch R
epub
lic
Slov
enia
Perc
enta
ge o
f stu
dent
s w
ho h
old
a ba
nk a
ccou
nt
0
5
10
15
20
25
30
35
40
45
Uni
ted
Sta
tes
Latv
ia
Cro
atia
Pola
nd
Flem
ish
Co
mm
unit
y(B
elgi
um)
Fran
ce
Isra
el
OEC
D a
vera
ge‐1
0
Ital
y
Esto
nia
Shan
ghai
‐Chi
na
Aus
tral
ia
Cze
ch R
epub
lic
Slov
eniaPe
rcen
tage
‐poi
nt d
iffer
ence
bet
wee
n to
p an
dbo
ttom
qua
rtile
s of
ESC
S in
the
prop
ortio
nof
stu
dent
s w
ho h
old
a ba
nk a
ccou
nt
Percentage difference between top and bottom quartiles of ESCS1
in the proportion of students who hold a bank account
2nd quartile 3rd quartileBottom quartile Top quartile
1. eScS refers to the PISA index of economic, social and cultural status.Countries and economies are ranked in descending order of the difference between the top and bottom quartiles of the PISA index of economic, social and cultural status in the percentage of students who hold a bank account. Source: oecd, PiSa 2012 database, table Vi.4.5.12 http://dx.doi.org/10.1787/888933094925
Note: differences that are statistically significant are marked in a darker tone (see annex a3).
4StudentS’ experience, AttitudeS And BehAviour, And their performAnce in finAnciAl literAcy
StudentS and Money: Financial literacy SkillS For the 21St century – VoluMe Vi © OECD 2014 105
advantaged and disadvantaged students (students in the top and bottom quartiles of the PISA index of economic, social and cultural status, respectively) in whether or not they hold a bank account is especially large in the united States (39 percentage points), latvia (38 percentage points) and croatia (26 percentage points). in croatia, estonia, italy and the united States, more advantaged students than disadvantaged students hold a prepaid debit card (table Vi.4.5).
Box Vi.4.1 legal framework for young people’s access to financial products
the legal framework in relation to the use of basic financial products by 15-year-olds, and by minors (under the age of 18) more generally, varies across countries.2 the cross-country differences found in PiSa and discussed above are consistent with different legislation across countries concerning 15-year-olds’ rights to have a bank account and a payment card in their own name.
in new Zealand and Slovenia, 15-year-olds do not need the consent of their parents to legally open, hold and operate a current or savings account. in these countries, 15-year-olds can also hold and use a prepaid card or debit card (although in new Zealand, banks can decide to restrict debit cards to people 16 years old and older). according to student reports from the PiSa student questionnaire, new Zealand and Slovenia also have the highest percentage of students holding a bank account.
Most other countries require parents’ consent for 15-year-olds to open and operate savings and current accounts. in some cases, the account has to be opened and/or operated by parents on behalf of their children. For instance, in all australian states and territories, minors can enter into contracts with financial institutions, but banking institutions may apply additional requirements (which may vary, depending on the age of the young person), such as joint account ownership with a parent or guardian. in colombia, parents can open savings accounts on behalf of, or jointly with, their children. in the czech republic, in addition to parents’ consent, banks can introduce other restrictions or conditions, such as putting limits on maximum withdrawals, allowing withdrawals only by parents, etc. in estonia, 15-year-olds can open an account with the permission of parents/guardians. in France, 16-year-olds may open a current account, which includes an atM card and a cheque book, with their parents’ agreement. in italy, children and teens cannot open current accounts but can open saving accounts jointly with parents/guardians (savings accounts for teens aged 12 to 17 have some limitations, e.g. on the number of withdrawals or the maximum amount that can be withdrawn). in latvia, minors from 16 years of age may open and operate an account with their parents’ permission and under the conditions defined by the account (e.g. they are allowed to operate their account independently after the age of 18). in Spain, parents can open savings and current accounts in the names of their children. in the united States, financial institutions (banks and credit unions) generally offer accounts only with the consent or co-ownership of the parent/guardian, but some institutions allow minors to own their own account.
Most countries also require parents’ consent to allow 15-year-olds to open and operate cash withdrawal/atM cards, prepaid cards and debit cards. this is the case in croatia, the czech republic, estonia, italy and latvia. in some countries, such as croatia and italy, in addition to parents’ permission, there are limitations to the operations that can be carried out by the minors with these cards. in Spain, minors over 14 years may be supplementary cardholders, but the main cardholder must be a parent/legal representative.
Some countries link access to current accounts by minors to their employment status. in colombia, people under 18 can open and use a current account in their own name only if they work. in israel, 15-year-olds can have savings accounts without the consent of their parent/guardian if the young person receives a salary on an ongoing basis.
access to credit cards is generally more restrictive than access to debit cards for people under 18. For instance, in the united States, consumers under the age of 21 seeking to obtain a credit card need to prove that they are independently able to repay charges unless they have a co-signer or similar party who is at least 21 years old. credit cards are not issued to minors in the czech republic, italy and new Zealand.
Students’ sources of money and financial literacyWhether students are using financial products, such as a bank account, also depends on whether they have access to money. “Money and transactions” is one of the content areas of the PiSa financial literacy assessment and most financial decisions relate to money in some way or another. it is therefore relevant to investigate where students get their money from and how their sources of money relate to financial literacy performance.
4StudentS’ experience, AttitudeS And BehAviour, And their performAnce in finAnciAl literAcy
106 © OECD 2014 StudentS and Money: Financial literacy SkillS For the 21St century – VoluMe Vi
• Figure Vi.4.6 • Students’ sources of money
0
10
20
30
40
50
60
70
80
90
100
Perc
enta
ge o
f stu
dent
s
New
Zea
land
Gifts of money from friends or relativesWorking outside school hours or in a family business or occasionallyPocket money for chores
Pocket money, without chores
Selling things (e.g. local markets or eBay)
Isra
el
Ital
y
Shan
ghai
-Chi
na
Spai
n
OEC
D a
vera
ge-1
3
Fran
ce
Cro
atia
Latv
ia
Aus
tral
ia
Cze
ch R
epub
lic
Uni
ted
Sta
tes
Esto
nia
Rus
sian
Fed
erat
ion
Flem
ish
Co
mm
unit
y (B
elgi
um)
Pola
nd
Slo
vak
Rep
ublic
Slo
veni
a
Countries and economies are ranked in ascending order of the percentage of students who receive gifts of money from friends and relatives.Source: oecd, PiSa 2012 database, table Vi.4.6.12 http://dx.doi.org/10.1787/888933094925
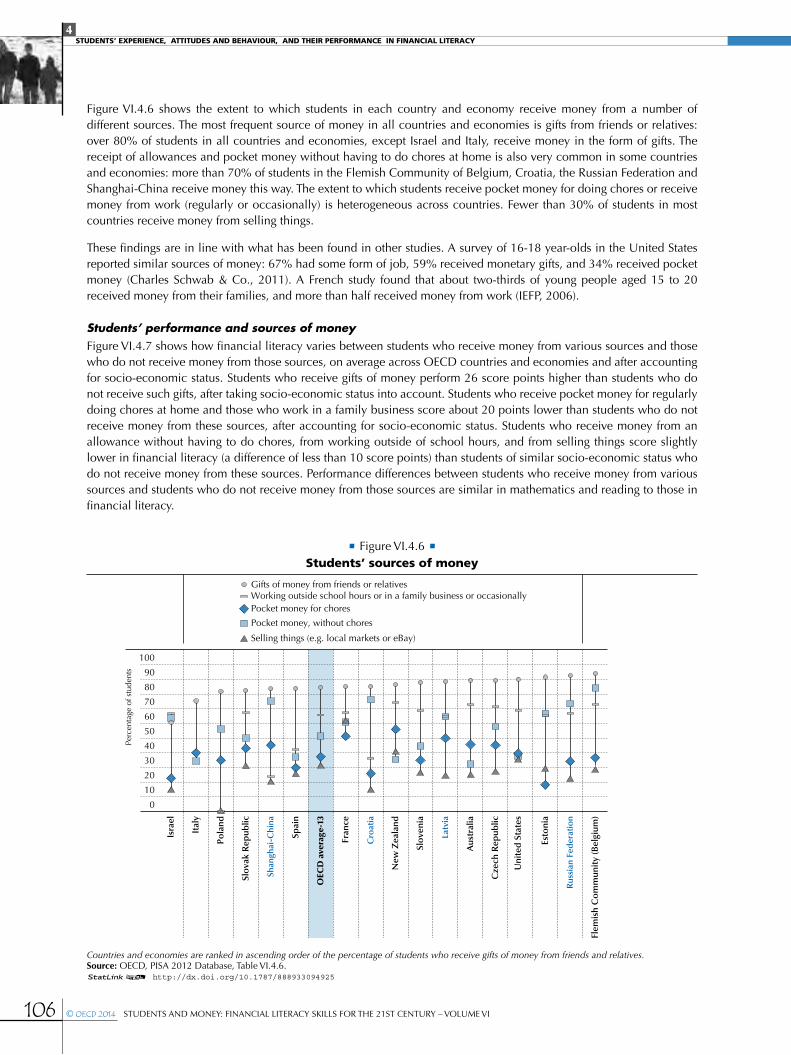
Figure Vi.4.6 shows the extent to which students in each country and economy receive money from a number of different sources. the most frequent source of money in all countries and economies is gifts from friends or relatives: over 80% of students in all countries and economies, except israel and italy, receive money in the form of gifts. the receipt of allowances and pocket money without having to do chores at home is also very common in some countries and economies: more than 70% of students in the Flemish community of Belgium, croatia, the russian Federation and Shanghai-china receive money this way. the extent to which students receive pocket money for doing chores or receive money from work (regularly or occasionally) is heterogeneous across countries. Fewer than 30% of students in most countries receive money from selling things.
these findings are in line with what has been found in other studies. a survey of 16-18 year-olds in the united States reported similar sources of money: 67% had some form of job, 59% received monetary gifts, and 34% received pocket money (charles Schwab & co., 2011). a French study found that about two-thirds of young people aged 15 to 20 received money from their families, and more than half received money from work (ieFP, 2006).
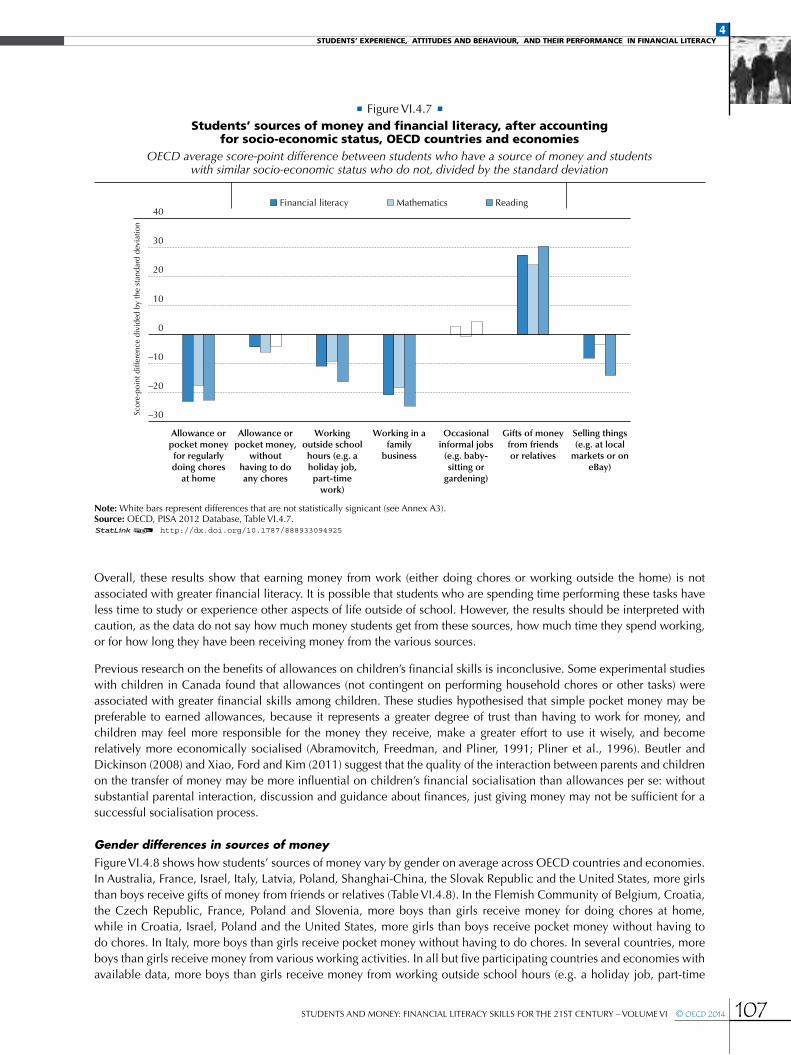
Students’ performance and sources of money Figure Vi.4.7 shows how financial literacy varies between students who receive money from various sources and those who do not receive money from those sources, on average across oecd countries and economies and after accounting for socio-economic status. Students who receive gifts of money perform 26 score points higher than students who do not receive such gifts, after taking socio-economic status into account. Students who receive pocket money for regularly doing chores at home and those who work in a family business score about 20 points lower than students who do not receive money from these sources, after accounting for socio-economic status. Students who receive money from an allowance without having to do chores, from working outside of school hours, and from selling things score slightly lower in financial literacy (a difference of less than 10 score points) than students of similar socio-economic status who do not receive money from these sources. Performance differences between students who receive money from various sources and students who do not receive money from those sources are similar in mathematics and reading to those in financial literacy.
4StudentS’ experience, AttitudeS And BehAviour, And their performAnce in finAnciAl literAcy
StudentS and Money: Financial literacy SkillS For the 21St century – VoluMe Vi © OECD 2014 107
overall, these results show that earning money from work (either doing chores or working outside the home) is not associated with greater financial literacy. it is possible that students who are spending time performing these tasks have less time to study or experience other aspects of life outside of school. however, the results should be interpreted with caution, as the data do not say how much money students get from these sources, how much time they spend working, or for how long they have been receiving money from the various sources.
Previous research on the benefits of allowances on children’s financial skills is inconclusive. Some experimental studies with children in canada found that allowances (not contingent on performing household chores or other tasks) were associated with greater financial skills among children. these studies hypothesised that simple pocket money may be preferable to earned allowances, because it represents a greater degree of trust than having to work for money, and children may feel more responsible for the money they receive, make a greater effort to use it wisely, and become relatively more economically socialised (abramovitch, Freedman, and Pliner, 1991; Pliner et al., 1996). Beutler and dickinson (2008) and Xiao, Ford and kim (2011) suggest that the quality of the interaction between parents and children on the transfer of money may be more influential on children’s financial socialisation than allowances per se: without substantial parental interaction, discussion and guidance about finances, just giving money may not be sufficient for a successful socialisation process.
Gender differences in sources of moneyFigure Vi.4.8 shows how students’ sources of money vary by gender on average across oecd countries and economies. in australia, France, israel, italy, latvia, Poland, Shanghai-china, the Slovak republic and the united States, more girls than boys receive gifts of money from friends or relatives (table Vi.4.8). in the Flemish community of Belgium, croatia, the czech republic, France, Poland and Slovenia, more boys than girls receive money for doing chores at home, while in croatia, israel, Poland and the united States, more girls than boys receive pocket money without having to do chores. in italy, more boys than girls receive pocket money without having to do chores. in several countries, more boys than girls receive money from various working activities. in all but five participating countries and economies with available data, more boys than girls receive money from working outside school hours (e.g. a holiday job, part-time
• Figure Vi.4.7 • Students’ sources of money and financial literacy, after accounting
for socio-economic status, oecd countries and economiesOECD average score-point difference between students who have a source of money and students
with similar socio-economic status who do not, divided by the standard deviation
–30
–20
–10
0
10
20
30
40
Allowance orpocket moneyfor regularlydoing chores
at home
Allowance orpocket money,
withouthaving to doany chores
Workingoutside schoolhours (e.g. aholiday job,part‐time
work)
Working in afamily
business
Occasionalinformal jobs
(e.g. baby‐sitting or
gardening)
Gifts of moneyfrom friendsor relatives
Selling things(e.g. at local
markets or oneBay)
Scor
e‐po
int d
iffer
ence
div
ided
by
the
stan
dard
dev
iatio
n
Financial literacy Mathematics Reading
Note: White bars represent differences that are not statistically signicant (see annex a3).Source: oecd, PiSa 2012 database, table Vi.4.7.12 http://dx.doi.org/10.1787/888933094925

4StudentS’ experience, AttitudeS And BehAviour, And their performAnce in finAnciAl literAcy
108 © OECD 2014 StudentS and Money: Financial literacy SkillS For the 21St century – VoluMe Vi
work). in all but five participating countries and economies with available data, more boys than girls receive money from working in a family business. in australia, the Flemish community of Belgium and israel, more girls than boys receive money from occasional jobs (such as baby-sitting or gardening), but in the russian Federation, more boys than girls receive money from occasional jobs. in all but two countries with available data, more boys than girls get money from selling things.
overall, these results suggest that more boys than girls are involved in regular working activities, and receive money in exchange for work inside and outside the household, while more girls than boys seems to receive money without working (pocket money and gifts), perhaps indicating that boys begin to seek ways of becoming less dependent financially at an earlier age than girls. to the extent that these gender differences reflect the way in which today’s adults were socialised when they were younger, these results might help explain differences in labour market participation today between men and women (oecd, 2012). at the same time, gender differences observed among 15-year-olds today may translate into gender differences that will be observed for the same cohorts in the future.
Previous evidence from a representative sample of students in the united States between the ages of 12 and 18 in the early 1990s found gender differences in their sources of money (Meeks, 1998). Boys were significantly more likely to be paid for jobs at home than girls (as found in PiSa) although girls were more likely than boys to have earnings from the marketplace (in contrast with the PiSa results).
Differences in sources of money by socio-economic statusacross participating countries and economies, sources of money also differ by students’ socio-economic status (Figure Vi.4.9 and table Vi.4.9). in australia, France, israel, italy, Spain and the united States, more advantaged students (those in the top quartile of the PISA index of economic, social and cultural status) than disadvantaged students receive money in the form of gifts; in the czech republic, France, latvia, the russian Federation, Slovenia, Spain and Shanghai-china, more advantaged students than disadvantaged students receive pocket money without having to do chores; and in croatia, israel and Shanghai-china, more advantaged students than disadvantaged students receive money from selling things.
• Figure Vi.4.8 • Students’ sources of money, by gender, oecd countries and economies
OECD average percentage difference between boys and girls who receive money from these sources
–20
–15
–10
–5
0
5
10
15
20
Allowance orpocket money for
regularly doingchores at home
Allowance orpocket money,
without having todo any chores
Working outsideschool hours
(e.g. a holiday job,part-time work)
Working in afamily business
Occasionalinformal jobs
(e.g. baby-sitting orgardening)
Gifts of moneyfrom friends or
relatives
Selling things(e.g. at local markets
or one Bay)
Perc
enta
ge‐p
oint
diff
eren
ce
More girls than boys receive money from these sources
More boys than girls receive money from these sources
Note: all percentage-point differences are statistically significant (see annex a3).Source: oecd, PiSa 2012 database, table Vi.4.8.12 http://dx.doi.org/10.1787/888933094925

4StudentS’ experience, AttitudeS And BehAviour, And their performAnce in finAnciAl literAcy
StudentS and Money: Financial literacy SkillS For the 21St century – VoluMe Vi © OECD 2014 109
in contrast, in italy and the Slovak republic, more disadvantaged students (those in the bottom quartile of the PISA index of economic, social and cultural status) than advantaged students receive an allowance for doing chores at home; in estonia and italy, more disadvantaged students than advantaged students work outside of school hours; and in Spain, more disadvantaged students than advantaged students work in a family business.
StudentS’ AttitudeS And finAnciAl literAcy attitudes are considered important elements of financial literacy. as mentioned in chapter 1, the definition of financial literacy used in PiSa 2012 contains motivation, confidence and attitudes, which can have an impact on money-management behaviour (Johnson and Staten, 2010). Generally speaking, non-cognitive personality traits are relevant predictors of economic and social outcomes in addition to cognitive skills (Borghans et al., 2008). More specifically, research from behavioural psychology yields interesting results with regard to the link between personality and financial literacy (noon and Fogarty, 2007), which may help better inform policy makers to improve the efficiency of financial education.
do attitudes toward learning influence students’ ability to apply their knowledge and skills to real-life situations? this section looks at whether students’ attitudes toward learning are associated with their performance in financial literacy.
the PiSa 2012 student questionnaire asks students if they would give up easily when confronted with a problem. Perseverance is an attitude that may be important to students when confronted with certain financial situations, such as saving for long-term goals or shopping around for better financial conditions. PiSa results show an association between students’ financial literacy and their perseverance. in all 18 participating countries and economies, students who agreed with the statement “when confronted with a problem, i give up easily” have significantly lower financial literacy than those who disagreed (Figure Vi.4.10a). after accounting for mathematics and reading scores, the students who answered that they would give up easily show lower levels of financial literacy, on average across oecd countries and economies (table Vi.4.10).
• Figure Vi.4.9 • Students’ sources of money, by socio-economic status, oecd countries and economies
OECD average percentage difference between students in the top and bottom quartiles of socio-economic status who receive money from these sources
–12
–8
–4
0
4
8
12
An allowance orpocket money for
regularly doingchores at home
An allowance orpocket money,
without having todo any chores
Working outsideschool hours (e.g. aholiday job, part‐
time work)
Working in afamily business
Occasional informaljobs (e.g. baby‐
sitting or gardening)
Gifts of moneyfrom friends or
relatives
Selling things(e.g. at local markets
or on eBay)
Perc
enta
ge‐p
oint
diff
eren
ce
More disadvantaged students thanadvantaged students receive money from
these sources
More advantaged students thandisadvantaged students receive money
from these sources
Note: -point differences that are statistically significant are marked in a darker tone (see annex a3).Source: oecd, PiSa 2012 database, table Vi.4.9.12 http://dx.doi.org/10.1787/888933094925
Percentage

4StudentS’ experience, AttitudeS And BehAviour, And their performAnce in finAnciAl literAcy
110 © OECD 2014 StudentS and Money: Financial literacy SkillS For the 21St century – VoluMe Vi
• Figure Vi.4.10a • differences in financial literacy performance, by level of perseverance
Students’ response to how well the statement “When confronted with a problem, I give up easily” describes them
300 350 400 450 500 550 600 650
Estonia
Shanghai‐China
Flemish Community (Belgium)
Croatia
Latvia
Russian Federation
Poland
Czech Republic
Italy
Slovak Republic
Spain
Israel
OECD average‐13
Slovenia
Australia
Colombia
France
New Zealand
United States
Mean score–80 –60 –40 –20 0
Score‐point difference
Mean score in �nancial literacyDifference
("Like me" - "Not like me")
Mean "Like me" "Not like me"
Note: “like me” includes students who answered “very much like me”, “mostly like me” or “somewhat like me”. “not like me” includes students who answered either “not much like me” or “not at all like me”. all differences are statistically significant (see annex a3).Countries and economies are ranked in descending order of the score-point difference (“like me” - “not like me”).Source: oecd, PiSa 2012 database, table Vi.4.10.12 http://dx.doi.org/10.1787/888933094925
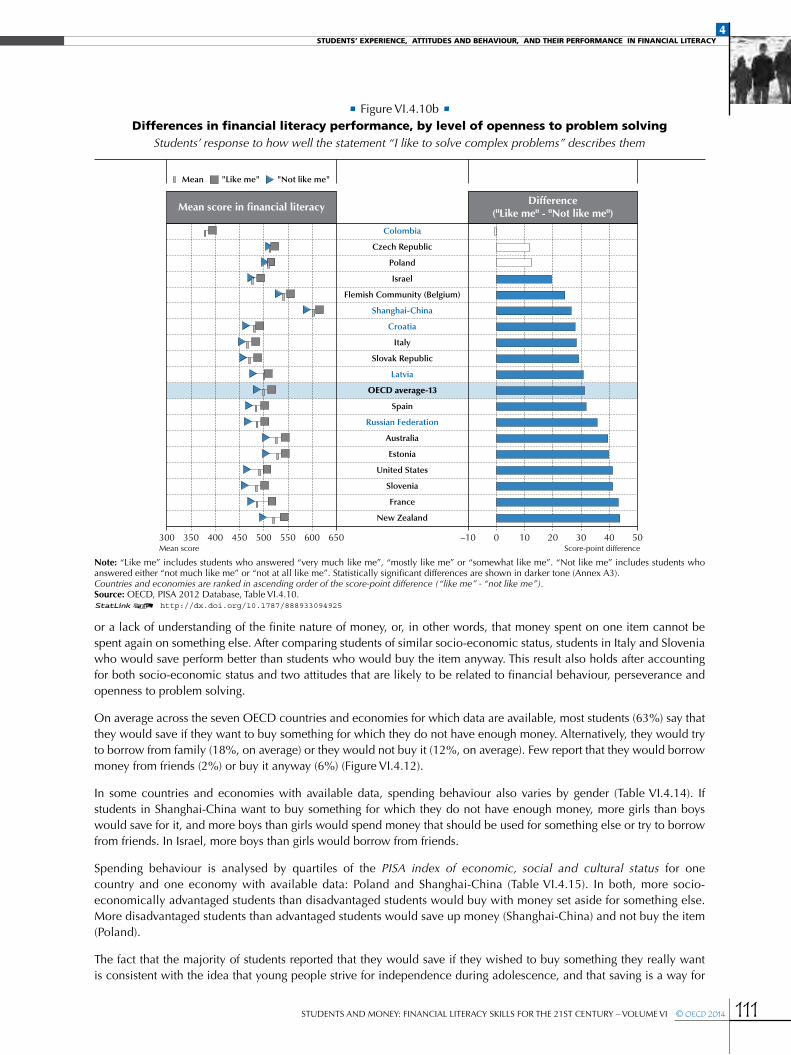
likewise, students’ openness to solve complex problems may influence their use of knowledge in making financial decisions as they grow up, when they are likely to face relatively complex financial problems, such as deciding when they can afford to leave home, or choosing a mortgage or a pension plan. the general student questionnaire asks students if they like to solve complex problems. again, PiSa results demonstrate an association between students’ performance in the financial literacy assessment and their openness to problem solving. in 15 of the 18 countries and economies, students who agreed with the statement “i like to solve complex problems” show better performance than those who disagreed (Figure Vi.4.10b). across oecd countries and economies, after accounting for mathematics and reading scores, the students who answered that they like to solve complex problems show greater proficiency in financial literacy (table Vi.4.10). these initial findings are consistent with the association between financial skills and attitudes as expressed in the PiSa definition of financial literacy.
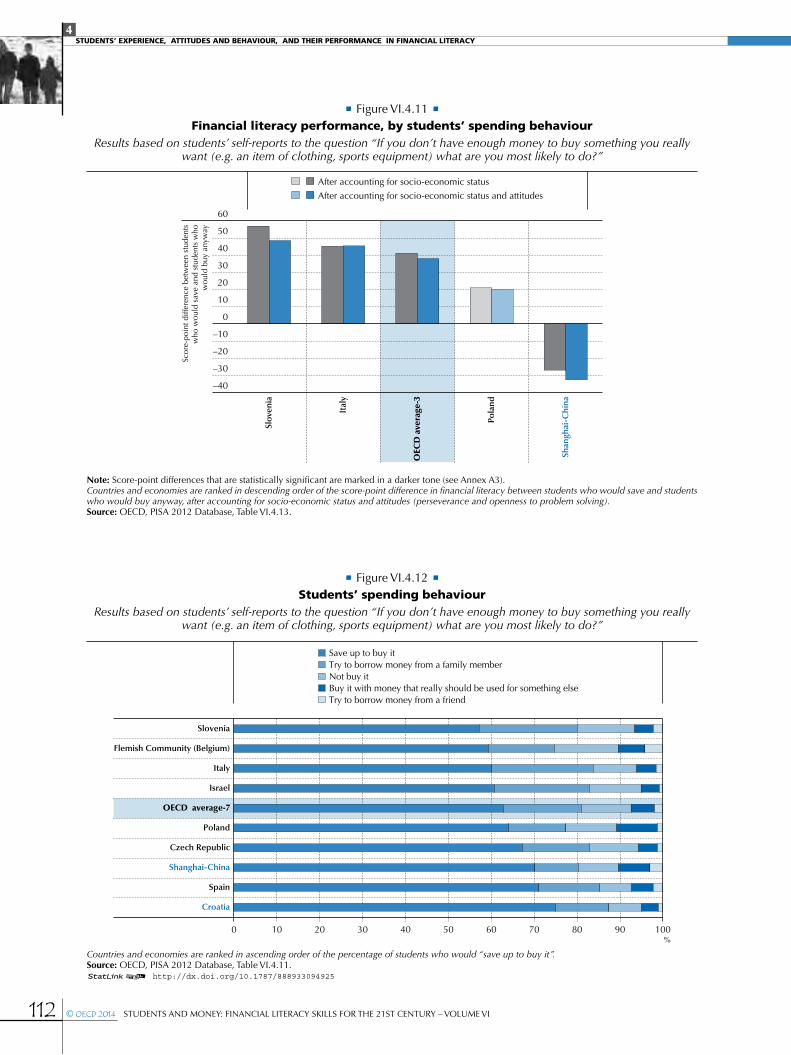
StudentS’ Spending BehAviour And finAnciAl literAcy PiSa 2012 asked students “if you don’t have enough money to buy something you really want (e.g. an item of clothing, sports equipment) what are you most likely to do?”, allowing them to choose among various hypothetical strategies, including buying the item anyway with money that should be used for something else; trying to borrow from a family member; trying to borrow from a friend; saving up money; or not buying it. data are available for the Flemish community of Belgium, croatia, the czech republic, israel, italy, Poland, Shanghai-china, Slovenia and Spain.
Figure Vi.4.11 shows the extent to which financial literacy varies across students who say they would save and students who say that they would buy the item anyway. Saving money and refraining from buying the item can be considered as safer choices than buying the item anyway, which may indicate a lack of ability to distinguish between needs and wants
4StudentS’ experience, AttitudeS And BehAviour, And their performAnce in finAnciAl literAcy
StudentS and Money: Financial literacy SkillS For the 21St century – VoluMe Vi © OECD 2014 111
• Figure Vi.4.10b • differences in financial literacy performance, by level of openness to problem solving
Students’ response to how well the statement “I like to solve complex problems” describes them
Colombia
Czech Republic
Poland
Israel
Flemish Community (Belgium)
Shanghai‐China
Croatia
Italy
Slovak Republic
Latvia
OECD average‐13
Spain
Russian Federation
Australia
Estonia
United States
Slovenia
France
New Zealand
300 350 400 450 500 550 600 650Mean score
–10 500 10 20 30 40Score‐point difference
Mean score in �nancial literacyDifference
("Like me" - "Not like me")
Mean "Like me" "Not like me"
Note: “like me” includes students who answered “very much like me”, “mostly like me” or “somewhat like me”. “not like me” includes students who answered either “not much like me” or “not at all like me”. Statistically significant differences are shown in darker tone (annex a3). Countries and economies are ranked in ascending order of the score-point difference (“like me” - “not like me”).Source: oecd, PiSa 2012 database, table Vi.4.10.12 http://dx.doi.org/10.1787/888933094925
or a lack of understanding of the finite nature of money, or, in other words, that money spent on one item cannot be spent again on something else. after comparing students of similar socio-economic status, students in italy and Slovenia who would save perform better than students who would buy the item anyway. this result also holds after accounting for both socio-economic status and two attitudes that are likely to be related to financial behaviour, perseverance and openness to problem solving.
on average across the seven oecd countries and economies for which data are available, most students (63%) say that they would save if they want to buy something for which they do not have enough money. alternatively, they would try to borrow from family (18%, on average) or they would not buy it (12%, on average). Few report that they would borrow money from friends (2%) or buy it anyway (6%) (Figure Vi.4.12).
in some countries and economies with available data, spending behaviour also varies by gender (table Vi.4.14). if students in Shanghai-china want to buy something for which they do not have enough money, more girls than boys would save for it, and more boys than girls would spend money that should be used for something else or try to borrow from friends. in israel, more boys than girls would borrow from friends.
Spending behaviour is analysed by quartiles of the PISA index of economic, social and cultural status for one country and one economy with available data: Poland and Shanghai-china (table Vi.4.15). in both, more socio-economically advantaged students than disadvantaged students would buy with money set aside for something else. More disadvantaged students than advantaged students would save up money (Shanghai-china) and not buy the item (Poland).
the fact that the majority of students reported that they would save if they wished to buy something they really want is consistent with the idea that young people strive for independence during adolescence, and that saving is a way for
4StudentS’ experience, AttitudeS And BehAviour, And their performAnce in finAnciAl literAcy
112 © OECD 2014 StudentS and Money: Financial literacy SkillS For the 21St century – VoluMe Vi
• Figure Vi.4.12 • Students’ spending behaviour
Results based on students’ self-reports to the question “If you don’t have enough money to buy something you really want (e.g. an item of clothing, sports equipment) what are you most likely to do?”
0 10 20 30 40 50 60 70 80 90 100
Croatia
Spain
Shanghai‐China
Czech Republic
Poland
OECD average‐7
Israel
Italy
Flemish Community (Belgium)
Slovenia
%
Save up to buy itTry to borrow money from a family memberNot buy itBuy it with money that really should be used for something elseTry to borrow money from a friend
Countries and economies are ranked in ascending order of the percentage of students who would “save up to buy it”. Source: oecd, PiSa 2012 database, table Vi.4.11.12 http://dx.doi.org/10.1787/888933094925
• Figure Vi.4.11 • financial literacy performance, by students’ spending behaviour
Results based on students’ self-reports to the question “If you don’t have enough money to buy something you really want (e.g. an item of clothing, sports equipment) what are you most likely to do?”
–40
–30
–20
–10
0
10
20
30
40
50
60
Slov
enia
Ital
y
OEC
D a
vera
ge‐3
Pola
nd
Shan
ghai
‐Chi
na
Scor
e‐po
int d
iffer
ence
bet
wee
n st
uden
tsw
ho w
ould
sav
e an
d st
uden
ts w
how
ould
buy
any
way
After accounting for socio‐economic status
After accounting for socio‐economic status and attitudes
Note: Score-point differences that are statistically significant are marked in a darker tone (see annex a3).Countries and economies are ranked in descending order of the score-point difference in financial literacy between students who would save and students who would buy anyway, after accounting for socio-economic status and attitudes (perseverance and openness to problem solving).Source: oecd, PiSa 2012 database, table Vi.4.13.
4StudentS’ experience, AttitudeS And BehAviour, And their performAnce in finAnciAl literAcy
StudentS and Money: Financial literacy SkillS For the 21St century – VoluMe Vi © OECD 2014 113
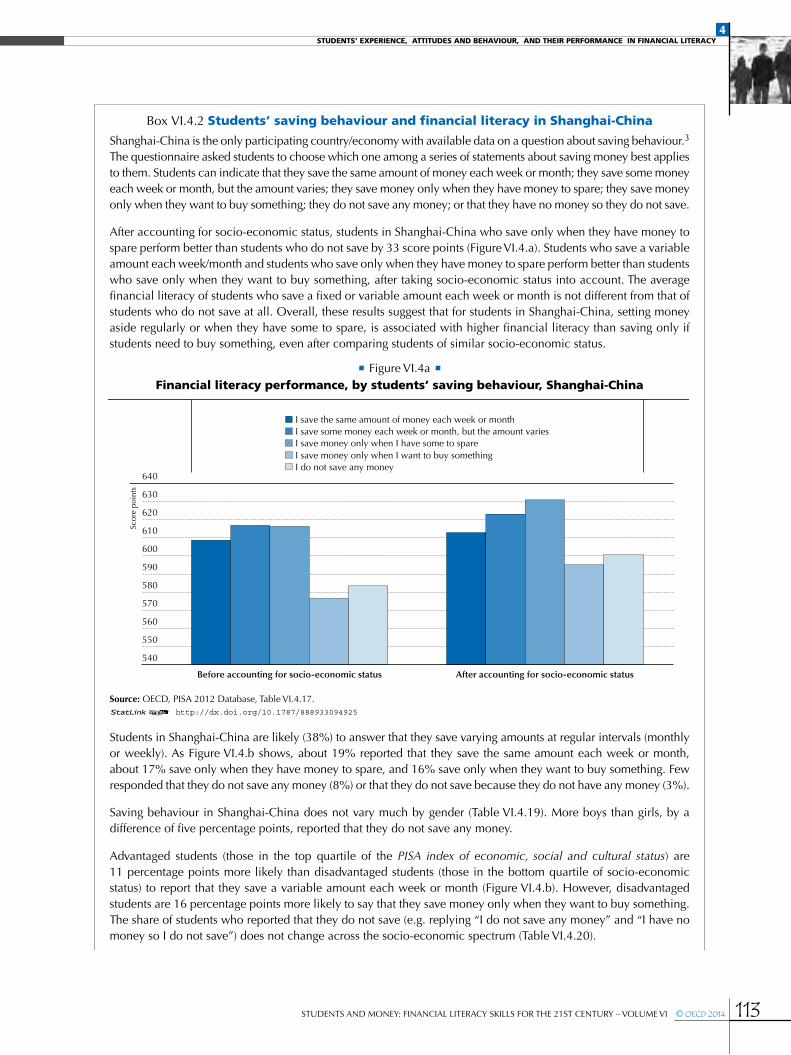
Box Vi.4.2 Students’ saving behaviour and financial literacy in Shanghai-china
Shanghai-china is the only participating country/economy with available data on a question about saving behaviour.3 the questionnaire asked students to choose which one among a series of statements about saving money best applies to them. Students can indicate that they save the same amount of money each week or month; they save some money each week or month, but the amount varies; they save money only when they have money to spare; they save money only when they want to buy something; they do not save any money; or that they have no money so they do not save.
after accounting for socio-economic status, students in Shanghai-china who save only when they have money to spare perform better than students who do not save by 33 score points (Figure Vi.4.a). Students who save a variable amount each week/month and students who save only when they have money to spare perform better than students who save only when they want to buy something, after taking socio-economic status into account. the average financial literacy of students who save a fixed or variable amount each week or month is not different from that of students who do not save at all. overall, these results suggest that for students in Shanghai-china, setting money aside regularly or when they have some to spare, is associated with higher financial literacy than saving only if students need to buy something, even after comparing students of similar socio-economic status.
• Figure Vi.4a • financial literacy performance, by students’ saving behaviour, Shanghai-china
540
550
560
570
580
590
600
610
620
630
640
Before accounting for socio-economic status After accounting for socio-economic status
Scor
e po
ints
I save the same amount of money each week or monthI save some money each week or month, but the amount variesI save money only when I have some to spareI save money only when I want to buy somethingI do not save any money
Source: oecd, PiSa 2012 database, table Vi.4.17.12 http://dx.doi.org/10.1787/888933094925
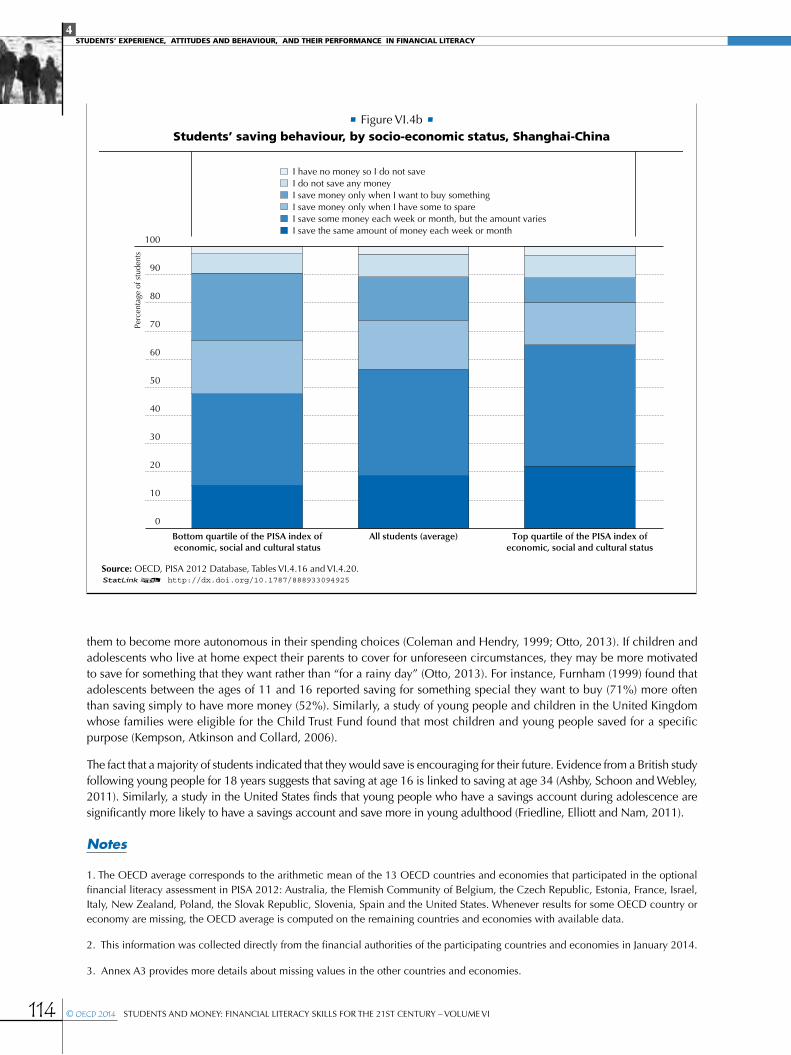
Students in Shanghai-china are likely (38%) to answer that they save varying amounts at regular intervals (monthly or weekly). as Figure Vi.4.b shows, about 19% reported that they save the same amount each week or month, about 17% save only when they have money to spare, and 16% save only when they want to buy something. Few responded that they do not save any money (8%) or that they do not save because they do not have any money (3%).
Saving behaviour in Shanghai-china does not vary much by gender (table Vi.4.19). More boys than girls, by a difference of five percentage points, reported that they do not save any money.
advantaged students (those in the top quartile of the PISA index of economic, social and cultural status) are 11 percentage points more likely than disadvantaged students (those in the bottom quartile of socio-economic status) to report that they save a variable amount each week or month (Figure Vi.4.b). however, disadvantaged students are 16 percentage points more likely to say that they save money only when they want to buy something. the share of students who reported that they do not save (e.g. replying “i do not save any money” and “i have no money so i do not save”) does not change across the socio-economic spectrum (table Vi.4.20).
4StudentS’ experience, AttitudeS And BehAviour, And their performAnce in finAnciAl literAcy
114 © OECD 2014 StudentS and Money: Financial literacy SkillS For the 21St century – VoluMe Vi
them to become more autonomous in their spending choices (coleman and hendry, 1999; otto, 2013). if children and adolescents who live at home expect their parents to cover for unforeseen circumstances, they may be more motivated to save for something that they want rather than “for a rainy day” (otto, 2013). For instance, Furnham (1999) found that adolescents between the ages of 11 and 16 reported saving for something special they want to buy (71%) more often than saving simply to have more money (52%). Similarly, a study of young people and children in the united kingdom whose families were eligible for the child trust Fund found that most children and young people saved for a specific purpose (kempson, atkinson and collard, 2006).
the fact that a majority of students indicated that they would save is encouraging for their future. evidence from a British study following young people for 18 years suggests that saving at age 16 is linked to saving at age 34 (ashby, Schoon and Webley, 2011). Similarly, a study in the united States finds that young people who have a savings account during adolescence are significantly more likely to have a savings account and save more in young adulthood (Friedline, elliott and nam, 2011).
Notes
1. the oecd average corresponds to the arithmetic mean of the 13 oecd countries and economies that participated in the optional financial literacy assessment in PiSa 2012: australia, the Flemish community of Belgium, the czech republic, estonia, France, israel, italy, new Zealand, Poland, the Slovak republic, Slovenia, Spain and the united States. Whenever results for some oecd country or economy are missing, the oecd average is computed on the remaining countries and economies with available data.
2. this information was collected directly from the financial authorities of the participating countries and economies in January 2014.
3. annex a3 provides more details about missing values in the other countries and economies.
• Figure Vi.4b • Students’ saving behaviour, by socio-economic status, Shanghai-china
Bottom quartile of the PISA index ofeconomic, social and cultural status
All students (average) Top quartile of the PISA index ofeconomic, social and cultural status
0
10
20
30
40
50
60
70
80
90
100
Perc
enta
ge o
f stu
dent
s
I have no money so I do not saveI do not save any moneyI save money only when I want to buy somethingI save money only when I have some to spareI save some money each week or month, but the amount variesI save the same amount of money each week or month
Source: oecd, PiSa 2012 database, tables Vi.4.16 and Vi.4.20.12 http://dx.doi.org/10.1787/888933094925
4StudentS’ experience, AttitudeS And BehAviour, And their performAnce in finAnciAl literAcy
StudentS and Money: Financial literacy SkillS For the 21St century – VoluMe Vi © OECD 2014 115
References
Abramovitch, R., J. Freedman and P. Pliner (1991), “children and Money: Getting an allowance, credit versus cash, and knowledge of Pricing”, Journal of Economic Psychology, 12, pp. 27-45.
Ashby, J.S., I. Schoon and P. Webley (2011), “Save now, Save later? linkages between Saving Behaviour in adolescence and adulthood”, European Psychologist, 16, pp. 227-237.
Beutler, I. and L. Dickson (2008), “consumer economic Socialization”, in J.J. Xiao (ed.), Handbook of Consumer Finance Research (pp. 83-102), Springer, new york.
Borghans L., A.L. Duckworth, J.J. Heckman and B. ter Weel (2008), “the economics and Psychology of Personal traits”, Journal of Human Resources, 43, pp. 972-1059.
Charles Schwab & Co. (2011), 2011 Teens & Money Survey Findings: Insights into Money Attitudes, Behaviors and Expectations of 16- to 18-year-olds, http://pressroom.aboutschwab.com/press-release/corporate-and-financial-news/charles-schwabs-2011-teens-money-survey-sheds-light-new-r.
Coleman, J. C. and L.B. Hendry (1999), The Nature of Adolescence (3rd ed.), routledge, london.
Friedline, T.L., W. Elliott and I. Nam (2011), “Predicting Savings from adolescence to young adulthood: a Propensity Score approach”, Journal of the Society for Social Work and Research, 2, pp. 1-22.
Furnham, A. (1999), “the Saving and Spending habits of young People”, Journal of Economic Psychology, 20, pp. 677- 697.
Garon, S. (2012), Beyond Our Means: Why America Spends While The World Saves, Princeton university Press, Princeton.
IEFP (institut pour l’Éducation Financière du Public) (2006), Étude sur l’argent et les problématiques financières auprès des jeunes 15- 20 ans, institut pour l’Éducation Financière du Public, Paris, www.lafinancepourtous.com/IMG/pdf/ Etudejeunescomplete-IEFP.pdf.
Johnson, C. and M. Staten (2010), “do inter-temporal Preferences trump Financial education courses in driving Borrowing and Payment Behaviour?”, Paper presented at the 1st annual Boulder conference on consumer Financial decision Making.
Kempson, E., A. Atkinson and S. Collard (2006), “Saving for children: a Baseline Survey at the inception of the child trust Fund”, HM Revenue & Customs Research Report 18.
Kotlikoff, L.J. and B.D. Bernheim (2001), “household Financial Planning and Financial literacy: the need for new tools”, in l.J. kotlikoff (ed.), Essays on Saving, Bequests, Altruism and Life-Cycle Planning (pp. 427-478), MitPress, cambridge; Massachusetts.
Meeks, C.B. (1998), “Factors influencing adolescents’ income and expenditures”, Journal of Family and Economic issues, 19 (2), pp. 131-150.
Noon, K.L. and G.J. Fogarty (2007), Cognitive and Personality Predictors of Financial Literacy among Adult Australians, in 42nd Australian Psychological Society Annual Conference 2007, 25-29 September 2007, Brisbane, australia.
OECD (2012), Closing the Gender Gap: Act Now, oecd Publishing, Paris, http://dx.doi.org/10.1787/9789264179370-en.
OECD/INFE (2013), Financial Literacy and Inclusion: Results of OECD/INFE Survey Across Countries and by Gender.
Otto, A. (2013), “Saving in childhood and adolescence: insights from developmental Psychology”, Economics of Education Review, 33, pp. 8-18.
Pliner, P., J. Freedman, R. Abramovitch and P. Drake (1996), “children as consumers: in the laboratory and Beyond”, in P. lunt and a. Furnham (eds.), Economic Socialization: The Economic Beliefs and Behaviors of Young People (pp. 11-34), edward elgar, cheltenham, united kingdom..
Schug, M.C. and C.J. Birkey (1985), “the development of children’s economic reasoning”, Theory and Research in Social Education, 13(1), pp. 31-42.
Sherraden S.M., L. Johnson, B. Guo and W. Elliot (2011), “Financial capability in children: effects of Participation in School-Based Financial education and Savings Program, Journal of Family & Economic Issues, 32, pp. 385-399, Doi: 10.1007/s10834-010-9220-5.
Xiao, J.J., M.W. Ford and J. Kim (2011), “consumer Financial Behavior: an interdisciplinary review of Selected theories and research”, Family & Consumer Sciences Research Journal, Vol. 39, no. 4, June 2011, pp. 399-414.
Whitebread, D. and S. Bingham (2013), Habit Formation and Learning in Young Children, the Money advice Service,. london.

From:PISA 2012 Results: Students and Money (VolumeVI)Financial Literacy Skills for the 21st Century
Access the complete publication at:https://doi.org/10.1787/9789264208094-en
Please cite this chapter as:
OECD (2014), “Students' Experience, Attitudes and Behaviour, and their Performance in Financial Literacy”,in PISA 2012 Results: Students and Money (Volume VI): Financial Literacy Skills for the 21st Century, OECDPublishing, Paris.
DOI: https://doi.org/10.1787/9789264208094-8-en
This work is published under the responsibility of the Secretary-General of the OECD. The opinions expressed and argumentsemployed herein do not necessarily reflect the official views of OECD member countries.
This document and any map included herein are without prejudice to the status of or sovereignty over any territory, to thedelimitation of international frontiers and boundaries and to the name of any territory, city or area.
You can copy, download or print OECD content for your own use, and you can include excerpts from OECD publications,databases and multimedia products in your own documents, presentations, blogs, websites and teaching materials, providedthat suitable acknowledgment of OECD as source and copyright owner is given. All requests for public or commercial use andtranslation rights should be submitted to [email protected]. Requests for permission to photocopy portions of this material forpublic or commercial use shall be addressed directly to the Copyright Clearance Center (CCC) at [email protected] or theCentre français d’exploitation du droit de copie (CFC) at [email protected].