Student Data Portal Application User's Guide - RI.gov
32
RIDE Portal – Student Data Portal Application User’s Guide The Student Data Portal provides role-appropriate access to confidential student-level statewide assessment performance for current and past years for use by educators to support instructional and curricular decisions. Users can review performance at a district, school, and/or course level (depending on role) in aggregate form, filtered by certain criteria, or at the individual student level. Table of Contents Accessing the Student Data Portal ............................................................................................................... 3 Site Users and Role Descriptions ........................................................................................................................ 3 Data Parameters/Permissions for this Site ......................................................................................................... 4 Formatting Used within this Guide ..................................................................................................................... 4 Questions and Technical Assistance ................................................................................................................... 4 Quick Reference Overview ........................................................................................................................... 6 General Notes about Tool Functionality ............................................................................................................. 6 Using the Filters and Chart Table ................................................................................................................. 8 Drill-Down Report ..................................................................................................................................... 11 Participation ...................................................................................................................................................... 11 Performance ..................................................................................................................................................... 12 Student Listing .................................................................................................................................................. 12 Viewing Individual Student Assessment Data ............................................................................................. 13 Searching for a Student..................................................................................................................................... 13 Students that Match Criteria ............................................................................................................................ 13 Student Profile .......................................................................................................................................... 14 Sections of the Student Profile ......................................................................................................................... 15
-
Upload
khangminh22 -
Category
Documents
-
view
1 -
download
0
Transcript of Student Data Portal Application User's Guide - RI.gov

RIDE Portal – Student Data Portal Application
User’s Guide
The Student Data Portal provides role-appropriate access to confidential student-level statewide assessment
performance for current and past years for use by educators to support instructional and curricular decisions.
Users can review performance at a district, school, and/or course level (depending on role) in aggregate form,
filtered by certain criteria, or at the individual student level.
Table of Contents
Accessing the Student Data Portal ............................................................................................................... 3
Site Users and Role Descriptions ........................................................................................................................ 3
Data Parameters/Permissions for this Site ......................................................................................................... 4
Formatting Used within this Guide ..................................................................................................................... 4
Questions and Technical Assistance ................................................................................................................... 4
Quick Reference Overview ........................................................................................................................... 6
General Notes about Tool Functionality ............................................................................................................. 6
Using the Filters and Chart Table ................................................................................................................. 8
Drill-Down Report ..................................................................................................................................... 11
Participation ...................................................................................................................................................... 11
Performance ..................................................................................................................................................... 12
Student Listing .................................................................................................................................................. 12
Viewing Individual Student Assessment Data ............................................................................................. 13
Searching for a Student..................................................................................................................................... 13
Students that Match Criteria ............................................................................................................................ 13
Student Profile .......................................................................................................................................... 14
Sections of the Student Profile ......................................................................................................................... 15

Rhode Island Department of Education – SDP User Guide – Updated 12/23/2021 2
Downloading Reports and Data ................................................................................................................. 16
Export or Print Data from Chart Table .............................................................................................................. 16
Download ISRs .................................................................................................................................................. 16
Download Reports ............................................................................................................................................ 17
Item Level Analysis .................................................................................................................................... 18
Criteria Dashboard ............................................................................................................................................ 18
Dynamic Table ................................................................................................................................................... 20
Item Analysis Graph .......................................................................................................................................... 21
Item Level Analysis Report ................................................................................................................................ 22
Student Listing .................................................................................................................................................. 24
Glossary of Key Terms ............................................................................................................................... 25

Rhode Island Department of Education – SDP User Guide – Updated 12/23/2021 3
Accessing the Student Data Portal
The Student Data Portal is only accessible through the RIDE Portal
(https://portal.ride.ri.gov).
Access to the Student Data Portal is managed by your local education agency
(LEA)’s data manager. Your data manager is able to associate user accounts
with your LEA and/or School, and can assign permission to access this
application.
Individuals may not share accounts or account information. Usage must comply with
FERPA parameters.
The portal automatically logs users out after 10 minutes of inactivity.
Users can choose to view students currently in their roster that day (“My Current Students”)
or view students associated with them through official assessment reports from a particular
year (“My Tested Students”).
Site Users and Role Descriptions
Users of this site are granted roles based on their position and responsibilities within an LEA:
• District administrators overseeing the district/LEA in which the student is enrolled.
• School administrators overseeing the school the student attends.
• Teachers responsible for the education of students assigned to them through the Teacher Course
Student linkage.
Role Name District Administrator School Administrator Teacher
Applicable Personnel
Authorized district-/LEA-level
personnel such as
superintendents, assistant
superintendents, curriculum
directors, directors of teaching
and learning, EL/MLL
directors, special education
directors, data managers, etc.
Authorized school
administrators such as
principals, assistant
principals, and charter
school chief
administrators.
Educators directly assigned to
students through Teacher Course
Student (TCS) linkages such as
classroom teachers, literacy and
math coaches, special education
teachers, etc.
Permissions Generate reports and drill
down to student-level data for
all students enrolled in any or
all schools within the LEA,
including outplacement,
depending on whether “My
Generate reports and
drill down to student-
level data for every
student enrolled in that
particular school,
depending on whether
Generate reports and drill down
to student-level data for all
students linked to that educator
in all the educator’s current
classes. For current students, the
educator has the ability to see
Rhode Island Department of Education – SDP User Guide – Updated 12/23/2021 4
Tested Students” or “My
Current Students” is selected.
“My Tested Students”
or “My Current
Students” is selected.
students’ prior school year
assessment results. For tested
students, the educator has the
ability to see only assessment
results for that specific school
year.
Data Parameters/Permissions for this Site
All data within this site are considered confidential under FERPA. Data accessed through this site must be
appropriately secured at all times whether in digital or print format, and whether during access to this site or
when exported from this site and saved to a secure location.
All data and information may only be accessed and used by those who have been granted access with relevant
individual credentials. Logins may not be shared.
As access to data is governed by teacher-course-student linkages and organization assignments, no data are
suppressed except that which would not be visible outside of those parameters.
Students’ historical assessment performance will be limited to a) educators (including administrators) who are
currently responsible for their learning, or b) administrators of the LEA or school that were responsible for the
student’s learning during a particular school year for a particular assessment. Data displayed through the
student profile report will automatically be restricted based on timeframe and user role.
Individual Student Reports (ISRs) generated through this system are intended for educator use only and should
not be shared with students or their families as the reports do not contain the contextual information needed
for those audiences.
Formatting Used within this Guide
Formatting is used to differentiate between elements found in the site.
• “Field, Filter, or Menu Option”
• Field Name
• Page Section
• Button or Other Active Link
Questions and Technical Assistance
If you have any questions about the data in this portal, please email [email protected] for assistance.
For technical issues, please submit a ticket through the RIDE Help Desk (https://support.ride.ri.gov). Please do
not include your username or password in an email for security purposes.

Rhode Island Department of Education – SDP User Guide – Updated 12/23/2021 5
What to include in communications to RIDE:
• Description of the issue you are having. Do not email screenshots where any personally-identifiable
student information (e.g., name, date of birth) are visible.
• Contextual information (e.g., district/LEA, school, user role, system section).
• Student-level information (only if relevant to the issue): Please remember to protect student
confidentiality by only including the following limited student-level information in any
communications: SASID, initials for student’s first and last names, grade level.

Rhode Island Department of Education – SDP User Guide – Updated 12/23/2021 6
Quick Reference Overview
• “My Tested Students”: Students taught in a previous school year, based on the static assessment
results data in the official historical test results reports
• “My Current Students”: Students currently listed in the district enrollment/school enrollment /class
roster on the day you run the report
• Item Analysis: This option opens a new page view. Item analysis is only available for RICAS ELA and
RICAS Math. Users may view item-level aggregate data and aggregate and student-level item
information in accordance with their role (district, school, or teacher) for a particular RICAS
administration and student grade level. For more information, please see the “Item Level Analysis”
section in this guide.
• Download ISRs: Coming soon. Only available for school and district administrators. Download system-
generated Individual Student Reports; intended for educator use, not for distribution to families.
• Search for Student: Enter a student’s SASID or name to go directly to their profile.
• Download Reports: Only available for school and district administrators. Download pre-loaded
student-level reports for particular assessments and store in a secure location.
• Filters: Broaden or narrow your analytical scope using these features. Note: some fields are dependent
upon the Test field and will be updated accordingly if a different test is selected. For more information
about filters, see the Using the Filters and Chart Table section.
• Reset: Returns the filters to the default setting.
• Show: Displays a report based on filter selections.
• Pin: Retain a row or rows from report generation to another for the same assessment.
General Notes about Tool Functionality
The default setting for the available filters is based on the user’s role. When a user’s specific district, school, or
teacher name is displayed by default, no other selections are possible for that field.

Rhode Island Department of Education – SDP User Guide – Updated 12/23/2021 7
• District administrator: Your district is displayed in the District field. “All Schools” is displayed in the
School field, so you can select any school in your district. “All Teachers” is displayed in the Teachers
field.
• School administrator: Your district is displayed in the District field, your school is displayed in the
School field, and “All Teachers” is displayed in the Teachers field.
• Teacher: Your district is displayed in the District field, your school is displayed in the School field, and
your name is displayed in the Teachers field.
Unlike the public Rhode Island Assessment Data Portal (RI-ADP), the user needs to click Show in order to
generate a chart table displaying the data within the filters chosen. Any changes made to the filters will not
update until Show has been clicked.
The following icons have been incorporated into the Students Tested column in the chart table in order to
indicate certain characteristics in the data for which users should take note:
• “Participation Increase” ( ): The number of test takers increased considerably for this group from the
previous year. Between year comparisons are not recommended.
• “Participation Decrease” ( ): The number of test takers decreased considerably for this group from
the previous year. Between year comparisons are not recommended.
• “Caution in Interpreting Results” ( ): The percentage of students tested is below 85%. Results may
have been different if more students had taken the test.
Rhode Island Department of Education – SDP User Guide – Updated 12/23/2021 8
Depending on the size of your browser window (or if viewing on a mobile device), users may need to scroll
down the page after clicking Show in order to see the full chart table for the report they generated. Users will
need to scroll to view the information in the Drill-Down Report after clicking any hyperlinked numbers in the
chart table.
The Pin feature allows single or multiple rows of data to be retained in the chart table even when new filters
are applied and Show is clicked. A Pin can be removed by clicking it to return it to an outline, or by clicking the
Clear Pinned Items link above the chart table. Note: clicking Reset will only remove pins from view until Show
is clicked again if the new filters still apply to the same assessment, in which case the pinned row(s) will
reappear with the new data in the chart table. If a new assessment is selected, the pin will not reappear when
Show is selected.
Export (XLS) and Print (PDF) can be used to save the reports you generate for future use or comparison.
‘Reports’ in this case refers to the any displays generated through this system which are able to be exported,
such as the chart table, the Drill-Down Report and its sections, and the Student Profile.
• Important: Reports created through this portal do not have suppression rules applied to protect
student confidentiality (i.e., there is no minimum n size of 10; there is no 95% rule) as exist on the
public RI-ADP, so it is possible even with anonymized data in this tool to determine student identities
for those familiar with the students in that school.
• Remember to store reports securely once downloaded or printed in order to protect student
confidentiality, and never share them via email or other unsecured methods. Delete downloads from
the downloads folder if you are using a device not assigned to you, and securely empty the trash
whenever you delete a report on any device you use.
• Data accessed and reports created through this portal are not intended for use by any but those who
are authorized to use it to fulfill their educational responsibilities for students.
• Reports for public view and/or posting online should use data generated through the public RI-ADP,
not from this tool. The RI-ADP can generate the same filtered chart table at the district or school level
and has suppression rules applied.
Using the Filters and Chart Table
1. First, determine which group of students you are reviewing:
a. For students who are currently in your roster, click “My Current Students” at the top of the
page.
b. For students you taught in a previous school year, click “My Tested Students”. Teachers can
access only one previous school year. School and district administrators can access all years for
which the student was enrolled in their school or LEA (currently, 2017-18 is the earliest
assessment data available).
2. At any point during your selection of filters, click Show and a chart will be generated based on your
current filter selections and will display on the page below the filters pane. To remove all filters and
Rhode Island Department of Education – SDP User Guide – Updated 12/23/2021 9
return to the default view, click Reset. Note: clicking Reset will also change the student group to “My
Tested Students”.
3. District defaults to the name of your LEA.
4. School is based on your role:
a. District administrators can choose from all schools in the LEA. Note: if “[LEA Name] Outplaced
Students” is selected, a new field called Tested School will appear below School. The district
administrator can then select an outplacement school attended by students in that LEA and
view results for those students.
b. School administrators and teachers are automatically assigned their own school.
5. Test shows all tests taken by the students that meet your selection. Please note: the School field is
dependent upon the Test field.
a. For district administrators, selecting a particular test will filter the schools available based on
the grade level of the assessment and may reset the School field (e.g., as a district user, clicking
“PSAT” will reset the School field to “District-wide” and the School menu will then only include
high schools; likewise, clicking “RICAS” will only include schools with grades 3-8 in the School
menu).
b. For school administrators, depending on your school’s grade levels, some assessment data may
not be available to you or visible on the Test drop-down (e.g., elementary or middle school will
not be able to access or select PSAT or SAT data).
c. For teachers, the grade levels (and therefore assessments) available for drill-down are limited
to the school’s grade level(s).
6. School Year can have multiple values, but defaults to the most recent data set for that assessment. To
add a school year (if applicable), click in the field and select from the drop-down menu. To remove a
school year, click the ‘x’ for that year.
7. Subgroup is also dependent upon the assessment selected, and can have multiple values in its field.
The default is “All Students”, which shows a total for all students (not a breakdown by subgroup). Click
on the field and select the subgroup you wish to analyze; repeat as needed. To remove a subgroup,
click on the ‘x’ for that subgroup. For definitions of each subgroup, see “Subgroup Filters” in the
Glossary of Key Terms at the end of this document.
8. Grade, like Subgroup, is dependent upon the assessment selected (e.g., PSAT only has grade 10; NGSA
only has 5, 8, and 11). The default is “All Grades”, which shows the total of all grades for the
assessment combined. Click on the field to view a menu of available grades, and select an individual
grade to analyze; repeat as needed if you would like to view multiple grades at once.
9. For Teachers, Classes, and Class Sections:
a. District or school administrators are able to filter either from the Teachers menu or from the
Classes menu. Selecting from one automatically filters the other.
b. Teachers see their own name in the Teachers field, and can then select from the classes they
teach.
c. The Class Sections menu defaults to “All Sections” until a class has been selected.
10. After making your selections, click Show to view your results in the space on the page below the filter
options. Note: It may take several seconds to load.

Rhode Island Department of Education – SDP User Guide – Updated 12/23/2021 10
a. A chart will display showing various elements based on your filters. Note: A row containing
statewide data for the Test, School Year, Subgroup, and Grade filters will display for comparison
purposes.
b. The performance levels legend immediately follows the filter section, then the name of the
assessment, and then a set of options which may include “Show Performance”, “Show Growth”
(only displays for RICAS and SAT, depending on school year selected), “View Results as Text”.
Check the box next to the option to change the chart display accordingly.
c. Within the chart, numbers that are hyperlinked (blue) allow users to drill down into that
particular group of students (see the Drill-Down Report section of this guide). Note: the
statewide comparison row has no hyperlinked numbers.
11. Two additional actions are always displayed: [XLS] Export and [PDF] Print.
a. When clicked, Export will generate a XLS file with the data and columns shown in the chart. In
the XLS file, “Subject” will display the name of the test and its subject area.
b. Print will generate a PDF showing the filter settings, timestamp, and the same chart display as
on the page.
12. The chart by default displays the following:
a. [Pin]: Clicking the grey Pin icon will retain the row(s) pinned so you can add additional filters for
the assessment selected. The row(s) will remain in the chart at the bottom after you update the
filters and click Show.
i. Any number of rows can be pinned across any number of filter updates.
ii. To clear a pin, simply click again to turn it grey; to clear all pins, click the [pin] Clear
Pinned Items action above the chart.
b. Name: Name of the assessment with filters listed that describe the data within that row.
c. Students Tested # / %: Displays the number and percent of students tested that match the
chosen filters.
d. Performance: Displays a color-coded bar chart of the percent of students tested at each
performance level for that assessment within the filters chosen. If “View Results as Text” is
selected, the colors will be replaced by the title for that color as shown in the performance level
legend above the chart.
e. Average Scale Score: Displays the average scale score for the group of students meeting the
criteria for the filters chosen.
13. You can now Export or Print this report. If you wish to go deeper, continue to the next section in this
guide, Drill-Down Report.

Rhode Island Department of Education – SDP User Guide – Updated 12/23/2021 11
Drill-Down Report
Once you have set your filters and clicked Show, the chart table will be displayed below the filter section. You
can now drill down into the data for each of those rows.
Note that the numbers within the Students Tested # and the percentages within Performance are links through
which you can access the Drill-Down Report for those groups of students.
• Click a number and then scroll down the page to the Drill-Down Report section. The filter information
from the row you selected is included below the section title.
• Note: drill-down is not possible for the “Statewide” comparison numbers on the chart.
• Individual sections can be printed or saved as PDFs through the [PDF] Print Participation, [PDF] Print
Performance, or [PDF] Print Student Listing links.
• The [XLS] Export Performance and [XLS] Export Student Listing creates a XLS file that automatically
downloads.
The Drill-Down Report has three sections:
• Participation: Table displaying participation metrics.
• Performance: Table breaking down the number and percent of students at each performance level.
• Student Listing: Interactive list of students with links to each individual Student Profile.
Participation
• This section can be expanded or collapsed using [Show/Hide]. The default is expanded.

Rhode Island Department of Education – SDP User Guide – Updated 12/23/2021 12
• Important: The participation metrics shown in the Drill-Down Report are for statewide assessment
reporting purposes only. The participation rate for accountability purposes is a separate calculation,
and not included in the Student Data Portal.
• Enrollment is the total enrollment of students in that district and school who meet the filter criteria.
• Exempt Recently Arrived English Learners applies to the ELA statewide assessments only. This refers to
the number of English Learners within their first year of education in the United States who by federal
statute are exempt from being assessed in ELA for that first year only.
• Medical Exemptions is the number of students who meet the medical exemption criteria for that
particular statewide assessment within the group selected for the Drill-Down Report.
• Eligible to Test is the difference between the enrollment and the two exemptions noted above.
• Participated is the number of students who took this assessment within this group.
• Participation Rate is the percentage resulting from the number of students who Participated divided by
the number of students Eligible to Test.
• Not Tested displays the number of students Eligible to Test (did not have one of the two exemptions)
who did not take the test.
Performance
• Name is the name of the assessment and the content area.
• Participants is the number of students who took this assessment within this group.
• The performance level descriptors change based on the assessment selected. For each level, the
number and percentage of students scoring at that level is displayed.
Student Listing
• The default view for this section has “Basic Info” and “Performance” displays checked. You can have as
many or as few displays shown. Note: removing “Basic Info” will display anonymized data, and apply to
Export or Print for reports while that view is active.
• “Basic Info” includes Student Name, SASID, Grade, Accommodations.
• “Demographics” includes Gender, Race/Ethnicity, English Learner, Special Education, Homeless,
Economically Disadvantaged, Migrant, Foster, and Military. The codes used correspond with the codes
in RIDE’s Data Dictionary (www.ride.ri.gov/Data-Dictionary).
• “Performance” includes Score, Performance Level, and Performance Level Name.
• “Growth” is only available for those assessments with growth metrics (i.e., RICAS, SAT). This option
displays SGP (Student Growth Percentile: 1-100) and SGP Level (Student Growth Percentile Level: Low,
Typical, High).
• “Subscore Performance” is only available for those assessments with subscores. This display shows the
categories and points or scores according to that assessment. For more information about subscores
for each assessment, go to www.ride.ri.gov/Assessment-Results.

Rhode Island Department of Education – SDP User Guide – Updated 12/23/2021 13
Viewing Individual Student Assessment Data
There are two ways to find student-level assessment data.
Searching for a Student
1. Click the Search for Student button.
2. In the pop-up window, enter the student’s SAID or
name. You are only able to search students within
your district and/or school (depending on role).
3. A list displays the SASID and student name.
4. Click Select and the Student Profile for that
student will display in a new window.
Students that Match Criteria
1. After creating the chart table by selecting the filters for the criteria and clicking Show, click on a blue
hyperlink within the chart table to drill down into that set of students (e.g., the number under Students
Tested, or the percent of students achieving a particular Performance level).
2. On the Drill-Down Report, select the student from the list by clicking on the student’s name or SASID.
Note: in the Participation section, click on any of the numbers that are hyperlinked to display the list of
those students, then click on the name or SASID.
Rhode Island Department of Education – SDP User Guide – Updated 12/23/2021 14
Student Profile
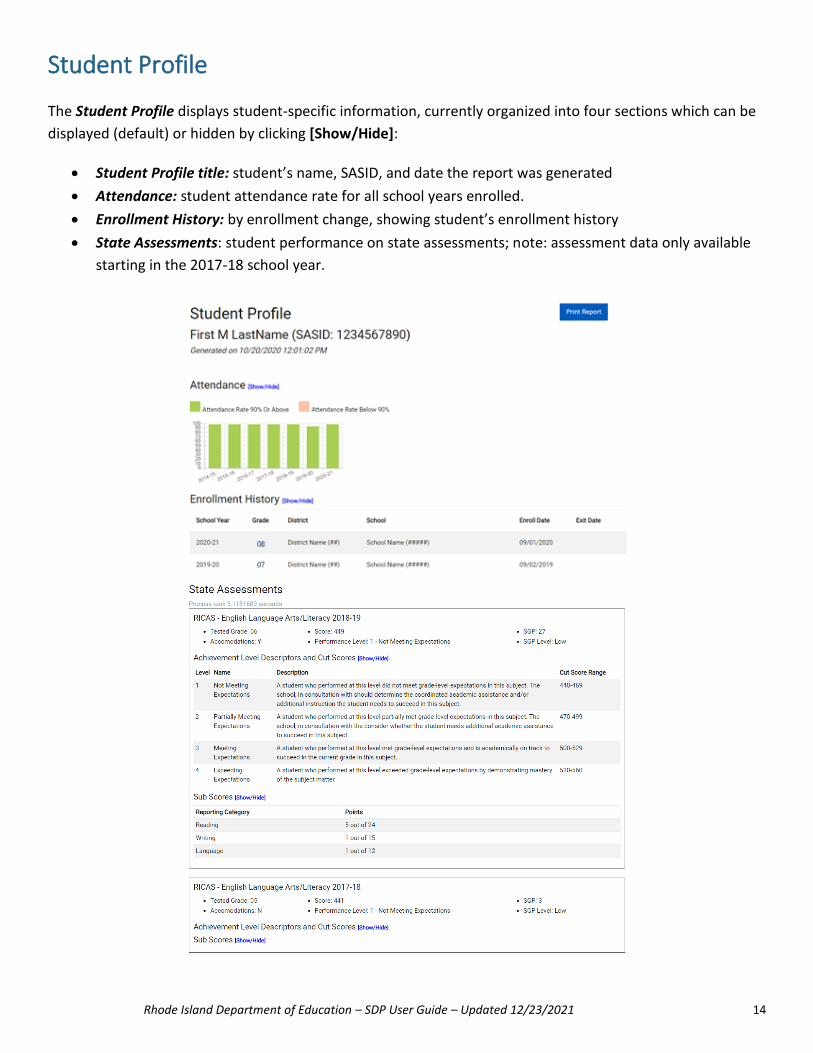
The Student Profile displays student-specific information, currently organized into four sections which can be
displayed (default) or hidden by clicking [Show/Hide]:
• Student Profile title: student’s name, SASID, and date the report was generated
• Attendance: student attendance rate for all school years enrolled.
• Enrollment History: by enrollment change, showing student’s enrollment history
• State Assessments: student performance on state assessments; note: assessment data only available
starting in the 2017-18 school year.
Rhode Island Department of Education – SDP User Guide – Updated 12/23/2021 15
The information displayed is based on role of the user generating the report:
• District administrators can see student’s information for the entirety of the student’s time enrolled in
the LEA.
• School administrators can see student’s information for the entirety of the time the student was
enrolled in that school.
• Teachers can see student’s information for the current school year and prior school year.
To generate a PDF of the information displayed on the page, click the Print Report button. Note: the PDF will
not include sections that have been hidden.
Sections of the Student Profile
Attendance • Bar chart by school year displaying attendance rate (0-100%) for the student for that year.
• The actual rate for that year will display when you hover the pointer over the bar for a particular year.
• Color-coded for at or above 90%, and below 90%.
Enrollment History
• Table displaying School Year, Grade, District, School, Enroll Date, and Exit Date, with the most recent (current) school year first.
• Note: there may be multiple entries for a particular school year.
State Assessment
• Organized by assessment, then administration (school year) of that assessment.
• Each assessment includes the following information: o Tested Grade: grade level at which the student took the assessment o Accommodations: the student took the assessment with (“Y”) or without (“N”) accommodations o Score: scale score for that assessment o Performance Level: performance level name o SGP: Student Growth Percentile (RICAS and SAT only, if applicable) o SGP Level: Student Growth Percentile Level – “Low”, “Typical”, or “High (RICAS and SAT only)
• The following elements are hidden by default and can be displayed by clicking [Show/Hide]: o Achievement Level Descriptors and Cut Scores displays a table describing the performance levels
and cut score ranges for that particular assessment. o Sub Scores for that particular student displays a table showing the points the student earned for
each reporting category, and/or the score or level. (Note: not all assessments have subscores, so this section may not be visible.)
o Sub Score Descriptors displays a table describing the subscore domain names, levels, level names, and descriptions. (Note: not all assessments have subscore descriptors, so this section may not be visible.)

Rhode Island Department of Education – SDP User Guide – Updated 12/23/2021 16
Downloading Reports and Data
Reports and data can be downloaded in a number of ways. Remember that all data within this site are
considered confidential under FERPA. Data accessed through this site must be appropriately secured at all
times whether in digital or print format, and whether during access to this site or when exported from this site
and saved to a secure location.
All data and information may only be accessed and used by those who have been granted access with relevant
individual credentials. Logins may not be shared.
Export or Print Data from Chart Table
When clicked, Export will generate a XLS file with the data and columns shown in the chart. In the XLS file,
“Subject” will display the name of the test and its subject area.
Print will generate a PDF showing the filter settings, timestamp, and the same chart display as on the page.
Download Individual Student Reports (ISRs)
School and District Administrators may use this functionality to download system-generated Individual
Student Reports (ISRs) for PSAT10 and SAT School Day for school records and to distribute to families. These
reports contain the performance levels for PSAT10 and SAT School Day which are not included on the ISRs
generated and sent by College Board to students.
The Download ISRs tool can be accessed on the main page of the Student Data Portal as indicated below,
through the button between the Item Analysis tool and the Search for Student tool.
Rhode Island Department of Education – SDP User Guide – Updated 12/23/2021 17
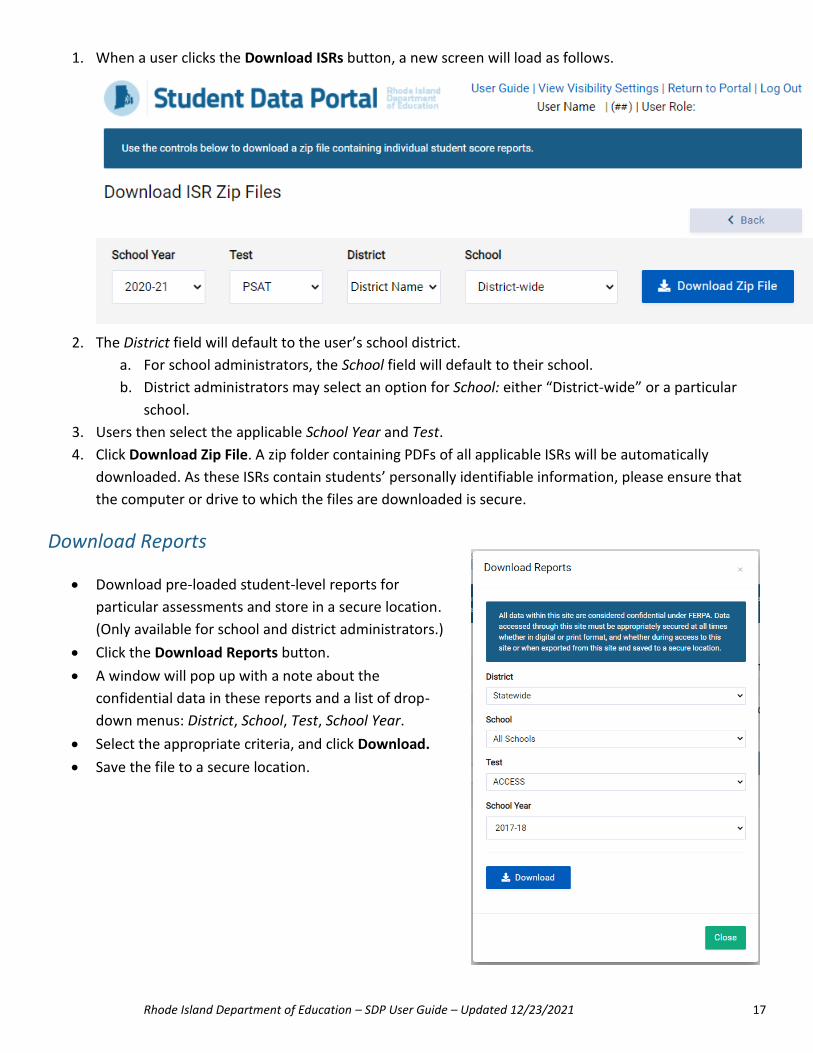
1. When a user clicks the Download ISRs button, a new screen will load as follows.
2. The District field will default to the user’s school district.
a. For school administrators, the School field will default to their school.
b. District administrators may select an option for School: either “District-wide” or a particular
school.
3. Users then select the applicable School Year and Test.
4. Click Download Zip File. A zip folder containing PDFs of all applicable ISRs will be automatically
downloaded. As these ISRs contain students’ personally identifiable information, please ensure that
the computer or drive to which the files are downloaded is secure.
Download Reports
• Download pre-loaded student-level reports for
particular assessments and store in a secure location.
(Only available for school and district administrators.)
• Click the Download Reports button.
• A window will pop up with a note about the
confidential data in these reports and a list of drop-
down menus: District, School, Test, School Year.
• Select the appropriate criteria, and click Download.
• Save the file to a secure location.

Rhode Island Department of Education – SDP User Guide – Updated 12/23/2021 18
Item Level Analysis
The Item Level Analysis tool in the SDP provides item-level data at the aggregate and individual student levels
for the RICAS ELA and RICAS Math state assessments. Users may review information for their district and/or
school in accordance with their user role permissions for a given content area, school year, grade level, and
subgroup.
Reminder about viewing, exporting, and printing reports:
• Important: Reports created through this portal do not have suppression rules applied to protect
student confidentiality (i.e., there is no minimum n size of 10; there is no 95% rule) as exist on the
public RI-ADP, so it is possible even with anonymized (aggregate) data in this tool to determine student
identities for those familiar with the students in that school.
• Remember to store reports securely once downloaded or printed in order to protect student
confidentiality, and never share them via email or other unsecured methods. Delete downloads from
the downloads folder if you are using a device not assigned to you, and securely empty the trash
whenever you delete a report on any device you use.
• Data accessed and reports created through this portal are not intended for use by any but those who
are authorized to use it to fulfill their educational responsibilities for students.
• Reports for public view and/or posting online should use data generated through the public RI-ADP,
not from this tool. The RI-ADP can generate the same filtered chart table at the district or school level
and has suppression rules applied.
Criteria Dashboard
The default setting for the available filters is based on the user’s role. When a user’s specific district, school, or
teacher name is displayed by default, no other selections are possible for that field.
Rhode Island Department of Education – SDP User Guide – Updated 12/23/2021 19
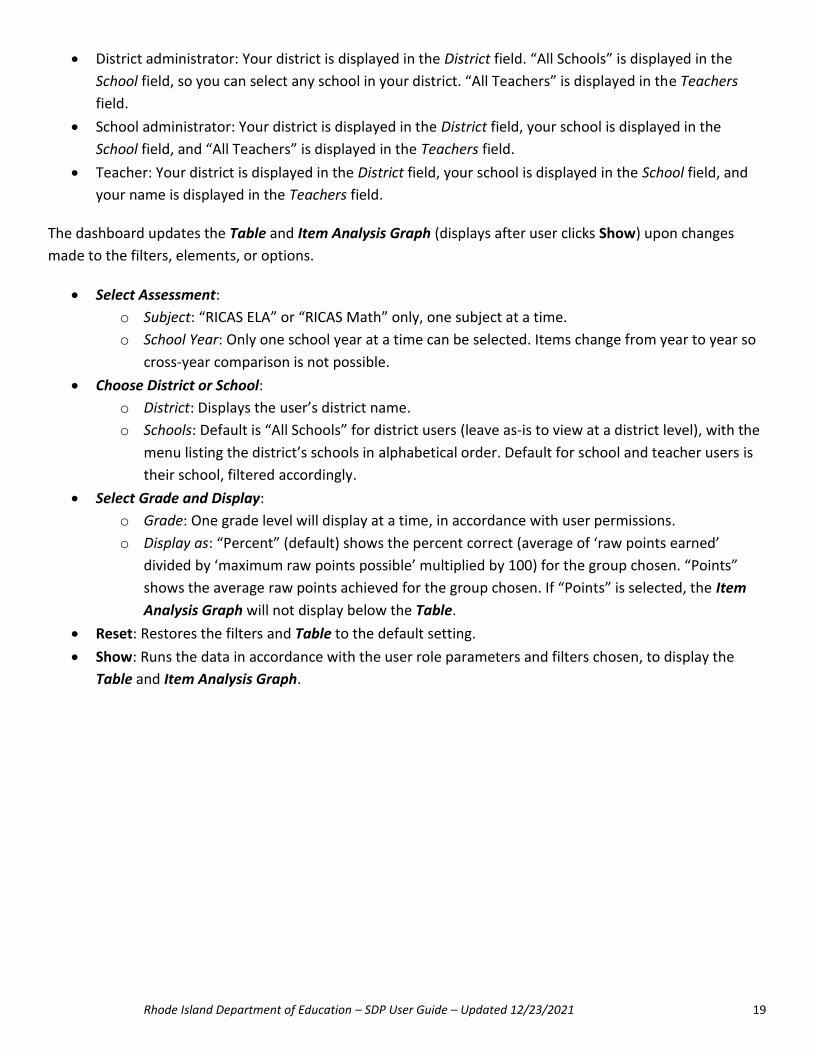
• District administrator: Your district is displayed in the District field. “All Schools” is displayed in the
School field, so you can select any school in your district. “All Teachers” is displayed in the Teachers
field.
• School administrator: Your district is displayed in the District field, your school is displayed in the
School field, and “All Teachers” is displayed in the Teachers field.
• Teacher: Your district is displayed in the District field, your school is displayed in the School field, and
your name is displayed in the Teachers field.
The dashboard updates the Table and Item Analysis Graph (displays after user clicks Show) upon changes
made to the filters, elements, or options.
• Select Assessment:
o Subject: “RICAS ELA” or “RICAS Math” only, one subject at a time.
o School Year: Only one school year at a time can be selected. Items change from year to year so
cross-year comparison is not possible.
• Choose District or School:
o District: Displays the user’s district name.
o Schools: Default is “All Schools” for district users (leave as-is to view at a district level), with the
menu listing the district’s schools in alphabetical order. Default for school and teacher users is
their school, filtered accordingly.
• Select Grade and Display:
o Grade: One grade level will display at a time, in accordance with user permissions.
o Display as: “Percent” (default) shows the percent correct (average of ‘raw points earned’
divided by ‘maximum raw points possible’ multiplied by 100) for the group chosen. “Points”
shows the average raw points achieved for the group chosen. If “Points” is selected, the Item
Analysis Graph will not display below the Table.
• Reset: Restores the filters and Table to the default setting.
• Show: Runs the data in accordance with the user role parameters and filters chosen, to display the
Table and Item Analysis Graph.
Rhode Island Department of Education – SDP User Guide – Updated 12/23/2021 20
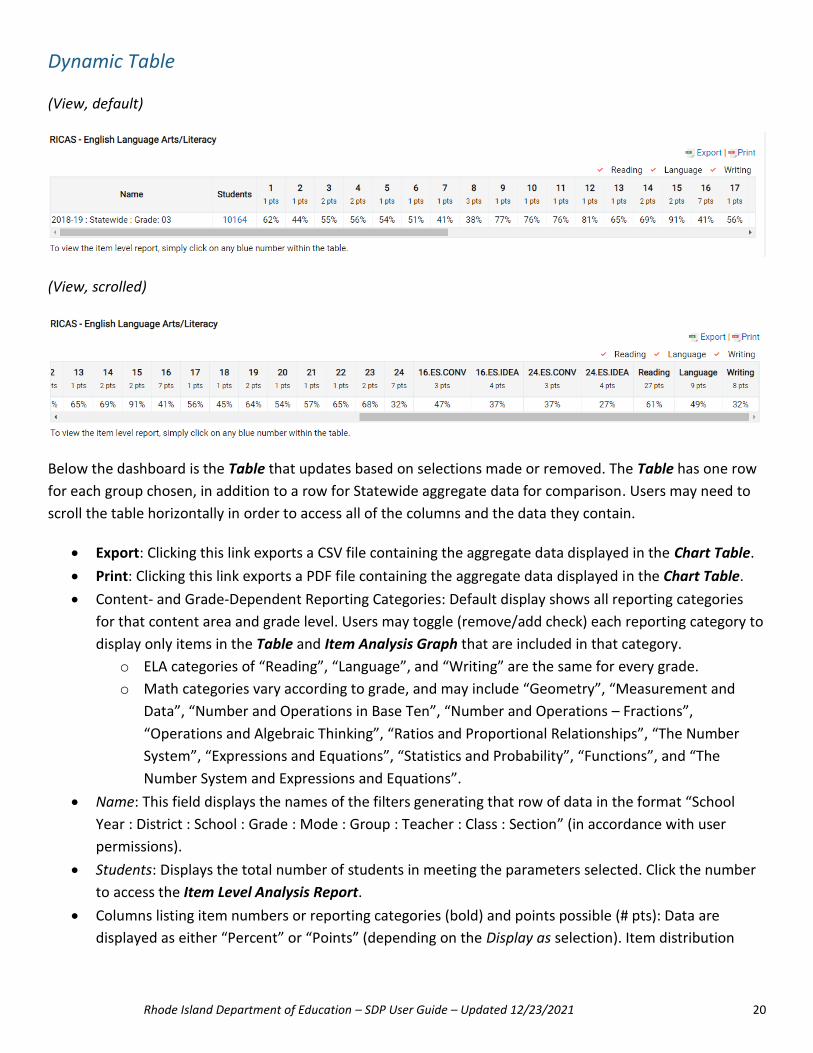
Dynamic Table
(View, default)
(View, scrolled)
Below the dashboard is the Table that updates based on selections made or removed. The Table has one row
for each group chosen, in addition to a row for Statewide aggregate data for comparison. Users may need to
scroll the table horizontally in order to access all of the columns and the data they contain.
• Export: Clicking this link exports a CSV file containing the aggregate data displayed in the Chart Table.
• Print: Clicking this link exports a PDF file containing the aggregate data displayed in the Chart Table.
• Content- and Grade-Dependent Reporting Categories: Default display shows all reporting categories
for that content area and grade level. Users may toggle (remove/add check) each reporting category to
display only items in the Table and Item Analysis Graph that are included in that category.
o ELA categories of “Reading”, “Language”, and “Writing” are the same for every grade.
o Math categories vary according to grade, and may include “Geometry”, “Measurement and
Data”, “Number and Operations in Base Ten”, “Number and Operations – Fractions”,
“Operations and Algebraic Thinking”, “Ratios and Proportional Relationships”, “The Number
System”, “Expressions and Equations”, “Statistics and Probability”, “Functions”, and “The
Number System and Expressions and Equations”.
• Name: This field displays the names of the filters generating that row of data in the format “School
Year : District : School : Grade : Mode : Group : Teacher : Class : Section” (in accordance with user
permissions).
• Students: Displays the total number of students in meeting the parameters selected. Click the number
to access the Item Level Analysis Report.
• Columns listing item numbers or reporting categories (bold) and points possible (# pts): Data are
displayed as either “Percent” or “Points” (depending on the Display as selection). Item distribution

Rhode Island Department of Education – SDP User Guide – Updated 12/23/2021 21
(types, points possible), reporting categories, item score breakdowns (ELA only), and total items vary
according to content area and grade level.
o ELA: In addition to items and reporting categories, the Table includes the breakdown of the
essay items’ total scores (displayed as a regular item number) into the score’s two components
of “conventions” (noted as “#.ES.CONV”) and “idea development” (noted as “#.ES.IDEA”).
o Math: Items and reporting categories only.
Item Analysis Graph
The Item Analysis Graph displays below the Table to show the “Percent Correct” by item number and
reporting category (and essay score breakdown for ELA) in accordance with the parameters set in the
Dashboard and the reporting categories selected in the Table. Each row of data in the Table will display as a
plotted line of a different color on the graph (statewide only shown in the example). If there is no data for a
particular filter selection, the Table will have “N/A” for that row and the graph will only contain the statewide
plotted line.
Changes made to the Dashboard (once the user clicks Show) or the Table (e.g., toggling reporting categories)
will update the graph accordingly. For example, removing a reporting category will remove items included in
that reporting category.
The graph will not display if “Points” is selected in the Display as field in the Dashboard.

Rhode Island Department of Education – SDP User Guide – Updated 12/23/2021 22
Item Level Analysis Report
The Item Level Analysis Report provides item-specific information, including the standard, description, link to
actual computer-based released item, and statistics about school/district/state performance. This section
displays information for the selected group as a whole; the following section (Student Listing) displays
student-level information.
As with all aspects of the Student Data Portal, please ensure that this information is kept confidential when
viewing or that any reports downloaded are stored so that there is no unauthorized access to student level
information (or to student information in n sizes less than 10 as that is possible to identify students
accordingly).
The parameters or filters selected through the Dashboard will be displayed at the top of the new page as a
title. The number of students in this group (i.e., students meeting the criteria set by the filters) will be
displayed below the title.
The table of the report contains the following information about each item. A user may Export Item and
Subscore Analysis (CSV) or Print Item and Subscore Analysis (PDF) to download a copy of this page. Please
note: although this report shows aggregate data, for student group n sizes less than 10 the report must be
kept secure when saved, as given the parameters or filters selected that small n size makes it possible to
identify students meeting that criteria.
• Item Number: The identifier for this item. Clicking the number in this report table will open a new
window displaying the item itself if it has been released, or displaying information about the item if the
item is not released.

Rhode Island Department of Education – SDP User Guide – Updated 12/23/2021 23
• Reporting Category: This represents the domain of the RI Core Standards being assessed through this
item. There may be one or more reporting categories associated with an item, and that varies
according to content area and grade level.
• Standard: The code identifying the particular RI Core Standard for that content area and grade level.
Clicking on the code will open a new window displaying the language of the standard itself.
• Item Type: The code in this column identifies whether the item is selected response (“SR”), constructed
response (“CR”), short answer (“SA”), or essay (“ES”). Information about each item type can be found
at www.ride.ri.gov/RICAS.
• Item Description: A description of the task to accomplish and skill or knowledge demonstrated through
this item.
• Correct Answer: Where applicable according to release status and item type, the answer will be
included in this column (e.g., some multiple-choice SR items, some math SA items where the answer is
a number).
• Release Status: This column indicates whether the item itself that students took on the test has been
released for public view or instructional use. Items that have not been released are still considered
secure and confidential and their contents are not shared.
• Possible Points: The maximum possible raw points for an item.
• This Report / School / District / State: Displays student performance on this item according to the
following groups: this report, school, district, and state levels for this grade, year, and content area.
Each primary column has two sub-columns with the average points and the percent of points,
respectively. This may be used to compare performance on this item at the various aggregate levels
displayed.
• School-State diff / School-District diff: Displays the difference between the school and either state or
district percent as a percent (positive if school percent is higher, negative if school percent is lower)
and a color-coded bar (green for positive difference, red for negative difference). This may be used to
compare performance on this item at the various aggregate levels displayed.

Rhode Island Department of Education – SDP User Guide – Updated 12/23/2021 24
Student Listing
The Student Listing displays a table with item-level information for each of the students meeting the criteria
of the parameters selected in the item analysis dashboard, including their performance on each item and in
each reporting category.
As with all aspects of the Student Data Portal, please ensure that this information is kept confidential when
viewing or that any reports downloaded are stored so that there is no unauthorized access to student level
information.
The table provides the same item metadata (i.e., Item Number, Reporting Category, Standard, Item Type,
Possible Points) as in the Item Level Report. Depending on the screen or browser window size, users may need
to scroll horizontally or to zoom out in order to see all columns in the table.
In addition, the Student Listing can be filtered by reporting category similar to the Table on the main Item
Level Analysis page. The default is all reporting categories checked and therefore displayed in the Student
Listing. Removing the check from any reporting category will remove associated items from the table.
Users may Export Item and Subscore Analysis (CSV) or Print Item and Subscore Analysis (PDF) to download a
copy of the Student Listing. As with any file that contains student information, the downloaded report must
be stored or transferred securely in order to maintain student privacy in accordance with FERPA.
To search for a particular student, users may enter any part of the student’s name (first or last) or SASID into
the Search field above the table. The table will automatically update and filter accordingly.
The default number of entries displayed in the table is 25. Users may increase or decrease accordingly by
clicking on the up/down triangles for the menu. Previous and Next navigation for multiple pages is found
below the table.
The table may be sorted by any column, ascending or descending, by clicking on the up/down arrow icon
within that particular column. The default sort is ascending by Student Name. The arrow
Clicking on the blue lettering of a Standard will open a separate window to display the language of the
standard.

Rhode Island Department of Education – SDP User Guide – Updated 12/23/2021 25
Glossary of Key Terms
Accommodations: changes to the format or delivery method of the test for a student 1) in accordance with a
504 or IEP and which address the diagnosed disability(ies) of the student by removing a barrier to the
student’s participation and access of the test, but do not modify the test itself (i.e., change or affect the
construct being measured, such as reading the reading test), and/or 2) in accordance with formal
documentation to provide language support for students who are English learners and being monitored
Achievement Level: a category covering a range of scores that describe how well student(s) meet the
expectations or content standards for their grade level, bounded on the low end by a cut score – levels
typically indicate not meeting, approaching, or below expectations at the lowest, then proficiency with
expectations, and mastery of expectations at the highest level (see also Achievement Level Descriptor, Cut
Score, Performance Level)
Achievement Level Descriptor: describe what students within each achievement level are expected to know
and to be able to do; link between the content and achievement standards (see also Achievement Level,
Performance Level)
Accountability: states are required to have a system of accountability that evaluates and publicly reports on
school performance; Rhode Island’s accountability system features a Star Rating for every public school, which
factors in a broad set of measures; accountability reporting that uses assessment data is not the same as
assessment data reporting
Aggregate Data: the combined total of all students in a particular group (see also Student-Level
Data/Information)
Attendance Rate: days in attendance out of total school days, displayed as a percent
Average Scale Score: the sum of scale scores for all students in a group, divided by the number of students in
that group (see also Scale Score)
Basic Information: a student’s full legal name, date of birth, and SASID (see FERPA, Personally-Identifiable
Information, Student-Level Data/Information, SASID)
Charter School: public schools authorized by the State of Rhode Island to operate independently from many
state and local district rules and regulations and are able to establish educational strategies that meet the
specific student achievement goals and objectives outlined in each school's charter.
Classes: List of courses taught at a particular school and/or by a particular teacher, coded by local course code.
The list defaults to “All Classes” for a particular school and/or particular teacher. Selecting a single class will
filter the data to only show results for that group of students.
Class Sections: Once a class is selected, all sections or a single section (if more than one) can be selected to
show results for that group of students.

Rhode Island Department of Education – SDP User Guide – Updated 12/23/2021 26
Cut Score: the score between two achievement levels that demonstrates the lowest possible score for which a
student would meet the criteria for the higher achievement level; derived from the knowledge and skills
measured by the test items that students at each achievement level are expected to be able to answer
correctly (see also Achievement Level, Achievement Level Descriptor, Performance Level)
Demographics: socioeconomic information concerning a particular student (e.g., grade level and subgroup
information such as gender, race/ethnicity, English learner status, accommodations, IEP or 504 plan status,
homeless, migrant, active military parent, economically disadvantaged)
District: public school district (regular or regional) or the administrative level of a charter school, state-
operated school, or regional collaborative (see also LEA)
District Administrator (role): authorized district-/LEA-level personnel such as superintendents, assistant
superintendents, curriculum directors, directors of teaching and learning, EL/MLL directors, special education
directors, data managers, etc.; this role has access within this system to all data pertaining to their LEA and its
students; may generate reports and drill down to student-level data for all students enrolled in all schools
within the LEA for the duration of that student’s enrollment in the LEA.
Drill-Down Report: a data display that shows upon clicking of a linked number for a particular filtered group
within the chart table; contains three sections with information about participation, performance, and student
listing
Eligible to Test: a student who is not exempt from taking the test due to an approved medical exemption or
due to being a first year EL for the ELA test; the difference between enrollment and the total of two
exemptions (see also Participation)
Enroll Date: date of a student’s enrollment in a class, grade, or school (see also Enrollment History)
Enrollment: total enrollment of students in a selected district or school (see also Participation)
Enrollment History: information regarding student enrollment in a school including the school year, district of
residence, the start and end date of the enrollment period at a particular school and/or grade level (see also
Enroll Date, Exit Date)
Exempt Recently Arrived English Learners: students with English Learners status who entered and were
enrolled in a United States school for less than the past twelve months (e.g., after April 1 of the previous
calendar year), and therefore by federal statute are exempt from being assessed in ELA for that first year only,
they are not exempt from participation in mathematics or (if applicable) science; also called “first year English
learners” (see also Participation)
Exit Date: date of a student’s exit or withdrawal from a class, grade, or school during the regular school term
or between regular school terms for known or unknown reasons (see also Enrollment History)
FERPA: Family Educational Rights and Privacy Act; a Federal law (20 U.S.C. § 1232g; 34 CFR Part 99) that
protects the privacy of student education records and applies to all schools that receive funds under an
Rhode Island Department of Education – SDP User Guide – Updated 12/23/2021 27
applicable program of the U.S. Department of Education; FERPA covers all student information stored within
and accessible through RIDE systems (see also Personally-Identifiable Information, Student-Level
Data/Information)
Grade: grade level of the student (see also Tested Grade)
Growth: student academic progress towards grade level expectations, typically measured from year to year on
certain state assessments (RICAS, SAT); growth percentiles can be used with content scores and achievement
levels to understand progress towards grade level expectations (see also SGP, SGP Level)
ISR: Individual Student Report; a report containing a student’s results for a particular state assessment (see
also Student-Level Data/Information)
LEA: Local Education Agency; there are 66 public LEAs or districts in Rhode Island, including 32 regular school
districts (single municipalities), 4 regional school districts (more than one municipality), 4 state-operated
schools (statewide), 1 regional collaborative LEA, and 25 charter schools (see also District)
Level of Mastery: typically relating to the standards within a particular discipline, domain, or topical area for
an assessment, level of mastery provides a general description of how well the student has mastered the
concepts and skills required by the standards (see Reporting Categories, Subscore)
Medical Exemption: number of students who meet the medical exemption criteria for a particular statewide
assessment; medical exemptions are only available for students with a medical condition or injury that
prevents both instruction and assessment, and whose exemptions have been approved by RIDE (see also
Participation)
My Current Students: Students currently listed in the district/school/class roster on the day you run the report
My Tested Students: Students taught in a previous school year, based on the static assessment results data in
the official historical test results reports
Not Tested: the number of students Eligible to Test who did not take the test (see also Eligible to Test,
Participation, Participation Rate)
Outplaced Students: students enrolled in the local public school district or a charter, but receive the entirety
of their educational instruction at a different institution in accordance with their needs; for users with the
district administrator role, this option in the School filter refers to the outplacement facilities educating
students enrolled in that LEA (see also Outplacement, School, Tested School)
Outplacement: a facility not the student’s enrolled school where the student has been placed according to
their needs (medical or otherwise) by the sending LEA/district; the student attends, receives instruction, and
takes the applicable state assessments at this facility, which may be located within Rhode Island or out of state
(see also Outplaced Students, School, Tested School)

Rhode Island Department of Education – SDP User Guide – Updated 12/23/2021 28
Participant: student who took the assessment and answered at least one question on each section (see also
Participated, Participation)
Participated: number or percent of students who took a particular assessment by answering at least one item
in each section of the assessment (see also Participation, Participation Rate)
Participation: data about the numbers or percentages of students who took, should have taken, were exempt
from taking, or did not take a particular state assessment (see also Eligible to Test, Not Tested, Participated,
Participation Rate)
Participation Rate: percentage resulting from the number of students who Participated divided by the number
of students Eligible to Test; the assessment participation rate is not the same as the accountability
participation rate, and should not be used for accountability purposes (see also Participation)
Personally-Identifiable Information: any data that could potentially be used to identify a particular student;
therefore that data must remain confidential and secure with access limited only to those who have a
relevant, educational or familial interest in that information (see also FERPA, Student-Level Data/Information)
Performance Level: a category covering a range of scores that describe how well student(s) meet the
expectations or content standards for their grade level, typically including levels for not meeting, approaching,
or below expectations, a level indicating proficiency, and the highest level indicating mastery (see also
Achievement Level, Achievement Level Descriptor)
Points Earned: how many raw points a student received out of the total possible for each reporting category,
or how many points a student received for a particular item on the test; points earned are not aligned to the
achievement levels and are not equivalent to a scale score; when used instructionally in conjunction with
released items, item descriptions, and other materials, points earned can help pinpoint where a student is
succeeding and where they may need additional support to enhance specific content area skills needed to
master grade-level standards (see also Reporting Categories, Subscores)
Raw Points: the actual points students earn for an item, item element, or reporting category; not equivalent
to a scale score and not aligned to the achievement levels (see also Points Earned, Scale Score)
Reporting Categories: domains, disciplines, or topical areas within a content area for which information is
provided about how well a student did; information is typically reported in the form of points earned out of
points possible, a subscore, or a level of mastery (see also Points Earned, Subscores)
SASID: State-Assigned Student Identification number, a ten-digit number assigned to each Rhode Island
student enrolled in Rhode Island public schools (see Student-Level Data/Information)
Scale Score: the number a student receives indicating how well they did overall on the test; this score is
calculated based on a formula and corresponds to the achievement levels for that assessment (see also
Achievement Level, Achievement Level Descriptor, Performance Level, Points Earned, Score)

Rhode Island Department of Education – SDP User Guide – Updated 12/23/2021 29
School: local public school or charter school; for most students there is no difference between the local or
charter public school in which the student is enrolled (i.e., responsible school) and the school in which the
student is placed to receive instruction (i.e., tested school), but students who are outplaced will have two
different schools listed and their scores will be assigned to both (see also Tested School)
School Administrator (role): any individual responsible for the administration of a PK-12 school, including
principals, assistant principals, and charter school chief administrators; this role has access within this system
to all data pertaining to their school and its students; may generate reports and drill down to student-level
data for every student enrolled in that particular school for the duration of that student’s enrollment in the
school.
School Year: academic year that runs from July 1 of one calendar year to June 30 of the following calendar
year (see also Tested Year)
Score: the number a student receives indicating how well they did on the test (see also Achievement Level,
Performance Level, Points Earned, Reporting Category, Scale Score, Subscore)
SGP: Student Growth Percentile; a number between 1 (least growth) and 99 (most growth) that describes a
student’s learning over time compared with their academic peers (other RI students in the same grade who
had similar scores on previous state tests) (see also Growth, SGP Level)
SGP Level: Student Growth Percentile Level, represented by Low (1-34), Typical (35-69), or High (70-100)
ratings (see also Growth, SGP)
State Assessments: high quality standards-aligned valid and reliable content area tests administered
statewide to all eligible public school students in Rhode Island as part of the state’s adherence to federal
statute for measuring educational performance and to support school accountability (see also Test)
• ACCESS for ELs – English Language Proficiency (grades K-12): an English language proficiency test that
measures students’ academic English language skills.
• Alt-ACCESS for ELs – English Language Proficiency (grades 1-12): an English language proficiency test
that measures students’ academic English language skills for students who have significant cognitive
disabilities.
• DLM – English Language Arts/Literacy (grades 3-8, 11), Mathematics (grades 3-8, 11), Science (grades 5,
8, 11): Dynamic Learning Maps (DLM) is an alternate assessment test designed for students with
significant cognitive disabilities; the structure of the alternate assessments are designed around the
students’ physical and cognitive disabilities in a way that allows them to answer test questions and
participate in the test as independently as possible.
• NGSA – Science (grades 5, 8, 11): Rhode Island Next Generation Science Assessment; a high-quality
assessment aligned to the Next Generation Science Standards (NGSS) which meets federal
requirements for an annual assessment in science covering elementary (grade 5), middle grades (grade
8), and high school (grade 11).

Rhode Island Department of Education – SDP User Guide – Updated 12/23/2021 30
• PSAT – English Language Arts/Literacy (grade 10), Mathematics (grade 10): Preliminary Scholastic
Aptitude Test, Preliminary SAT; the College Board creates and administers the PSAT which covers
reading and math for grade 10 in alignment with the Common Core State Standards (CCSS).
• RICAS – English Language Arts/Literacy (grades 3-8), Mathematics (grades 3-8): Rhode Island
Comprehensive Assessment System; a high-quality assessment aligned to the Common Core State
Standards (CCSS) which meets federal requirements for annual assessments in those grades and
content areas.
• SAT – English Language Arts/Literacy (grade 11), Mathematics (grade 11): Scholastic Aptitude Test; the
College Board creates and administers the SAT which covers reading, writing, and math for grade 11 in
alignment with the Common Core State Standards (CCSS).
Student-Level Data/Information: data and information pertaining to an individual student, rather than data
for a group of students combined as an aggregate; data or information that identify a particular student and as
such must be kept confidential and secure in accordance with FERPA (see also Personally-Identifiable
Information, FERPA)
Student Name: the legal name of the student as it exists within the enrollment system, displayed as “Last
Name, First Name Middle Initial” (see also Personally-Identifiable Information, Student-Level
Data/Information)
Student Profile: report generated for an individual student that contains basic information about the student
as well as other data such as attendance and state assessment performance (see also Student-Level
Data/Information)
Students Tested (# / %): number of students tested / percent of students tested (see also Participation,
Participation Rate)
Subgroup: a group of students who share similar characteristics, such as gender identification, racial or ethnic
identification, socioeconomic status, physical or learning disabilities, language abilities, or school-assigned
classifications (see also Subgroup Filters)
Subgroup Filters: each filter will also display a row for students who do not meet the criteria for that particular
subgroup (exceptions: gender, race/ethnicity) (see also Subgroup)
• All Students: no subgroup filter applied
• Accommodations: students who used accommodations
• Active Military Parent: students with a parent who is a member of the Armed Forces on active duty,
which includes a parent on full-time National Guard duty
• Economically Disadvantaged: students who are eligible for free or reduced lunch
• English Learner (not included for ACCESS): students who receive or received English language
development services
• Foster Care: students in foster care
• Gender: male students and female students

Rhode Island Department of Education – SDP User Guide – Updated 12/23/2021 31
• Homeless: students experiencing homelessness
• Migrant: student whose parent/guardian is a migratory agricultural worker or fisher who has moved
from one school district or school administrative area to another during the regular school year
• Race/Ethnicity: students whose demographic information indicates identification with one of the
race/ethnicity categories collected by RIDE (American Indian or Alaska Native, Asian, Black or African
American, Hispanic or Latino, Native Hawaiian or Other Pacific Islander, Two or More Races, White)
• Special Education: students with an IEP or 502 plan
• Years of Service (ACCESS only): for students who are English Learners, years of English language
development services
Subscore: a number (score or points earned) that indicates a student’s performance on a particular domain,
discipline, or reporting category for an assessment (see also Points Earned, Score, Subscore Descriptor,
Subscore Performance)
Subscore Descriptor: describes what students within each subscore area (reporting category, domain, or
discipline) know and are able to do (see also Subscore)
Subscore Performance: section within the Student Listing chart of the Drill-Down Report which displays the
score, level, and level name for students’ subscores (see also Subscore)
Teacher (role): educators directly assigned to students through Teacher Course Student (TCS) linkages (i.e.,
educator of record), such as classroom teachers, literacy and math coaches, special education teachers, etc.;
within this system, able to access information, generate reports, and drill down to student-level data for all
students linked to that educator in all the educator’s current classes (with the ability to see students’ prior
school year assessment results), and all students taught by that educator in the previous school year
Teacher Course Student: TCS; data used to link teachers to the students they teach and determines which
students’ information can be accessed by which teachers who have user accounts for RIDE systems; includes
courses offered, sections of the courses, staff assigned to teach courses and students enrolled in a course (see
also Teacher (role), User Role)
Test: a high quality assessment administered statewide in Rhode Island to all public school and charter school
students (see also State Assessments)
Tested Grade: the grade level of the standards being assessed, must correspond with the grade level of the
student at the time of testing (see also Grade)
Tested School: the school at which the student receives instruction, therefore the school at which the student
would be expected to take the state assessment (see also School)
Tested Year: the academic year in which the student took a state assessment, typically displayed as either
YYYY-YY (e.g., 2018-19) or Season YYYY (e.g., Spring 2019) (see also School Year)
Rhode Island Department of Education – SDP User Guide – Updated 12/23/2021 32
User Role: the category and technical permissions associated with it assigned to an individual based on criteria
met by the individual which grants access to particular sets of data within this system (see also District
Administrator (role), School Administrator (role), Teacher (role))