Structure of the carbon isotope excursion in a high-resolution lacustrine Paleocene–Eocene Thermal...
10
Earth and Planetary Science Letters 408 (2014) 331–340 Contents lists available at ScienceDirect Earth and Planetary Science Letters www.elsevier.com/locate/epsl Structure of the carbon isotope excursion in a high-resolution lacustrine Paleocene–Eocene Thermal Maximum record from central China Zuoling Chen a,b,∗ , Xu Wang a , Jianfang Hu c , Shiling Yang a , Min Zhu d , Xinxin Dong a , Zihua Tang a , Ping’an Peng c , Zhongli Ding a,∗ a Key Laboratory of Cenozoic Geology and Environment, Institute of Geology and Geophysics, Chinese Academy of Sciences, Beijing 100029, China b University of Chinese Academy of Sciences, Beijing 100049, China c Guangzhou Institute of Geochemistry, Chinese Academy of Sciences, Guangzhou 510640, China d Key Laboratory of Vertebrate Evolution and Human Origins, Institute of Vertebrate Paleontology and Paleoanthropology, Chinese Academy of Sciences, Beijing 100044, China a r t i c l e i n f o a b s t r a c t Article history: Received 24 February 2014 Received in revised form 5 October 2014 Accepted 19 October 2014 Available online xxxx Editor: J. Lynch-Stieglitz Keywords: PETM carbon isotope excursion positive feedback lacustrine Nanyang Basin The carbon isotope excursion (CIE) associated with the Paleocene–Eocene Thermal Maximum (PETM) has been recognized for the first time in the micritic carbonate, total organic carbon (TOC) and black carbon (BC) contained within the lacustrine sediments from the Nanyang Basin, central China. The remarkably large excursion (∼−6❤) in the δ 13 C TOC and δ 13 C BC values is possibly attributable to increased humidity and elevated pCO 2 concentration. The ∼−4❤ CIE recorded in the δ 13 C calcite , reflecting the average isotope change of the watershed system, is consistent with that observed in planktonic foraminifera. This correspondence suggests that the true magnitude of the carbon isotope excursion in the ocean– atmosphere system is likely close to −4❤. The ∼10 m excursion onset in our multi-proxy δ 13 C records demonstrates that the large input of 13 C-depleted carbon into the ocean–atmosphere system was not geologically instantaneous. Despite difference and somewhat smoothness in detailed pattern of the CIE due to localized controls on different substrates, inorganic and organic δ 13 C data generally depict a gradual excursion onset at least over timescales of thousands of years. In addition, continental temperature reconstruction, based on the distribution of membrane lipids of bacteria, suggests a warming of ∼4 ◦ C prior to the PETM and ∼7 ◦ C increase in temperature during the PETM. The temperature data are overall similar in pattern and trend to the δ 13 C change across the PETM. These observations, combined with pre-CIE warming, are in line with the idea that 13 C-depleted carbon release operated as a positive feedback to temperature, suggesting supply from one or more large organic carbon reservoirs on Earth’s surface. © 2014 Elsevier B.V. All rights reserved. 1. Introduction The Paleocene–Eocene Thermal Maximum (PETM; ∼55.5 Ma) is a geologically abrupt global warming event superimposed on a long-term warming trend of the early Cenozoic (Kennett and Stott, 1991; Zachos et al., 2001). The onset of the event occurred within ∼20 kyr and the complete event lasted ∼170 kyr (Röhl et al., 2007; Charles et al., 2011). During the PETM, temperatures in- * Corresponding authors at: Institute of Geology and Geophysics, CAS, 19 Beitucheng Western Road, Chaoyang District, Beijing 100029, China. Tel.: +86 10 8299 8378; fax: +86 10 6201 0846. E-mail addresses: [email protected] (Z. Chen), [email protected] (P. Peng). creased abruptly by at least 5 ◦ C globally (Kennett and Stott, 1991; Thomas et al., 1999; Zachos et al., 2003; Tripati and Elderfield, 2005) while stronger warming of up to 8 ◦ C has been reported at middle and high latitudes (Sluijs et al., 2006; Zachos et al., 2006; Weijers et al., 2007a). The short-lived warming events induced severe environmental perturbation, including mass extinction of benthic foraminifera, rapid northward migration of plants in North America, and mammalian turnover (Thomas, 1998; Wing et al., 2005; Clyde and Gingerich, 1998). Associated with the PETM are a globally recognized negative carbon isotope excursion (CIE) (Kennett and Stott, 1991; McInerney and Wing, 2011) and widespread dissolution of deep-sea carbon- ates (Zachos et al., 2005), which indicate more than 2000 gigatons of 13 C-depleted carbon entering the ocean–atmosphere system http://dx.doi.org/10.1016/j.epsl.2014.10.027 0012-821X/© 2014 Elsevier B.V. All rights reserved.
-
Upload
independent -
Category
Documents
-
view
2 -
download
0
Transcript of Structure of the carbon isotope excursion in a high-resolution lacustrine Paleocene–Eocene Thermal...

Earth and Planetary Science Letters 408 (2014) 331–340
Contents lists available at ScienceDirect
Earth and Planetary Science Letters
www.elsevier.com/locate/epsl
Structure of the carbon isotope excursion in a high-resolution
lacustrine Paleocene–Eocene Thermal Maximum record from
central China
Zuoling Chen a,b,∗, Xu Wang a, Jianfang Hu c, Shiling Yang a, Min Zhu d, Xinxin Dong a, Zihua Tang a, Ping’an Peng c, Zhongli Ding a,∗a Key Laboratory of Cenozoic Geology and Environment, Institute of Geology and Geophysics, Chinese Academy of Sciences, Beijing 100029, Chinab University of Chinese Academy of Sciences, Beijing 100049, Chinac Guangzhou Institute of Geochemistry, Chinese Academy of Sciences, Guangzhou 510640, Chinad Key Laboratory of Vertebrate Evolution and Human Origins, Institute of Vertebrate Paleontology and Paleoanthropology, Chinese Academy of Sciences, Beijing 100044, China
a r t i c l e i n f o a b s t r a c t
Article history:Received 24 February 2014Received in revised form 5 October 2014Accepted 19 October 2014Available online xxxxEditor: J. Lynch-Stieglitz
Keywords:PETMcarbon isotope excursionpositive feedbacklacustrineNanyang Basin
The carbon isotope excursion (CIE) associated with the Paleocene–Eocene Thermal Maximum (PETM) has been recognized for the first time in the micritic carbonate, total organic carbon (TOC) and black carbon (BC) contained within the lacustrine sediments from the Nanyang Basin, central China. The remarkably large excursion (∼ −6�) in the δ13CTOC and δ13CBC values is possibly attributable to increased humidity and elevated pCO2 concentration. The ∼ −4� CIE recorded in the δ13Ccalcite, reflecting the average isotope change of the watershed system, is consistent with that observed in planktonic foraminifera. This correspondence suggests that the true magnitude of the carbon isotope excursion in the ocean–atmosphere system is likely close to −4�. The ∼10 m excursion onset in our multi-proxy δ13C records demonstrates that the large input of 13C-depleted carbon into the ocean–atmosphere system was not geologically instantaneous. Despite difference and somewhat smoothness in detailed pattern of the CIE due to localized controls on different substrates, inorganic and organic δ13C data generally depict a gradual excursion onset at least over timescales of thousands of years. In addition, continental temperature reconstruction, based on the distribution of membrane lipids of bacteria, suggests a warming of ∼4 ◦C prior to the PETM and ∼7 ◦C increase in temperature during the PETM. The temperature data are overall similar in pattern and trend to the δ13C change across the PETM. These observations, combined with pre-CIE warming, are in line with the idea that 13C-depleted carbon release operated as a positive feedback to temperature, suggesting supply from one or more large organic carbon reservoirs on Earth’s surface.
© 2014 Elsevier B.V. All rights reserved.
1. Introduction
The Paleocene–Eocene Thermal Maximum (PETM; ∼55.5 Ma) is a geologically abrupt global warming event superimposed on a long-term warming trend of the early Cenozoic (Kennett and Stott, 1991; Zachos et al., 2001). The onset of the event occurred within ∼20 kyr and the complete event lasted ∼170 kyr (Röhl et al., 2007; Charles et al., 2011). During the PETM, temperatures in-
* Corresponding authors at: Institute of Geology and Geophysics, CAS, 19 Beitucheng Western Road, Chaoyang District, Beijing 100029, China. Tel.: +86 10 8299 8378; fax: +86 10 6201 0846.
E-mail addresses: [email protected] (Z. Chen), [email protected](P. Peng).
http://dx.doi.org/10.1016/j.epsl.2014.10.0270012-821X/© 2014 Elsevier B.V. All rights reserved.
creased abruptly by at least 5 ◦C globally (Kennett and Stott, 1991;Thomas et al., 1999; Zachos et al., 2003; Tripati and Elderfield, 2005) while stronger warming of up to 8 ◦C has been reported at middle and high latitudes (Sluijs et al., 2006; Zachos et al., 2006;Weijers et al., 2007a). The short-lived warming events induced severe environmental perturbation, including mass extinction of benthic foraminifera, rapid northward migration of plants in North America, and mammalian turnover (Thomas, 1998; Wing et al., 2005; Clyde and Gingerich, 1998).
Associated with the PETM are a globally recognized negative carbon isotope excursion (CIE) (Kennett and Stott, 1991; McInerney and Wing, 2011) and widespread dissolution of deep-sea carbon-ates (Zachos et al., 2005), which indicate more than 2000 gigatons of 13C-depleted carbon entering the ocean–atmosphere system
332 Z. Chen et al. / Earth and Planetary Science Letters 408 (2014) 331–340
(Dickens et al., 1995; Zachos et al., 2005; Panchuk et al., 2008; Zeebe et al., 2009; Cui et al., 2011). This is comparable in magni-tude to that which could occur over the coming centuries, and the PETM has thus become a focus for studies of past climate change. To date, however, there are still several first-order controversies concerning the carbon injection during the PETM. These include the source of carbon and its relationship to temperature. Possible sources of 13C-depleted carbon include the injection of thermo-genic methane (Svensen et al., 2004), impact of a comet (Kent et al., 2003), dissociation of seafloor methane hydrates (Dickens et al., 1995), combustion of the Paleocene peatlands (Kurtz et al., 2003), and permafrost thawing (DeConto et al., 2012). Underlying the current debate is whether the 13C-depleted carbon release is a positive feedback to the temperature rise. The key to solve the de-bate is to clearly define the magnitude and shape of the CIE and its relationship to temperature.
Since the mixing time of carbon in the exogenic carbon reser-voirs (including the atmosphere, terrestrial biosphere and ocean) is on the time-scale of ∼103 yr (Kump and Arthur, 1999), in the-ory the general character of the CIE recorded in the continental and marine sediments should be identical and synchronous. There is, however, a significant discrepancy in the pattern and magni-tude of the CIE in existing PETM records, depending on locations and analyzed substrates (Bains et al., 1999; Giusberti et al., 2007;McInerney and Wing, 2011; Sluijs and Dickens, 2012). For example, the general magnitude of the CIE from benthic foraminifera and bulk marine carbonate is 2 to 2.5� (Kennett and Stott, 1991; Bains et al., 1999; Thomas et al., 2002), and planktonic foraminiferal records shows up to 4� negative shift (Thomas et al., 2002;Zachos et al., 2006; Handley et al., 2008), while most terres-trial bulk organic and paleosol carbonates and biomarkers records yield excursion of ∼4–8� (Koch et al., 1992; Schmitz and Pu-jalte, 2003; Pagani et al., 2006a; Handley et al., 2008). Efforts to reconcile the ∼3� difference in terrestrial and marine records have focused on two hypotheses. The first hypothesis suggests that marine carbonates fail to record the full magnitude of the CIE, due to truncation caused by severe dissolution of carbon-ates or acidification (Zachos et al., 2005; Pagani et al., 2006a; McCarren et al., 2008), whilst the other hypothesis suggests that greater δ13C discrimination due to increasing humid, or plant com-munity change amplifies the terrestrial CIE (Bowen et al., 2004;Smith et al., 2007).
Another unsolved problem is the pattern of the CIE. Previous study, based on bulk carbonate records, showed that minimum δ13C values were reached in a stepped manner, suggestive of a pulsed liberation of carbon (Bains et al., 1999). Recently, many high-resolution stratigraphic records have challenged this conclu-sion and indicated a single, instantaneous addition of 13C-depleted carbon to the ocean–atmosphere system (Thomas et al., 2002;Giusberti et al., 2007). Even the greatly expanded sections from the New Jersey shelf areas did not see the feature of the stepped manner (Sluijs et al., 2007). So far, there are no any two records which share the consistent pattern of the CIE. Therefore, there is a critical need for further PETM records, especially high-resolution terrestrial carbon isotope records to tease out the pattern and mag-nitude of the CIE.
Here we recovered the first lacustrine PETM section based on high-resolution geochemical proxies from the Nanyang Basin, cen-tral China. Our new high-resolution terrestrial carbon isotope data provide a unique opportunity to define the structure of the CIE and its relationship to temperature in the terrestrial carbon reser-voir.
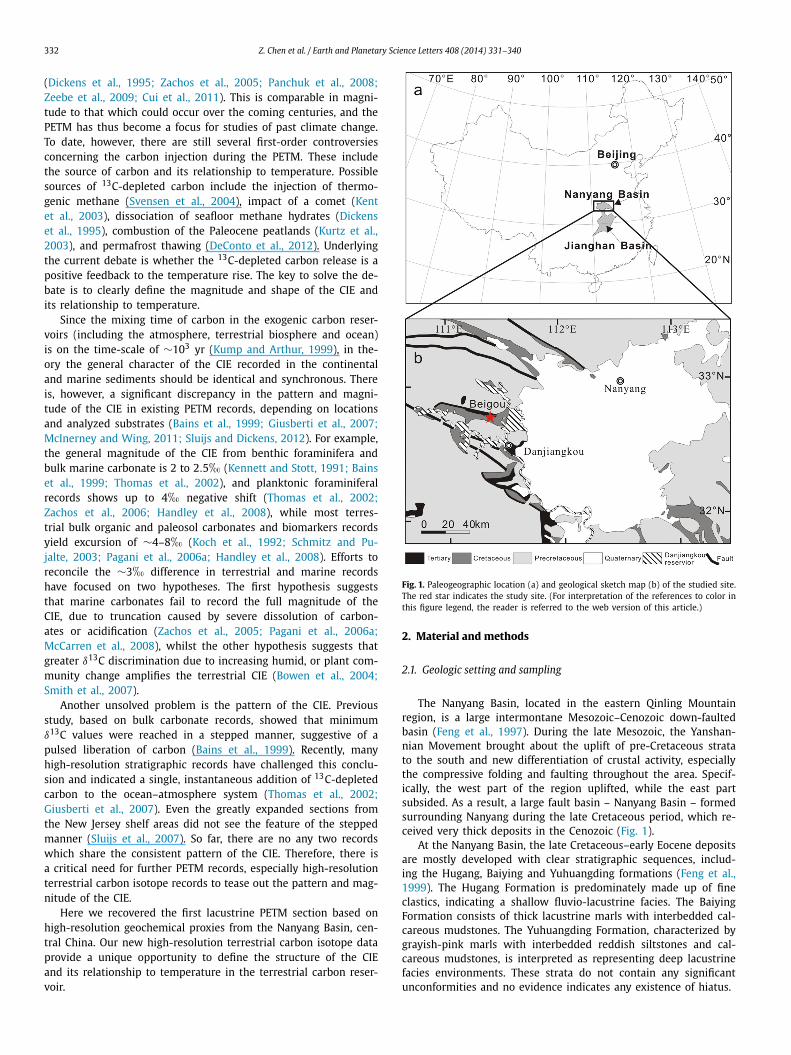
Fig. 1. Paleogeographic location (a) and geological sketch map (b) of the studied site. The red star indicates the study site. (For interpretation of the references to color in this figure legend, the reader is referred to the web version of this article.)
2. Material and methods
2.1. Geologic setting and sampling
The Nanyang Basin, located in the eastern Qinling Mountain region, is a large intermontane Mesozoic–Cenozoic down-faulted basin (Feng et al., 1997). During the late Mesozoic, the Yanshan-nian Movement brought about the uplift of pre-Cretaceous strata to the south and new differentiation of crustal activity, especially the compressive folding and faulting throughout the area. Specif-ically, the west part of the region uplifted, while the east part subsided. As a result, a large fault basin – Nanyang Basin – formed surrounding Nanyang during the late Cretaceous period, which re-ceived very thick deposits in the Cenozoic (Fig. 1).
At the Nanyang Basin, the late Cretaceous–early Eocene deposits are mostly developed with clear stratigraphic sequences, includ-ing the Hugang, Baiying and Yuhuangding formations (Feng et al., 1999). The Hugang Formation is predominately made up of fine clastics, indicating a shallow fluvio-lacustrine facies. The Baiying Formation consists of thick lacustrine marls with interbedded cal-careous mudstones. The Yuhuangding Formation, characterized by grayish-pink marls with interbedded reddish siltstones and cal-careous mudstones, is interpreted as representing deep lacustrine facies environments. These strata do not contain any significant unconformities and no evidence indicates any existence of hiatus.
Z. Chen et al. / Earth and Planetary Science Letters 408 (2014) 331–340 333
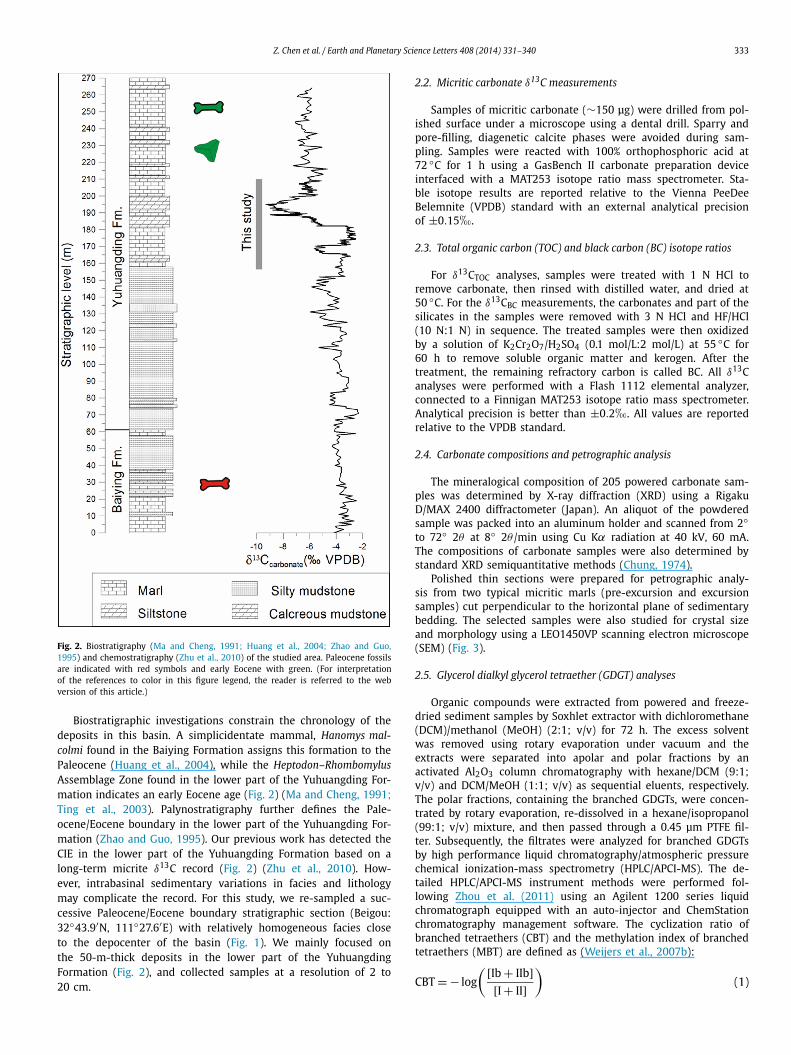
Fig. 2. Biostratigraphy (Ma and Cheng, 1991; Huang et al., 2004; Zhao and Guo, 1995) and chemostratigraphy (Zhu et al., 2010) of the studied area. Paleocene fossils are indicated with red symbols and early Eocene with green. (For interpretation of the references to color in this figure legend, the reader is referred to the web version of this article.)
Biostratigraphic investigations constrain the chronology of the deposits in this basin. A simplicidentate mammal, Hanomys mal-colmi found in the Baiying Formation assigns this formation to the Paleocene (Huang et al., 2004), while the Heptodon–RhombomylusAssemblage Zone found in the lower part of the Yuhuangding For-mation indicates an early Eocene age (Fig. 2) (Ma and Cheng, 1991;Ting et al., 2003). Palynostratigraphy further defines the Pale-ocene/Eocene boundary in the lower part of the Yuhuangding For-mation (Zhao and Guo, 1995). Our previous work has detected the CIE in the lower part of the Yuhuangding Formation based on a long-term micrite δ13C record (Fig. 2) (Zhu et al., 2010). How-ever, intrabasinal sedimentary variations in facies and lithology may complicate the record. For this study, we re-sampled a suc-cessive Paleocene/Eocene boundary stratigraphic section (Beigou: 32◦43.9′N, 111◦27.6′E) with relatively homogeneous facies close to the depocenter of the basin (Fig. 1). We mainly focused on the 50-m-thick deposits in the lower part of the Yuhuangding Formation (Fig. 2), and collected samples at a resolution of 2 to 20 cm.
2.2. Micritic carbonate δ13C measurements
Samples of micritic carbonate (∼150 μg) were drilled from pol-ished surface under a microscope using a dental drill. Sparry and pore-filling, diagenetic calcite phases were avoided during sam-pling. Samples were reacted with 100% orthophosphoric acid at 72 ◦C for 1 h using a GasBench II carbonate preparation device interfaced with a MAT253 isotope ratio mass spectrometer. Sta-ble isotope results are reported relative to the Vienna PeeDee Belemnite (VPDB) standard with an external analytical precision of ±0.15�.
2.3. Total organic carbon (TOC) and black carbon (BC) isotope ratios
For δ13CTOC analyses, samples were treated with 1 N HCl to remove carbonate, then rinsed with distilled water, and dried at 50 ◦C. For the δ13CBC measurements, the carbonates and part of the silicates in the samples were removed with 3 N HCl and HF/HCl (10 N:1 N) in sequence. The treated samples were then oxidized by a solution of K2Cr2O7/H2SO4 (0.1 mol/L:2 mol/L) at 55 ◦C for 60 h to remove soluble organic matter and kerogen. After the treatment, the remaining refractory carbon is called BC. All δ13C analyses were performed with a Flash 1112 elemental analyzer, connected to a Finnigan MAT253 isotope ratio mass spectrometer. Analytical precision is better than ±0.2�. All values are reported relative to the VPDB standard.
2.4. Carbonate compositions and petrographic analysis
The mineralogical composition of 205 powered carbonate sam-ples was determined by X-ray diffraction (XRD) using a Rigaku D/MAX 2400 diffractometer (Japan). An aliquot of the powdered sample was packed into an aluminum holder and scanned from 2◦to 72◦ 2θ at 8◦ 2θ /min using Cu Kα radiation at 40 kV, 60 mA. The compositions of carbonate samples were also determined by standard XRD semiquantitative methods (Chung, 1974).
Polished thin sections were prepared for petrographic analy-sis from two typical micritic marls (pre-excursion and excursion samples) cut perpendicular to the horizontal plane of sedimentary bedding. The selected samples were also studied for crystal size and morphology using a LEO1450VP scanning electron microscope (SEM) (Fig. 3).
2.5. Glycerol dialkyl glycerol tetraether (GDGT) analyses
Organic compounds were extracted from powered and freeze-dried sediment samples by Soxhlet extractor with dichloromethane (DCM)/methanol (MeOH) (2:1; v/v) for 72 h. The excess solvent was removed using rotary evaporation under vacuum and the extracts were separated into apolar and polar fractions by an activated Al2O3 column chromatography with hexane/DCM (9:1; v/v) and DCM/MeOH (1:1; v/v) as sequential eluents, respectively. The polar fractions, containing the branched GDGTs, were concen-trated by rotary evaporation, re-dissolved in a hexane/isopropanol (99:1; v/v) mixture, and then passed through a 0.45 μm PTFE fil-ter. Subsequently, the filtrates were analyzed for branched GDGTs by high performance liquid chromatography/atmospheric pressure chemical ionization-mass spectrometry (HPLC/APCI-MS). The de-tailed HPLC/APCI-MS instrument methods were performed fol-lowing Zhou et al. (2011) using an Agilent 1200 series liquid chromatograph equipped with an auto-injector and ChemStation chromatography management software. The cyclization ratio of branched tetraethers (CBT) and the methylation index of branched tetraethers (MBT) are defined as (Weijers et al., 2007b):
CBT = − log
( [Ib + IIb])(1)
[I + II]
334 Z. Chen et al. / Earth and Planetary Science Letters 408 (2014) 331–340
Fig. 3. Scanning electron microscope (SEM) images of the pre-excursion sample (a) and the excursion sample (b), and photomicrographs from thin sections of the pre-excursion sample (c) and the excursion sample (d) showing little fine-grained recrystallization (r) of primary micrite (m).
MBT = [I + Ib + Ic][I + Ib + Ic] + [II + IIb + IIc] + [III + IIIb + IIIc] (2)
Roman numbers correspond to different branched GDGTs: GDGTs I, II and III contain none, one or two extra methyl branches and can contain either one (Ib; IIb; IIIb) or two (Ic; IIc, IIIc) cy-clopentyl moieties (Weijers et al., 2007b). Annual mean air tem-perature (MAT) was then calculated from the CBT and MBT using the calibration equation developed by Sun et al. (2011) based on Asian modern lake surface sediments:
MAT = 6.803 − 7.062 × CBT + 37.090 × MBT (3)
3. Results
3.1. Composition of carbonate minerals
X-ray diffraction shows that mineral composition at the Beigou section is very simple, mainly including calcite, dolomite and quartz (Fig. 4), hence relative percentages of carbonate minerals are estimated from the bulk mineral diffractograms using the in-tensity of the strongest peak for each mineral (Chung, 1974). Prior to the CIE, there is abundant dolomite (28 to 100%) with a vari-able content of calcite in primary carbonate (Table S1). From the onset of the CIE, however, dolomite disappears and calcite is the only carbonate precipitate mineral (Fig. 5).
3.2. Nanyang micritic carbonate, total organic carbon and black carbon δ13C records
Micritic δ13Ccarbonate values range between −9.3� and −2.6�with an average of −5.4� over the whole section (Table S1). Sub-tle fluctuations around −3.7� in δ13Ccarbonate values are observed between 0 and 20 m (Fig. 5). Above this, the δ13Ccarbonate values drop slowly and gradually to the minimum (−9.3�) from 20 m to 33 m, with a sharp spike of −1.3� for 1 m (37.1–38.1 m). Fol-lowing this negative shift, the δ13Ccarbonate values increase slowly and finally stabilize around −6� at 40 m and for the remainder
Fig. 4. XRD patterns of representative samples, including pre-excursion samples and excursion samples.
of the section. The recovery values of δ13Ccarbonate are ∼2� more negative than the pre-excursion values.
δ13CTOC and δ13CBC values at the Beigou section broadly show similar change. Both of them range between −28.6� and −20�with an average value of −24� (Table S2). These are typical val-ues for C3 plants (i.e. values range between −34� and −20�). δ13CTOC and δ13CBC values fluctuate around a relatively stable back-ground level (−22�) between 0 and 20 m (Fig. 5). As with the δ13Ccarbonate record, the δ13CTOC and δ13CBC values decrease grad-ually from 20 m, but punctuated by 2.3� and 3.4� transient positive shifts around 24 m respectively, and then progress to the minimum (∼ −28�) at 30 m. Above this, the values increase slowly and finally stabilize around −24� at 40 m and for the re-mainder of the section.
3.3. Paleocene–Eocene continental temperature estimates
The BIT values, a proxy for the relative amount of soil-derived branched GDGTs versus aquatic archaeal GDGTs (Hopmans et al., 2004), range from 0.31 to 0.98 (Table S3), suggesting considerable
Z. Chen et al. / Earth and Planetary Science Letters 408 (2014) 331–340 335
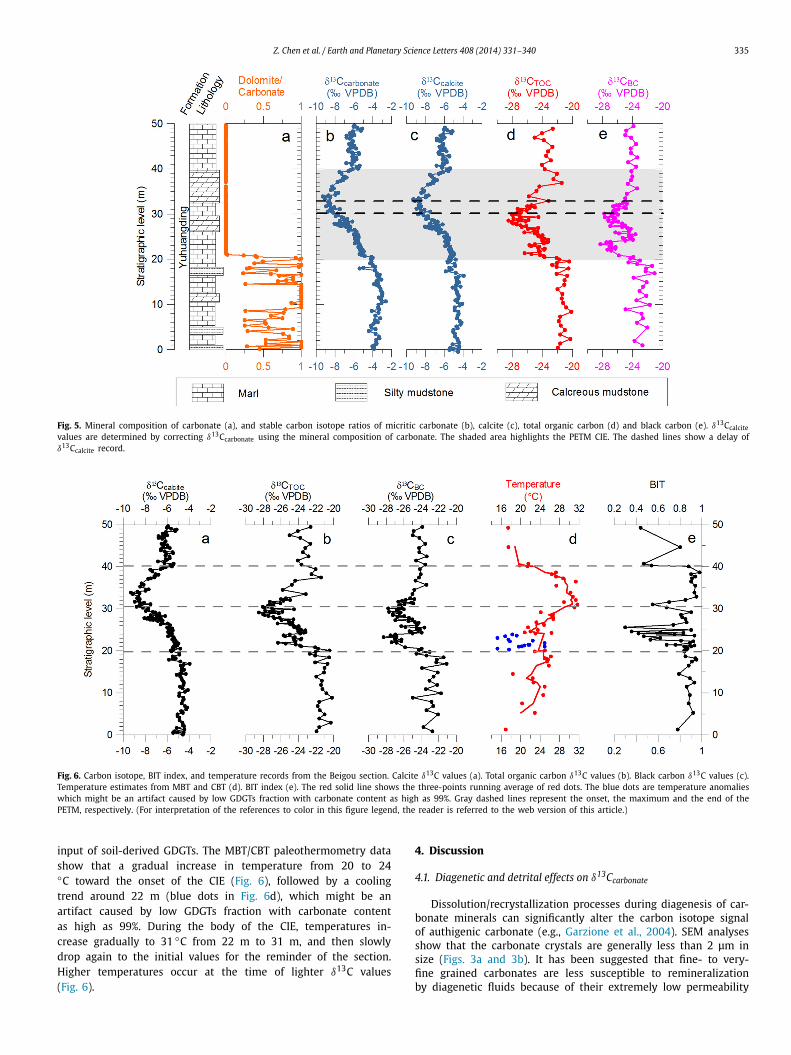
Fig. 5. Mineral composition of carbonate (a), and stable carbon isotope ratios of micritic carbonate (b), calcite (c), total organic carbon (d) and black carbon (e). δ13Ccalcitevalues are determined by correcting δ13Ccarbonate using the mineral composition of carbonate. The shaded area highlights the PETM CIE. The dashed lines show a delay of δ13Ccalcite record.
Fig. 6. Carbon isotope, BIT index, and temperature records from the Beigou section. Calcite δ13C values (a). Total organic carbon δ13C values (b). Black carbon δ13C values (c). Temperature estimates from MBT and CBT (d). BIT index (e). The red solid line shows the three-points running average of red dots. The blue dots are temperature anomalies which might be an artifact caused by low GDGTs fraction with carbonate content as high as 99%. Gray dashed lines represent the onset, the maximum and the end of the PETM, respectively. (For interpretation of the references to color in this figure legend, the reader is referred to the web version of this article.)
input of soil-derived GDGTs. The MBT/CBT paleothermometry data show that a gradual increase in temperature from 20 to 24 ◦C toward the onset of the CIE (Fig. 6), followed by a cooling trend around 22 m (blue dots in Fig. 6d), which might be an artifact caused by low GDGTs fraction with carbonate content as high as 99%. During the body of the CIE, temperatures in-crease gradually to 31 ◦C from 22 m to 31 m, and then slowly drop again to the initial values for the reminder of the section. Higher temperatures occur at the time of lighter δ13C values (Fig. 6).
4. Discussion
4.1. Diagenetic and detrital effects on δ13Ccarbonate
Dissolution/recrystallization processes during diagenesis of car-bonate minerals can significantly alter the carbon isotope signal of authigenic carbonate (e.g., Garzione et al., 2004). SEM analyses show that the carbonate crystals are generally less than 2 μm in size (Figs. 3a and 3b). It has been suggested that fine- to very-fine grained carbonates are less susceptible to remineralization by diagenetic fluids because of their extremely low permeability

336 Z. Chen et al. / Earth and Planetary Science Letters 408 (2014) 331–340
(Dickson and Coleman, 1980; Poulson and John, 2003). On the other hand, thin section analyses of two typical samples reveal that these carbonates are texturally wackestones with homoge-neous micritic matrix (Figs. 3c and 3d), while microsparry calcite is rare and sparry calcite is absent, indicating that the original sed-imentary fabric was not replaced after deposition. Overall, these petrographic features suggest that carbonates at the Beigou sec-tion have undergone little diagenetic alteration.
Detrital carbonate can also bias the isotopic composition of the carbonate that formed in situ (Leng et al., 2010). However, two lines of evidence suggest that allogenic carbonate did not signifi-cantly contribute to the isotopic composition of analyzed carbon-ates. Firstly, SEM analyses show that the pre-excursion sample pre-dominantly of ∼1 μm-sized euhedral crystals of dolomite (Fig. 3a) and the excursion sample is composed of ∼2 μm-sized anhedral crystals of calcite (Fig. 3b). Their morphology is consistent with authigenic carbonate precipitated in the water column. The angu-lar nature of the grains indicates that crystals had undergone little or no transportation or reworking. Secondly, thin sections analy-ses show no evidence for the existence of detrital grains (Figs. 3c and 3d). In summary, petrographic and mineralogical features, such as the homogeneous compositional and textural character of the carbonates, the absence of replacement textures support a direct primary origin and little or no diagenetic alteration for the carbon-ates. We thus conclude that the micritic δ13Ccarbonate values in this study could track the isotopic signal of dissolved inorganic carbon in lake water.
4.2. Bio- and chemostratigraphic recognition of the PETM
The Beigou section is predominately marl of lacustrine facies with very high abundance of carbonate, which induces too weak a magnetic signal to construct an age framework using paleomag-netic techniques. Therefore, we use biostratigraphic dating and car-bon isotope stratigraphy to confine the PETM at the site.
Detailed mammal and pollen fossils investigations have con-strained the Paleocene/Eocene boundary within the lower part of the Yuhuangding formation (Fig. 2) (Ma and Cheng, 1991;Zhao and Guo, 1995; Ting et al., 2003; Huang et al., 2004). Here our multiple δ13C data show that carbon isotope values fluctuate around a relatively stable background level between 0 and 20 m (δ13Ccarbonate: ∼ −3.7�; δ13CTOC: ∼ −22�; δ13CBC: ∼ −22�), and then shift gradually to the minimum around 31 m (δ13Ccarbonate: ∼ −9.3�; δ13CTOC: ∼ −28�; δ13CBC: ∼ −28�), followed by a slow return to values slightly lower than the pre-excursion level (Fig. 5). These results definitely exhibit a general excursion pattern that is similar to that defined by marine and other terrestrial records (Kennett and Stott, 1991; Koch et al., 1992;Magioncalda et al., 2004; Bowen, 2013). Although the δ13C val-ues of each substrate could be affected by different factors at the Beigou section, terrestrial plants (black carbon), aquatic plants (to-tal organic carbon) and lacustrine carbonate systems all document a large-magnitude carbon isotope excursion, demonstrating that a systematic negative carbon isotope shift occurred in the exogenic carbon reservoirs. The pronounced CIE recorded in the inorganic and organic substrates from 20 to 40 m, combined with bios-tratigraphy, confirms that the section spans the Paleocene/Eocene boundary and the PETM. We have thus established the first com-plete lacustrine record of the PETM, which is not associated with any formation boundary or major lithological change (Fig. 5).
The 20-m-thick CIE interval is greatly expanded relative to that found in existing deep-sea sections. High-resolution chronologies have been developed for terrestrial and marine sections and sug-gest a total PETM duration of 120–200 kyr (Norris and Röhl, 1999;Röhl et al., 2007; Aziz et al., 2008). If we assume a constant sed-imentation rate for the Beigou section, our record yields a mean
sedimentation rate of 10–16.7 cm/kyr across the PETM, which is almost ten times more rapid than that for most deep-sea sections. Therefore, our data might present a more detailed record of the CIE. Viewed together, multi-proxy δ13C data clearly display two distinctive features: (1) that the carbon isotope values of three sub-strates show an excursion of ∼ −6�, which is substantially larger than that generally recorded in bulk marine carbonate and benthic foraminifera (McInerney and Wing, 2011); and (2) that all δ13C curves generally show a gradual negative shift with transitional values, followed by an exponential return to initial values.
4.3. Magnitude of CIE
The magnitude of the CIE is critical for estimating the amounts of carbon addition during the PETM (Dickens et al., 1995) and evaluating the sensitivity of the climate system to the associated greenhouse gas forcing (Pagani et al., 2006b). Despite an abun-dance of carbon isotope records, some uncertainty still surrounds the full magnitude of the CIE, which shows a large variation be-tween −2� and −7�, depending on locations and analyzed sub-strates (McInerney and Wing, 2011; Sluijs and Dickens, 2012). The δ13C values of black carbon could elucidate the isotopic composi-tion in vegetation that was burnt, because it is inert and produced by the incomplete combustion of biomass (Schmidt and Noack, 2000). The δ13CBC values here show a prominent ∼6� negative shift across the PETM which reflects the δ13C signal of vegetation surrounding the lake (Fig. 5). The δ13CBC pattern is generally repro-duced in the carbon isotope record of total organic carbon, a mixed contribution of aquatic and terrestrial plants (Fig. 5). This coin-cidence, both in trend and isotopic shift, suggests that the TOC was substantially influenced by terrestrial components and lake biological productivity might be low at that time. This explana-tion is indeed consistent with the BIT values (Fig. 6e), which also suggest significant contribution of terrestrial soil organic material (Hopmans et al., 2004). Importantly, the CIE from the total organic carbon and black carbon (approximately −6�) is substantially larger than the CIE anomaly (about −2.5�) generally recoded in bulk marine carbonate and benthic foraminifera (Thomas et al., 2002; Zachos et al., 2005).
Three potential scenarios have been proposed to explain the anomalous large CIE recorded in terrestrial organic substrates. Firstly, C3 angiosperms are typically 3� depleted in 13C in comparison with gymnosperms (Schouten et al., 2007), an ef-fect likely related to the efficacy of water use (Chikaraishi and Naraoka, 2003). Thus, a notable increase of angiosperm flora rel-ative to gymnosperms has been invoked to explain the large CIE as recorded by organic substrates (Smith et al., 2007; Schouten et al., 2007). To reconcile the difference of ∼ 3� would require almost a 100% shift from gymnosperm to angiosperm vegetation across the PETM. However, this is inconsistent with palynolog-ical data which show that angiosperm taxa are the dominant palynomorph and no noticeable change in the taxonomic com-position occurs in the Yuhuangding Formation (Zhao and Guo, 1995). Secondly, increased ambient air humidity can lead to an increase in stomatal conductance and in turn amplify the car-bon isotope fractionation associated with photosynthesis (Gröcke, 1998). It has thus been suggested that a 20% increase in soil mois-ture and humidity would result in a 1.5–2.1� amplification of the CIE in terrestrial substrates during the PETM (Bowen et al., 2004). In support of this explanation are the remarkable variations in primary carbonate at the Beigou section. Before the onset of the CIE, dolomite is the dominating carbonate precipitate min-eral whereas it disappears and gives way to calcite during the PETM (Fig. 5). Often authigenic dolomite precipitates from a lake system are associated with highly evaporated lake water, sugges-tive of arid environment (Müller et al., 1972; Last, 1990). The

Z. Chen et al. / Earth and Planetary Science Letters 408 (2014) 331–340 337
sudden disappearance of primary dolomite in the strata is thus indicative of a transition from dry to wet across the PETM at the Nanyang Basin. These results are in line with the previous studies which indicate more precipitation at mid to high latitudes in-ferred from increased kaolinite deposits (Robert and Kennett, 1994;Bolle and Adatte, 2001) and n-alkane compound-specific hydro-gen isotopic changes (Pagani et al., 2006a). Finally, the larger shift measured in terrestrial organic substrates could record a response to elevated CO2 levels. Previous experiments have shown an in-crease in carbon isotope fractionation by land plants in response to increasing atmospheric pCO2 concentration (Feng and Epstein, 1995). During the PETM, a massive input of 13C-depleted carbon to the exogenic carbon reservoirs would necessitate a rise in at-mospheric pCO2, which in turn could amplify the δ13C signal by ∼1–2� through increasing photosynthesis fractionation (Schubert and Hope Jahren, 2013). In summary, the larger excursion observed in the δ13CBC and δ13CTOC could bias the true magnitude of the CIE due to severe environmental disturbance during the PETM.
Further insight into the magnitude of the CIE is provided by the δ13C values of micritic carbonate, with an excursion of ∼ −5.5�. Considering the fractionation differences between dolomite and calcite and assuming that both precipitated in isotopic equilibrium with lake water, we applied the method developed by Bristow et al. (2012) to correct the δ13Ccarbonate values of mixed carbon-ate minerals to that of calcite (δ13Ccalcite) (Table S1), which track the carbon isotopic composition of the dissolved inorganic car-bon (DIC) in the water mass. The resulting magnitude of the CIE is ∼ −4� (Fig. 5). It is smaller than that recorded in or-ganic substrates, but consistent with that observed in planktonic foraminifera (Thomas et al., 2002; Zachos et al., 2003; Handley et al., 2008; John et al., 2008). Clear interpretation of the carbon iso-tope ratios of authigenic carbonate is difficult because many factors contribute to the final isotopic composition of precipitated carbon-ates in lakes. In general, the carbon-isotope inventory in lake is controlled by three predominant factors: (1) the isotopic composi-tion of inflowing waters; (2) CO2 exchange between lake water and the atmosphere; (3) the balance between primary productivity and respiration of aquatic plants within the lake (Leng and Marshall, 2004). The highly alkaline lakes revealed by thick marl deposits, however, are less susceptible to biotic impacts, as the reservoir of dissolved inorganic carbon is so large. Generally, isotopically light CO2 liberated by decay of terrestrial organic matter in the soil en-ters the soil waters and shallow groundwaters (Leng and Marshall, 2004), and ultimately inputs the lake system through runoff and rivers. Therefore, the δ13Ccalcite values should reflect the average isotope composition of DIC in the watershed system with vary-ing degrees of equilibrium of the DIC with atmospheric CO2 (Bade et al., 2004). Since all of the processes interact directly or indi-rectly with the atmospheric CO2, the δ13Ccalcite values in this study might preserve time-averaged isotopic signal of atmospheric CO2and the CIE of ∼ −4� is thus likely close to the true magnitude of carbon isotope anomaly in the exogenic carbon reservoirs. This result is consistent with others recently published (Cui et al., 2011;Sluijs and Dickens, 2012; Schoon et al., 2013), suggesting that the magnitude of the CIE in the ocean–atmosphere system may have been larger than −3 to −2.5� that has generally been accepted.
4.4. The shape of the CIE and its relationship to temperature
The details of the CIE have important implications for the trig-gering of the isotopically light carbon addition and the nature of potential feedbacks during the PETM (Stoll, 2005). Multisubstrate data from the Nanyang Basin clearly show distinct stratigraphic pattern of δ13C change in the inorganic (δ13Ccalcite) and organic fractions (δ13CBC and δ13CTOC) across the PETM, with changes in the δ13Ccalcite being generally smoother than and lagging those
in organic fractions (Fig. 5). Often carbonates spend millennia in Earth surface systems before they are deposited in the sedimen-tary record (Blair and Kalff, 1995; Tenzer et al., 1997). Hence, it is expected that the isotopic composition of authigenic carbonate should track time-averaged signal of dissolved inorganic carbon in the watershed systems around the lake. The mixing of carbon from isotopically distinct sources could result in the smoothed record and somewhat later onset and apparently a lagging arrival of the minimum values in δ13Ccalcite.
In contrast, δ13CBC and δ13CTOC values show a relatively abrupt drop at the onset of the event, punctuated by a substantial in-crease in values around 24 m, and then gradually progress to the minimum values. Plants assimilate CO2 directly from the at-mosphere through photosynthesis and therefore could provide the most reliable record of the pattern of the CIE. The strong similari-ties between δ13CBC and δ13CTOC values, both in trend and isotopic shift, imply that the gradual carbon isotope excursion could un-ravel the true shape and profile of the CIE. These records are broadly similar in pattern to the majority of other well-resolved records worldwide (Bowen, 2013) except for a little more pro-tracted excursion onset and a sharp positive shift during the progress of negative excursion. One possible explanation for the prolonged onset might be attributable to extremely high sedimen-tation rates of carbonate during the CIE onset, although there is no direct evidence for this due to a lack of robust age con-trol. On the other hand, homogeneous marl depositions across the excursion onset demonstrate that changes in sedimentation rates are inapparent and could not significantly alter the pattern of the CIE onset. The sharp premature recovery to less negative δ13C values in our organic substrates is also observed in some of the terrestrial records from Bighorn Basin (Baczynski et al., 2013;Bataille et al., 2013). It has been indicated that intensive runoff could significantly enhance erosion of “old” carbon in soils or an-cient rocks, and as a result lead to anomalous change in organic δ13C values (Clark et al., 2013). Accordingly, we interpret the sharp positive shift around 24 m as a mixture of autochthonous carbon (δ13C: ∼27�) fixed during the PETM and allochthonous carbon (δ13C: ∼22�) eroded from pre-PETM soils or rocks as recently suggested by Bataille et al. (2013) and Schneider-Mor and Bowen(2013). Changes in authigenic carbonates support this argument and imply enhanced hydrological cycle during the PETM.
Despite subtle differences and complexity of their explanations in the CIE for each substrate as discussed in above paragraphs, our high-resolution δ13C curves generally depict a gradual excur-sion onset. The δ13C values of each fraction could be controlled by different environmental variables, but all of them were di-rectly or indirectly affected by atmospheric carbon pool. Taking account of the excessive excursion onset (∼10 m) in our records, we thus conclude that the carbon isotope excursion of atmospheric carbon reservoir possibly occurred in a gradual δ13C decrease at least over timescales of thousands of years. Recently, Wright and Schaller (2013) examined records from apparently rhythmically layered shelf sediments to argue that the onset of the CIE occurred within 13 yr, and further suggested an instantaneous release of 13C-depleted carbon. In contrast, the excursion onset was gradu-ally completed within ∼10 m stratigraphic space in our records. It is highly inconceivable that ∼10-m-thick carbonates deposited in 13 yr, thus implying that their explanation is not feasible. In-terestingly, our MBT/CBT paleothermometry data show a gradual increase of ∼7 ◦C and then a return to initial temperatures during the PETM, which is broadly similar in shape and trend to the car-bon isotope records (Fig. 6). Specifically, while δ13C values begin gradually to decrease at ∼20 m, the temperature starts to increase slowly. At approximately 31 m, the δ13C ratios reach their mini-mum, and the temperature increases to its maximum; then, as the

338 Z. Chen et al. / Earth and Planetary Science Letters 408 (2014) 331–340
δ13C values increase, the temperature gradually returns to the ini-tial values.
How a massive amount of 13C-depleted carbon was injected remains the focus of much debate (Bains et al., 1999; Giusberti et al., 2007; Cui et al., 2011; Wright and Schaller, 2013). It has been suggested that greenhouse feedback might have played a piv-otal role (Zachos et al., 2008), but no direct geological evidence exists. Here our high-resolution lacustrine records show that the minimum δ13C values were reached in a gradual manner with some transitional values. Similarly, high-resolution δ13CTOC data from Spitsbergen also generally depict the same feature of the CIE as that revealed by our records (Cui et al., 2011). Taken to-gether, δ13C data of different substrates from different sites all present a gradual excursion onset, implying an enormous input of 13C-depleted carbon into the atmosphere and ocean in a grad-ual manner rather than an instantaneous (Thomas et al., 2002;Giusberti et al., 2007) or pulsed manner (Bains et al., 1999) gen-erally defined in marine sediments. Furthermore, the pattern and trend of the CIE from our records are mirrored in the temperature data (Fig. 6). This correspondence strongly demonstrates that the injection of 13C-depleted carbon was intimately coupled with the temperature increase across the PETM. Taken with the fact of pre-CIE warming (Sluijs et al., 2007; Secord et al., 2010, this study), our observations provide a fundamental constraint on the event, in the form of a massive release of 13C-depleted carbon that oper-ated as a positive feedback to global warming. In particular, peak temperatures of sufficiently short duration are associated with the minimum carbon isotope values, implying that the carbon source was probably exhausted and the positive feedback ceased.
4.5. Implications for the carbon sources
Our high-resolution records clearly deconvolve the coupling of continental temperature change and the CIE. These findings have two important implications for the carbon sources. Firstly, the ∼4 ◦C warming occurred before the onset of the CIE does not correspond to any marked variation in multiple δ13C data, indi-cating that the pre-CIE warming, if forced by increasing pCO2, was likely attributable to volcano degassing with a δ13C value iden-tical to atmospheric CO2 (Wieczorek et al., 2013). Secondly, the fact of pre-CIE warming (Sluijs et al., 2007; Secord et al., 2010, this study), coupled with evidence of covariance between tem-perature and δ13C values during the CIE, is consistent with the idea that 13C-depleted carbon release operated as a positive feed-back to temperature rise, suggestive of carbon supply from one or more large organic carbon reservoirs on Earth’s surface. Potentially, the combustion of the Paleocene peatlands might be responsible for the CIE (Kurtz et al., 2003). However, the δ13C data of black carbon exhibit a similar CIE recorded in total organic carbon, in-dicating that this material was sourced from contemporaneous biomass rather than geologically old carbon. This is inconsistent with the prediction of wildfire hypothesis (Kurtz et al., 2003). Two other compelling possibilities for organic carbon feedback are per-mafrost (DeConto et al., 2012) and methane hydrates (Dickens et al., 1995). Because methane hydrate and permafrost reservoirs are relatively large and sensitive to temperature (Dickens et al., 1995;DeConto et al., 2012), our data are more consistent with the sug-gestion that most of 13C-depleted carbon should be sourced from the decomposition of one or both of these organic carbon pools.
5. Conclusions
We have recovered the first high-resolution lacustrine PETM section from central China based on carbon isotope records of inor-ganic and organic fractions. Total organic carbon and black carbon record a 6� negative carbon isotope shift, while the δ13Ccalcite
data reveal a carbon excursion of ∼ −4�. Elevated pCO2 concen-tration and enhanced precipitation, reflected by prominent changes in authigenic carbonate minerals, could be responsible for this re-markable large excursion. The CIE of ∼ −4� recorded in lacus-trine calcite reflects the average isotopic anomaly in the watershed, which is consistent with that found in planktonic foraminifera (Thomas et al., 2002; Zachos et al., 2003). We thus suggest that the CIE of ∼ −4� observed in these subsystems may indeed re-flect the true shift in the exogenic carbon reservoirs.
Multiple δ13C data reveal a ∼10 m excursion onset, meaning that the PETM is very unlikely to be a single, decadal-scale carbon release event as suggested by Wright and Schaller (2013). Local factors, such as enhanced erosion of “old” carbon due to intensive runoff during the PETM, might complicate the isotopic signal of each substrate and lead to subtle difference or somewhat smooth-ness in the detailed pattern of the CIE, but inorganic and organic substrates broadly record a gradual CIE onset. This result, com-bined with the excessive excursion onset (∼10 m), probably in-dicates an enormous input of 13C-depleted carbon into the ocean–atmosphere system in a gradual manner at least over timescales of thousands of years. Furthermore, the shape and trend of the CIE at the Nanyang Basin are generally mirrored in MBT/CBT paleother-mometry data. These observations, in conjunction with pre-CIE warming, demonstrates that 13C-depleted carbon release operated as a positive feedback to temperature rise, suggesting most of car-bon supply from the decomposition of one or both of methane hydrates and permafrost.
Acknowledgements
We thank G.R. Dickens for a constructive comment that im-proved the manuscript; P.D. White for a review of the initial manuscript; S. Feng and H. Jiang for the field work; and L. Cui for experiments. We also thank F. McInerney and the other anony-mous reviewer for their helpful comments, many of which have improved the final paper. This work was supported by the National Natural Science Foundation of China (grant 40730208), the (973) National Basic Research Program of China (grants 2012CB821905 and 2013CB956404), and the Strategic Priority Research Program of CAS (grant XDB03020503).
Appendix A. Supplementary material
Supplementary material related to this article can be found on-line at http://dx.doi.org/10.1016/j.epsl.2014.10.027.
References
Aziz, H.A., Hilgen, F.J., van Luijk, G.M., Sluijs, A., Kraus, M.J., Pares, J.M., Gingerich, P.D., 2008. Astronomical climate control on paleosol stacking patterns in the upper Paleocene–lower Eocene Willwood Formation, Bighorn Basin, Wyoming. Geology 36, 531–534.
Baczynski, A.A., McInerney, F.A., Wing, S.L., Kraus, M.J., Bloch, J.I., Boyer, D.M., Sec-ord, R., Morse, P.E., Fricke, H.C., 2013. Chemostratigraphic implications of spatial variation in the Paleocene–Eocene Thermal Maximum carbon isotope excursion, SE Bighorn Basin, Wyoming. Geochem. Geophys. Geosyst. 14, 4133–4152.
Bade, D.L., Carpenter, S.R., Cole, J.J., Hanson, P.C., Hesslein, R.H., 2004. Controls of δ13C–DIC in lakes: geochemistry, lake metabolism, and morphometry. Limnol. Oceanogr. 49, 1160–1172.
Bains, S., Corfield, R.M., Norris, R.D., 1999. Mechanisms of climate warming at the end of the Paleocene. Science 285, 724–727.
Bataille, C.P., Mastalerz, M., Tipple, B.J., Bowen, G.J., 2013. Influence of provenance and preservation on the carbon isotope variations of dispersed organic matter in ancient floodplain sediments. Geochem. Geophys. Geosyst. 14, 4874–4891.
Blais, J.M., Kalff, J., 1995. The influence of lake morphometry on sediment focusing. Limnol. Oceanogr. 40, 582–588.
Bolle, M.P., Adatte, T., 2001. Palaeocene early Eocene climatic evolution in the Tethyan realm: clay mineral evidence. Clay Miner. 36, 249–261.
Bowen, G.J., Beerling, D.J., Koch, P.L., Zachos, J.C., Quattlebaum, T., 2004. A humid climate state during the Palaeocene/Eocene thermal maximum. Nature 432, 495–499.

Z. Chen et al. / Earth and Planetary Science Letters 408 (2014) 331–340 339
Bowen, G.J., 2013. Up in smoke: a role for organic carbon feedbacks in Paleogene hyperthermals. Glob. Planet. Change 109, 18–29.
Bristow, T.F., Kennedy, M.J., Morrison, K.D., Mrofka, D.D., 2012. The influence of authigenic clay formation on the mineralogy and stable isotopic record of la-custrine carbonates. Geochim. Cosmochim. Acta 90, 64–82.
Charles, A.J., Condon, D.J., Harding, I.C., Pälike, H., Marshall, J.E.A., Cui, Y., Kump, L., Croudace, I.W., 2011. Constraints on the numerical age of the Paleocene–Eocene boundary. Geochem. Geophys. Geosyst. 12, Q0AA17. http://dx.doi.org/10.1029/2010GC003426.
Chikaraishi, Y., Naraoka, H., 2003. Compound-specific δD–δ13C analyses of n-alkanes extracted from terrestrial and aquatic plants. Phytochemistry 63, 361–371.
Chung, F., 1974. Quantitative interpretation of X-ray diffraction patterns of mixtures. II. Adiabatic principle of X-ray diffraction analysis of mixtures. J. Appl. Crystal-logr. 7, 526–531.
Clark, K.E., Hilton, R.G., West, A.J., Malhi, Y., Gröcke, D.R., Bryant, C.L., Ascough, P.L., Robles Caceres, A., New, M., 2013. New views on “old” carbon in the Amazon River: insight from the source of organic carbon eroded from the Peruvian An-des. Geochem. Geophys. Geosyst. 14, 1644–1659.
Clyde, W.C., Gingerich, P.D., 1998. Mammalian community response to the latest Paleocene thermal maximum: an isotaphonomic study in the northern Bighorn Basin, Wyoming. Geology 26, 1011–1014.
Cui, Y., Kump, L.R., Ridgwell, A.J., Charles, A.J., Junium, C.K., Diefendorf, A.F., Freeman, K.H., Urban, N.M., Harding, I.C., 2011. Slow release of fossil carbon during the Palaeocene–Eocene Thermal Maximum. Nat. Geosci. 4, 481–485.
DeConto, R.M., Galeotti, S., Pagani, M., Tracy, D., Schaefer, K., Zhang, T., Pollard, D., Beerling, D.J., 2012. Past extreme warming events linked to massive carbon re-lease from thawing permafrost. Nature 484, 87–91.
Dickens, G.R., O’Neil, J.R., Rea, D.K., Owen, R.M., 1995. Dissociation of oceanic methane hydrate as a cause of the carbon isotope excursion at the end of the Paleocene. Paleoceanography 10, 965–971.
Dickson, J.A.D., Coleman, M.L., 1980. Changes in carbon and oxygen isotope compo-sition during limestone diagenesis. Sedimentology 27, 107–118.
Feng, X., Epstein, S., 1995. Carbon isotopes of trees from arid environments and implications for reconstructing atmospheric CO2 concentration. Geochim. Cos-mochim. Acta 59, 2599–2608.
Feng, Z., Zhou, S., Wang, J., Gu, B., 1997. The changes of Meso-Cenozoic paleogeo-graphic environments in the southwest of Henan. Henan Geol. 12, 270–277.
Feng, Z., Zhou, S., Li, Z., 1999. The age of the late cretaceous red beds in southwest-ern Henan Provence. Reg. Geol. China 3, 320–328.
Garzione, C.N., Dettman, D.L., Horton, B.K., 2004. Carbonate oxygen isotope paleoal-timetry: evaluating the effect of diagenesis on paleoelevation estimates for the Tibetan plateau. Palaeogeogr. Palaeoclimatol. Palaeoecol. 212, 119–140.
Giusberti, L., Rio, D., Agnini, C., Backman, J., Fornaciari, E., Tateo, F., Oddone, M., 2007. Mode and tempo of the Paleocene–Eocene thermal maximum in an expanded section from the Venetian pre-Alps. Geol. Soc. Am. Bull. 119, 391–412.
Gröcke, D.R., 1998. Carbon-isotope analyses of fossil plants as a chemostratigraphic and palaeoenvironmental tool. Lethaia 31, 1–13.
Handley, L., Pearson, P.N., McMillan, I.K., Pancost, R.D., 2008. Large terrestrial and marine carbon and hydrogen isotope excursions in a new Paleocene/Eocene boundary section from Tanzania. Earth Planet. Sci. Lett. 275, 17–25.
Hopmans, E.C., Weijers, J.W.H., Schefuss, E., Herfort, L., Sinninghe Damste, J.S., Schouten, S., 2004. A novel proxy for terrestrial organic matter in sediments based on branched and isoprenoid tetraether lipids. Earth Planet. Sci. Lett. 224, 107–116.
Huang, X., Li, C., Dawson, M.R., Liu, L., 2004. Hanomys malcolmi, a new simplici-dentate mammal from the Paleocene of central China: its relationships and stratigraphic implications. Bull. Carnegie Mus. Nat. Hist. 36, 81–89.
John, C.M., Bohaty, S.M., Zachos, J.C., Sluijs, A., Gibbs, S., Brinkhuis, H., Bralower, T.J., 2008. North American continental margin records of the Paleocene–Eocene thermal maximum: implications for global carbon and hydrological cycling. Pa-leoceanography 23, PA2217. http://dx.doi.org/10.1029/2007PA001465.
Kennett, J.P., Stott, L.D., 1991. Abrupt deep-sea warming, palaeoceanographic changes and benthic extinctions at the end of the Palaeocene. Nature 353, 225–229.
Kent, D.V., Cramer, B.S., Lanci, L., Wang, D., Wright, J.D., der Voo, R.V., 2003. A case for a comet impact trigger for the Paleocene/Eocene thermal maximum and car-bon isotope excursion. Earth Planet. Sci. Lett. 211, 13–26.
Koch, P.L., Zachos, J.C., Gingerich, P.D., 1992. Correlation between isotope records in marine and continental carbon reservoirs near the Paleocene/Eocene boundary. Nature 358, 319–322.
Kump, L.R., Arthur, M.A., 1999. Interpreting carbon-isotope excursions: carbonates and organic matter. Chem. Geol. 161, 181–198.
Kurtz, A.C., Kump, L.R., Arthur, M.A., Zachos, J.C., Paytan, A., 2003. Early Cenozoic decoupling of the global carbon and sulfur cycles. Paleoceanography 18, 1090. http://dx.doi.org/10.1029/2003PA000908.
Last, W.M., 1990. Lacustrine dolomite—an overview of modern, Holocene, and Pleis-tocene occurrences. Earth-Sci. Rev. 27, 221–263.
Leng, M.J., Marshall, J.D., 2004. Palaeoclimate interpretation of stable isotope data from lake sediments. Quat. Sci. Rev. 23, 811–831.
Leng, M.J., Jones, M.D., Frogley, M.R., Eastwood, W.J., Kendrick, C.P., Roberts, C.N., 2010. Detrital carbonate influences on bulk oxygen and carbon isotope compo-sition of lacustrine sediments from the Mediterranean. Glob. Planet. Change 71, 175–182.
Ma, A., Cheng, J., 1991. On biostratigraphical subdivision of Yuhuangding formation in Liguanqiao Basin of eastern Qinling region. Sci. Geol. Sin. 1, 21–29.
Magioncalda, R., Dupuis, C., Smith, T., Steurbaut, E., Gingerich, P.D., 2004. Paleocene–Eocene carbon isotope excursion in organic carbon and pedogenic carbonate: direct comparison in a continental stratigraphic section. Geology 32, 553–556.
McCarren, H., Thomas, E., Hasegawa, T., Rohl, U., Zachos, J.C., 2008. Depth de-pendency of the Paleocene–Eocene carbon isotope excursion: paired ben-thic and terrestrial biomarker records (Ocean Drilling Program Leg 208, Walvis Ridge). Geochem. Geophys. Geosyst. 9, Q10008. http://dx.doi.org/10.1029/2008GC002116.
McInerney, F.A., Wing, S.L., 2011. The Paleocene–Eocene thermal maximum: a per-turbation of carbon cycle, climate, and biosphere with implications for the fu-ture. Annu. Rev. Earth Planet. Sci. 39, 489–516.
Müller, G., Irion, G., Förstner, U., 1972. Formation and diagenesis of inorganic Ca–Mg carbonate in the lacustrine environment. Naturwissenschaften 59, 158–164.
Norris, R.D., Röhl, U., 1999. Carbon cycling and chronology of climate warming dur-ing the Palaeocene/Eocene transition. Nature 401, 775–778.
Pagani, M., Pedentchouk, N., Huber, M., Sluijs, A., Schoutern, S., Brinkhuis, H., Damsté, J.S.S., Dickens, G.R., et al., 2006a. Arctic hydrology during global warm-ing at the Palaeocene/Eocene thermal maximum. Nature 442, 671–675.
Pagani, M., Caldeira, K., Archer, D., Zachos, J.C., 2006b. An ancient carbon mystery. Science 314, 1556–1557.
Panchuk, K., Ridgwell, A., Kump, L.R., 2008. Sedimentary response to Paleocene–Eocene Thermal Maximum carbon release: a model-data comparison. Geol-ogy 36, 315–318.
Poulson, S.R., John, B.E., 2003. Stable isotope and trace element geochemistry of the basal Bouse Formation carbonate, southwestern United States: implications for the Pliocene uplift history of the Colorado Plateau. Geol. Soc. Am. Bull. 115, 434–444.
Robert, C., Kennett, J.P., 1994. Antarctic subtropical humid episode at the Paleocene–Eocene boundary: clay-mineral evidence. Geology 22, 211–214.
Röhl, U., Westerhold, T., Bralower, T.J., Zachos, J.C., 2007. On the duration of the Paleocene–Eocene thermal maximum (PETM). Geochem. Geophys. Geosyst. 8, Q12002. http://dx.doi.org/10.1029/2007GC001784.
Schmidt, M.W.I., Noack, A.G., 2000. Black carbon in soils and sediments: analysis, distribution, implications, and current challenges. Glob. Biogeochem. Cycles 14, 777–793.
Schmitz, B., Pujalte, V., 2003. Sea-level, humidity, and land-erosion records across the initial Eocene thermal maximum from a continental–marine transect in northern Spain. Geology 31, 689–692.
Schneider-Mor, A., Bowen, G.J., 2013. Coupled and decoupled responses of conti-nental and marine organic-sedimentary systems through the Paleocene–Eocene thermal maximum, New Jersey Margin, USA. Paleoceanography 28, 105–115.
Schoon, P.L., Heilmann-Clausen, C., Schultz, B.P., Sluijs, A., Damsté, J.S.S., Schouten, S., 2013. Recognition of Early Eocene global carbon isotope excursions using lipids of marine Thaumarchaeota. Earth Planet. Sci. Lett. 373, 160–168.
Schouten, S., Woltering, M., Rijpstra, W.I.C., Aluijs, A., Brinkhuis, H., Damsté, J.S.S., 2007. The Paleocene–Eocene carbon isotope excursion in higher plant organic matter: differential fractionation of angiosperms and conifers in the Arctic. Earth Planet. Sci. Lett. 258, 581–592.
Schubert, B.A., Hope Jahren, A., 2013. Reconciliation of marine and terrestrial carbon isotope excursions based on changing atmospheric CO2 levels. Nat. Commun. 4, 1653.
Secord, R., Gingerich, P.D., Lohmann, K.C., Macleod, K.G., 2010. Continental warming preceding the Palaeocene–Eocene thermal maximum. Nature 467, 955–958.
Sluijs, A., Schouten, S., Pagani, M., Woltering, M., Brinkhuis, H., Damsté, J.S.S., Dick-ens, G.R., Huber, M., Reichart, G.J., Stein, R., Matthiessen, J., Lourens, L.J., Pe-dentchouk, N., Backman, J., Moran, K., et al., 2006. Subtropical arctic ocean temperatures during the Palaeocene/Eocene thermal maximum. Nature 441, 610–613.
Sluijs, A., Brinkhuis, H., Schouten, S., Bohaty, S.M., John, C.M., Zachos, J.C., Reichart, G.J., Damsté, J.S.S., Crouch, E.M., Dickens, G.R., 2007. Environmental precursors to rapid light carbon injection at the Palaeocene/Eocene boundary. Nature 450, 1218–1222.
Sluijs, A., Dickens, G.R., 2012. Assessing offsets between the δ13C of sedi-mentary components and the global exogenic carbon pool across early Pa-leogene carbon cycle perturbations. Glob. Biogeochem. Cycles 26, GB4005. http://dx.doi.org/10.1029/2011GB004224.
Smith, F.A., Wing, S.L., Freeman, K.H., 2007. Magnitude of the carbon isotope excur-sion at the Paleocene–Eocene thermal maximum: the role of plant community change. Earth Planet. Sci. Lett. 262, 50–65.
Stoll, H.M., 2005. Limited range of interspecific vital effects in coccolith stable iso-topic records during the Paleocene Eocene thermal maximum. Paleoceanogra-phy 20, PA1007. http://dx.doi.org/10.1029/2004PA001046.

340 Z. Chen et al. / Earth and Planetary Science Letters 408 (2014) 331–340
Sun, Q., Chu, G., Liu, M., Xie, M., Li, S., Ling, Y., Wang, X., Shi, L., Jia, G., Lü, H., 2011. Distributions and temperature dependence of branched glycerol dialkyl glycerol tetraethers in recent lacustrine sediments from China and Nepal. J. Geophys. Res. 116, G01008. http://dx.doi.org/10.1029/2010JG001365.
Svensen, H., Planke, S., Malthe-Sorenssen, A., Jamtveit, B., Myklebust, R., Eidem, T.R., Rey, S.S., 2004. Release of methane from a volcanic basin as a mechanism for initial Eocene global warming. Nature 429, 542–545.
Tenzer, G.E., Meyers, P.A., Knoop, P., 1997. Sources and distribution of organic and carbonate carbon in surface sediments of Pyramid Lake, Nevada. J. Sediment. Res. 67, 884–890.
Thomas, D.J., Bralower, T.J., Zachos, J.C., 1999. New evidence for subtropical warming during the late Paleocene thermal maximum: stable isotopes from Deep Sea Drilling Project Site 527, Walvis Ridge. Paleoceanography 14, 561–570.
Thomas, D.J., Zachos, J.C., Bralower, T.J., Thomas, E., Bohaty, S., 2002. Warming the fuel for the fire: evidence for the thermal dissociation of methane hydrate dur-ing the Paleocene–Eocene thermal maximum. Geology 30, 1067–1070.
Thomas, E., 1998. The biogeography of the late Paleocene benthic foraminiferal extinction. In: Aubry, M.P., Lucas, S., Berggren, W.A. (Eds.), Late Paleocene–Early Eocene Biotic and Climatic Events in the Marine and Terrestrial Records. Columbia University Press, New York, pp. 214–243.
Ting, S.Y., Bowen, G.J., Koch, P.L., Clyde, W.C., Wang, Y., Wang, Y., McKenna, M.C., 2003. Biostratigraphic, chemostratigraphic, and magnetostratigraphic studyacross the Paleocene–Eocene boundary in the Hengyang Basin, Hunan, China. In: Wing, S.L., Gingerich, P.D., Schmitz, B., Thomas, E. (Eds.), Causes and Conse-quences of Globally Warm Climates in the Early Paleogene. Geological Society of America, Boulder, Colorado, pp. 521–535.
Tripati, A., Elderfield, H., 2005. Deep-sea temperature and circulation changes at the Paleocene–Eocene thermal maximum. Science 308, 1894–1898.
Weijers, J.W.H., Schouten, S., Sluijs, A., Brinkhuis, H., Damsté, J.S.S., 2007a. Warm arc-tic continents during the Palaeocene–Eocene thermal maximum. Earth Planet. Sci. Lett. 261, 230–238.
Weijers, J.W.H., Schouten, S., van den Donker, J.C., Hopmans, E.C., Sinninghe Damsté, J.S., 2007b. Environmental controls on bacterial tetraether membrane lipid dis-tribution in soils. Geochim. Cosmochim. Acta 71, 703–713.
Wieczorek, R., Fantle, M.S., Kump, L.R., Ravizza, G., 2013. Geochemical evidence for volcanic activity prior to and enhanced terrestrial weathering during the Pale-ocene Eocene Thermal Maximum. Geochim. Cosmochim. Acta 119, 391–410.
Wing, S.L., Harrington, G.J., Smith, F.A., Bloch, J.I., Boyer, D.M., Freeman, K.H., 2005. Transient floral change and rapid global warming at the Paleocene–Eocene boundary. Science 310, 993–996.
Wright, J.D., Schaller, M.F., 2013. Evidence for a rapid release of carbon at the Paleocene–Eocene thermal maximum. Proc. Natl. Acad. Sci. USA 110, 15908–15913.
Zachos, J.C., Pagani, M., Sloan, L., Thomas, E., Billups, K., 2001. Trends, rhythms, and aberrations in global climate 65 Ma to present. Science 292, 686–693.
Zachos, J.C., Wara, M.W., Bohaty, S., Delaney, M.L., Petrizzo, M.R., Brill, A., Bralower, T.J., Premoli-Silva, I., 2003. A transient rise in tropical sea surface temperature during the Paleocene–Eocene Thermal Maximum. Science 302, 1551–1554.
Zachos, J.C., Röhl, U., Schellenberg, S.A., Sluijs, A., Hodell, D.A., Kelly, D.C., Thomas, E., Nicolo, M., Raffi, I., Lourens, L.J., McCarren, H., Kroon, D., 2005. Rapid acidifica-tion of the ocean during the Paleocene–Eocene thermal maximum. Science 308, 1611–1615.
Zachos, J.C., Schouten, S., Bohaty, S., Quattlebaum, T., Sluijs, A., Brinkhuis, H., Gibbs, S.J., Bralower, T.J., 2006. Extreme warming of mid-latitude coastal ocean during the Paleocene–Eocene Thermal Maximum: inferences from TEX86 and isotope data. Geology 34, 737–740.
Zachos, J.C., Dickens, G.R., Zeebe, R.E., 2008. An early Cenozoic perspective on green-house warming and carbon-cycle dynamics. Nature 451, 279–283.
Zeebe, R.E., Zachos, J.C., Dickens, G.R., 2009. Carbon dioxide forcing alone insuffi-cient to explain Palaeocene–Eocene Thermal Maximum warming. Nat. Geosci. 2, 576–580.
Zhao, H., Guo, S., 1995. The Strata and Palaeontology of the Zhoukou and Nanyang in Henan Province. Geological Publishing House, Beijing.
Zhou, H., Hu, J., Ming, L., Peng, P., Zhang, G., 2011. Branched glycerol dialkyl glyc-erol tetraethers and paleoenvironmental reconstruction in Zoigê peat sediments during the last 150 years. Chin. Sci. Bull. 56, 2456–2463.
Zhu, M., Ding, Z., Wang, X., Chen, Z., Jiang, H., Dong, X., Ji, J., Tang, Z., Luo, P., 2010. High-resolution carbon isotope record for the Paleocene–Eocene thermal maxi-mum from the Nanyang Basin, Central China. Chin. Sci. Bull. 55, 3606–3611.