Structural characterization of the large soluble oligomers of the GTPase effector domain of dynamin
10
Structural characterization of the large soluble oligomers of the GTPase effector domain of dynamin Jeetender Chugh 1 , Amarnath Chatterjee 1 , Ashutosh Kumar 1 , Ram Kumar Mishra 2 , Rohit Mittal 2 and Ramakrishna V. Hosur 1 1 Department of Chemical Sciences and 2 Department of Biological Sciences, Tata Institute of Fundamental Research, Mumbai, India Dynamin is an important protein of the endocytic machinery in cells [1,2]. It has a modular structure characterized by the presence of an amino-terminal GTP-binding domain, a contiguous ‘middle domain’ of ill-defined function, a lipid binding pleckstrin homol- ogy domain followed by a coiled-coil ‘assembly’ domain and a proline-arginine rich domain at the extreme carboxy-terminal end. The GTPase domain is the most highly conserved domain within the members of the dynamin family. The functional roles of the various domains of dynamin have been described in great detail in several reviews [3]. It is thought that Keywords circular dichroism; dynamin; GED; molecular assembly; multidimensional NMR Correspondence R. V. Hosur, Department of Chemical Sciences, Tata Institute of Fundamental Research, Homi Bhabha Road, Mumbai 400 005, India Fax: +91 22 22804610 Tel: +91 22 22804545 extension 2488 E-mail: [email protected] (Received 11 September 2005, revised 11 November 2005, accepted 23 November 2005) doi:10.1111/j.1742-4658.2005.05072.x Dynamin, a protein playing crucial roles in endocytosis, oligomerizes to form spirals around the necks of incipient vesicles and helps their scission from membranes. This oligomerization is known to be mediated by the GTPase effector domain (GED). Here we have characterized the structural features of recombinant GED using a variety of biophysical methods. Gel filtration and dynamic light scattering experiments indicate that in solution, the GED has an intrinsic tendency to oligomerize. It forms large soluble oligomers (molecular mass > 600 kDa). Interestingly, they exist in equilib- rium with the monomer, the equilibrium being largely in favour of the oligomers. This equilibrium, observed for the first time for GED, may have regulatory implications for dynamin function. From the circular dichroism measurements the multimers are seen to have a high helical content. From multidimensional NMR analysis we have determined that about 30 residues in the monomeric units constituting the oligomers are flexible, and these include a 17 residue stretch near the N-terminal. This contains two short segments with helical propensities in an otherwise dynamic structure. Neg- atively charged SDS micelles cause dissociation of the oligomers into monomers, and interestingly, the helical characteristics of the oligomer are completely retained in the individual monomers. The segments along the chain that are likely to form helices have been predicted from five different algorithms, all of which identify two long stretches. Surface electrostatic potential calculation for these helices reveals that there is a distribution of neutral, positive and negative potentials, suggesting that both electrostatic and hydrophobic interactions could be playing important roles in the oligo- mer core formation. A single point mutation, I697A, in one of the helices inhibited oligomerization quite substantially, indicating firstly, a special role of this residue, and secondly, a decisive, though localized, contribution of hydrophobic interaction in the association process. Abbreviations GED, GTPase effector domain; GST, glutathione-S-transferase; DLS, dynamic light scattering; TOCSY-HSQC, total correlated spectroscopy- heteronuclear single quantum coherence. 388 FEBS Journal 273 (2006) 388–397 ª 2005 The Authors Journal compilation ª 2005 FEBS
-
Upload
pioneerurban -
Category
Documents
-
view
0 -
download
0
Transcript of Structural characterization of the large soluble oligomers of the GTPase effector domain of dynamin

Structural characterization of the large soluble oligomersof the GTPase effector domain of dynaminJeetender Chugh1, Amarnath Chatterjee1, Ashutosh Kumar1, Ram Kumar Mishra2, Rohit Mittal2
and Ramakrishna V. Hosur1
1 Department of Chemical Sciences and 2 Department of Biological Sciences, Tata Institute of Fundamental Research, Mumbai, India
Dynamin is an important protein of the endocytic
machinery in cells [1,2]. It has a modular structure
characterized by the presence of an amino-terminal
GTP-binding domain, a contiguous ‘middle domain’ of
ill-defined function, a lipid binding pleckstrin homol-
ogy domain followed by a coiled-coil ‘assembly’
domain and a proline-arginine rich domain at the
extreme carboxy-terminal end. The GTPase domain is
the most highly conserved domain within the members
of the dynamin family. The functional roles of the
various domains of dynamin have been described in
great detail in several reviews [3]. It is thought that
Keywords
circular dichroism; dynamin; GED; molecular
assembly; multidimensional NMR
Correspondence
R. V. Hosur, Department of Chemical
Sciences, Tata Institute of Fundamental
Research, Homi Bhabha Road,
Mumbai 400 005, India
Fax: +91 22 22804610
Tel: +91 22 22804545 extension 2488
E-mail: [email protected]
(Received 11 September 2005, revised
11 November 2005, accepted 23 November
2005)
doi:10.1111/j.1742-4658.2005.05072.x
Dynamin, a protein playing crucial roles in endocytosis, oligomerizes to
form spirals around the necks of incipient vesicles and helps their scission
from membranes. This oligomerization is known to be mediated by the
GTPase effector domain (GED). Here we have characterized the structural
features of recombinant GED using a variety of biophysical methods. Gel
filtration and dynamic light scattering experiments indicate that in solution,
the GED has an intrinsic tendency to oligomerize. It forms large soluble
oligomers (molecular mass > 600 kDa). Interestingly, they exist in equilib-
rium with the monomer, the equilibrium being largely in favour of the
oligomers. This equilibrium, observed for the first time for GED, may have
regulatory implications for dynamin function. From the circular dichroism
measurements the multimers are seen to have a high helical content. From
multidimensional NMR analysis we have determined that about 30 residues
in the monomeric units constituting the oligomers are flexible, and these
include a 17 residue stretch near the N-terminal. This contains two short
segments with helical propensities in an otherwise dynamic structure. Neg-
atively charged SDS micelles cause dissociation of the oligomers into
monomers, and interestingly, the helical characteristics of the oligomer are
completely retained in the individual monomers. The segments along the
chain that are likely to form helices have been predicted from five different
algorithms, all of which identify two long stretches. Surface electrostatic
potential calculation for these helices reveals that there is a distribution of
neutral, positive and negative potentials, suggesting that both electrostatic
and hydrophobic interactions could be playing important roles in the oligo-
mer core formation. A single point mutation, I697A, in one of the helices
inhibited oligomerization quite substantially, indicating firstly, a special
role of this residue, and secondly, a decisive, though localized, contribution
of hydrophobic interaction in the association process.
Abbreviations
GED, GTPase effector domain; GST, glutathione-S-transferase; DLS, dynamic light scattering; TOCSY-HSQC, total correlated spectroscopy-
heteronuclear single quantum coherence.
388 FEBS Journal 273 (2006) 388–397 ª 2005 The Authors Journal compilation ª 2005 FEBS

GTP-bound dynamin assembles in the form of rings
around the necks of budding vesicles, and then a con-
formational change in the dynamin collar aids the scis-
sion of the vesicle from the parent membrane. The
coiled-coil ‘assembly’ domain of the protein has been
shown to mediate its assembly into oligomers [4] and
has also been shown to possess an assembly stimulated
GTPase accelerating property for the GTPase domain
[5]. Therefore this domain is also termed the GTPase
effector domain (GED). Further, the GED has been
reported to be involved in multiple intramolecular and
intermolecular interactions. It interacts with the
amino-terminal GTP-binding domain of dynamin [6]
and is also known to associate with other GED mole-
cules, possibly mediating dynamin oligomerization [5].
In addition, the GED has also been shown to bind the
middle domain of dynamin [7].
The above possibility of functional dissection of the
dynamin protein into specific domains suggests that a
detailed characterization of the intrinsic structural and
dynamic characteristics of the individual domains has
the potential to throw valuable light on the interac-
tions of the individual domains, and the mechanism
and variety of the overall functions of the full length
protein. As of now, the structural characteristics of
only the pleckstrin homology domain [8–10] and
GTPase domain [11] have been reported in the litera-
ture. In this background we report here structural
characterization of the GED using a variety of bio-
physical techniques. It turns out that the GED has a
high tendency to form large multimers (molecular
mass >600 kDa), in vitro. These oligomers exist in
slow equilibrium with the monomers. The GED is seen
to be largely helical in nature, and its oligomerization
occurs via intermolecular packing of the helices. A sin-
gle point mutation, I697A, significantly alters the
association characteristics of the protein, implicating,
first, a special role of the interactions at this site, and
second, contribution of hydrophobic interactions in
the association process.
Results and Discussion
The GED displays oligomer–monomer
equilibrium in solution
We monitored the state of the isolated GED of dyn-
amin under different conditions using gel filtration,
dynamic light scattering and nuclear magnetic reson-
ance. Gel filtration yields the molecular mass distribu-
tion in solution and when carried out on the isolated
GED of dynamin at pH 5.7 using a Superdex 200
column showed that most of the protein appeared in
the flow-through (Blue dextran, molecular mass
2000 kDa also appeared at the same place), and there
was also a small peak seen corresponding to the mono-
mer (Fig. 1A). This meant that the molecular mass of
the major species was at least 600 kDa (the column
Fig. 1. Size exclusion chromatograms of: (A) Approximately 1.6 mg
GED in 0.1 M phosphate buffer pH 5.7 at 27 �C, run on Hi Load
16 ⁄ 60 Superdex 200 column (Amersham), using a Bio-Rad BioLogic
LP system, at a flow rate of 0.5 mLÆmin)1; (B) Fractions corres-
ponding to the oligomer peak from [38–48 mL in (A)] were concen-
trated and applied to same column; (C) Fractions corresponding to
the monomer peak [114–124 mL in (A)] were concentrated and
applied to the same column. In each case an oligomer peak is
seen along with a peak corresponding to the GED monomer
(15 kDa). The positions of molecular mass standards are indicated
on top of (A).
J. Chugh et al. Structural characterization of GED
FEBS Journal 273 (2006) 388–397 ª 2005 The Authors Journal compilation ª 2005 FEBS 389

cut-off is � 600 kDa), although the possibility of oligo-
mers of different sizes all above 600 kDa cannot be
ruled out. In other words, the oligomers would consist
of at least 40 monomer units; the molecular mass of
the monomer is � 15 kDa. When the flow-through was
collected, concentrated and run through the column,
there was again a small monomeric component,
though the major portion was seen in the flow-through
(Fig. 1B). The same observation was made when the
monomeric fraction was collected, concentrated and
run through the column (Fig. 1C). This indicated that
the GED forms large soluble oligomers that are in
equilibrium with the monomer and the energy barriers
for the interconversion are not very high, as judged by
easy interconversions. The population of the two
would obviously depend upon the association constant.
In the above experiments, the population of the mono-
mer was estimated to be � 17% at a GED concentra-
tion of 100 lm, as calculated from areas under the
respective peaks.
We next examined the oligomeric state of the GED
using dynamic light scattering (DLS). DLS yields the
hydrodynamic radius of a species in solution and thus
reflects the state of association [12]. DLS measure-
ments carried out at 27 �C, pH 5.7, at different con-
centrations ranging from 15 to 100 lm yielded
uniformly a hydrodynamic radius of � 22 nm for the
major species of GED, as against a value of � 2–3 nm
typically expected for a monomeric protein of this size.
This clearly indicated that the protein had associated
into large oligomers even at micromolar concentrations
(Fig. 2A). As a reference we show in Fig. 2B the DLS
spectrum in the presence of 1% SDS, where the meas-
ured hydrodynamic radius for the major species is
3.37 nm, indicating loss of aggregation under these
conditions. The same hydrodynamic radius was
observed in 2.5% SDS as well. PAGE analysis at a
SDS concentration of 2% showed a single band corres-
ponding to the molecular mass of 15 kDa. Thus it is
clear that the oligomer dissociates into monomers in
the presence of 1% SDS in the solution. A simple
calculation indicates that an oligomer sphere with a
22 nm radius would accommodate about 200 mono-
mer spheres of 3 nm radii. Of course, this would be an
extremely rough estimate because the hydration shells
of the monomer and the oligomer would be different,
the molecular shapes can deviate from spheres, the
packing may not be closest, and the effective radius of
the native monomer could be slightly smaller than that
detected in SDS generated monomer. Nevertheless, the
above estimate is fairly consistent with the lower
bound of 40 monomers obtained from the gel filtration
data.
Within the full length dynamin the GED interacts
with the middle domain and the GTPase domain and
thus the entire surface of the GED would not be
exposed. This would limit the degree of association of
dynamin which could provide a rationale that the
building blocks of dynamin assembly are much smaller
[1].
NMR characterization of the GED oligomers
The 1H-15N heteronuclear single quantum coherence
(HSQC) spectrum of a protein displays one correlation
peak for every amino acid residue (except prolines
which do not have an amide proton) thereby providing
detailed structural information at the single residue
level. When a protein aggregates into a large mass,
the correlation peaks buried in the interior of the
A
B
Fig. 2. Histogram of distribution of hydrodynamic radii obtained
from ‘regularization analysis’ of data from dynamic light scattering
experiments. (A) 100 lM GED in 0.1 M phosphate buffer, pH 5.7,
27 �C; average Rh ¼ 22.37 nm; (B) 100 lM GED in 0.1 M phos-
phate buffer with 1% SDS (w ⁄ v), pH 5.7, 27 �C, average Rh ¼3.37 nm.
Structural characterization of GED J. Chugh et al.
390 FEBS Journal 273 (2006) 388–397 ª 2005 The Authors Journal compilation ª 2005 FEBS
aggregate become too broad to be observable. On the
other hand, those residues which lie on the surface of
the aggregate and are flexible still show correlation
peaks. We thus carried out 1H-15N HSQC analysis on
the isolated GED of dynamin (amino acids 618–753 of
human dynamin I) expressed as a recombinant protein
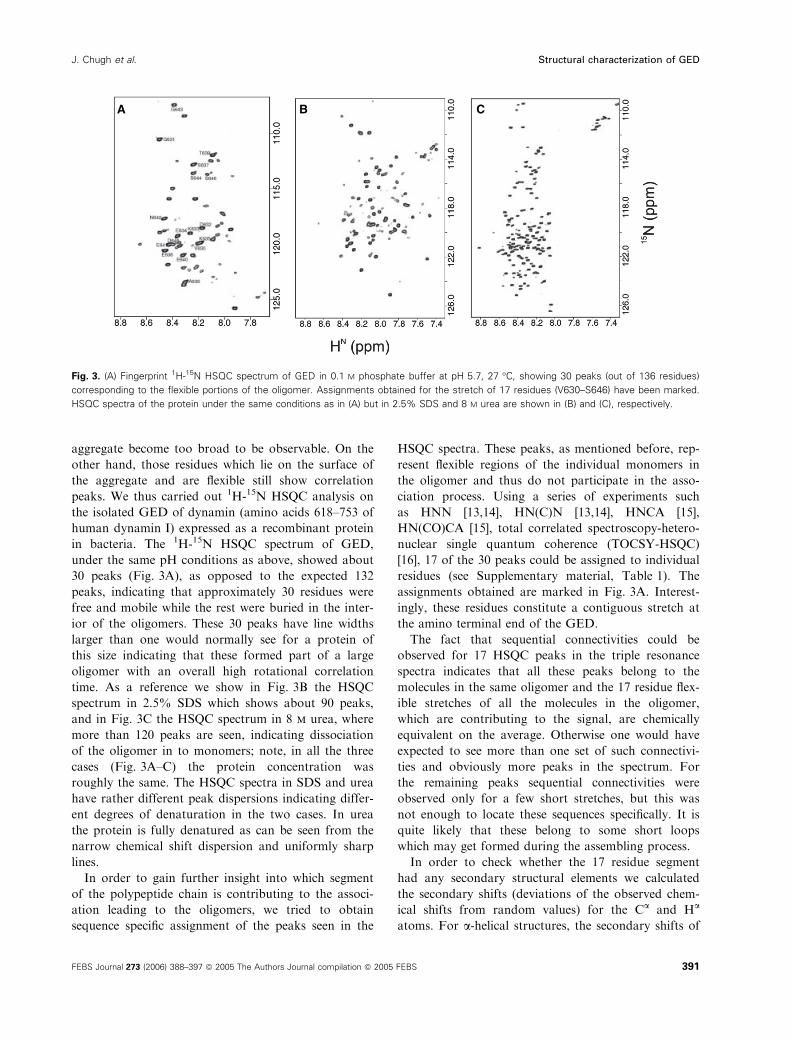
in bacteria. The 1H-15N HSQC spectrum of GED,
under the same pH conditions as above, showed about
30 peaks (Fig. 3A), as opposed to the expected 132
peaks, indicating that approximately 30 residues were
free and mobile while the rest were buried in the inter-
ior of the oligomers. These 30 peaks have line widths
larger than one would normally see for a protein of
this size indicating that these formed part of a large
oligomer with an overall high rotational correlation
time. As a reference we show in Fig. 3B the HSQC
spectrum in 2.5% SDS which shows about 90 peaks,
and in Fig. 3C the HSQC spectrum in 8 m urea, where
more than 120 peaks are seen, indicating dissociation
of the oligomer in to monomers; note, in all the three
cases (Fig. 3A–C) the protein concentration was
roughly the same. The HSQC spectra in SDS and urea
have rather different peak dispersions indicating differ-
ent degrees of denaturation in the two cases. In urea
the protein is fully denatured as can be seen from the
narrow chemical shift dispersion and uniformly sharp
lines.
In order to gain further insight into which segment
of the polypeptide chain is contributing to the associ-
ation leading to the oligomers, we tried to obtain
sequence specific assignment of the peaks seen in the
HSQC spectra. These peaks, as mentioned before, rep-
resent flexible regions of the individual monomers in
the oligomer and thus do not participate in the asso-
ciation process. Using a series of experiments such
as HNN [13,14], HN(C)N [13,14], HNCA [15],
HN(CO)CA [15], total correlated spectroscopy-hetero-
nuclear single quantum coherence (TOCSY-HSQC)
[16], 17 of the 30 peaks could be assigned to individual
residues (see Supplementary material, Table 1). The
assignments obtained are marked in Fig. 3A. Interest-
ingly, these residues constitute a contiguous stretch at
the amino terminal end of the GED.
The fact that sequential connectivities could be
observed for 17 HSQC peaks in the triple resonance
spectra indicates that all these peaks belong to the
molecules in the same oligomer and the 17 residue flex-
ible stretches of all the molecules in the oligomer,
which are contributing to the signal, are chemically
equivalent on the average. Otherwise one would have
expected to see more than one set of such connectivi-
ties and obviously more peaks in the spectrum. For
the remaining peaks sequential connectivities were
observed only for a few short stretches, but this was
not enough to locate these sequences specifically. It is
quite likely that these belong to some short loops
which may get formed during the assembling process.
In order to check whether the 17 residue segment
had any secondary structural elements we calculated
the secondary shifts (deviations of the observed chem-
ical shifts from random values) for the Ca and Ha
atoms. For a-helical structures, the secondary shifts of
A B C
Fig. 3. (A) Fingerprint 1H-15N HSQC spectrum of GED in 0.1 M phosphate buffer at pH 5.7, 27 �C, showing 30 peaks (out of 136 residues)
corresponding to the flexible portions of the oligomer. Assignments obtained for the stretch of 17 residues (V630–S646) have been marked.
HSQC spectra of the protein under the same conditions as in (A) but in 2.5% SDS and 8 M urea are shown in (B) and (C), respectively.
J. Chugh et al. Structural characterization of GED
FEBS Journal 273 (2006) 388–397 ª 2005 The Authors Journal compilation ª 2005 FEBS 391

Ca are positive, while those of Ha are negative. For bstructures the trend is opposite [17,18]. The measured
secondary shifts for the 17 residues in the present case
are shown in Fig. 4. It is seen that the secondary shifts
are small but not random. They indicate two stretches
of perceptible helical conformations in this portion of
the molecule in the oligomers. However, the NOE
experiments did not show perceptible NH-NH NOEs,
which must be expected for persistent helices. Similarly
the magnitudes of the amide proton temperature co-
efficients for all the 17 residues are larger than
)4.5 p.p.b.ÆK)1 (Fig. 5) indicating absence of any
intramolecular H bonds. Thus we conclude that the 17
residue stretch at the N-terminal has only some small
propensity for formation of short helices, transiently,
and the chain as such is highly dynamic.
Structure of the core of the oligomers
Because of the large size of the core of the oligomer,
the NMR spectra do not show any signals from the
interior of the core and thus do not give any informa-
tion on its structural details. Nevertheless, we did
derive useful insights into the structural aspects of the
core of the oligomer from circular dichroism spectros-
copy as described below.
Figure 6A shows the far UV circular dichroism spec-
trum of the GED at pH 5.7 and 27 �C. The spectrum
shows distinct double well a-helix characteristics with
minima at 208 and 222 nm. From this data, the helical
content in the oligomer was estimated to be 45–50%
(average of two calculations using the algorithms
selcon3 and continll ; see Supplementary material,
Table S2, for details). Thus a large portion of the core
of the oligomer is clearly helical in nature. Next, to
gain a greater insight into the monomer association in
the core, we tried to dissociate these oligomers into
monomers using mild denaturing conditions so that
the structural characteristics of the resulting monomer-
ic units would be minimally disturbed. These mono-
mers can then be probed further for the structural
details. Among the different denaturants tried, SDS
detergent appeared to satisfy our criteria to a large
extent. As can be seen from DLS data in Fig. 2B, 1%
SDS is sufficient to dissociate the oligomers into
monomers. The HSQC spectrum of the protein in
2.5% SDS (Fig. 3B), which has good dispersion of
peaks, indicates also that the protein retains a fair
amount of structure; compare this with the fully dena-
tured protein spectrum shown in Fig. 3C.
Far UV circular dichroism spectra of GED, recor-
ded as a function of SDS concentration in the range
0–10% are shown in Fig. 6B. As shown below, these
provide an extremely quantitative relation between the
A
B
Fig. 4. Sequence corrected secondary chemical shifts. Deviations
of observed chemical shifts from sequence corrected random coil
values (A) Ha, (B) Ca, have been plotted against the residue number
for the GED in 0.1 M phosphate buffer, pH 5.7 and 27 �C. Striped
cylinders indicate a-helical propensities.
Fig. 5. Amide proton temperature coefficients for the 17 residues
in the flexible region at the N-terminal. A horizontal line at
)4.5 p.p.b.ÆK)1 is drawn to indicate the cut-off for identification of
H-bonds.
Structural characterization of GED J. Chugh et al.
392 FEBS Journal 273 (2006) 388–397 ª 2005 The Authors Journal compilation ª 2005 FEBS

structure of the core and the structural characteristics
of the individual monomers. We observe in Fig. 6B
that the spectra are nearly independent of the SDS
concentration. Because 1% SDS is enough to break
the oligomers into monomers (Fig. 2B), no change in
the CD spectra on increasing the SDS percentage
implies that SDS denaturation has already reached a
saturation at 1% or that the SDS interaction does not
disturb the helical characteristics of the chain in the
present case. Secondly, the data also imply that the
oligomers have helical characteristics identical to those
of the SDS generated monomer. As there is no reason
to think that SDS perturbation would be similar to the
structural perturbations that may occur due to associ-
ation, we conclude that the helical characteristics of
the oligomer, represent, in fact, the intrinsic secondary
structural preferences along the polypeptide chain.
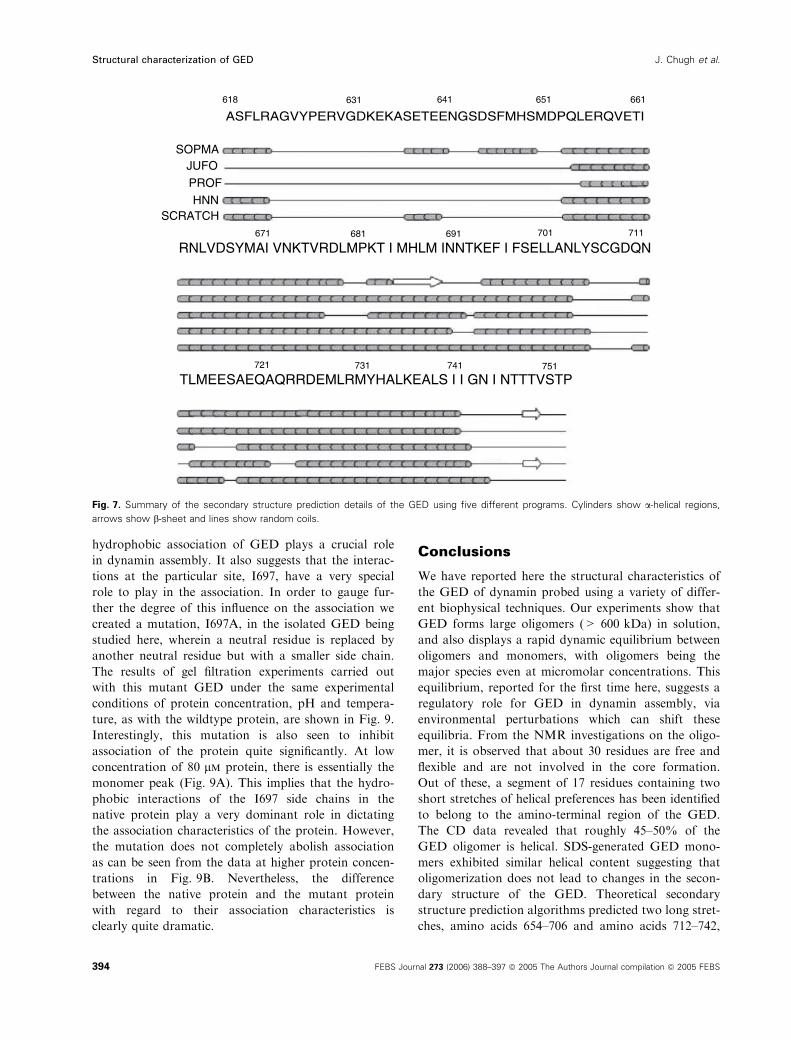
Next, to determine the intrinsic secondary structural
preferences and thus localize the individual helices in
the monomers, sequence specifically, we used recent
theoretical secondary structure prediction algorithms
[19–22], which are derived from analysis of enormous
structural data in the PDB database for sequence–
structure correlations and have proved to be highly
reliable. The results of such calculations by five differ-
ent algorithms are shown in Fig. 7. It is satisfying to
note that the predictions by the five algorithms are
similar. Here, we like to point out also that the helical
content that can be calculated from these predictions
(� 50–55%) closely matches that estimated (45–50%)
from the CD measurements. These establish the reliab-
ility of the predictions. Overall, we derive, as a consen-
sus, two long helices (comprising amino acids 654–706
and amino acids 712–742 with probabilities, as per
jufo algorithm, of 80% and 83%, respectively). The
C-terminal regions seem to be devoid of any definite
structure. Because the flexible N-terminal is not contri-
buting to the core, as seen from the NMR data, it fol-
lows that the core must be formed by packing of the
two long helices from each of the monomer units. In
an earlier study Okamoto et al. [4] showed that the
peptides, amino acids 654–681 and amino acids 712–
740, which are part of the above two helices had high
helical characteristics and had tendencies to aggregate
into tetramers and hexamers, respectively. The full
length GED, however, oligomerizes into much larger
mass as seen in the present work.
Hydrophobic association plays a crucial role
in core formation
In order to probe the forces governing the association
of the helices in the core of the oligomer, we calculated
the electrostatic potential of the surfaces of the two
long helical segments predicted from the above algo-
rithms; these are shown in Fig. 8. The two opposite
faces of the helices are shown in each case and we
observe that in the longer helix, one of the surfaces is
largely neutral. The opposite face has a distribution of
neutral, positive (blue) and negative (red) potentials.
The shorter helix has neutral surface at the two ends
and a positive potential at the centre. These suggest
that both hydrophobic association and electrostatic
interactions of the helices could be playing roles in the
core formation. Recently, Schmid et al. [23] showed
that a single point mutation, I697K, can inhibit the
assembly of dynamin. Location 697 lies in one of the
helices in the GED, and the particular mutation chan-
ges a hydrophobic residue into a positively charged
residue. This leads to an unfavorable energy factor for
the packing. Therefore, the mutational perturbation of
the association characteristics mentioned above pro-
vides strong and direct experimental evidence that
A
B
Fig. 6. Far UV circular dichroism spectra of (A) GED in 0.1 M phos-
phate buffer, pH 5.7 at 27 �C and (B) SDS titrations (0–10%) of GED
at pH 5.7 at 27 �C in the wavelength range 190–260 nm. The data
was smoothed using the negative exponential function in SIGMAPLOT.
Protein concentration of 15 lM was used to study the secondary
structure and an average of five spectral scans was taken.
J. Chugh et al. Structural characterization of GED
FEBS Journal 273 (2006) 388–397 ª 2005 The Authors Journal compilation ª 2005 FEBS 393
hydrophobic association of GED plays a crucial role
in dynamin assembly. It also suggests that the interac-
tions at the particular site, I697, have a very special
role to play in the association. In order to gauge fur-
ther the degree of this influence on the association we
created a mutation, I697A, in the isolated GED being
studied here, wherein a neutral residue is replaced by
another neutral residue but with a smaller side chain.
The results of gel filtration experiments carried out
with this mutant GED under the same experimental
conditions of protein concentration, pH and tempera-
ture, as with the wildtype protein, are shown in Fig. 9.
Interestingly, this mutation is also seen to inhibit
association of the protein quite significantly. At low
concentration of 80 lm protein, there is essentially the
monomer peak (Fig. 9A). This implies that the hydro-
phobic interactions of the I697 side chains in the
native protein play a very dominant role in dictating
the association characteristics of the protein. However,
the mutation does not completely abolish association
as can be seen from the data at higher protein concen-
trations in Fig. 9B. Nevertheless, the difference
between the native protein and the mutant protein
with regard to their association characteristics is
clearly quite dramatic.
Conclusions
We have reported here the structural characteristics of
the GED of dynamin probed using a variety of differ-
ent biophysical techniques. Our experiments show that
GED forms large oligomers (> 600 kDa) in solution,
and also displays a rapid dynamic equilibrium between
oligomers and monomers, with oligomers being the
major species even at micromolar concentrations. This
equilibrium, reported for the first time here, suggests a
regulatory role for GED in dynamin assembly, via
environmental perturbations which can shift these
equilibria. From the NMR investigations on the oligo-
mer, it is observed that about 30 residues are free and
flexible and are not involved in the core formation.
Out of these, a segment of 17 residues containing two
short stretches of helical preferences has been identified
to belong to the amino-terminal region of the GED.
The CD data revealed that roughly 45–50% of the
GED oligomer is helical. SDS-generated GED mono-
mers exhibited similar helical content suggesting that
oligomerization does not lead to changes in the secon-
dary structure of the GED. Theoretical secondary
structure prediction algorithms predicted two long stret-
ches, amino acids 654–706 and amino acids 712–742,
618 631 641 651 661
ASFLRAGVYPERVGDKEKASETEENGSDSFMHSMDPQLERQVETI
SOPMAJUFOPROFHNN
SCRATCH671 681 691 701 711
RNLVDSYMAI VNKTVRDLMPKT I MHLM INNTKEF I FSELLANLYSCGDQN
721 731 741 751
TLMEESAEQAQRRDEMLRMYHALKEALS I I GN I NTTTVSTP
Fig. 7. Summary of the secondary structure prediction details of the GED using five different programs. Cylinders show a-helical regions,
arrows show b-sheet and lines show random coils.
Structural characterization of GED J. Chugh et al.
394 FEBS Journal 273 (2006) 388–397 ª 2005 The Authors Journal compilation ª 2005 FEBS

to be helical in nature, implicating that these could be
the main contributors to the core of the oligomer. I697
located in one of the above helices appears to have a
special role in the association process, as mutation of
this Ile to Ala inhibited GED association quite signifi-
cantly. This also indicates a significant contribution of
hydrophobic interactions in the packing of the helices
in the core of the oligomer. Because GED is the pri-
mary driver of dynamin assembly, all these observa-
tions would throw valuable light on the extent and
mechanism of the assembly of dynamin, depending
upon the experimental conditions and sequence varia-
tions.
Experimental procedures
Protein expression and purification
cDNA corresponding to the GTPase effector domain
(amino acids 618–753) of human dynamin I protein was
subcloned into the bacterial expression plasmid pGEX4T1
(Amersham Biosciences Corp, Piscataway, NJ, USA) cut
with EcoRI and SalI. The clone was confirmed by multiple
restriction digests and DNA sequencing and then trans-
formed into Escherichia coli BL21 cells. Expression of the
glutathione-S-transferase (GST)-fusion protein was induced
with 100 lm of isopropyl-b-D-thiogalactopyranoside for
8 h at 28 �C. The harvested culture was lysed in TEND
buffer (20 mm Tris, pH 7.4, 1 mm EDTA, 150 mm NaCl,
and 1 mm dithiothreitol) containing lysozyme and protease
inhibitors. The lysed cells were sonicated and spun at
100 000 g for 45 min to obtain a clear supernatant. The
supernatant was incubated with glutathione-Sepharose
beads (Amersham) for 2 h at 4 �C to allow binding of over-
expressed GST-GED recombinant protein. The beads were
then washed with TEND buffer. Protein coated beads were
incubated with thrombin (Sigma-Aldrich, St. Louis, MO,
USA) for 20 h at 25 �C to remove the GST tag. GST
clipping was observed by running samples on 16%
SDS ⁄PAGE. The supernatant containing primarily the free
GED was then passed over GSH-sepharose column repeat-
edly to remove any contaminating GST or GST-GED. The
A
B
C
D
E
F
Fig. 8. Electrostatic potential calculations from MOLMOL (Wutrich
et al., Institute of Molecular Biology and Biophysics, Zurich, Switzer-
land) [25] for the two helical segments identified from the theoret-
ical prediction algorithms. (A) and (C) show two opposite surfaces
of the helix, amino acids 654–706, and (B) shows the helical struc-
ture. I697, the site of the mutation (see text) has been indicated.
(D–F) show similar data for the helix, amino acids 712–742, as in the
other helix in (A–C). In both cases red indicates negative potential,
blue indicates positive potential and grey indicates neutral surface.
Fig. 9. Size exclusion chromatograms as in Fig. 1 for the I697A
mutant of GED at two different protein concentrations, 80 lM (A)
and 400 lM (B). All the other experimental conditions are the same
as in Fig. 1.
J. Chugh et al. Structural characterization of GED
FEBS Journal 273 (2006) 388–397 ª 2005 The Authors Journal compilation ª 2005 FEBS 395

pure GED protein thus obtained was dialysed against 0.1 m
phosphate buffer (pH 5.7) containing 1 mm dithiothreitol,
1 mm EDTA and 150 mm NaCl.
Site directed mutagenesis
Point mutations were performed on the gene for GED from
human Dynamin I in pGEX4T1 vector by the QuickChange
method (Stratagene, La Jolla, CA) using the oligonucleotides
I697A-f 5¢-GATTAATAATACCAAGGAGTTCGCCTTC
TCGG-3¢ and I697A-r 5¢-CCGAGAAGGCGAACTCC
TTGGTATTATTAATC-3¢ (Sigma Aldrich). The construct
was confirmed by sequencing (Bangalore-Genei, Peenya,
Bangalore, India).
Gel filtration studies
Size exclusion chromatography was performed using a
Hi Load 16 ⁄ 60 Superdex 200 column (Amersham, cut-off,
� 600 kDa) with buffer (0.1 m phosphate, pH 5.7, 1 mm
EDTA, 1 mm dithiothreitol, 150 mm NaCl) at a flow rate
of 1.0 mLÆmin)1 with absorbance monitored at 280 nm
using Bio-Rad (Hercules, CA, USA) BioLogic LP system.
Gel filtration protein standards (Amersham) were used to
calibrate the column. Recombinant GED (100 lm, 1 mL)
was centrifuged at 15 600 g at 4 �C for 10 min and the
supernatant was applied to the Hi Load 16 ⁄ 60 Superdex
200 column. Fractions corresponding to 38–48 mL
(Fig. 1A) were collected and concentrated in an ultra-filtra-
tion cell (Amicon, Millipore, Billerica, MA, USA) with
3 kDa cut-off membrane (Millipore) under nitrogen atmo-
sphere and the volume was reduced to 1 mL, and reapplied
to the Hi Load 16 ⁄ 60 Superdex 200 column (Fig. 1B).
Fractions corresponding to 114–124 mL (Fig. 1A) were
processed in a similar manner (Fig. 1C).
Dynamic light scattering measurements
DLS experiments were performed on a DynaPro-MS800
instrument (Protein Solutions Inc., Charlottesville, VA,
USA) that monitors the scattered light at 90�. At least 20
measurements each of 10 s duration were collected. Buffer
solutions were filtered through 20 nm filters (Whatman An-
odisc 13, catalog no. 6809–7003, Whatman plc, Brentford,
UK). Extreme care was taken to reduce the contamination
of samples by dust. ‘Regularization’ software provided by
the manufacturer was used in analyzing the results for
obtaining distribution of hydrodynamic radius of particles
in the solution. Standard synthetic beads of 6 nm diameter
(provided by the manufacturers) and BSA (typical hydrody-
namic radius 3.0 nm) were used as standards. GED concen-
trations used varied from 15 to 100 lm, in a 50 lL volume
cuvette, in phosphate buffer with and without 1% (w ⁄ v)SDS. All measurements were done at 27 �C.
NMR spectroscopy
For NMR studies, isotopically labeled protein was prepared
from E. coli BL21 cells harboring the GST-GED expression
clone grown in M9 minimal medium containing 15NH4Cl
and 13C-glucose. The protein purified as described above
was concentrated to 1 mm and exchanged with buffer
(0.1 m phosphate, pH 5.7, 1 mm EDTA, 1 mm dithiothrei-
tol, 150 mm NaCl) in an ultra-filtration cell (Amicon) using
3 kDa cut-off membrane (Millipore). The final volume of
the sample was � 550 lL containing 10% (v ⁄ v) D2O.
All NMR experiments were performed at 27 �C on a
Varian (Palo Alto, CA, USA) Unity-plus 600 MHz NMR
spectrometer equipped with pulse-shaping and pulse field
gradient capabilities. For the HNCA [15] spectrum the delay
TN was 12.5 ms, and 32 and 80 complex points were used
along t1 and t2 dimensions, respectively. The HN(CO)CA
[15] spectrum was recorded with the same TN parameters,
and same number of t1 and t2 points. TOCSY-HSQC and
NOESY-HSQC [16] were recorded with a mixing time of
80 ms and 150 ms, respectively, 32 complex points along 15N
(t1) dimension and 80 complex points along 1H (t2) dimen-
sion. HNN and HN(C)N [13,14] were recorded with 32 com-
plex t1 points (15N) and 32 complex t2 points (15N). HSQC
were recorded with 256 t1 increments. Amide proton tem-
perature coefficients were measured by recording HSQC
spectra in the temperature range, 21–39 �C, at 3 �C intervals.
Circular dichroism measurements
The far-UV CD data were recorded on a Jasco (Easton,
MD, USA) J600 spectro-polarimeter in the 190–260 nm
region using a rectangular cuvette of 1 mm path length
thermostated at 27 �C. A protein concentration of 15 lmwas used in these measurements. All CD spectra measured
were baseline corrected by the buffer. The secondary struc-
ture elements of GED were computed from the data using
a computer program developed by Johnson and colleagues
for this purpose [24]. Spectral deconvolution was performed
on the average of five spectral scans. The data was
smoothed using the negative exponential function in sigma-
plot (Systat Software, Point Richmond, CA, USA) for
plotting; however, it was not smoothed for deconvolution.
Protein solutions of 15 lm were equilibrated with various
SDS concentrations, ranging from 0 to 10% (w ⁄ v), for 12 h
at 27 �C before the spectra were recorded.
Acknowledgements
We thank the Government of India for funding the
national facility for High Field NMR at the Tata Insti-
tute of Fundamental Research. We thank Mr T. Ram
Reddy for the DLS experiments.
Structural characterization of GED J. Chugh et al.
396 FEBS Journal 273 (2006) 388–397 ª 2005 The Authors Journal compilation ª 2005 FEBS

References
1 Praefcke GJ & McMahon HT (2004) The dynamin
superfamily: universal membrane tubulation and fission
molecules? Nat Rev Mol Cell Biol 5, 133–147.
2 Conner SD & Schmid SL (2003) Regulated portals of
entry into the cell. Nature 422, 37–44.
3 Hinshaw JE (2000) Dynamin and its role in membrane
fission. Annu Rev Cell Dev Biol 16, 483–519.
4 Okamoto PM, Tripet B, Litowski J, Hodges RS & Val-
lee RB (1999) Multiple distinct coiled-coils are involved
in dynamin self-assembly. J Biol Chem 274, 10277–
10286.
5 Sever S, Muhlberg AB & Schmid SL (1999) Impairment
of dynamin’s GAP domain stimulates receptor-mediated
endocytosis. Nature 398, 481–486.
6 Muhlberg AB, Warnock DE & Schmid SL (1997)
Domain structure and intramolecular regulation of
dynamin GTPase. EMBO J 16, 6676–6683.
7 Smirnova E, Shurland DL, Newman-Smith ED, Pish-
vaee B & van der Bliek AM (1999) A model for dyna-
min self-assembly based on binding between three
different protein domains. J Biol Chem 274, 14942–
14947.
8 Timm D, Salim K, Gout I, Guruprasad L, Waterfield
M & Blundell T (1994) Crystal structure of the pleck-
strin homology domain from dynamin. Nat Struct Biol
1, 782–788.
9 Downing AK, Driscoll PC, Gout I, Salim K, Zvelebil
MJ & Waterfield MD (1994) Three-dimensional solution
structure of the pleckstrin homology domain from dyna-
min. Curr Biol 4, 884–891.
10 Fushman D, Cahill S, Lemmon MA, Schlessinger J &
Cowburn D (1995) Solution structure of pleckstrin
homology domain of dynamin by heteronuclear NMR
spectroscopy. Proc Natl Acad Sci USA 92, 816–820.
11 Reubold TF, Eschenburg S, Becker A, Leonard M,
Schmid SL, Vallee RB, Kull FJ & Manstein DJ (2005)
Crystal structure of the GTPase domain of rat dynamin.
Proc Natl Acad Sci USA 102, 13093–13098.
12 Schmitz KS (1990) An Introduction to Dynamic Light
Scattering by Macromolecules. Academic Press, San
Diego, California.
13 Panchal SC, Bhavesh NS & Hosur RV (2001) Improved
3D triple resonance experiments, HNN and HN(C)N,
for HN and 15N sequential correlations in (13C,15N)
labeled proteins: application to unfolded proteins.
J Biomol NMR 20, 135–147.
14 Bhavesh NS, Panchal SC & Hosur RV (2001) An effi-
cient high-throughput resonance assignment procedure
for structural genomics and protein folding research by
NMR. Biochemistry 40, 14727–14735.
15 Ferentz AE & Wagner G (2000) NMR spectroscopy: a
multifaceted approach to macromolecular structure.
Q Rev Biophys 33, 29–65.
16 Fesik SW & Zuiderweg ER (1990) Heteronuclear three-
dimensional NMR spectroscopy of isotopically labelled
biological macromolecules. Q Rev Biophys 23, 97–131.
17 Wishart DS & Sykes BD (1994) The 13C chemical-shift
index: a simple method for the identification of protein
secondary structure using 13C chemical-shift data.
J Biomol NMR 4, 171–180.
18 Wishart DS, Bigam CG, Holm A, Hodges RS & Sykes
BD (1995) 1H, 13C and 15N random coil NMR chemical
shifts of the common amino acids. I. Investigations of
nearest-neighbor effects. J Biomol NMR 5, 67–81.
19 Baldi P, Brunak S, Frasconi P, Soda G & Pollastri G
(1999) Exploiting the past and the future in protein sec-
ondary structure prediction. Bioinformatics 15, 937–946.
20 Combet C, Blanchet C, Geourjon C & Deleage G
(2000) NPS@: network protein sequence analysis.
Trends Biochem Sci 25, 147–150.
21 Meiler J, Mueller M, Zeidler A & Schmaeschke F
(2001) Generation and evaluation of dimension-reduced
amino acid parameter representations by artificial neural
networks. J Mol Modeling 7, 360–369.
22 Pollastri G, Przybylski D, Rost B & Baldi P (2002)
Improving the prediction of protein secondary structure
in three and eight classes using recurrent neural net-
works and profiles. Proteins 47, 228–235.
23 Song BD, Yarar D & Schmid SL (2004) An assembly-
incompetent mutant establishes a requirement for dyna-
min self-assembly in clathrin-mediated endocytosis
in vivo. Mol Biol Cell 15, 2243–2252.
24 Johnson WC (1999) Analyzing protein circular dichro-
ism spectra for accurate secondary structures. Proteins
35, 307–312.
25 Koradi R, Billeter M & Wuthrich K (1996) MOLMOL:
a program for display and analysis of macromolecular
structures. J Mol Graph 14, 51–32.
Supplementary material
The following supplementary material is available
online:
Table S1. Chemical shifts of the assigned stretch of 17
residues in the GED at pH 5.7, 27 oC
Table S2. Secondary structure calculation details from
Circular Dichroism spectra of GED at pH 5.7, 27 oC
using selcon3 and continll under four different basis
sets*.
This material is available as part of the online article
from http://www.blackwell-synergy.com
J. Chugh et al. Structural characterization of GED
FEBS Journal 273 (2006) 388–397 ª 2005 The Authors Journal compilation ª 2005 FEBS 397