Structural and functional diversity of Nematoda in relation with environmental variables in the...
15
Structural and functional diversity of Nematoda in relation with environmental variables in the Setu ´ bal and Cascais canyons, Western Iberian Margin Jeroen Ingels a,n , David S.M. Billett b , Konstadinos Kiriakoulakis c , George A. Wolff d , Ann Vanreusel a a Marine Biology Department, Ghent University, Krijgslaan 281 S8, 9000 Ghent, Belgium b National Oceanography Centre, Southampton, SO14 3ZH, United Kingdom c School of Natural Sciences and Psychology, Liverpool John Moores University, Room 436, James Parsons Building, Byrom Street, Liverpool, L3 3AF, United Kingdom d School of Environmental Sciences, University of Liverpool, 4 Brownlow Street, Liverpool, L69 3GP, United Kingdom article info Available online 16 April 2011 Keywords: Submarine canyons NE Atlantic Western Iberian Margin Deep sea Meiofauna Nematodes Biogeochemistry Trophic Diversity Community Structure Conceptual Scheme Canyon-Fauna Interaction abstract Samples collected at two different depths (ca. 3200 and ca. 4200 m) in the Setu ´ bal and Cascais canyons off the Portuguese coast, during the HERMES RRS Charles Darwin cruise CD179, were analysed for (1) sediment biogeochemistry (TOC, TN) and (2) composition, and structural and trophic diversity of nematode communities. Multivariate PERMANOVA analysis on the nematode community data revealed differences between sediment layers that were greater than differences between canyons, water depths, and stations. This suggests that biogeochemical gradients along the vertical sediment profile are crucial in determining nematode community structure. The interaction between canyon conditions and the nematode community is illustrated by biogeochemical patterns in the sediment and the prevalence of nematode genera that are able to persist in disturbed sediments. Trophic analysis of the nematode community indicated that non-selective deposit feeders are dominant, presumably because of their non-selective feeding behaviour compared to other feeding types, which gives them a competitive advantage in exploiting lower-quality food resources. This study presents a preliminary conceptual scheme for interactions between canyon conditions and the resident fauna. & 2011 Elsevier Ltd. All rights reserved. 1. Introduction Submarine canyons are large-scale geological formations incis- ing the continental shelf and slope that form direct pathways from shallow water to the deep sea. They are complex systems in terms of topography, hydrography, and sedimentology and are typified by enhanced organic enrichment, greater hydrodynamic activity (Palanques et al., 2005; Canals et al., 2006; Palanques et al., 2006), high sedimentation rates and occurrence of resus- pension event (van Weering et al., 2002; De Stigter et al., 2007), and a great deal of habitat heterogeneity compared to open continental slopes (Tyler et al., 2009). These characteristics impact faunal assemblages on various spatial and temporal scales (Gage et al., 1995; Lamont et al., 1995; Soetaert and Heip, 1995; Duineveld et al., 2001; Levin and Gooday, 2003; Curdia et al., 2004; Baguley et al., 2006; Skliris and Djenidi, 2006; Garcia et al., 2007; Company et al., 2008; Danovaro et al., 2009; Ingels et al., 2009; Bianchelli et al., 2010; De Leo et al., 2010; Duros et al., 2011), and can often result in dominance of a limited number of species (Thorne-Miller and Catena, 1991), high biomass and abundance (Vetter and Dayton, 1998; Duineveld et al., 2001; Baguley et al., 2006; Skliris and Djenidi, 2006), and reduced diversity and equitability (Gage et al., 1995; Van Gaever et al., 2009). An increasing number of studies are reporting the relative importance of environmental factors in regulating canyon com- munities (e.g. Duros et al., 2011), but only few studies have compared different canyons (Danovaro et al., 2009; Bianchelli et al., 2010). Yet, such studies will allow a better understanding of how particular environmental factors in canyons control the structure and function of benthic communities. The EU FP6 HERMES programme focussed particular attention on the Western Iberian Margin (WIM). The WIM consists of a gently sloping narrow shelf connected to a relatively steep continental slope incised by several large submarine canyons, of which the largest and most active canyon, the Nazare ´ Canyon, has been studied extensively (Arzola et al., 2008; Tyler, 2008; Lastras et al., 2009). In this study, we focus on two other major canyons on the WIM, the Setu ´ bal and Cascais canyons. Benthic biology studies for both these canyons are limited (Gage et al., 1995; Lamont et al., 1995; Koho et al., 2008; Contents lists available at ScienceDirect journal homepage: www.elsevier.com/locate/dsr2 Deep-Sea Research II 0967-0645/$ - see front matter & 2011 Elsevier Ltd. All rights reserved. doi:10.1016/j.dsr2.2011.04.002 n Corresponding author. Tel.: þ32 9 264 85 31; fax: þ32 9 264 85 98. E-mail addresses: [email protected] (J. Ingels), [email protected] (D.S. Billett), [email protected] (K. Kiriakoulakis), [email protected] (G.A. Wolff), [email protected] (A. Vanreusel). Deep-Sea Research II 58 (2011) 2354–2368
Transcript of Structural and functional diversity of Nematoda in relation with environmental variables in the...
Deep-Sea Research II 58 (2011) 2354–2368
Contents lists available at ScienceDirect
Deep-Sea Research II
0967-06
doi:10.1
n Corr
E-m
dsmb@n
wolff@l
journal homepage: www.elsevier.com/locate/dsr2
Structural and functional diversity of Nematoda in relation withenvironmental variables in the Setubal and Cascais canyons,Western Iberian Margin
Jeroen Ingels a,n, David S.M. Billett b, Konstadinos Kiriakoulakis c, George A. Wolff d, Ann Vanreusel a
a Marine Biology Department, Ghent University, Krijgslaan 281 S8, 9000 Ghent, Belgiumb National Oceanography Centre, Southampton, SO14 3ZH, United Kingdomc School of Natural Sciences and Psychology, Liverpool John Moores University, Room 436, James Parsons Building, Byrom Street, Liverpool, L3 3AF, United Kingdomd School of Environmental Sciences, University of Liverpool, 4 Brownlow Street, Liverpool, L69 3GP, United Kingdom
a r t i c l e i n f o
Available online 16 April 2011
Keywords:
Submarine canyons
NE Atlantic
Western Iberian Margin
Deep sea
Meiofauna
Nematodes
Biogeochemistry
Trophic Diversity
Community Structure
Conceptual Scheme
Canyon-Fauna Interaction
45/$ - see front matter & 2011 Elsevier Ltd. A
016/j.dsr2.2011.04.002
esponding author. Tel.: þ32 9 264 85 31; fax
ail addresses: [email protected] (J. Inge
oc.soton.ac.uk (D.S. Billett), [email protected] (
iv.ac.uk (G.A. Wolff), [email protected]
a b s t r a c t
Samples collected at two different depths (ca. 3200 and ca. 4200 m) in the Setubal and Cascais canyons
off the Portuguese coast, during the HERMES RRS Charles Darwin cruise CD179, were analysed for
(1) sediment biogeochemistry (TOC, TN) and (2) composition, and structural and trophic diversity of
nematode communities. Multivariate PERMANOVA analysis on the nematode community data revealed
differences between sediment layers that were greater than differences between canyons, water
depths, and stations. This suggests that biogeochemical gradients along the vertical sediment profile are
crucial in determining nematode community structure. The interaction between canyon conditions and
the nematode community is illustrated by biogeochemical patterns in the sediment and the prevalence
of nematode genera that are able to persist in disturbed sediments. Trophic analysis of the nematode
community indicated that non-selective deposit feeders are dominant, presumably because of their
non-selective feeding behaviour compared to other feeding types, which gives them a competitive
advantage in exploiting lower-quality food resources. This study presents a preliminary conceptual
scheme for interactions between canyon conditions and the resident fauna.
& 2011 Elsevier Ltd. All rights reserved.
1. Introduction
Submarine canyons are large-scale geological formations incis-ing the continental shelf and slope that form direct pathwaysfrom shallow water to the deep sea. They are complex systems interms of topography, hydrography, and sedimentology and aretypified by enhanced organic enrichment, greater hydrodynamicactivity (Palanques et al., 2005; Canals et al., 2006; Palanqueset al., 2006), high sedimentation rates and occurrence of resus-pension event (van Weering et al., 2002; De Stigter et al., 2007),and a great deal of habitat heterogeneity compared to opencontinental slopes (Tyler et al., 2009). These characteristicsimpact faunal assemblages on various spatial and temporal scales(Gage et al., 1995; Lamont et al., 1995; Soetaert and Heip, 1995;Duineveld et al., 2001; Levin and Gooday, 2003; Curdia et al.,2004; Baguley et al., 2006; Skliris and Djenidi, 2006; Garciaet al., 2007; Company et al., 2008; Danovaro et al., 2009; Ingels
ll rights reserved.
: þ32 9 264 85 98.
ls),
K. Kiriakoulakis),
(A. Vanreusel).
et al., 2009; Bianchelli et al., 2010; De Leo et al., 2010; Duros et al.,2011), and can often result in dominance of a limited number ofspecies (Thorne-Miller and Catena, 1991), high biomass andabundance (Vetter and Dayton, 1998; Duineveld et al., 2001;Baguley et al., 2006; Skliris and Djenidi, 2006), and reduceddiversity and equitability (Gage et al., 1995; Van Gaever et al.,2009). An increasing number of studies are reporting the relativeimportance of environmental factors in regulating canyon com-munities (e.g. Duros et al., 2011), but only few studies havecompared different canyons (Danovaro et al., 2009; Bianchelliet al., 2010). Yet, such studies will allow a better understanding ofhow particular environmental factors in canyons control thestructure and function of benthic communities.
The EU FP6 HERMES programme focussed particular attention onthe Western Iberian Margin (WIM). The WIM consists of a gentlysloping narrow shelf connected to a relatively steep continental slopeincised by several large submarine canyons, of which the largest andmost active canyon, the Nazare Canyon, has been studied extensively(Arzola et al., 2008; Tyler, 2008; Lastras et al., 2009). In this study, wefocus on two other major canyons on the WIM, the Setubal andCascais canyons. Benthic biology studies for both these canyons arelimited (Gage et al., 1995; Lamont et al., 1995; Koho et al., 2008;

J. Ingels et al. / Deep-Sea Research II 58 (2011) 2354–2368 2355
Pattenden, 2008; Amaro et al., 2009) and have generally focussed onindividual localities within one canyon. It is becoming increasinglyclear that the environmental variability of different canyons and evenwithin one canyon system strongly influence the characteristics ofthe benthos (Tyler et al., 2009). Various hydrographic processes inand in the vicinity of canyons intensify slope-shelf exchange ofwater, sediments, and organic material. This is for instance illustratedby dense water cascading whereby strong currents affect canyonorganisms and nutrient transport to the deeper parts of the canyonsystem (Company et al., 2008). Also, enhanced primary productivityas a result of upwelling of nitrate-rich waters has been observed,leading to increased food availability for canyon benthos (Skliris andDjenidi, 2006), which is consequently responsible for high abun-dances and biomass of canyon fauna. So there is some understandingthat relatively large-scale processes that are associated with canyonsdefine the benthic assemblages present and that these may differsignificantly among canyons. However, it has become increasinglyclear that the sedimentary biogeochemical environment exerts asignificant control on the standing stock and composition of themeiobenthos (Ingels et al., 2009; Duros et al., 2011) and sedimentaryconditions may vary on a scale of centimetres. Whether such small-scale variability translates into standing stock and communitydifferences that transcend differences between canyons remainsundocumented.
The meiobenthos is an important component of the benthicfauna, particularly in the deep sea. Their high abundances andrelatively rapid reproduction rates, together with limited dispersalabilities, suggest they are useful organisms for assessing the effectsof environmental conditions on benthic communities (Coull andChandler, 1992; Thistle and Levin, 1998; Thistle et al., 1999;Schratzberger et al., 2009). In this study, the nematode fauna (mostabundant taxon in the metazoan meiofauna) of the Setubal andCascais canyons are studied in relation to biogeochemical factors andenvironmental information to investigate the impact of differentcanyon conditions on nematode structural and functional diversity.The differences in standing stocks, biomass, and community compo-sition between canyons, water depths, and along the vertical sedi-ment profile are compared and tested to see which factor exerts thegreatest control on the nematode community. Of particular interest
Fig. 1. Overview (left) and detailed map (right) of the study area. Note the vicinity of
respectively. CasD: Cascais Deep (4482 m), CasM: Cascais Middle (3214 m), SetD: Setu
Courtesy of V. Huvenne from the National Oceanography Centre, Southampton
are the linkages between the nematode community characteristicsand processes of sediment deposition, burial, and hydrodynamicdisturbance.
2. Material and methods
2.1. Study area and sampling
The WIM consists of a nearly flat, relatively narrow shelf(20–50 km wide), leading at the shelf break (100–200 m waterdepth) to a steep continental slope (Weaver and Canals, 2003). Therelatively short and sinuous Cascais Canyon begins at the shelf edgesouthwest of the mouth of the Tagus Estuary and extends down tothe abyssal plain at depths exceeding 4600 m (for detailed descrip-tion of morphology, see Lastras et al. (2009)). Although the CascaisCanyon is not connected directly to a river system (Lastras et al.,2009), there are indications that the head of the canyon receivesinput from the Tagus River (Jouanneau et al., 1998; De Stigter et al.,2011). Sampling site CasM was situated in the upper part of themiddle canyon section (2200–4510 m), characterised by a steepslope and a wide axis (Lastras et al., 2009). The northern wall isincised with numerous gullies whilst the southern wall is moresmooth, and here the axis is much wider than at the shallower parts(Lastras et al., 2009). The deep sampling site in the Cascais Canyon(CasD) was located in the lower middle canyon section (Fig. 1). Here,the slope shows strong evidence for erosion (Lastras et al., 2009).
The Setubal Canyon cuts the continental shelf at 150 m waterdepth in the vicinity of the mouth of the Sado River estuary, andextends to the abyssal plain at depths exceeding 4800 m. Thiscanyon receives input from both the Tagus and Sado rivers(Lastras et al., 2009). Sampling site SetM was situated in a narrowV-shaped canyon section typified by steep walls and high sinu-osity. The deeper Setubal sampling site (SetD), in contrast, lay in awide, U-shaped section of the canyon with steep flanking walls,which seemingly lacked an incised thalweg channel (Arzola et al.,2008).
To date, no detailed studies have been published on the hydro-dynamic activity of the Setubal and Cascais canyons, but time series
the Setubal Canyon and its upper Lisbon tributary to the Sado and Tagus Estuary,
bal Deep (4241 m), SetM: Setubal Middle (3275 m).
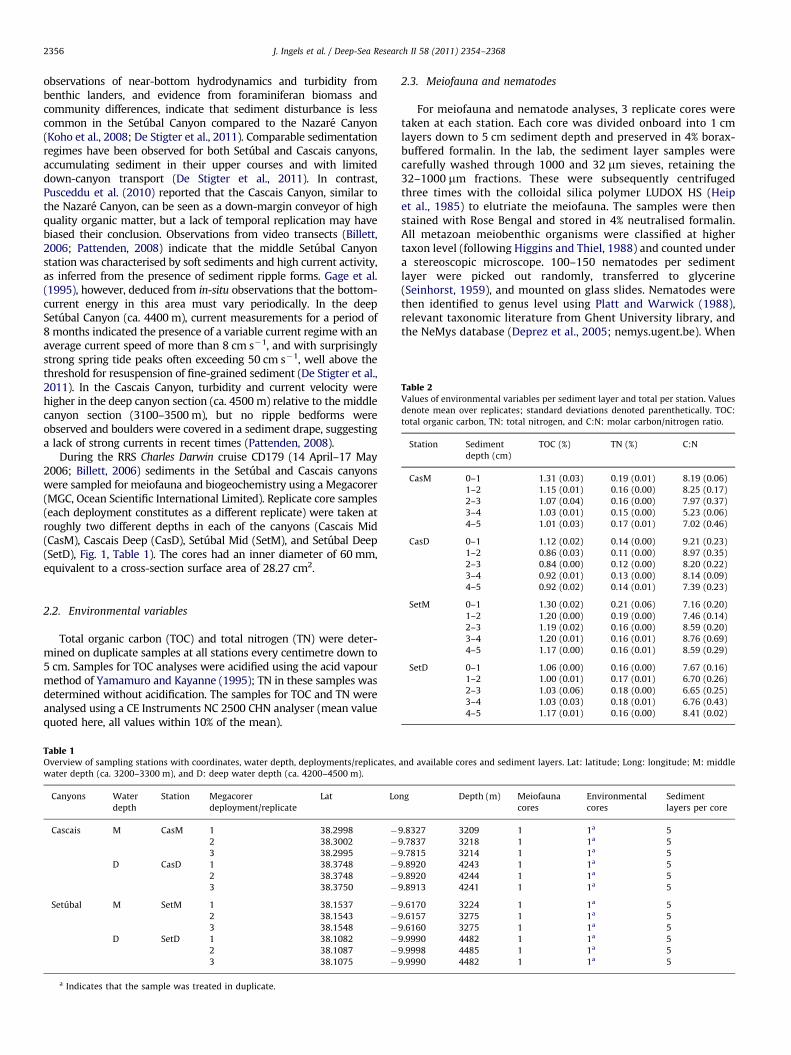
Table 2Values of environmental variables per sediment layer and total per station. Values
denote mean over replicates; standard deviations denoted parenthetically. TOC:
total organic carbon, TN: total nitrogen, and C:N: molar carbon/nitrogen ratio.
Station Sediment
depth (cm)
TOC (%) TN (%) C:N
CasM 0–1 1.31 (0.03) 0.19 (0.01) 8.19 (0.06)
1–2 1.15 (0.01) 0.16 (0.00) 8.25 (0.17)
2–3 1.07 (0.04) 0.16 (0.00) 7.97 (0.37)
3–4 1.03 (0.01) 0.15 (0.00) 5.23 (0.06)
4–5 1.01 (0.03) 0.17 (0.01) 7.02 (0.46)
CasD 0–1 1.12 (0.02) 0.14 (0.00) 9.21 (0.23)
1–2 0.86 (0.03) 0.11 (0.00) 8.97 (0.35)
2–3 0.84 (0.00) 0.12 (0.00) 8.20 (0.22)
J. Ingels et al. / Deep-Sea Research II 58 (2011) 2354–23682356
observations of near-bottom hydrodynamics and turbidity frombenthic landers, and evidence from foraminiferan biomass andcommunity differences, indicate that sediment disturbance is lesscommon in the Setubal Canyon compared to the Nazare Canyon(Koho et al., 2008; De Stigter et al., 2011). Comparable sedimentationregimes have been observed for both Setubal and Cascais canyons,accumulating sediment in their upper courses and with limiteddown-canyon transport (De Stigter et al., 2011). In contrast,Pusceddu et al. (2010) reported that the Cascais Canyon, similar tothe Nazare Canyon, can be seen as a down-margin conveyor of highquality organic matter, but a lack of temporal replication may havebiased their conclusion. Observations from video transects (Billett,2006; Pattenden, 2008) indicate that the middle Setubal Canyonstation was characterised by soft sediments and high current activity,as inferred from the presence of sediment ripple forms. Gage et al.(1995), however, deduced from in-situ observations that the bottom-current energy in this area must vary periodically. In the deepSetubal Canyon (ca. 4400 m), current measurements for a period of8 months indicated the presence of a variable current regime with anaverage current speed of more than 8 cm s�1, and with surprisinglystrong spring tide peaks often exceeding 50 cm s�1, well above thethreshold for resuspension of fine-grained sediment (De Stigter et al.,2011). In the Cascais Canyon, turbidity and current velocity werehigher in the deep canyon section (ca. 4500 m) relative to the middlecanyon section (3100–3500 m), but no ripple bedforms wereobserved and boulders were covered in a sediment drape, suggestinga lack of strong currents in recent times (Pattenden, 2008).
During the RRS Charles Darwin cruise CD179 (14 April–17 May2006; Billett, 2006) sediments in the Setubal and Cascais canyonswere sampled for meiofauna and biogeochemistry using a Megacorer(MGC, Ocean Scientific International Limited). Replicate core samples(each deployment constitutes as a different replicate) were taken atroughly two different depths in each of the canyons (Cascais Mid(CasM), Cascais Deep (CasD), Setubal Mid (SetM), and Setubal Deep(SetD), Fig. 1, Table 1). The cores had an inner diameter of 60 mm,equivalent to a cross-section surface area of 28.27 cm2.
3–4 0.92 (0.01) 0.13 (0.00) 8.14 (0.09)
4–5 0.92 (0.02) 0.14 (0.01) 7.39 (0.23)
SetM 0–1 1.30 (0.02) 0.21 (0.06) 7.16 (0.20)
1–2 1.20 (0.00) 0.19 (0.00) 7.46 (0.14)
2–3 1.19 (0.02) 0.16 (0.00) 8.59 (0.20)
3–4 1.20 (0.01) 0.16 (0.01) 8.76 (0.69)
4–5 1.17 (0.00) 0.16 (0.01) 8.59 (0.29)
SetD 0–1 1.06 (0.00) 0.16 (0.00) 7.67 (0.16)
1–2 1.00 (0.01) 0.17 (0.01) 6.70 (0.26)
2–3 1.03 (0.06) 0.18 (0.00) 6.65 (0.25)
3–4 1.03 (0.03) 0.18 (0.01) 6.76 (0.43)
4–5 1.17 (0.01) 0.16 (0.00) 8.41 (0.02)
2.2. Environmental variables
Total organic carbon (TOC) and total nitrogen (TN) were deter-mined on duplicate samples at all stations every centimetre down to5 cm. Samples for TOC analyses were acidified using the acid vapourmethod of Yamamuro and Kayanne (1995); TN in these samples wasdetermined without acidification. The samples for TOC and TN wereanalysed using a CE Instruments NC 2500 CHN analyser (mean valuequoted here, all values within 10% of the mean).
Table 1Overview of sampling stations with coordinates, water depth, deployments/replicates,
water depth (ca. 3200–3300 m), and D: deep water depth (ca. 4200–4500 m).
Canyons Water
depth
Station Megacorer
deployment/replicate
Lat Lo
Cascais M CasM 1 38.2998 �
2 38.3002 �
3 38.2995 �
D CasD 1 38.3748 �
2 38.3748 �
3 38.3750 �
Setubal M SetM 1 38.1537 �
2 38.1543 �
3 38.1548 �
D SetD 1 38.1082 �
2 38.1087 �
3 38.1075 �
a Indicates that the sample was treated in duplicate.
2.3. Meiofauna and nematodes
For meiofauna and nematode analyses, 3 replicate cores weretaken at each station. Each core was divided onboard into 1 cmlayers down to 5 cm sediment depth and preserved in 4% borax-buffered formalin. In the lab, the sediment layer samples werecarefully washed through 1000 and 32 mm sieves, retaining the32–1000 mm fractions. These were subsequently centrifugedthree times with the colloidal silica polymer LUDOX HS (Heipet al., 1985) to elutriate the meiofauna. The samples were thenstained with Rose Bengal and stored in 4% neutralised formalin.All metazoan meiobenthic organisms were classified at highertaxon level (following Higgins and Thiel, 1988) and counted undera stereoscopic microscope. 100–150 nematodes per sedimentlayer were picked out randomly, transferred to glycerine(Seinhorst, 1959), and mounted on glass slides. Nematodes werethen identified to genus level using Platt and Warwick (1988),relevant taxonomic literature from Ghent University library, andthe NeMys database (Deprez et al., 2005; nemys.ugent.be). When
and available cores and sediment layers. Lat: latitude; Long: longitude; M: middle
ng Depth (m) Meiofauna
cores
Environmental
cores
Sediment
layers per core
9.8327 3209 1 1a 5
9.7837 3218 1 1a 5
9.7815 3214 1 1a 5
9.8920 4243 1 1a 5
9.8920 4244 1 1a 5
9.8913 4241 1 1a 5
9.6170 3224 1 1a 5
9.6157 3275 1 1a 5
9.6160 3275 1 1a 5
9.9990 4482 1 1a 5
9.9998 4485 1 1a 5
9.9990 4482 1 1a 5

Table 3Results from univariate PERMANOVA analyses of differences in sedimentary
abiotic parameters between canyons (Setubal and Cascais), water depths (middle
and deep), sediment depths (1, 2, 3, 4, and 5 cm), and double interaction factors.
TOC: total organic carbon, TN: total nitrogen, and C:N: molar carbon/nitrogen
ratio. Bold values denote significant differences at po0.05; bold italic values
denote significant differences at po0.01.
df SS MS Pseudo-F P (perm) Unique
perms
TOC
Canyon (Ca) 1 10.752 10.752 33.722 0.003 995
Water depth
(WD)
1 1.0806 1.0806 3.3889 0.091 998
Sediment depth
(SD)
7 3.5466 0.50666 1.589 0.302 999
Ca�WD 1 0.59082 0.59082 1.853 0.192 994
Ca� SD 7 7.0931 1.0133 3.178 0.067 999
WD� SD 7 5.7046 0.81494 2.5559 0.115 998
Residual 7 2.232 0.31885
TN
Canyon (Ca) 1 6.5206 6.5206 19.21 0.005 997
Water depth
(WD)
1 1.5028 1.5028 4.4272 0.064 995
Sediment depth
(SD)
7 5.3759 0.76798 2.2625 0.16 999
Ca�WD 1 2.4813 2.4813 7.3099 0.036 997
Ca� SD 7 5.4952 0.78503 2.3127 0.138 999
WD� SD 7 7.2481 1.0354 3.0504 0.074 998
Residual 7 2.3761 0.33944
C:N
Canyon (Ca) 1 2.8275 2.8275 5.8586 0.055 995
Water depth
(WD)
1 4.58E-03 4.58E-03 9.49E-03 0.925 998
Sediment depth
(SD)
7 0.40324 5.76E-02 0.11936 0.993 998
Ca�WD 1 0.64285 0.64285 1.332 0.279 996
Ca� SD 7 20.686 2.9552 6.1233 0.022 999
WD� SD 7 3.0572 0.43674 0.90494 0.57 999
Residual 7 3.3783 0.48262
J. Ingels et al. / Deep-Sea Research II 58 (2011) 2354–2368 2357
a specimen could not be ascribed to a genus, it was groupedwithin the appropriate family to account for its presence in thesample. Specimens belonging to the family Monhysteridae wereidentified according to Fonseca and Decraemer (2008). All indivi-duals were assigned to one of the five trophic groups (selectivedeposit feeders (1A), non-selective deposit feeders (1B), epistra-tum feeders (2A), and predators/scavengers (2B), after Wieser(1953) and chemosynthetic nematodes that are characterised by adegenerated digestive system and the presence of endo-symbioticmicro-organisms. Nematode length (excluding filiform tail tips)and maximum width were measured using a Leica DMR com-pound microscope and Leica LAS 3.3 imaging software. The datawere used to calculate nematode wet weight (wwt) (Andrassy,1956). A dry-to-wet ratio of 0.25 was assumed to calculate nema-tode dry weight (dwt) (Heip et al., 1985). In order to calculatetotal biomass in different trophic groups, sediment layers, andsampling stations, the nematode biomass was averaged for eachgenus and multiplied by their respective densities.
2.4. Data analysis and diversity measures
Differences in nematode communities between canyons, waterdepths, and sediment layers were analysed using a multivariateanalysis of variance by permutation (PERMANOVA; Anderson,2005; Anderson et al., 2007). The data set required a three-way,fixed-effect, fully crossed design (factors: canyon, water depth,and sediment depth) designed in PERMANOVAþ for PRIMER(Anderson et al., 2007). For this analysis, replicate samples wereaveraged using standardised, square-root transformed data toaccount for the permutation assumption of independent samples.Averaging replicated samples provided a much tighter estimate ofthe community at a particular location, depth, and sedimentlayer. By removing the replicate level, leaving no residual degreesof freedom in the design, the residual used to test differencesincludes three-way interaction effects and is in fact an over-estimation of the true residual, leading to a conservative test inwhich significant results are emphasised. Bray–Curtis similarityvalues were used as resemblance measure. To visualise thestructural patterns of the community and to complement thePERMANOVA results, three non-metric MDS plots were con-structed using relative abundance data averaged over replicatesand water depths, over replicates and canyons, and overreplicates.
To reveal which genera mainly determine similarity or dis-similarity between canyons and water depths, a two-way crossedSIMPER analysis was performed in PRIMER on samples averagedper station. Complementing the community PERMANOVA analy-sis with MDS visualisation (to interpret visually the PERMANOVAresults) and a SIMPER analysis, a sound ecological analysis can beperformed (Anderson and Willis, 2003). In addition, a univariatePERMANOVA analysis was done on fourth-root transformedbiomass data, using Euclidean distance as a resemblance measure.
To assess structural diversity, Hill’s diversity indices (Hill,1973), and estimated number of genera (EG(51), Rarefaction afterSanders, 1968), were calculated and averaged over replicates.Hill’s (1973) numbers (H0, H1, H2, and Hinf) were used becausethey are variably dependent on relative genera abundances (i.e.with increasing order, they become less sensitive to the rare, andmore sensitive to the more abundant genera) and thus cover bothgenus richness and evenness or equitability (Heip et al., 1998).Functional diversity was measured by calculating trophic diver-sity (here calculated as the reciprocal value of the trophic index(Y�1) by Heip et al. (1998), so that higher values correspond tohigher trophic diversity).
In addition to average diversity values, genus richness and agenus diversity estimator were calculated based on pooled data.
We computed the Chao abundance-based coverage estimator(ACE) on genera abundances using EstimateS (Collwell, 2005). Thisestimator is mainly based on the abundances of genera withbetween 1 and 10 individuals (Chao and Lee, 1992; Colwell andCoddington, 1994; Magurran, 2003), and is hence dependent onthe equitability of the community sampled. ACE and other esti-mates of asymptotic richness are especially important when it isimpractical or even impossible to sample rich communities, suchas deep-sea nematode communities, exhaustively (Gotelli andColwell, 2001). However, it must be noted here that asymptoticrichness estimators provide lower-bound estimates for taxon-richgroups in which observed richness rarely reaches an asymptote,despite intensive sampling (Gotelli and Colwell, 2001).
For analysis of the geochemical variables (TOC, TN, C:N),separate univariate PERMANOVAs were performed on normaliseddata with averaging over duplicates. The same design was usedhere as for the community analysis, but Euclidean distance servedas a resemblance measure.
3. Results
3.1. Characterisation of the environment
Results from the TOC analysis show that roughly 1% of the bulksediment is organic carbon with TOC% values declining withincrease in sediment depth. TOC values ranged from 0.84% to1.31%, TN ranged from 0.11 to 0.21, and C:N ranged from 5.23 to9.21. The univariate PERMANOVA results based on geochemical
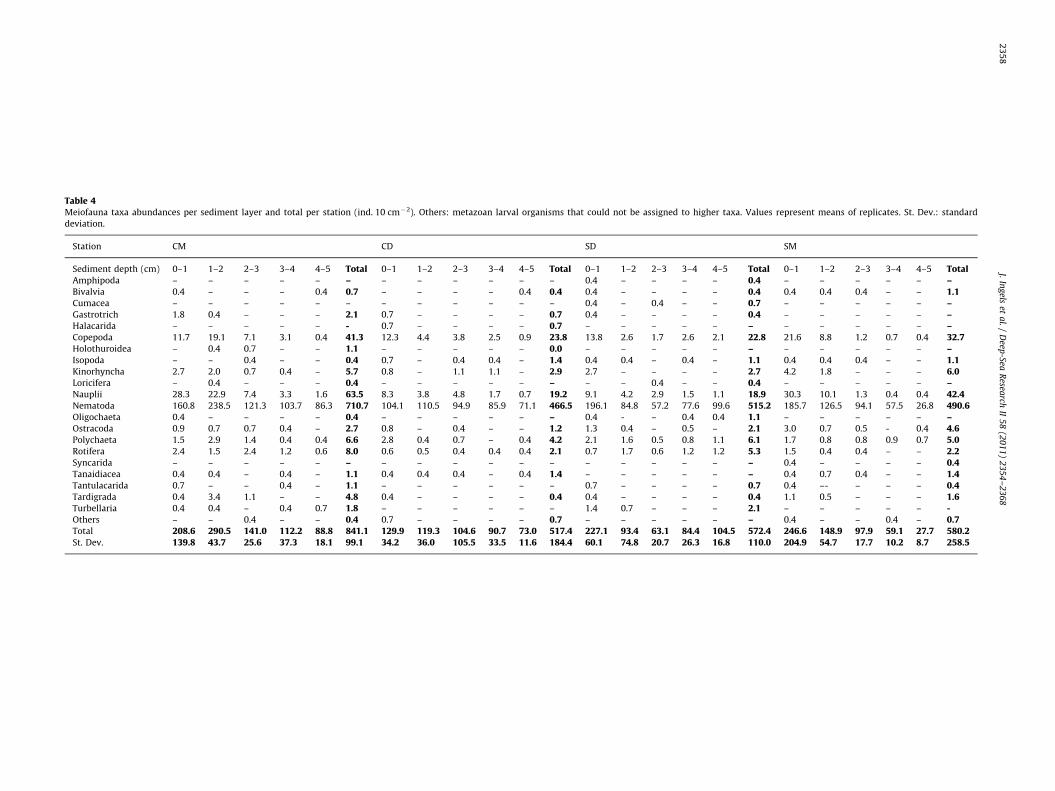
Table 4Meiofauna taxa abundances per sediment layer and total per station (ind. 10 cm�2). Others: metazoan larval organisms that could not be assigned to higher taxa. Values represent means of replicates. St. Dev.: standard
deviation.
Station CM CD SD SM
Sediment depth (cm) 0–1 1–2 2–3 3–4 4–5 Total 0–1 1–2 2–3 3–4 4–5 Total 0–1 1–2 2–3 3–4 4–5 Total 0–1 1–2 2–3 3–4 4–5 TotalAmphipoda – – – – – – – – – – – – 0.4 – – – – 0.4 – – – – – –Bivalvia 0.4 – – – 0.4 0.7 – – – – 0.4 0.4 0.4 – – – – 0.4 0.4 0.4 0.4 – – 1.1Cumacea – – – – – – – – – – – – 0.4 – 0.4 – – 0.7 – – – – – –Gastrotrich 1.8 0.4 – – – 2.1 0.7 – – – – 0.7 0.4 – – – – 0.4 – – – – – –Halacarida – – – – – - 0.7 – – – – 0.7 – – – – – – – – – – – –Copepoda 11.7 19.1 7.1 3.1 0.4 41.3 12.3 4.4 3.8 2.5 0.9 23.8 13.8 2.6 1.7 2.6 2.1 22.8 21.6 8.8 1.2 0.7 0.4 32.7Holothuroidea – 0.4 0.7 – – 1.1 – – – – – 0.0 – – – – – – – – – – – –Isopoda – – 0.4 – – 0.4 0.7 – 0.4 0.4 – 1.4 0.4 0.4 – 0.4 – 1.1 0.4 0.4 0.4 – – 1.1Kinorhyncha 2.7 2.0 0.7 0.4 – 5.7 0.8 – 1.1 1.1 – 2.9 2.7 – – – – 2.7 4.2 1.8 – – – 6.0Loricifera – 0.4 – – – 0.4 – – – – – – – – 0.4 – – 0.4 – – – – – –Nauplii 28.3 22.9 7.4 3.3 1.6 63.5 8.3 3.8 4.8 1.7 0.7 19.2 9.1 4.2 2.9 1.5 1.1 18.9 30.3 10.1 1.3 0.4 0.4 42.4Nematoda 160.8 238.5 121.3 103.7 86.3 710.7 104.1 110.5 94.9 85.9 71.1 466.5 196.1 84.8 57.2 77.6 99.6 515.2 185.7 126.5 94.1 57.5 26.8 490.6Oligochaeta 0.4 – – – – 0.4 – – – – – – 0.4 - – 0.4 0.4 1.1 – – – – – –Ostracoda 0.9 0.7 0.7 0.4 – 2.7 0.8 – 0.4 – – 1.2 1.3 0.4 – 0.5 – 2.1 3.0 0.7 0.5 - 0.4 4.6Polychaeta 1.5 2.9 1.4 0.4 0.4 6.6 2.8 0.4 0.7 – 0.4 4.2 2.1 1.6 0.5 0.8 1.1 6.1 1.7 0.8 0.8 0.9 0.7 5.0Rotifera 2.4 1.5 2.4 1.2 0.6 8.0 0.6 0.5 0.4 0.4 0.4 2.1 0.7 1.7 0.6 1.2 1.2 5.3 1.5 0.4 0.4 – – 2.2Syncarida – – – – – – – – – – – – – – – – – – 0.4 – – – – 0.4Tanaidiacea 0.4 0.4 – 0.4 – 1.1 0.4 0.4 0.4 – 0.4 1.4 – – – – – – 0.4 0.7 0.4 – – 1.4Tantulacarida 0.7 – – 0.4 – 1.1 – – – – – – 0.7 – – – – 0.7 0.4 –- – – – 0.4Tardigrada 0.4 3.4 1.1 – – 4.8 0.4 – – – – 0.4 0.4 – – – – 0.4 1.1 0.5 – – – 1.6Turbellaria 0.4 0.4 – 0.4 0.7 1.8 – – – – – – 1.4 0.7 – – – 2.1 – – – – – -Others – – 0.4 – – 0.4 0.7 – – – – 0.7 – – – – – – 0.4 – – 0.4 – 0.7Total 208.6 290.5 141.0 112.2 88.8 841.1 129.9 119.3 104.6 90.7 73.0 517.4 227.1 93.4 63.1 84.4 104.5 572.4 246.6 148.9 97.9 59.1 27.7 580.2St. Dev. 139.8 43.7 25.6 37.3 18.1 99.1 34.2 36.0 105.5 33.5 11.6 184.4 60.1 74.8 20.7 26.3 16.8 110.0 204.9 54.7 17.7 10.2 8.7 258.5
J.In
gels
eta
l./
Deep
-SeaR
esearch
II5
8(2
01
1)
23
54
–2
36
82
35
8

J. Ingels et al. / Deep-Sea Research II 58 (2011) 2354–2368 2359
data (Table 3) showed significant differences between the Setubaland the Cascais canyons (TOC, TN, po0.01), between stations(TN, po0.05), and between sediment layers within each canyon(C:N, po0.05).
3.2. Meiofauna
A total of 22 meiofauna higher taxa were observed, 19 inthe Cascais Canyon and 20 in the Setubal Canyon (Table 4).The highest meiofauna abundance occurred at station CasM(841799 ind. 10 cm�2), whilst at stations CasD, SetM, and SetDabundances were 5177184, 5807258 and 5727110ind. 10 cm�2, respectively (Table 3, Fig. 2), with great differencesamong replicates. Nematodes were the dominant group at allstations (84.5–90.2%), followed by copepods (4.0–5.6%) and nau-plius larvae (3.3–7.6%). Nematodes appeared more dominant atthe deeper canyon stations (ca. 90%) compared to the middlestations (ca. 85%); an opposite trend was observed for nauplii andcopepods (Table 4).
Table 5Observed Genus Richness (OGR) and estimated genus richness (Abundance-based
Coverage Estimator, ACE) for each station, canyon and both canyons together.
CasM CasD Cascais SetM SetD Setubal Cas. & Set.
OGR 92 72 100 91 93 120 140
ACE 132 88 118 122 127 163 176
Table 6Dominance list of nematode genera per station. Mean values based on relative abunda
CasM % CasD %
Acantholaimus 18.0 Acantholaimus 20.8
Halalaimus 12.2 Halalaimus 11.6
Thalassomonhystera 11.6 Monhystrella 10.7
Monhystrella 7.9 Thalassomonhystera 5.2
Tricoma 5.8 Aegialoalaimus 4.6
Amphimonhystrella 3.7 Amphimonhystrella 3.4
Metasphaerolaimus 3.5 Tricoma 3.4
Metasphaerolaimus 3.3
Fig. 2. Meiofauna and nematode total core densities and total nematode biomass
(dwt: dry weight) for each station. Bars represent mean values over replicates;
error flags denote standard deviations. CasD: Cascais Deep, CasM: Cascais Middle,
SetD: Setubal Deep, and SetM: Setubal Middle.
3.3. Nematoda
3.3.1. Structural diversity and community differences
From a total of 6379 identified nematode specimens, 140genera were found. Of the two canyons, Setubal seemed mostdiverse with 120 genera whilst in the Cascais Canyon 100 generawere identified (Table 5). In the Setubal Canyon, genus richnesswas high (91 and 93, for SetM and SetD, respectively), but only 64genera occurred at both depths. In the Cascais Canyon, genusrichness at the deeper station was poor (72) compared to themiddle site (92); also in the Cascais Canyon, 64 genera wereshared between the two sites.
The dominant genera at all stations was Acantholaimus
(13.3–20.8%), followed by Halalaimus (9.4–12.2%), Thalassomon-
hystera (4.9–17.2%), and Monhystrella (6.3–10.7%) (Table 6). Saba-
tieria was present in high relative abundances at CasD and SetM(2.9 and 9.4%, respectively) compared to CasM and SetD (1.1 and1.0%, respectively). The SIMPER analysis revealed dissimilarityvalues of 54.7% for the Cascais and Setubal canyons (across waterdepth groups), and 55.9% for different water depths (acrosscanyon groups, Table 7). Deeper stations seemed more similarto each other (56.0%) than the middle-depth stations (48.5%).The genera contributing most to the similarity values weresimilar across different groups: Acantholaimus, Halalaimus,Thalassomonhystera, and Monhystrella. The genus Sabatieria wasthe main contributor to dissimilarities between water depths andcanyons (Table 7).
The PERMANOVA results based on community data indicate asignificant effect of station (Canyon�water depth), water depth,and sediment depth on the community structure (po0.05,Table 8), which is clearly illustrated by the distance betweenthe averaged sampling points on the different MDS plots of Fig. 3.The community at station SetM was most diverse for averagedstructural diversity measures (Table 9). The OGR and ACE indicatethe SetD station as most diverse (Fig. 4). Station CasD harboursthe least diverse communities, in terms of richness and equit-ability (H0, Hinf, OGR, and ACE; Table 9, Fig. 4).
3.3.2. Trophic diversity
Apart from a decreasing trophic diversity with increase insediment depth at station SetM, there were no obvious trends. Atstation SetM, the relative abundance of the non-selective depositfeeders increased with increase in sediment depth. Some indivi-duals of chemosynthetic nematodes (lacking mouth, possessing arudimentary gut, and containing symbiotic micro-organisms)were recovered from CasM and SetD samples. Chemosyntheticnematodes aside, predators/scavengers (2B) were the least abun-dant group at all stations. Relative abundances of selectivedeposit feeders (1A) and epistratum feeders (2A) did not differgreatly between stations.
nces corrected for slice density differences.
SetM % SetD %
Acantholaimus 13.3 Acantholaimus 18.8
Sabatieria 9.4 Thalassomonhystera 17.2
Halalaimus 9.4 Halalaimus 10.3
Monhystrella 6.3 Monhystrella 8.6
Amphimonhystrella 6.2 Aegialoalaimus 3.9
Thalassomonhystera 4.9 Metasphaerolaimus 3.8
Desmoscolex 4.2 Syringolaimus 3.5
Tricoma 4.1 Daptonema 3.5
Xyalidae 3.0
Metasphaerolaimus 3.0
Aegialoalaimus 3.0
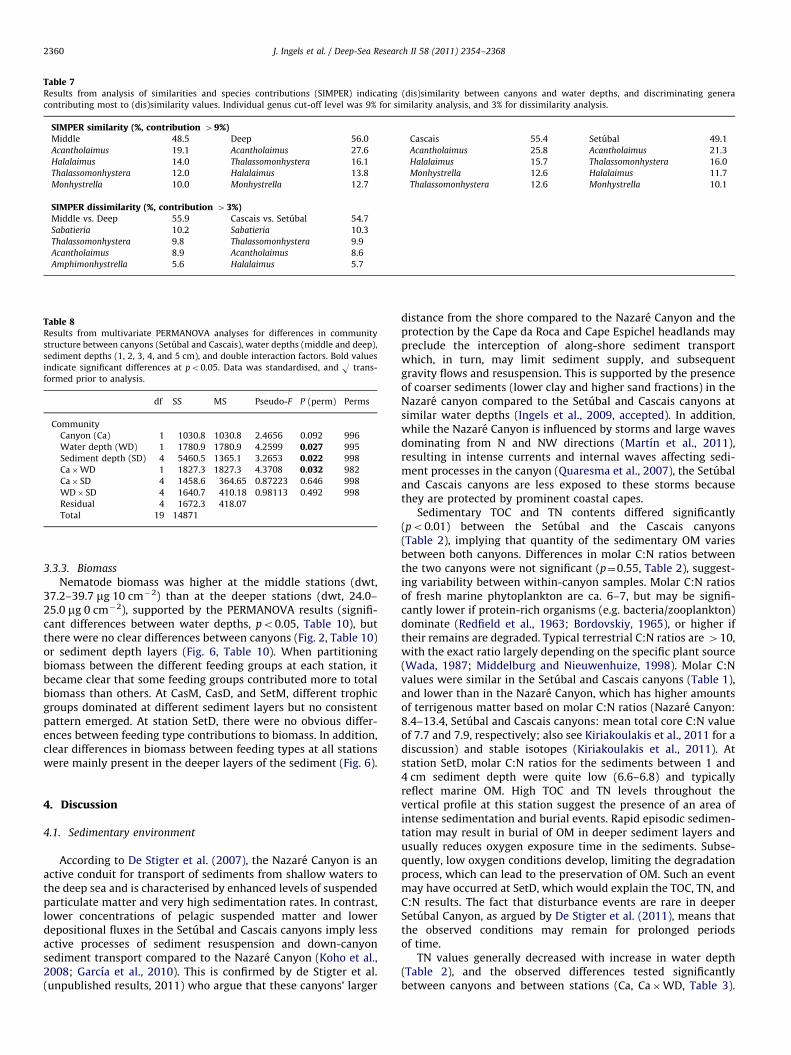
Table 7Results from analysis of similarities and species contributions (SIMPER) indicating (dis)similarity between canyons and water depths, and discriminating genera
contributing most to (dis)similarity values. Individual genus cut-off level was 9% for similarity analysis, and 3% for dissimilarity analysis.
SIMPER similarity (%, contribution 49%)Middle 48.5 Deep 56.0 Cascais 55.4 Setubal 49.1
Acantholaimus 19.1 Acantholaimus 27.6 Acantholaimus 25.8 Acantholaimus 21.3
Halalaimus 14.0 Thalassomonhystera 16.1 Halalaimus 15.7 Thalassomonhystera 16.0
Thalassomonhystera 12.0 Halalaimus 13.8 Monhystrella 12.6 Halalaimus 11.7
Monhystrella 10.0 Monhystrella 12.7 Thalassomonhystera 12.6 Monhystrella 10.1
SIMPER dissimilarity (%, contribution 43%)Middle vs. Deep 55.9 Cascais vs. Setubal 54.7
Sabatieria 10.2 Sabatieria 10.3
Thalassomonhystera 9.8 Thalassomonhystera 9.9
Acantholaimus 8.9 Acantholaimus 8.6
Amphimonhystrella 5.6 Halalaimus 5.7
Table 8Results from multivariate PERMANOVA analyses for differences in community
structure between canyons (Setubal and Cascais), water depths (middle and deep),
sediment depths (1, 2, 3, 4, and 5 cm), and double interaction factors. Bold values
indicate significant differences at po0.05. Data was standardised, and O trans-
formed prior to analysis.
df SS MS Pseudo-F P (perm) Perms
Community
Canyon (Ca) 1 1030.8 1030.8 2.4656 0.092 996
Water depth (WD) 1 1780.9 1780.9 4.2599 0.027 995
Sediment depth (SD) 4 5460.5 1365.1 3.2653 0.022 998
Ca�WD 1 1827.3 1827.3 4.3708 0.032 982
Ca� SD 4 1458.6 364.65 0.87223 0.646 998
WD� SD 4 1640.7 410.18 0.98113 0.492 998
Residual 4 1672.3 418.07
Total 19 14871
J. Ingels et al. / Deep-Sea Research II 58 (2011) 2354–23682360
3.3.3. Biomass
Nematode biomass was higher at the middle stations (dwt,37.2–39.7 mg 10 cm�2) than at the deeper stations (dwt, 24.0–25.0 mg 0 cm�2), supported by the PERMANOVA results (signifi-cant differences between water depths, po0.05, Table 10), butthere were no clear differences between canyons (Fig. 2, Table 10)or sediment depth layers (Fig. 6, Table 10). When partitioningbiomass between the different feeding groups at each station, itbecame clear that some feeding groups contributed more to totalbiomass than others. At CasM, CasD, and SetM, different trophicgroups dominated at different sediment layers but no consistentpattern emerged. At station SetD, there were no obvious differ-ences between feeding type contributions to biomass. In addition,clear differences in biomass between feeding types at all stationswere mainly present in the deeper layers of the sediment (Fig. 6).
4. Discussion
4.1. Sedimentary environment
According to De Stigter et al. (2007), the Nazare Canyon is anactive conduit for transport of sediments from shallow waters tothe deep sea and is characterised by enhanced levels of suspendedparticulate matter and very high sedimentation rates. In contrast,lower concentrations of pelagic suspended matter and lowerdepositional fluxes in the Setubal and Cascais canyons imply lessactive processes of sediment resuspension and down-canyonsediment transport compared to the Nazare Canyon (Koho et al.,2008; Garcıa et al., 2010). This is confirmed by de Stigter et al.(unpublished results, 2011) who argue that these canyons’ larger
distance from the shore compared to the Nazare Canyon and theprotection by the Cape da Roca and Cape Espichel headlands maypreclude the interception of along-shore sediment transportwhich, in turn, may limit sediment supply, and subsequentgravity flows and resuspension. This is supported by the presenceof coarser sediments (lower clay and higher sand fractions) in theNazare canyon compared to the Setubal and Cascais canyons atsimilar water depths (Ingels et al., 2009, accepted). In addition,while the Nazare Canyon is influenced by storms and large wavesdominating from N and NW directions (Martın et al., 2011),resulting in intense currents and internal waves affecting sedi-ment processes in the canyon (Quaresma et al., 2007), the Setubaland Cascais canyons are less exposed to these storms becausethey are protected by prominent coastal capes.
Sedimentary TOC and TN contents differed significantly(po0.01) between the Setubal and the Cascais canyons(Table 2), implying that quantity of the sedimentary OM variesbetween both canyons. Differences in molar C:N ratios betweenthe two canyons were not significant (p¼0.55, Table 2), suggest-ing variability between within-canyon samples. Molar C:N ratiosof fresh marine phytoplankton are ca. 6–7, but may be signifi-cantly lower if protein-rich organisms (e.g. bacteria/zooplankton)dominate (Redfield et al., 1963; Bordovskiy, 1965), or higher iftheir remains are degraded. Typical terrestrial C:N ratios are 410,with the exact ratio largely depending on the specific plant source(Wada, 1987; Middelburg and Nieuwenhuize, 1998). Molar C:Nvalues were similar in the Setubal and Cascais canyons (Table 1),and lower than in the Nazare Canyon, which has higher amountsof terrigenous matter based on molar C:N ratios (Nazare Canyon:8.4–13.4, Setubal and Cascais canyons: mean total core C:N valueof 7.7 and 7.9, respectively; also see Kiriakoulakis et al., 2011 for adiscussion) and stable isotopes (Kiriakoulakis et al., 2011). Atstation SetD, molar C:N ratios for the sediments between 1 and4 cm sediment depth were quite low (6.6–6.8) and typicallyreflect marine OM. High TOC and TN levels throughout thevertical profile at this station suggest the presence of an area ofintense sedimentation and burial events. Rapid episodic sedimen-tation may result in burial of OM in deeper sediment layers andusually reduces oxygen exposure time in the sediments. Subse-quently, low oxygen conditions develop, limiting the degradationprocess, which can lead to the preservation of OM. Such an eventmay have occurred at SetD, which would explain the TOC, TN, andC:N results. The fact that disturbance events are rare in deeperSetubal Canyon, as argued by De Stigter et al. (2011), means thatthe observed conditions may remain for prolonged periodsof time.
TN values generally decreased with increase in water depth(Table 2), and the observed differences tested significantlybetween canyons and between stations (Ca, Ca�WD, Table 3).

Fig. 3. Non-metric MDS plots based on standardised and square-root transformed
nematode genera relative abundance data, which were averaged over
(A) replicates and water depth, Set: Setubal, Cas: Cascais, sediment depth layers
in cm; (B) over replicates and canyons, M: middle water depth, D: deep water
depth, sediment depth in centimetres; and (C) over replicates, Labels denote
sediment layer in centimetre; CasD: Cascais Deep, CasM: Cascais Middle, SetD:
Setubal Deep, and SetM: Setubal Middle.
J. Ingels et al. / Deep-Sea Research II 58 (2011) 2354–2368 2361
As the sediment is intermittently transported down-canyonthrough sediment resuspension and transport processes, OMdecomposition tends to lower TN content and increase C:N valuesbecause of the preferential removal of labile, proteinaceous (i.e.N-rich) marine OM (Cowie and Hedges, 1992; Aller et al., 1996;Prahl et al., 1997; Aller and Blair, 2004). This is supported byincreasing proportions of terrestrial biomarkers towards themouth of both canyons; a clear indication of accumulation ofmore refractory, terrigenous material in the deeper parts of thecanyons (Kiriakoulakis et al., 2011).
4.2. Drivers for nematode abundance and biomass
In the deep sea there is a tendency for meiofauna abundanceand biomass to decrease with decrease in food availability (Vincxet al., 1994). Areas with relatively higher carbon input such ascanyons can exhibit high faunal standing stocks (Soetaert et al.,1991; Lampadariou and Tselepides, 2006; Ingels et al., 2009).For example, in the Nazare Canyon meiofauna densities attained264–1443 ind. 10 cm�2 for the 3000–4400m depth range(Soetaert et al., 2002; Ingels et al., 2009; Bianchelli et al., 2010),whilst on the open continental slope off southern Portugaldensities of 16–567 ind. 10 cm�2 were observed at similar depths(Rachor, 1975; Garcia et al., 2007; Ingels et al., 2009; Bianchelliet al., 2010). For the Setubal and the Cascais canyons such a foodeffect was not clear. Average meiofauna densities in thesecanyons reached 517–841 ind. 10 cm�2, nematode abundancessimilar to those on the slope (481–554 ind. 10 cm�2; Ingels et al.,2009). Nematode biomass exhibited similar trends; in the Setubaland Cascais canyons total core (0–5 cm) nematode biomassranged 24.0–39.7 mg 10 cm�2 and similar values were observedfor the Iberian open slope (29.9–53.7 mg 10 cm�2, Ingels et al.,2009). So there does not seem to be a large contrast in terms ofnematode standing stock between the slope and these twocanyons, supporting the observations of Danovaro et al. (2009)and Bianchelli et al. (2010). Another factor affecting nematodeabundance and biomass is hydrodynamic disturbance. This isillustrated by the very low densities (o100 ind. 10 cm2) observedby Garcia et al. (2007) for the Nazare Canyon axis and by VanGaever et al. (2009) for the bottom of the Congo Channel, where itis very likely that high levels of currents and sediment distur-bance preclude the establishment of an abundant meiobenthiccommunity. The PERMANOVA results indicated that there are nosignificant biomass differences between the two canyons, sta-tions, and sediment layers, but biomass is significantly differentbetween water depths (Table 10). Lower biomass values in thedeeper range of the canyons suggest limited food availabilitycompared to the shallower end of the canyons. This is supportedby de Stigter et al. (unpublished results, 2011) who document thelimited down-canyon transport of sediments and organic matter,but may also be related to the larger distance from the shelf breakwhere intensive upwelling and increased surface productionoccurs. Pusceddu et al. (2010) report a lower quality of sedimen-tary OM in the deeper Cascais Canyon compared to similar depthsin the Nazare Canyon.
4.3. Drivers for nematode compositional differences and structural
diversity
The PERMANOVA results based on nematode community datashow significant differences between water depths, stations, andbetween all sediment layers (po0.05). The MDS plots in Fig. 3 (A–C)clearly illustrate the extent to which sediment layer differencesexceed the (A) canyon, (B) water depth, and (C) station differencesin terms of community composition (as indicated by the p value inTable 10), since the total distance between different sediment layerpoints is consistently greater than the distance between points ofboth canyons, both water depths, or all four stations. Moreover, thebetter spatial clustering of the 0–1 cm layer points compared to thedeeper layer points in all three MDS plots indicates that generaassemblage differences are more prominent in the deeper sedimentlayers. The dominating sediment-depth effect suggests that gradientsalong the vertical sediment profile have a greater impact on nema-tode community structure than differences between water depths,canyons, and stations (pressure, OM input, hydrodynamic activity,etc.). A sediment depth effect that prevails on other gradients wasalso observed for the Nazare Canyon and the adjacent slope (Ingels
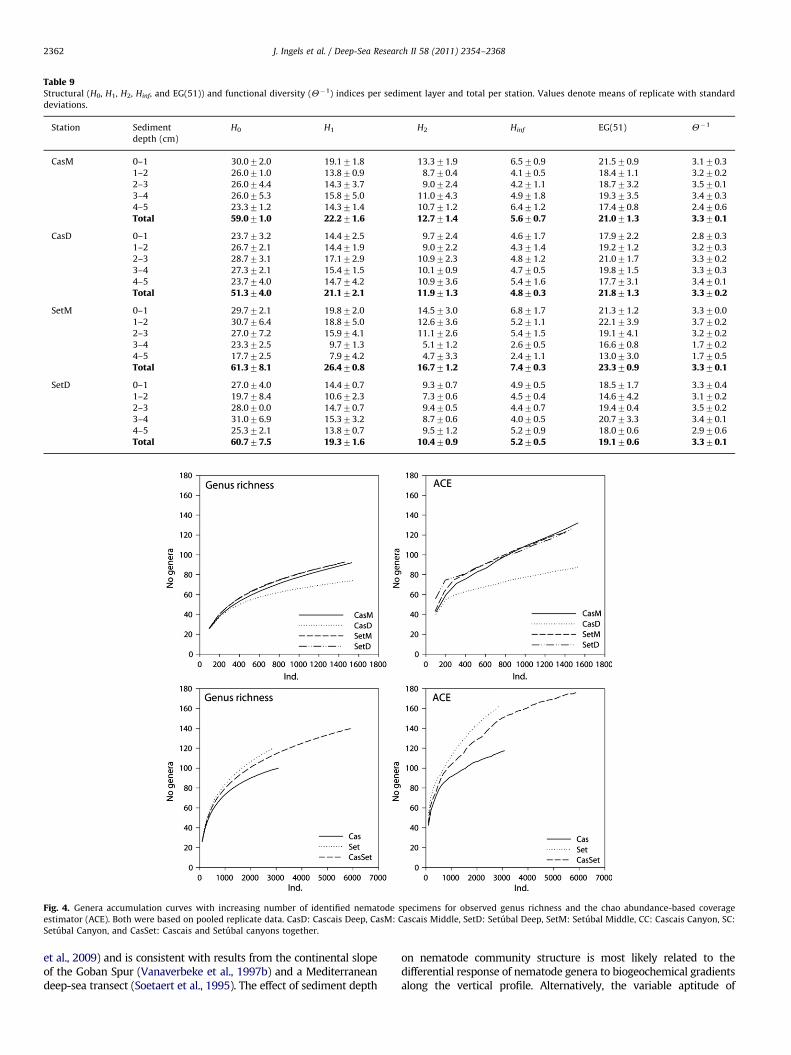
Table 9Structural (H0, H1, H2, Hinf, and EG(51)) and functional diversity (Y�1) indices per sediment layer and total per station. Values denote means of replicate with standard
deviations.
Station Sediment
depth (cm)
H0 H1 H2 Hinf EG(51) Y�1
CasM 0–1 30.072.0 19.171.8 13.371.9 6.570.9 21.570.9 3.170.3
1–2 26.071.0 13.870.9 8.770.4 4.170.5 18.471.1 3.270.2
2–3 26.074.4 14.373.7 9.072.4 4.271.1 18.773.2 3.570.1
3–4 26.075.3 15.875.0 11.074.3 4.971.8 19.373.5 3.470.3
4–5 23.371.2 14.371.4 10.771.2 6.471.2 17.470.8 2.470.6
Total 59.071.0 22.271.6 12.771.4 5.670.7 21.071.3 3.370.1
CasD 0–1 23.773.2 14.472.5 9.772.4 4.671.7 17.972.2 2.870.3
1–2 26.772.1 14.471.9 9.072.2 4.371.4 19.271.2 3.270.3
2–3 28.773.1 17.172.9 10.972.3 4.871.2 21.071.7 3.370.2
3–4 27.372.1 15.471.5 10.170.9 4.770.5 19.871.5 3.370.3
4–5 23.774.0 14.774.2 10.973.6 5.471.6 17.773.1 3.470.1
Total 51.374.0 21.172.1 11.971.3 4.870.3 21.871.3 3.370.2
SetM 0–1 29.772.1 19.872.0 14.573.0 6.871.7 21.371.2 3.370.0
1–2 30.776.4 18.875.0 12.673.6 5.271.1 22.173.9 3.770.2
2–3 27.077.2 15.974.1 11.172.6 5.471.5 19.174.1 3.270.2
3–4 23.372.5 9.771.3 5.171.2 2.670.5 16.670.8 1.770.2
4–5 17.772.5 7.974.2 4.773.3 2.471.1 13.073.0 1.770.5
Total 61.378.1 26.470.8 16.771.2 7.470.3 23.370.9 3.370.1
SetD 0–1 27.074.0 14.470.7 9.370.7 4.970.5 18.571.7 3.370.4
1–2 19.778.4 10.672.3 7.370.6 4.570.4 14.674.2 3.170.2
2–3 28.070.0 14.770.7 9.470.5 4.470.7 19.470.4 3.570.2
3–4 31.076.9 15.373.2 8.770.6 4.070.5 20.773.3 3.470.1
4–5 25.372.1 13.870.7 9.571.2 5.270.9 18.070.6 2.970.6
Total 60.777.5 19.371.6 10.470.9 5.270.5 19.170.6 3.370.1
Fig. 4. Genera accumulation curves with increasing number of identified nematode specimens for observed genus richness and the chao abundance-based coverage
estimator (ACE). Both were based on pooled replicate data. CasD: Cascais Deep, CasM: Cascais Middle, SetD: Setubal Deep, SetM: Setubal Middle, CC: Cascais Canyon, SC:
Setubal Canyon, and CasSet: Cascais and Setubal canyons together.
J. Ingels et al. / Deep-Sea Research II 58 (2011) 2354–23682362
et al., 2009) and is consistent with results from the continental slopeof the Goban Spur (Vanaverbeke et al., 1997b) and a Mediterraneandeep-sea transect (Soetaert et al., 1995). The effect of sediment depth
on nematode community structure is most likely related to thedifferential response of nematode genera to biogeochemical gradientsalong the vertical profile. Alternatively, the variable aptitude of

Table 10Results from univariate PERMANOVA analysis for differences in biomass (mg dwt) between canyons (Setubal and Cascais), water depths (middle and deep), sediment
depths (1, 2, 3, 4, and 5 cm), and double interaction factors. Data was standardised, and 4O transformed prior to analysis. The bold value denotes significant differences at
po0.05.
df SS MS Pseudo-F P (perm) Perms
Biomass
Canyon (Ca) 1 4.30E�03 4.30E�03 0.40192 0.561 994
Water depth (WD) 1 0.17652 0.17652 16.51 0.017 988
Sediment depth (SD) 4 5.54E�02 1.38E�02 12.952 0.412 999
Ca�WD 1 3.64E�05 3.64E�05 3.41E�03 0.965 987
Ca� SD 4 7.29E�02 1.82E�02 17.057 0.307 999
WD� SD 4 0.17441 4.36E�02 40.781 0.094 999
Residual 4 4.28E�02 1.07E�02
Total 19 0.52638
J. Ingels et al. / Deep-Sea Research II 58 (2011) 2354–2368 2363
nematode species to penetrate into deeper sediment layers may alsoexplain differences in the vertical profiles among groups (Soetaertet al., 1995; Vanaverbeke et al., 1997b).
More detailed differences between the two canyons and the waterdepths was illustrated by the SIMPER results, exhibiting dissimilarityvalues of 454%. The genus Sabatieria seemed to contribute most tothis dissimilarity with contributions 410%. Increasing proportions ofSabatieria are usually associated with increasing levels of sedimentdisturbance, possibly due to their resilience to burial, and alsodecreased benthic oxygen availability (Vanreusel, 1990; Vincx et al.,1990; Steyaert et al., 1999; Steyaert et al., 2007; Schratzberger et al.,2009). Sabatieria was more abundant at SetM (9.5%) than the otherstations (1.0–2.9%), which may suggest higher levels of sedimentburial and/or oxygen limitation at this station. The high levels of TOCat station SetM compared to the other stations imply recent burial orlow OM decomposition rates that are usually related with low-oxygen environments (see Section 4.1, Table 2) and support thishypothesis. A similar situation was observed for the Nazare Canyon(Ingels et al., 2009), where the dominant presence of Sabatieria in thecanyon and its absence at the adjacent slope were indicative ofreduced oxygen availability as a consequence of burial and greateravailability of OM below the oxic zone in the canyon. The occurrenceof the genus Astomonema in deeper sediment layers at CasM and SetDsuggests the presence of a reduced environment at these stations,since these nematodes are dependent on bacteria in their body thatfeed on sulphides and are typical inhabitants of sulphide-rich envi-ronments (Giere et al., 1995; Ingels et al., accepted). This corroboratesthe assumption of oxygen limitation a few centimetres down in thesediment. However, only two Astomonema individuals were found atthese stations, so their importance as indicators remains uncertain inthis case.
The dominance of the genus Acantholaimus at all stations(13.3–20.8%) was striking. Acantholaimus is considered a typicaldeep-sea genus within the free-living marine nematodes, occurringin continental slope and abyssal sediments worldwide. High Acantho-
laimus densities were associated with very low chl-a levels as statedby De Mesel et al. (2006) for Antarctic shelf sediments and the samewas true for the Aegean Sea (Lampadariou and Tselepides, 2006). Inaddition, Acantholaimus abundance was found to increase withincrease in water depth, concomitantly with decreasing food avail-ability (Vanaverbeke et al., 1997a, 1997b; Muthumbi et al., 2004).The inverse correlation of Acantholaimus with chl-a, together withits restricted colonisation abilities (Lee et al., 2001), has lead toAcantholaimus being considered as persisters rather than colonisers(for definition ‘‘persisters’’ and ‘‘colonisers’’ see Bongers et al., 1991;De Mesel et al., 2006). In these canyon sediments, where OM seemsto be of relatively low nutritional quality and sediment disturbanceregimes attain moderately higher levels than on slopes or the abyssalplain, such a strategy may be favourable. Furthermore, in environ-ments with enhanced bottom current activity, there is an increasedrisk of nematodes getting washed out of the surface sediments.
Acantholaimus seems well adapted to such environments, as they canuse their often numerous and stout setae and their typically long tailto avoid resuspension. This was also the case in the deep NazareCanyon, where Acantholaimus was much more abundant than on theslope at similar depth (31.3% and 13.6% relative abundances, respec-tively; Ingels et al., 2009).
The nematode community at station SetM was most diverseaccording to the averaged structural diversity indices while theobserved genus richness (OGR) and the Chao abundance-basedcoverage estimator (ACE) indicated that respectively, the stationsSetD and CasM Canyon harboured the most diverse communities.Genus richness measures based on pooled genera abundance data(OGR and ACE, Fig. 4) yield higher values than when the replicates areaveraged (structural diversity indices, Table 9) because differentreplicates from one particular site do not share all genera presentat that site. This is a well-known phenomenon in deep-sea nematodecommunity studies, where a high number of single-occurrencegenera are observed in samples. However, the discrepancy betweenthese two ways of measuring diversity indicated that even thoughthe community at station SetM had more genera per replicate (highmean H0), it is characterised by fewer low-occurrence genera (o10individuals per genus, cf. ACE calculation) compared to the CasM, andhence a lower equitability or evenness. In contrast, the most commongenus (Acantholaimus) at SetM was less dominant than in the CascaisCanyon as implied by the higher Hinf values at station SetM comparedto the other stations. So it remains equivocal which community ismost diverse or evenly distributed. The pooling of replicate samples,especially in nematode studies, will give a more realistic view oncommunity genus richness at a particular site. This is consistent withthe community PERMANOVA results, which indicated that sedimentdepth controls community variability. The lack of significant diversitydifferences caused by high replicate variability of the structuraldiversity values favours the use of OGR and ACE to compare stationdiversity differences. ACE is partially dependent on the evenness ofthe community (as do Hill’s diversity numbers) and offers greatpotential for estimating diversity in rich communities (Chazdon et al.,1998; Magurran, 2003), such as deep-sea nematodes.
Differences in both genus diversity and evenness between thestations, as measured by OGR and ACE, indicate that the CasDcommunity is the least diverse and evenly distributed. These resultsare consistent with the expectation that low nematode diversity andunevenness reflect greater disturbance at CasD where there is greaterhydrodynamic disturbance than at CasM (Billett, 2006; Pattenden,2008; De Stigter et al., 2011). The presence of gullies and erosivegrooves just north of station CasD may indicate the presence of high-energy currents, and supports this hypothesis. Van Gaever et al.(2009) found that rigorous hydrodynamic disturbance and low foodavailability reduces nematode diversity and evenness in the CongoChannel system (H0¼4�19, H2¼2.8�3.8) and similar conclusionswere made by Garcia et al. (2007) for the Nazare Canyonaxis (H0¼55). However, near-bottom flows causing erosion and/or

Fig. 5. Relative abundances (Rel. abund.) including standard deviations of trophic groups sensu Wieser (1953) for each station along the vertical sediment profile.
1A: selective deposit feeders, 1B: non-selective deposit feeders, 2A: epistratum feeders, 2B: predators/scavengers, Chemos.: chemosynthetic feeders. Trophic diversity
(Y�1) values including standard deviations (grey bar) for each station along the vertical profile. CasD: Cascais Deep, CasM: Cascais Middle, SetD: Setubal Deep, and SetM:
Setubal Middle.
J. Ingels et al. / Deep-Sea Research II 58 (2011) 2354–23682364
resuspension of the sediment could create patchiness by decreasingthe abundance of meiofauna on a scale that promotes diversity(Grassle, 1989) or by preventing competitive exclusion by dominantspecies in an assemblage (Schratzberger et al., 2009, and referencestherein). On the other hand, stronger or more frequent currentdisturbance could lower diversity by destroying the small-scalepatchiness that maintains it (Thistle, 1998). In addition to hydro-dynamic activity, oxygen availability in the sediments also plays acrucial role in maintaining meiofaunal diversity. Anoxia or reducedconditions have a negative effect on nematode diversity and evenness(Vanaverbeke et al., 2002, 2006). This is manifested in this studyby the abundance of Sabatieria at SetM, where high sub-surfaceTOC concentrations are high, suggesting OM burial and subsequentreduced conditions.
In general, the Setubal and Cascais canyons exhibit greaternematode diversity than the Nazare Canyon (Setubal H0: 120, CascaisH0: 121, Nazare H0: 100 (Ingels et al., 2009), Nazare Canyon axis H0:55 (Garcia et al., 2007)), indicating that environmental conditions aremore favourable for a high-diversity nematode community in theformer canyons than the latter. In fact, diversity in the Setubal andCascais canyons was very comparable to diversity at the Iberian slope(H0: 122; Ingels et al., 2009). Therefore, it is unlikely that sedimentdisturbance and the quantity and quality of sedimentary food sourcesin these canyons have a negative impact on the establishment ofdiverse nematode communities.
4.4. Drivers for nematode trophic diversity
Although variability between replicates was relatively high,average Y�1 were higher in both canyons when compared to theIberian open slope and very similar to average values for the NazareCanyon (Ingels et al., 2009). This implies a higher trophic complexityin the deep sections of the Portuguese canyons compared to theslope at similar depths. At all stations apart from CasD, non-selectivedeposit feeders were the dominant trophic group. These nematodesare able to explore a broad range of food sources like bacteria,ciliates, microalgae, and detritus, giving them an advantage overother feeding guilds (with usually more limited food preferences,Moens and Vincx, 1997) when fresher food sources become limited.This is supported by the observed increase in relative abundance ofnon-selective deposit feeders with increasing sediment depth atstations CasM and SetM (Fig. 5). It is likely that non-selective depositfeeders can outcompete the other trophic groups in deeper sedimentlayers because of their ‘opportunistic’, non-specific feeding beha-viour. In contrast, in the Nazare Canyon the high trophic complexitywas attributed to the relatively higher proportions of predatory andscavenging nematodes sustained by the very high nematode num-bers and standing stock, and concomitant high levels of preservedOM deeper in the sediment (Ingels et al., 2009). The meiofaunaresults corroborate the findings for macrofauna communities in thecanyons studied. Macrofauna communities in the Setubal and
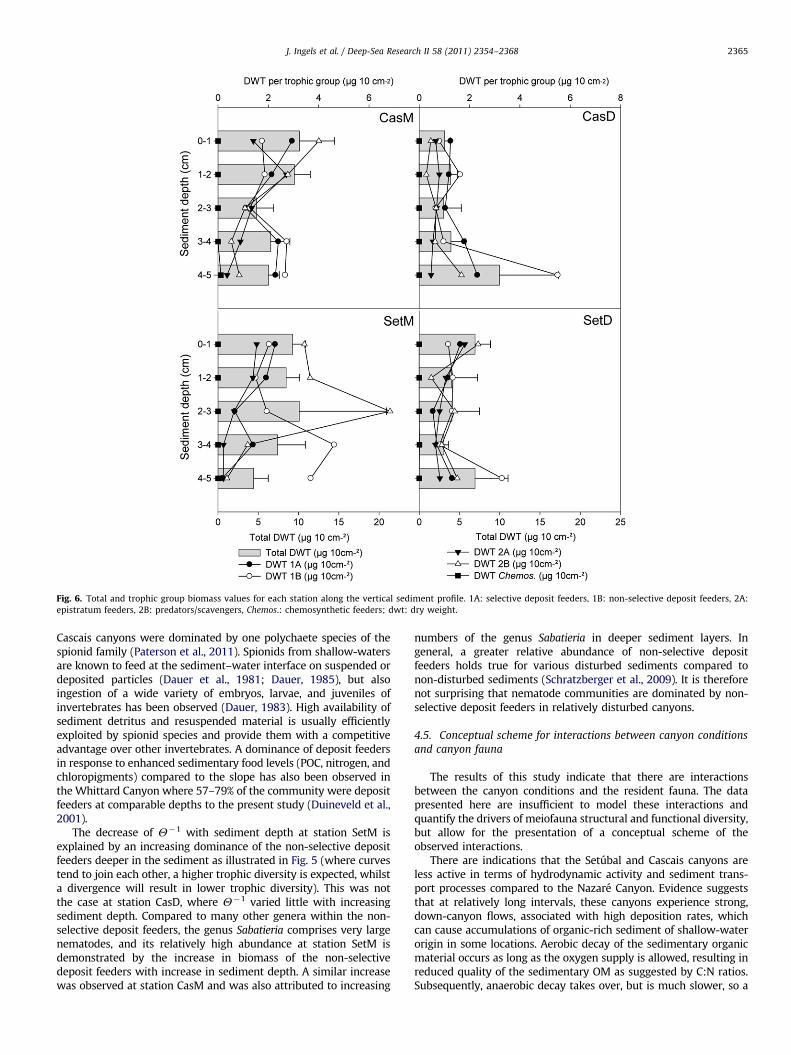
Fig. 6. Total and trophic group biomass values for each station along the vertical sediment profile. 1A: selective deposit feeders, 1B: non-selective deposit feeders, 2A:
epistratum feeders, 2B: predators/scavengers, Chemos.: chemosynthetic feeders; dwt: dry weight.
J. Ingels et al. / Deep-Sea Research II 58 (2011) 2354–2368 2365
Cascais canyons were dominated by one polychaete species of thespionid family (Paterson et al., 2011). Spionids from shallow-watersare known to feed at the sediment–water interface on suspended ordeposited particles (Dauer et al., 1981; Dauer, 1985), but alsoingestion of a wide variety of embryos, larvae, and juveniles ofinvertebrates has been observed (Dauer, 1983). High availability ofsediment detritus and resuspended material is usually efficientlyexploited by spionid species and provide them with a competitiveadvantage over other invertebrates. A dominance of deposit feedersin response to enhanced sedimentary food levels (POC, nitrogen, andchloropigments) compared to the slope has also been observed inthe Whittard Canyon where 57–79% of the community were depositfeeders at comparable depths to the present study (Duineveld et al.,2001).
The decrease of Y�1 with sediment depth at station SetM isexplained by an increasing dominance of the non-selective depositfeeders deeper in the sediment as illustrated in Fig. 5 (where curvestend to join each other, a higher trophic diversity is expected, whilsta divergence will result in lower trophic diversity). This was notthe case at station CasD, where Y�1 varied little with increasingsediment depth. Compared to many other genera within the non-selective deposit feeders, the genus Sabatieria comprises very largenematodes, and its relatively high abundance at station SetM isdemonstrated by the increase in biomass of the non-selectivedeposit feeders with increase in sediment depth. A similar increasewas observed at station CasM and was also attributed to increasing
numbers of the genus Sabatieria in deeper sediment layers. Ingeneral, a greater relative abundance of non-selective depositfeeders holds true for various disturbed sediments compared tonon-disturbed sediments (Schratzberger et al., 2009). It is thereforenot surprising that nematode communities are dominated by non-selective deposit feeders in relatively disturbed canyons.
4.5. Conceptual scheme for interactions between canyon conditions
and canyon fauna
The results of this study indicate that there are interactionsbetween the canyon conditions and the resident fauna. The datapresented here are insufficient to model these interactions andquantify the drivers of meiofauna structural and functional diversity,but allow for the presentation of a conceptual scheme of theobserved interactions.
There are indications that the Setubal and Cascais canyons areless active in terms of hydrodynamic activity and sediment trans-port processes compared to the Nazare Canyon. Evidence suggeststhat at relatively long intervals, these canyons experience strong,down-canyon flows, associated with high deposition rates, whichcan cause accumulations of organic-rich sediment of shallow-waterorigin in some locations. Aerobic decay of the sedimentary organicmaterial occurs as long as the oxygen supply is allowed, resulting inreduced quality of the sedimentary OM as suggested by C:N ratios.Subsequently, anaerobic decay takes over, but is much slower, so a

J. Ingels et al. / Deep-Sea Research II 58 (2011) 2354–23682366
portion of the organic matter in the accumulation is preserved andanaerobic conditions persist in between disturbance events. Whereaccumulations are not deposited, the effects of the disturbancecaused by the strong flows control the fauna. Such an interactionbetween the canyon conditions and the resident fauna is implied byhigh concentrations of sub-surface TOC concentrations and higherproportions of genera that are able to persist in disturbed sediments(e.g. Sabatieria, Acantholaimus, etc.) in the Setubal and Cascaiscanyons compared to slope environments. Trophic analysis of thenematode community indicated that non-selective deposit feedersare dominant (in terms of abundance and biomass), presumablybecause of their non-selective feeding behaviour compared to otherfeeding types, which gives them a competitive advantage inexploiting lower-quality food resources. In addition, the multivariatecommunity analysis revealed that the sediment-depth effect was ofgreater importance to community variability than other effects. Thissuggests that biogeochemical gradients along the vertical sedimentprofile are crucial in determining nematode community structure,especially in the deeper sediment layers and that differences in thesediment profile transcend larger-scale contrasts between canyonsor water depths.
Acknowledgments
This research was funded by the HERMES project, EC contractGOCE511234 funded by the European Commission’s Sixth Frame-work Programme and the EC FP7 HERMIONE project (Grant no.226354). We are very much indebted to the National OceanographyCentre, Southampton, for ship time during cruise CD179. Theauthors wish to thank the crew and captain of the R.R.S. Charles
Darwin, and all scientists for their efforts and hard work during theship’s penultimate scientific cruise. The first author would especiallylike to thank Prof. K.R. Clarke, PML, and Prof. M. Anderson for theiradvice on statistical methods within PERMANOVAþ and PRIMER,V. Huvenne for contributing with figures of the study site, andM. Vincx for the use of research facilities. Two anonymous reviewersare acknowledged for their constructive comments and henceimprovement of the manuscript.
References
Aller, R.C., Blair, N.E., 2004. Early diagenetic remineralization of sedimentaryorganic C in the Gulf of Papua deltaic complex (Papua New Guinea): net loss ofterrestrial C and diagenetic fractionation of C isotopes. Geochimica EtCosmochimica Acta 68, 1815–1825.
Aller, R.C., Blair, N.E., Xia, Q., Rude, P.D., 1996. Remineralization rates, recycling,and storage of carbon in Amazon shelf sediments. Continental Shelf Research16, 753–786.
Amaro, T., Witte, H., Herndl, G.J., Cunha, M.R., Billett, D.S.M., 2009. Deep-seabacterial communities in sediments and guts of deposit-feeding holothuriansin Portuguese canyons (NE Atlantic). Deep-Sea Research I: OceanographicResearch Papers 56, 1834–1843.
Anderson, M., 2005. PERMANOVA: Permutational Multivariate Analysis of Var-iance. Department of Statistics, Auckland.
Anderson, M.J., Gorley, R.N., Clarke, K.R., 2007. PERMANOVAþ for PRIMER: guideto software and statistical methods. PRIMER-E, Plymouth.
Anderson, M.J., Willis, T.J., 2003. Canonical analysis of principal coordinates: auseful method of constrained ordination for ecology. Ecology 84, 511–525.
Andrassy, I., 1956. The determination of volume and weight of nematodes. ActaZoologica (Hungarian Academy of Science) 2, 1–15.
Arzola, R.G., Wynn, R.B., Lastras, G., Masson, D.G., Weaver, P.P.E., 2008. Sedimen-tary features and processes in the Nazare and Setubal submarine canyons,West Iberian Margin. Marine Geology 250, 64–88.
Baguley, J.G., Montagna, P.A., Hyde, L.J., Kalke, R.D., Rowe, G.T., 2006. Metazoanmeiofauna abundance in relation to environmental variables in the northernGulf of Mexico deep sea. Deep-Sea Research I: Oceanographic Research Papers53, 1344–1362. doi:10.1016/j.dsr.2006.05.012.
Bianchelli, S., Gambi, C., Zeppilli, D., Danovaro, R., 2010. Metazoan meiofauna in deep-sea canyons and adjacent open slopes: a large-scale comparison with focus on therare taxa. Deep-Sea Research I: Oceanographic Research Papers 57, 420–433.
Billett, D.S.M., 2006. RRS Charles Darwin Cruise CD179, 14 April–17 May 2006.Hotspot ecosystem research in the Setubal, Lisbon, Cascais and Nazare
canyons on the Portuguese continental margin. National OceanographyCentre, Southampton, p. 65.
Bongers, T., Alkemade, R., Yeates, G.W., 1991. Interpretation of disturbance-induced maturity decrease in marine nematode assemblages by means ofthe maturity index. Marine Ecology-Progress Series 76, 135–142.
Bordovskiy, O.K., 1965. Sources of organic matter in marine basins. MarineGeology 3, 5–31.
Canals, M., Puig, P., de Madron, X.D., Heussner, S., Palanques, A., Fabres, J., 2006.Flushing submarine canyons. Nature 444, 354–357. doi:10.1038/nature05271ISSN:0250-6971.
Chao, A., Lee, S.M., 1992. Estimating the number of classes via sample coverage.Journal of the American Statistical Association 87, 210–217.
Chazdon, R.L., Colwell, R.K., Denslow, J.S., Guariguata, M.R., 1998. Statisticalmethods for estimating species richness of woody regeneration in primaryand secondary rain forests of northeastern Costa Rica. In: Dallmeier, F.C.,Comiskey, J.A. (Eds.), Forest Biodiversity Research, Monitoring and Modeling:Conceptual Background and Old World Case Studies. Parthenon Publishing,Paris, pp. 285–309.
Collwell, R.K., 2005. EstimateS: statistical estimation of species richness andshared species from samples. Version 7.5. User’s Guide and applicationpublished at: http://purl.oclc.org/estimates.
Colwell, R.K., Coddington, J.A., 1994. Estimating terrestrial biodiversity throughextrapolation. Philosophical Transactions of the Royal Society of London SeriesB—Biological Sciences 345, 101–118.
Company, J.B., Puig, P., Sarda, F., Palanques, A., Latasa, M., Scharek, R., 2008.Climate influence on deep sea populations. Plos One 3, 8. doi:10.1371/journal.pone.0001431.
Coull, B.C., Chandler, G.T., 1992. Pollution and meifauna—field, laboratory, andmesocosm studies. Oceanography and Marine Biology 30, 191–271.
Cowie, G.L., Hedges, J.I., 1992. Sources and reactivities of amino-acids in a coastalmarine-environment. Limnology and Oceanography 37, 703–724.
Curdia, J., Carvalho, S., Ravara, A., Gage, J.D., Rodrigues, A.M., Quintino, V., 2004.Deep macrobenthic communities from Nazare submarine canyon (NW Portu-gal). Scientia Marina 68, 171–180.
Danovaro, R., Bianchelli, S., Gambi, C., Mea, M., Zeppilli, D., 2009. α-, β-,γ-, δ- and ε—diversity of deep-sea nematodes in can-yons and open slopes of Northeast Atlantic and Mediterranean margins. MarineEcology Progress Series 396, 197–209. doi:10.3354/meps08269.
Dauer, D.M., 1983. Functional morphology and feeding behavior of Scolelepissquamata (Polychaeta, Spionidae). Marine Biology 77, 279–285.
Dauer, D.M., 1985. Functional morphology and feeding behavior of Paraprionospiopinnata (Polychaeta, Spionidae). Marine Biology 85, 143–151.
Dauer, D.M., Maybury, C.A., Ewing, R.M., 1981. Feeding behavior and generalecology of several spionid polychaetes from the chesapeake bay. Journal ofExperimental Marine Biology and Ecology 54, 21–38.
De Leo, F.C., Smith, C.R., Rowden, A.A., Bowden, D.A., Clark, M.R., 2010. Submarinecanyons: hotspots of benthic biomass and productivity in the deep sea.Proceedings of the Royal Society B: Biological Sciences. doi:10.1098/rspb.2010.0462.
De Mesel, I., Lee, H.J., Vanhove, S., Vincx, M., Vanreusel, A., 2006. Species diversityand distribution within the deep-sea nematode genus Acantholaimus on thecontinental shelf and slope in Antarctica. Polar Biology 29, 860–871.
De Stigter, H.C., Boer, W., Mendes, P., Jesus, C.C., Thomsen, L., van den Bergh, G.D.,van Weering, T.C.E., 2007. Recent sediment transport and deposition in theNazare Canyon, Portuguese continental margin. Marine Geology 246,144–164.
De Stigter, H.C., Jesus, C.C., Boer, W., Richter, T.O., Costa, A., van Weering, T.C.E.,2011. Recent sediment transport and deposition in the Lisbon–Setubal andCascais Canyon, Portuguese continental margin. Deep-Sea Research II 58,2321–2344.
Deprez, T., Steyaert, M., Vanaverbeke, J., Speybroeck, J., Raes, M., Derycke, S., DeSmet, G., Ingels, J., Vanreusel, A., Van Gaever, S., Vincx, M., 2005. NeMys. WorldWide Web Electronic Publication. nemys.ugent.be. Department of MarineBiology, Ghent University.
Duineveld, G., Lavaleye, M., Berghuis, E., de Wilde, P., 2001. Activity and composi-tion of the benthic fauna in the Whittard Canyon and the adjacent continentalslope (NE Atlantic). Oceanologica Acta 24, 69–83.
Duros, P., Fontanier, C., Metzger, E., Pusceddu, A., Cesbron, F., de Stigter, H.C.,Bianchelli, S., Danovaro, R., Jorissen, F.J., 2011. Live (stained) benthic foraminiferain the Whittard Canyon, Celtic margin (NE Atlantic). Deep-Sea Research I:Oceanographic Research Papers 58, 128–146.
Fonseca, G., Decraemer, W., 2008. State of the art of the free-living marineMonhysteridae (Nematoda). Journal of the Marine Biological Association ofthe United Kingdom 88, 1371–1390. doi:10.1017/s0025315408001719.
Gage, J.D., Lamont, P.A., Tyler, P.A., 1995. Deep-sea macrobenthic communities atcontrasting sites off Portugal, preliminary—results. 1. Introduction and diversitycomparisons. Internationale Revue Der Gesamten Hydrobiologie 80, 235–250.
Garcia, R., Koho, K.A., De Stigter, H.C., Epping, E., Koning, E., Thomsen, L., 2007.Distribution of meiobenthos in the Nazare Canyon and adjacent slope(Western Iberian Margin) in relation to sedimentary composition.Marine Ecology Progress Series 340, 207–220.
Garcıa, R., Thomsen, L., de Stigter, H.C., Epping, E., Soetaert, K., Koning, E., de JesusMendes, P.A., 2010. Sediment bioavailable organic matter, depositionrates and mixing intensity in the Setubal–Lisbon canyon and adjacent slope(Western Iberian Margin). Deep-Sea Research I: Oceanographic Research Papers57, 1012–1026.
J. Ingels et al. / Deep-Sea Research II 58 (2011) 2354–2368 2367
Giere, O., Windoffer, R., Southward, E.C., 1995. The bacterial endosymbiosis of thegutless nematode, Astomonema southwardorum — ultrastructural aspects.Journal of the Marine Biological Association of the United Kingdom 75 (1),153–164.
Gotelli, N.J., Colwell, R.C., 2001. Quantifying biodiversity: procedures and pitfalls inthe measurement and comparison of species richness. Ecology Letters 4,379–391.
Grassle, J.F., 1989. Species diversity in deep-sea communities. Trends in Ecology &Evolution 4, 12–15.
Heip, C., Herman, P., Soetaert, K., 1998. Indices of diversity and evenness.Oceanis 24, 61–87.
Heip, C., Vincx, M., Vranken, G., 1985. The ecology of marine nematodes.Oceanography and Marine Biology 23, 399–489.
Higgins, R.P., Thiel, H., 1988. Introduction to the Study of Meiofauna. SmithsonianInstitution Press, London.
Hill, M.O., 1973. Diversity and evenness: a unifying notation and its consequences.Ecology 54, 427–432.
Ingels, J., Kiriakoulakis, K., Wolff, G.A., Vanreusel, A., 2009. Nematode diversity and itsrelation to quantity and quality of sedimentary organic matter in the NazareCanyon, Western Iberian Margin. Deep-Sea Research I: Oceanographic ResearchPapers 56, 1521–1539. doi:10.1016/j.dsr.2009.04.010.
Ingels, J., Tchesunov, A., Vanreusel, A., accepted. Meiofauna in the Gollum Channelsand the Whittard Canyon, Celtic Margin: how local environmental conditionsshape nematode structure and function. Plos One.
Jouanneau, J.M., Garcia, C., Oliveira, A., Rodrigues, A., Dias, J.A., Weber, O., 1998.Dispersal and deposition of suspended sediment on the shelf off the Tagus andSado estuaries, SW Portugal. Progress in Oceanography 42, 233–257.
Kiriakoulakis, K., Blackbird, S., Ingels, J., Vanreusel, A., Wolff, G.A., 2011. Organicgeochemistry of submarine canyons: the Portuguese Margin. Deep-SeaResearch II 58, 2477–2488.
Koho, K.A., Garcıa, R., de Stigter, H.C., Epping, E., Koning, E., Kouwenhoven, T.J.,van der Zwaan, G.J., 2008. Sedimentary labile organic carbon and pore waterredox control on species distribution of benthic foraminifera: a case studyfrom Lisbon–Setubal Canyon (southern Portugal). Progress in Oceanography 79,55–82.
Lamont, P.A., Gage, J.D., Tyler, P.A., 1995. Deep-sea macrobenthic communities atcontrasting sites off Portugal, preliminary results: II spatial dispersion. Inter-nationale Revue Der Gesamten Hydrobiologie 80, 251–265.
Lampadariou, N., Tselepides, A., 2006. Spatial variability of meiofaunal communities atareas of contrasting depth and productivity in the Aegean Sea (NE Mediterranean).Progress in Oceanography 69, 19–36.
Lastras, G., Arzola, R.G., Masson, D.G., Wynn, R.B., Huvenne, V.A.I., Huhnerbach, V.,Canals, M., 2009. Geomorphology and sedimentary features in the CentralPortuguese submarine canyons, Western Iberian Margin. Geomorphology 103,310–329.
Lee, H.J., Gerdes, D., Vanhove, S., Vincx, M., 2001. Meiofauna response to icebergdisturbance on the Antarctic continental shelf at Kapp Norvegia (Weddell Sea).Polar Biology 24, 926–933.
Levin, L.A., Gooday, A.J., 2003. The deep Atlantic Ocean. In: Tyler, P.A. (Ed.),Ecosystems of the Deep Oceans. Ecosystems of the World. Elsevier, Amster-dam, Netherlands, pp. 111–178.
Magurran, A.E., 2003. Measuring Biological Diversity. Wiley-Blackwell.Martın, J., Palanques, A., Vitorino, J., Oliveira, A., de Stigter, H., 2011. Near-bottom
particulate matter dynamics in the Nazare submarine canyon under calm andstormy conditions. Deep-Sea Research II 58, 2388–2400.
Middelburg, J.J., Nieuwenhuize, J., 1998. Carbon and nitrogen stable isotopes insuspended matter and sediments from the Schelde Estuary. Marine Chemistry60, 217–225.
Moens, T., Vincx, M., 1997. Observations on the feeding ecology of estuarinenematodes. Journal of the Marine Biological Association of the United King-dom 77, 211–227.
Muthumbi, A.W., Vanreusel, A., Duineveld, G., Soetaert, K., Vincx, M., 2004. Nematodecommunity structure along the continental slope off the Kenyan Coast, WesternIndian Ocean. International Review of Hydrobiology 89, 188–205. doi:10.1002/iroh.200310689.
Palanques, A., Durrieu de Madron, X., Puig, P., Fabres, J., Guillen, J., Calafat, A., Canals,M., Heussner, S., Bonnin, J., 2006. Suspended sediment fluxes and transportprocesses in the Gulf of Lions submarine canyons. The role of storms and densewater cascading. Marine Geology 234, 43–61.
Palanques, A., Garcia-Ladona, E., Gomis, D., Martin, J., Marcos, M., Pascual, A., Puig, P.,Gili, J.M., Emelianov, M., Monserrat, S., Guillen, J., Tintore, J., Segura, M., Jordi, A.,Ruiz, S., Basterretxea, G., Font, J., Blasco, D., Pages, F., 2005. General patterns ofcirculation, sediment fluxes and ecology of the Palamo’s (La Fonera) submarinecanyon, northwestern Mediterranean. Progress in Oceanography 66, 89–119.doi:10.1016/j.pocean.2004.07.016.
Pattenden, A., 2008. The Influence of Submarine Canyons on the Structure andDynamics of Megafaunal Communities. Faculty of Engineering, Science andMathematics, School of Ocean and Earth Science. University of Southampton,Southampton, p. 184.
Paterson, G.L.J., Glover, A.G., Cunha, M.R., Neal, L., de Stigter, H., Kiriakoulakis, K.,Billett, D.S.M., Wolff, G.A., Tiago, A., Ravara, A., Lamont, P., Tyler, P., 2011.Disturbance, productivity and diversity in deep-sea canyons: a worm’s eyeview. Deep Sea Research II 58, 2448–2460.
Platt, H.M., Warwick, R.M., 1988. Free-living Marine Nematodes. Part II. BritishChromadorids: Pictorial Key to World Genera and Notes for the Identificationof British Species. E.J. Brill;W. Backhuys, Leiden.
Prahl, F.G., De Lange, G.J., Scholten, S., Cowie, G.L., 1997. A case of post-deposi-tional aerobic degradation of terrestrial organic matter in turbidite depositsfrom the Madeira Abyssal Plain. Organic Geochemistry 27, 141–152.
Pusceddu, A., Bianchelli, S., Canals, M., Sanchez-Vidal, A., Durrieu De Madron, X.,Heussner, S., Lykousis, V., de Stigter, H., Trincardi, F., Danovaro, R., 2010.Organic matter in sediments of canyons and open slopes of the Portuguese,Catalan, Southern Adriatic and Cretan Sea margins. Deep-Sea Research I:Oceanographic Research Papers 57, 441–457.
Quaresma, L.S., Vitorino, J., Oliveira, A., da Silva, J., 2007. Evidence of sedimentresuspension by nonlinear internal waves on the western Portuguese mid-shelf. Marine Geology 246, 123–143.
Rachor, E., 1975. Quantitative Untersuchungen uber das Meiobenthos der nordos-tatlantischen Tiefsee, Meteor Forschungsergebnisse, Deutsche Forschungsge-meinshaft. Gebruder Borntrager, Berlin, Stuttgart, Germany, pp. 1–10.
Redfield, A.C., Ketchum, B.H., Richards, F.A., 1963. The influence of organisms onthe composition of seawater. In: Hill, M.N. (Ed.), The Sea. Wiley, New York,pp. 26–79.
Sanders, H.L., 1968. Marine benthic diversity: a comparative study. AmericanNaturalist 102, 243–282.
Schratzberger, M., Lampadariou, N., Somerfield, P., Vandepitte, L., Vanden Berghe,E., 2009. The impact of seabed disturbance on nematode communities: linkingfield and laboratory observations. Marine Biology 156, 709–724.
Seinhorst, J.W., 1959. A rapid method for the transfer of nematodes from fixativeto unhydrous glycerine. Nematologica 4, 67–69.
Skliris, N., Djenidi, S., 2006. Plankton dynamics controlled by hydrodynamicprocesses near a submarine canyon off NW corsican coast: a numericalmodelling study. Continental Shelf Research 26, 1336–1358. doi:10.1016/j.csr.2006.05.004.
Soetaert, K., Heip, C., 1995. Nematode assemblages of deep-sea and shelf breaksites in the North-Atlantic and Mediterranean-Sea. Marine Ecology ProgressSeries 125, 171–183.
Soetaert, K., Heip, C., Vincx, M., 1991. The meiobenthos along a MediterraneanDeep-Sea transect off Calvi (Corsica) and in an adjacent canyon. MarineEcology—Pubblicazioni Della Stazione Zoologica Di Napoli I 12, 227–242.
Soetaert, K., Muthumbi, A., Heip, C., 2002. Size and shape of ocean marginnematodes: morphological diversity and depth-related patterns. MarineEcology Progress Series 242, 179–1793.
Soetaert, K., Vincx, M., Heip, C., 1995. Nematode community structure along aMediterranean shelf-slope gradient. Marine Ecology—Pubblicazioni DellaStazione Zoologica Di Napoli I 16, 189–206.
Steyaert, M., Garner, N., van Gansbeke, D., Vincx, M., 1999. Nematode communitiesfrom the North Sea: environmental controls on species diversity and verticaldistribution within the sediment. Journal of the Marine Biological Associationof the United Kingdom 79, 253–264.
Steyaert, M., Moodley, L., Nadong, T., Moens, T., Soetaert, K., Vincx, M., 2007.Responses of intertidal nematodes to short-term anoxic events. Journal ofExperimental Marine Biology and Ecology 345, 175–184.
Thistle, D., 1998. Harpacticoid copepod diversity at two physically reworked sitesin the deep sea. Deep-Sea Research II 45, 13–24.
Thistle, D., Levin, L.A., 1998. The effect of experimentally increased near-bottomflow on metazoan meiofauna at a deep-sea site, with comparison data onmacrofauna. Deep-Sea Research I: Oceanographic Research Papers 45,625–638.
Thistle, D., Levin, L.A., Gooday, A.J., Pfannkuche, O., Lambshead, P.J.D., 1999.Physical reworking by near-bottom flow alters the metazoan meiofauna ofFieberling Guyot (northeast Pacific). Deep-Sea Research I: OceanographicResearch Papers 46, 2041–2052.
Thorne-Miller, B., Catena, J., 1991. The Living Ocean. Understanding and ProtectingMarine Biodiversity. Island Press, Washington DC.
Tyler, P., 2008. HERMES Deliverable 101 (D101) Analysis of Megafauna in thePortuguese Canyons, HERMES Deliverables. National Oceanography Centre,Southampton.
Tyler, P., Amaro, T., Arzola, R., Cunha, M.R., de Stigter, H., Gooday, A., Huvenne, V.,Ingels, J., Kiriakoulakis, K., Lastras, G., Masson, D., Oliveira, A., Pattenden, A.,Vanreusel, A., Van Weering, T., Vitorino, J., Witte, U., Wolff, G., 2009. Europe’sGrand Canyon Nazare Submarine Canyon. Oceanography 22, 46–57.
Van Gaever, S., Galeron, J., Sibuet, M., Vanreusel, A., 2009. Deep-sea habitatheterogeneity influence on meiofaunal communities in the Gulf of Guinea.Deep-Sea Research II 56, 2259–2269.
Van Gaever, S., Moodley, L., de Beer, D., Vanreusel, A., 2006. Meiobenthos at theArctic Hakon Mosby Mud Volcano, with a parental-caring nematode thrivingin sulphide-rich sediments. Marine Ecology—Progress Series 321, 143–155.
van Weering, T.C.E., de Stigter, H.C., Boer, W., de Haas, H., 2002. Recent sedimenttransport and accumulation on the NW Iberian margin. Progress in Oceano-graphy 52, 349–371.
Vanaverbeke, J., Arbizu, P.M., Dahms, H.U., Schminke, H.K., 1997a. The Metazoanmeiobenthos along a depth gradient in the Arctic Laptev Sea with specialattention to nematode communities. Polar Biology 18, 391–401.
Vanaverbeke, J., Gheskiere, T., Steyaert, M., Vincx, M., 2002. Nematode assem-blages from subtidal sandbanks in the Southern Bight of the North Sea: effectof small sedimentological differences. Journal of Sea Research 48, 197–207.
Vanaverbeke, J., Soetaert, K., Heip, C., Vanreusel, A., 1997b. The metazoanmeiobenthos along the continental slope of the Goban Spur (NE Atlantic).Journal of Sea Research 38, 93–107.
Vanreusel, A., 1990. Ecology of the free-living marine nematodes from theVoordelta (Southern Bight of the North-Sea) .1. Species composition and

J. Ingels et al. / Deep-Sea Research II 58 (2011) 2354–23682368
structure of the nematode communities. Cahiers De Biologie Marine 31,439–462.
Vetter, E.W., Dayton, P.K., 1998. Macrofaunal communities within and adja-cent to a detritus-rich submarine canyon system. Deep-Sea Research II 45,25–54.
Vincx, M., Bett, B.J., Dinet, A., Ferrero, T., Gooday, A.J., Lambshead, P.J.D., Pfann-kuche, O., Soltwedel, T., Vanreusel, A., 1994. Meiobenthos of the Deep North-east Atlantic, Advances in Marine Biology, vol. 30. Academic Press Ltd, London,pp. 1–88.
Vincx, M., Meire, P., Heip, C., 1990. The distribution of nematode communities inthe southern bight of the North Sea. Cahiers De Biologie Marine 31, 107–129.
Wada, E., 1987. N-15 and C-13 abundances in marine environments with emphasison biogeochemical structure of food web. Isotopenpraxis 23, 320–322.
Weaver, P.R.E., Canals, M., 2003. The Iberian and Canaries Margin including NWAfrica. In: Mienert, J., Weaver, P.P.E. (Eds.), European Margin SedimentDynamics: Side-Scan Sonar and Seismic Images. Springer, Berlin, pp. 251–260.
Wieser, W., 1953. Beziehungen zwischen Mundhohlengestalt, Ernahrungsweiseund Vorkommen bei freilebenden marinen Nematoden. Arkiv For Zoologi 2,439–484.
Yamamuro, M., Kayanne, H., 1995. Rapid direct determination of organic-carbonand nitrogen in carbonate-bearing sediments with a Yanaco Mt-5 Chnanalyzer. Limnology and Oceanography 40, 1001–1005.