Strength of density feedback in census data increases from slow to fast life histories
13
Strength of density feedback in census data increases from slow to fast life histories Salvador Herrando-Pe ´ rez 1 , Steven Delean 1 , Barry W. Brook 1 & Corey J. A. Bradshaw 1,2 1 The Environment Institute and School of Earth and Environmental Sciences, University of Adelaide, South Australia, 5005, Australia 2 South Australian Research and Development Institute, P.O. Box 120, Henley Beach, South Australia, 5022, Australia Keywords Age at first reproduction, body size, density dependence, fertility, longevity, population dynamics. Correspondence Salvador Herrando-Pe ´ rez, The Environment Institute and School of Earth and Environmental Sciences, University of Adelaide, South Australia 5005, Australia. Tel: +61 8 8303 5254; Fax: +61 8 8303 4347; E-mail: salvador.herrando- [email protected] Funding provided by an Endeavour International Postgraduate Scholarship (University of Adelaide) to S. H. P., and by an Australian Research Council Discovery Project grant (DP0878582) to C. J. A. B. Received: 3 April 2012; Revised: 8 May 2012; Accepted: 9 May 2012 doi: 10.1002/ece3.298 Abstract Life-history theory predicts an increasing rate of population growth among species arranged along a continuum from slow to fast life histories. We examine the effects of this continuum on density-feedback strength estimated using long-term census data from >700 vertebrates, invertebrates, and plants. Four life-history traits (Age at first reproduction, Body size, Fertility, Longevity) were related statistically to Gompertz strength of density feedback using generalized linear mixed-effects models and multi-model inference. Life-history traits alone explained 10 to 30% of the variation in strength across species (after controlling for time-series length and phylogenetic nonindependence). Effect sizes were largest for body size in mammals and longevity in birds, and density feedback was consistently stronger for smaller-bodied and shorter-lived species. Over- compensatory density feedback (strength <1) occurred in 20% of species, predominantly at the fast end of the life-history continuum, implying relatively high population variability. These results support the idea that life history leaves an evolutionary signal in long-term population trends as inferred from census data. Where there is a lack of detailed demographic data, broad life-his- tory information can inform management and conservation decisions about rebound capacity from low numbers, and propensity to fluctuate, of arrays of species in areas planned for development, harvesting, protection, and popula- tion recovery. Introduction Density dependence (Smith 1935; Allee 1941) represents a causal relationship between population size (predictor) and a demographic rate (response), that is, a “density feedback”. Such relationship can be “compensatory” or “depensatory” if population growth, survival, and/or fer- tility rates decrease or increase with population boom, respectively (Herrando-Pe ´rez et al. 2012a). Statistical sup- port for those feedbacks indicates that demographic rates are shaped by social and trophic interactions such as competition, cooperation, disease, parasitism, or preda- tion, because the intensity of these ecological mechanisms varies with population size (Herrando-Pe ´rez et al. 2012b). In single-species population models that quantify density feedback (Brook and Bradshaw 2006; Eberhardt et al. 2008), it has been suggested that cross-taxa patterns of population dynamics can be predicted from information on life-history traits by arranging species along a contin- uum from “slow” to “fast” life histories (Saether et al. 2002). This continuum had been thoroughly investigated in the 1980s in homeotherms (Saether 1987; Galliard et al. 1989; Read and Harvey 1989) – the prediction being that fast taxa should be capable of growing to larger pop- ulation sizes at much higher rates than slow taxa via the former’s shorter gestation, shorter intervals between reproductive bouts, earlier maturity, smaller adult size, shorter life, shorter lactation, smaller and more prolific offspring, and more litters per year, regardless of whether one controls for body size (Stearns 1983; Saether et al. 1996). In support of such predictions, changes in popula- tion growth rate (sensitivities) arise mainly from variabil- ity in reproductive rates in fast species and in survival rates for slow species of birds (Saether and Bakke 2000), ª 2012 The Authors. Published by Blackwell Publishing Ltd. This is an open access article under the terms of the Creative Commons Attribution Non-Commercial License, which permits use, distribution and reproduction in any medium, provided the original work is properly cited and is not used for commercial purposes. 1
Transcript of Strength of density feedback in census data increases from slow to fast life histories

Strength of density feedback in census dataincreases from slow to fast life historiesSalvador Herrando-Perez1, Steven Delean1, Barry W. Brook1 & Corey J. A. Bradshaw1,2
1The Environment Institute and School of Earth and Environmental Sciences, University of Adelaide, South Australia, 5005, Australia2South Australian Research and Development Institute, P.O. Box 120, Henley Beach, South Australia, 5022, Australia
Keywords
Age at first reproduction, body size, density
dependence, fertility, longevity, population
dynamics.
Correspondence
Salvador Herrando-Perez, The Environment
Institute and School of Earth and
Environmental Sciences, University of
Adelaide, South Australia 5005, Australia.
Tel: +61 8 8303 5254; Fax: +61 8 8303
4347; E-mail: salvador.herrando-
Funding provided by an Endeavour
International Postgraduate Scholarship
(University of Adelaide) to S. H. P., and by an
Australian Research Council Discovery Project
grant (DP0878582) to C. J. A. B.
Received: 3 April 2012; Revised: 8 May 2012;
Accepted: 9 May 2012
doi: 10.1002/ece3.298
Abstract
Life-history theory predicts an increasing rate of population growth among
species arranged along a continuum from slow to fast life histories. We examine
the effects of this continuum on density-feedback strength estimated using
long-term census data from >700 vertebrates, invertebrates, and plants. Four
life-history traits (Age at first reproduction, Body size, Fertility, Longevity) were
related statistically to Gompertz strength of density feedback using generalized
linear mixed-effects models and multi-model inference. Life-history traits alone
explained 10 to 30% of the variation in strength across species (after controlling
for time-series length and phylogenetic nonindependence). Effect sizes were
largest for body size in mammals and longevity in birds, and density feedback
was consistently stronger for smaller-bodied and shorter-lived species. Over-
compensatory density feedback (strength <�1) occurred in 20% of species,
predominantly at the fast end of the life-history continuum, implying relatively
high population variability. These results support the idea that life history
leaves an evolutionary signal in long-term population trends as inferred from
census data. Where there is a lack of detailed demographic data, broad life-his-
tory information can inform management and conservation decisions about
rebound capacity from low numbers, and propensity to fluctuate, of arrays of
species in areas planned for development, harvesting, protection, and popula-
tion recovery.
Introduction
Density dependence (Smith 1935; Allee 1941) represents a
causal relationship between population size (predictor)
and a demographic rate (response), that is, a “density
feedback”. Such relationship can be “compensatory” or
“depensatory” if population growth, survival, and/or fer-
tility rates decrease or increase with population boom,
respectively (Herrando-Perez et al. 2012a). Statistical sup-
port for those feedbacks indicates that demographic rates
are shaped by social and trophic interactions such as
competition, cooperation, disease, parasitism, or preda-
tion, because the intensity of these ecological mechanisms
varies with population size (Herrando-Perez et al. 2012b).
In single-species population models that quantify density
feedback (Brook and Bradshaw 2006; Eberhardt et al.
2008), it has been suggested that cross-taxa patterns of
population dynamics can be predicted from information
on life-history traits by arranging species along a contin-
uum from “slow” to “fast” life histories (Saether et al.
2002). This continuum had been thoroughly investigated
in the 1980s in homeotherms (Saether 1987; Galliard
et al. 1989; Read and Harvey 1989) – the prediction being
that fast taxa should be capable of growing to larger pop-
ulation sizes at much higher rates than slow taxa via the
former’s shorter gestation, shorter intervals between
reproductive bouts, earlier maturity, smaller adult size,
shorter life, shorter lactation, smaller and more prolific
offspring, and more litters per year, regardless of whether
one controls for body size (Stearns 1983; Saether et al.
1996). In support of such predictions, changes in popula-
tion growth rate (sensitivities) arise mainly from variabil-
ity in reproductive rates in fast species and in survival
rates for slow species of birds (Saether and Bakke 2000),
ª 2012 The Authors. Published by Blackwell Publishing Ltd. This is an open access article under the terms of the
Creative Commons Attribution Non-Commercial License, which permits use, distribution and reproduction in any medium, provided
the original work is properly cited and is not used for commercial purposes.
1

mammals (Heppell et al. 2000; Oli and Dobson 2003; Oli
et al. 2005), fish (Cortes 2002), insects (Blackburn 1991),
and plants (Franco and Silvertown 2004). It is therefore
reasonable to postulate that the position of a species
along this continuum could also reflect the propensity of
population growth rates to vary in response to social/tro-
phic interactions among individuals, as inferred from
metrics of density feedback.
Evidence for density feedback increases with longevity
based on census data from bird species (Holyoak and
Baillie 1996), and species with slow life histories (longer
generation times, larger body size, smaller litters) experi-
ence more demographic stability when compensatory
density feedbacks operate than fast species with recruit-
ment-driven dynamics (Saether et al. 2002). The only two
studies that have investigated this matter over broad taxo-
nomic groups have focused on the shape (i.e., nonlinear-
ity) of density feedback and provided conflicting results.
First, Fowler (1981) formalized the links between convex
(compensatory feedback strongest at high numbers) and
concave (compensatory feedback strongest at low
numbers) density feedback with the life histories of
(large-bodied) mammals and (small-bodied) insects,
respectively. He later showed that the inflection point of
animal population growth curves declined with accelerat-
ing growth per generation (hence from slow to fast spe-
cies), irrespective of body size (Fowler 1988). Conversely,
Sibly et al. (2005) claimed an unprecedented ubiquity of
concave density feedback across mammals, birds, bony
fish, and insects by applying a modified, curve-fitting
form of the theta-logistic equation (Gilpin and Ayala
1973), with a change from concave to convex density
feedback from large to small body-sized mammals. This
article was repeatedly challenged immediately after publi-
cation (Doncaster 2006; Getz and Lloyd-Smith 2006; Ross
2006), and its conclusions soundly refuted due to funda-
mental flaws in the model-fitting approach employed
(Doncaster 2008; Polansky et al. 2009; Ross 2009; Clark
et al. 2010).
However controversial, the conclusions from these
kinds of studies are of immediate relevance to conserva-
tion and management, because strength and shape of
density feedback can dictate the (theoretical) capacity of a
population to recover from declines following natural
perturbations and/or harvest, thus exerting a strong influ-
ence on predictions of population extinction and viability
(Henle et al. 2004; Sabo et al. 2004), and harvesting quo-
tas (Boyce et al. 1999; Rose et al. 2001). So, while Fowler
(1981) suggested that large mammals should be harvested
at population sizes close to carrying capacity (where their
productivity is expected to peak given convex density
feedback), Sibly et al. (2005) stated that population
growth rates could be overestimated if convex density
feedback is assumed from life-history data (e.g., body
size), with potentially serious implications for harvesting
and management.
Here, we quantify strength of density feedback across
several hundred taxa (vertebrates, invertebrates, plants),
and determine effect sizes of and how much variance can
be explained by four life-history traits (age at first repro-
duction, body size, fertility, longevity) which capture the
slow–fast continuum. We hypothesize that the strength of
compensatory density feedbacks increases along this con-
tinuum, that is, from low to high fertility, extended to
short longevity, late to early age at first reproduction, and
large to small body size.
Materials and Methods
Data
We used the data set of Brook and Bradshaw (2006) and
Brook et al. (2006). In summary, these data consist of
one census of population abundance and one estimate of
four life-history traits for each of 1198 species (603
insects, 225 birds, 152 mammals, 115 fish, 36 aquatic
invertebrates, 30 plants, 27 amphibians, and 10 reptiles),
and feature >10 population counts per census (median =20, with 95% percentile range of [10–65]). We deemed
an annual time step appropriate to estimate population
turnover because most species’ census data were collected
from temperate regions, hence they generally experience
pronounced annual seasonality in reproductive events and
survival.
We obtained species-specific life-history traits from
independent sources (e.g., www.demogr.mpg.de/longevi-
tyrecords, www.bto.org, or genomics.senescence.info) for
each of the 1198 species: (i) average age at first repro-
duction (months), (ii) maximum body size (length in
mm), (iii) fertility (number of young per year), and
(iv) longevity (maximum age attained in the wild in
months) (Brook et al. 2006). These traits suffice to cap-
ture the principal features of the slow–fast continuum
in mammals and birds (Galliard et al. 1989), and fall
within the group of traits originally used to define this
continuum (Stearns 1983). We explored correlations
between traits representing gradients of life history
across taxa through principal-component analysis (Jol-
liffe 2004).
Strength of density feedback
Following Brook and Bradshaw (2006), we ranked
evidence for Ricker-logistic and Gompertz population
growth (density feedback present) against models of
random walk and exponential growth (density feedback
2 ª 2012 The Authors. Published by Blackwell Publishing Ltd.
Life History and Density Feedback S. Herrando-Perez et al.
absent) by means of Akaike’s information criterion cor-
rected for finite sample size (AICc, Sugiura 1978). AICc
and the Bayesian information criterion (BIC; Schwarz
1978), had approximately equivalent penalty terms for the
median time-series length in our samples and thus pro-
duced qualitatively similar results.
For those time series supported for Gompertz growth,
and having similar support for both Gompertz and Rick-
er-logistic growth (DAICc <4), we collated the estimates
of strength of compensatory density feedback from the
Gompertz equation (Medawar 1940; Nelder 1961), that is,
the slope of the relationship of r [= loge(Nt+1/Nt)] versus
population size on a log scale:
logeNtþ1
Nt
� �¼ aþ b logeðNtÞ þ et
where Nt = population size at time t, a = intercept,
b = strength of density feedback, and et = Gaussian ran-
dom variable with a mean of zero and a variance r2
reflecting stochastic variability in r. This model (i) is
measured on a proportional scale and so characterizes
the multiplicative nature of demographic rates (Bjørnstad
et al. 1995), (ii) clearly informs the magnitude of the
compensatory response of demographic rates to changes
in population size relative to nonlinear models (Doncas-
ter 2006), and (iii) slopes above and below –1 represent
the threshold between expected stable and chaotic
dynamics, respectively, and so provide a simple metric
with which to assess population variability (Varley et al.
1973; Doncaster 2008) – slopes <–1 imply that the pro-
portional number of survivors over any time step of a
census decreases by >100% for a one-order-magnitude
increase in population size. Furthermore, the Gompertz
model has performed robustly in describing the general
dynamics of populations over a wide range of body sizes
(Saitoh et al. 1999; Wang et al. 2002, 2009; White et al.
2007; Seavy et al. 2009; Pasinelli et al. 2011) is present in
multi-model inference scenarios where competing models
are contrasted (Saitoh et al. 1997; Zeng et al. 1998; Fryx-
ell et al. 2005; Chamaille-Jammes et al. 2008; McMahon
et al. 2009), is the top-ranked model in meta-analyses of
hundreds of species in which various alternatives have
also been evaluated (Brook and Bradshaw 2006), and has
been a model used in theoretical development about
density feedback (Dennis et al. 2006). We avoided fitting
the fully parameterized theta-logistic model (see Intro-
duction), or other highly parameterized analogs (e.g.,
hyperbolic growth). Yet, we also did all analyses using
the Ricker-logistic strength of density feedback as
response. In our study, we make no claim about the reg-
ulation of populations, because moderate compensatory
density feedback is only one requirement for population
regulation (Herrando-Perez et al. 2012b).
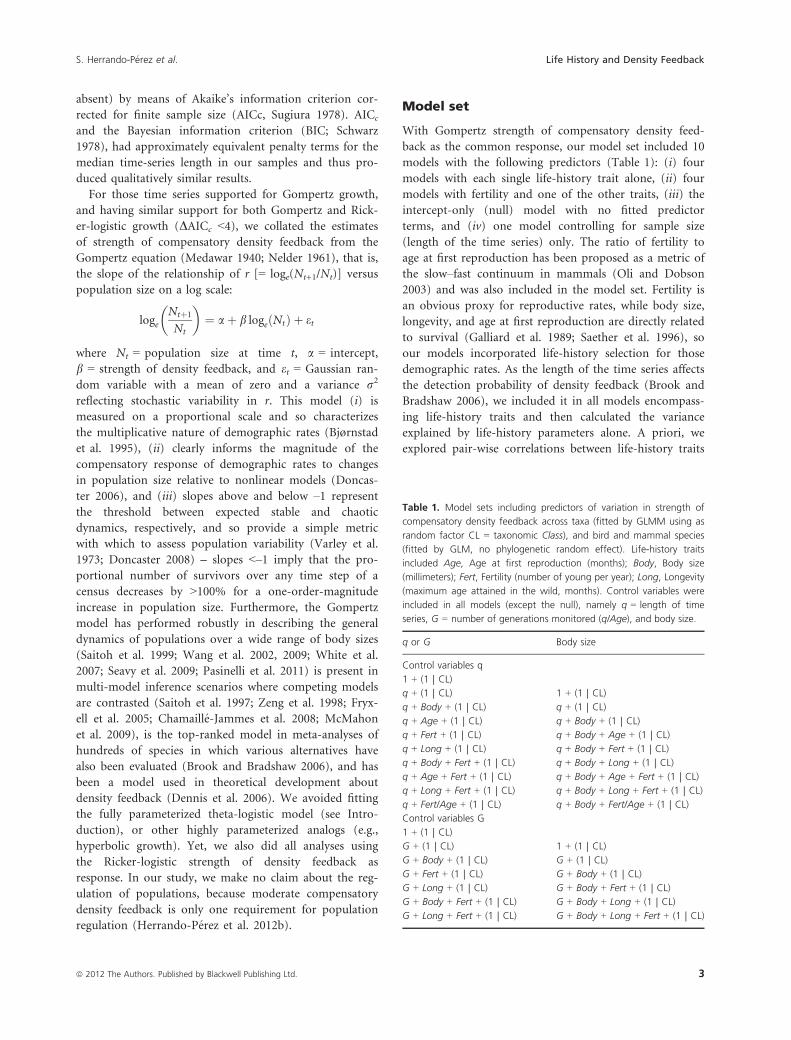
Model set
With Gompertz strength of compensatory density feed-
back as the common response, our model set included 10
models with the following predictors (Table 1): (i) four
models with each single life-history trait alone, (ii) four
models with fertility and one of the other traits, (iii) the
intercept-only (null) model with no fitted predictor
terms, and (iv) one model controlling for sample size
(length of the time series) only. The ratio of fertility to
age at first reproduction has been proposed as a metric of
the slow–fast continuum in mammals (Oli and Dobson
2003) and was also included in the model set. Fertility is
an obvious proxy for reproductive rates, while body size,
longevity, and age at first reproduction are directly related
to survival (Galliard et al. 1989; Saether et al. 1996), so
our models incorporated life-history selection for those
demographic rates. As the length of the time series affects
the detection probability of density feedback (Brook and
Bradshaw 2006), we included it in all models encompass-
ing life-history traits and then calculated the variance
explained by life-history parameters alone. A priori, we
explored pair-wise correlations between life-history traits
Table 1. Model sets including predictors of variation in strength of
compensatory density feedback across taxa (fitted by GLMM using as
random factor CL = taxonomic Class), and bird and mammal species
(fitted by GLM, no phylogenetic random effect). Life-history traits
included Age, Age at first reproduction (months); Body, Body size
(millimeters); Fert, Fertility (number of young per year); Long, Longevity
(maximum age attained in the wild, months). Control variables were
included in all models (except the null), namely q = length of time
series, G = number of generations monitored (q/Age), and body size.
q or G Body size
Control variables q
1 + (1 | CL)
q + (1 | CL) 1 + (1 | CL)
q + Body + (1 | CL) q + (1 | CL)
q + Age + (1 | CL) q + Body + (1 | CL)
q + Fert + (1 | CL) q + Body + Age + (1 | CL)
q + Long + (1 | CL) q + Body + Fert + (1 | CL)
q + Body + Fert + (1 | CL) q + Body + Long + (1 | CL)
q + Age + Fert + (1 | CL) q + Body + Age + Fert + (1 | CL)
q + Long + Fert + (1 | CL) q + Body + Long + Fert + (1 | CL)
q + Fert/Age + (1 | CL) q + Body + Fert/Age + (1 | CL)
Control variables G
1 + (1 | CL)
G + (1 | CL) 1 + (1 | CL)
G + Body + (1 | CL) G + (1 | CL)
G + Fert + (1 | CL) G + Body + (1 | CL)
G + Long + (1 | CL) G + Body + Fert + (1 | CL)
G + Body + Fert + (1 | CL) G + Body + Long + (1 | CL)
G + Long + Fert + (1 | CL) G + Body + Long + Fert + (1 | CL)
ª 2012 The Authors. Published by Blackwell Publishing Ltd. 3
S. Herrando-Perez et al. Life History and Density Feedback

and did not include strongly co-linear traits in our model
contrasts (except when controlling for body size [see
below]); and we dispensed with any interaction terms due
to the difficulty of their interpretation in this context,
thus avoiding over-parameterizing models. Finally, we did
not use the principal components of our PCA (principal
component analysis) analyses (see above) as predictors in
our models because we were not interested in (poten-
tially) maximizing model goodness of fit, but mainly in
teasing apart the relative fixed effects of single life-history
traits.
Model fitting
We fitted all models using generalized linear mixed-effects
models (GLMM; Breslow and Clayton 1993). Model
assumptions were met using a Gaussian variance function
after a square-root transformation of density-feedback
strengths, such transformation being supported by a like-
lihood-based test of Box and Cox (1964). Covariance
between life-history traits should be incorporated in
cross-taxa comparisons of demographic and evolutionary
responses (Felsenstein 1985), and can be accounted for by
allowing different intercepts for species grouped by higher
taxonomic levels (Blackburn and Duncan 2001). We did
so by including the Linnaean taxonomic level of Class as
a random effect in our GLMMs (Table 1). We discarded
nested random factors by Family and Order due to insuf-
ficient replication over half of the families and orders; we
also replicated our analyses for birds and mammals (see
below) separately using generalized linear models (GLM).
We quantified relative support for models in a set by
means of the BIC (Schwarz 1978) because BIC favors
more parsimonious models than AIC when sample sizes
are large (~50 to 300 estimates of strength in any of our
model contrasts) and we wanted to distinguish main from
tapering effects (Burnham and Anderson 2002; Link and
Barker 2006). Nevertheless, both BIC and AIC yielded
nearly identical model support and the same biological
conclusions emerged. Exploratory analyses confirmed that,
within each of 12 (“redundant studies” hereafter) of the
204 peer-reviewed data sources, individual species’ time
series had equal time-series length, and life-history traits
had equal or similar values. Such redundant information
was bound to overwhelm model fitting since it affected
613 species (~60% of the data set, of which 519 were
insects, for instance, multi-species monitoring of aphids
and moths at single field stations). To avoid this, we sepa-
rated “redundant species” from the remaining (nonredun-
dant) “core species.” Of the 772 times series supported for
Gompertz growth, 326 belonged to “core species” and 446
were from “redundant species.” After accounting for data
redundancy, we could fit our models robustly to all taxa,
mammals, and birds. We calculated model ranking and
relative fixed effects on 100 data subsets, each consisting
of one bootstrapped sample of all core species and one
randomly sampled species from each of the redundant
studies – that is, 100 contrasts of the same model set, each
time on a different bootstrapped sample. We measured
relative model support across the set by the medians and
95 percentile confidence intervals of BIC metrics (DBIC,model probabilities, deviances) over the 100 bootstrapped
samples. Furthermore, we used model averaging (Burn-
ham and Anderson 2002) to estimate the coefficients of
the fixed effects for each life-history trait on strength of
density feedback. Thus, we summed model probabilities
for each model containing a given life-history trait
weighted by its effect size as a measure of across-model
effect size. To confirm that effect sizes were comparable
among life-history traits of different range, we assessed
them with and without a post hoc standardization
(trait 9 SD [response]/SD [trait]).
Complementary analyses
To avoid the confounding effects of measuring error,
authors either set stringent criteria for data selection
(Knape and Valpine 2012), or use state-space models
(Dennis et al. 2006; Knape 2008; Ives et al. 2010), which
themselves are not, however, exempt of caveats (Knape
2008) and add further model complexity to cross-taxa
comparisons. Therefore, we decided to replicate all analy-
ses for (i) the entire data set, (ii) a subset of “high-qual-
ity” time series featuring stationarity, no temporal
trending, few missing values, no outliers, and length of
counts of >14 time steps (these criteria are fully explained
in Table S2), and (iii) simulated time series from the
observed Gompertz parameters with incorporation of 5%,
10%, and 15% of measurement error (we present this
simulation in the Supporting Information [Table S7]).
We did not have access to estimates of each species’
“generation time” as used elsewhere to relate single-species
population models to life history, for example, (Saether
et al. 2005, 2004). As body size correlates with generation
time and intrinsic growth rates (Peters 1983), and needs
to be accounted for when studying the slow–fast life-his-tory continuum (Stearns 1983; Galliard et al. 1989; Jeschke
and Kokko 2009), we controlled for allometric relation-
ships among species by redoing all analyses with a model
set including body size in all models, then compared rela-
tive effect sizes of each life-history trait in model sets with
and without the control for body size. As a further control
for generation time, we repeated all analyses using the
number of generations monitored in each census
(G = time-series length/age at first reproduction); this
model set had seven candidate models after removing
4 ª 2012 The Authors. Published by Blackwell Publishing Ltd.
Life History and Density Feedback S. Herrando-Perez et al.

those including age at first reproduction (Table 1). We
did all data analyses in R v2.14 (R Development Core
Team 2011), and gave sample sizes for every model con-
trast in Table S1.
Results
Magnitude of density feedback across taxa
Median model probabilities (with 95% percentile ranges)
for all species were 0.38 (0.07–0.97) for Gompertz, 0.23
(0.02–0.75) for Ricker-logistic, 0.16 (<0.01–0.67) for ran-
dom walk, and 0.05 (<0.01–0.30) for exponential popula-tion growth. We found support for either of the two
density-dependent models in 865 censuses, with total
median evidence of 0.78 (0.14–1.00) (pooled model prob-
ability for Gompertz and Ricker-logistic models). Overall,
the median probability of a population to show evidence
for compensatory density feedback was 3.5 times that of
not showing so. A total of 772 times series (64%, all data)
(and 583 or 73% of the high-quality time series) were
supported for Gompertz growth. We employed those sub-
sets of 772 and 583 censuses in further analyses (Table S1).
Median strength of density feedback was –0.7 (–1.4 to
–0.2), so increases in population size by a factor of ~3 (i.
e., one order of magnitude on a natural logarithm scale)
caused a median 70% reduction in population growth
rates. In order of strength by major taxonomic groups,
plants were highest at –0.9 (–1.3 to –0.6), followed by
herpetiles at –0.9 (–1.4 to –0.5), aquatic invertebrates
at –0.8 (–1.5 to –0.2), insects at –0.8 (–1.4 to –0.3), fishat –0.7 (–1.3 to –0.2), birds at –0.6 (–1.3 to –0.2), and
mammals at –0.4 (–1.4 to –0.1). We found similar magni-
tude and across-taxa ordering of strength of density feed-
back for the high-quality time series.
Overcompensatory density feedback (strength <�1)
occurred in ~20% of the censuses (all and high-quality
time series), being relatively common among some of the
small-bodied species of amphibians (seven species, 40% of
amphibians), insects (96, 22%), fish (11, 21%), mammals
(16, 18%), and birds (15, 10%). For instance, the five
strongest density feedbacks were for the small tortoiseshell
nymphalid Aglais urticae (–1.9 ± 0.4 SE), the common
shrew Sorex araneus (–1.8 ± 0.2 SE), the leaf miner agro-
myzid Chromatomyia suikazurae (–1.7 ± 0.5 SE), the red
crossbill finch Loxia curvirostra (–1.6 ± 0.3 SE), and the
oak aphid Tuberculatus annulatus (–1.6 ± 0.3 SE).
Predicting strength of density feedbackfrom life history
The variation in strength of density feedback explained by
life-history traits alone was 8 to 25% across all species, 28
to 34% for mammals, and 10 to 17% for birds over mod-
els controlling for census length (Table 2) and number of
generations monitored (Table S4). Top-ranked models
included longevity for all species and for just birds, and
body size in mammals (Tables 2 and S4). Length of time
series alone explained up to 21% (all species), 17%
(mammals), and 10% (birds) of the variation in strength
(Table 2), while the explanatory capacity was much lower
for the number of generations monitored, that is, 0.1%
(all species), 9% (mammals), and 2% (birds) (Table S4).
Moreover, models including life-history traits had
Table 2. Bayesian information criterion (BIC) support for the top-ranked modelsa relating life history to strength of density feedback through
GLMM for all taxa (aquatic invertebrates, amphibians, birds, fish, insects, mammals, plants, reptiles), and GLM for the subsets of mammal and
bird species. wBIC,%DE and D%DE are medians (in bold) from 100 bootstrapped samples (95% percentile range)b. Models included time-series
length (q), and body size (Body) as controls. We show effect sizes in Figure 1, model sets in Table 1, and sample sizes in Table S1.
Data set
Control
variable
Top-ranked model per
model set wBIC %DE D%DE ER
% Top-rank
consistency
All taxa q Strength ~ q+Long 0.57 (0.00–1.00) 30.7 (22.2–42.2) 9.5 (5.2–15.4) >1000 54 (19)
All taxa q,Body Strength ~ q+Body+Long 0.64 (0.01–0.99) 29.0 (21.1–40.4) 8.2 (3.4–13.8) >1000 63 (16)
Mammals q Strength ~ q+Body 0.79 (0.07–0.90) 45.2 (31.6–61.8) 28.9 (12.2–50.5) >1000 85 (11)
Mammals q,Body Strength ~ q+Body 0.59 (0.09–0.71) 45.2 (31.6–61.8) 28.3 (12.2–50.5) >1000 80 (18)
Birds q Strength ~ q+Long 0.60 (0.04–0.91) 19.4 (8.8–34.4) 10.0 (2.4–20.4) 200 75 (20)
Birds q,Body Strength ~ q+Body+Long 0.29 (0.02–0.88) 21.1 (9.2–35.5) 11.0 (3.2–21.3) 20 43 (42)
aModel sets: One single response (Strength of compensatory density feedback), and 1 or 2 life-history predictors (Age = Age at first reproduction
[months]; Body, Body size [mm]; Fert, Fertility [number of young per year]; and Long, Longevity [maximum age attained in the wild, months]).bBIC metrics: wBIC, BIC Model probabilities given each data and model set; %DE, % Deviance in Strength explained by each model within each
model set; D%DE, % Deviance in Strength explained by each model minus% Deviance in Strength explained by the model including only q (i.e.,
Deviance in Strength explained by life history conditional on q); ER, Evidence ratio of the top-ranked model wBIC compared to q-only model wBIC
for each model set (i.e., times support for top-ranked model equating life-history traits was larger than for the only q model); and %Top-ranked
consistency, times a model was top-ranked over the 100 bootstrapped samples (times each model was not the top-ranked model yet received
considerable support [DBIC < 4])
ª 2012 The Authors. Published by Blackwell Publishing Ltd. 5
S. Herrando-Perez et al. Life History and Density Feedback
between 20 and >1000 times higher statistical support
than models including only either of the two control vari-
ables (evidence ratios given in Tables 2 and S4). Impor-
tantly, the same model rankings and similar explained
deviances occurred in simulated time series after incorpo-
ration of 5% measurement error in all taxa and birds,
and up to 10% in mammals (Table S7).
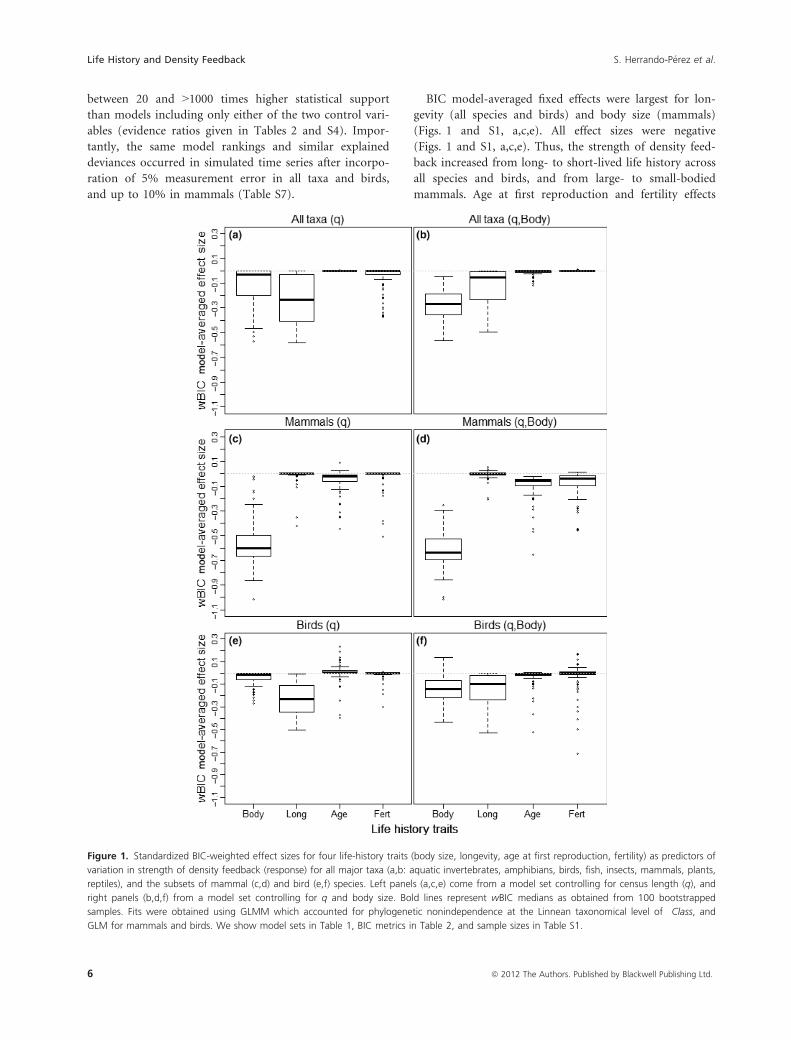
BIC model-averaged fixed effects were largest for lon-
gevity (all species and birds) and body size (mammals)
(Figs. 1 and S1, a,c,e). All effect sizes were negative
(Figs. 1 and S1, a,c,e). Thus, the strength of density feed-
back increased from long- to short-lived life history across
all species and birds, and from large- to small-bodied
mammals. Age at first reproduction and fertility effects
Figure 1. Standardized BIC-weighted effect sizes for four life-history traits (body size, longevity, age at first reproduction, fertility) as predictors of
variation in strength of density feedback (response) for all major taxa (a,b: aquatic invertebrates, amphibians, birds, fish, insects, mammals, plants,
reptiles), and the subsets of mammal (c,d) and bird (e,f) species. Left panels (a,c,e) come from a model set controlling for census length (q), and
right panels (b,d,f) from a model set controlling for q and body size. Bold lines represent wBIC medians as obtained from 100 bootstrapped
samples. Fits were obtained using GLMM which accounted for phylogenetic nonindependence at the Linnean taxonomical level of Class, and
GLM for mammals and birds. We show model sets in Table 1, BIC metrics in Table 2, and sample sizes in Table S1.
6 ª 2012 The Authors. Published by Blackwell Publishing Ltd.
Life History and Density Feedback S. Herrando-Perez et al.
scored relatively small model-averaged effect sizes (Figs. 1
and S1, a,c,e). The trends above prevailed when we con-
trolled for body size (Figs. 1, and S1, panels b,d,f), for the
high-quality data set (Tables S5 and S6; Figs. S2 and S3),
and using the Ricker-logistic strength of density feedback
as response in all model contrasts.
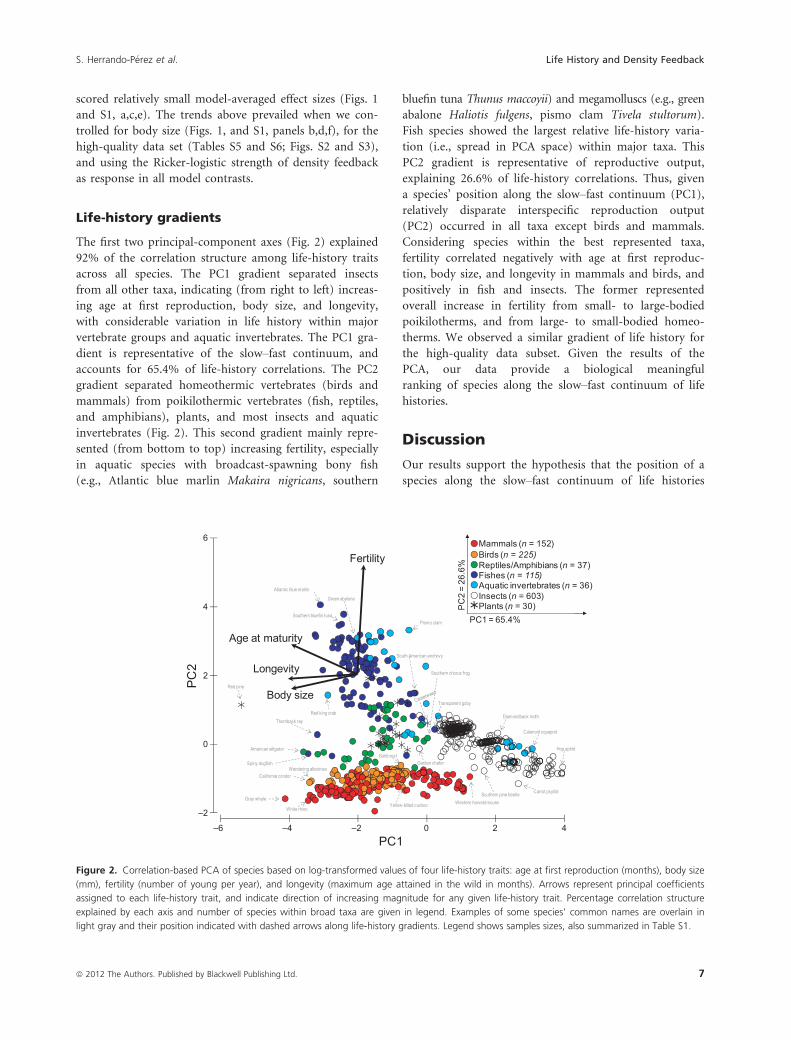
Life-history gradients
The first two principal-component axes (Fig. 2) explained
92% of the correlation structure among life-history traits
across all species. The PC1 gradient separated insects
from all other taxa, indicating (from right to left) increas-
ing age at first reproduction, body size, and longevity,
with considerable variation in life history within major
vertebrate groups and aquatic invertebrates. The PC1 gra-
dient is representative of the slow–fast continuum, and
accounts for 65.4% of life-history correlations. The PC2
gradient separated homeothermic vertebrates (birds and
mammals) from poikilothermic vertebrates (fish, reptiles,
and amphibians), plants, and most insects and aquatic
invertebrates (Fig. 2). This second gradient mainly repre-
sented (from bottom to top) increasing fertility, especially
in aquatic species with broadcast-spawning bony fish
(e.g., Atlantic blue marlin Makaira nigricans, southern
bluefin tuna Thunus maccoyii) and megamolluscs (e.g., green
abalone Haliotis fulgens, pismo clam Tivela stultorum).
Fish species showed the largest relative life-history varia-
tion (i.e., spread in PCA space) within major taxa. This
PC2 gradient is representative of reproductive output,
explaining 26.6% of life-history correlations. Thus, given
a species’ position along the slow–fast continuum (PC1),
relatively disparate interspecific reproduction output
(PC2) occurred in all taxa except birds and mammals.
Considering species within the best represented taxa,
fertility correlated negatively with age at first reproduc-
tion, body size, and longevity in mammals and birds, and
positively in fish and insects. The former represented
overall increase in fertility from small- to large-bodied
poikilotherms, and from large- to small-bodied homeo-
therms. We observed a similar gradient of life history for
the high-quality data subset. Given the results of the
PCA, our data provide a biological meaningful
ranking of species along the slow–fast continuum of life
histories.
Discussion
Our results support the hypothesis that the position of a
species along the slow–fast continuum of life histories
–2
0
2
4
6
Body size
Longevity
Age at maturity
FertilityMammals (n = 152)Birds (n = 225)Reptiles/Amphibians (n = 37)Fishes (n = 115)Aquatic invertebrates (n = 36)Insects (n = 603)Plants (n = 30)
PC1 = 65.4%
PC
2 =
26.6
%
–6 –4 –2 0 2 4
Southern chorus frog
Carrot psyllid
Southern bluefin tuna
American alligator
Gray whale
Atlantic blue marlin
Hop aphid
Green abalone
Red pine
Calanoid copepod
Thornback ray
Garden chafer
South American anchovy
Western harvest mouseYellow-billed cuckoo
California condor
Pismo clam
Red king crab
Wandering albatross
White rhino
Goldcrest
Diamondback moth
Southern pine beetle
Spiny dogfish
Transparent goby
PC1
PC2
Figure 2. Correlation-based PCA of species based on log-transformed values of four life-history traits: age at first reproduction (months), body size
(mm), fertility (number of young per year), and longevity (maximum age attained in the wild in months). Arrows represent principal coefficients
assigned to each life-history trait, and indicate direction of increasing magnitude for any given life-history trait. Percentage correlation structure
explained by each axis and number of species within broad taxa are given in legend. Examples of some species’ common names are overlain in
light gray and their position indicated with dashed arrows along life-history gradients. Legend shows samples sizes, also summarized in Table S1.
ª 2012 The Authors. Published by Blackwell Publishing Ltd. 7
S. Herrando-Perez et al. Life History and Density Feedback
imprints an evolutionary signal in population trajectories
apparently shaped by density feedback across several
hundred species of invertebrates, vertebrates, and plants.
Previous studies, using different statistical approaches and
plagued by violated assumptions (see below), provided
simple correlations between life history and metrics of
density feedback (Saether et al. 2002; Sibly et al. 2005;
Saether et al. 2005), inflection points (Fowler 1981, 1988;
Sibly et al. 2005), return to carrying capacity (Sibly et al.
2007), or sensitivities (Saether and Bakke 2000; Heppell
et al. 2000; Oli and Dobson 2003; Franco and Silvertown
2004). We thus give the first robust quantitative assess-
ment of the correlation between density feedback and life
history, simultaneously including controls for taxonomy,
allometry, prediction for several traits ecologically and
evolutionarily related to fertility and survival, and a quan-
tification of relative effect sizes.
Matching metabolic expectations, allometry (i.e., body
size) accounts for most of the explained variation in
strength of density feedback across all taxa, especially in
mammals (Duncan et al. 2007; Sibly and Brown 2007).
Indeed, fast life histories characterize species with relatively
low per capita biomass production (Ernest et al. 2003),
high intrinsic rates of increase, and high population densi-
ties and larger energy investments in reproduction relative
to body maintenance (Fenchel 1974; Blueweiss et al. 1978;
Brown et al. 2004), as a result, stronger compensatory den-
sity feedbacks are expected. After accounting for allometry,
we found that the effect sizes of other life-history traits on
the strength of compensatory density feedbacks remain low
in mammals, but longevity remains a good predictor for
birds. Mammals show the widest range of body sizes
among living vertebrates; however, body size in most birds
is constrained by flight, and longevity instead seems to be
selected for along the slow–fast continuum for this group
(Galliard et al. 1989). Furthermore, Gompertz strengths <–1 are indicative of overcompensatory density feedback,
which can result in populations overshooting carrying
capacity and undergoing chaotic fluctuations (Varley et al.
1973). We predicted such overcompensatory feedbacks in
~20% of all taxa and mammals, and ~10% of birds, mainly
at the fast end of the life-history continuum. This implies
more population variability in the long term for fast spe-
cies, as has indeed been shown for birds (Saether et al.
2002, 2004; Saether and Engen 2002) and mammals (Sin-
clair 1996; Erb et al. 2001; Fagan et al. 2001).
We used four life-history traits (age at first reproduc-
tion, body size, fertility, longevity) to represent the slow–fast continuum. However, life-history signaling in census
data might be even stronger than detected here if other
traits (particularly size of individual offspring and fre-
quency of reproductive bouts) were available to represent
other gradients of life history, such as those of altricial/pre-
cocial homeotherms (Stearns 1983), periodic/equilibrium/
opportunistic fish (Winemiller and Rose 1992), and bet-
hedgers (Saether et al. 1996). For insects and other inverte-
brates, the slow–fast continuum has been investigated only
in some hymenopterans and odonates (Blackburn 1991;
Johansson 2000), and future studies should carefully con-
sider tradeoffs between life-history traits operating from
larval to adult stages.
The link between density feedback and the slow–fastcontinuum has been previously assessed in a few studies,
albeit using contrasting metrics (i.e., density feedback
shape and strength, population growth rate inflection
points, process error, return rates), and from different
population growth models such as theta-logistic variants
(Saether et al. 2002, 2004; Saether and Engen 2002), age-
structured autoregression (Lande et al. 2002, 2006; Sae-
ther et al. 2005), and polynomials (Fowler 1981, 1988;
Sibly et al. 2007). Given these various choices, it is
unclear to what extent results across those studies are
comparable. Due to severe fitting issues with the theta-
logistic model such as the inherent play-offs between the
shape parameter h and maximum rate of population
increase rm (Clark et al. 2010), correlations between hand life history must be revisited. The assignment of clear
biological meaning to model parameters would certainly
facilitate understanding of the generality of results across
taxa and studies. Of particular relevance to assessing cor-
relations between long-term demographic data and life
history, is the understanding of how measurement error
affects estimates of density feedback (Freckleton et al.
2006; Knape and de Valpine 2012). We found that model
rankings remained unchanged after the introduction of
between 5% (all taxa and birds) and 10% (mammals)
additive measurement error in simulated time series. Fur-
ther work is required to specify, not only whether mea-
surement error can affect feedback detection and
parameter estimation by phenomenological models
(Freckleton et al. 2006) but which error thresholds begin
to erode the characteristics and biological interpretation
of population growth curves.
Conclusion
The mechanistic implication of our findings is that life
history is correlated with a degree of measurable demo-
graphic variation by making species prone to experience
larger or smaller negative crowding effects through trophic
and social processes, regardless of stochastic forces. How
and what processes relate to life history remains contro-
versial, even for (the best-studied) mammals (Caughley
and Krebs 1983; Krebs 2009). Increasing strength of den-
sity feedback can enhance population recovery, yet also
magnify population variability in the smallest species,
8 ª 2012 The Authors. Published by Blackwell Publishing Ltd.
Life History and Density Feedback S. Herrando-Perez et al.
hence potentially making these species more vulnerable to
extinction – an outcome of high predictive value for fish-
ery collapses (Anderson et al. 2008). Recent emphasis on
extinction dynamics caused by stochastic factors (Mel-
bourne and Hastings 2008) should also take into account
social/trophic interactions driving strong density feedback
with extreme population variability (Brook et al. 2008).
Methodologically, this underlines the need for broader
application of models capturing eruptive dynamics in the
analysis of long-term censuses, but for both slow (Forsyth
and Caley 2006) and fast species.
Managers and conservationists can resort to generalized
life-history estimates to predict population recoveries fol-
lowing harvesting and environmental shocks, and to rank
species by the propensity to undergo particular patterns
of change. In particular, our results are applicable where
management and conservation priorities need to be made
on the basis of rankings of species’ conservation status
(Knapp et al. 2003), in the absence of detailed demo-
graphic or, in general, quantitative data (Tulloch et al.
2011), such as in the monitoring of areas planned for
development, exploitation, protection, or focal investment
on population recovery (Possingham et al. 2002). The
strength of density feedback indicates rebound capacity
from low numbers, which can be approximated by the
position of a species along the slow–fast continuum, and
such approximation could complement other qualitative
measures of conservation status attempting to optimize
the allocation of always-limited resources (Possingham
et al. 2002; Tulloch et al. 2011).
Acknowledgments
Funding provided by an Endeavour International Post-
graduate Scholarship (University of Adelaide) to S. H. P.,
and by an Australian Research Council Discovery Project
grant (DP0878582) to C. J. A. B. We thank K. O. Winem-
iller and N. Owen-Smith for helpful comments that
improved an early version of our study.
References
Allee, W. C. 1941. Integration of problems concerning
protozoan populations with those of general biology. Am.
Nat. 75:473–487.
Anderson, C. N. K., C. H. Hsieh, S. A. Sandin, R. Hewitt,
A. Hollowed, and J. Beddington, et al. 2008. Why fishing
magnifies fluctuations in fish abundance. Nature
452:835–839. doi:10.1038/nature06851
Bjørnstad, O. N., W. Falck, and N. C. Stenseth. 1995.
Geographic gradient in small rodent density fluctuations - a
statistical modelling approach. Proc. R. Soc. Lond. B Biol.
Sci. 262:127–133.
Blackburn, T. M. 1991. Evidence for a ‘fast-slow’ continuum
of life-history traits among parasitoid hymenoptera. Funct.
Ecol. 5:65–74.
Blackburn, T. M., and R. P. Duncan. 2001. Determinants
of establishment success in introduced birds. Nature
414:195–197.
Blueweiss, L., H. Fox, V. Kudzma, D. Nakashima, R. Peters,
and S. Sams. 1978. Relationships between body size and
some life history parameters. Oecologia 37:257–272.
doi:10.1007/bf00344996
Box, G. E. P., and D. R. Cox. 1964. An analysis of
transformations (with discussion). J. Roy. Stat. Soc. B
26:211–252.
Boyce, M. S., A. R. E. Sinclair, and G. C. White. 1999.
Seasonal compensation of predation and harvesting. Oikos
87:419–426.
Breslow, N. E., and D. G. Clayton. 1993. Approximate
inference in generalized linear mixed models. J. Am. Stat.
Assoc. 88:9–25.
Brook, B. W., and C. J. A. Bradshaw. 2006. Strength of
evidence for density dependence in abundance time series of
1198 species. Ecology 87:1445–1451.
Brook, B. W., L. W. Traill, and C. J. A. Bradshaw. 2006.
Minimum viable population sizes and global extinction risk
are unrelated. Ecol. Lett. 9:375–382. doi:10.1111/j.1461-
0248.2006.00883.x
Brook, B. W., N. S. Sodhi, and C. J. A. Bradshaw. 2008.
Synergies among extinction drivers under global change.
Trends Ecol. Evol. 23:453–460.
Brown, J. H., J. F. Gillooly, A. P. Allen, V. M. Savage, and G.
B. West. 2004. Toward a metabolic theory of ecology.
Ecology 85:1771–1789.
Burnham, K. P., and D. R. Anderson. 2002. Model selection
and multimodel inference. 2nd ed. Springer Science,
Business Media, LLC, New York.
Caughley, G., and C. J. Krebs. 1983. Are big mammals simply
little mammals writ large? Oecologia 59:7–17.
Chamaille-Jammes, S., H. Fritz, M. Valeix, F.
Murindagomo, and J. Clobert. 2008. Resource variability,
aggregation and direct density dependence in an open
context: the local regulation of an African elephant
population. J. Anim. Ecol. 77:135–144. doi:10.1111/j.1365-
2656.2007.01307.x
Clark, F., B. W. Brook, S. Delean, R. H. Akcakaya, and C. J. A.
Bradshaw. 2010. The theta-logistic is unreliable for
modelling most census data. Methods Ecol. Evol. 1:253–262.
doi:10.1111/j.2041-210X.2010.00029.x
Cortes, E. 2002. Incorporating uncertainty into demographic
modeling: application to shark populations and their
conservation. Conserv. Biol. 16:1048–1062.
Dennis, B., J. M. Ponciano, S. R. Lele, M. L. Taper, and D. F.
Staples. 2006. Estimating density dependence, process noise,
and observation error. Ecol. Monogr. 76:323–341.
ª 2012 The Authors. Published by Blackwell Publishing Ltd. 9
S. Herrando-Perez et al. Life History and Density Feedback

Doncaster, C. P. 2006. Comment on “On the regulation of
populations of mammals, birds, fish, and insects” III.
Science 311:1100.
Doncaster, C. P. 2008. Non-linear density dependence in time
series is not evidence of non-logistic growth. Theor. Popul.
Biol. 73:483–489.
Duncan, R. P., D. M. Forsyth, and J. Hone. 2007. Testing the
metabolic theory of ecology: allometric scaling exponents in
mammals. Ecology 88:324–333.
Eberhardt, L. L., J. M. Breiwick, and D. P. Demaster. 2008.
Analyzing population growth curves. Oikos 117:1240–1246.
doi:10.1111/j.2008.0030-1299.16402.x
Erb, J., M. S. Boyce, and N. C. Stenseth. 2001. Population
dynamics of large and small mammals. Oikos 92:3–12.
Ernest, S. K. M., B. J. Enquist, J. H. Brown, E. L. Charnov,
J. F. Gillooly, V. M. Savage, et al. 2003. Thermodynamic
and metabolic effects on the scaling of production and
population energy use. Ecol. Lett. 6:990–995.
doi:10.1046/j.1461-0248.2003.00526.x
Fagan, W. F., E. Meir, J. Prendergast, A. Folarin, and P.
Karieva. 2001. Characterizing population vulnerability for
758 species. Ecol. Lett. 4:132–138.
Felsenstein, J. 1985. Phylogenies and the comparative method.
Am. Nat. 125:1. doi:10.1086/284325
Fenchel, T. 1974. Intrinsic rate of natural increase: the
relationship with body size. Oecologia 14:317–326.
Forsyth, D. M., and P. Caley. 2006. Testing the irruptive
paradigm of large-herbivore dynamics. Ecology 87:297–303.
Fowler, C. W. 1981. Density dependence as related to life-
history. Ecology 62:602–610.
Fowler, C. W. 1988. Population dynamics as related to rate of
increase per generation. Evol. Biol. 2:197–204.
Franco, M., and J. Silvertown. 2004. Comparative demography
of plants based upon elasticities of vital rates. Ecology
85:531–538.
Freckleton, R. P., A. R. Watkinson, R. E. Green, and W. J.
Sutherland. 2006. Census error and the detection of density
dependence. J. Anim. Ecol. 75:837–851. doi:10.1111/j.1365-
2656.2006.01121.x
Fryxell, J. M., I. M. Smith, and D. H. Lynn. 2005. Evaluation
of alternate harvesting strategies using experimental
microcosms. Oikos 111:143–149.
Gaillard, J. M., D. Pontier, D. Allaine, J. D. Lebreton,
J. Troivilliez, and J. Clobert. 1989. An analysis of
demographic tactics in birds and mammals. Oikos 56:59–76.
Getz, W. M., and J. O. Lloyd-Smith. 2006. Comment on “On
the regulation of populations of mammals, birds, fish, and
insects”. Science 311:1100.
Gilpin, M. E., and F. J. Ayala. 1973. Global models of
growth and competition. Proc. Natl Acad. Sci. USA
70:3590–3593.
Henle, K., S. Sarre, and K. Wiegand. 2004. The role of density
regulation in extinction processes and population viability
analysis. Biodivers. Conserv. 13:9–52.
Heppell, S. S., H. Caswell, and L. B. Crowder. 2000. Life
histories and elasticity patterns: perturbation analysis
for species with minimal demographic data. Ecology
81:654–665.
Herrando-Perez, S., S. Delean, B. W. Brook, and C. J. A.
Bradshaw. 2012a. Decoupling of component and ensemble
density feedbacks in birds and mammals. Ecology. doi:
10.1890/11-1415.1
Herrando-Perez, S., S. Delean, B. W. Brook, and C. J. A.
Bradshaw. 2012b. Density dependence: an ecological Tower
of Babel. Oecologia. doi: 10.1007/s00442-012-2347-3
Holyoak, M., and S. R. Baillie. 1996. Factors influencing
detection of density dependence in British birds. Oecologia
108:54–63.
Ives, A. R., K. C. Abbott, and N. L. Ziebarth. 2010. Analysis of
ecological time series with ARMA(p,q) models. Ecology
91:858–871. doi:10.1890/09-0442.1
Jeschke, J., and H. Kokko. 2009. The roles of body size and
phylogeny in fast and slow life histories. Evol. Ecol. 23:867–
878. doi:10.1007/s10682-008-9276-y
Johansson, F. 2000. The slow-fast life style characteristics in a
suite of six species of odonate larvae. Freshw. Biol. 43:149–
159.
Jolliffe, I. T. 2004. Principal component analysis. 2nd ed.
Springer Science, Business Media, LLC, New York.
Knape, J. 2008. Estimability of density dependence in models
of time series data. Ecology 89:2994–3000.
Knape, J., and P. de Valpine. 2012. Are patterns of density
dependence in the Global Population Dynamics Database
driven by uncertainty about population abundance? Ecol.
Lett. 15:17–23. doi:10.1111/j.1461-0248.2011.01702.x
Knape, J., and P. de Valpine. 2011. Effects of weather and
climate on the dynamics of animal population time series.
Proc. R. Soc. Lond. B Biol. Sci. 278:985–992. doi:10.1098/
rspb.2010.1333
Knapp, S. M., R. E. Russell, and R. K. Swihart. 2003. Setting
priorities for conservation: the influence of uncertainty on
species rankings of Indiana mammals. Biol. Conserv.
111:223–234. doi:10.1016/s0006-3207(02)00278-1
Krebs, C. J. 2009. Population dynamics of large and small
mammals: Graeme Caughley’s grand vision. Wildl. Res.
36:1–7. doi:10.1071/wr08004
Lande, R., S. Engen, B. E. Saether, F. Filli, E. Matthysen, and
H. Weimerskirch. 2002. Estimating density dependence from
population time series using demographic theory and life-
history data. Am. Nat. 159:321–337.
Lande, R., S. Engen, B. E. Saether, and T. Coulson. 2006.
Estimating density dependence from time series of
population age structure. Am. Nat. 168:76–87.
Link, W. A., and R. J. Barker. 2006. Model weights and the
foundations of multimodel inference. Ecology 87:2626–
2635.
McMahon, C. R., M. N. Bester, M. A. Hindell, B. W. Brook,
and C. J. A. Bradshaw. 2009. Shifting trends: detecting
10 ª 2012 The Authors. Published by Blackwell Publishing Ltd.
Life History and Density Feedback S. Herrando-Perez et al.

environmentally mediated regulation in long-lived marine
vertebrates using time-series data. Oecologia 159:69–82.
doi:10.1007/s00442-008-1205-9
Medawar, P. B. 1940. The growth, growth energy, and ageing
of the chicken’s heart. Proc. R. Soc. Lond. B Biol. Sci.
129:332–355. doi:10.1098/rspb.1940.0042
Melbourne, B. A., and A. Hastings. 2008. Extinction risk
depends strongly on factors contributing to stochasticity.
Nature 454:100–103. doi:10.1038/nature06922
Nelder, J. A. 1961. The fitting of a generalization of the logistic
curve. Biometrics 17:89–110.
Oli, M. K., and F. S. Dobson. 2003. The relative importance of
life-history variables to population growth rate in mammals:
Cole’s prediction revisited. Am. Nat. 161:422–440.
Oli, M. K., and F. S. Dobson. 2005. Generation time, elasticity
patterns, and mammalian life histories: a reply to Gaillard
et al. Am. Nat. 166:124–128.
Pasinelli, G., M. Schaub, G. Hafliger, M. Frey, H. Jakober,
M. Muller, et al. 2011. Impact of density and environmental
factors on population fluctuations in a migratory passerine.
J. Anim. Ecol. 80:225–234. doi:10.1111/j.1365-
2656.2010.01754.x
Peters, R. H. 1983. The ecological implications of body size.
Cambridge Univ. Press, New York, 329.
Polansky, L., P. de Valpine, J. O. Lloyd-Smith, and W. M.
Getz. 2009. Likelihood ridges and multimodality in
population growth rate models. Ecology 90:2313–2320.
Possingham, H. P., S. J. Andelman, M. A. Burgman,
R. A. Medellin, L. L. Master, and D. A. Keith. 2002. Limits
to the use of threatened species lists. Trends Ecol. Evol.
17:503–507. doi:10.1016/s0169-5347(02)02614-9
R Development Core Team. 2011. R: a language and
environment for statistical computing. R Foundation for
Statistical Computing, Vienna, Austria.
Read, A. F., and P. H. Harvey. 1989. Life-history differences
among the eutherian radiations. J. Zool. 219:329–353.
Rose, K. A., J. H. Cowan, K. O. Winemiller, R. A. Myers, and
R. Hilborn. 2001. Compensatory density dependence in fish
populations: importance, controversy, understanding and
prognosis. Fish Fish. 2:293–327.
Ross, J. V. 2006. Comment on “On the regulation of populations
of mammals, birds, fish, and insects”. Science 311:1100.
Ross, J. V. 2009. A note on density dependence in population
models. Ecol. Model. 220:3472–3474.
Sabo, J. L., E. E. Holmes, and P. Kareiva. 2004. Efficacy of
simple viability models in ecological risk assessment: does
density dependence matter? Ecology 85:328–341.
Saether, B. E. 1987. The influence of body weight on the
covariation between reproductive traits in European birds.
Oikos 48:79–88.
Saether, B. E., and O. Bakke. 2000. Avian life history variation
and contribution of demographic traits to the population
growth rate. Ecology 81:642–653.
Saether, B. E., and S. Engen. 2002. Pattern of variation in
avian population growth rates. Philos. Trans. R. Soc.
Lond. B Biol. Sci. 357:1185–1195. doi:10.1098/rstb.2002.
1119
Saether, B. E., T. H. Ringsby, and E. Røskaft. 1996. Life history
variation, population processes and priorities in species
conservation: towards a reunion of research paradigms.
Oikos 77:217–226.
Saether, B. E., S. Engen, and E. Matthysen. 2002. Demographic
characteristics and population dynamical patterns of solitary
birds. Science 295:2070–2073.
Saether, B. E., S. Engen, A. P. Møller, H. Weimerskirch, M. E.
Visser, W. Fiedler, et al. 2004. Life-history variation predicts
the effects of demographic stochasticity on avian population
dynamics. Am. Nat. 164:793–802.
Saether, B. E., R. Lande, S. Engen, H. Weimerskirch,
M. Lillegard, R. Altwegg, et al. 2005. Generation time and
temporal scaling of bird population dynamics. Nature
436:99–102. doi:10.1038/nature03666
Saitoh, T., N. C. Stenseth, and O. N. Bjornstad. 1997. Density
dependence in fluctuating grey-sided vole populations. J.
Anim. Ecol. 66:14–24.
Saitoh, T., O. N. Bjornstad, and N. C. Stenseth. 1999. Density
dependence in voles and mice: a comparative study. Ecology
80:638–650. doi:10.2307/176641
Schwarz, G. E. 1978. Estimating the dimension of a model.
Ann. Stat. 6:461–464.
Seavy, N. E., M. H. Reynolds, W. A. Link, and J. S. Hatfield.
2009. Postcatastrophe population dynamics and density
dependence of an endemic island duck. J. Wildl. Manag.
73:414–418. doi:10.2193/2007-420
Sibly, R. M., and J. H. Brown. 2007. Effects of body size and
lifestyle on evolution of mammal life histories. Proc. Natl
Acad. Sci. USA 104:17707–17712. doi:10.1073/
pnas.0707725104
Sibly, R. M., D. Barker, M. C. Denham, J. Hone, and M.
Pagel. 2005. On the regulation of populations of mammals,
birds, fish, and insects. Science 309:607–610.
Sibly, R. M., D. Barker, J. Hone, and M. Pagel. 2007. On the
stability of populations of mammals, birds, fish and
insects. Ecol. Lett. 10:970–976. doi:10.1111/j.1461-0248.
2007.01092.x
Sinclair, A. R. E. 1996. Mammal populations: fluctuation,
regulation, life history theory and their implications for
conservation. Pp. 127–154 in R. B. Floyd, A. W. Sheppard,
and P. J. De Barro, eds. Frontiers of population ecology.
CSIRO, Collingwood.
Smith, S. H. 1935. The role of biotic factors in the
determination of population densities. J. Econ. Entomol.
28:873–898.
Stearns, S. C. 1983. The influence of size and phylogeny on
patterns of covariation among life-history traits in the
mammals. Oikos 41:173–187.
ª 2012 The Authors. Published by Blackwell Publishing Ltd. 11
S. Herrando-Perez et al. Life History and Density Feedback
Sugiura, N. 1978. Further analysis of the data by Akaike’s
information criterion and the finite corrections. Commun.
Stat. Theor. Methods A7:13–26.
Tulloch, A., H. P. Possingham, and K. Wilson. 2011. Wise
selection of an indicator for monitoring the success of
management actions. Biol. Conserv. 144:141–154.
doi:10.1016/j.biocon.2010.08.009
Varley, G. C., G. R. Gradwell, and M. P. Hassell. 1973. Insect
population ecology. Blackwell Scientific Publications,
Oxford, U.K.
Wang, G. M., N. T. Hobbs, H. Galbraith, and K. M. Giesen.
2002. Signatures of large-scale and local climates on the
demography of white-tailed ptarmigan in Rocky Mountain
National Park, Colorado, USA. Int. J. Biometeorol. 46:197–
201. doi:10.1007/s00484-002-0134-2
Wang, G. M., N. Hobbs, S. Twombly, R. Boone, A. Illius, I.
Gordon, et al. 2009. Density dependence in northern
ungulates: interactions with predation and resources. Popul.
Ecol. 51:123–132. doi:10.1007/s10144-008-0095-3
White, P. J., J. E. Bruggeman, and R. A. Garrott. 2007.
Irruptive population dynamics in yellowstone pronghorn.
Ecol. Appl. 17:1598–1606. doi:10.1890/06-2032.1
Winemiller, K. O., and K. A. Rose. 1992. Patterns of life-
history diversification in North American fishes:
implications for population regulation. Can. J. Fish. Aquat.
Sci. 49:2196–2218.
Zeng, Z., R. M. Nowierski, M. L. Taper, B. Dennis, and W. P.
Kemp. 1998. Complex population dynamics in the real
world: modeling the influence of time-varying parameters
and time lags. Ecology 79:2193–2209.
Supporting Information
Additional Supporting Information may be found in the
online version of this article:
Figure S1. Standardized BIC-weighted effect sizes for four
life-history traits (Body size, Longevity, Fertility) as predic-
tors of variation in census-derived strength of compensa-
tory density feedback (response), over all time series
supported for Gompertz growth: (i) all taxa (a,b: aquatic
invertebrates, amphibians, birds, fish, insects, mammals,
plants, reptiles), and the subsets of (ii) mammal (c,d) and
(iii) bird (e,f) species. Left panels (a,c,e) come from a
model set controlling for number of generations moni-
tored (G), and right panels (b,d,f) from a model set con-
trolling for G and Body size. Bold lines represent wBIC
medians as obtained from 100 bootstrapped samples. Fits
were obtained using GLMM which accounted for phylo-
genetic nonindependence at the Linnaean taxonomical
level of Class, and GLM for the subset analyses of mam-
mals and birds. We show model sets in Table 1, sample
sizes in Table S1, and BIC metrics in Table S4.
Figure S2 Standardized BIC-weighted effect sizes for four
life-history traits (Body size, Longevity, Age at first repro-
duction, Fertility) as predictors of variation in census-
derived strength of compensatory density feedback
(response), over high-quality time series supported for
Gompertz growth: (i) all taxa (a,b: aquatic invertebrates,
amphibians, birds, fish, insects, mammals, plants, rep-
tiles), and the subsets of (ii) mammal (c,d) and (iii) bird
(e,f) species. Left panels (a,c,e) come from a model set
controlling for time-series length (q), and right panels (b,
d,f) from a model set controlling for q and Body size.
Bold lines represent wBIC medians as obtained from 100
bootstrapped samples. Fits were obtained using GLMM
which accounted for phylogenetic nonindependence at
the Linnean taxonomical level of Class, and GLM for the
subset analyses of mammals and birds. We show model
sets in Table 1, sample sizes in Table S1, and BIC metrics
in Table S5.
Figure S3. Standardized BIC-weighted effect sizes for
four life-history traits (Body size, Longevity, Fertility) as
predictors of variation in census-derived strength of
compensatory density feedback (response), high-quality
time series supported for Gompertz growth: (i) all taxa
(a,b: aquatic invertebrates, amphibians, birds, fish,
insects, mammals, plants, reptiles), and the subsets of
(ii) mammal (c,d) and (iii) bird (e,f) species. Left pan-
els (a,c,e) come from a model set controlling for num-
ber of generations monitored (G), and right panels (b,
d,f) from a model set controlling for G and Body size.
Bold lines represent wBIC medians as obtained from
100 bootstrapped samples. Fits were obtained using
GLMM which accounted for phylogenetic nonindepen-
dence at the Linnean taxonomical level of Class, and
GLM for the subset analyses of mammals and birds.
We show model sets in Table 1, sample sizes in Table
S1, and BIC metrics in Table S6.
Table S1. Number of species analyzed after removing
missing life-history traits, selecting only time series sup-
ported by Gompertz growth, and removing time series
supported for depensatory density feedback. Time series
showing Gompertz growth were split by core and redun-
dant species (see Methods), and all analyses were repli-
cated for all species’ time series, and only high-quality
times series (Table S2). Colored numbers in table match
with colored text below relative to the four types of anal-
yses undertaken.
Table S2. Summary of stages used to obtain the high-
quality time series with extreme departures from the
assumptions of the Ricker and Gompertz growth models.
Table S3. Summary of content of figures and tables for
model sets accounting for life-history effects on strength
of compensatory density feedback. Control variables are
12 ª 2012 The Authors. Published by Blackwell Publishing Ltd.
Life History and Density Feedback S. Herrando-Perez et al.

time-series length (q) and number of generations moni-
tored (G = q/age at first reproduction).
Table S4. Bayesian information criterion (BIC) support
for the top-ranked modelsa derived from GLMM relating
life history to strength of compensatory density feedback
for all time series supported for Gompertz growth,
including all major groups (aquatic invertebrates,
amphibians, birds, fish, insects, mammals, plants, rep-
tiles), and the subsets of mammal and bird species. wBIC,
%DE, and D%DE are medians (in bold) from 100 boot-
strapped samples (95% confidence intervals)b. Models
included number of generations monitored (G) and body
size (Body) as controls. We show effect sizes in Figure S1,
model sets in Table 1, and sample sizes in Table S1.
Table S5. Bayesian information criterion (BIC) support
for the top-ranked modelsa derived from generalized lin-
ear mixed modeling relating life history to strength of
compensatory density feedback for high-quality time ser-
ies supported for Gompertz growth, including all major
groups (aquatic invertebrates, amphibians, birds, fish,
insects, mammals, plants, reptiles), and the subsets of
mammal and bird species. wBIC, %DE, and D%DE are
medians (in bold) from 100 bootstrapped samples (95%
confidence intervals)b. Models included time-series length
(q) and body size (Body) as controls. We show effect sizes
in Figure S2, model sets in Table 1, and sample sizes in
Table S1.
Table S6. Bayesian information criterion (BIC) support
for the top-ranked modelsa derived from generalized lin-
ear mixed models relating life history to strength of com-
pensatory density feedback for high-quality time series
supported for Gompertz growth, including all major
groups (aquatic invertebrates, amphibians, birds, fish,
insects, mammals, plants, reptiles), and the subsets of
mammal and bird species. wBIC, %DE and D%DE are
medians (in bold) from 100 bootstrapped samples (95%
confidence intervals)b. Models included number of gen-
erations monitored (G) and body size (Body) as controls.
We show effect sizes in Figure S3, model sets in Table 1,
and sample sizes in Table S1.
Table S7. Bayesian information criterion (BIC) support
for the top-ranked models derived from GLMM (all taxa:
aquatic invertebrates, amphibians, birds, fish, insects,
mammals, plants, reptiles) and GLM (birds and mam-
mals) relating life history to strength of compensatory
density feedback for time series supported for Gompertz
growth. wBIC, %DE, and D%DE are medians (in bold)
from 100 bootstrapped samples (95% percentile ranges)a.
Models included time-series length (q, years) and body
size (Body, mm) as controls and three further life-history
traitsb, and we present results for observed (as in Table 2)
and simulated (below) time series with incorporation of
5%, 10%, and 15% of measurement error. Samples sizes
are given in Table S1.
Please note: Wiley-Blackwell are not responsible for the
content or functionality of any supporting materials sup-
plied by the authors. Any queries (other than missing
material) should be directed to the corresponding author
for the article.
ª 2012 The Authors. Published by Blackwell Publishing Ltd. 13
S. Herrando-Perez et al. Life History and Density Feedback