SEROUS LINED EXTRAMURAL ILEAL VALVE: A NEW CONTINENT URINARY OUTLET

q 2003 by the American Society of Ichthyologists and Herpetologists
Copeia, 2003(3), pp. 531–543
Stream Microhabitat Use by Larval Southern Two-Lined Salamanders(Eurycea cirrigera) in the Georgia Piedmont
STACY SMITH AND GARY D. GROSSMAN
Existing studies indicate that multiple physical habitat characteristics can affectthe abundance and distribution of larval stream salamanders. We quantified seasonalpatterns of microhabitat use by larval southern two-lined salamanders (Eurycea cir-rigera) and microhabitat availability in two Georgia Piedmont streams from April2000 to April 2001. Larvae were generally significantly underrepresented in deepareas with low percentages of coarse substratum, locations dominated by bedrocksubstrata, and areas lacking debris (November sample only). Both between-streamdifferences in microhabitat use and within-stream seasonal differences in microhab-itat use generally reflected differences in microhabitat availability. The close asso-ciation of larval two-lined salamanders with substrata that provided cover indicatesthat habitat heterogeneity is important for this species. Consequently, loss of habitatcomplexity through anthropogenic disturbance may result in decreases in abundanceof southern two-lined salamanders in Georgia.
CURRENTLY, there is limited published re-search on microhabitat use by larval
stream-dwelling salamanders. Nonetheless, ex-isting studies indicate that multiple physicalhabitat characteristics can affect the abundanceand distribution of larval stream salamanders.For example, Baumgartner et al. (1999) foundthat stream velocity influences the microdistri-bution of European fire salamander larvae (Sal-amandra salamandra salamandra, Salamandri-dae) within a stream. Studies of adult and larvalsouthern torrent salamanders (Rhyacotriton var-iegatus, Rhyacotritonidae) and larval Pacific gi-ant salamanders (Dicamptodon tenebrosus, Di-camptodontidae) in the western United Statesdemonstrate that availability of coarse substratais positively related to salamander presence andabundance (Parker, 1991; Diller and Wallace,1996; Welsh and Lind, 1996). Finally, both Or-ser and Shure (1972) and Corn and Bury(1989) found that anthropogenic stream deg-radation can negatively affect larval salamanderpopulations.
Given that both positive and negative rela-tionships exist between larval salamanders andphysical habitat characteristics, it is worthwhilefrom both a basic and applied perspective tofurther investigate these relationships. This isparticularly important in regions that are cur-rently undergoing land-use changes that havethe potential to produce declines in salamanderpopulations. Many streams in the Piedmont re-gion of Georgia have experienced major alter-ations such as channelization, siltation, and lossof coarse substratum (Trimble, 1974; Ruhlmanand Nutter, 1999). However, the single studythat noted a decline in larval populations in ur-
banized streams in the Georgia Piedmont didnot focus on microhabitat use (Orser and Shu-re, 1972). Although little is known about themicrohabitat requirements of Piedmont sala-mander populations, studies of other larval sal-amander species suggest that documenting thehabitat use patterns of these species should bea high priority.
Streams in the Georgia Piedmont support adiverse community of salamander species. Thesouthern two-lined salamander (Eurycea cirri-gera, Plethodontidae) and the Blue Ridge two-lined salamander (Eurycea wilderae, Plethodon-tidae) are both abundant in southern Piedmontstreams (Camp et al., 2000; Kozak and Montan-ucci, 2001). Of the two species, the southerntwo-lined salamander is the more widespread(Conant and Collins, 1998), and this was thespecies present within our study area (Camp etal., 2000). Although larvae of the Blue Ridgetwo-lined salamander and the northern two-lined salamander (Eurycea bislineata, Plethodon-tidae) have been well studied (Bruce, 1982,1985; Voss, 1993), there is little published infor-mation on the southern two-lined salamander.Adult two-lined salamanders are found both inand along the margins of small, rocky streamsbut also occur on the forest floor far from run-ning water (Martof, 1956; Mount, 1975; Petran-ka, 1998). Records for the southern Piedmontregion indicate that breeding occurs in the win-ter (Mount, 1975). Females attach their eggs tothe underside of submerged cobbles, logs, orplants and tend the eggs until hatching (Petran-ka, 1998). The abundance of cobbles suitablefor oviposition may limit population size (Stew-art, 1968). Demographic data suggest that the

532 COPEIA, 2003, NO. 3
larval period varies among populations and lastsfrom one to three years (Mount, 1975; Bruce,1985).
We examined microhabitat use by southerntwo-lined salamander larvae in two adjacent sec-ond-order streams in the Georgia Piedmont todetermine (1) size structure and growth ratesof larvae; (2) the physical factors influencingmicrohabitat use; and (3) how seasonal changesin microhabitat availability affect microhabitatuse.
MATERIALS AND METHODS
Study site.—Our study sites were located inThompson Mills Forest in the Piedmont regionof Georgia ( Jackson County) approximately 40miles northeast of Atlanta. Forest compositionwas predominately mature, second-growth,hardwood-conifer forest. Loblolly pine (Pinustaeda), sweet gum (Liquidambar styraciflua), andtulip poplar (Liriodendron tulipifera) dominatedthe stream canopy. The subcanopy consisted ofspice bush (Lindera benzoin), dogwood (Cornusflorida), and azalea (Rhododendron nudiflorum).Bank side vegetation included river oats (Uniolalatifolia) and Christmas fern (Polystichum acrosti-choides). Average annual rainfall for this area is141.7 cm and the average annual temperatureis 15.6 C (Georgia Automated EnvironmentalMonitoring Network, Gainesville, GA).
We chose study sites in Boscoe (34879400N,838489350W) and Lee (34879390N, 83848960W)Creeks, which were second-order tributariesthat flowed directly into the Mulberry River inthe Middle Oconee River drainage. BoscoeCreek drains an area of 93 ha, and Lee Creekdrains a 212-ha area. Prior to the 1960s, muchof the Lee and Boscoe watersheds were farm-land and pasture. Currently, the Lee Creek wa-tershed is forested with areas of granitic out-croppings, pastureland, and some suburban de-velopment about 0.5 km above the study plot.Boscoe Creek is entirely within the ThompsonMills Forest and is forested around and abovethe study area. These streams are representativeof many streams in the region. We chose two,50-m study plots in each stream as replicates.The plots were approximately 50-m apart andincluded riffle, run, pool, and bank habitat rep-resentative of that available in the rest of thestream. Boscoe Creek has a gradient of 0.5%and is incised to a depth of about 1 m. It con-tains predominately pool-riffle habitat dominat-ed by silt, sand, gravel and pebble that runsthrough seasonally flooded bottomland. LeeCreek has a gradient of 2.5% and is incised toa depth of 1–2 m. Also, it is dominated by pool-
riffle type habitat but with much less variationin depth and occasional areas of bedrockshoals. Substratum in this stream is predomi-nately cobble and bedrock. The forest adjacentto this stream is submesic ridge type habitat.
Surveys.—To determine our sampling regime,we used mean temperature and precipitationrecords from 1961 to 1990 for Gainesville, Geor-gia (Southeast Regional Climate Center), andsalamander life-history data (Mount, 1975) toidentify seasons in which salamanders would bemost active. We conducted surveys in each plotduring spring (2 April 2000 to 5 May 2000 and2–11 April 2001), summer (11–22 July 2000),and fall (10–16 November 2000) to evaluate sea-sonal variation in microhabitat use and avail-ability. For each season, a survey comprised (1)a single nocturnal and diurnal survey for sala-manders for each plot, and (2) larval microhab-itat use and microhabitat availability measure-ments. We randomly determined plot survey or-der for each seasonal sample.
To facilitate microhabitat measurements, wemarked plots with permanent stakes at 2-m in-tervals on each bank. We placed these stakes 2m from the active bank and used them asbenchmarks to triangulate larval capture loca-tions and microhabitat measurements.
Larval surveys.—We completed larval surveys inall sites for July, November, and April 2001, with-in two weeks of each other. We completed sur-veys of all sites in April 2000 over four weeksbecause of problems with weather conditions.We recorded water, soil, and air temperatureand weather conditions prior to each survey. Di-urnal searches involved a thorough search ofthe plot by lifting and replacing all cover ob-jects, while minimizing habitat disturbance. Weconducted nocturnal surveys by searching theplot for exposed salamanders with a spotlight;the substratum was not moved during these sur-veys. After capture, we held larvae in water-filledplastic bags until the conclusion of the survey.We marked capture locations of all larvae withnumbered weights. Data collected for each an-imal included exact location (triangulated rel-ative to permanent benchmarks), snout–ventlength (SVL, to the posterior edge of the vent6 1.0 mm), and weight (spring balance, 6 0.1g). At the conclusion of each survey, we releasedindividuals at the point of capture.
Microhabitat sampling.—We measured microhab-itat variables at the capture location of each sal-amander as well as at 25 random points perplot. To prevent spatial clumping of random

533SMITH AND GROSSMAN—EURYCEA CIRRIGERA HABITAT USE
measurements, we stratified each plot into five,10-m blocks of stream length with five randompoints assigned per block. We determined thelocation of random points using a random num-ber table to delineate x and y coordinates withinthe plot. In the first seasonal sample (April2000), a majority of random locations landed interrestrial habitat and fewer than 25 aquaticpoints per plot were chosen. In subsequent sea-sons, we continued sampling random points un-til there were 25 aquatic points.
At both random and larval capture locations,we made a visual estimate of the percent com-position of substratum types (inorganic, wood,and debris), size classes (silt , 0.063 mm, sand1–2 mm, gravel 2–16 mm, pebble 16–64 mm,cobble 64–256 mm, boulder . 256 mm with vis-ible edges, bedrock . 256 mm without visibleedges [Allan, 1995]), and percentage embed-dedness (the percentage of larger substratumcovered with fine particles) of a 0.5-m2 area sur-rounding the location. We also measured cur-rent velocity (cm/sec) and water depth (cm) ateach location.
Data analysis.—We analyzed larval microhabitatdata separately for each season to control forseasonal differences in microhabitat use andavailability. We combined day and night samplesto create a representative sample of microhabi-tat use for two-lined salamander larvae. Becausethe two streams had different geomorphologies,we analyzed data for the two streams separately.
We obtained larval mean SVL for each yearclass in each stream by using size-frequency his-tograms and resolving the distribution intocomponent normal distributions. We estimatedgrowth rates by comparing changes in meanSVL (mm) for each larval class among samples(Ryan, 1998). We compared mean SVL betweenstreams with a Wilcoxon two-sample test (alpha5 0.05).
We transformed all percentage data by arc-sine/square-root to naturalize variances and re-duce heteroscedasticity and kurtosis. Depth datacould not be normalized via transformation;hence, these data were not transformed. We didnot include current velocity in the principalcomponent analysis (PCA) because of the largenumber of samples that were too shallow formeasurement of this variable. We transformedcurrent velocity data by ln 1 1 to normalize thedata and variance and analyzed it using a Wil-coxon two-sample test to test for differences be-tween random and capture locations and differ-ences between streams and among seasons. Weused univariate analysis for depth as well as in-cluding it in the PCA because univariate analysis
of depth data yielded additional information.Because of small sample sizes in some analyses,we used 0.10 for alpha. Changes among seasonsin depth and flow were compared using a Krus-kal-Wallis test (alpha 5 0.05).
We tested for significant differences in micro-habitat use and availability both among seasonsand between streams using the methods ofGrossman and Freeman (1987) and Grossmanand Ratajczak (1998). We subjected the micro-habitat availability data to a PCA using the cor-relation matrix. We interpreted components thathad eigenvalues . 1.0 and explained patterns ofvariation that represented ecologically interpret-able salamander microhabitat. We used thesedata to test for significant differences in meancomponent scores using Kruskal-Wallis tests fordifferences among seasons, Wilcoxon two-sampletests for differences between streams, and Tukey-Kramer a posteriori tests (alpha 5 0.05). Princi-pal component analysis results were validated bycomparison with the raw data (Grossman and Ra-tajczak, 1998).
We also used the PCA techniques of Gross-man and Freeman (1987) and Grossman andRatajczak (1998) to test for patterns of nonran-dom microhabitat use by southern two-lined sal-amander larvae. We included depth and per-cent wood, debris, silt, sand, gravel, pebble, andcobble in the PCA for both streams. We includ-ed bedrock and boulder for Lee Creek; howev-er, these substrata were not present in BoscoeCreek. We subjected the microhabitat availabil-ity data for a given season to PCA using the cor-relation matrix. We only interpreted compo-nents that had eigenvalues . 1.0 and explainedpatterns of variation that represented ecologi-cally interpretable salamander microhabitat. Weused a chi-square goodness-of-fit test (alpha 50.10) to compare the score distributions of useand availability data. If a significant result wasobtained, we partitioned the analysis to identifythe significant classes within the distribution(Zar, 1999). We validated PCA results by com-parison with the raw data. These techniques al-lowed us to depict microhabitat use by salaman-ders within a multidimensional microhabitatgradient scaled by habitat availability.
RESULTS
Capture summary.—Southern two-lined salaman-ders, spotted dusky salamanders (Desmognathusconanti, Plethodontidae), spring salamanders(Gyrinophilus porphyriticus, Plethodontidae),three-lined salamanders (Eurycea guttolineata,Plethodontidae), seal salamanders (Desmognathusmonticola, Plethodontidae), slimy salamanders

534 COPEIA, 2003, NO. 3
(Plethodon glutinosus, Plethodontidae), and redsalamanders (Pseudotriton ruber, Plethodontidae)were all captured during stream surveys. Spottedsalamanders (Ambystoma maculatum, Ambystoma-tidae), and four-toed salamanders (Hemidactyliumscutatum, Plethodontidae) were also present inand near the study plots. Only southern two-lined salamander larvae met the minimum need-ed for analysis in any season. Capture numbersfor most other species did not exceed two orthree total for the entire study period.
Capture numbers for southern two-lined lar-vae for both streams varied seasonally ([BoscoeCreek: April 2000 5 84, July 5 150, November5 37, and April 2001 5 139] and [Lee Creek:April 2000 5 89, July 5 247, November 5 101,and April 2001 5 117]). The larval period in Leeand Boscoe creeks was approximately 14 months(Fig. 1). In both years, hatching occurred afterApril and by July two age classes of larvae werepresent. By November, the 1999 year class hadmetamorphosed and only young-of-the-year werepresent. Mean snout–vent lengths for the 1999larval class in Boscoe Creek were significantly dif-ferent than those in Lee Creek for April 2000 (t5 27.41, P 5 , 0.001) and July (t 5 5.81, P 5, 0.001). Mean snout–vent lengths for the 2000larval year class did not differ significantly be-tween streams in July or November, but larvaedid significantly differ in Lee Creek in April 2001(t 5 3.00, P 5 0.003). The growth rate in LeeCreek generally was higher than in BoscoeCreek. Between April 2000 and July 2000, the1999 year class grew at a rate of 0.6 mm/monthin Boscoe Creek and 0.9 mm/month in LeeCreek. Between July 2000 and April 2001, the2000 year class grew at a rate of 1.1 mm/monthin both streams.
Seasonal differences in microhabitat.—The PCA forBoscoe Creek retained three components formicrohabitat availability that explained 65% ofthe variance in the data (Table 1). Componentone indicated that November and April 2001Boscoe Creek samples had significantly moredepositional substrata, whereas April 2000 andJuly Boscoe Creek samples had significantlymore coarse substrata. Component two indicat-ed that April 2000 and November Boscoe Creeksamples had significantly greater depths andhigher percentages of wood and sand substrata.Significantly more silt was present in BoscoeCreek in July and April 2001 samples than inother seasons. Component three indicated thatApril Boscoe Creek samples contained signifi-cantly more sand than other seasons, whereasNovember and July Boscoe Creek samples con-tained significantly higher amounts of debris.
The PCA retained four components for LeeCreek that explained 65% of the variance in thedata (Table 1). Component one for Lee Creekrepresented the gradient between depositionaland coarse substrata with gravel, pebble, andcobble significantly more prevalent in April2000 and July and significantly higher percent-ages of substratum embeddedness and debris inNovember. There were no significant differenc-es among samples for component two. Com-ponent three for Lee Creek indicated that No-vember samples had a significantly higher per-centage of debris than July samples and Julysamples had significantly higher mean percent-ages of silt than November samples. For com-ponent four for Lee Creek, July and April 2001samples had significantly more sand than No-vember samples. November samples had a sig-nificantly greater percentage of debris than Julyand April 2001 samples.
Between-stream differences in microhabitat availabili-ty.—The PCA retained four components for mi-crohabitat availability analyses for all seasons (Ta-ble 2). In general, Lee Creek samples had a sig-nificantly higher percentage of silt, boulder, andbedrock substrata, and Boscoe Creek samples hadsignificantly greater depths and higher percent-ages of wood, debris, gravel, and pebble substrata.
Boscoe Creek microhabitat use.—For brevity, onlycomponents with significant nonrandom micro-habitat use will be described. For April 2000, thePCA retained three components that explained65% of the variance in the data set (Table 3).Larvae were significantly underrepresented invery shallow habitats with higher percentages ofembeddedness, sand, and coarse substrata withlower percentages of wood, debris, and silt([Component one, df 5 6, x2 5 14.33, P 50.026]; [two, df 5 4, x2 5 10.66, P 5 0.031];and [three, df 5 5, x2 5 19.20, P 5 0.002]). InJuly samples, the PCA retained three compo-nents that explained 72% of the variance in thedataset. Larvae were significantly underrepre-sented in deeper microhabitats with higher em-beddedness, silt, and debris and lower amountsof coarse substrata and sand (Component one,df 5 7, x2 5 21.25, P 5 0.003; Componentthree, df 5 7, x2 5 14.33, P 5 0.046). For No-vember 2000 samples, the PCA retained threecomponents that explained 70% of the variancein the dataset. As in the previous season, larvaewere underrepresented in deep microhabitatslacking sand, gravel, pebble, and cobble sub-strata, with high percentages of debris and silt;as well as in very shallow habitats dominated bygravel, pebble, cobble, and high embeddedness

535SMITH AND GROSSMAN—EURYCEA CIRRIGERA HABITAT USE
Fig. 1. Snout–vent length (mm) frequency distribution of southern two-lined salamanders in Lee andBoscoe Creeks, Thompson Mills, Georgia, including mean snout–vent length (mm) and standard deviation(6 mm) for larval year classes.
with low percentages of sand, debris, and silt(component one, df 5 7, x2 5 13.19, P 50.068). Larvae also were significantly underrep-resented in areas with lower than average per-centages of debris and sand, and more silt(component two, df 5 7, x2 5 15.82, P 5 0.027).For component three, larvae were significantlyunderrepresented in microhabitats of average
depth with little sand (df 5 7, x2 5 12.83, P 50.076). We did not detect significant nonran-dom microhabitat use for larvae in April 2001.
Lee Creek microhabitat use.—For April 2000 sam-ples, the PCA retained four components thatexplained 75% of the variance in the dataset(Table 4). Larvae were significantly underrep-
536 COPEIA, 2003, NO. 3
TABLE 1. SEASONAL DIFFERENCES IN MICROHABITAT AVAILABILITY FOR LARVAL TWO-LINED SALAMANDERS IN LEE
AND BOSCOE CREEKS FOR APRIL (A), JULY ( J), AND NOVEMBER (N) 2000 AND APRIL 2001 (A2). We tested forsignificant differences using Kruskal-Wallis tests on principal component scores followed by Tukey-Kramer tests(alpha 5 0.05). We only present variables with component loadings $ z0.40z. Only components with significant
differences are reported.
Significant com-ponent (% variance
explained) x2 Component loadingsSignificantdifferences
Boscoe Creek1(36) 36.15** % embed (0.79), % debris (0.66), % silt (0.50), depth
(0.42), % cobble (20.57), % pebble (20.81), % grav-el (20.83)
(N . A) (A2 . A)(N . J)
2 (17) 45.05** % wood (0.69), depth (0.44), % sand (0.42), % silt(20.72)
(A . J, A2)(N . J, A2)
3 (12) 15.88** % sand (0.81), % debris (20.48) (A . J, N) (A2 . N)
Lee Creek1 (23) 18.23** % pebble (0.76), % gravel (0.71), % cobble (0.68),
% debris (20.41), % silt (20.45), % embed (20.61)(A . N) ( J . N)
3 (14) 11.36** % wood (0.48), % debris (0.47), % silt (20.77) (N . J)4 (12) 17.34** % sand (0.82), % debris (20.59) (A2 . N) ( J . N)
Degrees of freedom 5 3 for all tests. * P , 0.05. ** P , 0.01.
TABLE 2. DIFFERENCES IN MICROHABITAT AVAILABILITY FOR LARVAL SOUTHERN TWO-LINED SALAMANDERS BETWEEN
LEE (L) AND BOSCOE (B) CREEKS. We tested for significant differences using Wilcoxon two-sample tests onprincipal component scores (alpha 5 0.05). We only present variables with component loadings $ z0.40z. Only
components with significant differences are reported.
Significant com-ponent (% variance
explained) t Component loadingsSignificantdifferences
April 20001 (23) 4.57** % pebble (0.56), depth (0.56), % sand (0.49), % wood
(0.45), % cobble (0.43), % silt (20.44), % boulder(20.52), % bedrock (20.71)
B . L
July2 (16) 6.47** % pebble (0.60), % gravel (0.41), % bedrock (20.84) B . L
November1 (28) 2.43* % pebble (0.76), % gravel (0.74), % cobble (0.66),
depth (20.45), % debris (20.51), % embedded(20.81)
L . B
3 (13) 25.77** depth (0.58), % bedrock (20.79) B . L
April 20012 (16) 24.92** % wood (0.58), depth (0.54), % debris (0.52), % sand
(20.46), % bedrock (20.52)B . L
3 (15) 4.32** % boulder (0.57), % debris (0.50), % silt (20.80) L . B
Degrees of freedom 5 1 for all tests. * P , 0.05. ** P , 0.01.
resented in shallower areas with a high per-centage of bedrock and lesser amounts of em-beddedness, silt, and coarse substrata (compo-nent one, df 5 5, x2 5 18.03, P 5 0.003). ForJuly samples, the PCA retained four compo-nents that explained 73% of the variance in thedataset. Larvae were significantly underrepre-sented in areas with a high percentage of bed-
rock and lower amounts of embeddedness, de-bris, and pebble substrata (component two, df5 6, x2 5 12.12, P 5 0.059). Component threeindicated that larvae were underrepresented inmicrohabitats of average depth with low per-centages of sand (df 5 7, x2 5 15.97, P 50.025). In November samples, the PCA retainedfour components that explained 72% of the var-

537SMITH AND GROSSMAN—EURYCEA CIRRIGERA HABITAT USE
TA
BL
E3.
ME
AN
SO
FM
ICR
OH
AB
ITA
TU
SED
AT
AFO
RB
OSC
OE
CR
EE
KFO
RPR
INC
IPA
LC
OM
PON
EN
TA
NA
LYS
ISC
AT
EG
OR
IES
INW
HIC
HL
AR
VA
LSO
UT
HE
RN
TW
O-L
INE
DSA
LA
MA
ND
ER
S
WE
RE
SIG
NIF
ICA
NT
LY
OV
ER-O
RU
ND
ER
RE
PRE
SEN
TE
D.(
Dif
fere
nces
wer
ede
tect
edw
itha
chi-s
quar
ego
odne
ss-o
f-fitt
est,
alph
a5
0.10
.)A
lso
pres
ente
dar
em
eans
and
vari
able
load
ings
(in
pare
nthe
ses)
for
mic
roha
bita
tav
aila
bilit
ym
easu
rem
ents
.We
only
pres
ent
data
for
vari
able
sw
ithco
mpo
nent
load
ings
$z0
.40z
.
n
Com
pone
nt(%
vari
ance
expl
aine
d)
Scor
eca
tego
ryra
nge
Sign
ifica
ntca
tego
ries
No.
non-
rand
omus
e
Ove
r-(R
)or
unde
rrep
re-
sent
ed(U
)D
epth
(cm
)Em
bed
%W
ood
%D
ebri
s%
Silt %
Sand %
Gra
vel
%Pe
bble
%C
obbl
e%
Apr
il20
01
Ran
dom
Cap
ture
24 83
1(2
7)2
(25)
3(1
3)1 2 3
21.
5to
2.5
22.
5to
2.0
22.
5to
2.5
22.
0to
2.0
21.
5to
1.5
22.
0to
2.0
22.
0to
21.
00.
5to
1.5
21.
0to
20.
5
4 8 2
U U U
11.0
(0.6
4)
3.0
38 (0.5
6)
55
3 (0.4
8)
(20.
50)
0 0
9 (0.6
5)
3
24
(20.
91)
8
22 (0.7
6)
32
21(2
0.71
)
53
15(2
0.64
)
34
6 (0.5
9)(0
.58)
12 0
July R
ando
m
Cap
ture
49 150
1(4
2)2
(16)
3(1
4)1 3
22.
0to
2.5
22.
0to
3.5
22.
0to
2.5
22.
0to
2.0
22.
5to
2.0
1.5
to2.
01.
5to
2.0
2 2U U
6.0
(0.5
9)
8.5
81 (0.9
2)
84
1 (0.7
8)
12 (0.6
8)(0
.44)
30
44 (0.5
2)(2
0.74
)
55
6
(20.
78)
0
17(2
0.82
)
0
13(2
0.78
)
0
6(2
0.57
)
0
Nov
embe
r
Ran
dom
Cap
ture
49 36
1(4
0)2
(18)
3(1
2)
1 2 3
22.
5to
2.0
22.
5to
2.5
22.
5to
3.0
22.
0to
1.0
22.
0to
1.5
22.
5to
1.5
22.
0to
22.
51.
0to
2.0
0.0
to0.
51.
0to
1.5
0* 0* 2 0*
U U U U
9.0
(0.5
0)
(0.6
1)
27.5 5.0
9.0
90 (0.8
9)
100 60
137 (0
.52)
(20.
75)
37 15 16
40 (0.5
8)(0
.69)
57 6 52
7(2
0.40
)(0
.49)
(20.
60)
0 2 4 0
7(2
0.83
)
0 23
4(2
0.79
)
0 32
3(2
0.65
)
0 11
Apr
il20
01
Ran
dom
Cap
ture
50 138
1(4
1)2
(22)
22.
0to
2.0
21.
5to
4.0
N/S
1
6.0
(0.4
0)(0
.55)
91 (0.9
4)2 (0.6
6)
13 (0.5
3)(0
.68)
57 (0.4
9)(2
0.68
)
5
(20.
54)
13(2
0.88
)5
(20.
90)
5(2
0.68
)
1N
/S:N
osi
gnifi
cant
cate
gori
es.*
Valu
esar
efo
rav
aila
ble
mic
roha
bita
t;th
ere
wer
eno
capt
ures
inth
ism
icro
habi
tat.
Embe
d5
embe
dded
ness
.

538 COPEIA, 2003, NO. 3
TA
BL
E4.
ME
AN
SO
FM
ICR
OH
AB
ITA
TU
SED
AT
AFO
RL
EE
CR
EE
KFO
RPR
INC
IPA
LC
OM
PO
NE
NT
AN
AL
YSIS
CA
TE
GO
RIE
SIN
WH
ICH
LA
RV
AL
SOU
TH
ER
NT
WO
-LIN
ED
SAL
AM
AN
DE
RS
WE
RE
SIG
NIF
ICA
NT
LY
OV
ER-O
RU
ND
ER
RE
PRE
SEN
TE
D.(
Dif
fere
nces
wer
ede
tect
edw
itha
chi-s
quar
ego
odne
ss-o
f-fitt
est,
alph
a5
0.10
.).A
lso
pres
ente
dar
em
eans
and
vari
able
load
ings
(in
pare
nthe
ses)
for
mic
roha
bita
tav
aila
bilit
ym
easu
rem
ents
.We
only
pres
ent
data
for
vari
able
sw
ithco
mpo
nent
load
ings
$z0
.40z
.
n
Com
pone
nt(%
vari
ance
expl
aine
d)
Scor
eca
tego
ryra
nge
Sign
ifica
ntca
tego
ries
No.
non-
rand
omus
e
Ove
r-(R
)or
unde
r-re
pres
ente
d(U
)D
epth
(cm
)Em
bed
%W
ood
%D
ebri
s%
Silt %
Sand %
Gra
vel
%Pe
bble
%C
obbl
e%
Bed
rock
%B
edro
ck%
Apr
il20
00
Ran
dom
Cap
ture
24 88
1(3
1)2
(16)
3(1
5)4
(13)
1
22.
0to
1.5
21.
5to
3.5
22.
0to
2.0
22.
0to
2.5
21.
5to
2.0
21.
5to
21.
03
U
6.0
(0.7
4)
3.0
48 (0.7
9)
0
0 (0.7
1)
8 (0.7
1)
33 (0.8
3)
26
10
(20.
78)
(0.4
2)
5 (0.4
8)(0
.73)
6 (0.4
2)(2
0.59
)(0
.47)
0
7 (0.6
7)(2
0.44
)
0
11(2
0.40
)
(0.5
5)5
18(2
0.79
)
48
July R
ando
m
Cap
ture
49 245
1(3
1)2
(18)
3(1
3)4
(11)
2 3
22.
0to
2.0
22.
5to
2.0
22.
5to
3.0
22.
0to
4.0
22.
5to
2.5
22.
0to
2.5
22.
5to
21.
51.
0to
1.5
10 12U U
5.0
(0.5
0)
(20.
48)
5.0
74 (0.7
5)(0
.43)
50
0 (0.6
6)
7 (0.4
3)
(0.6
2)
2
41 (0.8
1)8 (0.8
4)
1
8(2
0.73
)4
(20.
70)
(0.4
4)
1
10(2
0.66
)8
(20.
51)
12
(20.
94)
46
Nov
embe
r
Ran
dom
Cap
ture
48 101
1(2
7)2
(18)
3(1
5)4
(12)
2
22.
5to
2.5
22.
5to
2.0
22.
5to
2.0
22.
5to
3.5
22.
0to
2.5
22.
5to
22.
00*
U
5.0
(0.5
4)(2
0.64
)
87(2
0.60
)
(0.6
5)
0(2
0.52
)32
(20.
55)
(0.5
9)
7
37
(20.
68)
(0.4
5)
67
9 (0.5
5)(0
.66)
3 (0.6
8)2 (0.8
4)4 (0.6
7)7 (0.5
2)4
(20.
77)
(20.
44)
24

539SMITH AND GROSSMAN—EURYCEA CIRRIGERA HABITAT USE
TA
BL
E4.
CO
NT
INU
ED
.
n
Com
pone
nt(%
vari
ance
expl
aine
d)
Scor
eca
tego
ryra
nge
Sign
ifica
ntca
tego
ries
No.
non-
rand
omus
e
Ove
r-(R
)or
unde
r-re
pres
ente
d(U
)D
epth
(cm
)Em
bed
%W
ood
%D
ebri
s%
Silt %
Sand %
Gra
vel
%Pe
bble
%C
obbl
e%
Bed
rock
%B
edro
ck%
Apr
il20
01R
ando
m
Cap
ture
49 117
1(2
4)2
(16)
3(1
3)4
(12)
5(1
0)2 4 5
22.
0to
2.5
22.
0to
2.5
22.
0to
2.5
22.
0to
2.0
23.
0to
2.0
22.
5to
1.5
24.
0to
2.5
23.
0to
2.0
0.5
to1.
02
1.5
to2
1.0
0.5
to1.
0
8 4 7
U U U
5.0
(0.5
3)
4.0
85(2
0.48
)(0
.49)
(20.
51)
91
1 (0.5
9)
0
10 (0.7
5)
41(2
0.62
)(2
0.50
)
30
16 (0.6
6)(2
0.41
)(2
0.43
)
20 36
8 (0.8
1)2 (0.8
1)8 (0.7
4)7
(20.
74)
0
7
(20.
51)
(20.
51)
(0.4
5)6 11 8
*Va
lues
are
for
avai
labl
em
icro
habi
tat;
ther
ew
ere
noca
ptur
esin
this
mic
roha
bita
t.Em
bed.
5em
bedd
edne
ss,G
rav.
5gr
avel
,Cob
.5co
bble
,Peb
.5pe
bble
,Bld
r.5
boul
der,
Bdr
k.5
bedr
ock.
iance in the data. Larvae were significantly un-derrepresented in areas with high percentagesof bedrock and silt and a low percentage of de-bris (component two, df 5 8, x2 5 19.18, P 50.014). In April 2001, the PCA retained fivecomponents that explained 75% percent of thevariance in the data. Larvae were significantlyunderrepresented in microhabitats of averagedepth with average to higher amounts of bed-rock, low levels of wood, boulder, and silt, andgreater embeddedness and sand ([componenttwo, df 5 6, x2 5 19.22, P 5 0.004]; [componentfour df 5 7, x2 5 14.40, P 5 0.044]; and (com-ponent five df 5 7, x2 5 18.11, P 5 0.011]).
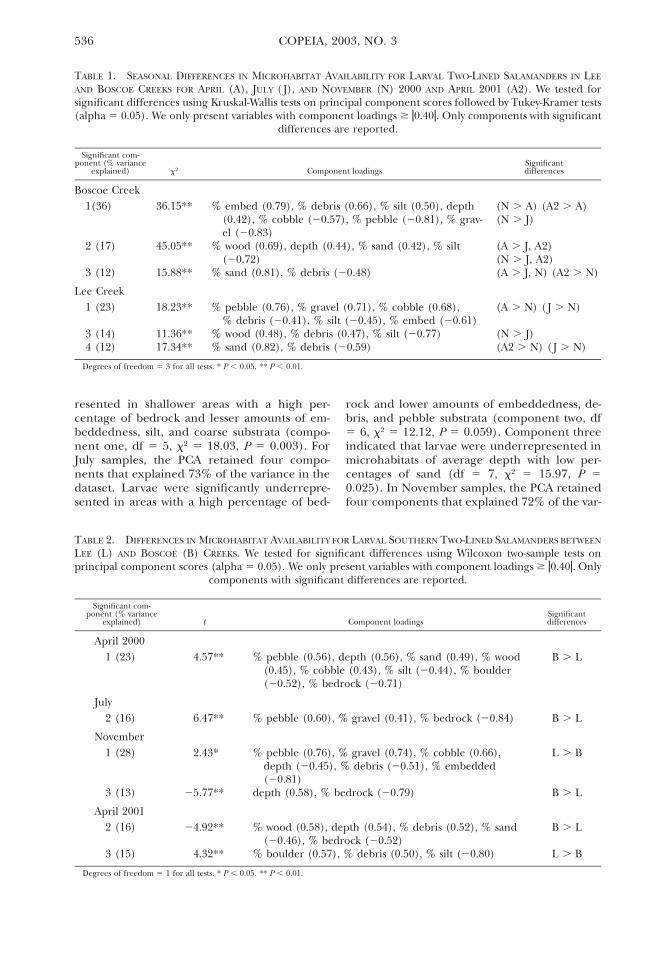
Current velocity, depth, and distance to cover.—Thesignificance of current velocity varied betweenstreams and seasons; depth was more importantto larval microhabitat use in Boscoe Creek thanin Lee Creek, and distance to cover was similarfor both streams (Table 5). Larvae used meancurrent velocities that differed significantlyfrom random for both streams in April 2000(Boscoe Creek: t 5 785.5, P 5 0.080; Lee Creek:t 5 865.50, P 5 0.053) and July (Boscoe Creek:t 5 1876.50, P 5 , 0.0001; Lee Creek: t 560004.00, P 5 0.004). Current velocity was sig-nificantly different among seasons for both Bos-coe (df 5 3, x2 5 22.66, P 5 0.0001) and Lee(df 5 3, x2 5 71.02, P 5 0.0001) Creeks. Larvaeoccupied depths that were significantly differ-ent from random in Boscoe Creek during April2000 (t 5 1755.00, P 5 0.001), July (t 55706.500, P 5 0.021), and November (t 51332.50, P 5 0.058). In Lee Creek, average cap-ture depth only differed significantly from ran-dom for July (t 5 8171.50, P 5 0.081). Capturedepth was significantly different among seasonsfor both Boscoe (df 5 3, x2 5 56.02, P 50.0001) and Lee (df 5 3, x2 5 39.05, P 50.0001) Creeks. Larvae stayed at an averagedepth of 5.3 cm (SD 5 3.4 cm) in Boscoe Creekand 4.8 cm (SD 5 3.2 cm) in Lee Creek. Aver-age available depth was 7.8 cm (SD 5 6.5 cm)in Boscoe Creek and 5.1 cm (SD 5 3.7 cm) inLee Creek. Distance of larvae from a suitablecover object averaged 1.0 cm in Boscoe Creekand 2.0 cm in Lee Creek.
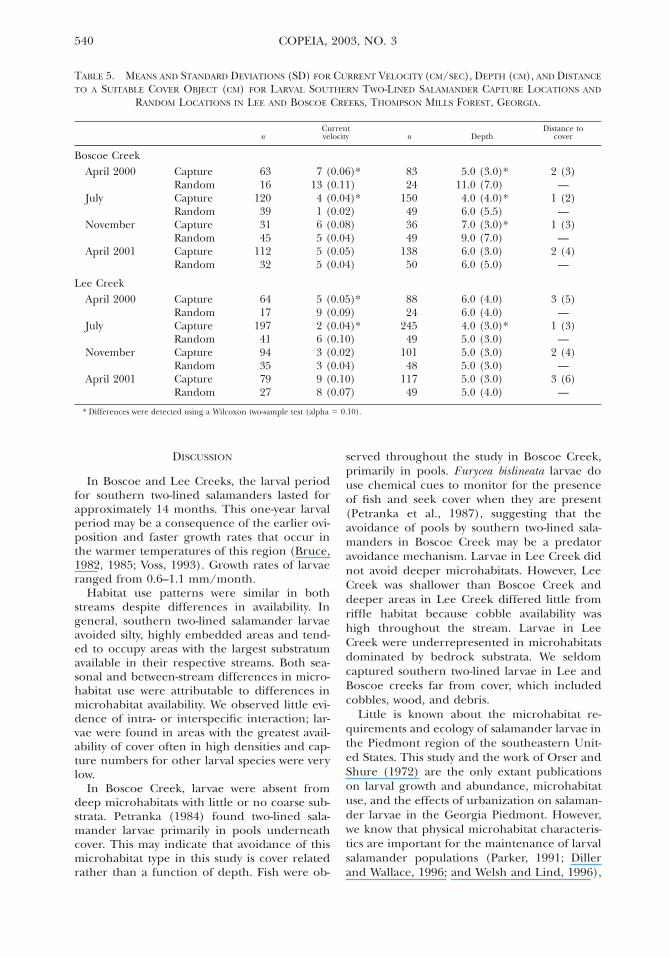
Among-season and between-stream differences inuse.—Both seasonal and between-stream differ-ences in microhabitat use were generally similarfor both streams. Differences in microhabitatuse generally reflected respective differences inmicrohabitat availability (Tables 6–7). The onlyexception was that in July larvae in Lee Creekused areas with significantly more bedrock.
540 COPEIA, 2003, NO. 3
TABLE 5. MEANS AND STANDARD DEVIATIONS (SD) FOR CURRENT VELOCITY (CM/SEC), DEPTH (CM), AND DISTANCE
TO A SUITABLE COVER OBJECT (CM) FOR LARVAL SOUTHERN TWO-LINED SALAMANDER CAPTURE LOCATIONS AND
RANDOM LOCATIONS IN LEE AND BOSCOE CREEKS, THOMPSON MILLS FOREST, GEORGIA.
nCurrentvelocity n Depth
Distance tocover
Boscoe CreekApril 2000
July
November
April 2001
CaptureRandomCaptureRandomCaptureRandomCaptureRandom
6316
120393145
11232
7 (0.06)*13 (0.11)4 (0.04)*1 (0.02)6 (0.08)5 (0.04)5 (0.05)5 (0.04)
8324
150493649
13850
5.0 (3.0)*11.0 (7.0)4.0 (4.0)*6.0 (5.5)7.0 (3.0)*9.0 (7.0)6.0 (3.0)6.0 (5.0)
2 (3)—
1 (2)—
1 (3)—
2 (4)—
Lee CreekApril 2000
July
November
April 2001
CaptureRandomCaptureRandomCaptureRandomCaptureRandom
6417
1974194357927
5 (0.05)*9 (0.09)2 (0.04)*6 (0.10)3 (0.02)3 (0.04)9 (0.10)8 (0.07)
8824
24549
10148
11749
6.0 (4.0)6.0 (4.0)4.0 (3.0)*5.0 (3.0)5.0 (3.0)5.0 (3.0)5.0 (3.0)5.0 (4.0)
3 (5)—
1 (3)—
2 (4)—
3 (6)—
* Differences were detected using a Wilcoxon two-sample test (alpha 5 0.10).
DISCUSSION
In Boscoe and Lee Creeks, the larval periodfor southern two-lined salamanders lasted forapproximately 14 months. This one-year larvalperiod may be a consequence of the earlier ovi-position and faster growth rates that occur inthe warmer temperatures of this region (Bruce,1982, 1985; Voss, 1993). Growth rates of larvaeranged from 0.6–1.1 mm/month.
Habitat use patterns were similar in bothstreams despite differences in availability. Ingeneral, southern two-lined salamander larvaeavoided silty, highly embedded areas and tend-ed to occupy areas with the largest substratumavailable in their respective streams. Both sea-sonal and between-stream differences in micro-habitat use were attributable to differences inmicrohabitat availability. We observed little evi-dence of intra- or interspecific interaction; lar-vae were found in areas with the greatest avail-ability of cover often in high densities and cap-ture numbers for other larval species were verylow.
In Boscoe Creek, larvae were absent fromdeep microhabitats with little or no coarse sub-strata. Petranka (1984) found two-lined sala-mander larvae primarily in pools underneathcover. This may indicate that avoidance of thismicrohabitat type in this study is cover relatedrather than a function of depth. Fish were ob-
served throughout the study in Boscoe Creek,primarily in pools. Eurycea bislineata larvae douse chemical cues to monitor for the presenceof fish and seek cover when they are present(Petranka et al., 1987), suggesting that theavoidance of pools by southern two-lined sala-manders in Boscoe Creek may be a predatoravoidance mechanism. Larvae in Lee Creek didnot avoid deeper microhabitats. However, LeeCreek was shallower than Boscoe Creek anddeeper areas in Lee Creek differed little fromriffle habitat because cobble availability washigh throughout the stream. Larvae in LeeCreek were underrepresented in microhabitatsdominated by bedrock substrata. We seldomcaptured southern two-lined larvae in Lee andBoscoe creeks far from cover, which includedcobbles, wood, and debris.
Little is known about the microhabitat re-quirements and ecology of salamander larvae inthe Piedmont region of the southeastern Unit-ed States. This study and the work of Orser andShure (1972) are the only extant publicationson larval growth and abundance, microhabitatuse, and the effects of urbanization on salaman-der larvae in the Georgia Piedmont. However,we know that physical microhabitat characteris-tics are important for the maintenance of larvalsalamander populations (Parker, 1991; Dillerand Wallace, 1996; and Welsh and Lind, 1996),
541SMITH AND GROSSMAN—EURYCEA CIRRIGERA HABITAT USE
TABLE 6. SEASONAL DIFFERENCES IN MICROHABITAT USE FOR LARVAL TWO-LINED SALAMANDERS IN LEE AND BOS-COE CREEKS FOR APRIL 2000 (A), JULY ( J), AND NOVEMBER (N) 2000 AND APRIL 2001 (A2). We tested forsignificant differences using Kruskal-Wallis tests on principal component scores followed by Tukey-Kramer tests(alpha 5 0.05). We only present variables with component loadings $ z0.40z. Only components with significant
differences are reported.
Significant com-ponent (% variance
explained) x2 Component loadingsSignificantdifferences
Boscoe Creek1 (35) 59.96** % embed (0.87), % silt (0.59), depth (0.57), % debris
(0.55), % cobble (20.42), % pebble (20.76), % gravel(20.80)
(N . A2, A, J)(A2 . A, J)
2 (15) 74.42** % sand (0.64), % debris (0.43), % silt (20.73) (N . A2, J)(A . A2, J)
3 (12) 9.61* % sand (0.68), % cobble (0.48), % debris (20.42) (A2 . N)
Lee Creek1 (22) 46.39** % pebble (0.76), % cobble (0.67), % gravel (0.62),
% silt (20.53), % embed (20.61)(A . N)( J . N, A2)(A2 . N)
2 (15) 13.89** % embed (0.53), % silt (0.51), % cobble (0.43), % bed-rock (20.77)
(A2 . J)
3 (14) 103.09** % debris (0.78), % wood (0.53), % sand (20.60) (N . J, A, A2)( J . A, A2)(A . A2)
Degrees of freedom 5 3 for all tests. * P , 0.05. ** P , 0.01.
TABLE 7. DIFFERENCES IN MICROHABITAT USE FOR LARVAL SOUTHERN TWO-LINED SALAMANDERS BETWEEN LEE
(L) AND BOSCOE (B) CREEKS. We tested for significant differences using Wilcoxon two-sample tests on principalcomponent scores (alpha 5 0.05). We only present variables with component loadings $ z0.40z. Only com-
ponents with significant differences are reported.
Significant com-ponent (% variance
explained) t Component loadingsSignificantdifferences
April 20001 (24) 24.76** % silt (0.74), depth (0.61), % embeddedness (0.58),
% debris (0.46), % pebble (20.65), % gravel (20.78)L . B
2 (18) 9.84** % embeddedness (0.54), % sand (0.50), % debris (0.48),% wood (0.44), % boulder (20.66), % cobble (20.67)
B . L
4 (9) 23.63** % wood (0.66), % debris (20.59) L . B
July1 (24) 24.48** % embed (0.76), % silt (0.73), depth (0.49), % gravel
(20.66), % pebble (20.68)L . B
2 (15) 14.71** % pebble (0.48), % bedrock, (20.62), % boulder(20.76)
B . L
4 (11) 4.76** % sand (0.63), % bedrock (0.44), % cobble (20.59) B . L
November2 (15) 2.78** % wood (0.54), % boulder (20.42), % silt (20.44),
% bedrock (20.68)B . L
4 (12) 25.16** % boulder (0.41), % gravel (20.49), % sand (20.82) L . B
April 20012 (15) 211.43** % wood (0.52), % pebble (0.52), % gravel (0.47),
% bedrock (20.48), % boulder (20.49)B . L
4 (11) 4.96** % boulder (0.55), % cobble (0.46), % bedrock (20.70) L . B
Degrees of freedom 5 1 for all tests. * P , 0.05. ** P , 0.01.

542 COPEIA, 2003, NO. 3
and the results of this study indicate that streamcomplexity probably is important to salamanderlarvae in the Georgia Piedmont.
Although the use of coarser substrates by sal-amanders in this study is consistent with micro-habitat use observations in other regions (Park-er, 1991; Diller and Wallace, 1996; and Welshand Lind, 1996), stream salamanders in thesouthern Piedmont region face a variety of dif-ferences in microhabitat availability. The south-ern Piedmont is a region with a history of in-tensive land use (Trimble, 1974), and this activ-ity may have decreased the availability of micro-habitats important to southern two-linedsalamander larvae. Many streams have experi-enced large amounts of siltation and subse-quent channelization (Trimble, 1974; Ruhlmanand Nutter, 1999). Consequently, it is likely thathabitat heterogeneity has been lost in thesestreams. Lack of cover objects could affect theability of larvae to avoid high current velocitiesand predators, as well as, decrease prey avail-ability. The microhabitat usage pattern of larvaein these streams suggests other meaningfulquestions; most important, how does the use ofmicrohabitats found in Piedmont streams affectthe growth and survival of individuals and pop-ulations?
Our study focused on larval two-lined sala-manders in two streams for one year and pro-vides basic habitat use information that was pre-viously lacking. However, much remains to beunderstood about stream salamanders in this re-gion and the factors that influence their popu-lation dynamics. Results from this study indicatethat presence of coarse substrata and habitatheterogeneity that allow larvae to avoid unfa-vorable habitat is important. Yet, the increasingurbanization in the southern Piedmont proba-bly threatens habitats that may be important forlarval survival in this region. Therefore, it is cru-cial that we learn more about the link betweenlarval microhabitat use and population persis-tence to protect stream salamander populationsin this region.
ACKNOWLEDGMENTS
Thank you to the following people for theircontributions. This research was partially fund-ed by the McIntire-Stennis project GEO-0086-MS to GDG, the Warnell School of Forest Re-sources, and the Graduate School of the Uni-versity of Georgia. D. Williams and B. Lott forsupport and access to Thompson Mills Forest;B. Ratajczak for field help, statistical assistance,and advice; B. Bury, C. Camp, R. Cooper, W.Gibbons, R. Jackson, R. Jaeger and T. Ryan for
their review of the proposal and ongoing ad-vice; M. Elliott, C. Anderson, S. Johansson, N.Nazdrowicz, S. Rooks, M. Wagner, C. Spearman,L. Sasser, A. Myszka, B. Womack, and J. Rogersfor field assistance. Georgia Scientific CollectingPermits (4/1/00 to 3/31/01: 29-WMB-00-43; 4/1/01 to 3/31/02: 29-WMB-01-71). All IACUCpolicies of the University of Georgia were fol-lowed during the course of this research.
LITERATURE CITED
ALLAN, J. D. 1995. Stream ecology: structure and func-tion of running waters. Chapman and Hall, Lon-don.
BAUMGARTNER, N., A. WARINGER, AND J. WARINGER.1999. Hydraulic microdistribution patterns of larvalfire salamanders (Salamandra salamandra salaman-dra) in the Weidlingbach near Vienna, Austria.Freshw. Biol. 41:31–41.
BRUCE, R. C. 1982. Larval periods and metamorphosisin two species of salamanders of the genus Eurycea.Copeia 1982:117–127.
———. 1985. Larval period and metamorphosis inthe salamander Eurycea bislineata. Herpetologica 41:19–28.
CAMP, C. D., J. L. MARSHALL, K. R. LANDAU, R. M.AUSTIN JR., AND S. G. TILLEY. 2000. Sympatric oc-currence of two species of the two-lined salamander(Eurycea bislineata) complex. Copeia 2000:572–578.
CONANT, R., AND J. T. COLLINS. 1998. Reptiles and am-phibians: Eastern/Central North America. 3d ed.Houghton Mifflin Co., New York.
CORN, P. S., AND R. B. BURY. 1989. Logging in westernOregon: responses of headwater habitats andstream amphibians. For. Ecol. Manag. 29:39–57.
DILLER, L. V., AND R. L. WALLACE. 1996. Distributionand habitat of Rhyacotriton variegatus in managed,young growth forests in north coastal California. J.Herpetol. 30:184–191.
GROSSMAN, G. D., AND M. C. FREEMAN. 1987. Micro-habitat use in a stream fish assemblage. J. Zool. 212:151–176.
———, AND R. E. RATAJCZAK. 1998. Long-term pat-terns of microhabitat use by fish in a southern Ap-palachian stream from 1983 to 1992: effects of hy-drological period, season and fish length. Ecol.Freshw. Fish 7:108–131.
KOZAK, K. H., AND R. R. MONTANUCCI. 2001. Geneticvariation across a contact zone between montaneand lowland forms of the two-lined salamander (Eu-rycea bislineata) species complex: a test of specieslimits. Copeia 2001:25–34.
MARTOF, B. S. 1956. Amphibians and Reptiles of Geor-gia. Univ. of Georgia Press, Athens.
MOUNT, R. H. 1975. The reptiles and amphibians ofAlabama. Univ. of Alabama Press, Tuscaloosa.
ORSER, P. N., AND D. J. SHURE. 1972. Effects of urban-ization on the salamander Desmognathus fuscus fus-cus. Ecology 53:1148–1154.
PARKER, M. S. 1991. Relationship between cover avail-ability and larval Pacific giant salamander density.J. Herpetol. 25:355–357.

543SMITH AND GROSSMAN—EURYCEA CIRRIGERA HABITAT USE
PETRANKA, J. W. 1998. Salamanders of the UnitedStates and Canada. Smithsonian Institution Press,Washington, DC.
———. 1984. Ontogeny of the diet and feeding be-havior of Eurycea bislineata larvae. J. Herpetol. 18:48–55.
———, A. B. KATS, AND A. SIH. 1987. Predator preyinteractions among fish and larval amphibians: useof chemical cues to detect predatory fish. Anim.Behav. 35:420–425.
RUHLMAN, M. B., AND W. L. NUTTER. 1999. Channelmorphology evolution and overbank flow in theGeorgia Piedmont. Am. Water Res. Assoc. 35:277–290.
RYAN, T. J. 1998. Larval life history and abundance ofa rare salamander, Eurycea junaluska. J. Herpetol.32:10–17.
STEWART, M. M. 1968. Population dynamics of Euryceabislineata in New York. Ibid. 2:176–177.
TRIMBLE, S. W. 1974. Man-Induced soil erosion on the
southern Piedmont: 1700–1970. Soil ConservationSociety of America, Milwaukee, WI.
VOSS, S. R. 1993. Relationship between stream orderand length of larval period in the salamander Eu-rycea wilderae. Copeia 1993:736–742.
WELSH, H. W., AND A. J. LIND. 1996. Habitat correlatesof the Southern Torrent Salamander, Rhyacotritonvariegatus (Caudata: Rhyacotritonidae), in North-western California. J. Herpetol. 30:385–398.
ZAR, J. H. 1999. Biostatistical analysis. 4th ed. PrenticeHall, Upper Saddle River, NJ.
DANIEL B. WARNELL SCHOOL OF FOREST RE-SOURCES UNIVERSITY OF GEORGIA ATHENS,GEORGIA 30602. PRESENT ADDRESS: (SS) 739BOULEVARD, ATHENS, GEORGIA 30601. E-mail:(SS) [email protected]; and (GDG)[email protected]. Send reprint requeststo GDG. Submitted: 9 Sept. 2002. Accepted:22 Jan. 2003. Section editor: M. J. Lannoo.
Copyright © 2022 FDOKUMEN