A giant boring in a Silurian stromatoporoid analysed by computer tomography
www.geologicacarpathica.sk
GEOLOGICA CARPATHICA, AUGUST 2010, 61, 4, 257—272 doi: 10.2478/v10096-010-0015-2
Introduction
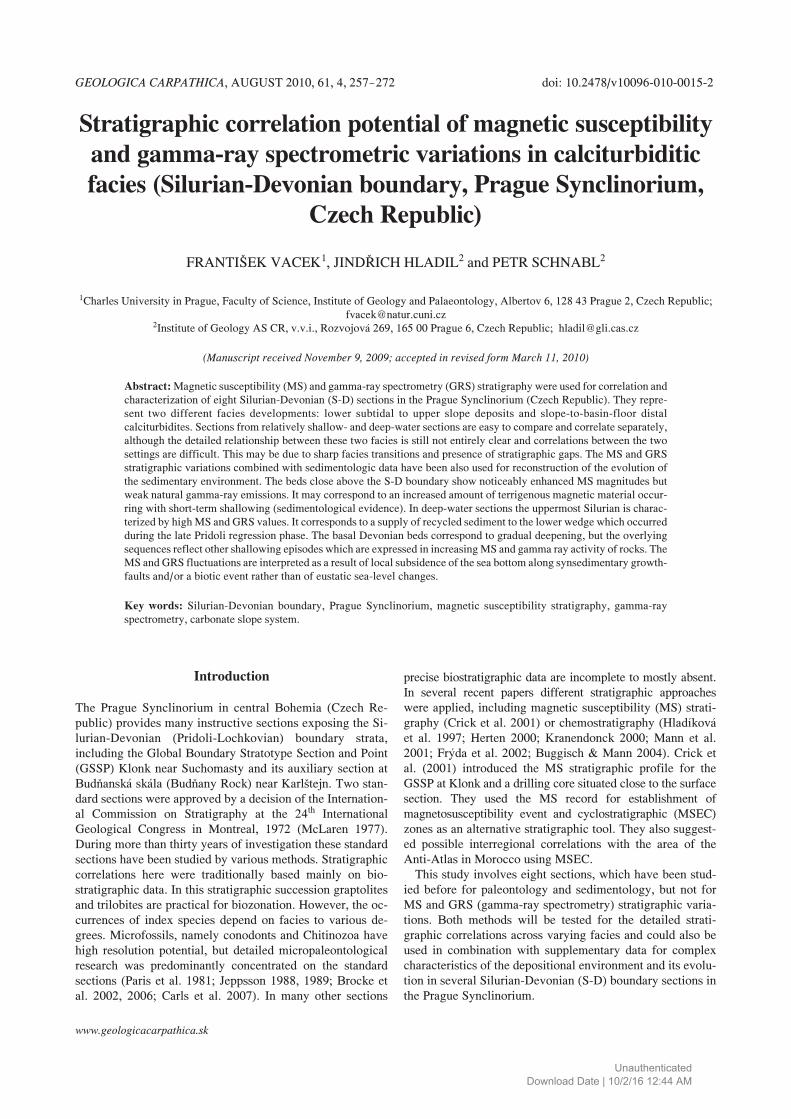
The Prague Synclinorium in central Bohemia (Czech Re-public) provides many instructive sections exposing the Si-lurian-Devonian (Pridoli-Lochkovian) boundary strata,including the Global Boundary Stratotype Section and Point(GSSP) Klonk near Suchomasty and its auxiliary section atBudňanská skála (Budňany Rock) near Karlštejn. Two stan-dard sections were approved by a decision of the Internation-al Commission on Stratigraphy at the 24th InternationalGeological Congress in Montreal, 1972 (McLaren 1977).During more than thirty years of investigation these standardsections have been studied by various methods. Stratigraphiccorrelations here were traditionally based mainly on bio-stratigraphic data. In this stratigraphic succession graptolitesand trilobites are practical for biozonation. However, the oc-currences of index species depend on facies to various de-grees. Microfossils, namely conodonts and Chitinozoa havehigh resolution potential, but detailed micropaleontologicalresearch was predominantly concentrated on the standardsections (Paris et al. 1981; Jeppsson 1988, 1989; Brocke etal. 2002, 2006; Carls et al. 2007). In many other sections
Stratigraphic correlation potential of magnetic susceptibilityand gamma-ray spectrometric variations in calciturbiditicfacies (Silurian-Devonian boundary, Prague Synclinorium,
Czech Republic)
FRANTIŠEK VACEK1, JINDŘICH HLADIL2 and PETR SCHNABL2
1Charles University in Prague, Faculty of Science, Institute of Geology and Palaeontology, Albertov 6, 128 43 Prague 2, Czech Republic;[email protected]
2Institute of Geology AS CR, v.v.i., Rozvojová 269, 165 00 Prague 6, Czech Republic; [email protected]
(Manuscript received November 9, 2009; accepted in revised form March 11, 2010)
Abstract: Magnetic susceptibility (MS) and gamma-ray spectrometry (GRS) stratigraphy were used for correlation andcharacterization of eight Silurian-Devonian (S-D) sections in the Prague Synclinorium (Czech Republic). They repre-sent two different facies developments: lower subtidal to upper slope deposits and slope-to-basin-floor distalcalciturbidites. Sections from relatively shallow- and deep-water sections are easy to compare and correlate separately,although the detailed relationship between these two facies is still not entirely clear and correlations between the twosettings are difficult. This may be due to sharp facies transitions and presence of stratigraphic gaps. The MS and GRSstratigraphic variations combined with sedimentologic data have been also used for reconstruction of the evolution ofthe sedimentary environment. The beds close above the S-D boundary show noticeably enhanced MS magnitudes butweak natural gamma-ray emissions. It may correspond to an increased amount of terrigenous magnetic material occur-ring with short-term shallowing (sedimentological evidence). In deep-water sections the uppermost Silurian is charac-terized by high MS and GRS values. It corresponds to a supply of recycled sediment to the lower wedge which occurredduring the late Pridoli regression phase. The basal Devonian beds correspond to gradual deepening, but the overlyingsequences reflect other shallowing episodes which are expressed in increasing MS and gamma ray activity of rocks. TheMS and GRS fluctuations are interpreted as a result of local subsidence of the sea bottom along synsedimentary growth-faults and/or a biotic event rather than of eustatic sea-level changes.
Key words: Silurian-Devonian boundary, Prague Synclinorium, magnetic susceptibility stratigraphy, gamma-rayspectrometry, carbonate slope system.
precise biostratigraphic data are incomplete to mostly absent.In several recent papers different stratigraphic approacheswere applied, including magnetic susceptibility (MS) strati-graphy (Crick et al. 2001) or chemostratigraphy (Hladíkováet al. 1997; Herten 2000; Kranendonck 2000; Mann et al.2001; Frýda et al. 2002; Buggisch & Mann 2004). Crick etal. (2001) introduced the MS stratigraphic profile for theGSSP at Klonk and a drilling core situated close to the surfacesection. They used the MS record for establishment ofmagnetosusceptibility event and cyclostratigraphic (MSEC)zones as an alternative stratigraphic tool. They also suggest-ed possible interregional correlations with the area of theAnti-Atlas in Morocco using MSEC.
This study involves eight sections, which have been stud-ied before for paleontology and sedimentology, but not forMS and GRS (gamma-ray spectrometry) stratigraphic varia-tions. Both methods will be tested for the detailed strati-graphic correlations across varying facies and could also beused in combination with supplementary data for complexcharacteristics of the depositional environment and its evolu-tion in several Silurian-Devonian (S-D) boundary sections inthe Prague Synclinorium.
UnauthenticatedDownload Date | 10/2/16 12:44 AM

258 VACEK, HLADIL and SCHNABL
Geological setting
The Variscan folded Silurian and Devonian formations cropout in the central part of the Prague Synclinorium betweenPrague and vicinity of Beroun (Fig. 1). They consist of marinesediments (mostly shales and limestones; Chlupáč et al. 1998)and submarine volcanic rocks (basic volcanics and coeval ba-sic/ultrabasic volcaniclastics; Fiala 1970; Patočka & Štorch2004). Prague Synclinorium was interpreted as located on thenorthern margins of Gondwana during the S-D interval withaffinities to Armorica (e.g. Krs & Pruner 1995; Krs et al.
2001), at a paleolatitude of about 17°S (Patočka et al. 2003).The S-D boundary is situated close to the boundary be-
tween the Požáry (approximately corresponding to the Prido-
li Series) and Lochkov Formations (~ the Lochkovian Stage).Both formations are generally characterized by lateral transi-tion from coarse-grained bioclastic limestones in the NWpart of the synclinorium to fine-grained limestones andshales in the SE part (Chlupáč et al. 1998), defining a NWshallow zone and SE deeper zone. However, the boundariesof these two lithostratigraphic units are slightly diachronousover the region. Proximity of the S-D boundary is broadlycharacterized by blooms of pelagic crinoids with plate-typeloboliths, typically Scyphocrinites, which often (but not al-ways) occur in the beds of the latest Pridoli and early Loch-kovian ages. They may form several meters thick beds ofcoarse-grained crinoidal limestones at the base of the Loch-kov Formation, informally called the Scyphocrinites Horizon(Scyphocrinites H). It may be locally associated with cepha-lopod limestones and also with beds of flat-pebble conglom-erates. It is better recognizable in the deeper zone because inthe shallow-water environment it may be concealed by over-all bioclastic deposition.
Several localities exposing the S-D boundary strata repre-senting the two different facies were selected for study (seeFig. 1, Table 1). These facies were deposited on the margin ofan open-sea carbonate shelf with adjacent carbonate slope en-vironment (Vacek 2007). Generally a deepening trend can betraced from the NW to the SE of the basin.
Methods
Limestone “beds” are traditionally numbered 1, 2, 3, etc.,designations such as 1/2, 2/3 are used for the shale “inter-beds”.
Magnetic susceptibility study
In the last ten years, the number of studies on stratigraphicMS variations in the Devonian marine carbonate or mixed se-quences has increased significantly (Crick et al. 1997, 2000,2001, 2002; Ellwood et al. 2000, 2001, 2006; da Silva &Boulvain 2006; Hladil et al. 2006; da Silva et al. 2009a,b,2010; Koptíková et al. 2010).
The outcrop sections were sampled for the MS study at0.05 m intervals. Small cubic or slice rock samples were col-lected (20—50 g). Only fresh samples were taken (i.e. avoidingthe veins, visible pyrite or limonite aggregates, various spots
related to late diagenetic alterations and weathering, epigenet-ic dolomitization and also shear-deformed parts of the rock).The thickness of the MS profiles ranges from 4 to 11 metersdepending on geological conditions. The complete samplecollection includes more than 1,000 samples. Measurementswere carried out in the Laboratory of Paleomagnetism (Inst.Geol. AS CR, Prague) on Kappabridges KLY-2 and 3 (pro-duced by Agico Ltd. Brno; for technical details we refer towww.agico.com). The values of magnetic susceptibility inthis paper are expressed as mass-related magnetic suscepti-bility (10—9 m3·kg—1). These are further referred as MS valueswhich are used for plotting the curves and assessment oftheir possible stratigraphic importance.
Magnetic susceptibility is the intrinsic property that deter-mines the amount of magnetism, which a rock can have in agiven magnetic field. It is related to bulk chemistry and mag-netic mineralogy and particularly to the amounts of easilymagnetizable minerals in a rock sample. The increased MSsignal in limestones is induced by presence of various ferro-magnetic (s.l.) minerals (magnetite, maghemite, hematite,monoclinic pyrrhotite), and also weakly magnetic but muchmore abundant paramagnetic minerals (clay minerals, pyrox-ene, amphibole, biotite, chlorite, pyrite, chalcopyrite, a.o.).
In contrast, diamagnetic minerals such as calcite, quartz,and others have very weak negative MS magnitudes and re-duce mass susceptibility of a rock sample. However, the MSof detrital ferromagnetic and paramagnetic minerals is muchgreater than the MS of diamagnetic minerals. Therefore, asmall amount of even weakly paramagnetic mineral can sig-nificantly outweigh the MS of volumetrically more abundantdiamagnetic minerals (Ellwood et al. 2000).
The amount of magnetic particles mainly depends on terrig-enous influx, which is mostly controlled by fluctuations in sealevel. Generally, the maximum input of terrigenous detrituscorresponds to intensive erosion during the lowstand of sealevel. This is considered to be recognizable on both the re-gional and global scale because of synchronous variations inglobal erosion controlled by eustasy (Ellwood et al. 2000,2001). The large-scale redistribution of sub-silt and silt-sizedparticles (<63 µm) often comes about through eolian trans-port, and the deep parts of carbonate slopes can also be affect-ed by distant riverine flux (Hladil 2002; Hladil et al. 2006).
Magnetite can also be produced by magnetotactic bacteriaor algae. However, it is mostly formed in shallow-water con-ditions with restricted circulation, which is not the case ofthe studied sections. The other magnetically important min-eral components related to deep-water carbonate or mixedcarbonate-siliciclastic sediments are authigenic carbonateswith iron in lattices or iron-oxide inclusions (siderite andrarely other minerals; e.g. Ellwood et al. 1988; Frederichs etal. 2003), and these are also tentatively related to bacterially-mediated precipitates. For more discussion on the primaryand secondary magnetic minerals in carbonates we refer toda Silva et al. (2009a).
Rock magnetic methods
Several methods have been used for identification of possi-ble carriers of the MS. They have been applied both on miner-
UnauthenticatedDownload Date | 10/2/16 12:44 AM

259MAGNETIC SUSCEPTIBILITY AND GAMMA-RAY IN CALCITURBIDITIC FACIES (PRAGUE SYNCLINORIUM)
al concentrates obtained by dissolution in acids (10 samples;X-ray diffraction – XRD; temperature dependence of theMS; magnetic hysteresis) and the whole-rock samples (5 sam-ples; isothermal remanent magnetization – IRM).
Mineral concentrates have been obtained by leaching in10% hydrochloric and acetic acids, separately. However,some important magnetic minerals such as iron oxides maybe dissolved in these acids, therefore we had to also use theIRM method applied to whole rock (see above).
The method of temperature dependent MS identifies mag-netic minerals and mineralogical phase changes during heat-ing. It was measured using KLY-4S Kappabridge (producedby Agico Ltd. Brno; Jelínek & Pokorný 1997) combinedwith a temperature control unit CS3 (Parma & Zapletal
1991) in the temperature range of 20—700 °C in an argon at-mosphere. Paramagnetic minerals exhibit parabolic-shapedMS decay curves at relatively low temperatures (up to
~200 °C) because the MS of these minerals is inversely pro-portional to the temperature (Hrouda 1994). On the otherhand, ferromagnetic minerals usually show increasing MSup to the point where it decays to the Curie temperature. For
magnetite the Curie temperature is ~580 °C and for hematiteit is ~680 °C.
The method of magnetic hysteresis is based on response of amagnetic material to magnetic field. Hysteretic behaviour ishighly dependent on mineralogy and grain size (Tauxe et al.1996). The sample is placed in an intensive magnetic field(+1 T) and magnetization is examined as the applied intensi-ty drops to zero and then increases to the negative maximum(—1 T). Changes in magnetization during regaining of theoriginal intensity (+1 T) are significant for interpretation ofmagnetic components. These measurements were performedon a vibrating sample magnetometer Model 3900 VSM (pro-duced by Princeton Measurement Corporation).
IRM was measured on Pulse Magnetizer MMPM 10 (pro-duced by Magnetic Measurements Ltd.) and magnetometerJR6a (produced by Agico Ltd. Brno) in order to identify co-ercivity spectra. The used field range was 10 to 2000 mT.Contribution of particular magnetic components ferromag-netic to the total remanent magnetization has been tested bythe IRM component analysis (Kruiver et al. 2001). Variousmagnetic minerals can be identified by B1/2 values, which isthe magnetic field at which a half of Saturated IsothermalRemanent Magnetization (SIRM) is reached. For magnetiteit is 20—63 mT, hematite 63—200 mT, and goethite >1 T(Grygar et al. 2003).
Gamma ray spectrometry study
The spectral gamma-ray approach is a significant parallel toMS-detected concentrations of background sediment impurityin limestone (Hladil et al. 2006). The MS-GRS combinationhas an overall potential to improve the quality of MS basedstratigraphic correlation, with the background reasoning inmagnetomineralogy.
The gamma-ray spectrometric (GRS) based correlations ofoutcrop logs have been frequently used in the last decade inthe Devonian of the Czech Republic on the platform to basinformations of Moravia (Hladil et al. 2000, 2003a,b; Hladil
2002; Geršl & Hladil 2004; Bábek et al. 2007, a.o.) or Pra-gue Synclinorium (Slavík et al. 2000; Koptíková et al. 2007,2008, 2010).
For this study, a gamma-ray spectrometer Geofyzika-Satis-
Geo GS-512 with NaI(Tl) scintillation detector 3”×3”(7.62×7.62 cm) and 3” photomultiplier was used (SatisGeo2009). This instrument was used in the mode that the whole ele-ment concentrations of K (%), U (mg/kg=ppm) and Th (ppm)were automatically calculated. The instrument was calibratedat the regional reference centre of Bratkovice near Příbram(parameters frequently quoted, e.g. Lis et al. 1997). Using thistechnique and instrument, the gamma rays registered for thispurpose correspond to isotopes 214Bi and 208Tl, uranium andthorium decay series isotopes in naturally occurring materials,respectively. The data on potassium is obtained using thespectra for 40K isotope. The total natural gamma-ray variationhas been inferred from selected energy windows, all above720 keV. With this instrument, this additional parameter isset to display automatically a notional uranium equivalent(eU) that is routinely expressed in mg/kg (ppm) of U-equiv-alent contents, but for imagination or rough comparisononly. In addition, the recalculation to API units or radioac-tive doses cannot be accomplished in general terms, for itsrelationships to techniques, conditions and details of probesor instruments (Geršl & Hladil 2004). These approximatedata on the totals of natural gamma ray (NGR or GR) emis-sion from measured sedimentary rocks often differs accord-ing to apparatuses and has, therefore, only relative and notabsolute information value.
The thicknesses of the GRS logs are identical with the MSones, except the lower part of the Praha-Podolí section, whichcould not be measured due to its intensive weathering.
The GRS measurement was performed with 0.25 m step at atime of 240 seconds, perpendicular to the rock face at the fullcontact. This regular spacing strategy was preferred over theirregular (rock-type selective) one. This choice was based onthe preliminary-test findings that gamma-ray signal of differ-ent magnitudes and structure was obtained from the beds ofcomparable lithology (e.g. great variation within the class ofcoarse-grain calciturbidites, or the same for the very fine-grained shale interbeds). The size of this 0.25 m step was se-lected heuristically but with respect to the fact thatapproximately 95% signal at the front of the probe (with crys-tal) originates from a slightly deformed hemisphere of mea-sured rocks that corresponds to a target of 0.25 m radius at anideal planar surface (Lovborg et al. 1971). Hence, this empiri-cally tested precondition for overlapping of measurementswith these sections makes possible to keep the overlap below15 % of the signal, even for irregular arrangements of bedsand rock materials. The combined error from conditions, in-strument and repeated measurements was established to beless than about ±7.5 % for the whole element U, Th, K auto-matically calculated results.
Detected concentrations of K, U, and Th are mostly relatedto amount of feldspars, micas, and clay minerals, among oth-ers. Uranium is also known to be remarkably trapped in or-ganic matter (e.g. Durrance 1986). Higher concentrations ofthese elements should again reflect increased amount of non-carbonate impurities in limestones that are caused by detrital
ø
UnauthenticatedDownload Date | 10/2/16 12:44 AM

260 VACEK, HLADIL and SCHNABL
influx from a supposed land surface in both the regional andinterregional contexts.
Sedimentology and studied sections
The lithology, sedimentology, and biostratigraphy of the se-lected sections have been described in many previous papers(for more details we refer to Chlupáč et al. 1972; Hladil 1991,1992; Čáp et al. 2003; Vacek 2007).
Shallow facies
The relatively shallow-water carbonate facies with predomi-nance of bioclastic, mainly crinoidal packstones to grainstonesis distributed in the NW flank of the synclinorium with severalother finger-like projections in its western part (studied sec-tions at Požáry Quarry near Praha-Řeporyje, Srbsko, andOpatřilka Quarry near Praha-Holyně; Fig. 1, Table 1). Thesedeposits locally show reworking by storms, which indicatesthe conditions above the storm wave base. It corresponds tothe lower subtidal to upper slope environment.
The shallow-water carbonate facies possess rich benthicfauna, including crinoids and trilobites, and brachiopods. Theuppermost Silurian is characterized by abundant occurrence ofthe index trilobite Tetinia minuta. The first appearance oftrilobite Warburgella rugulosa rugosa indicates the base ofDevonian (Chlupáč et al. 1972).
Deep facies
Deep-water facies are distributed in the SE flank of thePrague Synclinorium (sections at Karlštejn, Klonk, Praha-Radotín and Praha-Podolí; Fig. 1, Table 1). These facies arecharacterized as dark bioclastic and peloidal wackestones/packstones to mudstones alternating with calcareous shales,locally with several meters thick Scyphocrinites H. They yieldcommon pelagic fauna, including graptolites, cephalopodsand ostracods. The S-D boundary interval is characterized byabundant occurrence of crinoids of Scyphocrinites sp. The up-permost Silurian corresponds to the graptolite Monograptustransgrediens Zone. The base of Devonian is marked by thefirst appearance of the index graptolite Monograptus unifor-mis (Chlupáč et al. 1972). Other fossil groups (conodonts,
Fig. 1. Position of the studied localities in the Prague Synclinorium area: 1 – Požáry Quarry near Praha-Řeporyje; 2 – Opatřilka Quarrynear Praha-Holyně; 3 – Srbsko; 4 – Karlštejn (Budňany Rock); 5 – Praha-Radotín (U topolů); 6 – Praha-Radotín (near Cement Plant);7 – Praha-Podolí; 8 – Klonk near Suchomasty. GSSP – Global Boundary Stratotype Section and Point. The geological sketch map of thePrague Synclinorium benefits partly from the working materials provided by R. Melichar.
UnauthenticatedDownload Date | 10/2/16 12:44 AM
261MAGNETIC SUSCEPTIBILITY AND GAMMA-RAY IN CALCITURBIDITIC FACIES (PRAGUE SYNCLINORIUM)
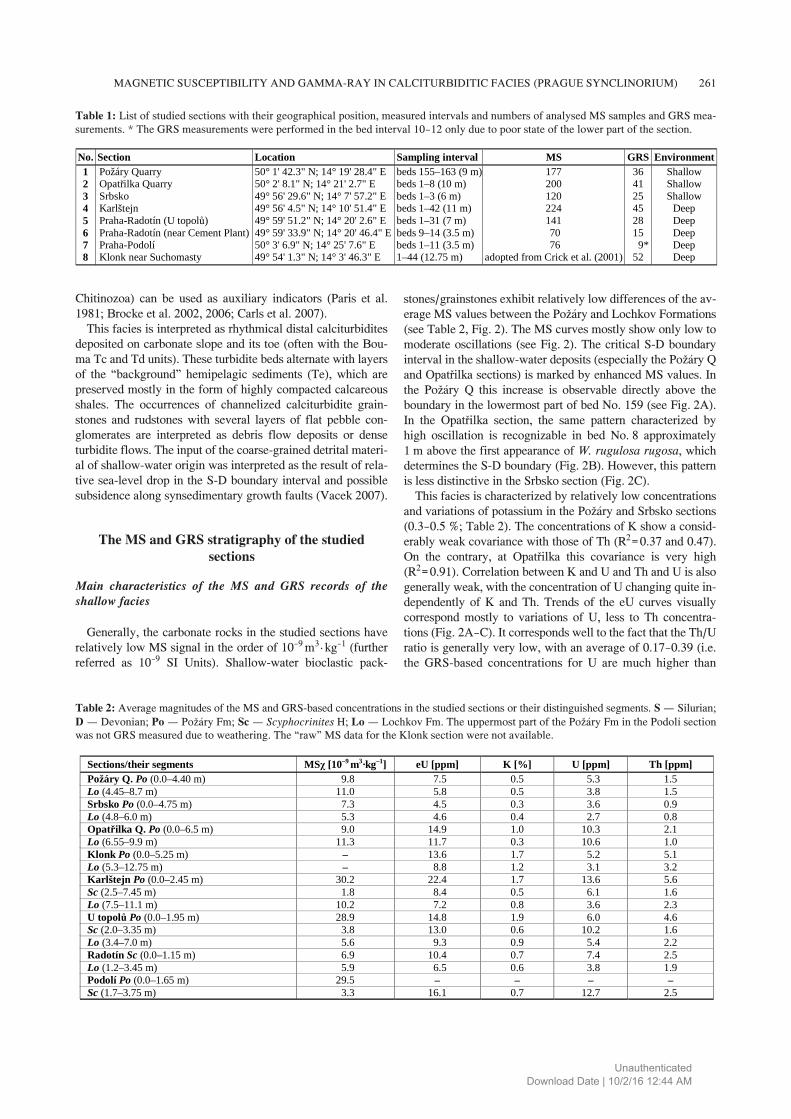
No. Section Location Sampling interval MS GRS Environment 1 Požáry Quarry 50° 1' 42.3" N; 14° 19' 28.4" E beds 155–163 (9 m) 177 36 Shallow 2 Opatřilka Quarry 50° 2' 8.1" N; 14° 21' 2.7" E beds 1–8 (10 m) 200 41 Shallow 3 Srbsko 49° 56' 29.6" N; 14° 7' 57.2" E beds 1–3 (6 m) 120 25 Shallow 4 Karlštejn 49° 56' 4.5" N; 14° 10' 51.4" E beds 1–42 (11 m) 224 45 Deep 5 Praha-Radotín (U topolů) 49° 59' 51.2" N; 14° 20' 2.6" E beds 1–31 (7 m) 141 28 Deep 6 Praha-Radotín (near Cement Plant) 49° 59' 33.9" N; 14° 20' 46.4" E beds 9–14 (3.5 m) 70 15 Deep 7 Praha-Podolí 50° 3' 6.9" N; 14° 25' 7.6" E beds 1–11 (3.5 m) 76 9* Deep 8 Klonk near Suchomasty 49° 54' 1.3" N; 14° 3' 46.3" E 1–44 (12.75 m) adopted from Crick et al. (2001) 52 Deep
Table 1: List of studied sections with their geographical position, measured intervals and numbers of analysed MS samples and GRS mea-surements. * The GRS measurements were performed in the bed interval 10—12 only due to poor state of the lower part of the section.
Chitinozoa) can be used as auxiliary indicators (Paris et al.1981; Brocke et al. 2002, 2006; Carls et al. 2007).
This facies is interpreted as rhythmical distal calciturbiditesdeposited on carbonate slope and its toe (often with the Bou-ma Tc and Td units). These turbidite beds alternate with layersof the “background” hemipelagic sediments (Te), which arepreserved mostly in the form of highly compacted calcareousshales. The occurrences of channelized calciturbidite grain-stones and rudstones with several layers of flat pebble con-glomerates are interpreted as debris flow deposits or denseturbidite flows. The input of the coarse-grained detrital materi-al of shallow-water origin was interpreted as the result of rela-tive sea-level drop in the S-D boundary interval and possiblesubsidence along synsedimentary growth faults (Vacek 2007).
The MS and GRS stratigraphy of the studiedsections
Main characteristics of the MS and GRS records of theshallow facies
Generally, the carbonate rocks in the studied sections haverelatively low MS signal in the order of 10—9 m3·kg—1 (furtherreferred as 10—9 SI Units). Shallow-water bioclastic pack-
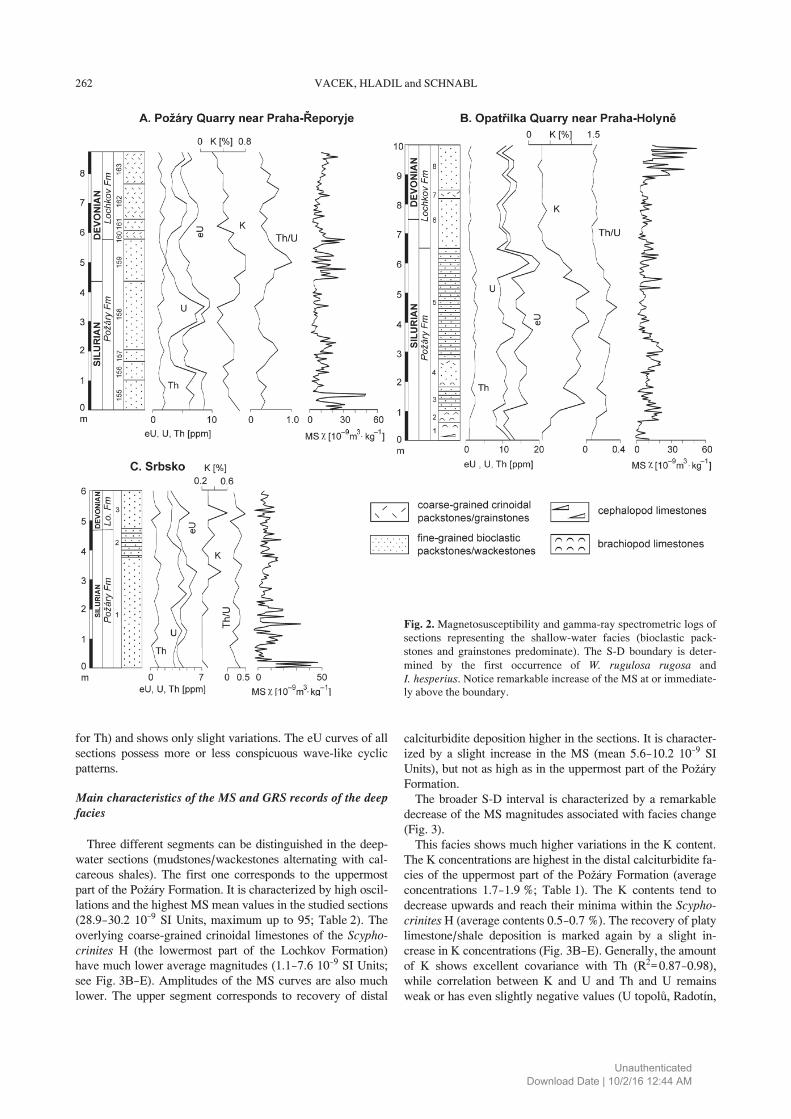
stones/grainstones exhibit relatively low differences of the av-erage MS values between the Požáry and Lochkov Formations(see Table 2, Fig. 2). The MS curves mostly show only low tomoderate oscillations (see Fig. 2). The critical S-D boundaryinterval in the shallow-water deposits (especially the Požáry Qand Opatřilka sections) is marked by enhanced MS values. Inthe Požáry Q this increase is observable directly above theboundary in the lowermost part of bed No. 159 (see Fig. 2A).In the Opatřilka section, the same pattern characterized byhigh oscillation is recognizable in bed No. 8 approximately1 m above the first appearance of W. rugulosa rugosa, whichdetermines the S-D boundary (Fig. 2B). However, this patternis less distinctive in the Srbsko section (Fig. 2C).
This facies is characterized by relatively low concentrationsand variations of potassium in the Požáry and Srbsko sections(0.3—0.5 %; Table 2). The concentrations of K show a consid-erably weak covariance with those of Th (R2=0.37 and 0.47).On the contrary, at Opatřilka this covariance is very high(R2=0.91). Correlation between K and U and Th and U is alsogenerally weak, with the concentration of U changing quite in-dependently of K and Th. Trends of the eU curves visuallycorrespond mostly to variations of U, less to Th concentra-tions (Fig. 2A—C). It corresponds well to the fact that the Th/Uratio is generally very low, with an average of 0.17—0.39 (i.e.the GRS-based concentrations for U are much higher than
Table 2: Average magnitudes of the MS and GRS-based concentrations in the studied sections or their distinguished segments. S – Silurian;D – Devonian; Po – Požáry Fm; Sc – Scyphocrinites H; Lo – Lochkov Fm. The uppermost part of the Požáry Fm in the Podolí sectionwas not GRS measured due to weathering. The “raw” MS data for the Klonk section were not available.
Sections/their segments MSχ [10–9 m3·kg–1] eU [ppm] K [%] U [ppm] Th [ppm] Požáry Q. Po (0.0–4.40 m) 9.8 7.5 0.5 5.3 1.5 Lo (4.45–8.7 m) 11.0 5.8 0.5 3.8 1.5 Srbsko Po (0.0–4.75 m) 7.3 4.5 0.3 3.6 0.9 Lo (4.8–6.0 m) 5.3 4.6 0.4 2.7 0.8 Opatřilka Q. Po (0.0–6.5 m) 9.0 14.9 1.0 10.3 2.1 Lo (6.55–9.9 m) 11.3 11.7 0.3 10.6 1.0 Klonk Po (0.0–5.25 m) – 13.6 1.7 5.2 5.1 Lo (5.3–12.75 m) – 8.8 1.2 3.1 3.2 Karlštejn Po (0.0–2.45 m) 30.2 22.4 1.7 13.6 5.6 Sc (2.5–7.45 m) 1.8 8.4 0.5 6.1 1.6 Lo (7.5–11.1 m) 10.2 7.2 0.8 3.6 2.3 U topolů Po (0.0–1.95 m) 28.9 14.8 1.9 6.0 4.6 Sc (2.0–3.35 m) 3.8 13.0 0.6 10.2 1.6 Lo (3.4–7.0 m) 5.6 9.3 0.9 5.4 2.2 Radotín Sc (0.0–1.15 m) 6.9 10.4 0.7 7.4 2.5 Lo (1.2–3.45 m) 5.9 6.5 0.6 3.8 1.9 Podolí Po (0.0–1.65 m) 29.5 – – – – Sc (1.7–3.75 m) 3.3 16.1 0.7 12.7 2.5
UnauthenticatedDownload Date | 10/2/16 12:44 AM
262 VACEK, HLADIL and SCHNABL
Fig. 2. Magnetosusceptibility and gamma-ray spectrometric logs ofsections representing the shallow-water facies (bioclastic pack-stones and grainstones predominate). The S-D boundary is deter-mined by the first occurrence of W. rugulosa rugosa andI. hesperius. Notice remarkable increase of the MS at or immediate-ly above the boundary.
for Th) and shows only slight variations. The eU curves of allsections possess more or less conspicuous wave-like cyclicpatterns.
Main characteristics of the MS and GRS records of the deepfacies
Three different segments can be distinguished in the deep-water sections (mudstones/wackestones alternating with cal-careous shales). The first one corresponds to the uppermostpart of the Požáry Formation. It is characterized by high oscil-lations and the highest MS mean values in the studied sections(28.9—30.2 10—9 SI Units, maximum up to 95; Table 2). Theoverlying coarse-grained crinoidal limestones of the Scypho-crinites H (the lowermost part of the Lochkov Formation)have much lower average magnitudes (1.1—7.6 10—9 SI Units;see Fig. 3B—E). Amplitudes of the MS curves are also muchlower. The upper segment corresponds to recovery of distal
calciturbidite deposition higher in the sections. It is character-ized by a slight increase in the MS (mean 5.6—10.2 10—9 SIUnits), but not as high as in the uppermost part of the PožáryFormation.
The broader S-D interval is characterized by a remarkabledecrease of the MS magnitudes associated with facies change(Fig. 3).
This facies shows much higher variations in the K content.The K concentrations are highest in the distal calciturbidite fa-cies of the uppermost part of the Požáry Formation (averageconcentrations 1.7—1.9 %; Table 1). The K contents tend todecrease upwards and reach their minima within the Scypho-crinites H (average contents 0.5—0.7 %). The recovery of platylimestone/shale deposition is marked again by a slight in-crease in K concentrations (Fig. 3B—E). Generally, the amountof K shows excellent covariance with Th (R2=0.87—0.98),while correlation between K and U and Th and U remainsweak or has even slightly negative values (U topolů, Radotín,
UnauthenticatedDownload Date | 10/2/16 12:44 AM

263MAGNETIC SUSCEPTIBILITY AND GAMMA-RAY IN CALCITURBIDITIC FACIES (PRAGUE SYNCLINORIUM)
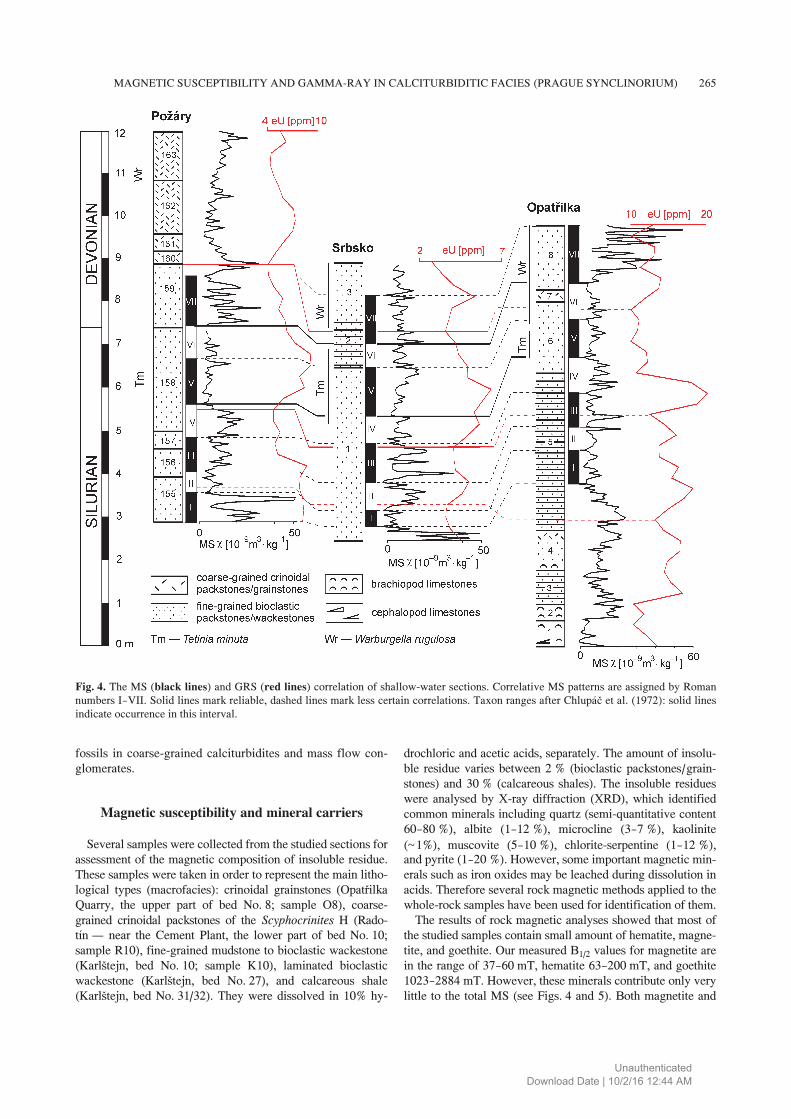
Fig. 3. Magnetosusceptibility and gamma-ray spectrometric record of sections representing the deep-water facies (slope distal calciturbid-ites predominate). The S-D boundary is determined by the first occurrence of M. uniformis. The lithological log of the GSSP at Klonk wasmodified after Chlupáč et al. (1972). The normalized MS curve was adopted from Crick et al. (2001).
UnauthenticatedDownload Date | 10/2/16 12:44 AM
264 VACEK, HLADIL and SCHNABL
and Podolí sections). Exceptionally, the Klonk and Karlštejnsections are characterized by good correlation between U andTh+K concentrations (R2 >0.8). This is expressed in similartrends and variations of K, U, Th and total gamma activitycurves (see Fig. 3A and B). In the above mentioned three sec-tions (U topolů, Radotín, Podolí), the eU variation is relatedmostly to changing U content (Fig. 3C—E).
The Th/U ratio is slightly higher than in the lower subtidaldeposits, but only exceptionally exceeds 1 (average 0.21—1.02).In some sections this ratio tends to increase upwards (Karlštejn,Praha-Radotín sections, Fig. 3B—D).
The MS and GRS correlations of the studied sections
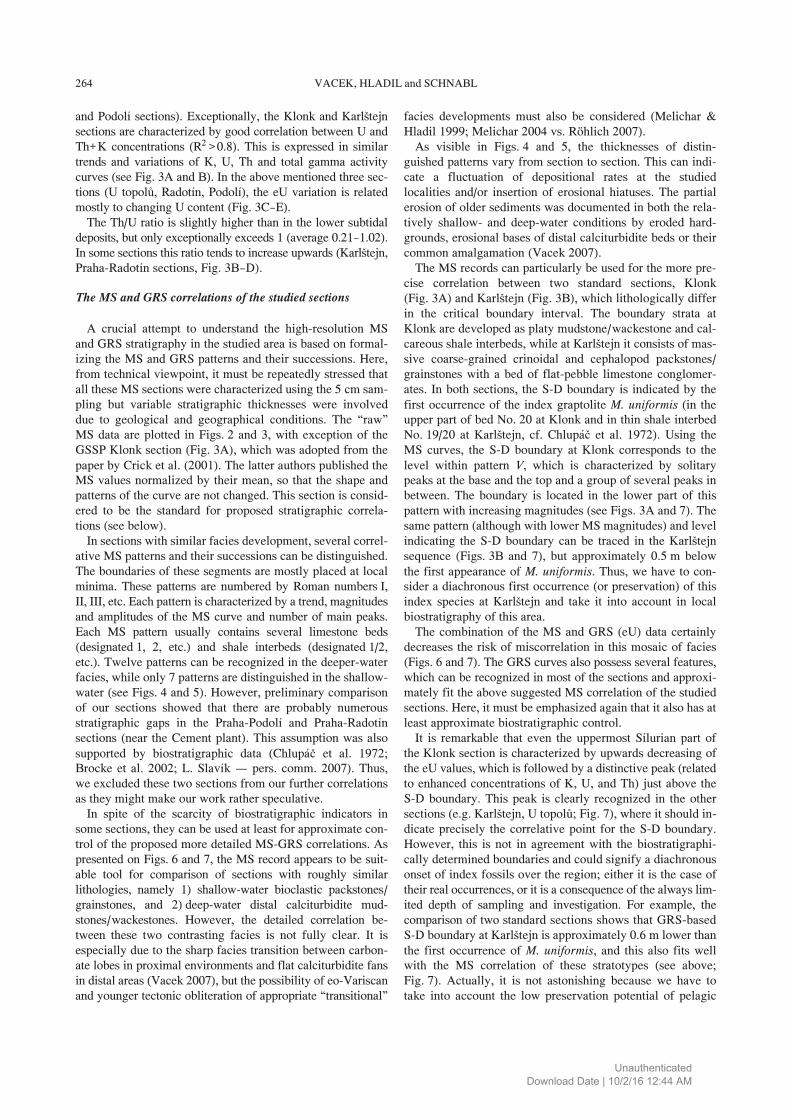
A crucial attempt to understand the high-resolution MSand GRS stratigraphy in the studied area is based on formal-izing the MS and GRS patterns and their successions. Here,from technical viewpoint, it must be repeatedly stressed thatall these MS sections were characterized using the 5 cm sam-pling but variable stratigraphic thicknesses were involveddue to geological and geographical conditions. The “raw”MS data are plotted in Figs. 2 and 3, with exception of theGSSP Klonk section (Fig. 3A), which was adopted from thepaper by Crick et al. (2001). The latter authors published theMS values normalized by their mean, so that the shape andpatterns of the curve are not changed. This section is consid-ered to be the standard for proposed stratigraphic correla-tions (see below).
In sections with similar facies development, several correl-ative MS patterns and their successions can be distinguished.The boundaries of these segments are mostly placed at localminima. These patterns are numbered by Roman numbers I,II, III, etc. Each pattern is characterized by a trend, magnitudesand amplitudes of the MS curve and number of main peaks.Each MS pattern usually contains several limestone beds(designated 1, 2, etc.) and shale interbeds (designated 1/2,etc.). Twelve patterns can be recognized in the deeper-waterfacies, while only 7 patterns are distinguished in the shallow-water (see Figs. 4 and 5). However, preliminary comparisonof our sections showed that there are probably numerousstratigraphic gaps in the Praha-Podolí and Praha-Radotínsections (near the Cement plant). This assumption was alsosupported by biostratigraphic data (Chlupáč et al. 1972;Brocke et al. 2002; L. Slavík – pers. comm. 2007). Thus,we excluded these two sections from our further correlationsas they might make our work rather speculative.
In spite of the scarcity of biostratigraphic indicators insome sections, they can be used at least for approximate con-trol of the proposed more detailed MS-GRS correlations. Aspresented on Figs. 6 and 7, the MS record appears to be suit-able tool for comparison of sections with roughly similarlithologies, namely 1) shallow-water bioclastic packstones/grainstones, and 2) deep-water distal calciturbidite mud-stones/wackestones. However, the detailed correlation be-tween these two contrasting facies is not fully clear. It isespecially due to the sharp facies transition between carbon-ate lobes in proximal environments and flat calciturbidite fansin distal areas (Vacek 2007), but the possibility of eo-Variscanand younger tectonic obliteration of appropriate “transitional”
facies developments must also be considered (Melichar &Hladil 1999; Melichar 2004 vs. Röhlich 2007).
As visible in Figs. 4 and 5, the thicknesses of distin-guished patterns vary from section to section. This can indi-cate a fluctuation of depositional rates at the studiedlocalities and/or insertion of erosional hiatuses. The partialerosion of older sediments was documented in both the rela-tively shallow- and deep-water conditions by eroded hard-grounds, erosional bases of distal calciturbidite beds or theircommon amalgamation (Vacek 2007).
The MS records can particularly be used for the more pre-cise correlation between two standard sections, Klonk(Fig. 3A) and Karlštejn (Fig. 3B), which lithologically differin the critical boundary interval. The boundary strata atKlonk are developed as platy mudstone/wackestone and cal-careous shale interbeds, while at Karlštejn it consists of mas-sive coarse-grained crinoidal and cephalopod packstones/grainstones with a bed of flat-pebble limestone conglomer-ates. In both sections, the S-D boundary is indicated by thefirst occurrence of the index graptolite M. uniformis (in theupper part of bed No. 20 at Klonk and in thin shale interbedNo. 19/20 at Karlštejn, cf. Chlupáč et al. 1972). Using theMS curves, the S-D boundary at Klonk corresponds to thelevel within pattern V, which is characterized by solitarypeaks at the base and the top and a group of several peaks inbetween. The boundary is located in the lower part of thispattern with increasing magnitudes (see Figs. 3A and 7). Thesame pattern (although with lower MS magnitudes) and levelindicating the S-D boundary can be traced in the Karlštejnsequence (Figs. 3B and 7), but approximately 0.5 m belowthe first appearance of M. uniformis. Thus, we have to con-sider a diachronous first occurrence (or preservation) of thisindex species at Karlštejn and take it into account in localbiostratigraphy of this area.
The combination of the MS and GRS (eU) data certainlydecreases the risk of miscorrelation in this mosaic of facies(Figs. 6 and 7). The GRS curves also possess several features,which can be recognized in most of the sections and approxi-mately fit the above suggested MS correlation of the studiedsections. Here, it must be emphasized again that it also has atleast approximate biostratigraphic control.
It is remarkable that even the uppermost Silurian part ofthe Klonk section is characterized by upwards decreasing ofthe eU values, which is followed by a distinctive peak (relatedto enhanced concentrations of K, U, and Th) just above theS-D boundary. This peak is clearly recognized in the othersections (e.g. Karlštejn, U topolů; Fig. 7), where it should in-dicate precisely the correlative point for the S-D boundary.However, this is not in agreement with the biostratigraphi-cally determined boundaries and could signify a diachronousonset of index fossils over the region; either it is the case oftheir real occurrences, or it is a consequence of the always lim-ited depth of sampling and investigation. For example, thecomparison of two standard sections shows that GRS-basedS-D boundary at Karlštejn is approximately 0.6 m lower thanthe first occurrence of M. uniformis, and this also fits wellwith the MS correlation of these stratotypes (see above;Fig. 7). Actually, it is not astonishing because we have totake into account the low preservation potential of pelagic
UnauthenticatedDownload Date | 10/2/16 12:44 AM
265MAGNETIC SUSCEPTIBILITY AND GAMMA-RAY IN CALCITURBIDITIC FACIES (PRAGUE SYNCLINORIUM)
Fig. 4. The MS (black lines) and GRS (red lines) correlation of shallow-water sections. Correlative MS patterns are assigned by Romannumbers I—VII. Solid lines mark reliable, dashed lines mark less certain correlations. Taxon ranges after Chlupáč et al. (1972): solid linesindicate occurrence in this interval.
fossils in coarse-grained calciturbidites and mass flow con-glomerates.
Magnetic susceptibility and mineral carriers
Several samples were collected from the studied sections forassessment of the magnetic composition of insoluble residue.These samples were taken in order to represent the main litho-logical types (macrofacies): crinoidal grainstones (OpatřilkaQuarry, the upper part of bed No. 8; sample O8), coarse-grained crinoidal packstones of the Scyphocrinites H (Rado-tín – near the Cement Plant, the lower part of bed No. 10;sample R10), fine-grained mudstone to bioclastic wackestone(Karlštejn, bed No. 10; sample K10), laminated bioclasticwackestone (Karlštejn, bed No. 27), and calcareous shale(Karlštejn, bed No. 31/32). They were dissolved in 10% hy-
drochloric and acetic acids, separately. The amount of insolu-ble residue varies between 2 % (bioclastic packstones/grain-stones) and 30 % (calcareous shales). The insoluble residueswere analysed by X-ray diffraction (XRD), which identifiedcommon minerals including quartz (semi-quantitative content60—80 %), albite (1—12 %), microcline (3—7 %), kaolinite
(~1%), muscovite (5—10 %), chlorite-serpentine (1—12 %),and pyrite (1—20 %). However, some important magnetic min-erals such as iron oxides may be leached during dissolution inacids. Therefore several rock magnetic methods applied to thewhole-rock samples have been used for identification of them.
The results of rock magnetic analyses showed that most ofthe studied samples contain small amount of hematite, magne-tite, and goethite. Our measured B1/2 values for magnetite arein the range of 37—60 mT, hematite 63—200 mT, and goethite1023—2884 mT. However, these minerals contribute only verylittle to the total MS (see Figs. 4 and 5). Both magnetite and
UnauthenticatedDownload Date | 10/2/16 12:44 AM

266 VACEK, HLADIL and SCHNABL
hematite can also be of diagenetic origin, while goethite is of-ten a weathering product. If so its amount could not be relatedto depositional processes.
Possible effects of secondary magnetite and other ferromag-netic minerals have been tested by the IRM component analy-sis. Contribution of the above mentioned minerals has been
Fig. 5. The MS (black lines) and GRS (red lines) correlation of deep-water sections. Correlative MS patterns are assigned by Roman num-bers I—XII. Solid lines mark reliable, dashed lines mark less certain correlation. Notice variable thickness or lack of distinguished MS pat-terns. It indicates unequal rate of preserved sediments due to variable supply or post-sedimentary erosion. Taxon ranges after Chlupáč et al.(1972) and Čáp et al. (2003): solid lines indicate occurrence in this interval, dots indicate occurrence in this bed only.
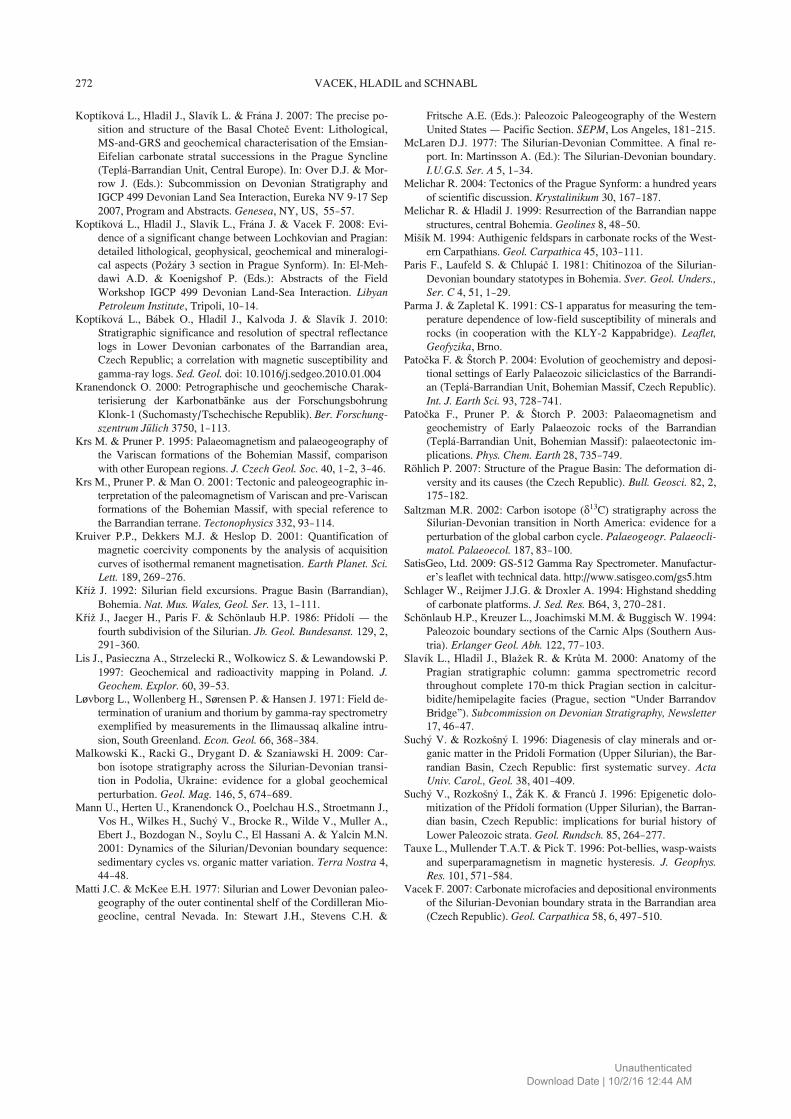
measured on 37 samples with remarkably high or low MS.The percentage contribution of magnetite to the remanentmagnetization has been compared with the bulk MS of thesamples (Fig. 5). Their covariance is very low (R2=—0.34),showing that the MS does not depend on magnetite content,and thus the role of diagenetic magnetite may be excluded.
UnauthenticatedDownload Date | 10/2/16 12:44 AM
267MAGNETIC SUSCEPTIBILITY AND GAMMA-RAY IN CALCITURBIDITIC FACIES (PRAGUE SYNCLINORIUM)
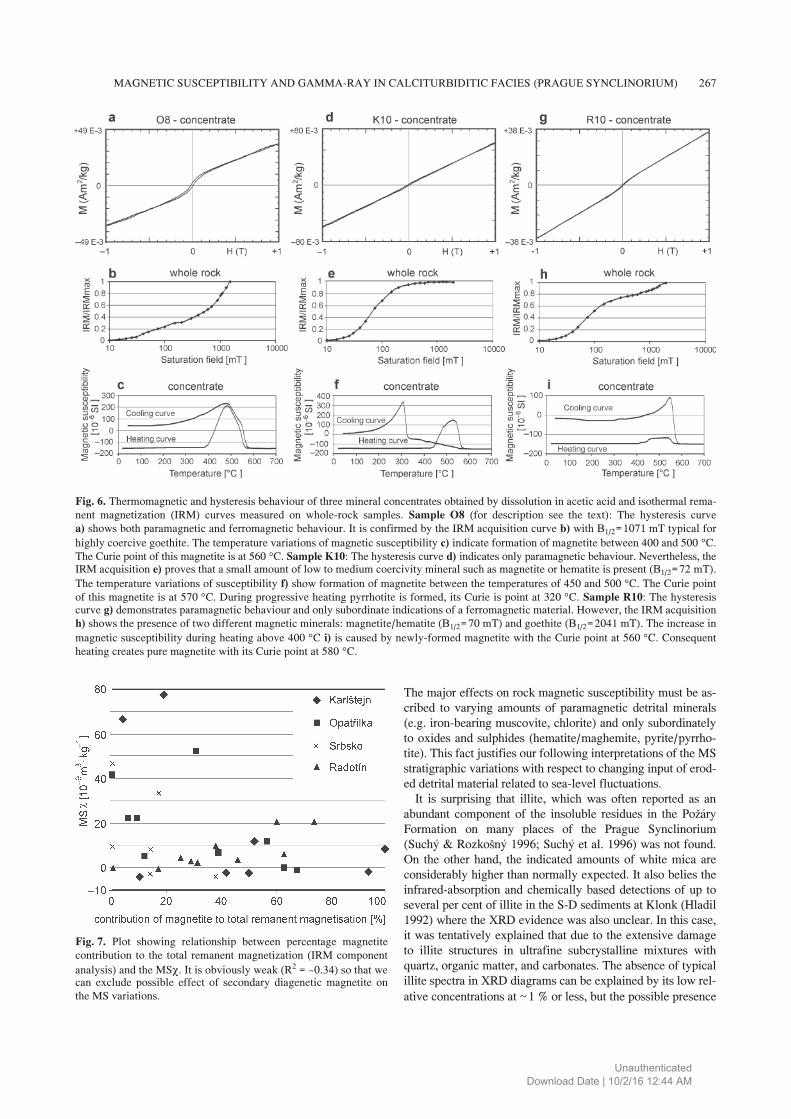
Fig. 6. Thermomagnetic and hysteresis behaviour of three mineral concentrates obtained by dissolution in acetic acid and isothermal rema-nent magnetization (IRM) curves measured on whole-rock samples. Sample O8 (for description see the text): The hysteresis curvea) shows both paramagnetic and ferromagnetic behaviour. It is confirmed by the IRM acquisition curve b) with B1/2=1071 mT typical for
highly coercive goethite. The temperature variations of magnetic susceptibility c) indicate formation of magnetite between 400 and 500 °C.The Curie point of this magnetite is at 560 °C. Sample K10: The hysteresis curve d) indicates only paramagnetic behaviour. Nevertheless, theIRM acquisition e) proves that a small amount of low to medium coercivity mineral such as magnetite or hematite is present (B1/2=72 mT).
The temperature variations of susceptibility f) show formation of magnetite between the temperatures of 450 and 500 °C. The Curie pointof this magnetite is at 570 °C. During progressive heating pyrrhotite is formed, its Curie is point at 320 °C. Sample R10: The hysteresiscurve g) demonstrates paramagnetic behaviour and only subordinate indications of a ferromagnetic material. However, the IRM acquisitionh) shows the presence of two different magnetic minerals: magnetite/hematite (B1/2=70 mT) and goethite (B1/2=2041 mT). The increase in
magnetic susceptibility during heating above 400 °C i) is caused by newly-formed magnetite with the Curie point at 560 °C. Consequentheating creates pure magnetite with its Curie point at 580 °C.
Fig. 7. Plot showing relationship between percentage magnetitecontribution to the total remanent magnetization (IRM component
analysis) and the MSχ. It is obviously weak (R2 = —0.34) so that wecan exclude possible effect of secondary diagenetic magnetite onthe MS variations.
The major effects on rock magnetic susceptibility must be as-cribed to varying amounts of paramagnetic detrital minerals(e.g. iron-bearing muscovite, chlorite) and only subordinatelyto oxides and sulphides (hematite/maghemite, pyrite/pyrrho-tite). This fact justifies our following interpretations of the MSstratigraphic variations with respect to changing input of erod-ed detrital material related to sea-level fluctuations.
It is surprising that illite, which was often reported as anabundant component of the insoluble residues in the PožáryFormation on many places of the Prague Synclinorium(Suchý & Rozkošný 1996; Suchý et al. 1996) was not found.On the other hand, the indicated amounts of white mica areconsiderably higher than normally expected. It also belies theinfrared-absorption and chemically based detections of up toseveral per cent of illite in the S-D sediments at Klonk (Hladil1992) where the XRD evidence was also unclear. In this case,it was tentatively explained that due to the extensive damageto illite structures in ultrafine subcrystalline mixtures withquartz, organic matter, and carbonates. The absence of typicalillite spectra in XRD diagrams can be explained by its low rel-
ative concentrations at ~1 % or less, but the possible presence
UnauthenticatedDownload Date | 10/2/16 12:44 AM

268 VACEK, HLADIL and SCHNABL
of both very high and very low crystalline forms related to il-lite remains unsolved.
The greatly increased amounts of albite and microcline areinteresting in comparison with the proportions of plagioclases,pyroxenes and amphiboles, which were detected in theserocks together with small, basalt related volcaniclastic grainsby direct observation and Energy Dispersive X-ray Spectro-scopy (EDX; e.g. Hladil 1992), but which have no significantrecord in XRD. At least some of these albites and microclinescan be considered authigenic, but the differentiation betweenthe detrital and authigenic populations according to their crys-tal shapes and compositions (cf. Kastner 1971; Kastner &Siever 1979; Mišík 1994) does not yet provide unambiguousevidence in favour of this origin. Of course, quartz and alsokaolinite (to lesser extent) are probably not only of purely de-trital origin (Hladil 1992).
Interpretation of the MS and GRS records
The MS and GRS variations can be used not only forstratigraphic correlations of the studied sections but also forinterpretation of sedimentary environments and their evolu-tion (especially in combination with sedimentological data).It is based on methods and principles described in chap-ter Methods.
The lowermost Lochkovian (and approximately the basalpart of the Lochkov Formation) in the shallow-water sectionsis characterized by an abrupt increase of the MS (Fig. 2). Onthe other hand, the eU curves mostly exhibit decreasing trendin the proximity of the S-D boundary (Fig. 2). It is mostly re-lated to decline of U content. It does not need to respond to thedecreasing content of clay, however. Very low covariance ofK and U contents indicates different natures and sources ofthese two components. Potassium is related to clay mineralsand K-feldspar, while U is also known to be significantlytrapped in organic matter. A slight increase of K concentra-tions immediately above this pattern is indicative of higheramount of clay minerals.
Thus, both magnitudes indicate enhanced amount of non-carbonate impurities (magnetic components and clay) andmay be interpreted as a result of sea-level fall, which causedincreased erosion and terrigenous influx to marine environ-ments (Ellwood et al. 2000). This is in accordance with sedi-mentological data, which also suggest a shallowing trend inthe lowest parts of the Lochkov Formation (approximately thebase of Lochkovian). It is expressed in partial sorting and re-working/rounding of bioclasts and washing out of fine-grained matrix in grainstone deposits in contrast to underlyingstrata (Vacek 2007).
In deep-water facies the high oscillation of the MS curve inthe upper part of the Požáry Formation (generally the upper-most Pridoli) is related to alternation of limestone and shaleinterbeds (Figs. 3 and 8). It is noticeable that there are a num-ber of analysed limestone beds, which have higher MS valuesthan the background hemipelagic shale interbeds, which usu-ally possess a higher amount of insoluble residue. It may beindicative of larger amount of detrital magnetic particles de-livered to the basin with calciturbidites. The short-term facies
change occurring in the slope environment as the Scypho-crinites H at the base of the Lochkov Formation (and close tothe S-D boundary) is usually interpreted as a result of a rela-tive sea-level fall, which caused increased erosion in shallow-water areas (e.g. Kříž et al. 1986; Chlupáč & Kukal 1988;Crick et al. 2001; Vacek 2007). Such facies changes indicat-ing relative shallowing of sedimentary environments havebeen described from other regions of Europe (e.g. CarnicAlps–Schönlaub et al. 1994), and North America (e.g. cen-tral Nevada–Klapper & Murphy 1975; Matti & McKee1977; Appalachian Basin–Denkler & Harris 1988). Howev-er, this event should be accompanied by increased magnitudesof the MS with enhanced supply with terrigenous detritalmagnetic particles. It is interesting that the MS of these rocksis much lower than of the underlying limestone/shale se-quence (Fig. 3). It might be explainable either by dispersion offine-grained magnetic particles in the bulk of calcium carbon-ate (carbonate dilution effect) or by significant washing-outbefore re-deposition to slope and toe-of-slope environments(e.g. da Silva & Boulvain 2006). More properly, the observedeffects of irregular washing of fine-grained matrix (often com-bined with current-driven orientation of cephalopod shells inthese beds) suggest condensed deposition affected by bottomcurrents. Another explanation of deposition of Scyphocrinites Hoccurring in the described facies mosaics may be increasedlocal subsidence at synsedimentary growth faults (namely“the precursor” Koda Fault, as presumed e.g. by Kříž 1992or Vacek 2007) and a large amount of carbonate materialwith primary low concentrations of magnetic minerals derivedfrom the upper part of the slope (as documented by the pres-ence of carbonate lithoclasts derived from slope areas). Thus,this locally developed rapid carbonate sedimentation alternat-ing with periods of sedimentary starvation is not expressed inenhanced MS values. Another explanation of the decline ofthe MS can be proposed as a restriction of terrigenous inputduring transgression. According to Schlager et al. (1994), themaximum thickness of calciturbidites corresponds to periodsof increased carbonate production during sea-level rise(highstand shedding).
An evident decreasing eU tendency from the upper PožáryFormation to the lowermost Lochkov Formation (related toconcurrently decreasing K, U, and Th concentrations) was doc-umented in records from the deep-water sections (especiallyKlonk and Karlštejn; Fig. 3). In the latter, it culminates withinthe Scyphocrinites H. The overlying limestone/shale sequenceof the Lochkov Formation is again characterized by a slightincrease of detected GRS values (Fig. 3). Here, the main eUpeaks partly correspond to background shale sediments withgreater proportion of insoluble residue (namely clay minerals).However, there are also peaks situated within the seeminglymassive bedding sets of proximal, often amalgamated calci-turbidites (Karlštejn or Radotín-U topolů; Fig. 3B and C). Atthe U topolů section two distinctive U peaks (related to theGRS-based concentrations of 15.1 and 16.4 ppm) are situatedwithin and slightly above the Scyphocrinites H (bed 11, sec-tion 2.75 and 3.75 m – Fig. 3C), which do not match en-hanced K and Th values. Uranium is known to be highlymobile during diagenesis, so these enormous peaks may corre-spond to post-sedimentary concentration or indicate consider-
UnauthenticatedDownload Date | 10/2/16 12:44 AM

269MAGNETIC SUSCEPTIBILITY AND GAMMA-RAY IN CALCITURBIDITIC FACIES (PRAGUE SYNCLINORIUM)
able dissolution (in some beds stylolites or extensive dissolu-tions can be observed). However, similar peaks can be traced atleast in two other sections (Klonk section 5.5 m and Karlštejnsection 4.0 m; Fig. 3A and B) and may therefore correspond tosome widespread basinal events such as hiatuses or periods ofsedimentary starvation, or delivery and concentration of exoticU-rich material.
At least three models must be considered for prograding ofbasinal carbonate deposits with reduced shale intercalations:1) the increased input of eroded material from shallow-marineareas during the falling stage and lowstand system tracts; 2) theopposite situation of a period of enhanced carbonate productionduring the transgressive pulse, accompanied by highstand shed-ding effect (Schlager et al. 1994), and 3) other environmentaleffects influencing the shallow-water carbonate factories orpelagic carbonate productivity would be employed (e.g. in-creased abundance of pelagic crinoids, cephalopods).
Our interpretation based on evaluation of the GRS and MSrecords of the slope facies and comparison with publisheddata is as follows: the uppermost part of the Požáry Formationhas a regressive character, which is expressed in high MS andeU values (Figs. 3 and 8). Decreased carbonate productivityand low depositional rates have been accompanied by lithifi-
cation of the sea-bottom. The lowermost part of the LochkovFormation reflects a transgressive pulse, which resulted in de-creased input of terrigenous material and pronounced declineof both magnitudes (Figs. 3 and 8). It was followed by slightMS and eU rise, which responded to gradual regression. How-ever, it is possible that deepening during the S-D interval wascaused by local sea-bottom subsidence and delivery of lithi-fied deposits from underlying strata. The following regressionmight have corresponded to a eustatic sea-level fall well docu-mented in shallow-marine areas. The deposition of theScyphocrinites H also did not have to result only from in-creased supply of eroded material, which was formerly accu-mulated on appropriate shallower-water parts of the slope butrather was related to the mass development of floating echino-derms in general, as their distribution is widespread across thearea and in many regions worldwide. Although it is certainlyless conspicuous in the shallow-water deposits composed most-ly of crinoidal limestones, thicker accumulations of Scypho-crinites debris are known, for example in the Daleje Valley(between the Požáry Q and Opatřilka sections).
This interpretation is partly in agreement with Crick et al.(2001), who presumed pronounced regression during the latePridoli followed by a moderate transgressive/regressive pulse
Fig. 8. Interpretation of the sea-level changes based on the MS records of the deep-water sections. Interpretation of the Klonk section was adoptedfrom Crick et al. (2001), our results correspond in its lower part, but differs in the upper. Po – the upper part of the Požáry Fm, Sc – Scypho-crinites H., Lo – the lower part of the Lochkov Fm.
UnauthenticatedDownload Date | 10/2/16 12:44 AM

270 VACEK, HLADIL and SCHNABL
in the critical S-D interval. According to results of the lastmentioned study, the earliest Lochkovian has a clearly trans-gressive trend (focused on Klonk), and this is in contrast toour present results, which are based on several juxtaposed sec-tions. The locally protracted high MS values with slowly de-creasing GRS values in the combination with the presence ofcoarse-grained crinoidal beds up to the lower Lochkovian(magnetic intervals VII—VIII) are unexpected or even counter-intuitive with the first lower Lochkovian transgressive episode(compare Fig. 8 herein to figs. 3, 4 in Crick et al. 2001).
However, we are aware that there are also alternative inter-pretations based on the MS and GRS variations and other data(e.g. carbon and oxygen isotopes) described in numerous pa-pers from the Silurian and Devonian of the Prague Synclinori-um and other regions. Due to limited space we briefly refer fordiscussion to Hladíková et al. (1997), Slavík et al. (2000),Mann et al. (2001), Saltzman (2002), Buggisch & Mann(2004), Buggisch & Joachimski (2006), Bábek et al. (2007),and Malkowski et al. (2009).
Conclusions
The combined MS-and-GRS stratigraphic assessment andregional comparison of the carbonate facies around the S-Dboundary in the Prague Synclinorium showed a significantlygood correlative value between sections with similar faciesdevelopment (i.e. lower subtidal to upper slope bioclasticgrainstones/packstones and lower slope to toe-of-the-slopecalciturbidites with predominance of bioclastic and peloidalwackestones/mudstones and calcareous shales). This compari-son shows that the onset of the index species and the biostrati-graphically determined S-D boundary may be diachronousand highly depend on facies. This fact makes the MS-and-GRS stratigraphy a powerful tool for precise correlationwithin the region. It also proved remarkable condensation andgaps in sedimentary record, especially in the lower slope con-ditions where distal calciturbidites predominate.
A major effect on the MS is ascribed to paramagnetic min-erals, which have been delivered to the basin from land.Therefore, we can relate the changing amount of this terrige-nous material detected by the MS and GRS to fluctuatingerosion and sea-level changes.
The critical S-D interval is characterized in relatively shal-low marine areas by increased values of MS, which are inter-preted as related to a higher influx of terrigenous materialduring a regressive pulse. This interpretation is supported bycontemporaneous increasing concentrations of GRS-detectedpotassium (clay) and is also supported by sedimentologicalevidence.
On the contrary, a broader S-D interval in the deep-waterfacies is characterized by visible facies change and decreasingof the MS values. Maxima of MS and GRS in the uppermostpart of the Požáry Formation (generally upper Pridoli) are in-terpreted as a response to a regressive phase associated with alow depositional rate and sea-bottom lithification. The verylowermost part of the Lochkov Formation (generally the baseof the Lochkovian) reflects a transgressive pulse leading to de-creased input of terrigenous material and distinctive decline of
both magnitudes. The overlying sequence characterized byslightly rising MS and eU corresponds to gradual regression.The deepening trend during the S-D interval was probably ac-companied by local subsidence and influx of eroded lithoclas-tic material. The following regression may reflect a eustaticsea-level drop well supported by evidence from the shallowestmarine areas. The facies change close to the S-D boundaryand deposition of the Scyphocrinites H might predominantlyresult from a biotic event unrelated to sea-level changes andlocal subsidence, rather than from sea-level rise/drop.
Acknowledgments: We are grateful to A.C. da Silva, F.Hrouda and one anonymous reviewer for valuable commentsand suggestions, which helped improve the original manu-script. Special thanks are due to colleagues who provided thecomplementary analyses used for the interpretation (V.Goliáš, XRD, Charles University, Prague; A. Langrová,EDX, WDS; P. Pruner, Academy of Sciences, Prague, rockmagnetism), and those who discussed environmental con-straints (J.E. Barrick, Texas Tech University, Lubbock, M.A.Murphy, University of California, Riverside and L. Slavík ,Academy of Sciences, Prague) and the importance of theKlonk MS section and observed periodicities (B.B. Ellwood,Louisiana State University, Baton Rouge). The role offramework grants is appreciated (MSM 0021620855,AV0Z30130516, IAA300130702, IGCP 580).
References
Bábek O., Přikryl T. & Hladil J. 2007: Progressive drowning of car-bonate platform in the Moravo-Silesian Basin (Czech Republic)before the Frasnian/Famenian event: facies, compositional vari-ations and gamma-ray spectrometry. Facies 53, 293—316.
Brocke R., Wilde V., Fatka O. & Mann U. 2002: Chitinozoa and acri-tarchs at the Silurian/Devonian boundary: Examples from theBarrandian area. In: Brock G.A. & Talent J. (Eds.): 1st Interna-tional Palaeontological Congress. Abstracts, Sydney, 192.
Brocke R., Fatka O. & Wilde V. 2006: Acritarchs and prasynophytesof the Silurian-Devonian GSSP (Klonk, Barrandian area, CzechRepublic). Bull. Geosci. 81, 1, 27—41.
Buggisch W. & Joachimski M.M. 2006: Carbon isotope stratigraphyof the Devonian of Central and Southern Europe. Palaeogeogr.Palaeoclimatol. Palaeoecol. 240, 68—88.
Buggisch W. & Mann U. 2004: Carbon isotope stratigraphy of Loch-kovian to Eifelian limestones from the Devonian of central andsouthern Europe. Int. J. Earth Sci. 93, 521—541.
Carls P., Slavík L. & Valenzuela-Ríos J.I. 2007: Revisions of con-odont biostratigraphy across the Silurian-Devonian boundary.Bull. Geosci. 82, 2, 145—164.
Chlupáč I. & Kukal Z. 1988: Possible global events and the stratigra-phy of the Barrandian Paleozoic (Cambrian—Devonian, Czecho-slovakia). Sbor. Geol. Věd, Geol. 43, 83—146.
Chlupáč I., Jaeger H. & Zikmundová J. 1972: The Silurian-Devo-nian boundary in the Barrandian. Bull. Canad. Petrol. Geol.20, 104—174.
Chlupáč I., Havlíček V., Kříž J., Kukal Z. & Štorch P. 1998: Palaeo-zoic of the Barrandian (Cambrian to Devonian). Czech Geol.Surv., Prague, 1—183.
Crick R.E., Ellwood B.B., El Hassani A., Feist R. & Hladil J. 1997:Magnetosusceptibility event and cyclostratigraphy (MSEC) ofthe Eifelian-Givetian GSSP and associated boundary sequences
UnauthenticatedDownload Date | 10/2/16 12:44 AM

271MAGNETIC SUSCEPTIBILITY AND GAMMA-RAY IN CALCITURBIDITIC FACIES (PRAGUE SYNCLINORIUM)
in north Africa and Europe. Episodes 20, 3, 167—175.Crick R.E., Ellwood B.B., El Hassani A. & Feist R. 2000: Proposed
magnetostratigraphy susceptibility magnetostratotype for Eife-lian—Givetian GSSP (Anti-Atlas, Morocco). Episodes 23, 2,93—101.
Crick R.E., Ellwood B.B., Hladil J., El Hassani A., Hrouda F. &Chlupáč I. 2001: Magnetostratigraphy susceptibility of the Pří-dolian—Lochkovian (Silurian—Devonian) GSSP (Klonk, CzechRepublic) and a coeval sequence in Anti-Atlas Morocco.Palaeogeogr. Palaeoclimatol. Palaeoecol. 167, 73—100.
Crick R.E., Ellwood B.B., Feist R., El Hassani A., Schindler E.,Dreesen R., Over D.J. & Girard C. 2002: Magnetostratigraphysusceptibility of the Frasnian/Famennian boundary. Palaeo-geogr. Palaeoclimatol. Palaeoecol. 181, 67—90.
Čáp P., Vacek F. & Vorel T. 2003: Microfacies analysis of Silurianand Devonian type sections (Barrandian, Czech Republic).Czech Geol. Surv., Spec. Pap. 15, 1—40.
da Silva A.C. & Boulvain F. 2006: Upper Devonian carbonate platformcorrelations and sea level variations recorded in magnetic suscep-tibility. Palaeogeogr. Palaeoclimatol. Palaeoecol. 240, 373—388.
da Silva A.C., Mabille C. & Boulvain F. 2009a: Influence of sedi-mentary setting on the use of magnetic susceptibility: examplesfrom Devonian of Belgium. Sedimentology 56, 1292—1306.
da Silva A.C., Potma K., Weissenberger J.A.W., Whalen M.T.,Mabille C. & Boulvain F. 2009b: Magnetic susceptibility evolu-tion and sedimentary environments on carbonate platform sedi-ments and atolls, comparison of the Frasnian from Belgium andfrom Alberta. Sed. Geol. 214, 3—18.
da Silva A.C., Yans J. & Boulvain F. 2010: Early—Middle Frasnian(early Late Devonian) sedimentology and magnetic susceptibili-ty of the Ardennes area (Belgium): identification of severe andrapid sea-level fluctuations. Geologica Belgica 13, 4, 319—332.
Denkler K.E. & Harris A.G. 1988: Conodont-based determination ofthe Silurian-Devonian boundary in the Valley and Ridge Prov-ince, Northern and Central Appalachians. US Geol. Surv. Bull. B1837, B1—B13.
Durrance E.M. 1986: Radioactivity in geology: principles and appli-cations. Ellis Horwood, Chichester, 1—441.
Ellwood B.B., Chrzanowski T.H., Hrouda F., Long G.J. & Buhl M.L.1988: Siderite formation in anoxic deep-sea sediments: a syner-getic bacterially controlled process with important implicationsin paleomagnetism. Geology 16, 980—982.
Ellwood B.B., Crick R.E., El Hassani A., Benoist S.L. & Young R.H.2000: Magnetosusceptibility event and cyclostratigraphy meth-od applied to marine rocks: Detrital input versus carbonate pro-ductivity. Geology 28, 12, 1135—1138.
Ellwood B.B., Crick R.E., Garcia-Alcade Fernandez J.L., Soto F.M.,Truyóls-Massoni M., El Hassani A. & Kovas E.J. 2001: Globalcorrelation using magnetic susceptibility data from Lower De-vonian rocks. Geology 29, 7, 583—586.
Ellwood B.B., Garcia-Alcade Fernandez J.L., El Hassani A., HladilJ., Soto F., Truyóls-Massoni M., Wedigge K. & Koptíková L.2006: Stratigraphy of the Middle Devonian boundary: Formaldefinition of the susceptibility magnetostratotype in Germanywith comparisons to sections in the Czech Republic, Moroccoand Spain. Tectonophysics 418, 31—49.
Fiala F. 1970: Silurian and Devonian diabases of the Barrandian.Sbor. Geol. Věd, Geol. 17, 7—97 (in Czech).
Frederichs T., Dobeneck T. Von, Bleil U. & Dekkers M.J. 2003: To-wards the identification of siderite, rhodochrosite, and vivianitein sediments by their low-temperature magnetic properties.Phys. Chem. Earth 28, 669—679.
Frýda J., Hladil J. & Vokurka K. 2002: Seawater strontium isotopecurve at the Silurian/Devonian boundary: a study of the globalSilurian/Devonian boundary stratotype. Geobios 35, 21—28.
Geršl M. & Hladil J. 2004: Gamma-ray and magnetic susceptibility
correlation across a Frasnian carbonate platform and the searchfor “punctata” equivalents in stromatoporoid-coral limestone fa-cies of Moravia. Geol. Quart. 48, 3, 283—292.
Grygar T., Dědeček J., Kruiver P.P., Dekkers M.J., Bezdička P. &Schneeweiss O. 2003: Iron oxide mineralogy in late Miocenered beds from La Gloria, Spain: rock-magnetic, voltammetricand Vis spectroscopy analyses. Catena 53, 2, 115—132.
Herten U. 2000: Petrographische und geochemische Charak-terisierung der Pelit-Lagen aus der Forschungsbohrung Klonk-1(Suchomasty/Tschechische Republik). Ber. ForschungszentrumJülich 3751, 1—78.
Hladil J. 1991: Evaluation of the sedimentary record in the Silurian/Devonian boundary stratotype at Klonk (Barrandian area,Czechoslovakia). Newslett. Stratigr. 25, 2, 115—125.
Hladil J. 1992: Are there turbidites in the Silurian/Devonian bound-ary stratotype (Klonk near Suchomasty, Barrandian, Czechoslo-vakia)? Facies 26, 35—54.
Hladil J. 2002: Geophysical records of dispersed weathering productson the Frasnian carbonate platform and early Famennian rampsin Moravia, Czech Republic: proxies for eustasy and palaeocli-mate. Palaeogeogr. Palaeoclimatol. Palaeoecol. 181, 213—250.
Hladil J., Bosák P., Jansa L.F., Těžký A., Helesicová K., HrubanováJ., Pruner P., Krůta T., Špaček P. & Chadima M. 2000: Frasnianeustatic cycles viewed with gamma spectrometric and magneto-susceptibility stratigraphy tools (Moravia): Six major floodingson cratonized basement. Subcommission on Devonian Stratigra-phy, Newsletter 17, 48—52.
Hladil J., Bosák P., Slavík L., Carew J.L., Mylroie J.E. & Geršl M.2003a: A pragmatic test of early origin and fixation of gamma-ray spectrometric (U, Th) and magneto-susceptibility (Fe) pat-terns related to sedimentary cycle boundaries in pure platformlimestones. Carbonate Evaporite 18, 2, 89—107.
Hladil J., Bosák P., Slavík L., Carew J.L., Mylroie J.E. & Geršl M.2003b: Early diagenetic origin and persistence of gamma-rayand magnetosusceptibility patterns in platform carbonates: com-parison of Devonian and Quaternary sections. Phys. Chem.Earth 28, 719—727.
Hladil J., Geršl M., Strnad L., Frána J., Langrová A. & Spišiak J.2006: Stratigraphic variations of complex impurities in plat-form limestones and possible significance of atmospheric dust:a study with emphasis on gamma-ray spectrometry and mag-netic susceptibility outcrop logging (Eifelian—Frasnian, Mora-via, Czech Republic). Int. J. Earth Sci. 95, 4, 703—723.
Hladíková J., Hladil J. & Kříbek B. 1997: Carbon and oxygen isotoperecord across Pridoli to Givetian stage boundaries in the Barran-dian basin (Czech Republic). Palaeogeogr. Palaeoclimatol.Palaeoecol. 132, 225—241.
Hrouda F. 1994: A technique for the measurement of thermal changesof magnetic susceptibility of weakly magnetic rocks by the CS-2apparatus and the KLY-2 Kappabridge. Geophys. J. Int. 118,604—612.
Jelínek V. & Pokorný J. 1997: Some new concepts in technology oftransformer bridges for measuring susceptibility anisotropy ofrocks. Phys. Chem. Earth 22, 179—181.
Jeppsson L. 1988: Conodont biostratigraphy of the Silurian boundarystratotype at Klonk, Czechoslovakia. Geologica et Palaeont. 22,21—31.
Jeppsson L. 1989: Latest Silurian conodonts from Klonk, Czechoslo-vakia. Geologica et Palaeont. 23, 21—37.
Kastner M. 1971: Authigenic feldspars in carbonate rocks. Amer.Mineralogist 56, 1403—1442.
Kastner M. & Siever R. 1979: Low temperature feldspars in sedimen-tary rocks. Amer. J. Sci. 279, 453—479.
Klapper G. & Murphy M.A. 1975: Silurian—Lower Devonian Con-odont Sequence in the Roberts Mountains Formation of CentralNevada. Univ. California Publ., Geol. Sci. 111, 1—62.
UnauthenticatedDownload Date | 10/2/16 12:44 AM
272 VACEK, HLADIL and SCHNABL
Koptíková L., Hladil J., Slavík L. & Frána J. 2007: The precise po-sition and structure of the Basal Choteč Event: Lithological,MS-and-GRS and geochemical characterisation of the Emsian-Eifelian carbonate stratal successions in the Prague Syncline(Teplá-Barrandian Unit, Central Europe). In: Over D.J. & Mor-row J. (Eds.): Subcommission on Devonian Stratigraphy andIGCP 499 Devonian Land Sea Interaction, Eureka NV 9-17 Sep2007, Program and Abstracts. Genesea, NY, US, 55—57.
Koptíková L., Hladil J., Slavík L., Frána J. & Vacek F. 2008: Evi-dence of a significant change between Lochkovian and Pragian:detailed lithological, geophysical, geochemical and mineralogi-cal aspects (Požáry 3 section in Prague Synform). In: El-Meh-dawi A.D. & Koenigshof P. (Eds.): Abstracts of the FieldWorkshop IGCP 499 Devonian Land-Sea Interaction. LibyanPetroleum Institute, Tripoli, 10—14.
Koptíková L., Bábek O., Hladil J., Kalvoda J. & Slavík J. 2010:Stratigraphic significance and resolution of spectral reflectancelogs in Lower Devonian carbonates of the Barrandian area,Czech Republic; a correlation with magnetic susceptibility andgamma-ray logs. Sed. Geol. doi: 10.1016/j.sedgeo.2010.01.004
Kranendonck O. 2000: Petrographische und geochemische Charak-terisierung der Karbonatbänke aus der ForschungsbohrungKlonk-1 (Suchomasty/Tschechische Republik). Ber. Forschung-szentrum Jülich 3750, 1—113.
Krs M. & Pruner P. 1995: Palaeomagnetism and palaeogeography ofthe Variscan formations of the Bohemian Massif, comparisonwith other European regions. J. Czech Geol. Soc. 40, 1—2, 3—46.
Krs M., Pruner P. & Man O. 2001: Tectonic and paleogeographic in-terpretation of the paleomagnetism of Variscan and pre-Variscanformations of the Bohemian Massif, with special reference tothe Barrandian terrane. Tectonophysics 332, 93—114.
Kruiver P.P., Dekkers M.J. & Heslop D. 2001: Quantification ofmagnetic coercivity components by the analysis of acquisitioncurves of isothermal remanent magnetisation. Earth Planet. Sci.Lett. 189, 269—276.
Kříž J. 1992: Silurian field excursions. Prague Basin (Barrandian),Bohemia. Nat. Mus. Wales, Geol. Ser. 13, 1—111.
Kříž J., Jaeger H., Paris F. & Schönlaub H.P. 1986: Přídolí – thefourth subdivision of the Silurian. Jb. Geol. Bundesanst. 129, 2,291—360.
Lis J., Pasieczna A., Strzelecki R., Wolkowicz S. & Lewandowski P.1997: Geochemical and radioactivity mapping in Poland. J.Geochem. Explor. 60, 39—53.
Lovborg L., Wollenberg H., Sorensen P. & Hansen J. 1971: Field de-termination of uranium and thorium by gamma-ray spectrometryexemplified by measurements in the Ilimaussaq alkaline intru-sion, South Greenland. Econ. Geol. 66, 368—384.
Malkowski K., Racki G., Drygant D. & Szaniawski H. 2009: Car-bon isotope stratigraphy across the Silurian-Devonian transi-tion in Podolia, Ukraine: evidence for a global geochemicalperturbation. Geol. Mag. 146, 5, 674—689.
Mann U., Herten U., Kranendonck O., Poelchau H.S., Stroetmann J.,Vos H., Wilkes H., Suchý V., Brocke R., Wilde V., Muller A.,Ebert J., Bozdogan N., Soylu C., El Hassani A. & Yalcin M.N.2001: Dynamics of the Silurian/Devonian boundary sequence:sedimentary cycles vs. organic matter variation. Terra Nostra 4,44—48.
Matti J.C. & McKee E.H. 1977: Silurian and Lower Devonian paleo-geography of the outer continental shelf of the Cordilleran Mio-geocline, central Nevada. In: Stewart J.H., Stevens C.H. &
Fritsche A.E. (Eds.): Paleozoic Paleogeography of the WesternUnited States – Pacific Section. SEPM, Los Angeles, 181—215.
McLaren D.J. 1977: The Silurian-Devonian Committee. A final re-port. In: Martinsson A. (Ed.): The Silurian-Devonian boundary.I.U.G.S. Ser. A 5, 1—34.
Melichar R. 2004: Tectonics of the Prague Synform: a hundred yearsof scientific discussion. Krystalinikum 30, 167—187.
Melichar R. & Hladil J. 1999: Resurrection of the Barrandian nappestructures, central Bohemia. Geolines 8, 48—50.
Mišík M. 1994: Authigenic feldspars in carbonate rocks of the West-ern Carpathians. Geol. Carpathica 45, 103—111.
Paris F., Laufeld S. & Chlupáč I. 1981: Chitinozoa of the Silurian-Devonian boundary statotypes in Bohemia. Sver. Geol. Unders.,Ser. C 4, 51, 1—29.
Parma J. & Zapletal K. 1991: CS-1 apparatus for measuring the tem-perature dependence of low-field susceptibility of minerals androcks (in cooperation with the KLY-2 Kappabridge). Leaflet,Geofyzika, Brno.
Patočka F. & Štorch P. 2004: Evolution of geochemistry and deposi-tional settings of Early Palaeozoic siliciclastics of the Barrandi-an (Teplá-Barrandian Unit, Bohemian Massif, Czech Republic).Int. J. Earth Sci. 93, 728—741.
Patočka F., Pruner P. & Štorch P. 2003: Palaeomagnetism andgeochemistry of Early Palaeozoic rocks of the Barrandian(Teplá-Barrandian Unit, Bohemian Massif): palaeotectonic im-plications. Phys. Chem. Earth 28, 735—749.
Röhlich P. 2007: Structure of the Prague Basin: The deformation di-versity and its causes (the Czech Republic). Bull. Geosci. 82, 2,175—182.
Saltzman M.R. 2002: Carbon isotope (δ13C) stratigraphy across theSilurian-Devonian transition in North America: evidence for aperturbation of the global carbon cycle. Palaeogeogr. Palaeocli-matol. Palaeoecol. 187, 83—100.
SatisGeo, Ltd. 2009: GS-512 Gamma Ray Spectrometer. Manufactur-er’s leaflet with technical data. http://www.satisgeo.com/gs5.htm
Schlager W., Reijmer J.J.G. & Droxler A. 1994: Highstand sheddingof carbonate platforms. J. Sed. Res. B64, 3, 270—281.
Schönlaub H.P., Kreuzer L., Joachimski M.M. & Buggisch W. 1994:Paleozoic boundary sections of the Carnic Alps (Southern Aus-tria). Erlanger Geol. Abh. 122, 77—103.
Slavík L., Hladil J., Blažek R. & Krůta M. 2000: Anatomy of thePragian stratigraphic column: gamma spectrometric recordthroughout complete 170-m thick Pragian section in calcitur-bidite/hemipelagite facies (Prague, section “Under BarrandovBridge”). Subcommission on Devonian Stratigraphy, Newsletter17, 46—47.
Suchý V. & Rozkošný I. 1996: Diagenesis of clay minerals and or-ganic matter in the Pridoli Formation (Upper Silurian), the Bar-randian Basin, Czech Republic: first systematic survey. ActaUniv. Carol., Geol. 38, 401—409.
Suchý V., Rozkošný I., Žák K. & Franců J. 1996: Epigenetic dolo-mitization of the Přídolí formation (Upper Silurian), the Barran-dian basin, Czech Republic: implications for burial history ofLower Paleozoic strata. Geol. Rundsch. 85, 264—277.
Tauxe L., Mullender T.A.T. & Pick T. 1996: Pot-bellies, wasp-waistsand superparamagnetism in magnetic hysteresis. J. Geophys.Res. 101, 571—584.
Vacek F. 2007: Carbonate microfacies and depositional environmentsof the Silurian-Devonian boundary strata in the Barrandian area(Czech Republic). Geol. Carpathica 58, 6, 497—510.
ø ø
UnauthenticatedDownload Date | 10/2/16 12:44 AM
Copyright © 2022 FDOKUMEN