Strategies to Achieve Congruence between Student Chronological Age and Grade Placement in the...
19
Journal of Education and Learning; Vol. 3, No. 3; 2014 ISSN 1927-5250 E-ISSN 1927-5269 Published by Canadian Center of Science and Education 76 Strategies to Achieve Congruence between Student Chronological Age and Grade Placement in the Compulsory Phase of Education in Botswana Byron Brown 1,2 & Ntonghanwah Forcheh 3 1 Faculty of Business and Leisure, Botswana Accountancy College, Gaborone, Botswana 2 University of Derby in Botswana, Gaborone, Botswana 3 Department of Statistics, University of Botswana, Gaborone, Botswana Correspondence: Byron Brown, Faculty of Business and Leisure, Botswana Accountancy College, Gaborone, P/Bag 00319, Gaborone, Botswana. Tel: 267-395-3062. E-mail: [email protected] Received: April 28, 2014 Accepted: July 21, 2014 Online Published: August 14, 2014 doi:10.5539/jel.v3n3p76 URL: http://dx.doi.org/10.5539/jel.v3n3p76 Abstract In many developing countries, researchers and policy makers have downplayed issues of age in grade intentionally. This is done partly to avoid the pedagogical issues that over-age or under-age children in schools raise. It is also done to avoid putting extra pressure on government especially in developing nations that is still working hard to achieve and maintain universal enrolment targets. However, age-in-grade incongruence cannot be ignored as it has implications for pedagogy and child development. The purpose of this study was to evaluate the degree of congruence between student-age and grade placement in the basic or compulsory education phase of the education system in one African country, Botswana. Contrast was made between grade placement practices at school and the Age-in-Grade placement policy of the country. Using data from the 2011 National Census, and adopting a survey research design, involving the entire population of 587,308 children still in basic education in 2011, the paper found high levels of incongruence between the actual grades in which students were in, and their age appropriate grade level. Lesser than 30 percent of the 7-13 year old still at school in the compulsory education phase was in their age appropriate grade. The population of learners in the basic education phase was either one or more grade levels ahead (or behind). Incongruence persisted across various demographic categories including citizenship, gender, and main language spoken at home which suggests the school system did not discriminate. None of the 28 Census Districts in the country had the majority of the population in the compulsory education phase in their expected grade level. There was gender variation in the age-in-grade incongruence. Compared to boys, more girls entered the compulsory education system early. More boys entered school over-aged. Likewise, compared to non-citizens, more citizens entered compulsory education over-aged, or at the right time. The evidence suggests a flouting of the age-in-grade policy, and points to systemic challenges such as drop out, repetition and re-enrolment which needs urgent attention. The paper theorized that the age-in-grade incongruence is indicative of chronic problems in the education system which in the long run can adversely affect education access, curriculum implementation, and educational attainment. Various implications for curriculum implementation and grade placement policy design have been discussed. Keywords: student chronological age, age appropriate grade, grade placement, compulsory education, over-age and under-age student, Botswana 1. Introduction Since the World Declaration on Education for All (EFA) following the Jomtien World Conference in Thailand in 1990, a rights-based approach to the provision of education has become the norm globally. The declaration solidifies basic or compulsory education as a human right, in line with Article 26 of the United Nation’s Universal Declaration of Human Rights (UDHR, 1948). The UN now protects basic education as a fundamental right. In the World Declaration on EFA, access to basic education, and completion thereof, became an obligation of the States who signed the agreement. The world declaration motivated governments in many countries globally to widen education access to accommodate the eligible compulsory school age cohort of the population into school. Often, the obligation to get these children into school was executed without much regard for age. In
Transcript of Strategies to Achieve Congruence between Student Chronological Age and Grade Placement in the...
Journal of Education and Learning; Vol. 3, No. 3; 2014 ISSN 1927-5250 E-ISSN 1927-5269
Published by Canadian Center of Science and Education
76
Strategies to Achieve Congruence between Student Chronological Age and Grade Placement in the Compulsory Phase of Education in
Botswana
Byron Brown1,2 & Ntonghanwah Forcheh3 1 Faculty of Business and Leisure, Botswana Accountancy College, Gaborone, Botswana 2 University of Derby in Botswana, Gaborone, Botswana 3 Department of Statistics, University of Botswana, Gaborone, Botswana
Correspondence: Byron Brown, Faculty of Business and Leisure, Botswana Accountancy College, Gaborone, P/Bag 00319, Gaborone, Botswana. Tel: 267-395-3062. E-mail: [email protected]
Received: April 28, 2014 Accepted: July 21, 2014 Online Published: August 14, 2014
doi:10.5539/jel.v3n3p76 URL: http://dx.doi.org/10.5539/jel.v3n3p76
Abstract
In many developing countries, researchers and policy makers have downplayed issues of age in grade intentionally. This is done partly to avoid the pedagogical issues that over-age or under-age children in schools raise. It is also done to avoid putting extra pressure on government especially in developing nations that is still working hard to achieve and maintain universal enrolment targets. However, age-in-grade incongruence cannot be ignored as it has implications for pedagogy and child development. The purpose of this study was to evaluate the degree of congruence between student-age and grade placement in the basic or compulsory education phase of the education system in one African country, Botswana. Contrast was made between grade placement practices at school and the Age-in-Grade placement policy of the country. Using data from the 2011 National Census, and adopting a survey research design, involving the entire population of 587,308 children still in basic education in 2011, the paper found high levels of incongruence between the actual grades in which students were in, and their age appropriate grade level. Lesser than 30 percent of the 7-13 year old still at school in the compulsory education phase was in their age appropriate grade. The population of learners in the basic education phase was either one or more grade levels ahead (or behind). Incongruence persisted across various demographic categories including citizenship, gender, and main language spoken at home which suggests the school system did not discriminate. None of the 28 Census Districts in the country had the majority of the population in the compulsory education phase in their expected grade level. There was gender variation in the age-in-grade incongruence. Compared to boys, more girls entered the compulsory education system early. More boys entered school over-aged. Likewise, compared to non-citizens, more citizens entered compulsory education over-aged, or at the right time. The evidence suggests a flouting of the age-in-grade policy, and points to systemic challenges such as drop out, repetition and re-enrolment which needs urgent attention. The paper theorized that the age-in-grade incongruence is indicative of chronic problems in the education system which in the long run can adversely affect education access, curriculum implementation, and educational attainment. Various implications for curriculum implementation and grade placement policy design have been discussed.
Keywords: student chronological age, age appropriate grade, grade placement, compulsory education, over-age and under-age student, Botswana
1. Introduction
Since the World Declaration on Education for All (EFA) following the Jomtien World Conference in Thailand in 1990, a rights-based approach to the provision of education has become the norm globally. The declaration solidifies basic or compulsory education as a human right, in line with Article 26 of the United Nation’s Universal Declaration of Human Rights (UDHR, 1948). The UN now protects basic education as a fundamental right. In the World Declaration on EFA, access to basic education, and completion thereof, became an obligation of the States who signed the agreement. The world declaration motivated governments in many countries globally to widen education access to accommodate the eligible compulsory school age cohort of the population into school. Often, the obligation to get these children into school was executed without much regard for age. In

www.ccsenet.org/jel Journal of Education and Learning Vol. 3, No. 3; 2014
77
many developing countries, researchers and policy makers have downplayed the issue of age in grade intentionally, often to avoid putting pressure on the government of the day, which in many instance, is still working hard to achieve and maintain universal enrolment targets. Other relevant agencies ignored the problem to avoid implicating themselves in the pedagogical issues that over-age or under-age children in schools raise.
In Botswana, gross and net enrolment rates are used to measure the overage and underage enrolment in the education system. However, gross and net enrolment rates do not show age-in-grade information. The national Age-in-Grade placement policy specifies that the grade in which a child is place must correspond to particular age (STATS BRIEF CSO, 2013). This mandate in the policy is in response to the design of the official school curriculum which is based on single grade. In other words, as opposed to a multigrade curriculum, which is developed to facilitate students of different age groups in one class, the single grade curriculum is organized based on a tight fit between age and grade level, with the outcome being age segregation.
Age-in-grade incongruence has implications for both pedagogy and child development, and these cannot be ignored. In the grade situation at school, learners may be in one of three positions relative to their age: (a) at the appropriate age for the grade, (b) under-age for the grade, or (c) over-age for the grade. Both the over-age and the under-age status reflect age-in-grade inconsistency. Under-age for the grade suggests that the child may have been grade accelerated, whereas over-age suggests that the child was ‘held back’ or deceleration. Grade acceleration is often a response to children’s levels of development, cognitive abilities, and social maturity (Dudeney, 2003). However, grade acceleration is not a malpractice. Human development researchers specified three conditions under which learners may be accelerated: (a) cognitive—whereby the child demonstrates quicker and deeper level of mastery of materials; (b) emotional maturity—whereby the child demonstrates higher level of emotional maturity than peers; and (c) social maturity—whereby the child is more socially capable (Rauenbusch, 2013; Alderman et al, 2001). To the extent that grade acceleration prevails in the Botswana education system, the rationale for the practice can be compared with these reasons.
On the other hand, motives for grade deceleration are viewed differently. Often it is due to curriculum challenges or deliberate family decision. For example, in other parts of Africa, as elsewhere in the world, it is not uncommon to find cases whereby families ‘hold back’ their children, especially girls. In general, there are two ways in which the issue of over-age children in a classroom occurs. One is through initial over-age enrolment; the other is through repetition or retention in the same grade (Hossain, 2010). Over-age enrolment is a complex issue and involves people’s perception of schooling, the age and the physical size of the child. The over age problem is usually compounded by a lack of birth registration documents. A lack of awareness of the importance of sending their children to school at the right age also contributes to over-age in class (Ghuman, 2006). As studies have demonstrated, the reasons for late enrolment often stem from pervasive illiteracy and poverty (Alderman et al, 2001; Hossain, 2010). Only a few parents recognise the stage and pace of child development and their implications on children’s education. Health and nutrition sometimes play important role in children’s delayed enrolment and school performance (Ghuman, 2006; Alderman et al, 2001). However, the consequences of late compulsory school enrolment are clear and studies show that a two-year late primary school enrolment, on average, costs individuals about six percent of their lifetime income (OECD, 2011; Fredriksson & Öckert, 2005; Glewwe & Jacoby, 1995).
The purpose of the study was to evaluate the degree of conformance to the Age-in-Grade placement policy being used in Botswana and in so doing determine the extent of overage and/or underage enrolment in the education system. Based on this, it assessed implications for curriculum implementation and related issues. The assumption was that without careful implementation and monitoring, the age-in-grade policy provision would be flouted. This study contributes to the broader literature on government policies that can influence school curriculum implementation. It also contributes to the wider literature on child development, educational attainment, and hence future labour market outcomes such as income since early entry to the labour market allows for extended contribution to GDP (STATS BRIEF CSO, 2013).
The remainder of the paper is structured as follows: first, an overview, looking at key concepts including the compulsory grade, the grade placement policy, and the consequences of mismatch between learner age and grade. This discussion leads into the critical questions posed for the investigation, and the methodology applied. The last section presents the results and implications.
1.1 Compulsory or Basic Education at School
Formal education in Botswana is divided into three distinct levels: primary, junior (lower) secondary and senior (upper) secondary school. The current structure of the education system is “7+3+2”, which comprises 7-years of Primary, and 3-years of Junior Secondary (JS), and 2-years of Senior Secondary. Compulsory education refers to

www.ccsenet.org/jel Journal of Education and Learning Vol. 3, No. 3; 2014
78
the first 10 years of formal schooling, which is also regarded as basic education. This equates to the age-range: 6 years to 15 years. Basic education then is compulsory, thereby being an automatic requirement of all the eligible population. These open up particular implications for parents and the State. As a compulsory provision, parents can be held accountable for their children’s nonattendance. The government is obliged to make this level of education accessible to all.
The definition of basic or compulsory education in Botswana is framed within a narrow view, compared to the expanded definition in the World Declaration on EFA. The EFA offers an expanded definition of basic education, which includes early childhood development education (UNESCO, 2012). Unlike elsewhere in the world, currently, pre-school education in Botswana, i.e., early stimulation and baby-care, play school or day care/ nursery, and pre-primary or reception education – does not form part of the basic or compulsory education provided by the State. Pre-school education is being provided by private schools but it is not compulsory. While there are plans in Botswana to make pre-school education compulsory (NRDE, 2008), for the purposes of this analysis, pre-school level was excluded as it falls outside the remit of basic education as defined in the country. Effective access to compulsory education is essential (Katz, 2000) but the narrow conception of compulsory education adopted by Botswana provides some indication that mitigating obstacles that limiting effective access can be a challenge.
1.2 Age-Grade Placement and the School Curriculum
Across the school system in Botswana, as elsewhere in the world, the formal school curriculum is designed to align with children’s chronological age and development. Proponents of the developmental approach to curriculum design agree that chronological age is the starting point for curriculum design. The reason is that the formal curriculum must be structured around a child’s readiness for learning which is estimated by age (Vygotsky, 2001).
Chronological age is a proxy for a child’s development level in the various development domains: cognitive, social, physical, motor and emotional (Vygotsky, 2001). Consequently, age determines the scope, nature and significance of the learning prescribed in a curriculum. Mismatch between children’s age and the grade in which they are placed often impinges on their optimal development across age-groups. For example, during the primary grades, curriculum planning is driven by the need to help children develop conceptual understanding that can apply across related subject discipline. But during the Junior Secondary (JS) school grades, curriculum planning attempts to help teenagers develop proficiency in learnt concept application. The curriculum materials and teaching methods target an appropriate age level. This means the curriculum for each grade level across the school system is designed to be at a level of difficulty appropriate to the anticipated chronological age. The knowledge, understanding and skills acquired at each preceding grade level form the foundation for learning at the next level (Dudeney, 2003).
Age-in-grade incongruence leads to negative outcomes. There is a lot of literature in relation to the negative effects of grade accelerated placement (i.e., under-age in grade). Conger (2012) found for instance that when some children are placed ahead of their age appropriate grade, they missed out on having aspects of their unique learning needs addressed in an orderly manner that acknowledges their maturity and development level. Furthermore, Rauenbusch (2013) found and further emphasized that accelerated academic learning in the compulsory education phase sometimes force the learner to rely on lower level processes such as memorisation instead of developing higher level cognitive strategies such as analysis, synthesis or problem solving skills. These situations in turn affect mastery of future learning. More importantly, grade acceleration means that the child is placed in a class with other children who are older (Brown, 2009; 2010b). Thus grade acceleration forces children to compare their reasoning abilities and products to that of older students. Such comparisons have shown to impact negatively on the younger learner’s self-esteem and learning motivation (Conger, 2012; Rauenbusch, 2013; Gagne, 2004). Grade acceleration may be a practice in the Botswana education system, which needs to be quantified and managed.
There is also a lot of literature in relation to the negative effects of grade decelerated placement (i.e., over-age in grade). Children in grade below their age appropriate grade levels are mature and older than their classmates. This reality creates a lot of challenges for the delivery of education. For these learners, they experience learning materials which are unchallenging; the materials they experience are below what Vygotsky calls the ‘zone of proximal development’ (Vygotsky, 2001). Simply by virtue of having lived longer, older children are more matured and have had more exposure to information than younger ones, which puts the older ones at an advantage in the classroom. The behaviour of older children in the classroom has shown to affect teachers’ evaluations of their performance and abilities (relative to their younger peers) (Elder & Lubotsky, 2007; Datar,
www.ccsenet.org/jel Journal of Education and Learning Vol. 3, No. 3; 2014
79
2006). Brown (2010a) found that in multigrade classes in South Africa, teachers verbally abuse older children who struggle to master curriculum concepts which are appropriate for the age of their younger classmates.
However, older children tend to perform better than younger ones in the same class. Strom (2004) (in Sprietsma, 2008) shows that the effect of being the oldest children in a cohort of learners is generally estimated to yield between 10-27 percent standard deviation higher on test scores than the youngest children. The academic performance of older learners who are in the same class with younger learners has shown to affect how teachers evaluate the younger learners. In the first grade of primary school, the relative immaturity of youngest children may disadvantage them because they are less able to perform the same tasks. Ability and maturity level can confuse teachers, and in class where young and old learners coexist, the less mature younger learners may be identified wrongly as low ability and low performing children—relatively to the older ones. Academic performance of mixed age group of learners can give the wrong information to the teachers, to the learners themselves, and to the parents and the community—to enrol children for school.
One of the principal reasons for a strict emphasis on grade to chronological age congruence is to limit the proliferation of what Brown (2009) called multi-age (multigrade) class in the school system. Multi-age teaching, whereby a teacher accommodates and instructs students of different age ranges in one class—raises policy questions because the school system is designed based on singlegrade teaching principles. Both grade acceleration and deceleration contribute to a multi-age class structure. However, multigrade teaching is not an official policy in Botswana. While there are benefits to multigrade teaching (Brown, 2009; 2010b), previous studies have illustrated that, without careful planning and preparation, the formation of multigrade class arrangement can lead to poor quality of education because teachers’ professional training focused only on singlegrade instruction (Mulryan-Kyne, 2007; Pridmore, 2007; Brown, 2010b).
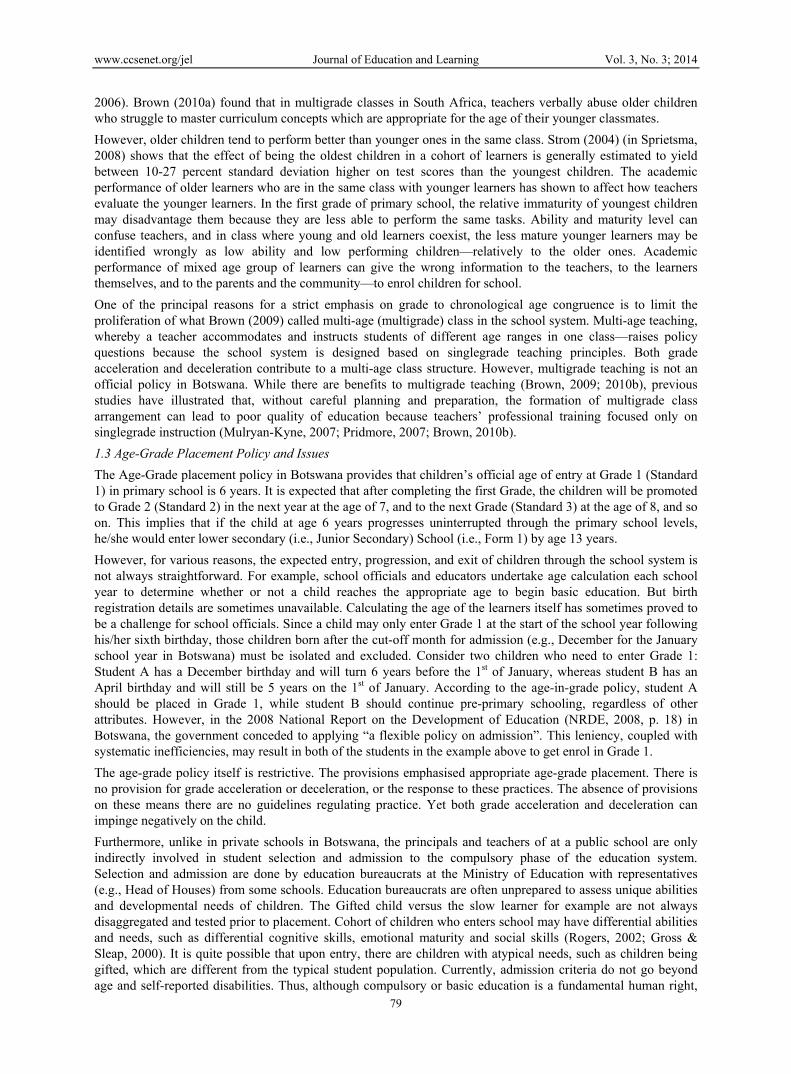
1.3 Age-Grade Placement Policy and Issues
The Age-Grade placement policy in Botswana provides that children’s official age of entry at Grade 1 (Standard 1) in primary school is 6 years. It is expected that after completing the first Grade, the children will be promoted to Grade 2 (Standard 2) in the next year at the age of 7, and to the next Grade (Standard 3) at the age of 8, and so on. This implies that if the child at age 6 years progresses uninterrupted through the primary school levels, he/she would enter lower secondary (i.e., Junior Secondary) School (i.e., Form 1) by age 13 years.
However, for various reasons, the expected entry, progression, and exit of children through the school system is not always straightforward. For example, school officials and educators undertake age calculation each school year to determine whether or not a child reaches the appropriate age to begin basic education. But birth registration details are sometimes unavailable. Calculating the age of the learners itself has sometimes proved to be a challenge for school officials. Since a child may only enter Grade 1 at the start of the school year following his/her sixth birthday, those children born after the cut-off month for admission (e.g., December for the January school year in Botswana) must be isolated and excluded. Consider two children who need to enter Grade 1: Student A has a December birthday and will turn 6 years before the 1st of January, whereas student B has an April birthday and will still be 5 years on the 1st of January. According to the age-in-grade policy, student A should be placed in Grade 1, while student B should continue pre-primary schooling, regardless of other attributes. However, in the 2008 National Report on the Development of Education (NRDE, 2008, p. 18) in Botswana, the government conceded to applying “a flexible policy on admission”. This leniency, coupled with systematic inefficiencies, may result in both of the students in the example above to get enrol in Grade 1.
The age-grade policy itself is restrictive. The provisions emphasised appropriate age-grade placement. There is no provision for grade acceleration or deceleration, or the response to these practices. The absence of provisions on these means there are no guidelines regulating practice. Yet both grade acceleration and deceleration can impinge negatively on the child.
Furthermore, unlike in private schools in Botswana, the principals and teachers of at a public school are only indirectly involved in student selection and admission to the compulsory phase of the education system. Selection and admission are done by education bureaucrats at the Ministry of Education with representatives (e.g., Head of Houses) from some schools. Education bureaucrats are often unprepared to assess unique abilities and developmental needs of children. The Gifted child versus the slow learner for example are not always disaggregated and tested prior to placement. Cohort of children who enters school may have differential abilities and needs, such as differential cognitive skills, emotional maturity and social skills (Rogers, 2002; Gross & Sleap, 2000). It is quite possible that upon entry, there are children with atypical needs, such as children being gifted, which are different from the typical student population. Currently, admission criteria do not go beyond age and self-reported disabilities. Thus, although compulsory or basic education is a fundamental human right,

www.ccsenet.org/jel Journal of Education and Learning Vol. 3, No. 3; 2014
80
there is very little literature and research in Botswana which explores the issue of age-in-grade congruence, or lack thereof, and consequences across the entire population. The central issues raised above have given rise to the following research questions which were investigated in this study:
a) What is the degree of congruence between student chronological age and the grade in which they are placed in the compulsory phase?
b) What is the relationship between student age-in-grade, and selected demographic factors such as gender; citizenship; district location, and main language spoken at home?
c) What are the policy implications of this evidence for curriculum implementation and grade placement policy design and implementation at school?
2. Methods and Summary Statistics
To respond to the research questions, the study adopted a quantitative tradition and was descriptive in nature. Furthermore, the dataset used was the 2011 national census, which was the full National Census of the Botswana population. For this reason, the study design was survey. The census covered the entire population of approximately 2, 024, 904 but the cohort of those still at school was 587,308. The survey was restricted to the group still at school to measure the trends among this group and to avoid confounding the main variable with other sub-variables such as never attended or left school.
The population census dataset contained information on individual current age (and hence year of birth). In the presence of a binding rule on the age to enter school, this was determined to be sufficient to determine the appropriate grade of the “still at school” cohort. We assumed that all individuals enter school at the modal age of entry (age 6 years), as was assumed for example in Angrist and Lavy (1997) study.
The population census dataset also contained information on school attendance; gender; citizenship; main language spoken at home; and their educational attainment, i.e., the highest Grade completed. This meant the Grade in which the cohort was in at the time of the census was not incorporated in the analysis since it was an incomplete school year. Among the cohort of those who were still at school, Grade completed referred to the Grade finished in the previous year. Thus, the dataset was used to assign birth cohort as well as the anticipated / expected Grade level of the population at school. A student who was 6-years old on the day of the census was assumed to be in Grade 1. But it was possible that a small percent of those born after the cut-off month of the day of the census was included in this list—though they may not have reached primary school age. All these students would still be in pre-school. However, this deviation was counterbalanced by those 5-years old who were in Grade 1 at the time of the census instead of pre-school.
Data was collected through the national census questionnaire. This is a standardised questionnaire which has been repeatedly validated and improved upon since 1966. The instrument was developed by the CSO, which is responsible for the administration of the national census. The main procedure used in the analysis was descriptive statistics. There was no need to apply inferential procedures because the entire population was used in the study. Table 1 show the school attendance pattern. Not surprisingly, the majority (56.8%) of the population aged 20 years or above. This cohort falls outside the compulsory school phase. However, in 2011, about 1 918 765 people reported to be aged 2 years or over. Each one of these was considered eligible for school attendance. There is a slight increase in 2011 over 2001 in the population aged 2 years or over (i.e., 1,918 765 currently compared to 1,601,885 in 2001).
The population still at school in the compulsory phase lies between age 5 and 16 years, as shown in the single age distribution in Table 1. There were between 45262 and 46723 children, in each of the 2 to 5 year old age, categories eligible for pre-school. Nationally, 101 197 of the 2 024 904 population was not eligible for pre-school —their age being under 2 years old in 2011. Overall, the number of children of eligible pre-school education age (i.e., 0-5) increased slightly, compared to the 2001 census – which indicates a growing demand for pre-school attendance.
3. Results
The chronological age distribution is shown in Table 1.
www.ccsenet.org/jel Journal of Education and Learning Vol. 3, No. 3; 2014
81
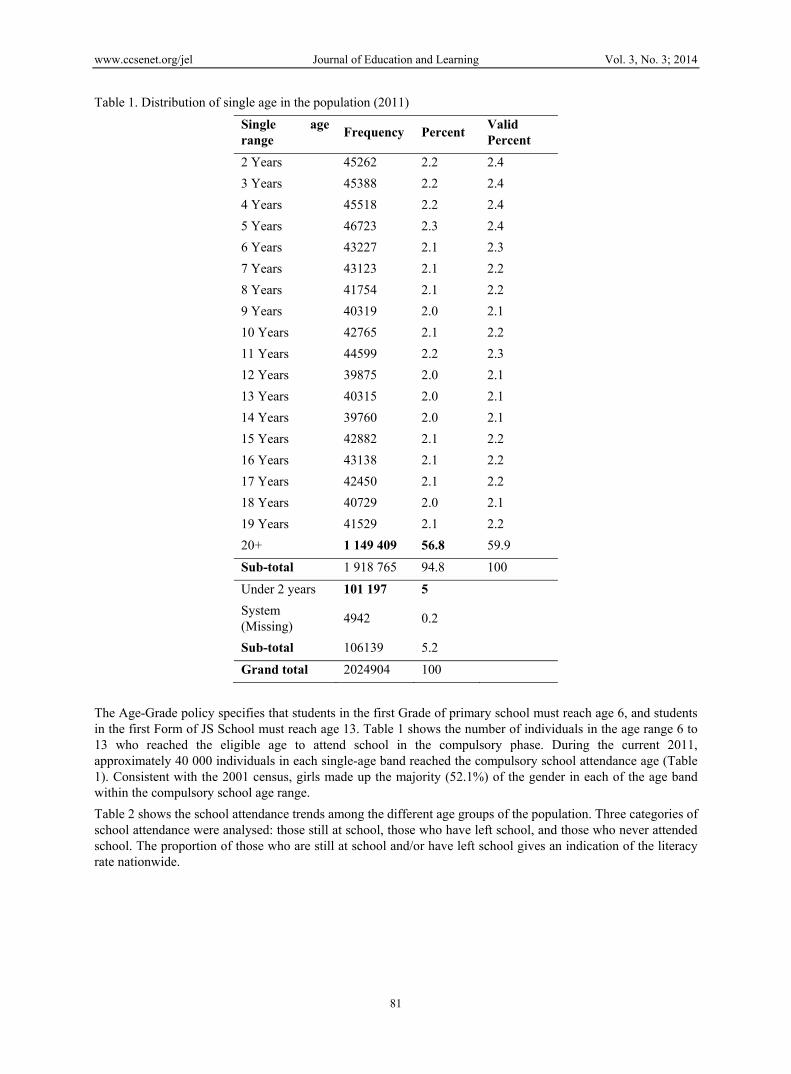
Table 1. Distribution of single age in the population (2011)
Single age range
Frequency Percent Valid Percent
2 Years 45262 2.2 2.4
3 Years 45388 2.2 2.4
4 Years 45518 2.2 2.4
5 Years 46723 2.3 2.4
6 Years 43227 2.1 2.3
7 Years 43123 2.1 2.2
8 Years 41754 2.1 2.2
9 Years 40319 2.0 2.1
10 Years 42765 2.1 2.2
11 Years 44599 2.2 2.3
12 Years 39875 2.0 2.1
13 Years 40315 2.0 2.1
14 Years 39760 2.0 2.1
15 Years 42882 2.1 2.2
16 Years 43138 2.1 2.2
17 Years 42450 2.1 2.2
18 Years 40729 2.0 2.1
19 Years 41529 2.1 2.2
20+ 1 149 409 56.8 59.9
Sub-total 1 918 765 94.8 100
Under 2 years 101 197 5
System (Missing)
4942 0.2
Sub-total 106139 5.2
Grand total 2024904 100
The Age-Grade policy specifies that students in the first Grade of primary school must reach age 6, and students in the first Form of JS School must reach age 13. Table 1 shows the number of individuals in the age range 6 to 13 who reached the eligible age to attend school in the compulsory phase. During the current 2011, approximately 40 000 individuals in each single-age band reached the compulsory school attendance age (Table 1). Consistent with the 2001 census, girls made up the majority (52.1%) of the gender in each of the age band within the compulsory school age range.
Table 2 shows the school attendance trends among the different age groups of the population. Three categories of school attendance were analysed: those still at school, those who have left school, and those who never attended school. The proportion of those who are still at school and/or have left school gives an indication of the literacy rate nationwide.

www.ccsenet.org/jel Journal of Education and Learning Vol. 3, No. 3; 2014
82
Table 2. School attendance profile of population
School attendance Frequency PercentValid Percent
Still at school 587308 29.0 30.6
Left school 979361 48.4 51.1
Never attended 351265 17.3 18.3
Sub-total 1917934 94.7 100.0
Too young to be at school 105431 5.2
Others 1539 0.1
Sub-total 106970 5.3
Grand total 2024904 100.0
The analysis indicates that less than a quarter (17.3%) of the population had never attended school; 29 % were still attending school; and about one half (48.4%) had left school; much less (5.2%) was too young to be at school. This finding was a slight contrast to the 2001 census, where a quarter of the population (24.7%) had never attended school, 30% were still attending school and 45% had left school. The percent of the population that had never attended school in Botswana has decreased by over 7% since the previous census, and the decreasing trend has been consistent since 1981. The decline in the number of people who never participated in the formal school system is a good sign because it further points to decreasing trend in illiteracy rate.
Whereas the proportion of individuals still at school in the current census (29%) was more or less the same as the number (30%) reported during the 2001 census, the proportion of those who have left school increased by 3.4% in the current census period, compared to the last census. The circumstance for leaving school, and the point where a person may have exited school, was not specified in the census data. In the previous census in 2001, for example, it was reported that most of the children aged 15-19 who were not attending school, actually quitted or left school permanently. Furthermore, reasons for leaving school may be multifaceted, including positive reasons such as successful completion of a level, but it could also be a result of negative reasons such as health and related personal problems, psychosocial constraints, and systemic inefficiencies such as drop out, and multiple repetition of Grade. Overall, school attendance increased over the last 10 years to 2011.
3.1 Student Chronological Age and Grade Levels Analysis
One of the challenges of education systems globally is maintaining age in grade coherence as student progress through the education system. An efficient education system is one in which there is a close match between student chronological age and their grade level. In Botswana, the Age-Grade policy propagated by the Government to guide student placement at school is recognition of the significance of age-grade coherency in the school system, especially during the primary (Grade 1-7) to the lower secondary (Grade 8-10) level where child cognitive and related development is most vulnerable. We analysed the chronological age of the population still at school in Grades in the Compulsory Phase, and determine the level of conformance to the Age-Grade Policy.
The Age-Grade Policy stipulates that a child should reach age 6 years to qualify to enter Standard 1, and should progress each year to the next Grade level. Thus, by the start of Grade 8 (Form 1), the child should be 13 years. This logic was used to assess the number of students in the population who fall within the expected grade completed based on their chronological age. Table 3 shows the comparison.
www.ccsenet.org/jel Journal of Education and Learning Vol. 3, No. 3; 2014
83
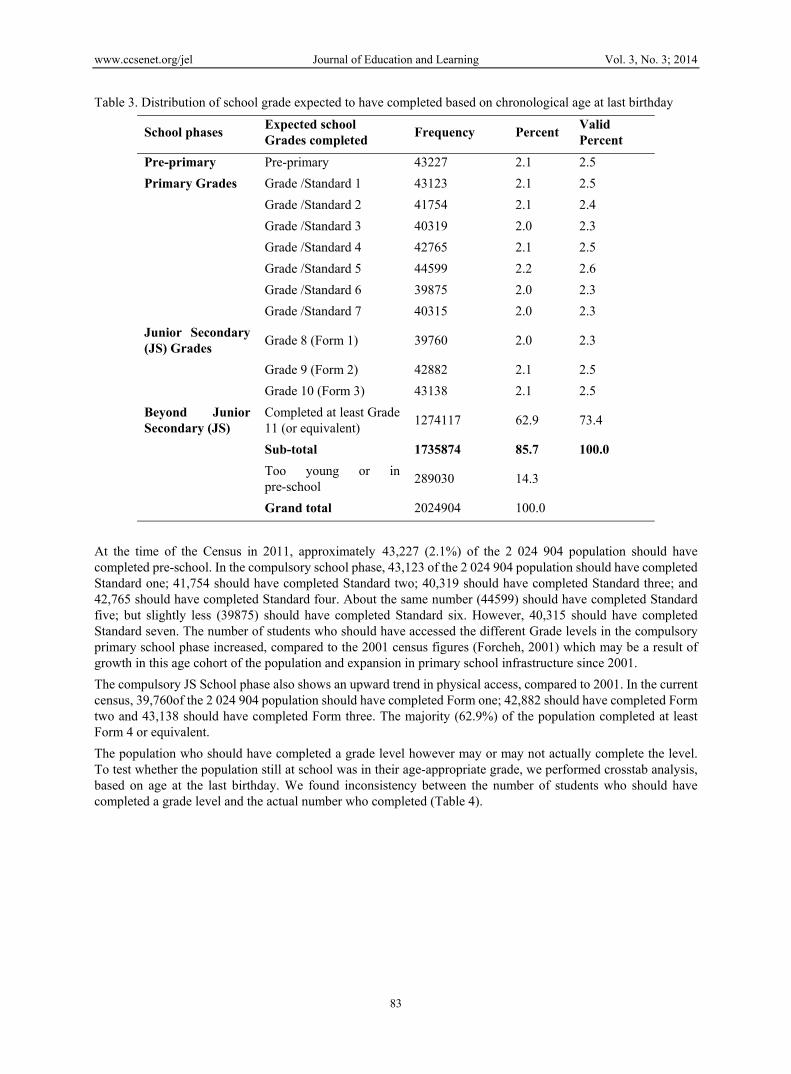
Table 3. Distribution of school grade expected to have completed based on chronological age at last birthday
School phases Expected school Grades completed
Frequency Percent Valid Percent
Pre-primary Pre-primary 43227 2.1 2.5
Primary Grades Grade /Standard 1 43123 2.1 2.5
Grade /Standard 2 41754 2.1 2.4
Grade /Standard 3 40319 2.0 2.3
Grade /Standard 4 42765 2.1 2.5
Grade /Standard 5 44599 2.2 2.6
Grade /Standard 6 39875 2.0 2.3
Grade /Standard 7 40315 2.0 2.3
Junior Secondary (JS) Grades
Grade 8 (Form 1) 39760 2.0 2.3
Grade 9 (Form 2) 42882 2.1 2.5
Grade 10 (Form 3) 43138 2.1 2.5
Beyond Junior Secondary (JS)
Completed at least Grade 11 (or equivalent)
1274117 62.9 73.4
Sub-total 1735874 85.7 100.0
Too young or in pre-school
289030 14.3
Grand total 2024904 100.0
At the time of the Census in 2011, approximately 43,227 (2.1%) of the 2 024 904 population should have completed pre-school. In the compulsory school phase, 43,123 of the 2 024 904 population should have completed Standard one; 41,754 should have completed Standard two; 40,319 should have completed Standard three; and 42,765 should have completed Standard four. About the same number (44599) should have completed Standard five; but slightly less (39875) should have completed Standard six. However, 40,315 should have completed Standard seven. The number of students who should have accessed the different Grade levels in the compulsory primary school phase increased, compared to the 2001 census figures (Forcheh, 2001) which may be a result of growth in this age cohort of the population and expansion in primary school infrastructure since 2001.
The compulsory JS School phase also shows an upward trend in physical access, compared to 2001. In the current census, 39,760of the 2 024 904 population should have completed Form one; 42,882 should have completed Form two and 43,138 should have completed Form three. The majority (62.9%) of the population completed at least Form 4 or equivalent.
The population who should have completed a grade level however may or may not actually complete the level. To test whether the population still at school was in their age-appropriate grade, we performed crosstab analysis, based on age at the last birthday. We found inconsistency between the number of students who should have completed a grade level and the actual number who completed (Table 4).

www.ccsenet.org/jel Journal of Education and Learning Vol. 3, No. 3; 2014
84
Table 4. Expected school grade completed based on chronological age and current school attendance
School phases Expected school grade completed
Ever attended school
Still at school Left school Never attended Total
Count Percent Count Percent Count Percent Count Percent
Pre-primary Pre-primary 27176 63.0 574 1.3 15400 35.7 43150 100.0
Primary Grade /Standard 1 39311 91.2 799 1.9 2976 6.9 43086 100.0
Grade /Standard 2 39395 94.4 947 2.3 1379 3.3 41721 100.0
Grade /Standard 3 38494 95.6 998 2.5 793 2.0 40285 100.0
Grade /Standard 4 40802 95.5 1127 2.6 798 1.9 42727 100.0
Grade /Standard 5 42647 95.7 1272 2.9 649 1.5 44568 100.0
Grade /Standard 6 38781 97.3 715 1.8 363 0.9 39859 100.0
Grade /Standard 7 39050 96.9 930 2.3 308 0.8 40288 100.0
Junior secondary Grade 8 (Form 1) 38172 96.1 1211 3.0 353 0.9 39736 100.0
Grade 9 (Form 2) 40159 93.7 2177 5.1 518 1.2 42854 100.0
Grade 10 (Form 3) 38350 89.0 4151 9.6 613 1.4 43114 100.0
Beyond Junior Secondary
Completed at least Grade 11 (or equivalent)
133864 10.5 960547 75.6 175751 13.8 1270162 100.0
Total 556201 32.1 975448 56.3 199901 11.5 1731550 100.0
Table 4 shows that 27176 (63%) of the 43150 students who were expected to have completed pre-school were still attending school while 35.7% are yet to start attending and 1.3% are reported to have left school. Likewise, 39311 of the 43086 students who were expected to have completed Standard 1 were still attending school, while 799 are reported to have left that Standard. The percentages for other age groups who were expected to complete but are still in the compulsory school phase ranged from 89.0% to 97.3%. However, the percentages drop drastically to 10.5% for those who were expected to have completed form 4 or equivalent grade but were still attending school. The drastic percentage change at the transition point between Grade 10 (Form 3) (i.e., end of the compulsory stage of schooling) and the start of senior secondary school (non-compulsory) may need further in-depth evaluation. At face value, it implies that there may be a high dropout and/or repletion rate at the end of Grade 10 (Form 3) because the number of students that lagged at Grade 10 (Form 3) did not transit into Form 4. In other words, there is evidence of a relatively low student transition from JS to senior secondary school.
The evidence in Table 4 confirmed the presence of late starters in the school system throughout the compulsory phase. The presence of late starters in the lower phase of the education system was also reported in the previous census in 2001. At the time, it was pointed out for example that while some 10 year olds were preparing to graduate from primary school, others were just starting the 7 year education journey (Forcheh, 2001). Forcheh (2001) also reported in the 2001 census analysis that 90 percent of children aged 5-9 years were attending standard one, two or three; and some children within the age group 10-14 were still in standard one. Thus, the present analysis of the 2011 census data highlights that the problems of late/early start of students in the system in the compulsory phase has not been corrected, 10 years after it was initially reported.
3.2 The Magnitude of the Population Ahead or Behind in the Compulsory School Phase
It is evident from the previous section that inconsistency between student chronological age and grade placement prevail. Further analysis was performed to determine the magnitude of the incongruence; i.e., the number of grade levels behind or the number of grade levels ahead the population still at school were in. This kind of treatment was being applied to the data for the first time.
Across the compulsory school phase, a population of 556 200 students were eligible to attend school. The actual Grade that the students were in at school was compared with their actual chronological age at the time of the census (Table 5). For those who have left school, incongruence indicates that it may be due primarily to their not continuing schooling after a certain grade. For example, the assumption is that all children should complete Grade 10 (Form 3). Those that drop out after Standard 7, and based on their current age, should have completed
www.ccsenet.org/jel Journal of Education and Learning Vol. 3, No. 3; 2014
85
Form 4 would have a congruent value of 4. Likewise, a student who started primary school at age 5 will have congruent value of -2, indicating that they have accelerated grade. This could result from early completion of reception class.
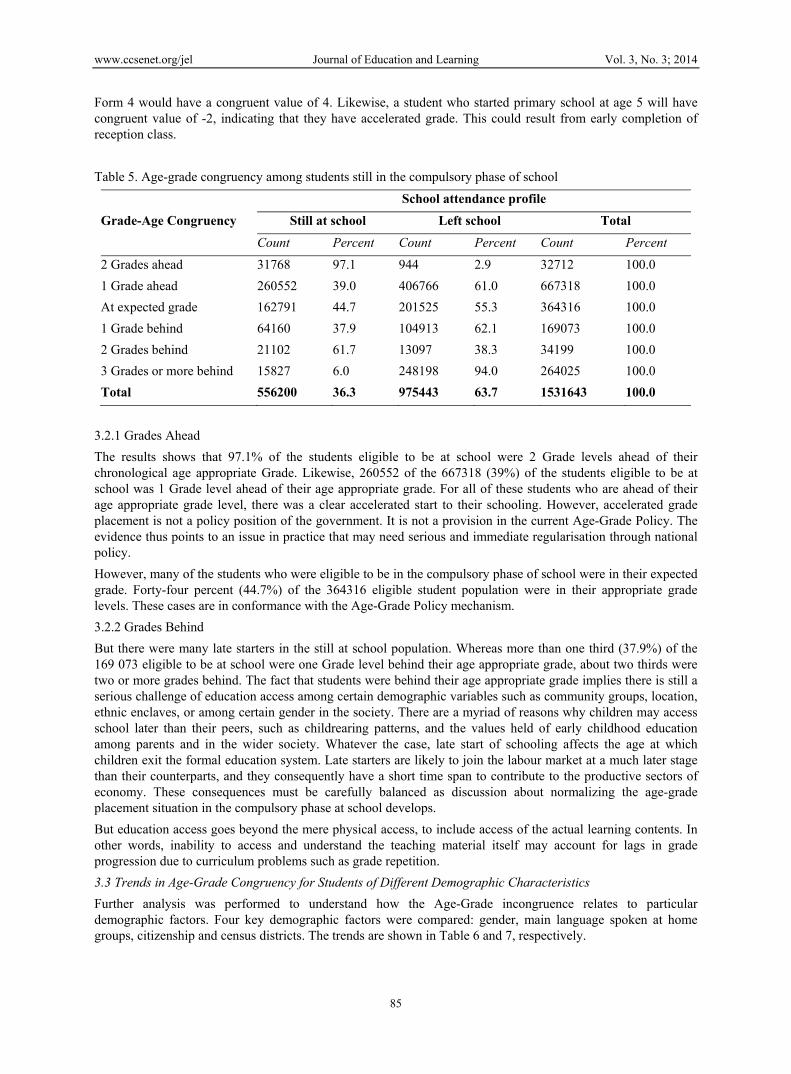
Table 5. Age-grade congruency among students still in the compulsory phase of school
Grade-Age Congruency
School attendance profile
Still at school Left school Total
Count Percent Count Percent Count Percent
2 Grades ahead 31768 97.1 944 2.9 32712 100.0
1 Grade ahead 260552 39.0 406766 61.0 667318 100.0
At expected grade 162791 44.7 201525 55.3 364316 100.0
1 Grade behind 64160 37.9 104913 62.1 169073 100.0
2 Grades behind 21102 61.7 13097 38.3 34199 100.0
3 Grades or more behind 15827 6.0 248198 94.0 264025 100.0
Total 556200 36.3 975443 63.7 1531643 100.0
3.2.1 Grades Ahead
The results shows that 97.1% of the students eligible to be at school were 2 Grade levels ahead of their chronological age appropriate Grade. Likewise, 260552 of the 667318 (39%) of the students eligible to be at school was 1 Grade level ahead of their age appropriate grade. For all of these students who are ahead of their age appropriate grade level, there was a clear accelerated start to their schooling. However, accelerated grade placement is not a policy position of the government. It is not a provision in the current Age-Grade Policy. The evidence thus points to an issue in practice that may need serious and immediate regularisation through national policy.
However, many of the students who were eligible to be in the compulsory phase of school were in their expected grade. Forty-four percent (44.7%) of the 364316 eligible student population were in their appropriate grade levels. These cases are in conformance with the Age-Grade Policy mechanism.
3.2.2 Grades Behind
But there were many late starters in the still at school population. Whereas more than one third (37.9%) of the 169 073 eligible to be at school were one Grade level behind their age appropriate grade, about two thirds were two or more grades behind. The fact that students were behind their age appropriate grade implies there is still a serious challenge of education access among certain demographic variables such as community groups, location, ethnic enclaves, or among certain gender in the society. There are a myriad of reasons why children may access school later than their peers, such as childrearing patterns, and the values held of early childhood education among parents and in the wider society. Whatever the case, late start of schooling affects the age at which children exit the formal education system. Late starters are likely to join the labour market at a much later stage than their counterparts, and they consequently have a short time span to contribute to the productive sectors of economy. These consequences must be carefully balanced as discussion about normalizing the age-grade placement situation in the compulsory phase at school develops.
But education access goes beyond the mere physical access, to include access of the actual learning contents. In other words, inability to access and understand the teaching material itself may account for lags in grade progression due to curriculum problems such as grade repetition.
3.3 Trends in Age-Grade Congruency for Students of Different Demographic Characteristics
Further analysis was performed to understand how the Age-Grade incongruence relates to particular demographic factors. Four key demographic factors were compared: gender, main language spoken at home groups, citizenship and census districts. The trends are shown in Table 6 and 7, respectively.

www.ccsenet.org/jel Journal of Education and Learning Vol. 3, No. 3; 2014
86
Table 6. Age-grade placement congruence by selected demographic factors
Demographic
factor
2 Grades
ahead
1 Grade
ahead
Expected
Grade
1 Grade
behind
2 Grades
behind
3 Grades or
more behind Total
Count Percent Count Percent Count Percent Count Percent Count Percent Count Percent Count Percent
Gender
Boys 12728 4.6 118803 43.0 84557 30.6 37647 13.6 13029 4.7 9237 3.3 276001 100.0
Girls 19040 6.8 141749 50.6 78234 27.9 26513 9.5 8073 2.9 6590 2.4 280199 100.0
Sub-total 31768 5.7 260552 46.8 162791 29.3 64160 11.5 21102 3.8 15827 2.8 556200 100.0
Language
Setswana 25354 5.7 209981 47.6 128879 29.2 49628 11.2 15814 3.6 11687 2.6 441343 100.0
English 1607 11.6 9189 66.1 2317 16.7 481 3.5 113 0.8 200 1.4 13907 100.0
Sekalanga 2268 5.3 19721 45.8 13287 30.9 5204 12.1 1539 3.6 1023 2.4 43042 100.0
Other
Botswana
language
1274 3.4 12306 32.8 12460 33.2 6459 17.2 2798 7.5 2257 6.0 37554 100.0
Other
Language 1265 6.2 9355 46.0 5848 28.7 2388 11.7 838 4.1 660 3.2 20354 100.0
Sub-total 31768 5.7 260552 46.8 162791 29.3 64160 11.5 21102 3.8 15827 2.8 556200 100.0
Citizenship
Non-Citizen 1660 11.5 8488 58.7 2911 20.1 787 5.4 279 1.9 331 2.3 14456 100.0
Citizen 30108 5.6 252064 46.5 159880 29.5 63373 11.7 20823 3.8 15496 2.9 541744 100.0
Sub-total 31768 5.7 260552 46.8 162791 29.3 64160 11.5 21102 3.8 15827 2.8 556200 100.0
3.3.1 Citizenship and Age-Grade Congruency
Age-Grade placement at the compulsory phase of school differed significantly by citizenship. Non-citizens, compared to citizens were far more likely to be one (non-citizen = 58.7%; citizen = 46.5%) or two (non-citizen = 11.5%; citizen = 5.6%) grade levels ahead in the school system. There were about 3 non-citizens to every 2 citizens in the population of those who were one grade level ahead in the compulsory education phase at school. Likewise, in the population of those who were two grade levels ahead, there were about 2 non-citizens to every citizen. In fact lesser non-citizens, compared to citizens, were at their expected age appropriate grade level (Table 6) because most of them had moved ahead of the grade level. More citizens, than non-citizens, were one or two grade levels behind.
There is no obvious explanation for the difference in Age-Grade placement by citizenship. However, accelerated grade position is a reflection of early entry to the education system, which may be a result of several other factors like being gifted, or more matured - cognitively; emotionally; socially.
3.3.2 Gender and Age-Grade Congruency
Age-Grade placement at the compulsory phase of school differed slightly by gender. More girls (57%), compared to boys (approx. 47%), were one or two Grade levels ahead of their age appropriate grade. In contrast, much more boys (21.6%), compared to girls (14.8%), were one or more grade level behind their expected age appropriate Grade level. However, about the same proportion of boys (30.6%) as girls (27.9%) were at their expected age appropriate Grade level (Table 6).
3.3.3 Language and Age-Grade Congruency
Age-Grade placement at the compulsory phase of school also differed slightly by main language spoken at home. Just 6.2% of those whose main home language is English are behind their expected grade, while 77.7% of them are one or two grade ahead of their expected grade (Table 6). For those whose main language spoken at home is Setswana, 17.4% are behind their expected grade. The situation is essentially the same for Sekalanga, where 18.1% are one or more grades behind their expected grade. For other Botswana languages and other languages

www.ccsenet.org/jel Journal of Education and Learning Vol. 3, No. 3; 2014
87
outside those used in Botswana, the majority of students were either at their expected Grade or one Grade ahead. The result implies then that those students who master the language of instruction can accelerate even at this basic level.
3.3.4 District and Age-Grade Congruency
District analysis was further undertaken to determine the areas in the country most affected by incidence of age-grade incongruence: i.e., incidence of accelerated grade placement, expected grade placement, or slow grade progression. Twenty eight (28) census districts were compared; results shown in Figure 1.
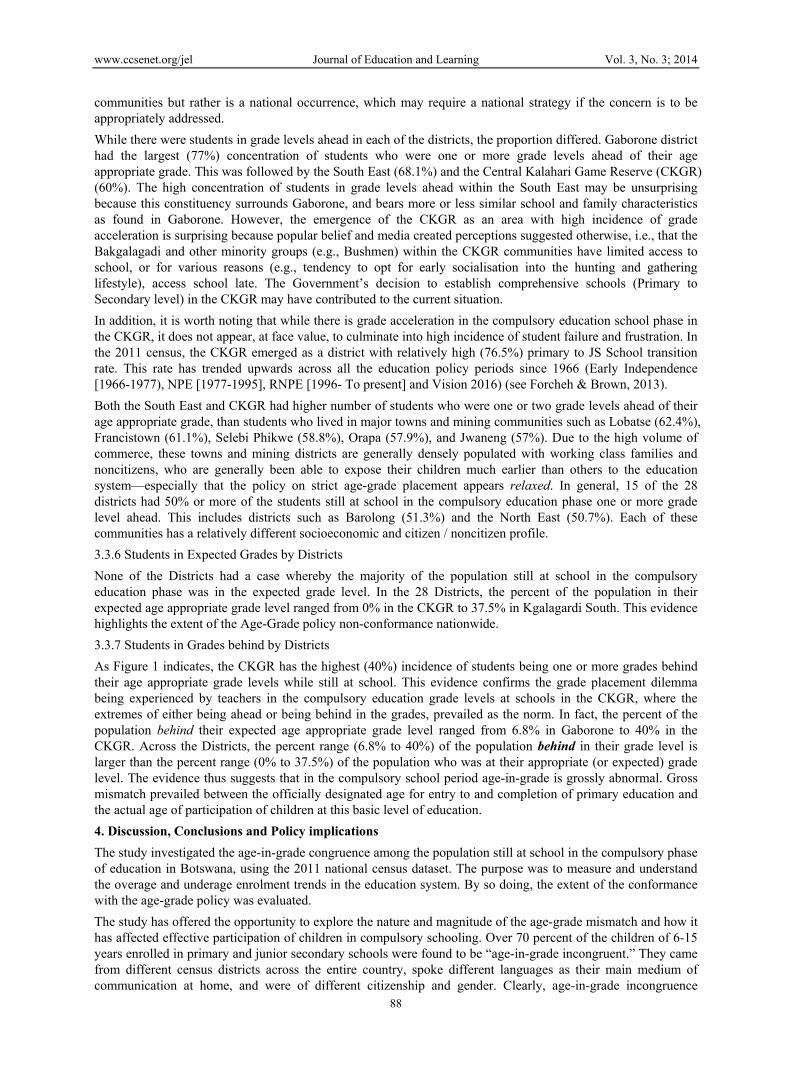
Figure 1. Age-grade congruency of population still at school by district
3.3.5 Students in Grade Ahead by Districts
All 28 districts had students who were ahead of their age appropriate grade level in the compulsory education phase (Figure 1). This confirmed that the age-grade incongruence is not a situation unique to particular
www.ccsenet.org/jel Journal of Education and Learning Vol. 3, No. 3; 2014
88
communities but rather is a national occurrence, which may require a national strategy if the concern is to be appropriately addressed.
While there were students in grade levels ahead in each of the districts, the proportion differed. Gaborone district had the largest (77%) concentration of students who were one or more grade levels ahead of their age appropriate grade. This was followed by the South East (68.1%) and the Central Kalahari Game Reserve (CKGR) (60%). The high concentration of students in grade levels ahead within the South East may be unsurprising because this constituency surrounds Gaborone, and bears more or less similar school and family characteristics as found in Gaborone. However, the emergence of the CKGR as an area with high incidence of grade acceleration is surprising because popular belief and media created perceptions suggested otherwise, i.e., that the Bakgalagadi and other minority groups (e.g., Bushmen) within the CKGR communities have limited access to school, or for various reasons (e.g., tendency to opt for early socialisation into the hunting and gathering lifestyle), access school late. The Government’s decision to establish comprehensive schools (Primary to Secondary level) in the CKGR may have contributed to the current situation.
In addition, it is worth noting that while there is grade acceleration in the compulsory education school phase in the CKGR, it does not appear, at face value, to culminate into high incidence of student failure and frustration. In the 2011 census, the CKGR emerged as a district with relatively high (76.5%) primary to JS School transition rate. This rate has trended upwards across all the education policy periods since 1966 (Early Independence [1966-1977), NPE [1977-1995], RNPE [1996- To present] and Vision 2016) (see Forcheh & Brown, 2013).
Both the South East and CKGR had higher number of students who were one or two grade levels ahead of their age appropriate grade, than students who lived in major towns and mining communities such as Lobatse (62.4%), Francistown (61.1%), Selebi Phikwe (58.8%), Orapa (57.9%), and Jwaneng (57%). Due to the high volume of commerce, these towns and mining districts are generally densely populated with working class families and noncitizens, who are generally been able to expose their children much earlier than others to the education system—especially that the policy on strict age-grade placement appears relaxed. In general, 15 of the 28 districts had 50% or more of the students still at school in the compulsory education phase one or more grade level ahead. This includes districts such as Barolong (51.3%) and the North East (50.7%). Each of these communities has a relatively different socioeconomic and citizen / noncitizen profile.
3.3.6 Students in Expected Grades by Districts
None of the Districts had a case whereby the majority of the population still at school in the compulsory education phase was in the expected grade level. In the 28 Districts, the percent of the population in their expected age appropriate grade level ranged from 0% in the CKGR to 37.5% in Kgalagardi South. This evidence highlights the extent of the Age-Grade policy non-conformance nationwide.
3.3.7 Students in Grades behind by Districts
As Figure 1 indicates, the CKGR has the highest (40%) incidence of students being one or more grades behind their age appropriate grade levels while still at school. This evidence confirms the grade placement dilemma being experienced by teachers in the compulsory education grade levels at schools in the CKGR, where the extremes of either being ahead or being behind in the grades, prevailed as the norm. In fact, the percent of the population behind their expected age appropriate grade level ranged from 6.8% in Gaborone to 40% in the CKGR. Across the Districts, the percent range (6.8% to 40%) of the population behind in their grade level is larger than the percent range (0% to 37.5%) of the population who was at their appropriate (or expected) grade level. The evidence thus suggests that in the compulsory school period age-in-grade is grossly abnormal. Gross mismatch prevailed between the officially designated age for entry to and completion of primary education and the actual age of participation of children at this basic level of education.
4. Discussion, Conclusions and Policy implications
The study investigated the age-in-grade congruence among the population still at school in the compulsory phase of education in Botswana, using the 2011 national census dataset. The purpose was to measure and understand the overage and underage enrolment trends in the education system. By so doing, the extent of the conformance with the age-grade policy was evaluated.
The study has offered the opportunity to explore the nature and magnitude of the age-grade mismatch and how it has affected effective participation of children in compulsory schooling. Over 70 percent of the children of 6-15 years enrolled in primary and junior secondary schools were found to be “age-in-grade incongruent.” They came from different census districts across the entire country, spoke different languages as their main medium of communication at home, and were of different citizenship and gender. Clearly, age-in-grade incongruence

www.ccsenet.org/jel Journal of Education and Learning Vol. 3, No. 3; 2014
89
among the compulsory schooling population still at school was relatively high. The fact that only 30 percent of the compulsory education population (6-15 years) still at school was in their age appropriate grade, is indicative of serious problems in the school system.
4.1 The Challenge of High Age-in-Grade Incongruence
Incongruence did not differ much by gender, which suggests the system may not be discriminating. Approximately 69.4 percent of boys, and 72.1 percent of girls, enrolled in the compulsory school system in 2011 were age-in-grade incongruent (i.e., either ahead or behind in grade). The same is evident by main language spoken at home and by citizenship. The high incongruence is a result of multiple factors. One essential factor seems to be the way the age-in-grade policy on admission is applied; there seems to be flexible and lenient application of the policy. The high proportion of age-in-grade incongruence is not a surprising outcome. It has been shown repeatedly in the gap in gross and net enrolment rate statistics in Botswana over the last decade or more (UNICEF, 2008; Botswana, 2010). Incongruence suggests students start school late or too early; it also suggests there are incidences of grade repetition, and dropout re-enrolment at school – all of which are serious systemic problems in the school system.
4.2 Categories of Age-in-Grade in Congruence
As the study found, there were two categories of age-in-grade incongruence, which have different explanation. One is the high incidence of students being ahead of their age appropriate grade (i.e., grade acceleration). The other form of incongruence is the high incidence of students being behind their age appropriate grade (i.e., late enrolment).
Late enrolment: Sending children to school at the ‘proper age’ is a complex issue and is influenced by several factors. As been argued elsewhere, some children may be sent to school late due to parents’ preferences (STATS BRIEF CSO, 2013) or expectation that older children do better at school (Hossain, 2010). Whether the children who start school late are among the top performers / achievers at school is an area that needs to be further investigated. Nevertheless, late enrolment often results from pervasive illiteracy and poverty. Ghuman (2006) and Alderman et al (2001) claim these were the main sources of similar late enrolment problems in Ghana and in India (Hossain, 2010). Poverty and illiteracy may also account for the late enrolment problems among students in Botswana because the Education Report, which is based on the Core Welfare Indicators Survey 2010 conducted by the CSO, found a strong relationship between poverty incidence and school attendance (STAT BRIEF COS, 2013).
Pervasive illiteracy and poverty often result in parents being unaware of the importance of sending their children to school at the right age; and/or leads to health and nutrition related problems which mediate appropriate enrolment. Poverty incidence still remains high in Botswana. Between 25 and 30 percent of the population live below the official poverty datum line in 2010—majority of whom lived in rural and deep rural areas (UNICEF, 2011), and the situation has not changed much since then. We have seen in this study that the highest concentration of the children who were behind their age appropriate grade levels lived in rural and deep rural communities such as the CKGR, Ghanzi, Kweneng West, Ngamiland West, Okavango Delta, and so on. This could be that children in these communities entered school late. It could also be that they dropped out and later returned, or were repeating grades. The communities mentioned above are among those with the highest dropout rates in Botswana (CSO, 2010/11). In the 2010 CSO First Term School Census primary and secondary schools report (CSO, 2010/11), it was noted that the Western Region of the country had the most primary school dropouts (25.6%), followed by South Central (20.8%), and Central South (20.7%).
Early enrolment: Grade acceleration was observed in this study but the reasons are unclear. Grade acceleration is an indication that the child entered the school system early, or he/she had skipped grades. Although grade acceleration practices need to be informed by child development data, in many compulsory schools, the measurement of student cognitive and socio-emotional maturity level prior to acceleration is not a common practice, and there is no policy regulating or mandating the practice. Thus acts of grade acceleration are generally unsystematic which offers little comfort that the practice in the local primary and junior secondary schools is based on learning theory and child development criteria as referenced by Rauenbusch (2013) and Dudeney (2003).
Grade acceleration was evident across all the demographic characteristics measured—census districts, gender, citizenship, main language spoken at home, and age groups. We could not determine whether any socio-economic difference (e.g., income level) exist among the parents whose children were grade accelerated. But US and European studies (Ray, 2012; Peters & Gentry, 2009) have shown that wealthy parents are the more
www.ccsenet.org/jel Journal of Education and Learning Vol. 3, No. 3; 2014
90
likely to send their children to school early (under-age) or push to have their children skip grades. There are several reasons why parents may want to accelerate their children: convenience (Ray, 2012); conjecture or factual evidence that the child is “gifted” (Ray, 2012); through recognition of the labour market and socioeconomic benefit of early exit from school (Peters & Gentry, 2009). There is in fact a historical precedent from the developed world for using grade acceleration to improve lifetime employment income and attainment. Regardless of parents’ motives, grade acceleration needs to be a considered decision by education practitioners. The fact that it is occurring at school makes a strong case that the age-in-grade policy, which does not make provision for grade acceleration, is being flouted.
4.3 Age-Grade Policy Flouting or Is It Leniency
Our work contributes to government policy literature by showing the extent of the age-in-grade congruence in the school system. The age-in-grade policy requirement of age 6 years as the age to start basic education bears little resemblance to what is taking place in practice. Thus, there is tension between policy and practice. Furthermore, it is not the first time that prevalence in under-age or over-age enrolment is being reported. In the 2001 census analysis, Forcheh (2001) drew attention to the situation, and the CSO reports on Education make reference to the problem each time that the net and gross enrolment rates are calculated. If the current practice of age in grade incongruence is the new norm that the education sector wishes to be institutionalised which we hope is not the case, then there needs to be policy revision to reflect the situation. In other words, it would make more sense to harmonise policy and practice.
The best policy position would be to enforce age-in-grade congruence. The merits for age-in-grade congruence are much stronger than any benefits for age-in-grade incongruence, especially in a system where the majority of the students are outside their expected grade level. As the section below indicates, the stress of being outside one’s age appropriate grade may nullify any gain in the long run. Clearly, decisions about children schooling are emotional as well as practical. Emotionally, parents want to send their children to school to get a good education (Peters et al, 2007). However, for practical reasons, like availability, affordability, social and cognitive benefits, it is ideal to have children enrolment at the “proper age”. Few parents recognise the stage and pace of child development and their implications on children’s education. Education officials therefore have an obligation to better monitor and regulate admission.
4.4 Gender and Age-in-Grade Congruence
We found gender variations in age-in-grade congruence. Compared to boys, more girls entered the compulsory education system early. More boys entered school over-aged. This meant more boys were behind at school than girls. The early entry of girls may be related to girl faster maturity than boys at younger age (Miller, 2009). Those girls who were behind may be those who re-enrolled after pregnancy (Molosiwa & Moselwa, 2012) or those who were ‘held back’ at home (Hossain, 2010). The boys who were behind may be those who re-enrolled after a brief period of drop out (Baputaki, 2011), or those who have had to repeat grades (Baputaki, 2011). The gender situation is happening at a time when according to the 2013 CSO Education Report, more boys since 2010 have been enrolling in primary schools than girls. This is due mainly to the sex ratio at birth in Botswana where boys are more than girls (STATS BRIEF CSO, 2013). Thus, more girls than boys enter the compulsory school early.
Fora patriarchal society, the finding that girls enter compulsory schooling earlier than boys is surprising. Socially constructed patriarchal patterns of thinking suggest there would be a preference to encourage boys’ early education over girls. The early entry of girls and the late starting of boys indicate the comparatively disadvantageous position of boys in the basic education phase. For instance, socially, boys are pressured after a certain age due to earning norms, or norms related to providing for their parents. They are also pressured by marriage norms (Ghuman, 2006). These pressures often interfere with grade progression rate among boys (Hossain, 2010). Already, boys are quitting schools at a higher rate than girls. The 2009 First Term School Census Report indicated that more boys drop out of school than girls (CSO, 2010), with most drop out cases observed at Grade 1 (Standard One) and the least at Grade 7 (Standard Seven). Girls drop out tend to occur much later in the school phase resulting mainly from pregnancy (Molosiwa & Moselwa, 2012).
With social pressures, more boys face the risk and disadvantage of exclusion from compulsory education. Their risk is the risk of dropping out, which according to Lewin (2007) who developed the CREATE model of zones of exclusion from basic education, falls within zone 3 or zone 5 of the model. CREATE model has six zones of exclusion, beginning with zone 0 which describes those children who had no pre-school. However, zone 1 describes those children, who for whatever reason, never attend primary school but zone 2 contains those children who are excluded from education due to drop out and failing to complete the cycle. Zone 3 include

www.ccsenet.org/jel Journal of Education and Learning Vol. 3, No. 3; 2014
91
students in school but at risk of drop out, most obviously as a result of systemic inefficiencies such as truancy, sporadic attendance, low ability, and being overage. Lewin (2007) points out however that zone 4 includes those students who fail to transit for whatever reason to lower secondary education; zone 5 includes those who drop out of lower secondary education; while the last zone, zone 6, describes those students at risk of drop out from lower secondary education (Lewin, 2007). A strong implication then is that those students particularly boys who re-enrol, repeat, and those who enter school overage are at risk of exclusion from compulsory education due to social integration or re-integration challenges as those who enter school underage. These children constitute the “silently excluded” at school.
4.5 Curriculum and Child Development Implications of Age-in-Grade Incongruence
Curriculum implications: The current research demonstrates that age-in-grade incongruence was far more prevalent in the compulsory education stage of the school system than age-in-grade congruence. While scholars have theorized about the concept of age-in-grade (Ghuman, 2006), and have made references to the existence of the problem and its causes, in the school system in Botswana (Molosiwa & Moselwa, 2012; Forcheh, 2001), our study shows the number of grade level ahead or behind that a given number of grade incongruent students were located, and as a result, hints at specific curriculum challenges to anticipate. These insights are important for both theory and practice.
Our work makes an important contribution to the curriculum implementation literature by showing that the age variation in classrooms in the compulsory school phase in Botswana is not consistent with the official monograde classroom formation. Curriculum development researchers and theorists have specified that monograde classrooms are characterised by students of similar ages. Students are brought together in monograde situation on the basis that learners of similar ages need similar learning opportunities to acquire the knowledge and skills expected of children of their age. The fact that 70 percent of the compulsory grade population was outside their age appropriate grade means that these students receive and experience education in classrooms typically defined as multigrade contexts. These contexts include what are also characterised as multi-age class, multi-level, multiple classes, composite class, and vertical group (Little, 2006). They are sometimes referred to as double stream classes, split grade classes, or combination classes (Padmanabha & Rama, 2010). The common denominator of students learning in multigrade classroom context is that the learners fall into different age brackets. Pedagogy in the compulsory education phase of the school system in Botswana is approached from a monograde perspective yet the composition of majority of the classes is multigrade. In other words, multigrade classes exist, unofficially, in officially monograde context. A strong implication of this finding is that for ‘monograde trained teachers’ multigrade teaching related training, which is designed to prepare individuals to flexibly adapt the monograde curriculum, is needed.
On a related note, our research sheds light on a grade-composition practice which may not be benefiting students in primary and JS schools. One of the obvious outcomes of placing students with diverse age characteristics in a class is a wide range of student learning needs. For students to perform to their full potential in a class with diverse learning needs, their teachers must be adequately prepared by being exposed to appropriate multigrade teaching methodologies (Brown, 2009). Training teachers for multigrade teaching creates opportunities for improvement in teaching which can benefit both mono-age and multi-age class. Scholars of multi-age teaching have illustrated in their work that for student to benefit from the school curriculum and succeed in their learning in multi-age grade context, the teaching must be underpinned by several prerequisites, including acknowledgement that the class is multi-age, careful organisation and adaptation of the curriculum, and teacher commitment (Brown, 2009; 2010b; Benveniste & McEwan, 2000; Little, 2006). The absence of these prerequisites leads to negative outcomes for students and teachers.
The current teacher education system in the Botswana does not prepare teachers for multigrade or multi-age teaching, and the singlegrade curriculum taught is un-adapted. The implication then is that the current multi-age composition of grades in the compulsory phase of the school system may partly explain the prevalence of systemic inefficiencies (e.g., drop out, repetition, failure, truancy) in the school system. Researchers have offered many factors that underpin the current high level of systemic inefficiencies occurring in Primary and Junior Secondary Schools, including pregnancy, substance abuse, physical violence, disinterest in schooling, and cognitive challenges (e.g., Molosiwa & Moselwa, 2012; Ramirez & Carpenter, 2008). However, multi-age grade composition has not been put forward as a possible explanation. We are adding to this debate by arguing that the systemic inefficiencies in the compulsory phase of schooling may also be linked to the multi-age grade composition which increases the demand on teachers who as a result have to cater for a wide range of student learning needs.
www.ccsenet.org/jel Journal of Education and Learning Vol. 3, No. 3; 2014
92
In a third domain, our research has implications for gender access to the curriculum. According to recent Central Statistics Office report, more boys drop out of the compulsory school phase than girls (STAT BRIEF COS, 2013). Our findings provide clues as to why more boys may have been quitting compulsory schooling much earlier than girls, despite being exposed to the same education system. In our study, the majority of the students, who were one or more grade level behind, were boys. This is indication that boys repeated grade levels, and/or re-enrolled in school after initially dropping out (Molosiwa & Moselwa, 2012). A significant alternative reason relates to late enrol (Baputaki, 2011). More boys may be enrolling late in school. Thus, in terms of educational access, boys are in a disadvantage position as they face the risk of exclusion.
There are consequences of late enrolment. Research by Brown (2013a; 2013b) in South Africa found that overage boys in classes with younger mates experience social stress that results from antisocial behaviours such as teasing and negative social labelling. In multigrade classes in South Africa, teachers verbally abuse older children who struggle to master curriculum concepts meant for younger classmates (Brown, 2010b). These pressures mediate boy’s access to the school curriculum. Furthermore, while there is no way to verify in this study whether late enrolees are among the cohort of boys who dropped out of school prematurely each year, overage enrolment increases the risk of premature quitting of school system due to frustration and perception of not achieving a level of attainment at a certain age. From a theoretical point of view, it would be interesting to gain a deeper understanding of the consequences of late enrolment for boys beyond social stress issues.
5. Policy Recommendations
The issue of age in grade incongruence needs to be regulated. Government should develop a robust policy to guide admission and grade acceleration practices in basic education. Birth registration policy should be followed and implemented properly in the rural and deep rural areas of the country. In the same vein, robust mechanisms to determine student readiness for grade acceleration and the monitoring of grade acceleration effects on student development and adjustment at school should be implemented.
Secondly, in order to achieve universal basic education, the number of under-age and over-age students at school needs to decline to free places for students in the official school age groups. Thus, the goal of achieving age-in-grade congruence in basic education should become top priority. The serious implications of overage and underage enrolment for pedagogy and curriculum make the matter even more urgent.
Thirdly, dealing with a wide range of age group children in the classroom is a pedagogical issue which should be given proper attention considering the multi-grade settings of the class. Multigrade / multiage teaching issues should be incorporated in teacher training and the teachers training modules. Teachers should use and be trained to use appropriate teaching methods and techniques to address the needs of a mixed age group of children.
The issue of “silent exclusion”, especially among boys, should be discussed among education stakeholders and particularly the relevant school authorities to let them understand the magnitude of the problem by measuring it with a simple measurement tool. It is important to have a common understanding of the characteristics of silently excluded children in primary and lower secondary schools to know how and when this process starts in the classroom, what the causes are and how it can be handled.
Fourthly, the school should prepare and preserve a profile of students for all grades separately including basic socioeconomic background of the learners and age. On the basis of the profile respective schools and designated teachers, responsible for a grade, should prepare the cohort analysis reports and teachers should be given opportunity to be involved in the research process and to take necessary actions.
Finally, for the intermediary or short term “stop gap method”, additional academic support for the silently excluded children should be provided by employing additional, local community teachers in low performing schools or by providing extra academic support to poor and silently excluded children by creating low cost out of school learning centres involving local NGOs, working in education. We need a large scale nationwide study to determine whether school performance correlates to age-in-grade incongruence.
References
Alderman, H., Behram, J. R., & Lavy, V. (2001). Child health and school enrollment: A longitudinal analysis. The Journal of Human Resources, XXXVI. http://dx.doi.org/10.2307/3069675
Angrist, J., & Lavy, V. (1997). The effect of a change in language of instruction on the returns to schooling in Morocco. Journal of Labor Economics, 15(1), 48-76. http://dx.doi.org/10.1086/209856

www.ccsenet.org/jel Journal of Education and Learning Vol. 3, No. 3; 2014
93
Baputaki, C. (2011). More boys drop out of school-CSO. The Mmegi. Retrieved September 10, 2013, from http://www.mmegi.bw/index.php?sid=1&aid=126&dir=2009/October/Wednesday21#sthash.fuo8kwAS.dpuf
Benveniste, L., & McEwan, P. (2000). Constraints to implementing educational innovations: The case of multigrade schools. International Review of Education, 46(1&2), 31-48. http://dx.doi.org/10.1023/A:1003922321999
Botswana, Republic of. (2010). Universal primary education and the millennium development goals. Retrieved November, 2013, from http://www.gov.bw/en/printingVersion/?printid=2779
UNICEF. (2011). UNICEF Annual Repor—Botswana. The United Nations Children’s Fund (UNICEF): Botswana Country Office.
Brown, B. (2009). Preparation of teachers for multigrade teaching: Global lessons for South Africa. Southern African Review of Education, 15(2), 61-84.
Brown, B. (2010a). Teachers’ account of the usefulness of multigrade teaching in promoting sustainable human development related outcomes in rural South Africa. Journal of Southern African Studies, 36(1), 189-207. http://dx.doi.org/10.1080/03057071003607428
Brown, B. (2010b). Social hostility and the “dropout” syndrome: Leadership assisting youths’ re-entry into school? Educational Review, 62(1), 53-67. http://dx.doi.org/10.1080/00131910903469577
Brown, B. (2013a). “I was terrified of being labelled”: Social experiences of ex-dropouts re-enrolled in secondary school in South Africa. European Scientific Journal, 9(14), 157-175.
Brown, B. (2013b). The social treatment of ex-dropouts who reenrolled in secondary school in South Africa. European Scientific Journal, 9(14), 230-251.
Conger, D. (2012). The effect of grade placement on English Language learners’ academic achievement. Educational Evaluation and Policy Analysis, 2(23), 341-355.
CSO. (2010/11). The 2009 First Term School Census report for primary and secondary. Gaborone: Central Statistics Office, Botswana.
Dudeney, H. (2003). Rage to master—Ellen Winner model. Gifted, 127(Feb), 13-14.
Elder, T., & Lubotsky, D. (2009). Kindergarten entrance age and children’s achievement: Impacts of State policies, family background and peers. Journal of Human Resources, 44(3), 641-683. http://dx.doi.org/10.1353/jhr.2009.0015
Fredriksson, P., & Öckert, B. (2005). Is early learning really more productive? The effect of school starting age on school and labour market performance. Sweden: Institute for the Study of Labour.
Forcheh, N. (2001). Education attainment as per 2001 population and housing census. In 2001 Population & Housing Census Analytical Report. Gaborone: Central Statistics Office, Botswana.
Gagne, F. (2004). Gagne’s differentiated model of giftedness and talent. Retrieved October, 2013, from http://www.gigers.com/matthias/gifted/gagnes_dmgt.html
Ghuman, S. (2006). Children’s Nutrition, School Quality and Primary School Enrollment in Philippines. Working Paper Series.
Glewwe, P., & Jacoby, H. (1995). An economic analysis of delayed primary-school enrolment in a low-income country: The role of early childhood nutrition. Review of Economics and Statistics, 77, 156-169. http://dx.doi.org/10.2307/2110001
Hossain, A. (2010). Age in grade congruence and progression in basic education in Bangladesh. CREATE Pathways to Access, Research Monograph, Brighton: University of Sussex.
Lewin, K. (2007). Improving Access, Equity and Transitions in Education: Creating a Research Agenda. CREATE Pathways to Access. Research Monograph No 1. Brighton: University of Sussex.
Little, A. (2006). Education for All and multigrade teaching: Challenges and opportunities. Dordrecht: Springer. http://dx.doi.org/10.1007/1-4020-4591-3
Miller, C. (2009). Developmental differences in boys and girls. Retrieved from http://www.livestrong.com
Molosiwa, S., & Moselwa, B. (2012). Girl-Pupil Dropout in Secondary Schools in Botswana: Influencing Factors, Prevalence and Consequences. International Journal of Business and Social Science, 3(7), 265-271.

www.ccsenet.org/jel Journal of Education and Learning Vol. 3, No. 3; 2014
94
Mulryan-Kyne, C. (2007). The preparation of teachers for multigrade teaching. Teaching and Teacher Education, 23(4), 501-514. http://dx.doi.org/10.1016/j.tate.2006.12.003
NRDE. (2008). National Report on the Development of Education: Inclusive Education the way of the future. Ministry of Education and Skills Development. Gaborone: Government Printers.
OECD. (2011). Access to education, participation and progression. Education at a Glance. UNESCO Institute for Statistics (World Education Indicators Programme). http://dx.doi.org/10.1787/eag-2011-en
Padmanabha, R., & Rama, A. (2010). Re-designing the elementary school-multilevel perspectives from River Valley, India. Rishi Valley Institute for Educational Resources.
Peters, M., Seeds, K., Goldstein, A., & Coleman, N. (2007). Parental involvement in children’s education. BMRB Social Research. Retrieved from http://www.educacation.gov.uk/research/data/uploadfiles/DCSF
Peters, S., & Gentry, M. (2010). Multi-group construct validity of the HOPE Scale: Instrumentation to identify low income elementary students for gifted programmes. Gifted Child Quarterly, 54(4), 298-313. http://dx.doi.org/10.1177/0016986210378332
Pridmore, P. (2007). Adapting the primary-school curriculum for multigrade classes in developing countries: A five-step plan and an agenda for change. Journal of Curriculum Studies, 39(5), 559-576. http://dx.doi.org/10.1080/00220270701488093
Ramirez, A. L., & Carpenter, D. (2008). Solving the Drop-out Puzzle: Strategies for success, Principal Matters. Journal for Secondary School Leaders in Australia, 76, 43-46.
Rauenbusch, F. (2013). Learning challenges: Grade acceleration.
Ray, L. (2012). Grade skipping factors for elementary students.
Rogers, K. (2002). Re-Forming gifted education: Matching the programme to the child. New York: Great Potential Press.
Sprietsmaa, M. (2008). Education Economics: Effect of relative age in the first grade of primary school on long-term scholastic results: International comparative evidence using PISA 2003. Centre for European Economic Research, Mannheim, Germany.
STATS BRIEF CSO. (2013). Education report drawn from 2009/10 Botswana core welfare indicators survey (No. 2013/15). Stats Brief. Government: Statistics Botswana.
UDHR. (1948). The Universal Declaration of Human Rights: 1948-2008. Geneva: United Nations.
UNESCO. (2012). The EFA 2000 assessment: Country report—Botswana.
UNICEF. (2008). Education statistics: Botswana. Division of Policy and Practice, Statistics and Monitoring. Retrieved from http://www.childinfo.org
Vygotsky, L. (2001). Pioneers in our field: Lev Vygotsky—Playing to learn. Early Childhood Today Series. Retrieved from http://www.scholastic.com/teachers/article/pioneers-our-field-lev-vygotsky-playing-learn
Copyrights Copyright for this article is retained by the author(s), with first publication rights granted to the journal.
This is an open-access article distributed under the terms and conditions of the Creative Commons Attribution license (http://creativecommons.org/licenses/by/3.0/).