RE ACHING - Botswana Stock Exchange
129
A N N U A L R E P O R T | 2 0 1 5 R E A C H I N G
-
Upload
khangminh22 -
Category
Documents
-
view
0 -
download
0
Transcript of RE ACHING - Botswana Stock Exchange
AN
N U A L R E P O R T | 2 0 1 5
R E A C H I N G
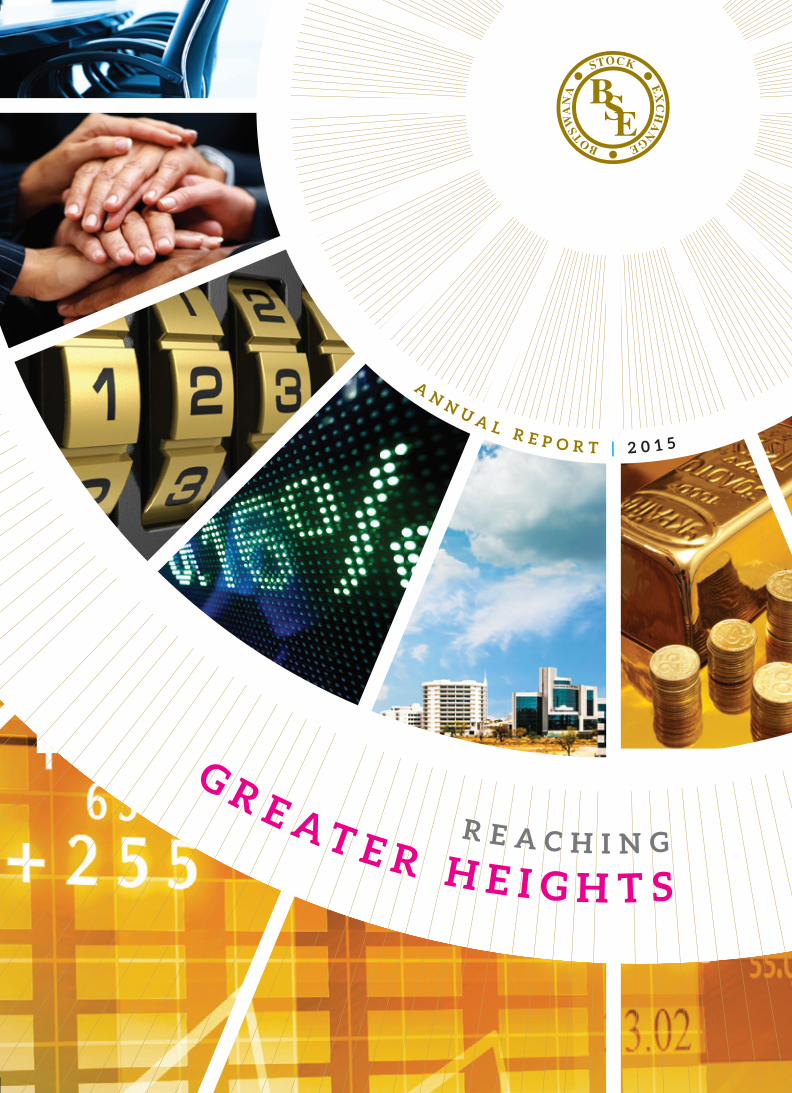
MILEsTONEs
20151. The BsE registered a yearly turnover
of P3.0 Bn, the highest ever recorded since the inception of the BsE
2. BsE Transition Act commenced
3. Afinitas Limited, a pure startup company, listed in July
4. BTCL IPO approved to commence in January 2016

Mission & Vision Statements 2
Our Values 3
2015 Highlights 4
The Botswana Stock Exchange 6Overview
Board Members 8
Management Team 10
Company Structure 14
Our Staff 16
Chairperson’s Statement 18
CEO’s Review 22
Graphical Review 86
Market Statistics 92
BSE Strategy 102
Corporate Governance 108
Financial Statements 113
CONTENTSOur Theme
“The theme for this year’s
financial and operational
report “Reaching Greater
Heights” paints a good
picture and adds strides
to the momentum
generated in the previous
year.”
Regina Vaka BSE Chairperson
001

Mission
To provide and
operate a fair,
transparent and
efficient stock market
for all stakeholders
in order to optimise
national economic
development.
Vision
Our vision is to be the leading Stock Exchange in Africa.
We will do this by:
• Growing the market in terms of number of listings, market capitalisation and liquidity, and in addition;
• Providing excellent returns for our participants;
• Attracting the most foreign portfolio investment; and
• Improving internal operations (including being self sustaining).
annual report 2015
MISSION & VISION STATEMENTS
002
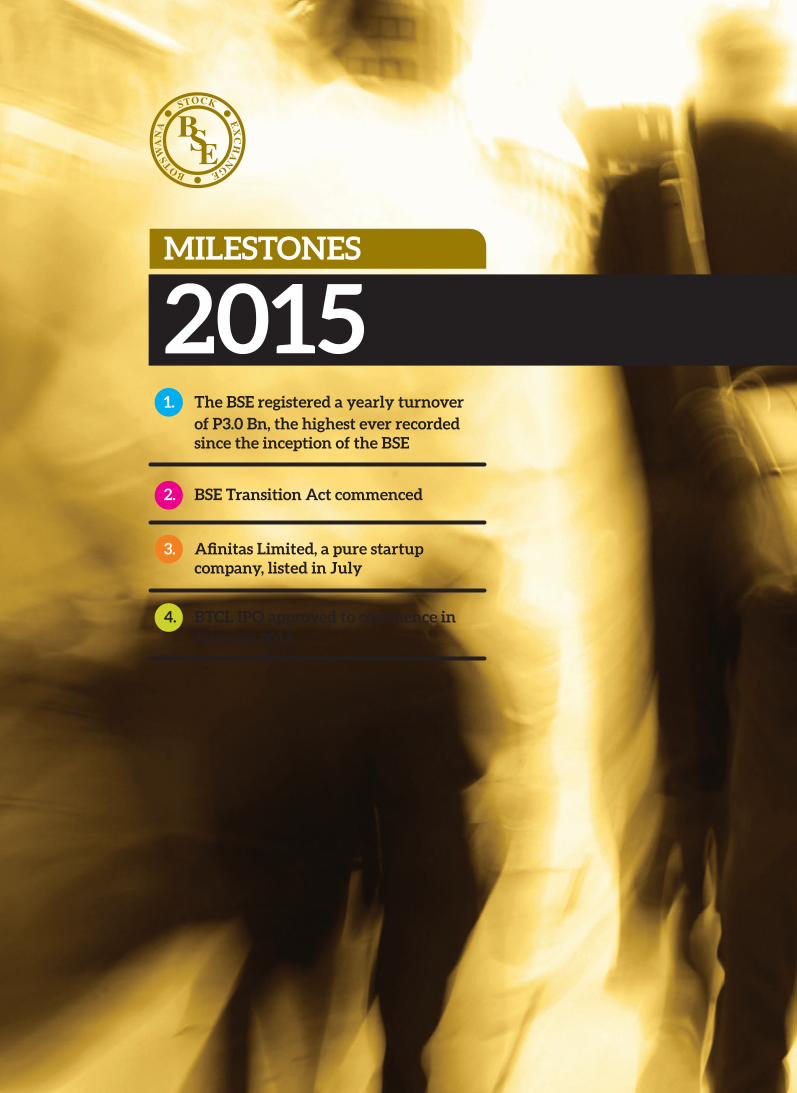
Our Values
• Corporate&PersonalEthics
• Credibility,Transparency&Accountability
• RiskManagement
• Achievement-driven• Excellence• ResultsFocused
• Teamwork&Collaboration
• KnowledgeSharing &Communication• Customer
Orientation
• CommittedtorealizingvalueandconvertingValuetoacompetitiveadvantage
• Committedtocontinuousimprovement
• Creativity&Innovation
• PersonalLearning,Growth,Development,Coaching&Developingothers
INTEGRITY
EXECUTION
RESPECT
DISCIPLINE
PASSION
003
R E A C H I N G G R E AT E R H E I G H T S
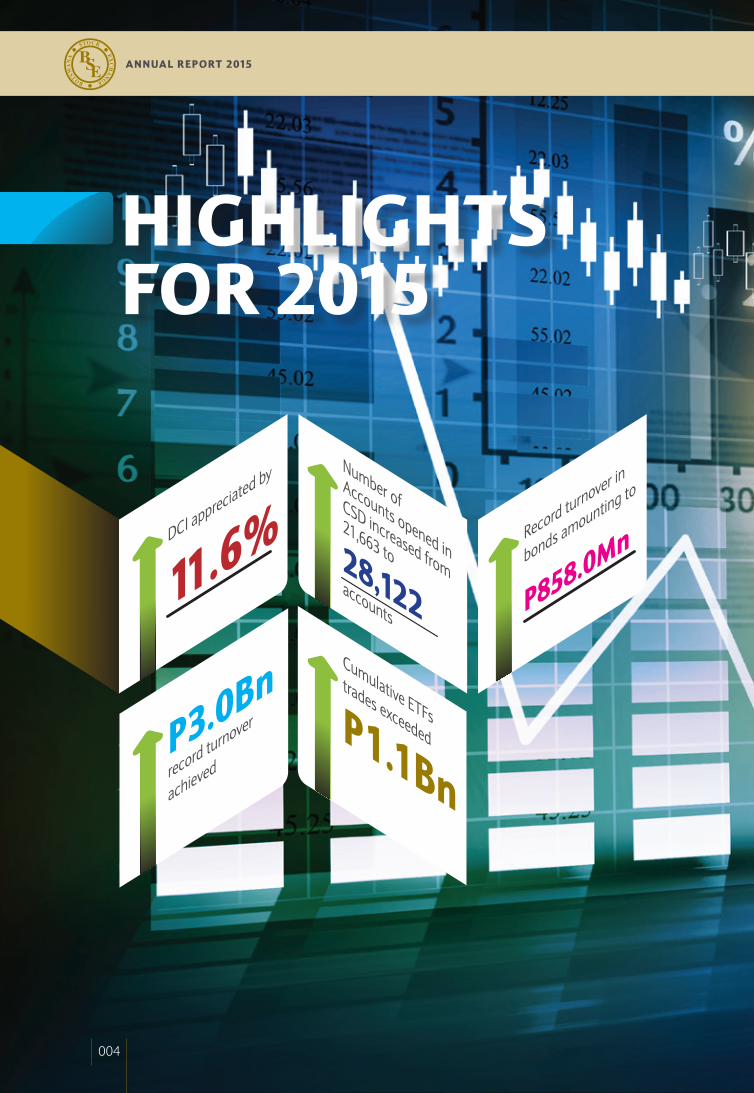
DCIappreciatedby
11.6%
NumberofAccountsopenedin
CSDincreasedfrom
21,663to28,122accounts
CumulativeETFs
tradesexceededP1.1BnP3.0Bn
recordturnover
achieved
Recordturnoverin
bondsamountingto
P858.0Mn
HIGHLIGHTS FOR 2015
annual report 2015
004

R E A C H I N G G R E AT E R H E I G H T S
005

BOTSWANA STOCK EXCHANGE OVERVIEW
The Botswana Stock Exchange
(BSE) is Botswana’s national
stock exchange, given the
responsibility to operate and
regulate equity and the fixed
interest security market.
Formally established in 1989,
the BSE traces its humble
beginnings to when it was
known as Botswana Share
Market (BSM).
At that time there was no formal stock exchange in Botswana and the BSM traded as an informal market. There were only 5 listed entities with a single broking firm i.e. Stock Brokers Botswana Ltd (SBB), which was also charged with facilitating trading on the exchange via the matching of orders. In order to encourage foreign investors to Botswana an interim exchange committee was set up in October 1990 with representatives from the private and public sector, including the secretary of the Zimbabwe Stock Exchange, the Chief Executive of SBB, the Permanent Secretary of the Ministry of Finance, and the Deputy Director of the Bank Supervision Department of Bank of Botswana. The committee had the power to list and to de-list a stock, and was also responsible for ensuring that the BSE traded ethically [Ruben Lee, 1998]. The necessity to detach the running of the exchange from the broking business set in motion a process for the establishment of an independent exchange.
In September 1994, the legislation to transform the BSM into a full exchange was passed by Parliament paving the way for the establishment of the Botswana Stock Exchange (BSE) where trading opened in November 1995. In March 1998, Ernst and Young took the full administration of the BSE. With effect from July 2001, a full time Chief Executive Officer was appointed with the aim of making the BSE completely independent.
In April 2003, in order to better execute the affairs of the Exchange, better serve stakeholders, and be more responsive to global events and to remain competitive, the BSE discontinued the secretarial role of Ernst and Young Botswana to become a fully independent entity.
The BSE continues to be pivotal to Botswana’s financial system, and in particular the capital market, as an avenue on which government, quasi- government and the private sector can raise debt and equity capital. The BSE plays host to the most pre-eminent companies doing business in Botswana. These companies represent a spectrum of industries and commerce; these are Banking, Financial Services, Wholesaling & Retailing, Tourism, Energy, Property & Trust, Security and Telecommunications (effective April 2016). Currently, there are 32 listed entities in the BSE comprising 22 domestic and 10 foreign companies. The BSE also has 38 listed bonds and 4 Exchange Traded Funds.
OUR PRODUCTS
The BSE aims to become a financial supermarket, meaning it aims to provide the right kind of products to suit investor and issuer so that it meets growing customer demands and challenges of the globalisation of financial markets. This can be done through product innovation and diversification.
annual report 2015
006

Currently, products that can be listed include Equities, Corporate Bonds, Government Bonds, Exchange Traded Products, Index Funds and Commercial Papers while products being developed are Global Depository Receipts and Real Estate Investment Trusts.
BOTSWANA STOCK EXCHANGE REGULATORY ENVIRONMENT
The main law which governs all the activities between the Exchange and its members, the proceedings of the Main Committee and its composition; the relationship between the Minister and the Exchange together with the relations between the Registrar, is the Botswana Stock Exchange Act No 11of 1994. The BSE is regulated by the Non Banking Financial Institutions Regulatory Authority (NBFIRA). A new Act, the BSE Transition Act commenced on 1 December 2015, paving the way for commencement of the demutualization of the BSE. Whilst the Securities Act has been approved, it is still awaiting a Commencement Order.
The members have promulgated Rules (Member Rules) which provide the requirements to be fulfilled for the securities listed and traded on the Exchange. Members Rules provide as the main objective thereof, “to operate a Stock Exchange in Botswana with due regard to the public interest to maintain fair and efficient dealing in securities for the protection of investors and regulate the affairs of members”.
In addition, the Exchange has a set of Listing Requirements which provide the pre-listing requirements and post-listing requirements to be observed by the issuers of listed securities. The emphasis is to make sure issuers disclose as much information to the public and investors as possible so that the latter can make informed investment decisions. The Rules were amended and subsequently approved in 2015, becoming effective in June 2016.
CORPORATE INFORMATION
BSE Office:Exchange HouseOffice Block 6Plot 64511, FairgroundsPrivate Bag 00417Gaborone
Independent Auditors:KPMG
Bankers:Barclays Bank of Botswana LimitedStandard Chartered Bank Botswana Limited
THE TRADING DAY AT THE BSE
Sessions Time Duration
(a) Pre-tradingSession 10:00hrsto10:10hrs. 10min
(b) OpenAuctionSession 10:10hrsto10:25hrs. 15min
(c) RegularTradingSession1 10:25hrsto11:55hrs 1hr30min
(d) InterimAuctionSession 11:55hrsto12:05hrs 10min
(e) RegularTradingSession2 12:05hrsto13:20hrs 1hr15min
(f) ClosingAuctionSession 13:20hrsto13:30hrs. 10min
(g) ClosingPricePublicationSession 13:30hrsto13:40hrs 10min
(h) ClosingPriceCrossSession 13:40hrsto13:50hrs 10min
(i) Post-CloseSession 13:50hrsto14:00hrs 10min
(j) MarketClose 14:00hrs.
R E A C H I N G G R E AT E R H E I G H T S
007

BOARD MEMBERS
ANNUAL REPORT 2015
008

A
D
G
B
E
H
C
F
I
B Mr. Gregory Matsake Vice Chairperson
E Mr. Nelson Letshwene Member
H Mr. Kabelo Mohohlo Member
C Ms. Goitseone Kgaodi Treasurer
F Gen. Tebogo C. Masire Member
I Ms. Itumeleng Magama Member
A Ms. Regina Vaka Chairperson
D Prof. John Kiggundu Member
G Mr. Martin Makgatle Member
009
R E A C H I N G G R E AT E R H E I G H T S

MANAGEMENT TEAM
annual report 2015
010

Mr. Thapelo TsheoleChief Executive Officer
Thapelo was appointed CEO of the BSE in January 2016. Prior to that, he was the Deputy CEO since February 2014. Thapelo joined the BSE February 2007 as a Product Development Manager. Thapelo holds a Bachelor of Social Sciences (Single Major Economics) from the University of Botswana and a Master of Commerce (MComm) in Financial Markets from Rhodes University (RSA). Further, he holds a Masters in Business Administration (MBA) from the Graduate School of Business, University of Cape Town (RSA).
Thapelo has also completed several financial markets programmes which include Registered Person Examination (RPE) conducted by South African Institute of Financial Markets (SAIFM) and SAFEX.
Ms. Mpho MogashaFinance and Administration Manager
Ms. Mogasha joined the BSE in 2006 as an Operations Officer – Finance & Admin, a position she held until July 2013, when she was appointed to the role of Acting Finance & Admin Manager. She assumed the role of Finance & Administration Manager in February 2014. Prior to joining the BSE she worked for Motswedi Securities as an Accountant. Before then, she worked for Grunwald Construction as an Assistant Accountant. Mrs. Mogasha graduated with a BA in Accounting from the University of Botswana. She is ACCA qualified and a member of the Botswana Institute of Chartered Accountants (BICA). She is currently pursuing a Management Development Programme with the University of Stellenbosch Business School (RSA).
Ms. Latelang ChakalisaCorporate Affairs Manager
Ms. Chakalisa joined the BSE in June 2009 as a Corporate Affairs Manager. Prior to joining the Botswana Stock Exchange, she was Senior Manager, Securities at Stanbic Bank Botswana Limited. Before then, she worked for the Attorney General’s Chambers as a Senior State Counsel in the Civil Litigation Department. She holds an LLB from the University of Botswana and Post Graduate Diploma Strategic Management from the University of Derby, UK.
R E A C H I N G G R E AT E R H E I G H T S
011

Ms. Lame AkanyangMarket Development Manager
Ms. Akanyang joined BSE in January 2007 as Market Development Manager. Prior to joining the BSE, she held different positions at international institutions such as General Electric and First Star Bank in the USA. She holds a BSBA Economics/Human Resources from Xavier University (USA) and MA in Economics from the University of Cincinnati (USA).
Ms. Masego P. PhetoCentral Securities Depository (CSD) Manager
Ms. Pheto joined BSE in December 2007 as CSD Manager. Prior to joining the BSE she was a Market Risk Manager at Stanbic Bank Botswana. Before then, she worked for Bank of Botswana on different units of the Financial Market Department as a Dealer, Settlement Officer and Portfolio Analyst. She graduated with a BA in Economics from the University of Botswana, and holds a MA in Economics from Stellenbosch University (RSA). She is currently pursuing CIMA.
Mr. Kopano MogorosiInformation Technology Manager
Mr. Mogorosi joined the BSE in January 2008 as a System and Network Administrator. In June 2009, he was redeployed to the role of Database Administrator, a position that he held until October 2011, when he was appointed to the role of Acting IT Manager. He assumed the role of IT Manager in May 2012. Prior to joining the BSE, Mr Mogorosi worked for Rural Industries Promotions Company Botswana (RIPCO) as a Systems Administrator. He has also worked for DCDM Consulting as an Analyst/ Programmer. Mr Mogorosi holds a BSc in Computer Engineering from the University of Miami, FL (USA).
annual report 2015
012

Mr. Tsametse MmolaiListings and Trading Manager
Mr. Mmolai joined BSE in May 2008 as Listings and Trading Operations Officer. Prior to joining BSE, he was the Branch Manager for Metropolitan Life Francistown office. Before then, he worked for BIFM as an Investment Accountant. Mr. Mmolai Tsametse graduated with a BCom (Finance) from Macquarie University in Australia and is an Accredited Member of the Compliance Institute of Southern Africa. He is currently pursuing a Management Development Programme with the University Stellenbosch Business School (RSA).
Mr. Kopano J. BolokweActing Product Development Manager
Mr. Bolokwe joined the BSE in May 2011 as Product Development Operations Officer and was appointed Acting Product Development Manager in February 2016. Prior to joining the BSE, Mr Bolokwe worked for STANLIB as an Investment Analyst and for ImaraCapital Securities as a Private Clients Broker. He holds a Degree in Finance from University of Botswana (UB), he has completed the Chartered Alternative Investment Analyst (CAIA) programme, he is a Chartered Financial Analyst (CFA) Level III candidate and a final year MBA student at University of Botswana. Mr Bolokwe is also a Registered Person (RPE) under the South African Institute of Financial Markets (SAIFM).
R E A C H I N G G R E AT E R H E I G H T S
013
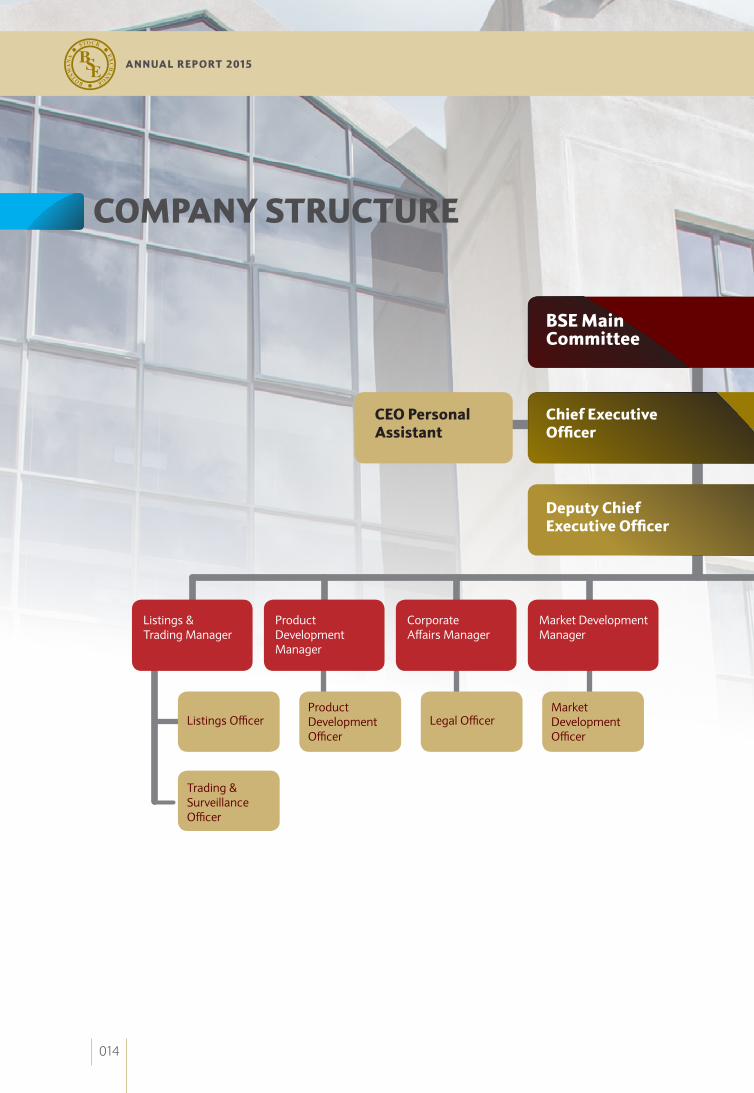
COMPANY STRUCTURE
BSE Main Committee
Chief Executive Officer
Deputy Chief Executive Officer
Listings&TradingManager
ListingsOfficer
Trading&SurveillanceOfficer
ProductDevelopmentOfficer
LegalOfficerMarketDevelopmentOfficer
ProductDevelopmentManager
CorporateAffairsManager
MarketDevelopmentManager
CEO Personal Assistant
annual report 2015
014

Accountant
FinanceOfficer
Receptionist
Messenger/Driver
SystemsAdministrator
CSDClerk
DatabaseAdministrator
CSDOfficer
Finance&AdministrationManager
InformationTechnologyManager
Clearing&SettlementManager
InternalAudit(Outsourced)
NetworkAdministrator
R E A C H I N G G R E AT E R H E I G H T S
015

OUR STAFF
016

R E A C H I N G G R E AT E R H E I G H T S
017

annual report 2015
018

Dear Stakeholder
The theme for this year’s financial and operational report“Reaching Greater Heights” paints a good picture and addsstridestothemomentumgenerated inthepreviousyear. Iamconvincedthattherecouldnothavebeenamorefittingthemeto encapsulate the accolades of 2015 by the Botswana StockExchange(BSE)thanthisone.
The year 2015 was an excellent year for the BSE despite the challenging global environment that was characterised by high levels of volatility in equities markets, a slump in commodities markets and sharp fall in currency values, particularly in Emerging Markets.
At the 19th Annual Conference of African Securities Exchanges Association (ASEA) held in November 2015 in South Africa, it was noted that the volatility in most African equities markets and the accompanying economic slowdown resulted in stock indices of a majority of stock exchanges that are members of ASEA experiencing a decline in value. By any measure, this occurrence is a negative for African markets but it largely reflects the susceptibility of the African continent to developments in more developed economies and to tying its success to markets such as China, which unfortunately delivered lacklustre performance in 2015.
As noted in several reviews and in succeeding sections of this report, Botswana’s economy also reflected the overall commodity-led slowdown in African economies, primarily due to a decline in diamond revenues. Notwithstanding, the BSE’s performance and the investor confidence in the domestic equity market reached greater heights against this backdrop.
The BSE registered a record turnover of P3.0 Bn in 2015, translating into P12.2 Mn worth of shares traded daily. This was an improvement from a turnover of P2.2Bn and an average daily turnover of P8.8 Mn in 2014. In addition, the Domestic Company Index (DCI) more than doubled its growth and ended the year with an appreciation of 11.6% in comparison to 5.0% in 2014. Interestingly, growth in the Exchange was broad- based as Bonds also traded an unprecedented turnover of P858.0 Mn whereas Exchange Traded Funds (ETFs) also performed well, trading the highest yearly turnover of P519.6 Mn. This stellar synopsis is as a result of greater effort from BSE Management and stakeholders, including market participants.
CHAIRPERSON’S STATEMENT
R E A C H I N G G R E AT E R H E I G H T S
019
On the financial front, the BSE delivered excellent financial results, growing the Group’s consolidated revenues by 40.0% to P37.7 Mn (2014: P26.4 Mn), and the after tax profit (prior to subvention) by 149.9% to P11.3 Mn from P4.6 Mn in 2014.
One of the highlights of the year was the commencement of the legislation enabling the Demutualization of the BSE, being the BSE Transition Act which commenced in December 2015. I am pleased that the new journey that the BSE has embarked on is expected to yield greater benefits for the market as a whole once Demutualization has happened. Whilst there, the Regulations to another landmark piece of legislation, the Securities Act, are being drafted by the Attorney General, pursuant to which the Ministry of Finance and Development Planning will issue a Commencement Order. The change in the securities landscape in Botswana arising from the change in the aforementioned Acts will be instrumental in enabling the BSE to offer services and products, conduct business and compete at an international level.
Dur ing the year, we made accomplishments with respect to several initiatives that cemented our position as one of the region’s leading Stock Exchanges. These initiatives include the approval of the New Equity Listing Requirements that will commence on 1 June 2016, the submission of Draft
Market-Making Rules, the listing of the fourth ETF called NewFunds Inflation-Linked Bond Index ETF, the listing of an Africa-focused pure start-up company on the Domestic Venture Capital Board in the name of Afinitas Limited and the announcement of commencement of the Initial Public Offering (IPO) of Botswana Telecommunicat ions Corporat ion Limited (BTCL). Let me highlight the announcement of the commencement of the BTCL IPO as a landmark transaction that has been met with great enthusiasm and excitement by the market. This is the first privatization of a State Owned Entity (SOE) after some years of negotiations and relentless groundwork and we are certain that it brings with it the “economies of knowledge” that can be applied in the future to bring more SOEs to the stock market through privatization.
We recognize the fact that the sustainability of the BSE is underpinned by a more robust and heterogeneous demand side of the market and also by the attractiveness of the Exchange to issuers of securities. Also, we hold in high esteem our commitment to investing in our society. In this respect, we continued to advance our financial literacy programs, promoting a wider reach through several media platforms and we also conceptualised strategies to attract companies to list on the Exchange. In as far as financial literacy is concerned, our commitment to cultivating a much more informed Youth through the Annual High School competition still
CHAIRPERSON’S STATEMENT [ CONTINUED ]for the year ended 31 December 2015
We recognize the fact that the sustainability of the BSE is underpinned by a more robust and heterogeneous demand side of the market and also by the attractiveness of the Exchange to issuers of securities.
020
annual report 2015

persists. The competition ran for the third consecutive year with increased participation by several schools from various parts of Botswana. Similarly, our Corporate Social Investment (CSI) initiatives also continued to touch many lives of Batswana in key areas such as health, education and general welfare. The Exchange continues to maintain its positive growth momentum and grow from strength to strength. This is largely a reflection of immense support from our stakeholders, and I would like to extend my sincere acknowledgement to our stakeholders, our clients, the market participants and our strategic partners for their continued support.
Let me conclude by thanking Mr. Hiran Mendis, the former Chief Executive Officer (CEO), who ended his employment with the BSE on 31st December 2015. Mr. Mendis joined the BSE in 2006 as CEO and we acknowledge the contribution he has made to the organization and to the development of the capital market over the past decade. Mr. Mendis is succeeded by Mr. Thapelo Tsheole who was his Deputy since 2014. I would like to take this opportunity to congratulate Mr. Tsheole on his new appointment as CEO and also wish him well in this new journey as he takes the organization to even greater heights. Let me also thank my colleagues in the BSE Main Committee and the BSE staff for their continued resilience and support.
I would like to close by saying that the next year, the year 2016, is a momentous year for the Republic of Botswana as it celebrates 50 years of Independence, so let us immerse ourselves in strategic success and more accomplishments to add to the country’s growth story. I wish you great success with revamped perspectives in the year ahead.
Regina VakaChairperson
021
R E A C H I N G G R E AT E R H E I G H T S

annual report 2015
022

1. THEME – REACHING GREATER HEIGHTS
Thethemeofthisyear’sAnnualReport,“ReachingGreaterHeights”,is an overarching recognition of a multi-faceted escalation of theperformance of the BSE. In respect of liquidity, we stretched andreachedgreaterheightsandpleasantly thiswasacross theboard–Equities,BondsandETFs.ArecordturnoverofP12.2MnperdayinEquitieswasregisteredin2015.
In 2013, the BSE experienced phenomenal increase in trading activity which culminated in average daily turnover reaching P9.3 Mn from P3.6 Mn in 2012. It was a great achievement and a reflection of the successful implementation of the Automated Trading System (ATS) which was commissioned in August 2012 and it indeed established “new heights” for the BSE.
Despite our excitement with this experience we were alive to the fact that it could be too premature to declare success until we have established a consistent increase in turnover levels as well as sustainability of such high turnover levels as those for 2013.
In 2014, it became imperative that we continue to elevate liquidity in the market, more so that in the same year, the BSE laid the foundation for its transition to a commercial entity through the process of Demutualization.
The theme of this year’s Annual Report, “Reaching Greater Heights”, is an overarching recognition of a multi-faceted escalation of the performance of the BSE. In respect of liquidity, we stretched and reached greater heights and pleasantly this was across the board – Equities, Bonds and ETFs. A
record turnover of P12.2 Mn per day in Equities was registered in 2015.
Despite these levels being the highest ever in the history of the BSE we are positively looking forward to breaking new ground. The approval of the New Equity Listings Requirements will help generate more liquidity in a good way through the change in the public float from 20% to 25% effective June 2017, increasing to 30% in December 2017 for domestic counters. In addition, the coming on board of BTCL in April 2016 will not only add diversity to the bourse but will also enhance heterogeneity in the investor base. It will also generate an impetus for the BSE to provide as many products and services to an expected broader citizen investor base comprising largely of retail investors.
In summation, the outlook for the BSE is very positive. Whilst we progress with Demutualization, we have equally developed strategies that will escalate the performance of the Exchange, create value for our stakeholders, enhance our regulatory competitiveness and make the Exchange a significant global competitor. We do not only strive to be a success, but additionally and more importantly, to be of value.
CHIEF EXECUTIVE OFFICER’S STATEMENT for the year ended 31 December 2015
R E A C H I N G G R E AT E R H E I G H T S
023

Itispleasingtonotethatthereisacontinuingtrendamonglisted companies to expand beyond Botswana. This trendcanbeemulatedbyotherbusinesses inBotswanaseekinggrowthcapitalbylistingontheexchangeinordertosupportregionalexpansionstrategies.
2. ECONOMIC BACKDROP
2.1 Overview of the World Economy
The slowdown and rebalancing of the Chinese economy, lower commodity prices, and strains in some large emerging market economies will continue to weigh on growth prospects in 2016, this is according to the International Monetary Fund’s (IMF) World Economic Outlook update released in January 2016. As a result, global growth is forecast to rise moderately from 3.1% in 2015 to 3.4% in 2016.
According to IMF, growth in advanced economies is projected to be 2.1% in 2016 which is an appreciation from a 1.9% growth estimate for 2015. Overall activity remains resilient in the United States, while Japan is also expected to firm in 2016 on the back of fiscal support, low oil prices, accommodative financial conditions and rising income.
Growth in emerging markets and developing economies is projected to increase from 4% in 2015 to 4.3% in 2016. The slow rate of growth is mainly attributed to the slowdown in China as the economy continues to rebalance.
Given that economies are to a large extent integrated, the weak global economic prospects have impacted negatively on the performance of sub-Saharan Africa, including Botswana. Consequently, growth in sub-Saharan Africa is expected to have declined to 3.5% in 2015, from 5.0% in 2014, reflecting the declining commodity prices, higher borrowing costs and increasing financial markets volatility. The IMF expects a slow pickup in growth in sub-Saharan Africa as these factors continue to weigh heavily on some of the region’s largest economies as well as a number of smaller commodity exporters.
2.2 Overview of the Botswana Economy
The continued slowdown in the major markets for Botswana’s diamonds has had profound impact on the domestic economy. The latest economic estimates from Statistics Botswana indicate that the domestic economy declined by 3.5% in the third quarter of 2015. As a result, the growth estimate for 2015 has been revised downwards from 2.6% to 1.0%. This compares to the growth rate of 3.2% recorded in 2014. Contributing to the slow growth in the domestic economy in 2015 was the Mining sector, which
declined by 14.0% in 2015 due to the reduction of diamond production. Water and Electricity sector also registered a decline of 104% due to continued water and electricity supply challenges. Growth in other non-mining sectors was also estimated to have slowed down during the year, reflecting the effect of the water and electricity shortages on domestic economic activities.
Inflation was fairly stable in 2015, having declined from 3.6% in January 2015 to 3.1% in December 2015. This was largely due to the suppressed global oil prices and benign inflation pass-through from Botswana’s major trading partners. Throughout the year, inflation was around the 3.0% mark. On the back of a stable inflation outlook, the Bank of Botswana (BoB) continued to maintain an accommodative monetary policy stance and adjusted the Bank Rate downward by a cumulative 150 basis points from 7.5% to 6.0% in 2015. Consequently, commercial bank credit expanded by 8.2% from P44.9 billion in November 2014 to P48.6 billion in November 2015, which was supportive to the non-mining sector.
CHIEF EXECUTIVE OFFICER’S STATEMENT [ CONTINUED ]for the year ended 31 December 2015
024
annual report 2015
The 2016 Budget Speech highlighted that the economy faces challenges emanating from lower external demand caused by the continued weak recovery of the global economy due to low commodity prices and persisting electricity and water shortages.
N o t w i t h s t a n d i n g , Government expects economic growth to hasten from the estimated 1.0% during 2015 to a projected 4.2% growth in 2016. With the woes of the diamond sector expected to continue in the short to medium term, Government has launched the Economic Stimulus Package (ESP) with a bid to diversify and boost economic growth while spurring job creation. Further, Botswana’s macroeconomic fundamentals remain desirable. The country has low debt levels as confirmed by external organisations such as Moody’s Investors Service (which reaffirmed Botswana’s A2 rating in December 2015, with a stable outlook) indicating that prudent economic management still persists. These provide a positive basis to attracting foreign investment into the country. These, undoubtedly, are the pillars for sustainable development of the domestic capital market as noted in past reviews.
2.3 Implications for Domestic Capital Market
It has been documented in past economic reviews that Botswana’s prudent approach to fiscal policy management has helped cushion the economy from severe external shocks over the years. In turn, the impact of the domestic economic slowdown has not been severe on the domestic private
sector. The continued deepening of the capital market is equally vital to support Government and private institutions during times of fiscal pressures. Despite the declining economic growth, the prevailing economic environment still bodes well for the private sector given the accommodative monetary policy and the stimulatory policies put in place to alleviate adverse economic impact. Further, the growth in the efficiencies of the BSE, both in respect of infrastructure and regulation, are some of the factors that will help breathe life into the domestic economy as companies turn to the stock market to raise growth capital.
The year 2015 was a historic year for the domestic capital market. The long awaited privatization of Botswana Telecommunicat ion Corporat ion Limited (BTCL) finally commenced, and the Initial Public Offering (IPO) was launched in December 2015 and opened on 11 January 2016. The IPO process, which ensures that BTCL shares are offered to citizens will contribute towards citizen economic empowerment and will enhance the financial inclusion of Batswana. This milestone event will have far reaching results on the growth of the bourse and the capital market. The listing of BTCL is expected to be finalised in April 2016.
In light of the slow pace of privatization of Government-owned entities, the BSE has also taken it upon itself to attract listings. In this regard, the BSE began the preparations to host the Inaugural BSE Listings Conference scheduled for 10 March 2016. The event will bring together the BSE listed companies to share lessons and experiences with the
private unlisted businesses as to how they utilised a listing to create value and grow beyond borders. It is also an opportunity for the BSE to create relationships with companies that can potentially list in the short, medium to long term.
Under the current economic climate, it is important for businesses to diversify across geographies. In that sense, Botswana businesses need to begin to look for growth opportunities across the region. It is pleasing to note that there is a continuing trend among listed companies to expand beyond Botswana. This trend can be emulated by other businesses in Botswana seeking growth capital by listing on the exchange in order to support regional expansion strategies.
025
R E A C H I N G G R E AT E R H E I G H T S
FCI FRSI
2014 1,577.6 729.2
2015 1,572.4 726.3
Source:BSE
0.0
200.0
400.0
600.0
Inde
x Le
vel (
Poin
ts)
1,000.0
800.0
1,200.0
1,400.0
1,600.0
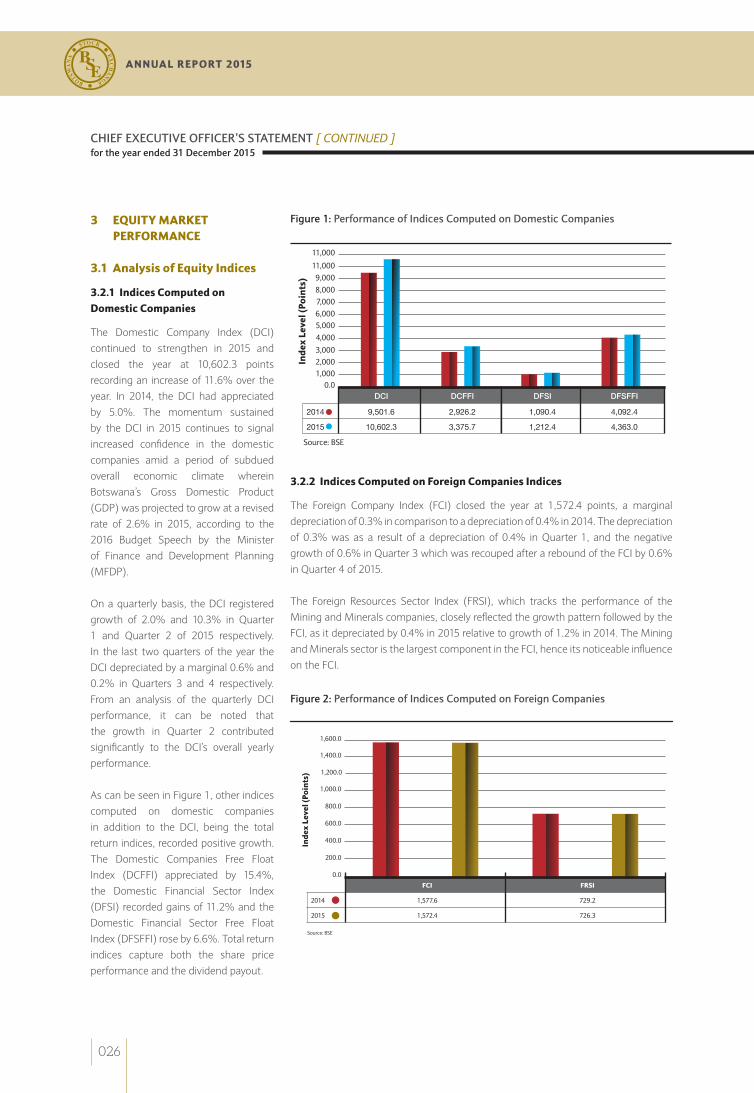
Figure 2: Performance of Indices Computed on Foreign Companies
3 EQUITY MARKET PERFORMANCE
3.1 Analysis of Equity Indices 3.2.1 Indices Computed on Domestic Companies
The Domestic Company Index (DCI) continued to strengthen in 2015 and closed the year at 10,602.3 points recording an increase of 11.6% over the year. In 2014, the DCI had appreciated by 5.0%. The momentum sustained by the DCI in 2015 continues to signal increased confidence in the domestic companies amid a period of subdued overall economic climate wherein Botswana’s Gross Domestic Product (GDP) was projected to grow at a revised rate of 2.6% in 2015, according to the 2016 Budget Speech by the Minister of Finance and Development Planning (MFDP).
On a quarterly basis, the DCI registered growth of 2.0% and 10.3% in Quarter 1 and Quarter 2 of 2015 respectively. In the last two quarters of the year the DCI depreciated by a marginal 0.6% and 0.2% in Quarters 3 and 4 respectively. From an analysis of the quarterly DCI performance, it can be noted that the growth in Quarter 2 contributed significantly to the DCI’s overall yearly performance.
As can be seen in Figure 1, other indices computed on domestic companies in addition to the DCI, being the total return indices, recorded positive growth. The Domestic Companies Free Float Index (DCFFI) appreciated by 15.4%, the Domestic Financial Sector Index (DFSI) recorded gains of 11.2% and the Domestic Financial Sector Free Float Index (DFSFFI) rose by 6.6%. Total return indices capture both the share price performance and the dividend payout.
3.2.2 Indices Computed on Foreign Companies Indices
The Foreign Company Index (FCI) closed the year at 1,572.4 points, a marginal depreciation of 0.3% in comparison to a depreciation of 0.4% in 2014. The depreciation of 0.3% was as a result of a depreciation of 0.4% in Quarter 1, and the negative growth of 0.6% in Quarter 3 which was recouped after a rebound of the FCI by 0.6% in Quarter 4 of 2015.
The Foreign Resources Sector Index (FRSI), which tracks the performance of the Mining and Minerals companies, closely reflected the growth pattern followed by the FCI, as it depreciated by 0.4% in 2015 relative to growth of 1.2% in 2014. The Mining and Minerals sector is the largest component in the FCI, hence its noticeable influence on the FCI.
DCI DCFFI DFSI DFSFFI
2014 9,501.6 2,926.2 1,090.4 4,092.4
2015 10,602.3 3,375.7 1,212.4 4,363.0
0.01,0002,0003,000
Inde
x Le
vel (
Poin
ts)
5,0004,000
6,0007,0008,0009,000
11,000
11,000
Figure 1: Performance of Indices Computed on Domestic Companies
Source:BSE
CHIEF EXECUTIVE OFFICER’S STATEMENT [ CONTINUED ]for the year ended 31 December 2015
026
annual report 2015

Source:BSE
LASI LASFFI
2014 781.0 2,575.3
2015 797.3 2,979.5
Financial Services & Insurance
Retail & Wholesaling
Property & Property Trust
Banking SecurityServices
Tourism Energy FuneralServices
2014 1.8 5.4 0.8 (3.6) 0.1 0.2 0.4 (0.0)
2015 5.3 4.2 3.8 (2.3) (0.0) 1.9 (0.5) (0.8)
(4.0)
(3.0)
(2.0)
(1.0)
Sect
or C
ontr
ibut
ion
(%)
1.0
0.0
2.0
4.0
3.0
5.0
6.0
Figure 4: Sector Contributions to Performance of the DCI
Source:BSE
3.2.3 Indices Computed on Local Asset Sector Companies
The Local Asset Status Index (LASI) and the Local Asset Status Free Float Index (LASFFI) are total return indices comprising all domestic and foreign companies that have been awarded local asset status. The difference between the performances of the 2 indices is solely explained by the weighting methodology. In 2015, both the LASI and LASFFI recorded positive growth of 2.1% and 15.7% respectively, compared to an annual appreciation of 2.7% and 11.2% in 2014.
3.2.4 Sector Contributions to Performance of the DCI
An analysis of sector contributions to the performance of the DCI is presented in Figure 4. The DCI’s growth of 11.6% in 2015 can be attributed to the positive performance of the Financial Services & Insurance sector, Retail & Wholesaling, Property & Trust as well as the Tourism sectors. These four sectors contributed 15.2 percentage points to the appreciation of the DCI and the balance of negative 3.7 percentage points came from the Banking, Security Services, Energy and Funeral Services sectors.
0.0
500.0
1,000.0
1,500.0
Inde
x Le
vel (
Poin
ts)
2,500.0
2,000.0
3,000.0
3,500.0
Figure 3: Performance of Indices Computed on Local Asset Companies
027
R E A C H I N G G R E AT E R H E I G H T S

It is good to note that the degree of influence by the Banking sector on the DCI has dissipated over the years, primarily due to the emergence and strengthening of other sectors, particularly the Retail & Wholesaling sector. The listing of Choppies Enterprises in 2012 has made the entity the biggest component by market capitalisation within the Retail & Wholesaling sector and as at 31 December 2015, the sector was the second largest after the Banking sector, followed by the Financial Services & Insurance sector and the Property & Trust sector. In the past the DCI was known to be heavily influenced by the Banking sector and this arose as a result of limited sectoral diversity within the bourse. The contribution to the DCI by more sectors than one is good and demonstrates broader representation by all companies listed on the Exchange.
Figure 5 below shows the sector contribution to performance of the FCI and it underscores the dominance of the Mining & Minerals sector on the Foreign Equity Board. This sector, which accounted for 95.1% of the foreign companies’ market capitalisation in 2015 almost solely accounted for the overall performance of the FCI. In 2015, the sector contributed a negative 0.42% and outweighed the Financial Services sector’s contribution on the FCI of a positive 0.09%, resulting in the FCI depreciating by 0.3%.
3.3 Liquidity and Stability of Turnover
Figure 6 gives a five year review of turnover on the BSE. The BSE registered a record turnover of P3.0 Bn in 2015 in comparison to P2.2 Bn in 2014. This amount is the highest ever recorded since the inception of the BSE in 1989. The average daily turnover for 2015 amounted to P12.2 Mn relative to P8.8 Mn per day in 2014.
The volume of shares traded in 2015 was 803.1 Mn shares in comparison to 591.6 Mn shares in 2014 and it also represents the highest number of shares ever traded in any given year since the inception of the BSE.
(0.5)
(0.4)
(0.3)
IND
EX L
EVEL
(PO
INTS
)
(0.1)
(0.2)
-
0.1
0.2
Figure 5: Performance of Indices Computed on Foreign Companies
Source:BSE
Financial Services & Insurance Mining & Minerals
2014 0.0 (0.4)
2015 0.0 (0.4)
CHIEF EXECUTIVE OFFICER’S STATEMENT [ CONTINUED ]for the year ended 31 December 2015
028
annual report 2015
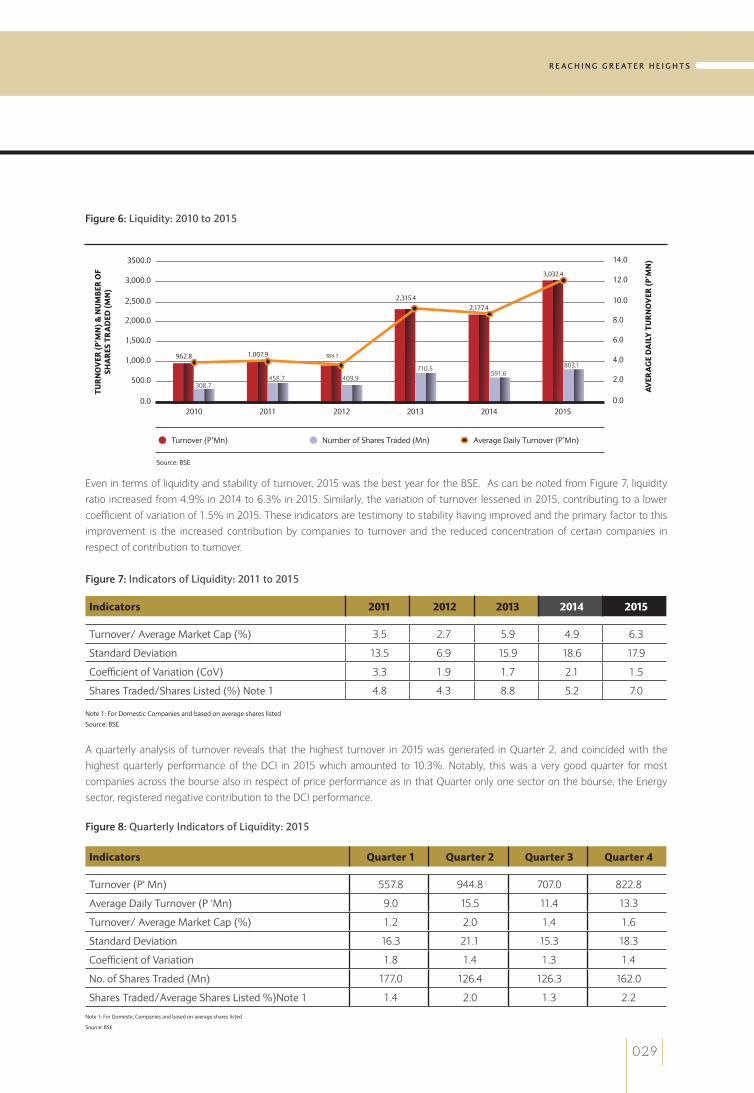
Even in terms of liquidity and stability of turnover, 2015 was the best year for the BSE. As can be noted from Figure 7, liquidity ratio increased from 4.9% in 2014 to 6.3% in 2015. Similarly, the variation of turnover lessened in 2015, contributing to a lower coefficient of variation of 1.5% in 2015. These indicators are testimony to stability having improved and the primary factor to this improvement is the increased contribution by companies to turnover and the reduced concentration of certain companies in respect of contribution to turnover.
Figure 7: Indicators of Liquidity: 2011 to 2015
Indicators 2011 2012 2013 2014 2015
Turnover/AverageMarketCap(%) 3.5 2.7 5.9 4.9 6.3
StandardDeviation 13.5 6.9 15.9 18.6 17.9
CoefficientofVariation(CoV) 3.3 1.9 1.7 2.1 1.5
SharesTraded/SharesListed(%)Note1 4.8 4.3 8.8 5.2 7.0
Note1:ForDomesticCompaniesandbasedonaverageshareslisted
Source:BSE
A quarterly analysis of turnover reveals that the highest turnover in 2015 was generated in Quarter 2, and coincided with the highest quarterly performance of the DCI in 2015 which amounted to 10.3%. Notably, this was a very good quarter for most companies across the bourse also in respect of price performance as in that Quarter only one sector on the bourse, the Energy sector, registered negative contribution to the DCI performance.
Figure 8: Quarterly Indicators of Liquidity: 2015
Indicators Quarter 1 Quarter 2 Quarter 3 Quarter 4
Turnover(P'Mn) 557.8 944.8 707.0 822.8
AverageDailyTurnover(P'Mn) 9.0 15.5 11.4 13.3
Turnover/AverageMarketCap(%) 1.2 2.0 1.4 1.6
StandardDeviation 16.3 21.1 15.3 18.3
CoefficientofVariation 1.8 1.4 1.3 1.4
No.ofSharesTraded(Mn) 177.0 126.4 126.3 162.0
SharesTraded/AverageSharesListed%)Note1 1.4 2.0 1.3 2.2
Note1:ForDomesticCompaniesandbasedonaverageshareslisted
Source:BSE
0.0
Turnover(P’Mn) NumberofSharesTraded(Mn) AverageDailyTurnover(P’Mn)
0.02010
962.8
2012
894.7
2014
2,177.4
2011
1,007.9
2013
2,315.4
2015
3,032.4
803.1591.6
710.5409.9458.7
308.7500.0 2.0
1,000.0 4.0
TUR
NO
VER
(P’M
N) &
NU
MB
ER O
F SH
AR
ES T
RA
DED
(MN
)
AVER
AG
E D
AIL
Y T
UR
NO
VER
(P’M
N)
1,500.0 6.0
2,000.0 8.0
2,500.0 10.0
3,000.0 12.0
3500.0 14.0
Figure 6: Liquidity: 2010 to 2015
Source:BSE
029
R E A C H I N G G R E AT E R H E I G H T S

The Lorenz Curve analysis presented in Figure 9 provides insight into the stability of turnover for the years 2012 through to 2015. Based on the illustration from Chart A of Figure 9, the Lorenz Curve provides further support to the conclusion that turnover was highly stable in 2015 in comparison to the other years. This can be deduced from the relative closeness of the average daily turnover for 2015 to the line of zero dispersion.
An analysis of the distribution of turnover contributed by companies
as depicted in Chart B of Figure 9 also supports the deduction that turnover distribution was more evenly distributed in 2015 in comparison to the other years. This is indeed a welcome development as it indicates that more companies have been comparatively liquid in 2015 and that concentration or dominance of a few stocks has lessened. In 2014, the observation was very marginal and it is good to witness an improving positive trend of the manner in which investments are broad based across the bourse. This improvement is also in line with the observed increase in the
liquidity ratio which rose significantly from 4.9% in 2014 to 6.3% in 2015.
The contribution to increased turnover and stability of turnover can be mainly attributed to the introduction of the Automated Trading System (ATS) in 2012. The ATS has helped to broaden the BSE’s market reach and improve efficiencies in the trading of securities. However, other initiatives also contributed to the increase in turnover, e.g. introduction of new products and marketing activities.
Cumulative % of Number of Companies
- 10 20 30 40 50 60 70 80 90 100
LineofZeroDispersion 2012 2013 2014 2015
0
0
10
10
30
30
20
20
Cum
ulat
ive
Freq
uenc
y of
Tur
nove
r (%
)C
umul
ativ
e %
of T
urno
ver
(%)
Cumulative Turnover (%)
60
60
40
40
50
50
70
70
80
80
100
100
20- 6040 80 100
90
90
Figure 9: Analysis of the Stability of Turnover using the Lorenz Curve
LineofZeroDispersion 2012 2013 2014 2015
Chart A: Cumulative % Frequency of turnover: 2012 - 2015
Chart B: Cumulative % Contribution to Turnover by Companies: 2012 - 2015
3.4 Trends in Turnover
Figure 10 presents an analysis of the medium term trend forecasts for the turnover recorded in 2015. This is to indicate the impact the actual turnover of P12.2 Mn has had on the turnover trend.
Based on Chart A of Figure 10, the medium term trend computed using the average daily turnover for the period 2005 to 2014 would have forecasted an average daily turnover of P10.2 Mn in 2015 whereas the medium term trend computed using figures for the period 2005 to 2015 would have predicted an average daily turnover of P10.5 Mn. Both forecasts are below the actual average daily turnover for 2015 but are above the actual average daily turnover for 2014, and this goes to show that the actual average daily turnover of P12.2 Mn achieved in 2015 had a positive upward impact on the medium term trend.
CHIEF EXECUTIVE OFFICER’S STATEMENT [ CONTINUED ]for the year ended 31 December 2015
030
annual report 2015
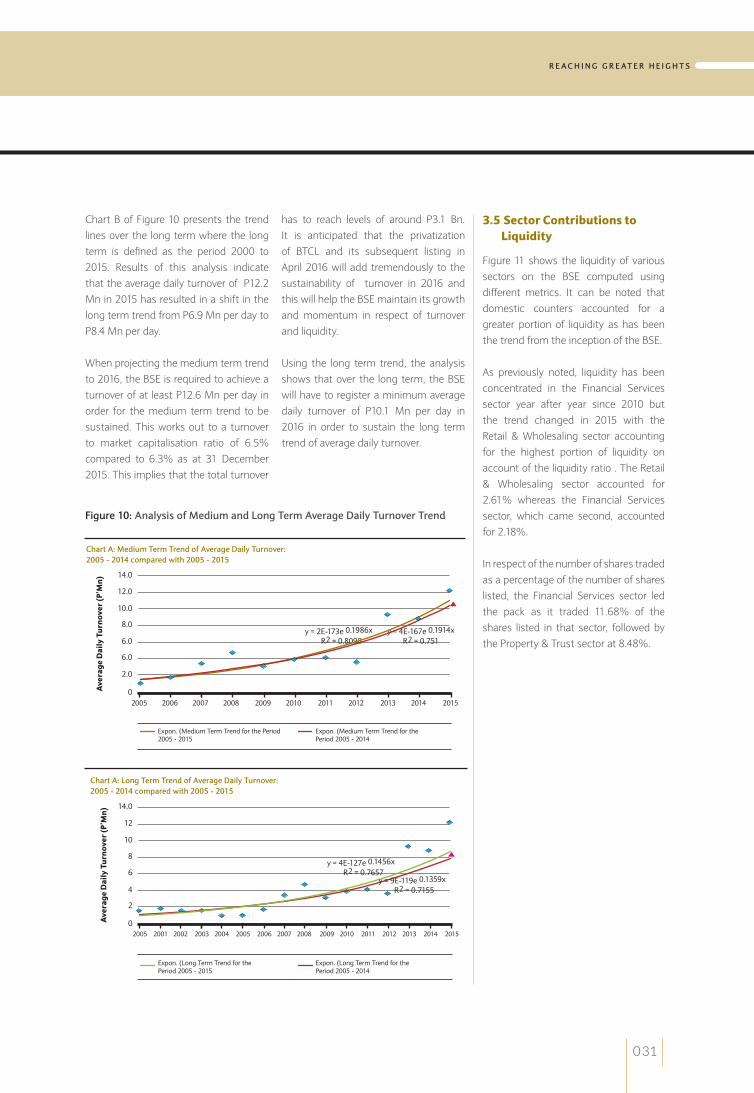
Chart B of Figure 10 presents the trend lines over the long term where the long term is defined as the period 2000 to 2015. Results of this analysis indicate that the average daily turnover of P12.2 Mn in 2015 has resulted in a shift in the long term trend from P6.9 Mn per day to P8.4 Mn per day.
When projecting the medium term trend to 2016, the BSE is required to achieve a turnover of at least P12.6 Mn per day in order for the medium term trend to be sustained. This works out to a turnover to market capitalisation ratio of 6.5% compared to 6.3% as at 31 December 2015. This implies that the total turnover
has to reach levels of around P3.1 Bn. It is anticipated that the privatization of BTCL and its subsequent listing in April 2016 will add tremendously to the sustainability of turnover in 2016 and this will help the BSE maintain its growth and momentum in respect of turnover and liquidity.
Using the long term trend, the analysis shows that over the long term, the BSE will have to register a minimum average daily turnover of P10.1 Mn per day in 2016 in order to sustain the long term trend of average daily turnover.
0
2.0
6.0
Ave
rage
Dai
ly T
urno
ver
(P’M
n)
8.0
6.0
10.0
12.0
14.0
y=2E-173e0.1986xR2=0.8098
y=4E-167e0.1914xR2=0.751
2005 2006 2007 2008 2009 2010 2011 2012 2013 2014 2015
Expon.(MediumTermTrendforthePeriod2005-2015
Expon.(MediumTermTrendforthePeriod2005-2014
Chart A: Medium Term Trend of Average Daily Turnover: 2005 - 2014 compared with 2005 - 2015
0
2
4
Ave
rage
Dai
ly T
urno
ver
(P’M
n)
8
6
10
12
14.0
y=4E-127e0.1456xR2=0.7657
2005 2001 2002 2003 2004 2005 2006 2007 2008 2009 2010 2011 2012 2013 2014 2015
Expon.(LongTermTrendforthePeriod2005-2015
Expon.(LongTermTrendforthePeriod2005-2014
Chart A: Long Term Trend of Average Daily Turnover: 2005 - 2014 compared with 2005 - 2015
y=9E-119e0.1359xR2=0.7155
Figure 10: Analysis of Medium and Long Term Average Daily Turnover Trend
3.5 Sector Contributions to Liquidity
Figure 11 shows the liquidity of various sectors on the BSE computed using different metrics. It can be noted that domestic counters accounted for a greater portion of liquidity as has been the trend from the inception of the BSE.
As previously noted, liquidity has been concentrated in the Financial Services sector year after year since 2010 but the trend changed in 2015 with the Retail & Wholesaling sector accounting for the highest portion of liquidity on account of the liquidity ratio . The Retail & Wholesaling sector accounted for 2.61% whereas the Financial Services sector, which came second, accounted for 2.18%.
In respect of the number of shares traded as a percentage of the number of shares listed, the Financial Services sector led the pack as it traded 11.68% of the shares listed in that sector, followed by the Property & Trust sector at 8.48%.
031
R E A C H I N G G R E AT E R H E I G H T S

It is worth noting that the dominance of certain liquid stocks continues to reduce over the years, particularly that of Letshego. In 2014, Letshego accounted for 45.9% of overall volume of shares traded in domestic companies but this reduced to 34.4% in 2015. This can be attributed to the improving liquidity in other stocks on the bourse that has resulted in increased trades in such stocks.
As an example, Choppies, whose significance in terms of the number of shares traded was much more noticeable in 2015 as it accounted for 15.4% of total volume from 12.2% of total volume in
2014. RDC Properties’s share of total volume has shot from 1.3% in 2014 to 10.0% in 2015, and that of Sefalana has risen from 2.3% in 2014 to 3.8% in 2015, amongst other stocks. This kind of spread is important for stability of turnover as already mentioned.
The pending implementation of Market-Making, whose rules are before the Non-Bank Financial Institutions Regulatory Authority (NBFIRA) for approval, will help to further promote liquidity across several stocks.
3.6 Investor Contribution to Equity Turnover
Unlike in 2014 when trading activity was dominated by foreign institutional investors (foreign companies), local institutional investors (local companies) took the lead in 2015 as can be noted from Figure 12. Trades by local companies accounted for 61.6% of the total turnover whereas foreign companies contributed 33.8% to total turnover in 2015. Foreign individuals registered an increase from 1.5% to 2.0% between 2014 and 2015 whereas local individuals recorded a decline of 1.3 percentage points over the same period to account for 2.4% of turnover in 2015.
Figure 11: Sector Contributions to Liquidity: 2014 and 2015
2014 2015
Sector Turnover/Avg Market Cap (%)
Shares Traded
(Mn)
Shares Traded/
Avg Shares
Listed (%)
Turnover/Avg Market Cap (%)
Shares Traded
Shares Traded/
Avg Shares
Listed (%)
Note 1 Note 2A Note 1 Note 2B Note 1 Note 2A Note 1 Note 2B
DOMESTIC
FinancialServ. 1.91 0.20 287.43 11.44 2.18 0.23 306.98 11.68
Retail 1.49 0.16 98.65 4.60 2.61 0.28 168.85 7.59
Property 0.44 0.05 99.93 5.38 0.51 0.05 162.98 8.48
Banking 0.86 0.09 77.27 1.95 0.99 0.11 99.01 2.58
SecurityServ. 0.01 0.00 1.28 1.60 0.01 0.00 1.66 2.07
Tourism 0.06 0.01 9.27 1.84 0.18 0.02 24.91 4.93
Energy 0.03 0.00 1.46 0.91 0.05 0.00 2.43 1.52
FuneralServ. 0.01 0.00 1.53 1.26 0.03 0.00 4.57 7.56
FOREIGN
FinancialServ. 0.00 0.00 0.00 0.00 0.00 0.00 0.00 0.00
Mining 0.01 0.01 14.83 0.26 0.03 0.02 31.70 0.60
Note 1: Computed separately for the domestic & foreign board.
Note 2A: Computed for all shares listed on the BSE
Note 2B: Computed for separately for each sector
CHIEF EXECUTIVE OFFICER’S STATEMENT [ CONTINUED ]for the year ended 31 December 2015
032
annual report 2015
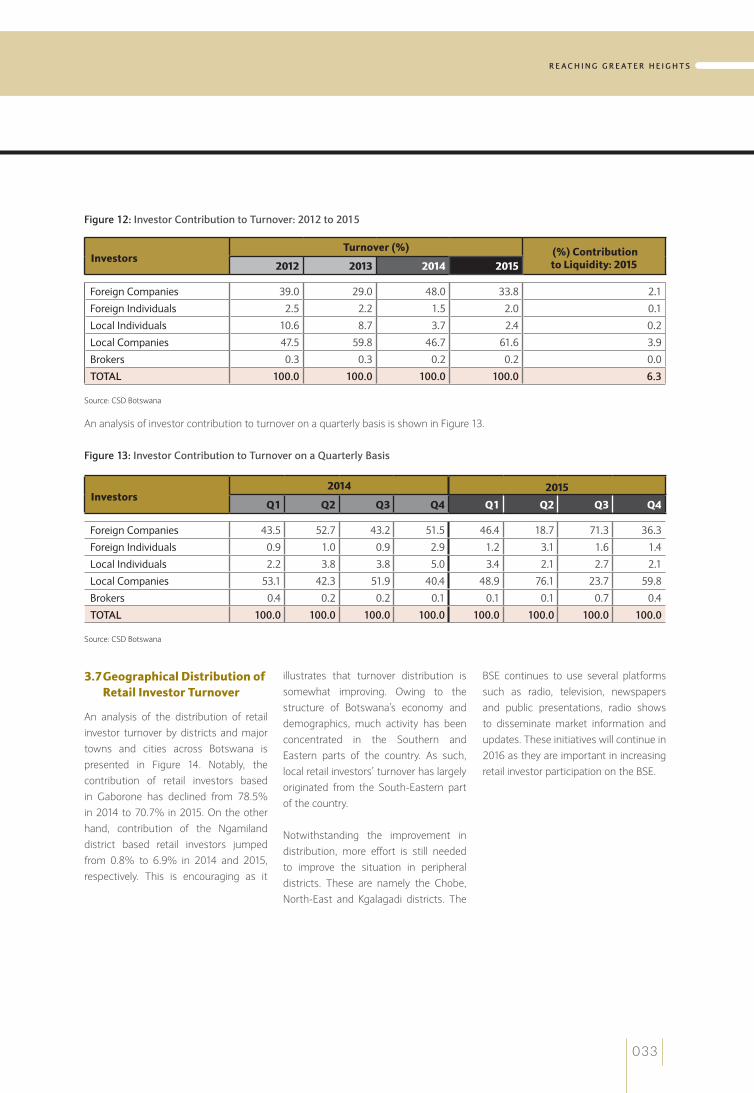
3.7 Geographical Distribution of Retail Investor Turnover
An analysis of the distribution of retail investor turnover by districts and major towns and cities across Botswana is presented in Figure 14. Notably, the contribution of retail investors based in Gaborone has declined from 78.5% in 2014 to 70.7% in 2015. On the other hand, contribution of the Ngamiland district based retail investors jumped from 0.8% to 6.9% in 2014 and 2015, respectively. This is encouraging as it
illustrates that turnover distribution is somewhat improving. Owing to the structure of Botswana’s economy and demographics, much activity has been concentrated in the Southern and Eastern parts of the country. As such, local retail investors’ turnover has largely originated from the South-Eastern part of the country.
Notwithstanding the improvement in distribution, more effort is still needed to improve the situation in peripheral districts. These are namely the Chobe, North-East and Kgalagadi districts. The
BSE continues to use several platforms such as radio, television, newspapers and public presentations, radio shows to disseminate market information and updates. These initiatives will continue in 2016 as they are important in increasing retail investor participation on the BSE.
Figure 12: Investor Contribution to Turnover: 2012 to 2015
Investors Turnover (%) (%) Contribution
to Liquidity: 20152012 2013 2014 2015
ForeignCompanies 39.0 29.0 48.0 33.8 2.1
ForeignIndividuals 2.5 2.2 1.5 2.0 0.1
LocalIndividuals 10.6 8.7 3.7 2.4 0.2
LocalCompanies 47.5 59.8 46.7 61.6 3.9
Brokers 0.3 0.3 0.2 0.2 0.0
TOTAL 100.0 100.0 100.0 100.0 6.3
Source: CSD Botswana
An analysis of investor contribution to turnover on a quarterly basis is shown in Figure 13.
Figure 13: Investor Contribution to Turnover on a Quarterly Basis
Investors 2014 2015
Q1 Q2 Q3 Q4 Q1 Q2 Q3 Q4
ForeignCompanies 43.5 52.7 43.2 51.5 46.4 18.7 71.3 36.3
ForeignIndividuals 0.9 1.0 0.9 2.9 1.2 3.1 1.6 1.4
LocalIndividuals 2.2 3.8 3.8 5.0 3.4 2.1 2.7 2.1
LocalCompanies 53.1 42.3 51.9 40.4 48.9 76.1 23.7 59.8
Brokers 0.4 0.2 0.2 0.1 0.1 0.1 0.7 0.4
TOTAL 100.0 100.0 100.0 100.0 100.0 100.0 100.0 100.0
Source: CSD Botswana
033
R E A C H I N G G R E AT E R H E I G H T S

Figure 14: Retail Investor (Resident in Botswana) Contribution to Turnover by Districts in Botswana: 2014 and 2015
NGAMILAND: 6.9% (0.8%)
KGALAGADI: 0.2% (1.1%)
CHOBE: 0.0% (0.1%)
NORTH-EAST: 0.3% (0.2%)
SELIBE-PHIKWE: 4.2% (3.9%)
FRANCISTOWN: 2.7% (2.1%)
CENTRAL: 4.1% (3.3%)
GHANZI: 1.7% (0.1%)
KWENENG: 2.6% (2.5%)
KGATLENG: 2.5% (4.2%)
GABORONE: 70.7% (78.5%)
SOUTH EAST: 3.1% (2.1%)
SOUTHERN: 1.1% (1.2%)
* FigureS in parentheSiS are For 2014
4. THE EXCHANGE TRADED FUNDS (ETFs) MARKET
4.1 ETFs Landscape on the BSE
Whilst it has been noted that the year 2015 was a great year for equities, it also was a year of reckon for ETFs on the BSE. Looking back to 2010, the BSE was the first stock exchange to introduce ETFs outside of the Johannesburg Stock Exchange (JSE), with the introduction of the NewGold ETF in July 2010. In May 2011, the BSE set the pace again by dual listing the BettaBetta ETF which is primarily listed on the JSE. The NewPlat ETF followed in August 2014.
Continuing on this development, and with a view of promoting liquidity and diversifying the product base, the BSE, in conjunction with Absa Capital of South Africa, listed the NewFunds Inflation Linked Bond Index (ILBI) ETF on 18 November 2015. The ETF was primarily listed on the JSE in January 2012. NewFunds ILBI ETF tracks the performance of South African Government Inflation Linked Bond benchmark index. The South African Government Inflation-Linked Bonds Index is a total return index comprising bonds issued by the South African government that are linked to the Consumer Price Index (CPI) of South Africa. This ETF is the fourth to be listed on the BSE.
Since the first ETF was listed in July 2010, the total cumulative turnover in ETFs amounted to P1.1 Bn as at 31 December 2015. This represents value creation by excess capital in the local market which in most cases struggles to find investible assets. This also gives an indication of the economic activity generated by these dual listed securities and their economic contribution to diversification of the capital market. As one of our strategic initiatives, the BSE will continue to leverage on Botswana’s competitive advantages such as liberal exchange controls to pursue initiatives to dual list ETFs and global securities on the BSE and to endeavour to position the BSE as an attractive investment destination to domestic and international investors.
CHIEF EXECUTIVE OFFICER’S STATEMENT [ CONTINUED ]for the year ended 31 December 2015
034
annual report 2015
* FigureS in parentheSiS are For 2014
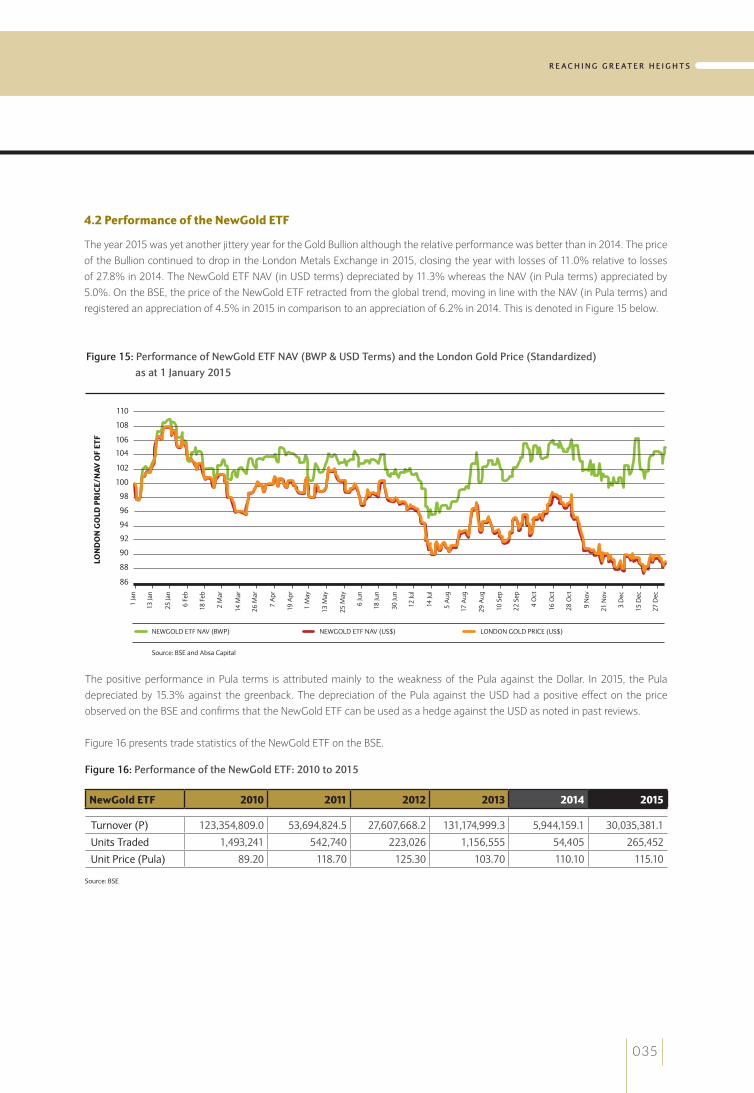
4.2 Performance of the NewGold ETF
The year 2015 was yet another jittery year for the Gold Bullion although the relative performance was better than in 2014. The price of the Bullion continued to drop in the London Metals Exchange in 2015, closing the year with losses of 11.0% relative to losses of 27.8% in 2014. The NewGold ETF NAV (in USD terms) depreciated by 11.3% whereas the NAV (in Pula terms) appreciated by 5.0%. On the BSE, the price of the NewGold ETF retracted from the global trend, moving in line with the NAV (in Pula terms) and registered an appreciation of 4.5% in 2015 in comparison to an appreciation of 6.2% in 2014. This is denoted in Figure 15 below.
Figure 15: Performance of NewGold ETF NAV (BWP & USD Terms) and the London Gold Price (Standardized) as at 1 January 2015
86
88
90
LON
DO
N G
OLD
PR
ICE/
NAV
OF
ETF
94
92
96
98
102
104
106
108
110
100
NEWGOLDETFNAV(BWP)
Source:BSEandAbsaCapital
NEWGOLDETFNAV(US$) LONDONGOLDPRICE(US$)
1Ja
n
13Ja
n
25Ja
n
6Fe
b
18F
eb
2M
ar
14M
ar
26M
ar
7A
pr
19A
pr
1M
ay
13M
ay
25M
ay
6Ju
n
18Ju
n
30Ju
n
12Ju
l
14Ju
l
5A
ug
17A
ug
29A
ug
10S
ep
22S
ep
4O
ct
16O
ct
28O
ct
9N
ov
21N
ov
3D
ec
15D
ec
27D
ec
The positive performance in Pula terms is attributed mainly to the weakness of the Pula against the Dollar. In 2015, the Pula depreciated by 15.3% against the greenback. The depreciation of the Pula against the USD had a positive effect on the price observed on the BSE and confirms that the NewGold ETF can be used as a hedge against the USD as noted in past reviews.
Figure 16 presents trade statistics of the NewGold ETF on the BSE.
Figure 16: Performance of the NewGold ETF: 2010 to 2015
NewGold ETF 2010 2011 2012 2013 2014 2015
Turnover(P) 123,354,809.0 53,694,824.5 27,607,668.2 131,174,999.3 5,944,159.1 30,035,381.1
UnitsTraded 1,493,241 542,740 223,026 1,156,555 54,405 265,452
UnitPrice(Pula) 89.20 118.70 125.30 103.70 110.10 115.10
Source:BSE
035
R E A C H I N G G R E AT E R H E I G H T S

Figure 18: London Gold Price and NAV (in USD Terms): 2015
Figure 17 presents a bar chart of the quarterly trade statistics of the NewGold ETF on the BSE.
Figure 17: Quarterly Performance of the NewGold ETF: 2015
86
88
90LON
DO
N G
OLD
PR
ICE/
NAV
OF
ETF
94
92
96
98
102
104
106
108
110
100
NEWGOLDETFNAV(US$)
Source:BSEandAbsaCapital
LONDONGOLDPRICE(US$)
Correlation:100.0%
1Ja
n
13Ja
n
25Ja
n
6Fe
b
18F
eb
2M
ar
14M
ar
26M
ar
7A
pr
19A
pr
1M
ay
13M
ay
25M
ay
6Ju
n
18Ju
n
30Ju
n
12Ju
l
14Ju
l
5A
ug
17A
ug
29A
ug
10S
ep
22S
ep
4O
ct
16O
ct
28O
ct
9N
ov
21N
ov
3D
ec
15D
ec
27D
ec
Quarter 1 Quarter 2 Quarter 3 Quarter 3
17,156.4 8,865.7 309.8 3,703.6
152.2 78.2 2.8 32.2
0.0
2,000
4,000TUR
NO
VER
(P’ 0
00)
VO
LUM
E (’
000)
8,000
6,000
10,000
12,000
14,000
16,000
Source:BSE
18,000 160
140
120
100
80
60
40
20
0
Turnover(P’000) Volume(‘000)
Figure 18 below shows the performance of the NewGold ETF NAV against the Gold Bullion Price in the London Metals Exchange, both in USD terms. It can be noted from Figure 18 that the efficiency of price discovery in the NewGold ETF and the Gold price is very high based on the 100.0% correlation between the two.
CHIEF EXECUTIVE OFFICER’S STATEMENT [ CONTINUED ]for the year ended 31 December 2015
036
annual report 2015

Figure 19 below shows a graphical presentation of the price of the ETF on the BSE and the NAV in Pula (BWP) terms on the days that the ETF traded on the BSE. As can be seen, the correlation between the NAV in BWP and the price of the ETF in BWP is relatively low at 87.1% in comparison to 95.6% in 2014. This is attributed to variables such as market-makers costs and discrepancies in applying exchange rates as well as the manner in which the closing price of the ETF is computed on the BSE.
Figure 19: Price Discovery in the NewGold ETF on the BSE and the NAV of the ETF (BWP)
4.3 Performance of the BettaBeta ETF
The BettaBeta ETF traded a record annual turnover of P427.7 Mn generated from a total of 10.4 Mn units with unit prices ranging between P37.70 and P45.30 per unit during 2015.
Figure 20: Performance of the BettaBeta ETF: 2011 to 2015
BetterBeta ETF Note 2011 2012 2013 2014 2015
Turnover(P) 37,229,615 38,876,378 774,890 170,253,020 427,688,318.4
UnitsTraded 1,143,370 1,121,502 20,519 4,023,278 10,439,416
UnitPrice(Pula) 31.10 39.35 37.15 38.55 37.70
Note1:TheBettaBetaETFwaslistedinMay2011
Source:BSE
94
96
VALU
E (S
TAN
DA
RD
IZED
)
98
100
104
106
108
102
BSE(BWP)
Note:ThegraphisbasedonlyondatesonwhichtheNewGoldETFtraded
Source:BSEandAbsaCapital
NEWGOLDETFNAV(BWP)
5Ja
n
17Ja
n
29Ja
n
10F
eb
22F
eb
6M
ar
18M
ar
30M
ar
11A
pr
23A
pr
5M
ay
17M
ay
29M
ay
10Ju
n
22Ju
n
04Ju
n
16Ju
l
28Ju
l
9A
ug
21A
ug
2Se
p
14S
ep
26S
ep
8O
ct
20O
ct
1N
ov
13N
ov
25N
ov
7D
ec
19D
ec
Correlation:87.1%
037
R E A C H I N G G R E AT E R H E I G H T S
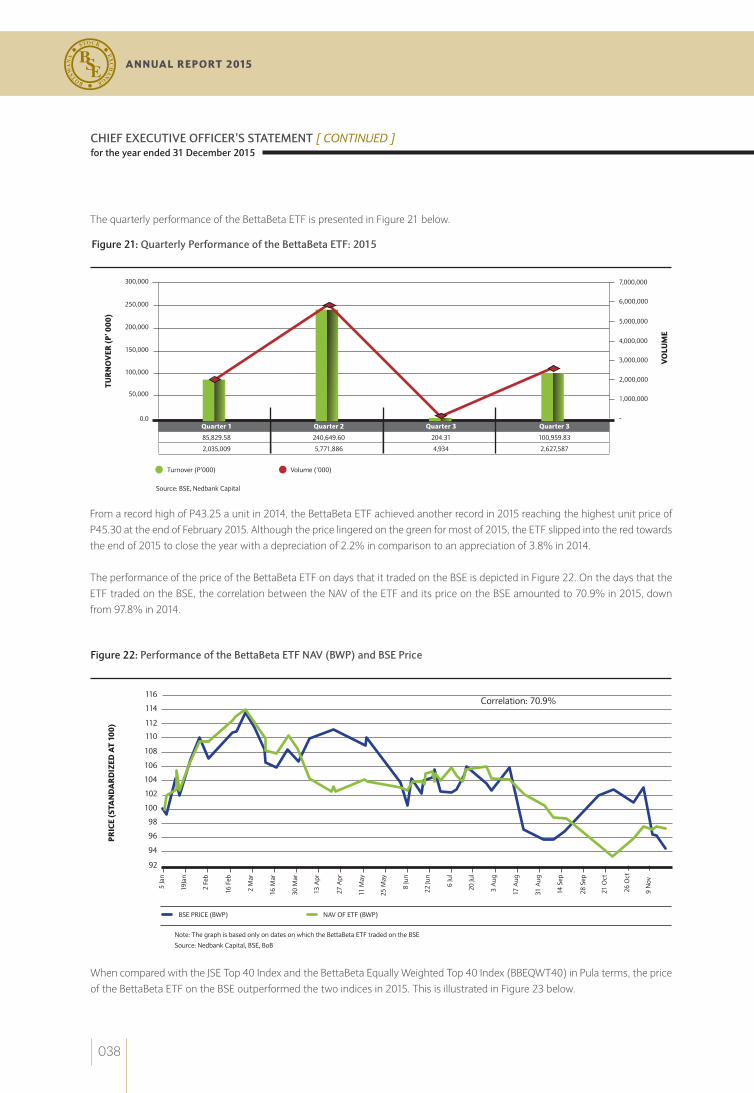
The quarterly performance of the BettaBeta ETF is presented in Figure 21 below.
Figure 22: Performance of the BettaBeta ETF NAV (BWP) and BSE Price
When compared with the JSE Top 40 Index and the BettaBeta Equally Weighted Top 40 Index (BBEQWT40) in Pula terms, the price of the BettaBeta ETF on the BSE outperformed the two indices in 2015. This is illustrated in Figure 23 below.
Figure 21: Quarterly Performance of the BettaBeta ETF: 2015
92
94
96PRIC
E (S
TAN
DA
RD
IZED
AT
100)
100
98
102
104
108
110
112
114
116
106
BSEPRICE(BWP)
Note:ThegraphisbasedonlyondatesonwhichtheBettaBetaETFtradedontheBSE
Source:NedbankCapital,BSE,BoB
NAVOFETF(BWP)
Correlation:70.9%
5Ja
n
19Ja
n
2Fe
b
16F
eb
2M
ar
16M
ar
30M
ar
13A
pr
27A
pr
11M
ay
25M
ay
8Ju
n
22Ju
n
6Ju
l
20Ju
l
3A
ug
17A
ug
31A
ug
14S
ep
28S
ep
21O
ct
26O
ct
9N
ov
Quarter 1 Quarter 2 Quarter 3 Quarter 3
85,829.58 240,649.60 204.31 100,959.83
2,035,009 5,771,886 4,934 2,627,587
0.0
50,000
TUR
NO
VER
(P’ 0
00)
VO
LUM
E
150,000
100,000
200,000
250,000
Source:BSE,NedbankCapital
300,000 7,000,000
6,000,000
5,000,000
4,000,000
3,000,000
2,000,000
1,000,000
-
Turnover(P’000) Volume(‘000)
From a record high of P43.25 a unit in 2014, the BettaBeta ETF achieved another record in 2015 reaching the highest unit price of P45.30 at the end of February 2015. Although the price lingered on the green for most of 2015, the ETF slipped into the red towards the end of 2015 to close the year with a depreciation of 2.2% in comparison to an appreciation of 3.8% in 2014.
The performance of the price of the BettaBeta ETF on days that it traded on the BSE is depicted in Figure 22. On the days that the ETF traded on the BSE, the correlation between the NAV of the ETF and its price on the BSE amounted to 70.9% in 2015, down from 97.8% in 2014.
CHIEF EXECUTIVE OFFICER’S STATEMENT [ CONTINUED ]for the year ended 31 December 2015
038
annual report 2015

Figure 23: Performance of the BettaBeta ETF (BSE Price), the JSE Top40 Index (BWP) and the BBEQWT40 Index (BWP): 2015
The BettaBeta ETF derives its price on the BSE from the price of the BettaBeta ETF listed on the JSE and quoted in South African Rands (ZAR). The price traded on the JSE is converted to Pula at prevailing exchange rates. As such, the ETF can act as a hedge against the Rand because an appreciation of the Rand against the Pula will positively affect the price of the ETF on the BSE. On the contrary, an appreciation of the Pula against the ZAR will have an adverse impact.
In ZAR terms, the NAV closed the year unchanged while it depreciated by 2.2% in Pula terms. This was as a result of the strengthening of the Pula against the ZAR by 13.4% in 2015.
The BettaBeta ETF, which follows the index that tracks the Top 40 companies listed on the JSE, derives its returns from price movement as well as dividend income. The quarterly dividends paid by the ETF in 2015 are presented in Figure 24. It can be noted that the total quarterly dividends paid out in 2015 amounted to 111 thebe in comparison to 97 thebe paid out in the whole of 2014. This gives a dividend yield of 2.7% based on the average price of P41.19 per unit in 2015. Therefore, on a total return basis it is estimated that the BettaBeta ETF returned 0.5% to unit holders in 2015 compared to 6.2% in 2014, while the JSE All Share Index gained 1.9%.
86
88
90
92
94
PRIC
E (S
TAN
DA
RD
IZED
)
96
98
100
102
104
110
112114
116
118
120
106
108
BSEPRICE(BWP)
Source:NedbankCapital,BSE
JSETOP40INDEX(BWP) BBEQWT40INDEX(BWP)
5Ja
n
13Ja
n
25Ja
n
6Fe
b
18F
eb
2M
ar
14M
ar
26M
ar
7A
pr
19A
pr
1M
ay
13M
ay
25M
ay
6Ju
n
18Ju
n
30Ju
n
12Ju
l
24Ju
l
5A
ug
17A
ug
29A
ug
10S
ep
22S
ep
4O
ct
16O
ct
28O
ct
9N
ov
21N
ov
3D
ec
15D
ec
27D
ec
039
R E A C H I N G G R E AT E R H E I G H T S

Quarter 1 Quarter 2 Quarter 3 Quarter 4
22.99 17.59 30.62 15.6121.08 29.68 21.41 25.2828.73 30.59 33.72 17.90
0.0
5
DIV
IDE
ND
(TH
EB
E)
15
10
20
25
30
Source: BSE, Nedbank Capital
35
2013 2014 2015
4.4 Performance of the NewPlat ETF
The NewPlat ETF registered a turnover of P61.9 Mn and recorded a volume of 554,504 units. The ETF traded at prices ranging between P89.80 and P117.00 a unit. The ETF depreciated by 12.8% in 2015 compared a depreciation of 12.2% in 2014.
Figure 25: Quarterly Performance of the NewPlat ETF: 2015
NewPlat ETFNote 1 2014 2015
Turnover(P) 26,507,435 61,859,814
AverageDailyTurnover(P) 315,565 249,434.7
No.ofUnitsTraded 215,088 554,504
NewPlatPrice(BWP) 111.20 97.00
Note1:TheNewPlatETFwaslistedon29August2014atP126.60perunit
Source:BSE
5 BOND MARKET PERFORMANCE
5.1 Performance of the Botswana Bond Index Series (BBIS)
During 2015, the BBI (a Composite Bond Index) appreciated by 6.4% whereas the GovI (a Government Bond Index) and CorpI (a Corporate Bond Index) registered returns of 8.2% and 6.4% respectively. This was mainly on account of adjustments to the bond yields quoted by primary dealers largely due to the reduction of the interest rates. The 3 indices have outperformed the monthly average inflation rate of 3.0% in 2015. The performance of the indices is detailed in Figure 26.
Figure 24: Dividends Paid by the BettaBeta ETF: 2014 and 2015
CHIEF EXECUTIVE OFFICER’S STATEMENT [ CONTINUED ]for the year ended 31 December 2015
040
annual report 2015

144.0
146.0
IND
EX
LE
VEL
INFL
ATI
ON
(%)
150.0
148.0
152.0
156.0
158.0
162.0
160.0
164.0 4.0
3.0
3.5
2.5
2.0
1.5
154.0
BBI CorpI
Source: BSE, BoB
GovI INflatIoN
1 Ja
n
22 J
an
12 f
eb
5 M
ar
16 M
ar
16 a
pr
7 M
ay
11 M
ay
18 J
un
9 Ju
l
30 J
ul
20 a
ug
10 S
ep
1 o
ct
22 o
ct
12 N
ov
3 De
c
24 D
ec
Figure 26: Performance of the BBIS versus Inflation: 2015
During 2015, inflation was within the Bank of Botswana (BoB) objective range of 3%-6%, albeit breaching the lower bound on some occasions. Inflation reduced from 3.6% in January 2015 to 2.9% at the end of the year. The BoB Monetary Policy Committee (MPC) adjusted the Bank rate twice during 2015. The initial adjustment was a 100 basis points (1.00%) cut on the 2nd of February 2015 and another was a 50 basis points (0.50%) reduction on the 6th of August 2015. Overall, these two adjustments reduced the Bank rate by a cumulative 150 basis points or 1.5% from 7.5% to 6.0%.
During its last meeting of 2015 in December, the MPC maintained that the medium term outlook for inflation was positive, with inflation forecast to remain within and closer to the lower bound of its 3% - 6% objective range. As a result, the Bank Rate was maintained at 6.0%.
Changes to the constituents of the indices were experienced during the year. The Debt Participation Capital Funding Limited bond (DPCF004) and the Standard Chartered Bank Botswana bond (SCBB006) exited the CorpI and BBI on 31 March 2015, while the Botswana Building Society bond (BBS002) exited the CorpI and the BBI on the 30 September 2015 as their maturity at the quarterly rebalancing date had fallen to below the stipulated 15 months.
As per the BBIS Ground Rules, BW012 became an eligible constituent of the GovI and the BBI when it was listed on the BSE on 18 August 2015, while SBBL064 (24 June 2015), SBBL065 (24 June 2015), FNBB005 (11 November 2015) and FNBB006 (11 November 2015) also became constituents of the CorpI and BBI during 2015.
5.2 Bond Market Turnover
2015 was undoubtedly a remarkable year in respect of liquidity in the bond market. The turnover of P858.0 Mn recorded in 2015 is the highest ever recorded over a calendar year since the inception of the BSE. However, the trades were solely on account of Government bonds and there was no liquidity in Corporate bonds. Further, 78.8% of the trades were generated by the BW003 bond which matured on 31 October 2015. The bond’s nominal amount was P1,642.0 Mn.
041
R E A C H I N G G R E AT E R H E I G H T S

P’M
n
Figure 27: Quarterly Analysis of Bond Trades: 2015
Quarter 1 Quarter 2 Quarter 3 Quarter 4
Value (P’Mn) Value (P’Mn) Value (P’Mn) Value (P’Mn)
Government
BW003 604.0 17.1 55.0 -
BW005 0.7 21.4 0.4 27.4
BW007 - - 30.3 -
BW008 4.8 - 0.4 22.8
BW010 2.2 - 0.1 56.7
BW011 14.3 - 0.2 -
BW012 - - - -
TOTAL 626.0 38.6 86.5 106.9
Source:BSE
5.3 Bond Market Capitalisation and Issuer Profile
There were 38 bonds listed on the BSE as at the end of 2015, a marginal increase from the 37 in 2014. Figure 28 below details the growth of the debt market analysed by issuer category since 2011. The total nominal debt market capitalisation amounted to P10.0 Bn in 2015 in comparison to P10.1 Bn in 2014. Figure 28: Debt Market Capitalisation (Nominal Values) by Issuer Category: 2011 – 2015
0.0
1,000
3,000
2,000
4,000
5,000
6,000
Source:BSE
7,000
8,000
GOVERNMENT QUASI PARASTATAL CORPORATE
2011 2012 2013 2014 2015
CHIEF EXECUTIVE OFFICER’S STATEMENT [ CONTINUED ]for the year ended 31 December 2015
042
annual report 2015

6 MARKET INDICATORS
6.1 Indicators of Value
Commonly used indicators of value in a stock market include the Price Earnings (P/E) Ratio, Dividend Yield (DY) and Price to Book (P/B) Value Ratio.
The P/E ratio for the market is computed by dividing market capitalisation by total earnings (profits) of listed companies. As can be seen from Figure 29, the market P/E ratio of the BSE decreased in 2015 to 12.3 times from 13.2 times in 2014. Notwithstanding, this P/E ratio was still above the 5-year average of 11.3 times.
Inversely, the DY for the market increased further to 4.0 in 2015 from 2.2 in 2014, while the P/B ratio increased from 1.9 times in 2014 to 2.2 times in 2015.
Figure 29: Market Indicators for Domestic Companies Listed on the BSE: 2011 to 2015
Domestic Companies 2011 2012 2013 2014 2015
Market indicators
Price/EarningsRatio(times) 10.2 9.2 11.5 13.2 12.3
DividendYield(%) 5.2 4.9 4.1 2.2 4.0
Price/BookValue(times) 2.8 2.5 2.7 1.9 2.2
Source:BSE
6.2 Equity Market Capitalisation
The BSE’s domestic market capitalisation for equity was P50.2 Bn as at the end of 2015, an increase of 8.7% in comparison to P46.2 Bn in 2014. However, the ratio of market capitalisation to GDP decreased slightly to 34.3% in 2015 from 34.5% in 2014. Notwithstanding, the ratio of turnover to market capitalisation improved from 4.9% in 2014 to 6.2% in 2015.
Figure 30: Market Capitalisation and Relative Performance: 2011 – 2015
Quarter 1 Quarter 1 Quarter 2 Quarter 3 Quarter 4
Market Capitalisation DomesticCompanies(P’Mn) 30,694.3 35,530.8 43,457.6 46,209.9 50,213.9
ForeignCompanies(P’Mn) 380,909.5 376,818.2 373,132.8 371,946.8 370,885.3
Total (P’Mn) 411,603.8 412,349.0 413,741.5 418,156.7 421,099.2Relative Performance
DomesticMarketCap/GDP(%)Note1 31.5 32.0 36.9 34.5 34.3
Turnover/Avg.DomesticCoMktCap(%) 3.4 2.6 5.7 4.9 6.2
Turnover/Avg.AllCoMarketCap(%) 0.2 0.2 0.6 0.5 0.7
Note1:CumulativeGDP(atcurrentprices)fromQuarter3ofthepreviousyeartoQuarter2ofthecurrentyearsubsequenttotherebasingofeconomicstatisticsbyStatisticsBotswana
Source:BSE,StatisticsBotswana
As can be seen in Figure 31, the increase in market capitalisation in 2015 is attributed to the impact of a price effect of 7.9% and a quantity effect of 0.8%. This is consistent with the developments in the market in 2015 where overall share prices grew modestly, outweighing the impact of the two delistings that occurred in 2015. The price effect contributed 90.7% of the percentage change in market capitalisation in 2015 in comparison to a contribution of 93.3% to the change in market capitalisation in 2014.
043
R E A C H I N G G R E AT E R H E I G H T S
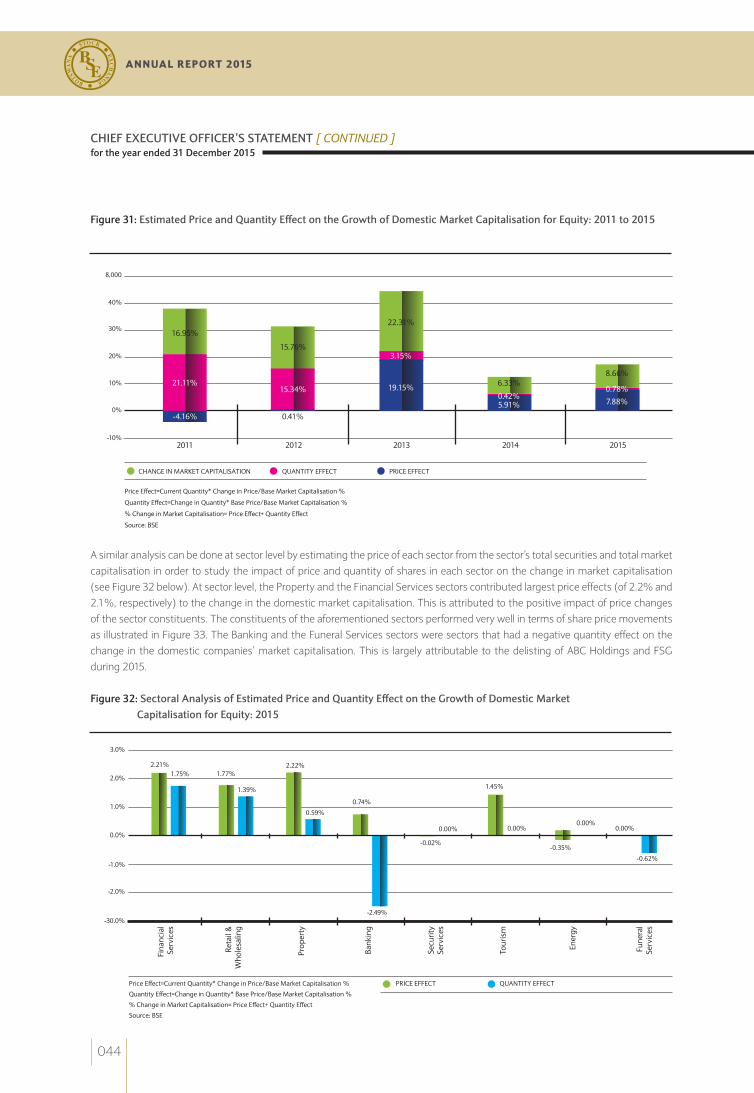
Figure 31: Estimated Price and Quantity Effect on the Growth of Domestic Market Capitalisation for Equity: 2011 to 2015
A similar analysis can be done at sector level by estimating the price of each sector from the sector’s total securities and total market capitalisation in order to study the impact of price and quantity of shares in each sector on the change in market capitalisation (see Figure 32 below). At sector level, the Property and the Financial Services sectors contributed largest price effects (of 2.2% and 2.1%, respectively) to the change in the domestic market capitalisation. This is attributed to the positive impact of price changes of the sector constituents. The constituents of the aforementioned sectors performed very well in terms of share price movements as illustrated in Figure 33. The Banking and the Funeral Services sectors were sectors that had a negative quantity effect on the change in the domestic companies’ market capitalisation. This is largely attributable to the delisting of ABC Holdings and FSG during 2015.
Figure 32: Sectoral Analysis of Estimated Price and Quantity Effect on the Growth of Domestic Market Capitalisation for Equity: 2015
-30.0%
-1.0%
-2.0%
0.0%
1.0%
2.0%
3.0%
2.21%1.75% 1.77%
1.39%
2.22%
0.59%
0.74%
-2.49%
-0.02%-0.35%
-0.62%
0.00%
1.45%
0.00%0.00%
0.00%
PRICEEFFECT QUANTITYEFFECT
Fina
ncia
lSe
rvic
es
Reta
il&
W
hole
salin
g
Prop
erty
Secu
rity
Serv
ices
Ener
gy
Bank
ing
Tour
ism
Fune
ral
Serv
ices
-10%
10%
0%
20%
30%
PriceEffect=CurrentQuantity*ChangeinPrice/BaseMarketCapitalisation%
QuantityEffect=ChangeinQuantity*BasePrice/BaseMarketCapitalisation%
%ChangeinMarketCapitalisation=PriceEffect+QuantityEffect
Source:BSE
PriceEffect=CurrentQuantity*ChangeinPrice/BaseMarketCapitalisation%
QuantityEffect=ChangeinQuantity*BasePrice/BaseMarketCapitalisation%
%ChangeinMarketCapitalisation=PriceEffect+QuantityEffect
Source:BSE
40%
8,000
CHANGEINMARKETCAPITALISATION QUANTITYEFFECT PRICEEFFECT
2011 2012 2013 2014 2015
-4.16% 0.41%
19.15%
5.91% 7.88%
21.11%15.34%
3.15%
0.42%0.78%
16.95%
15.76%
22.31%
6.33%8.66%
CHIEF EXECUTIVE OFFICER’S STATEMENT [ CONTINUED ]for the year ended 31 December 2015
044
annual report 2015
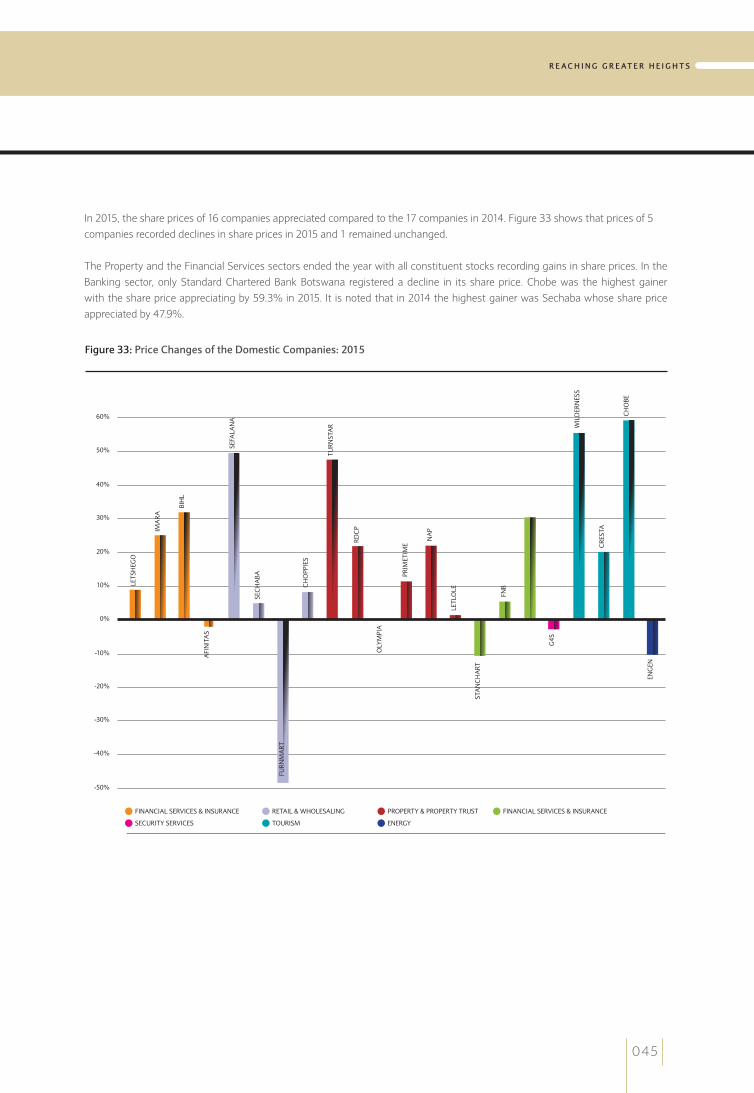
In 2015, the share prices of 16 companies appreciated compared to the 17 companies in 2014. Figure 33 shows that prices of 5 companies recorded declines in share prices in 2015 and 1 remained unchanged.
The Property and the Financial Services sectors ended the year with all constituent stocks recording gains in share prices. In the Banking sector, only Standard Chartered Bank Botswana registered a decline in its share price. Chobe was the highest gainer with the share price appreciating by 59.3% in 2015. It is noted that in 2014 the highest gainer was Sechaba whose share price appreciated by 47.9%.
Figure 33: Price Changes of the Domestic Companies: 2015
-50%
-40%
-30%
-20%
-10%
0%
10%
20%
30%
40%
50%
60%
LETS
HEG
O
IMA
RA
BIH
L
AFI
NIT
AS
SEFA
LAN
A
SEC
HA
BA
FURN
MA
RT
FINANCIALSERVICES&INSURANCE
SECURITYSERVICES
RETAIL&WHOLESALING
TOURISM
PROPERTY&PROPERTYTRUST
ENERGY
FINANCIALSERVICES&INSURANCE
CH
OPP
IES
TURN
STA
R
RDC
P
OLY
MPI
A
PRIM
ETIM
E
NA
P
LETL
OLE
STA
NC
HA
RT
FNB
G4S
WIL
DER
NES
S
CRE
STA
CH
OBE
ENG
EN
045
R E A C H I N G G R E AT E R H E I G H T S
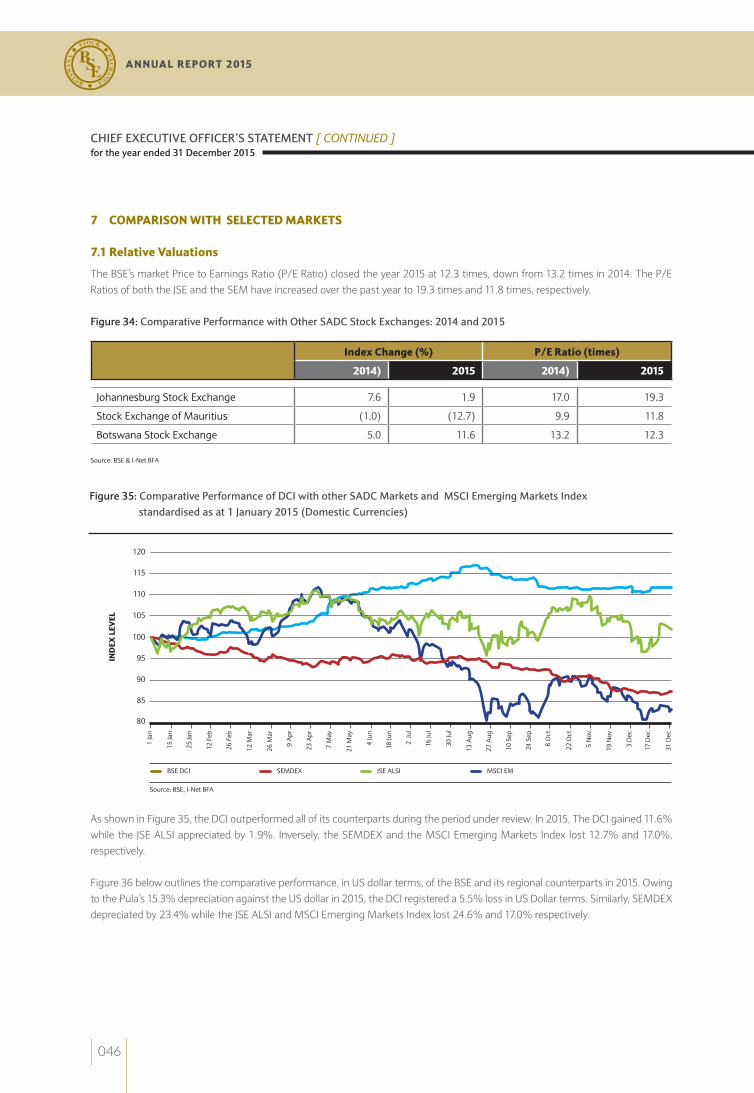
Figure 35: Comparative Performance of DCI with other SADC Markets and MSCI Emerging Markets Index standardised as at 1 January 2015 (Domestic Currencies)
As shown in Figure 35, the DCI outperformed all of its counterparts during the period under review. In 2015, The DCI gained 11.6% while the JSE ALSI appreciated by 1.9%. Inversely, the SEMDEX and the MSCI Emerging Markets Index lost 12.7% and 17.0%, respectively.
Figure 36 below outlines the comparative performance, in US dollar terms, of the BSE and its regional counterparts in 2015. Owing to the Pula’s 15.3% depreciation against the US dollar in 2015, the DCI registered a 5.5% loss in US Dollar terms. Similarly, SEMDEX depreciated by 23.4% while the JSE ALSI and MSCI Emerging Markets Index lost 24.6% and 17.0% respectively.
7 COMPARISON WITH SELECTED MARKETS
7.1 Relative Valuations
The BSE’s market Price to Earnings Ratio (P/E Ratio) closed the year 2015 at 12.3 times, down from 13.2 times in 2014. The P/E Ratios of both the JSE and the SEM have increased over the past year to 19.3 times and 11.8 times, respectively.
Figure 34: Comparative Performance with Other SADC Stock Exchanges: 2014 and 2015
Index Change (%) P/E Ratio (times)
2014) 2015 2014) 2015
JohannesburgStockExchange 7.6 1.9 17.0 19.3
StockExchangeofMauritius (1.0) (12.7) 9.9 11.8
BotswanaStockExchange 5.0 11.6 13.2 12.3
Source:BSE&I-NetBFA
80
IND
EX L
EVEL
90
85
95
105
115
110
120
100
BSEDCI JSEALSI
Source:BSE,I-NetBFA
SEMDEX MSCIEM
1Ja
n
15Ja
n
25Ja
n
12F
eb
26F
eb
12M
ar
26M
ar
9A
pr
23A
pr
7M
ay
21M
ay
4Ju
n
18Ju
n
2Ju
l
16Ju
l
30Ju
l
13A
ug
27A
ug
10S
ep
24S
ep
8O
ct
22O
ct
5N
ov
19N
ov
3D
ec
17D
ec
31D
ec
CHIEF EXECUTIVE OFFICER’S STATEMENT [ CONTINUED ]for the year ended 31 December 2015
046
annual report 2015

Figure 36: Comparative Performance of DCI with other SADC Markets and MSCI Emerging Markets Index standardized as at 1 January 2015 (US Dollar)
65
IND
EX L
EVEL
80
75
70
90
85
100
110
105
115
95
BSEDCI JSEALSI
Source:BSE,I-NetBFA
SEMDEX MSCIEM
1Ja
n
15Ja
n
25Ja
n
12F
eb
26F
eb
12M
ar
26M
ar
9A
pr
23A
pr
7M
ay
21M
ay
4Ju
n
18Ju
n
2Ju
l
16Ju
l
30Ju
l
13A
ug
27A
ug
10S
ep
24S
ep
8O
ct
22O
ct
5N
ov
19N
ov
3D
ec
17D
ec
31D
ec
As detailed in Figure 37, the DCI has recovered 74.6% since 13 May 2009, the point at which the index bottomed subsequent to the global financial crisis.
Figure 37: Comparative Performance of Indices since the Financial Crisis
IndexSteepest Decline since
13-Sept-2008Recovery to31-Dec - 15
13-Sep-08 to31-Dec-15 Jan-Dec
% Change Date % Change % Change % Change
JSEALSI 32.0 20-Nov-08 184.6 93.8 1.9
SEMDEX 44.4 03-Mar-09 96.9 9.5 -12.7
DCI 24.4 13-May-09 74.6 31.1 11.6
FCI 57.6 12-May-09 44.6 (38.5) 0.3
Source:BSE&I-NetBFA
7.2 Footprints
In order to assess the development of the BSE over time and in comparison to peer markets the BSE has plotted its “footprint” from 2010 by making reference to 4 variables.
The footprint for the purpose of the analysis is computed taking into account the relative size of the market (measured by Market Capitalisation/GDP), turnover (measured by Average Daily Turnover), liquidity (measured by Turnover/Market Capitalisation) and value (measured by the Earnings Yield - the reciprocal of the P/E ratio). The footprint of the BSE relative to 2010 is presented in Figures 38 and 39.
047
R E A C H I N G G R E AT E R H E I G H T S
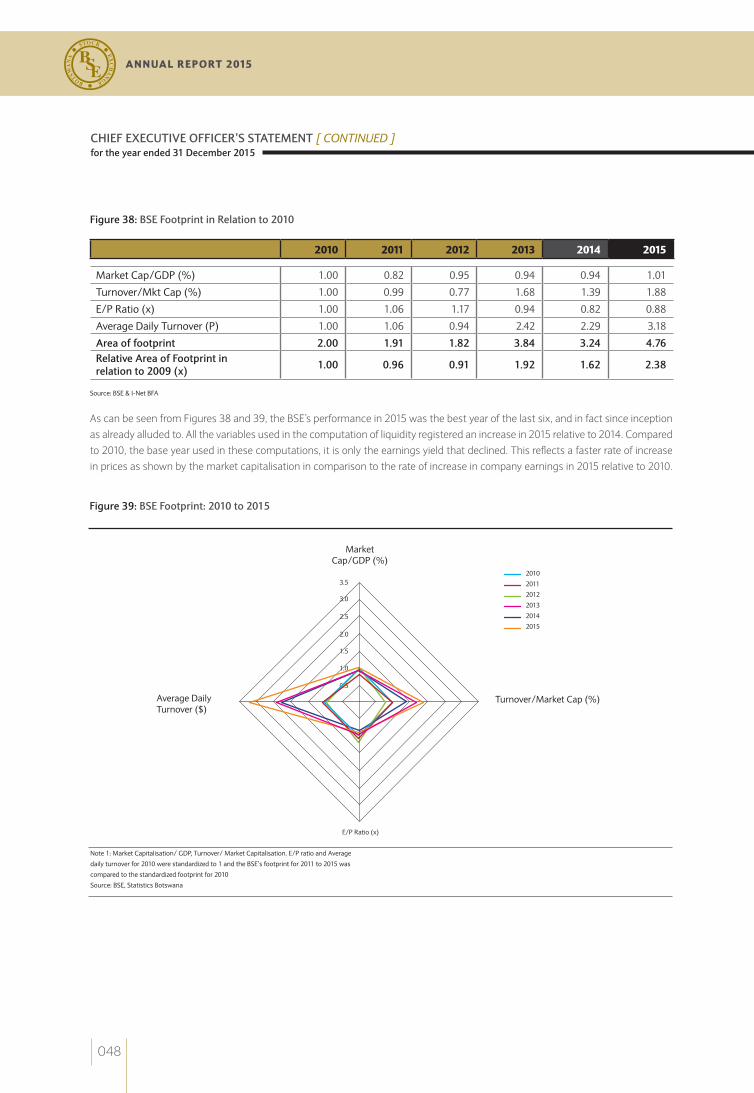
Figure 39: BSE Footprint: 2010 to 2015
Figure 38: BSE Footprint in Relation to 2010
2010 2011 2012 2013 2014 2015
MarketCap/GDP(%) 1.00 0.82 0.95 0.94 0.94 1.01
Turnover/MktCap(%) 1.00 0.99 0.77 1.68 1.39 1.88
E/PRatio(x) 1.00 1.06 1.17 0.94 0.82 0.88
AverageDailyTurnover(P) 1.00 1.06 0.94 2.42 2.29 3.18
Area of footprint 2.00 1.91 1.82 3.84 3.24 4.76Relative Area of Footprint in relation to 2009 (x) 1.00 0.96 0.91 1.92 1.62 2.38
Source:BSE&I-NetBFA
As can be seen from Figures 38 and 39, the BSE’s performance in 2015 was the best year of the last six, and in fact since inception as already alluded to. All the variables used in the computation of liquidity registered an increase in 2015 relative to 2014. Compared to 2010, the base year used in these computations, it is only the earnings yield that declined. This reflects a faster rate of increase in prices as shown by the market capitalisation in comparison to the rate of increase in company earnings in 2015 relative to 2010.
Turnover/MarketCap(%)
2010
2011
2012
2013
2014
2015
AverageDailyTurnover($)
E/PRatio(x)
Note1:MarketCapitalisation/GDP,Turnover/MarketCapitalisation.E/PratioandAverage
dailyturnoverfor2010werestandardizedto1andtheBSE’sfootprintfor2011to2015was
comparedtothestandardizedfootprintfor2010
Source:BSE,StatisticsBotswana
MarketCap/GDP(%)
3.5
3.0
2.5
2.0
1.5
1.0
0.5
CHIEF EXECUTIVE OFFICER’S STATEMENT [ CONTINUED ]for the year ended 31 December 2015
048
annual report 2015
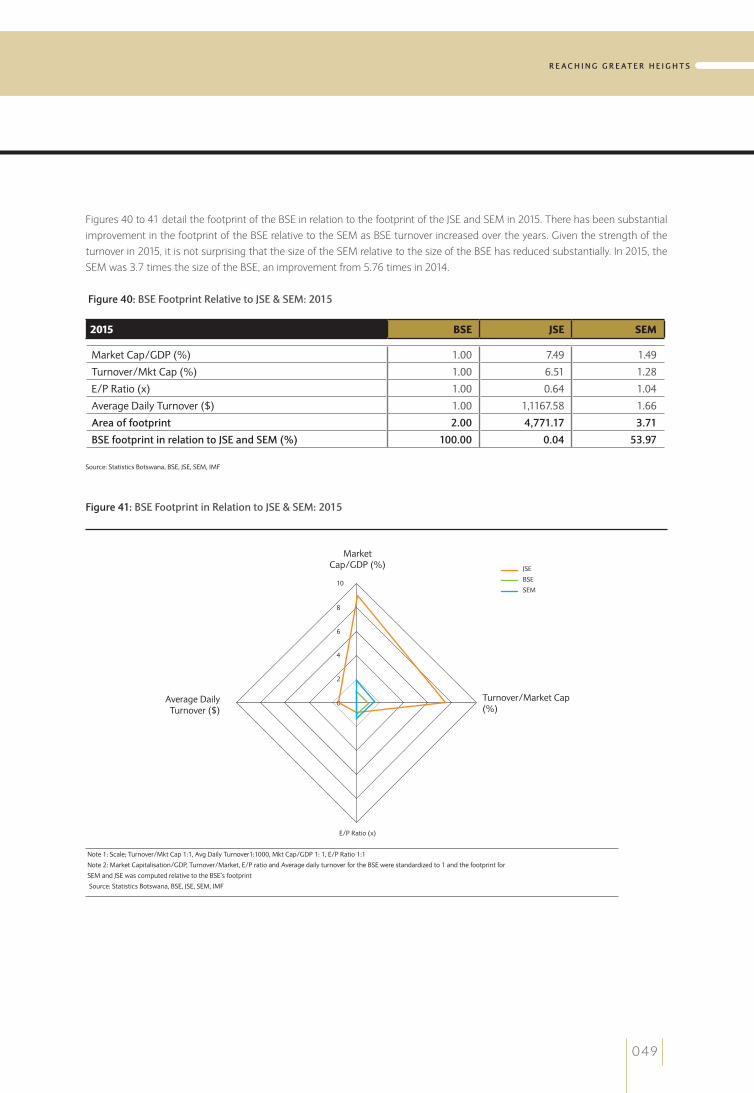
Figures 40 to 41 detail the footprint of the BSE in relation to the footprint of the JSE and SEM in 2015. There has been substantial improvement in the footprint of the BSE relative to the SEM as BSE turnover increased over the years. Given the strength of the turnover in 2015, it is not surprising that the size of the SEM relative to the size of the BSE has reduced substantially. In 2015, the SEM was 3.7 times the size of the BSE, an improvement from 5.76 times in 2014.
Figure 40: BSE Footprint Relative to JSE & SEM: 2015
2015 BSE JSE SEM
MarketCap/GDP(%) 1.00 7.49 1.49
Turnover/MktCap(%) 1.00 6.51 1.28
E/PRatio(x) 1.00 0.64 1.04
AverageDailyTurnover($) 1.00 1,1167.58 1.66
Area of footprint 2.00 4,771.17 3.71
BSE footprint in relation to JSE and SEM (%) 100.00 0.04 53.97
Source:StatisticsBotswana,BSE,JSE,SEM,IMF
Figure 41: BSE Footprint in Relation to JSE & SEM: 2015
Turnover/MarketCap(%)
JSE
BSE
SEM
AverageDailyTurnover($)
E/PRatio(x)
Note1:Scale;Turnover/MktCap1:1,AvgDailyTurnover1:1000,MktCap/GDP1:1,E/PRatio1:1
Note2:MarketCapitalisation/GDP,Turnover/Market,E/PratioandAveragedailyturnoverfortheBSEwerestandardizedto1andthefootprintfor
SEMandJSEwascomputedrelativetotheBSE’sfootprint
Source:StatisticsBotswana,BSE,JSE,SEM,IMF
MarketCap/GDP(%)
10
8
6
4
2
0
049
R E A C H I N G G R E AT E R H E I G H T S

As can be seen from Figures 42, the percentage footprint of the BSE was 53.97% in 2015, increasing from 34.72% in 2014, relative to the footprint of SEM. This can be majorly attributed to the BSE’s 22.5% increase in turnover in 2015 from 2014.
Figure 42: BSE Footprint in Relation to JSE & SEM: 2010 to 2015
2010 2011 2012 2013 2014 2015
BSErelativetoSEM(%) 33.41 24.44 35.07 72.76 34.72 53.97
BSErelativetoJSE(%) 0.02 0.01 0.01 0.03 0.03 0.04
Source:BSE,StatisticsBotswana
GDPfiguresforSouthAfricaandMauritiusarebasedonIMFrevisedGDPestimatesfortherespectivecountries
The foregoing illustrations show that the BSE’s vision to become the leading exchange in Africa is not far-fetched and it is indeed attainable. However, in order for the BSE to achieve this feat and continue to compete at a continental and global level, its liquidity has to be increased substantially.
8.0 PRIMARY MARKET
8.1. Equity
During 2015, four companies delisted from the BSE while there was one new listing. ABC Holdings (2 February 2015) and FSG (24 December 2015) delisted from the Domestic Main Board while African Copper (28 August 2015) and Discovery Metals (1 December 2015) delisted from the Foreign Venture Capital Board.
Afinitas Limited, a financial services pure start-up company, listed on the BSE’s Foreign Venture Capital Board on 27 July 2015. The company listed 213.9 Mn shares at offer price of P1.00 per share. Afinitas Limited raised P91.2 Mn through Private Placement and P2.7 Mn through an offer to the public.
8.2. Bonds
During the year 2015, Bank of Botswana held four bond auctions on 6 March, 5 June, 4 September and on 4 December 2015.
In the first auction, the Bank offered a 6 month Treasury bill (T-Bill) worth P340 Mn of which P339 Mn was allotted. The T-Bill was 1.6 times oversubscribed. Also on offer were additional tranches of two bonds, BW008 and BW011, at P100 Mn each. Only the BW011 was fully allotted after it was 2.2 times oversubscribed whereas the BW008 was not allotted although it was 1.1 times oversubscribed. In total P439 Mn was raised from this auction.
On 5 June 2015, another 6 month T-Bill was issued with 3 bonds reopening and a new bond issuance. The T-Bill issuance amounted to P340 Mn and was fully allotted with the bids 2.7 times in excess of the offer. The three existing bonds which were reopening, BW005 ( P50 Mn), BW007 (P50 Mn) and BW011 (P150 Mn) were 0.8 times, 1.2 times and 1.6 times oversubscribed respectively with allotments of P5 Mn, P15 Mn and P150 Mn, respectively. The new bond, BW012 (P249 Mn), was 1.9 oversubscribed and P249 Mn of the bond was allotted. The BW012 pays a fixed coupon rate of 6% annually and will mature on 13 June 2040. Interest on the bond is paid semi-annually.
CHIEF EXECUTIVE OFFICER’S STATEMENT [ CONTINUED ]for the year ended 31 December 2015
050
annual report 2015

On 4 September 2015, yet another 6 month T-Bill was issued along with additional tranches of four Government bonds. The T-Bill offered amounted to P500 Mn and it was fully allotted. Similarly, the reopening of the 3 Government bonds BW007 (P50 Mn), BW008 (P50 Mn) and BW011 (P100 Mn) were also fully allotted. An additional issuance of the BW012 (P100 Mn) was allotted up to P88 Mn despite the bond being 1.9 oversubscribed.
On 4 December 2015, Government raised P840 Mn after issuing a 6 month T-Bill (P340 Mn) and additional tranches of five bonds, all of which were oversubscribed and subsequently fully allotted. The Government bonds issued were; BW005 (P100 Mn), BW007 (P50 Mn), BW008 (P100 Mn), BW011 (P150 Mn) and BW012 (P100 Mn).
Stanbic Bank Botswana Limited (SBBL) listed two corporate bonds on 24 June 2015, the SBBL064 (P128.4 Mn) and the SBBL065 (P153.1 Mn), that will both mature on 18 June 2020. The SBBL064 bond carries a fixed coupon rate of 8% and the coupon is paid semi-annually. The SBBL065 bond is a floating rate bond that pays a quarterly coupon rate of Prime Lending Rate minus 50 basis points (0.50%). The SBBL048 (P175 Mn) which was issued by Stanbic Bank Botswana Limited on 11 June 2008 matured on 11 June 2015.
First National Bank Botswana (FNBB) also listed two bonds on 11 November 2015, the FNBB005 (P125.59 Mn) and FNBB006 (P112.12 Mn), both maturing on 11 November 2020. Both are floating bonds linked to the Bank Rate. FNBB005 pays a quarterly interest of Bank Rate plus 0.75% whereas FNBB006 pays a quarterly interest of Bank Rate plus 1.00%.
As at 31 December 2015, the total market capitalisation of bonds listed on the BSE was P10.0 Bn in comparison to P10.1 Bn at the end of 2014.
051
R E A C H I N G G R E AT E R H E I G H T S

9. DEPARTMENTAL REVIEWS
9.1 Central Securities Depository (CSD)
9.1.1 Dematerialization Status of Shares
Since the introduction of the CSD system in 2008, the rate of dematerialization of securities has increased steadily over the years as can be seen from Figure 43 below. As at 31 December 2015, 65.3% of shares of domestic companies were deposited into the CSD system compared to 59.9% in 2014.
Figure 43: Dematerialization Status of Domestic Companies: 2008 to 2015
Following the approval of compulsory dematerialization of securities by the Non-Bank Financial Institutions Regulatory Authority (NBFIRA) which effected in February 2015, the BSE and CSDB conducted education campaigns to sensitize the market and investors about dematerialization. Between 16 April 2015 and 30 April 2015, the BSE physically visited 10 places in Botswana which are Maun, Letlhakane, Serowe, Francistown, Selebi-Phikwe, Mahalapye, Lobatse, Mochudi, Kanye and Molepolole. The message was also spread through radio announcements and newspapers in order to reach the nation at large. The modest increase in the rate of dematerialization in 2015 could be attributed to the education campaigns held in 2015 in addition to the opening of new accounts by new investors. It is good to note that the campaigns helped in terms of mobilizing the public to open CSD accounts to deposit their shares into the CSD system. Investors have been given up to 31 March 2016 to have dematerialized their shares. In the interim, CSDB will dematerialize shares held in physical form using “Omnibus account” in respect of each company until investors come forth to deposit their shares in their own CSD accounts or open them by handing over the share certificate.
It can be noted from Figure 44 that the increase in the number of shares dematerialized was experienced across the board. There was a modest improvement of 5.4 percentage points in respect of the percentage shares of domestic companies held in the CSD system.
0
10
SHA
RES
IN C
SD (%
)
30
20
40
50
60
Source:CSDBotswana
70
2008
30.2
2010
45.8
2009
34.2
2012
48.9
2011
46.4
2013
59.3
2015
65.3
2014
59.9
CHIEF EXECUTIVE OFFICER’S STATEMENT [ CONTINUED ]for the year ended 31 December 2015
052
annual report 2015

Figure 44: Dematerialization Status of Domestic Companies: 2014 and 2015
2014 2015
Security % of Shares in CSD Number of Shares in Issue
Number of Shares Deposited into CSD % of Shares in CSD
ABCH 31.6% Delisted Delisted DelistedBarclays 29.7% 852,161,252 256,690,340 30.1%BIHL 97.3% 281,070,652 275,383,844 98.0%Chobe 40.2% 89,405,139 45,273,723 50.6%Choppies 98.1% 876,282,172 863,460,947 98.5%Cresta 26.9% 184,634,944 173,623,970 94.0%Engen 29.0% 159,722,220 46,653,239 29.2%FNBB 28.6% 2,563,700,000 743,351,307 29.0%FSG 93.5% Delisted Delisted DelistedFurnmart 22.8% 606,446,080 139,249,530 23.0%G4S 27.5% 80,000,000 22,386,100 28.0%Letshego 97.8% 2,184,901,665 2,157,191,934 98.7%Olympia 15.8% 28,600,000 4,531,187 15.8%Primetime 77.2% 179,890,200 139,297,887 77.4%RDCP 98.8% 347,547,222 346,115,768 99.6%Sechaba 81.0% 133,014,875 108,190,831 81.3%Sefalana 94.0% 222,868,186 211,660,863 95.0%Stanchart 22.5% 298,350,611 291,869,590 97.8%Turnstar 93.9% 572,153,603 538,706,840 94.2%Imara 69.2% 59,904,301 56,126,146 93.7%Wilderness 41.4% 97,251,145 95,851,636 98.6%NAP 15.6% 604,397,124 120,847,673 20.0%Letlole 98.3% 280,000,000 276,544,962 98.8%NewGold 100.0% 2,250,000 2,250,000 100.0%BettaBeta 100.0% 6,450,000 6,450,000 100.0%NewPlatinum 100.0% 1,900,000 1,900,000 100.0%NewFunds NotListed 4,400,000 4,400,000 100.0%MARKET 59.9% 72.76 34.72 53.97
Source:CSDBotswana
Figure 45: Dematerialization Status of Foreign Companies: 2014 and 2015
2014 2015
Security % of Shares in CSDNumber of Shares
on Botswana Registry
Number of Shares Deposited into CSD % of Shares in CSD
A-CapResources 60.6% 663,327 431,443 65.0%BotswanaDiamonds 87.1% 4,539,654 3,728,275 82.1%LucaraDiamonds 99.2% 28,485,752 28,318,827 99.4%AfricanEnergy 86.1% 1,966,492 1,692,171 86.1%GalaneGold 100.0% 130 130 100.0%Shumba 82.6% 212,005,676 187,445,017 88.4%Magnum 100.0% 5,300,000 5,300,000 100.0%DiscoveryMetals 67.3% Delisted Delisted DelistedMARKET 82.4% 252,961,031 226,915,863 89.7%
Source:CSDBotswana
As at the end of 2015 dematerialization of foreign company shares in the Botswana registry was 89.7% in comparison to 82.4% in 2014.
053
R E A C H I N G G R E AT E R H E I G H T S
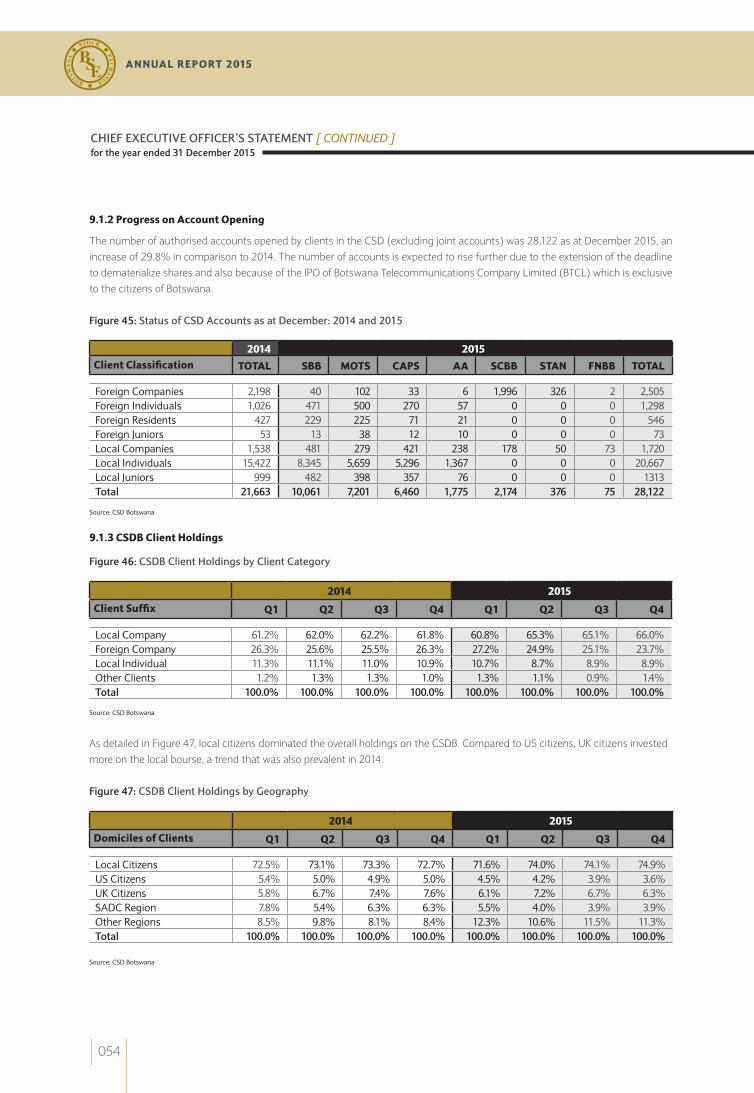
9.1.2 Progress on Account Opening
The number of authorised accounts opened by clients in the CSD (excluding joint accounts) was 28,122 as at December 2015, an increase of 29.8% in comparison to 2014. The number of accounts is expected to rise further due to the extension of the deadline to dematerialize shares and also because of the IPO of Botswana Telecommunications Company Limited (BTCL) which is exclusive to the citizens of Botswana.
Figure 45: Status of CSD Accounts as at December: 2014 and 2015
2014 2015Client Classification TOTAL SBB MOTS CAPS AA SCBB STAN FNBB TOTAL
ForeignCompanies 2,198 40 102 33 6 1,996 326 2 2,505ForeignIndividuals 1,026 471 500 270 57 0 0 0 1,298ForeignResidents 427 229 225 71 21 0 0 0 546ForeignJuniors 53 13 38 12 10 0 0 0 73LocalCompanies 1,538 481 279 421 238 178 50 73 1,720LocalIndividuals 15,422 8,345 5,659 5,296 1,367 0 0 0 20,667LocalJuniors 999 482 398 357 76 0 0 0 1313Total 21,663 10,061 7,201 6,460 1,775 2,174 376 75 28,122
Source:CSDBotswana
9.1.3 CSDB Client Holdings
Figure 46: CSDB Client Holdings by Client Category
2014 2015
Client Suffix Q1 Q2 Q3 Q4 Q1 Q2 Q3 Q4
LocalCompany 61.2% 62.0% 62.2% 61.8% 60.8% 65.3% 65.1% 66.0%ForeignCompany 26.3% 25.6% 25.5% 26.3% 27.2% 24.9% 25.1% 23.7%LocalIndividual 11.3% 11.1% 11.0% 10.9% 10.7% 8.7% 8.9% 8.9%OtherClients 1.2% 1.3% 1.3% 1.0% 1.3% 1.1% 0.9% 1.4%Total 100.0% 100.0% 100.0% 100.0% 100.0% 100.0% 100.0% 100.0%
Source:CSDBotswana
As detailed in Figure 47, local citizens dominated the overall holdings on the CSDB. Compared to US citizens, UK citizens invested more on the local bourse, a trend that was also prevalent in 2014.
Figure 47: CSDB Client Holdings by Geography
2014 2015
Domiciles of Clients Q1 Q2 Q3 Q4 Q1 Q2 Q3 Q4
LocalCitizens 72.5% 73.1% 73.3% 72.7% 71.6% 74.0% 74.1% 74.9%USCitizens 5.4% 5.0% 4.9% 5.0% 4.5% 4.2% 3.9% 3.6%UKCitizens 5.8% 6.7% 7.4% 7.6% 6.1% 7.2% 6.7% 6.3%SADCRegion 7.8% 5.4% 6.3% 6.3% 5.5% 4.0% 3.9% 3.9%OtherRegions 8.5% 9.8% 8.1% 8.4% 12.3% 10.6% 11.5% 11.3%Total 100.0% 100.0% 100.0% 100.0% 100.0% 100.0% 100.0% 100.0%
Source:CSDBotswana
CHIEF EXECUTIVE OFFICER’S STATEMENT [ CONTINUED ]for the year ended 31 December 2015
054
annual report 2015

9.2 MARKET DEVELOPMENT
9.2.1 Marketing Strategies to Attract Local Retail Investors
The BSE continued to pursue its market development initiatives which are aimed at promoting awareness about investment opportunities on the BSE in order to improve retail investor participation in the stock market. The BSE conducted public presentations to various institutions and participated in a number of exhibitions and trade fairs to further this objective. As detailed in Figure 55, 1,730 members of the public attended the presentations conducted by the BSE in 2015. Majority of the road shows were with regards to the dematerialization campaign. The campaigns were held in high foot count areas such as bus ranks and shopping mall and announcement of the schedule was publicised in print media and through radio stations.
Figure 48: Presentations Conducted by the BSE: 2015
Date Organisation Place No. of Participants
5/2/2015 NBFIRAFair Serowe 150
6/2/2015 NBFIRAFair Letlhakane 100
10/2/2015 St.Joseph'sCollegeStaffFairDay Kgale 31
3/3/2015 UBFSFinance&BankingWeek Gaborone 88
16/4/2015
CSDBDematerializationRoadshow
Maun 104
17/4/2015 Letlhakane 61
18/4/2015 Serowe 32
20/4/2015 Francistown 197
21/4/2015 Selibe-Phikwe 32
22/4/2015 Mahalapye 89
27/4/2015 Lobatse 9
28/4/2015 Mochudi 37
29/4/2015 Kanye 37
30/4/2015 Molepolole 126
10/6/2015 DeedsRegistryOffice Gaborone 36
18/6/2015 MarangC.J.S.S Gaborone 24
28/07/15 NBFIRARoadshow Ghanzi 26
29/07/15 NBFIRARoadshow Hukuntsi 51
30/07/15 NBFIRARoadshow Kang 24
17to23/08/15 ConsumerFair Gaborone 287
22/09/15 BotswanaCollegeofAgriculture Sebele 39
21/11/2015 DTCMensday Gaborone 100
1/12/2015 BDF(BSEOffices) Gaborone 29
15/12/15 OutofSchoolEducation&Training Gaborone 21
TOTAL 1,730
Source:BSE
055
R E A C H I N G G R E AT E R H E I G H T S
9.2.2 Social Media, Radio and Television Programmes
The BSE also used other platforms to disseminate market information and updates. A programme called “First Issues” featured the BSE’s market performance update every Tuesday evening on BTV, on RB1 the information was broadcast through “Sefalana sa Papadi” every Monday and “Tsele le Tsele” every Friday and again on RB2 “Business Fit In” every Friday. The BSE also presented market updates on Yarona FM and Gabz FM as and when requested. Throughout 2015, the BSE also maintained an interactive Facebook page and Twitter page.
9.2.3 Senior Secondary Schools Finance & Investment Competitions
In 2013, the BSE commenced a project to promote financial literacy and awareness amongst students, culminating in the inaugural Finance & Investment Senior Secondary Schools Competition in November 2013. The competition was open to all senior secondary schools in Gaborone in 2013, and was rolled out to six districts in 2014.
The BSE held the third annual Finance & Investment Senior Secondary Schools Competition in November 2015. Invitation to the competition was extended all senior secondary schools, both private and public, in Botswana. All 43 Senior Secondary Schools were invited and only 10 schools made it to the finals of the competition. This was an improvement from the 4 and 8 schools that made it to the final in 2013 and 2014, respectively. With this initiative, the BSE is inculcating a culture of investing from a young age as we strongly believe that students are investors of tomorrow. As such, initiatives such as this go a long way in increasing financial awareness at grassroot level.
9.2.4 Corporate Social Investment (CSI)
The BSE CSI policy prescribes that CSI initiatives taken up should be done with a medium to long term view. These initiatives are limited to 3 areas; education, job creation and community development. Moreover, the BSE CSI initiatives are undertaken in a manner that is not self-serving – not for the BSE to receive mileage – but rather in a way that makes meaningful contributions to receiving communities.
In 2013, the BSE took custody of Boitumelo Primary School in Sebele and Xakao Primary School in Shakawe under the Government’s “Adopt a School” project. The focus of the BSE activities in respect of this project has been to undertake initiatives that improve the learning environment, with the expected outcome of improving the schools’ academic performance. In 2015, the BSE continued to assist the two adopted primary schools by stocking their libraries with new books and computers.
Further, the BSE partnered with the Botswana Retired Nurses Society (BORNUS) in their Old Naledi Teenage Pregnancy Prevention Project. The project comprised counselling and education seminars and was aimed at trying to curb further teenage pregnancies in the area through community mobilization and youth empowerment. The BSE assisted by funding resources required for the counselling and peer education seminars. 9.2.5 Investor Awareness Survey
The BSE conducted an investor awareness survey between 12th and 20th September 2015 across 14 places in Botswana. The aim of the survey was to gauge the level of awareness about the BSE, its services and products among the public and the level of participation in the stock market. Generally, the results indicated that a larger percentage of the participants did not know about the BSE and therefore do not invest in the BSE. The primary reason was the lack of knowledge about the BSE and the lack of understanding about the products on the BSE.
It is worth noting that the low financial literacy level in Botswana has been identified as one of the impediments of liquidity on the BSE. For many years, the BSE has deployed several market development initiatives to promote awareness about the stock market. Based on the findings of the survey, there is strong indication that perhaps these initiatives have to be ramped up and have to be segmented across various target markets to try and address identified gaps in an effective manner.
CHIEF EXECUTIVE OFFICER’S STATEMENT [ CONTINUED ]for the year ended 31 December 2015
056
annual report 2015
9.2.6 Attracting Companies to List on the BSE
As one of the strategies to increase liquidity by way of attracting more companies to list, the BSE will be hosting an Inaugural BSE Listings Conference at the Gaborone International Convention Centre (GICC) on 10th March 2016 under the theme “Opening the BSE to the business community – creating value through listing”. The overall aim of the Inaugural BSE Listings Conference is to bring together the BSE, private companies, listed companies and experts in capital markets to discuss the value added to a private company by a listing on a stock exchange, and the listing process and requirements. This will be a platform for listed companies to share lessons on how they created value through listing and how they leveraged on their listing to expand to markets outside Botswana. The BSE has mainly invited over 130 small, medium, and large enterprises that are not listed to get to hear experiences of listed companies and how they used their listing to grow their companies. Follow up workshops will be held with selected private companies after the conference to sell the proposition at a one-to-one level.
9.3 PRODUCT DEVELOPMENT
9.3.1 Inclusion of BSE Listed Bonds in AfDB Bloomberg® African Bond Index
In October 2015, Botswana became the latest entrant into the African Development Bank (AfDB/AFMISM) Bloomberg® African Bond Index (ABABI). Calculated by Bloomberg, the composite index comprises the Bloomberg South Africa, Egypt, Nigeria, Kenya, Namibia local currency sovereign indices and now Government bonds issued by the Republic of Botswana and listed on the BSE. This is in line with the plans of the AFMI to provide transparent and credible benchmark indices that give investors a tool with which to measure and track the performance of Africa’s bond markets. For the BSE, this development gives more visibility to the domestic bond market and it gives credit to the developments of the local bond market. Further, the BSE contributed to a Call for Proposals submitted to AfDB’s African Financial Market Initiative (AFMI) by the Product Development Committee of the Committee of SADC Stock Exchange (CoSSE). The purpose of the proposal was to evaluate possible areas of intervention for local currency bond market development. The BSE highlighted certain areas of intervention including the support to the development of bond market indices, bond market association, retail investor development, centralized bond markets, development of repo markets and financial literacy projects. Driving these initiatives from a regional body such as CoSSE provides a platform for the different members to benchmark from each other as well as monitor and review each member’s progress in implementing the identified areas of intervention and the initiatives.
9.3.2 Listing of the NewFunds ETF
The BSE, in conjunction with Absa Capital (South Africa), listed the NewFunds Inflation Linked Bonds Index (ILBI) Exchange Traded Fund (ETF) on the BSE on 18 November 2015. The ETF was primarily listed on the JSE in January 2012. NewFunds ILBI ETF tracks performance of a benchmark index that tracks performance of the South African Government Inflation-Linked Bonds which comprises bonds issued by the South African government that are linked to the South African Consumer Price Index (CPI). This ETF is the fourth to be listed on the BSE following the success of the NewGold ETF, BettaBeta ETF and NewPlat ETF which were listed in July 2010, May 2011 respectively and August 2014.
It is a valuable addition to the product base as it helps cushion investors in Botswana against adverse effects of imported inflation (from South Africa) that culminate in high inflation in Botswana. With Inflation-Linked Bonds, the principal amount is always adjusted for changes in inflation to protect it against erosion of purchasing power. In the long run, it is also advisable and in the best interest of capital market development for Government of Botswana to also consider issuing Inflation-Linked Bonds as other countries like Namibia are also issuing such bonds to raise funds as well as to develop capital markets.
057
R E A C H I N G G R E AT E R H E I G H T S

9.3.3 Fixed Income Courses
The BSE conducted a course titled “Understanding Financial Markets” in April 2015 was attended by 16 participants. A course on “Introduction to Money Markets and Bonds” was conducted in August 2015 and 15 candidates participated. The course on “Introduction to Money Markets and Bonds” is part of the BSE debt market development strategy and is primarily aimed at promoting skills development amongst market participants. The course on “Understanding Financial Markets” was again conducted in November 2015.
The courses were conducted in conjunction with Geometric Progression, a skills development company specializing in providing finance related services, registered in Botswana and accredited by the Botswana Qualifications Authority (BQA) as a training institution. The response from market participants has been positive and the courses are scheduled to continue in 2016.
9.3.4 Centralization of Bond Trading, Clearing and Settlement
The BSE is firmly of the view that Botswana’s bond market can be further developed by centralizing the trading of both Government and corporate bonds on the BSE using the functionalities provided in the ATS and the CSD system. When implementing the ATS the BSE formulated pricing conventions and calculation methodologies for the Botswana market in consultation with bond market participants. These conventions and methodologies have been incorporated into the ATS.
At present, the trading of bonds is fragmented resulting in inefficiencies in pricing, transparency and access. Whereas listed Government bonds are traded on an Over-The-Counter (OTC) basis and reported to the BSE by the Bank of Botswana (BoB), corporate bonds are traded on the BSE by its Brokers. The present arrangement has many shortcomings:
a) The bond market as a whole is fragmented leading to inefficiencies in trading, clearing and settlement of bond tradesb) Primary Dealers who are bond market specialists are not provided the opportunity of trading in corporate bondsc) The ATS and CSD have the capacity to trade, clear and settle bonds which is not being utilized at presentd) Bond pricing conventions and calculation methodologies across the corporate and Government bond markets are not uniforme) The present system limits the accessibility of the Government bond market
The aforementioned Bond Market Development Strategy underscores the point that, “it is quite important that the BSE pushes to have the trades captured into a central capture point”. It also notes that, “bonds need to be settled on a DVP process through the CSD”. The interaction between the BSE’s Brokers and Primary Dealers would make bonds, which are presently mainly accessible to institutional investors, easily available to foreign investors and retail investors in an efficient and effective manner.
The BSE has communicated its thinking on the centralization of the trading, clearing and settlement of bonds to Bank of Botswana (BoB). BoB has communicated to the BSE that the issue is being considered under the National Payment Strategy and that BoB acknowledges the importance of creating an efficient and liquid bond market.
9.3.5 Establishing Botswana as a Regional Financial Hub
The BSE intends to optimise Botswana’s competitive advantages by establishing Botswana as a regional financial hub. The strategic intent is to position the BSE as a gateway to regional and international financial markets given its many competitive advantages. The strategy underscores the need to utilize the BSE as a platform for the trading of international financial instruments. This strategy is sound given that there is excess liquidity in domestic capital markets relative to existing investment opportunities.
CHIEF EXECUTIVE OFFICER’S STATEMENT [ CONTINUED ]for the year ended 31 December 2015
058
annual report 2015
As such it will assist local fund managers optimize risk and returns given that Botswana presently exports 60% to 70% of contractual savings without creating significant value locally. Thus, the creation of efficient, deep and broader financial markets is imperative in order for this capital to create value domestically before it can be exported to investment securities in offshore markets. Discussions in relation to creating a partnership between Saxo Bank and the BSE are still on-going. The BSE has shared the initiative with local fund managers and the preliminary feedback is positive, subject to more discussions with Trustees.
On another project, the BSE explored the feasibility of implementing Contracts for Difference (CFDs) in conjunction with ACM Gold of South Africa. Following the cost benefit analysis and due diligence of ACM Gold, the BSE has decided that it will not go ahead to implement the project in partnership with ACM Gold. The plan is to continue to search for strategic partnerships with established CFDs providers from outside Botswana taking into the need to balance costs with benefits of market development.
On another project, the BSE explored the feasibility of implementing Contracts for Difference (CFDs) in conjunction with ACM Gold of South Africa. Following the cost benefit analysis and due diligence of ACM Gold, the BSE has decided that it will not go ahead to implement the project in partnership with ACM Gold. The plan is to continue to search for strategic partnerships with established CFDs providers from outside Botswana taking into the need to balance costs with benefits of market development.
9.4 LEGISLATION AND REGULATION
9.4.1 Approval of the New BSE Equity Listing Requirements
The New Requirements which were approved by the Non-Bank Financial Institutions Regulatory Authority (NBFIRA) in November 2015 will become effective on 01 June 2016. One of the key amendments relates to the increase in the public shareholder threshold which has increased to 30%. However, the BSE Main Committee has authorized that the new minimum public shareholding structure requirements for listed companies (public float threshold) shall be phased in to assist listed companies to transition smoothly as follows:
Public Float threshold Latest Date for full compliance
MainBoard
25% 30June2017
30% 31December2017
VentureCapitalBoard
10% 31December2017
100PublicShareholders 31December2017
The new rules will go a long in promoting the vibrancy and liquidity of the BSE as well as promoting economic empowerment amongst the investors, prospects and existing.
9.4.2 Securities Act and BSE Transition Act
The Securities Act was approved by Parliament on 28 July 2014 and is currently awaiting a Commencement Order. The BSE Transition Act was approved by Parliament in November 2014 and subsequently commenced on 1 December 2015. Both Acts will have a positive and far reaching impact on the functionality of the capital market and the BSE itself as an organization.
The Securities Act is expected to commence once the Regulations referred to in the Act have been drafted. Following the commencement of the BSE Transition Act, the Constitution of the Exchange is being reviewed. Further, the model to convert Proprietary Rights held by Brokers and the Government subvention received by the Exchange into shares in the new company to be known as BSE Limited is still under discussion.
059
R E A C H I N G G R E AT E R H E I G H T S

2010 2011 2012 2013 2014 2015
P'000 P'000 P'000 P'000 P'000 P'000
BSE CSDB CONSOL BSE CSDB CONSOL BSE CSDB CONSOL BSE CSDB CONSOL BSE CSDB CONSOL BSE CSDB CONSOL
INCOME
CommissionIncome 2,620 1,940 4,560 2,699 2,092 4,791 2,507 1,813 4,320 6,192 4,667 10,859 5,840 4,407 10,247 8,074 6,206 14,280
ListingsandAnnualSustainingfees 8,335 - 8,335 12,635 - 12,635 16,777 16,777 13,048 - 13,048 13,325 - 13,325 15,088 - 15,088
OtherIncome 360 304 664 751 441 1,192 529 512 1,041 1,386 648 2,034 2,482 849 3,331 3,267 5,037 8,304
Total Income from Operations 11,315 2,244 13,559 16,085 2,533 18,618 19,813 2,325 22,138 20,626 5,315 25,941 21,647 5,256 26,903 26,429 11,243 37,672
EXPENDITURE -
DevelopmentExpenditure 1,356 633 1,990 799 746 1,545 1,492 741 2,233 1,643 975 2,618 3,313 1,079 4,392 3,829 1,324 5,153
AdministrativeExpenditure 10,318 2,810 13,128 11,762 3,074 14,836 10,277 3,463 13,740 13,596 4,150 17,746 13,511 4,444 17,955 16,834 4,301 21,135
Total Expenditure 11,674 3,443 15,117 12,561 3,820 16,381 11,769 4,204 15,973 15,239 5,125 20,364 16,824 5,523 22,347 20,663 5,625 26,288
Profit/(Loss)PriortoSubvention (359) (1,199) (1,558) 3,524 (1,287) 2,237 8,044 (1,879) 6,165 5,387 190 5,577 4,823 (267) 4,556 5,766 5,618 11,384
Subvention required to break even 359 1,199 1,558 - 1,287 - - 1,879 1,879 - - - - 267 - - - -
Subventionreceived 1,591 934 2,525 4,039 3,037 7,075 3,145 4,143 7,288 5,025 4,263 9,288 5,700 7,300 13,000 2,343 2,563 4,906
Profit 1,232 (265) 967 7,563 1,750 9,312 11,189 2,264 13,453 10,412 4,453 14,865 10,523 7,033 17,556 8,109 8,181 16,290
ExtenttowhichIncomefromopera-tionsmeetadministrativeexpenses 100% 80% 100% 100% 82% 100% 100% 67% 100% 100% 100% 100% 100% 95% 100% 100% 100% 100%
9.4.5 Introduction of Market –Making in Listed Securities
The Draft Rules with regards to Market-Making were completed in January 2015, which was followed by a period of consultation with external stakeholders, which included market participants and institutions identified as potential market-makers. The BSE has submitted to NBFIRA for approval.
9.5 FINANCE & ADMINISTRATION
The Group (BSE & CSDB) revenue increased by 40.0% in 2015. This was mainly due to the increase in turnover that was experienced in 2015 in comparison to 2014. The average daily turnover was P12.2 Mn in 2015 in comparison to P8.8 Mn recorded in 2014.
The assets of the Group grew by 37.7% in 2015. This was due to profits earned in 2015. BSE’s capital from inception was limited to Proprietary Rights issued to Brokers and has had to be bolstered with subventions from Government. However, since 2011 BSE has not had to depend on the subvention given that revenue earned from operations has been adequate to meet its expenses.
However, the operation of the CSDB has had to be supported by a subvention from its inception in 2008 with the exception of 2013 and 2015 in which years the expenditure of the CSDB was met from revenue generated.
The Group’s administrative expenses increased by 17.6% in 2015. Information Technology and Market Development which are regarded as development expenditure accounted for 19.6% of the total costs in 2015. The BSE embarked on marketing campaigns aimed at encouraging holders of physical share certificates to dematerialize their share certificates into electronic form. The BSE also made changes to the CSD system to prepare for the BTCL listing.
As a result of its financial performance, the Group’s cash position increased by an impressive 43.4%.
Figure 49: Financial Performance of the BSE: 2010 to 2015
CHIEF EXECUTIVE OFFICER’S STATEMENT [ CONTINUED ]for the year ended 31 December 2015
060
annual report 2015

9.6 HUMAN RESOURCE DEVELOPMENT
9.6.1 Human Capital Development
Members of staff were sent on several courses and conferences in the year under review in order to develop their understanding on capital markets and stock exchange operations.
9.6.2 Corporate Culture Index
The BSE conducted an external survey to formulate a corporate culture index. The survey was intended to gauge external stakeholders’ perception of the BSE. The results of the survey indicated that our external stakeholders have concerns with regards to particularly two areas; the BSE’s community involvement and creativity and innovation. Concerns with community involvement showed that whilst the BSE actually is involved in community development initiatives, which is through its CSI policy, there is less publicity about the extent to which it does so. This implies that the BSE does not communicate to the public its involvement in corporate social investment. Stakeholders attached a very high regard to the importance of creativity and innovation for the BSE.
From these findings, the BSE intends to develop initiatives to address the gaps in order to improve its perception by stakeholders. The corporate culture index constructed from the initial survey constituted the base index of 100. On a yearly basis, the BSE will undertake the survey and assess improvement and evaluate the effectiveness of the initiatives deployed to address some gaps.
9.7 REGIONAL COOPERATION AND PARTICIPATION AT CONFERENCES
The Committee of Southern African Exchanges (CoSSE) held several meeting in 2015. The BSE participated in meetings held in April in Livingstone, Zambia and in Johannesburg in September 2015.
BSE was represented at the ASEA Conference and the IMN Africa Debt Capital Market Conference which were both held in November 2015, in Johannesburg and Cape Town respectively.
CSDB was represented at the World Federation of CSDs (WFC) in Mexico in April 2015 and again at the African and Middle East Depository Association (AMEDA) meeting in Abu Dhabi in November 2015.
061
R E A C H I N G G R E AT E R H E I G H T S

10. APPRECIATION
I would like to express my sincere gratitude to Mr. Hiran Mendis, who was the CEO of the BSE from 2006 until the end of 2015, for his contribution to the development of the BSE and Botswana’s capital market. It is during his tenure that the BSE metamorphosed to become one of the leading stock exchanges in Africa. The intention is to continue in the same trajectory and take the BSE to greater heights.
Further, I wish to appreciate the leadership and direction provided by the Chairperson, BSE Main Committee and Sub-Committees in 2015. It was through their guidance that the BSE was able to achieve its strategic initiatives.
Moreover, I acknowledge both the Ministry of Finance & Development (MFDP) and the Non-Bank Financial Institutions Regulatory Authority (NBFIRA) for their stewardship and oversight. I am happy to say their collaborative efforts are instrumental in promoting a robust regulatory framework within which the BSE operates and in promoting effective responsiveness to market dynamics.
To my team, the BSE staff, I commend you for your continued dedication and hard work throughout the years. The onus is upon us to develop the organisation even further, and elevate it to “Greater Heights.”
I recognize the contribution and support of the BSE Members, CSDB Participants, Nominated Transfer Secretaries, Listed Companies, Investors and other stakeholders in the development of the BSE.
There is an old African proverb that reads “ifyouwanttogofastgoalone,ifyouwanttogofargotogether.” Hence, I urge all the stakeholders in the capital market to continue to be innovative and to engage collectively for the sustainable development of the market.
Mr Thapelo TsheoleChief Executive Officer
CHIEF EXECUTIVE OFFICER’S STATEMENT [ CONTINUED ]for the year ended 31 December 2015
annual report 2015
062
ANNUAL REPORT 2015

R E A C H I N G G R E AT E R H E I G H T S
063
The 2015 BSE sports day

GRAPHICAL REVIEW
ANNUAL REPORT 2015
064

2005 2006 2007 2008 2009 2010 2011 2012 2013 2014 2015
0
500
1000
Valu
e (P
’ Mn)
1500
2000
2500
3000
YEAR
3500
Value of Shares Traded
2005 2006 2007 2008 2009 2010 2011 2012 2013 2014 2015
0
100
200
No.
in m
illio
ns
300
400
500
600
YEAR
700
800
900
Volume of Shares Traded
Jan Feb Mar Apr May Jun Jul Aug Sep Oct Nov Dec
0
500
1,000
Valu
e(P
’Mn)
1,500
2,000
2,500
3,000
2015
3,500 14
12
8
10
6
4
2
CummulativeTurnover(P’Mn) CummulativeAverageDailyTurnover(P’Mn)
Cum
mul
ativ
eD
aily
Tur
nove
r(P’
Mn)
2005 2006 2007 2008 2009 2010 2011 2012 2013 2014 2015
0
100,000
200,000
P(M
illio
ns)
300,000
400,000
500,000
YEAR
600000
Turnover(P’000)
Total Market Capitalisation
EQUITIES
Cummulative Monthly Turnover
065
R E A C H I N G G R E AT E R H E I G H T S

YEAR
BSEDCI SEMDEX JSEALSI MSCIEM
2005 2006 2007 2008 2009 2010 2011 2012 2013 2014 2015
0
10
20Perc
enta
ge (%
)
30
40
50
YEAR
60
Domestic Market Capitalization as % of GDP
-1.0
-2.0
-3.0
0.0
1.0
2.0
3.5
4.0
5.0
900
DCI % Change
Jan Feb Mar Apr May Jun Jul Aug Sep Oct Nov Dec
YEAR
-0.3
-0.4
-0.5
-0.2
-1.0
0.0
0.1
0.2
0.3
0.4
Jan Feb Mar Apr May Jun Jul Aug Sep Oct Nov Dec
FCI % Change Comparative Performance of DCI
65
75
70
Leve
l (St
anda
rdiz
ed a
t 100
)
90
85
80
95
100
105
115
110
Jan
Feb
Mar
Apr
May Jun
Jun
Aug Se
p
Oct
Nov
Dec
GRAPHICAL REVIEW [ CONTINUED ]
066
ANNUAL REPORT 2015

BSEFCI BSEDCI
Price Earnings Ratio
YEAR
% Change
DCI & FCI Yearly % Change
2008
-50 -40 -30 -20 -21 0 10 20 30
2009
2010
2011
2012
2013
2014
2015
2005 2006 2007 2008 2009 2010 2011 2012 2013 2014 2015
0
Tim
es (x
)2
4
6
8
YEAR
10
12
Market Price to Book Value
0
9
10
Tim
es (x
)
11
12
13
15
14
16
2015
17
CummulativeTurnover(P’Mn) CummulativeAverageDailyTurnover(P’Mn)
2005 2006 2007 2008 2009 2010 2011 2012 2013 2014 2015 2005 2006 2007 2008 2009 2010 2011 2012 2013 2014 2015
0
Perc
enta
ge (%
)
Dividend Yield
2
3
1
4
5
6
7
067
R E A C H I N G G R E AT E R H E I G H T S
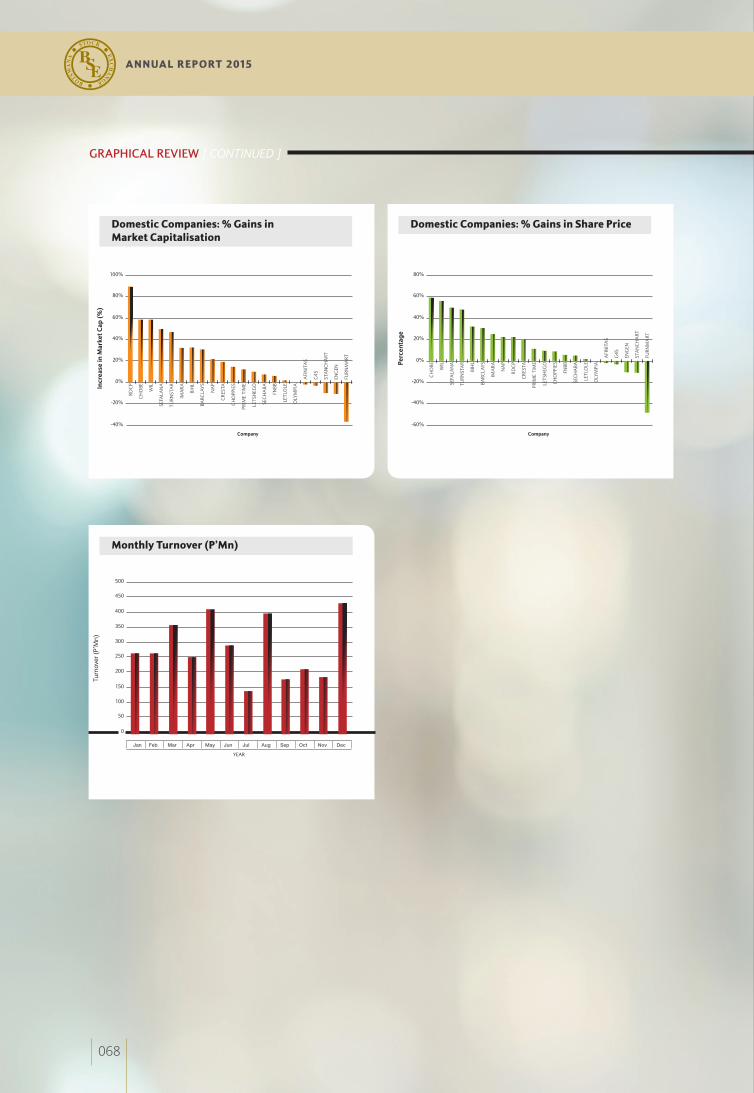
Domestic Companies: % Gains in Market Capitalisation
Domestic Companies: % Gains in Share Price
Monthly Turnover (P’Mn)
-40%
-20%
20%
0%
Incr
ease
in M
arke
t Cap
(%)
40%
60%
80%
100%
RDC
P
CH
OBE
WIL
SEFA
LAN
A
TURN
STA
R
IMA
RA
BIH
L
BARC
LAYS
NA
P
CRE
STA
CH
OPP
IES
PRIM
ETI
ME
LETS
HEG
O
SEC
HA
BA
FNBB
LETL
OLE
OLY
MPI
A
AFI
NIT
AS
G4S
STA
NC
HA
RT
ENG
EN
FURN
MA
RT
Company
-60%
-40%
0%
-20%
Perc
enta
ge 20%
40%
60%
80%
CH
OBE
WIL
SEFA
LAN
A
TURN
STA
R
BIH
L
BA
RCLA
YS
IMA
RA
NA
P
RDC
P
CRE
STA
PRIM
ETI
ME
LETS
HEG
O
CH
OPP
IES
FNBB
SEC
HA
BA
LETL
OLE
OLY
MPI
A
AFI
NIT
AS
G4S
ENG
EN
STA
NC
HA
RT
FURN
MA
RT
Company
0
100
200
150
50
Turn
over
(P’
Mn)
250
350
300
400
500
450
Jan Feb Mar Apr May Jun Jul Aug Sep Oct Nov Dec
YEAR
GRAPHICAL REVIEW [ CONTINUED ]
annual report 2015
068
ANNUAL REPORT 2015

Lobatse Senior Secondary School, winners of the 2015 Senior Secondary Schools
Finance & Investement Competition, with BSE CEO, Mr Thapelo Tsheole
R E A C H I N G G R E AT E R H E I G H T S
069

Market StatiSticS
070
ANNUAL REPORT 2015

Market Statistics
Table 1: Number of Companies Listed
Date 2009 2010 2011 2012 2013 2014 2015
NumberofNewListings 0 2 6 3 1 1 1
NumberofDe-listings 0 3 1 1 3 1 4
ForeignListings 11 9 12 13 12 12 10
DomesticListings 20 21 23 24 23 23 22
Total 31 30 35 37 35 35 32
Table 2: Market Capitalisation of BSE Listings: 2015
New Domestic Listings (IPOs) Number of Shares Price Per Share (P) Market Capitalisation (P)
Afinitas 213,946,250 1.00 213,946,250.00
Table 3: BSE Market Capitalisation as at Year ended December (P’000,000)
Date 2009 2010 2011 2012 2013 2014 2015
Domestic Market Capitalisation 28,536.15 26,245.68 30,694.26 35,530.83 43,457.57 46,209.87 50,213.85
Foreign Market Capitalisation 346,001.07 408,380.29 380,909.51 376,818.18 373,132.84 371,946.84 370,885.33
Total Market Capitalisation 374,537.22 434,625.97 411,603.77 412,349.01 416,590.41 418,156.71 421,099.19
Table 4: BSE Market Capitalisation as at Quarter ended (P’000,000)
Market Capitalisation Mar 14 Jun 14 Sep 14 Dec 14 Mar 15 Jun 15 Sep 15 Dec 15
DomesticMarketCapitalisation 42,989.66 44,419.62 45,929.47 46,209.87 45,279.00 50,461.58 50,362.63 50,213.85
ForeignMarketCapitalisation 372,823.25 373,800.19 372,152.92 371,946.84 370,418.23 370,671.79 368,674.55 370,885.33
Total MarketCapitalisation 415,812.91 418,219.81 418,082.71 418,156.71 415,697.23 421,133.37 419,037.18 421,099.18
071
R E A C H I N G G R E AT E R H E I G H T S

Table 5: Market Capitalisation by sector as at Year ended December (P’000,000)
Date 2009 2010 2011 2012 2013 2014 2015
Banking 16,858.3 12,953.8 16,116.8 16,674.8 19,815.1 17,815.3 17,005.4
FinancialServices&Insurance 20,466.1 21,353.5 21,574.8 24,560.7 25,958.9 27,087.9 29,222.2
Retailing&Wholesaling 3,134.7 2,617.5 3,098.3 6,099.8 8,884.8 11,859.5 13,322.2
Property&PropertyTrust 944.7 1,083.7 2,788.2 3,180.4 3,603.8 4,022.4 5,321.7
Mining&Materials 331,978.3 393,608.9 365,238.4 359,135.9 355,342.4 354,005.3 352,642.5
SecurityServices 188.8 263.0 480.0 465.6 246.4 229.2 289.6
InformationTechnology 7.9 7.6 7.9 11.0 0.0 0.0 0.0
FuneralServices 187.2 224.4 175.2 157.1 297.4 285.3 0.0
Energy 586.2 1,022.2 881.7 983.9 1,296.9 1,517.4 1,357.6
Tourism 185.1 1,491.5 1,242.6 1,079.9 1,144.8 1,264.5 1,938.1
Table 6: Market Capitalisation by sector as at Quarter ended (P’000,000)
Market Capitalisation Mar 14 Jun 14 Sep 14 Dec 14 Mar 15 Jun 15 Sep 15 Dec 15
Banking 17,711.80 18,228.40 17,922.70 17,815.30 16,757.88 17,477.13 17,347.57 17,005.39
FinancialServices&Insurance 8,190.80 8,146.10 8,992.00 9,146.40 26,681.44 29,271.11 29,536.75 29,222.16
Retailing&Wholesaling 10,359.60 11,071.40 11,748.70 11,859.50 12,236.54 13,733.96 13,001.95 13,322.15
Property&PropertyTrust 3,702.00 3,757.20 3,910.50 4,022.40 4,141.57 4,535.84 4,854.81 5,321.68
Mining&Materials 355,032.80 355,858.70 354,211.40 354,005.30 352,476.73 352,428.93 350,431.69 352,642.46
SecurityServices 225.60 199.20 297.60 299.20 268.80 280.00 288.00 289.60
InformationTechnology 0.00 0.00 0.00 0.00 0.00 0.00 0.00 0.00
FuneralServices 288.90 286.50 284.10 285.30 296.14 302.19 327.57 0.00
Energy 1,435.90 1,595.60 1,610.00 1,517.40 1,515.76 1,352.85 1,364.03 1,357.64
Tourism 1,075.10 1,075.30 1,167.20 1,264.50 1,322.37 1,751.37 1,884.81 1,938.10
MARKET STATISTICS [CONTINUED]for the year ended 31 December 2015
072
annual report 2015
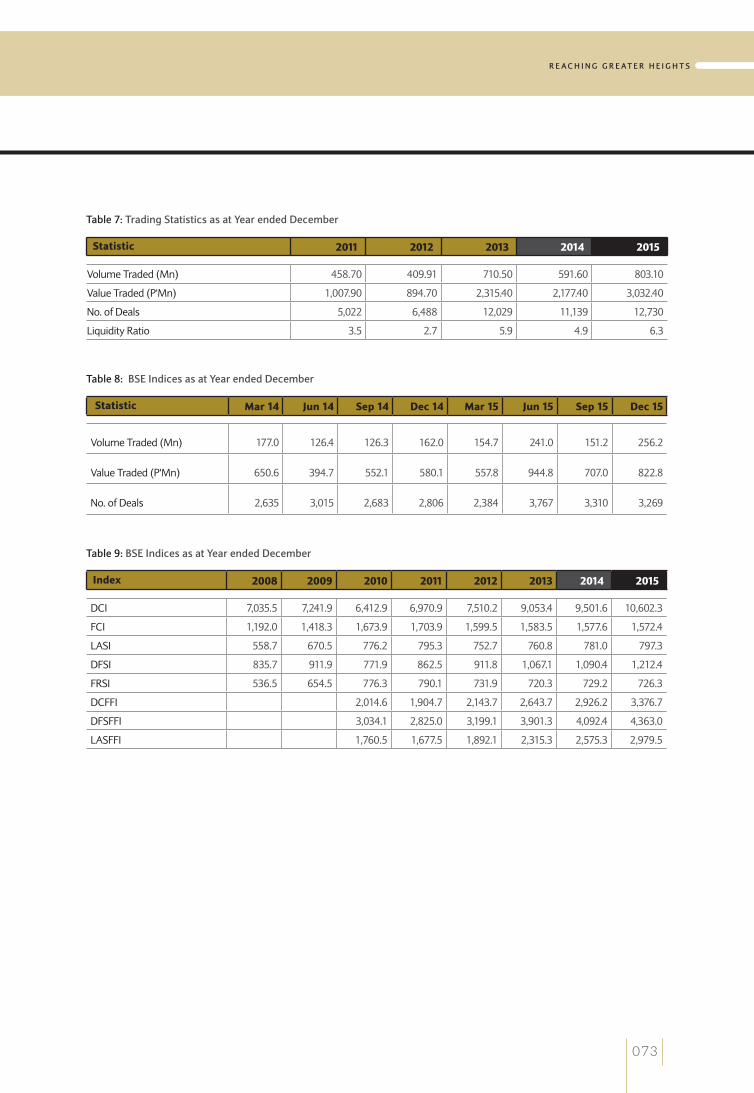
Table 7: Trading Statistics as at Year ended December
Statistic 2011 2012 2013 2014 2015
VolumeTraded(Mn) 458.70 409.91 710.50 591.60 803.10
ValueTraded(P'Mn) 1,007.90 894.70 2,315.40 2,177.40 3,032.40
No.ofDeals 5,022 6,488 12,029 11,139 12,730
LiquidityRatio 3.5 2.7 5.9 4.9 6.3
Table 8: BSE Indices as at Year ended December
Statistic Mar 14 Jun 14 Sep 14 Dec 14 Mar 15 Jun 15 Sep 15 Dec 15
VolumeTraded(Mn) 177.0 126.4 126.3 162.0 154.7 241.0 151.2 256.2
ValueTraded(P'Mn) 650.6 394.7 552.1 580.1 557.8 944.8 707.0 822.8
No.ofDeals 2,635 3,015 2,683 2,806 2,384 3,767 3,310 3,269
Table 9: BSE Indices as at Year ended December
Index 2008 2009 2010 2011 2012 2013 2014 2015
DCI 7,035.5 7,241.9 6,412.9 6,970.9 7,510.2 9,053.4 9,501.6 10,602.3
FCI 1,192.0 1,418.3 1,673.9 1,703.9 1,599.5 1,583.5 1,577.6 1,572.4
LASI 558.7 670.5 776.2 795.3 752.7 760.8 781.0 797.3
DFSI 835.7 911.9 771.9 862.5 911.8 1,067.1 1,090.4 1,212.4
FRSI 536.5 654.5 776.3 790.1 731.9 720.3 729.2 726.3
DCFFI 2,014.6 1,904.7 2,143.7 2,643.7 2,926.2 3,376.7
DFSFFI 3,034.1 2,825.0 3,199.1 3,901.3 4,092.4 4,363.0
LASFFI 1,760.5 1,677.5 1,892.1 2,315.3 2,575.3 2,979.5
073
R E A C H I N G G R E AT E R H E I G H T S

Table 11: Top Ten Domestic Companies by Volume Traded (Mn)
2014 2015
Company Volume Company Volume
Letshego 265.0 Letshego 276.5
Choppies 72.0 Choppies 123.8
FNBB 59.2 FNBB 80.7
Turnstar 53.2 RDCP 80.5
Letlole 26.9 Turnstar 51.8
BIHL 19.5 Sefalana 30.6
Sefalana 13.6 Imara 17.9
StanChart 12.1 Letlole 16.5
Sechaba 10.9 Wilderness 11.6
RDCP 1.9 Barclays 10.9
Table 12: Top Ten Domestic Companies by Value Traded (P’ Mn)
2014 2015
Company Value Company Value
Letshego 631.7 Letshego 796.8
Choppies 297.1 Choppies 585.8
Sechaba 261.3 Sefalana 361.2
BIHL 217.7 FNBB 306.0
FNBB 217.0 Sechaba 210.4
StanChart 145.3 Turnstar 134.0
Sefalana 104.6 BIHL 129.0
Turnstar 104.6 StanChart 92.9
Letlole 51.5 Wilderness 52.5
Chobe 23.0 Imara 47.2
Table 13: Top Ten Foreign Companies by Volume Traded (Mn)
2014 2015
Company Volume Company Volume
Shumba 11.959 Shumba 21.930
Magnum 1.167 Lucara 4.290
Lucara 0.645 Magnum 3.510
DiscoveryMetals 0.552 AfricanCopper 1.000
BotswanaDiamonds 0.457 DiscoveryMetals 0.520
AfricanCopper 0.039 BotswanaDiamonds 0.400
A-Cap 0.005 A-Cap 0.030
Anglo 0.0001 AfricanEnergy 0.010
Table 14: Table 14: Top Ten Foreign Companies by Value Traded (P’ Mn)
2014 2015
Company Value Company Value
Shumba 13.154 Lucara 65.170
Lucara 8.661 Shumba 29.840BotswanaDiamonds 0.189 Magnum 0.230
DiscoveryMetals 0.174 BotswanaDiamonds 0.090
Magnum 0.068 DiscoveryMetals 0.090
Anglo 0.022 AfricanCopper 0.020
AfricanCopper 0.005 AfricanEnergy 0.010
A-Cap 0.003 A-Cap 0.010
Table 10: BSE Indices as at Quarter ended
Index 2008 2009 2010 2011 2012 2013 2014 2015
DCI 7,035.5 7,241.9 6,412.9 6,970.9 7,510.2 9,053.4 9,501.6 10,602.3
FCI 1,192.0 1,418.3 1,673.9 1,703.9 1,599.5 1,583.5 1,577.6 1,572.4
LASI 558.7 670.5 776.2 795.3 752.7 760.8 781.0 797.3
DFSI 835.7 911.9 771.9 862.5 911.8 1,067.1 1,090.4 1,212.4
FRSI 536.5 654.5 776.3 790.1 731.9 720.3 729.2 726.3
DCFFI 2,014.6 1,904.7 2,143.7 2,643.7 2,926.2 3,376.7
DFSFFI 3,034.1 2,825.0 3,199.1 3,901.3 4,092.4 4,363.0
LASFFI 1,760.5 1,677.5 1,892.1 2,315.3 2,575.3 2,979.5
MARKET STATISTICS [CONTINUED]for the year ended 31 December 2015
074
annual report 2015

Table 15: Top Ten Domestic Companies by Market Capitalisation (P’ Mn)
2014 2015
Company Volume Company Volume
FNBB 9,280.6 FNBB 9,793.3
Letshego 5,789.4 Letshego 6,336.2
Choppies 4,767.3 Choppies 5,437.8
Stanchart 3,750.3 BIHL 4,272.3
Sechaba 3,737.7 Sechaba 3,990.5
BIHL 3,235.1 Barclays 3,834.7
Barclays 2,940.0 StanChart 3,377.3
Sefalana 2,057.1 Sefalana 3,075.6
ABCH 1,844.4 Turnstar 1,745.1
Engen 1,517.4 NAP 1,589.6
Table 16: Top Ten Domestic Companies by Market Capitalisation (P’ Mn)
2014 2015
Company Volume Company Volume
Anglo 344,269.4 Anglo 344,269.4
Investec 15,336.1 Investec 15,637.5
Lucara 6,961.4 Lucara 6,579.3
Blue 2,605.4 Blue 2,650.4
AfricanEnergy 1,641.8 AfricanEnergy 824.6
GalaneGold 355.6 GalaneGold 355.6
Shumba 216.7 A-Cap 290.0
AfricanCopper 178.2 Shumba 267.6
A-Cap 168.8 Magnum 34.0
DiscoveryMetals 96.9 BotswanaDiamonds 22.0
Table 17: Bond Market Statistics: 2015
Bond Code Maturity Date Nominal Amount (P) Coupon Rate % Trade (P)
BW003* 31/10/2015 - - 676,173,633
BW005 12/09/2025 1,338,000,000 10.00 49,968,626
BW007 10/03/2025 1,410,000,000 8.00 30,333,881
BW008 08/09/2020 1,083,000,000 7.75 27,972,846
BW010 14/03/2017 718,000,000 7.75 59,006,829
BW011 10/09/2031 1,370,000,000 7.75 14,516,917
BW012 13/06/2040 437,000,000 6.00 -
DPCF004 02/06/2016 220,000,000 10.45 -
DPCF005 02/06/2019 100,000,000 10.60 -
DPCF006 02/06/2022 55,000,000 10.75 -
DPCF007 02/06/2025 35,000,000 10.90 -
BBB016 31/10/2019 156,000,000 floating -
BBS002 15/12/2016 140,000,000 12.00 -
BBS004 26/11/2019 75,000,000 11.10 -
BBS005 03/12/2023 150,000,000 11.20 -
BBS006 04/08/2018 110,000,000 floating -
BHC017 10/12/2017 286,000,000 floating -
BHC020 10/12/2020 103,000,000 10.10 -
BVI001 07/05/2018 70,000,000 11.23 -
FML025 23/10/2025 150,000,000 8.20 -
FNBB005 11/11/2020 125,590,000 floating -
FNBB006 11/11/2022 112,120,000 floating -
LHL05 08/11/2017 50,000,000 8.25 -
075
R E A C H I N G G R E AT E R H E I G H T S

MARKET STATISTICS [CONTINUED]for the year ended 31 December 2015
Table 17: Bond Market Statistics: 2015 (continued)
Bond Code Maturity Date Nominal Amount (P) Coupon Rate % Trade (P)
LHL06 08/11/2023 200,000,000 10.50 -
LHL07 08/11/2025 75,000,000 10.50 -
LHL08 08/11/2027 25,000,000 11.00 -
NDB001 01/08/2017 165,000,000 11.25 -
SBBL003 01'/06/2017 100,000,000 10.50 -
SBBL056 13/06/2021 50,000,000 floating -
SBBL062 15/10/2017 66,600,000 floating -
SBBL063 15/10/2019 98,600,000 floating -
SBBL064 18/06/2020 128,400,000 floating -
SBBL065 18/06/2020 153,100,000 floating -
SCBB003 20/12/2020 50,000,000 10.50 -
SCBB006 12/05/2021 70,000,000 floating -
SCBB007 27/06/2022 50,000,000 floating -
SCBB008 27/06/2022 127,260,000 8.20 -
WUC001 26/06/2018 195,000,000 10.65 -
WUC002 26/06/2026 205,000,000 10.60 -
TOTAL 10,052,670,000 857,972,731 * BW003 matured before end of 2015
076
annual report 2015
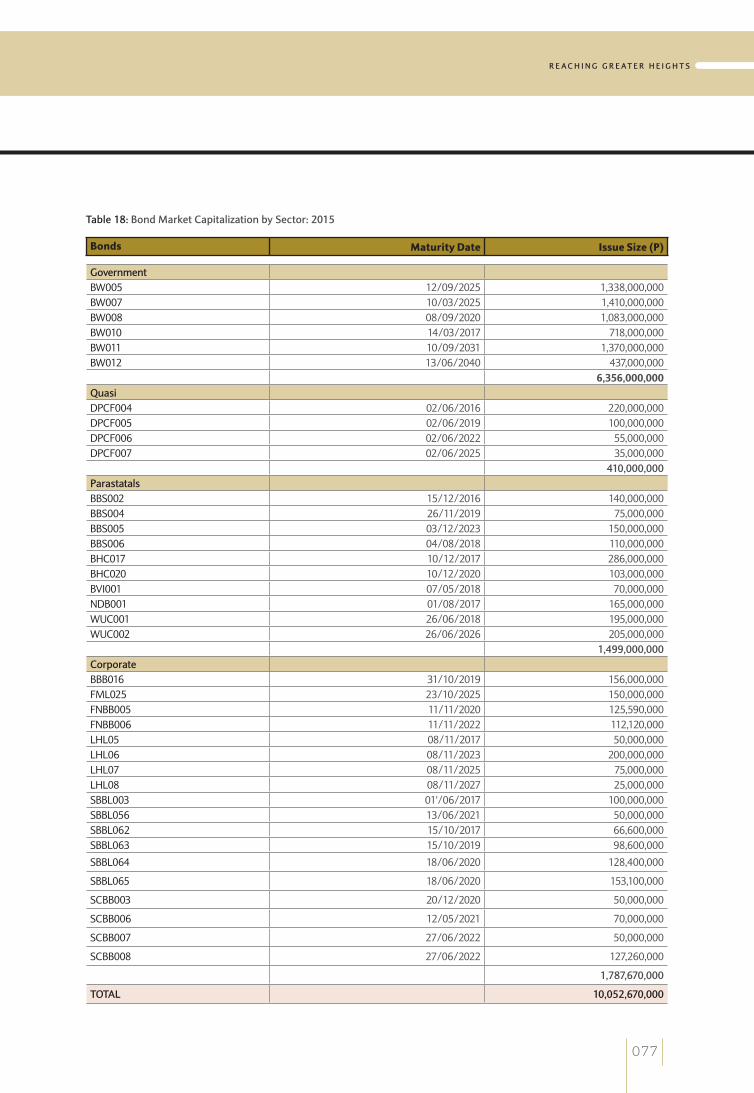
Table 18: Bond Market Capitalization by Sector: 2015
Bonds Maturity Date Issue Size (P)
Government BW005 12/09/2025 1,338,000,000BW007 10/03/2025 1,410,000,000BW008 08/09/2020 1,083,000,000BW010 14/03/2017 718,000,000BW011 10/09/2031 1,370,000,000BW012 13/06/2040 437,000,000 6,356,000,000Quasi DPCF004 02/06/2016 220,000,000DPCF005 02/06/2019 100,000,000DPCF006 02/06/2022 55,000,000DPCF007 02/06/2025 35,000,000 410,000,000Parastatals BBS002 15/12/2016 140,000,000BBS004 26/11/2019 75,000,000BBS005 03/12/2023 150,000,000BBS006 04/08/2018 110,000,000BHC017 10/12/2017 286,000,000BHC020 10/12/2020 103,000,000BVI001 07/05/2018 70,000,000NDB001 01/08/2017 165,000,000WUC001 26/06/2018 195,000,000WUC002 26/06/2026 205,000,000 1,499,000,000Corporate BBB016 31/10/2019 156,000,000FML025 23/10/2025 150,000,000FNBB005 11/11/2020 125,590,000FNBB006 11/11/2022 112,120,000LHL05 08/11/2017 50,000,000LHL06 08/11/2023 200,000,000LHL07 08/11/2025 75,000,000LHL08 08/11/2027 25,000,000SBBL003 01'/06/2017 100,000,000SBBL056 13/06/2021 50,000,000SBBL062 15/10/2017 66,600,000SBBL063 15/10/2019 98,600,000
SBBL064 18/06/2020 128,400,000
SBBL065 18/06/2020 153,100,000
SCBB003 20/12/2020 50,000,000
SCBB006 12/05/2021 70,000,000
SCBB007 27/06/2022 50,000,000
SCBB008 27/06/2022 127,260,000
1,787,670,000
TOTAL 10,052,670,000
077
R E A C H I N G G R E AT E R H E I G H T S

BSE STRATEGY
078
ANNUAL REPORT 2015

TO BE THE LEADING STOCK EXCHANGE IN
AFR
ICA
BSE CURRENT POSITION
DESIRED POSITION
BSE STRATEGIC VISION
BSE MISSION
To provide and operate a fair, transparent and efficient stock market for all stakeholders in order to optimise national economic empowerment.
079
R E A C H I N G G R E AT E R H E I G H T S

080
ANNUAL REPORT 2015

1. PROGRESS ON THE BSE STRATEGY
The BSE has made progress in achieving strategic objectives as detailed in the BSE’s strategic plan. A synopsis of progress to date is given below:
1.1 INFRASTRUCTURE DEVELOPMENT
• CSD implemented in May 2008, followed by subsequent shares dematerialisation
• Dematerialisation of shares continuing satisfactorily in the CSD System
• Electronic CSD account statements launched in 2010
• Dematerialisation of bonds into the CSD System commenced in 2011
• Compulsory dematerialisation of listed securities commenced in 2015
• Number of Accounts opened in CSD stood at 28,222 accounts in 2015
• Automated Trading System (ATS) was implemented in August 2012
• ATS was successfully upgraded in June 2013• Systems have been implemented to disseminate online
information to data vendors • Upgrade of IT infrastructure completed in 2014• Implementation of a data mining system completed in
2015
BSE STRATEGIC PILLARS
081
R E A C H I N G G R E AT E R H E I G H T S
1.2 REGULATION
• Code on corporate governance for listed companies implemented in 2008
• CSD rules drafted by BSE and implemented in 2008• Settlement cycle of transactions in the BSE reduced
from T+5 to T+4, and T+3 effective 2012• Strategies implemented to improve compliance by
listed companies• ATS Trading Rules for Debt and Equity instruments
implemented in 2012 • Trading in the ATS extended by one hour effective 4
November in 2013• Digitization of listing files in progress• New Equity Listing Rules approved in 2015• Market-Making Rules submitted to NBFIRA in 2015• X- News launched in 2014• OTC Serala Board approved in 2014• BSE Transition Act commenced in 2015, paving the way
for demutualization• Securities Act approved in 2014, awaiting
Commencement Order
1.3 MARKET DEVELOPMENT
• Improvements made to BSE publications• Selected BSE publications translated into Setswana• Series of road shows held nationwide to educate
general public about the BSE• BSE also participated at exhibitions and fairs around
the country• Continued awareness creation campaigns conducted
targeting retail investors• Commenced awareness creation on the listing process
targeted at companies with the potential to list• Promoted publicity of the BSE operations by inviting
the public to view live BSE trading sessions• Held Conferences and workshops to market the BSE
brand, product development and strategy. These conferences are; Creating Wealth for Batswana in 2007, Exchange Traded Funds in 2008, Securitisation and the Bond Market in 2008, Credit Rating Workshop in 2008.
• Strategic alliances with key institutions fostered• Partnered with Botswana Television to sponsor the
business segment of the “Daily Breakfast Show”• Partnered with the media by contributing articles and
taking part in radio and television talk shows• BSE conducting market performance presentations
on RB1 programmes of “Tsele le Tsele” and “Sefalana Sa Papadi” and the RB2 programme of “Business Twighlight” every year
• BSE conducting market performance presentations on BTV programme of “First Issues”
• BSE published a cartoon strip booklet titled “Sheleng”• ETFs snippets on Yarona FM aired to advertise ETFs• Inaugural BSE Senior Secondary Schools Finance and
Investment Quiz in 2013• Increased visibility of the BSE by putting up 7 billboards
in various places in Botswana in 2013• Re-vamping of the BSE website to start in 2014• Corporate Social Investment initiative successfully
undertaken with adoption of two primary schools in 2013; Sebele Primary School and Xakao Primary School
• The BSE’s 2013 Annual Report won the prize for the best report in the Not-for-Profit category at the Price Waterhouse Coopers Annual Report Awards
• Third Annual Senior Secondary Schools’ BSE Finance and Investment Quiz successfully hosted
1.4 PRODUCT DEVELOPMENT
• Series of indices constructed using “total return” methodology
• Series of indices based on “free float” constructed• Library to assist research established• Strategic Alliances formed with Absa Capital SA &
Nedbank Capital to implement ETFs in the BSE• Dual listed the NewGold Exchange Traded Fund in July
2010 in partnership with Absa Capital• Nedbank Capital made several presentations to fund
managers, brokers and other interested parties to raise aware on the BettaBeta ETF in 2011
• Dual listed the Bettabeta Equally Weighted Top 40 ETF in May 2011 in conjunction with Nedbank Capital
• Held several meetings with strategic partners to appraise them of the BSE’s plans to introduce Contract for Difference (CFDs)
• Partnered with Geometric Progression CC of South Africa to conduct financial market courses since 2010
• Bond Market Association established in 2010, with representation from several market participants
BSE STRATEGY [CONTINUED]
082
annual report 2015

• Consolidated the Bond Market Development Strategy Paper in 2011
• Bond Market Association officially registered with the Registrar of Societies to become a full-fledged Association
• Concept papers on CFDs approved by BSE Board• Compiled a research paper aiming at providing findings
and recommendations for promoting the trading, clearing and settlement of government bonds through the BSE to enhance liquidity, price discovery and the development of a market determined yield curve.
• Amended Debt Listing and Trading Rules in 2012• BSE currently revising Debt Listing Requirements• Three bond indices launched in 2013 in conjunction
with Nedbank Capital• 3 Bond Indices launched in 2013 • Held a workshop on Global Depository Receipts (GDRs)
and another one on ETFs in 2013• BSE drafted listing rules for GDRs• Brochures for ETFs and debt instruments completed • Contract negotiation with international data vendors
for dissemination of trading data secured, negotiations with other on-going
• NewPlat ETF, that tracks price of Platinum, listed in August
• Three financial markets courses conducted: Introduction to Financial Markets, Introduction to Money Markets, Money Markets and Bond Valuation and Bonds & Yield Curves and Swap Spreads
• NewFunds ILBI ETF listed in November
1.5 ORGANISATION STRUCTURE AND HUMAN RESOURCE DEVELOPMENT
• Performance appraisal system for staff implemented• BSE continued to train staff through workshops,
conferences and courses on operations of the stock exchange
• The BSE continues to offer internship to graduates under the government’s internship programme
• A project about evaluating the BSE’s organisation structure, job profiles, HR policies and procedures, Code of Conduct as well as succession and retention plans completed in 2012
• Internal audit function implemented• Internal Audit function is being reviewed with the
intention to internalise it in future• Team building exercises being done annually• Staff welfare and wellness activities hosted
1.6 GOVERNANCE STRUCTURE
• BSE Board Charter adopted• Differentiation between “independent” and “non
independent” committee members made in the constitution of sub-committees
1.7 FINANCIAL RESOURCES
• BSE Board Charter adopted• Differentiation between “independent” and “non-
independent” committee members made in the constitution of sub-committees
• BSE fees on transactions rationalised to reduce dependence on government subvention as well as rationalisation of expenditure by benchmarking against other exchanges
• BSE Strategic plan review in progress aimed at Commercialisation of the Exchange
• Breakeven levels of turnover and level of dependence on government computed
• Implementation of activity based management systems is in progress
083
R E A C H I N G G R E AT E R H E I G H T S

CORPORATE GOVERNANCE
084
ANNUAL REPORT 2015

CORPORATE GOVERNANCE
1. Main Committee
The Main Committee of the BSE established in terms of the BSE Act is made up of 3 members appointed by the Minister of Finance and Development Planning and a maximum of 6 members elected by member brokers, subject to a maximum of 2 persons elected from any one broking company.
The functions of the main Committee are to set the strategic direction of the BSE and to ensure that the BSE is being managed in line with policies set by the committee.
The BSE Board for the year was constituted by the following members:
MEMBER POSITION DATE AND PERIOD OF APPOINTMENT
Elected Members
PatrickO’Flaherty* Member Firstelectedin2010
MartinMakgatlhe Member Firstelectedin1998
KabeloMohohlo** Member ElectedinMay2011
GregoryMatsake Vice-Chairperson ElectedinMay2012
GoitseoneKgaodi Treasurer ElectedinMay2012
OosiLemo* Member ElectedinMay2014
Appointed Members
NelsonLetshwene Member AppointedinMay2014
ElainaGonsalves*** Member FirstappointedinOctober2011
ReginaVaka**** Chairperson FirstappointedinJune2013
Prof.JohnKiggundu Member FirstappointedinJune2013
Gen.TebogoC.Masire***** Member AppointedinMay2015
ItumelengMagama****** Member AppointedinSeptember2015
*Term ended on 29 May 2015
** Re-elected on 29 May 2015 but assumed office on 11 August 2015
*** Term ended on 31 August 2015
****First appointed Chairperson on 25 July 2014 and subsequently on 27 November 2015
***** Appointed on 29 May 2015 but assumed office on 11 August 2015
****** Appointed to Committee with effect from 1 September 2015 but assumed office on 15 December 2015
085
R E A C H I N G G R E AT E R H E I G H T S

2. BOARD SUB-COMMITTEES Note 1
2. Listings and Trading Sub-Committee
The Listings and Trading sub-committee sets policy and formulates rules with regard to listings and trading matters. It approves listing applications that require special dispensation from the listing rules referred to them by the Executive Committee.
The members of the Listings and Trading sub-committee are:
MEMBER ATTENDANCE
ReginaVaka*(Chairperson) 0/0
Gen.TebogoC.Masire** 0/0
Prof.JohnKiggundu 0/0
MartinMakgatlhe 0/0
OosiLemo* ElectedinMay2014
*Appointed Chairperson with effect from 25 July 2014 and subsequently on 27 November 2015
** Term ended on 31 August 2015
*** Appointed to Committee with effect from 1 September 2015 but assumed office on 15 December 2015
2.3 Investigations and Disciplinary Sub-Committee
The Investigations and Disciplinary sub-committee hears complaints made against any broker or broking firm (trading participant) referred to it by the BSE or any member of the public and determines its findings following a hearing; including, if applicable, pronouncement of sanctions.
The members of the Investigations and Disciplinary sub-committee are:
MEMBER ATTENDANCE
Prof.JohnKiggundu(Chairperson) 0/0
ElainaGonsalves* 0/0
NelsonLetshwene 0/0
ItumelengMagama** 0/0
* Term ended 31 August 2015
** Appointed to Committee with effect from 1 September 2015 but assumed office on 15 December 2015
2.4 Governance and Remuneration Sub-Committee
Governance and Remuneration sub-committee is responsible for all matters relating to corporate governance and practices of the BSE, nominations of members to be appointed to the BSE Committee and sub-committees as well as terms and conditions of employment for management of the BSE.
Note 1: 0/0 means there were no scheduled meetings or the members were elected after the scheduled meetings
CORPORATE GOVERNANCE [CONTINUED ]
086
annual report 2015

The members of Governance and Remuneration sub-committee are:
MEMBER ATTENDANCE
ElainaGonsalves* 2/2
NelsonLetshwene(Chairperson) 4/4
Prof.JohnKiggundu 4/4
ItumelengMagama** 0/0
ItumelengMagama** 0/0
* Term ended 31 August 2015
** Appointed to Committee with effect from 1 September 2015 but assumed office on 15 December 2015
2.5 Botswana Stock Exchange Security Fund Sub-Committee
Botswana Stock Exchange Security Fund was established to provide compensation for losses incurred under certain circumstances by registered stockbrokers, employees or associates and agents of registered stockbrokers or broking members. The sub-committee is responsible for all matters relating to the governance of the fund as outlined in the BSE Act.
The members of the BSE Security Fund sub-committee are:
MEMBER ATTENDANCE
Prof.JohnKiggundu(Chairperson) 0/0
KabeloMohohlo*** 0/0
ReginaVaka 0/1
OosiLemo* 1/1
ElainaGonsalves** 1/1
*Term ended on 29 May 2015
** Term ended 31 August 2015
*** Re-elected on 29 May 2015 but assumed office on 11 August 2015
2.5 Botswana Stock Exchange Board Tender Committee
Botswana Stock Exchange Board Tender Committee was established to be the body responsible to approve procurement of supplies, works and services in line with the BSE Procurement Procedures.
MEMBER ATTENDANCE
NelsonLetshwene(Chairperson) 2/2
OosiLemo* 0/0
GoitseoneKgaodi 2/2
KabeloMohohlo** 1/1
ElainaGonsalves** 1/1
*Term ended on 29 May 2015
** Re-elected on 29 May 2015 but assumed office on 11 August 2015
087
R E A C H I N G G R E AT E R H E I G H T S
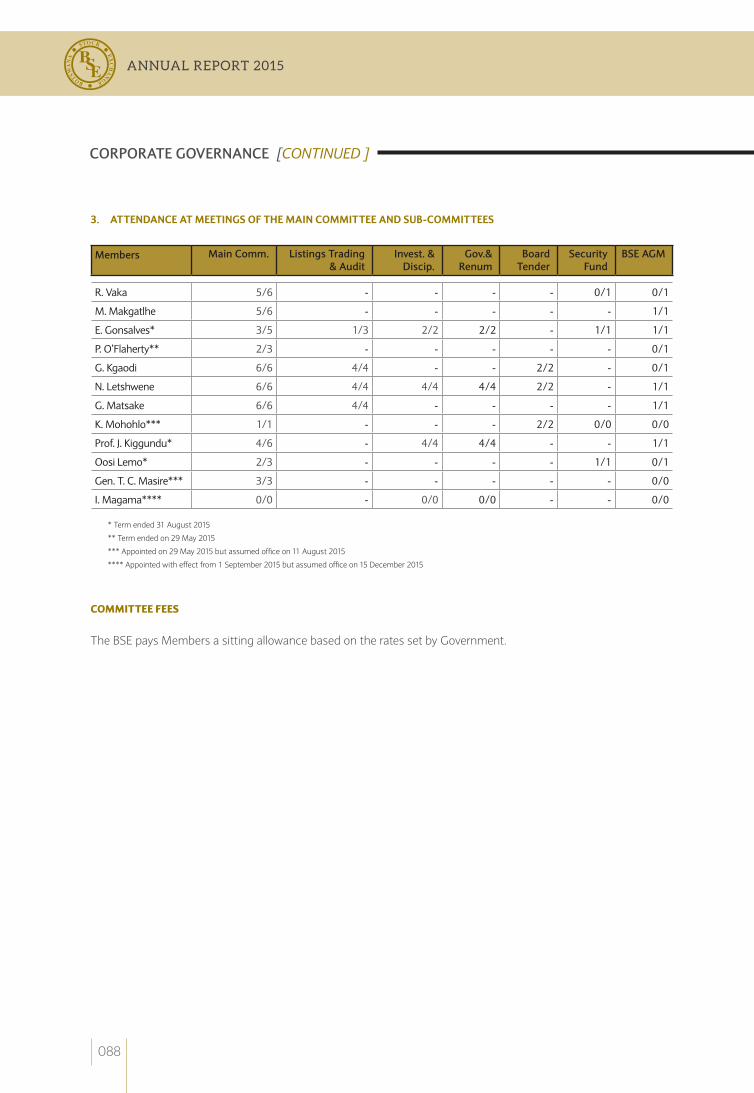
CORPORATE GOVERNANCE [CONTINUED ]
3. ATTENDANCE AT MEETINGS OF THE MAIN COMMITTEE AND SUB-COMMITTEES
Members Main Comm. Listings Trading & Audit
Invest. & Discip.
Gov.& Renum
Board Tender
Security Fund
BSE AGM
R.Vaka 5/6 - - - - 0/1 0/1
M.Makgatlhe 5/6 - - - - - 1/1
E.Gonsalves* 3/5 1/3 2/2 2/2 - 1/1 1/1
P.O’Flaherty** 2/3 - - - - - 0/1
G.Kgaodi 6/6 4/4 - - 2/2 - 0/1
N.Letshwene 6/6 4/4 4/4 4/4 2/2 - 1/1
G.Matsake 6/6 4/4 - - - - 1/1
K.Mohohlo*** 1/1 - - - 2/2 0/0 0/0
Prof.J.Kiggundu* 4/6 - 4/4 4/4 - - 1/1
OosiLemo* 2/3 - - - - 1/1 0/1
Gen.T.C.Masire*** 3/3 - - - - - 0/0
I.Magama**** 0/0 - 0/0 0/0 - - 0/0
* Term ended 31 August 2015
** Term ended on 29 May 2015
*** Appointed on 29 May 2015 but assumed office on 11 August 2015
**** Appointed with effect from 1 September 2015 but assumed office on 15 December 2015
COMMITTEE FEES
The BSE pays Members a sitting allowance based on the rates set by Government.
088
annual report 2015

R E A C H I N G G R E AT E R H E I G H T S
089
BSE CEO (then the Deputy CEO), Mr Thapelo Tsheole,
giving remarks at the Afinitas Limited Listing Ceremony
CORPORATE SOCIAL RESPONSIBILITY
BSE GIVES BACk: BSE sponsors the Botswana Retired Nurses Society (BORNUS) Teenage Pregnancy Prevention Project to curb teenage pregnancies in the Old Naledi community.
090
annual report 2015

BSE GIVES BACk: Adopt - a - School Program: In 2015, the BSE refurbished libraries of the 2 adopted schools, Xakau and Boitumelo Primary Schools, with new computers and books.
091
R E A C H I N G G R E AT E R H E I G H T S
Botswana Stock Exchangeand its subsidiary
ANNUAL GROUP FiNANciAL StAtEmENtSFOR tHE YEAR ENDED 31 DEcEmBER 2015
092

General information 094
Statement of Main Committee’s responsibilities 095
Report of the independent auditors 096
Statements of profit or loss and other comprehensive income 097
Statements of financial position 098
Statements of changes in equity 099
Statements of cashflows 100
Accounting policies 101
Financial risk management 110
Notes to the financial statements 115
Supplementary information
Detailed statement of profit or loss and other comprehensive income 125
CONTENTS
R E A C H I N G G R E AT E R H E I G H T S
093

GENERAL INFORMATION
GENERAL INFORMATION
Principal activities
Regulating and promoting the listing and dealing in shares and other securities listed on the Botswana Stock Exchange (BSE) CommitteesoftheBotswanaStockExchange
Main CommitteeMinisterial appointees: Elected Members:
ElainaGonsalves(resigned August 2015) ReginaVaka(Chairperson)
ProfessorJohnKiggundu PatrickO’Flaherty(resigned May 2015)
NelsonLetshwene GregoryMatsake
ItumelengMagama GoitseoneKgaodi
Gen.TebogoMasire(appointed May 2015)
KabeloMohohlo
MartinMakgatlhe
Membership of Sub Committees: ( 1 ) Listings and trading ( 2 ) Audit
ReginaVaka(Chairperson) GoitseoneKgaodi(Chairperson)
PatrickO’Flaherty(resigned May 2015) ElainaGonsalves(resigned August 2015)
MartinMakgatlhe GregoryMatsake
ProfessorJohnKiggundu ItumelengMagama
Gen.TebogoMasire(appointed May 2015) NelsonLetshwene
( 3 ) Investigations and disciplinary ( 4 ) Governance & RemunerationProfessorJohnKiggundu(Chairperson) ElainaGonsalves(Chairperson)(resigned August 2015)
ElainaGonsalves(resigned August 2015) ProfessorJohnKiggundu
ItumelengMagama ItumelengMagama
NelsonLetshwene NelsonLetshwene
Chief Executive Officer Secretary to the Board of DirectorsHiranMendis(resigned December 2015) LatelangChakalisa
ThapeloTsheole(appointed January 2016)
Regulator Postal addressNon-BankFinancialInstitutionRegulatoryAuthority(NBFIRA) PrivateBag00417
3rdFloorExponentialBuilding Gaborone
Plot54351,NewCBD
PrivateBag00314
Gaborone
Independent auditors BankersKPMG BarclaysBankofBotswanaLimited
StandardCharteredBankofBotswanaLimited
(ThefinancialstatementsareexpressedinPula,thecurrencyofBotswana)
094
BOTSWANA STOCK EXCHANGE AND ITS SUBSIDIARY COMPANY
annual report 2015

STATEMENT OF THE MAIN COMMITEE’S RESPONSIBILITIESfor the year ended 31 December 2015
The Main Committee of Botswana Stock Exchange (the “Exchange”) is responsible for the preparation and fair presentation of the annual group financial statements, comprising of the Exchange and group statements of financial position at 31 December 2015 and the statements of profit or loss and other comprehensive income, changes in equity and cash flows for the year then ended, and the notes to the financial statements, which include a summary of significant accounting policies and other explanatory information, in accordance with International Financial Reporting Standards.
The Exchange maintains systems of internal control, which are designed to provide reasonable assurance that the records accurately reflect its transactions and to provide protection against serious misuse or loss of company assets. The Main Committee is also responsible for the design, implementation and maintenance and monitoring of these systems of internal financial control. Nothing has come to the attention of the Main Committee to indicate that any significant breakdown in the functioning of these systems has occurred during the year under review.
The Main Committee has performed an assessment of the group’s ability to continue as a going concern based on the group’s budgets and available cash resources and have no reason to believe that the group will not be a going concern in the foreseeable future.
The external auditor is responsible for reporting on whether the annual group financial statements are fairly presented in accordance with International Financial Reporting Standards. The external auditors have unrestricted access to the Main Committee.
The financial statements set out on pages 97 to 124 and the supplementary information on page 125 to 126 were authorised for issue by the Main Committee on and are signed on its behalf by:
MEMBER MEMBER
095
R E A C H I N G G R E AT E R H E I G H T S
INDEPENDENT AUDITOR’S REPORT to the Members of the Main Committee of the Botswana Stock Exchange
We have audited the group and separate financial statements of Botswana Stock Exchange (the “Exchange”), which comprise the statements of financial position at 31 December 2015 and the statements of profit or loss and other comprehensive income, changes in equity and cash flows for the year then ended, and a summary of significant accounting policies and other explanatory notes, as set out on pages 97 to 124.
Main Committee’s responsibility for the financial statements The Main Committee is responsible for the preparation and fair presentation of these financial statements in accordance with International Financial Reporting Standards, and for such internal control as the committee determine is necessary to enable the preparation of financial statements that are free from material misstatement, whether due to fraud or error.
Auditor’s responsibility Our responsibility is to express an opinion on these financial statements based on our audit. We conducted our audit in accordance with International Standards on Auditing. Those standards require that we comply with ethical requirements and plan and perform the audit to obtain reasonable assurance whether the financial statements are free from material misstatement.
An audit involves performing procedures to obtain audit evidence about the amounts and disclosures in the financial statements. The procedures selected depend on the auditor’s judgement, including the assessment of the risks of material misstatement of the financial statements, whether due to fraud or error. In making those risk assessments, we consider internal control relevant to the entity’s preparation and fair presentation of the financial statements in order to design audit procedures that are appropriate in the circumstances, but not for the purpose of expressing an opinion on the effectiveness of the entity’s internal control. An audit also includes evaluating the appropriateness of accounting policies used and the reasonableness of accounting estimates made by management, as well as evaluating the overall presentation of the financial statements.
We believe that the audit evidence we have obtained is sufficient and appropriate to provide a basis for our audit opinion.
OpinionIn our opinion, the financial statements present a true and fair view of the group and separate financial position of Botswana Stock Exchange at 31 December 2015 and its group and separate financial performance and group and separate cash flows for the year then ended in accordance with International Financial Reporting Standards.
KPMG Certified Auditors GaboronePracticing member: AG Devlin (1996006023) 25 April 2016
096
BOTSWANA STOCK EXCHANGE AND ITS SUBSIDIARY COMPANY
annual report 2015

STATEMENTS OF PROFIT OR LOSS AND OTHER COMPREHENSIVE INCOMEfor the year ended 31 December 2015
GROUP EXCHANGE
2015 2014 2015 2014
Notes P P P P
Revenue 1 34 074 779 24 274 793 23 599 879 19 335 858
Government subvention 15 (c) 4 906 285 13 000 000 2 342 689 5 700 000
Other income 462 617 435 216 462 617 435 216
Income 39 443 681 37 710 009 26 405 185 25 471 074
Administrative expenses 2 (26 287 556) (22 346 676) (20 663 428) (16 823 841)
Operating profit 13 156 125 15 363 333 5 741 757 8 647 233
Finance income 4 3 133 768 2 193 211 2 367 259 1 875 614
Profit before income tax 16 289 893 17 556 544 8 109 016 10 522 847
Income tax expense 5 - - - -
Profit for the year 16 289 893 17 556 544 8 109 016 10 522 847
Other comprehensive income - - - -
Totalcomprehensiveincomefortheyear 16289893 17556544 8109016 10522847
097
R E A C H I N G G R E AT E R H E I G H T S

STATEMENTS OF FINANCIAL POSITIONas at 31 December 2015
GROUP EXCHANGE
2015 2014 2015 2014
Notes P P P P
ASSETSNon-current assets
Plant and equipment 7 2 068 396 2 438 326 1 246 005 1 305 079
Investment in subsidiary 6 - - 100 100
2 068 396 2 438 326 1 246 105 1 305 179
Current assets
Trade and other receivables 8 4 808 712 4 560 142 4 426 518 2 942 204
Money market investments 9 62 898 134 45 827 774 44 424 567 35 476 882
Cash and bank balances 9 6 637 782 2 661 592 2 763 715 1 542 073
74 344 628 53 049 508 51 614 800 39 961 159
Total assets 76 413 024 55 487 834 52 860 905 41 266 338
EQUITYCapital and reserves
Proprietary rights capital 10 5 200 5 200 5 200 5 200
Rights premium 777 476 777 476 777 476 777 476
Unutilised capital grant 5 000 000 - 5 000 000 -
Retained earnings 64 119 697 50 712 968 41 842 669 36 616 817
69 902 373 51 495 644 47 625 345 37 399 493
Non-current liabilitiesDeferred lease liability 13 93 721 187 131 93 721 187 131
Current liabilities
Trade and other payables 11 3 533 766 1 393 635 2 258 675 1 268 290
Amounts due to the Botswana Stock
Exchange Security Fund 12 2 883 164 2 411 424 2 883 164 2 411 424
6 416 930 3 805 059 5 141 839 3 679 714
Total equity and liabilities 76 413 024 55 487 834 52 860 905 41 266 338
098
BOTSWANA STOCK EXCHANGE AND ITS SUBSIDIARY COMPANY
annual report 2015

STATEMENTS OF CHANGES IN EqUITYfor the year ended 31 December 2015
Proprietaryrights
capitalRights
premium
Unutilised capital grants
Retained income Total
P P P P P
GROUP
Year ended 31 December 2014
Balance at 1 January 2014 5 200 777 476 - 35 567 848 36 350 524
Profit for the year - - - 17 556 544 17 556 544
Transfer to the Botswana Stock
Exchange Security Fund (note 12) - - - (2 411 424) (2 411 424)
Balance at 31 December 2014 5 200 777 476 - 50 712 968 51 495 644
Year ended 31 December 2015
Balance at 1 January 2015 5 200 777 476 - 50 712 968 51 495 644
Profit for the year - - - 16 289 893 16 289 893
Capital grant received - - 5 000 000 - 5 000 000
Transfer to the Botswana Stock
Exchange Security Fund (note 12) - - - (2 883 164) (2 883 164)
Balance at 31 December 2015 5 200 777 476 5 000 000 64 119 697 69 902 373
EXCHANGE
Year ended 31 December 2014
Balance at 1 January 2014 5 200 777 476 - 28 505 394 29 288 070
Profit for the year - - - 10 522 847 10 522 847
Transfer to the Botswana Stock
Exchange Security Fund (note 12) - - - (2 411 424) (2 411 424)
Balance at 31 December 2014 5 200 777 476 - 36 616 817 37 399 493
Year ended 31 December 2015
Balance at 1 January 2015 5 200 777 476 - 36 616 817 37 399 493
Profit for the year - - - 8 109 016 8 109 016
Capital grant received
Transfer to the Botswana Stock - - 5 000 000 - 5 000 000
Exchange Security Fund (note 12) - - - (2 883 164) (2 883 164)
Balance at 31 December 2015 5 200 777 476 5 000 000 41 842 669 47 625 345
In terms of the Botswana Stock Exchange Act, 1994, section 72(3), the Exchange is required to transfer annually, the greater of P 5 000 or half of its annual profit to the Botswana Stock Exchange Security Fund (note 12).
The Exchange received grants from the Government of Botswana towards the acquisition of internet trading facilities. These grants do not carry any terms of repayment and ownership vests with the Exchange until such time as decided by the Government. The capital grant was not yet utilised as at the reporting date. The utilised capital grants will be amortised to the profit or loss on a straight-line basis over the expected useful life of the related asset.
099
R E A C H I N G G R E AT E R H E I G H T S

STATEMENTS OF CASH FLOwSfor the year ended 31 December 2015
GROUP EXCHANGE
2015 2014 2015 2014
Notes P P P P
ASSETSCash flows from operating activities
Cash generated from operations 14 16 138 532 14 051 592 5 694 617 7 544 000
Taxation refund - 276 603 - -
Cash generated from operating activities 16 138 532 14 328 195 5 694 617 7 544 000
Cash flows from investing activities
Purchase of property, plant and equipment 7 (814 326) (383 893) (481 125) (383 893)
Sale of property, plant and equipment - 17 000 - 17 000
Interest received 4 3 133 768 2 193 211 2 367 259 1 875 614
Net cash generated from investing activities 2 319 442 1 826 318 1 886 134 1 508 721
Cash flows from financing activities
Capital grant received 5 000 000 - 5 000 000 -
Amounts paid to Botswana Stock
Exchange Security Fund 12 (2 411 424) (2 693 608) (2 411 424) (2 693 608)
Net cash generated from/(used in) financing activities 2 588 576 (2 693 608) 2 588 576 (2 693 608)
Increase in cash and cash equivalents 21 046 550 13 460 905 10 169 327 6 359 113
Cash and cash equivalents at beginning of year 48 489 366 35 028 461 37 018 955 30 659 842
Cash and cash equivalents at the end of year 9 69 535 916 48 489 366 47 188 282 37 018 955
Cash and cash equivalents comprise:
- Cash on hand and cash at bank 6 637 782 2 661 592 2 763 715 1 542 073
- Money market investments 62 898 134 45 827 774 44 424 567 35 476 882
69 535 916 48 489 366 47 188 282 37 018 955
100
BOTSWANA STOCK EXCHANGE AND ITS SUBSIDIARY COMPANY
annual report 2015

ACCOUNTING POLICIES for the year ended 31 December 2015
1. Reporting entity
Botswana Stock Exchange is involved in the regulation and promotion of listing and dealing of shares and other securities listed on the Stock Exchange. The principal accounting policies applied in the preparation of these group financial statements are set out below. These policies have been consistently applied to all the years presented, unless otherwise stated.
2. Basis of preparation
2.1 Statement of compliance
The financial statements have been prepared in accordance with IFRS and its interpretations adopted by the International Accounting Standards Board (“IASB”).
2.2 Basis of measurement
The financial statements are prepared on a historical costs basis.
2.3 Functional and presentation currency
The group’s financial statements are presented in and rounded to the nearest Pula, which is the group’s functional currency.
2.4 Use of estimates and judgements
The preparation of financial statements in conformity with IFRS requires the use of certain critical accounting estimates. It also requires management to exercise its judgement in the process of applying the group’s accounting policies. The areas involving a higher degree of judgement or complexity, or areas where assumptions and estimates are significant to the group’s financial statement are disclosed in the “Critical accounting estimates and assumptions” section of these financial statements.
Estimates and judgements are continually evaluated based on historical experience and other factors, including expectations of future events that are believed to be reasonable under the circumstances.
3. New standards and interpretations not yet effective
In the current year, the group has adopted all the new and revised Standards and Interpretations issued by the IASB and the IFRIC of the IASB that are relevant to its operations and effective for annual reporting periods beginning on 1 January 2015. The adoption of these standards has not resulted in changes to the group’s accounting policies.
At the date of authorisation of the financial statements the following relevant standards and interpretations were in issue but not yet effective at the reporting date:
IAS 1 (amended 2014) Presentation of Financial Statements - The amendments clarify the application of the materiality guidelines in the Standard; aggregation and disaggregation of items in the financial statements; and flexibility regarding the order and structure of notes to the financial statements – The amendments are effective for annual periods commencing on or after 1 January 2016 and is not expected to have material impact on the group’s financial statements.
IAS 16 and IAS 38 (amended 2014) Clarification of Acceptable Methods of Depreciation and Amortisation- The amendments
to IAS 16 Property, Plant and Equipment state that revenue-based methods of depreciation cannot be used for these assets. The amendments to IAS 38 Intangible Assets introduce a rebuttable presumption that the use of revenue-based amortisation methods is inappropriate unless revenue and the consumption of the economic benefits of these assets are highly correlated - Effective annual periods commencing on or after 1 January 2016, which will impact the financial statements for the first time in the financial year ending 31 December 2016.
101
R E A C H I N G G R E AT E R H E I G H T S

ACCOUNTING POLICIES [continued]for the year ended 31 December 2015
3. New standards and interpretations not yet effective [ continued ]
IAS 16 and IAS 38 (amended 2014) Clarification of Acceptable Methods of Depreciation and Amortisation - The amendments to IAS 16 Property, Plant and Equipment state that revenue-based methods of depreciation cannot be used for these assets. The amendments to IAS 38 Intangible Assets introduce a rebuttable presumption that the use of revenue-based amortisation methods is inappropriate unless revenue and the consumption of the economic benefits of these assets are highly correlated. The amendments are effective for annual periods commencing on or after 1 January 2016 and are not expected to have any impact on the group’s financial statements as the group does not have any assets which are deprecated on revenue based methods.
IFRS 9 Financial Instruments - New standard on Financial Instruments to replace IAS 39 Financial Instruments: Recognition and Measurement. IFRS 9 is built on a logical, single classification and measurement approach for financial assets that reflects the business model in which they are managed and their cash flow characteristics. Built upon this is a forward-looking expected credit loss model that will result in more timely recognition of loan losses and is a single model that is applicable to all financial instruments subject to impairment accounting. The Standard also includes an improved hedge accounting model to better link the economics of risk management with its accounting treatment. The standard is effective for annual periods commencing on or after 1 January 2018. The standard will result in changes in the classification, measurement and disclosure of financial instruments in the group’s 2018 financial statements.
IFRS 15 Revenue from Contracts with Customers- New standard on revenue that replaces IAS 18 Revenue as well as other IFRS dealing with revenue recognition. Entities will apply a five-step model to determine when to recognise revenue and the amount thereof. The model specifies that revenue should be recognised when (or as) an entity transfers control of goods or services to a customer, being either over time or at a point in time. New qualitative and quantitative disclosure requirements aim to enable financial statement users to understand the nature, amount, timing and uncertainty of revenue and cash flows arising from contracts with customers. The standard, which becomes effective for the group’s 2017 financial statements, with early adoption permitted, is not expected to have a significant impact on its current financial statements. The standard will however be considered for future contracts with customers and may have an impact on the timing and amount of revenue to be recognised by the group.
The group has evaluated the effect of all new standards, amendments and interpretations that have been issued prior to 31 December 2014, which would be effective for the group’s accounting periods on or after 1 January 2015. The full implications of the requirements of IFRS 9 Financial Instruments (effective 2018) and IFRS 15 Revenue from Contracts with Customers(effective 2017) are in the process of being evaluated. Based on management’s evaluation of other standards, amendments and interpretations issued but not yet effective, these are not expected to have a significant impact on the group’s results.
Amendments to IAS 27: Equity Method in Separate Financial Statements The amendments allow an entity to apply the equity method in its separate financial statements to account for its investments
in subsidiaries, associates and joint ventures. The amendments apply retrospectively for annual periods beginning on or after 1 January 2017 and early adoption is permitted. These amendments, which become effective for the group’s 2017 financial statements, are not expected to have any impact on its financial statements.
Amendments to IFRS 10, IFRS 12 and IAS 28: Investment Entities - Applying the Consolidation Exception The amendment to IFRS 10 Consolidated Financial Statements clarifies which subsidiaries of an investment entity are
consolidated instead of being measured at fair value through profit and loss. The amendment also modifies the condition in the general consolidation exemption that requires an entity’s parent or ultimate parent to prepare consolidated financial statements. The amendment clarifies that this condition is also met where the ultimate parent or any intermediary parent of a parent entity measures subsidiaries at fair value through profit or loss in accordance with IFRS 10 and not only where the ultimate parent or intermediate parent consolidates its subsidiaries.
102
BOTSWANA STOCK EXCHANGE AND ITS SUBSIDIARY COMPANY
annual report 2015

ACCOUNTING POLICIES [continued]for the year ended 31 December 2015
3. New standards and interpretations not yet effective [ continued ]
Amendments to IFRS 10, IFRS 12 and IAS 28: Investment Entities -Applying the Consolidation Exception The amendment to IFRS 10 Consolidated Financial Statements clarifies which subsidiaries of an investment entity are
consolidated instead of being measured at fair value through profit and loss. The amendment also modifies the condition in the general consolidation exemption that requires an entity’s parent or ultimate parent to prepare consolidated financial statements. The amendment clarifies that this condition is also met where the ultimate parent or any intermediary parent of a parent entity measures subsidiaries at fair value through profit or loss in accordance with IFRS 10 and not only where the ultimate parent or intermediate parent consolidates its subsidiaries.
The amendment to IFRS 12Disclosure of Interests in Other Entities requires an entity that prepares financial statements in which all its subsidiaries are measured at fair value through profit or loss in accordance with IFRS 10 to make disclosures required by IFRS 12 relating to investment entities.
The amendment to IAS 28 Investments in Associates and Joint Venturesmodifies the conditions where an entity need not apply the equity method to its investments in associates or joint ventures to align these to the amended IFRS 10 conditions for not presenting consolidated financial statements. The amendments introduce relief when applying the equity method which permits a non-investment entity investor in an associate or joint venture that is an investment entity to retain the fair value through profit or loss measurement applied by the associate or joint venture to its subsidiaries.
These amendments, which become effective for the group’s 2016 financial statements, are not expected to have a significant impact on its financial statements.
4. Basis of consolidation
The consolidated financial statements incorporate the financial statements of the Exchange and entities controlled by the Exchange (its subsidiaries) (collectively referred to as the “Group”).
The Group controls an entity when it is exposed to, or has rights to, variable returns from its involvement with the entity and has the ability to affect these returns through its power over the entity. Subsidiaries are fully consolidated from the date on which control is transferred to the group. They are de-consolidated from the date that control ceases.
The group applies the acquisition method to account for business combinations. The consideration transferred for the acquisition of a subsidiary is the fair values of the assets transferred, the liabilities incurred to the former owners of the acquiree and the equity interests issued by the group. The consideration transferred includes the fair value of any asset or liability resulting from a contingent consideration arrangement. Identifiable assets acquired and liabilities and contingent liabilities assumed in a business combination are measured initially at their fair values at the acquisition date.
The group recognises any non-controlling interest in the acquiree on an acquisition-by-acquisition basis, either at fair value or at the non-controlling interest’s proportionate share of the recognised amounts of acquiree’s identifiable net assets.
The Exchange controls the Central Securities Depository Company of Botswana Limited, which is a company registered in the Republic of Botswana.
103
R E A C H I N G G R E AT E R H E I G H T S
ACCOUNTING POLICIES [continued]for the year ended 31 December 2015
5. Plant and equipment
Items of plant and equipment are measured at historical cost less accumulated depreciation and impairments losses. Historical cost includes expenditure that is directly attributable to the acquisition of the assets.
Subsequent expenditure relating to an item of plant and equipment is capitalised only when it is probable that future economic benefits associated with the use of the asset will flow to the group and its cost can be measured reliably. All other subsequent expenditure is recognised as an expense in profit or loss as incurred.
Depreciation is based on cost of an asset less its residual value. Depreciation on assets is calculated using the straight-line method over their estimated useful lives as follows:
Leasehold improvements the lower of period of lease and ten years Office equipment 4 years Motor vehicles 4 years Furniture and fittings 10 years
The assets’ residual values and useful lives are reviewed, and adjusted if appropriate, at each statement of financial position date. When the carrying amount of the assets exceeds its recoverable amount, the carrying value of the asset is adjusted to its
recoverable amount through profit or loss.
Gains and losses on disposals are determined by comparing the disposal proceeds with the carrying amount and are recognised in profit or loss.
6. Foreign currency translation
Transactions in currencies other than the group’s functional currency (Pula) are recorded at the rate of exchange prevailing at the time of the transaction. Monetary assets and liabilities in other currencies are translated at rates of exchange ruling at the end of the financial year. Exchange gains or losses arising on translation are recognised in profit or loss except in the case of exchange gains or losses in respect of foreign financing specifically arranged for capital projects where differences are included in the costs of the assets concerned until the commissioning of such assets.
7. Cash and cash equivalents
Cash and cash equivalents includes cash in hand, deposits held at call with banks, other short-term highly liquid investments with original maturities of three months or less and bank overdrafts. Bank overdrafts are shown within the current liabilities on the statement of financial position.
8. Trade and other receivables
Trade receivables are recognised initially at fair value and subsequently measured at amortised cost using the effective interest method, less provision for impairment.
A provision for impairment of trade receivables is established when there is objective evidence that the group will not be able to collect all amounts due according to the original terms of the receivables. Significant financial difficulties of the debtor, probability that the debtor will enter bankruptcy or financial reorganisation, and default or delinquency in payments (more than 30 days overdue) are considered indicators that the trade receivable is impaired. The carrying amount of the asset is reduced through the use of an allowance account, and the amount of the loss is recognised in profit or loss within ‘administrative expenses’. When a trade receivable is uncollectible, it is written off against the administrative account for trade receivables. Subsequent recoveries of amounts previously written off are credited against ‘administrative expenses’ in profit or loss.
104
BOTSWANA STOCK EXCHANGE AND ITS SUBSIDIARY COMPANY
annual report 2015

ACCOUNTING POLICIES [continued]for the year ended 31 December 2015
9. Trade and other payables
Trade payables are recognised initially at fair value and subsequently measured at amortised cost using the effective interest method.
10. Provisions
Provisions are recognised when the group has a present obligation (legal or constructive) as a result of a past event, it is probable that an outflow of resources will be required to settle the obligation, and a reliable estimate of the amount of the obligation can be made.
11. Employee benefits
A defined contribution plan is a pension plan under which the group pays fixed contributions into a separate entity (a fund) and will have no legal or constructive obligations to pay further contributions if the fund does not hold sufficient assets to pay all employees benefits relating to employee service in the current and prior periods.
The group pays contributions to Glenrand MIB (Botswana) (Proprietary) Limited, who administers a pension insurance plan for the group. The regular contributions are recognised in profit or loss as incurred.
Employee entitlements to annual leave and gratuity are recognised when they accrue to employees and a provision is made for the estimated liability as a result of services rendered by employees up to the statement of financial position date. Contract staff are paid terminal gratuities in accordance with their respective employment contract.
12. Taxation
The group is exempt from income taxation in accordance with paragraph XV of part 1 of the second schedule to the Income Tax Act (Chapter 52.01) therefore, no provision for current and deferred taxation have been recognised in the financial statements.
The Exchange is expected to transition into a company during the following financial year. The company will initially be exempt from income tax for a period of five years following the Exchange’s demutualisation.
13. Proprietary rights
Proprietary rights capital is recognised at the fair value of the consideration received by the group.
14. Botswana Stock Exchange Security Fund
In terms of the Botswana Stock Exchange Act, 1994 (Section 77 (3)), the Exchange is required to transfer in cash or securities to the Botswana Stock Exchange Security Fund, the greater of half of the Exchange’s profits and P5 000 on an annual basis.
For the purpose of this transfer, profits exclude any donations, grant or other financial support received from the Government of Botswana.
105
R E A C H I N G G R E AT E R H E I G H T S
15. Leases
Leases of assets where the lessor retains all the risks and rewards of ownership are classified as operating leases. Payments made under operating leases are charged to the income statement on a straight-line basis over the period of the lease. When an operating lease is terminated before the lease period has expired, any payment required to be made to the lessor by way of penalty is recognised as an expense in the period which termination takes place.
Leases of property, plant and equipment where the group assumes substantially all risks and rewards of ownership are classified as finance leases. Finance leases are capitalised at values underlying estimated present value of the lease payments. Each lease payment is allocated between the liability and finance charges to achieve a constant rate on the finance balance outstanding. The interest is recognised in the profit and loss over the period of the lease. The asset is depreciated over its useful life.
16. Revenue recognition
Revenue comprises the invoiced value for services rendered, net of value added tax. The following specific recognition criteria is adopted for the specific revenue stream:
i. Botswana Stock Exchange fees In terms of the Botswana Stock Exchange Members Rules, 0.12% - 0.15% of the transaction value for trades on the Stock
Exchange is due to the Exchange on both the buy and sell sides. Revenue is recognised on trading date unless collectability is in doubt.
ii. Interest Interest revenue is accrued by reference to the principal outstanding and at the effective interest rate applicable, which is the rate
that exactly discounts estimated future cash receipts through the expected life of the financial asset to that asset’s net carrying amount on initial recognition.
iii. Listing fees Listing fees and documentation fees are billed as and when the services are provided. Revenue is recognised on invoicing or on
listing of the relevant security.
iv. Annual sustaining fees Annual sustaining fees are invoiced in advance for the year unless collection is in doubt.
v. Member fees Annual member/dealer fees are invoiced in advance for the year unless collection is in doubt.
vi. Central Securities Depository (CSD) fees CSD fee is charged on the transactions (for both the buyer and the seller) at 0.1% on the transaction value. Revenue is recognised
on the trading date unless collectability is in doubt.
vii. Other income Revenue is recognised on an accrual basis in accordance with the substance of the underlying transaction.
ACCOUNTING POLICIES [continued]for the year ended 31 December 2015
106
BOTSWANA STOCK EXCHANGE AND ITS SUBSIDIARY COMPANY
annual report 2015

17. Government subvention
Monetary Government subventions are recognised at their fair value where there is reasonable assurance that the company will comply with all attached conditions. Grants relating to costs are deferred and recognised in profit or loss over the period necessary to match them with the costs they are intended to compensate.
Non-monetary subventions are recognised at nominal amounts incurred to obtain such subventions. The Botswana Stock Exchange expects the Ministry of Finance to bestow ownership of the automated trading system to Botswana Stock Exchange in the coming year. The ownership rights to the automated trading system will be assigned on condition that the value of the automated trading system be converted into government equity in the Botswana Stock Exchange upon corporatisation of the Exchange.
18. Financial instruments
Financial assets and liabilities are recognised on the group’s statement of financial position when the group becomes party to the contractual provisions of instruments as follows.
Financial assets Financial assets are classified as ‘loans and receivables’. The classification depends on the nature and purpose of the financial
assets and determined at the time of initial recognition.
Loans and receivables are initially recognised at fair value and subsequently measured at amortised cost. Provision is made, where in the opinion of the directors, an impairment in value has occurred.
Financial liabilities Financial liabilities are classified as other financial liabilities.
Other financial liabilities, including borrowings, are initially measured at fair value, net of transaction costs. Other financial liabilities are subsequently measured at amortised cost using the effective interest method, with the interest expense recognised on an effective yield basis.
Fair value hierarchy The group measures fair values using the following fair value hierarchy which reflects the significance of the inputs in making the
measurements:
Level 1: Quoted market price in an active market for an identical instrument.
Level 2: Valuation techniques based on observable inputs, either directly (i.e. as prices) or indirectly (i.e. derived from prices). This category includes instruments valued using quoted market prices in active markets for similar instruments; quoted prices for identical or similar instruments in markets that are considered less than active; or other valuation techniques where all significant inputs are directly or indirectly observable from market data.
Level 3: Valuation techniques using significant unobservable inputs. This category includes all instruments where the valuation technique includes inputs not based on observable data and the unobservable inputs have a significant effect on the instrument’s valuation. This category includes instruments that are valued based on quoted prices for similar instruments where significant unobservable adjustments or assumptions are required to reflect differences between the instruments.
ACCOUNTING POLICIES [continued]for the year ended 31 December 2015
107
R E A C H I N G G R E AT E R H E I G H T S

18. Financial instruments [ continued ]
The group’s assets and liabilities are analysed as follows:
GROUP - 2015 Financial assets and liabilities Current/non- current
Total
At fair Value
through profit and
lossLoans and
receivablesArmotised
cost
Non-Financial
Instruments CurrentNon-
current
Assets
Plantandequipment 2 068 396 - - - 2 068 396 - 2 068 396
Tradeandotherreceivables 4 808 712 - 2 985 271 - 1 823 441 4 808 712 -
Moneymarketinvestment 62 898 134 - 62 898 134 - - 62 898 134 -
Cashinhandandatbank 6 637 782 - 6 637 782 - - 6 637 782 -
76 413 024 - 72 521 187 - 3 891 837 74 344 628 2 068 396
Liabilities
Deferredleaseliability 93 721 - - - 93 721 - 93 721
Tradeandotherpayables 3 533 766 - - 3 294 535 239 231 3 294 535 -
AmountsduetotheBotswanaStock
ExchangeSecurityFund 2 883 164 - - 2 883 164 - 2 883 164 -
6 510 651 - - 6 177 699 332 952 6 177 699 93 721
GROUP - 2014
Assets
Plantandequipment 2 438 326 - - - 2 438 326 - 2 438 326
Tradeandotherreceivables 4 560 142 - 4 290 663 - 269 479 4 560 142 -
Moneymarketinvestment 45 827 774 - 45 827 774 - - 45 827 774 -
Cashinhandandatbank 2 661 592 - 2 661 592 - - 2 661 592 -
55 487 834 - 52 780 029 - 2 707 805 53 049 508 2 438 326
Liabilities
Deferredleaseliability 187 131 - - - 187 131 - 187 131
Tradeandotherpayables 1 393 635 - - 1 265 973 127 662 1 265 973 -
AmountsduetotheBotswanaStock
ExchangeSecurityFund 2 411 424 - - 2 411 424 - 2 411 424 -
3 992 190 - - 3 677 397 314 793 3 677 397 187 131
ACCOUNTING POLICIES [continued]for the year ended 31 December 2015
annual report 2015
108
BOTSWANA STOCK EXCHANGE AND ITS SUBSIDIARY COMPANY

18. Financial instruments [ continued ]
The group’s assets and liabilities are analysed as follows:
EXCHANGE - 2015 Financial assets and liabilities Current/non- current
Total
At fair Value
through profit and
lossLoans and
receivablesArmotised
cost
Non-Financial
Instruments CurrentNon-
current
Assets
Plantandequipment 1 246 005 - - - 1 246 005 - 1 246 005
Investmentinsubsidiary 100 - - - 100 - 100
Tradeandotherreceivables 4 426 518 - 2 603 077 - 1 823 441 4 426 518 -
Moneymarketinvestment 44 424 567 - 44 424 567 - - 44 424 567 -
Cashinhandandatbank 2 763 715 2 763 715 - - 2 763 715 -
52 860 905 - 49 791 359 - 3 069 546 51 614 800 1 246 105
Liabilities
Deferredleaseliability 93 721 - - - 93 721 - 93 721
Tradeandotherpayables 2 258 675 - - 2 179 431 79 244 - -
AmountsduetotheBotswanaStock
ExchangeSecurityFund 2 883 164 - - 2 883 164 - 2 883 164 -
5 235 560 - - 5 062 595 172 965 2 883 164 93 721
EXCHANGE - 2014
Assets
Plantandequipment 1 305 079 - - - 1 305 079 - 1 305 079
Investmentinsubsidiary 100 - - - 100 - 100
Tradeandotherreceivables 2 942 204 - 1 118 763 - 1 823 441 2 942 204 -
Moneymarketinvestment 35 476 882 35 476 882 - - 35 476 882 -
Cashinhandandatbank 1 542 073 - 1 542 073 - - 1 542 073 -
41 268 388 - 38 137 718 - 3 128 620 39 961 159 1 305 179
Liabilities
Deferredleaseliability 187 131 - - - 187 131 - 187 131
Tradeandotherpayables 1 268 290 - - 1 221 640 46 650 1 221 640 -
AmountsduetotheBotswanaStock
ExchangeSecurityFund 2 411 424 - - 2 411 424 - 2 411 424 -
3 866 845 - - 3 633 064 233 781 3 633 064 187 131
ACCOUNTING POLICIES [continued]for the year ended 31 December 2015
R E A C H I N G G R E AT E R H E I G H T S
109
R E A C H I N G G R E AT E R H E I G H T S
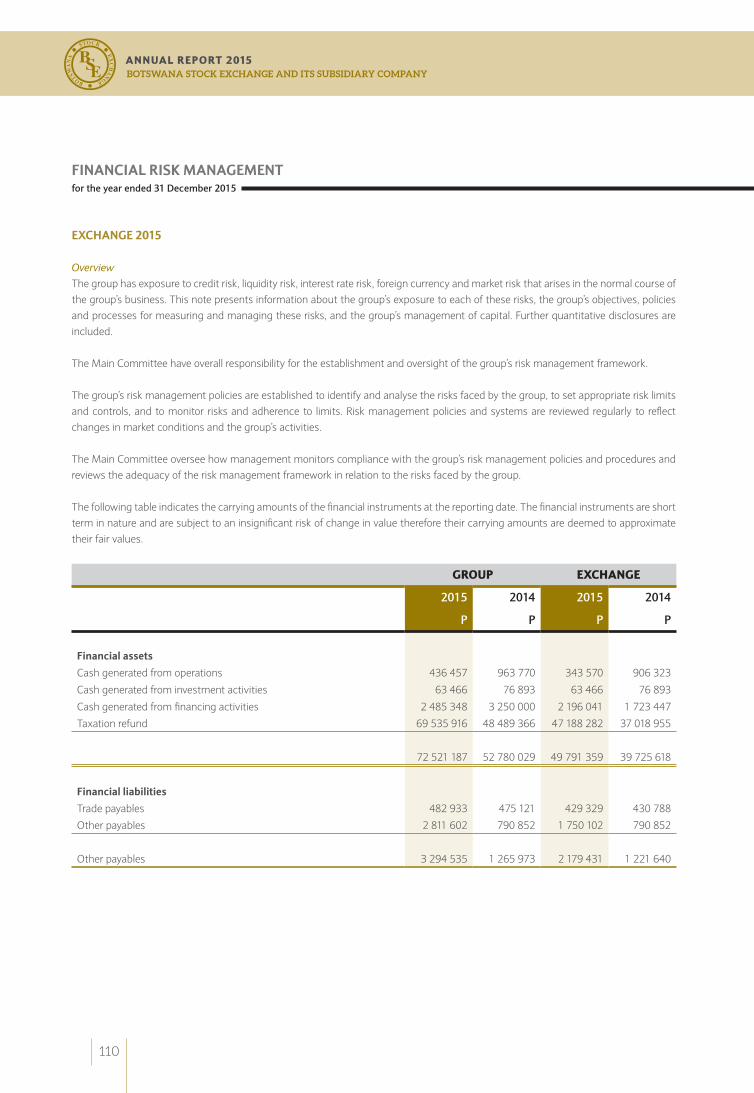
FINANCIAL RISk MANAGEMENTfor the year ended 31 December 2015
EXCHANGE 2015
OverviewThe group has exposure to credit risk, liquidity risk, interest rate risk, foreign currency and market risk that arises in the normal course of the group’s business. This note presents information about the group’s exposure to each of these risks, the group’s objectives, policies and processes for measuring and managing these risks, and the group’s management of capital. Further quantitative disclosures are included. The Main Committee have overall responsibility for the establishment and oversight of the group’s risk management framework.
The group’s risk management policies are established to identify and analyse the risks faced by the group, to set appropriate risk limits and controls, and to monitor risks and adherence to limits. Risk management policies and systems are reviewed regularly to reflect changes in market conditions and the group’s activities.
The Main Committee oversee how management monitors compliance with the group’s risk management policies and procedures and reviews the adequacy of the risk management framework in relation to the risks faced by the group.
The following table indicates the carrying amounts of the financial instruments at the reporting date. The financial instruments are short term in nature and are subject to an insignificant risk of change in value therefore their carrying amounts are deemed to approximate their fair values.
GROUP EXCHANGE
2015 2014 2015 2014
P P P P
Financial assetsCash generated from operations 436 457 963 770 343 570 906 323
Cash generated from investment activities 63 466 76 893 63 466 76 893
Cash generated from financing activities 2 485 348 3 250 000 2 196 041 1 723 447
Taxation refund 69 535 916 48 489 366 47 188 282 37 018 955
72 521 187 52 780 029 49 791 359 39 725 618
Financial liabilitiesTrade payables 482 933 475 121 429 329 430 788
Other payables 2 811 602 790 852 1 750 102 790 852
Other payables 3 294 535 1 265 973 2 179 431 1 221 640
110
BOTSWANA STOCK EXCHANGE AND ITS SUBSIDIARY COMPANY
annual report 2015
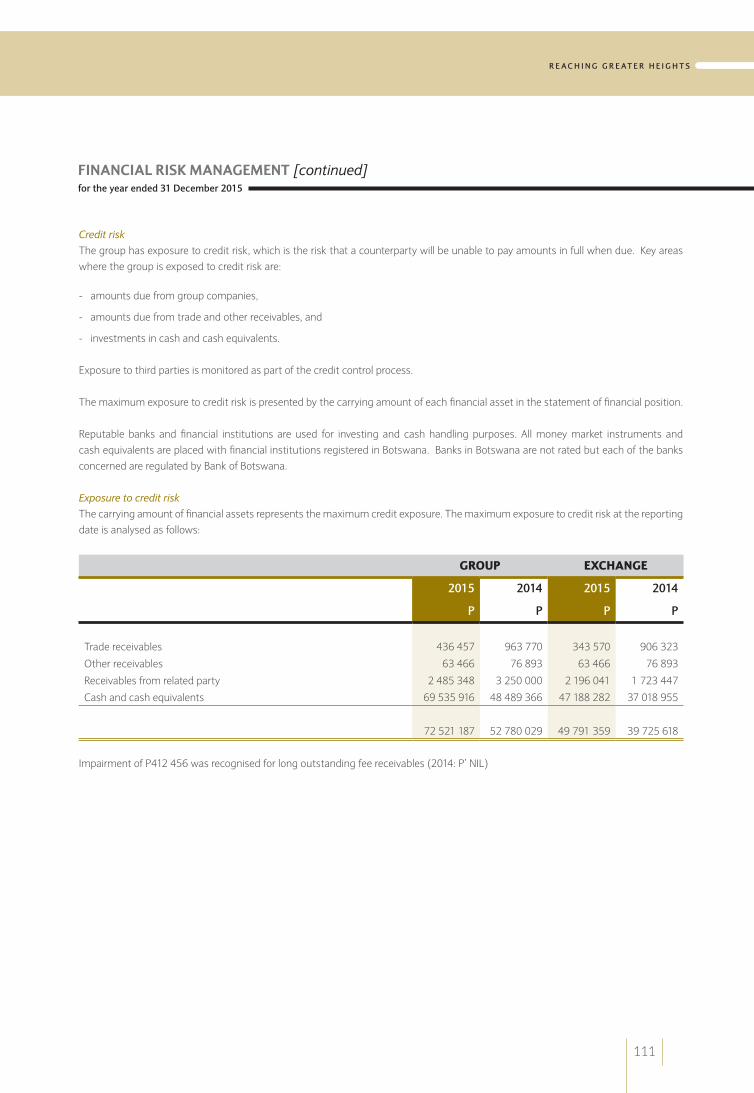
FINANCIAL RISk MANAGEMENT [continued]for the year ended 31 December 2015
Credit risk The group has exposure to credit risk, which is the risk that a counterparty will be unable to pay amounts in full when due. Key areas where the group is exposed to credit risk are:
- amounts due from group companies,
- amounts due from trade and other receivables, and
- investments in cash and cash equivalents. Exposure to third parties is monitored as part of the credit control process.
The maximum exposure to credit risk is presented by the carrying amount of each financial asset in the statement of financial position. Reputable banks and financial institutions are used for investing and cash handling purposes. All money market instruments and cash equivalents are placed with financial institutions registered in Botswana. Banks in Botswana are not rated but each of the banks concerned are regulated by Bank of Botswana. Exposure to credit risk The carrying amount of financial assets represents the maximum credit exposure. The maximum exposure to credit risk at the reporting date is analysed as follows:
GROUP EXCHANGE
2015 2014 2015 2014
P P P P
Trade receivables 436 457 963 770 343 570 906 323
Other receivables 63 466 76 893 63 466 76 893
Receivables from related party 2 485 348 3 250 000 2 196 041 1 723 447
Cash and cash equivalents 69 535 916 48 489 366 47 188 282 37 018 955
72 521 187 52 780 029 49 791 359 39 725 618
Impairment of P412 456 was recognised for long outstanding fee receivables (2014: P’ NIL)
111
R E A C H I N G G R E AT E R H E I G H T S

FINANCIAL RISk MANAGEMENT [continued]for the year ended 31 December 2015
GROUP
31-Dec-15 31-Dec-14
Counterparty Rating Credit limit Balance Credit limit Balance
P P
Barclays Bank of Botswana N/A N/A 15 682 431 N/A 134 964
Stanlib Investment Management Services (Pty) Ltd N/A N/A 8 826 937 N/A 15 259 962
African Alliance Asset Management Botswana N/A N/A 8 250 132 N/A 30 567 812
Botswana Insurance Fund Management N/A N/A 13 321 065 N/A -
First National Bank Botswana N/A N/A 10 000 000 N/A -
Standard Chartered Bank Botswana N/A N/A 13 455 351 N/A 1 402 606
EXCHANGE
31-Dec-15 31-Dec-14
Counterparty Rating Credit limit Balance Credit limit Balance
P P
Barclays Bank of Botswana N/A N/A 9 008 364 N/A 134 964
Stanlib Investment Management Services (Pty) Ltd N/A N/A 5 513 642 N/A 15 259 962
African Alliance Asset Management Botswana N/A N/A 5 918 171 N/A 20 216 920
Botswana Insurance Fund Management N/A N/A 9 592 754 N/A -
First National Bank Botswana N/A N/A 7 200 000 N/A -
Standard Chartered Bank Botswana N/A N/A 9 955 351 N/A 1 402 606
No credit limits were exceeded during the reporting period, and management does not expect any losses from non-performance by these counterparties. There are no credit ratings available in Botswana. The carrying amounts of the financial instruments approximate their fair value as they are subject to an insignificant risk of change in value.
Liquidity riskLiquidity risk is the risk that the group will not be able to meet its financial obligations as they fall due. The group’s approach to managing its liquidity is to ensure, as far as possible, that it has sufficient liquid funds available to meet its liabilities when due, both under normal and adverse economic conditions, without incurring unacceptable losses or risking damage to its reputation.
The group ensures that it has sufficient cash on demand to meet its expected operational expenses for a period of 30 days, including the servicing of any financial obligations. This excludes the potential impact of extreme circumstances which cannot be reasonably predicted, for example natural disasters.
112
BOTSWANA STOCK EXCHANGE AND ITS SUBSIDIARY COMPANY
annual report 2015
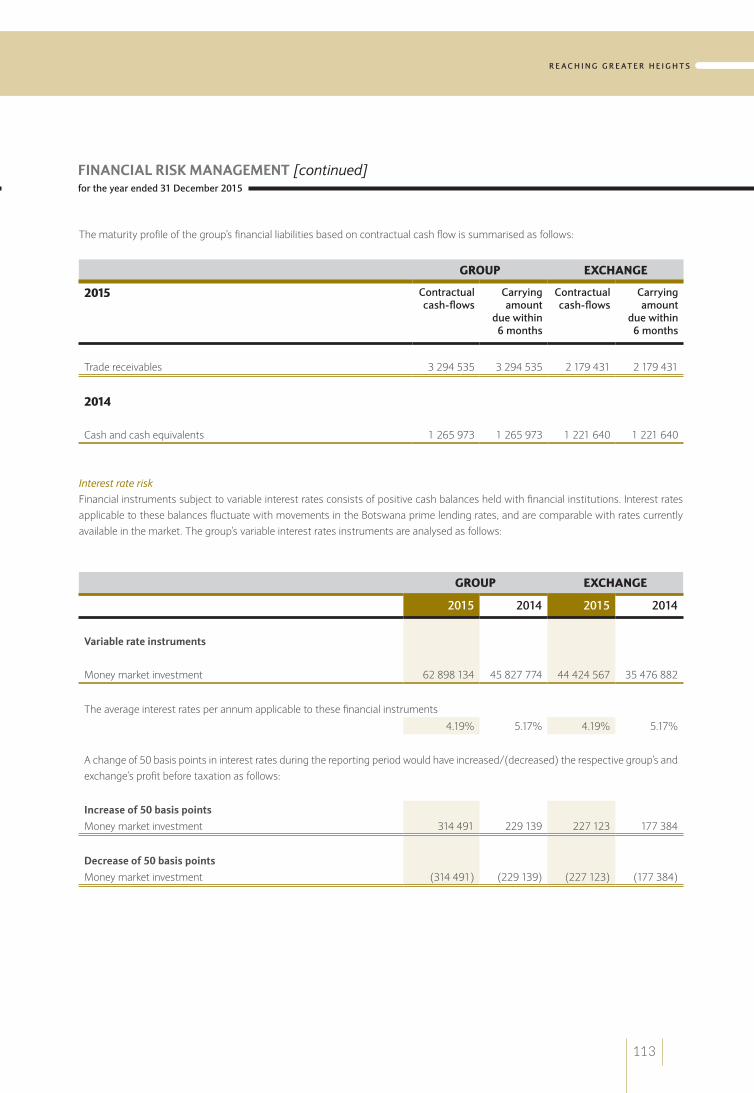
FINANCIAL RISk MANAGEMENT [continued]for the year ended 31 December 2015
The maturity profile of the group’s financial liabilities based on contractual cash flow is summarised as follows:
GROUP EXCHANGE
2015 Contractual cash-flows
Carrying amount
due within 6 months
Contractual cash-flows
Carrying amount
due within 6 months
Trade receivables 3 294 535 3 294 535 2 179 431 2 179 431
2014
Cash and cash equivalents 1 265 973 1 265 973 1 221 640 1 221 640
Interest rate riskFinancial instruments subject to variable interest rates consists of positive cash balances held with financial institutions. Interest rates applicable to these balances fluctuate with movements in the Botswana prime lending rates, and are comparable with rates currently available in the market. The group’s variable interest rates instruments are analysed as follows:
GROUP EXCHANGE
2015 2014 2015 2014
Variable rate instruments
Money market investment 62 898 134 45 827 774 44 424 567 35 476 882
The average interest rates per annum applicable to these financial instruments
4.19% 5.17% 4.19% 5.17%
A change of 50 basis points in interest rates during the reporting period would have increased/(decreased) the respective group’s and exchange’s profit before taxation as follows:
Increase of 50 basis pointsMoney market investment 314 491 229 139 227 123 177 384
Decrease of 50 basis pointsMoney market investment (314 491) (229 139) (227 123) (177 384)
113
R E A C H I N G G R E AT E R H E I G H T S
FINANCIAL RISk MANAGEMENT [continued]for the year ended 31 December 2015
Market riskThe Group primary revenue is fixed in terms of the Botswana Stock Exchange Act, 1994 and the listing and trading rules and is therefore not significantly susceptible to market risk.
Capital risk managementThe group’s objectives when managing capital are to safeguard its ability to continue as a going concern in order to perform the mandate for which it was created and benefits for other stakeholders and to maintain an environment of transparency for listed companies, the public and its stakeholders. The group had no borrowings during the years ended 31 December 2014 and 31 December 2015. The group is supported by the Government of Botswana who provides the necessary support to sustain the operations of the group.
Estimates and judgements are continually evaluated and are based on historical experience and other factors, including expectations of future events that are believed to be reasonable under the circumstances.
The group makes estimates and assumptions concerning the future. The resulting accounting estimates will, by definition, rarely equal the related actual results. The estimates and assumptions that have a significant risk of causing a material adjustment to the carrying amounts of assets and liabilities within the next financial year are outlined below:
Useful lives and residual values for plant and equipmentThe group tests annually whether, the useful life and residual value estimates were appropriate and in accordance with its accounting policy. Residual values of computers, plant and equipment and motor vehicles are based on current estimates of the value of these assets at the end of their useful lives. The estimate residual values of motor vehicles have been determined by management based on their knowledge of the industry.
Impairment of receivablesThe group follows the guidance of IAS 39 to determine when a receivable is impaired. This determination requires significant judgement. In making this judgement, the group evaluates, among other factors, significant financial difficulties of the debtor, probability that the debtor will enter bankruptcy and default or delinquency in payments, including factors such as industry and sector performance, changes in technology and operational and financing cash flow.
114
BOTSWANA STOCK EXCHANGE AND ITS SUBSIDIARY COMPANY
annual report 2015

NOTES TO THE FINANCIAL STATEMENTSfor the year ended 31 December 2015
GROUP EXCHANGE
2015 2014 2015 2014
P P P P
1 Revenue
Listing and annual sustaining fees 15 087 735 13 324 727 15 087 735 13 324 727
Commission income 14 279 868 10 247 311 8 073 644 5 840 021
X-News Publications 422 000 155 110 422 000 155 110
Member fees 16 500 16 000 16 500 16 000
Miscellaneous fees 4 268 676 531 645 - -
34 074 779 24 274 793 23 599 879 19 335 858
2 Administrative expenses
Internal audit fees 261 750 304 771 168 330 198 585
External audit fees 154 883 164 708 107 910 94 100
Employee benefit expenses (note 3) 14 645 907 12 605 828 11 846 658 9 504 339
Advertising costs 1 439 837 1 101 094 1 299 154 1 054 935
Depreciation (note 7) 1 184 256 1 144 034 540 199 526 622
Operating lease costs 933 768 936 899 786 126 801 501
Bad debt impairment 234 640 - 234 640 -
Bad debts written off 177 816 - 177 816 -
Computer expenses 3 712 770 3 291 711 2 529 817 2 258 265
Consulting fees 539 069 211 636 539 069 211 636
Seminars and conferences 212 512 227 452 212 512 227 452
Travelling and accommodation expenses 453 180 337 523 453 180 337 523
Training expenses 269 106 364 852 269 106 364 852
Members' sitting allowances 117 810 119 910 70 980 74 340
Other expenses 1 950 252 1 536 258 1 427 931 1 169 691
26 287 556 22 346 676 20 663 428 16 823 841
3 Employee benefit expenses
Salaries and other termination benefits 12 099 542 10 555 319 9 660 675 7 854 068
Pension costs and gratuity 2 223 851 1 724 499 1 838 435 1 324 261
Other benefits 347 548 326 010 347 548 326 010
14 670 941 12 605 828 11 846 658 9 504 339
Average number of persons employed during the year 22 20 18 15
115
R E A C H I N G G R E AT E R H E I G H T S

NOTES TO THE FINANCIAL STATEMENTS [continued]for the year ended 31 December 2015
GROUP EXCHANGE
2015 2014 2015 2014
P P P P
4 Finance income
Interest income on short term investments 3 133 768 2 193 211 2 367 259 1 875 614
5 Income tax expense
The Botswana Stock Exchange is exempt from income tax in accordance with the Income Tax Act.
6 Investment in subsidiary
Cost of shares - - 100 100
The investment in subsidiary comprises of 100% share investment in the Central Securities Depository Company of Botswana Limited, a company incorporated in the Republic of Botswana.
116
BOTSWANA STOCK EXCHANGE AND ITS SUBSIDIARY COMPANY
annual report 2015

NOTES TO THE FINANCIAL STATEMENTS [continued]for the year ended 31 December 2015
7 Plant and equipment
GROUP LeaseholdImprovements
Office Equipment
Furniture& Fittings
MotorVehicles Total
P P P P P
Year ended 31 December 2014Opening net book amount 294 269 2 305 157 350 338 265 703 3 215 467
Additions - 365 450 18 443 - 383 893
Disposals (17 000) - - - (17 000)
Depreciation (note 2) (47 137) (893 562) (70 485) (132 850) (1 144 034)
Closing net book amount 230 132 1 777 045 298 296 132 853 2 438 326
At 31 December 2014Cost 598 067 5 203 014 720 515 912 955 7 434 551
Accumulated depreciation (367 935) (3 425 969) (422 219) (780 102) (4 996 225)
Net book amount 230 132 1 777 045 298 296 132 853 2 438 326
Year ended 31 December 2015Opening net book amount 230 132 1 777 045 298 296 132 853 2 438 326
Additions - 806 578 7 748 - 814 326
Disposals - - - - -
Depreciation (note 2) (48 436) (931 203) (71 764) (132 853) (1 184 256)
Closing net book amount 181 696 1 652 420 234 280 - 2 068 396
At 31 December 2015Cost 598 067 6 009 592 728 263 912 955 8 248 877
Accumulated depreciation (416 371) (4 357 172) (493 983) (912 955) (6 180 481)
Net book amount 181 696 1 652 420 234 280 - 2 068 396
117
R E A C H I N G G R E AT E R H E I G H T S
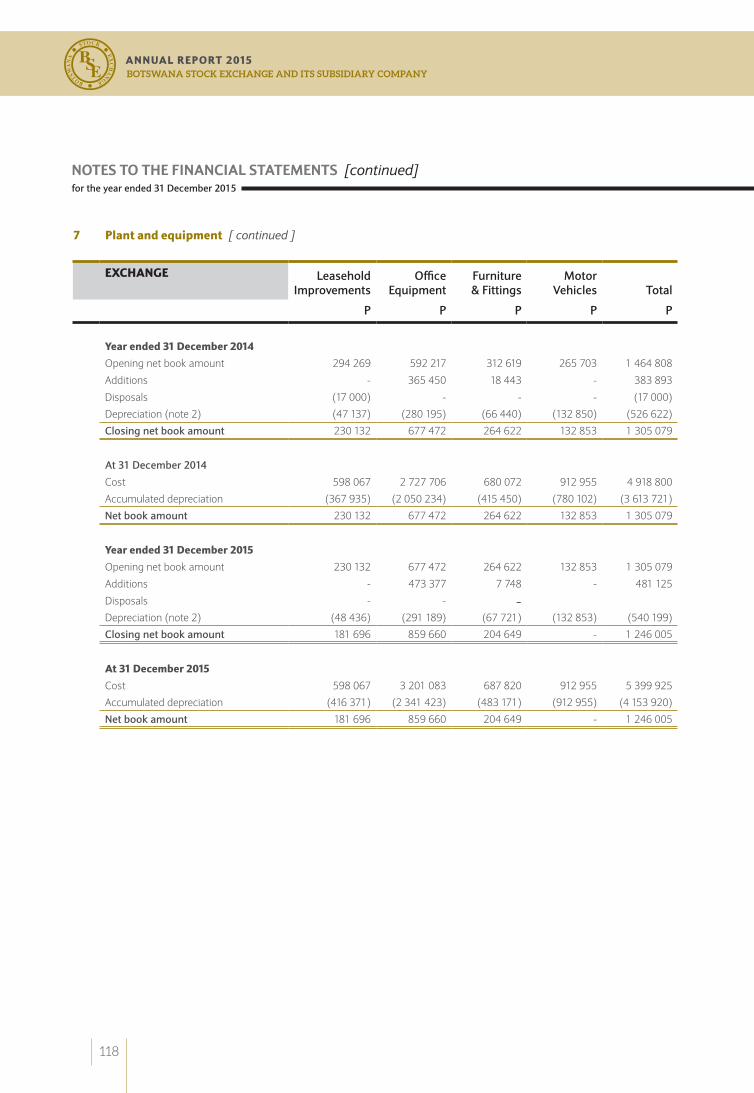
7 Plant and equipment [ continued ]
EXCHANGE LeaseholdImprovements
Office Equipment
Furniture& Fittings
MotorVehicles Total
P P P P P
Year ended 31 December 2014Opening net book amount 294 269 592 217 312 619 265 703 1 464 808
Additions - 365 450 18 443 - 383 893
Disposals (17 000) - - - (17 000)
Depreciation (note 2) (47 137) (280 195) (66 440) (132 850) (526 622)
Closing net book amount 230 132 677 472 264 622 132 853 1 305 079
At 31 December 2014
Cost 598 067 2 727 706 680 072 912 955 4 918 800
Accumulated depreciation (367 935) (2 050 234) (415 450) (780 102) (3 613 721)
Net book amount 230 132 677 472 264 622 132 853 1 305 079
Year ended 31 December 2015Opening net book amount 230 132 677 472 264 622 132 853 1 305 079
Additions - 473 377 7 748 - 481 125
Disposals - - -Depreciation (note 2) (48 436) (291 189) (67 721) (132 853) (540 199)
Closing net book amount 181 696 859 660 204 649 - 1 246 005
At 31 December 2015Cost 598 067 3 201 083 687 820 912 955 5 399 925
Accumulated depreciation (416 371) (2 341 423) (483 171) (912 955) (4 153 920)
Net book amount 181 696 859 660 204 649 - 1 246 005
NOTES TO THE FINANCIAL STATEMENTS [continued]for the year ended 31 December 2015
118
BOTSWANA STOCK EXCHANGE AND ITS SUBSIDIARY COMPANY
annual report 2015

8 Trade and other receivables
GROUP EXCHANGE
2015 2014 2015 2014
P P P P
Receivables from related party 2 485 348 3 250 000 2 196 041 1 723 447
Fee receivables 436 457 963 770 343 570 906 323
Prepayments and deposits 1 823 441 269 479 1 823 441 235 541
Other receivables 63 466 76 893 63 466 76 893
4 808 712 4 560 142 4 426 518 2 942 204
Prepayments and deposits are excluded from the trade and other receivables balance for fair value purposes, as this analysis is required only for financial instruments.
At 31 December 2015, fee receivables and other receivables of P436 457 (2014: P781 308) and P343 570 (2014: P 733 845) were fully performing for the group and exchange respectively.
The aging of these receivables is as follows:
GROUP EXCHANGE
2015 2014 2015 2014
P P P P
Up to 3 months 129 625 963 770 52 075 906 323
>3 to 6 months 306 832 - 291 495 -
436 457 963 770 343 570 906 323
NOTES TO THE FINANCIAL STATEMENTS [continued]for the year ended 31 December 2015
119
R E A C H I N G G R E AT E R H E I G H T S

9 Cash and cash equivalents
GROUP EXCHANGE
2015 2014 2015 2014
P P P P
Money market investments Interest rate
Stanlib Investment Management Services 5.58% 8 826 937 15 259 962 5 513 642 15 259 962
Botswana Insurance Fund 5.82% 13 321 065 - 9 592 754 -
African Alliance Liquidity Fund 3.92% 8 250 132 30 567 812 5 918 171 20 216 920
Barclays Bank Botswana 3.60% 10 000 000 - 7 200 000 -
Standard Chartered Bank 4.50% 12 500 000 - 9 000 000 -
First National Bank 2.75% 10 000 000 - 7 200 000 -
62 898 134 45 827 774 44 424 567 35 476 882
The short term investments are unsecured, earns average interest of 4.19% (2014: 5.61%) per annum and have no fixed maturity date. The investments can be liquidated subject to an average notice period of 48 hours to the investee company
Cash and bank balances
Cash on hand and at bank 6 637 782 1 124 019 2 763 715 4 500
Short-term bank deposits - 1 537 573 - 1 537 573
Total cash on hand and at bank 6 637 782 2 661 592 2 763 715 1 542 073
For the purpose of the statement of cash flows, cash and cash equivalents at the end of the year comprise the following:
Money market investment 62 898 134 45 827 774 44 424 567 35 476 882
Cash and bank balances 6 637 782 2 661 592 2 763 715 1 542 073
69 535 916 48 489 366 47 188 282 37 018 955
10 Proprietary rights capital
Issued proprietary rights capital 5 200 5 200 5 200 5 200
The holders of proprietary rights are entitled to receive interest at a rate fixed by the Exchange in the annual general meeting. Such interest may not exceed the balance available from interest or dividends on invested funds.
NOTES TO THE FINANCIAL STATEMENTS [continued]for the year ended 31 December 2015
120
BOTSWANA STOCK EXCHANGE AND ITS SUBSIDIARY COMPANY
annual report 2015

11 Trade and other payables
GROUP EXCHANGE
2015 2014 2015 2014
P P P P
Trade payables 482 933 475 121 429 329 430 788
VAT payable 239 231 127 662 79 244 46 650
Other payables 2 811 602 790 852 1 750 102 790 852
3 533 766 1 393 635 2 258 675 1 268 290
12 Amounts due to the Botswana Stock Exchange Security Fund
Balance at 1 January 2 411 424 2 693 608 2 411 424 2 693 608
Statutory transfer for the year 2 883 164 2 411 424 2 883 164 2 411 424 Settled during the year (2 411 424) (2 693 608) (2 411 424) (2 693 608)
Balance at 31 December 2 883 164 2 411 424 2 883 164 2 411 424
13 Deferred lease liability
Non-currentCurrent 93 721 187 131 93 721 187 131
Balance at 31 December 93 721 187 131 93 721 187 131
The group leases its office premises under 2 operating lease facilities. The leases run from February 2013 and April 2012 respectively and both expire in March 2017. Both leases have a renewal option upon expiry. Amounts recognised as an expense in profit or loss in respect of operating leases are disclosed in note 1 to the financial statements. Lease payments are escalated every year by the lower of 7% and the consumer price index.
At the end of the reporting period, the future minimum lease payments under non-cancellable operating leases are payable as follows:
Less than one year 912 166 940 175 912 166 940 175 Between one and five years 229 605 1 261 666 229 605 1 261 666
Total 1 141 771 2 201 841 1 141 771 2 201 841
NOTES TO THE FINANCIAL STATEMENTS [continued]for the year ended 31 December 2015
121
R E A C H I N G G R E AT E R H E I G H T S

14 Cash generated from operations
GROUP EXCHANGE
2015 2014 2015 2014
P P P P
Profit for the year 16 289 893 17 556 544 8 109 016 10 522 847
Adjustment for:
- Depreciation (note 7) 1 184 256 1 144 034 540 199 526 622
- Finance income (note 4) (3 133 768) (2 193 211) (2 367 259) (1 875 614)
- Bad debts written off and movement
in provision for bad debts 412 456 - 412 456 -
Changes in working capital
- Trade and other receivables (661 026) (1 354 969) (1 896 770) (560 152)
- Deferred lease liability (93 410) 39 293 (93 410) 39 293
- Trade and other payables 2 140 131 (1 140 099) 990 385 (1 108 996)
Cash generated from operations 16 138 532 14 051 592 5 694 617 7 544 000
15 Related party transactions
Related parties are entities under common control or ownership. The Exchange was set up by the Botswana Stock Exchange Act, 1994, and is therefore related to the Government of Botswana. All stock brokers who are members of the Botswana Stock Exchange are also related parties.
The following transactions were carried out with related parties.
a) Membership fees
- Stockbrokers Botswana (Pty) Ltd 4 000 3 750 4 000 3 750
- Imara Capital Securities (Pty) Ltd 4 500 4 500 4 500 4 500
- African Alliance Securities Botswana Limited 4 000 4 000 4 000 4 000
- Motswedi Securities (Pty) Ltd 4 000 3 750 4 000 3 750
16 500 16 000 16 500 16 000
NOTES TO THE FINANCIAL STATEMENTS [continued]for the year ended 31 December 2015
122
BOTSWANA STOCK EXCHANGE AND ITS SUBSIDIARY COMPANY
annual report 2015

15 Related party transactions [ continued ]
GROUP EXCHANGE
2015 2014 2015 2014
P P P P
b) Listing and annual sustaining fees on
Government bonds (at 0.125% on nominal
value of Government bonds 8 155 000 9 000 000 8 155 000 9 000 000
c) Government Subvention
Government of the Republic of Botswana:
- Capital grant 5 000 000 - 5 000 000 -
- Subvention income 4 906 285 13 000 000 2 342 689 5 700 000
9 906 285 13 000 000 7 342 689 5 700 000
d) Transfer to the Botswana Stock Exchange Security Fund 2 883 164 2 411 424 2 883 164 2 411 424
e) Sitting allowances by the Committee members 117 810 119 910 70 980 74 340
f) Remuneration for senior managers 6 668 536 7 706 082 4 942 240 6 112 738
g) Year end balances
Receivables
- Government of the Republic of Botswana 2 477 556 3 250 000 1 836 120 1 425 000
- Central Securities Depository Company
of Botswana Limited - - 359 921 298 447
2 477 556 3 250 000 2 196 041 1 723 447
Payables
- Botswana Stock Exchange Security Fund 2 883 164 2 411 424 2 883 164 2 411 424
NOTES TO THE FINANCIAL STATEMENTS [continued]for the year ended 31 December 2015
123
R E A C H I N G G R E AT E R H E I G H T S

16 Commitments The Botswana Stock Exchange expects the Ministry of Finance to bestow ownership of the automated trading system to
Botswana Stock Exchange in the coming year. The ownership rights to the automated trading system will be assigned on condition that the value of the automated trading system be converted into government equity in the Botswana Stock Exchange upon corporatisation of the Exchange.
17 Contingent liabilities The Exchange is defending a case in the labour court from a former employee on allegations of unfair dismissal. The proceedings
were still pending at reporting date. Management is of the opinion that the employment was terminated in accordance with the employee’s contract of employment. The level of compensation, if any, could not be estimated at the reporting date and will be determined upon delivery of judgement.
18 Events after the reporting date The Government of Botswana intends to repeal the Botswana Stock Exchange Act through the BSE Transition Act. Under the BSE
Transition Act, the Exchange will transition into a public company limited by shares under the Companies Act. The Government of Botswana will control the majority shareholding in this company.
19 Fiduciary accounts The group, through its subsidiary Central Securities Depository Company of Botswana Limited, is the custodian of brokers’
liquidity bank accounts. Brokers’ liquidity bank accounts are used to mitigate the systemic risk of transactions carried out on the Botswana Stock Exchange. The following were the brokers’ liquidity bank balances as at the end of the year:
2015 2014
P P
Favourable bank balances 3 635 580 23 871 953
NOTES TO THE FINANCIAL STATEMENTS [continued]for the year ended 31 December 2015
124
BOTSWANA STOCK EXCHANGE AND ITS SUBSIDIARY COMPANY
annual report 2015

DETAILED STATEMENT OF PROFIT OR LOSS AND OTHER COMPREHENSIVE INCOMEfor the year ended 31 December 2015
2015 2014P P
Revenue Commission income 8 073 644 5 840 021 Listing and annual sustaining fees 15 087 735 13 324 727 Members' fees 16 500 16 000 X-News Publication 422 000 155 110 Government subvention 2 342 689 5 700 000 Training income 317 179 417 002 Other income 145 438 18 214 Total income 26 405 185 25 471 074
Administrative expensesAdvertising 1 299 154 1 054 935 Internal audit fees 168 330 198 585 External audit fees 107 910 94 100 Bank charges 63 180 32 530 Bad debts 412 456 -Cleaning 74 843 71 636 Communication expenses 406 309 257 551 Computer expenses 2 529 817 2 258 265 Consulting fees 539 069 211 636 Recruitment expenses 56 143 14 297 Donations - 10 000 Depreciation 540 199 526 622 Electricity 101 666 101 456 Entertainment 49 013 68 648 Insurance 193 100 101 269 Internship allowances 51 064 83 423 Library expenses 5 393 926 Members' sitting allowances 70 980 74 340 Motor vehicle expenses 48 222 64 090 Office expenses 69 296 66 022 Printing and stationery 48 115 35 758 Rent 786 126 801 501 Repairs and maintenance 71 432 66 814 Salaries and wages 11 499 110 9 178 329 Security costs 96 122 96 014 Training Levy 27 502 23 332 Seminars and conferences 212 512 227 452 Staff welfare 347 548 326 010 Subscriptions 59 782 64 206 Training expenses 269 106 364 852 Travelling and accommodation 453 180 337 523 Water 6 749 11 719 Total expenses 20 663 428 16 823 841
The detailed statement of profit or loss and other comprehensive income does not form part of the financial statements covered by the audit opinion on page 97.
125
R E A C H I N G G R E AT E R H E I G H T S
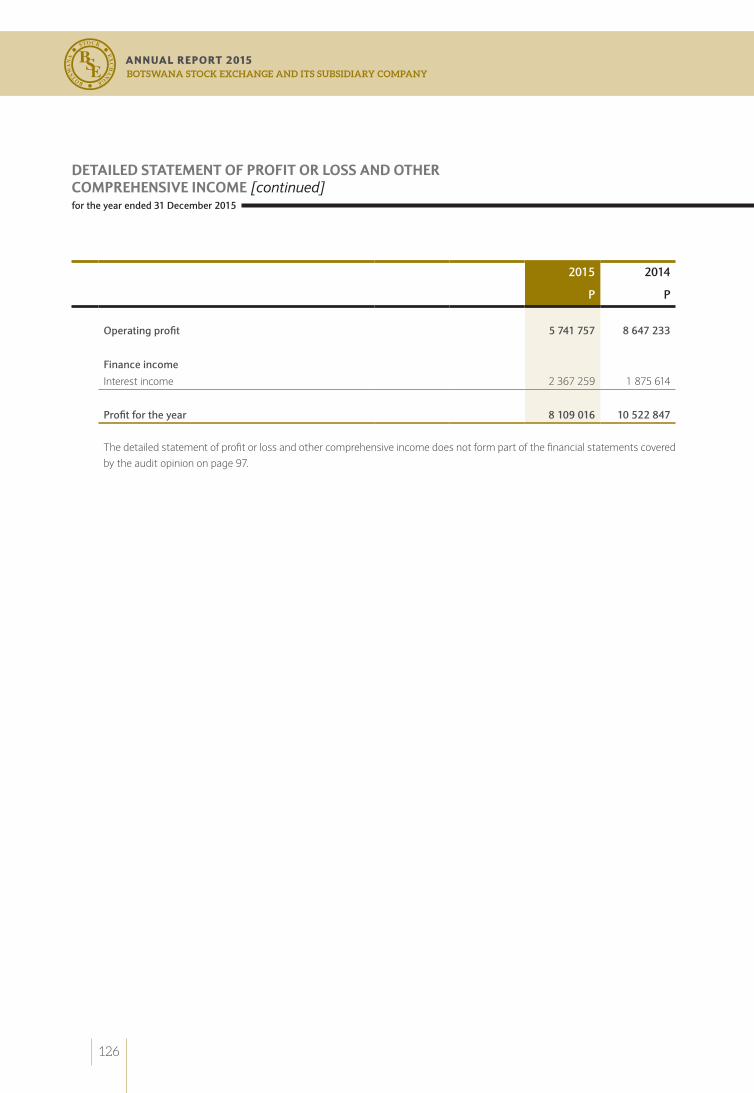
DETAILED STATEMENT OF PROFIT OR LOSS AND OTHER COMPREHENSIVE INCOME [continued]for the year ended 31 December 2015
2015 2014
P P
Operating profit 5 741 757 8 647 233
Finance income
Interest income 2 367 259 1 875 614
Profit for the year 8 109 016 10 522 847
The detailed statement of profit or loss and other comprehensive income does not form part of the financial statements covered by the audit opinion on page 97.
126
BOTSWANA STOCK EXCHANGE AND ITS SUBSIDIARY COMPANY
annual report 2015

GABORONE HEAD OFFICE
Plot 64511 Fairgrounds Gaborone
Private Bag 00417 I Gaborone I Botswana
Tel: (+267) 318 0201, Fax: (+267) 318 0175
www.bse.co.bw
Design & Layout by: The Dialogue Group
Compiled by: Thapelo Tsheole
Kopano Bolokwe
Thabelo Nemaorani
Printed by: Impression House
R E A C H I N G