
Strategic Management in Tourism - CiteSeerX
360
-
Upload
khangminh22 -
Category
Documents
-
view
3 -
download
0
Transcript of Strategic Management in Tourism - CiteSeerX


Strategic Management in Tourism

To my father

Strategic Management in Tourism
Edited byLuiz Moutinho
Department of Management StudiesUniversity of Glasgow
GlasgowUK
CABI Publishing

CABI Publishing is a division of CAB International
CABI Publishing CABI PublishingCAB International 10 E. 40th StreetWallingford Suite 3203Oxon OX10 8DE New York, NY 10016UK USA
Tel: +44 (0)1491 832111 Tel: +1 212 481 7018Fax: +44 (0)1491 833508 Fax: +1 212 686 7993Email: [email protected] Email: [email protected] site: http://www.cabi.org
© CAB International 2000. All rights reserved. No part of thispublication may be reproduced in any form or by any means,electronically, mechanically, by photocopying, recording or otherwise,without the prior permission of the copyright owners.
A catalogue record for this book is available from the British Library,London, UK.
Library of Congress Catalogin-in-Publication DataStrategic management in tourism/edited by Luiz Moutinho.
p.cm.Includes bibliographical references.ISBN 0-85199-282-x (alk. paper)1. Tourism–Management. I. Moutinho, Luiz.
G155.A1 S68 2000338.4'791–dc21 99-059381
ISBN 0 85199 282 X
Typeset by York House Typographic Ltd, LondonPrinted and bound in the UK by Biddles Ltd, Guildford and King’s Lynn

Contents
Contributors viiPreface ix
Part One: The Tourism Environment 11. Trends in Tourism
L. Moutinho3
2. The Marketing Environment for Travel and TourismK. Peattie and L. Moutinho
17
Part Two: Tourism Marketing Management 393. Consumer Behaviour
L. Moutinho41
4. Tourism Marketing ResearchL. Moutinho
79
5. Segmentation, Targeting, Positioning and Strategic MarketingL. Moutinho
121
Part Three: Functional Management in Tourism 1676. Human Resource Issues in Travel and Tourism
D. Nickson169
7. Financial Management in TourismJ. Bridge and L. Moutinho
187
8. Operations ManagementG. Southern
211
9. Strategic Quality ManagementH. Maylor
239
Part Four: Strategic Planning in Tourism 25710. Strategic Planning
L. Moutinho259
11. The Marketing Planning Index: A Tool for Measuring Strategic MarketingEffectiveness in the Hospitality SectorP.A. Phillips and L. Moutinho
283

12. Demand Modelling and ForecastingS.F. Witt and L. Moutinho
293
13. International Tourism ManagementF. Go and L. Moutinho
315
Index 337
vi Contents

Contributors
John Bridge, Cardiff Business School, University of Cardiff, Aberconway Building, ColumDrive, Cardiff CF1 3EU, UK
Frank Go, Rotterdam School of Management, Erasmus University Rotterdam, PO Box 1738,3000 DR Rotterdam, The Netherlands
Harvey Maylor, School of Management, University of Bath, Claverton Down, Bath BA27AY, UK
Luiz Moutinho, Foundation Chair of Marketing, University of Glasgow Business School,Department of Management Studies, 53–59 Southpark Avenue, Glasgow G12 8LF, UK
Dennis Nickson, Scottish Hotel School, University of Strathclyde, Curran Building, 94Cathedral Street, Glasgow G4 0LG, UK
Ken Peattie, Cardiff Business School, University of Cardiff, Aberconway Building, ColumDrive, Cardiff CF1 3EU, UK
Paul A. Phillips, Surrey European Management School, University of Surrey, GuildfordGU2 5XH, UK
Geoff Southern, University of Glasgow Business School, 53 Southpark Avenue, GlasgowG12 8LF, UK
Stephen F. Witt, Chair of Tourism Forecasting, School of Management Studies for theService Sector, University of Surrey, Guildford, Surrey GU2 5XH, UK. Also at School ofApplied Economics, Victoria University, Melbourne, Australia


Preface
New consumer trends, political changes, new technology, the fragmentation of markets,globalization, vertical, horizontal and diagonal integration, environmental concerns, eco-nomic integration and many other key developments are all adding to the complexity ofcorporate management in tourism. Today and in the future, the tasks of strategic manage-ment extend well beyond finding or creating new markets. Tourism managers must adjust toall sorts of changes to assure a sustained inflow of resources and a continuing outward flowof services. Under today’s pressures, tourism executives charged with strategic managementmust be alert to an increasing diversity of impacts that result from the strategy, policy andmanagement design they select.
This textbook confronts this highly dynamic environment in two ways: (i) it lays outmodels and approaches for tourism executives – and students – to use in tying theircompany or organization into the opportunities and challenges created; and (ii) it uses manyof these active forces in the text and cases to illustrate the application of the models,techniques and tools to realistic and demanding situations found in the area of strategicmanagement in tourism. These two distinctive features of the book make it relevant to aturbulent world. More specifically, in order to deal with the baffling array of influences andmarket opportunities, tourism managers need effective approaches or models to help themsort, interrelate and evaluate. Such decision-making models should suggest what to watchand how to put the pieces together into a meaningful analysis. At the same time, the modelsand techniques must be sufficiently simple, and easily related to concrete events, so thatpractising tourism managers can apply them to the situations they face.
By becoming familiar with the concepts and techniques, students will have powerfultools to analyse new business and tourism developments and to interpret threats andopportunities for tourism companies.
The book is structured in four major parts: (1) The Tourism Environment; (2) TourismMarketing Management; (3) Functional Management in Tourism; and (4) Strategic Planning inTourism. Part One introduces two chapters, one on future trends and globalization in tourism,and the other on the management of the environment. Part Two includes chapters onconsumer behaviour, marketing research, segmentation, targeting, positioning and managingthe marketing mix as well as site location analysis in tourism. Part Three deals with functionalmanagement implications in tourism arising from policies in human resource managementand total quality management. Finally, Part Four focuses on strategic planning in tourism,particularly strategic planning systems, performance and effectiveness measurement, demandmodelling and forecasting as well as international tourism management.

I wish to acknowledge the help of my chapter co-authors, who contributed ideas,perspectives and specialist knowledge which have greatly enhanced the content of the book.The actual drawing together of the manuscript and making it intelligible to the publisherwas ably performed by Sylvia Kerrigan. Finally, I would like to thank my editor, TimHardwick, for his patience, support and confidence. For all this assistance I am mostgrateful.
Luiz MoutinhoGlasgow, UK, 1999
x Preface

Part OneThe Tourism Environment


1Trends in Tourism
L. Moutinho
Despite regional uncertainties, the worldeconomic and social climate is generallypredicted to produce a strong increase intourism over the next 20 years. New marketswill emerge due to changing economic con-ditions, modified consumer behaviour andnew technologies. The composition of thetourist population will alter, with increasingproportions of senior citizens, for example.There will be greater emphasis onindividual/self-determined holidays, andon educational and active recreational pur-suits. On one hand, increasing environ-mental awareness will affect planning poli-cies and tourist demand. On the other hand,nature, which is the critical resource of tour-ism, will become more scarce and fragile.An ecological, long-term approach to tour-ism planning is postulated.
This chapter covers recent and probablefuture trends in tourism. The aim is not topresent a definitive picture of developmentsover this period. It is far more important forthis scenario to help the planners concernedwith tourism to come to terms with futurechanges than merely to describe future con-ditions. Thus we must examine anydistinguishable and important trends with aview to answering the question: ‘What deci-sions have to be taken now or in the comingyears to make adjustment to these trendspossible, in good time?’
Regional and Public Sector Policies
The characteristics of attractions at a desti-nation can be listed by referring to physical,social, historical and aesthetic attributes,among others, but the evaluation of theattractiveness will have to rely on somemeasure of visitor perception. The individ-ual attractions will play different roles fordifferent visitors; some single attractions areperceived as dominant to certain groups,while others will look at a region from amore holistic point of view and combina-tions of different types of attractions will,consequently, play the major role.
The tourism industry is dominated byprivate firms and small businesses across abroad spectrum of sectors, including trans-port, accommodation and attractions.However, the public sector has a key role toplay in the successful development of tour-ism in a particular locality. Public sectorintervention is necessary to ensure that theassociated benefits of tourism are maxi-mized and any potential problems areminimized for the benefit of the economy,society and environment, as well as for thelong-term interest of the tourism industryitself. Whether the government opts merelyfor the creation of a climate conducive to thegrowth of a successful tourism industry, ordecides to become more actively involved,perhaps even assuming an entrepreneurialrole, intervention by the government should
© CAB International 2000. Strategic Management inTourism (ed. L. Moutinho) 3
not merely be a manifestation of politicalrhetoric, but rather an organized, sustainedand flexible approach to tourism planningwith the aim of optimizing its social andeconomic returns.
Two characteristics of the tourism sector,the constant dependence of the tourist onthose rendering the services and the cur-rency foreign tourists bring in, have ledgovernments to become very rapidlyinvolved in this field, involvement whichhas above all produced special regulationsassuring a close control of the sector’s activ-ities. The government can limit itself tostrictly technical or administrative interven-tion or, conversely, enlarge it to include allaspects of the economy.
Economic Aspects
According to most futurologists, the eco-nomic future will be characterized bygreater amounts of freely disposableincome, an increasing proportion of citydwellers and a further fall in working hoursfor employees. Even if it is assumed that therate of these changes will slow down,experts some 20 years ago anticipated con-siderable rates of growth for tourismbetween 1980 and 2000:
● The World Tourism Organisation(WTO) anticipated an annual growthrate of arrivals in cross-border tourismto be between 4.5 and 5.5%.
● Half the experts in a Delphi poll antici-pated growth rates in the region of3–3.5%, in other words a doubling ofthe number of tourist arrivals within 20years, approximately (Krippendorf,1979).
● Herman Kahn forecasted that in the year2000 tourism would be the largestindustry and the most important exportsector in the world. He calculated thatby then expenditure on tourism maywell have risen fivefold, correspondingto an annual growth rate of about 8%(Kahn, 1979; WTO, 1999).
Yet, today, in the traditional industrialcountries the economic perspective is gen-
erally one of greatly decelerated growth andstagnating disposable per capita incomes.The desire to travel, in these countries, isapproaching saturation levels and sensitiv-ity to price levels is increasing. The limits totourist expansion are already detectable.The forecasts mentioned above for growth intourism, particularly that by Herman Kahn,are not likely to be maintained, at least as faras the traditional industrialized nations areconcerned. In countries like Switzerland,Sweden and Norway the net travel inten-sities, which are over 75%, are not likely toincrease significantly. In several large coun-tries, however, where the variance of travelintensities between urban and rural areas islarger, e.g. France, Germany, UK (net travelintensities between 57 and 60%), there isstill some growth potential.
Yet, even if long-haul flights for Euro-peans will expand less than forecasted, thetrend which will make the Asia-Pacificregion the boom area for tourism for the nextcentury will not be jeopardized, due to theenormous ‘internal’ potential of that area.Despite recent problems, in south-easternand eastern Asia more economic growth isexpected over the next 20 years than any-where else in the world. This ‘unfolding fan’of opportunity will spur transnational traveland hotel companies to expand to nearlyevery major gateway city in the Asia-Pacificregion.
Demand and Supply
Even though the volume of travel in theindustrialized countries has grown consid-erably, the tourist market worldwide haschanged from a seller’s market to a buyer’smarket. On a global scale, competition fromnew developing destinations and facilitieswill increase further. Significant structuralchanges currently in progress give a roughidea of how the situation might appear in15–20 years time.
On the supply side, there has been a dis-proportionate increase in the types oflodging provided by the ‘parahotel’ businessin relation to the traditional hotel business.In addition, a major proportion of traditional
4 L. Moutinho

hotels have had to develop new productstrategies to match the growing demand for amore active holiday. Holiday clubs, parksand villages, and hotels offering active lei-sure pursuits, are experiencing higher thanaverage increases in demand. It is likely thatthe market share of the traditional hoteltypes will continue to shrink.
There will be an increase in the will-ingness to spend holidays in cheaperaccommodation, with a lower volume of ser-vices consumed. A price-elastic touristdemand need not necessarily imply an endto all travel – after all, travel as such hasbecome close to being a ‘basic need’ – but itis more likely to result in demand forcheaper holidays. Thus, the market share oflow-price accommodation will probablyrise. If, as expected, the price elasticity oftourist demand increases, we can look for-ward to further significant shifts in marketshares among various countries.
Increasing customer sophistication willhave an impact on all product developmentthroughout the industry. There will be anincreased requirement for high standards ofproduct design, efficiency and safety. Thiswill be achieved through strong brandingand tailoring the product more closely to theneeds of specific market segments. Touristproduct innovation is more likely to beabout unpackaging rather than packaging,providing more individual attention withina number of price bands. Even so, packageholidays are not going to disappear. Indeed,they may increase in number as developingcountries come into the market. It is therelative importance of package tours thatwill decline. The price-based market sharebattle between the major operators has – inreality or in perception – lowered the qual-ity of the holidays on offer.
Seasonal Variation
By ‘seasonality’ we mean the tendency oftourist flows to become concentrated intorelatively short periods of the year. The sea-sonality of tourism is at the same time one ofits most widely recognized and least well-researched features. Patterns of seasonal
fluctuation in the tourist trade have nothinginevitable about them, and the emergence ofseasonal patterns, the degree of their inten-sity and their historical durability are allvariables which can both merit and repayresearch, especially at the local level. Effortsto reduce the seasonal fluctuations in touristflows will make further progress. In linewith the growth rates for supply anddemand, this will have an impact on occu-pancy, profitability and the ability of touristfacilities to adapt to changing needs. Betterand more varied products will probably beavailable for off-season periods.
Socio-demographic Changes
The following segments of the tourist marketare likely to gain in relative importance andtherefore grow at above average rates: seniorcitizens and active middle-aged personsbetween 50 and 65 (also called ‘young’ sen-ior citizens); singles (particularly thoseunder 35); ‘YUPs’ (young urban profession-als); guest workers; youngsters (the numberof young people travelling is increasingrapidly but supply is not well geared tothem); young families; and double incomefamilies (particularly ‘Dinks’: doubleincome, no kids). Psychographic and life-style segmentation will identify morespecific clusters of travellers. The maturemarket of Europeans between 55 and 65 hasnow reached about 100 million.
Sociocultural Aspects
Research carried out in several countries, inparticular a large-scale study by the StanfordResearch Institute (California, USA), indi-cates that there is a clearly defined trendaway from an ‘outward-directed’ lifestyletowards ‘inward-directed’ and ‘integrated’values. Several recent studies indicate that‘post-materialistic values’ (growing non-materialistic needs, environmental care,diminishing concerns about career, prestigeand status, etc.) will gain in importance.Materialistic lifestyles will not vanish, but a
5Trends in Tourism

polarization between exponents of materialand non-material values is likely to takeplace.
There is a strong trend leading away fromstandardization towards an ever greaterdiversity in lifestyles, inciting new approa-ches to life and recreation. The limits ofmass tourism are recognizable not only fromthe quantitative, but also from the qualita-tive point of view. The following trends areapparent and probably of a long-termnature:
● further increasing differentiation andpluralization of demand;
● the emergence of new specialized mar-kets and market segments;
● a decrease of physically and culturallypassive forms of vacation in favour ofmore active pastimes;
● a shift towards maximizing individualliberty in recombining elements tocustom-made holiday packages (mod-ular product design).
The growing need for non-standardized ser-vices and individualized tourist behaviouris directly linked to:
● the quest for self-determination (eman-cipation) and ‘do-it-yourself’;
● the advanced level of travel experiencein the population, which goes hand inhand with more selective, critical andquality-oriented approaches to individ-ual holiday planning as well as growingsophistication of demand and rational-ity of choice;
● an increasing desire to relate to nature,to gain first-hand experience and toengage in active pastimes (e.g. ‘hobbyholidays’, trekking holidays, farm tour-ism);
● higher levels of environmental con-sciousness and sensitivity to the qualityof life in general; and
● the increasing effort to learn, whichoften manifests itself in serious attemptsto get to know foreign cultures.
The suppliers of tourist services willincreasingly offer service packages whichdirectly address specific customer problemsand provide travellers with more opportu-
nity to shape their holidays as they wish.Activities, experiences, participation andlearning will all be key elements in thefuture. Adventure holidays, sports andhealth trips, sabbaticals and learning holi-days will all become more popular. Thedemand for ‘soft’ forms of transport andtourism, including ‘back-to-nature’ activ-ities will show a marked increase. Anincreasing number of tourists will look for aholistic type of recreation, in search of an‘overall balance’ of body, soul and mind.More and more travellers will define theirconcept of a ‘rich holiday’ in terms of thedepth rather than in terms of the diversity oftheir travel experiences.
Not only will the worldwide travel mar-ket itself be characterized by an ever greaterrange of possible types of travel and destina-tions, but substitutional competition willalso continue to increase. The range of alter-native uses to which free time can be put isconstantly expanding, a trend which islikely to continue over the next 20 years.Apart from travel, these options can be char-acterized as follows.
Leisure within the home or in the vicin-ity. Leisure-oriented design of living space,children’s playgrounds near to dwellings,public leisure facilities in residential areas,centres or leisure parks, green belt areasaround cities will all be central to currenteducation and further training. To a certainextent, and an ever increasing one, life isbecoming a permanent learning processowing to the rapid rate of change in pro-fessional structures and technologies. Thespectrum of educational facilities andopportunities is being continually enriched,even though the educational and profes-sional routes are being further formalized,under the direction of public institutions.Nevertheless, there is a clear trend towardsthe pluralization and liberalization of edu-cation and training in general, thanks toprivate initiatives. This applies to all levels,from primary school to university, but espe-cially to training in specific technologies,skills or professional profiles.
Schools of the future will not be institu-tions for imparting knowledge so much asintegrated centres for education, culture and
6 L. Moutinho

leisure. Leisure time will be used muchmore for productive purposes, in which con-text the following variants are relevant.
1. Paid work to increase disposableincome.
2. Home-based production, which meansnot only a greater degree of tasks ‘dele-gated’ by industry to the consumer(such as collecting, assembling, repair-ing and maintaining products) but alsoincreased production of an agriculturalor handicraft type. This type of produc-tion is often carried out on a communitybasis.
3. Sociocultural involvement: this cate-gory includes all types of social,political and cultural involvement. Thesocial cooperation networks whicheven today are expanding rapidly andwhich in 20 years are likely to supply asignificant proportion of social services,are a prominent example.
In view of the expansion of the ‘informal’economy and a certain shift, for technolog-ical reasons, of professional activities to thetraditional domicile, the boundariesbetween leisure time, work and living arebecoming increasingly hazy. Also, the indi-vidual will have more opportunities toarrange his or her working hours and leisuretime as required. Flexitime, job-splitting,job-sharing, individual arrangementsregarding holidays and pensions, etc., willbecome more commonplace.
There is a growing recognition of thevalue of cultural diversity (possibly a reac-tion to globalization). Parallel with thisrecognition is a desire to maintain and fosterthe special and unique characteristics of eth-nic groups and host societies as afundamental principle of tourism develop-ment and promotion.
Ecological Aspects
Concern for the environment will in thefuture be far more widespread among thepopulation than it is today. The growingappreciation that humankind and the natu-ral environment share a common fate is
promoting a conservationist approach atmany levels. Even today, we can see anincreasing environmental awareness in pub-lic opinion. This manifests itself in agrowing tendency to reject those foreigntourist spots which have already exceededtheir tolerance levels, not only in the opin-ion of the experts but also from the point ofview of the consumers.
The inhabitants of tourist areas, some ofwhom have exchanged their initial euphoriaat the influx of tourists for blatant resistance,will increasingly adopt realistic strategies toretain their independence and protect theirenvironment. For example, the dilemma fac-ing mountain regions concerning thebalance between destruction of the land-scape by tourist monoculture, anddesolation on account of depopulation, willbe handled better than it is today: by meansof multi-faceted development, that is reva-lorization of mountain farming, includingunconventional methods such as gamefarming, vegetable cultures, and blendingwith other branches of the economy. Theplanning authorities and political institu-tions, thanks largely to the pressure ofpublic opinion, will contribute to develop-ment in the interests of humans and theenvironment, by defining appropriate plan-ning guidelines and ensuring that they arefollowed.
Destruction of natural resources vital totourism will not be stopped immediately. Asa consequence, decline of some traditionaldestination areas (due to gradual spoilage or,in some cases, due to environmental cata-strophes) and rise of ‘substitutes’ inunspoiled surroundings will probably con-tinue (unfortunately) to a certain extent.Furthermore, artificial leisure environmentswill be created as a partial (and weak) com-pensation for the degraded natural milieu.Such developments will continue until soci-ety has implemented tourism strategieswhich reconcile man and nature.
On the other hand, growing environmen-tal sensitivity is likely to stimulatesubstantial efforts to protect, conserve andupgrade the natural as well as the socio-cultural milieu. In response to the questionraised by a WTO exponent, Schwaninger
7Trends in Tourism
(1989) maintained that the demand for ‘softforms of tourism’ would be a volume marketby 2010. Hopefully, on the supply side, achange towards a long-term planning men-tality, which should substitute forshort-sighted profit maximization, will takeplace. Even the best hotels and restaurantsin tourist resorts can only thrive if they arepart of an intact and sustainable environ-ment. An ecologically viable strategy is theprime requisite for success.
As far as the provision of accommodationfacilities is concerned, a dramatic re-arrangement of priorities, due to growingenvironmental awareness, has alreadybegun. If in the past the emphasis was on theerection of new buildings, the future shouldsee a comprehensive programme of renova-tion. The transformation of historicbuildings or other old buildings into train-ing and leisure establishments, and theshaping of the environment to accommodateleisure activities, both in the home and itsclose proximity, will continue to gain con-siderably in importance.
International travel has grown by morethan 500% in the past 25 years, according tothe World Travel and Tourism Council(1995). As a consequence, in the past decadealone, there has been a 25% increase in thenumber of hotels built across the globe. Butthere is also evidence of a growing concernamong both leisure and business travellersabout the damage being done to the environ-ment by tourism. And, increasingly,travellers are taking these concerns intoaccount when they book holidays or busi-ness trips. When the world’s biggest hotelchain, Holiday Inn, surveyed its guests, 78%of them said they were very concerned aboutthe environment and 28% said they tookenvironmental policies into considerationwhen choosing their hotel. The Travel Asso-ciation of America estimates from its ownresearch that 13 million people in the USAnow consider themselves ‘ecotourists’.What is more, these people are prepared topay an 8.5% premium to stay in an envir-onmentally friendly hotel (Holloway et al.,1992).
Technological Aspects
Technological developments will havemajor effects, particularly in those areaswhere originally isolated technologies canbe combined. In the leisure sector, thisapplies primarily to the converging technol-ogies of telecommunications, dataprocessing and office machines (Stipanuk,1993; Sheldon, 1997).
An increasing proportion of professionalwork will not be site-dependent. This leadsnot only to new forms of social organizationand interaction but also to a certain shift ofprofessional activity to the home of the work-ing individual. Thus, the boundaries betweenwork, living and leisure time become lessrigidly defined (see Cheong, 1995).
The new technologies give rise to newsales and distribution systems. New eco-nomic groupings engaged in the battle forthe holiday visitor (banks, clothing andsports shops, supermarkets, restaurants, lot-tery kiosks and petrol stations) are at presentcomplicating the established network ofsales channels. In the years to come, how-ever, electronic distribution, for example,will lead to dramatic structural change,including substitution of existing saleschannels. The Imholz travel agency, which afew years ago almost completely replacedthe traditional booking of holidays in branchoffices by telephone bookings, is a precursorof this development. On-line bookings overthe Internet are now becoming increasinglycommon. Another example is the airlinesbusiness, where further computerizationwill stimulate innovation, and dictate struc-tural changes among airlines and travelagents. The quest for more efficient distribu-tion will also lead to new alliances withinand between firms of these sectors (see VanHoot et al., 1996).
Yet, computerized services will alsobreed new opportunities for those travelagents who succeed in counselling their cus-tomers better. The new technologies willenable further specialization. New types oftravel agencies will emerge, which will havethe character of consulting rather than ofbooking agencies, using information sys-tems to design individualized travel
8 L. Moutinho

packages out of available offers. In the sec-tors which form the subject of tourism (airtransport, education, hotels, restaurants)and a few others (e.g. road transport), how-ever, there should be a positive effect onemployment, spurred on by developmentsin the field of microelectronics. It has beenestimated that by 2002 commercial air trans-portation will produce nearly 3.5 trillionrevenue passengers kilometres, roughly 2.3times the current level.
Teleconferencing may reduce businesstravel by 25% over the next 15 years, whileincreased automation through robotics willresult in more leisure which should triggerincreased recreational spending. Technol-ogy may also lead to increasing integrationbetween the different sectors of the industry.It was suggested some 15 years ago thattechnology would encourage the growth ofmega-corporations covering all aspects ofthe present industry as part of a new ‘tran-spitality’ industry (Palmer, 1984). Althoughconsiderable vertical and horizontal integra-tion does now exist, it is likely that furtherconsolidation of companies in all sectorswill continue with increasing economicconcentration in a small number of largecompanies. Furthermore, some of thesecompanies will combine across sectors cre-ating new ‘diagonal marketing systems’.These large corporations are likely to securegreater shares of the markets in which theyoperate, and there is no evidence that limitsto economies of scale have yet been reached(see Peacock, 1995 and Inkpen, 1998).
In the years to come, electronic distribu-tion will lead to dramatic structuralchanges. For example, as an added conveni-ence, there is already a new way of shoppingfor vacations at the shopping centre. Somecomputerized systems allow shopping cen-tre customers to walk up to a kiosk, give theemployee operating the computer the cri-teria for their dream holiday, then sit andwatch their options on a TV screen.
Political Aspects
The influence of public institutions on theleisure sector will continue to grow. On the
one hand there are socio-political motiveswhich, as part of the effort to humanizeworking conditions, are aimed at reducingthe statutory number of working hours andat promoting the involvement of companiesand public authorities in the field of leisurepolicies. On the other hand, economicmotives are aimed at sharing out an evi-dently shrinking volume of human work sothat full employment is guaranteed. Partic-ularly in tourism, there is a trend towards anincreasing amount of planning and also pro-tectionist intervention at national andinternational levels. Positive efforts to cur-tail the ecologically damaging effects ofhuman leisure activities are being takenmore and more seriously, and are meetingwith some success.
Political and planning decisions in oursociety take longer the less they are basedpurely on the representation principle. Forsome years now, there have been increasingdemands for participation by the peopleconcerned, for example inhabitants of tour-ist regions. In future, these demands will bebetter met than has so far been the case. Notonly is the view gaining ground that incor-poration of those concerned in the planningprocesses leads to better results, but thereare better and better means available whichcontribute to the efficient handling of suchcomplex decision-making processes.
Prospects for Planners
The most important challenges faced bythose responsible for planning in the touristsector, and those affected by it, are summa-rized as follows.
Integral planningIt is necessary to replace the old dominatingand uni-dimensional planning conceptswith integral, systematic planning whichwould be more adequate to cope with thecomplexity of real systems. If a leisurefacility or a holiday location is planned fromthe basis of a single viewpoint (be it exclu-sively economic, technological, ecological,social or aesthetic) the outcome can only beunsatisfactory. Integral planning calls for
9Trends in Tourism

the incorporation of all these aspects andcomponents of knowledge in the process ofanalysis and design. Thus it is not onlyinterdisciplinary but also transdisciplinaryin character. In order to realize socially andecologically viable strategies – which will behigh priority issues in many destinations –such planning should not be limited to con-sulting reports. All constituents(‘stakeholders’) that embody relevantknowledge (and ‘stakes’) should contributeto the planning process. In a tourist resort,not only representatives of tourist institu-tions and hotels should be included, butalso exponents of sectors such as trade, agri-culture and forestry and, ultimately, allcitizens.
Long-term thinking
The attractiveness of short-term advantagesis often in conflict with the need to obtainlong-term facilities, in other words to carefor and build up the resources which willform the basis for the future. The knowledgegained over the past few years on the long-term nature of fundamental cause-and-effectrelationships inherent in tourism businesssystems requires us to think strategically.Thinking in terms of large-scale and long-term relationships gives us the opportunityto concentrate on overall targets, such as themaintenance of a healthy natural environ-ment, without being led astray by short-termfluctuations. In many destinations, thedesign of ecological policies and strategieswill be of primary importance to maintainlong-term viability.
Consistent action
With regard to leisure and tourism a numberof plans and concepts have been elaborated,which contain a considerable amount ofintegral planning and long-term thinking.‘Strategic plans’ or ‘policies’ are essentialfoundations for coherent action in thefuture. Putting them into practice requirescommitment of decision-makers at all lev-els. A legal framework of tourist policy willbe helpful, but the understanding of thoseconcerned is the essential prerequisite forcommitment. This holds particularly when
short-term sacrifices are necessary in orderto maintain long-term viability, for instance,when ecological strategies are at stake. Alsoin this respect, the basis for effective imple-mentation of strategy is set by involving theconstituents of the system in its design(Schwaninger, 1989).
Summary of Trends and Forecasts
● The travel and tourism industry is theworld’s largest industry, employingover 101 million people worldwidewith gross sales exceeding US$2 tril-lion. It represents 5.5% of the world’sGNP.
● Debt for nature swaps are ‘in’ as devel-oping nations such as Bolivia andMadagascar are trading their interna-tional debt for land to be held asnational parks and protected areas.
● Diseases such as AIDS are having a neg-ative effect on tourism.
● The ‘developed world bust’ and ‘devel-oping world boom’ in population bothhave negative effects on tourism(despite their respective differences instructure).
● The tourism industry around the worldis broadening its focus to develop uni-fied positions on fiscal policies,taxation, capital formation and otherimportant issues.
● Capital market investment by Ameri-cans has slowed considerably in thehospitality industry while it has pickedup in Europe.
● Tourism will continue to be a majorgrowing economic factor in the worldwith real growth rates of up to 5% perannum.
● With computerized reservation systemsexpanding rapidly, smaller systems willfade from the marketplace.
● If the travel and tourism industry con-tinues to expand in the next decade atthe same rate it has in the 1990s, another50 million jobs could be created.
● ‘Poverty shock’ will turn the world’smegacities into zones of instability witha negative effect on tourism.
10 L. Moutinho

● The future tourism business environ-ment will be characterized by a smallernumber of global operators and a largernumber of local operators.
Global Tourism Issues forthe 21st Century
● Environmental concern has reached anall-time high and will continue to grow.This will bring increasing pressure onall tourism initiatives to demonstratethat they contribute to environmentallyfriendly and sustainable development.
● Broad-based political movements, inwhich the populations of many coun-tries are attempting to establish moreparticipatory forms of government, areimpacting on tourism. As a conse-quence, the residents of traveldestinations will increasingly demandthat tourism first and foremost servestheir interests by providing benefits thatoutweigh its costs.
● World economic order is changing.Relentless pressure for almost all coun-tries to adapt their economies to marketforces is bringing about a major restruc-turing of wealth and income patterns,which will be reflected in global travelpatterns.
● The ‘globalization’ of political and eco-nomic structures has initiatedmovement towards the ‘borderless’world. In this new world the transna-tional corporation is a powerful force.Superior access of financing, technol-ogy and information provide thisstateless entity with strategic and opera-tional strengths which give it clearcompetitive advantages (see Go andPine, 1995).
● World demographics will continue toevolve very predictably with wealthynations experiencing ageing and stabi-lizing populations and this will becountered by a strong growth in the pop-ulations of developing countries. Theimpact of this on global travel patternswill need to be carefully monitored.
● Technology, in particular the linkage
between (and interdependence of) tele-communications, transportation andtourism is receiving increasing atten-tion. The movement of information,goods and people is being examinedwith respect to both complementarityand substitutability.
● The role of tourism in developing coun-tries poses serious questions. Whilemany developing economies desper-ately need the financial receipts fromtourism, the social and environmentalcosts imposed by inappropriate forms oftourism development simply cannot beignored (see Oppermann and Chon,1997).
● The issues of environment and develop-ing countries are manifestations ofbroader concern relating to ethics, andresponsibility in tourism policy forma-tion and management. Tourism is nowso significant that it must seriouslyexamine the values on which it is basedin order to ensure that they continue toreflect those of the society it serves andaffects.
● Concerns related to health, security andlegal liability are very much at the fore-front of the minds of both tourists andindustry suppliers. International con-flicts and wars, growing crime andterrorism levels, and the spread ofdeadly communicable diseases will bevery real factors in the development oftourism.
● Concerns related to the availability of anappropriate workforce in the growingglobal tourism industry will intensify. Abroad range of social and economic poli-cies – particularly those impacting onpopulation planning, education, immi-gration, labour relations and the use oftechnology – will greatly influence theavailability of the industry in eachcountry to meet its human resourceneeds.
The trend towards customized tours at pack-age prices is a significant one for the travelindustry (see Laws, 1997). Furthermore, it isexpected that we will see a greater integra-tion of computer systems and satellite forms
11Trends in Tourism
of worldwide information collection anddistribution for tourism planning by govern-ment agencies.
Congestion is a word currently associatedwith all forms of transport. Airports and airroutes are crowded, roads are at a standstilland trains are filled beyond capacity. For airtransport, the next 10 years may have to be aholding period. An anticipated growth rateof 4–6% per year can only just be supportedby better management and improvements ofthe existing infrastructure and increases inaircraft size.
Ten Trends for the 21st Century
The trends which have led us into the mil-lennium have profound implications for allsectors of society. The corporate, govern-mental and educational sectors mustaddress and respond to these macro trendsfor, no matter what our individual interests,these factors will influence human behav-iour. Successful entities will examine eachtrend and develop plans of action to changetheir modus operandi to meet the newdemands, thought processes and needs of anew global marketplace. The pace of changeitself will require an ongoing assessment toremain in tune with the ever-changing mar-ketplace. Our political, educational andbusiness communities will be challenged tothink differently and respond tactically orface a market that is moving at a rate ofchange which will leave them behind. Thesechallenges will be greatest in the servicesector where ‘change’ will be a constant.Experts foresee ten macro trends having sub-stantial impact on the consumer (Nykiel,1996). Each trend requires careful assess-ment with respect to the impact andselection of related responses. These trendsare outlined below.
1. GlobalizationThe world is meshing at an acceleratingpace on all fronts. Multinational positioningand adaptation to cultural diversity are nowessential to achieve market share and meetcustomer needs. The implications extend to
finding, attracting and retaining a diverseworkforce. It will be essential to implementmotivational and reward systems includingmanagement development programmes thatbring diversity into the thought/decisionprocess. Service offerings must have univer-sal appeal and product development muststress adaptability to succeed in a globalmarketplace. From a consumer perspective,boundaries and territories are becomingobsolete, replaced by the universal appealfor the latest, newest and best value in bothproducts and services. Winners will recog-nise globalization as the macro force forsuccess. Losers will be those who do notunderstand it or do not change and adapt.
2. Technological accelerationThis acceleration is driven by both technol-ogy itself and the market’s insatiable desirefor ‘new everything’. Consumers will flockto those who deliver new conveniences,time savers and stress reducers. Businesseswill divide into two categories: ‘survivors’and ‘victims’. Survivors will be those whoadapt, move with, and invest in new tech-nologies. Victims will suffer technologicalannihilation from more responsive andadvanced competition, especially in thedelivery of services. Likewise, individualswill need to invest in keeping themselvescompetitive and up-to-date or risk being re-engineered into obsolescence.
3. Peacetime warThose in the service sector who understandthe power of this macro trend and address itdirectly will win customer loyalty. Offeringa safer service experience, whether travelrelated or in the work environment, willhelp attract and retain customers.
4. Debt wreckEven without another round of higher inter-est rates, debt is spiralling out of control atboth governmental and individual level.The re-engineering of middle and uppermanagement continues to shrink incomeswhile reducing tax revenues from thisgroup. The lower and lower middle incomeor ‘flattened’ workforce, whose emergent
12 L. Moutinho

purchasing power slowly moved the econ-omy, have almost run out of ‘credit’ andmore importantly, the ability to pay it allback. Those first few credit cards, care pay-ments and adjustable mortgages (somewhatfuelled by the easy consumer lender syn-drome of financial institutions) are alladding up to trouble. Given a slight spark ofinflation and/or higher interest rates, we arelikely to see a no-growth recessionary sce-nario. Simply stated, it is time to retain yourbest customers and take market share fromyour competitors. Protect your base at homeand think globally to attract new markets.
5. Re-engineered behaviour
The early 1990s in the West and the late1990s in Asia brought recession and a morecautious consumer. The insecurity causedby job elimination remains ingrained and isbeing reinforced daily by media headlines.Everyone is more cautious in their spending,including corporations, individuals andeven government. Economic uncertaintyand work environment insecurity are nowpart of the daily thought process precedingpurchase decisions. To propel sales it willbe necessary to overcome these stressfulthoughts through creative marketing, pro-motions and financial techniques. Make itpossible for consumers to say ‘it’s OK’ tothemselves, and you may still achieve salessuccess.
6. Fuelling growth
Recent years have witnessed a record num-ber of major acquisitions and mergers aswell as ‘break-ups’ of corporations. At thesame time the entrepreneurial spirit wasalive and well with more new business start-ups. In the future we can look for moreagreements, coalitions, networks, joint ven-tures, strategic market acquisitions and‘contracting out’ to fuel growth. Many suchaffiliations and activities will be driven bythe desire to strengthen global reach, buildbrand(s)/company competitiveness, findnew distribution channels and, frankly, toshow growth. The winners will pursue thesestrategies not only for reasons related to eco-nomics of size, but more importantly, to
provide consumer convenience and a value-related marketing advantage.
7. Centurism and expectationThe turn of the century has often been aperiod marked by the desire to hold on to thepast followed by an insatiable desire to jumpon board with the new. This latter behav-ioural pattern is usually fuelled by a periodor series of globally important events thatcause a psychology of great expectation,such as discoveries, cures or innovations.The pendulum swings rapidly, first to thetradition of the past and then to the ‘new-ness’ of the future. Successful enterpriseswill not only ride the momentum both ways,but know when to time the directionalchange.
8. Near-to-home syndromeCurrently we are experiencing a strongdesire and necessity to remain relativelyclose to home and work. Both job insecurityand two breadwinner households are sup-porting this trend and are likely to do so inthe future. Near-to-home syndrome keepsmany from long-distance (time) travel. Thefocus becomes extended weekends whenboth breadwinners can achieve mutualday(s) off. The desire to escape remains,both for couples as well as single workers.Helping to fulfil this desire with products orservices convenient to purchase, consumeor experience will result in market success.
9. Personal/self focusHumans are typically retrospective at theend of each year, decade and especially cen-tury. This inward focus is now manifestingitself as a response to stress. Some will seekto relieve their plight through relaxation,others through refreshing their psyche. Theimplication is for an increased desire for the‘personal’ which translates into taking careof oneself. Likely behavioural manifesta-tions include a renewed desire to purchasepersonal items such as clothes, meals outand other new interests. Much of this self-focus will come from the under 50-year-oldsegment, seeking more from life than thestress of work.
13Trends in Tourism

10. ExplorationWe can expect the over 50-year-old segmentof the population to increase exploring theglobe by seeking new destinations, to under-take new leisure pursuits and to want toexperience ‘newness’ in general. The coun-terbalance to this overwhelming desire willbe a real concern for long-term health costsand taking care of remaining parentalresponsibilities (care of children and par-ents).
The Future
The conventional ways of looking at con-sumer behaviour (see chapter 3), especiallyin tourism, are becoming outdated veryquickly. For example, it is no longer possi-ble to predict the purchasing habits ofconsumers of almost any product or servicesimply by labelling a group as ‘upscale’. Aworld of paradoxes in tourism and leisurebehaviour is emerging where existing oppo-sites operate simultaneously. Greatersameness and greater diversity, plus greatersecurity seeking and greater risk-takingoccur side by side. For example, there aresky-diving accountants all over the placeand campers who drive air-conditionedvans to ‘rough it’ in the woods. The sameindividuals may shop at both a discountstore and a famous department store and goto McDonald’s for lunch and a four-star res-taurant for dinner. Leisure lifestyle mosaicsare often elusive, inconsistent and contra-dictory.
Possible future developments in terms ofthe built environment are:
● Massive multi-storey, floating hotelswill be moored offshore and containrestaurants, shopping arcades, gymnas-iums and glass-enclosed elevators thatcarry tourists directly to the sea floor.
● Underwater hotels will attract the moreadventurous leisure travellers who canpeer at the undersea life through theirbedroom windows.
● The theme parks of the future will beindividual-experience centres wheretechnology will let people role play . . .
almost anything. For example, in Cal-ifornia a Victorian-style high-techhouse has been constructed that trans-ports visitors back into a romanticversion of the previous century. Thehouse includes: a three-dimensionalfilm theatre that employs vibratingchairs to simulate motion, a scent-projection device that is coordinatedwith images on the screen and a state-of-the-art sound system.
Future technological developments mayinclude the following:
● Robots will eventually occupy a largepart in planning many tourism-relatedfacilities and services, such as restau-rants, landscaping, park design andentertainment.
● Videocycles – a combination of a sta-tionary exercise bike and a TV/VCR –will be used extensively by bikers athome to tour scenic routes in forestedand urban environments, complete withexciting background music.
● Night-vision glasses will allow individ-uals to participate in outdoor recreationactivities in the dark. Electronic andother devices will be worn by outdoorenthusiasts to improve hearing, touch,sense of smell, strength and coordina-tion.
● Solar-powered bubbles (sunpods) willpermit bathers to relax outdoors at homefor an all-over tan even in below-freezing temperatures.
● People will be able to create their ownimages and scenes on their computersor TV screens; the viewer will be able tosimulate just about anything. For exam-ple, if a person wanted to enjoy a rafttrip down the Grand Canyon of the Col-orado River it will be possible to call upthe image on a wall size TV and with araft at home the viewer will experiencethe sensation of the trip.
● Image libraries will be available forhome viewing that will contain all theworld’s best art. Inexpensive flat panel-display devices will be available,throughout the house, with a resolutionso good that viewing a projection will be
14 L. Moutinho

like looking at the original oil painting.● Digital TV, which is already becoming
established, will allow the viewer tobecome a participant in the actual pro-duction. For example, if a person put awager on the wrong football team, he orshe can take a picture of the player,superimpose him scoring the winningplay, and at least get the thrill of havingthe match turn out the ‘right’ way.
● Sensavision TV will allow the viewer tofeel temperature, humidity, smell, andto walk around in the scene because thewhole room will be part of the TV set.
● Virtual reality gives us artificial worldsto explore, outside normal space andtime.
There are many possible future develop-ments in the area of transportation:
● Major technological advances willlower international travel costs.
● Scheduled commercial flight times willcontinue to take less time. Magnetictrains – trains that literally fly betweencities on cushions of electromagnetism– will be making short trips (for exam-ple, Los Angeles to Las Vegas) fasterthan airlines can manage today.
● Multiple transportation cars that con-vert to an aeroplane will be fuel efficientand economically accessible to thetourist.
● Vertical take-off and landing vehiclesthat cruise at 360 km h-1 above dailytraffic will be used for everyday perso-nal and commercial use.
● Skycycles – one person light aircraftwith wingspans of a DC-9 jet – will beused to fly 40 km or more at 25 km h-1 viapedal power.
● Ultralight two-person aircraft will bepopular for touring and soaring. Super-subs will be developed as a kind ofundersea tour bus with oversized win-dows and an interior like a passengerplane.
● Jet-powered backpacks for individualflight propulsion will be sold at priceswithin reach of the middle-income fam-ily budget.
A major new product looms in the 21st cen-tury in the form of space travel (Hawkins,1989). This may be a long way off, althoughpressure to make possible a limited numberof high-cost flights will build up as soon astechniques are devised to make capsulesmore inhabitable. A passenger modulecould be developed for the space shuttle thatwill carry passengers to an orbiting spacehotel or act as a hotel module itself. Some ofthe above may be in the realms of sciencefiction, but others, predicted 10 years ago,are already becoming a reality.
Conclusion
Essentially, the whole process of tourismstrategic planning boils down to planningon uncertainty. Uncertainty is the comple-ment of knowledge: the gap between what isknown and what needs to be known to makecorrect decisions. Dealing sensibly withuncertainty is not a byway on the road toresponsible tourism management decisions,it is central to it. To cope with future tourismplanning, management and research, tour-ism professionals need to be Renaissancemen and women. The need to imagine, per-ceive and gauge the future are paramountprofessional attributes of the tourism pro-fessionals of tomorrow. The future tourismphenomena will be managed by today’s pro-fessionals who look to the future and shapeit into a strategic vision. The informationpresented in this chapter has been aimed athelping to create that vision and wasdesigned to show that ‘we must not expectthe expected!’
References
Cheong, R. (1995) The virtual threat to travel andtourism. Tourism Management 16(6),417–422
Go, F. and Pine, R. (1995) Globalization Strategyin the Hotel Industry. International Thom-son Business Press, London.
Hawkins, D.E. (1989) Impact of world events ontourism. In: Witt, S.F. and Moutinho, L. (eds)Tourism Marketing and Management Hand-
15Trends in Tourism

book. Prentice Hall, Hemel Hempstead, pp.219–222.
Holloway, J.C. and Plant, R.V. Marketing for Tour-ism, 2nd edn. Pitman Publishing, London.
Inkpen, G. (1998) Information Technology forTravel and Tourism, 2nd edn. Longman,Harlow, UK.
Kahn, H. (1979) The Future of the World 1980 –2000. Molden, Vienna, Austria, p. 297.
Krippendorf, J. (1979) Tourism in the year 2010 –a Delphi Poll on Future Trends in Tourism inSwitzerland – Interpretations and Conclu-sions, 2nd edn. Forschungsinstitut furFremdenverkehr, Berne, Switzerland, pp. 6,55, 92.
Laws, E. (1997) Managing Packaged Tourism.International Thomson Business Press, Lon-don.
Nykiel, R.A. (1996) Top trends to the millennium.Journal of Hospitality and Leisure Marketing4(2), 77–80.
Oppermann, M. and Kye-Sung Chon (1997) Tour-ism in Developing Countries. InternationalThomson Business Press, London.
Palmer, J. (1984) The transpitality industry. Inter-national Journal of Hospitality Management3 (1), 19–23.
Peacock, M. (1995) Information Technology in theHospitality Industry: Managing People,Change and Computers. Cassell, London.
Schwaninger, M. (1989) Trends in leisure andtourism for 2000–2010 – scenario with con-sequences for planners. In: Witt, S.F. andMoutinho, L. (eds) Tourism, Marketing andManagement Handbook. Prentice-Hall,Hemel Hempstead, UK.
Sheldon, P.J. (1997) Tourism Information Tech-nology. CAB International, Wallingford,UK.
Stipanuk, D.M. (1993) Tourism and technology:interactions and implications. Tourism Man-agement (August), 267–278.
Van Hoot, H.B., Verbeeten, M.J. and Combrink,T.E. (1996) Information technology Revisited– International lodging industry technologyneeds and perceptions: a comparative study.Cornell Hotel and Restaurant Administra-tion Quarterly (December), 86–91.
WTO (World Trade Organisation) (1999) WorldTrade Organisation Estimates.www.ecotourism.org
World Travel and Tourism Council (1995) Traveland Tourism: A New Economic Perspective.Pergamon, Oxford.
16 L. Moutinho
2The Marketing Environment for
Travel and Tourism
K. Peattie and L. Moutinho
The relationship between the providers oftourism and travel services and the market-ing environment in which they operate isunique. For most other businesses, theboundary between the company and the‘world outside’ is distinct. For manufactur-ers there is one world within the factorygates, and another beyond them. For mostservice providers there is a distinct place atwhich the service encounter takes place,and can be managed. Changes in the worldoutside will affect such companies, togetherwith their customers and their competitors;but usually, with a little planning and somejuggling of the marketing mix when neces-sary, the effect of external change can bediluted enough to allow most businesses tocontinue ‘as usual’ within their own fourwalls. In tourism, the service encounter witha customer can occur within a journeywhich stretches from one side of the globe tothe other and back again. The whole planetis the ‘factory floor’ of the tourism industry.While for other industries, factors such asthe physical environment or culture of aregion may influence the nature of demand,they are a vital component of the productitself for the tourism industry. For tourismand travel providers there is no place to hidefrom the turbulent and unpredictable worldin which we live (Gee et al., 1994).
The special relationship between the
tourism industry and its marketing environ-ment means that the depth of understandingneeded concerning the influence of the envi-ronment goes far beyond that which sufficesfor many other industries. The externalenvironment of any industry contains a hostof interdependent factors which need to besomehow separated out and categorized tomake analysis of them possible. One of thesimplest but most enduring frameworks forthis analysis is the PEST framework whichprompts companies to consider Political,Economic, Social and Technical factorswhich may affect their company. This israther a broad brush form of analysis which,although adequate for industries less vul-nerable to environmentally relateddisruption, is scarcely adequate for tourismproviders. A more comprehensive approachis SCEPTICAL analysis which considersenvironmental influences in terms of:
Social factorsCultural factorsEconomic factorsPhysical factorsTechnical factorsInternational factorsCommunications and infrastructure factorsAdministrative and institutional factorsLegal and political factors.
Each of these categories may be the source of
© CAB International 2000. Strategic Management inTourism (ed. L. Moutinho) 17

changes which present tourism operatorswith significant opportunities and threats.As with any form of environmental analysis,the difficult part is not in seeing what ishappening in the world beyond the indus-try’s doors. The real challenge lies indisentangling the elements of threat fromthe elements of opportunity within thechanges in the wider world; in distinguish-ing the temporary ‘blips’ from the significantenvironmental shifts and, above all, indeciding what to do in the face of a changingand uncertain environment.
The Social Environment
Tourism is essentially a social phenomenonand, although like all industries it is influ-enced by the society in which it exists,tourism is unusual in that it involves a largescale, if temporary, transfer of individualsbetween different societies. This can createsocial change of both a temporary and alonger-term nature. Anyone who has visitedParis regularly will know that the city char-acter changes radically in August, when vastsections of the Parisian population go onvacation and are replaced by a mass influx oftourists. In other industries, customers andtheir needs shape the nature of companies’marketing strategies and the product offer-ings. In tourism, customers and their needscan actually shape the society which theyvisit, as any resident of the Costa del Sol,Klosters or Kathmandu can testify.
Demographic change
Currently some 78 million people are addedto the global population each year. There arenow around 6 billion people sharing theplanet, and many population experts pre-dict that this will increase to at least 8–10billion (some time between 2020 and 2050)before global growth stabilizes. The startlingreality is that over 90% of this growth will bein developing countries. As the populationsof North America, Europe and Japan growrelatively smaller and older, the rest of theworld is increasing rapidly and is getting
younger. Very soon over 80% of thosebetween 15 and 24 years of age will live indeveloping countries; by contrast, in West-ern Europe, one in three adults will be over55. This ‘developing countries boom–developed countries bust’ demographicscenario has a wide range of societal, eco-nomic and environmental implications, andalso significant implications for tourism(Kurent 1991). In particular for tourismmarketers:
1. Global demographic changes must bereflected in planning and decision-making with respect to the design,development, delivery and utilizationof tourism facilities and services.
2. There is a need to encourage and sup-port research to evaluate the needs ofthe growing population of older peopleworldwide. Mass market tourism hasgrown up with the assumption that themajority of its potential customers arerelatively young, active and healthy.Demographic change will inevitablyshift the age profile of the customerbase, and may require substantial mod-ifications to facility design, tourpackaging and event organization. Itmay also require new initiatives to linktourism services to other services suchas health care requirements.
The level and nature of demand for tourismand travel are currently being affected by anumber of demographic influences, dis-cussed below, most of which seem set tocontinue or intensify in the foreseeablefuture.
Population movementsMigration between countries and regions isan increasing feature of modern life, encour-aged by relatively cheap travelopportunities and the lowering of interna-tional barriers to relocation. Although manytourist journeys are made to visit a place,they are also often made to visit people, andthe gradual redistribution of people acrossthe globe opens up new opportunities fortravel marketing aimed at reunion and therediscovery of one’s ‘roots’.
18 K. Peattie and L. Moutinho
Women travellers
The rapid rise in the number of women inthe workforce is having a major impact onthe tourism industry. Today, 25–40% of themarket in the United States are female busi-ness travellers and soon it will be close to50%. The continuing social and economicemancipation of women is a relativelyglobal phenomenon (although its extent andspeed varies widely among different coun-tries) and it is leading to a greater number ofwomen travelling for pleasure internation-ally, both singly and in groups. In Japan acombination of increasing career opportun-ities for women and more liberal culturalattitudes have made it much more accept-able for women to travel, to the point whereamong the younger 18–44 age group, femaletourists now outnumber their male counter-parts two to one. These women willincreasingly expect alterations in tourismproducts to meet their needs.
Grey tourist power
The ageing populations in developed coun-tries will increasingly have the time and theresources to travel, creating a growing mar-ket for ‘grey’ or ‘mature’ travellers. Many ofthese consumers have a dependable pensionincome, no large mortgage commitmentsand considerable amounts of leisure time.Travel expenditure is an important elementof the modern grey consumer lifestyle, andas a market they are relatively discerning,and interested in value for money. Althoughthe mature end of the market offers con-siderable marketing opportunities, theseopportunities have often been missed bytourism marketers attracted by the allure of ayounger and more ‘glamorous’ marketingfocus. Consequently many of the early greytourism and travel initiatives had their rootsin organizations concerned with older peo-ple’s welfare, as opposed to from inside theindustry. See also Smith (1995).
Baby boomers on the move
Baby boomers, roughly those born between1946 and 1964, make up a large and power-
ful consumer group, whose beliefs andbehaviours are very different from the gen-eration that went before. They are ageneration that has grown up with travel as aright and expectation, rather than as a privi-lege or a luxury. During the 1990s they werein a period characterized by household for-mation and biological catch-up inchildbearing. This created a boom in family-orientated travel and tourism services of thetype exemplified by the Centre Parcs chainof holiday villages. The family market aimedat purchasers in the 35–55 age range is there-fore a growing market, but a complex onesince the baby boomers tend to approachholidays less as ‘getting away from it all’ andinstead see them as opportunities for learn-ing, cultural and environmental contact,health and fitness activities and spending‘quality time’ with their families. Movinginto the new millennium, the baby boomersare reaching the peak of their earning power.In America, the median income of peopleaged 45 to 54 was US$54,148 in 1998,according to the US Census Bureau, givingthem the highest income bracket of any agegroup. Their spending power is a key factorin the growth of sales for products such asluxury holidays and second holidayhomes.
New householdsAnother key demographic change is theincreasing shift away from the ‘conven-tional’ household based around the nuclearfamily unit. Single adult households nowaccount for almost one quarter of UK house-holds. Households in which original familyunits have been split and sometimes recom-bined are also becoming increasinglycommon. Marketers in tourism, and a vari-ety of other industries, may risk alienatingand marginalizing potential consumers ifthey attempt to impose an idealized or rigidconcept of ‘the family’ into their marketingstrategy for targeting the family market.Since ‘non-traditional’ households aregrowing more rapidly than their traditionalcounterparts, they offer considerable oppor-tunities for targeting tailored marketofferings.
19The Marketing Environment for Travel and Tourism

The democratization of tourismOne of the most important demographicallyrelated changes is the ‘democratization’ oftourism. On a global scale, the socioeco-nomic categories applied to individualnations become relatively meaninglesssince there are effectively two social groups:the enfranchised members of the consumersociety and the disenfranchised poor (Durn-ing, 1992). For the poor of the world, travelis usually undertaken for survival, and tour-ism is not an option. Among consumers, theopportunities for tourism have spreadwidely. The global economy is evolving insuch a way that each of the industrializednations has a solid, prosperous ‘middle-class’ core population. That in turn is beingjoined by significant middle-class popula-tions in virtually every other country of theworld. This middle-class is relatively well-educated and prosperous, and increasinglyhas discretionary money for recreation andleisure. In countries such as India or Indo-nesia, this middle-class ‘crust’ is quite thin,but its absolute numbers are large enough tooffer plenty of potential tourism business.So, although many in the world are exclu-ded from opportunities for travel andtourism, a process of ‘democratization’ oftourism is underway as it reaches many newconsumers. Key groups for whom new tour-ism opportunities are emerging include thefollowing.
The youngYounger people increasingly look upontourism as a natural part of either their ownformal and informal education, or as aninterval between stages in their education.As one futurist put it, as the essentials of lifebecome increasingly expensive – food,clothing, shelter – the amenities of life areincreasingly cheap. A young person with abackpack and US $100 can go almost any-where in the world; with a credit card andsympathetic parents there are virtually nolimits.
Dinkies and Twarfs‘Dual-income-no-kids’ and ‘Two-workers-also-raising-families’ households. The
increasing number of two income house-holds is generating more discretionaryincome and creating new opportunities formore travel. At the same time, the twoincome household has less leisure timeavailable, making 2, 3 and 4-day trips ratherthan 2, 3 and 4-week excursions moreattractive.
People with disabilities
With a growing emphasis on self-help andindependence, the disabled increasinglyexpect to travel as public transportationbecomes more accommodating to theirneeds. The tourism industry will increas-ingly make special provisions for them, interms of hotels, travel and sightseeing exper-iences. In the USA alone there are roughly37 million disabled persons. The recent pas-sage of The American Disabilities Act whichmandates special telephone devices for thehearing impaired and accommodation forwheelchairs on all public buses is part of alarger global trend towards empowermentfor the disabled. Access to tourism experi-ences will grow as an indication of thisempowerment for the disabled and an age-ing population in general. In the USA namessuch as ‘Flying Wheels Travel’, ‘Whole Per-son Tours’ and ‘Club Medic’, are anindication of this trend. In future there willbe more companies such as the one offeringkidney dialysis patients a cruise around theworld, accompanied by a clinic with anephrologist and nurses. Such specialistservices are naturally more expensive, butare likely to become more affordable asdemand increases (Kurent, 1991).
Global urbanization
Global urbanization is another significantdemographic shift starting in the 20th cen-tury, and one that has a variety of effects fortourism providers. In 1950 there werearound 600 million city dwellers. UN pop-ulation fund estimates suggest that by 2030more than 60% of the population will live inurban areas. Formerly rural countries suchas India, parts of Latin America and Africaare rapidly urbanizing, throwing off-balancetheir farm economies and wreaking havoc
20 K. Peattie and L. Moutinho

on physical and social support systems. Themillennium begins with around half of allhumanity residing in urban areas; UN fig-ures suggest that they are increasingly livingin ‘megacities’ of over 10 million people.The number of such cities has grown fromtwo in 1960 to 17 today and is projected toreach 26 by 2015, 22 in less-developedregions and 18 in Asia.
This rapid urban influx of millions insearch of work does not provide ideal condi-tions for tourism services and resources.Resulting increases in congestion, pollu-tion, poverty, unemployment and crime canall have a significant impact on the demandfor tourism. Relatively affluent tourists tra-ditionally have not been taught to notice orunderstand the economic realities of pov-erty around them (as witnessed by thecontents of conventional travel guides andliterature). Will tourists themselves demanda better understanding of the life that lies soclose to their luxury hotels and beaches?Will they wish to be educated as well asentertained? Perhaps instead they will sim-ply try to stay away from the megacities withtheir ‘belts of human misery’ that make well-to-do visitors feel unsafe anduncomfortable.
The outflow of people from rural areastypically contributes to the stagnation oflocal rural economies which has the effect ofincreasing the pressures for tourism devel-opment to compensate. Many rural areas areseeking to integrate tourism with more tradi-tional rural activities such as farming.Certain government policies are now pro-viding economic incentives for citizens tomove back to the countryside. Tourism willaid this redistribution by offering moretravel experiences in rural and out-of-the-way places as yet untapped for their tourismpotential.
Health and AIDSDespite its containment in the industrial-ized world, the continued spread of AIDSthreatens the development of tourism inregions such as Kenya and The Gambiawhich contain substantial AIDS popula-tions. Consumer fears about dangers fromlocal blood supplies and even unfounded
fears about food contamination can heightenperceived risks associated with a destina-tion and further dampen tourism. For theindustry, guest assurance of safety willbecome more important, as the industrycontinues to develop policies relating tofood handling, fraternization and other con-ditions in the workplace for AIDS sufferers.
The longer-term consequences of theunchecked spread of AIDS could be moreprofound for the industry. Host nationswhich presently have a relatively low inci-dence of AIDS may become increasinglyreluctant to admit travellers who are seen aslikely to spread the disease among the localpopulation. This concern has led to pro-posals to make AIDS testing a prerequisitefor admission to certain countries. Whilethis proposal is probably rather extreme andunrealistic, it does highlight the growingimpact that health-related dimensions arehaving on tourism. Further discriminationagainst certain nationalities with high inci-dences of AIDS could also result.
The Cultural Environment
The cultural environment enjoys a curiousrelationship with tourism and travel. Theculture of a region can be part of its attrac-tion to tourists, and there is a marked trendtowards consumers showing greater interestin the culture and food of a region asopposed to the more traditional attractionsof landscape and climate. Tourism productscan also become part of the culture of acountry. The Victorian ‘Grand Tour’, thehoneymoon, pilgrimages to shrines such asMecca and Lourdes, and even the traditionalBritish seaside holiday are all cultural sym-bols as well as tourism products.
Tourism is also remarkable in its capacityto bring different cultures together in a waythat has the potential to lower (or sometimesunfortunately reinforce) cultural barriersand prejudices. For tourism marketers, theincreasing variety of countries which nowcontribute to the global flow of touristsrequires an ability to respond to the needs ofpeople from a wide variety of cultural back-grounds. Some major hotel and airline
21The Marketing Environment for Travel and Tourism
companies are now investing in culturaltraining to familiarize their employees withthe language, etiquette, body language andsocial systems of other cultures. The rela-tionship between tourism and the culturalenvironment within which it operates canbe an uncomfortable one. Although tourismoffers economic benefits to the local popula-tion of a destination, there can be significanttrade-offs in terms of residents’ quality oflife and the erosion of traditional cultureand lifestyles. Tensions between permanentresidents and the incoming tourist popula-tion can become intense, particularly whensmall resorts become engulfed during a rela-tively short season. The concept of‘community planning’ in tourism develop-ment has arisen to try to manage thetrade-offs involved and to help to close thecultural gap that can exist between visitorsand residents.
Key cultural valuesIn addition to the potential clash of culturesand interests that can occur between visitorsand residents, the cultural environment pre-sents a challenge to tourism marketers intrying to assess how cultural trends arelikely to influence the nature of the demandfor their products. A number of culturaltrends such as an emerging belief in indi-vidualism, distrust in large companies,interest in the environment or concern aboutthe erosion of traditional ‘family values’ allhave the potential to present opportunitiesand threats to tourism destinations and mar-keters. Consumer demand is shiftingtowards more individually tailored holi-days, towards more active involvement withdestinations and their physical environ-ment and towards holidays geared aroundthe needs of families.
The dominant global trend in terms ofvalues could be termed ‘the adoption ofmiddle-class values’. Just as income levelsand lifestyles which fit the label ‘middleclass’ are becoming increasingly wide-spread, so middle-class values areexpanding globally, with the American mid-dle class acting as a role model for the rest ofthe world. It is increasingly educated andinformed, enjoying decades of relative peace
and economic prosperity. These togetherraise expectations and promote conscious-ness of the good things in life. The middleclass is also shifting from traditional indus-trial occupations which call for greatphysical strength and muscular activitiestowards an increasingly sedentary andunder-exercised lifestyle. This in turn leadsto a tendency to romanticize the very kind ofactivities that are in decline, such as hunt-ing, fishing, outdoor crafts and skills. Thatromanticizing draws many people back intothe natural environment to enjoy thoseexperiences, such as the grandfather whotakes his grandson and granddaughter out toexperience fishing in the wild, sharing withthem an activity that was much more centralto the grandfather’s own youth.
Cultural eventsSpecific cultural events or cultural expres-sion in the form of entertainment can alsobring considerable opportunities for tour-ism. Sports events, music or film festivals,pageants or traditional ceremonies can allact as a generator of tourism business for adestination. Wily tourism organizationsappreciating this fact have sought to estab-lish new festivals and other cultural eventswith the aim of attracting tourists andextending the tourism season (Getz 1991),which again demonstrates the curious inter-twining of the cultural environment and thetourism industry. In entertainment, when adestination is featured within a majormovie, tourist business can be boosted in away that is beyond the leverage available viaconventional tourism marketing. In Austra-lia there was much sadness at the passing ofthe ‘Crocodile Dundee Effect’ which hadacted to bring so much American touristbusiness into Australia during the 1980s. InOxford, the global popularity of the Inspec-tor Morse TV series has swelled visitornumbers into an already crowded town in away that has made coping with visitors ahigher priority for marketers than attractingmore of them. In using the culture of a desti-nation to promote tourist business, cautionmust be exercised, particularly in the face ofa global swing towards renewed interest indistinctive national and regional cultures in
22 K. Peattie and L. Moutinho

many areas (possibly as a reaction to theincreasing globalization of products mar-kets). The commercialization of the culturallife of an area can act to disenfranchise oralienate residents who have a prior andstronger claim on the artefacts and expres-sions of their culture than that of visitorsand the tourism marketers that serve theirneeds.
In search of future cultureCultural change can profoundly affect theprospects for any industry, and a ‘futurism’industry has emerged to try to anticipatewhat people will find desirable, important,acceptable and fashionable in the comingyears. Among the ten major cultural shiftspredicted by the improbably named futuristFaith Popcorn, are ‘cocooning’: a tendencyfor people to become more stay-at-home andrisk averse, and ‘fantasy adventure’: a trendtowards people wanting escapist themeswoven into their lives and the products theyconsume (Popcorn, 1992). While the formerrepresents a serious threat to the industry,the latter presents significant opportunitiesfor new products and forms of differentia-tion. This could involve a growth market for‘themed’ hotel bedrooms, for ‘murder mys-tery’ weekend breaks or simply increasingbusiness for the Disney theme parks.
Another trend identified by Popcorn isthat of ‘staying alive’ a desire among peopleto adapt their lifestyles to live longer andhealthier lives, which can in turn providetourism opportunities. The most significanttrend in worldwide health care is the move-ment from health treatment to healthpromotion and prevention. The most impor-tant health promotion and wellnessstrategies include proper nutrition, exercise,stress reduction and the avoidance of riskfactors such as excessive weight, smokingand alcohol abuse. As wellness strategiesbecome more entrenched in affluent societ-ies, travel experiences will increasingly belinked with stress alleviation and positivelifestyle behaviours. Already a new marketfor health tourism is evolving, an echo of thetrips made to spa towns in an earlier era.
With increasing concern about healthand security among tourists, it is essential
that the tourism industry becomes proactivein collaborating with international, nationaland local health organizations to ensure thatfood and water for travellers are safe andthat medical supplies and services are effec-tive and disease free. While tourists shouldnot necessarily expect a level of medicalservices which is superior to that enjoyed bylocal populations, they should be madeaware prior to travel of the quality of medi-cal services that can be expected shouldthey decide to travel in a given region. Just asfears about becoming sick in a strange placecan deter the tourist concerned with ‘stayingalive’, so can the perceived risks relating tocrime and accidents for potential tourismdestinations. New York’s attraction as atourism destination has increased dramat-ically with the success of the ‘zero tolerance’policing strategy, while Tokyo’s unusuallylow crime rate has acted as an attraction fortourists. Health, security and safety areimportant issues in tourism marketingtoday, but will be even more important inthe future. For tourism marketers the chal-lenge is to work with other organizations tohelp to reduce problems such as crimeagainst tourists and their possessions andinjuries due to negligence by the visitor or asa result of dangerous facilities, withoutimposing unnecessary fears and restrictionsupon visitors intent on leaving their troublesbehind them.
The Economic Environment
Economists refer to travel and tourism asluxury goods, for which demand increasesmore rapidly than average for the overalleconomy during a boom or drops moreseverely during recession. Disposableincome levels is the economic factor seen asthe most important, but other economic fac-tors are also important. Tourismexpenditure has been shown to be affectedby levels of employment in service indus-tries, and research conducted in the UK byBusiness Strategies Ltd showed that therewas also a link between tourism expenditureand house prices. Shifts within the globaleconomy will strongly influence the level of
23The Marketing Environment for Travel and Tourism

tourism and travel demand, particularlywithin the triad of major world markets, theUSA, Japan and Europe, home to the major-ity of the world’s tourists. Tourism demandis going to be strongly related to the ability ofthe Japanese economy to recover from reces-sion; the ability of America’s ‘GoldilocksEconomy’ to maintain corporate earningsgrowth and avoid recession; and to the suc-cess of Europe’s single currency. Althoughthese outcomes cannot be influenced bytourism marketers, long-range planning fortourism development cannot take continu-ing growth in demand from the USA andJapan for granted. On the supply side, recenteconomic difficulties in emerging marketsmay well increase local political pressure ondestinations to develop their tourism marketin search of foreign exchange earnings.
Economic shifts affect the pattern ofdemand as well as its overall level. Duringrecessions consumers who previously trav-elled internationally may decide to spendtheir holidays closer to home. Short ‘bargainbreaks’ may be substituted for the more tra-ditional overseas trip of two or more weeks.For those travelling internationally, thechoice of destination may be greatly influ-enced by the prevailing internationalexchange rate situation.
The production economics of the indus-try itself are highly dependent on the state ofthe global economy. Although, like otherservice industries, travel and tourism arelabour intensive, they are also energy inten-sive, which makes them vulnerable tofluctuations in oil prices. The recent trend inoil prices has been downward, to the benefitof travel operators. In the face of environ-mental degradation related to fossil fuelconsumption, and growing European pres-sure for some form of carbon tax, there maybe little alternative to rising fuel costs in thelonger term.
Tourism and taxationAn important economic issue which con-tinues to occupy the minds of those in thetourism industry is taxation, since tourismcontributes around 11% of all indirect taxespaid worldwide according to the WorldTravel and Tourism Council (WTTC). Indus-
try representatives view the milking oftourism as a ‘cash cow’ as a myopic andultimately unrewarding policy employed byhost governments, and lobby groups arebeing established with the aim of trying toreduce the tax burden on the industry (suchas WTTC’s Tax Policy Centre). There havebeen some victories: in 1994 the 5% tax onhotel rooms in New York was repealedwhen the local tourist organizations showedthat the US$73 million collected in taxeswas more than offset by an estimatedUS $94.4 million in lost tourism revenue.However, at a national level the power of theexchequer within a government usually out-weighs that of the minister for tourism by aconsiderable margin which tends to actagainst the reduction of the tourism taxburden.
The Physical Environment
Environmental problems including globalclimate change, ozone depletion, deforesta-tion, the extinction of species, soil erosion,desertification, acid rain, toxic wastes, waterand noise pollution have moved to the top ofthe international agenda in recent years.These problems are all international inscope, and they also touch on all aspects oftourism. There can be few industries wherethe interdependence between the physicalenvironment and economic activity is soclearly visible.
Although the relationship between tour-ism and the environment has been a focus ofconcern since the mid-1960s (Romeril,1989), it is only in the past decade that theenvironment has taken centre stage and theissue of the environmental sustainability oftourism has been seriously debated. A keychallenge for the 21st century is to discoverhow the development of sustainable tourismcan contribute to the move towards a sus-tainable global economy, incorporating theneed to combine sound economic develop-ment with the protection of naturalresources; the need to analyse the trade-offsbetween native cultural integrity and thebenefits of employment; and the need tounderstand the impact of rapid climatic
24 K. Peattie and L. Moutinho

changes on prime vacation areas, such ascoastlines.
EcotourismAlthough upheavals in the business envi-ronment are generally seen as potentialthreats, a particular trend can also createsignificant new marketing opportunities.For example, increasing global concernabout the physical environment is providingan opportunity in the form of a new marketfor ‘ecotourism’. Destinations such as theMaldives, Kenya and Belize, which havetaken advantage of this trend and their natu-ral resources to target the ecotourismmarket, saw a doubling of their tourist tradeduring the 1980s (Cater, 1993; Weaver,1998). There is some debate about whatexactly constitutes ecotourism, but at pres-ent it could be described generally as ‘a lowimpact offshoot of the adventure travelindustry’, which represents the best inten-tions of an educated and affluentmiddle-class to travel without despoilingthe environment. However, this can be diffi-cult to achieve in practice since the verypresence of tourists, regardless of their mis-sion to only watch wild animals, canthreaten the ecology of such areas as theAntarctic.
The concepts of ecotourism and sustain-able tourism are often spoken of as thoughthey were synonymous, but this is a miscon-ception. The sustainability of tourismrelates to its impact on the environment,whereas ecotourism involves the physicalenvironment acting as the central focus ofthe product offering, in a way that appeals toconsumers’ environmental interests andconcerns. Although ecotourism venturesmight be expected to take a lead in strivingtowards sustainable tourism, this is a jour-ney that the entire industry must make.
Policy implicationsThe concepts of strategic management stressthe importance of achieving and maintainingan appropriate ‘fit’ between an organizationand its environment. The tourism industryis one that has been, until recently, devel-oped very explicitly following the concept
of ‘exploiting’ local environmental resour-ces. In the majority of popular destinations,tensions have emerged on issues like landuse for tourism developments or the impacton residents’ quality of life. More specificissues can emerge in relation to local envi-ronmental conditions, such as competitionfor scarce water between tourism and otherneeds in arid countries. In the new millen-nium, concerns about sustaining thephysical environment will force the indus-try to work in closer harmony with localenvironments and communities. On the onehand, a new generation of environmentallyaware and educated travellers are activelyseeking an ‘unspoilt’ environment as a holi-day destination; on the other, localgovernments are trying to respond to thepursuit of sustainability under LocalAgenda 21. For destinations and the indus-try it will be necessary in future to developpolicies which pursue a more balanced rela-tionship between tourism and theenvironment (Middleton and Hawkins,1998).
The policy issues that will arise fromtrying to seek a better balance are numerous(for example see Pigram, 1990) and willinclude the following:
1. A need to recognize that the naturalenvironment is the core tourism prod-uct. As a consequence, the industrymust be proactive in collaborating withenvironmental and other organizationsin bringing about the preservation andrestoration of ‘quality environments’ inlocal and national settings that are bothnatural and man-made.
2. Environmental concerns must be incor-porated at all levels of tourism planningand development. Achievement of thisgoal would involve:● multi-regional coordination of tour-
ism development;● community impact assessments
prior to development;● public/private partnerships in tour-
ism planning and development;● taxation policy which favours
environmentally sensitive tourismdevelopment;
25The Marketing Environment for Travel and Tourism

● research and development to betterunderstand and support appropri-ate tourism development;
● efforts on the part of individual andprivate companies to develop tour-ism in an environmentallyresponsible manner;
● broader support from the cultural/environmental communities fortourism facility and product devel-opment.
3. There will need to be more and betterenvironmental impact assessments forboth existing and proposed tourismdevelopments.
4. Tourism planning and developmentwill need to involve wider consultationand community involvement to achievea better balance of economic, social andenvironmental needs.
5. Better linkages need to be forged at alllevels between tourism policy, naturalresource policy and policies relating tosocial and cultural development.
6. Those tourism facilities (most notablyparks and reserves) that are facingincreasing visitor pressure mustdevelop the appropriate infrastructureto manage the visitors and minimizetheir impact. Only in this way can theyavoid deterioration while generatingthe necessary revenues and employ-ment.
7. Comprehensive methods and researchapproaches must be developed to estab-lish and monitor the environmentalcarrying capacity of various types ofdestinations.
8. Economic communities, regions andcountries must recognize and introducetourism as a vital component of coordi-nated land use and regional planning.
9. There must be international pro-grammes to encourage bettermanagement and protection of thenational parks within developingcountries.
10. Environmental preservation andimprovement needs to become a keyfocus for research and developmentexpenditure among governments. Atpresent research money is being
channelled towards researching theproblems rather than developing solu-tions.
In summary, it is acknowledged that asglobal, national and local political restructur-ing continue, policymakers must recognizethat the economic, social, cultural and envi-ronmental significance of tourism is growing.Accordingly, they must see that tourism isincorporated into the planning and decision-making process in the public and privatesector at all levels (Pearce, 1992).
New knowledge, especially ecologicalknowledge, will shape tourism. Moresophisticated monitoring of actual environ-mental and biological conditions and betterunderstanding of naturally occurring cyclesof drought and flooding, animal and plantpopulations, and fire and regrowth withinecosystems may lead to more dynamic man-agement of tourism. Two current crudeexamples of this are the postings of warn-ings or closing of areas during high fire risktimes, or during outbreaks of diseases suchas plague or a rabies epidemic. In some areasenvironmental managers may emphasizeletting natural cycles take their course, andregulate the amount and nature of tourismaccording to the current conditions. For theholiday-maker, this may mean less reliablevacation planning, and a greater need foralternative plans.
The future of the physical environmentand of the environmental agenda will pose anumber of challenges for the tourism mar-keter:
● Climate change. Climatic conditionsglobally appear to be becoming less sta-ble, with increased incidence oftemperature extremes, drought periodsand storm activity in a wide variety ofcountries. Although this poses potentiallong-term problems for destinationsused to marketing themselves on thebenevolence and reliability of their cli-mate, at least the increasing accuracy ofweather prediction technology willallow destinations to become moreweather sensitive, and provide oppor-tunities for visitor itineraries to beplanned around the weather.
26 K. Peattie and L. Moutinho
● Energy policy. Tourism activities will beacknowledged as being inextricablylinked to any area’s energy consump-tion. In the next decade a part of goodtourism policy will be good energy pol-icy, namely a commitment to greatlyincreased energy efficiency, a system-atic exploration of long-term supplyoptions like photovoltaics and solarhydrogen power and an encouragementof lean transitional technologies (Kur-ent, 1991).
● Health and safety. Changes to the phys-ical environment can lead to dangers totourists which change consumer per-ceptions of particular destinations orforms of holiday. Blue-green algae orplagues of jellyfish in the Mediterraneanmight deter lovers of the conventionalbeach holiday; in Australia theincreased levels of ultraviolet radiationcaused by ozone depletion make lyingon the beach considerably more hazard-ous than before; and high levels of airpollution might deter tourists from try-ing to walk around cities like LosAngeles, Tokyo or Mexico City.
● Rural development. Tourism is one ofthe few growth industries in many ruralareas, and although tourism is generallyseen as one of the more acceptable formsof development for rural land, there canbe conflicts between tourism interestsand those seeking to preserve rural tra-ditions and land use patterns.
It is worth noting that although it is thenegative impacts of tourism and tourists ondestination environment which typicallycapture the headlines, tourism developmentcan also bring environmental improvements(Haulot, 1985) including conservation ini-tiatives, funding for environmentalimprovements and the reclamation of dere-lict sites (Weston, 1997).
The Technical Environment
For most service industries, the impact ofnew technology has been less profound thanfor the manufacturing sector. Tourism, like
the financial services sector, is an exceptionto this rule, and the delivery and manage-ment of tourism and travel services in thefuture will be heavily influenced by devel-opments in the technical environment, andby the evolution of information technologyin particular. Tourism is also unusual for aservice industry in the degree to which itinvolves ‘hard’ technologies in order to pro-vide the travel and hospitality elements ofthe service. Whether riding through theChannel Tunnel, being thrilled on SpaceMountain, or relaxing in an air-conditionedhotel room watching satellite TV, the typicaltourist requires a good deal of technology toprovide the ‘intangible’ benefits of travel.
The rate of technological innovationseems, at times, almost overwhelming, andtourism is not exempt from its effects. Indeveloped countries in particular technol-ogy is seen as a tool to greatly enhanceperformance and effectiveness. Computerreservations systems, video technology, andair transport and traffic technology havebeen particularly significant in improvingthe ability of the travel industry to make newtravel experiences available to a mass audi-ence and to do so at prices which areaffordable for much of the population.
Information technologyWith the transition towards the ‘InformationSociety’, information technology (IT) prom-ises to have an ever more profoundinfluence on tourism (Sheldon, 1997;O’Connor, 1999) . IT is playing an increas-ingly important part in the planning andmanagement of tourism operations, in sup-porting service delivery and is increasinglyvisible in all aspects of the marketing mix.Tourism is still characterized by a vast num-ber of small businesses on the supply side,but now the power of the typical PC canplace considerable information processingpower in the hands of the smallest provider.
The emergence of computerized reserva-tion systems (CRS) was perhaps the mostrevolutionary change to affect the travelindustry during the 1980s. These systemsoriginated as internally oriented systemsdesigned to automate clerical functions, andbecame powerful consumer-oriented mar-
27The Marketing Environment for Travel and Tourism
keting tools. The obvious impacts of suchsystems are in the reduction in time andpaperwork required to purchase tourismservices and in the choice that ‘one-stop’systems such as American AirlinesAPOLLO and United Airlines SABRE offer.The impact of CRS has gone beyond shapingthe strategies and service delivery of indi-vidual players, to change the very structureof the industry in several ways.
Loss of controlThe providers of hospitality services arebeginning to fear the loss of control of theircapacity to mega-reservation/distributionorganizations. For example, it is said thatthe largest corporations in the world,through their corporate travel managers,have significant influence over as much as40–50% of a particular hotel company’srooms capacity and with sophisticated CRS,the decisions about where to stay and howmuch to pay are increasingly being handledby the technology of the purchaser ratherthan that of the provider.
Supplier rationalizationJust as electronic point of sale systems havetipped the balance of power away from man-ufacturers and towards producers in thegrocery market, so CRS systems haveincreased the power of purchasers by mak-ing them better informed and better able toswitch between or consolidate suppliers.For example, the corporate travel manager ofone global electronics firm recently madethe decision to reduce the number of travelagents that the firm uses in the USA from430 down to two or three. Worldwide thecompany used over 1700 agents, and aims toreduce the number down to a manageablefew. This suggests that travel policy will bemore controlled and facilitated by technol-ogy and that providers will be more subjectto the demand of these large travel pur-chasers. If in fact large firms do control asmuch as 50% of any hotel company’s roomnights then it is likely that these hotel firmswill react to the demands of the travel pur-chaser to the exclusion of the travel needs ofthe non-corporate traveller. This suggests a
stronger differentiation between the busi-ness and leisure traveller than exists today.
Smart customersInformation technology, particularly theInternet, is helping to allow customers tobypass the ‘travel trade’ and arrange custom-ized packages by direct contact withsuppliers.
The roots of the World Wide Web are inthe academic, scientific and military com-munities, and yet the impact it has come tohave on the tourism industry is immense.Travel booking sites such as Sabre’s Trav-elocity, Microsoft’s Expedia, PreviewTravel, and Internet Travel Network allowusers to check air fares, arrange car rentals,book hotels, and even purchase completevacation packages online. A survey by theTravel Industry Association of Americareported that 33.8 million American travel-lers used online resources for planning tripsin 1998, up from 11.7 million in 1997.
New alliancesCommunications technology will encouragethe formation of strategic alliances amongall segments of the travel industry. It will beincreasingly important for airlines, hotels,surface transport providers, restaurants andcommunication firms to stay linked via res-ervation systems, in order to provide thequality of service demanded by the increas-ingly sophisticated and demandingtraveller. As the technology continues toimprove to facilitate these alliances it can beexpected that those firms which have inves-ted in the development of this technologywill emerge as the players in the most suc-cessful alliances and thus are likely tobecome the most profitable. This type ofinvestment has not been characteristic of thehospitality industry (see also Poon, 1993).
New risksThe increasing information intensity andcomputerization of the travel and tourismindustry brings with it new vulnerabilities,as concern about the ‘Millennium Bug’ ontravel-related information systems hasshown.
28 K. Peattie and L. Moutinho

Information technology andthe marketing mix
Although it is CRS that has dominated theindustry’s thinking in relation to technol-ogy, the application of technology isrevolutionizing elements of tourism servi-ces and service delivery mechanisms farremoved from the booking process. All ele-ments of the marketing mix are beingaffected (see Kotler et al., 1996).
Product
In the information age, information isincreasingly becoming a part of the contentof products generally. In the case of tourism,information in many formats (brochures,videos, timetables, guide books, itineraries)is increasingly being bundled with the travelexperience, and is being used as a basis todistinguish one set of travel services fromanother. These information by-productswill probably become independent prod-ucts sold to other travel companies (Kurent,1991). Tailor-made audio-video packageswill accompany tourists as they explore thenatural environment and explain in detailwhat can be seen, while increasingly sophis-ticated electronic translation systems willhelp tourists to vault language barriers. The‘smart’ hotel room with complete commu-nications capability (including informationand booking services built into the in-roomTV), airline seats with built in TV monitorsand computer facilities and high speedtransportation systems, are all continuing todevelop and evolve as a result of techno-logical advances.
Price
The pricing of rooms is fast becoming thefunction of a mathematical model which isdesigned to maximize revenue in the face ofvarying demand. The technology that hasemerged recently to improve decision-making has been the application of yieldmanagement thinking to the pricing of hotelrooms. While this decision support technol-ogy is designed to maximize revenuesagainst variable demand schedules it has notyet reached its full potential. This is partly
so because it is unable to take into accountthe buying power emerging among the largecorporate and distributor purchasers.Nevertheless, this type of technologicalapplication to decision-making will con-tinue to develop because competitivepressures will require it. The availability ofinformation over the Internet is also allow-ing travellers to become better informedabout prices, and more able to act as ‘price-takers’. Sites such as www.bestfare.comoffer highly discounted consolidator faresfrom bulk resellers. Some airlines will evenemail prospective customers details of last-minute bargain fares to the destinations theyspecify.
PlaceMany tourism organizations are using agreater variety of marketing channels thanever before. In today’s competitive environ-ment is not enough to rely on centralreservation systems and internal sales forceefforts. The importance of distribution net-works in tourism marketing is increasingwith the increasingly global and compet-itive nature of the market, the ‘perishability’of the product and the computerization ofmarket exchanges. Consumer access totravel databases via the Internet and otherpublic access networks allows them toresearch and book their own travel, whichpresents a clear and immediate threat totravel intermediaries. For intermediarieswithin travel markets, the increasing infor-mation intensity of the industry means thatthey must master and embrace all aspects ofinformation technology and seek new waysto add value and provide additional servicecomponents.
PromotionIn the near future, computers can be expec-ted to have ultra-high resolution screens,3-D graphics, high-level interactivity andartificial intelligence. These new technolo-gies will be a tremendous boon to the travelagent. Destination sites can be experiencedthrough video simulations and a range ofhypermedia databases can be used to indi-vidually tailor a trip to the needs of the
29The Marketing Environment for Travel and Tourism
consumer. This technology could eventu-ally eliminate some of the functions of thetravel agent as the personal computer takesover. CD-ROM technology is already capa-ble of creating electronic catalogues toreplace the traditional marketing mainstayof the industry, the brochure. Such elec-tronic brochures could use sound and videoclips to demonstrate the attractions of aresort or hotel, while also answering querieson price structures or travel options at thetouch of a button. In the USA, the NationalConference of Mayors has created a databaseof city attractions linked into CompuServeand to the SABRE and APOLLO CRS.
Travel technologyThe transportation and hospitality elementsof tourism require the application of hardtechnology which varies from the ancientand traditional to the state-of-the-art. Tech-nological advances in transportation willcontinue to affect the hospitality industry,and will continue to make worldwide traveleasier and hopefully more comfortable forthe traveller. For example, the technology isalready available to transport 1000 passen-gers in a supersonic aeroplane from NewYork to Tokyo in under 2 h (unfortunately,no airports are under construction to servicethis type of aircraft and its volume). Highspeed trains travelling in excess of480 km h21 are likely to become the pre-ferred alternative to air travel in the face ofincreasing airport congestion, delays andinconvenience. Such ‘world shrinking’technology will reduce the psychologicaldistance of ‘long haul’ destinations and maydramatically alter the pattern of touristflows. Automobiles will still be the princi-pal means for most domestic travel, but theywill become highly computerized and fuel-efficient. Cruise ships will continue to offereven more amenities to the traveller. Airtaxis are also forecast to become a popularmeans of transporting visitors from airportsto their destinations, bypassing the urbanchaos in between.
Technology as a substituteThe predicted impacts of the personal com-puter on society seem to have no limits, and
they include the potential for technology tobegin to operate as a substitute for tourismby allowing people to ‘travel’ and experi-ence virtual holiday destinations using theirPC. As PC and television technology evolveand become increasingly intertwined thenpeople can ‘transport themselves’ usinginteractive digital TV, ‘sensavision’ or com-puter simulations. In practice the advent ofthis technology may not create the expectedsubstitutions. Just as the advent of televisionand video have acted to stimulate ratherthan satiate people’s desire to ‘see’ otherplaces, virtual reality tourism is likely tostimulate people’s desire to visit places inactual reality. It is therefore more likely to beused as a marketing tool within the travelindustry rather than as a serious substitute.Teleconferencing has made some impact asa substitute for travel relating to routinebusiness contacts and for connecting dis-parate parties that cannot be physicallybrought together. However, because the pre-vailing business culture stresses theimportance of interpersonal relationshipsand of socialization with strategicallyimportant business contacts, it is unlikely toresult in substantial substitution withinbusiness travel.
Managing technologyThe information revolution already has hada great effect on the tourism industry. How-ever, automated ticket vendors, satelliteticket printers, and on-line services such asPRODIGY are only the beginning. Comput-ers will continue to develop in terms ofprocessing power, communications facili-ties, user friendliness, computability andcost effectiveness. Even familiar technolo-gies such as the telephone will re-evolve tobecome ‘end-to-end digital’, capable of car-rying text, data, graphics, pictures andfull-motion video as well as voice. Speaker-independent speech recognition systemswill recognize 5000 to 15,000 words of con-tinuous speech to allow easy, multi-lingualaccess to the wonderful world of new tech-nology.
As new technologies continue to evolve,concern must be given to whether or not theinfrastructure supporting them (or the user
30 K. Peattie and L. Moutinho

purchasing them), is keeping up with theseadvances. At present evidence seems to sug-gest that technological progress isoutstripping the ability of the purchaser/user to adapt, or of the infrastructure tocope. Much of the future structure of thehospitality industry will depend upon howtechnology will merge with the skills anddemand of the user and the infrastructure tosupport this demand. The industry shouldbe most concerned with bringing these for-ces together at the right time. However, thisis more easily said than done since forecast-ing which technologies will becomesuccessfully commercialized, when, andwith what effects, is very difficult. Shafer(1987) noted that, despite the quickeningpace of technological change within theindustry, ‘other technological phenomenaare occurring outside the scope of the tour-ism profession that eventually may haveeven more profound impacts on tourism inthe 21st century’.
There are those who look to oppose theapplication of new technology into labourintensive service industries such as tourismon the basis that jobs will be destroyed.While some argue that the increased use ofcapital/technology will require highly skil-led labour, others argue that computertechnology may, in fact, increase demandfor a ‘de-skilled’ labour force. Similarly,there are concerns that inappropriate tech-nologies introduced into developingcountries only serves to worsen the well-being of workers. Sophisticated technologyoften requires the importation of trainedoperators, thus displacing untrained localworkers. Furthermore, it is suspected thatthe increasing role of technology is having anegative influence on the balance of powerin the world in that it favours those witheconomic and technological strength, thusfurther worsening the global imbalance.
Despite fears about the future consequen-ces, technology is a reality that needs to bemanaged. The real question becomes one ofwhat technology should, rather than could,contribute to tourism development and howthis can best be achieved. The positiveaspects of technology (such as the develop-ment of cleaner fuels for environmentally
less damaging travel) must be harnessed iftourism is to develop on a sustainable basis.Conversely, the potentially harmful impactsof technology must be understood and man-aged so that their introduction can balanceeconomic efficiency and negative socialimpacts.
The International Environment
All industries that span internationalboundaries are concerned with interna-tional relations. As the most international ofall industries, the relationship between dif-ferent countries around the entire globe is ofgreat concern to those in travel and tourism.International tensions between govern-ments can deter tourists from venturing toparticular destinations and can create bar-riers to travel, in the form of visarestrictions, for example. Watching fordevelopments in international relations issecond nature for those within the tourismindustry, and recent years have witnessedsome extraordinary changes within EasternEurope, the former Soviet Union and theMiddle East.
For many years tourism opportunitiesacross Europe as a whole were restricted bythe Cold War, but its thawing has stimulatedmany new market opportunities. There isalready a pent-up demand for tourism tomany parts of Eastern Europe and the formerSoviet Union and that demand is likely tocontinue over the next several years. But,what is just as important is the tremendouspotential for two-way tourism, East andWest, although this may remain unrealizeduntil economic and political stabilityimprove. In the EU and the USA there aremany people with roots in Eastern Europe,who may find it appealing to engage in tour-ism which rediscovers the lands of theirancestors. These are exciting opportunitiesand the tourism industry needs to grasp theimportance of such changes.
The last decade has witnessed manychanges in international relations whichhave tended to promote tourism, as coun-tries have come together either driven by
31The Marketing Environment for Travel and Tourism

political will (as in the formation of theSingle European Market) or by economicforces (as in the evolution of the Pacific Rimmarket). International cooperation is anincreasingly important aspect of tourismdevelopment. Sometimes this comes in theform of reciprocal marketing alliancesbetween countries, in other cases it is part ofthe pattern of international aid and develop-ment support, exemplified by the EU’ssupport for tourism development in Africa,the Caribbean and the Pacific. Where con-flict replaces cooperation, tourism operatorscan be the first to suffer. The 1990s wit-nessed a remarkable number of twists andturns in the relations between countries.The return of Hong Kong to China in 1997;the disintegration of the former Yugoslavnations and their European neighbours; con-flict in the Gulf states; and the effect onrelations between France and the Pacificnations of the renewed French nuclear test-ing are all issues of international diplomacywhich affected tourism. For countriesembroiled in conflicts and tensions there isthe danger of rapidly losing business, whichwill be gratefully accepted by other coun-tries.
The Communications andInfrastructural Environment
Tourism providers are typically verydependent on an existing infrastructure tohandle travel, hospitality and communica-tion. Although tourism is viewed as anintangible service business, the investmentin infrastructure needed to support manytourism products would dwarf the capitalexpenditure of all but the most global man-ufacturers.
Transport
Although travel and tourism are services,the importance of physical distributionwithin the industry makes it much moreakin to those involving physical products.The requirement to move people around theworld, and within their destination areas,
quickly, punctually and comfortablyrequires considerable support in terms ofinfrastructure. Infrastructure to serve allmajor forms of transport continues toexpand with the network of cities and townsserved by air travel, and high speed road andrail links. Infrastructure development gen-erally tends to lag behind the expansion oftourism and travel, which can lead to bottle-necks and overloads. With respect to airtravel, congestion in the skies and on theground already exists and is increasing.While the popularity of air travel has sky-rocketed, the growth of the world’s airportshas, by comparison, proceeded very slowly.There need to be effective tourism policiesnow to reduce this congestion if air travel isto signify a bright future for tourism.
AccommodationOnce people have arrived at their destina-tion, they need to be accommodated, andthere are few factors that can deter futuretourists as easily as stories of unavailable,half-finished or inadequate accommodation.For many destination areas the availabilityof hotel rooms has been a crucial factor inconstraining tourism growth. The growth oftourism in India during the 1990s was ham-pered by an initial shortage of suitableaccommodation. In 1993 the country onlyhad 798 officially listed hotels with 47,400rooms with which to accommodate an esti-mated 1.8 million incoming tourists.
Facilities/attractions‘Attractions’ and other specific facilities alsoplay a key role in determining travel andtourism purchasing decisions, and manyregions are recognizing the importance ofsuch infrastructural developments in thelocal economy. In England some 400 newattractions were established between 1990and 1995. Judd (1995) describes how a fiercewar for tourist business among Americancities sparked the construction of 250 con-ference centres, sports arenas, communitycentres and performing arts venues at a costof over US$10 billion between 1976 and1986. See also US Travel Data Center(1995).
32 K. Peattie and L. Moutinho

The Administrative and InstitutionalEnvironment
For any form of business the environmentwill contain a wide range of institutionswhich can influence the operation anddevelopment of their business. For tourismthe number of institutions with an interestin, and potential influence on, the industryis vast, and includes:
● Trade unions. Within the tourismindustry, trade unions have not had agreat deal of influence in relation to hos-pitality where wage rates, skill levelsand union bargaining power are typi-cally low; but they have exertedconsiderable influence on the transportservices which tourism depends on.Strikes among airline or airport staff atpeak holiday times have been a com-mon occurrence over the last 20 years,with certain actions such as the Aus-tralian airline pilots’ strike having aprofound effect.
● Academic institutions. As an academicdiscipline, tourism is relatively young,but already the work of academics isinfluencing the decision-making pro-cesses within tourism covering issues ofplanning, service delivery and market-ing.
● Local government. Although nationalgovernments take considerable interestin tourism as a contributor to the econ-omy, the onus for the promotion,control and management of tourismdevelopment is frequently devolved tolocal government level. Local govern-ment administrators have theparticularly difficult task of trying toattract tourists into their region in pur-suit of the economic benefits that theybring, while protecting the quality of lifeof the local population that elected them(Hall and Jenkins, 1996).
● National Tourism Organizations(NTOs). Although there are some verylarge players within the airline, touroperator or hotel chain sectors of theindustry, tourism is a complex and frag-mented industry. For this reason issues
of planning, research and promotion forspecific destinations are typically han-dled by NTOs at a national level, andoften by similar smaller-scale agenciesat a local and regional level.
● Consumer groups. Travel is a major itemof expenditure for many households,and it also offers almost unprecedentedopportunities for the creation of con-sumer dissatisfaction. A holiday-makeris by definition, a long way from home,and is therefore deprived of all the com-forts and support networks that ‘home’entails. This tends to make problemswith a holiday product become veryserious for the consumer involved,since they cannot easily be escaped andcan render a major investment some-thing to be endured instead of enjoyed.For this reason, groups such as the Con-sumers’ Association have taken anincreasing interest in tourism and travelproducts, and there are now numerouspublished guides and television pro-grammes which provide consumerswith information to assist their purchas-ing decisions.
● Special interest groups. The size of thetourism and travel industry means thatit attracts the attention of an enormousnumber of special interest groups. Othertypes of group will try to influence thetourism industry on an issue-by-issuebasis, and will include groups relatingto the environment, rights for specificsections of the population, cultural her-itage and local businesses.
● Law enforcement agencies. The poten-tial for tourists to become targets forcriminal activities, combined with adesire among tourist operators andagencies to prevent crime levels actingas a deterrent to tourists, has tended tobring tourism operators and lawenforcement agencies closer together. InFlorida, concern about the impact ofcrime on tourism business led to theformation of the Central Florida Hotel/Motel Security Association to promotecooperation between the industry andthe law enforcement agencies.
● Organized religion. Although the influ-
33The Marketing Environment for Travel and Tourism
ence of organized religion has lessenedin the majority of developed countries,it continues to be an important socio-cultural influence and one that isgrowing in many developing countriesand within societies based on Muslimprinciples. Policies and pronounce-ments that encourage pilgrimage orwhich designate places as sacred canstimulate tourism, but religion can alsoreact against the influence of tourism inan area where it is perceived to bethreatening.
The Legal and Political Environment
The political shift to market-driven econo-mies is bringing about a global economicrestructuring in which market forces ratherthan ideology are used to guide decisionsand develop policy. Recently, entire polit-ical systems have undergone dramaticchanges in response to the pressure fromtheir populations to provide the goods andservices which they desire rather than thosewhich are determined by the state. As thepolitical tide ebbs and flows in differentparts of the world, the tourism industry cando little but respond to the changes as best itcan. Often it is political instability thatattracts the headlines, and in the tragedythat has been enacted in what was onceYugoslavia, the decimation of a boomingtourism trade was only one entry in a longlist of casualties. Other happier stories havebrought opportunities and a growth in tour-ism to areas such as South Africa, Berlin andNorthern Ireland.
Although history warns that we mustanticipate swings and counter-swings overtime, it is probable that the next decade willsee a continuation of the increasing role ofmarket forces in determining the shape ofworld economic activity in general, andtourism in particular. While policy-makersin tourism cannot do much to affect thistrend, there are two areas for policy action,namely:
● the need to encourage efforts to estab-lish public/private partnerships which
will ensure tourism development whichis economically viable yet sociallyresponsible; and
● the need to encourage responsible andresponsive research and developmentto support these partnerships.
Changes to subsidies and regulationsThe trend towards market economies andshrinking government budgets is creatingstrong pressures for privatization and dereg-ulation of tourism facilities and services.While the decade of the 1970s saw govern-ments become increasingly involved inmany areas of social and economic develop-ment, the realities of the 1990s are forcing adrastic retrenchment of government activ-ity. The reality is that governments in manycountries have simply found they are unableto support the many programmes and ini-tiatives that were put in place in earlieryears (Inskeep, 1994).
Tourism is only one economic sector fac-ing reductions in government subsidies, inlevels of regulation and a transfer of manage-ment responsibility into the private sector.One of the first indications of this was theprocess of liberalization and deregulation ofairline and commercial transportation, firstin the United States, and increasingly on aworldwide basis. The key effects are:
● Government subsidies to support tour-ism development are declining.Increasingly fees are being imposed forthe use of tourism facilities and servicesthat were previously ‘free’.
● Government investment in tourismfacility development is also decliningwith increasing pressures for privatiza-tion of all forms of tourismdevelopment. This trend is causing amarked change in the structure ofinvestment portfolios in tourism-relatedprojects.
● The trend to government decentraliza-tion of its structures and programmes ispushing responsibility for tourism plan-ning and development to the regionaland local level.
Policy-makers in tourism can no longer
34 K. Peattie and L. Moutinho

count on government support for tourismdevelopment as a form of social develop-ment or as a mechanism for theredistribution of income and employment.Tourism facilities and supporting serviceswill increasingly have to be competitive inthe marketplace and economically viable tosurvive in the 21st century.
Government attitudes to tourismDespite recent progress, recognition by gov-ernments of the tourism industry and itsimportance to social and economic develop-ment and well-being of regions is still farfrom satisfactory. During the 1980s, tourismmade substantial progress in gaining thisrecognition. Despite this, tourism is stillviewed in many quarters as a marginalindustry, largely due to the fact that itsimpacts are poorly documented and poorlyunderstood.
As such, there is a need for further effortto develop industry support for an inte-grated tourism lobby. In a related vein, thereis a need to focus the attention of publicinternational organizations on issues of sig-nificance to the tourism industry. Only inthis way will governments acknowledgetourism as a foreign policy issue as well as adomestic one. This in turn shouldstrengthen efforts to stimulate governmentsand internal lending institutions to increasethe flow of resources to projects in varioussectors of tourism. Similarly, greater recog-nition would stimulate governments toconsider tourism needs in the course of pub-lic infrastructure development. It wouldalso encourage the direct allocation of a por-tion of tourism taxes and fees to be used fortourism promotion, destination develop-ment and infrastructure development.
In the future, the tourism industry willprobably become more involved in collabo-rative relationships with governments tolessen the problems that plague overpopu-lated urban areas. By encouraginginnovations in urbanization that strengthenthe infrastructure of megacities – such as therecycling of waste, new and cheaper hous-ing materials and alternative energy sources– the industry will in turn preserve its owntourist markets.
The march of democracyEvents in South Africa, Eastern Europe andAsia during the 1990s have shown that,whatever the faults of existing democraticsystems, democracy is an environmentalforce for change which often proves irresisti-ble. As dissatisfaction with currentgoverning systems and process in undemo-cratic countries increases, so a newframework for tourism will be required. As apopulation becomes more educated andmore informed, pressure typically grows fora form of government which is more directlyresponsive to the population’s wishes, andthere is potential for a backlash against eco-nomic developments and wealthdistribution policies which have been put inplace without representation by those beingaffected.
In areas where this trend becomes estab-lished, it will have significant impacts ontourism policy. There will be a need for:
● tourism planning and development tomore accurately reflect the wishes oflocal populations;
● a fuller accounting of tourism costs andbenefits;
● an expanded concept of tourism policyin which tourism development is morethoroughly integrated with the overalleconomic and social policy of a countryor region;
● a longer-term approach to tourism plan-ning and development.
In some regions the existing political philos-ophy and process will make a countryvirtually closed to tourists as has been thecase with Afganistan, and also, untilrecently, Myanmar (Burma). However, else-where countries like Albania are nowopening up for tourists, and tourism com-mentators were surprised to see that Cubahas become one of the fastest growing touristdestinations.
Political instabilityPolitical instability and conflict betweenand within countries will always have adevastating effect on the tourist trade. Thosein the tourism and travel industry must
35The Marketing Environment for Travel and Tourism

always be in touch with the political risksthat exist across the world, but in recentyears this has become more difficult thanever. As governments continue to reinventthemselves all over Eastern Europe, the for-mer Soviet Union and other parts of theworld, the tourism industry will face greatchallenges. On the one hand, democratiza-tion brings tremendous opportunities forgrowth. On the other, increasing gapsbetween the rich and the poor and the vola-tility of post-Cold War political alliancesmay put tourism policy-makers in the busi-ness of serious risk analysis. Strategicplanners will need to become more adept at‘mapping’ zones of instability based on pop-ulation and poverty projections, and atassessing other indicators of vulnerabilitythat influence the levels of risk associatedwith tourism investments.
The size and international scope of thetourism industry has unfortunately made it,and the tourists within it, potential targetsfor politically motivated acts of terrorism.Recent episodes of fundamentalist violencedirected against tourists in Egypt and Kash-mir have caused these destinations to bere-evaluated by governments, tourism pro-viders and consumers alike. Acts ofterrorism, riots and political aggression arefelt immediately with declining arrivals andlower hotel occupancy. These realities haveled to a heightened need to protect touristsfrom terrorists and other forms of politicalinstability. Recognizing that the tourismindustry can only thrive in a peaceful world,it is essential that it takes a proactive role incollaborating with other organizations inpromoting international understanding andgoodwill at all levels.
Conclusions: Managing in anUncertain Environment
Changes in the external business environ-ment in the new millennium look certain tobe largely what management academicsdescribe as ‘discontinuous change’, charac-terized by surprises and departures frompast developments and trends. Althoughtourism’s relationship with its environment
might seem to concern how tourism man-agers can cope with the increasing rate ofenvironmental change, it is worth remem-bering that tourism is also a major andincreasing agent of change for the environ-ment (Mathieson, 1996).
An industry faced with turbulent envir-onments cannot cope simply by relying onthe accumulated experience of those withinit, or on conventional formal strategic plan-ning processes to develop strategies whichcan cope. In the future, strategies based onprediction and predetermined planning willhave to give way to strategies which empha-size preparation, detection ofenvironmental change, flexibility andresponsiveness. The ability of managers tounderstand the cross-impacts of externalchange will also be important. Analysing theenvironment by using SCEPTICAL analysis,or any similar framework, brings with it thedanger that specific external changes will beclassified under only one heading so thattheir relevance to other issues is underesti-mated. For example the increased concernabout the physical environment which hasemerged over the last 10 years is a socio-cultural change, but one that relates back tochanges in the physical environment. Envi-ronmental concern is leading to a variety ofother types of change in politics, in con-sumer behaviour, and to the adoption oflaws which are significant to many com-panies and which have the potential toaffect international relations (Germany’sdomestic environmental legislation forexample has been criticized as an ‘invisible’trade barrier in other countries). Addition-ally, a range of institutions from localgovernment to industry trade associationsare becoming involved in the effort toimprove the physical environment, andmoney is being invested to create new‘clean’ technologies. Any attempt to under-stand the implications of environmentalconcern by considering it solely under aheading marked ‘social issues’ or ‘politicalissues’ is doomed to failure.
A key problem for those within the tour-ism and travel industry is that there is littlethey can do to prevent wars, ecosystem deg-radation, economic recession or a host of
36 K. Peattie and L. Moutinho

other potential external threats. This is notto say that all threats cannot be dealt withproactively. The sheer size of the industrygives it enormous potential power whichcould be wielded to further lobbying cam-paigns, investment programmes andeducation initiatives. For the moment thefragmented nature of the industry, and itsown preoccupation with cut-throat, price-based competition has prevented it fromlooking further outward and proactivelyinfluencing events compared with othermajor industries such as oil and agriculture.Gradually governments are waking up to theimportance of tourism, not just as a foreignexchange cash cow, but as a strategic invest-ment for the future, and this gives theindustry increasing opportunities to influ-ence that future. In the meantime, however,Hawkins (1993) is likely to be correct inasserting that ‘Crisis marketing is now anessential ingredient for travel marketingprofessionals. Contingency planning, fore-casting, and creative responses to rapidlychanging world conditions are now essen-tial ingredients of success in the tourismindustry.’
References
Cater, E.A. (1993) Eco-tourism in the third world:problems for sustainable tourism develop-ment. Tourism Management 14(2), 85–90.
Durning, A.T. (1992) How Much Is Enough? Earth-scan, London.
Gee, C.Y., Makens, J.C. and Choy, D.J.L. (1994)The Travel Industry, 2 edn. Van NostrandRheinhold, New York.
Getz, D. (1991) Festivals, Special Events andTourism. Van Nostrand Rheinhold, NewYork.
Hall, C.M. and Jenkins, J.M. (1996) Tourism andPublic Policy. International Thomson Busi-ness Press, London.
Haulot, A. (1985) The environmental and socialvalue of tourism. International Journal ofEnvironmental Studies 28(4), 219–225.
Hawkins, D.E. (1993) Prospects and challenges fortourism in the millennium. Tourism Man-agement 14(5), 392–396.
Inskeep, E. (1994) National and Regional TourismPlanning – Methodologies and Case Studies.International Thomson Business Press, Lon-don.
Judd, D.R. (1995) Promoting tourism in US cities.Tourism Management 16(3), 175–187.
Kotler, P., Bowen, J. and Makens, J. (1996) Market-ing for Hospitality and Tourism. PrenticeHall, Englewood Cliffs, New Jersey.
Kurent, H.P. (1991) Tourism in the 1990s: threatsand opportunities. In: Hawkins, D.E., BrentRitchie, J.R., Go, F. and Frechtling, D. (eds)World Travel and Tourism Review – Indica-tors, Trends and Forecasts, vol. 1. CABInternational, Wallingford, UK, 78–82.
Mathieson, A. (1996) Tourism: Economic, Phys-ical and Social Impacts. Longman, Harlow,UK.
Middleton, V.T.C. and Hawkins, R. (1998) Sus-tainable Tourism. Butterworth-Heinemann,Oxford.
O’Connor, P. (1999) Electronic Information Dis-tribution in Hospitality and Tourism. CABIPublishing, Wallingford, UK.
Pearce, D. (1992) Tourist Organisation. JohnWiley & Sons, New York.
Pigram, J. (1990) Sustainable tourism – policyconsiderations. Journal of Tourism Studies1(2), 2–9.
Poon, A. (1993) Tourism, Technology and Com-petitive Strategies. CAB International,Wallingford, UK.
Popcorn, F. (1992) The Popcorn Report: Revolu-tionary Trend Predictions for Marketing inthe 1990s. Century Business, New York.
Romeril, M. (1989) Tourism and the environment– accord or discord? Tourism Management10(3), 204–208.
Shafer, E.L. (1987) Technology, tourism and the21st century. Tourism Management 8(2),179–182.
Sheldon, P.J. (1997) Tourism Information Tech-nology. CAB International, Wallingford,UK.
Smith, S.L.J. (1995) Tourism Analysis. Longman,Harlow, UK.
US Travel Data Center (1995) 1995 Outlook forTravel and Tourism, December. US TravelData Center, Alexandria, Virginia.
Weaver, D.B. (1998) Ecotourism in the DevelopingWorld. CAB International, Wallingford, UK.
Weston, J. (1997) Planning and EnvironmentalImpact Assessment in Practice. Longman,Harlow, UK.
37The Marketing Environment for Travel and Tourism


Part TwoTourism Marketing Management

3Consumer Behaviour
L. Moutinho
Introduction
Consumer behaviour refers to the process ofacquiring and organizing information in thedirection of a purchase decision and ofusing and evaluating products and services.This process encompasses the stages ofsearching for, purchasing, using, evaluationand disposing of products and services. Thetourist buying decision presents someunique aspects: it is an investment with notangible rate of return, and the purchase isoften prepared and planned through savingsmade over a considerable period of time.That is, the vacation tourist will invest withno expectation of material and economicreturn on his or her purchase of an intan-gible satisfaction.
As travellers become more sophisticatedin their vacationing behaviour, researchmust continue to become more sophisti-cated to explain this behaviour. There aremany factors that influence an individual’sbehaviour. To take adequate actions in thearea of tourism marketing, one must under-stand how people perceive such things asdestination areas, air travel, travel distancesand travel advertising; how they learn toconsume and to travel; how they make traveldecisions; and how personality affects thosedecisions. One must also analyse what moti-vations influence the individuals’ traveldecisions; how attitudes are formed; andhow various groups affect travel behaviour.
Considering factors of a broader nature,the tourism marketing context requires anappraisal of the effect of economic andsocial changes, generating factors that willincrease certain types of leisure activitiesand decrease others. The rise in the cost ofenergy, the trend to smaller family units andto live in smaller spaces, the improvementof forms of communication and the access ofmore people to higher education, are exam-ples of general and diverse factors that haveto be taken into account for an assessment ofthe trend in tourism, in relation to regional,national or foreign markets.
Travel decisions, therefore, are very muchaffected by forces outside the individual,including the influences of other people. Theforces that other people exert are called socialinfluences. As Fig. 3.1 shows, these socialinfluences can be grouped into four majorareas: (i) role and family influences; (ii) refer-ence groups; (iii) social classes; and (iv)culture and subculture.
The analysis of consumer behaviourrequires the consideration of various pro-cesses internal and external to theindividual (see Engel et al., 1995). Hence, tounderstand the purchasing behaviour oneneeds to examine the complex interaction ofmany elements, present at different stages,from arousal to decision, as well as frompurchase to post-purchase experiences. Fig-ure 3.2 shows the interaction of elementsthat are involved in consumer behaviour.
© CAB International 2000. Strategic Management inTourism (ed. L. Moutinho) 41

In the consideration of all these proces-ses, this chapter will first deal withdeterminants of a broader nature, the cul-tural and reference group influences. Next,concepts concerning the individual and hisor her relationship with the environmentwill be presented with a focus on: person-ality factors and self-concept; motivation;perception and cognition; and attitude andintention. Then other important determi-nants of tourist decision-making: perceivedrisk and the family decision process, will bediscussed. This previous set of concepts willpermit an integrated analysis of the
decision-making process. The final sectionwill present an illustration of tourist behav-iour modelling.
Cultural Influences andReference Groups
Cultural influencesCulture is the complex abstract and materialelements created by a society. It refers tovalues, ideas, attitudes and meaningful sym-bols, as well as artefacts elaborated in asociety. Those elements are transmitted
Fig. 3.1. Major influences on individual travel behaviour.
Fig. 3.2. Interaction of elements in the psychological field of the consumer that influence behaviour.
42 L. Moutinho
from one generation to another and serve toshape human behaviour, implying explicitor implicit patterns of and for behaviour.The concept of culture is broad and it is noteasy to analyse the culture determination ofbehaviours. Its influences is natural and sub-tle, and often the individuals are neitherconscious nor aware of it. The multiple cul-tural factors taken together will characterizea given society, such as its language, reli-gion, technology, etc. In the context ofconsumer behaviour, one can regard cultureas the total of learned beliefs, values andcustoms, including the material elements,which serve to regulate the consumptionpatterns of members of a particular society.
A form of investigation of this broad fac-tor is cross-cultural analysis, consisting of asystematic comparison of similarities anddifferences in the material and behaviouralaspects of cultures. These analyses may bestatistical, when describing the structure ofthe culture, or functional, when dealingwith factors determining behaviours andactivities in different cultures.
Within a society, an important broad fac-tor influencing consumer behaviour is socialclass. This constitutes a relatively perma-nent division of categories in a society, adivision that brings about some restrictionsof behaviour between individuals in differ-ent classes; individuals in a given socialclass share similar values, lifestyles, andbehaviour standards. However it must beemphasized that there are many ways ofestablishing such a classification. Research-ers may use different categorizations,resulting in three, four, five, six social clas-ses, and so forth. Social classes tend to behierarchical but they may be dynamic. It isvery likely that members of a social classwill follow the standards of behaviour ofthat class; nevertheless, individuals mayvary in the degree of congruence as to theirclass insertion.
The behaviour patterns of an individualare related to the beliefs and values thatwere incorporated. Beliefs constitute a per-son’s particular knowledge and assessmentof something (another person, a store, aproduct, a place, etc.), and are oftenexpressed as mental or verbal statements
(i.e. ‘I believe that . . .’). Values may have thecharacteristics of beliefs but they are notdirected towards a specific object: they serveas standards for appropriate behaviour; andthey are widely accepted by the members ofa social group. Stemming from the fact thatthere are values specific to a social group,some standards of behaviour are establishedand members are expected to conform tothem. These are norms and they consist ofconcepts or generalizations which guidebehaviour.
Reference groupsPeople turn to particular groups for theirstandards of judgement. Any person orgroup – real or imaginary – that serves as apoint of reference for an individual is said tostand as a reference group. It exerts a keyinfluence on the individual’s beliefs, atti-tudes and choices.
The family is a very important referencegroup in a particular culture. Differentvalues and expectations are built in the indi-vidual through the family. Other examplesof reference groups are religious and ethnicgroups, the trade union and the neighbour-hood. Reference groups may interact andoverlap. They can be classified in terms ofdifferent criteria. Those groups with whichthe individual has interpersonal contact arecalled affiliative groups. Taking the criterionof degree of interpersonal contact, two cate-gories can be identified: primary groups,with which the person has a regular contact;and secondary groups, with which the per-son interacts inconsistently or on fewoccasions. Also depending on their degreeof defined structure and organization,groups may be classified as formal (such as atrade union) or informal (such as a neigh-bourhood).
Groups that influence general values andthe development of a basic code of behav-iour are qualified as normative, while thosethat serve as points of reference or influencespecific attitudes and behaviour are desig-nated as comparative.
Opinion leadershipThe final social influence to be considered isopinion leadership. An opinion leader is a
43Consumer Behaviour

person who influences the actions or atti-tudes of others. Individuals may be opinionleaders, opinion seekers or opinion recipi-ents. Considering the person’s tendency tolead or seek for opinion, four categories ofinterpersonal communication result;
1. The socially integrated: a person whosescore is high in opinion leadership aswell as in opinion seeking.
2. The socially independent: a personwhose score is high on opinion leader-ship and low on opinion seeking.
3. The socially dependent: a person whosescore is low on opinion leadership andhigh on opinion seeking.
4. The socially isolated: a person whosescore is low on opinion leadership aswell as on opinion seeking.
Interpersonal communication relative toopinions may be initiated either by theleader or by the receiver. Also, in relation tothe four categories described above, it mustbe remembered that the characterization ofan individual is not absolute and may varyaccording to different social contexts.
Personality and Self-concept
Personality can be defined as the configura-tion of a person’s characteristics and ways ofbehaving, which determines his or heradjustment to the environment in a uniqueway. Personality is a concept that empha-sizes the effect of an individual’s pasthistory on his or her current behaviour. Traittheorists view personality as a collection oftraits, which are defined as relatively endur-ing characteristics. The trait concept impliesa more quantitative approach, with assess-ments effected through personality tests andinventories. More holistic approaches makeuse of personal observation, self-reportedexperiences or projective techniques.
The consideration of personality types isimportant to appraise vacation behaviourtrends. Psychocentric persons are more con-cerned with themselves, anxious andinhibited. Allocentric persons tend to beself-confident, outgoing and adventurous.These differences must be taken into
account since they will mean diverse vaca-tioning behaviours.
Tourist self-imageWithin the consumer’s conceptual structurethere are concepts that the individualbelieves characterize him or her. They con-stitute the consumer’s self-image. There isnot only one kind of self-image. Usually self-image is described as what the individualbelieves himself or herself to be but there isalso the ideal-self, referring to what he or shewould like to be. Purchase intentions relat-ing to some products tend to be correlatedwith self-image, while those relating to otherproducts are correlated with the ideal self-image. The activated self-image consists ofthe expectations a person holds about him-self or herself and his or her behaviour inrelation to an object or product. A similarinterpretation also assumes the existence ofthree categories: the present self, that is, theindividual’s self-image at a given time; thepast self; and the future self. Another sug-gestion of these categorizations emphasizesa kind of ‘others’ self-image’ which is howan individual thinks others see him or her.
The concept of self-image is important tomarketers mainly for marketing segmenta-tion and positioning of products; in thesetasks the self-image of individuals belongingto a target group must be taken into account.The tourist may prefer destinations and ser-vices that match his or her self-image – the‘looking glass’ concept.
The attitudinal dimensions of touristproducts can be classified into three classes:those related to ego-involvement with thesymbols associated with the product; thoseconcerning the sensory character of theproduct attributes; and those concerning thefunctional aspects of the product. When aperson wants to change his or her currentimage in order to gain entrance into a refer-ence group, a whole new pattern ofpurchases may result. This may lead to thetrial of new products and to a different levelof purchasing. Marketers must be aware ofthese tendencies. Appeals based on certaindesires of the tourist, such as to improvehealth and attractiveness, can have a stronginfluence on individuals aiming to change
44 L. Moutinho

their self-concept.The relation between self-image and
product-image is important to predict tour-ists’ behaviour towards destinations andservices. There are several ways of assessingthe congruity between these two images.One of them involves the use of the semanticdifferential technique, with scales havingbipolar adjective endpoints. The tourist isrequired first to identify the position on thescales of his or her self-concept and, follow-ing that, to go through the same procedurewith respect to product-image. Next, the dis-crepancy of the two images is calculated bythe following equation:
Dkj = Ï∑m
i=1(Sij 2 Pij)2
where Dkj is the overall linear discrepancybetween the jth tourist’s self-image and hisor her perception of the image of the kthdestination; i is the specific image compo-nent used to assess destination andself-image; Sij is the jth tourist’s self-perception on the ith image component; andPij is the jth tourists destination perceptionon the ith image component.
Perception and Cognition
The comprehension of the process of knowl-edge acquisition and incorporation ofexperiences will permit better predictions ofactual vacation behaviour. Perception andlearning strongly influence evaluation andjudgemental processes. Perception is theprocess by which an individual selects,organizes and interprets stimuli in a mean-ingful and coherent way. A stimulus is anyunit of input affecting any of the senses.Perceiving stimuli involves exposure,reception and assimilation of information.Our sensory system is sensitive to differentmodalities of external stimuli: auditory, vis-ual, tactile, olfactory and taste. When inputsare transmitted, information reception willdepend on the cues from the source of thestimuli (a product, a message, etc.) and the
individual’s reactions based on currentknowledge.
An individual tends to organize his or herperceptions and knowledge in order to pro-duce meaningful relationships amongseparate elements. What an individual per-ceives in many situations is determined notonly by the intrinsic nature of the stimulusobject or sensations, but also by his or herown system of values and needs determinedby the social context.
The first stage of perception is the atten-tion filter. One does not perceive all thestimuli arriving but grasps informationselectively through a process of comparisonof inputs with previous information. Fur-thermore, most stimuli to which one isexposed are screened out if they are unin-teresting and irrelevant. The second stage isthe interpretation process, whereby thestimulus content is organized into one’sown model of reality, resulting in awarenessand interpretation of the stimulus, that is, incognition.
Selective perceptionPerception is selective in two ways: atten-tion and distortion. Selective attentionrefers to the fact that individuals usuallyattend to those stimuli which are regardedas relevant to his or her needs and interests,and neglects or distorts inconsistent stimuli.Since we cannot perceive everything, webecome selective in our attention, blockingperception when an excessively high levelof stimuli are affecting us (stimulus bom-bardment), when arriving stimuli areirrelevant, or when they are culturally unac-ceptable, damaging or incompatible withour values and beliefs. That is the reasonwhy selective attention is also seen as a formof perceptual defence. The degree of com-plexity of stimuli will determine differentlevels of attention: moderately complexstimuli are more likely to attract our atten-tion than simple or too complex ones.
Perceptual bias or selective distortion is atendency for people to modify informationin the direction of personal meanings.Involvement in the object or message can bea function of self-perception which, in turn,is a function of need and social conditions;
45Consumer Behaviour

the result is selective distortion and selec-tive retention of available information. Theinformation obtained from a specific mes-sage is the sum of the relevant statements asperceived by the receiver. The audiencereceives the message and relates the symbolsit holds by relating it to prior learning. Inte-gration of information implies differentprocesses in the audience, resulting inacceptance or rejection of the message,retention or modification, belief or disbe-lief.
Vacation destination comprehension isrelated to the halo effect, which is the tend-ency of a tourist to be biased by his or heroverall opinion in the process of evaluatingdistinct attributes of a destination or service.This is a form of generalization and it mini-mizes the effort required to make traveldecisions.
Information searchAn important question is: how sensitive isthe average vacation tourist regarding theinformation received about a tourist prod-uct? Perceptual effects may be examined atthree levels: (i) the amount of informationavailable to the tourist; (ii) the amount ofinformation the tourist is exposed to; and(iii) the amount of information actuallyretained.
Information seeking is the expressedneed to consult various sources prior tomaking a purchasing decision. Initially,there is the recognition of the problemwhich is the result of a perceived imbalanceor need to shift to a desired state. It activatesthe decision process, through the search forinformation about alternatives. One type ofsearch is internal, that is, the retrieval ofinformation about alternatives, stored inmemory. However, and especially in thecase of vacation travel, the search is oftenexternal, involving active processes and avariety of information sources.
There are individual differences in termsof the likelihood of a tourist to be involvedin a search, but the level of active search isusually dependent on the degree of balancebetween expectation of predicted benefitsand costs, or on the degree of certainty aboutthe merits of alternative destinations and
services. The concept of overt searchincludes all the activities of a potential tour-ist directed at collecting information about aproduct. One reason for the occurrence of alimited external search is that tourists oftenhave available a large amount of informa-tion, previously acquired, that can beretrieved through internal search.
The mechanism of the use of informationby the tourist comprises four stages: expo-sure (contact with the sources ofinformation); awareness (interest in theproduct); assimilation (attitude towards theproduct attributes); attitude change (aware-ness of the product and association ofproduct and attributes).
MemoryMemory plays a major role in consumerchoice. There are three stages involved inmemory. First the information enters mem-ory and is encoded. Then the information isstored. The third stage is retrieval. Storage issaid to be a function of the level of informa-tion processing at the time the message isreceived so that retention will depend onhow information is processed. One influen-tial approach to memory assumes it to be amultiple-store process, with different typesof memory storage systems, each with spe-cific functions and properties. A typicalmodel of this type assumes a set of sensorystores, a short-term and a long-term store.
For an advertisement to be remembered,it must be encoded and stored in the long-term memory system. Information storedcan be of two types: that actively acquiredand that passively absorbed from the envi-ronment. The quantity of information thatwill be retained in long-term memory (dataconsidered relevant or useful) is only a frac-tion of the total information communicated.The stored information can be retrieved, thatis recovered for use. With respect to recall,an inappropriate context as well as new andold learning may interfere and reduce thepossibility of retrieving given material. For-getting is mainly the result of interference ofnew information and experiences occurringbetween the time of encoding and that ofretrieval.
The process of response to communica-
46 L. Moutinho

tion begins with a state of unawareness. Theinitial response is to become aware of amessage. This response is followed by com-prehension or knowledge, when the receivermust relate the message to prior learningexperiences so as to give meaning to it. Thesubsequent states are liking, preference,conviction and action.
Learning processComprehension or knowledge about thetourist product consists of the facts acquiredabout it that are used as the basic material fordecision-making. To understand the acqui-sition of knowledge about a product, it isnecessary to consider the learning process.
Learning refers to the establishment ofnew responses to the environment. Cogni-tive learning theory focuses on problemsolving, that is, on mental processing, andconsiders the tourist as an active learner.This approach emphasizes the topics dis-cussed above: information processingleading to comprehension and action.Instrumental learning theory emphasizesthe role of reinforcement and repeated trials.Reinforcement is the process by which aconsequence increases the likelihood of aspecific response to certain cues. When cuesare pertinent to expectations, they tend toactivate certain drives (Evans et al., 1996).
As mentioned above, in relation to thehalo effect, generalization is an importantaspect of the learning process to be takeninto account in the analysis of vacationbehaviour. Stimulus generalization is theprocess by which the same response is madeto similar but different stimuli, such aswhen a person responds to a given travelsituation in the same way he or she hasresponded to different but similar situationsin the past. On the other hand, stimulusdiscrimination involves the learning of dif-ferent responses to different but similarsituations. The processes of generalization,emphasizing stimulus similarity, and of dis-crimination, emphasizing stimulusdifference, are fundamental in consumerbehaviour assessment. Tourists can discrim-inate between two similar products andshow preference for one of them and theycan generalize about different, not yet expe-
rienced, aspects of a destination on the basisof known stimuli.
Hence, careful attention has to be given tothe stimuli related to travelling and the waythey affect tourist behaviour. The expres-sion ‘travel stimuli display’ refers to thedifferent kinds of information presented tothe tourist. Information may have a signifi-cative or a symbolic character related to theproduct attributes such as quality, distinc-tiveness, prestige and availability. Tourists’behaviour is influenced by affective and bysymbolic appeals.
Tourist sources of communicationDepending on the source of information,communication can be classified as primary(experiences derived directly from the prod-uct), secondary (mass communication),tertiary (information obtained from travelagencies or exhibitions), and personal.Tourists will actively process the informa-tion provided by the source but will notmake judgements about the product basedonly on information; they combine it withother experiences and previous knowledgeto develop attitudes and intentions and toreach a buying decision.
Messages received by the tourist aresometimes seen as ambiguous when con-fronted with previous experience. Thefiltration process serves to protect the touristsince it permits discrimination betweenfacts and exaggerations in advertising. Com-munication is the determinant of much ofvacation behaviour and an advertisement isintended to communicate, allowing theacquisition of knowledge, the formation orchange of a product image, the arousal ofneeds and wants, the creation of interest in aproduct, the inducement to action.
The primary form of communication isword of mouth. This conversation activity isa channel for both receiving and disseminat-ing information concerning vacationdestinations and tourist services. Productinvolvement is one of the motivations forword of mouth. When a tourist product isperceived to be central to the individual’sself-image, there is a high probability of theproduct being used and focused in conversa-tion. The content of conversation depends
47Consumer Behaviour
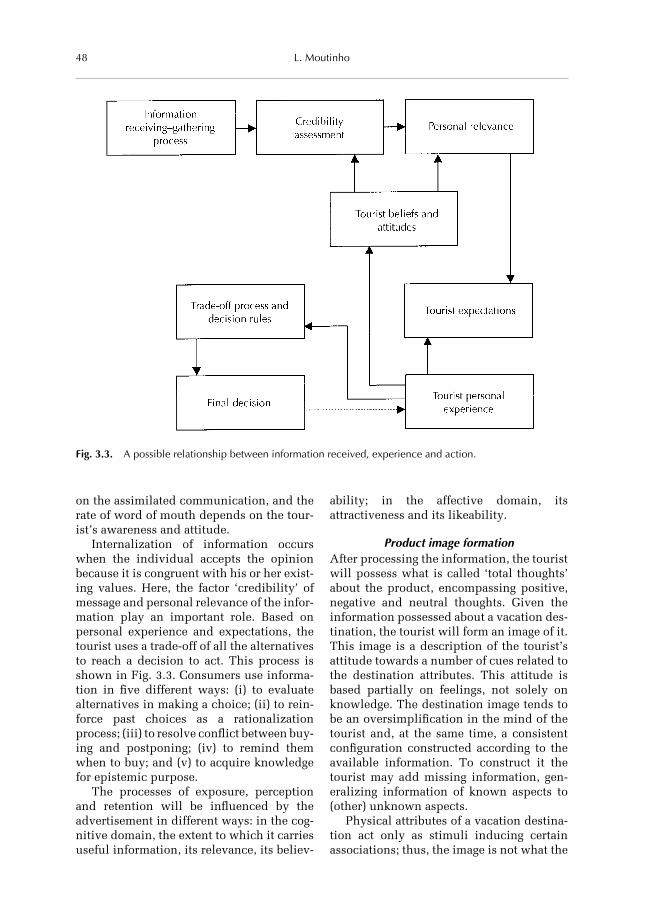
on the assimilated communication, and therate of word of mouth depends on the tour-ist’s awareness and attitude.
Internalization of information occurswhen the individual accepts the opinionbecause it is congruent with his or her exist-ing values. Here, the factor ‘credibility’ ofmessage and personal relevance of the infor-mation play an important role. Based onpersonal experience and expectations, thetourist uses a trade-off of all the alternativesto reach a decision to act. This process isshown in Fig. 3.3. Consumers use informa-tion in five different ways: (i) to evaluatealternatives in making a choice; (ii) to rein-force past choices as a rationalizationprocess; (iii) to resolve conflict between buy-ing and postponing; (iv) to remind themwhen to buy; and (v) to acquire knowledgefor epistemic purpose.
The processes of exposure, perceptionand retention will be influenced by theadvertisement in different ways: in the cog-nitive domain, the extent to which it carriesuseful information, its relevance, its believ-
ability; in the affective domain, itsattractiveness and its likeability.
Product image formationAfter processing the information, the touristwill possess what is called ‘total thoughts’about the product, encompassing positive,negative and neutral thoughts. Given theinformation possessed about a vacation des-tination, the tourist will form an image of it.This image is a description of the tourist’sattitude towards a number of cues related tothe destination attributes. This attitude isbased partially on feelings, not solely onknowledge. The destination image tends tobe an oversimplification in the mind of thetourist and, at the same time, a consistentconfiguration constructed according to theavailable information. To construct it thetourist may add missing information, gen-eralizing information of known aspects to(other) unknown aspects.
Physical attributes of a vacation destina-tion act only as stimuli inducing certainassociations; thus, the image is not what the
Fig. 3.3. A possible relationship between information received, experience and action.
48 L. Moutinho

product actually is, but what the tourist’sbeliefs tend to construct. There are threecomponents in image formation: (i) relatedto awareness, implying the information thetourist believes a tourist destination or serv-ice possesses; (ii) related to attitude,implying feelings and beliefs about the tour-ist product; and (iii) related to expectations,implying the benefits expected to be derivedfrom the tourist product. The concept ofimage can be formulated as:
I = f (Aw, BA, Ex)
where I is the image of the destination orservice; Aw is the level of awareness in rela-tion to the product; BA is the beliefs andattitudes developed about the product; andEx is the expectations created with theproduct.
The attractiveness of a tourist destinationand the choice of it will greatly depend onits image. It is an important fact to marketersthat, in general, images tend to be easilymodified.
Motivation
Motivation refers to a state of need, a condi-tion that exerts a ‘push’ on the individualtoward certain types of action that are seenas likely to bring satisfaction. Vacation tour-ist motivation is greatly determined bysocial factors and is related to the need foroptimal arousal. We have a need for stabilityas well as for novelty. In the case of travel-ling there are usually multiple motives,based on the tourist’s expectations of whatwill be gained from the purchase.
There are two views in relation to theindividual’s logical consistency. Some theo-ries stress the need for balance andharmony, considering the individual morelikely to be satisfied with the expected, andto be uncomfortable with the unexpected.However, other theories maintain that theunexpected is satisfying and that the indi-vidual will seek complexity, not sameness.In terms of travelling, the former theorywould predict that the individual wouldvisit well-known places, while according to
the latter theory people would seekunknown places, restaurants and hotels. Asa matter of fact, these theories explain differ-ent behaviours that do occur, and differentindividuals may behave more in accordancewith one or the other assumption. The mostlikely is that people will seek for a balancebetween consistency and complexity.
In the case of leisure travel there is asearch for variety, that is, for situationswhich offer a certain degree (variable amongindividuals) of incongruity, uncertainty,novelty and complexity, combined with adegree of familiarity; a contact with thefamiliar and the novel.
Travel motivatorsSatisfaction associated with vacation travelincludes relaxation of tension, which is astrong underlying element to differentdesires and expectations concerning a vaca-tion. The search for a mental state of renewalalways seems to be involved.
The answer to ‘why do people travel?’ isnot a simple one. Two sets of motivationsmust be distinguished: general and specific.General motivations imply that peopletravel for many reasons, and many times arenot fully aware of them. Some general travelmotivations are presented in Table 3.1. Thisrange of motives is broad, in common withother classifications, for they are attempts toencompass basic classes of motivators.
A new generation of travellers is begin-ning to emerge, in the sense that the travellerhas ceased to be a tourist and has become asearcher. For that reason, many travel fold-ers and advertisements are still speaking alanguage of the past. The motivationsinclude the discovering of oneself and psy-chological mobility, with the travellerwilling to know different cultures, the psy-chological aura, fauna and flora of an areaand a country. The challenge involved intravelling is based on the exploring instinctlabelled the ‘Ulysses factor’ in reference tothe hero of Homer’s Odyssey. It is the needfor exploration and adventure, involving anexciting and even (according to the individ-ual’s perception) risky action. It is a physicaland intellectual need related to knowledgeand curiosity.
49Consumer Behaviour

Attitude and Intention
AttitudeAn attitude is a predisposition, created bylearning and experience, to respond in aconsistent way towards an object, such as aproduct. This predisposition can be favour-able or unfavourable. Attitudes are generallyconsidered to have three components: cog-nitive, affective and conative. The cognitivecomponent is sometimes called the belief orknowledge component, consisting of thebeliefs and opinions, based on some evi-dence, that an individual holds aboutsomething (a place, an experience, anotherperson); the affective component refers tothe feelings and emotions about the destina-
tion or service and implies judgement on thebasis of emotion; the conative is the actiontendency which can have a favourable orunfavourable character (Hoyer and MacIm-mis, 1997).
Tourist attitude changeIn order to change attitudes, marketers can:
● modify the characteristics of the touristproduct (real positioning);
● alter beliefs about the product (psycho-logical positioning);
● alter beliefs about competitive products(competitive depositioning);
● change the relevant weights of the prod-uct attributes;
● induce attention to certain attributes;● modify the tourist’s ideal levels for cer-
tain attributes.
Inhibiting factors may lead the tourist torespond to a destination in a way differentfrom his or her attitude towards it. The senseof uncertainty, of caution, or indecisivenessare also present in vacation behaviour. Someinhibitors of a positive attitude are the avail-ability of alternatives, problems ofincompatible income, or other limiting fac-tors such as the impact of other people’sbehaviour. Travel preferences are devel-oped as a result of perception of benefits.When choosing a destination, the travellerassesses the level of different benefits ineach alternative. The outcome of this assess-ment is the intention to buy onedestination.
So, to influence a traveller’s decision, onemay increase the importance of one or somespecific benefits. The perception of benefitswill shape the overall attractiveness of adestination. Alternatives are regarded asviable, neutral or rejected. The viable alter-natives will then be more carefullyconsidered. Research has indicated thatusually travellers will analyse no more thanseven alternatives in a given vacation deci-sion.
So far we have discussed attitudestowards an object. However, an alternativeinterpretation holds that attitudes are actu-ally related to ‘behaviour towards’ an object.The Fishbein (1967) attitudes-towards-
Table 3.1. A list of examples of general travelmotivations.
Educational and cultural
To see how people in other countries live andwork
To see particular sights, monuments or works ofart
To gain a better understanding of current eventsTo attend special cultural or artistic events
Relaxation, adventure and pleasure
To get away from everyday routine andobligations
To see new places, people, or seek newexperiences
To have a good time, funTo have some sort of romantic sexual experience
Health and recreation
To rest and recover from work and strainTo practise sports and exercise
Ethnic and family
To visit places your family came fromTo visit relatives and friendsTo spend time with the family and children
Social and ‘competitive’
To be able to talk about places visitedBecause it is ‘fashionable’To show that one can afford it
50 L. Moutinho
behaviour model is expressed by thefollowing equation:
Attitude (behaviour) = ∑n
i=1biei
where bi is the strength of belief that ithspecific behaviour will have a specific con-sequence, and ei is the evaluation of theoutcome.
A multi-attribute object (e.g. a vacationdestination) is viewed as a bundle of attri-butes leading to costs and benefits ofdifferential desirability to individuals orsegments of the market. Overall affect is pos-ited to reflect the net resolution of anindividual’s cognitions (beliefs) as to thedegree to which given objects possess cer-tain attributes weighted by the salience(importance) of each attribute to the individ-ual. Our general attitudes, interests andoutlook towards life are related to our atti-tudes towards different kinds of vacationexperiences and to what we would like tofind in a vacation. Confidence generation isrelated to destination comprehension,intention, and the degree of satisfactiongained in the purchase and utilization of aproduct. Confidence also implies the tour-ist’s ability to judge the quality of theservices offered.
Intention
Intention indicates the likelihood of pur-chasing a tourist product; it is thereadiness-to-buy concept. Behaviouralintention is said to be a function of (i) eva-luative beliefs toward the tourist product;(ii) social factors which tend to provide aset of normative beliefs to the tourist; and(iii) situational factors than can be antici-pated at the time of the vacation plan orcommitment. This function is expressed inthe following equation:
BIij = B1 (Ebijk) + b2(SEij) = b3(ASij)
where BIij is individual i’s plan to behave ina certain way towards vacation destination j;Ebijk is individual i’s belief k about vacationdestination j; SEij is individual i’s socialenvironment influencing behaviour towards
j; and ASij is individual i’s anticipation ofevents at the time of his or her behaviourtowards j.
The assessment of a market potential hasto take into account that there are factorsthat can be anticipated and others that can-not. Variables that can be anticipated shouldbe analysed (for instance, demographic andeconomic factors) before further study ofbehavioural variables is initiated. The rela-tionship between attitude formation,intention and the travel decision-makingprocess is summarized in Fig. 3.4.
A final issue to be considered concerningattitude and intention refers to their meas-urement. Social psychologists haveattempted to create methods of assessment.Attitudes may be inferred from systematicobservations of the individual’s behaviourin social contexts or from responses to ques-tionnaires. One problem with thequestionnaire technique is that respondentsmay misrepresent their feelings in theirstatements. Researchers have been cautiousabout the power to predict subsequent buy-ing behaviour from the assessment ofattitudes and intentions. Actually, in realsituations, there is a gap in time and spacebetween the manifestation of an intentionand buying behaviour. Several non-predicted factors may appear during thisinterval. Despite this fact, a useful techniquefor measurement is the rank-order scalingprocedure.
Perceived Risk
Being faced with a purchasing situation, atourist has a certain degree of risk involvedin the decision to be made. Perceived risk isa function of uncertainty and consequences.This may include (i) uncertainty inherent inthe product; (ii) uncertainty in place andmode of purchase; (iii) degree of financialand psycho-social consequences; and(iv) the subjective uncertainty experiencedby the tourist. The degree of risk may varywith the costs involved in a decision and thedegree of certainty that the decision willlead to satisfaction. Costs may concern time
51Consumer Behaviour

costs, ego costs, monetary costs and othercosts resulting from the eventual failure ofneed satisfaction. For this last case the typesof consumer (vacation tourist) loss can bedefined as physical loss, loss in time, ego-loss, or financical loss.
Tourists can be risk-neutral, risk avoidersor risk-takers. The first types of risk to beperceived are connected with financial andsocial-psychological aspects. ‘Overall per-ceived risk’ includes performance, physical,social-psychological, and time risks. Theconcept of perceived risk can be formulatedas below:
PRx = f(PERx, PSRx, PPRx)
where PRx is perceived risk; PER is per-ceived economic risk; PSR is perceivedsocial risk; and PPR is perceived psycho-logical risk.
The origin of risk perception lies in theuncertainty of the congruence between self-image and product-image. Researchersregard risk handling as a risk reductionprocess. Risk reduction methods are useduntil its level reaches one which is tolerableto the individual and consistent with pur-chase goals. Figure 3.5 describes the riskvariables relationships.
To understand how vacation touristsreduce risk, it is necessary to consider themajor types of perceived risk:
1. Functional risk, the risk that the prod-uct will not perform as expected.
2. Physical risk, the risk that the touristproduct will be harmful.
3. Financial risk, the risk that the productwill not be worth its cost, either in timeor money.
Fig. 3.4. Attitudes and the travel decision-making process.
52 L. Moutinho

4. Social risk, the risk that a poor productchoice may result in embarrassmentbefore others.
5. Psychological risk, the risk that a poorproduct choice will harm the consu-mer’s ego.
The different types of risk have to beconsidered by a tourist organization in orderto help the tourist to reduce the perceivedrisk (Box 3.1). Some sources of perceivedrisk in a buying situation include uncertain
buying goals, uncertain purchase rewards,lack of purchasing experience, the predic-tion of positive or negative consequences,peer influence, and financial considerations(see Fig. 3.6).
For an assessment of tourist risk vari-ables, one should study the relationshipbetween the tourist’s past behaviour and hisor her learning process towards travel-related concepts, the tourist’s intra-personalcharacteristics, the type of information sour-ces used by him or her before and after the
Fig. 3.5. The relationship of tourist risk variables.
Box 3.1. The buying behaviour process for airline products.
Airlines deal intimately with customers, selling a service which to many is threatening, which fewprofess to be able to evaluate objectively, and which constitutes a sizeable expenditure.
Marketing-by-market promotional planning must continue the accent on reinforcing user‘loyalty’. Surveys indicate that individuals do not have clearly formed beliefs about most airlines(although frequent flyers generally prefer one above others), that utility for the ‘product’ is high, andthat there is little emotional involvement when they discuss airlines. Companies in the airlinebusiness need a systematic, ongoing process of data collection to evaluate marketplace perceptionsrather than awakening one day to find their position eroded by more astute competitors. Sinceairlines can seldom be tried out, inspected or tested without a purchase, and are intangible,testimonials are one method to signify that the ‘product’ performs well and that the ‘quality’ is high,adding to convenience value for air travellers. An airline that is marketing-oriented has to examineperiodically its responsiveness to tactical needs in different markets as well as to frenzied pricecompetition.
53Consumer Behaviour

tourist product purchase, the tourist’s levelof risk awareness and the tourist’s evalu-ation of the product attributes. Severalrisk-reduction strategies can be used bytourists:
● expecting less from the product orservice;
● regularly purchasing the same product(characterizing tourists’ loyalty);
● acquiring tourist information;● purchasing the most expensive prod-
uct;● relying on government or consumer
travel reports;● relying on tourist guarantees.
When studying the problem of adequacy,the analysis of the cost-benefit equilibriumlevel for the prices paid by the vacationtourist should be taken into account. Theconsistency of the product represents thesum of all real attributes perceived by the
tourist when utilizing the tourist service.Product consistency follows a kind of rank-ing system in the tourist’s mind, and it playsan important role for the vacation destina-tion ‘sold’ to the tourist.
Family Decision Process
Family goals and roles are major determi-nants of vacation decision-making. Familyinfluences are important in two major ways:(i) they affect individual personality charac-teristics, attitudes and values; and (ii) theyaffect the decision-making process that isinvolved in the purchase of tourism ser-vices.
One person in a family may be responsi-ble for problem recognition, another forsearch and still another for making the deci-sion. Family decision-making varies interms of social class. Decision-making in
Travel stimuli:AdvertisingTravel literatureTravel reportsTravel trade recommendations
Social and personal determinantsof travel behaviour:
Socio-economic statusPersonality featuresSocial influence and aspirationsAttitudes and values
Motivation Desires/needs Expectations
Travel desire Information research Travel assessment
Traveldecision/demand
External variables:Confidence in travel trade intermediary Image of destination/servicePrevious travel experienceTravel constraints, time costAssessment of risk (objective/subjective)
Destination considerations:Cost/value relationsAttractions/amenitiesTravel opportunityTravel arrangementsQuality/quantity of travel information
Fig. 3.6. Travel decision model.
54 L. Moutinho

families, with respect to product selection,may be described as syncratic, partiallysyncratic and autonomic. Syncratic decision-making generally means joint decisions andpartially syncratic decision-making meansthat some decisions are made on a joint basisand some are made by either partner. Auto-nomic decision-making means thatapproximately an equal number of separatedecisions are made by each partner.
Family life cycleChanges in family characteristics producechanges in lifestyle and dramatic changes inconsumer behaviour. Family life cycle (FLC)is a form of classification of family, maritalstatus, age and work status of family mem-bers. There are different FLC models. Theone presented by Wells and Gubar (1966)can illustrate this form of classification.They considered the following five stages:
1. bachelor stage;2. newly married couple with young chil-
dren or no children;3. full nest I (youngest child under 6), full
nest II (youngest children 6 or over), fullnest III (older married couples withdependent children);
4. empty nest I (no children at home, headin labour force), empty nest II (headretired); and
5. solitary survivor (in labour force orretired).
Joint decision-making predominates
when there is a great deal of perceived riskwith regard to product attributes. Anincrease in role specialization occurs overthe stages in the FLC, which is reflected by adecline in the degree of joint decision-making. There is a suggestion that menstrongly dominate decisions concerning theactual date of vacation, the amount spent,the length of stay, and the price of lodging.Syncratic decision-making prevails in rela-tion to the choice of the actual destinationand the type of lodging.
In Table 3.2, different aspects of traveldecisions are considered in relation to fam-ily decision style. There is a dominantdecision-making role of the male partner intwo areas, lodging and destination point.Joint decision-making is strong with respectto the vacation destination and the amountto be spent. Family vacation behaviour pat-terns are, thus, associated with the lifestages of the family, and the trips are oftenthe highlights of family life, especially whenthe family is growing.
Cosenza and Davis (1981) suggested sixstages of FLC, each with a characteristicdecision-making dominance:
1. syncratic;2. husband dominant;3. wife dominant;4. wife dominant;5. syncratic; and6. wife dominant.
In Stage 1, the couple is in the initial stage
Table 3.2. Family decision-making styles.
Family travel decisionPredominant familydecision-making style
Type of lodging accommodation Husband dominantVacation destination(s) Husband dominantWhether to take children along Joint influence-individual decisionHow long to stay on vacation Joint influence-individual decisionDates of vacation travel Joint influence-individual decisionMode of transportation on family vacation Joint influence-individual decisionVacation activities Joint influence-individual decisionWhether to go on vacation Joint influence-joint decisionHow much money to spend on vacation travel Joint influence-joint decision
55Consumer Behaviour
of marriage and willing to participate invacation decisions. They tend to seek infor-mation actively. A change appears in Stage2, with the husband playing a slightly domi-nant role, due to the fact that his career is ata critical stage and his work schedule is amajor criterion. In Stage 3, there is a dra-matic change to wife-dominant decisions.Role specialization leads the wife to takecharge of planning in the area of vacations.This is a stage with a high level of vacationpurchase. Stage 4 is marked by a slight shiftto syncratic decision again, but decisions arestill wife-dominant. Stage 5 is one of syn-cratic decisions, although with a slightlyhigher influence by the husband. In Stage 6decisions seem to be dominated by the wifeagain. This is the stage of the retired couplewho have been married for more than 40years. The frequency of vacation travel tendsto diminish at this stage.
A final aspect that has to be included inthe consideration of the family decision-making process is related to the children.The influence of children in the family deci-sion is very important but usually indirect:children’s needs as well as the benefits theycan gain from the travel experiences aretaken into account in the process. Also,travel is seen as an important opportunity tostrengthen family bonds. During the vaca-tion travel children still have little directinfluence but they may direct choices oflodging and restaurants, or of certain activ-ities. This influence by children will, ofcourse, depend on the stage of family life.
Vacation Tourist Process
A decision is an outcome of a mental processwhereby one action is chosen from a set ofavailable alternatives. Decision-processmodels describe how information isacquired and related in order to make adecision. Most of the models deal with fivedifferent steps in the decision process: prob-lem identification, information search,evaluation of alternatives, choice and post-choice processes.
The tourist decision process involves thetourist’s motives and intentions, as well as
the stimuli that turn intention into choice ofproduct or destination. The tourist can makea decision through different approaches,from highly routine to very extensive. In thecase of a routine decision-making approach,decisions are made quickly and with littlemental effort; the perceived knowledgeabout the alternatives available is high.When an extensive approach is taken, thereis need for considerable time and effort inthe search for information and evaluation ofalternatives.
The Influence of Friends andRelatives in Travel Decision-making
Although there are numerous facetsinvolved in the decision-making process,one area that has begun to receive moreattention is the issue of who makes the deci-sion within the travel group. This intereststems from a number of factors. First, a tour-ism experience appears to be a highly socialevent, i.e. involving two or more people inthe travel group and the likelihood thatmany of these trips involve visiting familyor friends. Second, destination and attrac-tion marketers must design their advertisingbased on their knowledge of who will beusing the information to make various typesof decisions.
Most attempts to understand the dynam-ics of group decision-making related totravel decisions have focused on the role ofthe spouse/partner or the children in theprocess. Very few, if any, research effortshave focused on the role of the spouse/partner or the children in the process. Veryfew, if any, research efforts have focused onthe role of friends and/or relatives in thedecision-making process, beyond the rolethis group plays in providing information towhat are considered the primary decision-makers. There would appear to be a numberof reasons why this latter group should beconsidered as a more dynamic element ofthe decision process. First, if we are visitingan area for the first time, it would seemlogical that we might defer at least some ofthe decision-making to individuals who aremore knowledgeable about the destination
56 L. Moutinho

area. Second, the friends/relatives may in anumber of instances become part of thegroup visiting a particular attraction.
Crompton (1981), in his research onpleasure travel, has suggested that friendsand/or relatives influence behaviourthroughout the recreation experience. Fromthe perspective of providing information todecision-makers, the influence of friendsand/or relatives has been well documented(Bultena and Field, 1980; Jenkins, 1978; vanRaaij and Francken, 1984). In fact, whenasked what sources provide trip-relatedinformation, friends and/or relatives areusually listed as the most frequent and mostcredible source (Gitelson and Crompton,1983; Capella and Greco, 1987).
Reference groups, including friends andrelatives, are also important factors in theoverall decision-making process. Accordingto Peter and Olson (1994), reference groupsexert a major influence over most aspects ofconsumer behaviour, especially thedecision-making process. They influencedecision-makers in three ways. The firsttype of influence involves the provision ofinformation, which is used or not used bythe decision-maker based on the perceptionthat the information is useful and the refer-ence group member is credible. The secondtype of influence is utilitarian in nature.This occurs when a member of a reference
group provides a reward or sanction forsomething that the decision-maker hasdone. The third type of influence is exertedon the decision-maker’s self-concept and iscalled value-expressive influence (Hawkinset al., 1997).
Results in Table 3.3 indicate that all ofthe travel-related decisions studied wereinfluenced by friends and/or relatives. Theextent to which friends and/or relativesplayed either the dominant or sole decision-making role ranged from 29% in the case ofdeciding how long the non-locals wouldstay to 39% in the decision process todecided what the non-locals would do whilein the region. An additional 11–25% of thesix decision areas were equally decided byfriends and/or relatives and one or moreother group members.
In slightly more than half of the decisions(54%), friends and/or relatives were not thedominant or sole decision-maker. Of the sixdecisions included in the study, friendsand/or relatives were involved in at leastone decision as the sole or dominantdecision-maker in 47% of the cases. Inapproximately one-third of the groups(34%), friends and/or relatives dominatedthe decision-making process in at least fourof the six types of decisions.
Past studies have restricted their focus tothe role these friends and/or relatives play
Table 3.3. Role played by friends and/or relatives in selected travel decisions (%).
Which sites Length of stay What to do Where to eat Trip info Where to stayLevel of influence (n = 67) (n = 66) (n = 67) (n = 64) (n = 60) (n = 45)
Sole decision maker 25 18 21 25 27 24Dominant role 13 11 18 11 10 9Equal role 12 20 16 25 12 11Lesser role 6 5 5 3 2 2No role 43 47 40 36 50 54
Number of decisions where friends and/or relatives played total or dominant role (%)
Did not play sole or dominant role in any decisions 54Sole or dominant decision maker in at least one type of decision 5Sole or dominant decision make in two or three decisions 8Sole or dominant decision maker in four or more decisions 34
Source: Gitelson and Kerstetter (1994)
57Consumer Behaviour

in providing decision-makers with informa-tion. But these results indicated that friendsand/or relatives shape behaviour in a moredirect fashion and, in many cases, take onthe role of ‘sole’ decision-maker. Thus,future research efforts need to includefriends and/or relatives as potentially equalpartners in the decision-making process,just as they have done with the spouse/partner and children. A number ofimportant issues related to the decision-making process deserve attention in futureresearch efforts. At what point in time dofriends and/or relatives become influential?For example, do friends and/or relativesaffect the decision-making process prior to,during, and/or after the trip has begun?Andereck (1992) suggests that informationrelated to the timing of various decisionswould allow researchers to better under-stand tourist behaviour and, as a result ofthis knowledge, help tourism marketers andsuppliers to more effectively target theirmarket(s).
External Information Search
External information sources are employedby tourists and form the basis for vacationplanning. For marketers it is relevant toknow what kind of information should beused in tour brochures to stimulate the tour-ist’s external search process.
Gathering tourist informationThe problems of tourism marketing are dif-ferent from the problems of traditionalproduct marketing. The differences are theresult of the characteristics of tourism sup-ply and demand. Tourism is a service. Anintangible experience is being sold, not aphysical good that can be inspected prior toservice (Mill and Morrison, 1985). General-izations that have widespread acceptanceamong scholars and practitioners in the fieldas being characteristic of services includeintangibility, simultaneity of productionand consumption and nonstandardization(see Zeithaml et al., 1985). Services are notdirectly perceptible and are unpredictable
in their outcomes for the buyer. This impliesthat they would influence the purchasingbehaviour of consumers. The fundamentalcharacteristics of services appear to createparticular uncertain and risky purchase sit-uations. In this context, Murray (1991) statesthat it is logical to expect that consumersacquire information as a strategy of riskreduction in the face of this specific uncer-tainty. Moreover he argues that services aremore difficult to evaluate than goods. As aconsequence, consumers may be forced torely on other cues and processes when eval-uating services.
Tourism marketers may benefit from theimproved knowledge of search behaviour invacation planning. In general, knowledge ofinformation acquisition strategies is impor-tant to marketing managers becauseinformation search is at an early influentialstage in the purchase decision process. Infact, the information sources employed bytourists form the basis for vacation planning(Van Raaij and Francken, 1984). Consumerinformation sources can be classified intotwo broad types, internal and external; bothtypes are used by consumers to gather infor-mation and cope with perceived risk.
Information sourcesIn this field of research, information impor-tance is a significant determinant of bothprepurchase and ongoing external search.Furthermore, ongoing external search andthe balance of prepurchase search activitiesare also influenced by enduring involve-ment and previous experience (see Perdue,1993). In general, sources of external infor-mation search can be classified in terms ofwhether the source is marketing oriented orwhether information comes from personalor impersonal communication (Engel et al.,1995). Non-marketer-dominated informa-tion sources such as personal media areexpected to play a particularly importantrole in the consumer decision process forservices. However, personal informationsources and mass media are related in sev-eral ways. For example, tourism indicatesthat mass media (such as tourist advertisingand brochures) are consulted most in thebeginning, and personal media (such as
58 L. Moutinho

salespersons, friends, personal advice) aremainly used at a latter stage of the vacationplanning (Van Raaij and Francken, 1984).
Tour brochures and other sources of massmedia initially play a significant role indetermining choice of recreation and vaca-tion destinations. Because consumersunderstand that the purpose of these massmedia is to persuade as well as to inform,they discount the value of this ‘biased’ infor-mation and seek to verify its authenticity(see Maute and Forrester, 1991). The phe-nomenon is reflected in the fact that peoplein the vacation group usually share in theinformation search process, and often sev-eral sources of information are consulted inplanning a trip. In general, the vacationsearch process involves one or more indi-viduals along with a variety of sources for amultiple set of decisions (e.g. see Capellaand Greco, 1987; Snepenger et al, 1990).With regard to vacation decision-making itis found that social information sources arethe most important. Members of theimmediate family rank first, relatives secondand friends third (Jenkins, 1978). These factsare in line with Murray’s (1991) conclusionthat service consumers prefer the opinionsand experiences of other comparable indi-viduals in making service purchasedecisions.
Vacations are intangibles, which means thatthe prospective buyer can neither see norfeel them prior to purchase, nor can he orshe return the product if dissatisfied. Man-sfeld (1992) states that tourism marketersshould follow two prevailing research strat-egies. One is the study of tourists’ statedpreferences; the other is the study of actualchoice. He suggests that the second researchdirection should look into the informationgathering stage. In this case, the impact ofpromotional information material on touris-tic choice behaviour should be examined.Because this material is meant to createfavourable images and to stimulate ‘non-leading’ motivations, it is important toevaluate its ‘bias effect’ on possible choicedirections. More specifically Perdue (1993,p. 184) states that research focusing on pro-pensity to seek information as a dependent
variable, particularly within the context ofthe growing body of hedonic consumptionliterature, may significantly improve exter-nal search theory, and distinguishingbetween the decision or propensity to seekinformation and the actual selection and useof alternative sources of information maysignificantly improve our theoretical under-standing of external search behaviour.
BrochuresLeisure studies demonstrate that touristsrely more on informational material whilepreparing their trip at home rather than afterarriving at their destination (Mansfeld,1992). In this context Manfredo (1989)points at the fact that so-called ‘active infor-mation seekers’ (i.e. individuals who aredeliberately searching for external informa-tion) are of particular interest because of thepossibility that they are ready to act (visit agiven area) and because they may be suscep-tible to persuasive appeals. When we keepin mind that tourists prefer personal infor-mation, it is reasonable to assume thatpersuasive communication strategiesshould stress experiential or subjectiverather than technical or objective dimen-sions of the trips on offer. This means thattravel agencies and tour operators shouldmake the faction more tangible in brochuresby providing visible or explanatory cues thatprospective tourists can use to evaluate theultimate (emotional) advantages and qualityof the vacation. Potential inclusive tour buy-ers, although they can bear in mindword-of-mouth and published recommen-dations as well as their own past personalexperience, still have to rely largely on whatthey read and see in operators’ brochures;the tour operators’ brochures have manysimilarities with commercial published lei-sure magazines. They are regarded by theirusers as being ‘a good read’, whetting theappetite for the vacation products on offer(see Hodgson, 1990). From this hedonic andmotivational point of view it is important tostress experiential information in bro-chures. Promotional leisure informationabout feelings of pleasure, relaxation,excitement, adventure and fun will prob-ably motivate tourists to plan a trip.
59Consumer Behaviour
Actually there is no scientific study avail-able in the travel research and destinationmarketing literature on whether advertisingstimulates tourism (see Woodside, 1990).While tourism ‘advertising conversionsresearch’ studies are helpful in comparingthe performance of different advertise-ments, media vehicles and media, suchadvertising conversion studies do notaddress the more basic question: what kindof information should be used in brochuresto trigger the external search behaviour oftourists?
Since tour brochures are infrequentlyeffective in getting the attention of the infor-mation seeker, it is useful to examine theimpact of different types of brochure-information on external search behaviour.
Mental Imagery and BehaviouralIntentions
In general, consumer researchers suggestthat the experiential aspects of consumptionplay an important role in consumer choicebehaviour (see Hirschman and Holbrook,1982). From this point of view, MacInnisand Price (1987) state that in the choice ofmany leisure services an important part ofthe choice involves assessing how it willfeel (the sensation surrounding the antici-pated leisure experience). Regarding thelatter, experiential processes, such as imag-ining, daydreams and emotions, play animportant role in vacation choice behaviour(see Mannell and Iso-Ahola, 1987). In thisperspective, it is reasonable to assume thatwhen consumers imagine tourist behaviourthey direct their attention on desirable feel-ings and leisure experiences. It isself-evident that other, more economic andrational, aspects of holidays will also beregarded (e.g. modes of travelling, accom-modation and expense).
MacInnis and Price (1987) provide sev-eral propositions about the potentiallyunique effects of elaborated imagery on con-sumer behaviour, such as the stimulatinginfluence of elaborated imagery on affectiveexperiences, purchase intentions, and pur-chase timing. This relationship between
elaborated imagery and enhanced purchasedesire is directly relevant to a promotionalstrategy that focuses on stimulating externalsearch behaviour. Evidence suggests thatimagery-producing advertisements result insuperior recall and more positive attitudestowards the product. However, there hasbeen limited examination of the relation-ship between imagery and behaviouralintentions in a marketing context.
Enactive imageryAccording to Aylwin (1990), adults can usethree different though interconnected formsof representation: verbal representation, orinner speech; visual imagery, or ‘pictures inthe mind’s eye’; and enactive imagery, akind of imagined action or role play. Enac-tive imagery is specialized, for representingthe temporal perspective of enactiveimagery extends to include the possible con-sequences of action. Enactive imageryprovides an insider’s perspective on situa-tions, and allows access to subjectiveaspects opaque to subjects using verbal orvisual representations. Aylwin (1990) statesthat effective and other subjective con-structs are most frequent in enactiveimagery. This fact is in line with Lang’s(1984) work, which shows that representa-tions involving active participation areaccompanied by more affective arousal (asindexed by physiological indices such asheart rate) than purely visual representa-tions.
Actually, enactive imagery is a form ofcognitive representation in which the con-sumer is personally involved with stimuli,through ‘do-it-yourself or experience-it-yourself’ thoughts (see Goossens, 1994a).The conceptualization of enactive imageryis comparable with the concept of ‘self-relatedness’ (see Bone and Ellen, 1990) andKrugman’s conception of high involvement.Krugman (1965) suggested that at the high-est level of involvement consumers produce‘personal connections’, or ‘bridging experi-ences’, whereby they relate theadvertisement content to meaningfulaspects of their own life. Furthermore, enac-tive imagery is narrowly related to theconcept of ‘constructive processing’. Here,
60 L. Moutinho

the consumer goes beyond the advertise-ment’s content and connects it in somemeaningful way to his or her own life. Exam-ples of these constructive elaborationsinclude thinking up novel uses for the prod-uct and/or imaging the product in use (seeMacInnis and Jaworski, 1989; Buchholz andSmith, 1991).
Self-related imagery
Bone and Ellen (1990) reported a studywhich provides a stimulating contributionto the knowledge of the effect of imageryprocessing and imagery content on behav-ioural intentions. Based on the study ofAnderson (1983), they empirically exam-ined the relationship between self-relatedimagery and behavioural intentions in aradio advertising context. In this experimentradio was selected as the experimentalmedium because self-generated imageryshould have a greater effect than other-generated imagery. If a consumer is forced tocreate his/her own images, then mental pro-cessing is at a deeper level than if the imagesare created for him/her (e.g. through pic-tures). In their study Bone and Ellen (1990)found support for the hypothesis that self-related imagery creates more positivebehavioural intentions than other-relatedimagery. Given the results of this self-relatedness factor, it appears that consumerresearchers may wish to investigate othermessage characteristics, such as promo-tional texts with hedonic information,which could directly or indirectly affectbehavioural intentions when imagery pro-cessing occurs (Antonides and Van Raaij,1998).
Brochure design
A characteristic of the medium ‘tour bro-chure’ is that pictures are used to generatemental imagery processing and emotionalexperiences. In this context is it relevant fortour operators to investigate the effect of theuse of self-related imagery – instructionsand verbal emotional information on exter-nal search behaviour. To be effective instimulating the external information searchof tourists, persuasive communication strat-
egies need to focus on helping persons toimagine the positive sensory and emotionalexperiences of vacations. From this point ofview the tourism industry should use emo-tional information in their promotioncampaigns. By using information about feel-ings of pleasure and fun, advertisers actuallytry to tempt the consumer to plan a trip.
‘The greater the use of cues that appeal tohedonic needs, the greater consumers’ moti-vation to attend to the ad’ (see MacInnis etal., 1991). Apart from verbal information,figural/prominent stimuli can be used toenhance the attention to tour brochures.Research indicates a strong impact of pic-tures on attention, elaboration and memory.Moreover the size of the advertisement itselfinfluences its prominence and consequentattention paid to it (Finn, 1988).
‘The greater the use of figural/prominentexecutional cues, the greater consumers’motivation to attend to the ad’ (see MacInniset al., 1991). Because of the widespread useof pictures in tour brochures, knowing theeffect of picture size on all kinds of depend-ent variables (such as attitude toward theadvertisement, behavioural intentions andovert behavioural responses) is of consider-able importance to tour brochure design.Brochures with enactive imagery instruc-tions, experiential texts and large picturesare supposed to be more attractive and willincrease the return of the response card.Brochures without texts and small pictureswill have a smaller impact.
According to MacInnis and Price (1987,p. 485) imagery instructions may be animportant manipulation strategy when con-sumers are allowed the time to generatevivid imagery, when cues are concrete,when instructions focus on subjects’ reac-tions to the image, and when consumershave sufficient knowledge to generateimagery about reactions. In a study, Goos-sens (1994b) found that both experientialtext and large pictures did not affect theattractiveness of the cover and the overallinformation provided in the brochures.Besides, the emotional texts did not affectthe degree to which the subjects could proj-ect themselves into the experience of thevacation situation (i.e. enactive imagery).
61Consumer Behaviour

There is reason to assume that a stated levelof low involvement with the particular tour-ist information explains the unexpectedresults. On the other hand, it is possible thatmere descriptive (verbal) experiential infor-mation is not effective in making brochuresmore attractive. This may be explained bythe fact that people tend to respond to adver-tising with what van Raaij (1989) calls aprimary affective reaction. Furthermore, heassumes that a cognitive elaboration ofinformation does not change the firstimpression of an advertisement. Accordingto van Raaij this phenomenon is especiallyvalid for visual information. In this perspec-tive Goossens (1993) argues that vacationpictures with people who express their pos-itive feelings visually will have a positiveeffect on the attractiveness of touristic bro-chures. Moreover visual information aboutemotional experiences, such as facialexpressions of positive feelings, are cueswhich probably improve the consumer’smotivation to attend to an advertisement.
In general, imagery processing is often usedby consumers to evaluate marketing stimuli,and consumers differ with respect to theirability and desire to invoke imagery pro-cesses. Imagery may potentially improve thebelievability and memorability of a commu-nication and influence consumer processingand responses. The understanding howindividuals differ in their abilities to processimagery in various senses (see Gutman,1988), and how use of enactive imageryinfluences the way consumers evaluate tourbrochures, may help identify more effectiveways to reach active vacation informationseekers.
Communication effectivenessRegarding this Stern (1988) argues that crea-tive and symbolic language may be used toendow the abstract service with senseappeal, and an analysis of figures of speechcan help advertisers determine which kindswill most effectively reach consumers.
In communication messages, emotionalinformation is often used to draw the atten-tion of the target group, to intensify their
interest, and to communicate the essence ofthe message. These three functions of emo-tions in information processing are essentialfor advertising goals. Nevertheless, consid-erable research suggests that advertisingexecutional cues may influence communi-cation effectiveness. Related researchindicates that communication effectivenessis in part driven by consumers’ motivationto process information from an advertise-ment. However, little research has explicitlylinked executional cues to communicationeffectiveness via their impact on motivationand levels of processing. The greater the useof visual cues that enhance the relevance ofthe vacation activities to the self, the greaterconsumers’ motivation to process informa-tion from the adverts. Follow-up research isrelevant because tourist organizationsusually communicate with their targetgroups in an emotional manner, for exampleby using hedonic and sensory informationin brochures, magazines, advertisements,and so on. An important part of this informa-tion concerns the consumption experienceof leisure products. Information about feel-ings of pleasure, relaxation, excitement,adventure and fun, meets consumers’hedonic needs; advertisers may motivatetourists with adequate pictures of travellerswho express their satisfactory (leisure) feel-ings.
Understanding search behaviourThe marketing implications of knowledge ofsearch processing are diverse. For example,insight into search processes may assist indetermining whether segmenting the audi-ence may improve the efficiency of mediacommunications. Knowledge of search pro-cesses may aid in the development ofadvertising appeals targeted at specific seg-ments. Knowledge of search processes mayalso help to select appropriate marketingstrategies for different market segments.Besides, knowledge of external informationsearch may be quite useful in improvinginformational campaigns.
Various types of customer analyses iden-tifying individuals’ search behaviour havebeen used in tourism market planning (see,e.g. Manfredo, 1989; Perdue, 1993). In par-
62 L. Moutinho

ticular Havitz and Dimanche (1989)suggested that the relationship of the‘involvement’ construct with search behav-iour and promotional stimuli is relevant intourism contexts. In addition, Bloch et al.(1986) noted that search behaviour is notalways limited to prepurchase events. Indi-viduals engaging in ‘ongoing search’ focusmore on the recreational and enjoymentvalue of the search than on its informationvalue. This so called ‘ongoing search’ con-cept is strongly related to ‘enduringinvolvement’. In this case consumers gatherinformation as a goal in itself. This meansthat the satisfaction (reward) stems fromengaging in the search process itself. Thus,‘ongoing searchers’ are primarily intrinsi-cally motivated for (leisure) information,which means that the search process can beseen as an activity for its own sake, or evenas a specific facet of their leisure-lifestyle.For direct marketers, such consumers areimportant with respect to ‘word-of-mouthinformation’ to other customers. Influenceexerted by those sources appears to confirmservice marketing theory, which suggeststhat consumers desire subjective and experi-ential information.
On the other hand, a consumer’s informa-tion search activity may be mainlyextrinsically motivated, which means thatthe activity is satisfying in terms of its con-sequence of payoffs. In fact theseinformation seekers are of particular interestfor direct marketers because they may besusceptible to the emotional benefits ofhedonic appeals. Considerably moreresearch is needed to develop communica-tion strategies that stimulate vacationsearch behaviour. Tourist mass media, suchas tour brochures, play a significant roleespecially in the beginning of the vacationplanning process in determining choice des-tinations. Since brochures are manageablesales tools for tourism marketers, moreresearch should be done on the effects ofdifferent kinds of verbal and visual informa-tion on vacation search behaviour.Continued research along these lines willaid advertisers and media planners in theirefforts to stimulate tourism (Goossens,1994b).
Tourist Evoked Set
The specific destinations or tourist productsthat a tourist will consider in making a pur-chase choice are known as the evoked set.Within the evoked set different types of setshave to be taken into account in the variousstages of a decision:
● The total set comprises all possible tour-ist alternatives in a particular touristproduct category that are available inthe market, even if the tourist is notaware of them or cannot recall them.
● The unawareness set is composed of allthe tourist product alternatives that thetourist is not aware of in the market.
● Within the awareness set, one can findall the alternatives that the tourist canrecall at a certain point in time.
● Among all the product alternatives thatthe tourist may recall, only some ofthem will be considered important in apurchase situation, and these will makethe consideration set.
● Some of the alternatives may be impor-tant but can be considered infeasible,i.e. due to financial constraints (infea-sible or inept set).
● Within the choice set, one will find onlythose alternatives that will be subjectedto a ‘mental weight evaluation’, in termsof the attributes considered important tothe tourist and his or her belief thatsome of them can deliver the expectedbenefits.
● Based on this evaluation process, someof the alternatives will be placed in thenon-choice set.
● Finally, the decision set will determinethe overall best alternatives to pur-chase.
In some cases, we may find an inert set,consisting of alternatives that the tourist isindifferent towards because they are not per-ceived as having any particular advantages.The ways in which travellers evaluate andchoose vacation destinations have criticalimplications in the planning and evaluationof destination tourism strategies. A centralconcern for the marketing strategist is togain entry for his/her product and service
63Consumer Behaviour

(specific brand) into customers’ abilities toretrieve such information into active mem-ory when making product and servicechoices.
Mental Categorization
Travellers are likely to consider a ratherlimited number of travel destinations inplanning their leisure travel behaviour. Therationale for the limited set is based uponHoward’s (1963) concept of evoked setwhich he originally defined as ‘the collec-tion of brands the buyer actually considersin the purchase decision process’. The con-cept of the evoked set was expanded byNarayana and Markin (1975), who also sug-gested the concepts of inert and inept sets.The inert set consists of those brands in theproduct category of which the consumer isaware but does not have sufficient informa-tion to evaluate them one way or the other.The inept set consists of those brands theconsumer has rejected from his purchaseconsideration, either because of an unpleas-ant experience or negative feedback fromother sources. Spiggle and Sewall (1987)divided the evoked set into two: an ‘actionset’ of alternatives towards which a con-sumer takes some action, for example, bytravelling to a destination from which he orshe has received information; and an ‘inac-tion set’.
Destination awarenessA general model of traveller leisure destina-tion awareness and choice has beenprovided by Woodside and Lysonski (1989).Destination awareness includes four cate-gories: consideration set, inert set,unavailable and aware set, and inept set.Affective associations are specific feelings(positive and negative) that are linked with aspecific destination considered by the trav-eller. The affective associations are positiveusually for destinations a consumer wouldconsider visiting and negative for destina-tions a consumer has decided definitely notto visit. The learning of these associationsbetween specific affective concepts and a
specific destination indicate how the desti-nation is positioned in the consumer’s mind(Woodside et al., 1999). In the model, cate-gorization in the destination awareness setis shown as a one-way directional influenceon affective associations because some min-imal amount of destination recognition/memory recall and categorization may benecessary to activate positive, neutral, ornegative affective associations.
Travellers construct their preferences foralternatives based on destination awarenessand affective associations. Preferences arethe rankings assigned to destinations by rel-ative attitude strength; that is, the ordering aconsumer assigns to alternative destinationsfrom most liked to least liked. Intention tovisit is the traveller’s perceived likelihood ofvisiting a specific destination within a speci-fied time period. In the model actualdestination choice is predicted to be affectedby both intention to visit and situationalvariables. Intention to act has been found tobe significantly associated with actualbehaviour, provided that the intention ques-tion is posed concretely and related to aspecific time period and situation. Thegreater the involvement or importance ofleisure travel for the consumer, the smallerthe number of travel destinations consid-ered. Previous travel to a destination relatespositively to the destination being includedin the consumer’s consideration set versusother mental categories of vacation destina-tions (Swarbrooke and Horner, 1999).
Destinations in consumers’ considera-tion sets are linked with more positiveassociations compared with destinations inother mental categories, while destinationsfound in consumers’ inept sets are mostlikely to be linked with negative associa-tions. Consumers’ preference for specificdestinations is associated positively withthe rank order in which the destinations arementioned in consumers’ considerationsets. On average, the first-mentioned desti-nation is preferred more than the second,the second more than the third. Intention tovisit a specific destination is influenced pos-itively by the consumer’s preference towardthe destination. While this preference-intention may appear self-evident, the link
64 L. Moutinho

between preference and intention may bestronger for some destinations than others.This general model is useful in planning fortourism marketing decisions and measuringperformance in implementing such deci-sions for specific destinations.
Consideration set
Some researchers have found an averageconsideration set of 3.4, and others an aver-age consideration set of 2.7. The average sizeof the consideration set tends to get largerwith foreign travel destinations. Overall, thesizes of the consideration sets are relativelysmall and quite similar in size to sets foundfor brands of non-durables being consideredfor purchase by consumers. The average sizeof the respondents’ consideration set is sig-nificantly greater than the average number ofdestinations mentioned in the respondents’inert, unavailable–aware, and inept sets.
Given that the set sizes are relativelysmall, being mentioned in a consumer’s con-sideration set represents value given thatmost respondents mention only a limitednumber of destinations and assuming thatconsumers are more likely to select finalchoice from alternatives mainly from theirconsideration set. Experience via previousvisits to a travel destination is associatedsignificantly with a subject’s categorizationof destinations in their consideration set.
Understanding destination awareness
Research results provide evidence that pref-erence is associated strongly withconsideration, that is, order of access ofalternatives from long-term memory intoworking memory. Thus, using unaidedawareness measurement is useful in learn-ing how well a nation is faring in building atraveller franchise; that is, preference overcompeting destinations. Vacation travellersare likely to consider a limited number ofvacation destinations when planning tripsand categorize these alternatives into differ-ent sets according to perception, preferenceand experience. Tracking potential custom-er’s awareness, preferences anddescriptions of competing vacation destina-tions is useful for measuring marketing
performance and planning marketingactions.
Tracking studies which focus on thetypes of sets discussed above reveals if aparticular nation often makes the traveller’smental ‘short list’ (the consideration set) andtherefore a contender for further evaluationand possible choice by travel customers.Such studies enable a marketing strategist tolearn the principle associations with his orher brand (i.e. country) stored in long-termmemories by potential customers. Learningsuch associations provides clues for themarketing strategist of what needs to bedone for his or her nation to gain entry intotravellers’ consideration sets, and how toconvert consideration into purchasingaction. (Woodside and Ronkainen, 1993).
In the process of evaluating alternatives, thetourist uses two kinds of information – therange of products available composing theevoked set, and the criteria for selection –concerning the attributes of the alternatives.The procedures used to facilitate the finalselection are called decision rules, decisionstrategies or heuristics. The compensatoryform of decision rule implies an evaluationof each attribute of each alternative. Theresult of this will be a higher score for aparticular alternative, what makes it likelyto be purchased. When tourists do not makea balanced evaluation of the different alter-natives, the decision rule is said to benon-compensatory.
The travel decision modelThe travel decision model is based on moti-vational levels, needs and desires of theindividual as well as his or her expectationswhen facing a travel decision. According tothe level of overall travel desire, he or shewill be more or less receptive to travel stim-uli such as advertising and promotion,travel reports, brochures, etc. The decisionprocess will be shaped according to socialand personal determinants of travel behav-iour such as personality, socioeconomicstatus, attitudes and values, referencegroups, and so on. The travel assessment ofthe different alternatives includes the analy-sis of a variety of factors, such as cost/value
65Consumer Behaviour

relations, attractions and amenities withineach destination, travel opportunity andarrangements as well as the quality andquantity of available travel information.Other external variables, such as confidencein the travel agent, the overall image of thealternative destinations and services, thetourist’s previous travel experience, travelconstraints (time, cost, etc.), and the degreeof perceived risks (financial, functional,social, physical and psychological) are alsoimportant determinants in the travel deci-sion model.
Decision rulesInformation-processing theory aims todescribe and explain the means by whichpeople absorb, structure and utilize infor-mation. In a marketing context, this is basedon the recognition that consumers are con-stantly exposed to more information thanthey can meaningfully cope with. Conse-quently, they adopt decision rules, orstrategies, in order to simplify the choiceprocess. Five major types of strategies havebeen identified:
1. A conjunctive or threshold rule: options(e.g. vacation destinations) are elimi-nated from further consideration whenthey are perceived to have certain unac-ceptable features. Minimum acceptablelevels exist for each attribute and eachalternative is judged in relation to thesecut-off points. An alternative that fallsbelow the cut-off point on one or morealternatives is eliminated. A secondstrategy (such as the lexicographic proc-ess) may be used to make a finalchoice.
2. A disjunctive rule: options are chosenon the grounds that they are believed topossess a single overwhelming advan-tage, in terms of the features beingconsidered. This is the simplest of alljudgement models.
3. A lexicographic rule: postulates that,on occasions, people may screenoptions by priorities, i.e. the first vaca-tion destination to demonstrate anadvantage on a subset of key attributes,considered in order of importance, will
be the one to be chosen. Alternatives arecompared on the one attribute that ismost important, and if one is noticeablybetter, it is selected with no furtherevaluation. If two or more are judgedabout equal, they are compared on thesecond most important attribute.
4. A compensatory rule: the option chosenwill be the one which is perceived tohave the best overall balance offavoured characteristics across all attri-butes. This fourth rule is at the basis ofmost well-known multi-attribute mod-els.
5. Elimination by aspects: like the con-junctive process, alternatives areevaluated against minimum cut-offs onattributes, but like the lexicographicprocess, evaluation starts with the mostimportant attribute. Those alternativesexceeding the cut-off point of the mostimportant attribute are evaluated on thesecond most important attribute, andthen the third, and so on.
A tourist may, in a particular choice situa-tion, adopt any one or more of these decisionrules. For instance, he or she may, by meansof the threshold rule, eliminate severalavailable alternatives from consideration:e.g. they may all be regarded as too expen-sive; this process will leave a repertoire ofalternatives for further consideration andthe choice from within this repertoire maythen be made by a compensatory balancingof pros and cons. Pre-decision informationsearch acts as a filter for the available set ofproducts and product attributes for eachvacation tourist.
Modelling decision-makingThe trade-off model is based on the assump-tion that, on many purchasing occasions,tourists are faced with a series of imperfectoptions. In arriving at a decision, an individ-ual will sacrifice (trade-off) a desired level ofa particular attribute in order to obtain acertain level of a different attribute. In mak-ing choices between different levels ofvarious attributes, the tourist will reveal theutilities, or the relative value, he or she atta-ches to these attributes. Stewart and Stynes
66 L. Moutinho

(1994) explored the development of a modelof decision-making associated with long-term, complex purchase processes. Thelengthy decision-making process associatedwith complex purchases creates moreopportunities than usual for marketers toassist, direct and influence a buyer’s choice,but to do so they must understand both howand when in an extended choice processpotential buyers are most easily reached.
The process of choosing one alternativeover others involves making a series of deci-sions in which an individual’s motivations,preferences, knowledge, cognitive proces-ses, resources and constraints all play a role.Research into the behaviours and conse-quences of decision-making is conducted inmany fields, each with a slightly differenttheoretical and methodological emphasis.Structural models are frequently groundedin economic theories of consumer choice,while process models rely more heavily onpsychological theories of perception, learn-ing and judgement. The research objectivesand methods used to test the two classes ofmodels reflect these different origins.
Structural modelsMost applications of decision research torecreation and tourism utilize discretechoice models, in particular multinomiallogit models (Stynes and Peterson, 1984)used together with conjoint scaling methods(Louviere, 1983; Louviere and Timmer-mans, 1990a). Conjoint choice modelspredict a consumer’s choice based on (i)attributes of the alternatives in the choiceset; (ii) assumptions about how perceptionsof the attributes are combined to form over-all evaluations; and (iii) the assumption thatthe individual will choose the alternativewhich maximizes his or her utility (Lou-viere, 1988). In recreation and tourismcontents, these models have been applied tostudies of park visitation (Louviere and Tim-mermans, 1990b), the effect of parkmanagement options on park choice (Leiberand Fesenmaier, 1984), and vacation desti-nation choice (Goodrich, 1978; Haider andEwing 1990). Structural models are not con-sidered useful as replica models of cognitive
or behavioural processes, but rather as pre-dictive tools.
Process modelsIn contrast to predictive structural models,process models focus on how a choice ismade, and argue that this process has muchto do with which choice is made. Behav-ioural decision theory states that decision-making involves learning and adaptation tothe decision environment. Learning canalter the decision-maker’s perception andjudgement, and is most likely to occur whenthe decision-maker is initially unfamiliarwith the choice alternatives or the decisionenvironment. Adaptation will be mostimportant when the decision environmentis unfamiliar, or when the environmentchanges over time. Both of these conditions,an unfamiliar task and a changing decisionenvironment, are most likely to be associ-ated with complex choice, implying thatlearning and adaptation will be most impor-tant when choice is most complex.
Other decision theories also support theconcept of learning and adaptation duringdecision-making. According to someresearchers, each person needs to under-stand and interpret or frame the choice intheir own terms before they begin trying tosolve it. In these models of problem solving,framing is proposed as a first step in solvinga problem or making a choice. The framecoordinates and directs other decision-making activities. Information processingresearch focuses on the ways people dealwith large amounts of information, and hasshown how people create and use a varietyof methods for searching and processinginformation to avoid being burdened withtoo much information; an example of adap-tive decision-making.
While structural models treat decision-making as a static or a temporal event,dynamics are an implicit element of mostprocess models, as the notion of a processimplies some sequence of events. The con-cept of adaptive behaviour, for example,assumes that the decision-maker will reactto perceptual and environmental changes,and their decision-making behaviour willreflect that reaction.
67Consumer Behaviour

Decision theory has moved from its originsin microeconomic consumer theory to amore psychologically based, empiricallysupported perspective which adds recogni-tion of the importance of bothenvironmental constraints and human cog-nitive limitations. The basis fordecision-making behaviour in process the-ory encompasses both the economic conceptof subjective expected utility maximization,and the psychological concepts of stimulus-response behaviour and cognitiveprocessing.
Simpler choices such as those widelystudied in marketing and tourism can beseen as special cases or simplifications ofmore general decision processes. Time isperhaps the dimension that decisionresearchers have most neglected, explainingthe general absence of learning, adaptation,and feedback processes within decisionmodels.
The importance of decision framing incomplex choice, together with the preva-lence of strategic and complex decisionsrelated to tourism has implications for con-ducting tourism choice research.Understanding how people frame tourismdecisions would allow researchers to pres-ent subjects with choices that utilize frameslike their own, improving the validity ofdecision experiments. The extent of individ-ual variation in decision-making makesreliance on a single choice model problem-atic. Because of their proposed link todecision behaviour, decision frames couldbe a useful tool for segmenting decision-makers into groups, allowing succinctstructural models to be developed for each.
Evaluation of Alternatives
Tourists interpret products as arrays of cuesand select only a few cues which have a highinformational value, based on predictiveand confidence values. Cues can also beconceptualized in terms of whether they arepart of the physical object (intrinsic) or aug-ment it (extrinsic). Tourists show apreference for intrinsic cues, but in somesituations (e.g. quality is difficult to evalu-
ate) are more reliant on extrinsic cues. Dueto the tourists’ limited cognitive capabil-ities, perceptual selectivity results in thetourist becoming more attentive to a limitednumber of tourist product attributes and,consequently, tourists may not notice a dif-ference when changes in a tourist productformulation do not reach a critical thresh-old. Tourism brand names are veryimportant extrinsic cues. Quality researchmay benefit from a de-emphasis on price asthe main extrinsic quality indicator.
A major difficulty in reaching value is thevariety of different meanings of ‘value’ heldby tourists. Building a model of valuerequires that the researcher understandswhich of many meanings are implicit in thetourists’ expressions of value. Tourists formjudgements based on samples of cues whichthey believe to be indicative of certain char-acteristics. Consumers assign informationvalues to the available cues, selecting thosewith the highest values.
A cue’s information value is a function ofits predictive value (accuracy of predictingan attribute) and its confidence value(consumer’s confidence in the predictivevalue assigned to the cue).
Research shows that tourists base their deci-sions on a limited number of the availablecues and that the predictive value of a cuehas a dominant effect on cue utilization,with a moderating effect from the confi-dence value. The somewhat restricted levelof information search undertaken by touristscan be explained within this framework. If afew cues offer high predictive and high con-fidence values, these will be selected.However, where none of the cues has highpredictive and high confidence values, morecues would be consulted. Learning, throughtourist product experience, would enabletourists to adjust their predictive and con-fidence values internally which wouldstabilize over time and reduce the need forinformation. In other words, each touristsees a tourist product as a bundle of productattributes with varying capacities for deliv-ering those benefits which can be acquiredby buying such tourist products or services.Consumers will pay the most attention to
68 L. Moutinho

those attributes that better connect withtheir needs.
Figure 3.7 shows a model which affordsan overview of the relationships among theconcepts of price, perceived quality and per-ceived value. Thus, according to this model,both intrinsic and extrinsic cues may deter-mine both the quality and perceived value.It is now time to discuss the circumstancesunder which these cues may affect theevaluation of tourist products from boththeir perceived quality perspective and per-ceived value.
Perceived qualityFigure 3.8 depicts the perceived qualitycomponent of the conceptual model in Fig.3.7. First of all, a tourist product’s quality isevaluated as high or low depending on itsrelative excellence or superiority amongtourist products or services that are viewedas substitutes by the tourist. The fact thatspecific or concrete intrinsic attributes differwidely across tourist products, as do theattributes tourists use to infer quality – even
within a tourist product category – may pro-vide different signals about quality. Asattributes become more abstract, touristproducts become common to more alterna-tives.
Tourists represent the attributes in mem-ory at abstract levels, this is seen in the wayby which, for example, tourists comparenon-comparable alternatives (e.g. how theychoose between such diverse alternatives asa stereo and a Hawaiian vacation). Touristsmay use informational cues to developbeliefs about products and that taskresponse (i.e. choice or evaluation) may be adirect function of these mediating beliefs.These beliefs may be of two types: descrip-tive, which involves a restatement of theoriginal information in more abstract terms;and inferential, which involves an inferenceto information missing in the environment.
Therefore, these distinctions illustratethe level at which dimensions of quality canbe conceptualized. The intrinsic touristproduct attributes that signal quality may beproduct-specific, but dimensions of quality
Extrinsicattributes
High levelabstractions
Intrinsicattributes
Intrinsicattributes
Perceivedquality
Perceivedmonetary
Perceivednon-monetary
price
Key: Lower-level attributesPerceptions of lower-level attributesHigher levels of attributes
Perceivedsacrifice
Perceivedvalue PURCHASE
Objectiveprice
Fig. 3.7. The relationship between price, perceived quality and perceived value.
69Consumer Behaviour

can be generalized to tourist product classesor categories. Price, brand name and level ofadvertising are the extrinsic cues frequentlyassociated with quality in research, yetmany other extrinsic cues are useful totourists.
Price
Price appears to function as a surrogate forquality although a multitude of experi-mental studies on the topic reveal that therelationship may not always be positive.However, the use of price as an indicator ofquality may be used:
● when the tourist has inadequate infor-mation about intrinsic attributes;
● when intrinsic cues to quality are read-ily accessible, when brand namesprovide evidence of a tourism compa-ny’s reputation, or when level ofadvertising communicates the tourismcompany’s belief in the brand, the tour-ist may prefer to use those cues insteadof price;
● when the tourist is aware of touristproduct prices;
● when consumers have not sufficienttourist product knowledge to detectquality variation among tourist prod-ucts.
Thus, tourists appear to depend more onprice as a quality signal in some touristproduct categories than others. Facts like thedifference in price–objective quality rela-tionship by tourist product category maymake the price as a signal of quality relevantor not; while the existence of little variationin prices within the same tourist productcategory may not attribute high quality totourist products that cost less than thecompetitors.
Brand name
Similarly, brand name may serve as a ‘short-hand’ for quality by providing tourists witha bundle of information about the touristproduct. It is accepted that tourists havelimited cognitive capabilities and that to
Brand name ordestination image
Level ofadvertising
Reputation
Intrinsicattributes
Abstractdimensions
Perceivedmonetary
price
Key: Lower-level attributesExtrinsic attributesIntrinsic attributesPerceptions of lower-level attributesHigher-level attributes
PERCEIVEDQUALITY
Objectiveprice
Fig. 3.8. The perceived quality component of the conceptual model.
70 L. Moutinho

overcome this limitation they seek efficientmeans of processing and storing informa-tion. There is clear evidence that touristsrecognize a brand name as an informationalchunk. Thus, the brand names may enablestored information to be recalled from mem-ory which then interacts with the intrinsiccues to produce different results.
Level of advertisingLevel of advertising has been related to tour-ist product quality. The level of advertising,rather than actual claims made, informstourists that the tourism company believesthe tourist products are worth advertising(i.e. are of high quality). Supporting thisargument is the finding that many consu-mers perceive heavily advertised brands tobe generally higher in quality than brandswith less advertising.
Thus, we can conclude by saying that extrin-sic cues serve as generalized qualityindicators across tourist brands, productsand categories. Research shows that extrin-sic cues serve as generalized qualityindicators across tourist products (e.g. brandname as a surrogate for quality), but thenature of intrinsic cues as indicators of qual-ity is tourist product specific. Besides,tourists show a preference for intrinsic cueswhen they have a choice. However, whenintrinsic cues are not available, if quality isdifficult to evaluate or when the evaluationof intrinsic cues requires more effort thantourists perceive to be worthwhile, extrinsiccues will be preferentially sought.
ImplicationsAll this consumer behaviour theory may beused to help tourism companies to decidewhether to invest in tourist productimprovements (intrinsic cues) or in market-ing (extrinsic cues) to improve perceptionsof quality. A single answer is unlikely to begiven because of the difficulties involved.On the one hand tourists depend on intrin-sic attributes when the cues have highpredictive value. On the other hand, touristsdepend on extrinsic attributes more thanintrinsic attributes when the tourist is oper-ating without adequate information about
intrinsic tourist product attributes. At thepoint of purchase, tourists cannot alwaysevaluate relevant intrinsic attributes of atourist product (insufficient time or interestor tourists have little or no experience withthe tourist product). The last difficulty isthat the signal quality changes over timebecause of the development of technicallybetter tourist products (the features that sig-nal superiority change), promotional efforts,and as a response of competence; changingtourist tastes and information.
The particular implications for tourismmarketing researchers are that attentionmust be focused on finding the few key tour-ist relevant attributes, rather than relying ona managerially derived attribute list. As theintrinsic cues used by tourists vary by tour-ist product, a standardized attribute listcannot be contemplated. Thus if tourismmarketers want to assess tourists’ apprecia-tion of formulation changes, the use oftrained panels may be of value. Besides,since tourists may develop categories andevaluate tourist products by deciding whichmental category the tourist products aremore similar to, and hence what their prop-erties are likely to be, it could happen thatthese categories do not contain mentalimages of all competing brands, but justthose perceived as relevant to the tourist.Thus, if, for example, a tourism companywants to be good at developing new touristproducts, given the rapid changes in prefer-ences, technology and competition, acomparative, rather than monadic, analysismay be very useful.
Perceived valueIn order to finish the whole picture, we addthe last component of the model, before thepurchase is completed: value. Value is pro-posed to be a higher level abstraction anddiffers from quality in two ways. First, valueis more individualistic and personal thanquality and is therefore a higher-level con-cept than quality. Although value has beendefined in many ways (as an ‘emotional pay-off’, an abstract, multi-dimensional, difficultto measure attribute, and as ‘instrumentalvalues’) the concept remains a high-levelabstraction for all of them. Second, value
71Consumer Behaviour
unlike quality involves a trade-off of ‘give’and ‘get’ components. Though many con-ceptualizations of value specify quality asthe only ‘get’ component in the value equa-tion, the tourist may include other factors,several that are in themselves higher levelsof abstraction, such as prestige and conveni-ence. Therefore, benefit components ofvalue include salient intrinsic attributes,extrinsic attributes, perceived quality, andother relevant high-level abstractions.
Tourists may sacrifice both money andother resources to obtain tourist productsand services. To some tourists, the monetarysacrifice is pivotal and anything that reducesthe monetary sacrifice will increase the per-ceived value of the tourist product. Lessprice-conscious tourists will find value evenat the expense of higher costs because timeand effort are perceived as more costly. Oth-ers may respond depending on the cues –often extrinsic cues – in forming impres-sions of value. Thus, tourists who maydefine value as low price, may not compare areduced price tourist product with the pri-ces of other tourist brands.
Those tourists who define value as thequality that they get for the price they paymay mention either intrinsic or extrinsicattributes (level of service, or brand name).Finally, the tourists who define value aswhat they get for what they pay, may dependon intrinsic attributes. However, not all theintrinsic attributes of tourist products can beevaluated in the same way. One wouldexpect to find a more rational evaluation insituations of high information availability,processing ability, time availability, andinvolvement in the purchase.
All this goes to show that the diversity ofmeaning of the perception of value for tour-ists may depend on the frame of reference inwhich the tourist is making an evaluation.That is, at the time of purchase, value maymean low price or sale, etc. (extrinsic attri-butes). On the other hand, value mayinvolve some calculation about the touristproduct itself (intrinsic attributes: locationand so on). Finally, it has also been sug-gested that not all tourists want to buy thehighest quality product in every touristproduct category. Instead, quality appears to
be factored into the explicit or implicit val-uation of a tourist product by manyconsumers. A given tourist product may behigh quality, but if the tourist does not haveenough money to buy it (or does not want tospend the amount required), its value willnot be perceived as being as high as that of atourist product with lower quality but amore affordable price. The same principlemay apply to tourist products that needmore decision-making time than the tour-ist’s time constraints allows.
ImplicationsResearch is required that investigates whichcues are important and how tourists formimpressions of quality based on objectivecues. Tourism companies may also benefitfrom research that identifies the abstractdimensions of quality desired by tourists ina tourist product basis. This processinvolves a careful look at situational factorssurrounding the purchase and use of thetourist product. Identifying the importantquality signals from the tourist’s viewpoint,then communicating those signals ratherthan generalities, is likely to lead to morevivid perceptions of quality. Linking lower-level attributes with their higher-levelabstractions locate the ‘driving force’ and‘leverage point’ for advertising strategy.
The dynamic nature of quality suggeststhat tourism marketers must track percep-tions over time and align tourist product andpromotion strategies with these changingviews. Because tourist products and percep-tions change, tourism marketers may be ableto educate tourists on ways to evaluate qual-ity. Advertising, the information provided,and visible cues associated with touristproducts can be managed to evoke desiredquality perceptions. Tourism marketersshould also acknowledge the existence ofnon-monetary costs, such as time and effort.Anything that can be built into tourist prod-ucts to reduce time, effort and search costscan reduce perceived sacrifice and therebyincrease perceptions of value.
Reducing monetary and non-monetarycosts, decreasing perceptions of sacrifice,adding salient intrinsic attributes, evoking
72 L. Moutinho

perceptions of relevant high levelabstractions, and using extrinsic cues tosignal value are all possible strategies thattourism companies can use to affect valueperceptions.
Thus, the selection of a strategy for a partic-ular tourist product or segment depends onits tourists’ definition of value. Strategiesbased on tourists’ value standards and per-ceptions will channel resources moreeffectively and will meet customer expecta-tions better than those based on tourismcompany standards.
An understanding of what quality andvalue mean to tourists offers the promise ofimproving tourism brand positions throughmore precise market analysis and segmenta-tion, tourist product planning, promotionand pricing strategy. An understanding ofconsumer behaviour can also help to designmore realistic marketing procedures andevaluate a tourism company’s strategy.Therefore, this line of thinking implies thattourism marketing researchers can betterguide marketing decisions by applying theseaspects of consumer behaviour theory to dif-ferent aspects of tourism marketingprocedures.
Tourist Behaviour Modelling
A vacation tourist behaviour model is pre-sented in Fig. 3.9. It consists of a flow-chartwith three parts: (I) pre-decision and deci-sion process; (II) post-purchase evaluation;and (III) future decision-making. Each part iscomposed of fields and subfields, linked byother concepts related to the tourist’s behav-ioural processes.
Part I: Pre-decision and decision processesThis part is concerned with the flow ofevents, from the tourist stimuli to purchasedecision. The fields included are: preferencestructure (as a major process in the pre-decision phase), decision and purchase. Asthe two last phases are outcomes of pre-decision, the model is more detailed inrespect to this process, and its analysisincludes the following subfields: stimulus
filtration, attention and learning processes,and choice criteria.
Field 1: Preference structureThe tourist’s preference structure for a par-ticular destination is based on a set offactors, and as additional objective informa-tion modifies that set, effective judgementsfor the destination can be expected tochange over time. Among those factors arethe internalized environmental influenceswhich include cultural norms and values,family and reference groups, financial statusand social class. These are broad determi-nants of preference structure and, thus, willinfluence tourist product evaluation. Indi-vidual determinants of preference structurecomprise concepts such as personality, life-style, perceived role set, learning andmotives. Motives can be defined as the con-scious recognition of a psychological needinfluenced by genetics, experience and sit-uation.
Intention to purchase depends on con-fidence generation, that is, certainty andsureness towards the vacation destination ortourist service. Confidence generation is a‘summary’ concept in the sense that itresults from all the preceding elements. Theconsumer has a pervasive sense of uncer-tainty, caution, anxiety and indecisiveness.Those sentiments are no less present intravel than elsewhere, and are no less con-sequential. They are inhibitors which causea tourist to respond differently from the wayhis or her attitude towards the destination orservice dictates.
SUBFIELD A: STIMULUS FILTRATION. Travelstimuli display can appear via mass mediaor personal sources and it has either a sig-nificant or symbolic connotation related toattributes such as quality, price, distinctive-ness, prestige, service and availability.Consumers do not use raw information pro-vided by mass communication, but processit before using it. Stimuli may be intention-ally or incidentally apprehended. Also,messages arriving to the tourist vary indegrees of stimulus ambiguity. This leads toa search for additional data and holds aconfrontation of information received and
73Consumer Behaviour

Fig. 3.9. A vacation tourist behaviour model.
74 L. Moutinho

real experience. Thus the filtration processcomes to protect the tourist, since it impliesthe ability to discriminate facts from exag-gerations in advertising.
The concept of search includes all activ-ities directed at collecting information abouta product. It may become stronger when thetourist is uncertain about the merits of alter-native destinations. One reason for thelimited scope of external search is that tour-ists often have available a wealth ofpreviously acquired information, based onpast experience and previous knowledge,which can be retrieved through internalsearch.
The promotional information may arriveeither from a tourist board/organization orfrom intermediaries or channels of distribu-tion. Advertising of a vacation productresults in a fraction of potential usersbecoming aware of the product and theremaining entering the non-aware class. Theaware tourists then become either triers ornon-triers.
SUBFIELD B: ATTENTION AND LEARNING PROCES-
SES. Assuming the system is active, theindividual ‘sizes up’ inputs selectivelythrough a process of comparison wherebyinputs are compared with informationstored in memory. Attention indicates sensi-tivity to information and deals with themagnitude of information intake by an indi-vidual at a specific time.
Learning can be considered as any sys-tematic change in behaviour, and ismeasured by the increase in the probabilityof making a particular response. It holds aninterrelationship with the cognitive struc-ture, which is an organized system ofknowledge and beliefs formed from sourcesof learning. The search for meaning, theneed to understand, the trend towards betterorganization of perceptions and beliefs toprovide clarity and consistency for the indi-vidual permit the comprehension of thetourist product.
SUBFIELD C: CHOICE CRITERIA. The criteriatourists employ in evaluating destinationsor tourist services that constitute their
evoked sets are usually expressed in termsof tourist product attributes that they feel areimportant to them. Sometimes the touristwould maintain in the long-term memory anoverall evaluation of the alternatives in hisor her evoked set. This would make assess-ment by individual attributes unnecessary.Instead, the tourist would simply select thealternative with the highest perceived over-all rating. This type of synthesized decisionrule has been labelled the ‘Affect ReferralRule’ and may represent the simplest of alldecision rules.
Field 2: DecisionThe decision process may be studied as asequence of conflicts; the conflict situationsconstituting a decision process are thosethat precede the choice and are necessary toexplain what is chosen. This decisionresults in a psychological predisposition interms of intention towards the buying act.
A tourist’s decisions may be based onperceived images, on information from tour-ism destination promotion, on previousexperience, on image of potential destina-tions, on travel intermediaries, advice or onsocial interaction. The decision process isdetermined by the tourist’s backgroundawareness, which includes formation ofbeliefs and images (revised tourist terms ofreference), the evaluation of vacation con-cepts and, finally, the travel decision (themerging of different beliefs and accommo-dation of opinions).
Field 3: PurchaseThe preceding steps can lead to the act ofbuying a vacation destination. Purchase hasbeen described as the outcome of psychicprocesses taking place more or less con-sciously. The total tourist product isgenerally purchased in a sequence (i.e.transportation, accommodation, tours, etc.)and not always as a tour package.
Purchases can occur out of necessity;they can be derived from culturally man-dated lifestyles or from interlock purchases;they can result from simple conformity togroup norms or from imitation of others.
75Consumer Behaviour

Part II: Post-purchase evaluationPost-choice evaluative feedback has a sig-nificant impact on the decision-maker’s setand/or subsequent behaviour. One of ourkey elements noted as affecting a tourist’sexpectations is the satisfaction with post-purchase. Post-purchase evaluation hasthree major purposes. First, it adds to thetourist’s store of experiences and it isthrough post-purchase assessment thatexperience is taken into the tourist’s frameof reference. Hence, it broadens personalneeds, ambitions, drives, perceptions andunderstanding. Second, post-purchaseassessment provides a check on market-related decisions. Third, it providesfeedback to serve as a basis for adjustingfuture purchase behaviour.
SUBFIELD D: ADEQUACY EVALUATION. Ade-quacy evaluation is the factor related to the‘ideal’ point of each attribute of the touristproduct as perceived by the tourist. Whenevaluating adequacy, the tourist uses a men-tal cost-benefit analysis; this leads to anequilibrium level for the prices paid. Prod-uct consistency represents the sum of allreal attributes perceived by the tourist whenutilizing the service, and follows a kind ofranking system in the user’s mind.
Field 4: Satisfaction/dissatisfactionGratification varies in terms of levels ofreward, and these are key factors to benefitdelivery and future decision-making. Thesatisfaction/dissatisfaction dimension mustalso be considered in relation to the cogni-tive dissonance mechanism. Althoughcommitment to repurchase will also dependon factors such as variety seeking, subse-quent behaviour will be shaped by zones orlatitudes of acceptance and of rejection inconsumer perceptions. In the present modela third zone was introduced, the non-commitment latitude.
Part III: Future decision-makingFuture decision-making is mainly related tothe study of the subsequent behaviour of thetourist by analysing different probabilitiesfor repeat buying a particular destination ortourist service.
Field 5: Repeat buying probabilitiesSubsequent behaviour will, thus, depend onlevels of return prospect and may result in:(i) ‘straight re-buy’; (ii) re-buy in differenttime parameters (subsequent, short-term,medium-term or long-term); and (iii) mod-ified re-buy behaviour, based on the changeto new tourist products or on the search for abetter quality of services.
The inclusion of post-purchase evaluationand future decision-making in this modelwas an attempt to contribute to a globalanalysis of tourist behaviour and, as a prac-tical outcome, to marketing decisionplanning. The development of the tourismindustry requires generation of criteria for abetter quality of services in order to matchthe changing needs and desires of the touristpopulation (Moutinho, 1987).
References
Andereck, K. (1992) Comments on researchingconsumer information. Proceedings of the23rd Annual Conference of the Travel andTourism Research Association. Travel andTourism Research Association, Minneapo-lis, Minnesota, pp. 50–52.
Anderson, C.A. (1983) Imagination and expecta-tion: the effect of imagining behaviouralscripts on personal intentions. Journal ofPersonality and Social Psychology 45(2),293–305.
Antonides, G. and van Raaij, W.F. (1998) Con-sumer Behaviour – A European Perspective.John Wiley and Sons, Chichester.
Aylwin, S. (1990) Imagery and affect: Big ques-tions, little answers. In: Hampson, P.J.Marks, D.E. and Richardson, J.T.E. (eds)Imagery: Current Developments. Interna-tional Library of Psychology, Routledge,London.
Bloch, P.H., Scherrell, D. and Ridgway, N. (1986)Consumer search: An extended framework.Journal of Consumer Research 13, 119–126.
Bone, P. and Ellen, P. (1990) The effect of imageryprocessing and imagery content on behav-ioural intentions. Advances in ConsumerResearch 17, 449–454.
Buchholz, L.M. and Smith, R.E. (1991) The role ofconsumer involvement in determining cog-nitive response to broadcast advertising.Journal of Advertising 20(1), 4017.
76 L. Moutinho

Bultena, G.L. and Field, D.R. (1980) Structuraleffects in national park going. Leisure Scien-ces 3(3), 221–240.
Capella, L.M. and Greco, A.J. (1987) Informationsources of elderly for vacation decisions.Annals of Tourism Research 14, 148–151.
Cosenza, R.M. and Davis, D.L. (1981) Family vaca-tion decision making over the family lifecycle: a decision and influence structureanalysis. Journal of Travel Research 20(2),pp. 17–23.
Crompton, J. (1981) Dimensions of the socialgroup role in pleasure vacations. Annals ofTourism Research 8(4), 550–567.
Evans, M., Moutinho, L. and van Raaij, W.F.(1996) Applied Consumer Behaviour.Addison-Wesley, Harlow.
Engel, J.F., Blackwell, R.D. and Miniard, P.W.(1995) Consumer Behavior, 8th edn. TheDryden Press, Fort Worth, Texas.
Finn, A. (1988) Print and recognition readershipscores: An information processing perspec-tive. Journal of Marketing Research 25 (May)168–177.
Fishbein, M. (1967) A behavioural theoryapproach to the relations between beliefsabout an object and the attitude toward theobject. In: Fishbein, M. (ed.) Reading in Atti-tude Theory and Measurement. John Wiley,New York, pp. 389–400.
Gitelson, R. and Crompton, J. (1983) The planninghorizons and sources of information used bypleasure vacationers. Journal of TravelResearch 21(3), 2–7.
Gitelson, R. and Kerstetter, D. (1994) The influ-ence of friends and relatives in traveldecision-making. Journal of Travel andTourism Marketing 3(3), 59–68.
Goodrich, J.N. (1978) The relationship betweenpreferences for and perceptions of vacationdestinations: application of a choice model.Journal of Travel Research 17 (Fall), 8–13.
Goossens, C.F. (1993) Picturing a holiday: a studyon effects of emotional information. PhDDissertation, Tilburg University, The Neth-erlands.
Goossens, C.F. (1994a) Enactive imagery: infor-mation processing, emotional responses andbehavioural intentions. Journal of MentalImagery
Goossens, C.F. (1994b) External informationsearch: effects of tour brochures with experi-ential information. Journal of Travel andTourism Marketing 3(3), 89–107.
Gutman, E. (1988) The role of individual differ-ences and multiple senses in consumerimagery processing: Theoretical perspec-
tives. Advances in Consumer Research 15,191–196.
Haider, W. and Ewing, G.O. (1990) A model oftourist choices of hypothetical Carribeandestinations. Leisure Sciences 12, 33–47.
Havitz, M.E. and Dimanche, F. (1989) Proposi-tions for testing the involvement construct inrecreational and tourism contexts. LeisureSciences, 12, 179–195.
Hawkins, D., Best, R. and Coney, K. (1997) Con-sumer Behavior, 7th edn. McGraw-Hill,Maidenhead, UK.
Hirschman, E.C. and Holbrook, M.B. (1982)Hedonic consumption: emerging concepts,methods and propositions. Journal of Mar-keting 46 (Summer), 92–101.
Hodgson, P. (1990) Using qualitative research tounderstand consumer needs in tour bro-chure design. Travel and Tourism ResearchAssociation, 21st Annual Conference Pro-ceedings (October). TTRA, Lexington,Kentucky.
Howard, J.A. (1963) Marketing Management. Richard D. Irwin, Homewood, Ilinois.
Hoyer, W. and MacInnes, D. (1997) ConsumerBehaviour. Houghton Mifflin Company,Abingdon, UK.
Jenkins, R.L. (1978) Family vacation decision-making. Journal of Travel Research 16(4),2–7.
Krugman, H.E. (1965) The impact of televisionadvertising: learning without involvement.Public Opinion Quarterley 29 (Fall),349–356.
Lang, P.J. (1984) Cognition in emotion: conceptand action. In: Izard, C., Kagan, J. and Zajonc,R. (eds) Emotions, Cognitions and Behav-iour. Cambridge University Press, NewYork.
Leiber, S.R. and Fesenmaier, D. (1984) Modellingrecreation choice: a case study of manage-ment alternatives in Chicago. RegionalStudies 18, 31–43.
Louviere, J. (1983) Integrating conjoint and func-tional measurement with discrete choicetheory: an experimental design approach.Advances in Consumer Research 10,151–156.
Louviere, J. (1988) Analysing Decision Making:Metric Conjoint Analysis. Sage universitypaper series on Quantitative Applications inthe Social Sciences, Series no. 07-001. Sage,Beverley Hills.
Louviere, J. and Timmermans, H. (1990a) Statedpreference and choice models applied torecreation: A review. Leisure Sciences 12,9–32.
77Consumer Behaviour

Louviere, J. and Timmermans, H. (1990b) Usinghierarchical information integration tomodel consumer response to possible plan-ning actions: a recreation choice illustration.Environment and Planning, A 22, 291–308.
MacInnis, D.J. and Jaworski, B.J. (1989) Informa-tion processing from advertisements:Toward an integrative framework. Journal ofMarketing 53 (4), 1024.
MacInnis, D.J. and Price, L.L. (1987) The role ofimagery in information processing: reviewand extensions. Journal of ConsumerResearch 13, 473–491.
MacInnis, D.J., Moorman, C. and Jaworski, B.J.(1991) Enhancing and measuring consumers’motivation, opportunity and ability to proc-ess brand information from ads. Journal ofMarketing 55 (October), 32–53.
Manfredo, M.J. (1989) An investigation of thebasis for external information search inrecreation and tourism. Leisure Sciences 11,29–45.
Mannell, R.C. and Iso-Ahola, S.E. (1987) Psycho-logical nature of leisure and tourismexperience. Annals of Tourism Research 19,314–331.
Mansfeld, Y. (1992) From motivation to travel.Annals of Tourism Research 19, 399–419.
Maute, M. and Forrester, W.R. (1991) The effect ofattribute qualities on consumer decisionmaking: a causal model of external informa-tion search. Journal of Economic Psychology12, 643–666.
Mill, R.C. and Morrison, A.M. (1985) The TourismSystem: An Introductory Text. Prentice Hall,Englewood Cliffs, New Jersey.
Moutinho, L. (1987) Consumer behaviour in tour-ism. European Journal of Marketing 21(10),1–44.
Murray, K.B. (1991) A test of services marketingtheory: consumer information acquisitionactivities. Journal of Marketing 55 (January),10–25.
Narayana, C.L. and Markin, R.J. (1975) Consumerbehaviour and product performance: analternative conceptualisation. Journal ofMarketing 39 (January), 1–6.
Perdue, R.R. (1993) External information searchin marine recreational fishings. Leisure Sci-ences 15, 169–187.
Peter, J.P. and Olson, J.C. (1994) UnderstandingConsumer Behaviour. Irwin, Boston.
van Raaij, W.F. (1989) How consumers react to
advertising. International Journal of Adver-tising 8, 261–273.
van Raaij, W.F. and Francken, D. (1984) Vacationdecisions, activities, and satisfactions.Annals of Tourism Research 11, 101–112.
Snepenger, D., Meged, K., Snelling, M. and Wor-rall, K. (1990) Information search strategiesby destination-naive tourists. Journal ofTravel Research 28 (Summer), 13–16.
Spiggle, S. and Sewall, M.A. (1987) A choice setsmodel of retail selection. Journal of Market-ing 51 (April), 97–111.
Stern, B.B. (1988) Figurative language in servicesadvertising: the nature and uses of imager.Advances in Consumer Research 15,185–190.
Stewart, S.I. and Stynes, D.J. (1994) Toward adynamic model of complex tourism choices:the seasonal home location decision. Journalof Travel and Tourism Marketing 3(3),69–88.
Stynes, D.J. and Peterson, G. (1984) A review oflogit models with implications for modellingrecreation choices. Journal of LeisureResearch 16 (4), 295–310.
Swarbrooke, J. and Horner, S. (1999) ConsumerBehaviour in Tourism – An InternationalPerspective. Butterworth-Heinemann,Oxford.
Wells, W.D. and Gubar, G. (1966) Life cycle con-cept in marketing research. Journal ofMarketing Research 3, 355–363.
Woodside, A.G. (1990) Measuring advertisingeffectiveness in destination marketing strate-gies. Journal of Travel Research, 28 (Fall),3–8.
Woodside, A.G. and Lysonski, S. (1989) A generalmodel of traveller destination choice. Jour-nal of Travel Research 27(4), 8–14.
Woodside, A.G. and Ronkainen, I.A. (1993) Con-sumer memory and mental categorisation ininternational travel destination decisionmaking. Journal of International ConsumerMarketing 5(3), 89–104.
Woodside, A.G., Crouch, G.I., Mazanec, J.A.,Oppermann, M. and Sakai, M.Y. (eds) (1999)Consumer Psychology of Tourism, Hospital-ity and Leisure. CAB International,Wallingford, UK.
Zeithaml, V.A., Parasuraman, A. and Berry, L.L.(1985) Problems and strategies in servicesmarketing. Journal of Marketing 49 (Spring),33–46.
78 L. Moutinho

4Tourism Marketing Research
L. Moutinho
Introduction
Marketing research in tourism is the system-atic gathering, recording and analysing ofdata about problems related to the marketingof tourism services. The five most commontypes of tourism marketing research activ-ities are as follows:
1. determination of market characteristics2. measurement of market potentials3. market share analysis4. sales analysis5. studies of tourism business trends.
The marketing research process is a struc-tured procedure linking together themarketing researcher, the marketingdecision-maker and the sources of relevantinformation concerning a particular prob-lem. The key to the process is planning. Themarketing research process has its roots inscientific research and the scientificmethod. In practice, however, marketingresearch studies in tourism range from the‘quick’ and ‘simplistic’ to carefully planned,systematic empirical investigations ofhypotheses. Marketing research is usuallyconducted on request to provide informa-tion relevant to the solution of specificproblems as they occur.
Marketing research is a growing andwidely used business activity in tourismbecause organizations need to know moreabout their final consumers but typically are
widely separated from those consumers.Marketing research is used throughout allfour phases of the management process:selecting strategies, developing marketingplans, putting the plans into action and eval-uating their effectiveness. Some tourismcompanies are now beginning to coordinateand integrate their marketing research activ-ities into marketing information systemsdesigned to provide managers with the rele-vant information they need for recurringproblems and decisions. However, market-ing research is not the same as a marketinginformation system (MIS) (see Table 4.1).The function of marketing research is toprovide information that will assist market-ing managers in recognizing and reacting tomarketing opportunities and problems. Theimportance of such information is shown inBox 4.1.
Benefits
Marketing research links the organizationwith its marketing environments. It involvesthe specification, gathering, analysing andinterpretation of information to help man-agement understand the environment,identify problems and opportunities, anddevelop and evaluate courses of marketingaction. Marketing research is defined as aninformational input to decisions, not simply
© CAB International 2000. Strategic Management inTourism (ed. L. Moutinho) 79

the evaluation of decisions that have beenmade.
The marketing research process is a toolthat helps tourism managers wisely or ade-quately resolve marketing problems. Manytourism companies are geographically sepa-rated from the bulk of their markets.Collecting information about these distantmarkets is essential so that management canmake intelligent decisions about what isneeded in far away places. Also, importantinformation is seldom obvious. Accurateanswers to important behavioural questions
may be essential in deciding effective strate-gies, yet the answers may be difficult formanagement to answer without conductingresearch. Relying on collected market infor-mation enables managers to make effectivedecisions relating to all target markets.Finally, accurate and carefully researchedinformation is needed because of the highcost of making a mistake. Tourism manage-ment cannot afford the risk of making awrong decision on the basis of intuition orguesses. Too little information results inneedless risk, but attempting to collect too
Table 4.1. Differences between marketing research and a marketing information system (MIS).
Characteristic Marketing research Marketing information system (MIS)
Data type 1. Primarily external information 1. Can be internal and external dataoriented
Problem orientation 2. Primary function is to solveproblems
2. Solves problems but also attemptsto prevent problems throughcontrols
System orientation 3. Handles projects in a prescribedproject-to-project basis
3. Operates as a true system ratherthan intermittent as projects
Information focus 4. Usually oriented towards presentand past data
4. Projection techniques providemeans for acquiring future orienteddata
Hierarchy 5. One source of information fordecision making and a marketinformation system
5. This system includes a variety ofsub-systems of which marketingresearch is one
Degree of commitment 6. Can be sporadic because of project-to-project basis
6. Total organizational commitmentsecures the best efficiency
Box 4.1. The place of information in effective marketing.
Marketing research information helps the marketer to be an effective decision-maker. To be effective,the marketer needs to gather enough information to:
● Understand past events● Identify what is occurring now● Try to predict what might occur in the future
Marketing research is the systematic and objective process of gathering, recording, and analysis ofdata for marketing decision-making.
Guideline 1: The term ‘marketing research’ suggests a specific, serious effort to do research. The term ‘research’ suggests a patient, objective, and accurate search.
Guideline 2: Marketing research is not limited to product research. Marketing research should yieldinformation that helps managers to make decisions.
80 L. Moutinho

much information involves excessive costs.Therefore, it is prudent for management tomake a trade-off between the cost of collect-ing and analysing additional information,and the expected cost of making a wrongdecision if the information is not collected.Neither marketing research nor marketinginformation systems can, however, elimi-nate all uncertainty and risk.
Relationships between managers andmarketing researchers are being improvedbecause both parties are communicatingmore effectively with each other and aredeveloping a better understanding of eachother’s needs and problems. Management isalso becoming more involved in marketingresearch. A marketing research activity pro-viding management with the maximumpossible support will be one that reflectsmanagement’s responsibility and involve-ment.
Classification of techniquesOne should take the line that a researchproblem with a certain basic format (e.g. theconvergent causal structure) leads to thechoice of a technique of multivariate analy-sis which corresponds to that format.Therefore, the first and most important cri-terion for the classification of techniques isthe underlying format. An obvious criterionis the measurement level of the variables:quantitative, ordinal or nominal. Anothercriterion of frequent occurrence is the pres-ence or absence of dependency, in otherwords the causal asymmetry, whereby thedistinction between independent anddependent variables is made. The measure-ment level and the dependency are the twomost widely used criteria for the classifica-tion of techniques. The basic format is themost important criterion, because it ensuresthe correspondence with the conceptualstructure of a social-scientific research prob-lem (Tacq, 1997).
Implementation
At the initial stage of the marketing researchprocess, a particular problem confronts the
company or organization; usually this prob-lem should be specifically and correctlydefined. To help identify the true prob-lem(s), a company should conduct asituation analysis, which is an investigationof the factors internal and external to thefirm or organization that potentially relate tothe problem area. In the situation analysis,the marketing manager or researcher relieson secondary data, which is data that hasalready been collected or published, for pur-poses other than the one immediately athand. The secondary data could come frominternal or external sources. Secondary datashould be used whenever possible becausethey are readily available and are relativelylow cost compared with primary data.
After having defined the specific researchobjectives and consulted the secondary dataavailable, the market researcher can lay outthe research design and then proceed to col-lect the necessary primary data. A researchdesign is a blueprint or map for obtainingand collecting the primary data needed tosolve a particular research problem.
Qualitative or motivational research canbe very useful for exploratory purposes. It isdesigned to find the ‘emotional hot buttons’of the tourist in relation to a particular sub-ject, by bringing hidden stimuli up to thelevel of conscious awareness (see Chapter3). Qualitative research involves many tech-niques ranging from in-depth interviews togroup discussions. In the give and take offocus group discussions, tourists oftenreveal attitudes and perceptions that theywould not make evident through other datacollection methods. Furthermore, motiva-tional research contributes to the process ofquestionnaire design. The most appropriatetype of survey depends on the nature of theinformation sought, the required samplesize, and the location of subjects.
A variety of methods can be used to col-lect primary data, and each method hascertain situations for which it is most appro-priate. The three principal methods forcollecting primary data are as follows:
1. The observation method where data areobtained by watching human behav-iour.
81Tourism Marketing Research

2. The survey method where people arequestioned directly by telephone, mailor personal interviews.
3. The experimental method in which theresearcher assesses how changes inmanipulated variables affect other vari-ables; the factor to be assessed is calledthe dependent variable, and the factorsthat affect it are called the independentvariables.
All methods for collecting data require sometype of data collection form. When design-ing a questionnaire, it is not easy to developeffective questions. There are, however, sixcriteria to consider for an effective question;it must be relevant, clear, brief, inoffensive,unbiased and specific. Several basic types ofquestions can be used: open-ended, struc-tured, indirect rating scales, semanticdifferential, control, semi-open, graphic rat-ing scales, verbal scales, filter, Likert scales,and Thurstone scales, among others. Sinceeven the experienced marketing researchercan make mistakes, many companies insiston questionnaire pre-testing, which consistsof administering the questionnaire to a smallgroup before using it to gather informationfrom the entire survey group.
In the next section of this chapter we willconsider methods of data collection in moredetail. However, almost all marketingresearch projects require a sample of thepopulation, because it is too costly in termsof time and money to contact all the peoplein the study population. Therefore, afterconsideration of data collection methodsand experimentation we will address theissue of sampling.
Data Collection
Acquiring data from respondents is a majorpart of tourism marketing research. Datamay be required concerning respondents’past behaviour (e.g. what tourism brandsthey have purchased), attitudes (whatbeliefs and feelings they have about a tour-ism product) and characteristics(demographic, socioeconomic, psychologi-cal or psychographic). The two basic ways of
collecting data from respondents are bycommunication and by observation. Weshall first look at methods of communica-tion.
Communication methodsA useful way to classify communicationmethods is by their degree of directness anddegree of structure, as shown in Fig. 4.1. Adirect approach is one where the objectivesof the research are obvious to the respondentfrom the questions asked, while an indirectapproach asks questions in such a way as todisguise these objectives. The degree ofstructure may be seen as a continuum, fromthe highly structured formal questionnairewhere the respondent must choose from pre-determined responses, throughsemi-structured questionnaires where res-ponses may be open-ended, to sets ofquestions which are no more than guide-lines for a discussion in which respondentsexpress their views freely. We shall nowconsider the uses, advantages and disadvan-tages of different methods.
Structured-directThis is the most commonly used method,the standardized questionnaire where res-ponses require selection of one or morealternatives from a set of predetermined res-ponses. Questions are asked with exactly thesame wording and in exactly the same orderfor each respondent. This type of approachis most appropriate where the data requiredfrom the respondent are easily articulated,clear-cut and limited in scope, but lessappropriate where researchers want morein-depth information related to the forma-tion and evolution of attitudes.Structured-direct questionnaires requiretime and skill to develop effectively, andgenerally also need extensive pretesting toensure that the questionnaire is correctlyinterpreted by respondents and that thequestions measure what they are designed tomeasure.
The advantages of this method are itsease of administration (by mail, telephone orpersonal interview) and ease of data pro-cessing and analysis. The format is designedto control response bias and thus increase
82 L. Moutinho

the data reliability. Disadvantages are thatrespondents may not be willing or able toprovide the required data, or the interview-ing process may bias their responses, e.g.they may give socially acceptable responsesrather than true ones.
Unstructured-directThe two main techniques using thisapproach are the depth interview and thefocus group.
THE DEPTH INTERVIEW. An unstructured per-sonal interview where the respondent isencouraged to express freely his or herdetailed beliefs and feelings on the subjectin question. The interviewer will have anote of the general areas for discussion butno fixed sequence in which they must becovered, and will use probing questions tofully explore the respondent's ideas and atti-tudes. The approach is used when the objectof the research is to get below surface reac-tions to the more fundamental reasons forrespondents’ beliefs and feelings.
The advantage of the depth interview isthe depth of insight which can be gainedinto the respondents’ feelings and motiva-tions, and so it is used mainly in exploratoryresearch. Disadvantages include the highdegree of reliance on the interviewer, who
must create an environment in which therespondent is comfortable to discuss thetopic freely. Interviewers with the skills andexperience to create a high level of rapport,while also probing to get the required levelof information, are relatively few in numberand generally highly paid. The high cost perinterview and the length of interviewrequired imply a small sample size, and this,coupled with the lack of structure, meansthat analysis will be qualitative rather thanquantitative (Brunt, 1999).
THE FOCUS GROUP INTERVIEW. A frequentlyused technique in tourism marketingresearch. It is a loosely structured interviewconducted simultaneously with a group ofrespondents, who all have something incommon (e.g. all full-time housewives, orteenagers who are still at school, or membersof a particular interest group). The inter-viewer, usually called a moderator, must behighly skilled and experienced in order toestablish rapport among the group, to keepthe discussion relevant to the topic andensure the required depth of discussion, andcreate interaction within the group ratherthan seem to be interviewing participantsindividually. The selection of respondentsand the physical setting of the group are alsoimportant. Focus group interviews can be
Indirect
Direct
Structured questionnaire
Semi-structured questionnaire
Focus-group interviewDepth interview
Performance ofobjective tasktechnique
Thematic apperception testRole playingCartoon completionWord associationSentence completion
Structured Unstructured
Fig. 4.1. Classification of communication methods.
83Tourism Marketing Research

used for several purposes: to stimulate newideas on tourism products or concepts, to getimpressions of new tourism product con-cepts, to generate hypotheses for furtherquantitative testing, or to interpret previ-ously obtained quantitative results.
The advantages of well-conducted focusgroup interviews are many. They are achance for tourism marketers to listendirectly to the consumer’s opinions, thusgaining a valuable insight into how theirtourism product is actually perceived. Thecombined group is likely to produce moreideas than the same number of respondentsinterviewed individually, due to participantinteraction, a higher level of involvement inthe discussion, and more spontaneous res-ponses. As with the depth interview, ahighly trained and experienced intervieweris required, but is used more efficiently in‘interviewing’ several people at once. Groupsessions are often recorded to allow furtheranalysis at a later date.
The major disadvantage of the focusgroup is that the data gathered cannot beused in a conclusive manner; no quantita-tive information can be elicited which canbe extended to tourism target markets, andfindings are highly dependent on the per-ception of the moderator and others whointerpret them. Other disadvantages relateto the risk that groups will be poorly recrui-ted or conducted.
Semi-structured-directThis category covers questionnaires whichare less formally structured than the stan-dardized questionnaire, but do not offer thecomplete flexibility of the depth interview.They would typically be used in a personalinterview where a range of information isrequired, some of which is easily classifiedinto categories and some of which requiresmore detail.
The advantages of a semi-structuredapproach are the possiblity of generatingboth quantitative and qualitative data, andthe flexibility of the approach. For instance,some or all of the standardized questionsmay be mailed to the respondent prior to theinterview date, so they are already answeredand the interviewer only needs to probe
where explanations and more detail arerequired. Disadvantages are that interviewsstill require a fair amount of interviewertime, so samples are likely to be fairly smalland, as in the depth interview, muchdepends on the skill and experience of theinterviewer (Sudman and Blair, 1998).
Structured-indirectThis method is often called the performanceof objective task technique. Respondents areasked to memorize and/or report informa-tion about a tourism-related topic, forexample they are exposed to a range of tour-ism advertisements and asked to recall whatthey remembered about them. The tech-nique assumes, based on research onselective information processing, that res-pondents are more likely to recallinformation which is consistent with theirown attitudes, and thus the amount and typeof information recalled is used to draw infer-ences regarding respondents’ underlyingattitudes.
The method is an attempt to gain the datacollection and processing advantages of astructured approach without asking respon-dents directly about behaviour and attitudeswhich they may be unwilling or unable todiscuss. However, many researchers doubtwhether it is valid to extend the researchfindings on which it is based to the measure-ment of factual information as a reliableindicator of attitudes and beliefs.
Unstructured-indirectThese data collection methods are known asprojective techniques. They are designed toobtain data indirectly about beliefs and feel-ings which respondents may be unwilling orunable to communicate, by asking them tointerpret the behaviour of others. The mostcommonly used techniques are the thematicapperception test (TAT), role playing, car-toon completion, word association andsentence completion.
● The thematic apperception test uses oneor more pictures or cartoons depicting ascenario concerning the tourism prod-uct or topic being investigated. Thesituation is ambiguous with no hint as
84 L. Moutinho

to whether its interpretation should bepositive or negative towards the tourismproduct or topic. The respondent isasked to describe what has happened orwill happen, and can thus indirectlyproject personal attitudes into theirinterpretation of the situation (Tull andHawkins, 1993).
● Role playing presents the respondentwith a situation in which they are askedto describe the feelings or reaction of athird person. Their response is believedto reveal their own attitudes. A variantof the technique is to ask respondents tocharacterize a person based on the tour-ism products they have bought; theirdescription is thought to reveal theirattitudes towards the tourism products.
● The cartoon completion technique asksrespondents to complete a cartoonshowing people in a situation relevantto the tourism product or topic, by com-pleting a caption to respond to a remarkmade by one of the characters, e.g. ‘Wehave just bought a trip and a cruise’,‘Our neighbour is thinking of buying atime-share’, etc.
● The word association technique uses alist of carefully selected words whichare presented in turn to respondents,who are asked to give the thoughts thatcome to them when they hear the word,or to give as many single associatedwords as possible in response to eachword. The test is analysed by the fre-quency of responses, the amount ofhesitation in responding, and the num-ber of respondents unable to respond toparticular words in a certain time. Non-response is assumed to indicate a highlevel of emotional involvement, andhesitation a lesser level.
● Sentence completion is similar; therespondent is asked to finish an incom-plete sentence with the first phrase thatcomes to mind, and these are analysed.
Projective techniques are used inexploratory research, to discover hypoth-eses to be tested using more directtechniques. Their advantage is in elicitingfeelings and attitudes which respondents
might not reveal when questioned directly.Their disadvantages lie in their complexity,which means that they need highly skilledinterviewers and interpreters. The cost perinterview is therefore high, which leads tothe use of small samples (Chisnall, 1996).
Communication mediaThe three main media of communication arethe personal interview, the telephone inter-view and the mail interview. Structuredcommunication techniques may use any ofthese, while unstructured techniques typi-cally need personal interviews. Table 4.2analyses the advantages and disadvantagesof each method.
Observation methodsThe other method of collecting data is byobservation, which involves recognizingand recording behaviour. Tourism market-ers frequently use informal observation,such as noting competitive prices or tourismproduct availability. Techniques for formalobservation are designed to minimize thelarge error potential in informal observation.Observation is useful in collecting dataabout tourism behaviour which therespondent is unaware of or unwilling todiscuss, and potential bias caused by theinterviewing process is eliminated. How-ever, attitudes and feelings cannot beobserved, and it is also difficult to observemany personal activities such as thosewhich take place within the home. For theobservation method to be cost-effective interms of observer time, the behaviour to beobserved must be reasonably predictable oroccur frequently, and must be of short dura-tion. Observation methods are therefore farless frequently used than communicationmethods.
There are several ways of classifyingobservation methods. The setting may benatural or contrived, e.g. watching peopleshopping normally as opposed to in a mock‘store’ created for the purpose of theresearch. Observation may be disguised orundisguised, according to whether respon-dents are aware of being observed. Instructured observation, observers are toldexactly what they are to measure and how it
85Tourism Marketing Research
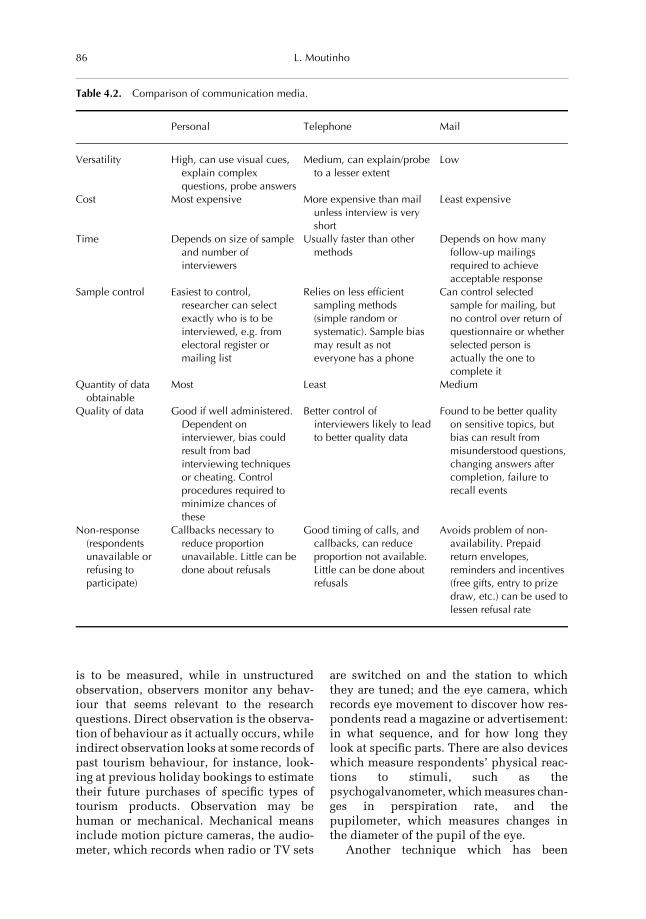
is to be measured, while in unstructuredobservation, observers monitor any behav-iour that seems relevant to the researchquestions. Direct observation is the observa-tion of behaviour as it actually occurs, whileindirect observation looks at some records ofpast tourism behaviour, for instance, look-ing at previous holiday bookings to estimatetheir future purchases of specific types oftourism products. Observation may behuman or mechanical. Mechanical meansinclude motion picture cameras, the audio-meter, which records when radio or TV sets
are switched on and the station to whichthey are tuned; and the eye camera, whichrecords eye movement to discover how res-pondents read a magazine or advertisement:in what sequence, and for how long theylook at specific parts. There are also deviceswhich measure respondents’ physical reac-tions to stimuli, such as thepsychogalvanometer, which measures chan-ges in perspiration rate, and thepupilometer, which measures changes inthe diameter of the pupil of the eye.
Another technique which has been
Table 4.2. Comparison of communication media.
Personal Telephone Mail
Versatility High, can use visual cues,explain complexquestions, probe answers
Medium, can explain/probeto a lesser extent
Low
Cost Most expensive More expensive than mailunless interview is veryshort
Least expensive
Time Depends on size of sampleand number ofinterviewers
Usually faster than othermethods
Depends on how manyfollow-up mailingsrequired to achieveacceptable response
Sample control Easiest to control,researcher can selectexactly who is to beinterviewed, e.g. fromelectoral register ormailing list
Relies on less efficientsampling methods(simple random orsystematic). Sample biasmay result as noteveryone has a phone
Can control selectedsample for mailing, butno control over return ofquestionnaire or whetherselected person isactually the one tocomplete it
Quantity of dataobtainable
Most Least Medium
Quality of data Good if well administered.Dependent oninterviewer, bias couldresult from badinterviewing techniquesor cheating. Controlprocedures required tominimize chances ofthese
Better control ofinterviewers likely to leadto better quality data
Found to be better qualityon sensitive topics, butbias can result frommisunderstood questions,changing answers aftercompletion, failure torecall events
Non-response(respondentsunavailable orrefusing toparticipate)
Callbacks necessary toreduce proportionunavailable. Little can bedone about refusals
Good timing of calls, andcallbacks, can reduceproportion not available.Little can be done aboutrefusals
Avoids problem of non-availability. Prepaidreturn envelopes,reminders and incentives(free gifts, entry to prizedraw, etc.) can be used tolessen refusal rate
86 L. Moutinho

attempted is brain wave analysis; the elec-trical ‘signals’ emitted from the brain can bemonitored to indicate the level and type ofinterest of respondents in the stimuli theyare presented with. The left hemisphere ofthe brain deals with more sequential andrational activities, while the right hemi-sphere specializes in pictorial andemotional responses. Thus the level of brainwaves emitted from each side of the braincan indicate the type of interest in the stim-ulus. However, brain wave monitoringneeds to be done in laboratory conditions,which may affect responses, and there areother complex theoretical and methodolog-ical issues associated with the analysis,which require further research.
Experimentation
The testing and evaluation of different alter-natives is a frequent part of tourismmarketing activities. For instance, a tourismproduct may be sold for a period at a higheror lower price than normal in order to mon-itor the effect on sales, or a travel agencyclaim may try out different wordings ofappeals to discover which one attracts mostdonations. Here, we discuss the essentialfeatures of a controlled experiment, the use-fulness of ex post facto studies whichresemble experiments, and the errors whichcan occur in experimental research. We thenlook at some of the most common experi-mental designs, and at suitableenvironments for conducting experiments.
What is experimentation?Experimentation involves the manipulationof one or more variables, in such a way as tomeasure its effect on other variables. Vari-ables being manipulated are known asindependent variables, while those vari-ables which reflect the impact of theindependent variable are known as depend-ent variables. For instance, in pricemanipulation, price is the independent vari-able and sales the dependent variable.
The treatment group is that part of thepopulation which is exposed to manipula-tion of the independent variable; for
example, those airline routes where theprice is changed. In order to measure theeffects of manipulation, it is also necessaryto have a part of the population where theindependent variable is unchanged; i.e. insome airline routes price should be left at itsoriginal level. This group is known as thecontrol group.
It can only be claimed that effects on thedependent variable are caused by manipula-tion of the independent variable, if effects ofother variables are measured or controlled.The two most usual methods of achievingthis are by randomization, random assign-ment of population elements to a treatmentand control group, and by matching, assign-ing elements specifically to treatment orcontrol groups in a way that achieves a bal-ance on key dimensions. A well-designedexperiment thus allows measurement of thecausal relationship between an independentand a dependent variable, because it con-trols all other possible causal relationshipsrelating to other variables (Kinnear andTaylor, 1996).
Ex post facto studiesAlthough frequently used in tourism mar-keting research, these are not trueexperiments. They attempt to trace backover time from a present situation, in orderto discover the causes of some aspect of thatsituation. For instance, in attempting to dis-cover why one travel agency hasconsistently higher sales than another in asimilar area, a researcher may discover adifference in management style, and deducethat a more democratic management style isa factor leading to success. However, thiscannot be proved; many other factors mayhave been overlooked which have greaterimpact upon sales, and it is impossible tosay how much, if any, of the difference insales is due to management style. The short-comings of this type of research are that theindependent variable is not manipulated bythe researcher, and that there is no preselec-tion of population elements into treatmentand control groups, in order to control extra-neous variables.
Ex post facto studies are frequently usedbecause experimentation may be impracti-
87Tourism Marketing Research

cal or impossible, but they do not have thevalidity of controlled experiments, and arevulnerable to many of the errors we nowdiscuss.
Common experimental errors1. Premeasurement refers to changes in
the dependent variable produced as aresult of initial measurement. A tourismfirm wishing to test the effect of achange in discounting (the independentvariable) on tourists’ purchase con-sumption of a certain travel packagetour may interview respondents beforeand after the change. A respondent whohas never before tried the package tourmay, after the first interview, decide totry it, and like it. By the time of thesecond interview, his or her travel pur-chase pattern may have totally changed,but this is due to the interest broughtabout by the original interview, ratherthan any effect of the discount change(Sheldon, 1993).
2. Interaction error occurs when respon-dents’ interest in, or sensitivity to, theindependent variable is changed by thepremeasurement. Tourism marketingresearch may test attitudes to a tourismproduct before and after a particularadvertising campaign. If the same peo-ple are interviewed, the very fact thatthey have answered questions about thetourism product may cause them to paymore attention to the campaign thanthey would have otherwise. Here thepremeasurement and the independentvariable (the advertising) jointly affectthe dependent variable (attitude to tour-ism product) (Pizam and Mansfield,1999).
3. Instrumentation error refers to changesin the measuring instrument over time.These are most likely to be due tohuman involvement; interviewers orobservers may become more skilled asthe experiment progresses, or they maybecome bored and disinterested so thatthe quality of interviewing or observa-tion diminishes.
4. Maturation refers to changes due solelyto the passing of time, which may affect
the dependent variable. This can beespecially problematic in experimentsthat continue over a long period of time,for instance repeated questioning ofyoung people on attitudes to a activityholiday camp. As these respondentsgrow older, their tastes and perceptionsare likely to change rapidly.
5. History refers to events outside the con-trol of the experimenter which occurbetween pre- and post-measurement,and affect the dependent variable. Anairline may attempt to measure theeffect of a price reduction on sales of aparticular route. However, if there is anunexpected heatwave during the exper-imental period, it will be difficult toseparate the effects of the price reduc-tion and the weather in accounting forincreased sales.
6. Selection of treatment and controlgroups can cause errors if the groups areinitially unequal with respect to thedependent variable, or in sensitivity tochanges in the independent variable.Random assignment and matching,described earlier, are techniques whichcan minimize this problem.
7. Mortality refers to the loss of respon-dents from the different experimentalgroups. A long-running experiment isalmost certain to lose some respondentsbetween start and finish. If differenttypes of respondents are lost from thetreatment group and the control group,the groups may no longer be well mat-ched, and conclusions may not bevalid.
8. Measurement timing errors can occurwhen either pre- or post-measurementsare made at an inappropriate time formeasuring the effect of manipulatingthe independent variable. A typical sit-uation is when post-measurements aretaken too early, measuring the immedi-ate rather than the long-term effect of achange.
9. Reactive errors occur when the experi-mental situation itself causes effectsthat alter the effects caused by themanipulation of the independent varia-ble. Respondents ‘shopping’ in an
88 L. Moutinho

experimental travel store may behavedifferently to their normal shoppingbehaviour. If they see prominently dis-played tourism products which theythink are of interest in the experiment,they may buy them because they feelthey ought to, or conversely, some peo-ple may resist buying them. Either way,results are affected. Reactive errors canonly be controlled by the structure ofthe experimental setting.
10. Surrogate situation errors occur whenthe experimental situation is somehowdifferent, in terms of environment, sam-ple population or variablemanipulation, from the actual situationwhich will occur. The experimentaltravel store cited above is an example ofsuch a situation. Alternatively, a tour-ism product which has beensuccessfully test marketed may not sellas well as predicted because competi-tors respond to its introduction byincreased advertising of, or price reduc-tions on, competing tourism products.
Experimental design
All the types of error described above, apartfrom reactive error, measurement timingand surrogate situation errors, can be con-trolled for by the experimental design.However, different designs are most effi-cient in the control of different types oferror, so researchers need to select a designthat controls for the most potentially seriousand most likely errors in their particularsituation. Experimental designs can bedivided into basic designs which considerthe impact of only one independent variableat a time, and statistical designs which mayconsider the impact of more than one.
Basic designs
1. After-only. Here the independent varia-ble is manipulated and then apost-measurement is made. Forinstance, a new tourism product is dis-played in travel stores and its sales aremonitored. After-only designs do notcontrol for errors of history, maturation,selection or mortality. Neither is it easy
to interpret results, with no standard ofcomparison.
2. Before-after. Here premeasurements aremade, followed by the manipulation ofthe independent variable, followed bypost-measurements. For instance, salesof a tourism product are monitored, theprice is reduced, and sales are mon-itored again in a similar fashion. If noerrors exist, price can be said to be thecause of any change in sales. However,this design may also be affected byerrors of premeasurement, history,interaction, instrumentation or mortal-ity.
The two above designs cannot controlhistory effects because they lack a controlgroup, and are thus often referred to asquasi-experimental designs.
3. Before-after with control. This is likethe before-after design, except that thetest population is divided into a treat-ment group and a control group. Allsources of potential error apart frominteraction and mortality should affectboth groups equally, so their effects onthe control group can be measured andthese changes subtracted from the totalchanges in the treatment group, tomeasure changes due solely to manip-ulation of the independent variable.However, premeasurement may causeinteraction errors, and mortality errorsmay be caused by loss of group mem-bers if the experiment is a lengthy one.
4. Simulated before-after. This designcontrols premeasurement and interac-tion errors by using two different,randomly selected groups of respon-dents for the pre- andpost-measurements. However, the otherpotential errors in the before-afterdesign can still occur.
5. After-only with control. Here, bothtreatment and control groups are selec-ted, but only post-measurements aretaken. The design eliminates interac-tion errors, and all other errorseliminated by the before-after with con-trol design apart from selection error. Itis thus suitable when selection error is
89Tourism Marketing Research
unlikely to be a problem, for instancewith large random samples.
6. Solomon four-group. This design, alsoknown as the four-group six-studydesign, consists of two treatment groupsand two control groups. One treatmentgroup and one control group are subjectto a before-after with control design,while an after-only with control designis used on the other treatment groupand control group. This design controlsfor all sources of error which can becontrolled by design, as the effects ofinteraction and mortality, which cannotbe controlled by the before-after withcontrol design, can be estimated bycomparison with the after-only groups.
Statistical designs
Statistical designs allow the travelresearcher to measure the effects of morethan one independent variable, and also tocontrol for specific extraneous variables.This is done by structuring a combination ofseveral experiments of basic design to runsimultaneously. Statistical designs are thussusceptible to the same errors that can occurin the basic designs used (Frechtling,1996).
Randomized blocks design
This design is appropriate when it isthought that there is one major extraneousvariable likely to influence results; forinstance, reactions to tourism destinationadvertisements may differ according to thegender of the respondent. Treatment andcontrol groups are stratified on the basis ofthis variable; for instance, if gender was theextraneous or blocking variable, the samplewould first be divided into male and femalesubgroups, and individual respondentswithin these groups would then be allocatedrandomly to treatment or control groups.The randomized blocks design is generallymore useful than a completely randomizeddesign because in most tourism marketingresearch studies there is at least one extra-neous variable – e.g. gender, age, income –which should be controlled for. However, ifthere is more than one such variable this
design cannot be used, a Latin square orfactorial design is needed.
Latin square designsThese allow the control of two non-interacting extraneous variables. Theyrequire that each of the two blocking vari-ables, and the independent variable, bedivided into an equal number of blocks orlevels. For instance, we may wish to exam-ine the impact of price reductions on sales ofa theme park product. We suspect that theimpact will vary according to the region ofthe country and also to the type of travelstore in which it is sold. We would thenconstruct a Latin square design in the formof table, with the two blocking variables asthe rows and columns. Here we will divideeach variable into three blocks: North, Mid-lands and South for the regions,independent travel agency, chain travelagency and department store travel shop forthe travel store types. The independent vari-able (price) must also be divided into three,so we will use three different reductions,£20, £40 and £60. These levels are randomlyassigned to the cells of the table, so that eachlevel occurs once and once only in each rowand each column. Table 4.3 shows ourdesign, known as a 3 3 3 Latin square as ithas three rows and three columns.
A basic design experiment is then con-ducted in each cell, usually either abefore-after or after-only design, with orwithout control. For instance, an after-onlydesign with control, using groups of tentravel outlets, would entail ten travel agen-cies in the North making a £40 reduction,ten in the Midlands making a £20 reduction,ten in the South making a £60 reduction, tenchain travel agencies in the North making a£60 reduction, etc. For each of the nine cellsa control group of ten travel outlets wouldhold the original price. Thus the effect ofeach price reduction could be seen once ineach type of store and once in each region.Levels of sales could be analysed to find outhow reductions affected sales, and how theeffect varied by region and travel outlettype.
Latin square designs are often used intourism marketing research, particularly in
90 L. Moutinho

retailing. One drawback is that it is notalways easy to subdivide blocking and inde-pendent variables into the same number ofgroups, and another is the requirement forthe blocking and independent variables tobe non-interacting. Also, only two extrane-ous variables can be controlled. However,the technique can be extended to control forthree such variables, this is known as theGraeco-Latin square design.
Factorial designFactorial designs can measure the effect oftwo or more independent variables, andallow for the possiblity of interactionbetween the variables, i.e. that the effect ofthe variables taken together may be differentfrom the sum of their effects taken sepa-rately. Interaction is measured by usingfactorial designs and analysis of variance(ANOVA) analytical procedures.
A factorial design with only two inde-pendent variables can be shown as a table,one variable being represented by the rowsand the other by the columns. A cell isneeded for each possible combination ofindependent variables, i.e. if there are fourlevels of one variable and five of the other,20 cells are required. The same basic experi-ment is then carried out in each cell.Analysis of variance procedures can deter-mine the effects of each variable and of theirinteraction (Fesenmaier et al., 1996).
If there are more than two independentvariables, the number of cells required willincrease rapidly, especially if each has sev-eral different levels. Thus factorial designscan become very complex and costly. It isoften the case, however, that only some ofthe effects and interactions are of interest,
and then a fractional factorial design can beused, consisting of only the relevant part ofthe full design.
Experimental environments
Experimental environments can be classi-fied according to how closely they mirrorthe normal situation in which the observedbehaviour takes place. An experiment test-ing the effect of different tourism productprices on sales in a normal store obviouslyhas a much higher degree of realism than anattempt to measure such effects by showingrespondents the same tourism products inan artificial laboratory setting and askinghow much they would be willing to pay forthem. Where human respondents are con-cerned, it is necessary to make a study asrealistic as possible, in order to minimizereactive error.
Experiments with a high degree of artifi-ciality are known as laboratory experiments,and those with a high degree of realism asfield experiments. The next section looks attypical uses of these experimental types,and the advantages and disadvantages ofeach.
Laboratory experiments
These are often used in initial testing of newtourism products and promotional material.They take place in an isolated setting, whereindependent variables can be manipulatedunder carefully controlled conditions. Thismeans that researchers can be sure that theexperiment will produce similar results ifreplicated (internal validity). Effects of his-tory are minimized as the experimenter is incontrol of the laboratory situation. Labora-
Table 4.3. 3 3 3 Latin square design.
Region
Travel store type North Midlands South
Independent travel agency £40 £20 £60Department store £60 £40 £20Travel shop £20 £60 £40
91Tourism Marketing Research
tory experiments generally use much lesstime and fewer resources, and they also havethe advantage of keeping ideas secret fromcompetitors.
However, the great strength of internalvalidity leads directly to the weakness oflow external validity, or generalizability.Behaviour of respondents in a laboratorysetting may not be replicated when they arein a more normal situation with many otherinfluences and distractions. Thus, labora-tory experiments are often used at a‘screening’ stage of development, and thetourism products or advertisements receiv-ing a favourable reception go on to markettesting.
Laboratory experiments may also be sub-ject to reactive errors, when respondents areinfluenced either by the experimental situa-tion or the experimenter. Respondents maydeduce the purpose of the experiment andattempt to behave as expected, or may reactto non-verbal cues by the experimenter.Reactive errors may be minimized by usingcontrol groups, and by using skilled experi-menters and, as far as possible, standard andimpersonal means of communication suchas written instructions or tape recordings.
Field experimentsField experiments in tourism marketingresearch generally take place in the market-place. This means that the advantage of ahigh degree of realism is offset by a lack ofcontrol of extraneous variables, and some-times even of the independent variable – forexample, some travel retailers may beunwilling to cooperate in varying the priceof a tourism product, making random selec-tion of travel stores impossible. Extraneousvariables such as competitor activity orweather conditions may affect findings.Internal validity is thus lower than for labo-ratory experiments, but external validity ishigher, due to the more realistic environ-ment. Marketers therefore tend to placegreater reliance on their results.
One of the most common types of fieldexperiment conducted in tourism marketingresearch is test tourism marketing. This maybe used to judge market acceptance of a newtourism product, or to test alternative mar-
keting mixes: different advertisingstrategies, different types of travel packag-ing, price changes, etc. In addition, theintroduction of a new tourist product to atest market may highlight problems with thetourist product that were not evident untilthe tourism product was actually bought orused in a realistic way. The three basic typesof test tourism marketing are standard, con-trolled and simulated market tests.
STANDARD MARKET TESTS. Here a sample ofmarket areas is selected – regions, towns,etc. – and the tourist product is sold asnormal, using either a standard tourism mar-keting mix or varying the mix in specific andcontrolled ways. Test markets are selectedcarefully to be representative, both demo-graphically and in terms of competition, ofthe wider travel market. They should belarge enough to give meaningful results, and(if being used for new tourist product test-ing) should allow testing of the touristproduct in all conditions in which it is likelyto be used. If more than one version of thetourism product, or more than one tourismmarketing mix, is to be tested, then test mar-kets must also be sufficiently similar toallow valid comparisons between them. Thelength of time for which test markets shouldbe run depends on initial consumerresponse, the purchase cycle for the tourismproduct, and the extent of competitive activ-ity. It is generally recommended that tests ofnew tourism products should run for 10–12months to achieve correct market shareforecasts.
Standard test tourism marketing is anexample of an after-only design experiment,and thus is subject to the errors discussed forthis design. In addition, test markets may besubject to greatly increased competitoractivity, designed to produce unfavourableresults for the test and thus stop the tourismproduct reaching the wider market. Testtourism marketing may also give competi-tors advance warning of tourism productsbeing developed, allowing them to producecompetitive tourism products which mayeven beat the original to the wider market.Another disadvantage of test tourism mar-keting is its high cost.
92 L. Moutinho

CONTROLLED MARKET TESTS. A controlledmarket test differs from a standard markettest in that the tourism product is not dis-tributed through normal channels, but by amarket research firm on behalf of the com-pany. This firm will pay a number of travelstores for the tourism product to be placedwith them: perhaps a small number of travelstores in several areas (controlled-store test)or a large percentage of travel stores in a fewsmaller areas (minimarket test)
The advantages of these tests are that theyare somewhat less visible to competitors,and competitors have no access to salesdata. They are also quicker and less costlythan standard test markets. However, thesmall sample of travel stores makes resultsless reliable, it is hard to test the effect ofadvertising as so few travel stores carry thetourism product, and there can be no esti-mate of retailer support as the participatingretailers are being paid for cooperating inthe test. These tests are therefore more oftenused as a final check before proceeding tostandard test tourism marketing, than as theonly precursor to national market launch.
SIMULATED TEST MARKETS. As the name sug-gests, these fall into the category oflaboratory experiments. A sample of respon-dents is selected, representative of the targetmarket. They are not informed of the truepurpose of the test. They are exposed toadvertising for the new tourism product, in adisguised format; for instance, they may seea television programme with several adver-tisements during the commercial breaks,only one of which is for the test tourismproduct. Respondents then have the oppor-tunity to purchase the tourism product,either in a real or simulated shopping envi-ronment. After allowing a reasonable timefor respondents to use the tourism productor travel to the destination product, they arecontacted again and asked for their evalu-ation of it. The percentage of the originalsample who purchased the tourism productis used to estimate the percentage of thetarget market who would try it, given knowl-edge of it and its availability to them. Theafter-use evaluations are used to estimatehow many of the triers will repeat the pur-
chase of the tourism product. Theseestimates are combined with an estimate offrequency rate in order to produce an esti-mated market share for the tourismproduct.
Due to the artificial environment, simu-lated test markets are vulnerable to surrogatesituation errors and reactive errors. Thesecan be controlled to some extent by compar-ing behaviour in laboratory situations withthat observed in the actual marketplace – anexperienced researcher may have discov-ered, for instance, that for every 20 peoplewho are inclined buy a new tourist productin a laboratory situation, only 14 will buy inthe actual market. This finding can be usedin future situations with similar tourismproducts (Moutinho et al., 1998).
Sampling
Once we have decided the method we willuse to collect data, we must consider thequestion ‘From whom will we collect thisdata?’ The alternatives are to take a census ora sample. In a census we use all availableelements of the population of interest, i.e. ifwe wanted to find out what consumersthought about a new tourism brand targetedto families with children, we would go to allhouseholds with children. For a sample, wewould select, based on clearly defined cri-teria, a subset of these households fromwhich it would be valid to draw inferencesabout the whole population.
Sampling offers major benefits over tak-ing a census. It saves time and money asfewer interviews are carried out. It may evenbe more accurate, as there will be fewer non-sampling errors, resulting from factors suchas less skilled interviewers and data pro-cessors, or inadequate control ofprocedures. (A sample will, however,include sampling errors, which will be dis-cussed later.) Thus most market researchstudies use sampling. Box 4.2 shows somekey aspects of sampling.
Before we discuss how a sample is selec-ted, we must define some basic concepts.
● Element. An element is the unit about
93Tourism Marketing Research

which information is required: an indi-vidual person, family, company, etc.
● Population. A population, or universe,is the aggregate of all the elementsdefined prior to the selection of the sam-ple. It is vital that the population isdefined in detail, in terms of elements,sampling units, extent and time. Thepopulation for a consumer survey on anew foreign tourism destination mightthus be defined as:
Element: travellers who contemplateholidaying abroad age 18+
Sampling units: travellers who con-template holidaying abroad 18+
Extent: UKTime: 1–14 October, 1999
● Sampling unit. A sampling unit is theelement or elements available for selec-tion at some stage of the samplingprocess. The example above is a singlestage sample, where the element and thesampling unit are the same; the sampleis selected directly from the population.More complex sampling proceduresmay use several stages, for instance, in asurvey of how young people spend theirleisure time, we may want to interviewyoung people aged 18–25 in householdsin towns with a population of under100,000. Here the primary samplingunit would be towns with populationunder 100,000, the secondary samplingunit would be households, and the terti-ary, and also final, sampling unit wouldbe adults aged 18–25.
● Sampling frame. A sampling frame is alist of all sampling units available forselection at a stage of the sampling proc-ess. For instance, in the last example thefirst sample frame would be a list oftowns with population under 100,000,the second sample frame would be a listof households within these towns, andthe third would be a list of adults aged18–25 within these households. Tele-phone directories, the electoral registerand mailing lists are commonly usedsample frames.
● Study population. A study populationis the aggregate of elements from whichthe sample is actually selected. This islikely to differ from the populationdefined at the start of the survey, assome members of the original popula-tion may be omitted through incompletesampling frames, e.g. people who haveno telephone or have an ex-directorynumber, or people who have recentlymoved house.
Sampling proceduresThe general procedure for selecting a sampleis shown in Fig. 4.2. We now continue witha discussion of specific sampling methods.First we must make a basic distinctionbetween probability and non-probabilitysamples (see Table 4.4). In probability sam-pling, sampling is done by mathematicaldecision rules so that each element of thepopulation has a known chance of beingchosen for the sample. This allows calcula-
Box 4.2. Selecting a sample: simple relationships.
Definition: A sample is simply a portion or subset of a larger population.
Sampling involves answering three questions:
1. Who is to be sampled?2. How big should the sample be?3. Who should be included in the sample?
Working definitions:
● Census: a survey of all the members of the group.● Probability sample: a sample in which every member of the population has a known, non-zero
probability of selection.● Non-probability sample: sample selected on the basis of convenience or personal judgement.
94 L. Moutinho

tion of the sampling error: the likely extentto which results for the sample differ fromthose for the population as a whole. In non-probability sampling, the selection ofsample elements is based partly on thejudgement of the researcher or interviewer.There is thus no known chance of selectionand no means of calculating samplingerror.
Non-probability sampling procedures
CONVENIENCE SAMPLE. A convenience sam-ple is selected on the basis of theconvenience of the researcher. Exampleswould be calls for volunteers for travel prod-uct testing, a university researcher usingstudents as research subjects, or stoppingpeople at random to ask for their opinions.Sample elements are either self-selected, orselected because they are easily available,
and so it is unclear what actual populationthe sample is drawn from. Thus samplingerror cannot be measured, and we cannotmake any conclusive statements aboutresults. The convenience sample is thereforemost often used at an exploratory stage ofresearch, as a basis for hypothesis genera-tion.
JUDGEMENT SAMPLE. A judgement (or pur-posive) sample is selected on the basis ofexpert judgement as to what particular sam-pling units would be most useful toresearch. For instance, in selecting travelagencies in an area to test a new touristproduct, experts might select the ‘best’ forthe purpose, on criteria such as typical trav-eller profile or turnover of similar touristproducts. Again, sampling error is unmea-surable and conclusive statements cannot bemade, but the method will give better resultsthan convenience sampling, as long as theexpert judgement is valid.
QUOTA SAMPLE. A quota sample seeks to rep-licate in the sample the distribution of thepopulation, on the basis of defined controlcharacteristics such as age, gender, socialclass, income, etc. For instance, if we knowthat 15% of the population is aged between35 and 44, and our total sample is to be 1000,then 150 people aged between 35 and 44should be interviewed. This can get muchmore complicated if we have several controlcharacteristics, and may cause problems forinterviewers trying to find the last few res-pondents in their quota. In a quota samplewe must ensure that all control character-istics related to the subject of interest areincluded, and that the proportions for eachcategory are correct and up to date, which isnot always easy. The selection of specificsample elements to fit the quota is left to theinterviewer; this may introduce anunknown bias, and thus it is again impos-sible to measure sampling error. However,quota samples are used in much consumerresearch, and carefully selected samples arelikely to produce the best results of non-probability methods. But they are likely tobe less valid than probability samplingmethods, which we shall now consider.
Define the population1. Elements2. Units3. Extent4. Time
Select a sampling procedure
Identify the sample frame
Determine sample size
Select the sample
Fig. 4.2. Procedure for selecting a sample.
95Tourism Marketing Research

Probability sampling methodsThe most simple method of probability sam-pling is known as simple random sampling.Here, the selection of sample elements ismade by using a list of random numbers.This means that each element in the popula-tion has an equal chance of being selected,and also, for a sample size of n, each possiblecombination of n elements has an equalchance of being selected. We shall now dis-cuss the types of statistics that can becalculated from a simple random sample.First, we need to explain some definitionsand the notation used.
● Continuous variable. A continuous vari-able may take any of a range of values.For instance, age, examination marksand prices would be continuous vari-ables.
● Dichotomous variable. A dichotomousor binomial variable may only take oneof two values, for instance yes or no,male or female.
● Parameter. A parameter describes somemeasure of the defined population, forinstance the average time period inplanning overseas travel, obtained byadding all the time periods and dividingby the number of people included in thedefined population.
● Statistic. A statistic describes somemeasure of the selected sample, and isused to estimate the population parame-ter. Thus, if in the above example asimple random sample of n overseastravellers was selected, the averageplanned time period obtained by addingthese n time periods and dividing by n(total sample) would be a statistic.
● Sampling fraction. The sampling frac-tion is the size of the sample divided bythe size of the population.
● Mean. The mean or average of a sampleis the sum of the sample values dividedby the sample size.
● Degrees of freedom. The number ofdegrees of freedom of a sample indicatesthe number of values that are free to varyin a random sample of given size. Thiscan also be expressed as ‘sample size –number of statistics calculated". If, forexample, we have calculated the meanof a sample of n observations, only n-1of those values would be free to vary,once we had set values for n-1 sampleobservations, only one possible valuefor the last observation would give thecorrect mean.
● Variance. The variance is the sum ofsquared deviations about the meandivided by the available degrees of free-dom. Thus the population variance isgiven by the formula
σ 2 = ∑n
i=1(Xi 2 µ)2
n
and the sample variance by the for-mula
s2 = ∑n
i=1(Xi 2 X)2
n22
For dichotomous variables thisbecomes
s2 = ∑n
i=1(Xi 2 p)2
n21
● Standard deviation. The standarddeviation is the square root of the vari-ance.
● Sampling error. Statistics used to esti-mate population parameters are subjectto sampling error: the differencebetween the sample statistic and the
Table 4.4. Classification of sampling procedures.
Non-probability procedures Probability procedures
Convenience sample Simple random sampleJudgement sample Stratified sampleQuota sample Cluster sample
Systematic sampleArea sample
96 L. Moutinho

true parameter, due to the fact that asample rather than a census has beentaken.
Table 4.5 shows the conventional symbolsused in sampling. Generally, Greek lettersare used for population parameters and Eng-lish letters for sample statistics.
EXAMPLE. An example will serve to illus-trate the various concepts discussed. Thefollowing list shows the ages of the 50 youngtourists taking a scuba-diving and para-gliding holiday.Young touristno.
Age Young touristno.
Age
1 20 26 192 19 27 193 19 28 204 18 29 195 20 30 196 18 31 217 21 32 208 19 33 239 20 34 2210 18 35 1811 22 36 1812 19 37 2013 19 38 1914 20 39 1915 22 40 2016 21 41 2617 18 42 3518 18 43 4219 21 44 2720 20 45 3021 20 46 3222 22 47 3723 21 48 2724 18 49 4025 18 50 28
The mean of this population is 22.22, thevariance 33.41 and the standard deviation5.78. These values can be calculated usingthe formulae given. Any good spreadsheetprogram should have a function to calculatethese parameters, and also sample statistics,directly.
Now, let us select ten random numbers inorder to take a simple random sample. Sayour numbers are 1, 9, 12, 13, 14, 25, 29, 31,41, 47. This is a sample of 10 from 50 so oursampling fraction is 10⁄50 = 0.2. The ages ofthese young holiday-makers are 20, 20, 19,19, 20, 18, 19, 21, 26, 37. The sample mean is21.9, sample variance is 32.99 and standarddeviation 5.74.
Confidence intervalsThe mean of a simple random sample pro-vides a good estimator of the mean of thewhole population, but it is of course highlyunlikely that it will be exactly equal to it,due to sampling error. Thus we use an inter-val estimation of the population mean, i.e.sample mean plus or minus a samplingerror. This is known as a confidence inter-val, and the probability that the truepopulation mean lies within this interval isthe level of confidence. On the basis that thesample mean calculated comes from a nor-mal distribution, we express confidenceintervals as sample mean plus or minus aspecified number of standard deviations.The table of areas under the normal curvewill tell us the number of standard devia-tions for different levels of confidence.
It is common to use a 95% confidencelevel, whose confidence interval is samplemean plus or minus 1.96 standard devia-tions. Thus for our example, the 95%
Table 4.5. Symbols used in sampling.
Population symbol Sample symbol
Continuous measures Size of population or sample N nMean (or average) µ xVariance σ 2 s2
Dichotomous measures Proportion answering ‘yes’ π pProportion answering ‘no’ (1 2 π) (1 2 p) or qVariance of proportion σ 2 s2
97Tourism Marketing Research

confidence interval would be 21.9 ±(1.9635.74) = 21.9±11.25 = 10.65 to 33.15This means that if we took 100 independentrandom samples and calculated the 95%confidence level for each, we could expectthe true population mean to lie within thatconfidence interval in 95 out of the 100samples. We can also talk about the preci-sion of our estimate of the mean at a 95%confidence level, precision being the widthof the confidence interval. (In this example,you will see that the confidence interval isvery large; we will discuss ways of reducingit when we look at more complex samplingmethods.)
Thus it is possible with simple randomsampling to measure our sampling error andstate clearly how accurate our statistics are,something that was impossible with thenon-probability sampling methods dis-cussed earlier. Although confidenceintervals are sometimes quoted for resultsfrom non-probability samples, such calcula-tion implicitly assumes that the samplingprocedure yielded a simple random sample,an assumption likely to be invalid and cer-tainly untestable.
Effect of sample size on precisionA sampling error occurs when the mean X ofany individual sample is used as an estimateof the population mean µ. For this reason wetalk about the standard error rather than thestandard deviation of the sample mean. Theformula for the standard error of the samplemean is
sx = s
=n=
!∑n
i=1(Xi 2 X)2 / n 2 1
=n
We note that the standard deviation variesinversely as the square root of the samplesize, and so will decrease as the sample sizeincreases, thus also lessening the width ofthe confidence interval around the meanand increasing the accuracy of our estimate.Increasing sample size thus improves ourestimation of the population mean.
Effect of population sizeSo far we have not discussed the size of thetotal population. For most marketing
research the total population of interest willbe very large, and thus we need not be con-cerned about corrections for populationsize. However, for finite populations ourprevious formula for the standard error ofthe sampling distribution of the mean needsto be corrected by the finite correction factor
N 2 n
N 2 1, so that our formulae become
σx̄ = σx
=n ! N 2 n
N 2 1and sx̄ =
s
=n ! N 2 n
N 2 12
σp = ! π(1 2π)
n ! N2n
N21and sp = ! pq
n ! N 2 n
N 2 1
For large values of N relative to n, the finitecorrection factor is approximately equal to1. Thus the correction can be ignored as longas the sampling fraction is relatively small; afrequently used rule of thumb in marketingapplications is only to use a correction fac-tor if the sample includes more than 5% ofthe population. If we ignore the correctionfactor when we should have used it, weoverstate the standard error and thusincrease the size of our confidence interval.
Non-sampling errorsWe must remember that calculation of con-fidence intervals only measures samplingerror. If non-sampling errors occur in proba-bility sampling procedures, an unknownelement of bias is introduced and we cannotstate our results with known accuracy. It isthus critical to control non-sampling errors.
Sample sizeWe have seen that in simple random sam-pling we can calculate the confidence levelof our estimate of the mean sample size,
using the equation X ± 1.96 s
=nat the 95%
confidence level and the precision of theestimate by using part of the equation Preci-sion = ± 1.96 s/=n. Now suppose we wantto reach a given level of precision. If we havea value for s, we can solve this equation forthe required sample size n. For instance,
98 L. Moutinho

suppose that we wish to obtain an estimate,at the 95% confidence level, of the mean age,within 1 year, of a target segment for a newchildren’s ‘boot camp’ resort. Assume wealso have a value for s of 5.0. The requiredsample size can then be obtained by sub-stituting in the equation:
Precision = ±1.96s/=n
1 = 1.9635/=n
=n = 9.8 <10
n = 100
A sample size of 100 will be required.
In this example we have expressed preci-sion in the relevant units, years. We call thisabsolute precision. Precision may also beexpressed as a percentage of the mean valuecalculated. Here precision would varyaccording to the size of the mean, and iscalled relative precision. Using .b to denotethe precision percentage expressed as a dec-imal, we can write our equation for a 95%confidence level as
.bX = ±1.96 =sn
This can be rearranged to make
.b=n = 1.96 sX
This rearrangement demonstrates that we donot need to know both mean X and standarddeviation s, but only the ratio of the standard
deviation to the mean, sX
. This ratio is
known as the coefficient of variation.Another ratio often used in practice is therelative allowable error, defined as0.5(precision)/mean. For instance, if aresearcher will accept an error of 1 yeareither way on a mean age of 10 years, theprecision will be ± 1 year = 2 years, and therelative allowable error is 1/10 = 0.1.
An instrument called a nomograph hasbeen developed so that researchers do nothave to solve the equation whenever they
wish to find an optimal sample size. Usingcoefficient of variation and relative allow-able error, the optimal sample size for aspecific confidence level can be simply readoff a graph.
Difficulties with calculation of optimalsample size
We see above that to calculate required sam-ple size we need a value of s for absoluteprecision and a value of s/X for relativeprecision. Although it is unlikely that wewill be able to cite an exact value for s,researchers experienced in the problem areaare likely to be able to obtain fairly accurateestimates. In addition, the scale used in themeasurement of the variable will set limitson the size of s; for example, a 5-point atti-tude rating scale would be likely to have an sof around 2, and it must certainly be under5.
For absolute precision the required sam-ple size will vary directly with theconfidence level required and the value of s,and inversely with the size of precisionrequired. In most marketing research studieswe would wish to measure many variables,and so the optimal sample size for eachwould be different. To assure required preci-sion for all variables, we would have toselect the largest of all these optimal samplesizes.
Optimal sample size for a proportionOur previous formulae have dealt with themeasurement of optimal sample size for acontinuous variable. Now let us look at thecorresponding calculations for a dichoto-mous variable. Assume p = 0.4 and we want± 0.05 as the absolute precision at a 95%confidence level. Then
0.05 = 1.96 !(0.4)(0.6)
n
so 0.24
n=
(0.05)2
1.96and n = 369
giving a required sample size of 369.In this case we need to know the mean p
in order to determine required sample size.However, p is likely to be the value we are
99Tourism Marketing Research

trying to obtain by carrying out the study. Asin the continuous variable case, experiencein the problem area and consideration of themeasurement scales used can give us rea-sonable estimates of p.
We can see then that the formula for cal-culation of required sample size relies inmost studies on an initial estimate of thevariables of interest, and thus functions as aguide to the researcher in determining opti-mal sample size, rather than a hard and fastrule. A researcher can assume different pos-sible values of X, s, p, etc. and see whatsample sizes are required.
There are several other factors which willaffect the determination of sample size, suchas the study objectives, cost, time, type ofanalysis planned, and existence and type ofnon-sampling errors. We shall briefly look atthese now.
STUDY OBJECTIVES. Sample size is affected bythe use to which the information is to be put.If precise informational inputs are notrequired, a small sample may be adequate.For instance, a company doing a survey todetermine the level of interest in a new hotelchain magazine might be happy to estimateto within 10 or 15%. However, in a survey ofvisitation intentions, an estimate which wasonly 1 or 2% out could make the differencebetween correct and incorrect prediction ofthe result, so a much larger sample would berequired.
COST. Financial constraints may limit thenumber of interviews it is possible to carryout and thus force the sample size down-wards. Conversely, if the study is wellfinanced, researchers must guard againstchoosing a larger than necessary sample sizejust because it can be afforded.
TIME. The larger the sample, the longer thestudy will take. But a long survey time maymean that final results are less valid or lessuseful. Sample size may have to be limitedso that results are produced in appropriatetime.
DATA ANALYSIS PROCEDURES. The most basictype of data analysis, univariate analysis,
deals with only one variable at a time. Wehave seen already how the precision of esti-mates of one variable is affected by samplesize. If we want to examine the relationshipsbetween two variables (bivariate analysis),the issue of sample size becomes more com-plex, and larger sample sizes will berequired. If we intend to carry out multi-variate analysis, examining relationshipsbetween several variables, the general rule isthat the more parameters we are estimating,the larger sample size we require. However,there are some multivariate analysis tech-niques which can be used with small samplesizes, e.g. multidimensional scaling, factoranalysis, cluster analysis, regression andanalysis of variance (ANOVA) (see later inthis chapter). Other techniques, such as theAID (automatic interaction detector) model,require very large samples. Thus researchersmust have an idea of the analyses they willwish to carry out before deciding on a sam-ple size.
NON-SAMPLING ERRORS. Some non-samplingerrors will get larger with increased samplesize; for instance, interviewer errors, non-response errors, data processing andanalysis errors. Thus decrease in samplingerror may be offset by increase in non-sampling error. There is a generalperception that studies based on large sam-ples are somehow more credible, but this isnot necessarily true. The statistical preci-sion quoted may be an accurate statement ofsampling error, but only detailed knowledgeof how the study was carried out will revealpossible sources, and likely size, of non-sampling error.
Stratified samplingWe now turn to more complex types of prob-ability sampling, which are more frequentlyused in practice than simple random sam-pling. First we consider stratified sampling,the advantage of which is that it may resultin a decrease in the standard error of anestimate.
Sample selectionThe first step in sample selection is to dividethe population into mutually exclusive and
100 L. Moutinho

collectively exhaustive subgroups or strata;that is, each sampling unit will belong to oneand only one stratum. Suitable strata couldbe chosen on the basis of gender, age (withmutually exclusive age groups covering thewhole span of ages in the population), orsome other suitable variable. Having sub-divided the population, an independentrandom sample is selected from each stra-tum.
Stratified sampling will only be of use inreducing the standard error of an estimate ofa variable if the designated strata are morehomogeneous on the variable of interestthan the population as a whole. Forinstance, let us return to our young touristpopulation. This group in fact contains sev-eral more experienced holiday-makers,those numbered 41–50, who are consider-ably older than the rest of the group. Thuswe can stratify the population into twogroups, less and more experienced holiday-makers. These two strata are morehomogeneous than the whole population onthe variable of interest, age.
Proportionate stratified samplingIf we draw samples from each stratum inproportion to the relative sizes of each stra-tum in the whole population, this is knownas proportionate stratified sampling. Let ustry this with the young tourists sample.There are 40 less experienced and 10 moreexperienced holiday-makers, so a propor-tionate stratified sample of 10 will include 8less experienced and 2 more experiencedholiday-makers. Conveniently, the samplepreviously selected is suitable.
We shall call less experienced touristsStratum 1 and more experienced tourists
Stratum 2 (see Table 4.6). The overall sam-ple mean is now a weighted average of thewithin-strata means, with the weight foreach stratum being the ratio of the popula-tion size of the stratum to the overallpopulation size, i.e.
X = ∑A
i=1 1 NSi
N 2 Xsi
where Nsi is the population size within stra-tum i, Xsi is the mean of stratum i, and A isnumber of strata.
In our example this works out to 21.9,that is, exactly the same as the mean calcu-lated without stratification. To calculate thestandard error of this mean, we need to usethe formula
sx = ∑A
j=1
(Wj)s st.j
=mst.j
where A is the number of strata, Wj is theweight for each stratum, sst.j is the standarderror within stratum j and mst.j is the size ofsample from stratum j.
For our example this works out as
Stratum 1 sx = 0.93
=4= 0.465 so s2
x = 0.22
Stratum 2 sx = 7.78
=1= 7.78 so s2
x = 60.53
so sx = (0.8)2 (0.22) + (0.2)2 (60.53) = 2.56
We may also calculate this directly with-out first calculating standard errors withineach stratum. The formula then is
Table 4.6. Comparative results for each stratum.
Mean Variance Standard deviation
Without stratification 21.9 32.9 5.74Stratum 1 19.5 0.86 0.93Stratum 2 31.5 60.5 7.78
101Tourism Marketing Research

s2x = ∑
A
j=1 1Nst.j
N
nst.j2
22
s2st.j
= ∑A
j=1
(Wj)2 s2st.j
nst.j
For our example this works out as
(0.8)2 (0.868)
4+
(0.2)2 (60.5)
1
giving the same final answer, 2.56. Using theunstratified sample, the standard error of themean was 5.67. The use of a stratified sam-ple has reduced this to 2.56.
CONFIDENCE INTERVAL. The 95% confidenceinterval for the stratified sample is 21.9 ±(1.96 3 2.56) = 21.9 ± 5 = 16.9 to 26.9. Theunstratified 95% confidence interval was10.65 to 33.15. The absolute precision hasthus been reduced from ± 11.25 to ± 5. Thusa stratified sampling procedure is muchmore efficient than an unstratified one. Thereason for this is that we are only usingwithin-stratum variability in calculating theoverall standard error, and across strata vari-ability becomes irrelevant. By usingstratified sampling we can increase the pre-cision of our estimates without increasingsample size. Alternatively, we could use asmaller sample than that used in unstratifiedsampling, to obtain the same precision.
Disproportionate stratified samplingIt is also possible to allocate the overall sam-ple size to strata on a basis disproportionatewith stratum sizes. The reason for thiswould be to allow for differences in variabil-ity between strata. For a fixed sample size,the overall standard error can be reduced bysampling more heavily in strata with highervariability. As an extreme case, suppose wehad a stratum in our young tourist popula-tion where the ages of all the holiday-makerswere 19. This stratum has no variability, andthus a sample of 1 is sufficient to measure itsmean accurately. Conversely, a stratum withhigh variability will require a larger samplesize to produce an efficient estimate of the
mean (because in order to calculate thestandard error within a stratum we dividethe within-stratum standard deviation bythe square root of the stratum sample size).
The optimal allocation of a fixed samplesize among strata is the one giving the leaststandard error for the overall estimate. Obvi-ously, then, we need to know somethingabout the variability in strata before weselect the sample. The formulae used tocombine within-strata statistics to provideestimates for the whole sample are exactlythe same as for proportionate stratifiedsampling.
Cluster samplingSo far, we have discussed probability sam-pling methods where each element for thesample is selected individually. In clustersampling, a cluster of elements is selected atone time. Thus, for this method, the popula-tion must be divided into mutuallyexclusive and collectively exhaustivegroups, from which a random sample ofgroups are selected. Let us return to ouryoung tourist population and divide theminto ten groups of five, for example:
Group Young tourist numbers1 1 2 3 4 52 6 7 8 9 103 11 12 13 14 154 16 17 18 19 205 21 22 23 24 256 26 27 28 29 307 31 32 33 34 358 36 37 38 39 409 41 42 43 44 4510 46 47 48 49 50
There are two ways in which we can select acluster sample of size 10. For the simplerway, one stage cluster sampling, we wouldrandomly select two of the above groups anduse all the elements in each. For two stagecluster sampling, we select groups and thenselect a random sample of elements fromwithin the chosen groups, for instance ourrandom selection of groups could be 1, 3, 4,7, 9, after which we would randomly selecttwo elements from each group.
The big difference between cluster sam-pling and simple random sampling is that in
102 L. Moutinho
cluster sampling not all combinations of ele-ments in the sample are equally likely. Infact, most combinations are impossible.Thus it is crucial to the success of clustersampling that the groups are as close aspossible in heterogeneity on the variable ofinterest to the heterogeneity of the wholepopulation. In our example above, this cri-terion is clearly not satisfied, as we knowthat groups 9 and 10 contain more experi-enced holiday-makers who are older thanthe others. If group 9 or 10 (or both) areselected in our cluster sample, the samplemean will be too high. If neither group isselected, it will be too low. Either way, biashas occurred due to the use of cluster sam-pling.
Ideally, groups would be exactly as het-erogeneous as the population; this ideal isnever reached in practice, but the closer itcan be approached, the less bias there willbe in our estimates. Thus the criterion forforming groups for cluster sampling isexactly the opposite of that used in formingstrata for stratified sampling.
The size of the standard error generatedfrom a cluster sample, compared with thatgenerated from a simple random sample,depends on the relative heterogeneity of thegroups and the population. If the groups areexactly as heterogeneous as the population,both methods will give the same standarderror. If the groups are less heterogeneousthan the population, cluster sampling willgive a greater standard error than thatobtained by simple random sampling. Thiscomparison of standard errors generated bydifferent sampling procedures is known asassessing the statistical efficiency of theprocedures.
If in practice groups are always less het-erogeneous than the population, so thatcluster sampling is less statistically efficientthan simple random sampling, why is clus-ter sampling used? Simply because clustersampling procedures are often muchcheaper than other procedures for a givensample size. The combination of statisticalefficiency with cost is known as overall ortotal efficiency. Cluster sampling is often themost efficient method overall in terms ofstandard error per pound spent, and is thus
extensively used in practice. We now go onto discuss briefly various methods of clustersampling.
Systematic samplingIn systematic sampling, every kth element inthe sampling frame is selected, starting froma random numbered element between 1 andk. If we wanted to select a sample of 10 fromour young tourist population, then k =50/10 = 5. This ratio, number in populationdivided by required sample size, is knownas the sampling interval. So first we wouldgenerate a random number between 1 and 5,say 4. Then the sample is obtained by start-ing with the fourth element and taking everyfifth element thereafter, so our sample of tenwould be the elements 4, 9, 14, 19, 24, 29,34, 39, 44, 49.
Given a starting random number andsample size, sample selection is automatic,so the selected elements form a cluster sam-ple. As we use all the elements in the cluster,systematic sampling is defined as a one-stage cluster sampling procedure. There areonly k possible samples that can be selected,e.g. in our example only five samples of ten.If the population is large relative to the sam-ple size, the sampling interval, and thus thenumber of possible samples, will increase.
It can be shown that the mean of thesampling distribution of means generated bytaking repeated systematic samples equalsthe population mean. Thus the mean from asystematic sample is an unbiased estimatorof the population mean, so confidence inter-vals may be calculated as with simplerandom sampling. If we are sampling from atruly random sampling frame, the resultsfrom a systematic sample are likely to bealmost identical to those from a simple ran-dom sample. Systematic sampling is oftenused in practice because it is easier andcheaper to select a sample systematicallythan by simple random sampling, duplica-tion of elements cannot occur, and it is notalways necessary to have a complete sampleframe. For instance, an interviewer couldselect every tenth house without a full list-ing of houses. Systematic sampling may alsobe used to select elements within strata instratified sampling.
103Tourism Marketing Research

Area samplingArea sampling was developed as a solutionto the problems of incomplete and inac-curate sample frames. It means thatgeographic areas, or pieces of land, are selec-ted for the sample, and then a furtherselection is made from the people who livein these areas. Area sampling usuallyinvolves more than one stage. Here is anexample of a multistage area sample (fourstages):
● Stage 1. The UK is divided into countiesand a sample of counties is chosen byone of the probability methods.
● Stage 2. The cities, towns and ruralareas in the chosen counties are listed,thus stratifying each county into threestrata. A probability sample is againselected within each stratum.
● Stage 3. Each location selected at stage 2is further subdivided, e.g. cities into dis-tricts, etc. All these are listed andanother probability sample chosen.
● Stage 4. All households in the areas cho-sen at stage 3 are listed and a finalprobability sample taken from these todecide on the final sample.
Multistage area sampling is much less statis-tically efficient than simple randomsampling, because of the accumulation ofstandard errors (one for each stage of thesample). The formulae for calculation ofstandard error in a multistage area sampleare too complex for discussion in this book.In practice, the final sample of a multistagearea sample is often treated as if it had beendirectly selected from the population, e.g. inthe case above the selected householdswould be treated as having been selectedfrom a listing of all UK households. Thus theformulae for simple random sampling andstratified sampling are used, leading to anunderstatement of standard error.
The highest statistical efficiency whenusing multistage area sampling is achievedby choosing a large number of clusters(areas) and a small number of elementswithin each cluster. This is because ele-ments within clusters (e.g. the people livingin a specific district of the city) tend to bemore homogeneous than the population as a
whole, so even a small sample may yield areasonably small sampling error. Clusterstend to be more heterogeneous (e.g. peopleliving in different city districts may differgreatly in terms of age, income, beliefs, etc.),so a large number of clusters is necessary toreduce the sampling error.
However, more clusters mean more listsof elements to be made, and higher inter-viewer travel costs. Thus consideration ofoverall efficiency may mean reducing thenumber of clusters and increasing the num-ber of elements selected from each.Researchers must make a trade-off betweenstatistical efficiency and cost, based onresearch objectives and budget, and theamount of acceptable error.
Probability area samplingOften in area sampling, elements do not allhave the same probability of being selected.There may be several reasons for this, someintentional and others not. For instance, aresearcher wanting to do detailed analysis ofsome particular subgroup may deliberatelyoversample that subgroup in order to have alarge enough sample for meaningful analy-sis. Or disproportionate stratified samplingmay be done at some stage of area samplingin order to reduce sampling error. It couldalso be found that the cluster sizes usedwere incorrect (due to new building forexample), or that a sample yields a differentproportion of a particular subgroup to thatfound in the whole population. In such acase, weighting of samples will be necessaryto achieve unbiased estimates for the wholesample. Most good computer statisticalanalysis packages have a facility for doingthis.
Finally, Table 4.7 shows a comparison ofthe various sampling methods we have con-sidered, on the basis of four criteria whichare likely to be of prime importance to atourism researcher.
Multivariate Analysis
With the growth of computer technology inrecent years, remarkable advances havebeen made in the analysis of psychological,
104 L. Moutinho

Tabl
e 4.
7.Su
mm
ary
of s
ampl
ing
met
hods
.
Non
-pro
babi
lity
sam
ples
Prob
abili
ty s
ampl
es
Dim
ensi
ons
Cen
sus
Con
veni
ence
Judg
emen
tQ
uota
Sim
ple
rand
omSt
ratifi
edSy
stem
atic
Are
a
1.G
ener
atio
n of
sam
plin
g er
ror
No
No
No
No
Yes
Yes
Yes
Yes
2.St
atis
tical
effi
cien
cy—
—N
o m
easu
rem
ent
—Th
e ba
se le
vel
for
com
pari
son
Hig
h w
hen
stra
tifica
tion
vari
able
s w
ork
Som
ewha
t low
Low
3.N
eed
for
popu
latio
nlis
tY
esN
oN
oN
oY
esY
esN
ot n
eces
sary
inal
l app
licat
ions
Onl
y fo
r se
lect
edcl
uste
rs4.
Cos
tV
ery
high
Ver
y lo
wLo
wM
oder
ate
Hig
hH
igh
Mod
erat
eM
oder
ate
to h
igh
105Tourism Marketing Research

sociological and other types of behaviouraldata. Computers have made it possible toanalyse large quantities of complex datawith relative ease. At the same time, theability to conceptualize data analysis hasalso advanced. Much of the increasedunderstanding and mastery of data analysishas come about through the study of statis-tics and statistical inference. Equallyimportant has been the expanded under-standing and application of a group ofanalytical statistical techniques known asmultivariate analysis.
Multivariate analysis is not easy todefine. Broadly speaking, it refers to all sta-tistical methods that simultaneouslyanalyse multiple measurements on eachindividual or object under investigation.Any simultaneous analysis of more than twovariables can be loosely considered multi-variate analysis. As such, multivariatetechniques are extensions of univariateanalysis (analysis of single variable distribu-tions) and bivariate analysis(cross-classification, correlation, and simpleregression used to analyse two variables). Tobe considered as truly multivariate analysis,all of the variables must be random variablesthat are interrelated in such ways that theirdifferent effects cannot meaningfully beinterpreted separately. The multivariatecharacter lies in the multiple variates (multi-ple combination of variables), not only inthe number of variables or observations.Like bivariate measures, the appropriatemultivariate measure depends on the scale
of measurement used (ratio, interval, ordi-nal or nominal).
There are two basic groups of multivari-ate techniques: dependence methods andinterdependence methods. If the techniqueattempts to explain or predict the dependentvariable(s) on the basis of two or more inde-pendent variables, we are attempting toanalyse dependence. Multiple regressionanalysis, multiple discriminant analysis,multivariate analysis of variance and canon-ical correlation analysis are some of themost important dependence methods. Incontrast, the goal of interdependence meth-ods of analysis is to give meaning to a set ofvariables or to seek to group things together.No one variable or variable subset is to bepredicted from or explained by the others.The most common interdependence meth-ods are factor analysis, cluster analysis andmultidimensional scaling.
In the following pages a number of multi-variate data analysis techniques arediscussed and summarized in Table 4.8.
Benefits of multivariate analysisAny researcher who examines only two vari-able relationships and avoids multivariateanalysis is ignoring powerful tools that canprovide potentially very useful information.Multivariate analysis methods make it pos-sible to ask specific and precise questions ofconsiderable complexity in natural settings.This makes it possible to conduct theoret-ically significant research and to evaluatethe effects of naturally occurring parametric
Table 4.8. The main multivariate analysis techniques.
Dependence methods Interdependence methods
Multiple regression analysis Path analysisMultivariate analysis of variance Factor analysisCanonical correlation analysis Principal components analysisMultiple discriminant analysis Linear structural relations
Confirmatory factor analysisLatent structure analysisCluster analysisMultidimensional scalingCorrespondence analysisConjoint analysis
106 L. Moutinho
variations in the context in which they nor-mally occur. In this way, the naturalcorrelations among the many influences onbehaviour can be preserved and separateeffects of these influences can be studiedstatistically without causing a typical isola-tion of either individual or variables.Another reason to use multivariate analysisis to improve the ability to predict variablessuch as usage or to understand relationshipsbetween variables such as advertising andusage.
Tourism managers are interested inlearning how to develop strategies to appealto customers with varied demographic andpsychographic characteristics in a market-place with multiple constraints (legal,economic, competitive, technological, etc.).Multivariate techniques are required tostudy these multiple relationships ade-quately and obtain a more complete,realistic understanding for decision-making.
The techniques of market segmentation(see Chapter 5), product positioning andperceptual mapping represent early applica-tion of methodologies such as clusteranalysis which are now thought to havesome potential for identifying strategicgroups. Researchers in the area of strategicmanagement are making use of methodolo-gies that are quite common tools inmarketing, such as those relating to segmen-tation and perceptual mapping approaches.Methodologies such as multidimensionalscaling, cluster analysis, factor analysis, andother techniques have been extensivelyused in market analyses. More recentlythose multivariate analysis techniques havebeen applied to the study of clusters of com-petitors, or strategic groups, in order toexplore better the dynamics of the marketstructure, and define subsequent strategicmoves.
Multivariate analyses are widely used instrategic marketing because of the wide vari-ety of flexible analytical techniquesavailable to analyse large and complex data-sets. They can be defined simply as theapplication of methods that deal with rea-sonably large numbers of measurements (i.e.variables) made on each object in one or
more samples simultaneously. The purposeof multivariate analysis is to measure,explain and/or predict the degree of rela-tionship among variates (weightedcombinations of variables) (Dillon and Gold-stein, 1984). What follows is a briefdescription of how some of these techniquescan be used to help analyse tourism market-ing management problems.
Multiple regression analysis
This is a relatively easy procedure that willbuild on one’s ability to deal with the sim-pler cases of univariate and bivariate data.Predicting a single Y variable from two ormore X variables is called multiple regres-sion. The goals when using multipleregression are the same as with simpleregression, i.e.:
● describe and understand the relation-ship
● forecast (predict) a new observation● adjust and control a process.
Multivariate analysis of variance(MANOVA)
When you have more than one quantitativeresponse variable, you may use the multi-variate analysis of variance to study thedifferences in all responses from one sampleto another. If, for example, you had threequantitative ratings measured for each tour-ism service (How friendly does it look? Howefficiently is it provided? How well is itexplained?) then you could use MANOVAto see whether these measures differ sig-nificantly according to the main effects ofshift (day or night) and supplier.
Canonical correlation analysis
Canonical correlation is the appropriatetechnique for identifying relationshipsbetween two sets of variables. If, based onsome theory, it is known that one set ofvariables is the predictor or independent setand another set of variables is the criterionor dependent set, then the objective of can-onical correlation analysis is to determine ifthe predictor set of variables affects the cri-terion set of variables. However, it is not
107Tourism Marketing Research

necessary to designate the two sets of vari-ables as the dependent and independentsets. In such cases the objective is simply toascertain the relationship between the twosets of variables.
Discriminant analysis
This involves deriving linear combinationsof the independent variables that will dis-criminate between the prior defined groupsin such a way that the misclassification errorrates are minimized. Discriminant analysisis the appropriate statistical technique whenthe dependent variable is categorical (nom-inal or non-metric) and the independentvariables are metric. Discriminant analysisis widely used in market segmentation,studies of the diffusion and adoption of newproducts and consumer behaviour analysis.However, enough attention has not beenaccorded to the assumptions which underlieits applicability.
Path analysis
Path analysis is a method for studying pat-terns of causation among a set of variables,which was popularized in the sociologicalliterature (Heise, 1975). Though path dia-grams are not essential for numericalanalysis, they are useful for displayinggraphically the pattern of causal relation-ships among sets of observable andunobservable variables. Path analysis pro-vides means for studying the direct andindirect effects of variables.
The method is not intended to accom-plish the impossible task of deducing causalrelations from the values of the correlationcoefficients. It is intended to combine thequantitative information given by the corre-lations with such qualitative information asmay be at hand on causal relations to give aquantitative interpretation.
Path-analytic models assume that therelationships among the variables are linearand additive. A path coefficient indicatesthe direct effect of a variable taken as a causeof a variable taken as an effect. Path coeffi-cients are equivalent to regression weights.Direct effects are indicated by path coeffi-cients. Indirect effects refer to the situation
where an independent variable affects adependent variable through a third variable,which itself directly or indirectly affects thedependent variables. The indirect effect isgiven by the product of the respective pathcoefficients.
A close approximation between thereproduced and original correlations canserve as evidence attesting to the validity ofthe proposed model. Essentially, it isdesired that the reproduced correlations areclose to the original correlations. When thisis true, the hypothesized causal structureunder which the reproduced correlationswere generated fits or is consistent with thepattern of the intercorrelations among thevariables. Thus, the ability of the hypothe-sized model to reproduce the correlationmatrix R plays a crucial role in assessing thevalidity of the model (Dillon and Goldstein,1984).
Factor analysis
This is usually applied in order to derive asmaller set of factors that are truly inde-pendent of each other, and that may explainthe intercorrelation among a larger set ofvariables. In other words, factor analysisaims to summarize the data contained in theoriginal variables with a minimum loss ofinformation. Primarily it is a tool to reduce alarge number of variables to a few inter-pretable constructs. Factor analysisattempts to simplify complex and diverserelationships that exist among a set ofobserved variables by uncovering commondimensions or factors that link together theseemingly unrelated variables, and conse-quently provides insight into the underlyingstructure of the data.
Principal components analysis
This method transforms the original set ofvariables into a smaller set of linear combi-nations that account for most of the varianceof the original set. The purpose of principalcomponents analysis is to determine factors(i.e. principal components) that explain asmuch of the total variation in the data aspossible with as few of these factors as possi-ble. It is often used in marketing research as
108 L. Moutinho

a basis for providing mathematical descrip-tions of attitude dimensions.
Linear structural relations (LISREL)This is a method of structural equation mod-elling that allows the researcher todecompose relations among variables and totest causal models that involve both observ-able (manifest) and unobservable (latent)variables. Path analysis and LISREL modelsare two important analytical approaches fortesting causal hypotheses. Essentially, theanalyst wants the reproduced correlations tobe close to the original correlations. TheLISREL model allows the researcher to eval-uate simultaneously both the measurementand causal (i.e. structural) components of asystem.
The LISREL model provides an integralapproach to data analysis and theory con-struction. The causal component refers tothe hypothesized structural relationshipsbetween the latent constructs. LISREL caneasily handle errors in measurement, corre-lated errors and residuals, and reciprocalcausation. It uses maximum likelihood esti-mation, which is a full informationapproach. This means that all the parame-ters are estimated simultaneously. With themaximum likelihood method, the fittingfunction is minimized by an iterative proce-dure, until convergence is obtained.
The measurement model can be descri-bed by two equations, which specify therelations between endogenous latent andmanifest variables and between exogenouslatent and manifest (i.e. observable) vari-ables, respectively.
Since the objective of LISREL is to repro-duce the covariances as closely as possible,if the observed covariances are very low, theresidual covariances must be even lower,and a good fit can thus be obtained. LISRELallows for a holistic, more realistic concep-tion of social and behavioural phenomena: itrecognizes that measures are imperfect,errors of measurement may be correlated,residuals may be correlated and that recipro-cal causation is a possibility.
A priori theory is absolutely necessary forcovariance structure analysis. In anyANOVA (analysis of variance) design, met-
ric independent variables, referred to ascovariates, can be included. The design isthen termed an analysis of covariancedesign or covariance structure analysis. Animportant strength of structural equationmodelling is its ability to bring together psy-chometric and econometric analyses.Structural equation modelling enables oneto decompose relations among variables andtest causal models that involve both observ-able and unobservable variables.
Confirmatory factor analysisIt is also possible to use confirmatory (asopposed to explatory) factor analysis toexamine whether a prior expectation of thegrouping is possible (often using the LISRELpackage). This essentially requires predict-ing the assignment (loading) matrix andseeing how well it fits the data.
Latent structure analysisLatent structure analysis is a statisticalmethodology somewhat related to factoranalysis and structural equation models,which can be used as a framework for inves-tigating causal systems involving bothmanifest variables and latent factors havingdiscrete components. Latent structure anal-ysis shares the objective of factor analysis(i.e. first to extract important factors andexpress relationships of variables with thesefactors and, second, to classify respondentsinto typologies).
The latent class model treats the manifestcategorical variables as imperfect indicatorsof underlying traits, which are themselvesinherently unobservable. The latent classmodel is only one model in a larger set ofmethods subsumed under what are com-monly called latent structure models. Latentclass models are quite flexible. They providea means for testing (via goodness-of-fit tests)whether a latent factor explains theobserved association of interest, the sub-stantive meaning of the latent variable, theprominence of the manifest variables asindicators of latent factors, and how toassign individuals to the classes of the latentfactor itself. There is also a close resem-blance between certain restricted latentclass models and some of the LISREL mod-
109Tourism Marketing Research

els. Latent class analysis begins with a two-or higher-dimensional contingency table inwhich the variables making up the tableexhibit association. Essentially, latent classanalysis attempts to ‘explain’ the observedassociation between the manifest variablesby introducing one or more other variables.When these so-called ‘moderator’ or ‘test’factors are controlled for, the relationshipamong the original variables making up theobserved contingency tables is one ofmutual independence in each of the condi-tional tables obtained at each level of the testfactor. Thus, the basic motivation behindlatent class analysis is the belief that theobserved association between two or moremanifest categorical variables is due to themixing of heterogeneous groups. In thissense, latent class analysis can be viewed asa data unmixing procedure. This assump-tion of conditional independence is directlyanalogous to the assumption in the factor-analytic model.
As indicated, the objective of latent classanalysis is to characterize the latent variablethat explains the observed association ofinterest. In practice, this is accomplished byestimating the latent class parameters,namely: (i) the relative frequency distribu-tion of the latent variable (i.e. the class sizes)and (ii) the relative frequencies of theobserved variables for each category of thelatent variable (i.e. the conditional latentclass probabilities). Thus, it is hoped that byestimating the latent class parameters (i.e. (i)and (ii)), the substantive meaning of thelatent class variable for the research ques-tion at hand can be inferred. In evaluatingthe latent class models several test statisticsand indices of fit can be used. The two teststatistics are the log-likelihood ratio (L2) andthe Pearson (X2) x2-statistics. Useful indicesof fit that can be applied are the symmetricindex of association and incremental fitindices.
A recent extension of the basic latentclass method is the so-called simultaneouslatent class model. With this method, theresearcher can formulate and test latentclass models for categorical variables acrossdifferent groups. A very flexible computerprogram for maximum likelihood latent
structure analysis called MLLSA is availableto marketing researchers. Latent class mod-els have great potential and no doubt will beused more frequently in marketing inves-tigation. However, one of the majorlimitations related to these models concernsthe estimation problem, which previouslymade this class of models largely inacces-sible to most marketing researchers. Thisproblem was later solved by formulatinglatent class models similarly to the generalframework of log-linear models.
Cluster analysisThis is an important technique which pro-vides a set of procedures that seek toseparate the component data into groups.The goal in such applications is to arrive atclusters of objects that display small within-cluster variation relative to thebetween-cluster variation. The goal in usingcluster analysis is to identify a smaller num-ber of groups such that objects belonging to agiven group are, in some sense, more similarto each other than to objects belonging toother groups. Thus, cluster analysisattempts to reduce the information on thewhole set of n objects, to information about,say, g subgroups, where g < n.
One of the major problems in strategicmarketing consists of the orderly classifica-tion of the myriad data that confront theresearcher. Clustering techniques look forclassification of attributes or subjects on thebasis of their estimated resemblance. Likefactor analysis, cluster analysis is anexploratory method that seeks patternswithin data by operating a matrix of inde-pendent variables. Usually objects to beclustered are scored on several dimensionsand are grouped on the basis of the likenessof their scores. The primary value of clusteranalysis lies in the preclassification of data,as suggested by ‘natural’ groupings of thedata itself. The major disadvantage of thesetechniques is that the implicit assumptionsof the researcher can seriously affect clusterresults. Cluster analysis can be applied instrategic marketing for clustering buyers,products, markets, as well as key competi-tors. It has been found to be a particularly
110 L. Moutinho

useful aid to market segmentation, experi-mentation and product positioning (Hair etal., 1994).
Several questions need to be answeredwith respect to a given cluster solution,including: (i) how the clusters differ, (ii)what is the optimal (i.e. correct) number ofclusters; and (iii) how good is the fit of thesolution for a pre-specified level of clusters?The first question concerns the distinctive-ness of cluster profiles. The second questionconcerns the trade-off between parsimony,in the sense of fewer clusters, and somemeasure of increase in within-cluster homo-geneity resulting from having more clustersin the solution. The third question concernscluster recovery which can be viewed interms of the fit between the input data andthe resulting solution. This should be high.
Cluster analysis is a flexible tool that pro-vides a number of opportunities for strategicmanagement. Cluster analysis can be con-sidered a technique for data reduction. Thegoal in most studies that have used cluster-ing techniques is to identify a smallernumber of groups such that elements resid-ing in a particular group are, in some sense,more similar to each other than to elementsbelonging to other groups.
Cluster analysis is a generic label appliedto a set of techniques designed to identify‘similar’ entities from characteristics pos-sessed by a group of entities. It aims tosummarize associative information in inter-dependent data structures. The clustersshould have high within-cluster homogene-ity and high between-cluster heterogeneityand the points within a cluster should begeometrically close together, while differentclusters should be far apart. Cluster proce-dures have been found to be a particularlyuseful aid to market segmentation, experi-mentation and product positioning. Byoffering a range of alternative views, clusteranalysis can be of utility to strategic manage-ment. Cluster analysis can be used in thiscase to define those groups of competitorswithin a particular industry who exhibitsimilar strategic behaviour. It is applied hereto maximize variance between potential stra-tegic groups. Cluster analysis is analogous tostratification in sampling and is concerned
with description rather than inference. Theconstruction of the homogeneous subgroupsof competitors is generally based on the (dis-)similarity of companies’ performance ratingprofiles within an industry.
Cluster analysis is concered with classifi-cation. Managers should seek to groupcompetitors so that each competitor within astrategic group is more like other membersof the group than competitors outside thestrategic group. The objective is to classifycompetitors into a small number of mutuallyexclusive and exhaustive groups based onsimilarities in corporate profile and strategy.Unlike discriminant analysis, the strategicgroups are not predefined. In fact, the majorobjectives of cluster analysis are to deter-mine how many strategic groups really existin the industry and what is their composi-tion.
Having identified a number of underlyingpatterns which seem adequately to describethe principal differences between industrycompetitors, managers can classify all thecompeting organizations into strategicgroups. The typical clustering procedureassigns each competitor to one and only onestrategic group class. Competitors within astrategic group class are usually assumed tobe indistinguishable from one another.Thus, we assume here that the underlyingstructure of the data which measure thecompetitive set involves an inordered set ofdiscrete classes. In some cases, we may alsoview these classes as hierarchical in nature,where some classes are divided into sub-classes.
The objective of the utilization of a clus-tering procedure for the definition ofstrategic groups of competitors can be statedas follows: Managers need to set up a classi-fication system which is relevant to thedesign of corporate policies and strategies.This classification should have the follow-ing characteristics:
● The differences between strategicgroups defined by the system should beimportant and large. Small differencesare of no consequence because they arenot actionable.
● The major strategic groups isolated by
111Tourism Marketing Research

the system should be large enough. Ifthey are not, they will probably not rep-resent competitive threats for corporatepolicy activity.
● If two competitors belong to the samestrategic group, managers should beable to approach both with the samecorporate strategy.
Many of the elements in cluster analysisprocedures were developed on the assump-tion that the data fell naturally into clusters.The overall effectiveness of clustering isdetermined by comparing the sum of thewithin-cluster variances with the originaltotal variance. The tightness of each strate-gic grouping is indicated by the coefficientof dissimilarity in an inverse relationship.The higher the coefficient, the more dissim-ilar are the competitors within the cluster.The level of association with a cluster ofcompetitors decreases as more companiesjoin the cluster. In a given cluster, com-petitors will usually vary in their strength ofmembership.
The manager should assume that the dataare ‘partially’ heterogeneous; that is, that‘clusters’ of competitors exist. This type ofpresupposition is different from the case indiscriminant analysis where a prior group ofcompetitors have been formed on the basisof criteria not based on profile resemblance.Given no information on strategic group def-inition in advance, the major problems ofuse in cluster analysis can be stated as:
1. What measure of intercompetitor sim-ilarity is to be used, and how is eachvariable to be ‘weighted’ in the con-struction of such a summary measure?
2. After intercompetitor similarities areobtained, how are the classes of com-petitors to be formed?
3. After the strategic groups have beenformed, what summary measures ofeach cluster are appropriate in adescriptive sense; that is, how are theclusters to be defined?
4. Assuming that adequate descriptions ofthe clusters of competitors can beobtained, what inferences can be drawnregarding their statistical reliability?
Once the clusters of competitors are devel-oped, we still face the task of describingthem. One measure that is used frequently isthe centroid: the average value of the com-petitors contained in the cluster on each ofthe variables making up each strategicgroup’s profile.
For researchers in strategic management,there is no substitute for analysis of severallevels within the clustering hierarchy, andpresenting them as clearly as possible todecision-makers so that the configurationthat most closely fits the needs and capabil-ities of the organization can be chosen. Thefinal clusters of competitors formed, theirusefulness, and even the decisions whichmanagers may make on the basis of them, arelikely to vary with the hierarchical proce-dure chosen.
With some degree of success, clusteranalysis has been used to aid strategic man-agement decisions in a number of ways (e.g.market segmentation, product positioning,etc.), but in all situations, it is one techniqueamong others which are available (i.e. factoranalysis, multidimensional scaling, etc.).
It seems that clustering techniques maybe useful – in many ways comparable withthe employment of factor analysis – as sys-tematic procedures for the orderlypreclassification of multivariate data relatedto strategic groups of competitors. Clusteranalysis is conceptually a simple idea.Partly because of its simplicity, users havedeveloped many variations in order to fittheir particular needs or inclinations.
Managers can investigate the relation-ship between the various strategic types andviews towards specific strategic marketingelements. The purpose is to investigate therelationship between the formation of strate-gic groups of competitors and the generalstrategy for the organization, as well as thespecific strategic marketing responses asso-ciated with each of the strategic groupswithin the industry. It is important that afirm is organized appropriately and that rel-evant strategies for the particular strategicgroup are planned and implemented. Mar-keting strategists are encouraged to evaluatethe consistency of the relationship betweenthe particular market environment and the
112 L. Moutinho

resulting strategic groups, and also the con-sistency between the strategic groups andthe corporate and marketing strategy ele-ments employed.
It is worthwhile considering organizationtypology in the context of the relationshipbetween strategic organizational types andthe development of corporate strategies.Competing firms within an industry exhibitpatterns of behaviour representative of fourbasic organizational (or strategic) types: (i)defenders; (ii) prospectors; (iii) analysers;and (iv) reactors (Miles and Snow, 1978).The key dimension underlying this typologyis the organization’s response to changingenvironmental conditions, that is, the rate atwhich an organization changes its productsor markets to maintain alignment with itsenvironment. According to Miles and Snow(1978), defenders have narrow product-market domains and tend not to searchoutside their domains for new opportun-ities. Prospectors continually search formarket opportunities and tend to be creatorsof change in the industry. Analysers are amixture of both, operating in perhaps onerelatively stable and one changing product-market domain. Reactors lack a consistentstrategy and simply respond to environmen-tal pressures when forced to do so.
Clustering procedures can then beemployed to determine if the complex com-petitive structure in a particular market canbe summarized into simpler corporate per-formance dimensions and whether thedifferent industry players can be groupedinto strategic types. The next stage is to eval-uate the alternative strategic groups andassess the strength of competition. Multi-variate analysis provides a valuableframework for decomposing the competitiveenvironment and building up a viable pos-itioning strategy.
Multidimensional scalingUnlike the other multivariate methods,multidimensional scaling starts with infor-mation pertaining to perceived similaritiesor dissimilarities among a set of objects suchas products, buyers, competitors, etc. Themain objective of using the technique is toobtain a configuration showing the relations
among the various variables analysed. Theattitudinal or perceived similarities (or dis-similarities) among a set of objectives arestatistically transformed into distances byplacing these objects in a multidimensionalspace.
Multidimensional scaling, especiallynon-metric (NMS), has been applied in stra-tegic marketing in areas such as productposition, market segmentation, large-scalenew product development models, the mod-elling and evaluation of buying behaviourand the determination of more effective mar-keting mix combinations. NMS may also beapplied in the product development processby finding consumer attitudes towards vari-ous product attributes. In such applicationsthe technique can (i) construct a productspace; (ii) discover the shape of the distribu-tion of consumers’ ideal points throughoutsuch a space; and (iii) identify likely oppor-tunities for new or modified products.
Correspondence analysisThis method is a visual or graphical tech-nique for representing multidimensionaltables. It can often be impossible to identifyany relationships in a table and very diffi-cult to account for what is happening.Correspondence analysis unravels the tableand presents data in an easy-to-understandchart. One approach for generating mapsuses cross-classification data (e.g. brandsrated as having or not having a set of attri-butes) as a basis (Hoffman and Franke,1986). In this approach, both brands andattributes are simultaneously portrayed in asingle space. This technique is particularlyuseful to identify market segments, trackbrand image, position a product against itscompetition and determine who non-respondents in a survey most closelyresemble. While development of thisapproach continues (cf. Carroll et al., 1986),it has shown promise.
Conjoint analysisThis is concerned with the joint effect of twoor more independent variables on the order-ing of a dependent variable. It is rooted intraditional experimentation. A definition ofconjoint analysis must proceed from its
113Tourism Marketing Research
underlying assumption that a compositionrule may be established to predict aresponse variable from two or more pre-dictor variables. Conjoint analysis, likemultidimensional scaling, is concernedwith the measurement of psychologicaljudgements, such as consumer preferences.
It seems that various types of marketingplanning models and other proceduresusing judgemental estimates in a formalmanner might benefit from the utilization ofconjoint models in additive or, more gen-erally, polynomial form. Moreover, buyerpreferences for multi-attribute items mayalso be decomposed into part-worth evalu-ations in a similar manner. Potential areas ofapplication for conjoint analysis includeproduct design, new product conceptdescriptions, price–value relationships, atti-tude measurement, promotional congruencetesting and the study of functional versussymbolic product characteristics. The out-put of conjoint analysis is frequentlyemployed in additional analyses. Sincemost studies collect full sets of data at theindividual respondent level, individualutility functions and importance weightscan be computed. This fosters two addi-tional types of analyses: (i) marketsegmentation; and (ii) strategic simulationof new factor-level combinations.
Example of applying multivariatedata analysis
A specific example of an application of amultivariate data analysis technique willnow be described. It was developed for atourism marketing study as described byMcDonagh et al. (1992). The aim was tomeasure the effect of three major environ-mental factors (exogenous variables), i.e.
● preservation of local landscape● preservation of architectural values,
and● overcrowding
as a direct causal impact on two criticalendogenous variables, i.e.
● concern towards a policy of global con-servation, and
● preservation of cultural values.
For this study, path analysis was the chosenmethod since, as has been described brieflyearlier in this chapter, it provides the meansfor studying the direct and indirect effects ofvariables, by offering quantitative informa-tion on the basis of qualitative data on causalrelations.
It was recognized that some of the vari-ables under study were actually directlyunobservable (latent) and had at best moder-ate reliabilities. Thus, since it is unrealisticto believe that a single indicator can capturecomplex constructs reliably and validly, theauthors decided to use multiple indicatorsand then assess the construct validity of theobservable measures.
The model being considered is assumedto be correctly specified a priori, that is, allof the causal determinants have been prop-erly included in the model. If other causaldeterminants of endogenous variables havebeen excluded, the assumption is that theyare independent of the ones included in themodel. Only variables for which directionalhypotheses could be developed and trans-lated into causal links were included in thepath analysis. Each link represents a theoret-ically founded hypothesis. Bearing in mindthe over-identified nature of the postulatedmodel, the path coefficients were estimatedthrough a series of regression equationswhereby only those variables assumed tohave direct causal effects on a given depend-ent variables were included as predictors.Subsequently, the non-significant pathswere removed, and the model re-estimatedin its reduced form.
Insight into the overall performance ofthe model can be gained by looking at thecoefficients of determination (R2) of thedependent variables. It should be stressed,however, that the prime purpose of pathanalysis is not to maximize R2, but rather totrace the consequences of a set of causalassumptions.
Spurious effects pertaining to the effectsof common antecedent variables can bedetected in the correlation between the twoendogenous variables. For example, ‘globalconservation’ and ‘preservation of culture’share two common causes: overcrowdingand preservation of architecture.
114 L. Moutinho
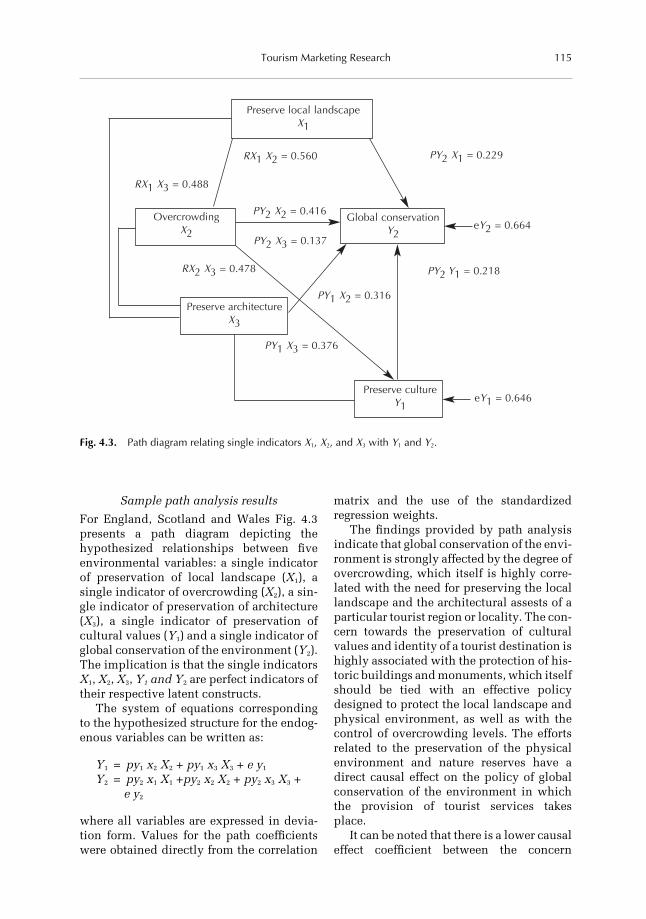
Sample path analysis results
For England, Scotland and Wales Fig. 4.3presents a path diagram depicting thehypothesized relationships between fiveenvironmental variables: a single indicatorof preservation of local landscape (X1), asingle indicator of overcrowding (X2), a sin-gle indicator of preservation of architecture(X3), a single indicator of preservation ofcultural values (Y1) and a single indicator ofglobal conservation of the environment (Y2).The implication is that the single indicatorsX1, X2, X3, Y1 and Y2 are perfect indicators oftheir respective latent constructs.
The system of equations correspondingto the hypothesized structure for the endog-enous variables can be written as:
Y1 = py1 x2 X2 + py1 x3 X3 + e y1
Y2 = py2 x1 X1 +py2 x2 X2 + py2 x3 X3 +e y2
where all variables are expressed in devia-tion form. Values for the path coefficientswere obtained directly from the correlation
matrix and the use of the standardizedregression weights.
The findings provided by path analysisindicate that global conservation of the envi-ronment is strongly affected by the degree ofovercrowding, which itself is highly corre-lated with the need for preserving the locallandscape and the architectural assests of aparticular tourist region or locality. The con-cern towards the preservation of culturalvalues and identity of a tourist destination ishighly associated with the protection of his-toric buildings and monuments, which itselfshould be tied with an effective policydesigned to protect the local landscape andphysical environment, as well as with thecontrol of overcrowding levels. The effortsrelated to the preservation of the physicalenvironment and nature reserves have adirect causal effect on the policy of globalconservation of the environment in whichthe provision of tourist services takesplace.
It can be noted that there is a lower causaleffect coefficient between the concern
Preserve local landscapeX1
OvercrowdingX2
Global conservationY2
Preserve architectureX3
Preserve cultureY1
RX1 X2 = 0.560 PY2 X1 = 0.229
PY1 X3 = 0.376
PY1 X2 = 0.316
RX1 X3 = 0.488
RX2 X3 = 0.478
PY2 X2 = 0.416
PY2 X3 = 0.137
PY2 Y1 = 0.218
eY2 = 0.664
eY1 = 0.646
Fig. 4.3. Path diagram relating single indicators X1, X2, and X3 with Y1 and Y2.
115Tourism Marketing Research

towards preserving architectural values andassets and the need for a global policy ofconservation and protection of the environ-ment as felt by the sampled English, Scottishand Welsh hotel managers. Furthermore, thesomewhat low path coefficient found in themeasurement of causation between the twoendogenous variables seems to indicate thatthe need to preserve cultural values and thecultural heritage of a tourist destination,region or country is not perceived to have avery strong direct causal effect on the globalprotection and conservation of the environ-ment.
Summary of multivariate data analysisMultivariate analysis methods will predom-inate in the future and will result in dramaticchanges in the manner in which tourismmanagers think about strategic problems andhow they design their research. The avail-ability of prepackaged computer programsfor multivariate analysis has facilitated thecomplex manipulation of data matrices thathave long hampered the growth of multi-variate techniques. Most tourism businessproblems are inherently multidimensional.As tourism researchers become increasinglyaware of the multidimensional nature oftheir problems, they will use multivariateanalysis more and more to help them solvecomplex problems.
Not all multivariate analyses need toinvolve relatively complex and sophisti-cated statistical techniques. Relativelysimple multivariate analysis can providesmall business management with a usefulfocus for developing marketing strategies.Techniques like the ‘importance-performance grid with attribute ratings’ andother similar multivariate analysis tools willbe low-cost and easily understood byresearch information users. A number ofcomputer software packages have changedtechniques that once were expensive andexotic into affordable and regular forms ofanalysis.
Neural Networks
Another analytical approach that is likely tobe increasingly useful in tourism marketing
research is neural networks. This approachis based on the working of the brain, whichis taken to comprise an interconnected set ofneurons. Neural network models attempt toreplicate the brain’s own problem solvingprocesses, whereby input neurons receivedirect stimuli which are then fed through apattern matching process to produce a con-clusion or response. Pattern matchingoperations translate well into the marketingenvironment, to the extent that we are con-cerned with perceptions, cognition andstimuli. The simplest form of neural net-works consist only of two sets or ‘layers’ ofneurons: input and output layers. Eachinput is potentially linked to each output.The modelling process involves inserting anoptional number of intermediate layers inbetween the input and output layers. Theselayers are the ‘hidden layers’ in that they donot contain directly measurable variables. Avital feature of the approach is that thevalues of the weights are established by‘training’, whereby they are induced fromexample connections. The neural networkapproach can be seen to have both a statis-tical framework as well as a strongfoundation in artificial intelligence. Candill(1993) provides a useful primer on the sub-ject.
The original inspiration for the neuralnetwork (NN) approach came from physiol-ogy and psychology. The aim is to work witha direct analogy of the human brain as a setof interconnected processing nodes operat-ing in parallel, copying the lower levelcomputational actions (as opposed to cogni-tive operations) carried out by the brain.Knowledge is acquired by the NN through aprocess of learning from examples presen-ted to it, and thus NNs can be viewed notjust in terms of the replication of humanintelligence but also as a mechanism formachine learning. Neural networks learndirectly from data using pattern recognitionto simulate human learning and make pre-dictions. Neural computing attempts tomodel directly the biological structure of thehuman brain and the way it processes infor-mation (albeit at a somewhat simple level).
One implication of neural networks forcomputing technology is that they may offer
116 L. Moutinho

new approaches to processes that have notbeen easily susceptible to conventionalcomputing, for example, those that involve alarge element of ‘gut feel’. Typically suchprocesses require integration of disparatetypes of data, including current, past(experience) and future data (expectations)as well as the use of data that are incomplete.Neural computing may therefore provide auseful tool for strategic management in tour-ism seeking to escape from the simpleextension of past trends which traditionalcomputing processes imply. Neural net-works have been applied in tourism to solvea number of specific problems such as, pos-itioning analysis, study of touristperceptions of product attributes, simulta-neous positioning and segmentationanalysis, as well as strategic planning effec-tiveness (see Mazanec, 1999; Phillips et al.,1999).
AdvantagesNeural networks are designed to offer theend-user the capability to by-pass the rigid-ity of expert systems (ES) and to develop‘fuzzy logic’ decision-making tools. Severalauthors claim that neural networks providethe user with the ability to design a decisionsupport tool in less time and with less effortthan can be accomplished with other deci-sion support system (DSS) tools. Datasets,rather than rules, are the basis for the devel-opment of many neural network models.
Neural networks use structured inputand output data to develop patterns thatmimic human decision-making. Input datais compared with relative output data formany data points. The relationshipsbetween the input data and output data areused to develop a pattern that represents thedecision-making style of the user. Thedevelopment of patterns from data pointseliminates the need to build rules that sup-port decision-making. Unlike the ES thatrequires user or knowledge engineer inter-vention to accommodate variable changeswithin the model, the neural network iscapable of re-training. Re-training is accom-plished through the addition of new inputand output data. The inclusion of additionaldata points weakens, reinforces or strength-
ens the pattern of the neural networkmodel.
Training a neural network involvesbuilding a set of parameters that define theinput and output used for training, or re-defining input/output for training anexisting network. In ‘supervised training’,the network is fed training pairs of relatedinputs and outputs. In ‘unsupervised train-ing’ it is forced to rely solely on inputvectors and learns by means of clusteringmethods. Learning depends very heavily onthe correct selection of training examples.Learning takes place through a statisticallybased procedure of iteratively adjusting theweights.
It is the purpose of m hidden units toextract and to compress the informationarriving from n input units (m < n). In the‘hybrid’ network, however, the hidden unitsshare responsibility for only a subset ofinput units.
An important strength of this method isits ability to bring together psychometricand econometric analyses so that the bestfeatures of both can be exploited. Whereasexpert systems are good at organizingmasses of information, neural networks mayprove capable of duplicating the kind ofintuitive, trial-and-error thinking that mar-keting managers typically require.
LimitationsWhile the accuracy of the neural network isnot as high as that of many other DSS, theneural network has the ability to learn fromincreased input/output facts and the abilityto address data that other DSS cannot han-dle logically. To examine a network’sperformance and practical relevance thesame prediction criteria which are custom-ary in discriminate analysis may be applied.Neural network techniques, in that they dealwith the inner workings of a process innumeric terms, employ what may be termed‘sub-symbolic’ computation and are moredifficult to interpret than expert systems.
The labelling of the endogenous non-observable variables is somewhat morecomplex in the NN approach, although theinterpretation of the interconnected rela-
117Tourism Marketing Research

tionships between these variables is actuallyricher in a neural network.
As trainability is one of the most usefulproperties of neural networks, the problemneeds to be one that is trainable. A fairlylarge number of training examples is neededto sufficiently train the neural network. Neu-ral networks might also involve morecomputing time. Neural networks are notwell suited for highly structured problems.However, neural networks have been suc-cessfully applied in the following marketingareas: consumer behaviour analysis, marketsegmentation, pricing modelling, copy strat-egy and media planning.
Follow-up
A research project should not be forgottenupon completion; in the final stage the ana-lysts should specify follow-up procedures.Proper follow-up procedures anticipatechanging conditions or incorrect conclu-sions that may have been drawn because oferroneous assumptions or other reasons. Byperforming follow-up studies, possible trou-ble spots may be uncovered before it is toolate to take corrective action.
How do we determine the value of theinformation that is collected?
If the information does not increase the like-lihood of making a good decision, then it isof little value. Information increases thelikelihood of going ahead with a success ornot proceeding with a failure. There are twoconditions under which information gen-erally proves to be most useful:
1. If there is a great deal of uncertaintyconcerning what is the best course ofaction to take.
2. If the alternative courses of actionwould lead to either substantial lossesor profits.
The actual worth of information depends onthree factors:
● the likelihood of making a correct deci-sion on the basis of informationcollected;
● the relative attractiveness (profitability)of the alternative decisions;
● the cost of acquiring the information.
Tourism managers need to pinpoint theexact types of information needed. In doingso, they should answer the following ques-tions:
1. What type of decisions do you regularlymake and what information do youneed for them?
2. What types of special studies do youneed?
3. What types of information would youlike to get that is currently unavail-able?
4. How should the information be repor-ted, in terms of both forms andfrequency?
5. What improvements in formationwould you like to see?
By itself, though, simply spending moneyon research is no guarantee of useful results.Some studies merely verify the obvious: oth-ers are performed haphazardly. Whether theresearch is done internally or contractedfrom outside sources; it is management’sresponsibility to be in a position to assess aresearch project’s usefulness and to judgewhether or not it represents a quality pieceof work. This is accomplished by under-standing the nature of objectivity and thescientific method.
Conclusion
Regardless of the primary objective of a tour-ism business, satisfactory profits must beobtained if the business is to remain finan-cially viable in the long run. It should beclear that marketing research plays a vitalrole in ensuring that satisfactory profits areachieved because it is through marketingresearch that a tourism business comes tounderstand which services will satisfy con-sumers’ needs and wants. Marketingresearch plays an extremely instrumentalrole in strategy development. The informa-tion collected through marketing researchcan provide valuable information on:
118 L. Moutinho

● change in the organization’s environ-ment;
● change in competitive offerings;● changes in the organization’s customer
base; and● reactions to new products/services or
product/service modifications.
Management’s need for information isongoing and ever increasing. Marketingresearch should be undertaken with a pre-determined strategy in mind; it consists ofplanning for, obtaining, analysing and inter-preting all the facts necessary to make anintelligent decision concerning a particularproblem. It involves systematically obtain-ing and analysing information about amarket, such as what tourists want, need,think and feel. The need for solid marketinginformation is ongoing for routine and dailymarketing operations in tourism. Objective,and therefore very useful, information isbest obtained by following the marketingresearch process, which involves followingseven steps: becoming familiar with the areaand specific definition of the research prob-lem, developing testable hypotheses,determining the specific information that isneeded to test the hypotheses, developingthe data collection instrument, acquiring thedata, analysing the data, and establishingfollow-up procedures.
While the involvement in the marketingresearch function varies from one tourismcompany to another, practically all firms, ofany size, do some marketing research. Mar-keting research projects are conducted on abroad array of topics by a variety of typesand sizes of tourism organizations. There isa direct correlation between size of a tour-ism company and the size of its marketingresearch department.
Size of the company, however, is not theonly determinant. The overriding factor isthe anticipated benefit associated with thecost of the department; the more extensiveand frequent the marketing research analy-ses required, the larger are the personneland operating budgets. The size of thedepartment also increases as its tasksbecome more complex. The two major areasin which doubt and uncertainty exist among
executives in small tourism companies arethe associated areas of sampling and cost.Nevertheless, small companies in tourismshould use simple methods of collectingmarket information, such as marketing intel-ligence systems, internal reports, customerdata-bank, and survey research.
References and Further Reading
Brunt, P. (1999) Market Research in Travel andTourism. Butterworth-Heinemann, Oxford.
Candill, M. (1993) Neural Networks Primer, 3rdedn. AI Expert/Miller Freeman, Inc., SanFrancisco.
Carroll, J.D., Green, P.E. and Schaffer, C.M. (1986)Interpoint distance comparisons in corre-spondence analysis. Journal of MarketingResearch 23 (August), 271–280.
Chisnall, P. (1996) Marketing Research, 5th edn.McGraw-Hill, Maidenhead, UK.
Dillon, W.R. and Goldstein, M. (1984) Multivari-ate Analysis – Methods and Applications.John Wiley, New York.
Duncan, O.D. (1975) Introduction to StructuralEquation Models. Academic Press, NewYork.
Fesenmaier, D.R., O’Leary, J.T. and Uysal, M.(1996) Recent Advances in Tourism Market-ing Research. The Haworth Press,Binghampton, New York.
Frechtling, D.C. (1996) Practical Tourism Fore-casting. Butterworth-Heinemann, Oxford.
Hair, J.F., Jr, Anderson, R.E. and Tatham, R.L.(1994) Multivariate Data Analysis, 2nd edn.Macmillan, New York.
Heise, D.R. (1975) Causal Analysis. Wiley, NewYork.
Hoffman, D.L. and Franke, G.R. (1986) Corre-spondence analysis: graphicalrepresentation of categorical data in market-ing research. Journal of Marketing Research23, 213–227.
Kachigan, S.K. (1982) Multivariate StatisticalAnalysis. Radius Press, New York.
Kinnear, T. and Taylor, J. (1996) MarketingResearch: An Applied Approach, 5th edn.McGraw-Hill, Maidenhead, UK.
Mazanec, J. (1999) Simultaneous position andsegmentation analysis with topologicallyordered feature maps: A tour operator exam-ple. Journal of Retailing and ConsumerServices 6(4) (October), 219–235.
McDonagh, P., Moutinho, L., Evans, M. and Tit-terington, A. (1992) The effects of
119Tourism Marketing Research

environmentalism on the English, Scottish,Welsh and Irish Hotel Industries. Journal ofEuromarketing 1(3). [This article containsthe full research study from which the exam-ple referred to in this chapter wasextracted.]
Miles, R. and Snow, C. (1978) OrganisationalStrategy, Structure, and Process. McGraw-Hill, New York.
Moutinho, L. and Evans, M. (1992) Applied Mar-keting Research. Addison-Wesley, London.[Contains a wide coverage of applications oftechniques and methodologies within themarketing mix.]
Moutinho, L., Goode, M. and Davies, F. (1998)Quantitative Analysis in Marketing Manage-ment. John Wiley, Chichester.
Phillips, P., Davies, F. and Moutinho, L. (1999)The interactive effects of strategic planningon hotel performance: a neural network anal-ysis. Management Decision 37(3), 279–288.
Pizam, A. and Mansfield, Y. (eds) (1999) Con-sumer Behaviour in Travel and Tourism. TheHaworth Press, Binghampton, New York.
Sheldon, P.J. (1993) Destination information sys-tems. Annals of Tourism Research 4,633–649.
Sudman, S. and Blair, E. (1998) MarketingResearch: A Problem-Solving Approach.McGraw-Hill, Maidenhead, UK.
Tacq, J. (1997) Multivariate Analysis Techniquesin Social Science Research: From Problem toAnalysis. Sage Publications, London.
Tull, D.S. and Hawkins, D.I. (1993) MarketingResearch – Measurement and Method, 6thedn. Macmillan Publishing Company, NewYork.
Wasserman, P.D. (1989) Neural Computing: The-ory and Practice. Van Nostrand Reinhold,New York. [A good text on neural networksand applications, although now somewhatdated.]
120 L. Moutinho

5Segmentation, Targeting, Positioning and
Strategic Marketing
L. Moutinho
Introduction
Marketing management is the process ofanalysing, planning, implementing, coordi-nating, and controlling programmesinvolving the conception, pricing, promo-tion, and distribution of products, servicesand ideas designed to create and maintainbeneficial exchanges with target markets forthe purpose of achieving organizationalobjectives. The foundation for contempo-rary marketing management is themarketing concept. It is a customer-orientedphilosophy implemented and integratedthroughout an organization so as to servecustomers better than competitors do andthereby to achieve specified goals. System-atic implementation of the marketingconcept can revolutionize an otherwise stag-nant organization.
Tourism marketing involves discoveringwhat tourists want (market research), devel-oping suitable tourist services (productplanning), telling them what is available(advertising and promotion), and givinginstruction where they can buy the services(channels of distribution: tour operators andtravel agents) so they will receive value(pricing), and the tourist organization willmake a profit and attain its goals (marketa-bility). Tourism marketing management isthe setting of marketing goals (considering
the resources of the tourism company andthe market opportunities) and the planningand execution of marketing activitiesrequired to meet the goals. When carried outeffectively, tourism marketing managementresults in creating and satisfying customersin a manner acceptable to society and leadsto profitable growth for the organizations.
As the practice of marketing enters the21st century its role in business practice isclearly critical. Rapid change and intenseglobal competition exist in many markets.Deregulation in key industries such as trans-portation and communications has led tothe need for market-driven strategies. Buy-ers of tourism services increasingly demandproducts that meet their specific needs. Sur-vival and growth in a turbulent environmentare more and more difficult to achieve with-out professional marketing practices.Because markets and market opportunityare greatly affected by worldwide environ-mental forces, marketing plays a leading rolein designing and implementing strategicbusiness plans. Marketing managementshould be viewed as an enterprise-spanningactivity, not restricted to the marketing orsales department. Broadly defined, market-ing is a responsibility of the entireorganization.
Substantial progress is occurring inadvancing the state-of-the-art of marketing
© CAB International 2000. Strategic Management inTourism (ed. L. Moutinho) 121

management practice. Strategic market con-cepts, behavioural and analyticaltechniques, and systematic approaches tomarketing decision-making are dramaticallyincreasing the impact of marketing in tour-ism organizations. The consumer’sperspective centres around the needs a tour-ist product or service satisfies or fulfils. Butthe tourist buying decision is unique in sev-eral ways:
1. There is no tangible rate of return on theinvestment.
2. The expenditure is often considerablein terms of the after-tax income earnedduring the year.
3. The purchase is not spontaneous.4. The expenditure is prepared and plan-
ned through savings made over aconsiderable time.
Marketing research should help pinpointtarget markets, help determine the propertytourist marketing mix, and help make mosteffective use of marketing efforts and expen-ditures. The concept of market segmentationarises from the recognition that consumersare different. Market segmentation is a strat-egy of allocation of marketing resourcesgiven a heterogeneous tourist population.
Market Segmentation
There are four strategies for market segmen-tation (Fig. 5.1):
● Undifferentiated marketing is whenmarketers determine that there is littlediversity among market segments. Note:Even the undifferentiated market maybe segmented based on ‘secondary’desires.
● Concentrated marketing is when a mar-keter selects one segment, develops anappropriate marketing mix, and directsits marketing efforts and resourcestoward that market segment exclu-sively. A competitive advantage canthen be established by the marketer. Thedangers are: (i) the selected marketingsegment is too narrow; and (ii) thewrong target market is selected.
● Differentiated marketing (multiple mar-ket segmentation) is when anorganization chooses more than one tar-get market segment and preparesmarketing mixes for each one. The deci-sion influences are:1. competitive conditions2. corporate objectives3. available resources4. alternative marketing opportunities.
● Customized marketing is when a marketis so diverse that the company attemptsto satisfy each customer’s unique set ofneeds with a separate marketing mix.
Tourist markets can be segmented or sub-divided in many different ways. Geographicsegmentation, demographics, geodemo-graphics, psychographics, benefitsegmentation, usage rate, and price sensitiv-ity are some of the most commonly usedsegmentation techniques in the tourismindustry. The various elements in the mar-keting mix and plans are designed in orderto exploit the different elasticities ofdemand for travel and tourism of the varioussegments.
The segments should then be rankedaccording to their economic value (substan-tially), by the level of demand for varioustourist product opportunities, by the vari-ance in responsiveness among marketsegments to available opportunities, by theaccessibility of market segments in terms ofcommunication strategies, growth potential,and by the degree of competitive vulnerabil-ity. Market segmentation contributes to thesynchronization of the marketing mix withthe tourist customer, to delineation of differ-ent demand curves, to a focused form ofpromotion and to greater tourist productloyalty because of the tailoring of the prod-uct to fit the market. Linked with marketsegmentation and market targeting is theconcept of product positioning, which is theact of formulating a competitive positioningfor the tourist product and a detailed mar-keting mix.
Once the target markets have been deter-mined, the marketing mix must be defined.In formulating a marketing mix, one mustmake sure that the elements are not con-
122 L. Moutinho

sidered in a vacuum but are, instead,considered as they are affected by changesin tourist attitudes, habits, changes in com-petition, changes in the economic outlookand changes in government activity.
Demographic Segmentation
There is work which relates demographiccharacteristics to patterns of decision-making for vacations (e.g. Jenkins, 1978;Smith, 1979; Cosenza and Davis, 1981; Toddand Lawson, 1991). Geography is being usedas a proxy variable for a variety of demo-
Fig. 5.1. Levels of market segmentation.
123Segmentation, Targeting, Positioning and Strategic Marketing

graphic, cultural and socioeconomiccharacteristics which render the behaviourof the British different from Australians, dif-ferent from US citizens, different fromJapanese and so on.
Analysis of the US tourist market reveals,among other characteristics, the changingage structure of the population. Like otherWestern countries, the United States has a‘greying’ population and those people over65 are regarded as having more money, moreleisure time and more needs to be addressedthan other age segments. Age is a crucial partof the definition of markets and is partic-ularly important for developing linkageswith media usage in order to promote thetourist destination.
For general tourism the most commondistinction that is made concerning familysize relates to whether children are presentor not. In the accommodation sector itshould be noted that family or group size isalso critically linked to pricing structures.There is a general expectation that econo-mies of scale gained from a large familygrouping will be passed on to the touristthrough a marginal pricing policy.
Family Life Cycle
This concept is rather more complex thanmost of the fundamental demographicissues discussed so far. The family life cycleis a processual variable which describes thehistory of a family from its formationthrough to the death of both partners.Usually eight or nine stages are identifiedwhich are defined by critical points such asmarriage, birth of the first child, childrenleaving home, and retirement. The mostcommonly quoted classification in the gen-eral marketing literature is a scheme devisedby Wells and Gubar (1966). Nine stages areidentified which represent an amalgam offactors concerned with the ages of differentfamily members, family size, discretionaryincome and time. The Wells and Gubar clas-sification emphasizes vacations and leisureexpenditure in four phases: Bachelor,Newly Married, Full Nest 3, and EmptyNest 1.
It is generally accepted that these relation-ships still hold today though the relativeemphasis on some characteristics may havechanged. Trends towards greater femaleemployment have brought more dual-income families into being and consequentlythe full nest periods may not be quite sofinancially stringent for all families.
Empty nest 2 and retired solitary sur-vivors may have high levels of incomeavailable for discretionary expenditure.Also improvements in medical science andenvironmental health have extended lifeexpectancies and extended the length of thelater stages of the life cycle. Both these lastchanges emphasize the growing significanceof these older groups as target markets fortourism. Expenditure patterns and types ofholiday vary considerably across the stagesof the life cycle.
Traditionally the evaluation of marketsegments takes place using three criteria:
● measurability; i.e. definition in usableterms
● substantiability; i.e. size● accessibility; i.e. ability to promote and
obtain distribution.
If these are correct, then it is argued thatprofitability naturally follows. If consideredin terms of these basic criteria, demograph-ics may be seen to potentially offersubstantial benefits over many other seg-mentation characteristics; especiallylifestyles and benefit segmentation schemes.The one important facet of measurabilitypertaining to demographics is that they aregenerally easy to obtain; often by observa-tion or as standard material required foraccommodation and travel bookings.
With respect to substantiability, demo-graphics also usually perform well in tworespects. Firstly, segment sizes basedaround demographics are normally largebecause they parcel total populations into alimited number of groups. The secondaspect of substantiability of demographicsegmentation refers to endurance. Many ofthe relationships established between dem-ographics and tourist behaviour have fairlyfundamental roots, such as physical con-straints on activities imposed by age or the
124 L. Moutinho

presence of young children. These areenduring features and, where they exist,they tend to the substantiability of segmentsover time.
On the accessibility criteria, demograph-ics also tend to perform well. Because basicdemographics are so established, mediaselection is easy in any market. This can bein contrast to benefit segmentation schemesor specific travel lifestyle segmentationschemes.
The recognized limitation of demo-graphic segmentation is that it gives little orno explanation for differences in consump-tion patterns. As psychographics orlifestyles, demographics say nothing regard-ing motivations and the value structureswhich guide people’s behaviour. To expressit a different way, demographics are oftencorrelated to behaviour but have little to dowith causation.
Demographic criteria are the most widelyapplied of all segmentation bases. They areeasy to understand and to apply and havethe practical advantage of established rela-tionships with media profiles. Of alldemographic variables, the two which offermost explanation and are likely to be appli-cable to tourism are ethnic identity and thefamily life cycle. The former may represent avariety of deep-seated cultural values and ishighly correlated with geography and a vari-ety of socioeconomic factors. The latter is anamalgam of ages of family members, maritalstatus, and participation in the labour force,which act in a combined way to influencethe amount of discretionary income andtime available for consuming products suchas vacations.
A basis for segmentation can be any tour-ist characteristic, such as age, sex, income,occupation, price sensitivity, destination ortourist product loyalty, product usage, atti-tude toward the country or destination.Theoretically there is no single correct basisfor segmentation. The selection of a specificbasis depends on management’s objectives.Once a market is segmented into a number ofhomogeneous segments, the key decision iswhich segment or segments the touristorganization should pursue. This decision isstrongly related to the positioning of the
product; a different positioning will appealto a different segment.
Psychographic Segmentation
Market segmentation based on benefitsassumes that consumers buy a product forthe potential benefit experienced from usingit. Its focus is on product attributes whichconsumers perceive to have goal-satisfyingcapabilities and this method usuallyemploys some psychographic variables.Psychographics, also referred to as data onlifestyles and on activities, interests andopinion (AIOs), attempt to provide adetailed understanding of consumers interms of their way of living. They take intoaccount how people spend their time (dailyactivities, hobbies, entertainment), whatthey place importance on (interests, com-munity involvement) and their opinionsand attitudes towards various types ofvacations.
In the travel literature a number of othermethods of market segmentation have beenreported and discussed, i.e. distance trav-elled, means of travel, length of stay,purpose of trip, time of visit, media habitsand exposure, average spending power andothers. Segments based on usage level differ-entiate heavy buyers from low volume users.The role of situation in tourism has becomemore important leading to a specific situa-tion segmentation. However, these methodsare often associated with some other ways ofsegmenting, either demographic or psycho-graphic.
Demographic and socioeconomic charac-teristics portray the basic differences whichare the determinants of a traveller’s behav-iour. But they merely describe and do notprovide an understanding of why buyer seg-ments respond to a product the way they do.There is increasing evidence that these vari-ables are insufficient means of effectivelydelineating the market segments. Psycho-graphics allow a substantially deeper graspof the tourists’ psychological make-up.Therefore, psychographic segmentation asan analytical tool has been shown to bebeneficial both in describing and in under-
125Segmentation, Targeting, Positioning and Strategic Marketing

standing the tourist. Although it can beargued that psychographics are too generalto predict specific behavioural differences,they are useful for marketing communica-tion purposes. In a highly competitiveenvironment psychographic segmentationleads to specifically directed promotionalprogrammes, more effective positioning andgreater ability to develop recreationalopportunities that appeal to distinctive cli-ent groups.
ExamplesAs the market is becoming ever more con-sumer orientated, changes in consumers’lifestyles are carefully followed and theirimpact on buying habits is monitored. TheEuropean population is changing its out-look, breaking away from the traditionallysought economic security and status, as wellas refusing to accept established stereo-types, while it seeks individuality, greaterinformality, spontaneity and sensitivity incontacts with others. The trend towardsEuropean unity has itself generated consid-erable interest among market researchorganizations in creating pan-Europeanresearch programmes, placing greateremphasis on the search for similarities thanon the definition of differences betweenmarkets.
Commercially developed segmentationschemes, which include a combination ofvariables, have been widely applied by alleconomic sectors including the hospitalityindustry. Psychographic variables, includ-ing geographic and socio-demographicones, in that way have become a basic part ofthe research instruments. All the segmenta-tion methods which will be brieflydescribed in the sections to follow share theapproach of determining a common base forsegmentation which can be applied cross-culturally and across sectors, and which canbe combined with other variables character-istic for a specific product, segment orsituation.
The ‘Eurostyle system’ represents a mul-tinational approach to lifestylesegmentation that is being continuallyupgraded since 1972 by the French enter-prise Centre de Communication Avance of
the Haves-Eurocom group. In 1989 thisresearch system was established in 15 Euro-pean countries. The instrument employedcomprises five principal dimensions of life-styles: (i) objective personal criteria; (ii)concrete behaviour; (iii) attitudes; (iv) moti-vations and aspirations; and (v) sensitivitiesand emotions. The resulting Eurostyle sys-tem (different for each country) consists of16 different lifestyle types. When employingthe Eurostyle typology, two different modescan be distinguished: accepting styles asready-made market segments, or usingstyles as additional criteria to characterizealready defined segments more comprehen-sively. The marketer’s task is to combine thepsychographic characteristics and the statedor observed product preferences of thefocused lifestyle types. He or she can alsoinclude target groups’ motives and attitudesinto the promotion of the new product.
Another segmentation scheme is the useof the concept of ‘Social Milieus’, i.e. groupsof people who share a common set of valuesand beliefs about those things which matterin everyday life. A range of Social Milieuswas identified in the UK, France, Italy andGermany. The underlying theory is to com-bine the understanding of the everyday lifeof consumers in different local cultures withinformation about behaviour and attitudetowards products. Such cultural depth isalso necessary to detect the dynamics ofsocial and cultural change both within andacross countries and how this affects differ-ent markets.
The Young & Rubicam advertisingagency uses motivation theory as the under-lying theoretical concept for itssegmentation scheme, entitled ‘the 4 C’s sys-tem of consumer classification’ (crosscultural consumer characterization). Tryingto find a similar pattern in culturally dissim-ilar markets, the main argument behind thisapproach is that motivations appear to bequite consistent from one culture to anotherand thus the analysis of consumer motiva-tions offers an opportunity for an insightbeyond the superficial behavioural differ-ences between cultures, consequentlyrevealing underlying commonalitiesbetween them. The resulting types are:
126 L. Moutinho

Resigned Poor, Struggling Poor, MainstreamAspirer, Succeeder, Transitional, Reformer.
In order to compete successfully in thehighly competitive international tourismmarket place it is necessary to sharpen theresearch tools in an attempt to generate moreaccurate data for strategic tourism develop-ment and planning. Within this context, theconcept and application of psychographicshas been widely accepted in the field ofmarketing. Knowledge about relevant seg-ments of travellers, their desires, motives,attitudes and lifestyles allows travel market-ers to become more focused and effective intheir efforts.
Usefulness of psychographicsResearch based on psychographics mayoffer particularly useful findings for personswho will implement the results: developersand planners, marketing executives, adver-tising directors and creative types atadvertising agencies. Proper use of thisapproach in segmenting a consumer marketrests on dividing the total market into finelytuned market segments. The objective is tocreate profiles which carve out character-istics of each segment and at the same timesubstantially differentiate the segments fromone another. Psychographics can help inanswering some marketing queries such as:
● how to make/design the tourist product(what services and products to offer);
● whom to sell it to (personality character-istics); and
● how to sell it (distribution and commu-nication channels).
Regarding the first of the above points, psy-chographic segmentation can be a usefultool in planning and developing productstrategies, such as package tours or themeparks. For example, it would appear thatknowing whether a traveller prefers historicsites, nightlife, gambling or indoor/outdoorsport activities can be useful for creating apackage, or knowing that psychographiccharacteristics such as impulsiveness in thedecision-making process, escaping fromeveryday life, enjoying wildlife or physicalactivities are more correlated with visitingNational Parks as vacation destinations. It is
important to find out which psychographiccharacteristics directly influence the prod-uct attributes the traveller is evaluatingwhen making a purchase decision. Thus,psychographics allow the creation of a tour-ism product which is more compatible withthe motivation, the attitudes and the opin-ions of the travellers.
Psychographic segmentation further pro-vides a unique way of viewing thetourist/consumer. It starts with people andreveals how they feel about a variety of sub-jects. Insight into a vacationer’s personality,attitudes and motivations is gained byasking questions about many aspects of life.Psychographics enable inferences to bedrawn from general questions on social sta-tus, profession or a tourist’s income bracketand possible travel expenditure levels. Itmust be remembered that respondents aremore often than not unwilling to provideaccurate answers to questions pertaining totheir income. Therefore, an indirect methodof obtaining such data can be extremelyvaluable.
Finally, psychographic research providesdetailed profiles that allow a marketer toalmost visualize the people he or she is try-ing to reach. It seeks to determine whypeople travel (and why they do not), howthey think, what their values and attitudesare, what types of destinations they want tovisit and what they want to do while stayingin a destination. When implemented in thesegmentation process, it can lead to moreeffective advertising strategies aimed at eachmarket segment. Marketing managementattempting to segment travel markets and todevelop promotional programmes needs torely on information about the lifestyles ofpotential travellers as well as on demo-graphic characteristics.
Successful advertising depends on effec-tively discerning the audience that themarketer can reach. One of the vital points ofmessage development is to understand whyconsumers want the benefit they desire. Thissuggests the copy appeal should reflect theconsumer’s desires, expectations, preferen-ces and perceptions about a travel
127Segmentation, Targeting, Positioning and Strategic Marketing

destination. Certain special attributes of aplace may be more appealing to a specifictarget audience. Also, psychographic vari-ables can be an invaluable aid to mediaresearch since people with different life-styles have different media habits.Therefore, psychographics provide valuableinformation for media selection and sched-uling of advertising time, and for creativethinking in developing advertising copy orthemes. In that way, promotional messagesand travel incentives as well as communica-tion channels can be better tailored to thereceptive market segments.
Psychographic segmentation is aresearch tool which provides new insightsinto consumer behaviour permitting a betterunderstanding of the market conditions andan improvement of the marketing strategies.It requires three steps:
1. Identification and differentiationbetween groups/segments which makeup the market.
2. Selection of one or more target seg-ments.
3. Development of a marketing strategy tobe applied in each of the selected targetmarkets.
The first two of the outlined steps are to beaccomplished through the use of adequateresearch instruments involving the selec-tion of an approach/model to be used andselection of variables. Psychographic seg-mentation represents ‘a posteriori’ type ofsegmentation in which the segments areobtained after the data analysis has beencompleted. The target segments are selectedon the basis of results produced by cluster,factor or some other type of analysis.
The crucial problem seems to be thequestion of identifying the variables whichare to be used for the clustering of con-sumers. Psychographic segmentationusually means administering up to a hun-dred questions or even more on variedtopics and a further set on media exposureand product usage. Therefore, this type ofsegmentation takes into account a largenumber of variables, usually measured insurveys and interviews and analysed
through multivariate statistical methods.The results often produce a larger number ofsegments, the validity and stability of whichmay at times be questionable, making theusual methods of result control highly rec-ommendable (split-half, rest-retest). Theirinterpretation may at times be quite diffi-cult, and the researcher usually has to find aconcise term to effectively label anddescribe the whole group. Some examples ofsuch terms may be ‘Adventurer’, ‘Planner’,‘Impulsive Decision-Maker’, ‘Action-Orientated Person’, ‘Outdoorsman’,‘Escapist’, ‘Self-Designed Opinion Leader’,etc.
Psychographic segmentation is relativelyexpensive to conduct and while today itsuse is growing, it is still infrequentlyemployed in travel and tourism. Comparedwith other industries, the use of psycho-graphic segmentation in travel and tourismcan be characterized as being in the initialphases. For example, main tour operators’summer ‘Sun and sea’ brochures show littlediscrimination between varying groups ofconsumers, as these usually consist of a sim-ple description of hotels followed by somegeneral information on the destination. Sofar the tendency has been to produceproduct-orientated travel brochures usingproduct-attribute segmentation (campsites,hotel, theme parks, etc.), without consider-ing the characteristics of consumers.
The value of psychographic segmentationA review of the literature reveals severalpoints of controversy or debate regarding theassessment of psychographic segmentation.First among these is the issue of ‘demo-graphics vs. psychographics’. Undoubtedly,demographic data has been, by far, the mostfrequently used technique for identifyingtourist (and other) markets. Demographicsare more readily available than informationon why a person chooses a particular trip ora particular vacation destination. Further-more, demographics are much easier toanalyse, understand and operationalize.Thus, there have been questions as towhether psychographic data adds anythingbeyond demographic analysis which is real,meaningful and relevant. The results of
128 L. Moutinho

numerous studies have shown that psycho-graphics do provide some additionalinformation over and beyond the demo-graphic profile. This, of course, does notimply that lifestyle analysis should replacedemographics. Although it is very useful indeveloping copy and message strategy, psy-chographics alone, without additionalguidelines in selecting the media, cannothelp deliver the proper message, in a propermanner, to the proper target. Today, it hasbecome quite clear that a combination ofpyschographic and demographic data offersstill greater insights into traveller preferen-ces. Further proof of this point are thequestionnaires used in psychographicresearch, which always include a set ofdemographic variables.
The second question in assessing thevalue of psychographics has been thedilemma of whether the variables employedare overly general for a meaningful segmen-tation in tourism. Psychographic variablescan be considered as subjective variablesthat are usually measured in surveys andinterviews. Recently, it has been recognizedthat such personality (subjective) variablesare not very well suited to explaining spe-cific behavioural differences. Thus,psychographic as general-level segments areuseful for marketing communication pur-poses, while specific-level segments areuseful for product improvement. Psycho-graphic segmentation is of most value whenit can predict underlying trends and changesin society which will lead to major shifts indemand for goods and services. However,there is a lack of studies in which touristconsumer behaviour is linked to general life-style variables.
In psychographic segmentation, as else-where, the research results, or the output,largely depend on what the researcher hasselected as the input. In contrast with demo-graphic analysis, in psychographics there donot exist standard categories for differenttypes of tourists. It is left to the researcher todecide about the input and to create thedimensions from his own point of view.This reveals the already mentioned ques-tions of (i) labelling the groups (‘a posteriori’segmentation); (ii) control of the research
results; and (iii) measuring the stability ofthe segments over time.
Psychographic segmentation is anapproach to tourism market segmentationbased on personality characteristics of con-sumers. In contrast to other ways of marketsegmenting, psychographics examine theactual motives for travel behaviour and offeranswers about why people travel, allowingthe tourism managers to focus their efforts.As mentioned above, psychographic seg-mentation is an ‘a posteriori’ type ofsegmentation. Target segments are selectedbased on the results obtained from some ofthe multivariate statistical methods, makingthe usual methods of result control highlyrecommendable.
Segments based on psychographic vari-ables provide travel marketers with valuableinformation for planning, designing, posi-tioning and distributing tourism products,for promoting and advertising them, as wellas for creating copy appeals and selectingthe proper media. Psychographics also ena-ble the identification of certain segments oftourists, as well as helping to better definethe majority of potential consumers, and inthat way achieve a better effectiveness ofmarketing and promotional budgets. In acompetitive environment it is a useful stra-tegic marketing tool.
Targeting
The target market decision is the choice ofwhich consumers in a product-markettowards which a company will aim its mar-keting programme positioning strategy. Thisdecision is one of management’s mostdemanding challenges. Should a companyattempt to serve all that are willing and ableto buy or selectively focus upon one or moresubgroups? Gaining an understanding of aproduct-market is essential to making thetarget market decision. Central to this task isdefining and analysing the competitivearena. The steps in selecting a target marketstrategy are as follows:
1. Decide how to form niches in theproduct-market.
129Segmentation, Targeting, Positioning and Strategic Marketing

3. Describe the consumers/organizationsin each niche.
3. Evaluate target market alternatives.4. Select a target market strategy.
The possibilities for selecting the company’starget group of customers in a product-market range from attempting to appeal tomost of the people in the market (a massmarket approach) to going after one or moreniches (subgroups or segments) within themarket. Management must somehow iden-tify possible niches and then, for each nicheof interest, determine which marketing pro-gramme positioning strategy will obtain themost favourable profit contribution net ofmarketing costs.
Niche marketsAn important question is whether or notbreaking apart a product-market is worthdoing. We need a basis of evaluation theworth of a particular niche scheme. Thereare five criteria that are useful for this pur-pose (Cravens et al. 1980).
1. The responsiveness of people in theproduct-market to marketing pro-gramme efforts.
2. It must be feasible to identify two ormore different customer groups.
3. A company must be able to aim anappropriate marketing programmestrategy at each target segment.
4. In terms of revenues generated and costincurred, segmentation must be worthdoing.
5. The segments must exhibit adequatestability over time so that the compa-ny’s efforts via segmentation will haveenough time to reach desired levels ofperformance.
Once niches are formed, each one of interestto the company should be evaluated toaccomplish three purposes:
1. Since there is often more than onepromising marketing programme pos-itioning strategy that can be used for agiven niche, a selection of the best alter-native is necessary for each nichecandidate.
2. After evaluation is completed, thoseniches which still look attractive as tar-get market candidates should be rankedas to their attractiveness.
3. Finally, management must decide if aniche strategy is better than a mass tar-get market approach.
Assuming that niches can be identified in aproduct-market, management has the optionof selecting one or more niches as a targetmarket or, instead, using a mass strategy(Cravens, 1982).
An undoubted attraction of many nichemarkets is the scope they offer for premiumpricing and above-average profit margins. Inaddition, an effective niche strategy has formany companies provided a convenientjumping off point for entry into a largermarket. There is, however, a hidden dangerin looking at what appears to be niche mar-kets. Many strategists with small brandsoften deceive themselves by believing theyhave a niche product. The reality may in factbe very different with the product being avulnerable number four or number fivebrand in a mass market. To clarify whether abrand is a true market nicher, Davidson(1987) therefore suggests posing three ques-tions:
1. Is the niche or segment recognized byconsumer and distributors, or is it just afigment of marketing imagination?
2. Is your niche product distinctive, anddoes it appeal strongly to a particulargroup of consumers?
3. Is your product premium-priced, withabove-average profit margin?
Unless the answer to all three of the ques-tions is ‘yes’, it is unlikely that the brand is atrue nicher, but is instead a poor performerin a far larger market segment.
In sum, the characteristics of the idealniche are:
1. It is of sufficient size to be potentiallyprofitable.
2. It offers scope for an organization toexercise its distinctive competences.
3. It has the potential for growth.
130 L. Moutinho

Other characteristics that favour nichingwould be patents, a degree of channel con-trol and the existence of customer goodwill.Niching should not, however, be seen as astrategy limited just to small organizations.
Segment evaluationHaving decided how best to segment themarket, the marketing manager is then facedwith a series of decisions on how many andwhich segments to approach. Three factorsneed to be considered:
1. The size and growth potential of eachsegment.
2. Their structural attractiveness.3. The organization’s objectives and
resources.
The starting point for this involves examin-ing each segment’s size and potential forgrowth. Obviously, the question of what isthe ‘right size’ of a segment will vary greatlyfrom one organization to another.
In so far as it is possible to develop broadguidelines, we can say that large companiesconcentrate on segments with large existingor potential sales volumes and quite deliber-ately overlook or ignore small segmentssimply because they are rarely worth bother-ing with. Small companies, by contrast,often avoid large segments partly because ofthe level of resources needed to operateeffectively, and partly because of the prob-lems of having to cope with a far largercompetitor.
With regard to the question of each seg-ment’s structural attractiveness, themarketing manager’s primary concern isprofitability. It may be the case that a seg-ment is both large and growing but that,because of the intensity of competition, thescope for profit is low. Several models formeasuring segment attractiveness exist,although arguably the most useful isMichael Porter’s (1979) five-force model.This model suggests that segment profitabil-ity is affected by five principal factors:
1. Industry competitors and the threat ofsegment rivalry.
2. Potential entrants to the market and thethreat of mobility.
3. The threat of substitute products.4. Buyers and their relative power.3. Suppliers and their relative power.
Having measured the size, growth rate andstructural attractiveness of each segment,the marketing manager needs then to exam-ine each one in turn against the backgroundof the organization’s objectives and resour-ces. In doing this, the marketing manager islooking for the degree of compatibilitybetween the segment and the organization’slong-term goals. It is often the case, forexample, that a seemingly attractive seg-ment can be dismissed either because itwould not move the organization signifi-cantly forward towards its goals, or becauseit would divert organizational energy. Evenwhere there does appear to be a match, con-sideration needs to be given to whether theorganization has the necessary skills, com-petences, resources and commitmentneeded to operate effectively. Withoutthese, segment entry is likely to be of littlestrategic value.
The final segmentation decision faced bythe marketing manager is concerned withwhich and how many market segments toenter. In essence, five patterns of marketcoverage exist:
1. Single segment concentration in whichthe organization focuses on just one seg-ment. Although a potentially high-riskstrategy in that the company is vulner-able to sudden changes in taste orpreference, or the entry of a larger com-petitor, concentrated marketing alongthese lines has often proved to be attrac-tive to small companies with limitedfunds. Left to itself, an organizationwhich opts to concentrate on a singlesegment can develop a strong marketposition, a specialist reputation andabove average returns for the industryas a whole.
2. Selective specialization. As an alterna-tive to concentrating on just onesegment, the company may decide tospread the risk by covering several mar-ket segments. These segments need notnecessarily be related, although each
131Segmentation, Targeting, Positioning and Strategic Marketing

should be compatible with the organi-zation’s objectives and resources.
3. Product specialization in which theorganization concentrates on marketinga particular product type to a variety oftarget markets.
4. Market specialization. Here the organi-zation concentrates on satisfying therange of needs of a particular targetgroup. Example: Saga Holidays (whichtargets the over 50s travel market).
5. Full market coverage. By far the mostcostly of the five patterns of market cov-erage, a strategy of full market coverageinvolves serving all customer groupswith the full range of products needed.
It is assumed that individual segments orcombinations of segments could be inde-pendently chosen, but this assumptionignores synergies that might exist betweenvarious market segments. For example, amarket consisting of 12 segments can lead tothe development of supersegments that willhelp a company attain a better efficiencylevel in terms of its allocation of marketingresources.
Targeting is becoming a nightmare for mar-keters who want to spend their marketingbudgets wisely. Long-established methodsof defining markets such as socio-demographic classifications may be the coreof television research, but the social founda-tions upon which they are built are shiftingand their relevance is increasingly question-able. Now, almost each week, new ways ofclassifying potential target markets are pre-sented. Acorn-style geodemographics wasonce the rage. Now, for some, the way for-ward lies in information technology. Youneed to get your targeting exactly right byworking out exactly who buys your product.NDL promises to categorize people by up to70 different buying/lifestyle attributes. Oth-ers, like Applied Future, are slicing thepopulation in novel ways and lumpingmany millions of people, ‘doing all sorts ofjobs from management to physical labour,earning salaries from vast to marginal’together as ‘inner directed’.
Only one overriding trend is clear: that
old assumptions are being swept aside. Newthinking on the subject is urgently needed.
The Rise of Individualism
For example, take the case of the 15–24 year-old age group in the UK, some 9 millionpeople. Whereas in the 1960s a recent Min-tel survey concluded that young people sawthemselves as part of a homogeneous mass,today they strive to distinguish themselvesas individuals, posing great problems formarketers. This rise of individualism needsa rapid reappraisal of the way markets aredescribed. Squeezing British citizens intosix ‘social classifications’ (A, B, C1, C2, E, F)was always a controversial technique, but inthis age of the individual, it is one which hasbeen eclipsed by events. The turmoil is onlycompounded by the rise of cross-bordermarketing within Europe. Is the emergenceof a ‘Euro-consumer’ a reality? Yes, there arecommon trends within Europe. But thevariations of language and culture inEurope, a developing and not declining phe-nomenon, coupled with the widely differentways products are positioned, resist notionsof Euro-homogeneity.
In a world of exponential choice, the con-sumer is no longer a grateful and passiverecipient. He or she is an expert and activeparticipant in the process, brand-aware butdemanding a high standard of service andquality, and seeking dialogue and a relation-ship. Data driven marketing is the means bywhich we can make sense of ever-fragmenting markets. In a marketingdatabase, proposals can be made to individ-ual consumers that fit their lifestage, theirlifestyle and their needs. By carefully col-lecting data, moreover, we can amass for thecompany one of the most effective sources ofmarketing research, a ‘model of our market-place’. We may have hundreds of thousandsof customer records in our database, we maybe updating them on a weekly basis, andhave at our disposal an all-encompassingsnapshot of all the important parameters ofour marketplace: pricing, promotion, dis-tribution and product design. The customermarketing database becomes the essential
132 L. Moutinho

source of information of how to do busi-ness.
Much effort in today’s ultra-competitiveworld is expended in gathering informationfor marketing databases (Coad 1992). Forexample, new target marketing techniquesallow the credit marketers greater scope todefine and target appropriate potential cus-tomers. The Lifestyle Network employs boththe geodemographic marketing techniquesand the lifestyle techniques of today to pro-vide the state-of-the-art in direct marketing.Applying the capabilities of Infolink’sDefine and NDL’s Lifestyle Selector to theelectoral roll for name and address selectionallows marketers to access and target themaximum mailable universe. The LifestyleNetwork allows the direct marketer to usecustomer profile analysis to score individ-uals according to their similarity to thatmarketer’s existing best customers. Look-alikes are then selected from InfoLink’sElectoral Roll for use in direct marketingcampaigns.
Outbound telemarketing has proven itsworth in a wide variety of industries.Whether a company is selling, servicing, orsurveying, telemarketing is a tool to helpreach customers and prospects. The key toits success lies in understanding when touse it. In some instances, outbound tele-marketing is effectively used to follow upleads generated from other direct responsemedia. In other instances, it can be used as aprequalifier with a mailing to follow up forqualified respondents. Whatever the appli-cation, it is essential to know who is beingcalled and why. New predictive dialling sys-tems can double the efficiency of outboundcalling and ease the burden of routine, time-consuming tasks, such as waiting on ringingtelephones and redialling busy signals.Effective outbound telemarketing cam-paigns have proven their usefulness for anumber of purposes, such as seasonal sales(Simon, 1991).
Mass Customization
Fundamentally, mass customization is theability to respond quickly and profitably to
the changing wants and needs of individualcustomers. Long-term growth is dependentnot on economies of scale, but rather econo-mies of scope: the application of a singleprocess to produce a greater variety of prod-ucts or services more cost effectively andmore quickly.
Mass customization is a holistic approach to
bringing products and services to market with thecustomer at the centre of
every aspect of the organization.
The customer becomes the catalyst forchange in the organization; the organizationexists to produce what customers want andvalue. Mass customization is a holisticapproach to bringing products and servicesto market with the customer at the centre ofevery aspect of the organization.
Moving towards mass customization willvary depending on the extent of market tur-bulence in any given industry. Somecompanies may move incrementallytowards mass customization. Others maycompletely transform existing businesses orcreate new ones. Rapid development, flex-ible production, individualized marketing,and instant delivery can each provide a sus-tained competitive advantage; together theycan leave the competition in the dust.
If you are fortunate to be a low-cost pro-ducer of tourist services, you will probablyhave an opportunity to win a high share ofthe market and enjoy a comfortable profitmargin. If, on the other hand, you are a smallproducer of tourist services with no reason-able hope of beating the big competitors,your best opportunity is to specialize in bothtourist products and markets. This strategyof segmentation is termed ‘niche-picking’and, nowadays, many marketing mindedtourist managers are learning to positiontheir products as true specialities with sig-nificant competitive advantages built in. Byfocusing on specific end-user tourists andtheir distributors, they can concentrate onproducts where quality and service are moreimportant, competitively, than price, andwhere continuing satisfaction brings repeatbusiness.
133Segmentation, Targeting, Positioning and Strategic Marketing

Positioning a Destination: Problemsand Challenges
Positioning a destination presents a numberof challenges, two of which are inherent inmarketing a service ‘product’, namely intan-gibility and inseparability. Intangibilityleads to customer uncertainty. Unlike a goodwhich Lovelock describes as an ‘object, adevice, a thing’, the service product can bemore aptly described as a ‘deed, a perform-ance, an effort’. When consideringdestination marketing, the word ‘experi-ence’ could be added, as the destinationmarketer is effectively selling tourist experi-ences. However, Ryan (1995, pp. 40–44)makes a distinction between holidays andother services. The tourist has a degree ofcontrol over the purchase, in that he or shecan dictate their level of involvement withdifferent elements of the service, for exam-ple, destination attributes, activities andpeople. In this way the tourism purchasediffers from, say, a retail service situationand enables the tourist to maintain a moreequitable balance in their levels of cognitivedissonance (an uncomfortable psychologicalstate – the person attempts to reduce it eitherby changing his or her position, or by down-grading the validity of incominginformation, or by seeking material, adver-tisements that will support the decision).
Despite the higher level of consumer par-ticipation in the tourism purchase, theholiday-maker will still perceive an elementof risk during the initial buying process. Inher study of the consumer evaluation proc-ess, Zeithaml hypothesized that consumersperceive greater risks when buying servicesthan when buying goods (Zeithaml, 1990). Itneeds to be added, however, that the degreeof perceived risk is dependent on the priceof the purchase, the benefits which the con-sumer expects to derive from a purchase,and whether or not the consumer has pur-chased the same or a similar service in thepast. According to marketing theory derivedfrom the 1960s, if the price of the service islow then the perceived risk of financial lossis low. It is arguable, however, in the case oftourism that the cost of the purchase cannotbe measured in financial terms alone. Even a
short break holiday requires the expenditureof valuable leisure time, at a time when thereare ever-increasing demands on disposableleisure time. Therefore, although this shortbreak may involve relatively little financialoutlay, the level of expectation may be quitehigh. Zeithaml supports her study of riskwith two additional hypotheses: consumersadopt innovations in services more slowlythan they adopt innovations in goods; andconsumers seek and rely more on informa-tion from personal sources than fromnon-personal sources when evaluating ser-vices prior to purchase. Consumers arenaturally more cautious when purchasingsomething which they cannot touch, experi-ence, test or experiment with and which isunlikely to come with a guarantee or war-ranty.
Because of the intangible nature of a des-tination, an explicit positioning strategy isvaluable in helping prospective visitors toget a ‘mental fix’ on a destination that mayotherwise be amorphous. The challengeposed by intangibility is compounded by thelack of consistency in buyer behaviourwithin market segments. Visitor expecta-tions can vary radically. For example, twofamilies on an identical short break packagemay record very different levels of satisfac-tion with the holiday because they haddifferent expectations and were looking fordifferent benefits from the package. This isin contrast to most consumer goods wherethe product has a given set of attributes andcustomers’ expectations can be more readilyidentified.
The second challenge relates to the insep-arability of the service production andconsumption processes. This can result ininconsistencies in the quality of the productand its delivery. The supplier of manufac-tured goods can put the product through arigorous test period before distribution andconsumption. This helps to avoid costlymistakes arising from customer dissatisfac-tion with the product. The tourism supplierdoes not have this opportunity as the pro-duction and consumption of the producttakes place simultaneously. This potentialfor inconsistency in delivering the destina-tion product is compounded by the high
134 L. Moutinho

level of human involvement in the produc-tion process. The challenge posed byinseparability is arguably stronger for thedestination marketer than for the serviceproduct marketer, due to the lack of controlwhich is exercised over the many suppliersof the tourism product. The multitude anddiversity of tourism suppliers in the destina-tion makes quality control and cohesion adifficult task.
Positioning in Other Tourism Sectors
Key players from the hospitality and touroperating sectors have pursued major repo-sitioning and product developmentstrategies. Both the processes and the resultsof these strategies provide potential insightsfor the regional tourist boards (RTBs). Thedevelopment of ‘Courtyard’ by the Marriotthotel group pioneered the use of newresearch and product development techni-ques. The development process involvedthe following stages: selection of a productdevelopment team; environment and com-petitor analysis; customer analysis; ideageneration; product refinement; productpositioning; and monitoring of results. Theenvironment and competitor analysis iden-tified a gap in the market. The remainingstages were underpinned by extensive con-sumer research, based around definingpreferred product attributes and benefits.Seven sets of attributes were identified:external factors; rooms; food-related servi-ces; lounge facilities; services; leisurefacilities; and security factors. A range ofindividual product attributes were devel-oped within each of these sets. A range ofmultivarious and inferential statistical ana-lyses were used by Marriott, includingconjoint, cluster analysis, multidimensionalscaling and multiple discriminant analysis.The exercise has proved a success for Mar-riott with the Courtyard brand expandingfrom three test hotels in 1983 to more than200 in 1994.
Forte Hotels also harnessed internal andexternal expertise to research the marketand identify key benefit-seeking market seg-ments as part of their restructuring process
in 1991. This form of benefit-related seg-mentation has been studied in depth byVavrik and Mazanec (1990) who also refer toit as a posteriori segmentation. Using multi-variate statistical techniques, individualsare aggregated into groups which seek sim-ilar benefits. This kind of analysis is useful,as the tourism manager is likely to be inter-ested in determining which group orsegments would support a given productcategory; how the segments differ in theirresponsiveness to a range of product offer-ings (brands, destinations, etc.) within thatcategory; and how they differ in their expec-tations (Calantone and Mazanec, 1991).
Several distinct brands were createdunder the Forte umbrella. One of the overallaims of the Forte re-branding exercise was toprovide reassurance to customers whenchoosing hotels in different destinations(Connell, 1994). In other words, the re-branding of hotels attempted to reduceconsumers’ perceived risk when purchasinga Forte product. Two further objectives ofthe Forte re-branding exercise were, firstly,to offer a clear position in an expandinginternational market and, secondly, to helpemployees identify themselves better withthe company and to make them understandtheir contribution towards the corporateeffort. This second objective recognizes theinseparability of the production and theconsumption processes and the integral partwhich hotel staff represent in the delivery ofthe overall product. Connell observes that asa result of the re-branding Forte is now ableto communicate the differences betweenbrands to make it easier for customers tochoose the hotel they need.
Any repositioning process will requirechange, particularly in the culture of theorganization and management attitudes. It isto some extent a ‘chicken and egg’ situationas many companies cite organizational fac-tors when talking of the benefits ofrepositioning. Clear product positioningmust be an integral part of any destinationmarketing strategy, due to the inherent char-acteristics of the destination product and theincreasingly complex needs of the tourist.Key players in the hospitality, tour operatorand airline sectors have pursued successful
135Segmentation, Targeting, Positioning and Strategic Marketing

positioning strategies which have beendriven by effective market segmentation andbrand management (Alford, 1998).
Building Perceptional Maps
There are different market-preference pat-terns such as clustered, diffused andhomogeneous preferences. In some cases,the basis market-preference pattern showsdistinct preference clusters, called naturalmarket segments. A company in this markethas three options: (i) position itself in thecentre hoping to appeal to all the groups(undifferentiated marketing); (ii) positionitself in the largest market segment (concen-trated marketing); and (iii) develop severalbrands, each positioned in a different seg-ment (differentiated marketing).
In contrast, in a diffused preference mar-ket, a company faces three different options:(i) to tap preferences of one of the corners, asingle-niche strategy, which is useful forsmall companies; (ii) two or more productscan be introduced to capture two or moreparts of the market, a multiple-niche strat-egy; and (iii) to tap the middle of the market,a mass-market strategy. A product located inthe centre minimizes the sum of the dis-tances of existing preferences from theactual product. It will minimize total dis-satisfaction.
If a company enters into a market con-taining a large entrenched competitor,instead of entering with a me-too product, orwith a single-segment product, it can intro-duce a succession of products aimed atdifferent segments, providing that the com-pany has the necessary resources. Eachproduct entry will create a loyal followingand take some business away from the majorcompetitor. The company should try to findmarket gaps where there is more profitpotential and less risk.
The techniques of market segmentation,product positioning and perceptual map-ping represent early applications ofmethodologies such as cluster analysiswhich are now thought to have some poten-tial for identifying strategic groups.Researches in the area of strategic manage-
ment are making use of methodologies thatare quite common tools in marketing such asthose relating to segmentation and percep-tual mapping approaches. Methodologiessuch as multidimensional scaling, clusteranalysis, and other techniques have beenextensively used in market analyses.
Multivariate analyses are widely used instrategic marketing because of the wide vari-ety of flexible analytical techniquesavailable to analyse large and complex data-sets. They can be defined simply as theapplication of methods that deal with rea-sonably large numbers of measurements (i.e.variables) made on each object in one ormore samples simultaneously. What followsis a brief description of how some of thosetechniques can be used to help analyse mar-keting management problems related tosegmentation, targeting and positioning.
Cluster analysisCluster analysis provides a set of proceduresthat seek to separate the component datainto groups. The goal in such applications isto arrive at clusters of objects that displaysmall within-cluster variation relative to thebetween-cluster variation. The goal in usingcluster analysis is to identify a smaller num-ber of groups such that objects belonging to agiven group are, in some sense, more similarto each other than to objects belonging toother groups. Thus, cluster analysisattempts to reduce the information on thewhole set of n objects, to information about,say, g subgroups where g < n.
One of the major problems in strategicmarketing consists of the orderly classifica-tion of the myriad data that confront theresearcher. Clustering techniques look forclassification of attributes or subjects on thebasis of their estimated resemblance. Clusteranalysis is an exploratory method that seekspatterns within data by operating a matrix ofindependent variables. Usually objects to beclustered are scored on several dimensionsand are grouped on the basis of the likenessof their scores. The primary value of clusteranalysis lies in the preclassification of data,as suggested by ‘natural’ groupings of thedata itself. The major disadvantage of thesetechniques is that the implicit assumptions
136 L. Moutinho
of the researcher can seriously affect clusterresults. Cluster analysis can be applied instrategic marketing for clustering buyers,products, markets, as well as key competi-tors. It has been found to be a particularlyuseful aid to market segmentation, experi-mentation and product positioning (Hair etal., 1995).
Several questions need to be answeredwith respect to a given cluster solution,including: (i) how the clusters differ; (ii)what is the optimal (i.e. correct) number ofclusters; and (iii) how good is the fit of thesolution for a pre-specified level of clusters.The first question concerns the distinctive-ness of cluster profiles. The second questionconcerns the trade-off between parsimony,in the sense of fewer clusters, and somemeasure of increase in within-cluster homo-geneity resulting from having more clustersin the solution. The third question concernscluster recovery which can be viewed interms of the fit between the input data andthe resulting solution. This should be high.
Discriminant analysisDiscriminant analysis is a useful technique todifferentiate within groups and predict groupmembership characteristics. Applicationsinclude uncovering characteristics of groupsmost likely to purchase products and deter-mining the qualities of first-time customers topredict repeat business. Discriminant analy-sis involves deriving linear combinations ofthe independent variables that will discrim-inate between a priori defined groups in sucha way that the misclassification error rates areminimized. Discriminant analysis is theappropriate statistical technique when thedependent variable is categorical (nominal ornon-metric) and the independent variablesare metric. Discriminant analysis is widelyused in market segmentation, studies of thediffusion and adoption of new products andconsumer behaviour analysis. However,enough attention has not been accorded tothe assumptions which underlie its applica-bility.
Multidimensional scalingMultidimensional scaling, unlike the othermultivariate methods, starts with informa-
tion pertaining to perceived similarities ordissimilarities among a set of objects such asproducts, buyers, competitors, etc. Themain objective of using the technique is toobtain a configuration showing the relationsamong the various variables analysed. Theattitudinal or perceived similarities (or dis-similarities) among a set of objectives arestatistically transformed into distances byplacing these objects in a multidimensionalspace.
Multidimensional scaling, especiallynon-metric scaling (NMS) has been appliedin strategic marketing in areas such as prod-uct positioning, market segmentation,large-scale new product development mod-els, the modelling and evaluation of buyingbehaviour and the determination of moreeffective marketing mix combinations. NMSmay also be applied in the product develop-ment process by finding consumer attitudestowards various product attributes. In suchapplications the technique can (i) constructa product space; (ii) discover the shape ofthe distribution of consumers’ ideal pointsthroughout such a space; and (iii) identifylikely opportunities for new or modifiedproducts.
Conjoint analysisConjoint analysis is concerned with the jointeffect of two or more independent variableson the ordering of dependent variables. It isrooted in traditional experimentation. Adefinition of conjoint analysis must proceedfrom its underlying assumption that a com-position rule may be established to predict aresponse variable from two or more pre-dictor variables. Conjoint analysis, likemultidimensional scaling, is concernedwith the measurement of psychologicaljudgements, such as consumer preferences.
Conjoint (trade-off) analysis products areessentially bundles of attributes such asprice and colour. Conjoint analysis softwaregenerates a deck of cards each of whichcombine levels of these product attributes.Respondents are asked to sort the cards gen-erated into an order of preference. Conjointanalysis then assigns a value to each leveland produces a ‘ready-reckoner’ to calculatethe preference for each chosen combination.
137Segmentation, Targeting, Positioning and Strategic Marketing

Conjoint analysis can be used to designpackaging, establish price, rank a hypothet-ical product against existing competitorsalready in the market and suggest modifica-tions to existing products which would helpto strengthen a product’s performance.
It seems that various types of marketingplanning models and other proceduresusing judgemental estimates in a formalmanner might benefit from the utilization ofconjoint models in additive or, more gen-erally, polynomial form. Moreover, buyerpreferences for multiattribute items mayalso be decomposed into part-worth evalu-ations in a similar manner. Potential areas ofapplication for conjoint analysis includeproduct design, new product conceptdescriptions, price–value relationships, atti-tude measurement, promotional congruencetesting and the study of functional versussymbolic product characteristics. The out-put of conjoint analysis is frequentlyemployed in additional analyses. Sincemost studies collect full sets of data at theindividual respondent level, individualutility functions and importance weightscan be computed. This fosters two addi-tional types of analyses: (i) marketsegmentation; and (ii) strategic simulationof new factor-level combinations.
Correspondence analysisCorrespondence analysis is a visual orgraphical technique for representing multi-dimensional tables. It can often beimpossible to identify any relationships in atable and very difficult to account for what ishappening. Correspondence analysis unrav-els the table and presents data in aneasy-to-understand chart. This technique isparticularly useful to identify market seg-ments, track brand image, position a productagainst its competition and determine whonon-respondents in a survey most closelyresemble.
Dimensions of Market Strategies
Market strategies deal with the perspectivesof markets to be served. These perspectivescan be determined in different ways and the
various aspects of marketing strategy are lis-ted below:
● Market scope. For example, a tourismcompany may serve an entire market ordissect it into key segments on which toconcentrate its major effort.
● The geographical dimensions of a mar-ket. A company may focus on a local,regional, national or international mar-ket.
● Time of entry into a market. A tourismcompany may be the first among the firstfew, or among the last to enter a mar-ket.
● Commitment to a market. This commit-ment can be to achieve marketdominance, to become a major player inthe market, or merely to play a minorrole in it.
● Dilution of a part of the market.
In summary form, the following 16 strategiesconstitute the major market strategies that acompany may pursue. The presentationstructure of these strategies follows the sameframework of analysis: definition, objective,requirements and expected results.
1. Single-minded strategyDefinition: Concentration of efforts in asingle segment.Objective: To find a segment currentlybeing ignored or observed inadequatelyand meet its needs.Requirements: (i) Serve the marketwholeheartedly despite initial difficul-ties; (ii) avoid competition withestablished firms.Expected results: (i) Low costs; (ii)higher profits.
2. Multimarket strategyDefinition: Serving several distinctmarkets.Objective: To diversify the risk of serv-ing only one market.Requirements: (i) Careful selection ofsegments to serve; (ii) avoid confronta-tion with companies serving the entiremarket.Expected results: (i) Higher sales; (ii)higher market share.
3. Total-market strategy
138 L. Moutinho
Objective: To compete across the boardin the entire market.Definition: Serving the entire spectrumof the market by selling differentiatedproducts to different segments in themarket.Requirements: (i) Employ differentcombinations of price, product, promo-tion, and distribution strategies indifferent segments; (ii) top managementcommitment to embrace entire market;(iii) strong financial position.Expected results: (i) Increased growth;(ii) higher market share.
4. Local-market strategyDefinition: Concentration of efforts inthe immediate vicinity.Objective: To maintain control of thebusiness.Requirements: (i) Good reputation inthe geographical area; (ii) good hold onrequirements of the market.Expected results: Short-term success;ultimately must expand to other areas.
5. Regional-market strategyDefinition: Operating in two or threestates or over a region of the country(e.g. New England).Objectives: (i) To diversify risk ofdependence on one part of a region; (ii)to keep control centralized.Requirements: (i) Management commit-ment to expansion; (ii) adequateresources; (iii) logistical ability to servea regional area.Expected results: (i) Increased growth;(ii) increased market share; (iii)increased profitability.
6. National-market strategyDefinition: Operating nationally.Objective: To seek growth.Requirements: (i) Top managementcommitment; (ii) capital resources; (iii)willingness to take risks.Expected results: (i) increased growth;(ii) increased market share; (iii)increased profitability.
7. International-market strategyDefinition: Operating outside nationalboundaries.Objective: To seek opportunitiesbeyond domestic business.
Requirements: (i) Top managementcommitment; (ii) capital resources; (iii)understanding of international mar-kets.Expected results: (i) increased growth;(ii) increased market share; (iii)increased profits.
8. First-in strategyDefinition: Entering the market beforeall others.Objective: To create a lead over com-petition that will be difficult for them tomatch.Requirements: (i) Willingness and abil-ity to take risks; (ii) technologicalcompetence; (iii) strive to stay ahead;(iv) heavy promotion; (v) create primarydemand; (vi) carefully evaluatestrengths.Expected results: (i) Reduced costs viaexperience; (ii) increased growth; (iii)increased market share; (iv) increasedprofits.
9. Early-entry strategyDefinition: Entering the market in quicksuccession after the leader.Objective: To prevent the first entrantfrom creating a stronghold in the mar-ket.Requirements: (i) Superior marketingstrategy; (ii) ample resources; (iii)strong commitment to challenge themarket leader.Expected results: (i) Increased profits;(ii) increased growth; (iii) increasedmarket share.
10. Laggard-entry strategyDefinition: Entering the market towardsthe tail end of growth phase of duringmaturity phase. Two modes of entry arefeasible: (i) Imitator-entering marketwith me-too product; (ii) initiator-entering market with unconventionalmarketing strategies.Objective: Imitator: To capture that partof the market that is not brand loyal.Initiator: To serve the needs of the mar-ket better than present firms.Requirements: Imitator: Marketresearch ability. Initiator: (i) Marketresearch ability; (ii) ability to generatecreative marketing strategies.
139Segmentation, Targeting, Positioning and Strategic Marketing

Expected results: Imitator: Increasedshort-term profits. Initiator: (i) Put mar-ket on a new growth path; (ii) increasedprofits; (iii) some growth opportun-ities.
11. Strong-commitment strategyDefinition: Fighting off challengesaggressively by employing differentforms of product, price, promotion anddisribution strategies.Objective: To defend position at allcosts.Requirements: (i) Operate optimally byrealizing economies of scale in promo-tion, distribution, manufacturing, etc.(ii) refuse to be content with presentsituation or position; (iii) ample resour-ces; (iv) willingness and ability to takerisks.Expected results: (i) Increased growth;(ii) increased profits; (iii) increasedmarket.
12. Average-commitment strategyDefinition: Maintaining stable interestin the market.Objective: To maintain the status quo.Requirement: Keep customers satisfiedand happy.Expected result: Acceptable profitabil-ity.
13. Light-commitment strategyDefinition: Having only a passing inter-est in the market.Objective: To operate in the black.Requirement: Avoid investing for anylong-run benefit.Expected result: Maintenance of statusquo (no incease in growth, profits ormarket share).
14. Pruning-of-marginal-markets strategyDefinition: Weeding out markets that donot provide acceptable rates of return.Objective: To divert investments ingrowth markets.Requirements: (i) Gain good knowledgeof the chosen markets; (ii) concentrateall energies on these markets; (iii)develop unique strategies to serve thechosen markets.Expected results: (i) Long-term growth;(ii) improved return on investment; (iii)decrease in market share.
15. Key-markets strategyDefinition: Focusing efforts on selectedmarkets.Objective: To serve the selected marketsextremely well.Requirements: (i) Gain good knowledgeof the chosen markets; (ii) concentrateall energies on these markets; (iii)develop unique strategies to serve thechosen markets.Expected results: (i) Increased profits;(ii) increased market share in the selec-ted markets.
16. Harvesting strategyDefinition: Deliberate effort to let mar-ket share slide.Objective: (i) To generate additionalcash flow; (ii) to increase short-termearnings; (iii) to avoid antitrust action.Requirement: High-market share.Expected result: Sales decline but use-ful revenues still come in.
Marketing Mix Strategies
The marketing objectives and strategy for aparticular tourist product-market must beconsistent with the direction and resourcesprovided by the company’s corporate andbusiness-unit strategies. On the other hand,a major part of the marketing manager’s jobis to monitor and analyse customers’ needsand wants and emerging opportunities andthreats posed by competitors and trends inthe external environment. Marketing man-agers must determine whether there aredifferent segments for potential customersfor their products and marketing pro-grammes and how those segments might bebest defined, described and appealed to.
Formulating Strategic MarketingProgrammes
Designing an effective strategic marketingprogramme for a tourist product-maketinvolves three interrelated sets of deci-sions:
140 L. Moutinho
1. The manager must set specific objec-tives to be accomplished within thetarget market, such as sales volume,market share and profitability goals.Those objectives must be consistentwith the company’s corporate andbusiness-unit strategic objectives, yetspecific enough to enable managementto monitor and evaluate the touristproduct-market’s performance overtime.
2. The manager must decide on an overallmarketing strategy to appeal to custom-ers and to gain a competitive advantagein the target market. The strategy mustbe consistent with the company’s capa-bilities, its corporate and business-unitstrategies and the tourist product-market objectives.
3. The manager must then make decisionsabout each element of the tactical mar-keting programme used to carry out thestrategy. These decisions must be inter-nally consistent and integrated acrossall elements of the marketing pro-gramme.
The strategic marketing programme for aparticular tourist product-market shouldreflect market demand and the competitivesituation within the target market. Asdemand and competitive conditions changeover time, the marketing strategy shouldalso be adjusted. A final critical determinantof a strategy’s success is the company’s abil-ity to implement it effectively. Theevaluation and control process providesfeedback to managers and serves as a basisfor a market opportunity analysis in the nextplanning period.
Product Mix
Once a tourism company decides whichmarkets to target, the single most importantactivity is product development. To a con-siderable extent, success here determinesthe company’s profitability, both short andlong term. In many cases, the tourist productserves as the basis for gaining a sustainablecompetitive advantage. It is a strong force in
determining the character of the marketingmix. It affects the nature and scope of theother elements: price (level), channels ofdistribution (activities required) and promi-tion (message).
Product mix decisions require an ongo-ing analysis of individual products and theirmarkets. The total view of tourist products ishighly relevant to the marketing decisionstaken by individual producers, especially inestablishing the interrelationships andscope for cooperation between suppliers indifferent sectors of the industry. To stayahead of the competition, proactive market-ing managers are constantly involved intourist product innovation.
Tourist Product Life Cycle
OverviewThe product life cycle (PLC) describes theevolution of a product as it passes throughthe stages of introduction, growth, maturityand decline with the growth of product salesfollowing an S-shaped pattern (which has itsbasis in biological studies). It hypothesizesthat products require different marketingstrategies at each stage. On the other hand,despite its logical and intuitive appeal, it isdifficult to operationalize and use the PLCfor, say, forecasting or decision taking. Notall growth curves follow the standard S-shape and a number of variants exist.
The extended PLC has an extended matu-rity stage with high repeat purchasesproviding a stable volume of sales (and littleloss of sales to other competitors). In thetourism field products which exhibit thispattern include luxury hotels, holidays andfood service outlets.
Although it could be argued that the tour-ism product is the sum of travel experiencesfrom anticipation to recall, the destination isa key element of the product. Destinationsgo through a cycle of evolution similar to theproduct life cycle. Some writers suggestthree stages to this tourism area life cycle ofevolution – discovery, local response andinitiative, and institutionalized ‘institution-alization’ – but a more detailed framework isnow generally accepted. This begins with
141Segmentation, Targeting, Positioning and Strategic Marketing

‘exploration’ by small numbers of visitorswho are adventurous by nature and tend toshun institutionalized travel. They areattracted by the natural beauty or culture atthe destination but numbers are restrictedby lack of access and facilities. At this stagethe attraction of the destination is that it is asyet unchanged by tourism and contact withlocal people will be high. Parts of LatinAmerica and the Canadian Arctic are exam-ples here.
In the involvement stage local initiativesto provide for visitors and later advertise thedestination result in increased and regularnumbers of visitors. A tourist season andmarket area emerges and pressure may beplaced on the public sector to provide infra-structure. The smaller, less-developedPacific and Caribbean islands are examplesof this stage.
The development stage sees large num-bers of visitors arriving, at peak periodsperhaps equalling or exceeding the numbersof local inhabitants. The organization oftourism begins to change as control ispassed out of local hands and external com-panies emerge to provide up-to-datefacilities, which may alter the appearance ofthe destination. However, in this very suc-cess lies the roots of failure. With increasingnumbers and popularity the destinationmay suffer problems of over-use and deteri-oration of facilities. Regional and nationalplanning and control will have become nec-essary in part to ameliorate problems butalso to market to the international tourist-generating areas as visitors become moredependent on travel arrangements bookedthrough the trade. Parts of Mexico and thenorth and west African coasts exemplify thisstage.
In the consolidation stage the rate of visi-tors has declined though total numbers arestill increasing and exceed permanent resi-dents. The destination is now fully-fledgedpart of the tourism industry with all themajor franchises and chains representedand there is an identifiable recreational busi-ness district. Many Caribbean and northernMediterranean destinations are exampleshere.
At stagnation peak numbers have been
reached and the destination is no longerfashionable. It relies on repeat visits andbusiness use of its extensive facilities andmajor efforts are needed to maintain thenumber of visitors. The destination may bynow have environmental, social and eco-nomic problems. The Costa Brava typifiesthis stage.
In decline visitors are lost to newerresorts and the destination becomesdependent on a smaller geographical catch-ment for day trips and weekend visits.Alternatively, the authorities may recognizethis stage and decide to rejuvenate by chang-ing the attractions. Similarly, somedestinations capitalize on previouslyunused natural resources, such as wintersports, to extend the season and attract anew market. These facility developmentsoften reflect joint public/private sector ven-tures to seek new markets and invest in thedestination in order to reach a cycle/recyclepattern.
As with the PLC the shape of the curvewill vary, but in this case is dependent onthe rate of development, access, governmentpolicy and competing destinations, each ofwhich can delay or accelerate progressthrough the various stages. In turn, thelength of each stage, and of the cycle itself, isvariable.
The true test of the PLC or tourist area lifecycle is whether they can be operationalizedas a tool for planning and managing prod-ucts or tourist areas. Both are useful asdescriptive tools to provide a versatile orga-nizing framework for product planning andstrategy. The main determinant of strategy isexpected market growth, and other factorsinclude distribution of market shares,degree of comptition and profitability. Eachof these varies at a different stage of the PLCand a different marketing mix is appropri-ate. They can also be used as forecastingtools though here they are less successfulbecause of the differing lengths of the stagesand the difficulty of obtaining standardizedsales histories or long runs of visitors arriv-als data. Tourist destinations are dynamic,with changing provision of facilities andaccess matched by an evolving market inboth quantitative and qualitative terms.
142 L. Moutinho

ImplementationThere are two basic, though interrelated,uses of the life cycle: as a guide for strategicdecision-taking and as a forecasting tool.The life cycle approach can be used to char-acterize the main marketing challenges ateach stage. At introduction concern is withbuilding up a strong market position anddeveloping experience and economies ofscale before competitors enter. In the growthstage emphasis changes to building marketshare through increased use of the productand pre-empting competitors’ customers. Asmaturity approaches defence of shareagainst competitors becomes important, asdoes maintaining margins and cash flow bycost control and avoiding price wars. How-ever, once sales or visitor numbers stabilize,management should not await decline asinevitable, but should seek to revitalize salesor visits. The danger here is that the market-ing effort involved in such activities may bebetter placed elsewhere in the portfolio ofproducts (i.e. resources should be allocatedto where they generate the greatest contribu-tion). By decline the task switches topreventing a cash drain in products with nofuture.
The overall lesson here is for companiesto have a portfolio of products at differentstages of the PLC so that, for example,mature products generate the cash neededfor investment in new products.
Some argue that it is erroneous to assumethat the determinant of marketing strategy isstage in the life cycle and the task is toutilize the stages of the life cycle to developand evaluate marketing strategy. This can bedone in two basic ways:
1. Life extension is a planned series ofactions to ensure that sales or numbersof visitors and profitability is sustainedfor as long as possible.
2. Incorporation of other inputs such asdata on market share, the competitiveenvironment and profitability.
Use of the life cycle approach as a forecast-ing tool depends upon the ability to isolateand predict the forces driving it. Most fore-casts assume a constraint on long-rungrowth, an S-shaped diffusion curve, homo-
geneity of customers and given explicitconsideration of marketing decisions or thecompetition. Forecasts can be successful ifthese limiting assumptions are acceptableand sales data are available to give stableparameter estimates.
Frustratingly for forecasters, retrospec-tive studies have shown that much salesdata fit this PLC. This empirical evidencecan be summarized as: sales of most prod-ucts follow the PLC pattern: profits peakduring rapid growth and problems of com-petition increase as the cycle progresses; theaverage length of the PLC is decreasing;there is now regularity in the length of thestages of the PLC; and the PLC can be tempo-rarily bent by heavy promotionalexpenditure.
Criticisms of the life cycle approachOther more detailed criticisms include:
● The danger of reacting to warning signswhich may have been misinterpreted.The PLC is often criticized as a pre-scriptive tool because there is poorempirical validation for shape or length.Clearly the life cycle approach isproduct- or destination-specific, andeach stage is variable in length and theshapes and patterns differ.
● Its main uses for decision-making andforecasting are in doubt. In particular,the wisdom of pursuing a standardizedmarketing strategy at each stage hasbeen questioned and it is also impreciseas a forecasting tool and difficult to cali-brate because of the lack of long runs ofdata on visitor numbers or sales.
● The difficulties of identifying stages andturning points. Identification of turningpoints is important in the later stages ofthe cycle given the increased cost ofreacting as the need for change becomesmore obvious. Turning points can beidentified by use of leading indicatorssuch as growth rate of sales or visits;level of ownership or visits comparedwith market potential; percentage offirst-time buyers or visitors; number ofcompetitors; levels of prices and profits;advertising; promotional and price elas-
143Segmentation, Targeting, Positioning and Strategic Marketing

ticity; and emergence of new productsmeeting customer needs more effec-tively. The variety of possible shapes ofthe curve and acceleration or delay dueto external factors make it difficult toidentify the stage reached by a destina-tion or product. This can be done byplotting rate of change of sales or visi-tors. For destinations, other measuresmay be visitor expenditure, type of tour-ist, market share or profitability.
● The level of aggregation is unclear. Dif-ferent shapes of the PLC emerge forproduct categories and forms (whereexternal influences are important) com-pared with brands (where companydecisions are dominant). Geographicalscale is important for the tourist area lifecycle as each country is a mosaic ofresorts and tourist areas (which in turncontain hotels, theme parks, etc.) anddepending on the scale taken each maybe at a different stage in the cycle (com-pare for example resorts in northern andsouthern France). The unit of analysis istherefore crucial and should be deter-mined by the intended use of theinformation.
● The life cycle assumes a homogeneousmarket but the market can be dividedinto many segments and a perfectly logi-cal stance would be for, say, adestination to introduce segmentssequentially. Equally, geographical seg-mentation would produce differingcurves for, say, domestic and interna-tional visitors, etc.
● For the tourist area life cycle, decline isrooted in visitor numbers exceedingcapacity levels at the destination. Butcapacity is a notoriously difficult con-cept to operationalize, particularly as itis possible to ‘manage’ a capacity. Also,no single capacity threshold exists for adestination – physical, environmentaland psychological capacity may each bedifferent – and, of course, this takes noaccount of spatial or temporal varia-tions, such as seasonality with theattraction of crowd-tolerant visitors inthe peak season and others in thequieter off-peak.
Branding in Tourism
Branding is one of the decisions involved indeveloping a tourism marketing strategy. Itis an important part of product planning. Abrand is a name, design or symbol (or combi-nation of these) which is used to identify aservice provided by an institution or organi-zation. The branding process in tourisminvolves researching, developing andimplementing an organization’s brand deci-sions. Branding decisions involve thedetermination of a word or letter/number toidentify the tourism service (brand name), asymbol, design or distractive colouring orlettering, and personified brand mark (tradecharacter). When a brand name, brand markor trade character is given legal protection, itis referred to as a trademark. Unless brandnames, brand mark and trade characters areregistered as trademarks, competitors canuse them. There are numerous examples ofbranding in the tourism and hospitalityindustry (e.g. hotel chains, rental car com-panies, cruise lines, tour companies andairlines).
The significance of banding in tourismcan be explained by five factors:
1. As firms in the hospitality industryjockey for global market share, it is crit-ical to carry over the positive images ofestablished names from country tocountry. For instance, US hotel chainssuch as Marriott, Days Inns andEmbassy Suites are aggressively seekingforeign markets and hope to capitalizeon established reputations.
2. Repeat business represents an impor-tant source of the tourism industryincome, and repeat business dependson satisfied customers and recognizablebrand name. In other words, productacceptance is improved when brandnames are popularized.
3. Considering the vast majority of newbrand introduction (from cruise lines,to car rental companies, to tour packagecompanies, to hotels), the consumer canonly be bemused and confused. Therapid rate of new brand introductioncomplicates the tasks of travel agents
144 L. Moutinho

and highlights the importance ofobtaining customer brand recognition.
4. The choice of a brand has implicationsfor the firm’s marketing mix consistingof product strategies, promotional strat-egies, pricing strategies anddistribution strategies.
5. Customer loyalty in tourism is difficultto establish, but critical. A number ofstudies have shown that even when cus-tomers are reasonably satisfied with atravel experience, curiosity wouldattract them to try other alternatives.Vacationers and tourists continuouslyseek out new experiences, new loca-tions, new airlines and new hotels. Themore diverse the customers and tourismadventures, the richer their experience.For all these reasons, brand loyalty isdifficult to obtain and hence branding isvery important.
Branding in tourism is a decision that isintegrated with other marketing mix deci-sions. The examples (from the lodgingindustry) discussed below show how firmsare progressively developing unique brandnames to serve different makets.
Branding is critical to creating uniqueimages to different niche markets. That is, itenhances market segmentation efforts. Thebranding decision in tourism is very impor-tant for a variety of reasons:
1. Brand names enable customers to iden-tify the product or service. A customercan then request the service by name;for example, a West German tourist mayprefer the airline Lufthansa. Recogniz-ability is important for patronage,implying that the name should be fairlysimple and distinctive. From this prem-ise, Western International Hotelschanged its name to Westin Hotels.
2. Brand name assures the customer of acertain product quality. Related to theissue of quality is image: brand namesuggests a product image. The Waldorf-Astoria in New York suggests highquality, while Comfort Inns suggestsreasonable cost and economy. TheQueen Elizabeth 2 (QE2) cruise liner
suggests a more exclusive image thanCarnival Cruise Lines.
3. The brand name does not just create animage for the product or service, it alsosuggests one for the firm. The producersof unbranded items cannot be identi-fied, therefore customers do not havethe opportunity to form an image of thefirm.
4. Brand names enable customers to makefewer price comparisons. If a brand isunique, the customer will associate a setof marketing attributes to it. Thus it iseasier for the customer to make deci-sions among brands that are closelyrelated and not compare those that arenot related. This is especially true whenspecial characteristics are attributed todifferent brands. For the firm in thetravel industry, the brand name enablesit to advertise its sources and associate abrand and its characteristics in theminds of the customers. For instance,Carnival Cruise Lines associates thecharacteristic of ‘fun ships’ with itsbrand name, while the QE2 associates‘unique experience’ with its promo-tional theme: ‘For once in your life,live’.
5. Simply having a brand name increasessocial visibility and product prestige. Itshows the firm is willing to standbehind its service.
6. Consumers experience less risk whenpurchasing a brand that is familiar andtowards which they have a favourableattitude.
7. Branding is a critical element of thefirm’s marketing plan since it helps seg-ment markets. By using multiplebrands, different market segments canbe attracted. The Hilton Hotels groupuses the Waldorf-Astoria brand name toattract the elite and politically influen-tial, while the Hilton brand name isused to attract business executives andfrequent lodgers.
8. A well-known brand name helpsincrease television channel coopera-tion. A strong brand increases control ofthe distribution channel, a particularlyimportant factor in very competitive
145Segmentation, Targeting, Positioning and Strategic Marketing

markets. The tourism and travel indus-try is a highly competitive industry,extremely dependent on travel agentsand tour companies. A strong brandname is easily remembered by the cus-tomer and travel agent; travel agents arequick to recommend strong brandnames to their clients.
9. Brands can be used to sell an entire lineof products. The Holiday Corporationuses the brand names Holiday InnHotels, Residence Inn, HI CrownePlaza, Hampton Inn, Embassy SuitesHotel and Granada Royale to market itsline of lodging services.
10. Branding can be used to enter new mar-kets and to serve new customergroups.
Branding decisions need to start with anunderstanding of market segments to be tar-geted. In fact, target markets need to beconsidered when making other brandingdecisions. Typically, implementation ofbranding decisions involves five steps: thechoice of corporate symbols, creation of abranding philosophy, selection of a brandname and deciding to seek legal protection.
Corporate symbols are a firm name, logoand trade character. Although corporatesymbols are designed or chosen to have ele-ments of permanency, changes frequentlyhave to be made. The firm operates in adynamic environment, therefore no corpo-rate symbol can serve all purposes at alltimes. Situations that call for a change, rede-sign and/or change of name are expansion ofproduct lines to currently unrelated fields;going into new geographical markets; reali-zation that the current name is indistinct,unwieldly or confusing; or starting a com-pletely new line. Corporate symbols have animpact on a firm’s marketing strategy andconsequently should not be developed with-out considering elements of the marketingmix. Embassy Suites Hotel has successfullyused Garfield the cat as its corporate sym-bol.
Confidence and reliability are of signifi-cant concern to travellers. Even when pricecompetition is a significant form of competi-tion, the product is not emphasized
exclusively. Brand extension, which is usedin the lodging industry, involves attaching aname extension to what would be a familyname. For instance, Marriott uses the exten-sions Hotels, Resorts, Courtyard, Marquisand Suites.
A good brand name should increase thechanges of consumer preference. ‘Brand-name hype’ only cannnot lead to sales unlessbacked by other substantive actions. Whilemeasuring sales is easy, the extent to whichincreased sales can be attributed to a goodbrand name is difficult. The effectiveness ofbranding decisions can ultimately be meas-ured on insistence on (or aversion to) theproduct. Brand loyalty, however, depends onsatisfaction with product performance.
Branding is a very important decision forfirms in the tourism industry. The develop-ment of brand name over time can offer thefirm a competitive edge, but the firm needsto plan and effectively execute a brandingdecision to ensure this benefit. Integration ofthe branding decisions into the marketingmix programme can result in considerablesynergistic effects. A brand cannot be trea-ted as simply a name, rather it is an integralpart of the firm’s efforts to establish a uniqueimage that is saleable to customers. Imagebuilding in service industries is significantbecause word of mouth advertising is amajor form of promotion. A firm operatingin the tourism industry should pay specialattention to its branding decisions. Brandloyalty and patronage may very well dependon a familiar brand name or symbol.
Dimensions of Product Strategies
The implementation of tourism productstrategies requires cooperation among dif-ferent groups: finance, operations, thecorporate staff and marketing. This level ofintegration makes tourism product strate-gies difficult to develop and implement. Inmany tourism companies, to achieve propercoordination among diverse business units,product strategy decisions are made by topmanagement. In some companies, the over-all scope of tourism product strategy is laidout at the corporate level, whereas actual
146 L. Moutinho

design is left to business units. These tour-ism companies contend that this alternativeis more desirable than other arrangementsbecause it is difficult for top management todeal with the details of product strategy in adiverse tourism company. Some nine keyproduct strategies are recognized here andeach strategy is examined from the point ofview of a strategic business unit (SBU).
1. Perspectives of product strategies:product-positioning strategyDefinition: Placing a brand in that partof the market where it will have afavourable reception compared withcompeting brands.Objectives: (i) To position the productin the market so that it stands apart fromcompeting brands; (ii) to position theproduct so that it tells customers whatyou stand for, what you are, and howyou would like customers to evaluateyou. In the case of positioning multiplebrands: (i) To seek growth by offeringvaried products in differing segments ofthe market; (ii) to avoid competitivethreats.Requirements: Use of marketing mixvariables, especially communicationefforts. (i) Successful management of asingle brand requires positioning thetourism brand in the market so that itcan stand competition from the tough-est rival and maintaining its uniqueposition by creating the aura of a dis-tinctive tourism product. (ii) Successfulmanagement of multiple tourismbrands requires careful positioning inthe market so that multiple tourismbrands do not compete with or canni-balize each other. Thus it is importantto be careful in segmenting the marketand to position an individual tourismproduct as uniquely suited to a partic-ular segment through promotion.Expected results: (i) Meet as far as possi-ble the needs of the specific segment ofthe market; (ii) limit sudden changes insales; (iii) make customers faithful tothe brands.
2. Perspectives of product strategies:product-repositioning strategy
Definition: Reviewing the current pos-itioning of the product and itsmarketing mix and seeking a new posi-tion for it that seems more appropriate.Objectives: (i) To increase the life of theproduct; (ii) to correct an original pos-itioning mistake.Requirements: (i) If this strategy isdirected towards existing customers,repositioning is sought through promo-tion of more varied uses of the product.(ii) If the business unit wants to reachnew users, this strategy rquires that theproduct be presented with a differenttwist to the people who have not beenfavourably inclined towards it. In doingso, care should be taken to see that, inthe process of enticing new customers,current ones are not alienated. (iii) Ifthis strategy aims at presenting newuses of the product, it requires search-ing for latent uses; there are productsthat may be used for purposes not origi-nally intended.Expected results: (i) Among existingcustomers: increase in sales growth andprofitability; (ii) among new users:enlargement of the overall market, thusputting the product on a growth route,and increased profitability; (iii) newproduct uses: increased sales, marketshare and profitability.
3. Perspectives of product strategies:product-overlap strategyDefinition: Competing against one’sown brand through introduction ofcompeting products, use of privatelabelling.Objectives: (i) To attract more custom-ers to the product and thereby increasethe overall market; (ii) to work at fullcapacity and spread overhead; (iii) tosell to competitors, to realize economiesof scale and cost reduction.Requirements: (i) Each competing prod-uct must have its own marketingorganization to compete in the market;(ii) private brands should not becomeprofit drains; (iii) each brand shouldfind its special niche in the market. Ifthat doesn’t happen, it will create con-
147Segmentation, Targeting, Positioning and Strategic Marketing
fusion among customers and sales willbe hurt. (iv) In the long run, one of thebrands may be withdrawn, yielding itsposition to the other brand.Expected results: (i) Increased marketshare; (ii) increased growth.
4. Perspectives of product strategies:product-scope strategyDefinition: The product-scope strategydeals with the perspectives of the prod-uct mix of a company. Theproduct-scope strategy is determinedby taking into account the overall mis-sion of the business unit. The companymay adopt a single-product strategy, amultiple-product strategy or a system-of-products strategy.Objectives: (i) Single product: toincrease economies of scale by develop-ing specialization; (ii) multipleproducts: to cover the risk of potentialobsolescence of the single product byadding additional products; (iii) systemof products: to increase the dependenceof the customer on the company’s prod-ucts as well as to prevent competitorsfrom moving into the market.Requirements: (i) Single product: com-pany must stay up-to-date on theproduct and even become the technol-ogy leader; (ii) multiple products:products must complement one anotherin a portfolio of products; (iii) system ofproducts: company must have a closeunderstanding of customer needs anduses of the products.Expected results: Increased growth,market share and profits with all threestrategies. With system-of-productsstrategy, the company achievesmonopolistic control over the market,and enlarges the concept of its product/market opportunities.
5. Perspectives of product strategies:product-design strategyDefinition: The product-design strategydeals with the degree of standardizationof a product. The company has a choiceamong the following strategic options:standard product, customized product,
and standard product with modifica-tions.Objectives: (i) Standard product: toincrease economies of scale of the com-pany; (ii) customized product: tocompete against mass producers ofstandardized products throughproduct-design flexibility; (iii) standardproduct with modifications: to combinethe benefits of the two previous strate-gies.Requirements: Close analysis ofproduct/market perspectives and envi-ronmental changes, especiallytechnological changes.Expected results: Increase in growth,market share and profits. In addition,the third strategy allows the company tokeep close contacts with the market andgain experience in developing newstandard products.
6. Perspectives of product strategies:product-elimination strategyDefinition: Cuts in the composition of acompany’s business unit product port-folio by pruning the number of productswithin a line or by totally divesting adivision or business.Objectives: To eliminate undesirableproducts because their contribution tofixed cost and profit is too low, becausetheir future performance looks grim, orbecause they do not fit in the business’soverall strategy. The product-elimination strategy aims at shaping thebest possible mix of products and bal-ancing the total business.Requirements: No special resources arerequired to eliminate a product or adivision. However, because it is impos-sible to reverse the decision once theelimination has been achieved, an in-depth analysis must be done todetermine (i) the causes of current prob-lems; (ii) the possible alternatives, otherthan elimination, that may solve prob-lems (e.g. are any improvements in themarketing mix possible?); and (iii) therepercussions that elimination mayhave on remaining products or units(e.g. is the product being considered for
148 L. Moutinho

elimination complementary to anotherproduct in the portfolio? What are theside effects on the company’s image?What are the social costs of an elimina-tion?)Expected results: In the short run, costsavings and in some cases an improvedreturn on investment can be expected.In the long run, the sales of the remain-ing products may increase becausemore efforts are now concentrated onthem.
7. Perspectives of product strategies: new-product strategyDefinition: A set of operations thatintroduces (i) within the business, aproduct new to its previous line ofproducts; (ii) on the market, a productthat provides a new type of satisfaction.Three alternatives emerge from theabove: product improvement/modification, product imitation andproduct innovation.Objectives: To meet new needs and tosustain competitive pressures on exist-ing products. In the first case, thenew-product strategy is an offensiveone; in the second case, it is a defensiveone.Requirements: A new-product strategyis difficult to implement if a ‘new prod-uct development system’ does not existwithin a company. Five components ofthis system should be assessed: (i) cor-porate aspirations toward newproducts; (ii) organizational opennessto creativity; (iii) environmental favourtowards creativity; (iv) screeningmethod for new ideas; and (v) evalu-ation process.Expected results: Increased marketshare and profitability.
8. Perspectives of product strategies:diversification strategyDefinition: Developing unfamiliar prod-ucts and markets through (i) concentricdiversification (products introduced arerelated to existing ones in terms of mar-keting or technology); (ii) horizontaldiversification (new products are unre-lated to existing ones but are sold to the
same customers); and (iii) conglomeratediversification (products are entirelynew).Objectives: Diversification strategiesrespond to the desire for (i) growthwhen current products/markets havereached maturity; (ii) stability byspreading the risks of fluctuations inearnings; (iii) security when the com-pay may fear backward integration fromone of its major customers; and (iv)credibility to have more weight in capi-tal markets.Requirements: In order to reduce therisks inherent in a diversification strat-egy, a business unit should (i) diversifyits activities only if current product/market opportunities are limited; (ii)have good knowledge of the area inwhich it diversifies; (iii) provide theproducts introduced with adequatesupport; and (iv) forecast the effects ofdiversification on existing lines ofproducts.Expected results: (i) Increase in sales;(ii) greater profitability and flexibility.
9. Perspectives of product strategies:value-marketing strategyDefinition: The value-marketing strat-egy concerns delivering on promisesmade for the product or service. Thesepromises involve product quality, cus-tomer service and meeting timecommitments.Objectives: Value-marketing strategiesare directed towards seeking total cus-tomer satisfaction. It means striving forexcellence to meet customer expecta-tions.Requirements: (i) Examine customervalue perspectives; (ii) design pro-grammes to meet customer quality,service and time requirements; (iii)train employees and distributors todeliver on promises.Expected results: This strategy enhan-ces customer satisfaction, which leadsto customer loyalty and, hence, tohigher market share. This strategymakes the firm less vulnerable to pricewars, permitting the firm to charge
149Segmentation, Targeting, Positioning and Strategic Marketing

higher prices and, thus, earn higherprofits.
Tourism Pricing
Tourism pricing is a complex decision,made even more so by the variability of theproduct, the high degree of competition incertain tourist markets, and difficulties inaccurately forecasting the level of demand.The latter may vary not only due to thespecial characteristics of this industry, butalso due to factors such as weather, terror-ism, strikes, etc. As a result, there is no oneuniversally accepted pricing method, andthe approach can vary considerably fromone tourism organization to another. Despitethis, tourism pricing has received and con-tinues to receive increasing attention inrecent research and publications.
A number of basic characteristics of thetourist industry affect pricing, for example:
1. Perishability. As the touristic productcannot be stored for future use, thismeans that an unsold service/product isrevenue lost, which cannot be recoupedlater. This will influence the profitabil-ity of the tourism organization/establishment, especially when the highfixed costs incurred by the industry areconsidered.
2. Intensive capital investment. In mostinvestments in touristic facilities, up to90% of the capital is invested in fixedassets. Consequently, the level of fixedcosts is very high in relation to otherindustries. This affects pricing deci-sions as explained below.
3. The costs of intensive staff employed.The quality of the product of the tour-ism industry depends, to a large extent,on the number and quality of the staffemployed, and the special and profes-sional skills they need to deal withguest/staff relationships. Another prob-lem here is that most of the tourismestablishments and facilities are verydependent on occupancy levels at off-peak times, in order to justify theretention of staff at these periods.
4. Customer characteristics. Differenttouristic destinations will appeal differ-ently to various income groups andsocial classes, who will have differentpatterns of spending, of length of stay,and different sensitivities.
5. Competition. Fluctuating levels ofdemand and overall business condi-tions.
Pricing in tourism can be employed toattract new customers into the market orentice them from competitors. In areaswhere customers find it difficult to assessquality in advance of purchase, price can actas an indication of quality. As a result ofthis, some hoteliers, for example, haveexpressed the view that pricing can also beused as a device to control the marketingthrust of a hotel. For instance, if a hotelwants to get out of a particular market andconcentrate on another type of business, itcan adjust its rates accordingly.
Another possibility is price discrimina-tion by time. Now nearly all the major hotelgroups, airlines, travel organizations, etc.,offer various sorts of ‘bargain’ holidays, atdiscounts of up to 50% of the normal price.Weekend packages are the most popular, butwith the trend for increased holiday entitle-ments, mini-holidays in spring and autumnare growing in popularity and the long-termtrend is developing for second and thirdholidays.
Tourism pricing affects and is affected byfuture demand, so the impact must be con-sidered carefully: should one use a low priceinitially to encourage long-run demands,and as a weapon aimed at capturing marketshare from existing competitors and dis-couraging potential ones from entering?Alternatively, if the market situation ismonopolistic (this does happen, due to loca-tion, for example), should the price be high,aiming at gaining short-term profits and risk-ing attracting potential competitors? Thereare four basic factors that influence pricingdecisions:
1. Cost structure. In the long term, theprice of a touristic product or servicemust be higher than the full costs incur-red by the tourism organization.
150 L. Moutinho
2. Competition prices. These should betaken into account in formulating pricestrategies.
3. The price the customers/guests are‘willing to pay’, i.e. their relative elas-ticities of demand for the particulartour, holiday, touristic experience, etc.This factor has recently been labelled‘customer focus’ (Schliessel and Cha-sin, 1991). However, in using thecustomer focus approach, due consid-eration should be given to the level ofdemand that correlated with the break-even point, when fixing the price level.Also the customers’ price-demandschedule should be established.
4. Tourism organization’s objectives.Prior to deciding the pricing objectives,the tourist organization must identifyand quantify the potential demand forthe particular tourist establishment. Inorder to achieve this, a market feasi-bility study must be conducted whichshould examine a number of factorssuch as: the nature and extent of exist-ing facilities in a particular location,socioeconomic structure of potentialvisitors, potential business from indus-tries and other sources, infrastructure,the form of existing and proposed trans-port networks, etc. Market researchmust also be conducted to identify whoare, or will be, the customers at whomits strategies will eventually be targeted,and what needs they have in terms ofstandard of services, facilities, atmos-phere, location, etc.
The main pricing objectives in the tourismindustry are:
1. Profit maximization. This is the mostcommonly cited pricing objective,because it (i) acts as a measurement ofmanagement efficiency; (ii) providescashflows; and (iii) in the hotel indus-try, it can be used to compensate forlower income in the off-peak season.
2. Maximization of return on investment.This is very important in the tourismindustry, which normally has a veryhigh level of fixed costs.
3. Survival. This objective is applicablewhere low levels of demand are experi-enced due to seasonality, intense orsuperior competition, economic reces-sion, etc. Examples include cheapholiday packages for off-season periods,and cost cutting exercises such as theones undertaken by, say, Spanish hotelsfollowing a period of very high labourinflation which resulted in a trendtowards self-service buffets, instead ofthe usual sit-down meals.
4. Volume of sales.● Maximizing occupancy. This is
closely connected with profitability;unsold beds mean lost profits. Theyield and management approach(see Table 5.1) is particularly rele-vant here.
● Stable occupancy. Again this isaimed at achieving high sales whichare connected with profitability, butin this case increased occupancymay have to be achieved throughlow rates and special discounts forlong stays; certain hotels offer par-ticularly low rates to guests stayinglong periods during the winter sea-son; airport hotels operate special(lower) prices at weekend whenoccupancy tends to fall sharply.
ImplementationIn the tourism industry, fixed costs are noto-riously high, therefore the strategic pricingis high. Yet, in periods of recession, touristestablishments often use pricing as a tacticalshort-term strategy, too. It should thereforebe expected that the pricing systems used inpractice are found to be market oriented.Traditionally this has not been the case, asmore formal cost-oriented pricing structureshave been used, such as those outlinedbelow.
Cost-plusThis method calculated the price on thebasis of variable costs to which is added acertain percentage which is regarded as cov-ering other fixed costs and providing asatisfactory profit margin. Typically anoperator will set this percentage on known
151Segmentation, Targeting, Positioning and Strategic Marketing
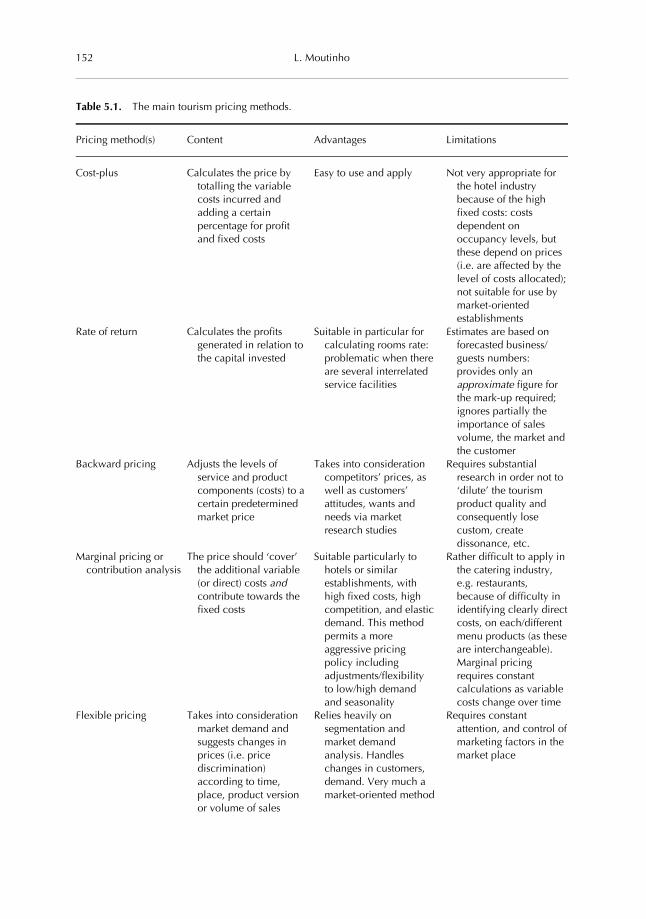
Table 5.1. The main tourism pricing methods.
Pricing method(s) Content Advantages Limitations
Cost-plus Calculates the price bytotalling the variablecosts incurred andadding a certainpercentage for profitand fixed costs
Easy to use and apply Not very appropriate forthe hotel industrybecause of the highfixed costs: costsdependent onoccupancy levels, butthese depend on prices(i.e. are affected by thelevel of costs allocated);not suitable for use bymarket-orientedestablishments
Rate of return Calculates the profitsgenerated in relation tothe capital invested
Suitable in particular forcalculating rooms rate:problematic when thereare several interrelatedservice facilities
Estimates are based onforecasted business/guests numbers:provides only anapproximate figure forthe mark-up required;ignores partially theimportance of salesvolume, the market andthe customer
Backward pricing Adjusts the levels ofservice and productcomponents (costs) to acertain predeterminedmarket price
Takes into considerationcompetitors’ prices, aswell as customers’attitudes, wants andneeds via marketresearch studies
Requires substantialresearch in order not to‘dilute’ the tourismproduct quality andconsequently losecustom, createdissonance, etc.
Marginal pricing orcontribution analysis
The price should ‘cover’the additional variable(or direct) costs andcontribute towards thefixed costs
Suitable particularly tohotels or similarestablishments, withhigh fixed costs, highcompetition, and elasticdemand. This methodpermits a moreaggressive pricingpolicy includingadjustments/flexibilityto low/high demandand seasonality
Rather difficult to apply inthe catering industry,e.g. restaurants,because of difficulty inidentifying clearly directcosts, on each/differentmenu products (as theseare interchangeable).Marginal pricingrequires constantcalculations as variablecosts change over time
Flexible pricing Takes into considerationmarket demand andsuggests changes inprices (i.e. pricediscrimination)according to time,place, product versionor volume of sales
Relies heavily onsegmentation andmarket demandanalysis. Handleschanges in customers,demand. Very much amarket-oriented method
Requires constantattention, and control ofmarketing factors in themarket place
152 L. Moutinho

industry practice or by analysis and projec-tion of the market conditions. This methodis easy to use and apply, but it has a numberof drawbacks, especially so for the accom-modation sector of the tourism industry.The cost-plus method does not take intoaccount demand for the product/service.This method of pricing is appropriate forcost-oriented industries, but not so formarket-oriented ones. There is little justifi-cation in using it for hotel rooms, forexample, since a room selling for, say, £96may have a direct cost of less than £16.
Rate of return
Those concerned with financial analysiswill argue that the true function of a tourist
enterprise, be it an airline or a restaurant, isto provide a satisfactory return on the capi-tal invested. Therefore, whereas thecost-plus method concentrates on the costsassociated with running the business, therate of return method concentrated on theprofits generated in relation to the capitalinvested. The criticism of rate of return pric-ing is that it is a rather mechanistic, rigidand unduly profit-oriented approach. Itignores more factors influencing pricing pol-icy, e.g. the importance of sales volume. Itsapproach to pricing problems is thereforetoo simple to be realistic. Its greatest failureis that it loses sight of the customer andmarket demand generally. Thus in a market-oriented business it cannot be whollyacceptable.
Table 5.1. continued
Pricing method(s) Content Advantages Limitations
Trial and error pricing Raising or lowering theprice on a randombasis, whilecontinuouslymonitoring customers’reactions and adaptingthe price accordingly inorder to maximizedepartmentalcontribution
Takes account of thecompetition; attempts tooptimize profits in theshort term
Customers’ reactions donot occur in asufficiently short periodof time to facilitateadequate changes inprices. In practice, it isdifficult to assesscustomers’ attitudes toprices as theirperceptions changeover time
Market penetrationpricing
Setting prices at a levellower than the marketin order to capture themarket share
Offer economies of scaleboth in production andin marketing
The tourism organizationshould or could expect‘retaliation’ fromcompetitors; if themarket penetration isnot successful, lowlevels of profitabilitywill be achieved.
Skimming pricing Setting a particularly highprice to indicate ahighly differentialproduct
Suitable when there is astrong inelastic demandfor, say, a certaintourism facility, withlimited (or weak)competitors
It is very difficult tooperate this price policyfor a long period oftime, as alternatives aredeveloped bycompetitors
Yield and revenue Evaluate sales and pricingalternatives in terms ofrevenue maximization
Increase the amount ofmoney (income) fromexisting demand (seeDunn and Brooks,1990)
Is ineffective for long-termpricing decisions
153Segmentation, Targeting, Positioning and Strategic Marketing

Backward pricingThis method of pricing adopts the procedureof going from price (normally that of a com-petitor) to cost. It starts with apredetermined market price and a givenspecified profit, and it then attempts to ach-ieve the latter by adjusting variable serviceand qualitative aspects to reduce costs. Assuch it must be used with care, as a thoroughanalysis of attitudes, psychology andrequirements of the tourist customer mustbe made before price selection, while mak-ing allowance for existing or potentialcompetition and for the psychologicaleffects of pricing in implying quality lev-els.
Marginal pricingThe marginal cost approach to pricing deci-sions recognizes that decision-making isessentially a process of choosing betweencompeting alternatives, each with its owncombination of income and costs. By esti-mating the demand curve for a particularproduct, it is possible to see what wouldhappen to total profits if the selling pricesare raised or lowered.
Such an approach could be useful in ahighly competitive industry with corre-sponding elastic demand and a high ratio offixed to variable costs. In such an industry, itis possible to set a range of prices all ofwhich are economically possible, i.e. eachprice generates enough revenue to covertotal costs and provide some profit. The cru-cial question to be answered here is, whatprice would maximize total contribution tofixed costs and profits? This is a useful tech-nique for industries with high fixed costs,like tourism. Marginal pricing has beenrecently used extensively by certain smalland middle sized hotels that were badlyaffected by the world recession and fallingdemand.
Marginal pricing permits a more aggres-sive pricing policy, by segmenting themarket and using product differentiation togain advantage of the different layers of con-sumer demand, and for selecting the mostprofitable pricing when capacity is limited,as, for example, in the peak season.
Flexible pricing
This method takes into consideration themarket demand and enables discriminationaccording to time, place, version or volume.Although clearly the most profitable way toprice is according to what the market willbear, it is not always easy to discover thecorrect level, and in the process, some costlymistakes may be made. ‘Charging what themarket will bear’ comes down to segmentingthe market and producing different pricesfor the different segments based on will-ingness and ability to pay. In other words,this is price discrimination. Several types ofdiscrimination are possible in the hotelindustry.
1. Discrimination by time. This is applica-ble where there are peaks and troughs ofdemand, e.g. hotels and airlines chargemore at peak holiday times and may beprepared at off-peak to accept low pri-ces that merely make a contribution tothe necessary costs of keeping a hotelready for business. This is a way ofmaintaining necessary services andretaining reliable and quality staff.Additionally, it can be argued that sig-nificant amounts of business can begenerated in other departments, e.g.from sales of food or beverages, result-ing from accommodation bookings, andthus it might even be feasible to acceptaccommodation tariffs below variablecosts.
2. Discrimination by place. An example ofthis could be hotel rooms with a bal-cony overlooking the sea, commandinghigher prices than the ones overlookingthe service yard or in close proximity tothe hotel’s disco.
3. Discrimination by product/service ver-sion. Hotel rooms with a bath can becharged at a higher rate than thosewithout.
4. Discrimination by volume. Here we areconcerned with volume and quantitydiscounts where end-users are con-cerned, e.g. in the case of tour operators,care must be taken that the actual book-ings reach their promised level,
154 L. Moutinho

otherwise concessions are not related tothe size of the booking.
Market penetration This involves setting a price below that ofthe market of competition to capture cus-tomers in the hope that prices may be raisedat a later date while retaining a high propor-tion of the custom that has been built up.This approach offers economies of scaleboth in production and in marketing.
SkimmingIn tourism this may be applied to a verydifferentiated product, such as new trans-portation method, or a new destination,where premium prices may be charged.Indeed, this pricing policy could be adoptedonly in circumstances where a strong (orinelastic) demand exists for the touristicproducts offered. Ownership of a certainunique location often offers an opportunityto charge particularly high prices.
Yield and revenueThis method attempts to maximize revenueby increasing the revenue from the existinglevel of demand. It is suitable (and used)particularly as a short-term approach.
AssessmentAn assessment of the various pricing meth-ods and techniques available in tourism ispresented in Table 5.1. Pricing is one of themost important elements in the tourismmarketing mix. Tourism customers rate theproduct at a price and without price there isno indication of value. Pricing decisions aretherefore essential for the profitability of thetourist establishment, as it has a tremendousimpact on demand and sales volume. Pric-ing is also often considered to be anindication of quality.
Setting the price is a critical decision forany tourism establishment. It is easy to dis-cover when a product is underpriced. Thepsychology of price is important in deter-mining a person’s price/value relationship.Attitudes to price also relate very closely tothe amount of risk the buyer feels isinvolved in the purchasing decision. For allthese reasons, cost-based methods of settingtourism prices can be dangerous; their real
value is in determining lower limits ofprice.
Although the pricing element is the mostimportant one of the marketing mix in termsof profitability, pricing cannot be seen inisolation from the other elements. Pricingmust be viewed as an integral part of themarket process and the interrelationshipwith the other elements in the mix must betaken into consideration. Recently, the infla-tion impact on tourism pricing has receivedsome attention (Arbel and Woods, 1991).The hotel industry, for example, was con-sidered to be inflation proof, because of itsability to raise room rates. Obviously, intoday’s economy, hotels should try to avoidsimplistic approaches. Instead, they couldemploy yield and revenue management(Dunn and Brooks, 1990).
Some of the pricing methods presentedabove are particularly suitable to small tour-ist enterprises and operators; examples arethe cost-plus method, marginal pricing tech-nique and market penetration pricing.However, even small tourism businesses, indeveloping a pricing policy, must carry outthe following before arriving at a decision.
1. Undertake a market feasibility studyand market research to determine:● the customers and the nature of the
demand;● the quality/quantity of the product/
service required and its costingelements;
● the nature of the competition;● the price that the customers are
‘willing to pay’ for the product inquestion.
2. Set clear pricing objectives (e.g. attain acertain level of return/profitability,sales/volume occupancy level(s), sur-vival, etc.).
3. The price strategies selected dependhighly on the customers serviced, thesmall tourist organization strengths andweaknesses, the opportunities andthreats in the market place, the competi-tion, and certain tourismnon-controllable marketing variables,e.g. weather, government interventionand regulation of tourism activities,
155Segmentation, Targeting, Positioning and Strategic Marketing

economic circumstances (e.g. inflation,unemployment), etc.
With the increase in computerization, anincreasing number of hotels and restaurantsanalyse the profitability of operations byindividual menu items, meal periods (e.g.breakfast vs. banquet business), or catego-ries of menus. A ‘profit and loss’ account forevery meal can be developed. This approachis particularly suitable for relatively smallestablishments and enables the manager tokeep an eye on the profitability of the restau-rant business (Meidan, 1994).
Dimensions of pricing strategiesStrategically, the function of pricing hasbeen to provide adequate return on invest-ment. Thus, the timeworn cost-plus methodof pricing and its sophisticated version,return-on-investment pricing, have histor-ically been the basis for arriving at price.Pricing is an important part of marketingstrategy. Despite the importance attached toit, effective pricing is not an easy task, evenunder the most favourable conditions. Alarge number of internal and external vari-ables must be studied systematically beforeprice can be set. For example, the reactionsof a competitor often stand out as an impor-tant consideration in developing pricingstrategy. Simply knowing that a competitorhas a lower price is insufficient; a price strat-egist must know how much flexibility acompetitor has in further lowering price.This presupposes a knowledge of the com-petitor’s cost structure.
In the dynamics of today’s environment,however, where unexpected economicchanges can render cost and revenues pro-jections obsolete as soon as they aredeveloped, pricing strategy is much moredifficult to formulate. This section now pro-vides a composite of pricing strategies forproducts. Each of five strategies is examinedfor its underlying assumptions and rele-vance in specific situations.
Perspectives on pricing strategies: pricestrategies for new products
1. Skimming pricingDefinition: Setting a relatively high
price during the initial stage of a prod-uct’s life.Objectives: (i) To serve customers whoare not price conscious while the mar-ket is at the upper end of the demandcurve and competition has not yetentered the market; (ii) to recover a sig-nificant portion of promotional andresearch and development coststhrough a high margin.Requirements: (i) Heavy promotionalexpenditure to introduce product, edu-cate consumers, and induce earlybuying; (ii) relatively inelastic demandat the upper end of the demand curve;(iii) lack of direct competition and sub-stitutes.Expected results: (i) Market segmentedby price-conscious and not so price-conscious customers; (ii) high marginon sales that will cover promotion; (iii)opportunity for the firm to lower itsprice and sell to the mass market beforecompetition enters.
2. Penetration pricingDefinition: Setting a relatively low priceduring the initial stages of a product’slife.Objective: To discourage competitionfrom entering the market by quickly tak-ing a large market share and by gaining acost advantage through realizing econo-mies of scale.Requirements: (i) Product must appealto a market large enough to support thecost advantage; (ii) demand must behighly elastic in order for the firm toguard its cost advantage.Expected results: (i) High sales volumeand large market share; (ii) low marginon sales; (iii) lower unit costs relative tocompetition due to economies of scale.
Perspectives on pricing strategies: pricestrategies for established products
3. Maintaining the priceDefinition: The price is kept at exactlythe same level.Objectives: (i) To maintain position inthe marketplace (i.e. market share, prof-itability, etc.); (ii) to enhance publicimage.
156 L. Moutinho

Requirements: (i) Firm’s served marketis not significantly affected by changesin the environment; (ii) uncertaintyexists concerning the need for or resultof a price change.Expected results: (i) Status quo for thefirm’s market position; (ii) enhance-ment of the firm’s public image.
4. Reducing the priceDefinition: The price is decreased froma previous level.Objectives: (i) To act defensively andcut price to meet the competition; (ii) toact offensively and attempt to beat thecompetition; (iii) to respond to a cus-tomer need created by a change in theenvironment.Requirements: (i) Firm must be finan-cially and competitively strong to fightin a price war if that becomes necessary;(ii) must have a good understanding ofthe demand function of its product.Expected results: Lower profit margins(assuming costs are held constant).Higher market share might be expected,but this will depend on the price changerelative to competitive prices and onprice elasticity.
5. Increasing the priceDefinition: The price is increased com-pared with a previous level.Objectives: (i) To maintain profitabilityduring an inflationary period; (ii) to takeadvantage of product differences, realor perceived; (iii) to segment the currentserved market.Requirements: (i) Relatively low priceelasticity but relatively high elasticitywith respect to some other factor suchas quality or distribution; (ii) reinforce-ment from other ingredients of themarketing mix; for example, if a firmdecides to increase price and differen-tiate its product by quality, thenpromotion and distribution mustaddress product quality.Expected results: (i) Higher sales mar-gin; (ii) segmented market (priceconscious, quality conscious, etc.); (iii)possibly higher unit sales, if differentia-tion is effective.
Promotion
The pattern of international travel and tour-ism demand, and its change over time, isquite pronounced. The determinants of thispattern are potentially many and varied, asevidenced by the large number of empiricalstudies which have been undertaken overthe last three decades. Destinations attemptto influence this pattern through their pro-motional activities in foreign countries.Many countries have substantiallyincreased their spending on such promo-tions in recent years as international tourismhas become much more lucrative and com-petitive.
The promotion of countries as touristdestinations has intensified considerably. Inmore recent years, however, national tour-ism organizations (NTOs) in particular havecome under increased scrutiny to demon-strate the success of their promotionalcampaigns and thereby to justify industryand government funding. However, the linkbetween promotion and demand is not easyto measure. Organizations which must com-pete for their survival know that promotionis important, but only vaguely understandhow promotion works. There is a sense that,while some promotion can be highly effec-tive, promotion involves much guess-work,‘gut feel’, and trial and error. Indeed, somepromotion is probably quite ineffective, butit is very difficult to really know what doesand doesn’t work because so many influ-ences can affect demand that, unless thepromotion is subject to experimental con-trol, it is almost impossible to apportion thevariance in demand to its possible causes.
The promotion of international tourismInternational tourism is promoted in a widevariety of ways by a wide variety of organi-zations. Airlines, travel agents, touroperators, resorts, convention and visitorbureaux, hotels and NTOs, for example,promote international travel and tourismindividually and in collaborative arrange-ments.
Promotion might be targeted at eitherconsumers or the travel trade. Consumer
157Segmentation, Targeting, Positioning and Strategic Marketing

promotions have typically relied on bro-chures and print advertising in newspapersand magazines. For some time airlines haveused television as the medium and morerecently, the budgets of NTOs have enabledthe mass television advertising of destina-tions. Publicity has been used to great effectas well. Many countries operate a pro-gramme for visiting journalists. Suchprogrammes have been found to be partic-ularly cost-effective, and can generatepublicity which, in value, exceeds the totalannual budget of the sponsoring NTO.
Trade promotions have also becomeincreasingly important. Travel trade shows,and corporate, incentive, and conventiontravel markets have grown in significance.Governments have opened travel offices inmajor origin markets, hence, the full promo-tional mix (advertising, sales promotion,personal selling, and publicity) is now usedextensively to promote international traveland tourism.
The main marketing function of NTOs isthe promotion of inbound internationaltourism, although promotion is only oneelement of the marketing mix. As interna-tional travel and tourism has grown, thepromotional budgets of NTOs have risensignificantly (Lavery, 1992). The entire pro-motion programme – objectives, creativecontent of messages and format, selection ofmedia and the budget – should followdirectly from marketing objectives and helpto achieve them. In this way, the marketingplan ensures that promotion is coordinatedwith marketing strategy. Advertising shouldinfluence the tourist’s assessment of thetourist product’s performance on a givenattribute, or on the combination of productattributes regarded as ‘ideal’. The messagesmust create or reinforce existing positiveattitudes or images and correct negativeattributes or image elements.
In terms of media planning, the touristcompany should deal with a basic question:which medium delivers the most key pro-spects at the lowest cost within a supportiveeditorial environment? The relative cost-effectiveness of the differentcommunication channels is also an impor-tant factor to be evaluated. Advertising and
sales promotion activities in tourism areeven more effective when supplemented bypublicity and personal selling.
Developing advertising strategiesA number of factors must be considered indeveloping advertising strategies. Onemodel of advertising strategy identifies fivekey elements, presented below:
1. Driving force: the value orientation ofthe advertising strategy; the end goal orvalue on which the advertising isfocused.
2. Consumer benefits: the key positiveconsequences for the consumer that areto be communicated in the advertise-ment, either visually or verbally.
3. Message elements: the concrete orabstract product attributes or featuresthat are to be communicated in theadvertisement, either verbally or visu-ally.
4. Leverage point: the specific way inwhich the value or end goal is linked tothe specific features of the advertise-ment; the ‘hook’ that activates or tapsinto the driving force.
5. Executional framework: all the detailsof the advertising execution – models,clothes used, setting – as well as theoverall scenario or action plot; theadvertisement’s overall theme or style;the vehicle for communicating themeans-end message.
Each of these advertising strategy factorsrequires many decisions by marketing andadvertising agency personnel. As we haveseen, the first step in developing an advertis-ing strategy is to analyse theconsumer/product relationship. Means-endmeasures of consumers’ knowledge struc-tures are useful for this purpose. From ameans-end perspective, the end goals orvalues that consumers seek to achieve arethe key to developing effective advertisingstrategies. The marketer must select the keyvalue, end state, goal or benefit to be com-municated in the advertisement. Then, themarketer must determine how the advertise-ment will communicate that the product canachieve or satisfy this end goal or value.
158 L. Moutinho

The attribute, consequence and valuelevels of product knowledge in a means-endchain are directly related to three of themajor decision elements of advertising strat-egy. Knowing consumers’ salient productattributes help marketers decide which mes-sage elements to include in anadvertisement. Data about the importantfunctional consequences consumers per-ceive can help identify the key consumerbenefits to be communicated. Values or endgoals are directly related to the driving forceof the advertising strategy.
Finally, developing the executionalframework and the leverage point requiresselecting and putting together the specificexecutional aspects of an advertisement –the product attributes mentioned or shown,the models used, the camera angles, the plot,the various cuts to different scenes, etc. – toeffectively communicate the connectionbetween the product and the basic goals andvalues the consumer is seeking. These deci-sions require creative imagination that canbe guided by means-end data. This is a con-venient framework that organizes and givesfocus to the many decisions. Generally, itshould produce more coherent and effectiveadvertising that communicates completemeans-end meanings.
Dimensions of promotion strategiesPromotion strategies are concerned with theplanning, implementation and control ofpersuasive communication with customers.The first strategic issue involved here is howmuch money may be spent on the promotionof a specific tourism product/market. Thedistribution of the total promotional budgetamong advertising, sales promotion and per-sonal selling is another strategic matter. Theformulation of strategies dealing with thesetwo issues determines the role that eachtype of promotion plays in a particular sit-uation.
Clear cut objectives and sharp focus ontarget customers are necessary for an effec-tive promotional programme. An integratedmarketing communication plan consistingof various promotional methods should bedesigned to ensure that customers in a tour-ist product/market cluster get the right
message and maintain a long-term cordialrelationship with the organization. Promo-tional strategies must also be properlymatched with product, price and distribu-tion perspectives.
The amount that a tourism company mayspend on its total promotional effort, whichconsists of advertising, sales promotion andpersonal selling, is not easy to determine.There are no unvarying standards to indi-cate how much should be spent onpromotion in a given tourist product/marketsituation. This is so because decisions aboutpromotion expenditure are influenced by acomplex set of circumstances. This sectionnow provides a set of promotion strategies.Four strategies are examined for their under-lying assumptions and relevance.
1. Perspectives on distribution strategies:promotion-expenditure strategyDefinition: Determination of theamount that a company may spend onits total promotional effort, whichincludes advertising, personal sellingand sales promotion.Objective: To allocate enough funds toeach promotional task so that each isutilized to its fullest potential.Requirements: (i) Adequate resources tofinance the promotion expenditure; (ii)understanding of the products/servicessales response; (iii) estimate of the dura-tion of the advertising effect; (iv)understanding of each product/marketsituation relative to different forms ofpromotion; (v) understanding of com-petitive response to promotion.Expected result: Allocation of sufficientfunds to the promotional tasks toaccomplish overall marketing objec-tives.
2. Perspectives on distribution strategies:promotion mix strategyDefinition: Determination of a judiciousmix of different types of promotion.Objective: To adequately blend thethree types of promotion to comple-ment each other for a balancedpromotional perspective.Requirements: (i) Product factors: (a)nature of product, (b) perceived risk; (ii)
159Segmentation, Targeting, Positioning and Strategic Marketing

market factors: (a) position in the lifecycle, (b) market share, (c) industry con-centration, (d) intensity of competition,and (e) demand perspectives; (iii) cus-tomer factors: (a) household versusbusiness customers, (b) number of cus-tomers, and (c) concentration tocustomers; (iv) budget factors: (a) finan-cial resources of the organization, and(b) traditional promotional perspec-tives; (v) marketing mix factors: (a)relative price/relative quality, (b) dis-tribution strategy, (c) brand life cycle,and (d) geographic scope of the market;(vi) environmental factors.Expected result: The three types of pro-motion are assigned roles in a way thatprovides the best communication.
3. Perspectives on distribution strategies:media-selection strategyDefinition: Choosing the channels(newspapers, magazines, television,radio, outdoor advertising, transitadvertising, and direct mail) throughwhich messages concerning a product/service are transmitted to the targets.Objective: To move customers fromunawareness of a product/service, toawareness, to comprehension, to con-viction, to the buying action.Requirements: (i) Relate media-selection objectives to product/marketobjectives; (ii) media chosen shouldhave a unique way of promoting thebusiness; (iii) media should bemeasure-minded not only in frequency,in timing, and in reaching the targetaudience but also in evaluating thequality of the audience; (iv) base mediaselection on factual not connotationalgrounds; (v) media plan should be opti-mistic in that it takes advantage of thelessons learned from experience; (vi)seek information on customer profilesand audience characteristics.Expected result: Customers are movedalong the desired path of the purchaseprocess.
4. Perspectives on distribution strategies:advertising-copy strategy
Definition: Designing the content of anadvertisement.Objective: To transmit a particularproduct/service message to a particulartarget.Requirements: (i) Eliminate ‘noise’ for aclear transmission of message; (ii) con-sider importance of (a) sourcecredibility, (b) balance of argument, (c)message repetition, (d) rational versusemotional appeals, (e) humour appeals,(f) presentation of model’s eyes in pic-torial ads, and (g) comparisonadvertising.Expected result: The intended messageis adequately transmitted to the targetaudience.
Tourism Distribution
The main function of a distribution systemis to extend the number of points of sale oraccess, away from the location at which ser-vices are performed or delivered. In thissense at least, the function of distribution isthe same for tourism products as it is forphysical goods. Still, an important second-ary function of services distribution is tofacilitate the purchase of products inadvance of their production.
The most crucial question for tourismdistribution analysis is what channels arethe most productive and whether a newchannel strategy is needed. A distributionstrategy involves determining the best wayin which the industry will try to sell itsproducts to designated end markets. Theleading factors for a tourism distributionpolicy to be effective are the market cov-erage, the costs of distribution involved, andthe effectiveness in generating sales in termsof motivation and image of the channels.The distribution strategy must be supportedby information services, publicity material,training seminars, joint special promotionsand trade advertising.
The allocation of available marketingfunds among the various components of thetourism marketing mix (advertising, public-ity, travel agents’ commissions, discountcoupons, pre-opening campaigns, new
160 L. Moutinho

product development, research, etc.) shouldbe determined. For tomorrow’s tourism mar-keting strategies, the name of the game will,above all, be how to achieve a sustainablecompetitive advantage.
The evolving role of tour operatorsTour operators function as intermediaries inthe tourism distribution system linking pro-ducers and consumers. Their expertise inpackaging tourism products allows for moreofferings to a wider range of tourists. Touroperators handle all the details of foreigntravel allowing the foreignness of the desti-nation to be observed but not trulyexperienced. Tour operators often negotiatediscount fares for package tours with metro-politan enterprises.
The ability of tour operators to combinetravel products and offer them to customersat prices generally lower than those avail-able to individuals provides travel economyand convenience for a significant segment oftourists. Product packaging and sellingthrough operators represents a significantportion of the international travel business.A tour operator will have more influence inthe travel decision process and hencebecome more important both to the travellerand destination area the greater the distancefrom point of visitor origin to destination.They are often the first and most influentiallink in the tourist flow chain.
The dependence of developing countrieson foreign tour operators derives fundamen-tally from the expertise of these operators asproducers and wholesalers of tourism-related services, their knowledge of themarket, particularly the international mar-ket, and their access to the relevantcomplementary services whereby a totalpackage of tourism-related services can beprovided. For example, tourists depend ontour operators as sources of, presumably,expert information about product qualityand consumption expectations.
We can identify three areas where touroperators provide necessary services to bothtravellers and developing countries. Touroperators are considered specialists in mar-keting and distribution of tourist-relatedservices and can achieve higher sales vol-
umes than single service providers. Second,given the high price elasticity of demand forinternational travel, the ability of tour opera-tors to obtain low cost charters is crucialand, finally, tour operators can arrange pack-ages that can be mass marketed on the basisof their brand name and quality assurance.In other words, tour operators are able toreduce economic distance (low cost char-ter), cultural distance (providing completepackages), and increase quality of host ser-vices (brand name and quality assurance).The resistance component of demand isthereby reduced, resulting in an increase intotal demand.
Another important role of tour operatorsis as a gatekeeper of information. Touroperators provide information about desti-nations even if travellers do not choose touse their services. This source of informa-tion can be considered as an induced imageformation agent critical to the perceptionstravellers hold about different destinationareas. Murphy (1983) agrees that informa-tion dissemination by tour operatorscontributes to the image travellers holdabout certain areas. McLellan and Foushee(1983) argue that country images to a greatextent work to influence the image held bytour operators and ultimately their clients.The role tour operators provide by distribut-ing information organizes the informationsearch process for the individual. Externalsources of information are minimized for theindividual if they choose to use the servicesof a tour operator.
In most industries the supplier or pro-ducer has full or at least decisive controlover the product including pricing, qualityand the manner in which it is distributed.Tourist service providers are an exception.According to Hawkins and Hudman (1989),the distribution sector of tourism is muchstronger and travel intermediaries have fargreater power to influence and direct con-sumer demand when compared with theircounterparts in other industries. The dis-tribution channel in tourism creates the linkbetween the producers of tourism servicesand their customers. Often tour operatorsare the distribution link and the channelbetween producers and consumers of inter-
161Segmentation, Targeting, Positioning and Strategic Marketing

national tourism products. Since tourismproducts are experiential and consumed onsite, tour operators are an integral link in thedistribution system (Morrison, 1989).Unlike other products which flow from pro-ducer to consumer, tourists flow to theproduct. This inverted distribution systemrelies on intermediaries to perform muchmore than simple delivery services.
In competing for customers, tour opera-tors must include destination attractivenessas one of the intangible qualities they market(Whipple and Thach, 1988). However, theoperators are concerned about the overalltourism experience for their clients and thiscan be affected by inefficient in-country ser-vices. Also, difficulty in obtaining services,which have higher than expected prices,may lead to destination substitution. Tour-ism demand could be increased by reducingeconomic distance for tour operators. Themore difficult it is to obtain needed informa-tion, reserve domestic airline space or bookblocks of hotel rooms, the more time-consuming and expensive it becomes fortour operators.
Questions that need to be addressedimmediately include:
● Are there measures which can be under-taken to improve the services forinternational tour operators?
● Are there opportunities for govern-ments in particular and all developingcountries in general to provide informa-tion and assistance in obtaining neededservices directly to tour operators,thereby reducing dependency on metro-politan enterprises?
● Are tour operators’ expectations of dis-count fares and preferential bookingsrealistic and in keeping with sustain-able development policies?
● What role does the government and pri-vate sector play in the provision ofservices to international tour opera-tors?
As an operator increases their business inthe country they are more likely to be con-fronted with increasing problems ofsecuring adequate services.
Travel intermediaries and the impact ofinformation technology
Computer reservation systems affiliatedwith vendor airlines have become known asglobal distribution systems (GDSs) andthose affiliated with non-vendor airlines arecalled computer reservation systems (CRSs).All GDSs provide important electronic dis-tribution channels for a variety of travelproducts. Travel agents are the most ubiqui-tous travel intermediaries varying in sizefrom multinational, multi-branch mega-agencies to small, independently ownedoffices.
Travel agencies have an unusual relation-ship with the Internet. It is both a threatsince it could remove much of their busi-ness, but it also provides additionalbusiness opportunities. Some travel agen-cies offer services on the World Wide Web,giving them a much broader geographic con-sumer base than if they operatedtraditionally. Travel agents can also use it asan important research tool in addition totheir GDS. This may be particularly impor-tant in the future as some travel productsbecome available only via the Internet. OfUnited States travel agents, 60% use theInternet to research products and destina-tions, 55% use it to receive e-mail fromclients, and 23% use it to make bookings forclients. In addition, 29% have set up a homepage on the Web and 42% access newsgroups through the Internet (Harris, 1996).
Tour packages are traditionally distrib-uted using brochures. Computers can assistin in-house brochure creation with the useof desktop publishing software. Brochures,however, represent a significant expense foragents and so many are looking to distributebrochures to agents electronically usinghigh band width data communicationslines, thus allowing full colour pictures andtext to be transmitted to an agent’s terminal.Integrated services digital network (ISDN) isan example of a technology that could facili-tate electronic brochure distribution.Reservations are then transmitted back tothe tour operator reservation system directlyfrom the travel agent’s terminal.
Electronic distribution of tour packagescan also be done with CD-ROMs, videotext,
162 L. Moutinho

GDS, or the World Wide Web. Many touroperators also place their inventory on theGDS as a way of facilitating travel agentbookings. Tour operators with their own res-ervation system can connect to systems suchas Tourlink, Tour Source or Leisure Shop-per, which are features accessible to GDSusers. On-line bookings for tour packagesare likely to be small because of the sig-nificant financial outlay that many tourpackages represent compared with othertravel products.
Much debate has ensued in the last fewyears about the continued viability of travelintermediaries, particularly in the light ofnew technological developments. Con-sumer access to travel databases creates animmediate threat to the existence of travelintermediaries as consumers book andresearch their own trips. The rapid growthof the Internet, the World Wide Web andother public access networks is having aprofound impact on travel product distribu-tion and therefore on travel intermediaries.
Travel intermediaries can respond to thisthreat in numerous creative ways. For exam-ple, many travel agents and tour operatorsnow offer their services to consumers on theInternet, significantly increasing their geo-graphical reach. Some travel agencies existsolely on the Internet, realizing that physicallocation is irrelevant in today’s electronicmarket place. In the future, as consumerbooking over the networks becomes easier,travel intermediaries will have to continu-ously redefine themselves. Travel is theInternet’s second largest convenience areaafter computer technology.
Additional methods allowing consumersto access travel information and databasesare:
● Automated ticket machines (ATMs).● Interactive television. This is a relative
of videotext, except that the commu-nication links are faster and able tohandle multimedia information whichis not the case with videotext. Inter-active TV systems are still in thedevelopment phase, but offer significantpotential for the travel industry. Thegraphical user interfaces and touch
screens are a vast improvement overtyped interfaces, but voice input andrecognition is the next step in makingcommunication with a computer easier.Research has shown that video confer-encing is expected to decrease thedemand for domestic air travel in theUSA by 12–16% by 2030. A Europeanstudy estimates similar trip reductionsof 13–23%.
● Electronic auctions. For example,United Airlines uses electronic auctionsto sell seats due to overbooking or whenit has empty capacities on its flights.
Vertical integration is also occurring astravel agents and tour operators are acquir-ing airlines, and airlines are acquiringhotels, for example. This vertical integrationmay be prompted by information technol-ogy in the sense that companies may want toleverage their investments in computer res-ervation technology across numerous anddiverse operations.
If future decisions on technology arebased solely on cost and convenience, moretechnology than is appropriate may beimplemented, leaving the industry lesseffective in the long run. All sectors of tour-ism must carefully examine theiroperations, strategic direction and customerneeds when deciding to implement newtechnologies. Over time, trends will cer-tainly emerge. At the present time, theproportion of travellers using electronicchannels is currently in the minority. How-ever fast the growth, it seems there willalways be a significant proportion who con-tinue to choose to use travel agents(Sheldon, 1997).
Dimensions of distribution strategiesDistribution strategies are concerned withthe channels a tourism company mayemploy to make its services available to cus-tomers. Channels are organized structures ofbuyers and sellers that bridge the gap of timeand space between the supplier and the cus-tomer. Which travel intermediary shouldthe supplier select to bring tourism servicesclose to the customer? Who should performthe concentration and dispersion tasks: the
163Segmentation, Targeting, Positioning and Strategic Marketing

tourism supplier or travel intermediaries?These questions are central to tourism dis-tribution strategies.
Other strategy-related matters includescope of distribution (i.e. how widespreaddistribution may be), use of multiple chan-nels to serve different segments, modi-fication of channels to accommodate envi-ronmental shifts and use of vertical systemsto institute control over tourism channels.Five approaches are now examined for theirrelevance in different circumstances.
1. Perspectives on distribution strategies:channel-structure strategyDefinition: Using perspectives of inter-mediaries in the flow of services.Distribution may be either direct orindirect.Objective: To reach the optimal numberof customers in a timely manner at thelowest possible cost while maintainingthe desired degree of control.Requirements: Comparison of directversus indirect distribution on the basisof (i) cost; (ii) product characteristics;(iii) degree of control; and (iv) otherfactors.Costs: (i) Distribution costs; (ii) oppor-tunity costs incurred because productnot available.Product characteristics: (i) Gross mar-gin; (ii) service requirements; (iii)search time.Degree of control: Greater when directdistribution used.Other factors: (i) Adaptability; (ii) tech-nological changes (e.g. computertechnology); (iii) social/culturalvalues.Expected results: (i) Direct distribution:(a) high marketing costs, (b) large degreeof control, (c) informed customers, and(d) strong image; (ii) indirect distribu-tion: (a) lower marketing costs, (b) lesscontrol, and (c) reduced channel man-agement responsibilities.
2. Perspectives on distribution strategies:distribution-scope strategyDefinition: Establishing the scope ofdistribution, that is, the target custom-ers. Choices are exclusive distribution,
intensive distribution and selectivedistribution.Objective: To serve chosen markets at aminimal cost while maintainingdesired product image.Requirements: Assessment of (i) cus-tomer buying habits; (ii) grossmargin/turnover rate; (iii) capability ofdealer to provide service.Expected results: (i) Exclusive distribu-tion: (a) strong loyalty, (b) high degreeof control, (c) good forecasting capa-bility, (d) sales promotion assistance,(e) possible loss in sales volume; (ii)selective distribution: (a) extreme com-petition in marketplace, (b) pricediscounting, and (c) pressure fromchannel members to reduce number ofoutlets; (iii) intensive distribution: (a)low degree of control, (b) higher salesvolume, (c) wide customer recognition,(d) high turnover, and (e) price dis-counting.
3. Perspectives on distribution strategies:multiple-channel strategyDefinition: Employing two or more dif-ferent channels for distribution ofservices. Multiple-channel distributionis of two basic types: complementary(each channel handles a different non-competing market segment) andcompetitive (two different and compet-ing channels sell the same product).Objective: To achieve optimal access toeach individual market segment toincrease business. Complementarychannels are used to reach market seg-ments otherwise left unserved;competitive channels are used with thehope of increasing sales.Requirements: (i) Market segmentation;(ii) cost/benefit analysis. Use of com-plementary channels promoted by (i)geographic considerations; (ii) volumeof business; and (iii) saturation of tradi-tional distribution channels. Use ofcompetitive channels can be a responseto environmental changes.Expected results: (i) Different services,prices, and support provided to differ-ent segments; (ii) broader market base;
164 L. Moutinho

(iii) increased sales; (iv) control prob-lems; (v) possible over-extension.Overextension can result in (i) decreasein quality/service and (ii) negativeeffects on long-run profitability.
4. Perspectives on distribution strategies:channel-modification strategyDefinition: Introducing a change in theexisting distribution arrangements onthe basis of evaluation and criticalreview.Objective: To maintain an optimal dis-tribution system given a changingenvironment.Requirements: (i) Evaluation ofinternal/external environmental shifts:(a) changes in consumer markets andbuying habits, (b) changes in the retaillife cycle, (c) changes in the financialstrength, and (d) changes in the productlife cycle; (ii) continuous evaluation ofexisting channels; (iii) cost/benefitanalysis; (iv) consideration of the effectof the modified channels on otheraspects of the marketing mix; (v) abilityof management to adapt to modifiedplan.Expected results: (i) Maintenance of anoptimal distribution system given envi-ronmental changes; (ii) disgruntledcustomers (in the short run).
5. Perspectives on distribution strategies:channel-control strategyDefinition: Takeover by a member of thechannel structure in order to establishcontrol of the channel and provide acentrally organized effort to achievecommon goals.Objectives: (i) To increase control; (ii) tocorrect inefficiencies; (iii) to realizecost-effectiveness through experiencecurves; (iv) to gain efficiencies of scale.Requirements: Commitment andresources to fulfil leadership obliga-tions. Typically, although not always,the channel controller is a large firmwith market leadership/influence.Expected results (vertical marketingsystem): (i) Increased control; (ii) pro-fessional management; (iii) central
programming; (iv) achievement of oper-ating economies; (v) maximum marketimpact; (vi) increased profitability; (vii)elimination of inefficiencies.
References and Further Reading
Alford, P. (1998) Positioning the destination prod-uct – can regional tourist boards learn fromprivate sector practice? Journal of Travel andTourism Marketing 7(2), 53–68.
Arbel, A. and Woods, R.H. (1991) Inflation andhotels: the cost of following a faulty routine.The Cornell Hotel and Restaurant Associa-tion Quarterly (February), 66–75.
Bennett, M. (1993) Information technology andtravel agency. Tourism Management(August), 259–278.
Calantone, R. and Mazanec, J. (1991) MarketingManagement and Tourism, Annals of Tour-ism Research 18, 101–119.
Coad, T. (1992) Distinguishing marks. MarketingBusiness 14 (October), 12–15.
Connell, J. (1994) Repositioning Forte hotels port-folio. English Tourist Board Insights(March), C43–51.
Cooper, C. (1994) Tourist product life cycle. In:Witt, S.F. and Moutinho, L. (eds) TourismMarketing and Management Handbook, 2ndedn. Prentice-Hall, Hemel Hempstead, pp.341–345.
Cosenza, R.M. and Davis, D.L. (1981) Family vaca-tion decision making over the family lifecycle: a decision and influence structureanalysis. Journal of Travel Research 2(2),17–23.
Cravens, D.W. (1982) Strategic Marketing. Richard D. Irwin Inc., Homewood, Illinois,pp. 178–181.
Cravens, D.W., Hills, G.E. and Woodruff, R.B.(1980) Marketing Decision Making: Conceptsand Strategy. Richard D. Irwin Inc., Home-wood, Illinois.
Crouch, G.I. (1994) Promotion and demand ininternational tourism. Journal of Travel andTourism Marketing 3(3), 109–125.
Davidson, J.H. (1987) Offensive Marketing or HowTo Make Your Competitors Followers, 2ndedn. Penguin, Harmondsworth, UK.
Dunn, K.D. and Brooks, D.E. (1990) Profit analy-sis: beyond yield management. The CornellHotel and Restaurant Association Quarterly(November), 80–90.
165Segmentation, Targeting, Positioning and Strategic Marketing
Gartner, W.C. and Bachri, T. (1994) Tour opera-tors’ role in the tourism distribution system:an Indonesian case study, Journal of Inter-national Consumer Marketing 6(3/4),161–179.
Hair, J.F., Anderson, R.E., Tatham, R.L. and Black,W.C. (1995) Multivariate Data Analysis, 4thedn. Prentice-Hall, Englewood-Cliffs, NewJersey.
Harris, L. (1996) US travel agency automationsurvey. Travel Weekly 65, 118–134.
Hawkins, D.E. and Hudman, L.E. (1989) Tourismin Contemporary Society: An IntroductoryText. Prentice Hall, Englewood Cliffs, NewJersey, 149–161.
Jain, S.C. (1997) Marketing Planning and Strategy,5th edn. South Western College Publishing,Cincinnati, Ohio.
Jenkins, R.L. (1978) Family vacation decisionmaking. Journal of Travel Research 16(4),2–7.
Kotler, P., Bowen, B. and Makens, J. (1996) Mar-keting for Hospitality and Tourism. PrenticeHall, Upper Saddle River, New Jersey.
Lavery, P. (1992) The financing and organizationof National Tourist Offices. Travel & Tour-ism Analyst 4, 84–101.
Lawson, R.W. (1994) Demographic segmentation.In: Witt, S.F. and Moutinho, L. (eds) TourismMarketing and Management Handbook, 2ndedn. Prentice-Hall, Hemel Hempstead, UK.
Lovelock, C.H. (1991) Services Marketing.Prentice-Hall, Hemel Hempstead, UK.
Lumsden, L. (1998) Tourism Marketing. Interna-tional Thomson Business Press, London.
McLellan, R.W. and Foushee, K.D. (1983). Neg-ative images of the United States asexpressed by tour operators from other coun-tries. Journal of Travel Research 22, 2–5.
Meidan, A. (1994) Pricing. In: Witt, S.F. and Mou-tinho, L. (eds) Tourism Marketing andManaging Handbook, 2nd edn. Prentice-Hall, Hemel Hempstead, pp. 354–358.
Middleton, V.T.C. (1999) Marketing in Travel andTourism, 2nd edn. Butterworth-Heinemann,Oxford.
Morrison, A. (1989) Hospitality and Travel Mar-keting. Delmar Publishers, Inc., Albany, NewYork.
Murphy, P.E. (1983) Perception of attitudes ofdecision making groups in tourists center. In:Stabler, M.J. (ed.) The Image of Destination
Region. Croom Helm, London, pp.133–160.
Okoroafo, S.O. (1994) Branding. In: Witt, S.F. andMoutinho, L. (eds) Tourism Marketing andManagement Handbook, 2nd edn. Prentice-Hall, Hemel Hempstead, pp. 346–349.
Pine, B. Joseph II (1993) Mass Customization, TheNew Frontier in Business Competition. Har-vard Business School Press, Boston,Massachusetts.
Porter, M.E. (1979). How competitive forces shapestrategy. Harvard Business Review 57(2)(March–April), 137–145.
Ryan, C. (1995) Researching Tourist Satisfaction:Issues, Concepts, Problems. Routledge, Lon-don.
Schliessel, M.R. and Chasin, J. (1991) Pricing ofservices: an interdisciplinary review. TheServices Journal 11(3), 271–286.
Sheldon, P.J. (1997) Tourism Information Tech-nology. CAB International, Wallingford,UK.
Simon, V. (1991). When is outbound effective?Target Marketing 14(11) (November),65–68.
Smith, V.L. (1979) Women – the taste makers intourism. Annals of Tourism Research 6(1),49–60.
Todd, S. and Lawson, R.W. (1991) Family vaca-tion decision making in New Zealand. In:Piercy, N. et al. (eds) Preparing Marketing forthe New Millenium, vol. 3. Marketing Educa-tion Group Annual Conference, Cardiff, UK.
Vavrik, U. and Mazanec, J. (1990) A priori andposteriori market segmentation: tailoringautomatic interaction detection and clusteranalysis for tourism marketing. Cahiers duTourisme, Serie C, no. 62. Centre des HautesEtudes Touristiques, Aix-en-Provence.
Wearne, N. and Morrison, A. (1996) HospitalityMarketing. Butterworth-Heinemann,Oxford.
Wells, W.D. and Gubar, G. (1966) The life cycleconception marketing research. Journal ofMarketing Research (November), 355–365.
Whipple, W. and Thach, V. (1988) Group tourmanagement: does good service produce sat-isfied customers? Journal of Travel Research27(2), 16–21.
Zeithaml, V. (1990) Delivering Quality Service:Balancing Customer Perceptions and Expec-tations. Free Press, New York.
166 L. Moutinho

Part ThreeFunctional Management in Tourism


6Human Resource Issues in Travel and Tourism
D. Nickson
Introduction
To compete with the best, we need toensure that . . . people, the industry’s mostimportant resource, perform to the best oftheir ability (Department of NationalHeritage, 1996, foreword by VirginiaBottomley, then Secretary of State forNational Heritage).
The importance of travel and tourismemployment in both developed and devel-oping countries is attested to by the WorldTravel and Tourism Council (WTTC), whosuggest that travel and tourism related activ-ities account for 192.3 million jobs, or 8.2%of jobs worldwide (WTTC, 1999). However,while the quantity of travel and tourism jobsis unquestionable, the quality of many ofthese jobs is of great concern to academicsand policy-makers alike. Thus, despite therhetoric of policy-makers and business lead-ers that people are the industry’s mostimportant asset, many remain unconvincedthat such a view is borne out by empiricalevidence (Price, 1994; Wood, 1997a; Scot-tish Tourism Research Unit (STRU), 1998).For example, Douglas Coupland, the notablecultural commentator, has for many cap-tured the Zeitgeist when he talkspejoratively of ‘McJob’ which he describesas ‘A low-pay, low-prestige, low-dignity,low-benefit, no-future job in the service sec-tor. Frequently considered a satisfyingcareer choice by people who have never
held one’ (Coupland, 1993: 5). In a moreacademic vein the collection of essays byMacDonald and Sirianni (1996) also recog-nizes the challenges of living and working ina service society which, according to them,is characterized by two kinds of service jobs:large numbers of low-skill, low-pay jobs,and a smaller number of high-skill, high-income jobs, with few jobs being in themiddle of these two extremes. Such a situa-tion leads labour analysts to ask what kindsof jobs are being produced and who is fillingthem. This point is also apparent within thetravel and tourism industry and it is impor-tant at the outset of this chapter to add acaveat about the generalizability (or other-wise) of the conditions of travel and tourismemployment throughout the world. Hence,Baum (1995: 151) reflecting the diversity ofemployment within the sector notes that:
In some geographical and subsector areas,tourism and hospitality provides anattractive, high-status working environmentwith competitive pay and conditions,which is in high demand in the labour forceand benefits from low staff turnover . . . Theother side of the coin is one of poorconditions, low pay, high staff turnover,problems in recruiting skills in a number ofkey areas, a high level of labour drawn fromsocially disadvantaged groups, poor statusand the virtual absence of professionalism(and see also Wood, 1997a: 183–197).
© CAB International 2000. Strategic Management inTourism (ed. L. Moutinho) 169

Clearly, then, organizations and managers inthe travel and tourism industry face realchallenges in recruiting, developing andmaintaining a committed, competent, well-managed, and well-motivated workforcewhich is focused on offering a high quality‘product’ to the increasingly demanding anddiscerning customer. Consequently thischapter will seek to address some of the keyhuman resource issues that have to be tack-led in order that organizations can maintainsuch an environment. To do so it will criti-cally review some of the problems whichlead many to characterize travel and tourismemployment as generally unrewarding andunappealing, before going on to look at someexamples of good practice, important policyresponses, and models of human resourcemanagement which may offer cause forgreater optimism in the way people are man-aged within the travel and tourism industry.In particular, the chapter will be cognizantof the seminal work of Baum (see especially1993 and 1995) which, along with academicrigour, also has a clear policy orientationwith his advocating of what he terms a ‘newsustainable human resource paradigm’. Theextent to which the travel and tourismindustry is moving towards such anapproach will be a key theme throughoutthis chapter, although we should begin byfirstly acknowledging the sheer scale oftravel and tourism employment.
The Quantity and Diversity of Traveland Tourism Employment
As has been noted it is increasingly widelyacknowledged that travel and tourism isnow the largest generator of jobs within theworld today and hugely important to bothdeveloped and developing nations as theyreinvent themselves as service economies.For example, the WTTC (1998) suggestedthat by 2000 over 200 million jobs will havebeen generated by travel and tourism activ-ities and that over the course of the nextdecade a further 98 million jobs are likely tobe created. It is of course unsurprising that abody such as the WTTC – a global coalitionof nearly 90 chief executive officers from all
sectors of the travel and tourism industryincluding accommodation, catering, crui-ses, entertainment, recreation,transportation and other travel-related ser-vices – will seek to aggrandize and ‘talk-up’the numbers of people employed in theindustry. They are seeking greater influenceover governmental decision-making whichis likely to affect the industry, for example,the amount of regulation in the labour mar-ket. Consequently these figures are usedadvisedly and with some caution and withthe recognition that there are no whollydefinitive figures that are accepted by all as atrue representation of the number of thoseworking in travel and tourism.
For example, Wood (1997b), writing inthe context of tourism employment in Scot-land sees real difficulties in securing reliablestatistical data on tourism employment. Healso notes the flawed interpretation of extanttourism employment statistics. Thus Woodquestions the extent to which jobs can bedisaggregated as being created by touristicactivities, particularly if a wholly inclusiveview of what connotes travel and tourismjobs is accepted. In that sense, Wood con-cedes that there is broad agreement as to thecore travel and tourism industries, whichinclude: hotel trade; restaurants, cafes andsimilar eating places; public houses andbars; night-clubs and other licensed clubs;other forms of tourist accommodation; tour-ist offices and similar services; and traveland related sectors, such as travel agenciesand airport services. (In reality these sub-sectors, usually characterized generically asthe hospitality industry, are likely toaccount for the majority of tourism relatedjobs, for example in the UK context theDepartment of National Heritage (1996) sug-gests that the commercial hospitalityindustry accounts for 70% of tourismemployment.) A consequence of this is thatthe bulk of academic work on human resour-ces issues in tourism focuses primarily onthe hospitality industry.
More controversially, according toWood, other industries which are conven-tionally added are: libraries; theatres;museums; sport and related leisure provi-sion; and the final and most controversial is
170 D. Nickson
a proportion of retail employment. Wood’scritique lies less in the acceptance that aproportion of this employment is reliant ontouristic activity, and more in the actualnumber of jobs that are created by the traveland tourism industry. It could of course beargued that this argument is merely seman-tics, but Wood (1997b: 7) is also concernedto raise more substantive and searchingquestions in his suggestion that:
in a country like the UK where tourism hasbeen frequently viewed as a panacea foremployment decline in manufacturing, all-inclusive definitions of tourism andtourism potential raise unrealistic hopesthat the quantity and quality of jobs intourism industries can, in the short-term,compensate across the economic board forerosion of the nation’s manufacturing base.
This is clearly a controversial contentionand one that will be addressed throughoutthis chapter.
At this juncture, however, the importantpoint remains that travel and tourism is akey source of employment in both devel-oped and developing countries. Moreover,within the broad classification of travel andtourism, there is massive diversity in thetypes of jobs generated, in relation to theirtechnical and skills demands, educationalrequirements, terms and conditions and thetype of person that is likely to be attracted toemployment in them (Baum, 1993). To fur-ther illustrate this we should note Baum’s(1997a: 97–98) description of the range ofpeople that a person buying a package holi-day is likely to interact with (this also nicelyillustrates a more inclusive view of tourismgenerated employment, i.e. both direct andindirect tourism employment contraWood):
● the retail travel agent;● insurance companies;● ground transport to and from the air-
port;● at least two sets of airport handling
agents (outbound and return);● airport services (shops, food and bev-
erage outlets, bureaux de change)(outbound and return);
● the airline on all legs of the journey;
● immigration and customs services;● local ground transportation;● the hotel or apartment;● tour services at the destination;● companies and individuals selling a
diversity of goods and services at thedestination (retail, food and beverage,entertainment, cultural and heritage,financial, etc.);
● emergency services at the destination(medical, police, legal); and
● service providers on return (photogra-phy processing, medical).
Baum characterizes all of these possibleintermediaries, and the interactions theywill have with the holiday-maker, as crucialin ‘making or breaking the tourist experi-ence’. Thus while the physical product isimportant, for most tourists the quality oftheir experience is likely to be also reliant toa large degree on the interactions they willhave with the variety of front-line staff in thetravel and tourism industry. These so-called‘moments of truth’ (Carlzon, 1987) are there-fore crucial for organizational effectiveness,success, competitiveness and profitability.Indeed, within an industry that is charac-terized by diversity and heterogeneity interms of the purpose, size, ownership anddemands of the enterprise, the only realpoint of homogeneity is delivering service tocustomers and the need to manage people insuch a way that they offer a quality service.The corollary of this would be the belief thatsuch front-line staff would therefore be suf-ficiently well paid, trained and motivated tooffer outstanding service. The reality, how-ever, is that often such staff have the loweststatus in the organization, are the leasttrained, and are the poorest paid employeesof the company. To begin to assess the impli-cations of such a situation we can now moveon and examine the vexed question of theperceived quality of much travel and tour-ism employment.
The Quality of Tourism Employment
As we have already noted there is consider-able diversity within both geographical and
171Human Resource Issues in Travel and Tourism

subsectoral aspects of travel and tourismemployment and in this sense the discus-sion contained here can only be thought ofas a ‘snapshot’ of some key issues in the waythat organizations manage their humanresources. Despite this we can contextualizeour debate by recognizing what Baum (1993:9–10) has termed a number of complex andinterrelated ‘universal themes’ in interna-tional tourism which are of concern to bothhuman resource professionals within theindustry and academics researching andwriting within this area. These themes arelikely to be apparent to a greater or lesserextent according to the enterprise or destina-tion context.
● Demography and the shrinking employ-ment pool/labour shortages,particularly in the developed countriesin Western Europe, North America andthe so-called Asian ‘tiger economies’.
● The tourism industry’s image as anemployer.
● Cultural and traditional perceptions ofthe industry.
● Rewards and benefits/compensation.● Recruitment, retention and staff turno-
ver.● Education and training, both within col-
leges and industry.● Skills shortages, especially at higher
technical and management levels.● Linking human resource concerns with
service and product quality and espe-cially a limited recognition of theimportance of human resource develop-ment in the provision of high qualityproducts and services.
● Poor management and planning infor-mation about human resource mattersin the tourism industry.
● The tendency to develop humanresource policies, initiatives and reme-dial programmes that are reactive towhat is currently happening rather thanproactive to what is likely to occur.
A number of these issues can be seen tounderpin the questions posed by Choy(1995) in his seminal work on the quality oftourism employment. Having firstly noted
that ‘the development of a tourism industrycreates new employment opportunities’, henonetheless goes on to recognize that ‘criticsof the industry contend that tourism pro-vides primarily low-paying, low-skilled jobswhich are demeaning’ (Choy, 1995: 129). Asa result he is concerned to assess theseissues within the milieu of Hawaii, whichmay be particularly apposite as directemployment in the Hawaiian tourist indus-try accounts for approximately a quarter oftotal civilian employment. Accordingly,Choy seeks to investigate four commonlyheld beliefs about tourism employment,these being:
1. Tourism generates primarily low-skilled jobs.
2. Tourism generates low-paying jobs.3. Tourism jobs do not offer high levels of
job satisfaction.4. Tourism offers limited opportunities
for advancement for local residents.
To explore these issues Choy focused uponthree sectors of the travel and tourism indus-try, namely: air transportation,hotels/lodging places and eating/drinkingplaces.
Skill levelsOn the question of the skill levels of tourismjobs, Choy argues that the predominance ofhotels, and eating and drinking places tendsto drive the perception (and arguably thereality) of the tourism industry as relativelylow-skilled, although Choy does extrapolatefigures from the Hawaii Department of Laborand Industrial Relations to suggest thataround 30% of occupations in this categoryare supervisory and/or skilled occupations.Indeed, these figures reflect the work ofRiley (1991) on the skills profile of the Brit-ish hotel and catering industry, which alsohas 30% supervisory and (skilled) craft jobs,along with 6% managerial jobs; the remain-der are semi- or unskilled operativepositions. However, Baum (1997b) offers analternative view of the nature of semi- andunskilled work within the hospitality indus-tries of developing nations, and cogentlyargues that subjective Eurocentric views of
172 D. Nickson

skill levels are inapplicable to developingcountries, where most tourism employment(and particularly that provided by multi-national companies) is likely to involve arelatively high level of ‘skill’, status and jobsecurity. Nonetheless, Riley (1993: 48) hassuggested that generally a consequence ofthe predominance of semi- and unskilledjobs, and the low entry barriers to employ-ment that this creates, is that ‘tourism oftenfinds itself awash with newcomers’. In addi-tion, this means high levels of on-the-jobtraining are required which are costly to theorganization, especially in tandem withhigh levels of labour turnover. Moreover,Riley also suggests that a further effect ofthis low skills base is a tendency for theindustry to be low paid, and these pressuresfor low pay are also exacerbated by severalfundamental structural features of theindustry, a point to which attention nowturns.
Remuneration and reward
The International Labour Office (1989)(cited in Baum, 1995) and Riley (1993) out-line a number of structural features of thetourism industry which are likely to havedownward pressure on wage levels, themost important of these are:
● Small unit structure of the industry. Theindustry in most countries is highlyfragmented and heterogeneous, beingan amalgam of small to large businesses.However, the majority of businesses aresmall and medium sized enterprises(SMEs). For example, in the UK, busi-nesses with 1–10 employees make up85% of hospitality establishments(HTF, 1999). These figures are repli-cated throughout the European Union(EU), with Downes (1997) citing Euro-stat – the European Commission’sstatistical service – who estimate thatbusinesses with nine or fewer employ-ees, so-called ‘micro-businesses’,account for 96% of accommodation andcatering businesses in the EU.
● Fluctuations in levels of business activ-ity. There is constant fluctuation in
consumer demand across large andsmall time periods.
● Cost pressures induced by competition.● A reliance on vulnerable and so-called
‘marginal’ (Wood, 1997a) workers. Forexample, drawing on sections of thelabour market who have little bargain-ing power, such as young people,students, married women returning towork and ethnic minorities.
Despite these fundamental features the pic-ture is again one of diversity betweenregions and subsectors. For example, Choy(1995) found that in the context of Hawaiiwithin air transportation the average annualwage was $29,621, in hotels it was $18,571,and in eating and drinking places $11,092,this is compared with an all-industry aver-age, excluding government, of $22,235.Moreover, within other service sector occu-pations, hotels came fifth out of thirteenoccupations, while eating places wouldhave been next to bottom, althoughstrangely they were not included withinChoy’s figures. Similarly Baum (1995) hasnoted that within the travel sector there isconsiderable disparity, with many airlinestaff being reasonably well remunerated,and indeed arguably the highest paid oper-ative staff throughout the travel and tourismindustry are flight crew staff. Equally,though, he recognizes that within travelagencies and tour operators, the predom-inately young female staff are poorlyremunerated, although to an extent this maybe a quid pro quo for perceived additionalbenefits in relation to travel opportunities,uniforms and a generally pleasant workingenvironment.
Baum (1995) does, however, concede thatwithin hotels and catering levels of remu-neration and reward are generally low andthis is supported by a range of empiricalevidence. For example, the UK’s Depart-ment of National Heritage (1996) suggestedthat average gross earnings in the hospitalityindustry in the UK are 40% lower than theservice sector average, and that gross earn-ings within retail, which shares commoncharacteristics of having many low orunskilled workers, were 20% higher than
173Human Resource Issues in Travel and Tourism

those in hospitality (and see STRU (1998:94–111); and Wood (1997a: 46–62) for amore comprehensive review of theseissues). As low pay is often cited as theprimary reason for people leaving anemployer in the hospitality industry, lowlevels of remuneration can be seen to play akey role in high levels of labour turnover.This has a range of attendant costs to theorganization, such as lost productivity, lossof customer service skills, time taken to trainand inculcate new members of staff to theorganizational culture and the possible lossof repeat business, as regular customers liketo see familiar faces.
There is an interesting issue which arisesfrom this discussion of remuneration withinthe travel and tourism industry and relatesback to the point raised by Wood (1997b)about the classification of tourism-relatedemployment and in particular a possibledisjuncture between hospitality and tour-ism employment in terms of its level of‘glamour’. Part of Wood’s concern lies in theperception that non-hospitality-relatedtourism employment may be perceived ashaving a more positive image than hotel andcatering employment (Wood, 1996) andprima facie this would appear to be truefrom the foregoing discussion on levels ofpay. However Baum (1996: 1–2) refutes thisargument with his contention that:
. . . it is simplistic to suggest that all work inthe hotel and catering area suffers fromnegative perceptions and reality, while allwork in tourism is glamorous and devoid ofproblems with respect to remuneration andrelated matters . . . Tourism also includesmuch work that is low paid andexploitative in character, factors both of thesmall business environment of muchactivity and of . . . the weak internal labourmarket characteristics of the sector.
To exemplify this point Baum outlines arange of non-hospitality travel and tourismjobs which are likely to suffer from low payand poor conditions such as: beach vendors,deck chair hands, tour operator representa-tives at resort destinations, time-sharesalespersons, bingo hall callers, entertainers
and retail operatives. Clearly, then, we areill-advised in seeking to portray a whollydefinitive view of remuneration levelsthroughout the travel and tourism sector.However, on balance it would seem sensibleto acknowledge that low pay does remain amajor and enduring problem in a number ofsubsectors and regions throughout theworld and plays a key role in sustaining agenerally negative view of many areas oftourism employment.
Levels of job satisfactionThe third area which Choy (1995) sought toaddress was the level of satisfaction withintourism industry jobs. To do this he utilizeda state-wide tourism impact core survey,which was undertaken in 1988 to collectresidents’ perceptions and attitudes towardstourism. Of the respondents to the survey,824 indicated that their primary jobs were inthe tourism industry and Choy reported that‘the large majority, 88%, of tourism industryworkers were satisfied with their jobs’(Choy, 1995: 134). However, there is littledetail as to why these workers were sat-isfied, although we could infer thatsatisfaction implies that workers werehappy with both extrinsic and intrinsicaspects of their jobs. We have already brieflydiscussed the most important extrinsicaspect of tourism employment, i.e. remuner-ation, so we should now examine someintrinsic elements of tourism employmentthat could conceivably engender a sense ofsatisfaction in employees. Indeed, a key partof Baum’s (1995) sustainable humanresource paradigm is a belief in the super-iority of intrinsic over extrinsic motivationin the workplace.
The Department of National Heritage(1996) suggested that in order to pursue a‘virtuous circle’ organizations need to have along-term commitment to excellence andcustomer satisfaction, and their employeesare the key to success within this process.Thus, having recognized that excellentemployers will pay above the industry aver-age wage, and provide other benefits such aspension schemes, Save As You Earnschemes, employee discounts, etc., thereport goes on to suggest a number of other
174 D. Nickson

employment practices (which are currentlyseen in a range of travel and tourism organi-zations including BAA plc, British Airways,Center Parcs, Granada plc/Forte Hotels,McDonald’s, Novotel, The Tussauds Groupand Whitbread) that recognize the impor-tance of intrinsic rewards. These are(Department of National Heritage, 1996:19–21):
● Motivating and involving the staff in thebusiness and communicating withthem, for example, ‘away days’ to dis-cuss key issues: one employer entrustedhis staff with developing an organiza-tional mission statement, paying staff tosample products offered by other com-panies, and empowering staff to havethe confidence to contribute to the run-ning of the organization and thewillingness to take decisions (and seeLashley, 1997).
● Recognition and the need for positivefeedback, for example, passing on pos-itive feedback from customers toemployees and also having a well-designed appraisal system which can beuseful in building trust between theemployee and the organization.
● Making jobs more interesting by the useof techniques such as job rotation, jobswap days: one company lets front-linestaff swap with head office staff to avoidan ‘us and them’ situation – and multi-skilling to create greater interest andvariety for staff, and greater labour flex-ibility for the organization.
● Understanding the importance of team-working, for example, formallyassigning workers to a team can encour-age a sense of belonging for employeesand increase feelings of loyalty withinthe team.
● Turning jobs into careers and, althoughthis is easier for larger organizationswhich can encourage a strong internallabour market by promoting fromwithin, it is also something whichsmaller firms can address. For example,STRU (1998) notes that within a numberof countries an effective response fromsmall businesses is to seek collaboration
and share responsibilities, resourcesand expertise in areas such as trainingand career development.
● Recognizing the key role of the unitmanager, so excellent organizations putparticular emphasis on managerialrecruitment, training and developmentin order that a manager can have theconfidence to run their unit autono-mously and act as an ‘intrapreneur’ inrunning their ‘business within a busi-ness’.
Implicit within many of these suggestions isthe notion that the organizations to whichthese approaches are most applicable arelikely to be large organizations. This reflectsan enduring strand to the debate about theadoption of progressive human resourcemanagement techniques by travel and tour-ism organizations. In particular, due to thevery fragmented nature of the industry andthe preponderance of small firms, there are anumber of difficulties in addressing prob-lems such as recruitment difficulties,shortages of skilled and qualified staff, rela-tively low pay and high staff turnover. Thus,much of the work which reports on goodpractice is often reported in relation to largerorganizations and less so in SMEs (see, forexample Price, 1994). Furthermore Lucas(1996) opines that proprietors and partner-ships, which make up a significant numberof hospitality and tourism organizationsthroughout the EU, are the least likely to beaware of both national and supranationallegal standards that are seeking to proscribeunscrupulous employment practices andalso more proactively encourage the devel-opment of good practice.
Clearly, there is the potential for a dichot-omous approach to the development ofhuman resource capital between large andsmall organizations particularly in the sensethat many smaller firms will not have themeans to develop their employees or to sus-tain a progressive approach to humanresource management; although, impor-tantly, good practice does still exist withinsmall firms (STRU, 1998). However, whilethe employment experience of those work-ing in a major airline, international hotel
175Human Resource Issues in Travel and Tourism

group, theme park or large heritage organiza-tion may be characterized as beingqualitatively different, the multinationalityof many of these organizations might initself pose a range of entirely different prob-lems and this is the issue that concerns Choy(1995) in his final theme concerning theadvancement of local residents.
Advancement opportunities for localresidents
The key point arising from Choy’s discus-sion of the possibilities for advancement forlocal residents is the recognition that withthe globalization of the travel and tourismindustry there is an increasingly major roleplayed by multinational companies (MNCs).The corollary of this is that as they locatethemselves throughout the world, MNCsface choices in their utilization of parentcountry nationals (PCNs), host countrynationals (HCNs) or third country nationals(TCNs). Within the Hawaiian context Choyfound that despite the increasing number offoreign owned MNCs operating withinHawaii the opportunities for advancementfor local residents remained encouraging.Thus, within both the airline and hotelindustries, which are more likely to haveinternational organizations operatingwithin these sectors, Choy found that over50% of managerial/administrative staffwere local residents. Obviously we cannotgeneralize on the basis of these results, andthe situation elsewhere may be wholly dif-ferent as MNCs may be over-reliant on theuse of expatriate labour. Nonetheless goodpractice would support the development oflocal residents by travel and tourism MNCsas far as this can reasonably be achieved. Forexample, a declaration from the Organiza-tion for Economic Co-operation andDevelopment (OECD) on how multination-als should develop their industrial relationsstrategy in host countries’ states ‘that MNCsshould, to the greatest extent practicable,utilize, train and prepare for upgrading,members of the local labour force’ (cited inGo and Pine, 1995: 218). Indeed, the need forMNCs to respond to particular socio-cultural, economic and environmentalneeds at the local level, via the pursuance of
a localization strategy, lies at the heart of Goand Pine’s impressive review of the globalhotel industry.
In summary, we have reviewed a numberof key areas within travel and tourismemployment to assess the question ofwhether the quality of this employment is,in simple and rather value-laden terms,‘good’ or ‘bad’. As we have already notedthere can be no universal truths abouthuman resource management within thetravel and tourism industry and instances ofboth good and bad practices abound. Not-withstanding that, the balance of academicevidence suggests that there are still majorand significant issues to be faced by thetravel and tourism industry and we can nowturn our attention to policy responses whichhave sought to develop innovative strategiesto address some of these issues.
Responding to the Issues: the PolicyDimension
Policy responses to the diversity of humanresource issues in travel and tourism aremost effectively presented through illustra-tions of existing approaches and practices,and Baum (1993: 17–20) provides a frame-work (and examples) which delineatesresponses at the level of the individual busi-ness and also within local, national andregional (i.e. transnational) frameworks(readers are also directed to the WTTC’sseries, Steps to Success, which reports onThe World Travel and Tourism HumanResource Centre’s global database of goodpractice in travel and tourism humanresource development, and see Boxes 6.1and 6.2). We can assess these in turn byexamining some recent initiatives that haveemanated from both public and private sec-tor sources.
Individual businessBaum suggests a variety of initiatives whichindividual enterprises may adopt. Theseinclude:
● Localized recruitment campaigns, tar-
176 D. Nickson
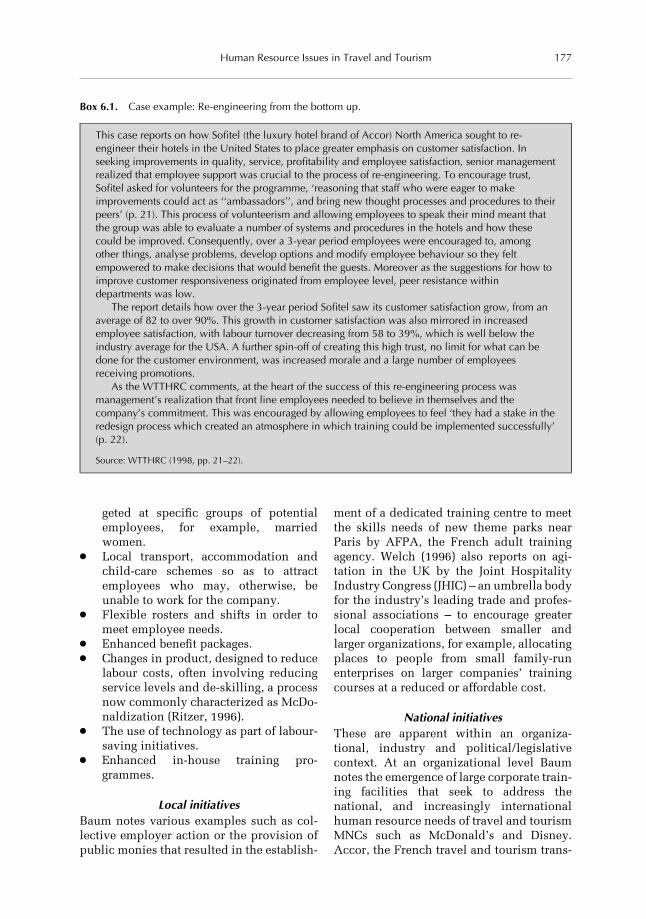
geted at specific groups of potentialemployees, for example, marriedwomen.
● Local transport, accommodation andchild-care schemes so as to attractemployees who may, otherwise, beunable to work for the company.
● Flexible rosters and shifts in order tomeet employee needs.
● Enhanced benefit packages.● Changes in product, designed to reduce
labour costs, often involving reducingservice levels and de-skilling, a processnow commonly characterized as McDo-naldization (Ritzer, 1996).
● The use of technology as part of labour-saving initiatives.
● Enhanced in-house training pro-grammes.
Local initiativesBaum notes various examples such as col-lective employer action or the provision ofpublic monies that resulted in the establish-
ment of a dedicated training centre to meetthe skills needs of new theme parks nearParis by AFPA, the French adult trainingagency. Welch (1996) also reports on agi-tation in the UK by the Joint HospitalityIndustry Congress (JHIC) – an umbrella bodyfor the industry’s leading trade and profes-sional associations – to encourage greaterlocal cooperation between smaller andlarger organizations, for example, allocatingplaces to people from small family-runenterprises on larger companies’ trainingcourses at a reduced or affordable cost.
National initiativesThese are apparent within an organiza-tional, industry and political/legislativecontext. At an organizational level Baumnotes the emergence of large corporate train-ing facilities that seek to address thenational, and increasingly internationalhuman resource needs of travel and tourismMNCs such as McDonald’s and Disney.Accor, the French travel and tourism trans-
Box 6.1. Case example: Re-engineering from the bottom up.
This case reports on how Sofitel (the luxury hotel brand of Accor) North America sought to re-engineer their hotels in the United States to place greater emphasis on customer satisfaction. Inseeking improvements in quality, service, profitability and employee satisfaction, senior managementrealized that employee support was crucial to the process of re-engineering. To encourage trust,Sofitel asked for volunteers for the programme, ‘reasoning that staff who were eager to makeimprovements could act as ‘‘ambassadors’’, and bring new thought processes and procedures to theirpeers’ (p. 21). This process of volunteerism and allowing employees to speak their mind meant thatthe group was able to evaluate a number of systems and procedures in the hotels and how thesecould be improved. Consequently, over a 3-year period employees were encouraged to, amongother things, analyse problems, develop options and modify employee behaviour so they feltempowered to make decisions that would benefit the guests. Moreover as the suggestions for how toimprove customer responsiveness originated from employee level, peer resistance withindepartments was low.
The report details how over the 3-year period Sofitel saw its customer satisfaction grow, from anaverage of 82 to over 90%. This growth in customer satisfaction was also mirrored in increasedemployee satisfaction, with labour turnover decreasing from 58 to 39%, which is well below theindustry average for the USA. A further spin-off of creating this high trust, no limit for what can bedone for the customer environment, was increased morale and a large number of employeesreceiving promotions.
As the WTTHRC comments, at the heart of the success of this re-engineering process wasmanagement’s realization that front line employees needed to believe in themselves and thecompany’s commitment. This was encouraged by allowing employees to feel ‘they had a stake in theredesign process which created an atmosphere in which training could be implemented successfully’(p. 22).
Source: WTTHRC (1998, pp. 21–22).
177Human Resource Issues in Travel and Tourism

national, have also established theimpressive Accor Academy. This self-styled‘School of Service’ offers training in man-agement techniques, service marketing,quality management, administration andnew techniques and each year the Academytrains over 15,000 Accor employees. Partic-ularly noteworthy is the ‘Vive en Accor’seminar which is targeted at newly pro-moted and newly hired Accor managers.The seminar introduces managers to theAccor Group and fosters adherence to itscorporate values, and encourages managersto keep ‘l’esprit Accor’ alive in their teams.Also the ‘Accor Summer Academy’ seeks toengender a longer-term and more proactiveapproach in bringing together 200 managersfrom around the world to explore strategicmanagement issues. Thus the ‘SummerAcademy’ has four key objectives: to enable
managers to meet each other; to exchangemanagement techniques and ideas; to pre-pare for the group’s future; and to promotethe concept of a chain (Accor Press Pack,1996).
At the industry level, concern over skillsshortages in the UK tourism and hospitalityindustry has led to a new campaign to attractthe brightest school leavers into the indus-try. Called ‘Let’s Make it First Choice’, thecampaign seeks to address what it considers‘myths’ about low pay and long hours andinstead presents a more upbeat view of thetourism and hospitality industry as offering‘exciting’ career prospects. This will involvesenior managers in the industry visiting thetop 400 schools in the UK three or four timesa year to talk about careers in tourism andhospitality in the hope of encouraging tal-ented young people into the industry as a
Box 6.2. Case example: Competency models for employee hiring and management skill transfer.
This case reports on how Miami-based Royal Caribbean International, the world’s largest brandcruise line, sought to improve skill transfer at management level. As cruising is a relatively newindustry, most Royal Caribbean International managers have acquired skills from a variety of otherindustry-related training. By working together the human resource personnel and successfulmanagers were able to develop management competency models which are now used for skillassessment, skill development, and to communicate expectations at the management level. Tofurther aid in skill development, key success factors were identified which are considered essentialfor the future.
Within this framework the company introduced The Wilson Learning Success Skills 2000programme, which allowed for an assessment of individual manager knowledge and skills in relationto their job. Furthermore the Leadership Practices Inventory was then applied to evaluate individualleadership practices. As the report notes ‘By comparing working skill sets with current leadershippractices, it was possible to define areas where managers might improve their ability to transfer skillsto employees’ (p. 27). To encourage ongoing learning Royal Caribbean has expanded itsmanagement-training programme by offering skill-training sessions throughout the year. This action-learning model, called Foundations for Success, focuses on management skill development, and istargeted at four levels of management: the new supervisor; the experienced supervisor; the newmanager; and the experienced manager. The success of this process is evaluated after a full year,again using the Wilson Learning Success Skills 2000 assessment process. This process of evaluationhas shown significant increases in skill development at the management level with the company.The success of managers is recognized with certificates of achievement and a once a year company-wide celebration acknowledging all programme participants.
The basic underpinning of this model is the belief that by sharing personal leadership experienceswhich have been successful within Royal Caribbean and drawing on accepted good practice outsidethe company, Foundations of Success allows for the development of a variety of perspectives, whichthe company considers necessary for success. As WTTHRC comments ‘What tourism businesses cangain from Royal Caribbean’s example is the joint partnership developed between department headsand human resources. Establishing goals that meet the organization’s objectives ensures thataccurate skill sets and competency models can be developed’ (p.27).
Source: WTTHRC (1999, pp. 26–27).
178 D. Nickson

first choice and not as a last resort (Shrimp-ton, 1996).
A further noteworthy national initiative(which has been successfully disseminatedinternationally as good practice) is the Cana-dian hospitality programme ‘SuperHost’,which was introduced in British Columbiain 1985 to support the growth of tourismaround the World Expo in Vancouver. Theprogramme’s excellence is recognized inter-nationally, and tourist agencies in England,Wales, Scotland, New Zealand, Australia,Alaska, Ontario, New Brunswick, Nova Sco-tia, Prince Edward Island andNewfoundland all have licence rights forSuperHost. For example, The English Tour-ist Board (ETB) became involved in 1992and has subsequently added three more ele-ments to the initial Welcome Host whichsought to enhance customer care withintravel and tourism organizations by improv-ing interpersonal communicationtechniques and customer service skills.These new varieties are Welcome Host Inter-national which is more oriented towardsoverseas visitors, Welcome Managementwhich trains managers in the best use oftheir front-line staff and finally Welcome Allwhich was launched in November 1996 andfocuses on the needs of disabled and specialneeds customers.
In the legislative context an interestingexample is the enactment, for the first time,of statutory minimum wage legislation bythe UK government. The government arguesthat the legislation will have a major bene-ficial effect on pay levels and morale withinthe UK tourism and hospitality industry.Although there is much concern within theUK tourism industry about the possibleeffects on the competitiveness of the indus-try and the potential for job losses with theintroduction of the minimum wage, ChrisSmith, the Secretary for Culture, Media andSport (previously known as the HeritageSecretary), has argued that the opposite islikely to be true, with the minimum wageenhancing Britain’s competitive positionand encouraging more people to workwithin the tourism industry (Caterer andHotelkeeper, 1997). It remains to be seenwhether this will be the case, although evi-
dence from the USA and EU remains mixedin relation to the effects of minimum wagelegislation on tourism and hospitalityemployment. For example, STRU (1998:104), in their review of best practice trainingand education for tourism, note that despitethe existence of a federal minimum wage ‘avast number of qualitative studies of hoteland catering employment in the USA sug-gest that far from being service-oriented,‘‘happy’’ workers, most workers view theirjobs as degrading, stressful and poorlypaid’.
In relation to the EU, the existence ofeither a government sponsored statutoryminimum wage, or a de facto minimumwage fixed by collective bargaining mecha-nisms, means all other EU countries haveminimum wage protection (IDS, 1998).Allied with what Wood (1997a: 186) calls‘high levels of cultural acceptability’ of tour-ism and hospitality employment acrossEurope (especially in countries like France,Germany and the Scandinavian countries),the high relative value of pay within a num-ber of EU countries arguably means a moremeaningful employment experience forthose working within the tourism sector.
Rather less controversially governmentshave the ability to substantially influencethe provision of support for in-companytraining. In this way in a number of coun-tries a range of training initiatives has beendeveloped and widely promoted in order toencourage greater commitment to trainingand staff development and improved skilllevels. For example, within the UK context,such initiatives have been particularly use-ful within the tourism industry due to theexisting low skills base, and include theNational Vocational Qualification (NVQ,S(cottish) VQ north of the border), aworkplace-based accredited qualificationwhich ranges from the level one foundationcourse to senior management level, which islevel five. A further initiative is Investors inPeople (IIP) which attempts to link staffdevelopment with development of the busi-ness and which has enjoyed a reasonablyhigh take up rate within the hospitalityindustry (Goldsmith et al., 1997: 86–90).Tourism Training Scotland (1996: 4) repor-
179Human Resource Issues in Travel and Tourism
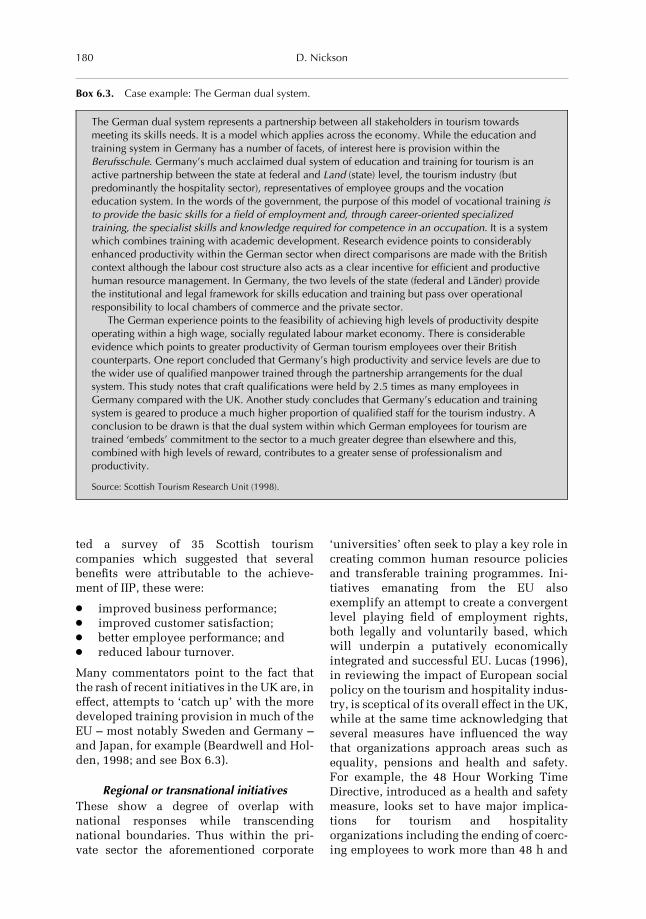
ted a survey of 35 Scottish tourismcompanies which suggested that severalbenefits were attributable to the achieve-ment of IIP, these were:
● improved business performance;● improved customer satisfaction;● better employee performance; and● reduced labour turnover.
Many commentators point to the fact thatthe rash of recent initiatives in the UK are, ineffect, attempts to ‘catch up’ with the moredeveloped training provision in much of theEU – most notably Sweden and Germany –and Japan, for example (Beardwell and Hol-den, 1998; and see Box 6.3).
Regional or transnational initiativesThese show a degree of overlap withnational responses while transcendingnational boundaries. Thus within the pri-vate sector the aforementioned corporate
‘universities’ often seek to play a key role increating common human resource policiesand transferable training programmes. Ini-tiatives emanating from the EU alsoexemplify an attempt to create a convergentlevel playing field of employment rights,both legally and voluntarily based, whichwill underpin a putatively economicallyintegrated and successful EU. Lucas (1996),in reviewing the impact of European socialpolicy on the tourism and hospitality indus-try, is sceptical of its overall effect in the UK,while at the same time acknowledging thatseveral measures have influenced the waythat organizations approach areas such asequality, pensions and health and safety.For example, the 48 Hour Working TimeDirective, introduced as a health and safetymeasure, looks set to have major implica-tions for tourism and hospitalityorganizations including the ending of coerc-ing employees to work more than 48 h and
Box 6.3. Case example: The German dual system.
The German dual system represents a partnership between all stakeholders in tourism towardsmeeting its skills needs. It is a model which applies across the economy. While the education andtraining system in Germany has a number of facets, of interest here is provision within theBerufsschule. Germany’s much acclaimed dual system of education and training for tourism is anactive partnership between the state at federal and Land (state) level, the tourism industry (butpredominantly the hospitality sector), representatives of employee groups and the vocationeducation system. In the words of the government, the purpose of this model of vocational training isto provide the basic skills for a field of employment and, through career-oriented specializedtraining, the specialist skills and knowledge required for competence in an occupation. It is a systemwhich combines training with academic development. Research evidence points to considerablyenhanced productivity within the German sector when direct comparisons are made with the Britishcontext although the labour cost structure also acts as a clear incentive for efficient and productivehuman resource management. In Germany, the two levels of the state (federal and Länder) providethe institutional and legal framework for skills education and training but pass over operationalresponsibility to local chambers of commerce and the private sector.
The German experience points to the feasibility of achieving high levels of productivity despiteoperating within a high wage, socially regulated labour market economy. There is considerableevidence which points to greater productivity of German tourism employees over their Britishcounterparts. One report concluded that Germany’s high productivity and service levels are due tothe wider use of qualified manpower trained through the partnership arrangements for the dualsystem. This study notes that craft qualifications were held by 2.5 times as many employees inGermany compared with the UK. Another study concludes that Germany’s education and trainingsystem is geared to produce a much higher proportion of qualified staff for the tourism industry. Aconclusion to be drawn is that the dual system within which German employees for tourism aretrained ‘embeds’ commitment to the sector to a much greater degree than elsewhere and this,combined with high levels of reward, contributes to a greater sense of professionalism andproductivity.
Source: Scottish Tourism Research Unit (1998).
180 D. Nickson

an entitlement to four weeks’ paid holiday(and see Goldsmith et al., 1997: 128–129).Moreover, the agreement of the Labour Gov-ernment to opt-in to the Social Chapter ofthe Maastricht Treaty will mean travel andtourism organizations within the UK willhave to consider the implementation ofdirectives on European Works Councils,parental leave and a wide-ranging directiveon part-time work (IRS, 1998).
It can be appreciated that even from sucha superficial review of possible policy res-ponses there are a variety of agendas that canbe followed in formulating and operational-izing policy. Further to this, the possiblydisparate interests of a range of public andprivate sector organizations complicate analready complex picture and thus theseissues are likely to be influenced and medi-ated by a large number of interested parties(for example, Brewton and Withiam, 1998,estimate that there are more than 180 inter-national non-governmental and inter-governmental organizations seeking toinfluence national tourism policies aroundthe world), including the following (Baum,1993: 12):
● the various industry sectors, throughtheir representative bodies as well as atindividual company level;
● national (state) education providers;● private educational institutions;● specialist training agencies;● national employment, labour or man-
power agencies;● a range of government departments;● social partner organizations, especially
trade unions; and● national, regional or local tourist agen-
cies.
Clearly, then, there is unlikely to ever be awholly definitive policy response whichwill gain universal approval from all of theabove bodies. Nonetheless, Baum (1995) hasoutlined what he terms a ‘new sustainablehuman resource paradigm’, which repre-sents an attempt to develop an overarchingmodel of best practice that offers a moreoptimistic view to which the travel and tour-ism industry can aspire in the future (seeTable 6.1).
This model is inspired by Baum’s noveland innovative use of the notion of sustain-ability and in human resource terms denotesan attempt to move away from ‘old’ andoutdated reactive personnel policies whichhave often characterized travel and tourismemployment. Key to this new approach isthe recognition that it involves a Rous-seauean social contract which suggests theacceptance of certain responsibilities, thus:
The theme of sustainability within themanagement of human resources isunderpinned by assumptions aboutmanagerial, corporate and governmentalresponsibility, depending on which levelthe sustainable model is applied. Indeed, itdraws in essence upon the notion of asocial contract between on the one handbusiness and an industry sector, and on theother community in which they operateand the people that they employ (Baum,1995: 14).
Baum’s support for such a sustainableapproach is based on a multiplicity of rea-sons that reflect both ethical and businessconsiderations, and these can be encapsu-lated in the simple sentiment that peoplerespond positively to good management andnegatively to bad management with theresult that a happier workforce is morelikely to be a productive workforce.
Conclusions and Discussion
This chapter has sought to review a range ofhuman resource issues within travel andtourism and in doing so has described some-thing of a polarized view of the nature of theemployment experience for those workingin travel and tourism. On the one hand whatBaum (1995) calls the ‘upbeat perspective’ ispromulgated by bodies such as the WTTCwho claim that travel and tourism generatesjobs across the employment spectrum fromhigh-tech managerial posts to limited-skillentry level and ‘shop floor’ jobs, with wagesthat are equal to or above the industrialnorm and career potential and training exist-ing at most levels. The basic premiseunderlying this is that all jobs are valuable
181Human Resource Issues in Travel and Tourism

Table 6.1. Traditional and sustainable human resource (HR) practices.
Old HR practice New sustainable HR paradigm
Recruitment and staff turnoverRecruitment undertaken without reference to local
community/labour marketRecruitment based on careful analysis of local
community and its labour marketAd hoc, unplanned recruitment to meet immediate
needsRecruitment of staff based on long-term HR
planningStaff recruited on basis of immediate skills needs Staff recruited on basis of potential developmentRecruitment/‘poaching’ of staff from other
companiesStaff recruited locally from schools/colleges/
universityExpatriate staff recruited on long-term basis Expatriate staff only employed to meet short-term
needs and to develop local staffHigh staff turnover seen as inevitable/desirable High staff turnover seen as problematic/undesirableNo measures to reduce staff turnover Active company policies designed to minimize staff
turnoverNo interest in why staff leave Exit interview policyContinuing high staff turnover Relatively low staff turnover
Promotion and career developmentFew opportunities for promotion/development
within companyCareer planning/tracking within company
No career ladder/unclear criteria for promotion Clearly defined career ladder/accessible criteria forpromotion
Promotion to ‘plug gaps’/no preparatory training Planned promotion with preparatory trainingprogramme
Key staff ‘imported’ from outside/abroad Key staff ‘grown’/developed within company/locality
Part-time or seasonal staff excluded from training/development/promotion opportunities
Part-time or seasonal staff integrated into training/development/promotion system
No long-term commitment to seasonal staff Long-term commitment to key seasonal staffCareer mobility seen as disloyal/disruptive Career mobility recognized as beneficial to the
individualOpportunities limited for women, ethnic minorities,
disabledGenuine equal opportunities in employment
Rewards and benefitsCompany offers minimum rewards and benefits Company offers competitive rewards and benefitsConditions to suit employer needs Conditions reflect local/individual circumstances
and needsFlexibility demanded to suit employer requirements Flexibility seen as employer–employee partnership
with mutual benefitsStaff attitude to company a matter of indifference Fostering of commitment and feeling of belonging
among employees
Education, training and developmentTraining and development not planned Planned training and development policies and
strategiesTraining compartmentalized with specialist
departmentTraining recognized as the responsibility of all
supervisors/managementNo senior management commitment to training Full commitment to training from CEO downTraining operates in isolation from other HR
practicesTraining linked to opportunities for promotion
182 D. Nickson

in times of high unemployment and partic-ularly where they offer opportunities and aplace for most members of society. Thustravel and tourism offers an unparallelednumber of entry-level jobs for the young,women and people disadvantaged on thebasis of race, immigrant status or physicaldisability. Moreover, travel and tourismstimulates jobs within SMEs and a high pro-portion of export-related trade, elementswhich are the backbone of a competitivemarket economy.
On the other hand, however, is whatBaum (1995) characterizes as a ‘picture ofdrudgery’ which suggests that once in thosejobs many employees suffer from low pay,anti-social conditions, limited or no train-ing, a lack of job security, poor treatment
from employers and contempt from custom-ers. As we noted earlier there are likely to bewide variations both within and across sec-toral and geographical areas and thereforeboth scenarios contain elements of truth.
Nonetheless the weight of academic evi-dence suggests that for too many people thelatter is more likely to be the reality and thiswill lead to continuing questions anddebates about the quality of much travel andtourism employment. Increasingly thoughthere is a recognition that the long-termcosts of a self-perpetuating vicious circle ofrecruitment difficulties, shortage of skilledand qualified staff, relatively low pay, highstaff turnover and a relatively unattractiveimage as an employing sector are unsustain-able. Consequently there is much talk about
Table 6.1. continued
Old HR practice New sustainable HR paradigm
Gap between industry and education system Partnership between industry and education systemEducation programmes with little industry relevance Education programmes based on industry research/
identified needsEducation/training programmes terminal and not
integratedEducation/training courses provide for further
development and progressionIndustry-developed skills not recognized by
educationIndustry-developed skills recognized and certified
by education
Management cultureStaff seen as short-term expedient Staff seen as key resourceStaff perceived as a cost Staff perceived as an assetAuthoritarian, remote management culture Democratic, participative management cultureAuthority vested in management alone Responsibility delegated to all levels of staff:
‘empowerment’Staff remote from decision-making Staff consulted/involved with decisions affecting
their area of responsibilityInflexible imposition of corporate culture Corporate culture responds flexibly to local culture
and needs
National HR planning for tourismFragmentation of HR planning for tourism Integrated approach to HR planning for tourismHR considerations not recognized in tourism policy
planningHR considerations to the fore in tourism planning
Quality in tourism seen in exclusively physicalproduct terms
Human resource contribution to quality recognizedand nurtured
Local population detached from/hostile to tourism Local population helped and encouraged torecognize their role in tourism
Source: Baum (1995: 12–13).
183Human Resource Issues in Travel and Tourism

the need to move towards a virtuous circleapproach of high quality products and ser-vices, high training standards, good termsand conditions of employment, high skillsand low labour turnover, as exemplified byBaum’s (1995) sustainable paradigm.
A key theme of Baum’s progressive sus-tainable approach is that it will not be eitheran easy or cheap process and requires realcommitment and a strategic approach tohuman resource management within local,regional and national tourism policy frame-works and the concomitant need for anincreasingly consistent, coordinated andintegrated response from industry, govern-ment and educational institutions.However, such commitment seems crucial iftravel and tourism is to take up its putativeposition as one of the new superserviceindustries for the 21st century. This notionwas suggested by the futurist and author ofthe Megatrends series of books, John Nais-bitt, who has recently argued that ‘the globaleconomy of the 21st century will be drivenby three superservice industries – Telecom-munications, Information Technology andTravel and Tourism’ (cited in Kelley, 1997:2). As travel and tourism is now widelyacknowledged as the largest employer in theworld it is increasingly imperative thatregions, nations, organizations and man-agers address the problems of poor humanresource management practices, if the new‘superservice’ industry is to offer a signifi-cant proportion of the world’s population apositive employment experience. Arguablythen the procurement and management ofquality personnel is the most importantchallenge facing the travel and tourismindustry today. Thus, human resource man-agement can be seen to play a key strategicrole within attempts to enhance the qualityof the tourism ‘product’ and market pos-itioning of tourism at the level oforganizations, specific destinations, regionswithin countries or whole nations.
References
Accor Press Pack (1996) Accor – A World of TravelTourism and Services. Paris: Accor Corpo-rate Communications.
Baum, T. (1993) Human resources in tourism: anintroduction. In Baum, T. (ed.) HumanResources in International Tourism.Butterworth-Heinemann, Oxford, pp. 3–21.
Baum, T. (1995) Managing Human Resources inthe European Hospitality and TourismIndustry – A Strategic Approach. Chapmanand Hall, London.
Baum, T. (1996) Human resource issues in inter-national tourism and hospitality – localisedor general concerns? Paper presented to elec-tronic conference Hospitality Management:The State of the Art (http://www.mcb.co.uk/services/conferen/apr96/hospitality/baum/baum.htm).
Baum, T. (1997a) Making or breaking the touristexperience: the role of human resource man-agement. In: Ryan, C. (ed.) The TouristExperience: A New Introduction. Cassell,London, pp. 92–111.
Baum, T. (1997b) Unskilled work in the hospital-ity industry: myth or reality? InternationalJournal of Contemporary Hospitality Man-agement 15(3), 207–209.
Beardwell, I. and Holden, L. (1998) HumanResource Management – A ContemporaryPerspective, 2nd edn. Pitman, London.
Brewton, C. and Withiam, G. (1998) United Statestourism policy. Cornell, Hotel and Restau-rant Administration Quarterly 39(1), 50–59.
Carlzon, J. (1987) Moments of Truth. Ballinger,Cambridge, Massachusetts.
Caterer and Hotelkeeper (1997) Smith slamsindustry conditions. Caterer and Hotel-keeper 3 July 1997, 16.
Choy, D. (1995) The quality of tourism employ-ment. Tourism Management 16(2),129–137.
Coupland, D. (1993) Generation X: Tales for anAccelerated Culture. Abacus, London.
Department of National Heritage (1996) TourismCompeting with the Best, No. 3, PeopleWorking in Tourism and Hospitality. Depart-ment of National Heritage, London.
Downes, J. (1997) European Union progress on acommon tourism policy. Travel and TourismAnalyst 1, 74–79.
Go, F. and Pine, R. (1995) Globalization Strategyin the Hotel Industry. Routledge, London.
Goldsmith, A., Nickson, D., Sloan, D. and Wood,R. (1997) Human Resource Management forHospitality Services. International ThomsonBusiness Press, London.
HTF (Hospitality Training Foundation) (1999)Key Facts and Figures. HTF, London.
IDS (Income Data Services) (1998) Labour flex-
184 D. Nickson

ibility OK – but we’re doing it our way.Employment Europe 434 (February), 11–18.
IRS (Industrial Relations Service) (1998) Towardsa one speed Europe. IRS Employment Trends679, 16–19.
International Labour Office (1989) Conditions ofWork in the Hotel and Catering and TourismSector, such as Hours of Work, Methods ofRemuneration, Security of Employment.Hotel, Catering and Tourism Committee ofthe ILO, Geneva.
Kelley, R. (1997) To create jobs, summiteersshould take a breath of Rocky mountain airand promote tourism. WTTC press release(http:www.wttc.org/WTTCGATE.MSF/35fac30c2231d81c8025639d0054id0a/b56).
Lashley, C. (1997) Empowering Service Excel-lence – Beyond the Quick Fix. Cassell,London.
Lucas, R. (1996) Social policy. In: Thomas, R. (ed.)The Hospitality Industry, Tourism andEurope: Perspectives on Policy. Cassell, Lon-don, pp. 135–165.
MacDonald, C. and Sirianni, C. (eds) (1996) Work-ing in the Service Society. Temple UniversityPress, Philadelphia.
Price, L. (1994) Poor personnel practice in thehotel and catering industry: does it matter?Human Resource Management Journal 4(4),44–62.
Riley, M. (1991) Human Resource Management: AGuide to Personnel Practice in the Hotel andCatering Industry. Butterworth-Heinemann,Oxford.
Riley, M. (1993) Labour markets and vocationaleducation. In: Baum, T. (ed.) HumanResources in International Tourism.Butterworth-Heinemann, Oxford, pp.47–59.
Ritzer, G. (1996) The McDonaldization of Society,revised edition. Pine Forge Press, ThousandOaks, California.
STRU (Scottish Tourism Research Unit) (1998)International Benchmarking and Best Prac-tice Study of Training and Education forTourism. STRU, Glasgow.
Shrimpton, D. (1996) Industry drive to lure youngstars. Caterer and Hotelkeeper 8 August, 7.
Tourism Training Scotland (1996) Annual Report1996. Tourism Training Scotland, Glasgow.
Welch, J. (1996) Hotels told to improve image.People Management 25 July, 10–11.
Wood, R.C. (1996) Employment in the hospitalityindustry. Paper presented to electronic con-ference Hospitality Management: The Stateof the Art (http://www.mcb.co.uk/services/conferen/apr96/hospitality/wood/roywood.htm).
Wood, R.C. (1997a) Working in Hotels and Cater-ing, 2nd edn. International ThomsonBusiness Press, London.
Wood, R.C. (1997b) Tourism employment in Scot-land, Mimeograph. Scottish Hotel School,Glasgow.
WTTC (World Travel and Tourism Centre) (1998)The Economic Impact of Travel and TourismDevelopment in the APEC Region. WTTC,London.
WTTC (World Travel and Tourism Centre) (1999)Travel and Tourism’s Economic Impact.WTTC, London.
WTTHRC (World Travel and Tourism HumanResource Centre) (1998) Steps to Success –Global Good Practice in Travel and TourismHuman Resource Development, Vol. 2, No. 1,WTTHRC, Vancouver.
WTTHRC (World Travel and Tourism HumanResource Centre) (1999) Steps to Success –Global Good Practice in Travel and TourismHuman Resource Development, Vol. 2, No. 2,WTTHRC, Vancouver.
185Human Resource Issues in Travel and Tourism


7Financial Management in Tourism
J. Bridge and L. Moutinho
Background
Financial management is particularlyimportant in organizations which have tomake a profit in order to survive but, even innon-profit making organizations or in busi-nesses which give priority to goals otherthan profit, financial planning systems arealways needed to ensure that activities arefinancially feasible in terms of their require-ments for fixed and working capital. Theperformance of the organization must bemonitored against its plans in order to deter-mine where modification is necessary in thelight of changing circumstances. This is thecontrol function of management and its effi-cacy determines how responsive theorganization will be to both opportunitiesand threats. Moreover, in a changing world,it is often too late to take appropriate correc-tive action once a problem has actually beenexperienced, so that forecasting has animportant part to play in both planning andcontrol.
Strategic Planning
The ultimate purpose of the strategic plan-ning process is the identification ofopportunities and the allocation of resour-ces towards strategies. A well-conceivedstrategy includes four basic components:scope, resource deployment, competitive
advantage and synergy. The scope compo-nent of a strategy specifies the present andplanned interactions between the organiza-tion and its environment, in order to achievea strategic fit. The strategy should include anoutline of the business’s projected resourcedeployment: how it will distribute itsresources across various areas. Resourcesneed to be allocated towards successfulproducts/services and away from less suc-cessful ones. The strategy should specify thecompetitive advantages that result from thescope of the business and its pattern ofresource deployment. Strategy should alsotake into account the synergy expected toresult from decisions about scope, resourcedeployment and competitive advantages.This allocation must take place in such away that the performance overall – acrossthe whole product/service range – can beoptimized. Each strategy can serve as aframework for developing specific actionplans and for specifying associated pro-grammes, expenditures and risks.
Budgeting and Control
All organizations have to operate withinfinancial constraints and maintain controlover costs. Decisions have to be taken abouthow resources are to be allocated betweencompeting uses, and the budgeting processis an essential element of this activity, since
© CAB International 2000. Strategic Management inTourism (ed. L. Moutinho) 187

it establishes what is feasible, and sets outagreed expenditure patterns. Budgetinginvolves expressing a set of planned activ-ities for specified time periods inquantitative and monetary terms. Because oftheir quantitative nature, they provide yard-sticks for measuring performance andfacilitate comparisons from one time periodto another. In particular, budgets serve fourprimary purposes.
1. They help managers to coordinateresources and projects.
2. They help define the standards neededin all control systems.
3. They provide clear and unambiguousguidelines about the organization’sresources and expectations.
4. They facilitate performance evaluationsof managers and units.
Budgeting is the linchpin of the financialplanning and control system. The relatedfunction of costing is essential to budgetingsince the financial consequences of plannedactivities have to be determined as preciselyas possible if the budget is to be achievable.The monitoring of costs (cost control) is animportant part of the overall resource man-agement process in demonstrating wherecosts have been exceeded, and why. Animportant aspect of both costing and budget-ing is the reporting and analysis of suchunfavourable variances, but of course whenfavourable variances occur it is equallyimportant to find out the underlying causeswith the aim of replicating the conditionsleading to resource savings.
Occupancy
Most of the above sections have been con-cerned with concepts which apply to allkinds of organization. However, the tourismindustry has many distinguishing character-istics which have to be explicitly consideredin the formulation of any plan or budget.One of the most important of these is occu-pancy, particularly in hotel managementand in the airlines business. Whereas a man-ufacturer often has the option of producingfor stock if there are insufficient orders to
utilize capacity fully, with a view to dispos-ing of stocks when demand increases, ahotel will lose revenue every time a nightpasses with beds unoccupied. One of thereasons why European hotels were amongthe least profitable in the world in the mid-1990s was that room occupancy (at 62.5% in1994) was 4% below the world average(1994 data from Horwath International citedin The Times, 1995). Likewise when an air-craft takes off with empty seats, it has lostthe revenues and profits on those seats for alltime.
Of course, one can try to avoid sparecapacity by ensuring that as many beds orseats are sold as possible; if necessary bydisposing of some of them at a smaller profitcontribution, this is one of the principles ofyield management which is discussed morefully below. Because of the occupancy prob-lem, all calculations from the initialinvestment appraisal through to the revenueand profitability assessment of current activ-ities must include this as a key factor. Anunrealistic opening assumption about occu-pancy can lead to a misallocation ofresources and, in the worst case, an expen-sive capital project may be initiated whichcan never realistically offer a worthwhilereturn.
Capital Budgeting
Fixed and working capitalFundamental to the strategy of any businessis the determination of the need for long-term capital and its availability from varioussources. The need will reflect the number ofprojects which are found to be necessary ordesirable, and the capital requirements ofeach. The balancing of need and availabilityimplies a capital budgeting mechanism.
The total capital employed by a businesscomprises both its fixed assets, and theworking capital used to finance raw materialpurchases, wages and other expenses incur-red in the day-to-day running of thebusiness. Before a business is started, it isnecessary to determine the expected profita-bility on the capital to be invested.Thereafter, every time a decision is to be
188 J. Bridge and L. Moutinho

taken about new projects, management mustassess the total capital requirements andview these against the finance available andthe cost of capital. The capital budgetingprocess requires a mechanism for allocatingresources among alternative projects, and inits simplest form amounts to ‘picking thewinners’ on an accept or reject basis.Although simple rules of thumb are oftenused in practice to determine viability onthe basis of a ‘payback period’ or an ‘averagerate of return’, the advocated methodology isdiscounted cash flow (DCF).
In many ways, it is actually easier to useDCF than the ‘simple’ rules of thumb, prima-rily because the computational difficultiesof DCF have been taken care of in the spread-sheet software through which mostinvestment appraisals will be conductednowadays. The difficult parts of theappraisal are in the forecasting, costing,budgeting and occupancy calculationswhich lie behind the quantification of theflows of cash entailed in the investment,rather than in the discounting of those flows.Nevertheless, having gone to the trouble ofmaking realistic cash flow estimates, it isessential that the appraisal is completedwith the aid of a technically correct meth-odology.
Revenues, costs, profit and cashflowBefore explaining how investment apprais-als are conducted through DCF in thefollowing section, it is necessary to under-stand how profit and cash flow are related toeach other. Both concepts measure the dif-ference between incoming revenues fromthe sale of goods and services, and outgoingexpenditures. However, calculations ofprofit designed to provide a measure offinancial health to investors follow the prac-tice of smoothing out the large outflows ofcash associated with capital projects bydepreciating the asset over its expected life.This has the advantage of recognizing thatfixed capital is not consumed in the periodof its purchase, but retains a residual valuewhich decreases year by year.
Corporate taxation also assumes that cap-ital assets gradually lose their value,although depreciation may be weighted
more heavily to the earlier years of theasset’s life as a way of reducing the tax bur-den, and thus acting as an investmentincentive in certain countries and regions.The main drawback to using profit net ofdepreciation as a measure of a business’sfinancial position is that it does not demon-strate the flows of cash in and out of thebusiness at the time of their occurrence. Thelatter is a vital consideration in DCF, and ifan appraisal has been worked out on thebasis of accounting profit after tax, it is nec-essary to add back in the amount allowed fordepreciation in order to give a measure ofcash flow. Viewing investments from theperspective of cash flow also makes sense inensuring that the capital invested is not dou-ble counted. There is always the danger thatthis may happen if the outflow is depre-ciated year by year, rather than taken onboard once as an initial capital outflow.
Discounted cash flowIn this section we shall demonstrate the gen-eral principles of discounted cash flow(DCF), and consider their application totourism projects.
Net present valueThe net present value (NPV) of an invest-ment project is defined as the present valueof the stream of net cash flows from theproject minus the project’s net investment.The cash flows are discounted at the rate ofreturn required by owners or shareholders,that is, its cost of capital. A firm’s cost ofcapital is defined as its minimum acceptablerate of return for investments of typical riskfor the kind of business in which the firmoperates. It is an ‘opportunity cost’ conceptsince it explicitly poses the question: ‘whatis the best return which investors couldobtain elsewhere, in a similar businesswhich is subject to the same risk?’
The time value of money can be demon-strated through the process ofcompounding, after which the inverse con-cept of discounting should be more easilyunderstood. If £1000 were invested now andinvestors required a real return of at least10% to compensate for waiting and riskbearing, a single inflation adjusted payment
189Financial Management in Tourism

of £1100 would be just sufficient as a rewardin one year’s time, compounding at 10%. Ifinvestors had to wait for two years, an extra£110 interest would be due, totalling £1210.Alternatively, the latter result could beexpressed by stating that the present valueof £1210 receivable in two years time is£1000, discounting at 10%. It follows thatthe present value of £1 receivable in twoyears time is £1/1.21 or £0.826, discountingat 10%.
In general,
● £1 now has a future value of £(1+k)n
compounding for n years at an interestrate k.
● £1 in the future has a present value of£1/(1+k)n discounting for n years at arate k.
As an example, with a discount rate of 20%,and a time interval of 3 years, each £1 wouldhave a present value of: £1/(1+0.2)3 or£1/1.23 which works out as £0.579. While£1000 receivable in 3 years time would havea present value of £579 discounting at20%.
The net present value of a new develop-ment project may be expressed as follows:
NPV 5 PVNCF 2 NINV
where NPV is the net present value; PVNCF,the present value of the net cash flows; andNINV is the net investment. Assuming a costof capital, k, the net present value for aproject with a 5-year expected life and cashflows A1, A2, . . . A5 would be the following:
NPV 5A1
(1+k)+
A2
(1+k)2+
A3
(1+k)3+
A4
(1+k)4
+ A5
(1+k)52 NINV
A5 may be assumed to include any salvagevalue remaining at the end of the project’slife.
EXAMPLE. In row 4 of a spreadsheet set outas in Table 7.1, a project requiring an initialoutlay of £60,000 (cash outflows carry a neg-ative sign) is evaluated. The cashflowswhich are forecast to benefit the business
(inflows are positive) are given at yearlyintervals, starting with £36,000 in a year’stime. These would be stated in real (adjustedto remove the effects of inflation) termssince it is usual to state the cost of capital inreal terms. This business requires a return of10% over and above inflation, so this is theappropriate discount rate to employ.
We evaluate the project using NPV, not-ing the equation:
NPV 5 PVNCF 2 NINV
The PVNCF may be found by calculating, orusing discount tables to reveal that the pres-ent values of each pound receivable after 1,2, 3, 4 and 5 years, have present values of£0.9091, £0.8264, £0.7513, £0.6830 and£0.6209, respectively. These are obtainedfrom the expression: present value 5£1/(1+k)n discounting for n years at a rate k.Where n takes on the value 1, 2, 3, 4 or 5,while k is set at 10% or 0.1.
For the £36,000 anticipated after oneyear, the present value will be 36,000 2£0.9091, which is £32,727. The total PVNCFis £180,000, found by adding the £36,364,£46,852, etc. to this figure. The NINV of£60,000 is then subtracted to leave anacceptable NPV of £120,000. The remaininginformation in Table 7.1 will be discussedbelow.
Many tourism projects, particularly thosewhich involve aircraft and hotel buildings,will have expected lives which stretch overperiods of 10, 20 or more years, but theprinciples are the same. With longer timeperiods, one must recognize the need forperiodic injections of capital for replace-ment or renovation, but these will simplyreduce the net inflow in the years of occur-rence and are easily accommodated withinthe appraisal procedure. Projects with pos-itive NPVs are to be accepted, those withnegative NPVs are to be rejected. When dis-counting at the firm’s required rate of return,that is, its cost of capital, a zero NPV indi-cates that while the investors will not add totheir wealth by accepting the project, theywill be no worse off. They would be indif-ferent, in that instance, between acceptanceand rejection.
190 J. Bridge and L. Moutinho

The NPV approach is superior to tradi-tional simplistic methods such as payback,or the average rate of return because it con-siders both the magnitude and the timing ofcash flows over a project’s entire expectedlife.
Internal rate of returnAn alternative DCF approach favoured bymany practitioners is the internal rate ofreturn (IRR). It is related to the NPV in thefollowing way. Suppose, as with the projectexhibited in Table 7.1, that at a discount rateof 10% a project comfortably offers a pos-itive NPV, to the extent that even whendiscounting at a rate of 68% it still brokeeven. The result at this limiting discountrate could then be written:
0 5 NPV 5 PVNCF 2 NINV
The discount rate (68.65% as identified inthe spreadsheet-derived table, and com-puted therein) at which this result occurs isdefined as the internal rate of return (IRR)and generally speaking, when the IRRexceeds the company’s cost of capital, theNPV will be positive and the project identi-
fied as acceptable. Many studies haveindicated a preference among managers forIRR – probably because it is expressed as apercentage, in common with other businessmeasures of profitability – and managersmay feel more comfortable with it than withNPV (expressed in pounds, dollars, etc.).
Capital rationing using the profitabilityindex
Despite the relative popularity of IRR, it isfrom the NPV concept that the criterion fordealing with capital rationing situations isdeveloped. When funds for investment arelimited, one is no longer accepting or reject-ing projects which have positive NPVswithout limit, but in the context of this anal-ysis, the approach is to invest the funds thatare available in that set of new tourist prod-uct projects with the highest total netpresent value. That is, the goal is to maxi-mize the net present value of the entirecurrent investment.
The principle of budgeting, whichapplies in this context, and in any othersituation where a limiting factor is in opera-tion, is that priorities should be established
Table 7.1. Investment appraisal calculations.
A B C D E F G H I
1. Year 0 1 2 3 4 5 NPV at10%
IRR ProfitabilityIndex
2.
3.
4. -60,000.00 36,000.00 44,000.00 62,000.00 62,000.00 35,400.00 120,000.00 68.65% 2.00
5.
6.
7.
8.
9. PV factors 0.9091 0.8264 0.7513 0.6803 0.6209
10.
11. PVNCF® 32,727.27 36,363.64 46,581.52 42,346.83 21,980.61 120,000 ¬NPV
191Financial Management in Tourism
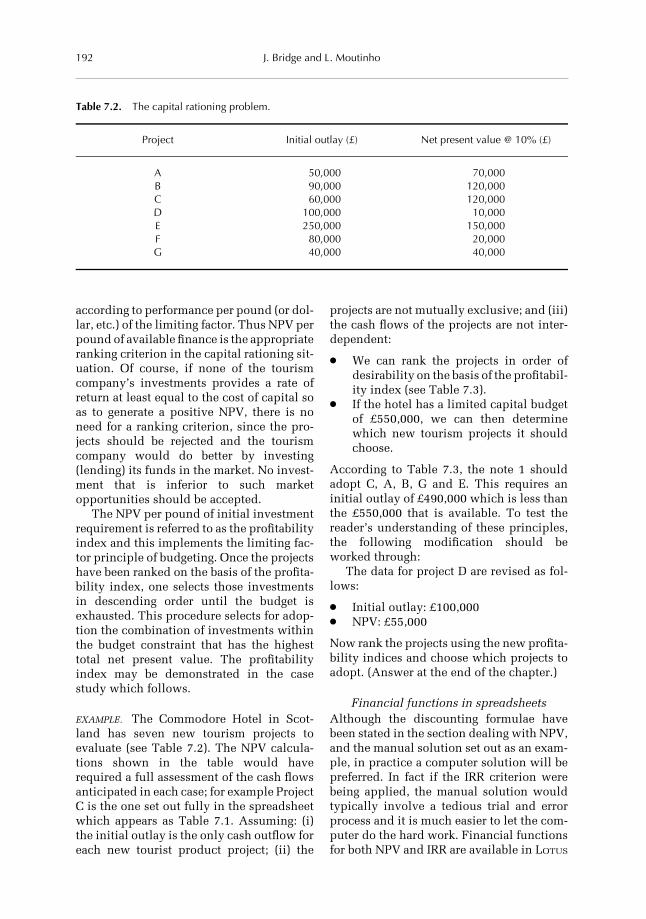
according to performance per pound (or dol-lar, etc.) of the limiting factor. Thus NPV perpound of available finance is the appropriateranking criterion in the capital rationing sit-uation. Of course, if none of the tourismcompany’s investments provides a rate ofreturn at least equal to the cost of capital soas to generate a positive NPV, there is noneed for a ranking criterion, since the pro-jects should be rejected and the tourismcompany would do better by investing(lending) its funds in the market. No invest-ment that is inferior to such marketopportunities should be accepted.
The NPV per pound of initial investmentrequirement is referred to as the profitabilityindex and this implements the limiting fac-tor principle of budgeting. Once the projectshave been ranked on the basis of the profita-bility index, one selects those investmentsin descending order until the budget isexhausted. This procedure selects for adop-tion the combination of investments withinthe budget constraint that has the highesttotal net present value. The profitabilityindex may be demonstrated in the casestudy which follows.
EXAMPLE. The Commodore Hotel in Scot-land has seven new tourism projects toevaluate (see Table 7.2). The NPV calcula-tions shown in the table would haverequired a full assessment of the cash flowsanticipated in each case; for example ProjectC is the one set out fully in the spreadsheetwhich appears as Table 7.1. Assuming: (i)the initial outlay is the only cash outflow foreach new tourist product project; (ii) the
projects are not mutually exclusive; and (iii)the cash flows of the projects are not inter-dependent:
● We can rank the projects in order ofdesirability on the basis of the profitabil-ity index (see Table 7.3).
● If the hotel has a limited capital budgetof £550,000, we can then determinewhich new tourism projects it shouldchoose.
According to Table 7.3, the note 1 shouldadopt C, A, B, G and E. This requires aninitial outlay of £490,000 which is less thanthe £550,000 that is available. To test thereader’s understanding of these principles,the following modification should beworked through:
The data for project D are revised as fol-lows:
● Initial outlay: £100,000● NPV: £55,000
Now rank the projects using the new profita-bility indices and choose which projects toadopt. (Answer at the end of the chapter.)
Financial functions in spreadsheetsAlthough the discounting formulae havebeen stated in the section dealing with NPV,and the manual solution set out as an exam-ple, in practice a computer solution will bepreferred. In fact if the IRR criterion werebeing applied, the manual solution wouldtypically involve a tedious trial and errorprocess and it is much easier to let the com-puter do the hard work. Financial functionsfor both NPV and IRR are available in LOTUS
Table 7.2. The capital rationing problem.
Project Initial outlay (£) Net present value @ 10% (£)
A 50,000 70,000B 90,000 120,000C 60,000 120,000D 100,000 10,000E 250,000 150,000F 80,000 20,000G 40,000 40,000
192 J. Bridge and L. Moutinho

1-2-3, QUATTRO-PRO and EXCEL. These maybe called up, and applied to any set of cashflows within the spreadsheet by identifyingthe specific acronym NPV or IRR. In the caseof EXCEL these are entered after ‘5’ but withLOTUS and QUATTRO spreadsheets these areprefixed by the @ character; thus @NPV or@IRR are the relevant functions:
EXAMPLE. In Table 7.1, the net inflows areset out in LOTUS 1-2-3 spreadsheet cells B4 toF4, while the initial outlay appears in cellA4. If we were to type @NPV(0.1, B4..F4), aresult of 180,000 would appear; in effect@NPV in the spreadsheet gives us PVNCFrather than NPV. Accordingly, we shouldtype into cell G4 the entry: @NPV(0.1,B4..F4)+A4 in order to take care of the NINVwhich requires the initial flow of 2£60,000to be incorporated. The first number insidethe bracket is the discount rate, which is10% in this example).
The IRR in cell H4 uses the financialfunction, whose form in this instance is:@IRR(0.5, A4..F4). The first number insidethe bracket is an initial ‘guess’ at the IRR,and the range A4..F4 embraces the full rangeof flows from the beginning to the end of theproject. The result of 68.65% appears in cellH4 after formatting that cell to indicate per-centages with two decimal places.
In applying the profitability index, allthat is required is to divide the NPV, com-puted as shown above, by the initial capitaloutlay. This involves dividing the contentsof one spreadsheet cell by another, which isone of the simplest arithmetic operations tobe performed. In this instance, the formula
entered in cell I4: 1G4/2A4 which woulddisplay the number 2.00 as shown.
Rather more complex, but again facili-tated by the spreadsheet, is the problem ofmultiperiod capital rationing. This ariseswhen spending limits affect several time-periods instead of just one. While theprofitability index is fine for dealing with asingle limiting factor, it cannot cope withmultiple limits, since one could easily havea series of conflicting rankings. Instead, thetechnique of linear programming must beemployed; again while manual solutions arelong and tedious, most spreadsheets containoptimization facilities, of which linear pro-gramming is the most frequently used.
The investment decision: the case of smalltourism companies
So far, we have argued that the technicallysound principles of DCF should be used inevaluating capital projects. Although theactual calculation of the cash flows requirescareful forecasting of the relevant revenuesand costs, the microcomputer spreadsheetcan facilitate these computations and thenapply the required financial functions ofNPV or IRR as shown above. However, thegap between the normative approach of thetextbook and the practice of small busines-ses in the tourist industry has been revealedin a study by Hankinson (1992). Indeed inthe smaller hotels which featured in thestudy, investment decisions were domi-nated by the ‘necessity’ criterion, i.e. onlyundertake new projects when there is anidentifiable specific need, which is so obvi-ous as to require no appraisal.
Table 7.3. Use of the profitability index (Pi).
Project Initial outlay (£) NPV (£) Pi
C 60,000 120,000 2.00A 50,000 70,000 1.40B 90,000 120,000 1.33G 40,000 40,000 1.00E 250,000 150,000 0.60F 80,000 20,000 0.25D 100,000 10,000 0.10
193Financial Management in Tourism

As Hankinson reports:
There was little evidence of positiveinvestment thinking, and very few of thesmaller hotels admitted to planning aheadbeyond 12 months. The majority merelyinvested when the ‘necessity criterion’dictated. In short, most investmentappeared to be non-strategic, piecemeal,non-anticipatory, and geared to survivalonly. Whilst there could be little doubt thata recessionary economic situation affectedthe decision to invest, it was equally clearthat other, and perhaps more basic, factorswere relevant. (Hankinson, 1992: 34–35)
A relationship appeared to exist betweeninvestment and past profit, rather thananticipated returns in the future, but thiscould have reflected the availability ofretained earnings rather than a backward-looking approach to capital spending.However, Hankinson described theobserved behaviour as ‘non-visionary capi-tal spending’ by some 80% of the sample.
Thus only 20% of the hotels had beenengaged in ‘visionary investment’. Indeed,very few of the hotels used leading or futureindicators as influences on their investmentdecisions, and most considered that no reli-able indicators existed. The mainconclusion to this part of the study wasthat:
investment was determined mainly bynecessity or crisis which rendered capitalspending imperative, provided that hotel’sown funds were available. The cost ofborrowing, credit availability, andgovernment investment incentives wererevealed to be mere influences rather thandeterminants of investment.
The main investment appraisal methodsused by the hotels were the traditional, non-discounting techniques. No hotel in thestudy was totally familiar with DCFalthough some claimed to be aware of thetechnique. Practically no hotel had beeninfluenced by the literature on the subject,or by courses offered at local colleges, or bythe advice of consultants. Forecasting ofcash flows was not evident and 31% used nomethod at all, while only 12% made
attempts to calculate cash flows. Althoughcapital budgeting, therefore, was only prac-tised on a narrow front in this sector,budgeting in its widest sense appeared to bethe most popular management technique.
The study also investigated the financingof investment, which had been provided foralmost equally by the hotels’ own funds, andbank credit. Many respondents seemedreluctant to take advantage of externalfinance facilities, and 90% of the hotels hadnot been concerned in any attempt to obtaininvestment finance through facilitiesbeyond the local bank, some indicating thatexternal credit was a threat to their inde-pendence. There was also a lack ofawareness of external sources. Even wheregovernment incentives were available, fewUK hotels had taken advantage of them.
Studies such as this suggest that tech-niques directed at goal optimization may notfind this sector to be fertile territory for theirapplication. There are some lessons to belearned for the theoretician in this, since itappears that forecasting is a difficult processin tourism and that financing may reflect amove from crisis to crisis, by necessity,rather than planned change. However, thefact that sophisticated techniques are to befound among larger tourism businesses,coupled with the increasing use of micro-computers at all levels, suggests that it isonly a matter of time before analytical tech-niques become better known and easier touse.
Hotel Marketing Budgeting
ERC (efficiency-risk coefficient)A strategic problem in determining the mar-keting budget is not merely the matter ofhow much to invest in marketing as a whole,nor in determining each element of the mar-keting mix, but how much to spend inrelation to the hotel total resources budgetavailable. The proportion spent on market-ing will affect the degree of risk to which thebudget is exposed. Suppose, for example,that the hotel has a total advertising budgetwhich may be spent in different media, withdifferent coverage and response rates and
194 J. Bridge and L. Moutinho

assuming the risk to be uniform, a compar-ative efficiency-risk coefficient (ERC) can beestablished to compare the effectiveness andrisk of each medium. This would be calcu-lated by multiplying the IPC factor (incomegenerated as a percentage of cost) by the totalbudget (B) available and dividing by thecampaign cost (C):
ERC 5 IPC 2 B/C
This will give an order of preference inwhich to allocate the hotel marketingresources to the media available, in order tocombine the highest return for the outlaywith the least risk in regard to the totalresources available. Of course, the incomegenerated is not the same as profit generated.For instance, the profit on the £800,000 ofincome generated by a TV campaign willprobably not be sufficient to cover the£200,000 cost of the campaign. Hence, itwill be useful, not merely to establish anorder of preference in the relative expendi-ture on the different media, but also to find acut-off point below which the expectedreturn for expenditure in the next mediumproposed is quite simply unprofitable.
Marketing mix and profitabilityThe importance of the hotel marketing budg-eting process should be seen within thedevelopment of hotel marketing plans: inparticular, regarding its role as a planningtool, its interrelationship with forecastingprocedures, its linkage with the definition ofhotel marketing objectives and alternativemarketing strategies, its crucial role in termsof the allocation of financial resources tomarketing mix programmes, and in terms ofbeing seen as a monitoring device within amarketing control system.
The hotel should seek to create a differ-ential advantage (DA), the set of uniquefeatures in a hotel’s marketing programmethat attracts customers and causes them topatronize the hotel and not its competitors.Without a DA, a hotel adopts a ‘me-too’philosophy and offers the customer no rea-sons to select its offerings over acompetitor’s. A DA can be achieved througha distinctive image, new products/servicesor features, quality of services, low rates,
and other hotel characteristics. The hotelmarketing mix requires a number of deci-sions and the budgeting of marketingactivities does not mean a guesswork alloca-tion of sums between various marketingactivities. Budgeting involves forecasting,selection of priority customer-generatingmarkets, and the planned manipulation ofall the variables that determine the hotel’sperformance in an effort to arrive at somepreferred market position in the future.
The profit from a given marketing-mixstrategy can be calculated from the equa-tion:
Z 5 Q(P 2 D 2 c) 2 F 2 M
where:
Z 5 total profits;Q 5 quantity of units sold;P 5 hotel list room rate;D 5 discount, trade allowance or com-
mission;c 5 service production variable cost,
such as labour;F 5 fixed costs, such as property tax and
managerial salaries;M 5 marketing costs associated with the
strategy in question;(P 2 D 2 c) is the gross contribution marginper unit; andQ(P 2 D 2 c) is the gross contribution avail-able to cover fixed costs, discretionarymarketing expenditures, and to provide forprofit.
The implications of this equation will bemore fully developed below, in the sectionwhich deals with cost-volume-profit analy-sis. In the present context of the marketingbudget, it should be clear that the attainmentof target sales and profit can be planned andcontrolled by setting up a marketing budgetwhich utilizes these relationships betweenactivity, revenues, costs and profit. Oneproblem which may remain, however, isthat the total amount to be spent is oftendetermined by a simple-rule-of-thumbmethod, such as percentage of annual expec-ted sales or last year’s budget plus anassumed growth percentage. More appro-priate, however, is a method which takes nosuch precedent for granted, and which
195Financial Management in Tourism

assesses the impact of setting the expendi-ture level on the achievement of businessobjectives.
Zero-base marketing budgetingThe planning technique called zero-basebudgeting (ZBB) continually assesses andquestions existing programmes. It also facil-itates the development of new programmes.The hotel manager can formulate a market-ing plan for each target market (TM) andestimate sales, for example, at three levels ofmarketing expenditure, such as 30% belowthe normal level, the normal level and 30%above the normal level. An example isshown in Table 7.4, outlining what a hotelmanager would do with each budget leveland the estimate of sales volume (the sales-response function). Then managementreviews this response function against thoseof other hotel products/services with differ-ent TMs and gives serious consideration toshifting funds from TMs with low marginalresponses to TMs with higher marginal salesresponses.
The application of a broad budgeting con-cept will help the hotel manager to prioritizewhere he or she wants to spend his or herlimited resources. The ZBB concept statesthat no expenditure is justified just becauseit was spent last year. Every expense is re-analysed and justified each year on the basis
that this expenditure will yield more favour-able results than spending the same amountin another way. Hence, one needs some cau-tion when applying this concept. Forexample, a hotel that relies on a reservationsystem, should see this feature as a ‘core’ orvital element which at the minimum mustbe maintained at a certain level. Oneapproach is to subdivide the budget into the‘vital core’ and an ‘all other category’, andonly apply the ZBB concept to the ‘all other’category.
For the TM illustrated in Table 7.4, theprospect of operating at the zero-base loses10,000 service units as compared with the‘normal’ £1,500,000 budget level. If the pos-sibility exists for re-allocating £450,000 to aTM’s marketing budget, which would gen-erate more service units than this potentialloss, the implications are clear.
From a practical standpoint, the hotelmarketing budgeting process involves fourdistinctive stages: (i) target profit planning;(ii) implementation of the right combinationof the marketing mix elements; (iii) applica-tion of suitable and effective budgetingtechniques; and (iv) monitoring of actionprogrammes. Budgeting facilitates effectivecontrol to enable the manager to monitormarketing operations and pinpoint problemareas. While budgeting facilitates coordina-tion and communication between target
Table 7.4. Illustration of zero-base marketing budgeting.
Budget (M) Summary of the marketing plan Sales forecast (Q)
£1,050,000 Maintain sales and market share in the short term byconcentrating sales effort on business travellers,advertising only in magazines, newspapers and directmail, sponsoring two promotions a year, and carryingon only limited marketing research
60,000 service units
£1,500,000 Implement a coordinated effort to expand market shareby contacting 80% of all tour operators and travelagents, adding magazine advertising, adding point-of-purchase displays, and sponsoring three promotionsduring the year.
70,000 service units
£1,950,000 Seek to expand market size and share by adding twonew hotel products, enlarging the sales staff, increasingmarketing research, and expanding the advertisingbudget
90,000 service units
196 J. Bridge and L. Moutinho

hotel departments, it can only lead to opti-mal results if the overall budget and itsallocation is carefully thought through. Ana-lytical approaches, such as ZBB, can help toestablish the budget on rational principles.
Cost-Volume-Profit Analysis*
The break-even chartA convenient device for gauging profitabil-ity at various production or service levels isthe break-even chart (Fig. 7.1). The analysisof the cost, revenue, and profit functionsgoes beyond the determination of the break-even point, which occurs where the cost andrevenue functions intersect, and where theprofit line cuts the output axis. It encom-passes an examination of the relationships,at all levels, between a changing volume ofproduction or service delivery, costs, sales-revenue and profits, and the subject isnormally called ‘cost-volume-profit’ (CVP)analysis.
In Fig. 7.1, cost, revenue and profit are alllinear functions of output. Each service unitprovided is sold at a common price whichdictates the slope of the revenue function.The total cost line does not pass through the
origin because there are fixed costs whichstill have to be borne when output is zero.The constant slope of the total cost functionis dependent on the unit variable costremaining unchanged.
The profit function is deduced from theother two functions, and is the differencebetween total revenue and total cost. Whenoutput is zero, profit will be negative by anamount equal to the fixed costs, and there-after it will rise by an amount (P2c) for everyunit produced, where P and c are the unitselling price and variable cost, respectively.The magnitude (P2c) is the contribution toprofit. Initially, the contribution from eachunit helps to offset the fixed costs, and noprofit overall is made until the break-evenoutput is reached: where total cost equalstotal revenue and profit is zero. Marketingcosts discussed in the section on marketingmix and profitability, can be handled withinthis framework, but for present purposes letus treat these as if they were included in thefixed costs.
If we let f 5 fixed cost and Q 5 output, wecan write:
Total cost 5 f 1 Qc
(the sum of fixed and variable costs) and
* Much of this section originally appeared in Bridge (1989) and is reproduced here with the permissionof the publishers.
Fig. 7.1. Break-even chart for dinner dance.
197Financial Management in Tourism

Total revenue 5 QP
The break-even output occurs where:
f 1 Qc 5 QP
from which it can be deduced that:
Q (break-even) 5f
(P 2 c)
For example, suppose that a dinner-dance isplanned at your hotel for which the ticketprice is set at £15. If the average variable costfor the food and wine is expected to be £6the contribution would be £9. Fixed costsfor the event, including the cost of staff,orchestra, and other entertainments arethought to be around £1800 (see Table 7.5),so substituting in the formula above:
Break-even quantity 51800
(15 2 6)
5 200 tickets
If the hotel is expected to sell 350 tickets forthe function, this gives a ‘margin-of-safety’of 150, or £2250 expressed in sales revenue.These latter figures show how far the ticketsales would have to fall below the estimatedlevel before losses emerged, and the corre-sponding fall in sales revenue. Expressed asa percentage, the margin of safety is:
(3502200)
3505 42.86%
Another attribute which may be measuredthrough CVP analysis is the ‘profit-volumeratio’, which is the contribution expressedas a proportion of sales revenue. On a singleunit sold:
profit-volume ratio 5(P 2 c)
P
5(15 2 6)
15
5 60%
This ratio will apply for the range of sales forwhich P and c remain constant. In thisrange, every £100 increase in ticket sales
will be accompanied by an increase in profitof £60. All the ratios and margin-of-safetyfigures were computed using a microcom-puter spreadsheet which was used togenerate Table 7.5.
On the face of it, there would be consider-able benefits to be gained if the price couldbe raised. In Fig. 7.2, the event now breakseven at a lower level of ticket sales, andachieves greater profits at all sales levels, asa result of raising the price from £15 to £18.It enjoys a larger profit-volume ratio, andmargin-of-safety. It is likely, however, that aprice increase would reduce the quantitydemanded, so an understanding of the priceelasticity of demand for the tickets wouldseem essential before the CVP analysiscould make further progress in assessingwhether a price increase (or reduction)
Table 7.5. Cost-volume-profit analysis.
Number oftickets Cost Revenue Profit
0 1800 0 (1800)50 2100 750 (1350)
100 2400 1500 (900)150 2700 2250 (450)200 3000 3000 0250 3300 3750 450300 3600 4500 900350 3900 5250 1350400 4200 6000 1800450 4500 6750 2250500 4800 7500 2700550 5100 8250 3150600 5400 9000 3600
Fixed costs (£) 1800Variable costs (£) 6Selling price (£) 15Contribution (£) 9Break-even quantity 200Break-even sales (£) 3000Estimated sales 350Margin-of-safety 150Or (£) 2250Or (%) 42.9Profit-volume ratio (%) 60
198 J. Bridge and L. Moutinho

would be beneficial to the firm. The need fordemand considerations to be made explicitis something which not only affects CVPanalysis, but all the issues tackled in thischapter from capital budgeting through toyield management which is discussed in thenext section.
It is apparent from the previous para-graph that total revenue will frequently notbe a linear function, since price adjustmentswill generally be required to dispose of addi-tional services: hotel beds, excursions,tickets for events, and so on, unless the tour-ism business operates in a perfect market.Furthermore, total costs may not be a linearfunction of output, either because unit varia-ble costs are not constant, or because thereare costs of a semi-fixed/semi-variablenature (e.g. wages of supervisory staff),which cause a sudden jump in the cost func-tion when a critical output is reached. Oncethe revenue and cost curves cease to be lin-ear, there is the possibility of additionalbreak-even points (a second appears in Fig.7.3), with a position of profit maximizationoccurring somewhere between the break-even points.
CVP and economic theory: marginal analysisEconomic theory relies heavily on marginalanalysis in the treatment of output and price
determination. Marginal cost is the changein cost brought about by a unit change inoutput. Since fixed costs are insensitive tooutput changes, by definition, it is thebehaviour of variable cost which is relevantin the application of marginal analysis. Onecould equally define marginal cost as thechange in variable cost brought about by aunit change in output. Marginal revenue isdefined similarly as the change in total reve-nue brought about by a unit change inoutput. The marginal functions show theslope of their respective total functions ateach possible output.
Profit maximization in competitiveconditions
In the micro-economic models of the firm,the profit maximizing output is locatedwhere marginal cost is equal to marginalrevenue. Under conditions of perfect com-petition, each firm is a price taker, with pricebeing determined impersonally by the inter-action of market supply and demand. Thefirm’s marginal revenue is then constant andequal to the market price. Instead of theusual economist’s diagram, based on themarginal functions, we can use the CVPchart (Fig. 7.3) to illustrate the profit-maximizing output in the short run. Thelinear revenue function is still used if a con-
Fig. 7.2. Break-even chart: effect of price increase.
199Financial Management in Tourism

stant selling price prevails in the market.However, if marginal cost is not constant,but rising, the total cost function will showan increasing slope.
One possible factor which could causerising marginal cost is ‘diminishing returns’(often explained in terms of the proverb ‘toomany cooks spoil the broth’), in which thelinear total cost function will be replaced bya curve as shown in Fig. 7.3. While linearcost functions will often be satisfactory formany practical purposes, it is important thatany service business which permits consid-erable variation in the mix of inputs (theratio of ‘cooks’ to ‘broth’ ingredients), isaware of possible falls in marginal product,and rises in marginal cost, if diminishingreturns set in.
The main lesson of CVP analysis is thatprofits will improve with an expansion ofoutput, so long as there is a positive con-tribution (P 2 c). In Fig. 7.3, marginal costrises unit by unit, and the contribution from
successive units will fall. In place of thesingle break-even point, with ever-increasing profit beyond, there are twobreak-even points shown, with a profit-maximizing output lying somewherebetween the two. This latter output may belocated through marginal analysis by find-ing where marginal cost is equal to marginalrevenue (5 market price, under perfectcompetition).
Pricing in less competitive conditionsAt the other extreme from perfect competi-tion lies the market form known asmonopoly. This is unlikely to be found intourism markets, despite the fact that mer-gers between hotel groups, tour operatorsand airlines in the UK may be referred to theCompetition Commission. These are moreproperly seen as examples of oligopoly,although this market form can behave in amanner detrimental to the consumer, hencepossible intervention according to competi-
Fig. 7.3. Cost curve with two break-even points (taken from Bridge (1989) with the permission of thepublishers).
200 J. Bridge and L. Moutinho

tion law. The monopolist can select anappropriate price and quantity, but mustensure that these are consistent (with marketdemand). In economic theory it is normallyassumed that the choice will be made so asto maximize profit.
So long as we restrict our attention tothose situations where there is some discre-tion over price and output, the analysis maybe loosely extended to cover big-businesssituations other than monopoly, althoughthere is no accommodation of interdepend-ence in what is exhibited here, and so thisfacet of oligopoly is not adequately repre-sented. In the CVP chart drawn in Fig. 7.4, alinear cost function is adopted once againfor simplicity, with fixed costs of £24 andunit variable costs of £8 (see Table 7.6).However, a new sales revenue function isintroduced. The slope of this function grad-ually falls until the curve flattens at its peak,beyond which the slope is negative. Thissales revenue behaviour is characteristic of alinear demand function for the service(product or brand). In this example the equa-
tion has been chosen to be:
Q 5 80 2 2P (as tabulated in Table 7.6)
In this case, the business adjusts its price(average revenue) according to the outputwhich it tries to sell. Disposal of 60 units perperiod requires a price of £10, while 40 unitsper period could be cleared at a price of£20.
Traditional economic theory proposes aprofit-maximizing solution, which willoccur at a quantity of 32 units and a price of£24. This may be read from Table 7.6 (orcomputed by the spreadsheet). The peak ofthe profit curve can also be identified fromFig. 7.4, which directly confirms the outputdecision. Alternatively the business maypursue sales-revenue maximization accord-ing to the ‘managerial’ sales-revenue-maximizing (SRM) model of the firm pro-posed by Baumol (1959). In this instance,the peak of the sales revenue curve would belocated at an output of 40 units and price of£20. The sales-revenue maximizer wouldtherefore produce a greater quantity and sell
Fig. 7.4. Maximum of sales and profit (taken from Bridge (1989) with the permission of the publishers).
201Financial Management in Tourism

at a lower price than its profit-maximizingcounterpart.
Economists anxious to defend the profit-maximizing assumption have attempted to
reconcile it with SRM, by arguing that SRMis a short-run objective consistent with long-run profit maximization. This is a plausiblereconciliation based on the view that a busi-
Table 7.6. Maximization of profits and sales (taken from Bridge (1989) with the permission of thepublishers).
Intercept 80 Fixed cost 24Slope -2 Variable cost 8
Quantity Av. revenue Sales Cost Profit
80 0 0 664 266478 1 78 648 257076 2 152 632 248074 3 222 616 239472 4 288 600 231270 5 350 584 223468 6 408 568 216066 7 462 552 29064 8 512 536 22462 9 558 520 3860 10 600 504 9658 11 638 488 15056 12 672 472 20054 13 702 456 24652 14 728 440 28850 15 750 424 32648 16 768 408 36046 17 782 392 39044 18 792 376 41642 19 798 360 43840 20 800 344 45638 21 798 328 47036 22 792 312 48034 23 782 296 48632 24 768 280 48830 25 750 264 48628 26 728 248 48026 27 702 232 47024 28 672 216 45622 29 638 200 43820 30 600 184 41618 31 558 168 39016 32 512 152 36014 33 462 136 32612 34 408 120 28810 35 350 104 2468 36 288 88 2006 37 222 72 1504 38 152 56 962 39 78 40 380 40 0 24 224
202 J. Bridge and L. Moutinho

ness may try to build up market share with acompetitive price, with the intention ofreaping larger profits in the future. AlthoughBaumol’s reasoning will not be explored indetail here, he cites other reasons for SRMbased on the fulfilment of managerial objec-tives. For example, size as measured by salesvolume, may confer salary benefits, as wellas the satisfaction of being associated with apowerful business, more effectively thanprofitability. SRM as a managerial objectivein pricing could then be at odds with share-holders’ interests.
An intermediate position, which is nei-ther profit- nor sales-maximizing in anabsolute sense, arises if sales revenue ismaximized subject to a profit constraint.Thus an absolute sales maximizer wouldreach the peak of the sales curve in Fig. 7.4achieving revenue of £800 at an output of 40units. The profit at this output is below themaximum (£456 as against £488). In tryingto achieve the highest sales level possiblewithout dipping below a profit of £470 (con-straint line in Fig. 7.4), the solution would
be to produce at 38 units and enjoy a salesrevenue of £798. If the profit requirementwere set as low as £230, the constraintwould not be binding on the SRM firm, sinceabsolute sales maximization would comfort-ably exceed this figure.
To summarize, we have:
Profitmaximization: price £24, output 32 unitsSRM: price £20, output 40 unitsConstrainedSRM: price £21, output 38 units
The form of the sales revenue curve used inthis example may be reconciled with theconventional CVP chart as shown in Fig. 7.5.The line marked rev 1 is the total revenueline which would be drawn for a sellingprice of £20. With the demand function:
Q 5 80 2 2P
in operation, it is found that 40 units can besold at this price. With the line marked rev 2,a price of £15 is taken, at which 50 units maybe sold. Finally, rev 3 corresponds to a sell-
Fig. 7.5. Alternative revenue assumptions (taken from Bridge (1989) with the permission of the publishers).
203Financial Management in Tourism

ing price of £10, at which 60 units aredemanded. The shape of the sales functionbegins to emerge when these outputs of 40,50 and 60 are marked on to their respectiverevenue lines as shown in Fig. 7.5. It is onlywhen the CVP analysis is extended toinclude demand analysis, that the implica-tions of profit or sales-revenuemaximization objectives for price and out-put (activity) decisions can be determined.
Efficiency in Capacity Utilization
After a business has determined and imple-mented its long-run investment strategy, itneeds to ensure that its viability as deter-mined by the forecasts of cash flow isactually realized. Of course, in an industrywhere short-run fixed costs tend to be high,break-even points become difficult to ach-ieve when there is a reduction in activitydue to economic conditions, and a flexibleapproach in managing the capacity is essen-tial. We shall examine first of all how a hotel,or other tourism business, might measure itsperformance in using its capacity.
ARGE: asset revenue generating efficiencySome capacity-constrained service organi-zations use percentage of capacity sold as ameasure of operational efficiency. Hotelsfrequently speak of ‘occupancy rates’,expressed as percentage figures, but thesetell us little of the relative profitability of thebusiness attracted, given that high utiliza-tion rates may be generated by offeringsubstantial discounts on normal rates, leav-ing little profit to be gained from theadditional turnover.
What is needed is a measure of therevenue-generating potential of the hotel’sassets. This must take into account a com-parison between the average price actuallyobtained per unit of service and the max-imum price that might have been charged,what is termed the ‘unit price efficiencyrate’. Whether a hotel should accept anadvance booking from a tour group of 400room-nights at £30 each or hold out in hopethat the same facilities might be in demandlater to business travellers at the full room
rate of £50 is a complex choice whichrequires appropriate information and ananalytical approach.
In theory, prices can be set by determin-ing the demand curves and relevantelasticities of different market segments, e.g.package tours as against business users.While complete knowledge of these is notgenerally available in practice, managementdoes form judgements, which can be refinedby examining patterns over time, as to howone expects to allocate available capacityamong different market segments at a spe-cific point in time. ‘Selective sell’ targets canbe assigned to advertising and sales person-nel, reflecting these expectations. To assistin monitoring performance and to enableselective sell targets to be more clearlyfocused, an index of asset revenue generat-ing efficiency (ARGE) may be employed. Aswe shall see, a similar concept relatingactual to potential revenue, proposed byOrkin (1988), is discussed in the context ofyield management below, but the value ofthe ARGE approach to performance meas-urement is that it forces explicit recognitionof the opportunity cost of accepting businessfrom one segment when another might sub-sequently yield a higher rate.
ARGE is determined as the product of thepercentage occupancy and the average unitprice efficiency rate. For example, a400-room hotel adopts a maximum postedroom-rate of £50. If only one-half of itsrooms are occupied on a given night, with100 rooms sold at £50 and another 100 at£30, then the average unit price efficiencyrate is 0.8 and the occupancy is 50%, there-fore ARGE is (50% 2 0.8) 5 40%.Alternatively, the ARGE may be calculatedby dividing total revenues received (£8000)by the maximum potential revenues thatcould have been obtained, i.e. by selling allrooms at the highest price (£20,000).
There is a trade-off between the twoterms in the ARGE equation. The percentageoccupancy might be improved by taking onmore low-margin business, but at the cost oflowering the unit price efficiency rate. Anydecision to accept or reject business shouldinclude a realistic estimate of the probabili-ties of alternative business becoming
204 J. Bridge and L. Moutinho

available, together with a recognition of anyincremental costs involved. Incrementalrevenues should always be greater thanincremental costs, unless the hotel service isto be marketed as a ‘loss leader’ or the actionprogramme is part of a pre-specified market-ing strategy.
CRM: critical ratio methodThe concept of probability raised in the pre-vious paragraph is related to frequency andoccupancy, in so far as a room which istypically occupied for half of the nights inthe year, has a probability of being occupiedaveraging 0.5. Of course, because of varia-tions in demand throughout the year, thisprobability will not be static, and it is theresponsibility of management to maintaindata which will enable accurate computa-tions of probability to be performed. Toassist in determining the desirability ofattracting additional guests, hotel busines-ses may utilize the critical ratio method.This technique is based on the expectedcontribution of an incremental availableroom. A room will generate a positive con-tribution if it is occupied. The expectedcontribution of an incremental availableroom can be seen as:
C 5 r 2 (s 1 c)
where: C 5 the expected contribution of anincremental available room; r 5 theoccupancy-variable revenues; s 5 theoccupancy-variable (servicing) costs; and c5 the capacity-variable (carrying) costs.
Then the hotel manager can calculate theexpected contribution of the nth room of acontemplated capacity of n rooms as fol-lows. Let:
ECn 5 expected contribution of the nthroom of a contemplated capacity ofn rooms
Pn probability that at least n rooms willbe demanded on a given night (orthe frequency with which demandwill reach this level)
Then:
ECn 5 Pn (r2s2c) 2 (1 2 Pn)c
i.e. the probability of the room being occu-
pied multiplied by the contribution to profitless the probability of it not being occupiedmultiplied by the carrying costs. There willbe a positive contribution so long as Pn(r2s2c) exceeds (1 2 Pn)c
The critical probability that at least nrooms will be demanded on a given night iswritten as p*n and this is given by theratio:
p*n 5c
(r2s)(crm equation 1)
At this critical ratio, there will be zero con-tribution, but when the probability (orfrequency of occupancy) exceeds this ratio,there will be a positive contribution
1 2 p*n 5(r2s2c)
(r2s)(crm equation 2)
As an example, suppose that for the nthroom of a hotel, the occupancy-variable rev-enues (r) per occupied room-night are £75and that its occupancy-variable costs (s) peroccupied room-night are £30. If the hotel’scapacity-variable costs (c) per availableroom-night are £15, one can find the criticalratio as: 15/(75 – 30) = 1/3, or 0.33 whichmeans that the nth room need only be uti-lized for one-third of the nights in the year tobreak even; any greater frequency of occu-pancy will yield a positive contribution.
The second equation gives the demandlevel equivalent to the probability thatcapacity will exceed demand and so the nthroom will not be occupied.
1 2 p*n 5(75 2 30 2 15)
(75 2 30)5 0.67 (the
same as 1 2 0.33)
so that as long as the probability of excesscapacity is less than two-thirds, a positivecontribution will be enjoyed.
As with the ARGE measure discussedpreviously, it is important to examine thetrade-offs implied in the ratio. Once again, abalance must be struck between havingadditional capacity standing idle and theacceptance of a lower contribution. Thus, inthe example just given, suppose that the nth
205Financial Management in Tourism
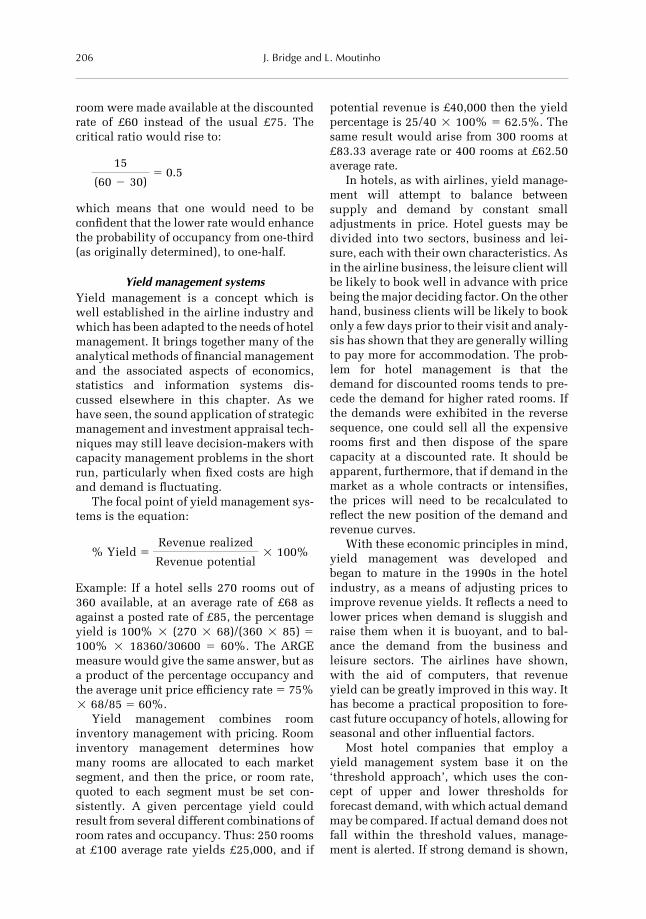
room were made available at the discountedrate of £60 instead of the usual £75. Thecritical ratio would rise to:
15
(60 2 30)5 0.5
which means that one would need to beconfident that the lower rate would enhancethe probability of occupancy from one-third(as originally determined), to one-half.
Yield management systemsYield management is a concept which iswell established in the airline industry andwhich has been adapted to the needs of hotelmanagement. It brings together many of theanalytical methods of financial managementand the associated aspects of economics,statistics and information systems dis-cussed elsewhere in this chapter. As wehave seen, the sound application of strategicmanagement and investment appraisal tech-niques may still leave decision-makers withcapacity management problems in the shortrun, particularly when fixed costs are highand demand is fluctuating.
The focal point of yield management sys-tems is the equation:
% Yield 5Revenue realized
Revenue potential2 100%
Example: If a hotel sells 270 rooms out of360 available, at an average rate of £68 asagainst a posted rate of £85, the percentageyield is 100% 2 (270 2 68)/(360 2 85) 5100% 2 18360/30600 5 60%. The ARGEmeasure would give the same answer, but asa product of the percentage occupancy andthe average unit price efficiency rate 5 75%2 68/85 5 60%.
Yield management combines roominventory management with pricing. Roominventory management determines howmany rooms are allocated to each marketsegment, and then the price, or room rate,quoted to each segment must be set con-sistently. A given percentage yield couldresult from several different combinations ofroom rates and occupancy. Thus: 250 roomsat £100 average rate yields £25,000, and if
potential revenue is £40,000 then the yieldpercentage is 25/40 2 100% 5 62.5%. Thesame result would arise from 300 rooms at£83.33 average rate or 400 rooms at £62.50average rate.
In hotels, as with airlines, yield manage-ment will attempt to balance betweensupply and demand by constant smalladjustments in price. Hotel guests may bedivided into two sectors, business and lei-sure, each with their own characteristics. Asin the airline business, the leisure client willbe likely to book well in advance with pricebeing the major deciding factor. On the otherhand, business clients will be likely to bookonly a few days prior to their visit and analy-sis has shown that they are generally willingto pay more for accommodation. The prob-lem for hotel management is that thedemand for discounted rooms tends to pre-cede the demand for higher rated rooms. Ifthe demands were exhibited in the reversesequence, one could sell all the expensiverooms first and then dispose of the sparecapacity at a discounted rate. It should beapparent, furthermore, that if demand in themarket as a whole contracts or intensifies,the prices will need to be recalculated toreflect the new position of the demand andrevenue curves.
With these economic principles in mind,yield management was developed andbegan to mature in the 1990s in the hotelindustry, as a means of adjusting prices toimprove revenue yields. It reflects a need tolower prices when demand is sluggish andraise them when it is buoyant, and to bal-ance the demand from the business andleisure sectors. The airlines have shown,with the aid of computers, that revenueyield can be greatly improved in this way. Ithas become a practical proposition to fore-cast future occupancy of hotels, allowing forseasonal and other influential factors.
Most hotel companies that employ ayield management system base it on the‘threshold approach’, which uses the con-cept of upper and lower thresholds forforecast demand, with which actual demandmay be compared. If actual demand does notfall within the threshold values, manage-ment is alerted. If strong demand is shown,
206 J. Bridge and L. Moutinho

then the price of rooms can be raised. Ifdemand is lower than expected then dis-counts can be offered.
In balancing the use of capacity, Sawh-ney and Lewis (1992: 11) point to theproblem of overselling discounted rooms,which results in lost revenue known as ‘spillor high rate spill’. Spill may be minimizedby accurate forecasting of later higher ratedtransient demand, and this is fundamentalto successful yield management. The samepoint is emphasized by another author whorefers to the ‘elasticity’ concept. Relihan(1989: 42–43) states that, ‘Judging whetherthe late booking, price-inelastic demandwill materialise is yield management’s pri-mary function.’
There are numerous examples of theapplication of yield management whichhave been cited in both academic journalsand the trade press. However, differencesmay exist between the perceived effective-ness by management and the claims of yieldmanagement experts. There have been somestudies which have cast doubt on its univer-sal effectiveness (see for example Sawhneyand Lewis, 1992), but there does appear tobe industry-wide acceptance of the value ofyield management as a tool for increasingrevenue and improving efficiency, at leastamong many of the large hotel chains. Forexample, Orkin (1988: 3), an expert who hasdeveloped such systems and installed themin many businesses states that, ‘Yield man-agement works. Hotels adopting the systemsand techniques have reported record increa-ses in revenue. In a recent test by HiltonHotels, every hotel employing a yield man-agement system experienced record highrevenues.’
If effective, yield management shouldassist the hotel to improve its revenues andlong-term profitability. This is accompli-shed by attempting to combine the largestnumber of guests possible and the highestrate from each guest, subject to the provisionof a predetermined level of quality of serv-ice. The concept of aiming to maximizerevenue is well established in theory andpractice, but increased intensity of competi-tion in the hotel industry, accompanied bymarket segmentation, has lowered potential
yields, and there may be an inconsistencybetween revenue and profit maximization.Indeed, a distinction can be drawn betweenyield management systems which are profitfocused, and those which are revenuefocused.
As we have seen with the application ofcapital budgeting, the availability of com-puters enables the business to carry outcomplex calculations and keep track of allthe important factors and data, in a mannerwhich was not previously possible. TheTimes (1997) reported how enquiries at bigchains such as Hyatt will result in acomputer-generated room rate quotation,around which there may be little scope fornegotiation. The same article, however,reports that there are still many hotels in theUK which have not installed yield manage-ment systems.
Donaghy et al. (1995) reported on the useof advanced technology: involving artificialintelligence and expert systems to assistmanagers in yield management. Despite theadvances which such technology undoubt-edly permits, these authors, in their reviewarticle, record an open verdict on yield man-agement and conclude: ‘Practitioners in theindustry would find it particularly helpfulto have some tangible quantitative evidenceof the impact of yield management on hotelperformance’ (1995: 149).
Conclusion
Financial management is a vital element inany tourism business in fulfilling its revenueand profitability objectives. The latter partsof this chapter have focused on the need toutilize capacity effectively through suchtechniques as yield management and cost-volume-profit analysis, but the main thrustof the earlier sections was the need to engagein strategic planning and capital budgetingto ensure that an appropriate level of capac-ity is planned in the first place. Capitalbudgeting concepts can assist both large andsmall businesses within the tourism indus-try, not only in determining fixed capitalrequirements but in deciding which market-ing strategies and marketing mix tools will
207Financial Management in Tourism

exploit an investment to its potential in gen-erating the desired return or net presentvalue.
Complex computer systems involvingartificial intelligence and expert systemshave been adopted in some yield manage-ment applications. Large hotel groupsemploying such systems will already havethe necessary hardware and appropriatesoftware, as well as a wealth of data onpatterns of demand. Together, these canassist in budgeting, forecasting and strategicplanning in addition to the short-term man-agement of capacity. For small businessessuch sophistication is not always necessaryor desirable, but microcomputer spread-sheets can assist in fostering a moresystematic decision-making process by pro-viding a more rigorous basis for financialmodelling, budgeting and control.
Answer to Exercise on Page 192
With the new figures, D has a profitabilityindex of 0.55 (£55,000/£100,000). The newranking is C, A, B, G, E, D and F. The hotelshould adopt C, A, B, E and D; this requires atotal initial outlay of £550,000 and has atotal net present value greater than that ofthe former allocation which comprised: C,A, B, G and E. The inclusion of D ahead of Garises from G’s failure to use all of the main-ing capital budget despite its morefavourable profitability index.
References and Further Reading
Atkinson, H., Berry, A. and Jarvis, R. (1995) Busi-ness Accounting for Hospitality andTourism. International Thomson BusinessPress, London.
Baumol, W.J. (1959) Business Behavior Value andGrowth. Macmillan, New York.
Bridge, J. (1989) Managerial Decisions with theMicrocomputer. Philip Allan, Hemel Hemp-stead, UK (especially Chapters 3 and 6).
Brown, D.O. and Kwansol, F.A. (1999) Using IRRand NPV models to evaluate societal costs oftourism projects in developing countries.International Journal of Hospitality Manage-ment 18(1), 31–43.
Coltman, M. (1994) Hospitality ManagementAccounting, 5th edn. Van Nostrand Rein-hold, New York (especially Chapters 6, 9 and10).
Donaghy, K., McMahon, U. and McDowell, D.(1995) Yield management: an overview.International Journal of Hospitality Manage-ment 14(2), 139–150.
Drury, C.(1997) Management and Cost Account-ing for Business Decisions. InternationalThomson Business Press, London.
Hankinson, A. (1992) The small hotel and theinvestment necessity criterion. Horae 3(2),31–39.
Harris, P.J. (1992) Hospitality profit planning inthe practical environment: integrating cost-volume-profit analysis and spreadsheetmanagement. International Journal of Con-temporary Hospitality Management 4(4),24–32.
Harris, P.J. and Brown, J.B. (1998) Research anddevelopment in hospitality accounting andfinancial management. International Journalof Hospitality Management 1(2), 161–181.
Kotas, R. and Conlan, M. (1997) HospitalityAccounting, 5 edn. International ThomsonBusiness Press, London.
Orkin, E.B. (1988) Yield Management – What,How and Why, CKC Report. ChervenakKeane and Company, New York.
Orkin, E.B. (1990) Strategies for managing tran-sient rates. Cornell Hotel and RestaurantAdministration Quarterly 30(4), 35–39.
Owen, G. (1998) Accounting for Hospitality, Tour-ism and Leisure, 2 edn. Longman, Harlow,UK.
Relihan, W.J. (1989) The yield managementapproach to hotel room pricing. CornellHotel and Restaurant Administration Quar-terly 30(1), 40–45.
Sawhney, S. and Lewis, R.C. (1992) Hotel yieldmanagement in practice: a case analysis.Journal of Hospitality and Leisure Marketing1(2), 7–25.
The Times (1995) UK hotels cost more, TravelNews, 14 September 1995, p. 40.
208 J. Bridge and L. Moutinho

The Times (1997) Room manoeuvres, Travel Sec-tion, 22 June 1997, p. 3.
Witt, S.F. and Moutinho, L. (eds) (1994) TourismMarketing and Management Handbook, 2ndedn. Prentice Hall, Hemel Hempstead, UK
(especially Parts II and III).Wood, F. and Lightowlers, P. (1991) Accounting
in the Hotel and Catering Industry, 6thimpression. Longman, Harlow, UK (espe-cially Chapter 37).
209Financial Management in Tourism


8Operations Management
G. Southern
What is Operations Management?
Operations management is concerned withthe design and control of transformation sys-tems to deliver the services, includingproducts, of an organization at the right qual-ity, at the right place and at the right time.
It should be noted that this definition takes asystems viewpoint of operations. It shouldalso be noted that the ‘right quality’ is intan-gible, particularly in the case of tourism,although the price and times are tangibleswhich are specified at the time of booking aholiday or journey in this sector. Quality isdetermined by the expectations and per-ceived delivery level for each of a bundle offactors for each customer. It has beendefined as:
● ‘the totality of features and character-istics of a product or service that bear onits ability to satisfy stated or impliedneeds’ (ISO 8042, 1989);
● ‘the total composite product and servicecharacteristics of marketing, engineer-ing, manufacture, and maintenancethrough which the product or service inuse will meet the expectation by thecustomer’ (Feigenbaum, 1983); and
● ‘fitness for purpose or use’ (Juran andGryna, 1980).
The first of these definitions leaves onewith the feeling that the word ‘service’ wasadded as an afterthought, and even the last
one is more easily applied to an artefact thanto a service. Specifying measurable para-meters for artefacts is easier than specifyingthem for services. Artefacts have shape andsize and can be seen and touched by custom-ers, frequently before purchase. Services aremore concerned with changes in the state offeelings of customers and as such are intan-gible to the highest degree.
This is particularly so with tourism,where the expectations of customers will bepositioned in terms of continuums such astranquillity to excitement, known tounknown, programmed activities to free-dom, simple to complex, and will cover thewhole range of human feelings. (The threeperiods of highest stress in human life aresaid to be marriage, moving house and goingon holiday.) Defining quality in service orga-nizations is, therefore, no simple matter,particularly for tourism where the product isbought unseen except in the case of repeatpurchases, and even here the ambience of alocation or mode of transport can changeyear by year. Tourist locations can, in theworld of mass communication, become pop-ular overnight and with little developmentcontrol builders can move almost asquickly.
Video and TV can let you see a place, buttravel consists of smells, noises, tastes andfeelings which sight alone can only hint at.Each holiday or journey booked can be con-sidered as an individual legally binding
© CAB International 2000. Strategic Management inTourism (ed. L. Moutinho) 211
contract with a vaguely specified product (or‘promise’ in legal terms). In fact complaintsconcerning quality are more likely to surfacein the popular press or on broadcast con-sumer affair programmes (see Box 8.1) thanin law courts, as changes in the state of acustomer’s happiness are much more diffi-cult to argue. When this happens thetourism company is given very little oppor-tunity to respond, and even if it takesreasonable steps to address the problem itsimage is already irrevocably damaged. Serv-ice quality aspects will be discussed ingreater detail in the next chapter on ServiceQuality Management, although tangiblemeasures will be considered later in thisone.
The systems viewOperations management owes much to sys-tems thinking, which is central to theconcepts of managing change. Interest inmanaging change arose in the late 1970s and1980s, when a rapidly changing workingenvironment led to a change in the role ofmanagers. It is associated with a number ofdevelopments in management styles and inthe socioeconomic and technological envi-ronment in which management is practised.The Open University (UK) definition of a
system is: ‘A set of components that dosomething; if any component is taken awayit changes the system; the system is of inter-est’ (Open University, ManagingDevelopment and Change, 1994).
But different people will see the samesystem in different ways, and that the sys-tems may contain subsystems. For example,within a tourist company an employee willsee the company as a work provision sys-tem, the owners as a profit generatingsystem, and the customer as a recreationprovision system. Each of these individualswill place the emphasis of their interest inthe way specified, and each would define adifferent boundary for the system. At thesame time systems can be structurally verycomplex, and may need to be considered interms of an interconnected set of subsys-tems, or components, related to thefunctions they fulfil in order to make man-agement possible. We need to take a holisticview of the total system, and relationshipswithin it, and it is therefore necessary tohave some way of representing systems. Asystems map fulfils this purpose.
The systems map for a typical tour oper-ating company is shown in Fig. 8.1. Seniormanagers of the organization will draw theirsystem boundary as shown here, or perhaps
Box 8.1. BBC and Cosmos Tours.
In a programme broadcast on 16 May, 1997 complaints about poor service, food provision andchildren’s play facilities provided to ‘no money’ holiday-makers were aired on BBC (UK) TV in aprogramme called Weekend Watchdog. The holidays involved package tours to Rhodes. ‘No money’is a concept where holiday-makers pay all cash needed on a holiday before going, including that tocover food, leisure activities, and drink to loosely specified standards: the implementation of theconcept is described in an earlier case by Voss et al. (1985). In the BBC programme it was apparentthat the perception of poor quality was enhanced by the fact that all the facilities were shared withhalf-board tourists, who paid for bed and breakfast up-front, but on a cash basis for anythingadditional to that. From the evidence presented in the programme it was obvious that the two sets ofholiday-makers were treated differently: the no-money people were ‘given’ drinks in plasticcontainers from a poorly equipped, unfinished bar and given low quality food with little variety, thehalf-board people were sold drinks in good glasses from a well-established and well-equipped barand sold food in good quality restaurants. (It was pointed out that the ‘second class’ citizens weremainly British, and the better served holiday-makers were German.) It was, however, agreed that thehotel rooms and the pool facilities had been reasonable.
The company offered £25 compensation to each adult from the complainants. The BBC invitedviewers to join a telephone survey, voting for whether the holiday-makers should receive £24, £250or a full refund of £600. The vote was about 5%, 35% and 60%, respectively.
The image of the company was damaged.
212 G. Southern
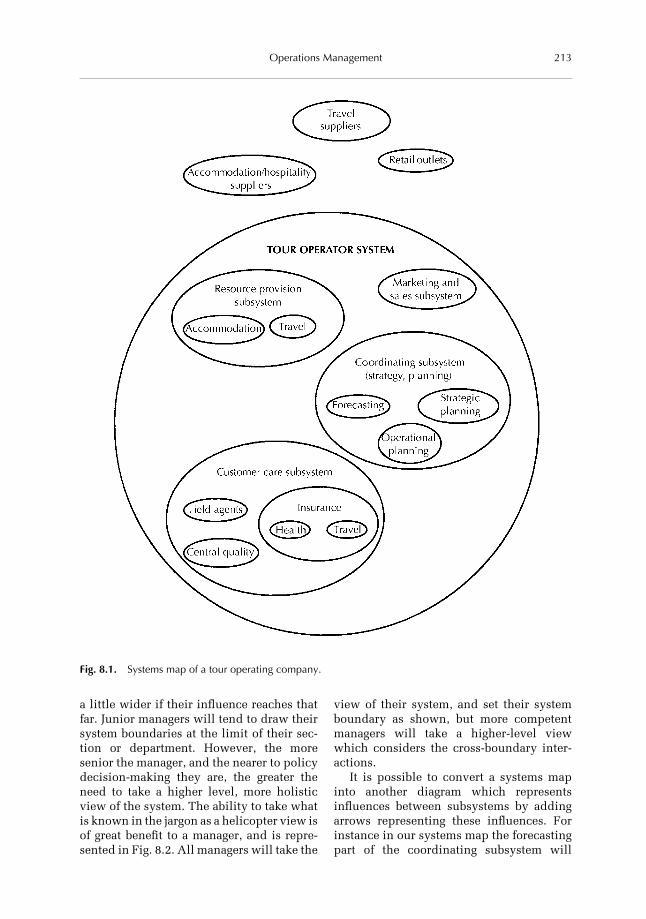
a little wider if their influence reaches thatfar. Junior managers will tend to draw theirsystem boundaries at the limit of their sec-tion or department. However, the moresenior the manager, and the nearer to policydecision-making they are, the greater theneed to take a higher level, more holisticview of the system. The ability to take whatis known in the jargon as a helicopter view isof great benefit to a manager, and is repre-sented in Fig. 8.2. All managers will take the
view of their system, and set their systemboundary as shown, but more competentmanagers will take a higher-level viewwhich considers the cross-boundary inter-actions.
It is possible to convert a systems mapinto another diagram which representsinfluences between subsystems by addingarrows representing these influences. Forinstance in our systems map the forecastingpart of the coordinating subsystem will
Fig. 8.1. Systems map of a tour operating company.
213Operations Management

influence the strategic planning subsystem,which will in turn influence activities in themarketing and resource provision subsys-tems. The resulting influence diagram isanother useful tool in gaining an apprecia-tion of the operating systems of anorganization. The systems view of the touroperating company shown in Fig. 8.1 isclosely related to the operations manage-ment analysis framework which will beintroduced later in the chapter, where thesubsystems representing resource provi-sion, customer care and coordination will beof particular relevance.
Representing system transformationsReturning to our definition of operationsmanagement: ‘Operations Management isconcerned with the design and control oftransformation systems to deliver the ser-vices, including products, of anorganization at the right quality, at the rightprice, and at the right time’, we see thatoperations management is concerned with atransformation process involving inputsand outputs. This is common to the defini-tion of a system. The transformation processcan be displayed by using an input/outputdiagram which allows us to begin an analy-sis of the transformation. Here we are notparticularly concerned with the transforma-tion mechanism itself, but only with the
outputs required and with the inputs neces-sary to deliver them. The transformationitself can for the moment be considered as a‘black box’.
An input/output diagram for the touroperating company displayed in Fig. 8.1 isshown in Fig. 8.3. Note that inputs to thetransformation system consist of tangibleitems (hotels, travel means and timetables,etc.) and knowledge of these. Output con-sists of feelings and perceptions created incustomers, i.e. intangibles. If we now con-sider the transformation process and itsrelationship to systems thinking in moredetail, we can see that outputs from onesubsystem usually become inputs to anothersubsystem. Referring back to Fig. 8.1, forexample, the outputs from the resource pro-vision subsystem of our tour operatingcompany become inputs to our customercare subsystem, and will provide informa-tion inputs into our marketing and salessubsystems. Using this principle it is possi-ble to build elaborate models of therelationships between systems and subsys-tems which lead to both a broad and a deepunderstanding of how operating systemsfunction. This concept has been developedinto computerized system (or process) mod-elling tools such as the IDEF0 modellingsystem (Peppard and Rowland, 1995). Suchtools are proving valuable in the analysis of
Fig. 8.2. The helicopter view of systems and systems boundaries.
214 G. Southern

material and information flow in organiza-tions to ensure that the services andproducts of an organization are delivered atthe right quality, at the right price, at theright time, either by incremental improve-ment (i.e. total quality management) or byradical redesign (business process re-engineering) (Hammer and Champy, 1993).
If we now wish to document the trans-formation mechanism of the system, or moreprobably a subsystem in detail, the mostuseful techniques we have are process flowdiagrams and activity sequence diagrams.Process flow diagrams are used to chart theflow of customers through a service deliveryprocess, such as a restaurant. In this case theentire experience of the customer will becharted, from arrival at the door until thedeparture at the end of the meal. Processflow diagrams use five symbols to representmove, store (planned storage, not veryappropriate to flow of customers), delay,inspect and ‘operate’ activities. The onlytype of activity which adds value to theproduct or customer are the operationalactivities, and in the case of a customer flowchart moves and particularly delays are per-ceived as points of low quality in the servicedelivery system. For example, in a fast food
outlet taking the order, handing over food,and paying are the only value adding points,all others, such as queuing detract from theperceived value of the service.
Activity sequence diagrams concentrateon the series of activities involved in deliv-ering the product or service, and are ofgreater value in the service delivery situa-tion. An activity sequence diagram for thesales subsystem of a typical holiday retailoutlet (see Fig. 8.1) is shown in Fig. 8.4. Thisplots the activities which a customer goesthrough when selecting and booking a holi-day. Process flow and activity sequencediagrams are particularly useful for identify-ing where value is added in the product orservice delivery process, and where cost oreffort is expended with little or no valueadded. Such activities should be eliminatedif possible, or combined with value addingactivities if not. An example of this is thetrend to eliminate inspection activities byredesigning the value delivery process toeliminate the possibility of defective serv-ice, and by placing responsibility for qualitywith the server. This trend correlates closelywith a general trend to worker empower-ment and job enrichment.
In a service situation such as tourism,
Fig. 8.3. Input/output diagram for a tour/holiday provision system.
215Operations Management

process flow and activity sequence dia-grams are particularly useful in identifyingpoints at which perception of poor quality iscreated by expecting the customer to queue
or wait. In this case attempts must be madeto eliminate or decrease the number andlength of these delays, usually by carefulmanipulation of capacity; the techniques for
Fig. 8.4. Activity sequence diagram, holiday sales.
216 G. Southern

doing this will be described later. Wherethis is not possible attempts should be madeto convert passive waits to active waits (seeBox 8.2). Passive waits can be defined asthose where the customer is delayed andfeels no progress or action are being taken, oris given no information to justify the delay.Providing information to delayed customersis important to avoid frustration. It is possi-ble to convert passive waits into active waitsby providing activities for the customer,preferably useful ones, such as browsingthrough brochures in the case described inour earlier activity sequence diagram. It isalso advisable to keep the customer advisedof progress; for example, in the case of holi-day bookings (Fig. 8.4) we should let thecustomer see our computer screen if we aremaking our computer checks and bookings.
Tourism: a Service Industry
Many of the classic concepts and techniquesof operations management have beenderived and developed for use in the manu-facturing sector. However, tourism is placedfirmly in the service sector, and there arefundamental differences between the twowhich indicate that we must be selective,adaptive and inventive in applying them.The underlying reasons for the differencesare concerned with customer expectationsand resulting perception of value and qual-ity, and with the ability to store the ‘value’delivered. Murdick et al. (1990) list 13 cri-teria for identifying types of service incontrast to manufacturing situations. Thesecriteria can be classified under the genericheadings of perishability, heterogeneity,simultaneity, and intangibility, although allthe generic factors and identification criteriaare interrelated.
Perishability‘A service is perishable, i.e. it cannot be keptin inventory, but is consumed in produc-tion’ (criterion 3). For example, consider ahotel room. What is sold here is the comfortof the room for the night, so if it is not soldon a particular night the potential to sell thatroom for that night is lost forever. This con-cept is even more transparent in the case ofan aircraft seat where the opportunity totransport someone is lost if it is empty dur-ing a journey.
Consideration of perishability is partic-ularly appropriate in tourism where, apartfrom the two cases already cited, tour opera-tors tend to buy or take options on travel andaccommodation which if not sold on to cus-tomers lead to losses, hence the resultingsale of short notice holidays at large pricediscounts.
Heterogeneity‘Services produce variable, non-standardoutput’ (criterion 2). As a result servicescannot be mass produced (criterion 7), andpricing options tend to be more elaborate(criterion 13). As a further result of criteria 7and 3, quality control is primarily limited tocontrol of the delivery process itself, i.e.process control (criterion 12). An indicationof heterogeneity in tourism is found in theplethora of retail outlets selling a wide rangeof tour packages, and even tailored holidays,in each location.
Simultaneity‘The customer participates in the process ofproviding the service’ (criterion 5). As corol-laries to this there is high customer contactthroughout the service process (criterion 4),skills (or knowledge) are sold directly to thecustomer (criterion 6), and high personaljudgement is employed by the individuals
Box 8.2. The Chicago Pizza Pie Company.
In the case of a London restaurant, the Chicago Pizza Pie Company (Voss et al., 1985), documentedin a London Business School case study, long queues were considered an asset in indicating thefashionability and popularity of the establishment and attracting customers. However, to amelioratethe frustration of customers the owners erected an automatic sign indicating expected queuing time,encouraged buskers to entertain the queue, and sometimes handed out garlic bread to queuingcustomers.
217Operations Management

performing the service (criterion 8). Obvi-ously because of this service firms tend to belabour intensive (criterion 9), and decen-tralized facilities are located near thecustomers (criterion 10). It is obvious in thecase of tourism that the service, or any ele-ments of it such as travel, residence, food orrecreation consumption, cannot be pro-vided without the presence andparticipation of the customer. The examplesgiven for heterogeneity also support thisaspect.
Intangibility‘Services produce intangible output’ (criter-ion 1). The quality of the deliverable canonly be gauged by the opinion of the cus-tomer. This facet is closely linked to boththat of heterogeneity and simultaneity. Inthe case of tourism this is self-evident andwas discussed at some length earlier in thesection dealing with the definition of opera-tions management, and quality within it.
Strategic Positioning and OperatingSystem Design
Although tourism as a business sector tendsto lie at the service end of themanufacturing–service continuum, thereare certain elements of it which aredelivered using philosophies and techni-ques which are more akin to those ofmanufacture. Standard package tours, forexample, can be considered as productswhich are sold to customers as mass pro-duced goods rather than tailored items. Evenwhere a tour is tailored to a customer’s indi-vidual wishes it is still likely to consist ofelements such as travel and accommoda-tion, which are readily available ‘off thepeg’, and it is in the combining of thesewhere the true service element is created.Any organization working in the touristindustry will thus be a blend of individualservice and ‘mass manufactured’ service ele-ments. The blend of offerings will be relatedto the competitive position taken by theorganization in the market place, which willin turn affect the operating systems of theorganization. Krajewski and Ritzman (1996)
name eight factors on which organizationscompete. These are considered below in thecontext of tourism under the generic head-ings of cost, quality, time and flexibility.
Cost1. Low cost operations, in the case of tour-
ism this means low cost tours (traveland accommodation).
Quality2. High performance design, in this case
perhaps the prestige or fashion level isequivalent to technical quality.
3. Consistent quality, in this the holidayalways reaches the specification agreedwith the customer, although percep-tions may vary. (Consider the differentspecifications in the no-money holidaycase considered earlier.)
Time4. Fast delivery time, this is probably
equivalent to availability here.5. On-time delivery, meeting the times
and dates of travel and accommodationagreed.
6. Development speed, the ability todeliver new holiday destinations andideas (recreation, styles) quickly to themarket.
Flexibility7. Customization, or tailoring to the cus-
tomer’s wishes.8. Volume flexibility, the ability to change
the supply of specific packages withdemand.
The design of the operating system of anyorganization will depend on the competitiveposition taken on these factors. It will beplaced on a continuum ranging from thecase where the design of the holiday or touris part of the delivery process and each tourwill be tailored to the wishes of each cus-tomer, to the case where packages arestandardized and the customer chooses onewith no variation. The first extreme of thiscontinuum is traditionally known as a proc-ess focused delivery system, or job shop,and the other extreme is known as a productfocused delivery system, or mass delivery.The competitive position adopted by a com-pany leads to consideration of a number of
218 G. Southern

alternatives in the detailed design of thedelivery system.
Backroom versus front office activitiesWhat should the back room to front officemix be? Back room activities are those inwhich the customer is not involved, such aspreparation of standardized items, calcula-tion of bills, issue of tickets, etc. Suchactivities are placed at the mass delivery endof the design continuum and are usually‘qualifying factors’ in the creation of per-ceived quality. They must be done to acertain level of competence or poor qualityis perceived, but surpassing that standarddoes not please the customer further. Forexample, receiving tickets for a business tripthree days before departure is acceptable,one day before and the customer becomesconcerned, but seven days in advance doesnot improve the quality of the travel com-pany in the traveller’s eyes. Front officeactivities are performed in collaborationwith the customer. They are usually person-alized transactions which require skills incommunication with the customer, and inoffering guidance to help the customer tomake decisions and are usually at the jobshop end of the design continuum. Theyenhance perceived value in proportion tothe skills offered and doing them well winscustomers, even when taking correctiveaction.
Physical items versus service elementsWhat is the relative importance of physicalitems to service elements? Physical itemsare the tangibles involved in the deliveryprocess, for example the food served in arestaurant. Service elements are the intan-gibles, the help received in choosing fromthe menu, the appropriateness of the back-ground music, the attention offered by theservers, etc. Service elements are of greaterimportance in job shop systems.
Programmable versus non-programmableservices
Which aspects of the service are program-mable, and which are not programmable?When a sequence of activities which a cus-tomer undergoes is predictable, then it can
be said that the transaction is programma-ble. If they are not predictable then thetransaction is not programmable. If thetransaction, or parts of it are programmablethen there are opportunities to create stand-ard procedures and in effect automate theprocess. If we consider the activity sequencediagram for holiday sales (Fig. 8.4), we cansee that it is possible to replace the server inmany places with a questionnaire, or evenbetter with a computerized questionnaire.The reservation system also represents aprogrammable procedure. However, this isonly the case when dealing with a computerliterate and confident customer, so if wewish to apply a common system to all cus-tomers there is an initial branch to either self(computer) service or face to face personalservice to be added.
Technical and interactive skillsWhat mix of technical and interactive skillsare needed in the operating system? In a jobshop tourism organization there is a greaterneed for technical skills to interrogate traveland accommodation alternatives than in themass delivery organization. Figure 8.5 illus-trates the relationship between thesefactors.
The Importance of Good OperatingSystems in Tourism
From the above discussion it is obvious thatthe design of operating systems is not simpleand straightforward. The inherent variety ofchoices to be made indicate the importanceof carefully and continuously consideringthe design of a system. The operating envi-ronment will change, possibly requiring astrategic repositioning within the compet-itive priority factors, and thus arepositioning of the operating system on thejob shop–mass delivery continuum.
The diagramming techniques describedso far enable the system designer to take aholistic view of the organization, to considerthe division of the organization into valueadding subsystems, and to take an overviewof the transformation mechanism within
219Operations Management

each subsystem. There is a need to ensurethat the entire system, and each of the sub-systems, deliver outputs efficiently. Theremainder of this chapter will concentrateon the design of operating systems at a microlevel.
A Framework for Analysis andImprovement of Operating Systems
The complexity and degree of choice in thedesign of operating systems is reflected in anabundance of techniques and methodolo-gies used in operations management. Thisdiversity sometimes overshadows the sim-ple, central purpose of the topic, to deliver
goods and services (in the case of tourismprimarily services) to the customer. LindaSprague proposes a five point framework forthe analysis of operating systems based onconsideration of capacity, standards, sched-uling, inventory and control (Devanna andCollins, 1990).
1. Capacity: perhaps better titled capa-bility, is the ability to yield output. At astrategic level it is usually measured inthe number of units of product or serv-ice which can be delivered in a specifictime unit. However, at an operationallevel, where resources are likely to beshared between different products orservices, capacity is usually measured
Fig. 8.5. Factors involved in the design of service operations (after Armistead, from Voss et al., 1985).
220 G. Southern
in terms of process (plant or equipment)or human resource hours.
2. Standards: consist of work standardsand product or service quality stan-dards. Work standards are measures ofeffort, usually specified in terms of timetaken at a reasonable level of work per-formance, to do a specific task. If thenumber of tasks to be done is known,then these times can be aggregated tocheck whether the capacity is availableto do them, and this information canalso be used to schedule the order ofactivities. Work standards thereforeconstitute the data needed to plan thelevel of capacity needed and the sched-uling of the capacity we have. Servicequality standards have already beendiscussed.
3. Scheduling: the planning of the use ofresources (or capacity) on a time base toproduce a service delivery plan. Sched-uling has two objectives: to deliverspecific products or services at a timeagreed with the customer, and to deliverall products and services at a low costby full utilization of resources. Theseobjectives are not always compatible.
4. Inventory: the management of flow andstorage of physical items necessary todeliver the product or services to thecustomer. This is of lesser importancein tourism where the cost of materials isrelatively lower than in manufacture.Service industries tend to be labourintensive, and it is here and in capital(travel and accommodation) equipmentwhere most costs are incurred.
5. Control: measuring the performance ofthe system to the capacity and schedul-ing plans described above, and theprocess of replanning remedialactions.
This framework is outlined in Fig. 8.6. Itprovides a useful systematic approach to theanalysis of operating systems and will beapplied to the tourism sector in the remain-der of this chapter. General conceptualissues concerned with each aspect will firstbe considered, and then quantitative tech-niques which support the decisions to be
made associated with each aspect, andwhich are particularly relevant in tourism,will be described.
Operations Management Decisions
Decisions to be made in operations manage-ment consist of two types:
● Those concerned with the design of thedelivery system; the service quality lev-els to be delivered, the level ofcapability (or capacity) needed todeliver these levels; and the way mate-rial is managed, i.e. with standards,capacity and inventory.
● Those concerned with the shorter termutilization of resources, in other wordswith scheduling and control decisions.
In order to make these decisions, and to planoperations, we need to know what tasksneed to be done and in what order, howmany times each task has to be done, andhow long each task will take. The processflow charts and activity sequence diagramsalready described are useful techniques foranalysing tasks and the sequence in whichthey are done. Forecasting techniquesdescribed elsewhere in this text will tell ushow many times each task has to be done.Work standards provide the final informa-tion needed for operationaldecision-making. They therefore make anappropriate starting point in applying theoperations management framework to thetourism sector.
Work Standards
A work standard is the time for a trainedworker, or team of trained workers, to per-form a task following a prescribed methodwith normal effort and skill. Frequently thetime to perform a task is influenced or evendictated by the pace of equipment, for exam-ple the speed of response of a computerbooking system when making reservations,or by legal limitations such as speed limitsfor public service vehicles. In other cases thetime to perform a task will be influenced by
221Operations Management

the customer, for example when waitingtable the meal completion time is influencedby both the food preparation and servingteam in delivering the food, and by the cus-tomer in consuming it. It is thereforeimportant, particularly in a service environ-ment where the conditions of bothheterogeneity and simultaneity apply, toensure that work standards are:
● appropriate, in that they are directlyunder the control of the worker or teamof workers; and
● realistic, in that they can be achievedrepeatedly by a competent worker orteam.
In effect these conditions will lead to awider distribution of completion times formost tasks undertaken, particularly in theservice sector where most tasks involvedealing with people, rather than materialsand equipment. So although work standardsare used to determine the number ofemployees needed to operate a service sys-tem, and thus indirectly specify work rates,
Fig. 8.6. A framework for operations management (after Sprague, from Devanna and Collins, 1990).
222 G. Southern

their use for direct payment is of minimalvalue. However, knowledge of service tasktime distributions is of paramount impor-tance in the simulation of queuing situationswhich are frequently met in tourism. Thiswill be described later.
So work standards are important as thebasic data used in evaluating the perform-ance of a system, or of the components of asystem. They are also of fundamental impor-tance in planning the level of resourcesrequired and in the scheduling of resourceswithin a system. Figure 8.7 indicates wherework standards are most useful.
Sources of work standardsWork standards are specified by simplemeasurement. Many tasks are repeatedmany times in the course of a working day,and many jobs may be broken down intosuch tasks. In a hotel, for example, the job ofcleaning a room may be divided into:
● change the bedding
● spot wipe windows and mirrors● vacuum the floor● clean the bathroom (may be divided
further)● replace bath linen and bathroom acces-
sories● replenish minibar● clean away tea crockery, replace and
replenish● dust surfaces
These tasks may be combined in any order,or omitted when cleaning a room. Theunderlying principles of three such approa-ches are described in Table 8.1, and appliedto the room cleaning example.
Such techniques may be of value in manysituations in tourism: checking in at recep-tion areas, checking in at airports, serving inbars and restaurants, etc. However, it shouldbe stressed that any work measurementexercises undertaken are not to be used forpayment purposes. They should be aimed atgaining information for resource planning
Fig. 8.7. Uses of works standards.
223Operations Management

only, in other works to calculate the neces-sary staffing levels at various times. Againthis is paramount when the heterogeneous,simultaneous and non-repetitive nature ofthe tasks is considered, and in many situa-tions it could be argued that in suchcircumstances the ‘analytical estimate’ of askilled tradesman may be both accurate andas useful, but only if not used for aggregateplanning purposes. Repetitive work is com-mon in manufacture, but less common intourism because of the heterogeneous andsimultaneous nature of the tasks them-selves, so the ‘predetermined data’ approachis appropriate.
Quality Standards
While the perception of quality in servicedelivery, and that of an organization, isintangible, the creation of that perception
will result, at least partially, from a bundleof tangible factors. We can set quality stan-dards for these tangible factors which willbe an integral part of the design of our oper-ating system. In service situations, becauseof the heterogeneity and simultaneityinvolved, these factors are frequently relatedto service availability and customer waitingtimes, and can readily be associated with theKrajewski and Ritzman competitive factorswhich were identified earlier. In fact any quality standards specified in an organiza-tion should be directed by the competitivestance adopted by the organization. Theyshould also be considered in terms of theconcept of order qualifying versus orderwinning criteria related to that stance. Thiswas discussed earlier in the context of backto front room operations, and in the flightticket delivery example.
Methods of measuring performance toquality standards are also important. Qual-ity factors can be considered as variables or
Table 8.1. Work measurement methods.
Simple time studySampled manual timing of simplerepetitive tasks. The person timing thetasks is trained to estimate a ‘work ratefactor’ which is incorporates thecompetence and effort of the worker(compared with reasonable levels). Thisfactor is multiplied by the task timeresulting in a work standard
In the case of hotel room cleaning the work study practitionermight measure the time taken to clean the hotel room severaltimes to find the average. However, the work standard wouldonly apply to that room, or perhaps a set of identical (or verysimilar) rooms
Elemental standard time dataWork is broken down into elementalincrements and the elements are timed.These times are recorded andsubsequently aggregated to give tasktimes
The work study practitioner would divide the job of roomcleaning into a list of elemental tasks such as that listed in thetext. The elemental times would then be aggregated asappropriate to give times for cleaning a series of rooms by a seriesof cleaning regimes. Some elements, for example vacuuming orspot wiping windows may be timed on a ‘per area’ basis foruniversal application later. The resulting work standards could beused across a series or chain of hotels
Work samplingThese consist of sampling systems toestimate the proportion of time spent onactivities. Sampling must be random
The work study practitioner might use this technique to determinethe time spent by the room cleaner not actually cleaning theroom. It would cover activities such as awaiting instructions orobtaining cleaning materials. It would result in a percentageallowance being added to the base time for room cleaning to givea practical work standard
224 G. Southern

attributes. Variables can be measured on acontinuous scale so that a ‘degree of error’can be stated, while attributes can bequickly and simply counted. As explainedearlier, quality in the service sector is cre-ated and measured in the process ofdelivery, and is often associated with com-petent completion of the tasks involved inthat process. Quality standards, therefore,need to be identified in terms of these tasks,which are related to work standards. Interms of our hotel room cleaning example,the act of cleaning the room before the entry(or return) of a customer might be consid-ered as an attribute. The time between roomcleaning (or checking) would be a variable.Both of these would probably be consideredqualifying quality criteria. At a moredetailed level the acts of changing the bed-ding and dusting surfaces will be attributesand probably qualifying quality criteria, butthe number of spot marks not wiped from amirror could be considered a variable and anorder winning criterion.
The customer service level which we areseeking to define can only be quantified interms of tangible quality criteria, and wemust seek to identify such factors which areparamount (qualifying), and important
(order winning) in satisfying the customer.Examples of tangible measures of qualityperformance and the related competitivefactor, which are appropriate in tourism andin the hospitality sector, are given in Table8.2. As an organization we must attempt todefine an acceptable service level for each ofa set of such criteria. The levels will berelated to the expectations of the market,and if we reach that expectation then wewill qualify to compete in the market. If weexceed that expectation for order winningcriteria we will in all probability win morethan our fair share of customers. However,the ability to reach the levels we set dependon the capacity, in terms of skills and capitalresources, which we have available at anyspecific time, which in turn will greatlyinfluence the cost of provision and price wemust charge the customer: the final com-petitive factor from our previous discussion.This is the crux of operations management,and is discussed in the next section oncapacity management.
Intangible factors of service quality canonly be delivered by people. Any organiza-tion playing must therefore pay carefulattention to selection and training of people,and to motivating them. This, and the sys-
Table 8.2. Customer service measures related to competitive priority factors.
Customer service measure Examples Related competitive factors
% of customers we can satisfywith their requirement
Specific requirements may be:journey departure time andmeans of transport, holiday inspecific hotel, brand of drink in abar, meal in a restaurant
Volume flexibility
Degree of choice offered Number of people we can satisfywith an acceptable alternative tothe above
Customization, high performancedesign, design/developmentspeed
Time to be acknowledged At retail shop counter, hotelreception, bar, restaurantreception
Fast delivery time
Time waiting until start ofservice delivery
Taking details at hotel reception,details or order in retail shop orbar, seated at table in restaurant
Fast delivery
Time to be served Until total service transaction iscomplete
On-time delivery
225Operations Management
tems of statistical process control to monitorperformance to identified tangible qualitystandards are covered in the next chapter.
Capacity Management
Capacity is the ability to yield output. At astrategic level it is usually measured in thenumber of units of product or service whichcan be delivered in a specific time unit.However, this section will concentrate oncapacity management at an operationallevel, where resources are likely to be sharedbetween different products or services. Herecapacity, or capability, is usually measuredin terms of process (associated with equip-ment) hours, or in terms of human resourcehours.
Most major decisions to be made inoperations management are concerned withensuring that sufficient resources are avail-able when needed to deliver the level ofcustomer service which is agreed, formallyor informally, with the customer. The valueof forecasting to find the level of customer-related activity, and of work standards toconvert this into levels of operational activ-ity, for example number of servers requiredat any time, have already been considered.Demand for resources is directly propor-tional to customer-related activity, and inthe tourism industry this varies on a cyclic(related to the economy), seasonal and dailybasis. This is true of all service situations,but the variation is higher in tourism than inmost others. The aim of capacity manage-ment is to deal with this variation as costeffectively as possible.
There are two extremes of strategy fordealing with variation in demand: adjust thecapacity available, and eliminate the need toadjust the capacity available. Very few orga-nizations will use either of these extremepolicies, and most organizations will findcost-effective solutions by using a mixture oftechniques associated with the extremes.
Methods of adjusting capacityThe following sections describe the genericmeans of adjusting capacity, in the case of
tourism equipment and labour availability,and how appropriate they may be.
SubcontractingSubcontracting can be used to vary the avail-ability of both labour and equipment. It maybe employed to add to resources when cus-tomer activity cannot be satisfied within-company resources or to eliminate theneed to hold certain resources at all. In thetourism sector both road and air transportprovide examples where subcontracting isextensively employed. Many tour compa-nies will have their own transport vehiclesbut will hire additional vehicles at partic-ularly busy times, sometimes with operatingstaff included. In dealing with departingpassengers at airports a similar mix occurs.Larger airlines will have their own receptionstaff and ‘top up’ with personnel from aspecialist service company (e.g. Service Air)when necessary; companies who use an air-port less frequently will only use thespecialist service company, thus in effectsharing the resource with a number of otherairlines. Unit costs of subcontracting arenaturally higher than those of in-house pro-vision in the short term, and the differencemust be optimized against the long-termcosts of holding excess resources at quietperiods.
Reschedule activitiesOpportunities to reschedule activities inservice industries, and particularly in tour-ism, are limited. Once again this is becauseof the heterogeneous and simultaneousnature of the service delivery process. How-ever, there is scope to reschedule activitiesrelated to the maintenance of plant andequipment. Major overhauls of equipmentcan be delayed until the next quiet period,for example at airports and hotels, althoughin the transport sector such delays are lim-ited more by health and safety legalrequirements.
Change workforce sizeThe workforce size can be changed byemploying more staff or increasing hoursworked. When a long-term underlying trend
226 G. Southern

in customer activity is recognized, then thepermanent workforce size can be changed asnecessary. This can be done in retrospectfollowing an increase or decrease in activity,or in anticipation if a change in activity isforecast. When the change in activity isshort term, then the hours worked by perma-nent staff can be temporarily changed, ortemporary workers can be employed if activ-ity increases. There is value in employing
workers on a part-time basis as workinghours are often more easily changed thanwhen a total full-time workforce isemployed (see Stakis case study in Box8.3).
Means of eliminating the need to adjustcapacity
The following sections describe the genericmeans of eliminating the need to adjust
Box 8.3. Stakis Hotels.
In a paper to the annual conference of the Operations Management Association (UK) in 1989, NickPaterson (1989) described some of the approaches to resource management adopted by the Stakisorganization.
At the time Stakis hotels were positioned in the three to four star market, and were acquiringhotels of 60 plus rooms to get greater economies of scale. Hotels in the group were classed intoresort and commercial categories so that senior management could compare like with like, andadvise accordingly. They were attempting to become ‘leaner’ by placing management responsibilityat the hotel itself, and their headquarters activities were being scaled down. Hotel workers wereclassed into three categories:
● Stable or core workers consisting of functional department heads, and including a largepercentage of female workers whose husbands worked locally and who found the workinghours convenient for social reasons. For example, room maids worked from 9.00 to 3.00,school hours, and evening shifts in restaurants coincided with the time that husbands were athome to baby sit.
● Transient workers were technically competent, young, and with few social attachments. Theywere geographically flexible, tending to spend summers in resort hotels and wintering incommercial or perhaps ski resort hotels.
● Casual or part-time workers were local people who worked on demand, usually at functions orto meet peak demand.
Comments on resource planning:
● Stakis managers used forecasts of activity and work standards to devise manpower resourceplans on a monthly basis for one year ahead. The profitability of the plan was assessed beforethe plan was finalized. This plan would concentrate on core and transient worker requirements.
● Changes in resource availability in the medium term were made possible by the transientworkforce and the mix of resort (summer) and commercial (and winter resort) ‘product’.
● Capacity management in the medium to long term was also aided by linking it to varioustraining programmes to ensure a pipeline of necessary skills and flexible workers. These coveredall levels of staff and ranged from a group training school to in-house training internally, andfrom using external specialist courses (e.g. health and safety, fitness programmes) to generalpurpose training in accommodation and catering.
● Although not explicitly stated, core and transient workers would almost certainly be scheduledinto a duty roster by a mixture of fixed schedule on a daily basis, and rotating schedule on aweekly basis. The mixture for each worker would depend on the type of work.
● Efforts to cope with short-term variation in demand for unforeseen peak periods and functionswere greatly helped by calling on casual labour from a large ‘pool’ at short notice.
In summary, in any particular hotel there is a need for volume flexibility in the workforce tosupport activity levels up to the bed capacity of the hotel, and above that for special functions. Tomeet this challenge a wide range of quantitative techniques and qualitative approaches are used toplan and manage resources. Flexibility of labour in both skill and availability is a central componentin the application of these techniques and approaches.
227Operations Management

capacity, and how appropriate they may bein tourism.
Maintain excess capacityAn organization may hold capacity which isabove that required at all times by custom-ers, although in most cases the cost of thispolicy, which will have to be passed on tocustomers, will be prohibitive. It is still auseful principle to consider applying to thecore competencies of any business, in otherwords the skills or service elements whichvery few other organizations can provide.Excess capacity held in these core compet-encies, combined with judicious use ofsubcontracting and queuing can create acompetitive advantage in the marketplace.
Accept loss of customersPlan to operate at a known level of activity,and accept a loss of customers above thislevel. This is closely related in most cases tothe degree of prestige which the service anorganization offers has in the market. If theservice an organization offers is specializedor unique, and is in demand for these rea-sons, then the prestige can be furtherenhanced by rarity. The organization canthen plan to operate at a specific level for alonger period rather than increase the avail-ability of the service; for example, asuccessful theatrical production may wishto remain in a smaller theatre and extend therun, rather than increase availability bymoving to a larger venue or duplicating theproduction in another venue. Obviously anorganization applying this policy willexpect customers to queue or wait for theservice. The policy will also affect the pric-ing policy adopted for the service.
Queuing or waitingRequire customers to queue or wait either inthe form of a physical queue or some kind ofbooking system for the service. Again refer-ence must be made here to the customerservice levels discussed earlier. In the caseof a queue the possibility of customersreneging, and the cost of this to the business,must be considered. Obviously some cus-tomers will not be willing to wait at all for
the service so this policy is practicallyalways used in collaboration with that ofaccepting a loss of customers. Much workhas been done on mathematical modellingof queuing situations to derive the times acustomer will have to queue in a specificqueuing system. These will be describedlater, but in essence the outcomes must thenbe compared with the appropriate servicelevels set by the organization, which in turnare related to the expectations of the mar-ket.
Altering demand
Alter the demand pattern by pricing oradvertising where the demand patternvaries greatly. An example of this in tourismis in the price of city centre hotel rooms,which are lower at weekends when there islittle demand from the business community.Here the concept of weekend city breaks at‘bargain’ prices has been introduced andaggressively marketed. Further examplesare in the price of flight tickets and the use ofstandby systems (also includes queuing) inairlines, and in the relatively high price ofholidays during school holiday periods. Theobjective of this policy is to level demand sothat changes in capacity requirement levelsare fewer.
Useful quantitative techniques in capacitymanagement
An organization will use a mixture of tech-niques when attempting to optimize the costof holding capacity against the customerservice level required. There are a number ofquantitative techniques which are availableto support the decision on which techniquesto use, and the degree to which each is used.The decision is in two stages. First the levelof activity and the probable utilization ofresources in terms of likely performance lev-els must be estimated or forecast. Thisinformation can then be used in modelswhich simulate delivery systems and allowthe necessary levels of resource needed to becalculated. The two stages therefore involveforecasting and modelling, and there are anumber of approaches possible at eachstage.
228 G. Southern

ForecastingTechniques of forecasting required rates ofbusiness activity, time series analysis,regression, Delphi techniques, marketresearch and the concept of a product lifecycle, are described in Chapter 12, dealingwith market forecasting.
We will concentrate here on forecastingthe output we can expect from a unit ofresource. In fact many of the techniqueslisted above can also be employed to fore-cast the performance of resources, forexample time series techniques can be usedto forecast any continuous improvementresulting from total quality managementprogrammes, and the Delphi technique canbe used to forecast any resulting improve-ments resulting from technology advancesin the field of information technology ortransport. In addition, much of the informa-tion needed for decision-making in capacitymanagement comes in the form of workstandards derived from work measurement,and many of the techniques associated withthis have been described earlier in thischapter.
In addition to these forecasting techni-ques, there are several behaviour patterns inthe performance of resources which are ofvalue to organizations. These include learn-ing curves and process life cycles. Learningcurves are concerned with the implementa-tion of a new approach to working, or a newoperating system. This may involve thetraining of workers or introduction of somenew aspect of equipment, for example a newhardware and/or software computer system.The performance of the new operating sys-tem will grow exponentially until reaching asteady state situation. This situation willrepresent the system operating in terms ofstandard performance; in terms of the newcomputer system, the average time per trans-action reported, or the number oftransactions dealt with per hour. Suchcurves are well established and recorded forvarious systems implementations and mustbe taken into consideration when a changeis made to an operating system.
Process life cycles are concerned with thelife of a process. Just as products have anatural life cycle of growth, steady state and
decline, so a process or piece of equipmentalso has a life cycle. The failure rate, or timeout of use (‘down-time’) is plotted for the lifeof the process. It is found that there is an‘infant failure’ stage where inherent faults orweak elements in the process or system arecorrected. The process then settles into asteady state until more parts of the processbegin to fail of old age and the process beginsto wear out until it is replaced when therepair costs become greater than the incomeearned. If, instead of the failure rate, themean time between failures is plotted, thegraph is inverted and becomes similar to theclassic product life cycle curve. Again thisrelationship is well established and hasbeen recorded for many situations wherenew investments are made. These can beresearched and used to predict performancecurves for any similar new equipment orsystems. They may also be used in thedesign of equipment replacement policy,and depreciation systems in the financefunction.
ModellingHaving sourced the data necessary to makecapacity decisions there are a number ofmodelling techniques which will help us tooptimize cost of provision to meet the cus-tomer service levels we wish to reach forspecified quality criteria.
LINEAR PROGRAMMING. This consists of a setof methods for deciding how to meet somedesired objective (i.e. minimizing cost, max-imizing profit) subject to constraints oncommodities required or resources avail-able. Developed under the auspices ofoperational research, the generic approachis to specify a mathematical model whichrepresents the limitations imposed by theconstraints, and which calculates the costsof system operations and possibly identifiesareas of greatest potential cost saving. (Themodel often takes the form of a set of simul-taneous equations which are difficult tosolve manually.) Any feasible solution, inother words one which satisfies the con-straints but not necessarily meeting theobjective, is then used iteratively to improveperformance against the objective until no
229Operations Management

further improvement results from the itera-tion process. It is at this point that the modelhas been optimized and the resulting solu-tion is the best available. One practicalexample in tourism is in routing transportbetween locations to maximize the numberof passengers carried, which is synonymouswith the number of locations reached, and tominimize the distance travelled, which issynonymous with cost. In fact this exampleis synonymous with a classic linear pro-gramming technique known colloquially as‘the travelling salesman problem’. There areother such techniques in the operationsresearch repertoire which, while they maynot offer immediate solutions, are a usefulstarting point for solving complex problemsof this sort. Computer programs are nowavailable to solve complex sets of simultane-ous equations, but the problem still has to bedefined in the first instance.
QUEUING THEORY. This is concerned withmathematical modelling, using probabilitytheory, of queuing situations which exist inlife, for example at airport check-ins, restau-rants for tables, self-service restaurants andfast food outlets. Such models can be used todesign the operating system and answerquestions related to the level of customerservice such as: Can we deliver the servicein a time which it is reasonable to expect thecustomer to queue or wait? It is not neces-sary to enunciate the mathematics of themodels in detail, but managers should beaware of the nature of the technique, and theinputs to, and outputs from the model, andof the alternative choices to be made in thedesign of the system itself. Questions whichneed to be considered in the model (i.e.inputs) are:
● What is the service mechanism, e.g. sin-gle queue for multiple identical servers,specific queue for each identical server,etc? How many servers?
● What is the queue discipline, e.g. firstcome first served, last come first served,shortest operation next (e.g. hand lug-gage only for flights), specified priorities(e.g. by class for flights), etc.?
● What is the nature of arrivals in the
queue? This is usually expressed as thedistribution of time between arrivals.
● What is the nature of service times,again expressed as a distribution?
With this information it is possible to modelthe situation, and again there are computersoftware packages to help us. From themodel the following outputs will help usdecide whether the system is acceptable interms of customer service levels:
● The server efficiency, for economic rea-sons.
● The customer service level in terms ofprobability of a queue forming, the aver-age length of queue, the longest queueformed and the average time spentqueuing.
With this information we can decide tochange the operating system, perhaps in theservice mechanism, or even by adding ortaking away server stations.
SIMULATION PACKAGES. These are computersoftware packages which enable the user tomodel a set of interconnecting queues. Assuch they are valuable in modelling verycomplex flow patterns in organizations, ofmaterials primarily in manufacturing situa-tions and, of particular relevance here, ofpeople primarily in service situations. Theyare invaluable in modelling the interactionof flow of different people and materialswith each other and with the utilization ofwhat are likely to be shared and limitedresources for processing them through thesystem. An example of where they may beapplied in tourism is in an airport. In thiscase arrivals into the system will be:
● Departing passengers arriving at the air-port who are separated from theirluggage (queue), may then proceed to ageneral departure lounge through emi-gration and security checks (queues),then to a departure area specific to theirflight (queue), and finally to the aircraft.The luggage, separated from the pas-sengers, will go to a sorting area (queue),to a vehicle designated to go to the own-er’s flight (queue), and then to be loadedon to the flight.
230 G. Southern

● Arriving passengers who will go to pass-port control (international passengers,queue), then baggage collection (queue,the baggage will have been unloadedand delivered to this area, anotherqueue), then to customs control (queue),and finally they leave the system.
● Arriving aircraft, which may have toqueue for a landing slot on the runway,then for a disembarking station. Theywill then interact with the passengerdisembarking/embarking systems, andwith the fuelling and provisioning sys-tems before joining another queue for atake-off slot.
Modelling a situation such as this is obvi-ously complex, particularly if the boundaryof the system is widened even more toinclude the supporting infrastructure ofancillary service provision (shops and com-fort provision), public transport, and airportservicing systems such as fuel and provi-sions. Arrivals of passengers and aircraftwill be a complex mix of scheduled activ-ities with ‘fixed’ times and probabilisticarrival distributions. However, the entiresystem can be modelled by:
● dividing the system into a set of inter-connecting queues (or subsystems), orin the language of simulation proces-ses;
● defining the people or materials (termedentities) which flow through the systemand the paths they will take, includingwhere they diverge or combine tobecome a single entity (for example theinterrelating paths of passengers, lug-gage and even aircraft);
● defining the service mechanisms andservice time distributions for eachentity at each process, and any inter-ruptions such as mechanicalbreakdown or sickness of staff whichmay be expected (i.e. elements of uncer-tainty) must also be incorporated.
The above are used in the software packageto model the airport operating system beforesimulating the combination of scheduledarrivals and ‘bursts’ of arrival distributions
around the scheduled arrivals on a timebase. There will also be an element of uncer-tainty here, for example late aircraft arrivals,which may also have to be considered.
Outputs from a simulation run using themodel will consist of performance indica-tors for each process in the system in termsof utilization of resources and passengerwaiting times. These will indicate points ofinefficiency and passenger frustration. Thesimulation run will also give indications ofthe performance of the entire system, prob-ably in terms of passenger throughput andaircraft turn around times. While the use ofthis technique has been described in termsof an airport, its value in other facets oftourism, for example in the modelling of aleisure park such as Disneyworld, is self-evident. Here activities are not scheduledand the circumstances of visitors renegingon arrival at a long queue must be con-sidered, but the process of modelling thesituation to indicate the need for increase inparticular resource availability is stillappropriate.
Evaluation of capacity plans: financialmodelling
Financial modelling is a tool which must beused to evaluate any resource provision planwe may propose to deliver the required serv-ice level to the customer. It enables theoutcomes from the resource (capacity) andservice level implications resulting from themodelling techniques described above to beconsidered on a cost/benefit basis. In linearprogramming the costs of provision willusually be incorporated into the modeldirectly, and when applying queuing andsimulation techniques the costs of resourceprovision will be calculated for the entiresystem model and compared with the levelof service provision delivered so that rela-tively objective management decisions canbe made.
At a more strategic level financial model-ling allows us to evaluate alternativecapacity plans comprising a mix of changingcapacity (subcontracting, reschedulingactivities, changing workforce size), andeliminating the need to change (carryingexcess, queuing, differential pricing), to
231Operations Management

meet daily or seasonal changes in demand.An example of this technique is given in the‘Bicycle Provision’ case study (see Box 8.4).While the bicycle provision example con-siders a single resource, the same argumentscould be made in the consideration of theairport case considered in the section onsimulation, above. If the airport is regionaland caters for a large number of vacationtravellers then the problems described in thebicycle case arise here also, and are possiblyreplicated for every facet of airport provi-sion.
Inventory Management
The management of inventory is far lessimportant in tourism than the managementof equipment or labour, as is the case formost service industries. In tourism inven-tory consists of materials which areconsumed in the delivery of the service, andthere is no equivalent of work in progress asrequired in the manufacturing sector. Mate-rial is less important in tourism because:
● the percentage of total operating cost
Box 8.4. Bicycle provision.
Consider two cases:
1. A bicycle hire shop must decide how many bicycles to have available for holiday-makers in acountry area. Demand is seasonal, although an indication of underlying trends is available fromprevious seasons. It also varies on a day-of-the-week basis, is greater at weekends than during theweek, and with the weather. The shop can carry the same number of bicycles all the time andaccept that some customers will be disappointed, or can carry more bicycles at busier periods,having more satisfied customers and increasing turnover but incurring acquisition costs for thebicycles. If the shop carries more bicycles at busier periods it may wish to integrate this policywith a replacement policy, selling older bicycles as the season ends and buying more as theseason begins. Numbers will depend on the depreciation rule followed, and is related toaccounting procedures adopted. The shop can also offer a differential pricing policy at less busyperiods, or when the weather is poor, to stimulate custom. All of these factors can be built into afinancial model based on predicted demand for the year. For each week, for example, the costs ofproviding the bicycles (interest, maintenance, storage) will be deducted from the predictedincome, resulting in a profit prediction for each week. The cost of lost sales can also be predicted.The number of satisfied customers (service level) for each week will be included in allconsideration of costs. There are implications of dissatisfied customers in terms of numbers ofreturn customers, and for the reputation of the bicycle supplier and the holiday centre.
2. A country holiday park supplies bicycles ‘free’ for its customers (guests) to use. The bicycles areleft in racks and guests use them on a needs basis, returning them to a rack when finished, similarto supermarket trolleys. Here detailed forecasts can come from the booking system which makesthe task a little easier. However, although the basic decisions of whether to change capacity ornot are the same there are subtle differences in customer expectations and the implications of notmeeting these. While there may not be an immediate loss of a potential sale, consideration ofreturn customers will be more important, and word about any lack of bicycle provision willspread quickly and lose us potential new customers (i.e. become an order loser). However, guestsmay not expect such a new bicycle, as long as it is a safe one, so perhaps the replacement policyis not so important.
In both cases the financial model will be similar. However, the shop will represent a profit centreand profit and cash flow will be considered immediate and paramount, lost sales will beconsidered a direct lost-opportunity cost, and the customer service level delivering the bestfinancial return will be accepted. The holiday park, on the other hand, will consider the provisionof bicycles as purely a cost centre. Here the minimum acceptable level of customer service,taking long-term considerations into account, will be predetermined and the aim will then be toprovide this at minimum cost. So although the models will be similar, their use will be subtlydifferent.
232 G. Southern

which can be attributed to materials isvery small when compared with theshare taken by labour, property and cap-ital equipment;
● much inventory in tourism has a limitedshelf-life, for example that of food,which is very short to medium term,drink, and brochures, which is usuallyone year or season.
As a result of these factors there are fewersavings to be made in improving the man-agement of materials in tourism except,perhaps, in ensuring the correct amounts areobtained, than in improving the manage-ment of labour and capital equipment.However, shortage of inventory will, inmany cases, result in near catastrophic per-ception of quality, for example consider arestaurant without a basic foodstuff or atravel agent without popular brochures.Absence of certain materials at the point ofservice must therefore be considered asorder sensitive (or loosing) criteria, and isworthy of consideration.
When designing systems to manage mate-rial it is worth considering the relative costof different materials to the organization,and to concentrate on managing the mostcostly materials, for obvious reasons. Themost frequently used technique for doingthis is called the Paretto, or more usually theABC, analysis. It plots the cumulative value(or cost) of material held by variety fromhighest value items to lowest value items.When such an analysis is undertaken it isfrequently found that about 20% of the vari-ety of materials, the category A items, areresponsible for 80% of the cost, and it isimportant to manage these materials well asgreater savings are possible. It is also foundthat about 50% of the variety of materials,the category C materials, are responsible forless than 10% of the cost and much lesssignificant savings are to be had by tightercontrol here. The B category items, ofcourse, fall between the two.
Dependency of demandMaterials can also be generically differen-tiated in terms of demand for them, and oneuseful way of classifying materials for the
purpose of managing them is in terms of thedependency of demand. Materials may besubject to independent or dependentdemand.
Independent demand for an item occurswhen demand is influenced purely by themarket, and can be said to be independent ofthe demand for other items. An example ofthis is the demand for brochures in a holidayshop. Dependent demand for an item occurswhen the demand is dependent on thedemand for another item or service activity.For example when a seat is booked on aflight then that reserved seat generates theneed for meals and drinks, which in turngenerate the need for the constituent parts ofthe meals and drinks.
Independent demandIn an independent demand situation costs ofinventory come from two sources: the cost ofacquiring it and the cost of holding it. Acqui-sition costs may include the cost ofpreparing to produce and the cost of deliv-ery. Holding costs may include the cost ofstorage, insurance, and the lost opportunityof money tied up. Using the holiday bro-chure again to illustrate this, acquisitioncosts would include the cost of preparing fora new print run and delivery. Holding costsin this case would mainly result from lostopportunity cost. (In addition to theseinventory costs there would an individualbrochure cost to cover material, labour andoverheads of production, and to recover thecost of preparing artwork at the start of theseason and possible obsolescence at theend.)
Studies of these cost relationships haveshown that if considered on a time basis, saycost per day, the acquisition cost is inverselyproportional to the quantity of stockobtained per delivery, while the holdingcost is directly proportional to the quantityobtained. The total cost per day is the sum ofthese two elements, and it therefore followsthat there is a minimum, or optimum costwhich occurs at a specific quantity whichwe shall call the economic batch quantity(EBQ) (also known as the economic orderquantity or economic lot size). This relation-ship is shown in Fig. 8.8. When this theory
233Operations Management

in put into practice the time to deliver thestock, known as lead time, must be con-sidered, and the demand during this leadtime, which will vary, must be estimated.This leads to the calculation of a re-orderpoint which triggers the placement of areplenishment order, and the operation of are-order point (ROP) inventory system. Sucha system demands that stock levels are con-stantly monitored.
In practice it is usually found that thecost is relatively insensitive to variation inquantity obtained in the region of the EBQ,in other words the bottom of the curve inFig. 8.8 is fairly flat. This presents the oppor-tunity to review the stock level periodically,perhaps in conjunction with a naturalsequential delivery schedule, and in effecttop up the stock level to a target calculatedso that the number obtained each timeapproximately equals the EBQ. In effect thissystem does not run at minimum cost, butthis is compensated for by simplicity ofoperation.
Dependent demandIn dependent demand situations materialrequirements are defined by ‘exploding’ theprimary requirement, for example thereserved seat, into the dependent material
requirements by means of a bill of material(BOM). This may consist of cascading needsthrough several layers of material as demon-strated in the reserved seat example above. Itis then possible to indicate to suppliers adelivery schedule for material. Such meth-ods of material management are termedmaterials requirement planning (MRP), andthey were initially developed in the manu-facturing sector where BOMs consist ofmany more layers than in service industriesbecause of the complexity of product andlarge numbers of stages of manufacture(Orlicky, 1994). The MRP process may bedriven by actual orders, where the deliverytime (or lead time) for material is less thanthe required lead time, or by forecasts whenit is not.
In practice the MRP process in the tour-ism sector is usually driven by a timetable inthe case of travel, or by a predicted scheduleof guest behaviour in the case of hospitalityand leisure, e.g. meal and other activitytimes. This results in the possibility of cus-tomers developing close supply chainrelationships with suppliers, and of sharinginformation on which material supply deci-sions are made. The suppliers may even beasked to make material requirement deci-sions based on planned activities and an
Fig. 8.8. Inventory cost curves (economic batch quantity).
234 G. Southern

extrapolation of previous material require-ments for these activities, and then todeliver what they think will be needed. Thesuccess of such a supply chain relationshipdepends on:
● Strong mutual trust between customersand suppliers, which can only beusually developed over a long timeperiod.
● A fast flow, or immediate sharing ofmarket information. The value of elec-tronic point of sale (EPOS) andelectronic data interchange (EDI) sys-tems is obvious in satisfying thisrequirement.
● A system for closely monitoring mate-rial waste, and an agreed procedure forsharing the cost of this waste betweenthe customer and supplier. Obviouslythe trust element is important here.
Supply chain relationships, and the man-agement of them, have been the subject ofresearch in recent years. Models have beendesigned to test and manage the compatibil-ity of customers and suppliers in terms ofoperating systems and organizational cul-ture (Macbeth and Ferguson, 1994).
Scheduling
As already stated, scheduling has twinobjectives: the delivery of specific productsor services at a time agreed with the cus-tomer, and the delivery of all products andservices at a low cost by efficient use ofresources (in other words by full utiliza-tion). In many business sectors we canschedule activities to level demand forresources, but in tourism there is an empha-sis on scheduling the availability ofresources so that they are available at pointof need and at the time when they are indemand. In effect this is capacity planningwith much shorter, daily or weekly, time-scales.
Many of the techniques which areemployed in capacity planning at the aggre-gate, or more strategic, level described aboveare also applicable in short-term scheduling,
for example queuing and reservation sys-tems and using price differentials to evenout demand. However, having employedthese techniques it now becomes necessaryto schedule the hours of the workforce sothat they are available when the customerneeds them. There are a number of con-straints to this process, such as:
● The need to match availability with thebiological clocks and daily routines ofcustomers, and the travel timetableswhich these also dictate. This will, ofcourse include weekend working andworking other unsociable hours whencustomers are at leisure.
● Any legal constraints on the servicessupplied, such as on the number ofsafety officers that must be available orthe maximum hours worked by vehicledrivers.
● The physiological needs of workers,which are often written into workplaceagreements, i.e. limits on consecutivehours or days worked, and time delaybefore start of the next work period.
While constraints such as these limit theoperations manager’s flexibility in develop-ing workforce schedules they actuallysimplify the process of scheduling itself.
The need to work unsociable hours and atweekends often results in the design of arotating schedule which ensures that thehardships are shared fairly equally amongthe workforce. In such a system a workerwill rotate through a series of workdays orhours, nesting with those of another worker.Systems exist to develop such schedulesusing simple heuristic rules, and in complexsituations computerized workforce schedul-ing systems are available.
Alternatively, the problems of workforcescheduling can be eliminated to someextent, particularly where demand is partic-ularly unpredictable, by having a largenumber of casual workers on tap. Suchworkers are often able to turn out at shortnotice and give the operations planner flex-ibility in being able to react to short-noticerequirements, thus offering the competitiveadvantage of volume flexibility. If any work-ers, full-time or casual, have a range of skills
235Operations Management

then the advantage of service product flex-ibility is also gained. The benefits of aflexible workforce are illustrated in the casestudy on Stakis Hotels (Box 8.3).
Control
Having developed a plan in terms of servicequality levels to be delivered, resources pro-vided to deliver these service levels, and aschedule of when these resources will beavailable, systems must now be put in placeto ensure that the plan is followed and per-forms to expectations. In operationsmanagement terms this is known as processcontrol, and it is analogous to budgetarycontrol in financial management. It involvesthe measurement of inputs and outputs,both in terms of quality and volume, and thecomparison of these to ensure that the con-version process is working as expected. It ishere where the work standards which wereused in the planning process are tested forauthenticity. The process is shown diagram-matically in Fig. 8.9, and it should be notedthat this is really an extension of the input/
output process used earlier to define thetransformation process itself.
The secret of good control of operations isin the selection of the output parameterswhich are closely monitored, and in theselection of the input parameters whichaffect the outputs, these must also be mon-itored. Output measures must be directlyrelated to the quality standards of the organ-ization as dictated by the competitivepriority factors on which the organizationcompetes in the market. Input measuresmust be in terms of the cost of delivery of theservice to these quality standards, usually interms of effort, or work standards. For eachsubsystem of the organization this results inthe establishment of several channels to bemonitored. In essence, for each output chan-nel monitored (Fig. 8.9), the inputs requiredto maintain the level of service required atthat channel are also monitored. At a com-parison point these inputs and outputs areconsidered to determine:
● if the quality service levels planned arebeing delivered; and
● if they are being delivered using theplanned level of resources.
Fig. 8.9. Control of operations, process control diagram.
236 G. Southern

Deviations from the plan will requireactions of two kinds, depending on the rea-son for the deviation.
If the deviation is a result of a differencein the level of activity from that planned,then we will naturally expect to use more (orless) resources than we had planned to use.We will check whether the work standardsare still appropriate, and in fact we couldalso expect some benefits from economies ofscale in terms of support functions. Forexample if a hotel is working at a higherroom occupancy rate than we had forecastthen we would expect to need more roomservicing labour than we had planned, per-haps as overtime or casual labour. (Inmanagement accounting terms this is equiv-alent to volume variance.) However, wewould not expect the supervisory effort toincrease as this tends to be a fixed overhead.In this case we would increase the resourceinput, or more likely acknowledge andendorse the actions the line managers havealready taken.
If the activity level is equal to that plan-ned, but we are using more resources thanplanned, then we must question our workstandards on which we are basing our con-version logic. (In management accountingterms this is equivalent to cost variance.) Wemust then either change the work standardsto be more realistic, or reconsider the con-version process itself and perhapsre-engineer it to make it better. In the case ofhotel room cleaning, where we are usingmore labour than planned we should firstcheck that the rooms themselves do not varygreatly from our ‘standard’, then that thecleaners are well supported and they do notspend time seeking cleaning materials orequipment, and finally perhaps that they arenot exceeding quality specifications. If thereare no discrepancies here, then we caneither redesign the room, or the cleaningregime to make it possible to do the tasks inthe time planned, or alter our work stan-dards (and readjust our expected profitmargins).
In most situations variances from theplan will be a caused by a combination ofdifferent activity rates from those used inthe plan, and different conversion rates from
those expected. Unravelling this situation isnever easy, and it is important to first selectthe parameters which we must measure tocontrol the perception of quality which wedeliver to the customer, and then to putinformation systems in place which deliverdata on both these parameters, and the costsof delivering them in terms of effort (man-hours) spent. Only when managers havesuch systems in place can they expect tocontrol the business.
Summary
1. Definition: Operations management isconcerned with the design and controlof transformation systems to deliver theservices, including products, of anorganization at the right quality, at theright price, and at the right time.
2. Organizations are systems. The techni-ques of representing and describingthem are invaluable in analysing howthey operate, and the interdependencyof subsystems.
3. Tourism is a service industry. As suchits product is perishable, heterogene-ous, and intangible, and the customer isan integral part of the product deliveryprocess (simultaneity).
4. Organizations should define their stra-tegic market position in terms ofestablished competitive criteria. Thesethen determine the standards to whichthey operate.
5. Decisions to be made in operationsmanagement consist of those pertainingto the design of the operating system(design decisions), and those concernedwith the effective short term utilizationof available resources (operating deci-sions).
6. A useful framework for analysingoperations management decisions inorganizations, or in parts of an organiza-tion, is by considering:
● the service delivery quality stan-dards adopted, these arefundamental to monitoring the fac-tors which create customer
237Operations Management
perception of the service deliverableat point of delivery;
● work (or performance) standardsadopted, these are fundamentalbuilding blocks for planning andmeasuring economic performance ofdelivery systems;
● capacity, to ensure that resourcesare available to deliver the servicelevel quality standards at standardwork performance;
● inventory, to ensure that systems arein place to supply materials neededin the service delivery at point andtime of need;
● scheduling, to finalize short-termplans to ensure that availableresources are there when needed;
● control, to monitor performance toplan and to take remedial actionwhen there are deviations from theplan.
Quantitative techniques and qualitativeapproaches are available to support themanagement of operations. They should beemployed flexibly in the operating contextof any specific organization.
References
Devanna, M.A. and Collins E.G.C. (eds) (1990)The Portable MBA. Wiley, London.
Feiginbaum, A.V. (1983) Total Quality Control:
Engineering and Management, 3rd edn.McGraw-Hill, New York.
Hammer, M.J. and Champy, J. (1993) Reengineer-ing the Corporation: A Manifesto forBusiness Revolution. Brearley, London.
ISO 8042 (1989) International Standard 8042.International Organization for Standards,Geneva.
Juran, J.M. and Gryna, F.M. (1980) Quality Plan-ning and Analysis, 2nd edn. McGraw-Hill,New York.
Krajewski, L.J. and Ritzman, L.P. (1996) Opera-tions Management: Strategy and Analysis,4th edn. Addison Wesley, Reading, Massa-chusetts.
Macbeth, D.K. and Ferguson, N. (1994) Partner-ship Sourcing: an Integrated Supply ChainManagement Approach. Pitman, London.
Murdick, R.G., Render, B. and Russel, R.S. (1990)Service Operations Management. Allyn andBacon, Boston.
Open University (UK) (1994) Managing Develop-ment and Change (B751, Course Material),Open University, Milton Keynes.
Orlicky, J. (1994) Material Requirements Plan-ning, 2nd edn. McGraw-Hill, New York.
Paterson, N.D.L. (1989) Resource Management inthe Hotel Industry, Proceedings of the Opera-tions Management Association (UK) AnnualConference 1989, Bedford, UK. IFS Publica-tions, Bedford, UK.
Peppard, J. and Rowland, P. (1995) The Essence ofBusiness Process Re-engineering. PrenticeHall, Hemel Hempstead, UK.
Voss, C., Armistead, C., Johnston, R. and Morris,B. (1985) Operations Management in ServiceIndustries and the Public Sector. Wiley,Chichester.
238 G. Southern
9Strategic Quality Management
H. Maylor
Introduction
When was the last time you received goodservice? What was it about the service thatset it apart from other service encounters?What had the organization or individualdone that made it good? What happened orwhat did they do to make you aware of it?We are all customers of service products, yetit is rare that we are provided with truly‘good quality service’. It is an unfortunateside-effect of studying this area that itincreases your ability to be critical of theservice quality you receive. It makes theexperience even more enjoyable, however,when you encounter an individual or anorganization that has this area well man-aged. Achieving service quality is aboutbeing competent in the delivery of customerneeds and expectations in the majority ofareas of the delivery process, and exceedingthem in one or two parts of it. As will beshown, this is a difficult balancing process,which requires a broad spread of achieve-ment in organizations. In tourist products,which will typically have different parts ofthe experience offered by different organiza-tions, this task is particularly onerous, andnotoriously difficult to manage. As Johnston(1999) comments, ‘Most managers knowthat designing their service right is impor-tant. Yet with few notable exceptions,service organizations seem unable to get togrips with the detailed design of services.’
This is a challenge for managers, to gobeyond the thin veneer of the smile of areceptionist, or a brand image and providethat elusive quality of service that more andmore customers want, and are being led toexpect.
This chapter is entitled ‘Strategic QualityManagement’. This reflects the requirementfor the consideration of quality to be carriedout at a strategic level, and the impact that itwill have on the systems of organizations asa whole. It also reflects the driver forimprovement in quality performance to beinextricably linked to success. The chapteris divided into three sections. The first con-siders the quality issues of service design (asmentioned above) and in particular the vitalactivity of definition and modelling of qual-ity. The second covers the management ofan ongoing operation, and the issues linkedto this. The third considers the means bywhich managers can bring about improve-ment of quality performance, including adiscussion of some of the people who havehad the greatest influence in this respect.
Service Quality Design
One of the key questions at the start of thischapter asked for a consideration of what itwas about a good service encounter that hadmade it seem good. This was asking for adefinition of the particular quality of that
© CAB International 2000. Strategic Management inTourism (ed. L. Moutinho) 239
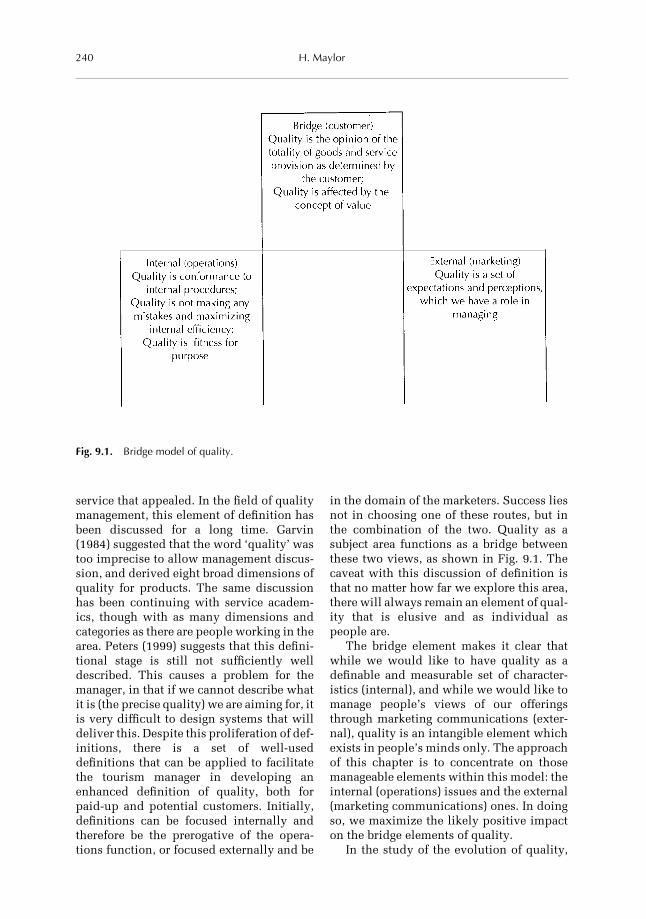
service that appealed. In the field of qualitymanagement, this element of definition hasbeen discussed for a long time. Garvin(1984) suggested that the word ‘quality’ wastoo imprecise to allow management discus-sion, and derived eight broad dimensions ofquality for products. The same discussionhas been continuing with service academ-ics, though with as many dimensions andcategories as there are people working in thearea. Peters (1999) suggests that this defini-tional stage is still not sufficiently welldescribed. This causes a problem for themanager, in that if we cannot describe whatit is (the precise quality) we are aiming for, itis very difficult to design systems that willdeliver this. Despite this proliferation of def-initions, there is a set of well-useddefinitions that can be applied to facilitatethe tourism manager in developing anenhanced definition of quality, both forpaid-up and potential customers. Initially,definitions can be focused internally andtherefore be the prerogative of the opera-tions function, or focused externally and be
in the domain of the marketers. Success liesnot in choosing one of these routes, but inthe combination of the two. Quality as asubject area functions as a bridge betweenthese two views, as shown in Fig. 9.1. Thecaveat with this discussion of definition isthat no matter how far we explore this area,there will always remain an element of qual-ity that is elusive and as individual aspeople are.
The bridge element makes it clear thatwhile we would like to have quality as adefinable and measurable set of character-istics (internal), and while we would like tomanage people’s views of our offeringsthrough marketing communications (exter-nal), quality is an intangible element whichexists in people’s minds only. The approachof this chapter is to concentrate on thosemanageable elements within this model: theinternal (operations) issues and the external(marketing communications) ones. In doingso, we maximize the likely positive impacton the bridge elements of quality.
In the study of the evolution of quality,
Fig. 9.1. Bridge model of quality.
240 H. Maylor

there have been numerous approaches,which will be brought together into twomodels of quality that will be discussed atthe end of this section. These concern theperspective or paradigm of the methodsused. Table 9.1 shows these perspectives,the definitions of quality that they supportand a short description of the approach. Atthe bottom of the table, the approach that istaken here, that of strategic quality manage-ment, is described.
MathematicalThe mathematical approach was the onlytool available to managers in pursuing qual-ity improvement for many years. This hasbeen incorporated as an element of otherapproaches and is now seen as a very lim-
ited approach if used alone.
System-structuralThe system-structural approach is whereprocedures are defined by a particular stand-ard, possibly ISO 9000 or any one of anumber of customer-specific sets of guide-lines. While there are marketing benefits tobe gained from organizations becomingaccredited to such standards, the measuresthey incorporate are also limited as theyfocus on assuring the reliability of the serv-ice product rather than the actual servicetransaction. Whether this is required andorganizations need to undergo the ‘jumpingthrough hoops’ of the standard mentioned isdebatable. It is clear, however, that as aninitiative alone it has limited merit. Rather it
Table 9.1. Perspectives on quality management.
Perspective Definition supported Description of approach
Mathematical Conformance to specification The management of quality is limited to theassurance of the ‘goodness’ of a mechanicalproduct or process. Activities are based onstatistical tools, such as statistical processcontrol (see tools in section on Service QualityImprovement)
System-structural Conformance to procedure This is encapsulated in the approach of thebureaucratic quality system as used as the basisfor the ISO 9000 model of quality management.The achievement of a level of quality relies onthe development and following of a hierarchicalset of procedural documents
Control-organizational Continuously meetingcustomer requirements
In this approach, employees and customers areviewed as key determinants of service quality.This notion has particular validity in the highcontact service portion of the tourism andhospitality industry.
Economic Cost of (un) quality The financial costs and benefits of qualitymanagement are assessed against the costs offailure
Holistic Continuously meetingcustomer requirements atlowest cost
The total quality approach relies on a change inthe entire way the operation approaches itsbusiness processes, from senior management tothe front-of-house staff
Strategic Quality as competitiveadvantage
The additional responsiveness that can come fromsuccessfully pursuing product and processimprovement is treated as part of thecompetitive strategy of the firm
241Strategic Quality Management

should be one part of a much wider qualitymanagement improvement effort if real ben-efit is to be gained by the system.
Control-organizationalIn the control-organizational approach,employees and customers are viewed as keydeterminants of service quality. This notionhas particular validity in the high contactservice portion of the tourism and hospital-ity industry. In the quality managementliterature, much attention is paid to this,though many argue that human resourcesstrategies have not been terribly effective inimproving quality performance. In consid-ering the degree of control that theorganization can exact over the actions ofindividuals, training and systems of pay andreward are the main ‘behaviour modifiers’.The imposition of control through excessivechains of command is shown to be ineffec-tive in many studies. What has been shownto be effective is to develop the concept of‘internal customers’ within organizations.An internal customer is someone whoreceives work from another person (the sup-plier) within the organization. This ensuresthat back office staff (those who have little orno contact with the customer) are connectedto the service delivery process, as their inputwill inevitably have an effect on the abilityof the front of house staff to deliver servicequality.
The co-operation of the customer in theservice delivery process has a number ofimplications. These include deciding whichparts of an operation can be transferred to becarried out by the customer (e.g. throughself-service and automatic vending facili-ties) with advantages for both the consumer(in response time) and the organization(resourcing).
EconomicThe approach to quality management froman economic perspective is highlightedthrough the work of Crosby, Taguchi andothers (see section on Service QualityImprovement). The idea that quality per-formance has both direct and indirect effectson the financial performance of the organi-zation is quantified and used as the basis for
management activity. Taguchi provides forthe further analysis of variation of productby applying a definition of quality in a neg-ative sense: it being a measure of the loss tosociety incurred by that product or service.
Recent surveys conclude that while therelationship between economic perform-ance and quality performance is positivelycorrelated, it has not been possible to pos-itively establish a causal relationshipbetween the two. Reicheld and Sasser (1990)have estimated that a 5% increase in cus-tomer loyalty can produce profit increasesfrom 25 to 85%. One reason for this largeimprovement in profitability is the cost ofattracting new customers. The old businessadage that ‘market share is everything’ istherefore replaced by ‘quality of marketshare is everything’. The effect of customerloyalty over a lifetime of loyal purchasingcan be assessed and more importantly, cus-tomer retention measured. A US pizza chainrecently reported that the lifetime value of asingle customer was US $8000. This meantthat if the customer defected to anotherpizza supplier, the loss to the firm was notjust that purchase, but a percentage of thelifetime revenue of that customer. In assess-ing the economic impact of quality, there arewell-developed methods for assessing the‘cost of quality.’ These will be discussedfurther in the following section.
The holistic approach to quality will be dis-cussed further in the section on ServiceQuality Improvement – as part of the impactof initiatives such as total quality manage-ment on business practice.
StrategicThe strategic approach to quality is to treatquality strategy in one of four ways:
● as a functional strategy, recognizing theneed for a quality management functionwithin the organization, which can planand optimize the use of its own resour-ces, yet have influence on the operationas a whole;
● as a single competitive strategy, focus-ing on the need for both relative levels ofquality and absolute levels of quality toestablish customer perception of the
242 H. Maylor

company and its products and hencedeliver higher differentiated value tocustomers;
● quality as one dimension of competitivestrategy, treating the quality perform-ance as one of a number of strategicvariables;
● quality as an organizational culture thatis appropriate to any competitive strat-egy; by having a quality orientation orquality thinking, management decisionsare made which will reflect on the needfor both internal and external percep-tions of quality to be placed above otherconsiderations.
These are the main approaches to the sub-ject. Table 9.1 showed the definitionsupported by each approach. These defini-tions are discussed further below, as thiswill help to identify the elements of servicequality that customers require. As managers,the task then becomes one of designing thesystem to ensure that these needs are met.
Other approachesConsidering other approaches to definitionof quality, and in particular, service quality,the literature has a more clearly definedidentity through the developmental work oftwo distinct schools: the Nordic and theNorth American. The Nordic school is typ-ified by the work of Grönroos, andGummesson (1991, 1993) and is character-ized by:
● considering service quality as a theresult of the provision of a serviceproduct;
● the service product comprising a techni-cal content (what is provided) and aservice content (how it is delivered);
● the service content being furtherdivided into the core service andsupporting/peripheral services;
● the core service and the customer inter-action being paramount as they cancompensate for poorer technical per-formance.
The North American school is dominated byParasuraman, Zeithaml and Berry, whosework is characterized by a focus on the proc-ess of the delivery of the service. Their
model of quality provision considers thefunction of five gaps identified as:
● between the actuality of customerrequirements and the perception ofmanagers who design the service tomeet these needs;
● between the perception of the needs andthe stated design (specification) of thesystem;
● between the specification and the actualservice system, i.e. that which isreceived by the customer;
● between that quality of service receivedby the customer and that which theywere led to expect from marketingcommunications;
● between the customer’s perception ofthe service delivered and their expecta-tions.
At a simpler level, many people only focuson the last of these, e.g. Maister’s first law(1993) states that:
Satisfaction 5 perception 2 expectation
This is a limited external view, and does notinclude the management of the internal ele-ments, and the functioning of the qualitybridge. Satisfaction, as a concept, clearly ismore complex, and requires considerationof the technical aspects as well as the inter-action aspects of the service.
Service system designHaving defined quality from a number ofperspectives and, in doing so, discussedmany of the design issues, there comes apoint when this has to be translated into asystem that will deliver these objectives.The main tool for design here is the serviceblueprint (after Shostack, 1984). A blueprintis a model of the service system, covering interms of activities and time, the progress of acustomer through the service system as inFig. 9.2. It shows the points where the cus-tomer encounters different elements of theservice system (in this case labelled as serv-ice elements), and is drawn using arrowsand boxes, akin to a conventional flowchart.This can be limiting, as the perspective canbe purely internal/operational. Taking the
243Strategic Quality Management

encounter from the customer perspective isbeneficial in this respect. A blueprint has afurther use. It can be employed to identifypotential fail-points in the system, and todesign vital recovery actions (see later sec-tion on failure management) that willminimize the damage of failure within thesystem. In Fig. 9.2, potential fail-points existwith the interactions between the customerand the service elements (e.g. failure tounderstand the automated ticketing sys-tem). In addition, there may be fail pointssuch as the customer failing to find a parkingspace or being unable to find their vehicle onreturning to the car park.
In designing the service system, the cus-tomer input will need to be interpreted in amanner that ensures the minimization of thegaps identified in the model of Parasuramanet al. (1985). A key tool for this is quality
function deployment (QFD). The construc-tion of a ‘House of Quality’ shows manycomplex relationships between factors, anddisplays them on a single sheet of paper. Itcrucially allows the nature of the customerrequirement to be expressed in the custom-er’s own language. The first correlation isthen between this stipulation and the lan-guage of the service provider, relating therequirement (the ‘what’) to the elementsunder the service manager’s control (the‘how’). Customers are asked to prioritizerequirements, which provides a rich sourceof information as to the way in which per-ceptions can be managed. Perceptions ofcompetitor performance (if available) areadded to see the relative position of each inthe eyes of the customer, on each of theattributes described. Finally the correlationis made between the hows – some will be
Fig. 9.2. Blueprint of service delivery system.
244 H. Maylor

complementary, others will be conflicting –and the whats. The manager now has aframework for making trade-off decisions onthe basis of good information.
The use of these extended correlationmatrices has profound strategic implica-tions. Many authors claim that QFD shouldform the root of the strategy process. It is acentral factor in the application of HoshinKanri (policy deployment).
Management of Quality
Within this area there are a number ofstrands of work. These clearly overlap withthe issues of design and improvement, andany classification of issues in this area israrely exclusive. The issues that will be dis-cussed here include the assessment ofquality costs, the management of failure andthe management of variability.
Quality costsQuality is not free. It costs. Precisely howmuch it costs is a matter for the managers ofthe system. Comparable companies in thesame sector routinely have widely differingapproaches to quality, and very differentassessments of their quality costs. It is notreported on balance sheets, but can have amajor impact on profitability. Quality costsinclude elements of prevention, appraisaland failure as described in Table 9.2.
The management of quality shouldinvolve the calculation of these costs; anactivity that is by no means a simple one.Quality costs, it seems, like quality have alarge number of definitions and the elementsthat are included under each heading inTable 9.2, are often subjective and vary fromorganization to organization. Typically,compiling cost reports is the mechanism formeasuring these costs. The objective is notthe keeping of further legions of ‘bean coun-ters’ in work, rather allowing a process ofself investigation to follow, i.e. the purposeis that of reducing quality costs, not simplymeasuring them. It has been found that acompany with a well-developed quality sys-tem will have quality costs in the region of2% of turnover. A company with a poorlydeveloped quality system will devote inexcess of 20% of its turnover to quality costs(Crosby, 1983). The impact on bottom-lineperformance from this consideration aloneis clearly significant. This establishes theimportance of quality management in thecosts of the service provision. The role formanagement in this is the control and reduc-tion of these costs.
Management of failureThe management of failure is requiredwhere for whatever reason, a customerbecomes dissatisfied with the serviceencounter that your organization has pro-vided or is in the process of providing.
Table 9.2. Quality cost categories.
Category Characteristic being measured Examples
Prevention The costs of ensuring that the requiredlevel of quality of service is met
Quality planningBlueprinting
Appraisal Measuring what level of quality of serviceis provided
Customer surveysRandom inspection/checksPerformance data gathering and analysis
Failure The costs of getting it wrong and putting itright, can be categorized as eitherinternal or external failure
Internal failure: mishaps or errors that areresolved without the customer everseeing them
External failure: occurs in the interactionwith the customer, may result in loss/withdrawal of business or rectification/rescue being required
245Strategic Quality Management

Customer perceptions, as will be discussedin the following section are transitory (theychange with time) and how the problem isresolved is a key element of the responsive-ness of the service encounter. Failuremanagement, or recovery as it is more cor-rectly termed, is not a fashionable issue.Organizations that recognize that failureswill occur, no matter how well planned thesystem, do have some chance of not onlyrescuing the current situation, but alsolearning from it, and improving in thefuture. As one organization noted, customercomplaints in the first instance were direc-ted to the person who was responsible forthat area. Any repeat customer complaintswere routed to the firms’ managing director.This attempt to eliminate these ‘repeat con-cerns’ was highly effective, and showed alevel of commitment to the issue of qualityat a high level. Moreover, it is a realisticapproach – mistakes do happen – most cus-tomers accept this (albeit grudgingly). It isthe actions that follow that determinewhether or not the event becomes a cause for‘consumer terrorism’ (customers who gladlytell everyone the problems that they hadwith a firm) or an opportunity to get closer tothe customer. The organization does have achoice in this respect. The stages in the man-agement of failure are as follows:
● identify that something has gonewrong;
● contain the situation: accept that thereis a problem, prevent further damage orescalation of the problem;
● put in place recovery actions to regainthe customer’s confidence;
● ensure that practices are changed so thatthis incident does not occur again.
The first step, identification, considers thatthere will be some cue from the customerthat all is not well. This may be through averbal comment made to a member of staff,or direct observation of customer behav-iour.
The second stage is that of recognitionand containment. For a customer the rejec-tion of their query by an organization can bethe first stage in a downward spiral. Front-line staff need to be aware of the need to be
accepting of customer views, rather thandefensive about their organizations. Havingdone so, it is vital that this is followedthrough to some resolution that is accept-able to both the organization and thecustomer. Containment is where the prob-lem is prevented from spreading; customersof tourism products are notorious forspreading dissatisfaction, by drawing atten-tion to (providing cues to other customers)elements of poor quality.
The third stage is the recovery action.This undoubtedly needs to consider thetechnical and interaction needs of the cus-tomer. Firstly, the technical needs should beaddressed, ensuring that a solution is foundthat is mutually acceptable. The second isthe interaction, the customer should be leftin little doubt that their needs were con-sidered and that everything possible hasbeen done to rectify the situation. Finally, itis vital that the organization learns from theproblems. Typically this would includesome analysis of the root causes of the prob-lems and remedial action through, forexample, training or amendment to proce-dures.
The discussion of such failure entailsmuch additional work for an organization,which cannot be cost-justified in conven-tional terms. If, however, an approach istaken which considers all costs, in this casequality costs (see below), the justificationbecomes far easier.
Management of variabilityThe last issue that will be considered in thissection is the management of variability.Service products, due to the involvement ofthe customer in their delivery and the reli-ance on staff for their quality, exhibit a fargreater variability in their delivery thanmanufactured products. This is not neces-sarily a problem if the service delivery, dueto being a high margin, customized servicefor example, includes the costs of such cus-tomization in the charges made tocustomers. Variability becomes a problemwhere, due to volume throughput require-ments, a standardized service is required.Staff may take more time dealing with cus-tomers than is allocated, and queuing or
246 H. Maylor

another form of delay results. Variabilityalso becomes problematic where the varia-bility introduced by staff is inappropriate forthe customers concerned.
Service Quality Improvement
Basic arguments for organizational qualityimprovement are:
● productivity-based (quality cost), moreout for the same input of resources;
● competitiveness-based, moving awayfrom definitions of quality that focus onattributes other than defect levels.
The role of the former has already been dis-cussed. Competitiveness based on quality isfar more difficult to assess once you moveaway from simply considering defect levels.The Profit Impact of Marketing Strategy(PIMS) database was established to inves-tigate the effect of high-level strategies onprofitability. The methodology involvesquestioning top executives of the companiesinvolved and establishing their perceptionsas to the relative market position of theircompanies in certain key areas, notablyquality performance (Buzzell and Gale,1987). This has been extensively criticizedas a methodology due to its subjectivenature and the lack of any verification of thedata being provided. Studies using the PIMSdata include that of Caves and Ghemawat(1992) who conclude that differentiation-related factors (such as quality) play more ofa role in generating sustained intra-industryprofit differentials than do cost-related ones,in addition to providing bigger margins.Similarly, Lynn (1992) states the existenceof a strong correlation between a firm’s prof-itability and the perceived quality of itsproducts and services. Hence the view thatquality improvement should provide thebasis for sustainable competitive advan-tage.
Mann and Kehoe (1994) try to quantifythe relationship between three factors: orga-nizational characteristics, qualityimprovement activities and business per-formance indicators. They conclude that allthe quality activities they investigated
(including the use of SPC, ISO 9000, Tagu-chi techniques, teamwork) have beneficialeffects on business performance. Theirresearch, like others, is not capable of pro-viding a control group to investigate theeffects of the pursuit of other activities andwhether scarce resources could have beenbetter deployed in other initiatives. A per-functory consideration of these factors castsdoubt as to whether this ‘evidence’ can beconsidered to be totally objective. Flynn etal. (1994) comment that ‘ . . . the majority ofthe empirical work on quality managementcan be characterized by a narrow focus and alack of rigour, particularly with regard toreliability and validity issues.’
As will be shown in the discussion oftotal quality management (TQM), it isalmost impossible to determine any certain-ties as to what will and will not work. Thebasis of much improvement should there-fore be a pragmatic assessment of thepossibilities for changing practices withinorganizations, followed by selection of theoptions most compatible with the goals ofthe organization.
The role of top management in qualityimprovement
Deming (1986) estimates that 94% of cus-tomer problems are caused by themanagement system rather than by individ-uals. This may not possess the quality ofdelighting the customer but has a significantrole in minimizing the ‘negative potential ofoperations’. Studies in the Japanese manu-facturing industry (e.g. Ebrahimpour andLee, 1988) have shown quite clearly that theway in which performance was measuredand rewarded was the key to high qualitylevels. Similarly, in a broader range ofindustries, the removal of purely quantity-based measures of performance (e.g. numberof clients ‘processed’) was a prerequisite toimprovement (Garvin, 1984).
The nature of this commitment is open todebate. There is little congruity over meas-ures of commitment and real levels ofcommitment to change can be easily dis-guised. The development of a qualitydepartment within an organization is seen toshow a degree of commitment from senior
247Strategic Quality Management
management. The real influence that thisquality function can have, however, has tobe set in perspective. Customers of tourismand hospitality operations are likely to dealwith a cross-section of staff and provision ofthe tourist product takes cross-functionalactivity. Expecting one department to‘police’ or have any great influence on theprocesses risks taking the responsibility for‘quality’ away from the place or peoplewhere it has greatest effect: in each of thefunctions throughout the organization,which has led to the slogan ‘quality is every-one’s business’. This need forcross-functional cooperation is reflected inthe organizational structure of some world-class companies who focus on processesrather than departments.
There is, however, a significant role dur-ing organizational change for a ‘qualitychampion’. Many organizations rely onexternal sources for this, though there is agood argument for the expertise to be devel-oped in-house, so as to retain the experiencegained from the process for future use. Onepersistent problem with such quality cham-pions who are then involved in the trainingof others (who would then train others andso on, known as ‘the cascade method’) wasthat often they were ‘only one chapter in thebook ahead of the people they were train-ing’. Anecdotal evidence suggests that manyimprovement programmes have foundereddue to the lack of credibility or authority ofsuch individuals. The proof of this has notbeen forthcoming; organizations are reluc-tant to admit that they have engaged in aquality programme which has failed, andthe quality industry (notably the consul-tancy firms which offer TQM training) hasnot encouraged such introspection.
Provision of resources for a qualityimprovement programme is just one areawhere a level of commitment from top man-agement is required. As Flynn et al. (1994)comment, the nature of quality-orientedtraining includes small-group problem-solving, communication, statistical processcontrol and other relevant areas, in additionto classroom and on-the-job training relatedto specific tasks. The objective is to developworkers who are flexible problem-solvers.
While there is a good logical argument thatbetter trained workers will provide a betterquality service to customers, the empiricalevidence is very sparse. As for evaluatingthe effectiveness of quality programmes as awhole, a direct causal link between theactivity (in this case the training) and theoutcome (better performance) has not beenestablished. One of the major challenges iseliminating the distorting influence of theinherent ‘level of quality’ of the employees,e.g. natural motivation, employment his-tory, background, education, etc. This is akey element that has been identified in anumber of cases where service quality hasbeen cited as excellent (Southwest Airlines,for example).
Evaluating service qualityIn order to improve elements of service qual-ity, the first step in the process is theestablishment of levels of current perform-ance. Measuring guest satisfaction inhospitality operations has been a matterlargely left to the comment card, which iscertainly ineffective, if not actually mislead-ing (see Jones and Ioannou, 1993). Anysurvey of customer satisfaction shouldaddress three issues. These are:
● the survey design;● survey distribution;● data processing.
Issues of survey design include how manypeople should be asked as to their opinions,and what they should be asked. Voluntarycompletion results in a massive non-response rate bias (i.e. the cards are onlycompleted by those with strong views –usually overwhelmingly negative – and donot give an indication of the overall picturethat a representative sample would provide;see e.g. Silver, 1997). The mechanism fordistribution should then be in-line with thesurvey design, and what it is intended toshow (an overall picture of customer sat-isfaction, or simply identification ofoutliers: customers with extremely good orextremely bad experiences). Data can be pro-cessed centrally (allowing some notion ofcontrol over the data and consistency withmeasurements from other service outlets), or
248 H. Maylor

locally (allowing addition of informal dataand client feedback). An important, butoften missed element of this process, is thatinformation is gathered in the language ofthe customer. It is too easy to ‘interpret’ thecomments and miss the issues that were ofgreatest importance to them.
Determining what questions to ask peo-ple is an issue that is as debated as thedefinition of quality itself. This should be nosurprise; the assessment should be a mirrorof the definition of quality that has beenadopted by the organization. It does notmean to say that it is the right definition,only that it is the one that has been used. Forthe service manager, the key issue here isavoiding putting their own views of theservice above those of the customer. It is notunusual to find a customer survey ques-tionnaire that reflected a manager’spreferences from the service, rather thanthat of the customer. One of the ways toavoid this is through the use of frameworks,adapted for the particular customer serviceexperience in question.
The major framework for the evaluationof performance, is SERVQUAL. This modelbreaks quality down into measurable ele-ments comprising: reliability,responsiveness, assurance, empathy andtangibles. Grönroos uses elements of pro-fessionalism and skills, behaviour andattitudes, accessibility and flexibility, relia-bility and trustworthiness, recovery,reputation and credibility (see alsoHaywood-Farmer (1988) and Mattsson(1992)). Each of these attributes is an ele-ment of a scale for analysing both theexpectations and perceptions of the serviceproduct (Parasuraman et al., 1985, 1986).The usefulness of such a scale has beenevaluated by, for example, Fick and Richie(1991). They concluded that while the scalewas useful in providing a means of assessingthe relative importance of the various attri-butes to the customer in one specificcircumstance, there were many practicalchallenges to delivering the questions tocustomers and providing an analysis of theirresponses. Johns (1993) concludes that ‘theSERVQUAL scale is likely to need furtheradaptation before it can be generally
accepted as a research tool for assessing thequality of hospitality provision’. Modifica-tions to the basic set of criteria include theaddition of new elements within each of thecriteria to suit the individual situation. Forexample, a recent evaluation of a hospitalityoperation expanded the tangibles element ofSERVQUAL (Mei et al., 1999). The charac-teristics under this heading in the originalscale were expanded to include the follow-ing elements:
● equipment, fixtures and fittings aremodern looking;
● facilities are visually appealing;● neat and professional employees;● materials are visually appealing;● fixtures and fittings are comfortable;● equipment and facilities are easy to
use;● equipment and facilities are generally
clean;● variety of food and beverages meets
guests’ needs;● services are operated at a convenient
time.
It is also appropriate to consider satisfactionas a continuum rather than a discretizedcommodity. This was promoted by Zeithamlet al. (1990) who introduced the concept of a‘zone of tolerance’ between a desired and an‘adequate’ level. The framework clearlyapplies to each of the dimensions of qualitydiscussed above. Furthermore, the studypresented by Liljander and Strandvik (1993)used what they call a ‘willingness to pay’construct to the expectations of service inthree forms:
● the adequate level of service;● the desired level of service;● the predicted level.
This changes the discussion from perceivedquality to ‘perceived service value.’
Johnston (1995; see also 1999) identifiedthree overlapping applications of the zoningconcept:
● the description of pre-performanceexpectations (as above);
● the satisfactory range of in-process serv-ice performance;
249Strategic Quality Management

● a description of the outcome state, rang-ing from dissatisfaction (negativedisconfirmation) to satisfaction (confir-mation) to delight (positivedisconfirmation). Johnston cites Ken-nedy and Thirkell (1988) as describingthe range state of satisfaction as possess-ing a zone of tolerance.
At the outset of the customer encounter, thecustomer possesses a mixture of expecta-tions, as already defined, due to priorexperience, marketing information or thirdparty information. The process encounterswill shape the outcome state, but carryimmediate perceptive valuations by the con-sumer. The role of marketing in theconsumer interpretation of the outcomestate will be discussed below.
In determining the width of the zone oftolerance, the level of involvement is citedas a crucial factor (Berry and Parasuraman,1991; Johnston, 1995), the relationshipbetween the two being that the higher thecustomer involvement, the narrower thezone of tolerance. Furthermore, Berry andParasuraman emphasize that the zone of tol-erance will (as for the absolute level) bedifferent for each quality factor, but is likelyto be narrowest in the element of reliability.Managing processes to ensure that, as in themanufacturing paradigm, they are keptwithin the acceptable limits, is a key task fortourism and hospitality managers.
Coyle and Dale (1993) reported on aninvestigation into the perceptions of impor-tance of service features from theperspectives of hospitality managers andcustomers. Their findings highlighted thedifferences between actual customerperceptions/expectations and their interpre-tation by service providers (managers ofhospitality operations). The major ‘feature’that customers required of the service trans-action, was problem handling ability andauthority in staff. Attitude and keepingpromises ranked second and third. Man-agers rated value for money highest, whichwas much further down the list of prioritiesfor customers.
Two major practical implications formanagers emerge from this discussion. The
first is that if you are performing satisfacto-rily in each of the quality dimensions, it isnot necessarily reasonable to expect yourcustomers to be pleased with this part of theservice. Making this the subject of question-ing increases the customers’ awareness ofthat issue and hence raises expectations.This may result in dissatisfaction in thelonger term where increases in the level ofawareness of aspects of the service is notmatched by increases in perceived customerbenefit from that aspect of the service. Thesecond is that in the service provision proc-ess, incursions into the region of delight atthe outcome or parts of the process, mayresult in a change in the expectations of theservice in the future (Gummesson’s ‘PeanutSyndrome,’ 1991). It is important that thesechanges can either be sustained or that someother compensation is made to the cus-tomer, e.g. in price.
The evolution of the subject of qualitymanagement
Figure 9.3 shows the evolution of the subjectfrom the centre of the figure (craft-centredindustry) to the modern situation of strategicquality management, which encompassesthe previous approaches. The craft-centredapproach – as typified by sole-trader busi-nesses – is still a feature of many tourismproducts. In such a situation, the onus is onthe individual to provide the necessaryqualities that customers are seeking, usingthe influence of individualism to secure cus-tomer approval. When products becomemore industrialized (through service-factories, for example) the requirementschange. Until recently, it was commonplacefor quality ‘inspectors’ to roam factories(service factories as much as manufacturingoperations), seeking out poor quality. Thefailing part of operation would then be bera-ted for their poor performance. Such anapproach was part of the Tayloristic com-mand and control structures ofindustrialized society. Apart from the obvi-ous negative-only feedback that thisprovides, the assumed principle of control isthat the error is created immediately prior tothe point of detection. This is rarely the case;errors are usually the sum of a set of actions
250 H. Maylor

in a chain, where the original cause is oftenwell removed from the point at which eitherthe customer experiences it, or the inspectordetects it.
As a result of recognizing these short-comings, increased use was made of qualityassurance. Errors or problems were trackedto their source, and the focus shifted to pre-vention, rather than detection andrectification. Where staff routinely give pooradvice, resulting in later problems for otherstaff, this would be found under a system ofquality assurance, whereas the problemwould be focused on the later incident in asystem of inspection.
Following the work of a number of influ-ential people in this area (see below), the1980s saw the emergence of the ideal of totalquality management. The author of this ‘hol-istic’ approach was Feigenbaum (1956) indescribing the work that he saw beingundertaken in Japan. His phrase ‘company-wide quality control’: the use of the tools ofquality control on all processes within thebusiness, was developed to the concept weknow today as total quality management.
The original phrase provided a good indica-tion as to the nature of what qualitymanagement activity was about, however itdid not possess the necessary mystiquewhich the quality industry required. Thephrase ‘total quality management’, now pos-sesses as many meanings as there areorganizations which claim to be ‘Total Qual-ity Companies’. Feigenbaum’s definition(1991) is:
Total Quality Control is an effective systemfor integrating the quality development,quality maintenance and qualityimprovement efforts of the various groupsin an organization so as to enableproduction and service at the mosteconomical levels which allow fullcustomer satisfaction.
Other definitions which are worthy of noteinclude ‘Continuously meeting customerrequirements at lowest cost,’ (P.A. Consult-ing Group, 1988) and ‘a proven systematicapproach to the planning and managementof activities’ (Munro-Faure and Munro-Faure, 1992). These represent two classes of
Fig. 9.3. Evolution of quality management.
251Strategic Quality Management

definition: one is objective-oriented (i.e.what are the objectives of TQM?) and theother is functional (what does TQM meanfor management?). This inexact definition ofthe nature of TQM has caused much blur-ring of the precise level and scope of qualitymanagement terms, such as quality assur-ance, quality planning and quality systems.Johns (1993) suggests that this blurring‘exists at a philosophical rather than a prac-tical level’, though the implications are that,like the original discussions of quality, thereis a high degree of ambiguity associated withthe jargon of quality management. Some ofthis is misplaced; TQM for example is a setof ideas or principles, whereas quality sys-tems are means of achieving these andquality procedures (such as SPC, QualityCircles, 7 tools of quality control) are thepractical day-to-day measures that a qualitysystem can draw upon to achieve its strate-gic objectives.
It is this holistic approach to quality man-agement which forms the basis of theAmerican Baldridge and European EFQMawards. All parts of the organization areassessed under the criteria shown in Fig.9.4. While the pursuit of holistic pro-grammes for management have been
championed by governments and consul-tancies alike, the evidence for theircontinued existence has been very sparse.Most of it is anecdotal and concerns largeblue-chip companies. The question of imit-ability is therefore raised again. Severalstudies will be examined to see if there is acorrelation between quality performanceand organizational financial performance(e.g. Powell, 1995; Lederer and Rhee,1995).
The current state for many organizationsis that they are launching quality initiativesfor the second or third time, previous pro-grammes having ‘faded’. The same cycle ofinitial enthusiasm followed by disillusionwas observed with the idea of Quality Cir-cles. These are groups of workers who areconvened for the purpose of solving qualityproblems around their work environment.Japanese experience was that they providedbenefits to the organizations that used themover a wide range of sectors. They becamevery popular for a short time during the1980s when many organizations were hav-ing their first experiments with qualitymanagement. They very quickly faded fromuse, however, with many organizationsreporting rapid declines in effectiveness.
Fig. 9.4. EFQM organizational quality assessment.
252 H. Maylor

The explanation postulated for this phe-nomenon is that the static nature of thegroups turns them from high-performingwork teams into talking-shops and socialgroups. In addition, as might be expected,80% of the benefit of the group is achievedrelatively quickly. After this, they have tofocus on relatively marginal projects andsuffer from dwindling management supportas a result.
This launching and relaunching of ini-tiatives means that we can expect theconcept of total quality to be dynamic asillustrated by Tranfield (1992). The approa-ches to TQM by organizations arecategorized into three main mindsets:
1. Planning: quality improvement can beplanned and measured as for any otherbusiness performance measure. Sys-tems are the means of achieving theintentions of this mindset.
2. Learning: focuses on the empowermentof individuals (with every pair of handsyou get a free brain) and the continualimprovement of the organization in itsability to solve problems.
3. Visionary: guided by senior managersas a top-down initiative through theapplication of systems of hierarchicalcontrol. Customer requirements areforced into the management decision-making processes.
Tranfield further adds that all of theseapproaches are limited and that the onlyway to success is for a fourth paradigm toemerge, termed ‘Transformational TotalQuality’. This is defined as cycling betweenthe three main paradigms in order to obtainthe benefits of each while not incurring thedrawbacks. The negative effects of each areseen to set in once the initiatives are allowedto become static.
Crosby (1983) stated that ‘quality is free’.In the short-medium term, this is unlikely tobe justified. Significant investment willhave to be made if the organization wishes topursue a strategy of becoming a total qualityorganization. The evidence to justify suchan investment is contradictory. There hasemerged a pragmatism in managementthinking demanding evidence of benefits
and costs from the application of TQM,which previously would have been consid-ered heretical. Lederer and Rhee (1995)consider TQM as an investment in new tech-nology, and the relative success (throughstock-market valuation) is assessed. Thefirst-mover advantage appeared to be sig-nificant in this case, particularly wherecompetitors were slow to follow. In otherindustries – particularly those cited as justi-fication for most new paradigms(automotive, electronics, white goods, com-munications) – the implementation of TQMprogrammes has not provided abnormalpositive returns.
Powell (1995) is far more careful to con-sider the causality of the relationshipsbetween apparent organizational successand TQM initiative. He notes that manyalready successful organizations take onTQM, and are, because of their predisposi-tion for success, more likely to succeed withthe initiative. There was also a survivor-biasin this research which would tend to under-state the positive impact of TQM; thoseorganizations which had not taken onboardthe work would, at least anecdotally, appearto be far more likely to have gone out ofbusiness. Such methodological problemsare preventing an objective interpretation of‘what works where’ in assessing such ini-tiatives.
Major influences on the development ofquality management theory and practice
The major popularists in the area of qualitymanagement and their influence on the sub-ject are shown in Table 9.3.
Tools of quality management
Available to the hospitality manager are the‘7 tools of quality management’. These aredescribed extensively in the quality andoperations management literature, thoughare as concerned with general problem-solving as quality improvement per se. Thetools (process flow charts, Pareto analysis,Ishikawa/cause and effect diagrams, histo-grams, correlation charts, process controlcharts, check sheets) are described in, forexample, Bicheno (1998). The benefits they
253Strategic Quality Management

offer include the ability to be used through-out the organization and do not require aquality specialist, once the simple princi-ples have been taught.
Mizuno (1988) and Barker (1990) demon-strated the use of ‘7 new tools of qualitymanagement’ (relations diagram, affinitydiagram, systematic diagram, matrix dia-gram, matrix data analysis, process decisionprogramme chart, and arrow diagram). Theirapplication requires a far greater commandof language than the original seven tools, asthey rely on the linguistic decomposition ofproblems.
Conclusion
This chapter started by asking for examplesof good service quality. As discussed theseseem all too difficult to find in practice. Yet,there are good examples available. Treatingquality as a strategic issue means that we canconsider it at a high level in organizations,and can begin to take some control of bothinternal (operations) and external (market-ing) aspects of quality, as it affectscustomers. As Deming (1986) comments,
94% of causes of poor quality are with thesystem rather than the individual. Thedesign of the system is the responsibility ofmanagement and there is a well-developedtool set to assist in this respect.
Achieving excellence has been shown tobe economically worthwhile, both in termsof competitiveness, and in terms of the costof gaining customers and the costs of qual-ity. The road to excellence is therefore achallenging one, but one that is very worth-while. Avoiding some of the hype thatsurrounds an initiative such as TQM is nec-essary for most organizations. Instead afocus on the strategic benefit from the con-tinuous improvement of different elementsof the service offering is required.
References
Barker, R.L. (1990) Drawing on Japanese experi-ence. Total Quality Management December,24–33.
Berry, L.L. and Parasuraman, A. (1991) MarketingServices: Competing Through Quality. FreePress, New York.
Bicheno, J. (1998) The Quality 60. PICSIE Books,Buckingham, UK.
Table 9.3. Major influences on the development of quality management.
Instigator Major influence
Deming Initially developed statistical methods for control of repetitive processes, and theirusage. Took the tools to Japan post World War II, and was seen as part of theJapanese quality revolution (though largely ignored in his native USA until the lastyears of his life). Recommended 14 points for management, the use of the Plan-do-check-act cycle (also know as the Deming Cycle)
Crosby Championed the notion of ‘zero defects’, and ‘quality is free’Feigenbaum The holistic approach to quality, company-wide or total quality controlTaguchi The proponents of Taguchi methods claim great results for the design of experiments,
though good examples are few and far between. A more nebulous approach toquality comes in the form of the loss function
Ishikawa Quality circles and brainstorming tools including the fishbone or Ishikawa diagramOhno Architect of the Toyota Production System which took quality to new levels in
manufacturing, through teamwork, training and education, ongoing continuousimprovement and a focus on the absolute elimination of waste
Juran The engineer’s quality guru established and compiled the requirements of systems andprocedures for sampling and control with tangible products. Many of the routinesare equally applicable to the tangible elements of service products
254 H. Maylor

Buzzell, R.D. and Gale, B.T. (1987) The PIMSPrinciple: Linking Strategy to Performance.Free Press, New York.
Caves, R.E. and Ghemawat, P. (1992) Identifyingmobility barriers. Strategic ManagementJournal 13(1), 1–12.
Coyle, M.P. and Dale, B.G. (1993) Quality in thehospitality industry: a study. InternationalJournal of Hospitality Management 12(2),141–153.
Crosby, P. (1983) Quality is Free. Mentor Press,New York.
Deming, W.E. (1986) Out of the Crisis: Quality,Productivity & Competitive Position. MITCentre for Advanced Engineering Study,Cambridge, Massachusetts.
Ebrahimpour, M. and Lee, S.M. (1988) Qualitymanagement practices of American & Jap-anese electronic firms in the United States.Production & Inventory Management Journal29(4), 28–31.
Feigenbaum, A. (1956) Company-wide QualityControl. McGraw Hill, New York.
Feigenbaum, A. (1991) Total Quality Control, 4thedn. McGraw Hill, New York.
Fick, G.R. and Richie, J.R.B. (1991) Measuringservice quality in the travel and tourismindustry. Journal of Travel Research 30(2),2–9.
Flynn, B.B., Schroeder, R.G. and Sakakibara, S.(1994) A framework for quality managementresearch and an associated measurementinstrument. Journal of Operations Manage-ment 11, 339–366.
Garvin, D. (1984) What does product qualityreally mean. Sloan Management Review Fall,25–44.
Grönroos, C. (1984) Strategic Management andMarketing in the Service Sector. Chartwell-Bratt, Bromley.
Gummesson, E. (1991) Truths and myths in serv-ice quality. International Journal of ServiceIndustry Management 2(3), 7–16.
Gummesson, E. (1993) Quality Management InService Organizations – An Interpretation ofthe Service Quality Phenomenon and a Syn-thesis of International Research. Researchreport No. 1 (January) International ServiceQuality Association.
Haywood-Farmer, J. (1988) A conceptual modelof service quality. International Journal ofOperations and Production Management8(6), 19–29.
Johns, N. (1993) Quality management in the hos-pitality industry. International Journal ofContemporary Hospitality Management 5(1),10–15.
Johnston, R. (1995) The zone of tolerance: explor-ing the relationship between servicetransactions and satisfaction with the overallservice. International Journal of ServiceIndustry Management 6(2), 46–61.
Johnston, R. (1999) Service operations manage-ment: return to roots. International Journalof Operations and Production Management19(2), 104–124.
Jones, P. and Ioannou, A. (1993) Measuring guestsatisfaction on UK-based international hotelchains: principles and practice. Interna-tional Journal of Contemporary HospitalityManagement 5(5), 27–31.
Lederer, P.J. and Rhee, S-K. (1995) Economics oftotal quality management. Journal of Opera-tions Management 12, 353–367.
Liljander, V. and Strandvik, T. (1993) Estimatingzones of tolerance in perceived service qual-ity and perceived service value.International Journal of Service IndustryManagement 4(2), 6–28.
Lynn, D.A. (1992) Overcome the barriers to supe-rior customer service. Journal of BusinessStrategy, 13(1), 18–24.
Maister, D.H. (1993) Managing the ProfessionalService Firm. Free Press, New York.
Mann, R. and Kehoe, D. (1994) An evaluation ofthe effects of quality improvement activitieson business performance. International Jour-nal of Quality & Reliability Management11(4), 29–44.
Mattsson, J. (1992) A service quality model basedon ideal value standard. International Jour-nal of Service Industry Management 3(3),18–33.
Mei, A.W.O., Dean, A.M. and White, C.J. (1999)Analysing service quality in the hospitalityindustry. Managing Service Quality 9(2),136–143.
Mizuno, S. (ed.) (1988) Management For QualityImprovement: the 7 New Quality Tools. Pro-ductivity Press, Cambridge, Massachusetts.
Munro-Faure, L. and Munro-Faure, M. (1992)Implementing Total Quality Management.Financial Times Management, London.
P.A. Consulting Group (1988) How to Take Part inthe Quality Revolution: A ManagementGuide. P.A. Consulting Group, London.
Parasuraman, A., Zeithaml, V.A. and Berry, L.L.(1985) A conceptual model of service qualityand its implications for future research. Jour-nal of Marketing 49 (Fall), 41–50.
Parasuraman, A., Zeithaml, V.A. and Berry, L.L.(1986) SERVQUAL: A Multiple Item Scale forMeasuring Customer Perceptions of ServiceQuality. Working Paper, Report No. 86–108,
255Strategic Quality Management

August. Marketing Science Institute, CoralGables, Florida.
Peters, V.J. (1999) Perspectives: total service qual-ity management. Managing Service Quality29(1), 6–12.
Powell, T.C. (1995) TQM as competitive advan-tage: a review & empirical study. StrategicManagement Journal 16(1), 15–37.
Reichheld, F.F. and Sasser, W.E. (1990) Zerodefections: quality comes to services. Har-vard Business Review (September–October),105–111.
Shostack, G.L. (1984) Designing services thatdeliver. Harvard Business Review 62 (Jan–Feb), 133–139.
Silver, M. (1997) Business Statistics, 2nd edn.McGraw Hill, Maidenhead, UK.
Tranfield, D. (1992) TQM2: a methodology forregenerating the TQ effort. Paper presentedat the conference TQM – A Review of Direc-tions, Newcastle.
Zeithaml, V.A, Parasuraman, A. and Berry, L.L.(1990) Delivering Service Quality. Free Press,New York.
256 H. Maylor

Part FourStrategic Planning in Tourism


10Strategic Planning
L. Moutinho
Before a tourism company can do business,before they can market their tourism prod-uct, before they can even plan their tourismproduct, they must first plan their strategy.Decisions regarding the type of business thefirm desires to be in, the segments of themarket they wish to pursue and the type oftourism products they wish to develop fortheir markets must all be carefully plannedout in what is known as the strategic plan.
Different levels of the tourism firm allengage in different levels of planning. Theyplan at the corporate level, the specific com-pany or business-unit level and also at thetourism product level. They also plan fordifferent periods of time. The time framethat encompasses the firm’s plan is knownas the planning horizon. Planning horizonsgenerally vary from 1 to 5 years, but Jap-anese firms are known for their extendedplanning horizons of 10–25 years and evenmore.
The Difference between Strategy andTactics
Long-term plans (those extending beyond3 years) are generally very strategic innature. In them, the firm’s long-term goalssuch as profit margin, market share and mar-ket growth are all indentified. The longerterm the plan, the less reliable availableinformation is on which to base the plan. As
any consumer behaviourist will tell you,consumer demand may change on a whim,so looking 5 years into the future combinesexperience and skill with a healthy portionof guesswork. So, while these plans mayoften be inaccurate, they still provide a tar-get that tourism firms can attempt to attain,or serve as a benchmark by which to identifythe company’s desired goals and ascertainthe extent to which they have been ach-ieved. (It should be noted, however, thatmany tourism companies are increasinglyusing scenario planning and computer sim-ulations to make more accurate projectionsand forecasts to help minimize thisunknown aspect of the future.)
Compared with the long-term strategicplan, the short-term plan, or annual plan, ismuch more operational (or tactical) innature, focusing more on the tourism firm’smarketing mix and to what degree it will beused for which tourism products. The planshould also identify the tourism firm’s mar-keting policy and the expected financialeffects on the firm (i.e. promotional costs,expected sales, etc.).
By identifying the difference between thelong-term plan and the short-term plan, wehave identified the difference between atourism firm’s strategy and its marketing tac-tics. The strategy is derived from a firm’sgoals and is a loose framework or set ofguidelines that a tourism firm will follow inorder to attain their goals. A tactic, mean-
© CAB International 2000. Strategic Management inTourism (ed. L. Moutinho) 259

while, consists of specific details as to howto execute the strategy. For example, a tour-ism firm’s goals may be to increase marketshare in Region A by 5% over the next3 years. The resulting strategy may be todevelop a new tourism product line that willallow the company to achieve a dominantshare of a certain target market. The tacticmay be to develop a specific, targeted prod-uct, sell it through a specific type of tourismretail outlet, price it at a specific level andposition it in a certain way to the consumerthrough the use of a TV advertising cam-paign. We will now examine strategies andtactics in more detail. Table 10.1 illustratesthe differences between the two types ofplans.
Strategy Characteristics
Strategies are different from tactics, as weidentified above. Whenever a tourism firmbegins to analyse a potential market or sell-ing situation, it must have a strategic planregarding its approach to the market. Unfor-tunately, many tourism managers attempt toact in the short term without the benefit ofconsidering the longer-term effects of theiractions. We will now examine some moreidentifying characteristics of strategy.
● Limited in number. Compared with tac-tics, tourism firms only follow one or afew strategies since following too manystrategies at once can spread the firm’sresources too thinly.
● Multi-department involvement. In orderto implement a strategy of introducing a
new tourism product line, many moredepartments than just marketing will beinvolved. Thus, strategies shouldalways have broad approval andencouragement.
● Allocation of resources. Tourism firmsmust constantly change to keep up withtheir changing environments. Thismeans that strategies must also changeover time and, thus, resource allocationmust also change to meet the new strat-egy requirements.
● Long-term strategic effects. Strategychanges represent changes in currentpositions of the firm and, in effect,changing the firm’s foreseeable future.In short, strategic changes are changesthat may affect a tourism company’sperformance for years, if not an entiredecade. Thus, firms should research andinvestigate potential changes in strategywith great care, but they also should notoverlook the need for revising or chang-ing their strategy if the circumstancesdictate it. Data should be gathered thatallow for intelligent, objective businessdecisions that firms should be comfort-able living with for some time.
Strategic development takes place on threelevels
Tourism businesses are often large organiza-tions composed of many differentdepartments, with each department havingits own set of goals, norms and methods ofoperation. But although each departmentoperates as an individual unit, they are notautonomous. The departments are a cohe-sive set of units that are all striving for
Table 10.1. Comparison of strategic and tactical planning.
Strategic planning Tactical planning
Duration Long term ( > 3 years) Short term ( < 1 year)Done by Senior management; top marketing
managementMarketing and product managers;
middle managementNecessary information Primarily external information Primarily information from within the
firmDegree of detail Broad in nature, based on a subjective
evaluationDetailed information and analysis
260 L. Moutinho
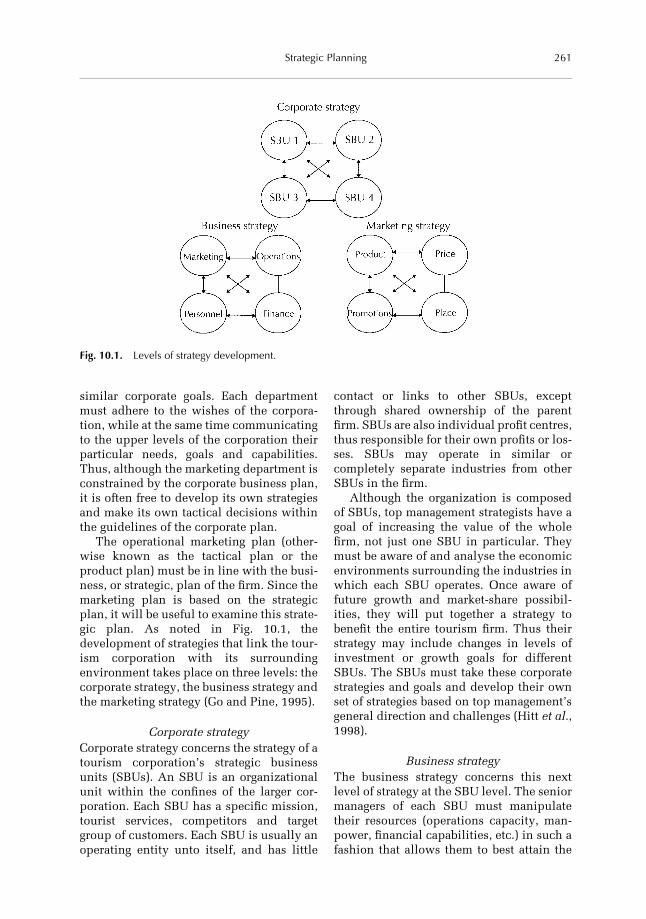
similar corporate goals. Each departmentmust adhere to the wishes of the corpora-tion, while at the same time communicatingto the upper levels of the corporation theirparticular needs, goals and capabilities.Thus, although the marketing department isconstrained by the corporate business plan,it is often free to develop its own strategiesand make its own tactical decisions withinthe guidelines of the corporate plan.
The operational marketing plan (other-wise known as the tactical plan or theproduct plan) must be in line with the busi-ness, or strategic, plan of the firm. Since themarketing plan is based on the strategicplan, it will be useful to examine this strate-gic plan. As noted in Fig. 10.1, thedevelopment of strategies that link the tour-ism corporation with its surroundingenvironment takes place on three levels: thecorporate strategy, the business strategy andthe marketing strategy (Go and Pine, 1995).
Corporate strategyCorporate strategy concerns the strategy of atourism corporation’s strategic businessunits (SBUs). An SBU is an organizationalunit within the confines of the larger cor-poration. Each SBU has a specific mission,tourist services, competitors and targetgroup of customers. Each SBU is usually anoperating entity unto itself, and has little
contact or links to other SBUs, exceptthrough shared ownership of the parentfirm. SBUs are also individual profit centres,thus responsible for their own profits or los-ses. SBUs may operate in similar orcompletely separate industries from otherSBUs in the firm.
Although the organization is composedof SBUs, top management strategists have agoal of increasing the value of the wholefirm, not just one SBU in particular. Theymust be aware of and analyse the economicenvironments surrounding the industries inwhich each SBU operates. Once aware offuture growth and market-share possibil-ities, they will put together a strategy tobenefit the entire tourism firm. Thus theirstrategy may include changes in levels ofinvestment or growth goals for differentSBUs. The SBUs must take these corporatestrategies and goals and develop their ownset of strategies based on top management’sgeneral direction and challenges (Hitt et al.,1998).
Business strategyThe business strategy concerns this nextlevel of strategy at the SBU level. The seniormanagers of each SBU must manipulatetheir resources (operations capacity, man-power, financial capabilities, etc.) in such afashion that allows them to best attain the
Fig. 10.1. Levels of strategy development.
261Strategic Planning

desired corporate goals. Although they aredeveloping strategy at a different level, theprocess that they follow to develop theirstrategy is similar to that of the corporate-level planners. First, they must analyse theirindividual markets, their competitors, theoutside forces that may affect their industryand present and emerging consumer trends.They then develop a strategy based on cor-porate guidelines that best utilizes theirresources and deals with their immediateenvironment. This strategy is then dissemi-nated to the various departments that makeup the SBU.
Marketing strategyFrom the SBU strategy comes the marketingstrategy. At this point, the marketing depart-ment must decide how the strategyestablished by the SBU affects the marketingeffort. They will utilize the variables of themarketing mix (the tourism product assort-ment that they offer and how the tourismproducts are positioned, advertised, pricedand distributed) as best they can in order toeffectively implement the strategy. In fact,each of these elements of the marketing mixwarrants a separate strategic plan. Thus, thetourism marketing manager is responsiblefor the development of a tourism productstrategy, a pricing strategy, a distributionstrategy and a promotion strategy. Thesestrategies all become a part of the overallbusiness plan of the tourism firm (SBU),because the marketing portion of the busi-ness plan is so significant that it often makeslittle sense to separate the two. All in all, it iseasier to understand the business plan of anoperation if the marketing specifics areincluded.
Many tourism firms have plans that are onething on paper and another thing in practice.In fact, some tourism firms merely reviewlast year’s plan and rubber stamp a con-tinuation of the previous policy for thecoming year. Worse yet, some tourism firmsdo not even have a plan to call on for guid-ance and direction. As mentioned before,tourism firms that fail to plan, or touristfirms that fail to plan correctly, are bound toflounder in the present without ever looking
toward the future. These tourist firms tendto spend their years reacting to competitiveand environmental forces without ever forg-ing their own identity with customers. Plansthat live in the present, as opposed to plan-ning for the future, are often short-lived andbest avoided.
A strategic planning modelStrategic decisions consist of fundamentalchoices for the long-term development ofthe organization. As customers becomemore demanding (and often less loyal), ascompetitors become more numerous andaggressive, as environmental conditionsbecome more difficult, then the value ofplanning increases. Now that we under-stand how a strategic plan affects anorganization, and the levels of strategicplanning that go on within a tourism cor-poration, we will now take a closer look atstrategic planning in itself. Just what is stra-tegic planning? Strategic planning is thedevelopment of a long-term plan that bestutilizes the resources of an organizationwithin the domain of the organization’s mis-sion. The strategic planning process consistsof a careful analysis of the tourism organiza-tion and the opportunities and threats thatcompetitors and environmental factors maybring.
The strategic decisions that are madedepend on the focus of the tourism com-pany, the markets in which it operates, andthe tourist product that the company sells. Itprovides a direction and generates momen-tum for the organization. Tactical decisions,on the other hand, are the methods of exe-cuting the formulated strategy. The specificstrategic planning process is outlined inFig. 10.2 and a large portion of this chapterwill be devoted to analysing this process.The strategic planning process consists offive steps that are linked together in con-tinuation.
At the completion of each phase, andbefore continuing to the next phase, theprogress made should be reviewed and theplanners should ensure that they have notlost sight of the tourism company’s overallmission. Thus, the feedback loop allows thetourism firm to check its progress towards
262 L. Moutinho

achieving the mission and incorporate chan-ges as needed. We will now examine thisprocess in greater detail.
Description of the Mission Statement
Up to this point, we have discussed strategyand its importance. But one further questionthat you may have asked yourself is: ‘Howdo you know which strategy to pursue in thefirst place?’ That is a very good question.How does a tourism company know its rolein the social structure? How does a tourismcompany know what goals to set and whichstrategies to pursue? All firms have a mis-sion. The mission, also known as thebusiness definition, is a statement, usuallywritten, that sums up why the tourism com-pany exists. It is a statement that anchors themultitudinous employees, departments anddivisions of a tourism firm to one definingdirection. It is the firm’s raison d’ être.
Formulation of the mission statementThe question that tourism firms should con-tinually ask themselves is: ‘What business
are we in?’ The answer may appear simple atfirst, but is actually quite complicated inmost cases. Tourism firms that invest moneyinto new product lines or purchase othercompanies in seemingly related fieldsshould first consult the(ir) defining ques-tion. And a difficult question it is as we willnow discover.
Too broad or too narrow?The mission statement should provideboundaries and direction for growth. Thus,the mission statement should be neither toobroad nor too narrow. If it is too broad, thetourism firm may invest in too many periph-eral activities that could detract from itsfocus. On the other hand, by maintaining toonarrow a focus a tourism firm may experi-ence significant opportunity costs bybypassing investments that they shouldentertain. This phenomenon is a study untoitself, known as marketing myopia.
The mission statement must focus theactivities of the tourism firm and at the sametime provide opportunities to expand.Another danger of a mission statement isthat it can become too rigid. Environmentschange with time. Consumers’ tastes
Fig. 10.2. The strategic planning process.
263Strategic Planning

change, technology changes, the competi-tive market changes. If a tourism firm insistson a strict definition of their mission state-ment that is inflexible, they may alsoexperience difficulty when adaptability isnecessary in order to survive. It is easy to seewhy mission statements are difficult todevelop, adhere to and maintain.
Internal versus external functions
Mission statements not only serve the func-tion of guiding and directing the tourismfirm, but also to let outside people under-stand what the tourism firm is all about.Many tourism companies have missionstatements printed in their annual reports orother communications tools that assistpotential investors, customers, communitymembers and other interested parties inunderstanding the firm and its guiding phi-losophy. These statements are known asexternal statements, and they may differfrom the internal statements used within thetourism company. Often a large conglomer-ate will print an external statement, whileusing different internal statements for thevarious divisions or subsidiaries.
The process of developing these state-ments is beneficial in itself, in that talkingthrough and arguing a problem may alsoresult in an optimal solution. While man-agers of the tourism firm are certainly moreinterested in adhering to an internal state-ment, the external statements may be usedas methods of announcing changes in direc-tions of tourism firms.
Structure of the mission statement
A final note on mission statements concernstheir longevity. Tourism firms produce mis-sion statements to act as guiding lights intheir travels through the business world. Itwould not serve the purpose of the state-ment to have to stop and reformulate it everyyear or so, so it is better for tourism firms todefine themselves by the needs that theysatisfy rather than the tourist product theydevelop. A statement must be developedthat can weather a changing environment toa certain degree. Change cannot be stunted,so a mission statement must be flexible
enough to accept changes and still be appli-cable. Typically, a mission statement shouldserve its purpose for 5–10 years, and someare applicable even longer.
SWOT Analysis
Growth for a tourism firm seldom occurs allon its own. Very few tourism firms are in theposition of being in exactly the right place atthe right time. More often, growth is a per-sistent dedication to striving forpre-established goals and objectives. Inorder for these goals be to realized, a tourismfirm dedicates itself to rigorous planningwith the goal set constantly in mind. Theplan, then, is the engine that drives the mar-keting department (and the rest of the firm)towards its goals. But the plan is not func-tional unless it is based on a reasonable setof assumptions and premises. In otherwords, it is hardly reasonable to develop aplan that will not be attainable due to exist-ing competitive pressures or environmentalsituations.
The first thing that many tourism firms doin the planning process is to complete aSWOT analysis. SWOT stands for Strengths,Weaknesses, Opportunities and Threats,and may also be known as the strategic auditor situational analysis. It is a methodicalexamination and evaluation of the internaland external operating environment of thefirm. A strong SWOT analysis is derivedbasically by asking numerous questionsabout the factors that may affect the tourismfirm. The main focus point of a SWOT analy-sis is illustrated by the questions in Table10.2, the results of which would then beused to ascertain the implications these dif-ferent factors have for the businessstrategy.
Internal analysisInternal factors of the strategic audit are thefactors that can be most readily influencedby the firm. Funding available for invest-ments, capabilities, technologies,knowledge and capabilities of personnel,tourist product line and assortment,
264 L. Moutinho

strength of the marketing plan, sales-forceability and corporate reputation are all vari-ables which the tourism firm can control. ASWOT analysis should above all be realistic:it is easy to come up with an analysis thatassuages everyone’s ego by telling themwhat they want to hear. In fact, it is humannature to rationalize that all of last year’seffort resulted in success. But covering upareas of weakness only hurts the tourismfirm in the long run. By accurately assessingthe strengths and weaknesses, opportunitiesand threats, the tourism firm can then best
determine how to allocate necessary resour-ces and to locate areas of potentialvulnerability.
The internal analysis leads us towardsbuilding a tourism company profile. Thisprofile is a snapshot of where the tourismfirm stands at that particular time. It is aneasy-to-understand graphic representationof the internal situation of the tourism firmand how it compares with the competition.You can quickly gauge how potentially suc-cessful this particular tourism company canbe in its market (Poon, 1993).
Table 10.2. SWOT analysis, with the principal questions listed.
Internal analysis External analysis
Strengths OpportunitiesDifferentiation possibilities?Sufficient financial resources?Appropriate competitive strategy?Good reputation with your clients?A known market leader?Brilliant strategy for each functional area?Possible scale advantages?Protected (so far as possible) from strong
competitive pressure?Unique technologyCost advantages?Competitive advantages?Capacity for product innovation?Proven management skills?Other strong points?
WeaknessesNo clear strategic orientation?Worsening competitive position?Ageing facilities?Insufficient profit from . . . ?Lack of management insight and experience?Shortage of specific skills?Bad experience with the implementation of the
strategy?Plagued by internal operational problems?Vulnerable to competitive pressure?Bad image in the market?Disadvantages compared with competitors?Less-than-average marketing skills?Not in a position to finance the necessary changes
in strategy?Other weak points?
Potential new markets or segments to enter?Expansion of the tourist product assortment?Diversification into related products?Vertical integration?Possibilities to move towards a better strategic
group composition?Contact with competitors?Fast(er) growth in the market?Other opportunities?
ThreatsPossible entrance of new competitors?Decreasing market growth?Negative government influence?Growing competitive pressure?Vulnerable to recessions and other economic
trends?Strengthening in the negotiation position of
customers and suppliers?Changing wants and desires of buyers?Threatening demographic changes?Other threats?
265Strategic Planning

External analysis: the world outside thetourism firm
After the tourism firm takes a long look inthe mirror at itself, it must turn its focus onthe outside world. This is important sincemarketing strategies and plans are derivedbased partially on what the competitive andregulatory environment allow a tourism firmto reasonably accomplish. The externalanalysis should focus on identifying thetrends of the environment and how theyinfluence or affect the tourism firm. Hope-fully, trends or market movements willemerge that will allow the firm to be pre-pared in advance (being proactive). Forinstance, a tourism firm interested in mov-ing into tourist product line A shouldcertainly be aware of any changes in con-sumer behaviour that may have an impacton the long-term demand for tourist productA. Watching trends in consumer behaviour,competitive movements and regulatoryactions allow tourism firms to avoid or takeadvantage of certain situations that mayhave not been apparent to the casual obser-ver, thereby increasing the tourism firm’scompetitive position or minimizing itsexposure to potential problems.
Recognizing the trends that are vital to asuccessful SWOT analysis is much easier ifthe mission of the firm is more clearlydefined, since the corporate mission morenarrowly focuses the arena of analysis. Inother words, it is clearly easier to find some-thing if we have been told just where to lookin general, plus it prevents us from gettingside-tracked and devoting too much timeand energy to considering areas that are notimportant to the tourism firm.
While our internal search centred aroundthe identification of internal, tourism firm-specific capabilities and development(‘internal trends’ to a certain degree), theexternal search will look more closely at(environmental) opportunities that mayexist. By looking outwards, tourism firmsmay see gaps (opportunities) in the marketthat other firms have not covered, or gapsthat are about to open due to regulatorychanges, competitor action or social or eco-nomic movements. For instance, thetourism firm that can spot a coming reces-
sion may begin to focus on value-basedpromotions and tourist products soonerthan its competitors. Also, it is interestinghow a potential threat can quickly be turnedinto an opportunity for the tourism firmbased on swift ‘proaction’, a skill which willbe of increasing importance as tourist prod-uct life cycles shrink (time-wise) andcompetition intensifies.
Once the SWOT analysis has been com-pleted, a tourism firm has a strong picture ofwhat its capabilities and vulnerable areasare, where it stands in the market whencompared with the competition and whatpotential trends and opportunities mayimpact the tourism firm. On this informa-tion, a marketing plan can then be moreaccurately formulated.
Goal Formulation
Once the tourism firm has determinedwhere they stand in the market based on anevaluation of their strengths and weaknes-ses, they can more readily set goals. Thetourism firm’s goals are basically the level ofachievement that they want to attain in acertain area. Not only does the tourism firmitself have goals, but the individual depart-ments within the firm will have goals aswell, in fact, as we reach deeper into theorganization, we find that the goals becomemore specific and detailed (going from amore strategic nature to a more tacticalnature). For instance, a major tourism hold-ing company may have a goal to grow by12% within the next calendar year. Thismay translate into a goal for Division A togrow by 12% within their tourist productmarket, and the resulting marketing-department goal may be to grow by 12%within a certain tourist product line targetedat a certain group of customers. The salesgoals of this corporation may also hinge onthe overall goal. Not only would the salesdepartment have a specific goal, but eachsales market and each sales representativewithin the territory may have individualgoals for individual customers.
Goals are effective only in certain cases,and many goals, if formulated incorrectly,
266 L. Moutinho

may even detract from the success of theoperation. For a goal to be effective, a fewthings should be kept in mind (see Table10.3 for examples of some well-formulatedgoals, and some not-so-well formulatedgoals).
1. The goals should be measurable inenough detail to give meaning anddirection to those attempting to achievethe goal.
2. The goals should be achievable. No onebenefits from goals that are set beyondreasonable attainment. When goals areknown to be unreasonably high or even‘impossible’ to obtain, then people willsometimes even work less at trying toachieve them because of their impos-sible nature.
3. Both long-term goals and short-termgoals should be developed. Althoughthe present is important, tourism firmsmust constantly know down whichpath they are travelling to the future,and make sure present goals and actionsare working towards the realization ofthe future ones.
4. The goals should be ordered in terms ofpriority to the tourism company. If dif-ferent divisions are all chasing widelydivergent goals, inefficiencies through alack of coordination may be experi-enced as a result. This is the case whereone department (i.e. finance) puts itsgoals first and ignores the needs of other
departments (i.e. marketing) which isdetrimental to the tourism firm’s overallwell-being in the end.
More on Strategic Business Units
Earlier in the chapter, we discussed strategicbusiness units (SBU) and how they can evenbe thought of as independent companies. AnSBU can vary in size and scope; it can mar-ket just one tourist product or product linefor a company, or it can entail the marketingof multiple lines of tourist products to mul-tiple targets. We can identify somecharacteristics of an SBU.
1. An SBU generally has its own missionstatement and its own mission.
2. An SBU is oriented towards the mar-ket(s) that it serves, as opposed tohaving an internal orientation.
3. SBUs generally, but not always, have aclearly defined target group that is dif-ferent from other target groups withinthe tourism firm.
4. SBUs are most always directed by anexperienced, marketing-oriented man-ager.
5. Most SBUs are responsible for control-ling their own resources.
6. SBUs tend to have their own separatestrategy and strategic plan, distinctfrom the rest of the tourism firm.
7. Most SBUs have their own set of com-
Table 10.3. Good and bad examples of goals.
Examples of badly formulated goals Examples of well-formulated goals
Long term Long termOur goal is to develop a leading tourist product
development position in the industryOur goal is to devote at least 20% of gross profit to
research between 2000 and 2002, resulting in atleast five new tourist products introduced in themarket by the end of 2002.
Short term Short termOur goal is to increase sales in 2000 Our goal is to broaden our market share in 2000
from 21% to 25% by opening 22 new travelagencies and increasing our advertising budgetby 15%
267Strategic Planning
petitors that are often unique anddifferent from the rest of the tourismorganization.
8. Finally, most SBUs possess a differen-tial advantage, which warrants theirbeing identified as a separate operatingunit.
SBU organizationStrategic business units can be organized ina variety of ways, and no particular way issuperior. SBU organization schemes aredeveloped by corporations to best meet theirindividual needs. Some tourism corpora-tions organize by segmentation variables,which are the variables that tourism firmsuse to segment their markets. For instance, atourist corporation may organize their SBUsby target-consumer age (e.g. Saga holidays);or they may have one SBU that producestourism products for young consumers andanother that produces for middle-aged con-sumers. The separate segments are thushomogeneous, and can be more readilyaccessed with a similar marketing plan.
Other methods of SBU organization mayinclude geographical location. Also, manyfirms engaged in international marketingmay have different SBUs in the separatecountries or territories of the globe that theyserve. This may be especially useful if theterritories are quite different in culture, lan-guage or methods of doing business.Tourism companies may also choose tobuild their SBUs around different touristproducts or product lines, or around theneeds of the customer. Target-market cus-tomers, or their channels of distribution,often provide the homogeneity needed forSBU organization.
How Many SBUs?The number of SBUs that a tourism com-pany has is unique to each firm. Dependingon some of the factors mentioned above,firms may have only a few SBUs or severaldozen. But however many that a tourismfirm may have, they should be appropriatefor the size of the organization and theextent to which the corporation wishes todelegate its authority. A trade-off existsbetween tourism firms that are more com-
fortable with a centralized level of control,and those tourism firms that prefer segment-ing for a sharper focus within the decisionunits. But even larger tourism companiesthat market literally hundreds of productsstill try to limit the number of SBUs to a fewdozen. In fact, some recent research indi-cates that some of the largest firms tend tohave fewer than 30 SBUs. Of course smallertourism companies should start with fewSBUs and add SBUs only when warranted toavoid unnecessary organizational costs andduplication of effort.
The move towards an SBU-based strategyhas been increasing in recent years. It issuggested by many management and mar-keting consultants, such as the BostonConsulting Group, as a way of more clearlyidentifying the businesses that tourism firmsdesire to be in, and appropriately organizingthe corporation to compete in those busi-nesses. More and more, managers are usingthe product portfolio analysis, advanced bythe Boston Consulting Group, as a method ofanalysing the strategic profile of their com-pany. The portfolio approach is based onthree basic concepts, the product life cycle,the products’ expected cash flow and thelearning curve.
The Life Cycle and Cash Flow
Years of observation have shown us thattourist products tend to live a limited life,somewhat like humans. Most products tendto experience a birth, a rapid growth phase, amaturing phase and then a decline phase.The speed with which a tourist product goesthrough these phases varies with elementsthat affect sales such as advertising spend-ing, number of competitors in themarketplace, etc. One of the aspects of thelife cycle is the growth rate of the touristproducts. It would appear logical that a tour-ism firm should employ different strategiesat different phases of the tourist product’slife cycle in order to deal with the changingcircumstances at these different points intime (Buttle, 1992).
A tourist product that experiences rapidgrowth tends to require a large amount of
268 L. Moutinho

cash to finance the growth. Growth does notcome without advertising support, distribu-tion channel maintenance, sales promotionsand other tourist product investments, andthose all require cash on the part of the firm.One way of increasing the flow of cash to thetourism firm from the market is to reducesome of these growth-supporting expendi-tures. In other words, once the touristproduct has been established and has beenentrenched into the mind of the consumer,and is on sufficient shelves in the traveloutlets in the market, it may not take as largea cash investment for adequate support.Thus, tourism companies often find that thecash requirements of a tourist productlessen after a high-growth phase, and thecash flows to the company improve corre-spondingly. This is often the case witholder, more established tourist products.
One thing tourism marketing managersmust do is control this balance between theflow of cash into the tourism firm and thegrowth of the tourist product in the market.The marketing manager has the ability toreduce advertising and other means of sup-port in order to slow growth, and possiblyincrease the net cash flow, or increase sup-port to increase growth and possiblydecrease the flow of cash. We will delvemore into this aspect in a moment.
The Learning Curve
As tourism companies strive to increasetheir market shares, they are also helping toensure their long-term success. Not onlydoes increased share boost sales and cashflow in the short run, but it drives downoperations and marketing costs per unit;sometimes as much as 20–30% every timesales double. Two factors work in the tour-ism firm’s favour: economies of scale andthe learning (or experience) curve.
Economies of scale are based on thepremise that a large tourism firm is moreefficient than a small tourism firm. As tour-ism firms grow, they can add units ofoperations at increasingly less expensiverates as overhead costs are apportioned outamong more and more units. While the over-
all operation costs per unit are dropping asvolume increases, so too are the marketingcosts per unit. Similar economies affect theselling of the tourist product since addi-tional advertising can be purchased at largerquantity discounts, marketing departmentmembers become more knowledgeableabout their market circumstances and sales-people can efficiently add more saleswithout greatly increasing their costs. Thisis known as the learning curve or experienceeffect. As people learn more about theirbusiness, they become more effective andefficient at it.
It is easy to see how the effect of thelearning curve can place a tourism firm in anupward spiral. As volume increases, costsper unit drop, which allows a differentialcost advantage over competitors. The tour-ism firm can utilize this advantage in avariety of ways: they may choose to retainthe cost advantage through increased mar-gins, they may choose to drop their sellingprice, they may choose to increase their pro-motional expenditures or they may chooseto reinvest the money into their tourism firmthrough superior technology, more efficientoperations or more aggressive research.
Portfolio Analysis
We have established that increased marketshare allows tourism firms a specific advan-tage that can be realized in a variety of ways.But since marketing is not accomplished ina vacuum, the tourism firm must also look atwhat is transpiring in the rest of the market.Earlier on we mentioned that as marketsgrow the tourism firm’s product requiresmore capital and investment in order tomaintain its place (share) in the market.Tourism firms may become more efficientand have more to invest, but even moremoney may be required to fuel the engine ofa rapidly growing tourist product segment,or else they will have a stable but decreasing(in terms of market share) piece of the mar-ket. Obviously, tourism firms will makedecisions on where to invest their fundsbased on their own picture of success as wellas what they predict their market will do.
269Strategic Planning

But this picture is further complicated whenwe consider that tourism firms very oftenhave multiple products or product lines,and these tourist product lines are in differ-ent markets, each with its own growthcurve. As tourism firms juggle the decisionsregarding the growth or stagnation of theirown products, along with the amount ofmoney that each separate tourist product orproduct line is generating, it can become amonumentally confusing task to identifyand implement optimal planning and allo-cation of the tourism firm’s resources.
The Boston Consulting Group matrixA simple, two-dimensional matrix devel-oped by the Boston Consulting Group (BCG)was developed as a guideline to assist firmswho face these investment dilemmas. Alsoknown as the product portfolio matrix, itworks well for those firms that have multi-ple product groups, or a portfolio ofproducts. As shown in Fig. 10.3, the matrixis made up of a horizontal axis and a verticalaxis, and the four quadrants of the graph thatare derived from the axes.
On the vertical axis, we have market
growth. Market growth is the percentage ofannual growth that a tourist product experi-ences adjusted for inflation. In this case, wehave defined a low growth rate as 0%, amoderate rate as 10% and a high growth rateas 20%, although the distinction betweenlow, moderate and high will vary greatlywith the industry and product line. Remem-ber that as the growth rate increases, thetourist product requires greater investmentto fuel its continued growth.
On the horizontal axis, we have relativemarket share, which is calculated by divid-ing our market share by that of the threelargest competitors within our strategicgroup. So if our share was 20% and ourcompetitors’ share was 25%, then our rela-tive share would be 80%. Obviously, if weare the market leader, then our relative mar-ket share will be greater than 100%. Recallthat the higher the share, the greater thedifferential cost advantage the tourism firmpossesses and the better the opportunity forsuccess.
By combining these two axes, we canlocate and plot almost any market situation.As you can see, the plots (SBUs) will fall into
Fig. 10.3. Boston Consulting Group matrix.
270 L. Moutinho

one of the four quadrants identified. We cantherefore establish the four quadrants asfollows.
StarsTourist products that experience highgrowth and at the same time enjoy a highshare of the market. Recall that if a touristproduct has a high market share, economicadvantages through economies of scale maybe realized, which contribute to potentiallyhigher margins and increased cash flows.The extra cash will be required if the touristproduct is also growing at a rapid pace.Constant funding is needed to support theadditional advertising, promotions andother sales efforts needed to sustain its pace.Having a star tourist product is an excellentposition for a firm to be in, but only becauseof the high share. Many stars reach a posi-tion where the cash generated and thefunding required are balanced, easing cashflow management problems. Also, once therapid growth is complete, the high sharesuggests that the tourist product maybecome a cash cow for the firm.
Cash cowsTourist products that generate a largeamount of cash because of their high marketshare, but do not require additional invest-ment because they are not growing. Atypical cash cow may be a tourist productthat is a leader in a stagnant or mature mar-ket. High market share ensures theeconomies of scale advantage over competi-tors, but the lack of growth means that thefunding is not required to be poured backinto the tourist product. Tourism firms liketo have cash cows around because they canhelp finance the growth of other touristproduct lines or other projects, also knownas cross subsidization. Cash cows do nothave an infinite life, and eventually willexperience a decline in sales and marketshare. But while they are around producinglarge net cash flows, tourism firms certainlyfind them advantageous.
Question marks (or problem children)Tourist products that are experiencing rapidgrowth, but have little market share to fund
their growth. Hence the name questionmark; tourism firms do not know the futureof the product. Question marks are foundquite frequently in new and uncertain mar-kets; it is unknown what life the touristproduct category will have, let alone thefirm’s actual product. If the tourist productis growing rapidly, it is producing a greatneed for funding, but with a low share it hasnot attained a cost advantage over the com-petition. So tourism firms must decide justhow long to fund a product that may havelittle long-run advantage. Many questionmarks are funded by the extra cash pro-duced by the cash cow(s).
DogsTourist products that are not growing, norhave high market shares. Generally, dogssimply are good tourist products, or are goodtourist products in a product category thatlost appeal to the consumer. Dogs enjoy few,if any, advantages over their competitors.Although there may be some reasons forkeeping this type of tourist product alive (forinstance, the continuation of the brandname until major modifications are ready orto round out a tourist product line), themajor decision becomes how to divest thistourist product or drop it from the line. Thiswill be discussed in more detail in the nextsection.
Marketing planning applicationsWe have described the above tourist productsituations on an individual basis. Of course,most tourism firms find that they have dif-ferent product lines, often within the sameSBU, that fit into different tourist productcategories. It is perfectly common to have astar, a cash cow, several dogs and a questionmark or two, all within the same touristproduct category. And just as financial man-agers seek to diversify away risk throughbalanced portfolios of financial investmentinstruments, tourism marketing managersalso seek to manage their product situationas if it were an investment portfolio. Tour-ism firms would like to have a product thatis a star, another that provides investmentfunds (a cash cow), and a question mark thathas the potential to become the firm’s next
271Strategic Planning

star. And as identified above, even dogshave their use to the tourism marketingmanager, although it may not always beimmediately apparent.
It is important to note that tourism man-agers have certain control over where theirproducts lie, and where they are destinedwithin the product matrix. By increasinginvestment, a tourism manager may be ableto adjust the growth of a product, or bycutting price, the tourist product may attaingreater market share. Tourism managers willlook at their whole portfolio of products,and much as seen in Fig. 10.3, will plan thepath that the tourist product should take tobest support the needs of the whole SBU.The path will determine the specific strategythat a manager should utilize in order toattain the goal (Beerel, 1998).
Four strategic alternatives are availablefor the manager:
1. Build. Building market share suggestsan aggressive growth strategy wheremarket share is more important thanprofit margins. By focusing on addi-tional target groups or outlets for thetourist product, new customers may beattracted. Question marks are an excel-lent example of the tourist product typethat needs to be supported with a buildstrategy. Funding for this strategy is notalways easy to find since there is somerisk involved, but cash cows are a primesource.
2. Hold. A defensive strategy that merelymaintains, or holds market share con-stant may be required for a cash cow.Cash cows eventually decline, and withthe decline goes a tourism firm’s sourceof funding projects. Moves are oftenmade to prop up the cash cow withoutattempting to gain share.
3. Harvest. This is an attractive short-runstrategy for tourism firms in need ofcash. There is a lag between the cessa-tion of promotional support and thedecline in sales of the tourist product.Tourism firms may decide to reap thebenefits of past investments by remov-ing support from the product whileenjoying the continued sales (and cash
flows). This strategy is popular for dogs,question marks or even for cash cowsthat have uncertain futures. But a tour-ist product will eventually be affectedby a decline in promotional support,and firms must constantly remindthemselves that there is a cost for pursu-ing this strategy.
4. Divest. Finally, when the tourism firm’sfinancial resources can be better usedsomewhere else, it is time to get out ofthe market. Tourism firms will oftenmanage this divestment process asclosely as a more aggressive strategy,since it is difficult to know just when todiscontinue the product. Tourist prod-uct lines are kept alive just long enoughto sell them off before the brand is eitherforgotten or tarnished by the poor sales.Other tourism companies may decide todrop the brand name altogether.
An evaluation of portfolio analysisAlthough many tourism firms subscribe tothe Boston Consulting Group (BCG) matrixand the accompanying strategies, many oth-ers do not. We will take a moment to analysethe positive and negative aspects of thisprocess.
AdvantagesIf a tourism manager uses the BCG approach,he or she is forced to evaluate the product orSBU on market-share and growth-rate per-spectives. This helps ensure the long-runviability of the tourist product, and inhibitsmanagement from making decisions in theshort run that may hurt the overall successof the SBU. The matrix also allows tourismmanagers to be aware of the product’s needs.By analysing the tourist product in isolation,and not comparing it with other productswithin the SBU, the manager may recognizecertain trends (growth may be decreasingwhile market share remains strong) thatwould otherwise remain hidden. Finally, asmentioned before, the portfolio approachallows portfolio management techniques.For example, the tourism marketing man-ager has several products that can be used tosupport each other with necessary invest-ment funding (cross-subsidization). The
272 L. Moutinho

importance of the total tourist product port-folio of the SBU will be given greaterconsideration than just the one or two mainproducts.
Disadvantages
While the portfolio approach is worthwhile,it is not easy to achieve. The informationneeded to build the portfolio matrix for thetotal market is difficult to come by, andpainstaking to properly maintain. Sometourism managers may find that it is moretrouble to acquire the necessary informationthan it is worth. This is probably a some-what myopic view in most cases. Secondly,the position and description of the touristproducts may be subjective. Even though thetourist product may fall into the quadrant ofthe cash cow, industries that are under siegemay not be strong enough to support theprofits that a cash cow should reap. In otherwords, just because the matrix suggest onething, the uniqueness of the tourist marketmay suggest another. Finally, recentresearch has identified that there are someindustries that do not necessarily subscribeto the economies of scale advantages that thematrix is based on. In many service indus-tries, the costs of producing the service donot change as much with increasing volumeto provide the advantageous position andthe resultant cash benefits as a product-based industry might. Therefore, use of thematrix should be carefully evaluated as to itsfit with the SBU’s particular industry(Aaker, 1999).
An alternative: the GE matrix
In recent years, the General Electric matrixhas become popularized because it can han-dle some of the shortcomings of the BCGmatrix. The BCG matrix tends to simplifythings on just two dimensions, growth andmarket share (however, these are two quiteimportant dimensions). In many cases, thereis also a need to assess return on investment,or profit, instead of only cash flow. Fur-thermore, the GE matrix makes use of somevery important qualitative information: pri-marily how strong the unit is compared withcompetitors, and how attractive an invest-
ment opportunity a particular industryoffers.
This technique is also known as theIndustry Attractiveness/Business Strengthsmatrix. By matching the strength of the SBUor tourism firm with the opportunitiesoffered by a specific market, the matrix givesus a suggested direction of how to managethe particular situation. We will now exam-ine these two dimensions a little moreclosely.
Industry attractivenessThe attractiveness of an industry can meanmany things. As a tourism firm looks at anindustry in an attempt to gauge investmentpotential, they may consider the growth rateof the industry, the average profit marginsexperienced by tourism firms competing inthe industry, how many competitors thereare, the strengths of the individual com-petitors and the areas or niches in the marketthat they do not cover. It also incorporates afactor that was discussed in the previousmatrix, economies of scale. Each industryhas a unique cost structure that contributesto the ability to attain efficiencies. Table10.4 provides us with an overview of someof the factors that one should consider whenevaluating the attractiveness of a potentialinvestment.
Table 10.4 provides some general charac-teristics that tourism managers shouldevaluate. However, not all areas may be ofsignificance for every decision. One possi-bility is to assign weights to thecharacteristics that are the most important tothe manager. Evaluation can be made ofeach characteristic on a scale of 1 to 5 andthe factors weighted so the combinedweights sum up to 1. After multiplying thefactor score by the weight assigned, tourismmanagers can sum up the results to score atotal value weight. The tourism managermay want to compare this industry scorewith other industries under consideration todetermine which ones are the most attrac-tive from an investment perspective.
Competitive strengthThe horizontal axis indicates the position of(business) strength that the tourism com-
273Strategic Planning

High Medium Low
High
Medium
Low
Competitive strength
3
5
GREEN
YELLO
W
RED42
1
Mar
ket
attr
acti
vene
ss
pany feels its unit possesses. A tourism firmcan gauge the strength of its SBU by itemssuch as relative market share, quality, imageof the brand and profitability (a more com-plete list is provided in the right column ofTable 10.4). The tourism manager will ana-lyse the strength of his or her SBU in muchthe same way that he or she determined theattractiveness of the market; by weightingand summing the appropriate factors, anapproximation can be made.
Determining the portfolioNext, the tourism manager will want to plotthese two indices to see where his or herSBU lies on a strengths/industry attractive-ness scale (Fig. 10.4). Each circle in thematrix represents a tourism firm’s SBUs.
The circumference of the circle representsthe size of the industry, not the size of theSBU as in the BCG Matrix. The band in thecircle represents market share.
Note that the matrix is divided into green,yellow and red zones. These colours meanmuch the same thing that a traffic signalmight. In the green zone there appears to bestrong match; the tourist market is quiteattractive to the firm and the product offer-ing of the SBU is quite strong. Although thetourism manager should evaluate the issuethoroughly, the matrix suggests that thismatch is too good to pass up, and the firmshould go ahead and invest in this market.Likewise, the yellow zones indicate that thematch between the strengths of the tourismcompany and the attractiveness of theindustry is less than optimal, so the firmshould proceed with great caution. Finally,the red zone indicates that the industry andthe SBU situations are not conductive toinvestment and the tourism firm should stopand proceed no further.
Can these two matrices be used simultane-ously? Yes, as some tourism firms choose toutilize the BCG matrix first to divide theirSBUs into appropriate divisions, and thenuse the GE matrix for a more detailed analy-sis and evaluation of potential strategy.Combined, the matrices can provide a rela-tively thorough picture of the goals andfinancial consequences that tourism firmsface (Deegan and Dineen, 1997).
Table 10.4. Some criteria for assessing the attractiveness of the sector and the competitive power.
Attractiveness of the sector Competitor power
Market size Relative market shareMarket growth percentage Market growth potentialPower position of the suppliers Quality of the productPower position of the customers Brand imageExtent of competition Location of the tourism companyAverage profit margin ProfitabilityThreat of potential entrants Insight into the marketThreat of substitute products Price competitionCyclical trends Contract with the managementScale advantages Effectiveness of the sales force
Fig. 10.4. The General Electric MarketAttractiveness-Competitive Position Model. 1, Hotelchain; 2, rollerblade, fast food; 3, discotheques; 4,casinos/gambling; 5, caravan parks.
274 L. Moutinho

Growth Strategies
Probably the most important stage in thetourist product’s life cycle is the growthstage. During growth, tourism firms begin torecoup the vast investments of productdevelopment and promotional expendituresnecessary to penetrate a market. Many tour-ism firms begin to experience their firstactual profitable months during the growthphase. Further, the growth phase can bethought of as a slingshot, in which the tour-ist product is hurled into the future. If atourism firm does an excellent job of manag-ing cash and growth, brand identity andtarget markets, then future success is morecertain. On the other hand, poorly handledgrowth phases can prevent the tourist prod-uct from ever reaching its potential marketshare. For this reason, it is useful to look atsome particular growth strategies that haveproved popular for many tourism firmsbased on their particular market situations.
Expansion strategiesIf a tourism firm has chosen a growth pathfor their product, there are several directionsthat they can take. They may choose to pene-trate deeper into an existing tourist market,they may choose to develop their market, orthey may choose a product-developmentroute. Finally, they may even choose todiversify their tourist product or productline in some way. What determines thedirection of growth that a tourism firm takesis dependent on two factors identified in theAnsoff product/market expansion matrixshown in Table 10.5.
Tourist market penetrationWhen a tourism firm is selling an existingproduct that it currently offers to an existingmarket that it already serves, it is pursuing a
market-penetration strategy. Techniquesdesigned to increase sales will result indeeper market penetration (increasing mar-ket share).
This can be done in one of two ways.First, market penetration refers to sellingmore of the tourist product to the existingcustomer base. This can be accomplished byeither increasing the size of the contents (theamount) that the customer buys, or byincreasing their usage rate. Second, the firmmay choose to go with a tourist marketbroadening strategy. This means more targetcustomers within the same existing touristmarket purchase the product. New custom-ers are hard to come by when you considerthat this usually requires converting themfrom the tourist brand that they normallypurchase. Thus, a penetration breadth strat-egy is generally more successful in touristmarkets that are continuing to grow(Knowles, 1996).
Of course, whether you are going afternew customers, a competitor’s customers oryour own customers, this usually requires achange in the marketing-mix strategy. Thepromotion of the tourist product could bealtered through increased advertising orpublicity, better shelf-space displays in thetravel outlets or intensified selling efforts. Aprice change could catalyse sales by offeringsales promotions, vouchers or even a reduc-tion in the selling price. Finally, changingthe channels of distribution may make thetourist product more attractive. The tourismfirm may sell the tourist product in a differ-ent type of outlet or they may make itavailable in more remote locations.
Tourist market developmentAnother method is to develop the touristmarket by finding new uses for the product,or by selling the product to new target seg-ments. In the Ansoff matrix this means
Table 10.5. Ansoff’s product/market expansion matrix.
Product tourist market Current tourist products New tourist productsCurrent markets Market penetration Product developmentNew markets Market development Diversification
275Strategic Planning

selling the same tourist product to new cus-tomers. This may entail finding newsegments who have previously not beenexposed to the tourist product. Although thetourist product may not change at all, manynew consumers are automatically potentialcustomers. Also, a tourism firm may wish tochoose a different demographic target seg-ment within the same country, or sell theproduct to a new institution or industrygroup, for example.
But is it reasonable to think that tourismfirms have these opportunities open to themthat they have not already tried to takeadvantage of? Possibly. If we consider that atourism firm may not have much expertiseor experience in certain geographic or demo-graphic areas, they may have shied awayfrom the market in the past. So it is easy tosee why many tourism firms utilize inter-mediary specialists of some sort who aremore familiar with these potential markets.Marketing communications campaigns anddistribution-channel changes are the twomost practicable mix variables to utilize inreaching new special-interest tourists.
Tourist product developmentAnother strategy includes altering the char-acteristics of the tourist product in order tomake it more attractive to the same generaltarget market. By increasing the quality ofthe tourist product, or by offering more ofthe product for a disproportionate increasein price, firms can significantly enhance thevalue of their tourist products to existingcustomers. Further, customers that previ-ously were non-users or purchasedcompeting brands may now consider pur-chase. Typical tourist product modificationsinclude making the tourist product moreaccessible or changing attributes and fea-tures of the tourist product in order toexpand its customer base (Laws, 1995).
DiversificationFinally, a tourism firm may choose to makemore dramatic changes. By diversifying, atourism firm attempts to generate new prod-ucts that they will sell to new customertarget groups. Tourism firms diversify formore reasons than to simply increase their
sales. There may be a tourist market thatthey feel offers aggressive growth opportun-ities for them. Generally, because the marketis one that the tourism firm is unfamiliarwith, companies will often purchase a firmthat is already competing in the market. Thisway they gain entry into a tourist market,they start with loyal customers to their pur-chased brand, and they have eliminated oneof their (potential) competitors. Other tour-ism firms choose to diversify in order tospread the firm’s risk among more markets,or to smooth out seasonal sales patterns. Wewill now give diversification the closerattention it deserves.
Tourism Diversification Strategies
Diversification is a generic term that we useto imply that a tourism firm is seeking newcustomer groups, or target markets, and isutilizing new products for this task. Table10.6 illustrates the four primary diversifica-tion strategies: vertical diversification,horizontal diversification, concentric diver-sification and conglomerate diversification.
Vertical diversificationVertical diversification (or vertical integra-tion) refers to a tourism firm taking over newmarkets or product groups within the firm’svertical channel of distribution. Integrationcan take the form of moving the tourism firmcloser to the end user or closer to the productsource. When the tourism firm integrates afunction between itself and the consumer, itis known as forward integration. Forwardintegration may include a large restaurantchain such as McDonald’s owning the localrestaurant as opposed to running it as a fran-chise. When the tourism firm integrates afunction between itself and its supplier(s) itis known as backward integration. Integra-tion is not without its risks, however. Manytourism firms are ill-suited to the industriesthat they integrate, even though they mayseem to go together. Generally, however,tourism firms find that they can often (butnot always) save overall costs throughincreased control of the channel function,which may contribute favourably to the
276 L. Moutinho

firm’s bottom line (profits). Therefore, beforeattempting forward or backwards integra-tion, a tourism firm needs to be certain that ithas the skills and requisite to take on thefunctions of the channel intermediary that itis buying or replacing.
Horizontal diversification
Horizontal diversification is diversifyinginto new tourist products, but targeting yourexisting customer base as the potential cus-tomers. Often firms feel that they haveestablished a brand loyalty with current cus-tomers or a certain knowledge of theirmarkets which allows them to introducenew products. An example might be if atravel agent, who normally books vacations,diversifies by purchasing a company sellingtravel insurance. The travel agent is servingthose same customers, but in a new manner.Horizontal diversification can be distingui-shed from horizontal integration by thenewness of the tourist product to the firm.(For instance, if the travel agent had pur-chased a competing agency it would havebeen an example of horizontal integration.)
The advantages of horizontal diversifica-tion are distinct. First of all, the tourism firmis offering an additional product to a currentcustomer base, so not as much effort has tobe expended to locate new customers. Sec-ond, if the tourism firm already hassignificant knowledge of or familiarity withthe customer base’s buying habits, then theycan be more efficient in the ways that they
serve them. But a major disadvantage of hor-izontal diversification is the flip side of thelast issue mentioned: the tourism firm hasnot spread out their risk, as in most diversifi-cation schemes. In fact, they may haveexposed themselves to even greater risk byinvesting even more in the same tourismmarket. In our example, if the travel indus-try endured a serious downturn, then ourfirm would suffer potential losses from boththe travel agent side and the travel insuranceside.
Concentric diversificationConcentric diversification entails the intro-duction of a new tourist product to a new,but related market. By related we mean thatthe tourist market must be somewhat similarto the firm’s existing market in either a mar-keting sense (customers, demographics,needs) or an operational sense.
Conglomerate diversificationAlso known as lateral diversification, con-glomerate diversification involvesmarketing tourist products that are notfamiliar to the firm, to customers who arenot their normal customers. It is so namedsince it is not unusual for large tourism con-glomerates to diversify the risk of theirportfolios of SBUs by seeking completelynew markets. Further, most conglomeratediversification is achieved by purchasing acompany or a division of a company that isalready in operation. While this strategy
Table 10.6. Diversification matrix.
New tourist products
New marketsCurrent tourist products New tourist products
Firm is own client Vertical integration
Same type market Horizontal diversification
Similar type market Marketing and technology-orientedconcentric diversification
Marketing-oriented concentricdiversification
New markets Technology-oriented concentricdiversification
Conglomerate diversification
277Strategic Planning

gains a tourism firm a new product line anda new set of customers to serve, it can bequite risky since the new managers usuallyknow very little about the new customerbase or the nuances of the new marketenvironment.
Selection of Growth Strategies
Although there is no specific set of rules orguidelines that allow a tourism company topick and choose the market growth strategythat will suit it best, there are a few usefulclues. The place to start is with the SWOTanalysis discussed earlier in the chapter.This will help identify the tourism firm’sstrong points, their mission and their goals.Next, by charting the strength of the touristmarket, whether it is growing or in decline,and looking at the strength of the competi-tion, a firm can then determine its actions(Tribe, 1997).
For instance, if a tourism firm is fortunateenough to be in a position where they arestrong, the market is growing and the com-petitors lack particular skills, they canusually attack aggressively by expansion.They may choose to attain a strong anchorposition in the tourist market, purchase oneor more of their weaker competitors (ifallowed by regulators) and then diversify bystriving for a more complete path to thecustomer through vertical integration. Otherstrategies are also available for other touristmarket situations.
Tactical Market Planning
As we have already discussed, strategicplanning consists of broad, goal-orientedstatements that specify the major directionsin which a tourism firm will head over thenext 1–5 years (or longer). There is little in astrategic plan or a strategic statement, how-ever, that tells us exactly how the goals willbe accomplished. The strategic plan guidestourism companies in the medium to longrun, but they must also rely on specific tac-tics, or a tactical plan, to guide them on aday-to-day basis.
Figure 10.5 provides us with a four-phasemodel of tactical market planning. Animportant element to note is that a tacticalplan is not developed in a vacuum. It shouldbe a logical continuation of the strategicplanning and the resultant goals. Control isprovided at the end of each phase of thestrategic plan through a feedback loop toensure that the plan is still on track and tomake any necessary modifications as nee-ded.
Phase 1: SWOT analysisThe first step a tourism firm takes is to con-struct a SWOT analysis, which as we knowfrom earlier is an internal and external anal-ysis of an organization or an SBU. This takesshape in the form of a matrix in which thestrong and weak points of a tourism firm aswell as the opportunities and threats facingit are presented and summarized. Much ofthe information necessary is available inter-nally or can be had through conversationswith colleagues.
The SWOT analysis covers the market(size and nature of the tourist market, thefirm’s own position in the market, trends),
Fig. 10.5. Tactical marketing planning.
278 L. Moutinho

the position of the competition, the mostimportant market factors, a description ofthe target group and its utilization pattern oramount, the (business) results of prior years,the distribution structure and the firm’s ownactivities (operators, promotion strategy,etc.)
Phase 2: goalsThose who are responsible for developingthe marketing plan should include as muchdetail as possible in formulating the tacticalgoals or objectives, otherwise it makes littlesense to continue with the rest of the phasesin the planning process. As one senior man-ager remarked: ‘if you don’t know where youwant to go, then one way or another you willalways arrive there. And as soon as youarrive there, then you won’t take the troubleto go any further.’ In other words, setting agoal such as ‘We will increase our marketshare’ will not challenge a tourism firm to doand achieve as much as a goal such as: ‘Weseek to improve our market share in theconcentrated birdwatching segment in thespecial interest tourism sector from 10% to15%’. Once a tourism firm can put its exacttactical plan to paper, then it is ready todevelop an action plan.
Phase 3: marketing action planOnce the tactical goals are known, assetsand resources may be allocated. Tourismmarketing managers make decisions regard-ing the marketing-mix elements and how tooptimally combine the 4Ps (Price, Product,Promotion, Place) in order to attain theestablished tactical goals. The marketingaction plan identifies how the departmentwill accomplish the goals on a step-by-stepbasis utilizing the 4PS.
The sequence of events in an action planis uniquely important since tourism firmsmust integrate their overall efforts in orderto effectively achieve their goals. If a tourismfirm releases an aggressive promotionalcampaign that inspires buyers to seek outtheir product, then they must also ensurethat there is enough of their product on thetravel outlets’ shelves or in the distributionpipeline in order to meet this demand. If not,a large amount of advertising money would
have been wasted and customers may havebeen upset and irritated at the out-of-stocksituation, thus generating an unfavourableattitude towards the tourism firm (they maypossibly buy a competing product to satisfytheir ‘immediate need’).
The information in the marketing actionplan should be specific enough that employ-ees know when events are to occur, howmuch funding will be available to supportthe events and how they will be carried out.Projected target dates should be establishedfor tourist product introduction, promo-tional campaigns, operations planning, andall other events that could affect the market-ing mix. Of importance are the financialconsequences the marketing action planprovides in the form of budgets and pro-jected cash-flow forecasts.
Providing accurate sales forecasts (thebasis of the financial consequences calcula-tions) is one of the most important, and mostdifficult functions of the tourism marketingdepartment. Decisions to hire, fire, investand divest are all based on expected sales.But accurate forecasts are difficult to comeby because of a lack of necessary informa-tion and the general level of uncertainty intourist markets. Tourism firms not only donot know what their closest competitors aregoing to do, but they also must estimategeneral economic and consumer behav-ioural trends, which is no easy task.Tourism firms should not only make oneforecast based on current data but also makesome alternative ones based on differentresults so they will be ready for any ‘sur-prises’ in the market. Finally, the tourismfirm needs to specify how they will trackand measure the (future) results and deter-mine if the objectives have been achieved.
Phase 4: implementation, monitoring andcontrolling
As the components of the marketing plan areimplemented, careful control methodsshould (already) be established. Reviewinggoals and expectations and comparing themwith results achieved allow tourism man-agers to keep a watchful eye over theprocess. If tourist product introductions orpromotional campaigns are not producing
279Strategic Planning

Box 10.1. Marketing planning strategy.
There are five main strategy components that allow tourism companies to be categorized. Marketingobjectives concern the objectives that a tourism company hopes to achieve through their marketingprogramme. There are basically three types including defensive objectives, steady sales-growthobjectives and aggressive sales growth or market domination. It is very likely that more aggressivestrategies would be more appropriate for rapidly growing tourism markets, whereas mature, sluggishmarkets may dictate a more defensive strategy. Strategic focus is the focus the tourism company willadopt to achieve its objectives. The most common strategic foci are market expansion, winning ofmarket share and focusing on productivity and cost reduction. Again, the focus may be partlydependent on the stage in the tourist product or industry life cycle that the company finds itself in.Market targeting refers to the portion of the tourist market that the company will aim at in order toimplement their focus. Some tourism companies may want to target a mass market, others maychoose certain groups (a social class, age group or geographic region for example) or even certainindividuals as their target. Quality positioning is the competitive stance that tourism companies willtake in relation to the quality of the product as it compares with the competition. A tourism companymay choose to have high-, moderate- or low-quality products in comparison with their competitors.Finally, price positioning is another way to relatively position a tourism company above, below ornear the competition. We would expect that in most cases, if everything else is held equal, lowpricing will tend to be the more successful strategy (but in actuality, this is seldom the case).
After clustering the companies according to their strategy components, five generic marketstrategies can be identified. A brief description of each one follows:
1. The Aggressors are tourism companies that are out to win and expand their market share throughaggressive sales growth and market domination. They usually target the entire tourism market astheir customer base. They try to sell a higher quality tourist product than the competition, but theywill not charge a higher price for it. They compete in new and growing tourism markets and,therefore, must respond to a rapidly changing set of customer needs. They are leaders in newtourist product development and are not afraid to take on any competitor. They usually reap thebenefits since this strategy group outperforms all the other groups.
2. The Premium Position Segmenters are just that. They sell a premium tourist product and charge apremium price for it. They develop this premium tourist product through an aggressive new touristproduct development programme. Obviously, they know that the whole tourist market will not bewilling to pay a high price, so they segment the portions of the market that they will target for sales.They are out to win market share and expand their market, but are more concerned with a steadygrowth pattern than a meteoric one. Usually, their market is more mature and stable, with littlemarket entry or exit. They perform better than most companies.
3. Stuck in the Middlers have a more mediocre success record. They are characterized by steadysales growth, and usually compete on a tourist product and price-parity level with the competition.The tend to be in more mature and stable tourist markets where growth is harder to come by. Theycompete by tourist segment and occasionally will avoid competition by letting competitors takeover certain segments that they may not deem as valuable.
4. High-value Segmenters have a higher-quality tourist product, but generally do not charge a higherprice for it, claiming to offer their customers higher value instead. They compete by touristsegments in new and growing markets and experience steady sales growth. They are also seekingto expand their market, but sometimes seem to avoid their competition.
5. Defenders are the worst performers of all. They are interested in defending their market shares andwill do whatever is necessary to prevent declines in their market share. New tourist productdevelopment is a low priority for them and, in fact, they are generally more interested in takingcosts out of their products in order to increase their own productivity. They usually go afterindividual customers instead of tourist market segments and compete in stable, mature markets.
These five categories are neither mutually exclusive nor exhaustive, nor are they rigid in their form ofmake-up. Tourism companies may move between the categories as their product life cycles ormarketing objectives and strategies change. There are certain tourism companies that do not fit into anyof these specific moulds, but this work is a unique way of looking at European companies and themarketing strategies that they pursue.
Adapted from: Hooley et al. (1992).
280 L. Moutinho

the results on which forecasts are based,managers must be made aware of the prob-lems immediately through a control(feedback) mechanism. Various controltools may include sales, share, growth, mar-gins, awareness, tourist productdevelopment and consumer intent.
But even though control has been estab-lished, it will only be beneficial if thetourism firm is ready and willing to adapt tomarket changes. Few introductions goexactly as planned due to many of the sameunforeseen circumstances that make fore-casting so difficult. When the controlmechanism indicates that things are gettingoff course, the tourism firm must decidewhat action to take, if any. Although drasticreformulations of the marketing-mix com-ponents may be highly unlikely, adaptationby the tourism firm to the reality of themarketplace is generally called for.
Adaptation may be as subtle as extendingthe advertising schedule for an extra week ortwo, or providing more brochure inventoryto certain regions. Further, tourism firmsfind that adaptations require additionalplanning in order to reallocate those samescarce resources discussed earlier, and thisis where the contingency plans the tourismfirm prepared earlier (for the ‘surprises’) cancome into play and save the firm valuabletime. As you can now see, once the plan isimplemented, the work has only justbegun.
Box 10.10 contains an analytical discus-sion of corporate generic strategies
examined by three leading British academ-ics.
References
Aaker, D.A. (1999) Strategic Market Management,5th edn. John Wiley and Sons, Chichester.
Beerel, A. (1998) Lead Through Strategic Plan-ning. International Thomson Business Press,London.
Buttle, F. (1992) The marketing strategy work-sheet: a practical tool. Cornell Hotel andRestaurant Association Quarterly 33(3)(June), 55–67.
Deegan, J. and Dimeem, D. (1997) Tourism Policyand Performance. International ThomsonBusiness Press, London.
Go, F. and Pine, R. (1995) Globalization Strategyin the Hotel Industry. International ThomsonBusiness Press, London.
Hitt, M.A., Ireland, R.D. and Hogkisson, R.E.(1998) Strategic Management and Compet-itiveness and Globalization Concepts, 3rdedn. South-Western, Cincinnati, Ohio.
Hooley, G., Lynch, J. and Jobber, D. (1992) Genericmarketing strategies. International Journal ofResearch in Marketing 9(1), 75–89.
Knowles, T. (1996) Corporate Strategy for Hospi-tality. Longman, Harlow, UK.
Laws, E. (1995) Tourist Destination Management– Issues, Analysis and Policies. InternationalThomson Business Press, London.
Poon, A. (1993) Tourism Technology and Com-petitive Strategies. CAB International,Wallingford, UK.
Tribe, J. (1997) Corporate Strategy for Tourism.International Thomson Business Press, Lon-don.
281Strategic Planning


11The Marketing Planning Index: A Tool for
Measuring Strategic Marketing Effectiveness inthe Hospitality Sector
P.A. Phillips and L. Moutinho
Managers practise in a consistently chang-ing environment necessitating the need foran effective strategic marketing process.Nevertheless, measurement of marketingeffectiveness has tended to be ignored in theliterature. In this short chapter we willdescribe one specific managerial tool calledthe marketing planning index, which meas-ures the effectiveness of marketing. The toolis applied to the service industry – in thiscase the hotel sector. Our findings have indi-cated that the marketing planning index is asimple but powerful managerial tool thathelps to develop the diagnostic informationneeded to generate corporate and businesslevel initiatives designed to improve strate-gic marketing effectiveness.
Despite the growing relevance andimportance of marketing effectiveness, thereis strong evidence that marketing remains anarea of significant weakness for companies(Ghosh et al., 1994; Phillips and Moutinho,1998; Phillips et al., 1999). Recent changesin competitive intensity in national andinternational hospitality markets have ledmarketers to seek higher levels of effective-ness. Although much has been written onhow hospitality firms ought to market theirproducts and services, relatively little hasbeen written on how to measure marketing
effectiveness. In addition, the marketingfunction within the hotel sector is currentlyunder scrutiny, as it has recently beendescribed as dangerously insular and back-ward (Michels, 1996). Michels argued thatmany of the industry’s sales and marketingtechniques were at best primitive. Given thisapparent gap between theory and practice,together with a lack of empirical research inmeasuring marketing effectiveness, anyapplied research on this topic appears bothtimely and relevant. It seems evident thatany managerial tool that can ascertain thebarriers to effective marketing planning willbe of benefit to the hospitality literature, andto practitioners. The purpose of this chapteris therefore threefold:
1. To propose a novel framework for meas-uring marketing effectiveness.
2. The creation of a diagnostic tool thatcan be used to enable management toidentify the strengths and weaknessesin its marketing function.
3. To test the proposed framework anddiagnostic tool on the hotel sector.
The entire chapter can therefore be treatedas an extended case study within the contextof this book as a whole.
© CAB International 2000. Strategic Management inTourism (ed. L. Moutinho) 283

Marketing Effectiveness
Recently, there has been a resurgence in theimportance of marketing planning (see, forexample, Greenley and Bayus, 1994; Piercyand Morgan, 1994; McDonald, 1996). Inreviewing the marketing planning literatureMcDonald concludes that companies withcomplete marketing planning systems(MPS) will be more successful than otherfirms competing in the same environmentaland competitive circumstances. Notwith-standing this importance, the measurementof marketing effectiveness remains anunder-studied area (Meidan et al., 1992).This is somewhat surprising given that theeffectiveness of the overall planning processmay be as important as formalization andcomprehensiveness.
There are a number of steps that can betaken to develop reliable measures of market-ing effectiveness. Marketing itself must bedefined in a way that encompasses all itsfunctions, including planning aspects. Themarketing measurement effort must beundertaken at all levels. Baseline data mustbe accumulated against which marketingmeasurements can be made, and target datesshould be set to evaluate whether demandforecasts and customer perception goals havebeen met. In addition, the importance ofeffective measurement must be clearly com-municated by top management to allorganizational levels. The amount of returnan organization receives on its investment inmarketing is often determined by the sophis-tication of the marketing leadership and thelevel of organizational support. The results ofmost marketing efforts are difficult to assessbecause they fall between the clear-cut win-ners and losers. A review of marketing planssubmitted to top-level administration shouldcheck for the following:
1. A tracking system that can measureresults for each product line, gauge con-sumer perceptions, analyse distributorand consumer satisfaction levels andmonitor the activities of competitors.
2. How the marketing staff spends its timeand pinpoints its priorities.
3. Measure sales-response functions in
relation to the elements of the market-ing mix.
4. Assess the positioning strategy of themarketing plans.
5. Evaluate the positioning of the market-ing department within the organizationfor maximum effectiveness.
6. How well the results achieved by mar-keting match the level of marketingdepartment sophistication.
Wanless (1991) argued that a first step inincreasing marketing efforts is an audit ofthe marketing department. He also pointedout that before cutting spending or changingthe marketing approach, companies shouldconsider what effect it will have on custom-ers. Scheuing (1989) proposed the use ofcustomer service audits to measure market-ing effectiveness. Accurate information onboth customer and costs is vital to marketingsuccess. By measuring performance by peerevaluation, Speed and Smith (1991) foundthat a strategy of attracting relativelywealthy customers and maintaining controlof costs was employed by retail financialservice companies with better performance.These findings appear to support Doyle’s(1987) model of generic strategy which stres-ses the need for a strategy that addressessimultaneously both sides of a company’soperations, the market and its financial posi-tion. In their review of the marketingeffectiveness literature, Meidan et al. (1992)concluded that ‘despite the importance ofassessing the effectiveness of all the market-ing variables taken together, so far there areno indexes or model(s) that could be used tohandle this aspect of marketing planning’.Hence, the marketing effectiveness index(MEI) proposed by Meidan et al. (1992) wasa major contribution to the literature. Tofulfil the objectives of this chapter, the pro-posed framework and diagnostic tool will bedeveloped by extending the seminal work ofMeidan et al. (1992), which focused on con-sumer goods manufacturing companies.Specifically, we emphasize the key attri-butes of marketing planning, and focus onthe service industry, and provide controlsfor market-level influences by beingrestricted to the hotel sector.
284 P.A. Phillips and L. Moutinho
The Marketing Planning Index (MPI)
MPI backgroundIn his study, Phillips (1996) observed theexistence of a planning–performance rela-tionship at the hotel unit level, together withfour key design parameters (formality, par-ticipation, sophistication and thoroughness)of the planning process. He found that effi-cient planning systems were associated withhigher levels of business performance.These results, therefore, have significantimplications for practitioners in the hospi-tality sector. Using the salient marketingplanning variables identified by Phillips(1996), together with the framework advo-cated by Meidan et al. (1992), this chapterdescribes the MPI.
MethodologyThe sampling frame used to develop thisstudy was the top 50 UK hotel groups (Hoteland Catering Research Centre, 1992). Thedata used to test our MPI were collected aspart of an ongoing research study (Phil-lips,1996). A 17 page questionnaire wasdeveloped, which sought information onorganizational strategy, strategic planningsystems characteristics, and business per-formance at the hotel unit level. Thequestionnaire was pre-tested through struc-tured interviews with academics andpractitioners, who were asked a series ofclosed and open-ended questions. An initialletter was sent to a contact or the managingdirector of each hotel group introducing theresearchers, explaining the study, andrequesting the hotel general managers’(HGMs) participation in the study. Fifteengroups agreed to participate in the study(30%). The final questionnaire was thenmailed to 130 HGMs and 100 were com-pleted and returned (77%).
The average hotel unit for the sampleconsisted of 137 rooms, with an averagesales turnover of £2.82 million. With regardsto sales per employee, the figure was£33,772. Although the sample size was byno means representative of the top 50 UKhotel groups, the key characteristics of roomsize, sales turnover and sales per employee
would appear to be comparable with sam-ples used in other studies (Slattery et al.,1994; BDO Hospitality Consulting, 1994).Factor Analysis (see Chapter 4) was used toestablish if the 15 attributes (see Table 11.1)could be transformed into a smaller set ofuncorrelated variables that contained mostof the original information. Any reductionwould reduce the attributes to a more man-ageable set of constructs.
The factorsAs previously mentioned, the foundationsof the MPI lies in constructs identified byPhillips (1996) during his survey of the lit-erature pertaining to planning systems.Fifteen attributes were factor analysed, mak-ing use of the recommendations by Kaiser(1960) on how many factors to retain. Kaisersuggests dropping factors with an Eigenva-lue of less than one. Factors wereinterpreted based on loadings greater than0.62 (Meidan et al., 1992). Results of thefactor analysis using varimax rotation on the15 attributes are shown in Table 11.1. Eigen-values for the five factors that emergedranged from 4.11 to 1.05, and these factorsaccounted for a cumulative variance of6.2%. Factor 1 consists of hotel performancevariables, while factors 2 to 5 consider thequality of marketing mix, innovation,SWOT analysis, and market segment analy-sis, respectively. As can be seen the scalesappear robust. They generally satisfy Nun-nally’s (1978) threshold level forexploratory research, taken as equal orgreater than a Cronbach alpha score of0.50.
Calculating the MPIUsing a similar methodology to that of Mei-dan et al. (1992), a figure can be derived fromthe sum of the five equations, which repre-sents the level of marketing planning. Figure11.1 illustrates the systematic approach toassessing the MPS. In order to calculate thelevel of marketing planning, it is first neces-sary to calculate the mean score of eachattribute that was included in the five fac-tors. These mean scores are then used toderive the weightings of the 12 attributes.For example
285The Marketing Planning Index

weightings of attribute a1 5a1/a1+a2+a3+a4+b1+b2 . . . f1
The weightings were used to determine theequation for determining the level of plan-ning. Meidan et al. (1992) advocated the useof a weighting scheme for two primary pur-poses: (i) it considers the relativeimportance that respondents would assignto each attribute; and (ii) it makes the sum ofthe weights equal to one. As a result of theabove, the equations for determining thelevel of marketing planning are as follows:
Hotel performance 5 0.0821a1 1 0.0834a2 10.0792a3
Marketing mix 5 0.0810b1 1 0.0895b2 10.0770b3
Innovation 5 0.0733c1 1 0.0733c2SWOT analysis 5 0.0918d1 1 0.0900d2Market segmentanalysis
5 0.0826e1 1 0.0969e2
A Worked Example
Obviously, it is necessary to obtain a figurefor the hotel sector, and then compare indi-vidual hotel units, to allow each HGM toascertain their relative level of marketingeffectiveness.
To improve marketing effectiveness,hoteliers need first to identify the gapbetween themselves and best practice. Thisgap is said to occur when the MPI for anindividual hotel unit is less than the figurefor its peer group. By way of an example, thissection describes how to determine the rele-vant measures for the peer group (which forillustrative purposes will be the average MPIof the sample), and an individual hotel unit(Hotel Y) within the sample.
Table 11.2 shows the mean scores foreach of the 12 attributes. It can be seen thattotal scores for the peer group and Hotel Ywere 62.23 and 45.10, respectively. At first
Table 11.1. Results of the factor analysis of those attributes that are important for calculating the MPI.
Variables that are important for calculatingthe MPI
Factor 1Hotel
performanceFactor 2
Marketing mixFactor 3
Innovation
Factor 4SWOTanalysis
Factor 5Market segment
analysis
Use of marketing data from a number ofdifferent sources
0.0308 0.4780 -0.0972 0.4438 0.3452
Use of sales and cost data relating todifferent market segments
0.0781 0.1245 0.1105 0.0548 0.7695
Use of market segment analysis 0.0118 -0.0878 -0.0498 0.0934 0.7332Use of budgets by market segments -0.0428 0.1351 0.3040 0.5333 0.3626Level of influence of sales and marketingexert on the long-range plan
-0.0139 0.1158 0.1511 0.8018 0.0343
Use of SWOT analysis 0.3226 -0.6373 -0.0784 0.7423 0.0056Quality of hotel facilities 0.1784 0.7000 0.3005 0.1200 -0.1474Hotel service levels 0.1829 0.7829 -0.0313 -0.0302 0.1445Brand image 0.0126 0.7642 0.0127 0.0630 -0.0201Performance-efficiency (past year) 0.8608 0.2237 0.0007 0.0588 -0.0553Performance-efficiency (next 2 years) 0.7081 -0.1045 0.5239 0.0337 0.1525Performance-effectiveness (past year) 0.6850 0.2942 0.2669 0.1767 0.0363Performance-effectiveness (next 2 years) 0.5663 -0.0071 0.6116 0.0696 0.1921Performance-adaptability (past year) 0.1152 0.2534 0.6689 0.1483 -0.2164Performance-adaptability (next two years) 0.1632 -0.0365 0.8660 0.0194 0.1418Eigenvalue 4.1065 1.9472 1.6805 1.1389 1.0454Percentage of variance 27.4 13.0 11.2 7.6 7.0Cumulative percentage of variance 27.4 40.4 51.6 59.2 66.2Cronbach alpha 0.7693 0.6797 0.6153 0.5530 0.4840
286 P.A. Phillips and L. Moutinho

Fig. 11.1. Procedural steps for developing the index of marketing planning effectiveness. Adapted fromMeidan et al. (1992).
Table 11.2. Mean scores of the 12 marketing planning attributes.
Peer group score Hotel Y
Variables Factor 1: Hotel performanceA1 Efficiency (past year) 5.11 5.50A2 Efficiency (next 2 years) 5.19 1.00A3 Effectiveness (past year) 4.93 3.60Variables Factor 2: Marketing mixB1 Quality of hotel facilities 5.04 3.00B2 Hotel services levels 5.57 5.00B3 Brand image 4.79 4.00Variables Factor 3: InnovationC1 Adaptability (past year) 4.56 4.00C2 Adaptability (next 2 years) 4.56 1.00Variables Factor 4: SWOT analysisD1 Level of influence of sales and marketing exert on the long-
range plan5.71 5.00
D2 Use of SWOT analysis 5.60 6.00Variables Factor 5: Market segment analysisE1 Use of sales and cost data relating to different market
segments5.14 3.00
E2 Use of market segment analysis 6.03 4.00Total 62.23 45.10
287The Marketing Planning Index

glance we can see that Hotel Y’s MPS is notas effective as its peer group. Closer exam-ination reveals the extent of the problem.The responses by the HGM of Hotel Y indi-cate that serious problems are expected overthe next 2 years, with the attributes of effi-ciency and adaptability (a2 and c2) onlyrating the minimum score. Although therecould be many causes for the lack of market-ing effectiveness, an area worthy ofimmediate investigation is the inappropri-ate marketing mix. The quality and level ofservice, together with its brand image is wellbelow the average. This is somewhat sur-prising as the SWOT analysis was ratedfairly important. However, this weaknessmay be attributable to the quality of informa-tion flowing from the SWOT analysis.
These mean scores are raw and need toincorporate the weightings of each attribute.Using the methodology as shown inFig. 11.1, the level of planning is then calcu-lated for the peer group and Hotel Y. Figure11.2 shows how to determine the marketingeffectiveness gap between the peer groupand Hotel Y. Table 11.3 shows that the MPIof 0.5456 for Hotel Y is well below the figurefor the peer group of 0.7462. This reinforcesthe results in Table 11.2 by revealing theprecise extent to which Hotel Y’s MPS lagsbehind its peer group. The lack of hotelperformance (34% below average) would
appear to be symptomatic of the problems inthe marketing mix (22%), innovation (46%),and market segment analysis (37%). Thisindicates that Hotel Y’s overall level of mar-keting planning appears rather poor, and theHGM should attempt to work more closelywith customers, by segmenting the marketand provide the experiences that consumerswant at a price they are willing to pay. As astarting point, the HGM should attempt toidentify other similar hotel units, to seewhat they are doing, and he or she is not.
In addition, the MPI for the peer group of0.7462 indicates that the level of effective-ness is moderate with plenty of scope forimprovement. This observation, although inconflict with Athiyaman and Robertson(1995), tends to support Medlik (1989:14),who stated: ‘only limited progress has beenmade in the translation of business andmanagement theory from manufacturing toservice industries generally and to hotels inparticular’.
Managerial Implications
This chapter shows how one study canextend the knowledge of marketing effec-tiveness to the service sector, through theuse of a novel approach. The MPI can meas-ure marketing effectiveness, and also
Fig. 11.2. How to use the marketing planning index. Adapted from Meidan et al. (1992).
288 P.A. Phillips and L. Moutinho

Tabl
e 11
.3.
Cal
cula
ting
the
MPI
.
Peer
gro
upH
otel
Y
Var
iabl
es*P
eer
grou
psc
ore
Wei
ghtin
gPe
er g
roup
MPI
Sub
tota
ls(A
)*H
otel
Ysc
ore
Wei
ghtin
gH
otel
YM
PISu
b to
tals
(B)
Stra
tegi
c ga
p(B
–A)/A
Hot
el p
erfo
rman
ceA
10.
7300
0.08
210.
0599
0.78
570.
0821
0.06
45A
20.
7414
0.08
340.
0618
0.14
290.
0834
0.01
19A
30.
7043
0.07
920.
0558
0.51
430.
0792
0.04
070.
1776
0.11
72–3
4%M
arke
ting
mix
B1
0.72
000.
0810
0.05
830.
4286
0.08
100.
0347
B2
0.79
570.
0895
0.07
120.
7143
0.08
950.
0639
B3
0.68
430.
0770
0.05
270.
5714
0.07
700.
0440
0.18
220.
1426
–22%
Inno
vatio
nC
10.
6514
0.07
330.
0477
0.57
140.
0733
0.04
19C
20.
6514
0.07
330.
0477
0.14
290.
0733
0.01
050.
0955
0.05
23–4
6%SW
OT
anal
ysis
D1
0.81
570.
0918
0.07
480.
7143
0.09
180.
0655
D2
0.80
000.
0900
0.07
200.
8571
0.09
000.
0771
0.14
680.
1427
–3%
Mar
ket s
egm
ent a
naly
sis
E10.
7343
0.08
260.
0606
0.42
860.
0826
0.03
54E2
0.86
140.
0969
0.08
350.
5714
0.09
690.
0554
0.14
410.
0908
–37%
Tota
l8.
8900
1.00
000.
7462
0.74
626.
4429
1.00
000.
5456
0.54
56–2
7%
*The
act
ual m
ean
scor
es h
ave
to b
e di
vide
d by
the
num
ber
of p
oint
s on
the
Like
rt s
cale
, i.e
. 7. T
his
allo
ws
the
figur
es to
be
less
than
1.
289The Marketing Planning Index

highlight strengths and weaknesses in themarketing planning process. The MPI is alsounique in that its considers both hard andsoft variables of the marketing planningprocess. Moreover, given the paucity of rele-vant research in the general and hospitalityliterature, the study provides a much nee-ded solid base for future academic work.The MPI is a simple but powerful manage-rial tool that helps develop the diagnosticinformation needed to generate corporateand business level initiatives designed toimprove the marketing planning process.Given the renewed vitality in the hotel sec-tor, together with the fact that a goodproduct only flows from a good process, MPIis a marketing planning tool that wouldseem to be of particular interest to managersin the hospitality sector. On a wider dimen-sion, this study builds on the work ofMeidan et al. (1992) by increasing the valid-ity and generalization of the proposed indexusing a survey of 100 hotels. This is a largersample than the 53 companies used by Mei-dan and colleagues. The study also providescontrols for market-level influences by beingrestricted to the hotel sector.
Thus, based on the MPI, if hoteliers wishto enhance marketing effectiveness, theycould make a useful impact by focusing onthe following:
● hotel performance (past and future);● competitive positioning;● rate of innovation;● customer-orientated SWOT analysis;● effective use of customer data.
Those hotels that understand and addressthese aspects in their MPS will be moresuccessful than those who do not. In addi-tion, the MPI can play an essential part inhelping hotel organizations to become fast-learning and flexible. The design, therefore,of an effective MPS should be near the top ofany manager’s agenda. However, as with anysingle study of an issue as broad and impor-tant as marketing planning, the results ofthis particular study must be interpreted inlight of the obvious limitations the studypossesses. The single industry study descri-bed provides some degree of control ofenvironmental nuances to each commercial
sector; however, while this enhances inter-nal validity, there is a limit to the extentthese findings can be applicable beyondhotels. Another shortcoming of this cross-sectional study relates to the reliance on asingle participant to provide his or herviews on marketing planning activities andperformance of their hotel unit. Such datamay be subject to various cognitive biases.Future studies would benefit by incorporat-ing a longitudinal approach, the use ofmultiple responses, together with the use ofsome objective data contained in archival orfinancial records. Future replicationresearch, addressing the limitations in thestudy will allow for the rapid advancementin the theory and practice of measuring mar-keting effectiveness.
References
Athiyaman, A. and Robertson, R.W. (1995) Strate-gic planning in large tourism firms: Anempirical analysis. Tourism Management16(3), 199–205.
BDO Hospitality Consulting (1994) United King-dom Hotel Industry. BDO HospitalityConsulting, London.
Doyle, P. (1987) Marketing and the British chiefexecutive. Journal of Marketing Manage-ment 3(2), 121–132.
Ghosh, B.C., Schoch, H.P., Huang, J.Y., Lai, W.B.and Hooley, G. (1994) A comparative studyof marketing effectiveness: profiles of topperformers in Taiwan and Singapore. Jour-nal of International Marketing andMarketing Research 19(2), 75–97.
Greenley, G.E. and Bayus, B.I. (1994) Marketingplanning processes in UK and US Compa-nies. Journal of Strategic Marketing 2,140–154.
Hotel Catering Research Centre (1992/3) UK HotelGroups Directory. Huddersfield Polytechnic,UK.
Kaiser, H.F. (1960) The application of electroniccomputers to factor analysis. Educationaland Psychological Measurement 20,141–151.
McDonald, M.H.B. (1996) Strategic marketingplanning: theory, practice and research agen-das. Journal of Marketing Management 12,5–27.
Medlik, S. (1989) The Business of Hotels. Heine-mann, London.
290 P.A. Phillips and L. Moutinho

Meidan, A., Moutinho, L. and Chan, R.S. (1992)Marketing effectiveness index (MEI): A toolfor strategic marketing planning. In: Critten-den, V. (ed.) Developments in MarketingScience, vol. XV. Proceedings of the AnnualConference of the Academy of Marketing Sci-ence, San Deigo, California, pp. 480–485.
Michels, D. (1996) Hotels – on industry or art?Savoy Lecture, London.
Nunnally, J.C. (1978) Psychometric Theory.McGraw-Hill, New York.
Phillips, P.A. (1996) Organisational strategy, stra-tegic planning systems characteristics, andbusiness performance in the UK hotel sector.PhD thesis, Cardiff Business School, Uni-versity of Wales, UK.
Phillips, P.A. and Moutinho, L. (1998) StrategicPlanning Systems in Hospitality and Tour-ism. CAB International, Wallingford, UK.
Phillips, P.A., Davies, F. and Moutinho, L. (1999)The interactive effects of strategic planningand strategic marketing planning on hotel
performance: a neural network analysis.World Marketing Conference, Malta, June.
Piercy, N.F. and Morgan, N.A. (1994) The market-ing planning process: behavioural problemscompared to analytical techniques inexplaining marketing plan credibility. Jour-nal of Business Research 29, 167–178.
Scheuing, E. (1989) Commentary: conducting cus-tomer service audits. Journal of ServicesMarketing 3(3) (Summer), 35–41.
Slattery, P., Feehely, G. and Savage, M. (1994)Quoted Hotels Companies: The World Mar-kets. Kleinwort Benson Securities Ltd,London.
Speed, R. and Smith, G. (1991) Marketing strategyand company performance: a discriminantanalysis in the retail financial services indus-try. International Journal of Bank Marketing9(3), 25–31.
Wanless, B. (1991) Managing your marketingbudget more effectively. Sales & MarketingManager Canada 32(5) (May), 25–26.
291The Marketing Planning Index


12Demand Modelling and Forecasting
S.F. Witt and L. Moutinho
Introduction
In science, and even in everyday life, manythings are highly predictable, but in othercircumstances prediction is often difficult.Furthermore, in making predictions, we areoften unsure about the outcome. Forecastingassists tourism managers to improvedecision-making. In an organizationaldesign context, forecasting should not beregarded as a self-contained activity, butshould be integrated within the planningcontext of which it is a part. The role offorecasts in the tourism planning processwas noted by Gunn (1994: 5):
Of interest to many tourist businesses isincreasing the ability to make forecasts.Decisions on the purchase of newgenerations of equipment, new sites, andnew technology may rest on predictions ofincreased demand for a specific tourismservice or product.
It is often stressed that accuracy is the crit-ical characteristic of a forecasting method,as noted by Archer (1994:105):
The accuracy of the forecasts will affect thequality of the management decision . . . Inthe tourism industry, in common with mostother service sectors, the need to forecast
accurately is especially acute because of theperishable nature of the product.
Martin and Witt (1988b), in a study whichreported the views of tourism academicsand practitioners on the desirable character-istics of forecasts, confirmed that forecastaccuracy is regarded as the most importantproperty of a forecasting method.
The purpose of this chapter is to examineseveral more advanced forecasting methods(qualitative and quantitative) and provideexamples which illustrate potential applica-tions of the various methods. The mainmethods described are:
● Delphi and jury of executive opinion;● Cross-impact analysis;● Probability forecasting;● Econometric forecasting.
More substantial textbooks dealing withforecasting are Frechtling (1996), Wilsonand Keating (1998) and Makridakis et al.(1998).
Delphi Forecasting/Jury of ExecutiveOpinion1
The Delphi method of forecasting has attrac-ted considerable attention in the tourism
1 Material in this section has appeared previously in Moutinho and Witt (1995).
© CAB International 2000. Strategic Management inTourism (ed. L. Moutinho) 293

literature since the late 1970s (Robinson,1979; Seeley et al., 1980; Kaynak and Mac-aulay, 1984; Var, 1984; Liu, 1988; Yong etal., 1989; Moeller and Shafer, 1994; Taylorand Judd, 1994). This technique aims toobtain expert opinion about the futurethrough questionnaire surveys of a group ofexperts in the field, and is particularly use-ful for long-term forecasting. Therespondents provide their estimates of theprobabilities of certain specified conditionsor events occurring in the future, and alsoestimate when the events would be likely tooccur. Delphi studies are carried out anony-mously in order to minimize conforminginfluences; thus, rather than meeting phys-ically to debate the various issues underconsideration, the experts are kept apart sothat their views are not affected by dominantpersonalities, social pressure, etc. Delphistudies involve several iterative rounds, andat each stage the derived group opinion isfed back to the participants in the form of therange and distribution of responses. Thepanel members are requested to re-evaluatetheir previous replies in the light of the sum-mary group opinion and to justify anyanswers which would still differ greatlyfrom the overall group opinion. The expertsare thus able to try to convince one anotherabout their views. Eventually a group con-sensus emerges and it is possible to draw upa forecast. The distinguishing characteris-tics of Delphi forecasting are the aim – togenerate aggregate expert opinion about thefuture – and the method used – maintenanceof strict anonymity within the group ofexperts and iterative polling of participantswith feedback of group opinion betweenpolls.
One example of the use of the Delphitechnique to predict future tourism trends inthe Province of Nova Scotia, Canada to theyear 2000 was described by Kaynak andMacaulay (1984). Subsequently, Liu (1988)carried out a Delphi study to forecast tour-ism to Hawaii by the year 2000. Also, Yonget al. (1989) used the Delphi method to fore-cast the future of the tourism industry inSingapore, with the most distant time hori-zon for the year of probable occurrencebeing ‘2000 and beyond’.
The above three cases are all examples ofstandard Delphi forecasting applications intourism involving postal questionnaires,strict anonymity and iterative polling of par-ticipants. However, Robinson (1979) andSeeley et al. (1980) presented a ‘symposiumDelphi’ approach which they suggest can beused at conferences to generate forecasts.The methodology was applied at the Inter-national Symposium on Tourism and theNext Decade which was held in Washing-ton, DC during 1979, and was used toforecast international tourism conditions upto the year 2000. A two-round ‘symposiumDelphi’ study was undertaken, with thesample group comprising 25 people (all ofthese participated in round 1, but only 19 inround 2). The questionnaires were admin-istered in a face-to-face situation with thewhole group present, and the mean resultsfor each question were displayed imme-diately. Clearly therefore, the usual Delphianonymity condition did not hold. On theother hand, ‘the interpersonal environmentprovided an opportunity to clarify respon-ses’ (Robinson, 1979, p. 271). A furthermajor advantage of the symposium Delphiapproach can be the existence of a captiveaudience with the resultant possibility of a100% response rate within a minimal timeperiod. Whether the forecasting approachadopted at the Tourism and the Next DecadeSymposium can be correctly termed a ‘Del-phi’ forecast is questionable; it is a‘consensus of expert opinion approach’, butdoes not satisfy all the Delphi require-ments.
The advantage of the Delphi approachover other consensus of expert opinion fore-casting approaches where participants domeet – that the views of the experts are notaffected by social pressure, etc. – needs to bebalanced against the disadvantages of beingunable to engage in debate with the otherexperts in order to exchange ideas, clarifypoints, etc. and the fairly long time periodrequired to carry out the exercise.
In this next section, the particular consensusforecasting approach examined is jury ofexecutive opinion. Results of a jury of execu-tive opinion forecasting exercise carried out
294 S.F. Witt and L. Moutinho
in 1992 are presented in which the distin-guishing characteristics were: (i) that aspecific time horizon far into the future(2030) was considered as opposed to themore usual year 2000 time horizon; (ii) thatthe emphasis was specifically upon theimpacts of developments in science andtechnology upon tourism; (iii) that the fore-cast focus was not destination specific (e.g.Nova Scotia, Singapore); and (iv) that thetourism experts were mainly European, butwith some Central Americans also present,compared with the more usual non-destination specific forecasting situation inwhich the views of North American tourismexperts predominate. The focus on theimpacts of developments in science andtechnology stems from: first, the fact thatthey have ‘come to dominate the economyand society in the developed world‘; andsecond, the expected rapid pace of techno-logical development as exemplified in thestatement that ‘All the technological knowl-edge we work with today will represent only1% of the knowledge that will be availablein 2050’ (Cetron and Davies, 1991, p. 5).Clearly, however, there are also many eco-nomic, social and environmental factorswhich will have a substantive influence onthe future nature and evolution of the fieldof tourism.
The objective of the study was to help tocreate a strategic vision of the future of tour-ism up to the year 2030. Underlying thisobjective is the premise that future tourismphenomena can be managed by looking atfuturistic scenarios which are based on theimpact of science and technology. In thisway management by anticipation and proac-tive strategies can be translated intocompetitive advantage.
Future developments affecting tourismTwenty-five possible future developmentsaffecting tourism were selected from aframework developed by Shafer and Moeller(1988, 1994), in which they describe possi-ble developments in science and technologythat may strongly impact tourism planningand development. Shafer and Moeller’svisions of future developments resultedfrom a review of over 100 popular and scien-
tific articles, and cover such areas as: video;transportation; recreation equipment; andcomputers and robotics. The questionsincluded in the present study were selectedon the basis of their direct relevance andimportance to tourism development overthe period to 2030. In addition, it was real-ized that the spread of knowledge among thetourism experts would be sketchy in some ofthe areas covered by Shafer and Moeller.Hence, attention was restricted to thosefacets in which the experts were expected tohave a high degree of interest/involvement;areas that they could visualize, relate to andrespond to.
The questions selected for inclusion inthis study cover the areas of tourism super-structure, robotics, artificial intelligence,recreation and transportation. These possi-ble future developments are listed anddescribed in Table 12.1. It was specificallyon account of the rather innovative/radicalnature of several of the possible tourismdevelopments under consideration that itwas felt important in this case to permit fulldiscussion among the tourism expertsbefore a forecast was generated, and thus tofollow a non-Delphi consensus approach.
ProcedureThe fieldwork was conducted in June 1992in Valencia, Spain, at a tourism seminar,where 25 tourism experts were asked abouttheir views on possible future developmentsin tourism. The tourism experts were selec-ted to achieve a broad spectrum andcomprised approximately 40% academics(drawn mainly from the areas of marketing,management, economics and accounting/finance), 40% from the commercial tourismindustry (mainly managers of hotel chainsand travel agencies, and consultants), and20% from central and local government andtourist offices. The latter group size wasrestricted to 20% as it was felt that tourismauthorities would generally be more distantfrom the effects of technological change thanacademics and the commercial tourismindustry. A time span of 4 h was allowed forthe exercise. First, the objectives of thestudy were explained, and then the ques-tionnaire was distributed. Next, the 25
295Demand Modelling and Forecasting

Table 12.1. Possible future developments and consensus forecasting results.
Possible developmentImpact/Importance(1 5 low, 5 5 high)
Mean probabilityof occurrence
(%)
Most likely year ofoccurrence
(1992–2030)
Tourism superstructureFloating hotelsMulti-storey floating hotels moored offshore,
containing shopping, gymnasiums andglass enclosed elevators carrying touriststo the sea floor
2.6 57 2000
Underwater hotelsBuilt completely underwater, visitors will be
able to study and watch undersea lifethrough their bedroom windows
2.8 26 2030
Theme parksIndividual experience centres where
technology lets people role play . . . Life inVictorian England, Early America orFrench Revolution
3.2 67 1997
RoboticsRobots play a large part in planning facilities
and services: restaurants, landscaping,park design and entertainment
2.6 50 2000
Robots will be built in the form of buildings,providing most services of modern hotels,and these hotels will be run by anadministrative computer
4.0 73 2000
Computers/Artificial intelligencePrograms which can make judgements will
be used by tourism managers to design thebest program mix for differing clienteleand to manage natural resources for amultiplicity of uses
4.0 69 2000
Computers with artificial intelligence willmimic human senses and attitudes
2.5 24 2030
RecreationArtificial environmentsSpecially created and commonly used for
recreational facilities and outdooractivities
3.1 60 2000
Skill training in recreationVideo tapes used on location to train tourists,
e.g. skiing, scuba diving, sailing
3.5 78 1995
VideocyclesCombination of stationary exercise bike and
TV/VCR used to tour scenic routes inforested and urban environments
2.9 63 1995
Night visionGlasses to allow participation in outdoor
recreation in the dark. Other devices toimprove hearing, touch, sense of smell,strength and coordination instantly
2.6 51 2000
296 S.F. Witt and L. Moutinho
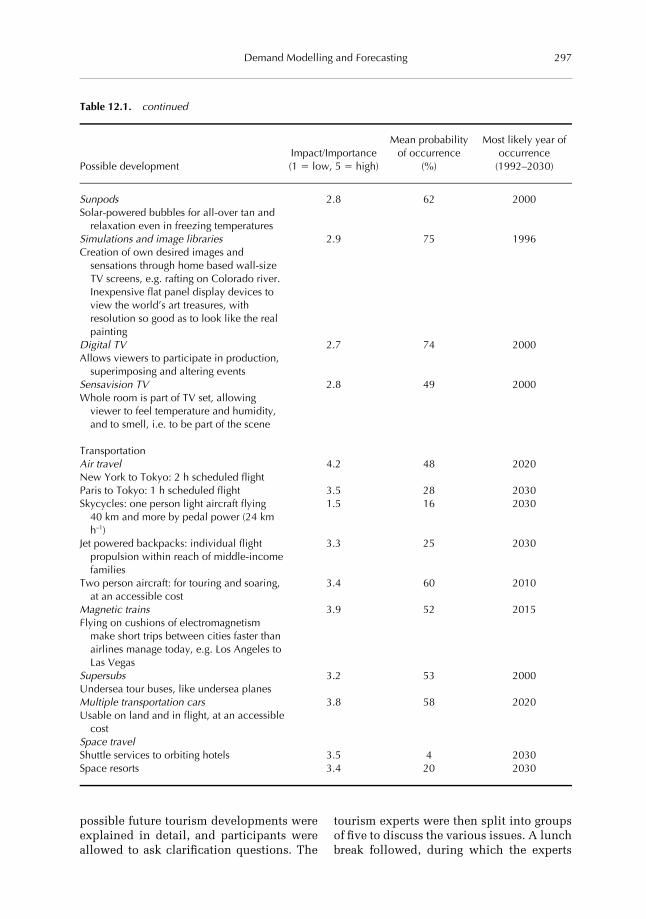
possible future tourism developments wereexplained in detail, and participants wereallowed to ask clarification questions. The
tourism experts were then split into groupsof five to discuss the various issues. A lunchbreak followed, during which the experts
Table 12.1. continued
Possible developmentImpact/Importance(1 5 low, 5 5 high)
Mean probabilityof occurrence
(%)
Most likely year ofoccurrence
(1992–2030)
SunpodsSolar-powered bubbles for all-over tan and
relaxation even in freezing temperatures
2.8 62 2000
Simulations and image librariesCreation of own desired images and
sensations through home based wall-sizeTV screens, e.g. rafting on Colorado river.Inexpensive flat panel display devices toview the world’s art treasures, withresolution so good as to look like the realpainting
2.9 75 1996
Digital TVAllows viewers to participate in production,
superimposing and altering events
2.7 74 2000
Sensavision TVWhole room is part of TV set, allowing
viewer to feel temperature and humidity,and to smell, i.e. to be part of the scene
2.8 49 2000
TransportationAir travelNew York to Tokyo: 2 h scheduled flight
4.2 48 2020
Paris to Tokyo: 1 h scheduled flight 3.5 28 2030Skycycles: one person light aircraft flying
40 km and more by pedal power (24 kmh–1)
1.5 16 2030
Jet powered backpacks: individual flightpropulsion within reach of middle-incomefamilies
3.3 25 2030
Two person aircraft: for touring and soaring,at an accessible cost
3.4 60 2010
Magnetic trainsFlying on cushions of electromagnetism
make short trips between cities faster thanairlines manage today, e.g. Los Angeles toLas Vegas
3.9 52 2015
SupersubsUndersea tour buses, like undersea planes
3.2 53 2000
Multiple transportation carsUsable on land and in flight, at an accessible
cost
3.8 58 2020
Space travelShuttle services to orbiting hotels 3.5 4 2030Space resorts 3.4 20 2030
297Demand Modelling and Forecasting

were encouraged to continue exchangingviews. Then a final question clarificationsession took place before participants filledin the questionnaires individually. Thus inaddition to the non-observance of the ano-nymity condition necessary for a Delphistudy, iterative polling of participants wasnot carried out. However, the instant feed-back which occurred in the discussiongroups obviated the potential benefits ofiterative polling.
The 25 tourism experts were asked torank the importance/impact of each of the25 possible future developments affectingtourism on a scale 1 (low importance/impact) to 5 (high importance/impact); toassess the probability of occurrence(0–100%); and to forecast the most likelyyear of occurrence (over the period1992–2030). Many of the developments pre-dicted to occur by the year 2000 have in facttaken place.
Empirical resultsThe mean scores of the responses by thegroup of tourism experts regarding theimpact/importance of each development, itsprobability of occurrence and its most likelyyear of occurrence are presented in Table12.1.
Cross-Impact Analysis2
In this section we focus upon a less well-known forecasting method, cross-impactanalysis, and examine its potential applica-tion within a tourism context. Althoughcross-impact analysis has received someattention in the general forecasting literature(e.g. Helmer, 1981), the technique appears tohave been largely overlooked in the tourismforecasting literature. However, there are afew documented examples of the applica-tion of cross-impact analysis to recreation(Bonnicksen, 1981; Becker et al., 1985,1986).
Cross-impact analysis is a technique usedfor examining the impacts of potentialfuture events upon each other. It identifies
groups of reinforcing or inhibiting events,and unfolds relationships between eventswhich may appear unrelated. In brief, cross-impact analysis provides a forecast, makingdue allowance for the effects of interactingforces on the shape of things to come. Thetechnique is suitable for projects whichinvolve environmental scanning, which istracking broad trends appearing in the envi-ronment. A tourism organization may usecross-impact analysis to study, for example,the impacts of technological trends in trans-portation capability, automation,communications and information process-ing.
Essentially, cross-impact analysis con-sists of selecting a group of five to ten peopleto serve as project participants. These wouldnormally be top decision-makers – the man-aging director, marketing manager,operations manager, etc. – as well as possi-bly outside consultants. They are asked tospecify critical events relating to the subjectof the project. For example, in a tourismmarketing project the events may fall intoany of the following categories:
1. corporate objectives and goals;2. corporate strategy;3. markets or customers (potential vol-
ume, market share, possible strategiesof key customers, etc.);
4. competitors (product, price, promotionand distribution strategies);
5. overall competitive strategic posture,whether aggressive or defensive;
6. internally or externally developed strat-egies which might affect the project;
7. legal or regulatory activities havingfavourable or unfavourable effects;
8. other social, demographic or economicevents.
The initial attempt is likely to generate a longlist of alternatives which needs to be con-solidated into a manageable size (e.g. 25–30events) by means of group discussion, con-centrated thinking, elimination ofduplication, and refinement of the essence ofthe problem. Management’s creativity andfarsightedness play an important role in an
2 Material in this section has appeared previously in Moutinho and Witt (1994).
298 S.F. Witt and L. Moutinho

organization’s ability to pinpoint the relevantareas of concern, and hence tourism organi-zations should seek to develop within theirmanagers the habit of creative thinking.
The project coordinator/moderator playsa crucial role in facilitating and directing thediscussion among participants, and hencein determining the effectiveness of the dis-cussion group. His or her role involvesstimulating discussion among all the partic-ipants, while at the same time ensuring thatthe focus of the discussion does not stray toofar from the subject. The coordinator musthave good observational, interpersonal,communication and interpretive skills inorder to recognize and overcome threats tothe discussion process. He or she shouldattempt to develop the following three sta-ges in the group discussion:
1. Establish a rapport with the group,structure the rules of group interactionand set objectives.
2. Provoke intense discussion in the rele-vant areas.
3. Summarize the group’s responses inorder to determine the extent of agree-ment.
The selected n events are represented in ann 2 n matrix for developing an estimatedimpact of each event on every other event.This is done by assuming, for each specificevent, that it has already occurred and willhave an enhancing, inhibiting or null effecton other events. The project coordinatorseeks the impact estimates from each projectparticipant individually, and displays theestimates in the matrix in consolidated form.The project participants then vote on theimpact of each event. If the spread of votes istoo wide, the coordinator will ask those vot-ing at the extremes to justify their positions.The participants are encouraged to discussdifferences in the hope of clarifying theproblem. Another round of voting takesplace. During this second round the opin-ions usually converge and the median valueof the votes is entered in the appropriate cellin the matrix. This procedure is repeateduntil the entire matrix is complete.
In the process of matrix completion, thereview of occurrences and interactions iden-
tifies those events, which are strong actorsand significant reactors, and provides a sub-jective opinion of their relative strengths.This information then serves as an impor-tant input in formulating strategy.
Case study exampleThe application of cross-impact analysis to atourism example is now considered. Thecase is real, but artificial data are used toillustrate application of the technique.
The Azores are situated in the AtlanticOcean, 1230 km from Lisbon and 3380 kmfrom New York, and include nine differentislands aggregated into three major groups.They are volcanic mountains, with variedcharacter and landscape. The existence ofnine dispersed islands makes access to theregion difficult. At present, only three of theislands have airports with the capacity toreceive intercontinental flights, but recentlythere has been an increase in the number ofinter-island flights. During the recent pastthere has been rapid growth in the supply oftourist accommodation; for example,between 1988 and 1989 capacity grew by20%. By the mid-1990s, the total number oftourist beds in the region had grown toapproximately 4000, about 50% beinglocated on São Miguel, 25% on Terceira,and 20% on Faial. Five other islandsaccount for the remaining 5%, with no tour-ist accommodation on one of the islands.
The evolution of tourist demand for theAzores is illustrated in Table 12.2. The
Table 12.2. Tourist arrivals and growth rates(1983–1989).
Tourist arrivals Growth rate (%)
1983 227,682 7.51984 245,430 7.81985 254,605 3.71986 282,451 10.91987 306,255 8.41988 323,214 5.51989 317,114 11.9
299Demand Modelling and Forecasting

market grew fairly rapidly throughout themid-1980s, but declined in 1989. The aver-age tourist length of stay during the periodwas stable at just over 3 days, and the aver-age occupancy rate in all touristaccommodation was 35%. The major touristorigin markets for the Azores were Portugal(67% of nights), followed by Germany(11%), and the USA (6%). A completebreakdown is presented in Table 12.3. From1988 there was a decline in the number ofAmerican and Canadian tourists (two of themore traditional markets for the Azores),and an increase in the number of touristsoriginating from less traditional Europeanmarkets, such as Holland, Belgium andSpain. Geographically, the two direct com-petitors to the Azores are Madeira and theCanary Islands. The average length of stayand spending level by tourists in the Azoreswere well below the levels recorded at thesedestinations.
Situation analysisThe Azores’ strengths and competitiveadvantages in the tourism sector, as per-ceived by Azores Tourist Board managers onthe basis of market research studies, weredescribed as follows:
1. High quality of life, absence of pollutionand the provision of close contact withnature.
2. Excellent location for deep-sea fishing,snorkelling, and scuba diving.
3. Good conditions for walking and hikingtrips, as well as bird watching, and ‘sci-entific’ tours to study the flora,vegetation and volcanic nature of theislands.
4. Ideal stopover location for yachting andgood facilities for golfers.
5. Potential for the development of cul-tural and rural tourism.
Some of the major weaknesses which mighthamper the development of tourism in theregion were as follows:
1. Distance from the most important originmarkets, cost of travel, and the reducednumber of scheduled flights to theAzores.
2. Lack of superstructure, particularly inthe area of entertainment: improve-ments here could increase tourists’average spending levels and length ofstay in the islands.
3. Inadequate professional qualificationand training skills provided to staffemployed in the tourism industry,which has a negative impact on thequality of tourist services offered tovisitors.
4. Seasonality effects which createmarked under-utilization of facilitiesduring the low season and over-utilization during the high season.
The tourism sector plays a crucial socio-economic role in the development of theAzores in terms of its contribution to thegross domestic product, balance of pay-ments, employment and payment ofreasonable salaries.
The Azores Tourist Board (ATB) fore-casted a cumulative annual growth rate of10% for foreign tourist arrivals until the year2000. It aimed to increase tourists’ averagelength of stay and reduce seasonalitythrough the implementation of promotionalprogrammes and by improving the enter-tainment facilities on the islands. The ATB
Table 12.3. Total shares of nights spent by foreigntourists (1990).
CountryShare of nights spent
(%)
Portugal 67.3Germany 11.4USA 5.6Switzerland 2.4United Kingdom 2.3Canada 2.0France 1.7Scandinavian countries 1.3Spain 1.2Belgium 0.9Holland 0.6Other countries 2.7
300 S.F. Witt and L. Moutinho

was particularly interested in encouragingtourism investment designed to developnew tourist products, activities and facili-ties such as spas, convention centres, andsports centres, which would enable foreignteams to come to the islands for trainingperiods, tourist trails, footpaths, scenicpoints and nature parks.
Use of cross-impact analysisBeing aware of the global trends in the tour-ism industry and tourist flows worldwide,and taking into consideration the internalsituation of the Azores, tourism authoritiesconsidered which marketing strategieswould be most effective in striking a balancebetween the role of tourism as a catalyst forsustainable socioeconomic development inthe region and the preservation of the localcultural heritage, quality of life and thephysical environment. The ATB recognizedthat continued growth and development inthe future stem from current strategic plan-ning and decided to use cross-impactanalysis in order to enable its managers tomap out a strategic plan more effectively.
In addition to competition, the ATB wasconcerned with the analysis of four mainenvironmental factors (events):
A A further decline in the number of tour-ist arrivals originating from the moretraditional markets.
B Increased dependency on a limitednumber of airlines and specialized touroperators and travel agents.
C Increased cost of international travel.D A general increase in domestic (inter-
nal) tourism.
These events are arranged in matrix form asshown in Table 12.4. The arrows show thedirection of the impacts. For example, theoccurrence of event D (a general increase ininternal tourism) is likely to bring about adecrease in the cost of international travel(event C). Hence, an inhibiting arrow isplaced in the cell at the intersection of row Dand column C. The increased dependencyon a limited number of airlines and spe-cialized tour operators and travel agents(event B) is likely to raise the cost of inter-national travel (event C). Therefore, anenhancing arrow is placed in the cell whererow B and column C intersect. It is notexpected that the occurrence of event Bwould have any effect on event A, so a hor-izontal line is placed in this cell. The othercells are completed in accordance with sim-ilar judgements. The completed matrix
Table 12.4. Basic format for the ATB cross-impact matrix. Up arrow, enhancing effect; horizontal line, noeffect; down arrow, inhibiting effect.
A A further decline in the number of tourist arrivalsoriginating from the more traditional markets
B Increased dependency on a limited number ofairlines and specialized tour operators and travelagents
C Increased cost of international travel
D A general increase in domestic (internal) tourism
If this event were to occurThen the impact on this event would be
A B C D
301Demand Modelling and Forecasting

shows the direction of impact of rows(actors) on columns (reactors). If interestfocuses primarily upon event D, for exam-ple, then column D should be studied foractor events. Each of these actor eventsshould be examined in turn to determinewhat degree of influence, if any, it is possi-ble to have on these actors in order to bringabout/prevent the occurrence of event D.
Next, the impact should be quantified toshow linkage strengths, i.e. to determine
how strongly the occurrence of one eventwould influence the occurrence of each ofthe other events. To assist in quantifying theinteractions, a subjective rating scale may beused (Table 12.5). Table 12.6 shows how thebasic cross-impact matrix can be modified toshow linkage strengths. Consider, for exam-ple, the impact of event D on event B. It isfelt that the occurrence of event D wouldhave a critically enhancing impact on thelikelihood of occurrence of event B. Both the
Table 12.5. Example of subjective rating scale.
Voting scale Subjective scale
18 Critical: Essential for success16 Major: Major item for success14 Significant: Positive, helpful, but not essential effect Enhancing12 Slight: Noticeable enhancing effect
0 No effect
12 Slight: Noticeable inhibiting effect14 Significant: Retarding effect Inhibiting16 Major: Major obstacle to success18 Critical: Almost insurmountable hurdle
6
6
Table 12.6. The ATB’s cross-impact matrix showing degrees of impact.
A A further decline in the number of tourist arrivalsoriginating from the more traditional markets
B Increased dependency on a limited number ofairlines and specialized tour operators and travelagents
C Increased cost of international travel
D A general increase in domestic (internal) tourism
If this event were to occurThen the impact on this event would be
A B C D
24
0
24
18
12
14 18
26
18
16
16
26
302 S.F. Witt and L. Moutinho

direction and degree of enhancing impactare shown in Table 12.6 by the +8 rating inthe appropriate cell. On the other hand,event A’s occurrence would make event Bless likely; the consensus rating is –4, andthis is entered in the appropriate cell. Thisprocess is continued until all interactionsare evaluated and the matrix is complete.
Another approach involves the use ofprobabilities of occurrence. Once the proba-bility of occurrence of each event isassessed, then the change in that probabilitycan be assessed for each interaction. Theprobabilities of occurrence can be entered inan information column preceding thematrix, and then the matrix may be con-structed in the conventional manner.However, in many instances the degree ofimpact is not the only important informa-tion to be gathered from a consideration ofinteractions. The time relationships areoften critical and can be shown in a numberof ways. For example, time information canbe added (within parentheses) to each prob-ability of occurrence depicted in thematrix.
Table 12.7 illustrates the use of a cross-impact matrix incorporating interactive
probabilities of occurrence and time rela-tionships. Consider the impact of event D onthe probable occurrence of event B. It isjudged to have a critically enhancing effectand the consensus is that the probability ofoccurrence of event B will change from 0.60to 0.80. (In this particular case study exam-ple, it was assumed that the participants’consensus judgement was that a value of +2on the voting scale in Table 12.5 translatedinto an increase in the probability of occur-rence of five percentage points in Table 12.7,a value of +4 into an increase of ten per-centage points, and so on. Similarly, a valueof –2 translated into a decrease in the proba-bility of occurrence of five percentagepoints, and so on.) The new probability is,therefore, entered in the appropriate cell.Event B is judged to have no effect uponevent A; therefore, the original probability,0.70, is unchanged. Event B is stronglyinhibited by the occurrence of event C, andthe resulting probability of occurrence islowered from 0.60 to 0.45. The occurrence ofevent B will increase the probability ofoccurrence of event D from 0.70 to 0.85. Thisprocedure is followed until all of the cellsare completed.
Table 12.7. The ATB’s cross-impact matrix showing interactive probabilities of occurrence.
A A further decline in the number of touristarrivals originating from the more traditionalmarkets
B Increased dependency on a limited numberof airlines and specialized tour operatorsand travel agents
C Increased cost of international travel
D A general increase in domestic (internal)tourism
If this event were to occurThen the new probability of occurrence of
this event would be
A B C D
0.50(+2 years)
0.75(+2 years)
0.80(+2 years)
0.80(+1 year)
0.35(+2 years)
0.40(+1 year)
0.90(immediate)
Having thisprobability ofoccurrence
0.70
0.60 0.70 0.70(immed.)
0.45(immed.)
0.85(immed.)
0.85(immed.)
0.50
0.70
303Demand Modelling and Forecasting

The time relationships in Table 12.7 canbe interpreted as follows. If event B were tooccur it would have a major enhancingeffect on event D, raising D’s probability ofoccurrence from 0.70 to 0.85; this enhance-ment would occur immediately. If event Cwere to occur, it would raise the probabilityof occurrence of event A from 0.70 to 0.75; itwould take 2 years for the enhancement tobe completed.
The information provided by the cross-impact matrices should have proved veryuseful for strategic planning by the AzoresTourist Board. It may be that the ATB wasparticularly concerned about a furtherdecline in the number of tourist arrivalsoriginating from the more traditional mar-kets and had plans to deal with the situationshould it occur. Various marketing strate-gies could be employed to halt the decline.By studying column A in Table 12.7, thetourism authorities could pinpoint thoseevents which were likely to have a markedimpact on the likelihood of occurrence ofevent A. Thus, for example, if there was anoticeable general increase in domestictourism, the probability of occurrence of afurther decline in the number of touristarrivals originating from the more tradi-tional markets would increase from 0.7 to0.8. Hence, the ATB would need to step upits marketing efforts accordingly.
The idea underlying cross-impact analysisis that the probability of occurrence of anevent is directly related to the occurrence/non-occurrence of other events. Byanalysing correlations between events, it ispossible to estimate the likelihood of futureevents occurring. This information can thenbe incorporated into the strategic planningprocess. Thus, cross-impact analysis canlead to improved strategic vision, and allowmanagement to follow a more proactiveapproach. Cross-impact analysis provides aframework for the analysis of a range ofpossible events and complex interactions.Given that tourism is characterized by a highdegree of interdependence among events.cross-impact analysis is a forecasting tech-nique that would seem to be particularlyrelevant for this field.
Probability Forecasting
It may not be necessary to obtain highlyaccurate forecasts of specific values, butonly to ascertain whether the probabilityfalls within a particular range of values, inorder to support good tourism managementdecisions. Furthermore, it is usuallyassumed that there is a cost trade-off whenchoosing a forecasting model. Fitzsimmonsand Sullivan (1982, p. 118) noted that: ‘Gen-erally the less-expensive models yieldless-accurate forecasts, and there are costsassociated with inaccuracies in the forecast. . . Is it worthwhile to spend more on anaccurate forecasting model than incur thepotential costs of a less-expensive but poorforecast?’ Although Martin and Witt (1988a,1989a, b) have provided some empirical evi-dence to the contrary, i.e. that moreexpensive models do not necessarily lead tomore accurate tourism demand forecasts, tothe extent that the widely quoted trade-offstated by Fitzsimmons and Sullivan is true,it is important to identify an acceptable levelof forecast accuracy.
Decision theory can be used to determineoptimal strategies when a tourism decision-maker is faced with several decisionalternatives and an uncertain or risk-filledpattern of future events, i.e. states of nature.(Risk is taken to mean a situation in whichvarious outcomes to a decision are possible,but where the probabilities of the alternativeoutcomes are known. Uncertainty describesa situation in which there is no such proba-bilistic knowledge or where the informationis fragmentary.) This section examines theprecision required for probability forecastsand the use of skew loss functions as appliedto tourism. For a general discussion of prob-ability forecasting, the reader is referred toWilson and Keating (1998), Delugio (1998),and Makridakis et al. (1998).
Required accuracy levelsHere we assess how accurate the forecasts ofthe probabilities associated with the occur-rence of alternative states of nature need tobe when we are considering problemsinvolving few possible actions and fewstates of nature. As an example of this class
304 S.F. Witt and L. Moutinho

of problem, suppose that a regional tourismauthority is interested in marketing a multi-unit tourist pack comprising local dairy,wines and handicraft products in order togenerate additional visitor arrivals andhigher spending levels. The product is madeby a batch process which, through equip-ment indivisibilities, is restricted to thefollowing annual capacities:
A1: 1 million unitsA2: 2 million unitsA3: 3 million units
The conditional opportunity losses under S1
(high sales) and S2 (low sales) are shown inTable 12.8.
As can be seen from Table 12.8, in thisexample if S1 obtains then act A3 is the bestcourse of action and is accordingly assigneda conditional opportunity loss of zero. If S2
obtains, however, act A1 becomes the bestcourse of action. Act A2 is a kind of ‘hedging’act in the sense that the conditional oppor-tunity losses associated with it are notextreme under either S1 or S2. The problemfacing tourist product planners is to estimatethe probabilities of occurrence of S1 and S2,and in particular they need to know howprecise these estimates should be.
Suppose that P(S1) denotes the probabil-ity that S1, occurs. Then P(S2) is equal to1 – P(S1). If P(S1) were equal to 0.1, then theexpected opportunity losses (EOLs) of thethree acts would be:
EOL(A1) 5 0.1(6) 1 0.9(0) 5 £0.6 mil-lionEOL(A2) 5 0.1(3) 1 0.9(3) 5 £3.0 mil-lion
EOL(A3) 5 0.1(0) 1 0.9(8) 5 £7.2 mil-lion
Clearly, under these conditions act A1 (thelow-capacity facility) would be preferable tothe other courses of action. By assumingvarious values that P(S1) could take, we canconstruct the chart of expected opportunitylosses shown in Fig. 12.1.
If P(S1) is less than 0.5, then act A1 is best,whereas if P(S1) is between 0.5 and 0.625, actA2 is best. If P(S1) exceeds 0.625, then act A3
is best. If P(S1) is exactly 0.5 either A1 or A2
could be chosen, and if P(S1) is exactly 0.625either A2 or A3 could be chosen. These ‘indif-ference’ points are determined by findingthe points on the abscissa where the lines ofexpected opportunity loss intersect, that iswhere:
EOL(A1) 5 EOL(A2)
Letting P(S1) 5 P, we have:
6P 1 0(1 2 P) 5 3P 5 0.5
Similarly:
EOL(A3) 5 EOL(A2)0P 1 8(1 2 P) 5 3P 5 0.625
The implication of these calculations is thatthe new tourist product planner does notneed to know the precise value of P(S1) butonly that it falls within specific ranges. Interms of the assumptions of this tourismproblem, the same act (act A1) would bechosen if P(S1) were, say, 0.1, as would bechosen if P(S1) were say, 0.4. Although theillustration is simple, it does serve to dem-onstrate that, in some tourism marketingproblems, forecasts do not need to be madewith high precision.
Skew loss functionsIn more realistic cases a greater number ofstates of nature and courses of action arepossible. For example in accommodationcapacity problems some ‘best’ level ofaccommodation may exist for each possiblesales level. In tourism demand capacityplanning problems, the quantity of bedsallocated may vary more or less continu-ously within a certain range. Let us nowsuppose that the same regional tourist
Table 12.8. Conditional opportunity losses: newmulti-unit tourist pack problem (£ million).
State of nature
Act S1 S2
A1 6 0A2 3 3A3 0 8
305Demand Modelling and Forecasting

authority is interested in determining the‘best’ (optimum) number of beds to offer fordistribution to tour operators and travelagents. If travel intermediaries’ requests forsuitable accommodation exceed the quan-tity available, unfilled requests will result. Ifthe number of beds available in the regionexceeds the demand, there will be costsassociated with the excess supply of accom-modation. For purposes of illustration,suppose that the imputed ‘cost’ for eachunfilled tour operator’s/travel agent’srequest per night is £12.00, and suppose thatthe cost associated with each bed vacant pernight is £3.00. The regional tourist authorityis interested in recommending some bestlevel of accommodation capacity that mini-mizes expected cost under an uncertaintourist demand.
The regional tourism planners shoulddefine the probability distribution of the
possible tourist demand levels for accom-modation in the area. As an example,suppose that the planners are willing tobelieve that tourist demand for accommoda-tion in the region will exceed 20,000 bedsbut will be no higher than 80,000 beds. Their‘most probable’ estimate of tourist demandis that it will be between 30,000 and 40,000beds. The cumulative probability distribu-tion can then be derived from a histogramchart. The smooth curve should be used toapproximate cumulative probabilitieswithin the histogram intervals. For example,the estimated probability of tourist demandbeing less than 35,000 beds can be seen to beapproximately 0.45 (Fig. 12.2).
To determine the optimal number of bedsto be offered to the market, tourism plannerswould like to find the appropriate balancepoint where the expected cost of under-construction just equals the expected cost of
Fig. 12.1. Expected opportunity losses: new multi-unit tourist pack problem (£ million).
306 S.F. Witt and L. Moutinho

over-construction. Both these costs are pro-portional to the difference between theamount offered and the amount requested.Fortunately, however, it is not necessary toconstruct a payoff table for each possible actand tourist demand level. Instead, the fol-lowing principle may be adopted. Keepincreasing the accommodation capacityuntil the highest level n is reached for whichthe expected incremental cost of adding thenth unit is still less than the expected incre-mental cost of not adding the nth unit to theaccommodation capacity level.
If we let D 5 tourist demand level, C0 5£3.00 = cost per night of over-construction,and Cu 5 £12.00 5 cost per unit per night ofunder-construction relative to touristdemand, then we have by application of theprinciple above:
C0 P (D < n) < Cu [1 2 P(D < n)][P(D < n)] (C0 1 Cu) < Cu
P(D < n) < Cu
C0 1 Cu
P(D < n) < £12.00
£3.00 1 £12.00
P(D < n) < 0.80
From Fig. 12.2, it can be seen that the largestn for which P(D < n) < 0.80 is approx-imately 48,000 beds. This represents thegraphical solution to the tourist capacityproblem. Had the planners not consideredthe asymmetry in the costs of over- versusunder-construction, they might have plan-ned for either:
● a capacity level equal to the midpoint ofthe bar in the histogram with the great-est incremental height (i.e. 35,000 beds),the modal forecast; or
● a capacity level equal to the median or0.5 cumulative probability level of thedistribution (i.e. 36,000 beds).
In either case, they would have considerably‘under-produced’ relative to the solutionthat takes into account the conditional costsof over- versus under-production.
Fig. 12.2. Probability distribution: tourist demand for regional accommodation (000 units).
307Demand Modelling and Forecasting

Although the need for accurate forecastsis often stressed, there are situations inwhich highly accurate point forecasts arenot particularly useful. In particular, in thecase of probability forecasting it is often nec-essary only to know whether or not theprobability falls within a particular range ofvalues. Even if increased accuracy can beobtained, it is often not the case that theadditional cost entailed is justified. Whenknowledge regarding error costs is available,this should be incorporated in the forecast-generating procedure. In particular, costasymmetries will affect the level of demandto plan for.
Econometric Forecasting3
The econometric approach to forecastingtourism demand involves the use of regres-sion analysis to estimate the quantitativerelationship between tourism demand andits determinants; the estimation is carriedout using historic data, and future values oftourism demand are obtained by using fore-casts of the demand determinants inconjunction with the estimated relation-ship. See, for example, Smeral et al. (1992)and Smeral and Witt (1996). The group ofvariables that influences international tour-ism demand will depend on the purpose ofvisit under consideration. As by far themajority of international tourist trips takeplace for holiday purposes, and it is only forholiday trips that individuals are com-pletely free to choose the destination,transport mode, and so on, we shall justconcentrate on those factors that influencethe demand for international holiday tour-ism.
Tourism demand functionThe variables involved in tourism demandforecasting are discussed below.
Forecast variableTourism demand is generally measured interms of the number of tourist visits from an
origin country to a foreign destination coun-try, or in terms of tourist expenditures byvisitors from the origin country in the desti-nation country. Tourist nights spent in thedestination country are an alternativemeasure.
PopulationThe level of foreign tourism from a givenorigin is expected to depend on the originpopulation. In some studies population fea-tures as an explanatory variable, but moreoften the effect of population is accommo-dated by modifying the dependent variableto become international tourism demandper capita.
IncomeIn tourism demand functions, origin coun-try income or private consumption isgenerally included as an explanatory varia-ble, and commonly enters the demandfunction in per capita form (correspondingto the specification of demand in per capitaterms). The appropriate form of the variableis private consumption or personal dispos-able income.
Own priceThe appropriate form of the price variable isby no means clear. In the case of tourismthere are two elements of price: the cost oftravel to the destination; and the cost ofliving for the tourist in the destination. Incertain studies where econometric forecast-ing models have been developed forinternational tourism demand, a specificdestination tourist’s cost of living variable isincorporated in the models. Usually, how-ever, the consumer price index in a countryis taken to be a proxy for the cost of tourismin that country. In general, this procedure isadopted on the grounds of lack of more suit-able data. Whichever destination pricevariable is used, it needs to be adjusted bythe rate of exchange in order to transform itinto origin country currency.
Exchange rates are also sometimes usedseparately to represent tourists’ living costs.The usual justification is that consumers are
3 Material in this section has appeared previously in Witt and Witt (1995).
308 S.F. Witt and L. Moutinho

more aware of exchange rates than destina-tion costs of living for tourists, and hence aredriven to use exchange rate as a proxy vari-able.
Substitute pricesEconomic theory suggests that the prices ofsubstitutes may be important determinantsof demand. For example, an increase in holi-day prices to Spain may increase demandfor holidays to Portugal. Mostly, those sub-stitution possibilities allowed for ininternational tourism demand studies arerestricted to tourist destination living costs.Substitute prices may be incorporated byspecifying the tourists’ cost of living varia-ble as destination value relative to aweighted average value calculated for a setof alternative destinations, or by specifyinga separate weighted average substitute desti-nation cost variable.
Just as tourists’ living costs in substitutedestinations are likely to influence thedemand for tourism to a given destination,so travel costs to substitute destinations mayalso be expected to have an impact, and canbe allowed for in a similar manner. Fur-thermore, if the data are disaggregated bytransport mode, then travel cost to the samedestination by alternative transport mode(s)would influence tourism demand to a partic-ular destination by a given transport mode.
Qualitative effectsDummy variables can be included in inter-national tourism demand functions to allowfor the impact of ‘one-off’ events. For exam-ple, when governments impose foreigncurrency restrictions on their residents (e.g.the £50 annual limit introduced in the UKduring late 1966 to late 1969), this is expec-ted to reduce outward tourism. Similarly,the 1973 and 1979 oil crises temporarilyreduced international tourism demand;although the impacts of the oil crises onholiday prices and consumer incomes areincorporated in these explanatory variables,a further reduction in international tourismdemand is likely because of the psycho-logical impact of the resultant uncertaintiesin the world economic situation. Witt andMartin (1987) discussed a range of one-off
events which have been accommodated bydummy variables.
TrendA trend mainly represents a steady changein the popularity of a destination countryover the period considered, as a result ofchanging tastes. It also, however, capturesthe time dependent effects of all otherexplanatory variables not explicitlyincluded in the equation, such as changes inair service frequencies and demographicchanges in the origins.
MarketingNational tourist organizations engage insales-promotion activities specifically toattempt to persuade potential tourists tovisit the country, and these activities maytake various forms including media adver-tising and public relations. Hence,promotional expenditure is expected to playa role in determining the level of interna-tional tourism demand. Muchtourism-related marketing activity is not,however, specific to a particular destination(for example, general travel agent and touroperator advertising) and therefore is likelyto have little impact on the demand for tour-ism to that destination. The promotionalactivities of national tourist organizationsare destination specific and are thereforemore likely to influence tourist flows to thedestination concerned.
Lagged dependent variableA lagged dependent variable, i.e. an autore-gressive term, can be justified on thegrounds of habit persistence. Once peoplehave been on holiday to a particular countryand liked it, they tend to return to that desti-nation. There is much less uncertaintyassociated with holidaying again in thecountry compared with travelling to a pre-viously unvisited foreign country.Furthermore, knowledge about the destina-tion spreads as people talk about theirholidays and show photographs, therebyreducing uncertainty for potential visitors tothat country. In fact, this ‘word of mouth’recommendation may well play a more
309Demand Modelling and Forecasting

important role in destination selection thandoes commercial advertising. A type oflearning process is in operation and as peo-ple are, in general, risk averse, the number ofpeople choosing a given alternative in anyyear depends on the numbers who chose itin previous years.
A second justification for the inclusion ofa lagged dependent variable in tourismdemand functions comes from the supplyside. Supply constraints may take the formof shortages of hotel accommodation, pas-senger transportation capacity and trainedstaff, and these often cannot be increasedrapidly. Time is also required to build upcontacts among tour operators, hotels, air-lines and travel agencies. Similarly, once thetourist industry to a country has becomehighly developed it is unlikely to dwindlerapidly. If a partial adjustment mechanismis postulated to allow for rigidities in sup-ply, this results in the presence of a laggeddependent variable in the tourism demandfunction (Gujarati, 1988, Chapter 16).
Empirical resultsExamples of estimated econometric modelsare presented in Table 12.9. The most com-prehensive study in terms of the variety oforigins/destinations covered is by Martinand Witt (1988c), and the first ten models aretaken from this study. The four modelsselected from other studies were specificallychosen because they include explanatoryvariables not covered in the Martin and Wittstudy. Thus model 11 incorporates popula-tion as a demand determinant, models 12and 13 incorporate marketing expenditureand model 14 incorporates a lagged depend-ent variable and travel time. (The elasticityvalues presented in model 14 are impulseestimates.) All the models are specified inlog-linear form.
Population features as an explanatoryvariable only in model 11, but the estimatedelasticity of 12.4 seems far too high to berealistic. (The population elasticity is expec-ted to be fairly close to unity.) Furthermore,an ‘incorrect’ coefficient sign is estimatedfor income. It appears, therefore, that multi-collinearity between population andincome may well be a problem in this
model, which is why population does not,in general, feature as an explanatory variablein tourism demand models. The results frommodel 11 are not included in the discussionwhich follows.
Income appears in each model in Table12.9, but the values of the estimated elastici-ties vary considerably, ranging from 0.4 to6.6. However, other than the 0.4 value, theestimated income elasticities exceed unity,showing clearly that foreign tourism is gen-erally regarded as a luxury. The medianvalue of 2.4 strongly supports a priori expec-tations about the luxury nature of foreigntourism. Many of the differences in elas-ticity estimates can be readily explained.For example, although the income elasticityobtained in model 5 (0.4) is somewhat lowerthan expected, travel from the USA to Can-ada is likely to be regarded in a similarmanner to domestic (USA) tourism, i.e. anecessity, rather than a luxury; whereas,overseas travel from the USA to the UK(model 6) is viewed as a luxury (incomeelasticity is 2.4). By contrast, the value of theincome elasticity for travel from France toSwitzerland (model 1) is similar to that fortravel from France to the UK (model 2) at 2.8.Again, this makes sense as Switzerland is adestination with a very high cost of living fortourists, whereas visiting the UK involves ahigh cost of travel because of the sea border,and therefore holidays to Switzerland andthe UK are likely to be regarded as being atabout the same luxury level by the French.(However, the income elasticity for travelfrom France to neighbouring cheap destina-tions (such as Spain) would be expected tobe much lower; see, for example, the differ-ence in income elasticities for travel fromGermany to Switzerland (high cost) andAustria (low cost).)
As far as own price is concerned, travelcost appears in 11 of the 14 models, and theelasticity estimates range from –0.04 to –4.3,with the median value being –0.5. The threecases where demand is most responsive toown travel cost are those models whichincorporate statistically significant substi-tute travel costs. Destination cost features in12 models, and the elasticity estimates rangefrom –0.05 to –1.5, with the median value
310 S.F. Witt and L. Moutinho

Table 12.9. Examples of estimated econometric models.
Explanatory variables
AuthorsRefDate
ModelNo
Methodof Est R2 Pop Inc
TravCost
DestCost
ExchRate
CombCost
SubstTC
SubstDC
SubstCC
DummyVariables Trnd Mark
LagDV
TravelTime
Martin and Witt 1988c 1 OLS 0.969 2.819* 11.242* 1.053 10.0221
10.034210.150*
(data1965– 2 CO 0.953 2.756* 10.708 0.600 10.204*1
1980) 3 CO 0.987 1.292* 10.037 10.755* 10.109*2
4 CO 0.896 4.923* 10.932 11.250 2.803* 10.0401 10.1225 OLS 0.776 0.372 10.355 10.364 0.156 10.0422 10.0186 CO 0.897 2.431* 10.198 10.4287 CO 0.991 4.550* 10.235 1.859* 0.130 10.258*1
10.619*2
10.061*3
8 CO 0.911 1.775 10.155 0.637 0.921 10.0221
9 CO 0.972 1.331 11.122*11.403* 2.258* 6.305* 10.604*2
10 CO 0.978 1.743 14.337* 10.679 1.827* 2.226* 3.308* 10.374*1
10.367*2
Chadee andMieczkowski
1987(data1976–1985)
11 OLS 0.95 12.401 12.901 11.52+ 1.26+ 0.6914
1.9015
0.5016
Papadopoulosand Witt
1985(data
12 CO 0.996 3.346* 10.458 10.721* 10.515*7 0.175
1972– 13 OLS 0.939 6.645* 10.475 10.706 10.552*7 0.0411982)
Witt 1980(data1964–1972)
14 OLS 0.969 1.386 10.199 10.049 10.0558
0.0919
0.15710
0.15211
0.145–1.01512
0.908* 10.165
Median valuesa 2.4 10.5 10.7 1.8 1.6 1.1 10.11
10.22
10.57
10.1 0.1
Notes: Pop, population; Inc, income; Trav Cost, travel cost; Dest Cost, destination cost; Exch Rate, exchange rate; Comb Cost, combined cost (travel + destination); Subst TC, substitute travelcosts; Subst DC, substitute destination costs; Subst CC, substitute combined costs; Trnd, trend; Mark, marketing (promotional) expenditure; Lag DV, lagged dependent variable; OLS, ordinaryleast squares; CO, Cochrane-Orcutt.
Model 1, France to Switzerland; Model 2, France to UK; Model 3, Germany to Austria; Model 4, Germany to Switzerland; Model 5, USA to Canada; Model 6, USA to UK; Model 7, UK toAustria; Model 8, UK to Spain; Model 9, UK to Austria by Air; Model 10, UK to Austria by Surface; Model 11, USA to Canada; Model 12, Austria to Greece; Model 13, Switzerland to Greece;Model 14, denotes UK to multiple destinations.
*, significant at 5% level; +, significant at 10% level; 1, 1974 oil crisis; 2, 1979 oil crisis; 3, UK currency restrictions 1967–69; 4, second quarter; 5, third quarter; 6, fourth quarter; 7,political disturbances/1974 oil crisis; 8, non-sterling area destination; 9, low cost of tourism or sterling area destination; 10, holiday type; 11, travel mode; 12, range of destination intrinsiccharacteristic values; a, ignoring results from model 11.
311D
emand M
odelling and Forecasting

being –0.7. Tourists thus seem to react in afairly similar manner to destination costchanges and travel cost changes. Exchangerate appears as an explanatory variable inonly 5 of the 14 models and in only one caseis it the sole representation of tourists’ desti-nation living costs. The estimatedelasticities range from 0.6 to 2.3, with amedian value of 1.8, indicating that for thoseorigin–destination pairs where exchangerate is important, there is a relatively highsensitivity of demand to exchange rate chan-ges. The fairly high absolute values obtainedfor the price elasticities again support a pri-ori expectations regarding the luxury natureof foreign tourism.
With regard to substitute prices, travelcost appears in 6 of the 14 models but desti-nation cost in only three. The travel costvalues span the range 0.2 to 6.3 with amedian value of 1.6, and the destination costelasticity values vary from 0.1 to 3.3, with amedian value of 1.1. A wide range of dummyvariables features in the models, showing, inparticular, that political events can havemarked impacts on tourism demand. Mod-els 12 and 13 indicate that marketing expenditure does have a positive impact ontourism demand, but that the estimated elas-ticities are low. Model 14 demonstrates thenegative impact of travel time on tourismdemand, and the importance of habit per-sistence and/or supply constraints (asrepresented by the lagged dependent varia-ble).
The forecasting performance of econometricmodels of international tourism demand ismixed. In the earlier studies econometricmodels often generated less accurate fore-casts than simple extrapolative methods.However, Witt and Witt (1995) and Lim(1997) suggested that this may have beencaused by lack of diagnostic testing coupledwith appropriate remedial action. The morerecent studies, which incorporate a range ofdiagnostic tests, partially support thishypothesis. For example, Kim and Song(1998) compared the forecasting perform-ance of econometric models with severalunivariate time-series models and discov-ered that the econometric models were the
most accurate. On the other hand, Kulen-dran and King (1997) found thateconometric models generated more accu-rate forecasts than some univariatetime-series models but less accurate fore-casts than others.
Conclusion
Forecasts of tourism demand are crucial forplanning purposes. In this chapter, a rangeof tourism forecasting methods has beenoutlined which can be applied in a widevariety of situations.
References and Further Reading
Archer, B.H. (1994) Demand forecasting and esti-mation. In: Ritchie, J.R.B. and Goeldner, C.R.(eds) Travel, Tourism and HospitalityResearch, 2nd edn. Wiley, New York, pp.105–114.
Becker, R.H., Dottavio, F.D. and Bonnicksen, T.M.(1985) Conventional wisdom and qualitativeassessment. In: Wood, J.D. Jr (ed.) Proceed-ings of 1985 National Outdoor RecreationTrends Symposium 2, vol 1. Science Publica-tions Office, National Park Service, USDepartment of the Interior, Atlanta.
Becker, R.H., Dottavio, F.D. and Menning, N.L.(1986) Threats to coastal national parks: atechnique for establishing management pri-orities. Leisure Sciences 8(3), 241–256.
Bonnicksen, T.M. (1981) Brushland fire manage-ment policies: a cross impact simulation ofSouthern California. Environmental Man-agement 5(6), 521–529.
Cetron, M.J. and Davies, O. (1991) 50 TrendsShaping the World. World Future Society,Bethesda, Maryland.
Chadee, D. and Mieczkowski, Z. (1987) Anempirical analysis of the effects of theexchange rate on Canadian tourism. Journalof Travel Research 26(1), 13–17.
Delugio, S. (1998) Forecasting Principles andApplications. McGraw-Hill, Maidenhead,UK.
Fitzsimmons, J.A. and Sullivan, R.S. (1982) Serv-ice Operations Management. McGraw-Hill,New York.
Frechtling, D.C. (1996) Practical Tourism Fore-casting. Butterworth-Heinemann, Oxford.
312 S.F. Witt and L. Moutinho

Gujarati, D.N. (1988) Basic Econometrics, 2ndedn. McGraw-Hill, New York.
Gunn, C.A. (1994) A perspective on the purposeand nature of tourism research methods. In:Ritchie, J.R.B. and Goeldner, C.R. (eds)Travel, Tourism, and Hospitality Research,2nd edn. Wiley, New York, pp. 3–11.
Helmer, O. (1981) Reassessment of cross-impactanalysis. Futures 13(5), 389–400.
Kaynak, E. and Macaulay, J.A. (1984) The DelphiTechnique in the measurement of tourismmarket potential: The case of Nova Scotia.Tourism Management 5(2), 87–101.
Kim, S. and Song, H. (1998) Analysis of inboundtourism demand in South Korea: a cointegra-tion and error correction approach. TourismAnalysis 3, 25–41.
Kulendran, N. and King, M.L. (1997) Forecastinginternational quarterly tourist flows usingerror-correction and time-series models.International Journal of Forecasting 13,319–327.
Lee, Choong-Ki (1996) Major determinants ofinternational tourism demand for SouthKorea: inclusion of marketing variable. Jour-nal of Travel and Tourism Marketing 5(1/2),101–118.
Lim, C. (1997) An econometric classification andreview of international tourism demandmodels. Tourism Economics 3, 69–81.
Lui, J.C. (1988) Hawaii tourism to the year 2000.Tourism Management 9(4), 279–290.
Makridakis, S., Wheelwright, S.C. and Hyndman,R. (1998) Forecasting – Methods and Appli-cations, 3rd edn. Wiley, Chichester.
Martin, C.A. and Witt, S.F. (1988a) An empiricalanalysis of the accuracy of forecasting tech-niques. In: Proceedings of Travel andTourism Research Association 19th AnnualConference. TTRA, Salt Lake City, pp.285–298.
Martin, C.A. and Witt, S.F. (1988b) Forecastingperformance. Tourism Management 9(4),326–329.
Martin, C.A. and Witt, S.F. (1988c) Substituteprices in models of tourism demand. Annalsof Tourism Research 15(2), 255–268.
Martin, C.A. and Witt, S.F. (1989a) Forecastingtourism demand: a comparison of the accu-racy of several quantitative methods.International Journal of Forecasting 5(1),1–13.
Martin, C.A. and Witt, S.F. (1989b) Accuracy ofeconometric forecasts of tourism. Annals ofTourism Research 16(3), 407–428.
Moeller, G. and Shafer, E.L. (1994) The DelphiTechnique: a tool for long-range travel and
tourism planning. In: Ritchie, J.R.B. andGoeldner, C.R. (eds) Travel, Tourism andHospitality Research: A Handbook for Man-agers and Researchers, 2nd edn. Wiley, NewYork, pp. 473–480.
Moutinho, L. and Witt, S.F. (1994) Application ofcross-impact analysis in tourism: a casestudy of the Azores. Journal of Travel andTourism Marketing 3(1), 83–95.
Moutinho, L. and Witt, S.F. (1995) Forecasting thetourism environment using a consensusapproach. Journal of Travel Research 33(4),46–50.
Papadopoulos, S.I. and Witt, S.F. (1985) A mar-keting analysis of foreign tourism in Greece.In: Shaw, S., Sparks, L. and Kaynak, E. (eds)Marketing in the 1990s and Beyond: Pro-ceedings of Second World MarketingCongress. University of Stirling, Stirling, pp.682–693.
Robinson, A.E. (1979) Tourism and the next dec-ade: a look to the future through ‘A Return toDelphi’. Proceedings of Travel and TourismResearch Association Tenth Annual Confer-ence. TTRA, Salt Lake City, pp. 269–282.
Seeley, R.L., Iglars, H. and Edgell, D. (1980) Utiliz-ing the Delphi Technique at internationalconferences: a method for forecasting inter-national tourism conditions. TravelResearch Journal 1, 30–35.
Shafer, E.L. and Moeller, G. (1988) Science andtechnology: the wild cards in tourism strate-gic planning. Paper presented at Benchmark1988: A National Outdoor Recreation andWilderness Forum, Tampa, Florida, 13–15January.
Shafer, E.L. and Moeller, G. (1994) Science andtechnology. In: Witt, S.F. and Moutinho, L.(eds) Tourism Marketing and ManagementHandbook, 2nd edn. Prentice-Hall, HemelHempstead, pp. 120–125.
Smeral, E. and Witt, S.F. (1996) Econometric fore-casts of tourism demand to 2005. Annals ofTourism Research 23(4), 891–907.
Smeral, E., Witt, S.F. and Witt, C.A. (1992) Econo-metric forecasts: tourism trends to 2000.Annals of Tourism Research 19(3),450–466.
Taylor, R.E. and Judd, L.L. (1994) Delphi forecast-ing. In: Witt, S.F. and Moutinho, L. (eds)Tourism Marketing and Management Hand-book, 2nd edn. Prentice-Hall, HemelHempstead, pp. 535–539.
Var, T. (1984) Delphi and GSV techniques in tour-ism forecasting and policy design. Problemsof Tourism 3, 41–52.
Wilson, H. and Keating, B. (1998) Business Fore-
313Demand Modelling and Forecasting

casting, 3rd edn. McGraw Hill, Maidenhead,UK.
Witt, S.F. (1980) An abstract mode-abstract (desti-nation) node model of foreign holidaydemand. Applied Economics 12(2),163–180.
Witt, S.F. and Martin, C.A. (1987) Measuring theimpacts of mega-events on tourism flows. In:The Role and Impact of Mega-Events andAttractions on Regional and National Tour-ism Development: Proceedings ofInternational Association of Scientific
Experts in Tourism (AIEST) 37th Congress.AIEST, St Gallen, Switzerland, pp.213–221.
Witt, S.F. and Witt, C.A. (1995) Forecasting tour-ism demand: a review of empirical research.International Journal of Forecasting 11,447–475.
Yong, Y.W., Keng, K.A. and Leng, T.L. (1989) ADelphi forecast for the Singapore tourismindustry: future scenario and marketingimplications. International MarketingReview 6(3), 35–46.
314 S.F. Witt and L. Moutinho

13International Tourism Management
F. Go and L. Moutinho
The focus of this chapter is on the manage-ment of tourism organizations in a dynamicenvironment. In particular, the competitionin tourism has traditionally taken placedomestically, where the bulk of the marketis concentrated. However, the adjective‘international’ in the title of this chapter isrelevant because both the domestic andglobal environments are intrinsic character-istics of modern industry. More specifically,a growing number of local businesses isbeing drawn into the global arena for twogeneral reasons. First, rapidly rising costsand the weakening of growth opportunitiesin ‘slow-growth’ industrialized economiesis ‘pushing’ transnational corporations inparticular to further their expansion abroad.Second, corporations that have their home-base in North America, Europe and Japanare increasingly ‘pulled’ into foreign mar-kets by growth opportunities, especially innon-Western countries, and linked with net-work affiliates via global distributionsystems (GDS).
The globalization of the tourism industryhas several significant strategic implica-tions. It increases competitive pressures bybringing more entrants into the market. Itincreases the complexity of doing business,from learning to find and manage employeeswith a diverse background in different coun-tries to designing and delivering productsuniquely suited for special interest travelmarkets. And it requires new knowledge, i.e.
knowledge beyond what is known anddeemed to be necessary knowledge by prac-titioners. For example, with economic andbusiness activity becoming increasinglyinternationalized, there is a great need formanagers of both private and public tourismorganizations to interact with the complexglobal tourism environment. In the next dec-ade, tourism managers will require a globalperspective in order to respond effectivelyto
a myriad of crises, such as overcrowding oftourist attractions, overuse and destructionof natural resources, resident-host conflicts,loss of cultural heritage, increased crimeand prostitution, inflation and escalatingland costs, and a host of other political,socio-cultural, economic andenvironmental problems that may bebrought about or exacerbated by tourismdevelopment’ (Theobald, 1994, p. ix).
Whereas Witt et al. (1991) surveyed themanagement of the international tourismenvironment, primarily by way of the tradi-tional managerial functions, this chaptertakes a somewhat different approach. It pin-points the globalization of the industry as acentral issue for tourism organizations andexamines how to organize, integrate andmanage activities to respond to the simulta-neous need for a sense of global strategicintent and a sense of localized focus andcompetitiveness. Three earlier works were
© CAB International 2000. Strategic Management inTourism (ed. L. Moutinho) 315
used in preparing this chapter: Go and Pine(1995) and Go (1994, 1995).
Globalization of the Travel andTourism Market
The increasing homogenization of customerneeds and lifestyles, the nature of the inter-national tourism industry’s macro-environment, which demands a worldwidepresence, and the development of comput-erized reservation networks have led to aglobal travel and tourism market.
Telecommunications, television andinternational travel have laid thegroundwork for a ‘global lifestyle’,especially in the metropolitan cities ofindustrialized countries. The film andtelevision media deliver the same imagesthroughout the global village. [Air] travelopens the avenues of exchange which hasresulted in a ‘globalized’ market comprisedof groups of consumers in largemetropolitan areas, like New York,Stockholm, and Milan who may show moresimilarities than consumers in Manhattanand the Bronx in New York itself (Naisbittand Aburdene, 1985, pp. 118–120).
The trend towards globalization in the ser-vices sector follows the precedent set bymanufacturers who produce their standar-dized products and sell them under a brandname on a worldwide basis to reap econo-mies of scale. The Japanese corporationshave been particularly successful in exploit-ing global markets by being verycustomer-oriented as Levitt observes:
What is distinct about Japan is theunrelenting drive for economizing andvalue-enhancing distinction. And thatspells everywhere and in everything a drivefor global standardization at high-quality-levels. The governing theory is that withreasonably restrained concern forsuitability, if you force costs and pricesdown and push quality and reliability in allthings up, everywhere around the worldcustomers will prefer your world-standardized generic offerings in risingproportions, regardless of whatconventional market research and evencommon observations may suggest about
the existence of different national andintranational tastes, preferences, needs andinstitutions. In this theory the Japanesehave been repeatedly vindicated (Levitt,1983, pp. 25–26).
The major transnational corporations thatare actively involved in travel and tourismtend to pursue global markets with standar-dized branded products. Whereinternational travel is extensive, for exam-ple in Europe, a global brand can have asubstantial advantage in that the brand hasan impact on country visitors through adver-tising and distribution outlets (Aaker, 1991;p. 265). The visitor may be aware of thebrand because of the marketing and distribu-tion activities that the internationalcorporations carry out in the visitor’s homecountry as part of the value chain activitiesthat are usually tied to the travel generatingmarkets. Due to the service nature of thetourism product, the ‘production’ and serv-ice delivery have to take place in thetraveller’s destination.
Day (1990, p. 91) has observed that ‘whenmarkets are globalizing then regional dis-tinctions become important’. In this regard,it should be observed that there are pitfallsand traps in an approach that overlooks cul-tural and regional differences but there isdanger as well in assuming too much sim-ilarity. Specifically, the more homogeneousconsumers’ lifestyles become, the moresteadfastly they are likely to cling to deepervalues and treasure the traditions that springfrom within (Naisbitt and Aburdene, 1985,p. 120). Furthermore, the needs and prefer-ences of customers around the globe willsimultaneously become more universal andmore specialized. Clear cut differences arelikely to remain from country to country, butinternational corporations will satisfy thesewith adjustments to standardized productsand services. The homogeneity and special-ization paradox will allow greater diversity,distinctiveness and uniqueness in customerpreferences (Hickman and Silva, 1987, p.102). Akin to this last observation, it shouldbe noted that globalization is not ‘an all ornothing proposition as far as branding isconcerned, [but that it] can involve someelements of the brands – the name, the sym-
316 F. Go and L. Moutinho

bol, the slogan, the perceived quality, or theassociations – it need not involve all ofthem’ (Aaker, 1991, p. 268). For example,the golfing ‘boom’ represents a global marketopportunity for corporations that is con-strained by the problem of building enoughgolf courses to accommodate players. Whilethe world’s golfing population has doubled,the number of golf courses has increased byonly 16% (Anon, 1989).
The globalization of travel and tourismincreases the complexity of doing businessin that companies have to be able to cater tothe tastes of foreign guests and manageemployees in foreign (host) countries andfrom diverse cultural backgrounds in thehome country. At a strategic level the globalmarket requires travel and tourism compa-nies to redefine their market and the ways ofdefining and accomplishing work (Mou-tinho, 1989, p. 139).
The Changing Environment of theInternational Tourism Industry
Slowing population growth rates in devel-oped nations due to a declining fertility rate,the deferred rate of marriage and risingdivorce rates have led to a decline in theindustrialized nations’ share of total worldpopulation. Therefore population growthmay become a national priority given thefact that in Western European countries thepopulation is shrinking (Czinkota et al.,1989, p. 631).
The once accepted authority and influ-ence of family, religion and politicalinstitutions are being replaced by emancipa-tion, a concern for ecology and a growinginterest in wellness, health and life-longlearning. The international travel and tour-ism industry will be the potentialbeneficiary of these trends in increasinglydiverse lifestyles if it manages to adapt to‘demographic and social shifts (that) areoccurring which will dramatically trans-form the level and nature of tourism’(Ritchie, 1991, p. 152).
For the international travel and tourismindustry, some of the more significant demo-graphic changes have included the ageing of
the population in industrialized countries,the reduction in household size, and adecline in the leisure time of people whopossess the bulk of the discretionaryincome.
Ageing populationAs a result of the increase in life expectancy,a larger share of travellers will consist ofolder people who are healthy enough, have asecure income, and fewer family responsi-bilities. Though population growth inEurope is close to zero and the propensityfor travel already high, the demand for travelcan be anticipated to increase as a functionof an ageing population. For example, inEurope, 20.1% of the population was over65 in 1980; by the year 2025 that figure willhave risen to 29.2%. Taking into considera-tion those aged between 55 and 65, thenumber of Europeans who are now part ofthe ‘mature market’ is about 100 million.
The average life expectancy in Europe in1980 was 72.2 versus 57.3 for the rest of theworld. The average world life expectancyhas now risen to approximately 65.3 and inEurope to 75.4 (ILO, 1989, p. 73). The ageingpopulation, especially in Europe and NorthAmerica, forms a large and affluent potentialtravel and leisure market. A larger share oftourists consists of older people. So far,attention in industrialized nations hasfocused largely on the pressures the growinggroup of elderly will place on pensions andhealth care. But in fact the changes to comewill range from where seniors will live,where they will eat, and what foods theywill consume: a market with enormousopportunity for the lodging industry. Realestate developers are beginning to investi-gate this relatively new but rapidlyexpanding market segment, i.e. the growingneed for senior citizen housing. Increasingdemands from the ageing population pro-vide opportunities for private retirementcentres, including the new lifecare concept,which has excellent growth potential wellinto the 21st century.
Household size reductionThe trend away from marriage and low pop-ulation growth implies that Western society
317International Tourism Management

will be increasingly influenced and in cer-tain countries perhaps dominated byhouseholds consisting of singles or couples.Smaller households with fewer childrenwill mean different spending patterns, moremoney to spend on themselves, and poten-tially greater mobility to devote to travel andleisure activities. International corporationswill have to be responsive to, for example,the consumers’ concerns for their physicalfitness and state of mind.
Discretionary income in relation to timeConventional wisdom held that the longworking hours of the 19th century woulddecline due to the automation of the work-place and the influence of unions and that asa consequence discretionary or leisure timewould increase for the average worker.Instead, the reverse seems to be happening.In America, for example, one survey showedthat:
From 1973 through 1985, the number ofleisure hours available to most Americansdropped from 26.2 hours to 17.7 hours aweek, a loss of 8.5 hours every week, or onehour and 12 minutes a day . . . Takentogether, the number of hours the averageAmerican spends at work each week hasincreased from 40.6 in 1973 to a current48.8, a rise of 8.2 hours a week or one hourand 10 minutes a day. One key reason forthe dramatic shifts in working hours andleisure time can be found in the increasingnumber of women who are working, nowup to an estimated 56% of all adult women.That means that both spouses are spendingmore time at work and have less time leftfor leisure. Another is that the country hasshifted radically away from blue-collarproduction to white-collar service jobs.Blue-collar hours have remained steady ordeclined, while white-collar hours of workhave risen (Harris, 1987).
Rising environmental concernsGreater interest in nature and the protectionof the environment are part of shifting valuestructures and lifestyles in society. For agrowing number of consumers in the indus-trialized world, quality of life issues havebecome as important as standard of livingissues, because the former are perceived to
affect their well-being.The present intellectual revolution in
society affects the travel and tourism marketin particular. On the one hand, rising urba-nization of world populations will increasethe demand for scenic beauty and nature.On the other hand, millions of consumerswill put increasing pressure on policymakers and business leaders to preserve theenvironment. For example, Aderhold (1992)reported on the growing sensitivity to envi-ronmental matters among Germans onvacation. Specifically, he indicated that thepercentage of German holiday-makers whonoticed problems relating to the environ-ment during their holidays doubledbetween 1985 and 1988.
The ‘environment’ has become a mega-force that will influence the type of productsthe market is likely to want in the future.The growing number of consumers who careabout the environment implies that theinternational tourism managers have todemonstrate greater concern about environ-mental matters. What has the industry doneto assure that its actions are environmen-tally compatible? The World Travel andTourism Council established the WorldTravel and Tourism Environment ResearchCentre (WTTERC) in 1991 to monitor, assessand communicate the environmental prac-tices of the travel and tourism industry(WTTERC, 1994).
Implications of Shifting TouristDemand
The mass movement of tourists is a con-sequence of contemporary migrationpatterns in industrialized society. Specifi-cally, recreational travel is a function ofmigration to the city and the commutingresulting from large-scale urbanization andspatial separation of the workplace and thehome. Travelling abroad for pleasure pur-poses by large numbers of people is arelatively modern occurrence, dating fromthe early 19th century. Increased awarenessof the outer world in particular, led to anincreased readiness among the more edu-cated groups in society to migrate
318 F. Go and L. Moutinho

temporarily or even on a permanent basis(Cohen, 1972, p. 197).
At present, there are a number of sig-nificant travel demand shifts taking placethat will affect the international hotel indus-try, including:
● A potential, substantial discontinuity(Crouch and Shaw, 1990, p. 18) of inter-national travel flows due to the dramaticchanges taking place in Central andEastern Europe and the Asia-Pacific Rimregion. Increasing numbers of visitorsfrom new markets will pose a challengefor destinations. For example, Asianvisitors tend to be uncomfortable in acompletely foreign setting. This recog-nition has implications for food service,language ability of service staff and soon.
● The ageing populations and the sizereduction of families in the industrialcountries (where the vast majority ofinternational travellers originate). Thecontemporary urban household oftenconsists of two income earners, includ-ing professional individuals whose jobsgenerally involve longer hours in a highpressure environment (Lakatos and VanKralingen, 1985; Gibbs, 1989).
● The emergence of more demanding cus-tomers. Greater affluence, higher levelsof education and more sophisticationplaces new demands on traditionaltravel activities including those involv-ing attractions, events, shopping anddining. Constant renovation of facilitiesand upgrading of service to ensure prod-uct quality are ‘musts’. For example,upscale consumers are searching fornew experiences including themedtours, cruising and all-inclusiveresorts.
The shifts in demand have implications forbusiness travel, pleasure travel, personaltravel and international travel. Market seg-mentation in the hotel industry hasgenerally taken place along the dimensionsof main target markets such as corporatetravellers, group travellers, conferencegroups, aircrews and leisure travellers. Eachsegment typically has its own specific
requirements. One now increasingly identi-fies visitor needs and interests asfundamental to a continuing research proc-ess necessary to better understand visitormarket segments and their motivations andbehaviours.
Changing Patterns of Competition
The advent of the air transportation industryin the post-war era resulted in the inter-national travel and tourism industry as weknow it today. It had its origin with PanAmerican Airways’ creation of subsidiaryInterContinental Hotels in 1946 to provideits passengers and crews with modernaccommodation in Latin America. Fromthese humble beginnings, the hotel groupwas built into a worldwide ‘hotel chain’.
The expansion of international air trans-portation and jumbo jets carrying greaternumbers of passengers created shortages ofquality accommodation in a number of loca-tions and accelerated airline involvement inthe international hotel industry. For exam-ple, in May 1967, Trans World Airlines(TWA) purchased Hilton InternationalHotels for US $17 million, making the air-line owner of 42 hotels in 28 countries(Sampson, 1984, p. 164). And in 1970, amerger was negotiated between Westin(then Western International Hotels) andUnited Airlines (UAL) Inc., with Westincontinuing to operate as an autonomous,wholly owned subsidiary.
The merger of airlines and hotel com-panies and the emergence of motelconglomerates such as Holiday Inns,Ramada Inns and Quality Inns expedited theintroduction of standardized hotel ‘formu-las’ and modern travel marketing practicesthroughout the world. The internationaliza-tion of American-based hotel corporationshad a profound effect on the domestic hotelindustries of many countries. Traditionallydomestic hotel industries which could sur-vive in less competitive times depended fortheir success on a durable competitiveadvantage. In particular, they operated in adefined, usually local, market wherein com-petition was restricted.
319International Tourism Management

For instance, Tideman (1987, p. 1)chronicled the significant change in theDutch Hotel industry when the Hilton Inter-national hotel in Amsterdam opened in1962. It was the first foreign-owned andoperated hotel in The Netherlands and theforerunner of an ‘invasion’ of internationalhotel chains. During the next quarter of acentury, other foreign-owned and operatedhotel companies penetrated the Dutch hotelmarket, despite the resistance and compet-itive counter measures of Dutch hoteliers. In1987, the five largest hotels (measured byrooms count) in The Netherlands were allowned and operated by corporations basedin foreign countries. By comparison, theGrand Hotel Krasnapolsky in Amsterdamwith 364 rooms was the largest domesticallyowned and operated hotel company in TheNetherlands, but ranked only sixth in termsof size.
The invasion of foreign hotel chainsresulted in a competitive response by Dutchhoteliers who banded together and, with thehelp of KLM (Royal Dutch Airlines), estab-lished the Golden Tulip Hotels Company. Inessence, the Golden Tulip Hotels Companyallows independently owned domestichotels to function more effectively under abrand name and through a reservations sys-tem. The Golden Tulip Hotels brand and itsreferral system has been successful both inThe Netherlands and abroad due, to a greatextent, to its link with KLM, the Dutchnational air carrier (Tideman, 1987, pp. 1,12).
Due to the internationalization of theeconomy and business activity, the competi-tion in the tourism industry has shifted fromthe local level to the global level. This devel-opment influences to a significant extent thestrategic decision process of both independ-ent tourism operators and internationaltourism organizations. Independent and, forthe most part, local tourism organizationswill increasingly attempt to become part of anetwork to benefit from the scale effectsbrought about by configuration to ensuresurvival. The application of the principle ofconfiguration has been illustrated by, forexample, the formation of referral and fran-chise systems. On the other hand,
established international tourism organiza-tions with a large network in place are likelyto focus more and more on system coordina-tion to remain competitive by improvingcommunications and cost control.
The above example draws together thebasic ideas of the evolving globalization andindustry structure in the travel and tourismsector. Most independently owned enterpri-ses are local in nature, whereas many of thelarger chain-operated corporations areactive on the global level. There is, there-fore, a need among independently ownedenterprises to be either unique and excel inwhat they do, or become affiliated with aglobal external network (alternatively anindependently owned enterprise canexpand into a corporate chain).
Competitive scenariosThe pattern of international competition dif-fers from industry to industry. However,Porter describes the generic pattern of inter-national competition as follows:
At one end of the spectrum, internationalcompetition takes a form that can be termedlocal, i.e. competition takes place on acountry by country basis. Some competitorsmay be multinational firms, but theircompetitive advantages are largely confinedto each country in which they compete(Porter, 1990, p. 53).
At the other end of the spectrum are globalindustries, in which a firm’s competitiveposition in one nation significantly affects(and is affected by) its position in othernations. Rivals compete against each otheron a truly worldwide basis, drawing oncompetitive advantages that grow out oftheir entire network of worldwideactivities. Firms combine advantagescreated at their home based with others thatresult from a presence in many nations,such as economies of scale, the ability toserve multinational customers, and atransferable brand reputation . . . Industrieshave increasingly become global in thepost-World War II period (Porter, 1990, p.53).
Although there is no conceptual differencein strategic management for domestic or
320 F. Go and L. Moutinho

international hotel firms, managers need aglobal mindset because the world-class serv-ice organizations offer a competitivebenchmark, whereas traditional servicefirms of the ‘Available for service’ and ‘Jour-neyman’ types proposed by Chase andHayes (1991) offer little inspiration forbuilding competitiveness.
To achieve a competitive advantage,international tourism managers have to‘craft’ an appropriate strategy and thenimplement this strategy through an effectivestructural process. The latter stage tends tobe the more complex of the two stages in thatit requires leadership and skilled and com-mitted workers. International tourismmanagers may be aware of global compet-itive benchmarks in the formulation ofstrategy. But the organizational structurerequired to implement the strategy leavesmuch to be desired, that is, if the findings inone study of the international hotel industry(Go and Pine, 1995) can be considered repre-sentative of organizational structure in thetourism sector.
In general, small business operators havelittle, if any, awareness of global standards.Hence, their performance expectation isusually based on local competitive bench-marks. Ideally, international tourismmanagers should think globally and traintheir staff according to global standardswhich lead to world-class service and excel-lent performance. However, their traditionaladministrative heritage prevents all but themanagers of the leading international tour-ism companies to compete on a world-classlevel. Due to fierce competition and limitedresources, domestic tourism organizationsfind the ‘internationalization’ process slowand difficult.
In summary, international tourism man-agers who may have developed appropriatestrategies but lack an internal process, can-not expect to make progress towards theworld-class service organization model pro-posed by Chase and Hayes (1991). Given thefierce competition in international tourism,managers should invest in those means thatwill help improve their organizational capa-bility and hence the management of processin their companies, or risk losing market
share, or worse the opportunity to survive.
The Technological Environment
Historically, new technology has beendeveloped with the goal of improving pro-ductivity and lowering the cost ofproduction. This trend is likely to continue,as new innovations and technologies arecombined with those of the industrial revo-lution. For managers, it will be important toenvisage the type and degree of change andto take steps, within the international tour-ism sector, to anticipate such change. In thetechnological environment, the speed ofnew transportation modes and advances ofinformation technologies are especially rel-evant to international tourism.
International tourism managers whoembrace new information technology byactively participating in the technologyplanning process will be able to identifynew uses of technologies and manage themfor improved competitive advantage. As thefocus of research shifts from creating tech-nology that improves business efficiency toidentifying innovative technology applica-tions that will enhance the traveller’sexperience, managers have to gain an in-depth understanding of the key attributes ofcustomers, competitors, and the strengthsand weaknesses of the company. Only byunderstanding the market will the managersbe able to determine business needs and thepotential use of technology.
Structural Dynamics of theInternational Tourism Industry
The significant relationship between indus-try structure and the market has beendiscussed elsewhere against the backdrop ofthe historical evolution of economic markettheory (de Jong, 1985). Within this frame-work, human economic activities arecharacterized by the ‘art of acquisition’. Inorder to acquire profits or ownership ofanother firm, a commercial organizationmust compete in the market; which means,
321International Tourism Management

according to Stigler (1965, p. 235), ‘rivalry isa race – a race to get limited supplies or arace to be rid of excess supplies. Competi-tion is a process of responding to a new forceand a method of reaching a new equilib-rium.’ Resistance on the part of traditionalinternational hotel firms to meet new chal-lenges, specifically their (i) high costcompared with substitute products andbudget type hotels; (ii) inflexibility in organ-ization; and (iii) inflexibility in corporatestrategy, could cause organizational decline.In turn, organizational inflexibility mightinhibit the capacity of hotel firms to success-fully adapt to human attitudes, (consumer)behaviour and civilization shaped by socie-tal structures which in turn are determinedby the production preconditions. Or to sum-marize Schumpeter’s theoreticalpropositions as cited by de Jong (1985, p.53): (i) production preconditions determinefundamental societal structures; and (ii)process determines structure.
Galbraith (de Jong, 1985, p. 63) viewedthe pressures applied by consumers andsuppliers respectively as a ‘countervailingpower’ in the world of oligopolistic enter-prises. For example, the large hotel chainshave been considered to take on, in effect, aninternationally functioning competitive oli-gopoly which operates only on the localmarket concerned (Go and Welch, 1991, p.91). J.S. Bain was a proponent of the ‘indus-trial organization theory’. According toBain, three elements determine the marketstructure in particular, namely: (i) the levelof industry concentration; (ii) the entry con-ditions or barriers to the industry inquestion; and (iii) product differentiation(de Jong, 1985, p. 73). The aforementionedeconomic theories lead to an overview of thetheory of competitive advantage.
Studies of large multinational firms in the1970s have shown that these corporationstypically compete in domestic and inter-national markets on the basis of competitiveadvantage. The competitive advantage the-ory offers a perspective on business strategythat facilitates analysis of the competitiveenvironment. The key factors for success ofdifferent industries lie in different produc-tion functions ‘at different points along the
value chain’ (Porter, 1990). The way inwhich one activity within the value chain isperformed affects the cost or effectiveness ofother activities.
In an increasingly complex and changingenvironment, international tourism organi-zations cannot effectively compete throughstructures that are uni-dimensional andstatic. But how can managers develop theorganizational structures, processes, andperspectives to implement the strategiccapability to achieve competitive advantagethat is broad-based, as opposed to uni-dimensional based? What model is designedto develop the kind of organization thatembraces change and complexity? Whichorganizational configuration of assets andresources is optimally responsive to theshifting distribution of roles and relation-ships and the different set of managementskills and capability needed in an environ-ment that demands a sensitivity of managersboth on the global and local levels?
In order to function effectively in theintegrated network in the fast-moving, com-petitive market requires an organizationalstructure like the ‘transnational model’ (Bar-tlett and Ghoshal, 1989) which incorporatesa much more flexible management mentalitythan the one which dominates the tradi-tional organizational hierarchy typicallyencountered in international tourism orga-nizations.
A transnational model (Bartlett and Gho-shal, 1989, p. 6) relevant to the internationaltourism organization emerged in the 1990s,characterized by: (i) the distribution of spe-cialized resources and capabilities throughan integrated network; (ii) the coordinationof flaws of products, resources and informa-tion across interdependent units; and (iii) amanagement mentality which treats world-wide tourism operations as an integratedand interdependent strategic network. Thetransnational organization model is signifi-cant in relation to the international tourismindustry because it enables internationaltourism organizations to balance globalreach and local adaptability. The latter isimportant in that it allows internationaltourism organizations to develop an optimalstrategy (between adapting completely to
322 F. Go and L. Moutinho

each local environment and standardizingacross them) for arriving at an integrated,sustainable and profitable operation.
‘The network avoids the problems ofduplication of effort, inefficiency and resist-ance to change to ideas developed elsewhereby giving subsidiaries the latitude, theencouragement, and tools to pursue localbusiness development within the frame-work of the global strategy’ (Czinkota et al.,1989, p. 609). The main tool for implement-ing this approach is to develop internationalteams of managers who meet regularly todevelop strategy.
For international tourism organizationswith the ambition to stay in or join the inter-national arena, the central issue is how toorganize, integrate and manage their activ-ities to respectively remain or becomesuccessful international players. This is par-ticularly true of tourism organizations thathave overseas expansion potential but arebeginning to comprehend that constructing,operating and controlling offshore proper-ties does not necessarily mean they areequipped to compete effectively on a globalbasis. Increasingly, the issue of globalexpansion deals with a series of differentia-tion and integration decisions.
On one hand, international tourism orga-nizations have a clear need for a sense ofglobal strategic intent, or for broad-basedresource, training and marketing allocationschemes. On the other hand, internationaltourism managers’ views must be ‘tuned-in’to local issues, for instance the availabilityof sites for tourism development in desirablelocations or understanding the grievances ofa host population which is against inter-national tourism development because of itsperceived negative impact on their commu-nity. Since community demands for activeparticipation in the setting of the tourismagenda and its priorities for tourism devel-opment and management cannot be ignored(Ritchie, 1991, p. 151), astute internationaltourism organizations will become moresensitive to the local community in whichthey (wish to) operate and compete. In addi-tion, they must be able to deal effectivelywith cultural conditions and differentbehavioural values.
Integrated Networks
The greater importance of information andknowledge transactions in the internationaltourism industry will require managers toextend their horizons well beyond the tradi-tional trade channels of distribution. Fierceinter-industry competition caused in partic-ular by technological change and thesubsequent reassessment of business strate-gies has encouraged leading internationaltourism organizations to target their servicesto specific user groups by complementingthe services performed by ‘mega’ industries.The result is the emerging networking ofinternational tourism organizations with, forexample, telecommunications, banking,finance, training and education organiza-tions. This dynamic network has beenformally defined as ‘an organizational archi-tecture that accommodates constant andaccelerating change while at the same timestimulating components of the corporateenvironment to build deep and lasting rela-tionships’ (Hickman and Silva, 1987, p. 210).
While service companies used to have asupporting role in the facilitation of eco-nomic transactions in the past, theyincreasingly tend to take on a transactionsdetermining role (de Jong, 1985, p. 9) and astrategic significance. For instance, the plan-ning and building of commercialaccommodation in a tourist destinationdetermines to a great extent the type of tour-ist market this destination will attract in thefuture.
Due to the scarcity of required expertise,the high development and operations costs,and the risk factors in the restructuring ofthe international tourism organizations, it isbecoming more common for internationaltourism organizations to seek long-termrelationships with production, research andmarketing groups around the world. Anintegrated network of relations betweenservice providers is emerging based on for-mal agreements to cooperate with oneanother by contributing specific knowledgeand information that are complementary.This type of cooperation does not take theform of a merger or a joint venture but israther a limited involvement of the parties
323International Tourism Management
designed to solve knowledge andinformation-related problems through theassistance and contribution of organizationswhich for instance know and understandlocal markets (Van Rietbergen et al., 1990, p.214). Thus, each of these service providersin the network contributes specific corecompetencies to the value chain on a short-term or long-term basis. Following this trainof thought, the international tourism organi-zations should therefore be viewed asderiving value-added services to a lesserextent from traditional functions and to anincreasingly greater extent from those func-tions that arrange and maintain transactionsin integrated networks (de Jong, 1985, p. 8).
These networks are designed to build thecentral competitive advantage of the 1990s:superior execution in a volatile environ-ment. No traditional corporate structure,regardless of how de-cluttered or delayeredit is, can compare with the speed and flex-ibility of networks (Charan, 1991, pp.104–105). Network effects create importantopportunities for gaining competitiveadvantage in the hotel industry in which thebasic service consists of linking buyers, sell-ers and third parties.
Strategic Change, Challenges andOpportunities
Strategy and organization are key determi-nants of business performance and are, atleast to some degree, subject to managerialinfluence. A concern of this chapter hasbeen to identify business strategies and orga-nizational structures which tourismenterprises need to effectively cope withchange, risk and uncertainty inherent in theinternational business environment.
To a certain extent, international tourismorganizations are captives of their past inthat their organizations affect managers’abilities to develop appropriate responses tochanging environmental forces. Interna-tional tourism managers often face changewith reluctance. Such managers may thinkthat they are making the necessary changeswhen in actual fact they are rearrangingthings through actions like reorganizations.
To continue with old ways in the globalizedenvironment is a blueprint for potentialdisaster.
Up to now, knowledge about the homemarket was sufficient to survive. On anotherlevel, technical knowledge was often con-sidered to be more important than themanagement of information. This is nolonger the case, because in the internationaloperating environment new ideas and newways of thinking about problems arerequired as successful business strategies,designed to sustain a competitive advan-tage, result from a particular state of mind(Ohmae, 1982, p. 4).
Astute managers will detect emergingopportunities in the changing environment.Specifically, in today’s information society,the modern international tourism organiza-tion can be viewed to derive less fromtraditional production functions and morefrom a portfolio of core competencies andencompassing value-creating disciplines.The skills-based view of the internationaltourism organization is based on these corecompetencies and value-creating disci-plines which allow a product to be deliveredto customers at the best possible price/performance trade-off (Hamel, 1991), andwhich form, for example, the raison d’êtrefor the multinational tourism organization(Caves, 1971; Buckley and Casson, 1985).Conceiving of the international tourismorganization as a portfolio of core compet-encies and value-creating disciplinesimplies that ‘inter-firm competition, asopposed to inter-product competition, isessentially concerned with the acquisitionof skills’ (Hamel, 1991).
To take advantage of new opportunitiesand build competitive advantage, interna-tional tourism organizations have todevelop three diverse and often conflictingstrategic capabilities simultaneously tomeet three major challenges:
● The multinational flexibility to respondto diverse, local market needs.
● The global competitiveness to captureefficiencies of scale.
● The international learning ability thatresults in worldwide innovation.
324 F. Go and L. Moutinho

Consequently, international tourism man-agement should be, among other things, ‘theadaptation of the organization to the chan-ges of the outside world. An adaptation thatis not passive and is forced by circumstan-ces but active, creating new answers andformulae suited to new situations’ (Cassee,1983, p. xv).
Implementing international tourism strategiesThe present shift, especially in the indus-trialized countries, from a resource-basedand labour intensive economy to one that isknowledge intensive rigorously challengesthe current acting and thinking of interna-tional tourism managers. Traditionally,tourism-related services have been classifiedas convenience services, as opposed toknowledge services (Tettero and Viehoff,1990). But as organizations prepare for theglobal economy and resources are being shif-ted out of low-wage activities into highervalue-added activities where advanced tech-nology, knowledge and service provide acompetitive edge, the continued prosperityof international tourism will depend largelyon well-educated human talent; particularlymanagers who are able to think, weigh andjudge critical issues in addition to renderingquality service (Grönroos, 1989).
In order to implement international tour-ism strategies effectively practitioners haveto be able to perform in world where USdominance has waned, Japan’s rapid expan-sion has plateaued, Europe may experiencea renaissance, and East Asia and EasternEurope represent to a lesser and greaterextent, respectively, the ‘wild cards’.
The successful implementation of inter-national tourism management will be basedon two learning processes (de Wilde, 1991).The first is conceptual in nature and isaddressed in terms of the way issues changeas a result of the global economy. Someexamples of such conceptual issues include,but are not limited to the following: globalcompetitive strategy and strategic alliances,organizational development and perform-ance in global markets, segmentation andtarget marketing, researching differencesbetween global and domestic markets,marketing strategies for middle and higher
income countries, and marketing issues inCentral and Eastern Europe. The secondprocess is skills-based and encompassesbroadly intercultural negotiating skills, theability to read different markets in differentcontexts and understand comparative poli-tics (de Wilde, 1991, pp. 41–44).
The globalization of travel and tourism isunderway. Some international tourismmanagers may ask if it is a fad or the initialphase of a long-lasting, important shift ininternational tourism. The unabated expan-sion and cumulative effects of informationtechnology, development of global capitalmarkets, and generation of exports-orientedbusinesses (de Wilde, 1991, p. 41) suggestthat globalization is here to stay.
Amid signs that the future will be moreunpredictable and unstable, there is the cer-tainty that value-creation for internationaltourism managers will remain a priority onthe agenda of consumers and organizationsalike. One of the main themes throughoutthis chapter has been that value creation intravel and tourism is derived from the abil-ity to cooperate and learn collectively in atransnational network. The implementationof effective international tourism strategiesimplies the need for creating and sustainingvalue for consumers, corporate stakeholdersand the host community. In turn, this mayrequire the upgrading of managementexpertise in some cases, and in other casesthe present incumbents may not be capableof meeting the challenge. Within the value-added context, the cultivation ofcompetencies and capabilities is movingfrom the realm of corporate philanthropy tothe realm of productivity. When that dis-tinction is linked to rising competitivepressures and labour shortages, the traveland tourism sector should have an incentiveto support international tourism manage-ment education, training and researchinitiatives.
New Directions for the HospitalityIndustry
The hospitality industry, which may beviewed as an important element of the tour-
325International Tourism Management

ism sector, has evolved in the post warperiod towards consolidation and interna-tionalization. In the UK, for example, publiccompanies have progressively become themajor owners of hotels. The same is true inthe USA and to a lesser extent in continentalEurope. The economies of scale that mayaccrue through their multiple units and thefinancial and managerial expertise they canmuster, means that the emerging larger orga-nizations have the ability to grow evenlarger and at a faster rate within the market-place. Therefore, hotel consolidation may bedefined as the growing concentration ofrooms and marketing expertise in the handsof relatively few, large organizations whoseinternational, multi-site operations have thecapability of attracting a broad customerbase (Go, 1989). In other words, consolida-tion is the amalgamation, or association ofdifferent companies in one or many indus-tries. It is the fusion of ownership,management and expertise that occurs as aresult of the structure of the industry, or thatis initiated as the strategy to gain marketing‘strength’.
Within this context, the emergence ofEuropean harmonization raises a query ofstrategic importance, namely: ‘How can astandardized product be packaged, brandedand distributed as effectively in export mar-kets as at home?’ While trends reveal thatthe main players of public hotel manage-ment groups and marketing consortiaappear to be gaining an increased compet-itive advantage, it should be noted that theEuropean market is very fragmented andoffers smaller hospitality firms the opportu-nity to build on the existing divergence ofcustoms, traditions and preferences withinthe marketplace. This chapter attempts toidentify the most important and pressingissues facing the global hospitality industryand the marketing implications related tocontemporary structural changes.
Strategic Thinking
There are a number of issues which are pre-dicted to have a major impact on thehospitality industry of the 21st century.
While the following trends are by no meansexhaustive, we believe that they representthe most important and pressing issues fac-ing the global hospitality industry.
The asset evolution phenomenonThe hospitality industry of the early 1980swas characterized as a heavily asset-basedindustry with a large part of world hospital-ity assets being concentrated in the hands ofa few, powerful hospitality firms. The sec-ond half of the 1980s, however, saw whathas been called the ‘asset evolution phe-nomenon’ (see Box 13.1). By this we refer tothe situation whereby US hospitality firmshave all but relinquished their assets. TheUS hospitality industry is no longer anasset-based industry, but rather a manage-ment contract-based industry. In order tomeet unrealistic pressure from the capitalmarkets for continued bottom-line growth,US hospitality organizations were forced topursue a strategy of asset liquidation. Thebuyers of those assets were predominantlythe Japanese and British.
Box 13.1. The asset evolution phenomenon.
● Japanese: Long-term asset appreciationand concentration
● European: Asset accumulation. Moredifficult to get adequate return
● USA: Asset liquidation. Growth inmanagement contracts
● Asia: Asset acquisition
The Japanese are clearly pursuing a strat-egy of asset appreciation. They are investingstrategically; i.e. on a long-term basis. TheJapanese tend to buy quietly and moder-ately. However, we have recently witnessedJapanese investors paying well above mar-ket price for individual hotel properties. Bysuddenly purchasing a property above mar-ket price the Japanese investor isconsciously raising the value of all otherproperties in his or her portfolio which sig-nificantly raises the value of the total assetholdings and in turn provides him or herwith much greater leverage in the market-
326 F. Go and L. Moutinho

place. This leverage permits furtheracquisition of properties.
It should be noted, however, that the Jap-anese are not the only major Far Easterninvestors with interests in the hospitalityindustry. Many other Asian corporations,especially those originating from the newlyindustrialized nations (NICs) have beenactively pursuing strategies of asset acquisi-tion in the industry.
The technological flood
The hospitality industry has been trans-formed into a more technology-orientedindustry. One only has to look at the evolu-tion of the ‘smart hotel room’, with its use offibre optics for video check-out facilities, forevidence of the emerging emphasis on tech-nology. The Japanese have even gone as faras to develop a ‘litmus paper toilet’ whichallows a guest, by observing the colour of thelitmus paper automatically injected into thetoilet basin he or she has just used, to deter-mine his or her biomedical status.
Marketing and technology
Attempts by lodging organizations to pursuebranding strategies are visible and indica-tive of the product-orientation of manyorganizations as well as their use of descrip-tive criteria for segmentation purposes.Branding, as currently practised, is a resultof product segmentation. Many of theattempts at branding in the lodging industrywere developed to create brand awareness,recognition, and ultimately brand loyalty bymaximizing brand switching costs. Unfortu-nately, the product orientation driving thewhole branding issue has led to customerconfusion. Differentiation through the use ofbrands in the lodging industry has all butbecome meaningless, for it does not clarifycustomer confusion but only serves toenhance it, the very problem it was designedto eradicate! We predict a greater emphasison a truly market orientation to brandingwhich will involve the development andimplementation of strong positioning state-ments, creation of well-defined images, thedetermination of benefits sought by the con-sumer, and the differentiation of those
benefits. This, in turn, will only come aboutwhen lodging organizations employ moresophisticated methods of segmentation, i.e.a move beyond purely descriptive methodsof segmentation to behavioural, psycho-graphic methods of segmentation.
In connection with the proliferation ofbrands, we predict an increase in the use offocus or concentrated growth strategies. Bythis we mean that growth for its own sake isno longer feasible, as demonstrated by thecase of Holiday Corporation. Rather, organ-izations will focus on what they do best.Marriott’s recent divesture of its restaurantdivision is evidence of this trend. There willbe a focus approach to global brand pro-liferation.
In future we will see a continuous streamof attempts by major hospitality corpora-tions to become ‘closer to the customer’.Customer expectations of service will raise.Some suggest that service, not price, is nowthe dominant differentiating factor.
In an attempt to provide more effectiveand efficient service some predict anincrease in expenditures by hospitality cor-porations on product design. Productinnovation will result in the introduction ofnew products ranging from the smart hotelroom, to the use of computerized touch-screen systems. Such touch-screenseffectively eliminate all contact with anyservice personnel by allowing the customerto select his or her choice of items by simplytouching the appropriate selection dis-played on the VDU screen.
Technology will also affect the control ofindustry capacity. We will see the growth ofwhat we term ‘mega-systems’ consisting ofseveral interchange systems between vari-ous components of the hospitality industry.An excellent example of an attempt at theintroduction of such a system was RupertMurdoch’s venture with ‘UltraSwitch’,which is an international network linkingtravel agencies, hotel and airline reservationsystems through a satellite communicationnetwork. The major issue arising out of thisgrowth in mega-systems is who will controlindustry capacity? Unless closely super-vised, such systems will effectively take thecontrol of industry capacity out of the hands
327International Tourism Management

of the organizations that actually providethe capacity.
The labour issueManagement culture in the hospitalityindustry is rooted in the ‘how-to’ side of thebusiness, as opposed to the behaviouralside. Traditionally, hospitality managershave been very task-oriented and practicereactive, as opposed to proactive, manage-ment styles. If hospitality management istruly to come of age, we need to pay increas-ing amounts of attention to developing amore behaviourally oriented manager. It isonly through the development of such anindividual that corporations will be able tosuccessfully pursue a strategy of differentia-tion through service. We still have anabundance of needs to address in the area ofmulticultural management.
In terms of labour supply, we see a grow-ing similarity between the situation of theWestern and Eastern worlds. In the Westchanging demographics have led to a labourshortage. In the USA for example, on anygiven working day, it is estimated that justabove 20% of positions go unfilled, or filledunsatisfactorily, due to a lack of availablelabour. The East has traditionally had anabundance of labour and has, as a directresult of labour supply outstripping labourdemand, been able to produce the levels ofservice for which Far Eastern hotels havebecome famous. It is predicted, however,that in the future we will see the beginningof some intense competition for labour inseveral Far Eastern countries with a result-ing lowering of the service level offered byhospitality organizations in these coun-tries.
As the hospitality industry becomesmore and more global in its focus, we needto devote increasing amounts of attentionand resources to educating (not training),individuals to be aware of, and adapt to, themulticultural nature of the industry. The‘imprinting’ of one’s own culture will nolonger be acceptable either to host countriesin which a hospitality organization oper-ates, or to customers of varied nationalitiesand beliefs. Multicultural education andtraining is a major issue that we need to
address in the future.The workforce of the 21st century will be
more demanding. By this we mean thatemployees will expect more of their employ-ers. The role of the institutions of higherlearning in the hospitality field should be tofurnish students with an ability to criticallyanalyse what they read and see with think-ing skills, not just technical skills.
Geopolitical–legal issuesDemocratization in Eastern Europe and theformer Soviet Union during the past decadeworked well for the hospitality industry,initially in the form of joint ventures. How-ever, the vast market potential that exists forthe hospitality industry in Eastern Europe issomewhat tainted by poor infrastructureand poor, if existent, tourism organizations.The impact of the NICs has also yet to bedetermined. Recent events seem to indicatethat these countries will experiment withservice industries far earlier in their eco-nomic development than did Japan.Hospitality organizations need to be poisedto take advantage of this trend, should itemerge with force.
It is predicted that government regulationwill continue to be an important aspect ofthe hospitality industry for several reasons.Perhaps the two most important reasons are(i) the pollution aspect; and (ii) the issue ofindustry capacity control. Both these issueswill become volatile areas of debate andlegislation. Evidence clearly suggests thatmoney is becoming multinational in nature.Since the early 1970s, the industrializednations of the world have steadily lifted reg-ulatory restrictions on international capitalflows and on foreign participation in domes-tic financial markets. At the same time thatgovernments have been liberalizing theirtrade and foreign investment policies, tele-communications have providedinstantaneous transmission and processingof information around the globe. Capitalnow moves swiftly across borders becausetechnological changes have reduced trans-action costs associated with global arbitrage.This recent globilization of capital marketshas radically altered the way lodging andother real estate properties are funded.
328 F. Go and L. Moutinho

Today, the global integration of capital mar-kets has widened the gap between realproperties and their financing sources. Theglobilization of finance may represent thefinal outcome in a gradual process of fund-ing sources and property. Today, debt andequity capital for hotel investments ema-nates principally from seven geographicalregions: Asia (Hong Kong, Taiwan, Korea),Australia, Europe, Canada, the Middle East,Japan and India.
Strategies for Global HospitalityFirms of the 2000s
In an attempt to adjust to, and take advan-tage of these trends in the global hospitalityindustry, hospitality firms have little choicebut to follow either a strategy of concentra-tion or a strategy of diversification. Aconcentrated growth strategy implies that afirm will direct its resources to the profitablegrowth of a single product, in a single mar-ket, with a single dominant technology. Themajority of major companies appear to fol-low an overall strategy of concentratedgrowth. Market developments will forcemost small and medium size enterprises(SME) to opt also for either a concentratedstrategy, for example by joining a franchisoror consortium or a diversification strategy.We shall address the latter issue later on.
In the hospitality industry, there appearto be several forms of concentrated growthas practised by the major corporations.These forms are strategic alliances, franchis-ing, management contracts, joint venturesand acquisition. All five of these strategicforms reflect the unique nature of the hospi-tality industry’s almost pure competitivestatus. Each will now be discussed in turn.
Strategic alliancesStrategic alliances may be defined as ‘orga-nizational arrangements and operatingpolicies through which separate organiza-tions share administrative authority, formsocial links through more open ended con-tractual arrangements as opposed to veryspecific, arm’s length contracts’ (Bardar-acco, 1991). Within the global market
companies cannot meet the value basedneeds of customers. They require the tech-nology and skills of others to meet suchneeds. Strategic alliances allow companiesto focus their attention on the areas in whichthey are to add the most value per unit ofinput, compete for the world’s best talent ina given activity, and make their organiza-tional structure ‘leaner’ (Quinn et al., 1990,p. 66).
Strategic alliances are also exemplified,at the strategic level of organizations, by thegrowth in consortia-type organizations suchas Best Western and Consort. In the simplestform of this strategy, firms are tied togetherby a common reservation and marketing sys-tem. While the physical product may not bestandardized, attempts are made by partici-pating organizations to standardize quality.The mainstay of this type of strategic alli-ance has been the small independentoperator. Strategic alliances are increasinglyevident through inter-company cooperativelink-ups for marketing purposes. For exam-ple, Radisson opted for a strategic alliancewith SAS International Hotels, MovenpickHotels and Park Lane Hotels in Hong Kong.An alliance with partners based in differentcontinents allows individual partners a newlogic for management action, in that theirfocus can switch to maximizing the mar-ginal sales contribution to fixed costs. At thesame time, the strategic alliance addressesthe global issue of global marketing as Radis-son distributes the Movenpick, SASInternational Hotels and Park Lane Hotelsproducts in North America, and vice versa.A more complex type of strategic alliance isbest exemplified by the Radisson HotelCompany affiliating with Movenpick(Swiss), SAS (Scandinavian), Park Lane(Hong Kong), Commonwealth Hospitality ofCanada, and Pacific Rim Leisure (Australia)in order to better promote its productworldwide.
The second type of alliance takes place atan operational level and is best exemplifiedby the concept of cross-franchising which isdefined as the process of two organizationswith different products but similar manage-ment styles or philosophies joining forcesunder one roof with the intention of reduc-
329International Tourism Management

ing overheads and increasing profits. Threeversions of cross-franchising can be seen: (i)where one franchisee becomes a franchiseeof another company; (ii) where there is acombination of units offering signatureitems within the same company; and (iii)where there is a combination of units featur-ing signature items of companies not in thesame organization.
The strength of strategic alliances as aform of concentrated growth lies in the factthat it can rapidly take advantage of thebrand recognition of several multinationalfirms. This is especially important in today’soperating environment where it is becomingincreasingly difficult to harness the capitalfor international expansion. Entering into analliance of the type described here requireslittle capital but produces substantial bene-fits such as (i) the spreading of marketingcosts over a larger base; (ii) a reduction in thepotential problem of acquiring labour andmanagement expertise; and (iii) a minimiza-tion of the problems associated with anymulticultural difference that might beencountered by an organization when seek-ing to expand into a new geographical partof the world.
In what is becoming an increasinglyfierce saturated and competitive operatingenvironment, hospitality organizations arehaving to join forces to ensure they harnessthe necessary resources, both financial andnon-financial, to penetrate the marketplace.We believe that the 21st century will see anincrease in both the number and the type ofstrategic alliances in the hospitality indus-try. Alliances will no longer be confined tocompanies operating in the same industryjoining together, as in the case of Radissonoutlined above. Rather we will see anincrease in strategic alliances between syn-ergistically related organizations such as carrental organizations, life insurance compa-nies, airlines and lodging corporations.
FranchisingThis form of growth is one of the most pop-ular and preferred methods of growth forinternational hospitality organizations. Thereasons for the popularity of franchising arenumerous: (i) the franchisor seldom has to
provide the capital; (ii) the franchisor doesnot have to endure alone the various prob-lems associated with regulations andlicensing activities required by manynations; and (iii) the franchisor does nothave to engage in extensive site selectionactivities in relatively unknown territories.Despite these advantages of franchising as aform of growth, there are several concernswhich the franchisor ought not to ignore.These include: (i) the selection and structureof organization of the franchise; (ii) thenature of the relationship between the fran-chisor and the host government; and (iii) theability to control standards and operationalprocedures of the franchisee.
The franchise method can be implemen-ted as simply as one firm with one unitlicensed from a franchisor or it can be ascomplex as master regional franchises. Thisis where one firm has the rights to expandthe brand throughout an area or region of theworld. Quality International has used themaster regional franchise extensively inorder to expand internationally, while DaysInns in India have used the concept in con-junction with the establishment ofpartnerships thus necessitating little or noequity on their part.
We believe that the growth in franchisingas a form of international expansion isdirectly related to the brand proliferationevident in the international hospitalityindustry. Many organizations believe thatbrand awareness, recognition and loyaltyare the keys to maintaining and increasingmarket share in this industry. By franchis-ing, organizations are able to effectivelyimplant their brand into any given locationwith few, if any, changes to the generalconcept.
Management contractsOne of the most popular and most prevalentforms of international growth by hospitalityorganizations is through the use of the man-agement contract method. A managementcontract is an agreement between a hotelowner and a hotel operating company, bywhich the owner employs the operator as anagent to assume full responsibility for themanagement of the property in a profes-
330 F. Go and L. Moutinho

sional manner. As an agent, the operatorpays, in the name of the owners, all propertyand operating expenses from the cash flowgenerated through operations, retains itsmanagement fees, and remits cash flows, ifany, to the owner. The owner provides thehotel land, building, furniture, furnishingsand equipment, and working capital, whileassuming full legal and financial responsi-bility for the hotel. Hyatt International,Hilton International, Marriott, SARA, Nikkoand Holiday are perhaps the best knownexamples of management contract compa-nies. Expansion through managementcontracts is also one of the common meth-ods of expansion used by largemultinational food service companies suchas Marriott, Trusthouse Forte and ARA.
The greatest advantage of the manage-ment contract is that it allows rapidexpansion and easy market penetration withlittle or no capital from the investor or devel-oper of the asset itself. Occasionally themanagement firm will adopt an equity inter-est in the business. Some management firmshave also engaged in the development of aproperty only to sell that property once ithas been fully developed.
Joint venturesThe joint venture has proved to be a populargrowth vehicle for those firms with substan-tial financial resources. The development ofboth local and global partners has broughttogether such firms as SAS and Saison ofJapan as they plan to grow their Interconti-nental chain worldwide. Additional jointventures include World International andWharf Holding with their purchase of theOmni chain, and the Ritzker family of Chi-cago and William Hunt Holdings of HongKong with their purchase of the SouthernPacific Hotel Corporation of Australia.
The joint venture strategy has usuallytaken the form of a large real estatedeveloper/holder and a hospitality/travel-related firm joining forces. Investors areusually global in nature and oriented toholding assets which can provide them withlong-term appreciation. The joint venturediffers from the other three strategies dis-cussed in that it concentrates on low capital
investment with the majority of the capitalrisk being shouldered by independent busi-nesses which come together primarily formarketing purposes.
AcquisitionThe last decade has seen a tremendousgrowth in the number of acquisitions in theinternational hospitality industry. The factthat the five largest hospitality organizationsin the world control over 1% of hospitalitymarket demand, in conjunction with othermarket factors, has led to an increase in thenumber of acquisitions in the global hospi-tality industry. Examples of the increases inacquisitions include Ladbroke Ltd’s acquisi-tion of Hilton International Co. from AllegisCorporation and Grand Metropolitan’sacquisition of Pillsbury and its Burger Kingsubsidiary.
Based on historic and current trends inacquisition activity worldwide, and basedon current and projected market conditions,it is predicted that there will be a continuedgrowth in horizontal integration, geographicdiversification, and forward integration. Inaddition a decline in acquisition involvingbackward integration and conglomeratediversification is predicted.
With international expansion forming a sub-stantial part of the strategic agenda’s oftoday’s hospitality corporations, scanningthe environment for trends that dictate stra-tegic postures is a necessary and vital part ofstrategic hospitality management.
The diversification issueWhat does the trend towards concentrationimply for SMEs? Will standardization leadto complete uniformity in the internationaltourism industry? We think not for severalreasons. First, the decision on standardiza-tion is not a dichotomous one betweencomplete standardization and customiza-tion; rather there can be degrees ofstandardization. Several authors haveargued that standardization is almost a givenfor countries that are economically similar.If one accepts this assumption, standardiza-tion should be rife across the USA, Western
331International Tourism Management

Europe and Japanese hospitality industries.This is clearly not the case.
Second, the globe is, and will remain, aculturally diverse place. Even within con-tinents such as North America or Europethere remain as many cultures as there arestates or countries. In Europe, for example,hospitality marketers would be foolish notto take different backgrounds into accountin the formulation and implementation oftheir marketing strategies, despite the cur-rent popularity of referring to Europe as if itwere going to be a single uniform entity.Values that are important to one culture maymean little to another. The potential con-flicts that may arise from such a situationbecome more intense in an industry thatsells very personal services to a diversifiedclientele. Different cultures reflect differentbeliefs, attitudes, motivations, moralities,perceptions and rituals. Although precon-ceived notions of what the hospitalityindustry wants may be discrepant with theguests’ own notions in any country, they canresult in disaster when marketing to differ-ent cultures. Therefore, it can be stated thatcultural differences have a tremendousimpact on marketing mix decisions in hospi-tality operations. Ignoring this impact hasoften resulted in expensive consequencesfor hotels operating in arenas outside theircorporate homeland.
Third, economic differences also need tobe formulated into marketing strategies, gen-erally at the National Tourism Associationlevel. The environment in which interna-tional marketing decisions are made is farmore complex than the environment inwhich domestic marketing decisions aremade. The Central and Eastern Europeanmarkets require a different approach fromthe OECD markets, due to the variance ineconomic development and the level ofwealth in the respective economies.
Finally, the rise of mass-individualization offers SMEs great oppor-tunities to add value through inter-firmalliances, for example through flexible net-works (Hakansson and Snehota, 1997). Thenumber and variety of inter-firm relationsand networks such as strategic allianceshave accelerated in the past two decades.
The process of networking and collabora-tion is also reflected in the proliferation ofpublications on aspects of interorganiza-tional relations (Burt, 1997; Uzzi, 1997;Gulati, 1998). Through the value network(Stabell and Fjeldstad, 1998) SMEs will beable to create competitive advantagethrough the access, control and coordina-tion of information, the stimulation ofcreativity through co-innovation and thestrategic collaboration of other firms (Dyerand Singh, 1998). The ‘consumer drivenvalue chain’ was introduced by Go et al.(1999) as an organizational structure forSMEs to bundle and build the organizationalcapability that results in the creation ofadded value.
Concluding Remarks
This chapter, although by no means exhaus-tive, has attempted to cover several trendsthat we believe should be taken into accountby hospitality corporations when they areformulating and implementing their globalstrategies. While concentration strategyseems to rule today’s business environment,it should not be inferred that standardiza-tion of products is a panacea. On thecontrary, environmental variability andcomplexity result in the frequency of changeand the heterogeneity and range of environ-mental activities that can be clearlyobserved in the market. It appears that massmarketing is a vestige of the past. Increas-ingly, guests will need to be wooed throughwhat is coming to be termed ‘micro-marketing’ or ‘niche marketing’. Thefragmented European market offers SMEs inparticular, ample opportunity for a diversifi-cation strategy. However, it is of the essenceto establish the net economic benefits thatthe entrepreneur would gain if he or shewere to diversify. Within this context, thetrend is towards customization. It is alsoessential that hospitality operators, largeand small, tailor the product to meet indi-vidual needs and tastes, or at least ensurethat provision is equipped with adequateflexibility to be adapted to multiple marketsegments, for example, and ‘mass-
332 F. Go and L. Moutinho

customization’ within brand-orientedcorporations. Finally, hospitality corpora-tions pursuing such a strategy must amendtheir marketing communications approachand use targeted and new media, whereappropriate.
References and Further Reading
Aaker, D.A. (1991) Managing Brand Equity: Capi-talizing on the Value of a Brand Name. TheFree Press, New York.
Aderhold, P. (1992) Bilanz. Schweizer WirtschaftsRevenue 2, 48–50.
Anon. (1989) Golf Digest Almanac, as reported inChristian Science Monitor (April), 9.
Bardaracco, J.L. (1991) The Knowledge Link: HowFirms Compete Through Strategic Alliances.Harvard Business School Press, Boston.
Bartlett, C.A. and Ghoshal, S. (1989) ManagingAcross Borders – The Transnational Solu-tion. Harvard Business School Press,Boston.
Buckley, P. and Casson, M. (1985) The EconomicTheory of the Multinational Enterprise. Mac-millan, London.
Burt, R. (1997) Structural Holes: The Social Struc-ture of Competition. Harvard UniversityPress, Cambridge, Massachusetts.
Cassee, E.Th. (1983) Introduction. In: Cassee,E.Th. and Reuland, R. (eds) The Manage-ment of Hospitality. Pergamon Press,Oxford.
Caves, R.E. (1971) International corporations: theindustrial economics of foreign investment.Economia (February).
Charan, R. (1991) How networks reshape organi-zations for results. Harvard Business Review(Sept–Oct), 104–115.
Chase, R.B. and Hayes, R.H. (1991) Beefing upoperations in service firms. Sloan Manage-ment Review 33(1), 15–26.
Cohen, E. (1972) Toward a sociology of inter-national tourism. Social Research 39(1)(Spring). Reprinted in McIntosh, R.W. andGoeldner, C.R. (1990) Tourism Principles,Practices and Philosophies, 6th edn. JohnWiley and Sons, New York, pp. 197–208.
Crawford-Welch S. and Tse, E.C.Y. (1990) Mer-gers, acquisitions and alliances in theEuropean hospitality industry. InternationalManagement 2(1), 10–16.
Crouch, G.I. and Shaw, R.N. (1990) Determinantsof international tourist flows: findings from30 Years of empirical research. Paper pre-
sented at the 21st Annual Conference of theTravel & Tourism Research Association,10–14 June, 1990, New Orleans, Louisiana.
Cullen, T.P. (1981) Global gamesmanship: howthe expatriate manager copes with culturaldifferences. The Cornell Hotel and Restau-rant Association Quarterly 22(3), 18–24.
Czinkota, M.R., Rivoli, P. and Ronkainen, I.A.(1989) International Business. Dryden, NewYork.
Davidson, R. (1998) Travel and Tourism inEurope, 2nd edn. Longman, Harlow, UK.
Day, G.S. (1990) Market Driven Strategy: Proces-ses for Creating Value. The Free Press, NewYork.
Dee (1988) The future of franchising. RestaurantBusiness (June).
Dyer, J. and Singh, H. (1998) The relational view:cooperative strategy and sources of inter-organizational competitive advantage.Academy of Management Review 23(4),660–679.
Gibbs, N. (1989) How America has run out of time.Time 133(17), 48–55.
Go, F. (1989) Key problems and prospects in theinternational hotel industry. Travel andTourism Analyst 4, 27–49.
Go, F.M. (1994) Emerging issues in tourism edu-cation. In: William, T. (ed.) Global Tourism:The Next Decade. Heinemann, Oxford, pp.330–346.
Go, F.M. (1995) Managing marketing for globaland local effectiveness, keynote paperdelivered to the International MarketingEducators and Researchers Conference, Grif-fith University, Gold Coast, Australia, 3 July,1995.
Go, F.M. and Pine, R. (1995) Globalization Strat-egy in the Hotel Industry. Routledge,London.
Go, F. and Welch, P. (1991) Competitive Strategiesfor the International Hotel Industry. SpecialReport No. 1180, March. The EconomistIntelligence Unit, London.
Go, F.M., Govers, R. and van den Heuvel, M.(1999) Towards interactive tourism: capital-ising on virtual and physical value chains.In: Buhalis, D. and Schertler, W. (eds) Infor-mation and Communication Technologies inTourism 1999. Springer, Vienna, pp. 11–24.
Grönroos, C. (1989) Service Management Prin-ciples. Working Paper 90(1). ServiceResearch Centre, University of Karlstad,Sweden.
Gulati, R. (1998) Alliances and networks. Strate-gic Management Journal, 19.
Hamel, G. (1991) Competition for competence and
333International Tourism Management

interpartner learning within strategic allian-ces. Strategic Management Journal 12,83–103.
Harris, L. (1987) Inside America. Random House,New York.
Hickman, C.R. and Silva, M.A. (1987) The Future500: Creating Tomorrow’s OrganizationsToday. Nal Penguin, New York.
Håkansson, H. and Snehota, I. (1997) DevelopingRelationships in Business Networks. Inter-national Thomson Business Press, London.
Horner, S. and Swarbrooke, J.S. (1996) MarketingTourism, Hospitality and Leisure in Europe.International Thomson Business Press, Lon-don.
ILO (1989) General Report, Hotel, Catering andTourism Committee, First Session Report,International Labour Organization, Geneva.
de Jong, H.W. (1985) Dynamische Markttheorie,3rd edn. Stenfert Kroese, Leiden, Nether-lands.
Lakatos, P.A.M. and Van Kralingen, R.M. (1985)Naar 1990 Een Kwestie van Tijd en Geld.Elsevier, Amsterdam.
Levitt, T. (1983) The Marketing Imagination. TheFree Press, New York.
Moutinho, L. (1989) Hotel marketing strategies for1992: uniqueness or me-too-ism? Built Envi-ronment 15(2), 138–145.
Naisbitt, J. and Aburdene, P. (1985) Re-Inventingthe Corporation: Transforming Your Job andYour Company for the New InformationSociety. Warner Books, New York.
Ohmae, K. (1982) The Mind of the Strategist: Busi-ness Planning for Competitive Advantage.Penguin, New York.
Olsen, M.D., Crawford-Welch, S. and Tse, E.C.Y.(1990) The global hospitality industry of the1990s: a position statement. Proceedings ofthe Conference on Strategic Developmentsfor the 1990s, Dorset Institute, Poole, UK, 3–4May, pp. 1–28.
Porter, M.E. (1980) Competitive Strategy: Tech-niques for Analyzing Industries andCompetitors. The Free Press, New York.
Porter, M.E. (1985) Competitive Advantage: Cre-ating and Sustaining Superior Performance.The Free Press, New York.
Porter, M.E. (1987) Changing patterns of inter-national competition. In: Teece, D.J. (ed.)The Competitive Challenge Strategies forIndustrial Innovation and Renewal. Harper &Row, New York.
Porter, M.E. (1990) Competitive Advantage ofNations. Free Press, New York.
Pred, A.R. (1977) City Systems in AdvancedEconomies: Past Growth, Present Processand Future Development Options. JohnWiley, New York.
Price, D.G. and Blair, A.M. (1989) The ChangingGeography of the Service Sector. BelhavenPress, London.
Quinn, J.B., Doorley T.L. and Paquette, P.C. (1990)Beyond products: services based strategy.Harvard Business Review (March/April),58–67.
van Raaij, W.F. and Francken, D.A. (1984) Vaca-tion decisions, activities, and satisfactions.Annals of Tourism Research 11(1),101–112.
Rapp, S. and Collins, T. (1992) The Great Market-ing Turnaround: The Age of the Individualand How to Profit From It. Plume/Penguin,New York.
Reich, R.B. (1990) Who is us? Harvard BusinessReview 9(1), 53–64.
Reichel, A. (1986) Competition and barriers toentry in service industries: the case of theAmerican lodging business. In: Lewis, R.C.,Beggs, T.J., Shaw, M. and Croffoot, S.A. (eds)The Practice of Hospitality Management II.AVI Publishing Company, Westport, Con-necticut, pp. 146–152.
Reuland, R., Choudry, J. and Mortier, W. (1989)The 1992 Challenge for the Hotel, Restaurantand Cafe Industry. Confederation of NationalHotel and Restaurant Associations in theEuropean Community (HOTREC), Paris.
van Rietbergen, T., Bosman, J. and de Smidt, M.(1990) Internationalisering van de Diensten-sector, Nederlandse Ondernemingen inModiaal Perspectif. Dick Coutinho, Muider-berg.
Ritchie, J.R.B. (1991) Global tourism policyissues: an agenda for the 1990s. In: Hawkins,D.E., Ritchie J.R.B., Go, F. and Frechtling, D.(eds) World Travel and Tourism Review:Indicators, Trends and Forecasts, vol. 1.CAB International, Wallingford, UK, pp.149–158.
Sampson, A. (1984) Empires of the Sky: the Poli-tics, Contests and Cartels of World Airlines.Hodder and Stoughton, London.
Stabell, C.B. and Fjelstad, O.D. (1998) Configuringvalue for competitive advantage: on chains,shops, and networks. Strategic ManagementJournal 19, 413–437.
Stigler, G.J. (1965) Essays in the History of Eco-nomics. University of Chicago Press,Chicago.
334 F. Go and L. Moutinho

Tettero, J.H.J.P. and Viehoff, J.H.R.M. (1990) Mar-keting voor dienstrerlenende organisatiesbereid en uitvoering. Kluwer, Deventer.
Theobald, N. (1994) Global Tourism in the NextDecade. Butterworth-Heinemann, Oxford.
Tideman, M.C. (1987) 25 Jaar Hotellerie in Neder-land. Address presented at the Hotleschool,the Hague (June).
Tsue, J.F. (1989) Finance goes global. LodgingHospitality (July), 78.
Uzzi, B. (1997) Social structure and competitionin interfirm networks: the paradox ofembeddedness. Administrative ScienceQuarterly 42(1), 35–67.
Verginis, C.S. and Wood, R.C. (1999) Accommo-dation Management – Perspectives for theInternational Hotel Industry. InternationalThomson Business Press, London.
de Wilde, J. (1991) How to train managers forgoing global. Business Quarterly 55(3),41–45.
Witt, S.F., Brooke, M.Z. and Buckley, P.J. (1991)The Management of International Tourism.Unwin, London.
WTTERC (1994) Travel and Tourism, Environ-ment and Development. The World Travel &Tourism Environment Research Centre,Oxford.
335International Tourism Management


Index
Page numbers in bold refer to illustrations and tables
accommodation 32, 307Accor Academy 177–178accuracy levels, forecasting 305–306acquired immune deficiency syndrome
(AIDS) 10, 23acquisition 331action 48action plan, marketing 279activities 219, 215–216, 226, 251–252activities interests and opinions (AIOs) 125–129adequacy evaluation 76administrative environment 33–34advancement opportunities 176advertising 71, 72, 127–128, 158–159advertising-copy strategy definition 160Afghanistan 35AFPA (French adult training agency) 177Africa 20, 32, 142ageing population 317AID (automatic interaction detector) model 100AIDS (acquired immune deficiency
syndrome) 10, 23AIOs (activities, interests and opinions)
125–129air transportation 319–320Albania 35Allegis Corporation 331alliances 28, 329–330alternative revenue assumptions 203alternatives, evaluation 65, 68–73America see United States of America (USA)analysis of variance (ANOVA) analytical
procedures 91, 100, 109ANOVA (analysis of variance) analytical
procedures 91, 100, 109
Ansoff’s product/market expansion matrix 275Antarctic 27APOLLO 28, 32Applied Future 132ARA 331area sampling 104ARGE (asset revenue generating efficiency)
204–205arrivals and growth rates (1983–1989) 299Asia 4, 13, 172, 325, 329Asia-Pacific region 4Asia-Pacific Rim 319asset evolution phenomenon 326–327asset revenue generating efficiency (ARGE)
204–205ATB (Azores Tourist Board) 300–304ATB cross-impact matrix 301, 302, 303ATMs (automated ticket machines) 163attention and learning process 75attitude 35, 44–45, 48, 50–51, 52attractions 32Australia 22, 329, 331automated ticket machines (ATMs) 163automatic interaction detector (AID) 100average-commitment strategy definition 140awards 252Azores 299–304, 300–304Azores Tourist Board (ATB) 300–304
baby boomers on the move 21backroom versus front office activities 219backward pricing 153Bain, J.S. 322BBC and Cosmos Tours 212
337

BCG (Boston Consulting Group) 268, 272–273,274
matrix 270–271behaviour 6, 60, 73–76
buying airline products 53decision making 52intentions 51, 60–63methods of segmentation 327models and modelling 50–51, 73–76re-engineered 13search behaviour 58, 62–63tourist 6, 60, 73–76travel 42
beliefs 43, 48, 49Belize 27Berlin 34best practice model 181Best Western 329bicycle provision, case study 231–232bill of material (BOM) 234Bolivia 10BOM (bill of material) 234–235booking sites 26–27, 162–163Boston Consulting Group (BCG) 268, 272–273,
274matrix 270–271
branded products 70–71, 135, 144–146, 316,327
break-even chart 197–199, 200Bridge model of quality 240British see United Kingdom (UK)brochures 59–60, 61–62budgeting and control 187–188Burger King 331Burma 35Business Strategies Ltd 25–26business strategy 261–262buying behaviour for airline products 53buying probabilities, repeat 76
California 14Canadian Antarctic 142Canadian hospitality programme, Superhost 179canonical correlation analysis 107–108capacity
adjusting 226, 227–228definition 220–221in a framework for operations
management 222management 226–232utilization 204–207
capital budgeting 188–194capital rationing 191–192Caribbean 32, 142Carnival Cruise Lines 145
case studiesasset evolution phenomenon 326–327Azores 299–304BBC and Cosmos Tours 212bicycle provision 231–232buying airline products 53Chicago Pizza Pie Company 217competency models for employee hiring 178German dual system 180MPI (marketing planning index) 283–291MPS (marketing planning strategy) 280,
283–290re-engineering from the bottom up 177Stakis Hotels 227tourist arrivals and growth rates
(1983–1989) 299cash cows 24, 270, 271cashflow 189, 268–269Central Florida Hotel/Motel Security
Association 33Centre Parcs 19centurism and expectation 13challenges 324–325Channel Tunnel 29channel-control strategy definition 165channel-modification strategy definition 164channel-structure strategy definition 164characteristics of strategy 260–263Chicago Pizza Pie Company 217China 32choice criteria 75classification of techniques 81climate change 28–29Club Medic 22cluster analysis 110–113, 135, 136–137cluster sampling 102–104cocooning 25cognition 45–49cognitive learning theory 47cognitive representation 60Comfort Inns 145Commodore Hotel, Scotland 192Commonwealth Hospitality of Canada 329communication 44, 47, 62, 82–85, 86communications and infrastructural
environment 32communications technology 30companies 193–194competency models for employee hiring, case
study 178Competition Commission 201competitiveness
based on quality 247changing patterns 319–321Competition Commission 201costs factor 218power 274
338 Index

competitiveness continuedpricing 200–204priority factors 225profit maximization in competitive
conditions 199–200scenarios 320–321strength 273–274
computerized reservation systems (CRS) 28, 29,30, 162
communication 47–48concentric diversification 277confidence intervals 97–98, 102confirmatory factor analysis 109conglomerate diversification 277conjoint analysis 113–114, 137–138consensus forecasting results 296–297consideration set 65consistent action 10Consort 329continuously meeting customer requirements at
lowest cost 251–252contracts 330–331control
costs 188framework 221, 222loss of 30of operations 235–237process control diagram 236quality 252, 253–254
control-organizational approach to servicequality design 242
controlling marketing planning 279, 281convenience sampling 95corporate strategy 261correspondence analysis 1, 138Cosmos Tours 212cost-plus 151cost-volume-profit (CVP) analysis 197–204Costa Brava 142Costa del Sol 20costs
capital projects 189control 188curve 200, 234factor in competitiveness 218quality 245
Coupland, Douglas 169Courtyard, Marriott hotel group 135critical ratio method (CRM) 205–207CRM (critical ratio method) 205–207Crocodile Dundee Effect 24Cronbach alpha score 285cross cultural consumer classification 126–127cross-cultural analysis 43cross-franchising 329–330cross-impact analysis 293, 298–304
subjective rating scale 302
CRS (computerized reservation systems) 10, 28,29, 30, 162–163
Cuba 35culture
diversity, Europe 332environment 23–25events 24–25influences 42–43values 22, 126–127
Culture Media and Sport 179customers 28, 225, 228, 246, 247–248customization 133CVP (cost-volume-profit), analysis 197–204
DA (differential advantage) 195–196data analysis 114–116data collection 81–87databases 30, 132–133, 176Days Inns 144, 330DCF (discounted cash flow) 189–194debt wreck 12–13decision making
behaviour 52family 54–56, 57future 76model 54, 65–66operations management 221patterns 123–124processes 52, 56–58, 73, 74, 75rules 66tourists 68–69
decision support system (DSS) 117decision-process models 56Delphi forecasting 4, 228–229, 293–298demand
dependent 233–235forecasting 308–310independent 233–234modelling and forecasting 293–312patterns 228regional accommodation 307shifts 319and supply 4–5tourist 307, 318–319
democratization of tourism 22democracy 35demography 20–21, 123–124, 328Department of Labor and Industrial Relations,
Hawaii 172Department of National Heritage, United
Kingdom 170, 173, 174–175depth interview 83designs 61–62, 89–91, 220destination 134–135destination awareness 64–65diagonal marketing systems 9
339Index

difference between strategy and tactics 259–263differential advantage (DA) 195–196dimensions of market strategies 138–140Dinkies (dual-income-no-kids) 22Dinks (double income, no kids) 5disabled people 22discounted cash flow (DCF) 189–194discriminant analysis 108, 137Disney theme parks 25Disneyworld 231dissatisfaction dimension 76distribution 160–165distribution strategies 163–165distribution-scope strategy definition 164diversification 276–277, 329, 331–332diversification strategy definition 149dogs 270, 271DSS (decision support system) 117–118dummy variables 309–310, 312Dutch Hotel Industry 320
early-entry strategy definition 139EBQ (economic batch quantity) 233–234ecological aspects 7–8econometric forecasting models 293, 308–312economic
approach to service quality design 242aspects 4environment 25–26lot size 233order quantity 233theory 199
economic batch quantity (EBQ) 233–234ecotourism 27EDI (electronic data interchange) 235effective marketing 80, 284–285, 287efficiency 204–207efficiency-risk coefficient (ERC) 194–195EFQM (European Foundation for Quality
Management) 252Egypt 36elasticity estimates 310, 311, 312electronic data interchange (EDI) 235electronic point of sale (EPOS) 235element 93–94Embassy Suites 144emotional hot-buttons 81empirical results in Delphi forecasting 298empirical results in econometric
forecasting 310, 312employment
competency models for employee hiring 178levels of in UK 25–26quality 171–176tourism, quality 171–176
enactive imagery 60–61, 60–62
energy policy 29England 115–116
see also United Kingdom (UK)English Tourist Board 179Environment 7–8, 26–29, 318EPOS (electronic point of sale) 235ERC (efficiency-risk coefficient) 194–195ES (expert systems) 117estimates 310, 311, 312EU (European Union) 31, 32, 173, 175, 179, 180Euro-consumer 132Europe
ageing population 317capital market investment 10, 329Central 319, 325cross border marketing 132cultural diversity 332Eastern 31, 35, 36, 319, 325, 328harmonization 326hotels 188long-haul flights 4market 332mature Europeans 5population 18, 126renaissance 325tourism demand 26tourism experts 295Western 331–332
European Commission’s statistical service(Eurostat) 173
European Foundation for Quality Management(EFQM) 252
European Union (EU) 31, 32, 173, 175, 179, 180European Works Councils 181Eurostat (European Commission’s statistical
service) 173Eurostyle system 126evaluation
adequacy 76alternatives 65, 68–73performance, framework 249–250portfolio analysis 272–273post-purchase 76segment 131–132service quality 248–250
evoked set 63–64ex post facto studies 87–88Excel 193exercise answer 208expansion strategies 275expectation and centurism 13experimentation 87–93expert systems (ES) 117exploration 14external analysis 266external information search 58–60external versus internal functions 264
340 Index

facilities 32factor analysis 108factorial design 91failure management 245–246Faith Popcorn 25family 19, 43, 54–56family life cycle (FLC) 55–56, 124–125fantasy adventure 25Far East 327, 328field experiments 92financial functions in spreadsheets 192–193financial management in tourism 187–209financial modelling 231–232first-in strategy definition 139five-force model 131fixed capital 188–189FLC (family life cycle) 55–56, 124–125flexible pricing 154Flying Wheels Travel 22focus group interview 83–85forecasting
cash flows 194consensus forecasting results 296–297Delphi forecasting 4, 229, 293–298and demand modelling 293–312econometric 293, 308–312possible future developments and consensus
forecasting results 296–297probability 293, 304–308required accuracy levels 305–306summary of trends and forecasts 10–11tools 142–143tourism growth 4variable 308
Forte Hotels 135, 331four-group six-study design 90frameworks 19–20, 220–221, 222, 249–250France 32franchising 329–330French adult training agency (AFPA) 177friends 56–58future 14–15, 23, 76, 295, 296–297
Gambia 23GDS (global distribution systems) 162, 315GE (General Electric) matrix 273–274General Electric (GE) matrix 273–274geo-political-legal issues 328–329German dual system 180Germans on vacation 318Germany 36global distribution systems (GDS) 162, 315global hospitality firms of the 2000s 329–332global tourism issues for the 21st century 11–12global urbanization 22–23globalization 11, 12, 315, 316–317, 325
goal formulation 266–267goals 278–279Golden Tulip Hotels Company 320Goldilocks Economy 26government attitudes 3–4, 35, 328–329government subsidies 34Graeco-Latin square design 91Grand Canyon, Colorado River 14Grand Hotel Krasnapolsky, Amsterdam 320Grand Metropolitan 331grey tourist power 19, 124groups 128growth 4, 13, 275–276, 278Gulf states 32
harvesting strategy definition 140Haves-Eurocom Group 126Hawaii 172, 173, 176, 294HCNs (host country nationals) 176health and AIDS 10, 23health and safety 29helicopter view of a systems and system
boundaries 214heterogeneity 217HGM (hotel general managers) 285, 286–290Hilton Hotels 142, 145, 319, 320, 331Holiday Corporation 146Holiday Inns 8, 319, 327, 331holiday sales 216Homer’s Odyssey 49Hong Kong 32, 331horizontal diversification 277Hoshin Kanri (policy deployment) 245hospitality industry 325–327, 328host country nationals (HCNs) 176hotel general managers (HGM) 285, 286–290hotel marketing budgeting 194–197House of Quality 244–245household size reduction 317–318households 21HR (human resource) 169–185, 182–183human resource (HR) 169–185, 182–183Hyatt International 207, 331
IDEFO modelling system 214IIP (Investor in People) 179imagery 60–63Imholz travel agency 8implications of alternatives 71, 72–73income 308, 318increasing the price definition 157index of market planning effectiveness 287, 288India 20, 329, 330individual business 176–177individualism 132–133Indonesia 22
341Index

industry attractiveness/business strengthsmatrix 273
Infolink 133Information 46, 58–60, 80, 118, 161, information technology (IT) 27–28, 29, 162–163,
184infrastructural environment 32initiatives 177–181input/output diagram for a tour/holiday
provision system 215Inspector Morse TV series 24institutional environment 33–36instrumental learning process 47intangibility 218integral planning 9–10integrated networks 323–324integrated services digital network (ISDN) 162interactive skills 219InterContinental Hotels 319internal rate of return (IRR) 191, 192–193internal versus external functions 264international environment 31–32International Labour Office (1989) 173International Symposium on Tourism in the
Next Decade, Washington DC (1979) 294international tourism
changing environment 317–318industry, structural dynamics 321–323management 315–333promotion 157–158strategy 325
international travel 8international-market strategy definition 139Internet 8, 163Internet Travel Network 26interpersonal communication 44interviews 83–85inventory cost curve 234inventory management 221, 222, 232–235investment appraisal calculations 191investment decision 193–194Investor in People (IIP) 179IRR (internal rate of return) 191, 192–193ISDN (integrated services digital network) 162Ishikawa/cause and effect diagrams 253–254ISO (9000) 241–242, 247
Japanasset appreciation 326asset evolution phenomenon 326–327corporations 316expansion 325extended planning horizons 259hospitality industry 332manufacturing industry 247population growth 20
Japan continuedQuality Circles 252tourism demand 26women travellers 21
JHIC (Joint Hospitality Industry Congress) 177job satisfaction 174–176Joint Hospitality Industry Congress (JHIC) 177joint ventures 331judgement sampling 95Jury of Executive Opinion 293, 294–295
Kahn, Herman 4Kashmir 36Kathmandu 20Kenya 21, 27key cultural values 24key-markets strategy definition 140KLM (Royal Dutch Airlines) 320Klosters 20
laboratory experiments 91–92labour issue 328Ladbroke Ltd 331laggard-entry strategy definition 139lagged dependent variable 309–310Las Vegas 15latent structure analysis 109–110Latin America 20, 142, 319Latin square design 90–91learning 47, 75, 268, 269legal environment 34–38leisure 6–7Let’s Make It First Choice 178–179life cycle 55–56, 124–125, 141–144, 229,
268–269lifestyle 5–7, 126, 129Lifestyle Network 133light-commitment strategy definition 140linear programming 229–230linear structural relations (LISREL) 109LISREL (linear structural relations) 109Local Agenda (21) 27local initiatives 177local residents 176local-market strategy definition 139long-term thinking 10Los Angeles 15Lotus 1-2-3 193Lourdes 23low cost operations 218
Maastricht Treaty, Social Chapter 181McDonald’s 14McJob 169Madagascar 10
342 Index

maintaining the price definition 156Maister’s first law 243Maldives 27management
contracts 330–331of failure 245–246of quality 245–247skill transfer 178of variability 246–247
managerial implications of MPI 288, 290management of technology 32–33MANOVA (multivariate analysis of
variance) 107marginal analysis 199marginal pricing 154market
development 275–276penetration 154, 275planning 278–281segmentation 122–123, 124, 125strategies 138–140
marketingaction plan 279effectiveness 80, 284–285, 288environment 19–39management 121–122mix 29, 140, 195–196planning 271–272, 278–281, 287, 288research 79–120strategies 138–140, 262and technology 327–328tourism-related 309
marketing effectiveness index (MEI) 284–285marketing information system (MIS) 79, 80Marketing Planning Index (MPI) 283–290marketing planning strategy (MPS) 280, 284,
285–286, 290Marriott hotel group 135, 144, 146, 327, 331mass customization 133materials requirement planning (MRP) 234–235mathematical approach to service quality
design 241matrix
Ansoff product/market expansion matrix 275BCG (Boston Consulting Group), matrix 270–
271, 272–273, 274cross-impact analysis, ATB cross-impact
matrix 301–304, 303diversification matrix 276–277GE (General Electric) matrix 273–274Industry Attractiveness/Business strengths
matrix 273product portfolio matrix 270–271
maximum likelihood structure analysis(MLLSA) 110
Mecca 23media 195, 316
media-selection strategy definition 160Mediterranean 142Megatrends series of books 184MEI (marketing effectiveness index) 284–285memory 46–47mental categorization 64–68mental imagery 60–63Mexico 142micro-marketing 332Microsoft’s Expedia 26Middle East 31, 329Mintel survey 132MIS (marketing information system) 79, 80mission statement 263–264MLLSA (maximum likelihood structure
analysis) 110MNCs (multinational companies) 176modelling
behaviour 50–51, 73–76best practice 181case study, competency models for employee
hiring 178decision model 54, 56, 65–68econometric forecasting models 308–312financial 231–232five-force model 131perceived quality 69–70process models 67–68service system design 243–245strategic planning model 262–263structural models 67techniques 229–231
behaviour 73–76transnational 322–323
Motel Security Association 33motivation 49–50, 81, 175Movenpick Hotels 329MPI (Marketing Planning Index) 283–290MPS (marketing planning strategy) 280, 284,
285–286, 290MRP (materials requirement planning) 234–235multi-unit tourist pack problem 305, 306multidimensional scaling 113, 137multimarket strategy definition 138multinational companies (MNCs) 176multiple regression analysis 107multiple-channel strategy definition 164multivariate analysis 81, 104, 106–116, 128,
135, 136multivariate analysis of variance
(MANOVA) 107Murdoch, (Keith) Rupert (1931–) 327
Naisbitt, John 184National Conference of Mayors (United States of
America) 32
343Index
National Tourism Association 332National Tourism Organizations (NTOs) 33, 309national tourist offices (NTOs) 157–158National Vocational Qualification (NVQ) 179national-market strategy definition 139NDL 132NDL’s Lifestyle Selector 133near-to-home syndrome 13net present value (NPV) 189–191, 192–193Netherlands 320networks 323–324neural networks (NN) 116–118New York 23, 24, 32new-product strategy definition 148–149Newly industrialized nations (NICS) 327, 328niche markets 130–131, 332NICS (newly industrialized nations) 327, 328Nikko 331NMS (non-metric multidimensional
scaling) 113, 137NN (neural networks) 116–118non-sampling errors 98non-metric multidimensional scaling
(NMS) 113, 137Nordic school 243North America
ageing populations 317Commonwealth Hospitality of Canada 329North American school 243population growth 20tourism experts 295
Northern Ireland 34Norway 4Nova Scotia 294, 295NPV (net present value) 189–191, 192–193NTOs (National Tourism Organizations) 157–
158, 309NVQ (National Vocational Qualification) 179
observation methods 85–87occupancy 188OECD (Organization for Economic Cooperation
and Development) 176, 332oligopoly, UK 201Omni chain 331Open University’s, definition of a system 212operating systems 218–221operations control 236operations management 221, 222, 238
definition 211–217, 237Operations Management Association (UK),
annual conference (1989) 227opinion leadership 43–44opportunities 176, 305, 306, 324–325opportunity losses 305, 306optimal sample size 99–100
Organization for Economic Co-operation andDevelopment (OECD) 176, 332
organizational quality assessment 252origin markets, Azores 300origin population 308Oxford 24
Pacific 4, 142, 319, 331Pacific Rim Leisure, Australia 329Pacific Rim market 32package holidays 5Pan American Airways 319parent country nationals (PCNs) 176Pareto analysis 253–254Paris 20Park Lane Hotels, Hong Kong 329path analysis 108path diagram 115patterns 123–124, 228, 319–321PCNs (parent country nationals) 176penetration pricing definition 156perceived quality 69–70perceived risk 51–54perceived value 69, 71–72perceptional maps 136–138perceptions 45–49, 246perishability 29, 217personal/self focus 13personality 44–45PEST (Political, Economic, Social and Technical
factors) 17–18physical environment 26–29physical items versus service elements 219PI (profitability index) 191–193Pillsbury 331PIMS (Profit Impact of Marketing Strategy) 247planners 9–10planning and development 33planning model 262–263planning process 263PLC (product life cycle) 141–144, 274–275policies
energy 29Hoshin Kanri (policy deployment) 245implications 27–29policy dimension of human resource
issues 176–181public sector policies 3–4regional 3–4, 142
policy deployment (Hoshin Kanri) 245Political, Economic, Social and Technical factors
(PEST) 19–20political aspects 9political environment 34–38population
ageing 317
344 Index

population continuedas an explanatory variable 310growth 317movements 20origin 308size 98study 94United Nations (UN) 22–23
Porter, Michael 131–132portfolio analysis 268, 269–274positioning 134–135, 218–219post-purchase evaluation 76preference structure 73Preview Travel 26pricing
backward 153competitiveness 200–204flexible 154increasing the price definition 157in less competitive conditions 200–204maintaining the price definition 156marginal 154methods 152–153, 155own price 308–309penetration pricing definition 156reducing the price definition 156rooms 31skimming pricing definition 156strategies 155–157substitute prices 309surrogate for quality 69, 70
principle components analysis 108–109probability 94–95, 96, 293, 304–308problem children (or question marks) 270, 271procedures 94–95, 96, 295, 297–298process control diagram 236process flow diagrams 215–216process life cycle 229process models 67–68PRODIGY 32product
design strategy definition 148development 141, 276elimination strategy definition 148image formation 48–49information by-products 31life cycle 141–144mix 141overlap strategy definition 147portfolio matrix 270–271positioning strategy definition 147repositioning strategy definition 147scope strategy definition 147strategies 146–149
product life cycle (PLC) 141–144, 268–269,274–275
Profit Impact of Marketing Strategy (PIMS) 247
profit maximization in competitiveconditions 199–200
profit and sales 189, 201, 202profitability 195–196profitability index (PI) 191–193programmable versus non-programmable
services 219promotion
expenditure strategy definition 159international tourism 157–160mix strategy definition 159new technologies 31–32
proven systematic approach to the planning andmanagement of activities 251–252
pruning-of-marginal-markets strategydefinition 140
psychographic segmentation 5, 125–129, 327public sector policies 3–4purchase 75–76
QE2 (Queen Elizabeth 2) 145QFD (quality function deployment) 244–245qualitative effects, dummy variables 309qualitative research 81quality
assessment 252Bridge model 240control 252, 253–254costs categories 245improvement 247–254
top management role 247–250management 245–247
development 254evolution 250–253
perspectives 241strategic approach 242–243theory and practice 253–254
Quality Circles 252–253quality function deployment (QFD) 244–245Quality Inns 319Quality International 330quantitative techniques 228–231Quattro-Pro 193Queen Elizabeth 2 (QE2) 145question marks (or problem children) 270, 271questionnaires 82–85, 248–249, 295, 297–298queuing 228, 246queuing theory 230quota sample 95
Radisson Hotel Group 329Ramada Inns 319randomized block design 90rate of return 151, 153rating scale 302re-engineered behaviour 13
345Index

re-engineering from the bottom up 177re-order point (ROP) 233reducing the price definition 156reference groups 19, 43, 54–58regional accommodation 307regional initiatives 180–181regional policies 3–4, 142regional-market strategy definition 139regulations 4, 34–37, 328–329relative market share 270relatives 56–57–58remuneration and reward 173–174reschedule activities 226research follow-up 118revenues 155, 189, 203risks 28, 51–54, 53, 134, 135Ritzer family, Chicago 331ROP (re-order point) 233Royal Caribbean 178Royal Dutch Airlines (KLM) 320RTBs 135rural development 29
SABRE (computerized reservation system) 28,32
Sabre’s Travelocity 26Saison, Japan 331sales 216sales and profit 201sales and profits 202sales-revenue-maximizing (SRM) model 202–
204samples and sampling
basic concepts 93–100cluster sampling 102–104judgement 95methods 105multivariate 104, 106–116optimal sample size 99–100population 94probability procedures 94–95, 96procedures 94–100sample frame 94sample path analysis results 115–116sample selection 94–95sample size 98–100selection 100stratified sampling 100–102symbols used in sampling 97unit 94
SARA 331SAS International Hotels 329, 331satisfaction dimension 76SBU (strategic business units) 147, 261–263,
267–268, 270–274, 277scaling 113, 135, 137
SCEPTICAL 19–20, 36scheduling 221, 222, 235School of Service 178Schumpeter’s theoretical propositions 322Scotland 115–116, 170, 179–180, 192
see also United Kingdom (UK)Scottish Tourism Research Unit (STRU) 169,
175, 179Scottish Vocational Qualification (SVQ) 179search behaviour 58, 62–63seasonal variations 5segmentation 121–129, 131–132, 136, 268, 327selective perception 45–46self-concept 44–45self-image 44–45self-related imagery 61semi-structured direct data collection 82–85seminar 295, 297–298service
delivery 222, 244industry 217–218operations design 220quality 239–245, 247–254system design 243–245
Service Quality Management 212SERVQUAL 249–250simulated test markets 93simulation packages 230–231simultaneity 217–218Singapore 294, 295Single European Market 32single-minded strategy definition 138situation analysis 300–301skew loss functions 306–308skills 172–173, 178, 219skimming 154–155skimming pricing definition 156small and medium sized enterprises
(SMEs) 173, 175, 183, 329, 331–332smart customers 30SMEs (small and medium sized
enterprises) 173, 175, 183, 329, 331–332Smith, Chris 179Social Chapter of the Maastricht Treaty 181social class 43social environment 20–23Social Milieus concept 126socio-demographic changes 5sociocultural aspects 5–7Solomon Four-Group 90South Africa 34, 35Southern Pacific Hotel Corporation,
Australia 331Space Mountain 29SPC (Statistical Process Control) 247, 252spreadsheets 192–193
346 Index

SRM (sales-revenue-maximizing) model 202–204Stakis hotels 227, 235standard market tests 92–93standards 92–93, 221–225Stanford Research Institute, California 5–7stars 270, 271statistical designs 90–91Statistical Process Control (SPC) 247, 252Steps to success 176stimuli 47, 48–49, 73, 75, 81, 86strategic business units (SBU) 147, 261–263,
267–268, 270–274, 277strategies
business 261–262characteristics 260–263corporate 261development 260–262distribution 163–165diversification 276–277, 329, 332expansion 275global hospitality firms of the 2000s 329–332growth 274–276implementing international tourism 325marketing 262single-minded strategy definition 138strong-commitment strategy definition 140
stratified sampling 100–102Strengths, Weaknesses, Opportunities, Threats
(SWOT) 264–266, 277, 278, 285, 287, 290strong-commitment strategy definition 140STRU (Scottish Tourism Research Unit) 169,
175, 179structural dynamics 321–323structural models 67structured-direct data collection 82–85structured-indirect data collection 82–85study population 94subcontracting 226subjective rating scale 302subsidies 34–37substitute prices 309summary of multivariate data analysis 116summary of trends and forecasts 10–11Superhost, Canadian hospitality programme 179superservice industries 184supplier rationalization 30supply and demand 4–5survey design 248–249sustainability 181, 182–183SVQ (Scottish Vocational Qualification) 179Sweden 4Switzerland 4SWOT (Strengths, Weaknesses, Opportunities,
Threats) 264–266, 277, 278, 285, 287, 290symbols used in sampling 97system-structural approach to service quality
design 241–242
systemsdefinition 212design 218–219map of a tour operating company 212–214and system boundaries, helicopter view 214tour/holiday provision system 215transformation process 214–217view 212–214
tactical planning 259–260, 278–281target market (TM) 122–123, 129–133, 196–197TAT (thematic apperception test) 84–85taxation 26technical environment 29–33technical skills 219techniques 81, 106, 228–231technology
acceleration 12aspects 8–9communications 30developments 14–15environment 321flood 327management 32–33and marketing 327–328new 31–33as a substitute 32
telecommunications 8, 316telecommunications industry 184thematic apperception test (TAT) 84–85tiger economies 172Times, The 207TM (target market) 196–197Tokyo 32top management role, quality
improvement 247–250Total Quality Companies 251Total Quality Control definition 251total quality management (TQM) 247, 248,
252–253total shares of nights spent by foreign
tourists 300total thoughts 48–49total-market strategy definition 138–139tour operator system 213tour operators 160–162tour/holiday provision system 215Tourism in the Next Decade, International
Symposium, Washington DC (1979) 294Tourism Training Scotland 179–180TQM (total quality management) 247, 248,
252–253Trans World Airways (TWA) 319transformation process 214Transformational Total Quality definition 253transnational initiatives 180–181
347Index

transnational model 322–323transnational tourism 177–178transport and transportation 15, 30, 32, 319–320travel
behaviour 42booking sites 26–27, 162–163decision model 54, 65–66decision-making 52, 55, 56–58intermediaries 162–163motivators 49–50technology 32
Travel Association of America 8Travel Industry Association of America 26–27Travel and Tourism industry 184trends 3–16, 309Trusthouse Forte 135, 331TWA (Trans World Airways) 319Twarfs (two-workers-also-rearing-kids) 22
UAL (United Airlines) Inc. 163, 319Ultraswitch 327Ulysses factor 49United Airlines (UAL) Inc. 28, 163, 319United Kingdom (UK)
British citizens social classification 132British hotel and catering industry 172British seaside holiday 23Department of National Heritage 170, 173,
174–175hotel groups 285hotel owners 326hotels 194households 21–22Joint Hospitality Industry Congress (HIC) 177Let’s Make It First Choice 178–179levels of employment 25–26oligopoly 201Open University’s definition of a system 212Operations Management Association, annual
conference (1989) 227recent initiatives 180–181statutory minimum wage legislation 179yield management systems 207see also England; Scotland
United Nations (UN) population fund 20, 23United States of America (USA)
American Airlines, APOLLO 28, 32American Baldridge award 252American Disabilities Act 22American middle class 24American tourists 22, 300Americans 10, 295diversification issue 331dominance 325Goldilocks Economy 26government subsidies 34
United States of America (USA) continuedhospitality firms 326hospitality industry 326labour supply 328National Conference of Mayors 32roots in Eastern Europe 31tourist market analysis 124United States Census Bureau 21US Travel Data Center 32
unstructured indirect data collection 82–85unstructured-direct data collection 82–85
vacation planning 58, 59vacation tourist process 56Valencia, Spain 295value 69, 71–72, 118value-marketing strategy definition 149values 43variability management 246–247variables 268, 309–310, 312vertical diversification 276–277Victorian ‘Grand Tour’ 23Vive en Accor seminar 178
waiting 228Waldorf-Astoria, NY 145Wales 115–116war 12, 31Welcome All 179Welcome Host International 179Welcome Management 179Western Europe 18, 172, 317Western International Hotels 145, 319Westin Hotels 145, 319Whole Person Tours 22William Hunt Holdings, Hong Kong 331women travellers 21work measurement methods 224work standards 221–224worked example, MPI 286–288workforce 226–227, 328working capital 188–189Working Time Directive, 48 Hour 180–181World Expo, Vancouver 179World International and Wharf Holding 331World Tourism Organisation (WTO) 4, 7–8World Travel and Tourism Council
(WTTC) 169, 318World Travel and Tourism Environment
Research Centre (WTTERC) 318World Travel and Tourism Human Resource
Centre, global database 176World Wide Web 30, 162–163WTO (World Tourism Organisation) 4, 7–8WTTC (World Travel and Tourism
Council) 169, 170, 176, 181, 318
348 Index

WTTERC (World Travel and TourismEnvironment Research Centre) 318
www.bestfare.com 31
yield 155yield management systems 188, 206–207younger people 22
Yugoslavia 32, 34YUPs (young urban professionals) 5
ZBB (zero-base budgeting) 196–197Zeitgeist 169zero-base budgeting (ZBB) 196–197zone of tolerance 249–250
349Index