Strategic accounting choice around firm level labour negotiations
42
Working papers Working papers ng papers e c serie Beatriz García Osma, Araceli Mora and Ana M. Sabater WP-EC 2010-09 Strategic accounting choice around firm level labour negotiations
Transcript of Strategic accounting choice around firm level labour negotiations

Wo
rkin
g p
aper
sW
ork
ing
pap
ers
ng
pap
ers
ecserie
Beatriz García Osma, Araceli Mora and Ana M. SabaterWP-EC 2010-09
Strategic accounting choice around fi rm level labour negotiations
Los documentos de trabajo del Ivie ofrecen un avance de los resultados de las investigaciones económicas en curso, con objeto de generar un proceso de discusión previo a su remisión a las revistas científicas. Al publicar este documento de trabajo, el Ivie no asume responsabilidad sobre su contenido. Ivie working papers offer in advance the results of economic research under way in order to encourage a discussion process before sending them to scientific journals for their final publication. Ivie’s decision to publish this working paper does not imply any responsibility for its content. La Serie EC, coordinada por Matilde Mas, está orientada a la aplicación de distintos instrumentos de análisis al estudio de problemas económicos concretos. Coordinated by Matilde Mas, the EC Series mainly includes applications of different analytical tools to the study of specific economic problems. Todos los documentos de trabajo están disponibles de forma gratuita en la web del Ivie http://www.ivie.es, así como las instrucciones para los autores que desean publicar en nuestras series. Working papers can be downloaded free of charge from the Ivie website http://www.ivie.es, as well as the instructions for authors who are interested in publishing in our series. Edita / Published by: Instituto Valenciano de Investigaciones Económicas, S.A. Depósito Legal / Legal Deposit no.: V-3473-2010 Impreso en España (septiembre 2010) / Printed in Spain (September 2010)
WP-EC 2010-09
Strategic accounting choice around firm level labor negotiations*
Beatriz García Osma, Araceli Mora and Ana M. Sabater**
Abstract We study accounting choice around firm-level collective agreement negotiations. Prior literature argues that managers make income-decreasing accounting choices to limit the concessions made to trade unions. However, empirical research to date fails to find evidence in support of this hypothesis. We expect that this lack of evidence is driven by the confounding effects of (i) methodological concerns and (ii) influential institutional factors. Using a sample of US firms that engage in firm-level labor bargaining during the period 1994-2007, we study whether managers act strategically in an attempt to reduce the proportion of firm wealth that is accrued to employees. Our findings suggest that managers take real rather than accounting actions to minimize payments. In particular, we find evidence consistent with (i) managerial strategic timing of the negotiation, and with (ii) increased conditional conservatism in the year of labor bargaining. We do not find evidence of earnings manipulation. This potentially signals that accounting choice around labor negotiations is informative rather than opportunistic. Keywords: accounting choice, earnings quality, collective bargaining. JEL Classifcation: M41, J30, J51
Resumen En el presente trabajo se estudia la elección de políticas contables en torno a la negociación de convenios colectivos. La literatura previa predice que los gerentes tratan de reducir el resultado contable para minimizar las concesiones realizadas a los sindicatos. Sin embargo, no hay evidencia empírica clara hasta la fecha que ratifique esta hipótesis. Esperamos que esta falta de evidencia se justifique por (i) problemas metodológicos de estudios previos, y (ii) la influencia de factores institucionales. Empleando una muestra de empresas de EEUU que negocian un convenio colectivo entre 1994 y 2007, se estudia si los gerentes actúan estratégicamente para reducir el porcentaje de renta empresarial que se transfiere a los trabajadores. Nuestros resultados sugieren que los gerentes se valen de decisiones operativas en lugar de contables para minimizar los pagos a empleados. En particular, encontramos evidencia de (i) elección estratégica de cuándo negociar, y (ii) mayor conservadurismo contable en el año del evento. No encontramos evidencia de gestión oportunista del resultado, lo que potencialmente indica que las decisiones contables en torno a la negociación colectiva son informativas. Palabras clave: elección contable, calidad del resultado, negociación colectiva. * We gratefully acknowledge the helpful comments and suggestions from Joaquina Laffarga, Joerg Werner and seminar participants at the Autonoma University of Madrid, 2010 EAA Annual Meeting and the 2010 ASEPUC Annual Meeting. We acknowledge financial contribution from the Instituto Valenciano de Investigaciones Económicas (Ivie) and the Spanish Accounting and Business Association (AECA) and the Spanish Ministry of Science and Innovation (ECO2010-19314). ** B. García Osma: Autonomous University of Madrid. A. Mora: University of Valencia. A.M. Sabater: Miguel Hernández University. Contact author: [email protected].
4
1. Introduction
We study if firms make use of their discretion to minimize the percentage of corporate rents accrued to employees. In particular, we depart from prior literature and separately study whether managers make use of the flexibility inherent to accrual calculations to artificially depress earnings before labor negotiations, or alternatively, they strategically time collective bargaining so that negotiations take place in periods when firm performance and outlook are worse.
It is widely accepted that publicly held firms are increasingly characterized by the existence of private benefits of control. Institutional investors, managers or large shareholders can extract firm rents at the expense of other parties such as employees or minority shareholders (Dyck and Zingales 2004). Against this backdrop, firm-level collective agreement negotiation potentially leads to a redistribution of firm wealth, limiting the ability of controlling parties to extract private benefits. As a result, firms are predicted to act strategically to improve their bargaining position with labor, by for example, holding less cash to shelter corporate income from the demands of unions. Recent work by Klasa et al. (2009) argues that by holding less liquid assets, firms can gain concessions from employees, as they can credibly make the case that the risk of liquidity shortages threatens the firm competitive viability. However, this strategy may prove harmful if the firm ends up facing liquidity constraints.
A potentially less costly alternative is to directly reduce income, by utilizing the flexibility inherent to accounting accruals calculation. During contract negotiations, the different parties use financial statements information data to inform their demands and expectations and to predict firm viability, growth and wealth over the collective agreement horizon. Particularly, they use accounting earnings as a major input (Watts and Zimmerman 1986, DeAngelo and DeAngelo 1991). However, accounting earnings need not always map into economic earnings. A large stream of research demonstrates that conflicts of interests, coupled with the prevalence of information asymmetries, result in the emergence of incentives to manage accounting numbers to conceal true economic performance (Healy and Wahlen 1999, Dechow and Skinner 2000).1
Prior work on accounting choice surrounding labor negotiations presents inconclusive evidence and mixed theories. In their seminal work, Watts and
1 Both the FASB and the IASB recognise that employees and their representatives are external users of financial information (IASB 1989, FASB 1978).
5
Zimmerman (1986) argue that managers make income-decreasing accounting choices to reduce firm visibility and political costs. This leads to the general prediction that managers decrease earnings prior to collective agreement negotiations to minimize payments to employees. However, the empirical evidence to date is generally inconclusive and appears to be sensitive to the research method employed, as well as to the structure of the labor market, i.e., the unit of negotiation or the strength of trade unions. Early work by DeAngelo and DeAngelo (1991) finds evidence that unionized firms artificially deflate earnings prior to negotiations, whilst Liberty and Zimmerman (1986) fail to document income-decreasing manipulations when using a different method to estimate accounting discretion. More recently, using discretionary accruals models, Mora and Sabater (2008) find evidence of income-decreasing activity in a continental European setting. They argue that it is the ‘open shop’ negotiation system, jointly with these countries’ institutional characteristics (historically more favorable to unionizing and employee rights movements) that creates incentives to manipulate earnings downwards prior to firm-level negotiations.
To shed light on the relative importance of research methods and institutional backgrounds in driving the results of prior literature, we identify a sample of US firms that sign firm-level collective agreements in the period 1994-2007, and study strategic accounting choice around labor contracts by benchmarking our results against a matched control group. We focus on US, a country where the labor union movement has achieved relatively low power (Mathias and Davis 1996), as exemplifying an environment with institutional factors that make the income-decreasing hypothesis less plausible. Using these data, we run two set of tests. First, we look at the timing of the collective agreement negotiation (the ‘event’). If wealth is redistributed amongst the parties due to labor negotiations, then, these negotiations could be seen as analogous to exercising an option. Managers probably have discretion as to the period of negotiation and likely consider the net benefits for multiple future periods during their decision. It is expected that managers can estimate the net benefits of negotiating with employees in any given year and develop a preference concerning when to negotiate. Managers likely decide whether to negotiate in period t or to wait based on these estimated net benefits. We test this hypothesis using an event history model similar to the work of Reppenhagen (2010).
The results from this test confirm the hypothesis that managers time their decision to negotiate with employees. In particular, we show negotiations take place when firm profitability and liquidity are low. This is consistent and complements the evidence in Klasa et al. (2009) on the association between industry unionizing and cash
6
holdings. Our evidence is also consistent with the relative strength of the different parties being important in determining when labor negotiations take place. We show that collective agreement negotiation is positively related to the relative power of the employee base.
In a second set of tests, we study accounting choice around negotiations. We measure accounting choice in two related ways. First we look at abnormal accrual and cash flow behavior around the event, using (i) abnormal accruals as calculated by the Jones (1991) model and its extensions, and (ii) abnormal cash flows as calculated by the Roychowdhury (2006) model. Second, we study conditional accounting conservatism (i.e., timely loss recognition) around the event using the asymmetric persistence model proposed by Basu (1997) and Ball and Shivakumar (2005). The joint use of these related but separate methods allows us to disentangle opportunistic from informative accounting decisions, i.e., to detect whether income-decreasing choices are associated to the existence of bad news about the firm or respond simply to strategic attempts to reduce employees’ share in firm rents. The results from this second test are generally consistent with a depression of reported income around labor negotiations that appears to be informative rather than opportunistic. The evidence from the earnings management tests is weak and does not support the hypotheses of opportunistic income depression. The results obtained from the conservatism tests suggest that conditional conservatism increases around collective agreement bargaining. This indicates that reductions in reported income surrounding contract negotiations are associated to a more timely recognition of bad news.
We make several contributions to the literature. First, we contribute to the literature on the determinants of accounting choice. In their review of the literature, Fields et al. (2001) call for further research on the determinants and consequences of accounting choice. We study an under-researched area: the incentives for and determinants of income-decreasing accounting choice. There is little prior evidence on this area and even less recent work on the potential consequences of accounting choice on employee wealth. As we mentioned previously, prior evidence is scarce and presents conflicting results (and theories). We also add to prior work by using a method that permits shedding light on the previously described confounding effects affecting the early studies. In particular, by using conditional conservatism models, we can better analyze if income decreasing accounting choices are driven by opportunistic or informative (signaling) motivations. Put together, our results are consistent with the industry-level results of Klasa et al. (2009), but suggest that managers time the decision to negotiate when profitability is low, rather than artificially deflate earnings before
7
negotiating. Finally, by studying firm-level labor negotiations in the US, we can analyze whether employee strength is a significant driver of accounting choice to avoid a transfer of wealth to the workers. We thus contribute to the understanding of results in prior literature and at the same time to point out the role of differences in institutional factors between countries with diverse quality of earnings.
The remainder of the paper is organized as follows: Section 2 reviews the prior literature and presents the hypotheses, as well as describes the institutional characteristics of collective agreements in US. Section 3 presents the research design and describes the sample. Section 4 presents the main results of the paper, and finally, section 5 concludes.
2. Literature review and predictions
Prior literature proposes two theoretical approaches to the study of the association between managerial accounting choices and labor considerations: (i) the ‘ability-to-pay’ theory that was tested by the early studies, and (ii) the more recent ‘attract-and-retain’ theory.
Broadly, the first perspective assumes that through labor negotiations employees can reduce the part of firm rents accrued to other parties. Because earnings are a key item to evaluate firm future outlook and profitability, the greater accounting earnings are, the greater the demands from trade unions and employees. In this setting, the onset of employee bargaining creates incentives to artificially deflate accounting earnings thereby lowering the firm perceived ability to pay high(er) wages, and thus, constraining employees’ demands. This hypothesis links directly with the influential ‘political cost’ hypothesis in Watts and Zimmerman (1986) positive accounting theory. Watts and Zimmerman (1986) predict that managers reduce accounting earnings to reduce firm visibility. Large, profitable firms draw the attention of interested parties such as the press, politicians or employees. This attention, in turn, may lead to governmental intervention (by for example, imposing new regulations or caps on prices) or more to the point of our research, to greater concessions to employees during collective agreement negotiations.
Early work on this hypothesis by Liberty and Zimmerman (1986) argues that union members presumably do not completely adjust reported earnings for expected manipulations because such adjustments are costly and thus, thanks to income-decreasing manipulation, a lower transfer of wealth to the employees may be agreed
8
upon. They analyze expense accruals in the period immediately preceding union wage bargaining but fail to find results in support of their hypothesis. They suggest that this failure may be due to economy-wide recession in the period, or to managerial beliefs that unions can see through the manipulation and adjust earnings accordingly, rendering manipulation meaningless. As an additional explanation to their (lack of) results, Liberty and Zimmerman (1986) indicate that it is likely that the method employed to proxy for income-decreasing manipulation is incapable of measuring it without error.
Subsequent work by DeAngelo and DeAngelo (1991) and Mautz and Richardson (1992) finds only weak evidence of patterns in expenses being associated to the timing of labor negotiations. In a slightly different setting, later studies, such as Scott (1994) or Cullinan and Knobett (1994) also find only weak evidence of an association between labor union intensity and accounting strategies. The more recent study of Cullinan and Bline (2003) fails to find evidence of an association between labor considerations and the choice of depreciation policies in Canada. Cullinan and Bline (2003) argue that the general lack of evidence in this line of research is due to labor negotiations being infrequent, and thus, other common incentives for income-increasing manipulation overriding the income-decreasing motives. In line with this argument, extant literature demonstrates that managers face income-increasing incentives derived from compensation and debt contracts, or to meet simple accounting targets, such as beating analysts’ forecasts or prior period earnings (Burgstahler and Dichev 1997, Degeorge et al. 1999).
Looking at real choices, Klasa et al. (2009) analyze if more unionized industries strategically hold less cash to gain concessions from employees. Klasa et al. (2009) argue that by strategically holding less liquid assets firms can credibly make the case that the risk of liquidity shortages threatens the firm competitive viability. This study is one of the few that has found evidence in support of strategic decision making around labor negotiations, although their evidence refers to real actions rather than accounting choices.
With regards to the alternative ‘attract-and-retain’ hypothesis, it is argued that in certain settings managers choose income-maximizing accounting policies to reassure their employees of firm financial strength (Bowen et al. 1995, Cullinan and Bline 2003). This hypothesis clearly applies to settings where it is possible to differentiate amongst classes of workers, as well as in settings (industries or firms) characterized by the presence of highly qualified, difficult to replace workers. Salaries are commonly negotiated directly with individuals, instead of via the signature of a collective
9
agreement. In the absence of collective negotiations, the incentives to reduce corporate income are attenuated, as (i) employees are unlikely to have sufficient power to individually demand increases in salary or other benefits; (ii) each individual contract represents an insignificant proportion of total firm wealth, and (iii) there is no single event when all or most contracts are negotiated at once. This is particularly the case in US, where the signature of a collective agreement only applies to unionized workers. Under these circumstances, labor negotiation, even if it results in increases in salaries, may not represent an event that creates sufficient incentives to override the more generally prevailing income-increasing motivations.
Hence, institutional factors are expected to be a significant driver of accounting choice around labor negotiations and may partly explain the inconsistency of results reported by prior work on this area. Work by Harris et al. (1994) and García Lara et al. (2005), while not directly testing their predictions, argues that income-decreasing practices in countries like Germany are partially motivated by the strength of labor unions. In addition, prior research by Leuz et al. (2003) or Ball et al. (2003) demonstrates that institutional factors significantly drive cross-country differences in accounting quality (and choices). In the next section, we discuss in more detail the institutional background of collective agreement negotiation.
2.1. Collective agreement negotiations: institutional background
The relationships between managers and workers, companies and employees or capitalists and proletarians are considered central to the modern process of economic growth. Different countries and economies have experienced different patterns of growth and followed different paths to establish modern economics, resulting in differing labor organization systems (Mathias and Davis 1996). In fact, nowadays, both the coverage rate of collective bargaining and the legal rules that mandate labor negotiations vary across countries.
Generally, collective bargaining can be organized under an ‘open-shop’ or a ‘close-shop’ rule. In the ‘close-shop’ system common in Anglo-Saxon countries, only unionized workers are affected by contract agreements. In these systems, labor negotiations are structured in a single level of bargaining: at the firm-level, and it is common for individual employees to negotiate their salaries and work conditions independently of other workers. One of the main differences between these systems is that in a ‘close-shop’ system the concessions and conditions agreed upon in the bargaining process only apply to unionized workers. This reduces the overall effect on
10
company earnings of an increase in wages. Thus, it is less likely that managers attempt to artificially depress earnings in firms operating in ‘close-shop’ systems, as the net benefits of such an action are unclear, particularly in the presence of overriding motivations to meet earnings targets or avoid debt-covenant violations.2
As previously mentioned, because of the potentially confounding effects that could cause the lack of empirical support for the income-decreasing hypothesis proposed by Watts and Zimmerman (1986), we focus on US firms. In general terms, the US system of collective bargaining fits with the outline of the Anglo-Saxon ‘close-shop’ model of collective bargaining, where collective bargaining can only cover agreements at the firm level. This generally leads to lower levels of unionizing. For example, according to the Bureau of Labor (2009), the percentage of unionized workers in the US is relatively low (10-15%), and the coverage of collective bargaining is around 14%. Likely, the incidence of formal firm-level bargaining is lower than the incidence of individual salary and working conditions negotiations, as only about 14% of employees are covered by firm-level collective agreement.
Firm-level collective agreements have a limited life. Their conditions can be renegotiated. It is rare for the workers to exert pressure to renegotiate the agreement because they cannot call for strikes in support of their demands, as strikes are held only by referendum.. This (re)negotiation of the conditions may last several months (and span different years), during which time the company gives the workers relevant information on current and future performance. To start negotiations both parties must be informed to plan their strategies and time their actions. The very fact that a firm signs a collective agreement signals the strength of its employee base as a pressure group, particularly in a country such as the US, where traditionally, trade unions are not as well organized or powerful as in other countries like France or Germany. To the extent that this process reduces the share of managers, debt-holders, shareholders and other parties in the firm’s wealth, it is expected that managers may intercede in the bargaining process to lower the percentage of firm’s rents that are distributed to the employees. We test two interlinked hypothesis, the first one related to the timing of the bargaining process:
2 . In ‘open-shop’ systems, labor agreements and concessions are extended to all workers, independently of their union status. Collective bargaining is often structured in multiple levels of negotiation, at the national-, industry- and firm- levels. Firm-level agreements cannot contradict the terms of higher-level agreements. Industry agreements establish a second layer of minimum wages (above the national statutory minimum) which can only be revised downwards by firm-level agreements under special circumstances. Hence, a salary increment agreed at the firm-level is almost always inevitably higher than the industry- and nation- level agreements.
11
H1: Managers strategically time collective agreement negotiations to limit the transfer of wealth to employees.
During contract negotiations, workers may have limited access to private information, but commonly, the information used to inform their demands and expectations comes mainly from the (prior) annual and (current) quarterly financial statements published by the company. Based on the previously discussed theories and evidence, we formulate a second hypothesis related to accounting choice around contract negotiations:
H2: Managers make strategic accounting choices to reduce corporate income before collective agreement negotiations thereby limiting the transfer of wealth to the employees.
3. Method and sample
We study managerial strategic actions around firm-level bargaining with employees (in the form of collective agreements). In our empirical tests, we run two set of analyses. First, we model the timing of firm collective agreement negotiations. Second, we study the relationship between labor bargaining in a given year (the event, henceforth) and accounting quality in the years that surround this event. If firm stakeholders are reluctant to share firm wealth with employees, on aggregate, we should observe (i) a strategic timing of the collective agreement negotiation; and (ii) lower (abnormal) earnings and delayed economic gains recognition before the event, to minimize the wealth transferred to employees.
3.1. Collective agreement negotiations timing
In our first set of tests, we study the timing of the signature of the agreement using an event history model designed for diffusion processes following Reppenhagen (2010) Event history analysis is used to illuminate the process leading to the occurrence of an event (Box-Steffensmeier and Jones 1997), in contrast to traditional binary regression techniques (e.g. logistic, probit) that focuses only on the event itself (LeClere 2000). In addition, binary regression cannot handle the heterogeneous timing dimension of labor negotiation decisions without bias whereas event history models excel in that area. Specifically, we estimate the following event history model relating the signature of a collective agreement to a set of corporate variables, firm visibility, performance, and a vector of dummy variables that control for industry membership:
12
0 1 2 3 4 5
6 71
,
γ γ γ γ γ γ
γ γ=
= + + + + +
+ + +∑it it it it it it
K
it it kitk
CollAgr CEOInf Lev ROA Nemp MKTB
Cash Visibility IND, (1)
where CollAgr takes the value of 1 if firm i signs a collective agreement in year t (eventit = 1) and 0 otherwise (eventit = 0); CEOInf is an indicator variable that takes the value of 1 if the CEO of the firm is also the chairman of the board of directors, 0 otherwise; Lev is financial leverage calculated as the value of total debt to total assets. We define CEOInf and Lev so that greater values of these variables are associated to more power from stakeholders other than employees. We expect that the greater the power of other stakeholders vis-à-vis employees, the more likely it is that the agreement will be strategically timed.
As additional variables in model (1) we incorporate ROA, Cash, Nemp and Visibility. ROA is the return on assets measured as the ratio of net income to total assets; Nemp is the natural logarithm of the number of employees; MKTB is the market-to-book ratio; Cash is cash and cash equivalents divided by beginning-of-period total assets; and Visibility is a vector of variables that measures firm visibility. Specifically, we consider a) SIZE, measured as the natural logarithm of firm assets; b) Leader, an indicator variable that takes the value of 1 if the ratio of annual changes in firm sales to industry change in sales is in the top quartile of the annual distribution, 0 otherwise; and c) Perform, a variable measuring prior firm performance that takes the value of 1 if the firm has had positive increases in earnings in each of the past two years, 0 otherwise. Finally, we incorporate industry dummies (IND) in the model.
If managers time their decision to negotiate with workers to reduce the share of employees in firm rents, it is expected that they will bargain in periods with low ROA and Cash, and will be less likely to negotiate after periods of consecutive growth (Perform=1), to minimize payments to employees. On the contrary, they may be obliged to negotiate when the employee base is greater, or they hold a position of leadership in their industry (visibility is high).
It is important to note in model (1) the difference between calendar time and time in the study. Firms enter the study continuously throughout the sample period (that spans the period 1994-2007). Some firms are censored (the non-event firms) while others experience the event (the firms that sign a collective agreement). In calendar time, both the entry and the exit time of the firms are staggered and can occur at any
13
time throughout the sample period. In some cases, firms may experience more than one event (if they sign more than one agreement).
3.2. Accounting choice surrounding collective agreement negotiations
An alternative to timing the decision to negotiate with employees when corporate performance is low is to directly reduce corporate income prior to labor negotiations. Managers can reduce employees’ share in firm profits by reducing earnings. We study if this is the case using two set of tests. First, we look at the evolution of firm abnormal accounting accruals in the years surrounding labor bargaining. If earnings are artificially depressed in the years leading up to the event, we should observe lower abnormal accruals in the years prior to the signature, and greater abnormal accruals after the event, when prior years’ abnormal accruals reverse.
Second, we study the level of conditional accounting conservatism around the event. Conditional conservatism is the consequence of the asymmetric verifiability requirements for the recognition of gains and losses that results in earnings that reflect bad news (losses) in a timelier fashion that good news (gains). This property of earnings is referred to as the asymmetric timeliness of earnings (Basu 1997) or conditional conservatism (Beaver and Ryan 2005). We study if managers are more likely to delay the recognition of gains and more likely to timely recognize losses, thereby increasing conditional conservatism (and lowering earnings, in this case, for informative purposes) around the signature of a collective agreement with employees.
By using these two methodologies in combination we can determine whether any evidence of income-decreasing activity is driven by opportunistic incentives to reduce employees’ share in firm rents, or responds to actual economic events (bad news) surrounding labor negotiation as indicated by the conditional conservatism tests.
3.2.1. Earnings management tests
The literature essentially distinguishes two accounting mechanisms used to manage earnings: (i) changes in accounting method; and (ii) timing the allocation of revenues and expenses. The first mechanism is clearly more visible. It is unlikely that managers change procedures during contract talks since this manipulation is easily observed, and the repeated game nature of labor contracts would necessitate switching back to the previous procedure after the talks (Liberty and Zimmerman 1986: 695).
14
Thus, we focus on the second mechanism and study accounting accruals and cash flow behavior.3
Accounting accruals adjustments reflect business transactions that affect future cash flows (for which cash has not yet changed hands). Under generally accepted accounting principles, firms have discretion to recognize these transactions so that reported earnings reflect the true underlying business condition of the firm. However, managerial flexibility in calculating these accruals opens up opportunities for opportunistic earnings management. Extant research calculates abnormal accruals using the Jones (1991) model in cross-section, to improve the estimation of the parameters, as suggested by DeFond and Jiambalvo (1994). The Jones model uses the unexplained part of a regression of total accruals on the change in revenue and gross property, plant and equipment as a proxy for abnormal accruals. We deviate from the basic Jones model for two reasons. First, we focus on analyzing working-capital accruals because current research indicates that management has the most discretion over current accruals, and that manipulation of long-term accruals such as depreciation, is unlikely due to their high visibility and low flexibility (Becker et al. 1998, Young 1999). Second, we employ the Kasznik (1999) model, which differs from the standard Jones model in that it incorporates the change in operating cash flow as an explanatory variable to take into account the negative correlation between accruals and cash flow from operations (Dechow 1994). To check the robustness of the findings, we also use the Jones (1991) and the modified Jones model (Dechow et al. 1995).
To obtain a measure of abnormal working capital accruals for all firms in industry j for year t, we estimate the Kasznik model in cross-section for all industry-year combinations with at least 6 observations of data, as follows:
0 1 31 1 1 1
1t t tt
t t t t
WCA REV CFOTA TA TA TA
α α α ε− − − −
⎡ ⎤ ⎡ ⎤ ⎡ ⎤Δ Δ= + + +⎢ ⎥ ⎢ ⎥ ⎢ ⎥
⎣ ⎦ ⎣ ⎦ ⎣ ⎦, (2)
where, WCA is working capital accruals, ΔREV is change in sales, ΔCFO is change in cash flow from operations and TA are total assets, and t is the time-period indicator. Next, for each firm, we calculate abnormal working capital accruals (AWCA) as:
3 Most of the previous evidence on the effect of labour agreements on earnings management focuses on the first mechanisms.
15
0 1 31 1 1 1
1ˆ ˆ ˆt t t tt
t t t t
WCA REV REC CFOAWCATA TA TA TA
α α α− − − −
⎛ ⎞⎡ ⎤ ⎡ ⎤ ⎡ ⎤Δ −Δ Δ= − + +⎜ ⎟⎢ ⎥ ⎢ ⎥ ⎢ ⎥⎜ ⎟⎣ ⎦ ⎣ ⎦ ⎣ ⎦⎝ ⎠
, (3)
where, 0α̂ , 1α̂ and 3α̂ are the fitted industry-coefficients from equation (2) and ΔREC is
the change in accounts receivable. To run models (2) and (3) all available observations are used, including firms that sign a collective agreement, to avoid introducing biases in the analysis.4
To obtain abnormal accruals measures using the modified Jones model, we use the same procedure, but we do not include ΔCFO as an additional variable in models (2) and (3). Finally, to estimate abnormal accruals using the original Jones model, we follow this last procedure (i.e., exclude ΔCFO from the models), but without subtracting change in accounts receivable from change in sales in the second step and adding as an additional regressor PPE (gross property, plant and equipment scaled by lagged total assets). Once we have obtained a measure of discretionary accruals, we study the association between collective agreement negotiation and earnings quality as follows:
0 1 2 3 4 5
6 71
,
β β β β β β
β β μ=
= + + + + + +
+ + +∑K
kit tk
AWCA Event SIZE MKTB Lev CFO
IssDEBT IssEQ IND, (4)
where Event takes the value of 1 if the firm signs a collective agreement during the year, 0 otherwise. We include in model (4) a set of variables that may influence the size and sign of accruals but that are not expected to be related to the event, as well as other variables that are potentially related to managerial strategic timing of collective bargaining and that were previously described in section 3.1 above. MKTB is the market-to-book ratio calculated as the ratio of year-end market value of equity to the year-end book value of shareholder’s equity. The greater MKTB is, the greater the investment opportunities available to the firm. Firms that operate in high MKTB industries are expected to have a greater proportion of highly qualified (and difficult to replace) workers, and be more likely to take measures in an attempt to retain their employees. CFO is cash flow from operations divided by beginning-of-period total assets. IssDEBT (IssEQ) is an indicator variable of whether the firm issued debt (equity) in the year, to proxy for debt (equity) issuances, we create a dummy variable that takes
4 The estimation is made based on a set of over 35,000 firm-year observations for the considered sample period.
16
the value of 1 if there is an increase of over 10 per cent in the value of outstanding debt (equity capital), 0 otherwise. All other variables as measured as before.
When running model (4), we are interested in studying the evolution of accounting quality surrounding the event, thus, we run the model from year t-1 to t+1, where t is the event year. If firms artificially depress earnings, we expect that β1 will be negative when we run model (4) in t and t-1, and positive in year t+1, indicating that firms that sign a collective agreement in year t depress earnings, and there is a reversal of previously negative accruals after the event.
As an additional analysis, and given the evidence in Klasa et al. (2009) of strategic cash holdings, we also look at abnormal cash flow behavior. Earnings are the sum of cash flows and accounting accruals, thus, to manage earnings, it is conceivable that both components could be manipulated. In fact, the recent survey conducted by Graham et al. (2005) suggests that US-based CFOs and CEOs may in fact prefer to manipulate earnings through the use of real (vs. purely accounting) actions. We estimate abnormal cash flows (AbCFO) using the Roychodhury (2006) model. Similar to the calculation of abnormal accruals in equations (2) and (3), the first stage consists of deriving normal cash flow activity. We run the following cross-sectional regression for every industry-year combination with at least 6 observations of data:
0 1 21 1 1 1
1t t tt
t t t t
CFO REV REV eTA TA TA TA
β β β− − − −
⎡ ⎤ ⎡ ⎤ ⎡ ⎤Δ= + + +⎢ ⎥ ⎢ ⎥ ⎢ ⎥
⎣ ⎦ ⎣ ⎦ ⎣ ⎦ (5)
where all variables are defined as before. For every observation, abnormal cash flow (ACFO) is obtained by subtracting from actual firm CFO the normal CFO calculated
using the estimated β̂ coefficients from equation (5). The procedure is the same as the
one previously explained.
3.2.2. Conditional conservatism tests
Our proxy of conditional conservatism is based on Basu (1997). Under conservative accounting, earnings capture bad news faster than good news because of the asymmetric standards of verification for losses and gains. Basu uses stock returns to proxy for good and bad news. Stock prices incorporate all information arriving to the market from multiple sources, including reported earnings, in a timely fashion. Therefore, stock price changes are a measure of news arrival during the period. Because earnings are timelier in recognizing bad news than good news, Basu expects to find a
17
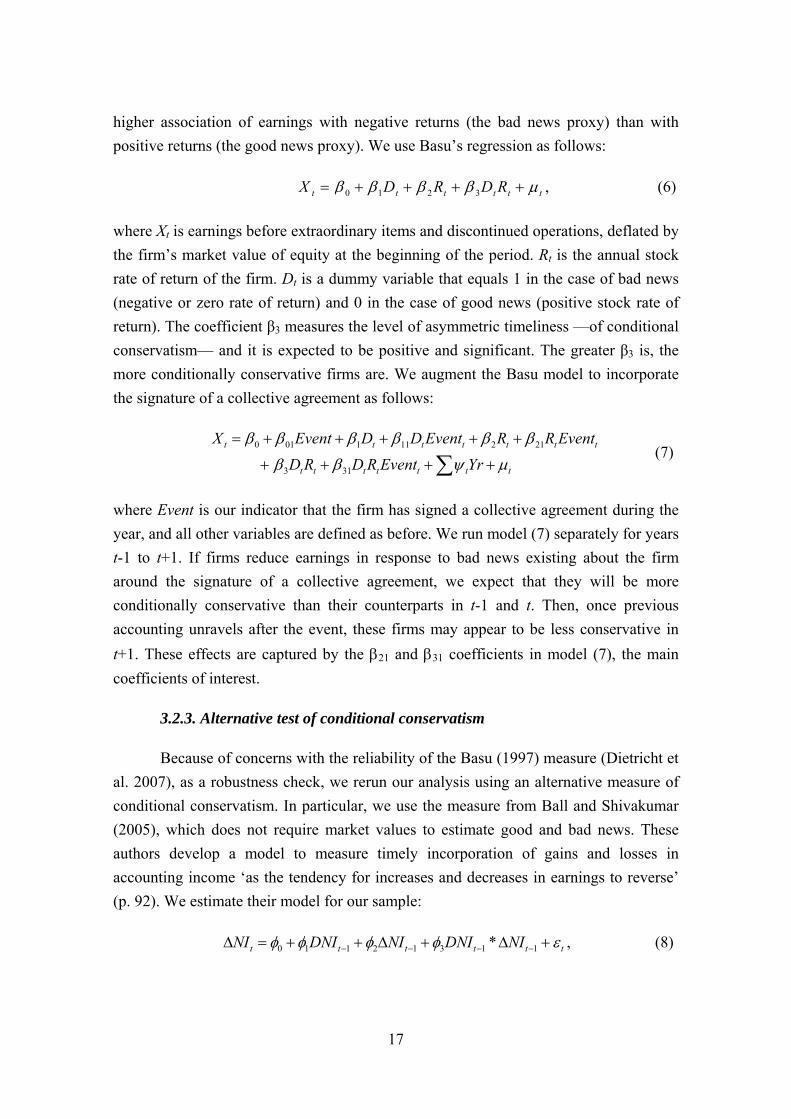
higher association of earnings with negative returns (the bad news proxy) than with positive returns (the good news proxy). We use Basu’s regression as follows:
0 1 2 3t t t t t tX D R D Rβ β β β μ= + + + + , (6)
where Xt is earnings before extraordinary items and discontinued operations, deflated by the firm’s market value of equity at the beginning of the period. Rt is the annual stock rate of return of the firm. Dt is a dummy variable that equals 1 in the case of bad news (negative or zero rate of return) and 0 in the case of good news (positive stock rate of return). The coefficient β3 measures the level of asymmetric timeliness —of conditional conservatism— and it is expected to be positive and significant. The greater β3 is, the more conditionally conservative firms are. We augment the Basu model to incorporate the signature of a collective agreement as follows:
0 01 1 11 2 21
3 31 t t t t t t t
t t t t t t t
X Event D D Event R R Event
D R D R Event Yr
β β β β β β
β β ψ μ
= + + + + +
+ + + +∑ (7)
where Event is our indicator that the firm has signed a collective agreement during the year, and all other variables are defined as before. We run model (7) separately for years t-1 to t+1. If firms reduce earnings in response to bad news existing about the firm around the signature of a collective agreement, we expect that they will be more conditionally conservative than their counterparts in t-1 and t. Then, once previous accounting unravels after the event, these firms may appear to be less conservative in t+1. These effects are captured by the β21 and β31 coefficients in model (7), the main coefficients of interest.
3.2.3. Alternative test of conditional conservatism
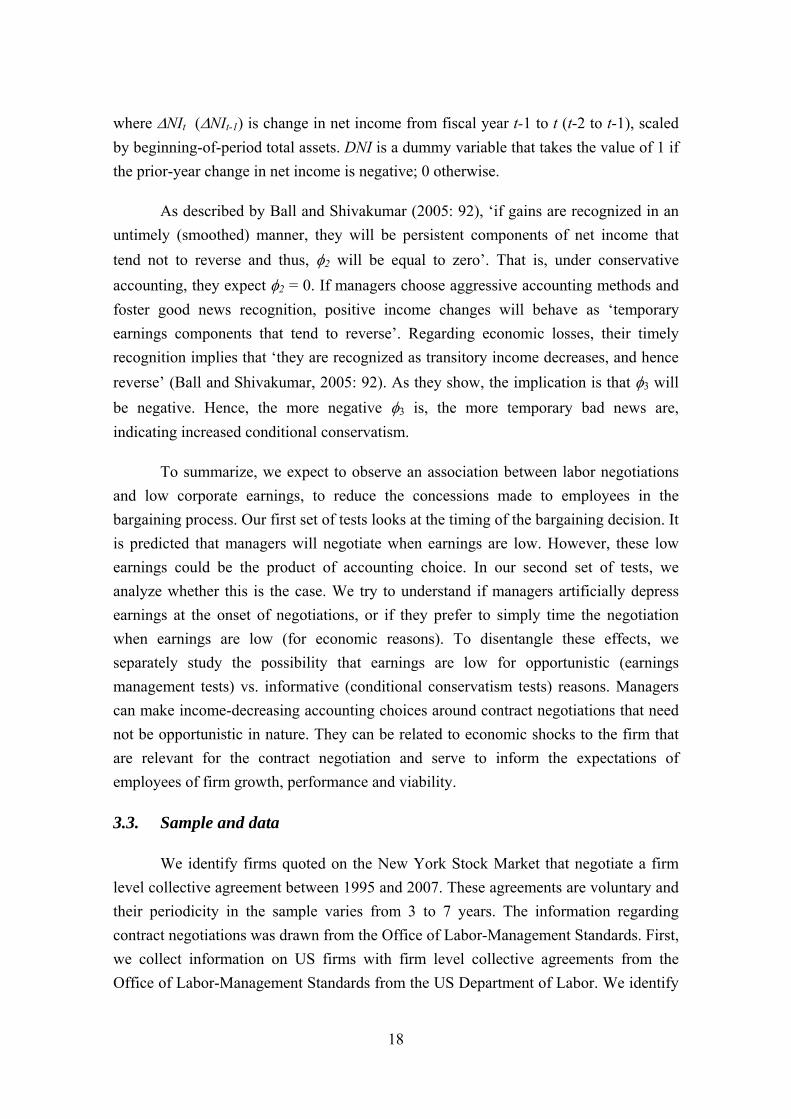
Because of concerns with the reliability of the Basu (1997) measure (Dietricht et al. 2007), as a robustness check, we rerun our analysis using an alternative measure of conditional conservatism. In particular, we use the measure from Ball and Shivakumar (2005), which does not require market values to estimate good and bad news. These authors develop a model to measure timely incorporation of gains and losses in accounting income ‘as the tendency for increases and decreases in earnings to reverse’ (p. 92). We estimate their model for our sample:
0 1 1 2 1 3 1 1*t t t t t tNI DNI NI DNI NIφ φ φ φ ε− − − −Δ = + + Δ + Δ + , (8)
18
where ΔNIt (ΔNIt-1) is change in net income from fiscal year t-1 to t (t-2 to t-1), scaled by beginning-of-period total assets. DNI is a dummy variable that takes the value of 1 if the prior-year change in net income is negative; 0 otherwise.
As described by Ball and Shivakumar (2005: 92), ‘if gains are recognized in an untimely (smoothed) manner, they will be persistent components of net income that tend not to reverse and thus, φ2 will be equal to zero’. That is, under conservative accounting, they expect φ2 = 0. If managers choose aggressive accounting methods and foster good news recognition, positive income changes will behave as ‘temporary earnings components that tend to reverse’. Regarding economic losses, their timely recognition implies that ‘they are recognized as transitory income decreases, and hence reverse’ (Ball and Shivakumar, 2005: 92). As they show, the implication is that φ3 will be negative. Hence, the more negative φ3 is, the more temporary bad news are, indicating increased conditional conservatism.
To summarize, we expect to observe an association between labor negotiations and low corporate earnings, to reduce the concessions made to employees in the bargaining process. Our first set of tests looks at the timing of the bargaining decision. It is predicted that managers will negotiate when earnings are low. However, these low earnings could be the product of accounting choice. In our second set of tests, we analyze whether this is the case. We try to understand if managers artificially depress earnings at the onset of negotiations, or if they prefer to simply time the negotiation when earnings are low (for economic reasons). To disentangle these effects, we separately study the possibility that earnings are low for opportunistic (earnings management tests) vs. informative (conditional conservatism tests) reasons. Managers can make income-decreasing accounting choices around contract negotiations that need not be opportunistic in nature. They can be related to economic shocks to the firm that are relevant for the contract negotiation and serve to inform the expectations of employees of firm growth, performance and viability.
3.3. Sample and data
We identify firms quoted on the New York Stock Market that negotiate a firm level collective agreement between 1995 and 2007. These agreements are voluntary and their periodicity in the sample varies from 3 to 7 years. The information regarding contract negotiations was drawn from the Office of Labor-Management Standards. First, we collect information on US firms with firm level collective agreements from the Office of Labor-Management Standards from the US Department of Labor. We identify
19
120 listed firms that negotiate a firm-level labour agreement during the period 1995-2007. To ensure the validity of the information we analyze the full text of each agreement. To be included in the sample labour contracts identified in the register must meet the following criteria: (1) the company’s annual earnings data is available for the year before the negotiation takes place (t-1) , negotiation year (t) and the following year (t+1); (2) the company has no merger processes, splits or any other relevant issue on the event year; and (3) the company does not belong to the financial and insurance sectors.
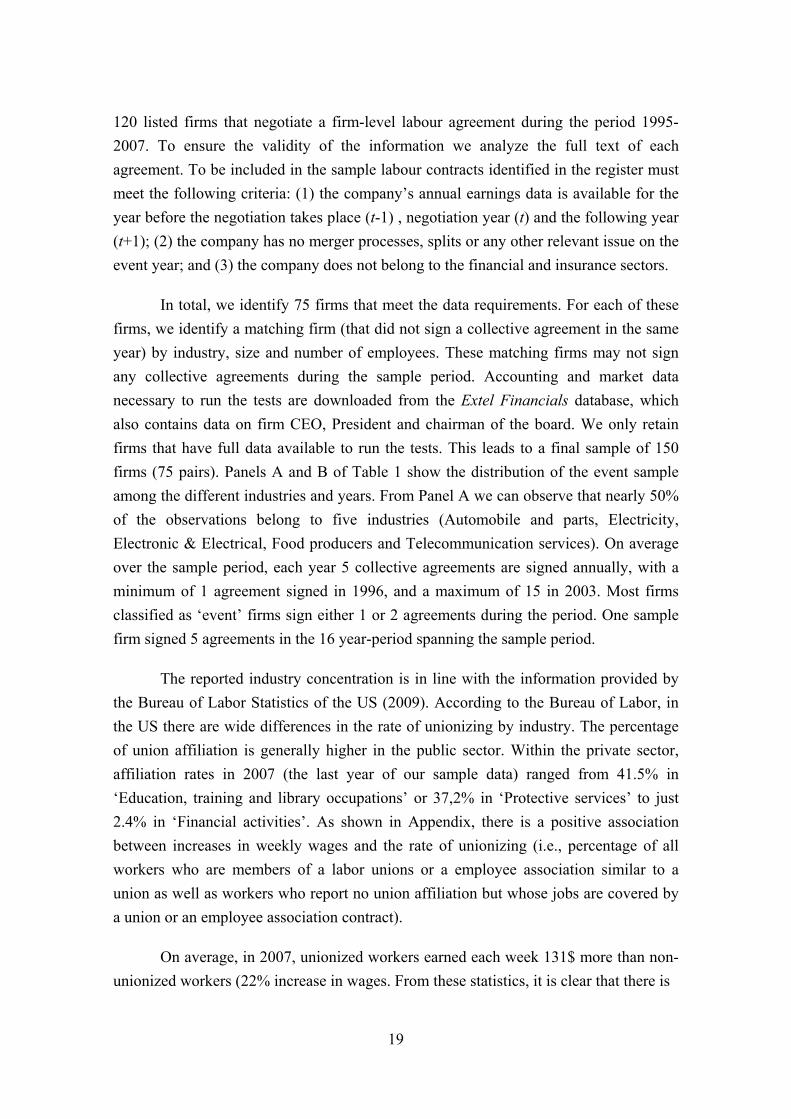
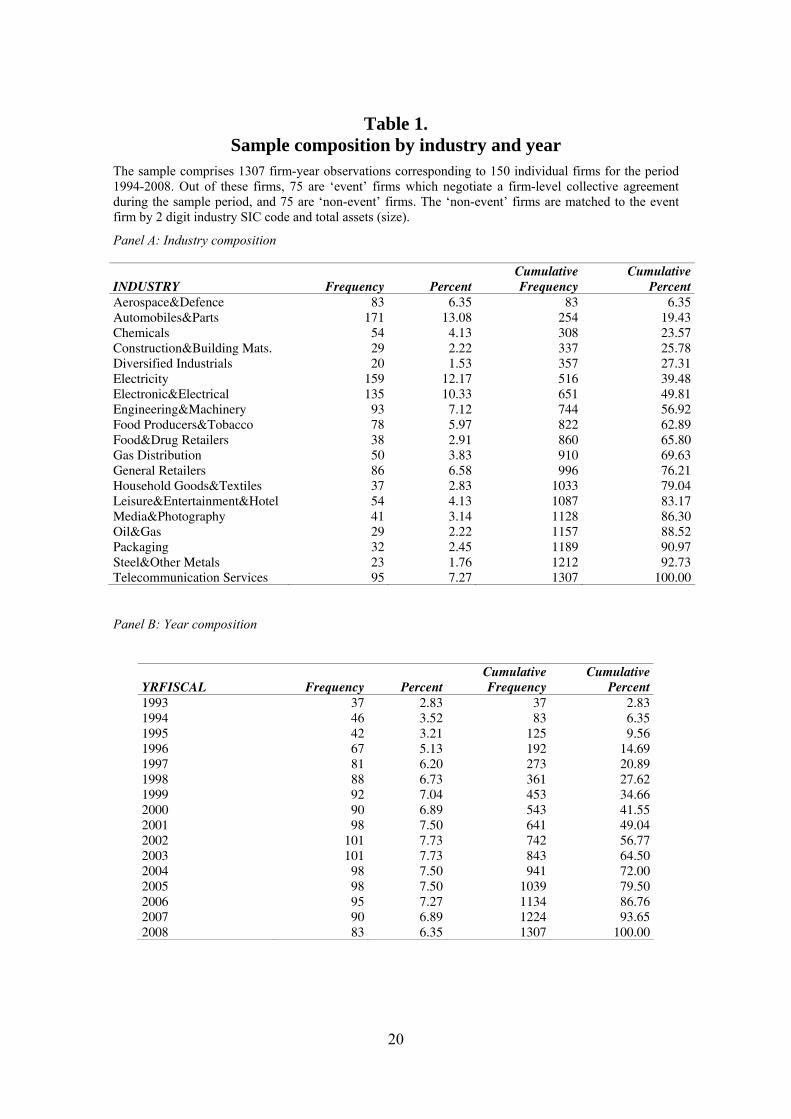
In total, we identify 75 firms that meet the data requirements. For each of these firms, we identify a matching firm (that did not sign a collective agreement in the same year) by industry, size and number of employees. These matching firms may not sign any collective agreements during the sample period. Accounting and market data necessary to run the tests are downloaded from the Extel Financials database, which also contains data on firm CEO, President and chairman of the board. We only retain firms that have full data available to run the tests. This leads to a final sample of 150 firms (75 pairs). Panels A and B of Table 1 show the distribution of the event sample among the different industries and years. From Panel A we can observe that nearly 50% of the observations belong to five industries (Automobile and parts, Electricity, Electronic & Electrical, Food producers and Telecommunication services). On average over the sample period, each year 5 collective agreements are signed annually, with a minimum of 1 agreement signed in 1996, and a maximum of 15 in 2003. Most firms classified as ‘event’ firms sign either 1 or 2 agreements during the period. One sample firm signed 5 agreements in the 16 year-period spanning the sample period.
The reported industry concentration is in line with the information provided by the Bureau of Labor Statistics of the US (2009). According to the Bureau of Labor, in the US there are wide differences in the rate of unionizing by industry. The percentage of union affiliation is generally higher in the public sector. Within the private sector, affiliation rates in 2007 (the last year of our sample data) ranged from 41.5% in ‘Education, training and library occupations’ or 37,2% in ‘Protective services’ to just 2.4% in ‘Financial activities’. As shown in Appendix, there is a positive association between increases in weekly wages and the rate of unionizing (i.e., percentage of all workers who are members of a labor unions or a employee association similar to a union as well as workers who report no union affiliation but whose jobs are covered by a union or an employee association contract).
On average, in 2007, unionized workers earned each week 131$ more than non-unionized workers (22% increase in wages. From these statistics, it is clear that there is
20
Table 1. Sample composition by industry and year
The sample comprises 1307 firm-year observations corresponding to 150 individual firms for the period 1994-2008. Out of these firms, 75 are ‘event’ firms which negotiate a firm-level collective agreement during the sample period, and 75 are ‘non-event’ firms. The ‘non-event’ firms are matched to the event firm by 2 digit industry SIC code and total assets (size).
Panel A: Industry composition
INDUSTRY Frequency Percent Cumulative Frequency
Cumulative Percent
Aerospace&Defence 83 6.35 83 6.35 Automobiles&Parts 171 13.08 254 19.43 Chemicals 54 4.13 308 23.57 Construction&Building Mats. 29 2.22 337 25.78 Diversified Industrials 20 1.53 357 27.31 Electricity 159 12.17 516 39.48 Electronic&Electrical 135 10.33 651 49.81 Engineering&Machinery 93 7.12 744 56.92 Food Producers&Tobacco 78 5.97 822 62.89 Food&Drug Retailers 38 2.91 860 65.80 Gas Distribution 50 3.83 910 69.63 General Retailers 86 6.58 996 76.21 Household Goods&Textiles 37 2.83 1033 79.04 Leisure&Entertainment&Hotel 54 4.13 1087 83.17 Media&Photography 41 3.14 1128 86.30 Oil&Gas 29 2.22 1157 88.52 Packaging 32 2.45 1189 90.97 Steel&Other Metals 23 1.76 1212 92.73 Telecommunication Services 95 7.27 1307 100.00
Panel B: Year composition
YRFISCAL Frequency Percent Cumulative Frequency
Cumulative Percent
1993 37 2.83 37 2.83 1994 46 3.52 83 6.35 1995 42 3.21 125 9.56 1996 67 5.13 192 14.69 1997 81 6.20 273 20.89 1998 88 6.73 361 27.62 1999 92 7.04 453 34.66 2000 90 6.89 543 41.55 2001 98 7.50 641 49.04 2002 101 7.73 742 56.77 2003 101 7.73 843 64.50 2004 98 7.50 941 72.00 2005 98 7.50 1039 79.50 2006 95 7.27 1134 86.76 2007 90 6.89 1224 93.65 2008 83 6.35 1307 100.00
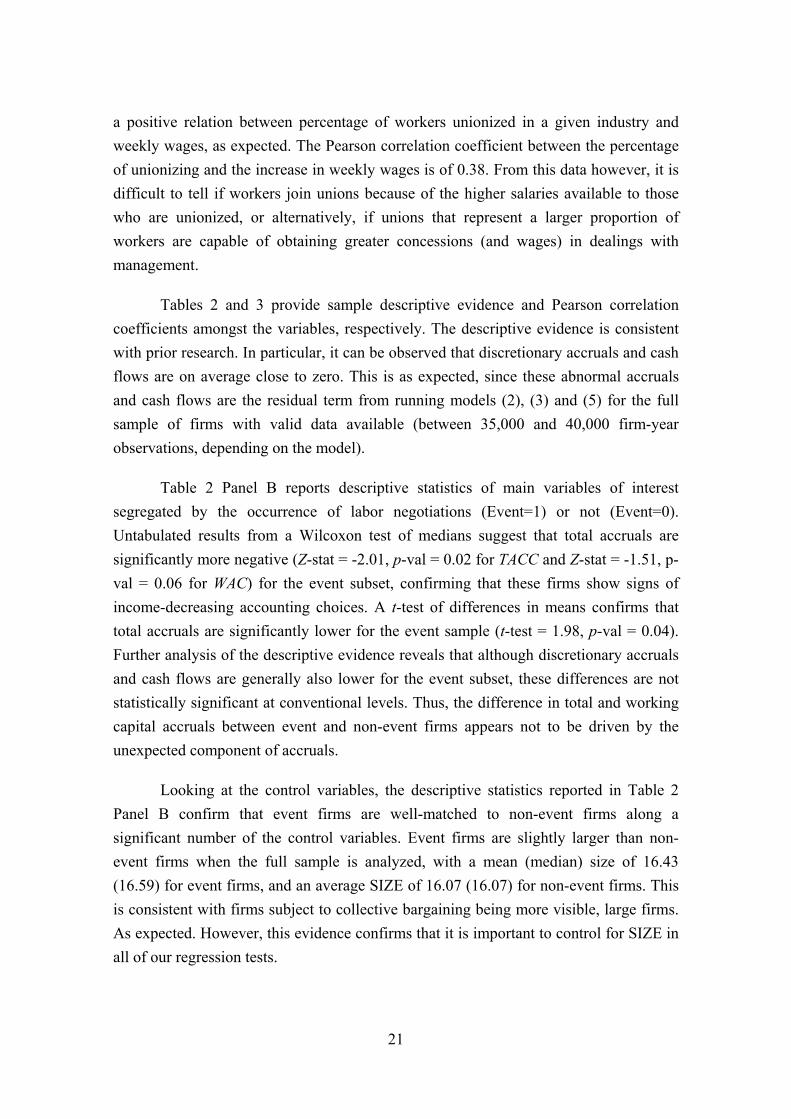
21
a positive relation between percentage of workers unionized in a given industry and weekly wages, as expected. The Pearson correlation coefficient between the percentage of unionizing and the increase in weekly wages is of 0.38. From this data however, it is difficult to tell if workers join unions because of the higher salaries available to those who are unionized, or alternatively, if unions that represent a larger proportion of workers are capable of obtaining greater concessions (and wages) in dealings with management.
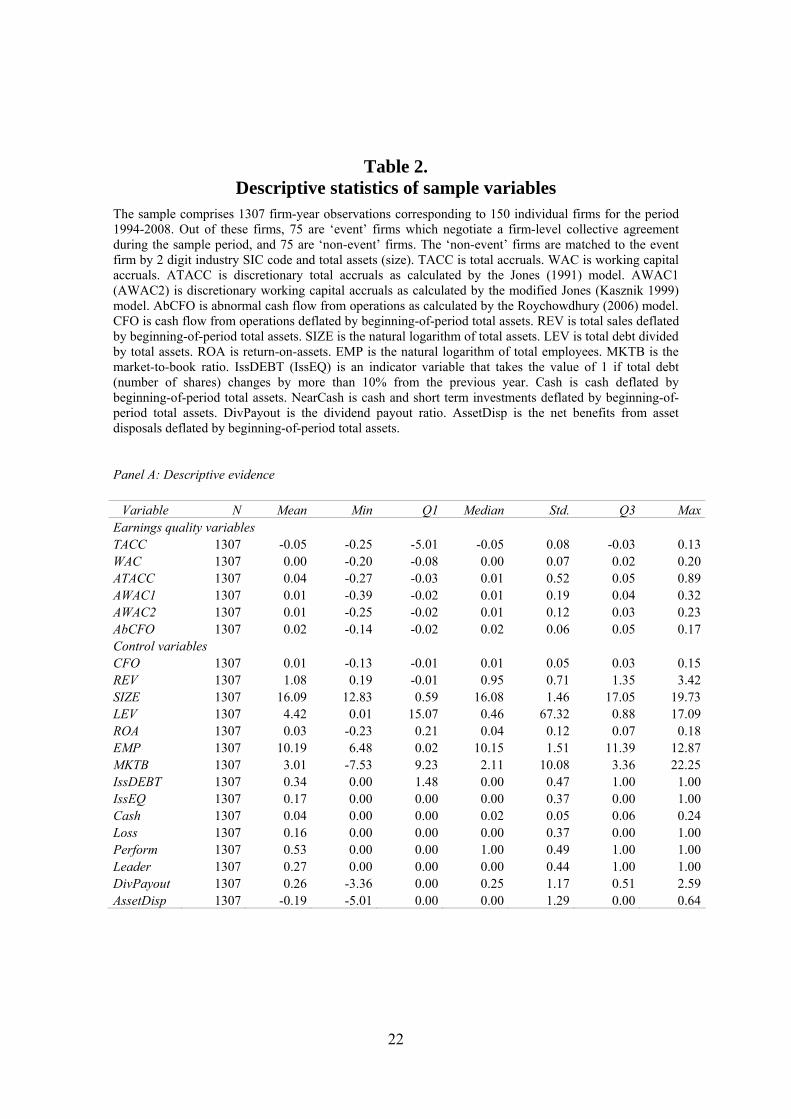
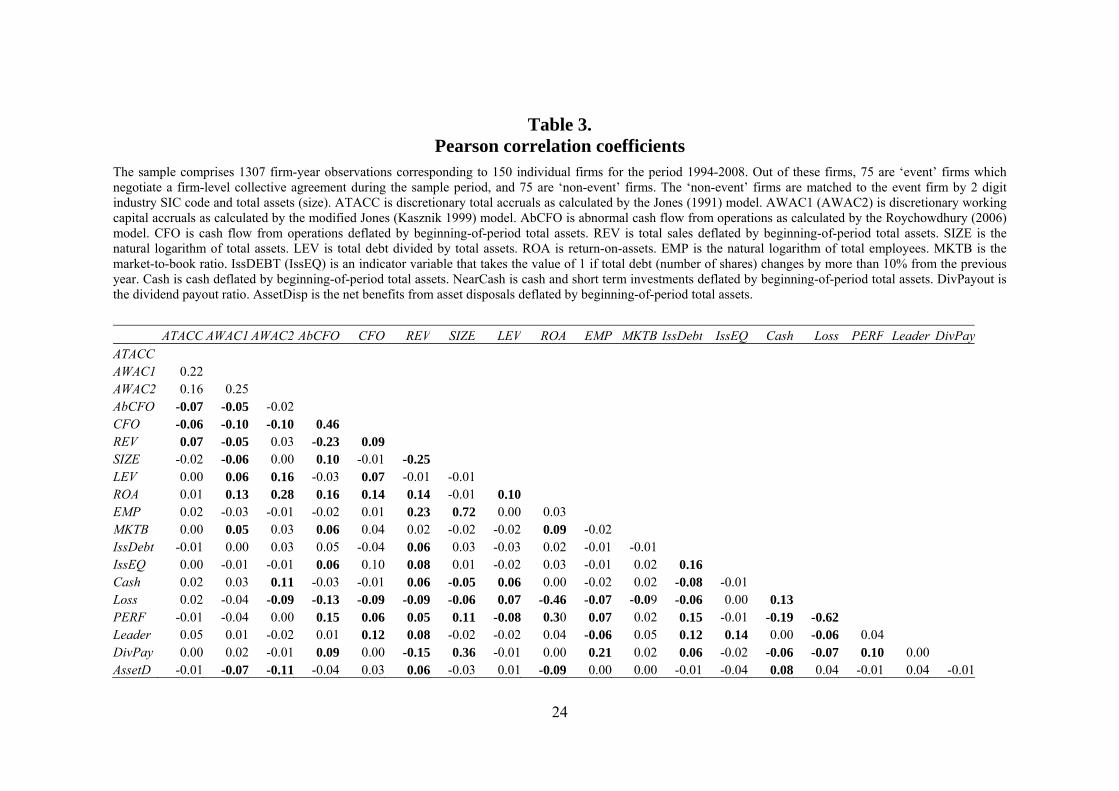
Tables 2 and 3 provide sample descriptive evidence and Pearson correlation coefficients amongst the variables, respectively. The descriptive evidence is consistent with prior research. In particular, it can be observed that discretionary accruals and cash flows are on average close to zero. This is as expected, since these abnormal accruals and cash flows are the residual term from running models (2), (3) and (5) for the full sample of firms with valid data available (between 35,000 and 40,000 firm-year observations, depending on the model).
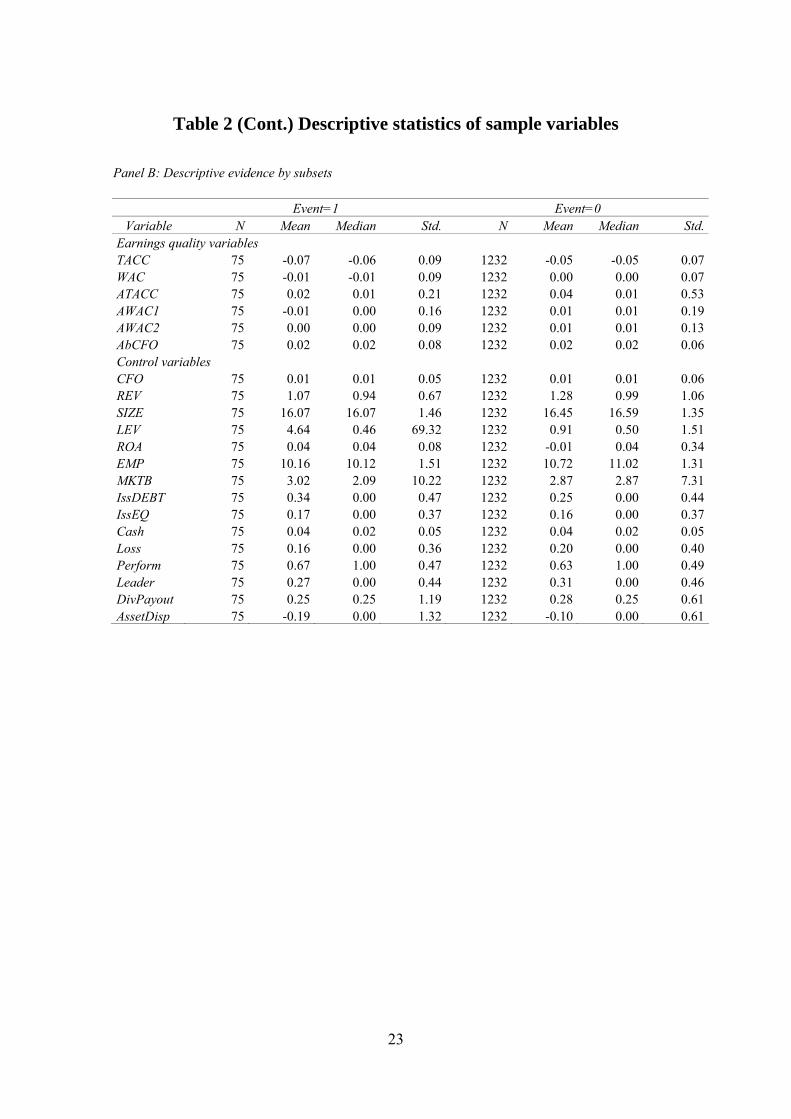
Table 2 Panel B reports descriptive statistics of main variables of interest segregated by the occurrence of labor negotiations (Event=1) or not (Event=0). Untabulated results from a Wilcoxon test of medians suggest that total accruals are significantly more negative (Z-stat = -2.01, p-val = 0.02 for TACC and Z-stat = -1.51, p-val = 0.06 for WAC) for the event subset, confirming that these firms show signs of income-decreasing accounting choices. A t-test of differences in means confirms that total accruals are significantly lower for the event sample (t-test = 1.98, p-val = 0.04). Further analysis of the descriptive evidence reveals that although discretionary accruals and cash flows are generally also lower for the event subset, these differences are not statistically significant at conventional levels. Thus, the difference in total and working capital accruals between event and non-event firms appears not to be driven by the unexpected component of accruals.
Looking at the control variables, the descriptive statistics reported in Table 2 Panel B confirm that event firms are well-matched to non-event firms along a significant number of the control variables. Event firms are slightly larger than non-event firms when the full sample is analyzed, with a mean (median) size of 16.43 (16.59) for event firms, and an average SIZE of 16.07 (16.07) for non-event firms. This is consistent with firms subject to collective bargaining being more visible, large firms. As expected. However, this evidence confirms that it is important to control for SIZE in all of our regression tests.
22
Table 2. Descriptive statistics of sample variables
The sample comprises 1307 firm-year observations corresponding to 150 individual firms for the period 1994-2008. Out of these firms, 75 are ‘event’ firms which negotiate a firm-level collective agreement during the sample period, and 75 are ‘non-event’ firms. The ‘non-event’ firms are matched to the event firm by 2 digit industry SIC code and total assets (size). TACC is total accruals. WAC is working capital accruals. ATACC is discretionary total accruals as calculated by the Jones (1991) model. AWAC1 (AWAC2) is discretionary working capital accruals as calculated by the modified Jones (Kasznik 1999) model. AbCFO is abnormal cash flow from operations as calculated by the Roychowdhury (2006) model. CFO is cash flow from operations deflated by beginning-of-period total assets. REV is total sales deflated by beginning-of-period total assets. SIZE is the natural logarithm of total assets. LEV is total debt divided by total assets. ROA is return-on-assets. EMP is the natural logarithm of total employees. MKTB is the market-to-book ratio. IssDEBT (IssEQ) is an indicator variable that takes the value of 1 if total debt (number of shares) changes by more than 10% from the previous year. Cash is cash deflated by beginning-of-period total assets. NearCash is cash and short term investments deflated by beginning-of-period total assets. DivPayout is the dividend payout ratio. AssetDisp is the net benefits from asset disposals deflated by beginning-of-period total assets.
Panel A: Descriptive evidence
Variable N Mean Min Q1 Median Std. Q3 MaxEarnings quality variables TACC 1307 -0.05 -0.25 -5.01 -0.05 0.08 -0.03 0.13WAC 1307 0.00 -0.20 -0.08 0.00 0.07 0.02 0.20ATACC 1307 0.04 -0.27 -0.03 0.01 0.52 0.05 0.89AWAC1 1307 0.01 -0.39 -0.02 0.01 0.19 0.04 0.32AWAC2 1307 0.01 -0.25 -0.02 0.01 0.12 0.03 0.23AbCFO 1307 0.02 -0.14 -0.02 0.02 0.06 0.05 0.17Control variables CFO 1307 0.01 -0.13 -0.01 0.01 0.05 0.03 0.15REV 1307 1.08 0.19 -0.01 0.95 0.71 1.35 3.42SIZE 1307 16.09 12.83 0.59 16.08 1.46 17.05 19.73LEV 1307 4.42 0.01 15.07 0.46 67.32 0.88 17.09ROA 1307 0.03 -0.23 0.21 0.04 0.12 0.07 0.18EMP 1307 10.19 6.48 0.02 10.15 1.51 11.39 12.87MKTB 1307 3.01 -7.53 9.23 2.11 10.08 3.36 22.25IssDEBT 1307 0.34 0.00 1.48 0.00 0.47 1.00 1.00IssEQ 1307 0.17 0.00 0.00 0.00 0.37 0.00 1.00Cash 1307 0.04 0.00 0.00 0.02 0.05 0.06 0.24Loss 1307 0.16 0.00 0.00 0.00 0.37 0.00 1.00Perform 1307 0.53 0.00 0.00 1.00 0.49 1.00 1.00Leader 1307 0.27 0.00 0.00 0.00 0.44 1.00 1.00DivPayout 1307 0.26 -3.36 0.00 0.25 1.17 0.51 2.59AssetDisp 1307 -0.19 -5.01 0.00 0.00 1.29 0.00 0.64
23
Table 2 (Cont.) Descriptive statistics of sample variables
Panel B: Descriptive evidence by subsets
Event=1 Event=0 Variable N Mean Median Std. N Mean Median Std.
Earnings quality variables TACC 75 -0.07 -0.06 0.09 1232 -0.05 -0.05 0.07WAC 75 -0.01 -0.01 0.09 1232 0.00 0.00 0.07ATACC 75 0.02 0.01 0.21 1232 0.04 0.01 0.53AWAC1 75 -0.01 0.00 0.16 1232 0.01 0.01 0.19AWAC2 75 0.00 0.00 0.09 1232 0.01 0.01 0.13AbCFO 75 0.02 0.02 0.08 1232 0.02 0.02 0.06Control variables CFO 75 0.01 0.01 0.05 1232 0.01 0.01 0.06REV 75 1.07 0.94 0.67 1232 1.28 0.99 1.06SIZE 75 16.07 16.07 1.46 1232 16.45 16.59 1.35LEV 75 4.64 0.46 69.32 1232 0.91 0.50 1.51ROA 75 0.04 0.04 0.08 1232 -0.01 0.04 0.34EMP 75 10.16 10.12 1.51 1232 10.72 11.02 1.31MKTB 75 3.02 2.09 10.22 1232 2.87 2.87 7.31IssDEBT 75 0.34 0.00 0.47 1232 0.25 0.00 0.44IssEQ 75 0.17 0.00 0.37 1232 0.16 0.00 0.37Cash 75 0.04 0.02 0.05 1232 0.04 0.02 0.05Loss 75 0.16 0.00 0.36 1232 0.20 0.00 0.40Perform 75 0.67 1.00 0.47 1232 0.63 1.00 0.49Leader 75 0.27 0.00 0.44 1232 0.31 0.00 0.46DivPayout 75 0.25 0.25 1.19 1232 0.28 0.25 0.61AssetDisp 75 -0.19 0.00 1.32 1232 -0.10 0.00 0.61
24
Table 3. Pearson correlation coefficients
The sample comprises 1307 firm-year observations corresponding to 150 individual firms for the period 1994-2008. Out of these firms, 75 are ‘event’ firms which negotiate a firm-level collective agreement during the sample period, and 75 are ‘non-event’ firms. The ‘non-event’ firms are matched to the event firm by 2 digit industry SIC code and total assets (size). ATACC is discretionary total accruals as calculated by the Jones (1991) model. AWAC1 (AWAC2) is discretionary working capital accruals as calculated by the modified Jones (Kasznik 1999) model. AbCFO is abnormal cash flow from operations as calculated by the Roychowdhury (2006) model. CFO is cash flow from operations deflated by beginning-of-period total assets. REV is total sales deflated by beginning-of-period total assets. SIZE is the natural logarithm of total assets. LEV is total debt divided by total assets. ROA is return-on-assets. EMP is the natural logarithm of total employees. MKTB is the market-to-book ratio. IssDEBT (IssEQ) is an indicator variable that takes the value of 1 if total debt (number of shares) changes by more than 10% from the previous year. Cash is cash deflated by beginning-of-period total assets. NearCash is cash and short term investments deflated by beginning-of-period total assets. DivPayout is the dividend payout ratio. AssetDisp is the net benefits from asset disposals deflated by beginning-of-period total assets.
ATACC AWAC1 AWAC2 AbCFO CFO REV SIZE LEV ROA EMP MKTB IssDebt IssEQ Cash Loss PERF Leader DivPayATACC AWAC1 0.22 AWAC2 0.16 0.25 AbCFO -0.07 -0.05 -0.02 CFO -0.06 -0.10 -0.10 0.46 REV 0.07 -0.05 0.03 -0.23 0.09 SIZE -0.02 -0.06 0.00 0.10 -0.01 -0.25 LEV 0.00 0.06 0.16 -0.03 0.07 -0.01 -0.01 ROA 0.01 0.13 0.28 0.16 0.14 0.14 -0.01 0.10 EMP 0.02 -0.03 -0.01 -0.02 0.01 0.23 0.72 0.00 0.03 MKTB 0.00 0.05 0.03 0.06 0.04 0.02 -0.02 -0.02 0.09 -0.02 IssDebt -0.01 0.00 0.03 0.05 -0.04 0.06 0.03 -0.03 0.02 -0.01 -0.01 IssEQ 0.00 -0.01 -0.01 0.06 0.10 0.08 0.01 -0.02 0.03 -0.01 0.02 0.16 Cash 0.02 0.03 0.11 -0.03 -0.01 0.06 -0.05 0.06 0.00 -0.02 0.02 -0.08 -0.01 Loss 0.02 -0.04 -0.09 -0.13 -0.09 -0.09 -0.06 0.07 -0.46 -0.07 -0.09 -0.06 0.00 0.13 PERF -0.01 -0.04 0.00 0.15 0.06 0.05 0.11 -0.08 0.30 0.07 0.02 0.15 -0.01 -0.19 -0.62 Leader 0.05 0.01 -0.02 0.01 0.12 0.08 -0.02 -0.02 0.04 -0.06 0.05 0.12 0.14 0.00 -0.06 0.04 DivPay 0.00 0.02 -0.01 0.09 0.00 -0.15 0.36 -0.01 0.00 0.21 0.02 0.06 -0.02 -0.06 -0.07 0.10 0.00AssetD -0.01 -0.07 -0.11 -0.04 0.03 0.06 -0.03 0.01 -0.09 0.00 0.00 -0.01 -0.04 0.08 0.04 -0.01 0.04 -0.01
25
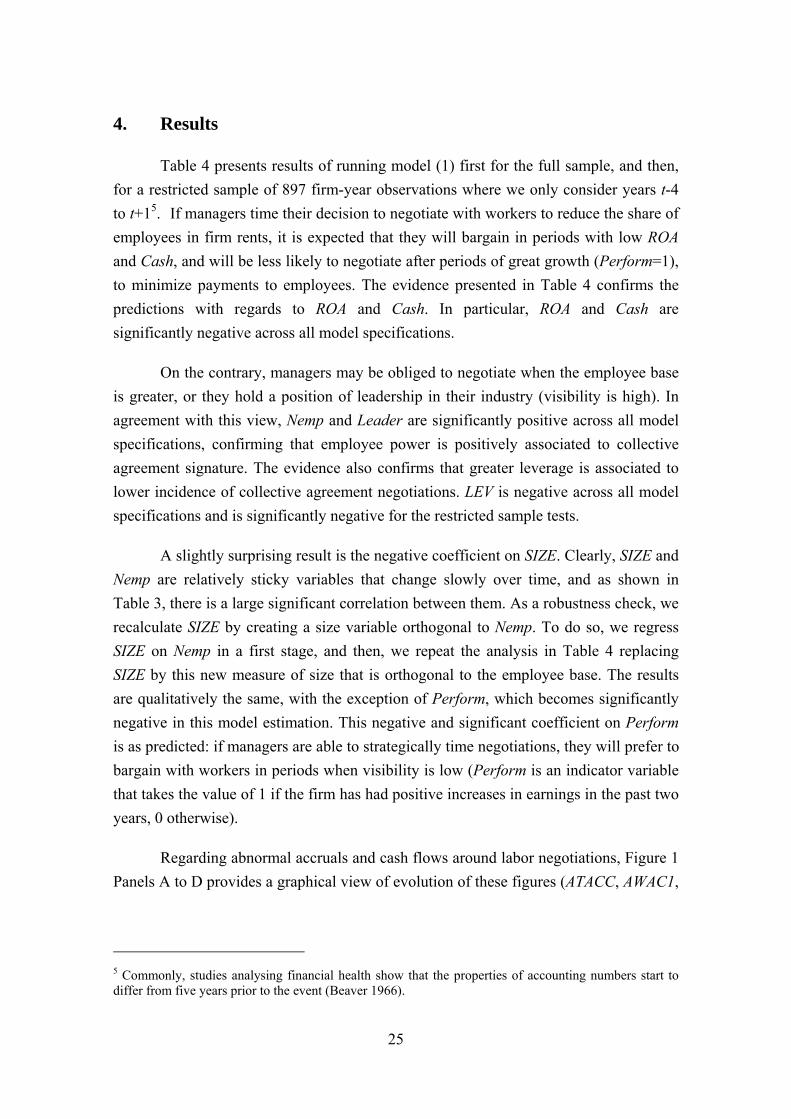
4. Results
Table 4 presents results of running model (1) first for the full sample, and then, for a restricted sample of 897 firm-year observations where we only consider years t-4 to t+15.1 If managers time their decision to negotiate with workers to reduce the share of employees in firm rents, it is expected that they will bargain in periods with low ROA and Cash, and will be less likely to negotiate after periods of great growth (Perform=1), to minimize payments to employees. The evidence presented in Table 4 confirms the predictions with regards to ROA and Cash. In particular, ROA and Cash are significantly negative across all model specifications.
On the contrary, managers may be obliged to negotiate when the employee base is greater, or they hold a position of leadership in their industry (visibility is high). In agreement with this view, Nemp and Leader are significantly positive across all model specifications, confirming that employee power is positively associated to collective agreement signature. The evidence also confirms that greater leverage is associated to lower incidence of collective agreement negotiations. LEV is negative across all model specifications and is significantly negative for the restricted sample tests.
A slightly surprising result is the negative coefficient on SIZE. Clearly, SIZE and Nemp are relatively sticky variables that change slowly over time, and as shown in Table 3, there is a large significant correlation between them. As a robustness check, we recalculate SIZE by creating a size variable orthogonal to Nemp. To do so, we regress SIZE on Nemp in a first stage, and then, we repeat the analysis in Table 4 replacing SIZE by this new measure of size that is orthogonal to the employee base. The results are qualitatively the same, with the exception of Perform, which becomes significantly negative in this model estimation. This negative and significant coefficient on Perform is as predicted: if managers are able to strategically time negotiations, they will prefer to bargain with workers in periods when visibility is low (Perform is an indicator variable that takes the value of 1 if the firm has had positive increases in earnings in the past two years, 0 otherwise).
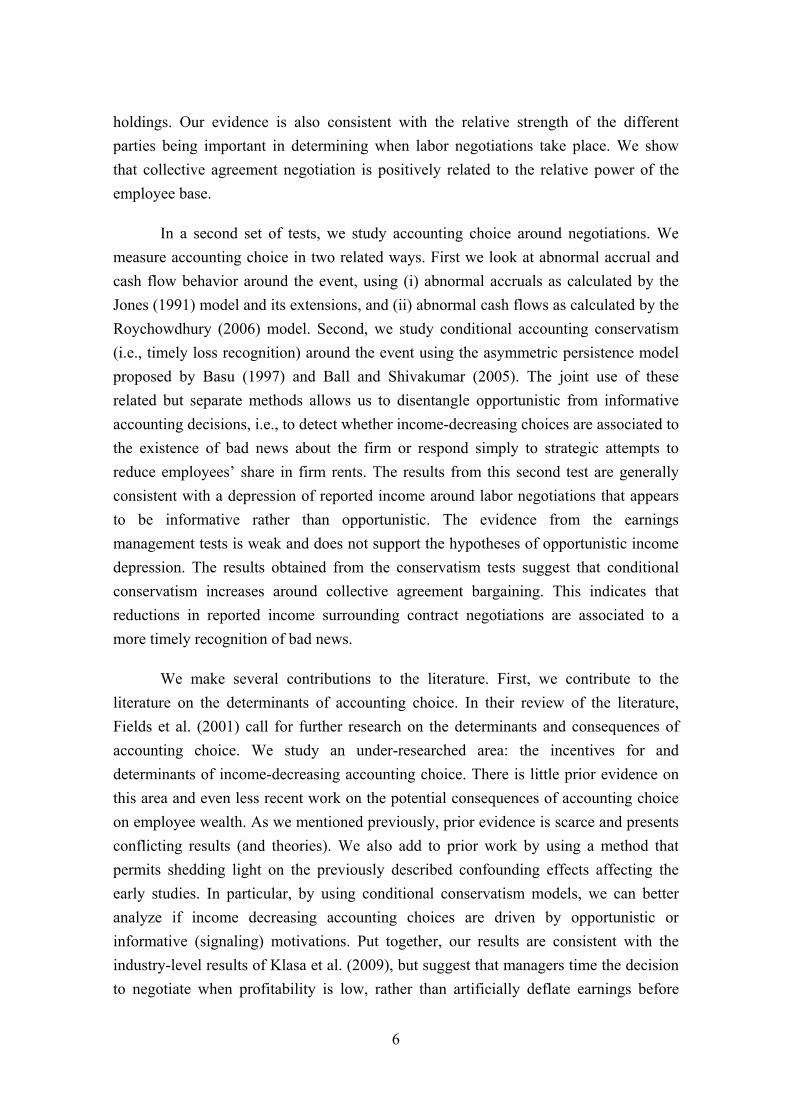
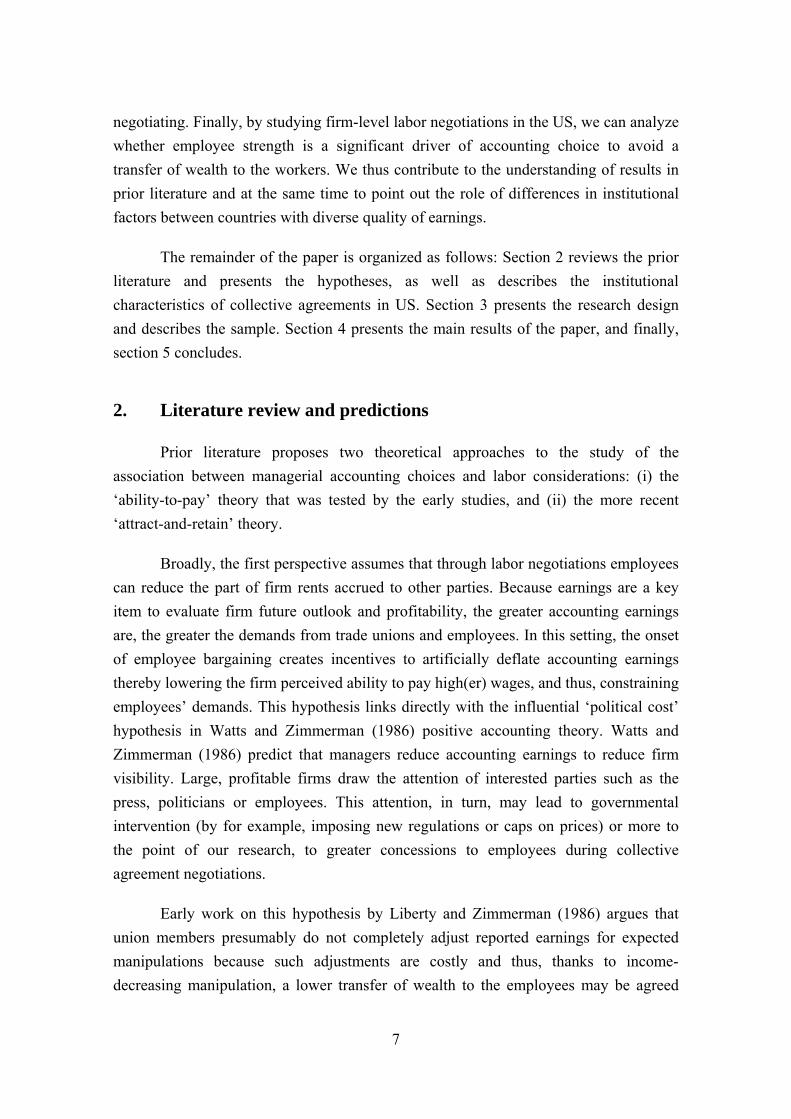
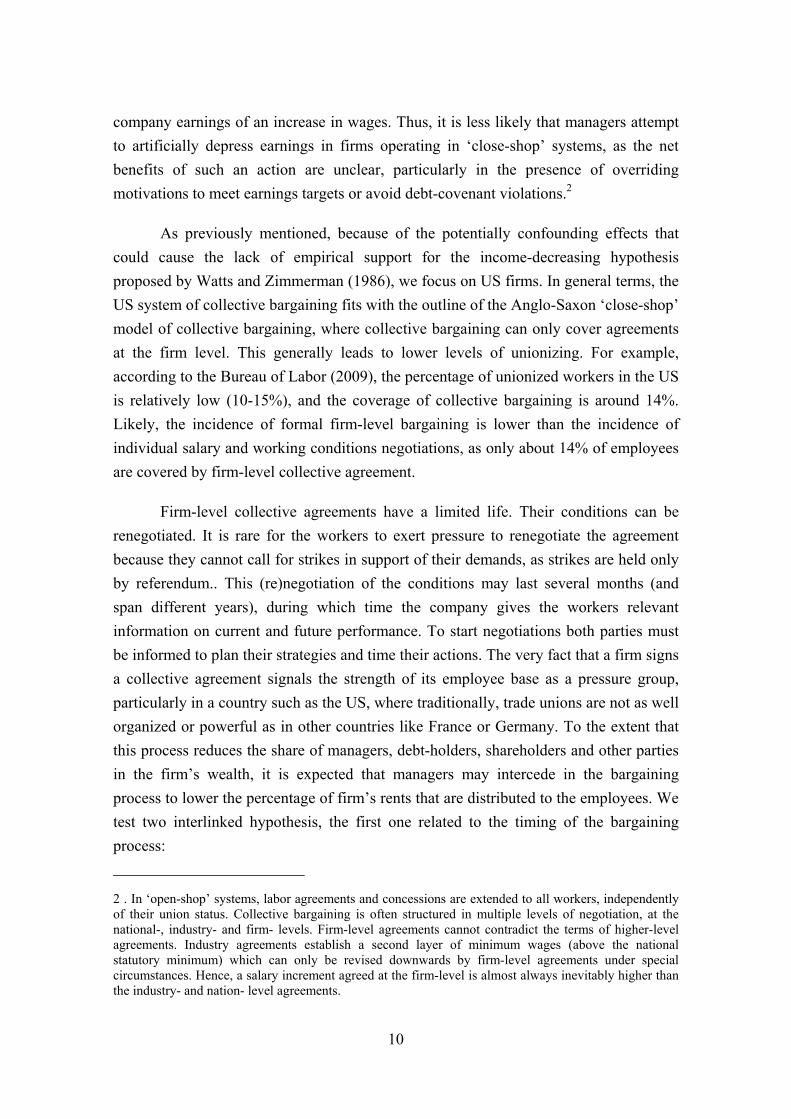
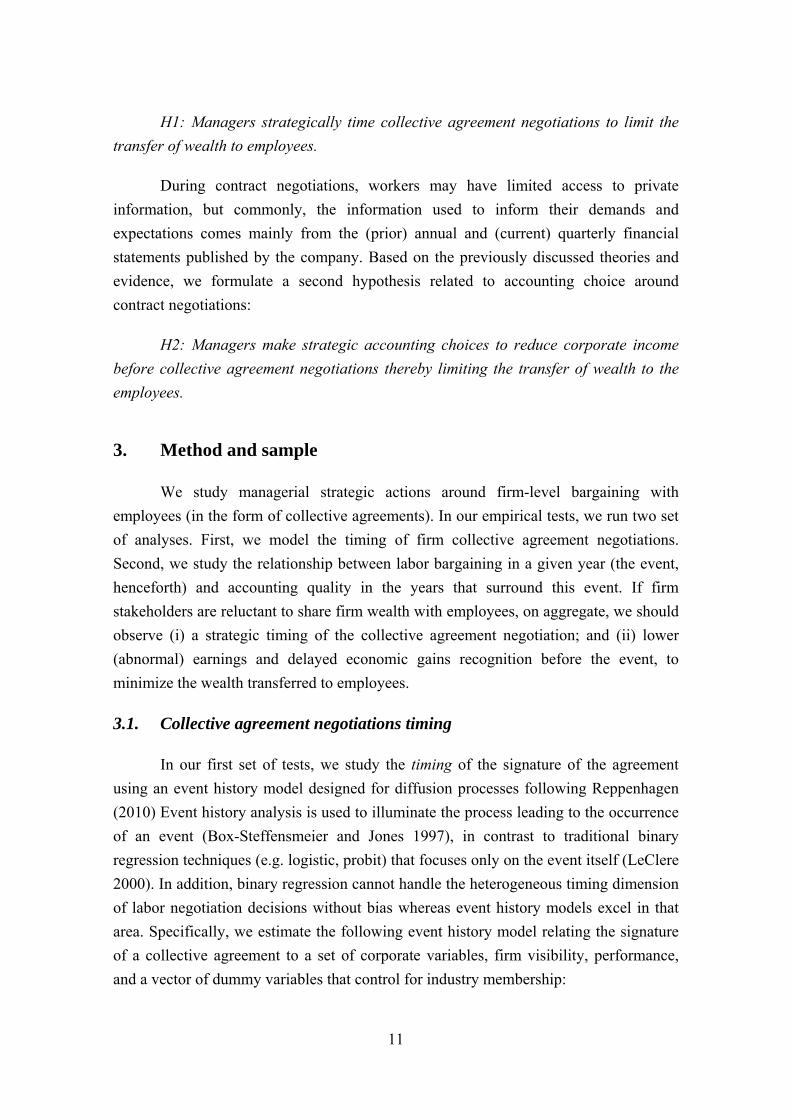
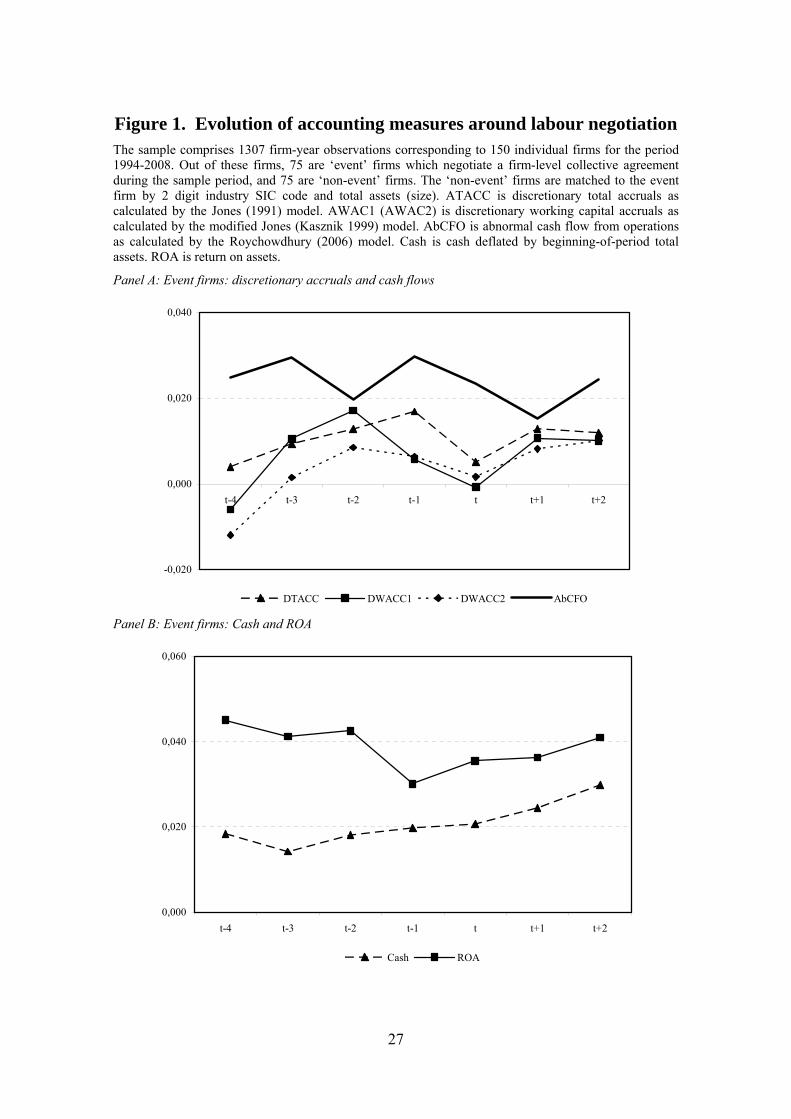
Regarding abnormal accruals and cash flows around labor negotiations, Figure 1 Panels A to D provides a graphical view of evolution of these figures (ATACC, AWAC1,
5 Commonly, studies analysing financial health show that the properties of accounting numbers start to differ from five years prior to the event (Beaver 1966).
26
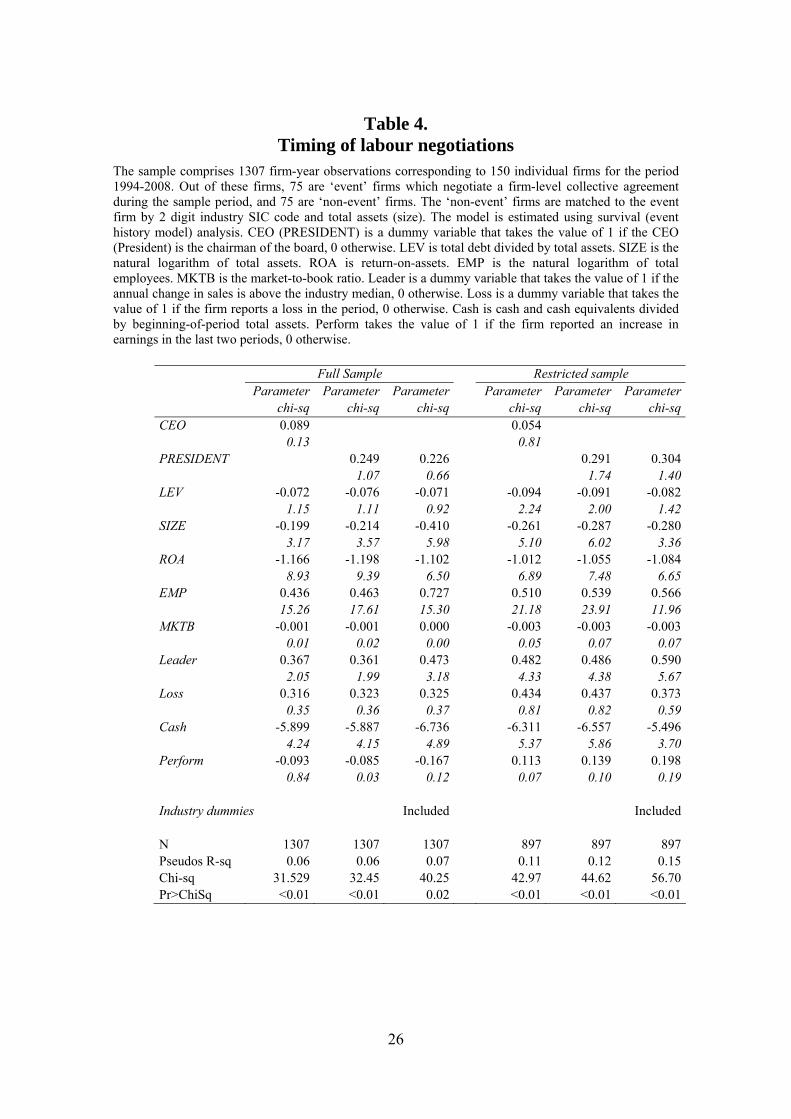
Table 4. Timing of labour negotiations
The sample comprises 1307 firm-year observations corresponding to 150 individual firms for the period 1994-2008. Out of these firms, 75 are ‘event’ firms which negotiate a firm-level collective agreement during the sample period, and 75 are ‘non-event’ firms. The ‘non-event’ firms are matched to the event firm by 2 digit industry SIC code and total assets (size). The model is estimated using survival (event history model) analysis. CEO (PRESIDENT) is a dummy variable that takes the value of 1 if the CEO (President) is the chairman of the board, 0 otherwise. LEV is total debt divided by total assets. SIZE is the natural logarithm of total assets. ROA is return-on-assets. EMP is the natural logarithm of total employees. MKTB is the market-to-book ratio. Leader is a dummy variable that takes the value of 1 if the annual change in sales is above the industry median, 0 otherwise. Loss is a dummy variable that takes the value of 1 if the firm reports a loss in the period, 0 otherwise. Cash is cash and cash equivalents divided by beginning-of-period total assets. Perform takes the value of 1 if the firm reported an increase in earnings in the last two periods, 0 otherwise.
Full Sample Restricted sample Parameter Parameter Parameter Parameter Parameter Parameter
chi-sq chi-sq chi-sq chi-sq chi-sq chi-sqCEO 0.089 0.054
0.13 0.81 PRESIDENT 0.249 0.226 0.291 0.304
1.07 0.66 1.74 1.40LEV -0.072 -0.076 -0.071 -0.094 -0.091 -0.082
1.15 1.11 0.92 2.24 2.00 1.42SIZE -0.199 -0.214 -0.410 -0.261 -0.287 -0.280
3.17 3.57 5.98 5.10 6.02 3.36ROA -1.166 -1.198 -1.102 -1.012 -1.055 -1.084
8.93 9.39 6.50 6.89 7.48 6.65EMP 0.436 0.463 0.727 0.510 0.539 0.566
15.26 17.61 15.30 21.18 23.91 11.96MKTB -0.001 -0.001 0.000 -0.003 -0.003 -0.003
0.01 0.02 0.00 0.05 0.07 0.07Leader 0.367 0.361 0.473 0.482 0.486 0.590
2.05 1.99 3.18 4.33 4.38 5.67Loss 0.316 0.323 0.325 0.434 0.437 0.373
0.35 0.36 0.37 0.81 0.82 0.59Cash -5.899 -5.887 -6.736 -6.311 -6.557 -5.496
4.24 4.15 4.89 5.37 5.86 3.70Perform -0.093 -0.085 -0.167 0.113 0.139 0.198
0.84 0.03 0.12 0.07 0.10 0.19
Industry dummies Included Included
N 1307 1307 1307 897 897 897Pseudos R-sq 0.06 0.06 0.07 0.11 0.12 0.15Chi-sq 31.529 32.45 40.25 42.97 44.62 56.70Pr>ChiSq <0.01 <0.01 0.02 <0.01 <0.01 <0.01
27
Figure 1. Evolution of accounting measures around labour negotiation The sample comprises 1307 firm-year observations corresponding to 150 individual firms for the period 1994-2008. Out of these firms, 75 are ‘event’ firms which negotiate a firm-level collective agreement during the sample period, and 75 are ‘non-event’ firms. The ‘non-event’ firms are matched to the event firm by 2 digit industry SIC code and total assets (size). ATACC is discretionary total accruals as calculated by the Jones (1991) model. AWAC1 (AWAC2) is discretionary working capital accruals as calculated by the modified Jones (Kasznik 1999) model. AbCFO is abnormal cash flow from operations as calculated by the Roychowdhury (2006) model. Cash is cash deflated by beginning-of-period total assets. ROA is return on assets.
Panel A: Event firms: discretionary accruals and cash flows
-0,020
0,000
0,020
0,040
t-4 t-3 t-2 t-1 t t+1 t+2
DTACC DWACC1 DWACC2 AbCFO
Panel B: Event firms: Cash and ROA
0,000
0,020
0,040
0,060
t-4 t-3 t-2 t-1 t t+1 t+2
Cash ROA
28
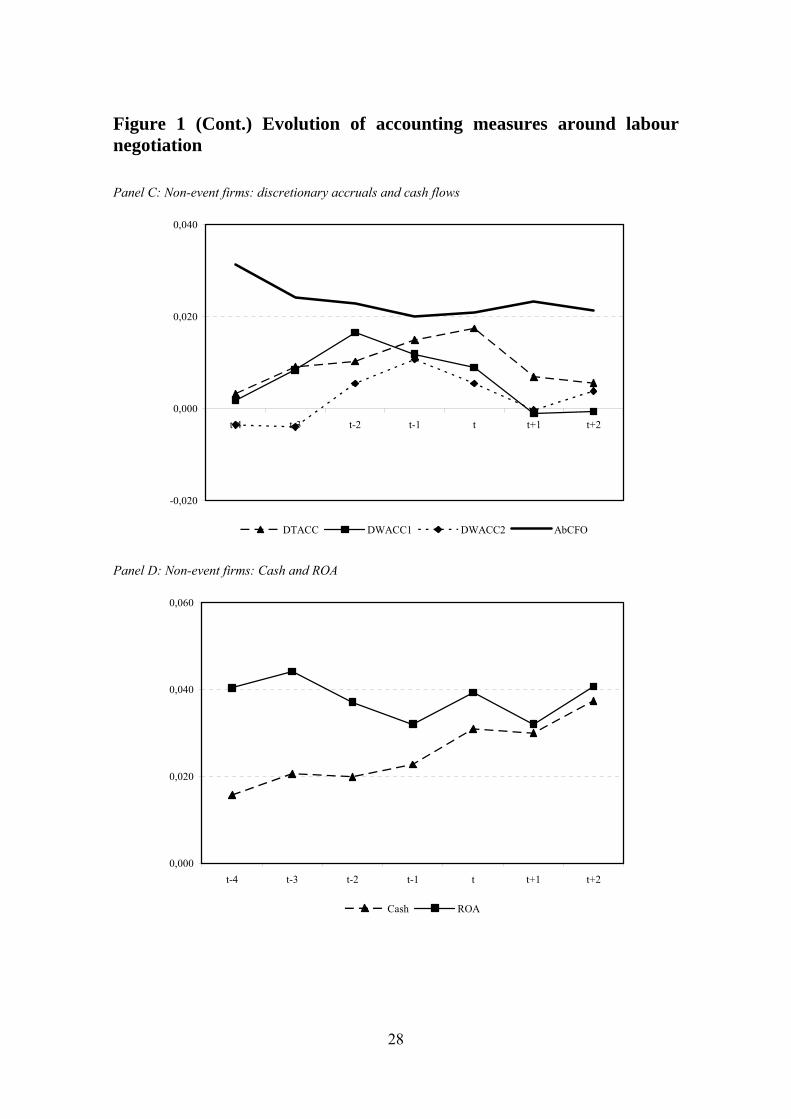
Figure 1 (Cont.) Evolution of accounting measures around labour negotiation Panel C: Non-event firms: discretionary accruals and cash flows
-0,020
0,000
0,020
0,040
t-4 t-3 t-2 t-1 t t+1 t+2
DTACC DWACC1 DWACC2 AbCFO
Panel D: Non-event firms: Cash and ROA
0,000
0,020
0,040
0,060
t-4 t-3 t-2 t-1 t t+1 t+2
Cash ROA
29
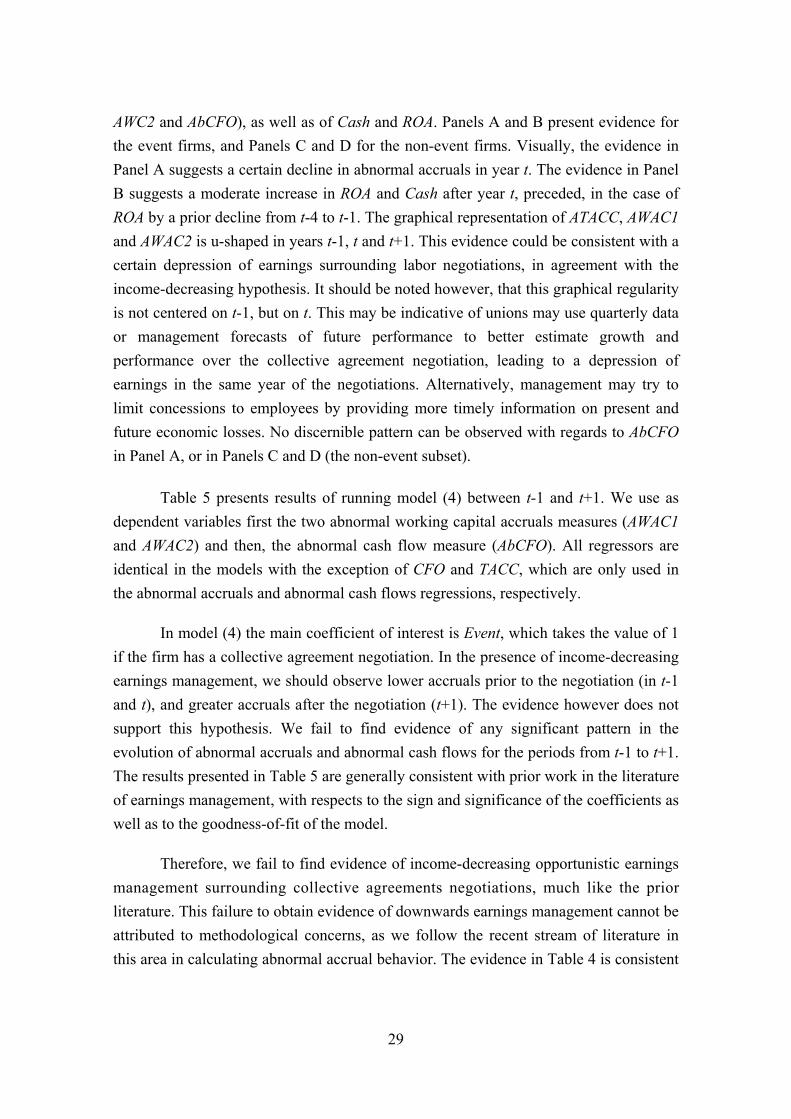
AWC2 and AbCFO), as well as of Cash and ROA. Panels A and B present evidence for the event firms, and Panels C and D for the non-event firms. Visually, the evidence in Panel A suggests a certain decline in abnormal accruals in year t. The evidence in Panel B suggests a moderate increase in ROA and Cash after year t, preceded, in the case of ROA by a prior decline from t-4 to t-1. The graphical representation of ATACC, AWAC1 and AWAC2 is u-shaped in years t-1, t and t+1. This evidence could be consistent with a certain depression of earnings surrounding labor negotiations, in agreement with the income-decreasing hypothesis. It should be noted however, that this graphical regularity is not centered on t-1, but on t. This may be indicative of unions may use quarterly data or management forecasts of future performance to better estimate growth and performance over the collective agreement negotiation, leading to a depression of earnings in the same year of the negotiations. Alternatively, management may try to limit concessions to employees by providing more timely information on present and future economic losses. No discernible pattern can be observed with regards to AbCFO in Panel A, or in Panels C and D (the non-event subset).
Table 5 presents results of running model (4) between t-1 and t+1. We use as dependent variables first the two abnormal working capital accruals measures (AWAC1 and AWAC2) and then, the abnormal cash flow measure (AbCFO). All regressors are identical in the models with the exception of CFO and TACC, which are only used in the abnormal accruals and abnormal cash flows regressions, respectively.
In model (4) the main coefficient of interest is Event, which takes the value of 1 if the firm has a collective agreement negotiation. In the presence of income-decreasing earnings management, we should observe lower accruals prior to the negotiation (in t-1 and t), and greater accruals after the negotiation (t+1). The evidence however does not support this hypothesis. We fail to find evidence of any significant pattern in the evolution of abnormal accruals and abnormal cash flows for the periods from t-1 to t+1. The results presented in Table 5 are generally consistent with prior work in the literature of earnings management, with respects to the sign and significance of the coefficients as well as to the goodness-of-fit of the model.
Therefore, we fail to find evidence of income-decreasing opportunistic earnings management surrounding collective agreements negotiations, much like the prior literature. This failure to obtain evidence of downwards earnings management cannot be attributed to methodological concerns, as we follow the recent stream of literature in this area in calculating abnormal accrual behavior. The evidence in Table 4 is consistent
30
Table 5. Accounting accruals and cash flows around labour negotiations
The sample comprises 1307 firm-year observations corresponding to 150 individual firms for the period 1994-2008. Out of these firms, 75 are ‘event’ firms which negotiate a firm-level collective agreement during the sample period, and 75 are ‘non-event’ firms. The ‘non-event’ firms are matched to the event firm by 2 digit industry SIC code and total assets (size). EVENT is a dummy variable that identifies if the firm has a collective agreement in time t, 0 otherwise. We model discretionary accruals and cash flows around time t (from t-1 to t+1). AWAC1 (AWAC2) is discretionary working capital accruals as calculated by the modified Jones (Kasznik 1999) model. AbCFO is abnormal cash flow from operations as calculated by the Roychowdhury (2006) model. LEV is total debt divided by total assets. SIZE is the natural logarithm of total assets. ROA is return-on-assets. MKTB is the market-to-book ratio. IssDEBT (IssEQ) is an indicator variable that takes the value of 1 if total debt (number of shares) changes by more than 10% from the previous year. CFO is cash flow from operations deflated by beginning-of-period total assets. TACC is total accruals deflated by beginning-of-period total assets. t-1 t t+1
WCACC
1 WCACC
2 AbCFO WCACC
1 WCACC
2 AbCFO WCACC
1 WCACC
2 AbCFO Coeff. Coeff. Coeff. Coeff. Coeff. Coeff. Coeff. Coeff. Coeff. (p-val) (p-val) (p-val) (p-val) (p-val) (p-val) (p-val) (p-val) (p-val) Intercept -0.362 0.023 -0.133 0.035 -0.034 -0.131 -0.198 -0.048 -0.121 (0.02) (0.31) (<0.01) (0.41) (0.27) (0.02) (0.05) (0.27) (0.01)EVENT -0.017 0.008 -0.005 0.008 0.001 0.002 0.005 0.001 -0.004 (0.25) (0.15) (0.23) (0.35) (0.45) (0.41) (0.36) (0.47) (0.32)SIZE 0.021 -0.002 0.006 -0.003 0.002 0.006 0.011 0.002 0.006 (0.02) (0.25) (<0.01) (0.33) (0.27) (0.07) (0.06) (0.31) (0.02)MKTB 0.006 0.001 0.001 -0.002 0.001 0.004 0.009 0.001 0.001 (<0.01) (0.21) (0.15) (0.21) (0.31) (0.32) (<0.01) (0.44) (0.24)LEV 0.002 0.001 -0.001 -0.001 -0.001 -0.001 0.003 0.002 -0.001 (0.43) (0.45) (0.40) (0.45) (0.24) (0.12) (0.27) (0.21) (0.45)ROA -0.232 0.323 0.507 0.168 0.176 0.191 0.465 0.659 0.502 (0.12) (<0.01) (<0.01) (<0.01) (<0.01) (<0.01) (<0.01) (<0.01) (<0.01)IssDebt -0.005 0.008 -0.003 -0.494 -0.091 0.015 -0.435 -0.307 0.016 (0.43) (0.16) (0.30) (0.02) (0.17) (0.11) (0.03) (0.02) (0.05)IssEQ 0.065 -0.013 -0.011 0.021 0.001 0.009 -0.054 -0.047 -0.002 (0.04) (0.12) (0.08) (0.22) (0.47) (0.25) (0.01) (<0.01) (0.45)CFO -0.211 -0.286 . 0.036 -0.001 . -0.081 0.033 . (0.25) (<0.01) . (0.12) (0.50) . (0.01) (0.05) .TACC . . -0.684 . . -0.753 . . -0.502 . . (<0.01) . . (<0.01) . . (<0.01) N 150 150 150 150 150 150 136 136 136Adj-Rsq 0.19 0.19 0.45 0.12 0.39 0.27 0.42 0.44 0.40
with the overriding and time-continued income-increasing motivations dominating any incentives to manage earnings downwards during contract negotiations. These results indicate that likely, the institutional setting in the US creates more incentives for income-increasing than income-decreasing manipulation, even in periods of greater political and visibility costs, such as the ones analyzed in this study.
31
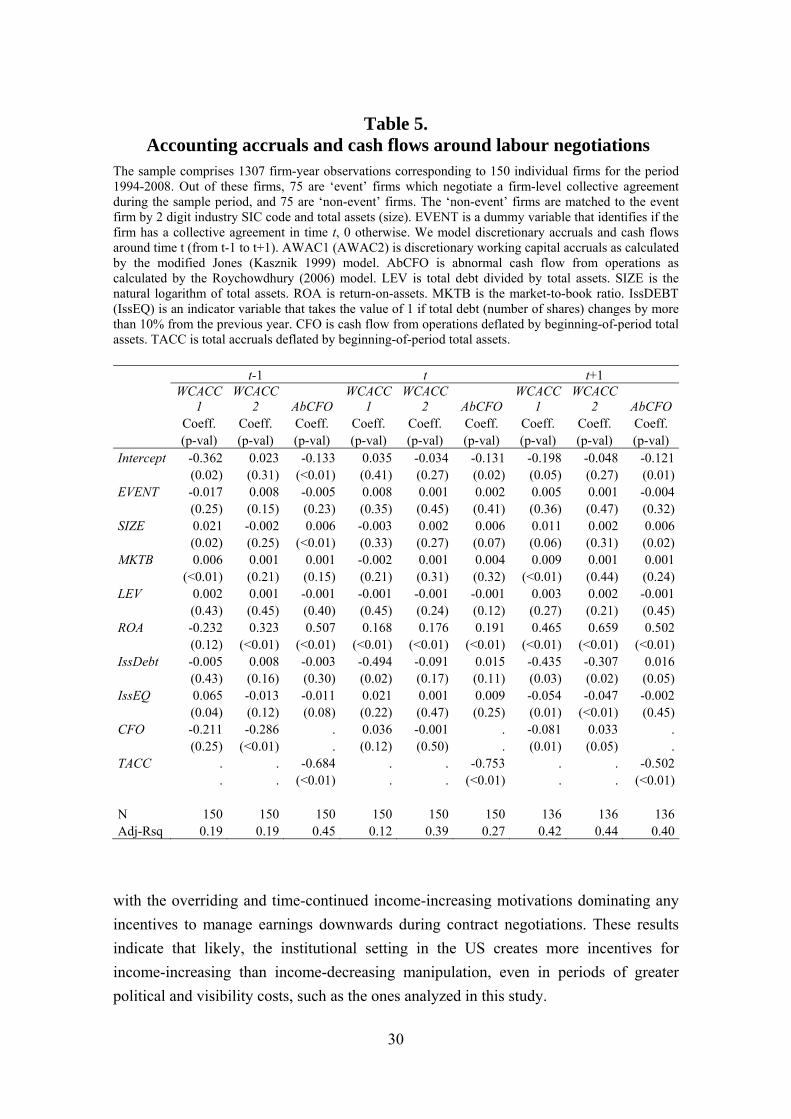
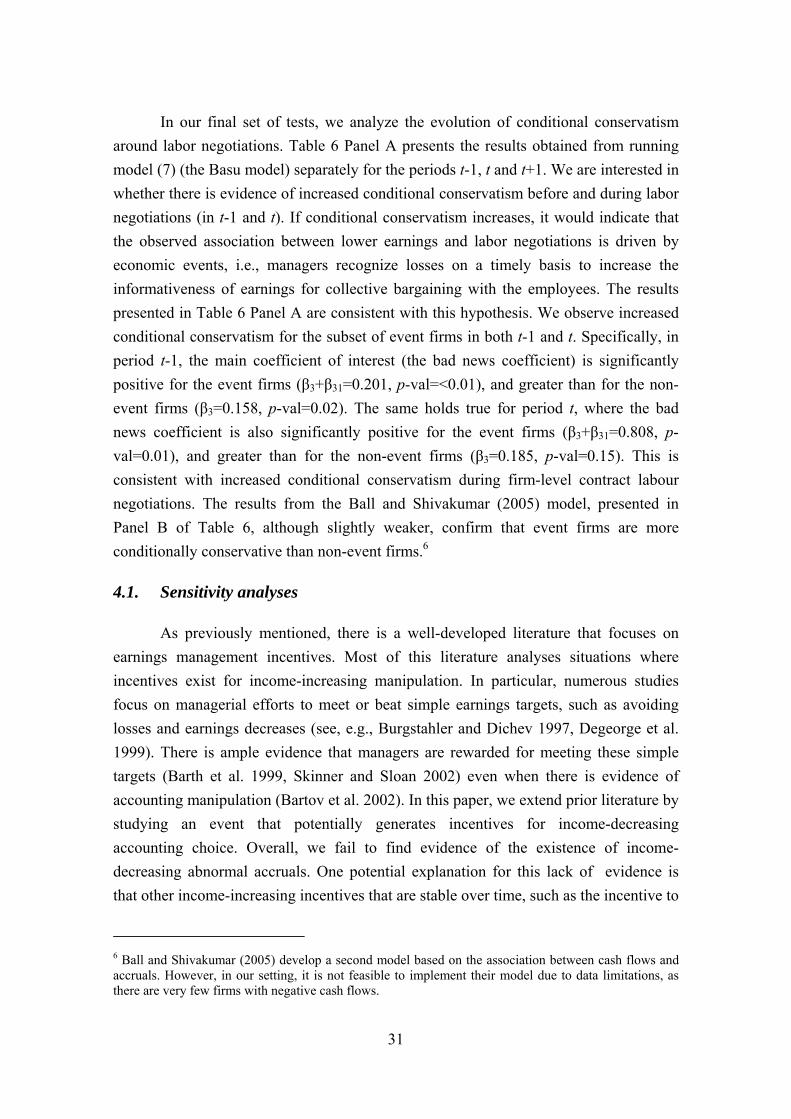
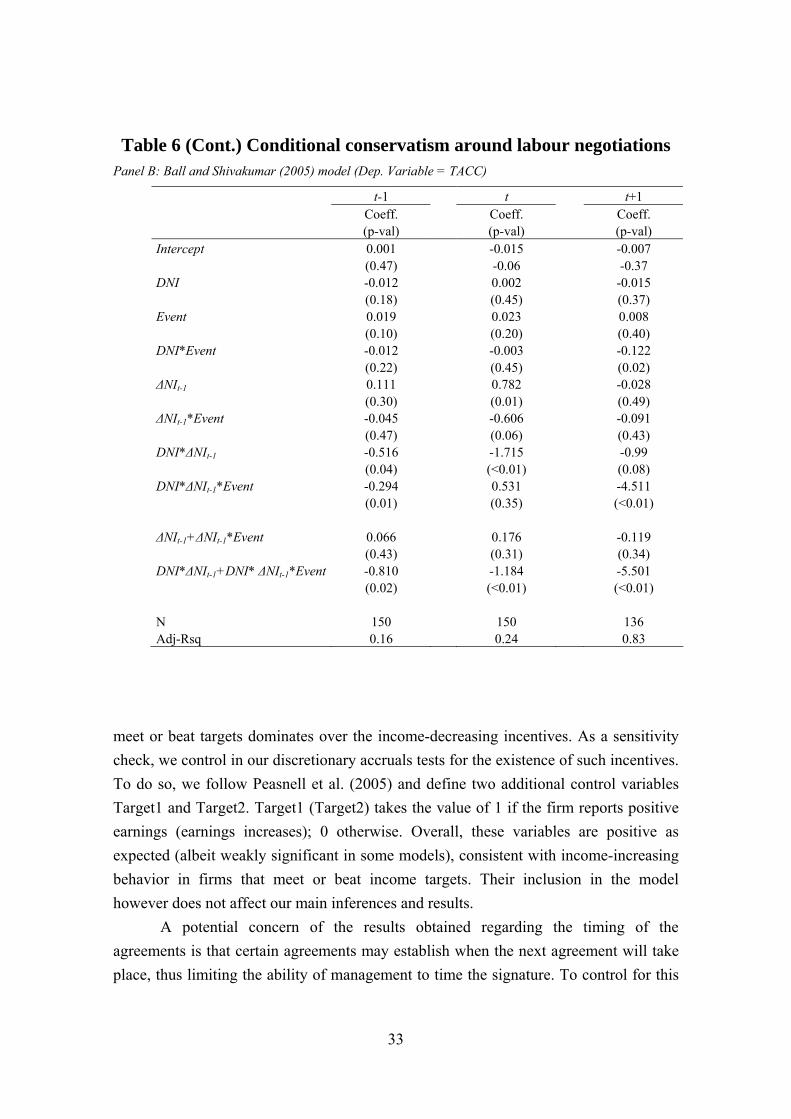
In our final set of tests, we analyze the evolution of conditional conservatism around labor negotiations. Table 6 Panel A presents the results obtained from running model (7) (the Basu model) separately for the periods t-1, t and t+1. We are interested in whether there is evidence of increased conditional conservatism before and during labor negotiations (in t-1 and t). If conditional conservatism increases, it would indicate that the observed association between lower earnings and labor negotiations is driven by economic events, i.e., managers recognize losses on a timely basis to increase the informativeness of earnings for collective bargaining with the employees. The results presented in Table 6 Panel A are consistent with this hypothesis. We observe increased conditional conservatism for the subset of event firms in both t-1 and t. Specifically, in period t-1, the main coefficient of interest (the bad news coefficient) is significantly positive for the event firms (β3+β31=0.201, p-val=<0.01), and greater than for the non-event firms (β3=0.158, p-val=0.02). The same holds true for period t, where the bad news coefficient is also significantly positive for the event firms (β3+β31=0.808, p-val=0.01), and greater than for the non-event firms (β3=0.185, p-val=0.15). This is consistent with increased conditional conservatism during firm-level contract labour negotiations. The results from the Ball and Shivakumar (2005) model, presented in Panel B of Table 6, although slightly weaker, confirm that event firms are more conditionally conservative than non-event firms.62
4.1. Sensitivity analyses
As previously mentioned, there is a well-developed literature that focuses on earnings management incentives. Most of this literature analyses situations where incentives exist for income-increasing manipulation. In particular, numerous studies focus on managerial efforts to meet or beat simple earnings targets, such as avoiding losses and earnings decreases (see, e.g., Burgstahler and Dichev 1997, Degeorge et al. 1999). There is ample evidence that managers are rewarded for meeting these simple targets (Barth et al. 1999, Skinner and Sloan 2002) even when there is evidence of accounting manipulation (Bartov et al. 2002). In this paper, we extend prior literature by studying an event that potentially generates incentives for income-decreasing accounting choice. Overall, we fail to find evidence of the existence of income-decreasing abnormal accruals. One potential explanation for this lack of evidence is that other income-increasing incentives that are stable over time, such as the incentive to
6 Ball and Shivakumar (2005) develop a second model based on the association between cash flows and accruals. However, in our setting, it is not feasible to implement their model due to data limitations, as there are very few firms with negative cash flows.
32
Table 6.
Conditional conservatism around labour negotiations The sample comprises 1307 firm-year observations corresponding to 150 individual firms for the period 1994-2008. Out of these firms, 75 are ‘event’ firms which negotiate a firm-level collective agreement during the sample period, and 75 are ‘non-event’ firms. The ‘non-event’ firms are matched to the event firm by 2 digit industry SIC code and total assets (size). EVENT is a dummy variable that identifies if the firm has a collective agreement in time t, 0 otherwise. We model discretionary accruals and cash flows around time t (from t-1 to t+1). Panel A presents results of running the Basu (1997) model. X is earnings before extraordinary items deflated by beginning of period market value. D is a dummy variable that takes the value of 1 if the firm has a negative or zero annual return, 0 otherwise. R is the annual stock return. Panel B presents results of running the Ball and Shivakumar (2005) model. CFO is cash flow from operations deflated by beginning-of-period total assets. TACC is total accruals deflated by beginning-of-period total assets. DCFO is a dummy variable that takes the value of 1 if the firm cash flow from operations is negative, 0 otherwise.
Panel A: Basu (1997) model (Dep. Variable = X)
t-1 t t+1 Coeff. Coeff. Coeff. (p-val) (p-val) (p-val) Intercept 0.065 0.048 0.034 (<0.01) (0.12) (0.01) D -0.027 0.012 0.056 (0.13) (0.44) (0.04) Event -0.029 -0.007 0.025 (0.06) (0.45) (0.16) D*Event 0.061 0.086 -0.088 (0.02) (0.21) (0.03) R -0.084 -0.003 -0.004 (0.01) (0.47) (0.35) R*Event 0.067 0.004 0.003 (0.03) (0.47) (0.47) D*R 0.158 0.185 0.233 (0.02) (0.15) (<0.01) D*R*Event 0.043 0.623 -0.137 (0.29) (0.01) (0.10) R+R*Event (β2 + β21) -0.017 0.001 -0.001 (0.23) (0.49) (0.49) D*R+D*R*Event (β3 + β31) 0.201 0.808 0.096 (<0.01) (<0.01) (0.15) N 150 150 135 Adj-Rsq 0.15 0.15 0.14
33
Table 6 (Cont.) Conditional conservatism around labour negotiations
Panel B: Ball and Shivakumar (2005) model (Dep. Variable = TACC)
t-1 t t+1 Coeff. Coeff. Coeff. (p-val) (p-val) (p-val) Intercept 0.001 -0.015 -0.007 (0.47) -0.06 -0.37 DNI -0.012 0.002 -0.015 (0.18) (0.45) (0.37) Event 0.019 0.023 0.008 (0.10) (0.20) (0.40) DNI*Event -0.012 -0.003 -0.122 (0.22) (0.45) (0.02) ΔNIt-1 0.111 0.782 -0.028 (0.30) (0.01) (0.49) ΔNIt-1*Event -0.045 -0.606 -0.091 (0.47) (0.06) (0.43) DNI*ΔNIt-1 -0.516 -1.715 -0.99 (0.04) (<0.01) (0.08) DNI*ΔNIt-1*Event -0.294 0.531 -4.511 (0.01) (0.35) (<0.01) ΔNIt-1+ΔNIt-1*Event 0.066 0.176 -0.119 (0.43) (0.31) (0.34) DNI*ΔNIt-1+DNI* ΔNIt-1*Event -0.810 -1.184 -5.501 (0.02) (<0.01) (<0.01) N 150 150 136 Adj-Rsq 0.16 0.24 0.83
meet or beat targets dominates over the income-decreasing incentives. As a sensitivity check, we control in our discretionary accruals tests for the existence of such incentives. To do so, we follow Peasnell et al. (2005) and define two additional control variables Target1 and Target2. Target1 (Target2) takes the value of 1 if the firm reports positive earnings (earnings increases); 0 otherwise. Overall, these variables are positive as expected (albeit weakly significant in some models), consistent with income-increasing behavior in firms that meet or beat income targets. Their inclusion in the model however does not affect our main inferences and results.
A potential concern of the results obtained regarding the timing of the agreements is that certain agreements may establish when the next agreement will take place, thus limiting the ability of management to time the signature. To control for this
34
potential problem, in our sensitivity analyses we include an additional variable (Repeat), that identifies firms that sign more than one agreement during the sample period. This variable turns out to be positive and significant, as expected, but its inclusion in the model does not affect the main results reported in Table 4.
5. Summary and conclusions
We study accounting choice around firm-level collective agreement negotiations. In their seminal work, Watts and Zimmerman (1986) argue that managers make income-decreasing accounting choices to reduce firm political costs and visibility and thus, limit the concessions made to trade unions during contract negotiations. However, the empirical research to date fails to find evidence in support of this hypothesis. We expect that this lack of evidence is driven by the confounding effects of (i) methodological concerns and (ii) influential institutional factors. Using a sample of US firms that engage in firm-level labor bargaining during the period 1994-2007, we study whether managers act strategically in an attempt to reduce the proportion of firm wealth that is accrued to employees. We use alternative methodologies to analyze income-decreasing accounting choices based on the developments of the discretionary accruals literature and the work on conditional conservatism. This choice permits disentangling whether any income-decreasing choices observed around labor negotiations are driven by opportunistic vs. informative motivations.
The results provide evidence in favor of the hypothesis that managers time their decision to negotiate with employees. In particular, we show that managers time the collective agreement negotiation when firm profitability and liquidity is low. This is consistent with the US evidence in Klasa et al. (2009) on the association between industry unionizing and cash holdings. Our evidence is also consistent with the relative strength of the different parties being important in determining when labor negotiations take place. Using an event history model, we show that collective agreement negotiation is positively related to the relative power of the employee base.
In a second set of analyses we study whether the coincidence of low corporate income and collective agreement negotiations is driven by accounting choices, and whether these decisions can be interpreted as being opportunistic or as signaling information to the market on future and current growth, performance and firm viability. The results also provide evidence in favor of the hypothesis that managers accelerate the recognition of losses and delay the recognition of gains in years surrounding collective bargaining. We do not find conclusive evidence of accounting accruals manipulation,
35
indicating that potentially, accounting choice around labor negotiation is informative of current economic conditions and not driven by managerial attempts to expropriate employees of their deserved share in the firms’ rents.
From the results of this study we con conclude that in a context where the impact on the average increase of salaries as a consequence of a collective agreement is not high, the managers have not incentives to decrease earnings through manipulations of accruals. However, managers select opportunely the timing of the agreement and increase conditional conservatism around the time of the agreement. To affect the results of those agreements
These results and conclusions have important implications for the understanding of the impact of institutional factors on earnings management and conditional conservatism , so on the quality of earnings. These results also give light on the comparability of financial information among different countries when there re institutional differences. More concretely, increase the knowledge about the behavior of managers in their relation with a specific political cost, the transfer of wealth to workers.
Future research of this political cost and the incentives of managers to manipulate earnings doing comparative studies among countries can help to better understand the accounting differences among countries non attributable to differences in accounting standards.

36
Appendix. Unionizing in the US according to data from the Bureu of Labor Statistics
Weekly Wages Difference in Wages Percent Union Non-Union Total $ Percent Union Management, professional and related 996 996 0 0% 14,9 Management, business & financial op 1066 1081 -15 -1% 6,0 Management occupations 1172 1160 12 1% 5,4 Business and financial op 934 940 -6 -1% 7,2 Porfessional and related occupations 987 942 45 5% 20,5 Computer and mathematical 1188 1231 -43 -3% 5,8 Architecture and ingeneering 1179 1221 -42 -3% 8,7 Life, physical, and social sci 1147 1036 111 11% 10,9 Community and social services 920 732 188 26% 17,1 Legal 1180 1148 32 3% 6,4 Education, training and library 959 742 217 29% 41,5 Art, design, entertainment, sport, media 1000 807 193 24% 9,3 Healthcare practitioner & technical 1005 906 99 11% 15,1 Service occupations 666 421 245 58% 12,4 Healthcare support 502 446 56 13% 11,1 Protective service 954 610 344 56% 37,2 Food preparation and serving 502 379 123 32% 4,9 Building and grounds cleaning and maintenance 551 407 144 35% 11,8 Personal care 585 420 165 39% 8,6 Sales and office occupations 717 587 130 22% 8,1 Sales and related 648 643 5 1% 3,7 Office and administrative support 726 560 166 30% 11,3 Natural resources, construction and maintenance 973 617 356 58% 17,7 Construction and extraction 976 597 379 63% 19,2 Installation, maintenance and repair 975 709 266 38% 18,0 Production, transportation and material moving 759 540 219 41% 16,8 Production 761 552 209 38% 14,8 Transportation and material moving 757 523 234 45% 19,0 Private sector 818 651 167 26% 8,2 Non-agriculture related industries 819 654 165 25% 8,2 Mining 960 975 -15 -2% 10,2 Construction 1000 624 376 60% 14,4 Manufacturing 783 708 75 11% 12,0 Wholesale and retail trade 639 584 55 9% 5,7 Transportation and utilities 902 695 207 30% 23,4 Information 1000 867 133 15% 13,1 Financial activities 729 784 -55 -7% 2,4 Professional and business services 800 782 18 2% 3,0 Education and health services 779 657 122 19% 10,0 Leisure and hospitality 580 431 149 35% 3,2 Other services 822 593 229 39% 3,3 Public sector 901 749 152 20% 39,8 Federal 927 996 -69 -7% 31,5 State 865 731 134 18% 34,0 Local 907 688 219 32% 45,6 Average 867 736 131 22% 14,5
37
References
Ball, R., Robin, A., Wu, J. S., 2003. Incentives versus standards: properties of accounting income in four East Asian countries. Journal of Accounting and Economics. 36: 235-270.
Ball, R., Shivakumar, L., 2005. Earnings quality in UK private firms: comparative loss recognition timeliness. Journal of Accounting and Economics 39 (1), 83-128.
Barth, M. E., Elliott, J. A., Finn, M. W., 1999. Market rewards associated with patterns of increasing earnings. Journal of Accounting Research 37 (2), 387-413.
Bartov, E., Givoly, D., Hayn, C., 2002. The rewards to meeting or beating earnings expectations. Journal of Accounting and Economics 33 (2), 173-204.
Basu, S., 1997. The conservatism principle and the asymmetric timeliness of earnings. Journal of Accounting and Economics 24 (1), 3-37.
Beaver, W.H., 1966. Financial ratios as predictors of failure. Journal of Accounting Research 5 (Supplement), 71-111.
Beaver, W. H., Ryan, S. G., 2005. Conditional and unconditional conservatism: Concepts and modeling. Review of Accounting Studies 10 (2): 269-310.
Becker, C., DeFond, M., Jiambalvo, J., Subramanyam, K., 1998. The effect of audit quality on earnings management. Contemporary Accounting Research 15 (1), 1-24.
Bowen, R. M., Ducharme, L., Shores, D., 1995. Stakeholders implicit claims and accounting method choice. Journal of Accounting and Economics 20 (3),225-294.
Box-Steffensmeier, J. M., Jones, B. S., 1997. Time is of the essence: Event history models in political science. American Journal of Political Science 41(4): 1414-1432.
Bureau of Labor Statistics 2009. Labor force statistics from the current population survey. US Department of Labor: Washington. January 2009. http://www.bls.gov/cps/cpsa2008.pdf
Burgstahler, D., Dichev, I., 1997. Earnings management to avoid earnings decreases and losses. Journal of Accounting and Economics 24 (1), 99-126.
Cullinan, C.P., Bline, D.M., 2003. The effects of labour on accounting choice in Canada. Canadian Accounting Perspectives 2 (2), 135-151.
Cullinan, C.P., Knoblett, J.A., 1994. Unionization and accounting policy choice: An empirical examination. Journal of Accounting and Public Policy 13 (1), 49-78.
DeAngelo, H., DeAngelo, L., 1991. Union Negotiations and corporate policy. Journal of Financial Economics 30 (1),3-43.
Dechow, P. M., 1994. Accounting earnings and cash flows as measures of firm performance: The role of accounting accruals. Journal of Accounting and Economics 18 (1), 3-42.
Dechow, P.M., Sloan R.G., Sweeney, P., 1995. Detecting earnings management. The Accounting Review 70: 193-225.
38
Dechow, P. M., Skinner, D. J., 2000. Earnings management: Reconciling the views of accounting academics, practitioners, and regulators. Accounting Horizons 14 (2): 235-251.
DeFond, M. L., Jiambalvo, J., 1994. Debt covenant violation and manipulation of accruals. Journal of Accounting and Economics 17 (1-2), 145-176.
Degeorge, F., Patel, J., Zeckhauser, R., 1999. Earnings management to exceed thresholds. Journal of Business 72 (1), 1-33.
Dietrich, J.R., Muller, K.A., Riedl, E.J., 2007. Asymmetric timeliness tests of accounting conservatism. Review of Accounting Studies 12, 95-124.
Dyck, A., Zingales, L., 2004. Private benefits of control: An international comparison. Journal of Finance 59(2), 537-600.
Fields, T., Lys, T., Vicent, L., 2001. Empirical research on accounting choice. Journal of Accounting and Economics 31, 255-307.
Financial Accounting Standards Board 1978. Objectives of financial reporting by business enterprises. Norwalk: FASB.
García Lara, J.M., García Osma, B., Mora, A., 2005. The effect of earnings management on the asymmetric timeliness of earnings. Journal of Business Finance and Accounting 32, April-May, 691-726.
Graham, J. R., Harvey C. R., Rajgopal S., 2005. The economic implications of corporate financial reporting. Journal of Accounting and Economics 40(1-3), 3-73.
Harris, T.S., Lang, M., Moller, P., 1994. The value relevance of German accounting measures: An empirical analysis. Journal of Accounting Research, 32: 187-209.
Healy, P., Wahlen, J., 1999. A review of the earnings management literature and its implications for standard setting. Accounting Horizons 13 (4): 365-383.
International Accounting Standards Board 1989. Framework for the preparation and presentation of financial statements. London: IASB.
Jones, J.J., 1991. Earnings management during import relief investigations. Journal of Accounting Research, 29: 193-228.
Kasznik, R., 1999. On the association between voluntary disclosure and earnings management. Journal of Accounting Research 37 (1), 57-81.
Klasa, S., Mazwell, W.F., Ortiz-Molina, H., 2009. The strategic use of corporate cash holdings in collective bargaining with labor unions. Journal of Financial Economics 92, 431-442.
LeClere, M. J., 2000. The occurrence and timing of events: Survival analysis applied to the study of financial distress. Journal of Accounting Literature 19, 158-180.
Leuz, C., Nanda D., Wysocki, P.D., 2003. Earnings management and investor protection: an international comparison. Journal of Financial Economics 69, 505-527.
Liberty, S., Zimmerman, J., 1986. Labor union contract negotiations and accounting choice. Accounting Review 61 (4), 692-712.
39
Mathias, P., Davis, J.A., 1996. The nature of industrialization. Enterprise and Labour: from the Eighteen century to the present. Blackwell Publishers: Cambridge.
Mautz, R.D., Richardson, F., 1992. Employer financial information and wage bargaining: Issues and evidence. Labor Studies Journal 17 (3):35-52.
Mora, A., Sabater, A.M., 2008. Evidence of income-decreasing earnings management before labour negotiations within firms. Investigaciones Económicas 32(2), 201-230.
Peasnell, K. V., Pope, P. F., Young, S., 2005. Board monitoring and earnings management: Do outside directors influence abnormal accruals. Journal of Business Finance and Accounting, 32 (7/8): 1311-1346.
Reppenhagen, D., 2010. Contagion vs. intrinsic factors of accounting policy choice. Review of Accounting Studies, forthcoming.
Roychowdhury, S., 2006. Management of earnings through the manipulation of real activities that affect cash flow from operations. Journal of Accounting and Economics 42, 335-370.
Scott, T.W., 1994. Incentives and disincentives for financial disclosure: Voluntary disclosure of defined benefit pension plan information by Canadian firms. The Accounting Review 69 (1): 26-43.
Skinner, D. J., Sloan, R. G., 2002. Earnings surprises, growth expectations, and stock returns or don't let an earnings torpedo sink your portfolio. Review of Accounting Studies 7 (2-3): 289-312.
Watts, R.L., Zimmerman, J.L., 1986. Positive Accounting Theory. Ed. Prentice Hall, New York.
Young, S., 1999. Systematic measurement error in the estimation of discretionary accruals: An evaluation of alternative modelling procedures. Journal of Business Finance and Accounting 26 (7-8), 833-862.
40
PUBLISHED ISSUES*
WP-EC 2009-01 “The effects of immigration on the productive structure of Spanish regions” J. Martín, G. Serrano, F. Requena. February 2009. WP-EC 2009-02 “Corporate governance and impression management in annual press releases” B. García, E. Guillamón-Saorín. March 2009. WP-EC 2009-03 “Factores determinantes de la salida a Bolsa en España” J.E. Farinós, V. Sanchis. April 2009. WP-EC 2009-04 “New challenges in competitiveness: knowledge development and coopetition” C. Camisón-Zornoza, M. Boronat-Navarro, A. Villar-López. April 2009. WP-EC 2009-05 “The determinants of net interest income in the Mexican banking system:
an integrated model” J. Maudos, L. Solís. April 2009. WP-EC 2009-06 “Explaining protectionism support: the role of economic factors” N. Melgar, J. Milgram-Baleix, M. Rossi. April 2009. WP-EC 2009-07 “Determinants of interest rate exposure of Spanish banking industry” L. Ballester, R. Ferrer, C. González, G.M. Soto. May 2009. WP-EC 2009-08 “Entrepreneurial orientation, organizational learning capability and performance
in the ceramic tiles industry” J. Alegre, R. Chiva. June 2009. WP-EC 2009-09 “El coste y el desequilibrio financiero-actuarial de los sistemas de reparto.
El caso del sistema Español” J.E. Devesa Carpio, M. Devesa Carpio. July 2009. WP-EC 2009-10 “Imposición y protección social: efectos sobre el nivel de empleo en la OCDE” J.R. García Martínez. July 2009. WP-EC 2009-11 “The role of learning in innovation: in-house versus externally contracted R&D
experience” P. Beneito, M.E. Rochina, A. Sanchis. October 2009. WP-EC 2009-12 “Do process innovations boost SMEs productivity growth? J.A. Máñez-Castillejo, M.E. Rochina-Barrachina, A. Sanchis-Llopis,
J.A. Sanchis-Llopis. October 2009. WP-EC 2009-13 “Esperanza de Vida Libres de Discapacidad por sexo y Comunidad
Autónoma:2004-2006” F.J. Goerlich, R. Pinilla. October 2009. WP-EC 2009-14 “How do market imperfections affect working capital management?” S. Baños-Caballero, P.J. García-Teruel, P.Martínez-Solano. November 2009. WP-EC 2009-15 “The effect of outplacement services on earning prospects of unemployed” E. Alfonso Arellano. December 2009. WP-EC 2009-16 “The market integration process under different regulatory regimes: evidence
from the European car sector” J. Balaguer. December 2009.
* Please contact Ivie's Publications Department to obtain a list of publications previous to 2009.
41
WP-EC 2010-01 “Devolution dynamics of Spanish local government” M.T. Balaguer-Coll, D. Prior, E. Tortosa-Ausina. January 2010. WP-EC 2010-02 “Output complexity, environmental conditions, and the efficiency of
municipalities: a robust approach” M.T. Balaguer-Coll, D. Prior, E. Tortosa-Ausina. March 2010. WP-EC 2010-03 “Spatial density, average prices and price dispersion. Evidence from the Spanish
hotel industry” J. Balaguer, J.C. Pernías. April 2010. WP-EC 2010-04 “Product placement in video games as a marketing strategy: an attempt to
analysis in Disney company” I. Küster, E. Pardo, T. Suemanotham. May 2010.
WP-EC 2010-05 “Efectos de los videojuegos en las marcas emplazadas: la asociación y transferencia de imagen a través de las emociones”
V. Castillo, I. Küster, N. Vila. May 2010. WP-EC 2010-06 “Renewable sources, technology mix, and competition in liberalized electricity
markets: the case of Spain” A. Ciarreta, C. Gutiérrez-Hita, N. Georgantzís. May 2010. WP-EC 2010-07 “Contribution of individual to collective brands” J.L. Nicolau, F.J. Mas. September 2010. WP-EC 2010-08 “Venture capitalists in Spain: cluster analysis of criteria used in the screening
process” M.C. Ramón-Llorens, G. Hernández-Cánovas. September 2010. WP-EC 2010-09 “Strategic accounting choice around firm level labor negotiations” B. García Osma, A. Mora, A.M. Sabater. September 2010.
ecserie
IvieGuardia Civil, 22 - Esc. 2, 1º
46020 Valencia - SpainPhone: +34 963 190 050Fax: +34 963 190 055
Website: http://www.ivie.esE-mail: [email protected]