Strain Effect on the Electrical Conductivity of CB/SEBS and GP/SEBS Composites
8
Strain Effect on the Electrical Conductivity of CB/SEBS and GP/SEBS Composites Iva´n Alziri Estrada Moreno, * Alberto Dı´az Diaz, Mo´nica Elvira Mendoza Duarte, Rigoberto Ibarra Go´mez Summary: Carbon black (CB) and Graphite (GP) were embedded in poly(styrene– ethylene/butylene–styrene) (SEBS) to form CB/SEBS and GP/SEBS composites. The electrical resistance was monitored in situ during tensile, compressive and dynamic mechanical tests, obtaining a correlation between the electrical response and strain. In the dynamic test the conductivity of the composites showed almost the same behavior than the elastic modulus, decreasing at deformations higher than 1%. Keywords: Payne effect; Piezoresistive effect; SEBS Introduction Conductive polymer composites can be obtained by adding conductive particles, such as carbon black, to an insulating matrix. Several applications have been found for these materials, such as electro- magnetic shielding materials, self-regulat- ing heaters, current protection devices, stress sensor and strain sensor. [1–3] Because of their good mechanical properties, like flexibility and capacity to absorb mechan- ical vibrations, and their low costs elasto- mers composites have gained attention in the last years. [4,5] The electrical behavior of this conductive composite follows the percolation theory that states that resistiv- ity decreases dramatically when a critical volume fraction is reached, named percola- tion threshold; above this value the com- posite behaves like a conductor. [6] When external stimulus, mechanical, thermal, magnetic or chemical, are applied to a composite with a concentration of particles around the percolation value an appreci- able variation in the resistivity can be observed. Among this stimulus, the effect of strain, named piezoresistance, has been mostly studied in compressive and in tensile strain, [3,7–10] under one of two conditions: a) fixed values of strain are applied or b) the composite is subjected to a continuous strain while electric resistance is read. However, no work has been found on the effect of dynamic strain under flexion, during a DMA measurement. In this work composites of SEBS with CB and GP were compounded at different volume fractions to study the piezoresistive behavior during a DMA measurement in flexion mode. Samples above the critical concentration of both particles were selected. Experimental Part SEBS was used as the polymer matrix and as reinforcing fillers were used Carbon Black (CB) and Graphite (GP). The composites were prepared by melt- compounding in an internal mixer (Bra- bender PLASTI-CORDER). The mixer was operated at 235 8C and at a speed of 30 rpm. Two kind of samples were obtain by compression molded, a) disc-shaped sam- ples of 19 mm diameter with 10 mm of thickness for compression measurements and b) rectangular-shaped of 63 12 mm and 3 mm thick for others tests. Materials used in this study are listed in Table 1. Macromol. Symp. 2009, 283–284, 361–368 DOI: 10.1002/masy.200950943 361 Centro de Investigacio ´n en Materiales Avanzados, Miguel de Cervantes 120 31109. Chihuahua, Me ´ xico, Fax: (þ52) 614 439-1112; E-mail: [email protected] Copyright ß 2009 Wiley-VCH Verlag GmbH & Co. KGaA, Weinheim
Transcript of Strain Effect on the Electrical Conductivity of CB/SEBS and GP/SEBS Composites
Macromol. Symp. 2009, 283–284, 361–368 DOI: 10.1002/masy.200950943 361
Cen
Mig
Fax:
E-m
Cop
Strain Effect on the Electrical Conductivity of
CB/SEBS and GP/SEBS Composites
Ivan Alziri Estrada Moreno,* Alberto Dıaz Diaz, Monica Elvira Mendoza Duarte,
Rigoberto Ibarra Gomez
Summary: Carbon black (CB) and Graphite (GP) were embedded in poly(styrene–
ethylene/butylene–styrene) (SEBS) to form CB/SEBS and GP/SEBS composites. The
electrical resistance was monitored in situ during tensile, compressive and dynamic
mechanical tests, obtaining a correlation between the electrical response and strain.
In the dynamic test the conductivity of the composites showed almost the same
behavior than the elastic modulus, decreasing at deformations higher than 1%.
Keywords: Payne effect; Piezoresistive effect; SEBS
Introduction
Conductive polymer composites can be
obtained by adding conductive particles,
such as carbon black, to an insulating
matrix. Several applications have been
found for these materials, such as electro-
magnetic shielding materials, self-regulat-
ing heaters, current protection devices,
stress sensor and strain sensor.[1–3] Because
of their good mechanical properties, like
flexibility and capacity to absorb mechan-
ical vibrations, and their low costs elasto-
mers composites have gained attention in
the last years.[4,5] The electrical behavior of
this conductive composite follows the
percolation theory that states that resistiv-
ity decreases dramatically when a critical
volume fraction is reached, named percola-
tion threshold; above this value the com-
posite behaves like a conductor.[6] When
external stimulus, mechanical, thermal,
magnetic or chemical, are applied to a
composite with a concentration of particles
around the percolation value an appreci-
able variation in the resistivity can be
observed.
Among this stimulus, the effect of strain,
named piezoresistance, has been mostly
tro de Investigacion en Materiales Avanzados,
uel de Cervantes 120 31109. Chihuahua, Mexico,
(þ52) 614 439-1112;
ail: [email protected]
yright � 2009 Wiley-VCH Verlag GmbH & Co. KGaA
studied in compressive and in tensile
strain,[3,7–10] under one of two conditions:
a) fixed values of strain are applied or b) the
composite is subjected to a continuous
strain while electric resistance is read.
However, no work has been found on the
effect of dynamic strain under flexion,
during a DMA measurement.
In this work composites of SEBS with
CB and GP were compounded at different
volume fractions to study the piezoresistive
behavior during a DMA measurement in
flexion mode. Samples above the critical
concentration of both particles were
selected.
Experimental Part
SEBS was used as the polymer matrix and
as reinforcing fillers were used Carbon
Black (CB) and Graphite (GP). The
composites were prepared by melt-
compounding in an internal mixer (Bra-
bender PLASTI-CORDER). The mixer
was operated at 235 8C and at a speed of
30 rpm. Two kind of samples were obtain by
compression molded, a) disc-shaped sam-
ples of 19 mm diameter with 10 mm of
thickness for compression measurements
and b) rectangular-shaped of 63� 12 mm
and 3 mm thick for others tests. Materials
used in this study are listed in Table 1.
, Weinheim
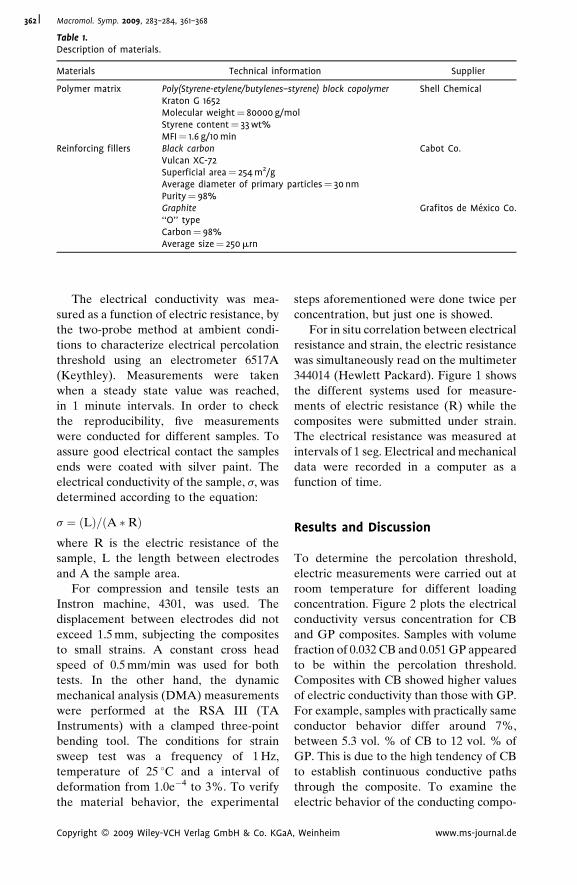
Table 1.Description of materials.
Materials Technical information Supplier
Polymer matrix Poly(Styrene-etylene/butylenes–styrene) block copolymer Shell ChemicalKraton G 1652Molecular weight¼ 80000 g/molStyrene content¼ 33 wt%MFI¼ 1.6 g/10 min
Reinforcing fillers Black carbon Cabot Co.Vulcan XC-72Superficial area¼ 254 m2/gAverage diameter of primary particles¼ 30 nmPurity¼ 98%Graphite Grafitos de Mexico Co.‘‘O’’ typeCarbon¼ 98%Average size¼ 250mrn
Macromol. Symp. 2009, 283–284, 361–368362
The electrical conductivity was mea-
sured as a function of electric resistance, by
the two-probe method at ambient condi-
tions to characterize electrical percolation
threshold using an electrometer 6517A
(Keythley). Measurements were taken
when a steady state value was reached,
in 1 minute intervals. In order to check
the reproducibility, five measurements
were conducted for different samples. To
assure good electrical contact the samples
ends were coated with silver paint. The
electrical conductivity of the sample, s, was
determined according to the equation:
s ¼ ðLÞ=ðA � RÞwhere R is the electric resistance of the
sample, L the length between electrodes
and A the sample area.
For compression and tensile tests an
Instron machine, 4301, was used. The
displacement between electrodes did not
exceed 1.5 mm, subjecting the composites
to small strains. A constant cross head
speed of 0.5 mm/min was used for both
tests. In the other hand, the dynamic
mechanical analysis (DMA) measurements
were performed at the RSA III (TA
Instruments) with a clamped three-point
bending tool. The conditions for strain
sweep test was a frequency of 1 Hz,
temperature of 25 8C and a interval of
deformation from 1.0e�4 to 3%. To verify
the material behavior, the experimental
Copyright � 2009 Wiley-VCH Verlag GmbH & Co. KGaA
steps aforementioned were done twice per
concentration, but just one is showed.
For in situ correlation between electrical
resistance and strain, the electric resistance
was simultaneously read on the multimeter
344014 (Hewlett Packard). Figure 1 shows
the different systems used for measure-
ments of electric resistance (R) while the
composites were submitted under strain.
The electrical resistance was measured at
intervals of 1 seg. Electrical and mechanical
data were recorded in a computer as a
function of time.
Results and Discussion
To determine the percolation threshold,
electric measurements were carried out at
room temperature for different loading
concentration. Figure 2 plots the electrical
conductivity versus concentration for CB
and GP composites. Samples with volume
fraction of 0.032 CB and 0.051 GP appeared
to be within the percolation threshold.
Composites with CB showed higher values
of electric conductivity than those with GP.
For example, samples with practically same
conductor behavior differ around 7%,
between 5.3 vol. % of CB to 12 vol. % of
GP. This is due to the high tendency of CB
to establish continuous conductive paths
through the composite. To examine the
electric behavior of the conducting compo-
, Weinheim www.ms-journal.de
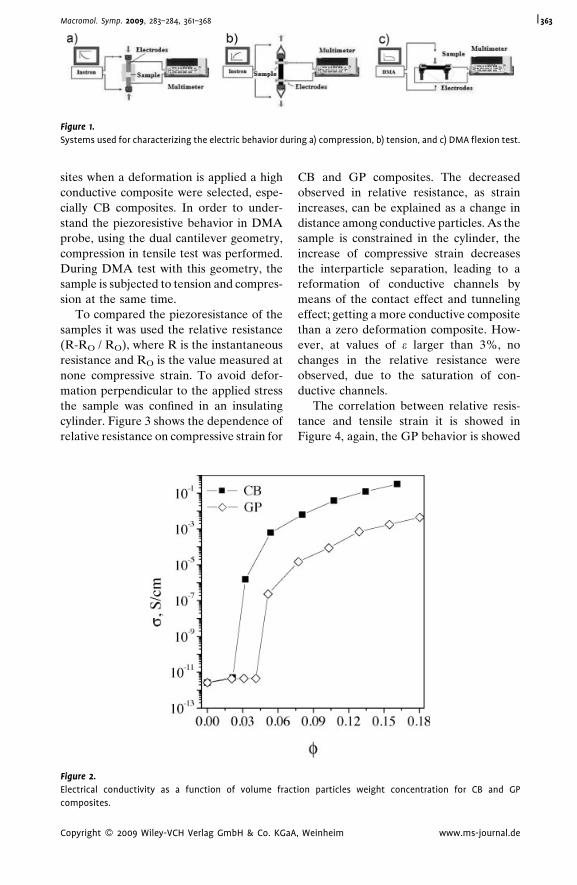
Figure 1.
Systems used for characterizing the electric behavior during a) compression, b) tension, and c) DMA flexion test.
Macromol. Symp. 2009, 283–284, 361–368 363
sites when a deformation is applied a high
conductive composite were selected, espe-
cially CB composites. In order to under-
stand the piezoresistive behavior in DMA
probe, using the dual cantilever geometry,
compression in tensile test was performed.
During DMA test with this geometry, the
sample is subjected to tension and compres-
sion at the same time.
To compared the piezoresistance of the
samples it was used the relative resistance
(R-RO / RO), where R is the instantaneous
resistance and RO is the value measured at
none compressive strain. To avoid defor-
mation perpendicular to the applied stress
the sample was confined in an insulating
cylinder. Figure 3 shows the dependence of
relative resistance on compressive strain for
Figure 2.
Electrical conductivity as a function of volume fract
composites.
Copyright � 2009 Wiley-VCH Verlag GmbH & Co. KGaA
CB and GP composites. The decreased
observed in relative resistance, as strain
increases, can be explained as a change in
distance among conductive particles. As the
sample is constrained in the cylinder, the
increase of compressive strain decreases
the interparticle separation, leading to a
reformation of conductive channels by
means of the contact effect and tunneling
effect; getting a more conductive composite
than a zero deformation composite. How-
ever, at values of e larger than 3%, no
changes in the relative resistance were
observed, due to the saturation of con-
ductive channels.
The correlation between relative resis-
tance and tensile strain it is showed in
Figure 4, again, the GP behavior is showed
ion particles weight concentration for CB and GP
, Weinheim www.ms-journal.de
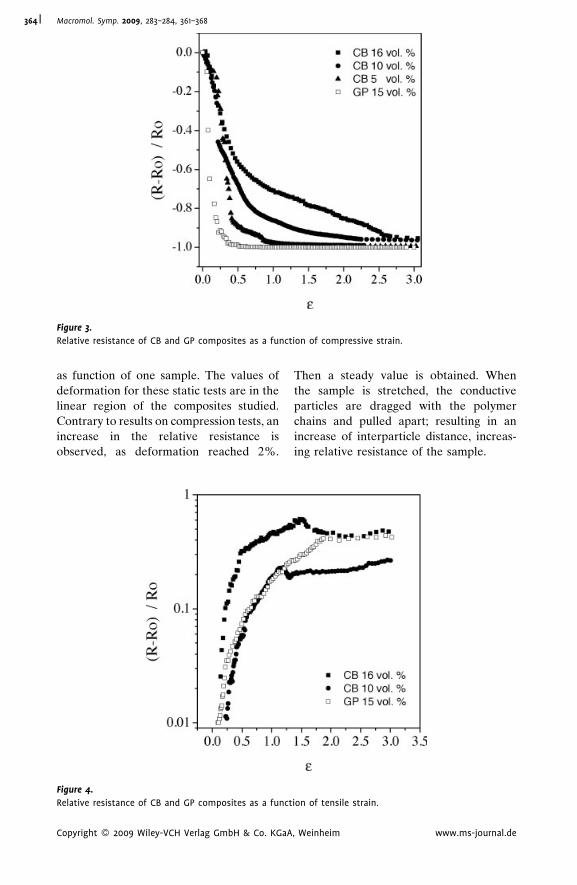
Figure 3.
Relative resistance of CB and GP composites as a function of compressive strain.
Macromol. Symp. 2009, 283–284, 361–368364
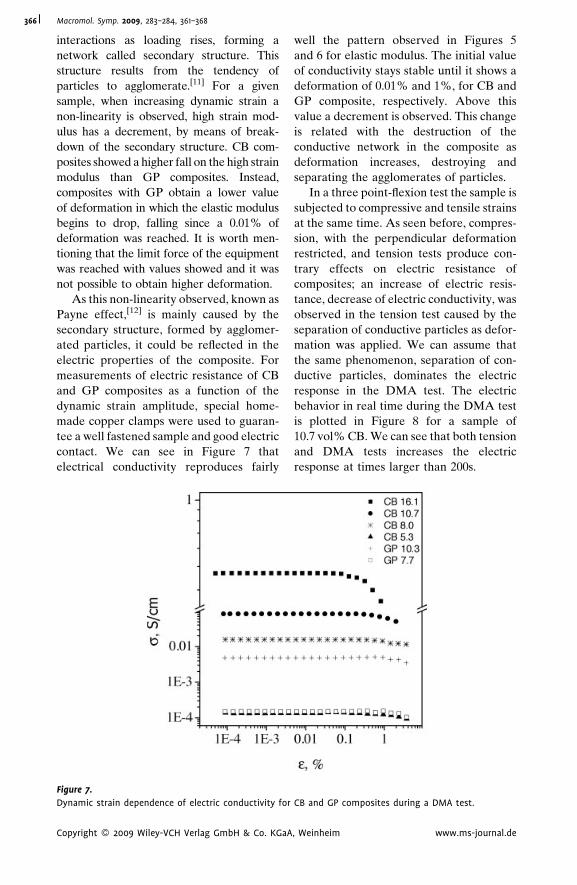
as function of one sample. The values of
deformation for these static tests are in the
linear region of the composites studied.
Contrary to results on compression tests, an
increase in the relative resistance is
observed, as deformation reached 2%.
Figure 4.
Relative resistance of CB and GP composites as a funct
Copyright � 2009 Wiley-VCH Verlag GmbH & Co. KGaA
Then a steady value is obtained. When
the sample is stretched, the conductive
particles are dragged with the polymer
chains and pulled apart; resulting in an
increase of interparticle distance, increas-
ing relative resistance of the sample.
ion of tensile strain.
, Weinheim www.ms-journal.de
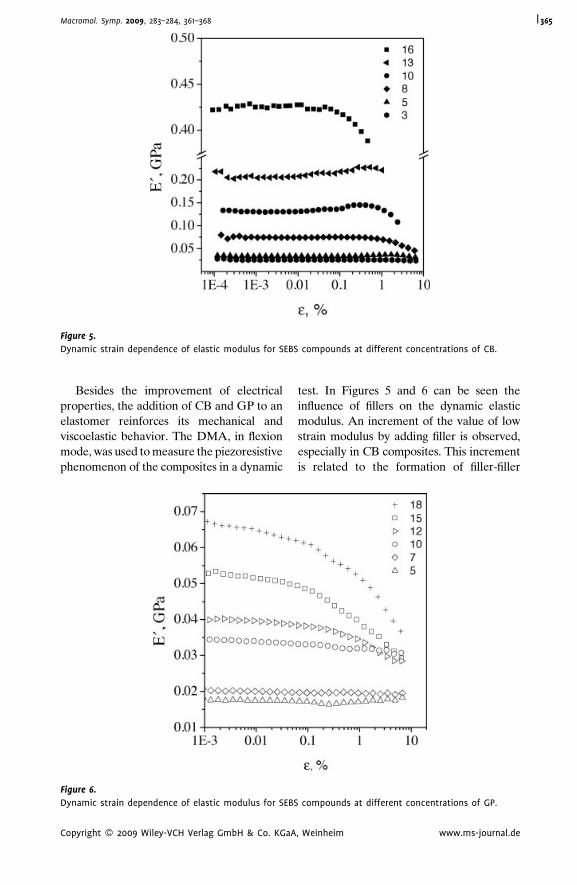
Figure 5.
Dynamic strain dependence of elastic modulus for SEBS compounds at different concentrations of CB.
Macromol. Symp. 2009, 283–284, 361–368 365
Besides the improvement of electrical
properties, the addition of CB and GP to an
elastomer reinforces its mechanical and
viscoelastic behavior. The DMA, in flexion
mode, was used to measure the piezoresistive
phenomenon of the composites in a dynamic
Figure 6.
Dynamic strain dependence of elastic modulus for SEBS
Copyright � 2009 Wiley-VCH Verlag GmbH & Co. KGaA
test. In Figures 5 and 6 can be seen the
influence of fillers on the dynamic elastic
modulus. An increment of the value of low
strain modulus by adding filler is observed,
especially in CB composites. This increment
is related to the formation of filler-filler
compounds at different concentrations of GP.
, Weinheim www.ms-journal.de
Macromol. Symp. 2009, 283–284, 361–368366
interactions as loading rises, forming a
network called secondary structure. This
structure results from the tendency of
particles to agglomerate.[11] For a given
sample, when increasing dynamic strain a
non-linearity is observed, high strain mod-
ulus has a decrement, by means of break-
down of the secondary structure. CB com-
posites showed a higher fall on the high strain
modulus than GP composites. Instead,
composites with GP obtain a lower value
of deformation in which the elastic modulus
begins to drop, falling since a 0.01% of
deformation was reached. It is worth men-
tioning that the limit force of the equipment
was reached with values showed and it was
not possible to obtain higher deformation.
As this non-linearity observed, known as
Payne effect,[12] is mainly caused by the
secondary structure, formed by agglomer-
ated particles, it could be reflected in the
electric properties of the composite. For
measurements of electric resistance of CB
and GP composites as a function of the
dynamic strain amplitude, special home-
made copper clamps were used to guaran-
tee a well fastened sample and good electric
contact. We can see in Figure 7 that
electrical conductivity reproduces fairly
Figure 7.
Dynamic strain dependence of electric conductivity for
Copyright � 2009 Wiley-VCH Verlag GmbH & Co. KGaA
well the pattern observed in Figures 5
and 6 for elastic modulus. The initial value
of conductivity stays stable until it shows a
deformation of 0.01% and 1%, for CB and
GP composite, respectively. Above this
value a decrement is observed. This change
is related with the destruction of the
conductive network in the composite as
deformation increases, destroying and
separating the agglomerates of particles.
In a three point-flexion test the sample is
subjected to compressive and tensile strains
at the same time. As seen before, compres-
sion, with the perpendicular deformation
restricted, and tension tests produce con-
trary effects on electric resistance of
composites; an increase of electric resis-
tance, decrease of electric conductivity, was
observed in the tension test caused by the
separation of conductive particles as defor-
mation was applied. We can assume that
the same phenomenon, separation of con-
ductive particles, dominates the electric
response in the DMA test. The electric
behavior in real time during the DMA test
is plotted in Figure 8 for a sample of
10.7 vol% CB. We can see that both tension
and DMA tests increases the electric
response at times larger than 200s.
CB and GP composites during a DMA test.
, Weinheim www.ms-journal.de
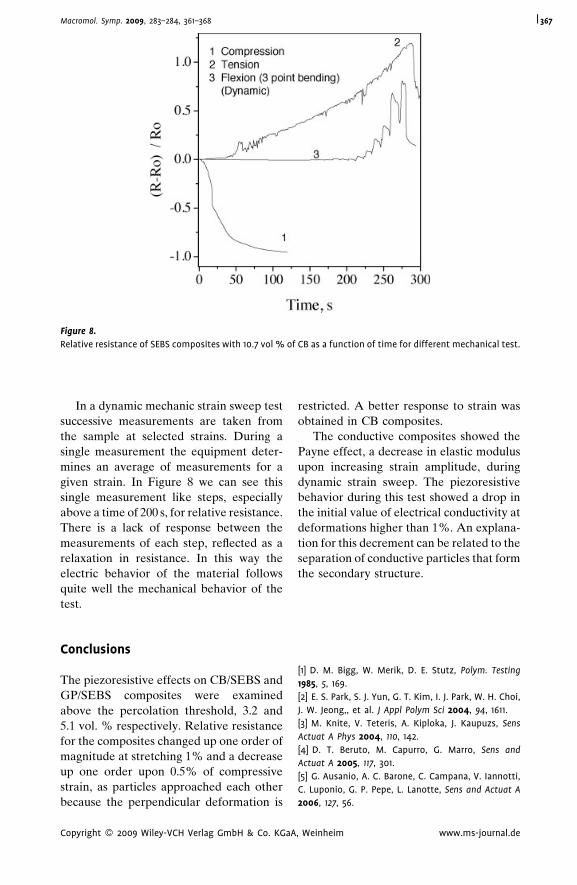
Figure 8.
Relative resistance of SEBS composites with 10.7 vol % of CB as a function of time for different mechanical test.
Macromol. Symp. 2009, 283–284, 361–368 367
In a dynamic mechanic strain sweep test
successive measurements are taken from
the sample at selected strains. During a
single measurement the equipment deter-
mines an average of measurements for a
given strain. In Figure 8 we can see this
single measurement like steps, especially
above a time of 200 s, for relative resistance.
There is a lack of response between the
measurements of each step, reflected as a
relaxation in resistance. In this way the
electric behavior of the material follows
quite well the mechanical behavior of the
test.
Conclusions
The piezoresistive effects on CB/SEBS and
GP/SEBS composites were examined
above the percolation threshold, 3.2 and
5.1 vol. % respectively. Relative resistance
for the composites changed up one order of
magnitude at stretching 1% and a decrease
up one order upon 0.5% of compressive
strain, as particles approached each other
because the perpendicular deformation is
Copyright � 2009 Wiley-VCH Verlag GmbH & Co. KGaA
restricted. A better response to strain was
obtained in CB composites.
The conductive composites showed the
Payne effect, a decrease in elastic modulus
upon increasing strain amplitude, during
dynamic strain sweep. The piezoresistive
behavior during this test showed a drop in
the initial value of electrical conductivity at
deformations higher than 1%. An explana-
tion for this decrement can be related to the
separation of conductive particles that form
the secondary structure.
[1] D. M. Bigg, W. Merik, D. E. Stutz, Polym. Testing
1985, 5, 169.
[2] E. S. Park, S. J. Yun, G. T. Kim, I. J. Park, W. H. Choi,
J. W. Jeong,, et al. J Appl Polym Sci 2004, 94, 1611.
[3] M. Knite, V. Teteris, A. Kiploka, J. Kaupuzs, Sens
Actuat A Phys 2004, 110, 142.
[4] D. T. Beruto, M. Capurro, G. Marro, Sens and
Actuat A 2005, 117, 301.
[5] G. Ausanio, A. C. Barone, C. Campana, V. Iannotti,
C. Luponio, G. P. Pepe, L. Lanotte, Sens and Actuat A
2006, 127, 56.
, Weinheim www.ms-journal.de
Macromol. Symp. 2009, 283–284, 361–368368
[6] D. Stauffer, A. Aharony, in: ‘‘Introduction to Perco-
lation Theory’’, Rev. 2nd ed., Taylor and Francis, London
1994, p. 89.
[7] P. K. Pramanik, D. Khastgir, S. K. De, T. N. Saha,
J Mater Sci 1990, 25, 3848.
[8] A. E. Job, F. A. Oliveira, N. Alves, J. A. Giacometti,
L. H. C. Mattoso, Synthetic Metals 2003, 136, 99.
Copyright � 2009 Wiley-VCH Verlag GmbH & Co. KGaA
[9] K. P. Sau, T. K. Chaki, D. Khastgir, Rubber Chem
Technol 2000, 73, 310.
[10] L. Wang, T. Ding, P. Wang, Composites Science and
Technology 2008, 68, 3448.
[11] M. J. Wang, Rubber chem technol. 1998, 71,
521.
[12] A. R. Payne, J. Appl. Polym. Sci. 1962, 19, 57.
, Weinheim www.ms-journal.de