
Poetic Borrowing in Early Mormonism - Scholarly Publishing ...

Travail de Fin d’Etudes Aurel Leven – Ecole Centrale de Lyon
07/04/2008 – 27/06/2008
Tuteur entreprise : Carl Kenigsberg Correspondant ECL : Jean-Pierre Katz
Stock borrowing costs in the Emerging Markets, with pricing implications for associated Equity Total Return Swaps
Kenneth Bok
Option Energie (Embarquée) Métier Ingénieur d’Affaires
Promo 2008

Travail de Fin d’Etudes: Stock borrowing costs in the Emerging Markets, with pricing implications for associated Equity Total Return Swaps BOK Kenneth, Aurel Leven Securities
Abstract Stock borrowing and lending is a major activity in both emerging and developed markets, and plays a part in efficient market functioning. In recent years, such activity has been increased in volume and sophistication, resulting in a variety of financial products. Amongst these, the Total Return Swap is an instrument which has proven to be very versatile and effective, and has grown significantly in popularity.
The aim of this project is to determine if the cost-of-carry model in the futures and spot market are able to predict stock borrowing costs in the emerging markets, and thus provide an indication of fair values of equity total return swaps.
A brief overview of the stock borrowing industry, the actors and their motivations are first described to provide the context. Thereafter, we examine research done into the pricing of similar total return swaps. Finally, we introduce the modified cost-of-carry model and back-test using market data.
The S&P Indian NIFTY 50 Spot Index and corresponding futures contracts were matched with TRS prices made available from Aurel Leven Securities. The implied borrowing costs, for the index over a span of 7 months ( Nov 2007 – May 2008) were found to be volatile and generally out-of-line with levels found in the actual TRS pricing data.
Synthèse L'activité de prêt emprunt est une activité aussi bien exercée dans les pays développés que dans les pays émergeants. Ce type d'activité devient de plus en plus sophistiqué et liquide, offrant ainsi une très vaste gamme de produit.
On compte parmi ces produits les Total Return Swap (TRS) qui ont su démontrer leur flexibilité et sont désormais très utilisés.
Le but de ce projet est de déterminer le model de ‘cost of carry’ sur le marchés des futures et du cash afin de prévoir les coûts de prêt emprunt sur les pays émergeants nous permettant ainsi d'avoir la ‘fair value’ des TRS un bref aperçu du prêt emprunt, les acteurs et leur principales motivations vont nous permettre d'analyser le contexte. Nous verrons ensuite les études réalisés sur le pricing des dits TRS. Nous terminerons en présentant le model de ‘cost of carry’ et back tester en utilisant des données de marchés.
L'indice S&P Indian NIFTY 50 et le Future sur cet indice ont servi de point de comparaison avec notre prix théorique du TRS. La comparaison des données s'étend sur une durée de 7 mois (de Novembre 2007 à mai 2008) qui généralement convergent pas avec les prix réels des TRS

Travail de Fin d’Etudes: Stock borrowing costs in the Emerging Markets, with pricing implications for associated Equity Total Return Swaps BOK Kenneth, Aurel Leven Securities
Table of Contents 1 Introduction.............................................................................................................................................. 5
2 Stock Lending – A Brief Primer.................................................................................................................. 6
2.1 What - Stock lending definitions ......................................................................................................... 6
2.2 Who and Why – Market participants and their motivations ................................................................ 7
2.2.1 Borrowers and Lenders ................................................................................................................ 7
2.2.1.1 Stock borrowers ..................................................................................................................... 7
2.2.1.2 Stock lenders ......................................................................................................................... 9
2.2.1.3 Cash borrowers .................................................................................................................... 10
2.2.1.4 Cash investors ...................................................................................................................... 10
2.2.2 Intermediaries ............................................................................................................................ 10
2.2.2.1 Broker-dealers ..................................................................................................................... 11
2.2.2.2 Prime brokers ...................................................................................................................... 11
2.2.3 Providers of clearing and settlement services ............................................................................. 13
2.3 Where - Developed vs emerging markets .......................................................................................... 14
2.4 How - Transactional varieties ............................................................................................................ 15
2.4.1 Stock lending and borrowing ...................................................................................................... 15
2.4.2 Repos (Sale and repurchase agreements) ................................................................................... 17
2.4.3 Contract for Difference ............................................................................................................... 17
2.4.4 Total Return Swaps .................................................................................................................... 18
2.4.5 Comparison between assets ....................................................................................................... 19
3 Bibliographic Study ................................................................................................................................. 21
3.1 Literature review .............................................................................................................................. 21
3.2 Pricing of a floating-for-equity swap ................................................................................................. 22
4 Pricing - Determination of implied borrowing costs ............................................................................... 28
4.1 The Futures – Spot relationship ........................................................................................................ 28
4.2 Dividends.......................................................................................................................................... 30
4.2.1 Procedure in processing dividend data ....................................................................................... 32
4.3 Interest rates .................................................................................................................................... 32

Travail de Fin d’Etudes: Stock borrowing costs in the Emerging Markets, with pricing implications for associated Equity Total Return Swaps BOK Kenneth, Aurel Leven Securities
4.4 Aurel Leven trade data ..................................................................................................................... 33
5 Results .................................................................................................................................................... 34
5.1 Implied borrowing costs from the cost of carry model ...................................................................... 34
5.2 Aurel leven trade data ...................................................................................................................... 37
5.3 Comparison between implied borrow and TRS pricing data .............................................................. 38
6 Conclusion .............................................................................................................................................. 40
7 References .............................................................................................................................................. 41
8 Glossary of terms .................................................................................................................................... 43
9 Appendix A: Calculation of dividends on an index .................................................................................. 45
10 Appendix B: Additional Charts .............................................................................................................. 46

Travail de Fin d’Etudes: Stock borrowing costs in the Emerging Markets, with pricing implications for associated Equity Total Return Swaps BOK Kenneth, Aurel Leven Securities
1 Introduction Stock borrowing is a growing industry that exists both in developed and emerging markets,
servicing the needs of various market participants – issuers, investors and traders. It plays a
significant part in the efficient functioning of the securities markets worldwide. The size of this
market is difficult to estimate, owing to the fact that it is an ‘over the counter’ (OTC) product.
However, according to Faulkner (2004), the balance of securities on loan globally exceeds £1
Trillion (~USD$ 2 Trillion).
In this report, we shall use the term ‘stock lending’ somewhat loosely to refer to a broader set of
transactions that are able to achieve the same economic outcomes as a direct stock lending
transaction. This includes: Sale and repurchase agreements (Repos), Buy / Sell backs, CFDs
(Contract for Difference), TRSs (Total Return Swaps). As the main aim of this study is to construct a
model to determine the borrowing cost of stocks, and not a study on legal and technical details
with stock lending transactions, we will focus on transactional details only when they impact price.
Also, while other literature in this domain will refer to ‘securities lending’, we will focus on stock
lending, and it is important that ‘securities lending’ refers to a broader set of transactions which
includes bonds
This study seeks to accomplish two goals. Firstly, to inform the reader of the recent developments
in the stock borrowing industry in the emerging markets, via treatment of the various instruments
available for such purposes. The particularities of emerging markets with respect to developed
markets will be discussed.
Secondly, we will attempt to establish a model for pricing Equity Total Return Swaps. This appears
to be a worthwhile venture from several perspectives: The amount of research in this particular
domain has been largely academic, with little testing with actual market data. This study will focus
on the differential between the spot and futures price – as both prices are readily available and
are liquidly traded.

Travail de Fin d’Etudes: Stock borrowing costs in the Emerging Markets, with pricing implications for associated Equity Total Return Swaps BOK Kenneth, Aurel Leven Securities
2 Stock Lending – A Brief Primer 2.1 What - Stock lending definitions
The borrowing (and lending) of stock refers to the market practice of temporarily transferring
ownership of stocks from one party, the lender, to another, the borrower, with an agreement by
the borrower to return equivalent securities to the lender at pre-agreed time. (British Bankers’
Association, 2002) For this service, the borrower is obliged to pay a fee based on the duration of
the borrow and other variables, which we will go into further detail in this report. We shall refer to
this as the borrow cost, and unless otherwise stated, it will be represented on an annual basis.
There are a number of implications that arise due to stock lending transactions:
Absolute title (representing sole documentation of title, meaning that ownership is defensible
against claims by third parties) (Answers.com, 2008) over the lent securities is exchanged between
both parties, therefore these securities can be sold outright.
The borrower of the stock gains certain rights, depending on the transaction. For example, the
right to sell or lend them to another party, or to participate in AGMs.
The borrower is entitled to the financial benefits of owning the stock (eg. Dividends), but
agreements to make, or ‘manufacture’, equivalent payments back to the lender will negate any
such benefits.
The issue of collateral will be examined in more detail in section 2.5, as different transactions have
different collateral requirements. In general, most stock lending is collateralised with cash
deposits or other securities. In the case of a direct stock loan, the price is negotiated between the
two parties and is determined by factors such as supply and demand, flexibility of collateral and
the likelihood of recalling the stock (sometimes referred to as ‘breaking’).
2.2 Who and Why - Market participants and their motivations
The main participants in securities lending markets include: end-users, i.e. borrowers and lenders,
intermediaries providing various specialised services, and providers of clearing and settlement

Travail de Fin d’Etudes: Stock borrowing costs in the Emerging Markets, with pricing implications for associated Equity Total Return Swaps BOK Kenneth, Aurel Leven Securities
services. In answering who the participants in this domain are, it is inextricably linked to the
question of their motivations for participation, in fact very often it defines their existence in the
financial markets. As such, we will examine both of these questions together.
There are two main motivations for stock lending; securities-driven, and cash-driven.
In securities-driven transactions, borrowing firms seek specific stocks, in order to facilitate their
trading operations. In many cases, stocks are sought after to avoid settlement failures. In the cash-
driven trades, the lender is able to increase the returns on an underlying portfolio by receiving a
fee for making its investments available to the borrower. Such transactions may boost overall
income returns, enhancing, for example, returns on a pension fund. Stock lending is particularly
attractive for large institutional holders of securities, as it is an easy way of generating income to
offset custody fees and requires little involvement or time.
The stock lending mechanism gives borrowers access to lender portfolios, which provide the
flexibility necessary when borrowing for strategic positioning and financing inventories. From the
macro-view, stock lending facilitates timely settlement, increases settlements, reduces market
volatility and improves liquidity.
2.2.1 Borrowers and Lenders
As securities lending markets comprise both cash-driven and securities-driven markets, end users
can be classified more specifically as (i) borrowers of securities, (ii) lenders of securities,
(iii) borrowers of cash and (iv) cash investors. For a number of the larger financial firms, securities
lending is a major business and they often assume multiple roles in the market. For instance, some
of the larger broker-dealers act as active borrowers, lenders, market making intermediaries and
providers of administrative services.
2.2.1.1 Stock borrowers
Firms borrow securities in order to meet a delivery obligation in circumstances in which they do
not currently have possession of those securities. These circumstances will occur when firms (1)
sell securities they have purchased but which have not yet been delivered to them, (2) open a
Travail de Fin d’Etudes: Stock borrowing costs in the Emerging Markets, with pricing implications for associated Equity Total Return Swaps BOK Kenneth, Aurel Leven Securities
‘short’ position, either voluntarily to establish a specific position or involuntarily as a result of an
obligation as a market-maker to fill a customer buy order, (3) need to deliver securities they have
not yet purchased against an exercise of a derivatives contract (e.g. the exercise of a call option),
(4) want to raise specific collateral, perhaps for another securities lending transaction, or (5) need
to cover a failed transaction in a securities settlement system.
The primary borrowers of specific securities are the major securities dealers most active in
domestic and global financial markets. They may borrow for any of the reasons above, and their
needs are often substantial. Time lags between the inward and outward delivery of securities
continue to account for a material part of securities borrowing, but this seems to be falling as a
proportion of total borrowing. Far more significant today are the borrowing needs arising from the
services these firms provide to their customer base, their proprietary positioning in securities or,
in some cases, an active intermediary role in the securities lending markets. Other borrowers of
securities include broker-dealers, hedge funds and registered investment companies. Trading
strategies including short positions have increased in recent years, and now account for by far the
greater part of borrowing demand. These strategies cover a range of financial markets including
equity, fixed income and derivatives markets. Short selling strategies are often directional, that is
where a firm borrows a security it does not currently own with the aim of realising a profit from an
expected fall in the security’s price. To achieve this, the firm sells the security, simultaneously
borrows the same quantity of the security to deliver to the purchaser, and hopes to buy back the
same quantity of the security once the price has fallen. The security bought back is then used to
unwind the securities borrowing. This leaves the short seller with a profit equivalent to the
difference between the selling and buyback price, less transaction costs and the cost of borrowing
the securities.
Firms also seek to borrow securities when markets present arbitrage opportunities. These are
opportunities to profit by exploiting a price difference between two instruments that should have
identical values. Securities arbitrage generally involves buying a security at a low price in one
market and simultaneously shorting the same security in another market at a higher price.

Travail de Fin d’Etudes: Stock borrowing costs in the Emerging Markets, with pricing implications for associated Equity Total Return Swaps BOK Kenneth, Aurel Leven Securities
Examples of arbitrage strategies include:
• Index arbitrage
• Tax arbitrage
• Merger arbitrage (commonly referred to as “deal” or “risk” arbitrage)
• Statistical arbitrage
Firms also seek to borrow securities to prevent settlement failures in outright transactions. In
cross-border transactions, where there has been an expansion of back-to-back trading, it is often
more efficient and cost-effective to borrow a security than to deal with the risk and costs
associated with a settlement failure. Some major market participants have indicated that the
borrowing activity resulting from need to prevent settlement failures still accounts for up to 20%
of securities borrowing activity in cross-border transactions.
2.2.1.2 Stock lenders
The primary lenders of securities are institutional investors that are typically long-term holders of
securities such as pension funds, insurance funds and mutual funds. They are attracted to
securities lending by the additional source of revenue it offers, and by the desire to avoid custody
fees for a large portfolio. Although the returns on securities lending are relatively small in the most
liquid securities, the additional income assists the institutions in providing a greater rate of return
for their clients. This can be important in a field as highly competitive as fund management, where
very small differences in performance can significantly affect performance ranking. Alternatively, if
not used to boost gross returns, the additional income can sometimes be used to defray the
custodian’s charges or other expenses of the fund.
Financial firms, such as banks and broker-dealers, also lend securities. Such business may either
provide a customer service or enable a firm to exploit market opportunities on a proprietary basis.
A financial institution may, for example, borrow securities in the expectation that others will
shortly be prepared to pay more to borrow them.

Travail de Fin d’Etudes: Stock borrowing costs in the Emerging Markets, with pricing implications for associated Equity Total Return Swaps BOK Kenneth, Aurel Leven Securities
2.2.1.3 Cash borrowers
The principal borrowers of cash in securities lending markets tend to be the same institutions that
actively borrow securities (e.g. securities dealers, banks and hedge funds). While major securities
dealers often have large amounts of capital, their daily financing needs can be many times that
amount and can fluctuate significantly on a daily basis due to the size of the positions they take
and due to their substantial market-making activities. As a result, dealers have to borrow funds
daily to finance their long positions, and actively look to do so using the securities they own as
collateral. A sale and repurchase of securities provides a proven and flexible mechanism for
arranging the borrowing of cash quickly and relatively cheaply. In particular, it can be used to
exploit interest rate differentials that allow the borrower to lock in a higher return or lower cost of
finance than would otherwise be available. The cheaper funding costs result from the cash
lender’s readiness to accept a rate reflecting the fact that the loan is fully collateralised.
Transactions are primarily arranged on a short-term basis (overnight or open transactions) via
direct contact with major customers, typically banks, securities firms and institutional investors.
2.2.1.4 Cash investors
Securities lending provides a short-term cash management tool for both financial institutions and
non-financial corporations. Investing cash through securities lending provides an alternative to the
outright purchase of short-term instruments such as short-term government debt, certificates of
deposit (CDs) or commercial paper (CP). Reverse repos, for example, can offer greater flexibility
than many other money market instruments because their maturities can be tailored precisely to
meet diverse investment needs. Investing cash through securities lending transactions is also
especially attractive to prudent investors and those subject to certain types of asset restrictions.
2.2.2 Intermediaries
Market participants often rely on a variety of intermediaries and service providers in conducting
securities lending transactions. While securities lending transactions are often negotiated directly
between principal counterparties, in many jurisdictions intermediaries are highly relied upon for
their market-making services. The market-making intermediaries may also provide trade matching
and confirmation services. In some instances, however, a specialised service provider may also

Travail de Fin d’Etudes: Stock borrowing costs in the Emerging Markets, with pricing implications for associated Equity Total Return Swaps BOK Kenneth, Aurel Leven Securities
offer a range of trade comparison and other processing services. It is seldom the case that
exchanges provide such services, although the Swiss Exchange (SWX) is one exception. In many
instances the provider of these administrative services is the same intermediary relied upon for
providing market-making services and trading services, as these intermediaries are offering a
straightforward service with little active client involvement.
2.2.2.1 Broker-dealers
Broker-dealers are leading intermediaries in securities lending markets, providing a wide range of
services. Most common is the broker-dealer acting as a principal intermediary between the
ultimate borrowers and suppliers of funds or securities. By running a repo book, major dealers,
using their capital and market-making capabilities, interpose themselves between the two parties,
earning a spread on the trade. This can offer the lender a measure of protection against an
unknown counterparty, and anonymity to a securities borrower which may not wish to reveal its
identity. Some broker-dealers may also not wish to disclose the identity of their client, for
purposes of their commercial protection.
Securities dealers also offer securities lending programmes to institutional investors (e.g. pension
funds, mutual funds, etc). In what is typically referred to as an ‘exclusive’, institutional investors
will enter into a contractual arrangement whereby the securities dealer is willing to pay a
guaranteed fee to the investor for the exclusive rights to the securities lending revenue of the
portfolio. The securities dealer will lend from the institutional investor’s portfolio on a principal
basis. There are fixed terms to these agreements and they normally involve a custodial
relationship whereby the securities firm has custody of all or part of the assets of the institutional
investor. Broker-dealers are also increasingly providing agency-lending services as institutional
investors look to unbundle securities lending from their custodial services.
2.2.2.2 Prime brokers
An important service for many securities borrowers is that offered by prime brokers.
Prime brokers provide clients with a range of centralised record-keeping, clearing and custodial

Travail de Fin d’Etudes: Stock borrowing costs in the Emerging Markets, with pricing implications for associated Equity Total Return Swaps BOK Kenneth, Aurel Leven Securities
services. Prime brokerage clients tend to be traders active in financial markets such as hedge
funds and other broker-dealers. Key components of prime brokerage services include financing of
securities positions and access to a ready supply of both liquid and illiquid securities for borrowing
at competitive rates.
Prime brokerage involves three distinct parties: the prime broker, the executing broker and the
customer. The prime broker is a registered broker-dealer that clears and finances the customer
trades executed by one or more registered broker-dealers (executing brokers) at the request of
the customer. The customer maintains its funds and securities in an account with the prime
broker. Orders placed with an executing broker are executed through an account with the
executing broker in the name of the prime broker for the benefit of the customer. The prime
broker next issues a confirmation or notification to the customer and computes all credit and
regulatory margin amounts. The executing broker confirms the transaction with the prime broker.
The trade may be submitted for clearance and settlement following normal securities lending
settlement procedures.
Prime brokerage enables active traders to centralise their clearing and record-keeping at one
broker, while executing trades through several, in order to spread commissions, get the best
execution and conceal their strategies. Since most securities lenders have stringent eligibility
qualifications for borrowers, many hedge funds and broker-dealers rely on their prime brokers for
access to borrowed securities. Prime brokers tend to be well-capitalised and active securities
borrowers, thereby enabling them to intermediate securities lending transactions on a principal
basis. In addition to stock borrowing activity, a prime brokerage business generates clients with a
high demand for executions in the cash market, stock loan margin financing, repo financing and
the use of OTC and exchange-traded derivatives. The prime brokerage customer may also obtain
more favourable financing costs by having all transactions offset through a single margin account.
Since the 1990s, hedge funds have become particularly significant. These funds generally have
little or no infrastructure of their own and rely substantially on outsourcing most of their trade
processing and administrative functions. When facilitating short positions for prime brokerage

Travail de Fin d’Etudes: Stock borrowing costs in the Emerging Markets, with pricing implications for associated Equity Total Return Swaps BOK Kenneth, Aurel Leven Securities
clients, the firms may adopt a variety of approaches to ensure that the client achieves as
efficiently as possible the economic objective of its strategy. In some cases, this will involve the
firm itself running the short position instead of the client. In this case it will arrange for the client
to take any capital benefit through a derivative arrangement, such as a contract for difference.
2.2.3 Providers of clearing and settlement services
The clearing and settlement of securities lending transactions follows the same basic process as
for the settlement of outright transactions. Where the settlement process tends to differ is in the
relatively undeveloped use of netting and clearing, and in the additional movements of securities
required, especially for margin requirements or substitution, during the life of the lending
transaction. In recent years, market participants have been showing increasing interest in the
development of central counterparty clearing services, including the use of clearing houses, with a
focus on repo transactions. Many market participants have indicated that the related costs of
clearing and information delivery are one of the biggest impediments to the growth of securities
lending activity. The prevailing view is that centralised matching and clearing can potentially
reduce settlement volumes and therefore costs (e.g. liquidity and collateral savings), allow
multilateral netting of credit exposures and increase the scope for trading anonymously (e.g.
through screen-based trading) because there is a single central counterparty to all transactions.
These services can also reduce supervisory capital costs through the associated balance sheet
netting of transactions. Clearing houses do, however, concentrate risk and adequate measures
must be taken to ensure that they are well managed and that the distribution of risk is
transparent.

Travail de Fin d’Etudes: Stock borrowing costs in the Emerging Markets, with pricing implications for associated Equity Total Return Swaps BOK Kenneth, Aurel Leven Securities
2.3 Where - Developed vs emerging markets This project aims to look into the price of TRSs in the emerging markets, as compared to that in
developed markets with established and liquid stock markets.
Emerging markets are countries that are restructuring their economies along market-oriented
lines and offer a wealth of opportunities in trade, technology transfers, and foreign direct
investment. According to the World Bank, the five biggest emerging markets are China, India,
Indonesia, Brazil and Russia. Other countries that are also considered as emerging markets include
Mexico, Argentina, South Africa, Poland, Turkey, and South Korea. They are the world's fastest
growing economies, contributing to a great deal of the world's explosive growth of trade. By 2020,
the five biggest emerging markets' share of world output will double to 16.1 percent from 7.8
percent in 1992. (World Bank, 2007)
The main difference between emerging and developed markets is that of liquidity. In emerging
markets, even mid to large size capitalised stocks do not trade with anywhere near the volume of
blue-chips in developed markets. Furthermore, there are currency risks as a result of geo-political
instability. Dividend data is difficult to predict as many companies are still experiencing rapid
growth and growth patterns are not stable. Thus, in such an endeavor, the challenge is that of
obtaining good data in a illiquid market and making assumptions if unavailable.
As a result of this, stock borrowing costs are likely to be higher in emerging markets because of the
lack of supply and also the due to the general lack of information that exists in the emerging
markets. For example, inter-dealer brokers can charge up to 5 basis points for a TRS transaction
for emerging market issues whereas a similar trade in a developed market such as the US or UK
could be less than 1 basis point.

Travail de Fin d’Etudes: Stock borrowing costs in the Emerging Markets, with pricing implications for associated Equity Total Return Swaps BOK Kenneth, Aurel Leven Securities
2.4 How - Transactional varieties 2.4.1 Stock lending and borrowing
The direct form of stock lending involves the temporary exchange of equity, usually for other
securities or cash of an equivalent value (or occasionally a mixture of cash and securities), with an
obligation to redeliver a like quantity of the same securities at a future date. Most securities
lending is structured to give the borrower legal title to the securities for the life of the transaction,
even though, economically, the terms are more akin to a loan. The borrow fee is generally agreed
in advance and the lender has contractual rights similar to beneficial ownership of the securities,
with rights to receive the equivalent of all interest payments or dividends and to have equivalent
securities returned. The importance of the transfer of legal title is twofold. First, it allows the
borrower to deliver the securities onward, for example in another securities loan or to settle an
outright trade. Second, it means that the lender usually receives value in exchange for the
disposition of legal title (whether in cash or securities), which ensures that the loan is
collateralised.
Figure 1: Transaction collateralised with other securities or assets Source: Faulkner, 2004
In the above diagram, the collateral is being held by a Tri Party Agent. This specialist agent (usually
a large custodian bank or International Central Securities Depository) will receive only eligible
collateral from the borrower and hold it in a segregated account to the order of the lender. The Tri
Travail de Fin d’Etudes: Stock borrowing costs in the Emerging Markets, with pricing implications for associated Equity Total Return Swaps BOK Kenneth, Aurel Leven Securities
Part Agent will mark this collateral to market, with information distributed to both lender and
borrower. In most cases, the borrower pays a fee to the Tri Party Agent.
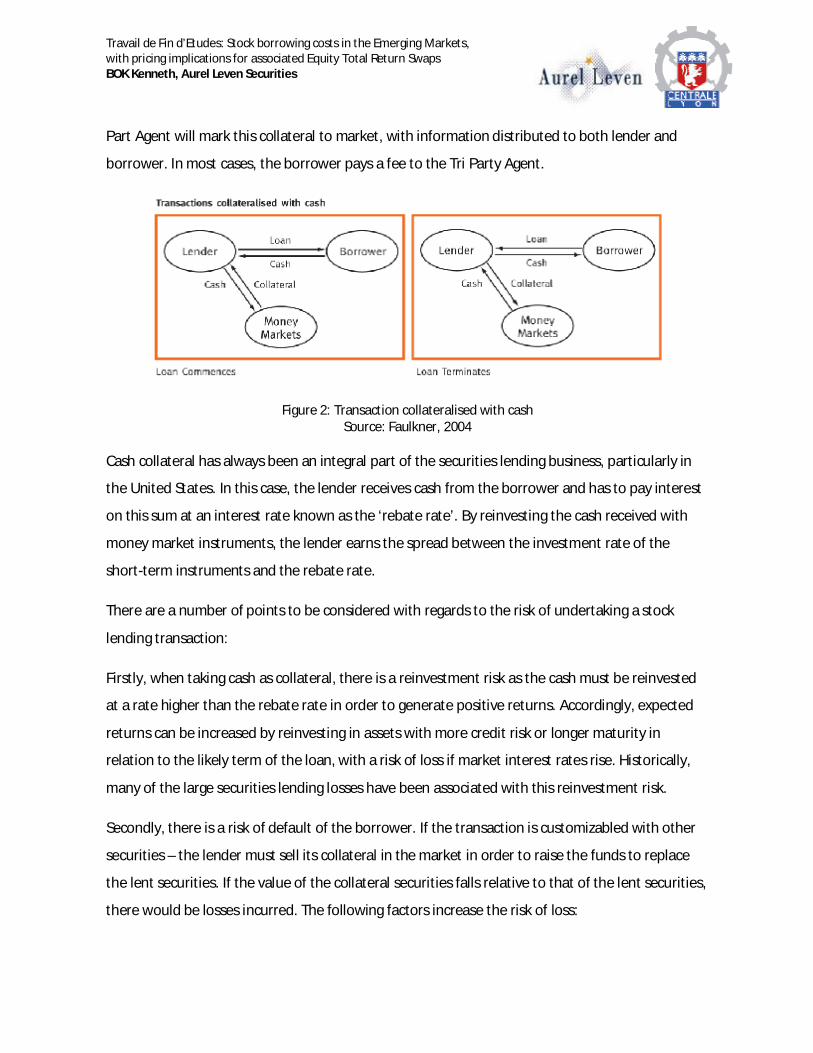
Figure 2: Transaction collateralised with cash Source: Faulkner, 2004
Cash collateral has always been an integral part of the securities lending business, particularly in
the United States. In this case, the lender receives cash from the borrower and has to pay interest
on this sum at an interest rate known as the ‘rebate rate’. By reinvesting the cash received with
money market instruments, the lender earns the spread between the investment rate of the
short-term instruments and the rebate rate.
There are a number of points to be considered with regards to the risk of undertaking a stock
lending transaction:
Firstly, when taking cash as collateral, there is a reinvestment risk as the cash must be reinvested
at a rate higher than the rebate rate in order to generate positive returns. Accordingly, expected
returns can be increased by reinvesting in assets with more credit risk or longer maturity in
relation to the likely term of the loan, with a risk of loss if market interest rates rise. Historically,
many of the large securities lending losses have been associated with this reinvestment risk.
Secondly, there is a risk of default of the borrower. If the transaction is customizabled with other
securities – the lender must sell its collateral in the market in order to raise the funds to replace
the lent securities. If the value of the collateral securities falls relative to that of the lent securities,
there would be losses incurred. The following factors increase the risk of loss:

Travail de Fin d’Etudes: Stock borrowing costs in the Emerging Markets, with pricing implications for associated Equity Total Return Swaps BOK Kenneth, Aurel Leven Securities
• If it takes a long time to close out the position
• If the collateral or lent stocks are incorrectly valued
• If the markets for these stocks are illiquid
• If the market prices of the lent and collateral stocks do not move in tandem
2.4.2 Repos (Sale and repurchase agreements)
Repos involve one party agreeing to sell stocks to another, with a simultaneous agreement to
repurchase the same stock at a specific price on an agreed date in the future. In the case of repos,
it is common to call the ‘lender’ the ‘seller’, and the ‘borrower’ the ‘buyer’. Repos occur for two
main reasons, to transfer ownership of the stock between the parties, or to facilitate customised
cash loans or funding transactions. If structured carefully, repo transactions involve very little
credit risk. (Hull, 2006) Repos are much like securities loans customised against cash, in that the
return generated is factored into an interest rate that is reflected in the interest rate differential
between the two legs of the transaction.
At the beginning of a transaction, stocks are valued and sold at the prevailing market price. At
termination, the stocks are resold at a pre-determined price equivalent to the original sale price
together with the previously agreed upon interest rate. The most common type of repo is an
overnight repo, in which the agreement is re-negotiated each day. However, longer-term
arrangements, known as term repos, are sometimes used.
2.4.3 Contract for Difference
A contract for difference (or CFD) is a contract between two parties, with the agreement that the
seller will pay to the buyer the difference between the current value of an asset and its value at
contract time. (If the difference is negative, then the buyer pays instead to the seller.) When
applied to equities, such a contract is an equity derivative that allows investors to speculate on
share price movements without the need for ownership of the underlying shares

Travail de Fin d’Etudes: Stock borrowing costs in the Emerging Markets, with pricing implications for associated Equity Total Return Swaps BOK Kenneth, Aurel Leven Securities
Contracts for differences allow investors to take long or short positions, and unlike futures
contracts have no fixed expiry date or contract size. Trades are conducted on a leveraged basis
with margins typically ranging from 1% to 30% of the notional value for CFDs on leading equities.
CFDs were originally developed in the early 1990s in London. Based on equity swaps, they had the
additional benefit of being traded on margin and being exempt of stamp duty, a UK tax.
CFDs are available in many developed markets such as the UK, France, Singapore and New
Zealand. CFDs are not currently permitted in the US due to restrictions by the US Securities and
Exchange Commission.
2.4.4 Total Return Swaps
A Total Return Swap is a swap agreement in which one party makes payments based on a set rate,
either fixed or variable (usually benchmarked against a rate such as LIBOR), while the other party
makes payments based on the return of an underlying asset, which includes both the income it
generates and any capital gains. In total return swaps, the underlying asset, referred to as the
reference asset, is usually an equity index, loans, or bonds. This is owned by the party receiving
the set rate payment.
The greatest benefit of a TRS is leverage – as the principal is not exchanged, the amount of
underlying can be many times greater than the initial outlay, if any. The parties do not transfer
actual ownership of the assets, as occurs in a repo transaction. This allows reduced up-front
capital to execute a trade. Due to these characteristics, Total Return Swaps are frequently used by
hedge funds.
A TRS can be used as a synthetic funding instrument offering improved financing costs. For
example, engaging in a repo transaction might cost LIBOR at 5.75% plus 125bp plus transaction
fees of 0.25% plus bid/offer spread of 5bp, for a total of 7.3% to a hedge fund. A TRS may cost
LIBOR at 5.75% plus 150bp spread to “lease” the bank’s balance sheet assets, for a total of 7.25%.
In addition, the hedge fund may save 5bp in asset servicing costs, reducing the expected financing
cost to 7.2%.

Travail de Fin d’Etudes: Stock borrowing costs in the Emerging Markets, with pricing implications for associated Equity Total Return Swaps BOK Kenneth, Aurel Leven Securities
Operational efficiency is another benefit of a TRS, as settlements, interest collection, payment
calculations, consent requests, reporting, and tracking associated with transferring ownership of
an asset can be avoided. Asset administration is left to the Total Return Payer so the Total Return
Receiver never has to deal with these issues.
TRSs are highly flexible. A TRS can be based on virtually any asset or series of assets. Furthermore,
the life of a TRS contract and its payment dates are up to the parties, and need not match the
payment or expiration dates of the reference asset.
TRSs can provide access to otherwise inaccessible asset classes, such as new issue loans, hedge
fund limited partnership interests, private equity securities, etc. Also, TRSs are often used to gain
exposure to emerging markets such as Russia or China, where due to legal and ownership issues it
may be difficult for an investor to buy the underlying directly. TRSs have also been used in the past
to circumvent paying extra tax on dividends, in the case of assets where local and foreign investors
are subject to different tax regimes, as the TRS contract is highly customizable. However, this
aspect of the TRS could change with increased scrutiny from agencies such as the IRS. (Alston Bird
LLP, 2007)
2.4.5 Comparison between assets
The differences between the products mentioned are numerous, and many pertain to the subtle
legal and ownership issues that occur due to the structure of the transaction. We shall focus on
issues that are most relevant to the end-user, as well as those that having implications on the
costs of stock borrowing.
Repos are short term contracts, with the most common time span being one day (ie. Overnight
repo). TRSs, however, are most commonly traded on a one year basis. In the context of stock
borrowing and lending operations, the minimum timeframe for negotiating a single contract is at
least a few months – as it takes resources to confirm trade details and to go through back office
settlement issues. Thus, the TRS is more commonly used than the repo for such purposes.
CFDs are commonly traded through brokers. The charges for entering a CFD transaction are either
directly charged, usually between 10 to 25 bps, depending on the regularity of trading activity and
Travail de Fin d’Etudes: Stock borrowing costs in the Emerging Markets, with pricing implications for associated Equity Total Return Swaps BOK Kenneth, Aurel Leven Securities
the size of the trades. (LearnMoney.co.uk, 2008) The prices quoted by these brokers will be
exactly the same as in the cash stockmarket. Brokers that charge zero commission make their own
prices (similar to how a market-maker operates). These prices for the larger stocks are often very
close to market prices but for mid level or small cap stocks can be significantly different. In a TRS
transaction, however, transaction costs are often significantly lower, ranging from 2 to 5 bps.
However, it must be noted that the size for a TRS transaction is nearly always quoted in the
millions, whereas CFDs are more accessible to retail investors and have little or no size
requirements. Very often, the only requirement to trade with a CFD broker is a minimum account
size of a few thousand dollars.
The key difference between TRSs and all other products, however, lies in the customizability of the
TRS contract. The TRS can be negotiated between the two counterparties, with clauses such as:
Breakability. The TRS can either be unbreakable or breakable at equity reset dates. This clause is
used depending on the needs of the various counterparties. For example, a pension fund with a
large inventory might opt for an unbreakable TRS as it allows it to ‘lock-in’ revenues and thus
reduce uncertainty from its stock lending operations.
Benchmark rate used. This is the floating rate used in the interest rate leg of the swap. Commonly
used benchmarks are 3 month to 1 year LIBOR and EURIBOR. The rate used is usually the same
whenever the same underlying is involved.
Duration. The typical duration of a TRS lasts for 3-12 months.
Underlying. Another unique characteristic of the TRS is that it can be used to gain exposure to an
index. Normally, an index only exists as a level which can be ‘bought’ using ETFs or futures.
However, these products usually only exist in developed markets where there is sufficient liquidity
and volume in order for financial actors to provide these services.
In view of these factors, we can see why the TRS is favoured in undertaking a stock borrowing
transaction. It is a highly customizable solution, with low commission costs and execution fees,
which can bypass many of the legal barriers to dealing with the underlying equity.

Travail de Fin d’Etudes: Stock borrowing costs in the Emerging Markets, with pricing implications for associated Equity Total Return Swaps BOK Kenneth, Aurel Leven Securities
3 Bibliographic study 3.1 Literature review
While the field of equity swaps is relatively new, there have been a few papers published on the
topic. We are particularly interested in the pricing of the floating-for-equity swap, as this is the
most commonly traded and is the most suitable within the domain of stock borrowing. In
examining the models used in pricing equity swaps, we recognize a large variety of modeling
techniques used and assumptions made. However, we have favored a less academic approach to
establishing a fair price for equity swaps. By and large, many of the studies have included many
assumptions to the behavior and availability of financial products which form the basis of such
models. For example, the assumption that stock prices follow the Black-Scholes lognormal model,
the presence of arbitrage-free conditions, and the presence of a liquidly traded zero-discount
bonds. Many of these assumptions are debatable at best and realistic at worse. Furthermore, we
are concerned with emerging markets, where liquidity (or lack thereof) is a major factor. We feel
that it is more pragmatic and practical to benchmark the borrowing cost with the active prices of
relevant assets in the market, which have a bearing on the prices of equity swaps. The model used
will be explained in greater detail in the following chapters.
However, we shall examine the research available for the sake of completeness, and present a
basic model hypothesized by Chance (2003). We feel that this model is simple enough for our
target audience while being able to communicate the key ideas in modeling the price of any kind
of swap.
Wu and Chen (2007) extended the BGM (Brace, Gatarek & Musielan, 1997) model by
incorporating stock price dynamics under the martingale measure. They then applied the resulting
model to pricing floating-for-equity swaps with either constant or variable notional principal.
Marshall, Sorensen and Tuncker (1992) provided a pricing model which is does not make the
arbitrage-free assumption. Rich (1995) used a forward-start forward contract approach to value
equity swaps. Jarrow and Turnbull (1996) provided a preference-free formula for equity-for-fixed
swaps. In a deterministic interest rate environment, Chance and Rich (1998) contributed to the

Travail de Fin d’Etudes: Stock borrowing costs in the Emerging Markets, with pricing implications for associated Equity Total Return Swaps BOK Kenneth, Aurel Leven Securities
literature on equity swaps by providing the valuation formulas for several types of equity swaps
within the framework of arbitrage-free replicating portfolios. Also, while many pricing models of
the various types of equity swaps have been presented, few articles have been written on the
floating-for-equity type. A reason for this is that in many of the interest rate models used, the
instantaneous forward rates are continuously compounded instead of simply compounded. These
are not appropriate for pricing the equity-for-floating swaps with a paid-in-arrears feature.
Furthermore, the instantaneous forward rates are not observable in the market, so recovering the
parameters in the model from the market-observed data is a difficult task.
3.2 Pricing of a floating-for-equity swap, as outlined by Chance (2003)
In building the model for a floating-for-equity swap, we note that it is identical to the combination
of the two following swap transactions:
• a swap to pay fixed, receive equity, plus
• a swap to pay floating, receive fixed
We note that the second swap transaction is a common floating-for-fixed interest rate swap,
whose characteristics are well-known. The first part of this section will focus on determining the
price of a fixed-for-equity swap. Whenever a TRS transaction is initiated, there is no exchange of
cash up front. Hence, the transactions have a market value of zero at the start. In the first
example, the fixed rate is determined so that the present value of the equity payments equals the
present value of the fixed payments, thereby giving the transaction zero market value.
For the first transaction we need to determine the appropriate fixed rate. This process is called
pricing the swap, although the term is a bit misleading. No “price” is determined. The fixed rate is
set such that the market value is zero. During the life of the swap, market conditions change and
the swap’s market value will deviate from zero. The determination of the value of the swap is
called, quite naturally, valuing the swap. In this section, we illustrate how pricing and valuation of
an equity swap is done. For the second and third swaps, there is no initial pricing, but we must
verify that the present values of both sets of payments are equal at the start and we must identify
how to value the swaps during their lives.

Travail de Fin d’Etudes: Stock borrowing costs in the Emerging Markets, with pricing implications for associated Equity Total Return Swaps BOK Kenneth, Aurel Leven Securities
We shall start by setting up the conditions and assumptions. We assume that the swap is initiated
at time 0 and has a set of n+1 payments that occur at times t, t+1, t+2, …, t+n. We choose an
arbitrary time point j, where 0 ≤ j ≤ t. Let S(j) be the price of the stock or level of the index at time
j. The fixed rate that we shall solve for is R, which will be a periodic rate. Thus, it is not an
annualized interest rate that must be multiplied by a factor such as 90/360 to determine the
actual payment. In practice, this periodic rate would be annualized by multiplying by 360/90 or
some other appropriate time factor. We shall do this in the examples shown in the appendix. Let
B(j,k) be the price of a zero coupon bond at time j that pays $1 at its maturity at time k, k ≥ j. The
value of the swap at time j is denoted as V(j;0,t+n), which is interpreted as the value at time j given
that the swap was initiated at time 0 and has a final payment at time t+n. We shall assume a
notional principal of $1.00, which we can do because all results are linearly related to the notional
principal. The actual payments and market value can be obtained by multiplying by the actual
notional principal.
The procedure will be that we determine the value of the swap at an arbitrary time j for a given
fixed rate R. To price the swap, we simply let j = 0, set the swap value to zero, and solve for R. To
determine the value of the swap, we follow the general procedure applicable to nearly all
derivative contracts. We find a trading strategy that replicates the cash flows from the derivative.
The market value of that trading strategy at time 0 will be the value of the derivative. Hence, we
need to find a trading strategy that generates the cash flows on these equity swaps.
The cash flows on this swap to the party paying a fixed rate of R and receiving the equity return
are as follows:
Time t Cash Flows
t S(t)/S(0) – (1 + R)
t+1 S(t+1)/S(t) – (1 + R)
t+2 S(t+2)/S(t+1) – (1 + R)
…
t+n S(t+n)/S(t+n-1) – (1 + R)

Travail de Fin d’Etudes: Stock borrowing costs in the Emerging Markets, with pricing implications for associated Equity Total Return Swaps BOK Kenneth, Aurel Leven Securities
To replicate the payments on this swap, we shall need to engage in a series of transactions at time
j, 0 ≤ j ≤ t. Consider the first payment, S(t)/S(0) – (1 + R). It can be replicated by doing the
following:
At j:
• Invest the amount S(j)/S(0) in the stock
• Borrow (1 + R)B(j,t)
At time t, the following occurs:
The stock will be worth
( ) ( ) ( ) ( ) = ( ) ( )
• Pay off bonds in the amount 1 + R.
The total cash flow will be ( ) ( )− ( + )
This amount is equivalent to the first swap payment.
To replicate the second swap payment, do the following:
At time j:
• Invest B(j,t) in a risk-free bond
• Borrow (1+r) B(j,t+1)
At time t:
The bond matures and is worth $1.
• Invest the $1 in the stock
At time t+1:

Travail de Fin d’Etudes: Stock borrowing costs in the Emerging Markets, with pricing implications for associated Equity Total Return Swaps BOK Kenneth, Aurel Leven Securities
The stock is worth ( + ) ( )
• Pay off bonds in the amount 1 + R.
The total cash flow will be ( + ) ( ) − ( + )
This amount is equivalent to the second swap payment.
The other swap payments can be replicated in a similar manner. Stock is purchased at time j, and
funds are invested in the risk-free asset to mature to a value of $1 one period prior to the date of
the cash flow we are replicating. Then that $1 is invested in stock. Also, at time j funds are
borrowed to be paid back in the amount of 1 + R at the time of the swap payment.
The total value of these transactions at j is ( ) ( )− ( + ) ( , ) + [ ( , )− ( + ) ( , + )] + ( , + )− ( + ) ( , + ) + ⋯+ ( , + − )− ( + ) ( , + )
= ( ) ( )− ( , )− ( , ) + ( , )− ( , + )− ( , + ) + ( , + )− ( , + )− ( , + ) + ⋯+ ( , + − )− ( , + )− ( , + )
This result can be simplified and gives the market value of the swap at time j:
( ; ; + ) = ( ) ( )− ( , + )− ( , + ) =
In this example, the swap was created at time 0 and the upcoming payment is the first one. This
formula is sufficiently general, however, that it is not necessary that the upcoming payment be the
first. In other words, we can, without loss of generality, let time 0 simply be the last date on which

Travail de Fin d’Etudes: Stock borrowing costs in the Emerging Markets, with pricing implications for associated Equity Total Return Swaps BOK Kenneth, Aurel Leven Securities
a payment was made or the swap initiation date, whichever is more recent, and n+1 be the
number of upcoming payments.
Now that we have the market value of the swap, we can easily price the swap. As noted above, we
let j = 0. Noting that we now have S(0)/S(0) = 1 for the first term, we set the market value to zero:
+ ( , + ) − ( , + ) =
Solving for R, we obtain
= − ( , + )∑ ( , + )
This simple formula is familiar to users of interest rate swaps. It is, in fact, the same formula as
that of the fixed rate on a plain vanilla interest rate swap. Surprisingly, the level of the stock is
irrelevant in pricing the pay-fixed equity swap.
Now consider the swap to pay a floating rate and receive the equity return. As mentioned earlier,
we observe that this swap can be replicated as follows:
Pay floating, receive equity ≡ (a) a swap to pay fixed, receive equity, plus
(b) a swap to pay floating, receive fixed
We know the value of swap (a) from the swap we did in the previous section. Note that swap (b) is
a plain vanilla interest rate swap, the value of which is well-known to be
( , + ) + ( , + )− + ( , ) ( , )
where r(0,t) is the one-period floating rate that was observed at time 0 and determines the next
payment. Adding the values of swaps (a) and (b), we obtain
( ) ( )− ( , + ) − ( , + ) + ( , + ) + ( , + )− + ( , ) ( , )

Travail de Fin d’Etudes: Stock borrowing costs in the Emerging Markets, with pricing implications for associated Equity Total Return Swaps BOK Kenneth, Aurel Leven Securities
Thus, the value of the pay floating, receive-equity swap is
( ; ; + ) = ( ) ( )− + ( , ) ( , )
As noted, there is no pricing of this swap, because it has no fixed rate. We need to verify, however,
that this value is zero at time j = 0. Otherwise, an investor could earn an arbitrage profit. Setting j
to 0 in the above equation, we obtain
( ; , + ) = ( ) ( )− + ( , ) ( , ) = − + ( , ) ( , )
By definition, B(0,t) = 1/(1 + r(0,t). Hence, the value of the swap is zero at the start.
Since the dealer would not be quoting a fixed rate, it would typically incorporate the bid-ask
spread into its floating rate. Alternatively, it could build the spread into the equity payment.
An alternative hedging strategy would entail engaging in the replicating strategy that was used to
price the swap, taking the opposite positions to the ones described here.
Hedging the position would require the holding of 1/S(0) units of the stock or index if paying the
equity return. Hedging the interest component of the model would require the use of a term
structure model, as noted above in the previous section. The floating rate component, however,
has relatively low sensitivity to changes in interest rates.

Travail de Fin d’Etudes: Stock borrowing costs in the Emerging Markets, with pricing implications for associated Equity Total Return Swaps BOK Kenneth, Aurel Leven Securities
4 Pricing – Determination of implied borrowing costs 4.1 The Futures-Spot relationship
This section will detail the theory with which we will try to extract an implied borrowing cost from
the futures and spot prices of the S&P Nifty 50 Index. The Nifty is the leading index for large
companies on the National Stock Exchange of Index, and is a well-diversified stock index including
50 large caps and accounting for 21 sectors of the economy. The constituents of the index and
corresponding weightings are detailed in the Appendix. This index was selected because of the
following reasons:
1. Amongst all the products traded on the Aurel Leven Emerging Markets Derivatives desk, it
is one of the most traded products. As such, it enables us to fit the predicted data with
actual trade data better as there are more data points.
2. The Nifty Index, while being an emerging market index, has sufficient liquidity in both the
spot and futures markets for our purposes.
From the cost-of-carry model with rational pricing assumptions, it is known that there exists a
relationship = ( )
Where F is the forward / futures price, S the spot price, T the time to maturity of the future in
years, r the continuously compounded rate to T, q the dividend yield on the stock to T, and x the
borrowing cost
For a case with discrete dividends, the formula is = ( − ) ( )
Where D is the present value of the known dividends between now and T.
This can be re-arranged to give

Travail de Fin d’Etudes: Stock borrowing costs in the Emerging Markets, with pricing implications for associated Equity Total Return Swaps BOK Kenneth, Aurel Leven Securities = − − It must be noted that these formulas are derived assuming arbitrage-free, perfect or near-perfect
market conditions. Also, in most textbooks, one will not find the term x, or the borrowing cost.
This is because in most developed markets, the cost of borrowing a liquidly traded stock is low and
is often of the same order of magnitude of commissions or the bid/ask spread. Thus, it is often the
case whereby the cost of borrowing is added into the transaction costs, which are often neglected
with perfect market assumptions. However, we cannot make this assumption in the emerging
markets, where the cost of borrowing can be around the order of several hundred basis points.
In our analysis, however, we shall use the following formula, which does not use continuous
compounding:
= / = ( − )( + ) /
Where
• is the ‘fair’ price of the futures contract, after removing any dividend premium and
accounting for interest until expiration.
• is the periodic risk-free rate
Since S, F and T are given values, the key determinants to finding the implied borrow are D and r.
While the formula may be simple, arriving at a value for the dividends and risk-free rate is a task
that involves a number of assumptions to be made. We shall examine how the data for these two
components was extracted in greater detail, in the following sections.
In choosing a futures price to match the spot price, we have a number of choices to make as there
will be anything ranging from 1-3 futures contracts to choose from at any moment in time. Ideally,
we would compare the spot prices with all futures contracts, however such a process is laborious
and the recomposition and representation of such data which also involve more assumptions
being made. The guiding principle in choosing the futures price is liquidity. In observation of the
pricing and volume data, we have found that liquidity gradually builds in the first 3-4 weeks of the

Travail de Fin d’Etudes: Stock borrowing costs in the Emerging Markets, with pricing implications for associated Equity Total Return Swaps BOK Kenneth, Aurel Leven Securities
contract being traded, is at a maximum during the month before the expiry, and goes down again
during the last month of expiry. Close to the end of the futures contract, nearly all liquidity would
have ‘rolled over’ to the next month. Thus, we have opted to use futures contracts which expire
one to two months before the expiry date. For example, for the spot prices in the month of
December, we will use the January futures contract (which expires end January). This rule is simple
and clear-cut, and allows us to select close to the most liquidly traded futures contract without
laborious comparison of volume data between contracts.
Also, in matching the futures price with the spot price, it must be noted that when using the field
LAST_PRICE to download daily historical data, there is a 30 minute disparity between the futures
price and the spot. This is because trading for the futures closes at 1530hrs (Indian Time), whereas
the National Stock Exchange (NSE), where the NIFTY is based, stops trading at 1600hrs. Thus, intra-
day historical data must be used, in order to match prices to the minute.
Intraday information is only available for the last 50 days from Bloomberg. As a result of this, the
date range available for backtesting is limited, starting from mid November 2007 to the time of
writing (May 2008).
4.2 Dividends
In the usage of dividend data, we must make a clear distinction between expected dividends and
historical dividends. For our purposes, it is necessary to subtract all expected dividends from the
present day until the time of expiry from the spot price, in order to obtain the fair value of the
futures price. However, since it is obviously impossible to predict the dividend payouts of
companies with 100% certainty, all information being priced into the current price is the best
guess of all market participants, based on all publicly available information. This is true for all
historical futures prices as well.
Thus, the question is – how does one determine this value? In the absence of expensive dividend
forecast reports, we turn to analyst predictions from investment banks, available on Bloomberg.
However, this information only exists for current data, not historical data. The following
screenshot shows current dividend estimates available on Bloomberg. In this case, the index is the
BSE SENSEX 30.

Travail de Fin d’Etudes: Stock borrowing costs in the Emerging Markets, with pricing implications for associated Equity Total Return Swaps BOK Kenneth, Aurel Leven Securities
Figure 3: FVD Screen on Bloomberg, for the BSE SENSEX 30
While obtaining current borrowing costs is certainly a worthwhile exercise – the short period
available for this study does not allow for a study of the progression of predicted borrowing costs.
We have opted to solve this by using historical dividend data in the back-testing of data. The
reasons for this are two-fold: firstly, it is readily available on Bloomberg; and secondly, it is a close-
enough approximation for the expected dividends, as we are analyzing large-cap companies with
arguably consistent and regular dividend payout schedules.
Obtaining a dividend payout for an index is an exercise that involves some understanding of the
composition of the index. This information can be found in the Appendix. For our purposes, we
shall use the formula
= ∙ ∙

Travail de Fin d’Etudes: Stock borrowing costs in the Emerging Markets, with pricing implications for associated Equity Total Return Swaps BOK Kenneth, Aurel Leven Securities
With all of the variables on the right-side of the equation being available on Bloomberg, we can
recompose the dividends on the index as a whole, historically.
4.2.1 Procedure in processing dividend data
The procedure in processing the data was as follows:
• Using the function MEMB on the NIFTY INDEX on Bloomberg, we ascertained the current
members of the index
• All changes to the index (eg. Additions and removals from the index) since 2006 were
tracked
• Having obtained a list of all members ever being included in the NIFTY since 2006, all
historical dividend information for each of the members was downloaded
• Each dividend action was sorted chronologically, according to its ex-dividend date and
matched with historical weighting data
• Dividend payout in index points, for each stock was calculated after obtaining the stock
price and index level, at that point in time
• All dividend payouts by different companies were added together if they occurred on the
same day
• In order to obtain the fair value of the futures, all the dividends (taken at present values)
until the expiration date were added up
4.3 Interest rates
In determining what risk-free rate to use in our calculations, there are a number of variables to be
considered:
Time frame The duration of the interest rate used should match the time to expiry. Interpolation
based on rates of different time periods should be minimized.
Currency As far as possible, the currency in which the futures and spot prices are based in should
be the same as the debt instruments used. In the case of the NIFTY, the Indian Rupee. It would be
possible to benchmark rates in foreign-currencies (eg. LIBOR), with consideration of exchange
Travail de Fin d’Etudes: Stock borrowing costs in the Emerging Markets, with pricing implications for associated Equity Total Return Swaps BOK Kenneth, Aurel Leven Securities
rates and interest rate differentials (ie. Interest rate parity), however, that is beyond the scope of
this study.
Liquidity The interest rate products used should be liquid enough in order to avoid any large
swings due to speculation, and also such that a complete time series of interest rates can be
constructed.
For our purposes, the duration ranges from 0 to a maximum of 3 months, as futures contracts on
the NIFTY are not traded more than 3 months before. For example, the December contract,
expiring at the end of December, would begin to trade beginning of October, at the very earliest.
It must be noted that the Indian money market is much less liquid than the LIBOR or EURIBOR
rates, and there are much fewer government issued money market instruments – especially with
durations of less than a year. In our study, we have opted to use the 3 month government bond
yield. (Bloomberg ticker: IYTB3M Index)
4.4 Aurel Leven trade data
The Aurel Leven (AL) trade data for TRSs on the MSCI Daily Total Return Emerging Markets India
USD (Bloomberg Ticker: NDEUSIA Index) contract was used in order to compare the implied
borrowing costs with actual market data. The NDEUSIA contract is similar to the NIFTY, and has a
close to 100% correlation with little tracking error. In the treatment of the AL data, bid and ask
interest levels were also used, in addition to actual trades. This was done for three reasons: firstly,
if only actual traded data was taken, there would only be 27 data points for the time period.
Secondly, the mid price of the bid-ask spread was found to be in-line with traded data. Thirdly, it
would be beneficial to observe the progression of the bid-ask spread through history.

Travail de Fin d’Etudes: Stock borrowing costs in the Emerging Markets, with pricing implications for associated Equity Total Return Swaps BOK Kenneth, Aurel Leven Securities
5 Results 5.1 Implied borrowing costs from the cost of carry model
Figure 4 shows the basis between the futures and spot levels of the NIFTY, based on intraday data
of 5 minute intervals starting 15/11/2007 and ending 30/5/2008. For this period, the average basis
was -6.14, with a standard deviation of 20.8 index points. In perspective, the closing price of the
NIFTY Index on the 30/5/2008 was 4867, which translates to the average basis being in the order
of 0.1%. Discounting the anomalous spike at the end of January, we observe that the basis
frequently reaches values as high as 75 index points. This would put the maximal disparity
between futures and spot prices at 1.5%.
Figure 4: NIFTY Basis (Futures – Spot), Nov 2007 to May 2008

Travail de Fin d’Etudes: Stock borrowing costs in the Emerging Markets, with pricing implications for associated Equity Total Return Swaps BOK Kenneth, Aurel Leven Securities
Figure 5 shows the results of the implied borrowing cost, based on the same dataset as Figure 4.
The average was 7.51%, with a standard deviation of 4.64%. At first glance, the result appears
anomalous, for the following reasons:
1. The implied borrow is extremely volatile, having a volatility of 4.64% with a 5 minute time
scale.
2. The borrow reaches highly improbable levels, of a maximum of 43% at one point in late
January.
3. The borrow sometimes goes into the negative, which would imply that stock lenders
would actually have to pay to lend stock out.
Figure 5: Implied Borrow of the S&P NIFTY 50, Nov 2007 – May 2008
In seeking to explain why there is such a large amount of volatility in the implied borrow, we
examine the 2 other variables that are assumed to be priced into the basis – the dividends and the
risk free rate. Correspondingly, taking the model we have used, if there was an increase in the
basis, it could be explained by 3 possibilities:

Travail de Fin d’Etudes: Stock borrowing costs in the Emerging Markets, with pricing implications for associated Equity Total Return Swaps BOK Kenneth, Aurel Leven Securities
1. There is a increase in the expected dividend payouts
2. There is a decrease in the interest rate
3. There is a decrease in the borrowing cost
Examining Figures 10 and 11 (Appendix B), which detail the 3 month Indian interest rate and
dividend payouts respectively, we do not observe any large variations in levels during the 7 month
period – at least to the extent whereby it would be significant toward the large gyrations observed
in the borrowing rate.
‘Noise’ in the market is short term fluctuation in the market that is phenomena not reflective of
general sentiment, can be attributed to program trading, dividend rolls and other short-term
speculative strategies. With such high volatility levels, we can assume that there is a substantial
element of noise in our 5 minute dataset. In order to remove this, we have opted to use a 2-day
moving average. The results of this are shown in Figure 7, on page 37.

Travail de Fin d’Etudes: Stock borrowing costs in the Emerging Markets, with pricing implications for associated Equity Total Return Swaps BOK Kenneth, Aurel Leven Securities
5.2 Aurel Leven trade data
The Aurel Leven data set is shown below, in Figure 6. Note that the bid / ask spread for TRSs are
quoted in a convention such as L-400 / L -350, where L represents the LIBOR rate. In our treatment
of the data, we have taken just the numerical information, ie. 400 and 350. This is why the bid rate
will appear to be higher than the ask rate.
The trade data is fairly consistent, with the mid price having an average of 419 bps (basis points)
and a standard deviation of 101.5 bps. The average bid / ask spread was 44.6 bps.
In particular, we are interested to see if the implied borrow rate has any predictive ability on the
actual traded rate. In mid February, the price of the TRS dipped significantly from around 400bps
to around 200bps. If this change is reflected in the model, there could be potential in using the
implied borrowing cost as a pricing tool for TRS.
Figure 6: Aurel Leven NIFTY TRS trade data, Jun 2007 – May 2008
0
100
200
300
400
500
600
700
800
4-Jun
24-Jul
12-Sep
1-Nov
21-Dec
9-Feb
30-Mar
19-May
Bas
is P
oint
s
Aurel Leven NIFTY TRS trade dataJun 2007 to May 2008
Bid
Ask

Travail de Fin d’Etudes: Stock borrowing costs in the Emerging Markets, with pricing implications for associated Equity Total Return Swaps BOK Kenneth, Aurel Leven Securities
5.3 Comparison between implied borrow and TRS pricing data
Figure 7: Borrow Cost / TRS price of the S&P NIFTY 50, Nov 2007 – May 2008
Figure 7 represents the comparison of the two data sets, the implied borrowing cost having being
treated with a 2-day moving average. The implied borrow is significantly more volatile and ranges
from 0.5% to 18%. The results for a test for linear correlation are shown in Figure 8. The R2
characteristic is 0.339, implying that a significant correlation between the two data sets is
improbable. While there appears to be some correspondence in the movements seen in early
January and late April, it is not statistically significant enough to make any conclusions.
The anomalous levels observed from February to March suggest that the model is inadequate in
describing fair values of borrowing costs. It is highly unlikely that the borrow for the index would
be at levels above 10%, for a period of a month. While borrowing costs for stocks have been
observed to have reached levels as high as 50% (D’Avolio, 2002), this happens rarely and does not
occur for extended periods of time. Furthermore, this occurs with single-stocks, and not indices.
0.00%
2.00%
4.00%
6.00%
8.00%
10.00%
12.00%
14.00%
16.00%
18.00%
20.00%
24-Dec
13-Jan
2-Feb
22-Feb
13-Mar
2-Apr
22-Apr
12-May
1-Jun
21-JunBorrow Cost / TRS price of the S&P NIFTY50
Nov 2007 - May 2008
AL trade data
Implied Borrow

Travail de Fin d’Etudes: Stock borrowing costs in the Emerging Markets, with pricing implications for associated Equity Total Return Swaps BOK Kenneth, Aurel Leven Securities
Figure 8: Correlation between trade data and implied borrow
y = 2.373x - 0.009R² = 0.339
0.00%
2.00%
4.00%
6.00%
8.00%
10.00%
12.00%
14.00%
16.00%
18.00%
20.00%
0.00% 1.00% 2.00% 3.00% 4.00% 5.00% 6.00%
Impl
ied
BC
Trade data
Correlation between trade data and implied borrow

Travail de Fin d’Etudes: Stock borrowing costs in the Emerging Markets, with pricing implications for associated Equity Total Return Swaps BOK Kenneth, Aurel Leven Securities
6 Conclusion In conclusion, we have found that there is no strong correlation between the actual TRS prices and the implied borrowing costs. The implied borrowing costs fluctuate widely and attain levels which are out of line of TRS prices. However, it must be noted that there are numerous limitations in the carrying out of this study – such as
• Limited historical data available for back testing (50 days)
• Unavailability of forecasted dividend data
• Lack of time to perform studies on other emerging markets
The extreme volatility observed in the implied borrowing cost can be attributed to the 5 minute intraday data being used. In subsequent studies, perhaps improvements could be seen by taking a volume-weighted average price for each day. This could possibly filter out noise better than taking a moving average, as we have done in this study.
This being said, the mostly positive values observed in the implied borrowing costs is a partial validation that borrowing costs are a factor in the basis. A similar study, carried out on indices in the developed world, such as the UK and the US, would be illuminating to see if borrowing costs for these markets are really indeed negligible.
The model used could be further worked upon and adjusted to account for other costs, such as execution and other transaction fees. The model used in this study, was simple and assumed that the basis included the three components. While we have assumed that other costs are negligible, a more in-depth study into the transaction process (hedging, commissions, illiquidity costs) would help to confirm this hypothesis.
Also, a method could be devised to incorporate all futures data, ie. even for multiple contracts trading on the same day. The implied borrowing cost obtained from analyzing each contract could be compared, and would be useful in determining if implied borrowing costs are similar.
The usage of dividend data could be improved in two ways: firstly, by keeping a record of expected dividend data (since Bloomberg does not keep a history of this); and secondly, by utilizing other sources such as estimates and research data from investment banks and other specialist research services. Evidently, the latter would be a costly solution, and with uncertain payoffs.
In closing, the author would like to thank Carl Kenigsberg, Martin Kavaliauskas and Ludovic Marinho, without whom this project would not have been possible.

Travail de Fin d’Etudes: Stock borrowing costs in the Emerging Markets, with pricing implications for associated Equity Total Return Swaps BOK Kenneth, Aurel Leven Securities
7 References Papers
Chance, D.M., and D. Rich. "The Pricing of Equity Swaps and Swaption." Journal of Derivatives, Summer 1998, pp. 19-31. Marshall, J.E., E. Sorensen, and A. Tucker. "Equity Derivatives: The Plain Vanilla Equity Swap and its Variants." Journal of Financial Engineering, 1992, pp. 219-241. Kijima, Masaaki, and Yukio Muromachi. “Pricing Equity Swaps in a Stochastic Interest Rate Economy.” The Journal of Derivatives, 8 (Summer, 2001), pp. 19-35. Laatsch, Francis E. “Tax Clienteles, Arbitrage, and the Pricing of Total Return Equity Swaps.” The Journal of Derivatives, 8 (Winter, 2000), pp. 37-46. Rich, Don. “A Note on the Valuation and Hedging of Equity Swaps.” Journal of Financial Engineering, 4 (1995), pp. 323-334. Liao, M., & Wang, M., (2003), Pricing Models of Equity Swaps, The Journal of Futures Markets, 23, 8, 751-772 D’Avolio, Gene. Harvard University, Graduate School of Business Administration (2002) The Market for Borrowing Stock http://papers.ssrn.com/sol3/papers.cfm?abstract_id=305479 Wu, Ting-Pin and Chen, Son Nan. Equity Swaps in a LIBOR Market Model. The Journal of Futures Markets, Vol 27, No. 9, 893-920 (2007)
Web references
Faulkner, Mark. Spitalfields Advisors. (2004) An Introduction to Securities Lending. http://www.isla.co.uk/sl_intro.asp Cacho, Alfredo Bachiller. Departamento de Contabilidad y Finanzas, Universidad de Zaragoza. (2008) Total Return Swap http://ciberconta.unizar.es/bolsa/total.htm Financial-edu (2007). Total Return Swap (TRS) http://www.financial-edu.com/total-return-swap-trs.php British Bankers’ Association (2002). Stock lending - Frequently asked questions http://www.bba.org.uk/bba/jsp/polopoly.jsp?d=130&a=1476

Travail de Fin d’Etudes: Stock borrowing costs in the Emerging Markets, with pricing implications for associated Equity Total Return Swaps BOK Kenneth, Aurel Leven Securities Wikipedia (2008). Securities lending http://en.wikipedia.org/wiki/Securities_lending Answers.com (2008) Banking Dictionary: Absolute Title http://www.answers.com/topic/absolute-title?cat=biz-fin International Securities Lending Association (ISLA). (2008) Securities Lending Fundamentals. http://www.isla.co.uk/sl_fundamentals.asp eSecLending. (2008) About Securities Lending http://www.eseclending.com/about_securities/lending101.php Bank for International Settlements. (July 1999). CPSS Publications No 32. Securities lending transactions: market development and implications http://www.bis.org/publ/cpss32.pdf?noframes=1 FinancialCad Corporation. (2008) Total Return Equity Swaps and Equity Forwards http://www.fincad.com/support/developerfunc/mathref/equity_trs.htm Alston Bird LLP. October 15 (2007) IRS Scrutinizes Derivatives Used by Hedge Funds. http://www.alston.com/files/Publication/8c7a4581-32fe-428b-bf9a-ca329144af0c/Presentation/PublicationAttachment/cc6a27ea-c478-4bb9-aca3-397ae3542f9b/Int%20Tax%20Adv%2010-07.pdf LearnMoney.co.uk. (2008) CFD commissions and margin – How they work. http://www.learnmoney.co.uk/cfd/examples-2.html Sheth, Jay. School of Management, Cranfield University. (2007) Index Arbitrage with NIFTY futures and options. https://dspace.lib.cranfield.ac.uk/bitstream/1826/2104/1/th.pdf Varma, Jayanth R., (2007) Indian Money Market: Market Structure, Covered Parity and Term Structure Indian Institute of Management, Ahmedabad http://www.iimahd.ernet.in/~jrvarma/papers/ijaf3-2.pdf
Texts
John C. Hull. Options, Futures, and Other Derivatives. (2006) Prentice Hall, Upper Saddle River, N J, Sixth edition.

Travail de Fin d’Etudes: Stock borrowing costs in the Emerging Markets, with pricing implications for associated Equity Total Return Swaps BOK Kenneth, Aurel Leven Securities
8 Glossary of terms Cash-driven securities lending transactions: transactions motivated by the wish to borrow/invest a cash amount through a repo (or loan) of securities. Clearing house: a department of an exchange or a separate legal entity that provides a range of services related to the clearance and settlement of trades and the management of risks associated with the resulting contracts. A clearing house is often central counterparty to all trades to be settled through the clearing house, that is, the buyer to every seller and the seller to every buyer. Contract for difference (CFD): a financial contract in which the difference between the agreed fixed price of an asset and its prevailing market price is periodically credited to the counterparty in the money. Since there is no transfer of principal, a CFD covers hedging or speculative needs. Custodian: an entity, often a bank, that safekeeps and administers securities for its customers and that may provide various other services, including clearance and settlement, cash management, foreign exchange and securities lending. Derivative: a financial contract the value of which depends on the value of one or more underlying reference assets, rates or indices. Equity swap: a swap which involves an exchange of return on a recognised stock index or a specified basket of individual stocks for a fixed or floating rate of interest. Hedge fund: a private investment fund, often leveraged, and often engaging in active trading strategies (including arbitrage). Hedge funds are typically subject to limited regulatory oversight. Manufactured payment: an equivalent payment made by the borrower of securities to the lender in lieu of actual dividends or other income earned on the securities (net of any applicable taxes), which the lender would have received if it had not lent the securities. Onlend: To lend funds that have been borrowed from one party to a third party, often within a short space of time. Over-the-counter (OTC): a method of trading that does not involve an exchange. In the over-the-counter markets, participants trade directly, sometimes through brokers, with each other, typically by telephone or computer links. Prime brokerage: the provision by firms (e.g. large securities houses) of credit, clearing, securities lending and other services to clients (typically hedge funds). Principal: a party to a transaction that acts on its own behalf. In acting as a principal, a firm is buying/selling (or lending/borrowing) from its own account for position and risk, expecting to make a profit. A lender institution offering customers’ securities on an undisclosed basis may also be considered to be acting as principal.
Travail de Fin d’Etudes: Stock borrowing costs in the Emerging Markets, with pricing implications for associated Equity Total Return Swaps BOK Kenneth, Aurel Leven Securities Proprietary (trading): trading in securities or derivatives for the account of a firm itself, rather than on behalf of clients. Quanto Swap: a type of equity swap in which the return on a nondomestic index is translated into the domestic currency Repurchase agreement (repo): a contract with a counterparty to sell and subsequently repurchase securities at a specified date and price. Reverse repurchase agreement (reverse repo): a contract with a counterparty to buy and subsequently resell securities at a specified date and price, the mirror image of a repo. Securities-driven securities lending transactions: transactions whose motivation lies in borrowing/lending specific securities via a repo or securities loan. See cash-driven securities lending transactions (repos). Sell-buybacks (or buy-sellbacks): transactions that have the same economic effect and intent as a repurchase agreement and which consist of two distinct simultaneous purchase and sale transactions for different value dates – one for immediate settlement and the other for forward settlement. Typically sell-buybacks do not allow for marking to market and margin calls. Short sale (or short position): a sale of securities which the seller does not own and thus must be covered by the time of delivery; a technique used (1) to take advantage of an anticipated decline in the price or (2) to protect a profit in a long position. Total return swap: an OTC swap with a fixed maturity, in which a dealer agrees to receive the total return on the shares of stock sold to the cash investor, counterparty of the swap, and in exchange to pay a floating rate of interest for the maturity to the counterparty. Payment to the cash investor at the termination of the swap is therefore the floating rate of interest plus any fall in the share price or minus any rise in the share price; on the other hand the cash investor sells the shares to get back his investment in the market. The end result of this arrangement is that the dealer borrowed cash at the floating rate for a set period of time, using his equity position as collateral. The total return swap is combined with an outright sale of stock in this way where the dealer is looking to finance an equity position and functions economically similarly to securities lending.

Travail de Fin d’Etudes: Stock borrowing costs in the Emerging Markets, with pricing implications for associated Equity Total Return Swaps BOK Kenneth, Aurel Leven Securities
9 Appendix A: Calculation of dividends on an index In general, for an index level
= ∑
Where I is the index level, k is the number of components of the index, n the number of shares of
a particular company in the index, p the price of the share, and the divisor – which is a number
used in the denominator of the ratio between the total value of an index and the index divisor,
allowing for comparability over time and adjusted for corporate actions.
The weight of a particular stock is given by
= ∑
Thus, the number of shares in an index is given by
= ∑ ∙ = ∙ ∙
If nominal dividends are considered,
= ∙ = ∙ ∙
Where is the dividend payout in index points and the nominal dividend payout.

Travail de Fin d’Etudes: Stock borrowing costs in the Emerging Markets, with pricing implications for associated Equity Total Return Swaps BOK Kenneth, Aurel Leven Securities
10 Appendix B: Additional Charts Note: Raw data for the charts below will not be reproduced here due to bulk. Please request from [email protected] if you wish to see the data in its entirety.
Figure 8: Bid-Ask Spread for Aurel Leven Trade data
Figure 9: 3 Month Indian Rate
-50
0
50
100
150
200
250
300
350
4-Jun
24-Jul
12-Sep
1-Nov
21-Dec
9-Feb
30-Mar
19-May
Bas
is P
oint
s
Bid - Ask Spread for AL Trade dataJun 2007 to May 2008
6.8
6.9
7
7.1
7.2
7.3
7.4
7.5
7.6
7.711/14/2007
1/3/2008
2/22/2008
4/12/2008
6/1/2008%
yie
ld, a
nnua
l
3 Month Indian Rate

Travail de Fin d’Etudes: Stock borrowing costs in the Emerging Markets, with pricing implications for associated Equity Total Return Swaps BOK Kenneth, Aurel Leven Securities
Figure 10: Dividend payouts on the NIFTY
Figure 11: Futures differential from spot levels
Copyright © 2022 FDOKUMEN