
Bank lending networks, experience, reputation, and borrowing costs
38
Université de Strasbourg Pôle Européen de Gestion et d’Economie 61 avenue de la Forêt Noire 67085 Strasbourg Cedex http://ifs.u-strasbg.fr/large Laboratoire de Recherche en Gestion & Economie Working Paper Working Paper 2010-07 Bank lending networks, experience, reputation, and borrowing costs Christophe J. Godlewski, Bulat Sanditov, Thierry Burger-Helmchen June 2010
Transcript of Bank lending networks, experience, reputation, and borrowing costs

Université de Strasbourg Pôle Européen de Gestion et d’Economie
61 avenue de la Forêt Noire 67085 Strasbourg Cedex
http://ifs.u-strasbg.fr/large
Laboratoire de Recherche
en Gestion & Economie
Working Paper
Working Paper
2010-07
Bank lending networks, experience, reputation,
and borrowing costs
Christophe J. Godlewski, Bulat Sanditov, Thierry Burger-Helmchen
June 2010

1
Bank lending networks, experience, reputation,
and borrowing costs
June 2010
Christophe J. Godlewski*♦
* University of Strasbourg – LaRGE Research Center & EM Strasbourg Business School
, Bulat Sanditov**, Thierry Burger-Helmchen***
** University of Maastricht, Faculty of Economics and Business Administration& University of
Strasbourg – BETA Research Center
*** University of Strasbourg – BETA Research Center & EM Strasbourg Business School
Abstract
We investigate the network structure of syndicated lending markets and evaluate the impact of
lenders’ network centrality, considered as measures of their experience and reputation, on
borrowing costs. We show that the market for syndicated loans is a “small world” characterized by
large local density and short social distances between lenders. Such a network structure allows for
better information and resources flows between banks thus enhancing their social capital. We then
show that lenders’ experience and reputation play a significant role in reducing loan spreads and
thus increasing borrower’s wealth.
Key words: agency costs, bank syndicate, experience, loan syndication, reputation, small world, social
network analysis.
JEL Classification: G21, G24, L14.
♦ Corresponding author. PEGE, 61 avenue de la Forêt Noire, 67 085 Strasbourg, France. Tel.: +33(0)368852121. E-mail: [email protected].

2
1. Introduction A syndicated loan is granted by a pool of banks that provide funding to a borrower under a single
agreement and lies at the crossroads of relationship and transaction lending (Dennis and Mullineaux
2000). In 2009, more than 1.5 trillion USD of debt has been raised on the worldwide syndicated
lending market, representing one third of external financing for companies (Thomson Financial
2009). The benefits of loan syndication both for lenders (portfolio risk and sources of revenues
diversification) and borrowers (mostly lower costs as compared to bond issues or a series of bilateral
loans) largely explain the success of syndicated lending. However, syndicated loans have their
drawbacks because the organization of a syndicate of banks may expose its members to the adverse
consequences of informational frictions and potential agency costs.
Important features of syndicates that gain in recent academic interest for their potential
mitigation effect of agency costs are lenders’ experience and reputation. Indeed, as the arrangers are
responsible for due diligence, allocation of the loan to other syndicate members, and ex post
monitoring, banks in the syndicate will often rely on the leaders’ reputation in making lending
decisions (Ross 2010). Hence, reputable and experienced leaders can enhance monitoring and the
ability to attract participants, help show the quality of the borrower and the deal, and reduce agency
costs (Gatti et al. 2008; Panyagometh and Roberts 2010).
Lender’s experience and reputation are closely related to trust and reciprocity which
represent critical forms of social capital (Song 2009), in particular for teams (Carpenter et al. 2009).
Social capital can be considered as the foundation of every economic transaction because it enables
exchange given that contracts are incomplete and allows transaction costs to be reduced (Arrow
1974). Social networks are considered as fundamental drivers of social capital (Di Cagno and Sciubba
2010) and syndicated lending market bears several social network features because it serves as an
information network which allows the acquisition of private information on borrowers’ quality and as
a capital network which allows the raising of the necessary funding of loans (Baum, Shipilov, and
Rowley 2003; Baum, Rowley, and Shipilov 2004; Morrison and Wilhelm 2007). Moreover, recent
empirical evidence by Champagne and Kryzanowski (2007), Cai (2010), and Cai, Saunders, and Steffen
(2010) show that collaboration and reciprocity are important features of bank loan syndication as
reciprocal arrangements among syndicate arrangers appear to be a very common practice leading to
choose banks having similar lending expertise.
In this article, we provide an in depth empirical investigation of the role of syndicate lenders’
experience and reputation for loan syndication using social network analysis. We first analyze the
small world properties of the syndicated lending market. A small world is a locally dense social
network where social distances between actors are short. Such a network improves market efficiency

3
as it allows larger information and resource flows. It can also develop reciprocity and trust between
lenders and thus enhance the formation of social capital, ultimately increasing lenders’ experience
and reputation. Hence, syndicated lending small world may provide benefits in terms of resource
procurement and the reduction of information asymmetry. This in turn can mitigate agency costs and
lower borrowing costs. Thus, we evaluate the sensitivity of loan pricing to lenders’ experience and
reputation, proxied by network centrality measures of banks.
We contribute to the developing literature dealing with small world features of financial
intermediation (Allen and Babus 2008), by providing an empirical description of the organization of
the syndicated lending market. Such a “big picture” gives a better insight into the complex
characteristics and dynamics of the interactions between lenders. We also contribute to the
literature investigating the role of banks’ experience and reputation in financial transaction
processing (Ross 2010), with a particular focus on their role in mitigating informational and agency
costs stemming from the particular features of bank loan syndication. We thus provide additional
empirical evidence on the impact of syndicate experience and reputation on borrowing costs and
thus on borrower wealth.
The rest of the article is organized as follows. We describe the loan syndication process and
its potential agency problems and survey relevant literature on social network analysis of financial
intermediation in section 2. Section 3 is devoted to the description of data and of the social network
analysis methodology. Results are displayed and discussed in section 4. Finally, section 5 concludes
the article.
2. Syndicated lending and social networks This section is devoted to the description of the loan syndication process, the related agency costs
and the role of lenders’ experience and reputation on the syndicated lending market. Then, we
provide a survey of the recent literature on social networks analysis applied to financial
intermediation.
2.1 Syndicated lending and agency costs
The transaction process of bank loan syndication can be divided into three main stages1
1 See Esty (2001) for a detailed presentation of the bank loan syndication process.
. During the
pre-mandated stage, after soliciting competitive offers to arrange the syndication from one or more
banks (usually the main relationship banks), the borrower chooses one or more arrangers that are
mandated to form a syndicate and negotiates a preliminary loan agreement. The syndication can
either involve a sole mandate or a joint one, the latter implying the participation of more than one

4
lead bank. Such syndications are usually chosen by the borrower in order to maximize the chances of
achieving the desired loan syndication. The arranger is responsible for negotiating the key loan terms
with the borrower, appointing the participants and structuring the syndicate.
During the post-mandated stage, the arranger prepares a documentation package - called an
information memorandum - for potential syndicate members, containing information about the
borrower's creditworthiness and the loan terms. The arranger largely determines the initial set of
potential participants to target, and factors such as previous experience with the borrower and/or
the arranger, in the industry sector or the geographic area, are strong drivers for being chosen by the
arranger to join the syndicate. The presentation and discussion of the content of the information
memorandum, as well as the announcement of closing fees and the establishment of a timetable for
commitments and closing are done during a road show. Then, the arranger sends formal invitations
to potential participants and determines the allocation for each participant.
Finally, the operational post-signing stage takes place after the completion date when the
deal becomes active and the loan is operational, binding the borrower and the syndicate members
by the debt contract.
The syndicated loan transaction process is heavily dependent upon the arrangers because of
their pivotal role in structuring the deal, negotiating the terms of the loan agreement, and organizing
the syndicate. However, the success of the syndication process is a function of negotiations and
information flows between all the parties involved in the transaction: borrower, arrangers, and other
syndicate members. Therefore, the fact that loan syndication involves several actors and is a complex
process involves specific agency costs which can increase borrowing costs and thus are harmful for
borrower’s wealth.
First, private information about the borrower can create adverse selection problems, as the
arranger may be inclined to syndicate loans for unreliable borrowers. However, such an opportunistic
behavior can damage the arranger’s reputation, having a negative impact on the success of future
syndications (Pichler and Wilhelm 2001). Hence, this “threat of reputation loss” can serve as a
disciplining device of the arranger’s behavior. Second, participating banks may delegate monitoring
to the arranger, but the banks are not in the loop as to what the arranger is doing, which might result
in situations of moral hazard. In addition, the arranger has less incentive to monitor the borrower
than if it were to lend the full amount of the loan (Pennachi 1998). Third, the borrower's financial
distress is an important factor in syndication as it is more complicated to reorganize and reformulate
the agreement for the borrower because a collective decision needs to be taken by the lenders
(Bolton and Scharfstein 1996).
Recent empirical evidence shows that adapting the organizational structure of a syndicate is
a crucial feature in mitigating the agency costs of syndication which stem from the fact that different

5
syndicate members have access to different degrees of information. In particular, syndicate
characteristics such as lenders’ interactions, experience, and reputation can mitigate syndication
agency problems2
Previous relationships between syndicate members can help to alleviate informational
frictions and agency costs of syndication. Indeed, repeated interactions over time directly aim at
solving problems of informational asymmetries because they create trust and reciprocity. Hence,
prior relationships between syndicate members have a significant impact on the probability of
syndicating a deal together (Champagne and Kryzanowski 2007). These relationships are often
reciprocal arrangements in the sense that lenders maintain stable relationships between them and
rotate their roles in subsequent joint syndications (Cai 2010). Moreover, Cai, Saunders, and Steffen
(2010) find that lead arrangers tend to choose participants having a close lending expertise in terms
of borrower industry or geographic location.
.
Furthermore, as the arrangers are responsible for due diligence, allocation of the loan to
other syndicate members, and ex post monitoring, banks in the syndicate will often rely on the
leaders’ reputation in making lending decisions (Ross 2010). Therefore, reputation is an important
aspect for syndicated lending (Gopalan, Nanda, and Yerramilli 2007), because reputable and
experienced leaders can enhance monitoring and the ability to attract participants, help show the
quality of the borrower and the deal, and reduce agency costs (Gatti et al. 2008; Panyagometh and
Roberts 2010). Approval from experienced, reputable and prestigious arrangers actually creates
economic value by reducing the overall costs of syndicated loans.
Recent empirical evidence tends to conclude that loan pricing is sensitive to information
costs of syndication (Focarelli, Pozzolo, and Casolaro 2008; Ivashina 2009) and lead banks reputation
is found to be a crucial feature for the success of syndication but its impact on loan pricing is mixed.
On the one hand, if lead banks’ reputation act as a certification device reducing adverse
consequences of information asymmetry within the syndicate, loan spreads can be lower especially
when informational frictions are expected to be severe (Gatti et al. 2008; Ross 2010). Regarding the
foundation of experience or reputation, i.e. reciprocity, results provided by Cai (2010) also show that
loans arranged in a reciprocal way are less costly for borrowers. Similar results are obtained by Cai,
Saunders, and Steffen (2010) for syndicates composed of arrangers which are closer in terms of
lending expertise. On the other hand, McCahery and Schwienbacher (2010) find that loans arranged 2 Other characteristics such as syndicate size and concentration also have an influence on agency costs (see Esty and W.L. Megginson 2003; Lee and Mullineaux 2004; Jones, Lang, and Nigro 2005; François and Missonnier-Piera 2007; Sufi 2007; Godlewski 2010).3 We consider as lead banks syndicate members bearing the following titles: administrative agent, agent, arranger, bookrunner, lead arranger, mandated arranger, senior arranger, underwriter, lead bank, joint arranger, managing agent, senior managing agent, syndication agent, co-agent, co-arranger, senior co-arranger, sub-underwriter, co-lead arranger, co-syndication agent, co-underwriter.

6
by reputable banks lead to higher loan spreads, especially for opaque borrowers who pay a
“reputation premium”.
Lenders’ experience and reputation are related to their social capital, the critical elements of
which are trust and reciprocity. These features are seen as fundamental because they enable the
reduction of transaction costs (Arrow 1974), which, in the case of a syndicated loan, are strongly
related to agency costs. Social capital features such as interaction, reciprocity, and trust are driven by
social networks (Di Cagno and Sciubba 2010) and syndicated lending markets exhibit many social
network features because they serve as information and capital networks (Baum, Shipilov, and
Rowley 2003; Baum, Rowley, and Shipilov 2004; Morrison and Wilhelm 2007).
2.2 Network analysis of financial intermediation
The linkages between financial institutions can be captured by using a network representation of
financial systems. The general concept of a network is intuitive: it describes a collection of nodes and
the links between them. The notion of nodes is fairly general: they may be individuals, firms or
countries. A link between two nodes represents a direct relationship between them.
Recently, Pistor (2009) provides an integrated approach looking at financial system from a
global perspective. Network-finance is a critical institutional arrangement when there is great
uncertainty about financing choices for which inter-firm relations come in different forms and
intensity. The concept of “strategic alliances” depicts a lose affiliation of firms and can be defined as
“voluntary arrangements between firms involving exchange, sharing, or co-development of products,
technologies or services” (Gulati 1998). According to this definition, any relation among independent
entities that involves collaborative efforts without fully allocating control rights to one member in
the alliance over another can be regarded as an alliance. Strategic alliances have become prominent
in industries marred by uncertainties, such as banking. Networks resemble alliances in the sense that
they are relatively loose configurations and typically lack a common governance structure. Networks
understood as governance devices for cooperative relations can facilitate the expansion of economic
activities.
However, the literature on financial networks is still at an early stage (Allen and Babus 2008).
Cohen, Frazzini, and Malloy (2008) investigate information transfers in security markets and find that
mutual fund portfolio managers place larger bets on firms they are connected with through their
networks, and perform significantly better on these holdings relative to their non-connected
holdings. These results suggest that social networks are an important mechanism for information
flows. Morrison and Wilhelm (2007) argue that investment banks exist because they create
networks. These financial institutions mainly issue and underwrite securities and these activities

7
require the development of two networks: an information network which allows the acquisition of
information about the demand for an issue, and a liquidity network to provide the funds to purchase
the securities. Indeed, Schnabel and Shin (2004) document how in the eighteenth century networks
of merchant banks allowed capital accumulated in one part of Europe to be invested in far distant
parts. These networks compensated for asymmetric information due to distance and also provided
the necessary capital.
Baum, Shipilov, and Rowley (2003) and Baum, Rowley, and Shipilov (2004) are the rare
authors to apply social network analysis to investigate Canadian bank syndicates. They argue that
the importance of understanding small world structures stems from their efficiency in moving
information, experience, and other resources that enable organizational learning, adaptation and
competitive advantage. External interdependence in the face of transaction costs is the most
common explanation for the emergence of interfirm networks. This interdependence focuses on two
main considerations: resource procurement (loan portfolio diversification and regulatory capital
requirements limits) and uncertainty reduction (expertise and information of syndicate members).
Hence, relations are built to share the costs and risks of undertaking large-scale projects, to develop
existing markets or enter new ones, to pursue resource specialization, or to mitigate competition.
Such objectives make firms interdependent with other firms that possess the capital, knowledge,
complementary assets, and technical capabilities.
Social network analysis is also applied to study venture capital (VC) finance. Kogut, Urso, and
Walker (2007) provide an extensive analysis of the US VC syndication market over a 40 year period.
They focus in particular on the dynamics and complexity of the network and show the rapid
emergence of a national network of syndications. Hochberg, Ljungqvist, and Lu (2007) examine the
influence of VC networking when syndicating their portfolio company investment on the
performance of VC firms in US. They find that better-networked VC firms have better fund
performance and that the portfolio companies of better networked VCs are more likely to survive
subsequent financing and eventual exit. This implies that one’s network position should be an
important strategic consideration for an incumbent VC, while presenting a potential barrier to entry
for new VCs. Finally, Meuleman et al. (2009) examine the influence of the network position of a
private equity investor on the relationship between agency costs and the decision to syndicate on
the UK private equity market. They find that the network position of an investor alleviates the
negative impact of agency costs on the syndication decision.
Overall, recent but scarce evidence shows that financial market networks play an important
role in organizing and shaping transactions, reducing informational frictions, and ultimately affecting
performances of actors (lenders and borrowers) on these markets.

8
3. Data and methodology In this section we describe the data and the social network analysis methodology. We especially
focus on the definition of a network and of its most important characteristics.
3.1 Data
Syndicated loans in Europe account for a third of the worldwide syndicated lending market. A recent
loan of 20 billion USD for the French company EDF was ranked as 3rd top deal (ThomsonFinancial
2009), while the French bank BNP Paribas was among the top 10 bookrunners in terms of proceeds
and underwritten volume. Furthermore, corporate financing through syndicated loans has gained in
importance as it represents more than 10% of private credit in France. It is also worth noticing that
bank syndicates lending to French companies exhibit some particular features as they are larger and
less concentrated as compared to syndicates in the US or the UK (Godlewski 2009). These particular
characteristics of the lending syndicates and the importance of syndicated loans in financing
companies provide us with a pertinent empirical framework with respect to the aim of this article.
Indeed, the presence of numerous lenders in the syndicates can signal an important level of social
interactions which may serve as drivers of banks experience and reputation. This in turn may affect
the syndicated lending market organization and development.
Data on the French syndicated lending market, including detailed information on the loan
agreement and bank syndicate characteristics, come from the Dealscan database (LPC, Reuters). This
database is commonly used in empirical studies on syndicated lending (Champagne and Kryzanowski
2007; Sufi 2007; Ivashina 2009; Ross 2010). We are able to identify the country, name, and role of
436 lenders that have participated in 924 syndicated deals to 776 French companies from 1992 to
2006. For each deal we have access to information on the loan amount, spread, maturity, guarantee,
covenants, type, and purpose. We also have information on the size, concentration and composition
of the banks syndicate.
The main descriptive statistics and definitions of variables are provided in Table 1 while Table
A (in appendix) displays the distribution of lenders’ countries in the sample. We remark that the
average loan size is close to 2 billion USD with a 120 bps spread over the benchmark rate (such as
Libor) and a maturity of almost 6 years. Loans are rarely guaranteed and only 1 out of 10 has financial
covenants. More than 1 out of 3 loans are for debt repayment purpose while the types of loans are
relatively balanced between term and revolving loans.
We also observe that an average syndicate is composed of 14 lenders with more than 5
arrangers. The presence of French banks is important as they represent 40% of an average syndicate.
Apart from France, lenders come from 40 different countries but most of the remaining banks are

9
from Germany, US, Japan, UK, the Netherlands, and Italy. The concentration of the loan shares
retained by arrangers is rather low, just above 10%. The presence of reputable lenders (listed on the
League Table by Reuters) is relatively important, equal to 34%. This figure drops to less than 15% if
we focus on the reputable French lenders only.
The most important industry sectors of the borrowers are Manufacturing (36%), Transport,
Communication and Electricity (15%), Finance and Insurance (14%), Construction (7%), Wholesale
Trade (7%), and Retail Trade (6%).
3.2 Network definition and characteristics
Information on banks’ participation in syndicated loans (or deals) provides us with an input to
construct an “affiliation network”. In social network analysis, an affiliation network is a two-mode
(bipartite) network with two types of nodes: actors linked with events in which they participate. In
our case, actors are banks, events are syndicated deals and ties connect banks with the deals in
which they participate. A hypothetical example of a bipartite network is shown in Figure 1 (a).
Connectivity in such a network is achieved through banks participating in several syndicates, such as
lenders 4 and 8 in Figure 1 (a).
Affiliation networks rarely become an object of study themselves but rather are used for
constructing the corresponding social networks of actors. To make a projection of the bipartite
network of syndicated deals we follow Baum, Shipilov, and Rowley (2003) who re-construct banks’
network by accounting only for the relationships between lead - participant banks. Indeed, banks
participating in the same syndicate typically have minimal contacts and their interactions are
primarily with lead banks3
Further, we assume that ties between lead banks and other syndicate members do not
disappear immediately, but remain active for several years. Hence, we use overlapping moving five-
year windows following Baum, Shipilov, and Rowley (2003). Thus, for each of the time windows we
construct lenders’ networks considering only the syndicated loans arranged during these periods. We
obtain 14 moving windows over the 1992-2006 time span, the first going from 1992-1995 and the
last from 2002-2006.
(Rhodes 2004).
An illustration of how a bipartite network can be projected to a one-mode network is
displayed in Figure 1 (b). With this illustrative network, we can introduce several network measures
needed to characterize a syndicated lending market.
3 We consider as lead banks syndicate members bearing the following titles: administrative agent, agent, arranger, bookrunner, lead arranger, mandated arranger, senior arranger, underwriter, lead bank, joint arranger, managing agent, senior managing agent, syndication agent, co-agent, co-arranger, senior co-arranger, sub-underwriter, co-lead arranger, co-syndication agent, co-underwriter.

10
A path between a pair of lenders i and j is a sequence of lenders beginning with lender i and
ending with lender j such that each lender in this sequence is unique and has ties with lenders
preceding and following him in the sequence. Two lenders are connected if there is a path between
them. The length of a path is the number of steps (“edges”) separating one from the other. Distance
between two lenders is defined as the length of the shortest path (called “geodesic”) connecting
them. Further, a connected component is a subset of nodes (lenders) such that any two nodes from
this subset are connected. An isolate is a component which consists of a single node.
For instance, on Figure 1 (b), lenders 1 and 10 are connected because there are several paths
between them, e.g. through lenders 2, 4, 5, 7 and 8. The corresponding geodesic, or shortest path
from 1 to 10, is (1 – 2 – 4 – 8 – 10) which has length 4. This network has two components {1÷10} and
{11}. Lender 11 is an isolate as it is disconnected from the rest of the network.
A generic feature of social and economic networks which has received much attention in the
recent years is “small world” structure (Uzzi, Amaral, and Reed-Tsochas 2007). Most social networks
are locally dense, but at the same time the social distances between the actors are relatively short.
This property can be quantified using notions of clustering coefficient and average path length.
Average path length is defined as the mean of the distances between all pairs of actors in a network
and measures how close the actors in the network are. The shorter the average path length the
faster and more efficient the information or resources may flow between two distant parts of the
network. The clustering coefficient of an actor (lender) is the share of the actor’s neighbors who have
direct contacts with each other.
For instance, on Figure 1 (b) lender 2 has clustering coefficient equal to 0 because none of his
contacts (lenders 1,3 and 4) have direct links with each other. Lender 6 has four contacts (lenders 4,
5, 7 and 8) which makes 6 pairs of which only one pair (lenders 4 and 7) does not have direct contact,
hence the clustering coefficient of lender 6 is 5/6.
In a social network with high average clustering, “friends” of my “friends” are likely to be my
“friends”, thus such a network is abundant with the closed triangle4
Many real world networks are “small worlds”: they are sparse, have short average path
length and are highly clustered. Watts and Strogatz (1998) showed how such structures may emerge
when a network composed of tightly knit clusters only marginally linked with each other (thus having
. Such network structures with
many alternative paths through which the information or resources can flow between actors allow
efficient social control alleviating the problems of opportunistic behavior and supporting reciprocity,
trust and social norms (Coleman 1988). These are important characteristics to reduce informational
frictions and agency costs in financial transactions such as syndicated loans.
4 a has a contact with b, b has a contact with c, but c also has contact with a closing the triangle abc.

11
high clustering and long average path length) is transformed by randomly rewiring only a small
fraction of links in the network. Their model is based on the fact that random rewiring creates
shortcuts between otherwise distant parts of the network and while the average distance is highly
responsive to the presence of shortcuts, the local structure (high clustering) is not. Consequently, if
the share of the rewired links is small, a network has both short distances and high clustering.
To examine whether an observed network is a small world, one compares it with a
benchmark random network. Following Watts and Strogatz (1998), most empirical studies compare
the average path length (La) and clustering coefficient (Ca) of the observed networks with
corresponding characteristics of an Erdos-Renyi (ER) random graph, where the same number of
actors is randomly connected by the same number of links as in the observed network.
While ER random graph may be a fair benchmark network for many social networks, in case
the network was reconstructed from an affiliation network comparison with ER may be misleading
(Newman, Strogatz, and Watts 2001). Indeed, making a projection of a two-mode network of teams
and actors onto the set of actors, one has to assume certain structures of relationships within a
team, thus teams will be represented by subgraphs of a fixed non-random structure. Therefore
comparison of resulting one-mode network with a random graph where any link, including within-
team links, may lead to wrong conclusions (Uzzi, Amaral, and Reed-Tsochas 2007).
To circumvent this problem, we construct benchmark random network as a projection of
randomly rewired two-mode lender-deals network (rather than rewiring one-mode projections to
obtain ER random graphs) as follows. First, we randomly reconnect deals and lenders in the observed
network controlling that (a) each lender in the rewired network participates in the same number of
deals as in the observed network, (b) each deal has the same number of lenders as in the observed
network, and (c) each deal has the same number of arrangers as in the observed network5
3.3 Individual characteristics within networks
. The
resulting random two-mode network is projected onto the set of lenders. For each of the 14
observed moving time windows, we simulate 100 random networks and determine their structural
properties. The average distance (Lr) and clustering (Cr) averaged over 100 simulation runs are
presented in columns Lr and Cr of the Table 2 along with the average distance (Ler) and clustering (Cer)
of corresponding ER random graphs, as a robustness check.
We now turn to the definition of the characteristics of lenders’ individual positions within the
syndicated lending network. We focus on several measures of actors’ importance: degree, closeness
5 Here we assume that the bank’s role (lead or participant) does not depend on the bank’s identity. Alternatively, one can also take into account that some banks become arrangers more often than others and control for the number of deals in which the given bank is an arranger.

12
and betweenness centralities. These measures serve as proxies of lenders’ experience and reputation
on the syndicated lending market.
Actor’s degree or degree centrality, CD, can be defined as the number of the closest
neighbors, the set of actors with which the focal actor has direct links. Degree centrality
characterizes the involvement of an actor in social relationships. It is a local measure, as it does not
depend on the configuration of the whole network except the local neighborhood of the actor.
Beside the simple definition of CD commonly used in many empirical studies, there is also a
standardized version of the degree centrality, which takes into account that the same number of
relationships in a small network is not exactly the same as the same number of relationships in a
larger network. The standardized version of degree centrality is defined as:
1'
−=
nCC D
D ,
where n is the size of the network (the number of actors in the network). Obviously, standardization
has no effect on analysis if centrality scores are compared among the agents in the same network.
Closeness centrality measures actor i's position in a network in terms of his proximity to
other actors. It is defined as an inverse of the sum of the social distances between the actor and
other (n-1) actors in the network (normalized by the size of the network):
),(1
jidnC
ijC ∑ ≠
−=
where d(i, j) is the distance between actor i and j. Closeness centrality conveys the intuitive
understanding of the centre of a network. The closer the actor to the centre of the network, the
higher his closeness centrality score6
Finally, betweenness centrality measures how well the actor is positioned with respect to
control over the flow of information or other resources in the network. Betweenness centrality of
actor i can be defined as the ratio of the shortest paths between all pairs of actors in the network
which passes through the actor (deflated by the number of alternative shortest paths):
.
∑<−−
=kj
iB kjg
kjgnn
C),(),(
)2)(1(2
where gi(j, j) is the total number of the shortest paths between actors j and k and g(j, j) is the total
number of the shortest paths between actors j and k.
6 Imagine a star network where one node occupies the centre to which all other (n-1) actors are connected and no ties exist between peripheral actors (e.g. a deal with one lead bank and (n-1) participant banks). Then closeness centrality of the star is 1, while for the other actors closeness centrality is 1/(2n-3).

13
4. Results We present and discuss in this section the results on the organization and structure of the French
syndicated lending network and the influence of lenders’ individual network characteristics on the
cost of bank loans for borrowers.
4.1 Small world Results for the French syndicated lending network for each of the 14 overlapping time windows are
displayed in Table 2. We first remark that as raising capital through syndicated loans became more
and more important over the period under investigation, the number of deals (column deals) has
been continuously increasing as well as the number of lenders (column lenders) albeit at a lower rate
for the last indicator. We observe that there were 82 deals and 166 lenders involved during time
window 1 and 494 deals and 347 lenders involved during time window 14. Peaks are observed for
window 13 (years 2002-2006) with 577 deals and 392 lenders. Due to the increased number of deals
and involved lenders, the number of links (column links) has been multiplied by 10, starting at 679
during time window 1 to reach 6634 during time window 14, for a peak in window 13 with 8151 links.
Regarding network characteristics, a remarkable feature of the French syndicated lending
network is its high connectedness as isolates (column isolates) comprise less than 5% of all lenders
for most periods. Furthermore, the largest connected component (LC) consists of more than 90% of
all lenders. Therefore when studying the properties of the network we can focus solely on the largest
component without loss of information.
To see how the average distance and clustering of the actual networks (La and Ca) differ from
the corresponding characteristics of the benchmark random networks constructed with the
simulation (Lr and Cr), we calculate LL ratio (La / Lr) and CC ratio (Ca / Cr). In the model of Watts and
Strogatz (1998) the small worlds emerge when CC ratio is many times greater than 1, while LL ratio is
close to 1. To quantify the small world characteristics of our networks, we also calculate the “small
world ratio” SW = CC / LL (Davis, Yoo, and Baker 2003; Uzzi and Spiro 2005).
We first discuss results obtained with the simulated benchmark random network method, to
comment later on results obtained with the ER method. In our network, LL ratio stays close to 1 for
all periods. However, although the CC ratio is above 1 for most of the periods, it is generally not very
different from 1. The SW is relatively low in comparison with the values of Watts and Strogatz (1998)
model. However, it should be emphasized that the choice of the benchmark random graph may in
general imply different values of the SW at the small world phase transition.
Although the relatively small values of SW ratio do not allow us to unambiguously assert that
the French syndicated lending network has small world properties, the dynamics of the CC, LL and

14
SW ratios displayed in Figure 2 (A) clearly indicates that the network becomes “small worldish” over
time. Indeed, as the network expands the rate at which the normalized clustering (CC ratio) grows
outpaces the growth of the normalized average distance (LL ratio), therefore SW as the ratio of the
two is growing over time. At the beginning of the observation both CC ratio and LL ratio are below 1.
The fact that the clustering and distances in the observed network are lower than in a corresponding
random network stems from certain regularities in the actual network.
A subgraph representing a single deal has a star-like structure, where the centre is occupied
by lead banks and the “rays” are participant banks (see Figure 1 (b): separate deals are shown by red
circles). Since the benchmark random graphs preserve the structure of deals (the number of
participants and the number of lead banks), the random networks consist of the identical set of star-
like subgraphs assembled in various ways. Indeed, the number of deals for each of the lenders was
kept the same as in the actual network. The structural properties of the assembled networks depend
on the identities of the active banks which connect the deals, more precisely on the roles played by
active banks in the respective syndicates, i.e. whether they are ordinary participants or lead banks.
When deals are connected via an ordinary participant of the two deals, the resulting network
will have longer social distances and lower clustering than if the deals were connected via a lead
bank. In the former case, the distance between participants of the two deals (excluding the
connecting participant) is 4, while in the latter it is 2. As for clustering, it should first be noticed that
when two deals are connected, only clustering coefficients of all but the connecting bank stay the
same as they would if the two deals were disconnected. The change in the clustering coefficient of
the connector depends on the number of direct links it has in the two deals. The higher it is, the
more “open triangles” the resulting network has and the less is the clustering. Since lead banks have
more connections, networks where deals are connected via leaders have lower clustering.
Since in the simulations we control for the number of deals in which each lender participates,
but not for the number of deals in which it has been lead bank, the fact that clustering and average
path length in the actual networks are lower than in the random benchmark networks suggests that
in the actual networks subgraphs corresponding to the deals are disproportionally more likely (in
comparison with the pure chance) to be connected through lead banks than through participant
banks. That may happen when there is a core of banks specializing in syndicated loans, while
participant banks are less likely to participate in many deals with different arrangers7
By contrast, at the end of the observation period, both CC and LL ratios are above 1 pointing
to the fact that now the network is more likely to be connected by the participants. This brings us
back to the idea of small worlds. A network connected by lead banks is likely to be highly centralized
.
7 For instance, three large banks (JP Morgan Chase, Bank of America, and Citigroup) control over half of the U.S. commercial loan market by volume through the syndication process (Ross 2010).

15
with a dense core occupied by leaders and periphery consisting of participant banks. By contrast, a
network where connections are done through participants may be less centralized and the core may
have several dense parts populated by lead banks which are connected through participant banks. In
this respect participant banks may play a similar role as the “shortcuts” in Watts and Strogatz (1998)
model.
To complete the analysis, let us compare our results with what we would have found had we
used ER random graphs as benchmark. The last three columns of Table 2 report average distance
(Ler), clustering coefficient (Cer) and small world ratio (SWer) for ER random graphs with the number of
banks and links between them as in the observed networks. First, ER random networks are
significantly less clustered (almost the order of the magnitude) than the observed networks which
owes to the fact that the ER does not account for the observed networks being projections of two-
mode networks. Average distances, however, are not very different from the distances in the
observed network. As a result, the small world ratio, mostly driven by the ratio of clustering
coefficients, is a fairly large number above 10. Thus had we used ER as a benchmark we might have
unambiguously concluded that the French syndicated network is a small world. However, our
analysis demonstrates that the matter is more subtle here. Our results suggest that the syndication
network becomes “small worldish” with time (see the dynamics of the small world ratio at Figure 2
(A)). The dynamics of CC, LL and SW ratios based on ER random graph presented at Figure 2 (B) does
not show any particular pattern.
Overall, we can claim that the dynamics of the French syndicated lending market tends to
confirm that over time the networks of lenders become small worlds in the sense of Watts (2003).
This particular feature has important implications for the flows of information between lenders and
their level of social capital which ultimately influences lenders’ experience and reputation. This in
turn can affect informational frictions and agency costs of syndication, and impact the borrowing
costs.
4.2 Impact of individual network characteristics on loan spread We investigate the influence of individual network characteristics of banks syndicating loans for
French borrowers on the loan spread. The latter is the main loan contract characteristic which
influences the cost of debt and ultimately the company cost of capital. We claim that greater
centrality of syndicate members indicates a higher level of social capital acquired through
interaction, reciprocity, and trust. This in turn increases their experience and reputation allowing the
mitigation of informational frictions within the syndicate and affecting borrowing costs.
We perform series of regressions of the loan spread over the benchmark rate (such as
Euribor or Libor) on the syndicate average lenders’ betweenness, closeness and degree centralities.

16
Betweenness is a measure of the lender’s position in the network and his control over network flows.
This particular feature is the most important in mitigating information asymmetries because it takes
the network’s intermediation position of the lender into account. Closeness measures the lender’s
distance to the network center, i.e. the closer a lender is to the network center, the better his access
to information and resources flows. Degree is a local measure of lender’s involvement in social
relationships. Univariate statistics for these measures are displayed in Table 1.
We evaluate the impact of each measure of centrality on the loan spread separately using six
different specifications. We employ OLS regressions with standard errors clustered at the syndicated
loan level8. The benchmark specification controls for the main loan characteristics such as loan
amount, maturity, the presence of guarantors and covenants, following notably Focarelli, Pozzolo,
and Casolaro (2008) and Ivashina (2009)9. Each subsequent specification includes separately a
specific syndicate characteristic: the number of lenders, the percentage of local lenders, syndicated
loan concentration, the percentage of league table lenders and local league table lenders10
𝐿𝑜𝑎𝑛 𝑠𝑝𝑟𝑒𝑎𝑑 = 𝑓(𝑆𝑦𝑛𝑑𝑖𝑐𝑎𝑡𝑒 𝑐𝑒𝑛𝑡𝑟𝑎𝑙𝑖𝑡𝑦,𝑂𝑡ℎ𝑒𝑟 𝑠𝑦𝑛𝑑𝑖𝑐𝑎𝑡𝑒 𝑐ℎ𝑎𝑟𝑎𝑐𝑡𝑒𝑟𝑖𝑠𝑡𝑖𝑐𝑠,𝐶𝑜𝑛𝑡𝑟𝑜𝑙𝑠)
. These
specifications aim at controlling for other syndicate characteristics that may mitigate informational
frictions and agency costs of syndication, such as the presence of better informed local lenders, more
concentrated holdings of the loan which reduce moral hazard, or banks listed on League Tables. The
estimated equation can be summarized as follows:
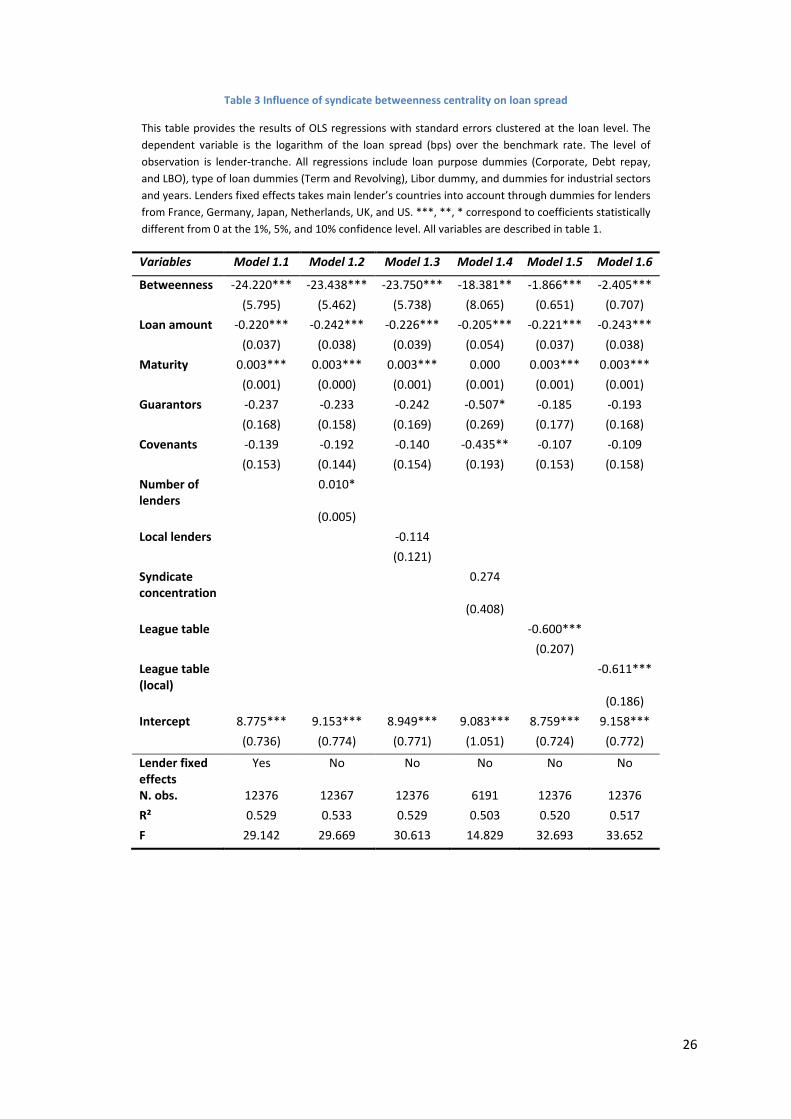
Results are displayed in Tables 3, 4, and 5 for betweenness, closeness, and degree centrality
measures respectively. A correlation matrix for all variables is provided in Table B (in appendix). We
first remark a satisfactory statistical quality of the regressions as the R² is close to 50% and the
Fischer statistic is always significant for every specification in Tables 3 to 5. Next we observe that all
three syndicate centrality measures exhibit significant and negative coefficients in a vast majority of
specifications11
8 Similar results are obtained when clustering at the borrower or lender level.
. The strongest results are obtained for the betweenness centrality measure as its
coefficient is always negative and significant in Table 3. Hence, in 8 cases out of 12 we are able to
9 Some of the loan characteristics can be endogenous such as the loan spread and amount. Unfortunately, we do not have enough information to build instrumental variables to perform multi stage regressions. However, to check if potential endogeneity could drive the results, we have also performed separate regressions adding step by step one loan variable to the benchmark specification, as well as trying different combinations of the loan characteristics variables. This procedure does not alter the coefficients of the syndicate centrality measures or the coefficients of other loan variables. 10 Although not always statistically correlated, these syndicate characteristics are expected to be economically related therefore we do not include them all at the same time in a single specification. Sample size is strongly reduced for regressions with the Syndication concentration variable because of missing information regarding the retained shares of the loan by arrangers. 11 Exceptions are models (2.4), (2.5), (2.6), and (3.5).

17
validate the benefit of a central syndicate in funding a loan in terms of reduced loan spread and thus
borrowing costs. In other words, borrowers can gain from reduced loan spreads when they are
funded by syndicates composed of lenders that are more central on the syndicated lending market.
Hence, lenders’ social capital matters for loan syndication as the presence of such experienced and
reputable lenders having access to greater amount and flows of information and resources serves as
a device mitigating informational frictions and agency costs related to loan syndication. This is shown
to be beneficial for the borrowers in terms of a reduced loan price.
We further notice interesting effects stemming from other syndicate characteristics that may
reduce information asymmetry and agency problems. First, we remark that the presence of local
lenders or a concentrated syndicate do not have any significant influence on the loan spread or on
the impact of syndicate centrality on the loan spread. The only two syndicate features that have a
significant and negative influence on the borrowing costs are the presence of league table lenders
and local league table lenders. This result is coherent with the signaling role of lead bank reputation
in reducing the costs of information asymmetries. Furthermore, we observe that in these cases, the
coefficients of the centrality measures are reduced in magnitude, especially for the betweenness
measure. However, their significance is not altered, except for the closeness and degree centrality
measures12
Finally, we remark that among loan characteristics, only loan amount and maturity bear
significant coefficients which remain robust across most of the specifications. Loan size has a
negative impact on loan spread for economies of scale reasons while longer maturities are positively
related to borrowing costs because of greater risk.
. Hence, league table reputation appears as an important syndicate feature to reduce
loan spread but not enough to vanish away the more important effect of syndicate betweenness
centrality.
We also perform robustness checks of our results by using the same specifications but on
sub-samples characterized by the presence of local lenders only, large loans, long maturities, large
syndicates, concentrated syndicates, numerous league table lenders and local league table lenders.
The classification of deals is done on the basis of the median of the relevant variable. Hence, we aim
to isolate syndicated deals that are more or less informational problematic. For instance, the
exclusive presence of (better informed) local lenders or numerous league table banks should reduce
information asymmetry and agency costs, so that the presence of central lenders in the syndicate
should play a weaker role. On the contrary, longer maturities or concentrated syndicates being
12 In these cases, league table lenders’ presence in the syndicate appears to be more important for loan pricing than banks’ distance to the centre of the network or the local involvement in the network. We remind that closeness and degree measures are statistically correlated with league table variables.

18
associated with riskier deals with greater moral hazard problems, we expect syndicate centrality to
play a more important role.
Results are displayed in Table 613
Overall, we remark that the main results remain robust in the sense that most centrality
measures remain significant and negative, except for two specifications with closeness centrality and
one specification with degree centrality. Regarding more informationally problematic deals (large
loans, long maturities, large and concentrated syndicates), we observe that for each of the three
syndicate centrality measures, coefficients are larger than to the main specifications in Tables 3, 4,
and 5. The exceptions concern the Large syndicates specification for which coefficients are lower or
not significant. We can interpret this result by the fact that larger syndicates could also signal better
quality deals with less informational frictions and agency problems which allow the organization of a
syndicate with more members (Lee and Mullineaux 2004; Sufi 2007). In such a case, the importance
of experienced, reputable and central lenders appears to be less important.
. The first four columns correspond to sub-samples where
information problems are expected to be severe. Large and complex loans imply more agency costs
and coordination problems, while longer maturities are usually associated with greater risk. Larger
syndicates are usually funding larger, more complex and riskier loans and coordination problems are
more likely in such syndicates, while greater syndicate concentration is related to more severe moral
hazard problems. The last three columns correspond to deals which are expected to have less
information problems because of the exclusive presence of local lenders and of league table banks.
When turning to deals where informational frictions should be less problematic (many local
lenders and numerous league table banks), we remark that evidence is more mixed. Coefficients for
syndicate centrality measures are lower or even not significant for deals funded exclusively by French
banks. Such deals leave less room for informational frictions and agency problems because of the
presence of better informed local lenders thus the importance of central lenders is less of an issue.
However, evidence is less clear-cut for deals funded by numerous league table lenders. Overall, it
seems that syndicate centrality matters, even very much, for such deals. We can explain this result by
stating that the probability of having central syndicate members increases with the presence of
league table banks. Indeed, centrality measures and league table variables are significantly
correlated and they are larger for the Many league table sub-sample than the average values for the
whole sample.
13 We do not display coefficients for main loan characteristics to save space. These coefficients remain robust and exhibit similar signs and significance levels as in tables 3, 4, and 5.
19
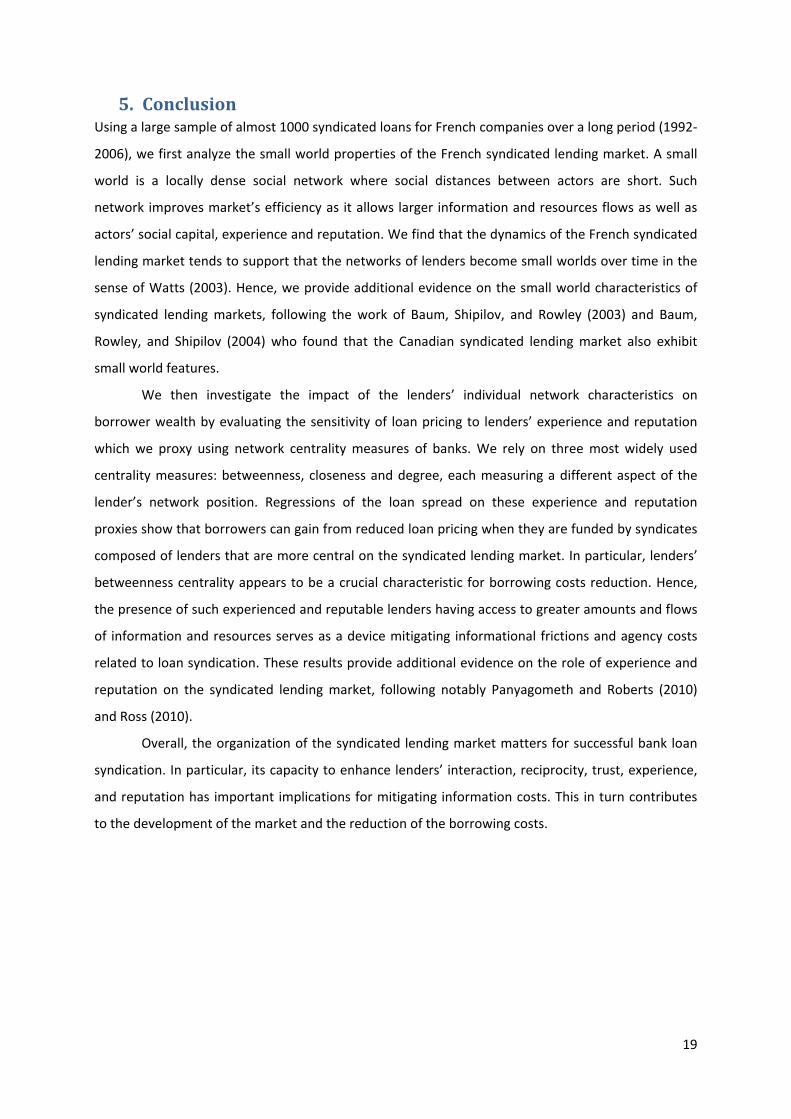
5. Conclusion Using a large sample of almost 1000 syndicated loans for French companies over a long period (1992-
2006), we first analyze the small world properties of the French syndicated lending market. A small
world is a locally dense social network where social distances between actors are short. Such
network improves market’s efficiency as it allows larger information and resources flows as well as
actors’ social capital, experience and reputation. We find that the dynamics of the French syndicated
lending market tends to support that the networks of lenders become small worlds over time in the
sense of Watts (2003). Hence, we provide additional evidence on the small world characteristics of
syndicated lending markets, following the work of Baum, Shipilov, and Rowley (2003) and Baum,
Rowley, and Shipilov (2004) who found that the Canadian syndicated lending market also exhibit
small world features.
We then investigate the impact of the lenders’ individual network characteristics on
borrower wealth by evaluating the sensitivity of loan pricing to lenders’ experience and reputation
which we proxy using network centrality measures of banks. We rely on three most widely used
centrality measures: betweenness, closeness and degree, each measuring a different aspect of the
lender’s network position. Regressions of the loan spread on these experience and reputation
proxies show that borrowers can gain from reduced loan pricing when they are funded by syndicates
composed of lenders that are more central on the syndicated lending market. In particular, lenders’
betweenness centrality appears to be a crucial characteristic for borrowing costs reduction. Hence,
the presence of such experienced and reputable lenders having access to greater amounts and flows
of information and resources serves as a device mitigating informational frictions and agency costs
related to loan syndication. These results provide additional evidence on the role of experience and
reputation on the syndicated lending market, following notably Panyagometh and Roberts (2010)
and Ross (2010).
Overall, the organization of the syndicated lending market matters for successful bank loan
syndication. In particular, its capacity to enhance lenders’ interaction, reciprocity, trust, experience,
and reputation has important implications for mitigating information costs. This in turn contributes
to the development of the market and the reduction of the borrowing costs.

20
References Allen, F., and A. Babus. 2008. Networks in Finance. Working Paper. Arrow, K. J. 1974. The Limits of Organization. W. W. Norton & Company. Baum, J. A. C., A. V. Shipilov, and T. J. Rowley. 2003. Where Do Small Worlds Come From? Industrial Corporate
Change 12: 697-725. Baum, J. A. C., T. J. Rowley, and A. V. Shipilov. 2004. The Small World of Canadian Capital Markets: Statistical
Mechanics of Investment Bank Syndicate Networks, 1952–1989. Canadian Journal of Administrative Sciences / Revue Canadienne des Sciences de l'Administration 21: 307-325.
Bolton, P., and D. S. Scharfstein. 1996. Optimal Debt Structure and the Number of Creditors. Journal of Political Economy 104: 1-25.
Cai, J. 2010. Competition or Collaboration? The Reciprocity Effect in Loan Syndication. Working Paper. Cai, J., A. Saunders, and S. Steffen. 2010. Diversification or Specialization? An Analysis of Distance and
Collaboration in Loan Syndication Networks. Working Paper. Carpenter, J., S. Bowles, H. Gintis, and S.-H. Hwang. 2009. Strong Reciprocity and Team Production: Theory and
Evidence. Journal of Economic Behavior & Organization 71, 2: 221-232. Champagne, C., and L. Kryzanowski. 2007. Are Current Syndicated Loan Alliances Related to Past Alliances?
Journal of Banking and Finance 31: 3145-3161. Cohen, L., A. Frazzini, and C. Malloy. 2008. The Small World of Investing: Board Connections and Mutual Fund
Returns. Journal of Political Economy 116: 951-979. Coleman, J. S. 1988. Social Capital in the Creation of Human Capital. American Journal of Sociology 94: S95. Davis, G. F., M. Yoo, and W. E. Baker. 2003. The Small World of the American Corporate Elite, 1982-2001.
Strategic Organization 1: 301-326. Dennis, S. A., and D. J. Mullineaux. 2000. Syndicated Loans. Journal of Financial Intermediation 9: 404-426. Di Cagno, D., and E. Sciubba. 2010. Trust, Trustworthiness and Social Networks: Playing a Trust Game when
Networks are Formed in the Lab. Journal of Economic Behavior & Organization (forthcoming). Esty, B. C. 2001. Structuring Loan Syndicates: A Case Study of the Hong Kong Disneyland Project Loan. Journal
of Applied Corporate Finance 14: 80-95. Esty, B. C., and W. L. Megginson. 2003. Creditor Rights, Enforcement, and Debt Ownership Structure: Evidence
from the Global Syndicated Loan Market. Journal of Financial and Quantitative Analysis 38: 37-59. Focarelli, D., A. F. Pozzolo, and L. Casolaro. 2008. The Pricing Effect of Certification on Syndicated Loans. Journal
of Monetary Economics 55: 335-349. François, P., and F. Missonnier-Piera. 2007. The Agency Structure of Loan Syndicates. Financial Review 42: 227–
245. Gatti, S., S. Kleimeier, W. L. Megginson, and A. Steffanoni. 2008. Arranger Certification in Project Finance.
Working Paper. Godlewski, C. J. 2009. L'organisation des syndicats bancaires en France : Taille, concentration et réputation.
Finance Contrôle Stratégie 12: 37–63. ———. 2010. Banking Environment and Loan Syndicate Structure: A Cross-Country Analysis. Applied Financial
Economics 20, 8: 637-647. Gopalan, R., V. Nanda, and V. Yerramilli. 2007. Lead Arranger Reputation and the Loan Syndication Market.
Working Paper. Gulati, R. 1998. Alliances and Networks. Strategic Management Journal 19: 293-317. Hochberg, Y. V., A. Ljungqvist, and Y. Lu. 2007. Whom You Know Matters: Venture Capital Networks and
Investment Performance. Journal of Finance 62: 251–301. Ivashina, V. 2009. Asymmetric Information Effects on Loan Spreads. Journal of Financial Economics 92: 300-319. Jones, J. D., W. W. Lang, and P. J. Nigro. 2005. Agent Behavior in Bank Loan Syndications. Journal of Financial
Research 28: 385-402. Kogut, B., P. Urso, and G. Walker. 2007. Emergent Properties of a New Financial Market: American Venture
Capital Syndication, 1960-2005. Management Science 53: 1181–1198. Lee, S. W., and D. J. Mullineaux. 2004. Monitoring, Financial Distress, and the Structure of Commercial Lending
Syndicates. Financial Management 33: 107-130. McCahery, J., and A. Schwienbacher. 2010. Bank Reputation in the Private Debt Market. Journal of Corporate
Finance (forthcoming). Meuleman, M., M. Wright, S. Manigart, and A. Lockett. 2009. Private Equity Syndication: Agency Costs,
Reputation and Collaboration. Journal of Business Finance & Accounting 36: 616-644. Morrison, A. D., and W. J. Wilhelm. 2007. Investment Banking: Institutions, Politics, and Law. Oxford University

21
Press. Newman, M. E. J., S. H. Strogatz, and D. J. Watts. 2001. Random Graphs With Arbitrary Degree Distributions
and Their Applications. Physical Review E 64: 026118. Panyagometh, K., and G. S. Roberts. 2010. Do Lead Banks Exploit Syndicate Participants? Evidence from Ex Post
Risk. Financial Management 39: 273-299. Pennachi, G. G. 1998. Loan Sales and the Cost of Bank Capital. Journal of Finance 43: 375-396. Rhodes, T. 2004. Syndicated Lending Practice and Document. Euromoney Books. Ross, D. 2010. The “Dominant Bank Effect”: How High Lender Reputation Affects The Information Content and
Terms of Bank Loans'. Review of Financial Studies (forthcoming). Schnabel, I., and H. S. Shin. 2004. Liquidity and Contagion: The Crisis of 1763. Journal of the European Economic
Association 2: 929-968. Song, F. 2009. Intergroup Trust and Reciprocity in Strategic Interactions: Effects of Group Decision-Making
Mechanisms. Organizational Behavior and Human Decision Processes 108: 164-173. Sufi, A. 2007. Information Asymmetry and Financing Arrangements: Evidence from Syndicated Loans. Journal of
Finance 62: 629-668. Thomson Financial. 2009. Syndicated Loans Review. Thomson. Uzzi, B., L. A. N. Amaral, and F. Reed-Tsochas. 2007. Small-World Networks and Management Science Research:
A Review. European Management Review 4: 77-91. Uzzi, B., and J. Spiro. 2005. Collaboration and Creativity: The Small World Problem. American Journal of
Sociology 111: 447-504. Watts, D. J., and S. H. Strogatz. 1998. Collective Dynamics of 'Small-World' Networks. Nature 393: 440-442. Watts, D. J. 2003. Small Worlds: The Dynamics of Networks between Order and Randomness. Princeton
University Press.

22
Figure 1 Constructing a network of lenders
Deals (A, B, C, D) are shown in black, lead arrangers (2, 5, 6, and 8) in gray, other participants in white. (a) Bipartite network of syndicated deals (A, B, C) and lenders (1 to 10). Lender 2 is the leader in deal A, lenders 5, 6, and 8 are leaders in deal B, and deal C is led by bank 8. (b) One-mode projection of the bipartite network onto the set of lenders. The circles indicate corresponding deals.
(a)
(b)
1 2 3 4 5 6 7 8 9 10
A B C
Lenders
Loans
11
D
1
2
3
4
5
6
7
8
9
10
11

23
(A) Dynamics using simulated random network method
(B) Dynamics using Erdos-Renyi random network method
Figure 2 Dynamics of the average distance (LL), clustering (CC) and small-world ratio (SW)
CC and CCer: ratios of Ca / Cr and Ca / Cer respectively. LL and LLer: ratios of La / Lr and La / Ler. SW and SWer: small world ratios defined as CC / LL and CCer / LLer respectively. Ca: clustering of the actual network. La: average distance of the actual network. Cr and Cer: clustering of the simulated and Erdos-Renyi random networks respectively. Lr and Ler: average distance of the simulated and Erdos-Renyi random networks respectively.
0,70
0,80
0,90
1,00
1,10
1,20
1,30
1 2 3 4 5 6 7 8 9 10 11 12 13 14
Moving time windows
CC
LL
SW
0,00
4,00
8,00
12,00
16,00
20,00
1 2 3 4 5 6 7 8 9 10 11 12 13 14
Moving time windows
CCer
LLer
SWer

24
Table 1 Description and univariate descriptive statistics for main syndicate, loan, and lenders’ individual network characteristics
This table provides the description and main statistics for syndicate, loan, and lender’s individual network characteristics in the sample.
Variables Description Mean Std. dev.
Spread Loan spread in bps over benchmark rate 120.2581 119.4219 Loan amount Loan amount in millions $ 1890.0000 3160.0000 Maturity Loan maturity in months 70.6261 36.6228 Guarantors =1 if guarantors are present 0.0645 0.2456 Covenants =1 if financial covenants are present 0.1044 0.3058 Number of arrangers Number of arrangers in the syndicate 5.3465 5.4026 Number of lenders Number of lenders in the syndicate 14.3789 10.5990 Local lenders % of French lenders in the syndicate 0.4097 0.2909 Syndicate concentration Average % of the loan held by arrangers in the syndicate 0.1178 0.1422 League table % of league tables lenders in the syndicate 0.3400 0.2129 League table (local) % of league table French lenders in the syndicate 0.1487 0.1734 Corporate purpose =1 if loan purpose is corporate purpose 0.1806 0.3847 Debt repay purpose =1 if loan purpose is debt repayment 0.3522 0.4777 LBO purpose =1 if loan purpose is LBO 0.1659 0.3720 Term loan =1 if loan is a term loan 0.3161 0.4649 Revolving loan =1 if loan is a revolving loan 0.4048 0.4909 Libor =1 if loan benchmark rate is Libor 0.2839 0.4509 Betweenness Average lenders’ betweenness by syndicate 0.0155 0.0080 Closeness Average lender’s closeness by syndicate 0.5218 0.0316 Degree Average lender’s degree by syndicate 219.7680 86.7679

25
Table 2 Syndicated lending network characteristics
This table displays network characteristics for the French syndicated lending market over the period 1992-2006. The first column displays the overlapping moving time windows while the second and third columns indicate the first and last year of the period under investigation. Each of the 14 overlapping periods contains 5 years of observations (except for the periods 1, 13, and 14). Columns 4 to 7 display the number of syndicated deals, the number of different lenders involved, the number of links between lenders, and the number of isolated lenders respectively. Columns 8 to 10 display the largest component (LC), the clustering of the actual network (Ca), and the average distance of the actual network (La). Columns 11 to 13 display the clustering of the simulated random network (Cr), the average distance of the simulated random network (Lr), and the small world ratio (SW) defined as CC / LL. Columns 14 to 16 display the clustering of the Erdos-Renyi random network (Cer), the average distance of the Erdos-Renyi random network (Ler), and the small world ratio (SWer) defined as CCer / LLer.
Moving time
window
start end #deals #lenders #links #isolates LC Ca La Cr Lr SW Cer Ler SWer
1 1992 1995 82 166 679 7 159 0,2031 2,363 0,2635 2,5804 0,8415 0,0525 2,627 6,3334 2 1992 1996 137 209 907 12 197 0,2278 2,5595 0,2688 2,6178 0,8666 0,0444 2,6747 10,2846 3 1992 1997 167 221 1104 15 206 0,312 2,5138 0,3239 2,58 0,9885 0,0476 2,5713 17,0909 4 1993 1998 214 258 1404 19 234 0,3319 2,5614 0,325 2,5699 1,0247 0,0443 2,566 21,9144 5 1994 1999 265 283 2082 13 265 0,3947 2,493 0,3666 2,4483 1,0573 0,0552 2,37 20,5085 6 1995 2000 375 363 4467 10 345 0,4096 2,327 0,3978 2,2446 0,9933 0,0721 2,1078 13,8693 7 1996 2001 415 356 6143 15 338 0,4879 2,2473 0,4474 2,1064 1,022 0,0972 1,934 11,2116 8 1997 2002 427 352 5851 16 331 0,5002 2,2685 0,4436 2,1169 1,0523 0,0947 1,9438 12,2984 9 1998 2003 480 367 6319 16 351 0,4656 2,1345 0,4249 2,0995 1,0779 0,0941 1,9412 11,4697
10 1999 2004 510 391 7745 16 375 0,467 2,1086 0,4298 2,0518 1,0573 0,1016 1,9143 10,0196 11 2000 2005 490 387 7683 18 369 0,5038 2,1127 0,4294 2,0517 1,1394 0,1029 1,912 11,3461 12 2001 2006 563 377 7465 16 361 0,5322 2,1285 0,4302 2,0079 1,1671 0,1054 1,9083 11,9783 13 2002 2006 577 392 8151 15 375 0,5186 2,0999 0,428 1,9994 1,1535 0,1062 1,9041 11,3558 14 2003 2006 494 347 6634 15 329 0,5174 2,0703 0,4365 1,9867 1,1374 0,1105 1,9023 10,59
26
Table 3 Influence of syndicate betweenness centrality on loan spread
This table provides the results of OLS regressions with standard errors clustered at the loan level. The dependent variable is the logarithm of the loan spread (bps) over the benchmark rate. The level of observation is lender-tranche. All regressions include loan purpose dummies (Corporate, Debt repay, and LBO), type of loan dummies (Term and Revolving), Libor dummy, and dummies for industrial sectors and years. Lenders fixed effects takes main lender’s countries into account through dummies for lenders from France, Germany, Japan, Netherlands, UK, and US. ***, **, * correspond to coefficients statistically different from 0 at the 1%, 5%, and 10% confidence level. All variables are described in table 1.
Variables Model 1.1 Model 1.2 Model 1.3 Model 1.4 Model 1.5 Model 1.6
Betweenness -24.220*** -23.438*** -23.750*** -18.381** -1.866*** -2.405*** (5.795) (5.462) (5.738) (8.065) (0.651) (0.707) Loan amount -0.220*** -0.242*** -0.226*** -0.205*** -0.221*** -0.243*** (0.037) (0.038) (0.039) (0.054) (0.037) (0.038) Maturity 0.003*** 0.003*** 0.003*** 0.000 0.003*** 0.003*** (0.001) (0.000) (0.001) (0.001) (0.001) (0.001) Guarantors -0.237 -0.233 -0.242 -0.507* -0.185 -0.193 (0.168) (0.158) (0.169) (0.269) (0.177) (0.168) Covenants -0.139 -0.192 -0.140 -0.435** -0.107 -0.109 (0.153) (0.144) (0.154) (0.193) (0.153) (0.158) Number of lenders
0.010*
(0.005) Local lenders -0.114 (0.121) Syndicate concentration
0.274
(0.408) League table -0.600*** (0.207) League table (local)
-0.611***
(0.186) Intercept 8.775*** 9.153*** 8.949*** 9.083*** 8.759*** 9.158*** (0.736) (0.774) (0.771) (1.051) (0.724) (0.772)
Lender fixed effects
Yes No No No No No
N. obs. 12376 12367 12376 6191 12376 12376 R² 0.529 0.533 0.529 0.503 0.520 0.517 F 29.142 29.669 30.613 14.829 32.693 33.652

27
Table 4 Influence of syndicate closeness centrality on loan spread
This table provides the results of OLS regressions with standard errors clustered at the loan level. The dependent variable is the logarithm of the loan spread (bps) over the benchmark rate. The level of observation is lender-tranche. All regressions include loan purpose dummies (Corporate, Debt repay, and LBO), type of loan dummies (Term and Revolving), Libor dummy, and dummies for industrial sectors and years. Lenders fixed effects takes main lender’s countries into account through dummies for lenders from France, Germany, Japan, Netherlands, UK, and US. ***, **, * correspond to coefficients statistically different from 0 at the 1%, 5%, and 10% confidence level. All variables are described in table 1.
Variables Model 2.1 Model 2.2 Model 2.3 Model 2.4 Model 2.5 Model 2.6
Closeness -3.1359** -3.1626** -3.0618** -2.8145 -1.1202 -2.2503 (1.4858) (1.4301) (1.4684) (1.9891) (1.8355) (1.5748) Loan amount -0.2222*** -0.2461*** -0.2293*** -0.2029*** -0.2227*** -0.2407*** (0.0379) (0.0392) (0.0397) (0.0556) (0.0376) (0.0397) Maturity 0.0033*** 0.0032*** 0.0033*** 0.0006 0.0032*** 0.0033*** (0.0011) (0.0009) (0.0010) (0.0013) (0.0011) (0.0010) Guarantors -0.2222 -0.2177 -0.2264 -0.5111* -0.1993 -0.2120 (0.1696) (0.1578) (0.1704) (0.2680) (0.1771) (0.1672) Covenants -0.1276 -0.1867 -0.1292 -0.4166** -0.1106 -0.1181 (0.1582) (0.1480) (0.1598) (0.1963) (0.1541) (0.1582) Number of lenders
0.0119*
(0.0062) Local lenders -0.1450 (0.1236) Syndicate concentration
0.2648
(0.4092) League table -0.5693** (0.2541) Local league table
-0.5234**
(0.2056) (0.1210) (0.1135) (0.1217) (0.1980) (0.1205) (0.1200) Intercept 10.0758*** 10.4952*** 10.2462*** 10.1813*** 9.2246*** 10.1177*** (0.9389) (0.9965) (0.9653) (1.3249) (1.0542) (0.9394)
Lender fixed effects
Yes No No No No No
N. obs. 12376 12367 12376 6191 12376 12376 R² 0.5156 0.5209 0.5155 0.4969 0.5209 0.5185 F 28.0483 29.6803 30.5641 14.9921 31.0070 31.5757

28
Table 5 Influence of syndicate degree centrality on loan spread
This table provides the results of OLS regressions with standard errors clustered at the loan level. The level of observation is lender-tranche. The dependent variable is the logarithm of the loan spread (bps) over the benchmark rate. All regressions include loan purpose dummies (Corporate, Debt repay, and LBO), type of loan dummies (Term and Revolving), Libor dummy, and dummies for industrial sectors and years. Lenders fixed effects takes main lender’s countries into account through dummies for lenders from France, Germany, Japan, Netherlands, UK, and US. ***, **, * correspond to coefficients statistically different from 0 at the 1%, 5%, and 10% confidence level. All variables are described in table 1.
Variables Model 3.1 Model 3.2 Model 3.3 Model 3.4 Model 3.5 Model 3.6
Degree -0.0014** -0.0014** -0.0014** -0.0012* -0.0007 -0.0011* (0.0006) (0.0006) (0.0006) (0.0007) (0.0008) (0.0006) Loan amount -0.2186*** -0.2421*** -0.2258*** -0.2006*** -0.2208*** -0.2361*** (0.0382) (0.0395) (0.0399) (0.0555) (0.0379) (0.0403) Maturity 0.0031*** 0.0031*** 0.0032*** 0.0005 0.0032*** 0.0033*** (0.0010) (0.0009) (0.0010) (0.0013) (0.0010) (0.0010) Guarantors -0.2379 -0.2336 -0.2426 -0.5072* -0.2100 -0.2257 (0.1698) (0.1579) (0.1704) (0.2676) (0.1761) (0.1679) Covenants -0.1404 -0.1983 -0.1420 -0.4340** -0.1185 -0.1287 (0.1573) (0.1472) (0.1589) (0.1958) (0.1541) (0.1578) Number of lenders 0.0117* (0.0061) Local lenders -0.1459 (0.1234) Syndicate concentration 0.2548 (0.4088) League table -0.5178* (0.2682) Local league table -0.4749** (0.2137) Intercept 8.6073*** 9.0085*** 8.8169*** 8.8981*** 8.6964*** 9.0248*** (0.7358) (0.7751) (0.7720) (1.0671) (0.7352) (0.7903)
Lender fixed effects Yes No No No No No N. obs. 12376 12367 12376 6191 12376 12376 R² 0.5176 0.5227 0.5175 0.4988 0.5215 0.5197 F 27.1606 29.1862 29.8898 14.7081 30.8546 30.8622

29
Table 6 Robustness checks for the influence of syndicate centrality measures on loan spread
This table provides the results of OLS regressions with standard errors clustered at the loan level. The dependent variable is the logarithm of the loan spread (bps) over the benchmark rate. The level of observation is lender-tranche. All regressions include loan main characteristics (Loan amount, Maturity, Guarantors, Covenants), loan purpose dummies (Corporate, Debt repay, and LBO), type of loan dummies (Term and Revolving), Libor dummy, and dummies for industrial sectors and years. The first regression is for large loans (loan amount greater than sample median: 662.7 millions $). The second regression is for long maturities (maturities greater than sample median: 61 months). The third regression is for concentrated syndicates (% of loan held by arrangers greater than sample median: 0.065). The fourth regression is for large syndicates (number of lenders greater than sample median: 13). The fifht regression is for loans funded by French lenders only. The sixth regression is for syndicates with many league table lenders (% of league table lenders greater than sample median: 0.29). The seventh regression is for syndication with many local league table lenders (% of French league table lenders greater than sample median: 0.09). ***, **, * correspond to coefficients statistically different from 0 at the 1%, 5%, and 10% confidence level. All variables are described in table 1.
Variables Large loans
Long maturities
Large syndicates
Concentrated syndicates
French lenders only Many league table Many league table (local)
Betweenness -28.1563*** -25.4679*** -20.3959** -28.1036*** -19.8812*** -1.3902** -2.8697***
(10.3210) (6.7935) (9.8816) (8.3596) (5.3377) (0.5843) (0.7856) N. obs. 6303 6338 6592 2907 4982 6455 6306 R² 0.5573 0.7078 0.5717 0.5161 0.5159 0.6330 0.5851 F 24.0023 27.3561 27.5264 13.1325 24.3822 29.4552 33.4562
Closeness -5.7443*** -5.3414*** -0.5550 -5.8459*** -2.1173 -3.0566* -3.1368* (2.1960) (1.5715) (2.6722) (2.0086) (1.4943) (1.7610) (1.8798) N. obs. 6303 6338 6592 2907 4982 6455 6306 R² 0.5502 0.7030 0.5640 0.5033 0.5040 0.6371 0.6024 F 22.8317 28.5250 25.3508 13.8550 23.8497 29.3336 31.1840 Degree -0.0020** -0.0023*** -0.0001 -0.0024*** -0.0012** -0.0018*** -0.0015**
(0.0008) (0.0006) (0.0009) (0.0008) (0.0006) (0.0006) (0.0008) N. obs. 6303 6338 6592 2907 4982 6455 6306 R² 0.5509 0.7048 0.5640 0.5083 0.5066 0.6408 0.6048 F 21.5975 27.8184 25.1641 14.9018 23.5543 30.4838 30.1415

30
Appendix
Table A List of lenders’ countries
Lender country Obs. Percent
Argentina 8 0,05 Australia 101 0,59 Austria 74 0,43 Bahrain 7 0,04 Belgium 450 2,63 Brazil 3 0,02 Canada 304 1,78 Chile 1 0,01 China 37 0,22 Denmark 39 0,23 Egypt 7 0,04 Finland 1 0,01 France 6 011 35,17 Germany 2 693 15,76 Hong Kong 396 2,32 Iceland 10 0,06 India 1 0,01 Ireland 200 1,17 Israel 4 0,02 Italy 886 5,18 Japan 1 221 7,14 Jordan 10 0,06 Kuwait 8 0,05 Luxembourg 117 0,68 Morocco 6 0,04 Netherlands 1 112 6,51 Norway 15 0,09 Poland 2 0,01 Portugal 43 0,25 Romania 6 0,04 Saudi Arabia 5 0,03 Singapore 13 0,08 South Africa 1 0,01 Spain 497 2,91 Sweden 21 0,12 Switzerland 220 1,29 Tunisia 2 0,01 USA 1 372 8,03 United Arab Emirates 7 0,04 United Kingdom 1 176 6,88

31
Table B Correlation matrix
* indicates a coefficient statistically different from 0 at the 10% confidence level.
Variables Betweenness Closeness Degree Spread Loan amount
Maturity Guarantors Covenants Number of lenders
Local lenders
Syndicate concentration
League table League table (local)
Betweenness 1.0000
Closeness 0.6462* 1.0000
Degree 0.6303* 0.8879* 1.0000
Spread -0.2417* -0.1395* -0.1338* 1.0000
Loan amount 0.1266* 0.2603* 0.3581* -0.3148* 1.0000
Maturity -0.0852* -0.0659* -0.0697* 0.2993* 0.0200* 1.0000
Guarantors -0.0992* -0.0869* -0.1308* 0.0538* -0.0777* 0.0768* 1.0000
Covenants -0.0124 -0.0113 -0.0346* -0.0561* 0.0713* -0.0237* -0.0772* 1.0000
Number of lenders -0.0371* 0.1363* 0.1875* -0.1806* 0.5194* 0.0601* -0.0918* 0.2272* 1.0000
Local lenders 0.0627* 0.0347* 0.0054 0.1546* -0.3002* 0.0561* -0.0126 -0.0423* -0.2869* 1.0000
Syndicate concentration -0.0914* -0.1098* -0.1622* 0.1439* -0.1270* 0.1830* -0.0369* 0.1249* -0.3009* 0.1988* 1.0000
League table 0.5327* 0.4734* 0.5314* -0.1069* 0.0297* -0.0311* -0.0239* 0.0348* -0.0355* 0.0716* -0.0240* 1.0000
League table (local) 0.3007* 0.2400* 0.2441* 0.1149* -0.2171* 0.0309* -0.0107 -0.0194* -0.2749* 0.4298* 0.2027* 0.5676* 1.0000

i
Working Papers
Laboratoire de Recherche en Gestion & Economie
______
D.R. n° 1 "Bertrand Oligopoly with decreasing returns to scale", J. Thépot, décembre 1993 D.R. n° 2 "Sur quelques méthodes d'estimation directe de la structure par terme des taux d'intérêt", P. Roger - N.
Rossiensky, janvier 1994 D.R. n° 3 "Towards a Monopoly Theory in a Managerial Perspective", J. Thépot, mai 1993 D.R. n° 4 "Bounded Rationality in Microeconomics", J. Thépot, mai 1993 D.R. n° 5 "Apprentissage Théorique et Expérience Professionnelle", J. Thépot, décembre 1993 D.R. n° 6 "Strategic Consumers in a Duable-Goods Monopoly", J. Thépot, avril 1994
D.R. n° 7 "Vendre ou louer ; un apport de la théorie des jeux", J. Thépot, avril 1994 D.R. n° 8 "Default Risk Insurance and Incomplete Markets", Ph. Artzner - FF. Delbaen, juin 1994 D.R. n° 9 "Les actions à réinvestissement optionnel du dividende", C. Marie-Jeanne - P. Roger, janvier 1995 D.R. n° 10 "Forme optimale des contrats d'assurance en présence de coûts administratifs pour l'assureur", S. Spaeter,
février 1995 D.R. n° 11 "Une procédure de codage numérique des articles", J. Jeunet, février 1995 D.R. n° 12 "Stabilité d'un diagnostic concurrentiel fondé sur une approche markovienne du comportement de rachat
du consommateur", N. Schall, octobre 1995 D.R. n° 13 "A direct proof of the coase conjecture", J. Thépot, octobre 1995 D.R. n° 14 "Invitation à la stratégie", J. Thépot, décembre 1995 D.R. n° 15 "Charity and economic efficiency", J. Thépot, mai 1996 D.R. n° 16 "Pricing anomalies in financial markets and non linear pricing rules", P. Roger, mars 1996 D.R. n° 17 "Non linéarité des coûts de l'assureur, comportement de prudence de l'assuré et contrats optimaux", S.
Spaeter, avril 1996 D.R. n° 18 "La valeur ajoutée d'un partage de risque et l'optimum de Pareto : une note", L. Eeckhoudt - P. Roger, juin
1996 D.R. n° 19 "Evaluation of Lot-Sizing Techniques : A robustess and Cost Effectiveness Analysis", J. Jeunet, mars 1996 D.R. n° 20 "Entry accommodation with idle capacity", J. Thépot, septembre 1996

ii
D.R. n° 21 "Différences culturelles et satisfaction des vendeurs : Une comparaison internationale", E. Vauquois-Mathevet - J.Cl. Usunier, novembre 1996
D.R. n° 22 "Evaluation des obligations convertibles et options d'échange", Schmitt - F. Home, décembre 1996 D.R n° 23 "Réduction d'un programme d'optimisation globale des coûts et diminution du temps de calcul, J. Jeunet,
décembre 1996 D.R. n° 24 "Incertitude, vérifiabilité et observabilité : Une relecture de la théorie de l'agence", J. Thépot, janvier 1997 D.R. n° 25 "Financement par augmentation de capital avec asymétrie d'information : l'apport du paiement du
dividende en actions", C. Marie-Jeanne, février 1997 D.R. n° 26 "Paiement du dividende en actions et théorie du signal", C. Marie-Jeanne, février 1997 D.R. n° 27 "Risk aversion and the bid-ask spread", L. Eeckhoudt - P. Roger, avril 1997 D.R. n° 28 "De l'utilité de la contrainte d'assurance dans les modèles à un risque et à deux risques", S. Spaeter,
septembre 1997 D.R. n° 29 "Robustness and cost-effectiveness of lot-sizing techniques under revised demand forecasts", J. Jeunet,
juillet 1997 D.R. n° 30 "Efficience du marché et comparaison de produits à l'aide des méthodes d'enveloppe (Data envelopment
analysis)", S. Chabi, septembre 1997 D.R. n° 31 "Qualités de la main-d'œuvre et subventions à l'emploi : Approche microéconomique", J. Calaza - P. Roger,
février 1998 D.R n° 32 "Probabilité de défaut et spread de taux : Etude empirique du marché français", M. Merli - P. Roger, février
1998
D.R. n° 33 "Confiance et Performance : La thèse de Fukuyama", J.Cl. Usunier - P. Roger, avril 1998 D.R. n° 34 "Measuring the performance of lot-sizing techniques in uncertain environments", J. Jeunet - N. Jonard,
janvier 1998 D.R. n° 35 "Mobilité et décison de consommation : premiers résultas dans un cadre monopolistique", Ph. Lapp,
octobre 1998 D.R. n° 36 "Impact du paiement du dividende en actions sur le transfert de richesse et la dilution du bénéfice par
action", C. Marie-Jeanne, octobre 1998 D.R. n° 37 "Maximum resale-price-maintenance as Nash condition", J. Thépot, novembre 1998
D.R. n° 38 "Properties of bid and ask prices in the rank dependent expected utility model", P. Roger, décembre 1998 D.R. n° 39 "Sur la structure par termes des spreads de défaut des obligations », Maxime Merli / Patrick Roger,
septembre 1998 D.R. n° 40 "Le risque de défaut des obligations : un modèle de défaut temporaire de l’émetteur", Maxime Merli,
octobre 1998 D.R. n° 41 "The Economics of Doping in Sports", Nicolas Eber / Jacques Thépot, février 1999
D.R. n° 42 "Solving large unconstrained multilevel lot-sizing problems using a hybrid genetic algorithm", Jully Jeunet,
mars 1999 D.R n° 43 "Niveau général des taux et spreads de rendement", Maxime Merli, mars 1999

iii
D.R. n° 44 "Doping in Sport and Competition Design", Nicolas Eber / Jacques Thépot, septembre 1999 D.R. n° 45 "Interactions dans les canaux de distribution", Jacques Thépot, novembre 1999 D.R. n° 46 "What sort of balanced scorecard for hospital", Thierry Nobre, novembre 1999 D.R. n° 47 "Le contrôle de gestion dans les PME", Thierry Nobre, mars 2000 D.R. n° 48 ″Stock timing using genetic algorithms", Jerzy Korczak – Patrick Roger, avril 2000
D.R. n° 49 "On the long run risk in stocks : A west-side story", Patrick Roger, mai 2000 D.R. n° 50 "Estimation des coûts de transaction sur un marché gouverné par les ordres : Le cas des composantes du
CAC40", Laurent Deville, avril 2001 D.R. n° 51 "Sur une mesure d’efficience relative dans la théorie du portefeuille de Markowitz", Patrick Roger / Maxime
Merli, septembre 2001 D.R. n° 52 "Impact de l’introduction du tracker Master Share CAC 40 sur la relation de parité call-put", Laurent Deville,
mars 2002 D.R. n° 53 "Market-making, inventories and martingale pricing", Patrick Roger / Christian At / Laurent Flochel, mai
2002 D.R. n° 54 "Tarification au coût complet en concurrence imparfaite", Jean-Luc Netzer / Jacques Thépot, juillet 2002 D.R. n° 55 "Is time-diversification efficient for a loss averse investor ?", Patrick Roger, janvier 2003 D.R. n° 56 “Dégradations de notations du leader et effets de contagion”, Maxime Merli / Alain Schatt, avril 2003 D.R. n° 57 “Subjective evaluation, ambiguity and relational contracts”, Brigitte Godbillon, juillet 2003 D.R. n° 58 “A View of the European Union as an Evolving Country Portfolio”, Pierre-Guillaume Méon / Laurent Weill,
juillet 2003 D.R. n° 59 “Can Mergers in Europe Help Banks Hedge Against Macroeconomic Risk ?”, Pierre-Guillaume Méon /
Laurent Weill, septembre 2003 D.R. n° 60 “Monetary policy in the presence of asymmetric wage indexation”, Giuseppe Diana / Pierre-Guillaume
Méon, juillet 2003 D.R. n° 61 “Concurrence bancaire et taille des conventions de services”, Corentine Le Roy, novembre 2003 D.R. n° 62 “Le petit monde du CAC 40”, Sylvie Chabi / Jérôme Maati D.R. n° 63 “Are Athletes Different ? An Experimental Study Based on the Ultimatum Game”, Nicolas Eber / Marc
Willinger D.R. n° 64 “Le rôle de l’environnement réglementaire, légal et institutionnel dans la défaillance des banques : Le cas
des pays émergents”, Christophe Godlewski, janvier 2004 D.R. n° 65 “Etude de la cohérence des ratings de banques avec la probabilité de défaillance bancaire dans les pays
émergents”, Christophe Godlewski, Mars 2004 D.R. n° 66 “Le comportement des étudiants sur le marché du téléphone mobile : Inertie, captivité ou fidélité ?”,
Corentine Le Roy, Mai 2004 D.R. n° 67 “Insurance and Financial Hedging of Oil Pollution Risks”, André Schmitt / Sandrine Spaeter, September,
2004

iv
D.R. n° 68 “On the Backwardness in Macroeconomic Performance of European Socialist Economies”, Laurent Weill,
September, 2004 D.R. n° 69 “Majority voting with stochastic preferences : The whims of a committee are smaller than the whims of its
members”, Pierre-Guillaume Méon, September, 2004 D.R. n° 70 “Modélisation de la prévision de défaillance de la banque : Une application aux banques des pays
émergents”, Christophe J. Godlewski, octobre 2004 D.R. n° 71 “Can bankruptcy law discriminate between heterogeneous firms when information is incomplete ? The case
of legal sanctions”, Régis Blazy, october 2004 D.R. n° 72 “La performance économique et financière des jeunes entreprises”, Régis Blazy/Bertrand Chopard, octobre
2004 D.R. n° 73 “Ex Post Efficiency of bankruptcy procedures : A general normative framework”, Régis Blazy / Bertrand
Chopard, novembre 2004 D.R. n° 74 “Full cost pricing and organizational structure”, Jacques Thépot, décembre 2004 D.R. n° 75 “Prices as strategic substitutes in the Hotelling duopoly”, Jacques Thépot, décembre 2004 D.R. n° 76 “Réflexions sur l’extension récente de la statistique de prix et de production à la santé et à l’enseignement”,
Damien Broussolle, mars 2005 D. R. n° 77 “Gestion du risque de crédit dans la banque : Information hard, information soft et manipulation ”, Brigitte
Godbillon-Camus / Christophe J. Godlewski D.R. n° 78 “Which Optimal Design For LLDAs”, Marie Pfiffelmann D.R. n° 79 “Jensen and Meckling 30 years after : A game theoretic view”, Jacques Thépot D.R. n° 80 “Organisation artistique et dépendance à l’égard des ressources”, Odile Paulus, novembre 2006 D.R. n° 81 “Does collateral help mitigate adverse selection ? A cross-country analysis”, Laurent Weill –Christophe J.
Godlewski, novembre 2006 D.R. n° 82 “Why do banks ask for collateral and which ones ?”, Régis Blazy - Laurent Weill, décembre 2006 D.R. n° 83 “The peace of work agreement : The emergence and enforcement of a swiss labour market institution”, D.
Broussolle, janvier 2006. D.R. n° 84 “The new approach to international trade in services in view of services specificities : Economic and
regulation issues”, D. Broussolle, septembre 2006. D.R. n° 85 “Does the consciousness of the disposition effect increase the equity premium” ?, P. Roger, juin 2007
D.R. n° 86 “Les déterminants de la décision de syndication bancaire en France”, Ch. J. Godlewski D.R. n° 87 “Syndicated loans in emerging markets”, Ch. J. Godlewski / L. Weill, mars 2007 D.R. n° 88 “Hawks and loves in segmented markets : A formal approach to competitive aggressiveness”, Claude
d’Aspremont / R. Dos Santos Ferreira / J. Thépot, mai 2007 D.R. n° 89 “On the optimality of the full cost pricing”, J. Thépot, février 2007 D.R. n° 90 “SME’s main bank choice and organizational structure : Evidence from France”, H. El Hajj Chehade / L.
Vigneron, octobre 2007

v
D.R n° 91 “How to solve St Petersburg Paradox in Rank-Dependent Models” ?, M. Pfiffelmann, octobre 2007
D.R. n° 92 “Full market opening in the postal services facing the social and territorial cohesion goal in France”, D.
Broussolle, novembre 2007 D.R. n° 2008-01 A behavioural Approach to financial puzzles, M.H. Broihanne, M. Merli,
P. Roger, janvier 2008
D.R. n° 2008-02 What drives the arrangement timetable of bank loan syndication ?, Ch. J. Godlewski, février 2008 D.R. n° 2008-03 Financial intermediation and macroeconomic efficiency, Y. Kuhry, L. Weill, février 2008 D.R. n° 2008-04 The effects of concentration on competition and efficiency : Some evidence from the french audit
market, G. Broye, L. Weill, février 2008 D.R. n° 2008-05 Does financial intermediation matter for macroeconomic efficiency?, P.G. Méon, L. Weill, février 2008 D.R. n° 2008-06 Is corruption an efficient grease ?, P.G. Méon, L. Weill, février 2008 D.R. n° 2008-07 Convergence in banking efficiency across european countries, L. Weill, février 2008 D.R. n° 2008-08 Banking environment, agency costs, and loan syndication : A cross-country analysis, Ch. J. Godlewski,
mars 2008 D.R. n° 2008-09 Are French individual investors reluctant to realize their losses ?, Sh. Boolell-Gunesh / M.H. Broihanne /
M. Merli, avril 2008 D.R. n° 2008-10 Collateral and adverse selection in transition countries, Ch. J. Godlewski / L. Weill, avril 2008 D.R. n° 2008-11 How many banks does it take to lend ? Empirical evidence from Europe, Ch. J. Godlewski, avril 2008. D.R. n° 2008-12 Un portrait de l’investisseur individuel français, Sh. Boolell-Gunesh, avril 2008 D.R. n° 2008-13 La déclaration de mission, une revue de la littérature, Odile Paulus, juin 2008 D.R. n° 2008-14 Performance et risque des entreprises appartenant à des groupes de PME, Anaïs Hamelin, juin 2008
D.R. n° 2008-15 Are private banks more efficient than public banks ? Evidence from Russia, Alexei Karas / Koen
Schoors / Laurent Weill, septembre 2008 D.R. n° 2008-16 Capital protected notes for loss averse investors : A counterintuitive result, Patrick Roger, septembre
2008 D.R. n° 2008-17 Mixed risk aversion and preference for risk disaggregation, Patrick Roger, octobre 2008 D.R. n° 2008-18 Que peut-on attendre de la directive services ?, Damien Broussolle, octobre 2008 D.R. n° 2008-19 Bank competition and collateral : Theory and Evidence, Christa Hainz / Laurent Weill / Christophe J.
Godlewski, octobre 2008 D.R. n° 2008-20 Duration of syndication process and syndicate organization, Ch. J. Godlewski, novembre 2008 D.R. n° 2008-21 How corruption affects bank lending in Russia, L. Weill, novembre 2008 D.R. n° 2008-22 On several economic consequences of the full market opening in the postal service in the European
Union, D. Broussolle, novembre 2008.

vi
D.R. n° 2009-01 Asymmetric Information and Loan Spreads in Russia: Evidence from Syndicated Loans, Z. Fungacova, C.J. Godlewski, L. Weill
D.R. n° 2009-02 Do Islamic Banks Have Greater Market Power ?, L. Weill D.R. n° 2009-03 CEO Compensation: Too Much is not Enough!, N. Couderc & L. Weill D.R. n° 2009-04 La cannibalisation des produits à prix aléatoires : L’Euromillions a-t-il tué le loto français?,
P. Roger & S. Chabi D.R. n° 2009-05 The demand for Euromillions lottery tickets: An international comparison, P. Roger D.R. n° 2009-06 Concentration in corporate bank loans What do we learn from European comparisons?,
C.J. Godlewski & Y. Ziane D.R. n° 2009-07 Le mariage efficace de l’épargne et du jeu : une approche historique, M. Pfiffelmann D.R. n° 2009-08 Testing alternative theories of financial decision making: an experimental study with
lottery bonds, P. Roger
D.R. n° 2009-09 Does Corruption Hamper Bank Lending? Macro and Micro Evidence, L. Weill D.R. n° 2009-10 La Théorie Comportementale du Portefeuille et l’Equilibre du Marché, O. Bourachnikova D.R. n° 2009-11 Déformation des Probabilités Objectives et la Théorie Comportementale du Portefeuille,
O. Bourachnikova D.R. n° 2009-12 La Théorie Comportementale du Portefeuille vs. le modèle moyenne – variance. Étude
empirique, O. Bourachnikova D.R. n° 2009-13 Symmetric vs. Downside Risk: Does It Matter for Portfolio Choice? O. Bourachnikova & N.
Yusupov D.R. n° 2009-14 Negative Agency Costs, J. Thépot D.R. n° 2010-01 Does family control of small business lead to under exploitation of their financial growth
potential? Evidence of the existence of conservative growth behavior in family controlled French SMEs, A. Hamelin
D.R. n° 2010-02 Better borrowers, fewer banks?, CJ. Godlewski & F. Lobez & J.-C. Statnik & Y. Ziane D.R. n° 2010-03 Responsabilité sociale de l’entreprise et théorie de l’organisation, J. Thépot D.R. n° 2010-04 Small business groups enhance performance and promote stability, not expropriation.
Evidence from French SMEs, A. Hamelin D.R. n° 2010-05 Are Islamic Investment Certificates Special? Evidence on the Post-Announcement
Performance of Sukuk Issues, C.J. Godlewski & R. Turk-Ariss & L. Weill D.R. n° 2010-06 Trading activity and Overconfidence: First Evidence from a large European Database, S.
Boolell-Gunesh & M. Merli D.R. n° 2010-07 Bank lending networks, experience, reputation, and borrowing costs, C.J. Godlewski, B.
Sanditov, T. Burger-Helmchen