
Staying Ahead in the Innovation Race: New ... - UCLA Anderson
42
Staying Ahead in the Innovation Race: New-Product Introductions and Relative Firm Value Shuba Srinivasan 1 Koen Pauwels 2 Jorge Silva-Risso 3 Dominique M. Hanssens 4 September 22, 2004 1 Assistant Professor of Marketing, A. Gary Anderson Graduate School of Management, University of California, Riverside, CA 92521-0203 (Email: [email protected] ). 2 Assistant Professor of Marketing, Tuck School of Business at Dartmouth, Hanover, New Hampshire 03755 (Email: [email protected] ). 3 Assistant Professor of Marketing, A. Gary Anderson Graduate School of Management, University of California, Riverside, CA 92521-0203 (Email: [email protected] ). 4 Bud Knapp Professor of Marketing, The Anderson Graduate School of Management, University of California, Los Angeles, CA 90095-1481 (Email: [email protected] ). The authors are indebted to Scott Neslin, the seminar participants at the 2004 UCI/UCLA/UCR/USC Marketing conference and the 2004 Marketing Science conference for their useful suggestions.
-
Upload
khangminh22 -
Category
Documents
-
view
6 -
download
0
Transcript of Staying Ahead in the Innovation Race: New ... - UCLA Anderson

Staying Ahead in the Innovation Race: New-Product Introductions and Relative Firm Value
Shuba Srinivasan1 Koen Pauwels2
Jorge Silva-Risso3 Dominique M. Hanssens4
September 22, 2004
1Assistant Professor of Marketing, A. Gary Anderson Graduate School of Management, University of California, Riverside, CA 92521-0203 (Email: [email protected]). 2Assistant Professor of Marketing, Tuck School of Business at Dartmouth, Hanover, New Hampshire 03755 (Email: [email protected]). 3Assistant Professor of Marketing, A. Gary Anderson Graduate School of Management, University of California, Riverside, CA 92521-0203 (Email: [email protected]). 4Bud Knapp Professor of Marketing, The Anderson Graduate School of Management, University of California, Los Angeles, CA 90095-1481 (Email: [email protected]).
The authors are indebted to Scott Neslin, the seminar participants at the 2004 UCI/UCLA/UCR/USC Marketing conference and the 2004 Marketing Science conference for their useful suggestions.

ABSTRACT
While product innovation is a key contributor to long-term firm performance, new-
product failure rate remains high, especially in the face of intense competition. Therefore,
marketers need a better understanding of how and why firms benefit from new product
activity relative to industry competitors. Which types of innovations have the greatest
impacts on relative firm value? In particular, which innovation, brand, firm and market
characteristics influence the long-term performance effects of new product introductions?
This paper addresses these questions with a large-scale empirical study on new-
product introductions in the economically important automobile industry. First, vector-
autoregressive models quantify the over-time impact of product introductions and
promotional incentives on relative financial performance and firm value. Second,
weighted least squares regression assesses the moderating role of innovation, brand, firm,
and market characteristics.
A key finding is that new-product introductions can be managed strategically for
competitive advantage in investor markets. Indeed, their relative performance impact is
higher in growth categories, and especially for pioneering innovations that are highly
advertised. In contrast, sales promotions do not offer such strategic benefits, as we find
no meaningful moderators of their impact on relative market value.
Key words: Product innovation, long-term financial performance, long-term firm value, promotions, empirical generalizations, and vector-autoregressive models.
1
1. LONG-TERM INNOVATION EFFECTS ON FIRM VALUE
What drives long-run corporate performance? Several studies have identified
innovation success as a key contributor to long-term firm sales, financial and stock
market performance (Anderson and Zeithaml 1984; Comanor 1965; Kay 1979; Mansfield
et al. 1971; Pauwels, Silva-Risso, Srinivasan and Hanssens, 2004). In the same vein,
Drucker (1973) cites innovation and marketing as the two factors crucial to long-term
corporate health. However, new-product failure rate is high (ranging from 33% to over
60%) and has not improved over the last decades (Boulding, Morgan and Staelin 1997,
Business Week 1993, Wind 1982; McMath and Forber 1998). Moreover, both Main
Street and Wall Street judge a new product not only on its own merits, but also on its
value relative to competition (e.g. Bayus et al. 1997; Chaney et al. 1991). For example,
Boeing’ stock price surged 7% when it scrapped development plans for the 747X in
January 1997, and declined 1.7% when the company revived the idea two years later - at
a cost of $4 Billion - to compete with the Airbus 380 (Wall Street Journal 1997, Dresdner
Kleinwort Benson Research 2000).
Faced with high product innovation uncertainty and pressure for financial results,1
managers want to focus on those innovations that persistently increase not only top-line
performance, but also bottom-line and stock market performance for their firm relative to
industry competitors (Financial Times 2004). Indeed, managers are often rewarded based
on relative performance measures (Lev 1969), and are urged to ‘run faster than
competitors’ in good times and bad times (D’Aveni 1994). As to the latter, while e.g.
minor product improvements and sales promotions fail to raise firms out of an industry
recession, they may enable them to outperform competitors and endure till better times

2
arrive. Therefore, “an increase in our understanding of how and why firms benefit from
new product activity relative to industry competitors is an important area for future
research” (Bayus et al. 2003).
This study examines how environmental and firm-strategy factors shape the long-
term effects of product innovation and price discounting on relative firm stock market
performance. For our empirical analysis, we focus on one industry in order to enhance the
internal validity of our research (Prabhu, Chandy and Ellis 2005). We choose the car
industry as a case in point, because of its economic importance and its reliance on both
new product introductions and sales promotions. Indeed, the automobile business
represents over 3% of the US Gross Domestic Product (J. D. Power and Associates 2002)
and consumers have come to expect a steady stream of styling innovations (Menge 1962,
Farr 2000). In this context, the main thrust of competition is in product development,
with each company trying to compete in every segment of the market, “with a plethora of
niche models designed to attract a particular group of consumers, and to renew them
rapidly enough to keep interest fresh” (The Economist 2004, p.14).
However, the costs of such styling changes can be substantial (White 2001), and their
success is far from certain (Farr 2000). Therefore, the large automobile firms face
innovation investment decisions across distinct product ‘segments’, which differ in
market attractiveness and competitive advantage factors. Finally, we believe that findings
in this industry will be generalizable to other settings, as a recent meta-analysis finds
little industry-specific effects of innovation performance and instead argues that, while
high returns may not be sustainable in any particular market, the process of generating
high returns can be sustainable (Capon et al. 1996, p. 214).

3
The remainder of this paper is organized as follows. Section 2 develops our
conceptual framework, while section 3 presents our methodology. We introduce our
dataset in chapter 4 and our empirical results in sections 5 and 6. Section 7 concludes
with managerial implications and suggestions for future research.
2. DRIVERS OF FIRM VALUE IMPACT
In their extensive review of innovation and financial performance, Capon et al. (1996)
describe a variety of competing explanations for superior firm performance that can be
organized in market environment and firm-strategy factors. Among those, we focus on
market, firm and product characteristics, which are better predictors than process
characteristics, yet have not been analyzed as often (Hernard and Syzanki 1998).
Furthermore, these competing explanations often require relatively complex statistical
techniques for empirical analysis. In particular, it is important to use longitudinal
analyses to assess the temporal stability of the key performance drivers (Montoya-Weiss
and Calantone 1994) and because new-product performance persists over time (Capon et
al. 1996, Pauwels et al. 2004). Thus, our conceptual framework should capture the main
new product performance drivers identified in previous research, and our methodological
framework should allow for persistent effects of changes in these performance drivers.
Cooper (1999) distinguishes two broad classes of critical success factors: doing the
right projects, and doing projects right. Doing the right projects is captured by a number
of external or environmental success factors that are crucial when selecting and
prioritizing projects. Environmental factors include market potential and market
competitiveness, while firm-strategy factors include company resources and product

4
advantage (Montoya-Weiss and Calantone 1994). Likewise, a recent meta-analysis
revealed that superior firms (1) operate in high-growth markets with little and weak
competition, (2) have exposure to international market, (3) attempt to enter markets early
and thus secure more revenues in introductory/growth stage products, (4) spend more on
R&D, and (5) spend a higher percentage of sales on advertising (Capon et al. 1996).
Therefore, we analyze both environmental and firm-strategy factors suggested in
previous research.
2.1 Market characteristics
How new-product introductions impact firm performance and therefore firm value
depends critically on market characteristics such as market size, growth and
concentration (Gatignon and Xuereb 1997). We examine these characteristics in turn.
2.1.1 Market size
The strength of market demand is an important factor in new product performance, and
many firms neglect market size assessment at their own peril (Cooper and Kleinschmidt
1993; Henard and Szymanski 2001). A first component of demand strength is the overall
size of the market or segment. Interestingly, market size may both benefit and harm the
performance impact of a new-product introduction. On the one hand, large markets
enable firms to spread their fixed R&D and launch costs over a greater number of
potential customers. On the other hand, large markets are also important to competitors,
and thus will draw more competitive innovation and attention.
H1: Market size increases the new product impact on firm value.
5
2.1.2 Market growth
When market demand is growing, it is easier for all competitors to acquire and retain
customers and earn profits (Cooper 1999; Scherer 1980). Competitive reactions to new
product introductions, for instance, are likely to be less aggressive when sales are
growing at a satisfactory rate, which is true especially when the new products itself
increase primary demand (Frey 1988). Likewise, advertising reactions to new product
introductions are less likely in growing versus static markets (Cubbin and Domberger
1988). Furthermore, investors are likely to reward share gains in growing markets
because the returns are expected to grow as the market grows (Day 1986). Market growth
rate is an important indicator of new product performance in the long run, as incorporated
in popular management tools such as the BCG matrix (Best 2004). Indeed, firms that
target high-growth markets achieve higher sales and financial performance (Bayus and
Putsis 1999, Capon et al. 1996). Therefore, we expect:
H2: Market growth rate increases the new product impact on firm value.
2.1.3 Competitive Structure
New product success also depends on the competitive conditions in the market, including
market concentration (Copper and Kleinschmidt 1993; Capon et al. 1996). When faced
with only a few competitors, firms can routinely monitor the competition, enabling them
to react quickly (Bowman and Gatignon 1995). Such reaction may decrease the relative
performance impact of new-product introductions in concentrated markets, which in turn,
reduces their attractiveness to investors.

6
H3: Concentration decreases the new product impact on firm value.
2.2 Firm and brand characteristics
The industrial organization and marketing strategy literature place considerable emphasis
on firm characteristics and how they can be used to compete, affecting new product
performance (Day 1984; Narver and Slater 1990). Firm-strategy factors include both
characteristics of the firm and firm-market synergies (Capon et al. 1996; Henard and
Szymanski 2001, Montoya-Weiss and Calantone 1994).
2.2.1 Pioneering innovations
While new product introductions benefit firm value and profitability on average, more
innovative products score a higher impact on firm value (Chaney et al. 1991, Pauwels et
al. 2004). Indeed, relative advantage is a consistently important determinant of adoption
rate (Holak and Lehmann 1990) and new-product success (Montoya-Weiss and
Calantone 1994). Likewise, the pioneering nature of the firm’s innovations indicates to
what extent it is cutting edge (ibid). One classification of pioneering innovations is based
on technological discontinuities that "advance by an order of magnitude the technological
state-of-the-art which characterizes such industries” (Anderson and Tushman 1991, p 27).
Highly innovative products "offer the possibility for greater long-term financial gain
given the possibility of revolutionizing the category". Therefore, they will surpass
moderately innovative products in terms of their profits and return-on-investment
(Kleinschmidt and Cooper 1991; Pauwels et al. 2004). Moreover, investors may view
such pioneering innovations both as platforms for future product introductions and as

7
signals that the firm is successful at the innovation process. Finally, pioneering
innovations offer new strategic choices for the firm by providing the opportunity to
leverage these to future products. For example, Dupont has leveraged their invention of
nylon and Teflon in a series of successful new-product introductions in a variety of
categories. In contrast to pioneering innovations, an innovation that is similar to existing
products cannot be highly differentiated and therefore will not have a major advantage
over existing competitors. Hence,
H4: Pioneering innovations increase the new product impact on firm value.
2.2.2 Perceived quality and appeal
In general, marketing theory predicts that a firm that serves the needs of its customers
better, especially by providing products that are superior to the competition, will be more
successful (Cooper 1999; Griffin and Hauser 1993). In other words, innovations that
create and deliver added consumer value contribute significantly to the success of brands
(Kashani et al. 2000). The new-product literature has consistently related innovation
success to the relative advantage or the product’s ability to provide benefits and features
not offered by alternative products (Cooper and Kleinschmidt 1990, Hollak and Lehmann
1990, Henard and Szymanski 2001). Customer-focused measures of this relative
advantage include customer appeal, quality and satisfaction. Investors are likely to
respond to improvements in such customer perception scores (Aaker and Jacobson 1994).
H5: Perceived quality and appeal increase the new product impact on firm value.

8
2.2.3 Brand advertising
Investors value a product based on its likelihood of commercial success. The role of
marketing investments in the success of new products has been well documented (e.g.
Cooper and Kleinschmidt 1990, Cooper 1999). Specifically, advertising builds
awareness, which is an essential component of new-product success. Firms that spend
more marketing resources, such as advertising and promotional budgets, can better
sustain the innovation and hence increase the adoption rate of their new products
(Chandy and Tellis 2000). Indeed the marketing literature highlights new product
introduction as requiring increased advertising spending (Bly 1993). Moreover, the
investments in brand equity through advertising can reduce consumers’ perceived risk,
particularly for radical innovations (Dowling and Staelin 1994). Similarly, investors may
view marketing investments such as new-product advertising as evidence of higher
product quality, which in turn is associated with higher market value (Joshi and Hanssens
2004). Investors also react favorably to firms’ shifting their strategic emphasis from value
creation, i.e. innovation and product development activities; to value appropriation, i.e.
extracting profits in the marketplace through more intensive product marketing (Mizik
and Jacobson 2003). Hence, we hypothesize that:
H6: Investments in brand advertising increase the new product impact on firm value.
2.2.4 Firm market share
The firm’s current market share in a category may impact the long-term performance
impact of its innovations in several ways. A firm’s high market share within a served
segment typically results from a strong relative advantage in that segment (Phillips,

9
Chang and Buzzell 1983). Insofar as this position brings with it a strong vested interest in
and commitment to that market due to its strategic importance for the firm, market share
could enhance new-product effectiveness. At the same time though, dominant firms 1)
have more to lose from cannibalization, which could jeopardize the price premiums on
their established products, and 2) are prone to inertia (Ghemawat 1991, Chandy and
Tellis 2000). Similarly, firms with a large share of a category may become complacent in
that market as their managerial priorities shift to other, higher-growth opportunities
(Kashani 2003). Other studies claim that incumbents are slow not only in introducing
radical innovations, but also lag the industry in introducing minor changes (Henderson
and Clark 1990).
H7: Dominance in a segment decreases the new product impact on firm value.
Last but not the least, an important contributor to new product effectiveness is the role of
firm-specific heterogeneity in providing a sustainable competitive advantage (e.g.
Wernerfelt 1984). For instance, the greater the resources of the firm, the more the market
power, which is a competitive advantage that translates into great effectiveness of the
new product introduction. These advantages can be in part due to the ability to invest
greater resources into the design of superior new product innovations. The finance
literature suggests that larger firms face less risk and that the market uses a smaller
discount rate when evaluating their future prospects (see e.g. Aldrich and Auster 1986).
While we control for firm-specific heterogeneity by including firm-specific dummy
variables, we do not advance hypotheses for these effects. Instead, we will discuss the
firm-specific findings in an exploratory fashion.

10
Our research framework outlined above is summarized in Figure 1.
---Insert Figure 1 about here ---
In summary, previous literature enabled us to identify factors that may moderate the
impact of new product introduction on firm value. In contrast, little research exists on
moderating factors of the firm value impact of promotions, despite their rising
prominence in many industries. Therefore, we investigate how the promotional impact on
firm value depends on the same market, firm and product factors.
In summary, the extant literature suggests that relative innovation plays an important role
in explaining the sales, financial and stock market performance of firms.
3. RESEARCH METHODOLOGY
In order to enable comparison with previous findings, the econometric modeling of
innovation and promotion effects is based on the approach used in Pauwels et al. (2004).
We follow a three-step procedure. First, we perform unit-root tests for each brand’s
performance and marketing variables. Second, based on the test results, we include the
performance and the marketing variables in Vector Autoregressive (VAR) models, as
presented in equation 1. We operationalize stock market performance as the firm’s
market-to-book ratio (Miller and Modigliani 1961, David et al. 2002). Earnings are
measured as earnings from operations (Allyannis and Weston 2003). Second, based on
the coefficient estimates, we derive impulse response functions to quantify the over-time
effects of product innovations on the performance variables. Finally, we relate the long-
term performance effects of new products to the car model’s innovation strategy in a

11
weighted-least squares regression in order to verify our proposed hypotheses (see e.g.
Srinivasan et al. 2004).
Following the results of unit-root tests in Step 1, the VAR model for each brand j in
category k from firm i, is specified as
,, ,
, ,
, ,1
, ,,
, ,
& 500VBRi t
INC
i t i t nt
i t i t nN t
ni t i t ntn
ijk t ijk t ni t
ijk t ijk t n
RVBR RVBR uS P
RINC RINC uConstruct
C BRREV RREVExchange
RNPI RNPIEPS
RSPR RSPR
−
−
−
=−
−
∆ ∆ ∆ ∆ ∆ ∆ = + × + Γ× +∆ ∆ ∆ ∆
∑,
,
,
,
(1)i t
REVi t
NPIijk t
SPRijk t
uuu
with Bn, Γ vectors of coefficients, [uVBRi,t, uINCi,t, uREVi,t, uNPIijk,t, uSPRijk,t]' ∼N(0,Σu), N the
order of the VAR system based on Schwartz’ Bayes Information Criterion (SBIC), and
all variables are expressed in logarithms or their changes (∆). In this system, all of the
variables are defined relative to competition. Such relative marketing and performance
benchmarks enjoy a long tradition in both marketing (Cooper and Nakanashi, 1988;
Carpenter et al. 1988) and finance (Lev 1969). Table 1 provides details on the
operationalization of the variables in the VARX model.
---Insert Table 1 about here ---
The first equation explains changes to firm value,2 operationalized as the ratio of the
firm’s market value to book value (RVBR) (Miller and Modigliani 1961), defined relative
to the competition. This variable reflects a firm's potential growth opportunities and is
used frequently for assessing a firm's ability to achieve abnormal returns relative to its
investment base (David et al. 2002). The second and third equations explain the changes
in, respectively, bottom-line (RINC) and top-line financial performance (RREV) of firm i.
The fourth and fifth equations model firm i's marketing actions, i.e. new-product
introductions (RNPI) and sales promotions (RSPR) for brand j in product category k.3

12
Note that in this VAR model, all endogenous variables are specified in relative-to-
competition terms; thus, competitive activity is endogenous in our model.4 In addition,
we estimated as the benchmark model, the VAR model specified in Pauwels et al 2004
(equation 1), with the same variables in absolute terms. This benchmark model facilitates
comparisons with our 'relative-to-competition' model.5
We control for seasonal demand variations in the vector C (Labor Day weekend,
Memorial Day weekend and the end of each quarter), and for fluctuations in the overall
economic and investment climate (S&P 500, Construction Cost index6 and dollar-Yen
exchange rate).
The VAR model (1) is estimated over three separate time windows -- June 1996- June
1998, June 1998- June 2000 and June 2000- June 2002 for the brands outlined in Table 2.
As a result, 159 sets of VAR parameters and corresponding impulse-response functions
are estimated and set aside for the weighted-regression models in the third step of this
research.
4. DATA DESCRIPTION AND VARIABLE OPERATIONALIZATION
We focus our analysis of the 1996-2002 automobile industry on Chrysler, Ford,
General Motors, Honda, Nissan and Toyota, representing about 86% of the U.S. car
market. Our data come from four major sources, J.D. Power & Associates (JDPA) for
weekly sales and marketing, CRSP and COMPUSTAT for firm performance, and I/B/E/S
for earnings.
Sales transaction data from J.D. Power & Associates are available for a sizeable
sample of dealerships in the major metropolitan areas in the US. We use data from
California dealerships, containing every new car sales transaction in a sample of 1,100
dealerships from October 1996 through June 2002. The detailed data for this region are

13
representative of other US regions, whose data periods are shorter. Each observation in
the JDPA database contains the transaction date, the manufacturer, model year, make,
model, trim and other car information, the transaction price, and sales promotions,
operationalized as the monetary equivalent of all promotional incentives per vehicle.
Moreover, this dataset is at the detailed ‘vehicle’ level, defined as every combination of
model year, make and model (e.g., 1999 Honda Accord, 2000 Toyota Camry), body type
(e.g., convertible, coupe, hatchback), doors (e.g., 2 door, 4 door, 4 door extended cabin),
trim level (e.g., for Honda Accord, DX, EX, LX, etc.), drive train type (e.g., 2WD,
4WD), transmission type (automatic, manual), cylinders (e.g., 4 cylinder, V6),
displacement (e.g., 3.0 or 3.3 liters) (Scott Morton, Zettelmeyer and Silva-Risso 2001).
The vehicle information is aggregated to the brand level, representing a company’s
presence in a certain category. For example, Chevrolet, GMC and Cadillac are the three
General Motors brands in the SUV category.
A second source of JDPA data is expert opinions on the innovation level of each
vehicle redesign or introduction. In line with the JDPA (1998) guidelines, these experts
rate such innovativeness on the 5-point scale presented in Table 2.
--- Insert Table 2 about here ---
Our innovation scale ranges from mere trimming and styling changes (levels 1 and 2)
to ‘design’ and ‘new benefit’ innovations (levels 3 and 4) to brand entry in a new
category (level 5). An example of level 1 is the 2002 Toyota 4Runner with minor exterior
styling changes, of level 2 is the 1999 Ford Explorer with minor updates to interior and
exterior, of level 3 is the 1998 Isuzu Rodeo with a major change to vehicle platform, of
level 4 is the 2001 Ford Explorer with a major change to a new platform and with
additional 'third-row' seating and, of level 5 is the 2001 Acura MDX. Furthermore, when
there are no visible changes between model years, an innovation value of zero is

14
assigned.7 These expert ratings operationalize our variable ‘new-product introduction’,
timed at the moment of their launch in the market. Innovation is defined at the brand
level as the maximum innovation level for all the brand’s vehicle changes in that
particular week.8
We consider 53 brands in six major product categories: SUVs, minivans, mid-size
sedans, compact cars, compact pickups and full-size pickups as shown in Table 3.
--- Insert Table 3 about here ---
Our measure of firm value is based on the comprehensive data set of firm market
capitalization and daily market indices (S&P500) of the NYSE obtained from the Center
for Research in Security Prices (CRSP). For firm-specific information and quarterly
accounting information such as book value, revenues and net income, we use the
Standard and Poor's 1999 COMPUSTAT database as in Pauwels et al. (2004).
Additionally, the COMPUSTAT dataset also provides monthly indices of the
Construction Cost Index and the Consumer Price Index (CPI). The CPI is used to deflate
all monetary variables. Finally, the I/B/E/S database provides quarterly analyst’ earnings
forecasts for the six major manufacturers in this study, Chrysler, Ford, General Motors,
Honda, Nissan and Toyota, representing about 86% of the U.S. car market. Table 4
shows that, during the period of observation, some of these categories experienced an
abundance of major and minor innovations (SUVs and full-size pickups) or a dominance
of major innovation (minivans), others saw a more moderate amount of innovation (mid-
size and compact cars) and yet others were characterized mainly by minor changes
(compact pickups).
--- Insert Tables 4 and 5 about here ---

15
Table 5 provides a listing of the brands in the study along with the descriptive
statistics for the measures that form the basis of our analysis. The operationalization of
the market, brand and firm characteristics in summarized in Table 6.
--- Insert Table 6 about here ---
For the “pioneering” innovation variable, in line with the JDPA (1998) guidelines,
JDPA experts rate such innovativeness as pioneering (level=1) or not (level=0). An
example of level 1 for the premium car category is the 2001 Toyota Prius, the first
gasoline-hybrid that could function as a versatile family car. In the truck category,
examples of pioneering innovations are: i) the 2002 Chevrolet Avalanche series, which
by incorporating a unique convertible cab system could transform itself from a five-
passenger sport-utility with a 5-foot-3-inch bed, into a standard cab pickup with a full 8-
foot-1-inch utility bed and, ii) the 2002 Lincoln Blackwood, introduced by Ford as a
cross between a luxury SUV and a pickup truck. Turning to the SUV category, examples
of pioneering innovation are: i) the 1999 Lexus RX300, the first car-based SUV designed
to compete in the luxury SUV segment and, ii) the 1998 Dodge Durango, the first mid-
size SUV to offer eight-passenger seating in its class, i.e., providing minivan
functionality, while offering the most cargo space in its class and three-and-a-half tons of
towing capacity. In fact, the Dodge Durango was considered the most versatile sport-
utility on the market at launch. Finally, turning to the minivan category, an important
pioneering innovation is the 1999 Honda Odyssey, which introduced a remarkable feature
for the first time: its hideaway, or "magic" seat.

16
5. EMPIRICAL RESULTS
The 159 estimated VAR models, (for each of the 53 brands in each of the 3 time
windows), with the number of lags selected by the SBIC showed good model fit (the F-
statistic ranges from 4.13 to 13.78, and the R2 ranges from 0.22 to 0. 72).9 We first
review our results on the performance impact of new-product introductions and sales
promotions of the benchmark model, which is the model estimated in Pauwels et al.
(2004). Next, we discuss how these effects differ for the relative-to-competition models.
Finally, we examine what brand, market and firm characteristics impact the long-term
effects of product innovation and price discounting on firm value.
5.1 Impact of new-product introductions and sales promotions on firm value --
Benchmark model
Table 7 shows the frequency of positive stock-market performance effects for brand-
level product introductions and promotions on firm-level performance10 over all 53x3
brands/windows for six categories and six companies. While short-run firm value effects
can be different across categories, they are positive for the most part. The long-run effects
of new-product introductions show a predominantly positive effect on firm value in each
of the six categories. Over the total sample, new-product introductions have a positive
long-run impact on market capitalization for 78% of all brands, confirming the previous
findings in Pauwels et al. (2004).
--- Insert Table 7 about here ---
Turning to sales promotions, while there is considerable entropy in the short run, the
effects of sales promotions on firm value are negative in the long run for over 60% of the
brands, once again confirming the findings in Pauwels et al. 2004. This result does not

17
necessarily imply that firms should abstain from sales promotions, which may be the only
means of bridging the long lead-time till the next great new product. In such cases, sales
promotions may temporarily correct gaps between demand and supply, and thus keep the
factories running.11 This scenario is consistent with our findings, as financial markets
apparently recognize that sales promotions signal the firm has fallen behind in the
innovation race. In other words, our results should not be interpreted to mean that
eliminating promotions would increase firm value.
Next, we examine the effect of new product introductions and promotions on
performance relative to competition, using the VAR model specified in equation (1).
5.2 Impact of new product introductions and sales promotions on relative firm value
The effects of relative innovation and promotions on the relative performance levels are
summarized in Table 8.
--- Insert Table 8 about here --
Overall, the short-run effects are similar, as both innovation and promotion effects have
high entropy. However, the long-run effects differ from those of the benchmark model on
absolute levels of performance and marketing activity. The frequency of positive new-
product effects in the long run is only 64%, as compared to the 78% for the benchmark
model. Similarly, the incidence of positive incentive program effects in the long run is
58%, as compared to 41% for the benchmark model. Thus, relative to competition
analysis suggests that innovations are not as predominantly beneficial and sales
promotions are not as predominantly detrimental across all brands and categories. The
former finding reflects the highly competitive nature of the car industry, where firm value
benefits are partly negated by competitive innovations. The latter finding confirms

18
managerial rationale for sales promotions to strengthen their position relative to
competitors, even when they fail to raise absolute firm value.
Second, for both new product introductions and promotions, the relative effects on
firm value differ significantly across brands and categories. Accordingly, a relevant
question from a manufacturer's standpoint is: what are the drivers of firm value impact of
innovations and promotions? In general, we expect that this finding is moderated by
several characteristics of the brand and market.
6 SECOND-STAGE ANALYSIS: MODERATORS
Our first-stage results on firm value impact reveal that, on average, innovations and price
promotions are not equally beneficial across brands and categories. The second stage
explores the drivers of innovation and promotional impact on firm value. As such, we try
to take maximum advantage of both the temporal (first stage) and cross-sectional (second
stage) richness of the data. While prior marketing theory outlined in Section 2 drives our
second-stage analysis for innovation effects, in contrast, our analysis of promotion effects
is exploratory in nature. Econometrically, the second stage uses weighted least-squares
estimation on three second-stage equations, using the firm value impact as the dependent
variables. The weights are the inverse of the standard errors of the dependent variables,
and account for the bias caused by statistical error around our first-stage estimates. The
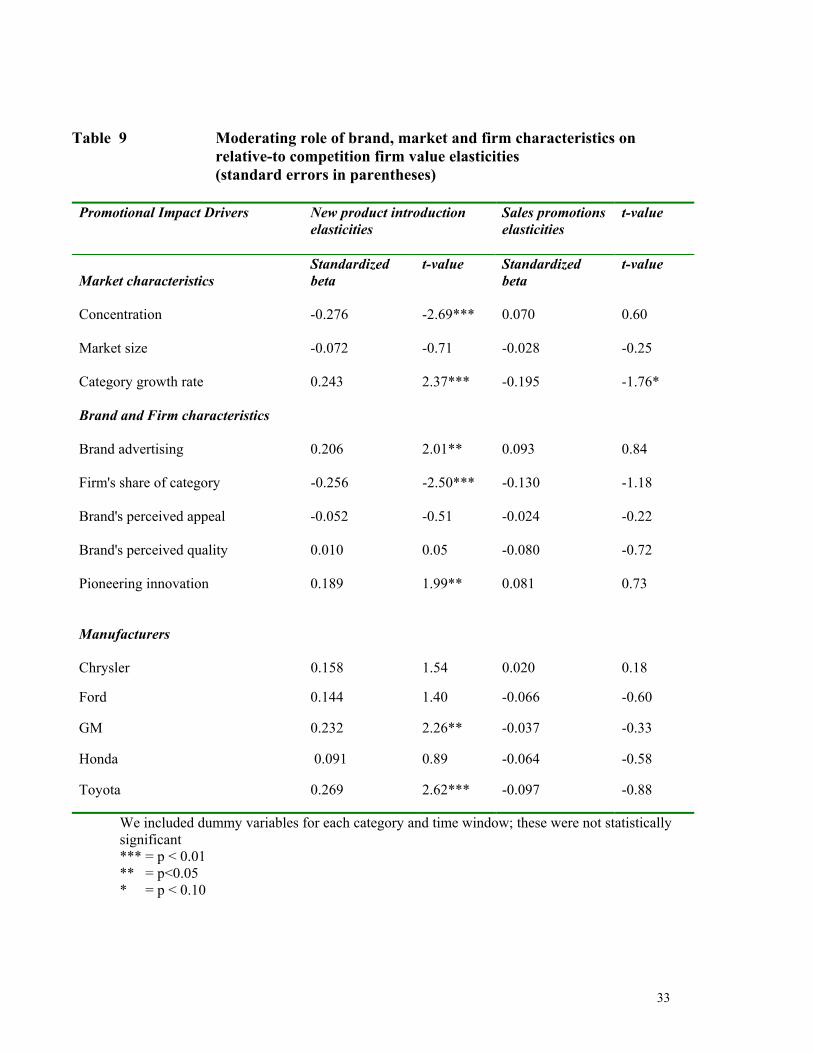
findings of this second-stage analysis are presented in Table 9.12
--- Insert Table 9 about here ---

19
6.1 Drivers of innovation effects on firm value
6.1.1 Market characteristics
Table 9 shows that the total new product introduction effect is moderated by two
market characteristics: category growth and concentration. First, the higher the market
growth rate, the higher is the impact of new products on firm value, which supports
hypothesis H2. Thus, market growth is an important indicator of new product
performance in the long run. Consequently, investors reward firms that target high-
growth markets. This finding extends previous literature on the positive relation between
market growth and sales performance (Bayus et al. 2001; Capon et al. 1996).
Second, the higher the market concentration, the lower the impact of new
products on firm value, consistent with hypothesis H3. In concentrated markets, a new
product introduction poses a threat to competitors’ profitability and thus competitors are
more likely to react faster and more aggressively (Bowman and Gatignon 1995). Hence
investors reward new product introductions in such categories to a lesser degree.
In contrast to hypothesis 1, market size does not significantly affect the firm value
impact of new product introductions. As we suggested before, large market benefits may
be offset by higher competitive attention to these markets.
6.1.2 Firm and Brand characteristics
Consistent with hypothesis 4, pioneering increases the firm value impact of
product innovation. Investors indeed reward such pioneering innovations both as
platforms for future product introductions and as signals that the firm is successful at the
innovation process. Overall, truly innovative breakthroughs achieve considerable long-
term benefits. For example, the introduction by Toyota of the first car-based luxury SUV
(Lexus RX 300) was instrumental in Lexus achieving the leading position in the US

20
luxury market. Thus, we find that investors value a firm's pioneering innovations
because they are viewed as more rewarding despite higher risks (Kashani et al. 2000).
The higher the brand advertising expenditure, the higher the impact of new
product introductions on firm value, as hypothesized in H6. This suggests that investors
reward innovative firms that put greater emphasis on extracting profits from their
innovations, i.e. value appropriation, supporting the findings of Mizik and Jacobson
(2003).
As for market share, the higher the market-share dominance in a category, the
lower the new-product performance impact on firm value (H7). This result supports
previous findings that dominant firms in a category are less likely to have success in
innovations (Chandy and Tellis 2000). There are three possible explanations for these
results. First, new product introduction effectiveness can be lower for dominant firms
since they have more to lose from cannibalization. In addition, such new-product
introductions may affect the premium such firms can extract from their current products.
Moreover, dominant firms in a category are prone to inertia causing them to be less
aggressive in innovations. In contrast, firms that are not dominant in a given category
may work assiduously at improving their market standing and are rewarded by investors
accordingly.
As for the brand's perceived appeal and quality, these are not significant, contrary
to hypothesis H5. A possible explanation is that JD Power and Associates' perceived
appeal and quality ratings are obtained from current vehicle owners of the automobile
brand. Even though such subjective performance measures are the most commonly used
in marketing strategy research (Gatignon and Xuereb 1997), it should be noted that those
surveys are not intended to capture how consumers who do not own the car perceive its
appeal and quality. Hence, our findings on these effects are not entirely surprising.

21
Finally, an important contributor to new-product effectiveness is the role of firm-
specific heterogeneity in providing a sustainable competitive advantage (e.g. Wernerfelt
1984). Our findings suggest that the two manufacturers that are rewarded significantly
more by investors are General Motors and Toyota. We offer two possible explanations
for this finding. First, GM and Toyota are the two largest auto manufacturers, in terms
of sales revenues and market shares, in the global marketplace. Thus they enjoy superior
economies of scale in manufacturing, R&D, advertising and communication and
distribution networks, relative to their smaller competitors. Second, GM and Toyota have
the most complete line-up in all the segments of the market, relative to the competitors.
Hence, they can reap greater benefits from economies of scope in new-product
introductions, as compared to their competitors. Moreover, investors may recognize that
these two firms can better spread the new-product investment costs over their complete
line-up, resulting in higher overall firm value effects.
6.2 Drivers of promotional effects on firm value
Table 9 shows that the total promotional impact on firm value is moderated only
by category growth rate. Indeed, the lower the category growth rate, the higher the total
promotional impact on firm value. Such low-growth rates are typical for the maturity or
decline phase of the product life cycle and therefore would not be good candidates for
major new-product introductions. Consequently, investors may reward price promotions
as a necessary tool to maintain the brand's competitive position in such markets.
Conversely, de-emphasizing price promotions may weaken the firm's market position in
an already saturated market.
Overall, a striking contrast in the second-stage analysis is that there are important
brand- and market- specific factors associated with product innovation impact, but not

22
promotional impact. Thus only new-product introductions can be managed strategically
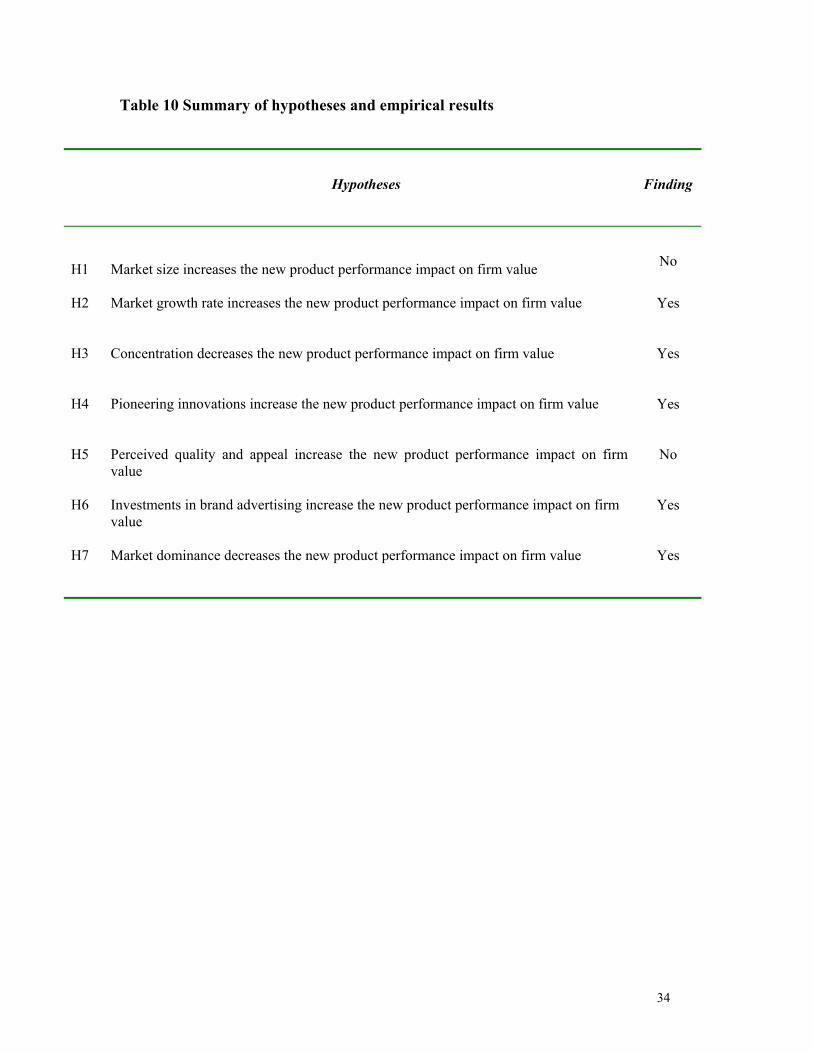
for competitive advantage in investor markets. The main findings on these drivers are
summarized in Table 10.
---Insert Table 10 about here---
7. CONCLUSIONS AND MANAGERIAL IMPLICATIONS
This paper has investigated the impact on firm value of new product
introductions. The breadth of the sample allows us to derive empirical generalizations on
relative innovation and promotion effectiveness13 and its drivers. We group our findings
on the firm value effects of new product introductions, promotions and moderators of
these effects, and summarize as follows:
(i) Focusing on absolute performance levels, new product introductions have positive
effects on firm value.
(ii) While investors typically view product introduction favorably, what really
differentiates firms is the extent of innovation relative to competition. Not all
firms benefit equally from new product innovations. It appears especially
important to analyze firm value benefits relative to competition, as the findings
differ from previous literature on absolute effects. Indeed, relative to competition
analysis suggests that innovations are not as predominantly beneficial and sales
promotions are not as predominantly detrimental across brands and categories.
(iii) There are significant moderators of product innovation effectiveness. First, firm
value impact of new-product introductions is higher in high-growth categories
that are less concentrated. Second, firm value impact of new-product
introductions is higher for pioneering innovations that are backed with high

23
advertising investments. Thus, pioneering brands that create and deliver
differentiated added value to consumers enjoy a higher firm value effect of their
innovations. Third, firm value impact of new product introductions are higher for
firms with a smaller share of the category. Thus while the race for innovation
advantage applies to both category leader and challengers, the stakes are by no
means the same. Unlike the dominant brands in a market, smaller players that pull
ahead of the competition gain a significant boost in firm value. Thus, our findings
suggest that new-product introductions can be a strategic way for firms to build
competencies in new categories.
(iv) Finally, while there are important brand- and market- specific factors associated
with product-innovation effectiveness, we have not found such systematic drivers
for promotional effectiveness. Consistent with current industry practice, sales
promotions appear the one-size-fits all solution to bridge the gaps between supply
and demand.
This study has several limitations that provide interesting avenues for future research.
First, we analyzed only one industry, albeit one in which product innovation and
consumer incentives are a major part of marketing strategy. A validation of our results in
other industries is an important area for future research. Second, researchers may
investigate consumer acceptance ratings prior to launch and thus may help predict the
performance impact of specific innovations. Third, future research could allow for non-
linear relations between innovation and promotional impact and the second-stage
characteristics, as well as the potential endogeneity of these characteristics. Finally, we
did not consider launch strategy or innovation process measures, both of which have been

24
researched extensively in the past.
In conclusion, the marketing literature to date has provided a number of insights on
the benefits and risks of product innovation for consumers and firms. This research adds
an important dimension to this knowledge: the investor community rewards innovative
firms by their willingness to pay a premium in valuation, and this premium depends on
the innovations of the firms relative to competition. Furthermore, innovation policy can
be managed strategically for competitive advantage in the investor markets, since there
are important brand- and market- specific factors associated with their effectiveness.
Staying ahead in the innovation race and continuing to invest in enhanced
consumer value relative to competitive offers are thus key imperatives from an investor
standpoint. Moreover, while innovations have a positive impact on firm value, the impact
may turn out to be negative if the firm fails to manage innovation strategically. First, an
innovation that is similar to existing products (i.e. is not a pioneering innovation) cannot
be highly differentiated and therefore will not provide a major advantage over existing
competitors. Such innovations will fail to increase relative firm value. Second, if a firm
does not invest in communicating the differentiated value provided by its innovation, this
could undermine the firm value impact of the innovation. Third, dominant firms may
become complacent in their market, which creates opportunity for smaller market
challengers. In other words (The Economist, 2004, p.22), “the old car firms must reinvent
themselves to seek profit, not just market share. Otherwise new, nimbler competitors will
take advantage of technological change to do the job for them.”

25
Figure 1 Research Model
New Product introductions
Price promotions
Firm value
Firm characteristics Firm's share of category Firm-specific dummy
variable
Brand characteristics Advertising Pioneering brand Brand's perceived appeal Brand's perceived quality
Market characteristics Concentration Market size Category growth rate Category-specific effects

26
Table 1 Measures, operationalization and data sources
Measure
Variable
Endogeneity
Operationalization
Data sources
Relative Firm value RVBRi,t Endogenous The ratio of the firm i’s market value to the sum of market value of competing firms.
CRSP
Relative Top-line performance
RREVi,t Endogenous The ratio of the firm i’s revenue to the sum of revenues of all competing firms .
COMPUSTAT J.D. Power transactions
Relative Bottom-line performance
RINCi,t Endogenous The ratio of the firm i’s income to the sum of income of all competing firms.
COMPUSTAT J.D. Power transactions
Relative Product innovation
RNPIijk,t Endogenous The brand innovation variable is defined at the 'brand level' as the maximum of the innovation variable for all 'vehicle' transactions for brand j in category k in a particular week. Relative product innovation is the ratio of brand's innovation level to the sum of brand innovation for all competing brands in category k.
J.D. Power expert opinion J.D. Power transactions
Relative Sales promotions
RSPRijk,t Endogenous The monetary equivalent of all promotional incentives for brand j in category k in a particular week (relative to brands of competing firms in category k). Relative sales promotions is the ratio of sales promotion of the brand to the sum of sales promotions for all competing brands in category k.
J.D. Power transactions
S&P 500
S&P 500t
Exogenous
The S&P 500 index
CRSP
Construction Cost Index
CONSTRUCT t Exogenous The construction cost index CRSP
Dollar-Yen exchange rate
Exchanget Exogenous The dollar $/Yen ¥ exchange rate
Federal Reserve's Foreign Exchange (FX)

27
Table 2 JDPA expert rating scale on innovation level for car model changes
Innovation scale
Innovation Level Description
0
No visible change
1 only styling change, affecting grille, headlight and taillight areas
2 minor changes affecting sheet metal in front and rear quarter areas and minor changes to interior, but not to the instrument panel
3 major changes affecting exterior sheet metal and considerable change to interior, including instrument panel
4 all new sheet-metal including the roof panel, e.g. new platform or change from rear-wheel to front-wheel drive
5 new entry into the market

28
Table 3 Brands of the six leading car manufacturers
Category
Chrysler
Ford
General Motors
Honda
Nissan
Toyota
Sport Utility Vehicle (14)
Dodge, Jeep
Ford Lincoln
Chevrolet, Cadillac GMC, Oldsmobile, Buick
Honda
Nissan Infiniti
Toyota Lexus
Minivan (9)
Dodge, Chrysler
Ford Mercury
Chevrolet, Oldsmobile
Honda
Nissan
Toyota
Premium Mid-size cars (9)
Chrysler
Ford Mercury
Chevrolet Oldsmobile, Buick
Honda
Nissan
Toyota
Premium Compact cars (8)
Chrysler
Ford Chevrolet, Pontiac Saturn
Honda
Nissan
Toyota
Compact Pick-up (6)
Dodge
Ford Chevrolet,GMC
Nissan
Toyota
Full-size Pick-up (7)
Dodge
Ford Lincoln
Chevrolet, GMC,Cadillac
Toyota

29
Table 4 New product introductions in six car categories
Category
Major innovations
(Levels 3-5)
Minor innovations
(Levels 1-2)
Total
Sport Utility Vehicle 93 55 148 Minivan 26 6 32 Premium Midsize 23 19 42 Premium Compact 27 24 51 Compact pick-up 21 32 53 Full-size pick-up 72 35 107 Total
262 171
433
Table 5 Characteristics of the six leading car manufacturers Oct. 1996-Dec. 2001
Characteristic
Chrysler*
Ford
General Motors
Honda
Nissan
Toyota
Brands
Dodge,
Jeep Chrysler
Ford
Lincoln
Chevrolet, Cadillac
GMC, Buick, Saturn
Honda Acura
Nissan Infiniti
Toyota Lexus
Number of models
15 16 30 9 9 19
US Market share
15% 21% 28% 8% 4% 10%
Market capitalization ($ M)
48310 52475 41770 36100 15360 119140
Market capitalization to Book value
1.91 2.36 1.90 2.29 1.51 2.16
Quarterly firm earnings ($ M) 845 1612 988 559 -108 1079
Quarterly firm revenue ($ M) 29120 39520 43355 12792 13065 26780 # major introductions (Levels 3-5) 40 82 68 25 17
30
# minor introductions (Levels 1-2) 33 43 32 21 11 31 Sales promotions per vehicle ($)
640
390
640
25
200
120
* Chrysler’s merger into Daimler-Chrysler (October 1998) is accounted for in the Chrysler VAR model by including dummy variables (see Nijs et al. 2001 for a similar treatment of exogenous variables).

30
Table 6 Market and Firm-Specific Variables, operationalization and data sources
Variables
Variable
Operationalization
Data sources
Market size
MKTSIZEk,t
The segment sales in $s and units for category k
J.D. Power
Market growth
GROWTHk,t Segment sales growth rate for category k J.D. Power
Segment concentration
CONCk,t Market-share of top-three brands in category k J.D. Power
Brand advertising
ADVijk,t Advertising for brand j
LNA
Market position SHARE ik,t Market share for firm i in category k JD Power
Pioneer LEADINN1ijk,t Pioneering innovation vs catching up innovation for brand j in category k
JD Power
APEAL/Performance, Execution and Layout
APEALijk,t APEAL rating for brand j in category k JD Power
Initial Quality IQSijk,t Initial quality rating for brand j in category k
JD Power

31
Table 7 Impact of product introduction and rebates on firm value*
New-product introductions
Sales promotions
Short-term
Long-term
Short-term
Long-term
SUV 56% 79% 53% 38%
Minivan 53% 88% 54% 31%
Premium midsize 48% 74% 58% 37%
Premium compact 75% 73% 76% 49%
Compact pickup 65% 79% 83% 36%
Full-size pick up 62% 75% 78% 56%

32
Table 8 Impact of product introduction and rebates on relative-to-competition firm value*
New-product introductions
Sales promotions
Short-term
Long-term
Short-term
Long-term
SUV 60% 62% 52% 48%
Minivan 56% 56% 48% 48%
Premium midsize 41% 59% 59% 56%
Premium compact 64% 59% 67% 54%
Compact pickup 72% 67% 83% 61%
Full-size pick up 61% 83% 50% 78%
33
Table 9 Moderating role of brand, market and firm characteristics on relative-to competition firm value elasticities
(standard errors in parentheses)
Promotional Impact Drivers
New product introduction elasticities
Sales promotions elasticities
t-value
Market characteristics
Standardized beta
t-value Standardized beta
t-value
Concentration
-0.276
-2.69***
0.070
0.60
Market size
-0.072
-0.71
-0.028
-0.25
Category growth rate
0.243
2.37***
-0.195
-1.76*
Brand and Firm characteristics
Brand advertising
0.206 2.01** 0.093 0.84
Firm's share of category -0.256 -2.50*** -0.130 -1.18
Brand's perceived appeal
-0.052 -0.51 -0.024 -0.22
Brand's perceived quality
0.010 0.05 -0.080 -0.72
Pioneering innovation
0.189 1.99** 0.081 0.73
Manufacturers
Chrysler 0.158 1.54 0.020 0.18
Ford 0.144 1.40 -0.066 -0.60
GM 0.232 2.26** -0.037 -0.33
Honda 0.091 0.89 -0.064 -0.58
Toyota 0.269 2.62*** -0.097 -0.88
We included dummy variables for each category and time window; these were not statistically significant *** = p < 0.01 ** = p<0.05 * = p < 0.10
34
Table 10 Summary of hypotheses and empirical results
Hypotheses
Finding
H1
Market size increases the new product performance impact on firm value
No
H2 Market growth rate increases the new product performance impact on firm value Yes
H3 Concentration decreases the new product performance impact on firm value Yes
H4 Pioneering innovations increase the new product performance impact on firm value Yes
H5 Perceived quality and appeal increase the new product performance impact on firm value
No
H6 Investments in brand advertising increase the new product performance impact on firm value
Yes
H7 Market dominance decreases the new product performance impact on firm value Yes
35
References Aaker, David and Robert Jacobson (1994), "The Financial Information Content of Perceived Quality," Journal of Marketing Research, May, 191-201. Adams, Marjorie and Joseph Lacugna (1994), “And Now for Something Completely Different: ‘Really’ New Products,” Marketing Science Report No. 94-124. Cambridge, MA: Marketing Science Institute. Aldrich, Howard E, and Ellen Auster (1986), "Even Dwarfs Started Small: Liabilities of Age and Size and Their Strategic Implications." in Barry Staw and L.L. Cummings (eds.), Research in Organizational Behavior, Vol. 8, 165-198, Greenwich, CT: JAI Press. Allayannis, George and James P. Weston (2003), “Earnings volatiliy, cash flow volatility, and firm value,” Working Paper, Darden Graduate School of Business, University of Virginia. Anderson, Carl A. and Carl P. Zeithaml (1984), “Stage of the Product Life Cycle, Business Strategy, and Business Performance,” Academy of Management Journal, 27 (1) March, 5-24. Anderson, Philip and Michael L. Tushman (1991), “Managing through cycles of technological change,” Research Technology Management, 34 (3), 26-31. Bayus, Barry, Gary Erickson and Robert Jacobson (2003), “The Financial Rewards of New-product introductions in the Personal Computer Industry,” Management Science, 49(2), February, 197-210. ----, Sanjay Jain and Ambar Rao (1997), “Too Little, Too Early: Introduction Timing and New Product Performance in the Personal Digital Assistant Industry,” Journal of Marketing Research, 34 (February), 50-63. ---- and William P. Putsis (1999), “Product proliferation: an empirical analysis of product line determinants and market outcomes,” Marketing Science, (18), 137-153. Boulding, William, Ruskin Morgan and Richard Staelin (1997), “Pulling the Plug to Stop the New Product Drain,” Journal of Marketing Research, 34 (February), 164-176. Bowman, Douglas and Hubert Gatignon (1995), “Determinants of competitor response time to new-product introduction,” Journal of Marketing Research, 32, 42-53. Best, Roger (2004). Market-Based Management, 3rd Edition. Upper Saddle River: Prentice Hall. Business Week (1993), “Flops,” August 16, 76-82.

36
Buzzell, Robert D. and Bratley T. Gale (1987), PIMS Principles, The Free Press. Capon, Noel, John U. Farley and Scott Hoenig (1996), Toward integrative explanation of corporate financial performance, Kluwer Academic Publishers, Norwell MA. Carpenter, Gregory S., Lee G. Cooper, Dominique M. Hanssens and David F. Midgley (1988), "Modeling Asymmetric Competition," Marketing Science, 7 (4), Fall, 393-412. Chandy, Rajesh and Gerard J Tellis (2000), “The incumbents' curse? Incumbency, size and radical product innovation,” Journal of Marketing, 64(3), 1-17. Chaney, Paul, Timothy Devinney and Russ Winer (1991), “The impact of new-product introductions on the market value of firms,” Journal of Business, 64 (4), 573-610. Comanor, W.S. (1965), “Research and Technical Change in the Pharmaceutical Research”, Review of Economics and Statistics, 47(2) May, 182-190. Cooper, Lee G. and Masao Nakanashi (1988), Market-share analysis: evaluating competitive marketing effectiveness, Kluwer Academic Publishers, MA. Cooper, Robert (1999), “How New Product Strategies Impact on Performance,” Journal of Product Innovation Management, 1, 5-18. ---- and Elko J. Kleinschmidt (1990), “New Products: The Key Factors in Success,” Monograph, American Marketing Association, Chicago. ---- and ---- (1993), “The impact of Product Innovativeness on Performance,” Journal of Product Innovation Management, 10, 90-111. Cubbin, John and Simon Domberger (1988), “Advertising and Post-entry Oligopoly Behavior,” Journal of Industrial Economics, 37(December), 123-40. D’Aveni, Richard (1994), Hypercompetition, The Free Press, NY. David, Julie Smith, Yuhchang Hwang, Buck K.W. Pei and J. Hal Reneau (2002), “The Performance Effects of Congruence Between Product Competitive Strategies and Purchasing Management Design,” Management Science,8(7) July, 866-885.
Day, George S. (1984), Strategic Marketing Planning. New York: West Publishing Company.
Day, George S. (1986), Analysis for Strategic Market Decisions. St. Paul, MN: West Publishing Company.
Dowling, Grahame and Richard Staelin (1994), “A model of perceived risk and intended risk-handling activity,” Journal of Consumer Research (21), 119-134.

37
Dresdner Kleinwort Benson Research (2000),“The Business Case for the Double Decker,” May 8, 34.
Drucker, Peter (1973), Management: Tasks, Responsibilities and Practices, New York: Harper & Row.
Economist (2004), “A survey of the car industry,” September 4-10th.
Farr, Max (2000), “Automobile Industry,” Hoover’s Online. February.
Frey, John B. (1988), “Commentary on ‘Marketing Mix Reactions to Entry’,” Marketing Science, 7, 386-87. Gatignon, Hubert, and Jean-Marc Xuereb (1997), “Strategic Orientation of the Firm and New Product Performance,” Journal of Marketing Research, 34 (February), 77-90. Ghemawat, Pankaj (1991) "Market Incumbency and Technological Inertia," Marketing Science 10, 161-171. Griffin, Abbie and John R. Hauser (1993), “The voice of the customer,” Marketing Science, 12 (1), 1-28. Henard, David and David M. Szymanski (2001) “Why some new products are more successful than others,” Journal of Marketing Research, 38 (August), 363-375. Henderson, Rebecca M. and Kim B. Clark (1990), “Architectural Innovation: The reconfiguration of existing product technologies and the failure of established firms,” Administrative Science Quarterly, 35(1), 9-30. Holak, Susan and Donald R. Lehmann (1990), “Purchase Intentions and Dimensions of Innovation: an Exploratory model,” Journal of Product Innovation Management, 7, 59-73. Joshi, Amit and Dominique M. Hanssens (2004), "Advertising Spending and Market Capitalization," working paper, The Anderson School at UCLA. J.D. Power and Associates (2002), “GM Expresses New Confidence, ”Powergram, April 24. Kalyanaram, Gurumurthy, William T. Robinson and Glen L. Urban (1995), “Order of Entry: Established Empirical Generalizations, Emerging Empirical Generalizations, and Future Research,” Marketing Science 14, G212-221. Kashani, Kamran (2003), “The path to growth: the power of brand innovation,” Innovation Europe, 2003, p. 56-58.

38
Kashani, Kamran, Miller, Joyce and Clayton, Tony (2000), “A virtuous cycle: Innovation, consumer value, and communication: key findings for policy-makers and chief executives,” Lausanne, International Institute for Management Development. Kay, Neil (1979), The innovating firm: a Behavioral Theory of Corporate R&D, New York: St-Martin’s Press. Kleinsmidt, E.J. and Robert G. Cooper (1991), “The Impact of Product Innovativeness on Performance,” Journal of Product Innovation Management, 8 (December), 240-251. Lev, B. (1969),”Industry Averages as Targets for Financial Ratios,” Journal of Accounting Research, 7, 290-299. Mansfield, Edwin, John Rappoport, Jeromee Schnee, Samuel Wagner and Michael Hamburger (1971), Research and Innovation in the Modern Corporation, New York: W.W.Norton. McMath, Robert and Thom Forbes (1998), What Were They Thinking? New York: Business-Random House. Menge, John A (1962), “Style change costs as a market weapon,” Quarterly Journal of Economics, 76, 632-647. Miller Merton and Franco Modigliani (1961), “Dividend Policy, Growth and Value of Shares,” Journal of Business, October, 411-433. Mizik, Natalie and Robert Jacobson (2003), “Trading Off Between Value Creation and Value Appropriation: The Financial Implications of Shifts in Strategic Emphasis,” Journal of Marketing, 67, 1 (January), 63-76. Montoya-Weiss, M.M. and Roger J. Calantone (1994) “Determinants of new product performance: A review and meta-analysis,” Journal of Product Innovation Management (11), 397-417. Narver, John C. and Stanley Slater (1990), “The effect of market orientation on business profitability,” Journal of Marketing (54), 20-35. Nijs, Vincent, Marnik Dekimpe, Jan-Benedict. E.M. Steenkamp, and Dominique M. Hanssens (2001), “The category demand effects of price promotions,” Marketing Science, 20 (1), 1-22. Pauwels, Koen, Dominique M. Hanssens, and S. Siddarth (2002), “The long-term effects of price promotions on category incidence, brand choice and purchase quantity,” Journal of Marketing Research, vol. 34 (November), 421-439.

39
Pauwels, Koen, J. Silva-Risso, S. Srinivasan and D.M. Hanssens (2004) “New Products, Sales Promotions and Firm Value, With Application to the Automobile Industry”, Journal of Marketing, forthcoming, October. Phillips, L. W., D.R. Chang, and R.D. Buzzell (1983), “Product quality, cost position and business performance,” Journal of Marketing, 47 (Spring), 26-43.
Prabhu, Jaideep, Rajesh Chandy and M. Ellis (2005), “The Impact of Acquisitions on Innovation: Poison Pill, Placebo, or Tonic?” Journal of Marketing, forthcoming.
Scherer, Frederic M. (1980), Industrial Market Structure and Economic Performance. Chicago: Rand McNally. Scott Morton, Fiona, Florian Zettelmeyer and Jorge Silva-Risso (2001), “Internet Car Retailing,” Journal of Industrial Economics, Vol. XLIX, 4, December. Srinivasan, Shuba, Koen Pauwels, Dominique M. Hanssens and Marnik Dekimpe (2004), “Do promotions benefit retailers, manufacturers, or both?” Management Science, 50 (5), May, 617-629.
Wall Street Journal (1997), “Boeing’s747 Shifts Rivalry with Airbus,” January 22, A3. Wernerfelt, Birger (1984), A Resource-based View of the Firm,” Strategic Management Journal, 5 (2), 171-80. White, Joseph B. (2001), “Ford and GM Work to Restore Prestige of Lincoln and Cadillac,” The Wall Street Journal, Eyes on the Road, December 3. Wind, Yoram J. (1982), Product Policy: Concepts, Methods, and Strategy. Reading, MA: Addison-Wesley.
40
Endnotes
1 Precisely, the uncertainty associated with product innovation, may result in a mismatch between
expectations and market outcomes when the product is actually introduced. In those cases, firms may resort to promotions, such as price discounting, to close gaps between supply and demand.
2 Other measures of firm value include return on assets, return on sales and return on equity. However,
these measures focus on the short term, they are not risk-adjusted and their typical level of temporal aggregation makes it harder to make the link to specific new-product introductions. Furthermore, since accounting measures are based on historical data, they do not adequately reflect future expected revenue streams (Kalyanaram, Robinson and Urban 1995).
3 Following Pauwels et al. (2004), we define brand as what is typically known as “nameplates” in the
auto industry. For example, Chevrolet, GMC and Cadillac are three General Motors brands in the SUV category.
4 The practice in the auto industry is to set regular prices on an annual basis. Promotions are used
tactically to adjust the “net price” offered to consumers according to market conditions. Hence, we account for price endogeneity by including promotions as an endogenous variable in the VARX model.
5 The advertising data available to the study was annual manufacturer advertising from LNA. This
advertising is aimed at strategic “brand building” rather than weekly, tactical responses to market conditions. Hence, we include this advertising variable as a moderator in the second-stage analysis, rather than as an endogenous variable in the VARX model estimated at the weekly level.
6 While inclusion of the transportation index appears more relevant than the construction index, the big
six car manufacturers account for much of the variation in this index, which could cause an endogeneity bias. We performed a sensitivity analysis with the transportation index and found similar results.
7 As stated earlier, we investigate only the launch of new or updated products (which may incorporate
process innovations), not process innovations by themselves. 8 For example, if Toyota offers two redesigned SUV models in a particular week, with innovation levels
1 and 3, the new- product introduction variable takes on the value of 3 for the Toyota brand in the SUV category in that week.
9 Detailed results are available from the first author upon request. 10 We follow Pauwels et al. (2002) in adopting static weights (i.e. average share across the sample) to
compute the weighted prices, rather than dynamic (current-period) weights. 11 Based on personal conversations with several automobile manufacturer executives. 12 To examine potential multicollinearity, the pair-wise correlations for all of the variables were
examined, these range from |0.07| to |0.34| indicating that multicollinearity among the independent variables is not likely to be an issue.
13 See 5.1 for caveats on the interpretation of promotion results.