Status Report - 2012 - Center for Education and Human ...
182
1 SCHOOL SECTOR REFORM PROGRAM (SSRP) S S t t a a t t u u s s R R e e p p o o r r t t - - 2 2 0 0 1 1 2 2 Government of Nepal Ministry of Education Department of Education Sanothimi, Bhaktapur Nepal
-
Upload
khangminh22 -
Category
Documents
-
view
0 -
download
0
Transcript of Status Report - 2012 - Center for Education and Human ...
1
SSCCHHOOOOLL SSEECCTTOORR RREEFFOORRMM
PPRROOGGRRAAMM ((SSSSRRPP))
SSttaattuuss RReeppoorrtt -- 22001122
Government of Nepal
Ministry of Education
Department of Education
Sanothimi, Bhaktapur
Nepal
2
Acknowledgements
The Status Report, 2012 presents the overall progress scenario of program
implementation in Fiscal Year (FY) 2011-12. The report also highlights the
major achievements, problems faced and efforts made for resolving the
problems, issues and lessons learned during the implementation of programs,
such as; School Sector Reform Program (SSRP), Second Higher Education
Project (SHEP), Community School Capacity Development Program, Education
for All - Shisu Vikash program and Technical Education and Vocational
Training (TEVT) Soft Skill program. All programs are implemented by
Department of Education (DOE) in collaboration and coordination with other
Central Level Agencies (CLAs) in FY 2011-12.
The report is an outcome of collective, collaborative and continuous effort of
many individuals, professionals and agencies. All three divisions and different
sections of DOE and CLAs played crucial role in the process of report
preparation. The senior level managers, Technical Assistant group (TA) and
Development Partners (DPs) have also contributed by providing valuable
feedback in the course of report preparation.
The primary sources of the report are Status Reports (SRs), Implementation
Progress Reports (IPRs) and Financial Monitoring Reports (FMRs) prepared and
submitted by the districts. In addition, newsletters, bulletins and other
publications made by the districts are also major sources of information of this
report. It also received secondary data from the School Level Educational
Statistics of Nepal: Flash Report I and II and other external sources.
We acknowledge the contributions of all who have been involved directly or
indirectly in the process of preparing this report. We also expect the valuable
suggestions from all concerned agencies, professionals and individuals for
betterment of the report.
3
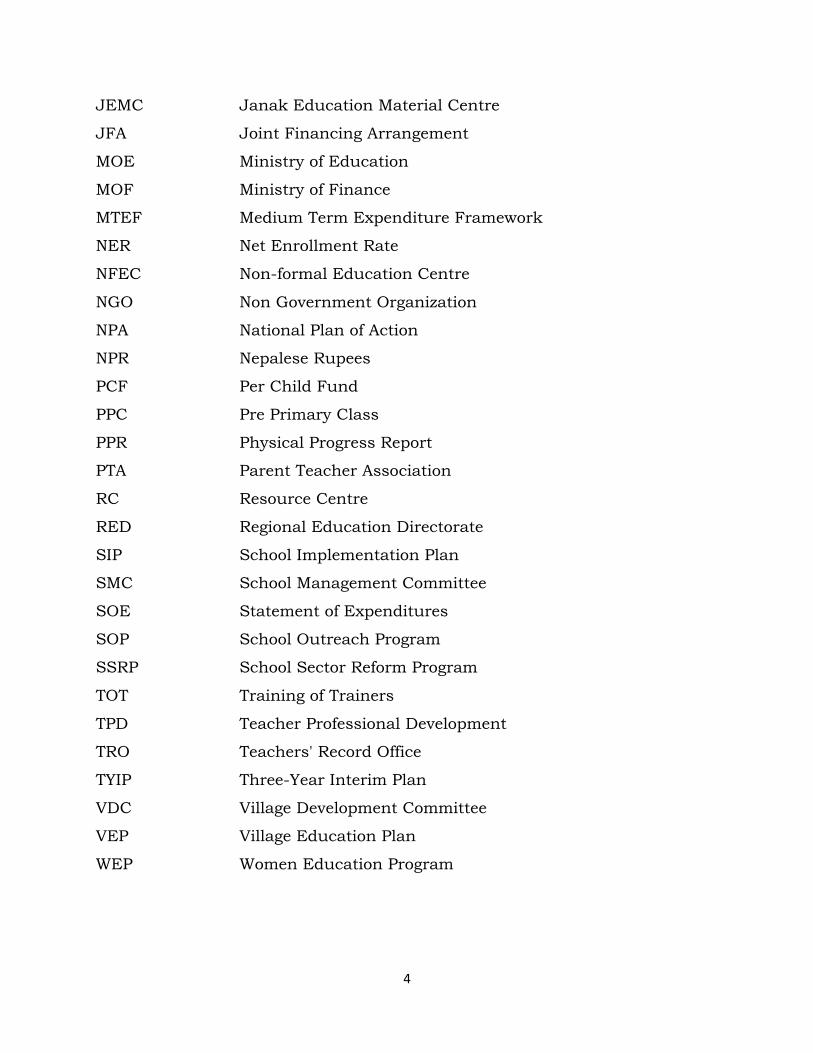
Abbreviations
ASIP Annual Strategic Implementation Plan
AWPB Annual Work Plan & Budget
CBO Community Based Organization
CD Capacity Development
CDC Curriculum Development Center
CLC Community Learning Centre
CRC Camera Ready Copy
DEO District Education Office
DOE Department of Education
DPs Donor Partners
DTCO District Treasury Comptroller's Office
ECED Early Childhood Education and Development
EFA Education for All
EMIS Education Management Information System
FCGO Financial Comptroller General's Office
FMR Financial Monitoring Report
FPR Financial Progress Rate
FPR Financial Progress Report
FSP Flexible School Program
FY Fiscal Year
GAS General Administration Section
GER Gross Enrollment Rate
GON Government of Nepal
GPI Gender Parity Index
IES Inclusive Education Section
IGP Income Generating Program
INGO International Non Government Organization
IPR Implementation Progress Report
4
JEMC Janak Education Material Centre
JFA Joint Financing Arrangement
MOE Ministry of Education
MOF Ministry of Finance
MTEF Medium Term Expenditure Framework
NER Net Enrollment Rate
NFEC Non-formal Education Centre
NGO Non Government Organization
NPA National Plan of Action
NPR Nepalese Rupees
PCF Per Child Fund
PPC Pre Primary Class
PPR Physical Progress Report
PTA Parent Teacher Association
RC Resource Centre
RED Regional Education Directorate
SIP School Implementation Plan
SMC School Management Committee
SOE Statement of Expenditures
SOP School Outreach Program
SSRP School Sector Reform Program
TOT Training of Trainers
TPD Teacher Professional Development
TRO Teachers' Record Office
TYIP Three-Year Interim Plan
VDC Village Development Committee
VEP Village Education Plan
WEP Women Education Program

5
Table of Contents
Acknowledgements .......................................................................................................... 1
Abbreviations ................................................................................................................... 3
Table of Contents ............................................................................................................. 5
List of Tables ................................................................................................................... 7
List of Figures .................................................................................................................. 8
List of Maps ................................................................................................................... 10
Executive Summary ....................................................................................................... 11
CHAPTER I GENERAL INTRODUCTION ........................................................................... 12
1.2 Objectives of the Report .............................................................................................. 15
1.3 Report Preparation Process ......................................................................................... 15
1.4 Remarks on Data Sources ........................................................................................... 15
1.5 Structure of the Report ............................................................................................... 16
CHAPTER II SCHOOL SECTOR REFORM PROGRAM (SSRP)............................................ 18
2.1 The SSRP Context ............................................................ Error! Bookmark not defined.
2.2 ASIP and AWPB 2011-12 ................................................. Error! Bookmark not defined.
2.2.1 Allocated Budgets in Education Sector ....................... Error! Bookmark not defined.
2.2.2 Total Education Budget Allocated in ASIP 2011-12 ..... Error! Bookmark not defined.
2.2.3. Program Components ............................................... Error! Bookmark not defined.
2.3 Overall Accomplishment in 2011-12 ................................. Error! Bookmark not defined.
2.3.1 Central Level Activities .............................................. Error! Bookmark not defined.
2.3.2 District Level Progress ............................................... Error! Bookmark not defined.
2.4. Component Wise Annual Progress analysis ..................... Error! Bookmark not defined.
2.4.1. Early Childhood Education and Development (ECED) ........................................... 19
2.4.2.1 Basic Education ................................................................................................ 26
2.4.2.2 Secondary Education ......................................................................................... 39
2.4.3. Literacy and Continuous Education ..................................................................... 49
2.4.4. Improving Quality in Education ........................................................................... 55
2.4.5. Teacher Professional Development ....................................................................... 63
2.4.6 Capacity Development .......................................................................................... 68
2.4.7. School Management and Monitoring .................................................................... 73
2.4.8. Incentive and Support ......................................................................................... 80
2.4.9. Per Child Funding (PCF) based Non-salary Grant Support to Schools ................... 83
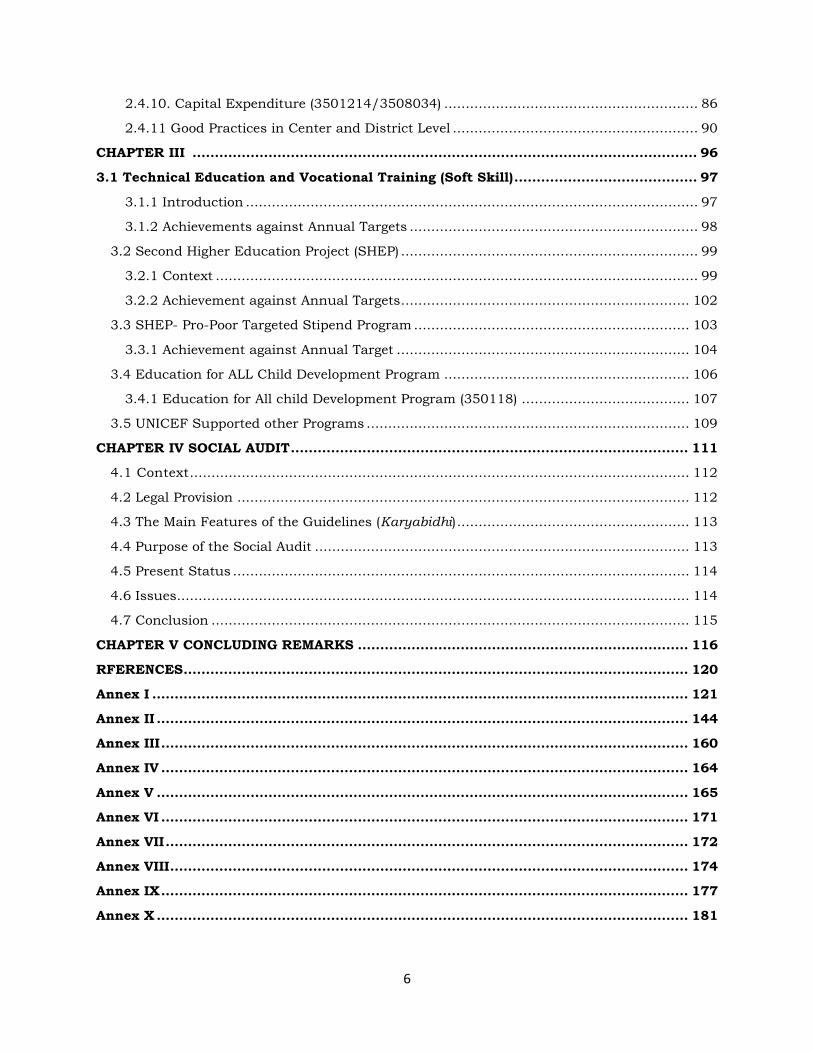
6
2.4.10. Capital Expenditure (3501214/3508034) ........................................................... 86
2.4.11 Good Practices in Center and District Level ......................................................... 90
CHAPTER III ................................................................................................................. 96
3.1 Technical Education and Vocational Training (Soft Skill) ......................................... 97
3.1.1 Introduction ......................................................................................................... 97
3.1.2 Achievements against Annual Targets ................................................................... 98
3.2 Second Higher Education Project (SHEP) ..................................................................... 99
3.2.1 Context ................................................................................................................ 99
3.2.2 Achievement against Annual Targets ................................................................... 102
3.3 SHEP- Pro-Poor Targeted Stipend Program ................................................................ 103
3.3.1 Achievement against Annual Target .................................................................... 104
3.4 Education for ALL Child Development Program ......................................................... 106
3.4.1 Education for All child Development Program (350118) ....................................... 107
3.5 UNICEF Supported other Programs ........................................................................... 109
CHAPTER IV SOCIAL AUDIT ......................................................................................... 111
4.1 Context .................................................................................................................... 112
4.2 Legal Provision ......................................................................................................... 112
4.3 The Main Features of the Guidelines (Karyabidhi) ...................................................... 113
4.4 Purpose of the Social Audit ....................................................................................... 113
4.5 Present Status .......................................................................................................... 114
4.6 Issues....................................................................................................................... 114
4.7 Conclusion ............................................................................................................... 115
CHAPTER V CONCLUDING REMARKS .......................................................................... 116
RFERENCES ................................................................................................................. 120
Annex I ........................................................................................................................ 121
Annex II ....................................................................................................................... 144
Annex III ...................................................................................................................... 160
Annex IV ...................................................................................................................... 164
Annex V ....................................................................................................................... 165
Annex VI ...................................................................................................................... 171
Annex VII ..................................................................................................................... 172
Annex VIII .................................................................................................................... 174
Annex IX ...................................................................................................................... 177
Annex X ....................................................................................................................... 181
7
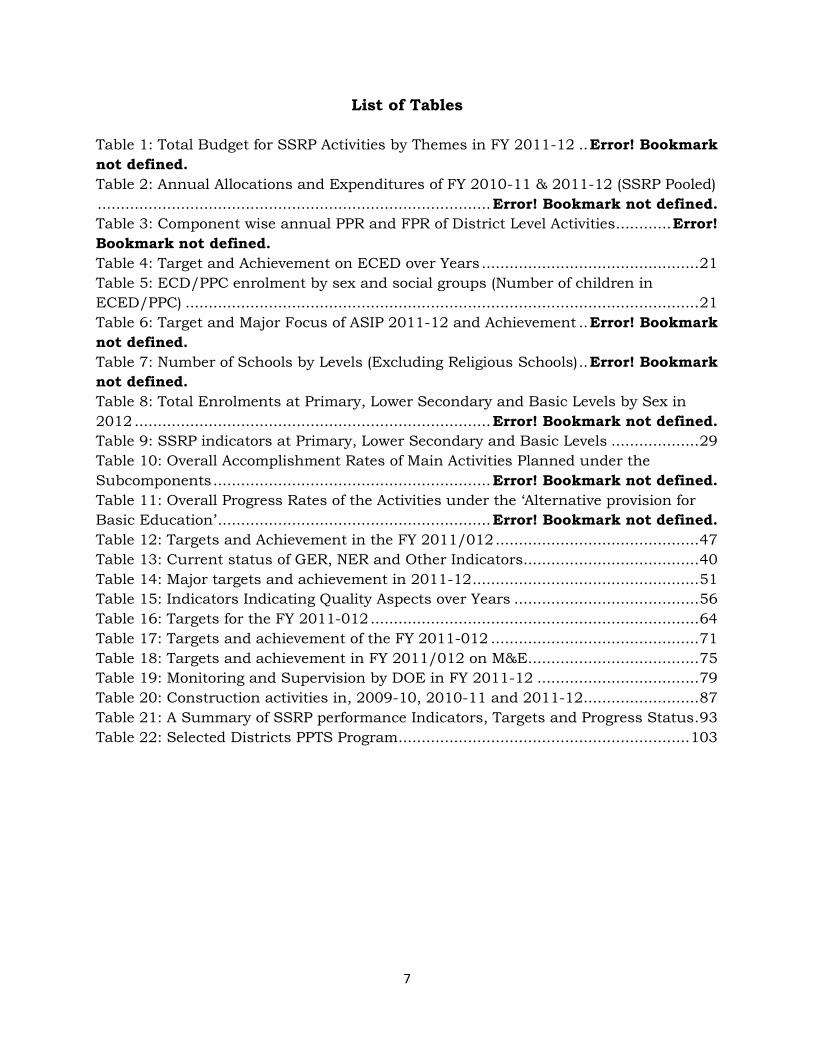
List of Tables
Table 1: Total Budget for SSRP Activities by Themes in FY 2011-12 .. Error! Bookmark
not defined.
Table 2: Annual Allocations and Expenditures of FY 2010-11 & 2011-12 (SSRP Pooled)
..................................................................................... Error! Bookmark not defined.
Table 3: Component wise annual PPR and FPR of District Level Activities ............ Error!
Bookmark not defined.
Table 4: Target and Achievement on ECED over Years ............................................... 21
Table 5: ECD/PPC enrolment by sex and social groups (Number of children in
ECED/PPC) ............................................................................................................... 21
Table 6: Target and Major Focus of ASIP 2011-12 and Achievement .. Error! Bookmark
not defined.
Table 7: Number of Schools by Levels (Excluding Religious Schools) .. Error! Bookmark
not defined.
Table 8: Total Enrolments at Primary, Lower Secondary and Basic Levels by Sex in
2012 ............................................................................. Error! Bookmark not defined.
Table 9: SSRP indicators at Primary, Lower Secondary and Basic Levels ................... 29
Table 10: Overall Accomplishment Rates of Main Activities Planned under the
Subcomponents ............................................................ Error! Bookmark not defined.
Table 11: Overall Progress Rates of the Activities under the ‘Alternative provision for
Basic Education’ ........................................................... Error! Bookmark not defined.
Table 12: Targets and Achievement in the FY 2011/012 ............................................ 47
Table 13: Current status of GER, NER and Other Indicators...................................... 40
Table 14: Major targets and achievement in 2011-12 ................................................. 51
Table 15: Indicators Indicating Quality Aspects over Years ........................................ 56
Table 16: Targets for the FY 2011-012 ....................................................................... 64
Table 17: Targets and achievement of the FY 2011-012 ............................................. 71
Table 18: Targets and achievement in FY 2011/012 on M&E ..................................... 75
Table 19: Monitoring and Supervision by DOE in FY 2011-12 ................................... 79
Table 20: Construction activities in, 2009-10, 2010-11 and 2011-12 ......................... 87
Table 21: A Summary of SSRP performance Indicators, Targets and Progress Status . 93
Table 22: Selected Districts PPTS Program ............................................................... 103
8
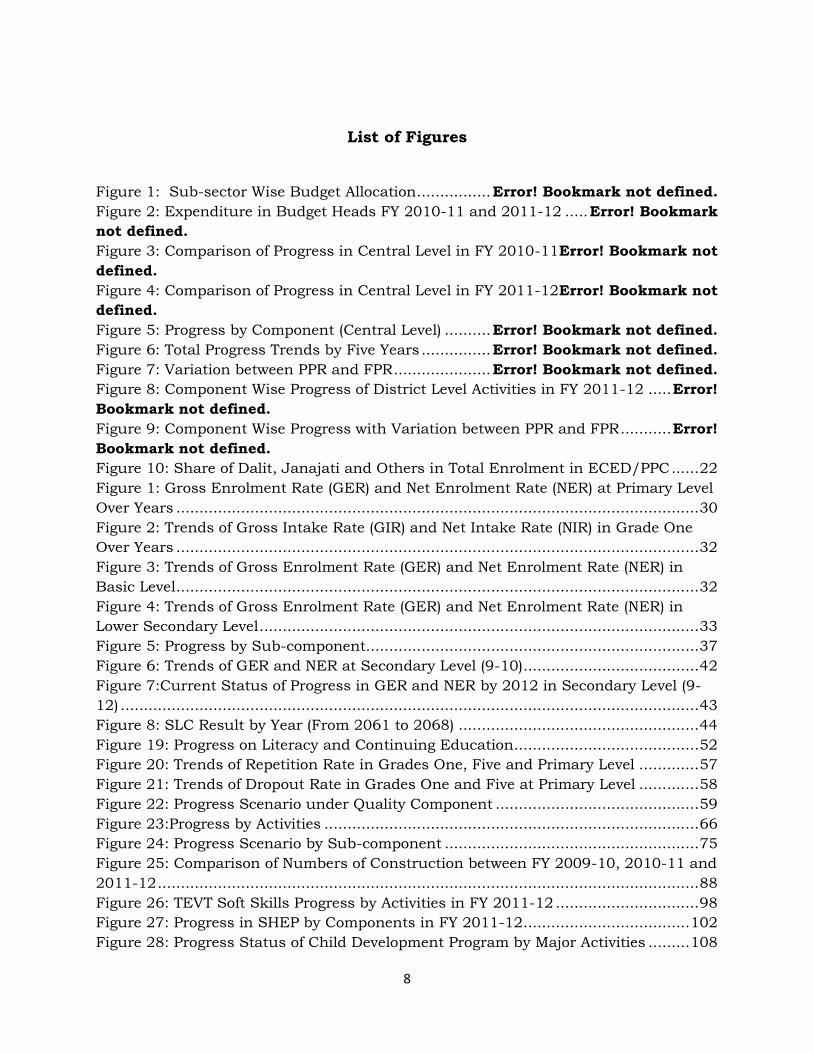
List of Figures
Figure 1: Sub-sector Wise Budget Allocation ................ Error! Bookmark not defined.
Figure 2: Expenditure in Budget Heads FY 2010-11 and 2011-12 ..... Error! Bookmark
not defined.
Figure 3: Comparison of Progress in Central Level in FY 2010-11 Error! Bookmark not
defined.
Figure 4: Comparison of Progress in Central Level in FY 2011-12 Error! Bookmark not
defined.
Figure 5: Progress by Component (Central Level) .......... Error! Bookmark not defined.
Figure 6: Total Progress Trends by Five Years ............... Error! Bookmark not defined.
Figure 7: Variation between PPR and FPR ..................... Error! Bookmark not defined.
Figure 8: Component Wise Progress of District Level Activities in FY 2011-12 ..... Error!
Bookmark not defined.
Figure 9: Component Wise Progress with Variation between PPR and FPR ........... Error!
Bookmark not defined.
Figure 10: Share of Dalit, Janajati and Others in Total Enrolment in ECED/PPC ...... 22
Figure 1: Gross Enrolment Rate (GER) and Net Enrolment Rate (NER) at Primary Level
Over Years ................................................................................................................. 30
Figure 2: Trends of Gross Intake Rate (GIR) and Net Intake Rate (NIR) in Grade One
Over Years ................................................................................................................. 32
Figure 3: Trends of Gross Enrolment Rate (GER) and Net Enrolment Rate (NER) in
Basic Level ................................................................................................................. 32
Figure 4: Trends of Gross Enrolment Rate (GER) and Net Enrolment Rate (NER) in
Lower Secondary Level ............................................................................................... 33
Figure 5: Progress by Sub-component ........................................................................ 37
Figure 6: Trends of GER and NER at Secondary Level (9-10) ...................................... 42
Figure 7:Current Status of Progress in GER and NER by 2012 in Secondary Level (9-
12) ............................................................................................................................. 43
Figure 8: SLC Result by Year (From 2061 to 2068) .................................................... 44
Figure 19: Progress on Literacy and Continuing Education ........................................ 52
Figure 20: Trends of Repetition Rate in Grades One, Five and Primary Level ............. 57
Figure 21: Trends of Dropout Rate in Grades One and Five at Primary Level ............. 58
Figure 22: Progress Scenario under Quality Component ............................................ 59
Figure 23:Progress by Activities ................................................................................. 66
Figure 24: Progress Scenario by Sub-component ....................................................... 75
Figure 25: Comparison of Numbers of Construction between FY 2009-10, 2010-11 and
2011-12 ..................................................................................................................... 88
Figure 26: TEVT Soft Skills Progress by Activities in FY 2011-12 ............................... 98
Figure 27: Progress in SHEP by Components in FY 2011-12 .................................... 102
Figure 28: Progress Status of Child Development Program by Major Activities ......... 108

9
10
List of Maps
Map 1: The Overall Physical Progress by Districts ......... Error! Bookmark not defined.
Map 2: Physical Progress of Early Childhood education and Development (ECED) by
district ....................................................................................................................... 23
Map 3: Physical Progress of Ensuring Access to School Education by Districts .......... 46
Map 4: Physical Progress of Literacy and Continuous Education by District .............. 54
Map 5: Physical progress of Enhancing Educational quality by districts .................... 60
Map 6: Physical progress of Teacher Professional Development Component by districts
.................................................................................................................................. 66
Map 7: Physical Progress of Capacity Development by districts .................................. 70
Map 8: Physical Progress of School Management and Monitoring by districts ............ 77
Map 9: Physical Progress of Incentive and Support Component by districts ............... 81
Map 10: Physical Progress of PCF by Districts ........................................................... 85
Map 11: Physical Progress of Capital Cost by districts .. Error! Bookmark not defined.

11
Executive Summary
12
CHAPTER I
GENERAL INTRODUCTION
Coverage:
1. Background
2. Objectives of the
Report
3. Report Preparation
Process
4. Remarks on data
sources
5. Structure of the
Report

13
1.1 Background
Education is an essential tool for social transformation. It equips people
with useful knowledge and skills that help them to alleviate poverty, to reduce
exclusion, to fight against ignorance and oppression, to maintain social
harmony and stability, to reinstate human rights, to live dignified life and
ultimately to contribute to the process of nation building. Thus, development of
education is tied up with poverty reduction, democratization of society, social
harmonization and peace and stability. Therefore, the Government of Nepal
(GoN) has given high priority to education sector and implemented various
reform initiatives to meet the varied needs, demands and expectations of its
citizen as well as to achieve the national and international commitments. The
government has continuously been concentrating its efforts towards socially
marginalized and deprived communities by working intensively for establishing
more inclusive educational environment.
The Ministry of Education (MOE) has been implementing various
educational programs to improve the status of education sector and to achieve
the national and international commitments (such as World Conference of
Education for All (EFA) by 2015, Dakar and Millennium Development Goals -
MDG) emphasizing equitable access to education for all. The ultimate aim of all
programs is to ensure the opportunity of school education as the fundamental
rights of the children with focus on marginalized sections of the population e.g.
women, Dalits, children with disabilities, and ethnic and linguistic minorities.
Basic and Primary Education Project I (BPEP-I) 1991-1996, Basic and Primary
Education Program II (BPEP-II) 1997-2004, Education for All (EFA) 2004-2009
were the major programs completed in education sector. Similarly, Secondary
Education Support Program (SESP-2003-2008), Teacher Education Project
(TEP, 2002-2007) and, the Community School Support Program (CSSP) were
other important programs implemented in the country.
With the successful experiences of all these earlier educational programs,
the School Sector Reform Plan (SSRP) has been designed and DOE has been
14
implementing the program throughout the country. Similarly, Second Higher
Education Project (SHEP, 2007-2014) has also been implemented with a view
to improve higher education. UNICEF is assisting DOE with various field level
activities in 22 districts under the framework of Decentralized Actions for
Children and Women (DACAW) while UNESCO has been supporting capacity
building aspects of the EMIS.
The Department of Education (DOE) implements educational policies and
programmes formulated and set by MOE and develop norms and standards to
ensure a working framework for regions, districts and schools. DOE is also
accountable for facilitating and monitoring educational programmes and
project activities. DOE is the agency that leads the implementation of SSRP in
dual financing modalities, namely, pooled and non-pooled. The pooled fund is
guided by the Joint Financial Arrangement (JFA), agreed upon by the pooled
financing Development Partners (DPs): GON, ADB, AusAid, EC, Denmark,
Finland, Norway, UK, UNICEF, and WB. The non-pooled funding DPs are
Government of Japan, UNESCO, UNICEF and WFP. The DOE is coordinating
with the National Centre for Educational Development (NCED), Curriculum
Development Centre (CDC), Office of the Controller of Examination (OCE) and
Non-formal Education Centre (NFEC), Higher Secondary Education Board
(HSEB) for preparing, implementing, monitoring, supervising and reporting of
these programmes.
Non-pool development partners supporting the SSR programme,
especially on capacity building supported by UNESCO, quality and girls’
education by UNICEF, mid-day meal and nutrition program by WFP, while Save
the Children Alliance, World Education and other I/NGOs have been providing
complementary support to MOE regular programs. In addition, DOE
collaborates with various organizations and research institutions such as the
Centre for Educational Research Innovation and Development (CERID) on
various research activities.
15
The government has been working with I/NGOs, and UN agencies
collaboratively for achieving the EFA targets and MDGs in education sector. In
this regard, consultations and collaborations with professional organizations
such as Community School National Network (CSNN), Teachers’ Union and
Fronts, Private and Boarding Schools’ Organization Nepal (PABSON),
N/PABSON, Parents Organization, Journalists, continued in FY 2011-12 as
well.
1.2 Objectives of the Report
The objectives of this report are to:
Analyze the overall status of the implemented programs by outlining the
potential strengths and Issues of the activities,
Analyze the underlying problems, issues and constraints that has been
faced during the implementation of the program, and
Share the status of the programs and the best practices among the
districts and central level agencies (CLAs) and the development partners
1.3 Report Preparation Process
The report utilized both qualitative and quantitative information from
multiple sources. The first-hand information from the field and the second-
hand information from districts and central level agencies were utilized while
preparing the report. Seventy five districts prepared district level and five
Regional Education Directorates (REDs) prepared regional level status report
and sent to the Department. These reports has provided strong base for the
preparation of this status report.
1.4 Remarks on Data Sources
The Part two in chapter two presents Financial Analysis (FA). The FA was
carried out on the basis of data obtained from the Financial Comptroller
General’s Office (FCGO) whereas the data used in the physical progress
analysis are the unaudited financial data obtained directly from District
Education Offices (DEOs) and Regional Education Directorate (REDs).
16
Moreover, the financial data obtained from DEOs are used in the progress
analysis for SSRP reporting since the FCGO data is not disaggregated as per
SSRP components and activities. Consequently, the analysis is based upon
financial and physical data received from all 75 districts, 5 regions and Central
Level Agencies (CLAs). Calculations of financial and physical progress on both
district and central level budget heads were carried out by using the National
Planning Commission guidelines.
DEOs managed to submit their status reports in time with the increased
assistance to and dialogue with DEOs through field visits to DEOs and schools.
ASIP workshop conducted at Dhangadhi, Banke, Chitwan, Kathmandu and
Biratnagar provided avenues to share for FMR and Status Report preparation
as well as timely reporting. Secondly, the members of DOE’s Finacial
Monitoring Report (FMR) committee have also utilized every opportunity to
discuss and highlight the importance of financial and physical monitoring of
the SSR to DEOs. Finally, increased facilities, activeness of DEOs and various
options provided by the centre in terms of communication channels could be
another reason for timely and quality reporting.
1.5 Structure of the Report
This report consists of five chapters. The Chapter one covers overall
general information related to various programs and activities. Chapter two
reflects the status of the SSR program and good practices of the central and
district levels. In like manner, Chapter three analyses progress of programs
contributed by non-pooled DPs. The chapter four describes a brief account of
social and financial audits and Chapter five presents concluding remarks.
Lastly, the annexes contain various detailed information for explanatory
purposes.
This report basically focuses on analyzing the component-wise physical
and financial progress against the targets outlined in the 2011-12 Annual
Strategic Implementation Plan (ASIP) and Annual Work Plan and Budget

17
(AWPB). It also looks at the current status of progress towards the targets of
the 15 national SSRP indicators.
18
CHAPTER II
SCHOOL SECTOR REFORM PROGRAM (SSRP)
Coverage: SSRP
1. SSRP Components (ASIP
and AWPB, 2011-12
2. Progress Analysis-Center
and Districts
3. Good Practices of Center
and district level
19
SCHOOL SECTOR REFORM PROGRAM (SSRP)
Chapter 1: Early Childhood Education and Development (ECED)
2.1.1 Introduction
The DoE has been implementing Early Childhood Education and
Development (ECED) program in collaboration with I/NGOs, Community Based
Organizations (CBOs) and local bodies. To this end, two forms of programs in
ECED are continued in operation since 2004-05. They are community based
ECED centers and school based ECED/PPCs.
ECED program was the continuation of the earlier programs (BPEP &
EFA) with the aim of fostering children's all-round development. The
Government of Nepal (GoN) has acknowledged the growing evidence of the
effects of ECED programs and believes that it is a real foundation for basic
education, offering opportunity for promoting retention and completion in basic
education which ultimately contributes to quality in education.
According to the flash report 2012, there were altogether 39075
ECED/PPCs in the country. About 86% (29,273) ECED/PPCs are established
and operated by the government. Out of 29,273 ECED centers, most of them
are school based. Only about 14% of the total ECED/PPCs centers are run by
institutional schools which mostly enroll in Nursery classes.
2.1.2. ASIP priorities
The ASIP 2011-12 had set the following major activities for the ECED
program.
o Continue support for the operation of 28,772 existing ECED centres,
o Establishment and and operation of 500 new ECED centres.
o Basic training to 500 facilitators and refresher training to 17000
facilitators

20
o Mapping of ECED in 10 additional districts
o Training for 14945 ECED management committee members.
About 5% of the total SSR budget was allocated for the ECED component
in FY 2011-12. The plan (ASIP) also made criteria for the establishment of new
ECED centres focusing ddisadvantaged and vulnerable communities with low
enrolment, high drop-out and repetition rates with due priority to those VDCs
or communities where there are no ECD/PPC at this moment.
Due to the meaningful effort of GON, the expansion of ECED has been
remarkably increased. This year 500 ECED centers were established specially
to ensure the access for children of the most vulnerable and marginalized
community. ECED mapping and HDI was the basic criteria made for the
establishment of the new ECED centers.
2.1.3. Achievement against Indicators
The table I below illustrates the achievement against indicators. On
observing the target set by SSRP core document and the achievement flashed
by the flash report, it was found that the overall Gross Enrollment Rate (GER)
of children in ECED/PPC has continued to increase and has reached to 73.7%
GER (with 73.1% for girls and 74.3% for boys). Last year the total GER in
ECED was 72.9%. Despite the continuous raising in the progress percentage,
the intended SSRP target (77% for 2011-12) was not met.
Similarly, the percentage of new entrants in grade one with ECED/PPCs
experiences has been 55.6% (with 55.9% for girls and 55.2% for boys), which is
by 1.3% more than the previous year (by 0.7% for girls and 1.7% for boys).
It is generally reported that the continuously increasing trends of
ECED/PPC experienced children in Grade One has contributed to reduce the
repetition rates, dropout rates and has increased the retention rates in Grade
One. Table 1 below shows the scenario of SSRP indicators regarding the ECED
component. It shows that GER of ECED is noted below by 3.3% against the
21
SSRP target for that year. Despite the low progress in GER, the percentage of
new entrants in Grade I with ECED/PPC experiences is noted higher than the
intended SSRP target (51% for 2011-12).
Table 1: Target and Achievement on ECED over Years
Indicator Baseline Status Status Status Achievements Target
2007/08 2008/09 2009/10 2010/11 2011/12 2011/12 2015/16
GER of ECED/PPCs 60 63 70 72.9 73.7 77 99
% of new entrants in
Gr.1 with at least 1-
year ECED experience
*
33% 36% 49.9% 54.3% 55.6 51% 80%
Similarly, table 2 presents the status of enrollment of the children by
social groups with the proportion of Dalit and Janajati children in the school
year 2011-12. Of the total enrollment of 1,053 thousand children in
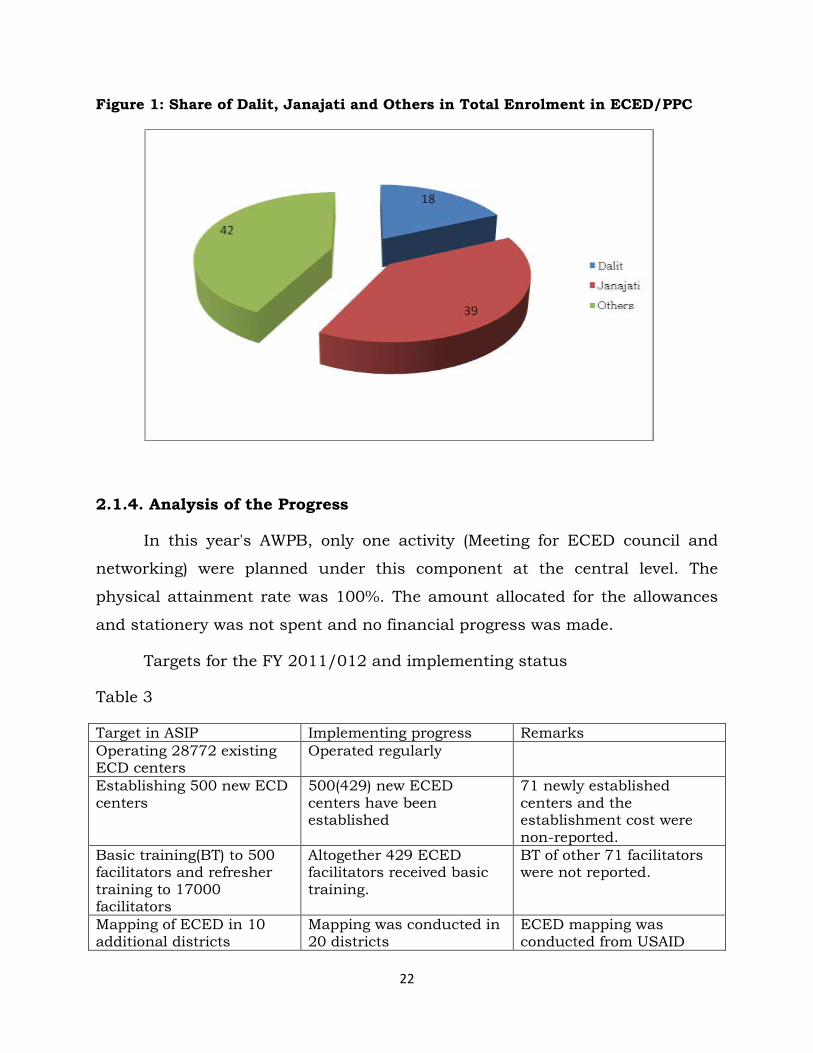
ECD/PPCs, 18% are Dalit and 39% are Janajatis. Among the Dalit students
enrolled, 19% are girls and 18% are boys. Likewise, for the Janajatis, the
enrollment rate for both boys and girls were equal with 39%. The Gender Parity
Index (GPI) of enrollment in total, Dalit and Janajati are 0.93, 1.1 and 1
respectively, which shows remarkable participation of girls in total enrollment.
The data indicates that the gender situation is attained among the Janajati
children but there is still a gap among the other overall enrollment. The figure
10 shows the share of enrollment in ECD/PPCS.
Table 2 : ECD/PPC enrolment by sex and social groups (Number of children in
ECED/PPC)
Students Total Dalit Janajati Others
Girls 506,725 96,296 200048 210,381
Boys 546,326 96,218 213,406 236,702
Total 1053051 192,514 413,454 447,083
Source: Flash Report I, 2011
22
Figure 1: Share of Dalit, Janajati and Others in Total Enrolment in ECED/PPC
2.1.4. Analysis of the Progress
In this year's AWPB, only one activity (Meeting for ECED council and
networking) were planned under this component at the central level. The
physical attainment rate was 100%. The amount allocated for the allowances
and stationery was not spent and no financial progress was made.
Targets for the FY 2011/012 and implementing status
Table 3
Target in ASIP Implementing progress Remarks
Operating 28772 existing ECD centers
Operated regularly
Establishing 500 new ECD centers
500(429) new ECED centers have been established
71 newly established centers and the establishment cost were non-reported.
Basic training(BT) to 500 facilitators and refresher training to 17000 facilitators
Altogether 429 ECED facilitators received basic training.
BT of other 71 facilitators were not reported.
Mapping of ECED in 10 additional districts
Mapping was conducted in 20 districts
ECED mapping was conducted from USAID
23
support under 350105 BH.
Training for 14945 ECD Management Committee members
12045 ECED management committee members were trained
Training program was supported from USAID
At the district level, there were two sub-components (New ECEDs and Old
ECEDs) and eight activities under this component. The overall physical and
financial progress of this component was observed 99% which appears
consistent as compared to last year (PPR 100% and FPR 97%). Under the sub-
component 'Existing ECED' each and every activities of this sub-component
achieved more than 97% physical progress, where the financial progress was
97%. Likewise, in the sub-component two 'New ECED center' there were
altogether five activities, wherein four activities were accomplished with 93% to
94% physical progress, and one with 88% physical progress. The financial
progress rate of these components were above 80% and less or equal to 92 %
(see annex II for detail information).
The financial and physical progress rate in second sub-component i.e.
New ECEDs was also observed with slightly less progress rate as compared
with the last year progress. It achieved 84% physical progress rate and the
financial one was only 64%. Last year this sub-component possessed 93 % PPR
and 87% FPR. This year, all districts were provided center grant in condition
with preparing ECED profile. They further required going on survey for the
establishment of the new ECED centers. It caused a sort of delay on
establishing new centers and no all grants were spent.
In terms of geographical distribution, 29 districts had achieved excellent
physical and financial progress of 100%, while other remaining districts had
achieved highly satisfactory physical progress between 75% and 99%.
Only one district namely Rukum achieved less than 75% (i.e. 71%)
progress (see annex III for details).
Map 1: Physical Progress of Early Childhood education and Development (ECED) by
District

24
2.1.2 Strengths
o Most of the districts developed ECED profile this year. It could pave the
way of merging, transferring of old centers and establishing of new
centers as required.
o 500 ECED centers have been distributed in needy areas of inhabitants
with the children of hard core groups and slump.
2.1.3. Areas of reform
o At the central level, the amount allocation for ECED council was
unspent as in the past. This allocation could contribute in other activity
and hence better not to allocate from coming years.
o Reporting of the districts was found still poor and need to be improved
in terms of time, contents and quality.
2.1.4 Constraints
Despite the enthusiastic efforts and progress made in ECED activities,
there existed still some constraints in order to implement the program
effectively and efficiently. Some major constraints are mentioned below.
a.Motivation factors: low remuneration of ECED facilitators, insufficient
materials in the centers were the major factors of de-motivating ECED
facilitators.

25
b. Poor coordination with local government bodies have caused sole
burden of MOE for the ECED program.
c. Quality of Basic training is still poor and low retention of trained
facilitators have influenced in implementing philosophy of ECED in the
centers.
Chapter 2: Ensuring Access to School Education
This component covers 'Basic Education', 'Secondary Education' and '
improvement of Physical facilities'. It possessed with forty-nine activities
altogether. Ensuring equitable access to quality education through a right
based approach and promotion of child friendly environment in schools has
been the goal of basic education. Likewise, meeting the national development
needs by producing competent and skilled human resources and providing a
sound foundation for tertiary education is one of the goals of secondary
education.
To this end, providing comprehensive literacy, numeracy and basic
competencies for imparting fundamental skills and life related values to all
children have been the objectives of Basic Education. Likewise, developing
students' knowledge, skills and competencies, equipping with life skills and
preparing them for the world of work has been the objectives of secondary
education. In line with the goal and objectives stated above, the activities
designed under the basic education, focused on expanding equitable access
and improving quality from Grade I to VIII, whereas the activities under the
26
secondary education focused for grade 9 to 10 and also for grade 11 to 12 in
some extent.
2.2.1 Basic Education
The ASIP (2011-12) emphasized on implementation of free basic
education as the GON has decided in 2009-10. It has planned to implement
some major interventions to ensure the free basic education. Improving school
performance, implementing child friendly schools with minimum enabling
conditions, improving equity and social inclusion, increasing quality and
relevance, implementing CAS and strengthening school governance and
management and school mapping were the major intervention categorized in
ASIP 2011-12.
2.2.2. ASIP Strategic Priorities
The ASIP 2011-12 has stated the following as key strategic priorities in order to ensure
free basic education.
A. Implementing Compulsory Basic education (CBE)
o Implementing VEP based CBE in phased manner at the outset, one VDC
with a RC location in each district which could contribute to expand to
wider coverage consolidating experiences and lessons learned.
o Using NFE data for tracking out of school children in those VDCs to
enroll them in school.
o Using alternative modes of schooling to address learning needs of
unschooled children.
o Developing and implementing age specific condensed interventions to
help entering the out of school children in appropriate grade.
o Collaborating and mobilizing with GOs, I/NGOs and other providers to
share expertise, experiences and resources in implementing CBE.
B. Improving school performance
o utilizing Resource Persons (RPs) and School Supervisors (SSs) in
order to improving school performances.
27
o Making progress reports and assessment of progress mandatory for the
release of RC management grants.
o Mobilizing Educational Training Centers (ETCs) to facilitate improving
classroom delivery methods of schools
C. Data based SIP
o Distributing FLASH information to each district and school has
already been practiced
o Encouraging School Management Committee (SMCs), Head Teachers
(HTs) to utilize the information in planning their School
Improvement Plans (SIPs).
o Identifying low performing schools in the district using school
accreditation and MEC indicators.
o Incorporating key priority indicators and standards of Child Friendly
School (CFS)/MEC in the School Improvement Plan (SIP) guidelines.
D. CFSF & MEC indicators
o Developing and implementing of the Child Friendly School Framework
(CFSF) aligned with the MEC. These MECs include separate girls'
toilets, classrooms, textbooks, basic learning materials, and required
number of teachers.
o Aligning construction activities in schools with MEC criteria.
E. School Mapping
o Carrying out School mapping activities to facilitate the restructuring
which include merging, downsizing and use of multi-grade teaching and
establishment of schools. It could contributing to optimizing utilization
of resources, improving child proximity to schools and thereby
improving access and efficiency.
F. Local curriculum, CAS and Mother tongue Education related strategies
o Integrating of local skills and technologies into the central curricula
o Orienting orientation of local curriculum development along with
Continuous Assessment System (CAS),
o Developing of mother tongue textbooks in different subjects
28
o Developing a framework (reference/ guidebook) for the DEOs and RCs to
help implement the local curricula in schools
o Providing technical and logistic support to strengthen and develop
materials on local curricula in schools through RCs; and
o Making arrangement for the delivery of the local curricula by
mobilizing resources and support from NGOs, local government and
other resource institution.
G. NASA & CAS related strategies
o Using the National Assessment of Student Achievements (NASA)
internationally by conducting standardized tests at the end of grades
3, 5 and 8.
o Ensuring reliability of scores in the test and help devising policy
options addressing achievement gaps of schools.
o Strengthening the CAS at the basic level of school education to ensure
students’ learning and the proper evaluation of the students.
H. Scholarship related strategies
o Scholarship to the targeted children is continuation of the earlier
program. It aims to increase access and promoting equity and social
inclusion in school education. The ASIP/AWPB 2011-12 adopted
following strategies for this program.
o Continuing scholarship schemes to support schooling of girls,
Dalits, children with disabilities including other disadvantaged and
marginalized communities.
o Revising the scholarship distribution criteria and based on the
study recommendations
I. Access and governance
o Providing schools with access to the necessary technical backstopping to
prepare and implement SIPs.
o Identifying the out-of-school children are, and the subsequent
development of practical actions to bring these children into school and
retain them there.

29
o Improving access through the construction and rehabilitation of schools
and classrooms.
o Ensuring cost-free services for admission, textbooks, tuition and
examinations.
o Continuing of efforts to strengthen transparency and accountability
mechanisms in general and at school level in particular
o Initiating the revision and development of curriculum and textbooks to
increase relevance in formal and non-formal teaching learning situations.
o Developing and implementing Continuous Assessment (CAS) system in
the coming years.
o Strengthening cooperation with religious institutions in areas of student
and teacher support as well as in aiding management and planning in
Madrasas, Gumbas, and Gurukuls.
2.2.4 Achievement against Targets
Observation from Flash I Report 2011-12
The Flash Report also provided information of a more detailed description
of SSR indicators at the Primary, Lower Secondary and Basic Education levels
are presented in the table 4 below. The data in the table indicate the progress
being achieved in recent years.
Table 4: SSRP indicators at Primary, Lower Secondary and Basic Levels
Indicators
2001 2002 2003 2004 2005 2006 2007 2008 2009 2010 2011 2012 2012
Achievement
Achi
eve
men
t
targ
et
GIR at G1 122.9 101.3 117 125.9 148.1 148.1 145.2 147.7 144 142.4 140.7 141.
2
137
NIR at G1 51 74 76.1 NA NA NA NA 83.1 86.4 89 90.7 91.2 88
GER
Grades 1-5 124.7 118.4 126.7 130.7 145.4 138.8 138.5 142.8 141.4 139.5 135.9 130
Grades 6-8 63.2 57.5 60 80.3 76 71.5 78.8 80.1 88.7 94.5 100 100.
6
Basic
(Grades1-
123.3 124.4 123.7 120 130
30
8)
NER
Grades 1-5 81 82.3 83.5 84.2 86.8 87.4 89.1 91.9 93.7 94.5 95.2 95.3 97
Grades 6-8 39.4 40.4 42.9 43.9 46.5 52.3 52.9 57.3 63.2 69.3 70 72.2
Basic
(Grades 1-
8)
86 86.6 87.5 88
Source: Flash I, 2012, Status Report 2011 & SSR 2009-15
The figures 2, 3, 4 and 5, below, add more information regarding the
SSRP indicators at Primary, Lower Secondary and Secondary Levels. The figure
11 explains the GER and NER trends in recent years at Primary Level. As the
figure suggests, GER was inconsistent and was fluctuating in the years 2004 to
2008, it's been gradually falling since 2008. In case of NER, it is in increasing
trend in almost of the school years. As it is observed, the gap, between the two,
is widest in 2005 since then it is becoming narrowed. This trend is gradually
continuous this year too. It suggests that the problems of overage and
underage children in primary level education have been addressed in gradual
manner.
Figure 2: Gross Enrolment Rate (GER) and Net Enrolment Rate (NER) at Primary Level
Over Years

31
Based on the total number of new enrolment in Grade One and the total
number of 4 years’ group population the overall GIR for Grade One is 141.2%
in the school year 2012 (Figure 2), which is lower than the last school year by
0.5%. However, it is still higher and this indicates a late entrance of children
into Grade One. This is highly likely to be affecting the overall internal
efficiency of primary education. Again, based on the total number of 4 years’
age group, new enrolment in Grade One and the 5 year’s age group population
in 2011, the overall NIR in Grade One is 91.2%. Compared with the NIR in the
last year, it has increased by only 0.5 percent points. The figure 3 illustrates
hardly decreasing trends of GIR and hardly increasing trends of NIR. It also
indicated that the target group is still to be identified intensively.
32
Figure 3 : Trends of Gross Intake Rate (GIR) and Net Intake Rate (NIR) in Grade One Over
Years
The Figure 4 shows that the total GER at the Basic level is 120% in the
school year 2011-12. When compared with the status of the previous year
(123.7%), the GER, in total, has decreased this year by 3.7%. In like manner,
the total NER is 87.5%. When compared to the status of the previous year
(86.6%), this increment is nominal but important in the sense that the
intervention of the program (such as free textbook, scholarship program etc) in
basic level is functioning continuously.
Figure 4: Trends of Gross Enrolment Rate (GER) and Net Enrolment Rate (NER) in Basic Level
Source: Flash I, 2012, Status Report, 2011 and SSRP core doc
33
Figure 5 shows the GER and NER at the lower secondary level, which
were 100.6% and 72.2% respectively. When compared with the status of the
previous year (100%), the GER in total has increased negligibly and reached up
to 100.6%. In terms of NER, it has increased by 2.2% against the NER of the
last year (70%). As the figure illustrates, the GER line is rising diagonally
upwards till the year 2011 since the year 2006. It appears almost linear
between last year and this year indicating enthusiastic participation of the
students in lower secondary level. The increasing trends of NER also justifies
this argument; however it also indicates almost 27% of the lower secondary
age group population is not attending in that level or if attended, not on the
appropriate age.
Figure 5: Trends of Gross Enrolment Rate (GER) and Net Enrolment Rate (NER)
in Lower Secondary Level
34
2.2.4 Analysis of the achievements
Central Level Activities
In this year's AWPB, six sub-components were planned under the
'Ensuring Access to school Education' component at the central level, where in
altogether twenty-six activities were planned under these sub-components. The
overall physical and financial progresses rates of this component were 100%
and 76% respectively. The overall physical and financial progress rates of the
first subcomponent (Alternative provision for ensuring access in Basic
Education) were 100% and 67% respectively. Last year it was 100% and 63%
indicating raising performance level. Likewise, the third sub-component
(Flexible School Program), the fourth (See annex I for detail) component (Open
school Program grade 6-8) and the fifth sub-component ( Non-formal primary
school for the adult women) were accomplished with highly satisfactory
progresses of 100 % both in terms of physical and financial progress rate. The
sixth sub-component (Inclusive Education program) achieved satisfactory
progress rate (96% PPR and 89% FPR). The relatively low achievement was
observed in the seventh sub-component which was 40% financially; however
the physical one was ranked with the highest (100%). The low FPR was due to
the amount not disbursed for the 2.7.4 activity. External source was mobilized
for the accomplishment of the program( see annex I for more detail information)
District Level Activities
At the district level, the highest progresses rate was observed in
implementation of third sub-component (physical facilities improvement) which
possessed 100% PPR and FPR. The first sub-component (Basic Education)
achieved 88% PPR and 78% FPR. The figure VI illustrates the progress scenario
by sub-component. All 49 activities were implemented this year. Most of the
activities achieved satisfactory progress rate.
For ensuring access to quality basic education MOE/DOE planned to
improve physical facilities of the schools, provide scholarships and
35
management cost to the schools. The major targets planned in ASIP/AWPB
2011-12, achievement level and outcomes reported by the districts are briefly
presented in the table 5 below.
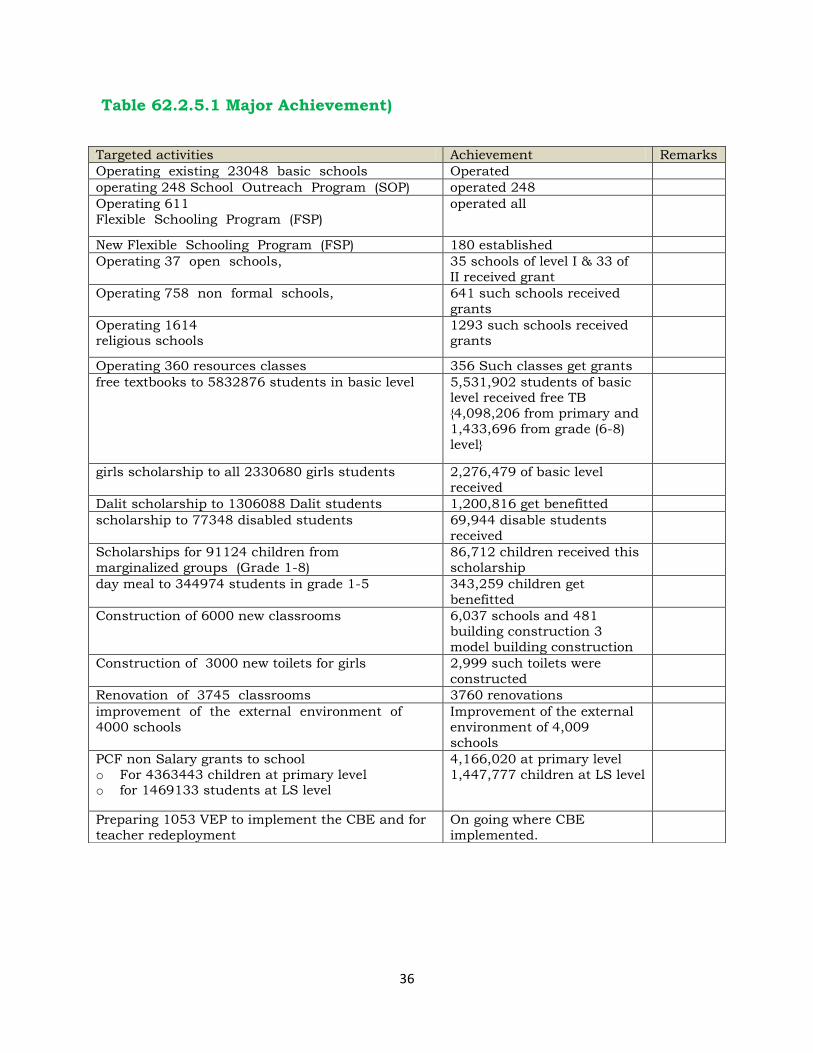
Most of the activities targeted in ASIP/AWPB 2011-12 were observed
implemented and the outcomes reported from the districts were satisfactory.
Despite, its impact need to be monitored and assessed for future planning.
Moreover, the activity of preparing Village Education Plan (VEP) seems to be
implemented very slowly or no remarkable progress was noted. There may be
various reasons such as lack of elected and full local government bodies, over
burden of VDC secretary, lack of coordination with local government bodies etc.
36
Table 62.2.5.1 Major Achievement)
Targeted activities Achievement Remarks
Operating existing 23048 basic schools Operated
operating 248 School Outreach Program (SOP) operated 248
Operating 611
Flexible Schooling Program (FSP)
operated all
New Flexible Schooling Program (FSP) 180 established
Operating 37 open schools, 35 schools of level I & 33 of
II received grant
Operating 758 non formal schools, 641 such schools received
grants
Operating 1614 religious schools
1293 such schools received grants
Operating 360 resources classes 356 Such classes get grants
free textbooks to 5832876 students in basic level 5,531,902 students of basic level received free TB
{4,098,206 from primary and
1,433,696 from grade (6-8)
level}
girls scholarship to all 2330680 girls students 2,276,479 of basic level
received
Dalit scholarship to 1306088 Dalit students 1,200,816 get benefitted
scholarship to 77348 disabled students 69,944 disable students
received
Scholarships for 91124 children from
marginalized groups (Grade 1-8)
86,712 children received this
scholarship
day meal to 344974 students in grade 1-5 343,259 children get
benefitted
Construction of 6000 new classrooms 6,037 schools and 481 building construction 3
model building construction
Construction of 3000 new toilets for girls 2,999 such toilets were
constructed
Renovation of 3745 classrooms 3760 renovations
improvement of the external environment of
4000 schools
Improvement of the external
environment of 4,009
schools
PCF non Salary grants to school
o For 4363443 children at primary level o for 1469133 students at LS level
4,166,020 at primary level
1,447,777 children at LS level
Preparing 1053 VEP to implement the CBE and for
teacher redeployment
On going where CBE
implemented.

37
Most of the activities as targeted in ASIP/AWPB 2011-12 were observed
implemented and the outcome reported from the districts were enthusiastic
and satisfactory. Despite the fact that, its output and impact is need to be
monitored and assessed for the future planning.
Based on the ASIP/AWPB 2011-12 and scholarship guideline the
scholarship scheme is further mentioned for clarity.
o Scholarship for Dalit students (Grade 1-8) - per unit cost NRs 400/year
o Girls' scholarship for 2,293,744 girls (Grade 1-8) including Students
from Karnali zone - per unit cost NRs 400/year
o Scholarship for 65,830 Disabled students (Grade 1-8) according to the
types of disability (Category A 10000/year, category B 5000/year,
Category C 3000/year and category D 500/year)
o Scholarships for 108,046 children from marginalized groups - Per unit
cost NRs 400/year in grade 1-8, 1700/year in grade 9-10
o Scholarship for martyr's children-per unit cost 1000/month in grade 1-5,
1500/month in grade 6-10 and 2000/month in grade 11-12
Scholarship for conflict affected children (10000/year in grade 1-5, 12000/year
in grade 6-8, 14000/year in grade 9-10 and 16000/year in grade 11-12)
2.1.5.2 Strengths
o Welcome to school Program is effective for reaching to the unreached the
continuous increasing in NER has justified the case.
o Alternative provision of education is good opportunity for out of school and
aged children for the mainstreaming in education.
o Grant support to religious schools is supportive for the mainstreaming.
2.2.5.3 Areas of under performances
Most of the activities designed under the basic components were implemented
with satisfactory progress rate. Grant support to religious schools program was
noticed relatively lower (but not lower then 70%) in progress rate.

38
2.2.5.4 Constraints
o Out of school children of hard core group(still 4.7% )
o Collection and verification of data
o Delay budget and delay of rights of expense has made complexity for the
timely implementation of the program.
o Expansion of religious school is a challenge.
2.2.5.5 Addressing constraints and Maximizing Achievements
Implementing welcome to school program more effectively by mobilizing
schools, RCs etc)
Piloting free and compulsory basic education program in 1053 VDCs
Data verification has been made mandatory for RPs, SS and DEOs.
School mapping has been made condition for the further establishment of
new schools.
Team and participatory monitoring has been highly prioritized from DOE
39
2.2.2 Secondary Education
2.2.2.1 Introduction
The overall goal of secondary education is to respond to national
development needs by producing competent and skilled human resources
and provide a sound foundation of tertiary education. Its objective is to
improve equitable access to quality and relevant school education. The policy
direction of secondary education is towards expanding free secondary
education ensuring opportunities to equitable participation in all aspects of
secondary education (ASIP, 2011-12).
Like Basic Education sub-component, the Secondary Education sub-
component was also designed under 'Ensuring Equitable Access to School
Education' component.
2.2.2.2 ASIP Priorities
The ASIP 2011-12 had set following major strategic priorities for secondary
education.
o Being responsive to the four major areas for policy reform (access and
participation, equity and social inclusion, quality and relevance and
governance and management) for the participation of children and
adolescent coming from marginalized and vulnerable communities in
secondary education.
o Strengthening alternative and open learning to facilitate access and
participation of female, ethnic groups, Madhesis, Dalits, disabled, Muslims
and other marginalized communities to secondary education.
o Forming a high level central coordination committee to oversee and facilitate
the integration process –developing legal and regulating frame works,
integration of curriculum and examination functions, supervision and
teacher support system including establishment of National Examination
Board.

40
o Continuing model building in five districts to draw lessons to facilitate the
process for developing viable ways to encourage restructuring grade 9-12.
o Developing and implementing guidelines for integrating SIP, SMC, Teacher
Management, accounting system, teacher profile including annual calendar
of operation for functional integration.
o Carrying out orientation, interaction and program, especially at regional and
district levels.
o Revising the scholarship distribution criteria and guidelines based on the
study recommendations to make it more effective particularly for
enrolment and retention of marginalized children.
o Carrying out necessary preparatory works for one window system so
that no one targeted student is missed or repeated from the
scholarship being awarded by the state.
2.2.2.3 Achievement against Indicators
Observation from Flash Report I (2012)
Status of access and enrollment: The flash data has indicated that over
the past few years the access of secondary (9-10) education has expanded.
According to the report, there are 5,805 community and 2,611 institutional
secondary schools (9-10) in the country. Likewise, 817 religious schools are
also in operation. The secondary school (9-10) student ratio comes to be 1:
104.3 this year.
Table 7: Current status of GER, NER and Other Indicators
Indicators 2001 2002 2003 2004 2005 2006 2007 2008 2009 2010 2011 2012
GER (9-
10)
43.8 44.8 46.4 50.4 49.3 56.7 55.9 59.5 65.7 66.3 70.1 71.7
NER (9-
10)
25.5 27.5 29.5 32 32.4 34.7 35.3 36.4 40.8 46.5 52.1 54.3
GER (9-
12)
36 40 46.2 49.4 51.7
NER (9-
12)
20 21 27.1 30.6 32.4
41
P/T (9-12) 42 39 37 1:23
SLC Pass 68.47 64.31 55.5 47.17
Flash Report I 2012, Status Report 2011
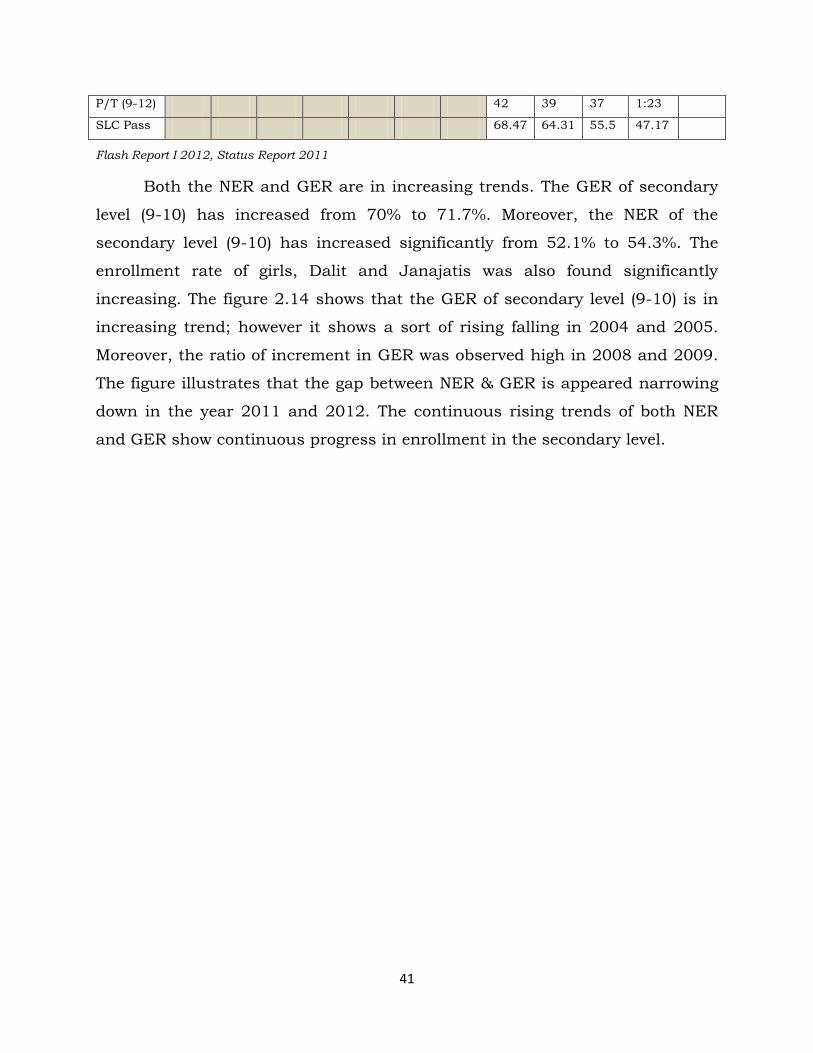
Both the NER and GER are in increasing trends. The GER of secondary
level (9-10) has increased from 70% to 71.7%. Moreover, the NER of the
secondary level (9-10) has increased significantly from 52.1% to 54.3%. The
enrollment rate of girls, Dalit and Janajatis was also found significantly
increasing. The figure 2.14 shows that the GER of secondary level (9-10) is in
increasing trend; however it shows a sort of rising falling in 2004 and 2005.
Moreover, the ratio of increment in GER was observed high in 2008 and 2009.
The figure illustrates that the gap between NER & GER is appeared narrowing
down in the year 2011 and 2012. The continuous rising trends of both NER
and GER show continuous progress in enrollment in the secondary level.
42
Figure 6 : Trends of GER and NER at Secondary Level (9-10)
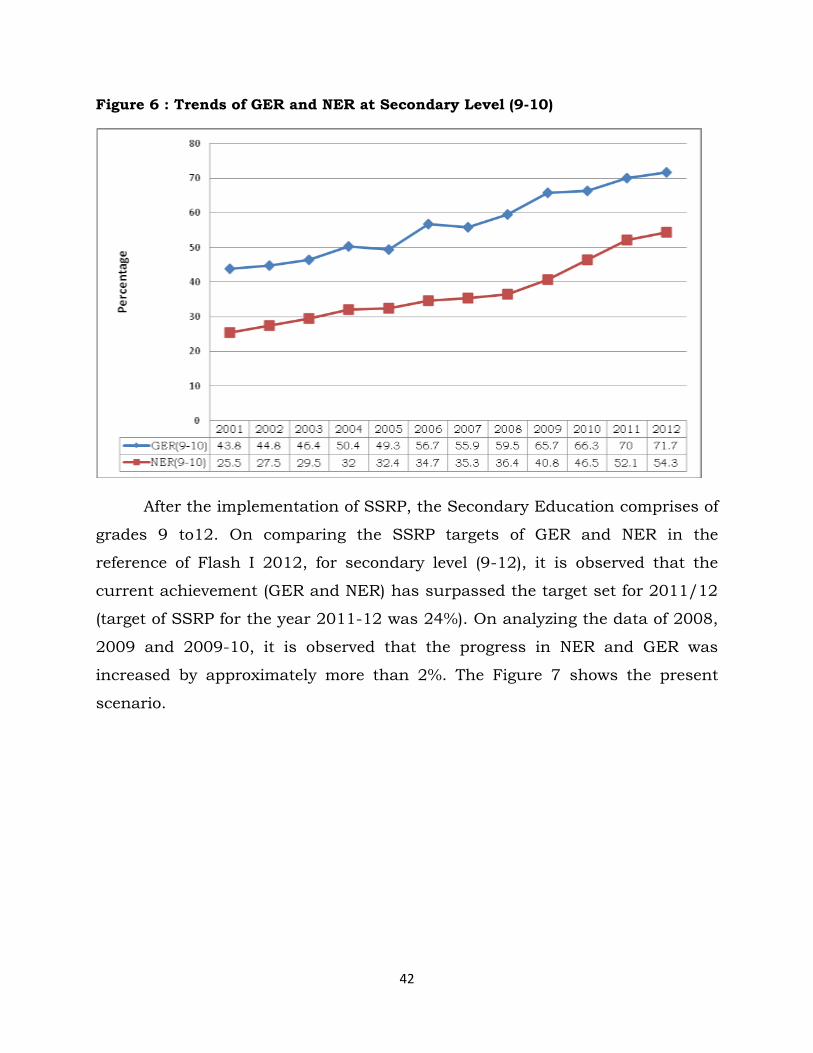
After the implementation of SSRP, the Secondary Education comprises of
grades 9 to12. On comparing the SSRP targets of GER and NER in the
reference of Flash I 2012, for secondary level (9-12), it is observed that the
current achievement (GER and NER) has surpassed the target set for 2011/12
(target of SSRP for the year 2011-12 was 24%). On analyzing the data of 2008,
2009 and 2009-10, it is observed that the progress in NER and GER was
increased by approximately more than 2%. The Figure 7 shows the present
scenario.
43
Figure 7: Current Status of Progress in GER and NER by 2012 in Secondary Level
(9-12)
Data Source: Flash Report I, 2012 and Status Report 2011
School Leaving Certificate Examination (SLC)
SLC is accepted as the gateway of tertiary education or further
educational opportunities since the beginning of modern education in Nepal.
The total outcomes of ten years study (Grade 1-10) are used to assess on the
basis of this result. The GoN has already implemented SSRP making Grade 9-
12 as secondary education, however, it is yet to be legalized and SLC is still in
high priority. The overall last nine years SLC result (Regular) is as illustrated in
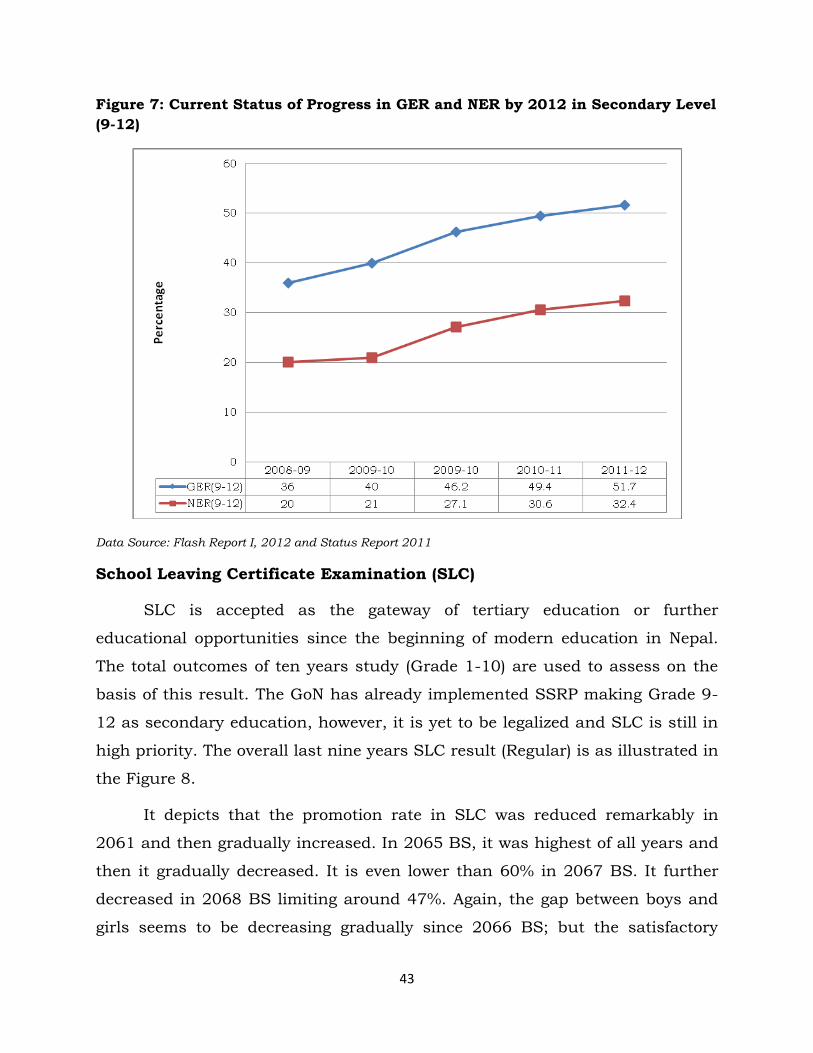
the Figure 8.
It depicts that the promotion rate in SLC was reduced remarkably in
2061 and then gradually increased. In 2065 BS, it was highest of all years and
then it gradually decreased. It is even lower than 60% in 2067 BS. It further
decreased in 2068 BS limiting around 47%. Again, the gap between boys and
girls seems to be decreasing gradually since 2066 BS; but the satisfactory

44
result has not yet been achieved. The Figure shows curvilinear trends of the
result where promotion rate of girls is always below the boys. The attention
towards SLC examination has risen to make it more fair which could attract
pupils' attention for in-depth reading of the subject. It had also caused a sort of
fall in SLC promotion rate. The policy level and implementation level both have
supposed to be raising the quality with sustainable progress rate in the future.
The SLC result indicates that the improvement in quality aspect is to be
prioritized along with the access in secondary education.
Figure 1: SLC Result by Year (From 2061 to 2068)
2.2.2.4 Achievement against annual targtes
Central Level Activities
In this year's AWPB, seven sub-components were planned under this
component which had to cover 26 activities altogether. The overall physical and
financial progresses of the first subcomponent (Alternative provision for
ensuring access in Basic Education) were 100% and 67% respectively.
45
Likewise, the third sub-component (Flexible School Program), the fourth (See
annex I for detail)component (Open school Program grade 6-8) and the fifth
sub-component (Non-formal primary school for the adult women) were
accomplished with highly satisfactory progresses of 100 % both in terms of
physical and financial progress rate. The sixth sub-component (Inclusive
Education program) achieved satisfactory progress rate (96% PPR and 89%
FPR. The relatively low achievement was observed in the seventh cub-
component which was 40% financially; however the physical one was ranked
with the highest (100%). The low FPR was due to the amount not expend for
the 2.7.4 activity. External source was mobilized for the accomplishment of the
program.
The overall progress figure of this component (100% PPR & 76% FPR)
indicates that the accomplishment rate was highly satisfactory.
District Level Activities
Secondary Education sub-component had to cover two major activities
(2.1.1) and 2.1.2). Under the title of 'Alternative program for secondary
education' five activities were planned and all of them were implemented and
achieved satisfactory progress (PPR-78% and FPR-85%). Some important
activities such as' establishment Grants for open education (grade 9-10)
operation', Grants for schools for special need students (blind schools-6 and
deaf schools-7), Non-formal secondary education for adult women (grade 9-10),
Grants support to religious secondary schools (Gurukul, Ashram, Madrasha,
Gumba and Bihar) and Support to girls' religious school (Gargi Kanya Gurukul)
were accomplished within this title. The second title 'Secondary Education :
Inclusive Education Program' had only one activity (Partnership between high
performing and low performing community schools for improving the SLC
results of low performing schools) which was noted with 93% PPR and 90%
FPR. The third sub-component was the new program (Physical facilities
improvement) designed under the recurrent budget heads. All thirteen activities
46
were about physical construction and were implemented with excellent
achievement rate of 100% both in terms of physical and financial progress rate.
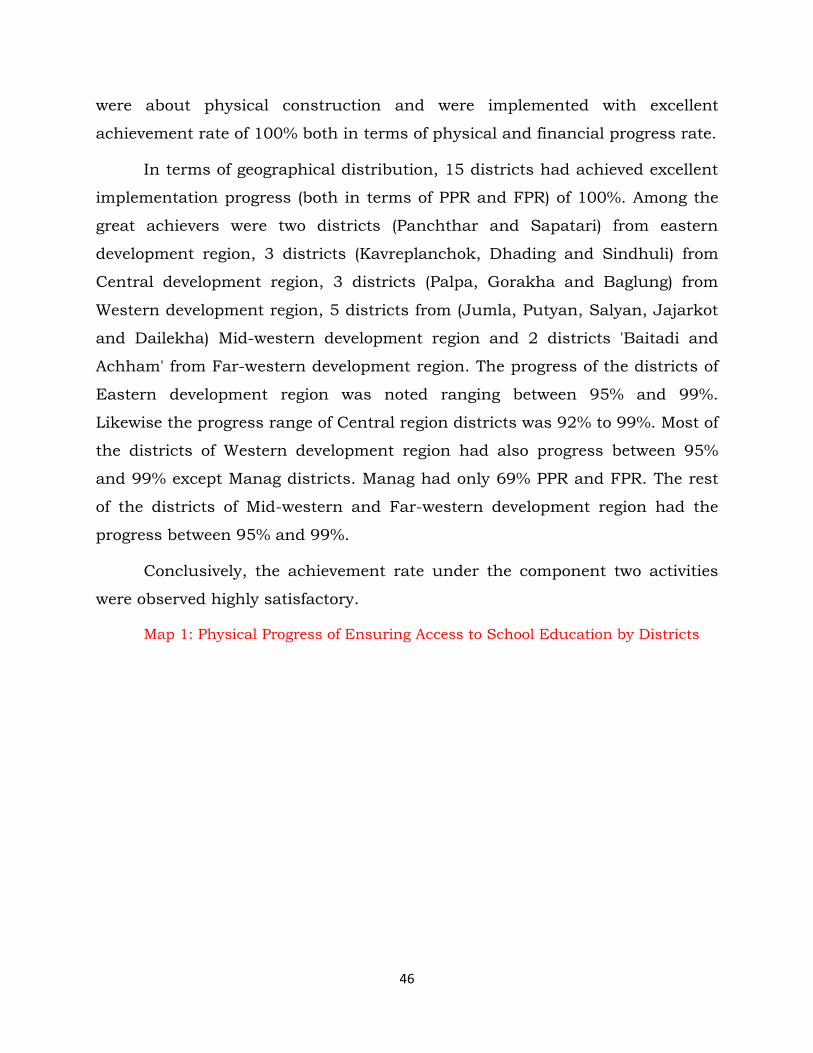
In terms of geographical distribution, 15 districts had achieved excellent
implementation progress (both in terms of PPR and FPR) of 100%. Among the
great achievers were two districts (Panchthar and Sapatari) from eastern
development region, 3 districts (Kavreplanchok, Dhading and Sindhuli) from
Central development region, 3 districts (Palpa, Gorakha and Baglung) from
Western development region, 5 districts from (Jumla, Putyan, Salyan, Jajarkot
and Dailekha) Mid-western development region and 2 districts 'Baitadi and
Achham' from Far-western development region. The progress of the districts of
Eastern development region was noted ranging between 95% and 99%.
Likewise the progress range of Central region districts was 92% to 99%. Most of
the districts of Western development region had also progress between 95%
and 99% except Manag districts. Manag had only 69% PPR and FPR. The rest
of the districts of Mid-western and Far-western development region had the
progress between 95% and 99%.
Conclusively, the achievement rate under the component two activities
were observed highly satisfactory.
Map 1: Physical Progress of Ensuring Access to School Education by Districts
47
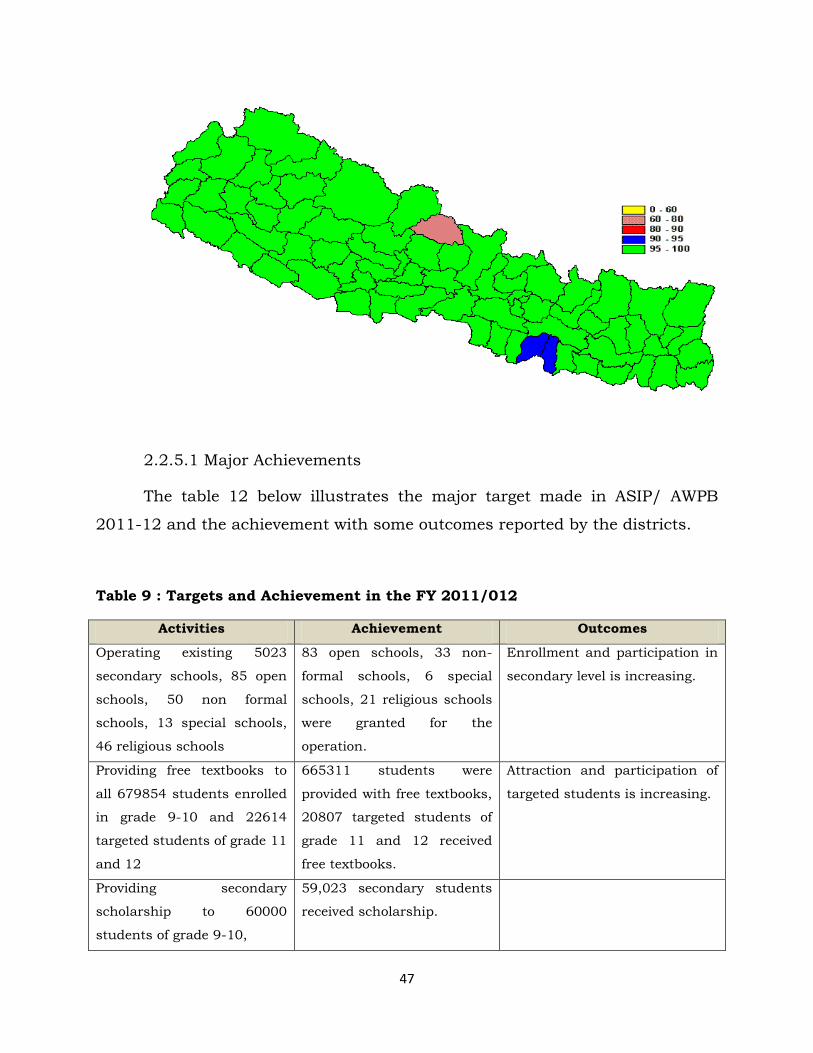
2.2.5.1 Major Achievements
The table 12 below illustrates the major target made in ASIP/ AWPB
2011-12 and the achievement with some outcomes reported by the districts.
Table 9 : Targets and Achievement in the FY 2011/012
Activities Achievement Outcomes
Operating existing 5023
secondary schools, 85 open
schools, 50 non formal
schools, 13 special schools,
46 religious schools
83 open schools, 33 non-
formal schools, 6 special
schools, 21 religious schools
were granted for the
operation.
Enrollment and participation in
secondary level is increasing.
Providing free textbooks to
all 679854 students enrolled
in grade 9-10 and 22614
targeted students of grade 11
and 12
665311 students were
provided with free textbooks,
20807 targeted students of
grade 11 and 12 received
free textbooks.
Attraction and participation of
targeted students is increasing.
Providing secondary
scholarship to 60000
students of grade 9-10,
59,023 secondary students
received scholarship.
48
Activities Achievement Outcomes
scholarship to all to all
81442 Dalit students
75,511 students received
this scholarship.
Enrollment is enthusiastic in
secondary level.
Scholarship to 6838
disabled students
6,193 students get benefitted
with this scheme.
Scholarship to all deprived
and marginalized 33904
students
32,703 students got this
scholarship.
Providing pro-poor targeted
stipend to 15500 students
all targeted students
received
Out is yet to be assessed.
Providing scholarships to
all Kamlari children,
children of martyrs,
conflicted affected children,
mountain and feeder hostel
children
62 martyrs children and 5
Kamlari, 74 conflict affected,
407 mountain and feeder
hostel children get
benefitted
Increased enrollment and
regularity.
Providing science
scholarship to targeted
grade 11 and 12 students
76 students got this
opportunity
Encouraged to study science.
Construction of 780 school
buildings (ongoing-300, new-
480)
Constructed as targeted
Renovation of 480 school
buildings (including
retrofitting of 50 schools)
Implemented as targeted.
Providing PCF salary grants
for teacher management
based on the unnerved
students
8,019 targeted group and
654,537 other students
based grants were provided.
Schools are managing teachers
and materials.
Implementing model building
activities for the integrated
secondary education (grade
9-12) in five districts
149 schools were granted.
Source: ASIP/AWPB 2011-12, Status reports of districts, progress reports etc.
49
2.2.5.2 Strengths
Science scholarship program has motivated students of remote and deprived
class in the study of science subject.
Implementation of model building activities for the integrated secondary
education has become opportunity of preliminary study for the complete
implementation.
2.2.5.3 Constraints
Poor infrastructure of higher secondary schools for science classes
Quality assurance in open secondary schools
2.2.5.4 Addressing constraints and maximizing Achievements
Construction of school building
Providing science, Dalit and other types of scholarship including free
textbooks
Chapter 3: Literacy and Continuous Education
2.3.1. Introduction
The literacy goal of the SSRP is to go beyond achieving 3 R skills to
literacy and lifelong learning and develop, among illiterate youths and
women, life skills facilitating to build competency in communication and
use of social service institutions to address their own, family as well as
community issues of daily life (ASIP, 2011-12).
Literacy and Continuous Education constitutes the rights to basic
education for all adults and youths between 15 and 45 years of age. The
objective of this component has been to provide the comprehensive literacy and
50
basic competencies for imparting life related values and skills that improve
quality of life leading to prosperity.
Nepal narrowed its adult illiteracy from 54% in 2001 to 34.1% in 2011.
Particularly, the 2011 revealed that Nepal's literacy rate (5+ years) is 65.9%
(male 75.1% and female 57.4%. Increasing adult's literacy to 75% by 2015 is
still a challenge and demands meaningful effort and devotion.
A geographical analysis of the literacy rates by districts also shows that
the literacy level is unevenly distributed with an overwhelming majority of Terai
districts in central and eastern development regions, and hills and mountains
districts in the Midwest and far west development regions having the lowest
literacy levels.
Currently, adult literacy, women literacy and functional literacy
programmes including skill based training for income generation (IG) are in
operation and a programme for drop outs together with CLC operation is being
carried out. Literacy campaign is the intensive program that is being
implemented since 2009 continuously. The progress report from the campaign
is not mentioned here.
3.1.2. Strategic Priorities of ASIP 2011-12
Based on the Non-formal Education Policy 1, the ASIP 2011-12 focused
on implementing the following strategic priorities:
o Targeting literacy and lifelong learning programs in pockets of
marginalized communities
o Strengthening the CLC with capacity building activity, resources and
technology as vehicle for implementing literacy and lifelong learning
programs and to complementing the national literacy program
o Developing CLCs to offer multiple options for learning and income
generation as well as meet the diverse needs of the community.
o Expanding (The success stories of piloting) Mother Tongue Based
Literacy (MTBL), Trilingual literacy and NFE MIS programs incorporating
51
success stories from the piloted districts to more districts in which, local
experts would be collaborated to develop contextual learning materials.
o Sharing ownership to program management with communities, and
encouraging information based planning, programming and decision
making.
o Mobilizing print and electronic media to facilitate national as well as local
level literacy campaigns.
o Aligning literacy programs with IGP and ICT programs to the extent
possible.
o Continuing partnership strategy in NFE program (planning, managing,
implementing, monitoring and evaluating the programs).
The ASIP also emphasized learner-centered instruction with adaptation
of curriculum and instructional materials.
3.3.3. Achievement against Annual Targets
The major activities as targeted in ASIP were found implemented;
however reliable information and data need to be obtained and verified for the
further strategies to be adopted in the coming years.
Table 10: Major targets and achievement in 2011-12
Program/Activities Achievement Outcomes
Operating existing 206
CLC
Granted to all 206
CLCs for operation
and management
In many districts CLCs conducted literacy
campaign and other NFE classes. CLCs are
also involved to conduct IGP program.
Conducting 3000 adult
literacy II classes
Approximately 2800
classes were
operated.
About 55,000 adults got this opportunity.
Conducting 3000 female
literacy II classes
About 2,700 such
classes were run.
About 55,000 female could grasp the
opportunity of participating in level II non-
formal or literacy classes.
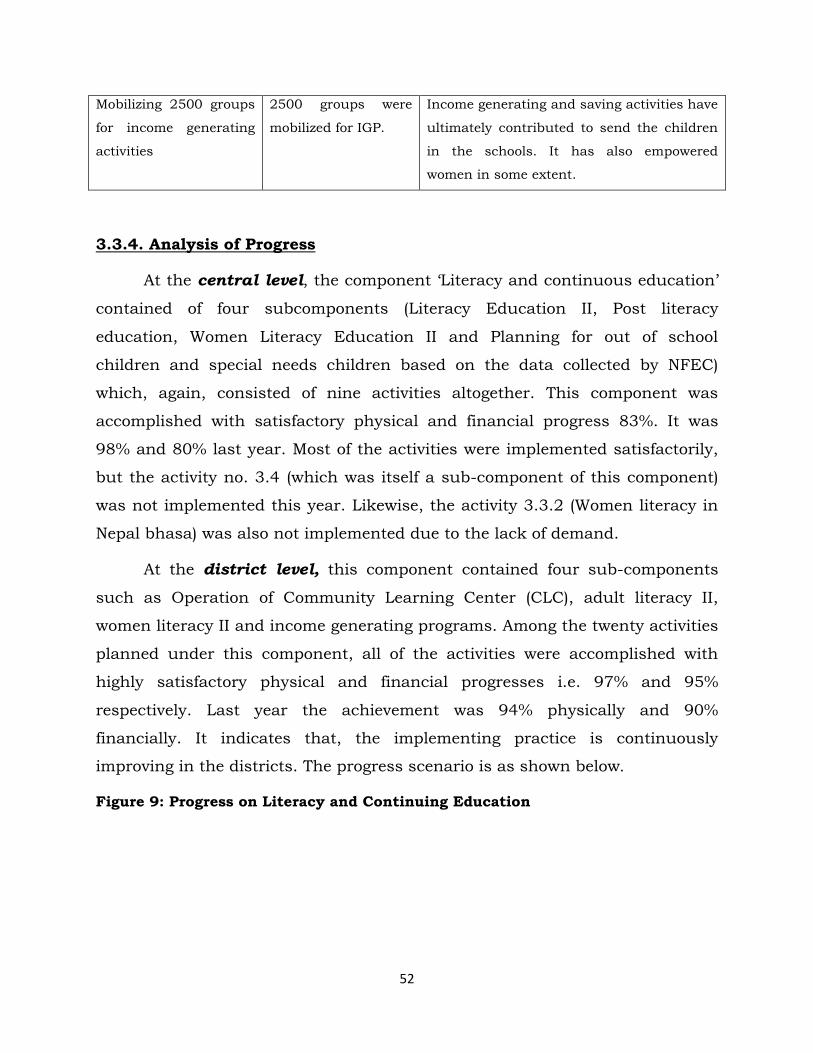
52
Mobilizing 2500 groups
for income generating
activities
2500 groups were
mobilized for IGP.
Income generating and saving activities have
ultimately contributed to send the children
in the schools. It has also empowered
women in some extent.
3.3.4. Analysis of Progress
At the central level, the component ‘Literacy and continuous education’
contained of four subcomponents (Literacy Education II, Post literacy
education, Women Literacy Education II and Planning for out of school
children and special needs children based on the data collected by NFEC)
which, again, consisted of nine activities altogether. This component was
accomplished with satisfactory physical and financial progress 83%. It was
98% and 80% last year. Most of the activities were implemented satisfactorily,
but the activity no. 3.4 (which was itself a sub-component of this component)
was not implemented this year. Likewise, the activity 3.3.2 (Women literacy in
Nepal bhasa) was also not implemented due to the lack of demand.
At the district level, this component contained four sub-components
such as Operation of Community Learning Center (CLC), adult literacy II,
women literacy II and income generating programs. Among the twenty activities
planned under this component, all of the activities were accomplished with
highly satisfactory physical and financial progresses i.e. 97% and 95%
respectively. Last year the achievement was 94% physically and 90%
financially. It indicates that, the implementing practice is continuously
improving in the districts. The progress scenario is as shown below.
Figure 9: Progress on Literacy and Continuing Education
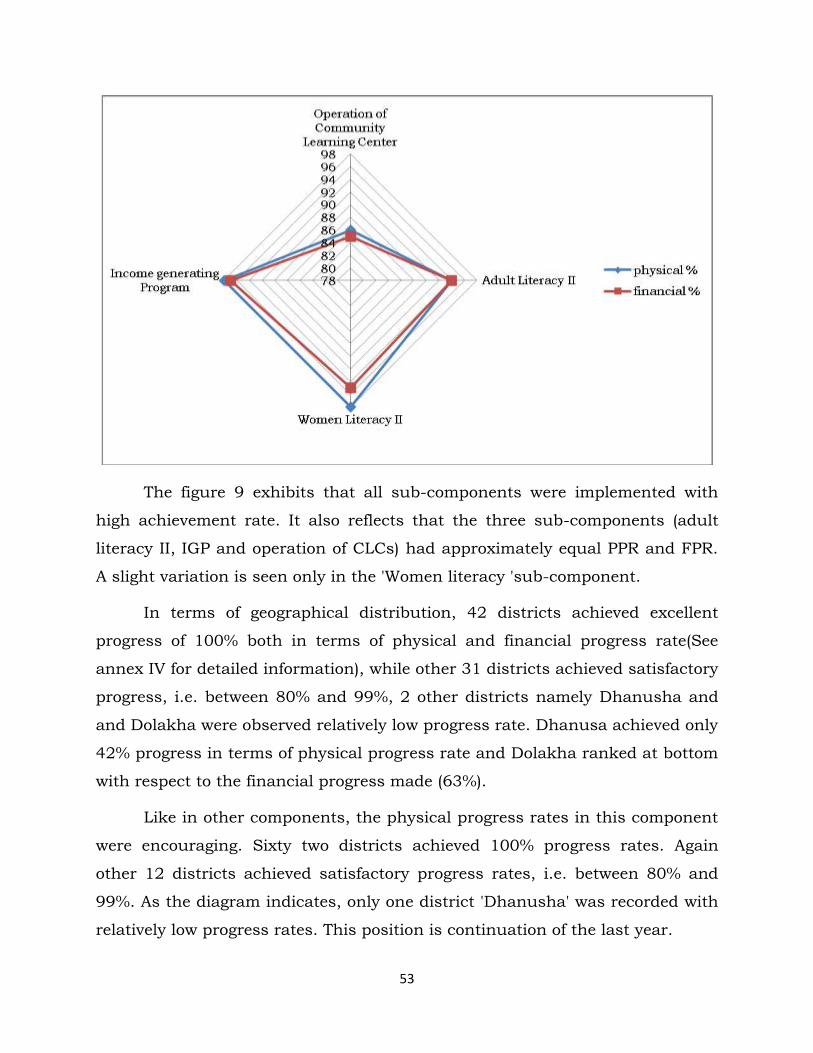
53
The figure 9 exhibits that all sub-components were implemented with
high achievement rate. It also reflects that the three sub-components (adult
literacy II, IGP and operation of CLCs) had approximately equal PPR and FPR.
A slight variation is seen only in the 'Women literacy 'sub-component.
In terms of geographical distribution, 42 districts achieved excellent
progress of 100% both in terms of physical and financial progress rate(See
annex IV for detailed information), while other 31 districts achieved satisfactory
progress, i.e. between 80% and 99%, 2 other districts namely Dhanusha and
and Dolakha were observed relatively low progress rate. Dhanusa achieved only
42% progress in terms of physical progress rate and Dolakha ranked at bottom
with respect to the financial progress made (63%).
Like in other components, the physical progress rates in this component
were encouraging. Sixty two districts achieved 100% progress rates. Again
other 12 districts achieved satisfactory progress rates, i.e. between 80% and
99%. As the diagram indicates, only one district 'Dhanusha' was recorded with
relatively low progress rates. This position is continuation of the last year.

54
Map 2: Physical Progress of Literacy and Continuous Education by District
3.3.4.1 Major Achievements
3.3.4.2 Strengths
o Non-formal and continuing education has contributed adults to continue
their study.
o Women Literacy classes have developed awareness among female or
targeted group. It has been gradually empowering rural women.
3.3.4.3 Constraints
o Duplication in non-formal classes
o Sustainability of saving and IGP
o Low and no concern of Local government bodies and stakeholders in NFE
o
3.3.4.5 Addressing constraints and Maximizing Achievements
Coordination with local government bodies in conducting NFE classes
Literacy survey has been made mandatory
55
Chapter 4: Improving Quality in Education
4.4.1 Introduction
Basically, this component focuses on improving quality aspects of
education, though it is not a specific component of SSRP. Ensuring quality
learning relates to assuring opportunities to schooling for all school aged
children in a congenial learning atmosphere entailing appropriate curriculum
goals followed by relevant contents, intensive use of time and effective delivery
techniques. This also involves careful use of instructional language and a
sound assessment policy.
Quality of education is as important as providing access to all. Without a
sufficient efficiency of the education system, it will suffer from wastage and low
efficiency and many children will not complete a primary education.
DOE has been considering a holistic development and learning and to
ensure this at least four basic elements are indispensable: teachers,
textbooks/instructional materials, the learning environment and the school
management.
4.4.2. Achievements against Annual Targets
The SSRP framework measures learning outcomes in literacy, numeracy
and essential life skills. As discussed above, data on literacy and innumeracy
rate is based on the NLFS, 2008 available from CBS. However, there are other
SSRP indicators that give indications about the quality of the education
system.
One of the indicators of the quality of the education system is the
repetition rate. The repetition rate for Grade One is in decreasing trend (Table
15), and has decreased from 39% in 2001 to 29.8% in 2006, 29.5% in 2007,
28.3 in 2008, 26.5% in 2009 , 22.6% in 2010, 21.3% in 2011 and 19.9% in
2012.

56
However, the repetition rate for Grade 5 is rather fluctuating. It
increased, steadily, from 2001 to 2003 and reached at 13.5% in 2003, since
then the decreasing trend has occurred. The current status of the repetition
rate in Grade 5, in the school year 2012, has been noted as 5.3%. Figure 17
provides information for comparative purposes. The Table 15, below, depicts
more information on other SSRP indicators.
Figure 10 shows the trends of repetition rates of Grades One, Five and
primary level students from 2005 to 2012. The more visible reduction (by 3.9%)
has been occurred in 2009 to 2010 for the Grade I. Likewise, the repetition rate
in Grade V was reduced remarkably in 2007 (by 2.6%). The recent rates
indicate almost linear trend indicating low rate of decreasing repetition rate in
grade V. It is observed that it took eleven years to reduce repetition by 50%
(20.7% in 2001). The repetition rate in grade I and grade V is noted decreasing
continuously.
Table 21: Indicators Indicating Quality Aspects over Years
Indicators 2001 2002 2003 2004 2005 2006 2007 2008 2009 2010 2011 2012
Achievement
Repetition rate G1 39 36.8 34 NA 30.4 29.8 29.5 28.3 26.5 22.6 21.3 19.9
Drop out in GI 20.9 16.1 11.2 9.9 8.3 7.9 7.7
Promotion Rate in
GI 49.3 54.5 60.5
63.5 69.1 70.7 72.5
Repetition rate G5 9 11 13.5 NA 11.5 10.4 7.8 7.3 6.7 5.7 5.4 5.3
Drop out in GV 14.8 10.2 9.1 7.4 6.5 6.2 6.0
Promotion Rate in
GV 74.8 82 83.5
85.8 87.8 88.4 88.7
Drop out in
Primary 15 12.4 8
6.5 6.0 5.4 5.2
Promotion Rate in
Primary 65.6 70 76.3
79.1 81.9 83.1 84.2
Repetition rate in
Primary 20.7 19.5 17.2 15.7
14.4 12.1 11.5 10.6
Again, the significant reduction in Primary level on the whole could be
noticed in 2007 and 2010. Since then, a rapid falling trend has been in case of
Grade One, whereas there has been a gradual fall in the case of Grade Five and
primary level. It could be the liberal promotion policy, child friendly school
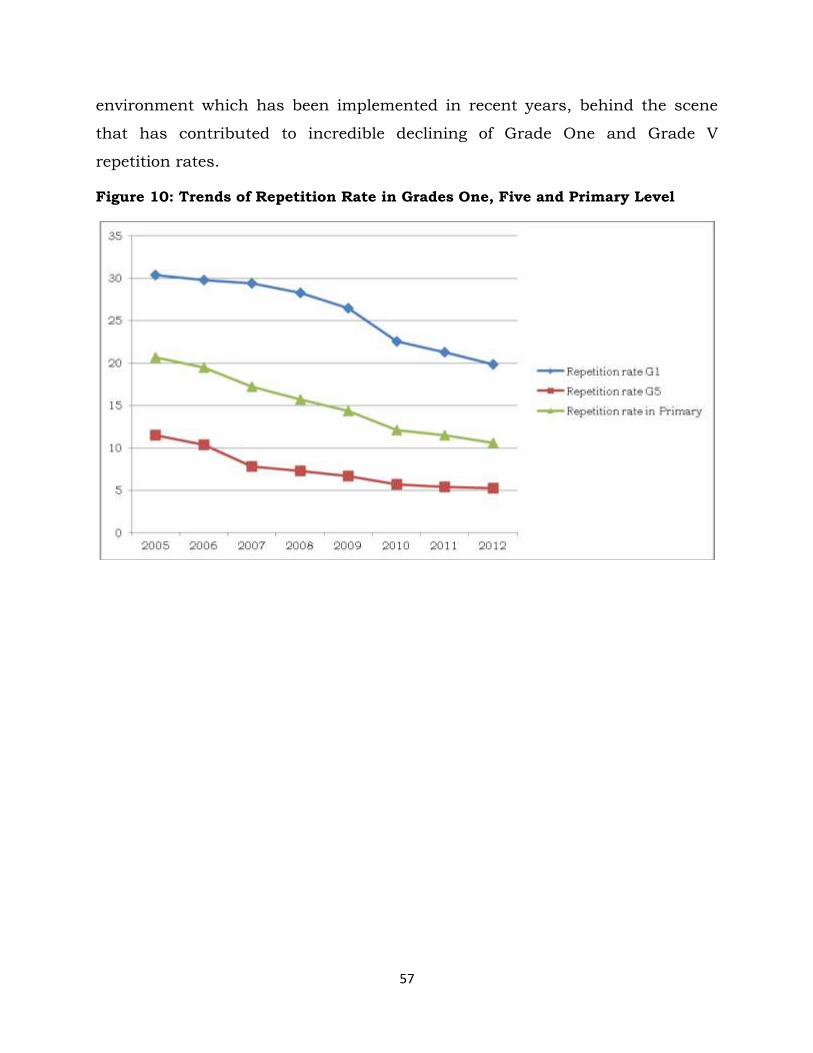
57
environment which has been implemented in recent years, behind the scene
that has contributed to incredible declining of Grade One and Grade V
repetition rates.
Figure 10: Trends of Repetition Rate in Grades One, Five and Primary Level

58
Figure 11: Trends of Dropout Rate in Grades One and Five at Primary Level
The Figure 11 also illustrates the status of dropout in Grade I of eight
years. It depicts that the dropout rate fall rapidly from 2005 to 2008. Since
that, it is falling gradually. It is tending to be closed with dropout rate of Grade
V and Primary level on the whole. It also justifies various intervention programs
such as scholarships, day meal, free textbooks, enrolment campaign, ECED
program and other various awareness program and activities.
Achievements against Annual Targets
At the central level, there were altogether eighty activities planned
under this component. The overall physical and financial implementation rates
of the component were 80% and 65% respectively. Seventeen of the activities
were completed with 100% physical and financial progress and forty-seven of
the activities attained 100% physical progress. Only fifteen activities were not
implemented this year which caused a bit reduction in overall progress rate.
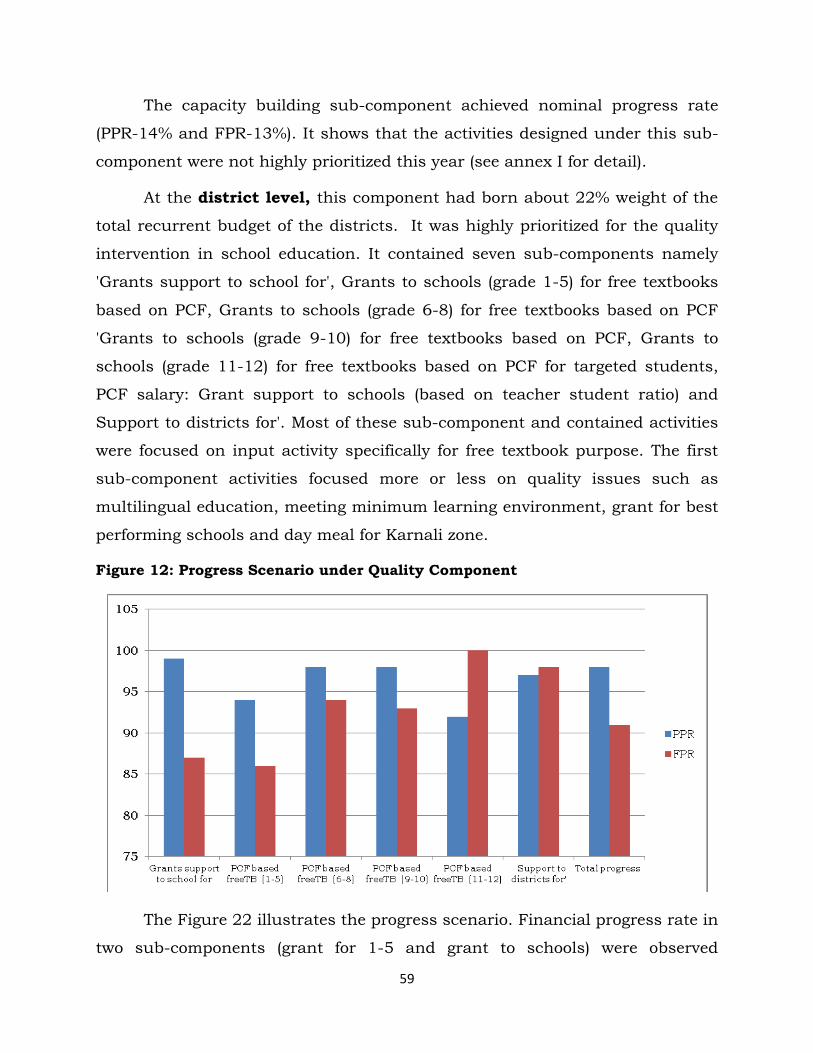
59
The capacity building sub-component achieved nominal progress rate
(PPR-14% and FPR-13%). It shows that the activities designed under this sub-
component were not highly prioritized this year (see annex I for detail).
At the district level, this component had born about 22% weight of the
total recurrent budget of the districts. It was highly prioritized for the quality
intervention in school education. It contained seven sub-components namely
'Grants support to school for', Grants to schools (grade 1-5) for free textbooks
based on PCF, Grants to schools (grade 6-8) for free textbooks based on PCF
'Grants to schools (grade 9-10) for free textbooks based on PCF, Grants to
schools (grade 11-12) for free textbooks based on PCF for targeted students,
PCF salary: Grant support to schools (based on teacher student ratio) and
Support to districts for'. Most of these sub-component and contained activities
were focused on input activity specifically for free textbook purpose. The first
sub-component activities focused more or less on quality issues such as
multilingual education, meeting minimum learning environment, grant for best
performing schools and day meal for Karnali zone.
Figure 12: Progress Scenario under Quality Component
The Figure 22 illustrates the progress scenario. Financial progress rate in
two sub-components (grant for 1-5 and grant to schools) were observed
60
relatively lower than others; however the progress rate wasn't below than 87%.
The low FPR for grant support to free Textbook for grade 1-5 indicates some
inconsistency and fluctuation of student's number in the primary school.
The overall physical progress rate on this component was 98% and
financial one was 87%. The physical progress rate of this year was noted by 6%
more and financial achievement was noted by 2% more than that of last year.
While analyzing the implementation status of the individual districts, it
was found that five districts (Taplejung, Sapatari, sarlahi, Pyuthan and salyan)
had achieved excellent progress rate of 100% both in terms of physical and
financial progress. In Eastern development region Dhankuta ranks at the
bottom with 89% PPR and 85% FPR, while Bara having 98% PPR and 63% FPR
ranks at the bottom among Central region districts. In Western development
region, Manang (PPR 88%, FPR 88%) became the low achiever in comparison
with other districts. In Mid-western development region, Pyuthan and Salyan
had highest achievement of 100% both in terms of physical and financial
progress rate. Banke ranks at the bottom with 86% PPR and 84% FPR. In Far
western development region, none of the districts had lower achievement than
93% in terms of physical one, but Bhajhang ranks at the bottom (67%) in
terms of financial progress rate.
While analyzing the progress made by RED, it was found that Central
RED, Mid-western and Far-western RED achieved excellent progress of 100%
both in terms of physical and financial progress rate. RED Western possessed
98% physical and 88% financial progress. Eastern RED obtained only 77%
physical progress rate.
Map 3: Physical progress of Enhancing Educational quality by districts
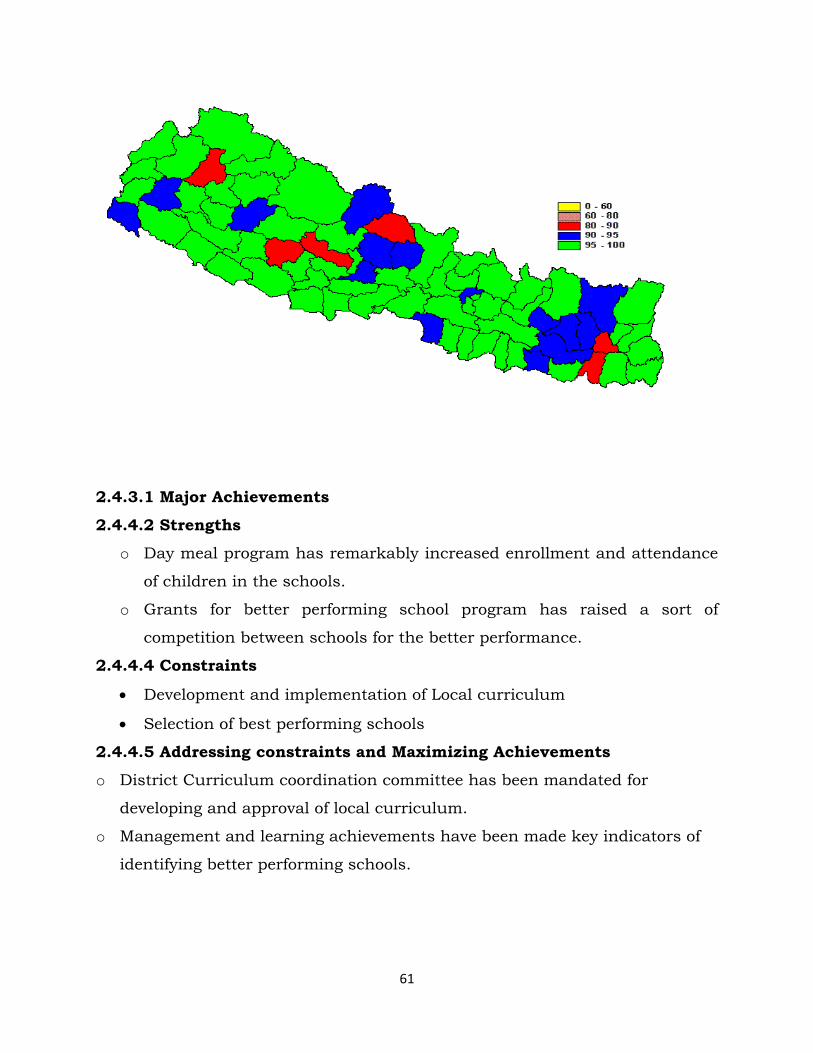
61
2.4.3.1 Major Achievements
2.4.4.2 Strengths
o Day meal program has remarkably increased enrollment and attendance
of children in the schools.
o Grants for better performing school program has raised a sort of
competition between schools for the better performance.
2.4.4.4 Constraints
Development and implementation of Local curriculum
Selection of best performing schools
2.4.4.5 Addressing constraints and Maximizing Achievements
o District Curriculum coordination committee has been mandated for
developing and approval of local curriculum.
o Management and learning achievements have been made key indicators of
identifying better performing schools.

62
63
Chapter 5: Teacher Professional Development
2.5.1. Introduction
Teacher professional development is another component of SSRP that
aims at providing teachers with the knowledge and skills that requires them to
facilitate effectively students learning processes, where as contributing to
improved performance of teachers through tailored and results oriented
professional training has been its immediate objectives.
2.5.2. ASIP Priorities
The ASIP aimed at fulfilling the following major activities and targets for
FY 2011-12
Strategic priorities
o Implementing field based TPD modules targeting to addressing
immediate pedagogical problems of teachers and continuous learning
opportunities for renewal of professional competencies.
o monitoring of teachers on their task and continues micro training so that
transformation in classroom practices could be materialized
o Making Continuous efforts to ensure the TDP responds to
individual needs of teachers, needs of schools and the needs of the
system include the continuous updating of the modules based on
lessons learned and changed needs.
o Integrating the CAS, ECED, MLE, and CFS in the regular NCED teacher
training curricula.
o Making efforts to ensure that at least 60% of working teachers have
access to at least one of the 10-day module to complete all three
modules of 30 days’ within five years’.
o Establishing linkage with RCs, LRCs, ETCs, and DEOs and channel
support system for effective implementation of the TPD programs.
o Making RCs to form institutional arrangement for delivering the TPD for
basic education teachers and LRCs/ETCs for secondary school teachers.
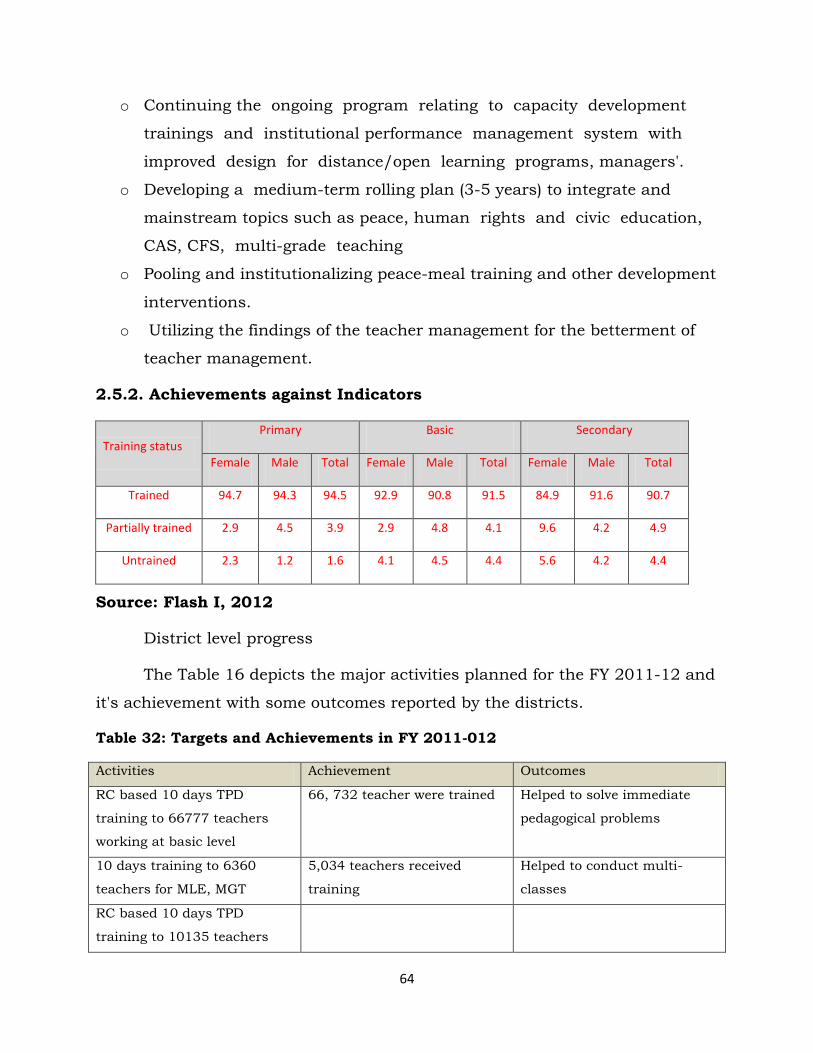
64
o Continuing the ongoing program relating to capacity development
trainings and institutional performance management system with
improved design for distance/open learning programs, managers'.
o Developing a medium-term rolling plan (3-5 years) to integrate and
mainstream topics such as peace, human rights and civic education,
CAS, CFS, multi-grade teaching
o Pooling and institutionalizing peace-meal training and other development
interventions.
o Utilizing the findings of the teacher management for the betterment of
teacher management.
2.5.2. Achievements against Indicators
Training status Primary Basic Secondary
Female Male Total Female Male Total Female Male Total
Trained 94.7 94.3 94.5 92.9 90.8 91.5 84.9 91.6 90.7
Partially trained 2.9 4.5 3.9 2.9 4.8 4.1 9.6 4.2 4.9
Untrained 2.3 1.2 1.6 4.1 4.5 4.4 5.6 4.2 4.4
Source: Flash I, 2012
District level progress
The Table 16 depicts the major activities planned for the FY 2011-12 and
it's achievement with some outcomes reported by the districts.
Table 32: Targets and Achievements in FY 2011-012
Activities Achievement Outcomes
RC based 10 days TPD
training to 66777 teachers
working at basic level
66, 732 teacher were trained Helped to solve immediate
pedagogical problems
10 days training to 6360
teachers for MLE, MGT
5,034 teachers received
training
Helped to conduct multi-
classes
RC based 10 days TPD
training to 10135 teachers

65
working at secondary level
30 days Head teachers
capacity building Training for
1,150 HTs
1,125 HTs were trained. Capacity of Head Teachers
was developed for the school
administration and
management.
Source: ASIP- 2011-12, District progress Report and Status report
Achievements against Annual Targets
At central level, this component contained of thirty three activities for
this fiscal year and the activities were accomplished with overall 99% physical
and financial 99% progress rates. It is remarkable progress in financial
attainment rate than that of last year which was 100% and 83% physically and
financially. Most of the activities possessed high PPR except activity 5.27 &
5.29. The activity 5.29 (One month in service training for Gazetted II class
officer was not conducted as planned in the AWPB and it achieved only 50%
PPR. The same scenario was observed in the activity 5.27. Despite 100% FPR,
PPR was only 50%. The overall accomplishment rate shows satisfactory
progress of this component.
At district level, only three activities namely 10 days' teacher professional
development (TPD) module for basic level teachers at RCs, 10 days' TPD
module for secondary level teachers at Educational Training Center ( ETCs) and
Lead Resource Center (LRCs) and 30 days' Head teachers' leadership capacity
building training (HT-LCBT) at ETCs and LRCs (including institutional school
principals)' were planned for the year 2011-12. It was implemented with highly
satisfactory progress rate (PPR 100% and FPR 95%). It was only 93% (both in
terms of physical and financial) in the last year. The progress record shows
that 66,732 teachers received basic level training. Likewise, 5,024 secondary
level teachers received professional development model training. This year,
1,125 Head teachers both from community and institutional schools received
CD training. The progress scenarios in terms of physical and financial rate are
as illustrated by the figure 13 below.
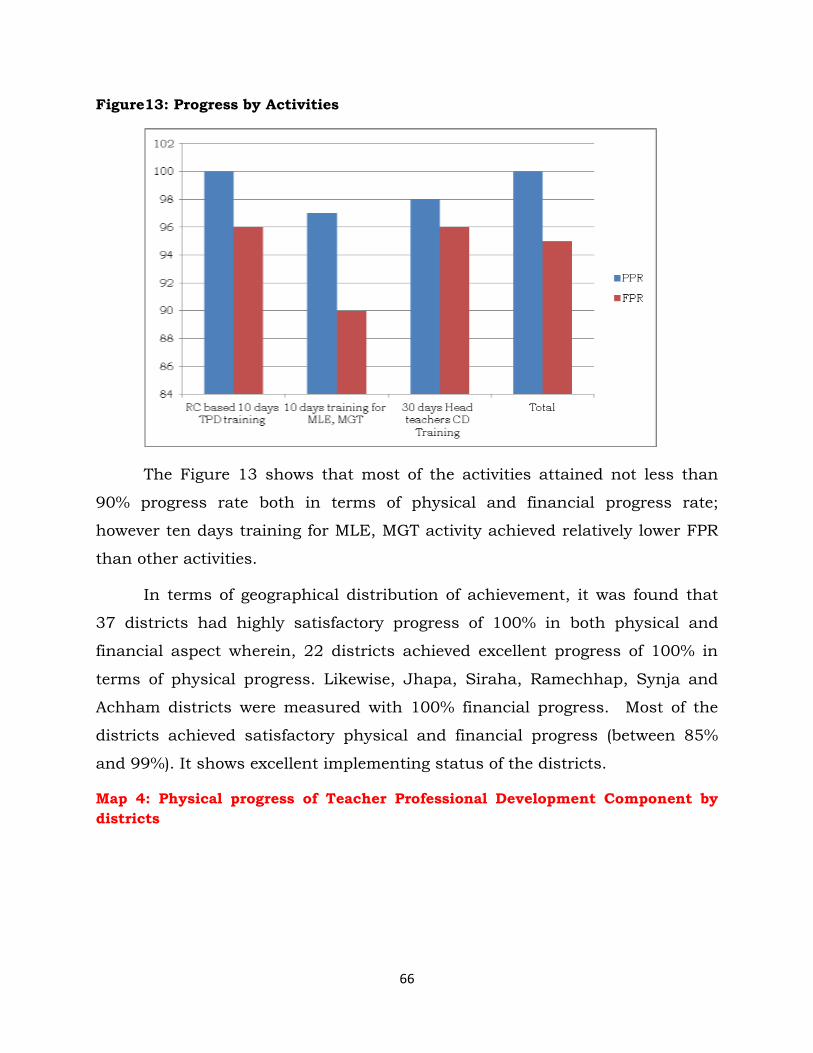
66
Figure13: Progress by Activities
The Figure 13 shows that most of the activities attained not less than
90% progress rate both in terms of physical and financial progress rate;
however ten days training for MLE, MGT activity achieved relatively lower FPR
than other activities.
In terms of geographical distribution of achievement, it was found that
37 districts had highly satisfactory progress of 100% in both physical and
financial aspect wherein, 22 districts achieved excellent progress of 100% in
terms of physical progress. Likewise, Jhapa, Siraha, Ramechhap, Synja and
Achham districts were measured with 100% financial progress. Most of the
districts achieved satisfactory physical and financial progress (between 85%
and 99%). It shows excellent implementing status of the districts.
Map 4: Physical progress of Teacher Professional Development Component by
districts
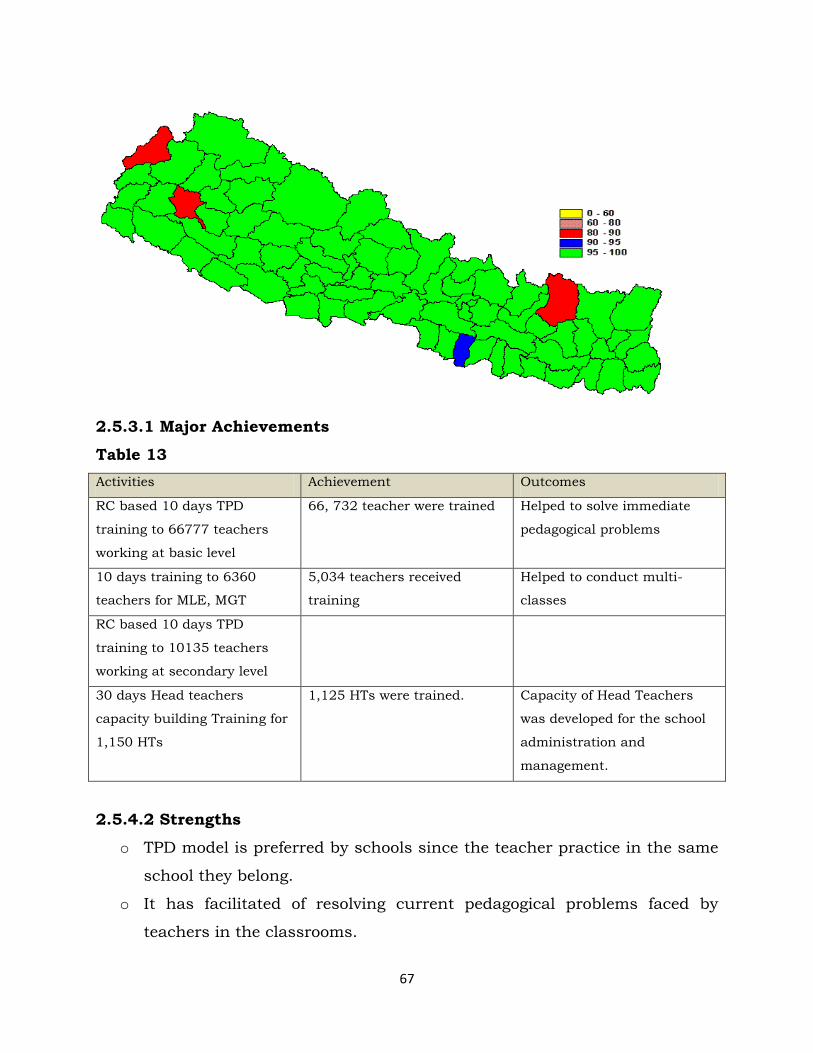
67
2.5.3.1 Major Achievements
Table 13
Activities Achievement Outcomes
RC based 10 days TPD
training to 66777 teachers
working at basic level
66, 732 teacher were trained Helped to solve immediate
pedagogical problems
10 days training to 6360
teachers for MLE, MGT
5,034 teachers received
training
Helped to conduct multi-
classes
RC based 10 days TPD
training to 10135 teachers
working at secondary level
30 days Head teachers
capacity building Training for
1,150 HTs
1,125 HTs were trained. Capacity of Head Teachers
was developed for the school
administration and
management.
2.5.4.2 Strengths
o TPD model is preferred by schools since the teacher practice in the same
school they belong.
o It has facilitated of resolving current pedagogical problems faced by
teachers in the classrooms.
68
2.5.4.3 Constraints
o Classroom implication of teacher training is still subject of investigation.
2.4.4.5 Addressing constraints and Maximizing Achievements
Monitoring and follow up is highly emphasized both in the districts and
centers
Chapter 6: Capacity Development
2.6.1. Introduction
Capacity development is the component of SSRP which aims to
contribute to a sustained improvement in the learning achievements of
students. The immediate objective of this component is to improve the
performance of the SSRP implementing agencies and its service delivery system
of the MOE as well as at the school level. The SSRP envisioned three
important aspects for CD: an enabling institutional framework through
endorsement of act, regulations, rules and guidelines; organizational
mandates, structures and relationships aligned with improved work
performance; and improved individual competencies and working
conditions through training, awareness raising, research activities and
provisions for incentives.
2.6.4. Priorities of ASIP for FY 2011-12
69
The ASIP (2011-12) stated that the CD (Capacity Development) activities
should be carried out both at systemic and individual levels. Likewise, it
emphasized on developing managerial as well as professional skills of persons
at individual level.
Strategic priorities for FY 2011/012
o Focusing on enhancing the capacity of planning and implementing at the
school level to improve the classroom services delivery.
o Preparing of agency-wise, results-oriented organizational CD plans aimed
at improving service delivery and supported by client satisfaction
rating over time and consolidating central level agencies' CD plans
and prioritizing activities for their implementation.
o Covering mainly three areas: i) enabling conditions, ii) organizational
strengthening and iii) individual competencies, aiming to produce result
and increase accountability.
o Giving priority to financial management (Budgeting and accounting)
capacity building of HTs or teacher/ accounting personnel at school
level for the implementation of the CD program to enhance
management efficiency, transparency and accountability.
o Supporting schools for planning based on the MEC and CFS criteria,
social audit and other contemporary issues.
o Conducting the capacity development program for RPs
2.6.5. Achievment aginst annual targets
Achievements against Annual Targets
At the central level, the component 'Capacity development for the
effective service delivery', which contained thirty-one activities in all. The
attainment rate in this component was observed satisfactory this year. This
component had thirty-one activities to be accomplished this year. Out of which
ten activities (6.1.7, 6.1.9, 6.13, 6.14, 6.15, 6.16, 6.18, 6.25, 6.29 and 6.32)
were not implemented this year (see annex I). The overall physical and financial
70
implementation rates were 78% and 66% for PPR and FPR. The progresses
were 63% and 35% last year. It shows remarkable improvement in
implementation of the program. Those implemented activities achieved highly
satisfactory progress; however, the unimplemented ten activities caused
deduction in over all achievement rates.
In district level, the capacity development program was designed and
provided separately under the budget head 3508033/34. This component
consisted of eight activities. Most of the activities were designed to develop
capacity for the effective service delivery. It included Capacity Development for
SMC, PTA and HTs, Accounting/ financial record keeping training to
HT/Account teacher to enhance financial management, Talent Hunt through
extra/co-curricular activities, Grading up Public Guthi Partnership co-
operation with Budhanilkantha School, Subsidies for Grihini Schools based on
the graduates of Grade 8 and SLC and Utilizing mass media to enhance
educational quality at district level. These activities were designed in order to
make service delivery effective. The overall physical implementation rate for
this component was 97% the financial one was 96%.
In terms of geographical distribution of individual districts, fifty-three
districts achieved 100% progress in both physical and financial aspects. Eight
districts had achieved 100% PPR. Baglung achieved 100% financial progress
against 91% PPR. The attainment rate of the all districts (except Dhausha) was
in between 85% and 99%. Dhanusha ranks in the bottom (only 18% both PPR
and FPR). The progress made by RED Western and Mid-western was 100%
both in terms of physical and financial rate; where other REDs achieved highly
satisfactory progress between 84% and 100% (see annex IV for detail).
Map 5: Physical Progress of Capacity Development by districts
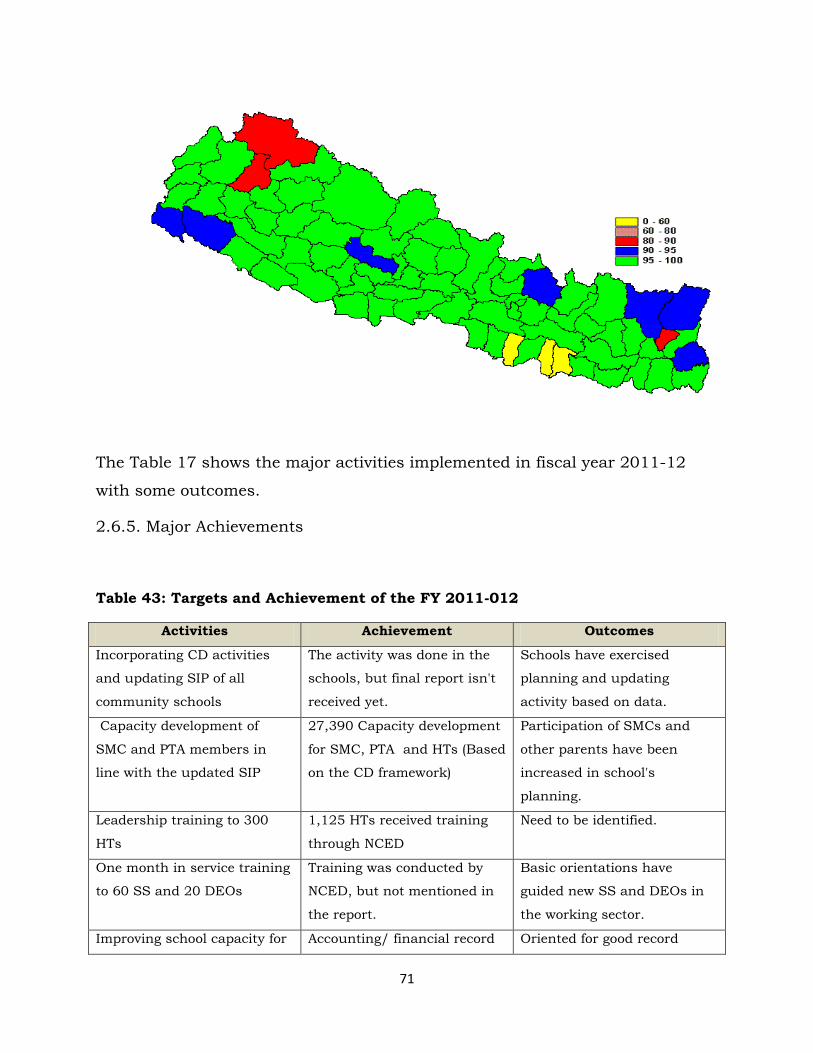
71
The Table 17 shows the major activities implemented in fiscal year 2011-12
with some outcomes.
2.6.5. Major Achievements
Table 43: Targets and Achievement of the FY 2011-012
Activities Achievement Outcomes
Incorporating CD activities
and updating SIP of all
community schools
The activity was done in the
schools, but final report isn't
received yet.
Schools have exercised
planning and updating
activity based on data.
Capacity development of
SMC and PTA members in
line with the updated SIP
27,390 Capacity development
for SMC, PTA and HTs (Based
on the CD framework)
Participation of SMCs and
other parents have been
increased in school's
planning.
Leadership training to 300
HTs
1,125 HTs received training
through NCED
Need to be identified.
One month in service training
to 60 SS and 20 DEOs
Training was conducted by
NCED, but not mentioned in
the report.
Basic orientations have
guided new SS and DEOs in
the working sector.
Improving school capacity for Accounting/ financial record Oriented for good record

72
financial report and record
keeping
keeping training to
HT/Account teacher to
enhance financial
management-27,435
keeping, but the practice is
needed to be monitored and
verified.
Capacity building program for
1091 RPs
Not implemented
Source: ASIP 2011-12, status Report and District Progress report, 2069
Other activities such as CB of DOE, NFE and DEO personals were also
accomplished and reported.
2.6.5.2 Strengths
o Capacity Development training has reenergized to the school HTs, SMC
chairperson and PTA for the effective management of the school.
o Financial record keeping training to HT and account teacher is useful for
financial management.
2.6.5.3 Constraints
Highly politicize in SMC formation
Lack of technical support to the schools for financial record keeping
2.6.5.4. Addressing Constraints and Maximizing Achievement
Following Education act and regulation
Financial audit and social audit has made mandatory
73
Chapter 7. School Management and Monitoring
2.7.1. Introduction
One of the major components of SSRP is monitoring and evaluation
(M&E) which is recognized as an integral part of program implementation to
achieve expected outcomes. The monitoring program under SSRP is meant to
facilitate decision making processes by ensuring quick access to relevant
and reliable information within time and providing strategic options for
improving efficiency and quality of service delivery. It also endeavors to
ensure transparency and accountability at all levels. Key outputs of the
monitoring component reflect number of forms, such as the FMR, Flash
reports, Status reports, Research reports etc. Its immediate objective is to
monitor program inputs, process, and outputs and evaluate the impact of plan.
This component integrates monitoring with school management. So
program and activities were designed both for monitoring activities and
essential activities for the management of schools. ASIP 2011-12 had focused
more on monitoring and reporting part.
2.7.2. Strategic Priorities of ASIP 2011-12
Based on the concept of SSRP the ASIP 2011-12 had set following key
priorities for the Fiscal Year 2011/12.
o Assessing schools on the basis of MECs
o Using t he ASIP/AWPB as the prime instrument for monitoring
performance and progress against the stated priorities, targets,
budgets and roles and responsibilities.
o Making and conducting Plan based and AWPB based monitoring.
o Implementing monitoring tools based on the monitoring plan reflecting
program targets and the differences observed between the planned
and actual outputs on identified program indicators.
74
o Strengthening monitoring mechanisms at all levels to insure quality
reporting
o Utilizing monitoring reports to put timely adjustments in the program
implementation avoiding deviations.
o Making use of monitoring reports as guidelines by decision makers for
improving quality of decisions.
The ASIP 2011-12 has also depicted roles of different institutions such as
schools, RCs, DEOs, REDs, DOE and other central level agencies and MoE in
relation to Monitoring and Reporting. It has also made budgetary provision for
the involvement of third party in monitoring. Expected roles of the different
agencies or institutions are expected as documented below.
Schools: Each school will prepare its monitoring plan. This plan will help
monitor the implementation of activities given in the School Improvement Plan
(SIP) involving parents and CBOs at local level.
Resource Centers (RC): Resource Centers will within its catchment
area, their action plan on the basis of SIPs and implement it.
District Education Offices (DEOs): DEOs are the main agencies for
implementing the program activities will prepare and implement a monitoring
plan as per the district ASIP through School Supervisors (SS) and Resource
Persons (RPs).
Regional Education Directorates (REDs): At regional level, REDs will
make its own action plan and conduct M & E action with in its region.
DOE and Central Level Authorities: The DOE and CLAs will undertake
monitoring of the program as to the ASIP and make reports available on both
performance and progress monitoring.
Ministry of Education: The MOE will review progress of program
implementation at intervals and provide feedback to concerned agencies for
review.
75
2.7.3. Analysis of the Progress
2.7.5.1. Achievement against Annual Targets
Central Level Activities
At the central level of this component, there were thirty three activities
altogether planned in the AWPB and was allocated 24.52% of the total central
SSRP budget. All activities were implemented as planned in AWPB. This
component achieved 89% PPR along with 73% FPR. The achievement rate in
last year was 91% physically and 67% financially. There observed slight
reduction in PPR, but the FPR was increased by 6%. Most of the activities were
implemented with highly satisfactory progress rate except activity no 7.9, 7.10,
7.20 and 7.32. The lowest PPR was observed in activity 7.32 (10% PPR and 2%
FPR), wherein; no FPR was made in activity no 7.20 (English Language testing
Program). The Progress reveals 100% PPR in the same activity concluding that
no expenditure was made for the accomplishment of the activities from the
SSRP budget head (See annex I for more detail). In general, the implementation
of this component was observed satisfactory.
District Level Activities
At the district level, the component consisted of five sub-components
(‘Districts’, ‘Resource centers’ and ‘Schools’, REDs and Financial tracking) with
nineteen activities altogether. All of the activities were accomplished. The
overall physical implementation rate at this level was 84% (last year 83%) and
the financial one was 78% (last year 76%). The attainment rate was slightly
increased than that of last year indicating continuous progress in
implementation.
Figure 14 : Progress Scenario by Sub-component

76
The Figure 14 indicates the progress status by sub-component of this
component. A slight gap between physical and financial progress is observed in
the district activities; but it is reduced and almost linear in the case of
Resource center and schools. Despite these nominal variations, the overall
progress made was noted satisfactory.
These activities designed under this component were very crucial for
making ASIP/AWPB, planning and monitoring activities, student's Identity
Card (ID), social auditing and financial tracking. Therefore; its qualitative
progress would be more important, but it takes time and have to wait to receive
result. On analyzing the progress scenario as documented by the districts,
most of the activities were implemented with highly satisfactory progress rate.
One activity under the schools title achieved relatively low progress. Incentive
grant for community managed schools were allocated for 2,290 schools, but in
practice only 1,046 schools management was transferred to the community
and this activity caused slightly reduction in overall progress figure.
The progress report of the districts shows that Bara and Jajarkot
districts had achieved 100% progress both in terms of physical and financial
progress rate. Likewise, Panchthar, Udayapur, Dhading, Nuwakot, Rupandehi,
Kaski, Rukum, salyan and Bajhang had achieved 100% progress in terms of

77
physical one. 13 districts of eastern development region had achieved progress
between 70% and 100%; however Bhojpur, Sunsari and Saptari had physical
progress between 62% and 68%. In the central development region Sindhuli
ranks at the bottom (PPR 67%, FPR 60%), but the progress rate is not less than
60%. While in mid-western development region, the progress of Bardiya ranks
at the bottom (51% PPR and 44% FPR). In Far-western development region
seven districts had achieved more than 60%, but Bajuara achieved only 59%
PPR and 51% FPR (See annex III for detail). On analyzing the progress made by
RED, it was observed that RED Central and Mid-western ranked among the
highest achievers of both in terms of physical and financial progress. Others
RED achieved highly satisfactory progress, but RED Eastern region achieved
only 73% progress in terms of financial one and ranked at the bottom. The map
8 clearly illustrates the scenario of the progress.
Map 6: Physical Progress of School Management and Monitoring by districts
2.7.5.1. Major Achievements
Table14: Targets and achievement in FY 2011/012 on M&E
Activities Achievement Outcomes
EMIS Flash I and Flash II Flash I and Flash II data The overall status of
78
data collection- 2 times
analysis and reporting
including FMR -3 times
status report- 1 time
collected and compiled as
targeted. IPR/FMR prepared 3
times at the end of each
trimester. Status report is
prepared and disseminated
annually.
enrollment, participation,
quality aspects, teacher
management, and physical
status were known. Analysis
of the report has made
adopting new strategies to
overcome the difficulties.
Monitoring the program
implementation from
central, regional, district and
RC level
DOE monitored …….districts,
RCs and schools in the fiscal
year 2011-12. The monitoring
was of three types namely
regular plan based monitoring
by CL, monitoring by ex-
educational personnel,
teachers and monitoring by
journalists. REDs, DEOs were
also provided grant for the
plan based regular
monitoring. Most of the
agencies reported of the
monitoring activities.
Districts could receive
immediate measures to solve
the problems occurred during
the implementation.
Central level could observe
the implementing status,
problems which could be
feedback for the future
planning. Regular trimester-
wise reporting have
communicated the progress
status and also shared
problems with CL agencies.
Research studies in different
areas
Researches were conducted
on: Gender audit, language
issue, Out of school children
and data validation, social
audit and teacher
management.
Research studies had
provided important
information pointed out
gaps, hindrances, positive
impacts etc which would be
fruitful for future planning
and decision making.
NASA
Functions of ERO ERO conducted standardized
test for 48,713 Grade 8
children. It also assessed
performance of 5 DEOs
(Ramechhap, Sindhupalchok,
Kanchanpur, Pyuthan and
Synja). It also carried out 4
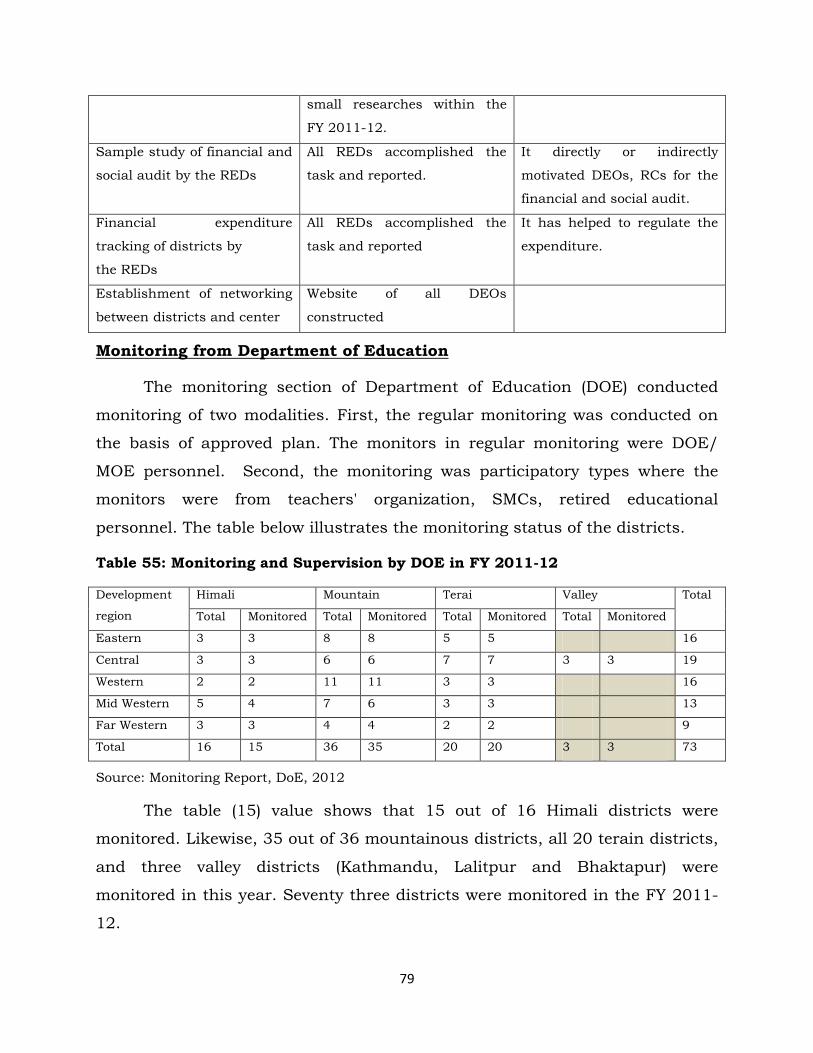
79
small researches within the
FY 2011-12.
Sample study of financial and
social audit by the REDs
All REDs accomplished the
task and reported.
It directly or indirectly
motivated DEOs, RCs for the
financial and social audit.
Financial expenditure
tracking of districts by
the REDs
All REDs accomplished the
task and reported
It has helped to regulate the
expenditure.
Establishment of networking
between districts and center
Website of all DEOs
constructed
Monitoring from Department of Education
The monitoring section of Department of Education (DOE) conducted
monitoring of two modalities. First, the regular monitoring was conducted on
the basis of approved plan. The monitors in regular monitoring were DOE/
MOE personnel. Second, the monitoring was participatory types where the
monitors were from teachers' organization, SMCs, retired educational
personnel. The table below illustrates the monitoring status of the districts.
Table 55: Monitoring and Supervision by DOE in FY 2011-12
Development
region
Himali Mountain Terai Valley Total
Total Monitored Total Monitored Total Monitored Total Monitored
Eastern 3 3 8 8 5 5 16
Central 3 3 6 6 7 7 3 3 19
Western 2 2 11 11 3 3 16
Mid Western 5 4 7 6 3 3 13
Far Western 3 3 4 4 2 2 9
Total 16 15 36 35 20 20 3 3 73
Source: Monitoring Report, DoE, 2012
The table (15) value shows that 15 out of 16 Himali districts were
monitored. Likewise, 35 out of 36 mountainous districts, all 20 terain districts,
and three valley districts (Kathmandu, Lalitpur and Bhaktapur) were
monitored in this year. Seventy three districts were monitored in the FY 2011-
12.
80
2.7.5.2 Strengths
Publication of Bulletins and mobilization of other media in education
have been found of contributing in enhancing transparencies in the
districts.
2.7.5.3. Areas of under performance
Transfer of school management to the community activity has been
observed with low performance among all other activities.
2.7.5.4. Constraints
o Resource in monitoring
o Restriction to transfer management of schools by Teacher unions
o Mobilization of RCS for academic supervision
1.7.5.5 Addressing of Constraints and Maximizing Achievements
RED, DEOs and RCs are effective mechanism of monitoring and hence
instructed for their proper mobilization
Dialogue between DOE and TU
Mandatory provision of monthly meeting and reporting of RCs.
DEOs have been requested of developing and submitting their monitoring
plan in DOE.
Chapter 8. Incentive and Support
2.8.1 Introduction
‘Incentive and Support’ is the 8th component of AWPB 2010-11. This
component supports in one way or other to second component ‘Ensuring
access to basic and secondary education’.
2.8.2. Achievement against Annual Targets
Like in other components, this component also has activities only at
district level, which are analyzed in separate headings below.
District Level activities
81
At the district level, this component was divided into two
subcomponents namely: ‘Basic Education’ and ‘Secondary Education’, which
was implemented with overall 97% physical progress rate and 89% financial
progress rates (See annex II for details). The implementation rate in the last
year was 95% both in terms of physical and financial and no more differences
were noted in its implementation.
The first sub-component comprised of two activities namely scholarship
for Dalit (grade 1-8), girl's scholarship (grade 1-8) including Karnali package. It
achieved 96% PPR and so as 91% FPR. The district report shows that
2,276,479 Dalit children graded1-8 achieved scholarship. Likewise, 1, 200,816
girls (Grade 1-8) were benefitted with Girl's scholarship. This number also
included all girls of Karnali zone.
The second sub-component contained twenty-two activities. Twelve out of
twenty two activities were scholarship grant for targeted students of secondary
level. Rests of the activities were about ICT in schools, school library, hostel
operation cost, Support to higher secondary schools for science program, grant
for model schools etc. All of the activities were implemented this year and
achieved 96% physical progress rate. Regarding the financial progress, it
achieved 87%.
Map 7: Physical Progress of Incentive and Support Component by districts
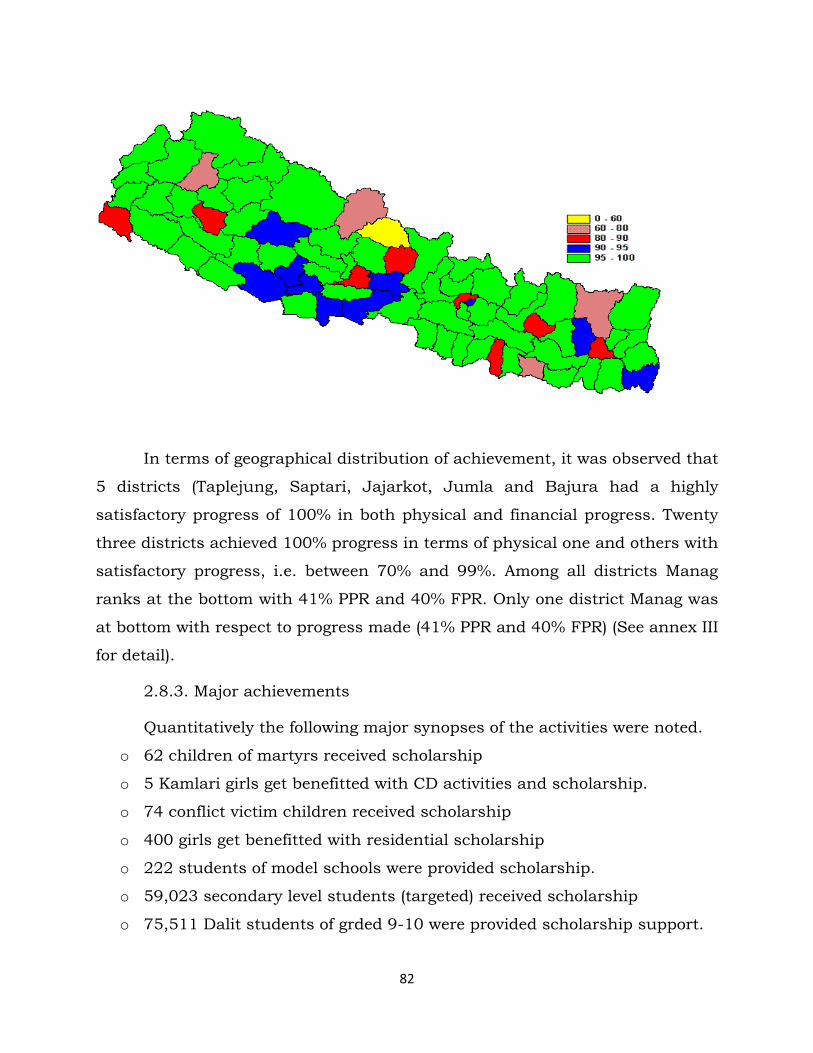
82
In terms of geographical distribution of achievement, it was observed that
5 districts (Taplejung, Saptari, Jajarkot, Jumla and Bajura had a highly
satisfactory progress of 100% in both physical and financial progress. Twenty
three districts achieved 100% progress in terms of physical one and others with
satisfactory progress, i.e. between 70% and 99%. Among all districts Manag
ranks at the bottom with 41% PPR and 40% FPR. Only one district Manag was
at bottom with respect to progress made (41% PPR and 40% FPR) (See annex III
for detail).
2.8.3. Major achievements
Quantitatively the following major synopses of the activities were noted.
o 62 children of martyrs received scholarship
o 5 Kamlari girls get benefitted with CD activities and scholarship.
o 74 conflict victim children received scholarship
o 400 girls get benefitted with residential scholarship
o 222 students of model schools were provided scholarship.
o 59,023 secondary level students (targeted) received scholarship
o 75,511 Dalit students of grded 9-10 were provided scholarship support.

83
o 6,193 disable children received scholarship
o 32,703 marginalized children get benefitted with scholarship
o 6,341 science streamed higher secondary schools received intensive
grant support
o 900 schools get grant support for matching fund based computer library
o 409 schools received grant for ICT.
Strengths
o Access of target group in education has been increased.
o Participation of stakeholders is more effective for the successful
implementation of the program.
Constraints
o Collection and verification of data
o Delay budget and delay of rights of expense.
o Nominal scholarship high opportunity cost
Addressing the constraints and maximizing the profit
o Mandatory provision of data verification by RPs, SS and DEOs
2.4.9. Per Child Funding (PCF) based Non-salary Grant Support to Schools
PCF non-salary grant support has been the funding modality continued
in the ASIP/AWPB 2011-12.
Major Activities
This component had three sub-components (Educational Material
Management Cost, School Management Cost and School Employee
Management Cost) with eleven activities. 'The following were the major
activities of the component:
o Grants to ECED classes
o Primary level grants.
o Lower Secondary Level grants to schools.
o Secondary Level (for targeted group) grants to schools.
84
o Secondary Level (general) grants to schools.
o School Management Cost(Basic level, Lower secondary level, secondary
level)
o School employee cost (primary, lower secondary and secondary)
Achievement against Annual Targets
There was no activity set under the ‘Per Child Funding (PCF) based non-
salary grant support to schools’ at the central level this financial year.
At the district level, there were three sub-components and eleven
activities planned under this component. The overall physical accomplishment
rate was 98% and the financial one was 96%. When the progress rates of the
individual activity are analyzed separately, the first activity ‘the PCF grants to
ECED classes was implemented with 97% PPR and 93% FPR, the second
activity ‘the PCF grants to Primary level with 96% PPR and 89% FPR and the
third one ‘Lower secondary Level with 99% PPR and 96% FPR. Likewise, the
fourth activity 'Secondary Level (for targeted children)' attained 86% PPR.
Again, it was implemented with 79% FPR. Again, the fifth activity ‘Secondary
Level (general) grants to schools’ was accomplished with 96% PPR and 94%
FPR (See annex II for more details). The second sub-component (school
management cost) was marked with excellent progress of 100% physical and
99% financial implementation rate. Lastly, the third sub-component was
School Employee management Cost under which, three types of grants (For
primary, lower secondary and secondary level) were provided. It achieved 100%
physical progress rate. In terms of financial one the attainment rate for this
sub-component was 99%.
Conclusively, this ninth component was accomplished with highly
satisfactory progress rate both in terms of physical and financial progress rate.
In terms of geographical distribution of implementation, it was found
that 17 districts (Panchthr, Khotang, Saptari, Dhanusha, Sarlahi,
Sidhupalchok, Kavreplanchok, Parsa, Mugu, Jumla, Rolpa, Pyuthan, salyan,
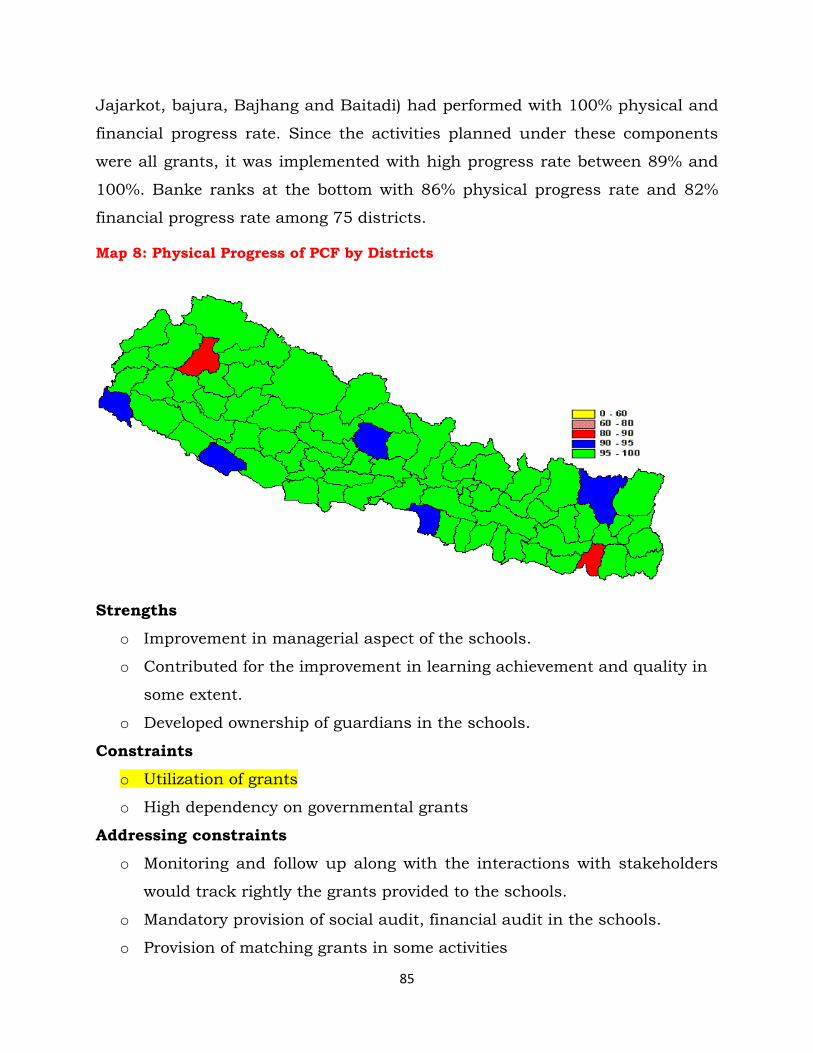
85
Jajarkot, bajura, Bajhang and Baitadi) had performed with 100% physical and
financial progress rate. Since the activities planned under these components
were all grants, it was implemented with high progress rate between 89% and
100%. Banke ranks at the bottom with 86% physical progress rate and 82%
financial progress rate among 75 districts.
Map 8: Physical Progress of PCF by Districts
Strengths
o Improvement in managerial aspect of the schools.
o Contributed for the improvement in learning achievement and quality in
some extent.
o Developed ownership of guardians in the schools.
Constraints
o Utilization of grants
o High dependency on governmental grants
Addressing constraints
o Monitoring and follow up along with the interactions with stakeholders
would track rightly the grants provided to the schools.
o Mandatory provision of social audit, financial audit in the schools.
o Provision of matching grants in some activities
86
2.4.10. Capital Expenditure (3501214/3508034)
The capital expenditures under the SSR program meant to ensure the
access of schooling children to school education for which there were some
activities set at both the central and district levels in the FY 2011-12. The
progress rates, issues and challenges, and strengths along with lesson learned
and best practices exercised at the districts are presented in the sections
below.
Central level (3501214)
There were three component titles (Ensuring Access, Improvement of
educational quality and capacity Development) under the capital budget head
in central level. The overall physical and financial progress rates of the
activities under the central level capital budget head were100% and 97%
respectively. The implementation rates in this budget head were observed quite
satisfactory.
District level (3508034)
This budget had only one component i.e. Ensuring access to school
education' under which 'Physical Facilities improvement' was designed as a
sub-component. Construction of DEO building and furniture for DEOs and
REDs were the task to be completed this year. All activities were implemented.
The overall physical and financial progresses were 100% and 99% respectively.
It was 99% and 98% last year. The major achievements were as follows.
o 45 DEOs were renovated
o 9 DEOs buildings were constructed
o 74 DEOs procured furniture.
Other construction activities were planned under the component '
Ensuring Access to school education'.
Conclusively, the implementation of physical improvement program
improved remarkably then of the previous year. Total construction activities
irrespective of the budget heads are illustrated on the table 16.
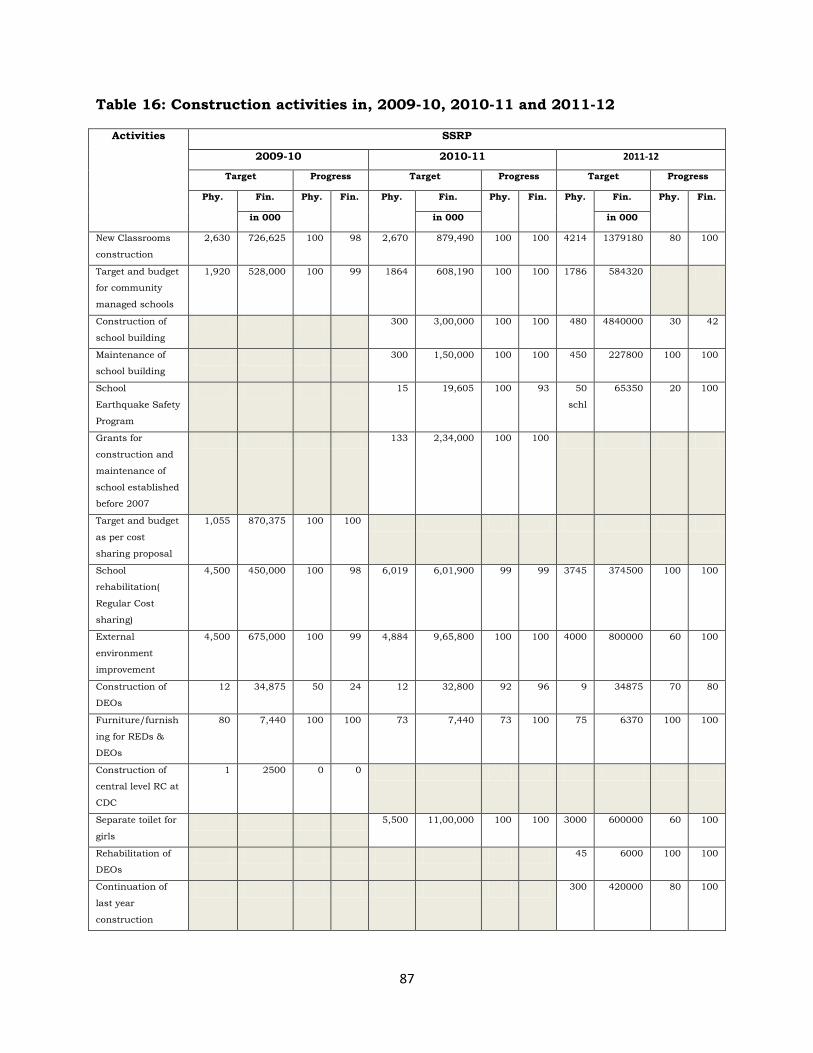
87
Table 16: Construction activities in, 2009-10, 2010-11 and 2011-12
Activities SSRP
2009-10 2010-11 2011-12
Target Progress Target Progress Target Progress
Phy. Fin. Phy. Fin. Phy. Fin. Phy. Fin. Phy. Fin. Phy. Fin.
in 000 in 000 in 000
New Classrooms
construction
2,630 726,625 100 98 2,670 879,490 100 100 4214 1379180 80 100
Target and budget
for community
managed schools
1,920 528,000 100 99 1864 608,190 100 100 1786 584320
Construction of
school building
300 3,00,000 100 100 480 4840000 30 42
Maintenance of
school building
300 1,50,000 100 100 450 227800 100 100
School
Earthquake Safety
Program
15 19,605 100 93 50
schl
65350 20 100
Grants for
construction and
maintenance of
school established
before 2007
133 2,34,000 100 100
Target and budget
as per cost
sharing proposal
1,055 870,375 100 100
School
rehabilitation(
Regular Cost
sharing)
4,500 450,000 100 98 6,019 6,01,900 99 99 3745 374500 100 100
External
environment
improvement
4,500 675,000 100 99 4,884 9,65,800 100 100 4000 800000 60 100
Construction of
DEOs
12 34,875 50 24 12 32,800 92 96 9 34875 70 80
Furniture/furnish
ing for REDs &
DEOs
80 7,440 100 100 73 7,440 73 100 75 6370 100 100
Construction of
central level RC at
CDC
1 2500 0 0
Separate toilet for
girls
5,500 11,00,000 100 100 3000 600000 60 100
Rehabilitation of
DEOs
45 6000 100 100
Continuation of
last year
construction
300 420000 80 100
88
Maintenance of
feeder hostel(girls)
20 6000 90 100
model school
building
construction
4 6200 60 100
The table 16 above shows the construction activities performed since FY
2009-10 to this year. It was observed that there was considerable increment in
progress this year. Progress rate achieved for the construction of community
managed schools was not obtained till this analysis. The number of
construction has increased per year. The comparative analysis of FY 2009-10
and 2010-11 is also shown by Figure 25 below. It illustrates only those
activities which were continued for this year too. Construction of new class
rooms is shown increased remarkably in comparison with previous two fiscal
years. Priorities for the new construction in community managed schools (CMS)
have continued this year too. External Environment Improvement (EEI) and
school rehabilitation program is observed decreased in number against
previous two fiscal years. Construction of DEOs, furnishing for REDs and
DEOs were continued program implemented this year too.
Figure 15: Comparison of Numbers of Construction between FY 2009-10, 2010-
11 and 2011-12

89
In terms of geographical distribution of implementation most of the
districts (69 districts) achieved 100% progress in both physically and
financially, however the progress rate of Illam, Okhaldhunga, sindhuli, Rukum
and Khotang were close to 100%. Despite the high physical progress rate
(100%), the financial progress of Sindhuli ranks at the bottom (50%) and the
progress under the capital budget head of Dhading were found not reported.
The progress made by RED shows they achieved highest progress rate of 100%.
This analysis is made only based on the capital expenditure, but more
construction activities were implemented under the recurrent budget head
3508033 (school physical facilities improvement Program planned under
second component of district SSRP).
Strengths
o Construction of fixed formed and standard building.
o Development of community ownership
o Improvement in teaching learning environment.
Constraints
90
o Limited quotas of construction
o Public contribution is negligible in rural areas.
o Technical personals are insufficient in the districts
Addressing Constraints
o Collaborations between DOE and I/NGOs for the management of school
physical facilities.
o Plan of recruiting technical staffs for the upcoming fiscal year
o Public contribution has been made compulsory.
2.4.11 Good Practices in Center and District Level
Central Level
Good Practices exercised at Central Level
o National center for Education and Development (NCED) conducted online
and offline CD training for instructor and roaster instructor. The
examination was also managed to conduct from online service.
Presentation of assignment and interaction was made Skype based.
o Curriculum Development Center (CDC) conducted talent haunt program
which conveyed good message among talent students of the country. It
also developed capacity of 30 officers for the development of competency
based and general vocational skill based curriculum.
o Education Review office could accomplish National Achievement Test of
Grade 8 students in three major subjects. It has also prepared test items
for the Grade 3 and 5.
o Department of Education (DoE) accomplished third party monitoring in
54 districts in order to monitor the implementing status.
o Department of education has developed twenty five indicators of
Minimum Enabling conditions (MECs) for basic level which would be the
necessary conditions for the school to be operated. Moreover; DOE
identified five indicators as prioritized Minimum Enabling Conditions
(PMECs) indicators which is regarded as mandatory conditions for
establishing and operating basic level schools (see annex for more detail).
91
o DOE has developed 104 indicators to assess the child friendly schools
under the nine difference areas (Effectiveness, inclusion, Gender in
education, participation of children, family and community, Health and
safety, physical environment, teaching learning in mother tongue and
school management).
o DOE had organized conference of DEOs which intensively discussed
about the program and activities initiated in education. It also analyzed
the implementing practice and the problems occurred during the
implementation. The conference declared 31 points commitment.
District Level
Many districts have tried to accomplish creative works by mobilizing
limited resources. Their best effort is briefly mentioned below. These practices
are taken from the Status report and other documents send by the concerned
districts. Their best effort is briefly mentioned below.
o Some districts like Palpa, Gorkha, Gulmi etc have managed to conduct
educational program through local radio.
o Most of the districts disseminated their program to all stakeholders
including representatives of political parties.
o Participation of Teachers' organization in decision making have been
continued in the districts.
o Guide book for school conduction and implementation of activities was
developed and distributed to the schools which contributed to bring
uniformity and transparency (Dhankuta, Illam)
o Dissemination of trimester wise progress in presence of mass media has
made personnel and schools more aware and responsible (Dhankuta).
o Most of the districts have initiated Tem supervision and was reported
effective in practice.
o Calendar with annual instructional plan has been published and
distributed to the schools (About 60% districts)
92
o Formation of Samajik Sambad Samanwaya Samittee (Social Dialogue
Coordination Committee) to overcome the educational issues(Jhapa,
Baglung etc)
o Some community schools are conducting English medium classes and
are being centers of attraction (Bojpur).
o Partnership with Himalayan Trust, RID, Nepal in Physical improvement,
teacher training, and orientation to the SMC members (Solukhumbu)
o DDC has supported 194 ECED basically for the remuneration of
facilitators (Myagdi)
o Some districts like Kavreplanchok have initiated rewarding best
performer teachers.
o Multiple intelligences and critical thinking approach is adopted in TPD
program for enhancing quality in education (Sindhupalchok).
o The district like Khotang has made social audit mandatory for the
financial audit.
o Nawalparasi has initiated child friendly local governance program.
o DEO Dolakha formed joint team (HT of secondary level and RP) for the
verification of data which visited sampled schools and checked the
reality.
o DEO Okhaldhunga and Dolakha have merged some primary schools
having no adequate children.
o DEO Tanahu lunched policy of free and compulsory basic education. in
some VDCs and ward 9 of Byas municipality.
o DEO Dolpa reduced financial irregularities into Zero; likewise DEO Palpa
has continuously keeping record of non-irregular district in terms of
financial expenditure.
o DEO, Jajarkot deducted salary of the teacher for their absent days which
contributed to promote the regularity of the teachers in the schools (as
reported).
SSRP Indicators and Achievement
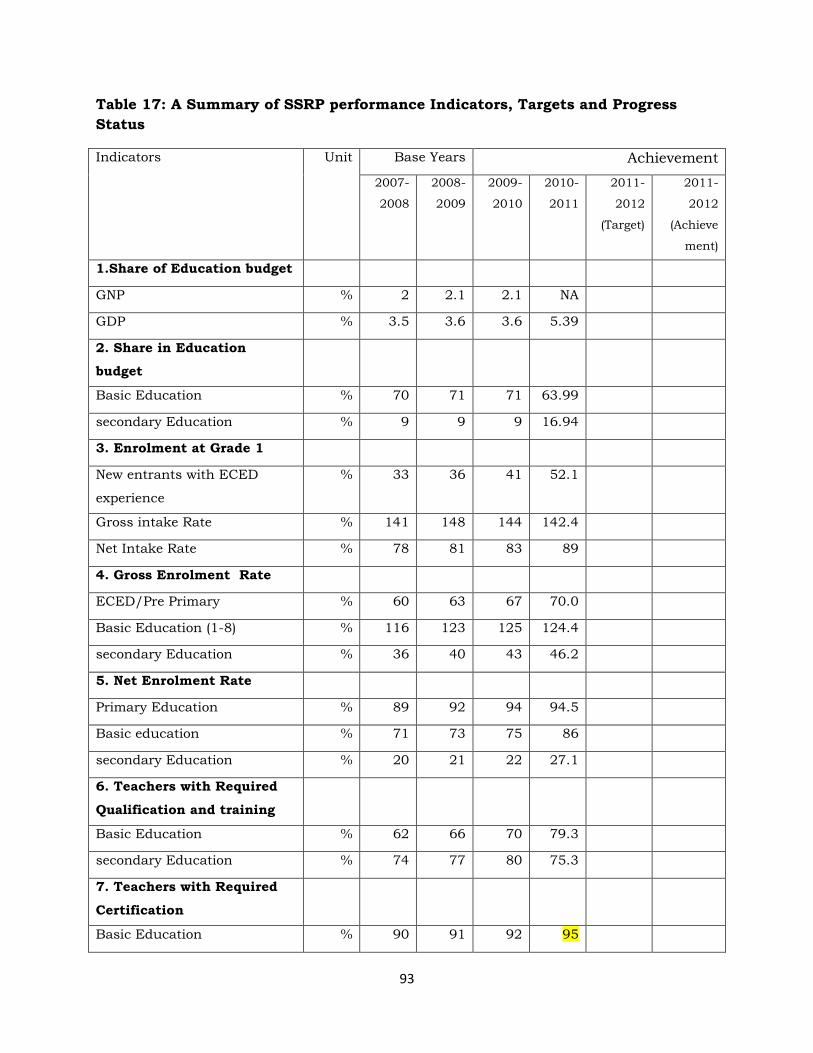
93
Table 17: A Summary of SSRP performance Indicators, Targets and Progress
Status
Indicators Unit Base Years Achievement
2007-
2008
2008-
2009
2009-
2010
2010-
2011
2011-
2012
(Target)
2011-
2012
(Achieve
ment)
1.Share of Education budget
GNP % 2 2.1 2.1 NA
GDP % 3.5 3.6 3.6 5.39
2. Share in Education
budget
Basic Education % 70 71 71 63.99
secondary Education % 9 9 9 16.94
3. Enrolment at Grade 1
New entrants with ECED
experience
% 33 36 41 52.1
Gross intake Rate % 141 148 144 142.4
Net Intake Rate % 78 81 83 89
4. Gross Enrolment Rate
ECED/Pre Primary % 60 63 67 70.0
Basic Education (1-8) % 116 123 125 124.4
secondary Education % 36 40 43 46.2
5. Net Enrolment Rate
Primary Education % 89 92 94 94.5
Basic education % 71 73 75 86
secondary Education % 20 21 22 27.1
6. Teachers with Required
Qualification and training
Basic Education % 62 66 70 79.3
secondary Education % 74 77 80 75.3
7. Teachers with Required
Certification
Basic Education % 90 91 92 95
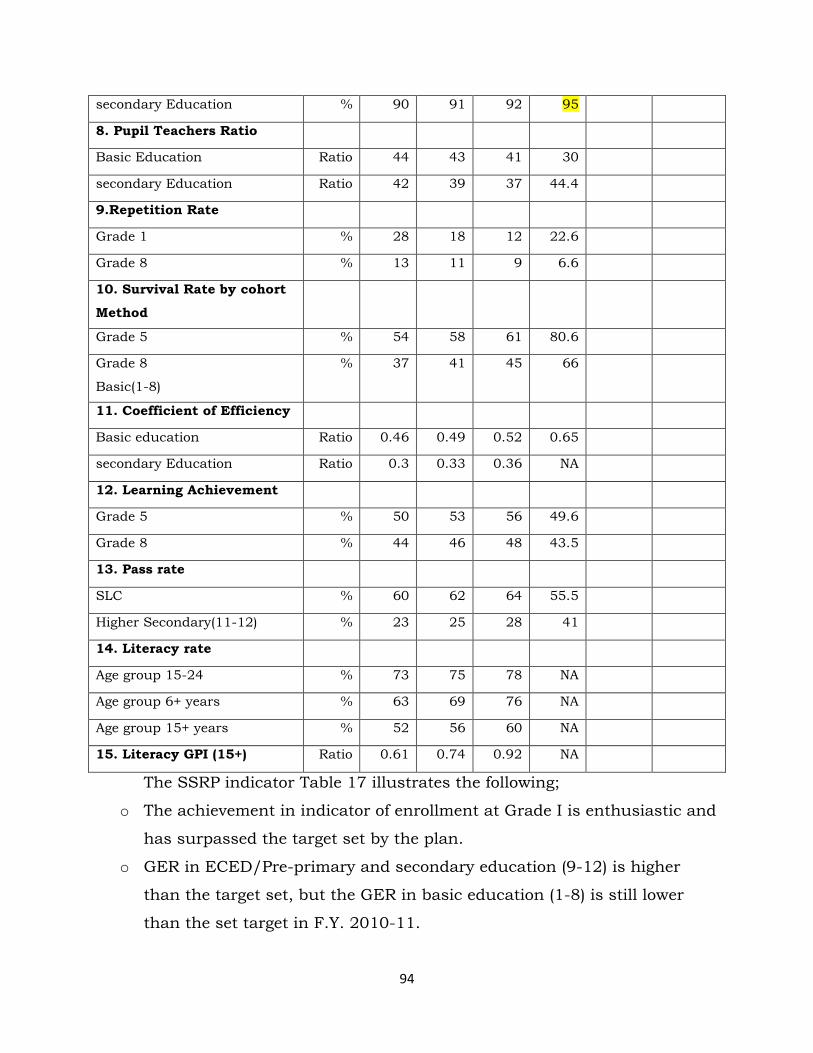
94
secondary Education % 90 91 92 95
8. Pupil Teachers Ratio
Basic Education Ratio 44 43 41 30
secondary Education Ratio 42 39 37 44.4
9.Repetition Rate
Grade 1 % 28 18 12 22.6
Grade 8 % 13 11 9 6.6
10. Survival Rate by cohort
Method
Grade 5 % 54 58 61 80.6
Grade 8
Basic(1-8)
% 37 41 45 66
11. Coefficient of Efficiency
Basic education Ratio 0.46 0.49 0.52 0.65
secondary Education Ratio 0.3 0.33 0.36 NA
12. Learning Achievement
Grade 5 % 50 53 56 49.6
Grade 8 % 44 46 48 43.5
13. Pass rate
SLC % 60 62 64 55.5
Higher Secondary(11-12) % 23 25 28 41
14. Literacy rate
Age group 15-24 % 73 75 78 NA
Age group 6+ years % 63 69 76 NA
Age group 15+ years % 52 56 60 NA
15. Literacy GPI (15+) Ratio 0.61 0.74 0.92 NA
The SSRP indicator Table 17 illustrates the following;
o The achievement in indicator of enrollment at Grade I is enthusiastic and
has surpassed the target set by the plan.
o GER in ECED/Pre-primary and secondary education (9-12) is higher
than the target set, but the GER in basic education (1-8) is still lower
than the set target in F.Y. 2010-11.
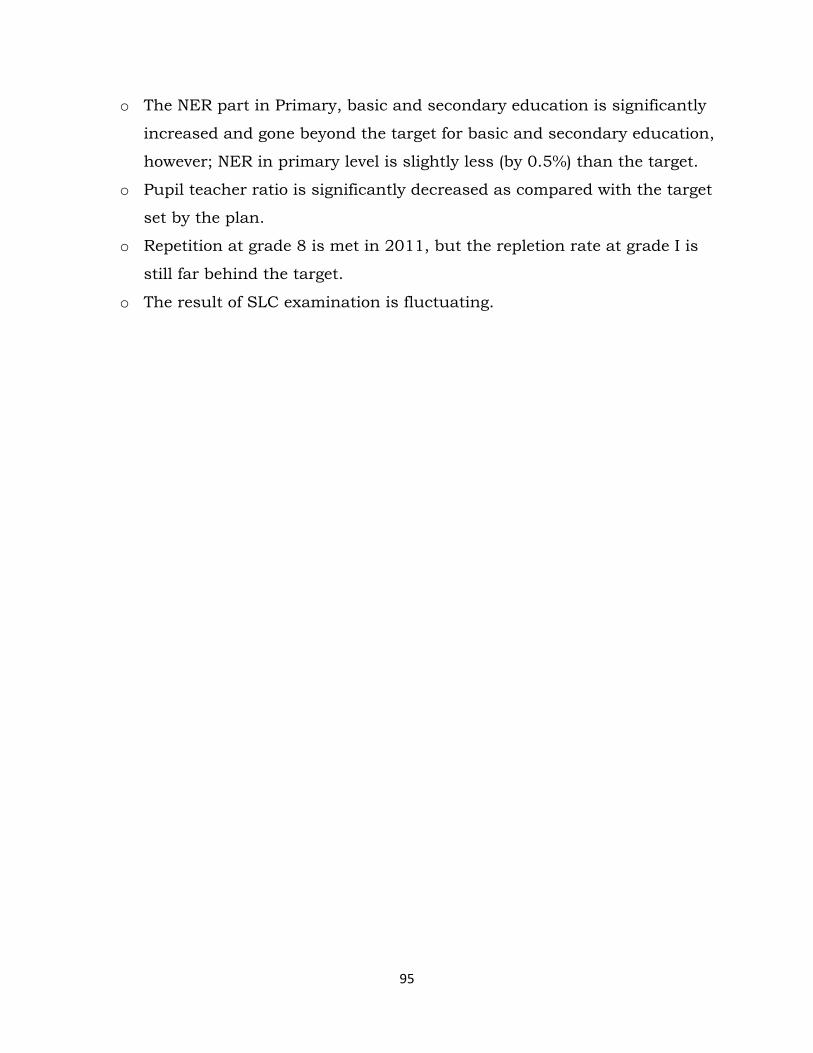
95
o The NER part in Primary, basic and secondary education is significantly
increased and gone beyond the target for basic and secondary education,
however; NER in primary level is slightly less (by 0.5%) than the target.
o Pupil teacher ratio is significantly decreased as compared with the target
set by the plan.
o Repetition at grade 8 is met in 2011, but the repletion rate at grade I is
still far behind the target.
o The result of SLC examination is fluctuating.
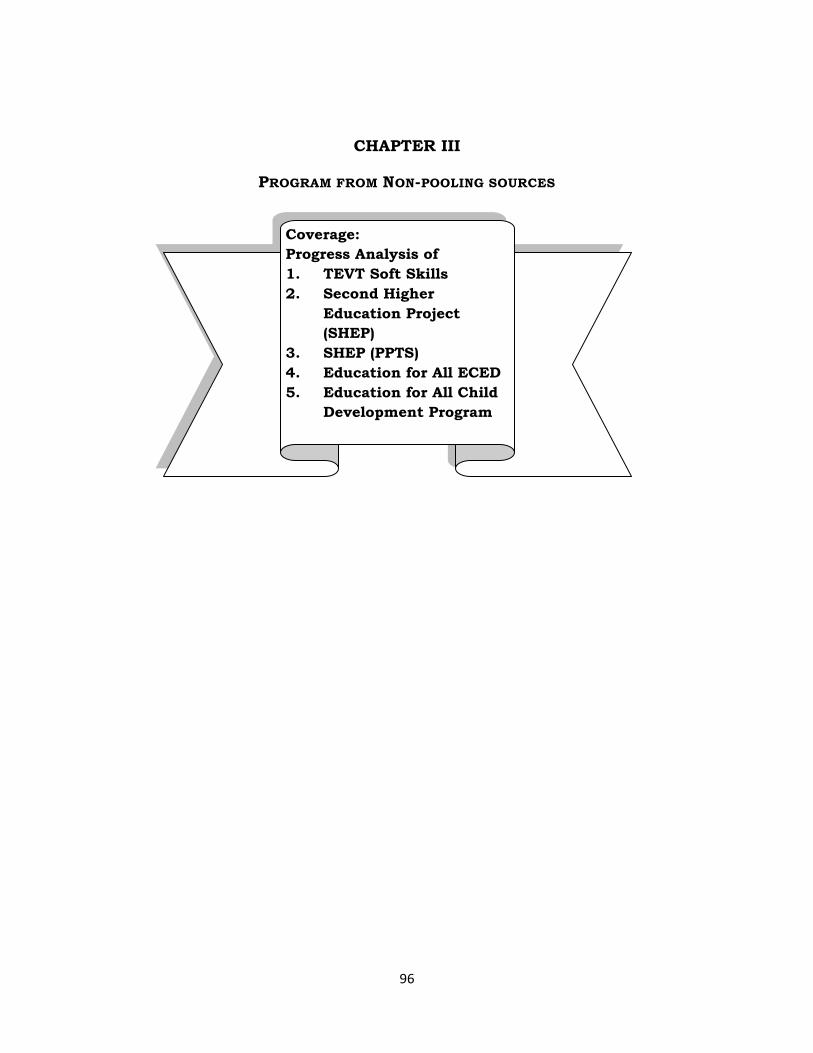
96
CHAPTER III
PROGRAM FROM NON-POOLING SOURCES
Coverage:
Progress Analysis of
1. TEVT Soft Skills
2. Second Higher
Education Project
(SHEP)
3. SHEP (PPTS)
4. Education for All ECED
5. Education for All Child
Development Program
97
3.1 Technical Education and Vocational Training (Soft Skill)
3.1.1 Introduction
The technical education and vocational training component of SSRP
aims at providing work oriented soft-skills to secondary school students.
However, expansion and consolidation of Technical Education and Vocational
Training (TEVT) programs require a significant level of resource
mobilization for technical capacity building; infrastructural development;
and teacher preparation including equipment support.
The ASIP 2011-12 had outlined following strategies for the
implementation of TEVT soft skill program which includes preparatory work
with piloting program in 100 schools of 15 districts.
Defining soft skills in a meaningful way for Nepal education eg skills for
employability – may be helpful to get short term specialist help to support this
and pilot preparation.
o Piloting soft-skills in 100 selected schools of 15 districts and
documenting the experiences carefully.
o Integrating soft skills in school curricula based on findings of the
piloting and learning and instructional materials developed
accordingly.
o Preparing teachers for the pilot program and initiating initial activities of
curriculum development for secondary level.
o Assigning focal persons in CDC, NCED, DOE, and DEOs in piloting
districts for coordination and carryout various activities i.e.
documentation, monitoring and follow up etc.
For the implementation of the program the ASIP had basically planned to
develop curriculum, textbooks, teacher manual and other reference materials
which were aimed to Piloting in selected community schools (100 schools). It
also emphasized on the teacher preparation part.
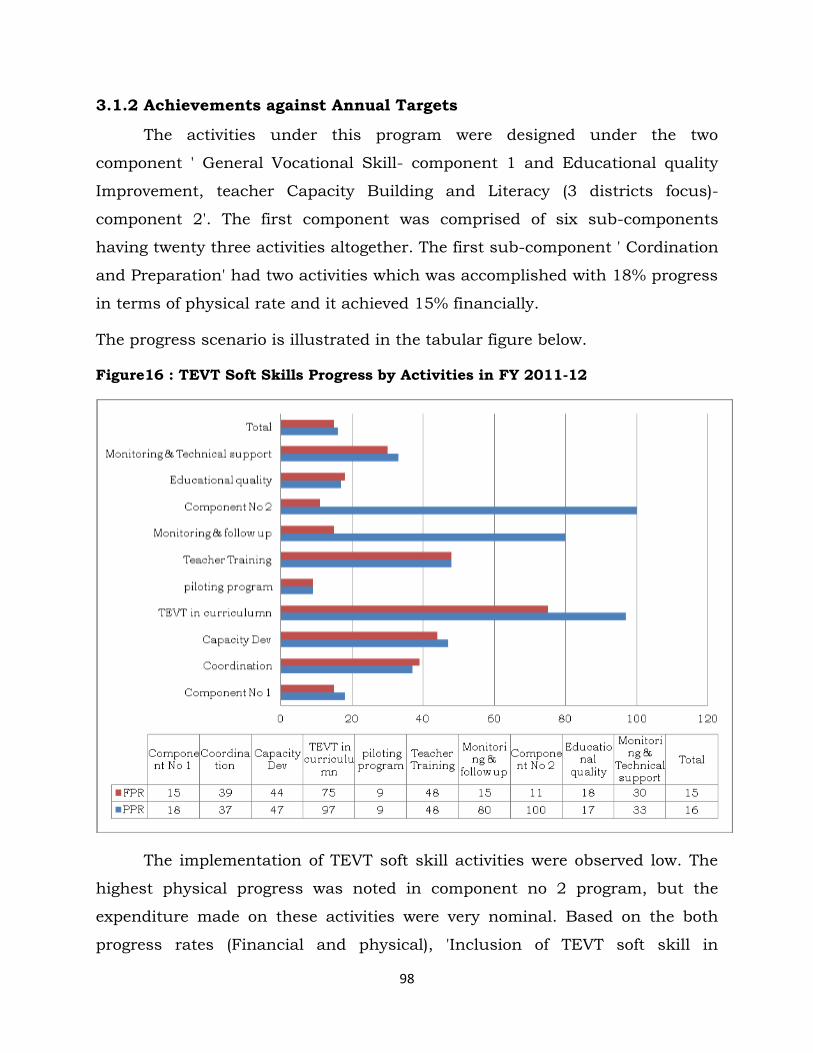
98
3.1.2 Achievements against Annual Targets
The activities under this program were designed under the two
component ' General Vocational Skill- component 1 and Educational quality
Improvement, teacher Capacity Building and Literacy (3 districts focus)-
component 2'. The first component was comprised of six sub-components
having twenty three activities altogether. The first sub-component ' Cordination
and Preparation' had two activities which was accomplished with 18% progress
in terms of physical rate and it achieved 15% financially.
The progress scenario is illustrated in the tabular figure below.
Figure16 : TEVT Soft Skills Progress by Activities in FY 2011-12
The implementation of TEVT soft skill activities were observed low. The
highest physical progress was noted in component no 2 program, but the
expenditure made on these activities were very nominal. Based on the both
progress rates (Financial and physical), 'Inclusion of TEVT soft skill in

99
curriculum and Textbook' sub-component had achieved 97% physical progress
wherein; the financial progress was made 75%.
The major activities implemented under this TEVT soft skill programs
were following.
o An interaction program was organized by Curriculum Development
Centre (CDC) in Pokhara where DEOs, School Supervisors (SS), Resource
Persons (RPs) of 18 piloted districts (Curriculum and textbooks of Grade
6-8) were participated.
o General vocational skill related teacher resource materials for grade 1-5
was developed with the academic assistance of expert which will be
printed in next fiscal year.
o A TEVT soft skills related booklet was published which was found useful
for the information of general vocation subject.
o A competency based curriculum development workshop of international
level was organized in Dhulikhel which contributed developing
competency of the CDC personnel.
o A report is prepared by identifying the possible TEVT soft skill contents
in grade 6-8 curriculum and text books. Curriculum of five vocational
subjects of grade 9-10 was developed this year.
o Program of Feedback collection on grade 6 subjects (Profession, vocation
and Technology) was accomplished in 18 piloted districts (100 teachers)
where 4 teachers of each 100 schools were participated.
3.2 Second Higher Education Project (SHEP)
3.2.1 Context
Higher education of Nepal has been facing problems related to access,
quality, relevancy, economic sustainability etc. The World Bank is supporting
higher education of Nepal in uprising quality higher knowledge capable to
contribute in country's economic growth and social harmony. Higher Education
Project I (HEP I) had contributed to Tribhuvan University (TU) in promoting
100
decentralized management and resolving the issues underlying in higher
education to some extent. However, some problems in higher education were
remained unresolved and it was realized that there was the need for another
project like HEP I. Nepal and international Development association (IDA)
reached on financing agreement in January 17, 2007 with the purpose of
improving access, quality to higher secondary education. The total cost
allocated (US $ 60 million) for the project duration (Only for higher secondary
Education component) was US $ 13 million (seven years). Department of
Education was made responsible for coordinating implementation and
reporting of the higher secondary education related component of the project.
The SHEP was designed and developed with the view of attaining the
following project objectives:
1. Enhanced quality and relevance of higher education and research
through a set of incentives for promoting effective management and
financial sustainability of academic institutions; and
2. Improved access for academically qualified under-privileged students,
including girls, Dalits and educationally disadvantaged Janajati to higher
education through financial assistance and enhanced capacity of higher
secondary schools.
In order to achieve the above mentioned objectives the project has been
divided into four components. Component 1 is related to improve quality and
market relevance of higher education by providing incentives for reforms and
performance. Component 2 is designed to improve access to higher education
for under-privileged groups including girls, Dalits and disadvantaged Janajati.
Component 3 is designed to improve access to higher secondary education to
rural students and quality of education by supporting higher secondary
schools (not-for-profit private schools). Component 4 aims at improving the
capacity of the University Grants Commission and Ministry of Education to
facilitate development of the higher education sector.
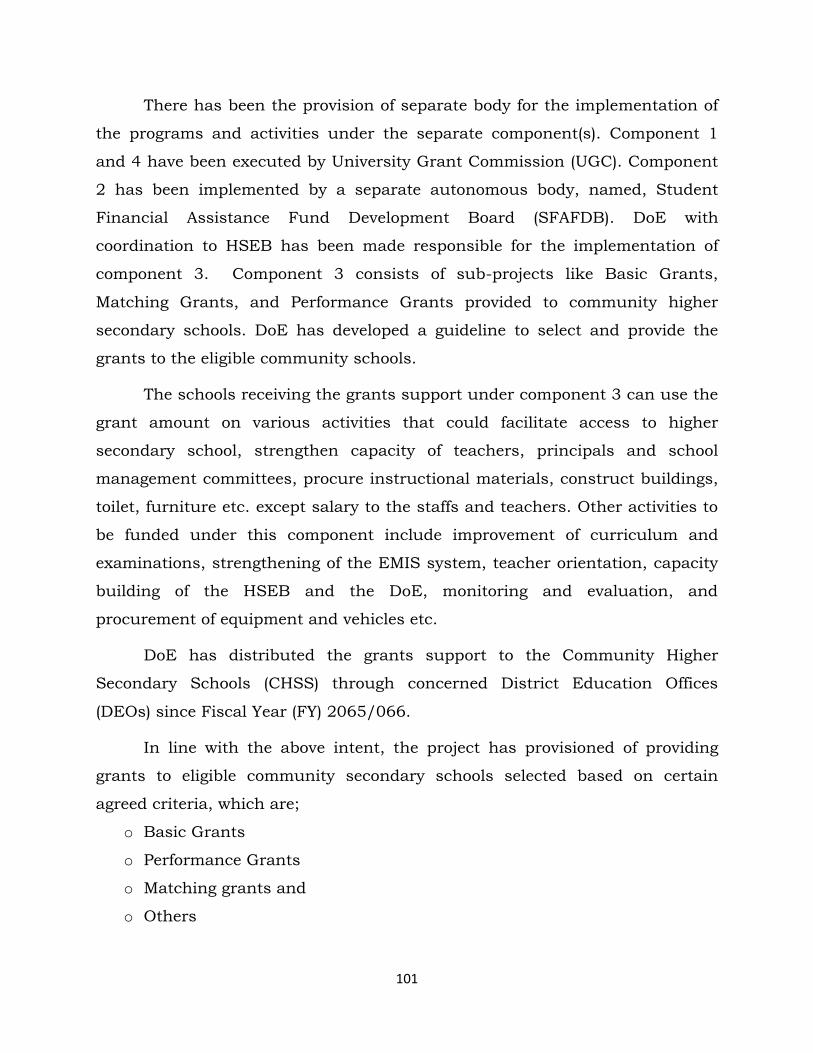
101
There has been the provision of separate body for the implementation of
the programs and activities under the separate component(s). Component 1
and 4 have been executed by University Grant Commission (UGC). Component
2 has been implemented by a separate autonomous body, named, Student
Financial Assistance Fund Development Board (SFAFDB). DoE with
coordination to HSEB has been made responsible for the implementation of
component 3. Component 3 consists of sub-projects like Basic Grants,
Matching Grants, and Performance Grants provided to community higher
secondary schools. DoE has developed a guideline to select and provide the
grants to the eligible community schools.
The schools receiving the grants support under component 3 can use the
grant amount on various activities that could facilitate access to higher
secondary school, strengthen capacity of teachers, principals and school
management committees, procure instructional materials, construct buildings,
toilet, furniture etc. except salary to the staffs and teachers. Other activities to
be funded under this component include improvement of curriculum and
examinations, strengthening of the EMIS system, teacher orientation, capacity
building of the HSEB and the DoE, monitoring and evaluation, and
procurement of equipment and vehicles etc.
DoE has distributed the grants support to the Community Higher
Secondary Schools (CHSS) through concerned District Education Offices
(DEOs) since Fiscal Year (FY) 2065/066.
In line with the above intent, the project has provisioned of providing
grants to eligible community secondary schools selected based on certain
agreed criteria, which are;
o Basic Grants
o Performance Grants
o Matching grants and
o Others
102
3.2.2 Achievement against Annual Targets
This project had a few budget which was allocated under the two
components. The first one was 'Matching and Performance Grants' and the
second was 'Program Management Cost'. There were only five activities all
together. The progress scenario by the components and the total is illustrated
in the figure 3.2 which shows that the overall physical progress for the
activities was 95% and it attained 94% progress financially. The first
component was matching and performance grants to community higher
secondary schools; which was distributed through DEOs of the concerned
districts. This type of fund was provided to those which had not received
matching grant in previous years and could show better performance in terms
of the pupil's achievement.
Figure 17: Progress in SHEP by Components in FY 2011-12
The second component was only cost for the management of cost which
included cost for joint monitoring, reporting, meeting and periodic donor
mission (see annex VI for detail information). The expenditure allocated for the
joint monitoring and facilitation for the effective implementation of the program
was observed not implemented this year which caused reduction in overall
achievement. Likewise, the meeting of the coordination committee consumed
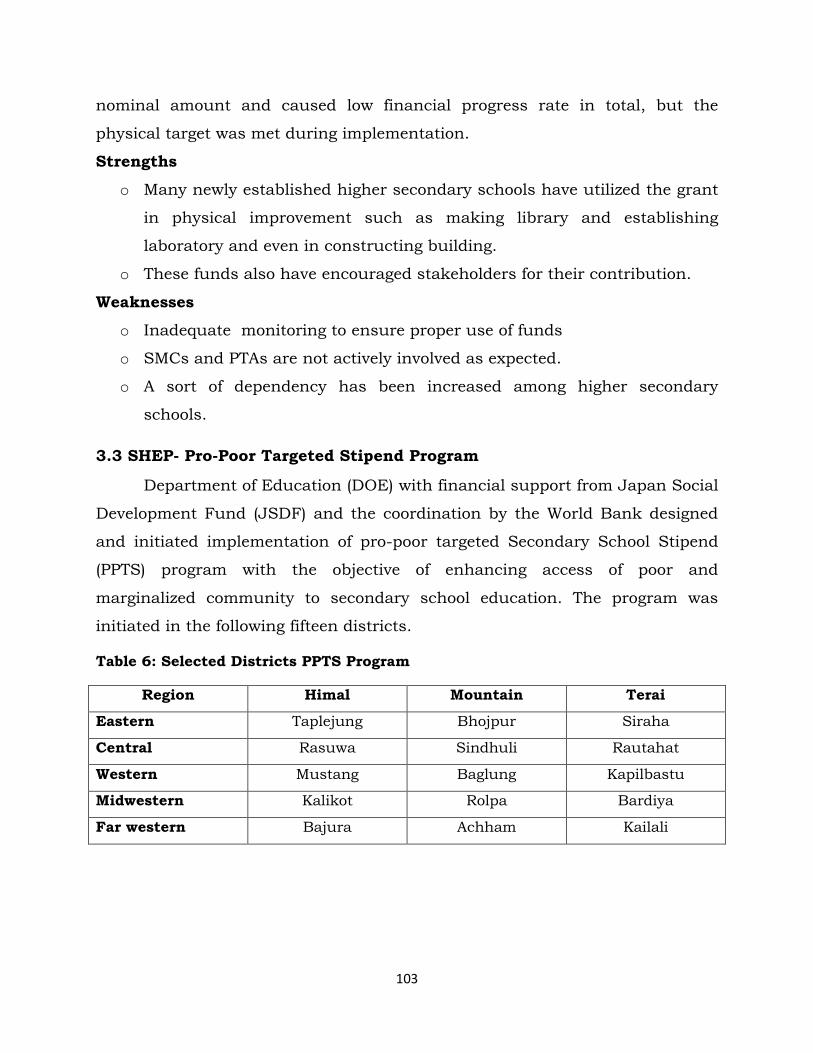
103
nominal amount and caused low financial progress rate in total, but the
physical target was met during implementation.
Strengths
o Many newly established higher secondary schools have utilized the grant
in physical improvement such as making library and establishing
laboratory and even in constructing building.
o These funds also have encouraged stakeholders for their contribution.
Weaknesses
o Inadequate monitoring to ensure proper use of funds
o SMCs and PTAs are not actively involved as expected.
o A sort of dependency has been increased among higher secondary
schools.
3.3 SHEP- Pro-Poor Targeted Stipend Program
Department of Education (DOE) with financial support from Japan Social
Development Fund (JSDF) and the coordination by the World Bank designed
and initiated implementation of pro-poor targeted Secondary School Stipend
(PPTS) program with the objective of enhancing access of poor and
marginalized community to secondary school education. The program was
initiated in the following fifteen districts.
Table 6: Selected Districts PPTS Program
Region Himal Mountain Terai
Eastern Taplejung Bhojpur Siraha
Central Rasuwa Sindhuli Rautahat
Western Mustang Baglung Kapilbastu
Midwestern Kalikot Rolpa Bardiya
Far western Bajura Achham Kailali

104
3.3.1 Achievement against Annual Target
This project was implemented under the budget head 3501163. It had
four activities all together. The overall accomplishment rate in terms of physical
progress rate was 100% and it was 97% financially. The first and main activity
namely 'Scholarship for marginalized secondary students' was implemented
with 100% financial progress rate. All 15,500 targeted students were provided
scholarship. Altogether, eight activities were planned under the title of Pro-poor
Targeted Secondary School Stipend (PPTS). Most of the activities were
implemented with highly satisfactory progress rate (See annex VII for detail).
Strengths
o Poor and marginalized students are getting benefit in enrollment and
completion of higher secondary level.
Weaknesses
o No effective studies have done to identify the effectiveness of the
program.
o Distribution of scholarship and its reporting is based on the NGO.
Observations and Views of the Monitors
Monitors who were mobilized for monitoring the status of grant
utilization under the project had presented their observations in some areas of
sub-project management. During the field visit, whatever they observed, they
reflected in the reports they have submitted in DoE. On the reports the
following observations were reflected:
o Most of the schools have used the grants in school building construction.
They have exercised flexibility and autonomy to decide the design of
school building. It was found that most of the schools have decided to
build the RCC buildings.
o The schools have mobilized the parents and the school management
committee members to collect the additional resources for the
improvement of school physical facilities. It was also found that the

105
parents and SMC members were highly engaged in selecting the activities
in the schools.
o In most of the monitored schools, it was found that the data
management practices were very poor. The systematic record keeping
was in absence. Therefore, some of the schools were unable to say what
type of grants they received in which fiscal year. Some schools were
found indifferent to provide adequate, accurate and clear information
while monitoring.
o The flow of the information from DEOs to schools has also the problem in
some districts. District Education Offices could not inform correctly while
releasing the grants to schools. The schools have felt confusion in the
type and utilization of grants they were receiving.
o Some schools responded that the criteria for basic grants and
performance grants distribution criteria are biased for the community
higher secondary schools located in remote areas, since in remote
locations there are not enough enrollments because of the low population
density, poverty and remoteness.
o It was found that most of the schools felt that the grants amount
provided under the project was inadequate to meet the requirement of
the schools. Therefore, it was found that some schools have kept the
grants amount in reserve in the hope to add on the amount from other
sources.
o The grants released at the end of the fiscal year created further burden to
the schools that they could not implement the proposed plan in proper
period of time. They sometimes have postponed their plan for future
implementation.
Problems and challenges
The problems, issues and challenges of the higher secondary schools as
mentioned and reflected in monitoring report were as follows:
106
o Increasing number of higher secondary schools as well as increasing the
enrollment of students have made the present school infrastructures
inadequate and have claimed for more school buildings, more classrooms
and more furniture to satisfy the mass of increasing number of
students. During the monitoring, it was found that schools were unable
to provide the facility of library, laboratory, hostel, drinking water and
qualified teachers to the students.
o In some rural locations, the students who are planning to continue their
higher secondary education in science subject nearby their homes could
not get such opportunities due to absence of science subject in the
schools. Rural schools are facing the problems related to financial and
human resources to run science subject classes in the schools.
o The status of data management, accountability and transparency is not
so satisfactory in some schools. Some of the schools were unable to
provide accurate information on grants utilization as well as the support
received from various other sources.
o In some cases, schools were found unable to take the community
support to complete school projects operated form the grant support
under SHEP and on schools activities. It was observed that the limited
community participation, low coordination, limited capacity of the SMC
has affected the operation of higher secondary schools.
o Meeting the need of students and community is another challenge for
higher secondary education. In some areas, schools were running the
classes on such subjects, in which they have the capacity including
human resources. They could not meet the needs of students on ICT
education, Science Education and other subjects they want to study to
meet their lifelong necessities.
3.4 Education for ALL Child Development Program
Under the recurrent budget head 3501183 (central level) three activities
were planned for the FY 2011-2012. They were 'Enhance capacity of REDs &
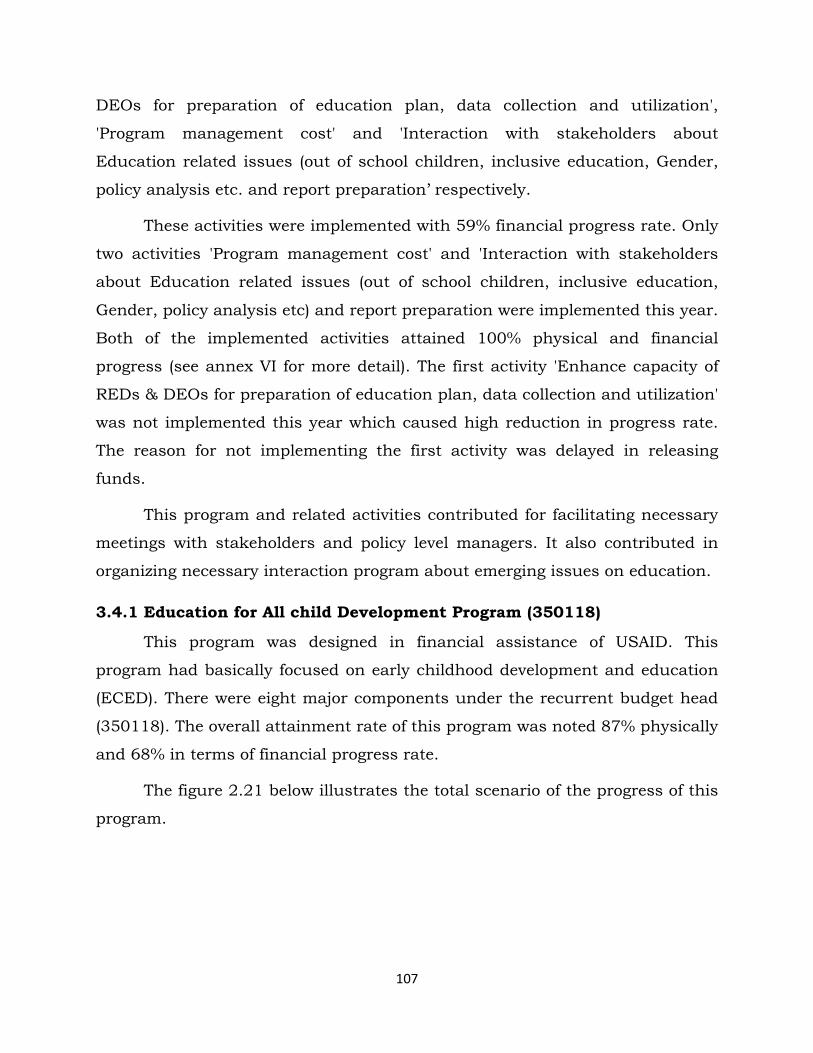
107
DEOs for preparation of education plan, data collection and utilization',
'Program management cost' and 'Interaction with stakeholders about
Education related issues (out of school children, inclusive education, Gender,
policy analysis etc. and report preparation’ respectively.
These activities were implemented with 59% financial progress rate. Only
two activities 'Program management cost' and 'Interaction with stakeholders
about Education related issues (out of school children, inclusive education,
Gender, policy analysis etc) and report preparation were implemented this year.
Both of the implemented activities attained 100% physical and financial
progress (see annex VI for more detail). The first activity 'Enhance capacity of
REDs & DEOs for preparation of education plan, data collection and utilization'
was not implemented this year which caused high reduction in progress rate.
The reason for not implementing the first activity was delayed in releasing
funds.
This program and related activities contributed for facilitating necessary
meetings with stakeholders and policy level managers. It also contributed in
organizing necessary interaction program about emerging issues on education.
3.4.1 Education for All child Development Program (350118)
This program was designed in financial assistance of USAID. This
program had basically focused on early childhood development and education
(ECED). There were eight major components under the recurrent budget head
(350118). The overall attainment rate of this program was noted 87% physically
and 68% in terms of financial progress rate.
The figure 2.21 below illustrates the total scenario of the progress of this
program.
108
Figure 2: Progress Status of Child Development Program by Major Activities
The figure indicates that the highest attainment rate was observed in
fifth, sixth and tenth activity i.e. ‘Modular Package Printing’ and ‘ECED Center
Mapping’ and ‘Advocacy Video Clips’. Likewise, the activity monitoring,
advocacy and awareness' was observed in the satisfactory progress rate in
terms of physical one; but the financial achievement was noted below the
satisfactory level. The activity 'ECED Management Committee training' had
moderate progress in terms of financial and physical progress rate. The lowest
FPR is seen in the activity 'Training for Head Teacher & Teacher' (See annex VII
for detail). The overall PPR was observed satisfactory but the financial rate
appears low.
Major outputs observed
o 1119 persons were oriented about the use of tool kits in ECED centers.
o Material development workshop may be more useful to make ECED
center resourceful and enrich in skill development of ECED facilitators.
o 13,884 Head Teachers and Graded I teachers were oriented about ECED
which might have contributed in management of ECED centers run in
schools.
109
o 41050 parents (more than targeted) were oriented about ECED and its
activities. It might have aware them about the philosophy of ECED
classes.
o ECED center mapping was carried out in 24 districts. It might have
provided clear idea of ECED center for the establishment and merging.
o Monitoring from CLA and REDs have collected clear sample picture of
ECED centers.
3.5 UNICEF Supported other Programs
Being non-pooled donor UNICEF is also supporting in implementing
some educational activities needed to intervene for the access, quality,
management and capacity development aspects. Some activities like policy
advocacy, child friendly service delivery, emergency preparedness, community
mobilization and capacity building. These activities were approved and
implemented under the budget head 350118 in the fiscal year 2068-69. A brief
analysis on the progress made on these activities is presented in this part.
Under the budget head 350118, forty activities were planned to be
implemented in the fiscal year 2068-69. There were different central level
agencies and concerned sections of DoE for the implementation of these
activities. Twenty activities were assigned to DoE, six activities to the
Curriculum Development Center (CDC), seven activities to the Non-formal
Education Center (NFEC) and eight activities were to be implemented by
National Center for Education and Development (NCED). Two activities (2.6.1
and 2.7.1) were only planned (See annex XI for detail), but the budget was not
released. All together forty one activities were to be implemented by different
CLAs.
Thirteen activities achieved 100% progress both in terms of physical and
financial rate. In terms of physical progress thirty-one activities achieved
excellent progress of 100%. The lowest physical progress of only 17% was
observed in the activity 'Five days refresher program for FSP facilitator level-2'.
110
In terms of financial progress rate the activity 'Preparation and printing of early
Learning Development Standard' achieved lowest progress among all activities.
It attained only 10% financial progress. Preparatory works were completed but
the printing of materials was not done due to the time constraints. Other
activities attained financial progress between 34% and 100%. Twenty nine
activities had achieved above 80% financial progress. The overall progresses in
terms of physical and financial progress were 77% and 69%.
In general, most of the activities were implemented with satisfactory
progress rate. Some activities were not completed within the targeted time.
Delayed in approving and releasing budget was mentioned as the primary
reasons for incompletion of tasks.
Major output of the activities
o Software for ECED related information collection was developed.
o The capacity of gender focal points, HTs, SMCs and feeder hostel warden
(80 persons) were developed.
o CRC for optional subject ECED of grade 10 is developed.
o Some resource materials for students on Emergency in Education (EI)
was developed and distributed.
o 150 teachers were oriented about Continuous Assessment of Student
(CAS) with technical support to districts.
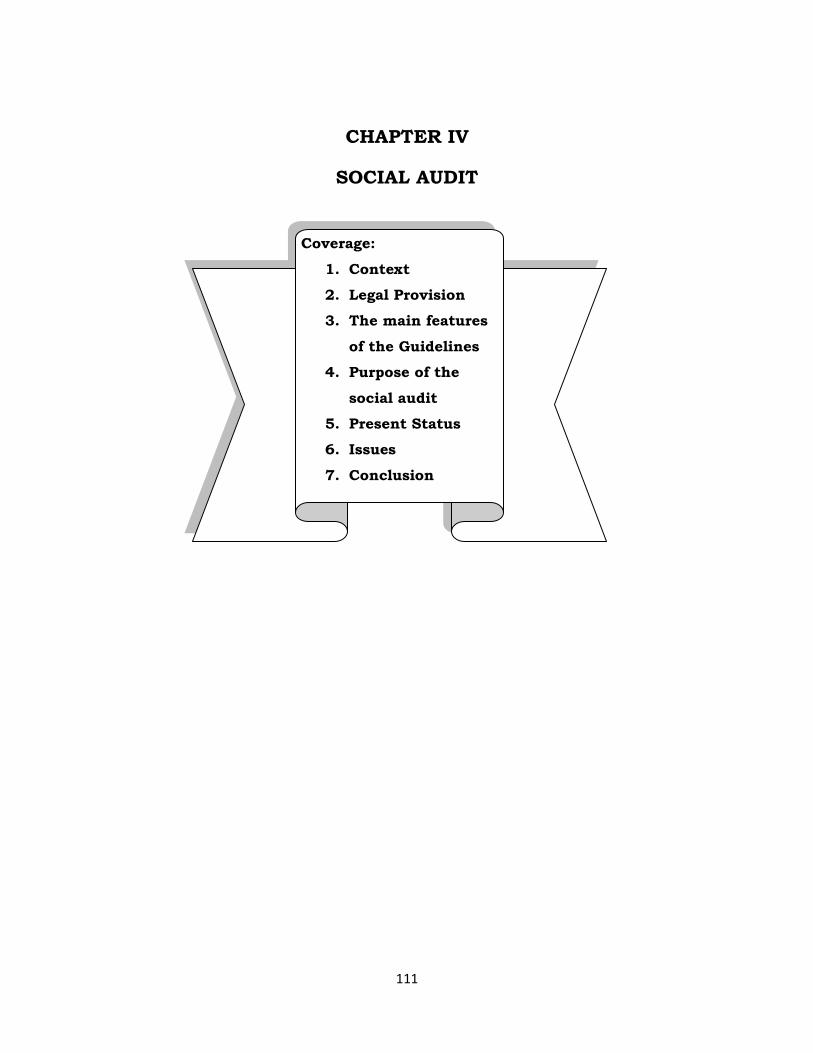
111
CHAPTER IV
SOCIAL AUDIT
Coverage:
1. Context
2. Legal Provision
3. The main features
of the Guidelines
4. Purpose of the
social audit
5. Present Status
6. Issues
7. Conclusion
112
4.1 Context
After new education system plan 1971, community was retracting their
support from the schools, because they had feeling that the schools are of
the government. To retrieve the community support to the schools as before,
to develop ownership feeling increasing accountability, transparency to
strengthen good governance for the quality education from the school, an
innovative approach social audit system was initiated in the schools of
Nepal. Different scholars have their different views on social audit, but
relevant in this concern is an approach to strengthen good governance
through a process which promotes transparency and accountability is social
audit (Charles Medoiver). A social audit is a systematic means of measuring
the social performance of an organization. It is a planning tool, a
management tool, and a communication tool for an organization. Essentially,
it is a dialogue designed to find out what is important to the organization
and its stakeholders, to measure what is important and then to report on
both the dialogue and the measurement. It is taken up for the purpose of
enhancing local governance, particularly for strengthening accountability
and transparency in local bodies.
4.2 Legal Provision
The Education Regulations (Including third amendment) 2062,
regulation article no. 171 'Ka' mentions that the social audit of school activities
has to be done each year. To conduct the audit there is a six-member social
audit committee on the coordination of the Parent Teacher Association (PTA)
chairperson in school. The other members of the committee are two persons
selected by the PTA among the respective school students' guardians including
one female, chairperson of respective Ward in which the school is located,
intellectual (Buddhijeebee) 1 person selected by the PTA, teacher staff one
person selected by Head teacher.

113
There is also a provision of inviting one boy and girl from the highest
grade in the school as invitees. To implement the above mentioned provision of
Education Regulations, the GoN has approved and implemented a School
Social Audit Guideline (Karyabidhi) 2005 (2062), on 2006 February and
amended it in 2008.
4.3 The Main Features of the Guidelines (Karyabidhi)
o Compulsory provision of performing social audit annually ie. in
September (end of bhadra).
o Provision of evaluating school activities through a social audit committee.
o Provision of table of subject matters with 31 components of school
activities to facilitate the task of social audit.
o 3 layers of reporting mechanism, School to School Supervisor (SS), SS to
(District Education Office) DEO and DEOs to (Regional Education
Directorate) RED and Department of Education) DOE.
On the basis of the provisions of social audit guideline, schools (Early
childhood Education Development, Primary, Lower secondary, Secondary and
higher secondary) throughout the country are undertaking the process of
Social audit since last 3 years.
4.4 Purpose of the Social Audit
Followings are the some important purposes of the social audit.
o To boost up the level of concern and participation of stakeholders on school
activities.
o To maintain transparency and responsibility of activities in school
administration.
o To help and regularize the school activities and proper use of resources
available in school.
o To establish supportive relationship between school and community.
o To provide future guideline for betterment of the school.
o To help for developing plan and proper implementation of it.
114
o To enhance the frequency of involvement of stakeholders in school related
activities.
o To develop ownership feeling among stakeholders towards school.
4.5 Present Status
o Social audit report has been considered as the requirement for each and
every school to receive the first trimester fund release; therefore, the DEOs
are actively tracking the schools for performing the social audit. It is
performed on the basis of guideline.
o Stakeholders during the interaction reflected their views on inadequacy of
orientation. DOE had organized an orientation and feedback collection
workshop.
o Progress and feedback collection workshops were conducted by DOE with
the participation of DEO officers and REDs' personal
o public notice per year used to published through national news paper to
accelerate the submission of report to the respective authorities
o Mainly community schools are focused.
o 82.7 % community schools had reported that they have conducted social
audit.(Flash II 2009/10)
o Still only 7 districts submitted the compiled social audit report followed by
social audit guideline (2008) format.
o Most of the districts education offices use to issue notice of social audit for
the all community schools to be carried out by the July 1st. These schools
complete their social audit as provision or guidance provided. Most of the
districts have (In their status report) mentioned that the report of social
audit were obtaining.
4.6 Issues
o Still all the stakeholders and other community people's participation are
found inadequate during the Social Audit in the schools.
o Social audit is accomplished for the formality
o Report is not made public amidst the parents.

115
o The quality part of the report has not found analyzed.
o The outcome of the social audit activity has not studied.
4.7 Conclusion
Social audit provision in every organization is very important tool to
ensure team sprite, ownership feeling, accountability, transparency and to
strengthen good governance with the help of open discussion with key
stakeholders for the betterment of the organizations. Particularly in the school
it is seen prominent to increase the relation with parent as well as community
people for the development of school and quality education.
116
CHAPTER V
CONCLUDING REMARKS
Coverage:
Concluding Remarks
117
From the experiences, lessons learned from the field, and activities
implemented through BPEP, TEP, EFA, SESP and other major programs, the
SSRP program has been designed and implemented throughout the country.
EFA and SESP programs significantly contributed to improve the access to
school education. Now SSRP has focused on quality education by improving
learning achievement of students through improved teaching learning
activities. In order to quality assurance, teacher's professional development,
restructuring and revisiting RC's functions and responsibilities, capacity
development at all levels, particularly at the local level have been the main
priority of SSRP which was clearly reflected in ASIP/AWPB in the last fiscal
year and in this report as well. Similarly, out of school children are the main
concerns of the ministry. In the direction of addressing these issues; important
activities such as operation of mobile schools, Alternative education programs
(SOP & FSP), mainstreaming of religious schools has been implemented and
gained momentum at the district level. ECED program has contributed to
reduce dropout rate and to increase retention in grade I. Likewise, the
scholarship scheme has motivated hard core group children towards school.
The increasing NER has proved this fact. The concept of Child Friendly schools
(CFS) has been forwarded and being implemented in the schools to learning
environment more friendly and conducive. Likewise, the development and
declaration of Minimum Enabling Conditions (MEC) and Prirotized Minimum
Enabling Conditions (PMEC) indicators by DOE are the important activities
paving way to promote quality and ensure child rights in education.
Despite the achievement aforementioned, there are still some challenges.
About 4.7% of the school age children are still out of schools. They belong to
the hard core group families and communities. It's a major challenge to bring
them in the system. The following aspects need to be addressed in coming
days.
o Enrollment of children in schools has improved significantly; however
children from hard core group are still out of school and they need to be

118
identified and enrolled in the school. For this purpose, local government
bodies need to be mobilized in the process of Village Education Plan (VEP)
and School Improvement plan preparation to make it more practical and
realistic.
o Scholarships have had a positive impact on enrolment and retention of
children; but the voice is being raised from the stakeholders to make it need
based and more practical.
o The mainstreaming of religious schools is being seen encouraging; but the
further expansion of the religious schools needs to be scrutinized critically.
o There is growing interest among schools and parents for the development of
ECED. More efforts are needed to make ECED centers more functional.
o The implementation of program/activities by the districts has improved
significantly; but there is a need of intensive monitoring to assess the
quality aspects regularly.
o Timely release of budget with authority letter accelerates the
implementation of program both in the center and the districts level. Thus,
there is the need to adapt the practice of releasing the budget on time.
o More than 90% of the budget goes to the schools which have had a positive
impact on improvement of teaching learning situation at the school level;
however the effective supervision and monitoring is still lacked at the local
level.
o SSRP is already initiated in the country, but it is still to be carried out
within the legal framework.
o Expansion of higher secondary school is rapid at present, but the question
of quality and sustainability is equally raised.
o Supplies of teachers are met thgrough Rahat and PCF grants; however it
has created a sort of confusion and incertainity among teachers. There is

119
more pressure of creating approved position for the settlement of the
problem.
o Data verification needs to be more focused and practical and make special
team for this purpose in the districts. Likewise, a high level team from
center level needs to be mobilized for the same purpose.
o Process of merging schools has begun and redeployment of teachers is going
on; however it can't solve the growing demand of teacher post in the
country.
120
RFERENCES
World Bank (2007). Document of The World Bank (for official use only (Human
Development Unit, South Asia Region, January 17, 2007)
DOE (2064). Second Higher Education Project Karya Pranali Nirdeshika.
Sanothimi: Author
DOE (2011). Status Report. Sanothimi: Author.
DOE (2011).Annual Strategic Implementation Plan, Annual Work Plan and
Budget, Fiscal year 2010-11. Sanothimi: Author.
MOE (2009). School Sector Reform Plan. Kathmandu: Author.
DOE (2012). Financial Monitoring Report 2010-11. Sanothimi: Author.
DOE (2008). Social Audit Guideline 2008. Sanothimi: Author
DOE (2012). Flash Report 2012, Sanothimi: Author.
DEOs, 71 districts (2068 B.S). Status Report: Author
DOE (2012). Monitoring Report (Joint and Participatory): Author
www.cbs.gov.np
121
Annex I SSRP
Central Level Progress
FY 2011-2012
SN Activities Unit
Target for Fiscal year 2068-69 Annual Progress
Physical
target
Unit
Cost Budget Weightage PPR Expenditure FPR Weight
Capital costs (3501214) 33,400 9.40 100 32291.13 97 9.40
2 Ensuring Access to all 1,200 0.34 100 1052.05 88 0.34
2.8 Procurement of Computer and Equipment for
DoE (DOE 6 Lacs, CDC 2 Lacs, OCE 1 Lac
50 thousands, NFEC 1 Lac NCED 1 Lac 50
thousands)
1,200 0.34 100 1052.05 88 0.34
4 Improvement of Quality 300 0.08 100 291.51 97 0.08
4.53 Procurement of Rack for Library of OCE 1 100 100 0.03 100 99.70 100 0.03
4.54 Establishment of Lab at Vocational subject at
CDC
Subject 1 200 0.06 100 191.81 96 0.06
6 Effective Service Delivery 31,900 8.98 100 30947.58 97 8.98
6.3 Procurement of Motorcycle and Scooter Number 7 150 1,100 0.31 100 1100.00 100 0.31
6.29 Procurement of Vehicles for DEOs 11 2,800 30,800 8.67 100 29847.58 97 8.67
Total Amount of Capital Cost 33,400 9.40 100 32,291 97 9.40
Recurrent costs (3501213) 322,020 90.60 69 188,073 58 62.44
1 Early Childhood Education and
Development
60 0.02 100 - 0 0.02

122
SN Activities Unit
Target for Fiscal year 2068-69 Annual Progress
Physical
target
Unit
Cost Budget Weightage PPR Expenditure FPR Weight
1.1 Meeting for ECD council and networking Times 4 60 0.02 100 0 0.02
2 Ensuring Access to all 27,280 7.68 100 20,762 76 7.55
2.1 Alternative Provision for ensuring the
access in Basic Education
300 0.08 100 200 67 0.08
2.1.1 Laingik Samabikash (journal) Publication Copy 1,000 200 0.06 100 100.0 50 0.06
2.1.2 Meeting for girls education networking Number 4 100 0.03 100 100.0 100 0.03
2.2 School Outreach Programme (SOP) - - 0
2.3 Flexible School Programme (FSP) 4,600 1.29 100 4,600 100 1.29
2.3.1 Five days training of trainers on alternative
schooling program for district level officers
Person 40 800 0.23 100 800.0 100 0.23
2.3.2 Printing and distribution of textbook of FSP Set 70,000 3,400 0.96 100 3,400.0 100 0.96
2.3.3 Development and Revision of Teachers'
guide (1st Level FSP) )
5 400 0.11 100 400.0 100 0.11
2.4 Open School Programme (Grade 6-8) 31 930 0.26 100 930 100 0.26
2.4.2 Orientation to Head teachers and subject
teachers on open education of Lower
secondary level
Person 161 580 0.16 100 580.0 100 0.16
2.4.3 Development, Printing and Distribution of
Orientation Manual for Subject wise Training
and Head Teacher Orientation on open
education of Lower secondary level
Set 100 350 0.10 100 350.0 100 0.10
2.5 Non-formal primary school education for
the adult women
950 0.27 950 100 0.27
123
SN Activities Unit
Target for Fiscal year 2068-69 Annual Progress
Physical
target
Unit
Cost Budget Weightage PPR Expenditure FPR Weight
2.5.1 Development of Guidelines/ manual for
Facilitators' working at non formal adult
schools (Grade 1-8 & Grade 9-10)
Set 1 350 0.10 100 350.0 100 0.10
2.5.2 Textbook for Non formal Education for the
adult women ( Grade 1-8 & Grade 9-10)
350 0.10 100 350.0 100 0.10
2.5.3 Development printing and distribution of
introductory books of Open schools and non
formal schools for adult and women
Set 250 0.07 100 250.0 100 0.07
2.6 Inclusive Education Programme 12,000 3.38 10,676 89 3.25
2.6.1 Materials development related to the
development and teaching methodology for
Blind Students at secondary level
Person 1 600 0.17 90 512.8 85 0.15
2.6.2 Five days orientation program to primary
Head teachers on Inclusive Education
Person 60 600 0.17 64 585.3 98 0.11
2.6.3 Development of long term working policy for
inclusive as well as Multilingual Education
1 300 0.08 90 109.0 36 0.08
2.6.4 Six days orientation for resource teacher on
Autism, Cerebral Palsy and Deaf
Persons 60 550 0.15 72 446.1 81 0.11
2.6.5 Printing and distribution of Braille books Sets 60 3,500 0.98 100 2,982.3 85 0.98
2.6.6 Development, printing and distribution of
textbooks in 6 different mother tongue
(Magar, Amar, Dhimal, Sambhota grade 3,
Mugali, Yakkha grade 5)
Subject 6 1,500 0.42 100 1,423.0 95 0.42
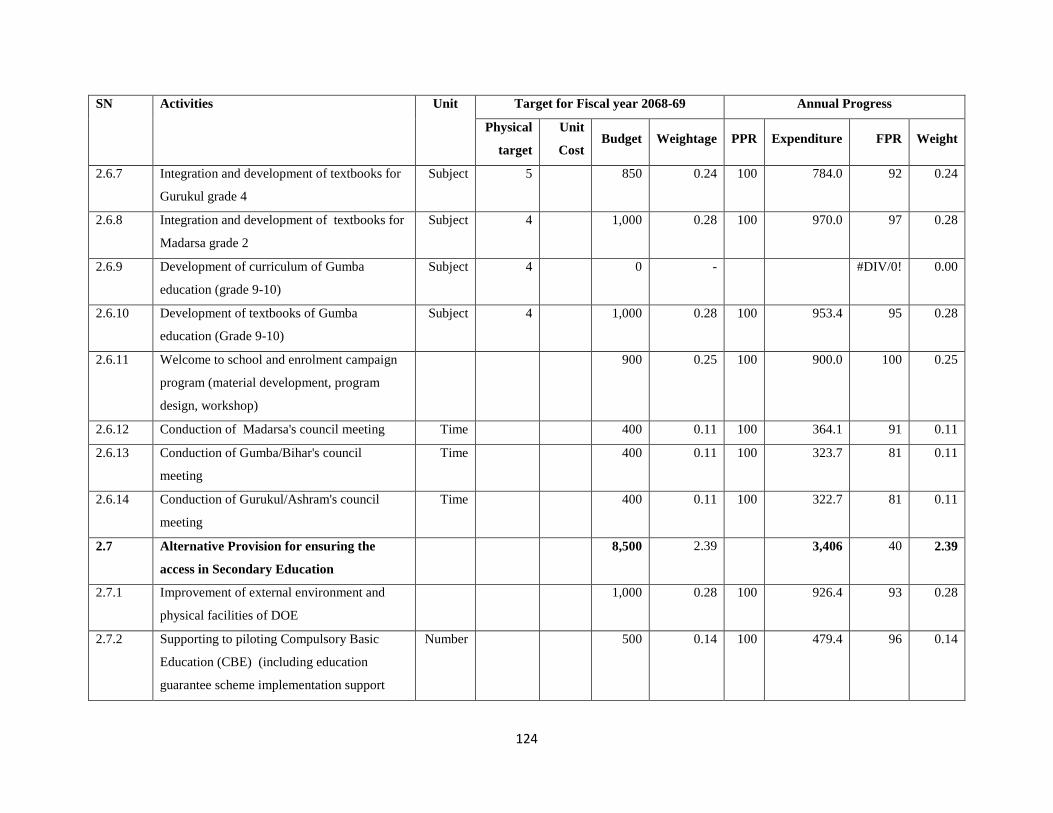
124
SN Activities Unit
Target for Fiscal year 2068-69 Annual Progress
Physical
target
Unit
Cost Budget Weightage PPR Expenditure FPR Weight
2.6.7 Integration and development of textbooks for
Gurukul grade 4
Subject 5 850 0.24 100 784.0 92 0.24
2.6.8 Integration and development of textbooks for
Madarsa grade 2
Subject 4 1,000 0.28 100 970.0 97 0.28
2.6.9 Development of curriculum of Gumba
education (grade 9-10)
Subject 4 0 - #DIV/0! 0.00
2.6.10 Development of textbooks of Gumba
education (Grade 9-10)
Subject 4 1,000 0.28 100 953.4 95 0.28
2.6.11 Welcome to school and enrolment campaign
program (material development, program
design, workshop)
900 0.25 100 900.0 100 0.25
2.6.12 Conduction of Madarsa's council meeting Time 400 0.11 100 364.1 91 0.11
2.6.13 Conduction of Gumba/Bihar's council
meeting
Time 400 0.11 100 323.7 81 0.11
2.6.14 Conduction of Gurukul/Ashram's council
meeting
Time 400 0.11 100 322.7 81 0.11
2.7 Alternative Provision for ensuring the
access in Secondary Education
8,500 2.39 3,406 40 2.39
2.7.1 Improvement of external environment and
physical facilities of DOE
1,000 0.28 100 926.4 93 0.28
2.7.2 Supporting to piloting Compulsory Basic
Education (CBE) (including education
guarantee scheme implementation support
Number 500 0.14 100 479.4 96 0.14
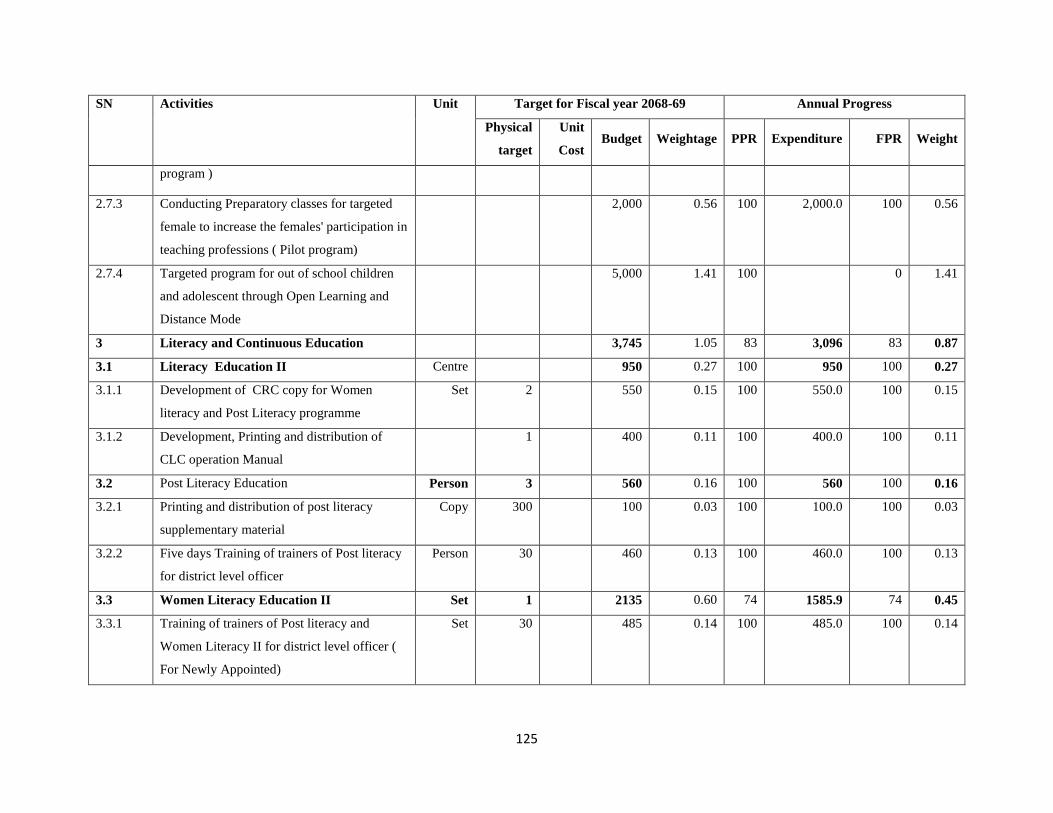
125
SN Activities Unit
Target for Fiscal year 2068-69 Annual Progress
Physical
target
Unit
Cost Budget Weightage PPR Expenditure FPR Weight
program )
2.7.3 Conducting Preparatory classes for targeted
female to increase the females' participation in
teaching professions ( Pilot program)
2,000 0.56 100 2,000.0 100 0.56
2.7.4 Targeted program for out of school children
and adolescent through Open Learning and
Distance Mode
5,000 1.41 100 0 1.41
3 Literacy and Continuous Education 3,745 1.05 83 3,096 83 0.87
3.1 Literacy Education II Centre 950 0.27 100 950 100 0.27
3.1.1 Development of CRC copy for Women
literacy and Post Literacy programme
Set 2 550 0.15 100 550.0 100 0.15
3.1.2 Development, Printing and distribution of
CLC operation Manual
1 400 0.11 100 400.0 100 0.11
3.2 Post Literacy Education Person 3 560 0.16 100 560 100 0.16
3.2.1 Printing and distribution of post literacy
supplementary material
Copy 300 100 0.03 100 100.0 100 0.03
3.2.2 Five days Training of trainers of Post literacy
for district level officer
Person 30 460 0.13 100 460.0 100 0.13
3.3 Women Literacy Education II Set 1 2135 0.60 74 1585.9 74 0.45
3.3.1 Training of trainers of Post literacy and
Women Literacy II for district level officer (
For Newly Appointed)
Set 30 485 0.14 100 485.0 100 0.14
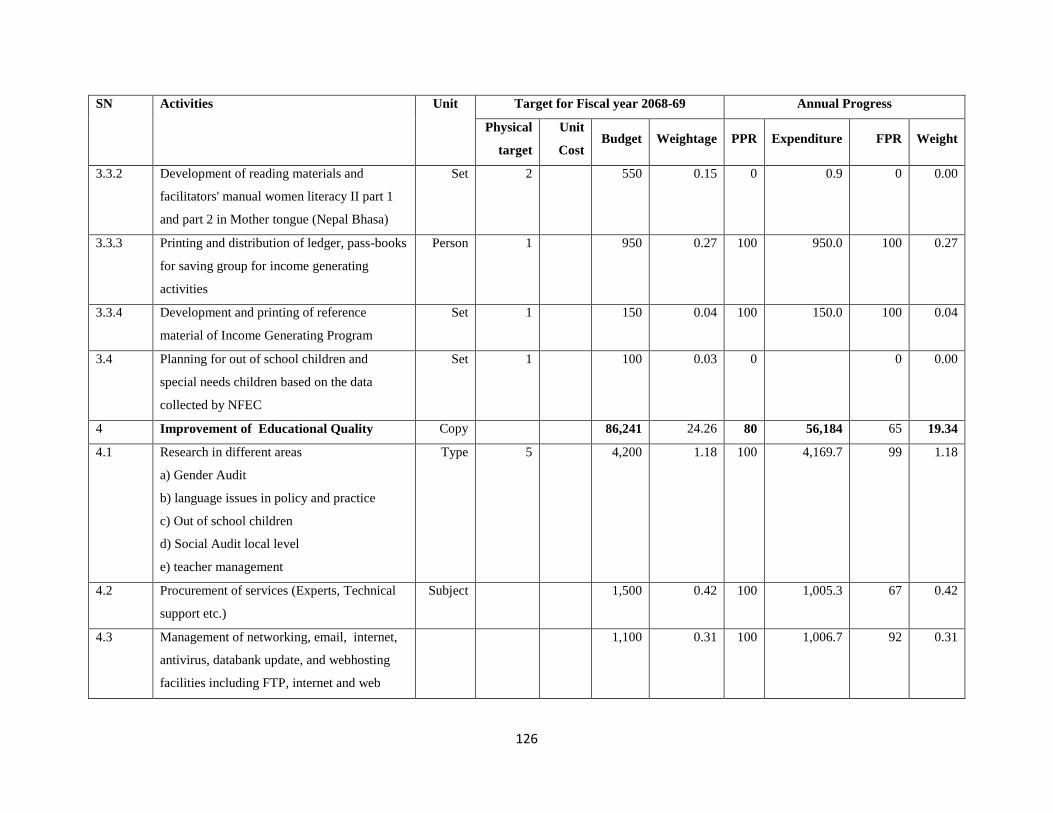
126
SN Activities Unit
Target for Fiscal year 2068-69 Annual Progress
Physical
target
Unit
Cost Budget Weightage PPR Expenditure FPR Weight
3.3.2 Development of reading materials and
facilitators' manual women literacy II part 1
and part 2 in Mother tongue (Nepal Bhasa)
Set 2 550 0.15 0 0.9 0 0.00
3.3.3 Printing and distribution of ledger, pass-books
for saving group for income generating
activities
Person 1 950 0.27 100 950.0 100 0.27
3.3.4 Development and printing of reference
material of Income Generating Program
Set 1 150 0.04 100 150.0 100 0.04
3.4 Planning for out of school children and
special needs children based on the data
collected by NFEC
Set 1 100 0.03 0 0 0.00
4 Improvement of Educational Quality Copy 86,241 24.26 80 56,184 65 19.34
4.1 Research in different areas
a) Gender Audit
b) language issues in policy and practice
c) Out of school children
d) Social Audit local level
e) teacher management
Type 5 4,200 1.18 100 4,169.7 99 1.18
4.2 Procurement of services (Experts, Technical
support etc.)
Subject 1,500 0.42 100 1,005.3 67 0.42
4.3 Management of networking, email, internet,
antivirus, databank update, and webhosting
facilities including FTP, internet and web
1,100 0.31 100 1,006.7 92 0.31
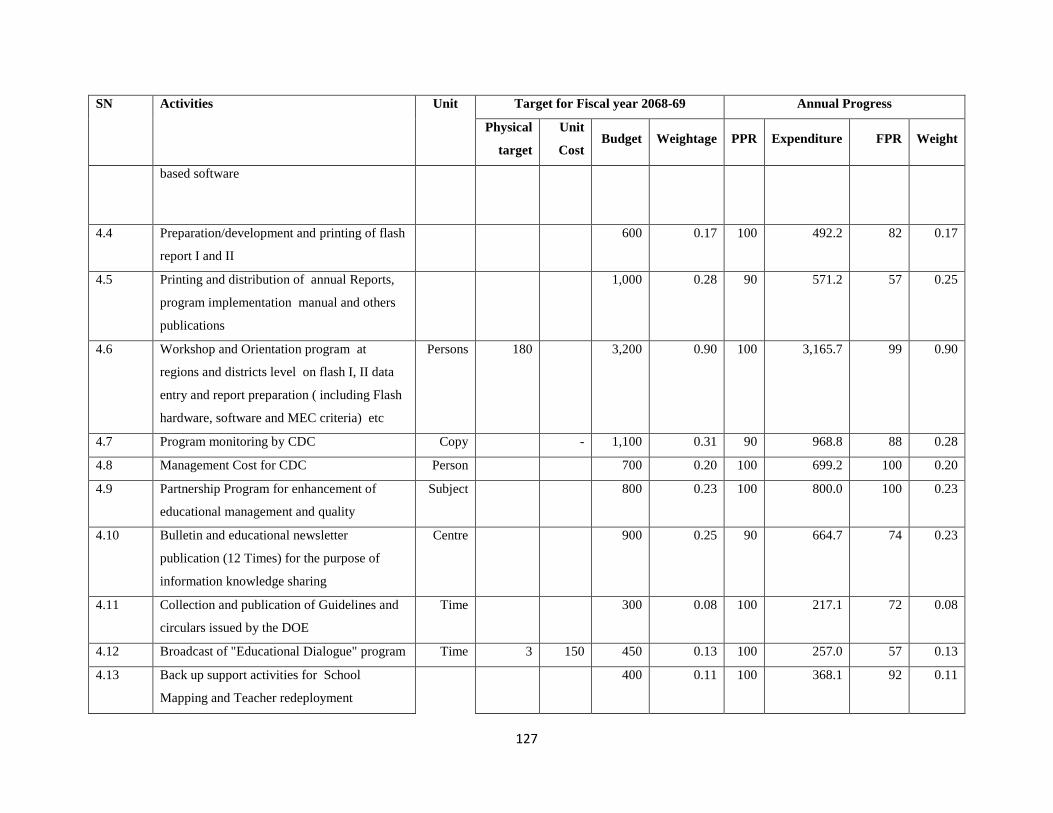
127
SN Activities Unit
Target for Fiscal year 2068-69 Annual Progress
Physical
target
Unit
Cost Budget Weightage PPR Expenditure FPR Weight
based software
4.4 Preparation/development and printing of flash
report I and II
600 0.17 100 492.2 82 0.17
4.5 Printing and distribution of annual Reports,
program implementation manual and others
publications
1,000 0.28 90 571.2 57 0.25
4.6 Workshop and Orientation program at
regions and districts level on flash I, II data
entry and report preparation ( including Flash
hardware, software and MEC criteria) etc
Persons 180 3,200 0.90 100 3,165.7 99 0.90
4.7 Program monitoring by CDC Copy - 1,100 0.31 90 968.8 88 0.28
4.8 Management Cost for CDC Person 700 0.20 100 699.2 100 0.20
4.9 Partnership Program for enhancement of
educational management and quality
Subject 800 0.23 100 800.0 100 0.23
4.10 Bulletin and educational newsletter
publication (12 Times) for the purpose of
information knowledge sharing
Centre 900 0.25 90 664.7 74 0.23
4.11 Collection and publication of Guidelines and
circulars issued by the DOE
Time 300 0.08 100 217.1 72 0.08
4.12 Broadcast of "Educational Dialogue" program Time 3 150 450 0.13 100 257.0 57 0.13
4.13 Back up support activities for School
Mapping and Teacher redeployment
400 0.11 100 368.1 92 0.11

128
SN Activities Unit
Target for Fiscal year 2068-69 Annual Progress
Physical
target
Unit
Cost Budget Weightage PPR Expenditure FPR Weight
4.14 Establishment of Networking and updating it
for regular operations for conducting
educational program, monitoring, financial
and budget management, emails and webs
District 5,500 1.55 100 0 1.55
4.15 Feedback collection of grade 6 Textbook and
Curriculum framework of grade 6-8
Time 16 1,500 0.42 100 1,488.4 99 0.42
4.16 Finalization of Grade 6-8 Curriculum Centre 10 500 0.14 100 430.5 86 0.14
4.17 Finalization of Grade 6-8 Textbook Centre 10 75 1,000 0.28 100 887.6 89 0.28
4.18 Grade 6-8 curriculum and textbook
orientation
Copy 350 - - 0
4.19 Music subject textbook development (Grade-
6)
District 1 300 0.08 100 229.5 77 0.08
4.20 Development of Minimum Enabling
Condition (MEC) standard and Indicators
2 300 0.08 100 150.0 50 0.08
4.21 English translation of grade 6 and 7 Textbook Subject 7 700 0.20 100 700.0 100 0.20
4.22 Teachers Guide development and revision for
grade 6
Subject 10 2,500 0.70 100 2,001.3 80 0.70
4.23 Grade 7 Textbook write up for piloting Subject 10 2,500 0.70 100 2,500.0 100 0.70
4.24 Grade 7 Textbook printing for piloting Copy 5,000 3,000 0.84 100 3,000.0 100 0.84
4.25 Revision of grade 6 and 7 Sanskrit Shiksha
textbook
Subject 4 1,000 0.28 100 938.9 94 0.28
4.26 Grade 9-12 Curriculum development Subject 1,500 0.42 100 1,494.9 100 0.42
4.27 Regional Level workshop on CAS Subject 5 1,000 0.28 60 605.2 61 0.17
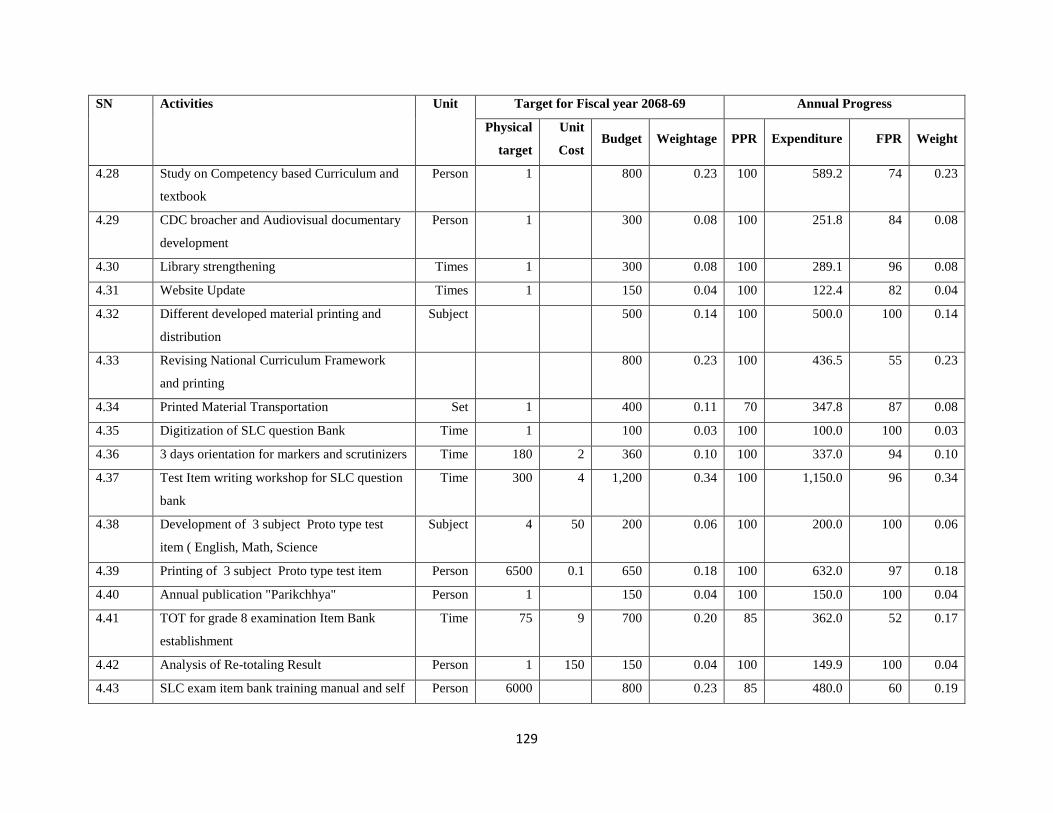
129
SN Activities Unit
Target for Fiscal year 2068-69 Annual Progress
Physical
target
Unit
Cost Budget Weightage PPR Expenditure FPR Weight
4.28 Study on Competency based Curriculum and
textbook
Person 1 800 0.23 100 589.2 74 0.23
4.29 CDC broacher and Audiovisual documentary
development
Person 1 300 0.08 100 251.8 84 0.08
4.30 Library strengthening Times 1 300 0.08 100 289.1 96 0.08
4.31 Website Update Times 1 150 0.04 100 122.4 82 0.04
4.32 Different developed material printing and
distribution
Subject 500 0.14 100 500.0 100 0.14
4.33 Revising National Curriculum Framework
and printing
800 0.23 100 436.5 55 0.23
4.34 Printed Material Transportation Set 1 400 0.11 70 347.8 87 0.08
4.35 Digitization of SLC question Bank Time 1 100 0.03 100 100.0 100 0.03
4.36 3 days orientation for markers and scrutinizers Time 180 2 360 0.10 100 337.0 94 0.10
4.37 Test Item writing workshop for SLC question
bank
Time 300 4 1,200 0.34 100 1,150.0 96 0.34
4.38 Development of 3 subject Proto type test
item ( English, Math, Science
Subject 4 50 200 0.06 100 200.0 100 0.06
4.39 Printing of 3 subject Proto type test item Person 6500 0.1 650 0.18 100 632.0 97 0.18
4.40 Annual publication "Parikchhya" Person 1 150 0.04 100 150.0 100 0.04
4.41 TOT for grade 8 examination Item Bank
establishment
Time 75 9 700 0.20 85 362.0 52 0.17
4.42 Analysis of Re-totaling Result Person 1 150 150 0.04 100 149.9 100 0.04
4.43 SLC exam item bank training manual and self Person 6000 800 0.23 85 480.0 60 0.19
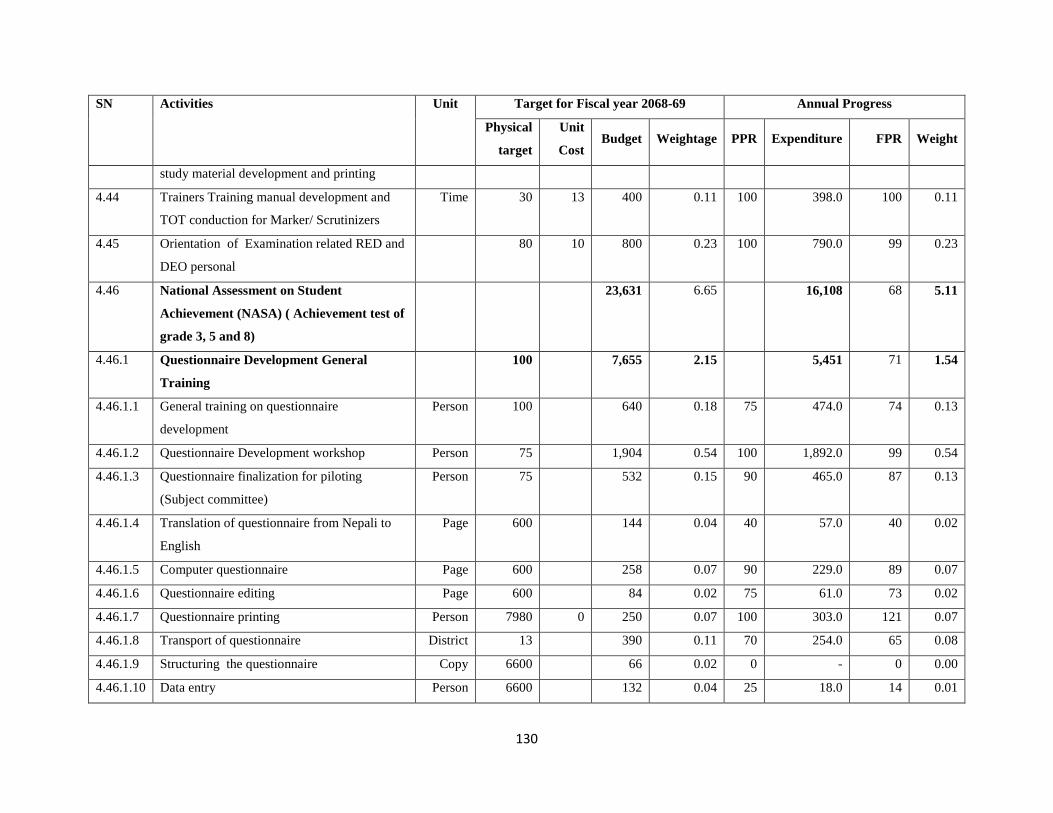
130
SN Activities Unit
Target for Fiscal year 2068-69 Annual Progress
Physical
target
Unit
Cost Budget Weightage PPR Expenditure FPR Weight
study material development and printing
4.44 Trainers Training manual development and
TOT conduction for Marker/ Scrutinizers
Time 30 13 400 0.11 100 398.0 100 0.11
4.45 Orientation of Examination related RED and
DEO personal
80 10 800 0.23 100 790.0 99 0.23
4.46 National Assessment on Student
Achievement (NASA) ( Achievement test of
grade 3, 5 and 8)
23,631 6.65 16,108 68 5.11
4.46.1 Questionnaire Development General
Training
100 7,655 2.15 5,451 71 1.54
4.46.1.1 General training on questionnaire
development
Person 100 640 0.18 75 474.0 74 0.13
4.46.1.2 Questionnaire Development workshop Person 75 1,904 0.54 100 1,892.0 99 0.54
4.46.1.3 Questionnaire finalization for piloting
(Subject committee)
Person 75 532 0.15 90 465.0 87 0.13
4.46.1.4 Translation of questionnaire from Nepali to
English
Page 600 144 0.04 40 57.0 40 0.02
4.46.1.5 Computer questionnaire Page 600 258 0.07 90 229.0 89 0.07
4.46.1.6 Questionnaire editing Page 600 84 0.02 75 61.0 73 0.02
4.46.1.7 Questionnaire printing Person 7980 0 250 0.07 100 303.0 121 0.07
4.46.1.8 Transport of questionnaire District 13 390 0.11 70 254.0 65 0.08
4.46.1.9 Structuring the questionnaire Copy 6600 66 0.02 0 - 0 0.00
4.46.1.10 Data entry Person 6600 132 0.04 25 18.0 14 0.01
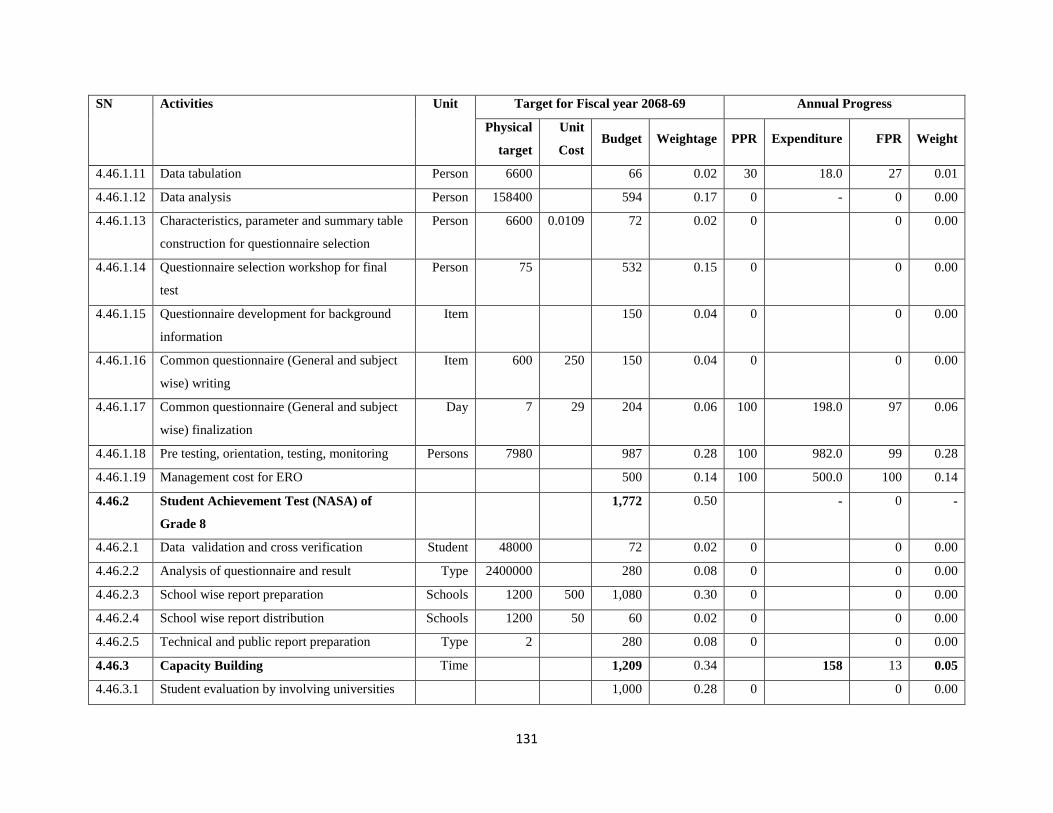
131
SN Activities Unit
Target for Fiscal year 2068-69 Annual Progress
Physical
target
Unit
Cost Budget Weightage PPR Expenditure FPR Weight
4.46.1.11 Data tabulation Person 6600 66 0.02 30 18.0 27 0.01
4.46.1.12 Data analysis Person 158400 594 0.17 0 - 0 0.00
4.46.1.13 Characteristics, parameter and summary table
construction for questionnaire selection
Person 6600 0.0109 72 0.02 0 0 0.00
4.46.1.14 Questionnaire selection workshop for final
test
Person 75 532 0.15 0 0 0.00
4.46.1.15 Questionnaire development for background
information
Item 150 0.04 0 0 0.00
4.46.1.16 Common questionnaire (General and subject
wise) writing
Item 600 250 150 0.04 0 0 0.00
4.46.1.17 Common questionnaire (General and subject
wise) finalization
Day 7 29 204 0.06 100 198.0 97 0.06
4.46.1.18 Pre testing, orientation, testing, monitoring Persons 7980 987 0.28 100 982.0 99 0.28
4.46.1.19 Management cost for ERO 500 0.14 100 500.0 100 0.14
4.46.2 Student Achievement Test (NASA) of
Grade 8
1,772 0.50 - 0 -
4.46.2.1 Data validation and cross verification Student 48000 72 0.02 0 0 0.00
4.46.2.2 Analysis of questionnaire and result Type 2400000 280 0.08 0 0 0.00
4.46.2.3 School wise report preparation Schools 1200 500 1,080 0.30 0 0 0.00
4.46.2.4 School wise report distribution Schools 1200 50 60 0.02 0 0 0.00
4.46.2.5 Technical and public report preparation Type 2 280 0.08 0 0 0.00
4.46.3 Capacity Building Time 1,209 0.34 158 13 0.05
4.46.3.1 Student evaluation by involving universities 1,000 0.28 0 0 0.00
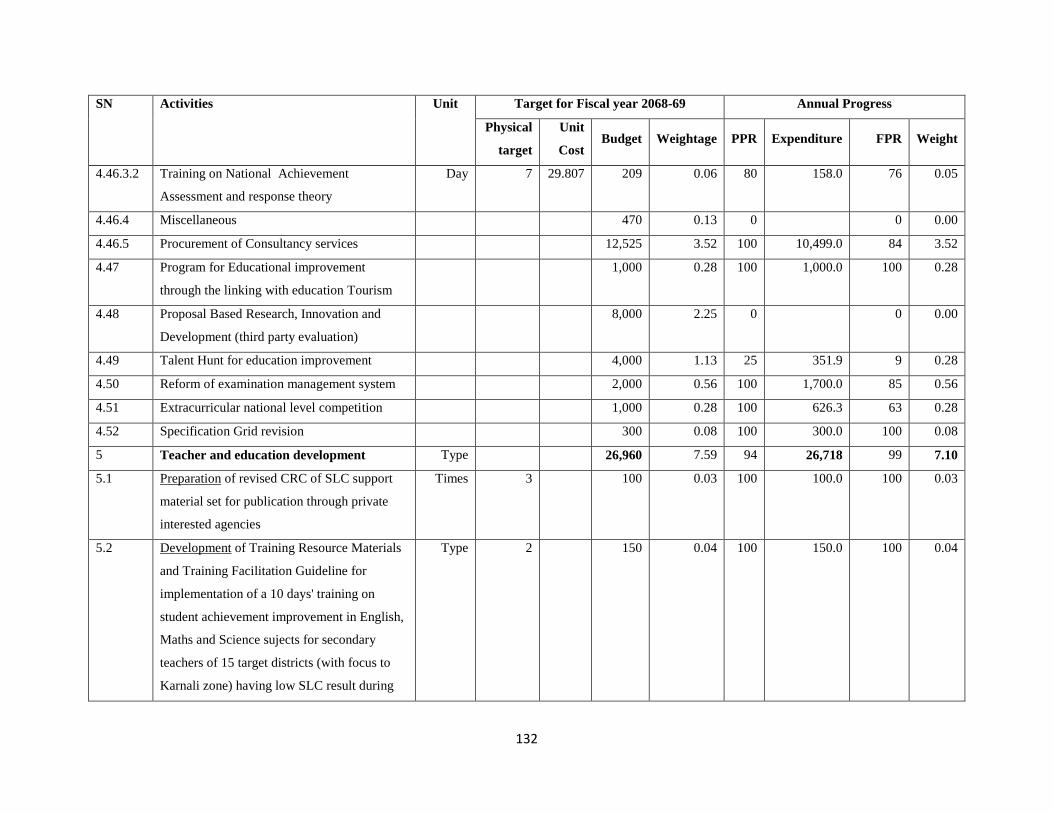
132
SN Activities Unit
Target for Fiscal year 2068-69 Annual Progress
Physical
target
Unit
Cost Budget Weightage PPR Expenditure FPR Weight
4.46.3.2 Training on National Achievement
Assessment and response theory
Day 7 29.807 209 0.06 80 158.0 76 0.05
4.46.4 Miscellaneous 470 0.13 0 0 0.00
4.46.5 Procurement of Consultancy services 12,525 3.52 100 10,499.0 84 3.52
4.47 Program for Educational improvement
through the linking with education Tourism
1,000 0.28 100 1,000.0 100 0.28
4.48 Proposal Based Research, Innovation and
Development (third party evaluation)
8,000 2.25 0 0 0.00
4.49 Talent Hunt for education improvement 4,000 1.13 25 351.9 9 0.28
4.50 Reform of examination management system 2,000 0.56 100 1,700.0 85 0.56
4.51 Extracurricular national level competition 1,000 0.28 100 626.3 63 0.28
4.52 Specification Grid revision 300 0.08 100 300.0 100 0.08
5 Teacher and education development Type 26,960 7.59 94 26,718 99 7.10
5.1 Preparation of revised CRC of SLC support
material set for publication through private
interested agencies
Times 3 100 0.03 100 100.0 100 0.03
5.2 Development of Training Resource Materials
and Training Facilitation Guideline for
implementation of a 10 days' training on
student achievement improvement in English,
Maths and Science sujects for secondary
teachers of 15 target districts (with focus to
Karnali zone) having low SLC result during
Type 2 150 0.04 100 150.0 100 0.04
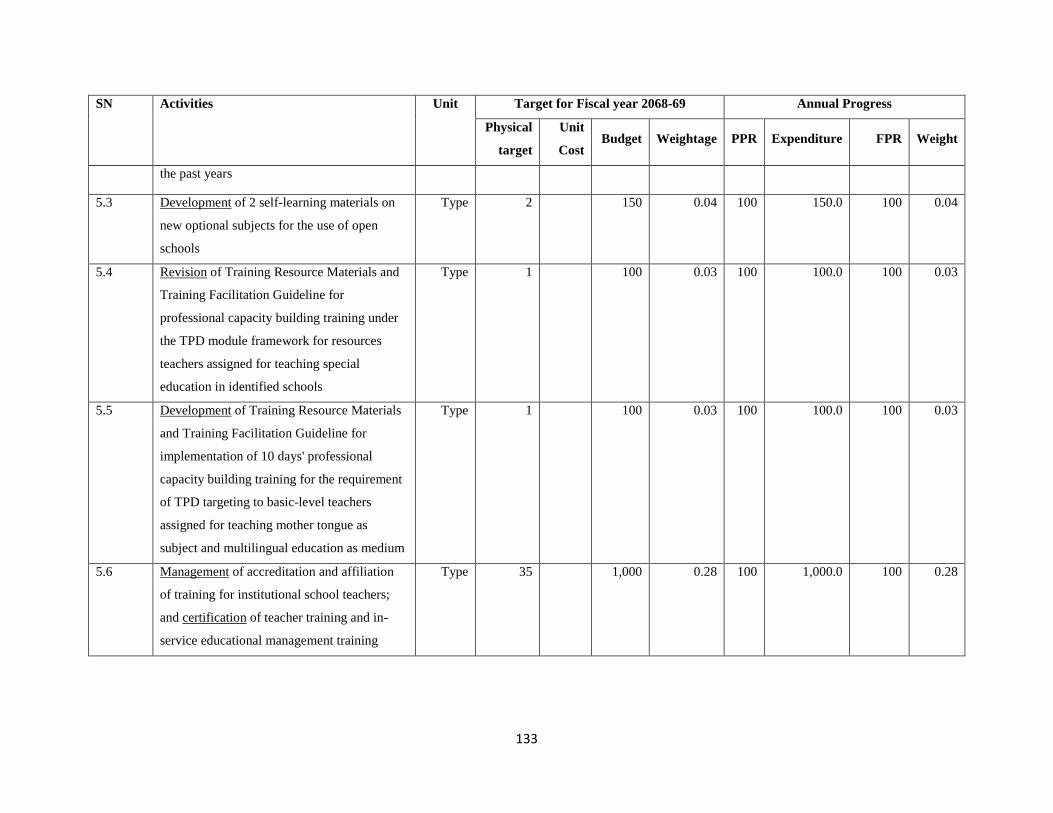
133
SN Activities Unit
Target for Fiscal year 2068-69 Annual Progress
Physical
target
Unit
Cost Budget Weightage PPR Expenditure FPR Weight
the past years
5.3 Development of 2 self-learning materials on
new optional subjects for the use of open
schools
Type 2 150 0.04 100 150.0 100 0.04
5.4 Revision of Training Resource Materials and
Training Facilitation Guideline for
professional capacity building training under
the TPD module framework for resources
teachers assigned for teaching special
education in identified schools
Type 1 100 0.03 100 100.0 100 0.03
5.5 Development of Training Resource Materials
and Training Facilitation Guideline for
implementation of 10 days' professional
capacity building training for the requirement
of TPD targeting to basic-level teachers
assigned for teaching mother tongue as
subject and multilingual education as medium
Type 1 100 0.03 100 100.0 100 0.03
5.6 Management of accreditation and affiliation
of training for institutional school teachers;
and certification of teacher training and in-
service educational management training
Type 35 1,000 0.28 100 1,000.0 100 0.28
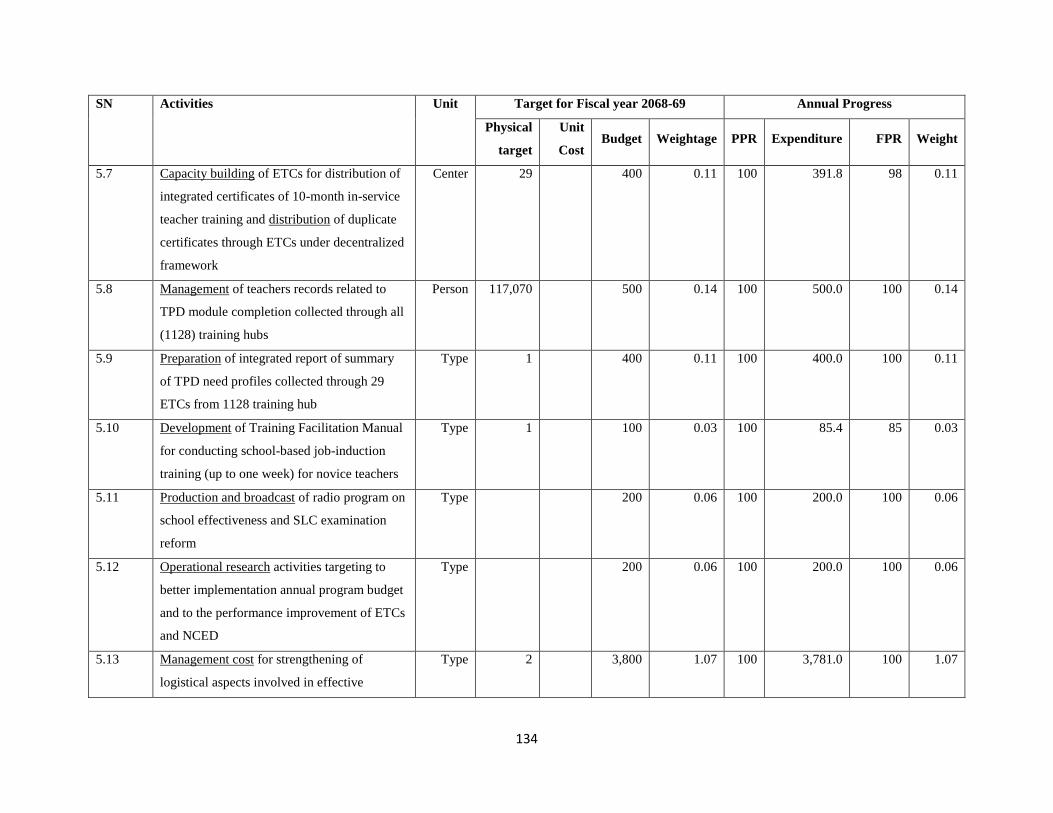
134
SN Activities Unit
Target for Fiscal year 2068-69 Annual Progress
Physical
target
Unit
Cost Budget Weightage PPR Expenditure FPR Weight
5.7 Capacity building of ETCs for distribution of
integrated certificates of 10-month in-service
teacher training and distribution of duplicate
certificates through ETCs under decentralized
framework
Center 29 400 0.11 100 391.8 98 0.11
5.8 Management of teachers records related to
TPD module completion collected through all
(1128) training hubs
Person 117,070 500 0.14 100 500.0 100 0.14
5.9 Preparation of integrated report of summary
of TPD need profiles collected through 29
ETCs from 1128 training hub
Type 1 400 0.11 100 400.0 100 0.11
5.10 Development of Training Facilitation Manual
for conducting school-based job-induction
training (up to one week) for novice teachers
Type 1 100 0.03 100 85.4 85 0.03
5.11 Production and broadcast of radio program on
school effectiveness and SLC examination
reform
Type 200 0.06 100 200.0 100 0.06
5.12 Operational research activities targeting to
better implementation annual program budget
and to the performance improvement of ETCs
and NCED
Type 200 0.06 100 200.0 100 0.06
5.13 Management cost for strengthening of
logistical aspects involved in effective
Type 2 3,800 1.07 100 3,781.0 100 1.07
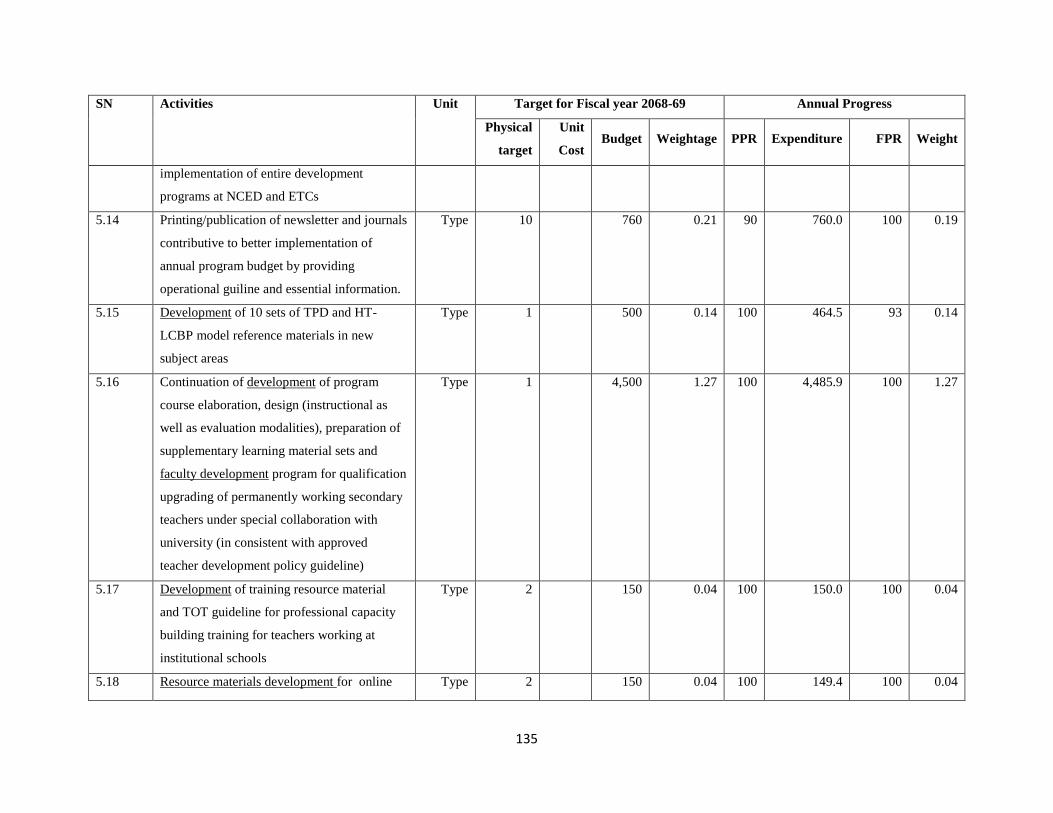
135
SN Activities Unit
Target for Fiscal year 2068-69 Annual Progress
Physical
target
Unit
Cost Budget Weightage PPR Expenditure FPR Weight
implementation of entire development
programs at NCED and ETCs
5.14 Printing/publication of newsletter and journals
contributive to better implementation of
annual program budget by providing
operational guiline and essential information.
Type 10 760 0.21 90 760.0 100 0.19
5.15 Development of 10 sets of TPD and HT-
LCBP model reference materials in new
subject areas
Type 1 500 0.14 100 464.5 93 0.14
5.16 Continuation of development of program
course elaboration, design (instructional as
well as evaluation modalities), preparation of
supplementary learning material sets and
faculty development program for qualification
upgrading of permanently working secondary
teachers under special collaboration with
university (in consistent with approved
teacher development policy guideline)
Type 1 4,500 1.27 100 4,485.9 100 1.27
5.17 Development of training resource material
and TOT guideline for professional capacity
building training for teachers working at
institutional schools
Type 2 150 0.04 100 150.0 100 0.04
5.18 Resource materials development for online Type 2 150 0.04 100 149.4 100 0.04

136
SN Activities Unit
Target for Fiscal year 2068-69 Annual Progress
Physical
target
Unit
Cost Budget Weightage PPR Expenditure FPR Weight
off line professional development course (up
to 3 months) for SS, RP, Roster and Trainers
5.19 Continuation of remaining training packages
of 7.5 months through distance mode for
those permanent teachers who were left to
complete the 10-month in-service training for
various reasons (for the final chance)
Person 1,000 2,000 0.56 60 2,000.0 100 0.34
5.20 Short-term customized training in new
modules for Gazetted-II and III officers
working under MOE system
Type 10 200 0.06 100 197.5 99 0.06
5.21 Management of printing and delivery of
different training handbooks and
materials/plan documents/reports for the use
of all training HUBs, DEOs, REDs
3,500 0.98 100 3,472.8 99 0.98
5.22 Preparation of model training reference
materials for professional capacity building
training of teachers teaching in traditional
school (Gumba, Gurukul, Madarsa)
Sets 100 0.03 100 95.8 96 0.03
5.23 Various capacity building activities based of
Capacity Development Plan of NCED and
implementation of post training follow up
/PMS
Center 2 200 0.06 100 107.5 54 0.06
5.24 Annual plan preparation and Technical Type 1 3,600 1.01 100 3,592.1 100 1.01
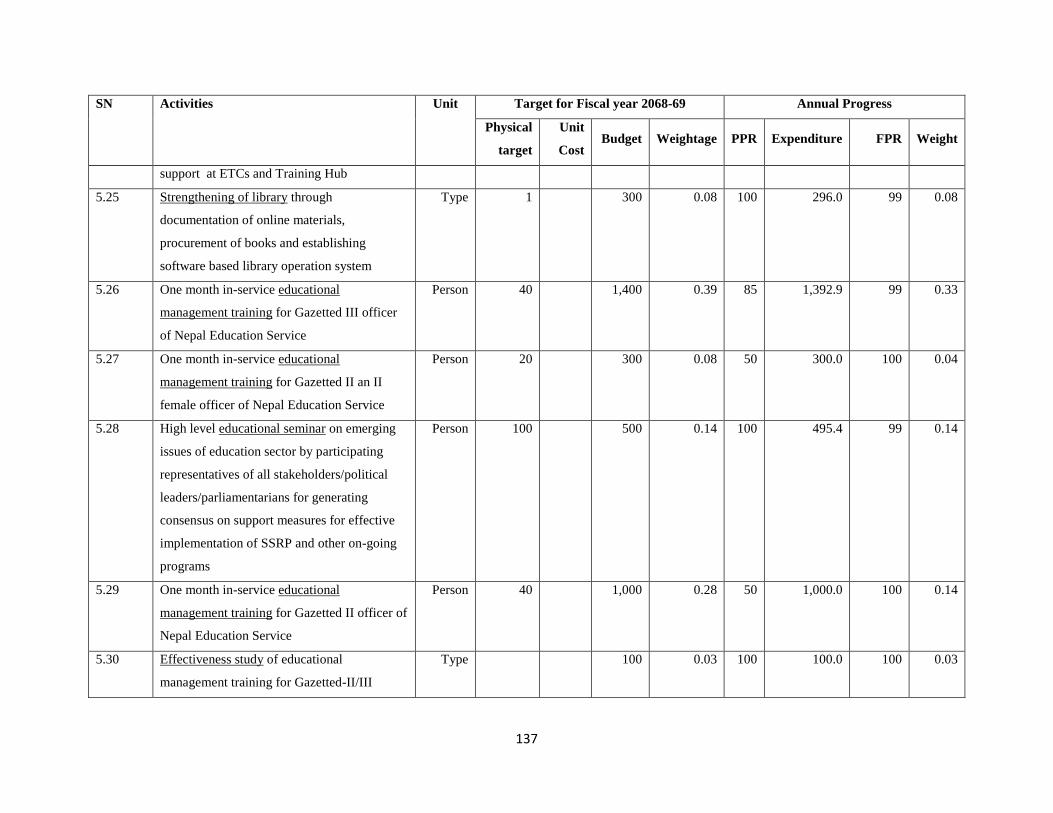
137
SN Activities Unit
Target for Fiscal year 2068-69 Annual Progress
Physical
target
Unit
Cost Budget Weightage PPR Expenditure FPR Weight
support at ETCs and Training Hub
5.25 Strengthening of library through
documentation of online materials,
procurement of books and establishing
software based library operation system
Type 1 300 0.08 100 296.0 99 0.08
5.26 One month in-service educational
management training for Gazetted III officer
of Nepal Education Service
Person 40 1,400 0.39 85 1,392.9 99 0.33
5.27 One month in-service educational
management training for Gazetted II an II
female officer of Nepal Education Service
Person 20 300 0.08 50 300.0 100 0.04
5.28 High level educational seminar on emerging
issues of education sector by participating
representatives of all stakeholders/political
leaders/parliamentarians for generating
consensus on support measures for effective
implementation of SSRP and other on-going
programs
Person 100 500 0.14 100 495.4 99 0.14
5.29 One month in-service educational
management training for Gazetted II officer of
Nepal Education Service
Person 40 1,000 0.28 50 1,000.0 100 0.14
5.30 Effectiveness study of educational
management training for Gazetted-II/III
Type 100 0.03 100 100.0 100 0.03
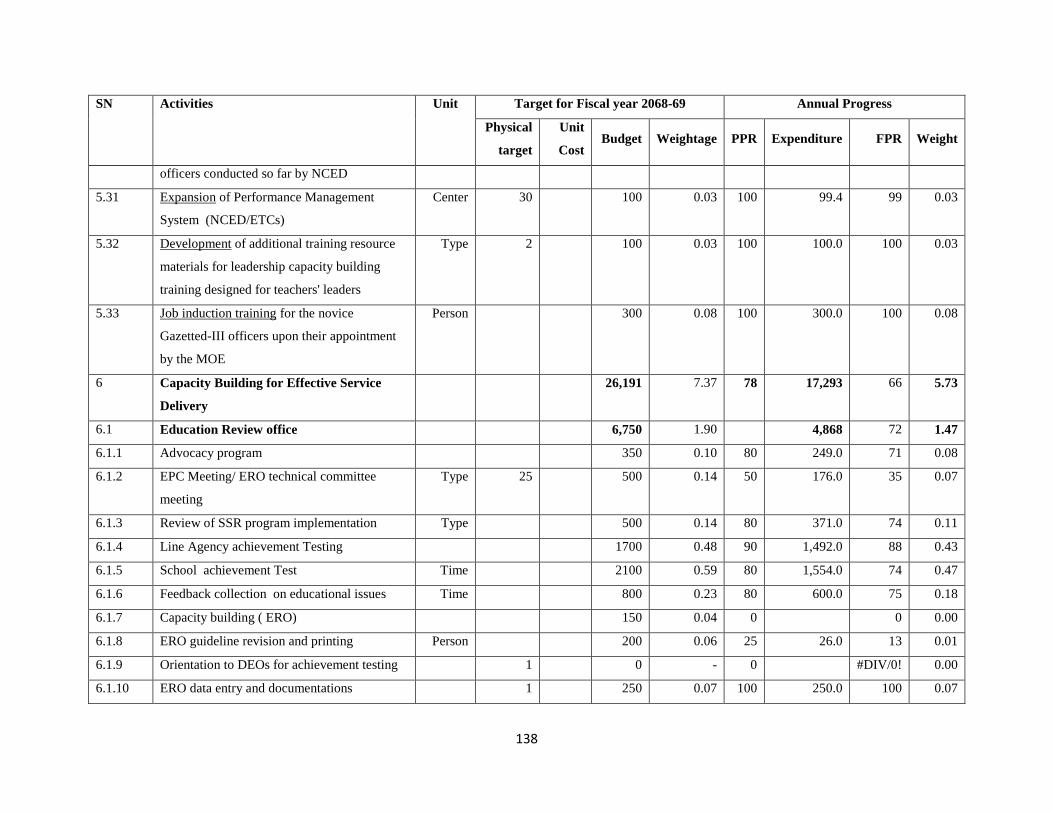
138
SN Activities Unit
Target for Fiscal year 2068-69 Annual Progress
Physical
target
Unit
Cost Budget Weightage PPR Expenditure FPR Weight
officers conducted so far by NCED
5.31 Expansion of Performance Management
System (NCED/ETCs)
Center 30 100 0.03 100 99.4 99 0.03
5.32 Development of additional training resource
materials for leadership capacity building
training designed for teachers' leaders
Type 2 100 0.03 100 100.0 100 0.03
5.33 Job induction training for the novice
Gazetted-III officers upon their appointment
by the MOE
Person 300 0.08 100 300.0 100 0.08
6 Capacity Building for Effective Service
Delivery
26,191 7.37 78 17,293 66 5.73
6.1 Education Review office 6,750 1.90 4,868 72 1.47
6.1.1 Advocacy program 350 0.10 80 249.0 71 0.08
6.1.2 EPC Meeting/ ERO technical committee
meeting
Type 25 500 0.14 50 176.0 35 0.07
6.1.3 Review of SSR program implementation Type 500 0.14 80 371.0 74 0.11
6.1.4 Line Agency achievement Testing 1700 0.48 90 1,492.0 88 0.43
6.1.5 School achievement Test Time 2100 0.59 80 1,554.0 74 0.47
6.1.6 Feedback collection on educational issues Time 800 0.23 80 600.0 75 0.18
6.1.7 Capacity building ( ERO) 150 0.04 0 0 0.00
6.1.8 ERO guideline revision and printing Person 200 0.06 25 26.0 13 0.01
6.1.9 Orientation to DEOs for achievement testing 1 0 - 0 #DIV/0! 0.00
6.1.10 ERO data entry and documentations 1 250 0.07 100 250.0 100 0.07
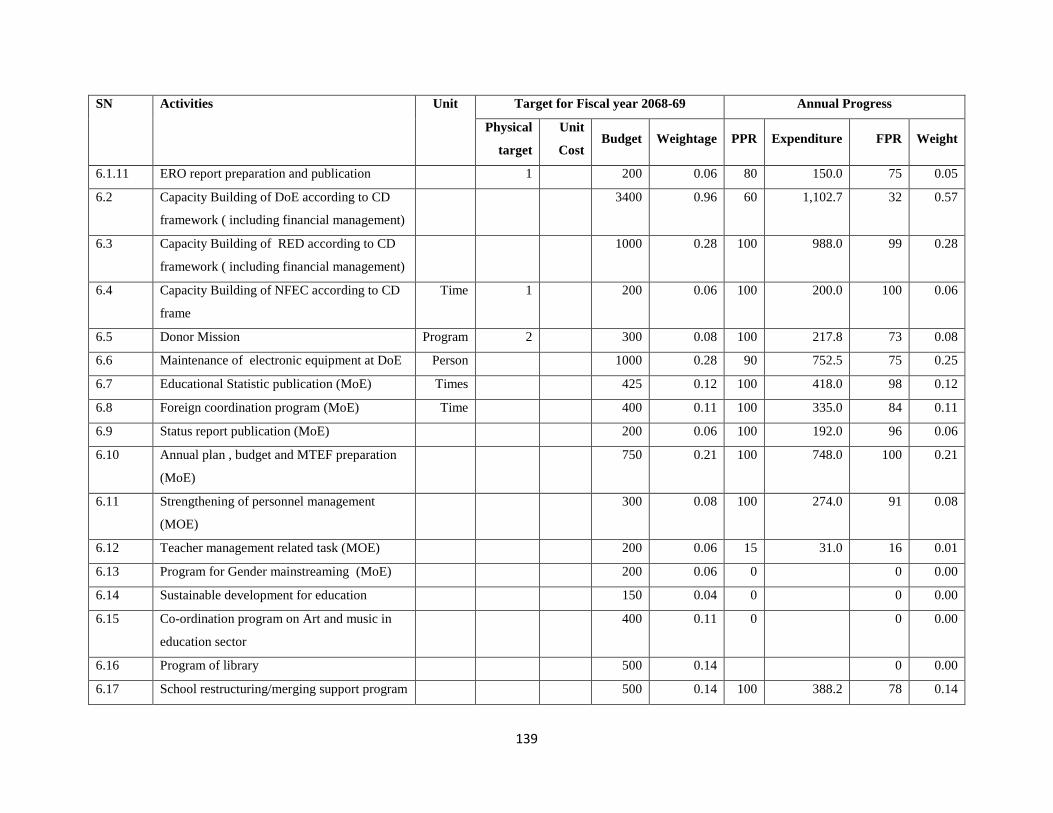
139
SN Activities Unit
Target for Fiscal year 2068-69 Annual Progress
Physical
target
Unit
Cost Budget Weightage PPR Expenditure FPR Weight
6.1.11 ERO report preparation and publication 1 200 0.06 80 150.0 75 0.05
6.2 Capacity Building of DoE according to CD
framework ( including financial management)
3400 0.96 60 1,102.7 32 0.57
6.3 Capacity Building of RED according to CD
framework ( including financial management)
1000 0.28 100 988.0 99 0.28
6.4 Capacity Building of NFEC according to CD
frame
Time 1 200 0.06 100 200.0 100 0.06
6.5 Donor Mission Program 2 300 0.08 100 217.8 73 0.08
6.6 Maintenance of electronic equipment at DoE Person 1000 0.28 90 752.5 75 0.25
6.7 Educational Statistic publication (MoE) Times 425 0.12 100 418.0 98 0.12
6.8 Foreign coordination program (MoE) Time 400 0.11 100 335.0 84 0.11
6.9 Status report publication (MoE) 200 0.06 100 192.0 96 0.06
6.10 Annual plan , budget and MTEF preparation
(MoE)
750 0.21 100 748.0 100 0.21
6.11 Strengthening of personnel management
(MOE)
300 0.08 100 274.0 91 0.08
6.12 Teacher management related task (MOE) 200 0.06 15 31.0 16 0.01
6.13 Program for Gender mainstreaming (MoE) 200 0.06 0 0 0.00
6.14 Sustainable development for education 150 0.04 0 0 0.00
6.15 Co-ordination program on Art and music in
education sector
400 0.11 0 0 0.00
6.16 Program of library 500 0.14 0 0.00
6.17 School restructuring/merging support program 500 0.14 100 388.2 78 0.14

140
SN Activities Unit
Target for Fiscal year 2068-69 Annual Progress
Physical
target
Unit
Cost Budget Weightage PPR Expenditure FPR Weight
for district level program
6.18 Model Building (9-12) of Secondary
Education
400 0.11 - 0 0.00
6.19 Policy, Act, and directives reform 350 0.10 100 333.0 95 0.10
6.20 Capacity Building on procurement plan Times 20 200 0.06 100 176.4 88 0.06
6.21 Orientation program on the school physical
facilities improvement for newly employed
technicians
Copy 400 0.11 100 400.0 100 0.11
6.22 Orientation school earthquake safety program
for Engineers/Sub-Engineers, Teachers, SMC
members etc
1800 0.51 100 1,749.7 97 0.51
6.23 Retrofitting materials printing and distribution 300 0.08 100 100.0 33 0.08
6.24 Consultancy service for retrofitting and ECED
building design
2116 0.60 100 1,505.7 71 0.60
6.25 Capacity building on professional Writing 200 0.06 0 0 0.00
6.26 O & M survey / PMIS 700 0.20 50 299.5 43 0.10
6.27 Electronic attendance system establishment 400 0.11 100 280.5 70 0.11
6.28 Institutional capacity building for CDC 500 0.14 100 423.4 85 0.14
6.29 Capacity building of OCE District 1 500 0.14 0 0 0.00
6.30 Networking with OCE to RED and DoE Schools 1 1,500 1500 0.42 100 1,360.0 91 0.42
6.31 WI-FI setting in the OCE training Hall 1 100 150 0.04 100 149.3 100 0.04
6.32 Capacity building training to RPs Person 1053 20 21060 5.93 0 0 0.00
7 School Management and Monitoring 87,143 24.52 89 64,020 73 21.85
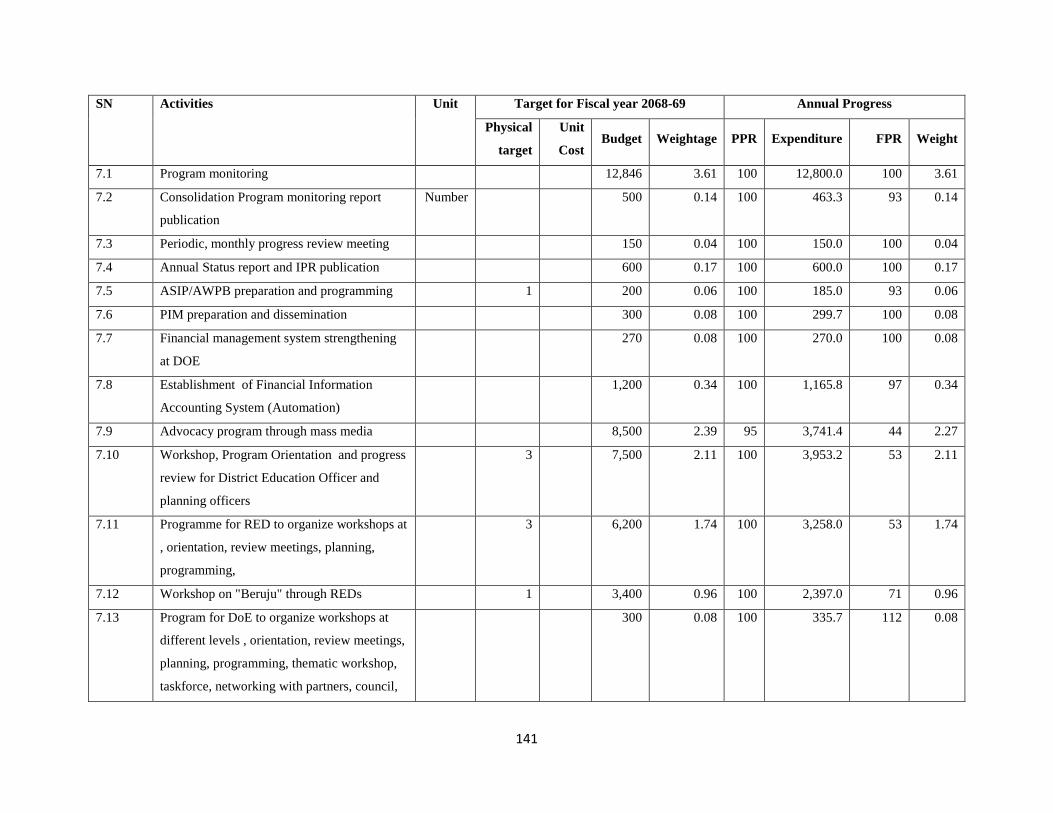
141
SN Activities Unit
Target for Fiscal year 2068-69 Annual Progress
Physical
target
Unit
Cost Budget Weightage PPR Expenditure FPR Weight
7.1 Program monitoring 12,846 3.61 100 12,800.0 100 3.61
7.2 Consolidation Program monitoring report
publication
Number 500 0.14 100 463.3 93 0.14
7.3 Periodic, monthly progress review meeting 150 0.04 100 150.0 100 0.04
7.4 Annual Status report and IPR publication 600 0.17 100 600.0 100 0.17
7.5 ASIP/AWPB preparation and programming 1 200 0.06 100 185.0 93 0.06
7.6 PIM preparation and dissemination 300 0.08 100 299.7 100 0.08
7.7 Financial management system strengthening
at DOE
270 0.08 100 270.0 100 0.08
7.8 Establishment of Financial Information
Accounting System (Automation)
1,200 0.34 100 1,165.8 97 0.34
7.9 Advocacy program through mass media 8,500 2.39 95 3,741.4 44 2.27
7.10 Workshop, Program Orientation and progress
review for District Education Officer and
planning officers
3 7,500 2.11 100 3,953.2 53 2.11
7.11 Programme for RED to organize workshops at
, orientation, review meetings, planning,
programming,
3 6,200 1.74 100 3,258.0 53 1.74
7.12 Workshop on "Beruju" through REDs 1 3,400 0.96 100 2,397.0 71 0.96
7.13 Program for DoE to organize workshops at
different levels , orientation, review meetings,
planning, programming, thematic workshop,
taskforce, networking with partners, council,
300 0.08 100 335.7 112 0.08
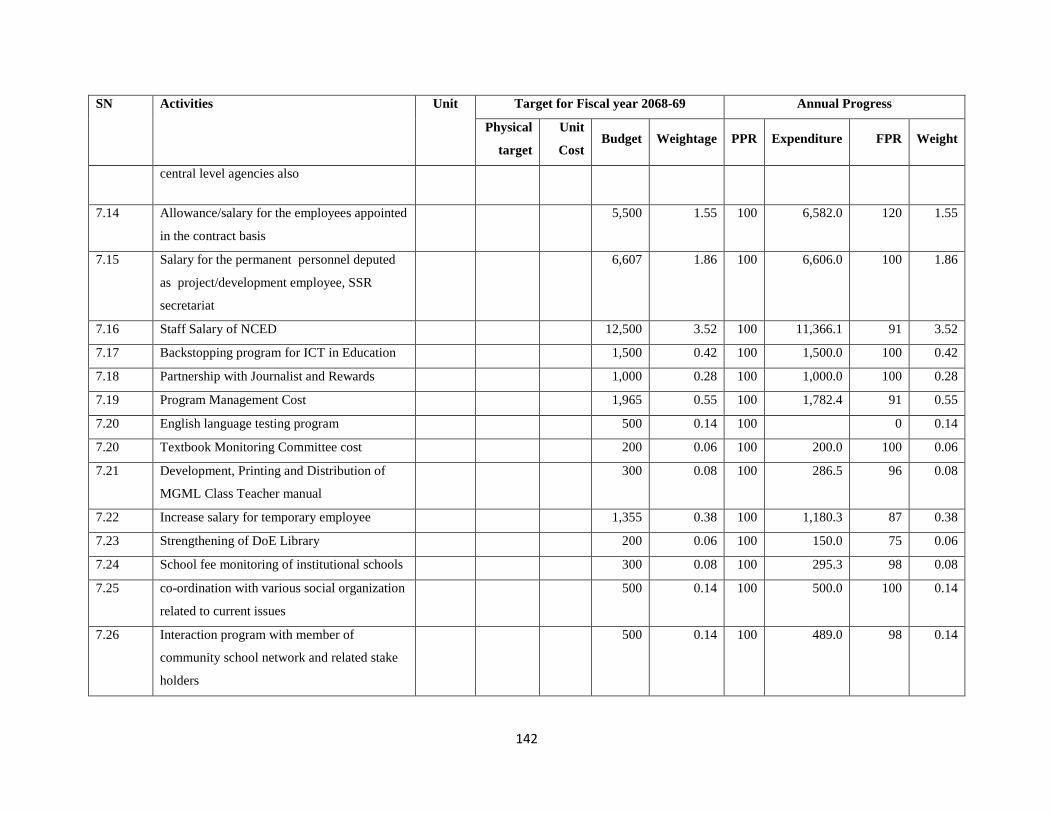
142
SN Activities Unit
Target for Fiscal year 2068-69 Annual Progress
Physical
target
Unit
Cost Budget Weightage PPR Expenditure FPR Weight
central level agencies also
7.14 Allowance/salary for the employees appointed
in the contract basis
5,500 1.55 100 6,582.0 120 1.55
7.15 Salary for the permanent personnel deputed
as project/development employee, SSR
secretariat
6,607 1.86 100 6,606.0 100 1.86
7.16 Staff Salary of NCED 12,500 3.52 100 11,366.1 91 3.52
7.17 Backstopping program for ICT in Education 1,500 0.42 100 1,500.0 100 0.42
7.18 Partnership with Journalist and Rewards 1,000 0.28 100 1,000.0 100 0.28
7.19 Program Management Cost 1,965 0.55 100 1,782.4 91 0.55
7.20 English language testing program 500 0.14 100 0 0.14
7.20 Textbook Monitoring Committee cost 200 0.06 100 200.0 100 0.06
7.21 Development, Printing and Distribution of
MGML Class Teacher manual
300 0.08 100 286.5 96 0.08
7.22 Increase salary for temporary employee 1,355 0.38 100 1,180.3 87 0.38
7.23 Strengthening of DoE Library 200 0.06 100 150.0 75 0.06
7.24 School fee monitoring of institutional schools 300 0.08 100 295.3 98 0.08
7.25 co-ordination with various social organization
related to current issues
500 0.14 100 500.0 100 0.14
7.26 Interaction program with member of
community school network and related stake
holders
500 0.14 100 489.0 98 0.14
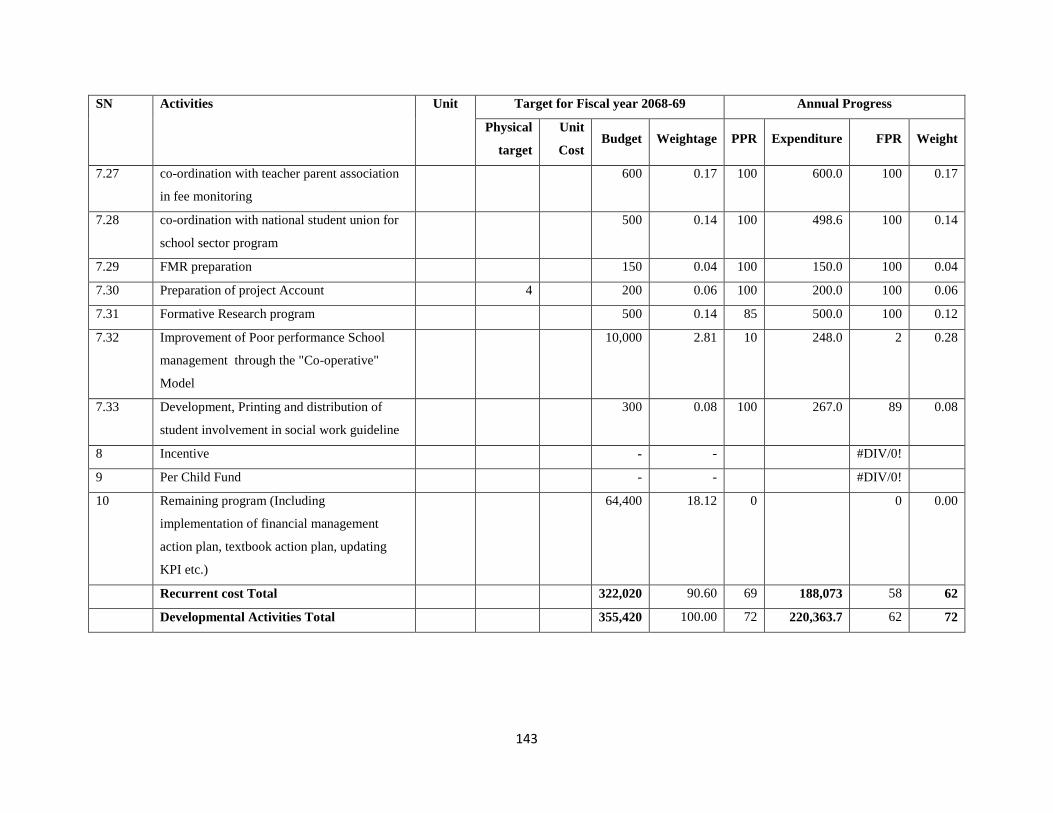
143
SN Activities Unit
Target for Fiscal year 2068-69 Annual Progress
Physical
target
Unit
Cost Budget Weightage PPR Expenditure FPR Weight
7.27 co-ordination with teacher parent association
in fee monitoring
600 0.17 100 600.0 100 0.17
7.28 co-ordination with national student union for
school sector program
500 0.14 100 498.6 100 0.14
7.29 FMR preparation 150 0.04 100 150.0 100 0.04
7.30 Preparation of project Account 4 200 0.06 100 200.0 100 0.06
7.31 Formative Research program 500 0.14 85 500.0 100 0.12
7.32 Improvement of Poor performance School
management through the "Co-operative"
Model
10,000 2.81 10 248.0 2 0.28
7.33 Development, Printing and distribution of
student involvement in social work guideline
300 0.08 100 267.0 89 0.08
8 Incentive - - #DIV/0!
9 Per Child Fund - - #DIV/0!
10 Remaining program (Including
implementation of financial management
action plan, textbook action plan, updating
KPI etc.)
64,400 18.12 0 0 0.00
Recurrent cost Total 322,020 90.60 69 188,073 58 62
Developmental Activities Total 355,420 100.00 72 220,363.7 62 72

144
Annex II SSRP
Annual Progress at District Level
FY 2011-2012
SN Activities Unit Target of FY 2068/69 Weight Annual Progress
Physical
qty
Budget Physical
target
PPR Expenditure FPR Weight
Capital Cost (3508034) 46,375.00 0.27 100 45,881.44 99 0.27
2 Ensuring access to school education 46,375.00 0.27 100 45,881.44 98.94 0.27
2.3 Physical facilities improvement 46,375.00 0.27 100 45,881.44 98.94 0.27
2.3.14 Furniture for DEOs District 74 5,500 0.03 74 100 5,430 99 0.03
2.3.15 DEO building construction District 9 34,875 0.21 9 100 34,452 99 0.21
2.3.16 Renovation of DEOs District 45 6,000 0.04 45 100 6,000 100 0.04
Capital Activities Total 46,375.00 0.27 - -
Recurrent Costs (3508033) 16,934,593.33 99.73 97 15,940,661.78 94 97.16
1 Early Childhood Education and Development 839,623.00 4.94 99 832,812.18 99 4.89
1.1 Existing ECEDs Center 833,691.00 4.91 99 828,896.30 99 4.86
1.1.1 Remuneration for facilitators (Mountain regions) Person 1,287 41,314 0.24 1,266 98 39,068 95 0.24
1.1.2 Remuneration for facilitator (Others) Person 27,392 763,877 4.50 27,124 99 762,382 100 4.45
1.1.3 Educational materials management cost Centre 28,649 28,500 0.17 27,885 97 27,447 96 0.16
1.2 New ECED centre Centre 500 5,932.00 0.03 84 3,915.88 66 0.03
1.2.1 Remuneration for facilitator (Mountain regions) Person 67 554 0.00 37 55 217 39 0.00
1.2.2 Remuneration for facilitator (others) Person 362 2,494 0.01 287 79 1,043 42 0.01
1.2.3 Establishment cost Centre 429 429 0.00 384 90 380 89 0.00
1.2.4 Educational materials management cost Centre 429 429 0.00 384 90 380 89 0.00
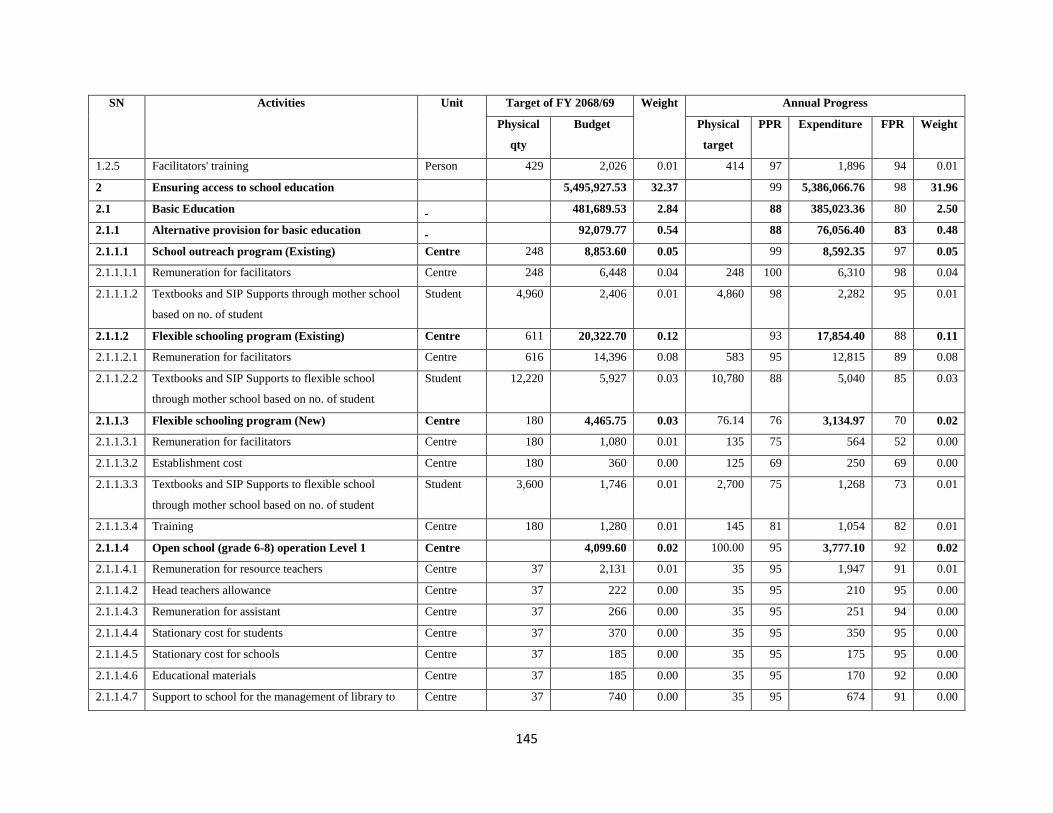
145
SN Activities Unit Target of FY 2068/69 Weight Annual Progress
Physical
qty
Budget Physical
target
PPR Expenditure FPR Weight
1.2.5 Facilitators' training Person 429 2,026 0.01 414 97 1,896 94 0.01
2 Ensuring access to school education 5,495,927.53 32.37 99 5,386,066.76 98 31.96
2.1 Basic Education 481,689.53 2.84 88 385,023.36 80 2.50
2.1.1 Alternative provision for basic education 92,079.77 0.54 88 76,056.40 83 0.48
2.1.1.1 School outreach program (Existing) Centre 248 8,853.60 0.05 99 8,592.35 97 0.05
2.1.1.1.1 Remuneration for facilitators Centre 248 6,448 0.04 248 100 6,310 98 0.04
2.1.1.1.2 Textbooks and SIP Supports through mother school
based on no. of student
Student 4,960 2,406 0.01 4,860 98 2,282 95 0.01
2.1.1.2 Flexible schooling program (Existing) Centre 611 20,322.70 0.12 93 17,854.40 88 0.11
2.1.1.2.1 Remuneration for facilitators Centre 616 14,396 0.08 583 95 12,815 89 0.08
2.1.1.2.2 Textbooks and SIP Supports to flexible school
through mother school based on no. of student
Student 12,220 5,927 0.03 10,780 88 5,040 85 0.03
2.1.1.3 Flexible schooling program (New) Centre 180 4,465.75 0.03 76.14 76 3,134.97 70 0.02
2.1.1.3.1 Remuneration for facilitators Centre 180 1,080 0.01 135 75 564 52 0.00
2.1.1.3.2 Establishment cost Centre 180 360 0.00 125 69 250 69 0.00
2.1.1.3.3 Textbooks and SIP Supports to flexible school
through mother school based on no. of student
Student 3,600 1,746 0.01 2,700 75 1,268 73 0.01
2.1.1.3.4 Training Centre 180 1,280 0.01 145 81 1,054 82 0.01
2.1.1.4 Open school (grade 6-8) operation Level 1 Centre 4,099.60 0.02 100.00 95 3,777.10 92 0.02
2.1.1.4.1 Remuneration for resource teachers Centre 37 2,131 0.01 35 95 1,947 91 0.01
2.1.1.4.2 Head teachers allowance Centre 37 222 0.00 35 95 210 95 0.00
2.1.1.4.3 Remuneration for assistant Centre 37 266 0.00 35 95 251 94 0.00
2.1.1.4.4 Stationary cost for students Centre 37 370 0.00 35 95 350 95 0.00
2.1.1.4.5 Stationary cost for schools Centre 37 185 0.00 35 95 175 95 0.00
2.1.1.4.6 Educational materials Centre 37 185 0.00 35 95 170 92 0.00
2.1.1.4.7 Support to school for the management of library to Centre 37 740 0.00 35 95 674 91 0.00
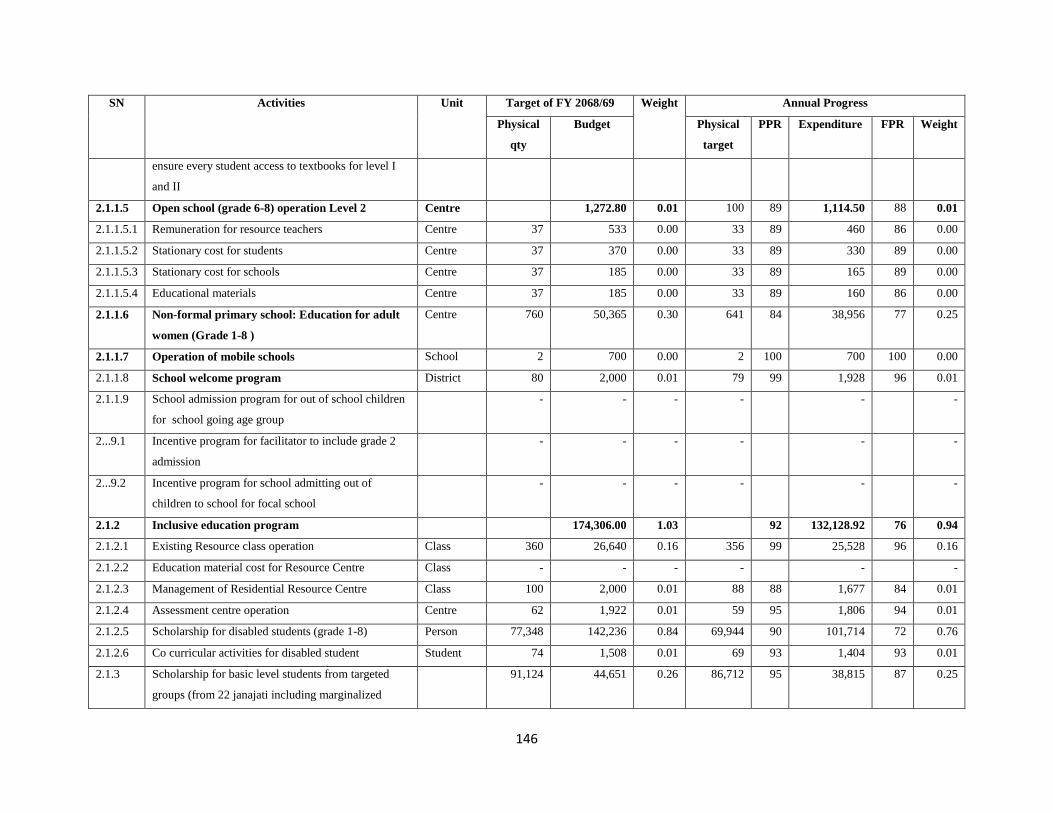
146
SN Activities Unit Target of FY 2068/69 Weight Annual Progress
Physical
qty
Budget Physical
target
PPR Expenditure FPR Weight
ensure every student access to textbooks for level I
and II
2.1.1.5 Open school (grade 6-8) operation Level 2 Centre 1,272.80 0.01 100 89 1,114.50 88 0.01
2.1.1.5.1 Remuneration for resource teachers Centre 37 533 0.00 33 89 460 86 0.00
2.1.1.5.2 Stationary cost for students Centre 37 370 0.00 33 89 330 89 0.00
2.1.1.5.3 Stationary cost for schools Centre 37 185 0.00 33 89 165 89 0.00
2.1.1.5.4 Educational materials Centre 37 185 0.00 33 89 160 86 0.00
2.1.1.6 Non-formal primary school: Education for adult
women (Grade 1-8 )
Centre 760 50,365 0.30 641 84 38,956 77 0.25
2.1.1.7 Operation of mobile schools School 2 700 0.00 2 100 700 100 0.00
2.1.1.8 School welcome program District 80 2,000 0.01 79 99 1,928 96 0.01
2.1.1.9 School admission program for out of school children
for school going age group
- - - - - -
2...9.1 Incentive program for facilitator to include grade 2
admission
- - - - - -
2...9.2 Incentive program for school admitting out of
children to school for focal school
- - - - - -
2.1.2 Inclusive education program 174,306.00 1.03 92 132,128.92 76 0.94
2.1.2.1 Existing Resource class operation Class 360 26,640 0.16 356 99 25,528 96 0.16
2.1.2.2 Education material cost for Resource Centre Class - - - - - -
2.1.2.3 Management of Residential Resource Centre Class 100 2,000 0.01 88 88 1,677 84 0.01
2.1.2.4 Assessment centre operation Centre 62 1,922 0.01 59 95 1,806 94 0.01
2.1.2.5 Scholarship for disabled students (grade 1-8) Person 77,348 142,236 0.84 69,944 90 101,714 72 0.76
2.1.2.6 Co curricular activities for disabled student Student 74 1,508 0.01 69 93 1,404 93 0.01
2.1.3 Scholarship for basic level students from targeted
groups (from 22 janajati including marginalized
91,124 44,651 0.26 86,712 95 38,815 87 0.25

147
SN Activities Unit Target of FY 2068/69 Weight Annual Progress
Physical
qty
Budget Physical
target
PPR Expenditure FPR Weight
groups including Muktakamiya, Haliya, Badi,
Churuwa)
2.1.5 Management cost for the activities of gender focal
point
Student 80 480 0.00 75 94 438 91 0.00
2.1.6 Piloting compulsory basic education including
educational program for guarantee scheme
including CFS and support to needy children such
as street children, HIV/AIDS affected children
Student 1,053 127,982 0.75 876 83 104,669 82 0.63
2.1.7 Grants support For Basic Religious School
(Gurukul, Ashram, Madarsha, Gumba and Bihar)
Number 1,621 42,191 0.25 1,293 80 32,917 78 0.20
2.2 Secondary Education 31,138.00 0.18 83 83 26,951.80 87 0.15
2.2.1 Alternative Provision for Secondary Education 20,178.00 0.12 78 78 17,078.20 85 0.09
2.2.1.1 Grants for open education (grade 9-10) operation School 85 9,350 0.06 83 98 8,999 96 0.05
2.2.1.2 Grants for schools for special need students (blind
schools - 6 and deaf schools - 7)
School 12 4,578 0.03 6 50 4,577 100 0.01
2.2.1.3 Non-formal secondary education for adult women
(grade 9-10)
Center 50 4,200 0.02 33 66 2,252 54 0.02
2.2.1.4 Grants support to religious secondary schools
(Gurukul, Ashram, Madrasha, Gumba and Bihar)
School 31 1,550 0.01 21 68 750 48 0.01
2.2.1.5 Support to girls' religious school (Gargi Kanya
Gurukul)
School 1 500 0.00 1 100 500 100 0.00
2.2.2 Secondary Education : Inclusive Education
Program
10,960.00 0.06 93 9,873.60 90 0.06
2.2.2.1 Partnership between high performing and low
performing community schools for improving the
SLC results of low performing schools
School 438 10,960 0.06 406 93 9,874 90 0.06

148
SN Activities Unit Target of FY 2068/69 Weight Annual Progress
Physical
qty
Budget Physical
target
PPR Expenditure FPR Weight
2.3 Physical facilities improvement 4,983,100.00 29.35 100 4,974,091.60 100 29.31
2.3.1 New class room construction Classroom 4,021 1,307,800 7.70 4,017 100 1,304,800 100 7.69
2.3.2 New class room construction for remote area Classroom 234 86,580 0.51 234 100 86,580 100 0.51
2.3.3 Classroom construction in community managed
schools
Classroom 1,702 554,450 3.27 1,700 100 553,800 100 3.26
2.3.4 Classroom construction in community managed
schools for remote area
Classroom 86 31,820 0.19 86 100 31,820 100 0.19
2.3.5 School Building construction Building 481 482,900 2.84 481 100 482,900 100 2.84
2.3.6 School Building construction ( Continuation of last
year construction )
Building 300 420,000 2.47 300 100 420,000 100 2.47
2.3.7 School Building maintenance Building 488 243,800 1.44 486 100 243,300 100 1.43
2.3.8 School earthquake safety program - Retrofitting ( 50
schools of 3 districts)
Classroom 50 65,350 0.38 50 100 64,043 98 0.38
2.3.9 Rehabilitation of class/school School 3,760 376,000 2.21 3,760 100 375,799 100 2.21
2.3.10 Improvement of external environment of schools School 4,012 802,200 4.72 4,009 100 801,200 100 4.72
2.3.11 Girls toilet construction Number 3,000 600,000 3.53 2,999 100 599,800 100 3.53
2.3.12 Feeder /Girls Hostel maintenance Number 20 6,000 0.04 19 95 5,400 90 0.03
2.3.13 Model school building construction 4 6,200 0.04 3 75 4,650 75 0.03
3 Literacy and continuing education 182,722.75 1.08 97 173,150.09 95 1.04
3.1 Operation of community learning centre Center 206 10,300 0.06 206 100 10,190 99 0.06
3.2 Adult literacy II Class 3,000 33,617.25 0.20 93 93 30,989.75 92 0.18
3.2.1 Training Class 3,000 5,859 0.03 2,800 93 5,408 92 0.03
3.2.2 Remunaration for facilitators Class 3,000 293 0.00 2,590 86 238 81 0.00
3.2.3 Incentive allowance Class 3,000 18,000 0.11 2,800 93 16,661 93 0.10
3.2.4 Remunaration for local motivators Class 3,000 1,125 0.01 2,640 88 955 85 0.01
3.2.5 Stationary cost Class 60,000 4,500 0.03 56,000 93 4,180 93 0.02
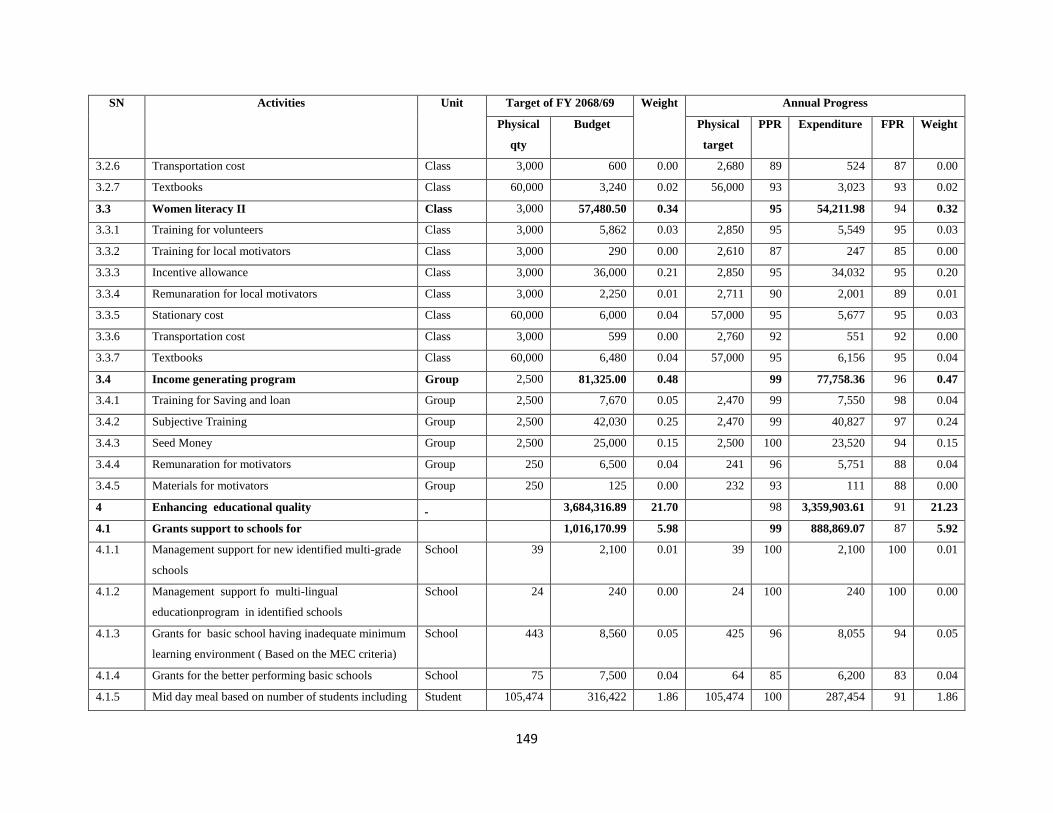
149
SN Activities Unit Target of FY 2068/69 Weight Annual Progress
Physical
qty
Budget Physical
target
PPR Expenditure FPR Weight
3.2.6 Transportation cost Class 3,000 600 0.00 2,680 89 524 87 0.00
3.2.7 Textbooks Class 60,000 3,240 0.02 56,000 93 3,023 93 0.02
3.3 Women literacy II Class 3,000 57,480.50 0.34 95 54,211.98 94 0.32
3.3.1 Training for volunteers Class 3,000 5,862 0.03 2,850 95 5,549 95 0.03
3.3.2 Training for local motivators Class 3,000 290 0.00 2,610 87 247 85 0.00
3.3.3 Incentive allowance Class 3,000 36,000 0.21 2,850 95 34,032 95 0.20
3.3.4 Remunaration for local motivators Class 3,000 2,250 0.01 2,711 90 2,001 89 0.01
3.3.5 Stationary cost Class 60,000 6,000 0.04 57,000 95 5,677 95 0.03
3.3.6 Transportation cost Class 3,000 599 0.00 2,760 92 551 92 0.00
3.3.7 Textbooks Class 60,000 6,480 0.04 57,000 95 6,156 95 0.04
3.4 Income generating program Group 2,500 81,325.00 0.48 99 77,758.36 96 0.47
3.4.1 Training for Saving and loan Group 2,500 7,670 0.05 2,470 99 7,550 98 0.04
3.4.2 Subjective Training Group 2,500 42,030 0.25 2,470 99 40,827 97 0.24
3.4.3 Seed Money Group 2,500 25,000 0.15 2,500 100 23,520 94 0.15
3.4.4 Remunaration for motivators Group 250 6,500 0.04 241 96 5,751 88 0.04
3.4.5 Materials for motivators Group 250 125 0.00 232 93 111 88 0.00
4 Enhancing educational quality 3,684,316.89 21.70 98 3,359,903.61 91 21.23
4.1 Grants support to schools for 1,016,170.99 5.98 99 888,869.07 87 5.92
4.1.1 Management support for new identified multi-grade
schools
School 39 2,100 0.01 39 100 2,100 100 0.01
4.1.2 Management support fo multi-lingual
educationprogram in identified schools
School 24 240 0.00 24 100 240 100 0.00
4.1.3 Grants for basic school having inadequate minimum
learning environment ( Based on the MEC criteria)
School 443 8,560 0.05 425 96 8,055 94 0.05
4.1.4 Grants for the better performing basic schools School 75 7,500 0.04 64 85 6,200 83 0.04
4.1.5 Mid day meal based on number of students including Student 105,474 316,422 1.86 105,474 100 287,454 91 1.86
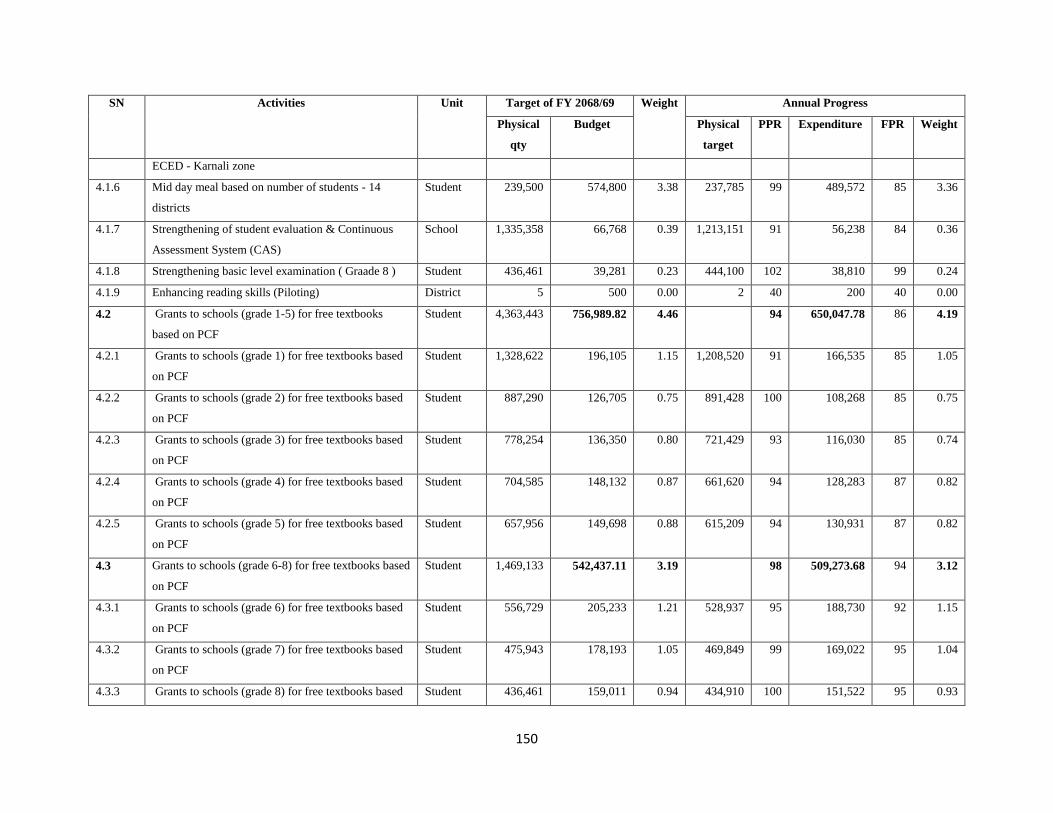
150
SN Activities Unit Target of FY 2068/69 Weight Annual Progress
Physical
qty
Budget Physical
target
PPR Expenditure FPR Weight
ECED - Karnali zone
4.1.6 Mid day meal based on number of students - 14
districts
Student 239,500 574,800 3.38 237,785 99 489,572 85 3.36
4.1.7 Strengthening of student evaluation & Continuous
Assessment System (CAS)
School 1,335,358 66,768 0.39 1,213,151 91 56,238 84 0.36
4.1.8 Strengthening basic level examination ( Graade 8 ) Student 436,461 39,281 0.23 444,100 102 38,810 99 0.24
4.1.9 Enhancing reading skills (Piloting) District 5 500 0.00 2 40 200 40 0.00
4.2 Grants to schools (grade 1-5) for free textbooks
based on PCF
Student 4,363,443 756,989.82 4.46 94 650,047.78 86 4.19
4.2.1 Grants to schools (grade 1) for free textbooks based
on PCF
Student 1,328,622 196,105 1.15 1,208,520 91 166,535 85 1.05
4.2.2 Grants to schools (grade 2) for free textbooks based
on PCF
Student 887,290 126,705 0.75 891,428 100 108,268 85 0.75
4.2.3 Grants to schools (grade 3) for free textbooks based
on PCF
Student 778,254 136,350 0.80 721,429 93 116,030 85 0.74
4.2.4 Grants to schools (grade 4) for free textbooks based
on PCF
Student 704,585 148,132 0.87 661,620 94 128,283 87 0.82
4.2.5 Grants to schools (grade 5) for free textbooks based
on PCF
Student 657,956 149,698 0.88 615,209 94 130,931 87 0.82
4.3 Grants to schools (grade 6-8) for free textbooks based
on PCF
Student 1,469,133 542,437.11 3.19 98 509,273.68 94 3.12
4.3.1 Grants to schools (grade 6) for free textbooks based
on PCF
Student 556,729 205,233 1.21 528,937 95 188,730 92 1.15
4.3.2 Grants to schools (grade 7) for free textbooks based
on PCF
Student 475,943 178,193 1.05 469,849 99 169,022 95 1.04
4.3.3 Grants to schools (grade 8) for free textbooks based Student 436,461 159,011 0.94 434,910 100 151,522 95 0.93
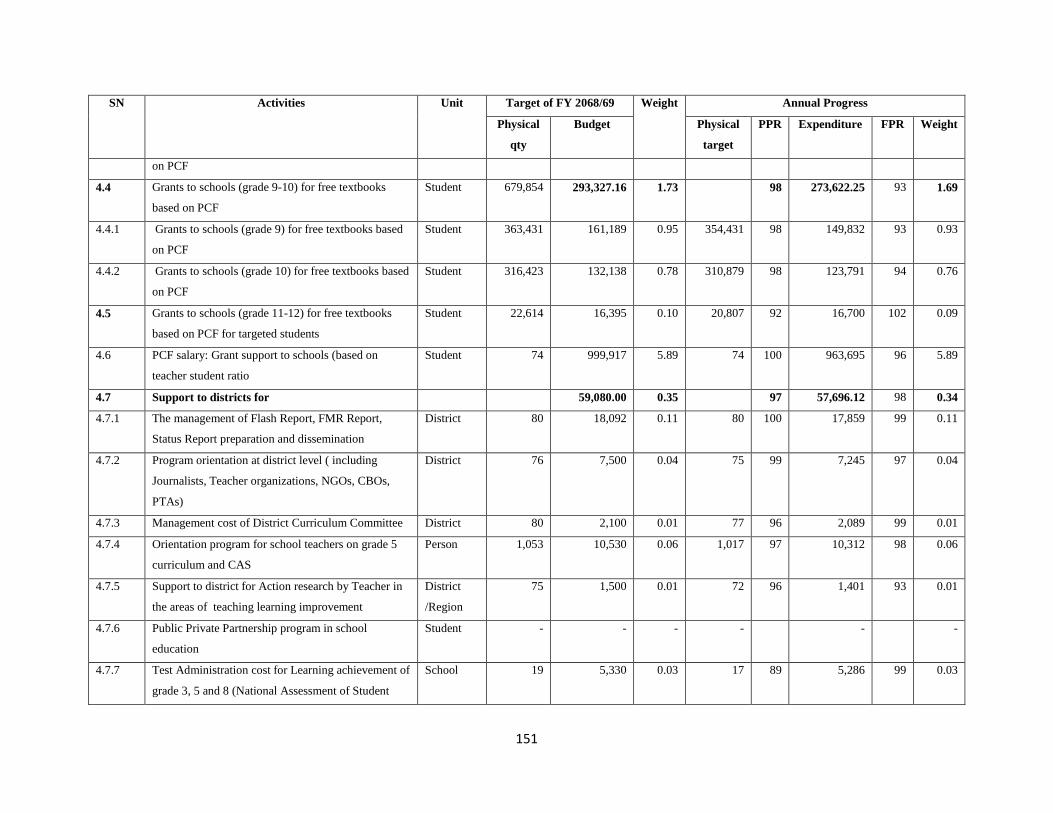
151
SN Activities Unit Target of FY 2068/69 Weight Annual Progress
Physical
qty
Budget Physical
target
PPR Expenditure FPR Weight
on PCF
4.4 Grants to schools (grade 9-10) for free textbooks
based on PCF
Student 679,854 293,327.16 1.73 98 273,622.25 93 1.69
4.4.1 Grants to schools (grade 9) for free textbooks based
on PCF
Student 363,431 161,189 0.95 354,431 98 149,832 93 0.93
4.4.2 Grants to schools (grade 10) for free textbooks based
on PCF
Student 316,423 132,138 0.78 310,879 98 123,791 94 0.76
4.5 Grants to schools (grade 11-12) for free textbooks
based on PCF for targeted students
Student 22,614 16,395 0.10 20,807 92 16,700 102 0.09
4.6 PCF salary: Grant support to schools (based on
teacher student ratio
Student 74 999,917 5.89 74 100 963,695 96 5.89
4.7 Support to districts for 59,080.00 0.35 97 57,696.12 98 0.34
4.7.1 The management of Flash Report, FMR Report,
Status Report preparation and dissemination
District 80 18,092 0.11 80 100 17,859 99 0.11
4.7.2 Program orientation at district level ( including
Journalists, Teacher organizations, NGOs, CBOs,
PTAs)
District 76 7,500 0.04 75 99 7,245 97 0.04
4.7.3 Management cost of District Curriculum Committee District 80 2,100 0.01 77 96 2,089 99 0.01
4.7.4 Orientation program for school teachers on grade 5
curriculum and CAS
Person 1,053 10,530 0.06 1,017 97 10,312 98 0.06
4.7.5 Support to district for Action research by Teacher in
the areas of teaching learning improvement
District
/Region
75 1,500 0.01 72 96 1,401 93 0.01
4.7.6 Public Private Partnership program in school
education
Student - - - - - -
4.7.7 Test Administration cost for Learning achievement of
grade 3, 5 and 8 (National Assessment of Student
School 19 5,330 0.03 17 89 5,286 99 0.03

152
SN Activities Unit Target of FY 2068/69 Weight Annual Progress
Physical
qty
Budget Physical
target
PPR Expenditure FPR Weight
achievement, NASA)
4.7.8 Orientation for Markers/Scrutinizers (5 REDs) Person 1,260 2,520 0.01 1,161 92 2,403 95 0.01
4.7.9 Developing and updating item banks for basic level
examinations (75 Districts 6 Subjects and 5 sets each
Person 2,250 9,000 0.05 2,161 96 8,726 97 0.05
4.7.10 Oral Examiner/monitors Orientation program Person 1,672 2,508 0.01 1,607 96 2,375 95 0.01
5 Teacher Education and Development 244,042.40 1.44 100 232,336.96 95 1.43
5.1 10 days' teacher professional development (TPD)
module for basic level teachers at RCs
Person 66,777 213,686 1.26 66,732 100 204,491 96 1.26
5.2 10 days' professional capacity building training for
the requirement of TPD targeting to basic-level
teachers assigned for teaching mother tongue as
subject and multilingual education as medium
Person - - - - - -
5.3 Training of Trainers (TOT) for professional capacity
building training designed for mother
tongue/multilingual teachers
Person - - - - - -
5.4 10 days' TPD module for secondary level teachers at
ETCs and LRCs
Person 5,195 22,858 0.13 5,024 97 20,636 90 0.13
5.5 Intensive TOT for TPD module facilitation (12 days) Person - - - - - -
5.6 TOT for professional capacity building training
designed for institutional school teachers
Person - - - - - -
5.7 30 days' Head teachers' leadership capacity building
training (HT-LCBT) at ETCs and LRCs (including
institutional school principals)
Person 1,150 7,498 0.04 1,125 98 7,210 96 0.04
5.8 TOT for leadership capacity building training
designed for school headteachers
Person - - - - - -
5.9 Development, printing and delivery of 08 sets of Center - - - - - -
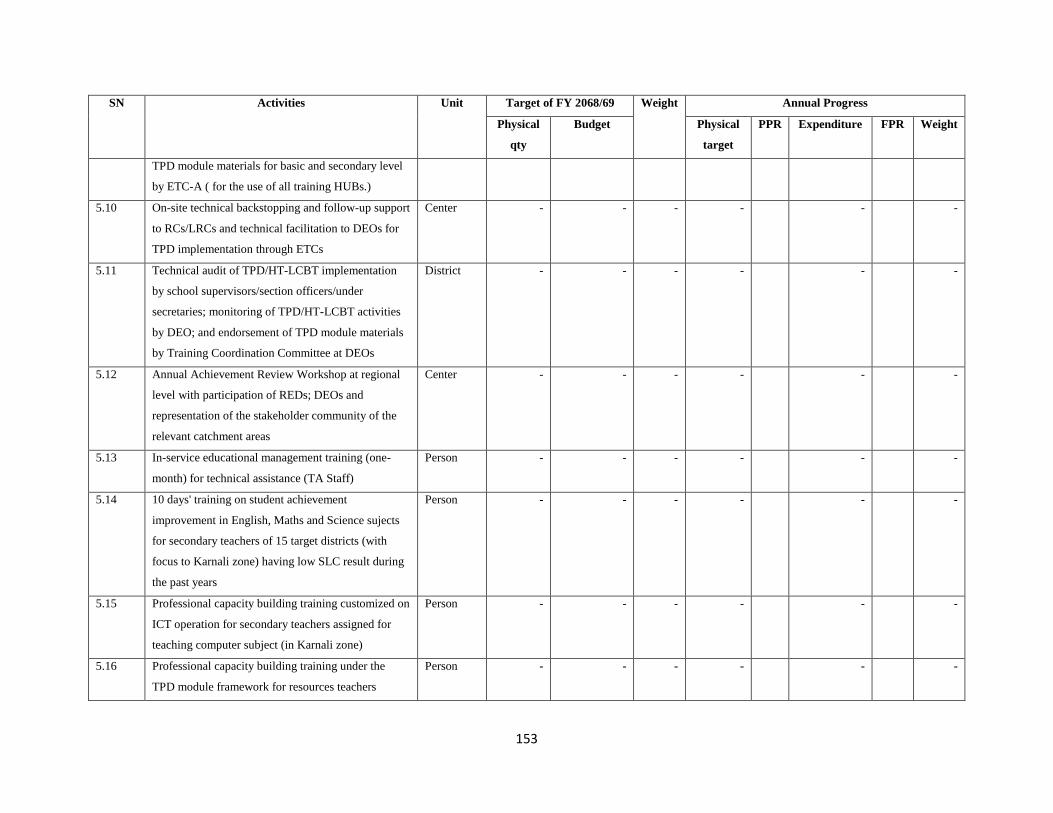
153
SN Activities Unit Target of FY 2068/69 Weight Annual Progress
Physical
qty
Budget Physical
target
PPR Expenditure FPR Weight
TPD module materials for basic and secondary level
by ETC-A ( for the use of all training HUBs.)
5.10 On-site technical backstopping and follow-up support
to RCs/LRCs and technical facilitation to DEOs for
TPD implementation through ETCs
Center - - - - - -
5.11 Technical audit of TPD/HT-LCBT implementation
by school supervisors/section officers/under
secretaries; monitoring of TPD/HT-LCBT activities
by DEO; and endorsement of TPD module materials
by Training Coordination Committee at DEOs
District - - - - - -
5.12 Annual Achievement Review Workshop at regional
level with participation of REDs; DEOs and
representation of the stakeholder community of the
relevant catchment areas
Center - - - - - -
5.13 In-service educational management training (one-
month) for technical assistance (TA Staff)
Person - - - - - -
5.14 10 days' training on student achievement
improvement in English, Maths and Science sujects
for secondary teachers of 15 target districts (with
focus to Karnali zone) having low SLC result during
the past years
Person - - - - - -
5.15 Professional capacity building training customized on
ICT operation for secondary teachers assigned for
teaching computer subject (in Karnali zone)
Person - - - - - -
5.16 Professional capacity building training under the
TPD module framework for resources teachers
Person - - - - - -
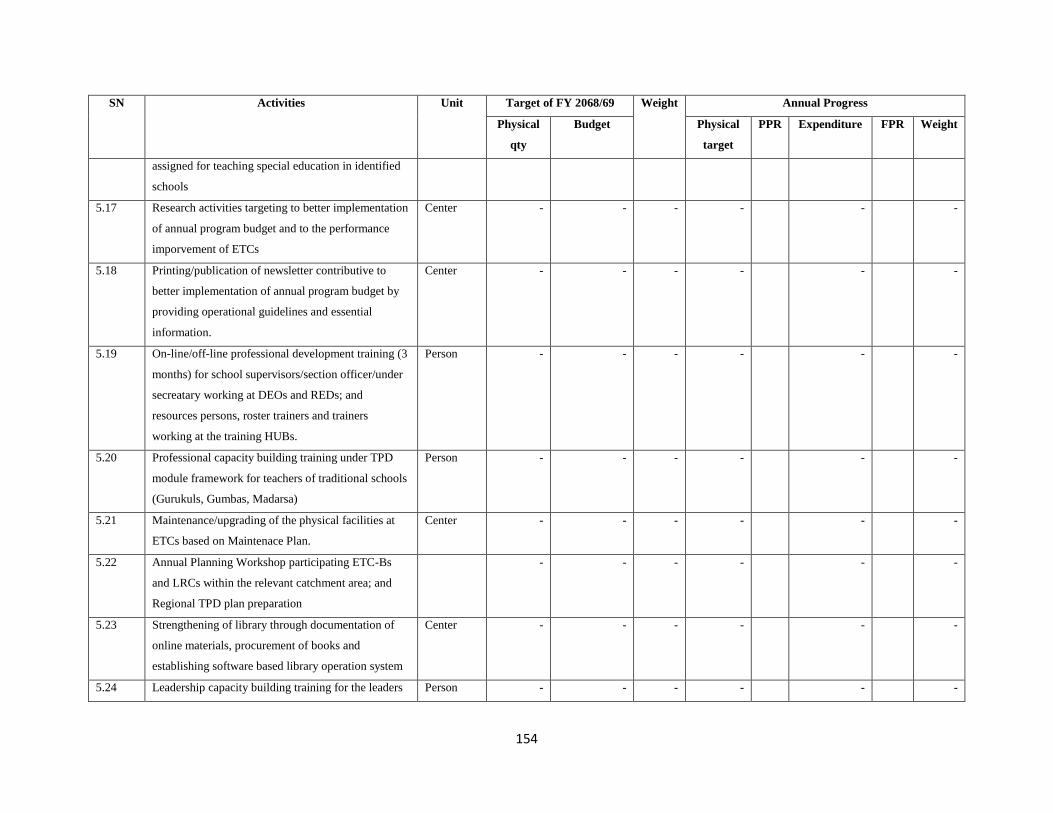
154
SN Activities Unit Target of FY 2068/69 Weight Annual Progress
Physical
qty
Budget Physical
target
PPR Expenditure FPR Weight
assigned for teaching special education in identified
schools
5.17 Research activities targeting to better implementation
of annual program budget and to the performance
imporvement of ETCs
Center - - - - - -
5.18 Printing/publication of newsletter contributive to
better implementation of annual program budget by
providing operational guidelines and essential
information.
Center - - - - - -
5.19 On-line/off-line professional development training (3
months) for school supervisors/section officer/under
secreatary working at DEOs and REDs; and
resources persons, roster trainers and trainers
working at the training HUBs.
Person - - - - - -
5.20 Professional capacity building training under TPD
module framework for teachers of traditional schools
(Gurukuls, Gumbas, Madarsa)
Person - - - - - -
5.21 Maintenance/upgrading of the physical facilities at
ETCs based on Maintenace Plan.
Center - - - - - -
5.22 Annual Planning Workshop participating ETC-Bs
and LRCs within the relevant catchment area; and
Regional TPD plan preparation
- - - - - -
5.23 Strengthening of library through documentation of
online materials, procurement of books and
establishing software based library operation system
Center - - - - - -
5.24 Leadership capacity building training for the leaders Person - - - - - -
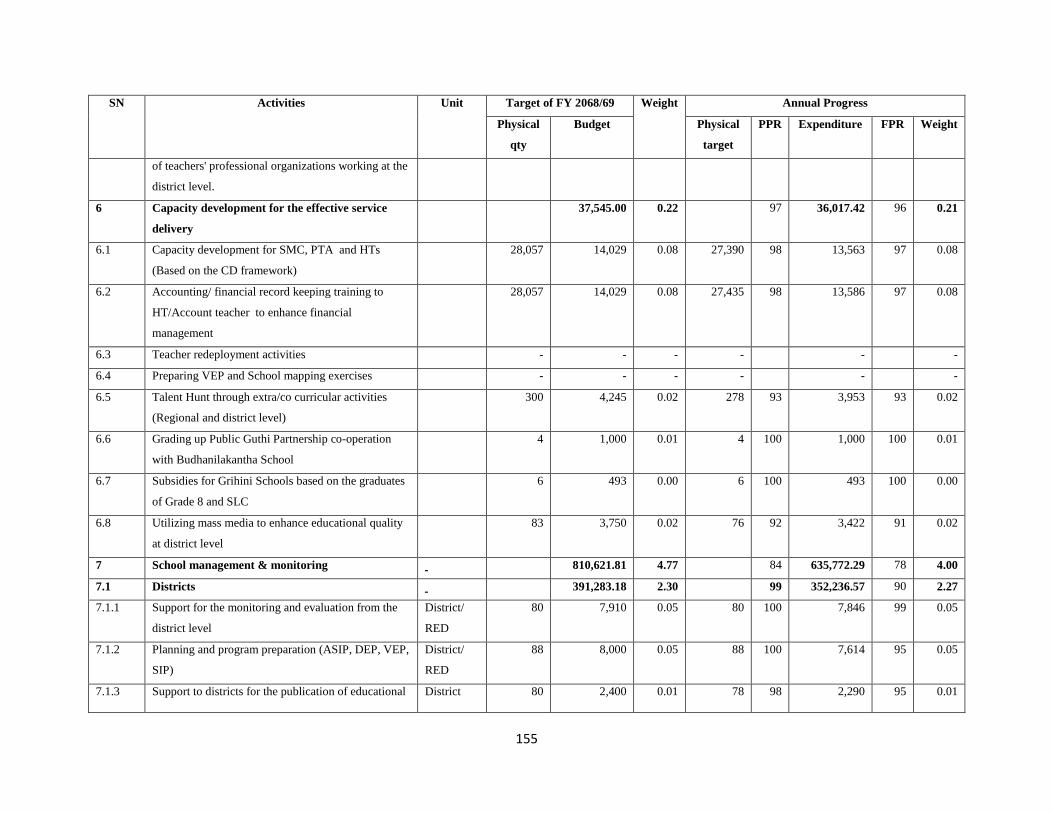
155
SN Activities Unit Target of FY 2068/69 Weight Annual Progress
Physical
qty
Budget Physical
target
PPR Expenditure FPR Weight
of teachers' professional organizations working at the
district level.
6 Capacity development for the effective service
delivery
37,545.00 0.22 97 36,017.42 96 0.21
6.1 Capacity development for SMC, PTA and HTs
(Based on the CD framework)
28,057 14,029 0.08 27,390 98 13,563 97 0.08
6.2 Accounting/ financial record keeping training to
HT/Account teacher to enhance financial
management
28,057 14,029 0.08 27,435 98 13,586 97 0.08
6.3 Teacher redeployment activities - - - - - -
6.4 Preparing VEP and School mapping exercises - - - - - -
6.5 Talent Hunt through extra/co curricular activities
(Regional and district level)
300 4,245 0.02 278 93 3,953 93 0.02
6.6 Grading up Public Guthi Partnership co-operation
with Budhanilakantha School
4 1,000 0.01 4 100 1,000 100 0.01
6.7 Subsidies for Grihini Schools based on the graduates
of Grade 8 and SLC
6 493 0.00 6 100 493 100 0.00
6.8 Utilizing mass media to enhance educational quality
at district level
83 3,750 0.02 76 92 3,422 91 0.02
7 School management & monitoring 810,621.81 4.77 84 635,772.29 78 4.00
7.1 Districts 391,283.18 2.30 99 352,236.57 90 2.27
7.1.1 Support for the monitoring and evaluation from the
district level
District/
RED
80 7,910 0.05 80 100 7,846 99 0.05
7.1.2 Planning and program preparation (ASIP, DEP, VEP,
SIP)
District/
RED
88 8,000 0.05 88 100 7,614 95 0.05
7.1.3 Support to districts for the publication of educational District 80 2,400 0.01 78 98 2,290 95 0.01
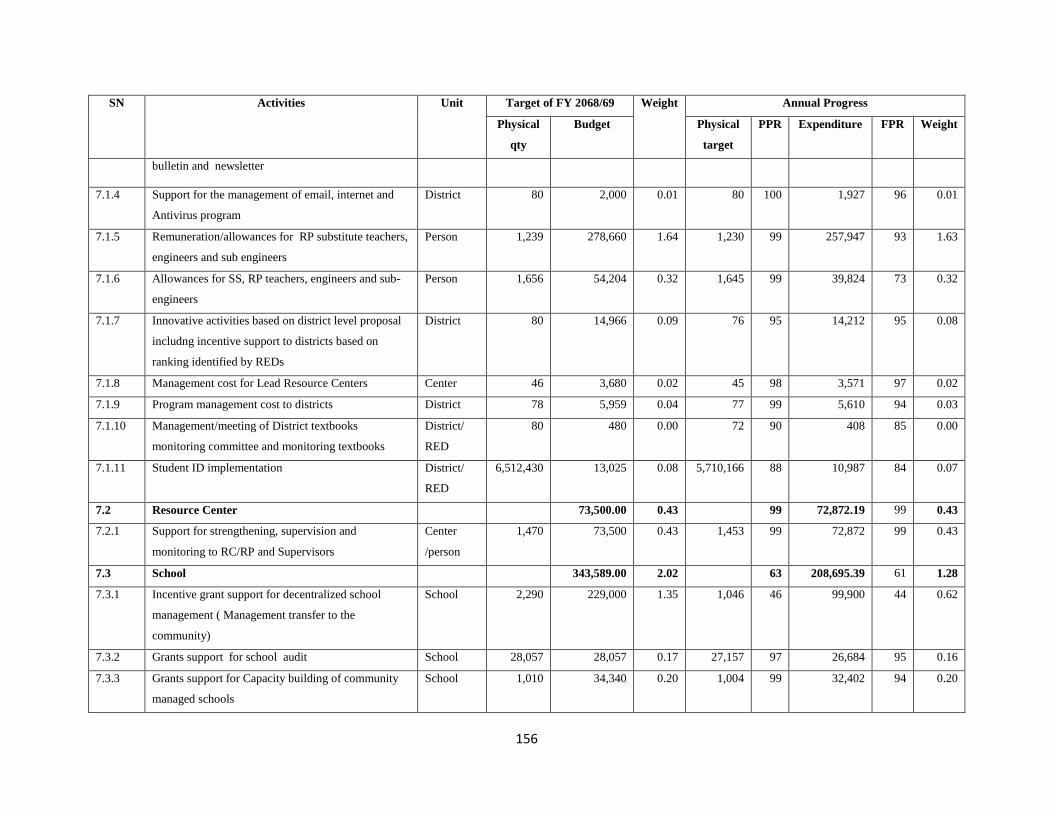
156
SN Activities Unit Target of FY 2068/69 Weight Annual Progress
Physical
qty
Budget Physical
target
PPR Expenditure FPR Weight
bulletin and newsletter
7.1.4 Support for the management of email, internet and
Antivirus program
District 80 2,000 0.01 80 100 1,927 96 0.01
7.1.5 Remuneration/allowances for RP substitute teachers,
engineers and sub engineers
Person 1,239 278,660 1.64 1,230 99 257,947 93 1.63
7.1.6 Allowances for SS, RP teachers, engineers and sub-
engineers
Person 1,656 54,204 0.32 1,645 99 39,824 73 0.32
7.1.7 Innovative activities based on district level proposal
includng incentive support to districts based on
ranking identified by REDs
District 80 14,966 0.09 76 95 14,212 95 0.08
7.1.8 Management cost for Lead Resource Centers Center 46 3,680 0.02 45 98 3,571 97 0.02
7.1.9 Program management cost to districts District 78 5,959 0.04 77 99 5,610 94 0.03
7.1.10 Management/meeting of District textbooks
monitoring committee and monitoring textbooks
District/
RED
80 480 0.00 72 90 408 85 0.00
7.1.11 Student ID implementation District/
RED
6,512,430 13,025 0.08 5,710,166 88 10,987 84 0.07
7.2 Resource Center 73,500.00 0.43 99 72,872.19 99 0.43
7.2.1 Support for strengthening, supervision and
monitoring to RC/RP and Supervisors
Center
/person
1,470 73,500 0.43 1,453 99 72,872 99 0.43
7.3 School 343,589.00 2.02 63 208,695.39 61 1.28
7.3.1 Incentive grant support for decentralized school
management ( Management transfer to the
community)
School 2,290 229,000 1.35 1,046 46 99,900 44 0.62
7.3.2 Grants support for school audit School 28,057 28,057 0.17 27,157 97 26,684 95 0.16
7.3.3 Grants support for Capacity building of community
managed schools
School 1,010 34,340 0.20 1,004 99 32,402 94 0.20
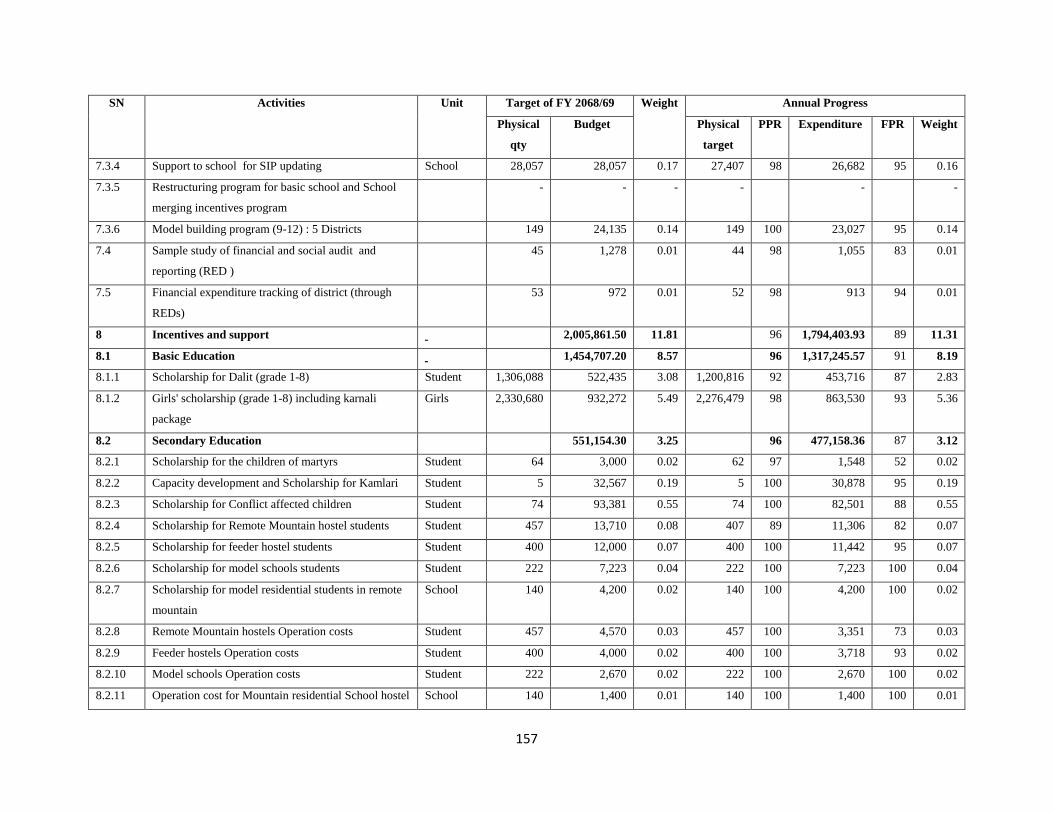
157
SN Activities Unit Target of FY 2068/69 Weight Annual Progress
Physical
qty
Budget Physical
target
PPR Expenditure FPR Weight
7.3.4 Support to school for SIP updating School 28,057 28,057 0.17 27,407 98 26,682 95 0.16
7.3.5 Restructuring program for basic school and School
merging incentives program
- - - - - -
7.3.6 Model building program (9-12) : 5 Districts 149 24,135 0.14 149 100 23,027 95 0.14
7.4 Sample study of financial and social audit and
reporting (RED )
45 1,278 0.01 44 98 1,055 83 0.01
7.5 Financial expenditure tracking of district (through
REDs)
53 972 0.01 52 98 913 94 0.01
8 Incentives and support 2,005,861.50 11.81 96 1,794,403.93 89 11.31
8.1 Basic Education 1,454,707.20 8.57 96 1,317,245.57 91 8.19
8.1.1 Scholarship for Dalit (grade 1-8) Student 1,306,088 522,435 3.08 1,200,816 92 453,716 87 2.83
8.1.2 Girls' scholarship (grade 1-8) including karnali
package
Girls 2,330,680 932,272 5.49 2,276,479 98 863,530 93 5.36
8.2 Secondary Education 551,154.30 3.25 96 477,158.36 87 3.12
8.2.1 Scholarship for the children of martyrs Student 64 3,000 0.02 62 97 1,548 52 0.02
8.2.2 Capacity development and Scholarship for Kamlari Student 5 32,567 0.19 5 100 30,878 95 0.19
8.2.3 Scholarship for Conflict affected children Student 74 93,381 0.55 74 100 82,501 88 0.55
8.2.4 Scholarship for Remote Mountain hostel students Student 457 13,710 0.08 407 89 11,306 82 0.07
8.2.5 Scholarship for feeder hostel students Student 400 12,000 0.07 400 100 11,442 95 0.07
8.2.6 Scholarship for model schools students Student 222 7,223 0.04 222 100 7,223 100 0.04
8.2.7 Scholarship for model residential students in remote
mountain
School 140 4,200 0.02 140 100 4,200 100 0.02
8.2.8 Remote Mountain hostels Operation costs Student 457 4,570 0.03 457 100 3,351 73 0.03
8.2.9 Feeder hostels Operation costs Student 400 4,000 0.02 400 100 3,718 93 0.02
8.2.10 Model schools Operation costs Student 222 2,670 0.02 222 100 2,670 100 0.02
8.2.11 Operation cost for Mountain residential School hostel School 140 1,400 0.01 140 100 1,400 100 0.01

158
SN Activities Unit Target of FY 2068/69 Weight Annual Progress
Physical
qty
Budget Physical
target
PPR Expenditure FPR Weight
8.2.12 Secondary Education Scholarship Student 60,000 102,000 0.60 59,023 98 101,004 99 0.59
8.2.13 Dalit Scholarship (Grade 9-10) Student 81,442 40,721 0.24 75,511 93 31,000 76 0.22
8.2.14 Scholarship for disabled students 6,927 6,838 0.04 6,193 89 4,786 70 0.04
8.2.15 Scholarship for marginalized and targeted students
(22 Janajati and Muktakamiya, Badi, Haliya, charuwa
etc.)
Student 33,904 57,637 0.34 32,703 96 23,753 41 0.33
8.2.18 Scholarship for targeted science students at grade 11
and 12
School 108 2,624 0.02 76 2,070 79 -
8.2.19 Support to higher secondary schools for science
program
school 7,177 49,575 0.29 6,341 88 45,690 92 0.26
8.2.21 Grants support to schools for computer and library
based on the matching fund
School 900 45,000 0.27 900 100 44,650 99 0.27
8.2.22 Internet facilities and computer support based on ICT
plan
School 435 68,040 0.40 409 94 63,970 94 0.38
9 PCF- non salary grants support to schools 3,633,932.45 21.40 99 3,490,198.54 96 21.09
9.1 Educational material management cost for
improvement of teaching activities
1,169,987.65 6.89 95 1,058,891.42 91 6.58
9.1.1 ECED Class Student 450,600 45,060 0.27 436,631 97 41,660 92 0.26
9.1.2 Primary Level Student 4,363,443 637,833 3.76 4,166,020 95 569,357 89 3.59
9.1.3 Lower secondary Student 1,469,133 244,493 1.44 1,447,777 99 235,046 96 1.42
9.1.4 Secondary Level (targeted group) Student 93,205 95,400 0.56 80,019 86 75,246 79 0.48
9.1.5 Secondary Level (in General) Student 679,854 147,202 0.87 654,537 96 137,582 93 0.83
9.2 School management Cost 515,465.00 3.04 100 507,362.66 98 3.04
9.2.1 Basic Level School 19,147 287,205 1.69 19,027 99 279,408 97 1.68
9.2.2 Lower secondary Student 3,901 78,020 0.46 3,918 100 77,986 100 0.46
9.2.3 Secondary level School 5,008 150,240 0.88 5,076 101 149,969 100 0.90
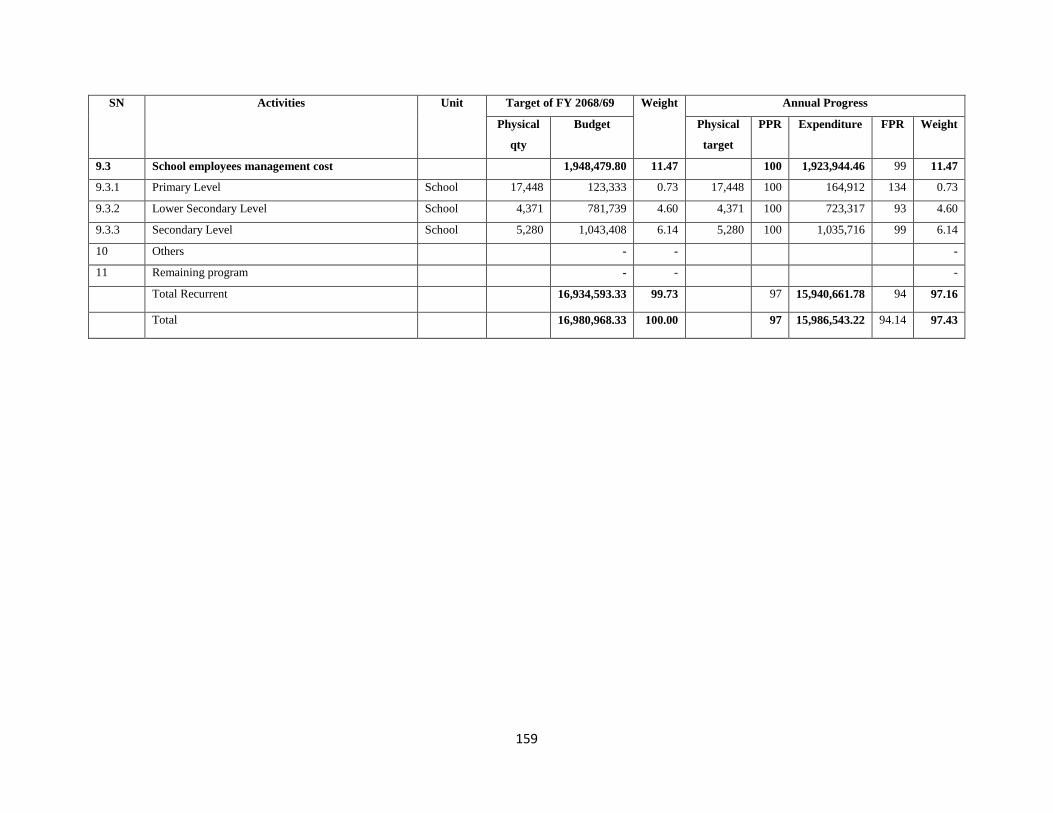
159
SN Activities Unit Target of FY 2068/69 Weight Annual Progress
Physical
qty
Budget Physical
target
PPR Expenditure FPR Weight
9.3 School employees management cost 1,948,479.80 11.47 100 1,923,944.46 99 11.47
9.3.1 Primary Level School 17,448 123,333 0.73 17,448 100 164,912 134 0.73
9.3.2 Lower Secondary Level School 4,371 781,739 4.60 4,371 100 723,317 93 4.60
9.3.3 Secondary Level School 5,280 1,043,408 6.14 5,280 100 1,035,716 99 6.14
10 Others - - -
11 Remaining program - - -
Total Recurrent 16,934,593.33 99.73 97 15,940,661.78 94 97.16
Total 16,980,968.33 100.00 97 15,986,543.22 94.14 97.43
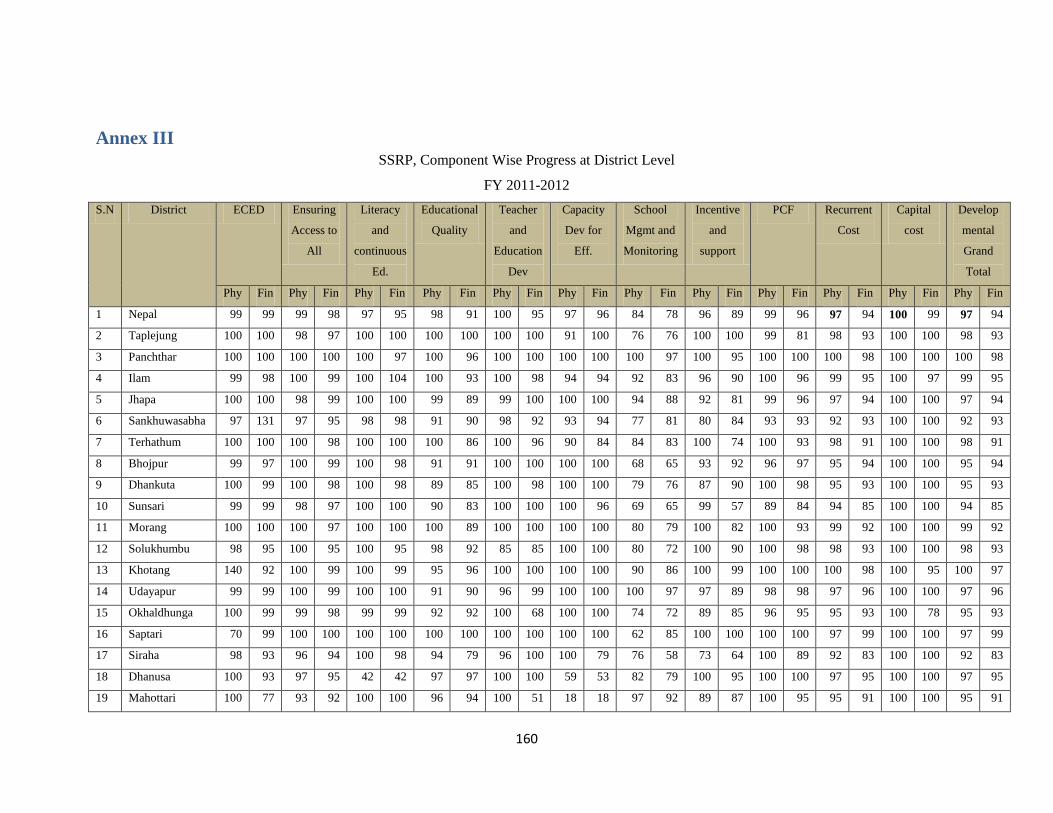
160
Annex III SSRP, Component Wise Progress at District Level
FY 2011-2012
S.N District ECED Ensuring
Access to
All
Literacy
and
continuous
Ed.
Educational
Quality
Teacher
and
Education
Dev
Capacity
Dev for
Eff.
School
Mgmt and
Monitoring
Incentive
and
support
PCF Recurrent
Cost
Capital
cost
Develop
mental
Grand
Total
Phy Fin Phy Fin Phy Fin Phy Fin Phy Fin Phy Fin Phy Fin Phy Fin Phy Fin Phy Fin Phy Fin Phy Fin
1 Nepal 99 99 99 98 97 95 98 91 100 95 97 96 84 78 96 89 99 96 97 94 100 99 97 94
2 Taplejung 100 100 98 97 100 100 100 100 100 100 91 100 76 76 100 100 99 81 98 93 100 100 98 93
3 Panchthar 100 100 100 100 100 97 100 96 100 100 100 100 100 97 100 95 100 100 100 98 100 100 100 98
4 Ilam 99 98 100 99 100 104 100 93 100 98 94 94 92 83 96 90 100 96 99 95 100 97 99 95
5 Jhapa 100 100 98 99 100 100 99 89 99 100 100 100 94 88 92 81 99 96 97 94 100 100 97 94
6 Sankhuwasabha 97 131 97 95 98 98 91 90 98 92 93 94 77 81 80 84 93 93 92 93 100 100 92 93
7 Terhathum 100 100 100 98 100 100 100 86 100 96 90 84 84 83 100 74 100 93 98 91 100 100 98 91
8 Bhojpur 99 97 100 99 100 98 91 91 100 100 100 100 68 65 93 92 96 97 95 94 100 100 95 94
9 Dhankuta 100 99 100 98 100 98 89 85 100 98 100 100 79 76 87 90 100 98 95 93 100 100 95 93
10 Sunsari 99 99 98 97 100 100 90 83 100 100 100 96 69 65 99 57 89 84 94 85 100 100 94 85
11 Morang 100 100 100 97 100 100 100 89 100 100 100 100 80 79 100 82 100 93 99 92 100 100 99 92
12 Solukhumbu 98 95 100 95 100 95 98 92 85 85 100 100 80 72 100 90 100 98 98 93 100 100 98 93
13 Khotang 140 92 100 99 100 99 95 96 100 100 100 100 90 86 100 99 100 100 100 98 100 95 100 97
14 Udayapur 99 99 100 99 100 100 91 90 96 99 100 100 100 97 97 89 98 98 97 96 100 100 97 96
15 Okhaldhunga 100 99 99 98 99 99 92 92 100 68 100 100 74 72 89 85 96 95 95 93 100 78 95 93
16 Saptari 70 99 100 100 100 100 100 100 100 100 100 100 62 85 100 100 100 100 97 99 100 100 97 99
17 Siraha 98 93 96 94 100 98 94 79 96 100 100 79 76 58 73 64 100 89 92 83 100 100 92 83
18 Dhanusa 100 93 97 95 42 42 97 97 100 100 59 53 82 79 100 95 100 100 97 95 100 100 97 95
19 Mahottari 100 77 93 92 100 100 96 94 100 51 18 18 97 92 89 87 100 95 95 91 100 100 95 91
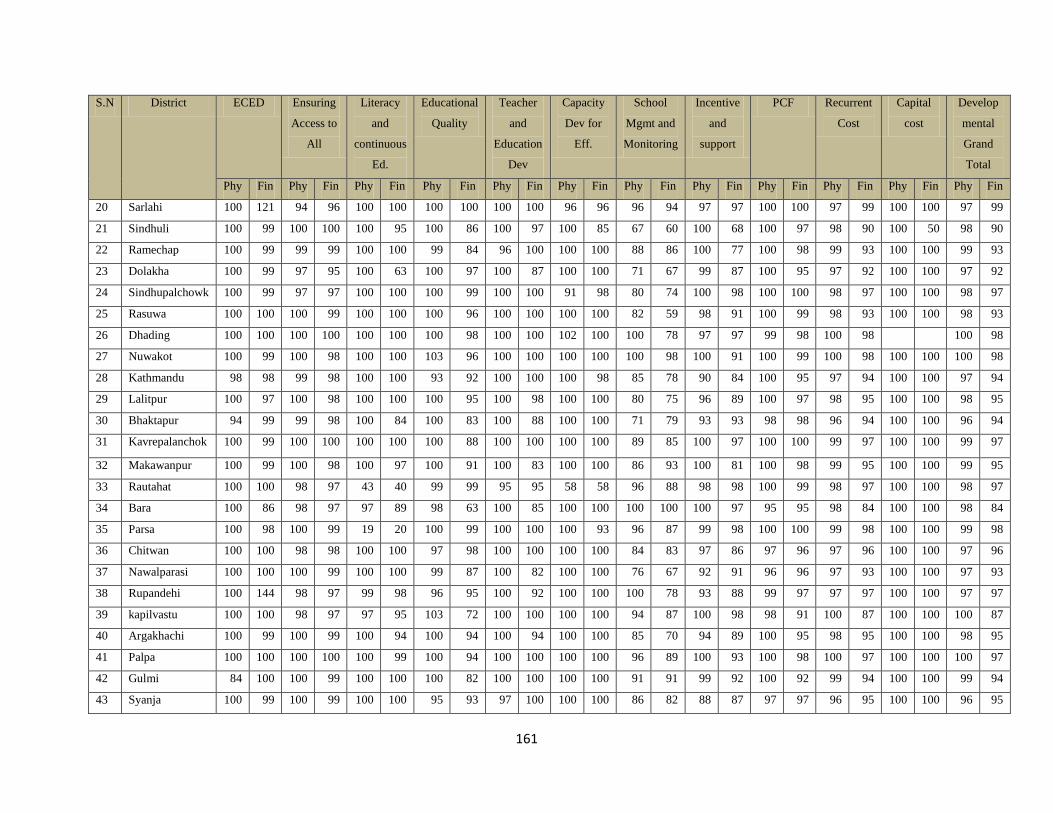
161
S.N District ECED Ensuring
Access to
All
Literacy
and
continuous
Ed.
Educational
Quality
Teacher
and
Education
Dev
Capacity
Dev for
Eff.
School
Mgmt and
Monitoring
Incentive
and
support
PCF Recurrent
Cost
Capital
cost
Develop
mental
Grand
Total
Phy Fin Phy Fin Phy Fin Phy Fin Phy Fin Phy Fin Phy Fin Phy Fin Phy Fin Phy Fin Phy Fin Phy Fin
20 Sarlahi 100 121 94 96 100 100 100 100 100 100 96 96 96 94 97 97 100 100 97 99 100 100 97 99
21 Sindhuli 100 99 100 100 100 95 100 86 100 97 100 85 67 60 100 68 100 97 98 90 100 50 98 90
22 Ramechap 100 99 99 99 100 100 99 84 96 100 100 100 88 86 100 77 100 98 99 93 100 100 99 93
23 Dolakha 100 99 97 95 100 63 100 97 100 87 100 100 71 67 99 87 100 95 97 92 100 100 97 92
24 Sindhupalchowk 100 99 97 97 100 100 100 99 100 100 91 98 80 74 100 98 100 100 98 97 100 100 98 97
25 Rasuwa 100 100 100 99 100 100 100 96 100 100 100 100 82 59 98 91 100 99 98 93 100 100 98 93
26 Dhading 100 100 100 100 100 100 100 98 100 100 102 100 100 78 97 97 99 98 100 98 100 98
27 Nuwakot 100 99 100 98 100 100 103 96 100 100 100 100 100 98 100 91 100 99 100 98 100 100 100 98
28 Kathmandu 98 98 99 98 100 100 93 92 100 100 100 98 85 78 90 84 100 95 97 94 100 100 97 94
29 Lalitpur 100 97 100 98 100 100 100 95 100 98 100 100 80 75 96 89 100 97 98 95 100 100 98 95
30 Bhaktapur 94 99 99 98 100 84 100 83 100 88 100 100 71 79 93 93 98 98 96 94 100 100 96 94
31 Kavrepalanchok 100 99 100 100 100 100 100 88 100 100 100 100 89 85 100 97 100 100 99 97 100 100 99 97
32 Makawanpur 100 99 100 98 100 97 100 91 100 83 100 100 86 93 100 81 100 98 99 95 100 100 99 95
33 Rautahat 100 100 98 97 43 40 99 99 95 95 58 58 96 88 98 98 100 99 98 97 100 100 98 97
34 Bara 100 86 98 97 97 89 98 63 100 85 100 100 100 100 100 97 95 95 98 84 100 100 98 84
35 Parsa 100 98 100 99 19 20 100 99 100 100 100 93 96 87 99 98 100 100 99 98 100 100 99 98
36 Chitwan 100 100 98 98 100 100 97 98 100 100 100 100 84 83 97 86 97 96 97 96 100 100 97 96
37 Nawalparasi 100 100 100 99 100 100 99 87 100 82 100 100 76 67 92 91 96 96 97 93 100 100 97 93
38 Rupandehi 100 144 98 97 99 98 96 95 100 92 100 100 100 78 93 88 99 97 97 97 100 100 97 97
39 kapilvastu 100 100 98 97 97 95 103 72 100 100 100 100 94 87 100 98 98 91 100 87 100 100 100 87
40 Argakhachi 100 99 100 99 100 94 100 94 100 94 100 100 85 70 94 89 100 95 98 95 100 100 98 95
41 Palpa 100 100 100 100 100 99 100 94 100 100 100 100 96 89 100 93 100 98 100 97 100 100 100 97
42 Gulmi 84 100 100 99 100 100 100 82 100 100 100 100 91 91 99 92 100 92 99 94 100 100 99 94
43 Syanja 100 99 100 99 100 100 95 93 97 100 100 100 86 82 88 87 97 97 96 95 100 100 96 95
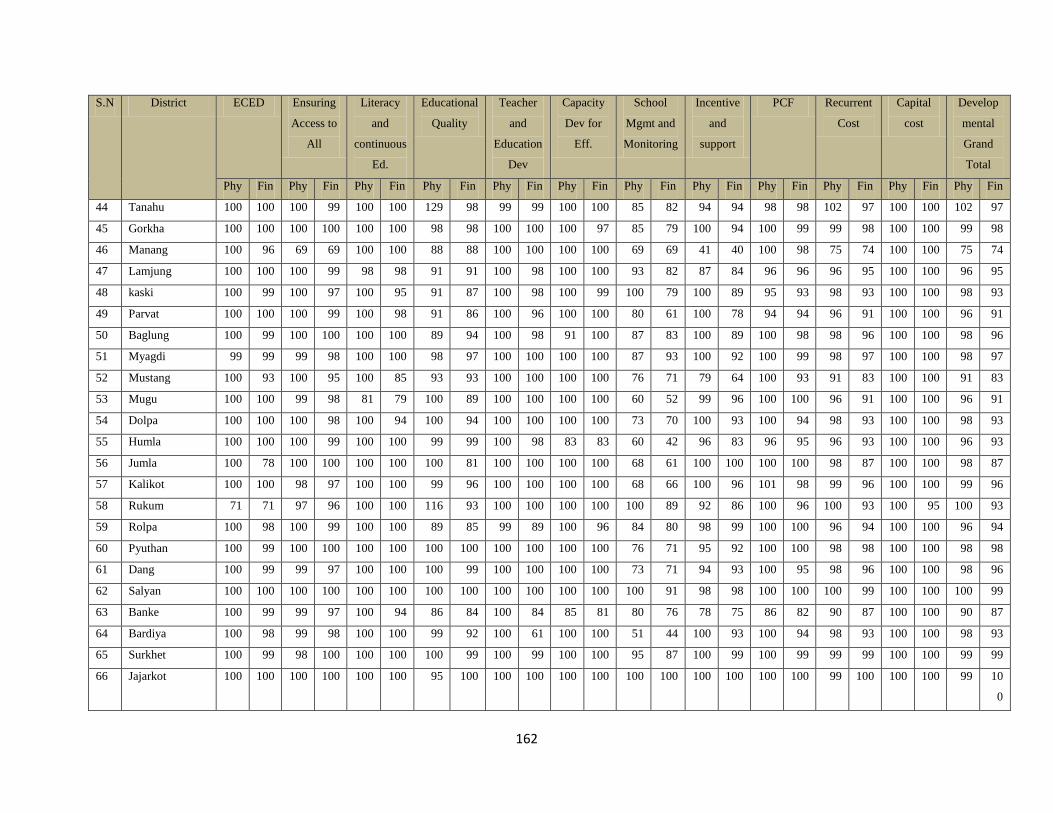
162
S.N District ECED Ensuring
Access to
All
Literacy
and
continuous
Ed.
Educational
Quality
Teacher
and
Education
Dev
Capacity
Dev for
Eff.
School
Mgmt and
Monitoring
Incentive
and
support
PCF Recurrent
Cost
Capital
cost
Develop
mental
Grand
Total
Phy Fin Phy Fin Phy Fin Phy Fin Phy Fin Phy Fin Phy Fin Phy Fin Phy Fin Phy Fin Phy Fin Phy Fin
44 Tanahu 100 100 100 99 100 100 129 98 99 99 100 100 85 82 94 94 98 98 102 97 100 100 102 97
45 Gorkha 100 100 100 100 100 100 98 98 100 100 100 97 85 79 100 94 100 99 99 98 100 100 99 98
46 Manang 100 96 69 69 100 100 88 88 100 100 100 100 69 69 41 40 100 98 75 74 100 100 75 74
47 Lamjung 100 100 100 99 98 98 91 91 100 98 100 100 93 82 87 84 96 96 96 95 100 100 96 95
48 kaski 100 99 100 97 100 95 91 87 100 98 100 99 100 79 100 89 95 93 98 93 100 100 98 93
49 Parvat 100 100 100 99 100 98 91 86 100 96 100 100 80 61 100 78 94 94 96 91 100 100 96 91
50 Baglung 100 99 100 100 100 100 89 94 100 98 91 100 87 83 100 89 100 98 98 96 100 100 98 96
51 Myagdi 99 99 99 98 100 100 98 97 100 100 100 100 87 93 100 92 100 99 98 97 100 100 98 97
52 Mustang 100 93 100 95 100 85 93 93 100 100 100 100 76 71 79 64 100 93 91 83 100 100 91 83
53 Mugu 100 100 99 98 81 79 100 89 100 100 100 100 60 52 99 96 100 100 96 91 100 100 96 91
54 Dolpa 100 100 100 98 100 94 100 94 100 100 100 100 73 70 100 93 100 94 98 93 100 100 98 93
55 Humla 100 100 100 99 100 100 99 99 100 98 83 83 60 42 96 83 96 95 96 93 100 100 96 93
56 Jumla 100 78 100 100 100 100 100 81 100 100 100 100 68 61 100 100 100 100 98 87 100 100 98 87
57 Kalikot 100 100 98 97 100 100 99 96 100 100 100 100 68 66 100 96 101 98 99 96 100 100 99 96
58 Rukum 71 71 97 96 100 100 116 93 100 100 100 100 100 89 92 86 100 96 100 93 100 95 100 93
59 Rolpa 100 98 100 99 100 100 89 85 99 89 100 96 84 80 98 99 100 100 96 94 100 100 96 94
60 Pyuthan 100 99 100 100 100 100 100 100 100 100 100 100 76 71 95 92 100 100 98 98 100 100 98 98
61 Dang 100 99 99 97 100 100 100 99 100 100 100 100 73 71 94 93 100 95 98 96 100 100 98 96
62 Salyan 100 100 100 100 100 100 100 100 100 100 100 100 100 91 98 98 100 100 100 99 100 100 100 99
63 Banke 100 99 99 97 100 94 86 84 100 84 85 81 80 76 78 75 86 82 90 87 100 100 90 87
64 Bardiya 100 98 99 98 100 100 99 92 100 61 100 100 51 44 100 93 100 94 98 93 100 100 98 93
65 Surkhet 100 99 98 100 100 100 100 99 100 99 100 100 95 87 100 99 100 99 99 99 100 100 99 99
66 Jajarkot 100 100 100 100 100 100 95 100 100 100 100 100 100 100 100 100 100 100 99 100 100 100 99 10
0
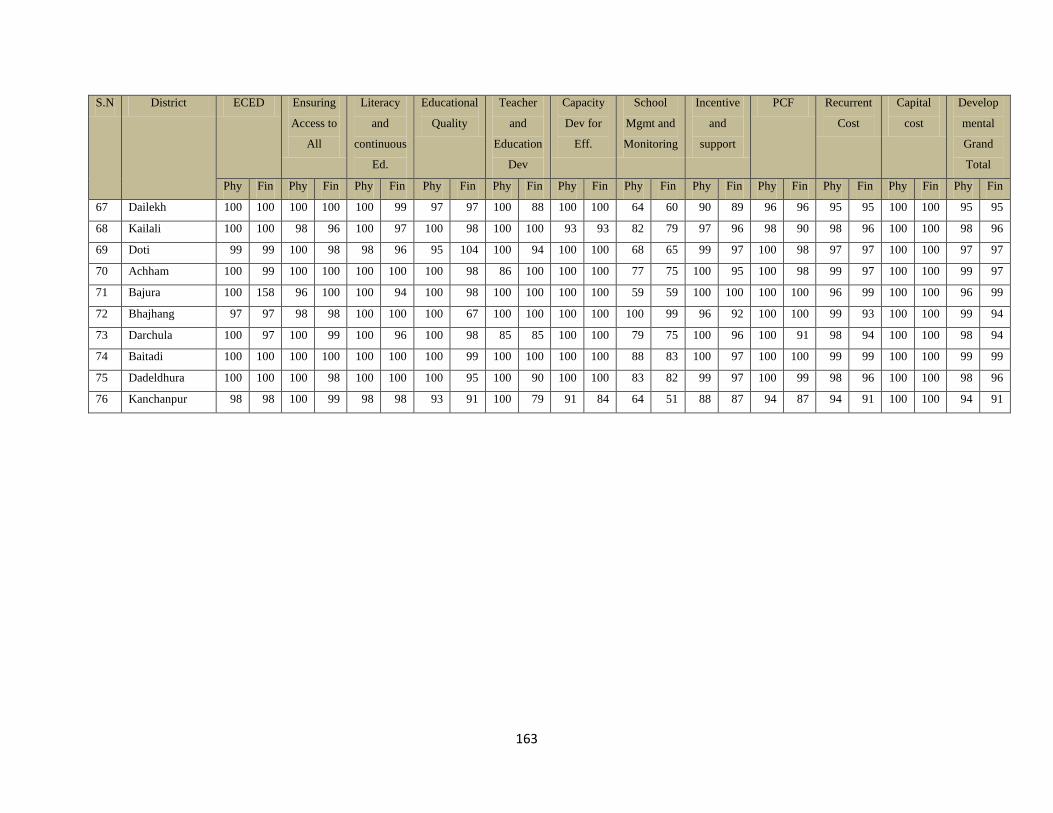
163
S.N District ECED Ensuring
Access to
All
Literacy
and
continuous
Ed.
Educational
Quality
Teacher
and
Education
Dev
Capacity
Dev for
Eff.
School
Mgmt and
Monitoring
Incentive
and
support
PCF Recurrent
Cost
Capital
cost
Develop
mental
Grand
Total
Phy Fin Phy Fin Phy Fin Phy Fin Phy Fin Phy Fin Phy Fin Phy Fin Phy Fin Phy Fin Phy Fin Phy Fin
67 Dailekh 100 100 100 100 100 99 97 97 100 88 100 100 64 60 90 89 96 96 95 95 100 100 95 95
68 Kailali 100 100 98 96 100 97 100 98 100 100 93 93 82 79 97 96 98 90 98 96 100 100 98 96
69 Doti 99 99 100 98 98 96 95 104 100 94 100 100 68 65 99 97 100 98 97 97 100 100 97 97
70 Achham 100 99 100 100 100 100 100 98 86 100 100 100 77 75 100 95 100 98 99 97 100 100 99 97
71 Bajura 100 158 96 100 100 94 100 98 100 100 100 100 59 59 100 100 100 100 96 99 100 100 96 99
72 Bhajhang 97 97 98 98 100 100 100 67 100 100 100 100 100 99 96 92 100 100 99 93 100 100 99 94
73 Darchula 100 97 100 99 100 96 100 98 85 85 100 100 79 75 100 96 100 91 98 94 100 100 98 94
74 Baitadi 100 100 100 100 100 100 100 99 100 100 100 100 88 83 100 97 100 100 99 99 100 100 99 99
75 Dadeldhura 100 100 100 98 100 100 100 95 100 90 100 100 83 82 99 97 100 99 98 96 100 100 98 96
76 Kanchanpur 98 98 100 99 98 98 93 91 100 79 91 84 64 51 88 87 94 87 94 91 100 100 94 91
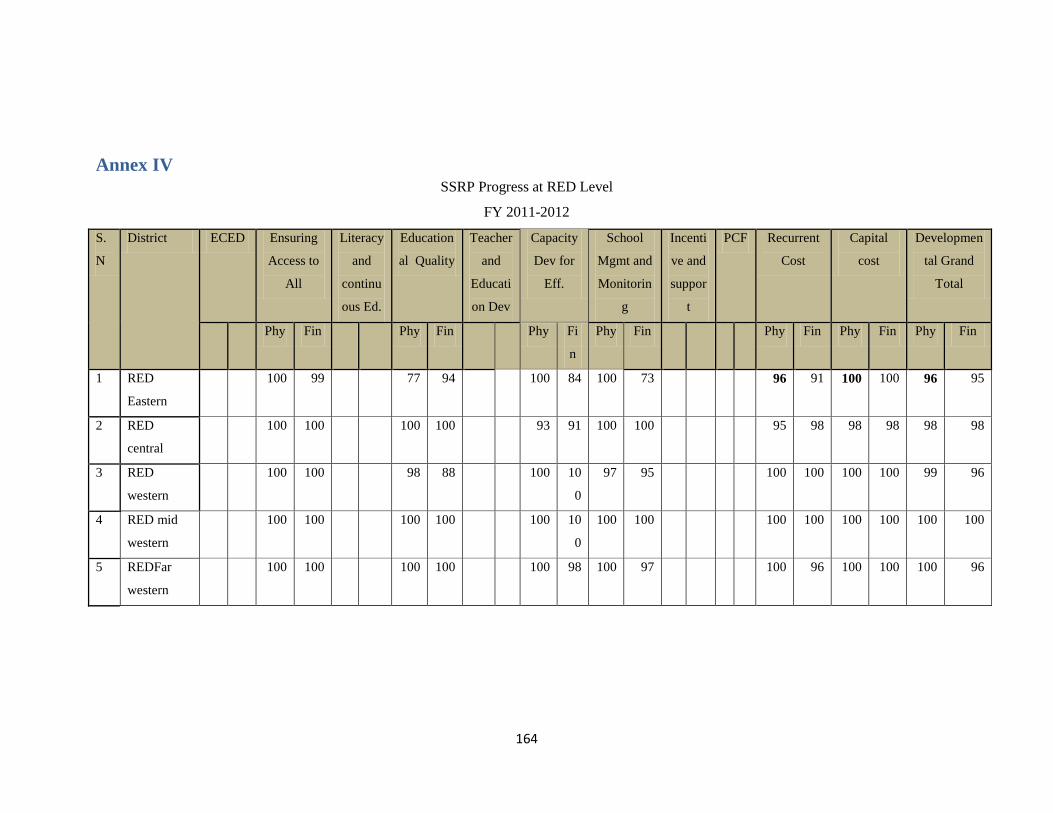
164
Annex IV SSRP Progress at RED Level
FY 2011-2012
S.
N
District ECED Ensuring
Access to
All
Literacy
and
continu
ous Ed.
Education
al Quality
Teacher
and
Educati
on Dev
Capacity
Dev for
Eff.
School
Mgmt and
Monitorin
g
Incenti
ve and
suppor
t
PCF Recurrent
Cost
Capital
cost
Developmen
tal Grand
Total
Phy Fin Phy Fin Phy Fi
n
Phy Fin Phy Fin Phy Fin Phy Fin
1 RED
Eastern
100 99 77 94 100 84 100 73 96 91 100 100 96 95
2 RED
central
100 100 100 100 93 91 100 100 95 98 98 98 98 98
3 RED
western
100 100 98 88 100 10
0
97 95 100 100 100 100 99 96
4 RED mid
western
100 100 100 100 100 10
0
100 100 100 100 100 100 100 100
5 REDFar
western
100 100 100 100 100 98 100 97 100 96 100 100 100 96
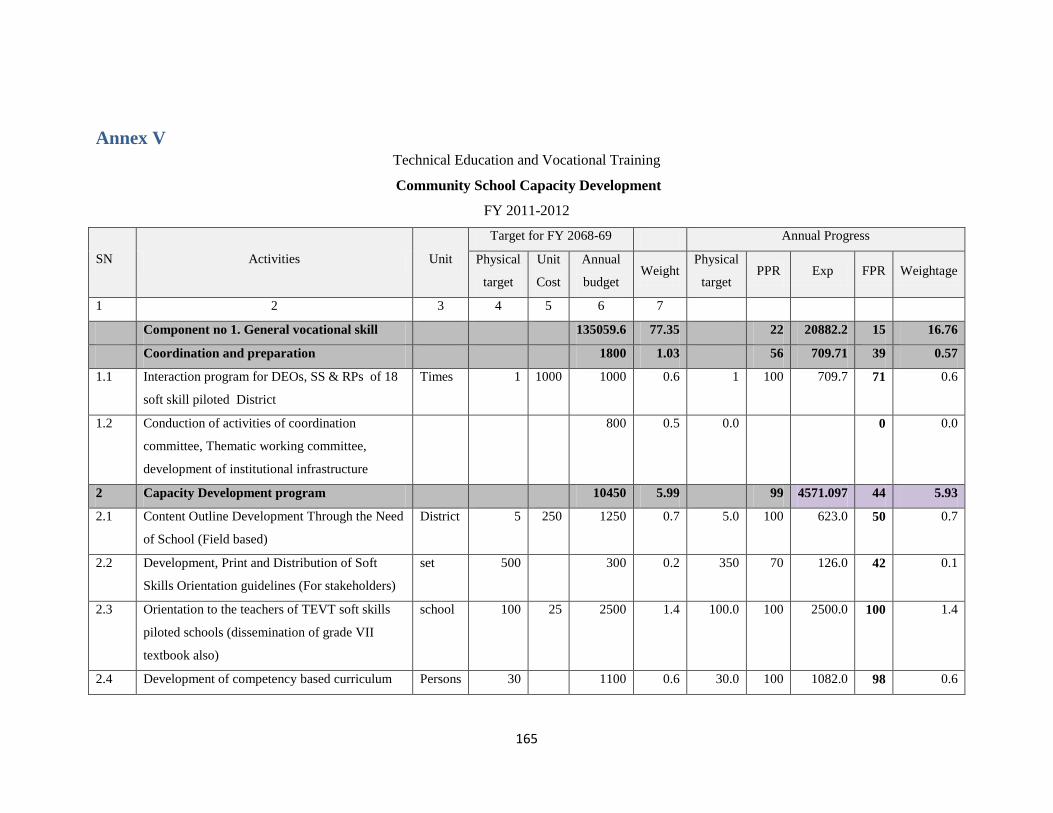
165
Annex V Technical Education and Vocational Training
Community School Capacity Development
FY 2011-2012
SN Activities Unit
Target for FY 2068-69 Annual Progress
Physical
target
Unit
Cost
Annual
budget Weight
Physical
target PPR Exp FPR Weightage
1 2 3 4 5 6 7
Component no 1. General vocational skill 135059.6 77.35 22 20882.2 15 16.76
Coordination and preparation 1800 1.03 56 709.71 39 0.57
1.1 Interaction program for DEOs, SS & RPs of 18
soft skill piloted District
Times 1 1000 1000 0.6 1 100 709.7 71 0.6
1.2 Conduction of activities of coordination
committee, Thematic working committee,
development of institutional infrastructure
800 0.5 0.0 0 0.0
2 Capacity Development program 10450 5.99 99 4571.097 44 5.93
2.1 Content Outline Development Through the Need
of School (Field based)
District 5 250 1250 0.7 5.0 100 623.0 50 0.7
2.2 Development, Print and Distribution of Soft
Skills Orientation guidelines (For stakeholders)
set 500 300 0.2 350 70 126.0 42 0.1
2.3 Orientation to the teachers of TEVT soft skills
piloted schools (dissemination of grade VII
textbook also)
school 100 25 2500 1.4 100.0 100 2500.0 100 1.4
2.4 Development of competency based curriculum Persons 30 1100 0.6 30.0 100 1082.0 98 0.6

166
SN Activities Unit
Target for FY 2068-69 Annual Progress
Physical
target
Unit
Cost
Annual
budget Weight
Physical
target PPR Exp FPR Weightage
(Including technical institutional development of
center)
CD of DOE 1 300 0.2 1.0 100 240.1 80 0.2
2.5 CD on TEVT soft skills for personnel of MOE,
DOE, NCED, CDC and CTEVT (international
level)
Persons 30 5000 2.9 30.0 100 0 2.9
3.00 Inclusion of TEVT soft skill in curriculum
and textbook
4600 2.63 3447.428 75 2.63
3.1 TG development and printing of soft skill for
grade (1-5)
set 1 600 0.3 1.0 100 338.5 56 0.3
3.2 Identification of contents of TEVT soft skills for
grade 6-8 new curriculum and textbook and
preparation of report
set 1 500 0.3 1.0 100 324.0 65 0.3
3.3 Development and printing of TG of profession,
occupation and technical subject Grade 7
textbook orientation manual development
Subject 1 1200 0.7 1 100 1184.1 99 0.7
3.4 Development of curriculum structure of
technical stream of grade 9-12
Subject 1 800 0.5 1 100 644.5 81 0.5
3.5 Development of Guideline related with grade 6-
8 students' evaluation process
Times 1 1500 0.9 1 100 956.3 64 0.9
7 Implementation of piloting program 111109.6 63.64 9587 9 6.36
7.1 Printing and distribution of piloted textbook of
grade 6 & 7
1 9486.6 5.4 1 100 9487.0 100 5.4
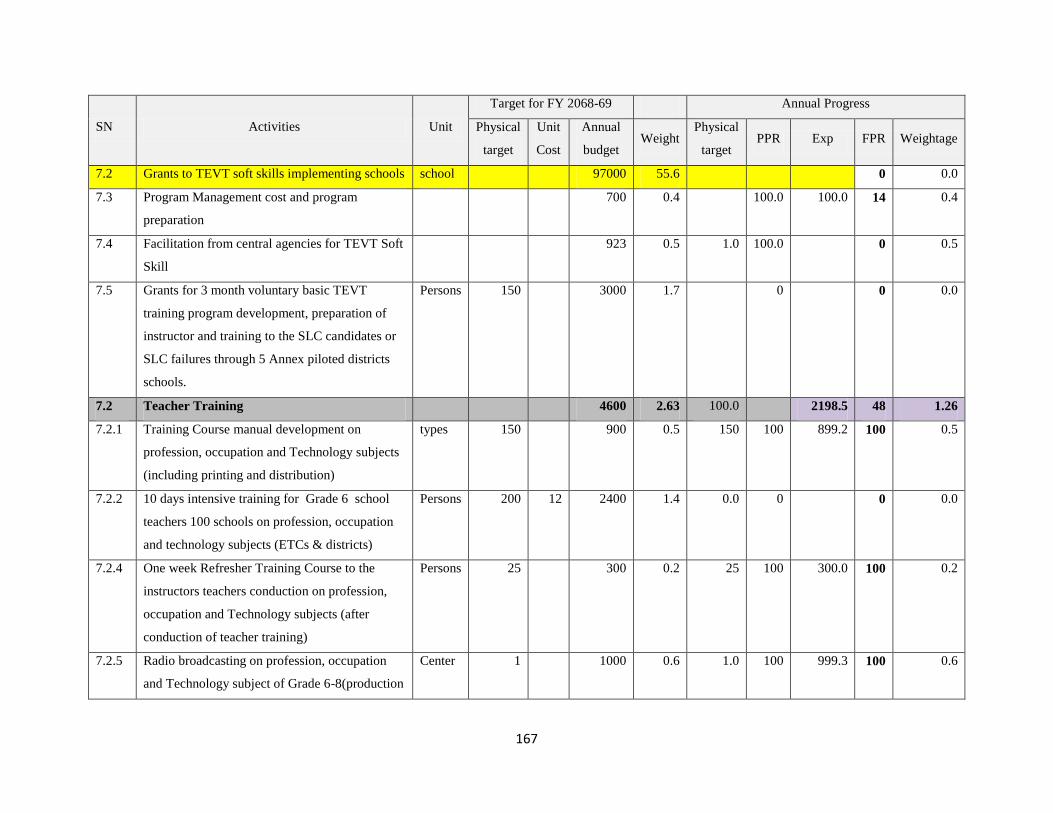
167
SN Activities Unit
Target for FY 2068-69 Annual Progress
Physical
target
Unit
Cost
Annual
budget Weight
Physical
target PPR Exp FPR Weightage
7.2 Grants to TEVT soft skills implementing schools school 97000 55.6 0 0.0
7.3 Program Management cost and program
preparation
700 0.4 100.0 100.0 14 0.4
7.4 Facilitation from central agencies for TEVT Soft
Skill
923 0.5 1.0 100.0 0 0.5
7.5 Grants for 3 month voluntary basic TEVT
training program development, preparation of
instructor and training to the SLC candidates or
SLC failures through 5 Annex piloted districts
schools.
Persons 150 3000 1.7 0 0 0.0
7.2 Teacher Training 4600 2.63 100.0 2198.5 48 1.26
7.2.1 Training Course manual development on
profession, occupation and Technology subjects
(including printing and distribution)
types 150 900 0.5 150 100 899.2 100 0.5
7.2.2 10 days intensive training for Grade 6 school
teachers 100 schools on profession, occupation
and technology subjects (ETCs & districts)
Persons 200 12 2400 1.4 0.0 0 0 0.0
7.2.4 One week Refresher Training Course to the
instructors teachers conduction on profession,
occupation and Technology subjects (after
conduction of teacher training)
Persons 25 300 0.2 25 100 300.0 100 0.2
7.2.5 Radio broadcasting on profession, occupation
and Technology subject of Grade 6-8(production
Center 1 1000 0.6 1.0 100 999.3 100 0.6

168
SN Activities Unit
Target for FY 2068-69 Annual Progress
Physical
target
Unit
Cost
Annual
budget Weight
Physical
target PPR Exp FPR Weightage
and weekly broadcasting)
8 Monitoring and follow-up (center and
district)
Cont 2500 1.4 80.0 368.5 15 0.0
9 Component No 2.Educational Quality
improvement, Teacher Capacity Building and
Literacy ( 3 district focus)
39540 22.6 100.0 4355 11 2
9.1 Educational Quality improvement, Teacher
Capacity Building and Literacy
23586 13.5 100.0 4177 18 2
9.1.1 10days Teacher Professional Training on
Multilingual Teachers(ETCs & districts)
Persons 763 2442 1.4 0.0 0 0.0
9.1.2 Training manual and Trainers book development
for Teacher Professional Training on
Multilingual Teachers(center)
types 4 700 0.4 2.0 50 654.6 94 0.2
9.1.3 10 days professional capacity development
training to all the teachers of multi-grade schools
(identified by DOE) based on existing grade 1
& 2 multi-grade teaching materials
Persons 573 1719 1.0 20.0 374.2 22 0.2
9.1.4 use of grade 1-2 multi-grade materials and
development of materials of CAS and instructor
guidelines(Center)
types 2 400 0.2 2.0 100 349.8 87 0.2
9.1.5 Intensive MTOT for Training teachers on
mother tongue , multilingual class teaching,
multi-lingual and TPD module(ETC & dist)
Persons 222 3330 1.9 0.0 0 0.0
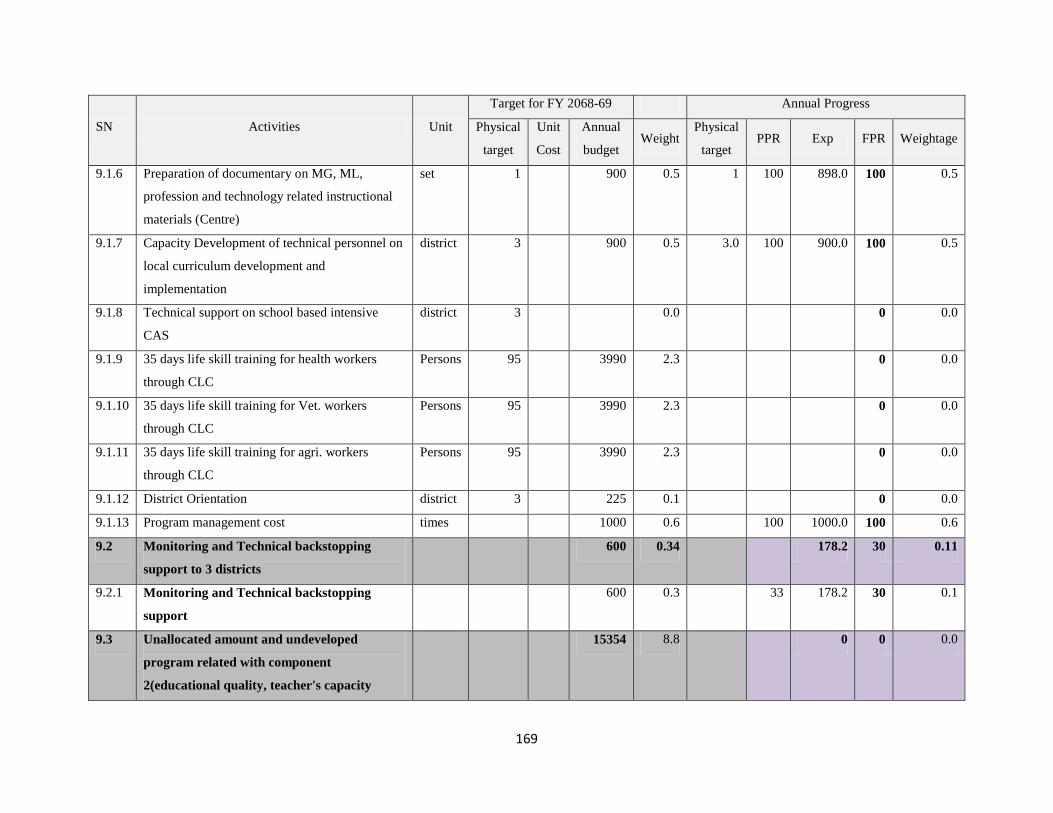
169
SN Activities Unit
Target for FY 2068-69 Annual Progress
Physical
target
Unit
Cost
Annual
budget Weight
Physical
target PPR Exp FPR Weightage
9.1.6 Preparation of documentary on MG, ML,
profession and technology related instructional
materials (Centre)
set 1 900 0.5 1 100 898.0 100 0.5
9.1.7 Capacity Development of technical personnel on
local curriculum development and
implementation
district 3 900 0.5 3.0 100 900.0 100 0.5
9.1.8 Technical support on school based intensive
CAS
district 3 0.0 0 0.0
9.1.9 35 days life skill training for health workers
through CLC
Persons 95 3990 2.3 0 0.0
9.1.10 35 days life skill training for Vet. workers
through CLC
Persons 95 3990 2.3 0 0.0
9.1.11 35 days life skill training for agri. workers
through CLC
Persons 95 3990 2.3 0 0.0
9.1.12 District Orientation district 3 225 0.1 0 0.0
9.1.13 Program management cost times 1000 0.6 100 1000.0 100 0.6
9.2 Monitoring and Technical backstopping
support to 3 districts
600 0.34 178.2 30 0.11
9.2.1 Monitoring and Technical backstopping
support
600 0.3 33 178.2 30 0.1
9.3 Unallocated amount and undeveloped
program related with component
2(educational quality, teacher's capacity
15354 8.8 0 0 0.0
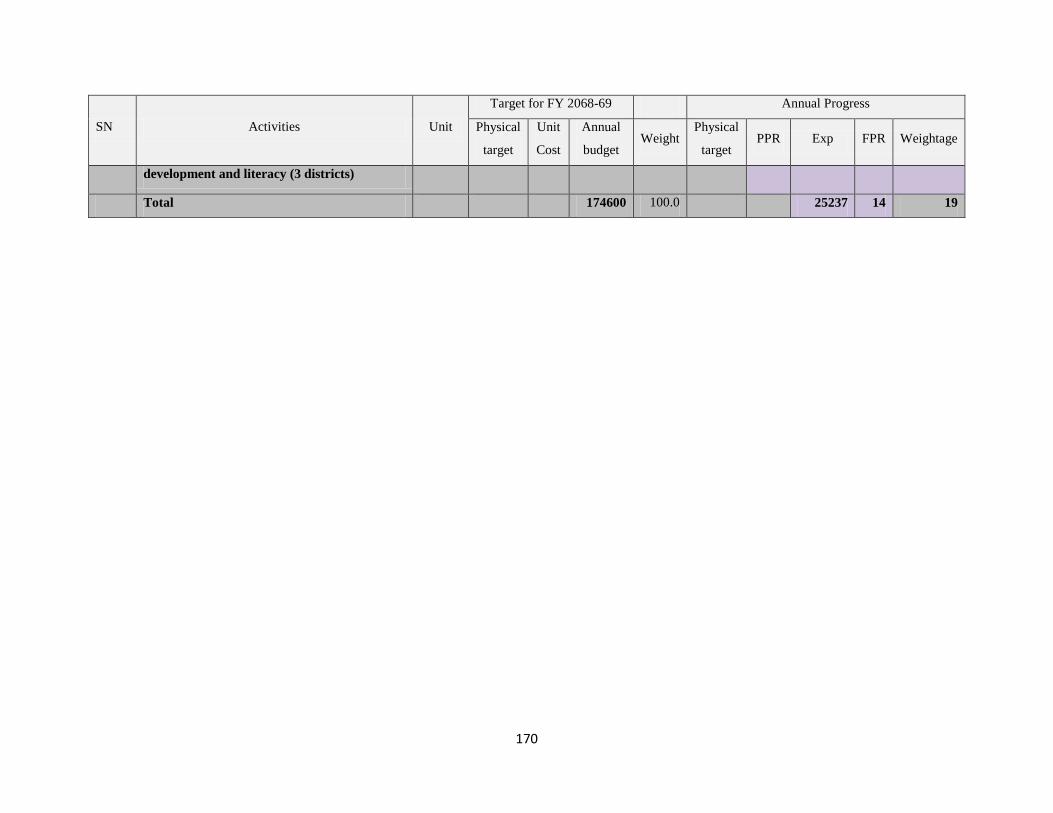
170
SN Activities Unit
Target for FY 2068-69 Annual Progress
Physical
target
Unit
Cost
Annual
budget Weight
Physical
target PPR Exp FPR Weightage
development and literacy (3 districts)
Total 174600 100.0 25237 14 19

171
Annex VI Second Higher Education Program (SHEP)
FY 2011-2012
SN Program & activities Unit Target for FY 2068-69 Annual Progress
Physical
Target
Weight Budget PPR Expend FPR Weightage
1 2 3 15 16 17
2.0 Grants 91 16000.00 100.00 16000.00 91.43
2.1 Performance grants and matching fund to community
schools
school 20 91.4 16000.00 100.00 16000.00 100.00 91.43
4 Capacity Development 0
6 Program management Cost 9 1500.00 40.00 463.16 3.43
6.1 Joint monitoring and facilitation for the conduction and
implementation of the project
5 900.00 0.00 0.00
6.6 Meeting Allowances for Project coordination
committee
Times 3 1 200.00 100.00 98.16 49.08 1.14
6.7 Preparation of Project report FMR Report 2 2 300.00 100.00 300.00 100.00 1.71
6.9 Donor Mission Times 1 1 100.00 100.00 65.00 65.00 0.57
Total 100 17500.00 94.86 16463.16 94.86
2 Recurrent Total 17500.00
Total 1+2 17500.00
Total expenditure 17500.00 16463.16

172
Annex VII Pro-poor Targeted Secondary School Stipend
FY 2011-2012
SN Project activities Unit
Target for FY 2068-69 Annual Progress
Physical
target
Unit
Cost Budget Weightage PPR Exp FPR Weightage
1 2 3 9 10 11 12
Recurrent Expenditure (3501163) 61166 59592 100
1 Pro-Poor Targeted Secondary School
Stipend
59966 58460 1726 98
1.1 Pro-Poor Targeted Secondary School
Stipend
students 15500 37500 61.31 100.00 37500.00 100.00 61.31
1.2 Incentive grants for leader & feeder school students 11816 19.32 100.00 11816.00 100.00 19.32
1.3 Media mobilization for effective program
implementation
Times 1374 2.25 100.00 1194.00 86.90 2.25
1.4 Program Management Cost Times 500 0.82 100.00 495.00 99.00 0.82
1.5 Consultancy Service- A (continue) Times 6000 9.81 100.00 4709.00 78.48 9.81
1.6 Consultancy Service -B (continue) Times 2500 4.09 100.00 2488.00 99.52 4.09
1.7 Dissemination Report finding Times 2 75 150 0.25 100.00 133.00 88.67 0.25
1.8 Budget discussion and AWPB preparation
workshop/meeting
Times 126 0.21 100.00 125.00 99.21 0.21
2 Monitoring 1200 1132 2
2.1 Monitoring and Monitoring report printing Dist & 16 1200 1.96 100.00 1132.00 94.33 1.96
173
and distribution centre
Total 61166 100 59592 100
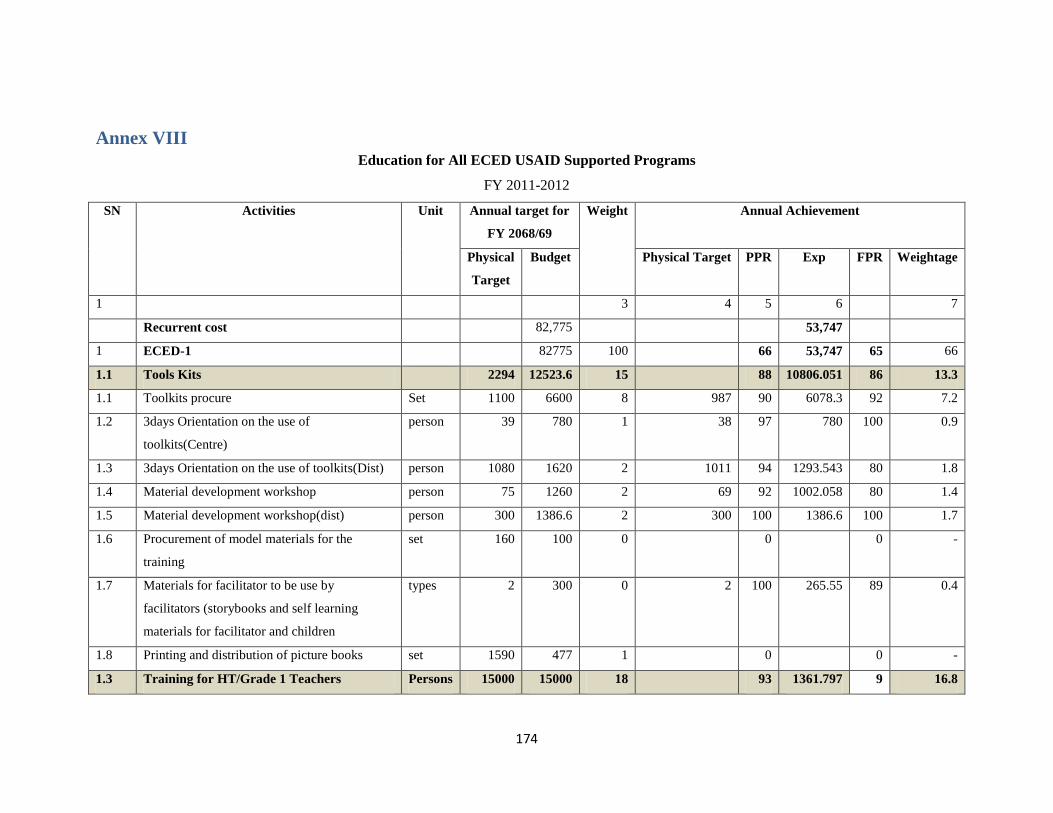
174
Annex VIII
Education for All ECED USAID Supported Programs
FY 2011-2012
SN Activities Unit Annual target for
FY 2068/69
Weight Annual Achievement
Physical
Target
Budget Physical Target PPR Exp FPR Weightage
1 3 4 5 6 7
Recurrent cost 82,775 53,747
1 ECED-1 82775 100 66 53,747 65 66
1.1 Tools Kits 2294 12523.6 15 88 10806.051 86 13.3
1.1 Toolkits procure Set 1100 6600 8 987 90 6078.3 92 7.2
1.2 3days Orientation on the use of
toolkits(Centre)
person 39 780 1 38 97 780 100 0.9
1.3 3days Orientation on the use of toolkits(Dist) person 1080 1620 2 1011 94 1293.543 80 1.8
1.4 Material development workshop person 75 1260 2 69 92 1002.058 80 1.4
1.5 Material development workshop(dist) person 300 1386.6 2 300 100 1386.6 100 1.7
1.6 Procurement of model materials for the
training
set 160 100 0 0 0 -
1.7 Materials for facilitator to be use by
facilitators (storybooks and self learning
materials for facilitator and children
types 2 300 0 2 100 265.55 89 0.4
1.8 Printing and distribution of picture books set 1590 477 1 0 0 -
1.3 Training for HT/Grade 1 Teachers Persons 15000 15000 18 93 1361.797 9 16.8
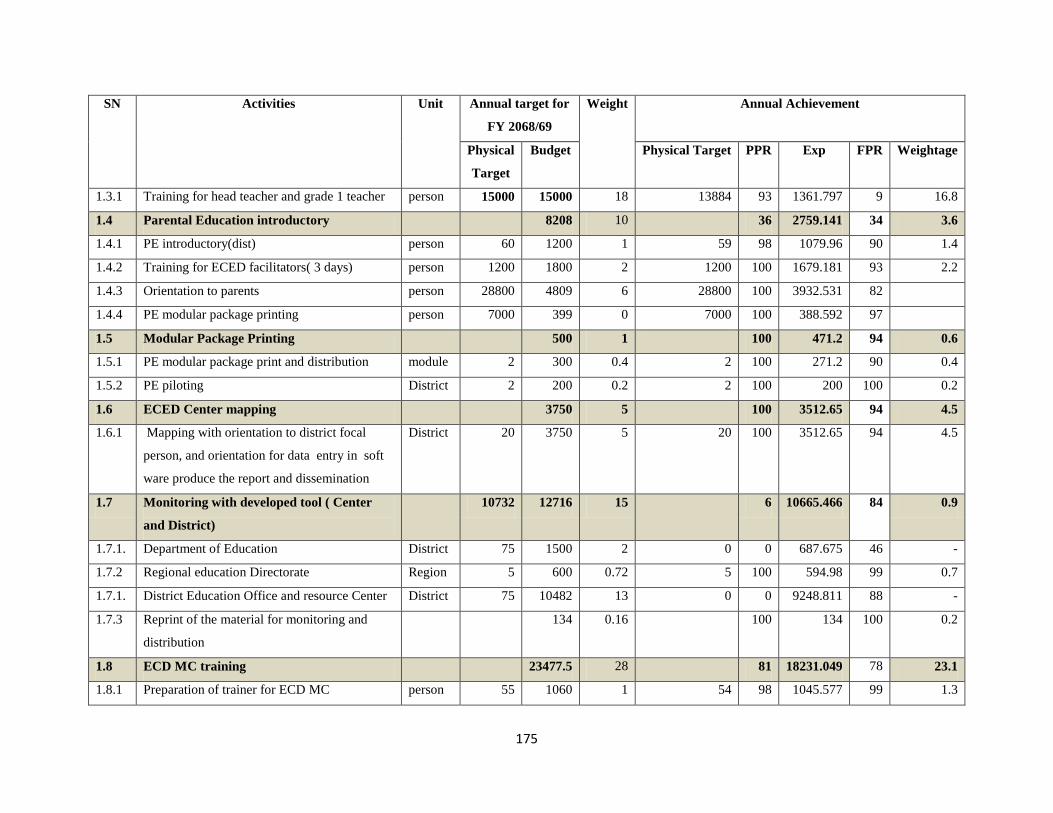
175
SN Activities Unit Annual target for
FY 2068/69
Weight Annual Achievement
Physical
Target
Budget Physical Target PPR Exp FPR Weightage
1.3.1 Training for head teacher and grade 1 teacher person 15000 15000 18 13884 93 1361.797 9 16.8
1.4 Parental Education introductory 8208 10 36 2759.141 34 3.6
1.4.1 PE introductory(dist) person 60 1200 1 59 98 1079.96 90 1.4
1.4.2 Training for ECED facilitators( 3 days) person 1200 1800 2 1200 100 1679.181 93 2.2
1.4.3 Orientation to parents person 28800 4809 6 28800 100 3932.531 82
1.4.4 PE modular package printing person 7000 399 0 7000 100 388.592 97
1.5 Modular Package Printing 500 1 100 471.2 94 0.6
1.5.1 PE modular package print and distribution module 2 300 0.4 2 100 271.2 90 0.4
1.5.2 PE piloting District 2 200 0.2 2 100 200 100 0.2
1.6 ECED Center mapping 3750 5 100 3512.65 94 4.5
1.6.1 Mapping with orientation to district focal
person, and orientation for data entry in soft
ware produce the report and dissemination
District 20 3750 5 20 100 3512.65 94 4.5
1.7 Monitoring with developed tool ( Center
and District)
10732 12716 15 6 10665.466 84 0.9
1.7.1. Department of Education District 75 1500 2 0 0 687.675 46 -
1.7.2 Regional education Directorate Region 5 600 0.72 5 100 594.98 99 0.7
1.7.1. District Education Office and resource Center District 75 10482 13 0 0 9248.811 88 -
1.7.3 Reprint of the material for monitoring and
distribution
134 0.16 100 134 100 0.2
1.8 ECD MC training 23477.5 28 81 18231.049 78 23.1
1.8.1 Preparation of trainer for ECD MC person 55 1060 1 54 98 1045.577 99 1.3

176
SN Activities Unit Annual target for
FY 2068/69
Weight Annual Achievement
Physical
Target
Budget Physical Target PPR Exp FPR Weightage
1.8.2 Training for ECD MC (RC level) person 14945 22417.5 27 12045 81 17185.472 77 21.8
1.9 Advocacy and Awareness 4600 1 72 4159.8 90 0.7
1.9.1 Broadcasting from local media Times 600 1 1 100 600 100 0.7
1.10 Advocacy Video clips Times 2000 2 1 100 1779.9 89 2.2
1.10.1 Poster Design and Print Types 200 0 5 80 0 0 -
1.10.2 Community mobilization Times 5 1800 2 5 100 1779.9 99 2.2
Total 82,775 100 66 53,747 65 66

177
Annex IX
Progress on UNICEF Supported Programs
FY 2011-2012
SN Activity and duration
Code
Authorized
Amount
Expenditures
accepted by
Agency
Target Jan-July 2012 Weight PPR Exp.% Weightage
2.1.1 Preparation and printing of Early Learning
Development Standard
IR2.1 3 150,000.00 0.47 100.00 15,100.00 10.07 0.47
2.1.2 Orientation on Early Learning Development Standard IR2.1 150 500,000.00 1.55 100.00 470,090.00 94.02 1.55
2.1.3 Orientation on ECD in Emergency IR3.4 1 150,000.00 0.47 - - -
2.1.4 Finalization of ECD software and training for REDs
and DEOs
IR2.1 350,000.00 1.09 75.00 284,650.00 81.33 0.81
2.2.1 Toolkits development for girls education
( procurement, collection, revision, printing and
development)
IR2.3 2000 2,000,000.00 6.21 100.00 1,815,431.00 90.77 6.21
2.2.2 Field testing of toolkits IR2.2 3 600,000.00 1.86 100.00 600,000.00 100.00 1.86
2.2.3 Capacity building program for gender focal point, head
teacher, SMC and feeder hostel warden
IR4.1 80 1,200,000.00 3.72 100.00 1,200,000.00 100.00 3.72
2.2.4 Stakeholders workshop for Policy making on
mainstreaming of Religious schools
IR1.1 700,000.00 2.17 100.00 568,880.00 81.27 2.17
2.3.1 Five day refresher programme for FSP facilitator level-
2)
IR2.2 173 500,000.00 1.55 17.00 215,884.00 43.18 0.26
2.3.2 Teachers Guide Development of CRC for FSP IR2.2 2 500,000.00 1.55 100.00 421,022.00 84.20 1.55

178
SN Activity and duration
Code
Authorized
Amount
Expenditures
accepted by
Agency
Target Jan-July 2012 Weight PPR Exp.% Weightage
facilitator training package and reference materials for
level -1 FSP
2.3.3 Review of existing packages of non formal program
and recommend standard packages suitable for
adolescents age group up to 19 years)open/distance
learning etc.
IR1.2 1 1,500,000.00 4.66 50.00 577,485.00 38.50 2.33
2.3.4 Capacity building of Community Learning
Center(CLC) for bringing out of school adolescent girls
(data base, computer support etc)
IR4.1 1 1,000,000.00 3.10 100.00 1,000,000.00 100.00 3.10
2.3.5 Joint Monitor and Supervision for qulaity support in
the non formal
IR4.3 3 80,000.00 0.25 100.00 79,000.00 98.75 0.25
2.3.6 Strengthening of Non formal Networking IR1.1 3 90,000.00 0.28 100.00 90,000.00 100.00 0.28
2.3.7 Development of self learning materials on education in
emergency
IR3.4 1 250,000.00 0.78 100.00 250,000.00 100.00 0.78
2.4.1 Printing and development of developed materials IR2.2 10 1,500,000.00 4.66 100.00 1,497,333.00 99.82 4.66
2.4.2 Workshop on Child Friendly School self evaluation. IR4.1 110 1,150,000.00 3.57 98.00 791,999.00 68.87 3.50
2.4.3 Development of materials on Child Friendly School
self evaluation.
IR4.1 1 750,000.00 2.33 100.00 257,675.00 34.36 2.33
2.4.4 Child Friendly School model building program IR2.2 875,000.00 2.72 - - -
2.4.5 Development of CRC for grade 10 for optional ECD
subject
IR2.2 1 100,000.00 0.31 100.00 99,965.00 99.97 0.31
2.4.6 Preparation and publication of teacher data base IR1.2 750,000.00 2.33 100.00 740,835.00 98.78 2.33
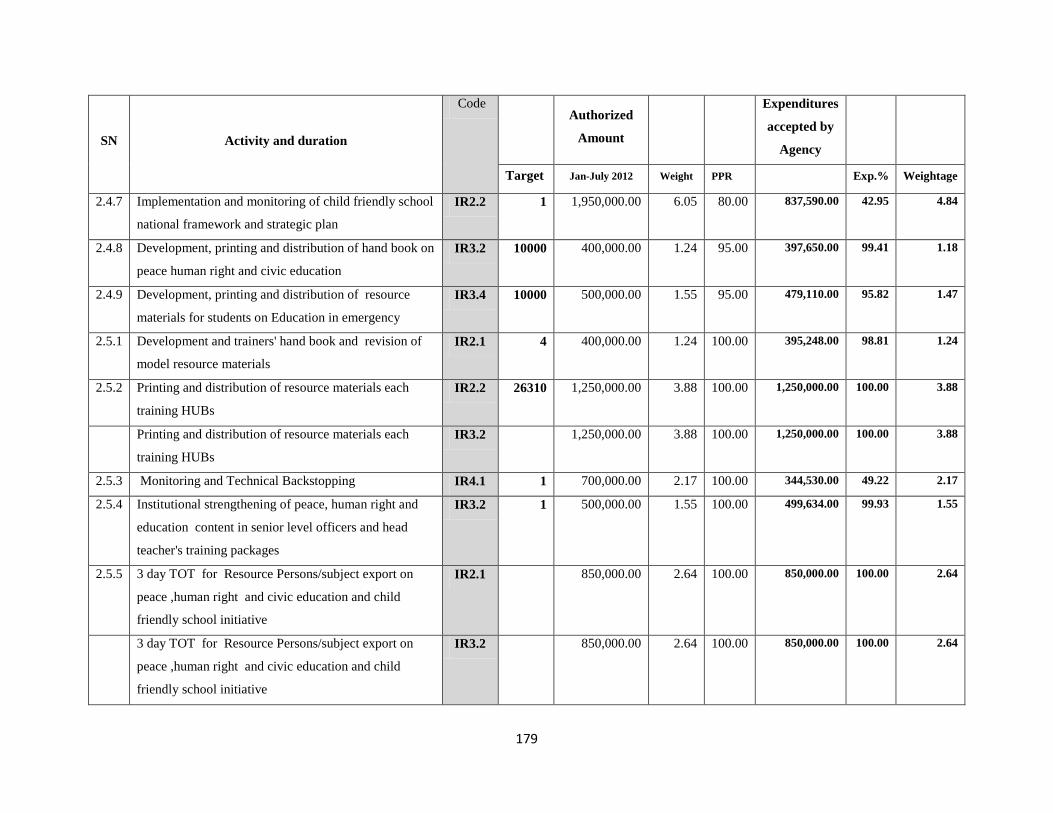
179
SN Activity and duration
Code
Authorized
Amount
Expenditures
accepted by
Agency
Target Jan-July 2012 Weight PPR Exp.% Weightage
2.4.7 Implementation and monitoring of child friendly school
national framework and strategic plan
IR2.2 1 1,950,000.00 6.05 80.00 837,590.00 42.95 4.84
2.4.8 Development, printing and distribution of hand book on
peace human right and civic education
IR3.2 10000 400,000.00 1.24 95.00 397,650.00 99.41 1.18
2.4.9 Development, printing and distribution of resource
materials for students on Education in emergency
IR3.4 10000 500,000.00 1.55 95.00 479,110.00 95.82 1.47
2.5.1 Development and trainers' hand book and revision of
model resource materials
IR2.1 4 400,000.00 1.24 100.00 395,248.00 98.81 1.24
2.5.2 Printing and distribution of resource materials each
training HUBs
IR2.2 26310 1,250,000.00 3.88 100.00 1,250,000.00 100.00 3.88
Printing and distribution of resource materials each
training HUBs
IR3.2 1,250,000.00 3.88 100.00 1,250,000.00 100.00 3.88
2.5.3 Monitoring and Technical Backstopping IR4.1 1 700,000.00 2.17 100.00 344,530.00 49.22 2.17
2.5.4 Institutional strengthening of peace, human right and
education content in senior level officers and head
teacher's training packages
IR3.2 1 500,000.00 1.55 100.00 499,634.00 99.93 1.55
2.5.5 3 day TOT for Resource Persons/subject export on
peace ,human right and civic education and child
friendly school initiative
IR2.1 850,000.00 2.64 100.00 850,000.00 100.00 2.64
3 day TOT for Resource Persons/subject export on
peace ,human right and civic education and child
friendly school initiative
IR3.2 850,000.00 2.64 100.00 850,000.00 100.00 2.64
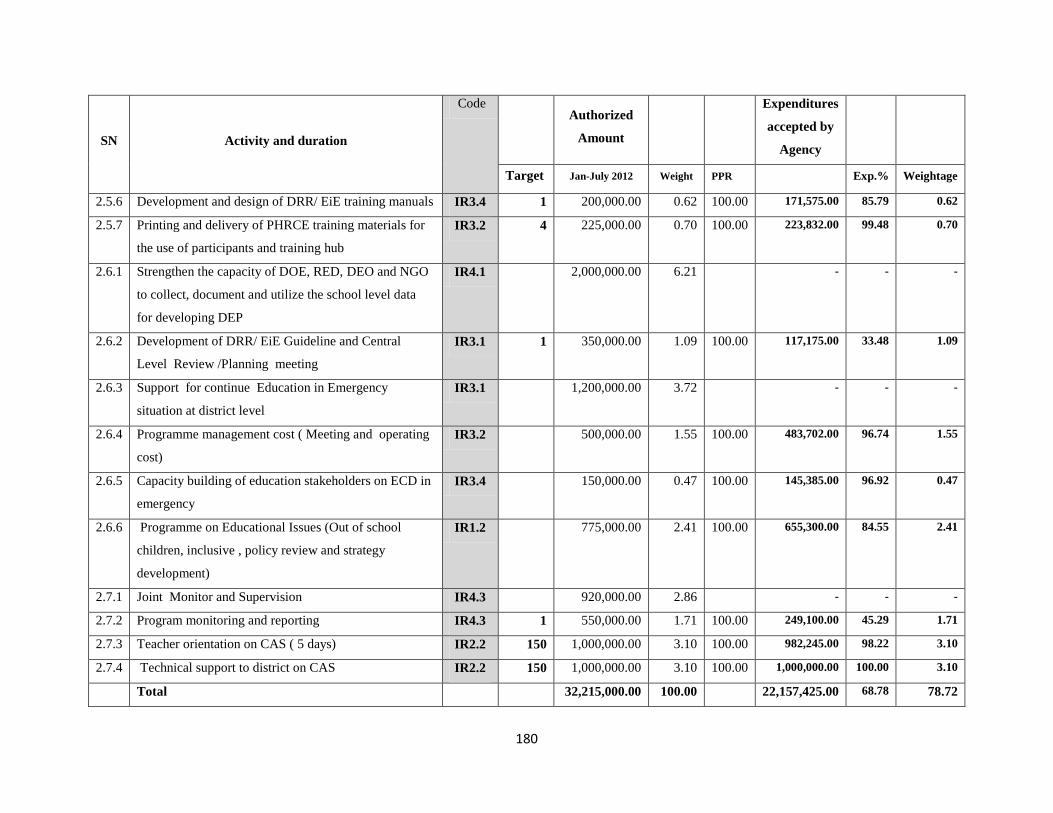
180
SN Activity and duration
Code
Authorized
Amount
Expenditures
accepted by
Agency
Target Jan-July 2012 Weight PPR Exp.% Weightage
2.5.6 Development and design of DRR/ EiE training manuals IR3.4 1 200,000.00 0.62 100.00 171,575.00 85.79 0.62
2.5.7 Printing and delivery of PHRCE training materials for
the use of participants and training hub
IR3.2 4 225,000.00 0.70 100.00 223,832.00 99.48 0.70
2.6.1 Strengthen the capacity of DOE, RED, DEO and NGO
to collect, document and utilize the school level data
for developing DEP
IR4.1 2,000,000.00 6.21 - - -
2.6.2 Development of DRR/ EiE Guideline and Central
Level Review /Planning meeting
IR3.1 1 350,000.00 1.09 100.00 117,175.00 33.48 1.09
2.6.3 Support for continue Education in Emergency
situation at district level
IR3.1 1,200,000.00 3.72 - - -
2.6.4 Programme management cost ( Meeting and operating
cost)
IR3.2 500,000.00 1.55 100.00 483,702.00 96.74 1.55
2.6.5 Capacity building of education stakeholders on ECD in
emergency
IR3.4 150,000.00 0.47 100.00 145,385.00 96.92 0.47
2.6.6 Programme on Educational Issues (Out of school
children, inclusive , policy review and strategy
development)
IR1.2 775,000.00 2.41 100.00 655,300.00 84.55 2.41
2.7.1 Joint Monitor and Supervision IR4.3 920,000.00 2.86 - - -
2.7.2 Program monitoring and reporting IR4.3 1 550,000.00 1.71 100.00 249,100.00 45.29 1.71
2.7.3 Teacher orientation on CAS ( 5 days) IR2.2 150 1,000,000.00 3.10 100.00 982,245.00 98.22 3.10
2.7.4 Technical support to district on CAS IR2.2 150 1,000,000.00 3.10 100.00 1,000,000.00 100.00 3.10
Total 32,215,000.00 100.00 22,157,425.00 68.78 78.72

181
Annex X School Sector Reform Program
Indicators for Minimum Enabling Conditions (MECs) for School Operation
S.N. Area Indicators of Minimum Enabling Conditions
1 School Building Built according to geographical situation and locally available materials and environment friendly. Room's height of
9 feet and safe from rain and sunlight.
2 Class Rooms Space of 0.75 sq. m. per student with adequate light and vetilation
3 Playground and sports materials suitable at least for the volleyball court and availability of sufficient sports materials
4 Furniture Based on the students age and the size, proper sized adequate furniture for all students, safe from cool and hot, proper
furnishing or carpeting and comfort group work.
5 Library/ Book Corner A library with separate room having 500, 1000 and 2000 books except than textbooks for school of grade 1-3, 1-5
and 1-8 respectively.
Also the availability of book corner in each class with minimum required reference materials.
6 Toilet Separate toilets for girls and boys with water supply, detergent powder and soap.
A separate compartment for each additional fifty students.
7 Drinking Water Availability of pure water with in the school compound.
8 Mid day meal Availability of the hot and hygienic mid day meal for the students.
9 Compound wall Minimum size of compound to stand all the students together and safe with compound wall or fencing to block the
outer disturbances.
10 First Aid First aid box with minimum medicines for primary health care.
11 Laboratory Laboratory with minimum required materials based on the curriculum
12 Curriculum textbook and
educational materials
Availability of a set of free textbook to each student within 2 weeks of new academic year.
A set of curriculum, textbooks and teacher's guide in the school.
Necessary teaching learning materials e.g. Black/white board, maps, globe, mathematical equipments and subject
specific materials.
13 Schoool Plan Periodic plan with long term vision and mission, updated SIP, annual Work plan and Daily routine according to
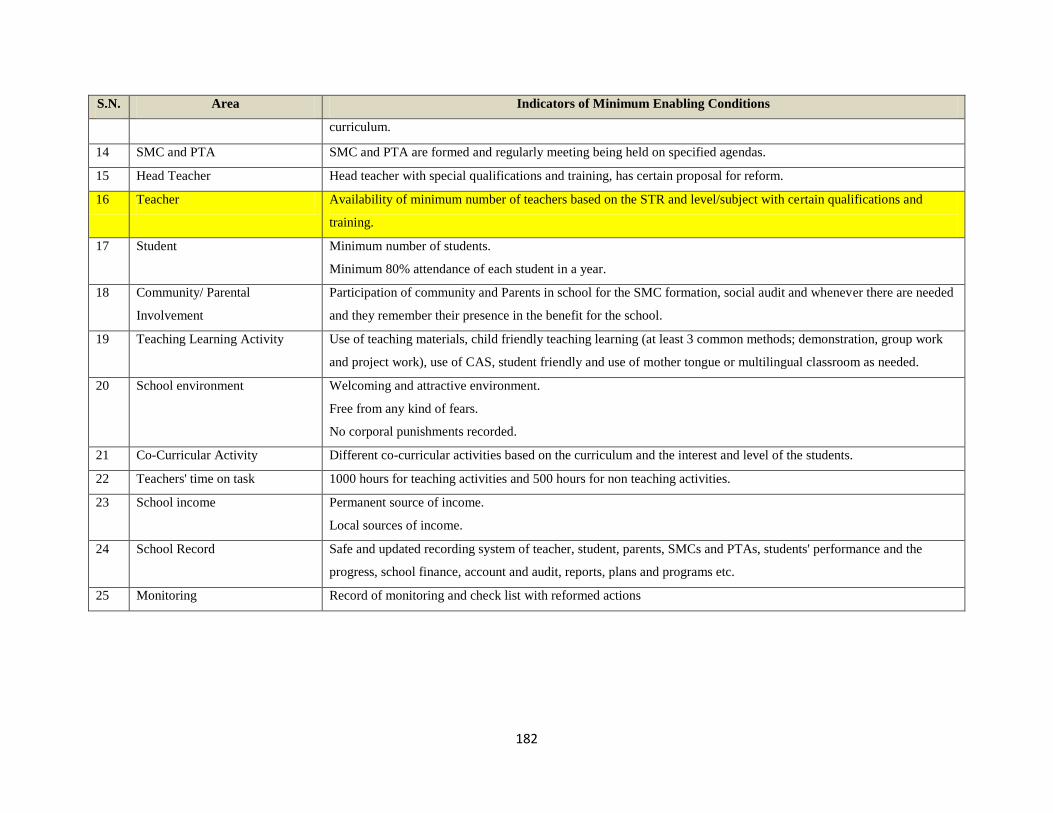
182
S.N. Area Indicators of Minimum Enabling Conditions
curriculum.
14 SMC and PTA SMC and PTA are formed and regularly meeting being held on specified agendas.
15 Head Teacher Head teacher with special qualifications and training, has certain proposal for reform.
16 Teacher Availability of minimum number of teachers based on the STR and level/subject with certain qualifications and
training.
17 Student Minimum number of students.
Minimum 80% attendance of each student in a year.
18 Community/ Parental
Involvement
Participation of community and Parents in school for the SMC formation, social audit and whenever there are needed
and they remember their presence in the benefit for the school.
19 Teaching Learning Activity Use of teaching materials, child friendly teaching learning (at least 3 common methods; demonstration, group work
and project work), use of CAS, student friendly and use of mother tongue or multilingual classroom as needed.
20 School environment Welcoming and attractive environment.
Free from any kind of fears.
No corporal punishments recorded.
21 Co-Curricular Activity Different co-curricular activities based on the curriculum and the interest and level of the students.
22 Teachers' time on task 1000 hours for teaching activities and 500 hours for non teaching activities.
23 School income Permanent source of income.
Local sources of income.
24 School Record Safe and updated recording system of teacher, student, parents, SMCs and PTAs, students' performance and the
progress, school finance, account and audit, reports, plans and programs etc.
25 Monitoring Record of monitoring and check list with reformed actions